MILLENNIUM DEVELOPMENT GOALS NEEDS ...
208
INVESTING IN SUSTAINABLE DEVELOPMENT: MILLENNIUM DEVELOPMENT GOALS NEEDS ASSESSMENT Full Report TAJIKISTAN
-
Upload
khangminh22 -
Category
Documents
-
view
2 -
download
0
Transcript of MILLENNIUM DEVELOPMENT GOALS NEEDS ...

INVESTING IN SUSTAINABLE DEVELOPMENT:
MILLENNIUM DEVELOPMENT GOALS
NEEDS ASSESSMENT
Full Report
TAJIKISTAN

INVESTING IN SUSTAINABLE DEVELOPMENT:
MILLENNIUM DEVELOPMENT GOALS
NEEDS ASSESSMENT
Full Report
TAJIKISTAN
DushanbeMay 2005

MILLENNIUM DEVELOPMENT GOALS NEEDS ASSESSMENT TAJ IK ISTAN
© MDG Need Assessment, UNDP, Tajikistan
1
INVESTING IN SUSTAINABLE DEVELOPMENT:
MILLENNIUM DEVELOPMENT GOALS
NEEDS ASSESSMENT
TAJIKISTAN
Full Report
The Government Working Groups on the Millennium Development Goals (MDGs) and the United Nations (UN) MDG Needs Assessment Team extend their deepest gratitude to the President of the Republic of Tajikistan, Emomali Rakhmonov, for his commitment to reduc-ing poverty and fostering economic, social, and human development in the country through realization of the MDGs. The President’s invaluable and continued support was crucial to the success of the MDG Needs Assessment in Tajikistan.
The MDG Needs Assessment Team would also like to express their gratitude to Fayzullo Kholboboyev, Economic Advisor to the President, for his effective coordination of the MDG Working Groups. The Working Groups were led by Vice-Prime Ministers of the Republic of Tajikistan, whose close collaboration and support are highly appreciated. We thank the Focal Points in the Ministry of Agriculture, the Ministry of Education, the Ministry of Health, the State Committee on Women’s and Family Affairs, and the Ministry of Melioration and Water Services, for leading the sectoral needs assessments.
We gratefully acknowledge the close collaboration of the Ministry of Finance, the Ministry of Economy, the State Environmental Agency, the State Statistical Committee, the Poverty Reduction Strategy Paper (PRSP) Monitoring Unit, and the Aid Coordination Unit of the President’s Office.
The MDG Needs Assessment Team is very grateful to the UN Resident Coordinator and UNDP Resident Representative, William Paton, and to UNDP Deputy Resident Representa-tive Igor Bosc, for their effective leadership of the MDG Needs Assessment work in Tajiki-stan.
The MDG Needs Assessment Team gratefully acknowledges the invaluable technical support and close collaboration of the Millennium Project, headed by Prof. Jeffrey D. Sachs.
More than 100 other organizations and individuals that have contributed to the MDG needs assessment process are named in the Acknowledgements section at the end of this report.
MILLENNIUM DEVELOPMENT GOALS NEEDS ASSESSMENT TAJ IK ISTAN
2
MILLENNIUM DEVELOPMENT GOALS NEEDS ASSESSMENT TAJ IK ISTAN
The MDG Needs Assessment Team:Temur Basilia, Team LeaderTuya Altangerel, Focal PointOliver Babson, Consultant Firuz Shukurov, Financial and Macroeconomic AnalystUsmon Rakhmonov, Policy AdvisorNino Nadiradze, Advisor on Environmental SustainabilityTanzila Ergasheva, Food Security and Rural Development AdvisorSabrina Hacene-Lhadj-Pirova, Gender AdvisorFiruz Bakiev, Health AdvisorIbaidullo Safarov, Education AdvisorKamoliddin Sirojiddinov, Water AdvisorBobokhon Ismoilov, PRSP AdvisorMakhvash Khamrayeva, Administrative and Research AssistantRustam Karimov, IT Specialist
Prepared by: Tuya AltangerelOliver BabsonTemur Basilia
Editor: Tuya Altangerel
Design: Mikhail Romanyuk
Printed by: Mir Polygrafii, Dushanbe
Photo Credits: UNICEF/Tajikistan/PirozziTuya Altangerel, UNDPJean-Luc Ray, AKF
3
TABLE OF CONTENT
1. Introduction .......................................................................................................... 7
2. MDG Needs Assessment Process in Tajikistan ................................................ 9 UN Country Team ........................................................................................................................... 10 UN Millennium Project ................................................................................................................... 10 Needs Assessment Report ............................................................................................................ 10
3. Key Institutional and Structural Reforms ......................................................... 11 Macroeconomic Environment ....................................................................................................... 11 Good Governance and Public Administration Reform ........................................................... 12 Tax and Customs Administration Reform ................................................................................. 14 Privatization and Private Sector Development ......................................................................... 15 Public Utilities Reform .................................................................................................................... 17
4. Methodology for MDG Needs Assessment ....................................................... 19
5. MDG 1: Combating Poverty and Hunger .......................................................... 25 Income poverty ................................................................................................................................. 25 Recommendations ............................................................................................................................ 26 Food Security (Nutrition and Rural Development) ................................................................. 28 Nutrition ............................................................................................................................................. 29 Agricultural Productivity ................................................................................................................ 35 Reform in the Cotton Sector ........................................................................................................ 38 Land Reform ...................................................................................................................................... 43 Agricultural Infrastructure ............................................................................................................. 45 Financial Estimations for reducing poverty and hunger .......................................................... 47 Financial Profitability of Small Farmers ....................................................................................... 48
6. MDG 2: Achieve universal primary education .................................................. 52 Overview ............................................................................................................................................ 52 Government Measures .................................................................................................................. 59 Recommendations ............................................................................................................................ 62 Financial Estimations for Education .............................................................................................. 62 Total costs for general secondary education ............................................................................ 70 Conclusion ......................................................................................................................................... 72
7. MDG 3: Achieving Gender Equality ................................................................... 74 Overview ............................................................................................................................................ 74 Government Measures .................................................................................................................... 78 Recommendations ............................................................................................................................ 79 Financial estimations for Promoting Gender Equality ............................................................. 80 Conclusion ......................................................................................................................................... 82
8. Health MDGs (4, 5 and 6): Lowering child (MDG 4) and maternal (MDG 5) mortality rates, and combating the spread of infectious diseases (MDG 6) ................................................................................ 83 Overview ............................................................................................................................................ 83 Government Measures .................................................................................................................... 87 Goal 4: Reduce child mortality ..................................................................................................... 88 Goal 5: Improve maternal health .................................................................................................. 89
MILLENNIUM DEVELOPMENT GOALS NEEDS ASSESSMENT TAJ IK ISTAN
4
MILLENNIUM DEVELOPMENT GOALS NEEDS ASSESSMENT TAJ IK ISTAN
Government measures on maternal and child health care .................................................... 91 Recommendations for improving maternal health care and RH .......................................... 92 Financial estimations for MDG 4 and 5 ....................................................................................... 94 Goal 6: Combat HIV/AIDS, malaria and other diseases ......................................................... 103 Combating Malaria ........................................................................................................................... 104 Financial estimations for combating the spread of malaria .................................................... 108 Parasitical Diseases (Helminthes) ................................................................................................ 109 Financial Estimations for combating parasitical diseases ........................................................ 110 Tuberculosis ....................................................................................................................................... 111 Financial Estimations for combating TB ...................................................................................... 113 Immunization ..................................................................................................................................... 115 Financial Estimations for immunization ....................................................................................... 117 Promoting healthy living .................................................................................................................. 118 Recommendations for Health MDGs .......................................................................................... 119 Financial Estimations for Health MDGs ...................................................................................... 121
9. MDG 7: Promoting Sustainable Environment and Improving Water and Sanitation Services ............................................................................................... 123 Achieving Environmental Sustainability ....................................................................................... 123 Climate Change Mitigation Activities and Policies ................................................................... 126 Land Degradation Programmes .................................................................................................... 127 Management of Protected Areas .................................................................................................. 129 Sustainable Forestry Management ............................................................................................... 131 Waste Management ......................................................................................................................... 132 Integrated Water Management (local strategies and action plans) ..................................... 134 Environmental Monitoring (air, water, soil) ............................................................................... 135 Disaster Prevention Management ................................................................................................ 137 Trans-boundary cooperation ......................................................................................................... 138 Integration of Environmental Sustainability into Sectoral Strategies .................................. 140 Recommendations for Achieving Environmental Sustainability (quick wins) ..................... 141 Financial Estimations for Achieving Environmental Sustainability ........................................ 142 Water and Sanitation ....................................................................................................................... 145 Overview ............................................................................................................................................ 145 Government Measures .................................................................................................................... 147 Recommendations ............................................................................................................................ 148 Financial Estimations for Water and Sanitation ........................................................................ 149
10. MDG 8. Global Partnership for Development .................................................. 160 Overview ............................................................................................................................................ 160 Recommendations for MDG 8 ...................................................................................................... 163
11. Financing for the Millennium Development Goals ........................................... 164 12. Conclusion and Next Steps ................................................................................. 16813. Annexes ................................................................................................................. 169 Macroeconomic Framework (High Growth) ............................................................................ 169 Macroeconomic Framework (Baseline Growth) ...................................................................... 170 Monitoring and Evaluation Framework for MDGs ................................................................... 171 MDG-compatible energy services development ...................................................................... 176 MDG-compatible transport services development ................................................................. 18614. References ............................................................................................................. 19415. Acknowledgements .............................................................................................. 198
5
ACRONYMS
AAH Action Against HungerADB Asian Development BankAIDS Acquired Immune Deficiency SyndromeARV Antiretroviral therapy CDM Clean Development MechanismCR Congenital RubellaCSSEI Centre of State Sanitary Epidemiological InspectionDOTS Directly Observed Treatment System DPT Diphtheria, Pertusis, Tetanus vaccineDT Diphtheria, Tetanus vaccine (for younger children)DTM Diphtheria, Tetanus vaccine (for elder children and adults)ECA Europe and Central AsiaEIA Environmental Impact AssessmentERB European Regional Bureau GBAO Gorno-Badakhshan Autonomous OblastGDP Gross Domestic ProductGoT Government of TajikistanCG Consultative GroupGHG Greenhouse GasGIS Geographic Information SystemHIV Human Immunodeficiency VirusICG International Crisis GroupICSD Interstate Commission on Sustainable DevelopmentIFC International Finance CorporationIMF International Monetary FundIOM International Organization of MigrationIDU Injection Drugs Users IUD Intrauterine Devise MDGs Millennium Development GoalsMDGR Millennium Development Goals ReportMEA Multilateral Environmental AgreementsM&E Monitoring and EvaluationMESCD Ministry of Emergency Situations and Civil DefenseMICS Multiple Indicator Cluster SurveyMTBF Medium-Term Budget FrameworkMH Ministry of HealthMP Millennium ProjectMMR Measles, Mumps, Rubella vaccineNAP National Action PlanNEAP National Environmental Action Plan
MILLENNIUM DEVELOPMENT GOALS NEEDS ASSESSMENT TAJ IK ISTAN
6
MILLENNIUM DEVELOPMENT GOALS NEEDS ASSESSMENT TAJ IK ISTAN
NGO Non-Governmental OrganizationODA Oversees Development AssistancePA Protected AreasPAU Poverty Assessment UpdatePIP Public Investment ProgrammePOPs Persistent Organic PollutantsPPP Purchasing power parityPRS Poverty Reduction Strategy PRSP Poverty Reduction Strategy PaperPHC Primary Health CareRH Reproductive healthRT Republic of TajikistanRRS Region Republican Subordination SES Sanitary Epidemiological Service SME Small and medium enterprisesSTD Sexual Transmitted DiseasesTA Technical assistanceTADAZ Tajik Aluminium SmelterTB TuberculosisTLSS Tajikistan Living Standard SurveyTT Tetanus Toxoid vaccineUN United NationsUNCT United Nations Country TeamUNEP United Nations Environment ProgrammeUNICEF United Nations International Children’s Emergency FundUSAID United States Agency for International DevelopmentUNFPA United Nations Population Fund WB World BankWFP World Food ProgrammeWHO World Health OrganizationWUA Water Users association
7
MDG NEEDS ASSESSMENT IN TAJIKISTAN
1. INTRODUCTION
INTRODUCTION
This report provides an overview of the policy reforms and financial resources required to meet key quantitative human development targets in Tajikistan within the framework of the eight Millennium Development Goals (MDGs).1 The report was produced by the Millennium Development Goals Needs Assessment Team of the United Nations Tajikistan, in close col-laboration with Government Working Groups on food security, education, gender, health, and water and sanitation, under the leadership of the Economic Unit of the President’s Office. Support of the Millennium Project (MP) team, based in New York.
As the Government’s 2003 Progress Towards the Millennium Development Goals report indicated, Tajikistan is unlikely to meet its MDG targets if it only continues along its current trajectory. Progress towards the targets will require a sustained Government commitment to policy reform and a major increase in financial resources, both national and international. Although significant external financing will be needed for MDG-related investments, calls for additional funding must be balanced with the imperative to manage a heavy burden of existing foreign debt. Thus it is important to carry forward profound reforms to improve the allocation of resources in the social sectors and strengthen the efficiency of public service delivery.
This report identifies a set of overarching structural and institutional reforms that are essential for creating an enabling environment for achieving the MDGs in Tajikistan. The recommended reforms are in the areas of good governance and public administration, tax administration, pri-vate sector development and public utilities. When implemented, the reforms will help scale up the MDGs, and will increase the Government’s capacity to effectively absorb the financial aid for the MDGs. The second part of the report focuses on interventions and investments needed for MDGs 1-7. Both structural reforms and MDGs interventions will need to start immediately, as of 2005, and continue through 2015. It is also crucial that the reforms and MDG interventions and financing are carried out simultaneously. This means that, as of 2005, the Government must demonstrate political will to commit to these reforms and MDG-related policies, while at the same time the international community should boost its commitment to Tajikistan by rechannel-ling existing aid to MDG-related priorities and by increasing the overall amount of aid.
The practical recommendations presented in this report cover activities that will spur the private sector and therefore the country’s economic development, and essential interventions needed to achieve human and social development. Thus it is intended that overall structural reforms, and the priorities and financing options identified in the areas of rural development, education, health, gender, water and sanitation and environment, serve as a basis for develop-ing a practical, MDG-prioritized Poverty Reduction and Economic Development Strategy for 2005-2007. In addition, the Government of Tajikistan will develop a long-term MDG strategy for the country based on this report.
1 See the Millennium Declaration of 8 September 2000, General Assembly Resolution A/55/L.2, available at
http://www.un.org/millennium/declaration/ares552e.htm
MILLENNIUM DEVELOPMENT GOALS NEEDS ASSESSMENT TAJ IK ISTAN
8
MILLENNIUM DEVELOPMENT GOALS NEEDS ASSESSMENT TAJ IK ISTAN
Though Tajikistan remains the poorest country in Central Asia, through progressive eco-nomic, social and political reforms it can prove its ability to “move mountains” and become an example of relative equality, modest prosperity and evolving democracy in the region. The Government’s commitment to achieving the MDGs offers a unique opportunity to foster equitable and sustainable development. If Tajikistan continues courageously down the path of reform and better national resource allocation, the international community should respond by providing greater support for national efforts to promote human development and equita-ble growth. At a minimum, donors will need to double existing aid to help Tajikistan meet its MDG targets by 2015.
9
2. MDG NEEDS ASSESSMENT
PROCESS IN TAJIKISTAN
The Government
MDG NEEDS ASSESSMENT PROCESS IN TAJIKISTAN
The Government of Tajikistan signed the UN Millennium Declaration in 2000 along with 191 other countries. Since then, the Government has undertaken a number of activities that dem-onstrate its commitment to achieving the MDGs: • In 2003, the Government and the UN Country Team (UNCT) produced a joint re-
port, Progress towards the Millennium Development Goals, which reviewed the chal-lenges and opportunities involved in fulfilling each of the MDG targets;
• The Government recognized that national development strategies and policies should be realigned with the MDG priorities, and that it should assess the financial resources needed to implement these priorities. Tajikistan is one of the eight pilot countries where the MDG needs assessment exercise is being undertaken in partnership with the Millennium Project in New York.
• In June 2004, President Emomali Rakhmonov conducted a videoconference with Mil-lennium Project Director Prof. Jeffrey D. Sachs on the MDG Needs Assessment. In August, five Working Groups were established by presidential decree for five sectors covered by the MDGs. Chaired by the deputy prime ministers responsible for the sec-tors, the Working Groups work on policy development and financial costing for the following areas:
o Education o Health o Water and Sanitation o Gender o Food Security and Nutrition. In January 2005, the Needs Assessment Team began assessing MDG-related needs in
the infrastructure sector (energy and roads analyses), and in the environment sector. The Ministry of Energy, the Ministry of Roads, and the State Committee for Environ-mental Protection and Forestry have actively participated in these assessments. The energy and roads sectors, while not directly targeted by the MDGs, have a lasting impact on the overall economic development of the country, and are part of the key infrastructure needed to achieve the MDGs in the health, education, water, agriculture and other sectors.
• The Working Groups are coordinated by the State Advisor to the President on Eco-nomic Policy, Fayzullo Kholboboyev. Their members are from line ministries, state agencies, and national and international NGOs. From November 2004 to March 2005, the Working Groups convened a series of meetings and consultations that culminated in national workshops in which Government agencies and members of the internation-al community and civil society participated. As a result of the workshops, the Needs Assessment Team and the Working Groups completed the identification of policy priorities and financial estimations in their respective sectors. The Working Groups’ sectoral needs assessments are incorporated into the full MDG Needs Assessment report.
MILLENNIUM DEVELOPMENT GOALS NEEDS ASSESSMENT TAJ IK ISTAN
10
MILLENNIUM DEVELOPMENT GOALS NEEDS ASSESSMENT TAJ IK ISTAN
• The finalized policy priorities and financial estimations resulting from the Working Group meetings and workshops will be incorporated into the revised Poverty Reduc-tion Strategy Paper (PRSP) during 2005. The Needs Assessment report will serve as a basis for the Government’s long-term development strategy for achieving the MDGs.
UN Country TeamThe UNCT supports Tajikistan’s efforts to integrate the MDGs into its national development strategies, budgetary frameworks, and ministerial priorities, as well as donor assistance frame-works and development programmes. In addition to preparing the MDG Needs Assessment report, the UNCT’s MDG Needs Assessment Team, comprising international and national experts, provides technical assistance to the Working Groups on the MDGs.
UN Millennium ProjectTo support the MDG process, UN Secretary-General Kofi Annan launched the Millennium Project (MP) to identify best practices and strategies for attainment of the MDGs in the coun-tries where the challenges are greatest. Headed by Prof. Sachs, the MP focuses on identifying the operational priorities, organizational means of implementation, and financing structures necessary to achieve the MDGs. While the country offices are in charge of carrying out country-specific MDG needs assessment, the MP team of experts is responsible for providing technical assistance and overall support.
Purpose of the MDG Needs AssessmentThe MDG Needs Assessment aims to:• Analyze current development trends in Tajikistan and explicitly discuss changes in na-
tional policies and sectoral strategies that may be required to achieve all eight MDGs;• Build comprehensive, but flexible models which the Government and its partners can
use to consider development scenarios, including detailed breakdowns of needs as well as estimates of both internal (Government) and external (donor) resources required;
• Provoke substantive debate on the practicalities of development in Tajikistan.
The assessment is a joint effort by the Government and the UNCT. It will have two majoroutcomes:A. A long-term national plan through to 2015 which will outline the policies, institutions
and investments needed to achieve the MDGs;B. Integration of the long-term plan into operative policy documents such as the revised
PRSP and the Medium-Term Budget Framework (MTBF).
Needs Assessment ReportThe completed assessment of the financial, human and institutional resources needed for MDG attainment in Tajikistan was prepared by the UN MDG Needs Assessment Team and the Government Working Groups, with MP support. The full study focuses on all eight MDGs: reducing poverty and hunger (MDG 1); achieving universal primary education (MDG 2), achieving gender equality (MDG 3); lowering child (MDG 4) and maternal (MDG 5) mortality rates; combating the spread of disease (MDG 6); promoting environmental sustainability and improving access to drinking water (MDG 7); and developing partnership for development (MDG 8). The study also analyzes MDG-compatible energy and road infrastructure needs.
11
POVERTY REDUCTION
3. KEY INSTITUTIONAL AND
STRUCTURAL REFORMS
Tajikistan is at a turning point in its development. Having survived a brutal civil war from 1992-97, the country is now on the road to economic recovery and even progress. Strength-ening privatization, particularly in the agricultural sector, increased investment in public in-frastructure, SME development, and public sector reform are core elements of the national development strategy. Below is an overview of the macroeconomic environment in Tajikistan, followed by recommendations for core institutional and structural reforms that will make a significant positive contribution to achieving the MDGs.
Macroeconomic EnvironmentThe medium-term macroeconomic framework focuses on lowering inflation and sustaining high rates of economic growth. After the civil war ended, improved stability made economic recovery possible. The peacetime economy was bolstered by some initial economic reforms, which allowed GDP to expand at an average rate of 9.3% over 2000-2004.2 Although some positive contributions to GDP growth were made by agriculture, non-traditional manufactur-ing and services, the major components of GDP growth were cotton and aluminium exports, as well as remittances from labour migrants working abroad. The economy is thus dependent on fluctuating cotton and aluminium prices on the global market, and on the seasonal migra-tion of workers to Russia. This makes it highly vulnerable to external shocks. The Interna-tional Monetary Fund (IMF) expects real economic growth will slow further and real GDP to expand at an average rate of 5% over the medium term.3
Fiscal policy aims to support economic growth and public service provision while striking a sustainable balance between increasing expenditures and limiting borrowing. The Government is seeking to reduce the burden of external debt service, which in 2005 stands at 42.2% of GDP. Although progress has been made on restructuring Tajikistan’s bilateral debts, the debt burden will remain heavy in the future and continue to pose a threat to macroeconomic stabil-ity, despite the recent debt cancellation by Russia amounting to US$ 245 million. This situation underscores the difficult trade-off Tajikistan must make between maintaining macroeconomic stability and taking in funds for badly needed public investment.
Foreign and domestic investments, which could form a stable basis for long-term and sustain-able growth, have not played a significant role in GDP expansion. Annual total investment to the economy from all sources remains at less than 10% of GDP to date. Although Parliament adopted a new Foreign Investment Law, per capita foreign direct investment (FDI) to the economy through 1998-2004 was at US$ 22, the lowest among the transitional economies. The weak banking system, political uncertainty, the weak legal and institutional environment, and Government interference at all levels of business processes adversely affect foreign and domestic investments, and the growth of SMEs. Future economic growth in the country will hinge on whether the Government will be able to cease control over markets, diversify sourc-
2 According to the IMF 2004 Country Report, real GDP grew by 10 percent in 2003, and is expected to grow by 8½ percent in 2004
3 IMF country report 2004
MILLENNIUM DEVELOPMENT GOALS NEEDS ASSESSMENT TAJ IK ISTAN
12
MILLENNIUM DEVELOPMENT GOALS NEEDS ASSESSMENT TAJ IK ISTAN
es of growth through SME development, and, by improving the business environment, attract foreign investment.
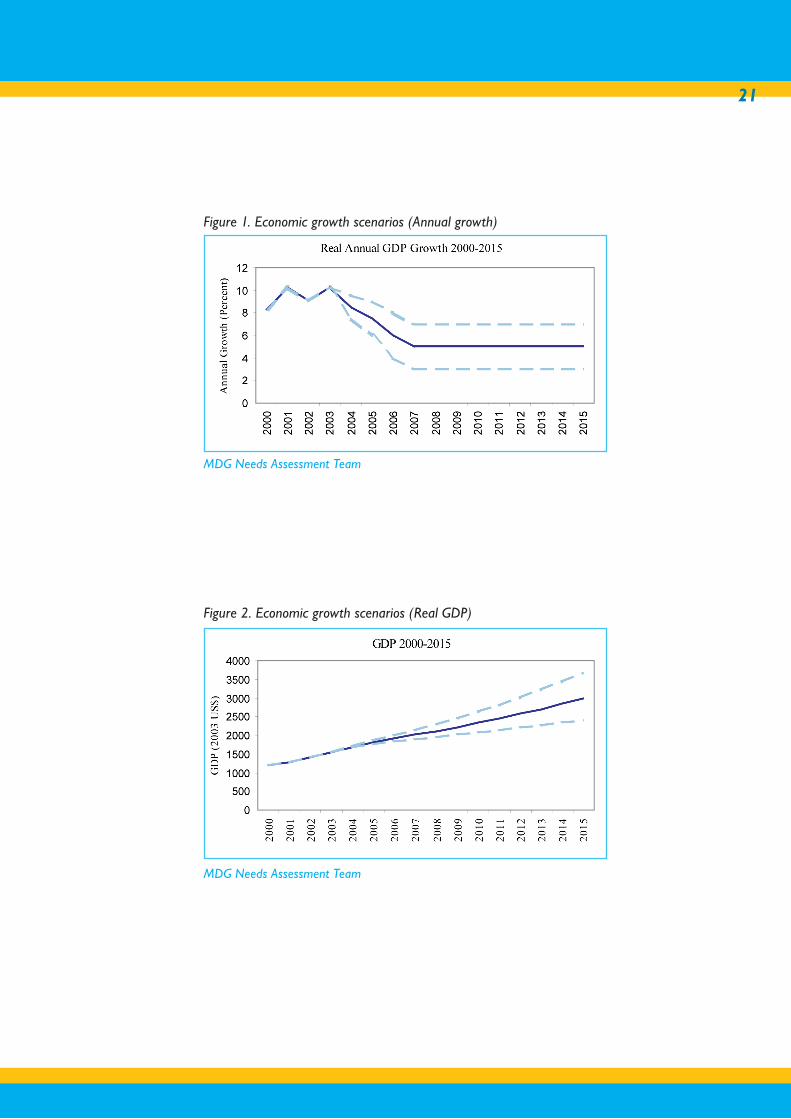
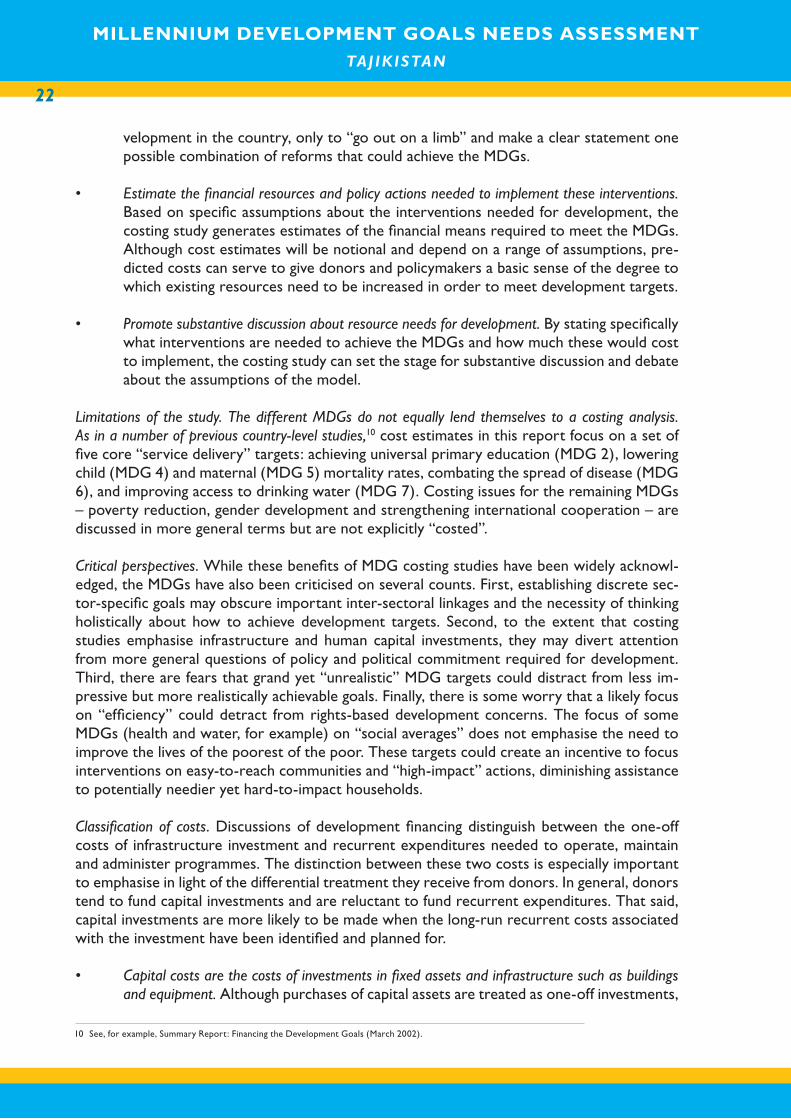
Projections. Taking into account the country’s high birth rate, which exceeds 1.5%, the coun-try’s annual GDP growth needs to be not less than 5% up through 2015 to make a significant difference. Under the baseline growth scenario, assuming 5% average annual growth, real per capita GDP will reach US$ 361 by 2015 (see Annex II). To alleviate poverty effectively, the country’s economic growth should be higher. Under the high-growth scenario, which assumes average annual GDP growth of 7% from 2007 on, real GDP per capita will reach US$ 442 by 2015 (see Annex I).
Good Governance and Public Administration Reform IssuesAn effective public administration system is important for achieving the MDGs. At present the public administration system inherited from the Soviet central planning system remains large-ly intact. Since 1999, the Government-initiated Institutional Building Technical Assistance-II (IBTA-II) Project has aimed at implementing public sector reforms, improving essential public sector services delivery, prioritizing and improving efficiency of public expenditure, and re-forming public enterprises.
The public sector reform strategy adopted by the Government aimed at reorganizing core ministries; establishing a Civil Service Department; consolidating overlapping Government agencies and ministerial departments; strengthening a strategic focus on national budgeting processes by developing a Medium-Term Budget Framework (MTBF); establishing a mechanism providing for priority-based allocations; continuing privatization of medium and large-scale public enterprises; and eliminating the red tape that hampers private sector development. Recently the President signed a decree setting up a task force made up of top Government officials to develop a coherent strategy for public sector reform. These future reforms will in-clude strengthening public administration and promoting transparency and good governance.
Despite the above-mentioned measures, public administration is in need of more effective reforms to eliminate corruption4 and promote small, efficient Government. Many structural problems still exist, such as the duplication of tasks and responsibilities. There is no clear divi-sion of responsibilities in regard to the development of national strategy and sectoral policies and preparation of the state budget. The lack of well-defined policy implementation mecha-nisms makes the bureaucracy unnecessarily cumbersome and ineffective. Civil servant wages are officially very low, below subsistence level, but various benefits and bonus systems exist to compensate for low salaries. This encourages illegal payments and abuse of the budgeted funds. Across-the-board staff cuts led to the reduction of some much-needed staff in line min-istries, while the number of bureaucrats duplicating tasks at the executive and local levels, and who also perform market functions, has remained intact. Currently there are over 480,000 public sector employees, an extremely high number by international standards. At around 2.8%, down from 3.8% in 2000,5 the proportion of local and central Government salaries in terms of GDP is among the lowest in the Europe and Central Asia (ECA) region.
4 Tajikistan is quoted by Transparency International, an international watchdog on corruption, as one of the five most corrupt countries in the world.
5 World Bank Tajikistan Public Expenditure and Institutional Review, 2004 and ADB Good Governance Review 2004
13
KEY INSTITUTIONAL AND STRUCTURAL REFORMS
No linkages exist between various policy strategy documents, economic and social priorities, annual and medium-term planning and budgeting. For example, the current mechanisms for development policy and implementation, the Public Investment Programmes (PIP), the PRSP, the Economic Development Programme for 2005-2015, and the MTBF, have differing priori-ties, and management of these policy documents is insufficiently harmonized. The lack of clear linkage between the development strategies and budget-making processes is one of the key reasons why disbursement ratios on some types of donor funding are as low as 10%, with negative implications for economic growth and development.6
Recommendations The next steps in reform should address key systemic issues related to four main aspects of public administration: policy and budget management, organizational structures, staffing issues and reform management itself. The following steps are recommended:
• Policy and Budget Management: ¤ Align the priorities of the existing policy and development strategy docu
ments, and align the annual budgets with the medium-term budgets; ¤ Transfer the tasks of developing sectoral policies and monitoring and evaluation
functions to the line ministries, and remove all market functions still being per-formed by the ministries through privatization of state economic enterprises under their control;
¤ Increase transparency in the budget preparation and implementation processes, and develop an MTBF that dictates the annual budget priorities;
¤ Include PIP disbursement sums into the state budget;¤ Develop Government accounting standards in accordance with IMF guidelines for
Government financial statistics and budget classification; • Structures:
¤ Eliminate duplication of functions at all levels;¤ Improve the function of the executive office and sector units of the presidential ad-
ministration, with better capacity and more focus on development of overall strate-gies and monitoring oversight;
¤ Improve capacity of the public service delivery officers at all levels, but especially at local level, and encourage flexible local service delivery mechanisms that address real local needs and priorities;
¤ Develop career staff (as opposed to political appointments at the ministerial level and higher), who are recruited through open competition, as stipulated by a presi-dential decree in 2004.
• Wages:
¤ Register all public servants, and identifying civil servants’ capacity levels;¤ Case-by-case review of staff cuts to avoid the damaging effects of across-the-board
cuts;¤ Set up a new salary system that incorporates all existing benefits and allowances
into the base salary.
6 World Bank Tajikistan Public Expenditure and Institutional Review, 2004
MILLENNIUM DEVELOPMENT GOALS NEEDS ASSESSMENT TAJ IK ISTAN
14
MILLENNIUM DEVELOPMENT GOALS NEEDS ASSESSMENT TAJ IK ISTAN
• Reform Management:¤ Choose a pilot ministry where a comprehensive diagnostic study can be conducted
that recommends reforms to be implemented at all levels, and draw up a reform plan, with the extra funds released by reforms;
¤ Design a holistic reform strategy based on a proper diagnosis of the actual size and capacity of the civil and public service;
¤ Reassess the wage system as a whole;¤ Reassess the current legal frameworks for civil and public service management;¤ Create effective reform management structures in the presidential administration,
headed by a plenipotentiary with a clear mandate.
Tax and Customs Administration ReformIssuesLaunched in 1996, the Government’s economic reform programme included policies aimed at strengthening fiscal regulation, reform of the tax system and public expenditures, and a shift to non-inflationary financing of the budget deficit. In particular, the extra-budgetary funds, such as the Social Protection Fund and the Road Fund, were consolidated into the state budget; the Treasury was established in 1996; the Tax Code was drafted in 1999; the revised Tax Code was adopted in 2004; the Public Finances Law was passed in 2002; and the budget manage-ment system reform was implemented during 2000-2004. The Tax Committee and Customs Office were consolidated and the new Ministry of State Revenues and Duties was created. As a result, budget revenues increased from 12% of GDP in 1998 to 17.2% in 2004; the forecast for 2005 is 16% of GDP. The budget surplus in 2004 (excluding the externally financed PIP) was 1% of GDP. The state revenues depend largely on tax collections from international trade, on customs duties and on the Value Added Tax (VAT).
As foreign financing is limited, the Government should aim at increasing the share of public revenue in the GDP by substantially increasing the tax collection rates. The share of tax rev-enue in the GDP is still one of the lowest among transition countries, with a tax collection rate at 15% in 2004. Tax authorities face problems taxing the rapidly growing informal sector, and excess administrative burdens on SMES, such as multiple inspections and complicated registration systems, drive many business into the informal economy or out of business com-pletely. Further progress in the area depends on simplification of the tax regime, expansion of the taxation base, improvements in tax administration and reduction of corruption, and the overall creation of a favourable institutional environment to encourage formalization of the informal sector.
The new Tax Code of 2004 has the potential to improve the business climate through the combined measures of lowering income tax rates, simplifying administrative procedures, and making more information on the tax administration system available to the taxpayers. Under the Tax Code, the threshold for applying VAT has increased to SMEs with an annual turnover of TJS 48,000 (US$ 16,000) and the profit tax rate is set at 12% for SMEs with an annual turnover of TJS 144,000 (US$ 48,000) or higher. The administrative burden for taxpayers is also expected to decrease, through the consolidation of numerous inspections to a one-time preplanned visit, simplified tax payment procedures, the establishment of a computerized tax registration system, allocation of tax collection to tax authorities, thereby bypassing local
15
KEY INSTITUTIONAL AND STRUCTURAL REFORMS
governments, and other measures aimed at reducing corruption and unnecessary losses. Hav-ing simplified the Tax Code, the Ministry of Revenues and Duties can direct its attention to increasing the effectiveness of tax collections from large enterprises and wealthy individuals, which together account for 70% of total tax revenues.
Recommendations Creating a sensible compromise between the need to reduce the existing burdens and the need for increasing tax collections is the core of tax administration reforms. The following are recommendations for improving the tax collection rates and thus boost Government rev-enues, which will allow the Government to increase financing of the MDG related expenses:• Further simplify the Tax Code, and establish a unified private income tax rate of 12%;• Increase the threshold for VAT for private enterprises with an annual turnover equiva-
lent to US$ 50,000 and higher;• Consider abolishing the sales tax and replacing it completely with VAT;• Reduce the new Single Agricultural Tax rate as it imposes an extra burden on poor
farmers, especially cotton farmers, many of whom are already in debt;• Improve tax collection from wealthy individuals (as a first step towards improving the
collection rate, the tax administration could identify the 100 wealthiest individuals and ensure collection of their taxes);
• Abolish tax benefits for large state-owned enterprises, and speed up their privatiza-tion;
• As a result of tax administration reforms, overall tax collection could be increased from the current level of 15% to 24% of GDP by 2010 (see Annex II).
Privatization and Private Sector DevelopmentIn 2003, industry contributed 23% of GDP and employed 10% of the total labour force. The sector is dominated by medium and large state-owned enterprises. Most are concentrated in non-ferrous metallurgy (accounting for 40% of total industrial production), energy, mining and the chemical industry. Smaller enterprises operate in the food industry. The majority of large enterprises do not operate at full capacity, due to inadequate management, a poor investment climate and the lack of fully developed markets. Development of SMEs, the country’s main path to economic development, has been weak as a result of institutional and administrative barriers, lack of investment, the small domestic market, underdeveloped infrastructure, espe-cially in the energy and transport sectors, and limited access to regional and world markets.
The Government believes that industrialization and private sector growth could play a signifi-cant role in raising living standards. Development of export-oriented growth is one of the pri-orities identified in the PRSP. Using comparative advantages in the production of hydroelectric energy, mining, textile and food products, the Government has been making efforts to bolster development in these industries. However, lack of sufficient investment, a poor institutional environment and the lack of marketing opportunities have slowed private sector growth. Fu-ture development of the private sector is largely dependent on the overall improvement of the domestic business climate and integration of the country’s economy into the regional and world economies.
MILLENNIUM DEVELOPMENT GOALS NEEDS ASSESSMENT TAJ IK ISTAN
16
MILLENNIUM DEVELOPMENT GOALS NEEDS ASSESSMENT TAJ IK ISTAN
Improving the overall business climate is imperative to private sector development and eco-nomic growth. The current registration, permit and licensing procedures are overly complex and burdensome for SMEs, legal entities and individual entrepreneurs. The cost of doing business in Tajikistan is prohibitively high. To register a new business, entrepreneurs need to spend the equivalent of twice the per capita GDP (about US$ 500), and the process takes about two months.7 Moreover, SMEs are subject to an average of 16 different inspections per year, and they spend about 17% of their net revenues on the payment of various taxes and fees. 98% of surveyed SMEs report paying bribes when dealing with inspections. There is a lack of affordable financing institutions for SMEs, and available loans have prohibitively high interest rates. All these barriers and burdens contribute to the current high rate of tax eva-sion and to the growing number of informal businesses.
Recommendations Integration of informal business into the formal economy, and development of SMEs and the private sector in general, will be crucial for sustainable economic growth, as the healthy de-velopment of the private sector will increase the number of taxpaying enterprises, thereby boosting state revenues, and become the single most important factor for the growth of real GDP. The recommendations for improving the business climate and fostering SME develop-ment include:• Cease Government control over market mechanisms and promote deregulation of
the economy;• Simplify the burdensome administrative procedures for the private sector by devel-
oping a standard package for registration and streamlining licensing, permits and ap-provals processes, limit the right to conduct tax inspections to state tax inspectors, reduce the frequency of inspections to once every two years (or at minimum once a year), and impose the issuance of mandatory notifications to SMEs before inspec-tions;
• Coordinate multiple other inspections (fire, safety, etc) by limiting the frequency to one per year and imposing time restrictions on the length of inspections;
• Develop alternative financing mechanisms such as leasing, credit unions and micro-finance institutions with affordable interest rates;
• Increase legal awareness, provide businesses with clear information on administrative procedures, and develop easy-to-use guidelines for both the enterprises and tax and inspection agencies;
• Establish SME mechanisms and measures to explicitly protect the rights and interests of entrepreneurs, and increase the independence and power of the State Agency for Anti-Monopoly Policy and Support of Entrepreneurship;
• Strengthen the Ministry of Economy’s role in promoting more favourable conditions for private sector development and improving the investment climate;
• Establish an Investment Council within the Economic Unit of the President’s Office on which the economy, finance, and interior ministers would be represented, to facilitate access to the President for potential large foreign investors, and to eliminate the vari-ous barriers and red tape that currently impede foreign investment.

17
KEY INSTITUTIONAL AND STRUCTURAL REFORMS
Public Utilities ReformThe Government recognizes the need to restructure the energy, water and telecommunica-tions sectors. Improving regular access to clean water is a key public health issue. Of the Cen-tral Asian countries Tajikistan is the richest in water resources, yet only 59% of the total popu-lation has access to safe drinking water. (For the serious public health implications, see “Water and Sanitation.” Both the water and energy sectors are plagued by low tariff collection rates that have limited the scope for much needed reinvestment in infrastructure. While raising user fees and reducing arrears are important for developing these sectors, the social impact of higher water and electricity prices needs to be considered. International financial institutions are helping the Government provide financial assistance to households most affected by price hikes. Harnessing private sector investment for rehabilitating these sectors could be an effec-tive and affordable way to make progress in developing public utility services.
Tajikistan has vast amounts of hydropower resources. Only 10% of a potential generating ca-pacity of 40,000 MW of electricity is currently being utilized. The electricity system consists of seven large and a few small hydropower stations, two thermal plants and an extensive grid network that reaches almost 100% of the population. In spite of this infrastructure and its po-tential, electricity shortfalls occur in wintertime, with a total annual deficit of about 3.4 billion kWh (or 2 billion kWh, according to the World Bank). Ensuring the sufficient supply of power for industry (including the Tajik Aluminium Plant, which consumes 35-40% of all electricity generated) and mechanized irrigation is the Government’s priority. Restrictions on electricity consumption are imposed every year on the general public and social services from November to April. In remote and rural areas electricity supply is limited to only two hours per day.
The Government’s strategy for solving the energy crisis during winter periods is to shift towards increasing the supply of gas, coal and biomass for heating. For larger cities the Gov-ernment proposes to rehabilitate thermal plants and restore central heating systems. An important task will be to drastically reduce electricity losses from low voltage transmission lines, and to rehabilitate distribution networks. Tariffs remain heavily subsidized, especially for large industries, and the collection rate is less than 70% for electricity and less than 80% for gas. Losses in electricity due to faulty production and distribution accounted for 30% of the total production in 2001. Meter usage is still very limited; the installation of meters is therefore of high priority for cost recovery and allocation of resources for maintenance and rehabilitation.8
Energy sector development has suffered from heavily subsidized tariff rates, poor manage-ment in recent years, and structural problems.9 The sector has accumulated significant ar-rears, which has reduced its ability to invest in rehabilitation. Production of electric power has declined by 19% over the last ten years. Electricity, when available, remains the main and cheapest source for heating and cooking. In winter, 55% of the electricity used by households goes towards heating.
7 SECO-IFC, Business Environment in Tajikistan as seen by Small and Medium Businesses, 2003
8 World Bank, Energy Utility Reform Review, 2004.
9 World Bank, Energy Utility Reform Review, 2004.
MILLENNIUM DEVELOPMENT GOALS NEEDS ASSESSMENT TAJ IK ISTAN
18
MILLENNIUM DEVELOPMENT GOALS NEEDS ASSESSMENT TAJ IK ISTAN
The Government issued the new Energy Law to privatize Barqi Tajik, the state-owned elec-tricity company, to create an independent regulatory mechanism, and to strengthen the role of the recently established Ministry of Energy. These measures are expected to improve efficiency and financial sustainability in the sector. Since 2000, the Government increased electricity and gas tariffs to improve the cost recovery. This step has improved the financial situation in the sector to a degree. The Government plans to further raise tariffs in line with market prices in order to attain full cost recovery.
Recommendations The following are recommendations for improving the overall performance of public utilities in Tajikistan:• Restructure and privatize Barqi Tojik and other large state utilities enterprises;• Create an independent regulatory system for both the energy and water sectors,
whose main functions will include establishing tariff rates and regulating independent utility providers;
• Rehabilitate and implement nationwide metering services for electricity and water us-age to increase the net collections;
• Increase tariff rates for public utilities, following an assessment of the public’s ability and willingness to pay;
• Restructure existing debt in public utilities;• Encourage mechanisms to reduce losses and leakages and unofficial usage of utilities;• Rehabilitate and restructure electricity and water distribution systems at regional lev-
els;• Encourage community involvement in public utilities management (i.e. water users’ as-
sociations);• Transfer generation, transmission, dispatch and distribution responsibilities from state
enterprises to private providers;• Invest in rehabilitating and expanding the local roads system to improve the access of
the population living in remote areas to hospitals and schools.
19
4. METHODOLOGY FOR MDG NEEDS ASSESSMENT
MDG needs assessment focuses on seven quantifiable MDG targets: combating poverty and hunger (MDG1), achieving universal secondary education (MDG 2), achieving gender equal-ity (MDG 3), lowering child (MDG 4) and maternal (MDG 5) mortality rates, combating the spread of disease (MDG 6), and ensuring environmental sustainability and improving access to drinking water (MDG 7). The purpose of this needs assessment study is to identify policy reforms and generate an approximate estimate of the overall costs and resources required to meet selected MDG targets, to discuss explicitly the inputs that may be required to achieve these targets, and to provoke substantive discussion about the practicalities of development in Tajikistan.
Macroeconomic and Population Projections. An assessment of long-term resource needs for de-velopment must necessarily be based on projections of economic growth and population. Population assumptions influence estimates of everything from how many schools will need to be built in the coming years, to how many health centres will be needed to provide community health care in rural areas, to how much new infrastructure will be needed to provide water to urban residents. Likewise, the pace and quality of macroeconomic have an equally important role to play not only in estimating resource needs but also in assessing the potential financial contributions of Government and households to sharing the financial burdens of building and operating public infrastructure.
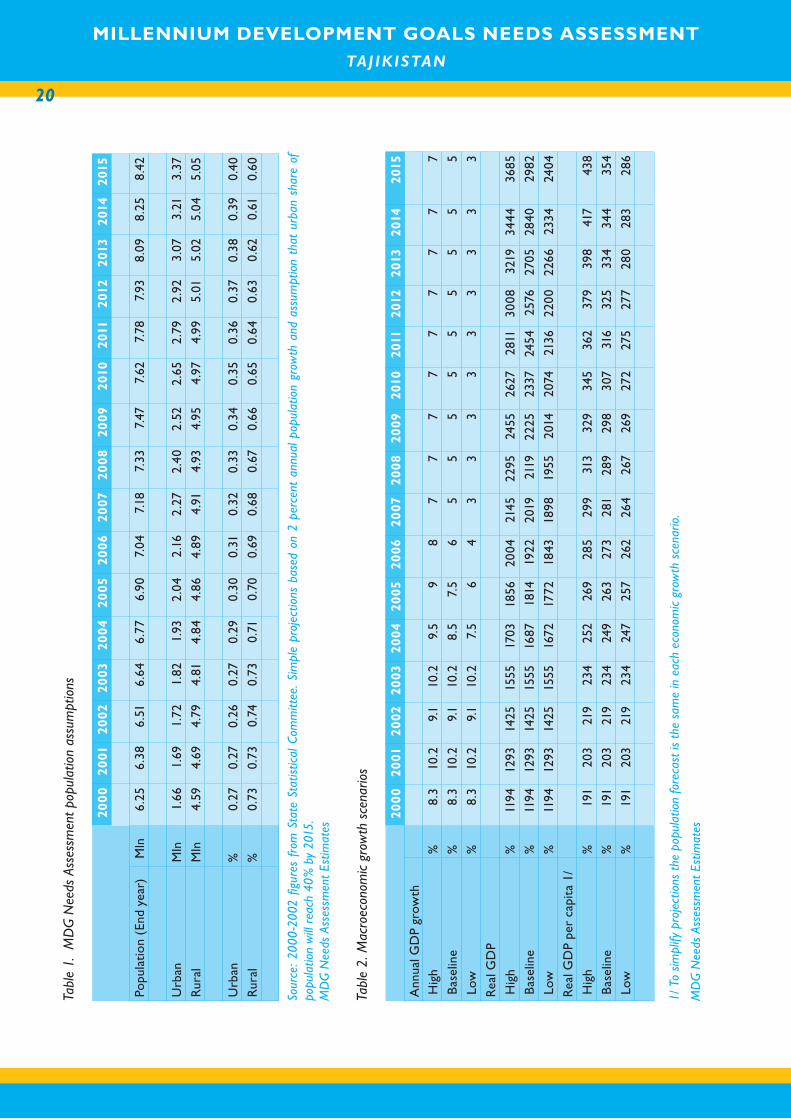
Population projections estimate that the population of Tajikistan will increase from 6.9 million in 2005 to 8.42 million people in 2015.The rate of population growth is estimated at 1.3. The population projections are presented in Table 1.
Macroeconomic projections used in this study are based on the most recent medium-term economic forecasts of the International Monetary Fund, presented in Table 2. The IMF cur-rently publishes national economic forecast through the year 2010. Forecasts for 2011-2015 assume no change in the IMF trends. In order to assess the potential impact of higher or lower economic growth on Tajikistan’s prospects for achieving the MDGs, two alterative eco-nomic growth scenarios are considered in the study. Growth scenarios – baseline growth, high growth and low growth are outlined in Figures 1 and 2, Table 2 below. All macroeconomic and population projections are presented in Annexes 1 and 2.
The MDGs are intended to focus attention on the practicalities of achieving real progress in human development. The clear quantitative targets established by the MDGs can help to strengthen monitoring and evaluation. Measurable targets can also facilitate long-term policy and financial planning. In particular, the costing exercise seeks to:
• Identify a framework of specific interventions necessary to achieve the MDGs. In order to produce specific cost estimates the study must make specific assumptions about the kind and scale of interventions required to meet MDG targets. It is important to note that assumptions of the study are not meant to suggest the definitive blueprint for de-
MILLENNIUM DEVELOPMENT GOALS NEEDS ASSESSMENT TAJ IK ISTAN
20
MILLENNIUM DEVELOPMENT GOALS NEEDS ASSESSMENT TAJ IK ISTAN
Tabl
e 1.
MD
G N
eeds
Ass
essm
ent p
opul
atio
n as
sum
ptio
ns
200
020
0120
0220
0320
0420
0520
0620
0720
0820
0920
1020
1120
1220
1320
1420
15
Popu
latio
n (E
nd y
ear)
Mln
6.25
6.38
6.51
6.64
6.77
6.90
7.04
7.18
7.33
7.47
7.62
7.78
7.93
8.09
8.25
8.42
U
rban
Mln
1.66
1.69
1.72
1.82
1.93
2.04
2.16
2.27
2.40
2.52
2.65
2.79
2.92
3.07
3.21
3.37
Rur
alM
ln4.
594.
694.
794.
814.
844.
864.
894.
914.
934.
954.
974.
995.
015.
025.
045.
05
U
rban
%0.
270.
270.
260.
270.
290.
300.
310.
320.
330.
340.
350.
360.
370.
380.
390.
40
Rur
al%
0.73
0.73
0.74
0.73
0.71
0.70
0.69
0.68
0.67
0.66
0.65
0.64
0.63
0.62
0.61
0.60
Sour
ce: 2
000
-200
2 fig
ures
fro
m S
tate
Sta
tistic
al C
omm
ittee
. Sim
ple
proj
ectio
ns b
ased
on
2 pe
rcen
t an
nual
pop
ulat
ion
grow
th a
nd a
ssum
ptio
n th
at u
rban
sha
re o
f po
pula
tion
will
rea
ch 4
0% b
y 20
15.
MD
G N
eeds
Ass
essm
ent E
stim
ates
Tabl
e 2.
Mac
roec
onom
ic g
row
th s
cena
rios
200
020
0120
0220
0320
0420
0520
0620
0720
0820
0920
1020
1120
1220
1320
1420
15A
nnua
l GD
P gr
owth
H
igh
%8.
310
.29.
110
.29.
59
87
77
77
77
77
Bas
elin
e%
8.3
10.2
9.1
10.2
8.5
7.5
65
55
55
55
55
Low
%8.
310
.29.
110
.27.
56
43
33
33
33
33
Rea
l GD
P
Hig
h%
1194
1293
1425
1555
1703
1856
2004
2145
2295
2455
2627
2811
3008
3219
3444
3685
Bas
elin
e%
1194
1293
1425
1555
1687
1814
1922
2019
2119
2225
2337
2454
2576
2705
2840
2982
Low
%11
9412
9314
2515
5516
7217
7218
4318
9819
5520
1420
7421
3622
0022
6623
3424
04
Rea
l GD
P pe
r ca
pita
1/
Hig
h%
191
203
219
234
252
269
285
299
313
329
345
362
379
398
417
438
Bas
elin
e%
191
203
219
234
249
263
273
281
289
298
307
316
325
334
344
354
Low
%19
120
321
923
424
725
726
226
426
726
927
227
527
728
028
328
6
1/ T
o sim
plify
pro
ject
ions
the
pop
ulat
ion
fore
cast
is t
he s
ame
in e
ach
econ
omic
gro
wth
sce
nario
.
MD
G N
eeds
Ass
essm
ent E
stim
ates
21
Figure 1. Economic growth scenarios (Annual growth)
MDG Needs Assessment Team
Figure 2. Economic growth scenarios (Real GDP)
MDG Needs Assessment Team
MILLENNIUM DEVELOPMENT GOALS NEEDS ASSESSMENT TAJ IK ISTAN
22
MILLENNIUM DEVELOPMENT GOALS NEEDS ASSESSMENT TAJ IK ISTAN
velopment in the country, only to “go out on a limb” and make a clear statement one possible combination of reforms that could achieve the MDGs.
• Estimate the financial resources and policy actions needed to implement these interventions.
Based on specific assumptions about the interventions needed for development, the costing study generates estimates of the financial means required to meet the MDGs. Although cost estimates will be notional and depend on a range of assumptions, pre-dicted costs can serve to give donors and policymakers a basic sense of the degree to which existing resources need to be increased in order to meet development targets.
• Promote substantive discussion about resource needs for development. By stating specifically what interventions are needed to achieve the MDGs and how much these would cost to implement, the costing study can set the stage for substantive discussion and debate about the assumptions of the model.
Limitations of the study. The different MDGs do not equally lend themselves to a costing analysis. As in a number of previous country-level studies,10 cost estimates in this report focus on a set of five core “service delivery” targets: achieving universal primary education (MDG 2), lowering child (MDG 4) and maternal (MDG 5) mortality rates, combating the spread of disease (MDG 6), and improving access to drinking water (MDG 7). Costing issues for the remaining MDGs – poverty reduction, gender development and strengthening international cooperation – are discussed in more general terms but are not explicitly “costed”.
Critical perspectives. While these benefits of MDG costing studies have been widely acknowl-edged, the MDGs have also been criticised on several counts. First, establishing discrete sec-tor-specific goals may obscure important inter-sectoral linkages and the necessity of thinking holistically about how to achieve development targets. Second, to the extent that costing studies emphasise infrastructure and human capital investments, they may divert attention from more general questions of policy and political commitment required for development. Third, there are fears that grand yet “unrealistic” MDG targets could distract from less im-pressive but more realistically achievable goals. Finally, there is some worry that a likely focus on “efficiency” could detract from rights-based development concerns. The focus of some MDGs (health and water, for example) on “social averages” does not emphasise the need to improve the lives of the poorest of the poor. These targets could create an incentive to focus interventions on easy-to-reach communities and “high-impact” actions, diminishing assistance to potentially needier yet hard-to-impact households.
Classification of costs. Discussions of development financing distinguish between the one-off costs of infrastructure investment and recurrent expenditures needed to operate, maintain and administer programmes. The distinction between these two costs is especially important to emphasise in light of the differential treatment they receive from donors. In general, donors tend to fund capital investments and are reluctant to fund recurrent expenditures. That said, capital investments are more likely to be made when the long-run recurrent costs associated with the investment have been identified and planned for.
• Capital costs are the costs of investments in fixed assets and infrastructure such as buildings and equipment. Although purchases of capital assets are treated as one-off investments,
10 See, for example, Summary Report: Financing the Development Goals (March 2002).
23
there is also a need for regular capital reinvestments to upgrade and replace depreci-ating capital. Some non-infrastructure investments, such as establishing new training programmes, are treated as capital costs.
• Recurrent costs refer to the regular costs of operating, maintaining and administering pro-grammes. Payments to labour comprise a large share of recurrent expenses for public services like health and education.
Demand-side vs. supply-side costs. One important issue of concern is that analysis of unit recur-rent and capital costs per se tell us only about supply-side costs, the costs of providing ser-vices; this does not tell us about the demand-side costs of getting people to use the services provided. Without accounting somehow for the incremental costs of enrolling a child in school or getting a sick person to consult a health care specialist, cost estimates essentially assume an attitude of “if we build it, they will come.” Estimating the cost of getting a child to enrol in school is extremely difficult, not least of all because it is not clear what precisely is needed to achieve this. A comprehensive and explicit treatment of the costs of raising take-up for social services is beyond the scope of this study. As a second-best approach, it is assumed that joint progress towards the various MDGs could reasonably be expected to increase demand for social services. For example, combined with explicit investments in the education system, re-ductions in income poverty, improved health outcomes and better water infrastructure would plausibly reduce many of the barriers currently keeping children from attending school.
Absorptive capacity. Another issue for MDG costing studies is the notion that there are di-minishing returns to public investment and international aid.11 The “absorptive capacity” con-straint, as it has been called, refers to the notion that governments can only efficiently manage a certain amount of money before institutions become too strained to effectively allocate and administer investments. Countries with weak institutions and poor policy frameworks have a lower “saturation point” for investment; as public investment programmes expand, larger and larger increases in financing are needed to produce smaller and smaller real improvements. Although this study does not take account of these diminishing returns to financing, ideally these would be considered in a costing analysis. To the extent that Tajikistan is subject to such a constraint, the ultimate costs of achieving the MDGs will be that much higher. Recognition of this constraint adds to the imperative for developing stronger institutions and better policies to improve capacity for effectively managing aid flows.
Projecting national contributions. An important element of the study is to assess the potential of the country for contributing to social investment. Macroeconomic assumptions are very im-portant at this stage of the analysis. Forecasts about future macroeconomic trends represent, among other things, expectations about the quality of future Government policy, which in turn partly determines the amount of money Government can be expected to mobilise for hu-man development. Successful broadening of the tax net to incorporate a greater share of the shadow economy, improved revenue collection and prudential management of debt will allow for increased public investment. Economic growth also influences household spending on key welfare-improving goods and services like health and education. An assessment of potential for future national expenditures for health, education and water are made in corresponding cost assessments.
11 See for example World Bank “Costing the Service Delivery MDGs” April 9, 2003 p.6, and Devarajan et al p.20.
MILLENNIUM DEVELOPMENT GOALS NEEDS ASSESSMENT TAJ IK ISTAN
24
MILLENNIUM DEVELOPMENT GOALS NEEDS ASSESSMENT TAJ IK ISTAN
Projecting MDG expenditure requirements. Estimating the hypothetical spending levels required to meet MDGs is at once the most important and most difficult element of the costing analy-sis. Absence of good data and other complexities noted above make it difficult to quantify the relationship between social sector spending and human development outcomes. There is no easy way to know, for example, what resources – how many teachers and books, how much training or what salary levels – are required to achieve universal primary enrolment. Ideally, statistical analysis might identify elasticities of health and education indicators with respect to public and private spending. Unfortunately, data to support such a study are not available. This being the case, we therefore take the alternative approach, taken in several other MDG costing studies, of assessing the costs of making key interventions and general sector-wide improvements in health and education under the assumption that strengthening the provision and quality of service will, when accompanied by general economic development and concomi-tant progress in other key sectors, be adequate to achieve MDG targets.
Caution in interpreting cost estimates. The challenge for MDG costing studies is to produce reasonable estimates in the face of significant uncertainties. Costing estimates are highly con-tingent on an array of factors – the quality and pace of economic reform and efficiency im-provements in public service delivery, for example – that are both difficult to measure and hard to predict. Another challenge is the limited availability and poor quality of data on which to base cost assessments. It is important to call attention to these limitations and to the need to interpret findings with caution.
25
5. MDG 1: COMBATING POVERTY AND HUNGER
Goal 1. Eradicate extreme poverty and hunger
Target 1: Halve, between 1990 and 2015, the proportion of people whose income is less than 1$ a day
Target 2: Halve, between 1990 and 2015, the proportion of people who suffer from hunger
Target for Tajikistan: Halve, between 1999 and 2015, the proportion of people whose income is less than $2.15 a day, and who suffer from hunger
This chapter provides with an overview of causes of poverty and hunger in Tajikistan, current Government policies, and the interventions needed to combat and hunger and improve the overall food security situation in the country. While the section on income poverty discusses the country’s trends in reducing poverty and the likelihood of achieving MDG Target 1 at least in respect to income poverty, the section on nutrition and food security discusses specific interventions that will have the greatest impact on improving livelihoods of the poor and the food insecure in Tajikistan.
Income poverty
OverviewPoverty in Tajikistan has increased in both breadth and depth since the collapse of the Soviet Union. Recent evidence from the 2003 Tajik Living Standards Survey suggests that high rates of economic growth over the last several years have succeeded in reducing poverty. According to the World Bank’s recent Poverty Assessment Update,12 all major poverty indices declined over 1999-2003. The proportion of the population living on less than $2.15 PPP per day fell by 16 percentage points to 64%. The proportion of the population living on less that $1.08 PPP per data also fell by around 13 percentage points to 18%. At least with respect to income poverty, rapid rates of economic growth have had a measurable and unambiguous impact on incomes.
While the country appears to be heading in the right direction, the overall poverty situation in the country remains severe and still numbers among the worst in the world. More than two thirds of the population continues to live on less than $2.15 per day. And there is evidence that higher income and consumption rates have not necessarily translated into improved living conditions for all: nutrition, for example, appears to have grown worse over the intervening four years, with significantly more families reporting that they eat only meal per day. Despite the apparent increase in income and consumption, a majority of households reported that they saw little improvement in their living condition since 1999.
12 Tajikistan Poverty Assessment Update. World Bank, June 2004.
MILLENNIUM DEVELOPMENT GOALS NEEDS ASSESSMENT TAJ IK ISTAN
26
MILLENNIUM DEVELOPMENT GOALS NEEDS ASSESSMENT TAJ IK ISTAN
Table 3. Changes in Poverty 1999-2003
Overall Poverty Extreme Poverty
PPP $2.15 Per Day PPP $1.08 Per day
1999 2003 change in % points 1999 2003 change in %
points
GBAO
Urban 100% 74% -26% 71% 16% -55%Rural 96% 86% -11% 68% 39% -28%Total 97% 84% -13% 69% 36% -33%
Sugd
Urban 71% 59% -12% 25% 18% -7%Rural 82% 66% -15% 27% 15% -12%Total 79% 64% -15% 26% 16% -11%
Khatlon
Urban 88% 78% -11% 39% 34% -5%Rural 92% 78% -14% 52% 26% -26%Total 91% 78% -13% 50% 27% -22%
Dushanbe Urban 61% 49% -12% 13% 12% -1%RRS
Urban 64% 55% -9% 19% 8% -12%Rural 72% 44% -29% 24% 8% -16%Total 71% 45% -26% 24% 8% -16%
Total
Urban 73% 59% -14% 27% 18% -9%Rural 84% 65% -19% 38% 18% -20%Total 81% 64% -18% 36% 18% -18%
Source: WB PAU 2004.
RecommendationsThe prospects for further poverty reduction appear favorable, although the rate of poverty reduction is likely to slow in the future without the impact of the one-time peace dividend and macroeconomic stabilization. Improved political and economic stability set the stage for continued positive economic growth, but maintaining the economic expansion will depend largely on external factors and on the Government’s success in carrying forward structural economic reforms.
The World Bank calculates the growth elasticity of poverty reduction over 1999-2003 as -1.6. This is high by international standards but not unusual for the CIS region.13 The initial burst of infrastructure development, for example, may have benefited many households in rela-tively accessible areas, but expanding infrastructure into remote regions is a far more costly exercise. Table 4 presents a matrix of possible scenarios for future poverty reduction. At any elasticity greater than -1.15, the MDG for poverty reduction will be achieved under all three growth scenarios. Given the current outlook for the economy, it seems Tajikistan may be able to achieve the MDG target 1 for poverty reduction. However, the evidence from recent household surveys also suggests that reductions in the poverty index may not correlate very closely with improvements in living standards; the sharp reduction in the poverty index has not been accompanied by similar improvements in educational or health outcomes. Success in reducing the poverty index should in no way divert attention or urgency from the need to pursue social sector reforms that aim to make specific improvements in the quality of life of the population.
13 WB PAU 2004.
27
Table 4. Poverty reduction scenarios (2005-2015)
GDP growth scenario2005-2015
Poverty reduction elasticity
Low Baseline High-0.60 -36% -44% -51%-0.80 -41% -51% -60%-1.00 -47% -58% -67%-1.20 -51% -63% -73%-1.40 -56% -68% -78%-1.60 -60% -73% -82%
Source: MDG Needs Assessment Estimates. Assumes constant elasticity and no change in income distribution.* Using PPP overall $2.15 poverty line.
Social sector investment. Given that official social sector spending in Tajikistan remains low in terms of GDP (5.7 percent14 of GDP in 2002), poverty reduction in Tajikistan will depend heavily on the ability of the country to sustain economic growth and ensure that the benefits of economic development – not only in terms of higher income and consumption, but also in * of better living conditions and improved quality of and access to social services – reach the poor. As the Government notes in its national poverty reduction strategy paper, improving public services is both an end and a means of economic development. Social spending is a criti-cal complement to poverty-reducing economic growth and an important means of improving welfare and strengthening the nation’s human capital to lay the foundation for sustainable long-term economic growth.
Strengthening the business environment and creating jobs. If economic growth is to be pro poor, then it must create jobs, especially in rural areas. The ability of the economy to generate jobs is in large part a question of the climate for entrepreneurship and business development. The Government’s poverty reduction strategy places land reform and agricultural sector restruc-turing at the centre of its programme for rural areas. It is hoped that these measures will improve welfare by expanding private ownership of arable land and by reducing constraints on the economic decision-making of farmers. Small and medium-sized enterprise development, supported by deepening privatisation and reform of the legal environment, is also expected to support economic growth and create jobs.
Targeting transfers. In addition to social sector investment, direct cash transfers to the poor could be an important complement to growth-led poverty reduction, helping to mitigate the impact of rising inequality. Until wages and levels of per capita GDP rise, payments into the system will be insufficient to support meaningful benefit levels. Distribution and targeting sys-tems also need to be strengthened to improve the efficiency of direct cash transfers.15
Local development. It is important to remember that the profile of poverty can differ substan-tially from region to region. As in many other countries, the economic, environmental and ethnic character of Tajikistan’s regions differ significantly. Because the problems faced by the regions are different, the strategies for reducing poverty in the regions should take account of these differences. It will be useful, moving forward, to evaluate the costs of poverty reduction at the regional level.Regional development. One of the greatest constraints on Tajikistan’s economic development is its location. In many ways, Tajikistan’s long-term prospects are tied to its neighbours. As a
14 2.6 percent of GDP on education, 2.1 percent on social security and welfare, 0.9 percent on health. MoF.
15 World Bank and IMF Joint Staff Assessment of the PRSP.
MILLENNIUM DEVELOPMENT GOALS NEEDS ASSESSMENT TAJ IK ISTAN
28
MILLENNIUM DEVELOPMENT GOALS NEEDS ASSESSMENT TAJ IK ISTAN
landlocked state, failure to establish stronger working relationships with these countries will impose a considerable constraint on the outlook for national development. The course of events in these countries, over which Tajikistan has little influence, will bear heavily on the ultimate success of Tajikistan’s efforts to meet the MDGs.
Food Security (Nutrition and Rural Development)
OverviewCombating hunger and poverty is the core MDG target for Tajikistan. At the1996 World Food Summit food security was defined as:
Food Security exists when all people, at all times, have physical, social and economic access to sufficient, safe and nutritious food which meets their dietary needs and food preferences for an active and healthy life.
Guided by the above definition, interventions in the following areas were identified by the Government Working Group on Nutrition and Food Security and the MDG Needs Assess-ment Team as having the greatest potential impact for reducing hunger and poverty: a) nutri-tion; b) agricultural productivity; c) reform in the cotton sector; d) land reform, and e) agri-culture infrastructure. This chapter describes the current situation, challenges, policy reforms and financial resources needed to achieve MDG 1.
A. Nutrition sector analyses causes of consumption-related malnutrition, and describes prevalent nutrition-related diseases in Tajikistan resulting from dietetic deficiencies in iodine, iron and vitamin A. Food relief targeting the most vulnerable segments of the population is also included as an intervention to protect the poor from food crisis situations. The analysis identifies national strategies and recommendations, as well as cost estimations for interventions directed towards improving nutrition situation in the country.
B. Improving agricultural productivity is important for strengthening the country’s own capability for supplying the population with staple food items, and decreasing its reli-ance on food aid and imports. This section focuses on wheat, vegetables and fruit production as they are essential sources of food in Tajikistan16. Specifically, the sec-tion focuses on interventions that will lead to intensification of all farmers’ productiv-ity through provision of critical inputs such as fertilizers, seeds, farm equipment and trainings to improve farmers’ knowledge and business skills. Additional interventions such as micro credit support and income generation activities have been identified as measures that will lead to improvement of farmers’ access to credits and facilitate in intensification as well as diversification of their food production.
C. Reform in the cotton sector is essential for reducing poverty and hunger in Tajikistan, as the cotton sector is the largest employer of the rural workforce, and more than 70% of the population engaged in this sector is affected by poverty17. Interventions targeted for speeding up the reform processes in the cotton sector comprise the fol-lowing components: i) measures for increasing productivity in the cotton sector; ii) market liberalization measures; iii) access to credits for the cotton farmers, and iv) resolution of debt in the cotton sector.
16 While animal husbandry is of some importance for food security in Tajikistan, the needs assessment does not discuss interventions needed in this
sector as it focuses on essential food that will have the greatest impact on reducing hunger in Tajikistan.
17 WB, Poverty and Social Impact Analysis: Cotton Farmland Privatization in Tajikistan, 2004
29
D. Investments for speeding up equitable land reform process in Tajikistan is very impor-tant for improving the overall food security in the country. Since securing access to land for the rural poor is an essential precondition for reducing hunger and poverty, interventions targeted towards fair distribution of land and equitable farm privatiza-tion have been identified in this section. Also, measures towards improving the overall institutional and legal environment, and public awareness and advocacy activities for the successful completion of the land reform processes are discussed in this section.
E. Improving agricultural infrastructure is needed to increase overall agricultural produc-tivity in the country. Interventions for improving general infrastructure situation in the country target rehabilitation of irrigation and melioration systems as well as improve-ment of community-based management of water and other natural resources. Critical investments in infrastructure such as energy and roads are separately discussed in the infrastructure annex of this report.
The main interventions for achieving the MDG 1 are provision of: 1) targeted food supplements and fortificants to mothers and children; 2) fertilizers for enriching soil nutrients; seeds, farm-ing equipment and other direct inputs; 3) equitable access to a land plot for all farmers; 4) development of small and medium private farms; 5) targeted support to cotton farmers, through debt resolution and agricultural productivity support measures; 6) capacity-building of farmers through technical and business trainings; 7) micro-credits with low interest rates to farmers; 8) public awareness programs on land legislature and creation of small farms; and 9) support for agricultural infrastructure by investing in irrigation and drainage measures and community-based infrastructure management practices.
The main coverage targets are as follows: 1) access of more than 50% of mothers and children to nutrition supplements and fortified food; 2) access of 90% of farmers to direct inputs (fer-tilizers, seeds, equipment, etc.); 3) restructuring of all existing farms to independent, private farms; 4) access to a land plot for all farmers; 5) resolution of cotton sector debt in 100 pilot cotton farms; 6) provision of capacity-building trainings to 80% of small farms; 7) access to micro-credit of up to US$ 4,000 to 58% of all small farmers; 8) coverage of 100,000 rural people by public awareness activities on farmers’ rights, and 6) rehabilitation of 70% of irriga-tion and drainage networks.
The outcome of this ambitious set of interventions for MDG1 is the creation of a viable private sector in rural Tajikistan, tripling of income of rural households, and development of healthy nu-trition practices for mothers and children. This outcome will result in stimulation of the overall economic development in the country, and in the lowering of extreme poverty and hunger.
Nutrition
OverviewConsumption-related malnutrition is directly linked to inadequate household food security. The ability to access adequate food to meet dietary needs through either household produc-tion or purchases can have a direct effect on individual nutritional status. On a short term basis inadequate food consumption could result in wasting, and over a longer period chronic malnutrition, in the form of stunting, could develop. An understanding of both the quantity (diversity) and the quality of the diet in terms of macro and micronutrients is important.
MILLENNIUM DEVELOPMENT GOALS NEEDS ASSESSMENT TAJ IK ISTAN
30
MILLENNIUM DEVELOPMENT GOALS NEEDS ASSESSMENT TAJ IK ISTAN
According to the 2003 Living Standards Measurement Survey, 67% of the total household expen-diture went for food, which showed that food remains to be the principal household expense. Also, many households continue employing coping strategies such as borrowing, relying on food gifts from relatives and consuming smaller portions of food. In 2003, a third of the best off households reported a reduced number of meals and smaller portions, and over a sixth of all households had sold assets in the previous month, and over a fifth had had to borrow from rela-tives, friends and neighbors18. Overall, using the Government’s nutrition norm as an indicator of poverty, as of 2003 nutrition-related poverty affected 83% of the total population.
During the first quarter of 2004, the average daily calorie intake reached 1993 Kcal per capita, which was slightly lower than 2100Kcal per day, recommended by World Health Organization (WHO)19. Nationwide analysis of nutrition conducted by UNICEF in 2003 showed that both in urban and rural areas per capita consumption of proteins and fats stayed below the recom-mended daily norm, and that the share of carbohydrates (mainly bread) was disproportionately large and constituted 77% in urban and 72% in rural areas accordingly. Overall, consumption of bread and bread products exceeded approved medical norm by 21% and amounted to 39kg in a quarter per capita. Unbalanced diet (shortage of essential vitamins and microelements, as well as proteins) leads to prevalence of diseases such as anemia, diabetes, and goiter.
Table 5. Composition of Total Household Expenditure (%) by Quintile Group
Household Expenditure Item Poorest 20%1st decile 2nd decile
Medium 20%2 3 4
Richest 20%5th All
Total Food Expenditure* 71 73 71 70 67 62 67
Non-food 10 11 12 13 15 18 14
Housing 8 7 6 7 7 6 7
Education 6 5 4 4 4 4 4
Health 3 3 4 5 5 7 5
Other 2 2 2 2 2 2 2
Total 100% 100% 100% 100% 100% 100% 100%
*Including food purchases, consumption of food produced at home, and food giftsTajikistan Living Standards Survey 2003, World Bank
Table 6. Poverty rates in Tajikistan based on Nutrition and Food Basket
Alternative Poverty Lines Head Count Index (P0) Poverty Gap (P1) Poverty Severity (P2)
1999 2003Change in % points
1999 2003 1999 2003
SSA Rational Nutrition Norm 1999 = TR 27,400 2003 = S 67.53
92.3 83.1 -9.2 51.1 40.0 31.7 22.5
SSA Minimum Food Basket 1999 = TR 16,830 2003 = S 35.03
74.9 44.4 -30.5 29.2 13.6 14.7 5.8
Tajikistan Poverty Assessment Update 2003, World Bank
18 Tajikistan Poverty Assessment Update, World Bank 2003
19 Food Security and Poverty Bulletin, State Committee on Statistics, Republic of Tajikistan, 2/20004
31
Malnutrition in Tajikistan is among the highest in the region with 36% of children 6-59 months of age chronically malnourished (stunted) and 5% are suffering from acute malnutrition20. Ap-proximately 15% of children are born malnourished, with a birth weight of less than 2,500 grams21, which is also an indication of poor maternal nutrition. According to a recent UNICEF survey, Tajikistan has the highest rate of infant mortality among the Central Asian states, with 89 deaths per 1000 live births, caused mostly by nutrition-related issues and prenatal diseases contracted during delivery.
Malnutrition can occur even when access to food and healthcare is sufficient and the environ-ment is reasonably healthy. The social context and care environment within the household and the community also directly influence nutrition. Factors influencing nutrition status are:• breastfeeding practices - exclusive breastfeeding up to 6 months of age• weaning practices – timely introduction of nutritious weaning foods• maternal hygiene behaviours – hand-washing, bathing, etc. • relationships between morbidity and water and sanitation• pregnancies and antenatal care – birth spacing, tetanus toxoid injections, vitamin A
supplementation• HIV/AIDS
Iodine deficiency is the single most common cause of preventable mental retardation and brain damage in the world. Maternal iodine deficiency causes miscarriages, other pregnancy complica-tions, and infertility. During pregnancy, if the foetus or newborn is not exposed to enough thy-roid hormone, it may have permanent mental retardation, even if it survives. Low birth weights and decreased child survival also result from iodine deficiency. The most visible consequence of iodine deficiency is goitre, or “an enlarged thyroid.” The 2003 UNICEF/ADB ‘Sentinel Study’ showed that 89% of children (2-15 years) had low urinary iodine levels (< 100 µg/L) while 58% suffered from folic acid deficiency. Total goitre rate was 5.8% among school aged children. The UNICEF/ADB survey also found that only 28% of households were consuming adequately io-dized salt. UNICEF estimates that 10-15% of the population in Tajikistan suffer from goitre.
Vitamin A deficiency (VAD) is the leading cause of preventable blindness in children and raises the risk of disease and death from common childhood infections such as diarrhoeal disease and measles. For pregnant women in high-risk areas, vitamin A deficiency occurs especially during the last trimester when demand by both the unborn child and the mother is highest. The mother’s deficiency is demonstrated by the high prevalence of night blindness during this period and may also increase the risk of maternal mortality. A recent UNICEF survey estimated that 52% of children 6-59 months were at risk of vitamin A deficiency. There is no national data on vitamin A supplementation in the country but a recent WFP survey of more than 5,000 rural households, only 31% of the women of reproductive age (15-49) had received a vitamin A capsule supplement after their most recent delivery. The 2000 MICS found that measles immunization was high, with 89% of the children immunized. However, more than 20% of children under five were suffering from diarrhea at the time of the survey. The 2000 MICS also found that less than half of rural households were: using drinking water from safe sources and/or had access to safe sanitation.
Iron deficiency is the most common nutritional disorder in the world. As many as 4-5 billion people or 66-80% of the world’s population, may be iron deficient; 2 billion people – over
20 2003 AAH/MC - NNWSS
21 Multiple Indicator Cluster Survey, UNICEF, 2000
MILLENNIUM DEVELOPMENT GOALS NEEDS ASSESSMENT TAJ IK ISTAN
32
MILLENNIUM DEVELOPMENT GOALS NEEDS ASSESSMENT TAJ IK ISTAN
30% of the world’s population – are anaemic, mainly due to iron deficiency, and in developing countries, frequently exacerbated by malaria and worm infections.• Iron deficiency is the main cause of anaemia; both affect all age groups.• Nine out of ten anaemia sufferers live in developing countries; on average, every sec-
ond pregnant woman and four out of ten preschool children are anaemic.• In many developing countries, iron deficiency anaemia is aggravated by worm infec-
tions, which cause blood loss to some 2 billion people worldwide; and malaria, which affects 300-500 million people.
• For children, health consequences include premature birth, low birth weight, infections and elevated risk of death. Later physical and cognitive development are impaired, re-sulting in lowered school performance. For pregnant women, anaemia contributes to 20% of all maternal deaths.
A UNICEF study found 37% of pre-school children in Tajikistan to be anaemic and 75% hav-ing low iron stores, which is a pre-condition for iron deficiency. Over 40% of non-pregnant women are anaemic while anaemia in pregnant women was 48 percent.
Tajikistan lacks a coherent system of monitoring and evaluating the nutrition situation of the population. The country still has not determined its minimum food basket, and the lack of national as well as regional data on nutrition prevents the Government from correctly de-termining the causes, scales and nature of malnutrition in the country. This also impedes the development of an effective and targeted strategy on decreasing malnutrition and improving nutrition status of mothers and children. The country has an inadequate technical and human resource base for effectively controlling and ensuring food safety in the country.
Government measures The Government plans to develop the national strategy on nutrition through 2015 within the framework of MDGs, which focuses on improving institutional environment and statistical capacity of the country on analyzing nutrition, and introducing national standards for essential food items. Determination of the minimum food basket and regional analyses of the nutrition status of the population will help the Government to determine the most effective measures to prevent and combat malnutrition and nutrition-related diseases. The Government Work-ing Group on Nutrition and Food Security noted the importance of developing a national program for food production in the country with the aim of reaching self-sufficiency in provi-sion of staple foods (grains, vegetables and fruits). The Government has developed a national strategy for combating diseases resulting from iodine deficiency through universal salt iodiza-tion (USI). Fortifying domestic wheat flour with micronutrients (iron, folic acid and essential vitamins) is one of the important steps towards combating nutrition-related diseases.
RecommendationsThe needs assessment team has identified the following measures as short-term priorities for improving the nutrition situation in the country:• Public awareness campaigns on prevention of food-borne diseases, including programs
on nutritious foods, health and sanitation campaigns;• Specific programmes targeting mother and child health, including programs on breast-
feeding and providing supplementary nutrition for pre-school children and school-age children (through school feeding programmes and local health houses);
• Countrywide implementation of the universal salt iodization program (including provi-
33
sion of financial support to domestic salt producing factories);• Micronutrient fortification of domestic wheat flour to combat iron and folic acid de-
ficiency (including financial support to domestic flour/milling companies to implement the program);
• Use of micronutrient fortified blended foods in school feeding programmes in the most food insecure areas of the country;
• Determination of the minimum food basket on the basis of an assessment of food con-sumption patterns of households;
• Effective supplementation programme for iron and vitamin supplementation for chil-dren under five and women of child bearing age.
The following are medium-term recommendations for improving the nutrition situation in Tajikistan:
• Developing food safety control system for imported and domestic foodstuffs;• Strengthening human resource base and technical capacity of the Nutrition Center of
the Ministry of Health, Sanitary Epidemiological Center, and community-based health workers;
• Improving measures protecting consumer’s interests through creation of consumer associations and strengthening legal and institutional environment for food safety and security;
• Developing the country’s capacity for domestic production of food fortificants and micro-nutrients;
• Implementation of an MDG-based nutrition strategy by 2007;• Adopting and implementing WHO/UNICEF global infant and young children feeding
policy;• Achieving 100% of universal salt iodization.
Financial estimations for Nutrition For improvement of the nutrition situation in the country, the following components have been identified and costed: i) complementary feeding interventions (including costs for pro-viding school meals and iron, iodine and vitamin A supplements for lactating mothers, preg-nant women, adolescent girls and children aged 6 months-5 years; ii) fortification of do-mestic wheat flour with Iron and wheat and realization of the program on universal salt iodization, including programs of capacity-building of domestic flour mills and salt industries; iii)strengthening Government’s capacities (National Nutrition Centre, Sanitary Epidemiology Centre (SES), customs officials, trade regulations, etc); iv)public awareness and advocacy pro-grams on healthy diets and nutrition; and v)monitoring and evaluation activities. The total cost for nutrition is on the order of US$ 79.14 million over the course of the next 11 years.
Table 7. Costs for Nutrition (US $millions, 2005-2015) 2005 2010 2015 TotalTotal 4.66 7.10 10.01 79.14Complementary Feeding Programme 3.86 4.69 5.53 51.63Supplementation Programmes 0.70 2.27 4.26 25.91Fortification Programme 0.10 0.14 0.22 1.60
MILLENNIUM DEVELOPMENT GOALS NEEDS ASSESSMENT TAJ IK ISTAN
34
MILLENNIUM DEVELOPMENT GOALS NEEDS ASSESSMENT TAJ IK ISTAN
For determining the needs for complementary school feeding programs, the team has as-sessed that currently, 22 % of school children are covered by the feeding programs, mainly implemented by WFP and its partner organizations. The team assumes that the level of aid directed to school feeding programmes will stay at the same level for the next 10 years. The financial estimations for school meals are covered in the education sector chapter of this re-port. For programs on dietary supplements, the group has determined the following baseline (2005) and target indicators (2015) for the following groups: pregnant women: current -40 %, target- 60 %; breastfeeding mothers-current-40 %, target 60 %; children aged 6months-5 years-current 23.6 %, target 60 %; adolescent girls (aged 15-19)-current 40 %, target 60 %. Baseline and target indicators for fortification programs are as follows: a) the program on universal salt iodization is expected to cover 100% of the population; b) the program on for-tification of domestic wheat flour with iron and folic assumes the current coverage rate to be at 53%, and by 2015 expects to cover 100% of all domestically produced flour. It is assumed that all iodine factories and flour mills will receive subsidies for technical equipment and capac-ity-building trainings by 2015. The program on strengthening capacities of Nutrition Centre, SES and customs officials comprise capacity-building trainings, round tables on trade regula-tions, support for establishment of national food safety control standards, as well as provision of necessary laboratory and testing equipments to the involved agencies. The monitoring and evaluation (M&E) program consists of the following activities: a) provision of international technical expertise to national agencies; b) carrying out yearly monitoring and evaluation of the nutrition situation in the country up through 2015; and c) M&E reports and auditing. The M&E program is expected to be realized by the National Centre on Nutrition of the Ministry of Health The public awareness and advocacy program targets the whole population through the mass media campaigns on healthy diets and nutrition, community-based outreach activi-ties, and capacity-building of the community heath workers. The costs estimated were based on the data provided by UNICEF, WFP, National Centre on Nutrition of the Ministry of Health, SES, and the State Statistical Committee.
Table 8. Financial Estimations for Nutrition, 2005-2015, (US $ thousands)
Components 2005 2010 2015 2005-2015
SupplementsVitamin A Children (6-12 months) Coverage 38% 80% 80%Capital expenditures 0,833 0,947 1,076 10,449Recurrent expenditures 8,326 9,469 10,761 104,488Children (1-5 years) Coverage 40% 100% 100%Capital expenditures 3,989 4,387 5,022 48,735Recurrent expenditures 39,887 43,874 50,221 487,345Iron Pregnant women Coverage (%) 40% 50% 60%Capital expenditures 1,437 1,984 2,628 22,037Recurrent expenditures 14,374 19,837 26,282 220,367Breastfeeding mothers Coverage (%) 40% 50% 60%Capital expenditures 0,792 1,127 1,536 12,558
35
Recurrent expenditures 7,924 11,265 15,362 125,577Adolescent girls (ages 15-19) Coverage (%) 40% 50% 60%Capital expenditures 1,901 2,376 2,716 25,834Recurrent expenditures 19,011 23,764 27,159 258,344Children (1-5years) Coverage (%) 23,6% 41,8% 60%Capital expenditures 1,123 1,988 2,716 21,564Recurrent expenditures 11,234 19,876 27,159 215,460Iodine Pregnant women Coverage (%) 9,1% 29,5% 50%Capital expenditures 10,199 36,598 68,381 414,418Recurrent expenditures 101,993 365,979 683,812 4144,182Breastfeeding mothers Coverage (%) 9,1% 29,5% 50%Capital expenditures 11,894 43,965 84,550 502,330Recurrent expenditures 118,937 439,646 845,499 5023,302Children (2-5 years) Coverage (%) 9,1% 29,5% 50%Capital expenditures 31,623 113,048 218,987 1297,770Recurrent expenditures 316,232 1130,479 2189,866 12977,70Fortificants Realization of fortification programs and capacity building of salt industries and flour mills
% of domestic flour fortified (with iron and folic acid) 53% 66% 80% 0Volume of flour to be fortified (kg) 622436,33 652118 681799,67 0Recurrent expenditures 454,149 427,816 401,482 4705,973Capacity building of Government agencies (Nutrition Cen-tre, SES, customs officials)
Recurrent Expenditures 9,667 9,667 9,667 106,333Public Awareness and Advocacy
Recurrent expenditures 33,333 6,667 6,667 126,667
Monitoring and Evaluation
Recurrent expenditures 13,647 0 0 27,293
Agricultural Productivity
OverviewTajikistan is an agricultural country. As of 2004, almost 60% of the labor force was employed in the agriculture sector, and the share of agriculture’s contribution to GDP was 27%22. Pov-erty reduction in the country heavily depends on reduction of the rural poverty, as poverty (PPP $2.15 per day) extends to 65% of the rural population, with the extreme poverty (PPP $1 per day) affecting 18% of the total rural population23. The country has limited land re-sources, comprising only 720 thousand hectares of agricultural land, out which 520.8 thousand hectares are irrigated. Main food items produced in Tajikistan are grains (mostly wheat), vegetables, and fruits, which use 60% of arable land. The remaining 40% of arable land is al-located for cotton production, the main cash crop of the country. From 1995 onwards, the
22 Tajikistan State Statistical Committee, 2004
23 PAU 2003, WB
MILLENNIUM DEVELOPMENT GOALS NEEDS ASSESSMENT TAJ IK ISTAN
36
MILLENNIUM DEVELOPMENT GOALS NEEDS ASSESSMENT TAJ IK ISTAN
Government initiated reforms in the agriculture sector that involved initial steps towards market liberalization, farm privatization, elimination of mandatory state quotas for agricultural produce, and cease of Government’s control and interventions in farming. While in recent years produc-tion of grain almost doubled, and production of cotton has slightly increased, the sector still experiences low agricultural productivity. In 2003, agriculture sector productivity was at US $65 per head of rural population, or about 60% of 1991 levels. More than 27% of the cropped land was not profitable in 2003. Increasing agricultural productivity depends on: a)implementation of effective institutional and structural reforms oriented towards liberalizing the agriculture sector; b) carrying out an equitable land reform; c) substantial investments in agriculture inputs (fertil-izers, equipment) and infrastructure (irrigation, melioration, etc); d) increasing access to low-interest credits for the poor, and e) building capacity and business skills of farmers.
Main sources of food production are Presidential plots and household plots (average size- 0.2 hectares), and about 84% of all rural households have access to either one or both of these plots. While productivity in the agriculture sector as a whole remains one of the lowest in the CIS region, independent dehqon24 farms growing vegetables, wheat and fruits have on average higher productivity and incur higher profits than collective farms and farms engaged in the cot-ton sector. Despite advantages of small dehqon farms in securing sustainable livelihoods, cur-rently only 9% of all agricultural land has been allocated to individual or family dehqon farms. As of July 2004, the country produced 161.9 thousand tons of grain, 6.8 thousand tons of potatoes, 80.9 thousand tons of vegetables, and 12.9 thousand tons of fruits25. Losses due to poor harvesting, storage and transportation are a major obstacle to increasing agricultural productivity-for example, in 2003, 25% of all domestically grown wheat did not reach the consumers due these losses. Thus, the country still experiences deficits in meeting demands for grains, vegetables (excluding potatoes) and fruits, and is dependent on imports from neighboring countries, and on food aid. While the country may not have a comparative advantage in growing grains due to the limited size of the avail-able agricultural land and probably will have to continue relying on imports for meeting the coun-try’s food demands, improving productivity on the existing land may significantly contribute to food security of the country26. Also, sales of low priced wheat flour donated by aid agencies in the wheat growing areas negatively affect sales and distribution of domestic wheat. There is a real opportunity to increase the production of fruits and kernels (nuts) through extending the usage of non-irrigated dry land, and improving productivity of existing fruit farms. Also, rehabilitating some 60 thousand hectares of land mainly in Khatlon region, which have become useless due to improper irrigation practices and the resulting high levels of salinity, will help increase the agricultural land size.
Table 9. Domestic production of wheat, grains and vegetables and imports (2004)
Name Stocks at the begin-ning of the period
Production in thousand tonnes
Import in thou-sand tonnes
Total
1 Cereals 223.2 660.2 353.3 1236.72 Potato 87.8 473.3 0.9 562.03 Vegetables and melons 15.9 721.5 0.3 737.74 Fruits and grapes 32.3 117.3 0.3 149.95 Meat and meat foods 0.2 49.1 3.6 52.96 Milk and dairy foods 1.9 459.1 0.8 461.87 Eggs (mln. pieces) 1.0 57.1 43.2 101.3
Source: Food Security Bulletin, GoT 2004
24 Independent farms
25 Food Security and Poverty Bulletin, State Committee on Statistics, 2/2004
26 The Ministry of Agriculture predicts that with improved productivity (through use of modern agricultural inputs) overall yields in wheat can reach
560 thousand tons, vegetables-1050 thousand tons, and fruits-2.5 million tons.
37
The lack of timely provision of inputs, such as fertilizers, farming equipment, quality seeds, and transportation, lack of access to low-interest credits, slow progress in land reform, deg-radation of the agricultural infrastructure, as well as institutional and structural barriers that prevent the farmers from growing a foodstuff of their choice that meets the market demands and allows them to incur profits, constitute the main obstacles to improving agricultural pro-ductivity in the country.
Government measuresIn 2002 Poverty Reduction Strategy Paper (PRSP) the Government of Tajikistan has com-mitted itself to carrying out a series of legislative and structural reforms to liberalize the agricultural sector, continue equitable land reform processes and support private farms with provision of key agricultural inputs to increase their productivity. However, since then no sig-nificant improvements in reforming the agriculture sector have been observed. The Ministry of Economy has developed the National Strategy for Economic Development for the period of 2004-2015, which calls for increasing the overall agricultural productivity and reaching self-suf-ficiency in wheat production by 2015. Both documents did not sufficiently clarify what specific interventions are needed for improving the agricultural productivity.
RecommendationsThe recommendations described in the subsequent sections on cotton sector reform, land reform and agricultural infrastructure contribute to the overall improvement in food security and poverty reduction. In conjunction with these reforms, the needs assessment team and the Government Working Group on Nutrition and Food Security recommend the following short-term measures to improve the agricultural productivity:• Increase availability of and access to key agricultural inputs such as fertilizers, quality
seeds, transportation and storage facilities for small farmers;• Extensification and diversification of fruit and kernel production in non-irrigated dry
lands; • Increase access to low-interest micro-credits to small farmers and vulnerable groups
(especially women) and establishment of community-managed revolving funds;• Measures aimed towards increasing soil quality and decreasing soil erosion and de-
sertification (through planting of trees and bushes, alternating land use, etc); • Target delivery of food aid to the most vulnerable and poor, and rechanneling humani-
tarian aid to support rural income generation activities;• Capacity building of small farmers through trainings aimed at improving their technical
and business skills.
In the medium-term, the following measures are of highest priority, if the country is to improve its agricultural productivity:• Complete liberalization of the agricultural sector and removal of all Government con-
trols over farmers’ production and market mechanisms;• Development of SMEs for storage, processing and transporting agricultural produce;• Development of marketing services through increasing access of farmers to domestic
markets and large cities and towns;• Establishment of quality seeds base for the country;• Removal of all administrative barriers and corruption that impede the effective devel-
opment of the agricultural sector27.
27 See the sections on the cotton sector and land reform for more detailed description of the existing administrative and institutional barriers
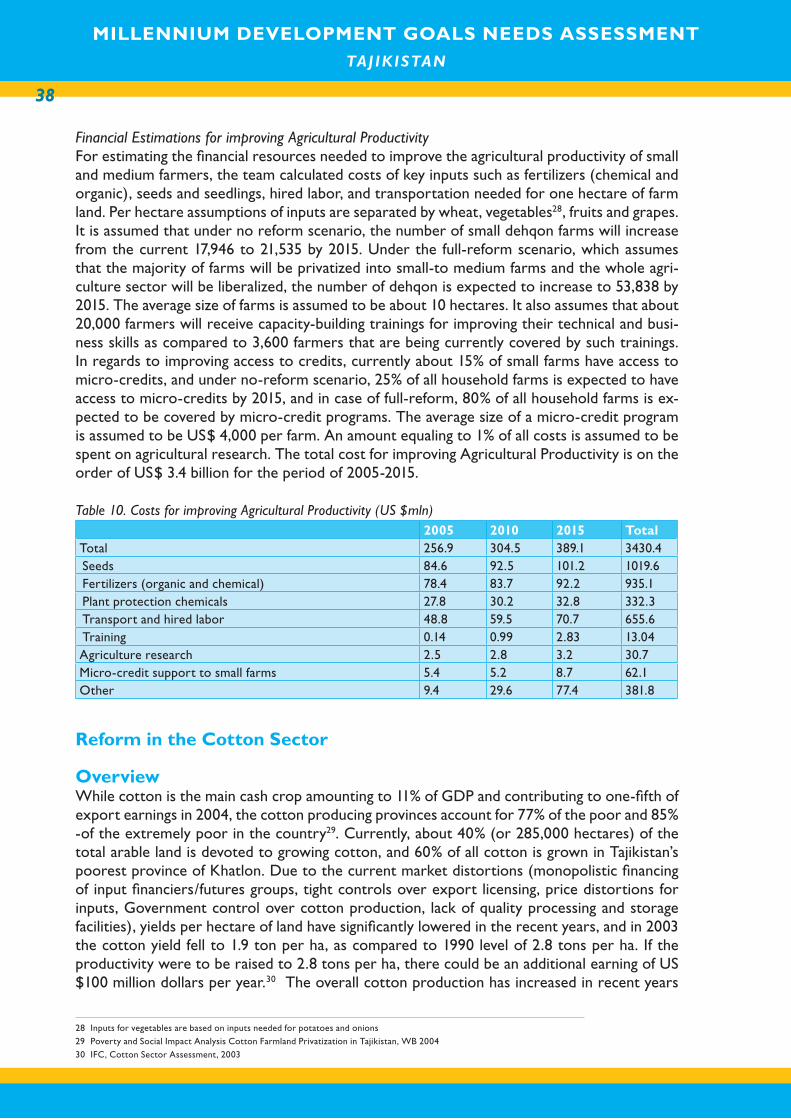
MILLENNIUM DEVELOPMENT GOALS NEEDS ASSESSMENT TAJ IK ISTAN
38
MILLENNIUM DEVELOPMENT GOALS NEEDS ASSESSMENT TAJ IK ISTAN
Financial Estimations for improving Agricultural ProductivityFor estimating the financial resources needed to improve the agricultural productivity of small and medium farmers, the team calculated costs of key inputs such as fertilizers (chemical and organic), seeds and seedlings, hired labor, and transportation needed for one hectare of farm land. Per hectare assumptions of inputs are separated by wheat, vegetables28, fruits and grapes. It is assumed that under no reform scenario, the number of small dehqon farms will increase from the current 17,946 to 21,535 by 2015. Under the full-reform scenario, which assumes that the majority of farms will be privatized into small-to medium farms and the whole agri-culture sector will be liberalized, the number of dehqon is expected to increase to 53,838 by 2015. The average size of farms is assumed to be about 10 hectares. It also assumes that about 20,000 farmers will receive capacity-building trainings for improving their technical and busi-ness skills as compared to 3,600 farmers that are being currently covered by such trainings. In regards to improving access to credits, currently about 15% of small farms have access to micro-credits, and under no-reform scenario, 25% of all household farms is expected to have access to micro-credits by 2015, and in case of full-reform, 80% of all household farms is ex-pected to be covered by micro-credit programs. The average size of a micro-credit program is assumed to be US$ 4,000 per farm. An amount equaling to 1% of all costs is assumed to be spent on agricultural research. The total cost for improving Agricultural Productivity is on the order of US$ 3.4 billion for the period of 2005-2015.
Table 10. Costs for improving Agricultural Productivity (US $mln) 2005 2010 2015 TotalTotal 256.9 304.5 389.1 3430.4Seeds 84.6 92.5 101.2 1019.6Fertilizers (organic and chemical) 78.4 83.7 92.2 935.1Plant protection chemicals 27.8 30.2 32.8 332.3Transport and hired labor 48.8 59.5 70.7 655.6Training 0.14 0.99 2.83 13.04Agriculture research 2.5 2.8 3.2 30.7Micro-credit support to small farms 5.4 5.2 8.7 62.1Other 9.4 29.6 77.4 381.8
Reform in the Cotton Sector
OverviewWhile cotton is the main cash crop amounting to 11% of GDP and contributing to one-fifth of export earnings in 2004, the cotton producing provinces account for 77% of the poor and 85% -of the extremely poor in the country29. Currently, about 40% (or 285,000 hectares) of the total arable land is devoted to growing cotton, and 60% of all cotton is grown in Tajikistan’s poorest province of Khatlon. Due to the current market distortions (monopolistic financing of input financiers/futures groups, tight controls over export licensing, price distortions for inputs, Government control over cotton production, lack of quality processing and storage facilities), yields per hectare of land have significantly lowered in the recent years, and in 2003 the cotton yield fell to 1.9 ton per ha, as compared to 1990 level of 2.8 tons per ha. If the productivity were to be raised to 2.8 tons per ha, there could be an additional earning of US $100 million dollars per year.30 The overall cotton production has increased in recent years
28 Inputs for vegetables are based on inputs needed for potatoes and onions
29 Poverty and Social Impact Analysis Cotton Farmland Privatization in Tajikistan, WB 2004
30 IFC, Cotton Sector Assessment, 2003
39
mainly through extensification measures, and in 2003 the country produced 537,000 tons, whereas in 2004 it produced 558,000 tons of cotton31. Poverty and cotton production seem to be strongly correlated, and if the country is to achieve the MDG target one of reducing poverty and hunger, immediate reforms in the cotton sector are in order.
Government Controls and Monopolistic FinanciersAccording to the Presidential Decree of 2000 and the 2002 PRSP, the central and local gov-ernments should not control the farmers’ production. However, the central Government still continues to set targets for the production of cotton (for example, the Government set a target for increasing cotton production up to 750,000ha by 2010), and the local governments wield a substantial amount of power over the farmers’ decision to grow cotton, and control farm inputs financing and cotton processing. In the cotton growing regions, all farms are re-quired to allocate 70% of their land to cotton growing, and if an independent farm decides to grow crop other than cotton, in some cases, retributions and even a seizure of the farmer’s land by a khukumat32 can be expected. A small group of input financiers/suppliers has divided the cotton growing regions amongst themselves, so that a cotton farm has no options but to buy inputs from one monopolistic financier. These financiers have been thus supplying inputs at prices much higher than market rates, and moreover control the local ginning factories, to which the farmers are pressured to sell their cotton at lower than market prices. Coupled with over-invoicing, the frequent delays in supplying inputs prevent farmers from planting cotton on time, ultimately driving the farmers’ productivity down. The continued control of interest groups over cotton production and sales impedes the progress of the reform in the cotton sector, and drives the farmers further into poverty.
Women’s and Child LaborIn Tajikistan, most if not all cotton is harvested by women. These women receive almost no benefits, and are often not paid enough for their work33. Labor migration of men to Russia34 and the aftermath of the civil war have left many rural women as heads of households with lit-tle income generating opportunities and no alternatives besides picking cotton or engaging in other seasonal labor markets. Although child labor is outlawed in Tajikistan, children can often be seen harvesting cotton alongside women. A recent survey conducted by IOM and NGO “Pulse” on child labor in the cotton fields confirmed that as much as 72% of schoolchildren in surveyed regions participated in the 2003 cotton harvest, working from 30 to 60 days a year. This has serious implications for the school attendance, with children in the cotton growing regions missing for up to one-third of the academic year35. Forced mobilization of university students for the cotton harvest can still be observed in some regions of the country, and re-fusal to participate could often end in expulsion36. While adjusting the school calendar could be a short-term solution for ensuring school attendance, the Government and donors should work together to implement the Convention on the Rights of the Child (CRC) in Tajikistan that calls for protecting children from economic exploitation and from performing any work that is hazardous and harmful to their physical, social, moral and mental development.37
31 The Curse of Cotton: Central Asia’s Destructive Monoculture, Crisis Group, 2005
32 Local Government
33 According the Crisis Group report, 17% of surveyed women in Khatlon province received a monthly wage of US $1.67, while almost 22% of women
did no receive any salary. Also, NGOs reported that in many occasion cotton stalks are given to women as payment for their work.
34 According International Organization for Migration, Tajikistan officially has 600,000 migrants, with 40.8% of whom from Khatlon Region.
35 Children in the Cotton Fields, IOM/PUlSE, 2003
36 The Curse of Cotton: Central Asia’s Destructive Monoculture, Crisis Group, 2005
37 Ibid., p.24

MILLENNIUM DEVELOPMENT GOALS NEEDS ASSESSMENT TAJ IK ISTAN
40
MILLENNIUM DEVELOPMENT GOALS NEEDS ASSESSMENT TAJ IK ISTAN
The Ginning ProcessThere are only 27 ginning factories in Tajikistan, all of which operate as monopolies in their re-spective regions. The ineffective ginning process in Tajikistan results in significant losses of the cotton outputs ready for export. The cost of processing one ton of cotton is more than US $140, and it takes about 200 days to process as compared to 90 days for Western gins38. The long delays in ginning result in the farmers’ capital being tied to the last year’s crop, which ne-cessitates them to borrow money again, encouraging the vicious cycle of the farmers’ indebt-edness to the financiers. As explained below in the cotton debt section, the input financiers, who also control the ginning factories, have a perverse incentive to prolong the ginning time, in order to keep charging the farmers the interest rates for inputs for as long as possible. The farmers also have to take their cotton to a designated ginning factory in the area, and this lack of competition provides the ginneries with no incentives to improve their current structure. The poor conditions of the ginning factories, including poor storage facilities, old machinery coupled with the lack of competition and proper accounting and cotton grading mechanisms adversely affect the overall productivity in the cotton sector.
The Cotton DebtThe existing farm debt is a serious constraint to further development in the agriculture sector. Only 10% of crop production is financed by commercial banks, and gross debt takes away 62% of the cotton sector revenues. The farm debt extends to cotton farms, which account for about 40% of the total irrigated area, and is closely linked to lending credits (mostly in the form of inputs) to the cotton farmers. Externals loans were distributed by the National Bank to the agricultural Agroinvest bank, which in turn distributed the monies to a small group of local en-trepreneurs, who lent the credits to cotton farmers that used their cotton crop as collateral.Instead of lending seed capital in cash, these local financiers supplied generally low-quality in-puts in-kind, and often with significant delays39. As mentioned earlier, they also control ginning factories, thus creating monopoly over the supply, production, processing and sales chains. Delays in the cotton processing not only negatively affected the quality of cotton produced for export, but also allowed the financiers to continue charging interest on input financing until the cotton has been ginned and ready for export40. This monopolistic system led to cor-ruption, with the financiers over-invoicing inputs, buying cotton from farmers at prices signifi-cantly lower than the market rates and delaying the processing of cotton.
The Government indicated that about 589 farms had internal debts and 384 -external debts. According to ADB report on cotton debt, the amount of farms with external debts could be up to 451 farms. The total debt as of January 2004 amounts to US $242.4 million, out of which US $65 million is an amount of gross arrears accumulated over a period of six years since 1997.
Table 11. Change in the Farm Debt Position January 2003 – January 2004 (US $million)
2002 2003 Change
Debt Source Debt Farm No Debt Farm No Debt Change Non Government 34 552 20.3 446 -13.7Government 40.3 607 42.7 549 2.4Total internal 74.3 609 63 549 11.3External 171 431 179.5 414 -8.5Total 245 627 242.4 566 -2.6
Source: Farm Debt Resolution and Policy Reforms, Asian Development Bank, March 2004
38 Poverty Social Impact Analysis: Cotton Farmland Privatization in Tajikistan, WB, 2004.
39 Poverty Social Impact Analysis: Cotton Farmland Privatization in Tajikistan, WB, 2004. According to the WB, total resource leakage from the cotton
sector because of over-invoicing ranges from USD8.5 mln to USD21 mln.
40 Ibid
41
ADB report offers various scenarios for resolving the accumulated debt in the cotton sec-tor. Option one suggests that the current debt rests with the indebted farms over the next 10 years, and allocating the gross debt across the whole agricultural sector. This means that a $10ha/per year tax will be levied to all arable land, including presidential lands. Option two calls for resolving the debt through levying supplemental taxation to the cotton producers only, amounting to US $30/ton of cotton fiber over the next 10 years. Option three allocates the responsibility among all key stakeholders, and proposes that the Government take up 50%, external financiers-10%, investors-25%, and farms-15% of debt. While all options have their own advantages and disadvantages, they all do not take into an account the causes of debt accumulated. Thus, as a first step, carrying out a comprehensive auditing of causes of debt in a few pilot farms through an independent arbitration agency may help clarify the real situation behind the scenes, and help separate the false debts (created through manipulations of input prices, illegal contracts with farmers, etc.) from the real ones. Government MeasuresThe Government of Tajikistan has carried out in 2003 a joint study with ADB on the cotton sector debt, but no concrete resolutions have yet emerged for solving the situation. As indi-cated earlier, the Government still regulates the cotton production and controls the cotton pricing mechanisms. While a decree on regulating the control of the quality of cotton has been issued in 2001, the decree is yet to be translated into implementation. The Government is working towards liberalizing the whole agricultural sector, including the cotton, but the prog-ress on this front has been slow and cumbersome, due to powerful vested interests in keeping the situation status quo. With the current state of agricultural policies, farmers do not have an economic incentive to improve performance.
RecommendationsThe most important measure is to resolve the cotton debt and to immediately start the pro-cess of complete liberalization of the whole cotton sector. In conjunction with the equitable land reform and measure to increase the overall productivity, the following steps over the short-term period are recommended:• Beginning of the resolution of the cotton debt, through arbitration processes in pilot
cotton farms and introduction of bankruptcy procedures for heavily indebted farm-ers;
• Introducing competitiveness in inputs supply and ginning mechanisms (breaking up the existing monopolies);
• Ceasing direct and indirect Government targets and controls over cotton produc-tion;
• Reforming supply of in-kind inputs to cash credits, and creating alternative financing mechanisms, especially low-interest micro-credit schemes;
• Modernizing the ginning factories and decreasing the processing time by at least half (3 months);
• Continue restructuring the collective cotton farms into completely independent pri-vate farms, coupled with the provision of appropriate training and legal support to farmers.
Over the medium-term, the following measures are recommended:• Resolution of all cotton sector debt;
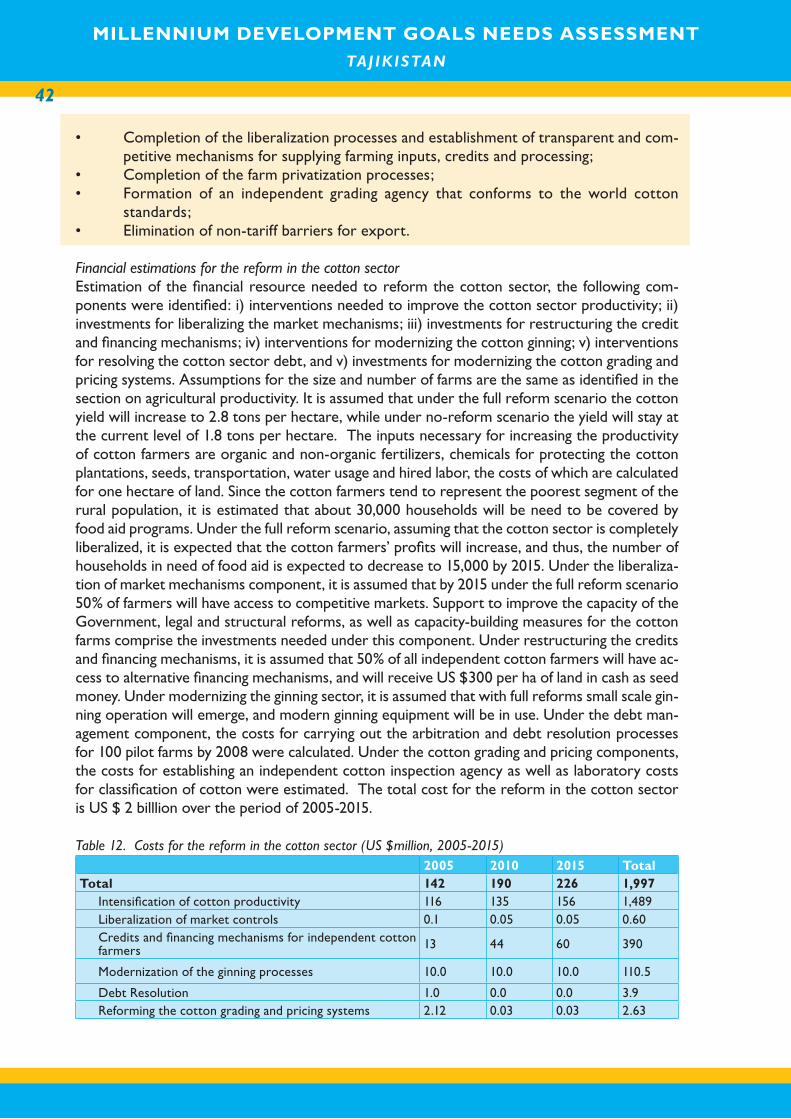
MILLENNIUM DEVELOPMENT GOALS NEEDS ASSESSMENT TAJ IK ISTAN
42
MILLENNIUM DEVELOPMENT GOALS NEEDS ASSESSMENT TAJ IK ISTAN
• Completion of the liberalization processes and establishment of transparent and com-petitive mechanisms for supplying farming inputs, credits and processing;
• Completion of the farm privatization processes;• Formation of an independent grading agency that conforms to the world cotton
standards;• Elimination of non-tariff barriers for export.
Financial estimations for the reform in the cotton sector Estimation of the financial resource needed to reform the cotton sector, the following com-ponents were identified: i) interventions needed to improve the cotton sector productivity; ii) investments for liberalizing the market mechanisms; iii) investments for restructuring the credit and financing mechanisms; iv) interventions for modernizing the cotton ginning; v) interventions for resolving the cotton sector debt, and v) investments for modernizing the cotton grading and pricing systems. Assumptions for the size and number of farms are the same as identified in the section on agricultural productivity. It is assumed that under the full reform scenario the cotton yield will increase to 2.8 tons per hectare, while under no-reform scenario the yield will stay at the current level of 1.8 tons per hectare. The inputs necessary for increasing the productivity of cotton farmers are organic and non-organic fertilizers, chemicals for protecting the cotton plantations, seeds, transportation, water usage and hired labor, the costs of which are calculated for one hectare of land. Since the cotton farmers tend to represent the poorest segment of the rural population, it is estimated that about 30,000 households will be need to be covered by food aid programs. Under the full reform scenario, assuming that the cotton sector is completely liberalized, it is expected that the cotton farmers’ profits will increase, and thus, the number of households in need of food aid is expected to decrease to 15,000 by 2015. Under the liberaliza-tion of market mechanisms component, it is assumed that by 2015 under the full reform scenario 50% of farmers will have access to competitive markets. Support to improve the capacity of the Government, legal and structural reforms, as well as capacity-building measures for the cotton farms comprise the investments needed under this component. Under restructuring the credits and financing mechanisms, it is assumed that 50% of all independent cotton farmers will have ac-cess to alternative financing mechanisms, and will receive US $300 per ha of land in cash as seed money. Under modernizing the ginning sector, it is assumed that with full reforms small scale gin-ning operation will emerge, and modern ginning equipment will be in use. Under the debt man-agement component, the costs for carrying out the arbitration and debt resolution processes for 100 pilot farms by 2008 were calculated. Under the cotton grading and pricing components, the costs for establishing an independent cotton inspection agency as well as laboratory costs for classification of cotton were estimated. The total cost for the reform in the cotton sector is US $ 2 billlion over the period of 2005-2015.
Table 12. Costs for the reform in the cotton sector (US $million, 2005-2015) 2005 2010 2015 TotalTotal 142 190 226 1,997
Intensification of cotton productivity 116 135 156 1,489Liberalization of market controls 0.1 0.05 0.05 0.60Credits and financing mechanisms for independent cotton farmers 13 44 60 390
Modernization of the ginning processes 10.0 10.0 10.0 110.5
Debt Resolution 1.0 0.0 0.0 3.9Reforming the cotton grading and pricing systems 2.12 0.03 0.03 2.63
43
Land Reform
OverviewLand tenure constitutes the most important precondition for sustainable livelihoods. With-out equitable access to land, poverty and hunger will continue plaguing the rural population in Tajikistan. Currently, all land and natural resources in Tajikistan are state properties, but farmers have the long-term usage rights of land.41 From 1996 on, the country began the pro-cess of restructuring the state and collective farms to smaller, independent farms. The Land Code of Tajikistan provides that the right to life-long use of land by state, private or collec-tive enterprises. Dehqon farms and household plots can be inherited. Also, the land can be rented for up to 20 years. The Land Code also provides that every family has the right to a household plot in the size of up to 0.12 hectares of irrigated land, and up to 0.24 hectares of dry land. Presidential land was allocated by presidential decrees in 1995 and 1997 in order to supplement household plots, the families with low incomes and large families having the first priority access42. Currently, about 84% of rural households have household and presidential plots which are considered to be the main sources of the household food production.
By 2004 the Government restructured 578 state-owned farms into 22,285 independent de-hqon farms43 out of which 90% needs to be restructured for the second time for completed privatization. In addition to this, the remaining 34 large state farms are due to be restructured by December 2005. According to the survey on land reform conducted by Action Against Hunger (AAH), most households (about 86.3%) continue to be workers for the large farms. Only about 9 percent of arable land belongs to individual or family dehqon farms, and about 14% of land belongs to dehqon farm associations. Thus, the privatization process continues to remain largely on paper, with farms keeping the old Soviet structures intact, under the control of local and central governments.
Many farmers working for restructured collective farms have no knowledge of their rights, and continue working as employees, not shareholders. The names of the collective farm members do not appear on land certificates, and the individual plots to which a farm member is entitled often are not actually allocated, and even when allocated, they are not properly demarcated. The farm managers are often the ex-heads of the collective farms and are usually appointed by the local Government. The farm managers have the power to purchase inputs and draw contracts with financiers without consulting the members of the farm, and this process has indebted many farm members without their prior consent or knowledge. Individuals or households wishing to become independent dehqon farms need to receive the approval of the local Government, the State Land Committee and other agencies, the process laden with red tape and administrative barriers. In the cotton growing regions, it is even harder to form an individual or household dehqon farm, due to the existing cotton debt and the Government’s interest to have the farm-ers remain part of the state cotton farm. One of the most important factors keeping the rural population from forming independent dehqon farms is the lack of knowledge of their entitle-ments to land and of processes of applying for land. According to AAH survey, only 7.8% of the survey respondents knew how to apply for land. Since the farmers’ rights and Government’s obligations are not explicitly defined in the Land Code, there have been cases in which the local governments took away the farmer’s land for not appropriate/ not targeted use of land.
41 The long-term use rights are not yet quantified
42 Land Code, articles 6-7, and Land legislation in the republic of Tajikistan, Renee Giovarelli, 2004
43 Ministry of Agriculture and the State Land Committee
MILLENNIUM DEVELOPMENT GOALS NEEDS ASSESSMENT TAJ IK ISTAN
44
MILLENNIUM DEVELOPMENT GOALS NEEDS ASSESSMENT TAJ IK ISTAN
Government measuresThe Government has taken measures to improve the present Land Code and to finalize priva-tization of state and collective farms. The State Land Committee has been working together with international partners to help modernize the land registration, to simplify procedures for taxing the land, and to improve the rural population’s knowledge of their rights for land tenure. The Union of Dehqon Farmers together with the Government has been working to support the farmers in application procedures for receiving land entitlements, and carrying out farmer capacity-building activities. While the progress is at hand, reforms in the legis-lature targeted at protecting the farmers’ rights is yet to be implemented, along with major improvements in the actual equitable land distribution on the ground.
RecommendationsAs mentioned earlier, access to natural capital such as land is a necessary precondition for reducing poverty and hunger. The team recommends the following short-term measures for immediate attention:• Provision of an individual farming plot to every farmer;• Access of every farmer to information on applying for the land title and on procedures
for applying for a dehqon farm;• Clarification of the local Government’s obligations on implementing the Land Code;• Strengthening institutions that protect the farmer’s rights and interests (i.e. the Union
of Dehqon Farmers);• Capacity-building of the State Land Committee for improving land registration proce-
dures.
In the medium-term period, the following measures need to be implemented:• Finalization of farm privatization and restructuring reforms;• Revision of the Land Code, to secure land tenure rights (such as the rights to transfer
land and to use the land as a collateral, establishment of life-long inheritance rights);• Cease of Government’s control over production and marketing mechanisms;• Creation of community-based associations for managing natural resources and for pro-
tecting the land tenure rights of farmers;• Creation of simple and transparent procedures for land registration and taxation, and
clear division of responsibilities of all implementing agencies (local khukumats, the State Land Committee, etc).
Financial Estimations for Land ReformTo estimate the financial resources needed for equitable land reform, the following compo-nents were identified: i) restructuring of state farms; ii) restructuring of semi-restructured farms to fully privatized farms; iii) institutional and administrative reforms; and iv) public aware-ness and advocacy campaigns. It is assumed that 34 large state farms will be fully restructured to fully privatized independent farms (it is assumed that about 252 independent farms will be established by 2015). By 2015 all of the 2,797 semi-restructured dehqon farms will become fully independent private farms. For facilitating further institutional and administrative re-forms, a lump sum of US $1 million dollars is estimated. For monitoring and evaluation of the institutional reforms, US $100,000 is estimated. It is assumed that by 2015, at least 100,000 households will be covered by the mass media and advocacy campaigns. The main activity of the mass media comprises distribution of up to date information of farmers’ and Government agencies’ rights and obligations, as well as instructions on applying for land tenure. The total cost for strengthening the land reform process is on the order of US$ 12.96 million.
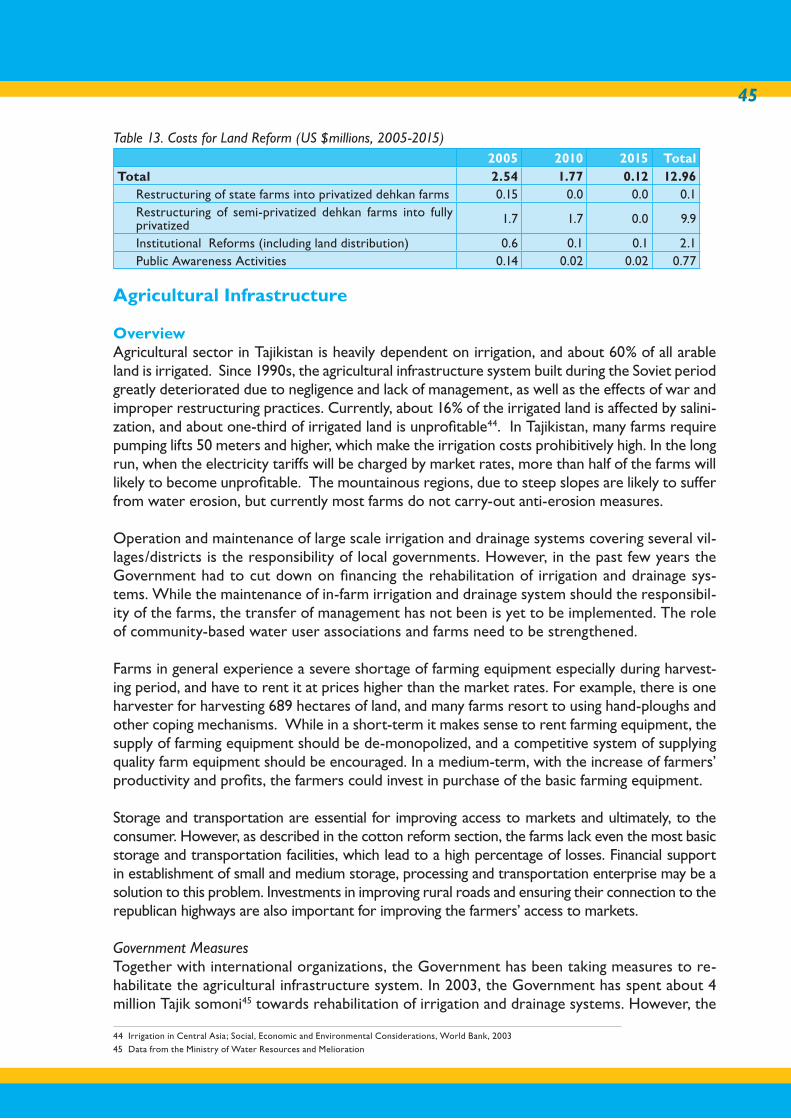
45
Table 13. Costs for Land Reform (US $millions, 2005-2015) 2005 2010 2015 Total
Total 2.54 1.77 0.12 12.96Restructuring of state farms into privatized dehkan farms 0.15 0.0 0.0 0.1Restructuring of semi-privatized dehkan farms into fully privatized 1.7 1.7 0.0 9.9
Institutional Reforms (including land distribution) 0.6 0.1 0.1 2.1Public Awareness Activities 0.14 0.02 0.02 0.77
Agricultural Infrastructure
OverviewAgricultural sector in Tajikistan is heavily dependent on irrigation, and about 60% of all arable land is irrigated. Since 1990s, the agricultural infrastructure system built during the Soviet period greatly deteriorated due to negligence and lack of management, as well as the effects of war and improper restructuring practices. Currently, about 16% of the irrigated land is affected by salini-zation, and about one-third of irrigated land is unprofitable44. In Tajikistan, many farms require pumping lifts 50 meters and higher, which make the irrigation costs prohibitively high. In the long run, when the electricity tariffs will be charged by market rates, more than half of the farms will likely to become unprofitable. The mountainous regions, due to steep slopes are likely to suffer from water erosion, but currently most farms do not carry-out anti-erosion measures.
Operation and maintenance of large scale irrigation and drainage systems covering several vil-lages/districts is the responsibility of local governments. However, in the past few years the Government had to cut down on financing the rehabilitation of irrigation and drainage sys-tems. While the maintenance of in-farm irrigation and drainage system should the responsibil-ity of the farms, the transfer of management has not been is yet to be implemented. The role of community-based water user associations and farms need to be strengthened.
Farms in general experience a severe shortage of farming equipment especially during harvest-ing period, and have to rent it at prices higher than the market rates. For example, there is one harvester for harvesting 689 hectares of land, and many farms resort to using hand-ploughs and other coping mechanisms. While in a short-term it makes sense to rent farming equipment, the supply of farming equipment should be de-monopolized, and a competitive system of supplying quality farm equipment should be encouraged. In a medium-term, with the increase of farmers’ productivity and profits, the farmers could invest in purchase of the basic farming equipment.
Storage and transportation are essential for improving access to markets and ultimately, to the consumer. However, as described in the cotton reform section, the farms lack even the most basic storage and transportation facilities, which lead to a high percentage of losses. Financial support in establishment of small and medium storage, processing and transportation enterprise may be a solution to this problem. Investments in improving rural roads and ensuring their connection to the republican highways are also important for improving the farmers’ access to markets.
Government MeasuresTogether with international organizations, the Government has been taking measures to re-habilitate the agricultural infrastructure system. In 2003, the Government has spent about 4 million Tajik somoni45 towards rehabilitation of irrigation and drainage systems. However, the
44 Irrigation in Central Asia; Social, Economic and Environmental Considerations, World Bank, 2003
45 Data from the Ministry of Water Resources and Melioration
MILLENNIUM DEVELOPMENT GOALS NEEDS ASSESSMENT TAJ IK ISTAN
46
MILLENNIUM DEVELOPMENT GOALS NEEDS ASSESSMENT TAJ IK ISTAN
majority of agriculture is still debilitated, and reforms towards establishing a transparent sys-tem of operation and maintenance are in order. Experience with projects on rehabilitation of rural agriculture supported by WB and ADB shows that devolvement of management to com-munity-based organizations such as Water User Associations is one of the effective measures to promote ownership and responsibility for agricultural infrastructure.
RecommendationsIn the short-term, the following measures are recommended:• Establishment of water user associations and other community-based organizations,
and devolvement of in-farm irrigation and drainage system management to them;• Creation of community-managed revolving funds for rehabilitation of minor infrastruc-
ture; • Investments in basic farming equipment;• Investments in anti-erosion measures.
In the medium-term, the following measures are recommended:• Creation of a competitive agricultural services market by investing in the development
of small and medium enterprises that supply farming equipment, transportation, stor-age and processing services;
• Improving access to markets through investments in rural roads system;• Investments in rehabilitation of irrigation and drainage systems managed by the state;• Gradual transition to low-lift irrigation, and increasing usage of non-irrigated dry land
for cultivation of fruits and other crops;• Rehabilitation of salinated land.
Financial Estimations for Agricultural InfrastructureFor estimating the financial resource needed for rehabilitating agricultural infrastructure, the interventions needed to improve the productivity of small and medium farmers were identified. The team considers that the single most important measure that would improve the productiv-ity of farmers is the devolvement of the management of in-farm irrigation and drainage systems to dehqon farms and water usage associations. It is assumed that in the full-reform scenario, by 2015, 90% of farms are assumed to be covered by community-based associations. For irriga-tion and rehabilitation measures, it is projected that about 70% of irrigation networks will be rehabilitated by 2015. The cost of rehabilitating in-farm system is US $300 per ha, and off-farm irrigation network is US $400 per ha. The cost of rehabilitating one pumping/lifting station is 1,000$. The team calculates that for operation and maintenance, US $30 is needed per hectare of land. For improving the cost recovery of electricity and water, it is assumed that by 2015 the price for water46 will increase from US 20 cents to US $5 per 1,000 cubic meters of water. The MDG-focused electricity costs are separately presented in the annex report. The total cost for rehabilitating agricultural infrastructure for 2005-2015 is US $727.40millions.
Table 14. Costs for the agriculture infrastructure rehabilitation (US $million, 2005-2015) 2005 2010 2015 TotalTotal 66.31 66.31 66.31 727.40
Water resource management 0.20 0.20 0.20 0.202
Irrigation Rehabilitation 66.11 66.11 66.11 727.20
46 This includes price for electricity for delivering water
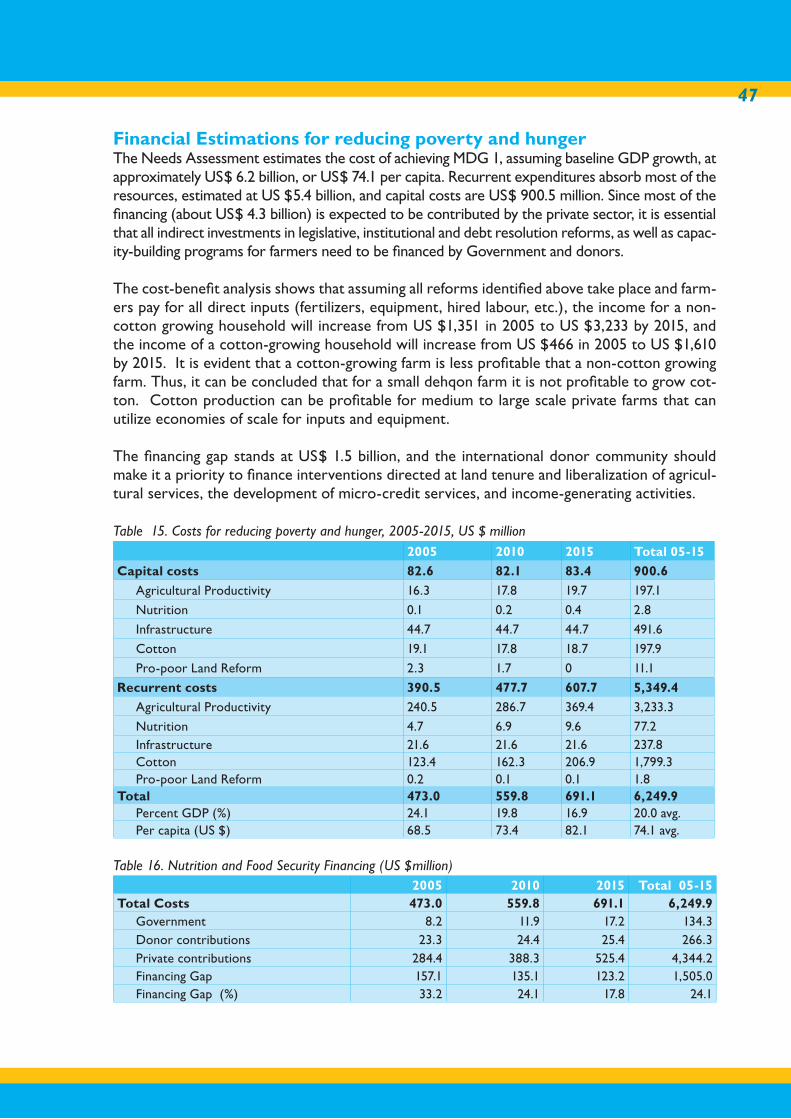
47
Financial Estimations for reducing poverty and hungerThe Needs Assessment estimates the cost of achieving MDG 1, assuming baseline GDP growth, at approximately US$ 6.2 billion, or US$ 74.1 per capita. Recurrent expenditures absorb most of the resources, estimated at US $5.4 billion, and capital costs are US$ 900.5 million. Since most of the financing (about US$ 4.3 billion) is expected to be contributed by the private sector, it is essential that all indirect investments in legislative, institutional and debt resolution reforms, as well as capac-ity-building programs for farmers need to be financed by Government and donors.
The cost-benefit analysis shows that assuming all reforms identified above take place and farm-ers pay for all direct inputs (fertilizers, equipment, hired labour, etc.), the income for a non-cotton growing household will increase from US $1,351 in 2005 to US $3,233 by 2015, and the income of a cotton-growing household will increase from US $466 in 2005 to US $1,610 by 2015. It is evident that a cotton-growing farm is less profitable that a non-cotton growing farm. Thus, it can be concluded that for a small dehqon farm it is not profitable to grow cot-ton. Cotton production can be profitable for medium to large scale private farms that can utilize economies of scale for inputs and equipment.
The financing gap stands at US$ 1.5 billion, and the international donor community should make it a priority to finance interventions directed at land tenure and liberalization of agricul-tural services, the development of micro-credit services, and income-generating activities.
Table 15. Costs for reducing poverty and hunger, 2005-2015, US $ million 2005 2010 2015 Total 05-15
Capital costs 82.6 82.1 83.4 900.6
Agricultural Productivity 16.3 17.8 19.7 197.1
Nutrition 0.1 0.2 0.4 2.8
Infrastructure 44.7 44.7 44.7 491.6
Cotton 19.1 17.8 18.7 197.9
Pro-poor Land Reform 2.3 1.7 0 11.1
Recurrent costs 390.5 477.7 607.7 5,349.4
Agricultural Productivity 240.5 286.7 369.4 3,233.3
Nutrition 4.7 6.9 9.6 77.2Infrastructure 21.6 21.6 21.6 237.8Cotton 123.4 162.3 206.9 1,799.3Pro-poor Land Reform 0.2 0.1 0.1 1.8
Total 473.0 559.8 691.1 6,249.9Percent GDP (%) 24.1 19.8 16.9 20.0 avg.Per capita (US $) 68.5 73.4 82.1 74.1 avg.
Table 16. Nutrition and Food Security Financing (US $million) 2005 2010 2015 Total 05-15
Total Costs 473.0 559.8 691.1 6,249.9Government 8.2 11.9 17.2 134.3Donor contributions 23.3 24.4 25.4 266.3Private contributions 284.4 388.3 525.4 4,344.2Financing Gap 157.1 135.1 123.2 1,505.0Financing Gap (%) 33.2 24.1 17.8 24.1
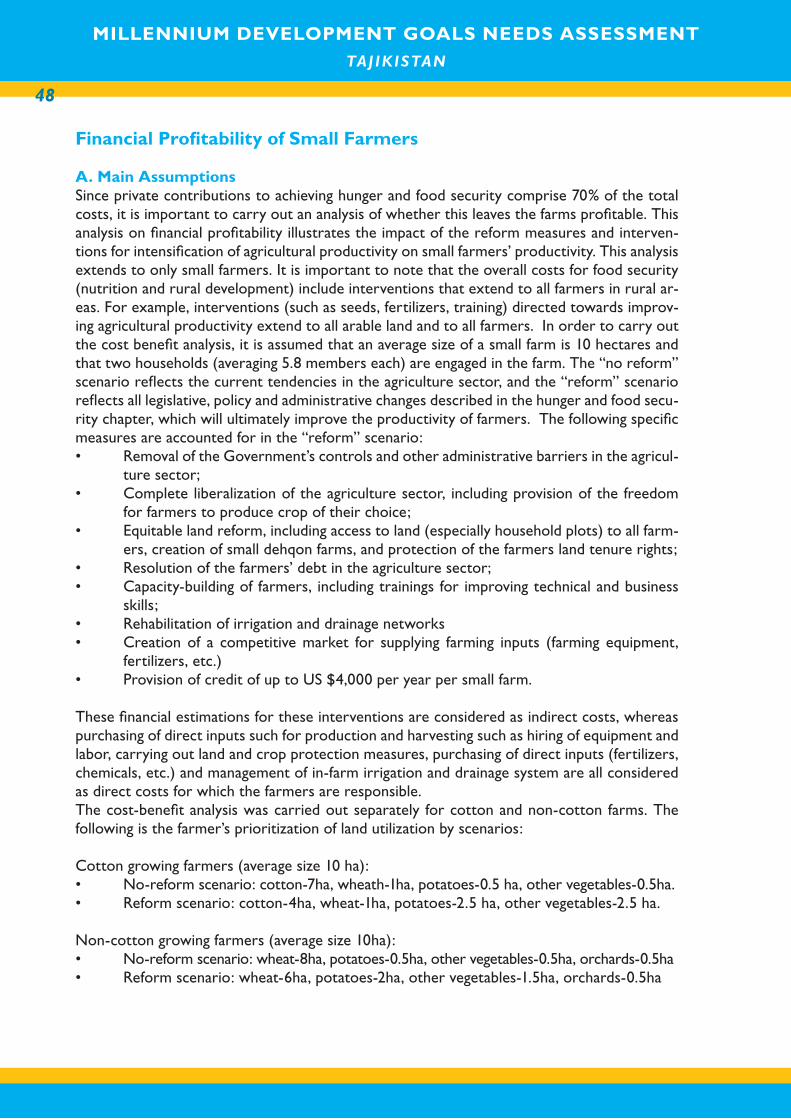
MILLENNIUM DEVELOPMENT GOALS NEEDS ASSESSMENT TAJ IK ISTAN
48
MILLENNIUM DEVELOPMENT GOALS NEEDS ASSESSMENT TAJ IK ISTAN
Financial Profitability of Small Farmers A. Main AssumptionsSince private contributions to achieving hunger and food security comprise 70% of the total costs, it is important to carry out an analysis of whether this leaves the farms profitable. This analysis on financial profitability illustrates the impact of the reform measures and interven-tions for intensification of agricultural productivity on small farmers’ productivity. This analysis extends to only small farmers. It is important to note that the overall costs for food security (nutrition and rural development) include interventions that extend to all farmers in rural ar-eas. For example, interventions (such as seeds, fertilizers, training) directed towards improv-ing agricultural productivity extend to all arable land and to all farmers. In order to carry out the cost benefit analysis, it is assumed that an average size of a small farm is 10 hectares and that two households (averaging 5.8 members each) are engaged in the farm. The “no reform” scenario reflects the current tendencies in the agriculture sector, and the “reform” scenario reflects all legislative, policy and administrative changes described in the hunger and food secu-rity chapter, which will ultimately improve the productivity of farmers. The following specific measures are accounted for in the “reform” scenario:• Removal of the Government’s controls and other administrative barriers in the agricul-
ture sector; • Complete liberalization of the agriculture sector, including provision of the freedom
for farmers to produce crop of their choice;• Equitable land reform, including access to land (especially household plots) to all farm-
ers, creation of small dehqon farms, and protection of the farmers land tenure rights;• Resolution of the farmers’ debt in the agriculture sector;• Capacity-building of farmers, including trainings for improving technical and business
skills;• Rehabilitation of irrigation and drainage networks• Creation of a competitive market for supplying farming inputs (farming equipment,
fertilizers, etc.)• Provision of credit of up to US $4,000 per year per small farm.
These financial estimations for these interventions are considered as indirect costs, whereas purchasing of direct inputs such for production and harvesting such as hiring of equipment and labor, carrying out land and crop protection measures, purchasing of direct inputs (fertilizers, chemicals, etc.) and management of in-farm irrigation and drainage system are all considered as direct costs for which the farmers are responsible. The cost-benefit analysis was carried out separately for cotton and non-cotton farms. The following is the farmer’s prioritization of land utilization by scenarios:
Cotton growing farmers (average size 10 ha):• No-reform scenario: cotton-7ha, wheath-1ha, potatoes-0.5 ha, other vegetables-0.5ha.• Reform scenario: cotton-4ha, wheat-1ha, potatoes-2.5 ha, other vegetables-2.5 ha.
Non-cotton growing farmers (average size 10ha):• No-reform scenario: wheat-8ha, potatoes-0.5ha, other vegetables-0.5ha, orchards-0.5ha• Reform scenario: wheat-6ha, potatoes-2ha, other vegetables-1.5ha, orchards-0.5ha
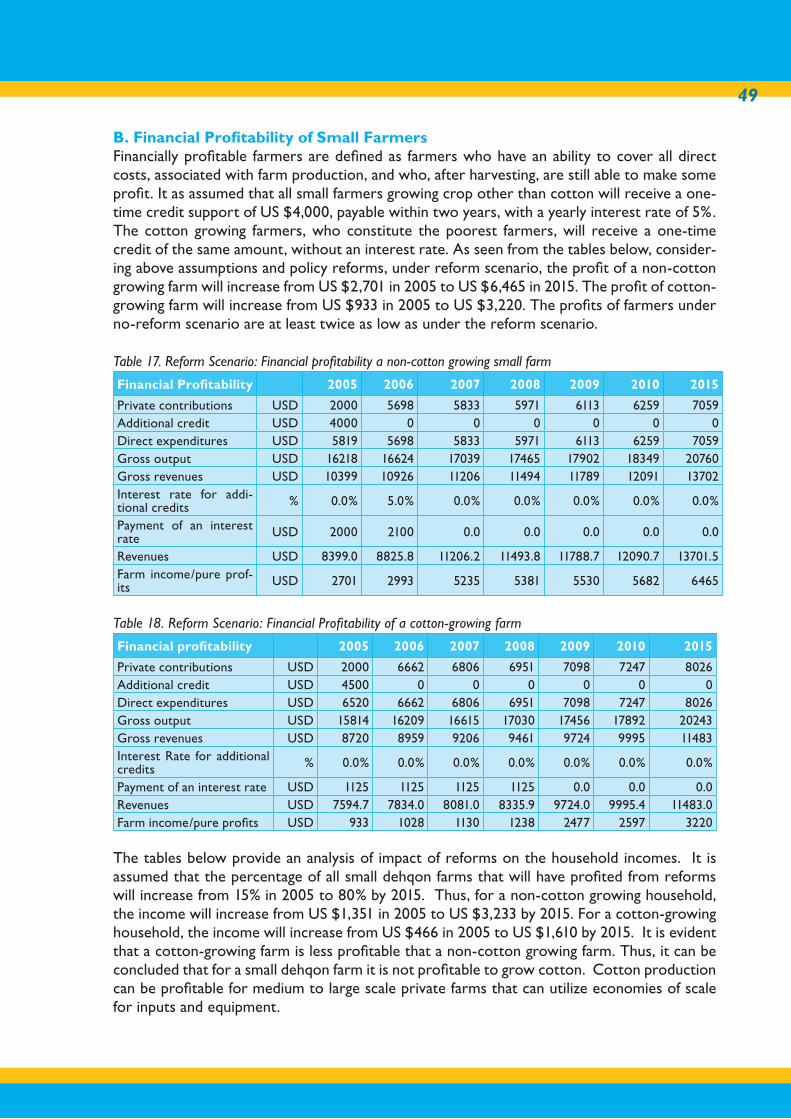
49
B. Financial Profitability of Small FarmersFinancially profitable farmers are defined as farmers who have an ability to cover all direct costs, associated with farm production, and who, after harvesting, are still able to make some profit. It as assumed that all small farmers growing crop other than cotton will receive a one-time credit support of US $4,000, payable within two years, with a yearly interest rate of 5%. The cotton growing farmers, who constitute the poorest farmers, will receive a one-time credit of the same amount, without an interest rate. As seen from the tables below, consider-ing above assumptions and policy reforms, under reform scenario, the profit of a non-cotton growing farm will increase from US $2,701 in 2005 to US $6,465 in 2015. The profit of cotton-growing farm will increase from US $933 in 2005 to US $3,220. The profits of farmers under no-reform scenario are at least twice as low as under the reform scenario.
Table 17. Reform Scenario: Financial profitability a non-cotton growing small farm
Financial Profitability 2005 2006 2007 2008 2009 2010 2015
Private contributions USD 2000 5698 5833 5971 6113 6259 7059Additional credit USD 4000 0 0 0 0 0 0Direct expenditures USD 5819 5698 5833 5971 6113 6259 7059Gross output USD 16218 16624 17039 17465 17902 18349 20760Gross revenues USD 10399 10926 11206 11494 11789 12091 13702Interest rate for addi-tional credits % 0.0% 5.0% 0.0% 0.0% 0.0% 0.0% 0.0%
Payment of an interest rate USD 2000 2100 0.0 0.0 0.0 0.0 0.0
Revenues USD 8399.0 8825.8 11206.2 11493.8 11788.7 12090.7 13701.5Farm income/pure prof-its USD 2701 2993 5235 5381 5530 5682 6465
Table 18. Reform Scenario: Financial Profitability of a cotton-growing farm
Financial profitability 2005 2006 2007 2008 2009 2010 2015
Private contributions USD 2000 6662 6806 6951 7098 7247 8026Additional credit USD 4500 0 0 0 0 0 0Direct expenditures USD 6520 6662 6806 6951 7098 7247 8026Gross output USD 15814 16209 16615 17030 17456 17892 20243Gross revenues USD 8720 8959 9206 9461 9724 9995 11483Interest Rate for additional credits % 0.0% 0.0% 0.0% 0.0% 0.0% 0.0% 0.0%
Payment of an interest rate USD 1125 1125 1125 1125 0.0 0.0 0.0Revenues USD 7594.7 7834.0 8081.0 8335.9 9724.0 9995.4 11483.0Farm income/pure profits USD 933 1028 1130 1238 2477 2597 3220
The tables below provide an analysis of impact of reforms on the household incomes. It is assumed that the percentage of all small dehqon farms that will have profited from reforms will increase from 15% in 2005 to 80% by 2015. Thus, for a non-cotton growing household, the income will increase from US $1,351 in 2005 to US $3,233 by 2015. For a cotton-growing household, the income will increase from US $466 in 2005 to US $1,610 by 2015. It is evident that a cotton-growing farm is less profitable that a non-cotton growing farm. Thus, it can be concluded that for a small dehqon farm it is not profitable to grow cotton. Cotton production can be profitable for medium to large scale private farms that can utilize economies of scale for inputs and equipment.
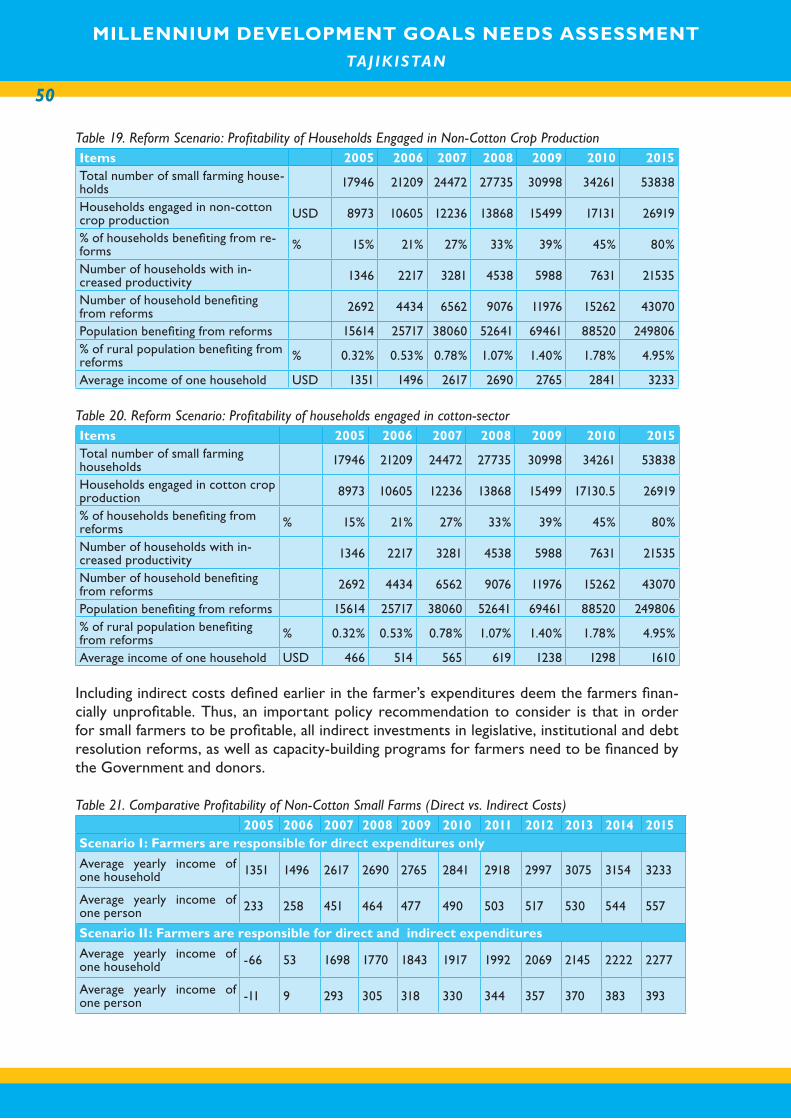
MILLENNIUM DEVELOPMENT GOALS NEEDS ASSESSMENT TAJ IK ISTAN
50
MILLENNIUM DEVELOPMENT GOALS NEEDS ASSESSMENT TAJ IK ISTAN
Table 19. Reform Scenario: Profitability of Households Engaged in Non-Cotton Crop ProductionItems 2005 2006 2007 2008 2009 2010 2015Total number of small farming house-holds 17946 21209 24472 27735 30998 34261 53838
Households engaged in non-cotton crop production USD 8973 10605 12236 13868 15499 17131 26919
% of households benefiting from re-forms % 15% 21% 27% 33% 39% 45% 80%
Number of households with in-creased productivity 1346 2217 3281 4538 5988 7631 21535
Number of household benefiting from reforms 2692 4434 6562 9076 11976 15262 43070
Population benefiting from reforms 15614 25717 38060 52641 69461 88520 249806% of rural population benefiting from reforms % 0.32% 0.53% 0.78% 1.07% 1.40% 1.78% 4.95%
Average income of one household USD 1351 1496 2617 2690 2765 2841 3233
Table 20. Reform Scenario: Profitability of households engaged in cotton-sector Items 2005 2006 2007 2008 2009 2010 2015Total number of small farming households 17946 21209 24472 27735 30998 34261 53838
Households engaged in cotton crop production 8973 10605 12236 13868 15499 17130.5 26919
% of households benefiting from reforms % 15% 21% 27% 33% 39% 45% 80%
Number of households with in-creased productivity 1346 2217 3281 4538 5988 7631 21535
Number of household benefiting from reforms 2692 4434 6562 9076 11976 15262 43070
Population benefiting from reforms 15614 25717 38060 52641 69461 88520 249806% of rural population benefiting from reforms % 0.32% 0.53% 0.78% 1.07% 1.40% 1.78% 4.95%
Average income of one household USD 466 514 565 619 1238 1298 1610
Including indirect costs defined earlier in the farmer’s expenditures deem the farmers finan-cially unprofitable. Thus, an important policy recommendation to consider is that in order for small farmers to be profitable, all indirect investments in legislative, institutional and debt resolution reforms, as well as capacity-building programs for farmers need to be financed by the Government and donors.
Table 21. Comparative Profitability of Non-Cotton Small Farms (Direct vs. Indirect Costs)2005 2006 2007 2008 2009 2010 2011 2012 2013 2014 2015
Scenario I: Farmers are responsible for direct expenditures only
Average yearly income of one household 1351 1496 2617 2690 2765 2841 2918 2997 3075 3154 3233
Average yearly income of one person 233 258 451 464 477 490 503 517 530 544 557
Scenario II: Farmers are responsible for direct and indirect expenditures
Average yearly income of one household -66 53 1698 1770 1843 1917 1992 2069 2145 2222 2277
Average yearly income of one person -11 9 293 305 318 330 344 357 370 383 393

51
Table 22. Comparative Profitability of Cotton Growing Small Farms (Direct vs. Indirect Costs) 2005 2006 2007 2008 2009 2010 2011 2012 2013 2014 2015
Scenario I: Farmers are responsible for direct expenditures only
Average yearly income of one household 466 514 565 619 1238 1298 1362 1428 1498 1571 1610
Average yearly income of one person 80 89 97 107 214 224 235 246 258 271 278
Scenario II: Farmers are responsible for direct and indirect expenditures
Average yearly income of one household -675 -629 -580 -527 316 374 436 500 568 639 655
Average yearly income of one person -116 -108 -100 -91 54 65 75 86 98 110 113
MILLENNIUM DEVELOPMENT GOALS NEEDS ASSESSMENT TAJ IK ISTAN
52
MILLENNIUM DEVELOPMENT GOALS NEEDS ASSESSMENT TAJ IK ISTAN
6. MDG 2: ACHIEVE UNIVERSAL PRIMARY
EDUCATION
Goal 2. Achieve universal primary education
Target 3. Ensure that, by 2015, children everywhere, boys and girls alike, will be able to complete a full course of primary schooling
Target 4. Eliminate gender disparity in primary and secondary education, pref-erably by 2005, and in all levels of education no later than 2015.
Target 3 for Tajikistan: Achieving universal basic education (1-9 grades), and eliminate gender gap in secondary education (1-11 grades)
Overview Providing quality education is an important factor for achieving sustainable and equitable develop-ment. Due to the combined effects of the civil war and the challenges of transition, Tajikistan faces considerable obstacles in achieving the MDG target of providing basic education to all girls and boys.47 Dropping attendance levels, a widening gender gap, growing barriers to full participation in the basic education for children of vulnerable groups, inappropriate curricula, low teacher salaries and the resulting difficulties in retaining good teachers, an inadequate and deteriorating physical structure of schools and weak capacity for conducting policy assessments are some of the difficul-ties that the education system is facing today. Overall non-enrollment in 2003 rose to 6 percent for boys and 18 percent for girls above grade fours in urban and peri-urban areas, compared to 4% and 7% respectively in the rural areas48. Even when children are enrolling, they are not always at-tending school. The attendance levels have declined to 88 % in 2003 compared to 90 % in 2000.49
The main interventions in the education sector are: 1) rehabilitation of school infrastructure, including provision of clean water, heating and gender-sensitive toilets; 2) provision of text-books to schoolchildren; 3) provision of school meals to children; 4) building of new schools nationwide, 5) training and skills improvement of primary and secondary school teachers, 6) curriculum development measures; 7) salary increase of teachers, 8) introduction of per-capita financing of schools and 9) mobilization of parents, teachers, community leaders and children for participation in decision making processes, school administration and management.
The main coverage targets for 2015 in the education sector are: 1) access to school for 99 percent of children; 2) provision of textbooks to 100 percent of children; 2) provision of 100 percent of schools with clean water, heating and gender sensitive toilets; 3) provision of free school meals to 50 percents of children; 4) 850 new schools in remote or overcrowded areas; 5) yearly re-qualification trainings of 20-25 percent of all teachers; 6) increasing by 4-5 times
47 While MDG 2 specifically refers to primary education (in Tajikistan “primary education” refers to grades 1-4), this study considers the costs of
achieving universal enrollment in the compulsory nine-year program of basic education
48 PAU, WB 2004
49 WB Poverty Assessment Update. June 2004
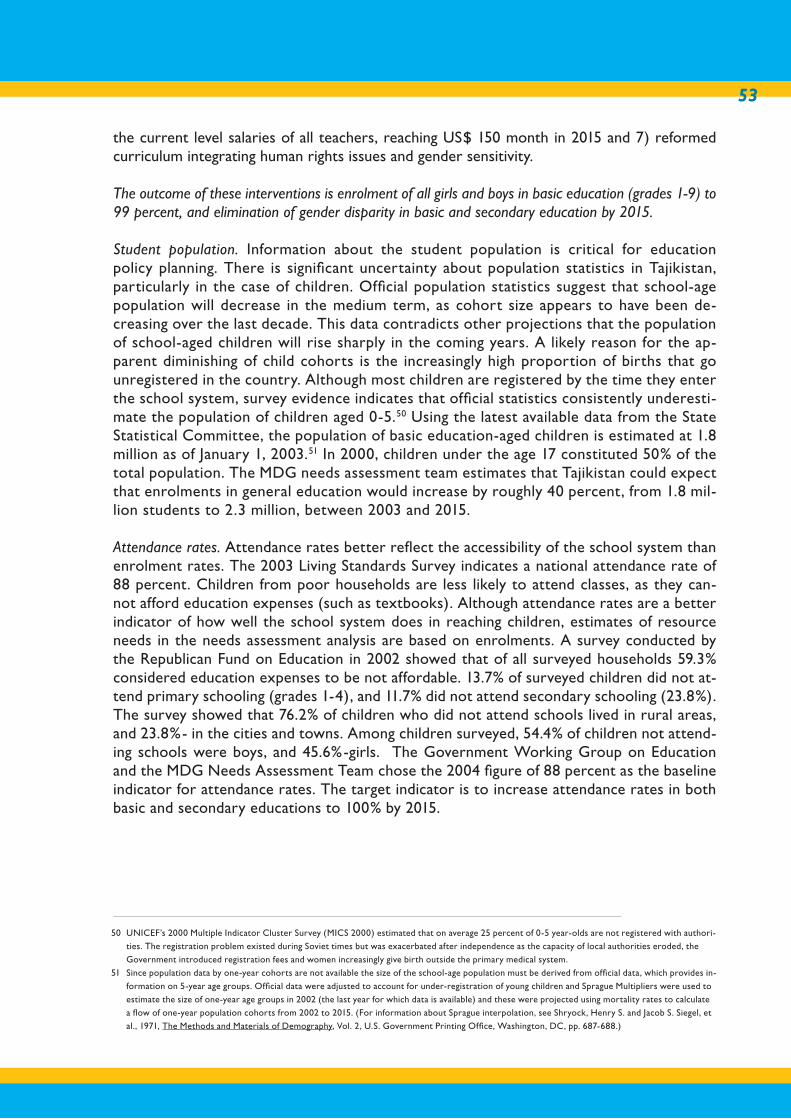
53
the current level salaries of all teachers, reaching US$ 150 month in 2015 and 7) reformed curriculum integrating human rights issues and gender sensitivity.
The outcome of these interventions is enrolment of all girls and boys in basic education (grades 1-9) to 99 percent, and elimination of gender disparity in basic and secondary education by 2015.
Student population. Information about the student population is critical for education policy planning. There is significant uncertainty about population statistics in Tajikistan, particularly in the case of children. Official population statistics suggest that school-age population will decrease in the medium term, as cohort size appears to have been de-creasing over the last decade. This data contradicts other projections that the population of school-aged children will rise sharply in the coming years. A likely reason for the ap-parent diminishing of child cohorts is the increasingly high proportion of births that go unregistered in the country. Although most children are registered by the time they enter the school system, survey evidence indicates that official statistics consistently underesti-mate the population of children aged 0-5.50 Using the latest available data from the State Statistical Committee, the population of basic education-aged children is estimated at 1.8 million as of January 1, 2003.51 In 2000, children under the age 17 constituted 50% of the total population. The MDG needs assessment team estimates that Tajikistan could expect that enrolments in general education would increase by roughly 40 percent, from 1.8 mil-lion students to 2.3 million, between 2003 and 2015.
Attendance rates. Attendance rates better reflect the accessibility of the school system than enrolment rates. The 2003 Living Standards Survey indicates a national attendance rate of 88 percent. Children from poor households are less likely to attend classes, as they can-not afford education expenses (such as textbooks). Although attendance rates are a better indicator of how well the school system does in reaching children, estimates of resource needs in the needs assessment analysis are based on enrolments. A survey conducted by the Republican Fund on Education in 2002 showed that of all surveyed households 59.3% considered education expenses to be not affordable. 13.7% of surveyed children did not at-tend primary schooling (grades 1-4), and 11.7% did not attend secondary schooling (23.8%). The survey showed that 76.2% of children who did not attend schools lived in rural areas, and 23.8%- in the cities and towns. Among children surveyed, 54.4% of children not attend-ing schools were boys, and 45.6%-girls. The Government Working Group on Education and the MDG Needs Assessment Team chose the 2004 figure of 88 percent as the baseline indicator for attendance rates. The target indicator is to increase attendance rates in both basic and secondary educations to 100% by 2015.
50 UNICEF’s 2000 Multiple Indicator Cluster Survey (MICS 2000) estimated that on average 25 percent of 0-5 year-olds are not registered with authori-
ties. The registration problem existed during Soviet times but was exacerbated after independence as the capacity of local authorities eroded, the
Government introduced registration fees and women increasingly give birth outside the primary medical system.
51 Since population data by one-year cohorts are not available the size of the school-age population must be derived from official data, which provides in-
formation on 5-year age groups. Official data were adjusted to account for under-registration of young children and Sprague Multipliers were used to
estimate the size of one-year age groups in 2002 (the last year for which data is available) and these were projected using mortality rates to calculate
a flow of one-year population cohorts from 2002 to 2015. (For information about Sprague interpolation, see Shryock, Henry S. and Jacob S. Siegel, et
al., 1971, The Methods and Materials of Demography, Vol. 2, U.S. Government Printing Office, Washington, DC, pp. 687-688.)
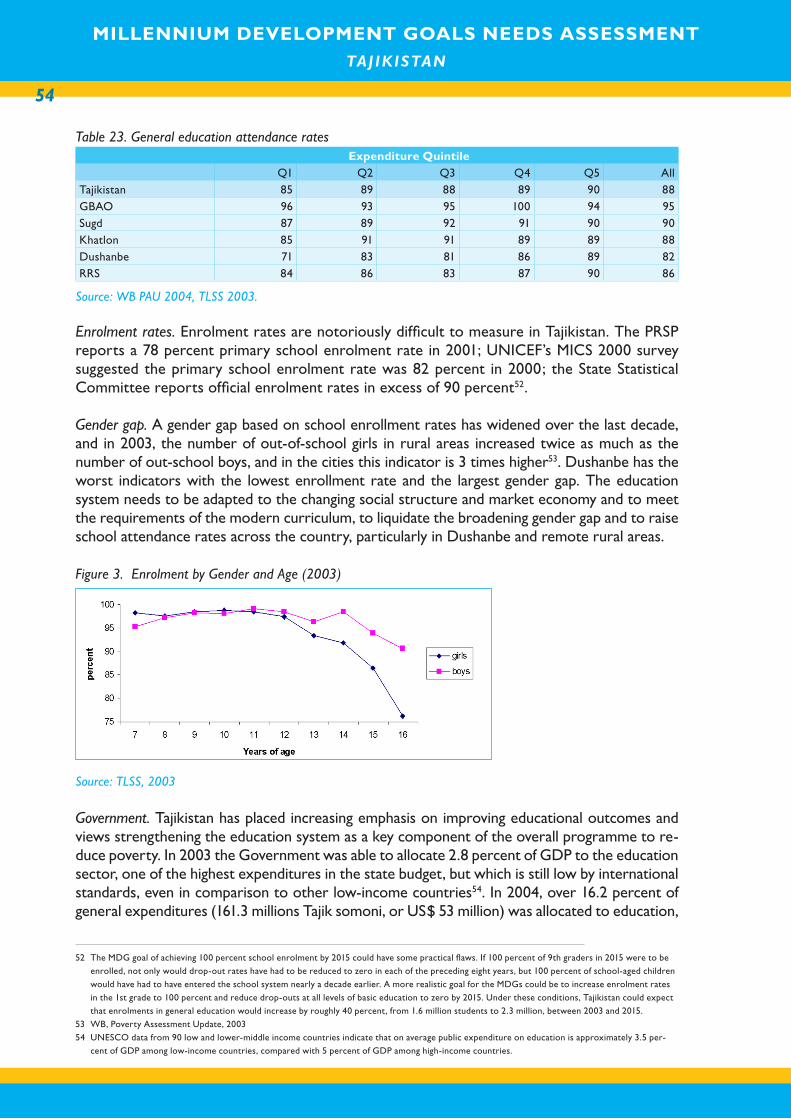
MILLENNIUM DEVELOPMENT GOALS NEEDS ASSESSMENT TAJ IK ISTAN
54
MILLENNIUM DEVELOPMENT GOALS NEEDS ASSESSMENT TAJ IK ISTAN
Table 23. General education attendance rates Expenditure Quintile Q1 Q2 Q3 Q4 Q5 AllTajikistan 85 89 88 89 90 88GBAO 96 93 95 100 94 95Sugd 87 89 92 91 90 90Khatlon 85 91 91 89 89 88Dushanbe 71 83 81 86 89 82RRS 84 86 83 87 90 86
Source: WB PAU 2004, TLSS 2003.
Enrolment rates. Enrolment rates are notoriously difficult to measure in Tajikistan. The PRSP reports a 78 percent primary school enrolment rate in 2001; UNICEF’s MICS 2000 survey suggested the primary school enrolment rate was 82 percent in 2000; the State Statistical Committee reports official enrolment rates in excess of 90 percent52.
Gender gap. A gender gap based on school enrollment rates has widened over the last decade, and in 2003, the number of out-of-school girls in rural areas increased twice as much as the number of out-school boys, and in the cities this indicator is 3 times higher53. Dushanbe has the worst indicators with the lowest enrollment rate and the largest gender gap. The education system needs to be adapted to the changing social structure and market economy and to meet the requirements of the modern curriculum, to liquidate the broadening gender gap and to raise school attendance rates across the country, particularly in Dushanbe and remote rural areas.
Figure 3. Enrolment by Gender and Age (2003)
Source: TLSS, 2003
Government. Tajikistan has placed increasing emphasis on improving educational outcomes and views strengthening the education system as a key component of the overall programme to re-duce poverty. In 2003 the Government was able to allocate 2.8 percent of GDP to the education sector, one of the highest expenditures in the state budget, but which is still low by international standards, even in comparison to other low-income countries54. In 2004, over 16.2 percent of general expenditures (161.3 millions Tajik somoni, or US$ 53 million) was allocated to education,
52 The MDG goal of achieving 100 percent school enrolment by 2015 could have some practical flaws. If 100 percent of 9th graders in 2015 were to be
enrolled, not only would drop-out rates have had to be reduced to zero in each of the preceding eight years, but 100 percent of school-aged children
would have had to have entered the school system nearly a decade earlier. A more realistic goal for the MDGs could be to increase enrolment rates
in the 1st grade to 100 percent and reduce drop-outs at all levels of basic education to zero by 2015. Under these conditions, Tajikistan could expect
that enrolments in general education would increase by roughly 40 percent, from 1.6 million students to 2.3 million, between 2003 and 2015.
53 WB, Poverty Assessment Update, 2003
54 UNESCO data from 90 low and lower-middle income countries indicate that on average public expenditure on education is approximately 3.5 per-
cent of GDP among low-income countries, compared with 5 percent of GDP among high-income countries.
55
a higher percentage than in most OECD countries55. In 2005, the Government plans to allocate 19.4% of general expenditures to education, or 3.5% of GDP. 72.4% of education expenditures (about 181.1 million Taj. Somoni or US$ 60 million) is planned to be directed towards general secondary education. Nevertheless, the Government emphasises the need for increased fund-ing; donors and members the international community emphasise that financial pressure can also be relieved by improving the effective allocation of resources in the education system. Reforms to the curriculum, staffing policy and the norms governing education sector budget disburse-ments could help to alleviate financial pressure by creating an environment in which additional funds can have a stronger impact on improving education outcomes.
Tajikistan has made efforts to achieve the MDG targets, as indicated in the PRSP. The Govern-ment has pledged to reduce poverty from 83% in 1999 to 58% by 2010, improve access to primary education from 78% in 200056 to 90% in 2015, and to eradicate gender inequality in primary and secondary education.57 The wages absorb 80% of the budget appropriations. In 2004, the wages of basic and secondary school teachers increased to 45-60 Tajik somoni per month, which constituted 70-80% increase from the last year Also, salaries of school direc-tors and executives increased by 30% in 2003, and were expected to increase by another 50% as of January 200558. However, some regions still experience significant delays in payments of teachers’ salaries. In 2004, the Government owed 835,144 Tajik somoni to teachers in Sugd province, and 198,010 Tajik somoni to teachers in Khatlon province59). Low salary, few op-portunities for promotion, particularly in rural areas, as well as socio-economic reasons have caused a significant drain of highly skilled teachers from schools.
Rehabilitation of school infrastructure. In order to improve the education system, the Govern-ment needs to address a range of challenges including inappropriate financing of the current education system, poor condition of school buildings and facilities, lack of up-to-date teaching methodology alongside with the constraints that prevent children from poor families to attend schools. The funds are needed for building rehabilitation, reequipping of schools with teach-ing materials and providing textbooks, increasing a teacher’s salary, and improving a teacher’s training and skills. The total damage the secondary education has endured due to the effects of the civil war is estimated on the order of 7 billion USD.60 According to the official statistics, the civil war has made 55 000 children orphans, 26 000 women widowed, and about 1 mil-lion people have become labor migrants. According to the IMF and WB surveys, about 20% schools were destroyed, and over 130 school buildings require rehabilitation and complete equipping. To replace 126 destroyed schools, the construction of new schools with the total capacity of 20 000 seats is required. Based on the preliminary estimations taking into account an inflation rate the construction of new schools and school rehabilitation and equipping will cost approximately 66.3 million Tajik somoni (equivalent to US$ 27.7 million)61.The budget spending for rehabilitation and renovation of physical infrastructure is minimal and has been done without following complete construction standards and requirements of schooling processes. The inventory accounting lacks as well as a list of the necessary new facilities. For example, during 2003-2004 education year, the secondary schools all across
55 OECD counties dedicated an average of 13 percent of spending to education in 1998. See OECD “Education at a Glance 2001.” Figures for Tajikistan
do not include expenditures under the Public Investment Programme.
56 Decline in school attendance from 90% in 1990 to 78% in 2000
57 Gender inequality is due to growing inequality in senior grades of secondary school, and reducing the gender gap would be possible only by 2010 or later
58 President’s Order, RT N 1403, November 2004
59 The report of the Ministry of Education for the nine months of 2004 . //Omuzgor//, №45, 29.10.2004.
60 ADB RETA: TA N° 5946-REG “Sub regional Cooperation in Managing Education Reforms (careduc)”, September 2002.
61 Rashidov A.Education to All -Dushanbe, 2000.
MILLENNIUM DEVELOPMENT GOALS NEEDS ASSESSMENT TAJ IK ISTAN
56
MILLENNIUM DEVELOPMENT GOALS NEEDS ASSESSMENT TAJ IK ISTAN
the country were short of more than 60000062 seats for students, which negatively affect quality and accessibility of secondary education. The survey conducted by the WB reported that among 1.845 reviewed schools 26% lacks a heating system, 24% - pipe water, and 35% - latrines. In many schools the glass windows are broken. International NGO ACTED re-ported in 2002 that in Khatlon province 50% schools had no access to water, whereas survey conducted jointly by Federation of Red Cross, ACTED and NGO “Manija” showed that 87% of all schools in Sugd and Khatlon regions lack adequate sanitation facilities63. Physical reha-bilitation of schools is done at the expense of state budget expenditures and international donor assistance. In 2003 IDB financed rehabilitation of 7 schools,ADB - 25 schools and the World Bank – 20 schools. According to the data of the Ministry of Education, by the end of 2003 rehabilitation and renovation works were accomplished in 1154 out of 2884 secondary schools64. Improvement of water and sanitation systems in schools is an important factor for increasing attendance levels, and improving gender equality. Studies have shown that in schools with modern water and sanitation facilities attendance of girls is higher than in schools that lack such facilities. Thus, it is important to pay attention to provide sanitation facilities that are separated by gender, and increase access of schools to clean water sources.
Compensations for poor children. In order to address non-attendance of children from poor house-holds, the Government of the Republic of Tajikistan has introduced a system of cash compensa-tion of 6 Tajik somoni per quarter per child from poorest households65. Over the last two years, 20% or 332,000 students ages 7-15 benefited from this assistance. A cash compensation scheme is allocated by school committees. Some problems exist with cash compensations, as some school workers subtract a textbook rental fee or parent contributions from this allowance.
Improving qualifications of secondary school teachers. The state statistical breakdown shows that during 2003-2004 educational year66 secondary schools employed 103 174 teachers including 63 963 teachers (61.9 %) with higher education, 4801 (4.6 %) teaching staff with incomplete higher education, 22 897 (22.1 %) with vocational training and 9 843 (9.5 %) with general secondary education. As a whole, more than 30 % of the primary school teachers only have vocational and secondary school education. The lack of qualified teachers for rural primary schools and inadequate qualification and preparedness of secondary school teachers are major constraints in the effectiveness of today’s education system. In order to provide schools with well trained and qualified teachers, the Government, in Article 44 of the new Law On Educa-tion (of May 17, 2004, №34) established a supplemental pay equaling to 10% of the monthly wage for expenditures associated with teaching methods, textbooks and skills improvement. Moreover, the teaching load of the primary school teachers (grades 1-4) increased by 10% more than the teaching loads of the secondary school teachers (grades 5-11).
Student numbers in classes. According to the regulations on general secondary schools in the Republic of Tajikistan» (1996) set up the size of 1-11 grades that is 25-30 students per group. The increasing number of secondary school age children results in overcrowded classes and schools especially in urban areas that have to operate on two-three shifts a day. Also, these overcrowded schools face problems of inadequate infrastructure, teaching equipment and disproportionate ratio of teachers to students. These factors have a negative impact on the
62 New requirement of the new time . //Omuzgor//.№35 20.08.2004
63 UNICEF, Assessment report on sanitary facilities and hygiene in schools of Khatlon and Sugd regions, September 2002.
64 PRSP Performance Report in 2003. March 2004
65 Government of Tajikistan. Education Resolution #565, December 30, 2001
66 Collection of Statistics of the Ministry of Education, Dushanbe, 2003
57
overall quality of education in. For example, in 1995 the city of Dushanbe had 87 secondary schools (with the capacity for about 70 thousand seats), attended by 88.5 thousand students. As of 2003, the number of school children increased to 53.7 thousand67, while the capacity of schools remained at 1995 levels. Thus, some primary schools in Dushanbe have an average size of 35 to 50 students per class. This is a common occurrence for many schools in large cities of Tajikistan. In order to accommodate an increasing number of students, Dushanbe and some other cities have tried to use pre-school facilities for primary schools, which could pose further problems in the education sector. The financial estimations section elaborates further on appropriate student-teacher ratio, and construction of new schools in overcrowded dis-tricts. When setting up regulations for student-teacher ratio the Government should take into an account districts with overcrowded schools and other regional specifics.
Curriculum development and textbooks. In 2004 the Ministry of Education has approved a new curriculum for secondary schools. Under this programme, 21 subjects have been approved, 13 teaching materials and education manuals are planned to be published, 32 titles of textbooks for secondary schools are prepared for the period of 2004-2007. During the period 1999-2003, the Ministry of Education published 94 titles of textbooks with 7.8 million prints. These textbooks were published with the support of donor organizations such as World Bank, ADB, OPEC and others. The Ministry of Education was able to provide only a miniscule amount of funding for publishing the school textbooks. For example, in 2004 only 0.42% (or 485 192 thousand Tajik somoni) of the total secondary school budget was allocated for textbooks, whereas in 2005 the Government plans to spend 0.34% (or 615,737 Tajik somoni) of the secondary education budget for textbooks. According to the data of the World Bank only 30% of secondary school students have a complete set of textbooks, and for some subjects 10% of students have textbooks 68. There is a shortage of textbooks in Tajik, Russian, Uzbek and Turkmen languages. Only a few newly published textbooks are consistent with the new teaching practices and approaches.
Table 24. Textbook provision for secondary schools by regions69
Region Provision by 25% Provision by 50% Provision by 75% 100%RRP 50.4 % 24,1% 17,3% 8.3%Dushanbe 16.1% 27,0% 31,2% 25.8%GBAO 50.0% 32,7% 10,2% 7.1%Khatlon oblast 61.7% 22,9% 8,4% 6.9%Sugd oblast 28.6% 29,1% 28,2% 14.1%Total 42.8% 26,3% 18,4% 12.5%
According to the new curriculum plan of the Ministry of Education, three main directions were identified for grades 5-11: social-humanitarian, mathematics-economics, and natural sciences, which require additional resources such as textbooks, qualified teachers and other technical support. According to the estimates of the Ministry of Education there is an overall need in the textbooks of 86 tittles, 93 700 desks and 26 206 personal computers.
Community support. In spite of the fact that secondary education should be free of charge ac-cording to the Tajik Constitution, due to the shortage of financial resources and the lack of support to the teachers and staff, the so-called parental payments are in place in all regions
67 Ministry of Education data, 2003
68 PRSP Performance Report in 2003. March 2004
69 NGO Pulse. Analysis of secondary school education in the Republic of Tajikistan 2002, p.76
MILLENNIUM DEVELOPMENT GOALS NEEDS ASSESSMENT TAJ IK ISTAN
58
MILLENNIUM DEVELOPMENT GOALS NEEDS ASSESSMENT TAJ IK ISTAN
of the country. The incoming parental contributions are not accounted for in the official sta-tistics. According to the current Law On Education, schools are permitted to charge a fee for additional services for extracurricular activities and studies, but often this intended money goes towards in-class education expenditures. According to the World Bank data of 1999 the private spending on education was 2 % of the GDP and public expenditures accounted for 2.1 % of the GDP70. Unfortunately, at the time being the official statistical data on private spending on secondary education are not available and such information is not collected yet.
According to the national survey carried out by the Education Reform Support Centre “Pulse,” to the question how do you feel about parental payments? 1102 (54.1 %) of respondents an-swered positively, 564 respondents (27.7 %) - negatively; 360 (18.1 %) teachers have not answered this question. The teachers from Sugd province (65.3 %) and GBAO (59.4 %) had a positive attitude towards parental fees for the education service delivery.
In Dushanbe, the proportion of parental payments for teaching support is rather high. The similar situation can also be observed in Sugd province, where 27 % of the respondents have answered positively about charging school fees. In urban areas, about one half of the inter-viewed have noted/confirmed that teachers received support from parents (47.1 %), but in rural areas parental support is at13.8 %71. In addition to education fees, parents and commu-nities render additional support for recurrent renovation and rehabilitation works, and for organizing extracurricular activities.
Over the last decade, a high interest in education research has been globally observed; in this connection, there is a drastically increased demand for authentic and comparable information on education system development in different countries. Description on quality and quantity of the educational system allows policy makers to assess the national situation in education against the background of other countries, to identify the country specific issues, and to find appropriate solutions. Since 2003, in Russia72 a single\unified Form № OSH- 273 was intro-duced to account for all public and private financing for secondary schools. However, Tajikistan lacks such kind of statistical reporting, and private spending on secondary education is not accounted for. Establishment of an accounting system similar to Russia’s can help contribute to the accurate assessment of private funding for a secondary school education in Tajikistan. The Government needs to take measures that regulate and monitor funds from parents and comminutes, and to develop a mechanism of their receipt and reallocation.
School Feeding Programmes. According to the official statistics, the caloric value and content of vitamins and nutrients in food intake of schoolchildren under 10 years is much below the rec-ommended level. High prevalence of chronic malnutrition, anemia and infectious illnesses is part of the reason that children are out of school. International humanitarian organizations provide some schools with lunches through school feeding programs. School feeding programmes help ameliorate child malnutrition and provide an incentive for children to attend school. In 1999 a WFP pilot school feeding programme found that the school feeding programmes had a dra-matic affect on school attendance in food insecure regions.74 Working with the Government and NGOs, in 2003/2004 the World Food Programme is providing one meal per day to 370,000 chil-dren (roughly 22 percent of the general education population) in regions where food insecurity
70 Nicholas Burnett, Moukim Temourov, WB, Tajikistan Education Sector Review, June 2002
71 Breakdown of secondary education status in RT. “Pulse”, Dushanbe 2002. P/ 20-22
72 Approved by Resolution of the State Statistics Committee as of 07.03.2003 (#40)
73 http://www.miccedu.com/
74 WFP Protracted Relief and Recovery Operation – Tajikistan 10231.0. Project Document, January 2003.
59
is most severe. In regions where traditional values often keep girls out of school, a programme of take-home rationing is being developed to promote female enrolment.
Despite financial restrictions, the Government has been taking measures to improve financing of school meals. For example, in 2004, 1.37% of the secondary school budget, or 1, 569, 596 Tajik somoni (US$ 530,000) was allocated for financing school meals. In 2005, 2.24% of the total secondary school budget, or 4,051,925 Tajik somoni (US$ 1,350,100) was allocated to school meals, an increase of 2.6 times compared to the last year75. However, these measures remain inadequate for providing all children in primary schools (grades 1-4) with free school meals.
Government MeasuresWithin the framework of reform and modernization processes of the secondary education system, the Government of the Republic of Tajikistan has approved and passed a number of resolutions:• The Law of the Republic of Tajikistan On Education (2004);• The National Education Concept (2003);• The Poverty Reduction Strategy Paper (2002);• The Action Plan for reforming the education system for 2004-2009 years
The Government accords a high priority to education and has recently initiated an ambitious program of reforms for the general education sector. Reform of the national curriculum, the centrepiece of the reform effort has widespread implications for the system. The education authorities have reduced the number of courses in the curriculum to focus more resources on core subjects; student curriculum hours have been reduced. Since September 1, 2004, instead of the planned 5 %, the teaching loads were reduced by 25.4 %, and, as a whole, more than 43 thousand teaching loads have been reduced76. According to the new norm, teachers’ loads increased by two hours77. Since September 1, for 2004/2005 academic year, the wages of teachers of secondary schools were increased by 25 %. Under the order of the President of RT as of November 4, 2004 (№1403), the wages of education sector workers will raise from 50 up to 70 % as of January 2005.
These changes have significant implications on many other areas of the education system: the textbooks should be in line with the new standards of the curriculum, teachers need to be trained in accordance with the new subjects. As of 2005-2006 academic year, higher edu-cational institutions in the country, which are engaged in training of the pedagogical staff for secondary schools, will revise the targets of admittance of students in universities, institutes, colleges and pedagogical schools, based on the integrated subjects and the requirement for teaching 2-3 subjects. In addition to these reforms, the national educational bodies are focused on developing new norms of financing based on the actual needs and demand, taking into ac-count the fact that schooling costs per pupil in sparsely populated mountain areas are higher. By the decision of the Government of RT № 441 as of November 1, 2004, On transition to the new forms of management and financing of educational establishments, as of January, 2005, a trial of per pupil financing and other new reforms will be conducted in 5 pilot districts and cities (Kyulab, Khorog, Khojend, Vakhdat and Yavan districts), and efforts to restructure a network of village schools by granting financial independence to these schools and introducing community management of schools will be implemented.
75 Official statistical data of the Ministry of Finance, December 22, 2004.
76 The report of the Ministry of Education for the nine months of 2004 . //Omuzgor//, №45, 29.10.2004.
77 As of September 1, 2004, weekly teaching loads of school teachers are as follows: for grades 1-4 it is 18 hours, for grades 5-11 it is 16 hours. Before
September 1, the loads were 16 and 14 respectively.
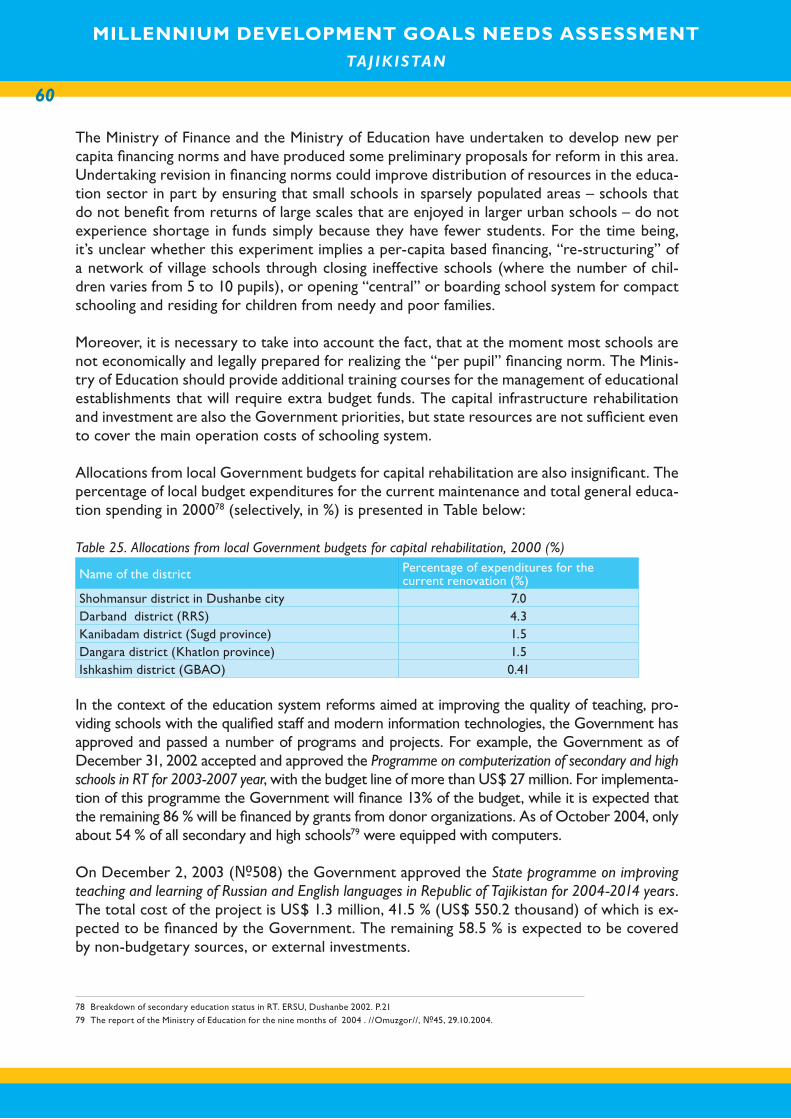
MILLENNIUM DEVELOPMENT GOALS NEEDS ASSESSMENT TAJ IK ISTAN
60
MILLENNIUM DEVELOPMENT GOALS NEEDS ASSESSMENT TAJ IK ISTAN
The Ministry of Finance and the Ministry of Education have undertaken to develop new per capita financing norms and have produced some preliminary proposals for reform in this area. Undertaking revision in financing norms could improve distribution of resources in the educa-tion sector in part by ensuring that small schools in sparsely populated areas – schools that do not benefit from returns of large scales that are enjoyed in larger urban schools – do not experience shortage in funds simply because they have fewer students. For the time being, it’s unclear whether this experiment implies a per-capita based financing, “re-structuring” of a network of village schools through closing ineffective schools (where the number of chil-dren varies from 5 to 10 pupils), or opening “central” or boarding school system for compact schooling and residing for children from needy and poor families.
Moreover, it is necessary to take into account the fact, that at the moment most schools are not economically and legally prepared for realizing the “per pupil” financing norm. The Minis-try of Education should provide additional training courses for the management of educational establishments that will require extra budget funds. The capital infrastructure rehabilitation and investment are also the Government priorities, but state resources are not sufficient even to cover the main operation costs of schooling system.
Allocations from local Government budgets for capital rehabilitation are also insignificant. The percentage of local budget expenditures for the current maintenance and total general educa-tion spending in 200078 (selectively, in %) is presented in Table below:
Table 25. Allocations from local Government budgets for capital rehabilitation, 2000 (%)
Name of the district Percentage of expenditures for the current renovation (%)
Shohmansur district in Dushanbe city 7.0Darband district (RRS) 4.3Kanibadam district (Sugd province) 1.5Dangara district (Khatlon province) 1.5Ishkashim district (GBAO) 0.41
In the context of the education system reforms aimed at improving the quality of teaching, pro-viding schools with the qualified staff and modern information technologies, the Government has approved and passed a number of programs and projects. For example, the Government as of December 31, 2002 accepted and approved the Programme on computerization of secondary and high schools in RT for 2003-2007 year, with the budget line of more than US$ 27 million. For implementa-tion of this programme the Government will finance 13% of the budget, while it is expected that the remaining 86 % will be financed by grants from donor organizations. As of October 2004, only about 54 % of all secondary and high schools79 were equipped with computers.
On December 2, 2003 (№508) the Government approved the State programme on improving teaching and learning of Russian and English languages in Republic of Tajikistan for 2004-2014 years. The total cost of the project is US$ 1.3 million, 41.5 % (US$ 550.2 thousand) of which is ex-pected to be financed by the Government. The remaining 58.5 % is expected to be covered by non-budgetary sources, or external investments.
78 Breakdown of secondary education status in RT. ERSU, Dushanbe 2002. P.21
79 The report of the Ministry of Education for the nine months of 2004 . //Omuzgor//, №45, 29.10.2004.

61
The education management system has been undergoing a series of reforms. According to Article 27 of the Law of Republic of Tajikistan On Education (2004), the education management system of the Republic of Tajikistan is the responsibility of both the state and communities. Under Article 36 of this law concerning development of public-private partnership, secondary schools are entitled to create self-governing structures jointly with international and national NGOs, and with community support. Recently, many secondary schools in the country have been covered by projects funded by donor agencies that are piloting diverse models of active participation of the community in the secondary education process, and in the process of improving the quality of teaching and increasing access of children to primary and secondary education. The World Bank projects on education, Asian Development Bank’s project on parent-teacher associations (PTA), Soros Foundation’s project on community’s involvement in schools, Aga Khan Foundation’s project on village councils, CARE International, Save the Children Fund’s projects on education have been greatly contributing to the development of community support and participation in general secondary education.
Since 1998, the Government has put in place target quotas for children from poor families entering higher education institutions, and has established scholarship schemes to compensate the expenses associated with the study of these children, with the aim of improving access and providing incentives for these children to continue education. The targets on allocation of scholarships to children from the very poor families and remote regions have quotas for young girls entering higher education institutions. The Decision of the Government of RT as of July 4, 2004 established quotas for boys and girls from poor families and from remote regions who are entering universities. With support of this initiative, currently 3,050 young girls and 165 boys have entered higher schools.
Figure 4. Number of girls and boys, entering higher education establishments under the Presidential quota system (1998-2004)80
Source: MDG Needs Assessment, based on PRSP Progress report 2004.
School transportation. Until 1991, in most regions of the country the local governments provided transportation of children to central district schools, which to a certain degree ensured school attendance of children from remote areas, and especially of girls. Organized school transporta-tion also provided security of for children, including girls. Nowadays, no local Government is concerned with transportation issues for children, and upon completing primary schooling (grade
80 PRSP Performance Report in 2003. March 2004 and the report of the Ministry of Education for the nine months of 2004 . //Omuzgor//, №45,
29.10.2004.
MILLENNIUM DEVELOPMENT GOALS NEEDS ASSESSMENT TAJ IK ISTAN
62
MILLENNIUM DEVELOPMENT GOALS NEEDS ASSESSMENT TAJ IK ISTAN
4), many rural children are not able to continue their education for grades 5-11, due to the lack of transportation to district schools. In 2004-2005 school year, about 33, 000 students were in primary schooling in 671 primary schools. For ensuring continuation of basic education of these children, it is important to provide with free public transportation (to district schools).
RecommendationsIn order for Tajikistan to achieve by MDG 2 target for providing universal primary, basic and secondary education, the following short- and medium-term priorities are proposed by the Government Working Group on Education and the MDG Needs Assessment Team:
Short-Term Priorities:• Distribute free meals to classes 1-4, especially for girls and children from poor and
vulnerable families; • Rehabilitate of all schools’ heating and water provision systems and provision of toilets,
usable for girls;• Provide transportation for primary schoolchildren from remote rural areas to district
schools;• Train/retrain of teachers in modern methods of teaching, enabling one teacher to
teach 2-3 subjects;• Mobilize parents, teachers, community leaders and children in the decision-making
processes of school administration and management decision making process;• Develop a comprehensive national education strategy, and becoming a Fast Track
country for Education for All.
Medium Term Priorities:• Provide quality education by raising teachers’ salaries, increasing teachers loads (from
18-16 to 20-18 hours a week), providing quality teachers’ trainings, and changing the student-teacher ratio (to 22/1), taking into consideration regional specifics;
• Implement a new per capita financing strategy, with the consideration of maximum and minimum financing demands and regional differences;
• Construct 850 new schools (Khatlon-289, Sugd-204, RRS-204, GBAO-73, Dushanbe-26);• Implement curriculum reforms, including modernizing textbooks and decreasing a
number of subjects taught in schools;• Teach gender equality in classes;• Provide information to secondary-school students on human rights, on sanitation and
hygiene, as well as on family planning and health safety.
Financial Estimations for EducationThe financial estimations presented in this section includes all costs required for the develop-ment and functioning of the general secondary education system in the country, which could provide quality education to all school-aged children (7-16 years) by 2015. It is important to emphasize that current level of investments in general secondary education are not adequate to ensure 100% school attendance and enrollment.
The proposed financial estimations were completed by the UN MDG needs assessment team, based on research and official data of the Government agencies, IMF, UNDP, World Bank, Asian Bank of Development, UNICEF, WFP, UNESCO and other international organizations. For preparation of this report, information provided by the Government Working Group on
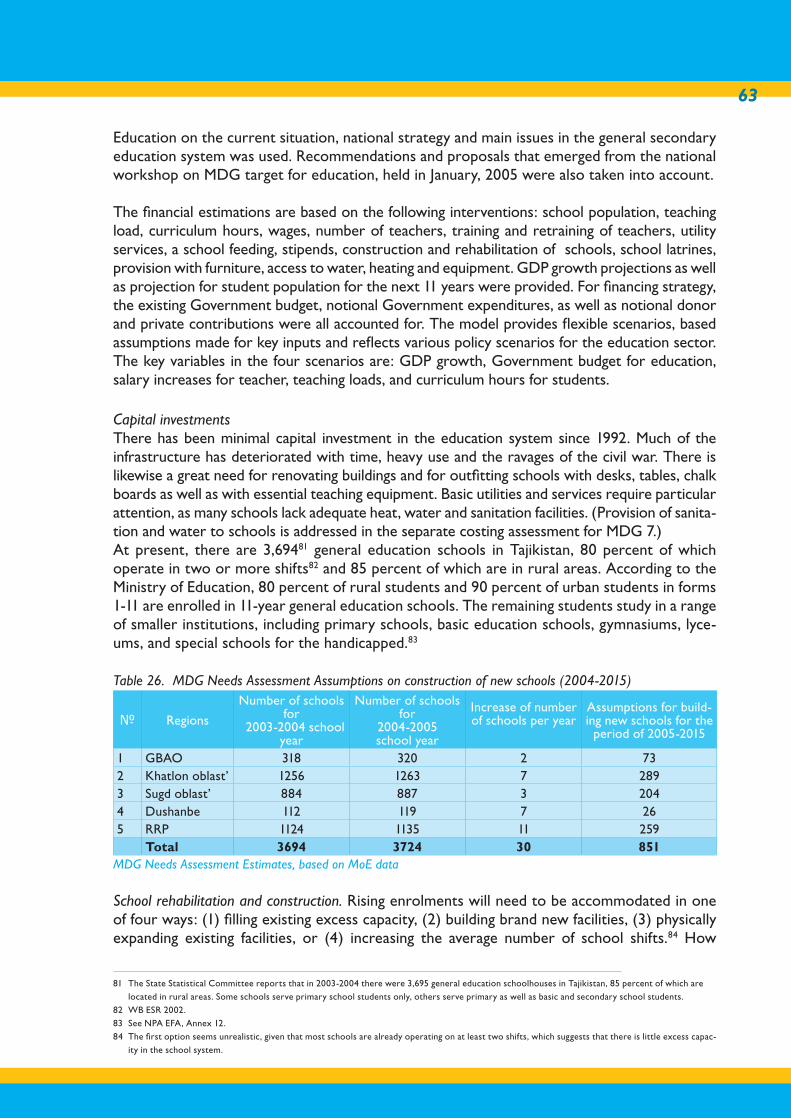
63
Education on the current situation, national strategy and main issues in the general secondary education system was used. Recommendations and proposals that emerged from the national workshop on MDG target for education, held in January, 2005 were also taken into account.
The financial estimations are based on the following interventions: school population, teaching load, curriculum hours, wages, number of teachers, training and retraining of teachers, utility services, a school feeding, stipends, construction and rehabilitation of schools, school latrines, provision with furniture, access to water, heating and equipment. GDP growth projections as well as projection for student population for the next 11 years were provided. For financing strategy, the existing Government budget, notional Government expenditures, as well as notional donor and private contributions were all accounted for. The model provides flexible scenarios, based assumptions made for key inputs and reflects various policy scenarios for the education sector. The key variables in the four scenarios are: GDP growth, Government budget for education, salary increases for teacher, teaching loads, and curriculum hours for students.
Capital investmentsThere has been minimal capital investment in the education system since 1992. Much of the infrastructure has deteriorated with time, heavy use and the ravages of the civil war. There is likewise a great need for renovating buildings and for outfitting schools with desks, tables, chalk boards as well as with essential teaching equipment. Basic utilities and services require particular attention, as many schools lack adequate heat, water and sanitation facilities. (Provision of sanita-tion and water to schools is addressed in the separate costing assessment for MDG 7.) At present, there are 3,69481 general education schools in Tajikistan, 80 percent of which operate in two or more shifts82 and 85 percent of which are in rural areas. According to the Ministry of Education, 80 percent of rural students and 90 percent of urban students in forms 1-11 are enrolled in 11-year general education schools. The remaining students study in a range of smaller institutions, including primary schools, basic education schools, gymnasiums, lyce-ums, and special schools for the handicapped.83
Table 26. MDG Needs Assessment Assumptions on construction of new schools (2004-2015)
№ Regions
Number of schools for
2003-2004 school year
Number of schools for
2004-2005 school year
Increase of number of schools per year
Assumptions for build-ing new schools for the
period of 2005-2015
1 GBAO 318 320 2 732 Khatlon oblast’ 1256 1263 7 2893 Sugd oblast’ 884 887 3 2044 Dushanbe 112 119 7 265 RRP 1124 1135 11 259
Total 3694 3724 30 851MDG Needs Assessment Estimates, based on MoE data
School rehabilitation and construction. Rising enrolments will need to be accommodated in one of four ways: (1) filling existing excess capacity, (2) building brand new facilities, (3) physically expanding existing facilities, or (4) increasing the average number of school shifts.84 How
81 The State Statistical Committee reports that in 2003-2004 there were 3,695 general education schoolhouses in Tajikistan, 85 percent of which are
located in rural areas. Some schools serve primary school students only, others serve primary as well as basic and secondary school students.
82 WB ESR 2002.
83 See NPA EFA, Annex 12.
84 The first option seems unrealistic, given that most schools are already operating on at least two shifts, which suggests that there is little excess capac-
ity in the school system.
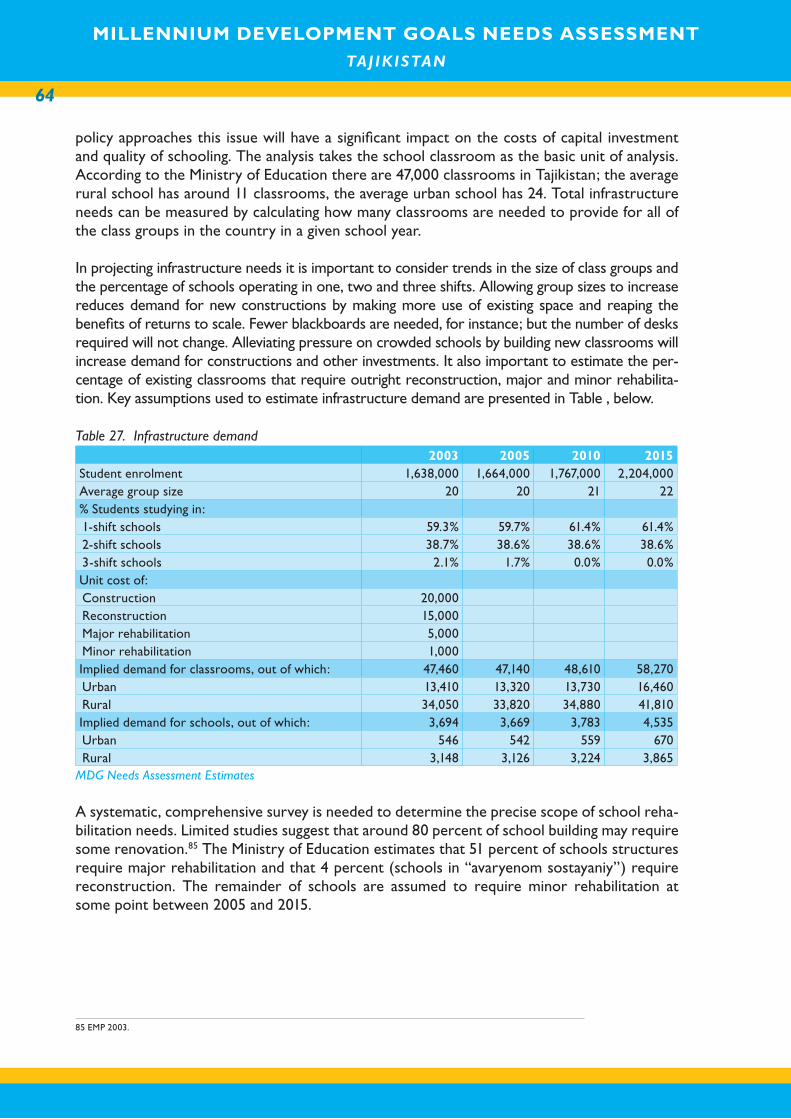
MILLENNIUM DEVELOPMENT GOALS NEEDS ASSESSMENT TAJ IK ISTAN
64
MILLENNIUM DEVELOPMENT GOALS NEEDS ASSESSMENT TAJ IK ISTAN
policy approaches this issue will have a significant impact on the costs of capital investment and quality of schooling. The analysis takes the school classroom as the basic unit of analysis. According to the Ministry of Education there are 47,000 classrooms in Tajikistan; the average rural school has around 11 classrooms, the average urban school has 24. Total infrastructure needs can be measured by calculating how many classrooms are needed to provide for all of the class groups in the country in a given school year.
In projecting infrastructure needs it is important to consider trends in the size of class groups and the percentage of schools operating in one, two and three shifts. Allowing group sizes to increase reduces demand for new constructions by making more use of existing space and reaping the benefits of returns to scale. Fewer blackboards are needed, for instance; but the number of desks required will not change. Alleviating pressure on crowded schools by building new classrooms will increase demand for constructions and other investments. It also important to estimate the per-centage of existing classrooms that require outright reconstruction, major and minor rehabilita-tion. Key assumptions used to estimate infrastructure demand are presented in Table , below.
Table 27. Infrastructure demand 2003 2005 2010 2015Student enrolment 1,638,000 1,664,000 1,767,000 2,204,000Average group size 20 20 21 22% Students studying in: 1-shift schools 59.3% 59.7% 61.4% 61.4%2-shift schools 38.7% 38.6% 38.6% 38.6%3-shift schools 2.1% 1.7% 0.0% 0.0%Unit cost of: Construction 20,000 Reconstruction 15,000 Major rehabilitation 5,000 Minor rehabilitation 1,000 Implied demand for classrooms, out of which: 47,460 47,140 48,610 58,270Urban 13,410 13,320 13,730 16,460Rural 34,050 33,820 34,880 41,810Implied demand for schools, out of which: 3,694 3,669 3,783 4,535Urban 546 542 559 670Rural 3,148 3,126 3,224 3,865
MDG Needs Assessment Estimates
A systematic, comprehensive survey is needed to determine the precise scope of school reha-bilitation needs. Limited studies suggest that around 80 percent of school building may require some renovation.85 The Ministry of Education estimates that 51 percent of schools structures require major rehabilitation and that 4 percent (schools in “avaryenom sostayaniy”) require reconstruction. The remainder of schools are assumed to require minor rehabilitation at some point between 2005 and 2015.
85 EMP 2003.
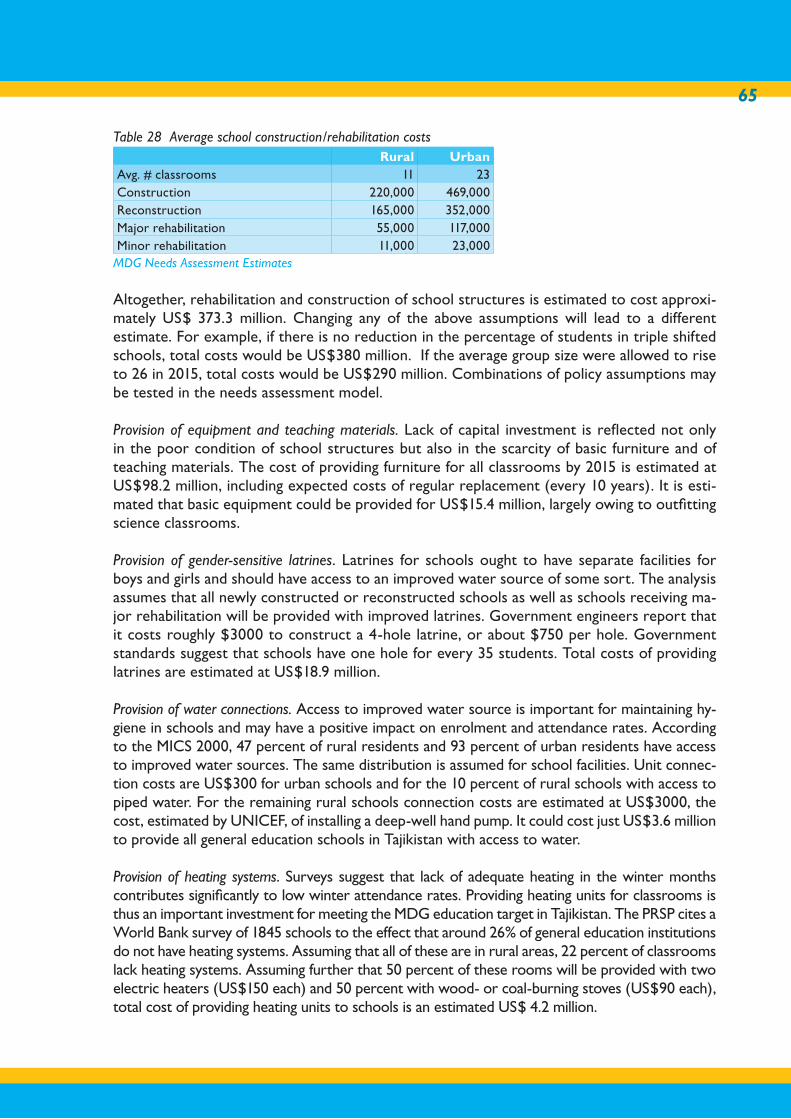
65
Table 28 Average school construction/rehabilitation costs Rural UrbanAvg. # classrooms 11 23Construction 220,000 469,000Reconstruction 165,000 352,000Major rehabilitation 55,000 117,000Minor rehabilitation 11,000 23,000
MDG Needs Assessment Estimates
Altogether, rehabilitation and construction of school structures is estimated to cost approxi-mately US$ 373.3 million. Changing any of the above assumptions will lead to a different estimate. For example, if there is no reduction in the percentage of students in triple shifted schools, total costs would be US$380 million. If the average group size were allowed to rise to 26 in 2015, total costs would be US$290 million. Combinations of policy assumptions may be tested in the needs assessment model.
Provision of equipment and teaching materials. Lack of capital investment is reflected not only in the poor condition of school structures but also in the scarcity of basic furniture and of teaching materials. The cost of providing furniture for all classrooms by 2015 is estimated at US$98.2 million, including expected costs of regular replacement (every 10 years). It is esti-mated that basic equipment could be provided for US$15.4 million, largely owing to outfitting science classrooms.
Provision of gender-sensitive latrines. Latrines for schools ought to have separate facilities for boys and girls and should have access to an improved water source of some sort. The analysis assumes that all newly constructed or reconstructed schools as well as schools receiving ma-jor rehabilitation will be provided with improved latrines. Government engineers report that it costs roughly $3000 to construct a 4-hole latrine, or about $750 per hole. Government standards suggest that schools have one hole for every 35 students. Total costs of providing latrines are estimated at US$18.9 million.
Provision of water connections. Access to improved water source is important for maintaining hy-giene in schools and may have a positive impact on enrolment and attendance rates. According to the MICS 2000, 47 percent of rural residents and 93 percent of urban residents have access to improved water sources. The same distribution is assumed for school facilities. Unit connec-tion costs are US$300 for urban schools and for the 10 percent of rural schools with access to piped water. For the remaining rural schools connection costs are estimated at US$3000, the cost, estimated by UNICEF, of installing a deep-well hand pump. It could cost just US$3.6 million to provide all general education schools in Tajikistan with access to water.
Provision of heating systems. Surveys suggest that lack of adequate heating in the winter months contributes significantly to low winter attendance rates. Providing heating units for classrooms is thus an important investment for meeting the MDG education target in Tajikistan. The PRSP cites a World Bank survey of 1845 schools to the effect that around 26% of general education institutions do not have heating systems. Assuming that all of these are in rural areas, 22 percent of classrooms lack heating systems. Assuming further that 50 percent of these rooms will be provided with two electric heaters (US$150 each) and 50 percent with wood- or coal-burning stoves (US$90 each), total cost of providing heating units to schools is an estimated US$ 4.2 million.
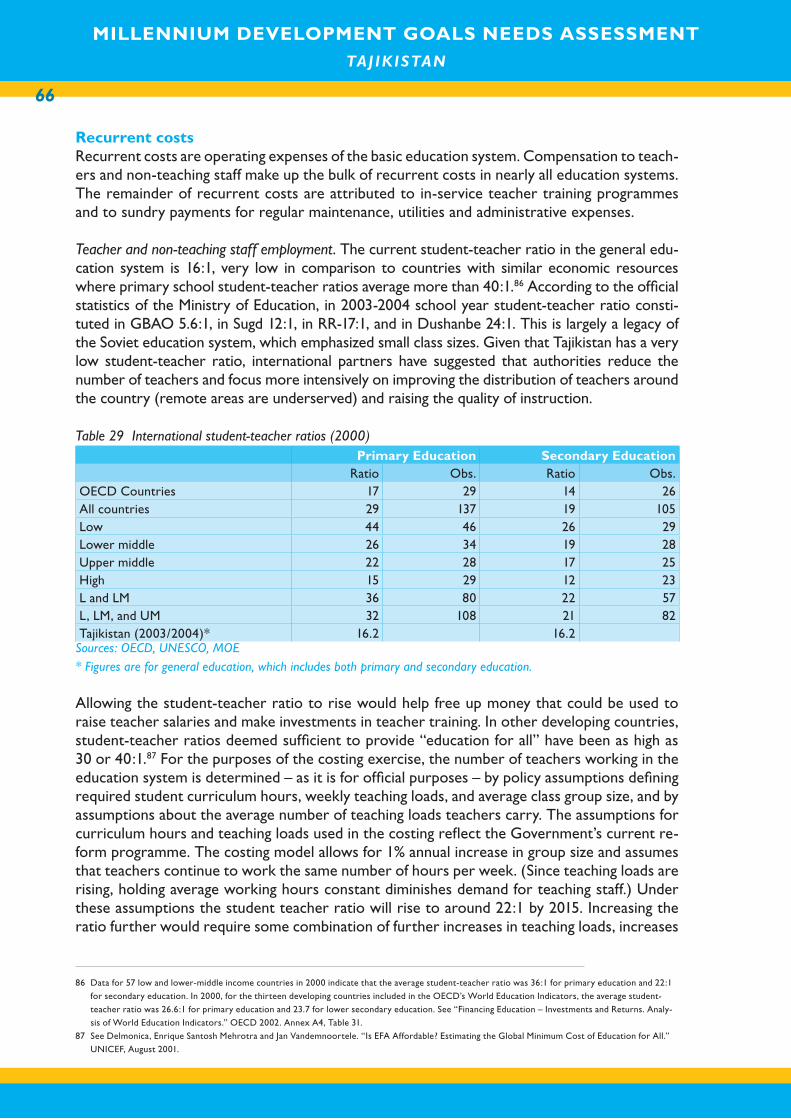
MILLENNIUM DEVELOPMENT GOALS NEEDS ASSESSMENT TAJ IK ISTAN
66
MILLENNIUM DEVELOPMENT GOALS NEEDS ASSESSMENT TAJ IK ISTAN
Recurrent costsRecurrent costs are operating expenses of the basic education system. Compensation to teach-ers and non-teaching staff make up the bulk of recurrent costs in nearly all education systems. The remainder of recurrent costs are attributed to in-service teacher training programmes and to sundry payments for regular maintenance, utilities and administrative expenses.
Teacher and non-teaching staff employment. The current student-teacher ratio in the general edu-cation system is 16:1, very low in comparison to countries with similar economic resources where primary school student-teacher ratios average more than 40:1.86 According to the official statistics of the Ministry of Education, in 2003-2004 school year student-teacher ratio consti-tuted in GBAO 5.6:1, in Sugd 12:1, in RR-17:1, and in Dushanbe 24:1. This is largely a legacy of the Soviet education system, which emphasized small class sizes. Given that Tajikistan has a very low student-teacher ratio, international partners have suggested that authorities reduce the number of teachers and focus more intensively on improving the distribution of teachers around the country (remote areas are underserved) and raising the quality of instruction.
Table 29 International student-teacher ratios (2000) Primary Education Secondary Education
Ratio Obs. Ratio Obs.OECD Countries 17 29 14 26All countries 29 137 19 105Low 44 46 26 29Lower middle 26 34 19 28Upper middle 22 28 17 25High 15 29 12 23L and LM 36 80 22 57L, LM, and UM 32 108 21 82Tajikistan (2003/2004)* 16.2 16.2
Sources: OECD, UNESCO, MOE* Figures are for general education, which includes both primary and secondary education.
Allowing the student-teacher ratio to rise would help free up money that could be used to raise teacher salaries and make investments in teacher training. In other developing countries, student-teacher ratios deemed sufficient to provide “education for all” have been as high as 30 or 40:1.87 For the purposes of the costing exercise, the number of teachers working in the education system is determined – as it is for official purposes – by policy assumptions defining required student curriculum hours, weekly teaching loads, and average class group size, and by assumptions about the average number of teaching loads teachers carry. The assumptions for curriculum hours and teaching loads used in the costing reflect the Government’s current re-form programme. The costing model allows for 1% annual increase in group size and assumes that teachers continue to work the same number of hours per week. (Since teaching loads are rising, holding average working hours constant diminishes demand for teaching staff.) Under these assumptions the student teacher ratio will rise to around 22:1 by 2015. Increasing the ratio further would require some combination of further increases in teaching loads, increases
86 Data for 57 low and lower-middle income countries in 2000 indicate that the average student-teacher ratio was 36:1 for primary education and 22:1
for secondary education. In 2000, for the thirteen developing countries included in the OECD’s World Education Indicators, the average student-
teacher ratio was 26.6:1 for primary education and 23.7 for lower secondary education. See “Financing Education – Investments and Returns. Analy-
sis of World Education Indicators.” OECD 2002. Annex A4, Table 31.
87 See Delmonica, Enrique Santosh Mehrotra and Jan Vandemnoortele. “Is EFA Affordable? Estimating the Global Minimum Cost of Education for All.”
UNICEF, August 2001.
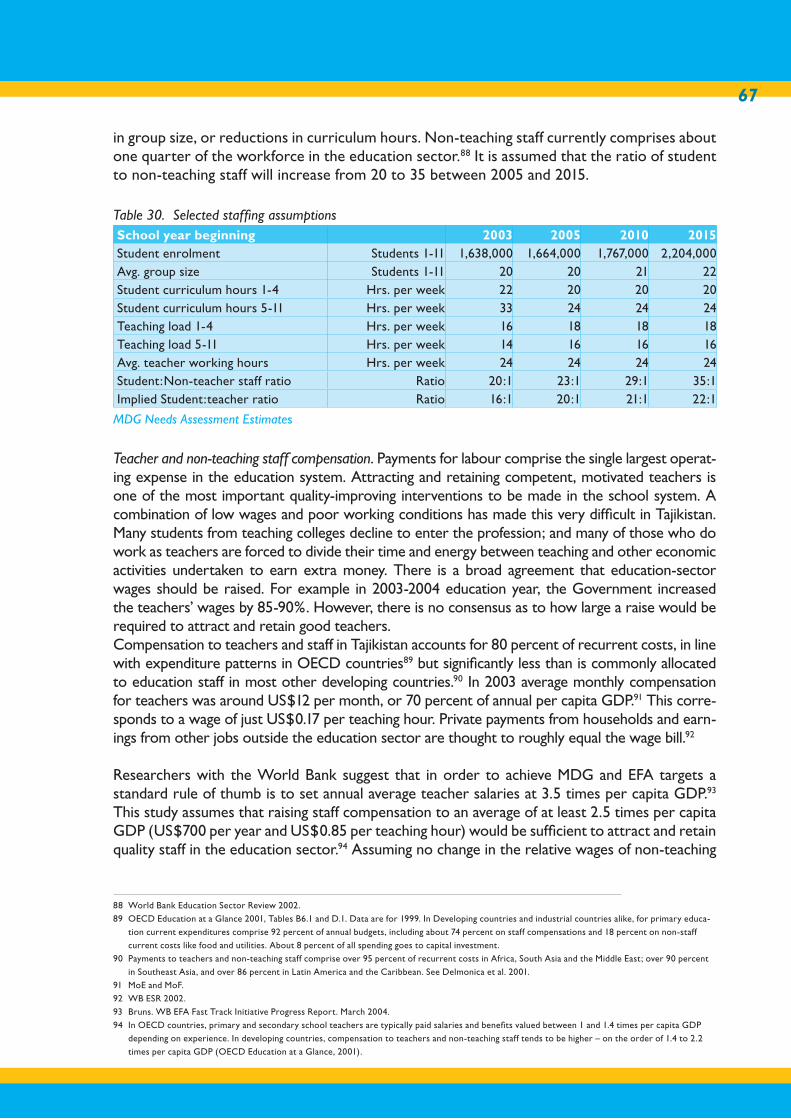
67
in group size, or reductions in curriculum hours. Non-teaching staff currently comprises about one quarter of the workforce in the education sector.88 It is assumed that the ratio of student to non-teaching staff will increase from 20 to 35 between 2005 and 2015.
Table 30. Selected staffing assumptionsSchool year beginning 2003 2005 2010 2015Student enrolment Students 1-11 1,638,000 1,664,000 1,767,000 2,204,000Avg. group size Students 1-11 20 20 21 22Student curriculum hours 1-4 Hrs. per week 22 20 20 20Student curriculum hours 5-11 Hrs. per week 33 24 24 24Teaching load 1-4 Hrs. per week 16 18 18 18Teaching load 5-11 Hrs. per week 14 16 16 16Avg. teacher working hours Hrs. per week 24 24 24 24Student:Non-teacher staff ratio Ratio 20:1 23:1 29:1 35:1Implied Student:teacher ratio Ratio 16:1 20:1 21:1 22:1
MDG Needs Assessment Estimates
Teacher and non-teaching staff compensation. Payments for labour comprise the single largest operat-ing expense in the education system. Attracting and retaining competent, motivated teachers is one of the most important quality-improving interventions to be made in the school system. A combination of low wages and poor working conditions has made this very difficult in Tajikistan. Many students from teaching colleges decline to enter the profession; and many of those who do work as teachers are forced to divide their time and energy between teaching and other economic activities undertaken to earn extra money. There is a broad agreement that education-sector wages should be raised. For example in 2003-2004 education year, the Government increased the teachers’ wages by 85-90%. However, there is no consensus as to how large a raise would be required to attract and retain good teachers.Compensation to teachers and staff in Tajikistan accounts for 80 percent of recurrent costs, in line with expenditure patterns in OECD countries89 but significantly less than is commonly allocated to education staff in most other developing countries.90 In 2003 average monthly compensation for teachers was around US$12 per month, or 70 percent of annual per capita GDP.91 This corre-sponds to a wage of just US$0.17 per teaching hour. Private payments from households and earn-ings from other jobs outside the education sector are thought to roughly equal the wage bill.92
Researchers with the World Bank suggest that in order to achieve MDG and EFA targets a standard rule of thumb is to set annual average teacher salaries at 3.5 times per capita GDP.93 This study assumes that raising staff compensation to an average of at least 2.5 times per capita GDP (US$700 per year and US$0.85 per teaching hour) would be sufficient to attract and retain quality staff in the education sector.94 Assuming no change in the relative wages of non-teaching
88 World Bank Education Sector Review 2002.
89 OECD Education at a Glance 2001, Tables B6.1 and D.1. Data are for 1999. In Developing countries and industrial countries alike, for primary educa-
tion current expenditures comprise 92 percent of annual budgets, including about 74 percent on staff compensations and 18 percent on non-staff
current costs like food and utilities. About 8 percent of all spending goes to capital investment.
90 Payments to teachers and non-teaching staff comprise over 95 percent of recurrent costs in Africa, South Asia and the Middle East; over 90 percent
in Southeast Asia, and over 86 percent in Latin America and the Caribbean. See Delmonica et al. 2001.
91 MoE and MoF.
92 WB ESR 2002.
93 Bruns. WB EFA Fast Track Initiative Progress Report. March 2004.
94 In OECD countries, primary and secondary school teachers are typically paid salaries and benefits valued between 1 and 1.4 times per capita GDP
depending on experience. In developing countries, compensation to teachers and non-teaching staff tends to be higher – on the order of 1.4 to 2.2
times per capita GDP (OECD Education at a Glance, 2001).

MILLENNIUM DEVELOPMENT GOALS NEEDS ASSESSMENT TAJ IK ISTAN
68
MILLENNIUM DEVELOPMENT GOALS NEEDS ASSESSMENT TAJ IK ISTAN
staff (relative to teacher salaries), total costs over 2005-2015 are estimated at US$ 149 million.
Assuming this wage target is achieved by 2015, the total eleven-year cost of paying teaching and non-teaching staff is estimated at just under US$ 712.3 million, 70 percent of annual re-current costs excluding internationally-funded feeding programs.
Teacher training. Teacher training programmes can make an important contribution to improv-ing the quality of schooling. As the education system changes, training programmes become even more important as they help integrate teaching methods with curriculum and textbook reforms. During the Soviet era, teachers were required to take a retraining course every four to five years. The state retains four training institutes and several training centres to provide professional development training, but, as with other elements of the education system, fi-nancial pressures have diminished capacity in this area.95 Although official statistics report that 14,000 teachers received some training in 2002,96 independent surveys suggest that training coverage has been very limited. According to a survey conducted by CARE, around two thirds of teachers have not received any training or professional development in the last five years.97 Recognising the need for improved professional development courses and the weakness of the current in-service teacher training system, international NGOs and aid agencies have initi-ated a variety of training programmes. These projects are unlikely to provide a viable long-run alternative to a restructured national system.
The per-teacher cost of in-service training varies widely depending on implementing agency and training model. International agencies engaged in teacher training report per-teacher costs rang-ing from US$50 to US$400.98 For the purposes of the costing study, it is assumed that each year 20-25 percent of teachers will attend at 20-day training course at a cost of US$200 per teacher. (These estimates assume 3 percent of old teachers retire each year and account for retrench-ments resulting from changes to the curriculum and teaching loads.) Total costs over 2004-2015 are estimated at around US$ 9.9 million. Lengthier 50-day pre-service training costs, at US$500 per teacher trained, are estimated to cost US$ 2.8 million over 2005-2015.
Utilities and maintenance costs. Payments for utilities (water and sewerage, heat and electricity) and regular maintenance are estimated at roughly US$61 million over eleven years, or US$ 5.5 million per year on average.
Table 31. Utility and maintenance cost assumptions Heating costs (electrical heaters) 6 US$/classroom/monthHeating costs (stoves) 9 US$/classroom/monthWater/sanitation costs 5 US$/connection/monthMaintenance 1 US$/classroom/monthElectricity 8 US$/classroom/month
MDG Needs Assessment Estimates
School feeding programme. Under the WFP programme the unit cost of providing a single meal is US$ 0.143, around 10 percent of which is paid for by community in kind contributions. WFP es-
95 ADB Education Sector Review 2003. Volume 4: Pedagogy.
96 MoE.
97 CARE Tajikistan “Teacher Education and Professional Development in the Republic of Tajikistan.” July 2003.
98 Interviews with international NGOs involved in teacher training.
69
timates that purchasing a greater share of basic foodstuffs from regional suppliers could reduce the unit cost of international contributions to meals by as much as a third (owing both to lower transport costs and lower commodity prices). Meals are provided for 180 days each year. An expansion of school feeding programs could provide strong support to Tajikistan’s efforts to raise school enrolment and attendance rates. As a baseline assumption, expansion of the programme to cover 50 percent of general education students would raise the annual cost of assistance from the current level of US$ 8 million to more than US$14.5 million in 2015 for total 11-year cost of US$ 160 million.
Disparity reduction programmes. There are a number of marginalized groups that face barriers to full participation in the education system. Children from poor families, boys and girls alike, are less likely to enrol and attend school than other children. Girls are more likely than boys to be kept out at home to care for relatives and perform household chores. (Although at the basic education level girls’ enrolment rates are only marginally lower than boys’, anecdotal evidence suggests that the disparity in attendance rates may be more substantial). Children in remote areas are frequently deprived of the same educational resources as their peers in more densely populated areas. In all, there are many underserved populations in the education system, and there is a need to address programmes to the specific needs of these groups. The aim of these projects should be to reduce the disparities between boys and girls, between poor children and children from relatively well off households, between rural resources and urban resources. School feeding programs are one prominent example of such programmes, but meeting the needs of diverse underserved populations will require a range of interventions. As a rough es-timate, the cost of providing scholarships (covering annual expenditures on uniforms, textbook rental fees and school supplies) to 10 percent of the general education population is estimated. The total cost of such a program would be US$22.6 million and would amount to 2.5 percent of annual recurrent expenditures (excluding school feeding programmes).
Textbooks. Textbooks are in short supply – available to only around 30 percent of students – and what few books are in use are considered to be of poor quality or unsuitable for instruction. The current curriculum requires an average of 8 textbooks per primary school student and 16 text-books per lower secondary school student.99 Under law, the Government is obligated to provide textbooks in minority languages, although in practice this requirement has not been met. Re-forms to the curriculum may reduce textbook requirements and hence textbook costs.
Tajikistan is in the process of developing a textbook rental program that will channel rental fees into a revolving fund for textbook publishing. Such funds can be difficult to operate but have been very successful in providing affordable textbooks to students in other former So-viet republics like Uzbekistan and Armenia. A costing model for the textbook rental program developed for this study suggests that full textbook provision (assuming the Government re-duces the number of required titles by half, as some officials have suggested) could be achieved for US$ 100million, 75 percent of which would be funded from household contributions.
Assessment. Developing an assessment program should be a goal for the education system. Assessment is needed to judge the impact of policy reforms and study the quality of service by measuring actual learning outcomes (as opposed to attendance and enrolment rates). Al-lowing for expenditures of US$5 per student per year, total assessment costs would average US$2 million annually, totalling US$22.6 over 2005-2015.
99 MoE.
MILLENNIUM DEVELOPMENT GOALS NEEDS ASSESSMENT TAJ IK ISTAN
70
MILLENNIUM DEVELOPMENT GOALS NEEDS ASSESSMENT TAJ IK ISTAN
Administrative costs. In this study it is assumed that administrative costs are an additional 5 percent of all recurrent expenditures including regular capital reinvestment in the upgrade and replacement of fixed assets. Total administrative costs are estimated at roughly US$ 59 million over 2004-2015, or around US$ 5.3 million a year on average.
Total financial estimations for the general secondary education Assuming baseline GDP growth, the cost of achieving the education MDG is estimated at approxi-mately US$ 1.76 billion, around US$ 160 million annually, and about US$ 84 per student per year. Recurrent expenditures on general education (excluding the cost of the school feeding pro-gramme, which is largely met by foreign aid, and not including spending on pre- and post-general education programmes, which currently absorb around 25 percent of the education budget) would need to rise from 2.0 percent of GDP in 2002 to 3.6 percent of GDP by 2015. Private contribu-tions are expected to be raised from parents’ contributions through Parent-Teacher Associations and other parent/community-based associations100, while taking care to introduce transparent ac-counting mechanisms for these contributions. Measures need to be developed to exempt poor parents from monetary contributions, and accept labour and other in-kind contributions.
These annual cost figures do not represent annual targets for fiscal policy, but they do clearly suggest that a very large increase in education spending will be needed to improve access to and quality of education. How this is achieved in practice will depend also on the timing and trend of policy. Education authorities could, for example, choose to frontload schoolhouse rehabilitation, to delay salary hikes or accelerate textbook provision – all with implications for the flow of costs. Although the reform programme could proceed in many ways, it is very clear that deferring action will make it more difficult to achieve the MDG target. The sooner reforms are implemented and financing is arranged, the easier it will be to achieve MDG tar-gets. The Government might also make policy decisions concerning the depth and quality of education reform. Authorities might undertake, for example, to implement more modest cuts in staffing or provide smaller pay raises. While this study relies on a number of assumptions about the nature and depth of the reforms required to meet MDG targets, these parameters will require careful study before being incorporated into formal policy. At the same time, as noted above, meeting the MDG target will also require prompt action. The sooner agreement can be reached on a reform agenda the better.
Looking forward, the single largest expenditure in the education system will continue to be the recurrent cost of paying teacher and non-teaching staff salaries. Assuming a reduction in the student-teacher ratio and a raise in compensation, expenditures on general education staff alone could require over US$60 million annually by 2015. The cost of school feeding programmes is also very high and will likely require a prolonged commitment for foreign aid to retain and perhaps expand. Capital expenses, though considerable, will cost far less than recurrent expenses. This is something for the Government to consider carefully, as the lo-cal expenditures comprising the great majority of recurrent costs are unlikely to receive the same level of foreign support as capital costs. This suggests that Tajikistan will have to increase spending on education and education-related expenses considerably in the future.
In all, the expenditures needed to meet the MDG for education are estimated to average 5.2 percent of GDP annually for the general education system alone. Under a high-growth sce-nario, no financing gap is anticipated and all costs are expected to be covered by the present
100 Parent-Teacher Associations already exist in some school districts, and it is expected that these will be formed in all schools nationwide.
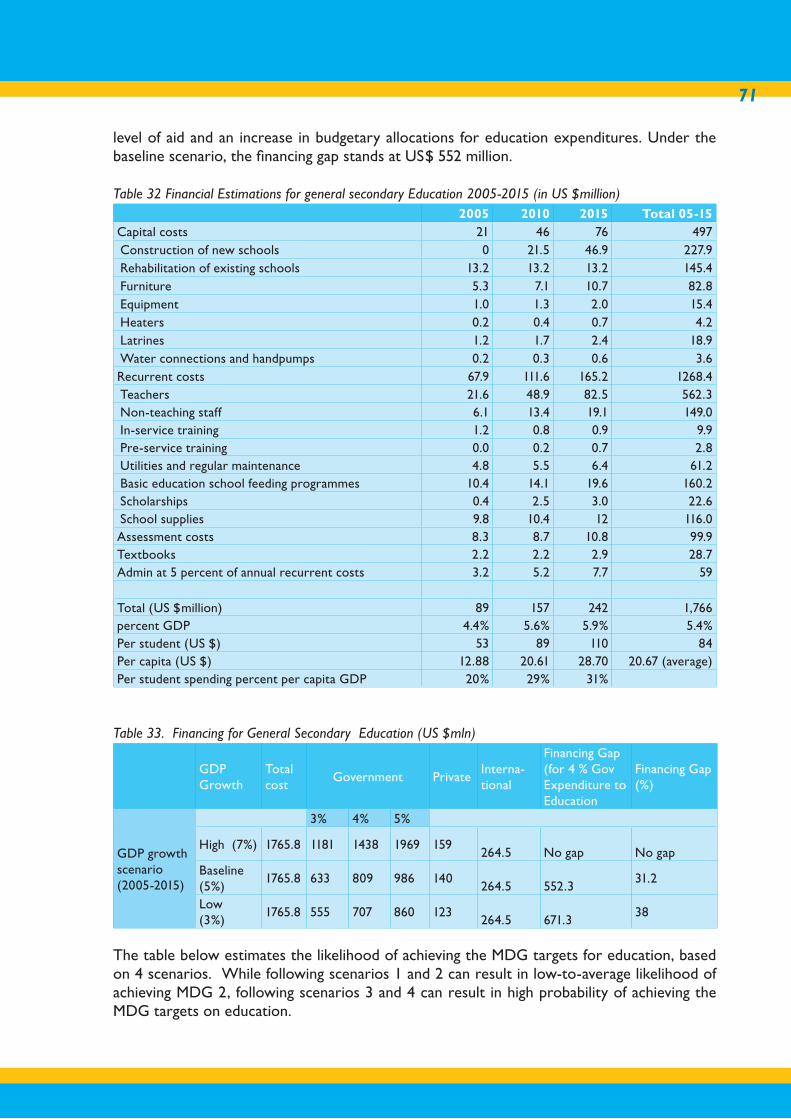
71
level of aid and an increase in budgetary allocations for education expenditures. Under the baseline scenario, the financing gap stands at US$ 552 million.
Table 32 Financial Estimations for general secondary Education 2005-2015 (in US $million) 2005 2010 2015 Total 05-15Capital costs 21 46 76 497Construction of new schools 0 21.5 46.9 227.9Rehabilitation of existing schools 13.2 13.2 13.2 145.4Furniture 5.3 7.1 10.7 82.8Equipment 1.0 1.3 2.0 15.4Heaters 0.2 0.4 0.7 4.2Latrines 1.2 1.7 2.4 18.9Water connections and handpumps 0.2 0.3 0.6 3.6Recurrent costs 67.9 111.6 165.2 1268.4Teachers 21.6 48.9 82.5 562.3Non-teaching staff 6.1 13.4 19.1 149.0In-service training 1.2 0.8 0.9 9.9Pre-service training 0.0 0.2 0.7 2.8Utilities and regular maintenance 4.8 5.5 6.4 61.2Basic education school feeding programmes 10.4 14.1 19.6 160.2Scholarships 0.4 2.5 3.0 22.6School supplies 9.8 10.4 12 116.0Assessment costs 8.3 8.7 10.8 99.9Textbooks 2.2 2.2 2.9 28.7Admin at 5 percent of annual recurrent costs 3.2 5.2 7.7 59 Total (US $million) 89 157 242 1,766percent GDP 4.4% 5.6% 5.9% 5.4%Per student (US $) 53 89 110 84Per capita (US $) 12.88 20.61 28.70 20.67 (average)Per student spending percent per capita GDP 20% 29% 31%
Table 33. Financing for General Secondary Education (US $mln)
GDP Growth
Total cost
Government PrivateInterna-tional
Financing Gap (for 4 % Gov Expenditure to Education
Financing Gap (%)
GDP growth scenario (2005-2015)
3% 4% 5%
High (7%) 1765.8 1181 1438 1969 159264.5 No gap No gap
Baseline (5%)
1765.8 633 809 986 140264.5 552.3
31.2
Low(3%)
1765.8 555 707 860 123264.5 671.3
38
The table below estimates the likelihood of achieving the MDG targets for education, based on 4 scenarios. While following scenarios 1 and 2 can result in low-to-average likelihood of achieving MDG 2, following scenarios 3 and 4 can result in high probability of achieving the MDG targets on education.
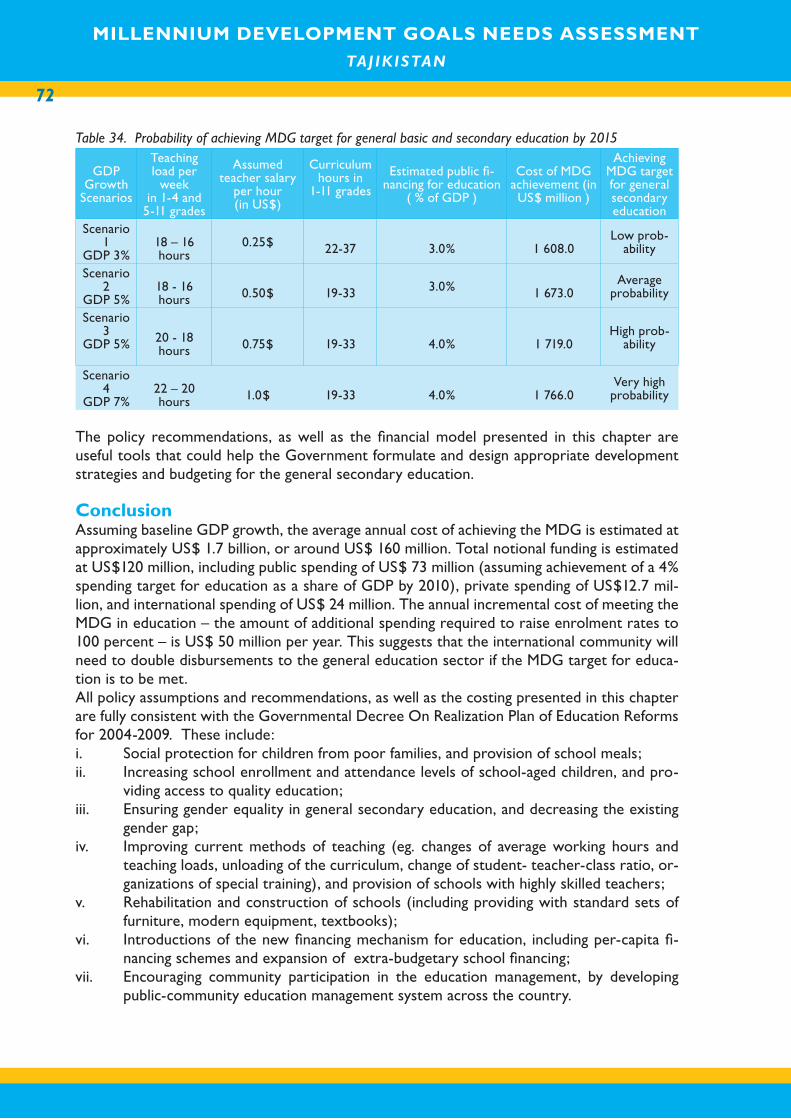
MILLENNIUM DEVELOPMENT GOALS NEEDS ASSESSMENT TAJ IK ISTAN
72
MILLENNIUM DEVELOPMENT GOALS NEEDS ASSESSMENT TAJ IK ISTAN
Table 34. Probability of achieving MDG target for general basic and secondary education by 2015
GDPGrowth
Scenarios
Teaching load per
weekin 1-4 and
5-11 grades
Assumed teacher salary
per hour (in US$)
Curriculum hours in
1-11 grades
Estimated public fi-nancing for education
( % of GDP )
Cost of MDG achievement (in US$ million )
Achieving MDG target for general secondary education
Scenario 1
GDP 3%18 – 16 hours
0.25$ 22-37 3.0% 1 608.0 Low prob-
ability
Scenario 2
GDP 5%18 - 16 hours 0.50$ 19-33 3.0% 1 673.0
Average probability
Scenario 3
GDP 5% 20 - 18 hours 0.75$ 19-33 4.0% 1 719.0
High prob-ability
Scenario 4
GDP 7%22 – 20 hours 1.0$ 19-33 4.0% 1 766.0
Very high probability
The policy recommendations, as well as the financial model presented in this chapter are useful tools that could help the Government formulate and design appropriate development strategies and budgeting for the general secondary education.
Conclusion Assuming baseline GDP growth, the average annual cost of achieving the MDG is estimated at approximately US$ 1.7 billion, or around US$ 160 million. Total notional funding is estimated at US$120 million, including public spending of US$ 73 million (assuming achievement of a 4% spending target for education as a share of GDP by 2010), private spending of US$12.7 mil-lion, and international spending of US$ 24 million. The annual incremental cost of meeting the MDG in education – the amount of additional spending required to raise enrolment rates to 100 percent – is US$ 50 million per year. This suggests that the international community will need to double disbursements to the general education sector if the MDG target for educa-tion is to be met.All policy assumptions and recommendations, as well as the costing presented in this chapter are fully consistent with the Governmental Decree On Realization Plan of Education Reforms for 2004-2009. These include: i. Social protection for children from poor families, and provision of school meals;ii. Increasing school enrollment and attendance levels of school-aged children, and pro-
viding access to quality education;iii. Ensuring gender equality in general secondary education, and decreasing the existing
gender gap;iv. Improving current methods of teaching (eg. changes of average working hours and
teaching loads, unloading of the curriculum, change of student- teacher-class ratio, or-ganizations of special training), and provision of schools with highly skilled teachers;
v. Rehabilitation and construction of schools (including providing with standard sets of furniture, modern equipment, textbooks);
vi. Introductions of the new financing mechanism for education, including per-capita fi-nancing schemes and expansion of extra-budgetary school financing;
vii. Encouraging community participation in the education management, by developing public-community education management system across the country.
73
If Tajikistan is to meet the MDG target for universal basic education enrolment by 2015 both the Government and its international partners must redouble their efforts to set the educa-tion system on a favourable course. For the Government, the low share of GDP allocated to education in general and to the basic education sector in particular must be raised. Deeper reforms will be needed to ensure that increased spending is used effectively. The attention currently being directed to per capita financing norms is very important in this regard. A strong commitment to implementing the recently decreed curriculum and staffing reforms will also help to improve the allocation of funds and improve the quality of schooling.
Tajiksitan’s international partners also have an important role to play if MDG targets are to be reached. International aid agencies, NGOs and financial institutions should continue to improve coordination with one another and with the Government. International organisa-tions must also strive to improve the efficiency and effectiveness of their own projects in the education sector. Most importantly, as Tajikistan demonstrates its willingness to undertake difficult reforms and direct more domestic financial resources towards the education system, international partners should be prepared to respond by increasing their own support and assistance. Developing a comprehensive national education strategy is important for qualifying for the Fast Track Initiative under Education for All, and receiving the necessary international support for closing the attendance and gender gaps at least in the primary schooling.
If committed, prudential reforms in the education system can be combined with increased spending, it will be possible to raise enrolments and improve the quality of schooling in Tajiki-stan. Whether the MDG target for education can be met, however, will depend most of all on the how quickly Tajikistan and the international community can translate general strategies into effective action.
MILLENNIUM DEVELOPMENT GOALS NEEDS ASSESSMENT TAJ IK ISTAN
74
MILLENNIUM DEVELOPMENT GOALS NEEDS ASSESSMENT TAJ IK ISTAN
7. MDG 3: ACHIEVING GENDER EQUALITY
Goal 3: Promote gender equality and empower women
Target 4: Eliminate gender disparity in primary and secondary education, prefer-ably by 2005, and to all levels of education no later than 2015
OverviewThe UN MDG Needs Assessment Team together with the Government Working Group on Gender and national and international organisations determined the priority reforms and the overall financial resources needed to achieve MDG 3. Tajikistan faces many challenges in overcoming inequality between women and men. In the past decade, due to the combined ef-fects of the civil war (1992-1997) and challenges of transition, livelihoods of Tajik women have significantly deteriorated and their position in the society weakened. Without a concerted effort from both the Government and international community, Tajikistan is unlikely to reach by 2015 the MDG on gender equality and empowerment of women.101
The main interventions for achieving gender equality are: 1) public awareness programmes on sexual and reproductive health; 2) income generation and skills training programmes for girls and women; 3) support for promoting political participation of women; 4) measures to end violence against women; and 5) measures promoting gender sensitization at all levels of public service, including police, schools and health centres.
The main coverage targets for 2015 are: 1) sexual and reproductive awareness programmes reach 80% of schoolchildren, and 50% of women; 2) skills training programmes aimed at help-ing girls and women generate income reach 30% of adolescent girls and about 5% of women; 3) provision of micro-credit to 1.5% of women; 4) coverage of 100% women-candidates for regional and national elections with support programmes; 5) 50% of women suffering from domestic violence are receive counseling, medical attention and access to shelters, and 100% of the population is reached by mass media campaigns promoting zero tolerance of violence against women; and 6) gender sensitization programmes reach 100% of public servants, in-cluding police, schools and health institutions. This programme also covers all ministries to strengthen women’s participation and role in the decision-making bodies.
The main outcomes of these interventions for MDG 3 are: increased practice of family planning among Tajik families, increased financial independence for women; creation of a “zero toler-ance” attitude towards violence against women; and gender empowerment in schools, health centers, local governments and ministries. This will result in social, political and economic empowerment of women in Tajikistan.
Current Situation and IssuesToday there is a noticeable reversal of trends in gender equality, marked by feminization of
101 Progress Toward the Millennium Development Goals, Government of Tajikistan and the UN Country Team, 2003
75
poverty, growing educational disparities between girls and boys, worsening of maternal and child mortality, poor public awareness on reproductive health (RH) issues, and increasing in-cidence of illnesses related to poor nutrition. Women face a range of institutional and cultural constraints on accessing and securing land, other forms of property and credits, which prevent them from conducting independent economic activities. Discrimination and domestic violence against women are a common occurrence. No adequate legal, and in particular institutional, mechanisms to protect women’s right to security and safety exist to date.
Poverty and Employment: Out of 64% of the population living below the poverty line, the major-ity are female-headed households, widows, cotton-growers, pensioners and other vulnerable groups. The main cause of widespread poverty among women is unemployment and the lack of coping mechanisms available to reduce vulnerability to risks and shocks. Women’s partici-pation in the formal labour market is low, and women’s wages make up 72% of those of men. 102 The greatest gender disparity is in agriculture and service sectors.103 Even though women’s labour significantly contributes to the households’ income, current labour market distortions and gender segregation in the professional fields prevent them from being employed in finan-cially secure jobs. Most women resort to seeking employment in the informal market, with little guarantee of securing a sustainable livelihood. Invisible ceilings prevent women from ad-vancing in their careers to occupy managerial and executive positions. Women’s labour, such as domestic labour, often goes unaccounted for. About 73% of women’s labour is not paid for, compared to 44% for men104. Female-headed households experience much more hardships, as they have limited opportunities for finding employment and for accessing child care services. According to the population census of 2002, there were 49,421 female-headed households (or 190,500 persons), which constituted 5% of all households in the country.
Education: As is noted in the education section, the gender gap in school attendance has been widening in recent years, and in 2003, the dropout rate was twice as high among girls than boys in rural areas, and three times as high in urban areas. Dushanbe city has the worst indica-tors – it has the lowest attendance level and the highest gender gap. In 2003, the gender gap in school attendance in grades 1-5 constituted 4%, whereas in grades 6-9 this gap increased to 10%. The highest gender gap of 20-21% was observed in grades 9-11105. The widening gen-der gap can be explained by the recent socio-political changes and increasing tendency in the society to value boy’s education over girls, and reconfirmation of traditional values that deem women as homemakers. Another reason for the widening gender gap in basic education is the fact that many schools are not equipped with sanitary facilities that can be used by girls. Also, as remote rural villages lack school transportations, children, especially girls, do not have means to reach schools that are usually located in rural district centres. According to the UN report Progress Towards Achieving the Millennium Development Goals, Tajikistan is unlikely to eliminate gender disparity in primary and secondary education by 2015.
Maternal and Infant Mortality and Reproductive Health: The Government reported a maternal mortality rate of 45 deaths per 100,000 live births for 2002. However, according to the WB, in 2003 the maternal mortality rate was 120 per 100,000 live births (this figure is accepted by the Government Working Group on Health as the baseline indicator for maternal mortality), and in some regions this indicator ranged from 126.3 to 842.1 per 100,000 live births. Rapid Assessment
102 Ibid
103 PAU, WB, 2004
104 Gender and Development, “Tajikistan-on the Way to Gender Equality,” UNDP, Tajikistan 2003
5 PRSP report for 2003, March 2004
105 UN Tajikistan and the Government of Tajikistan, Progress Towards the Millennium Development Goals, , 2003
MILLENNIUM DEVELOPMENT GOALS NEEDS ASSESSMENT TAJ IK ISTAN
76
MILLENNIUM DEVELOPMENT GOALS NEEDS ASSESSMENT TAJ IK ISTAN
of the Current State of Rural Health Services of the Republic of Tajikistan carried out in 2000 by the Ministry of Health (MoH) with the support of the World Health Organization (WHO) showed that the main reasons for such high maternal mortality rates were obstetric hemorrhages (which accounted for 37.3% of maternal deaths), hypertension of pregnant women (26.7%), complica-tions after abortion, and complication during delivery (12. 2%). According to the Ministry of Health statistics in 2003, the infant mortality rate declined to 13.5 per 1000 live births. However, the UNICEF MICS data showed that in 2000 the infant mortality rate was at 89 per 1000 live births, and under-five mortality rate –118 per 1000 live births UNI-CEF SOWC 2003. The Government Working Group on Health has agreed to take the UNI-CEF MICS figures on infant mortality as the baseline indicator for tracking the success towards the MDG targets. The main causes of neonatal mortality are premature delivery (accounting for 28% of deaths), pneumonia (20%), birth asphyxia (19%) and inborn pathology (28%).
According to the Yearly Statistics of the Republic of Tajikistan, the fertility rate was 3.9 in 2003. Awareness of and access to contraceptives are low, and according to the Republican Centre of Reproductive Health, only 20% of women had access to contraceptives in 2003. The low awareness of and access to family planning methods is evident in short spacing of births (usually two years). The gynaecological illnesses affect as much as 24% of the female population in the country. A high rate of unattended births – two thirds of all births occur at home,106 due to poor availability and quality of maternity wards and obstetrics services – combined with the lack of pre-and-postnatal services and low awareness about basic maternal health issues107 present serious obstacles to efforts to reduce maternal mortality rates. In Khatlon, GBAO, and RRS dis-tricts the rates of unattended births were the highest and constituted 68.3 %, 54.8 % and 51.6 % respectively. Key interventions for improving maternal mortality include provision of basic health services to decrease the rate of home birth, improving the availability and quality of reproductive health services, promoting general awareness about maternal health, and improving nutrition. These interventions are discussed in detail in the Health section of this report.
Nutrition: Chronic malnutrition stands at 36.3% among children.108 One out of ten women does not receive the daily recommended supply of calories.109 As a result of poor diet, women and children suffer from nutrition-related diseases such as iodine deficiency, anemia and vita-min A deficiency. Every fourth girl living in a rural area and more than 80% of pregnant women suffer from anaemia. Overall, more than 50% of children and women of reproductive age are afflicted with anaemia and iodine deficiency. Malnutrition and the resulting illnesses need to be solved by reaching out to poor households through improved social protection and public health programmes, as well as through the development of national programmes for enrich-ment of essential foods with micronutrient fortificants, and distribution of supplements to children and women of reproductive age suffering from these illnesses. The key interventions directed towards reducing nutrition-related diseases among women and children are discussed in detail in the Nutrition, Food Security and Rural Development chapter of this report.
Access to Resources: Under the Land Code, Labour Law and other legislation, Tajik women are guaranteed equal access to land use and economic activities. In reality most of the existing farms are owned by men, and women are allowed to use land through their male relatives. Less than 10% of the existing farms are headed by women, and many female-headed house-
106 World Bank, Health Sector Note, June 2004.
107 According the World Bank’s Health Sector Note, 37% of women in 2003 did not receive pre-/post-natal care services.
108 State Statistical Committee, Food Security Bulletin 2004.
109 UNDP, “Tajikistan: On the Way to Gender Equality,” Dushanbe, 2003.
77
holds are left without land. The majority of labourers picking cotton in the country’s poorest oblasts of Sugd and Khatlon are women and children, who receive less than three cents for one kilo of gathered cotton. Women’s access to financial, natural and physical capital is limited by the unavailability of micro-credit and other income-generating schemes, by poor aware-ness among women of their economic and other rights, and by their lack of knowledge of the requirements and procedures for acquiring land, property and other resources.
Discrimination and Violence Against Women: Equality between men and women is recognized by the Constitution of Tajikistan, and the country has ratified the Convention of Liquidation of All Kinds of Discrimination Against Women (1979), and Declaration of Elimination of Violence Against Women (1993). Despite the legal foundations that protect the rights of women, dis-crimination and violence against women persist in all social and economic spheres. Traditional patriarchal stereotypes, which dictate that women’s place is at home, are prevalent in most Tajik households, and go against the official gender policies of the country. Domestic violence is prevalent in many households; 30% of women report having experienced some form of domes-tic violence.110 There is a widespread lack of awareness by the Government employees, the legal and judicial sector, health workers, the police, and the private sector on gender equality and on the existing policy measures aimed at preventing discrimination against women by.
Current statistical data on discrimination and violence against women are often not accurate, as some forms of violence, especially domestic violence, are tabooed from public discussions, and often go unreported. According to the UNIFEM’s survey, in 2004 8% women suffered from violence from their husbands, parents and brothers; 2.2%- from sexual violence; 10%-from isolation and seclusion from society, 7.5%-from prohibition to seek employment; 6%-from prohibition to study. Approximately 5% of women were married without their consent, and in 65% of cases husbands were chosen by women’s parents111. Although outlawed by the Constitution, in a hidden form, polygamy is becoming popular in the contemporary Tajik soci-ety. Due to the lack of programmes and campaigns against violence and discrimination, and the lack of judicial and administrative mechanisms that provide effective protection of women’s rights, women have little choice and means of escaping violence.
There is a persistent lack of awareness of measures preventing discrimination against women among civil servants, health workers and police forces, and the private sector. While a small number of crisis centres and helplines exist to provide counselling and temporary protection to women suf-fering from violence, these efforts are not being integrated into the public service system, and are not yet able to cover the majority of women in need, especially women living in rural areas.
Gender Sensitisation: The courts of the Republic of Tajikistan undertake regular measures on preventing violence against women. This is, first of all, explanation and advocacy activity, aimed at increasing awareness on observing and respecting women rights in the family, job place, and in the society. The courts conduct mobile sessions to discuss family affairs, such as divorce, alimony, separation orders and family arrangement, ect. In the last five years courts arranged 1856 meetings, discussions and round tables in the enterprises, organizations, schools and jamoats (local governments), aimed at explanation of the current legislation on respecting women rights, and criminal responsibility for violence against women. Center of Psychological Support with the financial support of the Swiss Agency implemented trainings for district law
110 UNIFEM, Problems of Violence in Gender Statistics, 2004
111 GAD, UNIFEM, Violence in gender statistics, Dushanbe 2004
MILLENNIUM DEVELOPMENT GOALS NEEDS ASSESSMENT TAJ IK ISTAN
78
MILLENNIUM DEVELOPMENT GOALS NEEDS ASSESSMENT TAJ IK ISTAN
enforcement bodies on prevention and reduction of violence against women. Presently, only 5% of lawyers and 4% of law enforcement agencies have been covered by such sensitization and training programs, which shows the need of widening such programs to reach out to all legal and law enforcement bodies, bureaucrats and social workers. Although a small number of crisis centers and shelters exist for abused women, these services are not integrated into the mainstream social services, and do not reach most women, especially in rural areas, who need protection and counseling.
Women and Politics: As a result of elections in 2000, the number of women elected officials con-stituted 17.7% in the Lower House of the Parliament, 12.1%-in the Upper House, and 11.5%- in district and local legislative bodies112. The representation of women among judges is at 19 %. In 2004, the percentage of women in the local Government has increased from 14.5 to 22.4%. This increase was made possible through the establishment of a gender quota system by the President. Existing gender stereotypes, lack of training, and financial and other forms of support to women candidates are the reason that gender inequality persists in the political life of the country. There is a growing need in special education programmes on political empowerment of women and training of women leaders that should be launched at all levels, starting from secondary schools. Expansion and strengthening women’s movements should also be a part of gender empowerment policy in the country. The Government recognizes the importance of developing a strong civil society in the country, and in principle supports development of NGOs and community-based organizations. As of 2003, 152 women’s NGOs with support of donors and international NGOs were working at national and regional levels, providing legal education for women leaders, trainings for business skills development, and income generating activities to poor women through micro-credit schemes. A number of NGOs has started promoting gender equality through the mass media and public awareness campaigns. Association of NGOs on the Prevention of Violence Against Women was set up in the country.
Government MeasuresThe term ‘gender’ was first introduced in the Tajik legislature in September 1998 in the National Plan on Improving Women’s Position in the Society. This plan noted that gender mainstreaming would be needed in all existing legislatures of the country. The new state programme Basic Directions of the State Policy on Providing Equal Rights and Opportunities for Women and Men in the Republic of Tajikistan from 2001-201 approved in August 2001 now serves as a principal gender policy in Tajikistan, which in principle should be executed by all ministries and public agencies. Convention on Liquidation of All Forms of Discrimination against Women was also ratified by the Government. Gender priorities identified by the new directive of 2001 were reflected in the Law on Reproduc-tive health and rights of 2002, as well as in the Poverty Reduction Strategy Paper of 2002.
In 2003, the Upper House of the Parliament passed the Law On the State Guarantee of Equal Rights and Opportunities for Men and Women. The draft of the Law On social - legal protection from domestic violence has been prepared and submitted for review to the Parliament, which if passed, will serve as a legal basis of protecting women from violence and discrimination. In 2004, the Law On Fighting Trafficking of People was adopted. Considerable resources, lobby-ing, mass media and public awareness campaigns are needed for these laws to serve as a legal backbone for protecting women’s rights in Tajikistan.
112 Gender and Development NGO, Gender and Development, 2003

79
RecommendationsIn order to realize the MDG 3 on promoting gender equality in Tajikistan, the Government, civil society and the international community need to work jointly on strengthening women’s legal and institutional rights, and promoting gender sensitization in all spheres of the society. The following is the full list of recommendations of the MDG Needs Assessment Team and the Government Working Group on Gender Equality:1. Strengthen and intensify women’s participation in the decision-making and politics
through training of women for executive and managerial positions, supporting women candidates, establishing of quotas and other mechanisms to promote women leaders.
2. Conduct comprehensive analyses on women’s participation in politics, gender gap in education, access of women to material and natural resources, and on age and gender statistics of civil servants.
3. Organize campaigns, launched by women’s NGOs, to support progressive women can-didates and organize special funds to support promotion of women in politics.
4. Draft and implement special educational programmes on promoting gender equality in schools and universities
5. Provide free school meals for schoolchildren, textbooks and other assistance (clothes) for children from poor families.
6. Support young women in receiving education and finding sustainable employment through public awareness activities directed towards increasing girls’ enrolment in secondary and ter-tiary education, and development of vocational training and income generating activities.
7. Increase access of women to financial resources, and support small and medium busi-ness run by women.
8. Strengthen reproductive health in the country through measures directed towards: a) increasing sexual and reproductive health knowledge of women and men, b) improving access to modern contraceptive methods, and c) promoting public awareness pro-grams on family planning.
9. Provide free obstetrics, pre-and-postnatal services, emergency obstetrics services to women, and free healthcare services to children under five.
10. Develop community based health professionals, who can provide quality primary health care services in rural areas.
11. Promote public awareness campaigns directed towards improving maternal and child health care.
12. Adopt the law On social - legal protection from domestic violence.13. Create information centres, support groups and shelters at each district level that
provide psychological and legal support to abused women.14. Conduct a country wide public awareness campaign on zero tolerance against domes-
tic and other types of violence against women, and behaviour change advocacy cam-paigns among men.
15. Conduct trainings for law enforcement bodies on providing protection to victims of violence and trafficking.
16. Conduct public awareness and advocacy campaigns directed towards increasing awareness of the public and Government officials on human trafficking. Increase the role of the Min-istry of Labour and Social Protection on protecting the public from human traffickers.
17. Publish and circulate free of charge information on family, labour and women’s rights. 18. Promote gender mainstreaming in legislation and national development programmes. 19. Conduct gender sensitization programmes among Government agencies, law enforce-
ment bodies and public servants (schools/health centres) on gender issues; provide
MILLENNIUM DEVELOPMENT GOALS NEEDS ASSESSMENT TAJ IK ISTAN
80
MILLENNIUM DEVELOPMENT GOALS NEEDS ASSESSMENT TAJ IK ISTAN
linkage between the existing counseling and shelter services and the police force, health services and schools; train the police force, school official and health service providers to provide protection and counseling to abused women, and refer them to local women’s counseling and shelter services.
20. Involve and receive support from the Government, local khukumats, communities, and religious groups in promotion of gender equality in the country.
21. Organize media network that regularly updates the public on progress of the country towards achieving the MDG 3.
22. Mainstream gender issues in all relevant sections of the revised PRSP, and develop a separate chapter on promoting gender equality in the country, and create an indepen-dent monitoring body for MDG 3.
Short-Term Priorities:• Economic empowerment: Provide access to micro-credit for women, especially in
rural areas, and promote measures to assist out of school girls with technical trainings and income-generating activities;
• Personal empowerment: Conduct country-wide public awareness campaigns promot-ing “zero tolerance for violence.”
Medium-Term Priorities:• Strengthen and intensify women’s participation in decision-making and management;
train women for leadership from school age and throughout lifetime as well as provid-ing specific support to women candidates.
• Conduct integrated measures on RH and family planning issues. Integrate RH services into PHC aid; conduct informational educational activities.
• Conduct training for health workers, social workers, teachers and the police on pro-tecting women and girls from all kinds of discrimination (including gender discrimina-tion in schools), and providing professional support to women in crisis.
Financial estimations for Promoting Gender EqualityAccording to the MDG Needs Assessment results, about US$ 115.6 million, or US$ 1.3 per capita will be needed to achieve gender equality and women’s empowerment in Tajiki-stan. Interventions targeted towards supporting transition of girls and women to work bears the majority of the cost, estimated at US$ 47 million. The amount of additional resources needed to achieve the MDG3 is US$ 78.4 million.
Sexual and Reproductive Awareness Programme. Under the sexual and reproductive health (SRH) awareness component, public awareness and community-based advocacy campaigns on SRH have been costed. The coverage rate of SRH education programme for secondary school children is assumed to increase from the current levels of 20% to 80% by 2015. The coverage rate of SHR public awareness programme is 50% of all adolescent girls and women by 2015, compared to the present levels of coverage of 1.8% of girls and 20% of women. The total cost of the SRH programme is on the order of US$ 13.9 million.
Transition of girls and women to work. This component targets out of school adolescent girls and unemployed women, and aims to provide skills/vocations training for employment. As of 2004, vocational training programmes covered 2.4% of adolescent girls and 1% of women. The financial model targets to increase the coverage rate by 2015 to 30% for adolescent girls and 5%
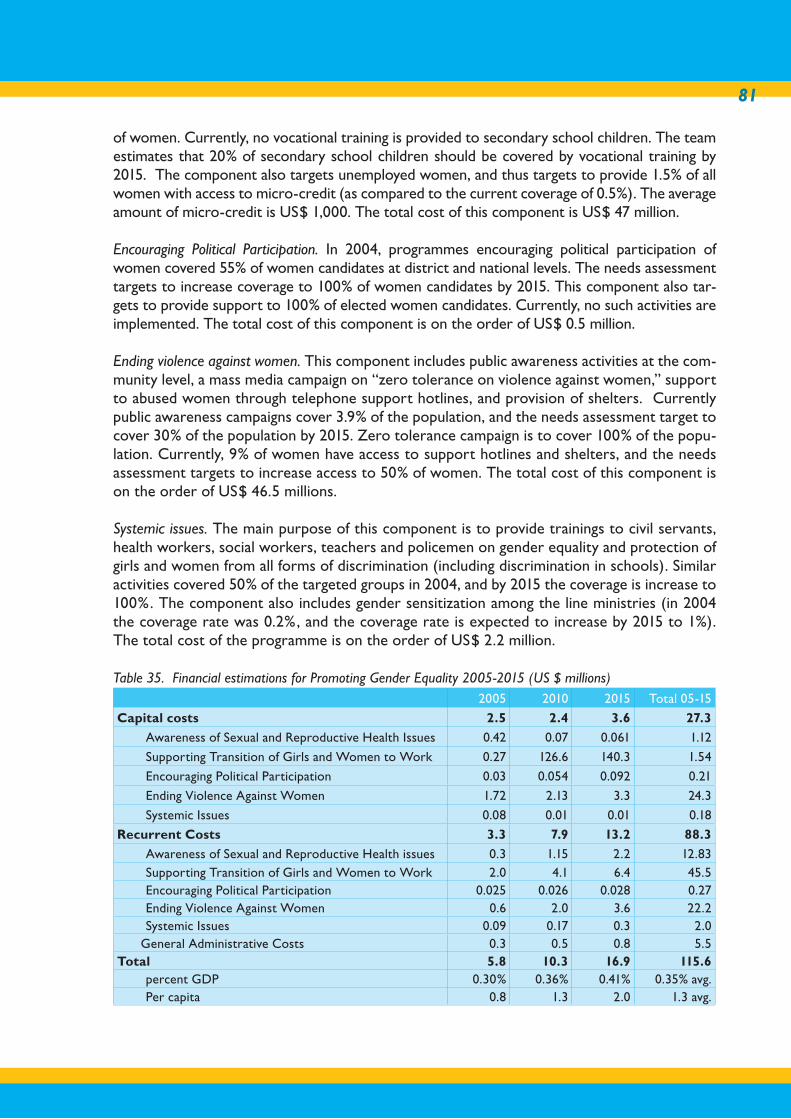
81
of women. Currently, no vocational training is provided to secondary school children. The team estimates that 20% of secondary school children should be covered by vocational training by 2015. The component also targets unemployed women, and thus targets to provide 1.5% of all women with access to micro-credit (as compared to the current coverage of 0.5%). The average amount of micro-credit is US$ 1,000. The total cost of this component is US$ 47 million.
Encouraging Political Participation. In 2004, programmes encouraging political participation of women covered 55% of women candidates at district and national levels. The needs assessment targets to increase coverage to 100% of women candidates by 2015. This component also tar-gets to provide support to 100% of elected women candidates. Currently, no such activities are implemented. The total cost of this component is on the order of US$ 0.5 million.
Ending violence against women. This component includes public awareness activities at the com-munity level, a mass media campaign on “zero tolerance on violence against women,” support to abused women through telephone support hotlines, and provision of shelters. Currently public awareness campaigns cover 3.9% of the population, and the needs assessment target to cover 30% of the population by 2015. Zero tolerance campaign is to cover 100% of the popu-lation. Currently, 9% of women have access to support hotlines and shelters, and the needs assessment targets to increase access to 50% of women. The total cost of this component is on the order of US$ 46.5 millions.
Systemic issues. The main purpose of this component is to provide trainings to civil servants, health workers, social workers, teachers and policemen on gender equality and protection of girls and women from all forms of discrimination (including discrimination in schools). Similar activities covered 50% of the targeted groups in 2004, and by 2015 the coverage is increase to 100%. The component also includes gender sensitization among the line ministries (in 2004 the coverage rate was 0.2%, and the coverage rate is expected to increase by 2015 to 1%). The total cost of the programme is on the order of US$ 2.2 million.
Table 35. Financial estimations for Promoting Gender Equality 2005-2015 (US $ millions) 2005 2010 2015 Total 05-15
Capital costs 2.5 2.4 3.6 27.3
Awareness of Sexual and Reproductive Health Issues 0.42 0.07 0.061 1.12
Supporting Transition of Girls and Women to Work 0.27 126.6 140.3 1.54
Encouraging Political Participation 0.03 0.054 0.092 0.21
Ending Violence Against Women 1.72 2.13 3.3 24.3
Systemic Issues 0.08 0.01 0.01 0.18
Recurrent Costs 3.3 7.9 13.2 88.3
Awareness of Sexual and Reproductive Health issues 0.3 1.15 2.2 12.83Supporting Transition of Girls and Women to Work 2.0 4.1 6.4 45.5 Encouraging Political Participation 0.025 0.026 0.028 0.27 Ending Violence Against Women 0.6 2.0 3.6 22.2 Systemic Issues 0.09 0.17 0.3 2.0
General Administrative Costs 0.3 0.5 0.8 5.5 Total 5.8 10.3 16.9 115.6
percent GDP 0.30% 0.36% 0.41% 0.35% avg.Per capita 0.8 1.3 2.0 1.3 avg.
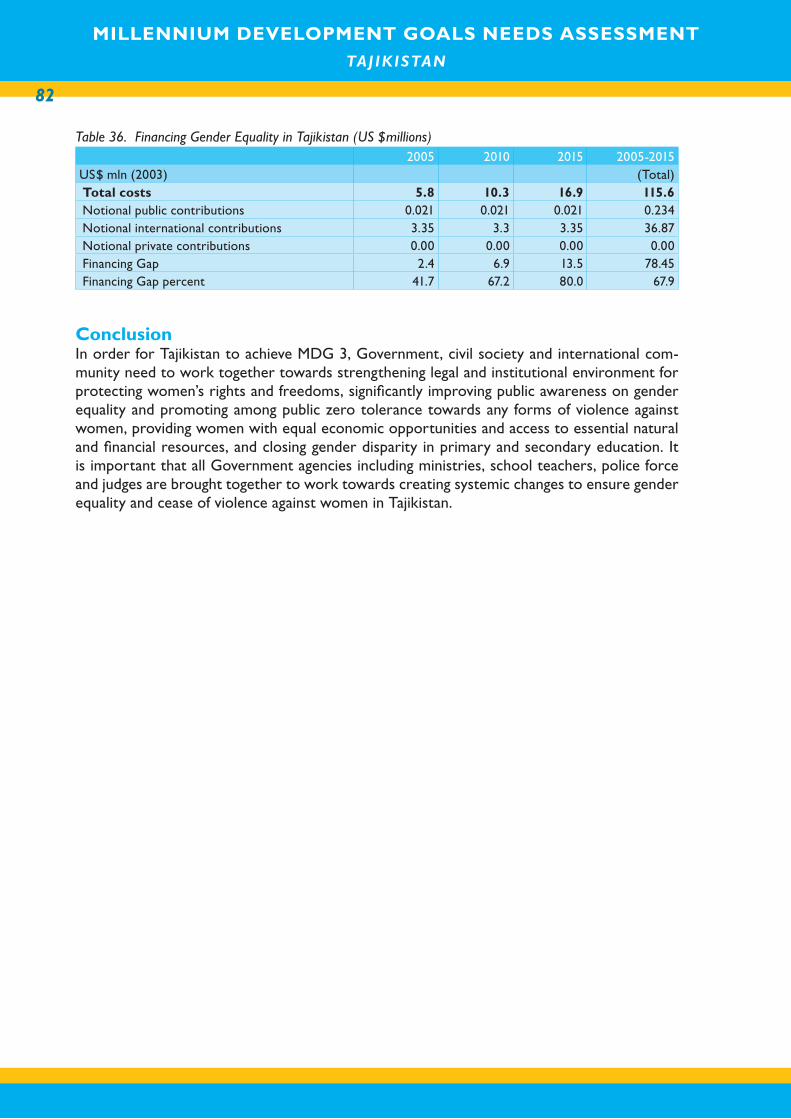
MILLENNIUM DEVELOPMENT GOALS NEEDS ASSESSMENT TAJ IK ISTAN
82
MILLENNIUM DEVELOPMENT GOALS NEEDS ASSESSMENT TAJ IK ISTAN
Table 36. Financing Gender Equality in Tajikistan (US $millions) 2005 2010 2015 2005-2015US$ mln (2003) (Total)Total costs 5.8 10.3 16.9 115.6 Notional public contributions 0.021 0.021 0.021 0.234Notional international contributions 3.35 3.3 3.35 36.87Notional private contributions 0.00 0.00 0.00 0.00Financing Gap 2.4 6.9 13.5 78.45Financing Gap percent 41.7 67.2 80.0 67.9
ConclusionIn order for Tajikistan to achieve MDG 3, Government, civil society and international com-munity need to work together towards strengthening legal and institutional environment for protecting women’s rights and freedoms, significantly improving public awareness on gender equality and promoting among public zero tolerance towards any forms of violence against women, providing women with equal economic opportunities and access to essential natural and financial resources, and closing gender disparity in primary and secondary education. It is important that all Government agencies including ministries, school teachers, police force and judges are brought together to work towards creating systemic changes to ensure gender equality and cease of violence against women in Tajikistan.
83
8. HEALTH MDGS (4, 5 AND 6): LOWERING
CHILD (MDG 4) AND MATERNAL (MDG 5)
MORTALITY RATES, AND COMBATING THE
SPREAD OF INFECTIOUS DISEASES (MDG 6)
Goal 4. Reduce Child Mortality
Goal 5. Improve Maternal Health
Goal 6. Combat HIV/AIDS, malaria and other diseases
Target 5: Reduce by two-thirds, between 1990113 and 2015, the under five mortal-ity rate.
Target 6: Reduce by three-quarters, between 1990114 and 2015, the maternal mor-tality rate.
Target 7: Have halted by 2015 and begun to reverse the spread of HIV/AIDs.
Target 8: Have halted by 2015 and begun to reverse the incidence of malaria and other major diseases.
OverviewTo estimate the costs of meeting MDG goals 4 (reduce child mortality), MDG 5 (improve maternal health) and MDG 6 (combating HIV/AIDS, malaria and other diseases), this study examines the political priorities and financial requirements needed to stabilise the core pil-lars of the primary care system: rural health houses, rural health centres, reproductive health cenres, urban polyclinics, general hospitals (city hospitals, central district hospitals and nu-meral hospitals), antenatal clinics, ambulance stations, laboratory facilities of national public healthcare authority and of Sanitary and Epidemiological Service. These institutions represent the mainstays of the basic health system and provide the platform from which interventions to address maternal and child health as well as disease control will be implemented. The study also provides priorities and financial estimates of long-term resource needs for combating HIV/AIDS, tuberculosis, malaria, and worm disease. The study also estimates resource needs for universal immunization and promoting healthy life style.
Achieving the Millennium Development Goal targets for health will be extremely difficult. As the Government’s 2003 Millennium Development Goal Report indicates, targeted reductions in maternal and child mortality rates are unlikely to be met on schedule. Improving the stand-ard of health services will require not only increased financial resources but also significant structural reforms to ensure that physical, financial and human assets are allocated more ef-ficiently within the sector. Tajikistan’s progress towards the MDGs will be regulated in large part by the success of these reforms, especially the reorientation of the health system away from hospital-based tertiary care towards preventative and primary health services.
113 For Tajikistan the base year is 2002 or later. (See Annex on M&E indicators for the baseline indicators)
114 See Annex for the exact baseline indicators
MILLENNIUM DEVELOPMENT GOALS NEEDS ASSESSMENT TAJ IK ISTAN
84
MILLENNIUM DEVELOPMENT GOALS NEEDS ASSESSMENT TAJ IK ISTAN
Over the past decade both the quality and accessibility of health care has deteriorated sharply in Tajikistan. Strained by economic transition and the hardships of civil war, spending on the health sector has fallen from 4.5% of GDP in 1991115 to less than 1% of a much lower level of GDP in 2002.116 Public expenditure on health was just US$2.2117 per capita in 2003. Such low levels of public spending are inadequate to operate the current system much less to meet criti-cal investment needs in health, or direct resources to the country’s most vulnerable groups. As the Government’s role in health care declines, the sector is becoming increasingly depen-dent on informal private payments to pay for basic services and on foreign aid to relieve the acute shortage of essential drugs and medical equipment. In 2003, total private spending on health services was US$12 per capita, one of the lowest levels of health spending in the world. Private payments comprised 70% of expenditures, compared with 16% from Government and 13% from international sources.118 Households reported that as much as 30% of household expenditures went towards covering health expenses119.
The main interventions for achieving health MDGs are: 1)construction and rehabilitation of primary medical health care facilities and Sanitary Epidemiological Stations (SES); 2) provision of medical equipment and essential drugs to rural health care facilities; 3) training of primary health physicians, family doctors, and especially obstetricians and midwives; 4) contraceptives provision to all primary healthcare institutions; 5) wage increase of medical staff through formalizing private payments; 6) scaling up of DOTS; 7) strengthening anti-malaria measures across the country; 8) de-worming campaigns for all children under 14 years of age, and 9) effective anti HIV/AIDS activities, targeting youth, and vulnerable populations.
The main coverage targets are as follow: 1) rehabilitation of 40% of health houses, 70% of rural health centres, 70% of polyclinics and 80% of urban and district hospitals, and 80% of SES; 2) rebuilding of 60% rural health houses, 30% of rural health centres, 30% policlinics, 20% of urban hospitals, 20% of rural district hospitals; 3) provision of pre-service and in-service training to 100% of obstetricians and midwives on safe child birth practices; 4) provision of varied contra-ceptives to 100% of the population; 5) improvement of detection and recovery of TB to 50% and 70% respectively; 6) improvement of prevention, detection and recovery rates of malaria; 7) coverage of 100% of children under the age of 14 with anti-worm medicines; 8) coverage of 80% of youth through mass media campaigns on preventing HIV/AIDS; increase of voluntary counselling and testing especially vulnerable young people to 60%, mandatory testing of all blood transfusion units, and provision of ARV treatments to 90% of HIV positive women.
Outcome Targets:The following are Tajikistan’s’ targets in health for 2015, as identified by the Needs Assessment Team and the Ministry of Health:• Infant mortality rate: 29.6 per 1000 live births, but preferably 25 per 1000;• Under five mortality rate: 39.3 per 1000 live births, but preferably 30 per 1000;• Maternal mortality rate: 30 per 100,000 live births;• Have halted by 2015 and begun to reverse the spread of HIV/AIDS, malaria, TB, worm dis-
ease and other diseases;• Detection and recovery rates for malaria and TB strengthened to at least 50%;• Immunization of 100% of children;
115 “Strategia respubliki Tajikistan po okhranye zdorov’ya naseleniya v period do 2010” p.77.
116 MoF.
117 State Statistical Committee, Note to the Ministry of Health #10-01, January 6, 2005
118 WB Health Sector Note, June 2004.
119 WB, TLSS, 2003
85
• Provision of safe birthing conditions to mothers, including provision of free emergency obsterics services across the country;
Accessibility and quality of health services. Compared to other sparsely settled, low-income coun-tries, Tajikistan was able under the Soviet Union to provide relatively easy access to primary health services. The sheer number of primary care facilities and development of a national transportation infrastructure improved access to health care. Access to health structures, however, is not the same as access to quality health services. This is particularly the case today in rural areas of the country where many facilities have severely deteriorated over the course of the last two decades and lack sufficient resources to offer quality care to the population. Patients from rural areas commonly bypass the primary health system altogether and travel considerable distances to seek care at hospitals and urban polyclinics, which are perceived to offer a higher standard of service. Mistrust of the primary health system is so deep that even fully rehabilitated and equipped local facilities may have trouble attracting patients.120 Rehabilitating the primary health infrastructure will therefore require not only direct financial investment for upgrading the standard of services but also time and effort to strengthen the links between the health system and local communities. Tajikistan has not yet developed its own pharmaceutical industry, and thus faces serious problems in procurement of medicines. Procurement of medicines occurs mainly through informal sources. Drug stores release medi-cines to the general public without prescriptions, which causes a great concern regarding con-trolling the quality of medicines and applying correct treatments.
Child mortality. As can be seen in Figures 1-4 below, Tajikistan’s child mortality rates are in line with international norms for countries of comparable per capita income. The 2000 UNICEF MICS estimated the infant mortality rate at 89.0 deaths per 1000 live births – the highest in the former Soviet Union. The UNICEF SOWC estimated an under-five mortality rate 118 deaths per 1000 live births in the 2003. The most recent official figure, 13.5 in 2003 according to the Ministry of Health, is substantially lower and almost certainly underestimates the true scale of infant mortality rate in the country. Key risks to child health include low quality and inaccessibil-ity of reproductive health services, prevalent waterborne diseases, malnutrition, and the threat posed by vaccine preventable diseases, particularly measles. To meet the MDG target for reduc-ing child mortality Tajikistan must improve the nutrition status of children, improve awareness of basic health in households and strengthen the ability of the basic health care system to provide quality reproductive health services and vaccinations in local communities. Improving access to clean water and adequate sanitation (discussed in the chapter of meeting MDG targets for water and sanitation) is an important component in the effort to improve child health.
Maternal mortality. Officially, the Republican Center of Medical Statistics reported a maternal mortality rate of 45.0 deaths per 100,000 live births, and 36.5 per 100,000 live births cor-respondingly for 2002-2003. This and other official maternal mortality figures in Tajikistan are much lower than corresponding estimates from the surveys carried out by internation-al organizations. The WHO study estimated Tajikistan’s maternal mortality rate at 123 per 100,000 live births in 1995.121 A high percentage of unattended births (according to the recent living standards survey of the World Bank, around two thirds of all births are delivered outside of hospitals or maternity wards compared with 90% during Soviet times122), lack of access to reproductive and peri-natal health services, and lack of awareness about basic maternal health
120 Notes from Interagency Health Coordination Meeting. Dushanbe, August 2003.
121 Hill, K., Abou Zahr, C. and Wardlaw, T. WHO Bulletin, Volume 79, number 3, 2001
122 WB Health Sector Note, June 2004.
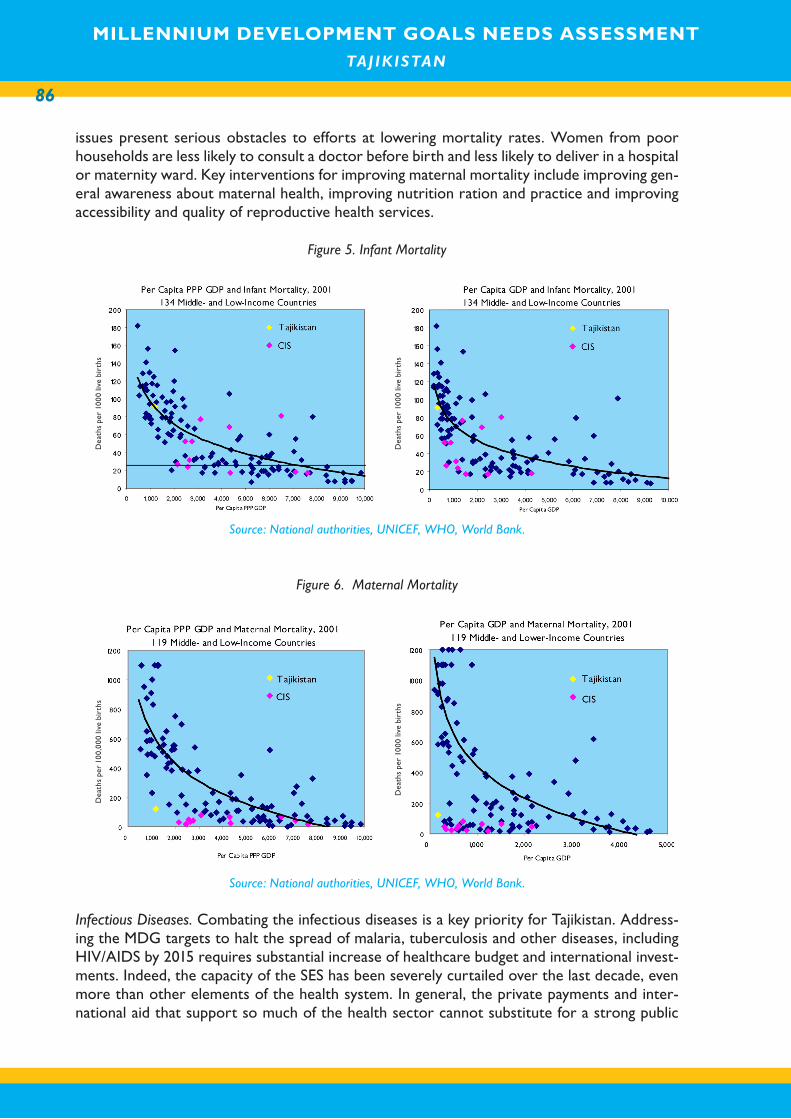
MILLENNIUM DEVELOPMENT GOALS NEEDS ASSESSMENT TAJ IK ISTAN
86
MILLENNIUM DEVELOPMENT GOALS NEEDS ASSESSMENT TAJ IK ISTAN
issues present serious obstacles to efforts at lowering mortality rates. Women from poor households are less likely to consult a doctor before birth and less likely to deliver in a hospital or maternity ward. Key interventions for improving maternal mortality include improving gen-eral awareness about maternal health, improving nutrition ration and practice and improving accessibility and quality of reproductive health services.
Figure 5. Infant Mortality
Source: National authorities, UNICEF, WHO, World Bank.
Figure 6. Maternal Mortality
Source: National authorities, UNICEF, WHO, World Bank.
Infectious Diseases. Combating the infectious diseases is a key priority for Tajikistan. Address-ing the MDG targets to halt the spread of malaria, tuberculosis and other diseases, including HIV/AIDS by 2015 requires substantial increase of healthcare budget and international invest-ments. Indeed, the capacity of the SES has been severely curtailed over the last decade, even more than other elements of the health system. In general, the private payments and inter-national aid that support so much of the health sector cannot substitute for a strong public
Dea
ths
per
1000
live
bir
ths
Dea
ths
per
1000
live
bir
ths
Dea
ths
per
100,
000
live
birt
hs
Dea
ths
per
1000
live
bir
ths

87
health service, which, like other public goods, requires Government leadership to develop and maintain. Urgent attention to improving epidemiological services, raising public awareness and strengthening preventative measures is needed to arrest the advance of diseases in Tajikistan. In the long run these investments could save the country considerable expenses.
Government MeasuresThere is broad consensus in the Government about the need to expand access to the health sys-tem and improve the standard of services in the sector. The National Poverty Reduction Strat-egy Paper and the 2002 Concept of Health Care Reform in the Republic of Tajikistan outline a vision for national health policy. The core themes of the national health strategy are:
1 Revising the state’s role in the health sector. During the Soviet era and the first decade of transition, the state held the exclusive legal responsibility for providing health ser-vices in Tajikistan. In June 2003, an amendment to the constitution abolished the state guarantee of free health care and implicitly recognized the de facto system of private payments that currently supports most health services in the country. The change in the legal framework opens the door for the introduction of new policy measures that would formally recognize and regulate private fee for service arrangements.
2 Strengthening primary care services. Strengthening the accessibility and quality of the primary health care system is as a key goal for the sector. Provision of improved community health services could have a significant impact on health outcomes in the country by making qual-ity basic health services more accessible to households. At present many residents bypass low-quality primary care institutions and appeal directly to hospitals for care.
3 Rationalising the hospital sector. Streamlining secondary and tertiary hospital care is an important complement to the development of the primary health care system. The match between resources and needs in the hospital system needs to be improved. Au-thorities have already begun reducing the high concentration of hospital beds to save money and consolidate resources. De facto financing norms continue to concentrate financing in tertiary facilities. Clarifying financing norms for the hospital system will be an important step for improving overall allocative efficiency in the sector.
4 Developing human resources. The policy emphasis on strengthening general care services underscores the need for new staffing and training norms. The distribution of staff, par-ticularly deployment to rural areas, should be improved. Redressing extremely low health sector wages123 is one of the most pressing needs in the health system. The health service has been weakened by the flight of skilled professionals to other sectors and countries. Remaining personnel have low morale and little training in modern medical practices.
5 Strengthening health care financing. Informal fee charging is a main source of funding for health institutions and probably comprises the greater part of payments to labour in the sector. Private, out of pocket expenditures on health have been estimated to absorb as much as 30 % of household expenditures.124 Authorities are developing new financing norms to better direct resources to where they are most needed. This will mean giving more weight to primary care services and abandoning norms that allocate funds to the hospital system according an inefficient “per-bed” formula.
123 Burnett and Temourov, p.34. Health sector wages in early 2002 were only TJS 11 or US$4 per month, lower than in any other sector but agriculture.
Anecdotal evidence suggests that doctors may earn between US$50 and US$150 from informal private payments each month.
124 World Bank SSER.
MILLENNIUM DEVELOPMENT GOALS NEEDS ASSESSMENT TAJ IK ISTAN
88
MILLENNIUM DEVELOPMENT GOALS NEEDS ASSESSMENT TAJ IK ISTAN
6 Improving monitoring and information systems. Raising awareness about diseases, nutri-tion, hygiene and available medical services is an important element in the strategy to improve health outcomes. Policy formulation and resource allocation is inhibited by weak data collection. Health reforms also aim to improve the dissemination of infor-mation about basic public health and hygiene.
7 Managing drug supply. Although spending on medicines is single largest expense in the
health system,125 most activity takes place in the largely unregulated private market. High levels of spending indicate that resources are available for purchasing medicines, but lack of regulation has at best encouraged ineffective use of medicines and at worst served to develop drug resistance in the population and allow improper, sometimes harmful use of pharmaceuticals to grow. Availability of vaccines is also a concern, as the population is increasingly exposed to a range of epidemics, including malaria and tuberculosis.
Goal 4: Reduce child mortalityBaseline and Target indicators. As noted in the Overview of this section, Tajikistan has the highest infant mortality rates in Central Asia. The MDG Needs Assessment Team and the Government Working Group on Health chose the baseline indicators for infant mortality rate of 89.0 per 1000 live births, based on the data from the UNICEF MICS 2000, and under five mortality rate of 118 per 1000 live births, based on the data from the UNICEF SOWC 2003. The 2015 target indicators for infant mortality are 29.6 per 1000 (preferably 25 per 1000 live births) and under 5 mortality target is 39.3 per 1000 (preferably 30 per 1000 live births)
Causes of infant mortality. In 2003, 178,134 births have occurred, which is a 4% decrease from 1998 (when 185,700 children were born). Table 37 provides main causes of neo-natal and post-neonatal mortality, based on the data from the Republican Centre of Medical Statistics and Information.
Table 37. Causes of infant mortality (2004)Causes of neonatal mortality Causes of post-neonatal mortality Premature birth/HBP 28% Diarrhea 27%Pneumonia 20% Pneumonia 19%Birth asphyxia 19% Malnutrition 17%Congenital pathology 11% Bacterimia septicemia 14%Others 9% Anemia (severe) 9%Diarrhea 6% Meningitis encephalitis 6%Birth injuries 4% Others 5%Local bacterial infection 3% Measles 3%
Key risks to child health include low quality and inaccessibility of reproductive health services, prevalent waterborne diseases, malnutrition, and the threat posed by vaccine preventable dis-eases, particularly measles. Chronic malnutrition affects almost one third of children under 5, which is caused by food insecurity and improper feeding practices. To meet the MDG target for reducing child mortality, Tajikistan must improve the nutrition status of children, improve aware-ness of basic health in households and strengthen the ability of the basic health care system to provide quality reproductive health services and vaccinations in local communities. Improving access to clean water and adequate sanitation (discussed in the chapter of meeting MDG targets for water and sanitation) is an important component in the effort to improve child health.
125 Cashin, C. “Draft Tajikistan Health Sector Note: Health Financing Report.” 2004. Estimates suggest that approximately 63 percent of all healt
spending in 2003 was for drugs and pharmaceuticals. Private payments account for roughly 80 percent of spending on medicines.
89
Challenges. The major challenges in reducing infant and children mortality in the Republic of Tajikistan are as follows:• Low quality of pre-natal, neonatal (0-6 days, and 7-27 days) and post-neonatal care (28
days -12 months);• Low practice of exclusive breast feeding and good nutrition practices for young chil-
dren; • High %age of home births unattended by skilled personnel; • Deterioration of the quality of the primary health care services: shortage of the quali-
fied medical personnel especially in rural areas; lack of basic medications especially in rural areas, lack of basic medical equipment and toolkits, poor infrastructure;
• Lack of systematic training of health care workers on new methods of pediatrics;• Low accessibility of reproductive health service in remote villages, due to the lack of
transportation and communication facilities;• Low sanitation standards in health care facilities;• Lack of standardization of primary healthcare services;• Increase of the spread of infectious diseases (typhus, measles, malaria, diphtheria);• Migration\outflow of healthcare workers due to low wages;• Low access to clean potable water and sanitation facilities;• Low financing of the primary health sector.
Goal 5: Improve maternal healthBaseline and target indicators for maternal mortality. The MDG Needs Assessment team and the Government Working Group on health determined the baseline maternal mortality indica-tor to be at 120 per 100,000 live births, based on 2003 data from the World Bank. The 2015 target maternal mortality rate is 30 per 100,000 live births.
Out of the total population, 49.8% are females, out of which 49.3% constitute women of child-bearing age and 9.4%- women above childbearing age. More than 72% of the female population resides in rural areas.126 According to Rapid Assessment of the Current Status of Reproductive Health Service in the Republic of Tajikistan, carried out by the Ministry of Health in 2000, with support of the ERB/WHO, the main causes of maternal mortality are obstetrical hemorrhage (37.3%), eclampsia (26.7%), abortion complications and extra genital diseases (12.2%), and sepsis (11.4%). Frequent deliveries- 34.8% of women had intervals of less than two years between births-cou-pled with low access to quality obstetrics care, contribute to maternal mortality.
Table 38. Women with birth intervals of less than 2 years by regions of the Republic of Tajikistan, 2001-2003 (in %ages)127
Dushanbe Khatlon Sugd RRS GBAO Total2001 23,4 44,3 35,4 35,6 39,8 38,92002 21,2 43,9 33,6 35 39,6 37,22003 17 27,5 32,2 34 36,7 34,8
According to the joint UNFPA and the GoT Project Improvement of Reproductive Health and Family Planning Services and their Accessibility (2000), every third woman of reproductive age (21-39 years) had sexually transmitted diseases in some cities and districts of Khatlon prov-ince. The same study showed that anemia, kidney illnesses and thyroid gland diseases (due to iodine deficiency) were the most prevalent chronic diseases among women.
126 The Republican Center for Medical Statistics and Information Science, the Republic of Tajikistan, 2004 .
127 NRHC of the Ministry of Health of the Republic of Tajikistan.
MILLENNIUM DEVELOPMENT GOALS NEEDS ASSESSMENT TAJ IK ISTAN
90
MILLENNIUM DEVELOPMENT GOALS NEEDS ASSESSMENT TAJ IK ISTAN
An increasing number of unattended home deliveries has become a serious threat to maternal health. The TLSS (2003) showed that about two thirds of births occurred at home, and in some regions of Tajikistan more than 80 % of deliveries occurred at home128. Home deliveries often proceed in unsafe conditions without birth attendants or unskilled personnel, with no emergency obstetrics care available for complications during birth (such womb rupture, hem-orrhage, and spasm occur). This problem is acute in Khatlon province, GBAO and RRP, where %ages of unattended births are 68.3 %, 54.8 % and 51.6 % accordingly.129
Abortion is still one of the most common and widespread methods of birth control in Tajikistan. Over the last decade, the rate of abortions has decreased by more than 2 times (com-pared to 150, 6 per 1000 live births in 1995, the rate of abortions in 2003 was 78.8 per 1000 live births). However, the rate of abortions has been increasing among adolescent girls, and now constitutes 8.63 % of the total of abortions.130 High prevalence of abortions as a birth control method implies limited access to safe contraceptive methods. Coverage of women of child bearing age by modern contraceptives has increased by two-three times during 1995-1998. However, in recent years Tajikistan experienced sharp decline in provision of contracep-tives by donors, and in 2003, only 21% of the population was covered by contraception.131
The estimates of the National Reproductive Health Centre of the Republic of Tajikistan (2003) show that 88.4% of reproductive age women who use contraceptives choose IUD, 4% use oral, injection and barrier contraceptives, and only 0.75% choose condoms. There is a tendency of increased use of contraceptives by young women of reproductive age (they constitute 23% of the total contraceptive users). Practice of using contraceptives post-partum and post-abor-tion is still low, and in some regions of the country it is not more than 16.1%. Low access to and usage of contraceptives shows the necessity of further expanding access of the population to family planning services, and the integration of reproductive health (RH) measures into the primary health care system.
Public access to information on prenatal care and family planning remains inadequate. In re-gards to prenatal care, basic services for pregnant women (such as urine and blood tests, medical examinations, etc.) are not often provided. Training of midwives and obstetricians in modern methods of pre- and post- natal care, and increasing access of pregnant women to emergency obstetrics services are important for decreasing maternal mortality. Provision of rural health houses and centres with the necessary medical equipment and drugs is also important for improving health care for mothers. As mentioned above, increasing access to modern RH practices (including access to a variety of contraceptives) and improving public awareness on family planning is crucial for women’s health. Also, social and economic context largely determine maternal and child health, and thus, a holistic approach targeting the well-being of mothers and children is important for achieving the MDG targets.
Challenges. The main challenges in providing adequate medical health care for mothers are:• Low quality of pre- and post-natal care;• Shortage of qualified emergency obstetrics professionals, and primary healthcare
workers especially in rural areas;
128 The Republican Center for Medical Statistics and Information Science, the Republic of Tajikistan, 2004 . NRHC of the Ministry of Health of the Re
public of Tajikistan
129 National Medical Statistics and Information Science Center of the Republic of Tajikistan 2004, NRHC of the Ministry of Health of the Republic of Tajikistan.
130 National Medical Statistics and Information Science Center of the Republic of Tajikistan 2004, NRHC of the Ministry of Health of the Republic of Tajikistan.
131 NRHC of the Ministry of Health of the Republic of Tajikistan.

91
• Inadequate training in modern birth methods for midwives and obstetricians; • Low access of the population to family planning services, especially in rural areas;• Deterioration of infrastructure of medical facilities;• Inobservance of sanitary norms in health care facilities;• A growing tendency among the poor population to postpone, or to stop medial treat-
ment due to prohibitive costs (informal charges) of even basic medical services.
Government measures on maternal and child health careOver the last decade, the Government has prioritized maternal and child health protection. Poverty Reduction Strategy Paper (PRSP) of 2002, and Concept on State Demographic Policy for 2003-2015 are main strategic documents that address issues of maternal and child health care in the country. Concept of healthcare reform of the Republic of Tajikistan approved by the Gov-ernment of Republic of Tajikistan in 2002 addresses policies and reforms that target maternal and child health. National strategic plan on reproductive health by 2014 approved in August 2004 by the Government Resolution №348 outlines the country’s demographic and Reproductive Health (RH) policies, and stresses the importance of increasing public awareness on family planning and access to safe, effective, and acceptable contraceptive methods. This plan also outlines measures that will help prevent the spread of STDs. Programme on Healthy Family is being implemented by the Governmentm with support of USAID for 2002-2007 periods. Other progammes on improving maternal and child health are being implemented together with UNFPA and UNICEF for 2005-2009. Sectoral programme on Safe Maternity was devel-oped by the Ministry of Health from 2000, covering through 2010. Prevention of Iron Deficiency and Anemia in Tajikistan through by 2010, and a project on Sustainable Food Fortification funded by the Japanese Poverty Reduction Fund # 9052 are also being developed.
Since June 2004, the Guaranteed Benefit Package and Paid Services programmes were approved by the Government Decree (No 279). A key objective of this programme is “to improve ac-cess to essential services, notably at the level of primary care, for vulnerable groups.132” This programme is being implemented in Varzob and Dangra rayons since July and August 2004 respectively. The Guaranteed Benefit Package includes free services for:• Primary health care consultations with a family doctor;• Free medicines (up to a maximum of 20 Somoni, or US$7) to vulnerable groups;• Diagnostic tests at PHC level;• Free health care, including immunization and hospital care to children under 5;• Free prenatal care for pregnant women and free hospital care for childbirth;• Consultations on HIV/AIDs and STDs.
The 2005 draft of this programme defines paid services and co-payments, and some of the services listed as free of charge appear to be liable for payments (for example, hospital stay for children under 5). According to this draft, the bulk of private payments is for hospitaliza-tion , and patients are to pay 80% of charges. The tariffs for services are now being defined by the Ministry of Health, but as it stands now, the co-payment procedures are overly complex and not standardized. For example, many of the tariffs are to be developed locally. While such measures could be a short-term response to improving financing for the health care, in the long run the country should develop a basic insurance scheme, paying particular attention to provide free health care for pregnant women, women undergoing delivery and children.
132 Project Sino, Technical Note 1: Implementing the Guaranteed Benefits Package: preliminary baseline survey findings on patient expenditures.
MILLENNIUM DEVELOPMENT GOALS NEEDS ASSESSMENT TAJ IK ISTAN
92
MILLENNIUM DEVELOPMENT GOALS NEEDS ASSESSMENT TAJ IK ISTAN
Recommendations for improving maternal health care and RH133
1. Decrease the number of unwanted and mistimed pregnancies. Increasing access to methods to control fertility can have a significant impact on the
number of maternal deaths, by reducing the number of times that a woman runs the risk that a fatal obstetric complication will occur. It has been estimated that if unmet need for contraception were filled and women had only the number of pregnancies at the intervals they wanted, maternal mortality would drop 20–35 %.
2. Reduce the maternal mortality ratio by ensuring access to emergency obstetric care. There is clear consensus internationally that scarce resources should not be spent try-
ing to predict which women will have life-threatening complications, as the vast major-ity of deaths occur in women with no known risk factors. Risk screening programmes, through antenatal care, have had little impact on overall maternal mortality levels. Instead, maternal mortality reduction programs should be based on the principle that every pregnant woman is at risk for life-threatening complications.
To reduce the maternal mortality ratio dramatically, all women must have access to high qual-ity delivery care. That care has three key elements:1. Access to emergency obstetric care 2. A skilled attendant at each delivery; and 3. A functional referral system.
Access to emergency obstetric care (EmOC). It is estimated that even under the very best cir-cumstances, 15% of pregnant women will experience potentially fatal complications and with access to emergency obstetric care virtually all of these complications can be treated. When emergency obstetric care is available and utilized, maternal mortality ratios are extremely low. In addition timely EmOC while a woman has complications can affect neonatal outcomes. Emergency obstetric care is generally categorized as either basic or comprehensive care, depending on the functions the facility performs. UN guidelines recommend a minimum of one comprehensive emergency obstetric care facility and four basic emergency obstetric care facilities per 500,000 population. While this is the minimum recommendation per population, consideration should also be given to the geographical distribution and therefore access to EmOC services within the country. Basic EmOC can be provided at a well functioning health centre staffed by skilled birth attendants, but comprehensive EmOC requires a well function-ing hospital at the district level capable of performing surgery and blood transfusions.
Box 1. Emergency Obstetric Care Services
Basic emergency obstetric care services Comprehensive emergency obstetric care services
• Administer parenteral antibiotics• Administer parenteral oxytocic drugs• Administer parenteral anticonvulsants for pre-ec-
lampsia and eclampsia• Perform manual removal of retained products (for
example, manual vacuum aspiration)• Perform assisted vaginal delivery
All services included in basic emergency obstetric care plus:• Perform surgery (cesarean section)• Perform blood transfusion
To track progress towards ensuring EmOC the UN have developed a set of 6 process indicators:
133 Recommendations from MP, as a result of the video-conference between the Ministry of Health of Tajikistan and health specialists of MP.
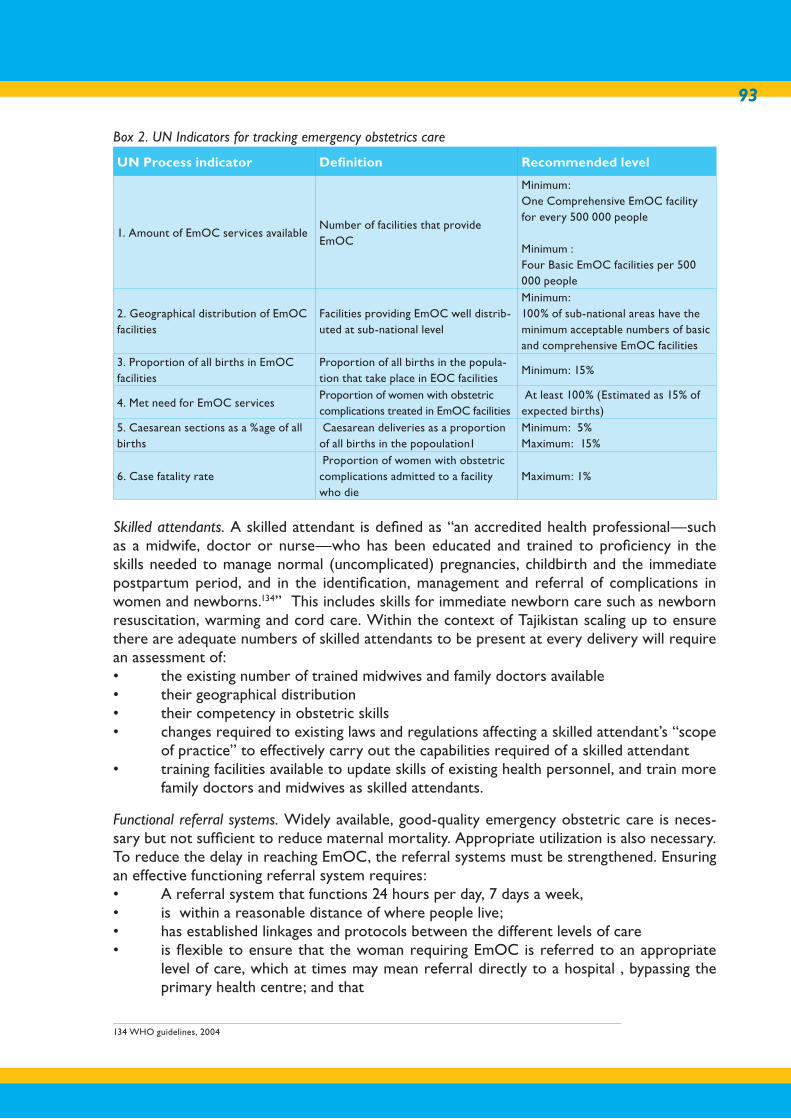
93
Box 2. UN Indicators for tracking emergency obstetrics care
UN Process indicator Definition Recommended level
1. Amount of EmOC services availableNumber of facilities that provide EmOC
Minimum: One Comprehensive EmOC facility for every 500 000 people
Minimum : Four Basic EmOC facilities per 500 000 people
2. Geographical distribution of EmOC facilities
Facilities providing EmOC well distrib-uted at sub-national level
Minimum: 100% of sub-national areas have the minimum acceptable numbers of basic and comprehensive EmOC facilities
3. Proportion of all births in EmOC facilities
Proportion of all births in the popula-tion that take place in EOC facilities
Minimum: 15%
4. Met need for EmOC servicesProportion of women with obstetric complications treated in EmOC facilities
At least 100% (Estimated as 15% of expected births)
5. Caesarean sections as a %age of all births
Caesarean deliveries as a proportion of all births in the popoulation1
Minimum: 5%Maximum: 15%
6. Case fatality rate Proportion of women with obstetric complications admitted to a facility who die
Maximum: 1%
Skilled attendants. A skilled attendant is defined as “an accredited health professional—such as a midwife, doctor or nurse—who has been educated and trained to proficiency in the skills needed to manage normal (uncomplicated) pregnancies, childbirth and the immediate postpartum period, and in the identification, management and referral of complications in women and newborns.134” This includes skills for immediate newborn care such as newborn resuscitation, warming and cord care. Within the context of Tajikistan scaling up to ensure there are adequate numbers of skilled attendants to be present at every delivery will require an assessment of:• the existing number of trained midwives and family doctors available • their geographical distribution• their competency in obstetric skills • changes required to existing laws and regulations affecting a skilled attendant’s “scope
of practice” to effectively carry out the capabilities required of a skilled attendant • training facilities available to update skills of existing health personnel, and train more
family doctors and midwives as skilled attendants.
Functional referral systems. Widely available, good-quality emergency obstetric care is neces-sary but not sufficient to reduce maternal mortality. Appropriate utilization is also necessary. To reduce the delay in reaching EmOC, the referral systems must be strengthened. Ensuring an effective functioning referral system requires:• A referral system that functions 24 hours per day, 7 days a week, • is within a reasonable distance of where people live; • has established linkages and protocols between the different levels of care• is flexible to ensure that the woman requiring EmOC is referred to an appropriate
level of care, which at times may mean referral directly to a hospital , bypassing the primary health centre; and that
134 WHO guidelines, 2004
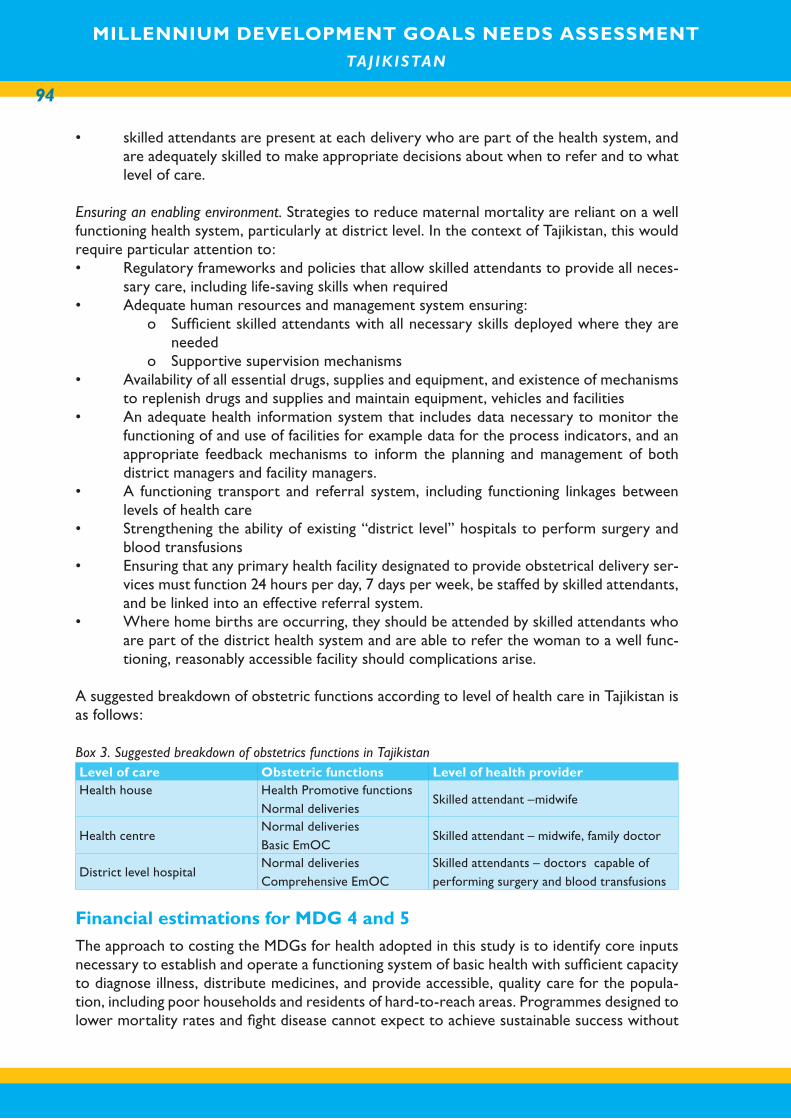
MILLENNIUM DEVELOPMENT GOALS NEEDS ASSESSMENT TAJ IK ISTAN
94
MILLENNIUM DEVELOPMENT GOALS NEEDS ASSESSMENT TAJ IK ISTAN
• skilled attendants are present at each delivery who are part of the health system, and are adequately skilled to make appropriate decisions about when to refer and to what level of care.
Ensuring an enabling environment. Strategies to reduce maternal mortality are reliant on a well functioning health system, particularly at district level. In the context of Tajikistan, this would require particular attention to: • Regulatory frameworks and policies that allow skilled attendants to provide all neces-
sary care, including life-saving skills when required• Adequate human resources and management system ensuring:
o Sufficient skilled attendants with all necessary skills deployed where they are needed
o Supportive supervision mechanisms• Availability of all essential drugs, supplies and equipment, and existence of mechanisms
to replenish drugs and supplies and maintain equipment, vehicles and facilities• An adequate health information system that includes data necessary to monitor the
functioning of and use of facilities for example data for the process indicators, and an appropriate feedback mechanisms to inform the planning and management of both district managers and facility managers.
• A functioning transport and referral system, including functioning linkages between levels of health care
• Strengthening the ability of existing “district level” hospitals to perform surgery and blood transfusions
• Ensuring that any primary health facility designated to provide obstetrical delivery ser-vices must function 24 hours per day, 7 days per week, be staffed by skilled attendants, and be linked into an effective referral system.
• Where home births are occurring, they should be attended by skilled attendants who are part of the district health system and are able to refer the woman to a well func-tioning, reasonably accessible facility should complications arise.
A suggested breakdown of obstetric functions according to level of health care in Tajikistan is as follows:
Box 3. Suggested breakdown of obstetrics functions in TajikistanLevel of care Obstetric functions Level of health providerHealth house Health Promotive functions
Normal deliveriesSkilled attendant –midwife
Health centre Normal deliveriesBasic EmOC
Skilled attendant – midwife, family doctor
District level hospitalNormal deliveriesComprehensive EmOC
Skilled attendants – doctors capable of performing surgery and blood transfusions
Financial estimations for MDG 4 and 5The approach to costing the MDGs for health adopted in this study is to identify core inputs necessary to establish and operate a functioning system of basic health with sufficient capacity to diagnose illness, distribute medicines, and provide accessible, quality care for the popula-tion, including poor households and residents of hard-to-reach areas. Programmes designed to lower mortality rates and fight disease cannot expect to achieve sustainable success without
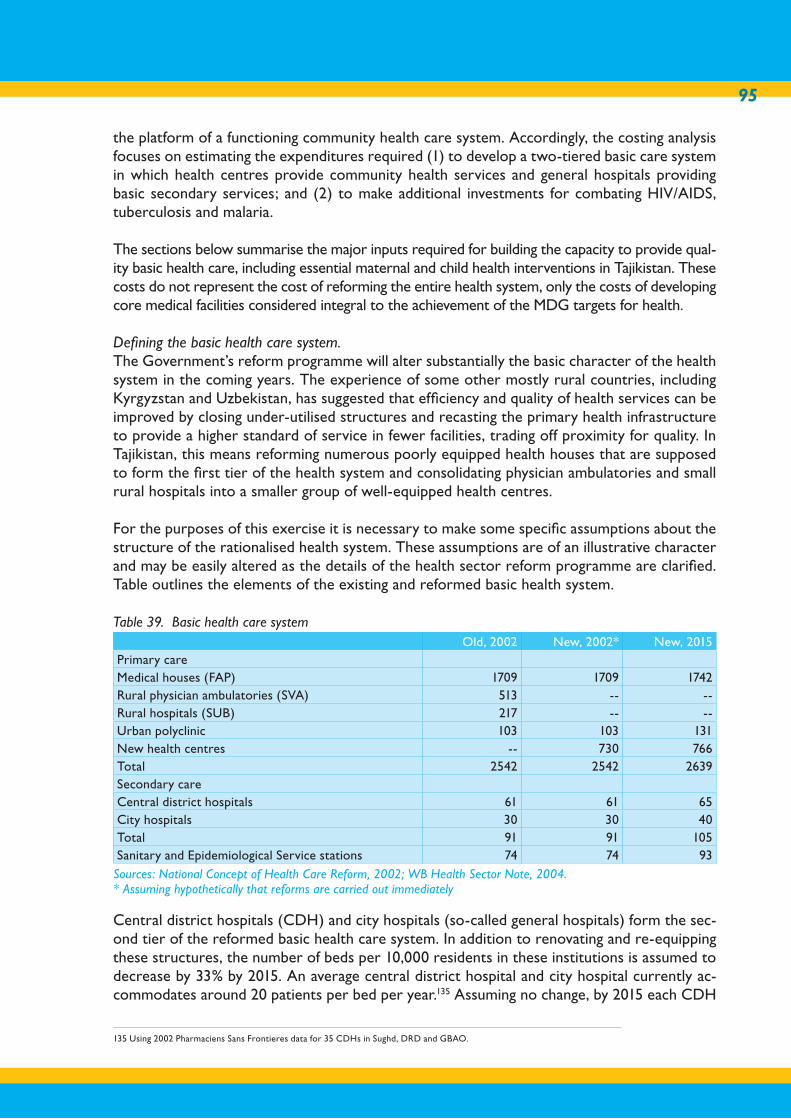
95
the platform of a functioning community health care system. Accordingly, the costing analysis focuses on estimating the expenditures required (1) to develop a two-tiered basic care system in which health centres provide community health services and general hospitals providing basic secondary services; and (2) to make additional investments for combating HIV/AIDS, tuberculosis and malaria.
The sections below summarise the major inputs required for building the capacity to provide qual-ity basic health care, including essential maternal and child health interventions in Tajikistan. These costs do not represent the cost of reforming the entire health system, only the costs of developing core medical facilities considered integral to the achievement of the MDG targets for health.
Defining the basic health care system.The Government’s reform programme will alter substantially the basic character of the health system in the coming years. The experience of some other mostly rural countries, including Kyrgyzstan and Uzbekistan, has suggested that efficiency and quality of health services can be improved by closing under-utilised structures and recasting the primary health infrastructure to provide a higher standard of service in fewer facilities, trading off proximity for quality. In Tajikistan, this means reforming numerous poorly equipped health houses that are supposed to form the first tier of the health system and consolidating physician ambulatories and small rural hospitals into a smaller group of well-equipped health centres.
For the purposes of this exercise it is necessary to make some specific assumptions about the structure of the rationalised health system. These assumptions are of an illustrative character and may be easily altered as the details of the health sector reform programme are clarified. Table outlines the elements of the existing and reformed basic health system.
Table 39. Basic health care systemOld, 2002 New, 2002* New, 2015
Primary careMedical houses (FAP) 1709 1709 1742Rural physician ambulatories (SVA) 513 -- --Rural hospitals (SUB) 217 -- --Urban polyclinic 103 103 131New health centres -- 730 766Total 2542 2542 2639Secondary careCentral district hospitals 61 61 65City hospitals 30 30 40Total 91 91 105Sanitary and Epidemiological Service stations 74 74 93
Sources: National Concept of Health Care Reform, 2002; WB Health Sector Note, 2004.* Assuming hypothetically that reforms are carried out immediately
Central district hospitals (CDH) and city hospitals (so-called general hospitals) form the sec-ond tier of the reformed basic health care system. In addition to renovating and re-equipping these structures, the number of beds per 10,000 residents in these institutions is assumed to decrease by 33% by 2015. An average central district hospital and city hospital currently ac-commodates around 20 patients per bed per year.135 Assuming no change, by 2015 each CDH
135 Using 2002 Pharmaciens Sans Frontieres data for 35 CDHs in Sughd, DRD and GBAO.
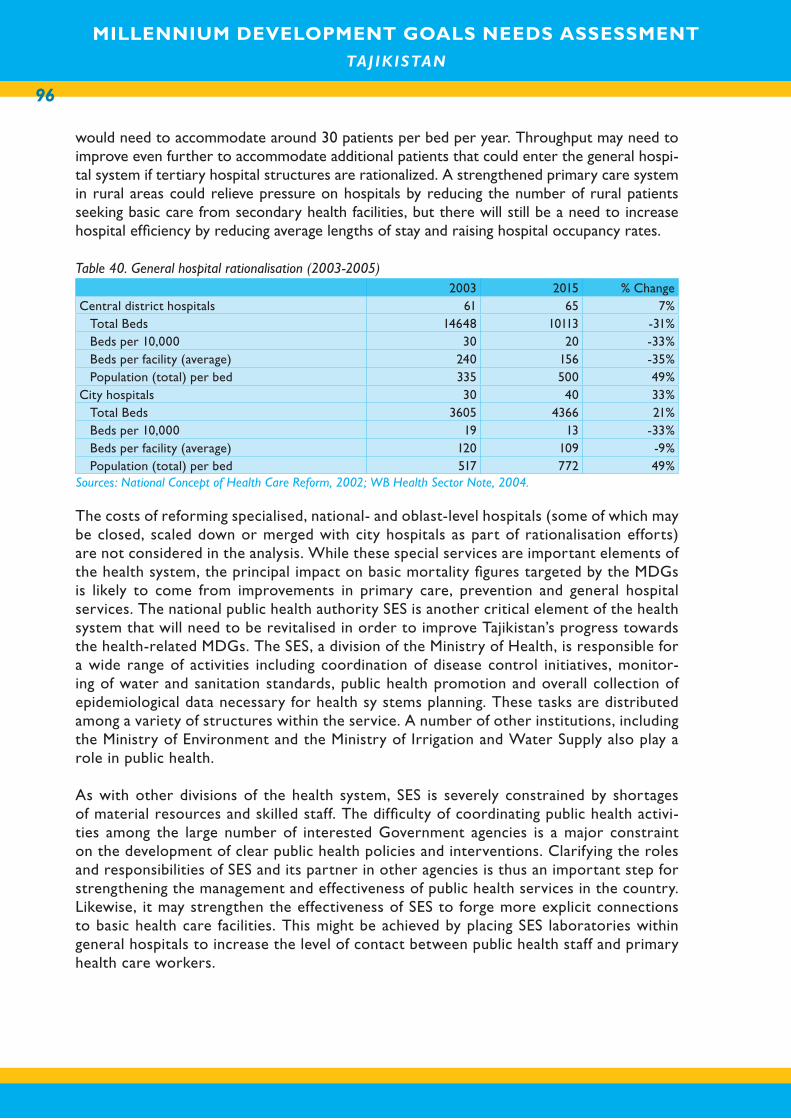
MILLENNIUM DEVELOPMENT GOALS NEEDS ASSESSMENT TAJ IK ISTAN
96
MILLENNIUM DEVELOPMENT GOALS NEEDS ASSESSMENT TAJ IK ISTAN
would need to accommodate around 30 patients per bed per year. Throughput may need to improve even further to accommodate additional patients that could enter the general hospi-tal system if tertiary hospital structures are rationalized. A strengthened primary care system in rural areas could relieve pressure on hospitals by reducing the number of rural patients seeking basic care from secondary health facilities, but there will still be a need to increase hospital efficiency by reducing average lengths of stay and raising hospital occupancy rates.
Table 40. General hospital rationalisation (2003-2005)2003 2015 % Change
Central district hospitals 61 65 7%Total Beds 14648 10113 -31%Beds per 10,000 30 20 -33%Beds per facility (average) 240 156 -35%Population (total) per bed 335 500 49%
City hospitals 30 40 33%Total Beds 3605 4366 21%Beds per 10,000 19 13 -33%Beds per facility (average) 120 109 -9%Population (total) per bed 517 772 49%
Sources: National Concept of Health Care Reform, 2002; WB Health Sector Note, 2004.
The costs of reforming specialised, national- and oblast-level hospitals (some of which may be closed, scaled down or merged with city hospitals as part of rationalisation efforts) are not considered in the analysis. While these special services are important elements of the health system, the principal impact on basic mortality figures targeted by the MDGs is likely to come from improvements in primary care, prevention and general hospital services. The national public health authority SES is another critical element of the health system that will need to be revitalised in order to improve Tajikistan’s progress towards the health-related MDGs. The SES, a division of the Ministry of Health, is responsible for a wide range of activities including coordination of disease control initiatives, monitor-ing of water and sanitation standards, public health promotion and overall collection of epidemiological data necessary for health sy stems planning. These tasks are distributed among a variety of structures within the service. A number of other institutions, including the Ministry of Environment and the Ministry of Irrigation and Water Supply also play a role in public health.
As with other divisions of the health system, SES is severely constrained by shortages of material resources and skilled staff. The difficulty of coordinating public health activi-ties among the large number of interested Government agencies is a major constraint on the development of clear public health policies and interventions. Clarifying the roles and responsibilities of SES and its partner in other agencies is thus an important step for strengthening the management and effectiveness of public health services in the country. Likewise, it may strengthen the effectiveness of SES to forge more explicit connections to basic health care facilities. This might be achieved by placing SES laboratories within general hospitals to increase the level of contact between public health staff and primary health care workers.
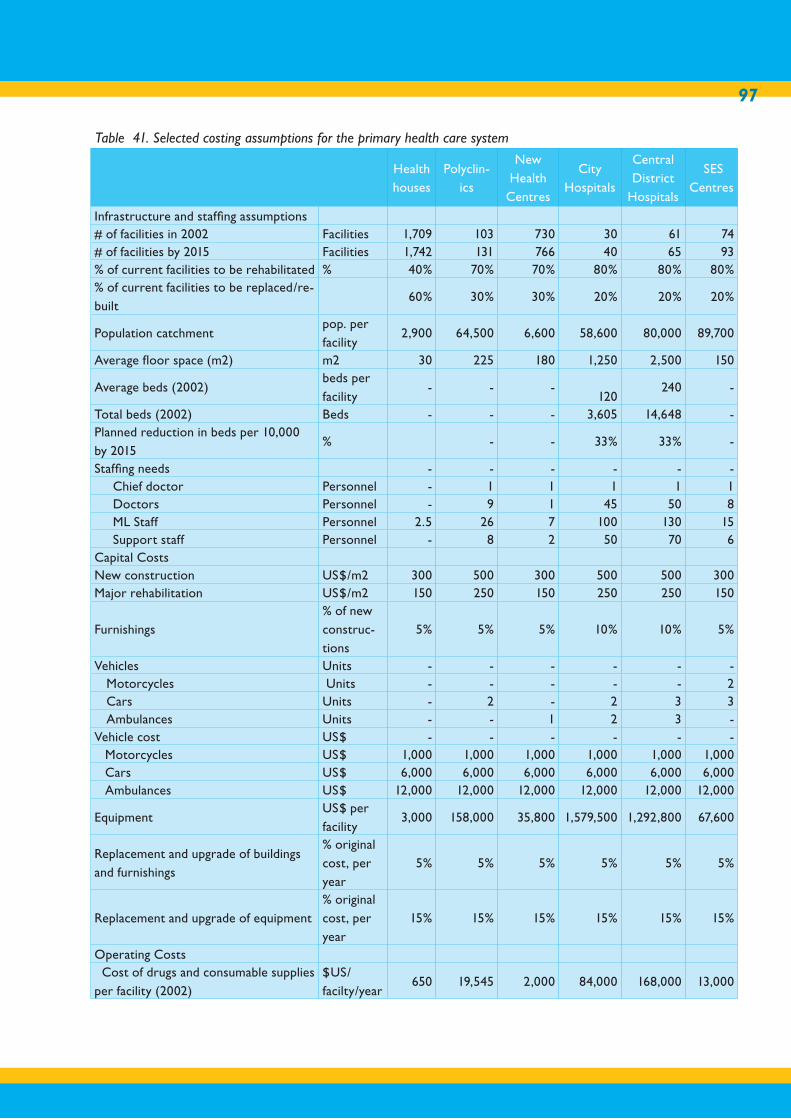
97
Table 41. Selected costing assumptions for the primary health care system
Health houses
Polyclin-ics
NewHealth
Centres
CityHospitals
CentralDistrict
Hospitals
SES Centres
Infrastructure and staffing assumptions # of facilities in 2002 Facilities 1,709 103 730 30 61 74 # of facilities by 2015 Facilities 1,742 131 766 40 65 93 % of current facilities to be rehabilitated % 40% 70% 70% 80% 80% 80%% of current facilities to be replaced/re-built
60% 30% 30% 20% 20% 20%
Population catchmentpop. per facility
2,900 64,500 6,600 58,600 80,000 89,700
Average floor space (m2) m2 30 225 180 1,250 2,500 150
Average beds (2002)beds per facility
- - -
120 240 -
Total beds (2002) Beds - - - 3,605 14,648 - Planned reduction in beds per 10,000 by 2015
% - - 33% 33% -
Staffing needs - - - - - - Chief doctor Personnel - 1 1 1 1 1 Doctors Personnel - 9 1 45 50 8 ML Staff Personnel 2.5 26 7 100 130 15 Support staff Personnel - 8 2 50 70 6 Capital Costs New construction US$/m2 300 500 300 500 500 300 Major rehabilitation US$/m2 150 250 150 250 250 150
Furnishings% of new construc-tions
5% 5% 5% 10% 10% 5%
Vehicles Units - - - - - - Motorcycles Units - - - - - 2 Cars Units - 2 - 2 3 3 Ambulances Units - - 1 2 3 -
Vehicle cost US$ - - - - - - Motorcycles US$ 1,000 1,000 1,000 1,000 1,000 1,000 Cars US$ 6,000 6,000 6,000 6,000 6,000 6,000 Ambulances US$ 12,000 12,000 12,000 12,000 12,000 12,000
EquipmentUS$ per facility
3,000 158,000 35,800 1,579,500 1,292,800 67,600
Replacement and upgrade of buildings and furnishings
% original cost, per year
5% 5% 5% 5% 5% 5%
Replacement and upgrade of equipment% original cost, per year
15% 15% 15% 15% 15% 15%
Operating Costs Cost of drugs and consumable supplies per facility (2002)
$US/facilty/year
650 19,545 2,000 84,000 168,000 13,000
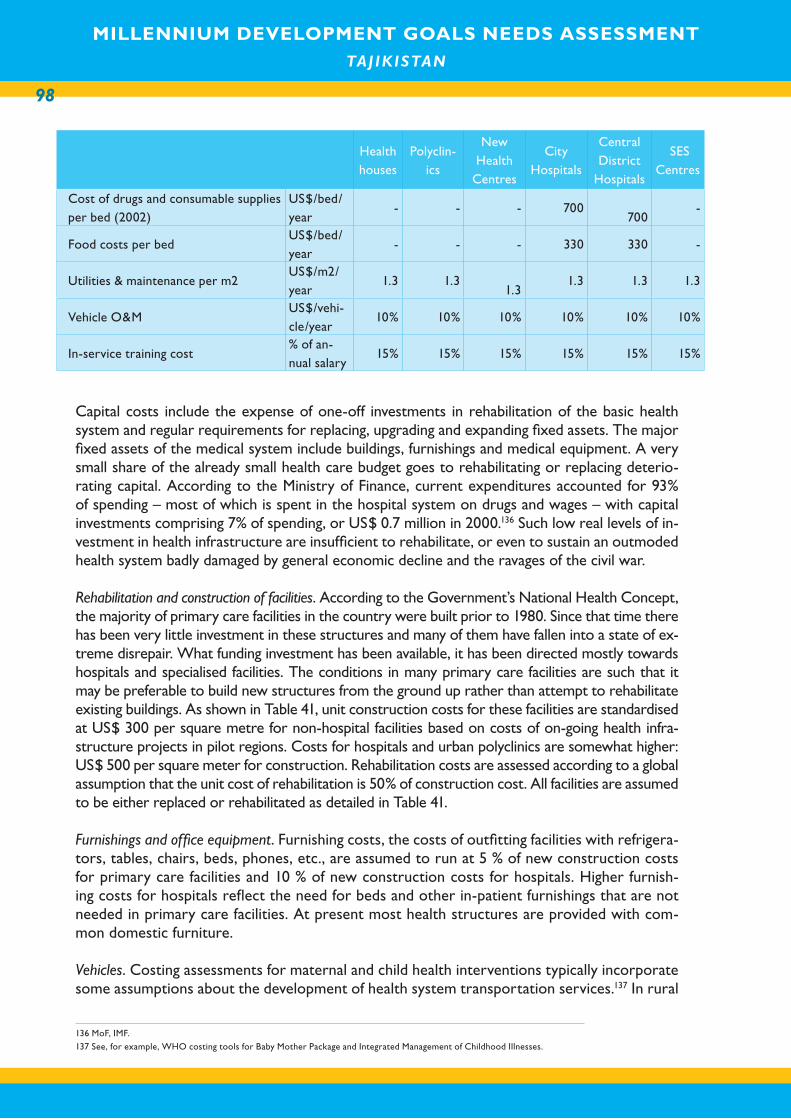
MILLENNIUM DEVELOPMENT GOALS NEEDS ASSESSMENT TAJ IK ISTAN
98
MILLENNIUM DEVELOPMENT GOALS NEEDS ASSESSMENT TAJ IK ISTAN
Health houses
Polyclin-ics
NewHealth
Centres
CityHospitals
CentralDistrict
Hospitals
SES Centres
Cost of drugs and consumable supplies per bed (2002)
US$/bed/year
- - - 700
700 -
Food costs per bedUS$/bed/year
- - - 330 330 -
Utilities & maintenance per m2US$/m2/year
1.3 1.3
1.3 1.3 1.3 1.3
Vehicle O&MUS$/vehi-cle/year
10% 10% 10% 10% 10% 10%
In-service training cost% of an-nual salary
15% 15% 15% 15% 15% 15%
Capital costs include the expense of one-off investments in rehabilitation of the basic health system and regular requirements for replacing, upgrading and expanding fixed assets. The major fixed assets of the medical system include buildings, furnishings and medical equipment. A very small share of the already small health care budget goes to rehabilitating or replacing deterio-rating capital. According to the Ministry of Finance, current expenditures accounted for 93% of spending – most of which is spent in the hospital system on drugs and wages – with capital investments comprising 7% of spending, or US$ 0.7 million in 2000.136 Such low real levels of in-vestment in health infrastructure are insufficient to rehabilitate, or even to sustain an outmoded health system badly damaged by general economic decline and the ravages of the civil war.
Rehabilitation and construction of facilities. According to the Government’s National Health Concept, the majority of primary care facilities in the country were built prior to 1980. Since that time there has been very little investment in these structures and many of them have fallen into a state of ex-treme disrepair. What funding investment has been available, it has been directed mostly towards hospitals and specialised facilities. The conditions in many primary care facilities are such that it may be preferable to build new structures from the ground up rather than attempt to rehabilitate existing buildings. As shown in Table 41, unit construction costs for these facilities are standardised at US$ 300 per square metre for non-hospital facilities based on costs of on-going health infra-structure projects in pilot regions. Costs for hospitals and urban polyclinics are somewhat higher: US$ 500 per square meter for construction. Rehabilitation costs are assessed according to a global assumption that the unit cost of rehabilitation is 50% of construction cost. All facilities are assumed to be either replaced or rehabilitated as detailed in Table 41. Furnishings and office equipment. Furnishing costs, the costs of outfitting facilities with refrigera-tors, tables, chairs, beds, phones, etc., are assumed to run at 5 % of new construction costs for primary care facilities and 10 % of new construction costs for hospitals. Higher furnish-ing costs for hospitals reflect the need for beds and other in-patient furnishings that are not needed in primary care facilities. At present most health structures are provided with com-mon domestic furniture.
Vehicles. Costing assessments for maternal and child health interventions typically incorporate some assumptions about the development of health system transportation services.137 In rural
136 MoF, IMF.
137 See, for example, WHO costing tools for Baby Mother Package and Integrated Management of Childhood Illnesses.
99
areas, medical facilities need access to a vehicle to facilitate, at a minimum, the transport of medicines, test samples for analysis and essential supplies. It is not necessary that every facility should have an ambulance; four-wheel drive vehicles, regular cars or even motorbikes could help provide some of these services. Since improving access to emergency obstetrics care is crucial for saving mothers’ lives, the needs assessment assumes in the costing that each rural health centre should one full ambulance vehicle, each city hospital – two full ambulances and each district hospital – three full ambulances.
Medical equipment. Providing medical facilities with sufficient medical equipment is a critical ele-ment of health system revitalization. There is a severe shortage of medical equipment in primary and secondary facilities alike. Needs are not limited to the equipment itself but also include spare parts and training in usage protocols. Without spare parts and training, equipment provided is less likely to be of lasting benefit to the health system. The cost of spare parts, replacement and upkeep of medical equipment is accounted for by allowing for additional annual capital expendi-ture on replacement and upgrade equal to 15 % of purchase costs. A detailed list of equipment packages for various facilities has been developed for use in the costing model.
Replacement and upgrade of fixed assets. For illustrative purposes it is assumed that all struc-tures will need 5 % of the cost of their construction each year on replacing and upgrading fixed investments in buildings, office equipment and furnishings. Since medical equipment de-preciates at a faster rate, due in part to active use and high standards for safety, the analysis budgets for annual expenditures on maintenance of medical equipment equivalent to 15 % of the original purchasing price.
Recurrent costsRecurrent operating costs comprise around 93% of total health care spending in Tajikistan. Payments to labour – salaries and other compensation, such as pension benefits – made up 33% of total costs in 2000. Food costs were 19%, purchases of medicines and basic medical supplies were 13%, and regular maintenance and repair costs accounted for 12% of formal expenditures. Other operating costs accounted for the remaining quarter of spending.138 In-formal payments are reported to pay for roughly 80% of medicines distributed in health facili-ties139 and constitute the greater part of payments to health personnel.
Staffing costs. Given that wages comprise a large share of operating costs, assumptions about staffing and compensation will bear heavily on cost calculations. With 13,500 physicians and 32,200 mid-level medical personnel in 2000 (21.6 doctors per 10,000 residents),140 Tajikistan has the lowest doctor-population ratio in Central Asia. The Government hopes to redress the understaffing problem, but attracting and retaining skilled staff into the health sector is difficult as long as wage levels remain so low, the rules governing fee charging are ill defined, and health facilities are so poorly equipped. Although a comprehensive analysis of health sys-tem staffing requirements is beyond the scope of this study, the staff required to operate the health structures outlined in the basic health care system may be assessed by identifying gen-eral norms for core facilities considered by the analysis (see Table 42.). Staffing requirements for Health Centres are taken from the primary health care reform pilot project in Dangara and Varzob Rayons. Personnel needs in Central District and City Hospitals are calculated on
138 MoF.
139 SINO Project “Drug Availability and Management in Pilot Rayon” July 2003.
140 Amde, Yisgedullish and Moukin Temourov, “Tajikistan Social Sector Expenditure Review” World Bank.
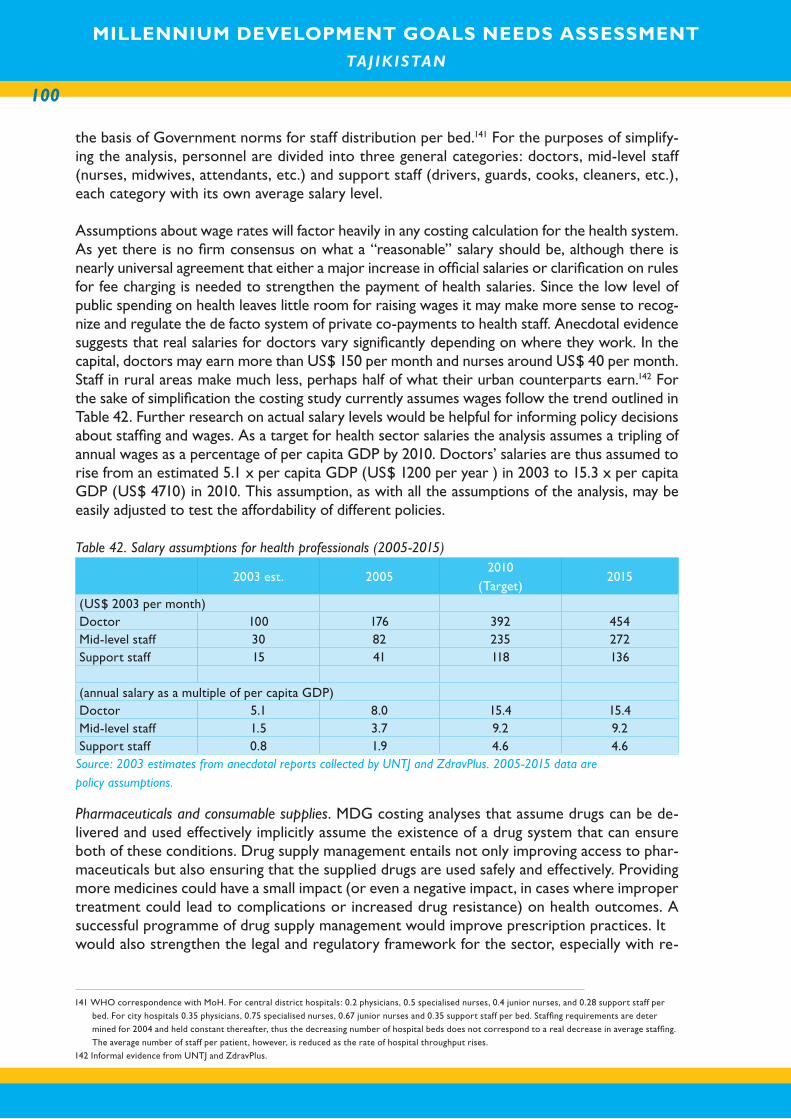
MILLENNIUM DEVELOPMENT GOALS NEEDS ASSESSMENT TAJ IK ISTAN
100
MILLENNIUM DEVELOPMENT GOALS NEEDS ASSESSMENT TAJ IK ISTAN
the basis of Government norms for staff distribution per bed.141 For the purposes of simplify-ing the analysis, personnel are divided into three general categories: doctors, mid-level staff (nurses, midwives, attendants, etc.) and support staff (drivers, guards, cooks, cleaners, etc.), each category with its own average salary level.
Assumptions about wage rates will factor heavily in any costing calculation for the health system. As yet there is no firm consensus on what a “reasonable” salary should be, although there is nearly universal agreement that either a major increase in official salaries or clarification on rules for fee charging is needed to strengthen the payment of health salaries. Since the low level of public spending on health leaves little room for raising wages it may make more sense to recog-nize and regulate the de facto system of private co-payments to health staff. Anecdotal evidence suggests that real salaries for doctors vary significantly depending on where they work. In the capital, doctors may earn more than US$ 150 per month and nurses around US$ 40 per month. Staff in rural areas make much less, perhaps half of what their urban counterparts earn.142 For the sake of simplification the costing study currently assumes wages follow the trend outlined in Table 42. Further research on actual salary levels would be helpful for informing policy decisions about staffing and wages. As a target for health sector salaries the analysis assumes a tripling of annual wages as a percentage of per capita GDP by 2010. Doctors’ salaries are thus assumed to rise from an estimated 5.1 x per capita GDP (US$ 1200 per year ) in 2003 to 15.3 x per capita GDP (US$ 4710) in 2010. This assumption, as with all the assumptions of the analysis, may be easily adjusted to test the affordability of different policies.
Table 42. Salary assumptions for health professionals (2005-2015)
2003 est. 20052010
(Target)2015
(US$ 2003 per month)Doctor 100 176 392 454Mid-level staff 30 82 235 272Support staff 15 41 118 136
(annual salary as a multiple of per capita GDP)Doctor 5.1 8.0 15.4 15.4Mid-level staff 1.5 3.7 9.2 9.2Support staff 0.8 1.9 4.6 4.6
Source: 2003 estimates from anecdotal reports collected by UNTJ and ZdravPlus. 2005-2015 data are policy assumptions.
Pharmaceuticals and consumable supplies. MDG costing analyses that assume drugs can be de-livered and used effectively implicitly assume the existence of a drug system that can ensure both of these conditions. Drug supply management entails not only improving access to phar-maceuticals but also ensuring that the supplied drugs are used safely and effectively. Providing more medicines could have a small impact (or even a negative impact, in cases where improper treatment could lead to complications or increased drug resistance) on health outcomes. A successful programme of drug supply management would improve prescription practices. It would also strengthen the legal and regulatory framework for the sector, especially with re-
141 WHO correspondence with MoH. For central district hospitals: 0.2 physicians, 0.5 specialised nurses, 0.4 junior nurses, and 0.28 support staff per
bed. For city hospitals 0.35 physicians, 0.75 specialised nurses, 0.67 junior nurses and 0.35 support staff per bed. Staffing requirements are deter
mined for 2004 and held constant thereafter, thus the decreasing number of hospital beds does not correspond to a real decrease in average staffing.
The average number of staff per patient, however, is reduced as the rate of hospital throughput rises.
142 Informal evidence from UNTJ and ZdravPlus.
101
spect to quality control, monitoring of private providers, and development of information sys-tems to strengthen prescription guidelines. To implement many of these measures will require some financial investment. A potentially more important investment will be the political will to overcome vested interests that could resist reforms to the present system. Cost estimates of reforming the drug supply management system are not included in this study.
If drug supply management cannot be strengthened, the already low likelihood that Tajikistan will meet MDG targets for health will be further reduced. Spending on drugs, vaccines and other consumable medical supplies (including bandages, syringes, gloves, record-keeping materials etc.) accounts for a large share of health spending in developing countries. While industrial countries typically spend between 10-15% of their health budgets on pharmaceuticals, developing countries may spend anywhere from one third to two thirds of their health budgets on medicines.143 Drug supply needs are best quantified by matching epidemiological data with treatment guidelines. In Tajikistan this information is not available or largely unreliable. As a second-best approach, rough estimates of needs can be made based on records of actual usage in different facilities. Using this method, international organisations engaged in drug supply operations estimate that current provision meets only 50 to 60% of needs.144 Reports from Pharmaciens Sans Frontieres, the International Federation of the Red Cross/Red Crescent and other groups providing health facilities with basic consumable supplies indicate that the great majority of patient needs (as high as 90% in some areas145) for medicines are met by private payments. This anecdotal evidence is support by WB estimates showing that out-of-pocket expenditures account for over 80% of national spending on drugs.146
The specific costs used to estimate minimum in-patient drug supply needs for the basic health care system are based on assessments from humanitarian aid agencies keeping records of sup-ply usage in different types of facilities around the country. It is noted that the supply opera-tions cited cover only around 25 % of hospitals and urban polyclinics and an even smaller %age of rural primary care facilities. It is also noted that prices may vary considerably over time and may differ considerably across supply sources. For these reasons the costs estimates provided here can give no better than a general idea of potential costs.
The overall cost of providing medicines should include an assessment of outpatient consump-tion. An international rule of thumb for developing countries suggests that expenditures of around US$ 13.50 per capita are required to ensure minimum necessary consumable sup-plies.147 Current spending from all sources on pharmaceuticals is approximately US$ 7. As noted above, merely increasing expenditures on medicines will provide at best only limited benefits unless drug supply management is strengthened to ensure that the appropriate medi-cines are used and used properly.
Food costs. MoH reports that food costs in general hospitals are currently $US 0.11 (TJS0.34) per bed per day, or approximately $US 40 per year. Food costs are adjusted to account for increased utilization of beds.
143 WHO and Management Sciences for Health “Managing Drug Supply” 2nd Edition. 1997. p.612. The original estimate was made in 1991. In 2003
prices, $10 would be around $13.50. As more in detailed studies of drug supply requirements are undertaken these will be integrated into the costing
analysis.
144 Correspondence with Pharmaciens Sans Frontieres and International Federation of Red Cross and Red Crescent Societies.
145 SINO Project “Drug Availability and Management in Pilot Rayon” July 2003.
146 WB Health Sector Note. August 2003.
147 Ibid. p.612; interviews with health professionals in Tajikistan.

MILLENNIUM DEVELOPMENT GOALS NEEDS ASSESSMENT TAJ IK ISTAN
102
MILLENNIUM DEVELOPMENT GOALS NEEDS ASSESSMENT TAJ IK ISTAN
In-service training of medical personnel. Improving health system staffing is a question not only of increasing the number of health care personnel but also of distributing those personnel among facilities and among regions, as well as of ensuring that health personnel have adequate training. New medical equipment will also need to be accompanied by training programmes to familiarise health personnel with proper usage applications and usage techniques. The costs of these programmes are difficult to judge but are likely to be significant. A standard WHO assumption for estimating these costs is to budget 10% of annual salaries for annual in-service training costs.148 Skilled attendants, especially in rural areas, are crucial for improving maternal health in the country. The following Table 43 provides the estimated coverage rates by in-ser-vice training for midwives, obstetricians.
Table 43. Training of Obstetricians and Midwives (2005-2015)Training of Obstetricians Training of midwives
Years 2005-2009 2010-2015 2005-2009 2010-2015Total 100 100 100 100Dushanbe 32,0 28,0 10,1 11,5Sugd 36,0 34,0 41,7 38,0Khatlon 15,8 20,0 28,6 30,0GBAO 2,7 3,0 3,6 3,5RRS 13,5 15,0 16,0 17,0
Source: MDG Needs Assessment, National Centre on Reproductive Health of the MoH, 2005
Provision of Contraceptives. As is noted in the recommendations section above, increasing access to safe birth control methods has a potential to reduce maternal mortality rates by 20-35%. The following Table provides with an estimated coverage rate by contraceptives for 2005-2015.
Table 44. Coverage by Contraceptives (2005-2015)Contraceptives (IUDs, oral, injections)
Years 2005-2009 2010-2015Total 100 100Dushanbe 10.4 10.5Sugd 23.9 24.4Khatlon 42.8 42.2GBAO 2.8 3.0RRS 20.1 20.0
Source: MDG Needs Assessment, National Centre on Reproductive Health of the MoH, 2005
Total costs for MDGs 4 and 5 The assessment of financial resources needed to reach the MDG targets of reducing maternal and child mortality, and improving their health status is presented in the financial model of the primary health care system. The Needs Assessment estimates that US$ 3.06 billion or US$ 36, 2 per capita is needed for improving the primary health care system in the country.
148 See Mother Baby Package and Integrated Management of Child Illness costing tools.
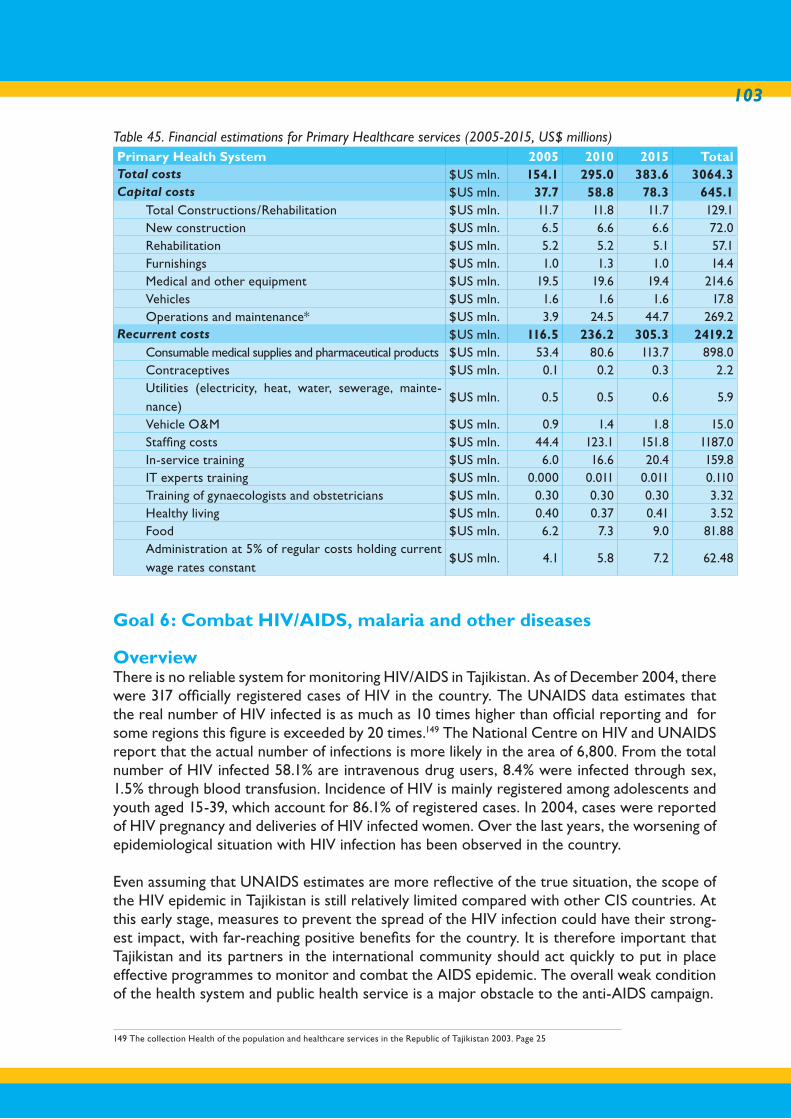
103
Table 45. Financial estimations for Primary Healthcare services (2005-2015, US$ millions)Primary Health System 2005 2010 2015 TotalTotal costs $US mln. 154.1 295.0 383.6 3064.3Capital costs $US mln. 37.7 58.8 78.3 645.1
Total Constructions/Rehabilitation $US mln. 11.7 11.8 11.7 129.1New construction $US mln. 6.5 6.6 6.6 72.0Rehabilitation $US mln. 5.2 5.2 5.1 57.1Furnishings $US mln. 1.0 1.3 1.0 14.4Medical and other equipment $US mln. 19.5 19.6 19.4 214.6Vehicles $US mln. 1.6 1.6 1.6 17.8Operations and maintenance* $US mln. 3.9 24.5 44.7 269.2
Recurrent costs $US mln. 116.5 236.2 305.3 2419.2Consumable medical supplies and pharmaceutical products $US mln. 53.4 80.6 113.7 898.0Contraceptives $US mln. 0.1 0.2 0.3 2.2Utilities (electricity, heat, water, sewerage, mainte-nance)
$US mln. 0.5 0.5 0.6 5.9
Vehicle O&M $US mln. 0.9 1.4 1.8 15.0Staffing costs $US mln. 44.4 123.1 151.8 1187.0In-service training $US mln. 6.0 16.6 20.4 159.8IT experts training $US mln. 0.000 0.011 0.011 0.110Training of gynaecologists and obstetricians $US mln. 0.30 0.30 0.30 3.32Healthy living $US mln. 0.40 0.37 0.41 3.52Food $US mln. 6.2 7.3 9.0 81.88Administration at 5% of regular costs holding current wage rates constant
$US mln. 4.1 5.8 7.2 62.48
Goal 6: Combat HIV/AIDS, malaria and other diseases
OverviewThere is no reliable system for monitoring HIV/AIDS in Tajikistan. As of December 2004, there were 317 officially registered cases of HIV in the country. The UNAIDS data estimates that the real number of HIV infected is as much as 10 times higher than official reporting and for some regions this figure is exceeded by 20 times.149 The National Centre on HIV and UNAIDS report that the actual number of infections is more likely in the area of 6,800. From the total number of HIV infected 58.1% are intravenous drug users, 8.4% were infected through sex, 1.5% through blood transfusion. Incidence of HIV is mainly registered among adolescents and youth aged 15-39, which account for 86.1% of registered cases. In 2004, cases were reported of HIV pregnancy and deliveries of HIV infected women. Over the last years, the worsening of epidemiological situation with HIV infection has been observed in the country.
Even assuming that UNAIDS estimates are more reflective of the true situation, the scope of the HIV epidemic in Tajikistan is still relatively limited compared with other CIS countries. At this early stage, measures to prevent the spread of the HIV infection could have their strong-est impact, with far-reaching positive benefits for the country. It is therefore important that Tajikistan and its partners in the international community should act quickly to put in place effective programmes to monitor and combat the AIDS epidemic. The overall weak condition of the health system and public health service is a major obstacle to the anti-AIDS campaign.
149 The collection Health of the population and healthcare services in the Republic of Tajikistan 2003. Page 25
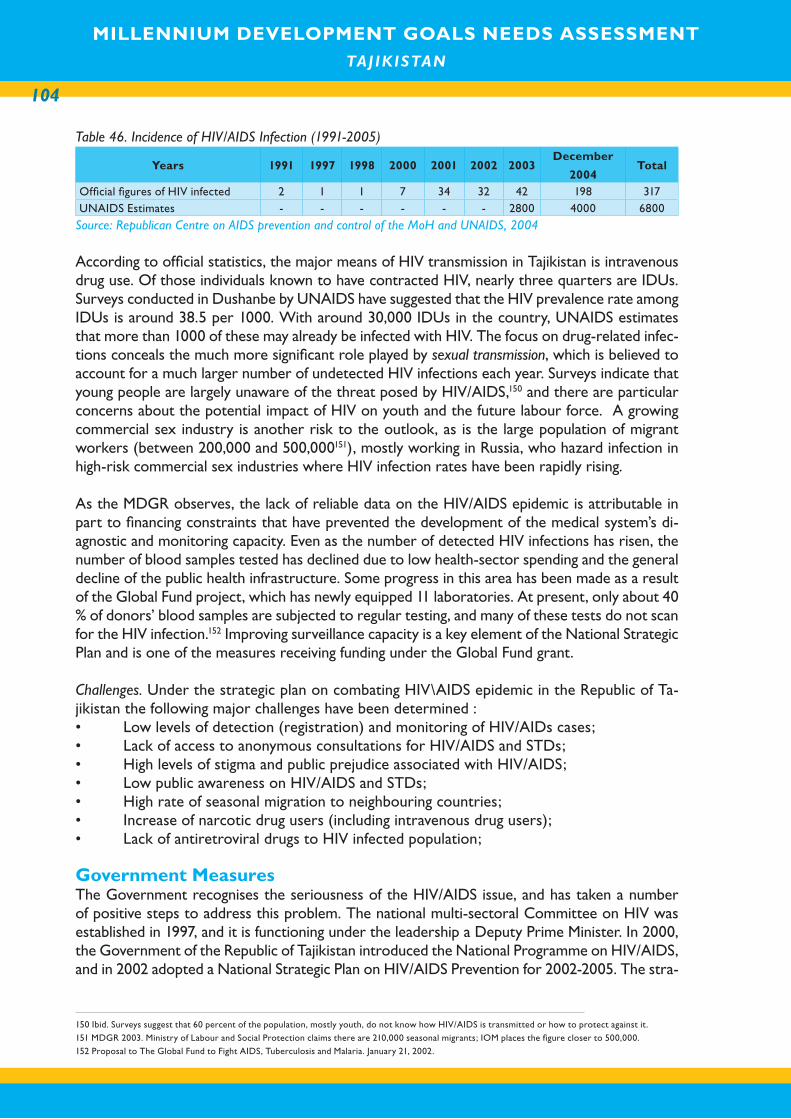
MILLENNIUM DEVELOPMENT GOALS NEEDS ASSESSMENT TAJ IK ISTAN
104
MILLENNIUM DEVELOPMENT GOALS NEEDS ASSESSMENT TAJ IK ISTAN
Table 46. Incidence of HIV/AIDS Infection (1991-2005)
Years 1991 1997 1998 2000 2001 2002 2003December
2004Total
Official figures of HIV infected 2 1 1 7 34 32 42 198 317UNAIDS Estimates - - - - - - 2800 4000 6800
Source: Republican Centre on AIDS prevention and control of the MoH and UNAIDS, 2004
According to official statistics, the major means of HIV transmission in Tajikistan is intravenous drug use. Of those individuals known to have contracted HIV, nearly three quarters are IDUs. Surveys conducted in Dushanbe by UNAIDS have suggested that the HIV prevalence rate among IDUs is around 38.5 per 1000. With around 30,000 IDUs in the country, UNAIDS estimates that more than 1000 of these may already be infected with HIV. The focus on drug-related infec-tions conceals the much more significant role played by sexual transmission, which is believed to account for a much larger number of undetected HIV infections each year. Surveys indicate that young people are largely unaware of the threat posed by HIV/AIDS,150 and there are particular concerns about the potential impact of HIV on youth and the future labour force. A growing commercial sex industry is another risk to the outlook, as is the large population of migrant workers (between 200,000 and 500,000151), mostly working in Russia, who hazard infection in high-risk commercial sex industries where HIV infection rates have been rapidly rising.
As the MDGR observes, the lack of reliable data on the HIV/AIDS epidemic is attributable in part to financing constraints that have prevented the development of the medical system’s di-agnostic and monitoring capacity. Even as the number of detected HIV infections has risen, the number of blood samples tested has declined due to low health-sector spending and the general decline of the public health infrastructure. Some progress in this area has been made as a result of the Global Fund project, which has newly equipped 11 laboratories. At present, only about 40 % of donors’ blood samples are subjected to regular testing, and many of these tests do not scan for the HIV infection.152 Improving surveillance capacity is a key element of the National Strategic Plan and is one of the measures receiving funding under the Global Fund grant.
Challenges. Under the strategic plan on combating HIV\AIDS epidemic in the Republic of Ta-jikistan the following major challenges have been determined : • Low levels of detection (registration) and monitoring of HIV/AIDs cases;• Lack of access to anonymous consultations for HIV/AIDS and STDs;• High levels of stigma and public prejudice associated with HIV/AIDS;• Low public awareness on HIV/AIDS and STDs;• High rate of seasonal migration to neighbouring countries; • Increase of narcotic drug users (including intravenous drug users);• Lack of antiretroviral drugs to HIV infected population;
Government MeasuresThe Government recognises the seriousness of the HIV/AIDS issue, and has taken a number of positive steps to address this problem. The national multi-sectoral Committee on HIV was established in 1997, and it is functioning under the leadership a Deputy Prime Minister. In 2000, the Government of the Republic of Tajikistan introduced the National Programme on HIV/AIDS, and in 2002 adopted a National Strategic Plan on HIV/AIDS Prevention for 2002-2005. The stra-
150 Ibid. Surveys suggest that 60 percent of the population, mostly youth, do not know how HIV/AIDS is transmitted or how to protect against it.
151 MDGR 2003. Ministry of Labour and Social Protection claims there are 210,000 seasonal migrants; IOM places the figure closer to 500,000.
152 Proposal to The Global Fund to Fight AIDS, Tuberculosis and Malaria. January 21, 2002.
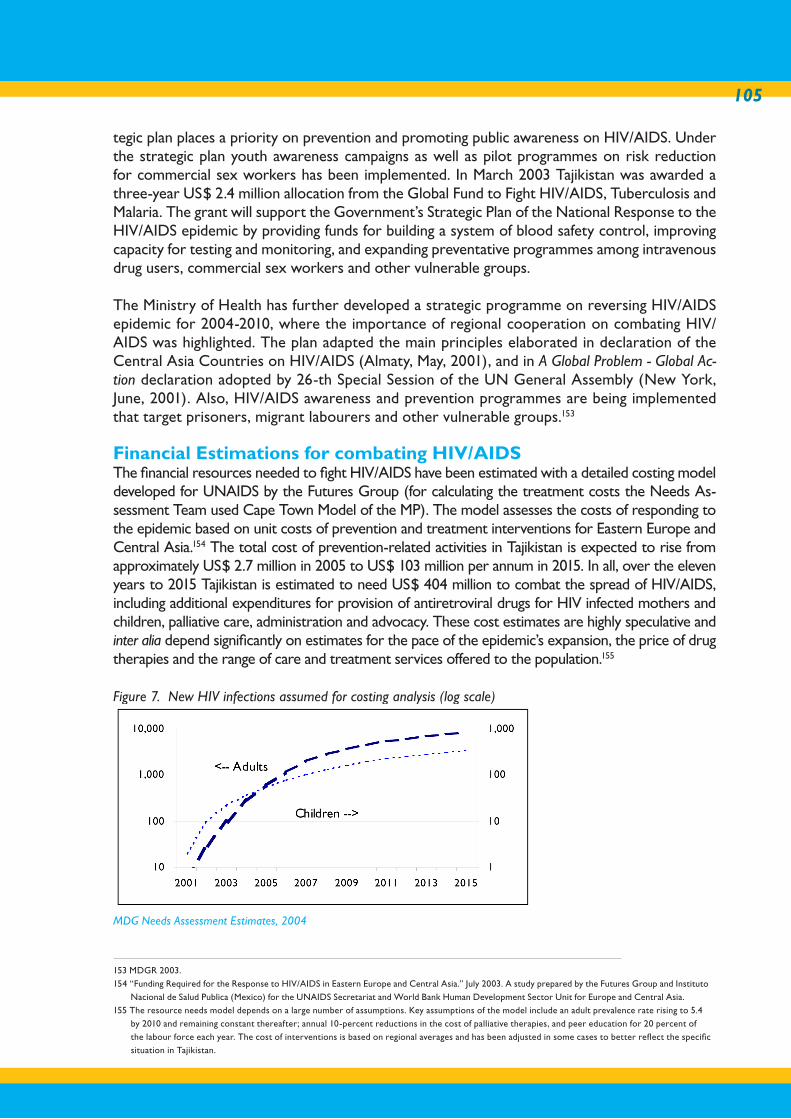
105
tegic plan places a priority on prevention and promoting public awareness on HIV/AIDS. Under the strategic plan youth awareness campaigns as well as pilot programmes on risk reduction for commercial sex workers has been implemented. In March 2003 Tajikistan was awarded a three-year US$ 2.4 million allocation from the Global Fund to Fight HIV/AIDS, Tuberculosis and Malaria. The grant will support the Government’s Strategic Plan of the National Response to the HIV/AIDS epidemic by providing funds for building a system of blood safety control, improving capacity for testing and monitoring, and expanding preventative programmes among intravenous drug users, commercial sex workers and other vulnerable groups.
The Ministry of Health has further developed a strategic programme on reversing HIV/AIDS epidemic for 2004-2010, where the importance of regional cooperation on combating HIV/AIDS was highlighted. The plan adapted the main principles elaborated in declaration of the Central Asia Countries on HIV/AIDS (Almaty, May, 2001), and in A Global Problem - Global Ac-tion declaration adopted by 26-th Special Session of the UN General Assembly (New York, June, 2001). Also, HIV/AIDS awareness and prevention programmes are being implemented that target prisoners, migrant labourers and other vulnerable groups.153
Financial Estimations for combating HIV/AIDSThe financial resources needed to fight HIV/AIDS have been estimated with a detailed costing model developed for UNAIDS by the Futures Group (for calculating the treatment costs the Needs As-sessment Team used Cape Town Model of the MP). The model assesses the costs of responding to the epidemic based on unit costs of prevention and treatment interventions for Eastern Europe and Central Asia.154 The total cost of prevention-related activities in Tajikistan is expected to rise from approximately US$ 2.7 million in 2005 to US$ 103 million per annum in 2015. In all, over the eleven years to 2015 Tajikistan is estimated to need US$ 404 million to combat the spread of HIV/AIDS, including additional expenditures for provision of antiretroviral drugs for HIV infected mothers and children, palliative care, administration and advocacy. These cost estimates are highly speculative and inter alia depend significantly on estimates for the pace of the epidemic’s expansion, the price of drug therapies and the range of care and treatment services offered to the population.155
Figure 7. New HIV infections assumed for costing analysis (log scale)
MDG Needs Assessment Estimates, 2004
153 MDGR 2003.
154 “Funding Required for the Response to HIV/AIDS in Eastern Europe and Central Asia.” July 2003. A study prepared by the Futures Group and Instituto
Nacional de Salud Publica (Mexico) for the UNAIDS Secretariat and World Bank Human Development Sector Unit for Europe and Central Asia.
155 The resource needs model depends on a large number of assumptions. Key assumptions of the model include an adult prevalence rate rising to 5.4
by 2010 and remaining constant thereafter; annual 10-percent reductions in the cost of palliative therapies, and peer education for 20 percent of
the labour force each year. The cost of interventions is based on regional averages and has been adjusted in some cases to better reflect the specific
situation in Tajikistan.

MILLENNIUM DEVELOPMENT GOALS NEEDS ASSESSMENT TAJ IK ISTAN
106
MILLENNIUM DEVELOPMENT GOALS NEEDS ASSESSMENT TAJ IK ISTAN
Given expected trends in public spending for health, the costs of anti-AIDS interventions could conceivably be met by Tajikistan - but only at the cost of significant forgone interventions re-quired to build capacity in the overall health system. Since basic needs for health sector reform and essential services will absorb most if not all of the health budget, the financing gap for HIV/AIDS is likely to go largely uncovered unless additional outside assistance can be found.
Table 47. Financial Estimations for combating HIV/AIDS, 2005-2015 (US$ million)Item 2005 2010 2015 Total
Total 2.7 24.9 103.0 404.0
Prevention 1.8 7.2 11.1 76.1
Care and Treatment 0.77 16.53 87.06 308.6Policy, administration and research 0.1 1.2 4.9 19.2
Source: MDG Needs Assessment, Republican Centre on AIDS Prevention and Control of the MoH, 2005
Combating Malaria
OverviewDespite vast investments and strenuous efforts, malaria was never totally eradicated within the southern frontiers of the former Soviet Union including Tajikistan.156 Throughout the 1970’s and 1980’s, malaria outbreaks were registered in the southern part of Tajikistan.157,158 Although these were contained, authorities were unable to achieve the complete interruption of malaria transmission in the country, and, as the present situation illustrates, the achievements of the Soviet-era malaria eradication programme could not be maintained indefinitely. Since the early 1990’s, the incidence of malaria has been on the rise, with some 30,000 cases officially registered in 1997.159 In recent years the re-appearance of endemic malaria in southern regions and a steady increase in the incidence of malaria in the other parts of the country have been observed. WHO estimates that there are currently between 300,000 and 400,000 people infected with malaria in Tajikistan, most of them living in the southern province of Khatlon.160
Economic decline and civil war disrupted the Government’s and community-level malaria con-trol measures that in the Soviet period had been effective at containing malaria risk. Factors contributing to rising infection rates include: renewed contact with malaria-ridden Afghani-stan, deterioration of the national health infrastructure, deteriorating drainage systems and the increase in rice cultivation near living areas. The majority of malaria cases in the country are of the non-lethal vivax strain. As discussed in the Government’s 2003 Millennium Devel-opment Goal Report, the re-emergence of potentially lethal P. falciparum malaria transmission and its spread across the country is an especially troubling development. WHO estimates that there may be between 30,000 and 50,000 cases of P. falciparum malaria countrywide.Tajikistan has committed itself to malaria control, and in 1997 the national health authorities, in
156 Lysenko AY et al. Results of three-years of work directed at the practical eradication of malaria in Tadjikskaya SSR. Proceedings on malaria and other
infectious diseases, Stalinabadsky Institute of Epidemiology and Hygiene, 1960, 11: 5-21.
157 Kasatsky AL et al. A rise in the incidence of malaria in Tadjikskay SSR and malaria control activities applied in 1984-1985. Proceedings of the scientific
conference on malaria control in USSR at the present time, Martsinovsky Institute of Medical parasitology and Tropical Medicine, 1985, 73-84.
158 Kasatsky AL et al. Tactical approaches and the effectiveness of malaria control measures taken in the period of P. vivax malaria epidemic in Pyanj dis
trict of Tajikskaya SSR in 1978-1984. Proceedings of the scientific conference on malaria control in USSR at the present time, Martsinovsky Institute
of Medical parasitology and Tropical Medicine, 1985, 85-93.
159 MDGR 2003.
160 WHO and MoH, Roll Back Malaria Project Document, 2002. The project document is available on-line at http://www.euro.who.int/document/ E76332.pdf.
107
close collaboration with WHO, developed the National Malaria Control Programme. Over the past several years, Tajikistan has revised its national strategy and programme in accordance with the concept and principles of the global and regional “Roll Back Malaria” campaign. In 2000 at a national-level Roll Back Malaria partnership meeting in Dushanbe, health authorities and partners committed themselves to taking all possible measures to contain the malaria epidemic in Tajikistan. The National Malaria Control Programme focuses on addressing malaria by enhancing national capacities for decision-making; investing in human development and capacity building; improving capacities for early diagnosis and prompt/radical treatment of malaria; strengthening capacities for early detection, containment and prevention of outbreaks; promoting cost-effective and sustain-able preventive measures; strengthening surveillance and ensuring community mobilisation. The Republic Centre on Tropical Diseases estimated the prevalence of malaria at 80.7 per 100,000 (2002), and 252 cases of acute malaria (2003). Currently, detection and recovery rates stand at 6%. Table 48. Malaria prevalence rate in Tajikistan for 1995-2003 (total cases) 1995 1996 1997 1998 1999 2000 2001 2002 2003
Total 6103 16561 29794 19351 13493 19064 11387 6160 5428
Caused by P. vivax (typical) 6103 16561 29794 19164 13158 18231 10561 5651 5176
Caused by by P. falciparum (tropical)
0 0 0 187 335 833 826 509 252
Source: MDG Needs Assessment, Republican Centre on Tropical Diseases of the MoH, 2004
Table 49. Malaria prevalence in Tajikistan by regions 1997-2003, (total cases)Regions 1997 1998 1999 2000 2001 2002 2003Dushanbe 1199 815 574 766 246 150 220Sugd 199 137 898 2513 697 307 142Khatlon 25364 15413 10133 11672 8405 4463 4420
GBAO 1083 1018 193 138 144 197 84RRS 1949 1968 1695 3975 1895 1043 562
Source: MDG Needs Assessment, Republican Centre on Tropical Diseases of the MoH, 2004
Malaria has acquired an endemic character in most areas in Tajikistan, especially in regions bordering Afghanistan, where the majority of cases are asymptomatic, and thus people are not tested and are not receiving treatment161. This has an effect on the official statistical data on Malaria cases, as only those patients who have positive lab tests can be registered. Children are most susceptible to the disease, and during the malaria epidemic of 2003 they accounted for 36.9% of cases.
Challenges. The national healthcare authorities are facing many challenges and constraints in-cluding on combating malaria, including:• Poor capacity for early diagnosis and treatment of malaria, particularly in rural areas;• Low preparedness on combating epidemic situations; including shortage of insecticides
and treatment drugs;• Low detection and monitoring rates, especially in regions bordering Afghanistan;• Lack of public awareness on malaria prevention measures;• Lack of access to malaria prevention methods by the public (especially living in malaria-
161 WHO, ACTED, MoH of RT, Survey on Malaria Prevalence in Tajikistan, 2002-03
MILLENNIUM DEVELOPMENT GOALS NEEDS ASSESSMENT TAJ IK ISTAN
108
MILLENNIUM DEVELOPMENT GOALS NEEDS ASSESSMENT TAJ IK ISTAN
prone regions), such as the availability of anti-malaria nets and insecticides;Government MeasuresThe Government adapted in 1997 a long-term National Programme on Combating Tropical Diseases for 1997-2005.162 In accordance with this programme, republican, regional, city and district centers for combating tropical diseases were created within the infrastructure of pub-lic health services, placing high importance on targeting malaria-prone areas. Over the past five years, Tajikistan has revised its national strategy and programme in accordance with the concept and principles of the global and regional “Roll Back Malaria” campaign.
The implementation measures of the National Programme on Combating Malaria include:• Training programmes for health professional at all levels of the tropical disease centres
on early diagnostics, treatment and malaria prevention measures;• Training of primary health care professionals on diagnostics and prevention mea-
sures;
Financial estimations for combating the spread of malariaUnless the primary health care system is strengthened and more resources are made avail-able for malaria control, it is unlikely that Tajikistan will be able to meet the MDG target for reversing the spread of the disease. The costs of initial measures aimed at controlling malaria were assessed under the WHO-MoH “Roll Back Malaria” programme for Tajikistan.163 This control phase would require the investment of approximately US$ 3.5 million over 2002-2005. Assuming concomitant strengthening of the primary health system, WHO and MH of RT officials estimate that the long-run expenditures required to maintain, operate and supply the national anti-malaria system and consolidate gains made under the control phase will be US$ 15 million over 2005-2015.
Recurrent costs. Provision of chemicals and drugs are likely to be the largest recurrent costs. These measures directed to decrease malaria cases through adequate treatment, and sea-sonal chemical prophylaxis are expected to cover 810,000 households and 770,000 organi-zations by 2015.
Capital Costs. Capital expenditures of malaria include equipping the National Malaria Cen-ter and regional labs with all necessary equipment as well as purchasing of transports for providing chemical prophylaxis. In total, US$ 6.84 million will be needed to cover all capital costs by 2015.
Table 50. Financial estimations for combating malaria 2005-2015 US$ million
Intervention 2005 2010 2015 Total
Total 1.72 1.23 1.23 14.88
Consumable supplies (nets, medical drugs, chemicals and etc) 0.41 0.33 0.21 3.39Other supplies (labs, equipment assembling and etc.) 0.86 0.55 0.62 6.84Public awareness 0.20 0.20 0.25 2.5Epidemiological surveillance 0.10 0.10 0.10 1.1Training 0.15 0.05 0.05 1.05
Source: MDG Needs Assessment, Republican Centre on Tropical Diseases of the MoH, 2005
162 Government Resolution, August 4, 1997 № 342
163 The project document is available on-line at http://www.euro.who.int/document/E76332.pdf.
109
Table 51. Provision of training, medicines and lab equipment by regions 2005-2015 (%)Anti malaria treatment Training of medical staff Lab Equipment
Years 2005-2009 2010-2015 2005-2009 2010-2015 2005-2009 2010-2015Total 100 100 100 100 100 100Dushanbe 9,1 10,3 14,3 14,3 10,8 9,8Sugd 13,1 12,5 19,1 19,0 14,2 14,4Khatlon 52,1 46,8 38,0 38,1 46,2 47,6GBAO 9,5 10,3 10,9 10,9 11,2 10,6RRS 16,2 20,1 17,7 17,7 17,6 17,6
Source: MDG Needs Assessment, Republican Centre on Tropical Diseases of the MoH, 2005
Parasitical diseases
OverviewThe prevalence of intestinal parasitical diseases among children in Tajikistan is of great concern. The Needs Assessment Team together with the Government Working Group on Health has identified parasitical diseases (helminthiasis) as an important issue that needs to be addressed as part of the MDG target 8. According to the Ministry of Health data, in 2004 there were 19,257 cases of intestinal parasitical infections, including 13,322 cases among children under 14. How-ever, the actual prevalence of enteric parasites is much higher than the official statistics report. The joint survey carried out in 2004 by the MoH, UNICEF and WFP indicated that 63% of chil-dren aged 6-11 are infected by one and more types of enteric parasites. The survey showed that 5% of all tested children suffer from moderate and heavy forms of parasitic infection caused by enterobiasis and hymenolepiasis. Another study conducted in 2001 by MoH and Aga Khan Foun-dation in GBAO a high prevalence rate of the disease among pregnant women (20-41 years old) and children (28-65 months). Ascariasis infections affected 41% of women and 19% of children, whereas enterobiasis infections affected 39% of women 13 % of children. As a whole, enteric parasites were detected in 64 % of women and 58 % of children.
Table 52. Reported incidence of infections with intestinal parasites (helminthiasis), Tajikistan, 2004 (total cases)
ItemPinworm (Entero-biasis)
Roundworm (Ascariasis)
Dwarf tapeworm (Hymeno-lepiasis)
Whip-worm
(Trichu-riasis)
Hydatid disease (Echino-coccosis)
Beef tapeworm (Taeniasis saginata)
Pork tapeworm (Taeniasis solium)
Roundworm (Trichinosis)
Total 5973 5554 3356 453 144 191 123 5Under 14 age
4081 3726 2399 127 53 92 51 4
Source: Republican Centre on Tropical Diseases of the MoH, 2004
Challenges. Intestinal parasites is especially dangerous for children under 14. For combating this disease the following challenges are identified:• Limited capacity for early diagnostics and prophylaxis;• Lack of treatment for children under 14;• Lack parasitological control of helminthes due to the unavailability of mobile technical
facilities and capacities;• Low public awareness on helminthes prevention measures; • Lack of financing of antihelminthes activities to date.

MILLENNIUM DEVELOPMENT GOALS NEEDS ASSESSMENT TAJ IK ISTAN
110
MILLENNIUM DEVELOPMENT GOALS NEEDS ASSESSMENT TAJ IK ISTAN
Government MeasuresThe Government of Tajikistan adopted the resolution of the 54th session of the UN World As-sembly on Healthcare held in 2001 to reduce a rate of intestinal parasites infection incidence, and to treat at least 75% of children being at risk to be infected by these diseases by 2010. Cur-rently, the Government is developing a national programme on combating parasitical diseases. The main goals of the program are as follows:• Maintain the prevalence rate of moderate and acute cases of ascariasis, trichuriasis and
hymenolepiasis incidence among children at 5 % and lower;• Decrease the incidence rate of enterobiasis and other intestinal parasites by 50 %
among children;• Conduct public awareness programs on intestinal parasites;• Treatment of each child under 14 with anti-parasite drugs. This campaign should be
conducted twice a year initially, and then every other year.
Financial Estimations for combating parasitical diseasesMeasures against the spread of intestinal parasites will be carried out by local, regional and na-tional branches of the Republican Centre of Tropical Diseases (RCTD). The capital costs (such as equipment, laboratory equipment, transportation) and the salary expenditures of health per-sonnel is not included in the financial estimations, as they are already reflected in the financial model for combating malaria. The main component of this model is the assumption that all chil-dren under 14 will receive treatment against intestinal parasites. In 2006, the number of children to receive treatments will be 2,500,000, and by 2010 about 1,000,000 will receive treatments. According to estimates of RCTD, prevention and treatment of helminthes among children will be on the order US$ 3.5 million for the period 2005-2025.
Table 53. Financial Estimation for Combating Parasitical Diseases, 2005-2015 (US$ million)
Items 2005 2010 2015Total
2005-2015Total 0.08 0.44 0.17 3.44Treatment (provision of anti-parasitical drugs for all children under 14)
0.0 0.29 0.00 2.25
Training 0.05 0.11 0.13 0.86Social mobilization 0.01 0.01 0.02 0.15Monitoring 0.01 0.01 0.01 0.07Anti-parasitical Lab Equipment 0.01 0.01 0.01 0.12
Source: MDG Needs Assessment, Republican Centre on Tropical Diseases of the MoH, 2005
Table 54. Provision of training, treatment and lab equipment by regions, 2005-2015, (%)Treatment Training of health professionals Lab Equipment
Years 2005-2009 2010-2015 2005-2009 2010-2015 2005-2009 2010-2015Total 100 100 100 100 100 100Dushanbe 10,3 13,2 11,7 10,6 10,1 12,3Sugd 28,0 25,2 21,4 23,4 16,7 18,2Khatlon 35,4 34,8 35,7 38,8 40,6 40,0GBAO 5,1 4,8 11,7 9,2 12,2 9,8RRS 21,1 22 19,5 18,0 20,4 19,7
Source: MDG Needs Assessment, Republican Centre on Tropical Diseases of the MoH, 2005
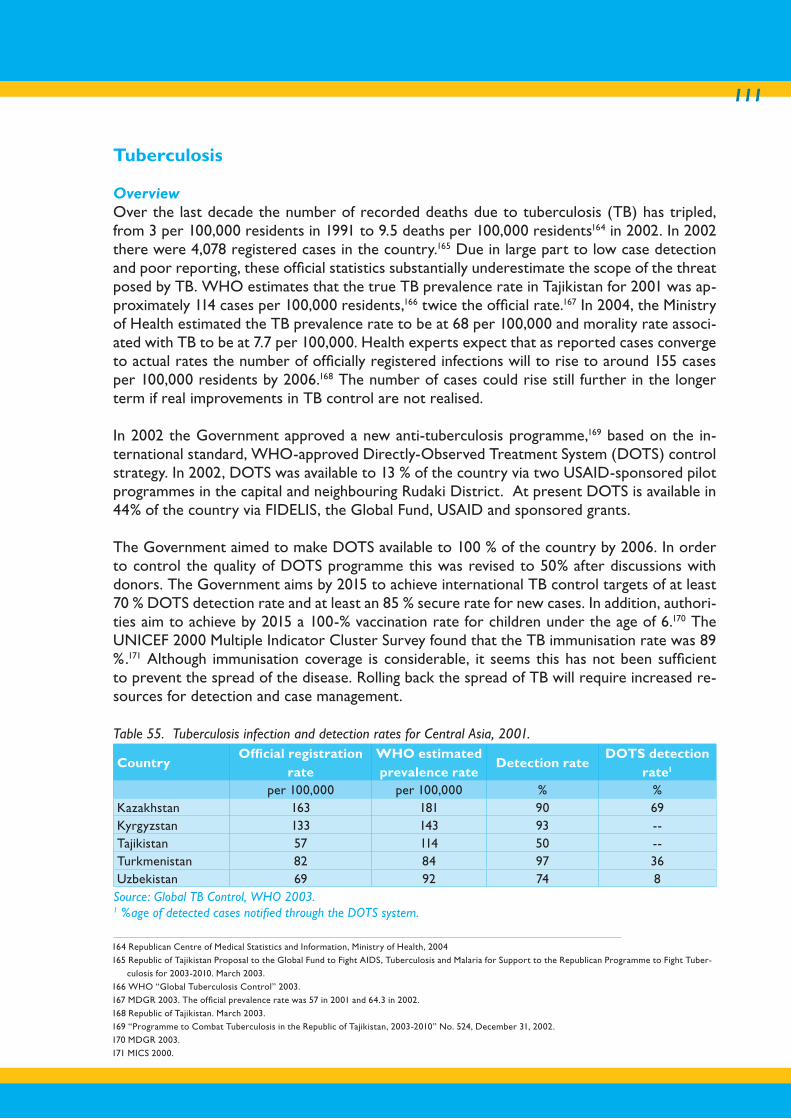
111
Tuberculosis
OverviewOver the last decade the number of recorded deaths due to tuberculosis (TB) has tripled, from 3 per 100,000 residents in 1991 to 9.5 deaths per 100,000 residents164 in 2002. In 2002 there were 4,078 registered cases in the country.165 Due in large part to low case detection and poor reporting, these official statistics substantially underestimate the scope of the threat posed by TB. WHO estimates that the true TB prevalence rate in Tajikistan for 2001 was ap-proximately 114 cases per 100,000 residents,166 twice the official rate.167 In 2004, the Ministry of Health estimated the TB prevalence rate to be at 68 per 100,000 and morality rate associ-ated with TB to be at 7.7 per 100,000. Health experts expect that as reported cases converge to actual rates the number of officially registered infections will to rise to around 155 cases per 100,000 residents by 2006.168 The number of cases could rise still further in the longer term if real improvements in TB control are not realised.
In 2002 the Government approved a new anti-tuberculosis programme,169 based on the in-ternational standard, WHO-approved Directly-Observed Treatment System (DOTS) control strategy. In 2002, DOTS was available to 13 % of the country via two USAID-sponsored pilot programmes in the capital and neighbouring Rudaki District. At present DOTS is available in 44% of the country via FIDELIS, the Global Fund, USAID and sponsored grants.
The Government aimed to make DOTS available to 100 % of the country by 2006. In order to control the quality of DOTS programme this was revised to 50% after discussions with donors. The Government aims by 2015 to achieve international TB control targets of at least 70 % DOTS detection rate and at least an 85 % secure rate for new cases. In addition, authori-ties aim to achieve by 2015 a 100-% vaccination rate for children under the age of 6.170 The UNICEF 2000 Multiple Indicator Cluster Survey found that the TB immunisation rate was 89 %.171 Although immunisation coverage is considerable, it seems this has not been sufficient to prevent the spread of the disease. Rolling back the spread of TB will require increased re-sources for detection and case management.
Table 55. Tuberculosis infection and detection rates for Central Asia, 2001.
CountryOfficial registration
rateWHO estimated prevalence rate
Detection rateDOTS detection
rate1
per 100,000 per 100,000 % %Kazakhstan 163 181 90 69Kyrgyzstan 133 143 93 --Tajikistan 57 114 50 --Turkmenistan 82 84 97 36Uzbekistan 69 92 74 8
Source: Global TB Control, WHO 2003.1 %age of detected cases notified through the DOTS system.
164 Republican Centre of Medical Statistics and Information, Ministry of Health, 2004
165 Republic of Tajikistan Proposal to the Global Fund to Fight AIDS, Tuberculosis and Malaria for Support to the Republican Programme to Fight Tuber-
culosis for 2003-2010. March 2003.
166 WHO “Global Tuberculosis Control” 2003.
167 MDGR 2003. The official prevalence rate was 57 in 2001 and 64.3 in 2002.
168 Republic of Tajikistan. March 2003.
169 “Programme to Combat Tuberculosis in the Republic of Tajikistan, 2003-2010” No. 524, December 31, 2002.
170 MDGR 2003.
171 MICS 2000.
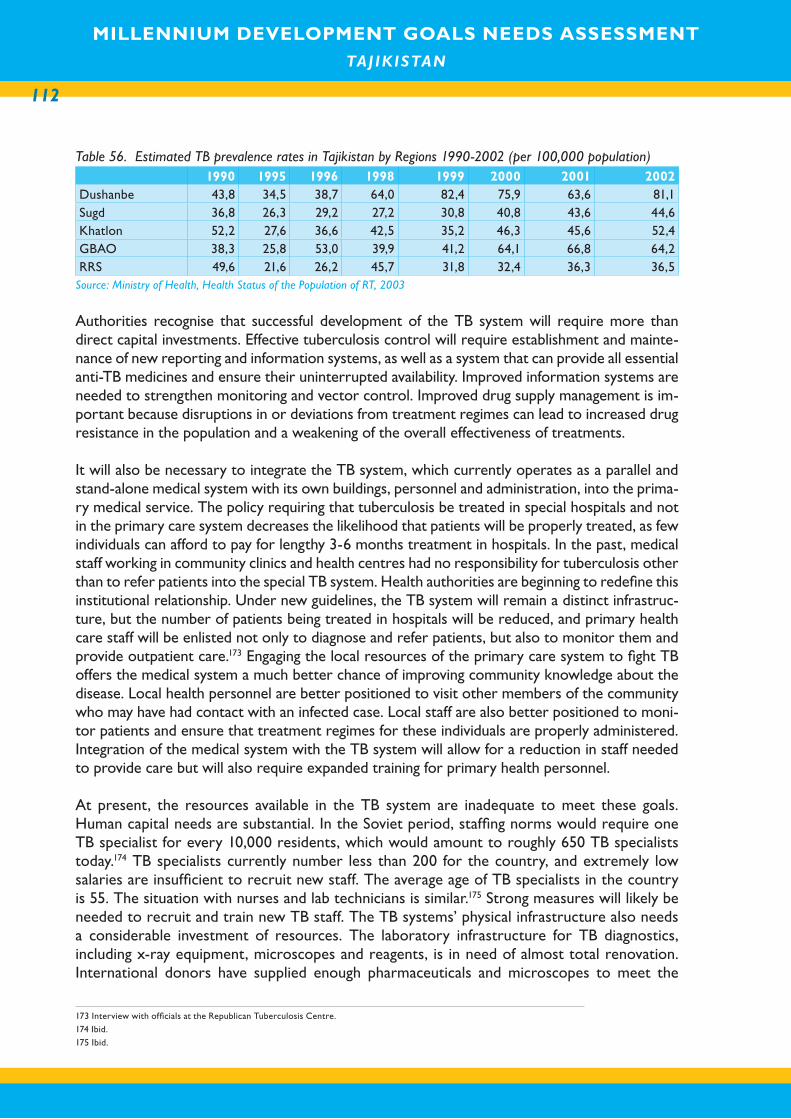
MILLENNIUM DEVELOPMENT GOALS NEEDS ASSESSMENT TAJ IK ISTAN
112
MILLENNIUM DEVELOPMENT GOALS NEEDS ASSESSMENT TAJ IK ISTAN
Table 56. Estimated TB prevalence rates in Tajikistan by Regions 1990-2002 (per 100,000 population)1990 1995 1996 1998 1999 2000 2001 2002
Dushanbe 43,8 34,5 38,7 64,0 82,4 75,9 63,6 81,1Sugd 36,8 26,3 29,2 27,2 30,8 40,8 43,6 44,6Khatlon 52,2 27,6 36,6 42,5 35,2 46,3 45,6 52,4GBAO 38,3 25,8 53,0 39,9 41,2 64,1 66,8 64,2RRS 49,6 21,6 26,2 45,7 31,8 32,4 36,3 36,5
Source: Ministry of Health, Health Status of the Population of RT, 2003
Authorities recognise that successful development of the TB system will require more than direct capital investments. Effective tuberculosis control will require establishment and mainte-nance of new reporting and information systems, as well as a system that can provide all essential anti-TB medicines and ensure their uninterrupted availability. Improved information systems are needed to strengthen monitoring and vector control. Improved drug supply management is im-portant because disruptions in or deviations from treatment regimes can lead to increased drug resistance in the population and a weakening of the overall effectiveness of treatments.
It will also be necessary to integrate the TB system, which currently operates as a parallel and stand-alone medical system with its own buildings, personnel and administration, into the prima-ry medical service. The policy requiring that tuberculosis be treated in special hospitals and not in the primary care system decreases the likelihood that patients will be properly treated, as few individuals can afford to pay for lengthy 3-6 months treatment in hospitals. In the past, medical staff working in community clinics and health centres had no responsibility for tuberculosis other than to refer patients into the special TB system. Health authorities are beginning to redefine this institutional relationship. Under new guidelines, the TB system will remain a distinct infrastruc-ture, but the number of patients being treated in hospitals will be reduced, and primary health care staff will be enlisted not only to diagnose and refer patients, but also to monitor them and provide outpatient care.173 Engaging the local resources of the primary care system to fight TB offers the medical system a much better chance of improving community knowledge about the disease. Local health personnel are better positioned to visit other members of the community who may have had contact with an infected case. Local staff are also better positioned to moni-tor patients and ensure that treatment regimes for these individuals are properly administered. Integration of the medical system with the TB system will allow for a reduction in staff needed to provide care but will also require expanded training for primary health personnel.
At present, the resources available in the TB system are inadequate to meet these goals. Human capital needs are substantial. In the Soviet period, staffing norms would require one TB specialist for every 10,000 residents, which would amount to roughly 650 TB specialists today.174 TB specialists currently number less than 200 for the country, and extremely low salaries are insufficient to recruit new staff. The average age of TB specialists in the country is 55. The situation with nurses and lab technicians is similar.175 Strong measures will likely be needed to recruit and train new TB staff. The TB systems’ physical infrastructure also needs a considerable investment of resources. The laboratory infrastructure for TB diagnostics, including x-ray equipment, microscopes and reagents, is in need of almost total renovation. International donors have supplied enough pharmaceuticals and microscopes to meet the
173 Interview with officials at the Republican Tuberculosis Centre.
174 Ibid.
175 Ibid.
113
country’s needs, but other essential supplies – including chemical reagents needed to use the donated microscopes – are still in short supply. Challenges. The National Programme on DOTS for 2003-2010 has identified the following challenges:• Low rates of TB detection and statistical reporting countrywide;• Low preparedness of health professionals;• High growth of TB incidence and mortality among convicts in penitentiary institu-
tions;• Shortage of anti-TB drugs;• Inadequate supply of diagnostic facilities (binocular microscopes, reagents, tuberculin,
x-ray film);• Inadequate supply of anti-TB medical drugs (Rifampicin, Izoniazid, Ethambutol, Strep-
tomycin, Pyrazinamide and others);• Increase of drug resistance forms of TB, due to inadequate treatment.
Government MeasuresThe Ministry of Health of the RT in connection with completion of the National Programme on Combating TB for 1996-2000 (approved by Governmental Decision as of 06/13/1996 in 2000) has developed a new program for 2003-2010 (Government Decree № 524, as of 12/31, 2002). The policy and strategy stated in the National Program are based on WHO-recommendations and international experience in TB.
The national DOTS program is based on:1. Detection of TB cases through improved referral system and improved testing meth-
ods (microscopic and x-ray testing of “risk” groups); 2. Application of a standard short chemical therapy course; 3. Continuous supply of all anti TB medicines;4. Development of a monitoring and evaluation system countrywide; 5. Guaranteed Government support at various levels of program implementation. This
support should include ensuring of sustainable local and external financing of all main program activities;
6. Training of health specialists at national, regional, city and district levels in accordance with WHO standards;
7. Improvement of TB information management system;8. Provision of laboratory equipment across the country; 9. Integration of DOTs into the primary health care system.
Financial Estimations for combating TBUltimately, the actual cost of halting and reversing the spread of TB in Tajikistan will depend in large part on the effective implementation of health reforms. Estimates of the financial resources needed to achieve this MDG target is on the order of US$ 62.1million (Table 58). Calculations are based on official cost estimates from Tajikistan’s 2003 application to the Global Fund to Fight AIDS, Tuberculosis and Malaria. Main assumptions of the costing model include population projections, detection rate per 100,000 population, estimated total TB cases and registered TB cases as well as projections on medical drug resistant forms of TB
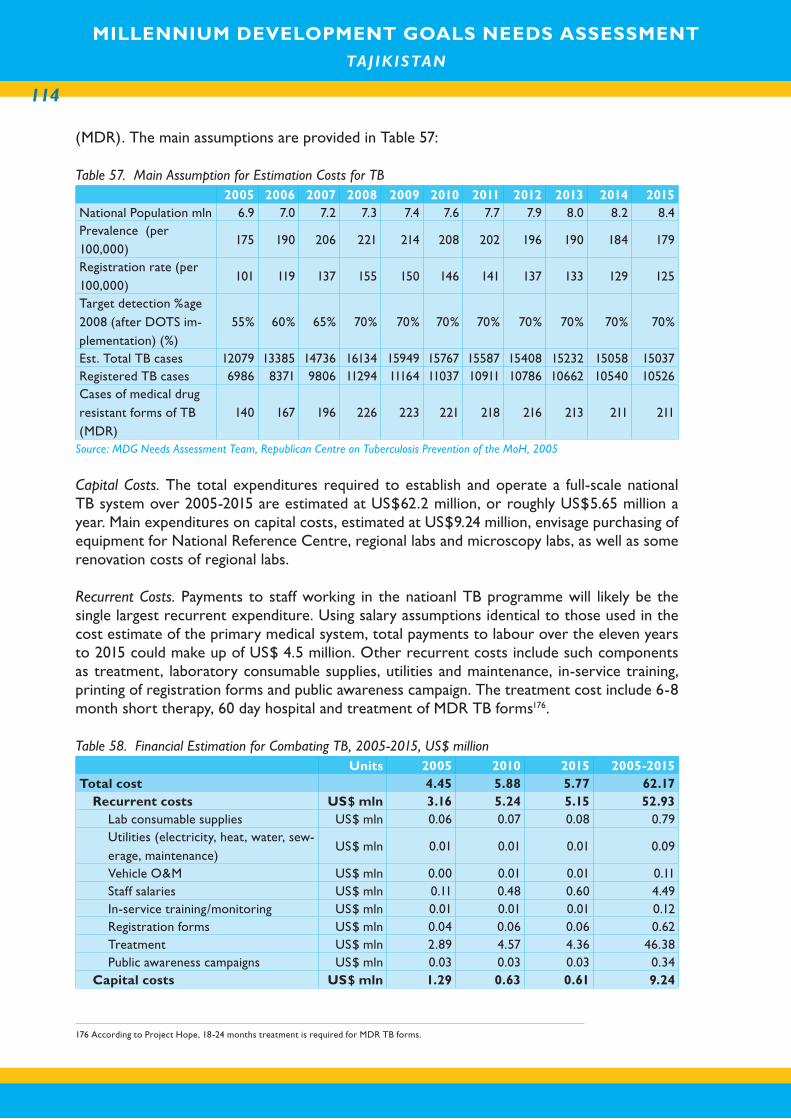
MILLENNIUM DEVELOPMENT GOALS NEEDS ASSESSMENT TAJ IK ISTAN
114
MILLENNIUM DEVELOPMENT GOALS NEEDS ASSESSMENT TAJ IK ISTAN
(MDR). The main assumptions are provided in Table 57:
Table 57. Main Assumption for Estimation Costs for TB2005 2006 2007 2008 2009 2010 2011 2012 2013 2014 2015
National Population mln 6.9 7.0 7.2 7.3 7.4 7.6 7.7 7.9 8.0 8.2 8.4Prevalence (per 100,000)
175 190 206 221 214 208 202 196 190 184 179
Registration rate (per 100,000)
101 119 137 155 150 146 141 137 133 129 125
Target detection %age 2008 (after DOTS im-plementation) (%)
55% 60% 65% 70% 70% 70% 70% 70% 70% 70% 70%
Est. Total TB cases 12079 13385 14736 16134 15949 15767 15587 15408 15232 15058 15037Registered TB cases 6986 8371 9806 11294 11164 11037 10911 10786 10662 10540 10526Cases of medical drug resistant forms of TB (MDR)
140 167 196 226 223 221 218 216 213 211 211
Source: MDG Needs Assessment Team, Republican Centre on Tuberculosis Prevention of the MoH, 2005
Capital Costs. The total expenditures required to establish and operate a full-scale national TB system over 2005-2015 are estimated at US$62.2 million, or roughly US$5.65 million a year. Main expenditures on capital costs, estimated at US$9.24 million, envisage purchasing of equipment for National Reference Centre, regional labs and microscopy labs, as well as some renovation costs of regional labs.
Recurrent Costs. Payments to staff working in the natioanl TB programme will likely be the single largest recurrent expenditure. Using salary assumptions identical to those used in the cost estimate of the primary medical system, total payments to labour over the eleven years to 2015 could make up of US$ 4.5 million. Other recurrent costs include such components as treatment, laboratory consumable supplies, utilities and maintenance, in-service training, printing of registration forms and public awareness campaign. The treatment cost include 6-8 month short therapy, 60 day hospital and treatment of MDR TB forms176.
Table 58. Financial Estimation for Combating TB, 2005-2015, US$ million Units 2005 2010 2015 2005-2015
Total cost 4.45 5.88 5.77 62.17Recurrent costs US$ mln 3.16 5.24 5.15 52.93
Lab consumable supplies US$ mln 0.06 0.07 0.08 0.79Utilities (electricity, heat, water, sew-erage, maintenance)
US$ mln 0.01 0.01 0.01 0.09
Vehicle O&M US$ mln 0.00 0.01 0.01 0.11Staff salaries US$ mln 0.11 0.48 0.60 4.49In-service training/monitoring US$ mln 0.01 0.01 0.01 0.12Registration forms US$ mln 0.04 0.06 0.06 0.62Treatment US$ mln 2.89 4.57 4.36 46.38Public awareness campaigns US$ mln 0.03 0.03 0.03 0.34
Capital costs US$ mln 1.29 0.63 0.61 9.24
176 According to Project Hope, 18-24 months treatment is required for MDR TB forms.
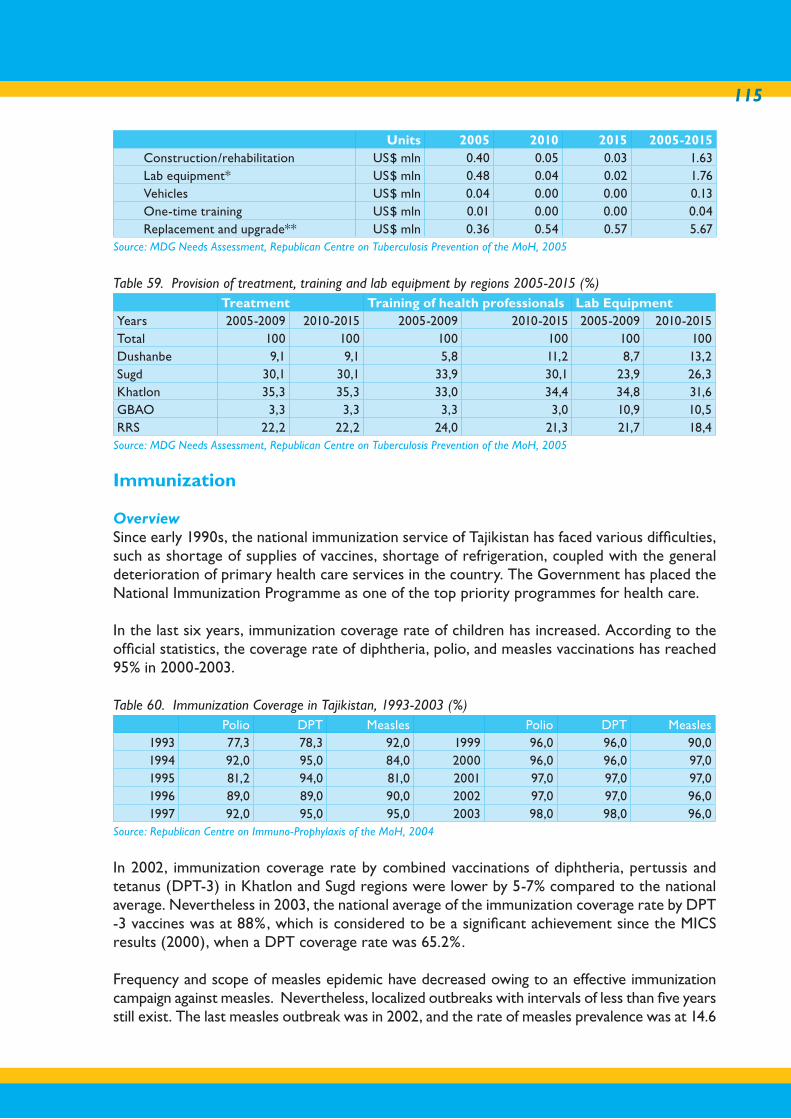
115
Units 2005 2010 2015 2005-2015Construction/rehabilitation US$ mln 0.40 0.05 0.03 1.63Lab equipment* US$ mln 0.48 0.04 0.02 1.76Vehicles US$ mln 0.04 0.00 0.00 0.13One-time training US$ mln 0.01 0.00 0.00 0.04Replacement and upgrade** US$ mln 0.36 0.54 0.57 5.67
Source: MDG Needs Assessment, Republican Centre on Tuberculosis Prevention of the MoH, 2005
Table 59. Provision of treatment, training and lab equipment by regions 2005-2015 (%)Treatment Training of health professionals Lab Equipment
Years 2005-2009 2010-2015 2005-2009 2010-2015 2005-2009 2010-2015Total 100 100 100 100 100 100Dushanbe 9,1 9,1 5,8 11,2 8,7 13,2Sugd 30,1 30,1 33,9 30,1 23,9 26,3Khatlon 35,3 35,3 33,0 34,4 34,8 31,6GBAO 3,3 3,3 3,3 3,0 10,9 10,5RRS 22,2 22,2 24,0 21,3 21,7 18,4
Source: MDG Needs Assessment, Republican Centre on Tuberculosis Prevention of the MoH, 2005
Immunization
OverviewSince early 1990s, the national immunization service of Tajikistan has faced various difficulties, such as shortage of supplies of vaccines, shortage of refrigeration, coupled with the general deterioration of primary health care services in the country. The Government has placed the National Immunization Programme as one of the top priority programmes for health care.
In the last six years, immunization coverage rate of children has increased. According to the official statistics, the coverage rate of diphtheria, polio, and measles vaccinations has reached 95% in 2000-2003.
Table 60. Immunization Coverage in Tajikistan, 1993-2003 (%)Polio DPT Measles Polio DPT Measles
1993 77,3 78,3 92,0 1999 96,0 96,0 90,01994 92,0 95,0 84,0 2000 96,0 96,0 97,01995 81,2 94,0 81,0 2001 97,0 97,0 97,01996 89,0 89,0 90,0 2002 97,0 97,0 96,01997 92,0 95,0 95,0 2003 98,0 98,0 96,0
Source: Republican Centre on Immuno-Prophylaxis of the MoH, 2004
In 2002, immunization coverage rate by combined vaccinations of diphtheria, pertussis and tetanus (DPT-3) in Khatlon and Sugd regions were lower by 5-7% compared to the national average. Nevertheless in 2003, the national average of the immunization coverage rate by DPT -3 vaccines was at 88%, which is considered to be a significant achievement since the MICS results (2000), when a DPT coverage rate was 65.2%.
Frequency and scope of measles epidemic have decreased owing to an effective immunization campaign against measles. Nevertheless, localized outbreaks with intervals of less than five years still exist. The last measles outbreak was in 2002, and the rate of measles prevalence was at 14.6
MILLENNIUM DEVELOPMENT GOALS NEEDS ASSESSMENT TAJ IK ISTAN
116
MILLENNIUM DEVELOPMENT GOALS NEEDS ASSESSMENT TAJ IK ISTAN
per 100,000. In 2003 the prevalence rate increased to 34.0 per 100,000. In order to prevent another measles outbreak the coverage rate against measles needs to reach 95% countrywide.Though diphtheria incidence over the recent years has been stabilized, and only sporadic cases from 0.60 per 100,000 (1999) to 0.24 per 100,000 (2003) have been registered. The last outbreak of diphtheria in Tajikistan was registered in 1994-1995, and the incidence rate was 34.4 and 76.8 per 100 000 accordingly. In1995 the registered lethal cases of diphtheria were 264, mostly among chil-dren and adolescents. Due to efforts of humanitarian aid agencies, public t campaign on diphtheria immunization was carried out in autumn of 1995, which stabilized the diphtheria epidemic. How-ever, since this campaign, the coverage rate by DT and DT M vaccinations decreased substantially, owing to the lack of vaccinations. This poses a potential risk of another outbreak.
In September 2003, the MoH developed an action plan to improve the safety of immunization administration. The results of the survey conducted by the MoH in 2002 showed that in two pilot areas of Dushanbe city and Khatlon province disposable syringes were used exclusively for administering vaccinations. However, in many rural areas basic sanitary procedures were not followed, and in some cases, contaminated needles were reused. Currently, only 50-60% of the primary health care units administering vaccinations are supplied with refrigeration sys-tems, and the shortage of refrigerating equipment contributes to the high rates of vaccination losses. The MoH reported that administrative losses of vaccines range from 12% up to 70%, due to the lack of appropriate equipment and storing methods.
Immunization financing. Financing of the National Immunization Programme is very low, and in 2003 the total budget of the program accounted to 12.4% of the total immunization efforts. Most of financing is received from key donors such as Global Alliance of Vaccination and Im-munization (GAVI) and UNICEF, who meet 22.95 % and 54.46 % of vaccination needs accord-ingly. Also, Aga Khan Foundation, Merlin, Medicine San Frontiers (Holland) also contribute to financing of immunization efforts in the country. Challenges. The main challenges in providing effective immunization coverage in the country are as follows:• Difficulty of vaccinating children living in remote mountainous regions;• Lack of funds for vaccines for adolescent and adult population;• Shortage of refrigerating equipment in healthcare facilities, inobservance of proper
storage of vaccines due to frequent seasonal power outages; • Inadequate monitoring mechanisms of localized outbreaks of diseases;• Low level of public awareness on the necessity of vaccinating children;• Low level of overall financing of the National Immunization Programme;• Lack of integration of vaccinations in the primary health care system.
Government MeasuresThe Republican Immuno-prophylaxis Centre coordinates at the national level all immunization activities. The centre was created in July 1996 by the Order of the Ministry of Health #304, and has six regional branches operating at the moment in Dushanbe, Kurgan Tube, Kulob (Khatlon province), Khujand (Sugd province), Khorog (GBAO), and Rasht (Rasht valley). In early 2004, 64 immuno-prophylaxis centres were created, which improved efforts to inte-grate vaccination efforts into the primary healthcare system.
In May 2000, the Inter-departmental Coordination Committee (ICC) on Immuno-prophylaxis
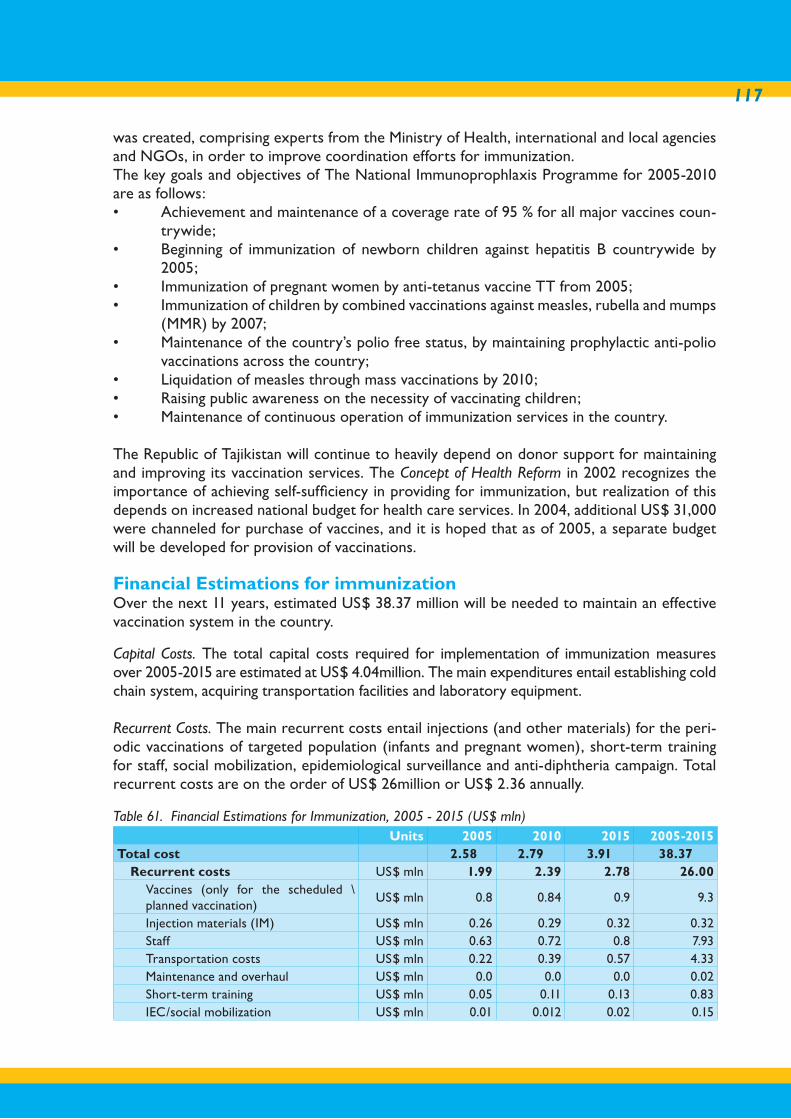
117
was created, comprising experts from the Ministry of Health, international and local agencies and NGOs, in order to improve coordination efforts for immunization. The key goals and objectives of The National Immunoprophlaxis Programme for 2005-2010 are as follows:• Achievement and maintenance of a coverage rate of 95 % for all major vaccines coun-
trywide; • Beginning of immunization of newborn children against hepatitis B countrywide by
2005;• Immunization of pregnant women by anti-tetanus vaccine TT from 2005;• Immunization of children by combined vaccinations against measles, rubella and mumps
(MMR) by 2007;• Maintenance of the country’s polio free status, by maintaining prophylactic anti-polio
vaccinations across the country; • Liquidation of measles through mass vaccinations by 2010;• Raising public awareness on the necessity of vaccinating children;• Maintenance of continuous operation of immunization services in the country.
The Republic of Tajikistan will continue to heavily depend on donor support for maintaining and improving its vaccination services. The Concept of Health Reform in 2002 recognizes the importance of achieving self-sufficiency in providing for immunization, but realization of this depends on increased national budget for health care services. In 2004, additional US$ 31,000 were channeled for purchase of vaccines, and it is hoped that as of 2005, a separate budget will be developed for provision of vaccinations. Financial Estimations for immunizationOver the next 11 years, estimated US$ 38.37 million will be needed to maintain an effective vaccination system in the country.
Capital Costs. The total capital costs required for implementation of immunization measures over 2005-2015 are estimated at US$ 4.04million. The main expenditures entail establishing cold chain system, acquiring transportation facilities and laboratory equipment.
Recurrent Costs. The main recurrent costs entail injections (and other materials) for the peri-odic vaccinations of targeted population (infants and pregnant women), short-term training for staff, social mobilization, epidemiological surveillance and anti-diphtheria campaign. Total recurrent costs are on the order of US$ 26million or US$ 2.36 annually. Table 61. Financial Estimations for Immunization, 2005 - 2015 (US$ mln)
Units 2005 2010 2015 2005-2015Total cost 2.58 2.79 3.91 38.37
Recurrent costs US$ mln 1.99 2.39 2.78 26.00Vaccines (only for the scheduled \ planned vaccination)
US$ mln 0.8 0.84 0.9 9.3
Injection materials (IM) US$ mln 0.26 0.29 0.32 0.32 Staff US$ mln 0.63 0.72 0.8 7.93Transportation costs US$ mln 0.22 0.39 0.57 4.33Maintenance and overhaul US$ mln 0.0 0.0 0.0 0.02Short-term training US$ mln 0.05 0.11 0.13 0.83IEC/social mobilization US$ mln 0.01 0.012 0.02 0.15
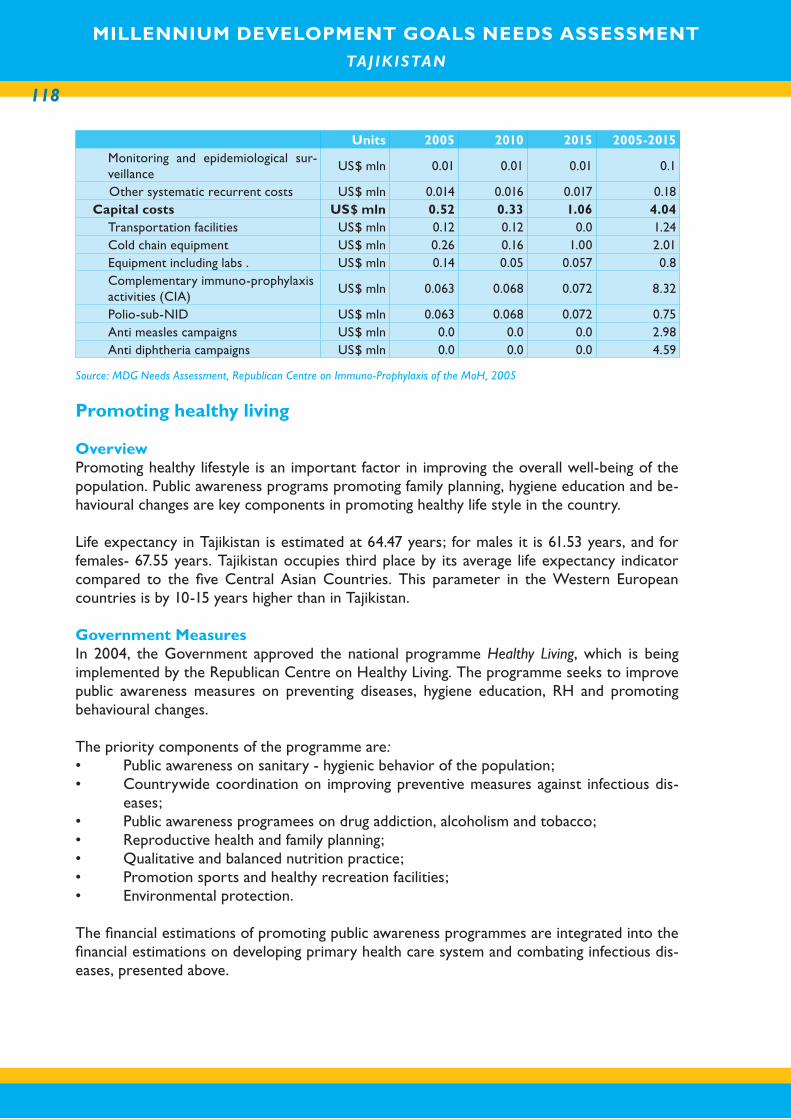
MILLENNIUM DEVELOPMENT GOALS NEEDS ASSESSMENT TAJ IK ISTAN
118
MILLENNIUM DEVELOPMENT GOALS NEEDS ASSESSMENT TAJ IK ISTAN
Units 2005 2010 2015 2005-2015Monitoring and epidemiological sur-veillance
US$ mln 0.01 0.01 0.01 0.1
Other systematic recurrent costs US$ mln 0.014 0.016 0.017 0.18 Capital costs US$ mln 0.52 0.33 1.06 4.04
Transportation facilities US$ mln 0.12 0.12 0.0 1.24Cold chain equipment US$ mln 0.26 0.16 1.00 2.01Equipment including labs . US$ mln 0.14 0.05 0.057 0.8Complementary immuno-prophylaxis activities (CIA)
US$ mln 0.063 0.068 0.072 8.32
Polio-sub-NID US$ mln 0.063 0.068 0.072 0.75Anti measles campaigns US$ mln 0.0 0.0 0.0 2.98Anti diphtheria campaigns US$ mln 0.0 0.0 0.0 4.59
Source: MDG Needs Assessment, Republican Centre on Immuno-Prophylaxis of the MoH, 2005
Promoting healthy living OverviewPromoting healthy lifestyle is an important factor in improving the overall well-being of the population. Public awareness programs promoting family planning, hygiene education and be-havioural changes are key components in promoting healthy life style in the country.
Life expectancy in Tajikistan is estimated at 64.47 years; for males it is 61.53 years, and for females- 67.55 years. Tajikistan occupies third place by its average life expectancy indicator compared to the five Central Asian Countries. This parameter in the Western European countries is by 10-15 years higher than in Tajikistan.
Government MeasuresIn 2004, the Government approved the national programme Healthy Living, which is being implemented by the Republican Centre on Healthy Living. The programme seeks to improve public awareness measures on preventing diseases, hygiene education, RH and promoting behavioural changes.
The priority components of the programme are:• Public awareness on sanitary - hygienic behavior of the population; • Countrywide coordination on improving preventive measures against infectious dis-
eases;• Public awareness programees on drug addiction, alcoholism and tobacco;• Reproductive health and family planning;• Qualitative and balanced nutrition practice;• Promotion sports and healthy recreation facilities;• Environmental protection.
The financial estimations of promoting public awareness programmes are integrated into the financial estimations on developing primary health care system and combating infectious dis-eases, presented above.
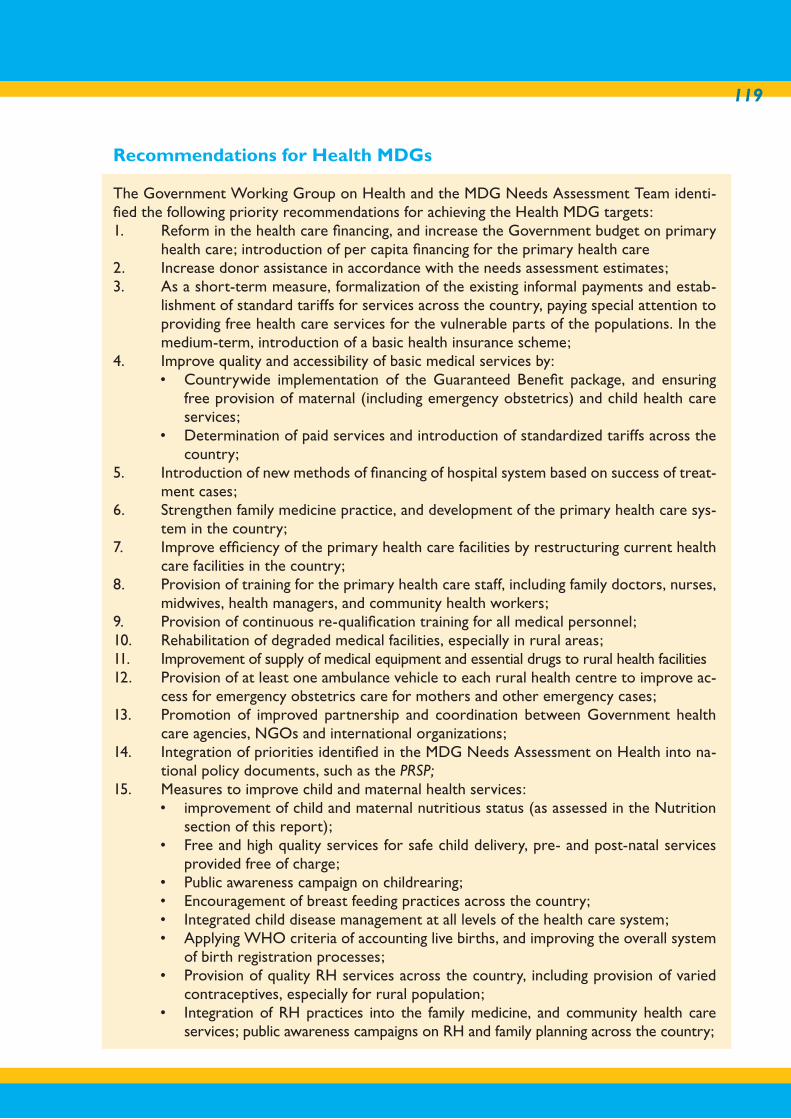
119
Recommendations for Health MDGs
The Government Working Group on Health and the MDG Needs Assessment Team identi-fied the following priority recommendations for achieving the Health MDG targets:1. Reform in the health care financing, and increase the Government budget on primary
health care; introduction of per capita financing for the primary health care2. Increase donor assistance in accordance with the needs assessment estimates;3. As a short-term measure, formalization of the existing informal payments and estab-
lishment of standard tariffs for services across the country, paying special attention to providing free health care services for the vulnerable parts of the populations. In the medium-term, introduction of a basic health insurance scheme;
4. Improve quality and accessibility of basic medical services by:• Countrywide implementation of the Guaranteed Benefit package, and ensuring
free provision of maternal (including emergency obstetrics) and child health care services;
• Determination of paid services and introduction of standardized tariffs across the country;
5. Introduction of new methods of financing of hospital system based on success of treat-ment cases;
6. Strengthen family medicine practice, and development of the primary health care sys-tem in the country;
7. Improve efficiency of the primary health care facilities by restructuring current health care facilities in the country;
8. Provision of training for the primary health care staff, including family doctors, nurses, midwives, health managers, and community health workers;
9. Provision of continuous re-qualification training for all medical personnel; 10. Rehabilitation of degraded medical facilities, especially in rural areas;11. Improvement of supply of medical equipment and essential drugs to rural health facilities12. Provision of at least one ambulance vehicle to each rural health centre to improve ac-
cess for emergency obstetrics care for mothers and other emergency cases;13. Promotion of improved partnership and coordination between Government health
care agencies, NGOs and international organizations;14. Integration of priorities identified in the MDG Needs Assessment on Health into na-
tional policy documents, such as the PRSP;15. Measures to improve child and maternal health services:
• improvement of child and maternal nutritious status (as assessed in the Nutrition section of this report);
• Free and high quality services for safe child delivery, pre- and post-natal services provided free of charge;
• Public awareness campaign on childrearing; • Encouragement of breast feeding practices across the country;• Integrated child disease management at all levels of the health care system;• Applying WHO criteria of accounting live births, and improving the overall system
of birth registration processes;• Provision of quality RH services across the country, including provision of varied
contraceptives, especially for rural population;• Integration of RH practices into the family medicine, and community health care
services; public awareness campaigns on RH and family planning across the country;
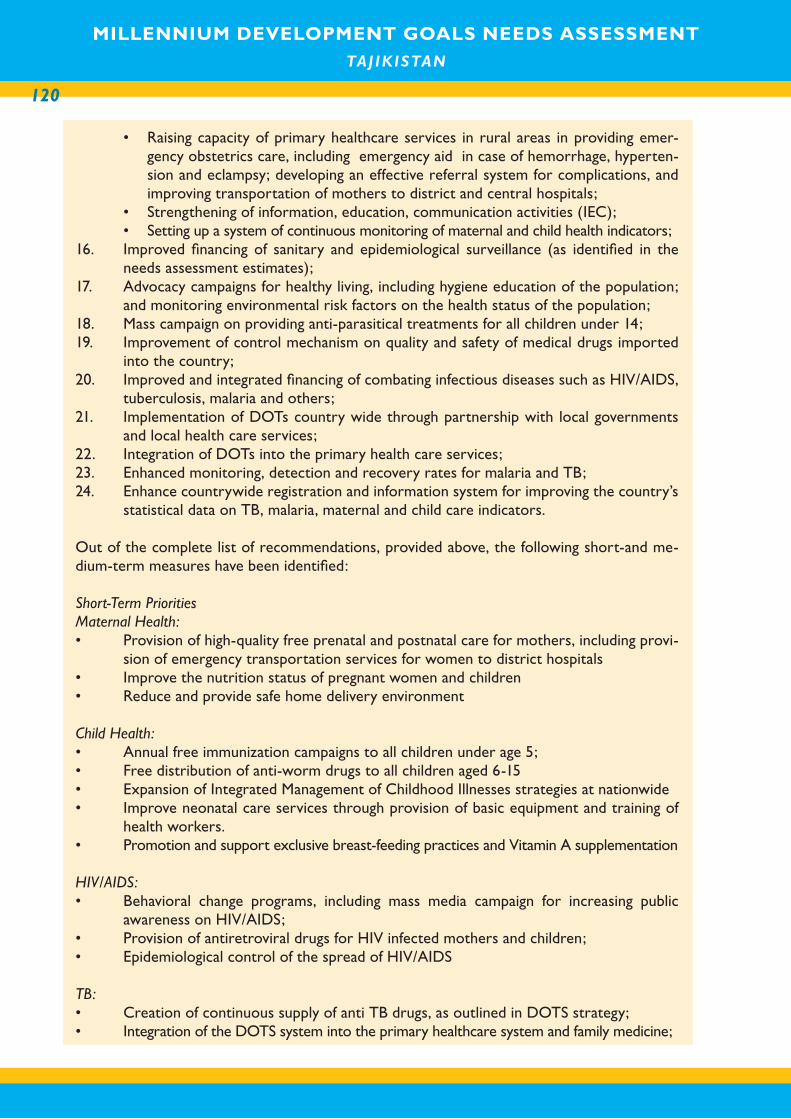
MILLENNIUM DEVELOPMENT GOALS NEEDS ASSESSMENT TAJ IK ISTAN
120
MILLENNIUM DEVELOPMENT GOALS NEEDS ASSESSMENT TAJ IK ISTAN
• Raising capacity of primary healthcare services in rural areas in providing emer-gency obstetrics care, including emergency aid in case of hemorrhage, hyperten-sion and eclampsy; developing an effective referral system for complications, and improving transportation of mothers to district and central hospitals;
• Strengthening of information, education, communication activities (IEC);• Setting up a system of continuous monitoring of maternal and child health indicators;
16. Improved financing of sanitary and epidemiological surveillance (as identified in the needs assessment estimates);
17. Advocacy campaigns for healthy living, including hygiene education of the population; and monitoring environmental risk factors on the health status of the population;
18. Mass campaign on providing anti-parasitical treatments for all children under 14;19. Improvement of control mechanism on quality and safety of medical drugs imported
into the country; 20. Improved and integrated financing of combating infectious diseases such as HIV/AIDS,
tuberculosis, malaria and others;21. Implementation of DOTs country wide through partnership with local governments
and local health care services;22. Integration of DOTs into the primary health care services;23. Enhanced monitoring, detection and recovery rates for malaria and TB;24. Enhance countrywide registration and information system for improving the country’s
statistical data on TB, malaria, maternal and child care indicators.
Out of the complete list of recommendations, provided above, the following short-and me-dium-term measures have been identified:
Short-Term PrioritiesMaternal Health: • Provision of high-quality free prenatal and postnatal care for mothers, including provi-
sion of emergency transportation services for women to district hospitals• Improve the nutrition status of pregnant women and children• Reduce and provide safe home delivery environment
Child Health:• Annual free immunization campaigns to all children under age 5;• Free distribution of anti-worm drugs to all children aged 6-15• Expansion of Integrated Management of Childhood Illnesses strategies at nationwide • Improve neonatal care services through provision of basic equipment and training of
health workers. • Promotion and support exclusive breast-feeding practices and Vitamin A supplementation
HIV/AIDS:• Behavioral change programs, including mass media campaign for increasing public
awareness on HIV/AIDS; • Provision of antiretroviral drugs for HIV infected mothers and children; • Epidemiological control of the spread of HIV/AIDS
TB:• Creation of continuous supply of anti TB drugs, as outlined in DOTS strategy;• Integration of the DOTS system into the primary healthcare system and family medicine;
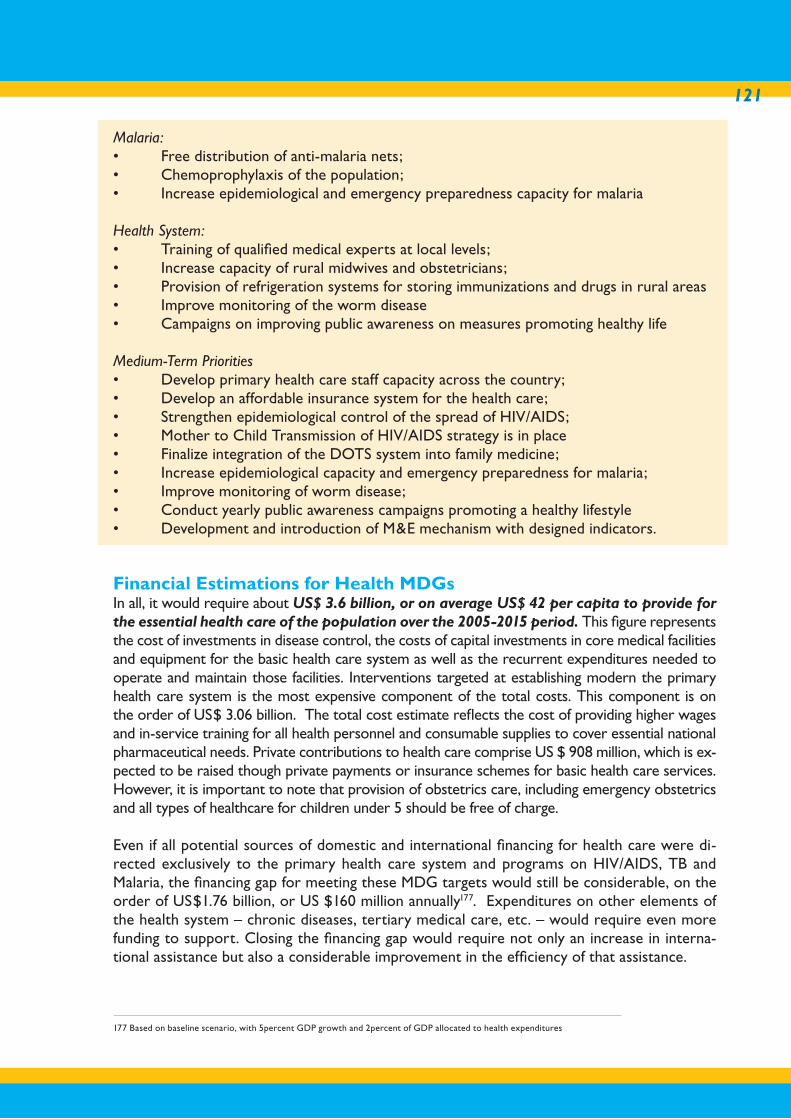
121
Malaria:• Free distribution of anti-malaria nets; • Chemoprophylaxis of the population;• Increase epidemiological and emergency preparedness capacity for malaria
Health System:• Training of qualified medical experts at local levels;• Increase capacity of rural midwives and obstetricians;• Provision of refrigeration systems for storing immunizations and drugs in rural areas• Improve monitoring of the worm disease• Campaigns on improving public awareness on measures promoting healthy life
Medium-Term Priorities• Develop primary health care staff capacity across the country;• Develop an affordable insurance system for the health care;• Strengthen epidemiological control of the spread of HIV/AIDS;• Mother to Child Transmission of HIV/AIDS strategy is in place• Finalize integration of the DOTS system into family medicine;• Increase epidemiological capacity and emergency preparedness for malaria;• Improve monitoring of worm disease;• Conduct yearly public awareness campaigns promoting a healthy lifestyle• Development and introduction of M&E mechanism with designed indicators.
Financial Estimations for Health MDGsIn all, it would require about US$ 3.6 billion, or on average US$ 42 per capita to provide for the essential health care of the population over the 2005-2015 period. This figure represents the cost of investments in disease control, the costs of capital investments in core medical facilities and equipment for the basic health care system as well as the recurrent expenditures needed to operate and maintain those facilities. Interventions targeted at establishing modern the primary health care system is the most expensive component of the total costs. This component is on the order of US$ 3.06 billion. The total cost estimate reflects the cost of providing higher wages and in-service training for all health personnel and consumable supplies to cover essential national pharmaceutical needs. Private contributions to health care comprise US $ 908 million, which is ex-pected to be raised though private payments or insurance schemes for basic health care services. However, it is important to note that provision of obstetrics care, including emergency obstetrics and all types of healthcare for children under 5 should be free of charge.
Even if all potential sources of domestic and international financing for health care were di-rected exclusively to the primary health care system and programs on HIV/AIDS, TB and Malaria, the financing gap for meeting these MDG targets would still be considerable, on the order of US$1.76 billion, or US $160 million annually177. Expenditures on other elements of the health system – chronic diseases, tertiary medical care, etc. – would require even more funding to support. Closing the financing gap would require not only an increase in interna-tional assistance but also a considerable improvement in the efficiency of that assistance.
177 Based on baseline scenario, with 5percent GDP growth and 2percent of GDP allocated to health expenditures
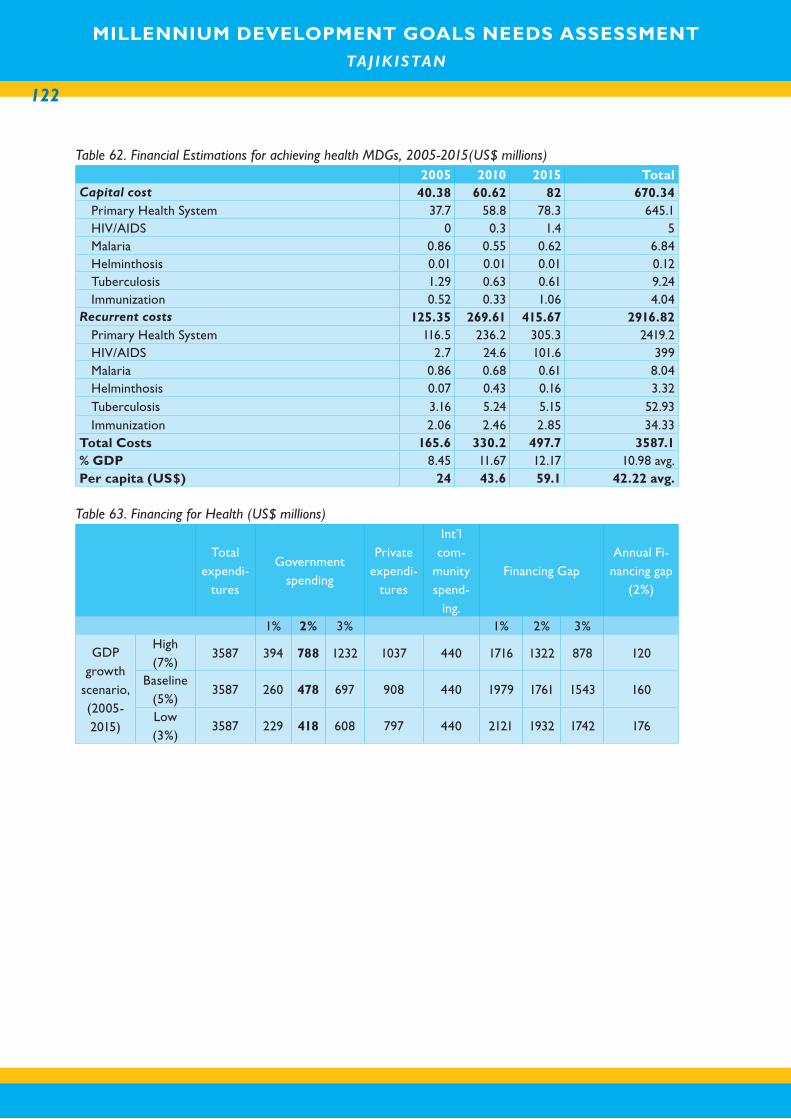
MILLENNIUM DEVELOPMENT GOALS NEEDS ASSESSMENT TAJ IK ISTAN
122
MILLENNIUM DEVELOPMENT GOALS NEEDS ASSESSMENT TAJ IK ISTAN
Table 62. Financial Estimations for achieving health MDGs, 2005-2015(US$ millions)2005 2010 2015 Total
Capital cost 40.38 60.62 82 670.34Primary Health System 37.7 58.8 78.3 645.1HIV/AIDS 0 0.3 1.4 5Malaria 0.86 0.55 0.62 6.84Helminthosis 0.01 0.01 0.01 0.12Tuberculosis 1.29 0.63 0.61 9.24Immunization 0.52 0.33 1.06 4.04
Recurrent costs 125.35 269.61 415.67 2916.82Primary Health System 116.5 236.2 305.3 2419.2HIV/AIDS 2.7 24.6 101.6 399Malaria 0.86 0.68 0.61 8.04Helminthosis 0.07 0.43 0.16 3.32Tuberculosis 3.16 5.24 5.15 52.93Immunization 2.06 2.46 2.85 34.33
Total Costs 165.6 330.2 497.7 3587.1% GDP 8.45 11.67 12.17 10.98 avg.Per capita (US$) 24 43.6 59.1 42.22 avg.
Table 63. Financing for Health (US$ millions)
Total expendi-
tures
Government spending
Private expendi-
tures
Int’l com-
munity spend-
ing.
Financing GapAnnual Fi-nancing gap
(2%)
1% 2% 3% 1% 2% 3%
GDP growth
scenario, (2005-2015)
High (7%)
3587 394 788 1232 1037 440 1716 1322 878 120
Baseline (5%)
3587 260 478 697 908 440 1979 1761 1543 160
Low(3%)
3587 229 418 608 797 440 2121 1932 1742 176
123
9. MDG 7: PROMOTING SUSTAINABLE
ENVIRONMENT AND IMPROVING WATER
AND SANITATION SERVICES
Goal 7. Ensure Environmental Sustainability
Target 9: Integrate the principles of sustainable development into country poli-cies and the programmes and reverse the loss of environmental resources
Target 10: Halve, by 2015, the proportion of people without sustainable access to safe drinking water and public sanitation
Target 11: Have achieved by 2020 a significant improvement in the lives of at least 100 million slum dwellers
Achieving Environmental Sustainability
OverviewEnvironmental sustainability is an essential part of the global effort to reduce poverty, improve situation with food security, education, health and gender inequality. Analysis of inextricable and casual linkages between the environmental degradation and the quality of life in Tajikistan allowed the MDG needs assessment team in consultation with various Government, non-Government and international institutions identify a number of activities that address issues of climate change (energy efficiency and Clean Development Mechanism (CDM)), natural resource management (water, forest, and land), waste management (household and indus-trial), biodiversity protection (protected areas), environmental monitoring, prevention of natural disasters, transboundary cooperation, and integration of principles and practices of environmental sustainability into the country’s policy and planning programmes. This chapter describes current situation in the above areas and focuses on policy reforms, selected activi-ties and the financial resources needed to achieve the Millennium Development Goal 7 and the Target 9 “Integrate the principles of sustainable development into country policies and the programmes and reverse the loss of environmental resources,” in particular. All identified activities have potential to contribute to sound planning in such sectors like agriculture, water, forestry, energy, transportation, health, and industrial development.
Main InterventionsA. Climate Change Mitigation Activities and Policies section provides information on the cur-
rent irregular supply of electricity and fuel to both households and the industrial sec-tor resulting from a number of reasons including obsolete equipment and the use of energy intensive production technologies. The analysis identifies national strategies and recommendations, as well as the cost estimation for interventions directed to-
MILLENNIUM DEVELOPMENT GOALS NEEDS ASSESSMENT TAJ IK ISTAN
124
MILLENNIUM DEVELOPMENT GOALS NEEDS ASSESSMENT TAJ IK ISTAN
wards improving situation through climate change mitigation activities and policies on energy efficiency and the CDM.
B. Preventing or reversing land degradation is in close relation with MDG 1. Since 70 % of Tajikistan’s population lives in rural areas, they all depend on natural resources for their livelihoods. By addressing land degradation caused by unsustainable agriculture practices, it will be possible to improve productivity and, therefore, increase income from arable lands and pastures. Specifically, this section focuses on the interventions that will enhance fertility of arable lands and improve quality of pastures through a number of activities such as rehabilitation of windbreaks, use of cover crops, training sessions on sustainable land management practices and land-use reforms.
C. Improving management of protected areas is a significant segment of the country’s de-velopment. Improved management of protected areas (PAs) will allow Tajikistan both maintain its unique biological diversity and contribute to local development though employment (services and handicraft business) and eco-tourism. Interventions such as infrastructure rehabilitation, capacity building, research and survey, and revision of current policies and legislation will improve status of the PAs and their management. Additional intervention such as micro credit support has been identified as the mea-sure to improve economic situation in the communities surrounding protected areas and prevent them from contributing to deforestation and environmental degradation.
D. Sustainable forestry is an important MDG indicator that provides linkages between the use of forest ecosystems and the living standards of the rural communities. Poverty and the constrained access to the sources of fuel for domestic cooking and heating, and rising prices for fossil fuels have contributed to the increased harvesting of forests for fuelwood, causing serious degradation of forests. This section focuses on reforestation activities and the capacity building for the employees of the forestry department and the existing nurseries. Also, a proposed feasibility study on needs for the community run nurseries and reforestation may help identify areas of possible intervention and, therefore, promote local development and improve situation with local employment.
E. Investments in waste management are essential for reducing negative impacts on hu-man health and the environment. The analysis of the current disposal practices helped identify national strategies and recommendations, as well as the cost estimation for interventions on introduction and enforcement of sound management practices of both the household and industrial waste. In addition, activities that promote accession to the Control of Transboundary Movements of Hazardous Wastes and their Disposal (Basel) and the POPs (Persistent Organic Pollutants) Conventions are considered ben-eficial for building capacity and information sharing on hazardous waste minimization, treatment, recycling and disposal methods and the protection of human health and the environment from persistent organic pollutants.
F. Development of new strategies for integrated waster resources management is key to sus-tainable development and the survival of ecosystems. Introduction of integrated water resources management will improve management of wetlands, water catchment areas, and freshwater ecosystems critical for ensuring access to drinking water and for func-tioning of ecosystems. This section identifies steps that will introduce policies based on the concept of water management by catchment area, which requires profound changes in the water institutions with decentralization of both decision-making and financing.
G. Environmental monitoring is crucial for having information on the state of the environ-ment as well as on various pollution trends and the effects of development. Rehabilita-tion of the weakened monitoring system will provide basis to analyze both the national
125
and international impact of various sources of pollution and assess the quality of en-vironment. Also, investments in regulatory and market reforms to reduce environ-mental degradation; legal and regulatory reforms, aimed at increasing efficiency of the overall monitoring system performance; and harmonization of standards and penalty structures - are key for ensuring environmental sustainability in Tajikistan..
H. Disaster prevention section combines investment activities in the areas of i) training on prevention and preparedness, awareness raising, early warning mechanisms for the most vulnerable communities and the strengthening of the indigenous knowledge on the nature of natural disaster; and ii) prevention through improving management of the existing infrastructures (e.g. considering original flood patters of rivers in order to avoid excessive floods downstream) and sustainable development practices (e.g. no deforestation in upstream areas, active reforestation). In addition, raising public awareness on disaster prevention is an important element of the strategy for improv-ing quality and safety of life.
I. Improving trans-boundary cooperation is critical for economic growth and poverty reduc-tion in Tajikistan. Tajikistan is part of a number of regional and bi-lateral agreements. The analysis identifies interventions such as assessment of the effectiveness of existing regional and bi-lateral agreements and of on-going activities. Additional investments such as technical assistance for harmonization of national legislation with internationally ac-cepted standards and norms have been identified as an important segment contributing to the success of trans-boundary cooperation on environmental issues.
J. Integration of environmental sustainability into sectoral strategies is essential to achieving all other Millennium Development Goals. This section focuses on interventions target-ing institutional strengthening, and reforms of the existing institutional arrangements, including environmental management systems. Also, investment is needed to integrate environmental strategies into all sectoral policies, strengthen environmental impact assessment (EIA) mechanisms, reform environmental fund(s), and improve skills of environmental experts working for various government agencies in the areas of agri-culture, health, energy, transport, and water supply.
The main coverage targets assume that by 2015: 1) 70% of the households, and 100% of policy makers, relevant industry representative and the majority of the population will be covered by public awareness programs for reducing effects of climate change; 2) 30% of all arable land will be affected by the proposed anti-erosion measures; 3) planting of cover crops will take place on 15% of pastures; 4) 90% of the PAs’ infrastructure will be rehabilitated; 5) all communities living near protected areas will be provided by micro-credit and other support for establish-ment of eco-tourism services (guest-houses, family-run restaurants, handicraft businesses) to improve employment opportunities and reduce negative impact on the PAs; 6) national disas-ter management plan with elements of disaster prevention mechanisms will be established; 7) reforestation increased to 13,000 hectares annually, and 8) the majority of the population will be effected by public awareness, and 100% local governments and service providers will be covered by capacity-building programmes on environmentally sustainable waste management practices. In addition, rehabilitation/construction of 159 landfills will take place by 2010.
Introduction of sustainable natural resources management practices by 2015 is the main outcome of these interventions.

MILLENNIUM DEVELOPMENT GOALS NEEDS ASSESSMENT TAJ IK ISTAN
126
MILLENNIUM DEVELOPMENT GOALS NEEDS ASSESSMENT TAJ IK ISTAN
Climate Change Mitigation
OverviewEnergy efficiency. During the Soviet era Tajikistan did not experience shortages in electricity supply. According to the Tajikistan National Communication on Climate Change (2003), in the 1990s Tajikistan experienced an almost tenfold decrease in electricity consumption (the result of economic decline). Despite the dramatic economic recession and the related reduc-tion in energy consumption, the share of electricity in the overall consumption of energy has increased to 84 %. This upward shift in electricity use could be explained by the fact that some industrial enterprises and the overwhelming majority of households switched to electricity intensive industrial processes and heating respectively. Increase in electricity consumption has been also the result of the relatively low tariffs on electricity and its easy-to-consume nature. According to the Poverty Reduction Strategy for Tajikistan (2002), the shortfall of the do-mestically generated electricity amounts to 15%, or about 2 billion kWh per year. Tajikistan fills the shortfalls through purchases from Uzbekistan, Kyrgyzstan, and Turkmenistan. The country also imports oil and gas for the Thermal Power Plants and the household use. Elec-tricity supply in rural and remote areas of Tajikistan is even worse; during the winter months these areas receive electricity for a few hours a day. Currently, systematic power cuts have also become frequent in large cities. In addition, the supplied electricity is usually of poor qual-ity (unstable voltage and frequency). This instability adversely affects the quality of services (electricity and water supply) and frequently causes equipment failure. In addition, obsolete equipment and outdated industrial production technologies use considerably more electricity compared to the previous years. For example, according to the Tajikistan National Commu-nication on Climate Change, Tajik Aluminum Plant is using 22 thousand kWh to produce one ton of aluminum that is twice as much as it should be.
Difficulties with electricity supply could be eased through introduction of energy efficient tech-nologies that reduce energy use, cut greenhouse gas emissions contributing to climate change, and save money to households and industry. Activities proposed by the needs assessment team target promotion of energy efficiency at household level (weatherization and use of energy-ef-ficient appliances) and at the level of the most energy-intensive industries, including agriculture, the aluminum and the mining industries. Also, the project team proposes to design an Energy Efficiency Strategy (Strategy) that could set conditions and opportunities for energy efficiency in Tajikistan and recommend priority activities in energy efficiency over short, medium, and long terms. The Strategy will help to remove obstacles and provide incentives, as needed, to encourage greater energy efficiency and the development and/or diffusion of new technologies for energy for sustainable development. Also, the Strategy could encourage greater international co-operation in the areas such as technology procurement, harmonization of environmental taxes, emissions trading, and energy efficiency standards for equipment and products.
Clean Development Mechanism. The Clean Development Mechanism (CDM) is one of several “flexibility mechanisms” authorized by the December 1997 Kyoto Protocol (the Protocol) to the 1992 United Nations Framework Convention on Climate Change. The Kyoto Protocol specifies legally binding commitments by most industrialized countries to reduce their collec-tive greenhouse gas (GHG) emissions by at least 5% compared to 1990 levels between the period 2008-2012. With the goal of reaching these targets at the lowest possible cost for the countries committed to reductions, the Protocol created two flexibility mechanisms, GHG emissions trading and the CDM. The CDM is an opportunity for the developing countries and
127
the countries in with the economies in transition that did not accept binding emissions reduc-tions at Kyoto to be involved in GHG mitigation. By introducing CDM Tajikistan will be able to attract foreign investments for areas such as: i) energy efficiency; ii) renewable energy sources and transition to safe fuels; iii) industrial and transport sectors; iv) forest rehabilitation; and v) agriculture and land management.
Government measuresIn June 2003 the Government approved the National Action Plan (NAP) on climate change. The NAP sets priorities and measures to address problems of climate change, to develop capacity for further research and analysis of the climate system, and to strengthen interna-tional cooperation in this area. The measures are designed to serve as a basis for planning and decision-making in all relevant sectors. The NAP includes a comprehensive list of investment projects that are thought to be implemented through the donor assistance.
RecommendationsThe needs assessment team has identified the following measures as short-term strategies for the interventions in climate change:• public awareness and advocacy campaigns on energy efficiency and the CDM that will:
i) create awareness on the energy efficient technologies resulting in less costly energy services and lower energy-related pollution and emissions; ii) demonstrate importance of life-cycle costing in energy efficiency analysis; iii) illustrate importance of energy ef-ficiency on household level;
• specific training programmes for policy makers, private sector and NGOs on energy efficiency.
The following are medium-term recommendations for climate change mitigation activities:
• technical assistance on energy efficiency strategy development that will include i) sup-port for the introduction of voluntary agreements between the industry and the envi-ronment enforcement authorities; ii) provide broad guidelines rather than more rigid standards that are more appropriate to the energy systems employed by the indus-tries; iii) analyze energy systems used by the industry and provide recommendations for improvements; iv) provide "train-the trainer" interventions with the objective of transferring knowledge and skills required to improve efficiency of the industry to national specialists; v) provide training on investments into energy efficiency to enable the trained experts to commercially market their services to industrial clients; vi) pro-mote investment into energy efficiency at national and industry levels.
Financial estimations To improve energy efficiency and introduce CDM, the needs assessment team has identified the following components: mass media campaigns on energy efficiency; energy efficiency ad-vocacy campaigns; technical assistance on energy efficiency; and the CDM advocacy campaign. Total cost of the proposed activities stands at 878 thousand USD.
Land Degradation Programmes
OverviewWind erosion. Land degradation was always present in Tajikistan, however, seriousness of the problem has visibly increased during the last decade. The most part of the arable lands (70%) is
MILLENNIUM DEVELOPMENT GOALS NEEDS ASSESSMENT TAJ IK ISTAN
128
MILLENNIUM DEVELOPMENT GOALS NEEDS ASSESSMENT TAJ IK ISTAN
located 800-2,500 meters above the sea level. 14.6 % of these lands are situated on the slopes of 10-200. Use of slopes over 100 contributes to their erosion. Due to widespread poverty and unemployment, the rural population develops new lands along slopes of 15-200 to plant wheat and other crops. At the moment, the country lacks an integrated assessment of lands, especially when it concerns processes of erosion. Based on a research carried out by the Soils Institute of the Tajik Academy of Agriculture, agricultural land affected by desertification in 1990 totaled 3,03 mln. ha while the lands affected by erosion totaled 2,65 mln. ha. For the last decade the area of agricultural lands affected by desertification has amounted to 4,33 mln. ha or on 1,3 mln. ha more than in 1990 (State Committee for Environmental Protection and Forestry).
Degradation of pastures. Pastures are the main component of the Tajikistan’s agricultural lands. Pastures occupy 3,515 thousand ha from which 1,870 thousand ha are summer pastures, 1,140 thousand ha are winter pastures, transitional (spring-summer, fall) cover 400 thousand ha, and 105 thousand ha are all-the-year-round pastures (National Report of the Republic of Tajikistan to Combat Desertification, 2002). Pastures are exposed to excessive exploitation, and the period of their natural rehabilitation is much slower than the rate of their exploita-tion. Although, according to the statistics households keep less livestock, still the existing numbers exceed carrying capacity of the available pastures (Department of Statistics, 2004). According to the National Report of the Republic of Tajikistan to Combat Desertification, all pastures are subject to (medium to heavy) erosion: 89% of summer, 97% of winter and 87 % of spring-fall pastures are eroded and affected by desertification. The Pamir region is especially vulnerable due to extremely severe climatic conditions. It occupies 45 % of the total territory of Tajikistan. More than 95 % of agricultural lands on Pamir are pastures (773 thousand ha), and the pressure on alpine ecosystems is severe. Due to overgrazing and intensive harvest of vegetation some areas lose up to 4,3 thousand m3/ha of soil annually (National Report of the Republic of Tajikistan to Combat Desertification, 2002).
Government measuresThe Government adopted its National Programme to Combat Desertification at the end of 2001. The Programme calls for a number of actions, including improving anti-erosion methods, increased public participation, and the development of social and economic instruments for actions against desertification. The Environmental Performance Review for Tajikistan (2004) identified two major obstacles in the fight against erosion and desertification: lack of funding and lack of awareness on new land management approaches. It is understood, that no single institution is able to implement measures to combat desertification and land degradation successfully. Therefore, only joint and integrated efforts, based on good information, can promote cost-effective measures and achieve their targets. No information has been found on the level of funding for the government identified interventions.
RecommendationsSince the issues of land degradation caused by water erosion have been addressed under the “Hunger and Foods Security” section of the document, this section will address land degrada-tion caused by wind erosion due to unsustainable agricultural practices including grazing. To reduce impact of wind erosion on crop lands, the needs assessment team has proposed plant-ing of windbreaks as an effective measure to reduce erosion. According to the First National Communication of the Republic of Tajikistan under the United Nations Framework Conven-tion on Climate Change (2003), in the 1990s due disruptions in energy supply, 4,5 thousand ha of windbreaks were cut for firewood. There are obvious advantages if rehabilitation or

129
planning of new windbreaks activities will be implemented because they will: i) prevent the loss of fertile soil; ii) reduce wind damage to crops; iii) reduce the loss of soil moisture; and iv) improve microclimate. At the same time, no windbreak can be expected to control all erosion problems—other con-servation practices such as cover crops and reduced tillage need to be in place. Cover crops are usually used to cover and protect the soil surface from wind and water erosion. The top growth covers the soil surface while the roots bind and stabilize the soil particles. Cover crops could be planted over the whole field for erosion protection, or they could be selectively planted in the most erosion prone areas.
To improve the situation, the Ministry of Agriculture, the State Committee for Land Administra-tion and the State Committee for Environmental Protection and Forestry need to work jointly to establish realistic action programmes to counteract soil erosion and the loss of pasturelands. Joint programmes should include improved management practices and standards on use of pas-tures as well as the coordinated enforcement activities. The programmes should be built on active involvement of farmers, communities and local authorities. Based on the available infor-mation, Tajikistan will be able to protect agricultural lands, increase soil fertility, and introduce sustainable use of pastures through implementation of the following short-term measures:• mass media campaigns on sustainable land management practices;• community awareness campaigns on sustainable use of pastures;• initiation of specific training programmes for farmers on sustainable land management
practices;• initiation of training the trainers programmes;• initiation of programmes on rehabilitation and planting of new windbreaks.
The following are medium-term recommendations to reduce land degradation in Tajikistan:• technical assistance on land degradation strategy development that will include: i) as-
sessment of current management practices of pastures; ii) advise on policy revision to include importance of integrated efforts by all relevant institutions; and iii) promote introduction of cost-efficiency in agricultural practices.
Financial estimationsSince there is little information on current status of windbreaks, use of cover crops, and the level of pasture degradation, financial estimations for this section’s investment portfolio are based on a number of assumptions. The team assumed that by 2015: 30% of all arable lands will be either protected by windbreaks or cover crops (whichever relevant for a particular environment); and 2% of the rural population will directly benefit from the land management training programmes while indirect impact will be much higher. It is expected that at least 50% of the rural population will benefit from public awareness programmes on sustainable land management practices. Total cost of the activities that are expected to reduce land degradation and improve land manage-ment practices in Tajikistan will amount to 154,3 mln. USD over the next 10 years.
Management of Protected Areas
OverviewTajikistan occupies 11% of Central Asia but the country has almost 36% the region’s flora. Com-bined with spectacular geography, the country is a nature treasure trove and a promising eco-tour-
MILLENNIUM DEVELOPMENT GOALS NEEDS ASSESSMENT TAJ IK ISTAN
130
MILLENNIUM DEVELOPMENT GOALS NEEDS ASSESSMENT TAJ IK ISTAN
ism destination. However, deforestation, over-grazing, poaching and human intrusion into pro-tected areas (especially widespread during the civil war) have taken their toll on these areas and the biodiversity they contain. Several “Red Data Book” species have been seriously effected.
The status of the PAs is tenuous. Since independence, individual protected areas have operated with vastly reduced budgets and staffing. They have little working equipment, transportation, or means of communication. Unable to properly patrol protected areas, the staff cannot suc-cessfully control and protect the territories from illegal logging, hunting, and the man caused fires. It will require considerable commitment and investment to reverse the downward spiral of degradation and neglect. Tourism. In Tajikistan tourism may include mountaineering, skiing, rafting, hunting, and hiking. Considering poorly developed infrastructure (access roads to protected areas, absence of trails, camp grounds etc.) and weak tourism industry, in the nearest future there could be potential only for eco-tourists with very modest expectations with regards to infrastructure and facilities. Proper development of eco-tourism may contribute to protection of valuable species and sites and generate revenues based on eco-fees and income to local communities for services (guest houses, rural restaurants, and handicrafts).
Government measuresIn September 2003, the Government adopted the National Strategy and Action Plan on the Conservation and Sustainable Use of Biodiversity to provide both in-situ and ex-situ conservation. The document includes a general action plan on biodiversity conservation and 15 individual action plans for nine ecosystems and six for: species conservation in natural habitats (in situ); biodiversity conservation outside natural habitats (ex situ); creation of a national ecological network; biodiversity conservation at geo-system level; urban ecosystems; and agro-ecosystems. It is a long-term programme with activities for short term (five years), medium term (ten years) and long term, at a cost of 27 mln. USD.
In March 2005, the Government approved the ten-year State Programme on the Development of Protected Areas for 2005-2015 prepared by the State Directorate of Protected Areas “Tajik National Park.” The Programme includes 28 project activities at the cost of 945 thousand USD.
RecommendationsThe needs assessment team considers that the increased awareness and understanding among the policy makers and the management of the protected areas on the benefits of the integrated resource management approaches emphasizing sustainability. As part of the proposed training pro-grammes to increase the management capacity, these programmes will include information on the role and importance of forest ecosystems to ensure water quality and supply, the importance of vegetation in maintaining hydrological regimes, and the role of biodiversity in maintaining soil fertil-ity. Since many of these issues are trans-boundary in nature, regional training, and cooperation will be of an advantage. Also, it will be to Tajikistan’s advantage to initiate an eco-tourism development strategy that would: i) contain educational features; ii) minimize any negative impact on the natural and socio-cultural environment; iii) and support protection of natural areas.
The needs assessment team has identified the following measures as short-term interventions to improve management strategies of the protected areas and contribute to local development:
131
• public awareness campaigns in the settlements located near protected areas on the importance and benefits of the PAs;
• initiation of rehabilitation/construction works within the PAs;• initiation of scientific surveys within the PAs; • initiation of training programmes for the management of the PAs.
Medium-term recommendations include:• improvements in monitoring system;• investments into communities located next to the PAs;• revision and update of current legislation; and• development of an eco-tourism strategy that, if properly implemented, may also con-
tribute to economic stability and development of Tajikistan.
Financial estimationsThe needs assessment team has identified and estimated costs of the activities designed to improve management practices of the protected areas, protect biological diversity, and con-tribute to local development. According to the team’s estimations, by 2015 Tajikistan may have 90% of the current protected areas fully rehabilitated and properly functioned; 100% of the employees trained and successfully manage protected areas; public awareness campaigns in the communities located close to the protected may reach 45 thousand individuals; loan programmes launched in the communities surrounding twenty protected areas; and legislation revised and updated. Total cost of these activities is estimated at 8,34 mln. USD.
Sustainable Forestry Management
OverviewAccording to the State Committee on Statistics, forests cover 410 thousand ha that is around 2.9 -3% of the total territory of Tajikistan. These numbers have not considerably changed since 1991 indicating that deforestation does not exist. Still, many national experts think that defor-estation does occur, however, it affects the density of forests while the total territory covered by the forests remains unaffected. According to the USAID Biodiversity Assessment (2001), forests in Tajikistan have been preserved only in alpine regions where access is made difficult; elsewhere, there has been a general trend towards a reduction in forest cover. Contrary to the data provided by the State Department of Statistics, the USAID Biodiversity Assessment states that currently forests cover approximately 215 thousand ha, occupying about 1.5% of the total territory. According to the same document, unique tugai woodlands, formerly wide-spread in river valleys and occupying 4.9% of the country’s forests, have almost disappeared and now constitute less than 0.6% of the total forest area. There are a number of factors that have contributed to the reduction in tugai forests: fires, cleaning for agriculture, extensive use of water for irrigation, and illegal harvest of trees near populated areas. In the Pamir region degradation of rare forests and shrubs is primarily due to over exploitation of pastures, poor electricity supply, and widespread poverty (people cannot buy coal or other fuel for cooking and heating). In addition, disappearance of tugai woodlands and other vegetation may have also affected local environment through increased soil erosion, and therefore, increased num-ber of deadly landslides (USAID Biodiversity Assessment). According to the Environmental Performance Review for Tajikistan (2004), altogether, annual forest destruction as a result of illegal logging, cattle grazing and natural disasters is estimated at 5,000 to 10,000 m3, i.e. 1.5-3 times higher than the natural increment and forest renewal in particular regions of Tajikistan.
MILLENNIUM DEVELOPMENT GOALS NEEDS ASSESSMENT TAJ IK ISTAN
132
MILLENNIUM DEVELOPMENT GOALS NEEDS ASSESSMENT TAJ IK ISTAN
A programme of reforestation has been in operation for some years. In 1986 some 4 thousand ha were planted. In the following years, however, reforestation decreased, declining to 3 thou-sand ha in 2000. Of those areas that have been planted, success has frequently been reduced as a consequence of poor growing locations and species selection. The Forestry Agency (the agency) manages five nurseries, which produce 2 million trees per year planted over 2 thou-sand ha. The Agency also gives away saplings to farmers to promote planting.
RecommendationsTo improve forest management practices and reduce rate of deforestation, the needs assess-ment team has identified the following measures as short-term strategies: • public awareness campaigns on the importance of forests for sustainable resource
management and the quality of life; and• initiation of training programmes for the employees of the relevant departments under
the State Committee for Environmental Protection and Forestry.
The medium-term recommendations are the following:• initiate reforestation in the selected areas;• where feasible introduce aforestation;• provide assistance in terms of a feasibility study on the need of the community man-
aged nurseries, afforestation and reforestation activities.
Financial estimationsThe needs assessment team considers investments into: implementation of sustainable forest management techniques through increased production of native tree seedlings to support re-forestation and afforestation would allow increase forest cover in some areas and satisfy demand for forest products in the others; reforestation of mountain slopes and along river banks, allow-ing reduce erosion of slopes and risks of deadly landslides and floods; and promotion of com-munity management of local resources including woods and introduction of locally available fast growing trees and bushes to reduce pressure on forests for fuel-wood. According to the team’s estimations, by 2015: 96,8 thousand ha will be reforested; 1,340 employees of the State Com-mittee for Environment Protection and Forestry trained; public awareness campaigns on the benefits provided by forests conducted; and the feasibility on the need of the community man-aged afforestation, reforestation activities and tree nurseries finalized. Total cost of the activities on the sustainable forestry management is estimated at 76,3 mln. USD.
Waste Management
OverviewPresent municipal waste disposal practices are not satisfactory. There is no separation of waste or recycling. Municipal waste disposal services have few vehicles for waste collection and transportation. There are few legally organized landfills, no municipal waste services in most rural areas, and no public awareness programmes on waste. Waste disposal charges to customers, including households, do not provide the funds necessary for cost recovery. This results in a continuing deterioration of services and makes customers even less willing to pay for them, thus creating a vicious circle.
Industrial waste is generated practically in all sectors of the economy. Some 100 mines are in operation in Tajikistan producing forty different kinds of minerals (including gold and ura-
133
nium). Although, it is considered that there is a relatively small number of industrial polluters, four industrial enterprises, namely the Tajik Aluminum Smelter (TAZAD), Isfarine Metal-lurgical Works, Yavan Electrochemical Enterprise and Vakhsh Fertilizer Plant are the major polluters of the country. Also, there are 210 mln. tons of a variety of wastes (including toxic and radioactive) of mining industry accumulated in mine tailings. There are 11 mine tailings of radioactive waste in Tajikistan. Only one accepts waste while the remaining are either closed or in the process of closure. Total volume of waste accumulated in these mine tailings is over 170 mln. tons. Three of these mine tailings of radioactive waste located in the area of Taboshar and Chkalovsk are in an unsatisfactory condition. The territories housing mine tailings are prone to mudslides, flashfloods and wind erosion. These natural phenomena may intensify destruction of the available protection measures and cause an ecological disaster.
Government measuresThere is no overall strategy or policy for waste management. The State Environment Programme for 1998-2008, adopted by the Government in 1997, does not contain a special section on waste, however, it does address some of the key issues related to waste management and waste minimization.
RecommendationsThe needs assessment team has identified the following measures as short-term strategies for improving waste management in Tajikistan:• public awareness campaigns on household waste management;• develop projects for construction of municipal landfills according to environmentally accept-
able standards. Complete rehabilitation/construction of 159 landfills by 2010 with the assumption that the remaining landfills will be rehabilitated/constructed by local gov-ernments;
• initiate training sessions for the relevant employees of the local governments, landfill management and the State Committee for Environmental Protection and Forestry on landfill management, financial mechanisms of waste management, and waste separa-tion;
• provide technical assistance to develop strategy and action plan on waste manage-ment;
• finalize inventory of household and industrial waste;• provide technical assistance on industrial recycling;• assess status of the existing industrial waste dumps and mine tailings;• facilitate implementation of the Law on Industrial and Household Waste by developing
necessary secondary legislation;• initiate advocacy campaigns on the Basel Convention on the Control of Transboundary
Movements of Hazardous Wastes and their Disposal and the POPs Convention.The following are medium-term recommendations for improving waste management in Tajikistan:• develop and promote adoption of a strategy and action plan for waste management;• continue training programmes for the relevant employees of the local governments,
landfill management and the State Committee for Environmental Protection and For-estry on landfill management, financial mechanisms of waste management, and waste separation;
• set up an information system on generation, recycling and disposal of all types of waste and develop a new system of waste codes and classification:
(a) introduce waste monitoring system at industrial and municipal landfills; and

MILLENNIUM DEVELOPMENT GOALS NEEDS ASSESSMENT TAJ IK ISTAN
134
MILLENNIUM DEVELOPMENT GOALS NEEDS ASSESSMENT TAJ IK ISTAN
(b) set up an inventory of all industrial and municipal waste disposal sites, including illegal ones.• introduce a system of partial refunding of fees on waste, so that industry could reinvest
these funds into waste reduction and recycling technologies.
Financial estimationsFor improvement of waste management situation in the country, the following components have been identified and estimated: five nation-wide public awareness campaigns completed; over 1,000 individuals trained on waste management (including overall management require-ments, financial mechanisms of waste management, and waste separation); waste management strategy and action plan developed; rehabilitation/construction of 159 landfills completed by 2010 with the assumption that the remaining landfills will be rehabilitated/constructed by local governments; inventory of household and industrial waste completed; and the relevant stud-ies on hazardous industrial and mining waste completed. Total cost of the activities on waste management is estimated at 17,6mln. USD.
Integrated Water Management (local strategies and action plans)
OverviewMountainous Tajikistan has a very dense network of water resources, with almost one thousand rivers. Their maximum run-off is in the summer, when snow and glaciers melt. There are 1,300 lakes containing 46 billion m3 of water, and 9 water reservoirs (overall capacity 15,3 billion m3, individual capacity from 0,028 to 10,5 billion m3). The latter are mainly used to produce electricity, to irrigate crops, and for flood protection.
Tajikistan needs to modernize its management of water resources. At present, water re-sources are managed in a highly centralized and sectoral manner. Experience has proven that a management closer to users and to the field gives better results. The concept of integrated water management by catchment area (i.e. hydrographic basin) could be the most efficient and rational water management strategy for Tajikistan. As it is now, the water legislation does not incorporate the concept of management by catchment area, which would require profound changes in the water institutions with decentralization of both decision-making and financing. The Water Code does not provide for such a principle and will have to be modified. Nor does it provide for sufficient incentives for water conservation and water protection. For instance, it contains disincentives to discourage users from polluting water (i.e. wastewater charges), but does not offer any positive measures to encourage and help the users and polluters to improve water protection (e.g. rebates for investing in protection equipment or planting trees to protect river banks).
Government measuresTajikistan’s water policy is expressed in the Concept on the Rational Use and Protection of Water of 2001 (the Concept). If this document is retained as State policy, its recommendations and objectives should be reviewed, specified, clarified and prioritized, and its cost and social impact estimated through a strategic action plan. This action plan could serve as a target indicator for all projects and actions decided by the Government in the water sector. It should be worked out through both a top-down and a bottom-up approach, as needs should be inventoried from field level and consolidated at the State level, taking into account national strategic priorities.
135
RecommendationsAccording to the Concept, the State Committee for Environmental Protection and Forestry is responsible for drawing up a strategy and action plan. However, as in any country, there are many stakeholders in water management. They all need to be involved to ensure a viable project in which all economic sectors will find their rightful place and cooperate to reach the agreed targets. At the moment, the State Committee for Environmental Protection and Forestry is being restructured and does not have the capacity or expertise to assume a leadership position in those negotiations. For this reason, it would be advisable to set up an inter-agency commission on water which, under the coordination of the State authority in charge of the protection and conservation of water, i.e. the State Committee for Environmental Protection and Forestry, would develop a strategy and action plan in collaboration with all other ministries and bodies involved in water management.
The needs assessment team has proposed the following measures as short-term strategies for improving water management in the country though:• public awareness campaigns on sustainable water management, including information
on local management of water resources and water management by catchment area; and
• development of a strategy and action plan to promote and introduce profound changes in water institutions with decentralization of both decision-making and financing.
Medium-term recommendations on improving water management in Tajikistan include:• continue public awareness campaigns on benefits of sustainable management practices
of local water resources and the implementation of a strategy and action plan on water management; and
• implementation of a strategy and action plan that would bring viable changes to the way water users manage available water resources.
Financial estimationsThe needs assessment team has proposed two major areas of intervention allowing the most impact on the way water resources are managed. These interventions include: extensive pub-lic awareness campaigns on sustainable water management practices at all levels, and the development of a strategy and action plan for sustainable water management and their imple-mentation. Coupled with other priority areas identified by the needs assessment team, the selected interventions are expected to have considerable impact on management of natural resources and water resources in particular. Total cost of the activities on sustainable water management practices is estimated at 350 thousand USD.
Environmental Monitoring (air, water, soil)
OverviewFollowing its independence in September 1991, Tajikistan experienced serious economic de-cline linked to its transition from centrally planned to a market economy, civil strife, and eco-nomic and social problems. The consequences included:• weakened monitoring and assessment of individual environmental media, industrial and
municipal pollution and of environmental impacts of natural-resource use in agriculture and forestry. For example out of 58 hydro-meteorological stations 15 are closed and around 30 stations send regular reports to the Hydro-meteorological Agency. The
MILLENNIUM DEVELOPMENT GOALS NEEDS ASSESSMENT TAJ IK ISTAN
136
MILLENNIUM DEVELOPMENT GOALS NEEDS ASSESSMENT TAJ IK ISTAN
situation is similar with the stations that should supply information on radiometric and hydrological situation, and air and water quality;
• inadequate management of data and information on the environment and a discontinu-ation of environmental reporting; and
• loss of interest among general public in environmental issues in general, and in the environmental performance of government authorities and economic actors, in par-ticular.
Government measuresThe State Environment Programme for 1998-2008, approved by the Government in 1997, and the Measures to Implement the State Environment Programme, approved by the Government in 1998, aimed to improve monitoring of water, air, land, sanitary conditions, vegetation, fauna and protected areas, and increase number of analytical laboratories; develop inventories of pollution sources, databases, environmental maps and a national environmental information system; introduce integrated assessment of environmental conditions and impacts; apply remote-sensing data for environmental assessments; develop a regional geographic information system (GIS); and promote environmental education, training and raise awareness. Some of these goals had clear timeframes for their implementation but no funding sources were identified.
RecommendationsThe needs assessment team has proposed the following measures as short-term strategies for improving environmental monitoring:• provide technical assistance on optimization of pollution monitoring stations;• initiate rehabilitation of monitoring stations on meteorology, air and water quality,
water quantity, glaciological data, and radioactive pollution – located near or within the settlements and the ones that provide information that can prevent life and property loss in those communities;
• rehabilitation and purchase of new equipment will be accompanied by extensive train-ing for the employees of relevant agencies;
• provide software allowing processing and analysis of hydrological, agro-meteorological, and other data; and
• provide technical assistance on harmonization of environmental standards on the re-gional level.
The following are medium-term recommendations for improving environmental monitoring situation in Tajikistan:• finalize rehabilitation of the remaining monitoring stations that supply data on me-
teorological conditions, air and water quality, water quantity, glaciological data, and radioactive pollution;
• wide dissemination and use of the existing data gathered through environmental moni-toring and assessments at national and local levels;
• development and implementation of pollution control standards;• harmonization of standards based on agreed regional standards (based on a core set of
indicators);• refine penalty structures (need for a new system to calculate damage);• strengthen enforcement system of environmental regulations;• taxation of environmental "bads" (e.g., pollution, degradation).
137
Financial estimationsThe needs assessment team has proposed to invest into a number of activities that will: reha-bilitate 100% of the environmental monitoring network, build capacity of the relevant agen-cies to forecast natural disasters and monitor pollution, strengthen enforcement mechanisms though a technical assistance provided to develop and implement pollution control standards and harmonize environmental standards with the neighboring countries. These interventions together with other priority areas identified by the needs assessment team will allow Ta-jikistan better forecast, respond, and minimize impact of natural disasters such as floods, avalanches, mudslides, landslides, droughts and others. In addition, the proposed technical as-sistance will help build capacity of the relevant agencies to strengthen enforcement system of environmental regulation, refine penalty structure, develop and implement pollution control standards, and harmonize environmental standards with the neighboring countries. Total cost of the activities on environmental monitoring is estimated at 2,1mln. USD.
Disaster Prevention Management
OverviewTajikistan’s mountainous and young geography in combination with variable climate explain the high incidence of small-scale but high-impact natural calamities such as floods, earthquakes and landslides. Between 1991 and 2001 over 66 thousand people were made homeless by natural disasters. During the first nine months of 2002 alone, 200 thousand people were affected by 65 small and mid-scale natural disasters (Asian Development Bank, 2003, Tajikistan. Summary Country Environmental Conditions). The 2004 floods and mudslides caused by torrential rains destroyed bridges, roads, parts of vital infrastructure, damaged water supply systems leaving 400 thousand people without access to safe drinking water in the capital Dushanbe, and considerably affecting Penjikent, Ayni, Varzob districts and parts of Khamadani (former Moskovski) and Vosei districts.
These natural disasters exacerbate poverty and hinder economic progress in the impover-ished country. However, local population may frequently contribute to deterioration of the surrounding environment through unsustainable agriculture practices and harvest of wood for fuel (due to inability to purchase coal and other fuels and unreliable electricity supply). These activities cause erosion and often lead to deadly land and mud slides.
Government measuresCurrent regulations make clear the responsibilities of various ministries to take action within their own spheres of technical responsibility (e.g. Ministry of Irrigation and Water Resources and Land Reclamation for flood control structures, Ministry of Agriculture for the protection of crops). The MESCD (Ministry of Emergency Situations and Civil Defense) is responsible for review and approval of all major constructions as well as for monitoring risks in general and advising relevant authorities of the risks and measures to be taken. However, this responsibil-ity assigned under the 1994 Law may not yet be widely known and respected, in part because of a technical weakness of the MESCD itself. At the same time, small-scale local works, e.g. for local slope stabilization, are be the responsibility of khukumats (local governments). Pre-vention is included in the terms of reference of the State Commission on Emergency Situa-tions but it is not clear to what extent the State Commission itself, or the regional and district commissions address these issues.

MILLENNIUM DEVELOPMENT GOALS NEEDS ASSESSMENT TAJ IK ISTAN
138
MILLENNIUM DEVELOPMENT GOALS NEEDS ASSESSMENT TAJ IK ISTAN
RecommendationsIn order to improve the situation, the country needs a national disaster management system that will allow introduction of measures to prevent or mitigate disasters in the long-term, in-tegrate them into development plans and programmes as well as into post-disaster rehabilita-tion and reconstruction programmes. The needs assessment team has proposed the following measures as short-term strategies for improving disaster prevention in Tajikistan:• public awareness campaigns on natural disasters and human impact (unsustainable ag-
riculture, use of pastures, and construction practices) on the severity of floods, mud-slides, landslides, and avalanches;
• initiate national disaster management system with elements of disaster prevention;• provide means of communication to the most vulnerable communities;• provide relevant agencies with training on use of satellite information, GIS system,
software, and computer models.
It is thought that identified activities under the short-term strategy will build capacity at both central and local levels to improve disaster prevention practices, avoid loss of life, property, and crops. Identified medium-term recommendations will further improve disaster prevention and empower local governments to better plan and prepare communities for natural disasters and their impact:• implementation of the national disaster management system with elements of disaster
prevention;• initiation of the local disaster prevention management plans.
Financial estimationsExcessive use of locally available natural resources (forest, water, mountain slopes for grazing and crops) may result in environmental degradation contributing to the severity of natural disasters. While the financial model for this intervention area includes a number of specific activities such as elements of the early warning system through provision of means of com-munication for the most vulnerable communities; public awareness campaigns; and the design and introduction of the national disaster management system with the disaster prevention elements - the prevention of human caused aggravated impacts is also addressed through a number of proposed activities under “Prevention of Land Degradation,” “Sustainable Forest-ry Management,” “Management of Protected Areas,” “Sustainable Water Management,” and “Environmental Monitoring.” Total cost of the activities on disaster prevention management is estimated at 450 thousand USD.
Trans-boundary cooperation
OverviewTajikistan’s immediate neighbors are among the country’s most important trading and busi-ness partners. Business ties can be strengthened through regional infrastructure and policy cooperation, both of which are critical for economic growth and poverty reduction. Similarly, transboundary watersheds, desertification, air pollution, and biodiversity can only be man-aged through regional strategies. And, since many local conflicts have repercussions on entire regions or are driven by regional tensions, management of transboundary problems requires regional cooperation to detect conflicts before they erupt and to develop coordinated re-sponses from neighboring countries to end them.
139
The following environmental issues are considered of transboundary significance: transboundary air pollution emitted by the Tajik aluminium plant located near the Uzbek border; Zeravshan river pollution (Tajikistan-Uzbekistan); the Aral Sea; and the water-related environmental issues in Fergana Valley. Identified environmental problems are mostly the legacy of the Soviet Union. However, the situation worsened with the post-independence disruption of energy and water supply agreements that changed the pattern of water storage and releases by Tajikistan, that forced to conserve more water for the country’s own winter energy needs, and due to dilapidation of industrial treatment facilities.
Government measuresThe Interstate Commission on Sustainable Development (ICSD) is a forum established by the five Central Asian countries to prepare their national sustainable development reports for the World Summit on Sustainable Development in Johannesburg (South Africa) in 2002. Its main functions are organizing and coordinating regional sustainable development strategy; managing regional environment and sustainable development programmes, action plans and projects; coordinating activities relating to the Multilateral Environmental Agreements (MEA) obligations of Central Asian countries; supporting harmonization of legislation and methodology for the environment; and supporting inter-State information exchange and establishing a regional information database on environment and sustainable development.
The ICSD is a potentially important forum that could provide strategic linkages among global, regional and sub-regional processes. However, the Steering Committee and its national set-up in Tajikistan have not yet been able to influence these linkages and tangible outcomes of its work are yet to be seen. The linkages in Tajikistan between a number of programmes, plans and strategies, such as the State Environment Programme for 1998-2008, the strategic plan for sustainable development, the Regional Environment Action Plan for Central Asia and the draft NEAP (National Environmental Action Plan) are not clear.
RecommendationsHarmonization of environmental legislation and pollution standards (on water, waste, air), biodiversity, and land degradation are of great importance for regional stability and devel-opment. Another issue of regional importance is effectiveness of the existing regional and bilateral agreements (mostly on water and energy). It is thought that most of them require revision and update. Therefore, the technical assistance and financial support are needed to initiate dialogue on harmonization of legislation and standards and to evaluate effectiveness of the existing agreements and, if necessary, to design new agreements. The needs assessment team has identified the following measures as short-term strategies for improving transbound-ary cooperation:• initiate dialogue on harmonization of national legislation and standards with the most
relevant and regionally accepted standards on environmental pollution, biodiversity, and land degradation; and
• analyze effectiveness of the available bilateral and regional agreement and the need of new agreements on environment and natural resources.
It is intended that by 2010 the country will complete assessment of the existing, identify the need for new bilateral and regional agreements and finalize the needs assessment on harmoni-zation of the national legislation and standards with the most relevant and regionally accepted environmental standards. Therefore, the needs assessment group has identified actual revision
MILLENNIUM DEVELOPMENT GOALS NEEDS ASSESSMENT TAJ IK ISTAN
140
MILLENNIUM DEVELOPMENT GOALS NEEDS ASSESSMENT TAJ IK ISTAN
of the existing and drafting of news agreements, as well as initiation of harmonization pro-cesses of the environmental legislation and standards as medium-term recommendations for improving situation with transboundary cooperation in Tajikistan.
Financial estimationsFor improving trans-boundary cooperation with the neighbouring countries, the needs assess-ment team identified and estimated the following components: technical assistance on harmo-nization of national legislation and standards with the most relevant and regionally accepted standards on environmental pollution, biodiversity, and land degradation; the assessment of the existing bilateral and regional agreements with neighboring countries; and the assessment of all transboundary environmental projects. Total cost of the activities on trans-boundary cooperation is estimated at 340 thousand USD.
Integration of Environmental Sustainability into Sectoral Strategies
OverviewCurrently, Tajikistan is in the process of establishing of a viable system of inter-agency co-operation. However, competing interest of agencies and information asymmetries result in numerous opportunities to abuse power – usually to the detriment of the poor and the environment. Problems like weak legal and institutional frameworks (i.e. environmental man-agement, monitoring framework), lack of environmental awareness, education, participation, and cooperation, severe fiscal constraints (for environmental conservation and management), harsh natural disasters and human strain on natural resources, limited official data, data gaps, and poor data reliability and others are the main barriers to environmental sustainability in the country. At the same time, even though environmental issues are considered or integrated into sectoral strategies on water resources, energy, transport, construction and others - that may have serious consequences for both environment and development – they are not fully followed and implemented. Therefore, this incorporation is usually formal.
Also, cooperation and coordination among different authorities is not always smooth. The co-operation between the Ministry of Agriculture, the State Committee for Land Administration and the State Committee for Environmental Protection and Forestry requires improvement. For example, the flow of information among the authorities is limited. There is also consider-able scope for improving cooperation and the division of labor among various state agencies.
Government measuresThe Government has established an interagency coordination committee that promotes a unified Government strategy and implements control over environmental statistics, coordinates criteria establishment and evaluation of indicators on the country’s environmental condition. In addition, two other initiatives need to be mentioned in the context of the Government’s efforts towards sustainable development and poverty reduction: the National Sustainable Development Report Rio+10 and the Economic Development Programme until 2015. The National Sustainable Development Report, prepared for the 2002 World Summit on Sustainable Development in Johannesburg (South Africa), calls for a number of policy actions for sustainable development that are largely consistent with those stipulated in the poverty reduction strategy. The National Commission on Sustainable Development has been formed under the presidential administration to follow up, report and monitor implementation of the report’s recommendations. The Commission is composed of representatives from different ministries and is chaired by the Vice-Prime Minister.
141
RecommendationsA major effort will be needed to achieve institutional reforms necessary for environmental sustainability. Areas where action is needed include: legal basis for management; monitoring and collecting environmental data and its use for decision-making; strengthening the State Committee for Environmental Protection and Forestry’s capacity for policy design and ability to work with other Government agencies (including better pay for civil servants); developing and implementing a modern cost effective and incentive compatible regulatory framework; reinforce environmental impact assessment (EIA); facilitating financing of environmental in-vestments from public and private sources and from donor institutions; and improving public access to information, including greater participation in key environmental decisions. All these will need substantial resources, both internal and external. The needs assessment team has identified the following measures as short-term strategies to facilitate integration of environ-mental sustainability into sectoral strategies:• technical support. Advisory mechanisms (to strengthen institutions for environmental
management and to provide technical support to the development of sector strategies);• environmental impact assessments. Strengthen environmental impact assessments (for
example, carry out environmental impact assessments for large-scale infrastructure projects and other development strategies that are likely to have major impact on environment);
• improve management of natural resources through market mechanisms, strengthened regulation and enforcement;
• reform environmental fund(s).
In case of the successful implementation of the short-term strategies, medium-term recommen-dations will be:• initiated integration of environmental strategies into all sectoral policies; • improved environmental expertise available within the agency;• increased investments, particularly in human resources; • reformed institutional arrangements, including management systems; • promoted direct investments in environmental management; and• promoted regulatory and market reforms to reduce environmental degradation.
Financial estimationsFor successful integration of environmental sustainability into sectoral strategies, the needs assessment team identified and estimated the following: technical assistance on integration of environmental sustainability into sectoral strategies; technical assistance on institutional devel-opment; and technical assistance on environmental impact assessments and its enforcement mechanisms. It is necessary to note that only implementation of all activities identified under the “Environmental Sustainability” section will be able to contribute to the success of integra-tion of environmental sustainability into sectoral strategies, address environmental degrada-tion, and improve the quality of life in Tajikistan. Total cost of the activities on integration of environmental sustainability into sectoral strategies is estimated at 520 thousand USD.
Recommendations for Achieving Environmental SustainabilityShort-Term PrioritiesTo produce an impact in the near future, MDGs needs assessment team proposes implemen-tation of the following activities:• initiation of public awareness campaigns on energy efficiency and advantages of “clean
MILLENNIUM DEVELOPMENT GOALS NEEDS ASSESSMENT TAJ IK ISTAN
142
MILLENNIUM DEVELOPMENT GOALS NEEDS ASSESSMENT TAJ IK ISTAN
fuels” provided by alternative energy sources to reduce risk of deforestation, land deg-radation, air and water pollution by 2006;
• establishment of an early warning mechanisms, strengthening disaster prevention, working with communities on sustainable land management practices to reduce vul-nerability of these communities to natural disasters by 2010.
Medium-Term PrioritiesWhile all identified activities need to be implemented in order to ensure the country’s prog-ress towards environmental sustainability, MDGs NA project identified the following priority medium-term policy activities: • establishment of a long-term strategy for environment supported by relevant budget-
ary allocations and transparent management of the existing extra budgetary resources (special funds) by 2012;
• revision of the existing laws, regulations and standards and their harmonization with the internationally accepted practices. These changes will allow sound enforcement and encourage industry and other sectors of economy to comply with the newly ac-cepted laws, regulations and standards by 2015;
• introduction of mechanisms promoting use of sustainable land management techniques to prevent land erosion, pollution of surface and ground waters, and changes in local hydrology by 2015.
Financial Estimations for Achieving Environmental SustainabilityThis section was prepared through a review of information from reports and documents prepared by various Government and donor organizations, and an intense consultative pro-cess, including a dialogue with employees of these organizations. Early draft was shared with participants of the seminar held on December 17, 2004. This was followed by another round of consultations with employees of the relevant Government and donor organizations. Based on the information gathered during six months of intense work, the MDGs needs assessment team has proposed activities and policy change to promote sustainable management of eco-systems, their constituent species, and their essential services that may contribute directly to planning activities in sectors such as agriculture, water, forestry, energy, transportation, health, and industrial production.
Environmental sustainability has the potential to offer opportunities and innovative choices for achieving food security, health improvements, income generation, reduce vulnerability and enhance provision of ecosystem services, essential for productive activities – key elements of the eight MDGs. Therefore, in recognition of a root cause of unmet human needs, the needs assessment team put special emphasis on MDG 7 and the Target 9 in particular. By introduc-ing this task, the team identified appropriate activities and policy measures that have potential to reverse environmental degradation and ensure productive management of ecosystems as a basis for enabling the other MDGs to be met.
The largest expenses for meeting MDG 7 Target 9 target are for the programmes on land degradation and forestry management. Due to the growing demand for natural resources, without significant investment in these and other identified areas Tajikistan is likely to become increasingly exposed to hazards of natural disasters and collapse of productive ecosystems. Also, for Tajikistan it will be difficult to meet MDGs under Target 9 without a coordinated
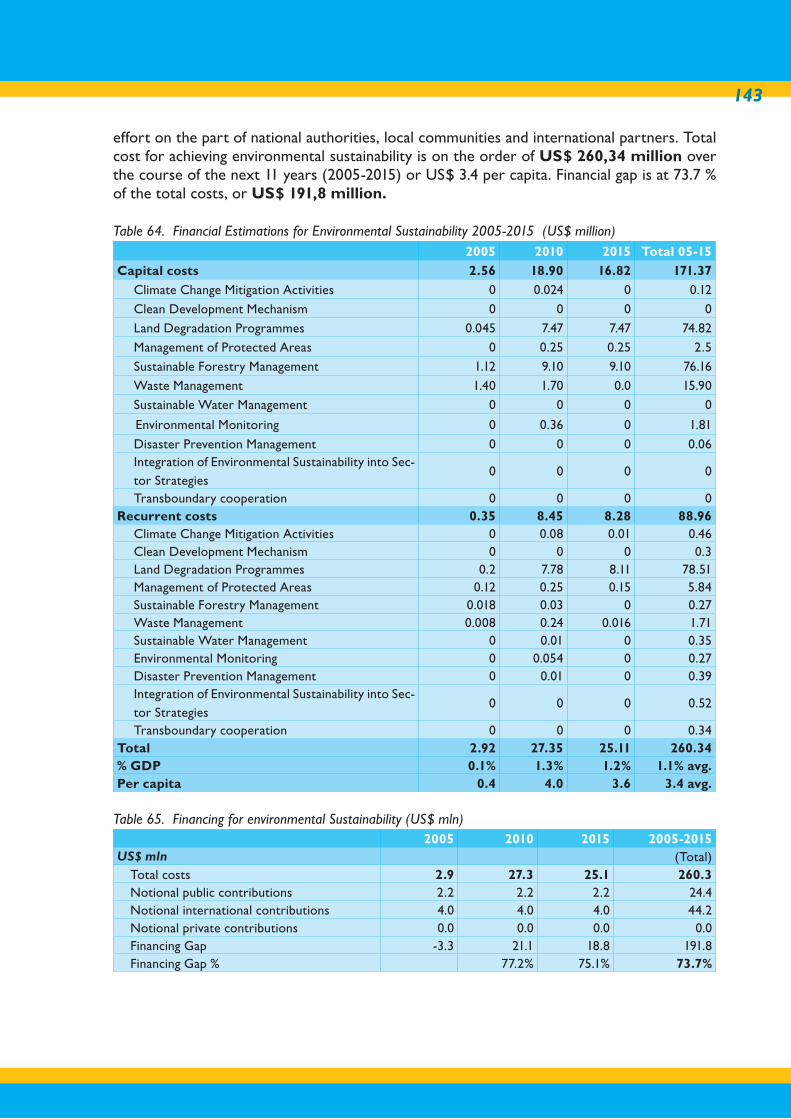
143
effort on the part of national authorities, local communities and international partners. Total cost for achieving environmental sustainability is on the order of US$ 260,34 million over the course of the next 11 years (2005-2015) or US$ 3.4 per capita. Financial gap is at 73.7 % of the total costs, or US$ 191,8 million.
Table 64. Financial Estimations for Environmental Sustainability 2005-2015 (US$ million)2005 2010 2015 Total 05-15
Capital costs 2.56 18.90 16.82 171.37Climate Change Mitigation Activities 0 0.024 0 0.12
Clean Development Mechanism 0 0 0 0
Land Degradation Programmes 0.045 7.47 7.47 74.82
Management of Protected Areas 0 0.25 0.25 2.5
Sustainable Forestry Management 1.12 9.10 9.10 76.16
Waste Management 1.40 1.70 0.0 15.90
Sustainable Water Management 0 0 0 0
Environmental Monitoring 0 0.36 0 1.81
Disaster Prevention Management 0 0 0 0.06Integration of Environmental Sustainability into Sec-tor Strategies
0 0 0 0
Transboundary cooperation 0 0 0 0Recurrent costs 0.35 8.45 8.28 88.96
Climate Change Mitigation Activities 0 0.08 0.01 0.46Clean Development Mechanism 0 0 0 0.3Land Degradation Programmes 0.2 7.78 8.11 78.51Management of Protected Areas 0.12 0.25 0.15 5.84Sustainable Forestry Management 0.018 0.03 0 0.27Waste Management 0.008 0.24 0.016 1.71Sustainable Water Management 0 0.01 0 0.35Environmental Monitoring 0 0.054 0 0.27Disaster Prevention Management 0 0.01 0 0.39Integration of Environmental Sustainability into Sec-tor Strategies
0 0 0 0.52
Transboundary cooperation 0 0 0 0.34Total 2.92 27.35 25.11 260.34% GDP 0.1% 1.3% 1.2% 1.1% avg.Per capita 0.4 4.0 3.6 3.4 avg.
Table 65. Financing for environmental Sustainability (US$ mln) 2005 2010 2015 2005-2015
US$ mln (Total)Total costs 2.9 27.3 25.1 260.3Notional public contributions 2.2 2.2 2.2 24.4Notional international contributions 4.0 4.0 4.0 44.2Notional private contributions 0.0 0.0 0.0 0.0Financing Gap -3.3 21.1 18.8 191.8Financing Gap % 77.2% 75.1% 73.7%
MILLENNIUM DEVELOPMENT GOALS NEEDS ASSESSMENT TAJ IK ISTAN
144
MILLENNIUM DEVELOPMENT GOALS NEEDS ASSESSMENT TAJ IK ISTAN
Water and Sanitation
Target 10 of the MDG 7 is to halve, by 2015, the proportion of people without sus-tainable access to safe drinking water.
Johannesburg Earth Summit in 2002 set the target to halve by 2015, the propor-tion of people without access to basic sanitation services.
The UN Special Session on children in 2002 adopted a resolution to provide by 2015 all schools with clean water and sanitation facilities.
OverviewGiven the potential benefits for social development, investment in and development of water services should be a high priority for Tajikistan. The resource needs for expanding access to safe water and adequate sanitation178 in Tajikistan are much lower than in the health and education sectors. The greatest needs are in rural areas – where water systems development is relatively cheap to build and operate. The cost of rehabilitating urban water systems, however, is expen-sive and adds considerably to the challenges and financing requirements facing the sector.
As is noted in Tajikistan’s 2003 National Human Development Report, the implications of unsafe water and poor sanitation for human development are considerable. It is highly unlikely that the MDG targets for infant and child mortality (MDGs 4 and 5) or for disease control (MDG 6) could be met without significant improvements in water and sanitation services. The high incidence of water-borne disease in areas with inadequate water and sanitation services is a prime cause of infant mortality and malnutrition in the country. Diarrhoea is the most widespread problem, affecting more than 1 in 100 residents in 2002.179 Other water-borne diseases, such as typhoid and bacterial dysentery also pose serious threats to public health. Improving water and sanitation systems is also an important element in the effort to raise school enrolment and attendance (MDG 2) as well as in efforts at promoting gender equality and the empowerment of women (MDG 3). For example, enrolment and attendance rates for girls have been shown to rise with the provision of clean latrines in schools. And supplying households with a convenient household or community water point can spare women and girls significant time and effort fetching water from more distant sources. Higher levels of fe-male education can help reduce the incidence of disease among children.
Improvements in basic water and sanitations services can have especially strong benefits for poor households, which either lack the resources to cope with poor water and sanitation or pay disproportionately more for these services. Indeed, international studies have suggested that despite being less able to bear the costs, poor households often pay more per cubic me-ter for drinking water than do wealthier households with better access to water systems.180
178 “Adequate” sanitation (disposal of excreta) refers to modern septic facilities, flush- or pour-toilets, ventilated and simple covered pit latrines, all of
which provide some additional measure of protection, beyond that offered by open pit latrines, from unhygienic contact between excreta and insects
or humans. See World Bank and IMF background paper “Water Supply and Sanitation and the Millennium Development Goals”, March 2003. “Safe”
water (also referred to as water from an “improved” source) refers to household connections, public taps, water drawn from boreholes, protected
wells, spring- and rain-water catchments. It should be noted that even so-called safe water sometimes fails to meet formal standards for potability.
179 MDGR.
180 World Bank and IMF, March 2003.
145
The main interventions for achieving MDG target of supplying the population with safe drinking water and sanitation are: 1 Water supply for urban and rural population:
• Construction and maintenance of water points (wells, spring catchments, bore-holes, public stand posts, etc.) for rural population and population in cities not connected to centralized systems;
• Major rehabilitation and maintenance of safe water supply infrastructure in cit-ies;
• Improvement of tariff collections and introduction of break-even tariffs;• Creation and development of Water User Associations;
2 Sanitation:• Construction and maintenance of modern sanitation for rural population and
population without access to centralized sewage systems (such as provision of flush toilets, improved pit latrines, sewage systems, septic tanks);
• Rehabilitation and maintenance of the centralized sewage networks and sewage water treatment facilities in the cities;
• Improved collection of sewage tariffs, and transition to break-even tariffs.3 Public Hygiene education and public awareness:
• Behaviour change programmes (including rational usage of drinking water) for public;
• Hygiene education in primary schools;• Country-wide mass media campaigns on hygiene
4 Wastewater Management:• Integration of waste water treatment into rural septic tanks and urban sewage
systems.
The main coverage targets assume that by 2015: 1) 74% of the rural, and 97% of urban popula-tion will have access to safe drinking water; 2) 45% of the rural and 65% of the urban will have access to improved sanitation. The hygiene education programme is to reach 20% of all pri-mary school children every year, and that mass media campaign is to reach 100% of the popu-lation. Wastewater treatment is to cover 0.19% of rural and 41% of the urban population.
The main outcome of interventions in water and sanitation that 83% of all population will have access to safe drinking water and 58% of all population will have access to improved sanitation. The result is drastic reduction of water borne diseases and improved health of the population.
Current Situation in Water Supply and Sanitation. At present, water supply and sanitation facilities in Tajikistan are neither safe nor adequate. According to the Ministry of Health as of 2004, out of the existing 699 centralized water supply systems 113 are not functioning and 358 do not meet the sanitary requirements. Water provision is irregular, marked by frequent outages. The existing situation does not guarantee sustainable access to safe drinking water. With an annual production of over 13,000 cubic metres of water per capita, Tajikistan is one of the most water wealthy countries in the world,181 yet the country is able to provide just 59 % of its population with access to safe drinking water. Overall, the country has the worst access to drinking water in the CIS, and outbreaks of waterborne illnesses pose a serious risk to public health. In some towns (such as Dushanbe, Sarband) untreated river water flows directly into cities’ water pipes, water systems are badly decayed and are subject to frequent service outages. In rural
181 NHDR 2003.

MILLENNIUM DEVELOPMENT GOALS NEEDS ASSESSMENT TAJ IK ISTAN
146
MILLENNIUM DEVELOPMENT GOALS NEEDS ASSESSMENT TAJ IK ISTAN
regions, where less than half of residents have access to improved water sources, large part of the population take their water from ponds, canals, rivers and other unsafe sources With regard to sanitation, nearly all households have access to pit latrines, but most of these are of poor construction and pose a risk to public health.182A majority of rural schools and medical institutions lack proper sanitation and water facilities. For example, out of 3,694 schools (546 urban and 3,148 rural) only 1,718 have access to piped water, and the remaining schools lack access to safe drinking water sources. 140 rural schools have no toilets. Due to the deterio-ration of the water distribution systems and other main water supply facilities, access of the population to the piped clean water is in decline.
Table 66. Access to improved water sources, 2000Tajikistan Urban Rural
% % % Safe 59.0 92.9 46.9
Piped into dwelling 19.2 49.7 8.3Piped into yard or plot 21.6 32.3 17.7Public tap 7.6 5.0 8.6Borehole with hand pump 6.0 3.6 6.8Protected spring 3.0 0.9 3.7Protected dug well 1.7 1.4 1.8Rainwater collection 0.0 0.0 0.0
Unsafe 40.9 7.1 53.0Bottled water 0.1 0.1 0.1Unprotected spring 3.4 0.9 4.3Unprotected dug well 0.6 0.6 0.6River or stream 31.6 4.1 41.5Tanker truck vendor 3.0 0.2 4.0Cut official pipe 0.0 0.0 0.0Other 2.2 1.2 2.5Don’t know 0.0 0.0 0.0
Source: UNICEF MICS 2000.
Table 67. Access to drinking water by regions in Tajikistan (% of the population)Drinking Water GBAO Sugd oblast Khatlon oblast RRS Dushanbe
Safe 25,4 57,6 48,3 56,2 98,5Not safe 74,6 42,4 51,7 43,8 1,5
Source: Based on GoT data (2000), MICS (2000), and Programme on Ecological Management in the city of Du-shanbe (2005)
There are several reasons for the poor state of Tajikistan’s water and sanitation services. As in other sectors, the hardships of post-Soviet economic transition and the civil war have taken a toll on the water supply infrastructure. Low levels of official budget allocations and difficulties collecting user fees have severely limited domestic financing, which has been insufficient to meet the substantial requirements for capital investment. Even if increased funding were made available, it is doubtful that the water authorities could apportion resources effectively among the sector’s many and pressing needs. As a complement to investment, structural reforms are needed to improve the efficiency of service provision and strengthen incentives to rationalise consumption.
182 UNICEF Tajikistan. “Water, Sanitation and Health” 2003.
147
Achieving the MDG target for water provision will require providing access to safe water for an additional 3 million183 people between 2004 and 2015. It is estimated that a little over 1 mil-lion of these will be born in areas where improved water systems are already in place.184 New infrastructure will have to be built to provide access to improved water sources for the re-maining 2 million people, the vast majority of whom reside in rural areas. As the Government notes in its National Poverty Reduction Strategy Paper (PRSP), since urban areas already have broader access to the water infrastructure, policy ought to focus on improving service for the rural population. Unfortunately, very little progress has thus far been made in this direction. Unless the situation changes soon and substantially Tajikistan is unlikely to meet its MDG target for water provision
Government MeasuresInstitutions. The Ministry of Irrigation and Water Resources (MIWR) is accountable for national water sector policy and planning. MIWR directly manages irrigation networks and agricultural water supply systems, but operational responsibilities for household and commercial water sup-ply have been devolved to municipalities. Bulk water provision is the province of four semi-au-tonomous public enterprises: Tajikselkhozvodaprovod, the rural water authority, which has re-sponsibility for providing water to rural communities; Dushanbe Vodakanal (DVK) and Khujand Vodakanal (KVK), which manage the water systems in the Dushanbe and Khujand; and Tajik-communservice (TCS), the urban water authority, which has responsibility for water provision to cities and towns other than Dushanbe and Khujand. Water quality is monitored by a number of agencies, including the Sanitary and Epidemiological Service (SES), which has some limited enforcement power, as well as by municipal authorities and service providers.185
Policy. The national poverty reduction strategy notes that water supply and sanitation, along with other key infrastructure services, are “essential to economic growth and contribute much to the improvement of living conditions.” The Government distinguishes between pri-orities for rural and urban areas: “in urban areas the focus will be on improving the reliability of the infrastructure, in rural areas the priority will be to provide access” to essential goods and services.186 Authorities also acknowledge the need to reform water sector financing to bolster incentives for rational consumption and ensure that service provision is financially “self-supporting” while taking steps to cushion the impact of tariff reforms on low-income households through targeted subsidy programmes. In 2002, the Government approved the National Concept on Rational Use and Protection of Water Resources, which emphasises the need to reduce wastage and strengthen conservation of national water supplies. Ultimately, progress will depend on the Government’s ability to translate its strategic vision into specific, well-implemented actions, and on the ability of Tajikistan and its international partners to meet resource requirements for development in this area.
183 This estimate assumes that existing infrastructure, with proper maintenance and reinvestment, will continue to provide safe water to people living in
serviced areas.
184 The current population of urban residents with access to improved water sources is estimated at 1.6 million. Assuming constant urban population
growth of 1.83 percent through 2015, the urban population with existing coverage will grow by around 0.4 million. Under similar assumptions (2.4
million people with access to improved sources, rural population growth of 2.07 percent), the rural population with access to improved water will
grow by around 0.6 million. It is assumed that ongoing investment in water infrastructure would enable these water systems to meet the needs of
increased population. If physical leakage and wasteful consumption can be reduced (discussed below) existing systems should have adequate capacity
to meet the needs of rising population in areas where water systems already exist.
185 NHDR 2003.
186 PRSP 2002.
MILLENNIUM DEVELOPMENT GOALS NEEDS ASSESSMENT TAJ IK ISTAN
148
MILLENNIUM DEVELOPMENT GOALS NEEDS ASSESSMENT TAJ IK ISTAN
The national drinking water strategy consists of five elements:
1 Increase investment. An important priority of the Government is to increase investment in water systems rehabilitation. At present, investment is financed mostly by interna-tional development assistance and is concentrated in cities and towns.187 As noted in the PRSP, authorities recognise the need to direct more investment towards rural areas.
2 Improve management of utility companies. Part of the Government’s national poverty re-duction strategy is improve the ability of service providers to operate and maintain water systems. Low wages and emigration have reduced staff capacity at both manage-ment and technical levels over the past decade.188 Management reform is also needed to strengthen the administration of the water authorities at the national and regional level.
3 Undertake legal and regulatory reforms. Legal and regulatory reforms are required to strengthen the efficiency of the water system, particularly in regards to legal regulation and tariff policy. Strengthening monitoring and regulatory capacity is also needed to separate responsibility for oversight from responsibility for operations. Amendments to utilities legislation will aim to further separate policymaking and regulatory bodies from service providers.
4 Strengthen cost recovery. “Full cost recovery,” which the PRSP identifies as an ultimate goal for utility services, will take some time to achieve and will require a major upgrade of the technical and administrative resources needed to monitor water flows, assess charges and collect user fees. Improved tariff reforms and fee collection will help strengthen incentives for rational use. The Government is aware of the impact that raising water tariffs and collection rates will have on poor households and hopes to work with international partners to design a program to cushion the impact of price hikes on poor households.
5 Rationalise water consumption. In addition to reducing physical leakage from the aging water supply system, the Government needs to strengthen incentives for consumers to reduce their wasteful consumption. Improving tariff collections and tariff policy is a must. Some limited tariff increases are planned for 2004, but it remains to be seen whether wa-ter authorities can achieve higher collection rates at the same time as they raise prices.
RecommendationsQuick Wins for Water and Sanitation:• Creation and development of Water User Associations in rural areas• Reconstruction of hand pumps and installation of deep water wells where needed• Chemical and bacteriological treatment of drinking water systems and protection of
water sources from pollution
Medium Term Strategy for Water and Sanitation:• Training and retraining of technical staff and managers of Water User Associations• Increase public awareness of sanitary-hygienic measures• Rehabilitation of all urban and rural systems • Reforms in the management of water provision and distribution systems to create
187 The 2002 World Bank Dushanbe Water Supply Project, for example, allocates approximately US$17 million in foreign aid to rehabilitation.
188 NHDR 2003.
149
independent water providers and regulators• Measures directed towards increasing incentives to decrease overuse of water• Increasing private financing for water and sanitation systems• Nationwide installation of meters, decrease in water leakages and increasing collection
of water tariffs
Financial Estimations for Water and SanitationAchieving the MDG target for access to safe water will require not only expanding access to clean water sources around the country but sustaining existing services as well. Although 93 % of urban residents have access to piped water, deteriorating distribution networks together with weak treatment capacity pose a threat to public health and economic development.
Urban Water SupplyUrban water consumption. Without installing water meters in households and improving fee collection, Tajikistan will find it extremely difficult to rationalise wasteful water consumption and harness domestic resources for investment in the operation and development of its urban water systems. Urban water consumption is extremely high, owing to wasteful use and large physical losses from leakage. Annual urban water provision in Tajikistan in the year 2002 was estimated at 440 million cubic metres, including 210 million cubic metres of physical leakage.189 During Soviet times, households did not pay for water services and the public became ac-customed to consume water without paying for the service. In Dushanbe average daily water consumption excluding leakage is around 570 litres per person per day,190 one of the highest rates in Asia.191 Including leakage, per capita water consumption exceeds 1,200 litres a day. If Tajikistan is to ensure the sustainability and quality of its urban water services it will need to rehabilitate water systems to staunch leakage, strengthen operating capacity and install water meters in households to promote efficient water use.
Rehabilitation of urban water systems. Major capital investments will be required to support the physical renovation of urban central water systems. These investments are needed to reduce leakage and improve the operation and safety of the water networks. Approximately 87 % or 1.5 million of Tajikistan’s estimated 1.75 million urban residents receive water from centralised water systems.192 Rehabilitating the urban water infrastructure will be an expensive undertak-ing. By some estimates urban water systems have depreciated by as much as 90 %193 over the past four decades. The urban water authority, for example, submitted proposals for more than US$60 million in essential water systems rehabilitation projects over 2000-2002.194 To date only a fraction of these investment needs have been met.
189 Tajikcomunservice, the urban water authority, reported daily average water provision of 280,000 cubic metres (102 million cubic metres per year,
including more than 30 million cubic metres of leakage) to towns and regional centres excluding Khujand and Dushanbe. DVK provided total annual
flows of around 270 million cubic metres with 53 percent leakage. Assuming per capita water supply and leakage in Khujand is comparable to Du-
shanbe, total water consumption in Khujand would be around 70 million cubic metres.
190 DWSP reports roughly 126 million cubic meters of annual authorised (111 million m3) and unauthorised (15 million m3) consumption for a population
of around 600,000.
191 See ADB “Asian Water Supplies, Reaching the Urban Poor” 2003.
192 Applying MICS 2000 figures on urban water system coverage to 2003 urban population estimate.
193 Correspondence with TCS.
194 Correspondence with TCS.

MILLENNIUM DEVELOPMENT GOALS NEEDS ASSESSMENT TAJ IK ISTAN
150
MILLENNIUM DEVELOPMENT GOALS NEEDS ASSESSMENT TAJ IK ISTAN
Table 68. Urban water systems development 2005 2010 2015 Total 05-15 2005 2010 2015 Avg. 05-15
US$ million (2003) Per capitaCapital costs 43.5 43.7. 44.0 480.9 21.3. 16.5 13.1 16.4
Distribution network 23.4 23.4. 23.4 257.9 11.5 8.8 7.0 8.8Water connections 1.7 1.9 2.2 21.3 0.8 0.7 0.7 0.7Treatment substations 6.4 6.4 6.4 70.5 3.1 2.4 1.9 2.4Booster stations 11.0 11.0 11.0 121.0 5.4 4.1 3.3 4.1Water meters 0.9 0.9 0.9 10.2 0.5 0.3 0.3 0.3
Recurrent costs 9.6 10.9 11.4 117.9 4.7 4.1 3.4 4.0Total costs 53.1 54.6 55.4 598.8 26.0 20.6 16.5 20.4
MDG Needs Assessment Estimates, 2005
The key investments for urban water rehabilitation are distribution networks, pump stations, water treatment facilities, booster stations, and water meters. Over the next three years and with support from the World Bank, the Dushanbe city water authority, Dushanbe Vodokanal (DVK), will spend US$5.5 million to make essential, non-comprehensive repairs to the capi-tal’s water distribution network.195 DVK estimates that these repairs will cover just 5 % of the city’s 670-kilometre water system.196 Water systems experts informally estimate that it may cost around US$41.4 million to make comprehensive repairs to the water provision network in Dushanbe alone.197 Additional expenses – US$12.5 million to install four new water treat-ment substations, including a high-capacity treatment substation at the Varzob river intake (where untreated river water is diverted into the city water system); and US$25 million to replace or upgrade the city’s 90 booster stations – will add to the bill for fixing the distribution network.198 Another US$2 million would be needed to install water meters at the household level.199 In all, it is estimated that it would cost roughly US$81 million, or US$130 per capita, to rehabilitate the Dushanbe city water system.
The costs for Dushanbe are not perfectly comparable with potential costs for urban areas else-where in the country. Dushanbe has higher leakage rates (53 % vs. 30 % reported by TCS) and the unusual problems of treating diverted river water and cleaning accumulated sand from its distribution network. Over the eleven years to 2015 the average per capita cost of developing urban water supply systems is US$180 (average per capita capital cost of US$16.3 x 11 years).
Recurrent operating costs of urban water systems. In addition to the one-off costs of rehabilitation, Tajikistan will need to meet the recurrent costs of maintaining and operating its urban water systems. The major operating expenses for urban water systems include payments to staff, elec-tricity charges, purchases of chemicals for use in water treatment, and basic maintenance. At present DVK operates on a budget of approximately US$0.6 million per annum, well short of what would be required to manage the water system effectively. According to DVK managers, US$2.5 million per year would be sufficient to pay essential operating costs of water provision and treatment. These operating costs are calculated based on unit costs per cubic metre of water delivered. Since official estimates do not recognise the full scope of water leakage, costs estimated in this manner underestimate real needs. Taking account of actual water provision,
195 DWSP 2002.
196 Correspondence with DVK.
197 Correspondence with MVV Consultants and Engineers GmbH, advisors to DVK and World Bank Dushanbe Water Supply Project.
198 Correspondence with DVK and MVV Consultants.
199 Assuming an average urban household size of 6 and a unit cost of US$20 per water meter installed, it would cost approximately US$2 million to
install household water meters in Dushanbe.
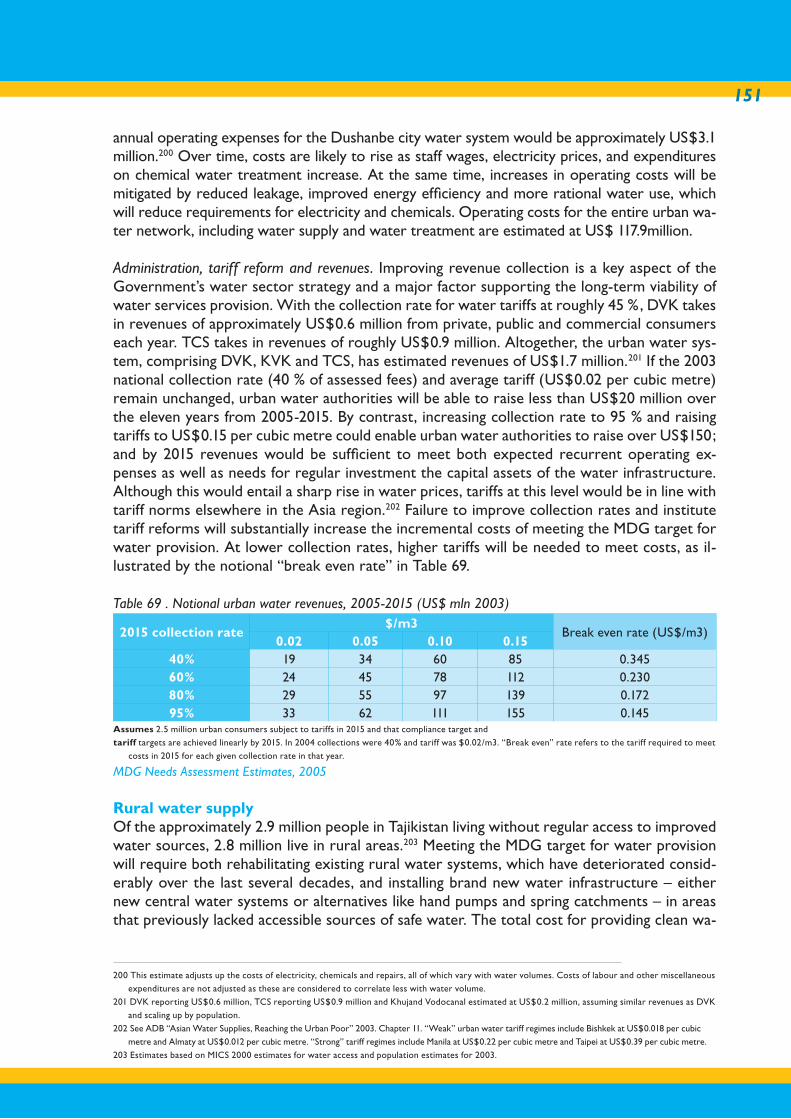
151
annual operating expenses for the Dushanbe city water system would be approximately US$3.1 million.200 Over time, costs are likely to rise as staff wages, electricity prices, and expenditures on chemical water treatment increase. At the same time, increases in operating costs will be mitigated by reduced leakage, improved energy efficiency and more rational water use, which will reduce requirements for electricity and chemicals. Operating costs for the entire urban wa-ter network, including water supply and water treatment are estimated at US$ 117.9million.
Administration, tariff reform and revenues. Improving revenue collection is a key aspect of the Government’s water sector strategy and a major factor supporting the long-term viability of water services provision. With the collection rate for water tariffs at roughly 45 %, DVK takes in revenues of approximately US$0.6 million from private, public and commercial consumers each year. TCS takes in revenues of roughly US$0.9 million. Altogether, the urban water sys-tem, comprising DVK, KVK and TCS, has estimated revenues of US$1.7 million.201 If the 2003 national collection rate (40 % of assessed fees) and average tariff (US$0.02 per cubic metre) remain unchanged, urban water authorities will be able to raise less than US$20 million over the eleven years from 2005-2015. By contrast, increasing collection rate to 95 % and raising tariffs to US$0.15 per cubic metre could enable urban water authorities to raise over US$150; and by 2015 revenues would be sufficient to meet both expected recurrent operating ex-penses as well as needs for regular investment the capital assets of the water infrastructure. Although this would entail a sharp rise in water prices, tariffs at this level would be in line with tariff norms elsewhere in the Asia region.202 Failure to improve collection rates and institute tariff reforms will substantially increase the incremental costs of meeting the MDG target for water provision. At lower collection rates, higher tariffs will be needed to meet costs, as il-lustrated by the notional “break even rate” in Table 69.
Table 69 . Notional urban water revenues, 2005-2015 (US$ mln 2003)
2015 collection rate$/m3
Break even rate (US$/m3)0.02 0.05 0.10 0.15
40% 19 34 60 85 0.34560% 24 45 78 112 0.23080% 29 55 97 139 0.17295% 33 62 111 155 0.145
Assumes 2.5 million urban consumers subject to tariffs in 2015 and that compliance target and
tariff targets are achieved linearly by 2015. In 2004 collections were 40% and tariff was $0.02/m3. “Break even” rate refers to the tariff required to meet
costs in 2015 for each given collection rate in that year.
MDG Needs Assessment Estimates, 2005 Rural water supplyOf the approximately 2.9 million people in Tajikistan living without regular access to improved water sources, 2.8 million live in rural areas.203 Meeting the MDG target for water provision will require both rehabilitating existing rural water systems, which have deteriorated consid-erably over the last several decades, and installing brand new water infrastructure – either new central water systems or alternatives like hand pumps and spring catchments – in areas that previously lacked accessible sources of safe water. The total cost for providing clean wa-
200 This estimate adjusts up the costs of electricity, chemicals and repairs, all of which vary with water volumes. Costs of labour and other miscellaneous
expenditures are not adjusted as these are considered to correlate less with water volume.
201 DVK reporting US$0.6 million, TCS reporting US$0.9 million and Khujand Vodocanal estimated at US$0.2 million, assuming similar revenues as DVK
and scaling up by population.
202 See ADB “Asian Water Supplies, Reaching the Urban Poor” 2003. Chapter 11. “Weak” urban water tariff regimes include Bishkek at US$0.018 per cubic
metre and Almaty at US$0.012 per cubic metre. “Strong” tariff regimes include Manila at US$0.22 per cubic metre and Taipei at US$0.39 per cubic metre.
203 Estimates based on MICS 2000 estimates for water access and population estimates for 2003.
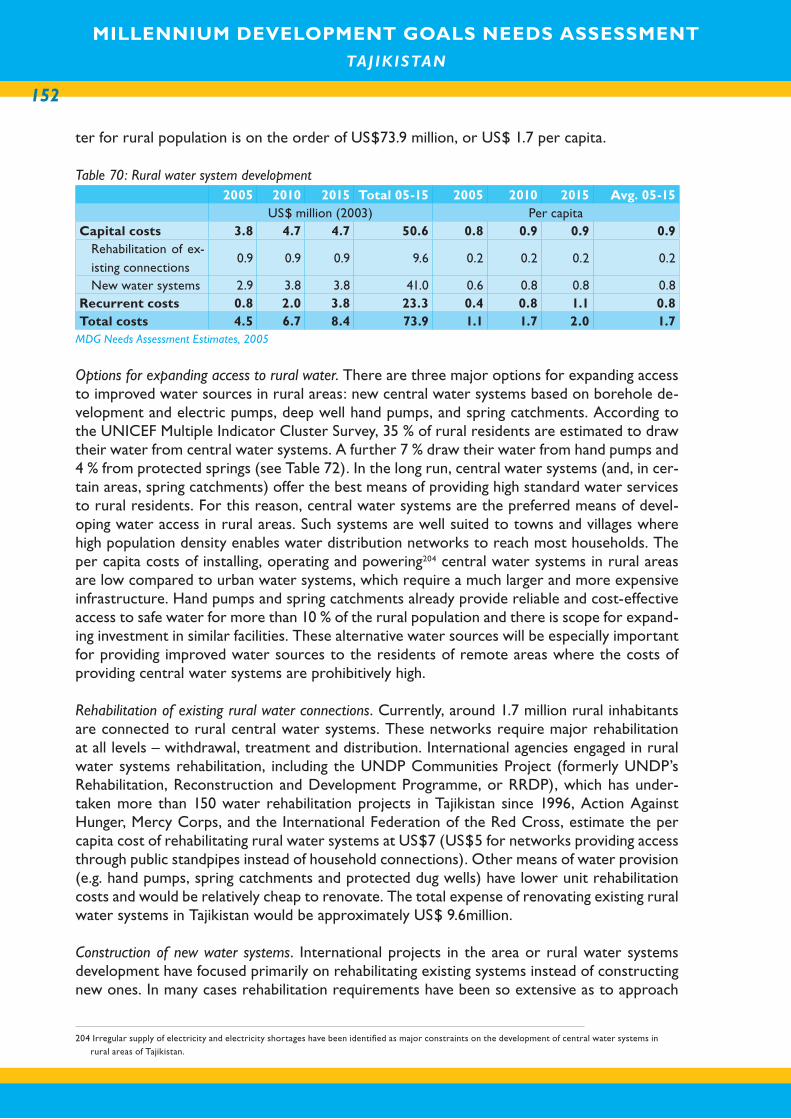
MILLENNIUM DEVELOPMENT GOALS NEEDS ASSESSMENT TAJ IK ISTAN
152
MILLENNIUM DEVELOPMENT GOALS NEEDS ASSESSMENT TAJ IK ISTAN
ter for rural population is on the order of US$73.9 million, or US$ 1.7 per capita.
Table 70: Rural water system development 2005 2010 2015 Total 05-15 2005 2010 2015 Avg. 05-15 US$ million (2003) Per capita
Capital costs 3.8 4.7 4.7 50.6 0.8 0.9 0.9 0.9Rehabilitation of ex-isting connections
0.9 0.9 0.9 9.6 0.2 0.2 0.2 0.2
New water systems 2.9 3.8 3.8 41.0 0.6 0.8 0.8 0.8Recurrent costs 0.8 2.0 3.8 23.3 0.4 0.8 1.1 0.8Total costs 4.5 6.7 8.4 73.9 1.1 1.7 2.0 1.7
MDG Needs Assessment Estimates, 2005
Options for expanding access to rural water. There are three major options for expanding access to improved water sources in rural areas: new central water systems based on borehole de-velopment and electric pumps, deep well hand pumps, and spring catchments. According to the UNICEF Multiple Indicator Cluster Survey, 35 % of rural residents are estimated to draw their water from central water systems. A further 7 % draw their water from hand pumps and 4 % from protected springs (see Table 72). In the long run, central water systems (and, in cer-tain areas, spring catchments) offer the best means of providing high standard water services to rural residents. For this reason, central water systems are the preferred means of devel-oping water access in rural areas. Such systems are well suited to towns and villages where high population density enables water distribution networks to reach most households. The per capita costs of installing, operating and powering204 central water systems in rural areas are low compared to urban water systems, which require a much larger and more expensive infrastructure. Hand pumps and spring catchments already provide reliable and cost-effective access to safe water for more than 10 % of the rural population and there is scope for expand-ing investment in similar facilities. These alternative water sources will be especially important for providing improved water sources to the residents of remote areas where the costs of providing central water systems are prohibitively high.
Rehabilitation of existing rural water connections. Currently, around 1.7 million rural inhabitants are connected to rural central water systems. These networks require major rehabilitation at all levels – withdrawal, treatment and distribution. International agencies engaged in rural water systems rehabilitation, including the UNDP Communities Project (formerly UNDP’s Rehabilitation, Reconstruction and Development Programme, or RRDP), which has under-taken more than 150 water rehabilitation projects in Tajikistan since 1996, Action Against Hunger, Mercy Corps, and the International Federation of the Red Cross, estimate the per capita cost of rehabilitating rural water systems at US$7 (US$5 for networks providing access through public standpipes instead of household connections). Other means of water provision (e.g. hand pumps, spring catchments and protected dug wells) have lower unit rehabilitation costs and would be relatively cheap to renovate. The total expense of renovating existing rural water systems in Tajikistan would be approximately US$ 9.6million.
Construction of new water systems. International projects in the area or rural water systems development have focused primarily on rehabilitating existing systems instead of constructing new ones. In many cases rehabilitation requirements have been so extensive as to approach
204 Irregular supply of electricity and electricity shortages have been identified as major constraints on the development of central water systems in
rural areas of Tajikistan.
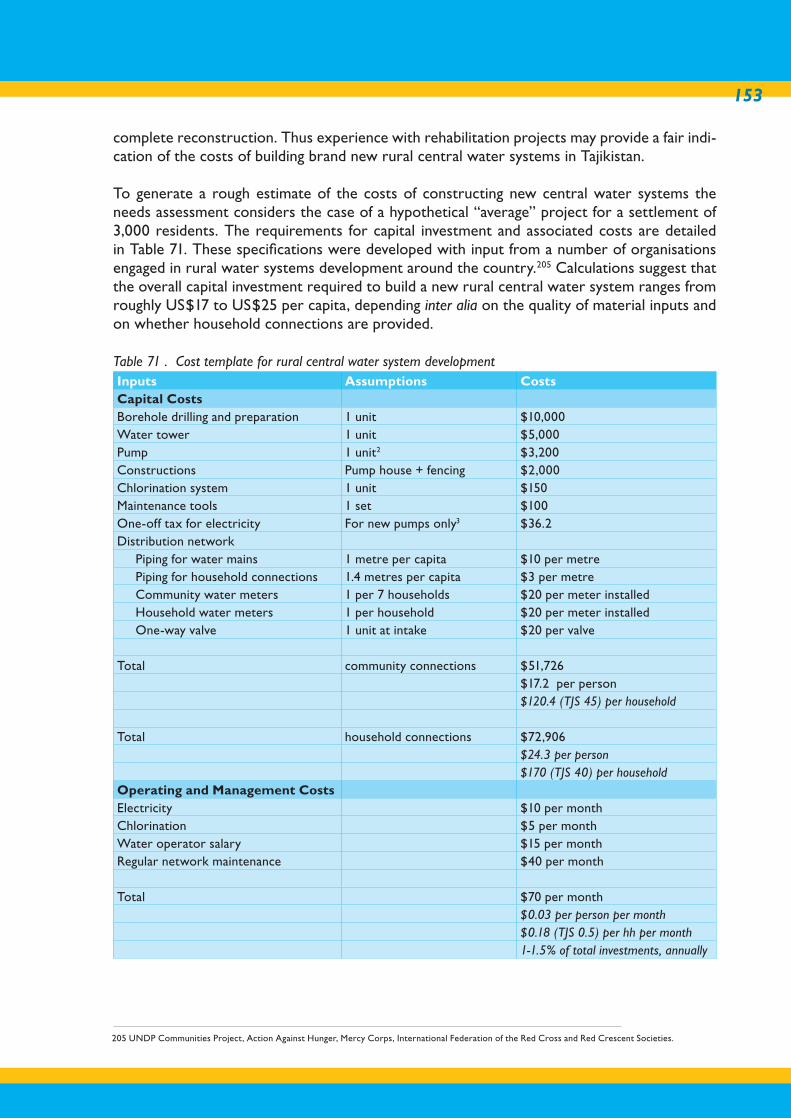
153
complete reconstruction. Thus experience with rehabilitation projects may provide a fair indi-cation of the costs of building brand new rural central water systems in Tajikistan.
To generate a rough estimate of the costs of constructing new central water systems the needs assessment considers the case of a hypothetical “average” project for a settlement of 3,000 residents. The requirements for capital investment and associated costs are detailed in Table 71. These specifications were developed with input from a number of organisations engaged in rural water systems development around the country.205 Calculations suggest that the overall capital investment required to build a new rural central water system ranges from roughly US$17 to US$25 per capita, depending inter alia on the quality of material inputs and on whether household connections are provided.
Table 71 . Cost template for rural central water system developmentInputs Assumptions CostsCapital CostsBorehole drilling and preparation 1 unit $10,000 Water tower 1 unit $5,000 Pump 1 unit2 $3,200 Constructions Pump house + fencing $2,000 Chlorination system 1 unit $150 Maintenance tools 1 set $100 One-off tax for electricity For new pumps only3 $36.2Distribution network Piping for water mains 1 metre per capita $10 per metre Piping for household connections 1.4 metres per capita $3 per metre Community water meters 1 per 7 households $20 per meter installed Household water meters 1 per household $20 per meter installed One-way valve 1 unit at intake $20 per valve
Total community connections $51,726 $17.2 per person
$120.4 (TJS 45) per household
Total household connections $72,906 $24.3 per person
$170 (TJS 40) per household Operating and Management CostsElectricity $10 per monthChlorination $5 per monthWater operator salary $15 per monthRegular network maintenance $40 per month
Total $70 per month $0.03 per person per month
$0.18 (TJS 0.5) per hh per month1-1.5% of total investments, annually
205 UNDP Communities Project, Action Against Hunger, Mercy Corps, International Federation of the Red Cross and Red Crescent Societies.

MILLENNIUM DEVELOPMENT GOALS NEEDS ASSESSMENT TAJ IK ISTAN
154
MILLENNIUM DEVELOPMENT GOALS NEEDS ASSESSMENT TAJ IK ISTAN
Inputs Assumptions CostsReplacement and Upgrade of Fixed Assets4
Total 5% of capital investments$327 per month (household connec-tions)$0.11 per person per month$0.76 (TJS 2.3) per hh per month5% of total investments, annually
1 Rural water systems typically serve a population of 3,000. Average household size in rural areas is 7.
2 According to the MDG Needs Assessment, the high quality deep water borehole ECV with capacity of 11kWt costs no more than US$ 850-900, control panel costs about US$ 450, and new transformer costs about US$ 1,650. The total cost is US$3,200 including the purchase and instalment of the equipment.
3 Taxes are levied to help pay for investments in the electrical system. Considering a tax of roughly $15 per kilowatt hour of new electricity demand, an 11 kw pump would require paying a one-time fee of $165. This would need to be paid only for pumps serving new boreholes and for pumps serving old boreholes that previously did not have pumps.
4 Capital costs include replacement, upgrade and addition of fixed assets invested in the water system. These may be viewed as savings for major operations not covered by regular operational maintenance.
Sources: UNDP Communities Project, Action Against Hunger, Mercy Corps and MDG estimates.
At US$0.18 (TJS 0.56) per month per household, the operating costs of rural water systems are sufficiently low that with effective community organization to collect fees these recurrent expenses may be covered in full.206 Of greater expense is the cost of maintaining, replacing and upgrading depreciating fixed assets. Assuming capital depreciation at a rate of 5 % per year, households would need to provide a further US$0.76 (TJS 2.3) each month to replace pumps, water mains, meters and other fixed assets not covered by regular maintenance operations. It is less clear that communities could meet these needs.
Using the template presented in Table 71, building sufficient rural central and alternative water systems to achieve the MDG target for clean water provision would cost approximately US$41 million. Expenditures on other means of access would cost a further US$5 million. These cost estimates are dependent on the degree to which communities and Government authorities prefer to rely on various means of water provision to improve rural access to water. The current estimate assumes the distribution shown in Table 72, which emphasizes the expansion of borehole development for household connections to piped water.
Table 72. Means of rural water access Current (2000) Target (2015)Household connections 26% 40%Public standposts 9% 19%Hand pumps 7% 8.1%Spring catchments 4% 4.5%Protected wells 2% 2%
MDG Needs Assessment Estimates, 2005
Alternative rural water supply measures. Hand pumps provide especially useful means of provid-ing clean water to small towns and remote communities where it is not cost effective to build
206 Correspondence with NGOs engaged in water systems development.
155
central water systems. Hand pumps can also provide dedicated safe water sources to schools and medical facilities, many of which lack access to safe water. Regionally, hand pumps are more suited to Khatlon province where, in most areas, ground water quality is suitable for drinking.207 Hand pumps are less suited to mountainous regions of the country where spring catchments can provide water more efficiently. (Also, in much of Sughd province the poor quality of ground water makes hand pumps a less attractive option for water provision.) Research by UNICEF suggests that the unit cost of installing a deep well hand pump, able to supply 300 people with clean water, is approximately US$3,000.208 After installation, the average annual operating cost, including maintenance and spare parts, is estimated at US$2 a year per pump.209
Realistically, hand pumps alone cannot meet the MDG target. (Hypothetically, this would re-quire the installation of more than 7,500 hand pumps.) These are best viewed as a means of extending improved water access to remote communities, establishing dedicated water sup-plies for schools and hospitals, and providing some measure of basic interim service to com-munities that will eventually receive central water systems.
Spring catchments offer another cost effective means of providing safe water in areas, usually mountainous, where springs of sufficient capacity can be harnessed to meet community needs. The typical spring catchment in Tajikistan provides for around 1500 people and costs between US$4000 and US$8000 to construct, depending on transport costs (which can account for as much as a quarter of expenses in hard-to-reach areas), quality of piping materials, and wheth-er water is transported through the distribution system by electric pump or by gravity.210 The annual operating cost of spring catchments is negligible; maintenance and replacement costs are needed only when natural disasters or human intrusions disrupt the water system. When needed, repair costs are typically met by local communities.211
Sustainability of rural water systems projects. Rural water systems are more likely to be sustain-able if communities and local governments are well organised and invested in projects. Training local water operators and supporting the development of community water associations can facilitate community support for water services. Sustainability may be improved by allowing households to collectively make decisions about the level of service, technology, and loca-tion of facilities.212 When informed about the different service options and associated costs households may express a willingness to contribute additional funds to add household water connections, larger water towers, and other service-improving investments above and beyond what outside project operators may plan for the community.
Rural water systems will rapidly deteriorate unless the resources are more effectively mobi-lised to provide adequate maintenance operations. Rural water development requires much more than installing infrastructure, it requires the development of the financial and technical capacity to maintain water systems. Although many water projects have sought, with some
207 See Mission Report on Water Supply in Tajikistan, UNICEF, January 2003. Survey of hand pump viability found that hand pumps are viable in Khatlon
Oblast but would not be cost-effective in Sughd Oblast.
208 UNICEF. Major cost components include drilling (US$1600), insulating the well shaft (US$900), installing a sealed concrete covering platform for
the well (US$100), and importing the hand pump itself (US$400). These costs could fall if local capacity could be developed to provide quality hand
pumps domestically and if borehole drilling prices were to fall, through increased competition for example. Presently, most organisations engaged in
hand pump installation prefer to import higher quality pumps from abroad.
209 UNICEF. Annual maintenance might require disassembling the pump, flushing the borehole and replacing any rubber seals that might have worn out.
210 Interviews with organisations involved in spring development.
211 Interviews with rural water provision projects.
212 UNDP “Making Rural Water Supply Sustainable: Recommendations from a Global Study” 1998.
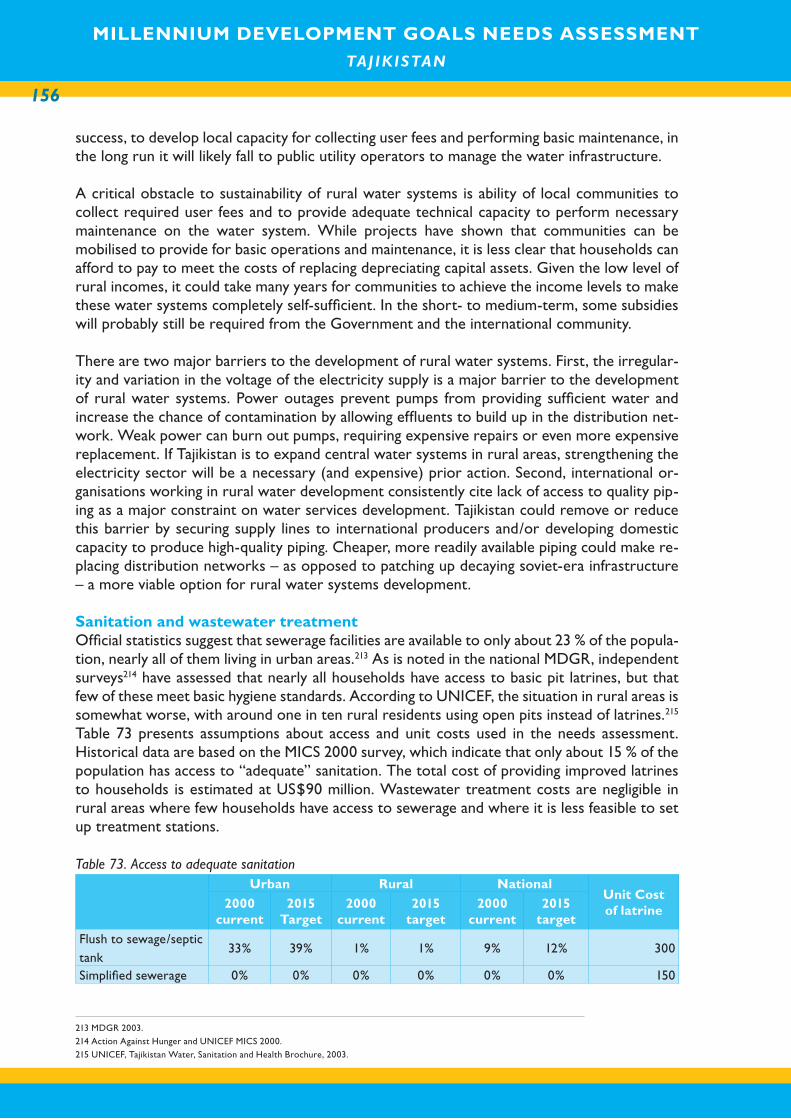
MILLENNIUM DEVELOPMENT GOALS NEEDS ASSESSMENT TAJ IK ISTAN
156
MILLENNIUM DEVELOPMENT GOALS NEEDS ASSESSMENT TAJ IK ISTAN
success, to develop local capacity for collecting user fees and performing basic maintenance, in the long run it will likely fall to public utility operators to manage the water infrastructure.
A critical obstacle to sustainability of rural water systems is ability of local communities to collect required user fees and to provide adequate technical capacity to perform necessary maintenance on the water system. While projects have shown that communities can be mobilised to provide for basic operations and maintenance, it is less clear that households can afford to pay to meet the costs of replacing depreciating capital assets. Given the low level of rural incomes, it could take many years for communities to achieve the income levels to make these water systems completely self-sufficient. In the short- to medium-term, some subsidies will probably still be required from the Government and the international community.
There are two major barriers to the development of rural water systems. First, the irregular-ity and variation in the voltage of the electricity supply is a major barrier to the development of rural water systems. Power outages prevent pumps from providing sufficient water and increase the chance of contamination by allowing effluents to build up in the distribution net-work. Weak power can burn out pumps, requiring expensive repairs or even more expensive replacement. If Tajikistan is to expand central water systems in rural areas, strengthening the electricity sector will be a necessary (and expensive) prior action. Second, international or-ganisations working in rural water development consistently cite lack of access to quality pip-ing as a major constraint on water services development. Tajikistan could remove or reduce this barrier by securing supply lines to international producers and/or developing domestic capacity to produce high-quality piping. Cheaper, more readily available piping could make re-placing distribution networks – as opposed to patching up decaying soviet-era infrastructure – a more viable option for rural water systems development.
Sanitation and wastewater treatmentOfficial statistics suggest that sewerage facilities are available to only about 23 % of the popula-tion, nearly all of them living in urban areas.213 As is noted in the national MDGR, independent surveys214 have assessed that nearly all households have access to basic pit latrines, but that few of these meet basic hygiene standards. According to UNICEF, the situation in rural areas is somewhat worse, with around one in ten rural residents using open pits instead of latrines.215 Table 73 presents assumptions about access and unit costs used in the needs assessment. Historical data are based on the MICS 2000 survey, which indicate that only about 15 % of the population has access to “adequate” sanitation. The total cost of providing improved latrines to households is estimated at US$90 million. Wastewater treatment costs are negligible in rural areas where few households have access to sewerage and where it is less feasible to set up treatment stations.
Table 73. Access to adequate sanitation
Urban Rural NationalUnit Costof latrine2000
current2015
Target2000
current2015
target2000
current2015
target
Flush to sewage/septic tank
33% 39% 1% 1% 9% 12% 300
Simplified sewerage 0% 0% 0% 0% 0% 0% 150
213 MDGR 2003.
214 Action Against Hunger and UNICEF MICS 2000.
215 UNICEF, Tajikistan Water, Sanitation and Health Brochure, 2003.
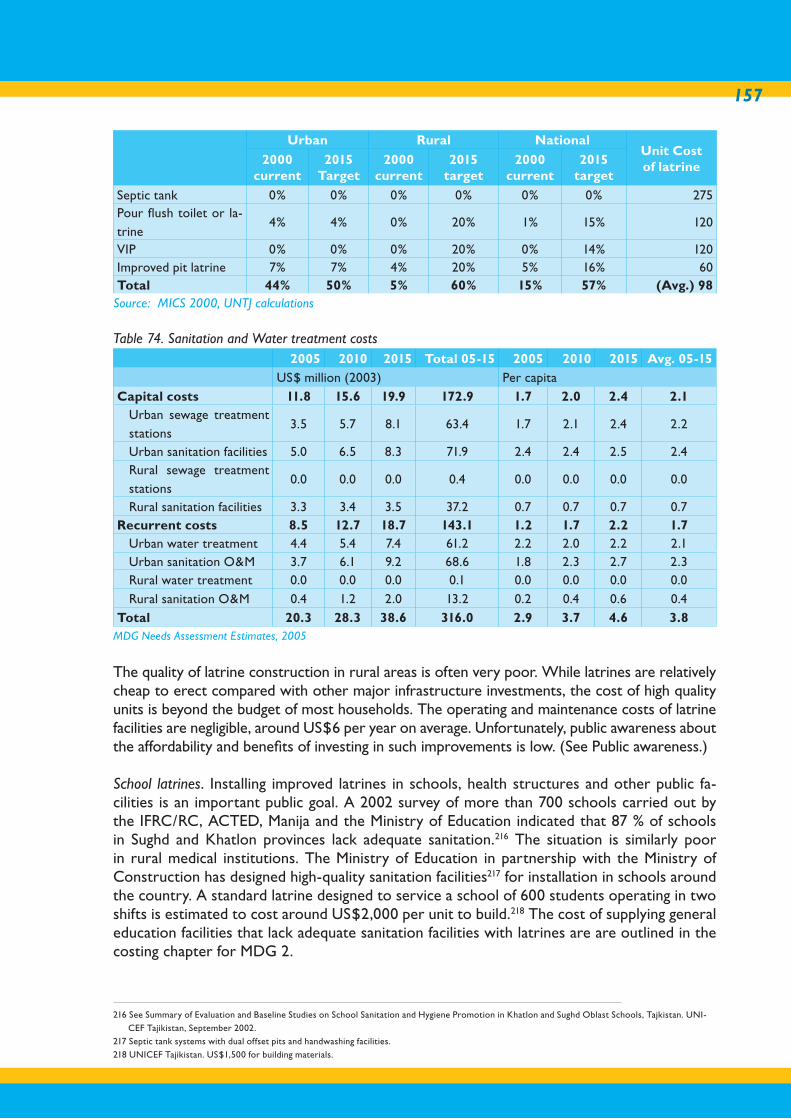
157
Urban Rural NationalUnit Costof latrine2000
current2015
Target2000
current2015
target2000
current2015
target
Septic tank 0% 0% 0% 0% 0% 0% 275Pour flush toilet or la-trine
4% 4% 0% 20% 1% 15% 120
VIP 0% 0% 0% 20% 0% 14% 120Improved pit latrine 7% 7% 4% 20% 5% 16% 60Total 44% 50% 5% 60% 15% 57% (Avg.) 98
Source: MICS 2000, UNTJ calculations
Table 74. Sanitation and Water treatment costs 2005 2010 2015 Total 05-15 2005 2010 2015 Avg. 05-15
US$ million (2003) Per capitaCapital costs 11.8 15.6 19.9 172.9 1.7 2.0 2.4 2.1
Urban sewage treatment stations
3.5 5.7 8.1 63.4 1.7 2.1 2.4 2.2
Urban sanitation facilities 5.0 6.5 8.3 71.9 2.4 2.4 2.5 2.4Rural sewage treatment stations
0.0 0.0 0.0 0.4 0.0 0.0 0.0 0.0
Rural sanitation facilities 3.3 3.4 3.5 37.2 0.7 0.7 0.7 0.7Recurrent costs 8.5 12.7 18.7 143.1 1.2 1.7 2.2 1.7
Urban water treatment 4.4 5.4 7.4 61.2 2.2 2.0 2.2 2.1Urban sanitation O&M 3.7 6.1 9.2 68.6 1.8 2.3 2.7 2.3Rural water treatment 0.0 0.0 0.0 0.1 0.0 0.0 0.0 0.0Rural sanitation O&M 0.4 1.2 2.0 13.2 0.2 0.4 0.6 0.4
Total 20.3 28.3 38.6 316.0 2.9 3.7 4.6 3.8MDG Needs Assessment Estimates, 2005
The quality of latrine construction in rural areas is often very poor. While latrines are relatively cheap to erect compared with other major infrastructure investments, the cost of high quality units is beyond the budget of most households. The operating and maintenance costs of latrine facilities are negligible, around US$6 per year on average. Unfortunately, public awareness about the affordability and benefits of investing in such improvements is low. (See Public awareness.)
School latrines. Installing improved latrines in schools, health structures and other public fa-cilities is an important public goal. A 2002 survey of more than 700 schools carried out by the IFRC/RC, ACTED, Manija and the Ministry of Education indicated that 87 % of schools in Sughd and Khatlon provinces lack adequate sanitation.216 The situation is similarly poor in rural medical institutions. The Ministry of Education in partnership with the Ministry of Construction has designed high-quality sanitation facilities217 for installation in schools around the country. A standard latrine designed to service a school of 600 students operating in two shifts is estimated to cost around US$2,000 per unit to build.218 The cost of supplying general education facilities that lack adequate sanitation facilities with latrines are are outlined in the costing chapter for MDG 2.
216 See Summary of Evaluation and Baseline Studies on School Sanitation and Hygiene Promotion in Khatlon and Sughd Oblast Schools, Tajkistan. UNI-
CEF Tajikistan, September 2002.
217 Septic tank systems with dual offset pits and handwashing facilities.
218 UNICEF Tajikistan. US$1,500 for building materials.
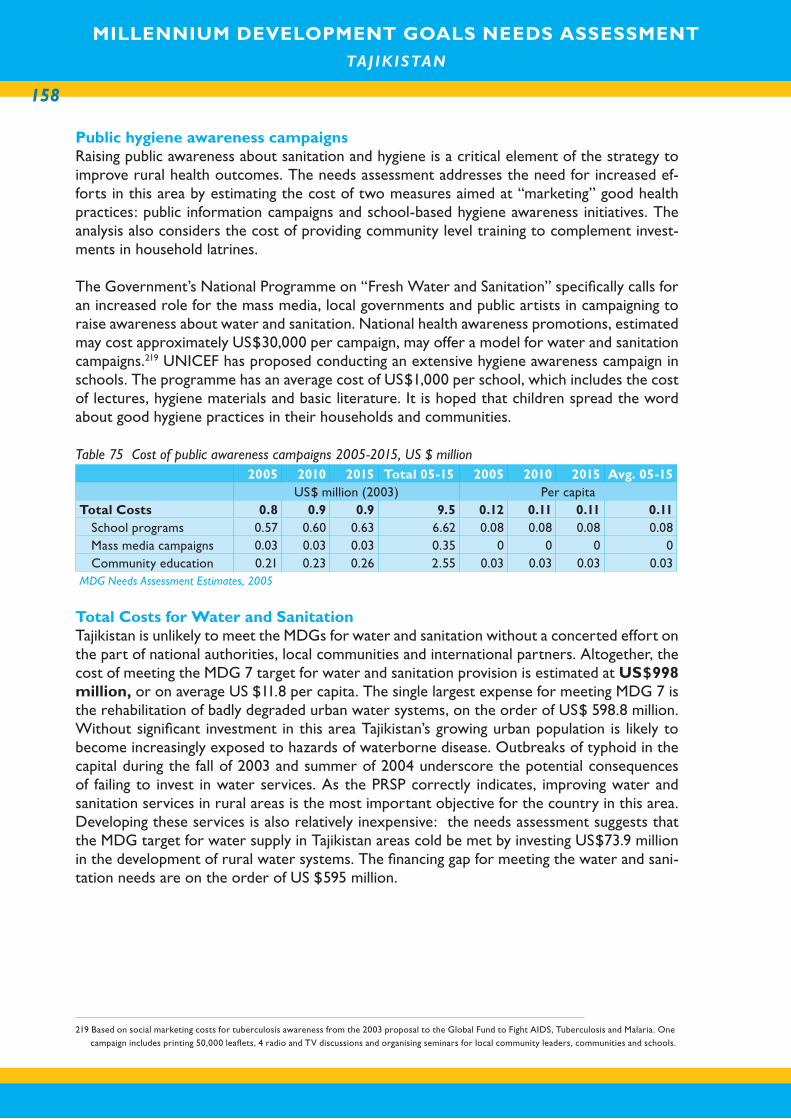
MILLENNIUM DEVELOPMENT GOALS NEEDS ASSESSMENT TAJ IK ISTAN
158
MILLENNIUM DEVELOPMENT GOALS NEEDS ASSESSMENT TAJ IK ISTAN
Public hygiene awareness campaignsRaising public awareness about sanitation and hygiene is a critical element of the strategy to improve rural health outcomes. The needs assessment addresses the need for increased ef-forts in this area by estimating the cost of two measures aimed at “marketing” good health practices: public information campaigns and school-based hygiene awareness initiatives. The analysis also considers the cost of providing community level training to complement invest-ments in household latrines.
The Government’s National Programme on “Fresh Water and Sanitation” specifically calls for an increased role for the mass media, local governments and public artists in campaigning to raise awareness about water and sanitation. National health awareness promotions, estimated may cost approximately US$30,000 per campaign, may offer a model for water and sanitation campaigns.219 UNICEF has proposed conducting an extensive hygiene awareness campaign in schools. The programme has an average cost of US$1,000 per school, which includes the cost of lectures, hygiene materials and basic literature. It is hoped that children spread the word about good hygiene practices in their households and communities.
Table 75 Cost of public awareness campaigns 2005-2015, US $ million 2005 2010 2015 Total 05-15 2005 2010 2015 Avg. 05-15 US$ million (2003) Per capita
Total Costs 0.8 0.9 0.9 9.5 0.12 0.11 0.11 0.11School programs 0.57 0.60 0.63 6.62 0.08 0.08 0.08 0.08Mass media campaigns 0.03 0.03 0.03 0.35 0 0 0 0Community education 0.21 0.23 0.26 2.55 0.03 0.03 0.03 0.03
MDG Needs Assessment Estimates, 2005
Total Costs for Water and SanitationTajikistan is unlikely to meet the MDGs for water and sanitation without a concerted effort on the part of national authorities, local communities and international partners. Altogether, the cost of meeting the MDG 7 target for water and sanitation provision is estimated at US$998 million, or on average US $11.8 per capita. The single largest expense for meeting MDG 7 is the rehabilitation of badly degraded urban water systems, on the order of US$ 598.8 million. Without significant investment in this area Tajikistan’s growing urban population is likely to become increasingly exposed to hazards of waterborne disease. Outbreaks of typhoid in the capital during the fall of 2003 and summer of 2004 underscore the potential consequences of failing to invest in water services. As the PRSP correctly indicates, improving water and sanitation services in rural areas is the most important objective for the country in this area. Developing these services is also relatively inexpensive: the needs assessment suggests that the MDG target for water supply in Tajikistan areas cold be met by investing US$73.9 million in the development of rural water systems. The financing gap for meeting the water and sani-tation needs are on the order of US $595 million.
219 Based on social marketing costs for tuberculosis awareness from the 2003 proposal to the Global Fund to Fight AIDS, Tuberculosis and Malaria. One
campaign includes printing 50,000 leaflets, 4 radio and TV discussions and organising seminars for local community leaders, communities and schools.

159
Table 76. Coverage targets for Water and Sanitation, 2005-2015, 2000 2005 2010 2015 Total 05-15Water supply
Total access 59% 61% 71% 83% Urban access 93% 93% 95% 97% Rural access 47% 49% 61% 74% Population provided with access each year - urban 62,340 72,471 84,119 800,519Population provided with access each year - rural 169,050 193,607 220,824 2,135,529
Sanitation Total access 15% 20% 39% 58%Urban access 44% 45% 45% 45%Rural access 5% 10% 35% 65%Population provided with access each year - urban 36,881 44,113 52,582 487,964Population provided with access each year - rural 272,252 317,130 367,115 3,499,666
MDG Needs Assessment Estimates, 2005
Table 77 . Financial Estimations for Water and Sanitation 2005-2015, (US$ million) 2005 2010 2015 Total 05-15Capital costs 59.0 64.0 68.6 704.4
Water Supply Urban 43.5 43.7 44.0 480.9Water Supply Rural 3.8 4.7 4.7 50.6Sanitation and Wastewater treatment Urban 8.5 12.2 16.4 135.3Sanitation and Wastewater treatment Rural 3.3 3.4 3.5 37.6
Recurrent costs 19.7 26.4 34.8 293.9Water Supply Urban 9.6 10.9 11.4 117.9 Water Supply Rural 0.8 2.0 3.8 23.3Sanitation and Wastewater treatment Urban 8.1 11.5 16.6 129.8 Sanitation and Wastewater treatment Rural 0.4 1.2 2.0 13.3Public Awareness campaign 0.8 0.9 0.9 9.5
Total 78,7 90.4 103.4 998.3% of GDP 4.0 3.2 2.5 3.2Per capita 11.4 11.9 12.3 11.9
MDG Needs Assessment Estimates, 2005
Table 78 . Financing for water supply and sanitation 2005 2010 2015 Total 05-15Total 78.7 90.4 103.4 998.3
Urban Households 4.7 22.7 46.0 263Rural Households 0.7 2.0 4.0 23Government 3.0 3.0 3.0 33.0International 7.7 7.7 7.7 84.7Financing Gap 62.5 55.1 42.7 595Financing Gap (%) 79.5 60.9 41.3 60.7
MDG Needs Assessment Estimates, 2005
MILLENNIUM DEVELOPMENT GOALS NEEDS ASSESSMENT TAJ IK ISTAN
160
MILLENNIUM DEVELOPMENT GOALS NEEDS ASSESSMENT TAJ IK ISTAN
10. MDG 8. GLOBAL PARTNERSHIP FOR
DEVELOPMENT
Goal 8: Develop a Global Partnership for Development
Target 12: Develop further an open, rule-based, predictable, non-discriminatory trading and financial system
Target 13: Address the special needs of the Least Developed Countries
Target 14: Address the special needs of landlocked developing countries and small island developing states
Target 15: Deal comprehensively with the debt problems of developing countries through national and international measures in order to make debt sustainable in the long term.
Target 16: In cooperation with developing countries, develop and implement strategies for decent and productive work for youth
Target 17: In cooperation with pharmaceutical companies, provide access to af-fordable, essential drugs
Target 18: In cooperation with private sector, make available the benefits of new technologies, especially information and communications technologies
OverviewAchievement of MDG 8 depends on commitment from developed countries to substantially increase the current levels of assistance to the poor countries. As the MP Report “Investing in Development: A practical plan to achieve the Millennium Development Goals” noted, the cur-rent development assistance and debt relief measures are not set to meet the MDGs. Moreover, the quality of bilateral aid is often very low, as it is highly unpredictable, targeted at emergency aid and technical assistance, tied to contractors from donor countries, and often directed to countries with poor governance for geopolitical reasons220. For low-income countries, only 24% of bilateral aid, and 54% of multilateral aid can actually finance investments on the ground.221 The current global trade system is not in favour of promoting the MDGs in poor countries, due to the existing barriers to exports from the poor countries. Without the will power and commit-ment of the developed nations to creating a non-discriminatory and fair trading and financial sys-tems, at least doubling the current amount of ODA and finding sustainable debt relief measures, the Goal Eight is unlikely to be achieved in Tajikistan, and in other poor countries.
220 Investing in Development: a practical plan to achieve the Millennium Development Goals, Millennium Project, 2005, New York, pgs.39-40
221 Ibid., p.40
161
Target 12: Trade and Financial Institutions. Tajikistan has had observer status at the World Trade Organization (WTO) since July 2001, and holds bilateral and multilateral negotiations with WTO members. With international trade accounting for more than half the country’s GDP, Tajikistan’s economy is very dependent on favourable conditions in the world market. In last 5 years, imports have exceeded exports. The inflow of international transfers, including labour migrants’ remittances from Russia, has balanced the trade deficit. Despite recent improve-ments in the banking and non-banking financial sector, serious structural problems remain to be solved. As the macroeconomic situation improved, the nominal interest rates began to decline, reaching 16% in 2003. The country’s four largest banks control about 80% of the total assets of the banking sector, which adversely affects competitiveness. The non-banking finan-cial sector is still in the early stages of development, and the legal and institutional frameworks need to be strengthened. Recently, some commercial banks have begun leasing activities. Al-though private insurance companies exist, their share of the insurance market is insignificant. Improved tax administration, and promotion of equitable privatization and other measures outlined in the structural reform section, will help develop open trade and non-biased trade and financial institutions in the country.
Target 14: Assisting Landlocked Countries. This target is highly relevant to geographically remote countries like Tajikistan. High transport costs affect both exports and imports. The Almaty Programme of Action, adopted in August 2003, addresses the special needs of landlocked developing countries within a new global framework for transit transport cooperation. The Government of Tajikistan is developing an international road corridor to facilitate Tajikistan’s trade with other countries. Under this strategy, roads are being built to link Tajikistan with neighbouring countries. The main road connecting Tajikistan with China has been completed, and the road connecting Tajikistan with Kyrgyzstan in the east is under construction. Devel-opment of an overarching regional strategy on economic cooperation and sustainable en-vironmental management of transboundary natural resources is critical. Improved regional cooperation, especially with neighbouring countries, will be a major factor contributing to the success of the MDGs in Tajikistan.
Target 15: ODA Assistance and Debt Resolution. The Government of Tajikistan recognizes the importance of global partnership for economic development and poverty reduction. Foreign aid, in the form of loans, grants, technical and humanitarian assistance, has played a substantial role in supporting the implementation of Government policies over the past decade. Incoming aid has been channelled through the Public Investment Programme (PIP) and Technical As-sistance (TA) programmes. Due to improved macroeconomic performance and recent struc-tural reforms, the level of aid has been increasing. At the 2003 Consultative Group (CG) meeting, donors pledged about US$ 930 million for the period 2003-2005. The actual dis-bursement as of September 2004 was US$ 376 million, or 40.4% of the total amount pledged. Notwithstanding Tajikistan’s weak long-term debt sustainability, the country is not eligible for the enhanced Heavily Indebted Poor Countries (HIPC) Initiative under the existing criteria. However, as noted in the structural reforms section of this report, the Government is seeking to reduce the burden of external debt service, which at the end of 2004 was about US$ 600 million.222 Although progress has been made on restructuring Tajikistan’s bilateral debts, the debt burden will remain heavy in the future and continue to pose a threat to macroeconomic stability, despite the recent debt cancellation by Russia amounting to about US$ 300 million.223
222 PIP, 2005-2007, p. 7.
223 Ibid., p. 7.
MILLENNIUM DEVELOPMENT GOALS NEEDS ASSESSMENT TAJ IK ISTAN
162
MILLENNIUM DEVELOPMENT GOALS NEEDS ASSESSMENT TAJ IK ISTAN
This situation underscores the difficult trade-off Tajikistan must make between maintaining macroeconomic stability and taking in funds for badly needed public investment.
Target 16: Productive Work for Youth. The Government recognizes the importance of developing an effective youth policy. Amendments to a Law on National Youth Policy made proposed in June 2004 identified youth employment as one of the priorities of the national youth policy. However, the lack of a clear implementation strategy and lack of financing are delaying imple-mentation. The Constitution expressly forbids forced labour of children and students. Yet this is still a common practice in the cotton fields of Tajikistan. The Government and donors should work together to implement the Convention on the Rights of the Child (CRC) in Tajikistan. The CRC calls for protecting children from economic exploitation and from performing any work that is hazardous and harmful to their physical, social, moral and mental development.224 Promoting employment of young women should be an essential part of the Government’s youth employment policy, since this issue is a critical one in Tajikistan. The gender section of this report identifies the provision of skills training and support for income generation for girls and women as an important intervention.
Target 17: Access to Affordable Essential Drugs. The cost of drugs in developing countries is a serious problem for people with low incomes. Due to budget constraints, governments cannot cover the cost of providing drugs to poor people. Patents are a key cost factor; the price of a drug drops substantially when it goes off patent. The majority of developing countries must import basic phar-maceutical products. The WTO adopted a rule under which poor countries are allowed to import cheap generic drugs for treating epidemics such as HIV/AIDS, malaria and tuberculosis. Under Target 17, essential drugs and vaccines should be made available to poor countries at low prices.
Tajikistan’s Access to Affordable Essential Drugs. There is only one pharmaceutical company in Ta-jikistan, the Tajik-Indian Ajanta Farma Ltd. It produces four of the 262 drugs on the List of Essen-tial Drugs approved by the Ministry of Health. The other drugs on the list are imported through private channels or provided by humanitarian programmes. The Government allocates US$ 0.29 per capita for drugs, but the average medicine needs per patient is US$ 2.6. The budget financing covers one quarter of the medicine needs, 28% is covered by humanitarian assistance, and the remainder is paid for by patients. Medicines are expensive for most of the population; purchasing them takes up a large share of the household budget. The quality control system for imported drugs and the distribution of humanitarian medicines is poorly developed. The Government has developed a national drug policy, which includes the reform of the pharmaceuticals sector to provided access to essential drugs.
Target 18: Information and Communication Technologies. Effective telecommunications acceler-ate the development process. The World Summit on the Information Society (WSIS), held in Geneva in 2003, concluded that information and communication technologies (ICT) are an important tool for achieving the MDGs. The WSIS adopted a Declaration of Principles and Plan of Action to establish a global Information Society by promoting the use of ICT-based products, networks, services and applications, and to help countries overcome the digital divide. With 3.5 telephones per 100 people, Tajikistan has the weakest telecommunications sector and the lowest telephone density per capita of all the CIS countries.225 In the rural areas of Tajikistan the density is 0.6 telephones per 100 people. A programme for providing telecommunications infrastructure to rural areas should be developed.
224 Ibid., p. 24.
225 Progress Towards the Millennium Development Goals, UN and GoT, 2003, Tajikistan.
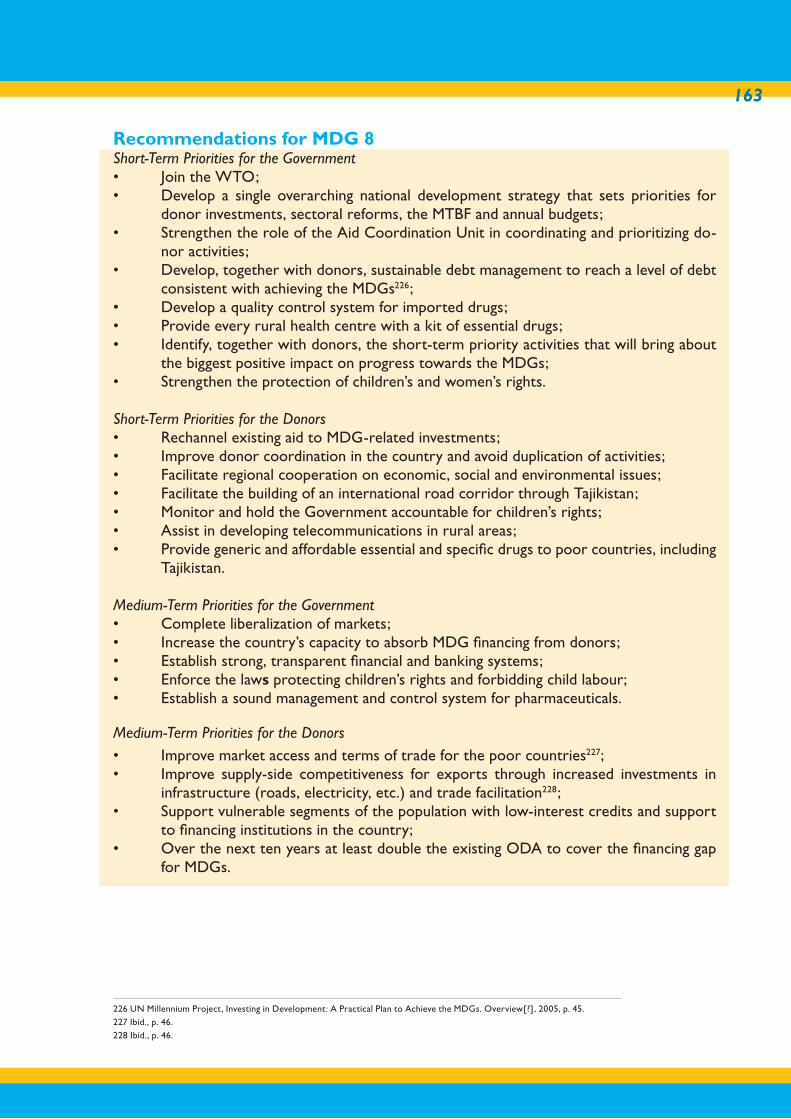
163
Recommendations for MDG 8Short-Term Priorities for the Government• Join the WTO;• Develop a single overarching national development strategy that sets priorities for
donor investments, sectoral reforms, the MTBF and annual budgets;• Strengthen the role of the Aid Coordination Unit in coordinating and prioritizing do-
nor activities;• Develop, together with donors, sustainable debt management to reach a level of debt
consistent with achieving the MDGs226;• Develop a quality control system for imported drugs;• Provide every rural health centre with a kit of essential drugs;• Identify, together with donors, the short-term priority activities that will bring about
the biggest positive impact on progress towards the MDGs;• Strengthen the protection of children’s and women’s rights.
Short-Term Priorities for the Donors• Rechannel existing aid to MDG-related investments;• Improve donor coordination in the country and avoid duplication of activities;• Facilitate regional cooperation on economic, social and environmental issues;• Facilitate the building of an international road corridor through Tajikistan;• Monitor and hold the Government accountable for children’s rights;• Assist in developing telecommunications in rural areas;• Provide generic and affordable essential and specific drugs to poor countries, including
Tajikistan.
Medium-Term Priorities for the Government• Complete liberalization of markets;• Increase the country’s capacity to absorb MDG financing from donors;• Establish strong, transparent financial and banking systems;• Enforce the laws protecting children’s rights and forbidding child labour;• Establish a sound management and control system for pharmaceuticals.
Medium-Term Priorities for the Donors• Improve market access and terms of trade for the poor countries227; • Improve supply-side competitiveness for exports through increased investments in
infrastructure (roads, electricity, etc.) and trade facilitation228;• Support vulnerable segments of the population with low-interest credits and support
to financing institutions in the country;• Over the next ten years at least double the existing ODA to cover the financing gap
for MDGs.
226 UN Millennium Project, Investing in Development: A Practical Plan to Achieve the MDGs. Overview[?], 2005, p. 45.
227 Ibid., p. 46.
228 Ibid., p. 46.
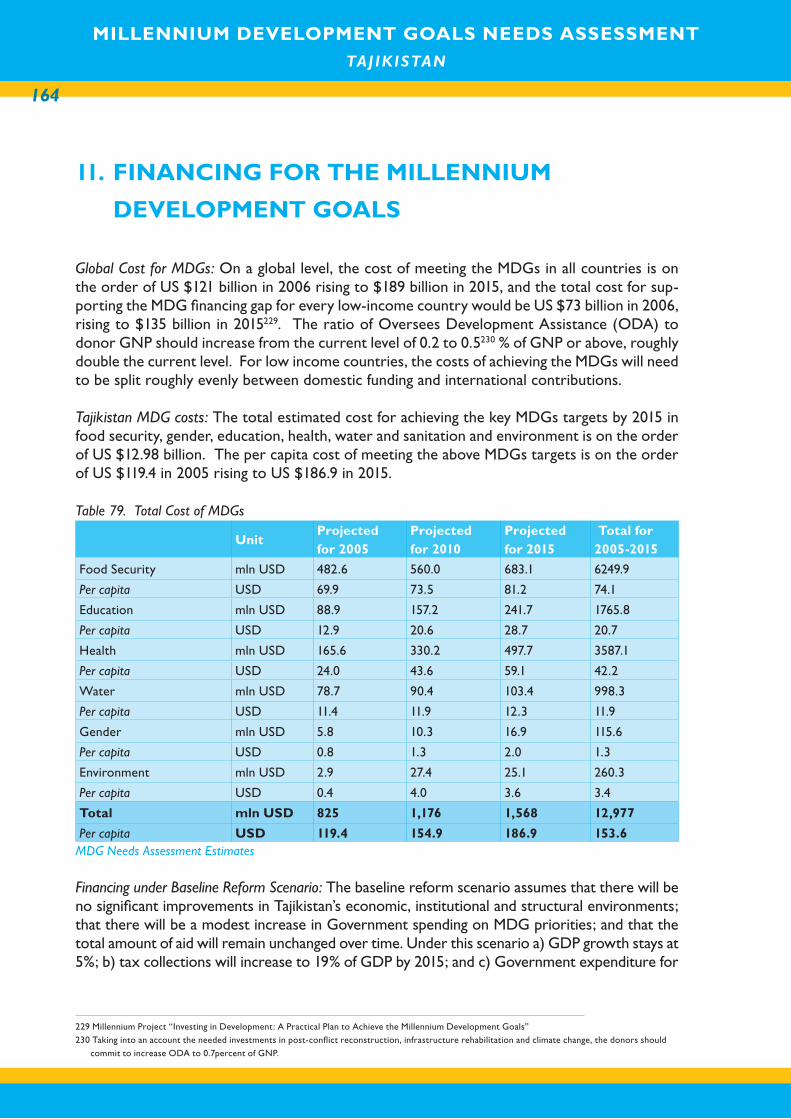
MILLENNIUM DEVELOPMENT GOALS NEEDS ASSESSMENT TAJ IK ISTAN
164
MILLENNIUM DEVELOPMENT GOALS NEEDS ASSESSMENT TAJ IK ISTAN
11. FINANCING FOR THE MILLENNIUM
DEVELOPMENT GOALS
Global Cost for MDGs: On a global level, the cost of meeting the MDGs in all countries is on the order of US $121 billion in 2006 rising to $189 billion in 2015, and the total cost for sup-porting the MDG financing gap for every low-income country would be US $73 billion in 2006, rising to $135 billion in 2015229. The ratio of Oversees Development Assistance (ODA) to donor GNP should increase from the current level of 0.2 to 0.5230 % of GNP or above, roughly double the current level. For low income countries, the costs of achieving the MDGs will need to be split roughly evenly between domestic funding and international contributions.
Tajikistan MDG costs: The total estimated cost for achieving the key MDGs targets by 2015 in food security, gender, education, health, water and sanitation and environment is on the order of US $12.98 billion. The per capita cost of meeting the above MDGs targets is on the order of US $119.4 in 2005 rising to US $186.9 in 2015.
Table 79. Total Cost of MDGs
UnitProjected for 2005
Projected for 2010
Projected for 2015
Total for 2005-2015
Food Security mln USD 482.6 560.0 683.1 6249.9
Per capita USD 69.9 73.5 81.2 74.1
Education mln USD 88.9 157.2 241.7 1765.8
Per capita USD 12.9 20.6 28.7 20.7
Health mln USD 165.6 330.2 497.7 3587.1
Per capita USD 24.0 43.6 59.1 42.2
Water mln USD 78.7 90.4 103.4 998.3
Per capita USD 11.4 11.9 12.3 11.9
Gender mln USD 5.8 10.3 16.9 115.6
Per capita USD 0.8 1.3 2.0 1.3
Environment mln USD 2.9 27.4 25.1 260.3
Per capita USD 0.4 4.0 3.6 3.4
Total mln USD 825 1,176 1,568 12,977
Per capita USD 119.4 154.9 186.9 153.6MDG Needs Assessment Estimates
Financing under Baseline Reform Scenario: The baseline reform scenario assumes that there will be no significant improvements in Tajikistan’s economic, institutional and structural environments; that there will be a modest increase in Government spending on MDG priorities; and that the total amount of aid will remain unchanged over time. Under this scenario a) GDP growth stays at 5%; b) tax collections will increase to 19% of GDP by 2015; and c) Government expenditure for
229 Millennium Project “Investing in Development: A Practical Plan to Achieve the Millennium Development Goals”
230 Taking into an account the needed investments in post-conflict reconstruction, infrastructure rehabilitation and climate change, the donors should
commit to increase ODA to 0.7percent of GNP.
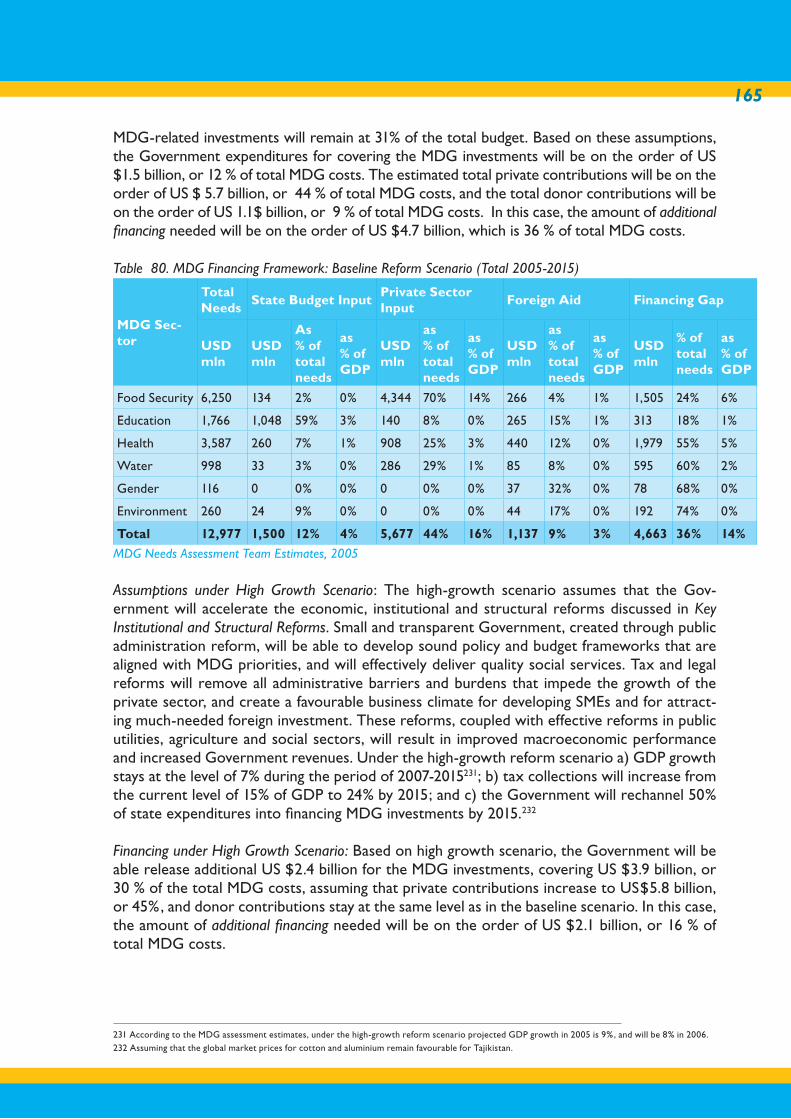
165
MDG-related investments will remain at 31% of the total budget. Based on these assumptions, the Government expenditures for covering the MDG investments will be on the order of US $1.5 billion, or 12 % of total MDG costs. The estimated total private contributions will be on the order of US $ 5.7 billion, or 44 % of total MDG costs, and the total donor contributions will be on the order of US 1.1$ billion, or 9 % of total MDG costs. In this case, the amount of additional financing needed will be on the order of US $4.7 billion, which is 36 % of total MDG costs.
Table 80. MDG Financing Framework: Baseline Reform Scenario (Total 2005-2015)
MDG Sec-tor
Total Needs
State Budget Input Private Sector Input
Foreign Aid Financing Gap
USD mln
USD mln
As % of total needs
as % of GDP
USD mln
as % of total needs
as % of GDP
USD mln
as % of total needs
as % of GDP
USD mln
% of total needs
as % of GDP
Food Security 6,250 134 2% 0% 4,344 70% 14% 266 4% 1% 1,505 24% 6%
Education 1,766 1,048 59% 3% 140 8% 0% 265 15% 1% 313 18% 1%
Health 3,587 260 7% 1% 908 25% 3% 440 12% 0% 1,979 55% 5%
Water 998 33 3% 0% 286 29% 1% 85 8% 0% 595 60% 2%
Gender 116 0 0% 0% 0 0% 0% 37 32% 0% 78 68% 0%
Environment 260 24 9% 0% 0 0% 0% 44 17% 0% 192 74% 0%
Total 12,977 1,500 12% 4% 5,677 44% 16% 1,137 9% 3% 4,663 36% 14%
MDG Needs Assessment Team Estimates, 2005
Assumptions under High Growth Scenario: The high-growth scenario assumes that the Gov-ernment will accelerate the economic, institutional and structural reforms discussed in Key Institutional and Structural Reforms. Small and transparent Government, created through public administration reform, will be able to develop sound policy and budget frameworks that are aligned with MDG priorities, and will effectively deliver quality social services. Tax and legal reforms will remove all administrative barriers and burdens that impede the growth of the private sector, and create a favourable business climate for developing SMEs and for attract-ing much-needed foreign investment. These reforms, coupled with effective reforms in public utilities, agriculture and social sectors, will result in improved macroeconomic performance and increased Government revenues. Under the high-growth reform scenario a) GDP growth stays at the level of 7% during the period of 2007-2015231; b) tax collections will increase from the current level of 15% of GDP to 24% by 2015; and c) the Government will rechannel 50% of state expenditures into financing MDG investments by 2015.232
Financing under High Growth Scenario: Based on high growth scenario, the Government will be able release additional US $2.4 billion for the MDG investments, covering US $3.9 billion, or 30 % of the total MDG costs, assuming that private contributions increase to US$5.8 billion, or 45%, and donor contributions stay at the same level as in the baseline scenario. In this case, the amount of additional financing needed will be on the order of US $2.1 billion, or 16 % of total MDG costs.
231 According to the MDG assessment estimates, under the high-growth reform scenario projected GDP growth in 2005 is 9%, and will be 8% in 2006.
232 Assuming that the global market prices for cotton and aluminium remain favourable for Tajikistan.

MILLENNIUM DEVELOPMENT GOALS NEEDS ASSESSMENT TAJ IK ISTAN
166
MILLENNIUM DEVELOPMENT GOALS NEEDS ASSESSMENT TAJ IK ISTAN
Table 81. MDG Financing Framework: High Growth Scenario (Total 2005-2015)
MDG Sector
Total Needs
State Budget Input Private Sector Input Foreign Aid Financing Gap
USD mln
USD mln
as % of total needs
as % of GDP
USD mln
as % of total needs
as % of GDP
USD mln
As % of total needs
as % of GDP
USD mln
% of total needs
As % of GDP
Food Security 6,250 617 10% 2% 4,344 70% 11% 266 4% 1% 1,023 16% 3%
Education 1,766 1,438 81% 4% 159 9% 0% 265 15% 1% no gap no gap 0%
Health 3,587 1,232 34% 3% 1,037 29% 3% 440 12% 0% 878 24% 2%
Water 998 443 44% 1% 286 29% 1% 85 8% 0% 185 19% 0%
Gender 116 72 63% 0% 0 0% 0% 37 32% 0% 6 5% 0%
Environment 260 84 32% 0% 0 0% 0% 44 17% 0% 133 51% 0%
Total 12,977 3,886 30% 1% 5,826 45% 15% 1,137 9% 3% 2,129 16% 5%
MDG Needs Assessment Team estimates, 2005
Table 82. State Budget and MDGs (High Growth Scenario)2005 2010 2015 2005-2015
Nominal GDP mln TJS 7047 12733 22793 149686Nominal GDP mln USD 2,237 3,424 5,437 39382TJS USD rate 3.15 3.72 4.19 Gov Revenues mln TJS 1,318 3,400 6,086 37956Gov Revenues mln USD 418.36 914.30 1451.73 9919Total Revenues as % of GDP 18.7% 26.7% 26.7% 24.5%Tax collection as % of GDP 16.0% 24.0% 24.0% 21.8%Bubget increment due tax reform (mln TJS) 10.54 299.17 535.53 2915Gov Expenditures mln TJS 1291 3400 6086 37040Gov Expenditures mln USD 412.26 914.30 1451.73 9662As % of GDP 18.4% 26.7% 26.7% 23.7%MDG related expenses 403.77 1700.3 3042.8 17596As % of GDP 5.73% 13.4% 13.4% 10.8%As % of State Budget 31.3% 50.0% 50% 44.9%
MDG Needs Assessment Team estimates, 2005
Donor Assistance: The amount of donor contributions toward financing the MDG costs will large-ly depend on the commitment of the Government of Tajikistan to see through the economic, institutional, and structural reforms. Assuming that the country reaches the high growth sce-nario, additional ODA support will be needed to cover 16 % of the total MDG costs, or US$ 2.1 billion. This would mean that the total amount of MDG-focused ODA support should increase from the present levels of US$ 1.14 billion to US $3.26 billion by 2015, an increase of US $193 million annually (in addition to the present levels of MDG-focused ODA amounting to US$ 103.4 million annually).
Donor Assistance (cont.): As Table 83 shows, nutrition and food security require the largest share of ODA support, followed by health, and water and sanitation. On the other hand, no additional donor investments will be needed for the education and gender sectors. Even with the Govern-ment allocating 50 % of the budget by 2015 to the MDG related expenditures, assuming that aid priorities stay the same and donors channel 55 % of the total ODA to MDG interventions, the remaining 16 % (or US$ 2.1 billion) of the total MDG expenses still require an additional US$ 193 million annually. Under this scenario, the total amount of MDG-focused ODA should increase
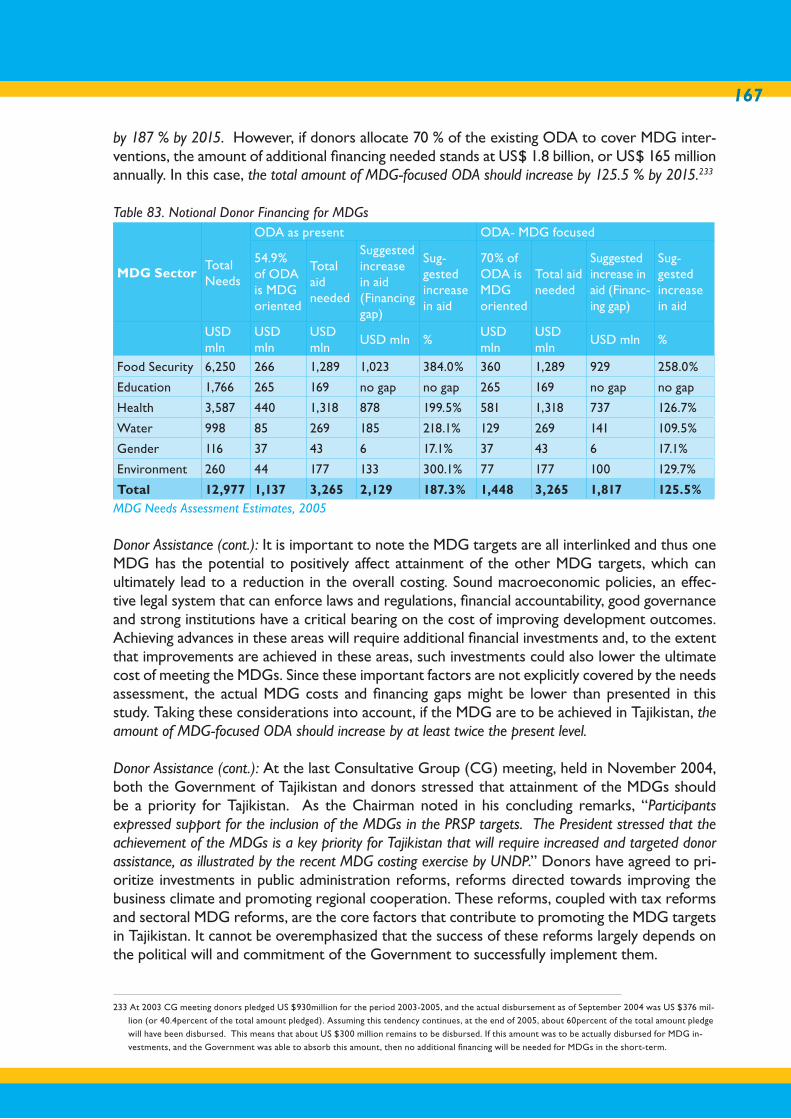
167
by 187 % by 2015. However, if donors allocate 70 % of the existing ODA to cover MDG inter-ventions, the amount of additional financing needed stands at US$ 1.8 billion, or US$ 165 million annually. In this case, the total amount of MDG-focused ODA should increase by 125.5 % by 2015.233
Table 83. Notional Donor Financing for MDGs
MDG SectorTotal Needs
ODA as present ODA- MDG focused
54.9% of ODA is MDG oriented
Total aid needed
Suggested increase in aid (Financing gap)
Sug-gested increase in aid
70% of ODA is MDG oriented
Total aid needed
Suggested increase in aid (Financ-ing gap)
Sug-gested increase in aid
USD mln
USD mln
USD mln
USD mln %USD mln
USD mln
USD mln %
Food Security 6,250 266 1,289 1,023 384.0% 360 1,289 929 258.0%
Education 1,766 265 169 no gap no gap 265 169 no gap no gap
Health 3,587 440 1,318 878 199.5% 581 1,318 737 126.7%
Water 998 85 269 185 218.1% 129 269 141 109.5%
Gender 116 37 43 6 17.1% 37 43 6 17.1%
Environment 260 44 177 133 300.1% 77 177 100 129.7%
Total 12,977 1,137 3,265 2,129 187.3% 1,448 3,265 1,817 125.5%MDG Needs Assessment Estimates, 2005
Donor Assistance (cont.): It is important to note the MDG targets are all interlinked and thus one MDG has the potential to positively affect attainment of the other MDG targets, which can ultimately lead to a reduction in the overall costing. Sound macroeconomic policies, an effec-tive legal system that can enforce laws and regulations, financial accountability, good governance and strong institutions have a critical bearing on the cost of improving development outcomes. Achieving advances in these areas will require additional financial investments and, to the extent that improvements are achieved in these areas, such investments could also lower the ultimate cost of meeting the MDGs. Since these important factors are not explicitly covered by the needs assessment, the actual MDG costs and financing gaps might be lower than presented in this study. Taking these considerations into account, if the MDG are to be achieved in Tajikistan, the amount of MDG-focused ODA should increase by at least twice the present level.
Donor Assistance (cont.): At the last Consultative Group (CG) meeting, held in November 2004, both the Government of Tajikistan and donors stressed that attainment of the MDGs should be a priority for Tajikistan. As the Chairman noted in his concluding remarks, “Participants expressed support for the inclusion of the MDGs in the PRSP targets. The President stressed that the achievement of the MDGs is a key priority for Tajikistan that will require increased and targeted donor assistance, as illustrated by the recent MDG costing exercise by UNDP.” Donors have agreed to pri-oritize investments in public administration reforms, reforms directed towards improving the business climate and promoting regional cooperation. These reforms, coupled with tax reforms and sectoral MDG reforms, are the core factors that contribute to promoting the MDG targets in Tajikistan. It cannot be overemphasized that the success of these reforms largely depends on the political will and commitment of the Government to successfully implement them.
233 At 2003 CG meeting donors pledged US $930million for the period 2003-2005, and the actual disbursement as of September 2004 was US $376 mil-
lion (or 40.4percent of the total amount pledged). Assuming this tendency continues, at the end of 2005, about 60percent of the total amount pledge
will have been disbursed. This means that about US $300 million remains to be disbursed. If this amount was to be actually disbursed for MDG in-
vestments, and the Government was able to absorb this amount, then no additional financing will be needed for MDGs in the short-term.
MILLENNIUM DEVELOPMENT GOALS NEEDS ASSESSMENT TAJ IK ISTAN
168
MILLENNIUM DEVELOPMENT GOALS NEEDS ASSESSMENT TAJ IK ISTAN
12. CONCLUSION AND NEXT STEPS
The MDG needs assessment suggests that even under the optimistic assumption that Tajikistan achieves high growth scenario, substantial amount of additional investments will be needed to cover the estimated financing gap. The study suggests that Government commitment to reforms is the key factor contributing to the success of achieving the MDGs in Tajikistan.
Tajikistan’s partners in the international community are committed to supporting the country in its efforts to accelerate human development. The volume of assistance already provided to Tajikistan stands as an indication of the continued interest of the international community in partnering with the Government to improve prospects for development. The Millennium Decla-ration stands not only as an affirmation of this commitment but also as a pledge to devote more attention and more resources to meeting the challenges of human development in countries like Tajikistan. As partners in this difficult but worthy endeavour, both Tajikistan and its international partners need to stand up to their respective commitments and responsibilities.
The MDG needs assessment is the first concrete step towards developing a practical plan for advancing the MDGs in Tajikistan. The next step is to develop a Poverty Reduction Strategy based on the findings of the MDG needs assessment, and develop an overarching national MDG strategy/framework for 2005-2015. The new MDG-based PRSP priorities should dictate the priority budget allocations for the Medium Term Budget Framework and annual budget plans. All national development policy documents such as the PIP and the Economic Development Plan for 2005-2015, should realign their priorities with the MDGs. The effect should be a strong and coherent strategy aimed at these specific targets. Next, the Government and donors should develop a concrete financing strategy for MDG interventions. As a first step of this financing strategy, the Government of Tajikistan and donors will need to make a political decision on pri-oritizing investment in one or two MDG targets that are of utmost importance to Tajikistan’s development and that will have the furthest reaching effect in improving the livelihoods of the country’s people, as well as contributing to the realization of other MDG targets.
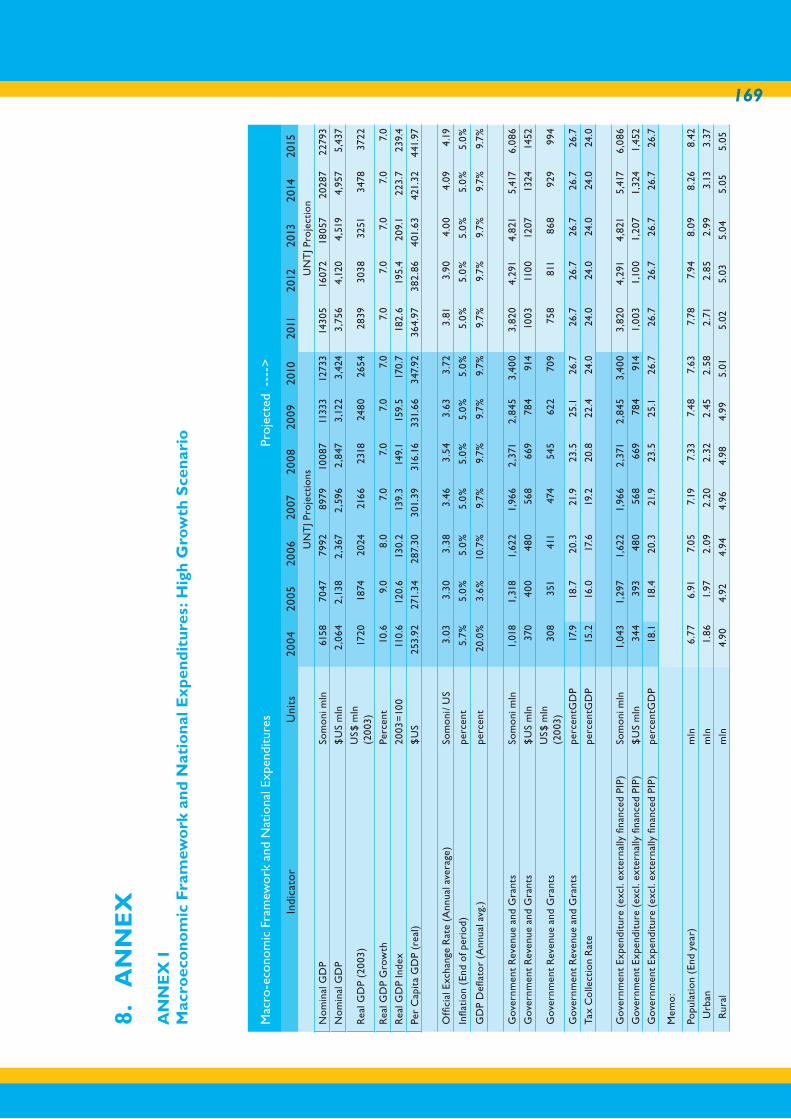
169
Mac
ro-e
cono
mic
Fra
mew
ork
and
Nat
iona
l Exp
endi
ture
sPr
ojec
ted
---
->
Indi
cato
rU
nits
2004
2005
2006
2007
2008
2009
2010
2011
2012
2013
2014
2015
UN
TJ P
roje
ctio
nsU
NT
J Pro
ject
ion
Nom
inal
GD
PSo
mon
i mln
6158
7047
7992
8979
1008
711
333
1273
314
305
1607
218
057
2028
722
793
Nom
inal
GD
P$
US
mln
2,06
42,
138
2,36
72,
596
2,84
73,
122
3,42
43,
756
4,12
04,
519
4,95
75,
437
Rea
l GD
P (2
003)
US$
mln
(2
003)
1720
1874
2024
2166
2318
2480
2654
2839
3038
3251
3478
3722
Rea
l GD
P G
row
thPe
rcen
t10
.69.
08.
07.
07.
07.
07.
07.
07.
07.
07.
07.
0
Rea
l GD
P In
dex
2003
=10
011
0.6
120.
613
0.2
139.
314
9.1
159.
517
0.7
182.
619
5.4
209.
122
3.7
239.
4
Per
Cap
ita
GD
P (r
eal)
$U
S25
3.92
271.
3428
7.30
301.
3931
6.16
331.
6634
7.92
364.
9738
2.86
401.
6342
1.32
441.
97
Offi
cial
Exc
hang
e R
ate
(Ann
ual a
vera
ge)
Som
oni/
US
3.03
3.30
3.38
3.46
3.54
3.63
3.72
3.81
3.90
4.00
4.09
4.19
Infla
tion
(En
d of
per
iod)
perc
ent
5.7%
5.0%
5.0%
5.0%
5.0%
5.0%
5.0%
5.0%
5.0%
5.0%
5.0%
5.0%
GD
P D
eflat
or (
Ann
ual a
vg.)
perc
ent
20.0
%3.
6%10
.7%
9.7%
9.7%
9.7%
9.7%
9.7%
9.7%
9.7%
9.7%
9.7%
Gov
ernm
ent
Rev
enue
and
Gra
nts
Som
oni m
ln1,
018
1,31
81,
622
1,96
62,
371
2,84
53,
400
3,82
04,
291
4,82
15,
417
6,08
6
Gov
ernm
ent
Rev
enue
and
Gra
nts
$U
S m
ln37
040
048
056
866
978
491
410
0311
0012
0713
2414
52
Gov
ernm
ent
Rev
enue
and
Gra
nts
US$
mln
(2
003)
308
351
411
474
545
622
709
758
811
868
929
994
Gov
ernm
ent
Rev
enue
and
Gra
nts
perc
entG
DP
17.9
18.7
20.3
21.9
23.5
25.1
26.7
26.7
26.7
26.7
26.7
26.7
Tax
Col
lect
ion
Rat
epe
rcen
tGD
P15
.216
.017
.619
.220
.822
.424
.024
.024
.024
.024
.024
.0
Gov
ernm
ent
Expe
ndit
ure
(exc
l. ex
tern
ally
fina
nced
PIP
)So
mon
i mln
1,04
31,
297
1,62
21,
966
2,37
12,
845
3,40
03,
820
4,29
14,
821
5,41
76,
086
Gov
ernm
ent
Expe
ndit
ure
(exc
l. ex
tern
ally
fina
nced
PIP
)$
US
mln
344
393
480
568
669
784
914
1,00
31,
100
1,20
71,
324
1,45
2
Gov
ernm
ent
Expe
ndit
ure
(exc
l. ex
tern
ally
fina
nced
PIP
)pe
rcen
tGD
P18
.118
.420
.321
.923
.525
.126
.726
.726
.726
.726
.726
.7
Mem
o:
Popu
lati
on (
End
year
)m
ln6.
776.
917.
057.
197.
337.
487.
637.
787.
948.
098.
268.
42
Urb
anm
ln1.
861.
972.
092.
202.
322.
452.
582.
712.
852.
993.
133.
37
Rur
alm
ln4.
904.
924.
944.
964.
984.
995.
015.
025.
035.
045.
055.
05
8.
AN
NE
X
AN
NE
X I
Mac
roec
on
om
ic F
ram
ewo
rk a
nd
Nat
ion
al E
xpen
dit
ure
s: H
igh
Gro
wth
Sce
nar
io
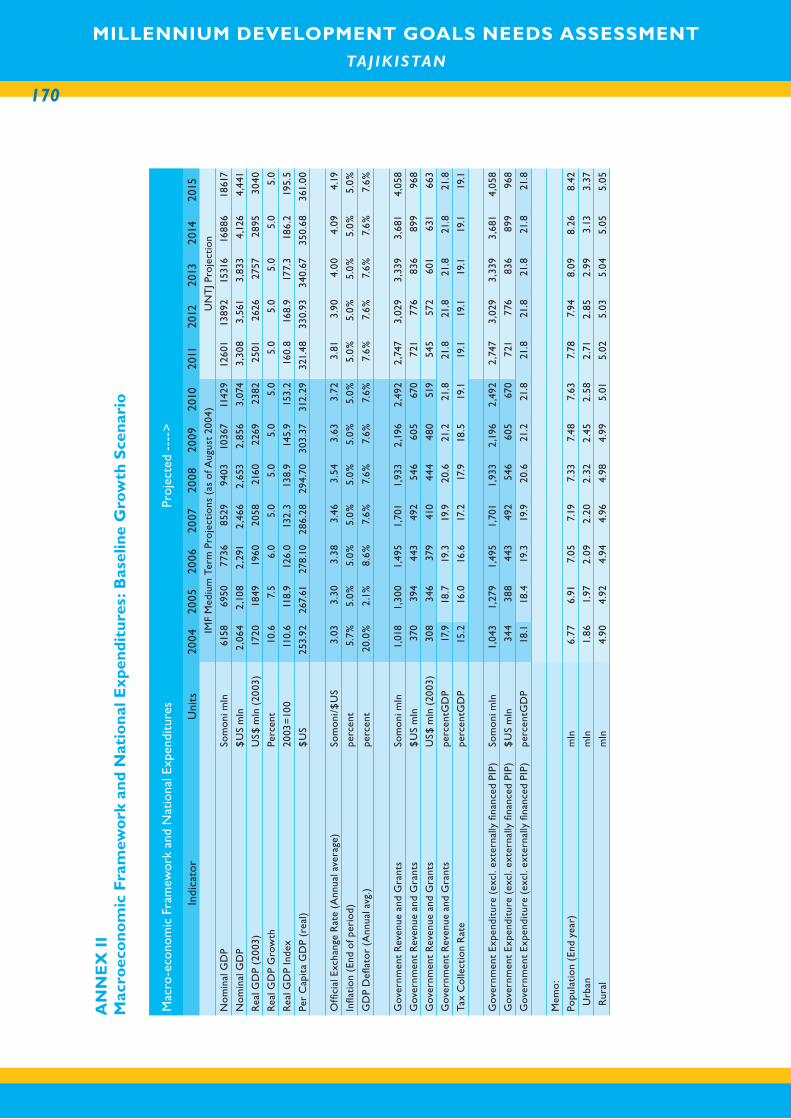
MILLENNIUM DEVELOPMENT GOALS NEEDS ASSESSMENT TAJ IK ISTAN
170
MILLENNIUM DEVELOPMENT GOALS NEEDS ASSESSMENT TAJ IK ISTAN
AN
NE
X I
IM
acro
eco
no
mic
Fra
mew
ork
an
d N
atio
nal
Exp
end
itu
res:
Bas
elin
e G
row
th S
cen
ario
Mac
ro-e
cono
mic
Fra
mew
ork
and
Nat
iona
l Exp
endi
ture
sPr
ojec
ted
----
>
Indi
cato
rU
nits
2004
2005
2006
2007
2008
2009
2010
2011
2012
2013
2014
2015
IMF
Med
ium
Ter
m P
roje
ctio
ns (
as o
f Aug
ust
2004
)U
NT
J Pro
ject
ion
Nom
inal
GD
PSo
mon
i mln
6158
6950
7736
8529
9403
1036
711
429
1260
113
892
1531
616
886
1861
7
Nom
inal
GD
P$
US
mln
2,06
42,
108
2,29
12,
466
2,65
32,
856
3,07
43,
308
3,56
13,
833
4,12
64,
441
Rea
l GD
P (2
003)
US$
mln
(20
03)
1720
1849
1960
2058
2160
2269
2382
2501
2626
2757
2895
3040
Rea
l GD
P G
row
thPe
rcen
t10
.67.
56.
05.
05.
05.
05.
05.
05.
05.
05.
05.
0
Rea
l GD
P In
dex
2003
=10
011
0.6
118.
912
6.0
132.
313
8.9
145.
915
3.2
160.
816
8.9
177.
318
6.2
195.
5
Per
Cap
ita
GD
P (r
eal)
$U
S25
3.92
267.
6127
8.10
286.
2829
4.70
303.
3731
2.29
321.
4833
0.93
340.
6735
0.68
361.
00
Offi
cial
Exc
hang
e R
ate
(Ann
ual a
vera
ge)
Som
oni/
$U
S3.
033.
303.
383.
463.
543.
633.
723.
813.
904.
004.
094.
19
Infla
tion
(En
d of
per
iod)
perc
ent
5.7%
5.0%
5.0%
5.0%
5.0%
5.0%
5.0%
5.0%
5.0%
5.0%
5.0%
5.0%
GD
P D
eflat
or (
Ann
ual a
vg.)
perc
ent
20.0
%2.
1%8.
6%7.
6%7.
6%7.
6%7.
6%7.
6%7.
6%7.
6%7.
6%7.
6%
Gov
ernm
ent
Rev
enue
and
Gra
nts
Som
oni m
ln1,
018
1,30
01,
495
1,70
11,
933
2,19
62,
492
2,74
73,
029
3,33
93,
681
4,05
8
Gov
ernm
ent
Rev
enue
and
Gra
nts
$U
S m
ln37
039
444
349
254
660
567
072
177
683
689
996
8
Gov
ernm
ent
Rev
enue
and
Gra
nts
US$
mln
(20
03)
308
346
379
410
444
480
519
545
572
601
631
663
Gov
ernm
ent
Rev
enue
and
Gra
nts
perc
entG
DP
17.9
18.7
19.3
19.9
20.6
21.2
21.8
21.8
21.8
21.8
21.8
21.8
Tax
Col
lect
ion
Rat
epe
rcen
tGD
P15
.216
.016
.617
.217
.918
.519
.119
.119
.119
.119
.119
.1
Gov
ernm
ent
Expe
ndit
ure
(exc
l. ex
tern
ally
fina
nced
PIP
)So
mon
i mln
1,04
31,
279
1,49
51,
701
1,93
32,
196
2,49
22,
747
3,02
93,
339
3,68
14,
058
Gov
ernm
ent
Expe
ndit
ure
(exc
l. ex
tern
ally
fina
nced
PIP
)$
US
mln
344
388
443
492
546
605
670
721
776
836
899
968
Gov
ernm
ent
Expe
ndit
ure
(exc
l. ex
tern
ally
fina
nced
PIP
)pe
rcen
tGD
P18
.118
.419
.319
.920
.621
.221
.821
.821
.821
.821
.821
.8
Mem
o:
Popu
lati
on (
End
year
)m
ln6.
776.
917.
057.
197.
337.
487.
637.
787.
948.
098.
268.
42
Urb
anm
ln1.
861.
972.
092.
202.
322.
452.
582.
712.
852.
993.
133.
37
Rur
alm
ln4.
904.
924.
944.
964.
984.
995.
015.
025.
035.
045.
055.
05
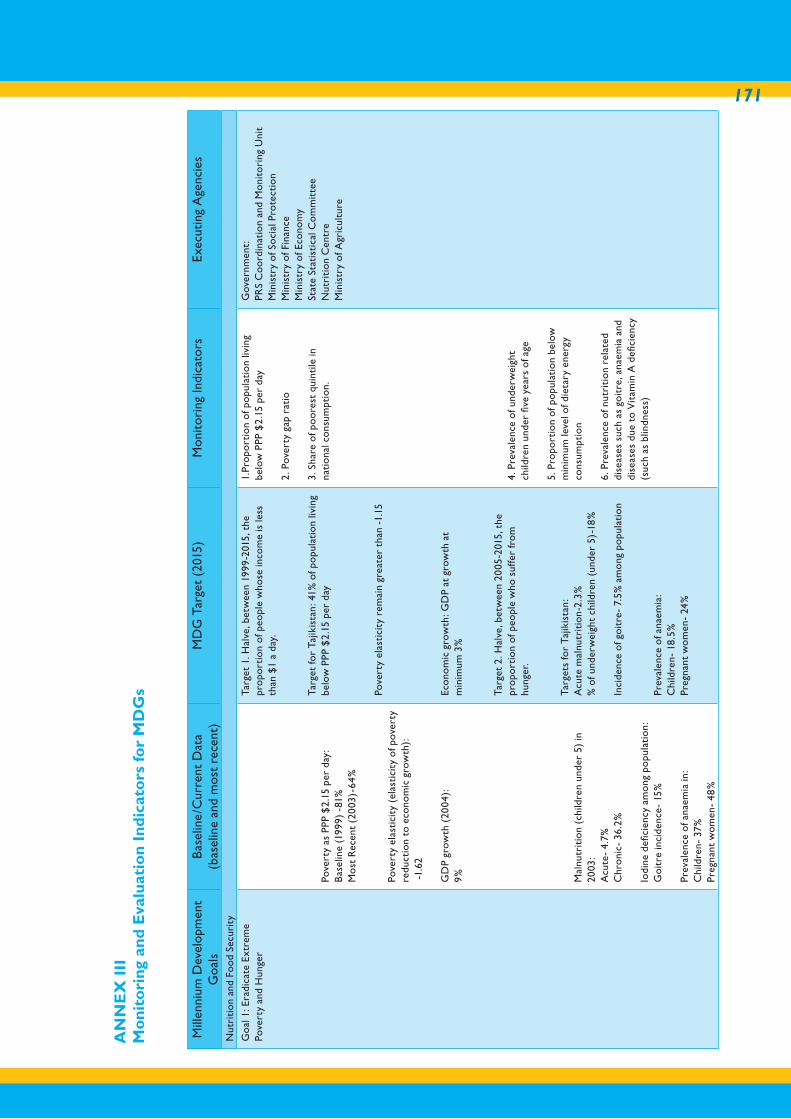
171
Mill
enni
um D
evel
opm
ent
Goa
ls
Bas
elin
e/C
urre
nt D
ata
(bas
elin
e an
d m
ost
rece
nt)
MD
G T
arge
t (2
015)
M
onit
orin
g In
dica
tors
Exec
utin
g A
genc
ies
Nut
riti
on a
nd F
ood
Secu
rity
Go
al 1
: Era
dica
te E
xtre
me
Pove
rty
and
Hun
ger
Pove
rty
as P
PP $
2.15
per
day
:B
asel
ine
(199
9) -
81%
Mos
t R
ecen
t (2
003)
-64%
Pove
rty
elas
tici
ty (
elas
tici
ty o
f pov
erty
re
duct
ion
to e
cono
mic
gro
wth
): -
1.62
GD
P gr
owth
(20
04):
9% Mal
nutr
itio
n (c
hild
ren
unde
r 5)
in
2003
:A
cute
- 4.
7%
Chr
onic
- 36
.2%
Iodi
ne d
efici
ency
am
ong
popu
lati
on:
Goi
tre
inci
denc
e- 1
5%
Prev
alen
ce o
f ana
emia
in:
Chi
ldre
n- 3
7%Pr
egna
nt w
omen
- 48
%
Targ
et 1
. Hal
ve, b
etw
een
1999
-201
5, t
he
pro
port
ion
of p
eopl
e w
hose
inco
me
is le
ss
than
$1
a da
y.
Targ
et fo
r Ta
jikis
tan:
41%
of p
opu
lati
on li
ving
be
low
PPP
$2.
15 p
er d
ay
Pove
rty
elas
tici
ty r
emai
n gr
eate
r th
an -
1.15
Econ
omic
gro
wth
: GD
P at
gro
wth
at
min
imum
3%
Targ
et 2
. Hal
ve, b
etw
een
2005
-201
5, t
he
pro
port
ion
of p
eopl
e w
ho s
uffe
r fr
om
hung
er.
Targ
ets
for
Tajik
ista
n:
Acu
te m
alnu
trit
ion-
2.3%
% o
f und
erw
eigh
t ch
ildre
n (u
nder
5)-
18%
Inci
denc
e of
goi
tre-
7.5
% a
mon
g po
pula
tion
Prev
alen
ce o
f ana
emia
:C
hild
ren-
18.
5%Pr
egna
nt w
omen
- 24
%
1.Pr
opo
rtio
n of
po
pula
tion
livi
ng
belo
w P
PP $
2.15
per
day
2. P
over
ty g
ap r
atio
3. S
hare
of p
oore
st q
uint
ile in
na
tion
al c
onsu
mpt
ion.
4. P
reva
lenc
e of
und
erw
eigh
t ch
ildre
n un
der
five
year
s of
age
5. P
ropo
rtio
n of
po
pula
tion
bel
ow
min
imum
leve
l of d
ieta
ry e
nerg
y co
nsum
ptio
n
6. P
reva
lenc
e of
nut
riti
on r
elat
ed
dise
ases
suc
h as
goi
tre,
ana
emia
and
di
seas
es d
ue t
o V
itam
in A
defi
cien
cy
(suc
h as
blin
dnes
s)
Gov
ernm
ent:
PRS
Coo
rdin
atio
n an
d M
onit
orin
g U
nit
Min
istr
y of
Soc
ial P
rote
ctio
nM
inis
try
of F
inan
ceM
inis
try
of E
cono
my
Stat
e St
atis
tica
l Com
mit
tee
Nut
riti
on C
entr
eM
inis
try
of A
gric
ultu
re
AN
NE
X I
IIM
on
ito
ring
an
d E
valu
atio
n I
nd
icat
ors
for
MD
Gs
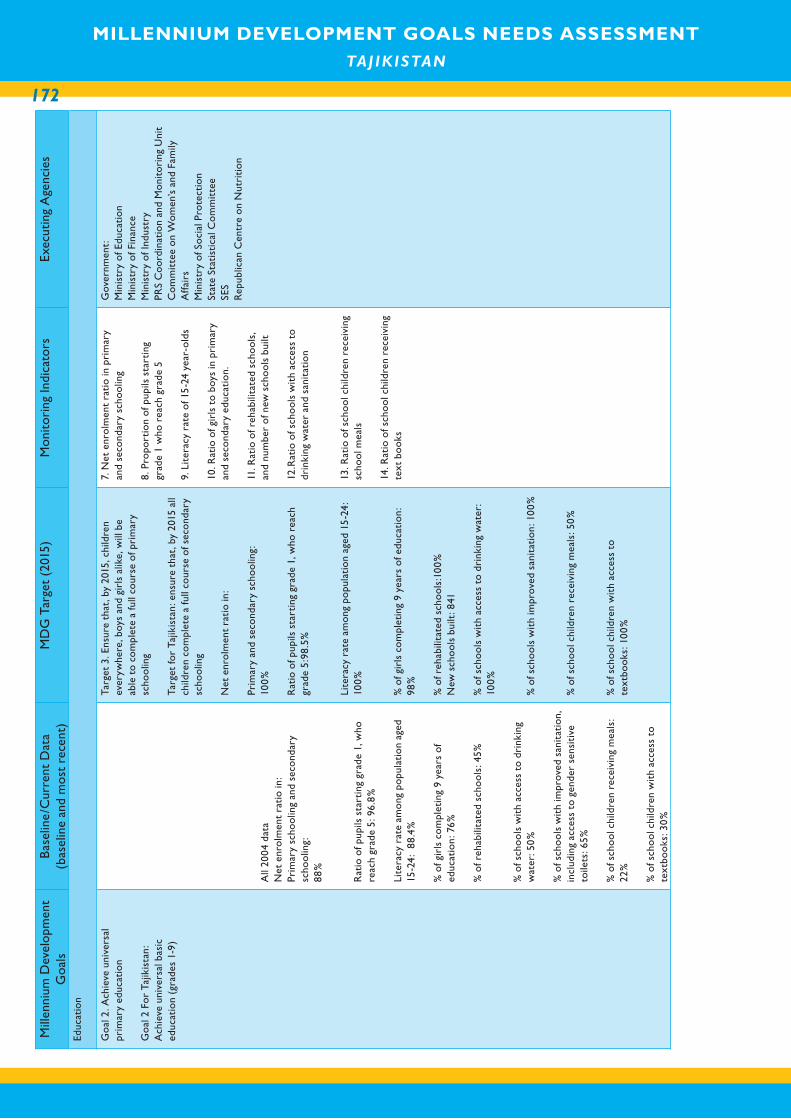
MILLENNIUM DEVELOPMENT GOALS NEEDS ASSESSMENT TAJ IK ISTAN
172
MILLENNIUM DEVELOPMENT GOALS NEEDS ASSESSMENT TAJ IK ISTAN
Mill
enni
um D
evel
opm
ent
Goa
ls
Bas
elin
e/C
urre
nt D
ata
(bas
elin
e an
d m
ost
rece
nt)
MD
G T
arge
t (2
015)
M
onit
orin
g In
dica
tors
Exec
utin
g A
genc
ies
Educ
atio
n
Go
al 2
. Ach
ieve
uni
vers
al
prim
ary
educ
atio
n
Go
al 2
For
Taj
ikis
tan:
Ach
ieve
uni
vers
al b
asic
ed
ucat
ion
(gra
des
1-9)
All
2004
dat
aN
et e
nrol
men
t ra
tio
in:
Prim
ary
scho
olin
g an
d se
cond
ary
scho
olin
g:88
%
Rat
io o
f pup
ils s
tart
ing
grad
e 1,
who
re
ach
grad
e 5:
96.
8%
Lite
racy
rat
e am
ong
popu
lati
on a
ged
15-2
4: 8
8.4%
% o
f gir
ls c
ompl
etin
g 9
year
s of
ed
ucat
ion:
76%
% o
f reh
abili
tate
d sc
hool
s: 4
5%
% o
f sch
ools
wit
h ac
cess
to
drin
king
w
ater
: 50%
% o
f sch
ools
wit
h im
prov
ed s
anit
atio
n,
incl
udin
g ac
cess
to
gend
er s
ensi
tive
to
ilets
: 65%
% o
f sch
ool c
hild
ren
rece
ivin
g m
eals
: 22
%
% o
f sch
ool c
hild
ren
wit
h ac
cess
to
text
book
s: 3
0%
Targ
et 3
. Ens
ure
that
, by
2015
, chi
ldre
n ev
eryw
here
, boy
s an
d gi
rls
alik
e, w
ill b
e ab
le t
o co
mpl
ete
a fu
ll co
urse
of p
rim
ary
scho
olin
g
Targ
et fo
r Ta
jikis
tan:
ens
ure
that
, by
2015
all
child
ren
com
plet
e a
full
cour
se o
f sec
onda
ry
scho
olin
g
Net
enr
olm
ent
rati
o in
:
Prim
ary
and
seco
ndar
y sc
hool
ing:
100%
Rat
io o
f pup
ils s
tart
ing
grad
e 1,
who
rea
ch
grad
e 5:
98.5
%
Lite
racy
rat
e am
ong
popu
lati
on a
ged
15-2
4:
100%
% o
f gir
ls c
ompl
etin
g 9
year
s of
edu
cati
on:
98%
% o
f reh
abili
tate
d sc
hool
s:10
0%N
ew s
choo
ls b
uilt
: 841
% o
f sch
ools
wit
h ac
cess
to
drin
king
wat
er:
100%
% o
f sch
ools
wit
h im
prov
ed s
anit
atio
n: 1
00%
% o
f sch
ool c
hild
ren
rece
ivin
g m
eals
: 50%
% o
f sch
ool c
hild
ren
wit
h ac
cess
to
text
book
s: 1
00%
7. N
et e
nrol
men
t ra
tio
in p
rim
ary
and
seco
ndar
y sc
hool
ing
8. P
ropo
rtio
n of
pup
ils s
tart
ing
grad
e 1
who
rea
ch g
rade
5
9. L
iter
acy
rate
of 1
5-24
yea
r-ol
ds
10. R
atio
of g
irls
to
boys
in p
rim
ary
and
seco
ndar
y ed
ucat
ion.
11. R
atio
of r
ehab
ilita
ted
scho
ols,
an
d nu
mbe
r of
new
sch
ools
bui
lt
12.R
atio
of s
choo
ls w
ith
acce
ss t
o dr
inki
ng w
ater
and
san
itat
ion
13. R
atio
of s
choo
l chi
ldre
n re
ceiv
ing
scho
ol m
eals
14. R
atio
of s
choo
l chi
ldre
n re
ceiv
ing
text
boo
ks
Gov
ernm
ent:
Min
istr
y of
Edu
cati
on
Min
istr
y of
Fin
ance
M
inis
try
of In
dust
ry
PRS
Coo
rdin
atio
n an
d M
onit
orin
g U
nit
Com
mit
tee
on W
omen
’s a
nd F
amily
A
ffai
rsM
inis
try
of S
ocia
l Pro
tect
ion
Stat
e St
atis
tica
l Com
mit
tee
SES
Rep
ublic
an C
entr
e on
Nut
riti
on

173M
illen
nium
Dev
elop
men
t G
oals
B
asel
ine/
Cur
rent
Dat
a (b
asel
ine
and
mos
t re
cent
)M
DG
Tar
get
(201
5)
Mon
itor
ing
Indi
cato
rsEx
ecut
ing
Age
ncie
s
Gen
der
Equa
lity
Go
al 3
. Pro
mot
e G
ende
r Eq
ualit
y an
d Em
pow
er W
omen
Rat
io o
f gir
ls t
o bo
ys in
pri
mar
y an
d se
cond
ary
educ
atio
n (2
004)
: 88
% R
atio
of l
iter
ate
wom
en t
o m
en, 1
5-24
ye
ars
old
(200
4): 9
8%
Shar
e of
wom
en in
wag
e em
ploy
men
t in
the
non
-agr
icul
tura
l sec
tor
(200
4):
41%
Pro
port
ion
of s
eats
hel
d by
wom
en in
na
tion
al p
arlia
men
t (2
004)
:13%
Shar
e of
po
pula
tion
cov
ered
by
publ
ic
awar
enes
s pr
ogra
ms
on r
epro
duct
ive
heal
th (
2004
): 2
0%
Shar
e of
sch
ool c
hild
ren
cove
red
by p
ublic
aw
aren
ess
prog
ram
s on
re
prod
ucti
ve h
ealt
h (2
004)
: 2.5
%
Pro
port
ion
of w
omen
cov
ered
by
scho
ol t
o w
ork
prog
ram
s (2
004)
: 2.
4%
Acc
ess
of w
omen
to
mic
ro-c
redi
t pr
ogra
ms
(200
4): 0
.5%
D
omes
tic
viol
ence
pre
vale
nce
rate
(2
004)
: 30%
Aw
aren
ess
amon
g pu
blic
sec
tor
empl
oyee
s on
mea
sure
s to
war
ds
elim
inat
ing
all f
orm
s of
dis
crim
inat
ion
agai
nst
wom
en (
2004
): 5
0
Targ
et 4
. Elim
inat
e ge
nder
dis
pari
ty in
pr
imar
y an
d se
cond
ary
educ
atio
n pr
efer
ably
by
200
5, a
nd in
all
leve
l of e
duca
tion
no
late
r th
an 2
015
Rat
io o
f gir
ls t
o bo
ys in
pri
mar
y an
d se
cond
ary
educ
atio
n: 1
00%
Rat
io o
f lit
erat
e w
omen
to
men
, 15-
24 y
ears
ol
d: 1
00%
Shar
e of
wom
en in
wag
e em
ploy
men
t in
the
no
n-ag
ricu
ltur
al s
ecto
r: 5
0%
Pro
port
ion
of s
eats
hel
d by
wom
en in
na
tion
al p
arlia
men
t: 3
3%
Shar
e of
po
pula
tion
cov
ered
by
publ
ic
awar
enes
s pr
ogra
ms
on r
epro
duct
ive
heal
th:
50%
Shar
e of
sch
ool c
hild
ren
cove
red
by p
ublic
aw
aren
ess
prog
ram
s on
rep
rodu
ctiv
e he
alth
: 80
%
Pro
port
ion
of w
omen
cov
ered
by
scho
ol t
o w
ork
prog
ram
s: 3
0%
Acc
ess
of w
omen
to
mic
ro-c
redi
t pr
ogra
ms:
1.5%
Dom
esti
c vi
olen
ce p
reva
lenc
e ra
te: 2
0%
Aw
aren
ess
amon
g pu
blic
sec
tor
empl
oyee
s on
mea
sure
s to
war
ds e
limin
atin
g al
l for
ms
of
disc
rim
inat
ion
agai
nst
wom
en: 1
00%
15. R
atio
of g
irls
to
boys
in p
rim
ary,
se
cond
ary
and
tert
iary
edu
cati
on
16. R
atio
of l
iter
ate
wom
en t
o m
en,
15-2
4 ye
ars
old
17. S
hare
of w
omen
wag
e em
ploy
men
t in
the
non
-agr
icul
tura
l se
ctor
.
18. P
ropo
rtio
n of
sea
ts h
eld
by
wom
en in
nat
iona
l par
liam
ent.
19. %
of p
opu
lati
on p
ract
icin
g fa
mily
pl
anni
ng
20. D
omes
tic
viol
ence
pre
vale
nce
rate
s
21. I
ncid
ence
of g
ende
r di
scri
min
atio
n in
sch
ools
and
at
wor
k.
Gov
ernm
ent:
Min
istr
y of
Edu
cati
onC
omm
itte
e on
Wom
en’s
and
Fam
ily
Aff
airs
Stat
e St
atis
tica
l Com
mit
tee
PRS
Coo
rdin
atio
n an
d M
onit
orin
g U
nit
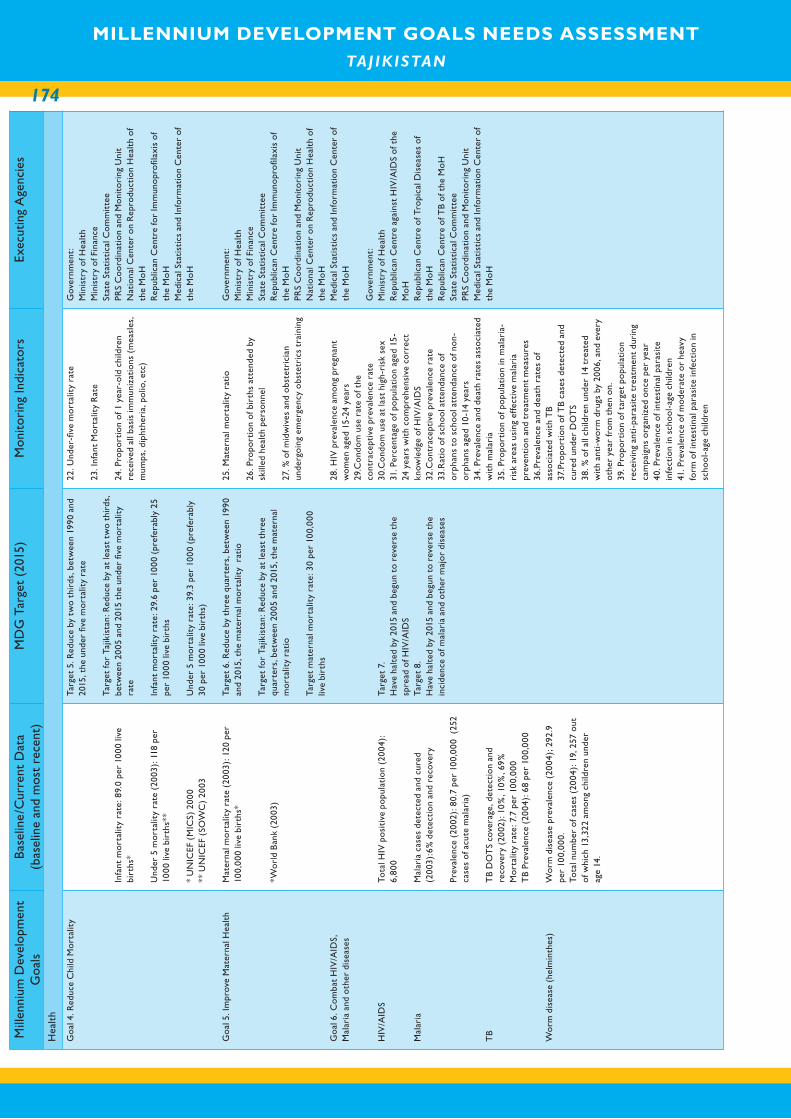
MILLENNIUM DEVELOPMENT GOALS NEEDS ASSESSMENT TAJ IK ISTAN
174
MILLENNIUM DEVELOPMENT GOALS NEEDS ASSESSMENT TAJ IK ISTAN
Mill
enni
um D
evel
opm
ent
Goa
ls
Bas
elin
e/C
urre
nt D
ata
(bas
elin
e an
d m
ost
rece
nt)
MD
G T
arge
t (2
015)
M
onit
orin
g In
dica
tors
Exec
utin
g A
genc
ies
Hea
lth
Go
al 4
. Red
uce
Chi
ld M
orta
lity
Go
al 5
. Im
prov
e M
ater
nal H
ealt
h
Go
al 6
. Co
mba
t H
IV/A
IDS,
M
alar
ia a
nd o
ther
dis
ease
s
HIV
/AID
S
Mal
aria
TB
Wor
m d
isea
se (
helm
inth
es)
Infa
nt m
orta
lity
rate
: 89.
0 pe
r 10
00 li
ve
birt
hs*
Und
er 5
mor
talit
y ra
te (
2003
): 1
18 p
er
1000
live
bir
ths*
*
* U
NIC
EF (
MIC
S) 2
000
** U
NIC
EF (
SOW
C)
2003
Mat
erna
l mor
talit
y ra
te (
2003
): 1
20 p
er
100,
000
live
birt
hs*
*Wor
ld B
ank
(200
3)
Tota
l HIV
pos
itiv
e po
pula
tio
n (2
004)
: 6,
800
Mal
aria
cas
es d
etec
ted
and
cure
d (2
003)
:6%
det
ecti
on
and
reco
very
Prev
alen
ce (
2002
): 8
0.7
per
100,
000
(25
2 ca
ses
of a
cute
mal
aria
)
TB
DO
TS
cove
rage
, det
ecti
on
and
reco
very
(20
02):
10
%, 1
0%
, 69%
M
orta
lity
rate
: 7.7
per
100
,000
TB
Prev
alen
ce (
2004
): 6
8 pe
r 10
0,00
0
Wor
m d
isea
se p
reva
lenc
e (2
004)
; 292
.9
per
100,
000.
Tota
l num
ber
of c
ases
(20
04):
19,
257
out
o
f whi
ch 1
3,32
2 am
ong
chi
ldre
n un
der
age
14.
Targ
et 5
. Red
uce
by t
wo
thir
ds, b
etw
een
1990
and
20
15, t
he u
nder
five
mor
talit
y ra
te
Targ
et fo
r Ta
jikis
tan:
Red
uce
by a
t le
ast
two
thir
ds,
betw
een
2005
and
201
5 th
e un
der
five
mor
talit
y ra
te
Infa
nt m
orta
lity
rate
: 29.
6 pe
r 10
00 (
pref
erab
ly 2
5 pe
r 10
00 li
ve b
irth
s
Und
er 5
mor
talit
y ra
te: 3
9.3
per
1000
(pr
efer
ably
30
per
100
0 liv
e bi
rths
)
Targ
et 6
. Red
uce
by t
hree
qua
rter
s, b
etw
een
1990
an
d 20
15, t
he m
ater
nal m
orta
lity
rat
io
Targ
et fo
r Ta
jikis
tan:
Red
uce
by a
t le
ast
thre
e qu
arte
rs, b
etw
een
2005
and
201
5, t
he m
ater
nal
mor
talit
y ra
tio
Targ
et m
ater
nal m
orta
lity
rate
: 30
per
100,
000
live
birt
hs
Targ
et 7
.H
ave
halt
ed b
y 20
15 a
nd b
egun
to
reve
rse
the
spre
ad o
f HIV
/AID
STa
rget
8.
Hav
e ha
lted
by
2015
and
beg
un t
o re
vers
e th
e in
cide
nce
of m
alar
ia a
nd o
ther
maj
or d
isea
ses
22. U
nder
-five
mor
talit
y ra
te
23. I
nfan
t M
orta
lity
Rat
e
24. P
ropo
rtio
n o
f 1 y
ear-
old
chi
ldre
n re
ceiv
ed a
ll ba
sis
imm
uniz
atio
ns (
mea
sles
, m
umps
, dip
hthe
ria,
po
lio, e
tc)
25. M
ater
nal m
orta
lity
rati
o
26. P
ropo
rtio
n o
f bir
ths
atte
nded
by
skill
ed h
ealt
h pe
rso
nnel
27. %
of m
idw
ives
and
obs
tetr
icia
n un
derg
oin
g em
erge
ncy
obs
tetr
ics
trai
ning
28. H
IV p
reva
lenc
e am
ong
pre
gnan
t w
om
en a
ged
15-2
4 ye
ars
29.C
ond
om
use
rat
e o
f the
co
ntra
cept
ive
prev
alen
ce r
ate
30.C
ond
om
use
at
last
hig
h-ri
sk s
ex31
. Per
cent
age
of p
opu
lati
on
aged
15-
24 y
ears
wit
h co
mpr
ehen
sive
cor
rect
kn
owle
dge
of H
IV/A
IDS
32.C
ont
race
ptiv
e pr
eval
ence
rat
e 33
.Rat
io o
f sch
oo
l att
enda
nce
of
orph
ans
to s
cho
ol a
tten
danc
e o
f no
n-or
phan
s ag
ed 1
0-14
yea
rs
34. P
reva
lenc
e an
d de
ath
rate
s as
soci
ated
w
ith
mal
aria
35. P
ropo
rtio
n o
f po
pula
tio
n in
mal
aria
-ri
sk a
reas
usi
ng e
ffect
ive
mal
aria
pr
even
tio
n an
d tr
eatm
ent
mea
sure
s36
.Pre
vale
nce
and
deat
h ra
tes
of
asso
ciat
ed w
ith
TB
37.P
ropo
rtio
n o
f TB
case
s de
tect
ed a
nd
cure
d un
der
DO
TS
38. %
of a
ll ch
ildre
n un
der
14 t
reat
ed
wit
h an
ti-w
orm
dru
gs b
y 20
06, a
nd e
very
o
ther
yea
r fr
om
the
n o
n.39
. Pro
port
ion
of t
arge
t po
pula
tio
n re
ceiv
ing
anti
-par
asit
e tr
eatm
ent
duri
ng
cam
paig
ns o
rgan
ized
onc
e pe
r ye
ar40
. Pre
vale
nce
of i
ntes
tina
l par
asit
e in
fect
ion
in s
cho
ol-
age
child
ren
41. P
reva
lenc
e o
f mo
dera
te o
r he
avy
form
of i
ntes
tina
l par
asit
e in
fect
ion
in
scho
ol-
age
child
ren
Gov
ernm
ent:
Min
istr
y of
Hea
lth
Min
istr
y of
Fin
ance
Stat
e St
atis
tica
l Co
mm
itte
ePR
S C
oor
dina
tio
n an
d M
oni
tori
ng U
nit
Nat
iona
l Cen
ter
on
Rep
rodu
ctio
n H
ealt
h o
f th
e M
oH
R
epub
lican
Cen
tre
for
Imm
uno
pro
filax
is o
f th
e M
oH
Med
ical
Sta
tist
ics
and
Info
rmat
ion
Cen
ter
of
the
Mo
H
Gov
ernm
ent:
Min
istr
y of
Hea
lth
Min
istr
y of
Fin
ance
Stat
e St
atis
tica
l Co
mm
itte
eR
epub
lican
Cen
tre
for
Imm
uno
pro
filax
is o
f th
e M
oH
PRS
Co
ordi
nati
on
and
Mo
nito
ring
Uni
tN
atio
nal C
ente
r o
n R
epro
duct
ion
Hea
lth
of
the
Mo
HM
edic
al S
tati
stic
s an
d In
form
atio
n C
ente
r o
f th
e M
oH
Gov
ernm
ent:
Min
istr
y of
Hea
lth
Rep
ublic
an C
entr
e ag
ains
t H
IV/A
IDS
of t
he
Mo
HR
epub
lican
Cen
tre
of T
ropi
cal D
isea
ses
of
the
Mo
HR
epub
lican
Cen
tre
of T
B of
the
Mo
HSt
ate
Stat
isti
cal C
om
mit
tee
PRS
Co
ordi
nati
on
and
Mo
nito
ring
Uni
tM
edic
al S
tati
stic
s an
d In
form
atio
n C
ente
r o
f th
e M
oH
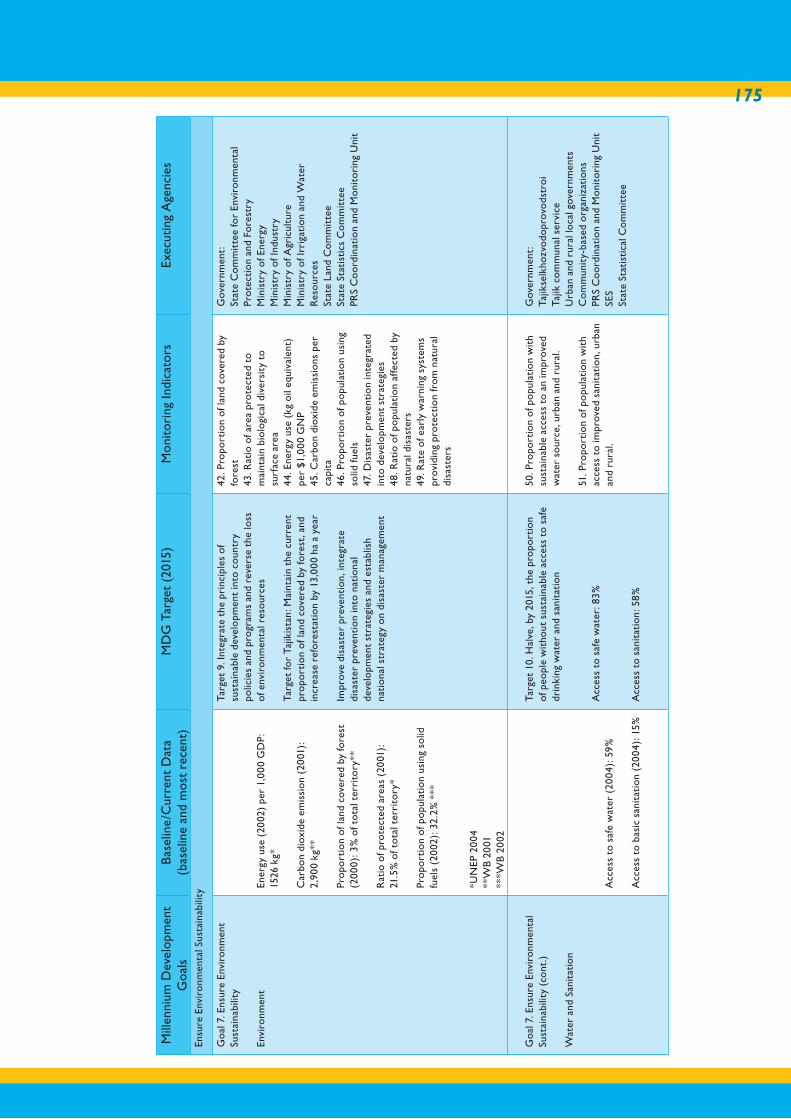
175
Mill
enni
um D
evel
opm
ent
Goa
ls
Bas
elin
e/C
urre
nt D
ata
(bas
elin
e an
d m
ost
rece
nt)
MD
G T
arge
t (2
015)
M
onit
orin
g In
dica
tors
Exec
utin
g A
genc
ies
Ensu
re E
nvir
onm
enta
l Sus
tain
abili
ty
Go
al 7
. Ens
ure
Envi
ronm
ent
Sust
aina
bilit
y
Envi
ronm
ent
Ener
gy u
se (
2002
) pe
r 1,
000
GD
P:
1526
kg*
Car
bon
diox
ide
emis
sion
(20
01):
2,
900
kg**
Pro
port
ion
of la
nd c
over
ed b
y fo
rest
(2
000)
: 3%
of t
otal
ter
rito
ry**
Rat
io o
f pro
tect
ed a
reas
(20
01):
21
.5%
of t
otal
ter
rito
ry*
Pro
port
ion
of p
opu
lati
on u
sing
sol
id
fuel
s (2
002)
: 32.
2% *
**
*UN
EP 2
004
**W
B 20
01**
*WB
2002
Targ
et 9
. Int
egra
te t
he p
rinc
iple
s of
su
stai
nabl
e de
velo
pmen
t in
to c
ount
ry
polic
ies
and
prog
ram
s an
d re
vers
e th
e lo
ss
of e
nvir
onm
enta
l res
ourc
es
Targ
et fo
r Ta
jikis
tan:
Mai
ntai
n th
e cu
rren
t pr
opo
rtio
n of
land
cov
ered
by
fore
st, a
nd
incr
ease
ref
ores
tati
on b
y 13
,000
ha
a ye
ar
Impr
ove
disa
ster
pre
vent
ion,
inte
grat
e di
sast
er p
reve
ntio
n in
to n
atio
nal
deve
lopm
ent
stra
tegi
es a
nd e
stab
lish
na
tion
al s
trat
egy
on d
isas
ter
man
agem
ent
42. P
ropo
rtio
n of
land
cov
ered
by
fore
st43
. Rat
io o
f are
a pr
otec
ted
to
mai
ntai
n bi
olog
ical
div
ersi
ty t
o su
rfac
e ar
ea44
. Ene
rgy
use
(kg
oil e
quiv
alen
t)
per
$1,0
00 G
NP
45. C
arbo
n di
oxid
e em
issi
ons
per
capi
ta46
. Pro
port
ion
of p
opu
lati
on u
sing
so
lid fu
els
47. D
isas
ter
prev
enti
on in
tegr
ated
in
to d
evel
opm
ent
stra
tegi
es
48. R
atio
of p
opu
lati
on a
ffect
ed b
y na
tura
l dis
aste
rs49
. Rat
e of
ear
ly w
arni
ng s
yste
ms
prov
idin
g pr
otec
tion
from
nat
ural
di
sast
ers
Gov
ernm
ent:
Stat
e C
omm
itte
e fo
r En
viro
nmen
tal
Prot
ecti
on a
nd F
ores
try
Min
istr
y of
Ene
rgy
Min
istr
y of
Indu
stry
Min
istr
y of
Agr
icul
ture
Min
istr
y of
Irri
gati
on a
nd W
ater
R
esou
rces
Stat
e La
nd C
omm
itte
eSt
ate
Stat
isti
cs C
omm
itte
ePR
S C
oord
inat
ion
and
Mon
itor
ing
Uni
t
Go
al 7
. Ens
ure
Envi
ronm
enta
l Su
stai
nabi
lity
(con
t.)
Wat
er a
nd S
anit
atio
n
Acc
ess
to s
afe
wat
er (
2004
): 5
9%
Acc
ess
to b
asic
san
itat
ion
(200
4): 1
5%
Targ
et 1
0. H
alve
, by
2015
, the
pro
port
ion
of p
eopl
e w
itho
ut s
usta
inab
le a
cces
s to
saf
e dr
inki
ng w
ater
and
san
itat
ion
Acc
ess
to s
afe
wat
er: 8
3%
Acc
ess
to s
anit
atio
n: 5
8%
50. P
ropo
rtio
n of
po
pula
tion
wit
h su
stai
nabl
e ac
cess
to
an im
prov
ed
wat
er s
ourc
e, u
rban
and
rur
al.
51. P
ropo
rtio
n of
po
pula
tion
wit
h ac
cess
to
impr
oved
san
itat
ion,
urb
an
and
rura
l.
Gov
ernm
ent:
Tajik
selk
hozv
odo
prov
odst
roi
Tajik
com
mun
al s
ervi
ceU
rban
and
rur
al lo
cal g
over
nmen
tsC
omm
unit
y-ba
sed
orga
niza
tion
sPR
S C
oord
inat
ion
and
Mon
itor
ing
Uni
tSE
SSt
ate
Stat
isti
cal C
omm
itte
e
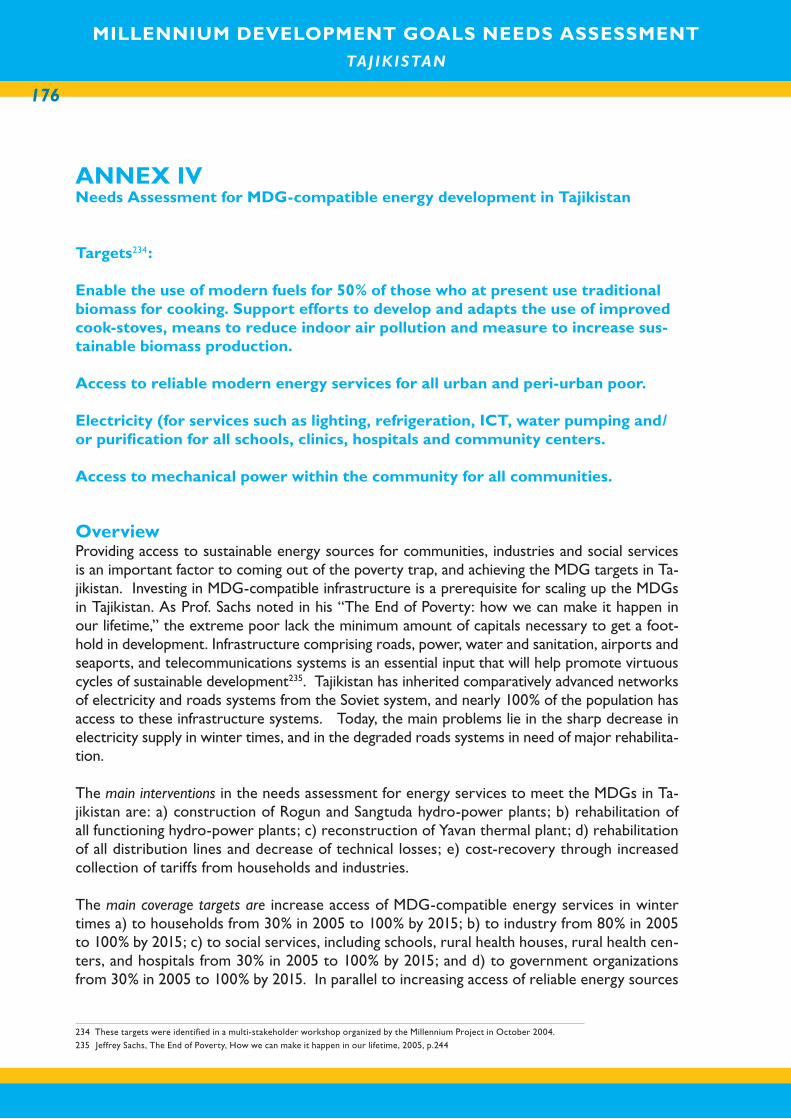
MILLENNIUM DEVELOPMENT GOALS NEEDS ASSESSMENT TAJ IK ISTAN
176
MILLENNIUM DEVELOPMENT GOALS NEEDS ASSESSMENT TAJ IK ISTAN
ANNEX IVNeeds Assessment for MDG-compatible energy development in Tajikistan
Targets234:
Enable the use of modern fuels for 50% of those who at present use traditional biomass for cooking. Support efforts to develop and adapts the use of improved cook-stoves, means to reduce indoor air pollution and measure to increase sus-tainable biomass production.
Access to reliable modern energy services for all urban and peri-urban poor.
Electricity (for services such as lighting, refrigeration, ICT, water pumping and/or purification for all schools, clinics, hospitals and community centers.
Access to mechanical power within the community for all communities.
OverviewProviding access to sustainable energy sources for communities, industries and social services is an important factor to coming out of the poverty trap, and achieving the MDG targets in Ta-jikistan. Investing in MDG-compatible infrastructure is a prerequisite for scaling up the MDGs in Tajikistan. As Prof. Sachs noted in his “The End of Poverty: how we can make it happen in our lifetime,” the extreme poor lack the minimum amount of capitals necessary to get a foot-hold in development. Infrastructure comprising roads, power, water and sanitation, airports and seaports, and telecommunications systems is an essential input that will help promote virtuous cycles of sustainable development235. Tajikistan has inherited comparatively advanced networks of electricity and roads systems from the Soviet system, and nearly 100% of the population has access to these infrastructure systems. Today, the main problems lie in the sharp decrease in electricity supply in winter times, and in the degraded roads systems in need of major rehabilita-tion.
The main interventions in the needs assessment for energy services to meet the MDGs in Ta-jikistan are: a) construction of Rogun and Sangtuda hydro-power plants; b) rehabilitation of all functioning hydro-power plants; c) reconstruction of Yavan thermal plant; d) rehabilitation of all distribution lines and decrease of technical losses; e) cost-recovery through increased collection of tariffs from households and industries. The main coverage targets are increase access of MDG-compatible energy services in winter times a) to households from 30% in 2005 to 100% by 2015; b) to industry from 80% in 2005 to 100% by 2015; c) to social services, including schools, rural health houses, rural health cen-ters, and hospitals from 30% in 2005 to 100% by 2015; and d) to government organizations from 30% in 2005 to 100% by 2015. In parallel to increasing access of reliable energy sources
234 These targets were identified in a multi-stakeholder workshop organized by the Millennium Project in October 2004.
235 Jeffrey Sachs, The End of Poverty, How we can make it happen in our lifetime, 2005, p.244
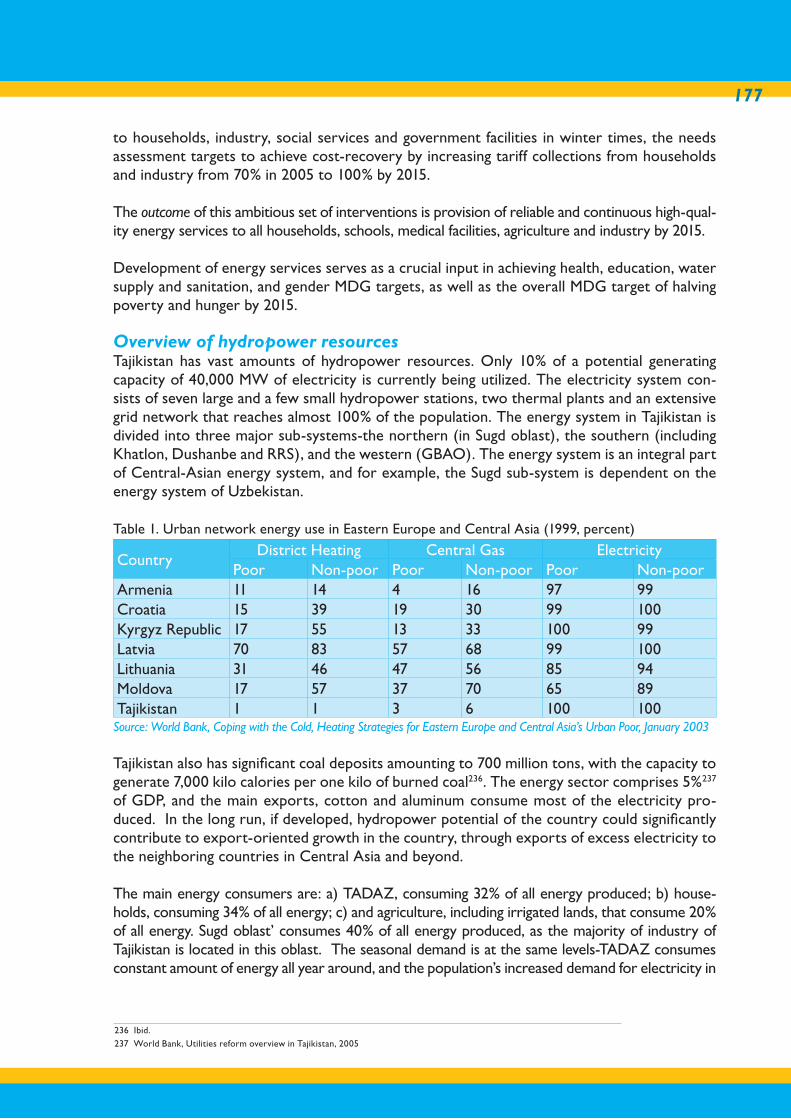
177
to households, industry, social services and government facilities in winter times, the needs assessment targets to achieve cost-recovery by increasing tariff collections from households and industry from 70% in 2005 to 100% by 2015.
The outcome of this ambitious set of interventions is provision of reliable and continuous high-qual-ity energy services to all households, schools, medical facilities, agriculture and industry by 2015.
Development of energy services serves as a crucial input in achieving health, education, water supply and sanitation, and gender MDG targets, as well as the overall MDG target of halving poverty and hunger by 2015.
Overview of hydropower resourcesTajikistan has vast amounts of hydropower resources. Only 10% of a potential generating capacity of 40,000 MW of electricity is currently being utilized. The electricity system con-sists of seven large and a few small hydropower stations, two thermal plants and an extensive grid network that reaches almost 100% of the population. The energy system in Tajikistan is divided into three major sub-systems-the northern (in Sugd oblast), the southern (including Khatlon, Dushanbe and RRS), and the western (GBAO). The energy system is an integral part of Central-Asian energy system, and for example, the Sugd sub-system is dependent on the energy system of Uzbekistan.
Table 1. Urban network energy use in Eastern Europe and Central Asia (1999, percent)
CountryDistrict Heating Central Gas Electricity
Poor Non-poor Poor Non-poor Poor Non-poorArmenia 11 14 4 16 97 99Croatia 15 39 19 30 99 100Kyrgyz Republic 17 55 13 33 100 99Latvia 70 83 57 68 99 100Lithuania 31 46 47 56 85 94Moldova 17 57 37 70 65 89Tajikistan 1 1 3 6 100 100
Source: World Bank, Coping with the Cold, Heating Strategies for Eastern Europe and Central Asia’s Urban Poor, January 2003
Tajikistan also has significant coal deposits amounting to 700 million tons, with the capacity to generate 7,000 kilo calories per one kilo of burned coal236. The energy sector comprises 5%237 of GDP, and the main exports, cotton and aluminum consume most of the electricity pro-duced. In the long run, if developed, hydropower potential of the country could significantly contribute to export-oriented growth in the country, through exports of excess electricity to the neighboring countries in Central Asia and beyond.
The main energy consumers are: a) TADAZ, consuming 32% of all energy produced; b) house-holds, consuming 34% of all energy; c) and agriculture, including irrigated lands, that consume 20% of all energy. Sugd oblast’ consumes 40% of all energy produced, as the majority of industry of Tajikistan is located in this oblast. The seasonal demand is at the same levels-TADAZ consumes constant amount of energy all year around, and the population’s increased demand for electricity in
236 Ibid.
237 World Bank, Utilities reform overview in Tajikistan, 2005

MILLENNIUM DEVELOPMENT GOALS NEEDS ASSESSMENT TAJ IK ISTAN
178
MILLENNIUM DEVELOPMENT GOALS NEEDS ASSESSMENT TAJ IK ISTAN
winter is balanced by the agriculture’s demand in electricity for irrigation in the summer times. In spite of the existing infrastructure and its potential, since 1990, production and consumption of electricity has significantly declined. Today, frequent electricity shortfalls occur in wintertime, with a total annual deficit of about 3.4 billion kWh (or 2 billion kWh, according to the World Bank). The sector has accumulated significant arrears, which has reduced its ability to invest in rehabilitation. Production of electric power has declined by 19% over the last ten years, and con-sumption decreased by one third, partly due to decrease in industries. Ensuring sufficient supply of power for major industries and mechanized irrigation is the Government’s priority.
Electricity remains the main and cheapest source for heating and cooking, when available. Electricity makes up 86% of all energy consumption in the country. This high dependence on electricity is encouraged by low tariff rates, and its high access throughout the country. How-ever, regular electricity supply is lacking in rural areas, especially in remote mountainous re-gions. During winter times, 55% of electricity used by households goes towards heating. Over 40% of households still rely on biomass and wood (supply of which is becoming scarce), 35% -on electricity, 15% -on natural gas, 8% -on coal, and 2% - on centralized heating. Restrictions on electricity consumption are imposed every year on the general public and social services from November to April. In remote and rural areas electricity supply is limited to only two hours per day in winter. In recent years, frequent power outages in winter times have started to occur even in major cities.
The existing major hydro power plants such as Nurek and Baipazan, and Vaksh cascade are in need of major repairs and infrastructure rehabilitation, and the water reservoirs suffer from heavy silting. The same situation is with Dushanbe and Yavan thermal plants (if in 1990, the thermal plants generated 6.7% of overall electricity in Tajikistan, in 2004 only 2% was generated; Yavan thermal plant has not operated for the last 5-6 years). In 2004, losses and leakages amounted to 14%, but in reality they amount to 20% of all electricity produced238. More than one half of losses occur in distribution networks, due to increased consumption of electricity from low-voltage lines, increased use of electricity for heating, and overloading of distribution lines. Non technical losses comprise informal usage of electricity, incorrect tariff accounting, and improper collection measures. The general public and social sectors receive electricity from low-voltage distribution networks, whereas major industries use high-voltage lines. Low voltage distribution networks are often overloaded due to the large rise in consumption by the population during winter times (from 8% to 33%). Due to overloading and near-zero efforts in the maintenance of the network itself, the distribution lines often malfunction and are in need of rehabilitation.
Tariffs remain heavily subsidized, especially for large industries, and the collection rate is about 84% for electricity and for gas. More than half of tariffs are paid in cash, whereas the remaining 30% are paid through barter and other informal measures. Due to such low cost-recovery, the debt of Barqi Tojik, Tajikistan’s energy provider amounts to the sum equivalent to 13 months of electricity sale. Agriculture industry paid only 91.5% of the overall consumption (but mechanized irrigation-only 43.19%), households-86%, and TADAZ-85.8%. Meter usage is still very limited; the installation of meters is therefore of high priority for cost recovery and allocation of resources for maintenance and rehabilitation.239 Currently, tariff for electricity is 0.6 cents for 1 kw/h, which constitutes one fourth of amount needed for the full cost recovery (or 2.1 cents for 1 kw/h). This amounts to the lack of monetary resources needed to ensure sustainability of electricity production, including maintenance and operation costs.
238 According to the State Energy Utility “Barqi Tojik”
239 World Bank, Energy Utility Reform Review, 2004.
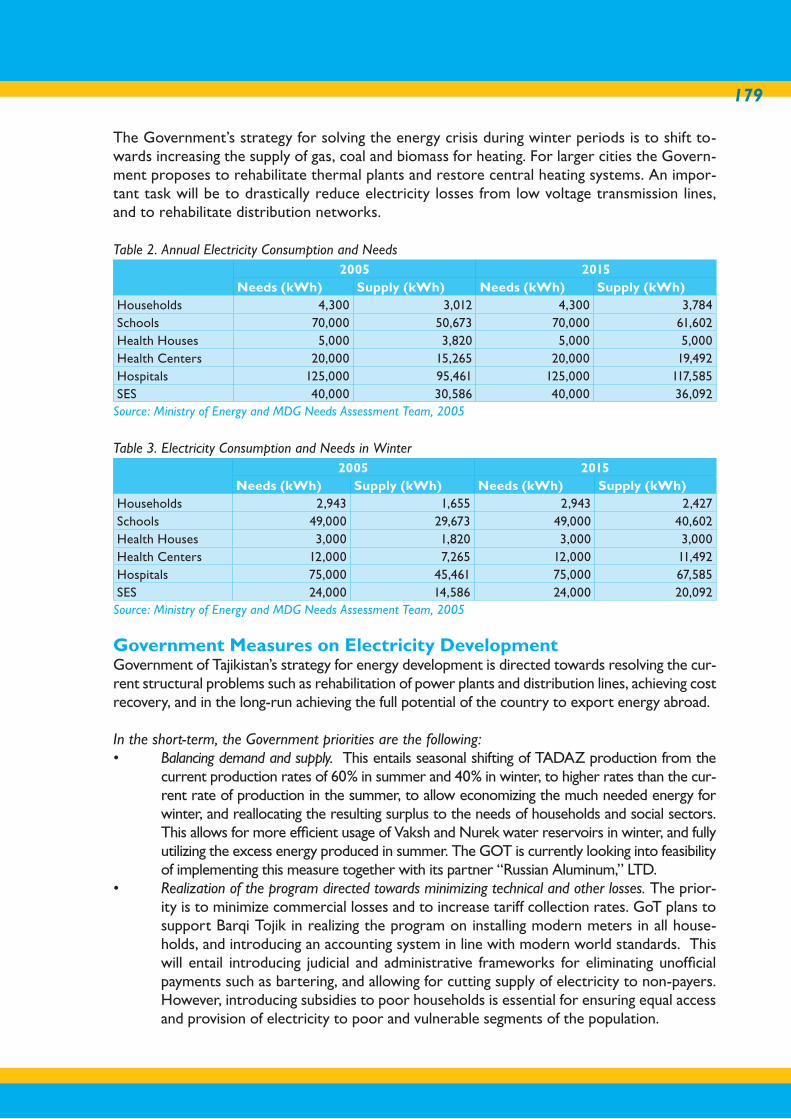
179
The Government’s strategy for solving the energy crisis during winter periods is to shift to-wards increasing the supply of gas, coal and biomass for heating. For larger cities the Govern-ment proposes to rehabilitate thermal plants and restore central heating systems. An impor-tant task will be to drastically reduce electricity losses from low voltage transmission lines, and to rehabilitate distribution networks.
Table 2. Annual Electricity Consumption and Needs2005 2015
Needs (kWh) Supply (kWh) Needs (kWh) Supply (kWh)Households 4,300 3,012 4,300 3,784Schools 70,000 50,673 70,000 61,602Health Houses 5,000 3,820 5,000 5,000Health Centers 20,000 15,265 20,000 19,492Hospitals 125,000 95,461 125,000 117,585SES 40,000 30,586 40,000 36,092
Source: Ministry of Energy and MDG Needs Assessment Team, 2005
Table 3. Electricity Consumption and Needs in Winter2005 2015
Needs (kWh) Supply (kWh) Needs (kWh) Supply (kWh)Households 2,943 1,655 2,943 2,427Schools 49,000 29,673 49,000 40,602Health Houses 3,000 1,820 3,000 3,000Health Centers 12,000 7,265 12,000 11,492Hospitals 75,000 45,461 75,000 67,585SES 24,000 14,586 24,000 20,092
Source: Ministry of Energy and MDG Needs Assessment Team, 2005 Government Measures on Electricity DevelopmentGovernment of Tajikistan’s strategy for energy development is directed towards resolving the cur-rent structural problems such as rehabilitation of power plants and distribution lines, achieving cost recovery, and in the long-run achieving the full potential of the country to export energy abroad.
In the short-term, the Government priorities are the following: • Balancing demand and supply. This entails seasonal shifting of TADAZ production from the
current production rates of 60% in summer and 40% in winter, to higher rates than the cur-rent rate of production in the summer, to allow economizing the much needed energy for winter, and reallocating the resulting surplus to the needs of households and social sectors. This allows for more efficient usage of Vaksh and Nurek water reservoirs in winter, and fully utilizing the excess energy produced in summer. The GOT is currently looking into feasibility of implementing this measure together with its partner “Russian Aluminum,” LTD.
• Realization of the program directed towards minimizing technical and other losses. The prior-ity is to minimize commercial losses and to increase tariff collection rates. GoT plans to support Barqi Tojik in realizing the program on installing modern meters in all house-holds, and introducing an accounting system in line with modern world standards. This will entail introducing judicial and administrative frameworks for eliminating unofficial payments such as bartering, and allowing for cutting supply of electricity to non-payers.However, introducing subsidies to poor households is essential for ensuring equal access and provision of electricity to poor and vulnerable segments of the population.
MILLENNIUM DEVELOPMENT GOALS NEEDS ASSESSMENT TAJ IK ISTAN
180
MILLENNIUM DEVELOPMENT GOALS NEEDS ASSESSMENT TAJ IK ISTAN
• Introducing and realizing new tariff methods for electricity. GoT increased tariffs in 2003 by about 2.3 times, and plans to further increase tariffs. However, increase of the current tariff of 0.5 cents per 1 kw/h to 2.1 cents per 1 kw/h demands gradual, step-by-step ap-proach, coupled with increased quality and stability of electricity supply to households. Government supports tariffs that vary in the summer and winter times, which was intro-duced in 2003, in order to increase cost-recovery in the high-demand winter season.
In the medium-term, GoT plans to implement the following measures:• Development of alternative sources of energy for cooking and heating, such as gas, coal
and renewable sources that will help meet demands for heating of households and social services;
• Continuation of the program on reducing energy losses. In the medium-term, GoT will focus on minimizing technical losses in the production and distribution systems, and investing in reconstruction and maintenance of electricity systems;
• Development of alternative soruces of increasing energy production, especially in winter months. In order to realize this, complete assessment on investments needed to rehabilitate Du-shanbe and Yavan thermal plants, research on environmentally friendly coal production.
• Cleaning water reservoirs from silts. For example, in Nurek platform, more than 50 me-ters are silted, which reduced energy production potential significantly.
In the long-term, GoT strategy focuses on development of the full potential of Tajikistan’s hydro-power potentials, and production of excess energy for exports, which will play a sig-nificant role in speeding up the economic development of the country. Realization of this potential consists of construction of Rogun and Sangtuda hydro-power plants, among others. Fulfillment of the long-term energy strategy will depend on the following:• Trans-boundary agreement on management of energy resources with neighboring countries,
especially Turkmenistan, Uzbekistan and Kyrgyzstan on joint management of Amudarya and Syrdarya water basins, and their tributaries Pyanj (flowing along the Afghan bor-der) and Vaksh (originating in Tajikistan);
• Development of markets for exporting excess energy. It is expected that 80% of energy produced by construction of Rogun and Sangdtuda hydro-power plants will be ex-ported to neighboring countries, in order to recover the investment costs. Once the construction costs are recovered, the energy produced will help promote export-ori-ented growth in the country
• Preparation of technical and socio-economic impact analyses associated with construction of hydro-power plants. This will entail preparation of tenders, carrying out environmental, social and economic impact analyses and measures to minimize the negative impacts, and financing options.
Natural Gas Resources Natural gas is the second most important MDG-compatible source in Tajikistan. The country’s natural gas reserves are on the order of 5.7 billion cubic meters. However, exploitation of these resources has been modest to date, constituting less than 5% of the total gas consump-tion in the country240. 95% of the demand is met through imports from Uzbekistan (the annual import is about 500-550 million cubic meters)241. Tajikistan pays Uzbekistan either through barter (allowing the passage of railroads transit through Tajikistan), or/and payment in cash.
240 Ministry of Energy, 2005
241 Ministry of Energy, 2005
181
99% of gas consumers constitute households, which consume about 51% of total energy con-sumed, whereas industry, commercial and state organizations consume the rest of gas. Only 30% of all households have access to natural gas242.
The gas sector faces similar problems to that of electricity. Technical losses amount to 7.6%, compared to 1% of losses in case of effective operations. Commercial losses are also high. Tariff collections are very low due to unavailability of meters in 90% of the populations, and tariffs are calculates on the basis of a predetermined norm. Thus, about 22% of consumption is not accounted for at all, and 77% of consumption is calculated on the basis of predetermined norm. This means that about 45% of consumed gas is not paid for243. Gas tariffs have been heavily subsidized, but with the increase of tariffs in 2003, the gap has decreased somewhat.
Government MeasuresThe main goal in development of the natural gas sector is to decrease financial losses, and to explore the potential of developing national gas production. In short-term, the following measures are of importance:• Realization of the program on minimizing losses for the gas sector. This entail increasing
collection of tariffs to 100% by 2007, through modernization of accounting systems, and installation of modern meters in all households, consuming gas;
• Change in the predetermined norms in lieu of meters. As installing of meters will take some-time to complete, in the meanwhile, new norms of accounting should be developed;
• Completion of implementation of new tariff measures. Tariffs need to be raised to ensure cost-recovery, and differences in domestic and imported gas tariffs will be eliminated.
In the medium-term, GoT plans to focus on decreasing technical losses from 7.6 to 1-2%, through improved system of distribution networks. Also, alternative measures, such as using gas for heating and lighting, and increasing access of gas to consumers are being considered. Through improved distribution networks, decreasing of losses, the sector can release extra resources to increase import of gas. Also, developing domestic gas production, through gas explorations and capital investments in development of this sector are being considered.
Thermal energy resourcesDevelopment of coal sources also contributes to MDG-compatible energy needs in the me-dium-term, provided that clean heating techniques and modern cooking stoves are used. As an average temperature in winter in Tajikistan is around +1°C to +3°C, and the lowest could reach –10°C to -15°C, providing households, social services and public facilities with adequate heating is of high importance. The cold period lasts from October to November for about 165 days in GBAO, and about 135 days from October and mid-March in the rest of the coun-try. Thermal energy in Tajikistan was developed during Soviet times. Central heating systems were in use, which covered 3% of all households, and 5% of all heating needs in the country. This system was intact until the early 1990, and relied on domestic coal production. Also, the country could meet most of its heating demands, through supply of gas, heating petroleum (petroleum residue) from the neighboring countries.Today, centralized heating systems almost ceased to exist. Two main suppliers, Dushanbe and Ya-van thermal plants are in need of major rehabilitation. Yavan thermal plant has not functioned in the last 5 years. Currently, only 18 out of 181 thermal boilers are in working order. In past few years,
242 WB, Utilities Reform Review in Tajikistan, 2005.
243 Ibid
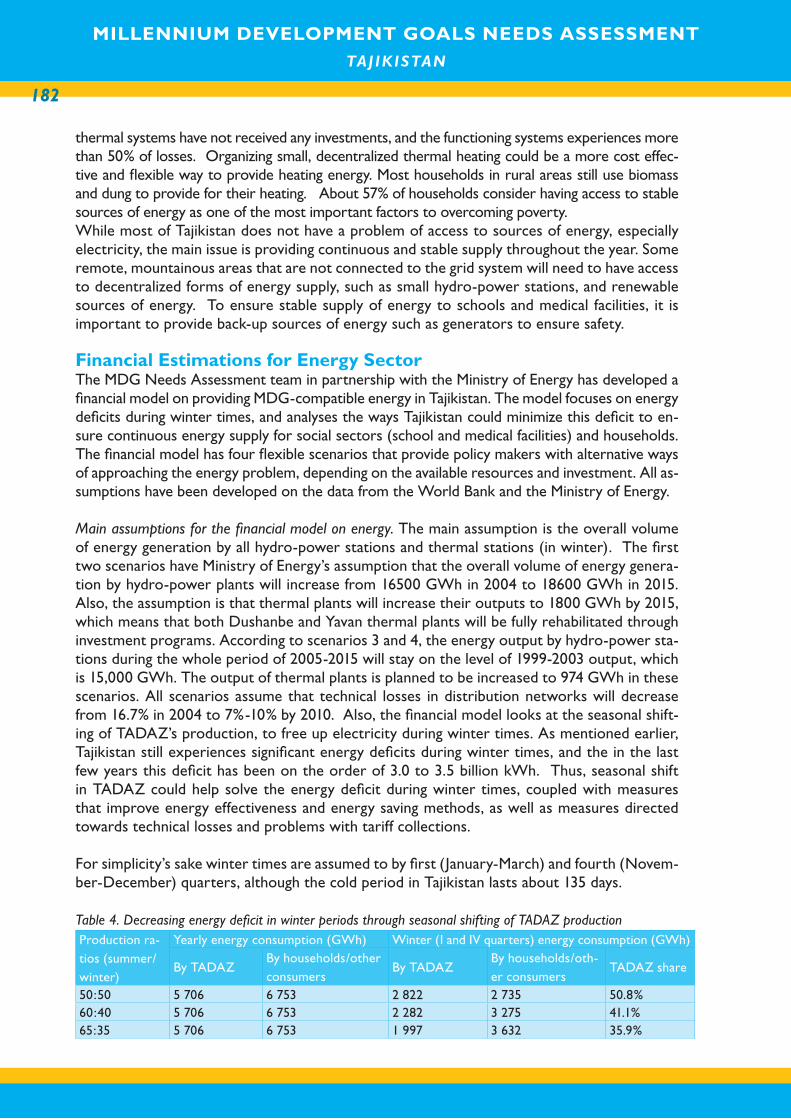
MILLENNIUM DEVELOPMENT GOALS NEEDS ASSESSMENT TAJ IK ISTAN
182
MILLENNIUM DEVELOPMENT GOALS NEEDS ASSESSMENT TAJ IK ISTAN
thermal systems have not received any investments, and the functioning systems experiences more than 50% of losses. Organizing small, decentralized thermal heating could be a more cost effec-tive and flexible way to provide heating energy. Most households in rural areas still use biomass and dung to provide for their heating. About 57% of households consider having access to stable sources of energy as one of the most important factors to overcoming poverty.While most of Tajikistan does not have a problem of access to sources of energy, especially electricity, the main issue is providing continuous and stable supply throughout the year. Some remote, mountainous areas that are not connected to the grid system will need to have access to decentralized forms of energy supply, such as small hydro-power stations, and renewable sources of energy. To ensure stable supply of energy to schools and medical facilities, it is important to provide back-up sources of energy such as generators to ensure safety.
Financial Estimations for Energy SectorThe MDG Needs Assessment team in partnership with the Ministry of Energy has developed a financial model on providing MDG-compatible energy in Tajikistan. The model focuses on energy deficits during winter times, and analyses the ways Tajikistan could minimize this deficit to en-sure continuous energy supply for social sectors (school and medical facilities) and households. The financial model has four flexible scenarios that provide policy makers with alternative ways of approaching the energy problem, depending on the available resources and investment. All as-sumptions have been developed on the data from the World Bank and the Ministry of Energy.
Main assumptions for the financial model on energy. The main assumption is the overall volume of energy generation by all hydro-power stations and thermal stations (in winter). The first two scenarios have Ministry of Energy’s assumption that the overall volume of energy genera-tion by hydro-power plants will increase from 16500 GWh in 2004 to 18600 GWh in 2015. Also, the assumption is that thermal plants will increase their outputs to 1800 GWh by 2015, which means that both Dushanbe and Yavan thermal plants will be fully rehabilitated through investment programs. According to scenarios 3 and 4, the energy output by hydro-power sta-tions during the whole period of 2005-2015 will stay on the level of 1999-2003 output, which is 15,000 GWh. The output of thermal plants is planned to be increased to 974 GWh in these scenarios. All scenarios assume that technical losses in distribution networks will decrease from 16.7% in 2004 to 7%-10% by 2010. Also, the financial model looks at the seasonal shift-ing of TADAZ’s production, to free up electricity during winter times. As mentioned earlier, Tajikistan still experiences significant energy deficits during winter times, and the in the last few years this deficit has been on the order of 3.0 to 3.5 billion kWh. Thus, seasonal shift in TADAZ could help solve the energy deficit during winter times, coupled with measures that improve energy effectiveness and energy saving methods, as well as measures directed towards technical losses and problems with tariff collections.
For simplicity’s sake winter times are assumed to by first (January-March) and fourth (Novem-ber-December) quarters, although the cold period in Tajikistan lasts about 135 days.
Table 4. Decreasing energy deficit in winter periods through seasonal shifting of TADAZ production Production ra-tios (summer/winter)
Yearly energy consumption (GWh) Winter (I and IV quarters) energy consumption (GWh)
By TADAZBy households/otherconsumers
By TADAZBy households/oth-er consumers
TADAZ share
50:50 5 706 6 753 2 822 2 735 50.8%60:40 5 706 6 753 2 282 3 275 41.1%65:35 5 706 6 753 1 997 3 632 35.9%
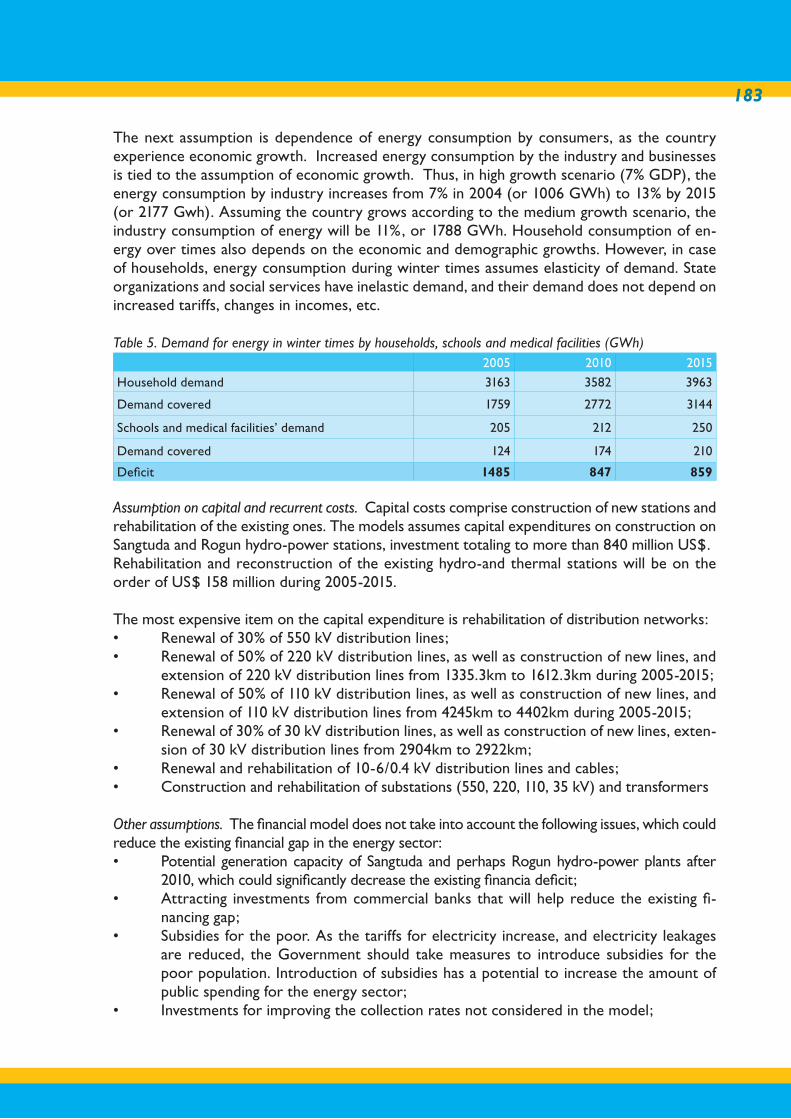
183
The next assumption is dependence of energy consumption by consumers, as the country experience economic growth. Increased energy consumption by the industry and businesses is tied to the assumption of economic growth. Thus, in high growth scenario (7% GDP), the energy consumption by industry increases from 7% in 2004 (or 1006 GWh) to 13% by 2015 (or 2177 Gwh). Assuming the country grows according to the medium growth scenario, the industry consumption of energy will be 11%, or 1788 GWh. Household consumption of en-ergy over times also depends on the economic and demographic growths. However, in case of households, energy consumption during winter times assumes elasticity of demand. State organizations and social services have inelastic demand, and their demand does not depend on increased tariffs, changes in incomes, etc.
Table 5. Demand for energy in winter times by households, schools and medical facilities (GWh)2005 2010 2015
Household demand 3163 3582 3963
Demand covered 1759 2772 3144
Schools and medical facilities’ demand 205 212 250
Demand covered 124 174 210
Deficit 1485 847 859
Assumption on capital and recurrent costs. Capital costs comprise construction of new stations and rehabilitation of the existing ones. The models assumes capital expenditures on construction on Sangtuda and Rogun hydro-power stations, investment totaling to more than 840 million US$.Rehabilitation and reconstruction of the existing hydro-and thermal stations will be on the order of US$ 158 million during 2005-2015. The most expensive item on the capital expenditure is rehabilitation of distribution networks: • Renewal of 30% of 550 kV distribution lines;• Renewal of 50% of 220 kV distribution lines, as well as construction of new lines, and
extension of 220 kV distribution lines from 1335.3km to 1612.3km during 2005-2015;• Renewal of 50% of 110 kV distribution lines, as well as construction of new lines, and
extension of 110 kV distribution lines from 4245km to 4402km during 2005-2015;• Renewal of 30% of 30 kV distribution lines, as well as construction of new lines, exten-
sion of 30 kV distribution lines from 2904km to 2922km;• Renewal and rehabilitation of 10-6/0.4 kV distribution lines and cables;• Construction and rehabilitation of substations (550, 220, 110, 35 kV) and transformers
Other assumptions. The financial model does not take into account the following issues, which could reduce the existing financial gap in the energy sector: • Potential generation capacity of Sangtuda and perhaps Rogun hydro-power plants after
2010, which could significantly decrease the existing financia deficit;• Attracting investments from commercial banks that will help reduce the existing fi-
nancing gap;• Subsidies for the poor. As the tariffs for electricity increase, and electricity leakages
are reduced, the Government should take measures to introduce subsidies for the poor population. Introduction of subsidies has a potential to increase the amount of public spending for the energy sector;
• Investments for improving the collection rates not considered in the model;
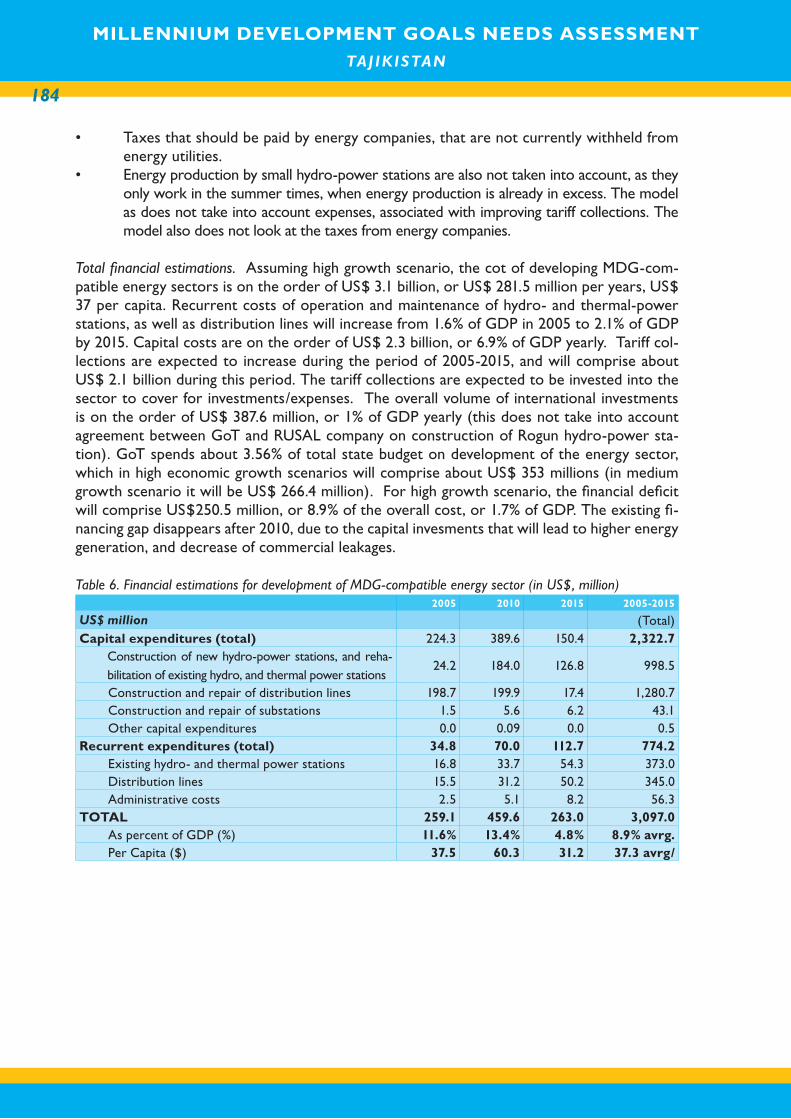
MILLENNIUM DEVELOPMENT GOALS NEEDS ASSESSMENT TAJ IK ISTAN
184
MILLENNIUM DEVELOPMENT GOALS NEEDS ASSESSMENT TAJ IK ISTAN
• Taxes that should be paid by energy companies, that are not currently withheld from energy utilities.
• Energy production by small hydro-power stations are also not taken into account, as they only work in the summer times, when energy production is already in excess. The model as does not take into account expenses, associated with improving tariff collections. The model also does not look at the taxes from energy companies.
Total financial estimations. Assuming high growth scenario, the cot of developing MDG-com-patible energy sectors is on the order of US$ 3.1 billion, or US$ 281.5 million per years, US$ 37 per capita. Recurrent costs of operation and maintenance of hydro- and thermal-power stations, as well as distribution lines will increase from 1.6% of GDP in 2005 to 2.1% of GDP by 2015. Capital costs are on the order of US$ 2.3 billion, or 6.9% of GDP yearly. Tariff col-lections are expected to increase during the period of 2005-2015, and will comprise about US$ 2.1 billion during this period. The tariff collections are expected to be invested into the sector to cover for investments/expenses. The overall volume of international investments is on the order of US$ 387.6 million, or 1% of GDP yearly (this does not take into account agreement between GoT and RUSAL company on construction of Rogun hydro-power sta-tion). GoT spends about 3.56% of total state budget on development of the energy sector, which in high economic growth scenarios will comprise about US$ 353 millions (in medium growth scenario it will be US$ 266.4 million). For high growth scenario, the financial deficit will comprise US$250.5 million, or 8.9% of the overall cost, or 1.7% of GDP. The existing fi-nancing gap disappears after 2010, due to the capital invesments that will lead to higher energy generation, and decrease of commercial leakages.
Table 6. Financial estimations for development of MDG-compatible energy sector (in US$, million) 2005 2010 2015 2005-2015
US$ million (Total)Capital expenditures (total) 224.3 389.6 150.4 2,322.7
Construction of new hydro-power stations, and reha-bilitation of existing hydro, and thermal power stations
24.2 184.0 126.8 998.5
Construction and repair of distribution lines 198.7 199.9 17.4 1,280.7Construction and repair of substations 1.5 5.6 6.2 43.1Other capital expenditures 0.0 0.09 0.0 0.5
Recurrent expenditures (total) 34.8 70.0 112.7 774.2Existing hydro- and thermal power stations 16.8 33.7 54.3 373.0Distribution lines 15.5 31.2 50.2 345.0Administrative costs 2.5 5.1 8.2 56.3
TOTAL 259.1 459.6 263.0 3,097.0As percent of GDP (%) 11.6% 13.4% 4.8% 8.9% avrg.Per Capita ($) 37.5 60.3 31.2 37.3 avrg/

185
Table 7. Table of summary costs and financing for development of MDG-compatible energy sector (US $) Ед. 2005 2010 2015 2005-2015US$ million (Total)Total costs US$ million. 259.1 459.6 263.0 3097.0Recurrent costs US$ mln. 34.8 70.0 112.7 774.2Capital costs US$ mln. 224.3 389.6 150.4 2322.7Notional government financing US$ mln. 15.1 32.5 51.7 353.0Notional international investments US$ mln. 14.7 47.6 35.2 387.6Contributions of energy companies US$ mln. 70.7 207.6 275.1 2106.0Financial deficit US$ mln. 158.6 171.8 -99.0 250.5Financial deficit as percentage of the total cost 61.2% 37.4% -37.6% 8.1%GDP % % 11.6% 13.4% 4.8% 8.9% avrg.Per capita cost US$ 37.5 60.3 31.2 37.3 avrg.
MILLENNIUM DEVELOPMENT GOALS NEEDS ASSESSMENT TAJ IK ISTAN
186
MILLENNIUM DEVELOPMENT GOALS NEEDS ASSESSMENT TAJ IK ISTAN
ANNEX V
Needs Assessment for MDG-compatible transport in Tajikistan
Target: All weather vehicle-accessible road and access to motorized transport to all communities.
OverviewRoads are important to the development of the transport and communications complex in Tajik-istan. Sustainable development of the roads contributes to the economic and social development of the country. Roads are public goods that play a central role in facilitating access of communi-ties to social services and linking communities and businesses to markets. Development of roads is one of the key issues that contribute to the realization and scaling up of the MDG targets. 58% of households in Tajikistan noted that improvement of roads networks is an important factor in overcoming poverty244. As noted in the energy sector review of the MDG needs assessment, development of the overall infrastructure is one of the essential capitals and prerequisites for gaining foothold out of poverty trap and towards sustainable development.
Development of an effective roads network is also an important factor to regional economic development. The trans-boundary roads networks not only help facilitate transport of goods and services from neighboring countries, but are also a means of improving communications, and providing access to markets and new technology.
Improving transport has direct and direct influence on improving rural health and education, as it not only reduces the isolation of rural areas, helping them attract and retain general health, education and other services, but also benefits the population by providing access to emergency health care facilities and other essential social services245. A DFID study reports that development of roads can improve livelihoods of women, and help increase their income and improve their social development246. Many other studies site benefits of rural roads to poverty reduction.
Thus, development of the roads sector is an important factor in the achieving education, gender and health MDGs, as well as the overall MDG target of halving poverty and hunger by 2015.The needs assessment for MDG-compatible roads systems has been developed by the MDG Needs Assessment team in partnership with the Ministry of Transport, and with support of the Millennium Project.
The main interventions are: • Repair and rehabilitation of republican highways;• Repair and rehabilitation of local roads;
244 Poverty reduction monitoring overview, ADB, 2002
245 MP, Energy Services for the poor, New York, 2004
246 Ibid, p.46, 2004
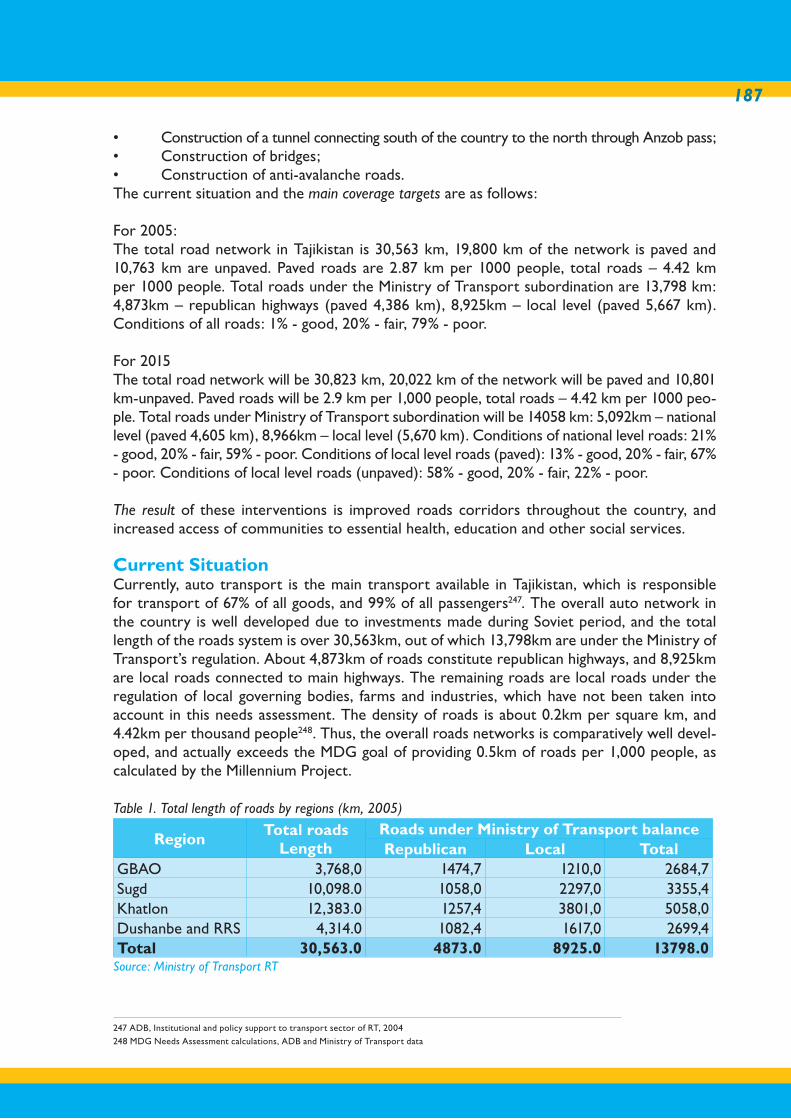
187
• Construction of a tunnel connecting south of the country to the north through Anzob pass;• Construction of bridges;• Construction of anti-avalanche roads.The current situation and the main coverage targets are as follows:
For 2005:The total road network in Tajikistan is 30,563 km, 19,800 km of the network is paved and 10,763 km are unpaved. Paved roads are 2.87 km per 1000 people, total roads – 4.42 km per 1000 people. Total roads under the Ministry of Transport subordination are 13,798 km: 4,873km – republican highways (paved 4,386 km), 8,925km – local level (paved 5,667 km). Conditions of all roads: 1% - good, 20% - fair, 79% - poor.
For 2015The total road network will be 30,823 km, 20,022 km of the network will be paved and 10,801 km-unpaved. Paved roads will be 2.9 km per 1,000 people, total roads – 4.42 km per 1000 peo-ple. Total roads under Ministry of Transport subordination will be 14058 km: 5,092km – national level (paved 4,605 km), 8,966km – local level (5,670 km). Conditions of national level roads: 21% - good, 20% - fair, 59% - poor. Conditions of local level roads (paved): 13% - good, 20% - fair, 67% - poor. Conditions of local level roads (unpaved): 58% - good, 20% - fair, 22% - poor.
The result of these interventions is improved roads corridors throughout the country, and increased access of communities to essential health, education and other social services.
Current SituationCurrently, auto transport is the main transport available in Tajikistan, which is responsible for transport of 67% of all goods, and 99% of all passengers247. The overall auto network in the country is well developed due to investments made during Soviet period, and the total length of the roads system is over 30,563km, out of which 13,798km are under the Ministry of Transport’s regulation. About 4,873km of roads constitute republican highways, and 8,925km are local roads connected to main highways. The remaining roads are local roads under the regulation of local governing bodies, farms and industries, which have not been taken into account in this needs assessment. The density of roads is about 0.2km per square km, and 4.42km per thousand people248. Thus, the overall roads networks is comparatively well devel-oped, and actually exceeds the MDG goal of providing 0.5km of roads per 1,000 people, as calculated by the Millennium Project.
Table 1. Total length of roads by regions (km, 2005)
RegionTotal roads
LengthRoads under Ministry of Transport balanceRepublican Local Total
GBAO 3,768,0 1474,7 1210,0 2684,7Sugd 10,098.0 1058,0 2297,0 3355,4Khatlon 12,383.0 1257,4 3801,0 5058,0Dushanbe and RRS 4,314.0 1082,4 1617,0 2699,4Total 30,563.0 4873.0 8925.0 13798.0
Source: Ministry of Transport RT
247 ADB, Institutional and policy support to transport sector of RT, 2004
248 MDG Needs Assessment calculations, ADB and Ministry of Transport data
MILLENNIUM DEVELOPMENT GOALS NEEDS ASSESSMENT TAJ IK ISTAN
188
MILLENNIUM DEVELOPMENT GOALS NEEDS ASSESSMENT TAJ IK ISTAN
Out of the roads network under the Ministry of Transport regulation, 3,883 km are roads with asphalt-concrete coverage, 6,202 km roads have gravel-crushed stone coverage, about 2,618 have gravel coverage, and 1,096km are dirt roads. In addition, bridges with the total length of 36567 meters exist.
It is anticipated that with economic and demographic growth of the country, automobile transport network will need to be extended and modernized. The anticipated extension of roads network will be due to the increase in demand from industry, agriculture, SMEs, and increase in passenger and freight traffic, increased communication between rural areas, towns and cities.
As Tajikistan is a landlocked country, further development of regional roads networks is crucial to the integration of Tajikistan to the global economy. Trans-regional, and even trans-continental highways will need to be developed in the region in the long run, to ensure access to global markets, and to the sea. With the development of regional cooperation on economic development networks, and increasing transit, freight and passenger traffic, the technical conditions of the roads are in need of substantial improvement and quality control.
Main IssuesTransport network in Tajikistan is need of much rehabilitation and repair. Due to the civil war of 1992-1997, many of the roads networks, including bridges, have been destroyed. These have been subsequently reconstructed with support of the World Bank, ADB and other donor organizations. However, the need for further investment is still great, exemplified by the fact that in winter times most of the north-south, west-east transport corridors cease to function, due to the closure of Anzob, Shakhristan and Khaburabod passes.
Operation and maintenance of the existing roads is not adequate, due to the lack of funds from the state budget. Modern standards for the roads quality and transport control systems are not yet applicable to Tajikistan. In addition to the degraded local roads, the republican roads systems in Sugd and GBAO oblast’s are yet to be formed. Due to the mountainous re-lief of Tajikistan, most of the roads go through elevated slopes, cliffs, and river banks, and are subject to frequent collapses, landslides, rock falls, avalanches due to seasonal storms, flooding and other natural disasters.
In recent years, auto roads of Tajikistan have been characterized by progressive tearing and wearing off of their coverage. Since more than 80% of roads in the country have been constructed at the end of 1960-80s in accordance with the norm for carrying freight for not more than 6 tons, the increased exploitation of roads have caused deterioration of the quality of roads. This is also due to the lack of investments in maintenance of roads in past 10-15 years. Due to the lack of funds, 90% of equipment used for maintenance of roads is in need of capital repairs.
Yearly technical inspections of roads by the Ministry of Transport have showed that only about 20% of roads are up to the quality standards249. Over 80% of roads carry serious defects, and exhibit the signs worn coverage, and other problems. About 30% of bridges and passes do not meet the weight standards (of 30 tons), and are in danger of collapse. These bridges have been qualified as being in “emergency” state250.
249 Ministry of Transport.
250 ADB, Institutional and policy support to transport sector of RT, 2004.
189
Government MeasuresIn 2002, the national program on social-economic development of the transport complex up to 2015 was developed, which focused on developing communications and roads net-works in Tajikistan.
The program highlights the following:1. Financing of investments for roads improvement. Finding the sources of financing for investments needed for improving the roads condition is crucial. Currently, expenses related to the maintenance of roads networks are financed from the state budget, with some support from donors. The program focuses on the need to im-prove budget planning for the transport sector, and in the face of limited funds available, to take measures to find alternative sources of financing, both internally and externally, especially for major capital investments.
2. Maintain the quality of existing roads and further expand road networks; ensure quality standards of major transit routes.Ensuring continuous maintenance of roads is the priority for the GoT. This entails continua-tion of reconstruction of destroyed/ruined roads, bridges, and rehabilitation of major transit routes, as well as construction of trans-national highways. Adoption of new technology, and strengthening of technical capacity and research and development (R&D) base are being con-sidered under this component of the program. Improving the overall quality of operations and administration is one of the priority areas. Es-tablishment of an effective system of management and monitoring of quality of constructions and repairs, inspection of the existing roads systems are some of the operational priorities. Other priorities include the following:• Development and modernization of technical norms and standards of roads, including
preparation of normative guidelines in line with the standards introduced by the CIS trans-national committee of roads workers;
• Establishment of information exchange system for improving the effectiveness of man-agement and control of the quality of roads;
• Development of quality standards of roads construction and maintenance works;• Improving the system of certification of raw materials, equipment and technology for
road works, which should be based on specifications and norms that must be followed at all stages of road works, from planning to construction and exploitation.
3. Provide secure and cost-effective conditions for foreign transits routes.National and trans-national highways that serve as transit routes should provide attractive and secure services in order to increase the flow of transit freights and passenger traffic. Efficient and secure transportation of transit goods, and provision of rest stops and other services are the main goals.
4. Develop the main trans-national highways and other routes that will allow Tajikistan to connect to the world markets.Development of the existing major transit routs and construction of new trans-national highways with that will connect Tajikistan to main economic markets will depend on GoT signing to international roads conventions and agreements.
5. Attract domestic and international investors for the development of international highways.
MILLENNIUM DEVELOPMENT GOALS NEEDS ASSESSMENT TAJ IK ISTAN
190
MILLENNIUM DEVELOPMENT GOALS NEEDS ASSESSMENT TAJ IK ISTAN
The state strategy of developing small and medium enterprises (SMEs) supports the alternative financing plans of transport services in Tajikistan. Private enterprises can help finance and maintain the following transport services: The first group of services constitutes parking lots, bus stops, repair shops and emergency call stations. Other services include rest stops, motels, inns, camping sites, gas stations, dining places, etc. Establishment and expansion of these services will help develop auto-tourism, and transit traffic. The government should ensure monitor and regulate these services, and provide investment friendly climate.
6. Establishment of an institutional basis for private and paid roads and routes. One of the sources of financing the road networks and improving the quality of road services are establishment of paid roads, bridges and passes. This will help attract investment of commercial banks and other financial institutions for building new roads and passes. Road tolls could be established at some of the existing republican highways, major transit routs that are currently under construction, bridges ad passes. However paid roads and passes could only be built if alternative routes exist for the same route. The amount of tolls should reflect not only cost-recovery considerations, but also cost-effectiveness for users. The appropriate legal and institutional basis should guide establishment of private and paid roads systems.
7. Improving a legal and regulatory framework for transport networks. Reforms to improve the effectiveness and security of roads system should be accompanied by further improvements in legal and regulatory frameworks and mechanisms and measures directed towards capacity building of central and local implementing agencies and authorities. Legal and regulatory frameworks should clarify rights and responsibilities of roads users, as well as individuals and organizations involved in construction of roads. These frameworks should also regulate transit traffic, trans-national roads systems, and access routes to major markets. Special attention should be paid to ensuring access of remote villages and communities to the main routes, to facilitate their access to essential social services and markets. The Road Fund of Tajikistan, established in 1993, should start fully functioning between the periods of 2005-2015. The Roads Fund is the main mechanism for redistributing finances for the roads networks in the country.
The Road Fund251
The Road Fund was established by the Government of Tajikistan on December 27, 1993, and began functioning since January 1, 1994. The Fund was intended for redistribution of finances for exploitation, construction and rehabilitation of republican roads, including expenses for roads management. Article 2 of the law on Road Fund articulated that the Fund’s resources raised from alternative sources, should be managed and monitored by regional authorities. These alternative sources of financing are the following:• Tax from road users raised through taxes on petroleum./fuel to be paid by all organizations;• Tax from foreign transit traffic; • Tax from new or used cars, equaling to 10% of the price (excluding cars for official use);• VAT: 0.1% of the annual production for cooperatives and enterprises, 0.2% of the
annual turnover for stock exchanges, insurance companies and sales enterprises, and 0.3% of turnover for sales companies (exemptions are for state roads construction enterprises, and enterprises transporting bread).
251 Prepared on the basis of ADB project report “Institutional and policy support for the transport sector of RT”, 2004
191
Ministry of Transport and Roads Services used to be responsible for the management of the Road Fund. Until July 1, 1996 the Ministry of Transport was also in charge for the collection and redistribution of the Fund, and monitored targeted expenditure of the financial resources (i.e. for construction, repair and maintenance of public roads). Collection of the financial resources for the Road Fund is now the responsibility of the Tax Committee under the President’s Office. The financial resources are now raised through:• 2% of the cost of goods and services for enterprises and cooperatives;• 0.2% of turnover of manufacturing, wholesales and sales enterprises;• Republican and local budget;• Voluntary (взносов) from enterprises, organizations and citizen.
Roads Investment Projects (2005-2015)In order to increase the effectiveness of foreign and domestic investment funding, the following main expenditure directions were identified:1. Construction of new roads, bridges, passes, tunnels from credits from commercial
banks, from revenues generated from road tolls, and joint-stock capitals2. Reconstruction and repair of roads, bridges, passes from funding/credits from WB and
commercial banks, through revenues generated by tolls from heavy freights, and licens-ing fees from road construction works.
3. Establishment of roads services through private investment.4. Operation and maintenance of roads through toll fees for heavy freights and transit
fees for foreign cars.
Currently, repair and reconstruction of more than 160km of road in Khatlon oblast are ex-pected; also road stretch of 55km from Obi Garm to Darbanda (Dushanbe-Khorog highway), and stretch of 65km Garm-Jirgital are planned to be repaired.Ministry of transport has been actively involved in attracting foreign investors such as Islamic Bank of Development (IBD), Asian Development Bank (ADB), Kuwei Bank of Arab Economic Development (KBAED), and other international financing institutions to finance road invest-ments up through 2015.This year, road rehabilitation on the stretch Zigar-Khostav-Shkev and Shagon-Zigar on Ku-lyab-Kalai-Khumb highways was finalized, funded by IDB, KBAED and other financial institu-tions. Dushanbe-Kurgan Tube-Kulyab highway is expected to be rehabilitated with funds from ADB, which expects to fund 76% of all project costs (or US$20 million). ADB also plans to release additional US $40 million from other projects.As mentioned earlier, construction of routes connecting Tajikistan to international highways are important for decreasing isolation of the country, and helping improve its access to inter-national markets. Thus, currently, the highways Djirgital-Kyrgyz border, Kulyab-Kalai Khumb (on Shurobod-Shagon, stretching 42.6km), Zeravshan and Yagnob local roads, Isfara-Guliston village stretch (on the border of Kyrgyzstan, stretching 12km), and Isfara-Batken-Akturpan-Kazandjai-Osi that enable access from Kyrgyzstan to Kazakhstan, Russia and China. Also, An-zob tunnel, which enables south-north connection in the winter times, is under construction with funding from Iran.Tavildara-Khovaling road, construction of Kurgan Tube-Kalininabad-Sangtuda-Nurek along Vaksh river are planned, which will to integrate Nurek town into Khatlon region, which could help develop tourism in the region. Construction of Dangara-Kangurt-Sovyetskii-Kulyab al-lows shortening by 100km access to Kalai-Kumb. This stretch will help connects Sovyet dis-
MILLENNIUM DEVELOPMENT GOALS NEEDS ASSESSMENT TAJ IK ISTAN
192
MILLENNIUM DEVELOPMENT GOALS NEEDS ASSESSMENT TAJ IK ISTAN
tricts, Khochasartez-Kulyab and Kalai-Khumb. At the moment, about 30-35% of the funding are absorbed, and additional funding is expected.Also, construction of Kabodiyen-Esanbai, Chirgital-Karakamut-Sarband, which will help im-prove central-north connection in the country. Also, rehabilitation of Penjikent-Aini-Matchoi Kukhi, and Dushanbe-Garm line will help increase various mining sites in this region. For this, ADB funding has been secured. Construction of a bridge over Pyanj river will help create a transport corridor to Afghanistan. At the end of this period, construction of tunnels over Shakhristan and Shar-Shar tunnels are expected.
Financial Estimations for development of MDG-based roads transportMDG Needs Assessment Group together with the Ministry of Transport of RT has conducted financial estimations of costs needed for the development of auto roads in the country. The roads needs assessment model has taken into account only those roads that are under the Ministry of Transport regulation, or republican and local roads totaling to 13, 798km. Other roads, managed by local governments, farms and enterprises were not taken into account. For simplicity of calculations, all republican roads are considered two-line roads, and all local roads as one-line roads. Also, roads were divided into roads with coverage (asphalt/concrete), and roads without coverage (gravel/dirt roads). The main assumption of the model is that reconstruction, rehabilitation and maintenance of the existing road system, coupled with building of bridges, tunnels and anti-avalanche galleries will be adequate for helping scale up MDG investments in the country. This model does not take into account other non-infrastructure investments such as access to public transporta-tion, school buses and emergency ambulances that could have a potential of improving house-holds’ access to hospitals, schools and markets. Emergency ambulances have been costed in the health model of the MDG needs assessment. As the MP study found, bringing a new motor vehicle to a village or farm could have more impact than building a new feeder road in the community where motorized transport is not available to public252. Thus, when developing investment plans that will help scale up the MDGs, the Government and its partners should consider investing into developing public transportation system throughout the country, and especially in remote areas.
Per unit cost of constructing one km of a hard-cover road is US$600,000; cost of the repair and rehabilitation of one km of a hard-cover road is about US$478,000. Repair of a dirt-covered road is about US$385,000. The total cost for developing an MDG-compatible roads sector is on the order of US $2.2 billion over the 2005-2015 period. The majority of costs entail reconstruction and rehabilitation of the existing roads system. The financing gap stands at US $1.8 billion. Such high deficit can be reduced through measures that increase private investments and payments for the roads sector, such as the Road Fund, attracting commercial banks for the roads upkeep, etc.
252 MP, Energy Services for the Poor, 2004
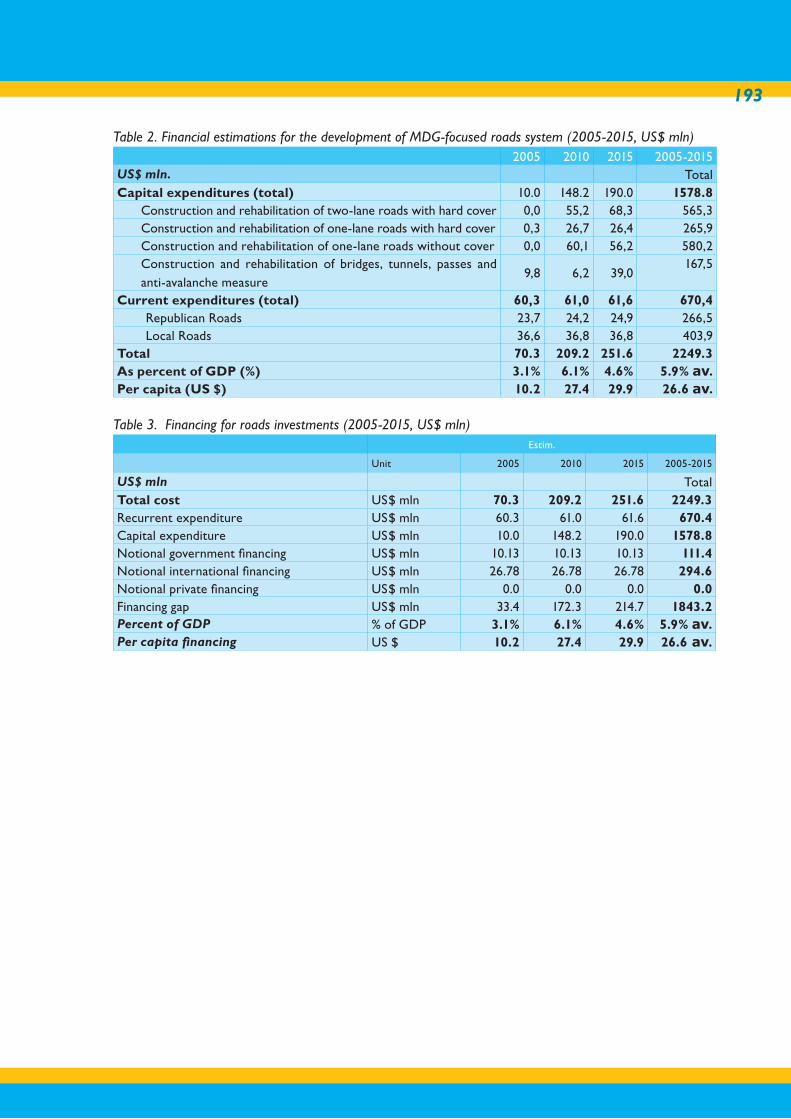
193
Table 2. Financial estimations for the development of MDG-focused roads system (2005-2015, US$ mln) 2005 2010 2015 2005-2015US$ mln. Total Capital expenditures (total) 10.0 148.2 190.0 1578.8
Construction and rehabilitation of two-lane roads with hard cover 0,0 55,2 68,3 565,3Construction and rehabilitation of one-lane roads with hard cover 0,3 26,7 26,4 265,9Construction and rehabilitation of one-lane roads without cover 0,0 60,1 56,2 580,2Construction and rehabilitation of bridges, tunnels, passes and anti-avalanche measure
9,8 6,2 39,0167,5
Current expenditures (total) 60,3 61,0 61,6 670,4Republican Roads 23,7 24,2 24,9 266,5Local Roads 36,6 36,8 36,8 403,9
Total 70.3 209.2 251.6 2249.3As percent of GDP (%) 3.1% 6.1% 4.6% 5.9% av.Per capita (US $) 10.2 27.4 29.9 26.6 av.
Table 3. Financing for roads investments (2005-2015, US$ mln)Estim.
Unit 2005 2010 2015 2005-2015
US$ mln TotalTotal cost US$ mln 70.3 209.2 251.6 2249.3Recurrent expenditure US$ mln 60.3 61.0 61.6 670.4Capital expenditure US$ mln 10.0 148.2 190.0 1578.8Notional government financing US$ mln 10.13 10.13 10.13 111.4Notional international financing US$ mln 26.78 26.78 26.78 294.6Notional private financing US$ mln 0.0 0.0 0.0 0.0Financing gap US$ mln 33.4 172.3 214.7 1843.2Percent of GDP % of GDP 3.1% 6.1% 4.6% 5.9% av.Per capita financing US $ 10.2 27.4 29.9 26.6 av.
MILLENNIUM DEVELOPMENT GOALS NEEDS ASSESSMENT TAJ IK ISTAN
194
MILLENNIUM DEVELOPMENT GOALS NEEDS ASSESSMENT TAJ IK ISTAN
14. REFERENCES
AAH (Action Against Hunger). 2003. Land Reform in Tajikistan: From the Capital to the Cotton Field. Obie Porteous. Dushanbe. ADB (Asian Development Bank). 2004. Farm Debt Resolution and Policy Reforms. Dushanbe ADB RETA: TA N° 5946-REG. 2002. Sub regional Cooperation in Managing Education Reforms. Dushanbe.ADB (Asian Development Bank). 2003. Poverty Reduction Monitoring Survey 2002. Dushanbe. 2003.______. 2004. Country Environmental Analysis. Tajikistan. July 2004.______. 2000. Tajikistan Environmental Profile. Tajikistan. 2000.______. 2003. Summary Country Environmental Conditions. Tajikistan..Bearing Point. 2004. MSRD – Observations on Consulting Reforms. Dushanbe.Bucknall, J., Klytchnikova, I., Lampietti, J., Lundell, M., Scatasta, M., Thurman, M. 2003. Irrigation in Central Asia: Social, Economic and Environmental Considerations. Washington D.C.: World Bank.CIGI (The Centre for International Governance Innovation). 2004. Executive Summary. Global Governance Initiative. London.Clark, R., Verheijen, T., 2004. Public Expenditure and Institutional Review (PEIR). World Bank. Washington DC.Dushanbe Water Forum. Water Resources of Tajikistan. Dushanbe. 2003.EBRD (European Bank for Reconstruction and Development). 2003. Strategy for Tajikistan. Tajikistan. ______. 2001. Tajikistan. Investment Profile. Dushanbe.Economic Commission for Europe. Committee on Environmental Policy. Environmental Perfor-mance Review of Tajikistan. Geneva. August 2004GoT (Government of Tajikistan). National Strategy and Action Plan on Conservation and Sus-tainable Use of Biodiversity. Tajikistan. 2003. ______. 1996. Regulation on secondary school. Dushanbe. Tajikistan. ______. 2002. Poverty Reduction Strategy Paper. Tajikistan. ______. 2002. Poverty Reduction Strategy Paper, Dushanbe.______. 2003. The First National Communication of the Republic of Tajikistan under the United Nations Framework Convention on Climate Change. Tajikistan______. 2003. The concept of use of the grounds in Republic of Tajikistan. Dushanbe.______. 2003. Report and recommendations of the President of RT to ADB on education reforms. Dushanbe.______. 2004. Report the WB consultant to the President of RT. Dushanbe.______. 2004. International Year of Fresh Water Publication. Dushanbe ______. 2004. Report of the Ministry of Education for 9 months of 2004. Newspaper “Omuzgor” #45. Dushanbe.______. 2004. Report on PRSP execution in 2003. Dushanbe. ______. 2004. The program of economic development of Republic of Tajikistan for the period till 2015. Dushanbe.______. 2004. Plan of Action to Reform the Public Administration System. DushanbeGovernment resolution #291. 2004. Education system reform implementation for 2004-2009. Dushanbe. Tajikistan. 30.06.2004. Government resolution #441. 2004. New forms of Management and Financing of Educational Institutions in Kulyab, Khujand, Khorog and Vahdat. Dushanbe. Tajikistan. ICG (International Crisis Group). 2005. The Curse of Cotton: Central Asia’s Destructive Monocul-
195
ture. Report N 93. Dushanbe.IFC (International Finance Corporation). 2003. Cotton Sector Assessment. Tajikistan______. 2003. Business Environment in Tajikistan as seen by Small and Medium Businesses. Dushanbe IMF (International Monetary Fund). 2004. Tajikistan Country Report. Tajikistan. IRIN News. 2004. Tajikistan: More than US $21 million needed to deal with disaster damage. From http://www.irinnews.org/report.asp?ReportID=43156&SelectRegion=Central_Asia&SelectCountry=TAJIKISTAN.Jovarelly, R., 2004. The land legislation of the Republic of Tajikistan. ARD/CHECCHI Commercial Law Project. Dushanbe.Law of the Republic of Tajikistan. 2004. About Education. Dushanbe. Tajikistan.MDG (Millennium Development Goals) Needs Assessment Team Tajikistan. 2004. MDG Needs Assessment Interim Report. Tajikistan. MP (Millennium Project). 2005. Investing in Development. A Practical Plan to Achieve the Millen-nium Development Goals. Overview. New York_____. 2005. Environment and Human Well-being: A Practical Strategy. Task Force on Environmen-tal Sustainability. London.Ministry for Nature Protection of the Republic of Tajikistan. Administration of Hydrometeo-rology and Environmental Monitoring. MoH (Ministry of Health) RT. 2002. National Concept of Healthcare Reform of the Republic of Tajikistan. Dushanbe.______. 1996. National Program on combating tropical diseases in the Republic of Tajikistan, 1997-2005. Dushanbe.______. 1999. Rapid assessment of the current condition of reproductive healthcare services in the Republic of Tajikistan (October - November 2000). Dushanbe.______. 2000. National Program of the Republic of Tajikistan on prevention and combating HIV/AIDS and sexually transmitted diseases, 2001- 2007. Dushanbe.______. 2000. National Strategy on protection of health of the population up to 2010. Dushanbe.______. 2001. National Strategic Plan on Prevention of HIV/AIDS. 2002-2005. Dushanbe.______. 2003. Immuno-prophylaxis Program of the Republic of Tajikistan for 2003 – 2010. Du-shanbe.______. 2003. Plan on ensuring financial sustainability of the immunization services in the Republic of Tajikistan for 2004-2013. Dushanbe.______. 2003. Program on Combating Tuberculosis in the Republic of Tajikistan, (DOTS) for 2003-2010. Dushanbe. ______. 2004. Strategic Program on counteraction of HIV/AIDS epidemic within the system of the Ministry of Health of the Republic of Tajikistan for period 2004-2010. Dushanbe._____. 2004. Analysis of contraceptive security/safety in the Republic of Tajikistan. Dushanbe. ______. 2004. Strategic plan of the Republic of Tajikistan on reproductive health for period 2005- 2014. Dushanbe.______. 2002. Strategic plan on integrated elimination of measles and prevention of rubella, and rubella inherent syndrome in the Republic of Tajikistan for 2003-2010. Dushanbe.______. 2005. Recommendation of Working Groups of the Ministry of Health of RT. Primary Health-care System, Immunization, Formation of healthy Living, Malaria, HIV/AIDS, Tuberculosis, Helminthes. National Human Development Report (NHDR). Tapping the Potential. Improving Water Management in Tajikistan. Tajikistan. 2003.NGO “Pulse.” 2002. National model of education development. Dushanbe. ______. 2002. State analysis of the secondary school in Tajikistan. Dushanbe.Needs Assessment of Rural Women on Land Tenure Rights in Tajikistan by Zongmin Li. Du-
MILLENNIUM DEVELOPMENT GOALS NEEDS ASSESSMENT TAJ IK ISTAN
196
MILLENNIUM DEVELOPMENT GOALS NEEDS ASSESSMENT TAJ IK ISTAN
shanbe 2000Newspaper “Omuzgor”#35. 2004. New challenges of new time. Dushanbe.OSCE (Organization for Security and Cooperation in Europe), UNEP (The United Nations Environment Programme), UNDP (The United Nations Development Programme). Addressing Environmental Risks in Central Asia. UNDP Regional Bureau for Europe and the CIS. 2003.”Rashidov A. 2000. Education for all. Statistical collection of the Ministry of Education. Dushanbe. Republican Fund of Education. 2002. Monitoring enrolled children not attending school. Dushanbe. Republican Seminar Materials. 2005. Advancing the Millennium Development Goals (MDGs) through Water and Sanitation Management. Dushanbe. Resolution of the Government of RT. 2001.Concept on water resources conservation. Dushanbe. Resolution of the Government of RT. Water Code of RT. # 34. 29.11.2000Resolution of the Mayor of Dushanbe on Water supply and Sanitation services tariffs. News-paper Asia Plus. 4.11.2004Resolution of the Senior State Sanitary Inspector of the Ministry of Health of RT # 3-7-1/234. 2004. Dushanbe.Sachs J. 2005. The End of Poverty: How We Can Make it in Our Lifetime. Penguin Press, London, 2005Saidov F. 2004.The national program of food safety in Tajikistan: social and economic aspects. Dushanbe.Sattar, S., Yatimov, B., Mohib. S,. 2004. Poverty and Social Impact Analysis: Cotton Farmland Privatization in Tajikistan. World Bank. Dushanbe.State Committee on statistics of the Republic of Tajikistan. 2004. Food security and poverty information bulletin of the Republic of Tajikistan. №2. Dushanbe.State Committee of the Republic of Tajikistan for Land Management. 2002. National Report of the Republic of Tajikistan to Combat Desertification. Tajikistan.Statistical collection. Health of the population and healthcare services in the Republic of Tajikistan in 1990-2002. Dushanbe.Statistical Collection. 2004. Health of the population and healthcare in the Republic of Tajikistan. Dushanbe.Statistical year book of RT. 2001. 2003. Dushanbe.Tabiat №89. 2004. Dushanbe. UN. (The United Nations). 2000 New Century, New Challenges. New York..______. 2003. The UN World Water Development Report: Water for People, Water for Life. New York. UNDP (United Nations Development Programme). 2003. Tajikistan: on the way to gender equality. Dushanbe. ______. 2004. Millennium Development Goal 7 Summary Review: 67 Country MDG Reports. New York.______. 2003. Achievement of Millennium Development Goals in the Republic of Tajikistan. Du-shanbe. UNEP (The United Nations Environment Programme), ADB (Asian Development Bank), UNDP (The United Nations Development Programme). 2004. Indicators of Sustainable Devel-opment of the Central Asia. Ashkhabad, Bishkek. UNICEF (The United Nations International Children Fund) Tajikistan. 2003. Water, Sanitation and Health. Tajikistan. ______. 2001. Child and family welfare in Tajikistan: the main trends and indicators. Dushanbe. ______. 2000. Multiple Indicator Cluster Survey. DushanbeUnited Nations Economic Commission for Europe. 2003. Strategic Partnership on Water for Sustainable Development. Kiev. UNIFEM. 2004. Violence in gender statistics (as a result of a sociological survey)
197
Gender And Development. Dushanbe.USAID (United States Agency for International Development). 2001. Biodiversity Assessment for Tajikistan. Washington DC. YB (Yearly Bulletin) of the RT (Republic of Tajikistan). State Statistics Committee of the RT. 2003Water resources of Tajikistan. 2003. Dushanbe. World Bank. Environment in Poverty Reduction Strategies and Poverty Reduction______. 2000. Development of Water supply services in the city of Dushanbe. Seminar Materials. Dushanbe______. 2003. Meeting the Environment Millennium Development Goal in Europe and Central Asia. Washington DC. ______. 2004. Poverty Assessment Update. Tajikistan. .______. 2004. Poverty and Social Impact Analysis Cotton Farmland Privatization in Tajikistan. Dushanbe.______. 2003. Development Attainment Goals in Environment of Europe and Central Asia/ Millen-nium Declaration. ______. 1999. Tajikistan Farm Privatization Support Project/ Project Assessment Document. Dushanbe.______. 2000. Tajikistan Rural Infrastructure Rehabilitation Project /Project Assessment Document. Dushanbe.WHO (World Health Organization). 2000. Manual on treatment of premises with insecticides of residual benefit for fighting against malaria carrier. Dushanbe.______. 2000. Paper on Malaria Microscopic Diagnostics. Dushanbe.______ statistical collection. 2002. Basic prenatal, prenatal and postnatal care. Dushanbe.
References for AnnexADB and State Statistical Committee of the Republic of Tajikistan. 2003. Poverty Reduction ADB. 2004. Institutional and Political Support to Transport Sector of the Republic of Tajiki-stan. DushanbeADB. 2000. RRP: TAJ 32514. Roads Rehabilitation Project Document. Dushanbe ADB 1999. TA 3168 – TAJ: Road Rehabilitation Project Document. DushanbeADB 1997. TA 5733-REG: A Review of Roads Design and Construction Standards. Dushan-be.Monitoring Survey (2002). Dushanbe.Julia A. Lampietti, Anke S. Meyer, World Bank, technical paper No. 529. 2002.Coping with the Cold: Heating Strategies for Eastern Europe and Central Asia’s Urban Poor. Washington IFC, Ministry of Energy, and WB. 2003. Project Appraisal Document, Pamir Energy Company for the Pamir Private Power Project. WB, Infrastructure and Energy Service Department, European and Cenral Asia Region. 2004. Tajikistan: Public Utility Reform. Washington. Ministry of Energy. 2003. The Concept of Development of Energy Sector of the Republic of Tajikistan for 2005-2015. Dushanbe. Millennium Project, Vijay Modi, 2004. Energy services for the poor, NY.Jeffrey Sachs. 2005. The End of Poverty: How We Can Make it Happen in Our Lifetime, Pen-guin Press London.Ministry of Transport. 2002. The Programme on Social Economic Development of Transport Sector. Dushanbe
MILLENNIUM DEVELOPMENT GOALS NEEDS ASSESSMENT TAJ IK ISTAN
198
MILLENNIUM DEVELOPMENT GOALS NEEDS ASSESSMENT TAJ IK ISTAN
15. ACKNOWLEDGEMENTS
The Government of Tajikistan and the MDG Needs Assessment Team would like to thank all individuals and organizations for their active support and invaluable contributions in the development of this report, and especially the following people:
GOVERNMENT OF TAJIKISTAN:
Working Group on Nutrition and Food Security: K. Koimdodov, former Deputy Prime Minister, Ambassador Extraordinary and Pleni-
potentiary to Turkmenistan Kh. Kholboyev, Head of the Department of the Agro-industrial Complex, President’s
Office B. Abdualimov, Deputy Minister of Agriculture, Head of Preparation and Implementa-
tion Group C. Oripova, Head of PRSP monitoring department of Ministry of Agriculture (de-
ceased) M. Khabirov, Deputy Chairman of State Land Comittee Kh. Khayrov, Director of Nutrition Centre, Ministry of Health A. Sharipov, Chairman of the Dehqon Farms and Entrepreneurship Union S. Kamolov, Head of Management of Science, Ministry of Melioration and Water
management. Nosirov R., Head of Plant Cultivation Division, Department of the Agro-industrial
Complex, President’s Office
Working Group on Education: Z. Vazirov, former Deputy Prime Minister, Minister of Social Protection A. Rakhmonov, Minister of Education L. Hasredinova, Deputy Minister, Team Leader of the Working Group on Education F. Khushvakhtov, Head of Science and Education Department, President’s Office M. Lutfulloyev, President of the Academy of Pedagogical Sciences, RT B. Bokilov, Head of Planning and Economics Department, Ministry of Education S. Aminov, Head of School and Pre-school Management Department, Ministry of
Education Z. Mirzoyev, Head of Budget Planning Unit for Education, Sciences and Culture, De-
partment of the State Budgeting, Ministry of Finance V. R. Naimova, Director of Republican Professional Union of Education and Science
workers of RT
Working Group on Health: Kh. Mavlonova, Deputy Prime Minister R. Abdurakhmanova, Head of Department of Health Women’s and Family’ issues,
President’s Office N. Faizullayev, Minister of Health A. Temurov, First Deputy Minister of Health O. Bobohojaev, Head of the Health Care Services Department of the Ministry of Health S. Miraliev, Head of the Reform Coordination and Management Unit of the Ministry of
199
Health B.Sharipova, Head of Economic and Finance Department of the Ministry of Health; D. Pirov, Head of Sanitary and Epidemiological Division of the Ministry of Health Kh.Aminov, Head of the Mother and Child Services Division of the Ministry of Health R.Alieva, Deputy Head of the Mother and Child Services, Division of the Ministry of Health Sh. Kurbanov, Director of the National Reproductive Health Centre of the Ministry of
Health of the Republic of Tajikistan Sh. Jobirov, General Director of the National Immuno-prophylactics Centre of the
Ministry of Health of the Republic of Tajikistan Sh. Ibod, Advocacy and Social Mobilization Program Coordinator of the National Im-
muno-prophylactics Centre of the Ministry of Health of the Republic of Tajikistan S. Aliev, Head of the Republican SES of the Republic of Tajikistan S. Karimov, Director of the Republican Center for Tropical Diseases of the Ministry of
Health of the Republic of Tajikistan G. Khojimuradov, Senior specialist of the international relations department of the
Ministry of Health S.Saydaliev, Director of Republican Tuberculosis Prevention Center of the Ministry of
Health of the Republic of Tajikistan A. Mirzoev, Director of the National Center for HIV/AIDS Prevention and Combating
of the Ministry of Health of the Republic of Tajikistan A. Sharipov, Director of the Republican Healthy Life Style Center of the Ministry of
Health of the Republic of Tajikistan S. Saifuddinov, Director of the National Medical Statistics and Information Centre of
the Ministry of Health of the Republic of Tajikistan
Working Group on Gender R. Kurbanova, Chairperson of the Committee on Women’s Family Affairs G. Rabieva, former Senior Advisor on Personnel to the President of Tajikistan, Mem-
ber of Parliament J. Hissamudinova, Deputy Minister of Education of RT K. Rustamova, Deputy Minister of Labour and Social Protection of RT B. Muhamaddieva, First Deputy Chairperson of State Committee of Statistic of RT Z. Davlatova, First deputy Director of the National Information Agency “Hovar” in
Tajikistan G. Tumanova, Head of External relations department, Ministry of Health of RT S. Sangakov, Executive Director of Judges Association of the RT
Environment: A. Karimov, Chairman, State Committee for Environmental Protection and Forestry
of the Republic of Tajikistan R. Latipov, Deputy Chairman, State Committee for Environmental Protection and
Forestry of the Republic of Tajikistan U. Shokirov, Head, Division of Ecology and Emergency Situation, Executive Presiden-
tial Office of the Republic of Tajikistan N. Safarov, Biodiversity and Biosafety National Focal Point, National Biodiversity and
Biosafety Center K. Kasirov, Director General, State Directorate of Protected Areas “Tajik National
Park”, State Committee for Environmental Protection and Forestry of the Republic
MILLENNIUM DEVELOPMENT GOALS NEEDS ASSESSMENT TAJ IK ISTAN
200
MILLENNIUM DEVELOPMENT GOALS NEEDS ASSESSMENT TAJ IK ISTAN
of Tajikistan A. Rajabov, First Deputy Minister, Ministry of Emergency Situations D. Gulmakhmadov, Chairman, National Focal Point for the UNCCD, State Commit-
tee on Land Resources and Land Management of the Republic of Tajikistan B. Makhmadaliev, Head, the Main Department of Hydrometeorology and Environ-
mental Monitoring, National Focal Point for UNFCCC, State Committee for Envi-ronmental Protection and Forestry of the Republic of Tajikistan
D. Buzrukov, Advisor to the Chairman, State Committee for Environmental Protec-tion and Forestry of the Republic of Tajikistan
Working Group on Water and Sanitation: A.Gulomov, Deputy Prime Minister N. Ashurov, Deputy Minister of Melioration and Water Services A. Azimov, General Director of Housing and Communal Services, State Unitary Enterprise A. Sobitov, Senior Specialist on Water and Sanitation, Head of Housing and Commu-
nal Service M. Isoyev, Head of “Tajikselkhozvodoprovodstroi,” State Planning and Construction
Enterprise G. Sharifov, Chief Engineer, “Tajikselkhozvodoprovodstroi,” State Planning and Con-
struction Enterprise U. Kayumov, Senior Specialist of PRSP Unit, President’s Office P. Shodmonov, Head of Republican Centre of Sanitary Epidemiological Division, Min-
istry of Health M. Burkhanova, Leader of NGO “Fund for Support of Citizen Initiatives” Ministry of Finance S. Najmudinov, Minister of Finance S. Saidshoyev, Deputy Minister of Finance
PRSP Unit, Executive Office of the President N. Khushvakhtova, Head of PRSP Division
ACU, Executive Office of the President M. Isakov, Head of ACU
MILLENNIUM PROJECT Jeffrey D. Sachs, Director John McArthur, Project Manager Margaret Kruk, Policy Advisor Chandrika Bahadur, Policy Advisor Stein Bernstein, Policy Advisor Guido Schmidt-Traub, Policy Advisor Joanna Rubinstein, Policy Advisor Albert Cho, Research Analyst Alice Wiemers, Research Analyst Michael Krouse, Research Analyst Nima Tabloei, Research Analyst
201
Lynn Freedman, Maternal and Child Health Task Force Leader Helen DePinho, Columbia UniversityUNDP
Kalman Mizsei, Assistant Administrator and Director, Regional Bureau for Europe and CISGulden Türköz-Cosslett, Senior Programme Manager and Team Leader, Regional Bureau for Europe and CISJacek Cukrowski, MDG Advisor, UNDP Bratislava OfficeThekla Hohmann, Head of UN Coordination Unit, UNDP Tajikistan Marzia Nazarova, Special Assistant to the Resident Coordinator, UNDP Tajikistan
UNICEF Tajikistan
Yukie Mokuo, RepresentativeNilufar Pourzand, Programme Coordinator, Murat Shahin Child Development OfficerDovlatsulton Dorgabekova, Programme Assistant
WFP Tajikistan
Ismail Omer, Representative/Country Director
UNIFEM TajikistanViloyat Mirzoyeva, Project Coordinator
FAO Tajikistan Matthias Lichtenberger, Program Officer Jeanne Reiser-Ansola, Land Reform Program Officer
UNFPA TajikistanZuhra Khamidova, Head of Office
WHO Tajikistan Nazira Artykova, Representative
UNESCO Tajikistan Munzifa Babajanova, Coordinator
IMF Tajikistan Peter Wingley, Head of the IMF Mission Sarmad Khavaja, Country Director
World Bank, TajikistanCevdet Denizer, Country Manager
IFC, TajikistanFlorentin Blanc, Project ManagerHans Woldring, Project Manager
ADB, TajikistanKazuko Motomura, former Country Director
MILLENNIUM DEVELOPMENT GOALS NEEDS ASSESSMENT TAJ IK ISTAN
202
MILLENNIUM DEVELOPMENT GOALS NEEDS ASSESSMENT TAJ IK ISTAN
Neeraj K. Jain, Country DirectorUSAID
Peter Argo, Country RepresentativeAshley Moretz, Deputy Country Representative
GTZChristian Reichard, Basic Education Project Manager
European Union, Tajikistan Barbara Plinkert, Head of Section, EC
Cecil Pichon, ECHO Coordinator for Central Asia Johannes Chudoba, EU Advisor/Team Leader, TACIS
DFID, TajikistanNicolette Stoddart, Deputy Program and Policy Manager for Central Asia and Europe
Embassy of Great Britain in TajikistanGraeme Loten, Ambassador Extraordinary and Plenipotentiary
Embassy of Sweden Maria Lagus, Counsellor
Swiss Agency for Development and CooperationDaniel Zuest, Head of Office
OXFAM, TajikistanSavio Carvalho, Country DirectorMark Buttle, Public Health Programme CoordinatorNargiza Khojazade, Policy Officer
CARE, TajikistanGenevieve Abel, Country Director
Project Hope, Tajikistan Thomas Mohr, TB Program Manager
Project SINO Robin Thompson, Project Coordinator
Health Consultant Yon Fleerackers, Consultant
EditingCara Michelle Morris, Editor
VolunteerFarrukh Achilov

203

MILLENNIUM DEVELOPMENT GOALS NEEDS ASSESSMENT TAJ IK ISTAN
204