Combating Poverty towards Actualizing the Millennium Development Goals and Beyond: Do Cash Transfer...
32
Journal of Economic and Social Studies Combating Poverty towards Actualizing the Millennium Development Goals and Beyond: Do Cash Transfer Programmes add up to the Agenda? Muazu Ibrahim i School of Oriental and African Studies (SOAS), University of London United Kingdom [email protected], [email protected] Thomas Yeboah University of Cambridge United Kingdom [email protected] Abstract: The Millennium Development Goals (MDG) among other things have not only brought poverty reduction onto the global development agenda but have also urged countries to help halve poverty by 2015. Various policy initiatives have been implemented towards actualizing the first MDG. Ghana, through its policy programmes is at the verge of meeting MDG 1 well before 2015. One of such programmes is the Livelihood Empowerment against Poverty (LEAP) which provides direct cash transfers to extreme poor and vulnerable. Do cash transfers add up to the agenda? By invoking a non- parametric chi-square test, we find evidence of the contribution of the cash transfer programme in LEAP-ing beneficiaries out of poverty by supplementing their income levels as well as improving their livelihoods. At least in our study area, we found a 29% decrease in the number of beneficiaries earning below the lower poverty line while 61% have been able to meet part of their basic needs. To ensure a continual reduction in poverty, we argue for the need to fundamentally go beyond short-term gains through co-ordinated, purposeful social and complementary services that will create opportunity for empowerment among the poor and vulnerable households. Keywords : LEAP, cash transfer, poverty, vulnerable, Ghana. JEL Classification: I38, P46, I32 Article History Submitted: 30 June 2013 Resubmitted: 15 July 2013 Resubmitted: 02 November 2013 Resubmitted: 05 December 2013 http://dx.doi.org/10.14706/JECOS S11425 101
Transcript of Combating Poverty towards Actualizing the Millennium Development Goals and Beyond: Do Cash Transfer...

Journal of Economic and Social Studies
Combating Poverty towards Actualizing the Millennium Development Goals and Beyond: Do Cash Transfer
Programmes add up to the Agenda?
Muazu Ibrahimi School of Oriental and African Studies (SOAS), University of London
United Kingdom [email protected], [email protected]
Thomas Yeboah
University of Cambridge United Kingdom
Abstract: The Millennium Development Goals (MDG) among other things have not only brought poverty reduction onto the global development agenda but have also urged countries to help halve poverty by 2015. Various policy initiatives have been implemented towards actualizing the first MDG. Ghana, through its policy programmes is at the verge of meeting MDG 1 well before 2015. One of such programmes is the Livelihood Empowerment against Poverty (LEAP) which provides direct cash transfers to extreme poor and vulnerable. Do cash transfers add up to the agenda? By invoking a non-parametric chi-square test, we find evidence of the contribution of the cash transfer programme in LEAP-ing beneficiaries out of poverty by supplementing their income levels as well as improving their livelihoods. At least in our study area, we found a 29% decrease in the number of beneficiaries earning below the lower poverty line while 61% have been able to meet part of their basic needs. To ensure a continual reduction in poverty, we argue for the need to fundamentally go beyond short-term gains through co-ordinated, purposeful social and complementary services that will create opportunity for empowerment among the poor and vulnerable households.
Keywords: LEAP, cash transfer, poverty, vulnerable, Ghana.
JEL Classification: I38, P46, I32
Article History Submitted: 30 June 2013 Resubmitted: 15 July 2013 Resubmitted: 02 November 2013 Resubmitted: 05 December 2013
http://dx.doi.org/10.14706/JECOSS11425
101

Muazu Ibrahim, Thomas Yeboah
Journal of Economic and Social Studies
Introduction Over the past three decades or so, the international development mantra seems to have converged on concerns for poverty reduction. The United Nations (UN) General Assembly at the turn of the new Millennium emphasized on halving the number of world’s people living on less than $1 a day by 2015 (United Nations, 2000). This has spawned a growing consensus on the need to identify the various determinants of poverty as well as providing effective approaches through which poverty can be reduced in a sustainable manner (Carr, 2008). With only two years to hit the 2015 deadline of meeting the Millennium Development Goals (MDG), policy makers, researchers and the international development community in general are beleaguered with a quandary as to whether even the first of the MDG target would be achieved in individual countries. The MDG report in 2012 however claimed that the number of people living in conditions of extreme poverty fell in all developing countries including sub-Saharan Africa (SSA) where poverty seem to be endemic. The report further showed that the proportion of people living on less than $1.25 a day fell significantly from 47% to 24% (representing a reduction in the absolute number from 2.4 to less than 1.4 billion people) between 1990 to 2008. With this, the report is optimistic that the first MDG which aims at reducing the number of people subsisting on less than $1.25 a day would be achieved at the global level well ahead of the 2015 deadline (MDG report 2012). Despite this progress, estimate also suggests that close to 1 billion people will still live on less than $1.25 a day by 2015 (MDG report, 2012). Notwithstanding the reduction in poverty rate at the global level, individual country performance especially in SSA is not encouraging. United Nations (2010) data shows that little progress has been made in reducing extreme poverty in SSA where the poverty rate marginally declined from 58% to 51% between 1990 and 2005. Portes and Hoffman (2003) argue that regardless of the global progress made in reducing poverty, majority of people continue to wallow below the poverty line especially in SSA and Mexico. In recent times, Ghana has made considerable amount of progress in economic growth and poverty reduction (Nicola et. al., 2009). Between 2000 and 2006, the nation had recorded a 90% rate of progress in halving the number of people subsisting on less than $1.25 per day and with a significant improvement in other non-income related MDG indicators such as gender equality, education and access to safe water (World Bank, 2011). This significant progress achieved in the country has been through various policy initiatives by the government. Typical of these include National Health Insurance Scheme (NHIS) established in 2003 which
102

Combating Poverty towards Actualizing the Millennium Development Goals and Beyond: Do Cash Transfer Programmes add up to the Agenda?
provides equitable health insurance for all; the Education Capitation Grant (ECG) introduced in 2005 (and expanded nationwide to all schools in 2006) with the view to improving the enrolment and retention in schools by providing grants to cover tuition and other levies that were previously paid by households; the School Feeding Programme (SFP) which was introduced in 2004 also aims at increasing school enrolment and retention by providing children with a daily meal at school; the National Youth Employment Programme (NYEP)ii which provides jobs for the unemployed and underemployed youth; and the Livelihood Empowerment Against Poverty (LEAP) which gives direct cash transfers to the poor and the vulnerable (Nicola et. al., 2009). There is a growing consensus on the view that cash transfer programmes form an essential component of economic and social development strategies and constitute an effective tool in reducing poverty and vulnerability in developing countries (Barrientos and Shepherd, 2003; Barrientos and DeJong, 2004). Halon et al., (1941) opine that although cash transfer may be presented as social spending or charity, they form an important pro-poor growth strategy and historical evidence suggested that such initiatives served as a condition for economic growth in Europe. While cash transfer programme in particular remains an important development strategy in Ghana and other developing countries, there has been relatively little systematic empirical research aimed at examining the role that these programmes play in this endeavour (Nicola et. al., 2009). In the Ghanaian context, few studies have been done to assess the contribution of LEAP on the lives of beneficiaries. Using the Kumasi Metropolis as a case study, this paper empirically assessed the contribution of the LEAP towards meeting MDG 1 in Ghana. We found a 29% decrease in the number of beneficiaries earning below the lower poverty line while 61% have been able to meet part of their basic needs. Thus, at least for the study area, one can argue that the cash transfer has contributed to improving the living standards of the poor and progress towards accelerating the attainment of the MDG 1 agenda. The aim of this paper is to add up to the few empirical studies of the contributions of cash transfers in reducing poverty. This paper is particularly relevant especially in the wake of the current debate where some policy makers remain sceptical of the contribution of cash transfer programme and thus calls for its abolishment. The rest of the paper is organized as follows; in the next section, we provide a brief trend of poverty in Ghana while section 3 contextualizes the link between cash
103

Muazu Ibrahim, Thomas Yeboah
Journal of Economic and Social Studies
transfer programmes and poverty reduction. Section 4 presents an overview of the LEAP while section 5 outlines our methodology. The empirical results and discussions are provided in section 6 and 7. Section 8 draws the implications for MDG 1 and post–2015. Conclusion and policy suggestions are provided in section 9. Brief Trend of Poverty in Ghana This section, which is based on the last three (3) surveys of the Ghana Living Standards Survey (GLSS)iii provides a brief diagnostic analysis of the poverty trend in Ghana. This trend is relevant in understanding the contribution of intervention programmes in poverty reduction. The GLSS through the formal surveys calculates household consumption and expenditure levels. Based on the five rounds of the GLSS, the GSS (2007) set a nutrition-based income measured poverty lines which translates in monetary terms as GH¢288.47 (US$196.23) (lower poverty line) and GH¢370.89 (US$255.77) (upper poverty line) per adult per year. The implication is that individuals whose total expenditure falls below GH¢288.47 are considered to be in extreme poverty. This group of people are unable to meet their minimum nutritional requirement even if they commit their entire budgets to food consumption.iv On the other hand, those whose income exceeds GH¢370.89 are able to purchase or consume enough food to meet their nutritional requirements as well meet other basic non-food needs (GSS, 2007). Considering the upper poverty line of GH¢370.89, Ghana had an impressive decline (from 51.7% in 1991/1992 to 28.5% in 2005/2006) of the population defined as poor. In furtherance to this, there was also a considerable decline in the absolute number of the poor from around 7,931,000 in 1991/1992 to 6,178,000 in 2005/2006. The proportion of the extreme poor also decreased considerably. At the national level, the percentage of this group decreased from 36% in 1991/1992 to 18% in 2005/2006. However, changes in the poverty levels have been unevenly distributed and thus vary among the geographical regions of Ghana. Between 1998/1999 to 2005/2006, Central and Eastern regions experienced the most significant reductions in poverty – 48% to 20% and 44% to 15% respectively. Ashanti region only had about 8% reduction - that is from 28% to 20%. Poverty is mainly concentrated in the Northern part (Northern region, Upper East region and Upper West region) of the country. While the poverty incidence is about 12% in Greater Accra and 20% in Ashanti region, Northern, Upper East and Upper West regions respectively have about 52%, 70% and 88% (GSS, 2007). To put it bluntly,
104

Combating Poverty towards Actualizing the Millennium Development Goals and Beyond: Do Cash Transfer Programmes add up to the Agenda?
poverty in Ghana has been predominantly rural. Two-thirds of the population in rural areas live in poverty. The 2005/2006 of GLSS 5 stated that the poverty incidence in this area was about 39% as against 11% in urban areas. The discussions above do not highlight on the depth of poverty - that is the income gap ratio. This shows the proportion by which the average consumption level of poor households fall below the poverty line. In other words, it shows the minimum amount of income that is needed to meet either the nutritional requirements in the case of lower poverty line or to meet both the food and non-food needs in the case of the upper poverty line. The GSS (2007) showed that the average consumption among poor households in Ghana is about 34% below the upper poverty line in 2005/2006 as against 35% in 1998/1999. With regard to the extreme poor, the income gap ratio has seen a marginal decline from 30% in 1998/1999 to 31% in 2005/2006. This therefore suggests that the average consumption of the extreme poor in Ghana is about 31% less than the lower poverty line. Cash Transfer and Poverty Reduction: Contextualizing the Links In recent times, especially in the wake of the global economic crunch and the general slowdown in the world’s economy, social protection for the vulnerable and destitute has increasingly become an essential part of mainstream development orthodoxy (Todd et al., 2006). The UN defined social protection as a “set of public and private policies and programmes undertaken by societies in response to various contingencies to offset the absence or substantial reduction of income from work; to provide assistance to families with children as well as provide people with basic health care and housing” (UN, 2000, p. 4). Given this understanding, it is noticeable that cash transfers have thus become an important and a growing part of social protection programming in many developing countries. Accordingly, within and across countries, these schemes have evolved differently with a significant variation in programme design and objectives. Different donor agencies, national governments and their development partners have increasingly presented different cash transfer programmes as an effective means of not only tackling transitory poverty and inequality but also for building human and physical asset of the poor (Slater, 2008). In some Latin American countries, these programmes have emerged in response to the growing inequality and the social cost of structural adjustment programme and the accompanying economic crises (Handa and Davis, 2006).
105

Muazu Ibrahim, Thomas Yeboah
Journal of Economic and Social Studies
Do cash transfers add up to the agenda of poverty reduction and MDG actualization in developing countries? Some theoretical literature that seeks to provide explanation for the above research proposition indicates that cash transfers do support household consumption and micro enterprise development, thus directly improve household welfare. The theoretical justification for the use of cash transfers in poverty reduction can be traced to Sen’s (1981) entitlement theory. At its very core, it argues that the lack of purchasing power limits the ability of the poor to gain access to or purchase food during hunger or emergencies. It then follows that cash support measures could be an appropriate response to increasing the purchasing power of the poor. Closely linked in ideology but fundamentally different in form is the paternalism theory which calls for transfers in-kind. This idea was first put-forward by Musgrave (1959). Interestingly, the paternalism theory has received different interpretations in the literature. However, the core argument is that societal welfare function is assumed to be non-egoistic. As such, individuals in society have a uniform or identical indifference curves for a good assumed to be socially desirable at any given level. This type of good is called by many economics textbook as merit good. However, whether cash or in-kind, transfers may be given at different times and policy makers are faced with Samaritan’s Dilemma. This dilemma introduced by Buchanan (1975) arise when policy makers are faced with the dilemma in choosing between bailing today’s recipients out in the future or letting the recipients’ current preferences be distorted albeit future transfers. Unfortunately, individuals have different preferences and ranks their choices based on need. They also vary their preferences in relation to time. As such, proponents of cash transfers call for equipping an individual with the purchasing power in order to acquire his choice of a good. Notwithstanding these theoretical debates, there is a growing body of empirical literature which have shown that the institutionalization of cash transfer schemes in some developing countries have led to a reduction of poverty and inequality. For instance, a World Bank study in Mexico found that transfers from the Oportunidades which provides cash transfers to rural households in Mexico consequently increased investment in livelihood activities (agriculture) and a significant investment in micro-enterprise development. The study further indicated that for each peso transferred, close to 88% were spent on household consumption while the remaining were invested by beneficiary household. The investment considerably raised the ability of recipient households to generate income with a return of 17.55% which points to the fact that these households were credit constrained (Gertler et al., 2006).
106

Combating Poverty towards Actualizing the Millennium Development Goals and Beyond: Do Cash Transfer Programmes add up to the Agenda?
In one study of cash transfer programme in Malawi, Miller (2009) reports that a $13 grant per month received by poorer households resulted in a reduction in the number of people living in absolute poverty in the Mchinji district in Malawi. It further found that out of that transfer given, more than 90% were spent on locally produced food, household goods and services and this resulted in increased sales by local businesses (Miller, 2009). It is therefore argued that such positive outcomes of cash transfer may lead to upward spiral of stimulating local economic growth. Indeed, well designed and targeted cash transfer programmes stimulate aggregate demand and consumption. Samson (2007) concur with this view, arguing that cash transfer leads to investment, economic growth and job creation which has an equalizing effect on poverty reduction. In South Africa, Samson (2007) notes that the poor spend more of their income on domestically produced labour intensive food. In effect cash transfer programmes have the potential to increase household welfare as well as productive economic activity and subsequent increase in economic growth. Critics however emphasize that the effect of cash transfer programmes should be evaluated by their relative efficiency on poverty - measured by poverty headcount and the poverty gap. Commentators further argue that given the long-term impact of conditional or unconditional transfers especially that which is spent on education of children, a ‘given dollar’ approach would be woefully inadequate in alleviating persistent poverty and thus ought to be complemented with measures spanning economic and social sectors (Hanlon, 2004). Handa and Davis (2006) in a study of conditional cash transfers in Latin America and the Caribbean found that cash transfers in general mostly achieve its core aims. However what remains unclear is whether such schemes have sufficiently addressed the ‘development bottleneck’ and whether conditional transfers are the most cost-effective or sustainable means of addressing such bottleneck. In this respect, the near exclusive focus of conditional cash transfers on human capital formation may pay no heed to opportunities relating to impact on household welfare and broader rural development context. Overview of Ghana’s Livelihood Empowerment against Poverty (LEAP) Programme The LEAP is a conditional social cash transfer programme which provides cash to the extremely poor households across Ghana to alleviate short-term poverty and also to encourage long-term human capital development. The goal of this programme is “to empower and help targeted population to provide for the basic needs, poise them
107

Muazu Ibrahim, Thomas Yeboah
Journal of Economic and Social Studies
to access existing government interventions, provide a ‘spring board to help them to ‘leap’ of the malaise of extreme poverty, and ultimately empower them to contribute to the socio-economic development of the country” (GoG, 2007, p. 36). It started its trial phase in March 2008 with 21 districts and then began expanding gradually to other districts. Beneficiaries on the programme would be assisted for a period of 1 to 3 years depending on the changes in their livelihoods. (LEAP, 2007) The LEAP which is the flagship programme of the National Social Protection Strategy (NSPS) has come to complement other existing social intervention programmes in Ghana. It targets the orphans and vulnerable children (OVC) who receive their cash transfer through the caregiver scheme, persons with severe disabilities (PWD) without any productive capacity and the extremely poor above 65 years. Targeting from the national level, districts are selected using the National Development Planning Commission (NDPC) poverty map; at the district level, targeting of communities by the District LEAP Implementing Committee (DLIC) is done using district poverty maps while at the community level, potential beneficiaries are targeted with the assistance of Community LEAP Implementing Committee (CLIC). Because members of the CLIC live with potential beneficiaries in the society, they tend to know some basic information regarding beneficiaries’ livelihoods and this reduces moral hazard and information asymmetry as some rich might portray to be poor in order to receive the cash grant. Data on potential beneficiaries are collected at the community level by trained data collectors; the data is verified at the district and regional levels and then submitted to the Department of Social Welfare (DSW) headquarters for entries. The data is then entered into a developed database (The Single Register) which ranks and selects potential beneficiaries. The ranked list is sent back to the community for verification and then returned to the DSW headquarters for further work. Photos of beneficiaries are taken, identification cards, photo albums and payment vouchers are developed to facilitate payments. The Ghana Post in collaboration with the DSW and the CLIC identify pay points where payments are conducted. Payments are done every two months with amounts ranging from GH¢8 (US$ 5.52)v to GH¢16 (US$ 11.03) per month depending on the number of dependents/households. The first payment of the cash grant was made available in 20 districtsvi between 27th and 30th March, 2008 where a total of 1,654 households received their initial payments. The second payments were done in the same districts in early June where an additional 198 households were enrolled onto the programme. An additional 1,050 households making a total of 2,902 received their cash grant during the third batch of payments which was done between 5th and 8th August, 2008.
108

Combating Poverty towards Actualizing the Millennium Development Goals and Beyond: Do Cash Transfer Programmes add up to the Agenda?
While they remain on the programme, beneficiaries are expected to comply with certain conditions. These are:
1. Orphans and Vulnerable Children (OVC) within the school going age in the beneficiary households should be enrolled and retained in public schools.
2. All members of the household must be registered with National Health Insurance Scheme (NHIS) and be able to produce a receipt in the absence of a card.
3. New born babies (0 – 18 months) must be registered with the Birth and Deaths Registry, attend required post natal clinics and complete the expanded programme on immunization.
4. Ensure that no child in the household is either trafficked or engaged in any activities constituting the worst forms of child labour (GoG, 2007, p. 45).
While recognizing that conditional cash transfers in particular are far from being a panacea for development (Farrington and Slater, 2006), its vital role in consumption smoothing, education, health and other livelihood activities cannot be overemphasized. Few empirical studies have been done to assess the impact of the LEAP in relation to MDG 1. While pointing to some key challenges, the aim of this paper is to bridge the gap in literature by assessing the contribution of the LEAP in meeting MDG 1 in Ghana. Methodology In conducting this research, both qualitative and quantitative data were collected. Questionnaires, in-depth interviews and focus group discussions were used to collect the primary data. This was done from March, 2011 to May, 2011. Secondary data was however collected through journals, policy documents and books. The qualitative data allowed for direct interaction with people who benefited from the programme while the quantitative data were presented in frequencies, charts, percentages and cross-tabulation of variables using Microsoft Excel 2007. This work thus adopted a mixed approach which balances the weaknesses and strengths of each method. That is, the weaknesses of one approach are potentially compensated for by the strength of the other. The study was conducted in the Kumasi metropolis - the second largest city in Ghana, with some people living in urban slum. In particular, 6 out of 11 beneficiary communities were selected for the study and included Asafo, Asawasi, Dichemso, Moshie Zongo, Asuoyeboah and Tarkwa Maakro. These communities were selected because they were the first beneficiary communitiesvii of
109

Muazu Ibrahim, Thomas Yeboah
Journal of Economic and Social Studies
the LEAP programme in the Kumasi Metropolis. The sum of all the beneficiaries in the 11 communities was 166. In all, 20 respondents from each of the 6 selected communities were randomly selected. This gave each beneficiary in the various communities a fair chance of being selected. The study therefore sampled 120 beneficiaries. Data on demographic and socio-economic characteristics of the beneficiaries were collected. This covered their sex, age, educational level, occupation, monthly incomes and number of dependents or households. Three (3) key officialsviii from the DSW were purposively selected to elicit adequate information regarding the programme. This was done through questionnaires and interviews. Data was also elicited in order to assess the possible impact of the LEAP programme in contributing to the poverty reduction agenda especially in our study communities. The hypothesis proposed for the study was; Null hypothesis (Ho): There is no improvement in the lives of beneficiaries. The quantitative data was based on empirics and the hypothesis was tested using the chi-square contingency test statistic. This test statistic which is a nonparametric tool entails the cross-tabulation of observations according to some identifiable traits with unequal expected frequencies. The chi-square is used when the level of measurement is nominal or ordinal and each variable of interest is based on counts. Hence the fact that poverty reduction is based on headcount justifies the use of this test statistic. Observed (fo) and Expected Frequency (fe) Values actually recorded in the contingency table which were based on our observations are called the observed frequencies. The expected frequencies were however calculated using the formula:
𝑓𝑓𝑒𝑒 ij = 𝑅𝑅𝑖𝑖 × 𝐶𝐶𝑗𝑗 𝑁𝑁� (1)
where N, 𝑅𝑅𝑖𝑖 and 𝐶𝐶𝑗𝑗 are the number of beneficiaries, row and column totals respectively. The hypothesis was tested at 5% significance level. The chi-square test statistic was computed by invoking the formula used by Lind et al., (2005);
110

Combating Poverty towards Actualizing the Millennium Development Goals and Beyond: Do Cash Transfer Programmes add up to the Agenda?
χ2 = ∑ ��𝑓𝑓𝑜𝑜𝑖𝑖𝑗𝑗 − 𝑓𝑓𝑒𝑒𝑖𝑖𝑗𝑗 �
2
𝑓𝑓𝑒𝑒𝑖𝑖𝑗𝑗� ~ 𝜒𝜒𝑑𝑑𝑓𝑓 ,0.05
2 (2)
where 𝑓𝑓𝑜𝑜𝑖𝑖𝑗𝑗 and 𝑓𝑓𝑒𝑒𝑖𝑖𝑗𝑗 observe their usual definitions. df = degrees of freedom => (r - 1)(c - 1) r is the number of rows c is the number of columns i and j index the rows and columns respectively. The computed test statistic (χ2) in equation (2) is compared to the critical value (𝜒𝜒𝑑𝑑𝑓𝑓 ,0.05
2 ) in making the decision. The Ho is rejected if the χ2 > 𝜒𝜒𝑑𝑑𝑓𝑓 ,0.052 otherwise we
do not reject Ho. We also focused on the challenges besetting the LEAP in contributing towards the actualization of the MDG 1 vis-à-vis cash transfers. Results and Discussions This section presents the empirical results of our study. It draws from the fieldwork conducted in the six communities in the Kumasi Metropolis. Demographic and Socio-economic Characteristics of Beneficiaries Age and Sex Regarding the age of beneficiaries, about 16% were between the ages 1 to 18 years. This age bracket was mainly the OVC who received their cash grant through the caregiver scheme. About 35% were between 41 to 65 years while 28% represented the aged (above 65 year) who had no productive capacity. It was revealed that 25% of the beneficiaries were between 19 to 40 years majority of who were disabled. The mean age of beneficiaries was 47.31 years. Of the 120 beneficiaries, about 87% were females while the remaining 13% were males. The study thus covered more females than males. This however varied from community to community. Each community under study had a female population of not less than 10. Among other criteria, gender roles influence the disbursement of cash to beneficiaries Thus women are more preferred to men in terms of who
111

Muazu Ibrahim, Thomas Yeboah
Journal of Economic and Social Studies
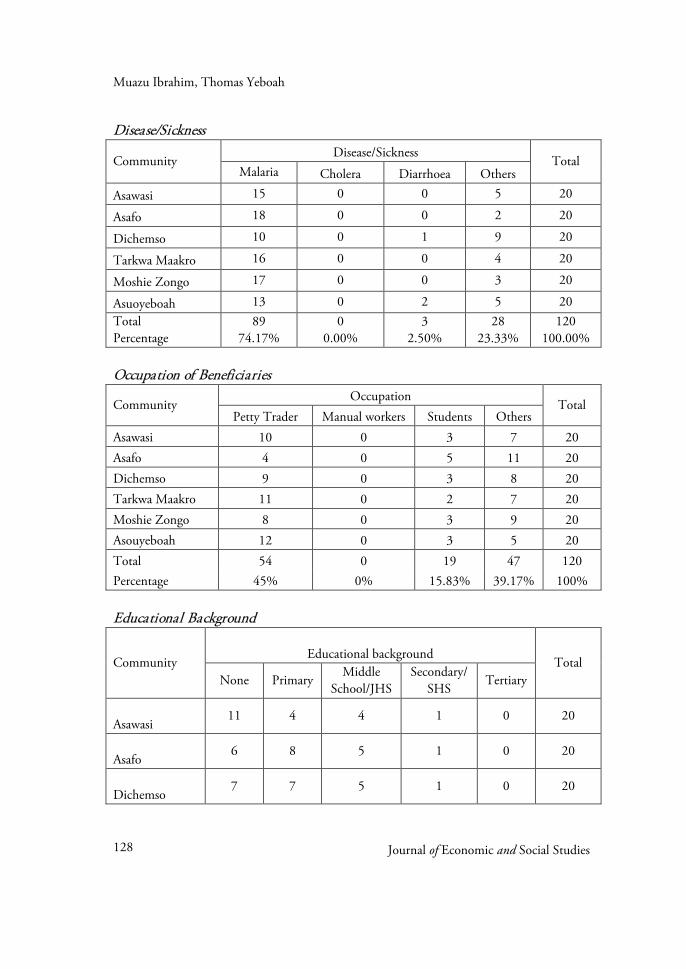
benefit from the LEAP development strategy. This is seen in the high number of females on the programme. This higher number of women takes precedence from the second and sixth objectivesix of the LEAP. The NSPS recognizes elderly women as vulnerable. Women are mostly the caregivers of the OVC and may also be PWD or the aged. This increases the chances of women’s enrolment on the programme. The higher number of females is therefore not surprising. Diseases The health status of beneficiaries was also considered. It was revealed that about 74% suffered from malaria in the first quarter of 2011. This is not surprising considering the unhygienic and poor drainage systems in the urban slums/communities which serve as breeding places for mosquitoes. It was further revealed that 2.5% of beneficiaries had also suffered from diarrhoea while 23% complained of other sicknesses.x Educational Background and Occupation Education is often considered as an investment in human capital and a key to poverty reduction and national economic development. From the research, it was revealed that 53 beneficiaries representing 44% had no formal education while 67 (56%) had some form of formal education. Out of this 67 beneficiaries, 63 had basic education (i.e. primary and Middle/Junior High School) while the remaining 4 had secondary education. The lack of higher formal educational attainment among the beneficiaries is largely attributed to lack of financial resources. And partly account for the poor socio-economic conditions that confront them. Regarding their economic activity, 45% were petty traders who engaged in the sale of such goods namely ice water, soap, kerosene, oranges and charcoal. Asuoyeboah had the highest number (12 out of 20) of beneficiaries who were engage in petty trading while Asafo had the lowest (4 out of 20). About 16% were students while the remaining 39% were the aged and the disabled who were jobless and had no livelihood source. Sources of Income and Savings Aside the cash grant, beneficiaries receive income from other sources which are often unreliable. Those who relied on personal sources for survival constituted about 45%.
112

Combating Poverty towards Actualizing the Millennium Development Goals and Beyond: Do Cash Transfer Programmes add up to the Agenda?
This group of beneficiaries often raise incomes from their petty trading. While 43% depends on their relatives, about 12% relies on other sources.xi In furtherance to this, while only 4% often save about GH¢2.60 per month, only 6% saves below GH¢2.60. Majority (90%) of the beneficiaries do not save. This is not only due to the inadequate amount of cash grant from the LEAP, but also from the low returns from their petty trading and insecure incomes. The inadequate finance leads to low capital outlay. This makes it difficult to expand their economic activities. This is further worsened by their inability to secure bank loans which they attributed to the lack of collateral securities since they have low asset base. Analysis of the LEAP Registration and Enrolment of Beneficiaries In 2008, a total of 34 beneficiaries were registered in the 6 communities. While Dichemso had the highest number (10) of registered beneficiaries, Moshie Zongo had the lowest (3). In 2009, a total of 73 new beneficiaries were registered with Tarkwa Maakro and Moshie Zongo each registering the highest number (15 new beneficiaries). Thirteen new beneficiaries were registered in 2010. It was realized that no beneficiary was registered in Tarkwa Maakro in 2010. Asafo, Dichemso and Asuoyeboah each registered 3 beneficiaries while Asawasi and Moshie Zongo registered 2. This means that after starting with 34 beneficiaries in 2008, 73 and 13 more were respectively enrolled in 2009 and 2010. Cash Grant and Number of Dependents/Households The amount of cash grant given to a beneficiary among other factors depends on the number of dependents/households of beneficiaries. A household is described by the Ghana Statistical Service (GSS) as an average of 5 persons. It was revealed that about 28% of the beneficiaries had no dependents while 26% had either 5 or more dependents. Majority (46%) of the beneficiaries had 1, 2, 3 or 4 dependents. Ideally, payments are supposed to be made once every two months with amounts ranging from GH¢8 (US$ 5.52) to GH¢16 (US$ 11.03) per month. Since payments are done “once in every two months”, beneficiaries get accumulated two months cash grants. Thus beneficiaries often receive a minimum of GH¢16 and a maximum of GH¢32 (US$ 22.07).
113

Muazu Ibrahim, Thomas Yeboah
Journal of Economic and Social Studies
On the aggregate, it was revealed that those with less than 5 dependents were receiving between GH¢16 (US$ 11.03) to GH¢30 (US$20.69). This category of beneficiaries represented about 74%. It was again revealed that beneficiaries with either 5 or more dependents often received above GH¢30. This group of beneficiaries represented about 26%. It is imperative to note that the number of dependents as well as the size of the households greatly varied from community to community and so is the cash grant. Table 1. Challenges of the LEAP Challenges Frequency/Percentage Inadequate cash grant 79 (65.83%)xii Complications at payment point 0 (0.00%) Delays in receiving cash grant 41 (34.17%) Total 120 (100%) Source: Authors’ field survey (May, 2011) Undeniably, the LEAP has made some achievements. However, it is still beset with challenges. Table 1 above depicts challenges of the LEAP beneficiaries often face. It indicates that about 66% of the beneficiaries complained of the inadequacy of the cash grant. Beneficiaries noted that the LEAP cash grant is rather too small and grossly inadequate for them to meet other pressing needs. They lamented on using the cash transfers in renewing their annual health insurance membership. Some respondents could not hide their feelings. “I mostly search for monies elsewhere to add to this small money [referring to the cash grant] to renew our NHIS cards. Now the monies are not coming again and all our NHIS cards have expired. No money to renew them.” (Woman, Asawasi, 2011) “This money is grossly inadequate to make any meaningful impact” (Married woman, Asouyeboah, 2011) The inadequacy of the cash grant limits their ability to meet their basic needs (mostly food) as well as expand their business activities especially those engaging in petty trading. A significant proportion of the respondents (34%) complained of the delays and irregularity of the disbursement of cash grant. This undoubtedly brings their businesses into standstill for those who invest the grant into their businesses. However, beneficiaries never encountered any complications at payment points
114

Combating Poverty towards Actualizing the Millennium Development Goals and Beyond: Do Cash Transfer Programmes add up to the Agenda?
which are mostly disbursed at some identified post offices. Interestingly, the major challenge beneficiaries’ face varies from community to community. While recognizing the inadequacy of the cash grant as the overall major challenge, the focus group discussions with beneficiaries revealed that almost all the beneficiaries had no idea regarding the period of payments of their cash grants and that they only wait to be told by a member of the CLIC when payments were due. This waiting period differ from community to community. Beneficiaries in Asawasi complained that instead of making payments once every two months, they receive their cash grants once every 5 months. As such, 19 out of the 20 beneficiaries in this community complained of such undue delays with only 1 beneficiary lamenting on the meagre amount they receive. Thus beneficiaries in this community consider the irregularity and the delays of cash receipt as their major problem. One male respondent retorted; “I don’t even know whether we are still part of the beneficiary communities because the last time we were called for the money was about 5 months ago if not more.” (Male, Asawasi, 2011) The situation was not different in Dichemso. Beneficiaries in Tarkwa Maakro, Moshie Zongo and Asuoyeboah complained they mostly receive their cash grant once every four months. However, it was only beneficiaries in Asafo who normally receive their cash grant once every two months. Apart from Asawasi, the other 5 communities consider the inadequacy of the cash grant as their major challenge and thus serving as a stumbling block in meeting their needs. We can therefore deduce that challenges faced by the beneficiaries are community-specific. Our findings are not different from OPM (2013). Their discussions with beneficiaries revealed that beneficiaries had different views about the delays and regularity of cash receipt. They found that some beneficiaries prefer a smaller but regular cash transfers so as to have a smooth consumption. However, “beneficiaries that prioritized the use of the transfer for investment over consumption smoothing preferred lumpier payments” (OPM, 2013, p. 47) Key informants were contacted to find out the reason for the varying times of payments. The Director of DSW argued that the cash grant disbursements were done in selected communities using the poverty maps given by the GSS as well as a range of other criteria including but not limited to the prevalence of adverse health
115

Muazu Ibrahim, Thomas Yeboah
Journal of Economic and Social Studies
conditions. The implication is that if a community has not been selected at any point in time by the GSS, beneficiaries in that community will not receive their cash grant. They will only receive their cash grants once they are selected. Table 2. Income Levels of Beneficiaries
Community Income Level Number of Beneficiaries
Before LEAP After LEAP
Asawasi Below GH¢288.47 17 14 Between GH¢288.47 - GH¢370.89 3 6 Above GH¢370.89 0 0
Asafo Below GH¢288.47 13 13 Between GH¢288.47 - GH¢370.89 7 5 Above GH¢370.89 0 2
Dichemso Below GH¢288.47 19 14 Between GH¢288.47 - GH¢370.89 1 6 Above GH¢370.89 0 0
Tarkwa Maakro Below GH¢288.47 16 6 Between GH¢288.47 - GH¢370.89 4 14 Above GH¢370.89 0 0
Mooshie Zongo Below GH¢288.47 20 12 Between GH¢288.47 - GH¢370.89 0 8 Above GH¢370.89 0 0
Asuoyeboah Below GH¢288.47 15 11 Between GH¢288.47 - GH¢370.89 5 6 Above GH¢370.89 0 3
Total 120 120 Source: Authors’ field survey (May, 2011) Table 2 above shows the income levels of beneficiaries before and after the introduction of the LEAP programme. As stated earlier, GH¢288.47 and GH¢370.89 represents the lower and upper poverty lines respectively. Those with income levels below GH¢288.47 represents the “hard core” or the extreme poor while those whose with income levels between GH¢288.47 to GH¢370.89 are the poor. However, those with incomes above GH¢370.89 are not considered poor since they can afford both their food and non-food needs in the Ghanaian context. While recognizing the impact of other sources on income,xiii from the table, it was revealed 116

Combating Poverty towards Actualizing the Millennium Development Goals and Beyond: Do Cash Transfer Programmes add up to the Agenda?
that Tarkwa Maakro had the highest improvement in income levels as a result of the LEAP. Before the LEAP, 16 beneficiaries in Tarkwa Maakro earned income below GH¢288.47. After implementing the programme, though most beneficiaries were still below the upper limit of GH¢370.89, 10 out of the 16 beneficiaries moved above the lower poverty line of GH¢288.47. There were also appreciable improvements in the income levels of beneficiaries in other communities. Asafo and Asuoyeboah had some of their beneficiaries moving above the upper poverty line. Asafo and Asuoyeboah respectively had 2 and 3 beneficiaries earning above GH¢370.89 after the LEAP programme. Figure 1. Overall income levels (per annum) of beneficiaries before and after LEAP
Source: Authors’ field survey (May, 2011)
Figure 1 above shows the income of beneficiaries before and after LEAP. Before the LEAP, of the 120 beneficiaries, 100 earned below GH¢288.47 and 20 earned between GH¢288.47 to GH¢370.89. This means 100 (83.33%) beneficiaries were “hard core” poor and could not meet their nutritional requirements as well as satisfy their basic non-food needs. With the introduction of the LEAP, 71 (59.71%) out of 120 beneficiaries were earning below the lower poverty line while 44 (36.67%) beneficiaries earned between GH¢288.47 to GH¢370.89. Thus, there was a 29% decrease in the number of beneficiaries earning below the lower poverty line while the number of beneficiaries who earned between GH¢288.47 to GH¢370.89 increased by 120%. However, only 5 beneficiaries were able to earn above GH¢370.89. This group of people could now meet their nutritional requirements as well as satisfy their basic non-food needs. The country-case report on LEAP provided by the Oxford Policy Management (OPM) found that this cash transfer programme has indeed functioned as a safety net and thus adds to the meagre household
83.33%
16.67%0.00%
59.17%36.67%
4.17%0
20406080
100120
Below GH¢288.47
Between GH¢288.47 -GH¢370.89
Above GH¢370.89
Num
ber o
f ben
efic
iari
es
Income levels
Before LEAP
After LEAP
117

Muazu Ibrahim, Thomas Yeboah
Journal of Economic and Social Studies
incomes. This enable beneficiaries to acquire better diet, have access to health care, reduction in school dropout and child labour. This finding is also consistent with earlier evidence provided by Osei (2011) based on his econometric microsimulation model. By using gini-coefficient to measure poverty and inequality, Osei (2011) noticed that this gini-coefficient decreased by 5 percentage points and that this reduction holds true for most regions in Ghana of which Ashanti region (with Kumasi as the regional capital) is not an exception. Thus such a universal social grant programme like the LEAP has reduced both the poverty incidence as well as the depth of poverty by bringing households closer to the poverty lines hence increases their chances of being “LEAP-ed” out of poverty. Such policy is pro-poor as it generally benefits relatively poorer households. Table 3. Impact of LEAP on Poverty in Ghana
Impact of the LEAP Communities
Total\Percentage Asa
wasi Asaf
o Dichemso
Moshie Zongo
Tarkwa Maakro
Asuoyeboah
Part of basic needs (mostly food)
10 (12.17)
14 (12.17)
12 (12.1
7)
16 (12.17)
12 (12.17)
9 (12.17
)
73 60.83%
Part of educational needs
6 (2.17)
3 (2.17)
2 (2.17
)
0 (2.17)
2 (2.17)
0 (2.17)
13 10.83%
Invest in business activity
0 (2.17)
3 (2.17)
1 (2.17
)
0 (2.17)
4 (2.17)
5 (2.17)
13 10.83%
Part of educational and basic needs
1 (1.00)
0 (1.00)
2 (1.00
)
2 (1.00)
1 (1.00)
0 (1.00)
6 5.00%
Part of educational and business activity
3 (1.67)
0 (1.67)
2 (1.67
)
0 (1.67)
1 (1.67)
4 (1.67)
10 8.33%
Both basic needs and business activity
0 (0.83)
0 (0.83)
1 (0.83
)
2 (0.83)
0 (0.83)
2 (0.83)
5 4.17%
Total 20 20 20 20 20 20 120 100%
Source: Authors’ field survey (May, 2011) **Figures in the brackets are their respective fe calculated from (1).
118

Combating Poverty towards Actualizing the Millennium Development Goals and Beyond: Do Cash Transfer Programmes add up to the Agenda?
From table 3, it is revealed that with the introduction of the LEAP, 73 beneficiaries representing 61% were able to meet part of their basic needs. It was also found out that about 11% of the beneficiaries were able to meet part of their educational needs. This 11% included OVC and other beneficiaries who used the grant to cater for the educational needs of their dependants. Thirteen (13) beneficiaries (11%) also invested the grant in their businesses. only 5 out of the 120 beneficiaries were able to meet both their basic needs as well as investing part into their business activities. Performing the non-parametric test using the contingency table above, from (2),
χ2 = (10−12.17)2
12.17 + (14−12.17)2
12.17 + ………. + (2−0.83)2
0.83 ~𝜒𝜒𝑑𝑑𝑓𝑓 ,0.05
2 Table 4. Computing the Chi-square Test Statistic
Impact of the LEAP ��𝑓𝑓𝑜𝑜𝑖𝑖𝑗𝑗 − 𝑓𝑓𝑒𝑒𝑖𝑖𝑗𝑗 �
2
𝑓𝑓𝑒𝑒𝑖𝑖𝑗𝑗�
Part of basic needs (mostly food) 2.698
Part of educational needs 11.444
Invest in business activity 10.522
Part of educational and basic needs 4.000
Part of educational and business activity 8.015
Both basic needs and business activity 5.817
χ2 = ∑ ��𝑓𝑓𝑜𝑜𝑖𝑖𝑗𝑗 − 𝑓𝑓𝑒𝑒𝑖𝑖𝑗𝑗 �
2
𝑓𝑓𝑒𝑒𝑖𝑖𝑗𝑗� 42.796
χ2 = 42.796 df = (6 - 1)(6 - 1) df = 25 Critical value (𝜒𝜒25,0.05
2 ) = 37.652
119

Muazu Ibrahim, Thomas Yeboah
Journal of Economic and Social Studies
Based on the sample evidence, we reject the Ho since the computed test statistic (χ2 = 42.796) is greater than the critical value (𝜒𝜒25,0.05
2 = 37.652). This means the implementation of the cash transfer has improved the lives of the beneficiaries at least in the study area with a stronger improvement in food consumption. This finding corroborates with Gertler et al.,’s (2006) study on Mexico’s Oportunidades. They argue that for every cash transfer made to the poor, a greater proportion goes to the household’s consumption. They also found that cash transfers serve as an additional working capital for the income generating activities of the beneficiaries. Cross country evidences indicate that transfers allow households to make small investments and in some cases take greater risks for higher returns (Arnold et al., 2011). In Dalung community in Northern Region of Ghana, the transfer provided an opportunity for beneficiary household caretakers to invest and expand their businesses, including but not limited to food preparation and processing of rice and shea butter. This presents complementary and synergistic local economy effect and the economic potential of the LEAP transfer. The LEAP money thus provided the necessary capital for the take-off especially in situations where the start-up capital posed to be the main challenge to emerging and growing businesses (OPM, 2013). From our focus group discussions, some beneficiaries asserted; “Despite the meagre cash grant, I mostly use it to buy food” (Elderly widow, Asafo, 2011) “As for me, all my monies including the LEAP cash grant go to food consumption” (Married Woman, Tarkwa Maakro, 2011) “Everyone in this community knows I sell ice water, though the money is too small, I still invest some into my business and some for consumption” (Married Woman, Mooshie Zongo, 2011) “I use all the LEAP monies to buy food especially when monies from people are not forthcoming” (Elderly man, Dichemso, 2011) “The child’s [referring to the OVC] parents died long time ago. So I only use the money to buy his books and get him school uniform” (Woman – Caregiver, Asawasi, 2011) Using Northern and Central regions of Ghana, OPM (2013) found that majority (40%) of the beneficiaries in all the communities in the regions use the cash grants for food consumption. Their finding was also strengthened by the perception that, LEAP beneficiaries were better able to meet their basic needs mostly food and health. Based on the sampled evidence, it can be concluded that the LEAP has been able to
120

Combating Poverty towards Actualizing the Millennium Development Goals and Beyond: Do Cash Transfer Programmes add up to the Agenda?
chalk some notable achievements by enabling the extreme poor and the vulnerable to meet their basic needs mainly food. Our findings therefore suggest that despite the small cash transfer, the programme has among other things improved the food consumption of beneficiaries. Our study confirms earlier evidence provided by Schady and Araujo (2008) and Amuzu et al., (2010). They concluded that the LEAP did impact significantly on household consumption by reducing their food expenditure. While noting the influence of household size on the spending decisions of caregivers, Dako-Gyeke and Oduro (2013) have shown that the cash grants received by caregivers are expended on all members of their households including non-beneficiary children. This dynamic can be attributed to the nature of the family living systems as well as the solidarity among the poor in Ghana. Implications for MDG 1 and Post-2015 The Growth and Poverty Reduction Strategy (GPRS II) in Ghana operationalizes the various international agreements with poverty reduction as their primary objective. One of such international agreements is the MDG. Ghana has since 2000 pledged to meet these goals especially in the area of poverty reduction. Our findings imply that the LEAP programme constitute an important initiative and has improved the well-being of both the extreme poor and the vulnerable. This is manifested in increases in their income levels as well as the ability to acquire their basic needs. In view of the renewed interest in spearheading poverty reduction and what will become post-MDG best practices this paper draws some implications for this endeavour. To begin with, efforts towards improving the living standards of the poor and addressing post-MDG inequality calls for effective institutional mechanisms and radical change in policy design and implementation practices. Our analysis indicates lack of effective political will demonstrated in the disbursement of cash grants given to beneficiaries. It is apparent that beneficiaries of the cash transfer significantly remain as passive players in the cash transfer initiatives as many are not consulted in the design while others do not even know the exact time they receive their cash grant. Nayaran et al., (2000) argue that efforts towards addressing poverty call for deepening the relationship between institutions on one hand, and poor on the other. In this regard, we argue for a radical shift in responsibilities in post-MDG policy design and implementation practices by constructing “a poor-centred design of cash transfer”. Such an approach will offer a means of not just supporting the poor by providing them with cash, but will also integrate them into policy design and
121

Muazu Ibrahim, Thomas Yeboah
Journal of Economic and Social Studies
implementation practices with local institutions providing the enabling environment. Secondly, while acknowledging the potential role cash transfers play in improving the lives of the poor, post-2015 strategies geared towards poverty reduction and inequality have to be in tandem with policies that support both the productive capacity and empowerment of the poor. It is imperative that post-2015 frameworks on poverty reduction and development should be constructed by revisiting the “productionist” approach of the old development economics (Chang, 2010) while paying adequate attention to policies that support improved access to credit, education, healthcare and social inclusion, as this would lead to addressing the multi-causal factors that influence poverty thereby improving the well-being of the poor. Conclusion The MDG have not only brought poverty reduction onto the global development agenda but have also encouraged and urged countries to help in halving poverty by 2015. As a result, several countries and developmental agencies have adopted pro-poor policies that seek to leap the poor out of poverty and to provide safety nets to the vulnerable. Ghana, through its various programmes has made remarkable efforts in meeting MDG 1 agenda. One of such programmes is the LEAP which provides conditional cash transfers to extreme poor and the vulnerable. Using chi-square test statistic, we found an improvement in the lives of the poor as well as increases in their incomes. While we find evidence of the positive contribution of the LEAP in poverty reduction in the short-run, it cannot however guarantee a sustained improvement in health and education outcomes and a reduction of poverty in the long-run. To ensure continual reduction in poverty, there is the need to move fundamentally beyond the short-term gains/effects through coordinated, purposeful social and complementary services to create opportunities for empowerment among beneficiaries. The existing ‘single register’ of LEAP beneficiaries provides the potential to develop an integrated database for a range of social protection programmes, which could facilitate referral to complementary programmes. However, increasing the cash grant is not a panacea for poverty reduction. Discussion with beneficiaries is extremely helpful in unearthing the different specific challenges they face at the community level. This will help in shaping the policy guidelines towards a successful future poverty reduction programmes.
122

Combating Poverty towards Actualizing the Millennium Development Goals and Beyond: Do Cash Transfer Programmes add up to the Agenda?
References Amuzu, C., Nicola, J. & Pereznieto, P. (2010). Gendered risks, poverty and vulnerability in Ghana: To what extent is the LEAP cash transfer programme making a difference? Overseas Development Institute (ODI) (Retrieved on December 18, 2012 from http://www.odi.org.uk/sites/odi.org.uk/files/odi-assets/publications-opinion-files/6252.pdf) Arnold, C., Conway, T. & Greenslade, M. (2011). DFID Cash Transfers Literature Review, Policy Division, DFID, London, UK (Retrieved on November 1, 2012 from http://r4d.dfid.gov.uk/PDF/Articles/cash-transfers-literature-review.pdf) Barrientos, A. & De Jong, J., (2004). Child Poverty and Cash Transfers: CHIP Report No.4, Childhood Poverty Research & Policy Centre, London (Retrieved on February 21, 2012 from http://www.peelearlyyears.com/pdf/Child%20Poverty %20and%20Cash%20Transfers.pdf) Barrientos, A. & Shepherd, A., (2003). Chronic Poverty and Social Protection, A paper prepared for presentation at the CPRC Conference on Chronic Poverty, University of Manchester, UK (Retrieved on March 12, 2012 from http://www.chronicpoverty.org/uploads/publication_files/CP_2003_Barrientos_Shepherd.pdf) Buchanan, J. M. (1975). The Samaritan's dilemma, in E.S. Phelps (ed.), Altruism, Morality and Economic Theory, New York, Sage Foundation 71-85. Carr, E. R. (2008). Rethinking Poverty Alleviation: A ‘Poverties’ Approach, Development in Practice, 18(6), 726-734 Chang H-J. (2010). Hamlet without the Prince of Denmark: How Development has Disappeared from Today's Development Discourse, in S. Khan and J. Christiansen (eds), Towards new Developmentalism: Market as Means rather Master, Routledge, Abingdon Dako-Gyeke, M. & Oduro, R. (2013). Effects of Household Size on Cash Transfer Utilization for Orphans and Vulnerable Children in Rural Ghana, Academic Journal of Interdisciplinary Studies, 2(1), 239-251
123

Muazu Ibrahim, Thomas Yeboah
Journal of Economic and Social Studies
Farrington, J. & Slater, R. (2006). Cash Transfers: Panacea for Poverty Reduction or Money Down the Drain? Development Policy Review, 24(5), 499-512 Gertler, P., Matinez S. & Rubio-Codina, M. (2006). Investing Cash Transfers to Raise Long–term Living Standards, World Bank Policy Research Paper, WPS3994-IE, Washington, DC (Retrieved on June 6, 2012 from http://www-wds.worldbank.org /servlet/WDSContentServer/WDSP/IB/2006/08/10/000016406_20060810124348/Rendered/PDF/wps3994.pdf) Ghana Statistical Service (2007). Pattern and Trends of Poverty in Ghana (1991 – 2006), Accra. (Retrieved on December 27, 2010 from http://catalog.ihsn.org/index.php/catalog/63/download/28521%E2%80%8E) Government of Ghana (2007). National Social Protection Strategy: Investing in People, Ministry of Manpower, Youth and Employment (MMYE) (Retrieved on October 13, 2011 from http://www.thewayforwardproject.org/file_uploads/G10%20 National%20Social%20Protection%20Strategy.pdf) Halon, J., Barrientos, A. & Hulme, D. (1941). Pro-Poor Growth: Turning a $1 Grant into $2 Income, in Halon J. Barrientos, A and Hulme D (eds) Just Give Money to the Poor: The Development Revolution from the Global South. Sterling: Kumarian Handa, S. & Davis, B. (2006). The Experience of Conditional Cash Transfers in Latin America and the Caribbean, Development Policy Review, 24(5), 513 – 537. Hanlon, J. (2004). It is Possible Just to Give Money to the Poor, Development and Change, 35(2), 375 – 383. Lind, D. A., Marchal, W. G., & Wathen, S. A. (2005). Statistical Techniques in Business & Economics, New York: McGraw Hill Livelihood Empowerment against Poverty (LEAP) Final Document (2007). Accra – Ghana Miller, C. (2009). Economic Evaljuation of the Mchinji Cash Transfer – Preliminary Findings, Boston University of Public Health, Boston Musgrave, R. A. (1959). The Theory of Public Finance, New York: McGraw Hill
124

Combating Poverty towards Actualizing the Millennium Development Goals and Beyond: Do Cash Transfer Programmes add up to the Agenda?
Narayan, D. Patel, R., Schaff, K., Rademacher, A. & Koch-Schulte, S. (2000). Voices of Poor: Can Anyone Hear Us?, Oxford University Press, New York. Published for the World Bank, 216-229. Nicola, J. Ahazie, W. & Doh, D., (2009). Social Protection and Children: Opportunities and Challenges in Ghana, UNICEF, GHANA – Ministry of Employment and Social Welfare. Osei, R. D. (2011). Reducing Poverty through a Social Grants Programme: The Case of Ghana, Institute of Statistical, Social and Economic Research (ISSER), University of Ghana, Legon (Retrieved on May 19, 2013 from http://siteresources.worldbank.org /EXTABCDE/Resources/7455676-1292528456380/7626791-13031416 41402/7878676-1306270833789/Parallel-Session-14-Robert_Darko_Osei.pdf) Oxford Policy Management (2013). Qualitative research and analyses of the economic impactsof cash transfer programmes in sub-Saharan Africa - Ghana country case study report, Food and Agriculture Organization (Retrieved on June 2, 2013 from http://www.fao.org/fileadmin/user_upload/p2p/Publications/Ghana_qualitative.pdf) Portes, A. & Hoffman, K. (2003). Latin American Class Structures: Their Composition and Change during the Neoliberal Era, Latin American Research Review, 38, 41-82. Samson, M. (2007). The Social and Economic Impacts of South Africa’s Social Grants; A paper presented at the Growing Up free from Poverty Seminar, November 12, 2007, London, Overseas Development Institute. Sen, A. (1981). Poverty and Famines; An essay on entitlement and deprivation, Oxford. Clarendon Press. Slater R., (2008). Cash Transfers, Social Protection and Poverty Reduction, Background paper commissioned for the UNRISD Flagship Report on Poverty: United Nations Research Institute for Social Development, Geneva (Retrieved on November 10, 2012 from http://www.unrisd.org/80256B3C005BCCF9/ (httpAuxPages)/207C8A9E75D293EAC12574FE003A4780/$file/draft_Slater.pdf) Schady, N. and Araujo, M.C (2008). Cash Transfers, Conditions and School Enrolment in Ecuador, Economía, 8 (2), 43 – 70.
125

Muazu Ibrahim, Thomas Yeboah
Journal of Economic and Social Studies
Todd, P. E., and Kenneth I. Wolpin (2006). Assessing the Impact of a School Subsidy Program in Mexico: Using a Social Experiment to Validate a Dynamic Behavioral Model of Child Schooling and Fertility, American Economic Review 96 (5), 1384–417 United Nations (2000). United Nations General Assembly: United Nations Millennium Declaration. A/RES/55/2: New York United Nations (2010). We Can End Poverty 2015 Millennium Development Goals, United Nations Summit 20-22 September 2010, New York High-level Plenary Meeting of the General Assembly (Retrieved on September 13, 2012 from http://mdgs.un.org/unsd/mdg/Resources/Static/Products/Progress2012/English2012.pdf) United Nations (2000). Enhancing Social Protection and Reducing Vulnerability in a Globalizing World, Report of the Secretary General to the Thirty-ninth Session E/CN.5/2001/2. Washington DC: United Nations Economic and Social Council. (Retrieved on July, 23, 2010 from http://www.icsw.org/un-news/pdfs/csdsocprotect.PDF) World Bank (2011). Republic of Ghana, Tackling Poverty in Northern Ghana, Report No. 53991-Gh, World Bank Washington DC (Retrieved on January 5, 2012 from https://openknowledge.worldbank.org/bitstream/handle/10986/2755/539910ESW0Gray00502301100BOX358360B.txt?sequence=2)
126

Combating Poverty towards Actualizing the Millennium Development Goals and Beyond: Do Cash Transfer Programmes add up to the Agenda?
Appendix Sex
Community Sex
Total Male Female
Asawasi 2 18 20 Asafo 3 17 20 Dichemso 3 17 20 Tarkwa Maakro 2 18 20 Moshie Zongo 4 16 20 Asouyeboah 2 18 20 Total 16 104 120 Percentage 13.33% 86.67% 100% Age
Community
Age
Total
1 - 18 19 - 30
31 - 40 41 - 65 Above 65
Asawasi 3 1 3 11 2 20
Asafo 5 3 3 6 3 20
Dichemso 3 1 1 10 5 20
Tarkwa Maakro 2 2 5 7 4 20
Moshie Zongo 3 1 2 4 10 20
Asouyeboah 3 1 2 4 10 20
Total 19 9 16 42 34 120 Percentage 15.83% 7.50% 13.33% 35.00% 28.33% 100%
127
Muazu Ibrahim, Thomas Yeboah
Journal of Economic and Social Studies
Disease/Sickness
Community Disease/Sickness
Total Malaria Cholera Diarrhoea Others
Asawasi 15 0 0 5 20
Asafo 18 0 0 2 20
Dichemso 10 0 1 9 20
Tarkwa Maakro 16 0 0 4 20
Moshie Zongo 17 0 0 3 20
Asuoyeboah 13 0 2 5 20 Total Percentage
89 74.17%
0 0.00%
3 2.50%
28 23.33%
120 100.00%
Occupation of Beneficiaries
Community Occupation
Total Petty Trader Manual workers Students Others
Asawasi 10 0 3 7 20 Asafo 4 0 5 11 20 Dichemso 9 0 3 8 20 Tarkwa Maakro 11 0 2 7 20 Moshie Zongo 8 0 3 9 20 Asouyeboah 12 0 3 5 20 Total 54 0 19 47 120 Percentage 45% 0% 15.83% 39.17% 100% Educational Background
Community Educational background
Total None Primary Middle
School/JHS Secondary/
SHS Tertiary
Asawasi 11 4 4 1 0 20
Asafo 6 8 5 1 0 20
Dichemso 7 7 5 1 0 20
128

Combating Poverty towards Actualizing the Millennium Development Goals and Beyond: Do Cash Transfer Programmes add up to the Agenda?
Tarkwa Maakro
6 7 6 1 0 20
Moshie Zongo 11 7 2 0 0 20
Asuoyeboah 12 6 2 0 0 20
Total Percentage
53 44.17%
39 32.50%
24 20.00%
4 3.33%
0 0.00%
120 100.00%
Year of Registration
Community Year of registration
Total 2008 2009 2010
Asawasi 6 12 2 20 Asafo 4 13 3 20 Dichemso 10 7 3 20 Tarkwa Maakro 5 15 0 20 Moshie Zongo 3 15 2 20 Asouyeboah 6 11 3 20 Total 34 73 13 120 Percentage 28% 61% 10.83% 100%
129

Muazu Ibrahim, Thomas Yeboah
Journal of Economic and Social Studies
Number of Dependents
Community Number of dependents
Total
None 1 2 3 4 5 or more
Asawasi 5 1 2 2 3 7 20
Asafo 10 0 2 3 3 2 20
Dichemso 5 1 0 1 4 9 20
Tarkwa Maakro 5 1 4 5 2 3 20
Moshie Zongo 5 2 10 1 1 1 20
Asouyeboah 4 0 3 2 2 9 20
Total 34 5 21 14 15 31 120
Percentage 28.33% 4.17% 17.50% 11.67% 12.50% 25.83% 100% Sources of Income
Community Sources of income
Total Personal Relatives Other
Asawasi 11 7 2 20
Asafo 4 14 2 20
Dichemso 8 9 3 20
Tarkwa Maakro 11 6 3 20
Moshie Zongo 8 9 3 20
Asuoyeboah 12 7 1 20 Total Percentage
54 45.00%
52 43.33%
14 11.67%
120 100.00%
130

Combating Poverty towards Actualizing the Millennium Development Goals and Beyond: Do Cash Transfer Programmes add up to the Agenda?
Cash Grant
Community Amount of cash received by each beneficiary
Total GH₵ 16 - GH₵ 30 Above GH₵ 30
Asawasi 13 7 20 Asafo 18 2 20 Dichemso 11 9 20 Tarkwa Maakro 17 3 20 Moshie Zongo 19 1 20 Asouyeboah 11 9 20 Total 29 31 120 Percentage 74.17% 25.83% 100% Challenges
iCorresponding Author **The authors wish to thank Kaleem Abukari Naeem, Opoku Emmanuel and Priscilla Adu-Sarfo for helping in the data collection. ii Now Ghana Youth Employment and Entrepreneurial Development Agency (GYEEDA)
Community Challenges of the LEAP Tot
al Inadequate cash grant
Complications at payment point
Delays in receiving cash grant
Asawasi 1 0 19 20 Asafo 14 0 6 20 Dichemso 16 0 4 20 Tarkwa Maakro 17 0 3 20 Moshie Zongo 19 0 1 20 Asouyeboah 12 0 8 20 Total 79 0 41 120
Percentage 65.83% 0.00% 34.17% 100%
131

Muazu Ibrahim, Thomas Yeboah
Journal of Economic and Social Studies
iiiGLSS was conducted in 1987/1988, 1988/1989, 1991/1992, 1998/1999 and 2005/2006. The third survey conducted in 1991/1992 established 51.7% as the poverty incidence. The fourth survey was also done in 1998/1999 which saw a decrease in poverty incidence from 51.7% to 39.5%. The fifth one was conducted in 2005/2006 which established 28.5% as the new poverty incidence. iv Given that they consume the average consumption basket. v Exchange rate as at the time of the survey was around GH¢1.45 to US$1. vi Payments in Bawku (one of the first 21 districts selected) was halted due to the protracted chieftaincy conflict in the area. vii As at 2010, the eleven (11) beneficiary communities in the Kumasi metropolis were Asawasi, Asafo, Dichemso, Moshie Zongo, Asuoyeboah, Tarkwa Maakro, Aboabo, Oforikrom, Apatrapa, New Tafo and Edwenase. viii The officials were the Metro Director of the DSW, the Regional Director and the Programme Head of the LEAP. ix The second objective specifies the criteria for targeting beneficiaries – OVC, PWD and the aged. OVC receive their cash grants through the caregiver scheme who are mostly women. The sixth objective explicitly states the adoption of a gender-sensitive approach in the implementation of the programme. x Most of the other sicknesses beneficiaries often suffer from are hypertension (high blood pressure), asthma, rheumatism and diabetes. xi This comprises of friends, religious groups and philanthropists who often live in the same community with the beneficiary. xii The numbers in the brackets are the respective percentages. xiii As said early on, apart from the LEAP cash transfer, beneficiaries earn incomes from other sources which also impacts on their overall income levels. To assess the impact of the cash transfer, those other sources of income were held constant.
132