Pakistan Millennium Development Goals Report 2013
195
-
Upload
khangminh22 -
Category
Documents
-
view
3 -
download
0
Transcript of Pakistan Millennium Development Goals Report 2013


PAKISTANMILLENNIUMDEVELOPMENT GOALS REPORT 2013Ministry of Planning, Development and ReformGovernment of Pakistan Block-P, Pakistan Secretariat, Islamabad-Pakistan

Executive Summary
Introduction
Chapter 1. National milestones around the MDG and impact on the development agenda
Chapter 2. MDG 1: Eradicate Extreme Poverty and Hunger
Chapter 3. MDG 2: Achieve Universal Primary Education
Chapter 4. MDG 3: Promote Gender Equality and Women’s Empowerment
Chapter 5. MDG 4: Reduce Child Mortality
Chapter 6. MDG 5: Improve Maternal Health
Chapter 7. MDG 6: Combat HIV/AIDS, Malaria and Other Diseases
Chapter 8. MDG 7: Ensure Environmental Sustainability
Chapter 9. MDG 8: Develop Global Partnership for Development
Chapter 10. Pakistan’s MDG Acceleration framework and Post – 2015 Development Agenda
List of Annexes
Annex 1. National adaptation of MDG Goals, Targets and Indicators
Annex 2-14. PSLM Indicators District Level Ranking by Provinces
Annex 15. List of Advisory/Coordination Committee for the MDGs
Annex 16. List of PMDGR Working Groups
Annex 17. UNDP and National MDGs Secretariate Team
1
5
9
15
25
41
53
69
85
91
103
115
123
128
180
181
183
ContentsList of Tables I | List of Figures II | Foreword III | Preface IV | Acknowledgements V | Acronyms VI

Table 1
Table 2
Table 3
Table 4
Table 5
Table 6
Table 7
Table 8
Table 9
Table 10
Table 11
Table12
Table 13
Table 14
Table 15
Table 16
Table 17
Table 18
Table 19
Table 20
Table 21
Table 22
Table 23
Table 24
Table 25
Table 26
Table 27
Table28
Table29
Table 30
Table 31
Table 32
Table 33
Table 34
Table 35
Table 36
Table 37
17
16
19
20
21
22
27
26
30
32
35
43
42
45
47
49
55
54
60
62
64
71
70
75
80
87
86
93
92
97
100
106
108
109
110
111
112
Tracking MDG 1
Status of Indicators- MDG 1
Expenditure Shares by Commodity groups
Gini Coefficients year-wise and by locations
Trends in Real Consumption by Quintile
Trends in Pro-poor Expenditures
Tracking MDG 2
Status of Indicators-MDG 2
Disparities across Districts - Net Enrolment Rate
Disparities across Districts - Primary Completion Rates
Disparities across Districts: Literacy Rates
Tracking MDG 3
Status of Indicators - MDG 3
Disparities across Districts - GPI (Primary Level)
Disparities across Districts - GPI (Secondary Level)
Disparities across Districts - GPI Youth Literacy
Tracking MDG 4
Status of Indicators - MDG 4
Disparities across Districts - Fully Immunized Children 12 – 23 months
Disparities across Districts - Less than 1 year Children Immunized against Measles
Disparities across Districts - Under Five Children who suffered from Diarrhea in last 30 day
Tracking MDG 5
Status of Indicators - MDG 5
Disparities across Districts - Births Attended by Skilled Birth Attendant
Disparities across Districts - Women giving birth during last 3 years and making at least one antenatal care consultation
Tracking MDG 6
Status of Indicators - MDG 6
Tracking MDG 7
Status of Indicators - MDG
Disparities across Districts - Access to Improved Drinking Water
Disparities across Districts - Access to Improved Sanitation
Trends in Imports and Exports from India and Afghanistan
Pakistan export trends: Textile, Non textile and Total
Indicators for External Debt Sustainability
Official Development Assistance (ODA) Indicators for Pakistan
Median Consumer Price Ratio
Estimate of telephone lines, computers and internet users
List of Tables
I

Pakistan Millennium Development Goals Report 2013
Figure 1
Figure 2
Figure 3
Figure 4
Figure 5
Figure 6
Figure 7
Figure 8
Figure 9
Figure 10
Figure 11
Figure 12
Figure 13
Figure 14
Figure 15
Figure 16
Figure 17
Figure 18
Figure 19
Figure 20
Figure 21
Figure 22
Figure 23
Figure 24
Figure 25
Figure 26
Figure 27
Figure 28
Figure 29
Figure 30
Figure 31
Figure 32
Figure 33
20
21
29
31
33
34
35
36
46
48
48
50
51
57
58
59
61
62
65
73
74
76
77
79
81
88
89
90
96
98
99
107
108
Trends in consumption based Gini coefficient
Trends in Real Consumption Expenditures
Targets and Achievements - Net Primary Enrolment Ratio
Provincial Averages and Spreads - Net Enrolment Rates
Provincial Averages and Spreads - Completion Rates
Literacy Rates Rural by location
Provincial Averages and Spread – Literacy Rates
Public Expenditure on Education as percentage of GDP
Provincial Averages and Spreads - GPI (Primary Level)
Provincial Averages and Spreads - GPI (Secondary Level)
Targets and Achievements - GPI Youth Literacy
Provincial Averages and Spreads - GPI Youth Literacy
Targets and Achievements - Share of Women in Wage Employment in the Non-Agricultural Sector
Targets and Achievements - Under 5 Mortality Rate
Targets and Achievements - Infant Mortality Rate
Target and Achievements - Proportion of Fully Immunized Children 12 – 23 months
Provincial Averages and Spreads - Fully Immunized Children
Target and Achievements under - 1 year children immunized against measles (%)
Provincial Average and Spread - Under Five Children who suffered from Diarrhea in last 30 days
Targets and Achievements - Maternal Mortality Ratio
Targets and Achievements - Births Attended by Skilled Birth Attendant (%)
Provincial Averages and Spreads - SBAs
Targets and Achievements - Total Fertility Rate
Targets and Achievements - Women 15-49 years who had given birth during last 3 years and made at least one antenatal care consultation
Provincial Averages and Spreads - Women 15-49 years who had given birth during last 3 years and made at least one antenatal care consultation
Targets and Achievements - Population in Malaria Risk Areas Using Effective Prevention and Treatment Measures
Targets and Achievements - Incidence of Tuberculosis per 100,000 Populations
Targets and Achievements - Proportion of TB Cases Detected and Cured under DOTS
Targets and Achievements - Proportion with Access to Improved Drinking Water Sources
Provincial Averages and Spreads - Improved Drinking Water
Targets and Achievements - Proportion with Access to Improved Sanitation
A Comparison of Tariffs
Pakistan’s International Trade and Market Access
List of Figures
II

Pakistan Millennium Development Goals Report 2013
ForewordAs a signatory to the Millennium Declaration, the Government of Pakistan is committed to maximizing the country’s progress towards the Millennium Development Goals (MDGs) and improving the lives of all Pakistanis. Thirteen years into the new millennium, the MDG framework has proven extremely valuable in focusing attention on some of the most important challenges facing Pakistan and the world. MDGs country report provides a credible assessment of Pakistan’s recent progress.
This is the fifth Millennium Development Goals Report produced by Pakistan. It takes stock of the progress made to date towards meeting the development goals set by the Millennium Declaration. Release of this report is yet another indicator of Government’s strong commitment to assigning high priority to the global development agenda.
The Millennium Development Goals provide us with concrete socioeconomic targets as we work towards good governance, social justice and poverty alleviation amid sustained growth. In reviewing the MDGs in the context of other developing countries, it is important to appreciate some unique characteristics of Pakistan. It is not surprising that the review of these goals depicts a mixed picture. Of the 34 indicators on which Pakistan reports progress, Pakistan is on track on 10 indicators. The reasons for missing most of the indicators include internal and external economic and non-economic challenges, including natural disasters, conflicts; institutional, administrative and political changes, weak commitments to economic reforms, lack of awareness, fading commitments by the development partners due to global recession of 2008 and belated ownership of MDG agenda at the sub-national level. The impact of above challenges reflected in slow progress and hence non-achievement of many of the indicators.
The Report examines the degree to which the MDGs have been integrated in national policy and demonstrates how de-facto each MDG has been addressed in the ongoing national programmes. The purpose of the Report is to raise awareness of all, including the Government, Donors, NGOs, academia, youth, the civil society about the national MDGs. The Report aims to take stock of Pakistan’s progress in achieving the MDG targets adjusted to the conditions of the country.
Hopefully, the findings and recommendations of the Report will strengthen planning and implementation process at all levels, in particular at provincial and districts, which will translate into improved quality of life and more secure social levels of the most vulnerable populations.
While led by Ministry of Planning, Development and Reform, this report is the product of a consultative process involving different Federal and Provincial Government Ministers/Departments, Academia, Research Organizations and the UNDP. As we approach the end of the MDGs era, the Government of Pakistan hopes to strengthen its constructive working relationship with international Development Partners. I am confident that the evidence contained in the report will make a significant contribution to a new global development agenda fully aligned to Pakistan’s transformative vision.
Pakistan needs a new framework for social change in wake of eighteenth amendment to provide equal opportunities and social justice to everyone, eliminate exploitation of the poor, harness its human resource potential and restore the dignity of the citizen. Government of Pakistan’s social agenda includes not only the vital sectors of Education and Health but also other important dimensions like empowerment of women and youth, population planning, speedy justice, and good governance at federal, provincial and local levels in order to revive the economy and restore the balance of power in favor of the people. Pakistan 2025 programme started by the government envisages such an integrated programme of social development which can create and broaden partnerships between different segments of society, reduce injustice and intolerance society and helps to achieve the Millennium Development Goals 2015 and produce high human and social capital for meeting the challenges of Knowledge Revolution era to make Pakistan one of the top ten economies in the world.
Prof. Ahsan Iqbal
Minister for Planning, Development and Reform
Foreword
III

Pakistan Millennium Development Goals Report 2013
The Millennium Development Goals Report is a continuing assessment of human development, poverty reduction and environmental sustainability as well as cooperation of the world community in achieving the set targets as part of the overall development goals for the country. This report sets out the national progress in achieving the eight MDGs based on national targets tailored to Pakistan’s development circumstances. The report highlights the progress made and the challenges faced in meeting the MDGs.
The aim of the report is to assess progress towards achievement of the MDGs, document achievements and challenges, and help frame the post-2015 development agenda for Pakistan in the light of Pakistan Vision 2025. This report, developed through a wide consultative process, presents the progress made for each of the MDGs, the challenges encountered along the way, and a concrete set of actions needed to keep the Pakistan on track to achieve the MDGs.
The Pakistan MDGs Progress Report is a product of the collaborative efforts of the Government of Pakistan and the UN Country Team particularly the United Nations Development Programme. A National MDGs Coordination Committee was set up by the Planning Commission to coordinate and oversee preparation of the country’s MDG report. Eighteen MDGs indicators spread over six MDGs (except Goals 6 and 8) are monitored through purpose built surveys conducted periodically; most of these at national, sub-national level through household surveys such as the Pakistan Living Standards Measurement Survey. For other indicators, estimates are periodically prepared by the Planning Commission and other relevant Ministries. Consensus on such estimates is reached through a consultative process and professional deliberations of the experts.
With only two years remaining, efforts for the achievement of the MDGs have become increasingly important. The developments in the last few years at the national and international front transformed the social, political, and economic landscape of Pakistan, all having an impact on the outcomes, achievements and targets of Pakistan’s Millennium Development Goals. Pakistan faced serious challenges in the last few years, stemming from a sudden meltdown in the global economy in 2008, along with a sharp rise in oil and food prices in the same year. At the domestic front security issues, war against extremism and IDPs, catastrophic floods of 2010 and 2011 adversely affected the overall economy and the achievement of many of the goals and targets.
Pakistan has shown gradual progress on all the indicators on most of the targets under the eight Goals. It is hoped that after the devolution, provincial Governments shall have more autonomy and with the help of enhanced resource distribution to them under the National Finance Commission Award, shall be able to reach closer to the set targets. Pakistan has made significant inroads in relation to protecting areas for wildlife conservation, reducing Sulphur content in high speed diesel, GDP per unit energy and access to safe drinking water.
The MDG Acceleration Framework (MAF) offers governments and their partners a systematic way to identify, prioritize and address bottlenecks to progress on MDG targets that are off track. Pakistan has prioritized achievement of MDG 2 Universal Primary Education. It has developed a National Plan of Action, specifically aimed to achieve: enrolment of 5.1 million out-of-school children (76 percent of the total number) in primary classes; in-school retention of all enrolled children and completion of their primary education; and improvement in the quality of primary education.
In framing the post-2015 agenda, it is necessary to localize the goals and targets in the socio-economic context of the country. A lesson learnt from the MDGs is that there is a need to set targets selectively with greater focus and align these targets with the resources available to achieve these. Instead of having stagnant end-point targets, short and medium term goals need to be identified as well as disaggregated targets at sub-national level and across gender and other divides. It is also important that all stakeholders sit together and agree on fulfilling their respective roles in order to ensure that the post MDGs agenda is set realistically and achieved jointly.
Hassan Nawaz Tarar Secretary Ministry of Planning, Development and Reform
Preface
Preface
IV

Pakistan Millennium Development Goals Report 2013
AcknowledgementsPakistan Millennium Development Goals Report 2013 is an outcome of a participatory process, involving the Ministry of Planning, Development and Reform, relevant Provincial Government Departments, the Government of Azad Jammu and Kashmir, Gilgit-Baltistan and Federal Administered Tribal Areas, Civil Society Organizations and Development Partners.
The report has been prepared under the leadership of Prof. Ahsan Iqbal, Minister for Planning, Development and Reform and under the supervision of Secretary, Planning, Development and Reform. The support of the National MDG Coordination Committee formed in the Planning Commission is appreciable. Four positions papers submitted by the Working Groups on Education, Health, Environment and International Trade and Finance constituted by the Planning Commission were a useful starting point for preparing the report. Continuous interaction with the above Working Groups during the preparation of the Report enriched the consultant’s understanding. Pakistan Bureau of Statistics provided the much needed statistical data support. The logistic, administrative and technical support provided by the Poverty Alleviation and MDGs Section of the Ministry of Planning, Development and Reform/Planning Commission is also acknowledged. The comments by Pakistan Institute of Development Economics (PIDE) and other stakeholders in validation workshop helped to improve the content and presentation of the Report. Presence of Ms. Marriyum Aurangzeb, MNA and Convener of Parliamentary Task Group on MDGs and her guidance in the validation workshop helped a lot in improving the Report. The financial, facilitationand technicalsupport provided by the United Nations Development Program (UNDP) is much appreciated.
Acknowledgements
V

Pakistan Millennium Development Goals Report 2013
AcronymsAEPAM Academy of Educational Planning and ManagementAJ&K Azad Jammu and Kashmir ALP Adult Literacy Programme APTTA Afghanistan Pakistan Transit Trade Agreement ATTA Afghan Transit Trade Agreement BISP Benazir Income Support ProgrammeCAR Central Asian Republics CDWAP Clean Drinking Water for All Programmecf. Compare (in writing) CFS Child Friendly Schools CPR Contraceptive Prevalence Rate CV Coefficient of variationDAC Development Assistance Committee DoC Declaration of Commitment DOTS Directly Observed Treatment Short CourseDRAP Drug Regulatory Authority of Pakistan EFA Education for All: National Plan of ActionEHACP Enhanced HIV/AIDS Control Project’ ELEP Early Learning Education Program EMIS Education Management Information SystemEPI Expanded Programme on ImmunizationESR Education Sector Reforms Programmes ESRA Education Sector Reform Assistance FATA Federally Administered Tribal Agencies FP&PHC Family Planning and Primary Health Care FP/RH Family Planning / Reproductive Health GB Gilgit-Baltistan GBGS Gender Based Governance SystemsGDP Gross Domestic Product GEPSP Gender and Education Policy Support ProgrammeGHGs Green House Gases GoB Government of Balochistan GoKP Government of Khyber PakhtunkhwaGoP Government of PakistanGoPb Government of Punjab GoS Government of SindhGRAP Gender Reforms Action Plan HIES Household Income and Expenditure SurveyHIPC Highly Indebted Poor Countries IDA International Development Association IMF InternationalMonetary Fund KP Khyber PakhtunkhwaKPP Khushhal Pakistan Program LFS Labour Force Surveys LHW Lady Health Workers MAF MDG Acceleration FrameworkMDGs Millennium Development Goals MEAs Multilateral Environmental Agreements MET Ministry of Education, Trainings & Standards in Higher EducationMICS Multiple Indicator Cluster Survey
MNCH Maternal, Neonatal and Child HealthMTDF Medium Term Development Framework MTEF Medium Term Expenditure Framework NACP National AIDS Control Programme NCS National Conservation Strategy NCSW National Commission on the Status of WomenNEAP National Environment Action Plan NEAS National Education Assessment System NEC National Economic Council NEP National Education Policy NER Net Enrolment RatioNGOs Non-Governmental OrganizationsNIPS National Institute of Population Studies NLP National Literacy Programme NTP National Tuberculosis ProgramODA Official Development Assistance PAIMAN Pakistan Initiative for Mothers & NewbornsPBM Pakistan Bait-Ul-Mal PBS Pakistan Bureau of Statistics (formerly FBS)PC Planning CommissionPDHS Pakistan Demographic and Health Survey PIDE Pakistan Institute of Development EconomicsPIHS Pakistan Integrated Household Survey PMN Pakistan Microfinance NetworkPPAF Pakistan Poverty Alleviation Fund PPHI People’s Primary Health Care Initiative PRSPs Poverty Reduction Strategy PapersPSDP Public Sector Development ProgrammePSLM Pakistan Social and Living Standards Measurement Survey PTA Pakistan Telecommunication AuthoritySAARC South Asian Association for Regional Cooperation SBA Skilled Birth Attendant SPDC Social Policy Development CenterSTIs Sexually Transmitted InfectionsTB TuberculosisUNCBD UN Conventions on Biological Diversity UNCCD UN Conventions to Combat Desertification UNFCCC United Nations Framework for Convention on Climate Change UPE Universal Primary Education U5MR Under Five Mortality RateWDI World Development Indicators WHO World Health Organization
Acronyms
VI

Pakistan Millennium Development Goals Report 2013
VII

1
Pakistan Millennium Development Goals Report 2013
The Pakistan Millennium Development Goals Report (PMDGR) 2013 is the fifth such report for Pakistan. The aim of the report is to assess progress towards achievement of the MDGs, galvanise for a final push on these, document successes and challenges, and share initial thoughts on the post-2015 development agenda for Pakistan. For the first time, this MDGR includes a review of sub-national and district level status and trends.
Methodology
An 18-member MDG Coordination Committee set up by the Planning Commission coordinated and oversaw preparation of the country’s MDG report in a process that involved extensive stakeholder consultations. The database for monitoring the MDGs is the same as used in previous reports. Eighteen MDG indicators undersix MDGs (except Goals 6 and 8) are monitored through specifically designed surveys conducted at varying time intervals; most of these at the national, provincial and regional levels through household surveys such as the Pakistan Social and Living Standards Measurement Survey (PSLM). For other indicators, estimates are periodically prepared by the Planning Commission and other ministries and consensus is reached through a consultative process. Analysis of survey-based indicators was thus possible to district level, but not of non-survey based indicators as district level data for these is virtually non-existent.
Country Context
Pakistan’s progress towards the MDGs has been influenced by developments in the country and outside. These include natural disasters, man-made conflicts, institutional, administrative and political changes, weak commitments to hardcore structural economic reforms, reductions in international aid by development partners due to the global economic crisis of 2007, and limited localization of the MDG agenda at the provincial level.
MDG1 Eradicate Extreme Poverty and Hunger
Under MDG1, Pakistan aims to halve by 2015, the proportion of people living below the national poverty line, achieve full and productive employment and
decent work for all, and halve the proportion of people who suffer from hunger. There has been a persistent downward trend in poverty incidence over the past decade - the percentage of population below the poverty line fell from 34.5 percent in 2001/02 to 12.4 percent in 2010/11 - and Pakistan is on track to achieve the MDG target with regard to poverty. Factors contributing to thedrop include increased allocations to the poor under the Benazir Income Support Program; those contributing to poverty include natural and manmade disasters, despite slow economic growth, the global recession and higher food inflation. Pakistan’s unemployment to population ratio increased from 27.1 percent in 2001/02 to 30.9 percent in 2010/11, making the prospect of full employment by 2015 highly unlikely. Malnutrition, measured as prevalence of underweight children under-5 years of age, decreased slightly from 40 percent in 1990/91 to 31.5 percent in 2011/12, but is still far off the MDG target of less than 20 percent. With two out of three targets off-track, the country is unlikely to achieve MDG 1.
MDG2 Universal Primary Education
The MDG2 for Pakistan targets 100 percent primary school enrolment, 100 percent completion of education from grades 1-5 and an 88 percent literacy rate.Rates of net primary enrolment and completion increased up to the mid-2000s but thereafter slowed and fluctuated, and in 2011/12 were 57 percent and 50 percent respectively. The literacy rate is 58 percent overall, but this is highly skewed towards males – 70 percent of males are literate compared to 47 percent of females. Pakistan is thus off-track on all three targets, and therefore not likely to achieve MDG 2.
MDG3 Promote Gender Equality & Women’s Empowerment
MDG3 aims to eliminate gender disparity in primary and secondary education by 2005, and in all levels of education by 2015. Gender parity in education has improved –for primary education, secondary education and youth literacy, but still falls short of the MDG targets set for 2015. Punjab, with its higher base, remains the leader in education indicators, but inter-provincial disparities
ExecutiveSummary
Executive Summary

2
Pakistan Millennium Development Goals Report 2013
between Punjab, Sindh and Khyber Pakhtunkhwa have narrowed; Balochistan is the exception – it improved but still lags behind the others. The share of women in non-agriculture wage employment is 10.45 percent in 2010/11, still short of the 14 percent target. Again, Punjab at 13.25 percent is very close to the MDG target; by contrast, Balochistan’s figure of 2.32 percent in 2010/11 is extremely low. There has been considerable progress on increasing women’s representation in legislative bodies. Overall, with all four indicators (with set targets) of this goal off-track, Pakistan is unlikely to meet MDG 3.
MDG4 Reduce Child Mortality
Under MDG 4, Pakistan has set itself the objective of reducingthe under-five child mortality (U5MR) by two-thirds. The country has shown slow and gradual progress on all the indicators related to this MDG. Under-five morality fell from 117 deaths in 1990/91 to 89 deaths per 1,000 live births in 2012/13; and the infant mortality rate in this period from 102 to 74 deaths per 1,000 live births. However, both are still short of the MDG targets of 52 deaths per 1,000 live births for under-five mortality, and 40 deaths per 1,000 live births for infant mortality. The coverage for fully immunized children increased from 75 to 80 percent and of measles immunization from 80 to 81 percent in this period; both are still short of the target of above 90 percent coverage. Pakistan was able to achieve the MDG target (less than 10 percent) for reducing the proportion of children under five who suffered from diarrhea in the last thirty days: it fell from 26 to 8 percent. Lady health worker coverage stood at 83 percent in 2008/09 against the target of 100 percent. Progress on health indicators has been affected by a number of internal and external factors and therefore despite the gains, Pakistan is off-track on five out of six indicators and hence unlikely to attain MDG 4.
MDG5 Improve Maternal Health
By 2015, Pakistan intends toreduce the maternal mortality rate (MMR) by three-quarters and ensure universal access to reproductive health.Over the past decade or so, a renewed focus on providing timely and efficient health care options to women of child-bearing age is apparent. Pakistan has shown considerable yet insufficient progress for achieving the targets set for 2015: MMR has been almost halved (down to 276 per 100,000 births in 2006/07), contraceptive usage has almost tripled (up to 35.4 percent), proportion of births attended by skilled birth attendants (SBAs) have more than doubled (up to
52.1 percent), and antenatal consultations have more than quadrupled (up to 68 percent) since 1990/91.The total fertility rate at 3.8 remains considerably higher than the target of 2.1. Overall, Pakistan is off track on all indicators and therefore unlikely to achieve MDG 5.
MDG6 Combat HIV/AIDS, Malaria and Other Diseases
MDG6 strives to reverse the spread of HIV/AIDS and the incidence of malaria and other major diseases.Most of the indicators show positive trends, particularly in the case of HIV prevalence among pregnant women, and detection and provision of healthcarefor TB patients. The latter has been achieved and the former is likely to be. This can be attributed to swift and focused action on the part of the government, particularly in the case of TB. However, the year on year growth of overall TB cases (up to 230 cases/10,000 population cf. target of 45/10,000) represents one of the worst faring indicators for Pakistan in all the MDGs. HIV/AIDS trends among vulnerable groups are also alarming. The proportion of people in malaria risk areas using effective prevention and treatment measures remains low (75 percent against the target of 40 percent). Pakistan is off-track on three out of five indicators and therefore unlikely to achieve MDG 6.
MDG7 Ensure Environmental Sustainability
MDG 7 aims to promote sustainable development, and has the target of halving the proportion of people without sustainable access to safe drinking water and basic sanitation, and bringing about a significant improvement in the lives of slum dwellers. Of the seven MDG 7 indicators, Pakistan is on track to achieve four: protecting areas for wildlife conservation (11.6 percent against the target of 12 percent), reducing sulphur content in high speed diesel, improving GDP per unit energy (measure of energy efficiency) and improving access to safe drinking water (89 percent against thetarget of 93 percent). However, it is lagging on access to sanitation; currently 72 percent of the populations have access to this facility against a target of 90 percent. Pakistan has also made progress on increasing forest cover – currently 5.2 percent – but is still short of the 6 percent target. Overall, with four out of seven indicators on track, Pakistan is likely to achieve MDG 7 with continued efforts; this is the only goal where the majority of indicators are on-track to be attained.
Executive Summary

3
Pakistan Millennium Development Goals Report 2013
MDG8 Develop Global Partnership for Development
Goal 8 represents the collaborative efforts and commitments of the developing and developed countries to foster multilateral, bilateral and regional north-south trade. Under this MDG the developed countries have committed financial, technical and capacity development support. For Pakistan, efforts to improve market access regionally and globally achieved mixed results: there was an impasse in the Doha Roundof WTO negotiations, bilateral trade with India strengthened but remains hampered by security concerns and mistrust; Pakistan did secure preferential trade agreements with a number of key partners (e.g. Malaysia, Iran, China, Sri Lanka). The trend in average tariffs imposed by developed markets upon developing markets imports, as one indicator of market access, are comparatively high for Pakistan - 8 percent compared to 6 percent for developing market economies. Debt sustainability indicators have shown improvement since their highs in 2001. ODA forms an important component in the realization of MDG 8.Aid as a percentage of Pakistan’s GNI has mostly remained in the range of 0.9-1.7 percentsince 2001. In absolute terms, aid per capita fluctuated between US$ 5-20 and total ODA between US$ 732 million to US$ 3.5 billion during this period.
Building on the National Plan of Action, the federal and sub national governments are finalizing MDG Acceleration Framework Action Plans which will offer area specific innovative and cross sector strategies to accelerate progress towards Universal Primary Education.
The Emerging Post 2015 Agenda for Pakistan
The MDG Framework will reach its deadline in December 2015. To gather inputs and feedback for Pakistan’s priorities for the post 2015 Development Agenda, UNDP, on behalf of the UN Resident Coordinator, undertook a national consultation process. This included diverse stakeholders including government officials, academia, civil society, private sector and the youth to identify Pakistan’s priorities and recommendations for the post-2015 development agenda. Key issues identified in these included: peace and security, governance, equitable economic growth, population growth, engaging Pakistan’s expanding youth population in positive activities, and gender equity. In framing the post-2015 agenda, the need for localized goals and targets suitable for specific conditions in Pakistan was stressed and a shift from purely quantitative modes of analysis, as is in the current MDGs, towards more qualitative indicators was suggested. Instead of having a stagnant end-point target, it was emphasized that short-term as well as mid-term goals need to be identified as well as disaggregated targets at sub-national level and across gender and other divides. Goals pertaining to human rights were also highlighted as needing to be made more stringent and absolute in their applicability. Both developed and developing countries need to be held more accountable was identified as necessary for fulfilling their respective obligations in relation to the development agenda.
Executive Summary

4
Pakistan Millennium Development Goals Report 2013 Executive Summary
Goal 1: Eradicate Extreme Poverty and Hunger
Proportion of population below the calorie based food plus non- food poverty line.
Prevalence of underweight children under 5 years of age
Proportion of population below minimum level of dietary energy consumption
Goal 2: Achieve Universal Primary Education
Net primary enrolment ratio ( percent)
Completion/survival rate Grade 1 to 5 ( percent)
Literacy rate ( percent)
Goal 3: Promote Gender Equality and Women’s Empowerment
GPI Primary Education
GPI Secondary Education
Youth Literacy GPI
Share of Women in Wage Employment
Proportion of Seats held by Women in National Assembly
Goal 4: Reduce Child Mortality
Under 5 Mortality Rate (Deaths per 1000 Live Births)
Infant Mortality Rate (Deaths per 1000 Live Births)
Proportion of Fully Immunized Children 12-23 Months
Proportion of under 1 year children immunized against measles
Proportion of Children Under 5 Who Suffered from Diarrhea in the Last 30 Days ( percent)
Lady Health Worker’s Coverage ( percent of target population)
Goal 5: Improve Maternal Health
Maternal Mortality Ratio
Proportion of births attended by Skilled Birth Attendants
Contraceptive Prevalence Rate
Total Fertility Rate
Proportion of women 15-49 who had given birth during last 3 years and made at least one antenatal consultation
Goal 6: Combat HIV/AIDS, Malaria and Other Diseases
HIV prevalence among 15-49 year old pregnant women
HIV prevalence among vulnerable groups
Proportion of population in malaria risk areas using effective prevention and treatment measures
Incidence of TB/10,000
TB cases detected and cured under DOTS
Goal 7: Ensuring Environmental Sustainability
Forest Cover ( percent)
Land Area Protected for Conservation of Wildlife ( percent)
GDP (in 1980-81 Rs.) per ton of oil equivalent (energy efficiency)
Sulfur Content in High Speed Diesel
Proportion of Population with Access to Improved Water Sources
Proportion of Population with Access to Sanitation
Proportion of Katchi Abadies Regularized
12.4
31.5
30
57
50
58
0.9
0.81
0.81
10.45
22
89
74
80
81
8
83
276
52.1
35.4
3.8
68
0.041
IDU = 37.4 FSW = 0.8 MSW = 3.1 HSW = 7.3
40
230
91
5.2
11.6
26,543
0.6
89
72
n/a
13
<20
13
100
100
88
1.00
1.00
1.00
14
n/a
52
40
>90
>90
<10
100
140
>90
55
2.1
100
Baseline reduced by 50%
Baseline reduced by 50%
75
45
85
6
12
28,000
0.5-0.25
93
90
95
On Track
Off Track
Off Track
Off Track
Off Track
Off Track
Off Track
Off Track
Off Track
Off Track
Achieved
Off Track
Off Track
Off Track
Off Track
Achieved
Off Track
On Track
Off Track
Off Track
Off Track
Off Track
On Track
Off Track
Off Track
Off Track
Achieved
Off Track
On Track
On Track
On Track
On Track
Off Track
Off Track
Indicators Target StatusLatest
NationalValue
Millennium Development Goals
5
Pakistan Millennium Development Goals Report 2013
The Pakistan Millennium Development Goals Report (PMDGR) 2013 is the fifth such report for Pakistan. With two years remaining in the 15-year (2000-2015) period allotted to achieve the Millennium Development Goals, PMDGR 2013 reviews Pakistan’s progress towards the MDGs, documents successes and challenges in achieving the MDGs and intends to galvanize a final push to accelerate progress towards the MDGs. The report also presents the preliminary thoughts on the post 2015 development agenda.
PMDGR 2013 is more comprehensive in its content and coverage than previous MDG reports. Building on the success of the four provincial MDG reports (2010-2014), this report compares provincial and regional progress towards the achievement of MDGs in detail. This report, for the first time, also reviews the status and trends on MDGs in the three regions of Pakistan: Azad Jammu and Kashmir (AJ&K), Gilgit-Baltistan (GB) and the Federally Administered Tribal Areas (FATA).
The format and structure of the report follows the guidelines recommended by the UN for review reports expected from member countries in the last two years of the MDG period. Chapter One assesses how the eight MDGs have influenced the development agenda of Pakistan in the last 13 years in terms of planning, policies and programmes and interventions. An overview of historical trends for 16 national MDG targets and 37 indicators adopted by Pakistan since 2000 at national and sub-national (provincial, regional and district) level is presented in Chapters Two to Nine. Thesechapters also highlight sub-national inequalities, including across gender, in progress towards various MDGs. Chapter Ten introduces the MDG Acceleration Framework for MDG 2 – universal primary education– which is being finalized and rolled out by the Government of Pakistan.The last chapter synthesizes the views and feedbackof diverse stakeholders on the post-2015 development agenda for Pakistan.
Preparation of PMDGR 2013 Process and Stakeholders
The process of preparing PMDGR 2013 was initiated in the Planning Commission, Ministry of Planning, Development and Reform in December 2012. A National Millennium Development Goals Coordination Committee (NMDGCC) was constituted to coordinate and oversee preparation of the country’s MDG report.
The Committee, headed by the Chief Economist of the Planning Commission, was composed of nine section chiefs of the Planning Commission, representatives of provincial governments, the Ministry of Education and Training and the Ministry of Inter-Provincial Coordination.It also included representatives from the Pakistan Institute of Development Economics (PIDE) and National Institute of Population Studies (NIPS). Subsequently four thematic working groups of key stakeholders were constituted in the areas of: International Trade and Finance, Environment, Health and Education. These working groups were chaired by the respective section chiefs of the Planning Commission. UNDP provided technical guidance on the content and structure of the report.
The working groups on relevant MDGs prepared four position papers and these, along with other inputs of the committees, were synthesized by a team of consultants, supported and guided by the UNDP.
On behalf of the UN Resident Coordinator, UNDP conducted an extensive round of post-2015 country consultations over a period of five months from December 2012 to April 2013, involving a broad section of Pakistani society to elicit views on the roadmap for the post-2015 agenda. The chapter on the post-2015 agenda in the report mainly reproduces the outcomes of these consultations. The chapter on MDG Acceleration Framework summarizes the Government’s plans / strategies, including at the sub-national level, to speed up progress toward Universal Primary Education in Pakistan.
The initial first draft of the PMDGs report was discussed at a consultation/validation workshop in which different stakeholders participated, including officials from various government ministries and departments, civil society organizations, UN agencies and international development partners. The final report has incorporated the feedback of these stakeholders.
Methodology and Analytical Framework
The database of monitoring the MDGs is the same as used forprevious reports. The Pakistan Social and Living Measurement Survey (PSLM) provides data on eighteen MDG indicators spread over six MDGs (except Goals 6 and 8) through purpose built
Introduction
Introduction

6
Pakistan Millennium Development Goals Report 2013 Introduction
surveys conducted every year by the Pakistan Bureau of Statistics. For other MDGs indicators, estimates are periodically prepared by the Planning Commission, Ministry of Health, Ministry of Education and National Institute of Population Studies (NIPS).
Most of the survey-based MDG indicators are monitored at national and sub-nationallevel through the following household surveys: Pakistan Integrated Household Survey (PIHS), Household Income and Expenditure Survey (HIES), Pakistan Social and Living Standards Measurement (PSLM) Survey and Labour Force Surveys (LFS). Since 2001-02, a total of nine rounds (non-panel) of PIHS, HIES and PSLM have been conducted.Due to security concerns and the law and order situation, the PSLM 20011/12 was not conducted in 57 out of a total of 144 Primary Sampling Units (PSUs) in Balochistan and hence the data for the province is not representative. The household sample of four rounds of the above surveys (2004/05, 2006/07, 2008/09 and 2010/11) is representative of the population at national, provincialand district level, while the sample of the remaining surveys is representative of the population at national and provincial level. Consequently intra-provincial or inter-district comparisons and disparities in survey-based MDG indicators are analyzed for the above four selected years. National and provincial trends and inequalities (except poverty indicators) are analyzed from all eight rounds of surveys. For AJ&K, the PSLM database comprises offour rounds, namely 2006/07, 2007/08, 2010/11 and 2011/12. For GB, the PSLM database comprises offive rounds, namely 2005/06, 2006/07, 2007/08, 2010/11 and 2011/12.
Aforementioned surveys have been used for analyzing the status and trends of survey based indicators at the national and sub-national level. For non-survey based indicators, the status and trends as reported by the Planning Commission and relevant Federal Ministries (at national level), provincial and regional planning departments are analyzed in the report. At district level, the trends and status of only the relevant survey-based MDG indicators are reported as non-survey based data on MDG indicators is almost non-existent.
In the case of the indicator for poverty incidence, the series estimated from Multiple Indicator Cluster Survey (MICS) and reported by the provinces is incorporated in this report.It is important to note that the methodology for estimating poverty using MICS data is in variation with the one used for estimating poverty from PSLM data using official poverty estimation methodology.
Inter-district disparities, district ranking in MDG indicators and trends over time have been analyzed using summary measuresi.e. range, coefficient of variation and Spearman’s rank correlation.1 Province-wise ranking of individual districts, by selected MDG indicators for initial and terminal years are compared in the appendices.
Challenges and Opportunities in Achieving MDGs
Overall, Pakistan’s journey towards the MDGs has been arduousand generally plagued by internal and external economic and other challenges, albeit with some periods of ‘smooth running’. Pakistan’s attempts to achieve the MDGs, as detailed in the rest of the report, cannot be appreciated or evaluated meaningfully without understanding the roadblocks experienced by the country in the last 13 years. Among these are natural disasters, man-made conflicts, institutional, administrative and political changes, weak commitments to hardcore structural economic reforms, fading commitments by development partners due to the global economic crisis of 2007, and belated localization and ownership of the MDG agenda at sub-national level.
Natural and Man-made DisastersWith regard to natural disasters, Sindh and Balochistan were in the midst of a two-year drought at the start of the decade, whichcontributed to raising the poverty levels in these two provinces in 2001. A devastating earthquake struck the region of Azad Jammu and Kashmir (AJ&K) and Khyber Pakhtunkhwa in 2005 causing the loss of 75,000 lives and widespread damage to infrastructure including schools and health facilities. In 2010 widespread floods of unprecedented scale in parts of Khyber Pakhtunkhwa, Punjab and Sindh provinces destroyed economic and social infrastructure in the plains leaving 18 million people affected. In 2011, Pakistan again experienced floods in Sindh and Balochistanthat affected more than 8.5 million people.
1 A more sophisticated measure of inequality, e.g., Gini coefficient is not used in this report for measuring disparities at the provincial and district level as it is multi-dimensional and requires primary and representative data on incomes or consumption. HIES is representative at the national and provincial level, but the sample for Balochistan province is small to estimate a robust multi-dimensional distribution. PSLM is representative at the district level but income and consumption data is not collected at the district level. Therefore Gini cannot be calculated at the district level. Moreover, the summary statistic Range is uni- dimensional and is distribution free. Similarly Coefficient of Variation (CV) is a ratio of standard deviation to mean. It is also distribution free but uses 2 estimates/parameters based on distributions.
Introduction

7
Pakistan Millennium Development Goals Report 2013
Natural disasters cannot be predicted, but for a resource constrained economy like Pakistan, they necessitate the immediate and unplanned diversion of limited resources to disaster management, restoration of livelihoods, reducing internal displacement and rebuilding infrastructure. Disasters also curtail regular access of the affected population to education and health facilities. Moreover, as survival, relief and humanitarian activities take priority demand for these facilities, additional resource attention is required. Unfortunately, since the 2005 earthquake and subsequent floods, the process of rebuilding economic and social infrastructure continues, impacting the regular allocations of development funds needed for new infrastructure. This is in spite of the financial and technical cooperation extended by different development partners.
The start of the MDG period also coincided with the war against extremism after the 9/11 attacks in 2001, the short and long-term impacts of which are proving to be far more widespread and devastating for Pakistan than the above referred natural disasters. As a full-fledged f rontline state and partner in the war against extremism, Pakistan initially benefited in terms of loan write-offs and debt re-scheduling by bilateral and multilateral donors. However, this conflict intensified in 2008-09 with the start of a proxy war on Pakistani soil. The resulting costs and damage to the infrastructure and economy of Pakistan has far outweighed the financial relief provided to the country during 2001-11. According to official estimates, Pakistan suffered direct and indirect losses of US$ 68 billion during 2001-112 as compared to the US$ 10 billion it received, including debt relief from coalition partners.
The security deficits have had a multifaceted impact on the economy and on the achievement of MDG targets . Increased expenditures on beefing up internal security and on defence to fight militancy have diverted precious resources from other much needed sectoral allocations. Consequently, the increased allocations required for the education, health and environment sectors to achieve the MDGs received less priority. The net effect is nominal increases, if any, in allocations for key social sectors.The observed increase in nominal terms mostly relates to increases in salaries to compensate employees for the rise in inflation. In real terms development expenditure in the relevant ministries and provincial government departments stagnated after 2008. The only exception was a substantial real growth in expenditures on social safety nets (notably the Benazir Income Support Programme). After 2008, growing militancy destroyed the educational infrastructure specifically, female education institutions and roads in parts of FATA and the province of Khyber Pakhtunkhwa. As a by-product of increased militancy, internal displacement of the affected population to safer areas increased the fiscal burden on the federal government and other provinces intermittently.
Economic DevelopmentThe period 2002 to 2006 was one of respectable economic growth which offered opportunities to put the country on a sustained high growth trajectory. However, lack of political will to implement long-standing hardcore structural reforms meant these opportunities were lost to populist economic management. It is a matter of debate whether the healthy performance of the economy during 2002 to 2006 was due to the fiscal space provided by debt rescheduling and loan write-offs, increased foreign investment, internationally driven low interest rate environment, expanding world trade, domestic consumer led growth or a combination of all the above. But the fact remains that no serious attempt was made to implement ‘second generation reforms’ – this despite announced public commitments to such reforms.
During 2002 to 2006, Pakistan lost an opportunity to meaningfully raise the tax-to-GDP ratio in a time of booming economic growth. For the elected governments that followed in 2008 and 2013, it became even more difficult politically to implement strong domestic resource mobilization efforts at a time of weak growth and with serious security and law and order challenges facing the country. For Pakistan, since the 1990s the failure to reform the taxation system and raise domestic resources has hampered successive governments from providing resources to transform the social sectors. Consequently, the officially announced commitment in many national and international forums in 2001 to achieve the MDGs have fallen victim to subsequent weak resource mobilization efforts.
The core of ‘second generation’ reforms consisted of institutional reforms to improve efficiency and reduce the losses of public sector enterprises and utilities. Implementing these with political commitment would have led to reduction in subsidies and financing from the government budget and thereby created space for increased investment in the social sectors. Unfortunately, successive governments since 2001 are struggling to implement these reforms and, with the exception of privatization of two
2 Pakistan Economic Survey 2010-11
Introduction

8
Pakistan Millennium Development Goals Report 2013
commercial banks and two industrial banks, no visible progress was made. Due to subsidized energy pricing and inefficiencies in the government power generation and distribution sector, the phenomenon of ‘circular debt’ led to a severe energy crisis and unsustainable debt burden on the government in recent years. This has not only dashed hopes for creating much needed fiscal space for the social sectors, but reduced the overall growth of the economy, as well as revenue generation and increased the risk of higher incidence of poverty and unemployment in the country.
Disturbed law and order situation in certain parts of the country impacted inflow of foreign investment. This plummeted from a peak of over US$ 5 billion in 2007/08 to US$ 800 million in 2011/12. The poor law and order condition and energy shortages in the country also made it difficult to maintain the pre-2006 momentum in exports. This resulted in pressure on the foreign exchange rate and depreciation of the Pakistani rupee, leading to resort to the IMF for Balance of Payments support, and to increased foreign borrowing on expensive terms and ballooning of the foreign debt. The poor performance of the foreign sector transmitted to the domestic economy in terms of higher inflation, lower GDP growth, higher budget deficits and slower growth in nominal allocations to the development budget of social sectors (except for social safety nets) needed to attain the MDGs.
The after effects of the global financial crisis of 2008 are still reverberating in slow and uncertain growth momentum. As the US and EU are the biggest markets for Pakistani exports. Combined with low productivity and country diversification of exports and failure of the Doha Round, the growth rate of Pakistan’s exports decelerated after 2008, creating further pressure on its balance of payments. Moreover the commitments made by development partners under MDG 8 waned due to recessionary conditions. This adverse external environment in foreign assistance inflows created additional roadblocks for Pakistan in meeting the MDG targets.
Political and Institutional LandscapeThe revival of a democratically elected government in Pakistan in March 2008 led to a number of profound changes in the political and institutional landscape of the country. Although these changes will place the country’s economic and social development on a more sustainable path in the coming years, they slowed down the achievement of MDGs in the immediate to short-term. One notable observation is the tolerance of the political system towards a more outspoken, assertive and vibrant media and judiciary. The new Finance Commission Award to the provinces increased their share of the divisible pool and for the first time introduced multi-dimensional criteria, including poverty and backwardness, for determining the inter-provincial shares.
The 18th Constitutional Amendment and its active implementation from July 2011 significantly changed the country’s institutional and administrative landscape. The Ministries of Education, Health, Environment, Labour and Social Welfare were completely devolved to the provinces except vertical programmes underway in social and economic sectors remained with the federal government. The immediate challenges (i.e. capacity issues)j notwithstanding, decentralization resulting from the 18th amendment to the constitution brings positive prospects for the achievement of MDGs. Democracy in Pakistan was further strengthened with the successful May 2013 national and provincial elections. For the MDGs and post-2015 agenda, Pakistan’s sustained progression along the path of democracy signifies continuity of policies for social development, irrespective of inter-party differences on the economic paradigm to be followed in the coming years.
Under the pre-18th Amendment government structure prevailing at the start of the MDG period, the administrative and implementation commitment of the federal ministries to achieve the MDGs was strong. Evidence of this was seen in the influence of MDGs on Pakistan’s planning process, policies, programs and interventions (documented in the next chapter). However, co-opting and building ownership of sub-national or provincial governments in achieving the MDGs and targets was belated and only came after the MDG Summit 2005. Consequently the setting of national targets, which are in an operational sense the aggregate/average of sub-national (provinces and districts) performance, lacked rigorous and coordinated effort at the start of the MDG period. As a result these national targets - against which the provinces later judged their own performance (as documented in provincial MDG reports first published in 2010/12) - were considered ambitious.
With the passage of the 18th Amendment just four years before the end of the MDG period, the provinces began to develop a strong commitment to achieve the education and health related MDGs. The MDG Acceleration Framework being finalized by the provinces to achieve UPE by 2016 will be a test case to show the commitment of the four provinces three administrative regions to the MDGs and the post-2015 Agenda.
Introduction

9
Chapter 1
National Milestones around the MDGs and Impact on the Development Agenda
Chapter 1
Pakistan Millennium Development Goals Report 2013
10
This chapter assesses the alignment and influence of the goals and targets in Pakistan’s planning process, programs and priorities. In order to facilitate this analysis the MDGs have been grouped into four areas: poverty (Goal 1); education, literacy, and empowerment of women (Goals 2 and 3); health (Goals 4, 5 and 6); and environment (Goal 7).
Nearly ten years have passed since the Millennium Declaration. The international and local development contexts have changed significantly since then. Pakistan entered the millennium with high hopes of continued economic growth and fairly optimistic resource budgets. However, the situation changed significantly, as the country passed through various socio-political changes, economic challenges, natural disasters and internal and external security issues, but it still managed to uphold its commitment to the MDGs. The Government of Pakistan formulated three strategic planning documents during the initial five years of the MDG period that reinforced the commitments to the MDGs in an elaborated and operational manner: Poverty Reduction Strategy Paper (PRSP); Medium Term Development Framework (MTDF) 2005-10 and Vision 2030.
The strategic objectives of PRSPs were comprehensively aligned with the MDG priority areas from the onset. The total number of indicators aligned under I-PRSP was 13; this increased to 48 under PRSP I and II.3 The MDGs provided the long-term perspective within which the strategies to achieve the social, human and sustainable development objectives of the MTDF were formulated. Vision 2030 is an all-encompassing document that reflected the extent to which the MDGs were embedded in the on-going plans and strategies to achieve the 2015 targets. Vision 2030 recognizes that eradication of poverty and hunger is a first step in promoting a just and progressive society. It addresses primary education, literacy and reduction in infant and maternal mortality through various strategies and gives equal importance to other MDG targets.
Goal 1 Eradicate Extreme Poverty and Hunger
Major policy documents like the PRSPs had a significant focus on poverty, with Goal 1 in perspective.4 Enhanced allocations for the social sectors, recognizing the need for a comprehensive social safety nets framework to protect the poor and vulnerable, the focus on the rural economy, water resource availability and health and social services, all reflected the level of influence of the MDGs on the MTDF and Vision 2030.
At the policy level, the National Social Protection Strategy (2007) more specifically addressed key targets of Goal 1 such as food insecurity and investment in human and physical assets. At the program level the government aligned its existing social safety net programs, i.e. the Zakat program (1980) and Pakistan Bait-Ul-Mal (1992), with the adapted indicators. The Food Support Program (2002) was another success story whereby Rs. 2,000 per year were extended to around 1.25 million poor families in two biannual installments of Rs. 1,000 through country-wide post offices; with rising levels of need the subsidy amount was increased.
The Khushhal Pakistan Programme (KPP) generated economic activity through public works and temporary employment covering 17 sectors implemented by the district governments. Implementation of income generation projects relating to roads, water supply and sanitation improved people’s quality of life. Similarly the Pakistan Poverty Alleviation Fund (PPAF) was set up in 2000 with a view to enhance access of low-income communities to government socioeconomic services. The Benazir Income Support Program (2010) targeted the poor through unconditional cash transfers. Various initiatives at provincial level such as the Sasti Roti (affordable bread) scheme in Punjab and the Bacha Khan Rozgar Scheme are a clear reflection of the MDGs influence at the programme level.5
3 PRSP, Ministry of Finance, Government of Pakistan 4 UNDP Review of PRSP 5 Provincial MDG Reports 2011
Chapter 1

Pakistan Millennium Development Goals Report 2013
11
The common factor in Goals 2 and 3 is ensuring primary education for both boys and girls, with a focus on girls’ education. Goals 2 and 3 respectively address secondary education, adult literacy and youth, women empowerment and employment. Benchmarks for Goal 2 include Net Enrolment Ratio (NER),6 completion/survival rate (grade 1 to 5) and the literacy rate.7
In aligning with MDG 2 of achieving universal primary education, the interim and first PRSPs took major initiatives to address primary enrolment, dropout and literacy rates, with enhanced focus on resource management capacity of the government. The provision of free books, waiver of school fees, and scholarships to girls significantly improved girls’ enrolment. Financing new and existing programs for adult literacy continued nationwide to achieve the MDG indicators.8 There was a strong commitment to enhance employment opportunities for young women, through investment in innovative programs and harnessing support from private and non-governmental sectors. In parallel the MTDF included strategies to reduce gender gaps in enrolment and retention by providing financial and nutritional incentives to girl students, especially in rural areas. Mechanisms like employment quotas, micro credit and low interest credit for women entrepreneurs were introduced as important tools for economic empowerment of women.9 Vision 2030 clearly reflected its commitment to the set targets with a focus to reduce gender gaps in terms of access to education and employment.
The National Education Policies (1998) and (2009) are the two main policy documents advocating the cause and spirit of the MDGs. These emphasized the removal of urban, rural and gender imbalances specifically addressing the issue of out of school children and expansion of non-formal education to complement the formal system, and suggested initiatives such as functional literacy programs for adults, curriculum reform, strengthening education facilities, encouraging private sector participation and effective community involvement.10 Issues like lack of basic facilities in schools for equaliz access to education for underprivileged/marginalized groups, were focused on to increase enrolment and improve retention and completion rates.
Specific policies addressing empowerment of women were formulated in line with international commitments and MDGs. The National Commission on the Status of Women (2000) and the National Policy for the Development and Empowerment of Women (2002) were key steps to ensure a gender sensitive approach to development planning and implementation. Similarly the Labour Policy 2002 and Labour Protection Policy 2006 renewed the government’s commitment to reduce gender disparities in wages and promote equal employment opportunities. The Gender Reforms Action Plan (GRAP) 2005 was constituted at the national and sub-national levels. This plan worked on engendering planning and budgetary processes, restructuring the national machinery dealing with gender issues, and facilitating the requisite policy shifts. A number of programs were initiated in line with the targets set by the MDGs. The combination of the Education Sector Reforms Programmes (ESR) and the National Plan of Action of Education for All (EFA) was an important step. The entire focus was on universal primary education, reducing illiteracy, and eliminating gender disparities in primary and secondary education partly funded by various international development partners. Two additional programs in support of MDG 2 and 3 were launched at provincial level, namely National Education Assessment System (NEAS) and Education Sector Reform Assistance (ESRA) to ensure the achievement of targets.11 Other noteworthy programs included the National Literacy Program addressing the learning and education needs of out-of-school children, young people and adults; and the Tawana Pakistan Programme focused on poor nutritional status and school enrolment of primary school age girls.
A number of other programs including the National Programme for Women’s Political Participation (2002) and Gender Mainstreaming in Planning and Development Project (2004-2007) were initiated to promote women’s full and equal participation at all levels of governance, formulation, implementation, and monitoring and evaluation of government
6 Number of children 5 – 9 years of age attending primary level classes 7 Proportion of people aged 10+ years who can read and write with understanding 8 Ibid 9 MTDF 2005 – 2010, Planning Commission, Government of Pakistan 10 National Education Policy 1998, Ministry of Education, GoP 11 PRSPs, Ministry of Finance, Government of Pakistan
Chapter 1
Achieve Universal Primary Education & Promote Gender Equality and Women Empowerment Goals 2 and 3

Pakistan Millennium Development Goals Report 2013
12
Maternal and Child Mortality HIV/AIDS, Malaria and Other Diseases Goals 4, 5 and 6
policies, plans, programs and projects.12 Two noteworthy legal initiatives in line with MDG targets included the Protection of Women Act 2006 and the Reproductive Healthcare and Rights Bill 2009.
The Jafakash Aurat (Hardworking Women), Education Sector Reforms and Child Friendly Schools (CFS) in Punjab were other noteworthy interventions.13 The Gender Based Governance Systems (GBG) project in Khyber Pakhtunkhwa14 supported by UNDP, SDC and the Early Childhood Education and Early Learning Education Program in Sindh are other important initiatives at provincial level.15 The Government of Balochistan also initiated various programs for improvement of education and women empowerment.16
A significant portion of the MDGs (4, 5 and 6) is focused on health issues. Informed by the Participatory Poverty Assessment (PPA) in 2000, the I-PRSP focused on improving performance of the health sector to achieve MDG targets. The PPA, MTDF and PRSP played an instrumental role in developing a new vision for a National Health Policy from curative to preventive healthcare and inclined more towards the disadvantaged and those belonging to rural areas.17 The MDGs also played a key role in expanding the scope of the government’s approach to health issues, where the strategy pointed out the need for alignment of various government policies to collectively address interlinked issues.
Policies and program interventions outlined in the MTDF reflected the urgency and commitment that the government attached to achieving Goals 4, 5 and 6 in a comprehensive manner. It addressed all the targets and indicators.18 Vision 2030 spelled out that Pakistan’s future was dependent on trends in fertility and mortality. The basic health needs were noted by the Vision in terms of indicators such as rates of morbidity and mortality (especially infant and maternal mortality rates), illiteracy and malnutrition. It stressed innovative models of private-sector partnerships to address TB, Malaria and HIV/AIDS.
The National Health Policy 2001 and 2009, consistent with MDG targets, addressed childhood diseases and provision of quality care to reduce maternal mortality. The focus was on increased immunization coverage, recruitment and training of LHWs to cover the entire target population; annual provision of necessary vitamins to all under-5 children; and reduction in low birth weights of babies.19 Implementation modalities included: introduction of a new national program against Tuberculosis based on DOTS (Directly Observed Treatment Short Course); implementation of new national malaria control program, focusing on malaria microscopy through upgraded basic health facilities and early diagnosis with prompt treatment; prevention of HIV transmission through health education; surveillance system; early detection of Sexually Transmitted Infections (STIs); improved care of affected persons; and promotion of safe blood transfusions.20 Budgets were increased and modern best practices were introduced. Free of charge access for the deserving population to primary level public health facilities was institutionalized.21 The policies that aligned effectively in support of the health targets were the Population Policy 2002 and 2010 which focused on reducing population growth and fertility rates through enhanced access to family planning information and services.22 The National HIV/AIDS Policy 2007 aimed at providing an enabling
12 Gender Mainstreaming in Planning and Development Division and Departments 2007, Government of Pakistan http://www.pc.gov.pk/usefull%20links/Gender%20Mainstreaming/publications/Reports/QPRQ12007GMPnD1.doc13 UNICEF CFC Punjab : http://www.unicef.org/pakistan/CFS.pdf14 CEDAW shadow report NGOs 2012 AF http://www.af.org.pk/pub_files/1358697993.pdf 15 UNESCO, Policy Analysis of Education In Sindh – (2011) http://unesco.org.pk/education/documents/situationanalysis/Policy_Analysis_Sindh.pdf16 UNESCO, Policy Analysis of Education In Sindh – (2011) http://unesco.org.pk/education/documents/situationanalysis/Policy_Analysis_Sindh.pdf17 PRSP I, Ministry of Finance, Government of Pakistan 18 The list of targets and indicators adopted by Pakistan compared to the original set under MDGs is annexed (A 1) 19 National Health Policy 2001, Ministry of Health Government of Pakistan 20 National Health Policy 2001, Ministry of Health, Government of Pakistan21 Health Policy 2009, Ministry of Health, Government of Pakistan ––22 The Asian Forum of Parliamentarians on Population and Development: http://www.afppdpopulationpolicies.org/Population/Pakistan/National_Population_Policy_Pakistan_Draft_2010.html
Chapter 1

Pakistan Millennium Development Goals Report 2013
13
environment for HIV/AIDS prevention and care programs and services.
Noteworthy programs influenced by the MDGs include: the “Expanded Programme on Immunization” (EPI) focused at strengthening maternal and child health services within the existing health system:23 the Pakistan National Maternal Neonatal and Child Health Programme (MNCH); the Population Welfare Programme; People’s Primary Health Care Initiative (PPHI) . The Family Planning and Primary Health Care (FP&PHC) program launched in 1994 joined hands with the Pakistan Initiative for Mothers and Newborns (PAIMAN) in 2007. PAIMAN established a communication and publication cell in 2010 and employed over 100,000 LHWs to cover 65% of the population.24 The National AIDS Control Programme (NACP) launched in 1994 was brought under the ‘Social Action Program Project’ and its time-frame was extended until 2003. Following the Declaration of Commitment (DoC) in 2001, the ‘Enhanced HIV/AIDS Control Project’ (EHACP) for 2003/2008 funded by the World Bank, DFID and the government was approved. The DOTS strategy was piloted in Pakistan from 1995 but the real progress in TB control was achieved after revival of the National Tuberculosis Program in 2001, when TB was designated as a national emergency through the Islamabad Declaration.25 The mission of the current NTP Strategic Plan 2010/15 is to achieve countrywide control of TB through effective implementation of the National Stop TB strategy.26 The National Malaria Control Program under which the national treatment policy was revised in 2006 to conform to the most recent WHO guidelines on the radical treatment of falciparum and vivax malaria. Two noteworthy legal initiatives include the HIV & AIDS Prevention and Treatment Act 2007 and the Reproductive Healthcare and Rights Act 2013. The stronger emphasis of the MDGs on health issues, is matched at provincial level as evident in the replication of the aforementioned national programs such as EPI, MNCH, TB Control (DOTS), Malaria and HIV/AIDS control programs.
Goal 7 Ensure Environmental Sustainability
Environmental sustainability was initially addressed by the interim-PRSP through the National Conservation Strategy (NCS) within which the National Environment Action Plan (NEAP) was also approved. This helped the government develop provincial capacity for implementing environmental protection laws.27 The MTDF framework was prepared with the long-term objective of attaining sustainable economic growth without environmental degradation. It identified the country’s specific priorities and addressed them within the framework of comprehensive national strategies, the Johannesburg Plan of Implementation and the Water, Energy, Health, Agriculture and Biodiversity Frameworks.28 Vision 2030 for environmental conservation and management aimed at equitable sharing of environmental benefits, increased community management of national resources, and integration of environmental issues into socio-economic planning to achieve sustainable development.29
Many of the policies in the environment sector address MDG targets such as water, sanitation, forests and climate change. The key points of the National Environment Policy 2005 aligned with the MDGs include: effective management of resources and sustainable development; conservation of the country’s water resources; sustainable management of natural forests; and effective management of protected areas. The National Sanitation Policy 2006, National Forest Policy 2010 and National Drinking Water Policy 2009 adequately cover the targets of MDG 7. These include adequate sanitation coverage and integration of sanitation programs with planning policies through innovative actions such as the use of component sharing model and incentives; monitoring by the environment protection agencies; capacity building and awareness of officials and communities. These policies also cover the conservation of surface and groundwater resources, use of appropriate technologies and standardization, community participation, and
23 Health Department, Government of Punjab http://health.punjab.gov.pk/?q=epi24 Revised PC LHW, Government of Pakistan, http://www.pc.gov.pk/downloads/pc1- forms_verticalhealthprogram/National%20Program%20for%20Family%20Planning.pdf25 The government declared TB a national emergency in March 2001 in the “Islamabad declaration,” in which the national tuberculosis programme was asked to implement WHO’s recommended strategy against TB through DOTS (directly observed treatment short course) strategy.26 Government of Pakistan - Ministry of Inter-Provincial Coordination - National TB Control Program http://www.ntp.gov.pk/27 Ministry of Environment, Government of Pakistan28 ibid29 Vision 2030, Government of Pakistan
Chapter 1

Pakistan Millennium Development Goals Report 2013
14
public awareness and the sustainable management of forests and allied natural resources. In addition the National Climate Change Policy 2012 addresses challenges of climate change by integration with the other inter-related aforementioned national policies.30
Noteworthy programs under this goal include: the National Environmental Information Management System (NEIMS) 2005; Clean Drinking Water for All (CDWA) Programs (2005); Community Led and School-Led Total Sanitation (CLTS) Programs. The provinces mainly follow the national policies, however a few province-specific examples include: the Punjab Clean Drinking Water Policy;31 establishment of the Sindh Environmental and Alternate Energy Department;32 the Khyber Pakhtunkhwa Sanitation and Drinking Water Supply Policy/Strategy;33 and the Balochistan Environment, Sports and Youth Affairs Department.34
The government is also finalizing the MDG Acceleration Framework which has prioritized the MDG target for Universal Primary Education. Bottlenecks and associated solutions have been identified and the MDG Acceleration Framework will provide a list of innovative solutions to accelerate progress towards net enrolment ratio.
In conclusion, the above evidence highlights Pakistan’s success in aligning a plethora of its policies, programs and projects to achieving the MDGs within the stipulated time period. However, the following chapters will reveal that Pakistan’s actual performance fell far short of the blueprint and roadmap laid out in the above policies and programs. In large part the inability to achieve the MDGs clearly rests on the already mentioned challenges facing Pakistan since the start of the millennium. Nonetheless, there is one common thread of weakness in many of these policies and programs. Most of them lacked in-built robust frameworks for timely monitoring and evaluation during implementation – vital to meet the time bound MDGs. The consequent resort to mid-way course correction and fine tuning of interventions from lessons learnt became administratively and politically difficult. Thus, in spite of the red flags raised by the previous three national MDG reports about the difficulty in achieving many of the important MDG indicators, the programs’ implementation continued with business-as-usual momentum and dynamics.
30 National Climate Change Policy 2012, Ministry of Climate Change, Government of Pakistan 31 MDG Report 2011, P&D Department, Government of Punjab 32 Government of Sindh : http://www.sindh.gov.pk/dpt/Environment/index.htm33 Government of Khyber Pakhtunkhwa: http://www.khyberpakhtunkhwa.gov.pk/Environment/Department/index.php34 Government of Baluchistan http://www.balochistan.gov.pk/index.php?option=com_content&view=featured&Itemid=17
Chapter 1

Eradicate ExtremePoverty and Hunger
Chapter 2

Pakistan Millennium Development Goals Report 2013
16
Chapter 2 MDG 1
Key Points
Under MDG1 Pakistan aims to halve by 2015, the proportion of people living below the poverty line, to achieve full and productive employment and decent work for all, and to halve the proportion of people who suffer from hunger.
The country is off-track on two out of three targets. There has been a downward trend in poverty incidence over the past decade, and Pakistan is on track to achieve the MDG target with regard to poverty.
Pakistan’s employment to population ratio increased from 27.1 percent in 2001/02 to 30.9 percent in 2010/11, making the prospect of full employment by 2015 highly unlikely.
Malnutrition, measured as prevalence of underweight children under-5 years of age, decreased slightly from 40 percentin 1990/91 to 31.5 percent in 2011/12, but is still far off the MDG target of less than 20 percent by 2015. For the indicator “Proportion of population below the minimum level of dietary energy consumption”, the latest available figure is 30 percent for 2001/02; achieving the target of 13 percent in 2015 looks difficult.
but thereafter slowed and fluctuated to 57 percent and 50 percent in 2011/12. The literacy rate is 58 percent overall, but this is highly skewed towards males – 70 percent of males are literate compared to 47 percent of females.
Poverty is dynamic and multifaceted in its nature, and dependent upon a host of factors includingfood price volatility, access to financial capital and physical assets, employment opportunities, internal and external economic shocks;level of literacy, health and access to other social services,economic growth, if inclusive and equitable can lead to poverty reduction.
MDG 1 aims to halve the proportion of people living under the poverty line by 2015, and ensure full and decent employment for all, and halve the proportion of people suffering from hunger. Progress is measured against three indicators: proportion of population below the calorie based food plus non- food poverty line; prevalence of underweight children under 5 years of age; and proportion of population below minimum level of dietary energy consumption.
Introduction
Proportion of population below the calorie based food plus non- food poverty line.
Prevalence of underweight children under 5 years of age
Proportion of population below minimum level of dietary energy consumption
12.4
31.5
30
13
<20
13
On Track
Off Track
Off Track
Table 2 Status of Indicators - MDG 1
Indicators Target StatusLatest
NationalValue

Pakistan Millennium Development Goals Report 2013
17
Chapter 2 MDG 1
35 Based on consumption data of households collected through household surveys by the Pakistan Bureau of Statistics and poverty trends analyzed by the Planning Commission and CRPRID/CPRSPD. Provincial estimates for Punjab from Pakistan Microfinance Network (PMN) and Social Policy Development Center (SPDC, 2006): for Khyber Pakhtunkhwa from PMN and CDS 2009/10; Balochistan from PMN and SPDC (2006); for Sindh from SPDC (2006). 36 Labor Force Survey, Various Issues37 Labor Force Survey, Various Issues 38 Statistical Appendix: Various Issues of Pakistan Economic Survey. Calculated as GDP (fc) at 1999-2000 prices divided by Total Employed Labor Force.
Indicators Region 1990/91 2001/02 2004/05 2005/06 2006/07 2007/08 2008/09 2009/10 2010/11 2011/12
Proportion of population below the calorie based food plus non- food poverty line. 35
Employment to population ratio 36
Proportion of own-account and contributing family workers in total employment 37
Growth in Labor Productivity (Constant factor cost in Rs; year on year growth) 38
Pakistan
Punjab
Sindh
KP
Balochistan
AJ & K
FATA
Pakistan
Punjab
Sindh
KP
Balochistan
Pakistan
Punjab
Sindh
KP
Balochistan
Pakistan
17.2*
n/a
n/a
n/a
n/a
n/a
n/a
30.5
32.0
31.3
24.6
27.1
63.1
62.2
62.9
65.4
71.0
0.6
26.1
n/a
n/a
n/a
n/a
n/a
n/a
n/a
n/a
n/a
n/a
n/a
n/a
n/a
n/a
n/a
n/a
n/a
n/a
n/a
n/a
39.0
n/a
n/a
n/a
31.0
32.4
31.9
25.3
27.0
63.0
62.7
62.0
64.3
70.0
-4.4
34.5
26.0
31.0
29.0
48.0
n/a
n/a
27.1
29.7
25.9
20.5
23.4
59.3
60.5
54.6
62.5
59.3
-0.7
n/a
n/a
n/a
n/a
n/a
n/a
n/a
31.2
33.1
31.5
24.4
26.1
63.3
64.0
61.0
62.0
71.8
0.5
23.9
n/a
n/a
n/a
n/a
43.0
n/a
n/a
n/a
n/a
n/a
n/a
n/a
n/a
n/a
n/a
n/a
6.9
12.4*
n/a
n/a
n/a
n/a
n/a
n/a
30.9
33.1
31.0
24.3
24.5
62.6
63.2
60.9
59.2
72.3
1.9
22.3
n/a
n/a
28.2
50.9
n/a
n/a
30.2
32.8
28.7
23.3
28.6
61.9
63.7
55.6
61.1
71.9
-3.4
n/a
n/a
n/a
n/a
n/a
n/a
47.0
n/a
n/a
n/a
n/a
n/a
n/a
n/a
n/a
n/a
n/a
1.6
13.0
n/a
n/a
n/a
n/a
n/a
n/a
n/a
n/a
n/a
n/a
30.1
32.8
29.0
22.3
27.8
61.8
63.1
57.6
59.9
70.5
5.3
Table 1 Tracking MDG 1
MDGTarget(2015)
* The figures may be considered interim indication of poverty situation in the country. A Technical Group on Poverty is reviewing official methodology and to find out possible causes of variance in poverty numbers and recommend final official estimates.
Target 1A: Halve, between 1990 and 2015, the proportion of people below the poverty line (percent)Target 1B: Achieve full and productive employment and decent work for all, including women and young people Target 2: Halve, between 1990 and 2015, the proportion of people who suffer from hunger (percent)

Pakistan Millennium Development Goals Report 2013
18
Chapter 2 MDG 1
39 Data on nutrition related indicators are collected periodically through the Nutrition Survey and analyzed by the Planning Commission. Information reported for 1990-91 and 2000-01 is from the 1998-99 and 2000-01 survey respectively40 Planning Commission41 Fact sheet provided by, P&D Department, Govt. of GB 42 Fact sheet provided by P&D Department, FATA Secretariat 43 These figures may be considered interim indication of poverty situation in the country. A Technical Group on Poverty is reviewing official methodology and to find out possible causes of variance in poverty numbers and recommend final official estimates.
Indicators Region 1990/91 2001/02 2004/05 2005/06 2006/07 2007/08 2008/09 2009/10 2010/11 2011/12
Prevalence of underweight children under 5 years of age. 39
Proportion of population below minimum level of dietary energy consumption 40
Pakistan
Punjab
Sindh
KP
Balochistan
AJ&K
GB
Pakistan
Punjab
Sindh
KP
Balochistan
GB 41
FATA 42
38.0
33.6
n/a
n/a
43.0
n/a
n/a
n/a
n/a
n/a
n/a
n/a
n/a
n/a
40.0
n/a
n/a
n/a
n/a
n/a
n/a
25.0
n/a
n/a
n/a
n/a
n/a
n/a
38.0
n/a
n/a
n/a
n/a
n/a
n/a
n/a
n/a
n/a
n/a
n/a
n/a
n/a
41.5
n/a
n/a
38.0
n/a
n/a
n/a
30.0
36.4
40.0
27.1
49.7
n/a
n/a
n/a
n/a
n/a
n/a
n/a
n/a
n/a
n/a
n/a
n/a
n/a
n/a
n/a
n/a
38.0
n/a
40.0
n/a
n/a
31.0
n/a
n/a
n/a
n/a
n/a
n/a
n/a
n/a
n/a
n/a
n/a
n/a
n/a
n/a
50.0
n/a
n/a
n/a
n/a
n/a
39.0
n/a
38.0
n/a
n/a
n/a
n/a
n/a
n/a
n/a
n/a
n/a
n/a
n/a
n/a
n/a
31.5
29.8
40.5
24.1
39.6
n/a
n/a
n/a
n/a
n/a
n/a
n/a
n/a
32.6
<20
13.0
38.0
n/a
n/a
n/a
n/a
38.0
n/a
n/a
n/a
n/a
n/a
n/a
n/a
n/a
MDGTarget(2015)
Table 1 Tracking MDG 1 (Continued)
Status and Trends
Status of Poverty in Pakistan The official poverty line in Pakistan is calorie based, and is defined as per capita food and non-food expenditure per month to support food consumption yielding 2,350 calories per adult equivalent per day. In Pakistani rupees the official poverty line was set at Rs.673.54 in 1998/99 (Table 1). Using this definition of poverty line in Pakistan, the head count (proportion of people below the poverty line) was 26.11 percent in 1990-91, the benchmark year for the MDGs. Consistent with the universal target of halving the poverty rate by 2015, Pakistan set the target for absolute poverty reduction of 13 percent.Table 1 shows that incidence of absolute poverty increased to 34.5 percentin the 1990s, and declined thereafter to 12.4 percent by 2010/11. 43
In the context of Pakistan, the relationship between poverty and growth is not clear-cut. In the sixties, high growth did not lead to an appreciable decline in poverty, while in the seventies the incidence of consumption based poverty declined in spite of low growth. The eighties and early 2000s witnessed high growth leading to reduced poverty, lending support to the poverty-growth nexus.

Pakistan Millennium Development Goals Report 2013
19
Chapter 2 MDG 1
A declining percentage of food expenditure indicates that households can afford to spend a larger share of income on other commodities such as education and leisure. As Table 3 shows, by and large expenditure shares were stable and varied within a narrow range for most of the commodity groups between 2005 and 2011. Expenditure shares on food, rent and miscellaneous items were more volatile than the other groups. After a period of slight decline between 2004/05 and 2005/06, the percentage consumption on the food and beverage commodity group had reverted back by 2010/11 to previous levels. Transport and communication generally show a rising trend. In 2010/11, the rise in food share came at the cost of smaller sharesforeducation, rent and miscellaneous.
Trends in InequalityThe Gini coefficient is commonly used as a measure of inequality in access among different geographical areas and income groups. The range of values for Gini coefficient vary between 0 and 1, where 0 denotes perfect equality - everyone in the society has equal income - and 1 signifies that all the income is with a single individual. Table 4 below shows the values of consumption based Gini coefficient in Pakistan.
Food, beverage and tobacco
Apparel, textile and footwear
Transport and communication
Cleaning, laundry and personal appearance
Recreation and entertainment
Education
Rent
Fuel and lighting
Miscellaneous
Commodity Group 2004/05 2005/06 2007/08 2010/11
48.3
6.0
5.2
3.7
0.4
3.0
13.0
7.8
12.7
43.1
5.7
6.2
3.6
0.7
3.7
15.2
8.0
14.0
44.2
5.5
6.2
3.6
0.7
3.9
15.1
7.6
13.2
48.9
5.1
6.0
3.7
0.4
3.5
13.9
7.6
10.8
Table 3 Expenditure Shares by Commodity Groups
Source: HIES 2004/05, 2005/06, 2007/08, 2010/11
The empirical evidence from household surveys and pro-poor expenditure (macro-level) presented in the remaining sections of this chapter is extended to include the post-2006/07 period. This evidence strengthens the earlier contention that consumption-based data on real household expenditure and inequality show an improvement in the nation’s well-being. The share of food and essentials as a percentage of total consumption expenditure in Table 3 shows the dynamics at household level.

Pakistan Millennium Development Goals Report 2013
20
Chapter 2 MDG 1
As seen consumption based Gini coefficient does not indicate severe inequalities in Pakistan. It ranged between 0.3027and 0.2752from 1998/99 to2010/11, and shows a cyclical trend (Figure 1). Over the last few years, Pakistan’s consumption inequality has narrowed. The trends in consumption based Gini coefficients for the four provinces` closely mimic the national trend. Punjab began with a comparatively higher inequality and in 2010/11 its Gini coefficient is still the highest among the four provinces. It is closely followed by Sindh and Khyber Pakhtunkhwa. Inequality is lowest in Balochistan, suggesting that a larger proportion of its population may be below the poverty line. In terms of rural/urban divide, the figures highlight that historically, inequality is higher in urban centers as opposed to rural regions of Pakistan. Both rural and urban areas mirror the national cyclical trends,although the urban coefficient of 0.3124 is lowest in 2010/11. Inequality has fallen faster in urban areas than in rural areas.
Gini Coefficient
Year Region 1998/99 2001/02 2004/05 2005/06 2007/08 2010/11
Pakistan
Punjab
Sindh
KP
Balochistan
Rural
Urban
0.3027
0.3113
0.3082
0.2684
0.2319
0.2526
0.3607
0.275
0.2746
0.3030
0.2273
0.2065
0.2367
0.3222
0.2976
0.3043
0.3023
0.2533
0.2394
0.2519
0.3388
0.3018
0.3000
0.3162
0.2627
0.2451
0.2462
0.349
0.2897
0.2891
0.2997
0.2531
0.2327
0.2529
0.3245
0.2752
0.2832
0.2825
0.2379
0.1899
0.2371
0.3124
Table 4 Gini Coefficients year-wise and by locations
Source: Pakistan Economic Survey 2010/11
In order to review the impacts of growth on income redistribution within society and to see whether the growth has been inclusive in its nature, the increase in overall income is compared with changes in income for individual segments of society. Table 5 below provides a basis for such an analysis. Using household data from various PBS surveys it compares the expenditure trends in constant prices of 2001/02 for the five consumption quintiles between 2001/02 and 2010/11. In real terms, consumption expenditure has increased in Pakistan over a period of time, which can be taken as a proxy for increased incomes (higher incomes translate into higher consumption expenditures).44 There was an overall increase in
44 There are a few studies which have shown that the propensity to save is highest for the middle income brackets, which may mean that incomes might have increased at a larger rate than increased consumption expenditure. Similarly, the poorest people have the highest propensity to consume.
Figure 1 Trends in consumption based Gini coefficient
Source: Pakistan Economic Survey 2010/11

Pakistan Millennium Development Goals Report 2013
21
Chapter 2 MDG 1
Thus, while the real growth rate in consumption expenditure from 2007-11 was less than in the period 2001-06, a larger portion of that growth has been tilted towards the poor segments of society.
Quintile
2001/02 2004/05 2005/06 2007/08 2010/11 2005/06 2010/11
Year Growth rates
2001/02- 2007/08-
13.9
13.5
12.5
11.1
6.2
8.3
5.7
8.3
11.8
16.1
34.8
20.3
680
938
1,175
1,525
2,891
1,441
537
747
945
1,242
2,572
1,207
519
738
929
1,225
2,447
1,178
508
690
845
1,070
1,908
1,004
Poorest 20 %
Second
Third
Fourth
Richest 20%
All
597
826
1,044
1,373
2,721
1,313
Table 5 Trends in Real Consumption by Quintile
Source: PIHS 2001/02, HIES 2004/05, 2005/06, 2007/08, 2010/11
incomes from Rs. 1,004 to Rs. 1,441 or 43.5percent (Figure 2). While consumption expenditure for people in the poorest quintile did increase over time, it was the lowest increase for the quintiles during the 2001/02-2005/06 period. By contrast, consumption expenditure increased the most (34.8 percent) for people in the highest quintile. This indicates that incomes did increase across the board between 2001/02 and 2005/06, but these were disproportionate in their nature and skewed in favor of the richer segments of the population.In the period 2007/08 consumption expenditure growth in the highest quintiles slowed, while it grew in the lowest quintiles.
Figure 2 Trends in Real Consumption Expenditures
Source: PIHS 2001/02, HIES 2004/05, 2005/06, 2007/08, 2010/11

Pakistan Millennium Development Goals Report 2013
22
Chapter 2 MDG 1
45 Including roads, highways & bridges, water supply & sanitation, education, health, population planning, agriculture, land reclamation, rural development, subsidies, social security & welfare (including BISP), food support program, Pakistan Bait-ul-Mal, peoples’ works program, natural calamities, low cost housing, administration of justice, and law & order.
Pro-poor Expenditure From Table 6, it is clear that expenditure on pro-poor sectors in Pakistan increased appreciably over the years. As a percentage of GDP, pro-poor expenditure more than doubled from 3.8 percent to 9.9 percent between 2001/02 and 2011/12. In nominal terms there has been an approximately ten-fold increasein expenditure on pro-poor sectors in Pakistan. As a percentage of GDP, pro-poor expenditure reached a peak of 9.7 percent in 2007/08, but then fell to around 7-8 percent before rising to 9.9 percent in 2011/12.
2001/02 2002/03 2003/04 2004/05 2005/06 2006/07 2007/08 2008/09 2009/10 2010/11 2011/12 2005/06 2011/122001/02- 2006/07-
Growth ratesIn Billion RupeesAnnual Trends
Market Access and Community Services
Human Development
Rural Development
Safety Nets
Governance
Total
As % of GDP
96.0
159.1
73.8
4,326.6
2,836.1
356.4
102.5
478.2
120.2
223.0
253.9
(79.4)
126.4
30.8
150.1
577.2
176.4
832.2
211.4
1,947.3
9.9
128.1
443.9
159.6
605
184
1,520.6
8.3
123.9
361
159
303.9
154.6
1,102.4
7.5
121.8
329.4
136
272.7
113.9
977.2
7.4
104.5
256.8
151.5
433.3
94
1,042.0
9.7
76.6
222.8
101.5
18.8
7.2
426.7
4.9
63.6
191.1
78.5
36.1
6.8
376.1
4.9
41.7
152.9
59.7
11.3
50.5
316.2
4.8
28.5
129.4
44.6
16.3
41.8
261.3
4.6
16.6
108.9
34.2
14.61
39
209.0
4.3
11
86.8
24.3
10.2
33
166.1
3.8
Table 6 Trends in Pro-poor Expenditures 45
Source: Progress Reports of PRSP, Ministry of Finance - Various Issues
Table 6 also gives the breakdown of pro-poor expenditures.It shows a marked change in growth of allocations to different sectors from 2006/08. The largest growth was recorded in Safety Net programmes (up from 6 percent in 2001/02 to nearly 42 percent in 2011/12), with a phenomenal increase in subsidies. Similarly, large growth (close to 2,800 percent) in public expenditure on Governance was recorded. A drop in spending was seen for Market Access and Community Services along with Rural Development. Human Development is the second largest recipient category of pro-poor expenditures. Over the years, the largest increase in this sector has been in the education category followed by health.
Employment and PovertyOver the ten years from 2001/02 to 2010/11, the employment to population ratio in Pakistan fluctuated but overall increased slightly from 27.1 percent to 30.9 percent. All fourprovinces showed a significant jump between 2001/02 and 2004/05 in this ratio, but thereafter fluctuated in a narrow range, with the exception of Balochistan. Punjab has a larger share of population employment ratio than the other provinces with slow increase over the years. By contrast, the employment share in Balochistan has shown constant decline from 2005/06 onwards, falling from 28.6percent to 24.5percent in 2010/11.
Although increased participation of females in the labor force contributed to the above improvement in the employment to population ratio, the share of own-account and contributing family workers has fluctuated in the narrow range of 58.7 - 63.1 percentover the last 20 years. The majority of this class of workers is in agriculture and females. As they are “self-employed” and their remuneration is based directly upon the household farm income, their employment and income is

Pakistan Millennium Development Goals Report 2013
23
Chapter 2 MDG 1
considered ‘vulnerable’, dependent on the vagaries of weather and economic and other shocks. A reduction in this figure will reduce vulnerabilities and will act as a deterrent to the increased incidence of poverty.
It is notable that a very large proportion of the population in Balochistan, ranging between 70 to 73percentbetween 2005/06 and 2010/11, comprise of own-account workers, while all the other provinces hover close to the national average of around 60 percent. The inter-provincial comparison of time trends indicates a marked jump in the vulnerable population of Balochistan from 59 to 72 percentbetween 2001/02 and 2005/06, as compared to nominal changes in the other three provinces in the same period. This could indicate reduced paid employment opportunities outside agriculture, thereby forcing contribution in farms as family workers.
The trend in growth in labor productivity (measured as ratio of GDP to total employed) is fluctuating in Pakistan; it reached a peak of 6.9 percent in 2004/05 and a low of -4.4 percent in 2008/09. Since then, it is once more positive but low at 1.6 percent for 2011/12. This low level of productivity arises from the fact that there is large workforce entrance in Pakistan and this workforce is taking on low paying work.
MalnutritionChild malnutrition is an important indicator to measure population nutritional standards and health conditions. The indicator used to quantify the nutritional standard of the community is ‘Prevalence of underweight children under 5 years of age’. Between 1990/91 and 2000/01, the prevalence of underweight children increased from 40percent to 41.5percent, and then fell to 38percent in 2004/05. The latest national nutritional survey reveals that the prevalence of underweight children under 5 years has fallen to 31.5 percent in 2010/11. Similarly in provinces, based on the available data, a falling trend is seen in Punjab, Khyber Pakhtunkhwa and Balochistan, while in Sindh child malnutrition increased minutely. In AJ&K child malnutrition increased between 2004/05 and 2006/07. The single value for GB indicates that 50 percent of children are malnourished while in FATA the indicator is close to the national level.
Based on the data that is available and linked with other factors, it seems highly unlikely that the target of 20 percent prevalence of underweight children will be met. There is not much data for the indicator of the proportion of population below the minimum level of dietary energy consumption, however the last reported figure was for 2000/01 at 30 percent while the MDG target is 13 percent.

Pakistan Millennium Development Goals Report 2013
24
Chapter 2 MDG 1

Achieve UniversalPrimary Education
Chapter 3

Pakistan Millennium Development Goals Report 2013
26
Chapter 3 MDG 2
Key Points
MDG2 aims to achieve 100 percent primary school enrolment, 100 percent completion of education from grades 1-5 and an 88 percent literacy rate.
The country is off-track on all three indicators. Rates of primary enrolment and completion increased up to the mid-2000s but thereafter slowed and fluctuated to 57 percent and 50 percent in 2011/12. The literacy rate is 58 percent overall, but this is highly skewed towards males – 70 percent of males are literate compared to 47 percent of females.
It is now widely accepted that development of human capital, notably education and skills, is critical to a country achieving growth and prosperity and improving human development outcomes.
MDG 2 aims endeavors to increase access to primary education and achieve universal primary education (UPE) in the country by 2015. Progress is measured through tracking three indicators: primary enrolment rate, completion rate (grades 1-5) and adult literacy rate.
Under Article 25a of the constitution of Pakistan two significant provisions impacting education have been introduced. One, education has been made a basic human right for every citizen of the state. Two, itis now the state’s responsibility to “provide free and compulsory education to all children of the age of five to sixteen years”. 52 The 18th Amendment also provided for extensive devolution of functions to provincial governments including the subject of education
Introduction
Net primary enrolment ratio (%)
Completion/survival rate Grade 1 to 5 (%)
Literacy rate (%)
100
100
88
Off Track
Off Track
Off Track
Table 8 Status of Indicators - MDG 2
Indicators Target StatusLatest
NationalValue
52 Article 25A, Constitution of Pakistan
57
50
58

Pakistan Millennium Development Goals Report 2013
27
Chapter 3 MDG 2
46 Pakistan Integrated Household Survey (PIHS) 1990/91, 2001/02, Pakistan Social and Living Standard Measurement Survey (PSLM) 2004/05, 2005/06, 2006/07, 2007/08, 2008/09, 2010/11, 2011/1247 2005/06,2006/07,2007/08 and 2010/11(PSLM ), for other years (Fact Sheet, P&D DepartmentGB)48 National Education Management Information System (NEMIS) 1990/91, 2001/02, PSLM 2004/05, 2005/06, 2006/07, 2007/08, 2008/09, 2010/11, 2011/1249 PSLM 2006/07,2007/08 and 2010/11, for other years (Fact Sheet, P&D Department,AJ&K)50 Fact Sheet, P&D Department, FATA Secretariat
Table 7 Tracking MDG 2
Indicators Region 1990/91 2001/02 2004/05 2005/06 2006/07 2007/08 2008/09 2010/11 2011/12
Net primary enrolment ratio (percent) 46
Completion/survival rate Grade 1 to 5 (percent) 48
Pakistan
Punjab
Sindh
KP
Balochistan
AJ & K
GB 47
FATA
Pakistan
Male
Female
Punjab
Mali
Female
Sindh
Male
Female
KP
Male
Female
Balochistan
Male
Female
AJ&K 49
FATA 50
46
n/a
n/a
n/a
n/a
n/a
n/a
n/a
50
n/a
n/a
n/a
n/a
n/a
n/a
n/a
n/a
n/a
n/a
n/a
n/a
n/a
n/a
n/a
n/a
42
45
40
41
n/a
74
n/a
n/a
57
53
33
n/a
n/a
n/a
n/a
n/a
n/a
n/a
n/a
n/a
n/a
n/a
n/a
91
n/a
52
58
48
47
37
n/a
n/a
n/a
44
55
64
46
55
37
47
58
34
36
52
20
27
40
12
n/a
n/a
53
57
50
49
34
88
42
n/a
43
54
33
45
54
37
46
57
35
37
53
23
25
36
11
94
n/a
56
62
50
49
41
60
41
n/a
46
56
35
49
57
40
47
57
36
38
55
21
29
42
14
n/a
n/a
55
61
51
49
41
60
36
n/a
47
58
37
50
58
42
49
60
36
38
54
24
32
46
15
n/a
n/a
57
62
54
52
44
n/a
n/a
n/a
49
59
38
51
59
42
51
62
38
41
57
24
34
48
16
n/a
n/a
56
61
53
51
47
61
36
n/a
49
59
39
52
60
44
52
62
40
41
57
26
32
48
13
n/a
n/a
57
64
50
53
39
62
41
31
50
60
40
52
60
44
53
63
41
42
59
27
35
50
16
93
66
100
100
MDGTarget(2015)
Target 3: Ensure that by 2015, children everywhere, boys and girls alike, will be able to complete a full course of primary schooling.

Pakistan Millennium Development Goals Report 2013
28
Chapter 3 MDG 2
51 PIHS for 1990/91, 2001/02, PSLM for 2004/05, 2005/06, 2006/07, 2007/08, 2008/09, 2010/11, 2011/1253 Education Policy in Pakistan: A Framework for Reform, Tahir A. Andrabi, Jishnu Das and Ijaz Khwaja, 2010
Status and Trends
Primary School Enrolment One of the major objectives of MDG2 is to achieve universal primary education. Against the baseline of 46 percent in 1990/91, Pakistan adopted the MDG target of 100 percent for 2015. However, evidence from the last 12 years indicates that Pakistan has not shown significant progress on this indicator. Primary school enrolment increased by 10 percentage points to 52 percent between 2001/02 and 2004/05 but then stagnated. As seen in Figure 3, there has been virtually no appreciable improvement in the enrolment rate over the last decade. It should also be noted that the number of private schools grew to more than 50,000 in 2005, which accounted, according to one estimate, for one third of total primary school enrolment.53 It could be difficult for Pakistan to meet the MDG target on this indicator.
Indicators Region 1990/91 2001/02 2004/05 2005/06 2006/07 2007/08 2008/09 2010/11 2011/12
Literacy rate (percent) 51
Pakistan
Male
Female
Punjab
Male
Female
Sindh
Male
Female
KP
Male
Female
Balochistan
Male
Female
AJ&K
Male
Female
GB
Male
Female
FATA
35
48
21
n/a
n/a
n/a
n/a
n/a
n/a
n/a
n/a
n/a
n/a
n/a
n/a
n/a
n/a
n/a
n/a
n/a
n/a
n/a
45
58
32
47
57
36
46
60
31
38
n/a
n/a
n/a
n/a
n/a
58
n/a
n/a
n/a
n/a
n/a
n/a
53
65
40
55
65
44
56
68
41
45
64
26
37
52
19
n/a
n/a
n/a
n/a
n/a
n/a
n/a
54
65
42
56
66
47
55
67
42
46
64
30
38
54
20
60
n/a
n/a
n/a
n/a
n/a
n/a
55
67
42
58
67
48
55
67
42
47
67
28
42
58
22
71
83
59
50
64
36
n/a
56
69
44
59
70
48
56
69
42
49
68
33
46
66
23
70
83
58
52
64
39
n/a
57
69
45
59
69
50
59
71
45
50
69
31
45
62
23
n/a
n/a
n/a
49
64
34
n/a
58
69
46
60
70
51
59
71
46
50
68
33
41
60
19
71
84
59
49
63
36
n/a
58
70
47
60
70
51
60
72
47
52
72
35
46
65
23
74
n/a
n/a
56
n/a
n/a
24
88
MDGTarget(2015)
Table 7 Tracking MDG 2 (Continued)

Pakistan Millennium Development Goals Report 2013
29
Chapter 3 MDG 2
Provincial and Special Area Status and TrendsThe four provinces have also adopted the MDG target of 100 percent primary enrolment. There are marked differences in enrolment rates across the provinces: Punjab has the highest rate, followed closely by Sindh and Khyber Pakhtunkhwa, while Balochistan is significantly lagging behind the others. Moreover, over time, the disparity in primary enrolment ratio between Punjab and the other three provinces has widened. Punjab is the only province above the national average; due to its larger population share, it is actually Punjab that has pulled up the national average. From this perspective, the slowing of enrolment growth after 2004/05 nation wide mirrors the slow improvement in ratios in Punjab after 2004/05.
Khyber Pakhtunkhwa shows a slow but steady increase in the period under consideration. Given the concurrent war against extremism and consequent security situation, it has fared well relative to other provinces in that the net enrolment rate has not witnessed a decrease. Sindh has shown a marked decrease in its enrolment rates since 2008/09, falling from 54 percent to 50 percent in 2011/12 (Figure 4). This drop can be attributed to the impact of floods and the ensuing displacement of the indigenous population in the province.
The short NER time series for AJ&K indicates a rising trend between 2001 and 2006, but this has been stagnantat around 60 percent between 2006/07 and 2010/11. GB showed a moderate reversal between 2005/06 and 2010/11, but its NER climbed back to 41 percent in 2011/12. FATA’s NER at 31 percent in 2012 is the lowest in the country.
Disparities across DistrictsTable 9 below summarizes the disparity in net enrolment rates among the districts of each province. The summary statistic ‘range’ gives the difference between the district with the highest primary enrolment rate and the district with the lowest. The higher the range, the greater the inequality or disparity within the province. In 2004/05, intra-provincial disparities based on the value of range were fairly similar. However, by 2010/11, these inequalities increased within Khyber Pakhtunkhwa and Balochistan, but narrowed marginally in Sindh and in Punjab. Across years the trend in range values for the threeprovinces (except Punjab) remained uneven.
The coefficient of variation (CV) is another simple measure of inequality. It is more precise than range as it is a ratio of spread (standard deviation) of enrolment rates of all the districts in the province divided by the average of enrolment rates of all the districts. The higher the CV value the higher the disparity among districts in a province. In Punjab and Sindh, CV is
Figure 3 Targets and Achievements - Net Primary Enrolment Ratio
Source: PIHS 1990/91, 2001/02, PSLM 2004/05, 2005/06, 2006/07, 2007/08, 2008/09, 2010/11, 2011/12

Pakistan Millennium Development Goals Report 2013
30
Chapter 3 MDG 2
low and decreased overtime, while in Khyber Pakhtunkhwa and Balochistan intra-provincial disparities are comparatively high, uneven and increased overtime. 54
Rank correlation is another summary indicator showing how the districts’ standing in enrolments has changed, in this case between 2004/05 and 2010/11. Enrolment of districts is ordered from highest to lowest in period 2004/05. The ranking of the same districts is noted in 2010/11 and correlation is estimated for the two series. If the correlation is high, it means the ranking of districts has not changed significantly between the two periods, and vice versa.
The estimates for the fourprovinces suggest that districts in Punjab and Khyber Pakhtunkhwa did not change their position during the period, i.e. those who were at the top (or bottom) in 2004/05 remained at top (or bottom) in 2010/11.In the case of Sindh and Balochistan, the low correlation indicates that considerable shuffling took place among the ranking of the districts between the two periods.55 Districts that showed most improvement in NER are: in Punjab, T.T. Singh with 13 percent; in Sindh, Hyderabad with 22 percent; in Khyber Pakhtunkhwa, Upper Dir with 21 percent; and in Balochistan Jhal Magsi with 44 percent. Similarly, the largest marked decrease was seen in of Sialkot (17 percent), Badin (7 percent), Abbottabad (12 percent), and Loralai (21 percent) respectively. The inter-provincial averages and spread are depicted in Figure 4.
The Punjab Government introduced a free textbook scheme and provided 12.2 million textbooks in 2004-05; the scheme has been extended to secondary school education until 2013. During this period 10.6 million students were provided
55 The measure of Rank Correlation can be interpreted as an indicator of progress among districts within a province. A high correlation denotes that progress in districts was evenly or equally spread across the province. Therefore ranking of districts between the periods would remain unchanged denoted by high correlation. If the progress is uneven among districts during the period, for example interventions concentrated in some districts and not in others, the ranking will change and the correlation will be low.
Punjab
Sindh
KP
Balochistan
Punjab
Sindh
KP
Balochistan
Province
Range (No. of Districts)
Coefficient of Variation (%)
Rank Correlation (between 2004/05 and 2010/11)
2004/05 2006/07 2008/09 2010/11
46(35)
40(26)
43(24)
44(24)
21
20
25
31
46(35)
34(16)
45(24)
48(26)
18
20
22
29
41(36)
33(22)
35(24)
59(28)
18
17
20
34
Punjab
Sindh
KP
Balochistan
0.84
0.33
0.75
0.24
41(37)
38(24)
52(24)
58(30)
16
17
22
38
Table 9 Disparities across Districts - Net Enrolment Rate

Pakistan Millennium Development Goals Report 2013
31
Chapter 3 MDG 2
56 Economic Survey of Pakistan, 2012-13, Ministry of Finance57 The estimates for the year 1990/91 and 2001/02 come from survey conducted by the National EducationManagement Information System (NEMIS). It is an administrative data source. A technical committee has been set up in PC to reconcile the methodologies of PSLM and NEMIS data sets for arriving at consistent estimates of completion rates.
access to free textbooks. To improve female enrolment, an incentive of Rs. 200 per month was given to females enrolled in grades 6-10 in low literacy districts. Similarly, Sindh introduced a free textbook scheme in 2003 for primary school students and extended it to secondary school students in 2005-06. A total of 4.7 million free textbooks were distributed. To promote higher education, 600 students were granted scholarships once a year of Rs. 25,000. Khyber Pakhtunkhwa also provided over 30 million free textbooks from primary to secondary level and provided stipends amounting to Rs. 200 to girls in low literacy districts. Balochistan provided free textbooks amounting to Rs. 150 million for students upto secondary level. 56
All four provinces have introduced free textbook schemes: Punjab provided 12.2 million free primary textbooks in 2004-05; Khyber Pakhtunkhwa and Sindh provided a total of over 30 million and 4.7 million free primary and secondary textbooks respectively; and Balochistan provided free secondary textbooks amounting to Rs. 150 million.
Figure 4 Provincial Averages and Spreads - Net Enrolment Rates
Source: PSLM 2004/05 - 2010/11
Completion / Survival Rate to Grade 5 Table 7 shows a consistent and sluggish increase in completion rate in Pakistan from 43percent in 2005/06 to 50percent in 2011/12. Prior to that, a different data source was used and hence comparison between the two periods may not be accurate.57 Given the current pace of progress on this indicator, it seems that Pakistan will be unable to reach the target of 100 percent completion rate. The rate of increase in completion rate remains essentially the same for both genders after 2004/05 (see Table 7).
Provincial and Special Area Status and TrendsThe completion rates in Punjab and Sindh were almost at par during the period of analysis. The completion rates for these provinces showed an increasing trend from 2005/06 onwards, matching the national average. Both provinces remained slightly above the national average during this period. Khyber Pakhtunkhwa came next, with Balochistan lagging behind the other provinces on this indicator.

Pakistan Millennium Development Goals Report 2013
32
Chapter 3 MDG 2
AJ&K has the highest primary completion rate in the country in the range of 90-94 percent (based on Non-PSLM source) and as a region is very close to achieving the MDG target of 100 percent for 2015. FATA at 66 percent primary level completion rate is the second highest after AJ&K based on the data provided by FATA secretariat.
Disparities across DistrictsThe disparity amongst districts within each of the four provinces remained within the 15 percent range between 2004/05 and 2010/11. Over time disparities among districts within Sindh province are stable in the range of 42-45. The disparity in completion rates in Punjabis more prominent, reaching a maximum of 60 percent in 2008/09.
The coefficient of variation (CV) in percentage terms is low and similar in three provinces, but much greater in Balochistan. As CV is a ratio of standard deviation to mean, the latter is sensitive to extreme values. In the case of Balochistan, the more extreme values at the lower end will lower the value of mean and thus raise the CV value as seen in Table 10. The value of Range is roughly the same for all provinces.
The rank correlationremained very high in both Khyber Pakhtunkhwa and Punjab, meaning that districts in these provinces retained their ranks over the period. The value of 0.75 for Sindh shows that a few districts changed their ranks during this period. Balochistan also had a very low rank correlation, showing that a lot of districts changed their ranking between 2004/05 and 2010/11. Districts showing the biggest drop in completion rates were: Rajanpur with 7 percent Shikarpur with 6 percent, D.I. Khan with 4 percent and Musa Khel with 16 percent. On the other hand, the highest increases in completion rates were:14 percent in T.T. Singh, 18 percent in Dadu, 15 percent in Batagram and 27 percent in Awaran.
Punjab
Sindh
KP
Balochistan
Punjab
Sindh
KP
Balochistan
Province
Range (No. of Districts)
Coefficient of Variation (%)
Rank Correlation (between 2004/05 and 2010/11)
2004/05 2006/07 2008/09 2010/11
47(35)
43(26)
37(24)
39(24)
27
28
26
36
56(35)
45(16)
41(24)
42(26)
28
31
25
38
60(36)
42(22)
49(24)
53(28)
27
25
25
42
Punjab
Sindh
KP
Balochistan
0.95
0.75
0.91
0.22
53(37)
44(24)
48(24)
45(30)
26
25
27
39
Table 10 Disparities across Districts - Primary Completion Rates
Source: PSLM 2004/05, 2006/07, 2008/09, 2010/11

Pakistan Millennium Development Goals Report 2013
33
Chapter 3 MDG 2
Figure 5 Provincial Averages and Spreads - Completion Rates
Source: PSLM 2004/05 - 2010/11
Literacy Rate Pakistan has been able to make only minor progress in improving its literacy rate since 2004/05. From1990/91 to 2004/05 the literacy rate for the population aged 10 years and above increased from 35 percent to 53 percent. Since then, the rate of progress has stagnated and by 2011/12 the literacy rate had reached only 58 percent. Table 7 shows that there are significant gender disparities in the literacy rate in Pakistan; moreover, this has not reduced over time, but essentially remained the same.
Pakistan is an overtly urban literate country, as seen in Figure 6. This urban-rural gap also does not markedly decrease over time. While the urban literacy rate increased by 11 percentage points (from 64 percent to 75 percent) between year 2001/02 and 2011/12, the rural literacy rate increased by 13 percentage points during the same time period (from 36 percent to 49 percent). Concerted efforts will be needed in order to achieve this MDG target.
Provincial and Special Area Status and TrendsLiteracy rates in Punjab and Sindh have increased at a sluggish pace, rising by 13 and 14 percentage points respectively from 2001/02 to 2011/12. Both Khyber Pakhtunkhwa and Balochistan not only started with a smaller base but also showed slow progress: the literacy rate in these provinces increased from 38 percent to 52 percent and from 37 percent to 46 percent respectively. They thus lag behind the national average on this indicator, and are significantly behind both Sindh and Punjab.

Pakistan Millennium Development Goals Report 2013
34
Chapter 3 MDG 2
Figure 6 Literacy Rates Rural by location
Source: PSLM 2001/02 - 2011/12
At around 70 percent, AJ&K’s literacy rate is the highest in the country. The short time series indicate that literacy increased between 2001/02 and 2006/07 from 58 to 71 percent and in the last year moved up to 74 percent. Between 2006/07 and 2011/12, GB’s literacy rate gradually moved up from 50 to 56 percent, slightly above that of Balochistan.
Disparities across DistrictsWith the exception of Balochistan, the disparity (in statistical terms‘ range’) in literacy rates among districts of the provinces has remained between 37–48 percentage points between 2004/05-2010/11 (Table 13). Disparity decreased over time for Punjab and Sindh, but increased for Khyber Pakhtunkhwa and Balochistan.
Coefficient of variation estimates show that the inequality in literacy rates among districts of Pakistan is similar to that in enrolment rates. It is least for Punjab and comparatively high in Balochistan. Moreover, overtime intra-provincial inequality declined for Punjab and Balochistan but increased marginally in Sindh and Khyber Pakhtunkhwa.
Again with the exception of Balochistan, the high rank correlation of literacy rates between 2004/05 and 2010/11 for the provinces indicates that most districts maintained theintra-provincial ranking in literacy rates in 2010/11 that they had in 2004/05. Literacy rates fell by 6 percent in Rajanpur (Punjab), 33 percent in Ghotki (Sindh), 4 percent in D.I. Khan (Khyber Pakhtunkhwa), 16 percent in Pishin (Balochistan); and increased by 13 percent in Lodhran (Punjab), 10 percent in Hyderabad (Sindh), 21 percent in Upper Dir (Khyber Pakhtunkhwa), and 24 percent in Sibi (Balochistan). Figure 7 shows the spread of the range of values between the districts in all four provinces.

Pakistan Millennium Development Goals Report 2013
35
Chapter 3 MDG 2
Punjab
Sindh
KP
Balochistan
Punjab
Sindh
KP
Balochistan
Province
Range (No. of Districts)
Coefficient of Variation (%)
Rank Correlation (between 2004/05 and 2010/11)
2004/05 2006/07 2008/09 2010/11
46(35)
44(26)
39(24)
46(24)
21
24
21
33
46(35)
48(16)
37(24)
41(26)
18
26
19
28
41(36)
39(22)
43(24)
62(28)
18
22
19
35
Punjab
Sindh
KP
Balochistan
0.84
0.73
0.86
0.49
41(37)
43(24)
44(24)
48(30)
16
22
22
30
Table 11 Disparities across Districts: Literacy Rates
Source: PSLM 2004/05, 2006/07, 2008/09, 2010/11
Figure 7 Provincial Averages and Spread –Literacy Rates
Source: PLSM 2004/05 - 2010/11
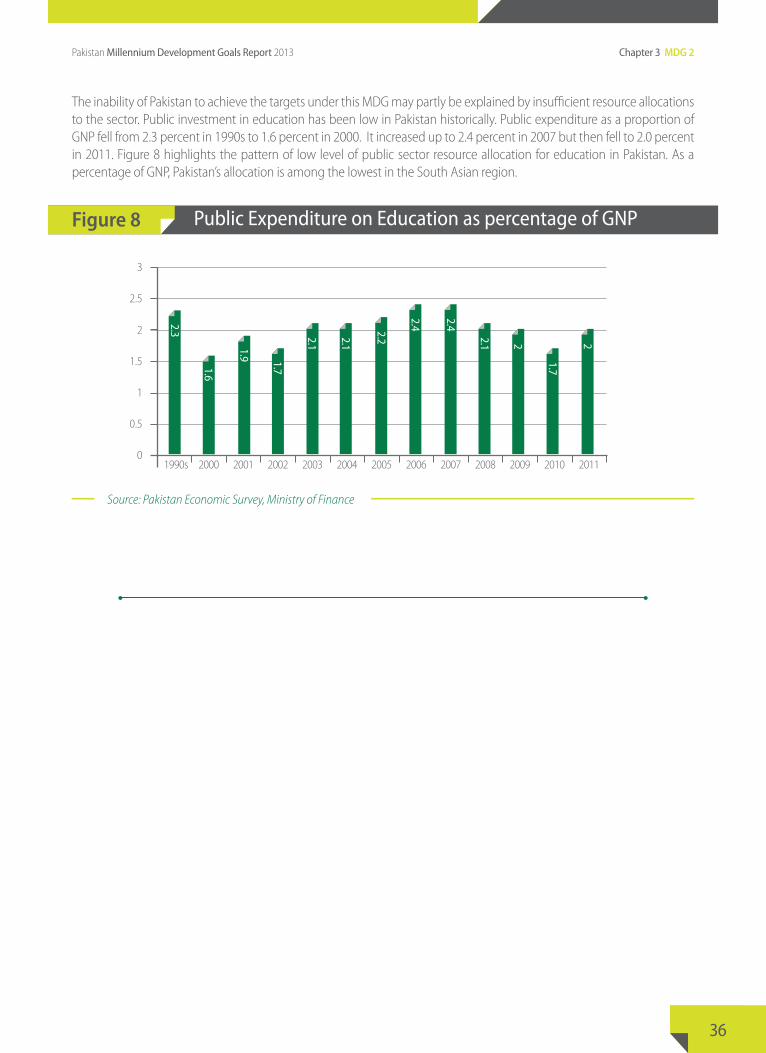
Pakistan Millennium Development Goals Report 2013
36
Chapter 3 MDG 2
The inability of Pakistan to achieve the targets under this MDG may partly be explained by insufficient resource allocations to the sector. Public investment in education has been low in Pakistan historically. Public expenditure as a proportion of GNP fell from 2.3 percent in 1990s to 1.6 percent in 2000. It increased up to 2.4 percent in 2007 but then fell to 2.0 percent in 2011. Figure 8 highlights the pattern of low level of public sector resource allocation for education in Pakistan. As a percentage of GNP, Pakistan’s allocation is among the lowest in the South Asian region.
Figure 8 Public Expenditure on Education as percentage of GNP
Source: Pakistan Economic Survey, Ministry of Finance

Pakistan Millennium Development Goals Report 2013
37
Chapter 3 MDG 2
Net Primary Enrolment Rate (5-9 Year) A Comparison

Pakistan Millennium Development Goals Report 2013
38
Chapter 3 MDG 2
Completion Survival Rate (Grade 1-5) A Comparison

Pakistan Millennium Development Goals Report 2013
39
Chapter 3 MDG 2
Literacy Rate A Comparison
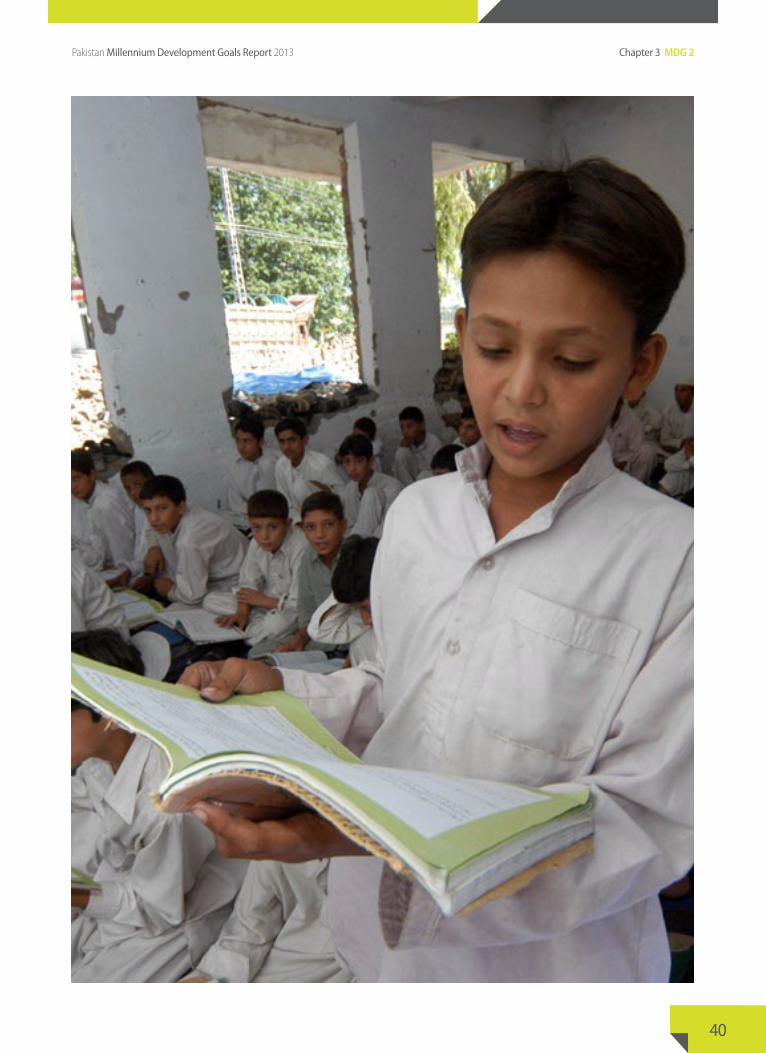
Pakistan Millennium Development Goals Report 2013
40
Chapter 3 MDG 2

Promote Gender Equality & Women’s Empowerment
Chapter 4
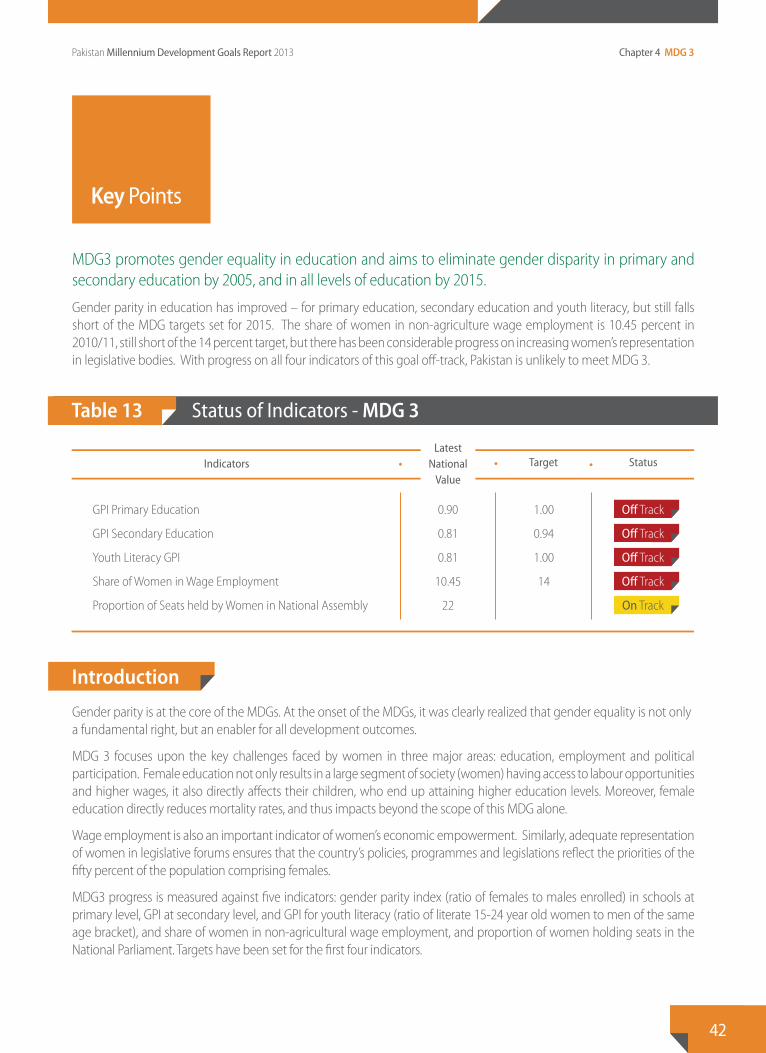
Pakistan Millennium Development Goals Report 2013
42
Chapter 4 MDG 3
Key Points
MDG3 promotes gender equality in education and aims to eliminate gender disparity in primary and secondary education by 2005, and in all levels of education by 2015.
Gender parity in education has improved – for primary education, secondary education and youth literacy, but still falls short of the MDG targets set for 2015. The share of women in non-agriculture wage employment is 10.45 percent in 2010/11, still short of the 14 percent target, but there has been considerable progress on increasing women’s representation in legislative bodies. With progress on all four indicators of this goal off-track, Pakistan is unlikely to meet MDG 3.
Gender parity is at the core of the MDGs. At the onset of the MDGs, it was clearly realized that gender equality is not only a fundamental right, but an enabler for all development outcomes.
MDG 3 focuses upon the key challenges faced by women in three major areas: education, employment and political participation. Female education not only results in a large segment of society (women) having access to labour opportunities and higher wages, it also directly affects their children, who end up attaining higher education levels. Moreover, female education directly reduces mortality rates, and thus impacts beyond the scope of this MDG alone.
Wage employment is also an important indicator of women’s economic empowerment. Similarly, adequate representation of women in legislative forums ensures that the country’s policies, programmes and legislations reflect the priorities of the fifty percent of the population comprising females.
MDG3 progress is measured against five indicators: gender parity index (ratio of females to males enrolled) in schools at primary level, GPI at secondary level, and GPI for youth literacy (ratio of literate 15-24 year old women to men of the same age bracket), and share of women in non-agricultural wage employment, and proportion of women holding seats in the National Parliament. Targets have been set for the first four indicators.
Introduction
Table 13 Status of Indicators - MDG 3
GPI Primary Education
GPI Secondary Education
Youth Literacy GPI
Share of Women in Wage Employment
Proportion of Seats held by Women in National Assembly
0.90
0.81
0.81
10.45
22
1.00
0.94
1.00
14
Off Track
Off Track
Off Track
Off Track
On Track
Indicators Target StatusLatest
NationalValue

Pakistan Millennium Development Goals Report 2013
43
Chapter 4 MDG 3
58 Net Enrolment, 5-9 age, excluding Katchi; Source: Pakistan Bureau of Statistics59 2006/07,2007/08 and 2010/11(PSLM ), for other years (Fact Sheet, P&D Department, AJ&K)60 2005/06,2006/07,2007/08 and 2010/11(PSLM ), for other years (Fact Sheet, Govt. of GB)61 Fact Sheet, P&D Department, FATA Secretariat62 Net Enrolment, 10-14 age, Class level 6-10; Source: Pakistan Bureau of Statistics63 Age group 15-24 literacy; Source: Pakistan Bureau of Statistics
Target 4: Eliminate gender disparity in primary and secondary education by 2005 and at all levels of education by no later than 2015.
Table 12 Tracking MDG 3
Indicators Region 1990/91 2001/02 2004/05 2005/06 2006/07 2007/08 2008/09 2010/11 2011/12
Gender Parity Index, Primary Education 58
Gender Parity Index, Secondary Education 62
Youth literacy GPI 63
Pakistan
Punjab
Sindh
KP
Balochistan
AJ&K 59
GB 60
FATA 61
Pakistan
Punjab
Sindh
KP
Balochistan
AJ&K
GB
FATA
Pakistan
Punjab
Sindh
KP
Balochistan
AJ&K
GB
FATA
0.73
n/a
n/a
n/a
n/a
n/a
n/a
n/a
n/a.
n/a
n/a
n/a
n/a
n/a
n/a
n/a
0.51
n/a
n/a
n/a
n/a
n/a
n/a
n/a
0.82
0.92
0.77
0.67
0.63
n/a
n/a
n/a
0.75
0.86
0.68
0.45
0.43
n/a
n/a
n/a
0.65
0.76
0.63
0.41
0.33
n/a
n/a
n/a
0.85
0.92
0.79
0.75
0.66
n/a
n/a
n/a
0.77
0.87
0.74
0.53
0.63
n/a
n/a
n/a
0.68
0.80
0.70
0.48
0.40
n/a
n/a
n/a
0.85
0.88
0.87
0.78
0.69
0.96
0.75
n/a
0.78
0.84
0.83
0.61
0.63
n/a
0.71
n/a
0.79
0.86
0.76
0.59
0.56
n/a
0.45
n/a
0.85
0.95
0.75
0.74
0.65
1.02
0.74
n/a
0.78
0.88
0.77
0.49
0.57
0.89
0.79
n/a
0.75
0.83
0.74
0.49
0.46
0.49
0.36
n/a
0.88
0.95
0.84
0.74
0.74
1.01
0.72
n/a
0.82
0.94
0.77
0.61
0.58
0.93
0.75
n/a
0.78
0.85
0.75
0.60
0.44
0.44
0.25
0.26
0.88
0.94
0.86
0.78
0.71
1.04
n/a
n/a
0.80
0.91
0.76
0.59
0.50
n/a
n/a
n/a
0.78
0.85
0.77
0.54
0.46
n/a
n/a
n/a
0.88
0.95
0.84
0.79
0.63
1.03
0.87
n/a
0.85
0.97
0.79
0.60
0.41
0.98
0.77
n/a
0.79
0.87
0.78
0.57
0.39
0.51
0.33
n/a
0.90
0.95
0.89
0.81
0.58
1.01
0.96
0.60
0.81
0.85
0.84
0.59
0.41
0.89
0.67
0.60
0.81
0.88
0.85
0.60
0.45
0.53
0.32
n/a
1.00
0.94
1.00
MDGTarget(2015)

Pakistan Millennium Development Goals Report 2013
44
Chapter 4 MDG 3
64 Labor Force Survey (LFS), whole series; various LFS issue | 65 National Assembly Secretariat
Status and Trends
The Gender Parity Index for Primary EducationStarting with the benchmark of 0.73 in 1990/91, the national GPI for primary education increased steadily to 0.85 by 2004/05. It remained unchanged for the next two years and then jumped to 0.88. Again it showed no progress for next three years, when it increased to 0.90 in 2011/12.
The empirical evidence from household surveys and pro-poor expenditure (macro-level) presented in the remaining sections of this chapter is extended to include the post-2006/07 period. This evidence strengthens the earlier contention that consumption-based data on real household expenditure and inequality show an improvement in the nation’s well-being. The share of food and essentials as a percentage of total consumption expenditure in Table 3 shows the dynamics at household level.
Provincial and Special Area Status and TrendsGPI for primary education in Punjab at 0.92 was higher than the national level in 2004/05, and since then has remained so. The MDG 2015 target for gender parity in primary education in Punjab is in sight if political and administrative commitment is assured. Sindh has shown steady improvement year on year: starting with primary level GPI of 0.77 in 2001/02 (against 82 percent of national GPI), its GPI in 2011/12 is 0.89, almost equal to national GPI. Khyber Pakhtunkhwa saw nominal improvement in its GPI, from 0.78 in 2005 to 0.81 in 2011/12; attacks at female schools likely account for the resulting impact on for female education. GPI at primary level in Balochistan regressed during the 2004/05-2011/12 from 0.66 to 0.58.
GPI in primary education for AJ&K gradually increased from 0.96 in 2005/06 to 1.04 in 2008/09. For the latest year it is slightly lower at 1.01, but still marginally higher than the MDG target for 2015. GB gradually increased its GPI at primary level from 0.75 in 2005/06 to 0.96 in 2011/12, very close to the MDG target of 1.0 for 2015. These two regions have the highest and second highest GPI respectively in the country, closely followed by Punjab. FATA lags behind with the GPI of 0.60.
Table 12 Tracking MDG 3 (Continued)
Indicators Region 1990/91 2001/02 2004/05 2005/06 2006/07 2007/08 2008/09 2010/11 2011/12
Share of women in wage employment in the non-agricultural sector 64
Proportion of seats held by women in national Parliament 65 National/Provincial Assembly (% of Seats)
Senate (% of Seats)
Pakistan
Punjab
Sindh
KP
Balochistan
AJ&K
GB
Pakistan
Punjab
Sindh
KP
Balochistan
AJ&K
8.07
n/a
n/a
8.70
n/a
n/a
n/a
n/a
n/a
n/a
n/a
n/a
0.01
9.65
6.57
6.17
3.04
n/a
n/a
n/a
n/a
n/a
n/a
n/a
n/a
n/a
10.11
n/a
n/a
4.03
n/a
n/a
n/a
21
20
18
17
19
17
10.93
7.67
8.33
4.14
n/a
4.45
n/a
21
20
18
17
19
10
17
10.53
5.53
6.95
5.60
n/a
n/a
n/a
21
20
18
17
19
10
17
9.89
4.16
5.95
2.29
n/a
n/a
n/a
22
20
18
17
18
10
17
10.64
7.10
7.93
6.90
1.63
n/a
n/a
22
20
18
17
18
10
17
10.45
13.25
7.33
6.54
2.32
n/a
n/a
22
20
18
17
18
10
17
n/a
n/a
n/a
n/a
n/a
n/a
10.00
22
20
18
17
18
17
14.0
n/a
MDGTarget(2015)

Pakistan Millennium Development Goals Report 2013
45
Chapter 4 MDG 3
Disparities across DistrictsThe range, or difference between districts with maximum and minimum GPI shows uneven trends for the four provinces (see Table 14). Comparing the initial and terminal years, inter-district inequalities as measured by range, have declined in Punjab and Khyber Pakhtunkhwa. In Sindh, intra-provincial disparity increased marginally, while in Balochistan it increased from 0.68 in 2004/05 to 0.77 in 2010/11. The disparities among districts in Balochistan are more than twice than those among districts in Punjab and have grown over time.
Coefficient of variation (CV) in primary level GPI is the lowest in Punjab, and experienced a drop from 11 percent in 2004/05 to 8 percent in 2010/11. In Sindh, CV for GPI fluctuated but increased marginally overall, it remained stable in Khyber Pakhtunkhwa and increased markedly in Balochistan.
Intra-provincial rank correlation between districts’ standing in 2004/05 and 2010/11 is lowest in Punjab and highest in Balochistan and Khyber Pakhtunkhwa. For Punjab, this signifies that the trend towards increased enrolment of females relative to males impacted on districts’ GPI. In Khyber Pakhtunkhwa and Balochistan, the ranking of districts did not change noticeably. The greatest increase in GPI (0.27) was recorded in Chakwal, while it decreased the most in Vehari (by 0.13) in Punjab. The best and worst performers were Hyderabad (+0.27) and Nowsheroferoz (-0.10) for Sindh, Lower Dir (+0.28) and Mansehra (-0.22) for Khyber Pakhtunkhwa, and Kohlu (+0.33) and Harnai (-0.46) for Balochistan repeatedly.
Punjab
Sindh
KP
Balochistan
Punjab
Sindh
KP
Balochistan
Province
Range (No. of Districts)
Coefficient of Variation (%)
Rank Correlation (between 2004/05 and 2010/11)
2004/05 2006/07 2008/09 2010/11
0.37 (35)
0.49 (16)
0.75 (24)
0.68 (24)
11
15
24
29
0.47 (35)
0.51 (16)
0.66 (24)
0.60 (26)
10
21
24
31
0.43 (36)
0.49 (22)
0.78 (24)
1.16 (28)
11
14
22
38
Punjab
Sindh
KP
Balochistan
0.48
0.58
0.69
0.68
0.30 (37)
0.53 (23)
0.65(24)
0.77 (30)
8
17
24
39
Table 14 Disparities across Districts - GPI (Primary Level)
Source: PSLM 2004/05, 2006/07, 2008/09, 2010/11

Pakistan Millennium Development Goals Report 2013
46
Chapter 4 MDG 3
Source: PSLM 2004/05, 2006/07, 2008/09, 2010/11
Figure 9 Provincial Averages and Spreads - GPI (Primary Level)
GPI for Secondary EducationThe GPI for secondary education, reported at 0.75 in 2001/02, has improved slightly over the years and now stands at 0.81 in 2011/12, after reaching a peak of 0.85 the previous year. The goal of gender parity at secondary level is a complex one, and impacts on the employability of women in non-agriculture sectors. Reasons for failure to achieve gender parity at secondary level are varied in nature and include the opportunity cost associated with attending secondary education, especially for the lower and middle income classes, where time spent at school could be used for income generating household activities.
The gender divide is much greater in rural areas, where secondary education is often seen as wasteful, in particular for girls, and the opportunity cost of an extra farming hand is often steep – all of which creates a disincentive for agricultural families to send their daughters for secondary education. Finally, the problem is also exacerbated by pressures on parents to marry their daughters off at a young age.
Provincial and Special Area Status and TrendsGPI in secondary education has increased overall in Sindh and Khyber Pakhtunkhwa between 2001 and 2012, from 0.68 to 0.84 for Sindh and from 0.45 to 0.69 for Khyber Pakhtunkhwa. For Punjab, it improved significantly to 0.97 in 2010/11 but then fell to 0.85 in the last year. For Balochistan, it regressed to 0.41 in 2011/12 from a peak of 0.63 in 2005/06. AJ&K’s GPI for secondary education at 0.98 in 2010/11 was above the MDG target of 0.94 for 2015. However the ratio slipped to 0.89 in 2011/12. GB’s GPI trend shows an initial rise reaching a peak of 0.79 in 2006/07 and then fall to 0.67 in 2011/12. The significant fall in both primary and secondary GPI in one year calls for further investigation.
Disparities across DistrictsInter-district inequalities, as measured by the range, declined between initial and final years in the Punjab, Khyber Pakhtunkhwa and Sindh, but in Balochistan GPI disparities across districts remained very high.
Coefficient of variation in GPI is the lowest in Punjab, and dropped from 23 in 2004/05 to 21 2010/11 (see Table 15). CV shows a fluctuating trend in Sindh, while it has increased consistently in Khyber Pakhtunkhwa and Balochistan since 2006/07.

Pakistan Millennium Development Goals Report 2013
47
Chapter 4 MDG 3
Intra-provincial rank correlation between the districts’ standing in 2004/05 and in 2010/11 is lowest in Sindh. This can be accounted for by rapid changes in enrolment rates of males vs. females. To a lesser extent, the same trend was seen in Punjab. By contrast, the high rank correlation in Khyber Pakhtunkhwa and Balochistan signifies that rankings were not affected by gender related changes. The greatest increase in GPI was recorded in Attock (+0.32), whilst it decreased the most in Mandi Bahauddin (-0.36) for Punjab. The best and worst performers were Hyderabad (+0.35) and Sukkur (-0.34) for Sindh, Upper Dir (+0.50) and Tank (-0.24) for Khyber Pakhtunkhwa, and Sibbi (+0.36) and Gwadar (-1.15) for Balochistan.
Punjab
Sindh
KP
Balochistan
Punjab
Sindh
KP
Balochistan
Province
Range (No. of Districts)
Coefficient of Variation (%)
Rank Correlation (between 2004/05 and 2010/11)
2004/05 2006/07 2008/09 2010/11
0.78 (35)
0.78 (16)
0.82 (24)
1.4 (24)
24
36
41
65
0.81 (35)
0.78 (16)
0.76 (24)
0.87 (26)
25
38
40
53
0.69 (36)
0.67 (22)
0.99 (24)
0.84 (28)
23
26
48
57
Punjab
Sindh
KP
Balochistan
0.59
0.26
0.82
0.60
0.90 (37)
0.92(23)
1.16 (24)
0.85 (30)
21
37
49
67
Table 15 Disparities across Districts - GPI (Secondary Level)
Source: PSLM 2004/05, 2006/07, 2008/09, 2010/11

Pakistan Millennium Development Goals Report 2013
48
Chapter 4 MDG 3
Figure 10 Provincial Averages and Spreads - GPI (Secondary Level)
Figure 11 Targets and Achievements - GPI Youth Literacy
Source: PSLM 2004/05, 2006/07, 2008/09, 2010/11
Source: Calculations by Pakistan Bureau of Statistics

Pakistan Millennium Development Goals Report 2013
49
Chapter 4 MDG 3
Youth Literacy GPIThe baseline in 1990/91 for Youth Literacy GPI was 0.51. Pakistan has been able to achieve sustained, albeit quite slow, growth in this indicator. It rose rapidly from 0.65 in 2001/02 to 0.75 in 2005/06, but then slowed and fluctuated after 2005/06, standing at 0.81 in 2011/12 (see Figure 11). Given the slow progress for this indicator, it appears difficult that the Youth Literacy GPI target of 1.0 will be achieved by 2015.
Provincial and Special Area Status and TrendsYouth Literacy GPI increased for all provinces during the MDG period. In 2001/02 Punjab’s GPI was above the national GPI, while Sindh’s was near this. In 2011/12, both Punjab’s and Sindh’s GPI were above the national average. In spite of respectable progress, the Khyber Pakhtunkhwa and Balochistan Youth Gender Parity Indices are 75 percent and 55 percent respectively. Youth Literacy GPI in AJ&K increased slowly from 0.49 in 2006/07 to 0.53 in 2011/12. Compared to GPI for youth literacy of 0.45 in 2005/06, GB shows a downward trend in later years and is 0.32 in 2011/12. All three regions have the lowest ratios in the country.
Disparities across Districts Inter-district inequalities, as measured by Range, declined between initial and terminal years in Punjab and Khyber Pakhtunkhwa. In Sindh, the intra-provincial disparity increased marginally, while in Balochistan it increased from 0.55 in 2004/05 to 0.76 in 2010/11. The disparities among districts in Balochistan are thus greater than that of other provinces and have increased over time.
Punjab
Sindh
KP
Balochistan
Punjab
Sindh
KP
Balochistan
Province
Range (No. of Districts)
Coefficient of Variation (%)
Rank Correlation (between 2004/05 and 2010/11)
2004/05 2006/07 2008/09 2010/11
0.60(35)
0.65(16)
0.73(24)
0.55(24)
23
28
41
46
0.56(35)
0.71(16)
0.70(24)
0.63(26)
20
35
41
49
0.52(36)
0.65(22)
0.93(24)
0.71(28)
19
24
43
61
Punjab
Sindh
KP
Balochistan
0.91
0.80
0.90
0.43
0.57(37)
0.72(23)
0.68(24)
0.76(30)
18
29
37
57
Table 16 Disparities across Districts - GPI Youth Literacy
Source: PSLM 2004/05, 2006/07, 2008/09, 2010/11

Pakistan Millennium Development Goals Report 2013
50
Chapter 4 MDG 3
Coefficient of Variation in GPI is lowest in Punjab, and dropped from 23 in 2004/05 to 18 in 2010/11 (see Table 16). GPI CV fluctuated in Sindh but increased marginally overall, it remained stable and eventually decreased in Khyber Pakhtunkhwa, and increased in Balochistan.
Intra-provincial rank correlation between districts’ standing in 2004/05 and in 2010/11 is high, denoting consistency in ranking for the three provinces other than Balochistan. The greatest increase in GPI was recorded in Mianwali (+0.33) for Punjab, whilst it decreased the most in Hafizabad (-0.04). The best and worst performers were Hyderabad (+0.33) and Sukkur (-0.11) for Sindh, Batagram (+0.23) and Lakki Marwat (-0.04) for Khyber Pakhtunkhwa, and Awaran (+0.37) and Panjgur (-0.43) for Balochistan.
Figure 12 Provincial Averages and Spreads - GPI Youth Literacy
Source: PSLM 2004/05, 2006/07, 2008/09, 2010/1

Pakistan Millennium Development Goals Report 2013
51
Chapter 4 MDG 3
Figure 13 Targets and Achievements - Share of Women in Wage Employment in the Non-Agricultural Sector
Source: Labor Force Survey, Various Issues
Women’s share in Wage EmploymentThe MDG target with regard to ‘Share of Women in Non-Agricultural Wage Employment’ has been set at 14 percent. Women’s share of employment increased steadily across the years, from an original value of 8.07 in 1990/91, to 10.93 in 2005/06. It then fell consecutively for two years, recovering to 10.64 in 2008/09, before falling again to 10.45 in 2010/11. The target of 14 percent for 2015 would have been achievable if employment of women in non-agriculture had increased at the rates witnessed during 2001 - 2006, but the lack of recovery since 2008/09 (see Figure 13) means it is unlikely that the MDG target of 14 percent will be met in 2015.
The drop in the women share in wage employment after 2007 indicates that women’s employment in non-agriculture is fairly sensitive to the downturn experienced by the Pakistan economy. Earlier gains in this ratio, as well as in women’s employment to population ratio (possibly due to the increased labour force participation of women and vibrant manufacturing and services sector), could not be sustained in the later part of the decade.
Provincial and Special Area Status and TrendsWith regard to provinces, the share of women in non-agricultural wage employment increased from 6.57 in 2001/02 to 13.25 in 2010/11 in Punjab. For Sindh, it grew from 6.17 in 2008/09 to 7.33 in 2010/11. Much work needs to be done in order to bring Khyber Pakhtunkhwa and Balochistan - at 6.54 and 2.32 in 2010/11 respectively – at par with the national average. Currently, Punjab is the only province among the four provinces, which show a satisfactory trend and is in a position to achieve the national target of 14 percent.
Proportion of Seats held by Women in National ParliamentHistorically, for much of Pakistan’s existence, women did not have meaningful representation in the country’s legislative forums. Indeed, in 1990/1991 the total number of women in parliament was two, or 0.9 percent of the total strength of the parliament. Similarly, the Senate in 1990/1991 had just one woman in 87 seats.

Pakistan Millennium Development Goals Report 2013
52
Chapter 4 MDG 3
The situation greatly improved with the passage of affirmative action bills, which ensured women’s and minority representation in the parliament (60 seats were reserved for women in the National Assembly). In 2004/05, women held 73 seats (or 21 percent) in the National Assembly, and 17 seats out of a 100 (17 percent) in the Senate. In the following elections, women’s share in the National Assembly rose to 22.2 percent, and remained constant in the Senate. The provincial and regional profile of women in the National Assembly indicates that AJ&K at 10 percent has the lowest representation followed by Khyber Pakhtunkhwa.
It should be noted that Pakistan’s parliament, owing to the aforementioned affirmative action programs and so on, has a greater share of women than many other older countries including some of the developed nations. Moreover, women parliamentarians have contributed large number of resolutions raised and passed, as well questions discussed in the forum, a trend which has persisted since their increased allotment of seats. 67
67 Sustainable Development conference 2009, http://www.sdpi.org/sdc/12thsdc/role_of_women_parliamentarians.html

Reduce Child Mortality
Chapter 5

Pakistan Millennium Development Goals Report 2013
54
Chapter 5 MDG 4
Key Points
MDG4 targets a reduction in under-five mortality by two-thirds.
Pakistan has shown slow and gradual progress on all the indicators on this MDG. Despite the gains, the country is off track on five out of six indicators (Table 18) and thus unlikely to attain MDG 4.
The international target for reducing child mortality is to reduce by two-thirds, the under five mortality rate (U5MR) between 1990 and 2015.
There are a number of cross-cutting issues which accentuate and aggravate child health and mortality. For instance, poor health and sanitation facilities lead to high rates of diarrhea, which is one of the leading causes of child mortality. Similarly, education of the mother and availability of basic health facilities have a positive impact on reducing child mortality. The inter-dependency of this indicator with MDGs 3 and 5 suggests that multi-sectoral government interventions will positively impact this indicator.
After 18th Constitutional Amendment, functional and administrative responsibilities in relation to the social sectors, including health, have been devolved to provincial level since 2011. The increase in responsibilities of the provinces has led to new challenges as well as opportunities for health and other MDGs. To capitalize on the devolved responsibilities, the provinces will need to improve the overall governance structures, increase resource allocations for health, human resource development especially Lady Health Workers (LHW) as well as to ensure equity, quality and efficiency in health care services. Progress on MDG 4 is measured against six indicators: under-five child mortality rate; infant mortality rate; proportion of children 12-23 months fully immunized; proportion of children under one year of age immunized against measles; proportion of children under five years of age suffering from diarrhea in previous 30 days; and Lady Health Worker coverage.
Introduction
Table 18 Status of Indicators - MDG 4
Under 5 Mortality Rate (Deaths per 1000 Live Births)
Infant Mortality Rate (Deaths per 1000 Live Births)
Proportion of Fully Immunized Children 12-23 Months
Proportion of under 1 year children immunized against measles
Proportion of Children Under 5 who suffered from Diarrhea in the last 30 Days (%)
Lady Health Worker’s Coverage (percent of target population)
89
74
80
81
8
83
52
40
>90
>90
<10
100
Off Track
Off Track
Off Track
Off Track
Achieved
Off Track
Indicators Target StatusLatest
NationalValue

Pakistan Millennium Development Goals Report 2013
55
Chapter 5 MDG 4
68 Provincial Numbers for Balochistan may not be representative, across all Health and education indicators, as 57 Primary Sampling Units out of 144 were dropped in PSLM 2011/12 due to adverse security situation. 69 Pakistan Demographic and Health Survey (PDHS) 1990/91, PDHS 2006/07 and PDHS 2012/13 at Federal Level. Figures for Punjab from Multiple Indicator Cluster Survey (MICS) 2003/04, MICS 2007/08 and MICS 2011; Sindh from MICS 2003/04; KHYBER PAKHTUNKHWA from MICS 2007/08; Balochistan from MICS 2003/04.70 2012/13 preliminary PDHS findings71 PDHS 1990/91, 2006/07 and 2012/13 at Federal Level. Figures for Punjab from MICS 2003/04 ,2007/08 and 2011; Sindh from MICS 2003/04; KHYBER PAKHTUNKHWA from MICS 2001/02 and MICS 2007/08; however, Provincial IMR (through MICS) is only provided for reference, and is not representative of/nor aggregated in the calculation of the National IMR numbers70 2012/13 preliminary PDHS findings
Table 17 Tracking MDG 4
Indicators68 Region 1990/91 2001/02 2003/04 2004/05 2005/06 2006/07 2007/08 2008/09 2010/11 2011/12
Under 5 Mortality Rate (Deaths per 1000 Live Births). 69
Infant Mortality Rate (Deaths per 1000 Live Births) 71
Pakistan
Punjab
Sindh
KP
Balochistan
AJ&K
GB
FATA
Pakistan
Punjab
Sindh
KP
Balochistan
AJ&K
GB
FATA
94
n/a
n/a
75
n/a
n/a
n/a
n/a
75
n/a
n/a
63
n/a
n/a
n/a
n/a
117
n/a
n/a
n/a
n/a
n/a
n/a
n/a
102
n/a
n/a
n/a
n/a
n/a
n/a
n/a
n/a
111
n/a
n/a
n/a
96
n/a
104
n/a
77
n/a
76
n/a
62
n/a
n/a
n/a
n/a
n/a
n/a
n/a
n/a
n/a
n/a
77
n/a
n/a
79
n/a
n/a
n/a
n/a
n/a
n/a
n/a
n/a
n/a
n/a
n/a
n/a
n/a
n/a
n/a
n/a
n/a
n/a
n/a
n/a
n/a
112
112
n/a
158
n/a
n/a
n/a
n/a
77
71
n/a
104
n/a
n/a
n/a
n/a
104
n/a
n/a
n/a
n/a
n/a
n/a
n/a
82
n/a
n/a
n/a
n/a
n/a
n/a
n/a
n/a
n/a
n/a
n/a
n/a
n/a
n/a
77
n/a
n/a
n/a
n/a
n/a
n/a
n/a
89 (for year 2012/13)70
n/a
n/a
n/a
n/a
122
74 (for year 2012/13)72
n/a
n/a
n/a
n/a
n/a
92
80
52
40
n/a
n/a
n/a
n/a
n/a
n/a
n/a
n/a
76
n/a
n/a
n/a
n/a
n/a
n/a
n/a
MDGTarget(2015)
Target 5: Reduce by two thirds, between 1990 and 2015, the under-five mortality

Pakistan Millennium Development Goals Report 2013
56
Chapter 5 MDG 4
73 Baseline set by Health Section, Planning Commission; Pakistan Demographic Survey 2006/07 for year 2001/02; PSLM for year 2004/05 onwards at National and Provincial level74 Baseline set by Health Section, Planning Commission; Pakistan Demographic Survey 2006/07 for year 2001/02; PSLM for year 2004/05 onwards at National and Provincial level75 PSLM 2006/07,2007/08 and 2010-11, for other years (Fact Sheet, P&D Department, AJ&K)76 PSLM 2005/06,2006/07,2007/08 and 2010/11, for other years (Fact Sheet, P&D Department, Govt. of GB)77 Fact Sheet, P&D Department, FATA Secretariat
Table 17 Tracking MDG 4 (Continued)
Indicators Region 1990/91 2001/02 2003/04 2004/05 2005/06 2006/07 2007/08 2008/09 2010/11 2011/12
Proportion of Fully Immunized Children 12-23 Months 73
Proportion of under 1 year children immunized against measles 74
Proportion of Children Under 5 Who Suffered from Diarrhea in the Last 30 Days (%)
Lady Health Worker’s Coverage (percent of target population)
Pakistan
Punjab
Sindh
KP
Balochistan
AJ&K
GB
FATA
Pakistan
Punjab
Sindh
KP
Balochistan
AJ&K 75
GB 76
FATA 77
Pakistan
Punjab
Sindh
KP
Balochistan
AJ&K
GB
FATA
Pakistan
Punjab
Sindh
KP
Balochistan
AJ&K
GB
76
83
65
76
54
77
70
n/a
77
84
66
76
54
77
70
n/a
11
11
12
8
7
7
4
n/a
76
n/a
n/a
n/a
n/a
59
n/a
75
n/a
n/a
n/a
n/a
n/a
n/a
n/a
80
n/a
n/a
n/a
n/a
n/a
n/a
n/a
26
14
n/a
n/a
n/a
n/a
n/a
n/a
n/a
n/a
n/a
n/a
n/a
n/a
n/a
73
76
67
74
57
82
68
n/a
76
80
68
75
67
84
68
n/a
10
11
7
12
8
2
1
19
76
50
n/a
n/a
n/a
59
n/a
53
57
45
57
24
78
n/a
n/a
57
63
46
n/a
n/a
78
n/a
n/a
12
n/a
11
n/a
n/a
n/a
n/a
n/a
38
n/a
n/a
n/a
n/a
57
n/a
78
85
69
73
43
94
n/a
n/a
79
86
70
75
44
94
n/a
n/a
10
10
12
10
6
n/a
n/a
n/a
83
55
46
58
28
60
126
n/a
50
n/a
n/a
n/a
n/a
n/a
n/a
n/a
n/a
n/a
n/a
n/a
n/a
n/a
n/a
14
15
n/a
n/a
n/a
n/a
n/a
n/a
n/a
35
n/a
n/a
n/a
n/a
n/a
81
86
75
77
56
79
68
n/a
82
86
77
78
58
79
64
n/a
11
11
12
10
13
4
12
n/a
n/a
48
n/a
n/a
n/a
n/a
n/a
80
86
71
80
37
83
77
80
81
87
72
83
38
85
78
71
8
9
8
5
13
3
2
21
n/a
n/a
n/a
n/a
n/a
n/a
n/a
77
84
73
76
62
83
n/a
n/a
78
85
73
77
62
83
n/a
n/a
16
15
18
15
13
n/a
n/a
n/a
66
n/a
n/a
n/a
n/a
58
n/a
>90
>90
<10
100
71
76
71
64
48
89
64
n/a
76
81
73
65
70
89
65
n/a
12
14
8
15
4
n/a
11
n/a
72
n/a
n/a
n/a
n/a
58
n/a
MDGTarget(2015)

Pakistan Millennium Development Goals Report 2013
57
Chapter 5 MDG 4
Under-Five Mortality
Under MDG 4, the first indicator to measure progress is the U5MR. Pakistan has shown a consistent positive trend on this indicator over the years. In 1990/91, the reported number of deaths per thousand live births was 117. By 2012/13, this number decreased to 89 deaths per 1,000 live births. There is a general paucity of provincial data, but the available data indicates that Khyber Pakhtunkhwa has fared better than Punjab and Sindh. Balochistan’s status on this indicator shows least progress among all four provinces. Punjab shows some improvement over the years, despite having more than 100 deaths per 1,000 live births as per the latest data. The single period U5MR estimates in the three Special Areas of AJ&K, GB and FATA, ranging from 96-122 deaths per 1000 live births are similar to those in the rest of the country. Based on the evidence of slow improvements in this indicator over the years, Pakistan is unlikely to achieve the MDG target of 52 deaths of under five children per 1000 live births by 2015.
There could be a number of factors impacting this indicator. Firstly, public sector expenditure on health is not adequate. Secondly, in the last few years, the increase in intensity of terrorist attacks on health teams, floods in many districts and internal population displacement have all contributed to a breakdown of health service delivery mechanisms, especially in the provinces of Balochistan and Khyber Pakhtunkhwa.
Status and Trends
Figure 14 Targets and Achievements - Under 5 Mortality Rate
Source: PSLM Various Issues
Infant mortality rate
Infant mortality rate (IMR), a subset of U5MR, measures the recorded deaths of children under the age of one year per 1,000 live births.
Deaths Per 1000 live births

Pakistan Millennium Development Goals Report 2013
58
Chapter 5 MDG 4
As seen in Figure 15, the number of deaths decreased from 102 to 77 deaths per 1,000 between 1990/91 and 2001/02. However, in the decade since then, it has only reduced to 74 deaths per 1,000 live births in 2012/13. Pakistan remains significantly far away from reaching the desired figure of 40. The patchy time series province-wise data suggest that improvements have reversed in KHYBER PAKHTUNKHWA and Punjab recently. One point estimates in time for the three regions indicate that AJ&K’s IMR at 62 was the lowest in the country in 2007/08. However, latest numbers from the GB and FATA indicate fairly high IMRs.
Proportion of fully immunized children 12-23 months
Immunization against the common communicable diseases is important in preventing morbidity and mortality amongst children, especially newborns and infants. Following a massive decline in the ‘Proportion of Fully Immunized Children under the age of 12-13 months’ in Pakistan from 75 percent in 1990/91 to 53 percent in 2001/02, the country increased its coverage to 80 percent in 2011/12. Between 2004/05 and 2011/12, the proportion at national level has fluctuated but overall it has shown only a marginal increase from between 77 percent to 2004/05 80 percent in 2011/12 (see Figure 16). There are urban-rural, gender and provincial variations. In 2011/12, the percentage of fully immunized male children was 81 percent and for females 79 percent; the rural-urban breakdown was 87 percent and 77 percent respectively. The fact that the indicator increased by 24 percentage points in just a three-year period prior to 2004/05, but has almost stagnated since then, shows that a similar strategy and commitment could take coverage to above 90 percent (Figure 16). However, due to the administrative and capacity problems facing the provinces post-18th Amendment, it is unlikely that the target will be met.
Source: PSLM Various Issues
Figure 15 Targets and Achievements - Infant Mortality Rate
Deaths Per 1000 live births

Pakistan Millennium Development Goals Report 2013
59
Chapter 5 MDG 4
100
90
75
>90
80
70
60
50
53
77
7176
7378
81 80
401990/91(bench Mark) Actual Progress Required Progress
2001/02 2007/082004/05 2008/092005/06 2010/112016/07 2011/12M DGTarget2015
Figure 16 Target and Achievements - Proportion of Fully Immunized Children 12 – 23 months
Source: PSLM Various Issues
Provincial and Special Area Status and Trends
Punjab and Khyber Pakhtunkhwa both had coverage of 57 percent in 2001/02; by 2011/12 this had increased to 86 percent and 80 percent respectively. Sindh has also shown progress in increasing immunization coverage, although it has not always been able to sustain this. For example, coverage increased to 73 percent in 2004/05 but fell to 65 percent in 2006/07, and then increased back to 75 percent in 2010/11. The largest variation is seen in Balochistan, falling from 62 percent in 2004/05 to 37 percent in 2011/1278 . The inter-provincial disparities at two points in time, i.e. 2001/02 and 2011/12, have remained stable.
In 2008/09 AJ&K attained the MDG target of greater than 90 percent rate of fully immunized children. However this could not be sustained and the rate slipped to 78 in 2010/11 before increasing marginally to 83 in 2011/12. The progress in GB for this indicator is gradual, improving from 64 in 2005/06 to 77 in 2011/12. FATA single point estimate stands at 80 in 2011/12.
Disparity across Districts
Table 19 summarizes the profile of intra-provincial disparities. In Punjab and Sindh, inequality as measured by the range (difference between districts with maximum and minimum values of proportion of fully immunized children) shows stability except for Punjab in 2006/07. In Sindh disparity between districts is slightly higher as compared to districts in Punjab. Disparity between districts of Khyber Pakhtunkhwa and Balochistan is notably very high and rising overtime (see Table 19).
78 Although we said that Balochistan data is not representative for 2011-12 due to law & order situation. Provincial Numbers for Balochistan may not be Numbers for Balochistan may not be representative, across all Education and Health indicators for 2011/12, as 57 out of 144 Primary Sampling Units were dropped due to adverse security situation.

Pakistan Millennium Development Goals Report 2013
60
Chapter 5 MDG 4
Punjab
Sindh
KP
Balochistan
Punjab
Sindh
KP
Balochistan
Range (No. of Districts)
Coefficient of Variation (%)
Rank Correlation (between 2004/05 and 2010/11)
Province 2004/05 2006/07 2008/09 2010/11
35 (35)
53 (16)
52 (24)
69 (24)
9
23
18
28
63 (35)
54 (16)
50 (24)
87 (26)
14
31
22
41
45 (36)
60 (22)
60 (24)
66 (28)
11
26
25
41
Punjab
Sindh
KP
Balochistan
0.11
0.59
0.78
0.21
31 (37)
48 (23)
83 (24)
89 (30)
8
19
25
45
Table 19 Disparities across Districts - Fully Immunized Children 12 – 23 months
Source: PSLM 2004/05, 2006/07, 2008/09, 2010/11
The coefficient of variation (CV) is fairly low in Punjab suggesting that the extent of coverage of immunization is similar across its districts. Overtime it exhibits an inverted U-shaped trend. Immunization coverage CV is comparable for Sindh and Khyber Pakhtunkhwa, albeit lower in Khyber Pakhtunkhwa. Significantly large variations in coverage exist for districts in Balochistan and again these are increasing overtime.
Estimates of rank correlation for districts of Punjab and Balochistan stand out as they are low compared to the other two provinces. This suggests that improvements across districts have been uneven. The high rank correlation for Khyber Pakhtunkhwa indicates that improvements or reversals across districts were relatively equal. Sindh’s slightly smaller rank correlation points to the same explanation. Mianwali in Punjab, Nowshero Feroze in Sindh, and Kohistan in Khyber Pakhtunkhwa had reduced coverage by 14 percent, 25 percent and 38 percent respectively. In Balochistan, Ziarat recorded a huge 69 percent reduction over the period of analysis. On the other hand, coverage increased by 20 percent in Rajanpur, Punjab; 22 percent in Jacobabad, Sindh; 21 percent in Kohat, Khyber Pakhtunkhwa; and 48 percent in Barkhan, Balochistan.

Pakistan Millennium Development Goals Report 2013
61
Chapter 5 MDG 4
Figure 17 Provincial Averages and Spreads - Fully Immunized Children
Source: PSLM 2004/05, 2006/07, 2008/09, 2010/11
Proportion of less than 1 year Children immunized against measlesMeasles is one of the leading causes of death among young children. A major outbreak of measles in Pakistan occurred in the last quarter of 2012. From January 2012 to February 2013, there were 19,048 suspected measles cases out of which 463 deaths were recorded throughout the country. This has been a significant increase, especially given the trends in previous years. With the high level of child malnutrition in Pakistan, the vulnerability to measles becomes even more serious.Given that immunization against measles is a sub-component of full immunization, it is not surprising that the national and provincial status and trends (see Figure 18) for this indicator are similar to those of the full immunization. Other than Balochistan, coverage in the three provinces has either remained the same or has increased by 1-2 percentage points for most of the years. The two series (full immunization and measles immunization) differ over time only in the case of Balochistan. Regional trends show immunization against measles closely mirroring national trends for full immunization.

Pakistan Millennium Development Goals Report 2013
62
Chapter 5 MDG 4
Figure 18 Target and Achievements under - 1 year children immunized against measles (%)
Disparities across DistrictsTable 20 summarizing the profile of inter-district inequalities in the coverage of immunization against measles is also similar to the full immunization indicator, with the exception of Balochistan. Inequality in coverage across districts is lowest in Punjab followed by Sindh and Khyber Pakhtunkhwa; it is highest in Balochistan. Over time, inequalities have reduced for the three provinces except Balochistan. The rank correlation mirrors the position of districts in each province observed for full immunization.
Source: PSLM Various Sources
Punjab
Sindh
KP
Balochistan
Punjab
Sindh
KP
Balochistan
Range (No. of Districts)
Coefficient of Variation (%)
Rank Correlation (between 2004/05 and 2010/11)
Province 2004/05 2006/07 2008/09 2010/11
35 (35)
53 (16)
46 (24)
69 (24)
9
23
18
28
63 (35)
52 (16)
50 (24)
87 (26)
14
31
22
41
42 (36)
60 (22)
60 (24)
63 (28)
11
26
24
38
Punjab
Sindh
KP
Balochistan
0.11
0.62
0.80
0.34
31 (37)
54 (23)
83 (24)
95 (30)
8
18
25
49
Disparities across Districts - Less than 1 year Children Immunized against Measles
Source: PSLM 2004/05, 2006/07, 2008/09, 2010/11
Table 20

Pakistan Millennium Development Goals Report 2013
63
Chapter 5 MDG 4
Proportion of Children under five who suffered from diarrhea in the last 30 daysOne of the major causes of child mortality is diarrhea. The indicator used to track progress in reducing mortality due to diarrhea is the ‘proportion of children under five who suffered from diarrhea in the last 30 days’. From yearly national trends, it is clear that Pakistan has achieved the MDG target for this indicator: the proportion of children who suffered from diarrhea fell from 26 percent in 1990/91 to 8 percent in 2011/12, compared to the target of reducing the proportion to under 10 percent by 2015. Pakistan has thus achieved the MDG target (under 10 percent) for this indicator.
However, after falling consistently up to 2007/08, the rate shows fluctuations within a narrow range of 1-2 percentage point. The data to be gathered in the next two years will indicate whether this reduction in diarrhea cases is sustainable at national and provincial level. The Government through the Health Ministry at the federal level and Health Departments at provincial level, with assistance from UN agencies, is active in engaging and advocating for remedial and preventive actions against diarrhea. These include use of Oral Rehydration Salts (ORS) and improved childhood nutrition (e.g. the Baby Friendly Hospital Initiative). Doctors, pediatricians and paramedics across the country, in both the public and private sector, receive training in standardized protocols. LHWs are also engaged in the advocacy campaign along with large scale advertisements targeting the general public.
Provincial and Special Area Status and TrendsAmong the provinces, only Balochistan lags in meeting the MDG target for this indicator, even though it had essentially reduced the figure down to 4 percent in 2005/06. Since 2008/09, all the other provinces have shown a declining trend in the proportion of cases reported, strengthening the possibility of a sustained and robust improvement. Khyber Pakhtunkhwa has shown the largest improvement since 2008/09 (reducing the number from 10 percent to 5 percent in 2011/12), while Sindh and Punjab reduced the occurrence to 4 percent and 2 percent respectively. It is worth mentioning, however, that with the exception of Punjab, prior to 2008/09 all the provinces have, at one point or the other, had a history of setbacks with regard to diarrhea incidence.
The brief time series of this indicator for the three regions show that AJ&K has performed better and has achieved the MDG target. The trend in GB is unstable with both setbacks and progress towards the achievement of the MDG target. With a value of 21 percent in 2011/12, progress in FATA is much lower. This is due to the peculiar law and order situation in some areas of FATA.
Disparity across DistrictsTable 21 and Figure 20 show that disparities in the incidence of diarrhea reported in terms of its attack (in the last 30 days) across districts in each province have increased over the years. As per the range values, the increase in inequality has been rapid for Sindh and Balochistan and less for the other two provinces.

Pakistan Millennium Development Goals Report 2013
64
Chapter 5 MDG 4
Punjab
Sindh
KP
Balochistan
Punjab
Sindh
KP
Balochistan
Range (No. of Districts)
Coefficient of Variation (%)
Rank Correlation (between 2004/05 and 2010/11)
Province 2004/05 2006/07 2008/09 2010/11
21 (35)
18 (16)
20 (24)
28 (24)
37
28
36
43
18 (35)
14 (16)
17 (24)
29 (26)
37
38
54
50
16 (36)
22 (22)
26 (24)
22 (28)
46
47
77
68
Punjab
Sindh
KP
Balochistan
0.47
0.18
0.35
0.10
23 (37)
31 (23)
29 (24)
62 (30)
41
49
66
90
Disparities across Districts - Under Five Children who suffered from Diarrhea in last 30 days
Source: PSLM 2004/05, 2006/07, 2008/09, 2010/11
Table 21

Pakistan Millennium Development Goals Report 2013
65
Chapter 5 MDG 4
Figure 19 Provincial Average and Spread - Under Five Children who suffered from Diarrhea in last 30 days
Source: PSLM 2004/05, 2006/07, 2008/09, 2010/11
Lady Health Worker’s Coverage of Target Population The Lady Health Worker (LHW) Programme was launched in 1994 and is also known as the National Programme for Family Planning and Primary Health Care. The LHWs have a number of roles that include identifying pregnant women, providing them with multi-vitamin supplements, referring them to antenatal care services at the Basic Health Units (BHUs), and basic functions of providing family planning advice and basic health care. The LHWs visit homes, interact freely with married female members, thus helping overcome women’s lack of education and mobility. The number of LHWs in the field increased from 95,000 in 2008 to almost 100,000 in 2011.
Given their coverage and outreach, the LHWs are also utilized by the government for other programmes, e.g. polio campaigns, tuberculosis treatment initiatives. There is lack of data of the progress of the programme after the 18th Amendment and devolution of the federal Health Ministry to the provinces. The latest data at federal level for 2008/09 estimates the share of the target population covered by LHWs to be 83 percent, progressively increasing from 38 percent in 2001/02. Sparse and patchy provincial time series data show that the coverage of target populations by LHWs at provincial level has remained between 28 - 58 percent. Given that health is now a provincial subject, strong financial and administrative commitment is needed from provinces to reach the target of 100 percent coverage in a short period of three years.

Pakistan Millennium Development Goals Report 2013
66
Chapter 5 MDG 4
Children Under 5 who suffered from Diarrhea A Comparison

Pakistan Millennium Development Goals Report 2013
67
Chapter 5 MDG 4
Children ( < 1 Year ) Immunized Against Measles A Comparison

Pakistan Millennium Development Goals Report 2013
68
Chapter 5 MDG 4
Fully Immunized Children 12 - 23 Months A Comparison

ImproveMaternal Health
Chapter 6

Pakistan Millennium Development Goals Report 2013
70
Chapter 6 MDG 5
Key Points
Under MDG 5, Pakistan aims to reduce maternal mortality rate (MMR) by three-quarters and ensure universal access to reproductive health.
Pakistan has shown progress on all indicators for their MDG 5: MMR has been almost halved, contraceptive usage has almost tripled, proportions of births attended by SBAs have more than doubled, and antenatal consultations have more than quadrupled since 1990/91. Despite this, it is off track on all indicators and therefore unlikely to achieve MDG 5.
Millennium Development Goal 5 aims to substantially decrease maternal mortality rates by 2015. Maternal mortality is affected by numerous factors, notably access to pre and post-natal care, as well as general access to health care services, and access to family planning and services.
The government’s National Maternal, Neonatal and Child Health Programme (NMNCH), initiated in 2006, is based on the 3-delays model (of Thaddeus and Maine). This states that successful maternal and child emergency interventions depend on an effective referral process that enables movement of patients to an appropriate facility and/or from one level of care to the next with speed and agility, resulting in adequate treatment being provided in a timely manner.
Progress on MDG 5 is measured against five indicators: MMR, proportion of births attended by skilled birth attendants (SBAs), contraceptive prevalence rate, total fertility rate, and proportion of women aged 15-49 years who gave birth in the last three years who had at least one antenatal consultation.
Introduction
Maternal Mortality Ratio
Proportion of births attended by Skilled Birth Attendants
Contraceptive Prevalence Rate
Total Fertility Rate
Proportion of women 15-49 who had given birth during last 3 years and made at least one antenatal consultation
276
52.1
35.4
3.8
68
140
>90
55
2.1
100
Off Track
Off Track
Off Track
Off Track
Off Track
Indicators Target StatusLatest
NationalValue
Table 23 Status of Indicators - MDG 5

Pakistan Millennium Development Goals Report 2013
71
Chapter 6 MDG 5
Table 22 Tracking MDG 5
Indicators Region 1990/91 2001/02 2003/04 2004/05 2005/06 2006/07 2007/08 2008/09 2010/11 2011/12 2012/13 81
Maternal Mortality Ratio
Proportion of Births Attended by Skilled Birth Attendants
Contraceptive Prevalence Rate
Pakistan
Punjab
Sindh
KP
Balochistan
AJ&K
GB 84
FATA 85
Pakistan
Punjab
Sindh
KP
Balochistan
AJ&K 91
GB 92
FATA 93
Pakistan
Punjab
Sindh
KP
Balochistan
AJ&K
GB
FATA
276
227
n/a
275
758
n/a
n/a
n/a
37 89
36
43
33
19
43
23
n/a
30 94
32
22
25
25
n/a
n/a
n/a
533 82
n/a
n/a
n/a
n/a
n/a
n/a
n/a
18 86
n/a
n/a
n/a
n/a
n/a
n/a
n/a
12
n/a
n/a
n/a
n/a
n/a
n/a
n/a
n/a
n/a
n/a
n/a
n/a
201
n/a
n/a
40
43
44
32
26
22
23
n/a
30
32
n/a
39
n/a
31
n/a
n/a
350 83
n/a
n/a
n/a
n/a
n/a
n/a
n/a
24 87
23
21
20
8
n/a
n/a
n/a
28
22
15
14
n/a
n/a
n/a
n/a
n/a
n/a
345-350
n/a
n/a
n/a
n/a
n/a
41
43
42
32
17
n/a
n/a
n/a
31 95
n/a
n/a
n/a
n/a
n/a
n/a
n/a
n/a
n/a
600
n/a
n/a
n/a
n/a
n/a
n/a
n/a
n/a
n/a
n/a
n/a
n/a
n/a
n/a
36
31
n/a
13
n/a
n/a
n/a
n/a
n/a
n/a
n/a
n/a
n/a
n/a
n/a
47 90
48
50
29
45
32
21
n/a
n/a
35
n/a
n/a
n/a
n/a
n/a
n/a
400
n/a
n/a
n/a
n/a
n/a
n/a
n/a
30 88
29
38
23
14
n/a
n/a
n/a
n/a
n/a
n/a
n/a
n/a
n/a
n/a
n/a
n/a
n/a
n/a
n/a
n/a
n/a
450
290
51
52
59
43
43
47
45
55
n/a
n/a
n/a
n/a
n/a
n/a
30
27
n/a
n/a
n/a
n/a
n/a
n/a
n/a
n/a
52
53
61
48
18
n/a
n/a
n/a
35
41
30
28
20
n/a
n/a
n/a
140
>90
55
380
n/a
n/a
n/a
n/a
n/a
n/a
n/a
41
41
43
32
44
n/a
14
n/a
n/a
n/a
n/a
n/a
n/a
n/a
n/a
n/a
Target2015
80
80 Provincial Numbers for Balochistan may not be representative, across all Education and Health indicators for 2011/12, as 57 out of 144 Primary Sampling Units were dropped due to adverse security situation.81 All values reported for 2012/13 are preliminary, and based upon findings of the latest PDHS Report.82 Pakistan Reproductive Health and Family Planning Survey 2000/01 has quoted MMR as 533 based on Sisterhood Method83 Estimates of Ministry of Health, Government of Pakistan84 Fact sheet, P&D Department, Govt. of GB85 Fact sheet, P&D Department, FATA Secretariat86 PIHS 2001/02, PSLM 2004/05, 2005/06, 2006/07, 2007/08, 2008/09, 2011/12 (whole series)87 SBA for the year 2001/02 includes Doctor, Nurse and LHV88 SBA for the year 2004/05 includes Doctor and Nurse89 SBA for the year 2006/07 & 2008/09 includes Doctor, Nurse and Midwife90 SBA for the year 2010/11 and onwards includes Doctor, Nurse, Midwife and LHV91 PSLM 2006/07,2007/08 and 2010/11, for other years (Fact Sheet , P&D Department, AJ&K)92 PSLM 2005/06,2006/07,2007/08 and 2010/11, for other years (Fact Sheet , P&D Department, GB)93 Fact Sheet , P&D Department, FATA Secretariat94 PDHS Survey 2006/0795 Estimate provided by Ministry of Health

Pakistan Millennium Development Goals Report 2013
72
Chapter 6 MDG 5
Table 22 Tracking MDG 5 (Continued)
Indicators Region 1990/91 2001/02 2003/04 2004/05 2005/06 2006/07 2007/08 2008/09 2010/11 2011/12 2012/13
Total Fertility Rate
Proportion of woman 15-49 years who had given birth during last 3 years and made at least one antenatal care consultation
Pakistan
Punjab
Sindh
KP
Balochistan
AJ&K
GB
Pakistan
Punjab 99
Sindh
KP
Balochistan
AJ&K
GB
FATA
4.1 97
3.9
n/a
4.3
n/a
n/a
n/a
53
56
56
46
31
72
49
n/a
5.4 96
n/a
n/a
5.4
n/a
5.4
n/a
15 98
n/a
n/a
n/a
n/a
n/a
n/a
n/a
3.9
4.3
n/a
3.8
n/a
4.0
n/a
56
59
59
48
39
72
51
n/a
n/a
n/a
n/a
n/a
n/a
n/a
n/a
35
40
38
22
21
n/a
n/a
n/a
3.8
n/a
n/a
3.7
n/a
4.0
n/a
58
61
60
49
36
82
n/a
n/a
n/a
4.7
5.3
n/a
7.1
n/a
n/a
n/a
n/a
n/a
n/a
n/a
n/a
n/a
n/a
3.6
3.6
n/a
n/a
n/a
n/a
n/a
58
61
60
49
36
77
56
n/a
n/a
n/a
n/a
n/a
n/a
n/a
n/a
50
56
55
39
35
n/a
n/a
n/a
n/a
n/a
n/a
n/a
n/a
n/a
5.0
68
71
73
57
43
71
57
65
3.8
3.8
3.9
3.9
4.2
n/a
n/a
n/a
n/a
n/a
n/a
n/a
n/a
n/a
n/a
2.1
100
n/a
3.5
n/a
n/a
n/a
n/a
n/a
52
53
56
43
36
46
n/a
Target2015
96 Estimates of Ministry of Health for 1990/9197 Estimates of NIPS, provided by Ministry of Health98 Pakistan Integrated Household Survey (PIHS) 2001/2002, PSLM 2004/05, 2005/06, 2006/07, 2007/08, 2008/09, 2011/12 (whole series)99 Provincial PSLM Data, various issues

Pakistan Millennium Development Goals Report 2013
73
Chapter 6 MDG 5
Figure 20 Targets and Achievements - Maternal Mortality Ratio
Source: PSLM Various Issues
Status and Trends
Maternal Mortality RatioThe Maternal Mortality Ratio (MMR) is defined as number of deaths occurring in every 100,000 women during childbirth or pregnancy, for a given year. The MMR reflects the quality of health care provision, particularly for childbearing women. In 1990/91 the MMR was 533, which decreased substantially to 350 deaths per 100,000 women in 2000. In 2004/05 it increased slightly to 400. Since then, the number has steadily decreased, from 380 (an estimate of Ministry of Health, GoP) in 2005-06, to the last recorded number of 276 in 2006/07 (see Figure 20). The monitoring of MMR is dependent on large data sets that are conducted at irregular intervals of 4-6 years. The MMR declined by 74 (deaths per 10,000 childbirths) between the two survey periods of 2001/02 and 2006/07, i.e. over 6 years. Even if the next survey shows a decline of 100, this will be close but insufficient to achieve the target of 140. It will also be challenging for Pakistan to maintain the historical downward trend in the face of 2010 and 2011 floods and other capacity issues in the provinces in the post-18th amendment devolution
Provincial and Special Area Status and TrendsThe time series data on MMR for provinces is patchy. With the exception of Sindh, the provinces used the national data base of PDHS 2006/07 to report on the latest status of MMR in their respective provinces. Sindh relied on the Multiple Indicator Cluster Survey (MICS) to report on MMR figures. In 2006/07, Punjab was below the national average and Khyber Pakhtunkhwa at the national average, while Balochistan’s MMR was three times the national figure. Between 2003/04 and 2008/09, Sindh halved the MMR. Had it not been for the 2010 and 2011 floods and their impact on access to health facilities, three provinces (except Balochistan) were on course to achieve the MDG target of 140 for MMR. Floods and other calamities had an adverse impact on MDG5 like other MDGs. In the aftermath of the floods, however, they will not be able to meet the MDG 2015 target for this indicator.
The patchy and ‘one point in time’ estimates for the three special areas indicate that AJ&K’s MMR was 201 in 2007/08, better than the national average of 276 in 2006/07. AJ&K thus has a chance of achieving the MDG target of 140. The other two regions lag far behind the national average for this indicator.
Deaths Per 100,000 w
omen

Pakistan Millennium Development Goals Report 2013
74
Chapter 6 MDG 5
Proportion of Births Attended by Skilled Birth AttendantThe proportion of births attended by skilled birth attendants (SBA) directly impacts on the maternal mortality rate. SBA serves as a proxy indicator to assess the timelines of maternal health care provision. In 1990/91, at national level there were 18 SBAs present per 100 child births. By 2001/02, this had increased to 24, then reached 41 in 2005/06 before falling in the following two years (2006 and 2008) to 37 and 40 respectively. The proportion then steadily improved over the following years, 41 in 2008/09, 51 in 2011/12, and 52.1 in 2012/13 (see Figure 21). The target level of skilled birth attendants for 2015, however, is over 90 SBA per 100 births. It seems unlikely this will be achieved, given the slow rate of progress on this indicator.
For the purpose of this analysis, particularly in the case of districts, the number of years has been limited to 2008-09 and 2010-11, using the definition of skilled birth attendants that includes ‘Doctor’, ‘Nurse’ and ‘Midwife’.
Figure 21 Targets and Achievements - Births Attended by Skilled Birth Attendant (%)
Source: PSLM Various Issues

Pakistan Millennium Development Goals Report 2013
75
Chapter 6 MDG 5
Provincial and Special Area Status and TrendsSindh is the best performer in this indicator amongst all the provinces, with a reported value of 38 in 2004/05, which steadily increased to 43 in 2006/07, 42 in 2008-09, 50 in 2010/11 and 60.5 in 2012/13. Punjab has lagged behind Sindh, with SBA at 29 in 2004/05, improving to 36 in 2006/07, 43 in 2008/09 and 48 in 2010/11. For the latest year of 2012/13, it hovers around the national average of 52.1 with a value of 52.5.
SBA proportions for Balochistan present a troubling trend, wherein between 2004/05 and 2012/13, this indicator marginally improved from a very low number of 14 to 17.8 – having reached peak of 45 in 2010/11. In the case of Khyber Pakhtunkhwa , a steady, albeit slow improvement is seen in SBA proportions, from 23 in 2004/05, to 32 in 2008/09, 29 in 2010/11, and a marked improvement to 48.3 in 2012-13. Much greater focus is needed on Khyber Pakhtunkhwa and Balochistan, if the national average on this indicator is to be improved and brought up to the required proportion of over 90.
Based on short time series, the progress on SBA is uneven in the regions of AJ&K and GB. In AJ&K, the indicator value declined from 43 in 2006/07 to 22 in 2007/08, then picked up swiftly to reach 47 in 2010/11. In contrast, after slow progress since 2005/06, the SBA proportion increased in just one year in GB from 21 (2010/11) to 45 (2011/12).
Punjab
Sindh
KP
Balochistan
Punjab
Sindh
KP
Balochistan
Coefficient of Variation (%)
Rank Correlation (between 2008/09 and 2010/11)
Province 2008/09 2010/11
80(36)
75(22)
59(24)
60(28)
41
56
51
81
Punjab
Sindh
KP
Balochistan
0.76
0.73
0.57
0.25
58(37)
74(23)
49(24)
71(30)
34
42
41
63
Disparities across Districts - Births Attended by Skilled Birth Attendant
Range (No. of Districts)
Source: PSLM 2008/09, 2010/11
Table 24

Pakistan Millennium Development Goals Report 2013
76
Chapter 6 MDG 5
Disparities across DistrictsTable 24 shows intra-provincial disparities that exist amongst districts within individual provinces. From the estimates of Range for the two periods 2008/09 and 2010/11, disparities (defined as the difference between districts with a maximum and minimum value for the indicator) have decreased markedly in Punjab and Khyber Pakhtunkhwa , from 79.8 to 57.7 and from 59.0 to 49.2 respectively. In the case of Sindh, disparities persist, while for Balochistan, they increased markedly from 60 to 70 – in the same time period.
The coefficient of variation (CV) largely supports this finding, wherein the lowest value at 33.5 is recorded for Punjab. However, for Balochistan, even though the CV is the largest of the four provinces in 2010/11, it decreased markedly from 2008/09. This indicates that, even though there is a large difference between districts with the highest and lowest proportion of SBA, overall variation between personnel presence at childbirth has decreased.
Both Punjab and Sindh have high rank correlation values of 0.76 and 0.73, indicating that districts in these provinces did not change their positions and improvements were synchronized in most districts. In Khyber Pakhtunkhwa with rank correlation of 0.57, districts did change ranks, while the low value of 0.25 in Balochistan shows that a large number of districts changing ranks. The greatest increase in SBA for Punjab was recorded in Bahawalnagar at 19.14 percent, whilst it decreased the most in Jehlum by 15.25 percent. The best and worst performers were Mir Pur Khas (+21.65 percent) and Tando Muhd Khan (-7.51 percent) for Sindh, Charsadda (+20.34 percent) and Bannu (-27.21 percent) for Khyber Pakhtunkhwa , and Quetta (+38.92 percent) and Qilla Saifullah (-45.6 percent) for Balochistan.
Contraceptive Prevalence RateThe prevalence of modern forms of contraception has a direct effect on maternal mortality, in that they help curtail birth rates, and enable and empower couples, in particular women, to decide whether or not to bear a child. Contraceptive Prevalence Rate (CPR) is an important indicator for assessing overall maternal health and family planning practices.
Figure 22 Provincial Averages and Spreads - SBAs
Source: PSLM 2008/09, 2010/11

Pakistan Millennium Development Goals Report 2013
77
Chapter 6 MDG 5
The national CPR was 12 percent in 1990/91. This rate more than doubled in the following decade to 28 percent in 2001/02, but growth in the use of contraceptives slowed in the following eight years reaching just 30.8 in 2008/09. The rate for 2012/13 is 35.4 percent. At the current rate of progress the national target for CPR at 55 percent for 2015 is unlikely to be met. PDHS survey 2012/13 shows that usage of modern contraception is rapidly increasing, and has far surpassed that of traditional means of preventing insemination.
Provincial and Special Area Status and TrendsPunjab has shown the highest year on year growth in CPR, from 22 percent in 2001/02, jumping to 36 percent in 2003/04. However, it hovered around 32 percent for the period 2006 to 2008, then rose to 35 percent in 2010/11, before reaching 41 percent in 2012/13. Punjab is thus noticeably ahead of the other provinces as well as the national average, and at the current rate, it should come quite close to or even achieve the target of 55 percent. Sindh too, has shown a marked improvement from 15 percent CPR in 2001/02 to 31 percent in 2003/04. However, this rate came down to 22 percent in 2006/07 before again reaching 30 percent in 2012/13.
Khyber Pakhtunkhwa registered improvement for CPR from 14 percent in 2001/02 to 38.6 percent in 2007/08. Since 2007/08, this momentum could not be sustained, most probably due to the security situation leading to internal population displacement, and contraceptive prevalence fell to 28 percent in 2012/13.Balochistan is lagging the furthest behind, with a very low CPR of 13 percent in 2003/04, the same year when both Punjab and Sindh saw a marked increase in CPR. The Balochistan rate almost doubled by 2006/07 to 25 percent, but according to the survey of 2012/13, it has fallen again to 20 percent. Much work needs to be done to bring it closer to the MDG target or at least the national average.
Based on single year estimates for each of the three regions (FATA, GB, AJK), CPR in the range of 28-31 percent is comparable with provincial estimates and well short of the MDG target of 55 percent set for 2015.
Figure 23 Targets and Achievements - Total Fertility Rate
Source: PSLM Various Issues

Pakistan Millennium Development Goals Report 2013
78
Chapter 6 MDG 5
Total Fertility RateTotal Fertility Rate (TFR) is a measure of the average number of childbirths to women over their lifetime in a given population. Higher TFRs are linked to higher population growth rates, and take a toll on female health and maternal mortality. For obvious reasons TFR is directly affected by CPR.
The Total Fertility Rate for Pakistan was 5.4 average childbirths per woman over her lifetime in 1990/91. This rate gradually declined annually and was 4.1 in 2006/07 and 3.6 in 2010/11. The latest PDHS (2012/13) calculated the TFR at 3.8 (see Figure 23). While the falling TFR from 2006-09 was in line with increased CPR in the same period, the reverse correlation is not apparent for the past few years. This is a troubling trend, and could be attributed to a number of factors such as economic instability (whereby young people are seen as extra breadwinners) and the security crisis in the country. The 2015 target for TFR is 2.1 and, if current trends persist, is unlikely to be met.
Provincial and Special Area Status and TrendsWhile Punjab generally has the least values of TFR among the four provinces, the trend is erratic. Punjab recorded its lowest rate of 3.5 in 2005/06, rising to 4.3 in 2007/08, before falling to 3.6 in 2010/11 and rising again to the national average in 2012/13. Based on the two data points for Sindh and Balochistan, TFR has fallen appreciably in both provinces over the nine years from 2003/04 to 2012/13. Khyber Pakhtunkhwa , like Punjab, shows an erratic trend with fewer data points and TFR in the range of 3.7 - 4.3. In conclusion, despite evidence that all provinces except Punjab have generally shown a declining trend, the national target may not be attainable.
Since 1990/91, AJ&K has succeeded in bringing down its fertility rate from 5.4 to 4.0 in 2008/09. GB’s TFR at 5.0 in 2011/12 is higher than the national average.
Proportion of Women aged 15-49 years who had given birth during Last Three Years and made at least One Antenatal Care ConsultationAntenatal services are of particular concern as they not only represent women’s access to proper health provision but timely consultations with specialists can ensure that any complications in the process of childbirth are identified, and proper referrals made in an effective manner. Thus, prenatal visits to doctors impact MMR and IMR, as well as the general health of the mother and child. Coverage of the LHW programme increased during the period, and is currently around 83 percent as noted under MDG 4. The LHW programme is particularly beneficial in downtrodden rural areas where it provides an accessible means of support to women who might not otherwise have been able to get even rudimentary checks.
The national figure was 15 percent in 1990/91, and this more than doubled to 35 percent in 2001/02. It further increased to 50 percent in 2004/05. Progress on this indicator then slowed, reaching 58 percent in 2008/09. It picked up momentum again in 2011/12 to reach 68 percent. If this can be sustained, Pakistan could come very close to the target of 100 percent for 2015.
Provincial and Special Area Status and TrendsPunjab and Sindh have shown steady improvement on this indicator since 2001/02. Starting at 40 and 38 percent in 2001/02 respectively, averages for both provinces in 2011/12 are higher than the national average. Khyber Pakhtunkhwa and Balochistan, starting at a low base, have also recorded a steady increase over the years, but at around 50 percent in 2011/12, pull down the national average.
AJ&K’s attempt to increase the proportion of woman making at least one antenatal consultation during the MDG period did not succeed. Based on a few data points, it peaked at 82 percent in 2008/09 but then gradually dropped to 71 percent by 2011/12. GB’s progress is steadier, progressing from 46 percent in 2005/06 to 57 percent in 2011/12. The FATA single point estimate at 65 percent in 2011/12 is higher than GB, Khyber Pakhtunkhwa and Balochistan. The three regions are not likely to achieve the MDG target of 100 in 2015.

Pakistan Millennium Development Goals Report 2013
79
Chapter 6 MDG 5
Disparities across DistrictsFrom the estimates of range given in Table 25, disparities between the districts with lowest and highest proportion of women getting antenatal care do not show a clear decline or rise over the years but rather fluctuate up and down. Overall, inequalities in access increased across all provinces except Khyber Pakhtunkhwa . The inter-district estimates of coefficient of variation (CV) are consistent with the estimates of range. The CV of three provinces (except Balochistan) is smaller when the value of range is smaller and vice versa. Only in the case of Balochistan, the estimates of CV differ from estimated values of Range, and show a decline in variability between its districts.
In terms of rank correlation between 2004/05 and 2010/11, Khyber Pakhtunkhwa and Sindh exhibit a degree of rank retention amongst districts with regard to accessing consultations, with values of 0.73 and 0.64 respectively. Districts showed a large degree of shuffling in Punjab and Balochistan, with rank correlation of 0.33 and 0.26 respectively, indicative of change in antenatal healthcare provision and/or shift in public attitudes. The greatest increase on this indicator for Punjab was recorded in Mandi Bahauddin at 48.1 percent, whilst it decreased the most in Narowal by 36.21 percent. The best and worst performers were Hyderabad (+25.88 percent) and Mir Pur Khas (-4.99 percent) for Sindh, Kohat (+31.7 percent) and Mansehra (-10.56 percent) for Khyber Pakhtunkhwa , and Awaran (+44.89 percent) and Ziarat (-29.3 percent) for Balochistan.
Source: PSLM Various Issues
Targets and Achievements - Women 15-49 years who had given birth during last 3 years and made at least one antenatal care consultationFigure 24
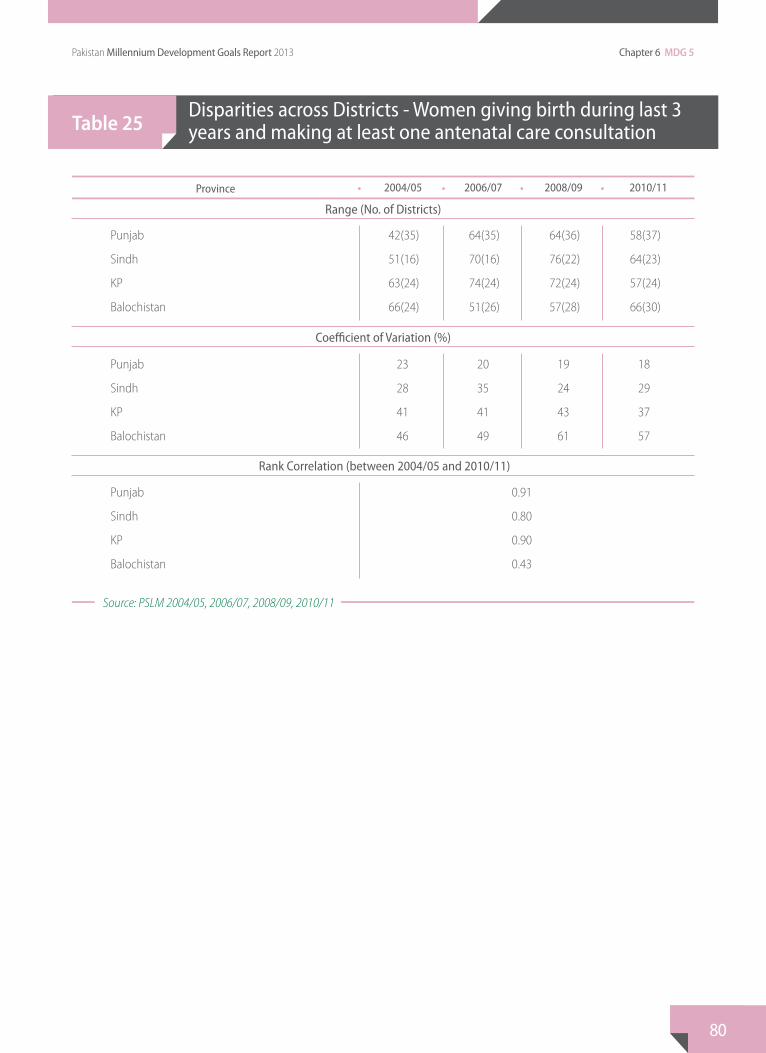
Pakistan Millennium Development Goals Report 2013
80
Chapter 6 MDG 5
Punjab
Sindh
KP
Balochistan
Punjab
Sindh
KP
Balochistan
Range (No. of Districts)
Coefficient of Variation (%)
Rank Correlation (between 2004/05 and 2010/11)
42(35)
51(16)
63(24)
66(24)
23
28
41
46
64(35)
70(16)
74(24)
51(26)
20
35
41
49
64(36)
76(22)
72(24)
57(28)
19
24
43
61
Punjab
Sindh
KP
Balochistan
0.91
0.80
0.90
0.43
58(37)
64(23)
57(24)
66(30)
18
29
37
57
Disparities across Districts - Women giving birth during last 3 years and making at least one antenatal care consultation
Source: PSLM 2004/05, 2006/07, 2008/09, 2010/11
Table 25
Province 2004/05 2006/07 2008/09 2010/11

Pakistan Millennium Development Goals Report 2013
81
Chapter 6 MDG 5
Source: PSLM 2004/05, 2006/07, 2008/08, 2010/11
Provincial Averages and Spreads - Women 15-49 years who had given birth during last 3 years and made at least one antenatal care consultation Figure 25

Pakistan Millennium Development Goals Report 2013
82
Chapter 6 MDG 5
Births Attended by Skilled Birth Attendants A Comparison

Pakistan Millennium Development Goals Report 2013
83
Chapter 6 MDG 5
Pre-natal consultation A Comparison

Pakistan Millennium Development Goals Report 2013
84
Chapter 6 MDG 5

Combat HIV/AIDS, Malaria and Other Diseases
Chapter 7

Pakistan Millennium Development Goals Report 2013
86
Chapter 7 MDG 6
Key Points
Under MDG6 Pakistan aims to halt and have begun to reverse the spread of HIV/AIDS and the incidence of malaria and other major diseases.
Most indicators show a positive trend, particularly in the case of HIV prevalence among pregnant women, and successful detection and provision of healthcare for TB patients. The latter has been achieved and the former is likely to be achieved.
However, Pakistan is off-track on the other indicators – incidence of TB is very high - and therefore it is unlikely to achieve MDG6.
Millennium Development Goal 6 pertains to the control and eventual elimination of three debilitating, communicable and life-threatening diseases, HIV/AIDS, tuberculosis and malaria. For Pakistan, HIV prevalence is largely in control, insofar as its spread is limited to specific vulnerable groups of society like sex workers, drug users etc.
Pakistan remains particularly vulnerable to viral, in particular water borne infections such as dengue, and in relation to this MDG, malaria. Similarly, Hepatitis B & C are endemic, as is tuberculosis, a disease which has almost been eradicated in the developed world. However, TB continues to affect a significant proportion of the population, and its communicability gives it more scope to afflict large numbers of people unless it is completely eliminated.
Progress on MDG 6 is measured against five indicators: HIV prevalence among pregnant women aged 15-29 years, and among vulnerable groups; proportion of population in malaria risk areas using effective prevention and treatment measures; incidence of TB; and TB cases detected and cured under DOTS.
Introduction
Table 27 Status of Indicators - MDG 6
HIV prevalence among 15-49 year old pregnant women
HIV prevalence among vulnerable groups
Proportion of population in malaria risk areas using effective prevention and treatment measures
Incidence of TB/100,000
TB cases detected and cured under DOTS
0.041
IDU= 37.4 FSW= 0.8 MSW= 3.1 HSW= 7.3
40
230
91
Baseline reduced by 50 %
Baseline reduced by 50 %
75
45
85
On Track
Off Track
Off Track
Off Track
Achieved
Indicators Target StatusLatest
NationalValue

Pakistan Millennium Development Goals Report 2013
87
Chapter 7 MDG 6
100 National Aids Control Programme101 Ibid102 Roll Back Malaria Control Programme103 National TB Control Programme104 ibid
Target 7: Have halted by 2015, and begun to reverse, the spread of HIV/AIDSTarget 8: Have halted by 2015, and begun to reverse, the incidence of malaria and other major diseases
Table 26 Tracking MDG 6
HIV Prevalence among 15-49 year old pregnant women (%)100
HIV Prevalence among vulnerable group e.g., active sexual workers (%) 101
Proportion of population in malaria risk areas using effective malaria prevention and treatment measures 102
Incidence of Tuberculosis per 100,000 population 103
Proportion of TB cases detected and cured under DOTS(Direct Observation Treatment Short Course) 104
Pakistan
Pakistan
Pakistan
Pakistan
Pakistan
n/a
n/a
n/a
171
n/a
n/a
n/a
20
181
79
n/a
n/a
30
181
80
n/a
IDU=10.8 FSW=<0.05 MSW=0.4 HSW=0.8
25
181
85
n/a
IDU=15.8 FSW=<0.02 MSW=1.5 HSW=2.1
30
181
85
n/a
IDU=20.8 MSW=0.9 HSW=6.4
30
181
85
n/a
IDU=37.4 FSW=0.8 MSW=3.1 HSW=7.3
40
230
n/a
n/a
n/a
25
181
85
n/a
n/a
35
230
91
Baseline to be reduced
by 50 %
Baseline to be reduced
by 50 %
75
45
85
Indicators Region 1990/91 2001/02 2004/05 2005/06 2006/07 2007/08 2008/09 2009/10 2010/11 Target2015
Status and Trends
HIV prevalence among 15-49 year old Pregnant Women The limited data that is available on the indicator suggests that a very small percentage of the general population is currently affected by HIV/AIDS. A larger study is, however, required to holistically assess the spread of HIV in the country. This has been impeded by the fact that national surveys are very expensive, and a proxy of the general population i.e. [sero-surveillance of ] antenatal women (sexually active part of the population) have been surveyed and an estimate drawn regarding the status of the virus in the general population. The overall objective is to provide the correct direction to policy making.
As the data stands, <0.1 percent of the 15-49 age bracket pregnant women are affected by HIV, which has more than halved to 0.041 percent by 2010/11. In the absence of a baseline, it can be safely assumed that this target will be met by 2015.

Pakistan Millennium Development Goals Report 2013
88
Chapter 7 MDG 6
HIV Prevalence among vulnerable groups e.g. active sex workers (percent)There is an alarming increase in HIV prevalence amongst vulnerable groups, especially Intravenous Drug Users (IDUs). HIV prevalence has consistently increased from 10.8 percent in 2005, to 37.4 in 2010/11, registering an annual growth rate of 23 percent over 6 years. Moreover, it is highest among all vulnerable groups including FSWs (Female Sex Workers), MSWs (Male Sex Workers) and HSW (Hijra Sex Workers). HIV prevalence among HSW of 7.3 in 2010/11 is the second highest after IDU, but its absolute levels are much smaller – though it shows a higher rate of increase (45 percent). HIV prevalence has also increased both for FSW and MSW between 2005-10, from 0.4 to 3.1 and from 0.05 to 0.8 respectively. These figures indicate a dangerous trend because as the percentage rises in the vulnerable population, it can spill over to the general population and can be the precursor to a widespread HIV/AIDs epidemic. The target for this indicator – to halve baseline values by 2015 - is likely to be missed.
Proportion of population in Malaria Risk Areas using effective Malaria Prevention and Treatment measuresIn recent years, Pakistan’s risks for most air-borne endemics have increased. It suffered annual outbreaks of swine flu, multiple iterative dengue viruses affecting all provinces, as well as spread of malaria. Historically malarial infections have remained widespread in the country, in part to low levels of education about hygienic practices and poverty. Improvement in socio-economic conditions is highly correlated to survivability, detection, as well as avoidance of malaria endemics.
Analysis of national trends indicates a positive trend in terms of the proportion of population employing preventive measures and treatment. In 2001/02, this was 20 percent, increasing to 30 percent in 2004/05 but then reversed to 25 percent in 2005/07. Following 2007, it has shown a steady, albeit slow annual increase reaching 40 percent in 2010/11 (Figure 26). Given the 2015 target of 75 percent for this indicator, it is unlikely that this will be met at the current slow pace of growth.
Source: PSLM Various Issues
Targets and Achievements - Population in Malaria Risk Areas Using Effective Prevention and Treatment MeasuresFigure 26

Pakistan Millennium Development Goals Report 2013
89
Chapter 7 MDG 6
TuberculosisTuberculosis (TB) is one of the major endemics in Pakistan. Pakistan is termed as a high-burden TB country and accounts for 61 percent of the TB burden in the Eastern Mediterranean region. A large number of reported TB cases come from the 15-49 years age group. Estimates show that there are around 420,000 new TB cases reported every year and half of them are verified positive. 105
The incidence of TB has gradually increased in Pakistan. The number of cases per 100,000 population rose from 171 to 230 between 1990/91 and 2010/11. This is one of the worst faring indicators for Pakistan in all the MDGs. There is little chance that Pakistan will meet the 2015 target of 45 TB cases per 100,000 populations.
Source: PSLM Various Issues
Targets and Achievements - Incidence of Tuberculosis per 100,000 PopulationsFigure 27
105 The Global Plan to Stop TB, WHO, 2013

Pakistan Millennium Development Goals Report 2013
90
Chapter 7 MDG 6
Source: PSLM Data Various Issues
Targets and Achievements - Proportion of TB Cases Detected and Cured under DOTSFigure 28
Direct Observation Treatment Short Course (DOTS) is one of the core strategies adopted to reduce TB. It has five basic elements: political commitment, case detection, standardized treatment, effective drug supply system and monitoring and evaluation system.106 Starting with 79 percent in 2001/02, Pakistan achieved the 2015 target of 85 percent in 2005/06 for detecting the proportion of cases under Direct Observation Treatment Short Course (DOTS). By 2009/10, it had attained 91 percent detection, and thus surpassed the MDG target set for this indicator.
105 WHO, The five elements of DOTS, http://www.who.int/tb/dots/whatisdots/en/index4.html

Ensure Environmental Sustainability
Chapter 8

Pakistan Millennium Development Goals Report 2013
92
Chapter 8 MDG 7
Key Points
Under MDG 7, Pakistan aims to promote sustainable development, halve the proportion of people without sustainable access to improved drinking water and basic sanitation, and bring about a significant improvement in the lives of slum dwellers (by 2020).
Of the seven MDG 7 indicators, Pakistan is on track to achieve four. Pakistan has made inroads in relation to protecting areas for wildlife conservation, reducing Sulphur content in high speed diesel, GDP per unit energy and access to safe drinking water. MDG 7 is the only goal which Pakistan is currently on-track to achieve by 2015 (more indicators on-track).
The environmental strains faced by Pakistan over the last decades have become a major challenge for its citizens and economy.
Climate change poses a grave threat to gains made in poverty reduction and development. While climate change is a global phenomenon, its impact is felt more severely by the developing world due to their greater vulnerabilities and lesser capacity to manage the effects of climate change, and similarly, within society, by marginal and vulnerable groups including women and children. Pakistan’s emissions of greenhouse gases (GHGs) are much lower than those of the rest of the world. Environmental degradation along with poor home hygiene, lack of basic sanitation and unsafe drinking water has a huge impact on the health of the population, particularly children under five. The estimated cost to the economy due to poor sanitation and access to clean drinking water is Rs. 112 billion or 1.81 percent of the GDP,117 while that due to environmental and resource related damage is Rs. 365 billion per year or 6 percent of GDP. The total health costs are estimated at Rs. 62-65 billion which is equivalent to 1 percent of GDP.118
Introduction
Forest Cover (%)
Land Area Protected for Conservation of Wildlife (%)
GDP (in 1980/81 Rs.) per ton of oil equivalent (energy efficiency)
Sulfur Content in High Speed Diesel
Proportion of Population with Access to Improved Water Sources
Proportion of Population with Access to Sanitation
Proportion of Katchi Abadies Regularized
5.2
11.6
26,543
0.6
89
72
n/a
12
28,000
0.5-0.25
93
90
95
Off Track
On Track
On Track
On Track
On Track
Off Track
-
Indicators Target StatusLatest
NationalValue
Table 29 Status of Indicators - MDG 7
117 Pakistan Strategic Country Environmental Assessment, 2006 118 Ibid.

Pakistan Millennium Development Goals Report 2013
93
Chapter 8 MDG 7
Progress on MDG 7 is measured against seven indicators: forest cover, land area protected for conservation of wildlife, energy efficiency [GDP (in 1980/81 Prices.) per ton of oil equivalent], sulphur content in high speed diesel, proportion of population with access to improved water sources and to sanitation, and proportion of Katchi Abadies regularized.
Target 9: Integrate the principles of sustainable development into country policies and programmes and reverse the loss of environmental degradationTarget 10: Halve by 2015, the proportion of people without sustainable access to safe drinking water and basic sanitation Target 11: Have achieved by 2020, a significant improvement in the lives of slum dwellers
Indicators Region 1990/91 2001/02 2004/05 2005/06 2006/07 2007/08 2008/09 2009/10 2010/11 2011/12
Forest Cover (%)108
Land Area Protected for Conservation of Wildlife (%)109
GDP (in 1980-81 Rs.) per ton of oil equivalent (energy efficiency)110
Sulfur Content in High Speed Diesel111
Pakistan
Punjab
KP
Balochistan
AJ&K
GB
FATA
Pakistan
KP
AJ&K
GB
Pakistan
Pakistan
5.0
n/a
n/a
n/a
32
n/a
n/a
11.3
n/a
9
n/a
24,852
1.0
4.8
n/a
n/a
n/a
27
n/a
n/a
9.1
n/a
1
n/a
26,471
1.0
5.0
n/a
17.4
n/a
33
n/a
n/a
11.5
12.4
9
n/a
26,543
1.0
4.8
n/a
n/a
n/a
28
n/a
n/a
11.2
n/a
2
n/a
27,047
1.0
5.2
n/a
n/a
n/a
34
n/a
n/a
11.5
n/a
9
n/a
n/a
0.8
4.9
n/a
n/a
n/a
30
n/a
n/a
11.3
n/a
4
n/a
27,000
1.0
5.2
3.1
n/a
n/a
34
n/a
n/a
11.5
n/a
9
n/a
n/a
0.6
5.2
n/a
n/a
n/a
n/a
9
22
11.5
n/a
n/a
44
n/a
n/a
5.0
n/a
n/a
n/a
30
n/a
n/a
11.3
n/a
4
n/a
27,300
1.0
6.0
12.0
28,000
0.5-0.25
5.0
n/a
n/a
n/a
31
n/a
n/a
11.3
n/a
4
n/a
26,233
1.0
MDGTarget(2015)
Table 28 Tracking MDG 7107
107 It was decided in the meeting of Planning Commission’s Working Group on Environment that indicator on Number of Vehicles using CNG (and monitored in all 4 previous National MDG reports) will be dropped as an MDG indicator. Consequently it wasn’t included in the position paper submitted by the Working Group. 108 Ministry of Environment, Government of Pakistan from 1990/91 - 2008/09 and Environment Section, Planning Commission, 2009/10 and 2010/11 at National level; for Punjab Government of Punjab district statistics 2009/10; for Khyber Pakhtunkhwa, Department of Environment, Government of Khyber Pakhtunkhwa109 Ministry of Environment, Government of Pakistan from 1990/91 - 2008/09 and Environment Section, Planning Commission, 2009/10 and 2010/11 at National level; for KHYBER PAKHTUNKHWA, Department of Environment, Government of Khyber Pakhtunkhwa110 HDIP, Ministry of Petroleum and Natural Resources, Government of Pakistan (whole series). This indicator is monitored at the federal level.111 HDIP, Ministry of Petroleum and Natural Resources, Government of Pakistan, 1990/91 - 2008/09; and Pakistan Economic Survey 2009/10 onwards. This indicator is monitored at the federal level.

Pakistan Millennium Development Goals Report 2013
94
Chapter 8 MDG 7
112 Pakistan Integrated Household Survey (PIHS) 2001/02 and Pakistan Social and Living Standard Measurement Survey (PSLM) 2004/05, 2005/06, 2006/07, 2007/08, 2008/09, 2010/11, 2011/12113 PSLM 2006/07,2007/08 and 2010/11, for other years (Fact Sheet, P&D Department, AJ&K)114 PSLM 2005/06,2006/07,2007/08 and 2010/11, for other years (Fact Sheet, P&D Department, GB)115 Fact Sheet, P&D Department, FATA Secretariat116 Ibid
Proportion of Population with Access to Improved Water Sources 112
Proportion of Population with Access to Sanitation 116*
Proportion of Katchi Abadies Regularized
Pakistan
Punjab
Sindh
KP
Balochistan
AJ&K 113
GB 114
FATA 115
Pakistan
Punjab
Sindh
KP
Balochistan
AJ&K
GB
91
96
87
73
61
66
65
n/a
66
73
57
63
27
73
49
n/a
n/a
53
n/a
n/a
n/a
n/a
n/a
n/a
n/a
30
n/a
n/a
n/a
n/a
n/a
n/a
n/a
n/a
88
95
89
73
61
56
n/a
n/a
63
69
60
56
24
61
n/a
n/a
n/a
86
96
81
58
37
n/a
n/a
n/a
45
n/a
n/a
n/a
n/a
n/a
n/a
n/a
50
n/a
n/a
n/a
n/a
n/a
n/a
n/a
n/a
n/a
n/a
n/a
n/a
n/a
n/a
n/a
n/a
n/a
84
97
87
65
48
49
n/a
n/a
54
66
51
48
23
39
n/a
n/a
60
87
93
89
70
47
64
66
n/a
66
72
62
62
31
78
55
n/a
n/a
89
95
90
71
62
62
74
68
72
78
61
71
37
82
57
n/a
n/a
90
95
89
72
51
n/a
58
n/a
60
66
59
54
19
50
n/a
n/a
93
90
95
87
96
86
64
46
68
60
n/a
58
64
55
52
25
60
47
n/a
n/a
MDGTarget(2015)
Table 28 Tracking MDG 7 (Continued)
Indicators Region 1990/91 2001/02 2004/05 2005/06 2006/07 2007/08 2008/09 2009/10 2010/11 2011/12
Pakistan Millennium Development Goals Report 2013
95
Chapter 8 MDG 7
Forest Cover
The total area under forests and planted trees in Pakistan is 4.224 million hectares out of a total land area of 87.98 million, or 5.2 percent. Pakistan has thus shown marginal progress in this indicator against the baseline of 4.8 percent in 1990/91 and still counts among the list of countries with low forest cover. This low level can be attributed to the large areas of arid and semi-arid land in the country. Based on current trends, it is highly unlikely that forest cover will reach the target of 6.0 percent by 2015.
The government has taken a number of steps to increase forest cover in Pakistan. These include mass afforestation and tree planting campaigns under which 111.38, 91.73, and 92.26 million trees were planted in 2008, 2009 and 2010 respectively.119 In the same year, Pakistan planted a record number of 541,176 mangrove trees to enter the Guinness World Records.120 Provincial breakdown of ‘Forest Cover’ and ‘Wildlife Protection’ areas is not available. However, Khyber Pakhtunkhwa reported both these indicators for 2008/09 as 17.4 percent and 12.4 percent respectively. Coverage in Khyber Pakhtunkhwa thus already exceeds the MDG targets. Among the regions, forest cover in AJ&K of 34 percent, GB of 9 percent and FATA of 22 percent in 2010/11 and 2011/12 also far exceeded the MDG target set for the country.
The areas for wildlife conservation have increased from 9.1 percent to 11.5 percent. Pakistan now has a vast network of protected areas covering 9,939,480 hectares and consisting of 19 national parks, 99 wildlife sanctuaries, 96 game reserves and 16 unclassified regions.121 Over the past ten years Pakistan has added quite a few regions, especially in Khyber Pakhtunkhwa and AJ&K for wildlife preservation.122 In GB the 44 percent of land area set aside for wildlife exceeds the MDG target by fourfold. AJ&K’s progress on achieving this target has been gradual but consistent, as it moved from 1 percent in 1990/91 to 9 percent in 2010/11; however, this is still below the national average.
Pakistan is a party to several UN Conventions on Biological Diversity (UNCBD), Combat Desertification (UNCCD), Migratory Species, Ramsar on Wetlands, and the Convention on International Trade of Engendered Species of Wild Fauna & Flora (CITES, UN Forum on Forests). Awareness and understanding about the obligations and opportunities under these agreements are improving at federal level, but there is a need to involve stakeholders at provincial and local level . As a result, opportunities available under UN Conventions are not being adequately harnessed. Following the 18th Amendment, there is a need to involve provincial government departments in the implementation of Multilateral Environmental Agreements (MEAs).
Energy Use
The proxy measure used to estimate the efficiency of energy use in Pakistan is the GDP per unit of energy used, given as value addition per ton of oil equivalent. GDP per unit of energy use has fluctuated but remained within the range of Rs. 25,000 - 27,000 over the last 13 years. Despite severe ‘load shedding’ (power cuts) affecting every sphere of economic activity in the last few years, energy use is characterized by a high degree of waste and inefficiency. In the absence of investment in conservation technologies and weak grassroots level advocacy for conservation, it is possible that the MDG target for this indicator might not be attained. Nonetheless, with effort and greater reliance on low cost energy, efficiency could increase. Finally, there is also the likelihood that international oil price fluctuations could impact this indicator.
Status and Trends
119 Pakistan Economic Survey 2010-11, Ministry of Finance, Government of Pakistan 120 Pakistan Economic Survey 2009-10, Ministry of Finance, Government of Pakistan121 Pakistan Economic Survey 2012-13, Ministry of Finance, Government of Pakistan122 These new National Parks include Central Karakoram, Pir Lasorha, Shiekh Badin, Toli Pir, Deva Batala and Karumbar Parks, Environment Section, Planning Commission
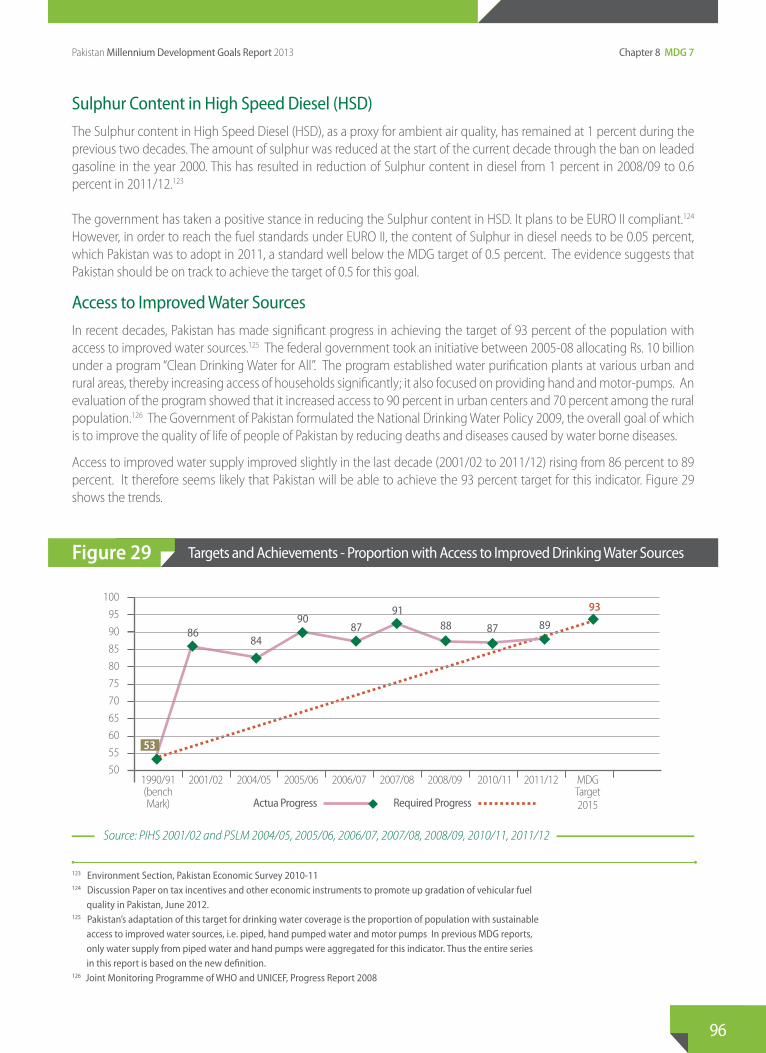
Pakistan Millennium Development Goals Report 2013
96
Chapter 8 MDG 7
Sulphur Content in High Speed Diesel (HSD)
The Sulphur content in High Speed Diesel (HSD), as a proxy for ambient air quality, has remained at 1 percent during the previous two decades. The amount of sulphur was reduced at the start of the current decade through the ban on leaded gasoline in the year 2000. This has resulted in reduction of Sulphur content in diesel from 1 percent in 2008/09 to 0.6 percent in 2011/12.123
The government has taken a positive stance in reducing the Sulphur content in HSD. It plans to be EURO II compliant.124 However, in order to reach the fuel standards under EURO II, the content of Sulphur in diesel needs to be 0.05 percent, which Pakistan was to adopt in 2011, a standard well below the MDG target of 0.5 percent. The evidence suggests that Pakistan should be on track to achieve the target of 0.5 for this goal.
Access to Improved Water Sources
In recent decades, Pakistan has made significant progress in achieving the target of 93 percent of the population with access to improved water sources.125 The federal government took an initiative between 2005-08 allocating Rs. 10 billion under a program “Clean Drinking Water for All”. The program established water purification plants at various urban and rural areas, thereby increasing access of households significantly; it also focused on providing hand and motor-pumps. An evaluation of the program showed that it increased access to 90 percent in urban centers and 70 percent among the rural population.126 The Government of Pakistan formulated the National Drinking Water Policy 2009, the overall goal of which is to improve the quality of life of people of Pakistan by reducing deaths and diseases caused by water borne diseases.
Access to improved water supply improved slightly in the last decade (2001/02 to 2011/12) rising from 86 percent to 89 percent. It therefore seems likely that Pakistan will be able to achieve the 93 percent target for this indicator. Figure 29 shows the trends.
Figure 29 Targets and Achievements - Proportion with Access to Improved Drinking Water Sources
Source: PIHS 2001/02 and PSLM 2004/05, 2005/06, 2006/07, 2007/08, 2008/09, 2010/11, 2011/12
123 Environment Section, Pakistan Economic Survey 2010-11 124 Discussion Paper on tax incentives and other economic instruments to promote up gradation of vehicular fuel quality in Pakistan, June 2012. 125 Pakistan’s adaptation of this target for drinking water coverage is the proportion of population with sustainable access to improved water sources, i.e. piped, hand pumped water and motor pumps In previous MDG reports, only water supply from piped water and hand pumps were aggregated for this indicator. Thus the entire series in this report is based on the new definition. 126 Joint Monitoring Programme of WHO and UNICEF, Progress Report 2008

Pakistan Millennium Development Goals Report 2013
97
Chapter 8 MDG 7
Provincial and Special Area Status and Trends
Punjab has already achieved the MDG target and by 2011/12, 95 percent of the province’s population had access to improved drinking water. Sindh also shows positive signs of improvement reaching 90 percent in 2011/12, up from 81 percent in 2001/02; it too seems likely to achieve the 93 percent target. Both Khyber Pakhtunkhwa and Balochistan lag behind Punjab and Sindh on this indicator, at 71 and 62 percent respectively for 2011/12, but this too represents considerable improvement from 2001/02.
A brief historical review of access to improved drinking water in AJ&K shows mixed trends. In the space of two years, between 2004/05 and 2006/07, the progress jumped from 49 to 68 percent, but then dropped to the range 56-66 percent between 2007/08 and 2011/12. In contrast, in GB the population’s access to improved water increased steadily from 58 percent in 2005/06 to 74 percent in 2011/12, though this is still far off the 93 percent target.
Disparities across Districts
The range shows that disparities among districts in Punjab in access to improved drinking water are not wide (see Table 30). This is in direct contrast with the other provinces where the range is significantly higher (above 90), and reaching 95 in Balochistan in 2010/11.
Punjab
Sindh
KP
Balochistan
Punjab
Sindh
KP
Balochistan
Range (No. of Districts)
Coefficient of Variation (%)
Rank Correlation (between 2004/05 and 2010/11)
Province 2004/05 2006/07 2008/09 2010/11
25(35)
71(16)
74(24)
73(24)
6
23
30
37
27(35)
88(16)
65(24)
83(26)
6
27
31
65
28(36)
91(22)
87(24)
74(28)
7
24
27
60
Punjab
Sindh
KP
Balochistan
0.79
0.89
0.54
0.50
32(37)
83(23)
90(24)
95(30)
9
23
32
77
Table 30 Disparities across Districts - Access to Improved Drinking Water
Source: PSLM 2004/05, 2006/07, 2008/09, 2010/11

Pakistan Millennium Development Goals Report 2013
98
Chapter 8 MDG 7
The coefficient of variation (CV) for Punjab confirms this position: Punjab’s CV is considerably lower than that of the other provinces. Disparities within districts increased significantly in Balochistan post-2004/05; Khyber Pakhtunkhwa and Sindh had high values of CV as well, but far less than Balochistan.
The rank correlation of Khyber Pakhtunkhwa and Balochistan is near 0.5, showing that half the districts changed their positions between 2004/05 and 2010/11. Sindh and Punjab have a much higher rank correlation showing that a large number of districts changed positions between 2004/05 and 2010/11. D.G. Khan with 18 percent, Tharparkar with 11 percent, Upper Dir with 22 percent, and Chagai with 46 percent reduction were the worst performing districts in Punjab, Sindh, Khyber Pakhtunkhwa and Balochistan respectively. Districts which showed most improvements were Jhelum and Okara (Punjab) with 2 percentage points, Mir Pur Khas (Sindh) with 22 percentage points, Shangla (Khyber Pakhtunkhwa) with 43 percentage points and Jaffarabad (Balochistan) with 30 percentage points. The fluctuations in disparities (CV), specifically in Balochistan, could be due to completion of water supply projects post-2004/05 in some districts and not in others. The small fluctuations seen in Sindh and Khyber Pakhtunkhwa could also be due to temporary disruption from water supply schemes undergoing repair and/or up-gradation or those non-operational due to flooding.
Figure 30 Provincial Averages and Spreads - Improved Drinking Water
40
20
60
80
100
-2004/05 2006/07 2008/09 2010/11
PUNJAB RangeAverage
40
20
60
80
100
-2004/05 2006/07 2008/09 2010/11
SINDH RangeAverage
40
20
60
80
100
-2004/05 2006/07 2008/09 2010/11
KP RangeAverage
40
20
60
80
100
-2004/05 2006/07 2008/09 2010/11
BALOCHISTAN RangeAverage
Source: PSLM 2004/05, 2006/07, 2008/09, 2010/11

Pakistan Millennium Development Goals Report 2013
99
Chapter 8 MDG 7
Access to Sanitation
Poor access to sanitation is linked not only to poor hygiene, but to a wide range of illnesses such as typhoid, diarrhea, intestinal worms and hepatitis. Poor water supply combined with poor access to sanitation leads to high IMR and MMR. Pakistan has made significant progress in increasing sanitation coverage from 30 percent in 1990/01 to 72 percent in 2011/12 (see Figure 31), with a particularly rapid rise (15 percentage points) in just five years between 2001/02 and 2005/06. However, it slowed down during the latter half of the decade and is unlikely to meet the target of 90 percent coverage by 2015. There is also disparity in access to flush toilets between the urban and rural poor: 97 percent of urban household have access to flush systems, compared to only 58 percent of rural households. Concerted efforts are also needed to reduce these urban-rural disparities.
Figure 31 Targets and Achievements - Proportion with Access to Improved Sanitation
Source: PIHS 2001/02 and PSLM 2004/05, 2005/06, 2006/07, 2007/08, 2008/09, 2010/11, 2011/12
Provincial Trends and Status
Punjab has the highest proportion of population with access to sanitation, while Balochistan’s population has the least access. All provinces showed an increase between 2004/05 and 2011/12, but the most rapid growth has been in Khyber Pakhtunkhwa, with an increase of 23 percentage points. Despite this progress, and large scale efforts and public investments, it seems highly unlikely that the three provinces other than Punjab will achieve the MDG target. Even Punjab has to perform exceedingly well during 2012/15 to achieve the MDG target. Inter-provincial disparities in access to sanitation are less in 2011/12 than in 2004/05.
In AJ&K access to sanitation at 82 percent of the population in 2011/12 is the highest in the country and fairly close to the MDG 2015 target of 90 percent. It increased steadily from 39 percent in 2004/05 to its current level. GB’s progress in providing access to sanitation is less increasing slowly from 49 percent in 2007/08 to 57 percent in 2011/12.

Pakistan Millennium Development Goals Report 2013
100
Chapter 8 MDG 7
Punjab
Sindh
KP
Balochistan
Punjab
Sindh
KP
Balochistan
Range (No. of Districts)
Coefficient of Variation (%)
Rank Correlation (between 2004/05 and 2010/11)
Province 2004/05 2006/07 2008/09 2010/11
58(35)
77(16)
65(24)
74(24)
22
49
33
78
71(35)
90(16)
65(24)
82(26)
30
62
34
97
77(36)
93(22)
86(24)
87(28)
29
48
44
94
Punjab
Sindh
KP
Balochistan
0.79
0.79
0.65
0.33
68(37)
90(24)
69(24)
88(30)
24
47
30
75
Table 31 Disparities across Districts - Access to Improved Sanitation
Source: PSLM 2004/05, 2006/07, 2008/09, 2010/11
Disparities across Districts
Disparities are high between the districts in every province, with the highest variation in Balochistan, followed by Sindh. The range in Khyber Pakhtunkhwa and Punjab were similar in 2011/12. The CV estimates further confirm that disparities in access to sanitation are much higher in Sindh and Balochistan compared to the other two provinces. Moreover there are considerable year-on-year fluctuations for all four provinces. These could be due to the time difference in completion of sanitation schemes in smaller towns and cities.
With regard to rank correlation, in Punjab and Sindh, a high correlation of 0.79 between the district rankings over six years indicates that districts have maintained their positions. However in Khyber Pakhtunkhwa many districts changed their ranking (rank correlation of 0.65), while in Balochistan, a low correlation of 0.33 indicates that most districts changed their position during this period (see Table 31). The worst and best performing districts respectively were: in Punjab, Rajanpur (-22 percent) and Chakwal (+29 percent); in Sindh, Shikarpur (-10 percent) and Larkana (+33 percent); in Khyber Pakhtunkhwa, D.I. Khan (-16 percent) and Chitral (+41 percent); and in Balochistan, Chagi (-16 percent) and Pashin (+42 percent).
Proportion of Katchi Abadies regularized
Slums, commonly referred to as katchi abadies in Pakistan, are largely concentrated in urban regions, mostly within the provinces of Sindh and Punjab. This indicator looks to track improvement in the lives of slum dwellers. However, while some exercises have been conducted by provincial governments to track the katchi abadies, there is no national level data available to measure progress against this indicator.
127 Based on PSLM district level data

Pakistan Millennium Development Goals Report 2013
101
Chapter 8 MDG 7
Access to Imrpoved Drinking Water A Comparison

Pakistan Millennium Development Goals Report 2013
102
Chapter 8 MDG 7
Access to Imrpoved Sanitation A Comparison

Develop Global Partnership for Development
Chapter 9

Pakistan Millennium Development Goals Report 2013
104
Chapter 9 MDG 8
Key Points
Through MDG 8, the developing world was expecting strong partnership with the developed world through access to trade and technology and financial support. However this has not happened in the desired way. The impasse in the Doha Round rendered Pakistan’s attempt to seek improved market access in the textile and clothing sectors unfulfilled. Its attempt to gain market access ‘regionally’ had mixed results. Pakistan’s attempt to increase exports to Central Asia under the APTTA signed in 2010 is mired in various discriminatory transit policies. India granted MFN status to Pakistan in 1996 and Pakistan in principal has agreed to give MFN status to India, but security concerns and mistrust continue to hamper bilateral trade relations.
During the last ten years, Pakistan secured preferential trade agreements with a number of key partners (e.g. Malaysia, Iran, China, Sri Lanka) which created accessible trade options, providing nominal to duty free access. Overall, following 2001, the indebtedness of the country in relation to its output decreased from 52.1 in 2001 to 28.5 percent in 2012.
Aid as a percentage of Pakistan’s GNI has mostly remained in the range of 0.9 to 1.7 percent since 2001. In absolute terms, aid per capita fluctuated between US$ 5-20 and total ODA between US$ 732 million to US$ 3.5 billion since 2000.
In framing of the MDGs in the late nineties, it was recognized that any effort to achieve the MDGs by developing countries - and specifically by the least developed countries - would be difficult if not impossible without the partnership and support of more well-off nations. ‘Partnership for development’ was defined in a holistic manner to include financial, technical and capacity support along with frameworks to foster multilateral, bilateral and regional north-south trade.
The linkages between specific MDGs and strengthened global partnership include: a) MDG1 for poverty reduction is intimately linked with enhancing growth and employment opportunities and thus with provision of market access and fair trade regimes; b) Meeting the targets of MDGs 2-6 requires increased diversion of resources to social sectors. Efforts at additional domestic resource mobilization and creation of fiscal space through debt reduction can help ensure this. Greater flow of ODA can also boost investment in social capital to attain the above five MDGs; c) In many countries where resources are not the binding constraint, cooperation in capacity building at institutional and administrative level, specifically through use of ICT, in the services sector will speed up the attainment of MDGs.
The inclusion of MDG 8 in the UN Agenda is a reflection of the commitment and contribution of developed nations towards the MDGs in the shape of increased market access, official development assistance (ODA) and transfer of technology. Developing countries commitment to achieve sustainable debt ratios is a derivative of commitments made by the developed world.
Introduction

Pakistan Millennium Development Goals Report 2013
105
Chapter 6 MDG 5
Status and Trends
Market Access Access to the global trade markets is essential to the economic viability of any country, and particularly so for a struggling economy. With the global economic crunch persisting, Pakistan’s primary export markets shrank by about 4.8 percent in 2009-2010. In Pakistan almost all tariffs (99.4 percent) are ad valorem (levying of tax or customs duties in proportion to the estimated value of the goods or transaction concerned) and peak ad valorem rates have dropped from 250 percent to 90 percent. 128 Pakistan’s economic strategy is to strengthen economic ties with its key allies and economic partners, as well as push for access to markets at various international trade forums and consortiums. Measures taken in this regards are as follows:
Doha RoundPakistan’s aim in the Doha Round of trade negotiations at WTO level has been to secure maximum possible improvement in market access and trading conditions, particularly for non-agricultural products in sectors of major export interest, notably textiles and clothing. The impasse in the Doha Rounds has necessitated that developing countries consider other options for market access such as having a “regional focus”.
The United StatesThe US Government had agreed to establish Reconstruction Opportunity Zones (ROZs) in Pakistan in 2009, from where the US would allow duty free imports. However, the US Congress failed to pass any legislation for this until 2011, and since then it has been dropped as an intervention for market access. In addition, Pakistan has been seeking enhanced market access for its textile products. In 2013, U.S. imports from Pakistan remained US$3.6 billion out of which US$ 195 million (5.4 percent) of the total imports were GSP covered.
Europe and the United KingdomThe situation regarding global partnership in the context of trade with the EU is more encouraging. The import vulnerability threshold for GSP covered imports has been raised by the EU from 1 percent to 2 percent in 2013, and is applicable from 2014. Pakistan has benefitted from the EU’s revision of its criteria for GSP+ eligibility; as per the new criteria, Pakistan hopes to have duty free access on most of its products going to the European market. Inclusion into the GSP+ category, however, entails a number of policy stipulations on imports into the EU, and is subject to countries coming up to par on standards pertaining to human rights, copyright security and acts, etc. Pakistan has signed up to ensuring the required standards and, with the submission of relevant documents guaranteeing this, should start benefitting from GSP+ in the year 2014.
South Asia and AfghanistanSince 1965, security concerns and mistrust between India and Pakistan have overshadowed any meaningful and rapid development of bilateral trade relations. However, since the last one decade, bilateral confidence-building measures and trade activism under the South Asian Association for Regional Cooperation (SAARC, signed in 1985) encouraged both countries to grant greater market access to each other’s exports. India granted Most Favoured Nation (MFN) status to Pakistan in 1996, and recently Pakistan had in principle agreed to give MFN status to India. However, elections in Pakistan and slow progress on the reduction of non-tariff barriers by India, delayed this. Pakistan replaced its positive list of nearly 2,000 items importable from India with a negative list of 1,209 items in 2012. This too will ultimately be phased out with the process leading to normal trade relations with India on MFN basis. The transition from a positive list of items to a negative list directly resulted in an immediate increase of 21 percent in bilateral trade, or US$ 410 million, between April 2012 and March 2013. As Table 32 indicates, over the years Pakistan’s exports to India increased from US$ 84 million in 2003/04 to US$ 333 million in 2011/12; this is at a slightly higher pace, albeit starting from a low base, than imports from India.
128 World Trade Organization-Pakistan, Trade Policy Review; Pakistan Economic Affairs Division

Pakistan Millennium Development Goals Report 2013
106
Chapter 9 MDG 8
Rest of the WorldDuring the last ten years, Pakistan has secured preferential trade agreements with a number of key partners, which have created accessible trade options, providing nominal to duty free access. Pakistan signed bilateral FTAs with China in 2007, with Sri Lanka in 2005, and with Malaysia in 2007. Moreover, Preferential Trading Arrangements signed, a) with Iran in 2004 is effective since 2006, b) with Mauritius since 2007 and c) with Indonesia since 2012. To promote trade, the State Bank of Pakistan (SBP) has recently signed bilateral currency swap agreements with the People’s Bank of China and the Central Bank of Turkey.
Over the last two decades, tariffs have decreased substantially generally in many countries of the world, both developed and developing. However, it is increasingly being realized that simple decrease in tariffs is insufficient, as it is not the only factor curtailing bilateral trade. A large obstacle, in particular for Pakistan, is the presence of non-tariff barriers. Removal of such barriers will give more market access to Pakistan’s exports.
Regional Cooperation (SAARC, signed in 1985) encouraged both countries to grant greater market access to each other’s exports. India granted Most Favoured Nation (MFN) status to Pakistan in 1996, and recently Pakistan had in principle agreed to give MFN status to India. However, elections in Pakistan and slow progress on the reduction of non-tariff barriers by India, delayed this. Pakistan replaced its positive list of nearly 2,000 items importable from India with a negative list of 1,209 items in 2012. This too will ultimately be phased out with the process leading to normal trade relations with India on MFN basis. The transition from a positive list of items to a negative list directly resulted in an immediate increase of 21 percent in bilateral trade, or US$ 410 million, between April 2012 and March 2013. As Table 32 indicates, over the years Pakistan’s exports to India increased from US$ 84 million in 2003/04 to US$ 333 million in 2011/12; this is at a slightly higher pace, albeit starting from a low base, than imports from India.
Pakistan also shares an extensive border with Afghanistan. Trade is carried out with the country not only through direct and unsanctioned routes, but Afghanistan also serves as a transitory and accessible route from Pakistan to the Central Asian Republics (CAR). To this end, the outdated and discriminatory 129 Afghan Transit Trade Agreement (ATTA, 1965) was replaced in 2010 with the Afghanistan Pakistan Transit Trade Agreement (APTTA), and is based on the principle of complete reciprocity as against the unilateral transits provided in ATTA. Unlike the old agreement, APTTA provides Pakistani exports access to the CARs region through Afghanistan. Under this Agreement, Gawadar Port is also included as an entry point for transit goods along with Karachi and Port Qasim. However, exports to the CARs are still stagnant, as discriminatory transit policies, other than those of non-tariff are still in effect, creating a disincentive for local exporters.
Imports
Exports
Imports
Exports
Trade with India
Trade with Afghanistan
2003-04 2004-05 2005-06 2006-07 2007-08 2008-09 2009-10 2010-11 2011-12
1445
287
10
1865
1253
333
13
1380
1061
259
3
1204
1032
313
0
975
1442
263
2
1032
1181
315
2
680
770
264
2
831
486
190
1
732
377
84
3
403
Table 32 Trends in Imports and Exports from India and Afghanistan
Source: State Bank of Pakistan 2011/12.
(In million US$)
129 Facilitating Two-Way Transit Trade, M.A. Khan. Published in Dawn, 2008.

Pakistan Millennium Development Goals Report 2013
107
Chapter 6 MDG 5
Under MDG 8, the indicator that refers to average tariffs imposed by developed markets upon less developed market’s imports, Pakistan was subjected to higher tariffs in comparison to other developing markets. It is evident from these indicators that market access is an issue that is constraining Pakistan’s economic standing as a global partner, and in particular, leads to slower economic growth in comparison to similar developing economies.
Market Access IndicatorsOwing to a collaborative effort between ITC, UNCTAD and WTO, two indicators are selected to compare market access among developing countries. Under MDG 8, the indicator that refer to share of imports by developed market economies from Pakistan (developing market economies and LDCs), remained in the low 20s (see Figure 32). At its peak this reached 58 in 2003, but this was still much less than that of developing market economies, whose share increased to 70.
Source: World Trade Organization
Figure 32 A Comparison of Tariffs

Pakistan Millennium Development Goals Report 2013
108
Chapter 9 MDG 8
Source: Source: World Trade Organization
Figure 33 Pakistan’s International Trade and Market Access
Exports from PakistanPakistan has a limited export basket; a few major categories, namely raw cotton, other textile goods, rice and leather products, have traditionally comprised the disproportionately major chunk of exports for the country. In order to assess the state of Pakistan’s economy with reference to its exports, year on year figures for exports are assessed, divided into three broad categories: textiles, all other exports, and total exports. This has been further sub-divided into two distinct economic periods during which major policy shifts occurred, so that these two periods can be compared.
Textile
Non-Textile
Total
2001-02 2002-03 2003-04 2004-05 2005-06 2006-07 2007-08 2008-09 2009-10 2010-11 2011-12 Growth Rate
4,503
4,632
9,135
7,795
3,366
11,160
8,643
3,670
12,313
9,378
5,013
14,391
10,468
5,983
16,451
13,181
11,476
24,657
10.26%
9.45%
13,230
12,209
25,439
10,333
9,299
19,632
9,946
9,266
19,212
10,780
8,272
19,052
11,014
5,962
16,976
Table 33 Pakistan export trends: Textile, Non textile and Total
Source: State Bank of Pakistan (SBP) Annual Reports, various years
(In million Rupees)

Pakistan Millennium Development Goals Report 2013
109
Chapter 6 MDG 5
The data from 2001-2007 (see Table 33) show that textile exports accounted for a major share of total exports. Textile exports showed year on year growth, especially in 2001-03, and overall almost tripled in five years from $4,503 million to $11,014 million.
Non-textile exports, after declining initially, showed healthy growth during the three year period 2005-2007. The remaining period 2007-2008 onwards presents a varying landscape. Non-textile exports saw a marked improvement following 2007, increasing from $5,952 million in 2006 to $8,272 million in 2007. They continued to increase and reached US$ 11.4 billion in 2011/12, almost equal to textile exports. However, overall growth for total exports from 2007-2012 at 5.9 percent was lower than that of 2001-06.
Pakistan accounts for a nominal share of the global market, and its share of exports declined sharply after 2005, falling from a peak of 0.16 percent in 2003 to its lowest value in 2008 at 0.12 percent. This is largely owing to the worsening financial conditions globally in this period. The average share of exports for the years 2001-2007 was 0.15 percent, which fell in the 2007-2012 period to 0.13 percent.
External Debt SustainabilityDebt sustainability is an important measure of a country’s ability to service its debt, as well as to assess its capacity to pay the principal amount of debt, and its potential to incur more debt for its development needs. A number of comparative ratios are calculated that indicate if debts accrued by the country are sustainable.
Indebtedness can be gauged by the External Debt and Liabilities to GDP (EDL/GDP) ratio, which assesses a country’s net economic productivity in comparison to the loans accrued. Pakistan’s EDL/GDP ratio decreased from 52.1 percent in 2001 to 28.5 percent in 2012. The IMF has recently approved a financial assistance package to the tune of US$ 6.7 billion for the country. It is a three-year arrangement, aimed at supporting Pakistan’s plans of economic reform and inclusive growth, under the Extended Fund Facility (EFF).
A country’s capacity for debt repayment is more accurately captured by expressing EDL as a percentage of foreign exchange earnings and reserves, i.e. FEE and FER. In 2012, external debt and liabilities were 4.3 times foreign exchange reserves. The external debt to foreign exchange earnings (FEE) ratio is better than EDL/FER as FEE includes remittances from Pakistani expatriates in the Middle East and Western countries. It closely follows the trend of EDL/FER. With regard to DS/XGS, after reaching a low of 8.6 percent in 2008, it is again rising due to pressure on balance of payments (see Table 34).
EDL/FER (times)
EDL/GDP
EDL/FEE (times)130
DS/FEE
DS/XGS
11.5
52.1
2.6
N/A
32.7
5.8
50.9
2.4
N/A
36.7
3.3
43.1
1.8
N/A
22.8
3.0
36.7
1.6
N/A
32.5
2.7
32.7
1.3
N/A
11.1
3.6
31.5
1.4
11.4
n/a
4.3
28.5
1.4
12.7
n/a
3.7
34.9
1.6
16.6
12.2
4.2
32.3
1.5
18.0
13.2
4.0
28.1
1.2
11.8
8.6
3.0
28.3
1.2
12.6
9.2
2.9
29.4
1.2
13.2
10.0
(In Percent) 2001 2002 2003 2004 2005 2006 2007 2008 2009 2010 2011 2012
Table 34 Indicators for External Debt Sustainability
Source: Pakistan Economic Survey, Various Issues; SBP Annual Reports (Various Issues).
(In million Rupees)
130 FEE: Foreign Exchange Earnings; EDL: External Debt and Liabilities; FER: Foreign Exchange Reserves Rollover Ratio (Principal Repayments/ Disbursements); DS: Debt Servicing; XGS: Exports of Goods and Services

Pakistan Millennium Development Goals Report 2013
110
Chapter 9 MDG 8
Official Development AssistanceOfficial Development Assistance (ODA) is an indicator of total monetary and non-monetary assistance provided to developing and least developed countries, and includes both standard loans as well as proportioned grants. In the G-8 meeting of 2005 held in the UK, member states reiterated their commitment to enhance ODA to facilitate developing countries, LDCs and Highly Indebted Poor Countries (HIPC) in achieving the MDGs. The actual performance of Development Assistance Committee (DAC) countries in disbursing ODA has fallen short of the above commitments. In 2011, the DAC countries had disbursed US$ 133.5 billion, equivalent to 0.31 percent of their combined GNI.131 US$3.2 billion has been received by Pakistan from the US under the Kerry Lugar Bill since 2009, of which US$ 2.1 billion was disbursed as bilateral civilian assistance, whilst the remaining US$ 1.06 billion was provided under the Emergency Flood Response.
Table 35 gives the trend for three indicators for ODA received by Pakistan from 2000 to 2011. Aid as a percentage of Pakistan’s GNI has remained in the range of 0.9 to 1.7 percent for most of the period except for the years 2001 and 2002, when it exceeded 2 percent - the result of support from western countries for Pakistan’s participation in the war against extremism. In absolute terms, aid per capita fluctuated between US$ 5-20 and total ODA between US$ 732 million to US$ 3.5 billion during the period. The peaks in cyclical fluctuations in absolute amount of ODA reflect the periods when Pakistan was under a structural/standby agreement with multilateral donors.
The following factors can largely explain the reasons for the fluctuating ODA to Pakistan and consequent low financing of MDGs. Although an ally in the war against extremism, Iraq and Afghanistan competed with Pakistan for ODA and thus - from a geopolitical perspective - it remained a low priority. Commitments made to Pakistan in various forums were not honored, for example commitments following the 2005 Earthquake and those made under “Friends of Democratic Pakistan”. Thirdly, the momentum for ODA for MDGs weakened with the onset of the global financial crisis affecting developed countries from 2008 onwards.
131 The Global Partnership for Development: Making Rhetoric a Reality; MDG Gap Task Force Report 2012, UN
2000
2001
2002
2003
2004
2005
2006
2007
2008
2009
2010
2011
1.24
2.7
2.9
1.2
1.4
1.4
1.7
1.6
0.9
1.7
1.6
1.6
5.4
13
14
7
9
10
14
14
9
16
17
20
732
1942
2105
1072
1439
1614
2180
2269
1549
2769
3013
3508
Year Aid (%) of Pakistan’s GNI Aid per Capita (Current US$) ODA (Million US$)
Table 35 Official Development Assistance (ODA) Indicators for Pakistan
Source: World Development Indicators

Pakistan Millennium Development Goals Report 2013
111
Chapter 6 MDG 5
Pakistan received a total of US$ 16,605 million as ODA between 2000/01 and April 2013, with the largest share (US$ 8,016 million) coming from the International Development Association (IDA).132
Access to Affordable MedicineIn Pakistan, essential drugs are too costly for the general public. Given the dire need of essential drugs, their inaccessibility involves basic human rights issues. Drug laws within the country have a huge impact on the availability of affordable, essential medicines. Prior to devolution of the Ministry of Health in 2011, the Drugs Act of 1976 regulated the import, export, manufacture, storage, distribution and sale of medicines in Pakistan. While the Act was comprehensive, its implementation proved difficult both in the open market as well as inside hospitals. In 2012, the Supreme Court directed the government to establish a Drug Regulatory Authority to ensure implementation of the laws. The Drug Regulatory Authority of Pakistan (DRAP) was thus established under the DRAP Act of 2012. DRAP falls under the administrative control of the federal government with headquarters in Islamabad. DRAP reports to the Ministry of National Health Services, Regulations and Coordination and aims to ensure effective coordination and enforcement of the Drugs Act, 1976 and to bring harmony in inter-provincial trade and commerce of therapeutic medicines.
With regard to availability, only 3.3 percent of government health facilities had stock availability of essential medicines. Private practices are also unable to meet medicinal needs adequately, as they serve about one third of the required set of medicines. There have been a few positive changes, however. The latest budgetary allocation in Khyber Pakhtunkhwa , for example, allocated Rs. 1 billion for the provision of free medicine and healthcare in government-run hospitals.
The consumer price ratio is a comparative representation of indigenous prices of generic medicine to the international level of pricing. Table 36 gives the median consumer price ratios of selected generic medicines in private practices for selected countries. As seen the ratio for Pakistan in 2004 is 2.26, as compared to 1.9 for India from 2003-2011, Iran at 1.32 (2007), Malaysia at 6.57 (2004), Sri Lanka at 1.14 (2001), the U.A.E. at 13.75 (2006) and 1.38 for China (2004-2012).
Pakistan
India
Iran
Malaysia
Sri Lanka
U A E
China
2.26 (2004)
1.9 (2003-2011)
1.32 (2007)
6.57 (2004)
1.14 (2001)
13.75 (2006)
1.38 (2004-2012)
Country Value/Year
Table 36 Median Consumer Price Ratio133
Source: World Health Organization
132 Source: Economic Affairs Division (EAD). The World Bank estimates given in Table 35 total US $ 24,192 million during the period 2000-2011. The difference in EAD and World Bank estimates is due to the difference in definitions adopted by the two institutions. The definition adopted by World Bank is reproduced as follows: Net official development assistance (ODA) consists of disbursements of loans made on concessional terms (net of repayments of principal) and grants by official agencies of the members of the Development Assistance Committee (DAC), by multilateral institutions, and by non- DAC countries to promote economic development and welfare in countries and territories in the DAC list of ODA recipients. It includes loans with a grant element of at least 25 percent (calculated at a rate of discount of 10 percent). Data are in current U.S. dollars.133 Median consumer price ratio (ratio of median local unit price to Management Sciences for Health international reference price) of selected originator medicines.

Pakistan Millennium Development Goals Report 2013
112
Chapter 9 MDG 8
Thus, while Pakistan’s consumer price ratio is better than a number of countries, medicinal prices in Pakistan are greater than in three of its immediate neighbors, China, India and Iran. Relatively developed countries exhibit higher median price cost ratios but those costs are usually cushioned by national and private health insurance schemes, medical benefits and so on. Studies have found that: whilst public procurement of essential medicines is efficient in so far as low-priced medicine is concerned, the requisite quantities are often not available; the poor do not have access to many essential medicines;134 provision of essential medicines for poor segments of society is inefficient and costly, resulting in the utilization of ‘alternative medicine’ and faith-healing etc., dubious practices with little to no medical credence; children under-five years of age are among those suffering the most from this availability gap; 135 and the healthcare system primarily suffers from inherent systemic weaknesses, as well poor pharmaceutical regulation. 136
Access to New TechnologyFollowing deregulation of the telecom sector in 2004, this attracted substantial investment. Over the last seven years more than US$ 12 billion were invested in telecom infrastructure and new technologies, leading to the current situation where 90 percent of the population has access to telecom services. The internet is regarded as an economic stimulus rather than just a communication tool. However, the broader the scope of internet use, the greater the need for regulation. Regulatory provisions such as rules, regulations, SOPs, licensing and authority directives of the telecom sector should be shaped to meet the challenges ahead.
2000
2001
2002
2003
2004
2005
2006
2007
2008
2009
2010
2011
2012 (DEC)
3340
3656
4949
4460
5191
5128
4806
4546
3700
3,417
3,016
2,985
N/A
742
1698
2404
5022
12771
34506
63163
88019
91422
99,186
108,895
120,151
121,946
800
1000
1600
2000
2100
2400
3500
3700
3700
N/A
N/A
N/A
N/A
2.4
2.6
3.4
3
3.5
3
3
3.2
2.8
2.16
1.9
1.7
1.7
0.57
0.7
1.1
1.3
1.4
1.6
2.2
2.3
2.3
7.5
8.0
9.0
N/A
26611
45153
168082
413809
900648
1491491
2101315
2350246
Year Telephones in ‘000’ Cell Phones in ‘000’ Internet Connections in ‘000’
Telephone Lines per 100 population
BroadbandSubscribers
Internet Users per 100 population 138
Table 37 Estimate of telephone lines, computers and internet users
Source: PTA Annual Report 2011-12
134 Tisocki, Kiani & Mustafa. The Network for Consumer Protection, 2006 135 Shafiq, Shaikh and Kumar. J Ayub Medical College Abbottabad, 2011 136 Zaidi S, Bigdeli M etel. US National Library of Medicine, 2013 137 Pakistan Economic Survey, 2012-13 138 World Bank Estimates for last 3 years for Internet Users per 100 populations.

Pakistan Millennium Development Goals Report 2013
113
Chapter 6 MDG 5
At the end of 2012 total tele-density of Pakistan increased to 71.7 percent, representing growth of 5 percent over the previous year. Cellular mobiles contributed solely towards this (see Table 37), as the number of fixed line telephones, as well as telephone lines per 100 population, decreased. Broadband adoption has also more than doubled over the last three years, and the trend persists; and internet connections overall, as well as the proportion of people out of every 100 with internet access, has improved. The telecom sector has been contributing significantly to the national exchequer. During 2012, it contributed Rs.132.5 billion or 30 percent of total revenue, compared to Rs. 117 billion in the previous year. With the expected launch of 3G/4G services in the country , it is expected that the cellular mobile sector will attract significant investment in the next two years.
139 Pakistan Economic Survey, 2012-2013.

Pakistan Millennium Development Goals Report 2013
114
Chapter 9 MDG 8

Chapter 10
Pakistan’s MDG Acceleration framework and Post - 2015 Development Agenda
Chapter 10

Pakistan Millennium Development Goals Report 2013
116
Chapter 10
The MDG Acceleration Framework (MAF) is a methodological framework offering governments and their partners a systematic way to identify and address bottlenecks to progress on MDG targets that are off track.140 The MAF is formulated by the government in consultation with all relevant stakeholders. It comprises four systematic steps for each off-track MDG target: prioritization of country-specific interventions; identification and prioritization of bottlenecks to effective implementation; selection of feasible, multi-partner acceleration solutions; and planning and monitoring of implementation.
After consultation at the federal and sub-national level, Pakistan has selected MDG 2 (Net Enrolment Ratio) for acceleration. The MAF for education specifically aims to achieve: enrolment of a maximum number of out-of-school children in primary classes; in-school retention of all enrolled children and completion of their primary education; and improvement in the quality of primary education.
MDG Acceleration Framework targets
Some preliminary work on the MAF for Education has already been done. The Ministry of Education, Training and Standards in Higher Education, in consultation with the four provinces and regions and with technical support from UNICEF and UNESCO has prepared a National Plan of Action (NPA) which aims to enroll 5.1 million out-of-school children between 2013 and 2016, equivalent to 76 percent of the total number of out-of-school children.
Identification and prioritization of bottlenecks to the effective implementation
The NPA has identified a few reasons driving low enrolment rates in Pakistan:
Reasons for never attending School: Among children who never attended school, the most predominant reason for girls is “parents did not allow” (40 percent), followed by “too expensive” (16 percent), “child not willing” (10 percent) and “too far” (9 percent). For boys, the reasons seem a bit different, with “child not willing” (37 percent), followed by “too expensive” (21 percent); and “has to help at work” (10 percent).
Reasons for dropping out-of-school before completing primary: For girls, the predominant reason for dropping out of primary school is “child not willing” (14 percent), followed by “parents did not allow” (10 percent) and “too expensive” (7 percent). With boys, too, the predominant reason is also “child not willing” (26 percent) but this is followed by “had to help at work” (7 percent).
Lack of access to education/high drop-out rate; relevant factors here include: a) lack of capacity of teachers, teacher absenteeism and harsh attitudes; b) insufficient number of schools, poor or no facilities, and long distances to schools.
Poor quality of education: Issues include poor teaching quality and outdated methods; missing facilities; lack of supervision as well as incentives for teachers; and management and political pressures.
Acceleration Solution
In light of the reasons identified, the NPA proposes the following four strategies to enhance enrolment rates:
a) Enrolment of new students in existing schools (under-utilized/closed schools): Under the strategy of enrolling new students in existing schools, a total of 3.2 million new students will be enrolled in primary classes in Pakistan between 2013 and 2016.
140 The MAF broadly defines bottlenecks as the proximate and removable constraints that impede implementation of MDG related interventions. Bottlenecks can be identified as belonging to one of five categories — supply side (provisioning perspective); demand side (including social and cultural issues); policy and planning; budget and financing; and crosscutting (including coordination and alignment)

Pakistan Millennium Development Goals Report 2013
117
Chapter 10
Of these, 56 percent will be enrolled in public formal and 13 percent in public non-formal schools, and 15 percent in deeni madaris and other schools. Private schools are expected to absorb another 16 percent of students. The human resource requirement (teachers and administrators/supervisors) for these new enrolments under the strategy will be recruitment of a total of 16,750 new formal and 14,775 new non-formal school teachers and 19 supervisors. The total cost of implementing the strategy, which entails increasing access along with quality enhancement as well as innovative strategies (e.g. awareness campaigns to promote the importance of education, community involvement in supervision of local education; and use of media), for three years (2013-16) is estimated to be Rs. 69,574 million, of which 66 percent is for increasing access to education.
b) Enrolment of new students in formal schools through provision of an additional room: the 10 percent (511,095) new students to be enrolled in primary classes in Pakistan from 2013-16 will be accommodated in formal public schools which will be provided with an additional classroom and one additional teacher. Assuming 30 students per classroom, a total of 20,915 additional rooms (and 20,915 teachers) will be provided in 20,915 formal schools. Assuming a teacher-supervisor ratio of 40:1, around 427 new supervisors will be recruited to monitor new teaching activities. The total cost of implementing this strategy, i.e. provision of public sector formal schools with one additional room and teacher, is estimated to be Rs. 37,252 million over three years. Some of this amount will be directed towards quality enhancement, innovative strategies, and for miscellaneous/unforeseen events.
c) Enrolment of Children in new schools: Of the children to be enrolled in new schools, 24 percent will be enrolled in formal public sector new schools and 76 percent will be enrolled in equal proportions in new non-formal primary and feeder schools. The human resource requirement under this strategy are for recruitment of 6,917 formal school teachers, 33,757 non-formal teachers, 857 supervisors and 835 other support staff. The total cost of implementing this strategy is estimated at Rs 50,900 million, of which almost 80 percent covers development and recurrent (operational) costs. The remaining 20 percent is for costs due to quality enhancement measures, innovative awareness campaigns and miscellaneous/unforeseen events.
d) Targeted Incentives for access and retention for disadvantaged groups and girls (15 percent of all enrolment): Under this strategy, for all (old and new) primary enrolment, 15 percent of students will be provided incentives equivalent to Rs. 3,000 per child, for access and retention in primary schools. A total of 10.3 million children will be targeted at a cost of Rs. 30.9 billion. Targeted interventions to deal with out of school factors: These include awareness campaigns to improve enrolment and reduce drop outs; incentives for students, teachers and parents; awareness raising in meetings/trainings/workshops for community leaders; media campaigns and community support for education interventions; alternate Learning Centers/Feeder Schools/Mobile and second shift schools. Also included are provision of other incentives (e.g. stipends, food for education, uniforms, etc) to retain children from the most disadvantaged/rural/remote areas, especially girls. The Government of Punjab has aligned these efforts in a more education oriented approach through: parental education and adult literacy programmes; social mobilization and involvement of community in decision-making; community sensitization and functional literacy; and need-based identification of sites for schools/transport facilities through public private partnership.
MAF Action Plan
Building on the NPA, the Ministry of Planning, Development and Reform, in close collaboration with the Ministry of Education, Training and Standards in Higher Education, provinces, and with UNDP’s technical support, is organizing consultation workshops to gather inputs from different stakeholders on innovative and area specific interventions to accelerate progress towards attaining MDG 2. At the provincial level, the Planning and Development Departments have constituted MDG/MAF coordination Committees which facilitate discussions and consultations at the sub-national level.

Pakistan Millennium Development Goals Report 2013
118
Chapter 10
Post – 2015 Development Agenda
The Millennium Development Goals which were endorsed by the member states in the Millennium Declaration adopted in 2000, have defined and informed a common framework of priorities for the Development community. Since their inception in 2001, the MDGs and relevant indicators have been regarded by countries as development milestones against which optimal end points were anointed and frameworks development for their achievement. Many countries report positively on the achievement of targets. However as the target date of December 2015 approaches, for many countries targets several targets remain unmet giving rise to a number of contentions on the path that much be taken once the stipulated timeline ends. Discussions and consultations on the development agenda that will build on the MDGs after 2015 have been initiated around the world.
The UN Secretary General (UN SG) Report on accelerating progress toward the MDGs and the issues for advancing the UN development agenda beyond 2015 (A/66/126) stated that “the post- 2015 development framework is likely to have the best development impact if it emerges from an inclusive, open and transparent process with multiple stakeholder participation.”
A number of development challenges emerged or exacerbated after the adoption of MDG Framework would inform the Post 2015 Development Agenda. Inequality has increased worldwide, although poverty has reduced. Demographics are shifting and by 2050 there will be more aged people especially in the developed world. Pakistan and some other countries will however continue to benefit from the youth bulge particularly until 2030. There are growing environmental issues and an increase in insecurity due to violence and political conflict. Countries where the latter was prevalent have not achieved a single MDG target. Deficits related to governance, accountability, rule of law and lessons from the 2008 financial crisis are also informing the debate on the Post 2015 Agenda.
Post-2015 Consultations in Pakistan
The UN selected Pakistan one of the 100 countries for the national consultations. UNDP, on behalf of the UN Resident Coordinator in Pakistan, conducted national consultations to gather inputs and feedback from different stakeholders on the Pakistan specific priorities for the Post 2015 Development Agenda. The consultation process in Pakistan started on the 20th December 2012. Until end of March 2013, more than 21,987 people around Pakistan belonging to different professions and representing diverse communities were consulted through face to face meetings / workshops and an online survey. The people who participated in the process included representatives from Civil Society Organizations (CSOs), farmers, labourers, employers and workers associations, religious, ethnic and sexual minorities, students, parliamentarians, academia, development partners including donors and national staff of UN agencies, disabled persons, government officials at the federal and provincial levels, media, private sector, internally displaced people, women organizations etc. Through the online survey, feedback from across Pakistan was gathered. The inputs were gathered by employing different formats including face to face discussions, online survey, focus groups discussions, seminars and panel discussions.
To benefit from the existing knowledge base, different policy documents / strategies, situational analyses, thematic reports etc were used to draw key messages for the post 2015 agenda. A few reports to mention here include the Meta Analysis Report / Common Country Assessment 2011 undertaken by the UN System for the second generation One UN Programme in Pakistan, the Planning Commission’s Framework for Economic Growth 2011, Global Peace Index, Pakistan’s Participatory Poverty Assessment National Report 2013, the Global Competitiveness Report 2012-13, National and Provincial MDGs Reports, National Climate Change Policy 2012, Household Integrated Economic Survey 2010-11 and a number of other documents.

Pakistan Millennium Development Goals Report 2013
119
Chapter 10
Priority Areas for Post-2015
1. Reflections on the MDG framework
One of the key messages, especially from the civil society and academia, that emerged during the consultations was that the MDGs framework, though useful in its own right, would have made more impact had it been localized at the provincial level at the onset. A large number of respondents doubted the reliability of the national data used for MDGs monitoring and progress reporting. A useful recommendation for the post 2015 development agenda is that there should be adequate investment in developing the capacities of statistical machineries to generate, compile and analyze timely, reliable and accessible (to public at large) data. One of the feedbacks was that while the government should lead the process of progress reporting on the post 2015 MDGs framework, it should also involve the civil society and academia in this process to help ensure broader acceptability for the government reports. The respondents also proposed that the post 2015 development agenda should be guided by the principles of human rights. The new development framework must include issues like violence against women, right to freedom of information and expression, reproductive rights, health and education rights etc. The participants also proposed that it should be binding on the sates to put in place appropriate policies, plans, budgetary frameworks and legislation to pursue the post 2015 development agenda.
2. Peace and security
Peace and security emerged as the most critical development challenge for Pakistan. There was a complete convergence among the respondents that without resolving the issues concerning security, law and order in the country, the achievements of other development targets will remain a distant dream. Majority of the respondents were of the view that the current security situation in Pakistan is the direct consequence of the international war on terrorism. The respondents emphasized that the international stakeholders, in the war on terror, should therefore appreciate the realities on the ground and shouldn’t enforce its policies / agenda on the national government. At the national level, efforts should be made to enhance social cohesion among people from different sects and ethnic groups with the objective to promote tolerance for diverse views and beliefs.
3. Good Governance
Good governance underpinned by the principles of transparency, accountability and the rule of law emerged as the second most pressing priority for the people of Pakistan. The respondents opined that bad governance had been the main barrier to the achievement of MDGs in Pakistan. The government officials themselves recognized the need for increasing efficiencies in the public service delivery systems and the Results Based Management system in the public offices. The respondents also underlined that full functioning local government system brings governing apparatus closer to the citizens and improves accountability and transparency mechanisms through greater people’s participation. As part of the good governance system, rule of law and access to justice was identified as a key priority for Pakistan. The respondents observed that access to and use of legal system is unevenly distributed among different social and economic groups. The national legal system should be inclusive and should protect the property rights of women and marginalized groups and should provide safeguards against the abuse of political, economic or institutional authority by the elite class.
4. Inclusive Economic growth
Economic growth in Pakistan has remained volatile resulting into unsustainable patterns of employment creation. But even high growth periods have not led to substantial reduction in poverty and inequalities in Pakistan. Some of the academics observed that the current political and economic structures in the country generate rents for the rich. The national economy needs institutional reforms to promote more equitable distribution of productive resources / assets (like land) and to help ensure that poor people participate as partners / actors in the economic development process rather than mere beneficiaries. Pakistan is bestowed with a huge youth bulge which should be converted into a “youth dividend” by enhancing their income generation skills and providing them business development opportunities. The need for inclusive economic growth was highlighted.

Pakistan Millennium Development Goals Report 2013
120
Chapter 10
5. Rule of Law
The Workers’ Federation emphasized that to foster inclusive economic growth and decent employment, rule of laws and implementation of laws, especially the Industrial Relations Laws to guarantee the rights available under ILO Conventions 87 and 98, should be accorded priority. Investment in Human Resource Development should also be prioritized and apart from developing ‘market-based strategies’, some basic standards need to be developed to measure workers’ performance while keeping in view their specific challenges.
6. Inclusive Social Development
Pakistan needs an agenda for inclusive social development. High fertility rate is one of the key obstacles to reaping the benefits of growth and should therefore be prioritized for appropriate interventions in the post MDGs’ era. Women’s reproductive rights should be guaranteed. Besides recognizing education as a fundamental human right, the quality of education should be improved. The education system should be equitable by providing equal accessibility and benefits to the rich and the poor cadres of the society. The government, civil society and media should promote spaces for cultural and social activities especially for youth. Social development services, especially health and education services shouldn’t be the sole responsibility and domain of the public sector. The private sector stands ready to contribute to the social development in the country and should therefore be encouraged and provided enabling environment to play its due role.
7. Gender Equality and Women Empowerment
There was a strong voice for gender equality and women empowerment. The participants observed that different forms of violence against women have put constraints on women’s meaningful participation in social, economic and political fields. Women share in wage employment is one of the lowest in the South Asian Region. Programmes like Benazir Income Support Programme, a social safety net initiative, plays an important role in women’s empowerment and should therefore be pursued and expanded. Women should be provided enabling environment, like the provision of safe transport, protection against harassment and abuse, so that they could freely take part in the social and economic activities. Pakistan has one of the highest quotas for women in the parliament; however women from the less privileged strata should also be provided opportunities to benefit from the quota system, which at the moment mostly benefits the upper class. A unanimous recommendation was that besides specific goal on gender equality, the same should be mainstreamed across all other goals to be set for the post 2015 framework.
8. Sustainable and Low Cost Energy
Access to sustainable and low cost energy resources is also one of the key development priorities for the citizens of Pakistan. Food insecurity and nutrition deficits have drastically increased in Pakistan over the past few years. Besides the issues related to production and availability, higher prices and declining purchasing powers have put significant stress on poor’s accessibility to food items. The respondents underlined that the governments need to design appropriate policies to check inflation, especially food prices, and at the same time, invest in increasing its citizens’ resilience to economic shocks through social safety nets / protection initiatives.
9. Disaster Preparedness and Response
It was interesting to note that disaster preparedness and response (related to natural calamities) appeared at the bottom of the list of development priorities gathered through the online survey in which more than 18,000 Pakistanis participated. However, participants in the face to face discussions did identify natural disasters as one of the key development challenges, at the national and global levels, and therefore called for appropriate measures to enhance people’s and institutions’ capacities to prevent, mitigate and manage the consequences of natural disasters. It was proposed that state should make adequate financial allocations in its budgets and development plans for disaster preparedness and mitigation.
Pakistan Millennium Development Goals Report 2013
121
Chapter 10
10. Role of the Developed World
Many of the participants criticized the role and contribution of the developed world in the MDGs framework. They proposed that the role of the developed world in the post 2015 agenda should be much broader than a mere provision of donor of funds. The developed world should be made legally bound to commit and provide adequate and predictable resources to the developing world. The developing counties should be provided access to global markets without any conditions and an anticipation of politically motivated returns. The developed countries should commit to “good governance” at the global level so that the likes of 2008 financial crisis are not repeated. It should be underlined that issues related to climate change are mostly the outcomes of the acts of developed countries. It is therefore obligatory on the developed world to make sufficient investments to reduce the impact of climate change and global warming. The developed countries should be held responsible for their policies and interventions affecting peace and security in the developing countries, the participants underlined.
Suggested Parameters for the Post-2015 Development Framework
The new framework should enhance responsibility and ownership of national as well as sub-national policy-making and actions thereof. Moreover, there needs to be a shift from purely quantitative modes of analysis, as is in the current MDGs, towards more qualitative indicators. The progress of these should be gauged at regular intervals by means of real-world participatory surveys. Instead of having a stagnant end-point target, short-term as well as mid-term goals need to be identified, so that progress towards the final target can be more succinctly quantified and accelerated as needed.
Goals pertaining to human rights need to be made more stringent and absolute in their applicability; they should follow an absolute standard, as opposed to a relative one, which could be achieved in phases. These rights include gender equality, minority protection, etc. To this end, new parameters pertaining to specific ethnic and socio-economic groups, as well as those based on age demographics should be established. Options include (there could be others): children, adolescents, youth, peace and security, social justice, emergencies, disasters, environment, population, demography, energy, infrastructure, water scarcity, economic migrants, regional conflicts, internal displacement and gender equality.
Educational progress should be measured not only by net enrolment, but rather this should be used in conjunction with improvement in learning outcome indicators. Finally, democratic governance, health and education, and peace and security along with climatic resilience are seen as the most urgent priority areas for Pakistan.
Measurement Methodology
There must be strong focus on localization of targets/goals to country level ground realities: the focus needs to shift from a universal all-encompassing approach to specific measurement frameworks. Moreover, a system for check and balances is needed, in order to cogently measure the success and failures of various strategies. Finally, targets need to be disaggregated, so disparity across different population segments, e.g. gender, ethnicity, can be observed.
Monitoring of Progress
Updates on targets must be made available on more regular intervals; moreover, reviewing mechanisms need to be set up via independent bodies. Roadmaps should be prepared by each country, for the execution of their policy frameworks, and such frameworks need to be synergized amongst the various relevant branches, i.e. fiscal, planning and so on. Indicators must take into account gender, and in particular other marginalized segments.

Pakistan Millennium Development Goals Report 2013
122
Chapter 10
Responsibilities of Stakeholders
Each country should be asked to prepare a clear implementation plan with roles and responsibilities for different stakeholders and partners. Political ownership, at the national level, will be the most important drivers of success for the future development agenda. Civil society should be involved in progress monitoring.
Investment in building the capacity of statistical institutions should be made to help trace the progress on development goals and collection of reliable data. The UN should play a more proactive role to monitor progress towards the global development agenda and to ensure the effectiveness of development interventions on the lives of poor and marginalized segments of the society. To make it binding, the developing countries should also commit their share of resources for the post-2015 development framework. There should be a more robust system of accountability for the developed countries. In addition to fulfilling their financial and capacity/technical support commitments, developed countries should be held responsible for their policies and interventions affecting peace and security in developing countries.
For further details about the national consultations on the Post-2015 Development Agenda, please visit: http://www.worldwewant2015.org/regions/160516

Pakistan Millennium Development Goals Report 2013
123
Annexes
PMDGR 2013 Annexes Annex 1
MDG Goals and targets Nationally Adapted Goals & Targets
Original Indicators for monitoring
Nationally adopted indicators
GOAL 1: ERADICATE EXTREME POVERTY & HUNGER
GOAL 2: ACHIEVE UNIVERSAL PRIMARY EDUCATION
GOAL 3: PROMOTE GENDER EQUALITY AND EMPOWER WOMEN
Y/N If yes, describe new goals/targets and indicate dates (when these were adopted)
Target 1.A: Halve, between 1990 and 2015, the proportion of people whose income is less than $1.25 a day
Target 1.B: Achieve full and productive employ-ment and decent work for all, including women and young people
Target 2.A: Ensure that, by 2015, children everywhere, boys and girls alike, will be able to complete a full course of primary schooling
Target 3.A: Eliminate gender disparity in primary and secondary education, preferably by 2005, and in all levels of education no later than 2015
Target 1.C: Halve, between 1990 and 2015, the proportion of people who suffer from hunger
Target 1: Halve, between 1990 and 2015, the proportion of people whose income is less than one dollar a day
* Target 2: In co-operation with developing countries, develop and implement strategies for decent and productive work for youth
Target 4: Ensure that, by 2015, children everywhere, boys and girls alike, will be able to complete a full course of primary schooling
Target 5: Eliminate gen-der disparity in primary and secondary education preferably by 2005 and to all levels of education no later than 2015.
Target 3: Halve between 1990 and 2015, the proportion of people who suffer from hunger
1.1 Proportion of population below $1 (PPP) per day1.2 Poverty gap ratio1.3 Share of poorest quintile in national consumption
1.4 Growth rate of GDP per person employed1.5 Employment-to-population ratio1.6 Proportion of employed people living below $1(PPP) per day1.7 Proportion of own-account and contributing family work-ers in total employment
2.1 Net enrolment ratio in primary education2.2 Proportion of pupils starting grade 1 who reach last grade of primary2.3 Literacy rate of 15-24 year-olds, women and men
3.1 Ratios of girls to boys in primary, secondary and tertiary education3.2 Share of women in wage employment in the non-agri-cultural sector3.3 Proportion of seats held by women in national parliament
1.8 Prevalence of underweight children under-five years of age1.9 Proportion of population below minimum level of di-etary energy consumption
1. Proportion of population below the calorie based food plus non-food poverty line2. Poverty gap ratio (incidence x depth of poverty)
3. Unemployment rate of 15-24 year olds
5. Net enrolment ratio in primary education6. Proportion of pupils starting grade 1 who reach grade57. Literacy rate of 15-24 years olds
8. Literacy (10+) GPI9. Youth literacy GPI10. Share of women in wage employment in the non agri-cultural sector11. Proportion of seats held by women in national Parliament
4. Prevalence of underweight children (under-five years of age)
Y
N
Y
Y
Y
National adaptation of MDG Goals, Targets and Indicators

Pakistan Millennium Development Goals Report 2013
124
Annexes
PMDGR 2013 Annexes Annex 1
MDG Goals and targets Nationally Adapted Goals & Targets
Original Indicators for monitoring
Nationally adopted indicators
GOAL 4: REDUCE CHILD MORTALITY
GOAL 5: IMPROVE MATERNAL HEALTH
GOAL 6: COMBAT HIV/AIDS, MALARIA AND OTHER DISEASES
Y/N If yes, describe new goals/targets and indicate dates (when these were adopted)
Target 5.A: Reduce by three quarters the mater-nal mortality ratio
Target 5.B: Achieve universal access to reproductive health
Target 6.A: Have halted by 2015 and begun to reverse the spread of HIV/AIDS
Target 6.B: Achieve, by 2010, universal access to treatment for HIV/AIDS for all those who need it
Target 6: Reduce by two-thirds, between 1990 and 2015, the under-five mortal-ity rate
Target 4.A: Reduce by two thirds, between 1990 and 2015, the under-five mortality rate
Target 7: Reduce by three-quarters, between 1990 and 2015, the maternal mortality ratio
Target 8: Have halted by 2015, and begun to reverse, the spread of HIV/AIDS.
4.1 Under-five mortality rate4.2 Infant mortality rate4.3 Proportion of 1 year-old children immunized against measles
5.1 Maternal mortality ratio5.2 Proportion of births attended by skilled health personnel
5.3 Contraceptive prevalence rate5.4 Adolescent birth rate5.5 Antenatal care coverage (at least one visit and at least four visits)5.6 Unmet need for family planning
6.1 HIV prevalence among population aged 15-24 years6.2 Condom use at last high-risk sex6.3 Proportion of population aged 15-24 years with compre-hensive correct knowledge of HIV/AIDS6.4 Ratio of school attendance of orphans to school atten-dance of non-orphans aged 10-14 years6.5 Proportion of population with advanced HIV infection with access to antiretroviral drugs
12. Under-five mortality rate13. Infant mortality rate14. Fully Immunized children (12-23m)15. Proportion of children under five who suffered from diarrhea in the last 30 days and received ORT16. Lady Health Workers’ coverage
17. Maternal mortality ratio18. Proportion of births attend-ed by skilled health Personnel
19.Total Fertility Rate20.Contraceptive Prevalence Rate21.ANC coverage
22. HIV prevalence among 15-24 year old pregnant women23. HIV prevalence among vulnerable group (%)
Y
Y
Y
Y
Y

Pakistan Millennium Development Goals Report 2013
125
Annexes
PMDGR 2013 Annexes Annex 1
MDG Goals and targets Nationally Adapted Goals & Targets
Original Indicators for monitoring
Nationally adopted indicators
GOAL 6: COMBAT HIV/AIDS, MALARIA AND OTHER DISEASES
GOAL 7: ENSURE ENVIRONMENTAL SUSTAINABILITY
Y/N If yes, describe new goals/targets and indicate dates (when these were adopted)
Target 7.A: Integrate the principles of sustain-able development into country policies and programmes and reverse the loss of environmental resources
Target 7.B: Reduce biodiversity loss, achieving, by 2010, a significant reduction in the rate of loss
Target 9: Have halted by 2015, and begun to reverse, the incidence of malaria and other major diseases.
Target 6.C: Have halted by 2015 and begun to reverse the incidence of malaria and other major diseases
Target 10: Integrate the principles of Sustainable development into country policies and programs and reverse the loss of environ-mental resources.
6.6 Incidence and death rates associated with malaria6.7 Proportion of children under 5 sleeping under insec-ticide treated bed nets6.8 Proportion of children under 5 with fever who are treated with appropriate anti-malarial drugs6.9 Incidence, prevalence and death rates associated with tuberculosis6.10 Proportion of tuberculosis cases detected and cured under directly observed treat-ment short Course
7.1 Proportion of land area covered by forest7.2 CO2 emissions, total, per capita and per $1 GDP (PPP)7.3 Consumption of ozone-de-pleting substances7.4 Proportion of fish stocks within safe biological limits7.5 Proportion of total water resources used7.6 Proportion of terrestrial and marine areas protected7.7 Proportion of species threatened with extinction
24. Proportion of population in malaria risk areas using effective malaria prevention and treat-ment measures25. Proportion of TB cases detected and cured under DOTS (Directly Observed Treatment Short Course)26. Incidence of TB per 100,000 population
27. Proportion of land area covered by forest28. Land area protected as % of total area29. No. of vehicles using CNG fuel30. GDP per unit of energy use (as proxy for energy efficien-cy)7.1 Forest cover including state-owned and private forest and farmlands
Y
Y
N
National adaptation of MDG Goals, Targets and Indicators

Pakistan Millennium Development Goals Report 2013
126
Annexes
PMDGR 2013 Annexes Annex 1
MDG Goals and targets Nationally Adapted Goals & Targets
Original Indicators for monitoring
Nationally adopted indicators
GOAL 7: ENSURE ENVIRONMENTAL SUSTAINABILITY
Goal 8: Develop a Global Partnership for Development
Y/NIf yes, describe new goals/targets and indicate dates (when these were adopted)
Target 7.D: Achieve, by 2020, a significant im-provement in the lives of at least 100 million slum dwellers
Target 8.A: Develop further an open, rule-based, predictable, non-discriminatory trading & financial system
Target 11: Halve, by 2015, the proportion of people without sustainable access to safe drinking water
Target 7.C: Halve, by 2015, the proportion of the population without sustainable access to safe drinking water and basic sanitation
Target 12: By 2020, to have achieved a significant improvement in the lives of at least 100 million slum dwellers
Target 13: Develop further an open, rule-based, predictable, nondiscrimina-tory trading and financial system. Includes a commitment to good governance, development, and poverty reduction-both nationally & internationally
7.8 Proportion of population using an improved drinking water source7.9 Proportion of population using an improved sanitation facility
7.10 Proportion of urban population living in slums
Some of the indicators listed below are monitored separately for the least developed countries (LDCs), Africa, landlocked developing countries and small island developing States. Official de-velopment assistance (ODA)8.1 Net ODA, total and to the least developed countries, as percentage of OECD/DAC donors’ gross national income8.2 Proportion of total bilat-eral, sector-allocable ODA of OECD/DAC donors to basic social services (basic education, primary health care,nutrition, safe water and sanitation)8.3 Proportion of bilateral official development assistance of OECD/DAC donors that is untied8.4 ODA received in landlocked developing countries as a proportion of their gross national incomes8.5 ODA received in small island developing States as a proportion of their gross national incomes
31. Proportion of population with access to clean water32. Proportion of people with access to sanitation
33. Proportion of katchi abadis (slums) regularized
Official Development Assistance34. Net ODA as percentage of DAC donors’ GNI (targets of 0.7% in total and 0.15% for LDCs)35. Proportion of ODA to basic social services (basic edu-cation, primary health care, nutrition, safe waterand sanitation)36. Proportion of ODA that is untied37. Proportion of ODA for environment in small island developing states38. Proportion of ODA for transport sector in landlocked countries
Y
Y
Y

Pakistan Millennium Development Goals Report 2013
127
Annexes
PMDGR 2013 Annexes Annex 1
MDG Goals and targets Nationally Adapted Goals & Targets
Original Indicators for monitoring
Nationally adopted indicators
Goal 8: Develop a Global Partnership for Development
Y/N If yes, describe new goals/targets and indicate dates (when these were adopted)
Target 14: Address the Spe-cial Needs of the Least De-veloped Countries Includes: tariff and quota free access for LDC exports; enhanced programme of debt relief for HIPC and cancellation of official bilateral debt; and more generous ODA for countries committed to poverty reduction
Target 15: Address the Special Needs of landlocked countries and small island developing states (through Barbados Programme and 22nd General Assembly provisions)
Target 16: Deal compre-hensively with the debt problems of developing countries through national and internationalmeasures in order to make debt sus-tainable in the long term
Target 17: In-co-operation with pharmaceutical com-panies, provide access to affordable, essential drugs in developing countries.
Target 18: In co-operation with the private sector, make available the bene-fits of new technologies, especially information and communications
Target 8.B: Address the special needs of least developed countries
Target 8.C: Address the special needs of landlocked developing countries and small island developing States
Target 8.D: Deal compre-hensively with the debt problems of developing countries
Target 8.E: In cooperation with pharmaceutical companies, provide access to affordable essential drugs in devel-oping countries
Target 8.F: In cooperation with the private sector, make availablethe benefits of new technologies, especially information andcommunications
Market access8.6 Proportion of total de-veloped country imports (by value and excluding arms) from developing countries and least developedcountries, admitted free of duty8.7 Average tariffs imposed by developed countries on agri-cultural products and textiles and clothing from developing countries8.8 Agricultural support estimate for OECD countries as a percentage of their gross domestic product8.9 Proportion of ODA provid-ed to help build trade capacity
Debt sustainability8.10 Total number of countries that have reached their HIPC decision points and number that have reached their HIPC completion points(cumulative)8.11 Debt relief commit-ted under HIPC and MDRI Initiatives Debt service as a percentage of exports of goods and services
8.12 Proportion of population with access to affordable essential drugs on a sustain-able basis
8.13 Fixed telephone lines per 100 inhabitants8.14 Mobile cellular subscrip-tions per 100 inhabitants8.15 Internet users per 100 inhabitants
Market Access39. Proportion of exports (by value and excluding arms) ad-mitted free of duties and quotas40. Average tariffs and quotas on agricultural products and textiles and clothing41. Domestic and export agricultural subsidies in OECD countries42. Proportion of ODA provided to help build trade capacity
Debt sustainability43. Proportion of official bilater-al HIPC debt cancelled44. Debt service as a percentage of exports of goods and services45. Proportion of ODA provided as debt relief46. Number of countries reach-ing HIPC decision and comple-tion points
47. Proportion of population with access to affordable essen-tial drugs on a sustainable basis
48. Telephone lines per 1000 people49. Personal computers per 1000 people
Y
Y
Y
Y
Y
National adaptation of MDG Goals, Targets and Indicators

Pakistan Millennium Development Goals Report 2013
128
Annexes
PMDGR 2013 Annexes Annex 2
2.A: Punjab
Net Primary Enrolment RatioDistrict Level Ranking by Provinces
Rank Districts 2004-05
1 Sialkot 83.6
2 Narowal 83.1
3 Jhelum 81.6
4 Islamabad 77.7
5 Chakwal 74.9
6 Gujrat 72.9
7 Rawalpindi 71.2
8 Attock 69.6
9 Lahore 66.5
10 Khushab 65.3
11 Gujranwala 65.2
12 Faisalabad 64.4
13 Mianwali 64.1
14 Mandi Bahauddin 63.5
15 Jhang 62.7
16 Sargodha 59.2
17 Sahiwal 58.3
18 Hafizabad 57.9
19 Kasur 57.6
20 Toba Tek Singh 57.4
21 Okara 56.8
22 Sheikhupura 56.2
23 Layyah 54.3
24 Khanewal 51.8
25 Bhakkar 51.1
26 Vehari 50.5
27 Rajanpur 49.8
28 D.G.Khan 49.7
29 Multan 49.3
30 Bahawalnagar 48.6
31 Pakpattan 48.4
32 RY Khan 41.9
33 Muzaffargarh 39.3
34 Lodhran 37.7
35 Bahawalpur 37.6 *New District/s created after 2004-05
Rank Districts 2010-11
1 Chakwal 81.3
2 Jhelum 76.6
3 Islamabad 76.0
4 Rawalpindi 75.6
5 Attock 73.5
6 Narowal 72.4
7 Toba Tek Singh 70.8
8 Okara 69.1
9 Mandi Bahauddin 68.8
10 Gujrat 68.4
11 Mianwali 68.1
12 Lahore 67.6
13 Hafizabad 67.4
14 Gujranwala 67.1
15 Sialkot 67.0
16 Sargodha 66.1
17 Sahiwal 65.0
18 Nankana Sahib 64.6
19 Sheikhupura 63.8
20 Khanewal 63.8
21 Khushab 63.6
22 Faisalabad 62.8
23 Layyah 62.5
24 Kasur 62.2
25 Pakpattan 61.6
26 Multan 59.0
27 Jhang 56.5
28 Vehari 55.8
29 Bhakkar 54.1
30 Bahawalnagar 53.1
31 Chiniot 50.9
32 D.G.Khan 50.8
33 Lodhran 49.7
34 Muzaffargarh 47.9
35 Rajanpur 46.1
36 RY Khan 43.4
37 Bahawalpur 40.4

Pakistan Millennium Development Goals Report 2013
129
Annexes
PMDGR 2013 Annexes Annex 2
2.B: Sindh
Net Primary Enrolment RatioDistrict Level Ranking by Provinces
Rank Districts 2004-05
1 Karachi 65.3
2 Sukkur 55.4
3 Naushahro Feroze 53.9
4 Shikarpur 52.0
5 Ghotki 50.2
6 Badin 48.1
7 Tharparkar 46.0
8 Hyderabad 45.4
9 Khairpur 44.0
10 Sanghar 42.2
11 Larkana 42.1
12 Mirpur Khas 41.6
13 S. Benazirabad 41.2
14 Dadu 40.4
15 Thatta 33.1
16 Jacobabad 24.6
Rank Districts 2010-11
1 Hyderabad 67.1
2 Karachi 60.0
3 Khairpur 59.7
4 Umer Kot 58.1
5 Dadu 57.4
6 Sukkur 56.2
7 Sanghar 53.7
8 Naushahro Feroze 53.5
9 Mirpur Khas 52.5
10 Tharparkar 52.3
11 Larkana 51.6
12 S. Benazirabad 51.2
13 Shikarpur 49.2
14 Mitiari 49.1
15 Ghotki 48.3
16 Kashmore 48.0
17 Jacobabad 45.8
18 QS Kot 43.7
19 Jamshoro 43.3
20 Tando Allahyar 41.4
21 Badin 40.9
22 Thatta 34.4
23 Tando Md Khan 29.6

Pakistan Millennium Development Goals Report 2013
130
Annexes
PMDGR 2013 Annexes Annex 2
2.C: Khyber Pakhtunkhwa
Net Primary Enrolment RatioDistrict Level Ranking by Provinces
1 Abbottabad 70.0
2 Mansehra 63.8
3 Haripur 63.1
4 Karak 62.2
5 Chitral 55.3
6 Mardan 55.0
7 Swabi 52.4
8 Lakki Marwat 49.6
9 Bannu 48.8
10 Kohat 48.3
11 Nowshera 48.2
12 Malakand 45.4
13 Peshawar 45.3
14 Batagram 45.0
15 Hangu 42.2
16 Swat 41.3
17 Charsadda 41.2
18 Lower Dir 38.8
19 Buner 38.5
20 D. I. Khan 35.4
21 Tank 35.0
22 Upper Dir 33.5
23 Shangla 27.0
24 Kohistan 26.9 *New District/s created after 2004-05
1 Haripur 72.5
2 Nowshera 63.1
3 Swabi 59.8
4 Mansehra 58.5
5 Abbottabad 58.3
6 Chitral 57.3
7 Karak 57.1
8 Buner 57.0
9 Charsadda 56.0
10 Peshawar 55.8
11 Upper Dir 54.9
12 Batagram 54.6
13 Mardan 54.2
14 Kohat 51.1
15 Malakand 50.9
16 Bannu 49.9
17 Lower Dir 48.1
18 Lakki Marwat 46.9
19 Hangu 45.7
20 Swat 41.6
21 Tank 40.2
22 D. I. Khan 36.0
23 Shangla 30.2
24 Kohistan 20.1
25 Tor Ghar* -

Pakistan Millennium Development Goals Report 2013
131
Annexes
PMDGR 2013 Annexes Annex 2
2.D: Balochistan
Net Primary Enrolment RatioDistrict Level Ranking by Provinces
Rank Districts 2004-05
1 Kech 63.3
2 Ziarat 50.6
3 Mastung 49.6
4 Quetta 45.2
5 Gwadar 43.5
6 Awaran 42.8
7 Kalat 42.4
8 Jaffarabad 41.5
9 Loralai 40.1
10 Khuzdar 39.2
11 Pishin 38.3
12 Lasbela 37.6
13 Barkhan 37.3
14 Sibi 34.3
15 Musakhel 33.6
16 Kharan 31.4
17 Chagai 29.5
18 Bolan 29.2
19 Killa Saifullah 26.0
20 Zhob 25.9
21 Jhal Magsi 22.6
22 Nasirabad 21.2
23 Panjgur 19.5
24 Killa Abdullah 18.7
25 Dera Bugti* -
26 Kohlu* - *New District/s created after 2004-05
Rank Districts 2010-11
1 Mastung 70.2
2 Awaran 69.1
3 Jhal Magsi 66.8
4 Kalat 66.6
5 Sibi 66.2
6 Quetta 64.8
7 Khuzdar 62.2
8 Washuk 59.7
9 Kharan 59.2
10 Sherani 57.9
11 Bolan 57.7
12 Pishin 56.3
13 Gwadar 54.5
14 Killa Abdullah 53.8
15 Panjgur 52.8
16 Harnai 52.2
17 Ziarat 46.6
18 Kech 45.3
19 Jaffarabad 38.1
20 Chagai 34.6
21 Noshki 33.2
22 Nasirabad 33.1
23 Lasbela 30.6
24 Zhob 30.4
25 Killa Saifullah 29.1
26 Kohlu 28.4
27 Barkhan 19.2
28 Loralai 19.2
29 Musakhel 15.5
30 Dera Bugti 11.7
31 Mach* -

Pakistan Millennium Development Goals Report 2013
132
Annexes
PMDGR 2013 Annexes Annex 3
3.A: Punjab
Population that has Completed Primary level or Higher (%)District Level Ranking by Provinces
Rank Districts 2004-05
1 Islamabad 75.0
2 Lahore 66.0
3 Rawalpindi 66.0
4 Chakwal 64.0
5 Sialkot 60.0
6 Gujranwala 59.0
7 Gujrat 59.0
8 Jehlum 59.0
9 Faisalabad 51.0
10 Attock 49.0
11 Narowal 47.0
12 Sheikhupura 47.0
13 T.T.Singh 47.0
14 Mandi Bahuddin 46.0
15 Mianwali 44.0
16 Sahiwal 44.0
17 Sargodha 43.0
18 Hafizabad 42.0
19 Layyah 42.0
20 Kasur 40.0
21 Khanewal 40.0
22 Khushab 40.0
23 Bhakhar 39.0
24 Multan 37.0
25 Bahawalnager 36.0
26 Jhang 36.0
27 Pakpatten 36.0
28 Okara 34.0
29 Vehari 34.0
30 D.G.Khan 33.0
31 Bahawalpur 32.0
32 Rahim Yar Khan 32.0
33 Rajanpur 30.0
34 Muzaffar Garh 29.0
35 Lodhran 28.0
Rank Districts 2010-11
1 Islamabad 76.0
2 Rawalpindi 71.0
3 Lahore 70.0
4 Chakwal 69.0
5 Jehlum 66.0
6 Gujranwala 64.0
7 Gujrat 64.0
8 Sialkot 62.0
9 T.T.Singh 61.0
10 Faisalabad 60.0
11 Narowal 57.0
12 Attock 55.0
13 Mandi Bahuddin 55.0
14 Sheikhupura 54.0
15 Nankana Sahib 51.0
16 Mianwali 50.0
17 Sargodha 49.0
18 Hafizabad 49.0
19 Khushab 49.0
20 Sahiwal 48.0
21 Kasur 48.0
22 Multan 48.0
23 Vehari 44.0
24 Khanewal 43.0
25 Bahawalnager 42.0
26 Jhang 42.0
27 Layyah 41.0
28 Okara 40.0
29 Bahawalpur 39.0
30 Bhakhar 38.0
31 Rahim Yar Khan 38.0
32 Chiniot 38.0
33 Pakpatten 36.0
34 Lodhran 36.0
35 Muzaffar Garh 34.0
36 D.G.Khan 28.0
37 Rajanpur 23.0 *New District/s created after 2004-05

Pakistan Millennium Development Goals Report 2013
133
Annexes
PMDGR 2013 Annexes Annex 3
3.B: Sindh
Population that has Completed Primary level or Higher (%)District Level Ranking by Provinces
Rank Districts 2004-05
1 Karachi 69.0
2 Sukkur 55.0
3 Shikarpur 47.0
4 Nowshero Feroze 46.0
5 Hyderabad 45.0
6 Ghotki 43.0
7 Khairpur 41.0
8 Mir Pur Khas 37.0
9 Nawabshah 36.0
10 Dadu 35.0
11 Sanghar 35.0
12 Badin 33.0
13 Larkana 31.0
14 Tharparkar 30.0
15 Jaccobabad 26.0
16 Thatta 26.0
Rank Districts 2010-11
1 Karachi 72.0
2 Hyderabad 61.0
3 Dadu 53.0
4 Sukkur 51.0
5 Nowshero Feroze 47.0
6 Mir Pur Khas 44.0
7 Khairpur 43.0
8 Larkana 43.0
9 Shikarpur 41.0
10 Sanghar 41.0
11 Matiari 41.0
12 Tando Allah Yar 40.0
13 Ghotki 38.0
14 Nawabshah 38.0
15 Jamshoro 38.0
16 Shahdadkot 35.0
17 Umer Kot 35.0
18 Tharparkar 33.0
19 Kashmore 33.0
20 Badin 32.0
21 Tando Muhammad Khan 30.0
22 Jaccobabad 29.0
23 Thatta 28.0

Pakistan Millennium Development Goals Report 2013
134
Annexes
PMDGR 2013 Annexes Annex 3
3.C: Khyber Pakhtunkhwa
Population that has Completed Primary level or Higher (%)District Level Ranking by Provinces
1 Abbottabad 54.0
2 Haripur 48.0
3 Chitral 41.0
4 Peshawar 40.0
5 Karak 39.0
6 Kohat 39.0
7 Malakand 39.0
8 Swabi 39.0
9 Mardan 38.0
10 Lower Dir 36.0
11 Mansehra 36.0
12 Nowshera 36.0
13 Lakki Marwat 35.0
14 Hangu 33.0
15 Swat 33.0
16 Bannu 32.0
17 D.I.Khan 32.0
18 Charsada 31.0
19 Tank 28.0
20 Shangla 25.0
21 Batagram 22.0
22 Bonair 20.0
23 Upper Dir 20.0
24 Kohistan 17.0
1 Haripur 61.0
2 Abbottabad 59.0
3 Chitral 52.0
4 Malakand 47.0
5 Peshawar 46.0
6 Mansehra 46.0
7 Karak 45.0
8 Swabi 44.0
9 Nowshera 42.0
10 Lower Dir 41.0
11 Kohat 40.0
12 Swat 40.0
13 Mardan 39.0
14 Bannu 38.0
15 Hangu 37.0
16 Charsada 37.0
17 Batagram 37.0
18 Lakki Marwat 36.0
19 Upper Dir 33.0
20 Tank 31.0
21 D.I.Khan 28.0
22 Shangla 25.0
23 Bonair 24.0
24 Kohistan 13.0
25 Tor Ghar* -

Pakistan Millennium Development Goals Report 2013
135
Annexes
PMDGR 2013 Annexes Annex 3
3.D: Balochistan
Population that has Completed Primary level or Higher (%)District Level Ranking by Provinces
Rank Districts 2004-05
1 Quetta 53.0
2 Ketch 38.0
3 Mastung 33.0
4 Pashin 33.0
5 Ziarat 31.0
6 Gwadar 28.0
7 Musa Khel 28.0
8 Jafarabad 27.0
9 Sibbi 26.0
10 Loralai 24.0
11 Panjgur 24.0
12 Bolan 23.0
13 Lasbilla 23.0
14 Kalat 22.0
15 Qilla Abdullah 21.0
16 Barkhan 20.0
17 Chaghi 20.0
18 Khuzdar 19.0
19 Nasirabad 18.0
20 Awaran 17.0
21 Kharan 17.0
22 Zhob 17.0
23 Jhal Magsi 14.0
24 Qilla Saifullah 14.0
25 Dera Bugti* -
26 Kohlu* -
Rank Districts 2010-11
1 Quetta 54.0
2 Mastung 50.0
3 Sibbi 48.0
4 Harnai 45.0
5 Awaran 44.0
6 Pashin 38.0
7 Kalat 37.0
8 Qilla Abdullah 37.0
9 Khuzdar 37.0
10 Bolan 36.0
11 Kharan 36.0
12 Ziarat 34.0
13 W ashuk 33.0
14 Nushki 32.0
15 Gwadar 30.0
16 Panjgur 28.0
17 Jhal Magsi 27.0
18 Ketch 25.0
19 Lasbilla 24.0
20 Qilla Saifullah 24.0
21 Kohlu 24.0
22 Chaghi 23.0
23 Zhob 23.0
24 Jafarabad 22.0
25 Nasirabad 20.0
26 Sherani 19.0
27 Loralai 17.0
28 Musa Khel 12.0
29 Barkhan 9.0
30 Dera Bugti 9.0
31 Mach* -

Pakistan Millennium Development Goals Report 2013
136
Annexes
PMDGR 2013 Annexes Annex 4
4.A: Punjab
Literacy Ratio (10+ Year) District Level Ranking by Provinces
Rank Districts 2004-05
1 Islamabad 84.1
2 Rawalpindi 75.2
3 Lahore 73.3
4 Chakwal 73.2
5 Gujranwala 69.4
6 Jhelum 69.3
7 Gujrat 66.5
8 Sialkot 64.3
9 Attock 61.0
10 Toba Tek Singh 59.3
11 Faisalabad 58.2
12 Sheikhupura 56.7
13 Mandi Bahauddin 56.4
14 Narowal 55.8
15 Sargodha 53.7
16 Sahiwal 52.8
17 Mianwali 52.7
18 Layyah 51.8
19 Khushab 50.9
20 Hafizabad 50.5
21 Khanewal 49.9
22 Kasur 48.8
23 Multan 48.4
24 Bhakkar 47.5
25 Bahawalnagar 45.2
26 Vehari 44.8
27 Pakpattan 43.8
28 Jhang 42.9
29 Okara 42.0
30 D.G.Khan 40.9
31 Bahawalpur 40.2
32 RY Khan 40.1
33 Rajanpur 39.7
34 Muzaffargarh 35.8
35 Lodhran 33.6
Rank District 2010-11
1 Islamabad 81.8
2 Rawalpindi 78.5
3 Chakwal 78.0
4 Lahore 76.6
5 Jhelum 74.9
6 Gujranwala 74.2
7 Gujrat 71.4
8 Toba Tek Singh 69.2
9 Faisalabad 66.2
10 Sialkot 66.0
11 Mandi Bahauddin 64.7
12 Attock 63.7
13 Sheikhupura 62.7
14 Mianwali 61.3
15 Nankana Sahib 60.3
16 Khushab 59.6
17 Sargodha 58.5
18 Kasur 58.3
19 Narowal 58.2
20 Multan 58.1
21 Hafizabad 58.1
22 Sahiwal 56.4
23 Vehari 54.7
24 Layyah 54.7
25 Khanewal 53.1
26 Jhang 51.7
27 Okara 50.0
28 Bhakkar 49.3
29 Bahawalnagar 49.2
30 Bahawalpur 47.0
31 Lodhran 46.8
32 RY Khan 45.5
33 Pakpattan 44.6
34 Chiniot 43.7
35 D.G.Khan 43.5
36 Muzaffargarh 43.2
37 Rajanpur 34.0

Pakistan Millennium Development Goals Report 2013
137
Annexes
PMDGR 2013 Annexes Annex 4
4.B: Sindh
Literacy Ratio (10+ Year) District Level Ranking by Provinces
Rank Districts 2004-05
1 Karachi 78.1
2 Sukkur 63.3
3 Naushahro Feroze 58.1
4 Shikarpur 55.9
5 Hyderabad 52.5
6 Ghotki 50.8
7 Khairpur 48.1
8 Dadu 47.3
9 S. Benazirabad 45.2
10 Sanghar 45.1
11 Mirpur Khas 44.0
12 Badin 41.8
13 Larkana 38.2
14 Tharparkar 36.2
15 Thatta 34.6
16 Jacobabad 33.8
Rank District 2010-11
1 Karachi 79.3
2 Hyderabad 68.8
3 Dadu 64.8
4 Sukkur 56.5
5 Naushahro Feroze 55.3
6 Mirpur Khas 52.8
7 Khairpur 52.2
8 Larkana 52.2
9 Sanghar 51.3
10 Shikarpur 49.6
11 Mitiari 48.0
12 Tando Allahyar 47.1
13 S. Benazirabad 46.1
14 Tharparkar 46.1
15 Ghotki 44.2
16 Umer Kot 43.9
17 Jamshoro 43.9
18 QS Kot 43.8
19 Kashmore 39.1
20 Badin 39.0
21 Jacobabad 37.4
22 Tando Md Khan 36.2
23 Thatta 36.0

Pakistan Millennium Development Goals Report 2013
138
Annexes
PMDGR 2013 Annexes Annex 4
4.C: Khyber Pakhtunkhwa
Literacy Ratio (10+ Year) District Level Ranking by Provinces
1 Abbottabad 64.7
2 Haripur 57.2
3 Malakand 50.6
4 Chitral 48.9
5 Swabi 48.4
6 Mardan 48.1
7 Peshawar 47.7
8 Karak 47.6
9 Kohat 47.4
10 Lower Dir 46.6
11 Mansehra 46.3
12 Nowshera 44.9
13 Swat 42.3
14 Lakki Marwat 42.0
15 Hangu 41.9
16 Bannu 39.9
17 D. I. Khan 38.1
18 Charsadda 37.5
19 Batagram 35.4
20 Shangla 33.4
21 Tank 32.4
22 Buner 30.0
23 Upper Dir 29.0
24 Kohistan 25.4
1 Haripur 70.1
2 Abbottabad 69.4
3 Chitral 61.6
4 Malakand 58.6
5 Mansehra 58.3
6 Peshawar 53.8
7 Lower Dir 53.4
8 Karak 52.3
9 Swabi 51.6
10 Nowshera 51.2
11 Swat 51.2
12 Upper Dir 49.6
13 Batagram 48.8
14 Bannu 48.1
15 Kohat 48.0
16 Mardan 47.9
17 Charsadda 44.9
18 Hangu 44.3
19 Lakki Marwat 42.9
20 Shangla 36.7
21 Tank 36.5
22 D. I. Khan 34.4
23 Buner 32.4
24 Kohistan 25.7
25 Tor Ghar* -*New District/s created after 2004-05

Pakistan Millennium Development Goals Report 2013
139
Annexes
PMDGR 2013 Annexes Annex 4
4.D: Balochistan
Literacy Ratio (10+ Year) District Level Ranking by Provinces
Rank Districts 2004-05
1 Quetta 65.3
2 Pishin 57.9
3 Kech 48.3
4 Ziarat 45.0
5 Mastung 42.6
6 Gwadar 38.5
7 Jaffarabad 34.7
8 Sibi 33.8
9 Chagai 33.6
10 Kalat 33.4
11 Bolan 31.7
12 Lasbela 31.5
13 Loralai 31.2
14 Musakhel 30.2
15 Khuzdar 29.3
16 Kharan 29.1
17 Killa Abdullah 28.7
18 Barkhan 27.7
19 Panjgur 27.6
20 Awaran 26.2
21 Zhob 25.2
22 Nasirabad 23.4
23 Killa Saifullah 20.0
24 Jhal Magsi 19.6
25 Dera Bugti* -
26 Kohlu* -
Rank District 2010-11
1 Quetta 63.8
2 Mastung 58.0
3 Sibi 57.8
4 Harnai 51.2
5 Gwadar 49.9
6 Khuzdar 49.8
7 Kalat 48.8
8 Awaran 47.0
9 Bolan 45.1
10 Ziarat 44.6
11 Noshki 43.1
12 Kech 43.0
13 Panjgur 42.9
14 Pishin 41.9
15 Washuk 40.9
16 Killa Abdullah 40.8
17 Kharan 40.1
18 Jhal Magsi 36.1
19 Chagai 34.9
20 Killa Saifullah 32.9
21 Sherani 32.8
22 Lasbela 31.9
23 Zhob 31.8
24 Kohlu 31.2
25 Jaffarabad 29.7
26 Nasirabad 27.0
27 Loralai 25.2
28 Musakhel 22.6
29 Barkhan 16.0
30 Dera Bugti 15.7
31 Mach* -
*New District/s created after 2004-05

Pakistan Millennium Development Goals Report 2013
140
Annexes
PMDGR 2013 Annexes Annex 5
5.A: Punjab
GPI Primary EducationDistrict Level Ranking by Provinces
Rank Districts 2004-05
1 Toba Tek Singh 1.07
2 Narowal 1.05
3 Lahore 1.04
4 Jhelum 1.02
5 Sialkot 1.01
6 Gujranwala 1.01
7 Mandi Bahauddin 0.99
8 Sargodha 0.99
9 Gujrat 0.97
10 Attock 0.97
11 Rawalpindi 0.96
12 Hafizabad 0.95
13 Chakwal 0.94
14 Vehari 0.93
15 Multan 0.93
16 Kasur 0.92
17 Sheikhupura 0.92
18 Faisalabad 0.90
19 D.G.Khan 0.90
20 Pakpattan 0.90
21 Sahiwal 0.89
22 Bahawalpur 0.89
23 Khanewal 0.85
24 Mianwali 0.84
25 Jhang 0.84
26 Bahawalnagar 0.84
27 RY Khan 0.83
28 Khushab 0.81
29 Layyah 0.81
30 Islamabad 0.81
31 Rajanpur 0.81
32 Okara 0.77
33 Lodhran 0.73
34 Bhakkar 0.70
35 Muzaffargarh 0.69
Rank Districts 2010-11
1 Sialkot 1.08
2 Sheikhupura 1.07
3 Mandi Bahauddin 1.07
4 Hafizabad 1.05
5 Gujrat 1.05
6 Gujranwala 1.02
7 Rajanpur 1.01
8 Islamabad 1.00
9 Faisalabad 0.98
10 Rawalpindi 0.98
11 Narowal 0.97
12 Sargodha 0.97
13 Khushab 0.97
14 Chakwal 0.96
15 Lahore 0.96
16 Attock 0.96
17 RY Khan 0.95
18 Jhelum 0.95
19 Nankana Sahib 0.94
20 Okara 0.94
21 Jhang 0.94
22 Kasur 0.93
23 Mianwali 0.93
24 Pakpattan 0.93
25 Bahawalnagar 0.92
26 Multan 0.91
27 Sahiwal 0.91
28 Chiniot 0.90
29 Bahawalpur 0.89
30 Bhakkar 0.88
31 Layyah 0.87
32 Toba Tek Singh 0.87
33 Lodhran 0.84
34 Khanewal 0.83
35 Muzaffargarh 0.82
36 Vehari 0.81
37 D.G.Khan 0.78

Pakistan Millennium Development Goals Report 2013
141
Annexes
PMDGR 2013 Annexes Annex 5
5.B: Sindh
GPI Primary EducationDistrict Level Ranking by Provinces
Rank Districts 2004-05
1 Karachi 0.97
2 Sukkur 0.86
3 Shikarpur 0.86
4 Naushahro Feroze
0.85
5 Dadu 0.78
6 Hyderabad 0.76
7 Ghotki 0.75
8 Sanghar 0.74
9 Badin 0.73
10 Tharparkar 0.72
11 Thatta 0.70
12 Khairpur 0.70
13 Mirpur Khas 0.70
14 S. Benazirabad 0.67
15 Larkana 0.63
16 Jacobabad 0.48
Rank Districts 2010-11
1 Karachi 1.02
2 Hyderabad 1.01
3 Dadu 0.99
4 Umer Kot 0.90
5 Tharparkar 0.83
6 Khairpur 0.83
7 Badin 0.83
8 Mitiari 0.81
9 Sukkur 0.81
10 Shikarpur 0.79
11 Sanghar 0.76
12 Jamshoro 0.76
13 Naushahro Feroze 0.75
14 QS Kot 0.74
15 S. Benazirabad 0.73
16 Larkana 0.72
17 Tando Allahyar 0.71
18 Mirpur Khas 0.71
19 Thatta 0.70
20 Ghotki 0.67
21 Jacobabad 0.64
22 Kashmore 0.53
23 Tando Md Khan 0.49

Pakistan Millennium Development Goals Report 2013
142
Annexes
PMDGR 2013 Annexes Annex 5
5.C: Khyber Pakhtunkhwa
GPI Primary EducationDistrict Level Ranking by Provinces
1 Mansehra 1.00
2 Abbottabad 0.99
3 Haripur 0.91
4 Mardan 0.87
5 Peshawar 0.84
6 Lower Dir 0.80
7 Swabi 0.79
8 Swat 0.77
9 Chitral 0.76
10 Nowshera 0.72
11 Hangu 0.72
12 Karak 0.72
13 Malakand 0.72
14 Batagram 0.71
15 D. I. Khan 0.68
16 Buner 0.65
17 Charsadda 0.64
18 Kohat 0.64
19 Bannu 0.59
20 Lakki Marwat 0.59
21 Upper Dir 0.53
22 Tank 0.49
23 Shangla 0.47
24 Kohistan 0.25
1 Lower Dir 1.07
2 Chitral 1.00
3 Haripur 0.99
4 Swabi 0.91
5 Abbottabad 0.90
6 Charsadda 0.89
7 Peshawar 0.88
8 Nowshera 0.87
9 Swat 0.86
10 Mardan 0.84
11 Upper Dir 0.79
12 Batagram 0.78
13 Mansehra 0.78
14 Buner 0.73
15 Kohat 0.71
16 Karak 0.70
17 Malakand 0.69
18 Bannu 0.68
19 Lakki Marwat 0.56
20 D. I. Khan 0.53
21 Shangla 0.52
22 Hangu 0.52
23 Kohistan 0.47
24 Tank 0.42
25 Tor Ghar* -*New District/s created after 2004-05

Pakistan Millennium Development Goals Report 2013
143
Annexes
PMDGR 2013 Annexes Annex 5
5.D: Balochistan
GPI Primary EducationDistrict Level Ranking by Provinces
Rank Districts 2004-05
1 Quetta 0.92
2 Sibi 0.89
3 Gwadar 0.87
4 Kech 0.86
5 Mastung 0.85
6 Panjgur 0.83
7 Chagai 0.79
8 Kalat 0.78
9 Lasbela 0.71
10 Ziarat 0.69
11 Bolan 0.60
12 Barkhan 0.60
13 Khuzdar 0.57
14 Jhal Magsi 0.56
15 Pishin 0.56
16 Killa Saifullah 0.54
17 Zhob 0.53
18 Jaffarabad 0.52
19 Nasirabad 0.51
20 Kharan 0.48
21 Awaran 0.48
22 Loralai 0.47
23 Musakhel 0.26
24 Killa Abdullah 0.24
25 Dera Bugti* -
26 Kohlu* -
Rank Districts 2010-11
1 Gwadar 0.87
2 Quetta 0.87
3 Khuzdar 0.87
4 Sherani 0.83
5 Harnai 0.83
6 Awaran 0.81
7 Sibi 0.79
8 Bolan 0.76
9 Jhal Magsi 0.76
10 Mastung 0.74
11 Lasbela 0.74
12 Washuk 0.72
13 Kalat 0.71
14 Jaffarabad 0.64
15 Kech 0.60
16 Noshki 0.59
17 Panjgur 0.56
18 Zhob 0.54
19 Killa Saifullah 0.51
20 Chagai 0.51
21 Kharan 0.43
22 Kohlu 0.41
23 Nasirabad 0.37
24 Pishin 0.34
25 Killa Abdullah 0.32
26 Barkhan 0.32
27 Loralai 0.29
28 Ziarat 0.23
29 Musakhel 0.21
30 Dera Bugti 0.11
31 Mach* -
*New District/s created after 2004-05

Pakistan Millennium Development Goals Report 2013
144
Annexes
PMDGR 2013 Annexes Annex 6
6.A: Punjab
GPI Secondary EducationDistrict Level Ranking by Provinces
Rank Districts 2004-05
1 Mandi Bahauddin 1.34
2 Sialkot 1.19
3 Lahore 1.13
4 Gujranwala 1.10
5 Faisalabad 1.04
6 Islamabad 1.04
7 Jhelum 1.01
8 Rawalpindi 0.98
9 Gujrat 0.98
10 Bahawalpur 0.93
11 Toba Tek Singh 0.91
12 Hafizabad 0.88
13 Sargodha 0.87
14 Multan 0.86
15 RY Khan 0.85
16 Attock 0.84
17 Bahawalnagar 0.84
18 Lodhran 0.84
19 Okara 0.83
20 Sheikhupura 0.79
21 Narowal 0.78
22 Chakwal 0.76
23 Khanewal 0.71
24 Kasur 0.71
25 Bhakkar 0.70
26 Sahiwal 0.70
27 Vehari 0.67
28 Muzaffargarh 0.64
29 Pakpattan 0.62
30 Layyah 0.61
31 Khushab 0.61
32 Rajanpur 0.60
33 Jhang 0.58
34 D.G.Khan 0.57
35 Mianwali 0.56
Rank Districts 2010-11
1 Sialkot 1.39
2 Lahore 1.25
3 Toba Tek Singh 1.20
4 Attock 1.16
5 Gujrat 1.15
6 Gujranwala 1.14
7 Rawalpindi 1.11
8 Bahawalpur 1.05
9 Mandi Bahauddin 0.98
10 Chakwal 0.97
11 Narowal 0.97
12 Nankana Sahib 0.97
13 Jhelum 0.96
14 Sheikhupura 0.96
15 Faisalabad 0.95
16 Multan 0.95
17 Kasur 0.91
18 Islamabad 0.90
19 RY Khan 0.90
20 Sahiwal 0.88
21 Bahawalnagar 0.85
22 Muzaffargarh 0.85
23 Khushab 0.85
24 Vehari 0.84
25 Sargodha 0.80
26 Rajanpur 0.78
27 Lodhran 0.78
28 Khanewal 0.76
29 Hafizabad 0.76
30 Okara 0.73
31 Jhang 0.73
32 Mianwali 0.71
33 Chiniot 0.68
34 Layyah 0.67
35 Pakpattan 0.65
36 D.G.Khan 0.60
37 Bhakkar 0.49

Pakistan Millennium Development Goals Report 2013
145
Annexes
PMDGR 2013 Annexes Annex 6
6.B: Sindh
GPI Secondary EducationDistrict Level Ranking by Provinces
Rank Districts 2004-05
1 Karachi 1.03
2 Mirpur Khas 0.95
3 Hyderabad 0.79
4 Sukkur 0.79
5 Shikarpur 0.69
6 Badin 0.69
7 Tharparkar 0.65
8 Naushahro Feroze 0.63
9 S. Benazirabad 0.53
10 Jacobabad 0.51
11 Sanghar 0.49
12 Ghotki 0.41
13 Khairpur 0.40
14 Larkana 0.40
15 Dadu 0.38
16 Thatta 0.25
Rank Districts 2010-11
1 Karachi 1.17
2 Hyderabad 1.14
3 Mirpur Khas 0.97
4 Sanghar 0.81
5 Shikarpur 0.70
6 Larkana 0.69
7 Khairpur 0.68
8 Dadu 0.67
9 Naushahro Feroze 0.64
10 Tando Allahyar 0.56
11 QS Kot 0.56
12 Badin 0.54
13 Umer Kot 0.51
14 Jamshoro 0.51
15 Tando Md Khan 0.50
16 Jacobabad 0.50
17 Mitiari 0.49
18 Kashmore 0.47
19 Tharparkar 0.47
20 Thatta 0.46
21 Sukkur 0.45
22 S. Benazirabad 0.39
23 Ghotki 0.24

Pakistan Millennium Development Goals Report 2013
146
Annexes
PMDGR 2013 Annexes Annex 6
6.C: Khyber Pakhtunkhwa
GPI Secondary EducationDistrict Level Ranking by Provinces
1 Abbottabad 0.94
2 Chitral 0.71
3 Mansehra 0.71
4 Peshawar 0.66
5 Malakand 0.63
6 Swat 0.63
7 Tank 0.60
8 Lower Dir 0.59
9 D. I. Khan 0.58
10 Haripur 0.52
11 Mardan 0.50
12 Swabi 0.42
13 Kohat 0.41
14 Nowshera 0.40
15 Hangu 0.40
16 Karak 0.40
17 Charsadda 0.39
18 Shangla 0.37
19 Bannu 0.28
20 Buner 0.24
21 Lakki Marwat 0.23
22 Upper Dir 0.21
23 Batagram 0.12
24 Kohistan* -
1 Abbottabad 1.16
2 Haripur 0.97
3 Mansehra 0.92
4 Chitral 0.90
5 Upper Dir 0.71
6 Swabi 0.70
7 D. I. Khan 0.64
8 Peshawar 0.62
9 Lower Dir 0.60
10 Nowshera 0.57
11 Malakand 0.57
12 Mardan 0.55
13 Swat 0.51
14 Karak 0.50
15 Charsadda 0.45
16 Shangla 0.40
17 Kohat 0.38
18 Batagram 0.38
19 Tank 0.36
20 Buner 0.31
21 Hangu 0.30
22 Bannu 0.30
23 Lakki Marwat 0.21
24 Kohistan -
25 Tor Ghar* -
*New District/s created after 2004-05

Pakistan Millennium Development Goals Report 2013
147
Annexes
PMDGR 2013 Annexes Annex 6
6.D: Balochistan
GPI Secondary EducationDistrict Level Ranking by Provinces
Rank Districts 2004-05
1 Gwadar 1.55
2 Khuzdar 1.49
3 Kalat 1.01
4 Quetta 0.92
5 Awaran 0.80
6 Kech 0.68
7 Pishin 0.67
8 Killa Saifullah 0.65
9 Panjgur 0.62
10 Kharan 0.59
11 Mastung 0.54
12 Zhob 0.49
13 Chagai 0.46
14 Barkhan 0.44
15 Sibi 0.43
16 Nasirabad 0.37
17 Lasbela 0.36
18 Jaffarabad 0.34
19 Bolan 0.33
20 Loralai 0.31
21 Musakhel 0.26
22 Ziarat 0.22
23 Killa Abdullah 0.14
24 Jhal Magsi 0.13
Rank Districts 2010-11
1 Quetta 0.85
2 Sibi 0.79
3 Lasbela 0.69
4 Zhob 0.69
5 Mastung 0.61
6 Khuzdar 0.52
7 Pishin 0.45
8 Gwadar 0.40
9 Noshki 0.39
10 Jhal Magsi 0.35
11 Kalat 0.34
12 Barkhan 0.32
13 Awaran 0.27
14 Jaffarabad 0.27
15 Kech 0.26
16 Harnai 0.26
17 Killa Abdullah 0.25
18 Ziarat 0.24
19 Bolan 0.23
20 Killa Saifullah 0.22
21 Sherani 0.21
22 Kharan 0.21
23 Chagai 0.20
24 Washuk 0.19
25 Musakhel 0.14
26 Panjgur 0.13
27 Nasirabad 0.13
28 Loralai 0.10
29 Kohlu 0.08
30 Dera Bugti -
31 Mach* -
*New District/s created after 2004-05

Pakistan Millennium Development Goals Report 2013
148
Annexes
PMDGR 2013 Annexes Annex 7
7.A: Punjab
GPI Youth LiteracyDistrict Level Ranking by Provinces
Rank Districts 2004-05
1 Sialkot 1.04
2 Lahore 1.01
3 Gujranwala 1.01
4 Gujrat 0.99
5 Islamabad 0.99
6 Jhelum 0.92
7 Rawalpindi 0.91
8 Toba Tek Singh 0.90
9 Faisalabad 0.90
10 Chakwal 0.89
11 Sheikhupura 0.88
12 Hafizabad 0.88
13 Narowal 0.83
14 Mandi Bahauddin 0.82
15 Sahiwal 0.80
16 Sargodha 0.75
17 Kasur 0.74
18 Bahawalnagar 0.72
19 Multan 0.72
20 Okara 0.71
21 Attock 0.70
22 Bahawalpur 0.70
23 RY Khan 0.69
24 Khanewal 0.68
25 Layyah 0.66
26 Khushab 0.64
27 Pakpattan 0.60
28 Vehari 0.60
29 Jhang 0.54
30 Lodhran 0.54
31 D.G.Khan 0.53
32 Rajanpur 0.52
33 Bhakkar 0.51
34 Muzaffargarh 0.47
35 Mianwali 0.44
Rank Districts 2010-11
1 Sialkot 1.10
2 Gujranwala 1.04
3 Gujrat 1.03
4 Sheikhupura 1.02
5 Faisalabad 0.99
6 Lahore 0.99
7 Chakwal 0.96
8 Rawalpindi 0.96
9 Islamabad 0.95
10 Sahiwal 0.93
11 Mandi Bahauddin 0.93
12 Jhelum 0.91
13 Toba Tek Singh 0.90
14 Narowal 0.89
15 Attock 0.88
16 Kasur 0.86
17 Bahawalpur 0.86
18 Bahawalnagar 0.85
19 Nankana Sahib 0.85
20 Hafizabad 0.84
21 Sargodha 0.82
22 Multan 0.82
23 RY Khan 0.78
24 Mianwali 0.77
25 Jhang 0.74
26 Khushab 0.74
27 Vehari 0.74
28 Layyah 0.73
29 Okara 0.70
30 Khanewal 0.70
31 Lodhran 0.68
32 Pakpattan 0.65
33 Chiniot 0.63
34 Bhakkar 0.62
35 Rajanpur 0.58
36 Muzaffargarh 0.58
37 D.G.Khan 0.53

Pakistan Millennium Development Goals Report 2013
149
Annexes
PMDGR 2013 Annexes Annex 7
7.B: Sindh
GPI Youth LiteracyDistrict Level Ranking by Provinces
Rank Districts 2004-05
1 Karachi 0.97
2 Sukkur 0.75
3 Hyderabad 0.69
4 Mirpur Khas 0.64
5 Shikarpur 0.64
6 Naushahro Feroze
0.61
7 Dadu 0.58
8 S. Benazirabad 0.57
9 Khairpur 0.55
10 Badin 0.55
11 Larkana 0.47
12 Sanghar 0.44
13 Thatta 0.44
14 Tharparkar 0.43
15 Ghotki 0.42
16 Jacobabad 0.33
Rank Districts 2010-11
1 Hyderabad 1.02
2 Karachi 1.01
3 Mirpur Khas 0.81
4 Dadu 0.80
5 Naushahro Feroze
0.70
6 Tando Allahyar 0.70
7 Mitiari 0.69
8 Tando Md Khan 0.65
9 Larkana 0.64
10 Sukkur 0.63
11 Badin 0.61
12 QS Kot 0.60
13 Jamshoro 0.59
14 Khairpur 0.56
15 Thatta 0.55
16 S. Benazirabad 0.55
17 Shikarpur 0.55
18 Sanghar 0.54
19 Umer Kot 0.51
20 Kashmore 0.45
21 Tharparkar 0.38
22 Ghotki 0.34
23 Jacobabad 0.30

Pakistan Millennium Development Goals Report 2013
150
Annexes
PMDGR 2013 Annexes Annex 7
7.C: Khyber Pakhtunkhwa
GPI Youth LiteracyDistrict Level Ranking by Provinces
1 Abbottabad 0.80
2 Haripur 0.72
3 Mansehra 0.59
4 Chitral 0.57
5 Peshawar 0.54
6 Malakand 0.53
7 Mardan 0.53
8 Swabi 0.50
9 D. I. Khan 0.49
10 Nowshera 0.48
11 Kohat 0.47
12 Lower Dir 0.43
13 Charsadda 0.40
14 Karak 0.40
15 Swat 0.39
16 Tank 0.29
17 Bannu 0.29
18 Shangla 0.29
19 Batagram 0.28
20 Lakki Marwat 0.28
21 Hangu 0.28
22 Buner 0.21
23 Upper Dir 0.20
24 Kohistan 0.07
1 Abbottabad 0.90
2 Haripur 0.90
3 Chitral 0.69
4 Mansehra 0.68
5 Swabi 0.67
6 Peshawar 0.66
7 Nowshera 0.60
8 Malakand 0.59
9 Lower Dir 0.58
10 Mardan 0.57
11 Kohat 0.54
12 Karak 0.53
13 Swat 0.52
14 Batagram 0.51
15 D. I. Khan 0.50
16 Charsadda 0.41
17 Upper Dir 0.37
18 Bannu 0.34
19 Hangu 0.33
20 Shangla 0.31
21 Tank 0.29
22 Buner 0.26
23 Lakki Marwat 0.24
24 Kohistan 0.23
25 Tor Ghar* -
*New District/s created after 2004-05

Pakistan Millennium Development Goals Report 2013
151
Annexes
PMDGR 2013 Annexes Annex 7
7.D: Balochistan
GPI Youth LiteracyDistrict Level Ranking by Provinces
Rank Districts 2004-05
1 Quetta 0.67
2 Pishin 0.57
3 Mastung 0.53
4 Panjgur 0.52
5 Sibi 0.50
6 Gwadar 0.50
7 Kech 0.49
8 Lasbela 0.48
9 Chagai 0.42
10 Killa Saifullah 0.37
11 Khuzdar 0.36
12 Kalat 0.31
13 Bolan 0.31
14 Ziarat 0.29
15 Jhal Magsi 0.25
16 Zhob 0.23
17 Awaran 0.23
18 Jaffarabad 0.23
19 Kharan 0.21
20 Barkhan 0.20
21 Musakhel 0.19
22 Loralai 0.16
23 Nasirabad 0.14
24 Killa Abdullah 0.13
Rank Districts 2010-11
1 Sibi 0.80
2 Mastung 0.65
3 Khuzdar 0.60
4 Awaran 0.60
5 Quetta 0.59
6 Washuk 0.58
7 Lasbela 0.55
8 Gwadar 0.54
9 Zhob 0.42
10 Kohlu 0.42
11 Kalat 0.41
12 Killa Saifullah 0.40
13 Jhal Magsi 0.35
14 Noshki 0.33
15 Jaffarabad 0.31
16 Kech 0.30
17 Loralai 0.30
18 Chagai 0.30
19 Musakhel 0.25
20 Harnai 0.24
21 Barkhan 0.23
22 Ziarat 0.22
23 Kharan 0.18
24 Pishin 0.16
25 Bolan 0.14
26 Sherani 0.12
27 Nasirabad 0.10
28 Killa Abdullah 0.10
29 Panjgur 0.10
30 Dera Bugti 0.04
31 Mach* -
*New District/s created after 2004-05

Pakistan Millennium Development Goals Report 2013
152
Annexes
PMDGR 2013 Annexes Annex 8
8.A: Punjab
Fully Immunized Children (12-23 month) %District Level Ranking by Provinces
Rank Districts 2004-05
1 Jhelum 99.2
2 Sialkot 97.7
3 Khushab 96.5
4 Attock 95.4
5 Chakwal 94.3
6 Gujrat 93.7
7 Mianwali 93.4
8 Bahawalnagar 93.1
9 Rawalpindi 92.2
10 Pakpattan 91.6
11 Narowal 90.4
12 Bhakkar 89.9
13 Sahiwal 89.4
14 Toba Tek Singh 89.2
15 Gujranwala 89.1
16 Islamabad 88.9
17 Lahore 87.4
18 Layyah 86.6
19 Lodhran 86.3
20 Khanewal 85.7
21 Sargodha 85.3
22 Sheikhupura 85.0
23 Vehari 84.6
24 Multan 83.2
25 RY Khan 83.0
26 Jhang 82.1
27 Mandi Bahauddin 81.7
28 Kasur 80.6
29 Okara 79.9
30 Faisalabad 78.8
31 D.G.Khan 78.6
32 Hafizabad 77.8
33 Rajanpur 72.2
34 Muzaffargarh 69.0
35 Bahawalpur 64.0
Rank District 2010-11
1 Chakwal 99.0
2 Nankana Sahib 96.1
3 Gujrat 96.0
4 Narowal 94.7
5 Hafizabad 94.6
6 Chiniot 94.1
7 Mandi Bahauddin 93.5
8 Rawalpindi 93.1
9 Rajanpur 92.5
10 Multan 91.1
11 Okara 90.5
12 Vehari 90.3
13 Layyah 90.3
14 Faisalabad 88.6
15 Sahiwal 88.5
16 Khushab 88.5
17 Sialkot 88.3
18 Jhang 88.2
19 Lodhran 87.7
20 Khanewal 87.4
21 Attock 86.7
22 Jhelum 86.2
23 Lahore 85.4
24 Gujranwala 84.8
25 Muzaffargarh 83.8
26 Bhakkar 83.6
27 Toba Tek Singh 83.4
28 Sargodha 82.9
29 Islamabad 82.9
30 Bahawalnagar 81.4
31 Kasur 81.0
32 Mianwali 79.7
33 Pakpattan 79.0
34 RY Khan 76.9
35 Sheikhupura 76.3
36 D.G.Khan 74.3
37 Bahawalpur 68.2

Pakistan Millennium Development Goals Report 2013
153
Annexes
PMDGR 2013 Annexes Annex 8
8.B: Sindh
Fully Immunized Children (12-23 month) % District Level Ranking by Provinces
Rank Districts 2004-05
1 Hyderabad 87.9
2 Naushahro Feroze 87.6
3 Karachi 83.4
4 Shikarpur 82.9
5 Larkana 82.1
6 Dadu 78.4
7 Ghotki 78.1
8 Sukkur 75.3
9 Badin 75.0
10 Mirpur Khas 70.6
11 Thatta 63.7
12 Khairpur 61.7
13 Tharparkar 53.6
14 S. Benazirabad 51.5
15 Sanghar 45.8
16 Jacobabad 35.2
Rank District 2010-11
1 Karachi 91.1
2 Jamshoro 91.0
3 Larkana 85.1
4 Umer Kot 84.1
5 Dadu 84.0
6 QS Kot 82.8
7 Mitiari 81.0
8 Shikarpur 79.2
9 Hyderabad 78.4
10 Khairpur 72.7
11 Sukkur 70.8
12 Kashmore 69.8
13 S. Benazirabad 67.0
14 Tando Allahyar 66.8
15 Mirpur Khas 64.4
16 Badin 63.9
17 Thatta 63.3
18 Ghotki 62.9
19 Naushahro Feroze 62.3
20 Sanghar 57.7
21 Jacobabad 57.1
22 Tharparkar 45.9
23 Tando Md Khan 42.7

Pakistan Millennium Development Goals Report 2013
154
Annexes
PMDGR 2013 Annexes Annex 8
8.C: Khyber Pakhtunkhwa
Fully Immunized Children (12-23 month) % District Level Ranking by Provinces
1 Chitral 100.0
2 Abbottabad 92.6
3 Swat 90.8
4 Charsadda 90.1
5 Swabi 88.3
6 Malakand 87.9
7 Haripur 87.3
8 Upper Dir 86.0
9 Mardan 85.5
10 Nowshera 85.3
11 Lower Dir 84.8
12 Peshawar 81.3
13 Mansehra 80.0
14 Batagram 80.0
15 D. I. Khan 77.5
16 Bannu 74.8
17 Hangu 68.7
18 Karak 66.6
19 Tank 65.0
20 Kohat 59.2
21 Buner 56.3
22 Lakki Marwat 55.9
23 Shangla 54.8
24 Kohistan 48.2
1 Haripur 93.1
2 Upper Dir 91.9
3 Abbottabad 91.7
4 Malakand 90.6
5 Chitral 89.5
6 Charsadda 88.2
7 Lower Dir 87.5
8 Peshawar 87.5
9 Mardan 84.7
10 Bannu 83.7
11 Swat 83.4
12 Kohat 80.0
13 Swabi 76.9
14 Nowshera 74.7
15 Tank 72.3
16 D. I. Khan 70.8
17 Mansehra 70.5
18 Hangu 69.1
19 Shangla 63.3
20 Karak 61.6
21 Buner 58.5
22 Lakki Marwat 53.1
23 Batagram 52.1
24 Kohistan 9.7
25 Tor Ghar* -
*New District/s created after 2004-05

Pakistan Millennium Development Goals Report 2013
155
Annexes
PMDGR 2013 Annexes Annex 8
8.D: Balochistan
Fully Immunized Children (12-23 month) %District Level Ranking by Provinces
1 Gwadar 96.5
2 Zhob 88.5
3 Ziarat 83.7
4 Quetta 76.0
5 Kalat 75.9
6 Bolan 71.3
7 Pishin 71.0
8 Awaran 70.4
9 Jhal Magsi 67.9
10 Khuzdar 67.1
11 Loralai 65.4
12 Kech 65.0
13 Mastung 64.7
14 Kharan 60.8
15 Nasirabad 55.0
16 Lasbela 52.8
17 Panjgur 50.3
18 Sibi 50.2
19 Chagai 48.8
20 Musakhel 48.3
21 Barkhan 44.8
22 Killa Abdullah 41.3
23 Jaffarabad 32.5
24 Killa Saifullah 27.9
1 Barkhan 92.5
2 Kharan 92.4
3 Awaran 89.8
4 Quetta 89.0
5 Zhob 85.1
6 Mastung 82.7
7 Kalat 82.1
8 Washuk 78.3
9 Bolan 76.4
10 Killa Saifullah 72.9
11 Khuzdar 71.1
12 Noshki 69.8
13 Sherani 67.1
14 Sibi 61.3
15 Jhal Magsi 61.0
16 Nasirabad 59.0
17 Lasbela 53.1
18 Panjgur 46.4
19 Gwadar 42.8
20 Pishin 41.0
21 Killa Abdullah 39.9
22 Kech 38.8
23 Loralai 35.3
24 Chagai 33.7
25 Kohlu 30.4
26 Harnai 28.9
27 Musakhel 23.2
28 Jaffarabad 19.8
29 Ziarat 15.0
30 Dera Bugti 3.2
31 Mach* -
*New District/s created after 2004-05

Pakistan Millennium Development Goals Report 2013
156
Annexes
PMDGR 2013 Annexes Annex 9
9.A: Punjab
Proportion of Under 1 year Children Immunized against MeaslesDistrict Level Ranking by Provinces
Rank Districts 2004-05
1 Jhelum 99.2
2 Attock 98.7
3 Chakwal 98.6
4 Sialkot 97.7
5 Mianwali 97.1
6 Khushab 96.5
7 Bahawalnagar 93.8
8 Gujrat 93.7
9 Rawalpindi 93.0
10 Pakpattan 91.6
11 Bhakkar 91.3
12 Islamabad 90.6
13 Narowal 90.4
14 Toba Tek Singh 90.4
15 Sahiwal 89.4
16 Gujranwala 89.1
17 Layyah 88.9
18 Lahore 87.9
19 Sargodha 87.1
20 Sheikhupura 86.3
21 Lodhran 86.3
22 Khanewal 85.7
23 Vehari 85.4
24 RY Khan 83.6
25 Multan 83.6
26 Jhang 82.1
27 Mandi Bahauddin 81.7
28 Kasur 80.6
29 Okara 80.4
30 Hafizabad 80.0
31 Faisalabad 79.6
32 D.G.Khan 78.6
33 Rajanpur 72.2
34 Muzaffargarh 69.0
35 Bahawalpur 64.4
Rank Districts 2010-11
1 Chakwal 99.0
2 Nankana Sahib 96.1
3 Gujrat 96.0
4 Narowal 94.7
5 Hafizabad 94.6
6 Chiniot 94.1
7 Mandi Bahauddin 93.5
8 Multan 93.2
9 Rawalpindi 93.1
10 Rajanpur 92.5
11 Vehari 91.3
12 Sialkot 90.8
13 Okara 90.5
14 Layyah 90.3
15 Faisalabad 89.0
16 Sahiwal 88.5
17 Khushab 88.5
18 Lodhran 88.4
19 Khanewal 88.4
20 Jhang 88.2
21 Attock 86.7
22 Jhelum 86.2
23 Lahore 85.7
24 Toba Tek Singh 85.3
25 Bhakkar 85.1
26 Gujranwala 84.8
27 Muzaffargarh 84.8
28 Sargodha 83.9
29 Islamabad 82.9
30 Bahawalnagar 82.2
31 Kasur 81.0
32 Mianwali 79.7
33 Pakpattan 79.0
34 RY Khan 76.9
35 Sheikhupura 76.3
36 D.G.Khan 74.3
37 Bahawalpur 68.2

Pakistan Millennium Development Goals Report 2013
157
Annexes
PMDGR 2013 Annexes Annex 9
9.B: Sindh
Proportion of Under 1 year Children Immunized against MeaslesDistrict Level Ranking by Provinces
Rank Districts 2004-05
1 Hyderabad 88.3
2 Naushahro Feroze 87.6
3 Karachi 83.8
4 Shikarpur 82.9
5 Larkana 82.5
6 Dadu 79.0
7 Ghotki 78.1
8 Sukkur 75.3
9 Badin 75.0
10 Mirpur Khas 70.6
11 Thatta 65.3
12 Khairpur 61.7
13 Tharparkar 53.6
14 S. Benazirabad 51.5
15 Sanghar 46.5
16 Jacobabad 35.2
Rank Districts 2010-11
1 Dadu 96.5
2 Karachi 92.0
3 Jamshoro 91.0
4 Umer Kot 86.9
5 Larkana 85.7
6 QS Kot 82.8
7 Mitiari 81.0
8 Shikarpur 79.2
9 Hyderabad 78.4
10 Sukkur 77.6
11 Kashmore 75.7
12 Khairpur 73.8
13 S. Benazirabad 69.9
14 Mirpur Khas 68.4
15 Tando Allahyar 66.8
16 Ghotki 64.5
17 Badin 63.9
18 Thatta 63.8
19 Naushahro Feroze 62.3
20 Tharparkar 61.7
21 Sanghar 59.6
22 Jacobabad 57.1
23 Tando Md Khan 42.7

Pakistan Millennium Development Goals Report 2013
158
Annexes
PMDGR 2013 Annexes Annex 9
9.C: Khyber Pakhtunkhwa
Proportion of Under 1 year Children Immunized against MeaslesDistrict Level Ranking by Provinces
1 Chitral 100.0
2 Abbottabad 92.6
3 Swat 90.8
4 Charsadda 90.1
5 Malakand 88.7
6 Swabi 88.3
7 Upper Dir 87.6
8 Haripur 87.3
9 Mardan 86.1
10 Lower Dir 85.6
11 Nowshera 85.3
12 Peshawar 83.3
13 Mansehra 81.9
14 Batagram 80.0
15 D. I. Khan 78.5
16 Bannu 77.7
17 Hangu 68.7
18 Karak 67.5
19 Tank 65.0
20 Buner 59.9
21 Kohat 59.2
22 Lakki Marwat 55.9
23 Shangla 54.8
24 Kohistan 53.5
1 Haripur 93.1
2 Abbottabad 92.5
3 Upper Dir 92.3
4 Malakand 90.6
5 Chitral 89.5
6 Charsadda 89.0
7 Lower Dir 88.6
8 Peshawar 88.1
9 Mardan 85.9
10 Bannu 84.4
11 Swat 84.0
12 Kohat 81.3
13 Swabi 79.7
14 Nowshera 74.7
15 Tank 73.5
16 Mansehra 72.2
17 D. I. Khan 71.6
18 Hangu 69.1
19 Shangla 64.7
20 Karak 61.6
21 Buner 58.5
22 Batagram 53.7
23 Lakki Marwat 53.7
24 Kohistan 9.7
25 Tor Ghar* -
*New District/s created after 2004-05

Pakistan Millennium Development Goals Report 2013
159
Annexes
PMDGR 2013 Annexes Annex 9
9.D: Balochistan
Proportion of Under 1 year Children Immunized against MeaslesDistrict Level Ranking by Provinces
Rank Districts 2004-05
1 Gwadar 96.5
2 Zhob 88.5
3 Ziarat 83.7
4 Quetta 76.0
5 Kalat 75.9
6 Kharan 71.6
7 Bolan 71.3
8 Pishin 71.0
9 Awaran 70.4
10 Jhal Magsi 67.9
11 Khuzdar 67.1
12 Loralai 65.4
13 Kech 65.0
14 Mastung 64.7
15 Nasirabad 55.0
16 Lasbela 52.8
17 Panjgur 50.3
18 Sibi 50.2
19 Chagai 48.8
20 Musakhel 48.3
21 Barkhan 44.8
22 Killa Abdullah 41.3
23 Jaffarabad 34.1
24 Killa Saifullah 27.9
Rank Districts 2010-11
1 Zhob 98.7
2 Jhal Magsi 95.0
3 Barkhan 92.5
4 Kharan 92.4
5 Awaran 89.8
6 Quetta 89.8
7 Mastung 85.4
8 Kalat 82.1
9 Washuk 80.9
10 Bolan 79.0
11 Killa Saifullah 72.9
12 Khuzdar 71.1
13 Noshki 69.8
14 Sibi 67.9
15 Sherani 67.1
16 Gwadar 57.3
17 Lasbela 55.1
18 Panjgur 48.3
19 Pishin 41.4
20 Kech 41.4
21 Chagai 39.9
22 Killa Abdullah 39.9
23 Loralai 35.3
24 Kohlu 32.7
25 Harnai 28.9
26 Musakhel 23.2
27 Jaffarabad 20.9
28 Ziarat 15.0
29 Nasirabad 7.7
30 Dera Bugti 3.2
31 Mach* -
*New District/s created after 2004-05

Pakistan Millennium Development Goals Report 2013
160
Annexes
PMDGR 2013 Annexes Annex 10
10.A: Punjab
Proportion of children under five who suffered from diarrheaDistrict Level Ranking by Provinces
Rank District 2004-05
1 Bahawalpur 27.7
2 Vehari 26.9
3 D.G.Khan 23.0
4 Attock 21.7
5 Jhang 21.1
6 Layyah 20.7
7 Lodhran 20.0
8 Bahawalnagar 19.6
9 Muzaffargarh 19.1
10 Sialkot 18.4
11 Sargodha 18.2
12 Rajanpur 17.8
13 Khanewal 17.2
14 RY Khan 17.2
15 Khushab 17.1
16 Multan 16.6
17 Faisalabad 16.5
18 Mandi Bahauddin 15.5
19 Pakpattan 15.3
20 Toba Tek Singh 15.0
21 Sahiwal 13.9
22 Okara 13.2
23 Mianwali 11.6
24 Narowal 11.5
25 Hafizabad 10.6
26 Gujranwala 10.4
27 Lahore 9.9
28 Bhakkar 9.4
29 Rawalpindi 9.1
30 Kasur 9.0
31 Sheikhupura 8.8
32 Chakwal 8.4
33 Gujrat 7.2
34 Islamabad 6.9
35 Jhelum 6.5
Rank District 2010-11
1 Mianwali 25.9
2 Layyah 19.3
3 Khanewal 17.4
4 D.G.Khan 16.9
5 Jhang 15.2
6 Sargodha 14.8
7 Bahawalpur 14.7
8 Bahawalnagar 14.7
9 Multan 14.3
10 Islamabad 13.6
11 Sheikhupura 13.4
12 Muzaffargarh 13.0
13 Sialkot 12.4
14 Lodhran 12.4
15 Rajanpur 12.3
16 Pakpattan 12.3
17 Bhakkar 12.2
18 Kasur 11.2
19 Toba Tek Singh 11.1
20 Lahore 11.0
21 Okara 10.8
22 Hafizabad 9.7
23 Khushab 9.5
24 Vehari 9.4
25 Nankana Sahib 8.8
26 RY Khan 8.2
27 Faisalabad 8.0
28 Narowal 7.5
29 Mandi Bahauddin 7.4
30 Chakwal 6.8
31 Attock 6.8
32 Sahiwal 6.7
33 Chiniot 6.4
34 Jhelum 6.0
35 Rawalpindi 5.9
36 Gujranwala 5.1
37 Gujrat 2.7

Pakistan Millennium Development Goals Report 2013
161
Annexes
PMDGR 2013 Annexes Annex 10
10.B: Sindh
Proportion of children under five who suffered from diarrheaDistrict Level Ranking by Provinces
Rank Districts 2004-05
1 Larkana 30.0
2 Naushahro Feroze
25.1
3 S. Benazirabad 23.6
4 Hyderabad 22.2
5 Shikarpur 20.2
6 Dadu 19.6
7 Sanghar 18.3
8 Mirpur Khas 16.8
9 Khairpur 16.6
10 Ghotki 15.8
11 Sukkur 15.4
12 Thatta 15.1
13 Karachi 14.7
14 Jacobabad 12.6
15 Badin 12.3
16 Tharparkar 12.3
Rank District 2010-11
1 Sanghar 33.5
2 Tando Allahyar 28.7
3 Mitiari 18.5
4 Hyderabad 17.7
5 Mirpur Khas 16.8
6 Tharparkar 16.6
7 Tando Md Khan 16.6
8 QS Kot 15.8
9 Naushahro Feroze 15.2
10 Badin 14.7
11 Umer Kot 13.7
12 Larkana 13.6
13 Jamshoro 13.1
14 S. Benazirabad 12.0
15 Sukkur 11.6
16 Dadu 11.0
17 Thatta 11.0
18 Karachi 8.6
19 Ghotki 8.4
20 Khairpur 7.9
21 Jacobabad 6.5
22 Shikarpur 5.6
23 Kashmore 2.5

Pakistan Millennium Development Goals Report 2013
162
Annexes
PMDGR 2013 Annexes Annex 10
10.C: Khyber Pakhtunkhwa
Proportion of children under five who suffered from diarrheaDistrict Level Ranking by Provinces
1 D. I. Khan 28.7
2 Lakki Marwat 26.8
3 Tank 23.8
4 Upper Dir 22.5
5 Batagram 19.7
6 Mansehra 16.9
7 Buner 16.6
8 Bannu 16.1
9 Lower Dir 15.2
10 Peshawar 15.1
11 Swat 14.9
12 Malakand 13.9
13 Charsadda 13.7
14 Mardan 13.3
15 Swabi 13.1
16 Chitral 11.8
17 Karak 11.7
18 Shangla 11.5
19 Kohistan 10.4
20 Hangu 10.2
21 Nowshera 10.1
22 Kohat 10.0
23 Abbottabad 9.7
24 Haripur 8.5
1 Bannu 32.7
2 Lakki Marwat 21.2
3 Tank 18.3
4 Swat 16.8
5 D. I. Khan 16.1
6 Karak 15.7
7 Mansehra 14.7
8 Upper Dir 13.5
9 Chitral 10.7
10 Kohat 10.0
11 Haripur 9.7
12 Swabi 8.6
13 Batagram 7.0
14 Mardan 6.7
15 Abbottabad 6.6
16 Malakand 6.3
17 Kohistan 5.8
18 Shangla 5.6
19 Peshawar 5.6
20 Hangu 4.9
21 Charsadda 4.9
22 Buner 4.4
23 Nowshera 4.1
24 Lower Dir 3.3
25 Tor Ghar* -
*New District/s created after 2004-05

Pakistan Millennium Development Goals Report 2013
163
Annexes
PMDGR 2013 Annexes Annex 10
10.D: Balochistan
Proportion of children under five who suffered from diarrheaDistrict Level Ranking by Provinces
Rank Districts 2004-05
1 Gwadar 33.7
2 Musakhel 18.2
3 Kech 17.8
4 Mastung 17.6
5 Nasirabad 14.9
6 Loralai 14.7
7 Panjgur 14.5
8 Kalat 13.7
9 Awaran 13.6
10 Khuzdar 13.3
11 Killa Saifullah 13.1
12 Quetta 12.6
13 Barkhan 12.4
14 Jaffarabad 12.2
15 Bolan 10.9
16 Lasbela 10.9
17 Jhal Magsi 10.7
18 Kharan 10.0
19 Killa Abdullah 9.9
20 Ziarat 9.9
21 Pishin 9.4
22 Zhob 8.7
23 Sibi 6.3
24 Chagai 5.3
Rank Districts 2010-11
1 Harnai 65.2
2 Sibi 43.1
3 Barkhan 25.6
4 Kalat 23.6
5 Mastung 22.4
6 Zhob 22.4
7 Panjgur 21.4
8 Kohlu 18.0
9 Gwadar 16.4
10 Noshki 16.3
11 Quetta 15.9
12 Awaran 15.4
13 Kech 13.4
14 Khuzdar 11.8
15 Chagai 10.9
16 Pishin 10.0
17 Jaffarabad 9.6
18 Nasirabad 8.5
19 Sherani 8.5
20 Bolan 8.4
21 Ziarat 8.0
22 Killa Abdullah 7.3
23 Musakhel 6.1
24 Lasbela 5.6
25 Washuk 5.2
26 Dera Bugti 4.9
27 Killa Saifullah 4.4
28 Loralai 4.2
29 Jhal Magsi 3.9
30 Kharan 3.4
31 Mach* -
*New District/s created after 2004-05

Pakistan Millennium Development Goals Report 2013
164
Annexes
PMDGR 2013 Annexes Annex 11
11.A: Punjab
Proportion of births attended by skilled birth attendantsDistrict Level Ranking by Provinces
Rank District 2008-09
1 Islamabad 84.3
2 Lahore 76.4
3 Rawalpindi 71.7
4 Chakwal 68.9
5 Jhelum 59.8
6 Gujranwala 51.7
7 Sheikhupura 51.2
8 Sialkot 49.6
9 Multan 48.6
10 Faisalabad 47.6
11 Gujrat 47.0
12 Sahiwal 45.9
13 Bahawalpur 43.0
14 Jhang 42.6
15 Khanewal 40.9
16 Sargodha 40.3
17 Vehari 40.2
18 Kasur 40.1
19 Hafizabad 38.7
20 Okara 37.4
21 Narowal 37.2
22 Mianwali 37.0
23 Nankana Sahib 36.7
24 Layyah 35.7
25 Toba Tek Singh 35.6
26 Khushab 34.6
27 Mandi Bahauddin 33.4
28 Pakpattan 32.8
29 Attock 30.9
30 Bahawalnagar 29.3
31 Lodhran 28.9
32 Muzaffargarh 23.7
33 RY Khan 22.0
34 Bhakkar 19.6
35 D.G.Khan 13.1
36 Rajanpur 4.5
Rank District 2010-11
1 Islamabad 73.4
2 Lahore 67.0
3 Gujrat 63.7
4 Rawalpindi 61.3
5 Sheikhupura 60.5
6 Chakwal 59.6
7 Sialkot 57.2
8 Sargodha 54.2
9 Toba Tek Singh 53.1
10 Gujranwala 52.2
11 Faisalabad 48.8
12 Nankana Sahib 48.8
13 Bahawalnagar 48.4
14 Khushab 46.5
15 Jhelum 44.6
16 Hafizabad 44.3
17 Multan 43.7
18 Jhang 43.1
19 Narowal 42.3
20 Sahiwal 41.3
21 Mianwali 40.9
22 Vehari 40.5
23 Mandi Bahauddin 38.6
24 Okara 35.3
25 Pakpattan 34.6
26 Bahawalpur 32.4
27 Chiniot 32.1
28 Attock 31.7
29 Kasur 31.6
30 Layyah 31.5
31 Khanewal 30.6
32 RY Khan 27.5
33 Bhakkar 25.6
34 D.G.Khan 22.9
35 Lodhran 20.4
36 Muzaffargarh 19.3
37 Rajanpur 15.7

Pakistan Millennium Development Goals Report 2013
165
Annexes
PMDGR 2013 Annexes Annex 11
11.B: Sindh
Proportion of births attended by skilled birth attendantsDistrict Level Ranking by Provinces
Rank Districts 2008-09
1 Karachi 83.6
2 Hyderabad 79.1
3 Tando Allahyar 44.4
4 Mitiari 43.3
5 Tando Md Khan 40.7
6 Sanghar 37.4
7 Naushahro Feroze 36.8
8 Badin 35.6
9 Sukkur 33.0
10 Mirpur Khas 33.0
11 Thatta 31.0
12 S. Benazirabad 30.9
13 Shikarpur 27.9
14 Jamshoro 26.0
15 Jacobabad 24.8
16 Larkana 22.3
17 Khairpur 21.8
18 Ghotki 18.7
19 Dadu 17.1
20 QS Kot 16.4
21 Kashmore 14.7
22 Tharparkar 8.3
23 Umer Kot* -
Rank District 2010-11
1 Karachi 87.8
2 Hyderabad 77.0
3 Mirpur Khas 54.6
4 Mitiari 50.0
5 Naushahro Feroze 49.6
6 Sukkur 48.3
7 Umer Kot 42.9
8 S. Benazirabad 42.2
9 Sanghar 38.4
10 Tando Allahyar 38.0
11 Badin 37.8
12 Jamshoro 36.7
13 Kashmore 34.5
14 Tando Md Khan 33.2
15 Larkana 32.0
16 QS Kot 31.7
17 Dadu 31.3
18 Ghotki 31.1
19 Shikarpur 29.5
20 Khairpur 28.0
21 Thatta 27.0
22 Jacobabad 18.3
23 Tharparkar 13.6

Pakistan Millennium Development Goals Report 2013
166
Annexes
PMDGR 2013 Annexes Annex 11
11.C: Khyber Pakhtunkhwa
Proportion of births attended by skilled birth attendantsDistrict Level Ranking by Provinces
1 Bannu 63.0
2 Lakki Marwat 51.5
3 Peshawar 50.0
4 Karak 48.4
5 Malakand 45.9
6 Nowshera 43.5
7 Haripur 43.2
8 Abbottabad 39.3
9 Lower Dir 38.2
10 Hangu 34.4
11 Swabi 33.7
12 Kohat 29.0
13 Chitral 27.5
14 Mardan 26.0
15 Mansehra 23.9
16 Charsadda 23.8
17 Swat 22.2
18 Buner 21.8
19 Batagram 17.6
20 D. I. Khan 12.8
21 Upper Dir 12.1
22 Tank 11.2
23 Kohistan 7.6
24 Shangla 4.0
1 Peshawar 58.4
2 Lower Dir 50.8
3 Abbottabad 48.8
4 Haripur 46.4
5 Kohat 45.7
6 Charsadda 44.1
7 Malakand 43.9
8 Hangu 41.4
9 Nowshera 40.4
10 Swat 38.6
11 Mardan 36.5
12 Bannu 35.8
13 Karak 33.3
14 Swabi 28.2
15 Batagram 27.3
16 Lakki Marwat 27.3
17 Mansehra 22.8
18 D. I. Khan 22.8
19 Upper Dir 22.5
20 Buner 17.6
21 Chitral 15.9
22 Tank 15.5
23 Shangla 12.3
24 Kohistan 9.1
25 Tor Ghar* -

Pakistan Millennium Development Goals Report 2013
167
Annexes
PMDGR 2013 Annexes Annex 11
11.D: Balochistan
Proportion of births attended by skilled birth attendantsDistrict Level Ranking by Provinces
Rank Districts 200809
1 Killa Saifullah 61.5
2 Loralai 39.9
3 Quetta 35.4
4 Sibi 31.4
5 Chagai 28.3
6 Lasbela 25.7
7 Gwadar 22.4
8 Noshki 21.1
9 Killa Abdullah 18.5
10 Mastung 16.9
11 Pishin 15.2
12 Kech 15.0
13 Panjgur 14.5
14 Jaffarabad 12.1
15 Washuk 11.5
16 Ziarat 11.3
17 Kharan 11.1
18 Zhob 11.0
19 Kalat 9.8
20 Barkhan 8.7
21 Khuzdar 8.3
22 Jhal Magsi 7.5
23 Musakhel 6.7
24 Bolan 4.5
25 Nasirabad 3.6
26 Dera Bugti 3.3
27 Awaran 3.2
28 Kohlu 1.2
Rank Districts 2010-11
1 Quetta 74.3
2 Sibi 49.4
3 Barkhan 36.9
4 Killa Abdullah 33.9
5 Jhal Magsi 29.7
6 Gwadar 29.2
7 Pishin 29.0
8 Washuk 28.1
9 Panjgur 24.5
10 Kohlu 24.2
11 Awaran 23.9
12 Jaffarabad 23.6
13 Kech 23.0
14 Mastung 22.4
15 Noshki 21.6
16 Harnai 21.5
17 Lasbela 21.2
18 Kalat 18.7
19 Chagai 17.7
20 Killa Saifullah 15.9
21 Loralai 14.4
22 Nasirabad 14.2
23 Ziarat 12.4
24 Kharan 11.0
25 Musakhel 10.9
26 Khuzdar 10.5
27 Bolan 9.2
28 Zhob 9.0
29 Sherani 6.6
30 Dera Bugti 3.5
31 Mach* -

Pakistan Millennium Development Goals Report 2013
168
Annexes
PMDGR 2013 Annexes Annex 12
12.A: Punjab
Proportion of women 15-49 years who had given birth during last 3 years and made at least one antenatal care consultation
District Level Ranking by Provinces
Rank District 2004-05
1 Attock 80.4
2 Sialkot 80.2
3 Lahore 77.7
4 Rawalpindi 72.1
5 Narowal 71.5
6 Islamabad 67.3
7 Gujranwala 67.2
8 Sheikhupura 62.6
9 Toba Tek Singh 59.4
10 Sargodha 59.0
11 D.G.Khan 57.6
12 Multan 57.0
13 Jhelum 55.3
14 Hafizabad 55.3
15 Gujrat 54.3
16 Bhakkar 53.7
17 Faisalabad 53.5
18 Mianwali 53.3
19 Khushab 53.3
20 Muzaffargarh 52.6
21 Sahiwal 51.6
22 Bahawalpur 49.9
23 Pakpattan 49.8
24 Chakwal 49.2
25 Vehari 49.1
26 Kasur 48.7
27 Khanewal 48.6
28 Okara 46.9
29 Layyah 45.5
30 Bahawalnagar 41.4
31 Jhang 41.1
32 Rajanpur 39.8
33 RY Khan 39.6
34 Mandi Bahauddin 39.6
35 Lodhran 38.1
Rank District 2010-11
1 Islamabad 93.4
2 Mandi Bahauddin 87.7
3 Rawalpindi 86.3
4 Jhelum 84.6
5 Lahore 81.7
6 Gujrat 80.9
7 Toba Tek Singh 78.2
8 Nankana Sahib 78.1
9 Sahiwal 77.8
10 Sheikhupura 76.7
11 Chiniot 76.5
12 Gujranwala 75.0
13 Vehari 73.7
14 Chakwal 72.1
15 Attock 70.2
16 Okara 69.0
17 D.G.Khan 68.0
18 Sialkot 66.8
19 Multan 66.4
20 Kasur 65.9
21 Khanewal 65.2
22 Bahawalpur 64.0
23 Layyah 63.9
24 Faisalabad 62.2
25 Pakpattan 60.7
26 RY Khan 59.0
27 Khushab 58.7
28 Mianwali 58.4
29 Lodhran 57.7
30 Bahawalnagar 56.9
31 Sargodha 56.6
32 Muzaffargarh 55.3
33 Jhang 55.3
34 Rajanpur 54.4
35 Hafizabad 49.9
36 Bhakkar 48.3
37 Narowal 35.3

Pakistan Millennium Development Goals Report 2013
169
Annexes
PMDGR 2013 Annexes Annex 12
12.B: Sindh
Proportion of women 15-49 years who had given birth during last 3 years and made at least one antenatal care consultation
District Level Ranking by Provinces
Rank Districts 2004-05
1 Karachi 81.0
2 Naushahro Feroze 60.9
3 Hyderabad 58.8
4 Dadu 57.3
5 Sukkur 56.9
6 Mirpur Khas 53.4
7 Badin 50.2
8 Jacobabad 49.4
9 Larkana 48.4
10 Thatta 45.8
11 Shikarpur 42.8
12 Sanghar 38.8
13 Tharparkar 37.2
14 Ghotki 35.7
15 Khairpur 33.4
16 S. Benazirabad 29.8
Rank District 201011
1 Karachi 93.4
2 Hyderabad 84.7
3 Mitiari 79.6
4 Sukkur 76.6
5 Dadu 66.1
6 Thatta 65.1
7 Jamshoro 59.6
8 Naushahro Feroze 56.0
9 Jacobabad 55.8
10 Sanghar 54.9
11 Larkana 52.6
12 Khairpur 49.6
13 S. Benazirabad 49.4
14 Kashmore 49.1
15 Shikarpur 48.6
16 Mirpur Khas 48.4
17 Ghotki 47.9
18 Badin 46.8
19 Tharparkar 44.6
20 QS Kot 42.3
21 Umer Kot 39.8
22 Tando Allahyar 39.3
23 Tando Md Khan 28.9

Pakistan Millennium Development Goals Report 2013
170
Annexes
PMDGR 2013 Annexes Annex 12
12.C: Khyber Pakhtunkhwa
Proportion of women 15-49 years who had given birth during last 3 years and made at least one antenatal care consultation
District Level Ranking by Provinces
1 Abbottabad 71.0
2 Haripur 65.7
3 Mansehra 60.1
4 Nowshera 56.5
5 Peshawar 53.9
6 Lower Dir 52.3
7 Malakand 45.0
8 Hangu 44.3
9 Chitral 43.9
10 Charsadda 43.2
11 Mardan 43.0
12 Swabi 39.1
13 Swat 39.0
14 Lakki Marwat 38.9
15 Bannu 38.8
16 Upper Dir 38.1
17 D. I. Khan 37.4
18 Batagram 27.6
19 Tank 26.9
20 Karak 23.5
21 Kohat 19.5
22 Buner 17.0
23 Shangla 10.7
24 Kohistan 8.0
1 Haripur 75.8
2 Mardan 69.0
3 Peshawar 68.5
4 Malakand 64.8
5 Abbottabad 64.6
6 Nowshera 60.0
7 Swabi 57.1
8 Charsadda 55.6
9 Kohat 51.2
10 Mansehra 49.6
11 Chitral 49.0
12 Lower Dir 48.4
13 Swat 46.4
14 D. I. Khan 45.3
15 Upper Dir 41.9
16 Lakki Marwat 41.8
17 Hangu 41.6
18 Buner 40.6
19 Bannu 38.6
20 Shangla 36.6
21 Batagram 32.5
22 Tank 32.0
23 Karak 28.8
24 Kohistan 19.1
25 Tor Ghar* ‐

Pakistan Millennium Development Goals Report 2013
171
Annexes
PMDGR 2013 Annexes Annex 12
12.D: Balochistan
Proportion of women 15-49 years who had given birth during last 3 years and made at least one antenatal care consultation
District Level Ranking by Provinces
Rank Districts 2004-05
1 Gwadar 72.2
2 Bolan 60.3
3 Panjgur 58.9
4 Jaffarabad 57.3
5 Quetta 55.0
6 Ziarat 49.0
7 Kech 42.1
8 Nasirabad 41.2
9 Lasbela 39.9
10 Kharan 36.6
11 Sibi 33.7
12 Chagai 32.8
13 Pishin 32.7
14 Mastung 30.9
15 Loralai 25.9
16 Zhob 24.9
17 Killa Abdullah 24.9
18 Killa Saifullah 19.3
19 Jhal Magsi 18.7
20 Khuzdar 17.1
21 Kalat 13.4
22 Musakhel 11.5
23 Barkhan 11.3
24 Awaran 6.2
Rank Districts 2010-11
1 Harnai 76.5
2 Kech 69.7
3 Lasbela 67.2
4 Gwadar 63.5
5 Jaffarabad 59.9
6 Nasirabad 59.3
7 Kharan 53.1
8 Awaran 51.1
9 Zhob 48.7
10 Kalat 46.0
11 Quetta 45.5
12 Musakhel 44.1
13 Panjgur 43.8
14 Sibi 42.4
15 Jhal Magsi 42.3
16 Noshki 41.9
17 Sherani 40.2
18 Washuk 37.1
19 Khuzdar 36.5
20 Barkhan 34.2
21 Mastung 32.2
22 Bolan 31.7
23 Chagai 30.4
24 Dera Bugti 23.9
25 Ziarat 19.7
26 Killa Abdullah 18.9
27 Pishin 17.5
28 Loralai 17.5
29 Kohlu 17.0
30 Killa Saifullah 10.5
31 Mach* -

Pakistan Millennium Development Goals Report 2013
172
Annexes
PMDGR 2013 Annexes Annex 13
13.A: Punjab
Access to Improved Drinking Water (%)District Level Ranking by Provinces
Rank District 2004-05
1 Sheikhupura 99.9
2 Narowal 99.9
3 Layyah 99.8
4 Gujranwala 99.8
5 Lahore 99.7
6 Bhakhar 99.7
7 Kasur 99.7
8 Sialkot 99.6
9 Hafizabad 99.6
10 Mandi Bahuddin 99.5
11 Gujrat 99.4
12 Rahim Yar Khan 99.4
13 Muzaffar Garh 99.3
14 Vehari 98.8
15 Khanewal 98.7
16 Multan 98.7
17 Khushab 98.7
18 Sargodha 98.5
19 Jhang 98.3
20 Sahiwal 98.3
21 Okara 97.8
22 Lodhran 97.2
23 Pakpatten 96.5
24 T.T.Singh 96.4
25 Bahawalnager 96.3
26 Faisalabad 95.3
27 Bahawalpur 94.1
28 Rajanpur 91.0
29 Chakwal 90.3
30 Mianwali 89.0
31 D.G.Khan 86.2
32 Jehlum 85.9
33 Islamabad 81.7
34 Attock 77.8
35 Rawalpindi 75.0
Rank District 2010-11
1 Layyah 100.0
2 Okara 99.8
3 Chiniot 99.6
4 Bhakhar 99.6
5 Gujranwala 99.3
6 Sahiwal 99.3
7 Mandi Bahuddin 98.7
8 Gujrat 98.6
9 Narowal 98.6
10 Jhang 98.6
11 Lahore 98.5
12 Sheikhupura 98.5
13 Muzaffar Garh 98.4
14 Kasur 98.3
15 Hafizabad 98.3
16 Khanewal 98.1
17 Nankana Sahib 97.7
18 Sialkot 97.6
19 T.T.Singh 97.3
20 Multan 97.2
21 Bahawalnager 96.7
22 Vehari 96.5
23 Pakpatten 96.1
24 Sargodha 96.1
25 Khushab 96.0
26 Bahawalpur 94.8
27 Rahim Yar Khan 93.2
28 Lodhran 90.6
29 Mianwali 89.7
30 Jehlum 88.0
31 Chakwal 86.3
32 Rajanpur 86.3
33 Faisalabad 78.4
34 Islamabad 78.3
35 Attock 73.8
36 Rawalpindi 72.7
37 D.G.Khan 68.1

Pakistan Millennium Development Goals Report 2013
173
Annexes
PMDGR 2013 Annexes Annex 13
13.B: Sindh
Access to Improved Drinking Water (%)District Level Ranking by Provinces
Rank District 2004-05
1 Shikarpur 99.7
2 Ghotki 99.6
3 Hyderabad 99.0
4 Nowshero Feroze 99.0
5 Nawabshah 98.9
6 Khairpur 98.3
7 Sukkur 98.1
8 Larkana 93.1
9 Jaccobabad 93.0
10 Sanghar 90.3
11 Karachi 88.8
12 Badin 88.0
13 Dadu 73.7
14 Thatta 64.0
15 Mir Pur Khas 58.2
16 Tharparkar 28.3
Rank District 2010-11
1 Larkana 100.0
2 Ghotki 100.0
3 Shikarpur 99.8
4 Matiari 99.7
5 Nowshero Feroze 99.6
6 Sukkur 98.3
7 Nawabshah 97.7
8 Hyderabad 97.5
9 Khairpur 97.5
10 Kashmore 96.7
11 Sanghar 96.7
12 Tando Muhd Khan 96.3
13 Tando Allah Yar 95.1
14 Karachi 94.3
15 Shahdad Kot 87.9
16 Jaccobabad 82.5
17 Badin 81.4
18 Mir Pur Khas 80.2
19 Dadu 75.2
20 Thatta 68.7
21 Jamshoro 64.0
22 Umer Kot 53.2
23 Tharparkar 17.2

Pakistan Millennium Development Goals Report 2013
174
Annexes
PMDGR 2013 Annexes Annex 13
13.C: Khyber Pakhtunkhwa
Access to Improved Drinking Water (%)District Level Ranking by Provinces
1 Bannu 93.6
2 D.I.Khan 87.8
3 Peshawar 84.5
4 Nowshera 82.8
5 Lakki Marwat 82.6
6 Haripur 78.0
7 Abbottabad 76.9
8 Kohat 74.0
9 Mardan 73.0
10 Tank 69.6
11 Mansehra 60.5
12 Swabi 59.7
13 Swat 59.0
14 Lower Dir 58.6
15 Bonair 57.1
16 Hangu 53.8
17 Charsada 51.9
18 Malakand 51.4
19 Karak 50.4
20 Chitral 49.1
21 Batagram 48.9
22 Upper Dir 38.6
23 Kohistan 28.9
24 Shangla 19.5
1 Bannu 98.5
2 Peshawar 93.9
3 Batagram 83.6
4 Mardan 79.2
5 Tank 79.0
6 Abbottabad 75.9
7 Charsada 75.2
8 Haripur 74.4
9 Swabi 74.4
10 Mansehra 72.6
11 D.I.Khan 71.6
12 Hangu 71.3
13 Nowshera 68.9
14 Kohat 66.3
15 Lower Dir 66.2
16 Lakki Marwat 63.6
17 Malakand 63.1
18 Shangla 62.1
19 Bonair 61.7
20 Swat 56.0
21 Karak 49.8
22 Chitral 37.8
23 Upper Dir 16.7
24 Kohistan 8.3
25 Tor Ghar* -

Pakistan Millennium Development Goals Report 2013
175
Annexes
PMDGR 2013 Annexes Annex 13
13.D: Balochistan
Access to Improved Drinking Water (%)District Level Ranking by Provinces
Rank District 2004-05
1 Quetta 84.7
2 Pashin 62.7
3 Awaran 60.2
4 Jafarabad 60.2
5 Mastung 58.7
6 Chaghi 57.6
7 Gwadar 54.3
8 Sibbi 54.1
9 Kalat 53.2
10 Qilla Saifullah 50.4
11 Lasbilla 50.1
12 Kharan 46.8
13 Zhob 44.2
14 Nasirabad 43.9
15 Khuzdar 41.7
16 Loralai 40.1
17 Barkhan 39.7
18 Qilla Abdullah 39.5
19 Bolan/Kachhi 33.3
20 Ketch 32.4
21 Panjgur 22.4
22 Jhal Magsi 22.0
23 Musa Khel 17.3
24 Ziarat 11.2
25 Dera Bugti* -
26 Kohlu* -
Rank District 2010-11
1 Quetta 95.7
2 Pashin 91.6
3 Jafarabad 90.3
4 Sibbi 73.6
5 Gwadar 66.4
6 Nasirabad 65.7
7 Loralai 46.5
8 Lasbilla 43.5
9 Qilla Saifullah 42.4
10 Kalat 39.6
11 Khuzdar 38.5
12 Ketch 38.4
13 Ziarat 35.3
14 Mastung 34.9
15 Barkhan 34.0
16 Nushki 31.0
17 Qilla Abdullah 25.6
18 Bolan/Kachhi 24.8
19 Panjgur 23.5
20 Kharan 22.3
21 Awaran 20.5
22 Harai 19.5
23 Zhob 15.8
24 Chaghi 11.5
25 Kohlu 11.0
26 Jhal Magsi 7.3
27 Dera Bugti 5.6
28 Washuk 5.2
29 Musa Khel 0.9
30 Sherani 0.01
31 Mach* -

Pakistan Millennium Development Goals Report 2013
176
Annexes
PMDGR 2013 Annexes Annex 14
14.A: Punjab
Access to Improved Sanitation Facility (%)District Level Ranking by Provinces
Rank District 2004-05
1 Lahore 94.0
2 Gujranwala 89.0
3 Islamabad 81.0
4 Sialkot 79.0
5 Faisalabad 78.0
6 Rawalpindi 76.0
7 Sheikhupura 75.0
8 Toba Tek Singh 71.0
9 Attock 69.0
10 Sargodha 68.0
11 Multan 67.0
12 Gujrat 66.0
13 Kasur 65.0
14 Sahiwal 63.0
15 Jhelum 62.0
16 Mandi Bahauddin 60.0
17 Bahawalpur 57.0
18 Hafizabad 56.0
19 Mianwali 56.0
20 Pakpattan 54.0
21 Vehari 54.0
22 Bahawalnagar 53.0
23 RY Khan 53.0
24 D.G.Khan 52.0
25 Layyah 52.0
26 Khanewal 51.0
27 Khushab 51.0
28 Rajanpur 51.0
29 Lodhran 48.0
30 Narowal 48.0
31 Chakwal 47.0
32 Okara 47.0
33 Jhang 44.0
34 Bhakkar 43.0
35 Muzaffargarh 36.0
Rank District 2010-11
1 Lahore 97.0
2 Gujranwala 96.0
3 Islamabad 96.0
4 Sialkot 91.0
5 Sheikhupura 88.0
6 Kasur 87.0
7 Faisalabad 86.0
8 Rawalpindi 84.0
9 Gujrat 84.0
10 Jhelum 80.0
11 Toba Tek Singh 78.0
12 Khushab 78.0
13 Nankana Sahib 78.0
14 Chakwal 76.0
15 Sargodha 75.0
16 Multan 74.0
17 Hafizabad 74.0
18 Mandi Bahauddin 73.0
19 Sahiwal 69.0
20 Attock 68.0
21 Mianwali 66.0
22 Okara 65.0
23 Narowal 64.0
24 Bahawalnagar 62.0
25 Lodhran 60.0
26 RY Khan 59.0
27 Vehari 58.0
28 Bahawalpur 56.0
29 Chiniot 56.0
30 Layyah 55.0
31 Khanewal 55.0
32 Pakpattan 52.0
33 Jhang 51.0
34 Muzaffargarh 45.0
35 Bhakkar 43.0
36 D.G.Khan 38.0
37 Rajanpur 29.0

Pakistan Millennium Development Goals Report 2013
177
Annexes
PMDGR 2013 Annexes Annex 14
14.B: Sindh
Access to Improved Sanitation Facility (%)District Level Ranking by Provinces
Rank District 2004-05
1 Karachi 91.0
2 Sukkur 69.0
3 Shikarpur 54.0
4 Hyderabad 52.0
5 Ghotki 39.0
6 Larkana 39.0
7 Naushahro Feroze 37.0
8 S. Benazirabad 35.0
9 Khairpur 33.0
10 Mirpur Khas 33.0
11 Jacobabad 32.0
12 Sanghar 31.0
13 Dadu 26.0
14 Badin 23.0
15 Thatta 20.0
16 Tharparkar 14.0
Rank District 2010-11
1 Karachi 97.0
2 Hyderabad 84.0
3 Larkana 72.0
4 Sukkur 61.0
5 Mirpur Khas 54.0
6 Ghotki 53.0
7 QS Kot 52.0
8 Badin 46.0
9 Shikarpur 44.0
10 Naushahro Feroze 43.0
11 S. Benazirabad 43.0
12 Sanghar 42.0
13 Umer Kot 37.0
14 Kashmore 36.0
15 Dadu 35.0
16 Jamshoro 35.0
17 Khairpur 33.0
18 Mitiari 33.0
19 Tando Allahyar 32.0
20 Jacobabad 26.0
21 Tando Md Khan 21.0
22 Thatta 20.0
23 Tharparkar 7.0

Pakistan Millennium Development Goals Report 2013
178
Annexes
PMDGR 2013 Annexes Annex 14
14.C: Khyber Pakhtunkhwa
Access to Improved Sanitation Facility (%)District Level Ranking by Provinces
1 Peshawar 73.0
2 Abbottabad 68.0
3 Lower Dir 62.0
4 Haripur 60.0
5 Hangu 55.0
6 Swat 53.0
7 Mardan 52.0
8 Nowshera 52.0
9 Kohat 50.0
10 Swabi 50.0
11 Mansehra 48.0
12 D. I. Khan 46.0
13 Lakki Marwat 46.0
14 Chitral 45.0
15 Bannu 40.0
16 Charsadda 40.0
17 Batagram 38.0
18 Shangla 38.0
19 Malakand 32.0
20 Tank 32.0
21 Upper Dir 30.0
22 Karak 29.0
23 Buner 22.0
24 Kohistan 8.0
1 Chitral 86.0
2 Peshawar 81.0
3 Haripur 80.0
4 Swat 77.0
5 Lower Dir 74.0
6 Nowshera 70.0
7 Swabi 67.0
8 Mansehra 66.0
9 Batagram 66.0
10 Abbottabad 65.0
11 Shangla 65.0
12 Mardan 62.0
13 Upper Dir 61.0
14 Hangu 60.0
15 Bannu 59.0
16 Malakand 58.0
17 Kohat 57.0
18 Charsadda 57.0
19 Buner 45.0
20 Lakki Marwat 43.0
21 Karak 36.0
22 D. I. Khan 30.0
23 Tank 27.0
24 Kohistan 17.0
25 Tor Ghar* -

Pakistan Millennium Development Goals Report 2013
179
Annexes
PMDGR 2013 Annexes Annex 14
14.D: Balochistan
Access to Improved Sanitation Facility (%)District Level Ranking by Provinces
Rank District 2004-05
1 Quetta 76.0
2 Sibi 41.0
3 Jaffarabad 29.0
4 Killa Abdullah 27.0
5 Panjgur 26.0
6 Chagai 25.0
7 Gwadar 23.0
8 Loralai 20.0
9 Zhob 20.0
10 Lasbela 18.0
11 Mastung 17.0
12 Nasirabad 17.0
13 Ziarat 17.0
14 Bolan 16.0
15 Pishin 14.0
16 Killa Saifullah 14.0
17 Kech 11.0
18 Kalat 9.0
19 Khuzdar 9.0
20 Barkhan 8.0
21 Kharan 8.0
22 Musakhel 8.0
23 Jhal Magsi 4.0
24 Awaran 2.0
Rank District 2010-11
1 Quetta 91.0
2 Pishin 56.0
3 Sibi 51.0
4 Zhob 45.0
5 Barkhan 43.0
6 Musakhel 42.0
7 Gwadar 35.0
8 Sherani 35.0
9 Loralai 33.0
10 Killa Abdullah 32.0
11 Ziarat 24.0
12 Lasbela 23.0
13 Kech 23.0
14 Noshki 23.0
15 Mastung 20.0
16 Kharan 20.0
17 Harnai 19.0
18 Khuzdar 18.0
19 Panjgur 16.0
20 Jaffarabad 15.0
21 Bolan 15.0
22 Killa Saifullah 15.0
23 Dera Bugti 15.0
24 Awaran 12.0
25 Nasirabad 10.0
26 Chagai 9.0
27 Kalat 8.0
28 Jhal Magsi 4.0
29 Washuk 4.0
30 Kohlu 3.0
31 Mach* -

Pakistan Millennium Development Goals Report 2013
180
Annexes
PMDGR 2013 Annexes Annex 15
List of National Coordination Committee on MDGsSr. # Designation Role
1. Chief Economist Chairman
2. Sr .Chief Education Section Member
3. Sr .Chief Nutrition Section Member
4. Chief Environment Section Member
5. Chief Population and Social Planning Section Member
6. Chief Info. Technology Section Member
7. Chief Health Section Member
8. Chief Int. Trade and Finance Section Member
9. Chief Gender Section Member
10. Chief Physical Planning and Housing Section Member
11. Representative of M/o Education and Training Member
12. Representative of Pak. Bureau of Statistics Member
13. Representative of Inter – Provincial Coordination Member
14. A Representative of Government of Punjab, Sindh Khyber Pakhtunkhwa and Balochistan
Member
15. Representative of PIDE Member
16. Representative of NIPS Member
17. D.G. JACC Member
18. Chief, Poverty Alleviation & MDGs Section Member Secretary
Committee Constituted on December 18, 2012

Pakistan Millennium Development Goals Report 2013
181
Annexes
PMDGR 2013 Annexes Annex 16
List of Working Groups on PMDGR 2013
1. Composition of Working Group on I T & F
2. Composition of Working Group on Health and Population
# Name Designation Organization
1. Dr. Ali Bat Khan Chief IT&F Section, Ministry of Planning, Development & Reform
2. Dr. Ather Maqsood Professor NUST Business School
3. Mr. Nisar Ahmed Khan Deputy Secretary Economic Affairs Division, Islamabad
4. Mr. Mirza Ahmad Hassan General Manager National Commission for Human Development, Islamabad
5. Mr. Muzaffar Ali Burki Debt Policy Coordination Office(DPCO), Finance Division, Islamabad
6. Mr. Muhammad Siddique Research Officer Debt Policy Coordination Office(DPCO), Finance Division, Islamabad
7. Mr. Ricardo Rossi European Commission, Islamabad
8. Mr. Mohammad Tehseen Trade Development Authority of Pakistan
9. Mr. Shakeel Ahmad Policy Specialist UNDP Islamabad
10. Ms. Anum Parvez YPO UNDP Islamabad
11. Mr. Nausheen Saba Nizami Assistant Chief IT & F Section P &D Division
# Name Designation Organization
1. Dr. Ghulam Asghar Abbasi
Chief (Health) Ministry of Planning, Development and Reform - Chair
2. Mr. Shahzad Ahmad Malik
Chief (Population) Ministry of Planning, Development and Reform
3. Dr. Muhammad Raza Director General Pakistan Bureau of Statistics, Islamabad
4. Mr. Ayaz ud Din, Deputy Director General
Pakistan Bureau of Statistics, Islamabad
5. Ms. Tanveer Kiyani Director (Research and Survey)
NIPS, Islamabad
6. Mr. Akbar Deputy Director National Health Information Resource Center, Islam-abad
7. Dr. Zeba Sathar Country Director Population Council, Islamabad
8. Dr. Muhammad Shafiquddin
Ex-Chief (Health) Islamabad
9. Representative from WHO, UNFPA, UNDP, UNICEF, USAID
10. Dr. SamanYazdani Director Centre for Health and Population Studies (CHPS), Pakistan
11. Dr. Muhammad Asif Deputy Chief (Health)
Member Secretary

Pakistan Millennium Development Goals Report 2013
182
Annexes
PMDGR 2013 Annexes Annex 16
List of Working Groups on PMDGR 2013
3. Composition of Working Group on Environment
4. Composition of Working Group on Education
# Name Designation Organization
1. Mr. Syed Mehmood Nasir
Inspector General (Forest) Ministry of Climate Change, Islamabad
2. Mr. Ayaz-ud-Din Dy. Director General Pakistan Bureau of Statistics , Islamabad
3. Mr. Imran Tarique Director General (Environment) Ministry of Climate Change
4. Mr. Anwar Hussain Chaudhary
Chief, PP&H Section Ministry of Planning, Development and Reform
5. Mr. Hamid Marwat Chief, Environment Section Ministry of Planning, Development and Reform
# Name Designation Organization
1. Mr. Abdul Ha-meed
Senior Chief (Edu-cation Section)
Ministry of Planning, Development and Reform
2. Secretary Capital Administration and Development Division, Islamabad
3. Secretary Elementary & Secondary Education Department, Govt. of Punjab, Lahore
4. Secretary Education and Literacy, Department Govt. of Sindh Secretariat, Karachi.
5. Secretary Education Department, Govt. of Azad Jammu & Kashmir Muzaffarabad
6. Secretary Education Department, Gilgit Baltistan, Gilgit
7. Mr. Jamaluddin Chief Planning Officer
Elementary & Secondary Education Department, Khyber Pakhtunkhwa , Peshawar
8. Mr. Muhammad Tayyab Lehri
Additional Secre-tary
Secondary Education, Govt. of Balochistan, Quetta
9. Ms. Rabia Awan Chief Statistical Officer
Pakistan Bureau of Statistics , Islamabad
10. Dr. Imran Ullah Khan
Deputy Secretary (Education)
Ministry of Education, Training and Standards in Higher Education, Islamabad
11. Mir Mukhtar Hussain Talpur
Director Bureau for University Extension & Special Programmes/Projects, Allama Iqbal Open University, Islamabad

Pakistan Millennium Development Goals Report 2013
183
Annexes
PMDGR 2013 Annexes Annex 17
UNDP and National MDGs Secretariat Team
1. UNDP Team
2. Poverty Alleviation & MDGs Section
# Name Designation
1. Mr. Shakeel Ahmad Policy Specialist, Development Policy Unit
2. Dr. Sajjad Akhtar Senior Consultant
3. Mr. Kamran Ahmad Data Specialist/Consultant
4. Mr. Mohammad Shoaib Junior Consultant
5. Mr. Jawad Rehman Junior Consultant
6. Mr. Nadeem Shaukat Junior Consultant
7. Ms. Anam Parvez Young Professional Officer, Development Policy Unit
# Name Designation
1. Mr. Shahid Naeem Deputy Chief
2. Mr. Irfan Khan Assistant Chief
3. Dr. M. Aman Ullah Assistant Chief
4. Dr. Lubna Shahnaz Social Protection Policy Expert
5. Ms. Rehana Afzal M & E Specialist
6. Mr. Muhammad Anwar Assistant
7. Mr. Muhammad Iqbal Assistant Private Secretary

Pakistan Millennium Development Goals Report 2013
184
Annexes