Retrofitting to reach climate goals
132
Retrofitting to reach climate goals Energy label specific retrofitting of Dutch office buildings Master thesis Energy Science (30 EC) Utrecht University Date: 04-06-2020 Word count: 17,923 Pam Engwirda (5549647) [email protected] Supervisor: Jesus Rosales Carreon Second reader: Robert Harmsen Internship at SPIE Nederland B.V. Internship supervisor: Jacco Saaman
-
Upload
khangminh22 -
Category
Documents
-
view
1 -
download
0
Transcript of Retrofitting to reach climate goals

Retrofitting to reach climate goals Energy label specific retrofitting
of Dutch office buildings
Master thesis Energy Science (30 EC) Utrecht University Date: 04-06-2020 Word count: 17,923 Pam Engwirda (5549647) [email protected] Supervisor: Jesus Rosales Carreon
Second reader: Robert Harmsen
Internship at SPIE Nederland B.V. Internship supervisor: Jacco Saaman

Master thesis - Energy Science Pam Engwirda (5549647)
2
Acknowledgments
With writing this word of thanks, the final product of my master programme Energy Science at the Utrecht
University is finished. I would like to take this space to thank those who helped me achieve this milestone.
First, I would like to thank my supervisor from Utrecht University: Jesus Rosales Carreon. I would like to
thank you for your consistency, advices and willingness to help me wherever you could. Especially, I would
like to highlight the feeling you gave me after every meeting: I have work to do but I can do it. I really
enjoyed our corporation (and I am a bit sad that the pizza is finished).
Next, I would like to thank my internship supervisors from SPIE: Jacco Saaman, Ilko Wiersma and Martijn
de Ruijter. From the minute I walked into your office I felt welcome. Thank you for the challenging
meetings, which most of the time ended up with me having a red head from the effort. You challenged me
to go that step further and your enthusiasm for the project worked contagious.
Lastly, I would like to thank my roommates for their sympathetic ear (especially at times of the corona
epidemic) and my family for their endless support and pride in everything I do.
04-06-2020
Pam Engwirda

Master thesis - Energy Science Pam Engwirda (5549647)
3
Abstract
The built environment is responsible for 40% of the total CO2 emissions of the European Union (Dekker &
Schuur, 2018). The Dutch Cabinet is aiming for a low-carbon building stock in 2050 (TNO, 2019). As
incorporated in the Building Decree of 2012: by 2023, all office buildings bigger than 100 m2 need to have
at least energy label C and by 2030 energy label A (RVO 2, 2019). When an office building does not reach
this energy label, the building cannot be used as an office anymore. The obligation for an energy label C
affects 52% of the current office area and energy label A affects 75% (EIB, 2016). An effective way to
improve the energy performance of existing buildings, is retrofitting (Ma et al., 2012). Much research has
been carried out to determine the best retrofit options for existing buildings. However, they do not focus
on reaching a certain energy performance level, e.g. energy label, after retrofitting. Based on this, the
research aim was to build a Decision Support System (DSS) which considers the future mandatory energy
labels, following the Dutch Building Decree of 2012, when selecting retrofit measures for office buildings
in the Netherlands. The ISSO 75.3 was used as the guideline for the energy label calculation. This
publication is widely used in the Dutch building sector. In addition, the DSS enabled the possibility to
include the office building owner’s preferences regarding costs and sustainability ambitions in the selection
of retrofit measures. The DSS was tested on three office buildings and showed that the preferences of the
owner highly impacted the proposed retrofit measures. The preferences of the owner could result in more
retrofit measures proposed than needed to obtain energy label C or A. Regarding the financial and
environmental implications of the retrofit measures, the highest investment costs are coupled to the
retrofitting of the heat and cold suppliers. The highest energy use reduction and therefore CO2 emission
reduction is achieved by heat suppliers. When a heat pump is proposed as a suitable retrofit measure, it
can be beneficial to wait a few years before installing. Its relatively short lifetime could namely interfere
with the energy label A target year in 2030. Lastly, the robustness of the DSS was tested through a
sensitivity analysis, which validated the results of this research. This research can be used to build other
DSS using the energy requirements from different countries.
Keywords: Office building, Energy label, Retrofitting, Decision Support System (DSS)

Master thesis - Energy Science Pam Engwirda (5549647)
4
Index
1. INTRODUCTION .......................................................................................................................................6
2. THEORY....................................................................................................................................................9
2.1 THE DEVELOPMENT OF CURRENT AND FUTURE ENERGY REQUIREMENTS IN THE BUILT ENVIRONMENT ........................... 9
2.1.1 Future developments building energy requirements ....................................................................... 11
2.2 RETROFITS BASED ON TRIAS ENERGETICA ....................................................................................................... 12
2.2.1 Energy use of a building ................................................................................................................... 13
2.2.2 Heat balance of a building ............................................................................................................... 14
2.2.3 Building retrofit measures ............................................................................................................... 15
2.3 OFFICE BUILDINGS: REQUIREMENTS AND TYPICAL ENERGY USE ............................................................................ 16
2.3.1 Energy use office building ................................................................................................................ 17
2.3.2 Retrofit measures suitable for office buildings ................................................................................ 17
2.4 AVAILABLE DSS FOR OFFICE BUILDINGS ......................................................................................................... 21
2.5 CRITERIA FOR RETROFITTING ........................................................................................................................ 23
3. METHOD ................................................................................................................................................ 25
3.1 THE OPERATION OF THE DSS ....................................................................................................................... 26
3.1.1 Questionnaire .................................................................................................................................. 26
3.1.2 Energy label calculation ................................................................................................................... 26
3.1.3 Retrofit impact calculation .............................................................................................................. 27
3.1.4 Selection of the optimal set of retrofit measures............................................................................. 29
3.1.5 Construction of timeline ................................................................................................................... 31
3.2 SENSITIVITY ANALYSIS................................................................................................................................. 31
4. OPERATION OF THE DSS ......................................................................................................................... 33
4.1 INPUT DATA ............................................................................................................................................. 33
4.1 ENERGY USE REDUCTION ESTIMATION ........................................................................................................... 34
4.1 OPTIMISATION PROCESS ............................................................................................................................. 34
4.2 RESULTS DSS ........................................................................................................................................... 35
5. RESULTS ................................................................................................................................................. 37
5.1 NORIT AMERSFOORT ................................................................................................................................. 37
5.2 FREUDENTHAL UU .................................................................................................................................... 39
5.3 OFFICE SPIE ............................................................................................................................................ 43
5.4 SENSITIVITY ANALYSIS................................................................................................................................. 46
5.4.1 Gas price .......................................................................................................................................... 47
5.4.2 Electricity price ................................................................................................................................. 47
5.4.3 CO2 emission factor Dutch electricity grid........................................................................................ 48
5.4.4 Investment cost ................................................................................................................................ 48
5.4.5 Weights MCDA ................................................................................................................................. 48
5.4.6 Ranking of retrofit measures ........................................................................................................... 49
6. DISCUSSION ........................................................................................................................................... 50
6.1 FINDINGS ................................................................................................................................................ 50
6.2 OPERATION OF THE DSS............................................................................................................................. 51
6.3 THEORY .................................................................................................................................................. 51
6.4 PRACTICAL APPLICATION ............................................................................................................................. 52
6.5 LIMITATIONS AND SUGGESTIONS FOR FURTHER RESEARCH ................................................................................. 52

Master thesis - Energy Science Pam Engwirda (5549647)
5
7. CONCLUSION ......................................................................................................................................... 53
REFERENCES ................................................................................................................................................... 55
QUESTIONNAIRE ...................................................................................................................... 65
ASSUMPTIONS LINKED TO YEAR OF CONSTRUCTION ............................................................... 75
CALCULATIONS FOR ENERGY LABELS IN THE NETHERLANDS .................................................... 76
C.1 ENERGY LABELS THROUGH THE ENERGY-INDEX ................................................................................................ 76
C.2 NZEB REQUIREMENTS ............................................................................................................................... 79
CALCULATION ENERGY DEMAND OFFICE BUILDING ................................................................ 80
D.1 CALCULATION OF TOTAL ENERGY USE OFFICE BUILDING ..................................................................................... 80
D.2 ENERGY USE FOR SPACE HEATING ................................................................................................................. 81
D.3 ENERGY USE BY VENTILATORS ...................................................................................................................... 94
D.4 ENERGY USE BY LIGHTING ........................................................................................................................... 96
D.5 ENERGY USE FOR PUMPS............................................................................................................................. 98
D.6 ENERGY USE FOR COOLING .......................................................................................................................... 99
D.7 ENERGY USE FOR HUMIDIFICATION ............................................................................................................. 106
D.8 ENERGY USE FOR THE PREPARATION OF HOT TAP WATER ................................................................................. 107
D.9 ENERGY CONTRIBUTION BY PHOTOVOLTAICS ................................................................................................. 109
D.10 ENERGY CONTRIBUTION THROUGH THE APPLICATION OF COGENERATION ............................................................ 110
WEATHER DATA ..................................................................................................................... 113
RETROFIT MEASURES ............................................................................................................. 115
F.1 REDUCE ENERGY DEMAND ........................................................................................................................ 115
F.2 APPLY SUSTAINABLE ENERGY RESOURCES ..................................................................................................... 121
F.3 USE FOSSIL FUEL EFFECTIVELY .................................................................................................................... 121
QUESTIONNAIRE NORIT AMERSFOORT ................................................................................. 122
QUESTIONNAIRE FREUDENTHAL UU ...................................................................................... 125
QUESTIONNAIRE OFFICE SPIE .................................................................................................. 129

Master thesis - Energy Science Pam Engwirda (5549647)
6
1. Introduction
The effect of CO2 emissions due to human activities on the Earth’s climate and the need to reduce them is
widely acknowledged (Boasson & Wettestad, 2016; Schneider & Thompson, 1981; Sellers et al., 1996). A
main contributor to the emittance of CO2 is the built environment. In the European Union (EU), this sector
is responsible for around 40% of energy-related CO2 emissions (UN Environment and International Energy
Agency, 2017). Utility buildings are one of the biggest contributors, being 60% more energy intensive than
residential buildings (Rousselot, 2018). In the Netherlands, utility buildings account for 18% of the total
CO2 emissions, which equals 460 million m2 floor area and approximately 380.000 buildings who are
responsible for 280 Peta Joule. The largest contributors to the energy use in utility are industrial- and office
buildings, 44% and 15% respectively (Dekker & Schuur, 2018).
The Dutch Cabinet is aiming for a low-carbon building stock in 2050 by promoting far-reaching CO2
reduction measures. The target is set on reducing the emittance of CO2 emissions by 49% in 2030 and 95%
in 2050 compared to the reference year 1990 (TNO, 2019). To reach this goal, the government incorporated
the following in the Building Decree of 2012: by the first of January 2023, all office buildings bigger than
100 m2 need to have energy label C or higher (RVO 2, 2019). When an office building does not reach this
energy label, the building cannot be used as an office anymore. By 2030, this target will be stricter and all
office buildings bigger than 100 m2 need to have energy label A or higher. The obligation for an energy
label C affects 52% of the current office area. When setting the mandatory energy label A, 75% of the
current office area does not comply with these requirements (EIB, 2016). This shows that there is a high
need to improve the energy performance of Dutch office buildings in the coming years.
An effective way to improve the energy performance of existing buildings at relatively low cost and high
uptake rates, is retrofitting (Ma et al., 2012). A retrofit involves modifications to existing buildings that may
improve energy efficiency or decrease energy demand (U.S. Department of Energy, 2019). The
effectiveness of retrofitting existing buildings to reduce energy use has been researched extensively. The
OFFICE project by the Design and Evaluation Group showed that substantial reductions can be achieved in
both thermal- and electrical energy use by using passive and low-energy technologies (Hestnes & Kofoed,
2002). Dascalaki & Santamouris (2002) stated that due to retrofitting, cost-effective energy savings in the
order of 20-30% can be achieved. Ardente et al. (2011) showed with multiple case studies that substitution
of insulation, lighting and glazing components provided significant reductions in energy use.
In addition, much research has been carried out to determine the best retrofit options for existing
buildings. Ma et al. (2012) described a systematic approach to identify the best retrofit options for existing
buildings. Chidiac et al. (2011) developed a method to screen office buildings for their current level of
energy consumption and potential for retrofit technologies. Their decision for the best retrofit measures
was influenced by climate, occupancy, heating and cooling systems, envelope properties and building
geometry. Caccavelli & Gugerli (2002) developed a decision-making tool for selecting office building
upgrading solutions considering deterioration, functional obsolescence of building services, energy
consumption and indoor environmental quality.

Master thesis - Energy Science Pam Engwirda (5549647)
7
What these methods have in common is that they all focus on the characteristics of the existing building
and possible retrofit measures. When consulting these methods, the result will be a set of suitable retrofit
measures for a specific building. However, they do not focus on reaching a certain energy performance
level, e.g. energy label, after retrofitting. To effectively retrofit the Dutch office buildings according to the
requirements of the 2012 Building Decree, this needs to be incorporated. In addition, to enable specific
planning to reach these future climate goals, the time needed to install the retrofit measures should also
be considered.
Based on this, the research aim is to build a Decision Support System (DSS) which considers the future
mandatory energy labels, following the Dutch Building Decree of 2012, when selecting retrofit measures
for office buildings in the Netherlands. In the selection of the retrofit measures suitable to obtain a better
energy label, the cost and sustainability ambitions of the office building owner are incorporated. The DSS
aims to advice to the office building owner about the financial and environmental implications of the
selected retrofit measures. Therefore, the DSS answers the following research question:
What are the financial and environmental implications of different retrofit measures for office
buildings when aiming to reach mandatory energy labels following the Dutch Building Decree of 2012?
To answer this research question and to develop the DSS, the following sub questions are answered first:
1. How are the Dutch energy labels for office buildings determined?
By answering this question, insight is given in the energy label system for office buildings in the
Netherlands. The results are used to determine the criteria to obtain a certain energy label. For example,
the yearly energy use of the building.
2. What are office building characteristics that determine its energy use?
This question provides insights in the characteristics of office buildings that determine the level of energy
use. Examples of these characteristics are the amount of fresh air needed per occupant and heat
production by appliances.
3. What are the available retrofit measures and their characteristics for office buildings in the
Netherlands?
The result of this question is a list of the available retrofit measures in the Netherlands, which are
considered in this research. In addition, the financial and environmental implications and the installation
time corresponding to these measures are collected.
4. What are the decision variables for the office building owner when selecting retrofit measures?
The answer to this question describes the decision criteria for a certain set of retrofit measures for a
building. These criteria are used in a Multicriteria Decision Analysis (MCDA) to compare the different
retrofit measures and to incorporate the preferences of the office building owner.
The answers to the sub questions are used to build the DSS. The DSS is tested on three office buildings and
the preferences of their owner. The results of the DSS are two sets of retrofit measures which aim to reach
either energy label C in 2023 or energy label A in 2030. These sets are presented with their financial and
environmental implications and their installation time. With these results, the research question is
answered, and the research aim is reached.

Master thesis - Energy Science Pam Engwirda (5549647)
8
At the moment, no retrofit decision model is available which considers the need to meet mandatory energy
labels after retrofitting and shows the time needed to realize the retrofit measures. Since the energy labels
of Dutch office buildings will be checked in the near future and specific planning is required to reach these
energy labels, the need for such a model is high. With this research, more insights are given in the method
to select retrofit measures for office buildings in the Netherlands considering these two variables. In
addition, existing methods are compared on their strong and weak points to learn from when building this
DSS. Lastly, this research contributes to the Dutch Cabinet’s aim to reduce the energy consumption of the
built environment.
This research was part of an internship at SPIE Nederland BV. SPIE is a specialist in the installation branch
and one of their pillars focuses on energy efficient buildings. SPIE provides energy efficient electrical
installations. For example, a unified digital platform, which enables building owners to manage their inside
environment from a single interface. They are involved in a project called Road to Paris, in which multiple
companies gather their knowledge to tackle the energy improvement challenge of existing office buildings
in the Netherlands. With the results of this research, SPIE aspires to change the way in bringing in
assignments. Instead of waiting for the client to come with a retrofit project to them, they want to
approach possible clients with retrofit possibilities. The DSS aims to fit to this desire of SPIE. Lastly, SPIE
hopes to use this DSS in other countries and for different types of buildings in the future. Therefore, the
DSS is made in a way so adjustments and additions can easily be made.
The remainder of this research reads as follows. Section 2 describes important concepts in this research.
Section 3 describes the methodology for using the DSS and generating the results. Section 4 gives an
overview of the operation of the DSS, including screenshots from the model. Next, Section 5 describes the
results of the DSS for three different office buildings. Section 6 includes the discussion of the results and of
the operation of the DSS. Lastly, the conclusions are given in Section 7.

Master thesis - Energy Science Pam Engwirda (5549647)
9
2. Theory
This chapter describes relevant theory regarding this research. Section 2.1 describes the development of
the current and future energy requirements in the Dutch built environment. The concept of retrofitting
and the energy flows in a building to be considered when retrofitting are described in Section 2.2. Section
2.3 describes the energy requirements for office buildings and their specific energy use. In addition, the
retrofit measures suited for office buildings are specified. Section 2.4 gives an overview of the already
existing DSS for retrofitting office buildings and describes the theory used to build the DSS. Lastly, Section
2.5 describes the decision criteria when retrofitting existing buildings.
2.1 The development of current and future energy requirements in the built environment
The development of energy requirements in the built environment started with the 1973 oil crisis (Zeiler,
2013). Due to political motivated oil embargos by the Organization of Arab Petroleum Exporting Countries
(OPEC), the price of oil increased with nearly 400% (Francisco, 2004). Since the Netherlands imported most
of its oil from the OPEC, this crisis forced the Dutch government to consider alternative sources and
strategies for energy use. Before this period, the governmental regulations in the built environment were
primarily concerned with the indoor environment and health. After this energy crisis, the focus shifted to
saving energy. Between 1973 and 1990, energy efficiency and diversification became key subjects in new
governmental energy policies (Zeiler, 2013).
The first Building Decree entered into force in 1992, stating technical building regulations for the entire
country. Besides safety, usability and health requirements, also energy efficiency requirements where
incorporated. For existing and new residential buildings, these requirements where based on thermal
insulation and air permeability (Online bouwbesluit, n.d.). For new non-residential buildings, also an Energy
Performance Coefficient (EPC) was introduced. The EPC is a figure expressing the energy performance of a
building depending on the energy consumed for space heating and cooling, hot water, lighting, ventilation
and humidification (Filippidou, Nieboer & Visscher, 2017). The non-building-related energy use is not
considered, also referred to as use-related energy use. Examples are computers, household appliances and
machines (NTA 8800, 2019). The EPC is based on an index number and uses the year 1990 as a reference.
In 1990, the average energy use of a residential building corresponded to an EPC of 1.0. When a house has
an index of 0.6, he uses 60% of the energy he would have used in 1990 (Lepper, 2018). The lower the EPC,
the more energy efficient the building should be (Santin, Itard & Visscher, 2010). The aim of the
introduction of the EPC was to stimulate energy savings and the use of sustainable energy (Eco-logisch,
2020). In 1995, the EPC was incorporated in the Dutch building code of the ‘Sustainable Building Plan:
Investing in the Future’, making it applicable to new residential buildings as well (Zeiler, 2013). If the EPC
were to be calculated in 1995, the EPC for residences would been on average 1.5. The first EPC requirement
was therefore set at 1.4 (Maldonado, Wouters, & Papaglastra, 2011). This gave the market time to get used
to the new requirements and to adapt the construction method accordingly (Scheffe, 2015). Every couple
of years these requirements are tightened. This tightening has gone hand in hand with innovation in
construction and installation technology (Valk, 2014).
In the past, a certified EPC calculation for new buildings was enough to demonstrate that a building met
EPC requirements (RVO 1, n.d.). Since 2008, a national labelling scheme is added to these requirements
(Majcen, Itard & Visscher, 2013). Each building that is being sold, let or newly built, must carry an energy
label. These requirements correspond to the 2002 Directive on the Energy Performance of Buildings (EPBD)
by the EU (European Commission, 2002) and were incorporated in the Dutch Building Decree of 2012. With
the introduction of an energy label, the government aimed at stimulating building owners to retrofit their

Master thesis - Energy Science Pam Engwirda (5549647)
10
buildings even more. Making these requirements applicable to all buildings, new and existing. In contrast
to the EPC, an energy label includes retrofit possibilities for the corresponding building (RVO 2, n.d.).
Moreover, an energy label contains the following: 1) the result of the energy performance calculation, 2)
reference values which can be used to compare and assess the energy performance, and 3)
recommendations for a cost-optimal or cost-effective improvement in energy performance, unless there
is no reasonable potential for such an improvement in relation to the applicable energy performance
requirements (Overheid.nl, 2006). The energy labels range from G to A, with A being the most energy
efficient.
The energy label for new building is based on the EPC calculation. For existing buildings, another method
is introduced, since exact specifications of structures and details (such as thermal bridges) of many existing
buildings are not known (RVO 2, n.d.). The energy label for existing buildings is determined using the
Energy-Index. The Energy-Index (EI) is described as a figure indicating the energy consumption based on
the amount of energy deemed necessary for the different needs (also described as the allowed energy use)
related to the standardized use of a building (Artikel 3.1 of Besluit energieprestatie gebouwen, 2019). The
EI typically takes values between 0 (extremely good performance) to 4 (extremely bad performance)
(Filippidou et al., 2017). In the ISSO 75.1 publication (2013), these values are linked to an energy label, as
presented in Table 1.
Table 1: Energy label with corresponding Energy-Index (ISSO 75.1, 2013)
Energy label Limits Energy-Index
A ≤1.05
B 1.06 – 1.15
C 1.16 – 1.30
D 1.31 – 1.45
E 1.46 – 1.60
F 1.61 – 1.75
G >1.75
Up to 2014, the need of an energy label was not enforced. In most cases the buyer and seller of a building
agreed on the absence of an energy label when little benefit was expected from it (Vringer, Van Middelkoop
& Hoogervorst, 2016). However, research by Brounen and Kok (2011) has shown that buildings of high
energy efficiency were being sold sooner and for a higher price. This resulted in an incentive for sellers to
provide such an energy label. Since the beginning of 2015, every homeowner is obliged to register the
energy label of his home. However, on October 17, 2018, the Council of State ruled that the enforcement
of the energy label system is legally rattling. If the energy label for the property sold is not yet registered
as final, the seller risks a fine of € 405. That fine is in the first instance a "penalty payment". This means
that the seller is given the option of applying for the energy label in the short term. If this is done, there
will be no fine. But the energy label can only be requested by the owner. And so, after passing the deed,
the seller of the house can no longer apply for the energy label. He is then no longer the owner (Samen
energie besparen, 2018). To overcome this, the Human Environment and Transport Inspectorate (ILT) has
announced that as of July 3rd, 2019, it will immediately impose a fine without the possibility of rectifying
this afterwards. The fine is € 170 for individuals and € 340 for organizations (Leeuw, 2019). In addition, as
of July 1st, 2020, an energy label can only be granted by a professional. Vereniging Eigen Huis (2019)
criticizes this measure, because it merely increases the costs. They expect that this will reduce support by
building owners.

Master thesis - Energy Science Pam Engwirda (5549647)
11
2.1.1 Future developments building energy requirements
With the rising awareness of climate change, more attention is given to clean energy in addition to energy
efficiency. In 2013, more than 40 organisations and the government agreed upon the Energy Agreement
(Energieakkoord in Dutch). The aim of this agreement is to secure an affordable and clean energy supply.
They also aim to create jobs and exploit economic opportunities for the Netherlands in the clean
technology markets. The Energy Agreement covers energy savings, sustainable supply, clean technologies
and climate policy (SER 1, n.d.). The regulations are divided into twelve domains, of which one covers the
built environment. The following points describe the governmental ambition for the built environment
(SER 2, n.d.):
- Energy neutral built environment in 2050
- Up until 2020, annually 300.000 existing dwellings and other buildings at least two steps higher in
energy label
- All new construction almost energy neutral from 2020
- Minimum energy label B in 2020 for houses of rent corporations
- 80% energy label C in 2020 for private rental houses
- Energy saving in built environment contributes to an average of 15.000 extra full-time jobs per
year
- The built environment (buy, rent and real estate) contributes 53 PJ to the intended energy savings
of 100 PJ in 2020
These ambitions resulted in an information obligation for existing buildings, from July 2019 onwards (see
Figure 1). Which means that the building owners are obligated to report the energy label of their building
(RVO 3, 2019). This obligation is the starting point for the introduction of mandatory energy labels and the
control of these labels. The first mandatory energy labels are set for office buildings. Following the Building
Decree of 2012, starting the first of January 2023, office buildings must have an energy label C or higher.
In 2030, office buildings must at least have an energy label A. When an office building does not reach these
energy label targets, its use will be prohibited as of that date (Christ, 2018). The competent authority for
the Building Decree - usually the municipality where the office building is located - is responsible for
enforcing these energy label obligations. They can take various measures: from giving a warning to
imposing an order subject to periodic penalty payments, administrative enforcement or - in the event of
repeated violations - an administrative fine. The competent authority will consider for each situation which
enforcement measures are necessary and desirable (RVO 5, n.d.). However, there is much uncertainty on
how strictly the requirements will be enforced (Christ, 2018). This is of importance since the enforcement
of the requirement is a big part of the incentive for office building owners to retrofit. Moreover, real estate
markets fear that office owners who wait until 2022 to make their offices more sustainable will face a
shortage of construction workers who is able to take retrofit measures (Eerenbeemt, van den, 2018).
Following the energy saving ambitions of the Dutch government in the built environment, the current EPC
is no longer adequate. For example, you can place a large glass wall in a building and meet the EPC
requirement by compensating these energy losses through the glass with solar panels; the current
construction requirement does not take into account the energy loss of the building due to its shape (RVO
3, n.d.). Hence, the current requirement does not promote energy saving as much as possible. For that
reason, the Dutch government is working on a new method to calculate the energy performance of new
buildings, the NTA 8800. The NTA 8800 follows the European standards and replaces the current EPC with
the energy requirement per square meter (kWh/m2) (NEN, 2020). The energy requirement per square
meter will be used to set the Nearly Zero-Energy Buildings (NZEB) requirements. The NZEB requirements
are based on the Trias Energetica, which is explained more elaborate in Section 2.2. It is not possible to

Master thesis - Energy Science Pam Engwirda (5549647)
12
improve the energy performance by solar panels while the building envelope is not insulated when
considering the Trias Energetica. The 3 NZEB requirements differ per type of building and are based on the
following parameters (RVO 4, n.d.):
1. the maximum energy requirement in kWh per m2 of usable area per year;
2. the maximum primary fossil energy consumption, also in kWh per m2 usable area per year;
3. the minimum of renewable energy in percentages.
The introduction of the NTA 8800 is delayed until the 1st of January 2021 (Tweede Kamer, 2020). The reason
for this delay is the yet unavailable calculation software to determine the energy performance of buildings
based on this NTA 8800 method. After the introduction for new buildings, it is expected that these
requirements will be implemented for existing buildings as well, since one of the ambitions of the Dutch
government is an energy neutral built environment in 2050. These developments and the energy label
requirements for office buildings as described are presented on a timeline in Figure 1.
Figure 1: Sustainable building policy timeline (RVO 1, 2019)
2.2 Retrofits based on Trias Energetica
An effective way to improve the energy performance of buildings and to come to the required energy
labels, is retrofitting. Retrofitting is described as the directed alteration of the fabric, form or systems that
comprise the building to improve energy, water and waste efficiencies (Eames et al., 2014). In this research,
the focus lies on the improvement of the energy efficiencies and therefore reduce the energy use. The Trias
Energetica is the most used strategy to select energy saving measures (RVO, 2013). The use of a strategy
to determine retrofit measures is of importance, because this ensures the optimal result in both costs and
energy use reduction. The Trias Energetica states that the energy demand should be reduced first. This
results in the best base for the implementation of renewable energy technologies and energy efficient
installations (RVO, 2013).

Master thesis - Energy Science Pam Engwirda (5549647)
13
Figure 2: Trias Energetica (RVO, 2013)
Figure 2 presents the three levels of the Trias Energetica, which should be followed in that order. They are
explained as follows (Brouwers & Entrop, 2005):
1. Take measures which reduce the energy use of the building, for example insulation and efficient ventilators;
2. Use as much sustainable energy resources as possible to fulfil the energy demand; 3. In case of insufficient supply of energy by sustainable energy resources, it is necessary to use fossil
fuel resources. Use this energy supply as efficiently as possible, for example by replacing an old boiler with a more efficient one.
2.2.1 Energy use of a building
To reduce the energy use of a building, it is important to know which elements of a building determine this
energy use. Figure 3 describes the energy use of a building through the different energy flows and system
boundaries. The energy use of a building is determined by the energy demand for heating, cooling,
ventilation, domestic hot water (DHW), lighting and appliances. This is represented as the energy need in
the green box in Figure 3. Moreover, the energy demand for heating and cooling is determined by a
preferred inside temperature. The inside temperature is influenced by the heat exchange through the
building envelope and the solar and internal heat gains. These two factors therefore impact the energy
need of the building (Kurnitski et al., 2011). Therefore, the net energy need is the energy need minus these
two factors. The net energy need is supplied by the building technical systems (the blue box in Figure 3).
Examples of these building technical systems are boilers and air-conditioners. The building technical
systems need energy inputs, like electricity or fuels, to deliver the needed output. The energy input is
depended on the system losses and energy conversion in some systems (i.e. heat pumps, fuel cells). The
energy input for these building technical systems comes from delivered energy to the building or from
onsite renewable energy (without fuels). The energy delivered to the building contains electricity from the
grid, district heating and cooling and fuels. This makes up the net delivered energy to the building (Kurnitski
et al., 2011). To conclude, the energy use of a building depends on the energy need, the solar and internal
heat gains, the heat exchange through the building envelope and the system losses of the building technical
systems.

Master thesis - Energy Science Pam Engwirda (5549647)
14
Figure 3: Energy boundaries of a building (Kurnitski et al., 2011)
2.2.2 Heat balance of a building
As discussed in Section 2.2.1 and shown in Figure 3, the heating (and cooling) demand of a building is
determined by the heat exchange through the building envelope and by solar and internal heat gains. This
heat exchange comes in two forms: sensible heat and latent heat. Sensible heat flow results in a change in
temperature, which flows from hot to cold. Latent heat flow results in a change in moisture content
(humidity), which flows from areas of greater concentration to areas of lower concentration. These two
flows together determine the total heat flow and the inside comfort to occupants (BPAC, n.d.).
Sensible heat flows between two areas in three ways: 1) Conduction, which is described as the heat transfer
between substances which are in direct contact with each other, 2) Convection, which is de movement of
gases and liquids caused by heat transfer, and 3) Radiation, which occurs by electromagnetic waves (from
the sun, for example) (BPAC, n.d.). The rate of heat flow depends on (The Open University, n.d.):
- the temperature difference between the two sides
- the total area available for the flow
- the insulating qualities of the material.
Hence, more heat flows through a large area of wall or window than a small one, and more when there is
a bigger difference between preferred inside temperature and the outside temperature. The different heat
flows in a building are shown in Figure 4.

Master thesis - Energy Science Pam Engwirda (5549647)
15
Figure 4: Heat balance of a building (Simon, 2017)
In Figure 4, Q represents the heat flow (Simon, 2017). As can be seen, heat enters the building though solar
irradiation, heating generators (e.g. radiators), appliances, occupants and DHW. Heat is loss from the
building through fabric, ventilation and hot water. Heat loss through the fabric (e.g. building envelope)
depends on the difference in temperature between two side and the characteristics of the building fabric
(as described above). The building fabric comprises walls, floors and the roof, as well as windows and doors.
To overcome this heat flow, attention should be paid to the insulating qualities of the materials. Moreover,
the amount of heat loss through the building envelope depends on the insulation value of the surface. This
value is presented by the U-value, also described as the rate of heat flow through the material. This value
is measured in W/m2K. The U-value of a building surface is determined by the thickness of the surface and
the thermal conductivity. In addition to the building envelope, much heat is loss through ventilation as
well. The heat loss through ventilation is described as the passage of air through the building. This means
the controllable air movement through openable windows, extractor fans, or a mechanical ventilation
system (The Open University, n.d.).
2.2.3 Building retrofit measures
To improve the energy performance of a building, multiple retrofit measures are available. Ma et al. (2012)
described three main categories of building retrofit technologies: demand side management, supply side
management and energy consumption patterns. These three categories are linked to the concept of the
Trias Energetica: reduce energy demand, apply sustainable energy resources and use fossil fuel effectively,
respectively. Hong et al. (2019) divided these three main categories into five subcategories. These are the
following: building envelope, equipment system, new/renewable technology, energy conserving behaviour
and energy management and control systems. See Table 2 for an overview and corresponding retrofit
measures.

Master thesis - Energy Science Pam Engwirda (5549647)
16
Table 2: General building retrofit measures and classification (Ma et al., 2012; Hong et al., 2019)
Trias Energetica Building Retrofit
Classification
Building Retrofit Measures
Reduce energy demand Building Envelope – Building fabric insulation (i.e., ceiling, wall,
etc.)
– Windows retrofits (i.e., multiple glazing, low-E
coatings, shading systems, etc.)
– Airtightness
– Cool roofs and coatings
– Floor retrofits, etc.
Equipment System – Natural ventilation
– Control upgrade
– Lighting upgrade
– Energy-efficient equipment (HVAC, water
heating, lift, etc.)
– Thermal storage and heat recovery, etc.
Apply sustainable energy
resources
New/Renewable
Technology
– Solar PV/PVT systems
– Solar thermal systems
– Biomass systems
– Electric system retrofits
– Geothermal systems
– Wind power systems, etc.
Use fossil fuel effectively Energy
Management and
Control System
– Management and maintenance (i.e., review
service systems, energy sourcing, utility rate
structure, etc.)
– Access to control (i.e., automatic control
systems, optimization control strategies, etc.)
Energy Conserving
Behaviours
– Occupancy regimes, schedules and activities
– Comfort requirements
– Staff training
– New management scheme
– Monitoring strategies, etc
2.3 Office buildings: requirements and typical energy use
An office building is described as a building, or part of a building, where the use area (in m2) with an office
function is larger than the use area of the individual other building functions in that building. The office
function is therefore the main function and not an ancillary function (RVO 5, n.d.). As described in Section
2.1.1, office buildings will be obligated to energy label requirements in the future. However, in some
circumstances an exception is made, and the energy label requirements do not apply (Christ, 2018; Online
bouwbesluit, n.d.):
- the office building is part of a (larger) building and the total usable area for office functions is less
than 50% of the total usable surface area of that building;
- the total usable area for office functions and ancillary functions in the office building or the
building in which the office building is a part is less than 100 m2;

Master thesis - Energy Science Pam Engwirda (5549647)
17
- an office building that is mentioned in Article 2.2 Energy Performance Buildings Decree.
Examples are:
o an office building that is a national monument;
o an office building that is only used for a maximum of two year
As described in Section 2.1.1, the NZEB requirements will be introduced for new buildings in 2021 by the
Dutch government. The NZEB requirements for new office buildings are shown in Table 3 (RVO 4, n.d.). It
is expected that these requirements will be introduced for existing buildings as well in the future.
Table 3: NZEB requirements office buildings
Energy requirement [kWh / m2.yr]
Primary fossil energy consumption [kWh / m2.yr]
Share of renewable energy [%]
Office building 50 25 50
2.3.1 Energy use office building
To successfully retrofit office buildings, it is useful to know their specific energy use. The spread of energy
use in a typical office building is presented in Figure 5 (Liu et al., 2011). Heating represents the highest
energy consumption in an office building. The second biggest contributor is lighting.
Figure 5: Percent Energy Use by Office Building (Liu et al., 2011)
2.3.2 Retrofit measures suitable for office buildings
This section describes the retrofit measures suitable for office buildings. From the building retrofit
classification described in Section 2.2.3, the category Energy Conserving Behaviour is not suitable to reduce
the energy use of an office building. Since most of the office buildings are rented and can be rented by
other people in the future, the behaviour of occupants can differ per renter. It can therefore not be
assumed that the behaviour will stay the same after being changed to improve the energy performance of
35%
10%
6%
25%
2%
3%
3%
6%
10%
Percent Energy Use by Office Building
Heating
Cooling
Ventilation
Lighting
Water Heating
Refrigeration
Office Equipment
Computers
Other

Master thesis - Energy Science Pam Engwirda (5549647)
18
an office building. In addition, the behaviour of occupants is not part of the energy label calculation (ISSO
75.3, 2011). The energy label can therefore not be improved by changing the behaviour of occupants. The
categories Building Envelope, Equipment System, New/Renewable Technology and Energy Management
and Control System are suitable for retrofitting office buildings and can be included in the energy label
calculation.
Building Envelope
Wall insulation
The insulation of construction parts impacts the energy use of the building as described in Section 2.2.2.
This section describes the different insulation materials for walls. In buildings there are commonly two
types of walls, cavity walls and solid walls (Isolatie-info.nl, n.d.). If a cavity wall is present, the insulation
can be placed within the wall. When this is not the case, the wall can be insulated on the outside of the
building or on the inside. The most used insulation materials and their corresponding U-value are shown
in Table 4 (Isolatie-info.nl, n.d.; Isolatiemateriaal.nl 1, n.d.; Baveco et al., 2015).
Table 4: Wall insulation materials per installation method
Type of wall Installation method Material U-value [W/m2K]
Cavity wall Cavity insulation Glass wool 0.32-0.40
EPS pearls 0.32-0.36
PUR 0.23-0.35
Solid Outside EPS 0.36
XPS 0.34-0.36
Inside PUR 0.22
Glass wool 0.30
Rock wool 0.30
Roof insulation
A roof can be insulated on the inside and on the outside. Outside insulation can be considered, since office
buildings can have flat roofs. The most used roof insulation materials are glass wool, rock wool, PUR and
PIR (Dakdek-gigant.nl, 2020). See Table 5 for the roof insulation materials corresponding to the installation
method (Dakisolatie-advies.nl, n.d.; Isolatie-weetjes, n.d.).
Table 5: Roof insulation per installation method
Installation method Material U-value [W/m2K]
Inside Glass wool 0.32-0.40
Rock wool 0.32-0.40
PUR 0.23-0.35
Outside PIR 0.23-0.26
Floor insulation
For the insulation of the floor, a distinction is made between two types of floors: wood and concrete. The
type of insulation material namely depends on the type of floor. A wooden floor can be insulated from
below, while a concrete floor can also be insulated on top. The most used materials for floor insulation and
their corresponding U-values are shown in Table 6 (Isolatiemateriaal.nl 2, n.d.; Isolatie-info.be 1, n.d.).

Master thesis - Energy Science Pam Engwirda (5549647)
19
Table 6: Floor insulation per installation method
Type of floor Installation method Material U-value [W/m2K]
Wood Below Glass wool 0.22
Rock wool 0.54
Concrete Below EPS 0.36
PIR 0.31
On top EPS 0.36
XPS 0.66
PIR 0.31
PUR 0.26
Windows
The next retrofit measure regards the outside windows of the building. They impact the energy use of the
building by their U-value and the ZTA-value. The ZTA-value is a characteristic of a glazing type and
represents the total amount of solar energy transmitted through the glass. This value lies between 0 and
1. The higher the ZTA-value, the more heat enters (help.vabi.nl, n.d.). There are six types of windows
suitable for office buildings, shown in Table 7.
Table 7: Glazing types and corresponding U- and ZTA-value
Glazing type U-value [W/m2K] ZTA-value [-]
Single clear glass 5.37 0.73
Double glazing 3.20 0.63
HR glass 2.00 0.59
HR + glass 1.52 0.56
HR ++ glass 1.10 0.52
Triple glazing 0.80 0.45
Awning
Awning is a suitable retrofit measure since it can reduce the energy needed for cooling by blocking
incoming solar radiation. The most suitable awning for office buildings are screens. They are weather
resistant, let through the light and can be connected to an energy management system (Zonweringgigant.nl
1., n.d.). Screens can reflect up to 90% of the incoming solar radiation, keeping the building cooler at sunny
days (Zonweringgigant.nl 2, n.d.). Only automatic awning is considered, since this ensures the use of
awning at higher floors.
Equipment system
Heat generators
The ISSO 75.3 (2011) describes multiple heat generators for buildings. The ones suitable for office buildings
are CHP (Cogeneration), electric installation, heat delivery by third parties, direct fired air heater, HR-107
boiler and a heat pump. A heat pump can have different types of heat sources. The four most common are
soil/outside air, heat from return/exhaust air, ground water and surface water (Warmtepompplein.nl,
n.d.). The heat generators impact the energy use of the building through their generation efficiency and
impact the operational CO2 emissions of the building through the fuel needed.
Master thesis - Energy Science Pam Engwirda (5549647)
20
Cold suppliers
The cold suppliers cool down the building on warmer days. The ISSO 75.3 (2011) describes multiple cold
suppliers for buildings. These are all suitable for the cooling of office buildings. They are a compression
cooling machine, absorption cooling machine on heat supply by third parties, absorption cooling machine
on CHP, cold storage and a heat pump in summer operation (in combination with cold storage). The cold
suppliers linked to a heat generator, for example the absorption cooling machine on CHP is linked to the
CHP, can only be installed when the corresponding heat supplier is also installed.
Lighting
The improvement of lighting ranges from conventional to LED lighting. There are three types of lights who
are most used in office buildings according to SPIE. Namely, TL-D, PLC and TL-5 lights. See Figure 6-8 for an
example of these lights.
Figure 6: TL-D light
Figure 7: PLC light
Figure 8: TL-5 light
The conventional lights can be replaced by LED versions. This reduces the energy use, since a conventional
light of a certain wattage can be replaced by a LED light of a lower wattage. In addition, for conventional
lights, the energy use including ballast is higher than the installed wattage because of the energy needed
to start the light. Therefore, the energy use of a conventional light is even higher than the installed power.
This difference is almost 16%, which is based on calculations made by Eleqtron1. The corresponding LED
lights are found on Budgetlight.nl (n.d.). The energy use of a LED light is the same as its power since it does
not need extra power to be turned on. The type of lights and their corresponding LED versions are shown
in Table 10.
Table 8: Lights per W and corresponding LED version
Type of light Power [W] Energy use incl. ballast [W] Power LED [W] Energy use LED [W]
TL-D 18 21 9 9
36 42 18 18
58 68 20 20
PLC 9 11 4.5 4.5
13 15 4.5 4.5
18 21 6.5 6.5
26 30 9.5 9.5
TL-5 14 16 8 8
21 25 12 12
28 33 16 16
42 49 20 20
56 65 26 26
1 Eleqtron is founder of prefabricated, pluggable installations in the Netherlands.

Master thesis - Energy Science Pam Engwirda (5549647)
21
Movement detection lights
The energy use of lights can also be reduced by installing movement detection. The ISSO 75.3 (2011)
considers a 20% reduction in energy use for lighting when adding movement detection.
Ventilators
Ventilators impact the energy use of a building by the temperature of the incoming air from outside and
by losing the heated/cooled air from the inside. The type of supply and extraction is therefore of
importance. There are four types of ventilators; 1) only mechanical drain, 2) only mechanical supply, 3)
mechanical supply and drain without recirculation or heat recovery and 4) mechanical supply and drain
with recirculation or heat recovery (ISSO 75.3, 2013). In addition, flow control can be added to the
ventilation system. This results in a more constant flow of air, resulting is a more constant use of the
ventilator, which reduces its energy use.
New/Renewable Technology
For the renewable technology systems, solar energy systems are most applicable to office buildings. Other
renewable energy systems, like wind or biomass, are used less often since in most cases there is no space
around the office building to realize these solutions. For solar energy systems, there are two types: a solar
collector used for heating and solar panels used to produce electricity. The two most common solar panels
are the ones with amorphous cells and the ones with mono or multi crystalline cells (ISSO 75.3, 2011).
Office buildings most of the time have flat roofs, which results in the possibility to place the solar panels in
the most preferable orientation. The best way to place the solar energy systems is facing south with an
angle of 35°. In practice, in terms of distance, at least 1 panel must fit between each panel, so about 50%
of the surface of the flat roof can be covered with solar energy systems (Zonnepaneelprijzen.nl, n.d.).
Energy Management and Control system
A Building Energy Management System (BEMS) can reduce the energy use of the building by controlling
and monitoring energy-related building service plants and equipment. For example, lightning or heating,
ventilation and air conditioning (HVAC) systems (Sayed & Gabbar, 2018). In addition, Rottondi et al. (2015)
showed that the use of a BEMS can optimize the use of solar energy systems. When adding a BEMS, the
following reductions can be achieved: 39.5% for lightning (provided LED) and for HVAC between 14.1% and
16.7%. In addition, 10% more solar energy can be used when using the BEMS due to flexibility of the energy
use (Lee & Cheng, 2016). A BEMS could also reduce the energy use of the appliances in a building. However,
in the energy label calculation as described in Section 2.1, appliances are not considered. Therefore, the
impact of a BEMS on the energy use of the appliances is not part of this research.
2.4 Available DSS for office buildings
The office building retrofitting market has been growing strongly since the life span of office buildings is
much shorter than residential buildings. Furthermore, occupants’ needs and expectations have increased,
demanding working spaces with improved amenities for comfort, infrastructures and services (Balaras et
al., 2002). Due to these developments, much research has been done in retrofitting one single office
building (Güçyeter & Günaydın, 2012; Wilkinson, 2012; Higgins et al, 2014; Nazi et al., 2017; Hillebrand et
al., 2014). However, only a few DSS have been designed to help determine retrofit measures for office
buildings. According to Nielsen et al. (2016), which combined research of Wang et al (2009), Ferreira et al.
(2013) and Alanne (2004), the ideal retrofit decision process consists of six areas where formal decision-
making methods can contribute in retrofit projects. Namely; Goal Setting, Criteria Weighting, Building

Master thesis - Energy Science Pam Engwirda (5549647)
22
Diagnosis, Design Alternatives Generation, Performance Estimation and Design Alternatives Evaluation.
See Figure 9. These six areas are used to compare the different DSS specified to retrofitting office buildings.
Figure 9: Six areas where formal decision-making methods can contribute in renovation projects (Nielsen et al., 2016)
TOBUS is a DSS specifically made for selecting office building upgrading solutions. The decision-making
process of TOBUS starts with the diagnosis of the general state of the office building (Caccavelli & Gugerli,
2002). It therefore skips the first two steps of the Nielsen et al. (2016) method. Next, retrofitting actions
are proposed to improve the office building condition, the building energy performance and the indoor
environment quality (Caccavelli & Gugerli, 2002). The costs corresponding to these measures is also
calculated. The TOBUS model does not evaluate design alternatives. What distinguishes this DSS from
others, is that it considers the complex installations of an office building (e.g. central heating, air-
conditioning and ventilation, fire protection, low current networks etc.). In addition, the TOBUS model
considers the functional obsolescence of building services, so when an installation is dated and in need for
renovation it is given the priority in the advised measures (Balaras et al., 2002).
The OFFICE project (Roulet et al., 2002) developed global retrofitting strategies, tools and design guidelines
promoting successful and cost-effective implementation of passive solar and energy efficient retrofitting
measures to office buildings. The OFFICE project proposed interventions aiming at 1) improving the
envelope of the building, 2) reducing the energy use of air conditioning, 3) improving lighting conditions
and 4) improving the efficiency of selected building services, like HVAC systems (Santamouris & Dascalaki,
2002). The OFFICE project therefore aims at improving the current conditions. However, it is not possible
to set a predefined goal. The methodology allows to rank buildings or retrofit scenarios according to more
than one criterion. The OFFICE project therefore includes criteria weighting. Design alternative evaluation
is not part of the OFFICE project.
REFLEX developed by Juan et al. (2010) is an integrated DSS for office building retrofits that assesses the
current condition of the office building and provides sustainable renovation implementation solutions for
decision makers. This study recommends an optimal set of sustainable renovation actions, considering
trade-offs between renovation cost, improved building quality, and environmental impacts. The REFLEX
model does not include criteria weighting, but the user can set a budget to the project. Furthermore,
according to Nielsen et al. (2016) this model does not include design alternative evaluation. However, the

Master thesis - Energy Science Pam Engwirda (5549647)
23
model does evaluate the energy performance of the different scenarios and effectiveness of the algorithm
(Juan et al., 2010).
Regarding energy label specific retrofitting of office buildings, in the Netherlands, the RVO (2017) published
an Energy savings explorer. With this tool, insight is given in the possibilities to improve the energy label of
an office building. Investment costs, annual savings in energy use and the Payback Period (PBP) of different
retrofit measures are calculated. Also, the reduction in CO2 emissions is incorporated. However, this model
is very simplified in the building characteristics compared to the other models. Examples of these
simplifications are 1) that the choice can be made between small, medium or large size and 2) no distinction
can be made between area of windows or walls. This model does therefore not contain the building
diagnosis. Furthermore, building owners can determine which measures they want to take. No design
alternatives are generated. The Energy savings explorer does show the impact of the different retrofit
measures on the energy label of the building.
Table 9: Comparison DSS for office building retrofits
Six areas by Nielsen et al. (2016)
Type of DSS Year Authors/ developers
Goal setting
Criteria weighting
Building diagnosis
Design alternatives Generation
Performance estimations of retrofit measures
Design alternative evaluation
Energy labels
TOBUS 2002 Balaras et al.
OFFICE project 2002 Roulet et al.
REFLEX 2010 Juan et al.
Energy savings explorer 2017 RVO
Table 9 gives an overview of the discussed DSS for office buildings and which of the six areas they included.
There is no DSS for office building retrofits available which considers the six areas of retrofitting described
by Nielsen et al. (2016). Moreover, there is no DSS for any type of building available that combines all these
areas (Nielsen et al., 2016). In addition, the calculation of energy labels into a DSS for retrofitting is missing
in most cases. For these reasons and because of the ambition of the Dutch government to reduce the
energy demand in office buildings, there is a high need for a model containing all six steps and energy label
calculations.
2.5 Criteria for retrofitting
To incorporate the preferences of the office building owner, criteria which enable the comparison of the
retrofit measures need to be selected. Lombardi et al. (2017) described a suitable set of criteria for urban
energy retrofitting. These criteria are considered in this research and are presented in Table 10 below.

Master thesis - Energy Science Pam Engwirda (5549647)
24
Table 10: Description of the considered criteria (Lombardi et al., 2017)
Aspect Criteria Description Unit
Economic Investment costs Investment costs related to the installation of a
retrofit technology or adjustment to existing
building envelope
Euro
Payback Period (PBP) Performance measure used to evaluate the
efficiency of an investment
Years
Maintenance costs Running fixed and variable costs due to
maintenance of the retrofit technology
Euro
Environmental Reduction of CO2
emissions
Reduction of the CO2 pollutant emissions %
Technical Reduction of energy
requirement
Percentage of reduction in energy demand of the
office building due to the retrofit measures applied
%

Master thesis - Energy Science Pam Engwirda (5549647)
25
3. Method
This chapter describes the method to answer the research question and to reach the research aim. The
aim was to build a DSS which considers the future mandatory energy labels, following the Dutch Building
Decree of 2012. Figure 10 shows the research design that was applied to achieve this aim. First, a literature
review regarding laws and regulations of the Dutch energy label system was done which followed in the
energy consumption requirements for office buildings (see Section 2.1). The second step consisted of a
literature review concerning the energy use in office buildings (see Section 2.3.1). The third step consisted
of a literature review regarding the available retrofit measures for office buildings in the Netherlands,
including their financial and environmental implications (see Section 2.3.2.). The decision criteria when
retrofitting are determined through literature review in step 4 (see Section 2.5). In step 5, the DSS was
made. In step 6, data of three office buildings was collected to test the DSS. In this chapter, Section 3.1
explains how the DSS works and describes the data used to build it. In addition, the data used to make the
timeline is described. Lastly, Section 3.2 describes the validation of the DSS through a sensitivity analysis,
which is represented as the feedback loop in Figure 10.
Figure 10: Research design

Master thesis - Energy Science Pam Engwirda (5549647)
26
3.1 The operation of the DSS
This section describes how the DSS works and how it should be used (see Figure 11). First, a questionnaire
should be filled in, collecting the input data for the DSS. Section 3.1.1 elaborates upon this questionnaire.
Next, Section 3.1.2 explains how the energy label calculation is done (blue box in Figure 11), presenting the
current situation and the reduction needed in energy use to achieve either energy label C or A. Next, the
retrofit measure impact calculation is done (described in Section 3.1.3). This step consists of determining
the impact of the retrofit measures on the energy use and a Multicriteria Decision Analysis. Section 3.1.4
describes how the DSS determines the optimal set of retrofit measures according to the preferences of the
office building owner. This is done by combining the previous steps, as presented by the grey box in Figure
11. This results in a set of retrofit measures aiming at achieving energy label C or A and the timeline. Section
3.1.5 describes how the timeline is constructed.
Figure 11: Flow diagram operation of DSS
3.1.1 Questionnaire
The questionnaire collects the input data for the DSS. It is divided into four blocks. The first block collects
demographic information, e.g. name of the company, address etc. The second block collects the
construction details of the building, e.g. insulation values, glazing type etc. The third block collects
information about the installations of the building, e.g. heat supplier, ventilator type etc. Lastly, the
preferences of the office building owner are gathered using the questions in the fourth block. These
preferences are based on two questions. The first one asks the office building owner to divide 100 points
over the decision criteria described in Section 2.5. The criterion with the highest preference should get the
most points. In the second question, the office building owner is given the ability to rank the retrofit
measures on importance to be a part of the proposed measures. For example, an office building owner is
planning to renovate the heat supplier, which should therefore be a part of the set of renovation measures
advised. This measure must therefore be included in the ranking. The questionnaire can be found in
Appendix A, including the email that was send to the office building owners. The questionnaire was
validated by SPIE before sending it to the office building owners. To make sure the DSS can be used when
the office building owner does not know the answer to all questions, a database is made of assumptions
related to the year of construction. These can be found in Appendix B.
3.1.2 Energy label calculation
The first thing the DSS determines is the current situation; energy label and energy use of an office building.
The energy label calculation for existing buildings is based on the Energy-Index (EI) as described in Section
2.1. The EI consists of two parts, the allowable energy use of the building and the actual energy use of the
building. The allowable energy use is attributed to the building based on its function of use, area of use,
loss area, ventilation and presence of cooling (Sipma, Kremer & Vroom, 2017). In this research, the ISSO
75.3 (2011) method is used to calculate the EI. This version is widely used in the Dutch building sector,
making it suitable for the DSS. The formulas for the EI and the allowable energy use can be found in
Appendix C. The calculations to determine the actual energy use of the office building are presented in

Master thesis - Energy Science Pam Engwirda (5549647)
27
Appendix D. After inserting these calculations into the DSS, the energy label calculation was validated by
calculating the energy label of a building, which already consisted of an energy label. This building and the
energy label were provided by SPIE. In addition to the energy label calculation, the energy use in kWh per
m2 is calculated. This energy use in kWh/m2 does not include the energy generated by solar energy systems.
This corresponds to the expected new energy use requirements of the Dutch government, as described in
Section 2.1.1.
Next, the reduction in energy use needed to obtain either energy label C or A is calculated. The formula
used in the DSS is Formula 1.
𝑄𝑝𝑟𝑖𝑚;𝑟𝑒𝑑𝑢𝑐𝑡𝑖𝑜𝑛 = 𝑄𝑝𝑟𝑖𝑚;𝑏𝑢𝑖𝑙𝑑𝑖𝑛𝑔;𝑐𝑢𝑟𝑟𝑒𝑛𝑡 − 𝐸𝐼 ∗ 𝑄𝑝𝑟𝑖𝑚;𝑎𝑙𝑙𝑜𝑤 [1]
In which 𝑄𝑝𝑟𝑖𝑚;𝑏𝑢𝑖𝑙𝑑𝑖𝑛𝑔;𝑐𝑢𝑟𝑟𝑒𝑛𝑡 presents the current energy use of the building in GJ, 𝐸𝐼 the energy index
corresponding to energy label C or A and 𝑄𝑝𝑟𝑖𝑚;𝑎𝑙𝑙𝑜𝑤 the allowable energy use of the building. This formula
can also be used to determine the energy reduction needed for any other energy label. As described in
Section 2.2, the energy use of a building partly depends on the weather. The weather data used in this
research is based on the Test Reference Year De Bilt (ISSO 75.3) in the Netherlands. This data is used since
De Bilt is the reference point of the Dutch climate. The weather data used is presented in Appendix E.
3.1.3 Retrofit impact calculation
The retrofit measures suitable for office buildings are described in Section 2.2.3. The characteristics of
these measures – investment and maintenance costs and lifetime – can be found in Appendix F. These
characteristics are based on extensive literature review and in consultation with SPIE. For the characteristic
investment costs, it should be noted that this includes both the costs for installation as the costs of
purchase. This ensures a complete indication of costs for the office building owner. However, the prices
for installation of HVAC systems can differ per installer. Therefore, the assumption was made that the costs
for installation of HVAC systems is 50% of the total costs. So, when the purchase of a heat pump costs
€5,000, then the total investment costs including installation is €10,000. This assumption is based on the
experience of the installers at SPIE. The price data was validated through a check by SPIE. Since they are an
established market player, they were able to tell if the values were logical.
In the DSS, a Multicriteria Decision Analysis (MCDA) is performed to incorporate the preferences of the
office building owner. A MCDA is a tool to structure decision-making processes and to help decision makers
find an optimal balance between conflicting goals (Beinat et al., 1994; Guitouni & Martel, 1998). To find
this optimal balance, a MCDA enables the decision maker to prefer certain criteria over others. In the DSS,
the criteria are the characteristics of the retrofit measures and the decision maker is the office building
owner. The steps of a MCDA are the following (Dodgson et al., 2009): 1) Establish the decision context, 2)
Identify the options to be appraised, 3) Identify criteria, 4) Assign scores, 5) Assign weights, 6) Derive overall
value and 7) Examine the results. Table 11 shows steps 1 until 3 for this research.

Master thesis - Energy Science Pam Engwirda (5549647)
28
Table 11: Steps 1-3 MCDA
Steps Description
1. Decision context Need to retrofit to obtain a better energy label
2. Options to be appraised Retrofit measures
3. Criteria • Investment costs
• Payback Period
• Maintenance costs
• Reduction of CO2 emissions
• Reduction of energy requirement
In step 4 of the MCDA, the scores of the different criteria are calculated as follows. First, the values for the
different criteria per retrofit measure are determined. For Investment costs and Maintenance costs, these
values are shown in Appendix F. The Payback Period (PBP) is determined with Formula 2 (Blok, 2006):
𝑃𝐵𝑃 = 𝐼
𝐵 − 𝐶 [2]
Where 𝐼 represents the initial investment [€], 𝐵 the annual benefits [€] and 𝐶 the annual cost [€]. The initial
investment are the investment costs. The annual costs are the maintenance costs. The annual benefit is
the energy use reduction due to the retrofit measure. To translate this reduction in energy use to monetary
terms, the price of gas and electricity in the Netherlands in 2019 were considered. The price for gas for
large office buildings in 2019 was 51.99 cents/m3. For electricity this was 12.72 cents/kWh (RVO 6, n.d.).
When the PBP is infinite, meaning that the measure will never pay back itself, the term infinite is given.
The Reduction of the CO2 emissions due to retrofitting is related to the reduction in operational CO2
emissions. This is calculated using the CO2 emission factors of the Dutch electricity and gas grid. The
emission factors are shown in Table 12 (Milieubarometer, n.d.). The year 2019 is taken as the reference
year. Since the DSS calculates all energy related values in MJ, the following conversion numbers are used
to translate the MJ to the corresponding unit of the fuel type: the calorific value of natural gas (=35.17
MJ/m3) and the primary energy content of electricity (=3.6/ƞel MJ/kWh).
Table 12: Emission factors 2019 (The Netherlands)
Fuel Unit kg CO2/unit
Gas m3 gas 1.89
Electricity kWh 0.649
Heat GJ 36.0
The Reduction of energy requirement per retrofit measures differs per office building. For example, an
office building with more windows can reduce its energy use more with installing a better type of glass
than an office building with fewer windows. To ensure that the impact per office building can differ, the
reduction of energy use per retrofit measure is inserted in the DSS as a formula and not as a given number.
One parameter in changed in the energy label calculation, for example the U-value of glass, and the energy
use of the building is calculated again. The difference in energy use between the real situation and the
situation with the changed parameter is the energy reduction that can be achieved from this retrofit
measure.

Master thesis - Energy Science Pam Engwirda (5549647)
29
As described in Table 10 in Section 2.5, the criteria for retrofitting have different units. To fairly compare
the different criteria, the scores are standardized using a maximum standardization. This means that each
score is translated to a value between 0 and 1. To do so, each score at a certain criterion is recalculated as
(X - min X)/(max X - min X), where X represents the score of the criterion in the original data set. This
method allows scores to have differing means and standard deviations but equal ranges. In this case, there
is at least one observed value at the 0 and 1 endpoints (Biomedware, n.d.). For the criterion PBP, the max
X is set at 10 years since this is considered a reasonable PBP. All values longer than 10 years get the score
of 0. Next, the weights are set by the preferences of the office building owner in step 5 of the MCDA. These
weights are collected through the questionnaire, as described in Section 3.1.1. These are scaled between
0 and 1. The sum of the weights of all criteria should add up to 1. The weight times the standardized score
determines the overall value of the retrofit measure, step 6. The higher the overall value, the higher the
change that this retrofit measure is selected in the proposed set of retrofit measures.
3.1.4 Selection of the optimal set of retrofit measures
Determining which retrofit measures should be selected in order to achieve energy label C or A, can be
described as a binary ‘knapsack problem’ (Alanne, 2004). The binary knapsack problem is a problem in
combinatorial optimization: given a set of items (in this case the retrofit measures), each with a weight and
a value, it determines which item should be included in a collection so that the total value is as large as
possible (Shahpasand & Golpayegani, 2014). The Excel Solver was used to solve this problem, because of
its ability to find optimal solutions in decision problems. The binary knapsack problem as used in this
research is mathematically described as follows.
- Decision variables (the considered retrofit measures) 𝑎1, 𝑎2, … 𝑎𝑛
- 𝑎𝑖 is a binary value, if retrofit measure 𝑎𝑖 is proposed 𝑎𝑖 = 1, else 𝑎𝑖 = 0
The objective function is to maximise the sum of overall values:
𝑀𝐴𝑋 ∑ 𝑎𝑖 ∗ (𝑆𝑖 + 𝑃𝑖)
𝑛
𝑖=1
[3]
Where 𝑆𝑖 is the overall value achieved by selecting the retrofit measure 𝑎𝑖 and 𝑃𝑖 describes the points
following from the ranking. The index number 𝑖 relates to the different retrofit measures. The overall value
for an arbitrary retrofit action is then:
𝑆𝑖 = 𝑤1𝑠1,𝑖 + 𝑤2𝑠2,𝑖 + ⋯ + 𝑤𝑛𝑠𝑛,𝑖 [4]
Where 𝑤𝑛 is the weight set by the office building owner (between 0 and 1) for criterion n and 𝑠𝑛,𝑖 is the
standardized score number for the retrofit measure 𝑖 in respect to the score value for criterion n. To
incorporate the ranking of the retrofit measures, points are added to the overall value of the retrofit
measure. The retrofit measures are characterized in the following 7 types: glazing, insulation, heat supplier,
cold supplier, ventilators, lightning and solar energy systems. These types can be ranked in order of
preference. When only one retrofit measure is highlighted in the ranking list, the overall value for this
retrofit measure is increased with 7 points. When two retrofit measures are listed, the first one gets 7/3*2=
4.67 points and the second 7/3*1=2.33 points. When three retrofit measures are listed, the first one gets
7/6*3=3.5 points, the second 7/6*2=2.33 points and the last 7/6*1=1.17 points. The formula used to divide
these points is Formula 5. In which 𝑃𝑖 represents the points for retrofit measure 𝑖, 𝑦 is the number of
retrofit measures listed and 𝑝𝑙𝑎𝑐𝑒 the place in the ranking.

Master thesis - Energy Science Pam Engwirda (5549647)
30
𝑃𝑖 =7
𝑦(𝑦 + 1)2⁄
∗ (𝑦 + 1 − 𝑝𝑙𝑎𝑐𝑒) [5]
The aim of this DSS is to maximise the highest sum of overall values in combination with obtaining the
required energy label. This latter is inserted as a constraint. Namely, the new energy use of the office
building should be equal or lower than the energy use required to obtain either energy label C or A.
Therefore, one of the two formulas below apply:
𝐸𝑢𝑠𝑒,𝑛𝑒𝑤 ≤ 𝐸𝐶 [6]
𝐸𝑢𝑠𝑒,𝑛𝑒𝑤 ≤ 𝐸𝐴 [7]
In which 𝐸𝑢𝑠𝑒,𝑛𝑒𝑤 represents the energy use after retrofitting in MJ. 𝐸𝐶 represents the maximum energy
use to obtain energy label C in MJ. The maximum energy use to obtain energy label A in MJ is presented
by 𝐸𝐴. Since this model is based on a linear problem, the interaction between the retrofit measures is not
considered. As described in Section 3.1.3, the impact of a retrofit measure on the energy use of the building
is calculated by changing one variable in the energy label calculation. The result therefore does not show
the mutual impact of different retrofit measures on their energy use reduction capabilities. For example,
imagine improving the insulation value of the walls. Less energy is needed to heat the building. Therefore,
the energy reduction that can be achieved by replacing the heat supplier decreases. In a linear model, this
counter interaction cannot be considered. To make sure that the energy use of the building cannot reduce
below zero, which technically isn’t possible, the following constraint is added.
𝐸𝑟𝑒𝑑 ≤ 𝐸𝑢𝑠𝑒,𝑐𝑢𝑟𝑟𝑒𝑛𝑡 [8]
In which 𝐸𝑟𝑒𝑑 represents the energy reduction achieved by the proposed retrofit measures in MJ and
𝐸𝑢𝑠𝑒,𝑐𝑢𝑟𝑟𝑒𝑛𝑡 represents the current energy use before retrofitting in MJ.
This problem also consists of other constraints. For several retrofit measures, only one type can be
selected. For example, usually only one glazing type is selected when retrofitting. Therefore, the sum of 𝑎𝑖
representing glazing types should be 0 or 1. This is expressed by the constraint equation 9. This constraint
also applies to floor, roof and wall insulation, solar energy systems, ventilators, cold suppliers and heat
suppliers.
∑ 𝑎𝑖 ≤ 1
𝑔𝑙𝑎𝑧𝑖𝑛𝑔 𝑡𝑦𝑝𝑒𝑠
𝑖=1
[9]
For floor and wall insulation, only the insulation material types corresponding to the right type of floor and
wall can be installed. So, when a cavity wall is present, the cavity wall insulation materials can be selected
as well. In addition, the DSS is given the ability to select the option “No change” for energy type of retrofit
measure. This corresponds to doing nothing for that construction part or installation in the building. The
score for this option is calculated considering no investment and maintenance costs, a payback period of
0, and no energy or CO2 emission reduction. Lastly, a budget constraint is added.
∑ 𝑎𝑖𝐶𝑖 ≤ 𝐶𝑀𝐴𝑋
𝑛
𝑖=1
[10]
Where 𝐶𝑖 represents the investment costs of retrofit measure 𝑎𝑖 and 𝐶𝑀𝐴𝑋 is the budget of the office
building owner.

Master thesis - Energy Science Pam Engwirda (5549647)
31
3.1.5 Construction of timeline
After the DSS selected the optimal set of retrofit measures for an office building, the timeline
corresponding to the time needed to realise this set of measures was made. The total process of the
preparation of a tender to the completion of the project is considered. Regarding the installation time of
the retrofit measures, these include both the demolition of the current construction parts as the
installation of the new construction parts. The durations are based on the experience of SPIE and are
presented in Table 13. When a calculation is made to come to the duration of a specific part in the process,
this is explained in the third column in Table 13. In addition, the assumption is made that a working day
consists of 8 hours and a year consists of 180 working days (Vereniging Eigen Huis, n.d.). Lastly, the
assumption is made that on average 10 people (supervisors/planners/installers) are working on the
retrofits per day (based on experience of SPIE).
Table 13: Time per part of retrofitting process
Part Time Explanation
Quotation 0.02 minute per euro of total investment
The costs to prepare a quotation are set at 2% for the total investment costs. The labour costs of a supervisor are around €60 per hour, €1 per minute. Taking 2% of the labour costs, results in 0.02 minute per euro quotation.
Preparation and planning
0.10 minute per euro of total investment
The costs for the preparation and planning is 7% of total investment costs. The labour costs of a planner are around €40 per hour, €0.67 per minute. Taking 7% of the labour costs, results in 0.10 minute per euro.
Retrofit measures
Insulation 60 min/m2 wall/roof/floor
Experience of SPIE
Windows 60 min/m2 window Experience of SPIE
Heat supplier Demolish: 10 min/m2 Install: 20 min/m2
Based on brochure by Arcadis (2016).
Cold supplier Demolish: 10 min/m2 Install: 20 min/m2
Based on brochure by Arcadis (2016).
Ventilators 600 min Experience of SPIE
Lighting Demolish: 15 min/light Install: 36 min/light
Experience of SPIE
Solar energy systems
0.4 min per Watt/peak Experience of SPIE
BEMS 0.6 min/m2 Experience of SPIE
Completion of the project
0.05 minute per euro of total investment
The costs for the completion of the project is 5% of total investment costs. The labour costs of a project leader are around €60 per hour, €1 per minute. Taking 5% of the labour costs, results in 0.05 minute per euro.
3.2 Sensitivity analysis
A sensitivity analysis is conducted to validate the results and the operation of the DSS. The characteristics
of one office building, equal distribution of weights per criterion and no ranking is set as the base scenario.
The impact of changes in input data on this base scenario is reviewed in this sensitivity analysis. The
assumptions regarding the price developments of gas and electricity and the CO2 emission factor of the
electricity grid are changed 10% up and down, since these values might change in the future, due to for
example more renewables in the electricity mix. Also, the investment costs of the retrofit measures, the
weights set by the office building owner and the ranking of the different retrofit measures are changed to

Master thesis - Energy Science Pam Engwirda (5549647)
32
see their impact on the results. The investment costs are changed with 20%. This range is larger compared
to the other assumptions, since these values are most uncertain. In addition, it is expected that the
investment costs could change in the future due to innovation. Changing this price data can give an idea of
what this could do to the proposed sets of retrofit measures. Regarding the weights for the criteria, each
criterion is given the preference once by setting its weight on 0.5 and the others on 0.125 each. Lastly, each
type of retrofit measure is ranked once by assigning 7 points to this measure. These two types of input
data are changed to see the impact of the preferences of the office building owner on the proposed set of
retrofit measures. See Table 14 for an overview of the sensitivity limits.
Table 14: Limits sensitivity analysis
Assumption Lower limit Higher limit
Gas price -10% +10%
Electricity price -10% +10%
CO2 emission factors -10% +10%
Investment costs retrofit measures -20% +20%
Preferred criterion Others
Weights determined by the owner 0.5 0.125
Ranked measure Others
Ranking 7 0

Master thesis - Energy Science Pam Engwirda (5549647)
33
4. Operation of the DSS
This chapter describes the operation of the DSS using screenshots of the Excel model. First, where the
building characteristics need to be inserted is explained in Section 4.1. Next, Section 4.2 describes how the
energy reduction needed to obtain either energy label C or A is determined. Furthermore, the Excel Solver
set up and how the generated scores for the different retrofit measures per criterion are presented is
described in Section 4.3. This includes an example on how the DSS selects the proposed set of retrofit
measures. Lastly, Section 4.4 describes how the DSS presents the results.
4.1 Input data
First, the green fields of the questionnaire should be filled in at the tap “Questionnaire”. This list of values
corresponds to the questionnaire presented in Appendix A. It includes information divided in four
categories: demographic information, construction details of the building, installations of the building and
the preferences of the office building owner. Figure 12 shows a screenshot of the “Questionnaire” tap of
the DSS. By filling in these values, the current energy label is calculated and presented in the tab “Advice”.
Figure 12: DSS Questionnaire tab

Master thesis - Energy Science Pam Engwirda (5549647)
34
After filling in the necessary input data in the “Questionnaire”, the scores for the MCDA and ranking are
added in the tab “Solver calculation”. These scores represent the preferences of the office building owner.
Figure 13 shows a screenshot of the corresponding tables. The user should insert its preferences regarding
the MCDA criteria and the ranking in the green cells.
Figure 13: DSS MCDA and ranking tables
4.1 Energy use reduction estimation
The reduction needed in energy use of the office building to obtain either energy label C or A is determined
next. Formula 1, as described in Section 3.1.2, is used to calculate the needed reduction in energy use. The
cell showing the EI value (green cell) should be set to the EI value corresponding to the energy label aimed
for. For energy label C, this must be 1.3 and for energy label A 1.05. The cell marked red than shows the
reduction in energy use needed (negative sign means reduction).
Figure 14: DSS Goal seek table
4.1 Optimisation process
To find the optimal set of retrofit measures, the values for the different criteria per retrofit measure are
gathered. See Figure 15, columns E until I. These values are copied from other sheets and do not have to
be inserted by the user. These values are used to calculate the scores for the different criteria, see Figure
16 columns N until R. Column S shows the overall score including the weights set by the office building
owner. Column T shows the overall score including the priority points set by the owner.
Figure 15: DSS Values per criterion per type of glazing

Master thesis - Energy Science Pam Engwirda (5549647)
35
Figure 16: DSS Scores per criterion per type of glazing
In order to exemplify how the optimization process works, an example of glazing renovation is shown.
However, the DSS contains different options for insulation, solar energy systems, lighting, ventilation, cold
suppliers, heat suppliers and BEMS. In the first column, the different options for glazing are presented
including the option “No change”. The green column in Figure 15 represents the yes/no decision, which is
determined by the Excel Solver using the Knapsack model as described in Section 3.1.4. As can be seen, the
triple glazing is given the number 1. As described in Section 3.1.4, this means that this measure is selected.
This selection is based on the scores for the different criteria of the MCDA. Figure 16 shows that the retrofit
measure triple glazing got the highest overall score including priority. This measure was therefore selected
by the Excel Solver. For all types of retrofit measures, these scores are calculated, and the Excel Solver
determines which is best to select. It is possible that the Excel Solver doesn’t pick the highest score for a
certain retrofit measure, since it must comply with the constraints of reaching the energy reduction
corresponding to the required energy label. For example, when an office building owner assigns all the
weights to the criterion Investment costs, the option of no change always gets the hights score. However,
when the building does not have the right energy label yet, some retrofit measures with a lower score
should be selected.
4.2 Results DSS
The Excel Solver generates the optimal set of retrofit measures, corresponding to the preferences of the
office building owner and the energy label target. The “results” screen is shown in Figures 17 and 18. The
first table in Figure 18 shows the “New situation”, which is the state of the building after applying the
proposed retrofit measures. The energy use in MJ and kWh/m2 is presented, as well as the EI and
corresponding energy label. The second table in Figure 18 presents the proposed retrofit measures by the
Excel Solver. The name of the retrofit measure is shown, including the values for the different criteria. The
last row represents the totals. The value 1000 in the PBP column corresponds to an infinite PBP.

Master thesis - Energy Science Pam Engwirda (5549647)
36
Figure 17: DSS Results new situation and proposed measures
Table 18 represents the times needed to realize certain parts of the retrofit process. In the second column,
the times as described in Section 3.1.5 are presented. In the column “This project”, the times per part
considering the proposed measures by the DSS are presented. The last two rows represent the time total
in days and in years.
Figure 18: DSS Results installation times

Master thesis - Energy Science Pam Engwirda (5549647)
37
5. Results
This chapter describes the results from the DSS for three office buildings and the sensitivity analysis.
Section 5.1 describes the results for Norit Amersfoort, a client of SPIE who is (at the time of writing this
thesis) in the process of retrofitting its building. Section 5.2 describes the results for the Utrecht University
Freudenthal building, this building will be undergoing several scheduled maintenance activities at the end
of 2020 or in the beginning of 2021. Section 5.3 shows the results for the SPIE Utrecht office building, a
new office building of SPIE which needs a retrofit. First, the office building is described, followed by the
current energy label. Next, the measures proposed by the DSS to either reach energy label C or A are
presented. The timeline shows whether the measures can be achieved on time. Lastly, Section 5.4 presents
the sensitivity analysis to validate the results and test the robustness of the DSS.
5.1 Norit Amersfoort
Norit Amersfoort is a client of SPIE, who wants to retrofit its office building. At the time of writing this
thesis, SPIE was in negotiations about the retrofit measures suitable for this building. The office building
was built in 1960 and currently not in use. The office building owner therefore wants everything to be
updated. This shows in the priority points (see Table 16), since every type of retrofit measure is included
in the ranking. In addition, the weights for the criteria in Table 15 show that the office building owner
doesn’t find the costs and PBP relevant, which shows that the office building owner is willing to pay more
when it reduces the energy use of the building even more. The filled in questionnaire can be found in
Appendix G.
Table 15: Weights Norit Amersfoort
Criteria Weights office owner
Lowest investment costs 0
Fastest Payback Period in years 0
Lowest maintenance costs 0
Reduction of CO2 emissions 20
Reduction of energy requirement 80
Table 16: Priority points Norit Amersfoort
Priority Points office owner
Insulation 1.75
Windows 1.5
Heat supplier 1.25
Cold supplier 0.5
Ventilators 0.25
Lighting 0.75
Solar energy systems 1
Current situation
The current energy label of this building is G, with an energy index of 2.02. This energy index is based on
the energy consumption allowed, which is 904 GJ per year for this building according to the calculations of
the ISSO 75.3. The total operational CO2 emissions related to the energy use of the building are 95 ton per
year. The results can be found in Table 17.

Master thesis - Energy Science Pam Engwirda (5549647)
38
Table 17: Current situation Norit Amersfoort
Current situation
Energy label G
EI 2.02
Energy use per year
Building 1,822 GJ 191 kWh/m2
Allowed 904 GJ
CO2 emissions
Total 95 tonne
Energy label C
To reach energy label C, the building should reduce its yearly energy use by 643 GJ. The proposed measures
when aiming at an energy label C are described in Table 18.
Table 18: Measures energy label C Norit Amersfoort
Measures Investment costs Payback period (years)
Maintenance costs (per year)
Energy reduction (GJ)
Reduction in CO2 (tonne)
Glazing Triple glazing € 34,170 19.00 € - 122 6
Awning Remaining windows (automatic)
€ 83,214 infinite € 804 8 0.4
Floor insul. PIR (below) € 71,523 14.5 € - 333 16.8
Roof insul. PUR € 85,500 17.3 € - 334 16.9
Wall insul. Glass wool € 49,245 10.0 € - 333 16.9
Solar energy sys.
Mono cristalline € 367,045 0.0 € 3,325 537 32.9
Lighting Replace lights with LED
€ 28,748 7.5 € - 108 6.6
Movement detection
No change € - 0.0 € - 0 0
Ventilation Mechanical supply and drain with recirculation or heat recovery
€ 116,556 60.6 € 115 58 3.5
Heat supplier
Heat delivery by third parties
€ 42,384 6.2 € - 463 23.5
Cold supplier
Cold storage € 1,189,673 infinite € 47,424 5 0.3
Flow control
No change € - 0.0 € - 0 0
BEMS BEMS € 251,655 143.2 € - 50 2.8
€ 2,319,713 infinite € 51,668 2,351 126.9
With the retrofit measures advised in Table 18, the new yearly energy use of the building will be -537 GJ.
The energy use has become negative since the proposed measures reduce the energy use until zero and
the addition of solar panels who generate electricity pushes that energy use below zero. It should be noted
that the building is still using energy for its heating and cooling demand. The energy use following from the
model is zero, since the DSS uses a linear model as described in Section 3.1.4. This means that the impact

Master thesis - Energy Science Pam Engwirda (5549647)
39
of certain measures on the energy reduction of other measures is not included. For example, when
insulating the walls which results in an energy reduction, the impact of placing triple glazing is lower than
when only doing that measure. This causes the energy use to be able to drop to zero. In this case, the
energy index will be equal to 0 which corresponds to an energy label A. So, when aiming for energy label
C, the most suitable set results in an energy label A. The energy use per m2 comes at 0.0 kWh. However,
when aiming for an energy label C, a combination between solar panels and replacing lights with LED is
enough to reduce the energy use by 643 GJ. What stands out in Table 18, is that replacing the lights with
LED reduces more CO2 emissions than the measure triple glazing, while triple glazing reduces more energy.
This can be explained by the fact that the conversion factor from MJ electricity to CO2 emissions is larger
than that of MJ gas to CO2 emissions. Since the triple glazing impacts the heat demand, and the current
heating installation uses gas, the emission factor of gas is used here.
Energy label A
Considering the preferences of the office building owner, the set of retrofit measures aiming for energy
label C resulted in an energy label A. Therefore, the same measures can be advised when aiming for energy
label A. However, the proposed measures reduce the energy use more than needed to obtain energy label
A. An energy reduction of 873 GJ compared to the current situation is needed to obtain energy label A.
Therefore, the combination of solar panels and heat delivery by third parties or insulating the whole
building is enough to reach energy label A.
Timeline
Figure 19 shows the timeline for the proposed set of retrofit measures presented in Table 18. The time
needed to realize these retrofit measures, is 191 days. This corresponds to 1 year and 1 months. The
lifetime of the different retrofit measures is 15 years or longer (see Appendix F). When realizing the retrofit
measures today, their lifetime will not have to be extended before 2030, the target year of energy label A.
Therefore, all measures could be realized today to reach both energy label targets.
Figure 19: Timeline retrofits Norit Amersfoort
5.2 Freudenthal UU
The Freudenthal building is an office building from the Utrecht University (UU). It was built in 1970 and it
has not been renovated since. The filled in questionnaire can be found in Appendix H. The box about the
preferences of the office building owner is filled in by two people, one financial manager and one technical
maintenance manager. Their weights are presented in Table 19. They both give the most preference to the
lowest maintenance costs. This can be explained by the inconvenience of doing maintenance activities in
a building which is constant in use for education. However, the distribution of the weights differs between
the two managers. Regarding the ranking, the technical maintenance manager is more focused on the

Master thesis - Energy Science Pam Engwirda (5549647)
40
installations, while the financial manager also includes the structure of the building. The priority points are
given in Table 20.
Table 19: Weights criteria Freudenthal UU
Criteria Weights financial manager Weights technical maintenance manager
Lowest investment costs 20 0
Fastest Payback Period in years 0 30
Lowest maintenance costs 50 40
Reduction of CO2 emissions 10 20
Reduction of energy requirement 20 10
Table 20: Priority points Freudenthal UU
Priority Points financial manager Points technical maintenance manager
Insulation 1.17 0
Windows 1.17 0
Heat supplier 2.3 2.8
Cold supplier 2.3 1.4
Ventilators 0 0
Lighting 0 2.1
Solar energy systems 0 0.7
Current situation
The current energy label of this building is E, with an energy index of 1.53. This energy index is based on
the energy consumption allowed, which is 1,407 GJ per year for this building according to the calculations
of the ISSO 75.3. The total operational CO2 emissions related to the energy use of the building are 164 ton
per year. The results can be found in Table 21.
Table 21: Current situation Freudenthal UU
Current situation
Energy label E
EI 1.53
Energy use per year
Building 2,151 GJ 130 kWh/m2
Allowed 1,407 GJ
CO2 emissions
Total 164 tonne
Energy label C
To reach energy label C, the building should reduce its yearly energy use by 326 GJ. The proposed measures
when aiming at an energy label C with the preference of the financial manager are described in Table 22.

Master thesis - Energy Science Pam Engwirda (5549647)
41
Table 22: Measures energy label C Freudenthal (financial manager)
Measures Investment costs Payback period (years)
Maintenance costs (per year)
Energy reduction (GJ)
CO2 emission reduction (tonne)
Glazing Triple glazing € 218,960 64.5 € - 230 11.6
Awning No change € - 0.0 € - 0 0
Floor insul. Glass wool € 11,823 19.1 € - 42 2.1
Roof insul. Glass wool € 15,483 25.6 € - 41 2.1
Wall insul. Glass wool € 22,540 37.3 € - 41 2.1
Solar energy sys.
Mono crystalline € 108,955 0.1 € 987 159 9.8
Lighting Replace lights with LED
€ 55,854 7.1 € - 223 13.7
Movement detection
Add movement detection
€ 44,269 50.5 € - 25 1.5
Ventilation Mechanical supply and drain with recirculation or heat recovery
€ 201,432 27.7 € 115 209 12.8
Heat supplier
Heat pump: Heat from return / exhaust air - Gas
€ 250,600 26.0 € 150 661 33.5
Cold supplier
Cold storage € 1,869,083 Infinite € 74,507 28 1.7
Flow control
Flow control € 13,734 5.0 € - 77 12.1
BEMS No change € - 0.0 € - 0 0
€ 2,716,942 Infinite € 75,759 1,736 103.0
After completing the retrofit measures advised in Table 22, the new yearly energy use of the building will
be 415 GJ. The energy index will be equal to 0.29 which corresponds to an energy label A. So, when aiming
for energy label C, the most suitable set results in an energy label A. The energy use per m2 comes at 34.8
kWh. When only aiming for an energy label C, replacing the heat supplier is enough. Or a combination of
placing solar panels and replacing the lights with LED. What stands out in Table 22 is the high investment
costs, maintenance costs and therefore the infinite PBP of the cold storage. The financial manager ranked
the cold supplier at the first place in the ranking, which resulted the inclusion of this measure in the
proposed set. However, without the cold storage, energy label C can be reached as well. When removing
the cold storage from the set of proposed measures, the PBP becomes 64.5 years (based on the measure
triple glazing).
The results considering the preferences of the technical maintenance manager are shown in Table 23.

Master thesis - Energy Science Pam Engwirda (5549647)
42
Table 23: Measures energy label C Freudenthal (technical maintenance manager)
Measures Investment costs Payback period (years)
Maintenance costs (per year)
Energy reduction (GJ)
CO2 emission reduction (tonne)
Glazing No change € - 0.0 € - 0 0
Awning No change € - 0.0 € - 0 0
Floor insul. No change € - 0.0 € - 0 0
Roof insul. No change € - 0.0 € - 0 0
Wall insul. No change € - 0.0 € - 0 0
Solar energy sys.
Mono crystalline € 108,955 0.1 € 987 159 9.8
Lighting Replace lights with LED
€ 55,854 7.1 € - 223 13.7
Movement detection
Add movement detection
€ 44,269 50.5 € - 25 1.5
Ventilation No change € - 0.0 € - 0 0
Heat supplier
Heat pump: Heat from return / exhaust air - Gas
€ 250,600 26.0 € 150 661 33.5
Cold supplier
Cold storage € 1,869,083 Infinite € 74,507 28 1.7
Flow control
No change € - 0.0 € - 0 0
BEMS No change € - 0.0 € - 0 0
€ 2,328,760 Infinite € 75,758.95 1,096 60.1
After completing the retrofit measures advised in Table 23, the new yearly energy use of the building will
be 1,054 GJ. The energy index will be equal to 0.75 which corresponds to an energy label A. So, when
aiming for energy label C, the most suitable set results in an energy label A. The energy use per m2 comes
at 73.7 kWh. Again, when only aiming for an energy label C, replacing the heat supplier is enough. Or a
combination of installing solar panels and replacing the lights with LED. The proposed set of measures
considering the preferences of the technical maintenance manager is very different from the set
considering the preferences of the financial manager. The main difference is the selection of insulation
measures. The technical maintenance manager did not include insulation in their ranking, which resulted
in selecting “No change” for these measures. What both proposed sets of retrofit measures included but
was not included in both rankings by the different managers, were the replacing of lights with LED and the
installation of solar panels. These measures are therefore suitable regardless of the preference of the
owner.
Energy label A
For the preferences of both the financial manager and the technical maintenance manager, the proposed
set of retrofit measures aiming for energy label C resulted in an energy label A. Therefore, the same
measures can be advised when aiming for energy label A. However, only a reduction of 583 GJ is needed
to obtain energy label A. This can be achieved by installing the heat pump or a combination of solar panels,
LED lights and triple glazing.

Master thesis - Energy Science Pam Engwirda (5549647)
43
Timeline
Figure 20 shows the timeline for the two different set of retrofit measures, as presented in Tables 22 and
23. The installation time corresponding to the proposed set of retrofit measures considering the
preferences of the financial manager, is 212 days (1 year and 2 months). The time needed to realize the
retrofit measures considering the preferences of the technical maintenance manager is 148 days (10
months). The lifetime of the heat pump proposed in both sets is 10-15 years. Since the energy label A target
year is in 10 years, it could be preferable to realize this measure in a few years, to ensure that it is still
active when reaching 2030. The lifetime of the other retrofit measures in both sets is 15 years or longer
(see Appendix F). When realizing the retrofit measures today, their lifetime will not have to be extended
before 2030, the target year of energy label A. It could therefore be preferable to use these measures to
reach energy label C, and install the heat pump when reaching the target year for energy label A.
Figure 20: Timeline retrofits UU Freudenthal
5.3 Office SPIE
The SPIE office building is a new property of SPIE in Utrecht. The office building is still empty and that is
why SPIE is considering retrofitting before the employees are moving into this building. The preferences
are set by the facility manager of SPIE. The weights and priority points are presented in Tables 24 and 25,
respectively. Most preference is given to low investment costs. However, the facility manager aims at
improving all components of the building. Therefore, the focus will lie on the cheapest retrofit measure
resulting in an energy reduction rather than changing nothing. The filled in questionnaire can be found in
Appendix I.
Table 24: Weights criteria Office SPIE
Criteria Weights office owner
Lowest investment costs 30
Fastest Payback Period in years 20
Lowest maintenance costs 20
Reduction of CO2 emissions 10
Reduction of energy requirement 20

Master thesis - Energy Science Pam Engwirda (5549647)
44
Table 25: Priority points Office SPIE
Priority Points office owner
Insulation 0.25
Windows 1.75
Heat supplier 0.75
Cold supplier 1
Ventilators 0.5
Lighting 1.5
Solar energy systems 1.25
Current situation
The current energy label of this building is D, with an energy index of 1.32. This energy index is based on
the energy consumption allowed, which is 1,422 GJ per year for this building according to the calculations
of the ISSO 75.3. The total operational CO2 emissions related to the energy use of the building are 101 ton
per year. The results can be found in Table 26.
Table 26: Current situation Office SPIE
Current situation
Energy label D
EI 1.32
Energy use per year
Building 1,877 GJ 119 kWh/m2
Allowed 1,422 GJ
CO2 emissions
Total 101 tonne
Energy label C
To reach energy label C, the building should reduce its yearly energy use by 27 GJ. The proposed measures
when aiming at an energy label C are described in Table 27.

Master thesis - Energy Science Pam Engwirda (5549647)
45
Table 27: Measures energy label C Office SPIE
Measures Investment costs Payback period (years)
Maintenance costs (per year)
Energy reduction (GJ)
Reduction in CO2 (tonne)
Glazing HR ++ glass € 63,180 13.89 € - 129 7.9
Awning No change € - 0.0 € - 0 0
Floor insul. Glass wool € 61,635 36.5 € - 48 2.9
Roof insul. PIR € 32,760 22.6 € - 41 2.5
Wall insul. PUR € 36,713 36.2 € - 29 1.8
Solar energy sys.
Mono crystalline € 121,705 0.1 € 1,103 178 10.9
Lighting Replace lights with LED
€ 4,508 0.8 € - 154 9.4
Movement detection
No change € - 0.0 € - 0 0
Ventilation Mechanical supply and drain with recirculation or heat recovery
€ 192,588 17.9 € 115 307 18.9
Heat supplier
Heat delivery by third parties
€ 70,032 4.4 € - 447 27.4
Cold supplier
Cold storage € 1,659,375 Infinite € 66,147 24 1.5
Flow control Flow control € 13,131 5.0 € - 74 11.6
BEMS No change € - 0.0 € - 0 0
€ 2,255,627 Infinite € 67,365 1,431 94.8
With the retrofit measures advised in Table 27, the new yearly energy use of the building will be 446 GJ.
The energy index will be equal to 0.31 which corresponds to an energy label A. So, when aiming for energy
label C, the most suitable set results in an energy label A. The energy use per m2 comes at 39.6 kWh. To
only reach energy label C, insulating the walls, roof or floor is enough. What stands out in Table 27 is again
the high investment and maintenance costs and infinite PBP of the cold storage. The same explanation
applies as for the other buildings that the inclusion of the cold supplier into the ranking resulted in the
addition of the cold storage is the set of proposed measures. Again, this measure isn’t needed to achieve
energy label C. Without the cold storage, the PBP of the proposed set of retrofit measures becomes 36.5
years (based on the floor insulation measure).
Energy label A
Considering the preferences of the office building owner, the proposed set of retrofit measures aiming for
energy label C resulted in an energy label A. Therefore, the same measures can be advised when aiming
for energy label A. However, to reach energy label A, a reduction of 383 GJ in energy use is enough. This
corresponds to the change in heat supplier.
Timeline
Figure 21 shows the timeline for the realization of the proposed retrofit measures. The installation time
corresponding to the proposed set of measures presented in Table 27, is 209 days. This corresponds to 1
year and 2 months. The lifetime of the different retrofit measures is 15 years or longer (see Appendix F).
When realizing the retrofit measures today, their lifetime will not have to be extended before 2030, the

Master thesis - Energy Science Pam Engwirda (5549647)
46
target year of energy label A. Therefore, all measures could be realized today to reach both energy label
targets.
Figure 21: Timeline retrofits SPIE office building
5.4 Sensitivity analysis
This section describes the sensitivity analysis to validate the operation of the DSS. The input data to be able
to run the DSS, is based on the characteristics of the Freudenthal UU building. Every other building could
be used to conduct the sensitivity analysis. The preferences of the office building owner are not considered
in this case to fairly see the impact of the changes in variables on the results. Therefore, the weights are
divided equally, and no ranking is made. The energy reduction aimed for corresponds with the energy label
C. Table 28 shows the results of the DSS for the Freudenthal UU building without the preferences of the
office building owner. With this set of measures, energy label A is reached. The impact of the change in
variables on this set of measures is researched in this sensitivity analysis.
Table 28: Base scenario sensitivity analysis results
Measures Investment costs Payback period (years)
Maintenance costs (per year)
Energy reduction (GJ)
Reduction in CO2 (tonne)
Glazing No change € - 0.0 € - 0 0
Awning No change € - 0.0 € - 0 0
Floor insul. No change € - 0.0 € - 0 0
Roof insul. No change € - 0.0 € - 0 0
Wall insul. No change € - 0.0 € - 0 0
Solar energy sys.
Mono crystalline € 108,954 0.1 € 987 159 9.8
Lighting No change € - 0.0 € - 0 0
Movement detection
No change € - 0.0 € - 0 0
Ventilation No change € - 0.0 € - 0 0
Heat supplier
Heat pump: Heat from return / exhaust air - Gas
€ 250,600 26.0 € 150 661 33.5
Cold supplier
No change € - 0.0 € - 0 0
Flow control No change € - 0.0 € - 0 0
BEMS No change € - 0.0 € - 0 0
€ 359,554 26.0 € 1,137 820 43.2
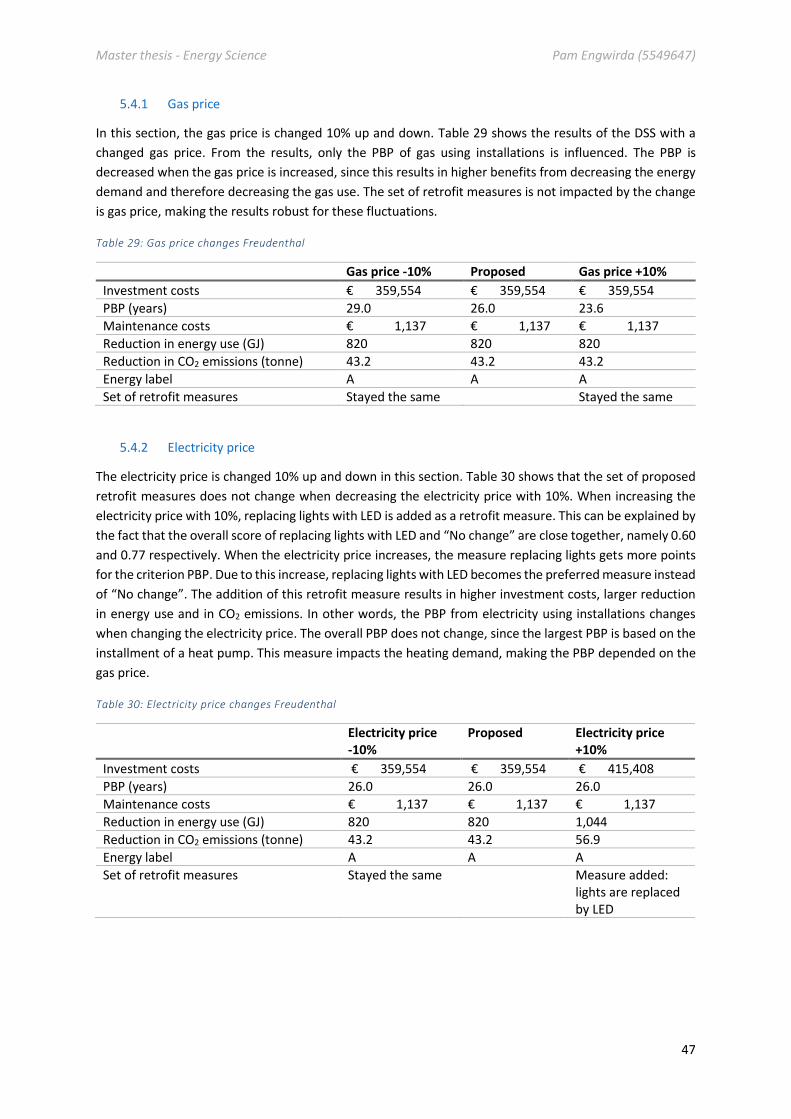
Master thesis - Energy Science Pam Engwirda (5549647)
47
5.4.1 Gas price
In this section, the gas price is changed 10% up and down. Table 29 shows the results of the DSS with a
changed gas price. From the results, only the PBP of gas using installations is influenced. The PBP is
decreased when the gas price is increased, since this results in higher benefits from decreasing the energy
demand and therefore decreasing the gas use. The set of retrofit measures is not impacted by the change
is gas price, making the results robust for these fluctuations.
Table 29: Gas price changes Freudenthal
Gas price -10% Proposed Gas price +10%
Investment costs € 359,554 € 359,554 € 359,554
PBP (years) 29.0 26.0 23.6
Maintenance costs € 1,137 € 1,137 € 1,137
Reduction in energy use (GJ) 820 820 820
Reduction in CO2 emissions (tonne) 43.2 43.2 43.2
Energy label A A A
Set of retrofit measures Stayed the same Stayed the same
5.4.2 Electricity price
The electricity price is changed 10% up and down in this section. Table 30 shows that the set of proposed
retrofit measures does not change when decreasing the electricity price with 10%. When increasing the
electricity price with 10%, replacing lights with LED is added as a retrofit measure. This can be explained by
the fact that the overall score of replacing lights with LED and “No change” are close together, namely 0.60
and 0.77 respectively. When the electricity price increases, the measure replacing lights gets more points
for the criterion PBP. Due to this increase, replacing lights with LED becomes the preferred measure instead
of “No change”. The addition of this retrofit measure results in higher investment costs, larger reduction
in energy use and in CO2 emissions. In other words, the PBP from electricity using installations changes
when changing the electricity price. The overall PBP does not change, since the largest PBP is based on the
installment of a heat pump. This measure impacts the heating demand, making the PBP depended on the
gas price.
Table 30: Electricity price changes Freudenthal
Electricity price -10%
Proposed Electricity price +10%
Investment costs € 359,554 € 359,554 € 415,408
PBP (years) 26.0 26.0 26.0
Maintenance costs € 1,137 € 1,137 € 1,137
Reduction in energy use (GJ) 820 820 1,044
Reduction in CO2 emissions (tonne) 43.2 43.2 56.9
Energy label A A A
Set of retrofit measures Stayed the same Measure added: lights are replaced by LED

Master thesis - Energy Science Pam Engwirda (5549647)
48
5.4.3 CO2 emission factor Dutch electricity grid
In this section, the CO2 emission factor from the Dutch electricity grid is changed. Table 31 shows that a
lower emission factor does not change the proposed measures. However, increasing the emission factor
results in the addition of LED lights. This, again, can be explained by the fact that the overall score of
replacing lights with LED and “No change” are close together. When the CO2 emission factor increases, the
measure replacing lights with LED gets more points for the criterion Reduction in CO2 emission. Due to this
increase, replacing lights with LED becomes the preferred measure instead of “No change”. This added
measure results in higher overall investment costs, larger reduction in energy use and in CO2 emissions.
Table 31: CO2 emission factor change Freudenthal
CO2 emission factor -10%
Proposed CO2 emission factor +10%
Investment costs € 359,554 € 359,554 € 415,408
PBP (years) 26.0 26.0 26.0
Maintenance costs € 1,137 € 1,137 € 1,137
Reduction in energy use (GJ) 820 820 1,044
Reduction in CO2 emissions (tonne) 43.2 43.2 56.9
Energy label A A A
Set of retrofit measures Stayed the same Measure added: lights are replaced by LED
5.4.4 Investment cost
The next step of the sensitivity analysis consists of changing the investment costs of the different retrofit
measures. They are changed 20% up and down individually. When increasing the investment costs of the
different measures, no change occurred in the proposed set of retrofit measures. Even when the price of
solar energy system or the heat suppliers (which are incorporated in the base set) are increased, the
proposed retrofit measures stay the same. This can be explained by the high overall score of the solar
energy systems and the heat supplier. These scores are high due to their large impact on the energy use,
which is not changed when increasing the investment costs. The corresponding PBP does increase. With
higher investment costs, the PBP is longer. When decreasing the investment costs of the different
measures, in most of the cases no change occurred in the proposed set of retrofit measures. However,
when decreasing the investment costs of replacing lights with LED, this measure was included in the
proposed set. As described before, this can be explained by the small difference between the scores in the
options changing the lights with LED and “No change”.
5.4.5 Weights MCDA
The weights for the criteria from the MCDA are changed in this section. When giving the preference to the
criterion Investment costs, no solar panels were installed. This is to be expected since the solar panels score
lower on the criterion Investment costs than the option “No change”. The score for Reduction of energy
requirement or Reduction of CO2 emissions is not high enough to raise the overall score of the solar panels
above the option “No change”. The disappearance of the solar panels in the set of proposed retrofit
measures, resulted in an energy reduction corresponding to an energy label B instead of A. When giving
the preference to the PBP and the Maintenance costs, no change occurred in the proposed set of retrofit
measures. When preferring the criterion Reduction of energy requirement and Reduction of CO2 emissions,
the set of retrofit measures changed. Namely, the retrofit measures triple glazing, replace lights with LED,

Master thesis - Energy Science Pam Engwirda (5549647)
49
ventilation with mechanical supply and drain with recirculation and flow control were added. This can be
explained by the fact that retrofitting becomes more interesting than doing nothing when preferring these
two criteria, since retrofitting reduces the energy use and CO2 emissions of the building.
5.4.6 Ranking of retrofit measures
The points for the ranking of the retrofit measures are changed last in the sensitivity analysis. Each type of
retrofit measure is included in the ranking once individually. When including a retrofit measure in the
ranking, it was included into the set of proposed measures. For example, when ranking windows, triple
glazing was added to the set of measures. This is explained by the fact that the scores of the corresponding
retrofit measures are increased, while the score of the option “No change” is not. This sensitivity analysis
therefore showed that when including a measure in the ranking, it is certain that this measure is including
in the set of proposed retrofit measures.

Master thesis - Energy Science Pam Engwirda (5549647)
50
6. Discussion
This chapter describes the discussion of the research. First, the results of the DSS are discussed in Section
6.1. Section 6.2 discusses the operation of the DSS. Next, the theory used to build the DSS is discussed in
Section 6.3. Section 6.4 describes the use of the DSS in practice and what should be noted when consulting
this DSS. Lastly, Section 6.5 describes the limitations and suggestions for further research.
6.1 Findings
The results of the DSS for the three office buildings showed that most energy reduction can be achieved
by retrofitting the heat supplier and replacing the conventional lights with LED. This corresponds to the
expectations described in Section 2.3.1, which showed that heating and lighting make up most of the
energy demand of an office building. Another measure that can reduce the energy demand of an office
building effectively is the installment of solar panels. Solar panels are specifically suitable for office
buildings, since office buildings require most energy during the day which matches the energy production
of solar panels when the sun shines.
What stands out from the results of the DSS is the overall high PBP. A reason for this overall high PBP could
be that the investment costs of the retrofit measures is too high, or the energy reduction achieved is too
low. This latter could be explained by the fact that when changing from double glass to HR+ glass, for
example, the effect on the energy reduction is marginal. This results in a longer PBP since the price remains
the same, but the energy reduction is lower than when changing from single glass to HR+ glass for example.
The sensitivity analysis showed that a decrease in investment costs could lead to the addition of a retrofit
measure. Therefore, the user of this DSS should be aware that when the investment costs decrease, the
proposed set of measures can change. In addition, the DSS currently considers every retrofit measure, even
when it will not be able to payback itself. A constraint could be added to exclude these measures from the
proposed set, to ensure the cost-effectiveness of the proposed set of retrofit measures.
The results of the DSS showed that when aiming for energy label C and considering the preferences of the
office building owner, it is possible that the measures proposed could reduce the energy use as much as to
an energy label A. This can be explained by the fact that a retrofit measure can get a higher point on the
MCDA compared to the “No change” option. For example, when the office building owner prioritizes the
criterion Reduction of energy requirement, a retrofit measure will get a higher score for this criterion than
the “No change” option since this doesn’t reduce the energy demand. The sensitivity analysis confirmed
that the results are highly depended on the preferences of the office building owner. Especially when
ranking a type of retrofit measure to be included in the set of proposed measures, it is certain that it will
be selected. The results of the DSS therefore provides an advice to the office building owner, considering
its preferences. However, it could be that the office building owner does not want to retrofit more than
necessary. The results of the DSS should therefore be interpreted as an advice and not as the way to go.
In addition, this ranking method can be used to operate according to the principle of the Trias Energetica.
When prioritizing the insulation, it is certain that these measures will be selected first. The ranking method
can also be used to include the functional obsolescence of building services. On the other hand, the weights
for the criteria can be used to select the most cost-effective retrofit measures to obtain energy label C or
A by assigning all the points to the criterion Investment costs. In this case, the proposed set of retrofit
measures includes the minimum of retrofit measures needed to reach the selected energy label, since the
option of “No change” always scores higher on the criterion Investment costs than a retrofit measure.

Master thesis - Energy Science Pam Engwirda (5549647)
51
6.2 Operation of the DSS
The DSS is made to select retrofit measures to reduce the energy use of the building to a certain energy
use level. To do so, the Knapsack problem (described in Section 3.1.4) is used in this research. It should be
noted that the addition of the possibility to not change a building characteristic was added to this problem.
When this option of “No change” is not added, only retrofit measures can be selected by the Excel Solver.
In some cases, retrofitting is not preferred, for example when the improvement of a construction part does
not result in a significant energy reduction. In addition, when renovating to aim for a better energy label,
it is possible that only improving the insulation is enough. The model should therefore be able to select
“No change” on the other types of renovation measures. For that reason, the addition of a “No change”
decision variable is crucial when using the Knapsack problem to renovate a building to a certain energy
label.
Moreover, the DSS considered the Dutch energy label requirements. Since the energy label is based on the
net energy use per year, it is possible to obtain a better energy label by only placing solar panels. The net
energy use is namely described by the actual energy demand of the building minus the energy generated
by for example solar energy systems. When improving the energy label by installing solar panels, the net
energy use is lowered, but the actual energy demand isn’t. Which is strange, because when the solar panels
do not generate electricity, for example with cloudy weather, the energy use is the same as with the old
energy label. As described in Section 2.3, the energy use requirements are therefore changing in the future
to NZEB requirements. These requirements focus more on the Trias Energetica, resulting in a maximum
energy use per m2. This makes it impossible to obtain a good energy label by only placing solar panels at
the roof and not improving the insulation for example. The DSS is made is such a way that the energy use
per m2 can be set as a constraint instead of the energy use in MJ. In addition, as explained in Section 5.1,
the ranking can also be used to incorporate the Trias Energetica principle with the current energy label
system. This together makes sure that the DSS will stay valuable even when the energy requirements are
changed by the Dutch government.
6.3 Theory
The theory of Nielsen et al. (2016) was used to build the DSS (see Section 2.4). The six steps of the ideal
retrofit decision process are implemented as follows: 1) Goal setting is covered with the aim to reach either
energy label C or A, 2) Criteria weighting is specified by the preferences of the office building owner, who
divides 100 points over the six criteria, 3) the characteristics of the building are described in the
questionnaire, therefore covering the step Building Diagnosis, 4) the DSS generates the ideal set of retrofit
measures (Design Alternatives Generation) and 5) the results of the DSS describe the performance of these
measures (Performance Estimation). Lastly, step 6 includes the Design Alternatives Evaluation which is
partly done through a sensitivity analysis of the results. What is lacking is the evaluation of the sustainability
of the proposed retrofit measures. This research showed the impact on the operational CO2 emissions but
did not consider the embedded CO2 emissions for example.
The criteria used in the MCDA were based on research by Lombardi et al. (2017), as described in Section
2.5. These criteria are described as suitable for retrofitting. However, some of the criteria partly overlap.
For example, the criterion PBP is based on the criteria Investment costs, Maintenance costs and Reduction
of energy requirement. When preferring the PBP, indirectly the others are preferred as well because low
investment costs, low maintenance costs and high energy reduction result in a short PBP. In addition, the
criterion Reduction in CO2 emissions is depended on the criterion Reduction of energy requirement. Due
to this interdependence of the different criteria, criteria could get more priority without the user of the

Master thesis - Energy Science Pam Engwirda (5549647)
52
DSS knowing. Therefore, the user should be aware of this interdependency and he/she should
communicate this with the office building owner who needs to provide its preferences.
6.4 Practical application
In practice, the DSS will be useful to advice which set of retrofit measures should be realized to achieve a
certain energy label. It gives the office building owner the possibility to manage its property and plan its
renovation. However, during this research, the collection of the characteristics of the building was more
difficult than expected. Most of the office building owners were not aware of the conditions of their
building. As described in Section 2.1, up until 2014 the energy label was not enforced by the Dutch
government. This resulted in the seller and buyer of a building to agree upon the absence of the energy
label. In other words, the building characteristics determining the energy use of the building were
unknown. This could be an explanation for the lack of knowledge of this empirical data by office building
owners. Therefore, when using this DSS, enough time (couple of weeks) should be reserved to be able do
a complete energy audit of the building (Krarti, 2016).
6.5 Limitations and suggestions for further research
The first limitation of this research was the exclusion of the energy use by appliances in the office building.
This energy use is not considered in the energy label calculation by the ISSO 75.3 (2011) and therefore not
considered in this research. However, this energy use accounts for 3% of the total energy use in an office
building as described in Section 2.3.1. It is expected that the new NTA 8800 (described in Section 2.1.1) will
include the energy use of appliances. When this calculation method is available, it should be added to the
DSS.
The second limitation of this research was that the DSS did not allow for the solar panels to be scalable. In
some cases, it would be preferable to only install a few solar panels and not use all the available space at
the roof of the building. For example, using the total available space could lead to an overproduction of
electricity. When the office building is not able to store this electricity and use it later, this energy is sent
back to the grid. When the netting arrangement (“salderingsregeling”) currently active in the Netherlands
is removed, this energy is loss. Therefore, it could be financially more attractive to place fewer solar panels
who generate just enough electricity to cover the demand of the building. The Excel Solver used in this DSS
was not able to include this scalability, since this resulted in a non-linear problem. Other programs could
therefore be tested to build this DSS which could handle a non-linear problem. Another limitation of the
DSS, which could probably be solved with a non-linear model, is the mutual impact of the retrofit measures.
As described in Section 3.1.4, the DSS was not able to include this interaction between the retrofit
measures and their energy reduction capability.
This research did not consider a discount rate or the price development of the retrofit measures. It could
be possible that the price of for example heat pumps will decrease in the coming years. Since the target
year of energy label A is still 10 years away, it could be beneficial to invest in a heat pump in a later year
than today. A study considering the experience curve of the considered retrofit measures in this research
is suggested. In addition, these expected investment cost decreases (or increases) could be added to the
DSS to determine the right moment to make the investment.
Lastly, this research was missing the sustainability impact of the retrofit measures in the last step of the
ideal DSS as described by Nielsen et al. (2016). Examples of this sustainability impact are the embedded
CO2 emissions or the waste generation when retrofitting. These sustainability criteria could be added to
the MCDA, giving the office building owner the ability to include these in their decision as well.

Master thesis - Energy Science Pam Engwirda (5549647)
53
7. Conclusion
The aim of this research was to build a Decision Support System (DSS) which considers the future
mandatory energy labels, following the Dutch Building Decree of 2012, when selecting retrofit measures
for office buildings in the Netherlands. To build the DSS, first the following sub questions were answered.
1. How are the Dutch energy labels for office buildings determined?
In the Netherlands, the energy labels are based on the Energy Index (EI). In the Dutch building sector, the
ISSO 75.3 (2011) is widely used to determine the EI of a building. This method was therefore used in the
DSS to determine the energy use of an office building and subsequently its energy label. In the future, the
energy label requirements are going to change to the NZEB requirements, which are given in kWh/m2.
Therefore, this aspect was included in the DSS, keeping it valuable when the energy requirements change.
2. What are office building characteristics that determine its energy use?
As found through a literature review (see Section 2.3.1), the heating demand and lighting of an office
building highly determine its energy use. Moreover, the heating demand is impacted by the insulation
values of the construction parts and the efficiency of the heat suppliers.
3. What are the available retrofit measures and their characteristics for office buildings in the
Netherlands?
The retrofit measures suitable for office buildings were selected based on the theory by Ma et al. (2012)
and Hong et al. (2019). From this theory, the category Energy Conserving Behaviour was not considered
suitable to reduce the energy use of an office building. For the other four categories, retrofit measures
were collected including their financial implications (see Section 2.3.2 and Appendix F).
4. What are the decision variables for the office building owner when selecting retrofit measures?
The decision criteria for selecting retrofit measures by the owner of the building are Investment costs,
Payback period, Maintenance costs, Reduction of energy requirement and Reduction of CO2 emissions (see
Section 2.5). These criteria are based on research by Lombardi et al. (2017). When using these criteria in
the DSS, it should be noted that they are interdependent.
With the answers to the above sub questions, the DSS was build. The sensitivity analysis in Section 5.5
showed that the operation of the DSS was robust for fluctuations in input data. However, when the overall
score of two retrofit measures are close to each other, a slight change in input data could result in another
proposed measure. The results of the DDS where highly dependent on the preferences of the office
building owner. Including a type of retrofit measure in the ranking ensured its inclusion in the proposed
measures. In addition, the test results of the DSS showed that the preferences of the office building owner
can result in more retrofit measures proposed than needed to obtain a certain energy label. The DSS is
based on the energy label calculation and therefore doesn’t include the principle of the Trias Energetica.
However, the ranking of retrofit measures can be used to ensure the inclusion of insulating measures and
energy efficient installations.
The DSS was able to answer the main research question, namely:
What are the financial and environmental implications of different retrofit measures for office buildings
when aiming to reach mandatory energy labels following the Dutch Building Decree of 2012?

Master thesis - Energy Science Pam Engwirda (5549647)
54
The financial and environmental implications of the different retrofit measures for the three tested office
buildings are presented in Section 5. Overall, the highest investment costs are coupled to the retrofitting
of the heat and cold suppliers. The highest energy use reduction and therefore CO2 emission reduction is
achieved by heat suppliers. In addition, the installation of solar panels and the replacement of lights with
LED are financially attractive retrofit options for office buildings. However, it should be noted with the
changing energy requirements, that only installing solar panels isn’t enough to comply with this new
regulation. The timeline of the three test buildings showed that the total set of proposed measures takes
around a year to be realized. This ensures that the office buildings can reach the two energy label target
years in time, when retrofitting is started today. When a heat pump is proposed in the set of retrofit
measures, it can be beneficial to wait a few years before installing it, due to its relatively short lifetime.
This ensure its use in 2030 when energy label A needs to be reached. In that case, other measures can be
used to obtain energy label C.
With this research, a tool is presented to support the decision regarding retrofits for office buildings in the
Netherlands. SPIE will be able to use the DSS to provide quick indications of the measures needed to
improve the energy use of an office building. This will help them to support the governmental ambition to
reduce the Dutch CO2 emissions linked to the built environment. In addition, this research can be used to
build other DSS using the energy requirements from different countries. What is needed to do so is a clear
calculation of the energy requirements valid in that country.

Master thesis - Energy Science Pam Engwirda (5549647)
55
References
Abelenco.nl (n.d.) Mechanische ventilatie vervangen: kan ik dat zelf? Retrieved 23-03-2020 from:
https://abelenco.nl/kennisbank/mechanische-ventilatie-vervangen/
Aircogroep.nl (n.d.). Hoeveel airco heeft u nodig? (Koelcapaciteit airco berekenen). Retrieved 05-05-2020
from: https://www.aircogroep.nl/nieuws/hoeveel-airco-heeft-u-nodig-koelcapaciteit-airco-berekenen
Alanne, K. (2004). Selection of renovation actions using multi-criteria “knapsack” model. Automation in
Construction, 13(3), 377-391.
Alrwashdeh, S. S., & Ammari, H. (2019). Life cycle cost analysis of two different refrigeration systems
powered by solar energy. Case Studies in Thermal Engineering, 16, 100559.
Ardente, F., Beccali, M., Cellura, M., & Mistretta, M. (2011). Energy and environmental benefits in public
buildings as a result of retrofit actions. Renewable and Sustainable Energy Reviews, 15(1), 460-470.
Artikel 3.1 van het Besluit energieprestatie gebouwen (2019). Regeling energieprestatie gebouwen.
Retrieved 17-01-2020 from: https://wetten.overheid.nl/BWBR0020921/2019-10-22
Balaras, C. A., Dascalaki, E., Droutsa, K., & Kontoyiannidis, S. (2002). EPIQR-TOBUS-XENIOS-INVESTIMMO,
European Methodologies and Software Tools for Building Refurbishment, Assessment of Energy Savings
and IEQ. In 33rd HVAC Congress, December (pp. 4-6).
Baveco, D., Corbijn, L., Heiden, van der T., Roest, van der E., Roos, C. (2015). Energy cost savings and CO2
reduction in primary schools in Alblasserdam. Utrecht University.
Beinat, E., Nijkamp, P., & Rietveld, P. (1994). Value functions for environmental pollutants: a technique
for enhancing the assessment of expert judgements. Environmental monitoring and assessment, 30(1), 9-
23.
Bengshop.nl (n.d.). Wolf Luchtverhitter THL-EC40-4 230V 6523860. Retrieved 08-04-2020 from:
https://www.bengshop.nl/WOLF-LUCHTVERHITTER-TLH-EC40-4-230V-6523860-
art?gclid=EAIaIQobChMIjv6-z8zY6AIVQud3Ch1AKQuNEAYYBSABEgLHfvD_BwE
Berliner Energieagentur GmbH (2009). Meeting cooling demands in SUMMER by applying HEAT from
cogeneration. Intelligent Energy Europe. Retrieved 07-04-2020 from:
https://ec.europa.eu/energy/intelligent/projects/sites/iee-
projects/files/projects/documents/summerheat_publishable_final_report_en.pdf
Binnenklimaat.be (n.d.). Onderhoud ventilatiesysteem. Retrieved 10-04-2020 from:
https://www.binnenklimaat.be/onderhoud-ventilatiesysteem
Biomedware (n.d.). Methods for data standardization. Retrieved 09-04-2020 from:
https://www.biomedware.com/files/documentation/boundaryseer/Preparing_data/Methods_for_data_
standardization.htm
Blok, K. (2006). Introduction to energy analysis. Techne Press. Amsterdam.
Boasson, E. L., & Wettestad, J. (2016). EU climate policy: Industry, policy interaction and external
environment. Routledge.

Master thesis - Energy Science Pam Engwirda (5549647)
56
Bouwkosten.nl (n.d.). Toelichting en condities. Retrieved 16-04-2020 from:
http://www.bouwkosten.nl/Installatiekosten_elektra_en_verlichting/kostengegevens-
Kostenkengetallen/550404.htm
BPAC (n.d.) Heat Energy Flows in Buildings. Retrieved 25-02-2020 from:
https://sites.google.com/site/twbpac/ch3-energy-literacy-building-loads/33heatenergyflowsinbuildings
Brounen, D., & Kok, N. (2011). On the economics of energy labels in the housing market. Journal of
Environmental Economics and Management, 62(2), 166-179.
Brouwers, J., & Entrop, A. G. (2005, September). New triplet visions on sustainable building. In Action for
sustainability. Proceedings of the 2005 world sustainable building conference, Tokyo, 27-29 September
2005 (on CD-Rom) (pp. 4330-4335).
Budgetlight.nl (n.d.). LED verlichting. Retrieved 04-06-2020 from : https://www.budgetlight.nl/led-
lampen
Caccavelli, D., & Gugerli, H. (2002). TOBUS—a European diagnosis and decision-making tool for office
building upgrading. Energy and buildings, 34(2), 113-119.
CE Delft (2018). Vereffenen kosten warmtetransitie. Kostentoedeling in de warmtetransitie.
Publicatienummer: 18.3L96.024
Chidiac, S. E., Catania, E. J. C., Morofsky, E., & Foo, S. (2011). A screening methodology for implementing
cost effective energy retrofit measures in Canadian office buildings. Energy and Buildings, 43(2-3), 614-
620.
Christ, J. (2018). Energy Label C Obligation for All Office Buildings in the Netherlands in 2023 (With Few
Exceptions). Retrieved 13-02-2020 from: https://www.natlawreview.com/article/energy-label-c-
obligation-all-office-buildings-netherlands-2023-few-exceptions
Cobouw Bouwkosten (n.d.). KOSTENKENGETALLEN (51) WARMTE-OPWEKKING. Retrieved 13-05-2020
from:
https://www.bouwkosten.nl/Proefabonnement_Ramen/Utiliteitsbouw/_Kostenkengetallen_51_Warmte
-opwekking/kostengegevens-kostenkengetallen/3966004-RB_Gebouw.htm
Comfort Klimaat (n.d.). LG monobloc warmtepomp LG-HM121M.U33. Retrieved 08-04-2020 from:
https://www.comfortklimaat.nl/categorieen/1274-lg-monoblock-warmtepomp-lg-hm121m-u33-
.html?utm_source=Google+Merchant+Center&utm_medium=referral&utm_campaign=EasyAds&gclid=E
AIaIQobChMIhIDdu-LY6AIV0eF3Ch0qywKqEAYYASABEgJQC_D_BwE
Cv-kosten.nl (n.d.). Cv-ketel onderhoud kosten. Retrieved 10-04-2020 from: https://cv-kosten.nl/cv-ketel-
onderhoud/
CVketelkiezen.nl. (n.d.). Vermogen berekenen cv-ketel. Retrieved 05-05-2020 from:
https://cvketelkiezen.nl/vermogen-cv-ketel-berekenen
Dakdek-gigant.nl (2020). Dakisolatie. Retrieved 06-04-2020 from: https://www.dakdek-
gigant.nl/dakisolatie/#Dakisolatie_kosten
Dakisolatie-advies.nl (n.d.). Isolatiewaarde van dakisolatie. Retrieved 06-04-2020 from:
https://www.dakisolatie-advies.nl/isolatiewaarde-dak

Master thesis - Energy Science Pam Engwirda (5549647)
57
Dascalaki, E., & Santamouris, M. (2002). On the potential of retrofitting scenarios for offices. Building and
Environment, 37(6), 557-567.
Dekker, T. & Schuur, R. (2018). Werkdocument Verduurzaming utiliteitsbouw. Retrieved 14-11-19 from:
https://www.klimaatakkoord.nl/binaries/klimaatakkoord/documenten/publicaties/2018/06/21/inputnoti
tie-verduurzaming-utiliteitsbouw/04+Input-notitie+verduurzaming+utiliteitsbouw.pdf
Dodgson, J. S., Spackman, M., Pearman, A., & Phillips, L. D. (2009). Multi-criteria analysis: a manual.
Retrieved 16-12-2019 from: http://eprints.lse.ac.uk/12761/1/Multi-criteria_Analysis.pdf
Dubbelglas-weetjes.nl (n.d.). HR +++ of driedubbel glas. Retrieved 06-04-2020 from:
https://www.dubbelglas-weetjes.nl/hr-glas/driedubbel-glas/
Dubbelglasprijzen.net (n.d.). Levensduur dubbel glas. Retrieved 06-04-2020 from:
https://www.dubbelglasprijzen.net/levensduur-dubbel-glas/
Eames, M., Dixon, T., Lannon, S. C., Hunt, M., De Laurentis, C., Marvin, S., ... & Georgiadou, M. C. (2014).
Retrofit 2050: critical challenges for urban transitions.
Eco-logisch (2020). Het EPC. Retrieved 10-02-2020 from: https://www.eco-logisch.nl/kennisbank-Het-
EPC--166
Eerenbeemt, van den M. (2018). Bijna de helft van de Nederlandse kantoren moet in 2023 sluiten als de
energie labels niet snel worden opgeschroefd. De Volkskrant. Retrieved 21-02-2020 from:
https://www.volkskrant.nl/nieuws-achtergrond/bijna-de-helft-van-de-nederlandse-kantoren-moet-in-
2023-sluiten-als-de-energielabels-niet-snel-worden-opgeschroefd
EIB (2016). Verplicht energielabel voor kantoren. Retrieved 25-11-19 from:
https://www.eib.nl/pdf/verplicht_energielabel_voor_%20kantoren.pdf
Electricaboiler.nl (n.d.). Bosch elektrische cv-ketel 12 kW (tot 150 m2). Retrieved 05-05-2020 from:
https://electraboiler.nl/collections/elektrische-cv-ketels/products/bosch-elektrische-cv-ketel-12-kw-tot-
150-m2?gclid=EAIaIQobChMIn-7E8Jec6QIVzrLVCh0hQQslEAYYASABEgKni_D_BwE
Electrototaalmarkt.nl (n.d.). Bewegingsmelders. Retrieved 06-04-2020 from:
https://www.elektrototaalmarkt.nl/verlichting/bewegingsmelders
Emis (2020). Warmte-kracht-koppeling. Retrieved 10-04-2020 from: https://emis.vito.be/nl/bbt/bbt-
tools/techniekfiches/warmte-kracht-koppeling-wkk?language=en
Energie vastgoed (2015). WKO: ‘70% van de systemen haalt rendement niet’. Retrieved 08-04-2020 from:
https://www.energievastgoed.nl/2015/02/20/wko-70-van-de-systemen-haalt-rendement-niet/
European Commission (2002). Directive 2002/91/EC of the European Parliament and of the Council of 16
December 2002 on the energy performance of buildings. Official Journal L 001, 04/01/2003, 0065-0071.
Ferreira, J., Pinheiro, M. D., & de BRITO, J. (2013). Refurbishment decision support tools review—Energy
and life cycle as key aspects to sustainable refurbishment projects. Energy Policy, 62, 1453-1460.
Filippidou, F., Nieboer, N., & Visscher, H. (2017). Are we moving fast enough? The energy renovation rate
of the Dutch non-profit housing using the national energy labelling database. Energy Policy, 109, 488-498.

Master thesis - Energy Science Pam Engwirda (5549647)
58
Francisco, P. (2004). Oil Politics: a modern history of petroleum. Ibtauris publication, 336-338.
Güçyeter, B., & Günaydın, H. M. (2012). Optimization of an envelope retrofit strategy for an existing office
building. Energy and Buildings, 55, 647-659.
Guitouni, A., & Martel, J. M. (1998). Tentative guidelines to help choosing an appropriate MCDA method.
European Journal of Operational Research, 109(2), 501-521.
Help.vabi.nl (n.d.). Glas gegevens. Retrieved 06-04-2020 from:
https://help.vabi.nl/elements/nl/index.html#!Documents/constructies.glasgegevens.htm
Hestnes, A. G., & Kofoed, N. U. (2002). Effective retrofitting scenarios for energy efficiency and comfort:
results of the design and evaluation activities within the OFFICE project. Building and Environment, 37(6),
569-574.
Higgins, A., Syme, M., McGregor, J., Marquez, L., & Seo, S. (2014). Forecasting uptake of retrofit packages
in office building stock under government incentives. Energy Policy, 65, 501-511.
Hillebrand, G., Arends, G., Streblow, R., Madlener, R., & Müller, D. (2014). Development and design of a
retrofit matrix for office buildings. Energy and Buildings, 70, 516-522.
Homedeal.nl (n.d.). Zonwering schoonmaken. Retrieved 10-04-2020 from:
https://www.homedeal.nl/zonwering/zonwering-schoonmaken/
Hong, Y., Ezeh, C. I., Deng, W., Hong, S. H., & Peng, Z. (2019). Building Energy Retrofit Measures in Hot-
Summer–Cold-Winter Climates: A Case Study in Shanghai. Energies, 12(17), 3393.
Isolatie-info.be 1 (n.d.). Vloerisolatie. Retrieved 08-04-2020 from: https://www.isolatie-
info.be/vloerisolatie
Isolatie-info.be 2 (n.d.). Gespoten vloerisolatie PUR. Retrieved 08-04-2020 from: https://www.isolatie-
info.be/vloerisolatie/gespoten-vloerisolatie-pur
Isolatie-info.nl (n.d.). Muurisolatie: mogelijkheden & prijs. Retrieved 06-04-2020 from:
https://www.isolatie-info.nl/muurisolatie
Isolatie-weetjes (n.d.). Isolatiematerialen. Retrieved 06-04-2020 from: https://www.isolatie-
weetjes.nl/isolatiematerialen/
Isolatiemateriaal.nl 1 (n.d.). Wat is het beste isolatiemateriaal voor mijn klus? Retrieved 06-04-2020
from: https://www.isolatiemateriaal.nl/kenniscentrum/wat-is-het-beste-isolatiemateriaal/
Isolatiemateriaal.nl 2 (n.d.). Vloerisolatie vanuit de kruipruimte. Retrieved 08-04-2020 from:
https://www.isolatiemateriaal.nl/kruipruimte-isolatie/vloerisolatie/
Isolatiemateriaal.nl 3 (n.d.). Betonvloer isoleren. Retrieved 08-04-2020 from:
https://www.isolatiemateriaal.nl/vloerisolatie/betonvloer-isolatie/
ISSO 75.1 (2013). Handleiding Energieprestatie utiliteitsgebouwen energielabel. Methode 2013. ISBN
978-90-5044-260-2
ISSO 75.3 (2011). Formulestructuur EI utiliteitsgebouwen. Herziene versie 2011. ISBN 978-90-5044-145-2

Master thesis - Energy Science Pam Engwirda (5549647)
59
Juan, Y. K., Gao, P., & Wang, J. (2010). A hybrid decision support system for sustainable office building
renovation and energy performance improvement. Energy and buildings, 42(3), 290-297.
Krarti, M. (2016). Energy audit of building systems: an engineering approach. CRC press.
Kurnitski, J., Allard, F., Braham, D., Goeders, G., Heiselberg, P., Jagemar, L., ... & Seppänen, O. (2011). How
to define nearly net zero energy buildings nZEB. Rehva Journal, 48(3), 6-12.
Lampdirect.nl (n.d.). Overstappen op LED. Retrieved 06-04-2020 from:
https://www.lampdirect.nl/overstappen-op-led/
Ledlampenfabriek.nl (n.d.). Hoe lang gaan ledlampen mee? Retrieved 06-04-2020 from:
https://www.ledlampenfabriek.nl/levensduur/
Lee, D., & Cheng, C. C. (2016). Energy savings by energy management systems: A review. Renewable and
Sustainable Energy Reviews, 56, 760-777.
Leeuw, de W. (2019). Het energielabel. Wat is er veranderd per juli 2019? En wat gaat er nog meer
veranderen? Retrieved 24-02-2020 from: https://www.deleeuw.nl/blog/nieuws/759-veranderingen-op-
komst-voor-het-energielabel
Lepper, de R. (2018). EPC berekeningen. Retrieved 31-05-2020 from:
https://bouwadviesshop.nl/verbouw-tips/bouwbesluitberekening/epc-berekeningen/
Liander (n.d.). Nieuwe warmteoplossingen: het perspectief vanuit de netbeheerder. Retrieved 26-03-
2020 from: https://www.liander.nl/sites/default/files/Brochure%20warmtevoorziening-%20v0118.pdf
Liu, G., Liu, B., Wang, W., Zhang, J., Athalye, R. A., Moser, D., ... & Hatten, M. (2011). Advanced energy
retrofit guide office buildings (No. PNNL-20761). Pacific Northwest National Lab.(PNNL), Richland, WA
(United States).
Lombardi, P., Abastante, F., Torabi Moghadam, S., & Toniolo, J. (2017). Multicriteria spatial decision
support systems for future urban energy retrofitting scenarios. Sustainability, 9(7), 1252.
Ma, Z., Cooper, P., Daly, D., & Ledo, L. (2012). Existing building retrofits: Methodology and state-of-the-
art. Energy and buildings, 55, 889-902.
Majcen, D., Itard, L. & Visscher, H. (2013). Energy labels in Dutch dwellings – their actual energy
consumption and implications for reduction targets. ECEEE. Retrieved 10-01-2020 from
https://www.google.com/url?sa=t&rct
Maldonado, E., Wouters, P., & Papaglastra, M. (2011). Implementing the energy performance of buildings
directive (EPBD). Part of the EU Concerted Action: Energy Performance of Buildings. Retrieved from www.
epbd-ca. eu on, 21(02), 2013.
Mijnbenovatie.be (n.d.). Ik BENOveer en isoleer ik mijn buitenmuren aan de binnenkant. Retrieved 06-04-
2020 from: https://www.mijnbenovatie.be/nl/stappen/buitenmuren/binnen/isolatie/
Milieubarometer (n.d.). Actuele CO2-parameters 2019. Retrieved 08-04-2020 from:
https://www.milieubarometer.nl/CO2-footprints/co2-footprint/actuele-co2-parameters-2019/
Nazi, W. I. W. M., Royapoor, M., Wang, Y., & Roskilly, A. P. (2017). Office building cooling load reduction
using thermal analysis method–A case study. Applied Energy, 185, 1574-1584.

Master thesis - Energy Science Pam Engwirda (5549647)
60
NEN (2020). NTA 8800 rekenmethode energieprestatie gebouwen beschikbaar. Retrieved 10-02-2020
from: https://www.nen.nl/NEN-Shop/Bouwnieuwsberichten/NTA-8800-rekenmethode-energieprestatie-
gebouwen-beschikbaar.htm
Nielsen, A. N., Jensen, R. L., Larsen, T. S., & Nissen, S. B. (2016). Early stage decision support for sustainable
building renovation–A review. Building and Environment, 103, 165-181.
NTA 8800 (2019). Energy performance of buildings – Determination method. ICS 91.120.10; 91.140.30.
Offerteadviseur.nl 1 (n.d.). Kosten zonnescherm. Retrieved 16-04-2020 from:
https://www.offerteadviseur.nl/categorie/tuin/zonwering/kosten-zonnescherm/
Offerteadviseur.nl 2 (n.d.). Kosten zonnepanelen per m2. Retrieved 23-03-2020 from:
https://www.offerteadviseur.nl/categorie/energie/zonnepanelen/kosten-per-m2/
Online bouwbesluit (n.d.) Building Decree 1992. Retrieved 12-02-2020 from:
https://www.onlinebouwbesluit.nl/?v=11
Overheid.nl (2006). Besluit energieprestatie gebouwen. Retrieved 12-02-2020 from:
https://wetten.overheid.nl/BWBR0023734/2016-07-01
Plusisolatie.nl (n.d.). Muurisolatie buitenkant. Retrieved 06-04-2020 from:
https://www.plusisolatie.nl/muurisolatie-buitenkant.html
Ramen-weetjes.be (n.d.). Ramen prijzen. Retrieved 06-04-2020 from: https://www.ramen-
weetjes.be/ramen-prijzen/
Rawal, G. (2016). Costs, savings, and ROI for smart building implementation. Intel. Retrieved 07-04-2020
from: https://blogs.intel.com/iot/2016/06/20/costs-savings-roi-smart-building-
implementation/#gs.34asey
Rottondi, C., Duchon, M., Koss, D., Verticale, G., & Schätz, B. (2015, March). An energy management
system for a smart office environment. In 2015 International Conference and Workshops on Networked
Systems (NetSys) (pp. 1-6). IEEE.
Roulet, C. A., Flourentzou, F., Labben, H. H., Santamouris, M., Koronaki, I., Dascalaki, E., & Richalet, V.
(2002). ORME: A multicriteria rating methodology for buildings. Building and Environment, 37(6), 579-
586.
Rousselot, M. (2018). Energy efficiency trends in buildings. Odyssee-Mure. Retrieved 27-05-2020 from:
https://www.odyssee-mure.eu/publications/policy-brief/buildings-energy-efficiency-trends.pdf
RVO (2011). Absorptiekoeling. Retrieved 10-04-2020 from:
https://www.rvo.nl/sites/default/files/bijlagen/2MJAP1127-Absorptiekoeling.pdf
RVO (2013). Infoblad Trias Energetica en energieneutraal bouwen. Retrieved 27-11-19 from:
https://www.rvo.nl/sites/default/files/Infoblad%20Trias%20Energetica%20en%20energieneutraal%20bo
uwen-juni%202013.pdf
RVO (2017). Snel inzicht in besparingsopties met de Energiebesparingsverkenner kantoren. Retrieved 26-
02-2020 from: https://energieslag.rvo.nl/news/view/51138486/snel-inzicht-in-besparingsopties-met-de-
energiebesparingsverkenner-kantoren

Master thesis - Energy Science Pam Engwirda (5549647)
61
RVO 1 (2019). Beleid en ontwikkeling rondom duurzame gebouwen. Powerpoint presentation Selina
Roskom. Retrieved 15-01-2020 from:
https://energieslag.rvo.nl/file/download/51191806/20190924%20DGBW%20ING%20informatiesessie%2
0Verduurzamen%20Kantoren.pdf
RVO 2 (2019). Energielabel C kantoren. Retrieved 14-11-19 from:
https://www.rvo.nl/onderwerpen/duurzaam-ondernemen/gebouwen/wetten-en-regels/bestaande-
bouw/energielabel-c-kantoren
RVO 1 (n.d.). Energieprestatie (EPC). Retrieved 06-02-2020 from:
https://www.rvo.nl/onderwerpen/duurzaam-ondernemen/gebouwen/wetten-en-
regels/nieuwbouw/energieprestatie-epc
RVO 2 (n.d.). Verschil Energie-Index (EI) en Energie Prestatie Coëfficiënt (EPC). Retrieved 21-04-2020
from: https://www.rvo.nl/onderwerpen/duurzaam-ondernemen/gebouwen/wetten-en-
regels/bestaande-bouw/energie-index/verschil-energie-index-en-epc
RVO 3 (n.d.). BENG-indicatoren. Retrieved 10-02-2020 from:
https://www.rvo.nl/onderwerpen/duurzaam-ondernemen/gebouwen/wetten-en-
regels/nieuwbouw/energieprestatie-beng/indicatoren
RVO 4 (n.d.) BENG Overheidsgebouwen. Retrieved 12-03-2020 from:
https://www.rvo.nl/onderwerpen/duurzaam-ondernemen/gebouwen/wetten-en-
regels/nieuwbouw/energieprestatie-beng/beng-gebouwtype/overheidsgebouwen
RVO 5 (n.d.). Veelgestelde vragen Energielabel C kantoren. Retrieved 21-02-2020 from:
https://www.rvo.nl/onderwerpen/duurzaam-ondernemen/gebouwen/wetten-en-regels/bestaande-
bouw/energielabel-c-kantoren/veelgestelde-vragen-energielabel-c-kantoren
RVO 6 (n.d.). Energieprijzen. Retrieved 08-04-2020 from:
https://energiecijfers.databank.nl/dashboard/dashboard/energieprijzen/
RVO 7 (n.d.). Factsheet: WKO en warmtepompen. Retrieved 10-04-2020 from:
https://www.rvo.nl/sites/default/files/2017/07/RVO.nl%20-
%20Factsheet%20WKO%20en%20warmtepompen.pdf
Samen energie besparen (2018). BZK: “Geen boete bij ontbreken energielabel”. Retrieved 24-02-2020
from: https://www.samenenergiebesparen.nl/nieuws/geen-boete-bij-ontbreken-energielabel/
Santamouris, M., & Dascalaki, E. (2002). Passive retrofitting of office buildings to improve their energy
performance and indoor environment: the OFFICE project. Building and Environment, 37(6), 575-578.
Santin, Itard & Visscher (2010). Effects of the Dutch energy performance regulations on energy savings in
dwellings. Delft University of Technology. Retrieved 21-01-2020 from:
https://pdfs.semanticscholar.org/967f/956ffd76708f42eefc60bff48b9bccebf0d2.pdf
Sayed, K., & Gabbar, H. A. (2018). Building Energy Management Systems (BEMS). Energy Conservation in
Residential, Commercial, and Industrial Facilities, 15-81.
Scheffe, A. (2015). EPC-eisen vanaf 1995. Retrieved 12-02-2020 from:
https://www.bouwformatie.nl/thema/educatieartikel-4-epc-eisen-vanaf-1995(1)

Master thesis - Energy Science Pam Engwirda (5549647)
62
Schepers, B., Meyer, M., Burger, E. (2018). Kosten voor verwarmen. Analyse van de spreiding bij
eindverbruikers. CE Delft. Retrieved 26-03-2020 from: https://www.ce.nl/publicaties/download/2614
Schneider, S. H., & Thompson, S. L. (1981). Atmospheric CO2 and climate: importance of the transient
response. Journal of Geophysical Research: Oceans, 86(C4), 3135-3147.
Sellers, P. J., Bounoua, L., Collatz, G. J., Randall, D. A., Dazlich, D. A., Los, S. O., ... & Jensen, T. G. (1996).
Comparison of radiative and physiological effects of doubled atmospheric CO2 on climate. Science,
271(5254), 1402-1406.
SER 1 (n.d.). Wat is het energieakkoord? Retrieved 17-02-2020 from:
https://www.ser.nl/nl/thema/energie-en-duurzaamheid/energieakkoord/wat
SER 2 (n.d.). Gebouwde omgeving. Retrieved 17-02-2020 from: https://www.ser.nl/nl/thema/energie-en-
duurzaamheid/~/link.aspx?_id=D88E14B4D54B43808C7D4A92AB689AAF&_z=z
Shahpasand, M., & Golpayegani, S. A. H. (2014). Optimum countermeasure portfolio selection: a
knapsack approach. In Emerging Trends in ICT Security (pp. 301-314). Morgan Kaufmann.
Simon, F. (2017). Energy and sustainability in Chile: Simulation modelling of low-carbon technologies and
energy in buildings.
Sipma, Kremer & Vroom (2017). Energielabels en het daadwerkelijk energiegebruik van kantoren. ECN.
Retrieved 01-06-2020 from: https://publicaties.ecn.nl/PdfFetch.aspx?nr=ECN-E--16-056
Subsidies-zonnepanelen.nl (n.d.) Kosten per soort paneel. Retrieved 23-03-2020 from:
https://www.subsidies-zonnepanelen.nl/kosten-per-soort-paneel/
Technische Unie (n.d.). Assortiment. Retrieved 06-04-2020 from: https://www.technischeunie.nl/home/
The Open University (n.d.). Energy in buildings: 2.3 Cutting ventilation losses. Retrieved 25-02-2020 from:
https://www.open.edu/openlearn/nature-environment/energy-buildings/content-section-2.3
Tima (2015). Wanneer kies ik voor het type plafond voor een gesloten of open/geen? Retrieved 13-03-2020
from: https://www.bouwbesluittoetsing.nl/wanneer-kies-ik-voor-het-type-plafond-voor-een-gesloten-of-
opengeen/
TNO (2019). Routekaart verduurzaming van het zorgvastgoed – Ziekenhuizen. Retrieved 14-11-2019
from:
https://www.rijksoverheid.nl/binaries/rijksoverheid/documenten/rapporten/2019/04/30/routekaart-
verduurzaming-van-het-zorgvastgoed---ziekenhuizen/Routekaart+verduurzaming+van+het+vastgoed+-
+ziekenhuizen.pdf
Tweede Kamer (2020). Duurzame ontwikkeling en beleid. Brief van de minister van binnenlandse zaken
en koninkrijksrelaties. Vergaderjaar 2019-2020, 30 196, nr. 695. Retrieved 15-01-2020 from:
https://www.tweedekamer.nl/kamerstukken/brieven_regering/detail?id=2020Z00138&did=2020D00322
UN Environment and International Energy Agency (2017): Towards a zero-emission, efficient, and
resilient buildings and construction sector. Global Status Report 2017. Retrieved 14-11-19 from:
https://www.worldgbc.org/sites/default/files/UNEP%20188_GABC_en%20%28web%29.pdf

Master thesis - Energy Science Pam Engwirda (5549647)
63
Unizon.nl (n.d.). Veel gestelde vragen. Retrieved 06-04-2020 from: http://www.unizon.nl/pg-31072-7-
101017/pagina/veel_gestelde_vragen.html
U.S. Department of Energy (2017). Absorption chillers for CHP Systems. Retrieved 18-05-2020 from:
https://www.energy.gov/sites/prod/files/2017/06/f35/CHP-Absorption%20Chiller-compliant.pdf
U.S. Department of Energy (2019). Retrofit Existing Buildings. Retrieved 26-11-2019 from:
https://www.energy.gov/eere/buildings/retrofit-existing-buildings
Valk, H. (2014). Is er toekomst voor de EPC? Duurzaam Gebouwd. Retrieved 10-02-2020 from:
https://www.duurzaamgebouwd.nl/expertpost/20140321-is-er-toekomst-voor-de-epc
Ventilatieysteemabcd.nl (n.d.). Prijs ventilatiesysteem. Retrieved 23-03-2020 from:
https://www.ventilatiesysteemabcd.nl/prijs-ventilatiesysteem
Verbouwkosten.com (n.d.). Vloerisolatie, comfortabeler, warmere voeten en geld besparen. Retrieved
16-04-2020 from: https://www.verbouwkosten.com/vloerisolatie/
Vereniging Eigen Huis (2019). VEH: “Schrap plannen voor duur en zinloos nieuw energielabel”. Retrieved
24-02-2020 from: https://www.eigenhuis.nl/actueel/2019/07/11/06/00/schrap-plannen-voor-nieuw-
energielabel#/
Vereniging Eigen Huis (n.d.). Werkbare dagen tijdens de bouw: 5 vragen. Retrieved 30-05-2020 from:
https://www.eigenhuis.nl/huis-kopen/nieuwbouw/bouwperiode/werkbare-werkdagen#/
Verwarming-info.nl (n.d.). Accumulatieverwarming: Verwarmen met accumulatoren. Retrieved 10-04-
2020 from: https://www.verwarming-info.be/elektrische-verwarming/accumulatieverwarming
Vringer, K., van Middelkoop, M., & Hoogervorst, N. (2016). Saving energy is not easy: An impact
assessment of Dutch policy to reduce the energy requirements of buildings. Energy Policy, 93, 23-32.
Wang, J. J., Jing, Y. Y., Zhang, C. F., & Zhao, J. H. (2009). Review on multi-criteria decision analysis aid in
sustainable energy decision-making. Renewable and sustainable energy reviews, 13(9), 2263-2278.
Warmtepomp-info.nl 1 (n.d.). Kosten warmtepomp. Retrieved 26-03-2020 from:
https://www.warmtepomp-info.nl/kosten-warmtepomp/
Warmtepomp-info.nl 2 (n.d.). Onderhoudskosten warmtepomp. Retrieved 10-04-2020 from:
https://www.warmtepomp-info.nl/onderhoudskosten-warmtepomp/
Warmtepompplein.nl (n.d.). Warmtepomp soorten. Retrieved 04-06-2020 from:
https://warmtepompplein.nl/warmtepomp-werking/warmtepomp-soorten/
Wilkinson, S. (2012). Analysing sustainable retrofit potential in premium office buildings. Structural Survey.
Zeiler, W. (2013). Dutch efforts towards a sustainable built environment. In Sustainability, Energy and
Architecture (pp. 1-25). Academic Press Inc..
Zonneboiler-advies.nl 1 (n.d.) Levensduur zonneboiler. Retrieved 23-03-2020 from:
https://www.zonneboiler-advies.nl/levensduur-zonneboiler
Zonneboiler-advies.nl 2 (n.d.) Zonnecollector: info & prijs. Retrieved 23-03-2020 from:
https://www.zonneboiler-advies.nl/zonnecollector

Master thesis - Energy Science Pam Engwirda (5549647)
64
Zonneboiler-info.nl (n.d.). Onderhoudskosten zonneboiler 2020. Retrieved 10-04-2020 from:
https://www.zonneboiler-info.nl/onderhoudskosten/
Zonnepaneelprijzen.nl (n.d.). Zonnepanelen op plat dak, hoger rendement dan op schuin dak! Retrieved
31-05-2020 from: https://www.zonnepaneelprijzen.nl/plat-dak/
Zonnepaneelprijzen.nl (2020). Zonneboiler kosten. Retrieved 16-04-2020 from:
https://www.zonnepaneelprijzen.nl/zonneboiler/kosten/
Zonnepanelen.net (n.d.). Onderhoud zonnepanelen. Retrieved 10-04-2020 from:
https://www.zonnepanelen.net/onderhoud-zonnepanelen/
Zonnepanelen-weetjes.nl (n.d.). Zonnecollector prijs. Retrieved 23-03-2020 from:
https://www.zonnepanelen-weetjes.nl/zonnecollector/prijzen-zonnecollector/
Zonneplan.nl (n.d.) Levensduur zonnepanelen. Retrieved 23-03-2020 from:
https://www.zonneplan.nl/kenniscentrum/zonnepanelen/levensduur
Zonwering-weetjes.nl (n.d.). Screens prijzen. Retrieved 06-04-2020 from: https://www.zonwering-
weetjes.nl/zonwering-prijzen/screens-prijzen/
Zonweringgigant.nl 1 (n.d.). Wat zijn de voordelen van screens? Retrieved 26-04-2020 from:
https://www.zonweringgarant.nl/voordelen-van-screens
Zonweringgigant.nl 2 (n.d.). Vergelijking tussen screens en rolluiken. Retrieved 26-04-2020 from:
https://www.zonweringgarant.nl/vergelijking-rolluiken-screens

Master thesis - Energy Science Pam Engwirda (5549647)
65
Questionnaire
This section presents the questionnaire and the email that has been send to the office building owners in
this research. Since Dutch building owners where part of this research, also a Dutch version is added.
A.1 English email and questionnaire
Questionnaire
Demographic information
Name office building
Address
Year of construction
Months building is in use per year months
Office building construction characteristics
Surfaces and sizes
Total floor area office building m2
Floor area 1st floor m2
Crawlspace present?
Dear [office building owner],
My name is Pam Engwirda and I am currently writing my graduation thesis (Utrecht University) on the
retrofitting of Dutch office buildings. As you might know, the energy requirements for office buildings
are changing in the near future. As of January 1st, 2023, every office building in the Netherlands should
carry an energy label C. In 2030, this requirement is even set at an energy label A. To improve the
energy label of your building, multiple retrofit options are possible. The aim of my research is to select
the best suited retrofit options for a specific office building. In this case your office building. To do so, I
made a decision support system in collaboration with SPIE Nederland BV. I would like to test this model
using the characteristics of your office building.
What’s in it for you? The result will be two sets of retrofit measures specified to your office building.
One set aiming to achieve energy label C and one set aiming to achieve energy label A. The results will
show the expected costs (investment and maintenance), payback period, reduction in CO2 emissions
and a timeline showing the time needed to install these measures.
What I need from you is to answer the added questionnaire to the best of your abilities. If something
is unclear or you could not answer the question, please make a note. I will use this to optimise the
questionnaire.
Would you be willing to help me?
Thank you in advance!
Kind regards,
Pam Engwirda

Master thesis - Energy Science Pam Engwirda (5549647)
66
Hight building m
Hight per floor m
Area outside walls (incl. windows/doors) m2
Area roof m2
Area windows (all outside windows, including glass doors) m2
Insulation values
U (based on
year of construction) If known, fill in here
Floor 5.882 W/m2K
Walls 2.326 W/m2K
Roof 1.163 W/m2K
If applicable, year of renovation
Type of floor, ceiling, facade
Mass of floor construction (kg/m2)
Type of ceiling
Facade type
Windows
Type of glazing
Outdoor blinds present?
If yes, type of blinds
Office building installations
Climate system nr See tab Climate system nr
Heating and cooling system
Type of heat generator
Individual control heating
Cold supplier
Area of cooled zones m2
CHP
Present?
Electric power kW
Thermal power kW
Type of distribution
More detailed information heating system
Heat pump
Source
Type of fuel
Demanded temperature level
Boiler
Type of boiler
Temperature level heat supply

Master thesis - Energy Science Pam Engwirda (5549647)
67
One or more central heating appliances that supply heat for an use area of
Steam boiler
Economizer
Air preheater
Hot water boiler with 150 °C water
Flue gas condenser
Ventilators
Type of ventilation system
Provision in ventilation system
Type of arrangement
Heat recovery system
Ventilation facility with cooling requirement
Humidification
Type of humidification installation
Moisture recovery
Hot tap water
Type of generator
Distribution system
Solar energy systems
Solar panels
Present
Type of pv-system
Peak power (Other pv system) W/m2
Surface area m2
Orientation
Slope angle
Solar collector
Present
Surface area m2
Lighting (see box below) Total installed power of lighting Conventional 0.00 kW
LED kW
Luminaire type
Type of control/switch
Movement detection
Preferences retrofit

Master thesis - Energy Science Pam Engwirda (5549647)
68
I would like to ask you to divide 100 points over the next criteria. The one who is of most importance to you, should get the most points. The second most important a little less and so on.
Points Example
Lowest investment costs 50
Fastest Payback Period in years 20
Lowest maintenance costs 0
Reduction of CO2 emissions 10
Reduction of energy requirement 20
0
Lastly, I would like you to rank the retrofit measures in order of preference. At number 1, place the building characteristic that is in the highest need of renovation. At number 7, place the building characteristic that has your least preference of being renovated. For example, a year ago you improved the insulation of your building so you would want to do other renovations first.
1
2
3
4
5
6
7
Notes
Lighting
Power (W) Amount Fill in the amount of lights per type. If not known which type of lights are installed or other lights are installed, fill in the green box below.
TLD 18
36
58
72 Installed conventional lights (kW)

Master thesis - Energy Science Pam Engwirda (5549647)
69
116
PLC 9
13
18
26
36
TL5 14
21
28
42
56
Climate System number
Different calculations in the energy label calculation depend on the climate system present in the building. Especcially the transport of heat and cold within these systems. The tabel below shows the relation between the distribution systems and the system number. Dual duct (twee kanalen) system is only considered for totally air based climate systems.
Heat transport through Cold transport through Dual duct System nr
Water or water and air
n.a. n.a. 1
Water n.a. 2
Air n.a. 3
Water and air n.a. 4
Locally n.a. 9
Air
n.a. n.a. 5
Water n.a. 6
Air Yes 13
No 7
Water and air n.a. 8
Locally n.a. 10
Locally n.a. n.a. 11
Locally n.a. 12

Master thesis - Energy Science Pam Engwirda (5549647)
70
A.2 Dutch email and questionnaire
Vragenlijst
Demografische informatie
Naam kantoorpand
Adres
Bouwjaar
Aantal maanden pand is in gebruik maanden
Kantoorpand constructie eigenschappen
Oppervlakten en maten
Totale vloeroppervlakte m2
Vloeroppervlakte begane grond m2
Kruipruimte aanwezig?
Hoogte kantoorpand m
Hoogte per verdieping m
Oppervlakte buiten muren (incl. ramen/deuren) m2
Oppervlakte dak m2
Beste [kantoorpand eigenaar],
Mijn naam is Pam Engwirda en momenteel schrijf ik mijn afstudeer opdracht (Universiteit Utrecht) over
de verduurzaming van kantoorpanden in Nederland. Zoals u wellicht weet worden de eisen voor het
energie gebruik van kantoorpanden aangescherpt. Per 1 januari 2023 dienen alle kantoorpanden in
Nederland een energie label C te dragen. In 2030, dit wordt nog verder aangescherpt tot een energie
label A. Er zijn verschillende renovatie mogelijkheden mogelijk om het energie label van uw pand te
verbeteren. Het doel van mijn onderzoek is om de meest geschikte renovatie mogelijkheden te
selecteren voor een specifiek kantoorpand. In dit geval dat van u. Om dit te doen, heb ik in samen
werking met SPIE Nederland BV een model opgesteld. Graag zou ik dit model willen testen aan de hand
van de karakteristieken van uw kantoorpand.
Het resultaat van het onderzoek zijn twee sets van renovatie mogelijkheden voor uw kantoorpand. Een
met het doel om energie label C te behalen en de ander met energie label A als doel. De resultaten
laten de te verwachten kosten (investering en onderhoud), terug verdientijd, reductie in CO2 uitstoot
en een tijdlijn die aangeeft hoelang de renovatie verwacht te duren.
Wat ik daarvoor van u wil vragen is om bijgevoegde vragen lijst in te vullen. Mochten er dingen niet
duidelijk zijn, of heeft u bepaalde informatie niet paraat? Maak hier een notitie van, dit zal ik gebruiken
om de vragenlijst de verbeteren.
Zou u mij willen helpen?
Alvast bedankt!
Met vriendelijke groet,
Pam Engwirda

Master thesis - Energy Science Pam Engwirda (5549647)
71
Oppervlakte ramen grenzend aan buiten m2
Issolatie waarden U Indien bekend, vul hier in
Vloer 5.882 W/m2K
Muren 2.326 W/m2K
Dak 1.163 W/m2K
Eventueel renovatie jaar
Type vloer, plafond en gevel
Massa van vloerconstructie [kg/m2]
Type plafond
Gevel type
Ramen
Type beglazing Zonwering aanwezig (aan de buitenkant)?
Zo ja, type zonwering
Kantoorpand installaties
Klimaat systeem nr Zie tab Climate system nr
Warmte en koude voorziening
Type verwarmingsinstallatie Individuele regeling verwarming
Koude leverancier
Oppervlakte van gekoelde zones m2
WKK
Aanwezig?
Elektrisch vermogen kW
Thermisch vermogen kW
Soort distributie
Gedetailleerde informatie warmte voorziening
Warmtepomp
Bron
Brandstof
Temperatuur niveau warmteaanvoer
Ketel
Type ketel
Temperatuur niveau warmteaanvoer
Een of meer centrale verwarmingstoestellen die warmte leveren voor een oppervlakte van
Stoomketel
Economizer

Master thesis - Energy Science Pam Engwirda (5549647)
72
Luchtvoorverwarmer
Heetwaterketel
Rookgascondensor
Ventilatoren
Type ventilatie systeem
Provision in ventilation system
Regeling
Systeem type warmte terugwinning
Ventilatie voorziening voor koelbehoefte
Bevochtiging
Type bevochtigingsinstallatie
Vochtterugwinning
Warm tap water
Type toestel
Distributie systeem
Zonne-energie systemen
Zonnepanelen
Aanwezig
Type zonnepaneel
Indien anders, piekvermogen W/m2
Oppervlakte paneel m2
Orientatie
Hellingshoek
Zonne collector
Aanwezig
Oppervlakte paneel m2
Verlichting (zie box rechts) Totaal geinstalleerd vermogen verlichting Conventioneel 0.00 kW
LED kW
Armatuurtype
Type regeling/schakeling
Bewegingsmelders
Voorkeuren renovatie
Verdeel 100 punten over de onderstaande criteria. Diegene die voor u het belangrijkste is, vul daar de meeste punten in. De tweede belangrijkste iets minder en zo verder.

Master thesis - Energy Science Pam Engwirda (5549647)
73
Punten Voorbeeld
Laagste inversteringskosten 50
Snelste terug verdientijd 20
Laagste onderhoudskosten 0
Reductie van CO2 uitstoot 10
Reductie van energie gebruik 20
0
Als laatste wil ik u vragen de verschillende renovatie mogelijkheden te rangschikken op prioriteit. Zet op nummer 1 dat gene neer wat u het liefst aangepakt ziet worden. Op nummer 7 diegene die het laatste gedaan moet worden. Bijvoorbeeld als u net de isolatie heeft vervangen, heeft dit minder prioriteit.
1
2
3
4
5
6
7
Notities
Verlichting
Vermogen (W) Aantal Vul het aantal lampen per type in. Als dit niet bekend is, vul dan hieronder het totale vermogen van de conventionele verlichting in.
TLD 18
36
58
72 Totaal geïnstalleerd conventioneel vermogen (kW)
116
PLC 9

Master thesis - Energy Science Pam Engwirda (5549647)
74
13
18
26
36
TL5 14
21
28
42
56
Klimaat Systeem nummer
Diverse berekeningen in de rekenkern hangen af van het type klimaatsysteem dat aanwezig is, in het bijzonder hoe het warmte- en koudetransport plaatsvindt. De tabel hieronder geeft de relatie tussen de typen distributiesystemen en het systeemnummer aan. Een dual duct (tweekanalen) systeem kan alleen voorkomen bij volledige lucht systemen.
Warmtetransport door Koudetransport door Dual duct Systeem nr
Water of water en lucht
n.v.t. (geen koeling n.v.t. 1
Water n.v.t. 2
Lucht n.v.t. 3
Water en lucht n.v.t. 4
Lokaal n.v.t. 9
Lucht
n.v.t. (geen koeling n.v.t. 5
Water n.v.t. 6
Lucht Ja 13
Nee 7
Water en lucht n.v.t. 8
Lokaal n.v.t. 10
Lokaal n.v.t. (geen koeling n.v.t. 11
Lokaal n.v.t. 12

Master thesis - Energy Science Pam Engwirda (5549647)
75
Assumptions linked to year of construction
This section describes the assumptions linked to the year of construction. Table 32 describes the different
U-values for the facades, the floor and the roof. These values are received from the ISSO 75.3.
Table 32: Insulation values linked to year of construction
Insulation values
Building period
U-value (W/m2K)
Facade Floor Roof
1965 1975 2.326 5.882 1.163
1975 1983 0.769 1.923 0.769
1983 1988 0.769 0.769 0.769
1988 1992 0.500 0.769 0.500
1992 2013 0.395 0.395 0.395
2013 0.286 0.286 0.286

Master thesis - Energy Science Pam Engwirda (5549647)
76
Calculations for energy labels in the Netherlands
This section presents the formulas of the energy label calculation. An energy label can be calculated for
different types of buildings. Since this research focussed on the energy label of an office building, only the
formulas and variables corresponding to this building type are described. First, the link between the energy
labels and the Energy-Index is described. Next, the formula to calculate the Energy-Index is presented.
Specific values for the variables in the Energy-Index formula specified on office buildings are presented.
Lastly, the calculations needed to incorporate the NZEB requirements in the DSS are presented.
C.1 Energy labels through the Energy-Index
As described in Section 2.1, in the Netherlands, the energy label of a building is determined based on the
Energy-Index. In the ISSO 75.1 publication, these values are linked to an energy label, as presented in Table
33. As can be seen, an energy label C or lower is reached when the Energy-Index is lower or equal to 1.30.
Table 33: Energy label with corresponding Energy-Index (ISSO 75.1, 2013)
Energy label Limits Energy-Index
A ≤1.05
B 1.06 – 1.15
C 1.16 – 1.30
D 1.31 – 1.45
E 1.46 – 1.60
F 1.61 – 1.75
G >1.75
The calculation of the EI is based on formulas presented in the ISSO 75.1 and the ISSO 75.3 publications.
The EI is calculated with Formula A1.
𝐸𝐼 = 𝑄𝑝𝑟𝑖𝑚;𝑡𝑜𝑡,𝑏𝑢𝑖𝑙𝑑𝑖𝑛𝑔
𝑄𝑝𝑟𝑖𝑚;𝑎𝑙𝑙𝑜𝑤 [A1]
In which:
𝑄𝑝𝑟𝑖𝑚;𝑡𝑜𝑡,𝑏𝑢𝑖𝑙𝑑𝑖𝑛𝑔 = total primary energy use of the building [MJ]
𝑄𝑝𝑟𝑖𝑚;𝑎𝑙𝑙𝑜𝑤 = total allowable primary energy use of the building [MJ]
The calculation of the total primary energy use of the building is described in Appendix D. The calculation
for the total allowable primary energy use of the building is presented below. In these calculations, some
variables are specific to an office building.
The total allowable energy use of the building (𝑄𝑝𝑟𝑖𝑚;𝑎𝑙𝑙𝑜𝑤) is calculated with Formula A2.

Master thesis - Energy Science Pam Engwirda (5549647)
77
𝑄𝑝𝑟𝑖𝑚;𝑎𝑙𝑙𝑜𝑤 = ∑ ((
1
𝑓𝑐𝑜𝑜𝑙) ∗ 𝑐𝑔;𝑎𝑙𝑙𝑜𝑤 ∗ 𝐴𝑔;𝑠𝑐 ∗ 𝐸𝑃𝐶𝑟𝑒𝑞;𝑠𝑐 ∗ 𝑐𝐸𝑃𝐶;𝑠𝑐 ∗ 𝑐𝐸𝑃𝐴;𝑠𝑐 +
𝑦𝑉 ∗ 𝑐𝑉 ∗1
ℎ∗ 𝑓𝑢𝑠𝑒;𝑠𝑐 ∗ 𝑢𝑣;𝑚𝑖𝑛;𝑠𝑐 ∗ 𝐴𝑔;𝑠𝑐 ∗ 𝑓𝑜𝑐𝑐𝑢𝑝𝑖𝑒𝑑 𝑎𝑟𝑒𝑎
)
𝑠𝑐
+ 𝑐𝑙𝑜𝑠𝑠;𝑎𝑙𝑙𝑜𝑤 ∗ 𝑦𝑙𝑜𝑠𝑠 ∗ 𝐴𝑙𝑜𝑠𝑠
[A2]
In which:
𝑄𝑝𝑟𝑖𝑚;𝑎𝑙𝑙𝑜𝑤;𝑠𝑐 = total allowable primary energy use of space category in the building [MJ]
𝑐𝑙𝑜𝑠𝑠;𝑎𝑙𝑙𝑜𝑤 = measure for transmission losses (= 65) [MJ/m2]
𝑦𝑙𝑜𝑠𝑠 = correction factor from Building decree 2006 (= 1.2) [-]
𝐴𝑙𝑜𝑠𝑠 = loss area of the energy sector [m2]
𝑓𝑐𝑜𝑜𝑙 = weighting factor that provides partial compensation for the presence of cooling [-]
𝑐𝑔;𝑎𝑙𝑙𝑜𝑤 = reference energy use (= 330) [MJ]
𝐴𝑔;𝑠𝑐 = surface area of space category sc [m2]
𝐸𝑃𝐶𝑟𝑒𝑞;𝑠𝑐 = EPC requirement of space category sc in 2003 [-]
𝑐𝐸𝑃𝐶;𝑠𝑐 = correction factor for the EPC requirement of the space category sc [-]
𝑐𝐸𝑃𝐴;𝑠𝑐 = correction factor for space category sc (= 1) [-]
𝑦𝑉 = correction factor from Building decree 2006 (= 1.25) [-]
𝑐𝑉 = factor from Building decree 2006 for energy use deemed acceptable for ventilation (= 135)
[MJ∙s/dm3]
ℎ = conversion factor from dm3/s to m3/h (= 3.6) [-]
𝑓𝑢𝑠𝑒;𝑠𝑐 = usefactor: surface area weighted time fraction of which the ventilation is in operation for the space
category sc [-]
𝑢𝑣;𝑚𝑖𝑛;𝑢𝑓 = minimum ventilation rate of air coming directly from outside for use function [dm3/s∙m2]
𝑓𝑜𝑐𝑐𝑢𝑝𝑖𝑒𝑑 𝑎𝑟𝑒𝑎 = correction factor for surface of occupied area (= 0.8) [-]
Most of the values in the formula above are standardized for all types of buildings. If so, they are mentioned
behind the corresponding variable in brackets. However, for two variables, another formula is needed to
calculate these. In the ISSO 75.3 publication these formulas are explained.
The weighting factor that provides partial compensation for the presence of cooling (𝑓𝑐𝑜𝑜𝑙) is calculated
with Formula A3.
𝑓𝑐𝑜𝑜𝑙 = 𝑐𝑐𝑜𝑜𝑙 ∗ 𝑦𝑐𝑜𝑜𝑙
𝑐𝑐𝑜𝑜𝑙 ∗ 𝑦𝑐𝑜𝑜𝑙 +𝐴𝑔;𝑐𝑜𝑜𝑙
𝐴𝑡𝑜𝑡
[A3]

Master thesis - Energy Science Pam Engwirda (5549647)
78
In which:
𝑐𝑐𝑜𝑜𝑙 = coefficient for cooling from building decree (= 4)
𝑦𝑐𝑜𝑜𝑙 = coefficient for cooling from building decree (= 3)
𝐴𝑔;𝑐𝑜𝑜𝑙 = surface area of cooled zones in the building [m2]
𝐴𝑡𝑜𝑡 = total surface area of the building [m2]
The loss area of the energy sector (𝐴𝑙𝑜𝑠𝑠) is calculated with Formula A4.
𝐴𝑙𝑜𝑠𝑠 = ∑ 𝑑𝑘 ∗ 𝐴𝑘
𝑘
[A4]
In which:
𝑑𝑘 = weighting factor [-]
𝐴𝑘 = surface area of shell part k [m2]
The weighting factor (𝑑𝑘) for the surface of an element from the separation structure of a building depends
on the space on the other side of the element, typeborder;k. See Table 34.
Table 34: Weighting factor d
Construction adjoins (𝒕𝒚𝒑𝒆𝒃𝒐𝒓𝒅𝒆𝒓;𝒌) 𝒅𝒌 [-]
Ground 0.7
Crawlspace 0.7
Other 1
Lastly, in Formula A1, some variables are specific to the building type. Regarding office buildings, they are
presented in Table 35. As can be seen in Table 35, the EPC requirements are becoming stricter in time. The
EPC requirement set in 2015 is used in further calculations.
Table 35: Variables Energy-Index specific for office buildings
Variable Amount Unit
𝐸𝑃𝐶𝑟𝑒𝑞;𝑠𝑐 1.5 (2003), 1.1 (2009), 0.8 (2015) -
𝑐𝐸𝑃𝐶;𝑠𝑐 0.96 -
𝑓𝑢𝑠𝑒;𝑠𝑐 0.3 -
𝑢𝑣;𝑚𝑖𝑛;𝑠𝑐 1.3 dm3/s∙m2
To conclude, the following variables need to be determined by the office building characteristics to
calculate the total allowable primary energy use of the office building:
- 𝐴𝑔;𝑐𝑜𝑜𝑙 = surface area of cooled zones in the building [m2]

Master thesis - Energy Science Pam Engwirda (5549647)
79
- 𝐴𝑡𝑜𝑡 = total surface area of the building [m2]
- 𝐴𝑘 = surface area of shell part [m2]
C.2 NZEB requirements
As described in Section 2.1.1., the energy label system will change in the near future. Namely, to the Nearly-
Zero Energy Building (NZEB) requirements. To ensure the usability of the DSS in the future, these
requirements are incorporated as well. These requirements are based on the energy requirement per
square meter (kWh/m2). Filippidou et al. (2017) linked a mean theoretical primary energy consumption to
the different energy labels, expressed in kWh/m2/year. This link is presented in Table 36.
Table 36: Energy label with corresponding mean energy consumption (Filippidou et al., 2017)
Energy label Limits Energy-Index Mean theoretical primary energy consumption (kWh/m2/year)
A ≤1.05 96.8
B 1.06 – 1.15 132.5
C 1.16 – 1.30 161.6
D 1.31 – 1.45 207.8
E 1.46 – 1.60 265.0
F 1.61 – 1.75 328.0
G >1.75 426.9
As it can be seen, the NZEB requirements described in Section 2.3 are stricter than the energy label
requirements. To incorporate the NZEB requirements, the primary energy consumption in kWh/m2/year is
calculated as well. This is done by Formula A5.
𝑄𝑝𝑟𝑖𝑚;𝑡𝑜𝑡,𝑏𝑢𝑖𝑙𝑑𝑖𝑛𝑔 [𝑘𝑊ℎ
𝑚2 ∗ 𝑦𝑒𝑎𝑟] =
𝑄𝑝𝑟𝑖𝑚;𝑡𝑜𝑡,𝑏𝑢𝑖𝑙𝑑𝑖𝑛𝑔 [𝑀𝐽
𝑦𝑒𝑎𝑟]
ℎ ∗ 𝐴𝑢 [A5]
In which:
𝑄𝑝𝑟𝑖𝑚;𝑡𝑜𝑡,𝑏𝑢𝑖𝑙𝑑𝑖𝑛𝑔 = total primary energy use of the building [MJ]
ℎ = conversion factor from MJ to kWh (= 3.6)
𝐴𝑢 = use area of building [m2]

Master thesis - Energy Science Pam Engwirda (5549647)
80
Calculation energy demand office building
This section describes the calculations needed to determine the energy use of an office building. These
calculations are presented in the ISSO 75.1 and the ISSO 75.3. The generation efficiencies for electricity
used are 𝜂𝑒𝑙 = 0.39 and 𝜂𝑒𝑙,𝑚𝑎𝑟𝑔 = 0.39. These follow from ISSO 75.3 and since this method is widely used
in the building sector, these values are used in this research.
D.1 Calculation of total energy use office building
The total net energy use of the building is equal to the sum of the total energy use, minus the contributions
of solar energy and cogeneration. This is described in Formula A6.
𝑄𝑝𝑟𝑖𝑚;𝑡𝑜𝑡,𝑏𝑢𝑖𝑙𝑑𝑖𝑛𝑔 = 𝑄𝑝𝑟𝑖𝑚;𝑡𝑜𝑡;𝑢𝑠𝑒 − 𝑄𝑝𝑟𝑖𝑚;𝐶𝐻𝑃 − 𝑄𝑝𝑟𝑖𝑚;𝑝𝑣 [A6]
In which:
𝑄𝑝𝑟𝑖𝑚;𝑡𝑜𝑡,𝑏𝑢𝑖𝑙𝑑𝑖𝑛𝑔 = total net primary energy use of the building [MJ]
𝑄𝑝𝑟𝑖𝑚;𝑡𝑜𝑡;𝑢𝑠𝑒 = total primary energy use [MJ]
𝑄𝑝𝑟𝑖𝑚;𝐶𝐻𝑃 = total primary energy contribution of cogeneration [MJ]
𝑄𝑝𝑟𝑖𝑚;𝑝𝑣 = total primary energy contribution of solar panels [MJ]
In Formula A6, the energy contribution of solar panels depends on the type of panel. An amorfe cell has a
peak power of 45 W/m2, while a mono- or multi crystalline cell has a peak power of 120 W/m2. The energy
contribution by cogeneration depends on the primary energy contribution of a CHP and thermal and
electric conversion numbers.
The total primary energy use of an office building is calculated with Formula A7.
𝑄𝑝𝑟𝑖𝑚;𝑡𝑜𝑡;𝑢𝑠𝑒 = 𝑄𝑝𝑟𝑖𝑚;𝑠ℎ + 𝑄𝑝𝑟𝑖𝑚;𝑣𝑒𝑛𝑡 + 𝑄𝑝𝑟𝑖𝑚;𝑙𝑖𝑔ℎ𝑡 + 𝑄𝑝𝑟𝑖𝑚;𝑝𝑢𝑚𝑝𝑠 + 𝑄𝑝𝑟𝑖𝑚;𝑐𝑜𝑜𝑙𝑖𝑛𝑔 + 𝑄𝑝𝑟𝑖𝑚;ℎ𝑢𝑚 +
𝑄𝑝𝑟𝑖𝑚;𝑡𝑎𝑝 [A7]
In which:
𝑄𝑝𝑟𝑖𝑚;𝑡𝑜𝑡;𝑢𝑠𝑒 = total primary energy use [MJ]
𝑄𝑝𝑟𝑖𝑚;𝑠ℎ = total primary energy use for space heating [MJ]
𝑄𝑝𝑟𝑖𝑚;𝑣𝑒𝑛𝑡 = total primary energy use for ventilation [MJ]
𝑄𝑝𝑟𝑖𝑚;𝑙𝑖𝑔ℎ𝑡 = total primary energy use for lightning [MJ]
𝑄𝑝𝑟𝑖𝑚;𝑝𝑢𝑚𝑝𝑠 = total primary energy use for pumps [MJ]
𝑄𝑝𝑟𝑖𝑚;𝑐𝑜𝑜𝑙𝑖𝑛𝑔 = total primary energy use for cooling [MJ]
𝑄𝑝𝑟𝑖𝑚;ℎ𝑢𝑚 = total primary energy use for humidification [MJ]
𝑄𝑝𝑟𝑖𝑚;𝑡𝑎𝑝 = total primary energy use for preparation of hot tap water [MJ]

Master thesis - Energy Science Pam Engwirda (5549647)
81
D.2 Energy use for space heating
The primary energy use for space heating can be described with Formula A8:
𝑄𝑝𝑟𝑖𝑚;𝑠ℎ = 𝑄𝑠ℎ [𝐴8]
In which:
𝑄𝑝𝑟𝑖𝑚;𝑠ℎ = total primary energy use for space heating [MJ]
𝑄𝑠ℎ = energy use for space heating [MJ]
The energy use for space heating of the total period is equal to the sum of the energy use per month,
Formula A9. The energy use per month is calculated with Formula A10.
𝑄𝑠ℎ = ∑ 𝑄𝑠ℎ;𝑖
𝑛𝑚𝑜𝑛𝑡ℎ;𝑝𝑒𝑟𝑖𝑜𝑑
𝑖=1
[𝐴9]
𝑄𝑠ℎ;𝑖 = 𝑄𝑠ℎ;𝑑𝑒𝑚;𝑖 ∗ 𝑓𝑢𝑠𝑒
𝜂𝑔𝑒𝑛;𝑠ℎ;𝑖 ∗ 𝜂𝑠𝑦𝑠;𝑠ℎ [𝐴10]
In which:
𝑄𝑠ℎ = energy use for space heating in total period [MJ]
𝑄𝑠ℎ;𝑖 = energy use for space heating in month i [MJ]
𝑄𝑠ℎ;𝑑𝑒𝑚;𝑖 = heat demand in month i [MJ]
𝑓𝑢𝑠𝑒 = use factor the building is in use [-]
𝜂𝑔𝑒𝑛;𝑠ℎ;𝑖 = efficiency for heat generation in month i [-]
𝜂𝑠𝑦𝑠;𝑠ℎ = yearly average system efficiency for space heating [-]
D.2.1 Heat demand
The heat demand per month of a building is determined as followed:
If the temperature demand inside is higher than the outside temperature (𝑇𝑖 > 𝑇𝑜;𝑖) and 𝛾 ≤ 2.5 then:
𝑄𝑠ℎ;𝑑𝑒𝑚;𝑖 = 𝑄𝑡𝑟;𝑖 + 𝑄𝑣𝑒𝑛𝑡;𝑖 − 𝜂𝑢;𝑠ℎ;𝑖 ∗ (𝑄𝑖𝑛𝑡𝑒𝑟𝑛;ℎ𝑝;𝑖 + 𝑄𝑠𝑢𝑛;𝑡;𝑖 + 𝑄𝑠𝑢𝑛;𝑒𝑠;𝑖) [𝐴11]
Otherwise:
𝑄𝑠ℎ;𝑑𝑒𝑚;𝑖 = 0 [𝐴12]
In which:
𝑄𝑡𝑟;𝑖 = heat loss through transmission in month i [MJ]
𝑄𝑣𝑒𝑛𝑡;𝑖 = heat loss through ventilation in month i [MJ]

Master thesis - Energy Science Pam Engwirda (5549647)
82
𝑄𝑖𝑛𝑡𝑒𝑟𝑛;ℎ𝑝;𝑖 = heat gain through internal heat production in month i [MJ]
𝑄𝑠𝑢𝑛;𝑡;𝑖 = sun heat gain through transparent construction parts in month i [MJ]
𝑄𝑠𝑢𝑛;𝑒𝑠;𝑖 = sun heat gain through solar energy systems in month i [MJ]
𝜂𝑢;𝑠ℎ;𝑖 = utilization factor for heat gain in month i [-]
𝛾 = gain/loss ratio in month i [-]
D.2.2 Heat loss through transmission
The transmission loss per month can be calculated with Formulas A13 and A14:
𝑄𝑡𝑟;𝑖 = 𝐻𝑡𝑟 ∗ (𝑇𝑖𝑛 − 𝑇𝑜;𝑖) ∗ 𝑡 [𝐴13]
𝐻𝑡𝑟 = ∑(𝑎𝑘 ∗ 𝐴𝑘 ∗ (𝑈𝑘 + 𝑈𝑡𝑏)) [𝐴14]
𝑘
In which:
𝑄𝑡𝑟;𝑖 = heat loss through transmission in month i [MJ]
𝐻𝑡𝑟 = specific heat loss through transmission [W/K]
𝑇𝑖𝑛 = inside temperature [C] → is 19 C for office buildings
𝑇𝑜;𝑖 = monthly average outside temperature in month i [C]
𝑡 = time in a month (= 2.63) [Ms]
𝑎𝑘 = the weighting factor to be assigned to the partition construction k [-]
𝐴𝑘 = area of the projection of partition construction k [m2]
𝑈𝑘 = heat transfer coefficient of partition construction k [W/(m2K)]
𝑈𝑡𝑏 = surcharge for thermal bridges (= 0.1) [W/(m2K)]
In this research, the outside temperature corresponds to the monthly average temperatures measured in
De Bilt in 2019. They are presented in Appendix E.
The summation of k describes all constructions adjacent to outside air, ground, water, unheated spaces or
strong ventilated spaces. The transmission loss cannot be smaller than 0. If 𝑄𝑡𝑟;𝑖 < 0 then: 𝑄𝑡𝑟;𝑖 = 0.
U value
The U-value for a closed construction is calculated with Formula A15.
𝑈 =1
𝑅𝑎 [𝐴15]
In which:

Master thesis - Energy Science Pam Engwirda (5549647)
83
𝑅𝑎 = air-to-air heat resistance of a structure [m2K/W]
𝑈 = heat transfer coefficient of a structure [W/m2K]
The air-to-air heat resistance consists of the construction resistance 𝑅𝑐, the resistance of the air layer inside
the construction 𝑅𝑖 and the resistance of the air layer outside the construction 𝑅𝑒. See Formula A16.
𝑅𝑎 = 𝑅𝑖 + 𝑅𝑐 + 𝑅𝑒 [𝐴16]
In which:
𝑅𝑎 = air-to-air heat resistance [m2K/W]
𝑅𝑐 = heat resistance of construction [m2K/W]
𝑅𝑖 = heat resistance of air layer inside the construction (= 0.13) [m2K/W]
𝑅𝑒 = heat resistance of air layer outside the construction [m2K/W] (see Table 37)
Table 37: The values for Re when heat flows from inside out
Construction type Construction adjoints to 𝑹𝒆 [m2K/W]
Facade, panel, window, door
Outside air or water 0.04
Highly ventilated, non-lockable space 0.13
Unheated adjacent space 0.13
Ground 0.13
Roof Outside 0.04
Ground 0.13
Unheated upper room 0.13
Floor Outside air or water 0.04
Highly ventilated, non-lockable space 0.13
Unheated lower room 0.13
Crawlspace 0.13
Ground 0.13
An additional calculation applies to floors, to consider the resistance of the floor package:
𝑈𝑘 =1
1𝑈𝑓𝑙𝑜𝑜𝑟
⁄ + 5 [𝐴17]
In which:
𝑈𝑘 = U-value to be charged for the floor including the ground package
𝑈𝑓𝑙𝑜𝑜𝑟 = U-value of the floor conform Formula A15
Weighting factor of partition construction
The weighting factor to be assigned to the partition construction k depends on the space on the other side
of the element, 𝑡𝑦𝑝𝑒𝑏𝑜𝑟𝑑𝑒𝑟;𝑘. See Table 38.

Master thesis - Energy Science Pam Engwirda (5549647)
84
Table 38: Weighting factor a
Construction adjoins (𝒕𝒚𝒑𝒆𝒃𝒐𝒓𝒅𝒆𝒓;𝒌) 𝒂𝒌 [-]
Outside air or water 1
Strong ventilated space 1
Unheated adjacent space 1/(1+𝑈𝑘/10)
Unheated upper floor 1/(1+𝑈𝑘/3)
Ground 1/(1+𝑈𝑘)
Crawl space 1/(1+𝑈𝑘)
In this research, the assumption is made that the outside walls only adjoin outside air, that the floor adjoins
either ground or crawlspace and the roof adjoins outside air. This to simplify the calculations, which is
needed due to time constraints.
D.2.3 Heat loss through ventilation
The monthly heat loss through ventilation (as a result of infiltration, natural and mechanical ventilation
and flushing) is calculated with Formulas A18 and A19:
𝑄𝑣𝑒𝑛𝑡;𝑖 = 𝐻𝑣𝑒𝑛𝑡 ∗ (𝑇𝑖𝑛 − 𝑇𝑜;𝑖) ∗ 𝑡 [𝐴18]
𝐻𝑣𝑒𝑛𝑡 = 𝜌 ∗ 𝑐𝑙 ∗1
ℎ∗ (𝑣𝑣;𝑖𝑛𝑓 + 𝑣𝑣;𝑛𝑎𝑡 + (1 − 𝜂ℎ𝑟𝑒) ∗ 𝑣𝑣;𝑚𝑒𝑐ℎ) ∗ 𝑉𝑠𝑒𝑐𝑡𝑜𝑟 [𝐴19]
In which:
𝐻𝑣𝑒𝑛𝑡 = specific heat loss through ventilation [W/K]
𝜌 ∗ 𝑐𝑙 = heat capacity of air (=1.2) [J/dm3K]
ℎ = conversion factor from dm3/s to m3/h (= 3.6) [-]
𝑣𝑣;𝑖𝑛𝑓 = ventilation rate of to be heated fresh air coming directly from outside through infiltration [1/h]
𝑣𝑣;𝑛𝑎𝑡 = ventilation rate of to be heated fresh air coming directly from outside through natural ventilation
[1/h]
𝜂ℎ𝑟𝑠 = efficiency of the heat recovery system [-]
𝑣𝑣;𝑚𝑒𝑐ℎ = ventilation rate of to be heated fresh air coming directly from outside through mechanical
ventilation [1/h]
𝑉𝑠𝑒𝑐𝑡𝑜𝑟 = net volume of the energy sector [m3]
The ventilation loss cannot be smaller than 0. If 𝑄𝑣𝑒𝑛𝑡;𝑖 < 0 than 𝑄𝑣𝑒𝑛𝑡;𝑖 = 0.
Ventilation rate through infiltration
𝑣𝑣;𝑖𝑛𝑓 = 𝑓𝑤𝑖𝑛𝑑 ∗ 𝑓𝑖𝑛𝑓 ∗ 𝑞𝑣10;𝑠𝑝𝑒𝑐 ∗ ℎ ∗𝐴𝑢;𝑠𝑒𝑐𝑡𝑜𝑟
𝑉𝑠𝑒𝑐𝑡𝑜𝑟 [𝐴20]

Master thesis - Energy Science Pam Engwirda (5549647)
85
In which:
𝑓𝑤𝑖𝑛𝑑 = building height dependent correction factor wind pressure introduced infiltration [-]
𝑓𝑖𝑛𝑓 = correction factor due to ventilation system [-]
𝑞𝑣10;𝑠𝑝𝑒𝑐 = specific infiltration [-]
ℎ = conversion factor from dm3/s to m3/h (= 3.6) [-]
𝐴𝑢;𝑠𝑒𝑐𝑡𝑜𝑟 = area of use from energy sector [m2]
𝑉𝑠𝑒𝑐𝑡𝑜𝑟 = net volume of the energy sector [m3]
The factor 𝑓𝑤𝑖𝑛𝑑 corresponds to the sector height, presented in Table 39.
Table 39: Correction factor fwind
Sector height 𝒇𝒘𝒊𝒏𝒅 [-]
Lower than 13 m 1.00
Between 13 and 70 m 0.425*hbuild0.333
Higher than 70 m 1.75
The factor 𝑓𝑖𝑛𝑓 describes the correlation between the infiltration and type of ventilation system, see
Table 40.
Table 40: Correction factor f inf
Ventilation system Description 𝒇𝒊𝒏𝒇
A Systems with natural supply and drain 0.080
B Systems with mechanical supply and natural drain 0.085
C Systems with natural supply and mechanical drain 0.100
D Systems with mechanical supply and drain; balance ventilation 0.115
𝑞𝑣10;𝑠𝑝𝑒𝑐 = 𝑓𝑡𝑦𝑝𝑒 ∗ 𝑓𝑦𝑒𝑎𝑟 ∗ 𝑞𝑣10;𝑠𝑝𝑒𝑐;𝑐𝑎𝑙 [𝐴21]
In which:
𝑓𝑡𝑦𝑝𝑒 = coefficient for building type [-]
𝑓𝑦𝑒𝑎𝑟 = coefficient for year of construction [-]
𝑞𝑣10;𝑠𝑝𝑒𝑐;𝑐𝑎𝑙 = calculation value for 𝑞𝑣10;𝑠𝑝𝑒𝑐 [dm3/s.m2]
Table 41: Relation between Awind/Vbuild, building shape class and ftype
Awind/Vbuild (1/m) Building shape class 𝒇𝒕𝒚𝒑𝒆
> 0.15 1 2.2
0.15 ≥ A/V > 0.10 2 2.4
0.10 ≥ A/V > 0.08 3 2.8
0.08 ≥ A/V > 0.05 4 3.4

Master thesis - Energy Science Pam Engwirda (5549647)
86
0.05 ≥ A/V 5 4.6
The building shape class is determined by the ratio between the wind-blown building area (Awind) and the
building volume (Vbuild). In which Awind is defined as the building circumference multiplied with the building
height. The ratio can be calculated with the following formula:
𝐴𝑤𝑖𝑛𝑑
𝑉𝑏𝑢𝑖𝑙𝑑= 2 ∗ √
ℎ𝑤𝑖𝑛𝑑;𝑏𝑢𝑖𝑙𝑑
ℎ𝑓𝑙𝑜𝑜𝑟 ∗ 𝐴𝑢;𝑡𝑜𝑡 [𝐴22]
In which:
ℎ𝑤𝑖𝑛𝑑;𝑏𝑢𝑖𝑙𝑑 = height above ground level from highest usage layer [m]
ℎ𝑓𝑙𝑜𝑜𝑟 = representative floor height = 3.5 m [m]
𝐴𝑢;𝑡𝑜𝑡 = use surface [m2]
Table 42: qv10;spec;cal as function of façade type
Façade type 𝒒𝒗𝟏𝟎;𝒔𝒑𝒆𝒄;𝒄𝒂𝒍
Standard façade 0.25
Cover or climate façade air technical open 0.23
Cover or climate façade air technical closed 0.22
Table 43: Year of construction fyear
Year of construction 𝒇𝒚𝒆𝒂𝒓
Before 1975 1
Between 1975 and 2005 1.0 – 0.02*(year of construction – 1975)
After 2005 0.4
Ventilation rate through natural ventilation
𝑣𝑣;𝑛𝑎𝑡 = 𝑓𝑢𝑠𝑒 ∗ 𝑣𝑣;𝑛𝑎𝑡;𝑢 [𝐴23]
In which:
𝑓𝑢𝑠𝑒 = usefactor: use area weighted average time fraction of operation of ventilation (=0.3 for office)
𝑣𝑣;𝑛𝑎𝑡;𝑢 = ventilation rate through natural ventilation during usage time [1/h]
𝑣𝑣;𝑛𝑎𝑡;𝑢 = 𝑓𝑢𝑠𝑒 𝑎𝑟𝑒𝑎 ∗ 𝑢𝑣;𝑚𝑖𝑛 ∗ ℎ ∗𝐴𝑢;𝑠𝑒𝑐𝑡𝑜𝑟
𝑉𝑠𝑒𝑐𝑡𝑜𝑟 [𝐴24]
In which:
𝑓𝑢𝑠𝑒 𝑎𝑟𝑒𝑎 = correction factor for surface of use area (=0.8) [-]
𝑢𝑣;𝑚𝑖𝑛 = minimal air volume flow due to natural ventilation [dm3/s.m2] (=1.3 office)

Master thesis - Energy Science Pam Engwirda (5549647)
87
Ventilation rate through mechanical ventilation
𝑣𝑣;𝑚𝑒𝑐ℎ = 𝑓𝑢𝑠𝑒 ∗ 𝑣𝑣;𝑚𝑒𝑐ℎ;𝑢 [𝐴25]
In which:
𝑣𝑣;𝑚𝑒𝑐ℎ;𝑢 = ventilation rate through mechanical ventilation during usage time [1/h]
𝑣𝑣;𝑚𝑒𝑐ℎ;𝑢 = 𝑢𝑣;𝑚 ∗ ℎ ∗𝐴𝑢;𝑠𝑒𝑐𝑡𝑜𝑟
𝑉𝑠𝑒𝑐𝑡𝑜𝑟 [𝐴26]
For mechanical supply, mechanical extraction and balanced ventilations, the following applies:
If 𝑓𝑢𝑠𝑒 𝑎𝑟𝑒𝑎 ∗ 𝑢𝑣;𝑚𝑖𝑛 ≤ 𝑓𝑟𝑒𝑔;𝑣𝑒𝑛𝑡 ∗ 𝑢𝑣;𝑚;𝑚𝑎𝑥 [𝐴27]
Then 𝑢𝑣;𝑚 = 𝑓𝑟𝑒𝑔;𝑣𝑒𝑛𝑡 ∗ 𝑢𝑣;𝑚;𝑚𝑎𝑥 [𝐴28]
Otherwise 𝑢𝑣;𝑚 = 𝑓𝑢𝑠𝑒 𝑎𝑟𝑒𝑎 ∗ 𝑢𝑣;𝑚𝑖𝑛 [𝐴29]
For natural ventilation, the following applies:
𝑢𝑣;𝑚 = 0 [𝐴30]
In which:
𝑢𝑣;𝑚𝑖𝑛 = minimal air volume flow [dm3/s.m2]
𝑓𝑟𝑒𝑔;𝑣𝑒𝑛𝑡 = weighting factor for provisions for back control of outside air supply [-]
𝑢𝑣;𝑚 = air volume flow by mechanical ventilation [dm3/s.m2]
𝑢𝑣;𝑚;𝑚𝑎𝑥 = maximum air volume flow by mechanical ventilation [dm3/s.m2]
Table 44: Reduction factor for the provision in ventilation
Provision in ventilation system 𝒕𝒚𝒑𝒆𝒓𝒆𝒈;𝒗𝒆𝒏𝒕 𝒇𝒓𝒆𝒈;𝒗𝒆𝒏𝒕
Recirculation 0.6
Flow regulation 0.6
Recirculation and flow regulation 0.6
No recirculation or flow regulation 1
Table 45: Efficiency of heat recovery
Heat recovery system type 𝒕𝒚𝒑𝒆𝒉𝒓𝒔 𝜼𝒉𝒓𝒔
No heat recovery system 0
Plate or tube heat exchanger 0.65

Master thesis - Energy Science Pam Engwirda (5549647)
88
Two elements system (twin-coil) 0.60
Cold drawers with air handling units 0.40
Slow rotating or intermittent heat exchangers 0.70
D.2.4 Heat gain through internal heat production
𝑄𝑖𝑛𝑡𝑒𝑟𝑛;ℎ𝑑;𝑖 = (𝑄𝑖;𝑝𝑒𝑟𝑠;𝑖 + 𝑄𝑖;𝑎𝑝𝑝;𝑖 + 𝑄𝑖;𝑣𝑒𝑛𝑡;𝑖 + 𝑄𝑖;𝑙𝑖𝑔ℎ𝑡;𝑖) ∗ 𝑎ℎ𝑑 [𝐴31]
𝑄𝑖𝑛𝑡𝑒𝑟𝑛;𝑐𝑑;𝑖 = (𝑄𝑖;𝑝𝑒𝑟𝑠;𝑖 + 𝑄𝑖;𝑎𝑝𝑝;𝑖 + 𝑄𝑖;𝑣𝑒𝑛𝑡;𝑖 + 𝑄𝑖;𝑙𝑖𝑔ℎ𝑡;𝑖) ∗ 𝑎𝑐𝑑 [𝐴32]
In which:
𝑄𝑖𝑛𝑡𝑒𝑟𝑛;ℎ𝑑;𝑖 = heat gain through internal heat production in month i, used for the heat demand
calculation [MJ]
𝑄𝑖𝑛𝑡𝑒𝑟𝑛;𝑐𝑑;𝑖 = heat gain through internal heat production in month i, used for the cooling demand
calculation [MJ]
𝑄𝑖;𝑝𝑒𝑟𝑠;𝑖 = internal heat production through persons in month i [MJ]
𝑄𝑖;𝑎𝑝𝑝;𝑖 = internal heat production through appliances in month i [MJ]
𝑄𝑖;𝑣𝑒𝑛𝑡;𝑖 = internal heat production through ventilators in month i [MJ]
𝑄𝑖;𝑙𝑖𝑔ℎ𝑡;𝑖 = internal heat production through lightning in month i [MJ]
𝑎ℎ𝑑 = auxiliary factor = 0.8
𝑎𝑐𝑑 = auxiliary factor = 1
𝑄𝑖;𝑝𝑒𝑟𝑠;𝑖 = 𝑓𝑢𝑠𝑒 ∗ 𝑞𝑖;𝑝𝑒𝑟𝑠 ∗ 𝐴𝑢 ∗ 𝑡 [𝐴33]
In which:
𝑓𝑢𝑠𝑒 = usefactor: use area weighted average time fraction of operation of ventilation (=0.3 for office) [-]
𝑞𝑖;𝑝𝑒𝑟𝑠 = specific internal heat load by persons (=3 for office) [W/m2]
𝐴𝑢 = use surface of energy sector [m2]
𝑡 = time in a month (=2.63) [Ms]
𝑄𝑖;𝑎𝑝𝑝;𝑖 = 𝑞𝑖;𝑎𝑝𝑝 ∗ 𝐴𝑢 ∗ 𝑡 [𝐴34]
In which:
𝑞𝑖;𝑎𝑝𝑝 = specific heat production by appliances (=3 for office) [W/m2]
𝑄𝑖;𝑣𝑒𝑛𝑡;𝑖 = 𝑓𝑖;𝑣𝑒𝑛𝑡 ∗ 𝑄𝑝𝑟𝑖𝑚;𝑣𝑒𝑛𝑡;𝑖 ∗ 𝜂𝑒𝑙 [𝐴35]

Master thesis - Energy Science Pam Engwirda (5549647)
89
In which:
𝑓𝑖;𝑣𝑒𝑛𝑡 = reduction factor regarding internal heat load of ventilators [-]
𝑄𝑝𝑟𝑖𝑚;𝑣𝑒𝑛𝑡;𝑖 = primary energy use by ventilators in month i [MJ]
𝜂𝑒𝑙 = efficiency of electricity supply [-]
Table 46: Reduction factor for the internal heat load by ventilators
Ventilator type 𝒕𝒚𝒑𝒆𝒗𝒆𝒏𝒕 𝒇𝒊;𝒗𝒆𝒏𝒕
Only mechanical extraction 0
Only mechanical supply 0.3
Mechanical supply and drain without recirculation or heat recovery
0.6
Mechanical supply and drain with recirculation or heat recovery
0.8
𝑄𝑖;𝑙𝑖𝑔ℎ𝑡;𝑖 = 𝜂𝑒𝑙 ∗ ∑ 𝑓𝑙𝑖𝑔ℎ𝑡;𝑧 ∗ 𝑄𝑙𝑖𝑔ℎ𝑡;𝑧;𝑖 [𝐴36]
𝑧
In which:
𝑓𝑙𝑖𝑔ℎ𝑡;𝑧 = reduction factor for lightning in lightning zone z [-]
𝑄𝑙𝑖𝑔ℎ𝑡;𝑧;𝑖 = primary energy use by lightning in lightning zone z in month i [MJ]
Table 47: Reduction factor for lighting
Luminaire type 𝒕𝒚𝒑𝒆𝒍𝒖𝒎 𝒇𝒍𝒊𝒈𝒉𝒕
Lightning luminaires are being suctioned 0.5
Other cases 1
D.2.5 Solar heat gain through transparent construction components
𝑄𝑠𝑢𝑛;𝑡;𝑖 = ∑(𝑞𝑠𝑢𝑛,𝑖 ∗ 𝑧𝑠𝑢𝑛,𝑛 ∗ 𝑟𝑛;𝑖 ∗ 𝑓𝑠𝑢𝑛;𝑛;𝑖 ∗ 𝑍𝑇𝐴𝑛 ∗ 𝐴𝑛 ∗ 𝑘) [𝐴37]
𝑛
In which:
𝑞𝑠𝑢𝑛,𝑖 = amount of solar energy which falls on a horizontal plane per m2 at the respective climate in
month i [MJ]
𝑧𝑠𝑢𝑛,𝑛 = orientation factor [-]
𝑟𝑛;𝑖 = shading reduction factor of the daylight opening in month i [-]
𝑓𝑠𝑢𝑛;𝑛;𝑖 = reduction factor of adjustable blinds in month i [-]
𝑍𝑇𝐴𝑛 = sun entry factor of the relevant daylight opening [-]
𝐴𝑛 = area of window including frame [m2]
𝑘 = frame factor (=0.75) [-]

Master thesis - Energy Science Pam Engwirda (5549647)
90
Table 48: Shading reduction factor of daylight opening (r)
Period i
Situation 𝒓 heating season (oct. until apr.) 𝒓 summer (may until sept.)
No awning 1 1
Awning 1 0.9 0.75
Awning 2 0.75 0.6
Type of awning are described as follows:
No awning if 𝑐−ℎ1
ℎ2≤
1
5
Awning 1 if 1
5<
𝑐−ℎ1
ℎ2<
1
3
Awning 2 if 𝑐−ℎ1
ℎ2≥
1
3
In which:
𝑐 = width cantilever [m]
ℎ1 = vertical distance between cantilever and window [m]
ℎ2 = height window [m]
Table 49: Reduction factor for adjustable blinds
Period i
Sun protection system 𝑻𝒚𝒑𝒆𝒔𝒖𝒏𝒑𝒓𝒐𝒕𝒆𝒄𝒕𝒊𝒐𝒏
𝒇𝒔𝒖𝒏;𝒏;𝒊 heating season (oct. until apr.)
𝒇𝒔𝒖𝒏;𝒏;𝒊 summer (may until sept.)
Manual outdoor blinds 0.5 0.5
Automatic outdoor blinds 0.5 0.35
All other cases 1 1
D.2.6 Solar heat gain through solar collectors for space heating
𝑄𝑠𝑢𝑛;𝑧𝑒;𝑖 = 𝜂𝑧𝑒 ∗ 𝑞𝑠𝑢𝑛 ∗ 𝐴𝑧𝑒 [𝐴38]
In which:
𝜂𝑧𝑒 = the average collector efficiency (=0.5) [-]
𝑞𝑠𝑢𝑛 = the amount of solar energy that falls on a horizontal surface in month i [MJ/m2]
𝐴𝑧𝑒 = area of the smallest surface that connects the collector edges [m2]

Master thesis - Energy Science Pam Engwirda (5549647)
91
D.2.7 Utilization factor for heat gain
The usability of the heat gain depends on the profit / loss ratio. As the profit / loss ratio becomes smaller,
the usability of the heat gain increases.
𝜂𝑢;𝑠ℎ;𝑖 =(1 − 𝛾𝑖
𝑎)
(1 − 𝛾𝑖𝑎+1)
, 𝑤ℎ𝑒𝑛 𝛾 ≠ 1 [𝐴39]
𝜂𝑢;𝑠ℎ;𝑖 =𝑎
(1 + 𝑎), 𝑤ℎ𝑒𝑛 𝛾 = 1 [𝐴40]
In which:
𝜂𝑢;𝑠ℎ;𝑖 = utilization factor for heat gain in month i [-]
𝛾𝑖 = profit / loss ratio in month i [-]
𝑎 = auxiliary variable [-]
The profit / loss ratio follows from the following formulas.
𝛾𝑖 =𝑄𝑝𝑟𝑜𝑓𝑖𝑡;𝑖
𝑄𝑙𝑜𝑠𝑠;𝑖 [𝐴41]
𝑄𝑝𝑟𝑜𝑓𝑖𝑡;𝑖 = 𝑄𝑖𝑛𝑡𝑒𝑟𝑛;𝑖 + 𝑄𝑠𝑢𝑛;𝑡;𝑖 + 𝑄𝑠𝑢𝑛;𝑧𝑒;𝑖 [𝐴42]
𝑄𝑙𝑜𝑠𝑠;𝑖 = 𝑄𝑡𝑟;𝑖 + 𝑄𝑣𝑒𝑛𝑡;𝑖 [𝐴43]
In which:
𝛾𝑖 = profit / loss ratio in month i [-]
𝑄𝑝𝑟𝑜𝑓𝑖𝑡;𝑖 = heat gain through solar and internal heat production in month i [MJ]
𝑄𝑙𝑜𝑠𝑠;𝑖 = heat loss through transmission and ventilation in month i [MJ]
𝑄𝑖𝑛𝑡𝑒𝑟𝑛;𝑖 = heat gain through internal heat production in month i [MJ]
𝑄𝑠𝑢𝑛;𝑡;𝑖 = solar heat gain through transparent construction parts in month i [MJ]
𝑄𝑠𝑢𝑛;𝑧𝑒;𝑖 = solar heat gain through solar collectors for space heating in month i [MJ]
𝑄𝑡𝑟;𝑖 = heat loss through transmission in month i [MJ]
𝑄𝑣𝑒𝑛𝑡;𝑖 = heat loss through ventilation in month i [MJ]
The value for the auxiliary variable follows from Formula A44:
𝑎 = 𝑐1 +1
𝑐2∗
𝐷 ∗ 𝐴𝑢
𝐻𝑡𝑟 + 𝐻𝑣𝑒𝑛𝑡 [𝐴44]
In which:

Master thesis - Energy Science Pam Engwirda (5549647)
92
𝑐1 = constant (=0.81 for office buildings) [-]
𝑐2 = constant (=76.9 for office buildings) [-]
𝐷 = specific effective thermal capacity per m2 of use area [Wh/(m2K)]
𝐴𝑢 = use area [m2]
𝐻𝑡𝑟 = specific heat loss through transmission [W/K]
𝐻𝑣𝑒𝑛𝑡 = specific heat loss through ventilation [W/K]
The specific effective thermal capacity D depends on the mass of the floor construction per m2 use area
and the presence or absence of an open ceiling. See Table 50.
Table 50: Specific effective thermal capacity D
D [Wh/(m2K)]
Ceiling type
Mass of floor construction per m2 use area [kg/m2]
Closed ceiling No or open ceiling
Less than 100 (woody) 15 15
Between 100 and 400 (floating screed) 30 50
More than 400 (stony) 50 100
A suspended ceiling is a closed type ceiling. With no false ceiling or with ceiling islands (mini-times 15% of
the surface of the ceiling is open) can be selected for open / no ceiling type. Not applying a suspended
ceiling is beneficial for it use of the building mass. Without a suspended ceiling, the slowly heat / cool the
building mass (concrete floors) store heat / cold and then release it to its environment. The disadvantage
of no suspended ceiling is, however, that the extraction of the lighting fixtures can no longer go through
the suspended ceiling to be realized (Tima, 2015).
D.2.8 Efficiency of heat generation
When only one generating device is present or a combination of several generating devices with the
same efficiency, the following applies:
𝜂𝑔𝑒𝑛;𝑠ℎ;𝑖 = 𝜂𝑔𝑒𝑛;𝑠ℎ [𝐴45]
In which:
𝜂𝑔𝑒𝑛;𝑠ℎ;𝑖 = efficiency for heat generation in month i [-]
𝜂𝑔𝑒𝑛;𝑠ℎ = efficiency of generating device [-]
In the other cases, Formula A46 applies:
𝜂𝑔𝑒𝑛;𝑠ℎ;𝑖 =1
𝑓𝑝𝑟𝑒𝑓;𝑖
𝜂𝑔𝑒𝑛;𝑠ℎ;𝑝𝑟𝑒𝑓 +
(1 − 𝑓𝑝𝑟𝑒𝑓;𝑖)𝜂𝑔𝑒𝑛;𝑠ℎ;𝑛𝑝𝑟𝑒𝑓
[𝐴46]

Master thesis - Energy Science Pam Engwirda (5549647)
93
In which:
𝜂𝑔𝑒𝑛;𝑠ℎ;𝑖 = efficiency for heat generation in month i [-]
𝑓𝑝𝑟𝑒𝑓;𝑖 = monthly average fraction of the total heat supply that is supplied by the preferentially switched
appliance [-]
𝜂𝑔𝑒𝑛;𝑠ℎ;𝑝𝑟𝑒𝑓 = efficiency of the preferentially switched appliances [-]
𝜂𝑔𝑒𝑛;𝑠ℎ;𝑛𝑝𝑟𝑒𝑓 = efficiency of the other generating devices [-]
Table 51: Fraction of the total heat supply by the preferred appliance
𝒇𝒑𝒓𝒆𝒇;𝒊 [-]
Type of preferred appliance
Month i CHP Other
January 0.418 0.79
February 0.668 0.79
March 0.911 0.79
April 0.947 0.79
May 0.947 0.79
June 0.947 0.79
July 0.947 0.79
August 0.947 0.79
September 0.947 0.79
October 0.947 0.79
November 0.947 0.79
December 0.781 0.79
The generation efficiency of a heat pump depends on the source which the heat pump uses to extract heat,
the type of fuel and the temperature demand. The different efficiencies are presented in Table 52.
Regarding other heat generators, the efficiency depends on the type of generator, the use area (Au) for
which the generator is used to produce heat and the temperature demand. The use area (Au) is described
as: “the area measured at floor level, between the ascending partition constructions, which enclose the
relevant space or group of spaces.” These efficiencies are shown in Table 53 and 54.
Table 52: Generation efficiencies heat pumps
Heat pump Generation efficiency
Sources Demanded temperature level
< 35 ˚C 35 – 45 ˚C 45 – 55 ˚C
Type of fuel
Electricity Gas Electricity Gas Electricity Gas
Soil / outside air 3.4 ∗ 𝜂𝑒𝑙 1.6 3.1 ∗ 𝜂𝑒𝑙 1.5 2.8 ∗ 𝜂𝑒𝑙 1.4
Heat from return / exhaust air
6.1 ∗ 𝜂𝑒𝑙 2.6 5.1 ∗ 𝜂𝑒𝑙 2.2 4.4 ∗ 𝜂𝑒𝑙 2.0
Ground water 4.7 ∗ 𝜂𝑒𝑙 2.1 4.2 ∗ 𝜂𝑒𝑙 1.9 3.6 ∗ 𝜂𝑒𝑙 1.8
Surface water 4.1 ∗ 𝜂𝑒𝑙 1.9 3.7 ∗ 𝜂𝑒𝑙 1.8 3.3 ∗ 𝜂𝑒𝑙 1.7

Master thesis - Energy Science Pam Engwirda (5549647)
94
Table 53: Generation efficiencies for heating other than heat pumps
Heating installation Generation efficiency Type of fuel
Electric installation Local gas heating of oil heating Cogeneration Heat delivery by third parties Steam boiler Hot water boiler Direct fired air heater
𝜂𝑒𝑙 0.65
𝜀𝐶𝐻𝑃;𝑡ℎ
𝜂𝑡ℎ 𝜂𝑠𝑡𝑒𝑎𝑚 ∗ 𝑓𝑙𝑜𝑠𝑠;𝑠𝑡 𝜂𝑠𝑡𝑒𝑎𝑚 ∗ 𝑓𝑙𝑜𝑠𝑠;ℎ𝑤
0.80
Electricity Gas Gas Heat Gas Gas Gas
Temperature level heat supply ≤ 55 ˚C > 55 ˚C
One or more central heating appliances (hot water) that supply heat for a use area of less than 500 m2 Conventional boiler VR-boiler HR-100 boiler HR-104 boiler HR-107 boiler
0.75 0.80
0.925 0.95
0.975
0.75 0.80 0.90
0.925 0.95
Gas Gas Gas Gas Gas
One or more central heating appliances (hot water) that supply heat for a use area of 500 m2 or bigger Conventional boiler VR-boiler HR-100 boiler HR-104 boiler HR-107 boiler
0.70 0.75
0.875 0.90
0.925
0.70 0.75 0.85
0.875 0.90
Gas Gas Gas Gas Gas
Table 54: Efficiencies of steam boilers and hot water boilers
Type of boiler Economizer Air preheater Flue gas condenser 𝜼𝒔𝒕𝒆𝒂𝒎
Steam boiler With Without n.a. 0.94
Without Without n.a. 0.90
Without With n.a. 0.95
Hot water boiler with 150 ˚C water
n.a. n.a. Without 0.93
n.a. n.a. With 0.95
D.3 Energy use by ventilators
There are four types of ventilators: 1) natural supply and drain, 2) natural supply and mechanical drain, 3)
mechanical supply and natural drain and 4) mechanical supply and drain. The energy use of these
ventilators is determined as the product of the maximum running time in a year, the effective power in
which a weighting for the control is included and the hours of use imposed. The total primary energy use
by ventilators per energy sector can be determined with the Formulas A47 and A48:
𝑄𝑝𝑟𝑖𝑚;𝑣𝑒𝑛𝑡 = ∑ 𝑄𝑝𝑟𝑖𝑚;𝑣𝑒𝑛𝑡;𝑖
𝑛𝑚𝑜𝑛𝑡ℎ,𝑝𝑒𝑟
𝑖=1
[𝐴47]
𝑄𝑝𝑟𝑖𝑚;𝑣𝑒𝑛𝑡;𝑖 =𝑔 ∗ 𝑡 ∗ 𝑃𝑒𝑓𝑓 ∗ 𝑓𝑢𝑠𝑒;𝑣𝑒𝑛𝑡
𝜂𝑒𝑙 [𝐴48]
In which:

Master thesis - Energy Science Pam Engwirda (5549647)
95
𝑄𝑝𝑟𝑖𝑚;𝑣𝑒𝑛𝑡 = total primary energy use per energy sector by the ventilator(s) in the calculation period [MJ]
𝑛𝑚𝑜𝑛𝑡ℎ,𝑝𝑒𝑟 = number of months in the calculation period (=12) [months]
𝑄𝑝𝑟𝑖𝑚;𝑣𝑒𝑛𝑡;𝑖 = total primary energy use per energy sector by the ventilator(s) in month i [MJ]
𝑔 = factor for converting kWh to MJ (=3.6) [-]
𝑡 = maximum running time per year in hours (=8760) [h]
𝑃𝑒𝑓𝑓 = effective power of the ventilator(s) in the energy sector [kW]
𝑓𝑢𝑠𝑒;𝑣𝑒𝑛𝑡 = use factor: average time fraction that the ventilators are in use [-]
𝜂𝑒𝑙 = efficiency of electricity supply [-]
The effective power of the ventilator is determined with Formula A49:
𝑃𝑒𝑓𝑓 =𝑃𝑠ℎ𝑎𝑓𝑡 ∗ 𝑓𝑐𝑜𝑛𝑡𝑟𝑜𝑙
𝜂𝑒𝑙𝑚 [𝐴49]
In which:
𝑃𝑠ℎ𝑎𝑓𝑡 = total shaft power of the ventilator(s) [kW]
𝑓𝑐𝑜𝑛𝑡𝑟𝑜𝑙 = reduction factor for the control of the ventilator(s) [-]
𝜂𝑒𝑙𝑚 = efficiency of the electric motor(s) (=0.75) [-]
D.3.1 Shaft power of the ventilators
The shaft power of the ventilators is determined with Formula A50:
𝑃𝑠ℎ𝑎𝑓𝑡 =𝑒𝑣𝑒𝑛𝑡 ∗ 𝑢𝑣;𝑣𝑒𝑛𝑡𝑖𝑙𝑎𝑡𝑜𝑟 ∗ 3.6 ∗ 𝐴𝑢
1000 [𝐴50]
In which:
𝑒𝑣𝑒𝑛𝑡 = specific electricity use by the ventilator(s) [Wh/m3]
𝑢𝑣;𝑣𝑒𝑛𝑡𝑖𝑙𝑎𝑡𝑜𝑟 = the air flow rate to be charged for the calculation of ventilator energy [dm3/s.m2]
𝐴𝑢 = use area of the energy sector [m2]
With mechanical supply or balanced ventilation, the following applies:
𝑢𝑣;𝑣𝑒𝑛𝑡𝑖𝑙𝑎𝑡𝑜𝑟 = 𝑢𝑣;𝑚;𝑚𝑎𝑥 [𝐴51]
With mechanical extraction, the following applies:
𝑢𝑣;𝑣𝑒𝑛𝑡𝑖𝑙𝑎𝑡𝑜𝑟 = 𝑓𝑢𝑠𝑒 𝑎𝑟𝑒𝑎 ∗ 𝑢𝑣;𝑚𝑖𝑛 [𝐴52]
In which:

Master thesis - Energy Science Pam Engwirda (5549647)
96
𝑢𝑣;𝑣𝑒𝑛𝑡𝑖𝑙𝑎𝑡𝑜𝑟 = the air flow rate to be charged for the calculation of ventilator energy [dm3/s.m2]
𝑢𝑣;𝑚;𝑚𝑎𝑥 = maximum air flow rate by mechanical ventilation [dm3/s.m2]
𝑢𝑣;𝑚𝑖𝑛 = minimal air flow rate [dm3/s.m2]
𝑓𝑢𝑠𝑒 𝑎𝑟𝑒𝑎 = correction factor for surface of use area (=0.8) [-]
The specific electricity use by the ventilators follows from Table 55.
Table 55: Specific electricity use by ventilators
Ventilation system System number 𝒆𝒗𝒆𝒏𝒕 [Wh/m3]
Natural ventilation 0
Mechanical extraction 0.25
Mechanical supply or balanced ventilation
3 or 7 (cooling by air) 0.62
Other 0.41
D.3.2 Reduction of the electricity consumption of ventilators by arrangements
The electricity use by ventilators can be reduced using flow control. The factor 𝑓𝑐𝑜𝑛𝑡𝑟𝑜𝑙 depends on the
type of arrangement according to Table 56.
Table 56: Reduction factor for the control of the ventilators
Arrangement 𝒇𝒄𝒐𝒏𝒕𝒓𝒐𝒍
No arrangement or throttle control 1
Flow control 0.7
D.4 Energy use by lighting
The energy use for lightning depends on the type and amount of lights installed, the operating hours and
the type of switch (movement sensors or not). The assumption is made that an office building yearly has
2400 operating hours for lighting. Furthermore, when movement sensors are installed, this reduces 20%
in energy use for lightning than when normal switches are used. The total energy use for lighting is
calculated with Formula A53.
𝑄𝑝𝑟𝑖𝑚;𝑙𝑖𝑔ℎ𝑡 = ∑ 𝑄𝑙𝑖𝑔ℎ𝑡;𝑖 [𝐴53]
𝑛𝑚𝑜𝑛𝑡ℎ;𝑝𝑒𝑟
𝑖=1
In which:
𝑄𝑝𝑟𝑖𝑚;𝑙𝑖𝑔ℎ𝑡 = total primary energy use for lighting [MJ]
𝑄𝑙𝑖𝑔ℎ𝑡;𝑖 = primary energy use for lighting in the energy sector in month i [MJ]
𝑛𝑚𝑜𝑛𝑡ℎ,𝑝𝑒𝑟 = number of months in the calculation period (=12) [-]

Master thesis - Energy Science Pam Engwirda (5549647)
97
For lighting it is possible to divide an energy sector into zones. Separate preconditions can be specified for
each zone. The energy consumption for lighting is equal to the sum of the energy consumption for lighting
per zone. See Formula A54.
𝑄𝑙𝑖𝑔ℎ𝑡;𝑖 = ∑ 𝑄𝑙𝑖𝑔ℎ𝑡;𝑧;𝑖 [𝐴54]
𝑧
In which:
𝑄𝑙𝑖𝑔ℎ𝑡;𝑖 = primary energy use for lighting in the energy sector in month i [MJ]
𝑄𝑙𝑖𝑔ℎ𝑡;𝑧;𝑖 = primary energy use for lighting in the energy sector in month i in zone z [MJ]
The energy consumption for lighting is determined per zone using the installed power per m2. See Formula
A55.
𝑄𝑙𝑖𝑔ℎ𝑡;𝑧;𝑖 =𝑝𝑙𝑖𝑔ℎ𝑡 ∗ 𝑔
𝜂𝑒𝑙 ∗ 𝑚𝑦𝑒𝑎𝑟∗ (𝑓𝑐𝑜𝑛𝑡;𝑑𝑎𝑦𝑙 ∗ 𝐴𝑑𝑎𝑦𝑙 + 𝑓𝑐𝑜𝑛𝑡;𝑎𝑟𝑡𝑙 ∗ 𝐴𝑎𝑟𝑡𝑙) ∗ 𝑓𝑝𝑟𝑒𝑠𝑒𝑛𝑐𝑒 ∗ 𝑡𝑙𝑖𝑔ℎ𝑡 [𝐴55]
In which:
𝑝𝑙𝑖𝑔ℎ𝑡 = installed power for lightning per m2 [kW/m2]
𝑔 = factor for converting kWh to MJ (=3.6) [-]
𝜂𝑒𝑙 = efficiency of electricity supply [-]
𝑚𝑦𝑒𝑎𝑟 = number of months per year (=12) [-]
𝑓𝑐𝑜𝑛𝑡;𝑑𝑎𝑦𝑙 = factor for the switch/control system in the daylight sector [-]
𝐴𝑑𝑎𝑦𝑙 = area of daylight sector [m2]
𝑓𝑐𝑜𝑛𝑡;𝑎𝑟𝑡𝑙 = factor for the switch/control system in the artificial light sector [-]
𝐴𝑎𝑟𝑡𝑙 = area of artificial light sector [m2]
𝑓𝑚𝑜𝑣𝑒 = valuation factor for movement detection [-]
𝑡𝑙𝑖𝑔ℎ𝑡 = hours of illumination [h]
The installed power for lightning per m2 is determined with Formula A56.
𝑝𝑙𝑖𝑔ℎ𝑡 =𝑃𝑙𝑖𝑔ℎ𝑡
𝐴𝑢𝑠𝑒;𝑧𝑜𝑛𝑒 [𝐴56]
In which:
𝑃𝑙𝑖𝑔ℎ𝑡 = total installed power of lightning [kW]
𝐴𝑢𝑠𝑒;𝑧𝑜𝑛𝑒 = use area of lightning zone [m2]

Master thesis - Energy Science Pam Engwirda (5549647)
98
The surface area of the daylight sector is a fixed fraction of the usage area of the lighting zone depending
on the usage function within which the lighting zone is located. The surface area of the artificial light sector
is equal to the total surface area of the lighting zone minus the surface area of the daylight sector. See
Formulas A57 and A58.
𝐴𝑑𝑎𝑦𝑙 = 𝑓𝑑𝑎𝑦𝑙 ∗ 𝐴𝑢𝑠𝑒;𝑧𝑜𝑛𝑒 [𝐴57]
𝐴𝑎𝑟𝑡𝑙 = 𝐴𝑢𝑠𝑒;𝑧𝑜𝑛𝑒 − 𝐴𝑑𝑎𝑦𝑙 [𝐴58]
In which:
𝐴𝑑𝑎𝑦𝑙 = area of daylight sector [m2]
𝐴𝑎𝑟𝑡𝑙 = area of artificial light sector [m2]
𝐴𝑢𝑠𝑒;𝑧𝑜𝑛𝑒 = use area of lightning zone [m2]
𝑓𝑑𝑎𝑦𝑙 = ratio between the area of the daylight sector and the total area of use of the lighting zone (Adayl /
Ause;zone) [-] (=0.2 for offices)
The annual number of hours of illumination are depended on the use function in which the lightning zone
lies. For office buildings, this is 2400 h.
Table 57 presents the factors of the control/switch systems.
Table 57:Factor for the type of switch
Description control/switch 𝒇𝒄𝒐𝒏𝒕;𝒅𝒂𝒚𝒍 𝒇𝒄𝒐𝒏𝒕;𝒂𝒓𝒕𝒍
Centrally on/off 1 1
Sweep pulse switch 0.75 0.75
Sweep pulse switch in combination with daylight depending control
0.55 0.7
Departure switch 0.9 0.9
Departure switch with separation daylight-/artificial light sector
0.75 0.9
Daylight dependent switch 0.6 0.8
The valuation factor for the presence of movement detection is presented in Table 58.
Table 58: Factor for the presence of movement detection
Description control 𝒇𝒎𝒐𝒗𝒆
Movement detection 0.8
No movement detection 1
D.5 Energy use for pumps
The primary energy use by pumps per energy sector follows from Equation A59.
𝑄𝑝𝑟𝑖𝑚;𝑝𝑢𝑚𝑝𝑠 =𝑒𝑝𝑢𝑚𝑝
𝜂𝑒𝑙 ∗ 𝑚𝑦𝑒𝑎𝑟∗ (𝑓𝑐𝑜𝑛𝑡𝑟𝑜𝑙;ℎ𝑒𝑎𝑡 ∗ 𝐴𝑢 ∗ 𝑚𝑜𝑛𝑡ℎ{𝑄ℎ𝑒𝑎𝑡;𝑑𝑒𝑚;𝑖 > 0} + 𝑓𝑐𝑜𝑛𝑡𝑟𝑜𝑙;𝑐𝑜𝑜𝑙 ∗ 𝐴𝑢
∗ 𝑚𝑜𝑛𝑡ℎ{𝑄𝑐𝑜𝑜𝑙;𝑑𝑒𝑚;𝑖 > 0}) [𝐴59]

Master thesis - Energy Science Pam Engwirda (5549647)
99
In which:
𝑄𝑝𝑟𝑖𝑚;𝑝𝑢𝑚𝑝𝑠 = total primary energy use for pumps [MJ]
𝑒𝑝𝑢𝑚𝑝 = specific electricity use by pumps (=8) [MJ/m2]
𝜂𝑒𝑙 = efficiency of electricity supply [-]
𝑚𝑦𝑒𝑎𝑟 = number of months per year (=12) [-]
𝑓𝑐𝑜𝑛𝑡𝑟𝑜𝑙;ℎ𝑒𝑎𝑡 = weighting factor for the type of control in the heating system [-]
𝐴𝑢 = use area of the energy sector [m2]
𝑚𝑜𝑛𝑡ℎ{𝑄ℎ𝑒𝑎𝑡;𝑑𝑒𝑚;𝑖 > 0} = total amount of months in which the heat demand is higher than zero [-]
𝑓𝑐𝑜𝑛𝑡𝑟𝑜𝑙;𝑐𝑜𝑜𝑙 = weighting factor for the type of control in the cooling system [-]
𝑚𝑜𝑛𝑡ℎ{𝑄𝑐𝑜𝑜𝑙;𝑑𝑒𝑚;𝑖 > 0} = total amount of months in which the cooling demand is higher than zero [-]
The weighting factor for the pump control type for cooling depends on the presence of cooling. The
presence of cooling can be deduced from the system number. The weighting factor for heating is a
constant. See Table 59.
Table 59: Weighting factor for type of control
System number 𝒇𝒄𝒐𝒏𝒕𝒓𝒐𝒍;𝒄𝒐𝒐𝒍 𝒇𝒄𝒐𝒏𝒕𝒓𝒐𝒍;𝒉𝒆𝒂𝒕
1, 5, 9, 10 (no or local cooling) 0 0.75
11, 12 (no or local cooling and local heating) 0 0
Other 0.75 0.75
D.6 Energy use for cooling
The primary energy use for cooling per energy sector is calculated with Formula A60.
𝑄𝑝𝑟𝑖𝑚;𝑐𝑜𝑜𝑙𝑖𝑛𝑔 = 𝑄𝑐𝑜𝑜𝑙𝑖𝑛𝑔 [𝐴60]
In which:
𝑄𝑝𝑟𝑖𝑚;𝑐𝑜𝑜𝑙𝑖𝑛𝑔 = primary energy use for cooling [MJ]
𝑄𝑐𝑜𝑜𝑙𝑖𝑛𝑔 = energy use for cooling [MJ]
The energy use for cooling in the total period is equal to the sum of the energy use per month.
𝑄𝑐𝑜𝑜𝑙𝑖𝑛𝑔 = ∑ 𝑄𝑐𝑜𝑜𝑙𝑖𝑛𝑔;𝑖
𝑛𝑚𝑜𝑛𝑡ℎ;𝑝𝑒𝑟
𝑖=1
[𝐴61]
In which:
𝑄𝑐𝑜𝑜𝑙𝑖𝑛𝑔;𝑖 = energy use for cooling in month i [MJ]

Master thesis - Energy Science Pam Engwirda (5549647)
100
𝑛𝑚𝑜𝑛𝑡ℎ;𝑝𝑒𝑟 = total amount of months in calculation period (=12) [months]
The energy use for cooling per month is calculated with Formula A62.
𝑄𝑐𝑜𝑜𝑙𝑖𝑛𝑔;𝑖 =𝑄𝑐𝑜𝑜𝑙𝑖𝑛𝑔;𝑐;𝑖
𝜂𝑔𝑒𝑛;𝑐𝑜𝑜𝑙𝑖𝑛𝑔;𝑟𝑒𝑠 ∗ 𝜂𝑠𝑦𝑠;𝑐𝑜𝑜𝑙𝑖𝑛𝑔 [𝐴62]
In which:
𝑄𝑐𝑜𝑜𝑙𝑖𝑛𝑔;𝑐;𝑖 = (corrected) cooling requirement in month [MJ]
𝜂𝑔𝑒𝑛;𝑐𝑜𝑜𝑙𝑖𝑛𝑔;𝑟𝑒𝑠 = resulting efficiency of cold generation [-]
𝜂𝑠𝑦𝑠;𝑐𝑜𝑜𝑙𝑖𝑛𝑔 = annual average system efficiency for cooling [-]
D.6.1 Cooling requirement
The cooling requirement per year (needed for the calculation of the system efficiency) is equal to:
𝑄𝑐𝑜𝑜𝑙𝑖𝑛𝑔;𝑟𝑒𝑞;𝑦𝑒𝑎𝑟 = ∑ 𝑄𝑐𝑜𝑜𝑙𝑖𝑛𝑔;𝑐;𝑖
𝑛𝑚𝑜𝑛𝑡ℎ;𝑝𝑒𝑟
𝑖=1
[𝐴63]
In which:
𝑄𝑐𝑜𝑜𝑙𝑖𝑛𝑔;𝑟𝑒𝑞;𝑦𝑒𝑎𝑟 = annual cooling requirement [MJ]
𝑄𝑐𝑜𝑜𝑙𝑖𝑛𝑔;𝑐;𝑖 = (corrected) cooling requirement in month i [MJ]
𝑛𝑚𝑜𝑛𝑡ℎ;𝑝𝑒𝑟 = total amount of months in calculation period (=12) [months]
The corrected cooling requirement, including latent cooling load, is calculated with Formula A64.
𝑄𝑐𝑜𝑜𝑙𝑖𝑛𝑔;𝑐;𝑖 = 𝑓𝑙𝑎𝑡𝑒𝑛𝑡 ∗ 𝑄𝑐𝑜𝑜𝑙𝑖𝑛𝑔;𝑟𝑒𝑞;𝑖 [𝐴64]
In which:
𝑓𝑙𝑎𝑡𝑒𝑛𝑡 = correction factor for the calculation of the latent cooling load (=1.1)
𝑄𝑐𝑜𝑜𝑙𝑖𝑛𝑔;𝑟𝑒𝑞;𝑖 = cooling requirement in month i [MJ]
The cooling requirement in month i is calculated with Formulas A65 and A66.
𝑄𝑐𝑜𝑜𝑙𝑖𝑛𝑔;𝑟𝑒𝑞;𝑖 = 𝑄𝑖𝑛𝑡𝑒𝑟𝑛;𝑐𝑟;𝑖 + 𝑄𝑠𝑢𝑛;𝑡;𝑖 + 𝑄𝑠𝑢𝑛;𝑛𝑡;𝑖 − 𝜂𝑢;𝑐𝑜𝑜𝑙𝑖𝑛𝑔;𝑖 ∗ (𝑄𝑡𝑟;𝑐𝑜𝑜𝑙𝑖𝑛𝑔;𝑖 + 𝑄𝑣𝑒𝑛𝑡;𝑐𝑜𝑜𝑙𝑖𝑛𝑔;𝑖) 𝑖𝑓 𝜆𝑖
≤ 2.5 [𝐴65]
𝑄𝑐𝑜𝑜𝑙𝑖𝑛𝑔;𝑟𝑒𝑞;𝑖 = 0 𝑖𝑓 𝜆𝑖 > 2.5 [𝐴66]
In which:

Master thesis - Energy Science Pam Engwirda (5549647)
101
𝜆𝑖 = profit / loss ratio in month i [-]
𝑄𝑖𝑛𝑡𝑒𝑟𝑛;𝑐𝑟;𝑖 = internal heat production used for the cold requirement calculation in month i [MJ]
𝑄𝑠𝑢𝑛;𝑡;𝑖 = sun heat gain through transparent construction parts in month i [MJ]
𝑄𝑠𝑢𝑛;𝑛𝑡;𝑖 = sun heat gain through non-transparent construction parts being part of the outside
construction in month i [MJ]
𝜂𝑢;𝑐𝑜𝑜𝑙𝑖𝑛𝑔;𝑖 = utilization factor for heat losses in month i [-]
𝑄𝑡𝑟;𝑐𝑜𝑜𝑙𝑖𝑛𝑔;𝑖 = heat loss through transmission in month i [MJ]
𝑄𝑣𝑒𝑛𝑡;𝑐𝑜𝑜𝑙𝑖𝑛𝑔;𝑖 = heat loss through ventilation in month i [MJ]
D.6.2 Incoming solar heat through non-transparent construction components
The incoming solar heat through non-transparent construction components adjacent to outside, except
for floors, is calculated with Formula A67.
𝑄𝑠𝑢𝑛;𝑛𝑡;𝑖 = ∑(𝑓 ∗ 𝑞𝑠𝑢𝑛;𝑖 ∗ 𝑧𝑠𝑢𝑛;𝑛𝑡 ∗ 𝑈𝑘 ∗ 𝐴𝑘) [𝐴67]
𝑘
In which:
𝑓 = factor for the absorption coefficient for solar radiation divided by the heat transfer coefficient to the
outside air (= 0.9/20 = 0.045) [-]
𝑞𝑠𝑢𝑛;𝑖 = the amount of solar energy that falls on a horizontal surface per m2 in month i [MJ]
𝑧𝑠𝑢𝑛;𝑛𝑡 = average orientation factor for non-transparent parts at an angle of inclination [-]
𝑈𝑘 = the heat transfer coefficient of partition construction k [W/(m2.K)]
𝐴𝑘 = projected area of the relevant partition construction k [m2]
𝐼𝑓 𝐴𝑠ℎ𝑒𝑙𝑙;𝑜𝑢𝑡𝑠𝑖𝑑𝑒
𝐴𝑢< 1.2, 𝑡ℎ𝑎𝑛 𝑄𝑠𝑢𝑛;𝑛𝑡;𝑖 = 0 [𝐴68]
𝑂𝑡ℎ𝑒𝑟𝑤𝑖𝑠𝑒 𝑄𝑠𝑢𝑛;𝑛𝑡;𝑖 = 𝑄𝑠𝑢𝑛;𝑛𝑡;𝑖 [𝐴69]
In which:
𝐴𝑠ℎ𝑒𝑙𝑙;𝑜𝑢𝑡𝑠𝑖𝑑𝑒 = total construction area of the energy sector adjacent to outside air [m2]
𝐴𝑢 = use area of energy sector [m2]
Construction area adjacent to outside air
The total construction area adjacent to outside air depends on the area of the shell parts of the energy
sector and the weighting factor, depending on the space on the other side. The total construction area
adjacent to the outside air is calculated with Formula A70.

Master thesis - Energy Science Pam Engwirda (5549647)
102
𝐴𝑠ℎ𝑒𝑙𝑙;𝑜𝑢𝑡𝑠𝑖𝑑𝑒 = ∑ 𝑑𝑘 ∗ 𝐴𝑘 [𝐴70]
𝑘
In which:
𝑑𝑘 = weighting factor [-]
𝐴𝑘 = surface area of shell part [m2]
Table 60: Weighting factor d
Construction adjacent to 𝒅𝒌 [-]
Outside air 1
Other 0
D.6.3 Heat loss through transmission
The transmission loss per month can be calculated as followed:
𝑄𝑡𝑟;𝑐𝑜𝑜𝑙𝑖𝑛𝑔;𝑖 = 𝐻𝑡𝑟;𝑐𝑜𝑜𝑙𝑖𝑛𝑔 ∗ (𝑇𝑖𝑛;𝑐𝑜𝑜𝑙𝑖𝑛𝑔 − 𝑇𝑜;𝑖) ∗ 𝑡 [𝐴71]
𝐻𝑡𝑟;𝑐𝑜𝑜𝑙𝑖𝑛𝑔 = ∑(𝑎𝑘 ∗ 𝐴𝑘 ∗ (𝑈𝑘 + 𝑈𝑐𝑏)) [𝐴72]
𝑘
In which:
𝑄𝑡𝑟;𝑐𝑜𝑜𝑙𝑖𝑛𝑔;𝑖 = heat loss through transmission in month i [MJ]
𝐻𝑡𝑟;𝑐𝑜𝑜𝑙𝑖𝑛𝑔 = specific heat loss through transmission [W/K]
𝑇𝑖𝑛;𝑐𝑜𝑜𝑙𝑖𝑛𝑔 = inside temperature [C] → is 24 C for office buildings
𝑇𝑜;𝑖 = monthly average outside temperature in month i [C]
𝑡 = time in a month (= 2.63) [Ms]
𝑎𝑘 = the weighting factor to be assigned to the partition construction k [-]
𝐴𝑘 = area of the projection of partition construction k [m2]
𝑈𝑘 = heat transfer coefficient of partition construction k [W/(m2K)]
𝑈𝑡𝑏 = surcharge for thermal bridges [W/(m2K)] (=0.1)
D.6.4 Heat loss through ventilation
The monthly heat loss through ventilation is calculated as follows:
𝑄𝑣𝑒𝑛𝑡;𝑐𝑜𝑜𝑙𝑖𝑛𝑔;𝑖 = 𝐻𝑣𝑒𝑛𝑡;𝑐𝑜𝑜𝑙𝑖𝑛𝑔 ∗ (𝑇𝑖𝑛;𝑐𝑜𝑜𝑙𝑖𝑛𝑔 − 𝑇𝑠𝑡;𝑖) ∗ 𝑡 [𝐴73]
𝐻𝑣𝑒𝑛𝑡 = 𝜌 ∗ 𝑐𝑙 ∗1
ℎ∗ 𝑓𝑢 ∗ (𝑣𝑣;𝑣𝑒𝑛𝑡;𝑐𝑜𝑜𝑙𝑖𝑛𝑔 + 𝑣𝑣;𝑚𝑒𝑐ℎ) ∗ 𝑉𝑠𝑒𝑐𝑡𝑜𝑟 [𝐴74]

Master thesis - Energy Science Pam Engwirda (5549647)
103
In which:
𝐻𝑣𝑒𝑛𝑡;𝑐𝑜𝑜𝑙𝑖𝑛𝑔 = specific heat loss through ventilation [W/K]
𝑇𝑖𝑛;𝑐𝑜𝑜𝑙𝑖𝑛𝑔 = inside temperature (= 24 C for office buildings) [C]
𝑇𝑠𝑡;𝑖 = supply temperature of ventilation air in month i [C]
𝑡 = time in a month (= 2.63) [Ms]
𝜌 ∗ 𝑐𝑙 = heat capacity of air (=1.2) [J/dm3K]
ℎ = conversion factor from dm3/s to m3/h (= 3.6) [-]
𝑓𝑢 = use factor: average time fraction that the ventilator is turned on (=0.3) [-]
𝑣𝑣;𝑣𝑒𝑛𝑡;𝑐𝑜𝑜𝑙𝑖𝑛𝑔 = ventilation rate of cooling, air coming directly from outside through natural ventilation
[1/h]
𝑣𝑣;𝑚𝑒𝑐ℎ = ventilation rate cooling, air coming directly from outside through mechanical ventilation [1/h]
𝑉𝑠𝑒𝑐𝑡𝑜𝑟 = net volume of the energy sector [m3]
The ventilation loss cannot be smaller than 0. If 𝑄𝑣𝑒𝑛𝑡;𝑖 < 0 than 𝑄𝑣𝑒𝑛𝑡;𝑖 = 0.
Ventilation rate of cooling, air coming directly from outside through natural ventilation
𝑣𝑣;𝑣𝑒𝑛𝑡;𝑐𝑜𝑜𝑙𝑖𝑛𝑔 = 𝑢𝑣;𝑣𝑒𝑛𝑡;𝑐𝑜𝑜𝑙𝑖𝑛𝑔 ∗ ℎ ∗𝐴𝑢;𝑠𝑒𝑐𝑡𝑜𝑟
𝑉𝑠𝑒𝑐𝑡𝑜𝑟 [𝐴75]
In which:
𝑢𝑣;𝑣𝑒𝑛𝑡;𝑐𝑜𝑜𝑙𝑖𝑛𝑔 = air volume flow through natural ventilation during a period with cooling needs
[dm3/s.m2]
ℎ = conversion factor from dm3/s to m3/h (= 3.6)
𝐴𝑢;𝑠𝑒𝑐𝑡𝑜𝑟 = area of use from energy sector [m2]
𝑉𝑠𝑒𝑐𝑡𝑜𝑟 = net volume of the energy sector [m3]
Table 61: Flow of air by natural ventilation in a period with cooling demand
Ventilation facility 𝒖𝒗;𝒗𝒆𝒏𝒕;𝒄𝒐𝒐𝒍𝒊𝒏𝒈 [dm3/s.m2]
Non 0
Ventilation grilles 0.5
Windows to be opened 2

Master thesis - Energy Science Pam Engwirda (5549647)
104
D.6.5 Utilization factor for heat losses ηu;cooling;i
The utilization factor for cooling depends on the profit / loss ratio. As the profit / loss ratio becomes
smaller, the usability of the coolness increases.
𝜂𝑢;𝑐𝑜𝑜𝑙𝑖𝑛𝑔;𝑖 =(1 − 𝜆𝑖
𝑎)
(1 − 𝜆𝑖𝑎+1)
, 𝑤ℎ𝑒𝑛 𝜆 ≠ 1 [𝐴76]
𝜂𝑢;𝑐𝑜𝑜𝑙𝑖𝑛𝑔;𝑖 =𝑎
(1 + 𝑎), 𝑤ℎ𝑒𝑛 𝜆 = 1 [𝐴77]
In which:
𝜂𝑢;𝑐𝑜𝑜𝑙𝑖𝑛𝑔;𝑖 = utilization factor for cooling in month i [-]
𝜆𝑖 = loss / profit ratio in month i [-]
𝑎 = auxiliary variable [-]
Loss / profit ratio
The profit / loss ratio follows from the following formulas.
𝜆𝑖 =𝑄𝑙𝑜𝑠𝑠;𝑖
𝑄𝑝𝑟𝑜𝑓𝑖𝑡;𝑖 [𝐴78]
𝑄𝑝𝑟𝑜𝑓𝑖𝑡;𝑖 = 𝑄𝑖𝑛𝑡𝑒𝑟𝑛;𝑖 + 𝑄𝑠𝑢𝑛;𝑡;𝑖 + 𝑄𝑠𝑢𝑛;𝑧𝑒;𝑖 [𝐴79]
𝑄𝑙𝑜𝑠𝑠;𝑖 = 𝑄𝑡𝑟;𝑐𝑜𝑜𝑙𝑖𝑛𝑔;𝑖 + 𝑄𝑣𝑒𝑛𝑡;𝑐𝑜𝑜𝑙𝑖𝑛𝑔;𝑖 [𝐴80]
In which:
𝜆𝑖 = loss / profit ratio in month i [-]
𝑄𝑝𝑟𝑜𝑓𝑖𝑡;𝑖 = heat gain through solar and internal heat production in month i [MJ]
𝑄𝑙𝑜𝑠𝑠;𝑖 = heat loss through transmission and ventilation in month i [MJ]
𝑄𝑖𝑛𝑡𝑒𝑟𝑛;𝑖 = heat gain through internal heat production in month i [MJ]
𝑄𝑠𝑢𝑛;𝑡;𝑖 = solar heat gain through transparent construction parts in month i [MJ]
𝑄𝑠𝑢𝑛;𝑧𝑒;𝑖 = solar heat gain through solar collectors for space heating in month i [MJ]
𝑄𝑡𝑟;𝑐𝑜𝑜𝑙𝑖𝑛𝑔;𝑖 = heat loss through transmission in month i [MJ]
𝑄𝑣𝑒𝑛𝑡;𝑐𝑜𝑜𝑙𝑖𝑛𝑔;𝑖 = heat loss through ventilation in month i [MJ]
Auxiliary variable
The value for the auxiliary variable follows from Formula A81:

Master thesis - Energy Science Pam Engwirda (5549647)
105
𝑎 = 𝑐1;𝑐𝑜𝑜𝑙𝑖𝑛𝑔 +1
𝑐2;𝑐𝑜𝑜𝑙𝑖𝑛𝑔∗
𝐷 ∗ 𝐴𝑢
𝐻𝑡𝑟;𝑐𝑜𝑜𝑙𝑖𝑛𝑔 + 𝐻𝑣𝑒𝑛𝑡;𝑐𝑜𝑜𝑙𝑖𝑛𝑔 [𝐴81]
In which:
𝑐1;𝑐𝑜𝑜𝑙𝑖𝑛𝑔 = constant (=1.83 for office buildings) [-]
𝑐2;𝑐𝑜𝑜𝑙𝑖𝑛𝑔 = constant (=83.3 for office buildings) [-]
𝐷 = specific effective thermal capacity per m2 of use area [Wh/(m2K)]
𝐴𝑢 = use area [m2]
𝐻𝑡𝑟;𝑐𝑜𝑜𝑙𝑖𝑛𝑔 = specific heat loss through transmission [W/K]
𝐻𝑣𝑒𝑛𝑡;𝑐𝑜𝑜𝑙𝑖𝑛𝑔 = specific heat loss through ventilation [W/K]
D.6.6 Generation efficiency for cold generators
In the presence of one cold generator or a combination of cold generators with the same efficiency, the
generation efficiency for cold is equal to:
𝜂𝑔𝑒𝑛;𝑐𝑜𝑜𝑙𝑖𝑛𝑔;𝑟𝑒𝑠 = 𝜂𝑔𝑒𝑛;𝑐𝑜𝑜𝑙𝑖𝑛𝑔 [𝐴82]
In which:
𝜂𝑔𝑒𝑛;𝑐𝑜𝑜𝑙𝑖𝑛𝑔;𝑟𝑒𝑠 = resulting generation efficiency of cold generators [-]
𝜂𝑔𝑒𝑛;𝑐𝑜𝑜𝑙𝑖𝑛𝑔 = generation efficiency of cold generators [-]
In the other cases, the following applies:
𝜂𝑔𝑒𝑛;𝑐𝑜𝑜𝑙𝑖𝑛𝑔;𝑟𝑒𝑠 =1
𝛼𝑐𝑜𝑜𝑙𝑖𝑛𝑔
𝜂𝑔𝑒𝑛;𝑐𝑜𝑜𝑙𝑖𝑛𝑔;𝑝𝑟𝑒𝑓 +
(1 − 𝛼𝑐𝑜𝑜𝑙𝑖𝑛𝑔)𝜂𝑔𝑒𝑛;𝑐𝑜𝑜𝑙𝑖𝑛𝑔;𝑛𝑝𝑟𝑒𝑓
[𝐴83]
In which:
𝜂𝑔𝑒𝑛;𝑐𝑜𝑜𝑙𝑖𝑛𝑔;𝑟𝑒𝑠 = resulting generation efficiency of cold generators [-]
𝛼𝑐𝑜𝑜𝑙𝑖𝑛𝑔 = ratio between the cold requirement coverage by the applied cold generators with the highest
efficiency and the total cold requirement (=0.8) [-]
𝜂𝑔𝑒𝑛;𝑐𝑜𝑜𝑙𝑖𝑛𝑔;𝑝𝑟𝑒𝑓 = efficiency of the preferentially switched cooling appliances [-]
𝜂𝑔𝑒𝑛;𝑐𝑜𝑜𝑙𝑖𝑛𝑔;𝑛𝑝𝑟𝑒𝑓 = efficiency of the other cold generating devices [-]
Generation efficiencies
The generation efficiency of a device depends on the type of device and the type of source. See Table 62.

Master thesis - Energy Science Pam Engwirda (5549647)
106
Table 62: Generation efficiencies for cold suppliers
Cold supplier Generation efficiency Type of fuel
Compression cooling machine 4 ∗ 𝜂𝑒𝑙 Electricity Absorption cooling machine on heat supply by third parties 0.7 ∗ 𝜂𝑡ℎ Heat
Absorption cooling machine on CHP 1.0 ∗ 𝜀𝐶𝐻𝑃;𝑡ℎ Gas
Cold storage 12 ∗ 𝜂𝑒𝑙 Electricity
Heat pump in summer operation (in combination with cold storage)
5 ∗ 𝜂𝑒𝑙 Electricity
D.7 Energy use for humidification
The primary energy use for humidification per energy sector is calculated with Formula A84.
𝑄𝑝𝑟𝑖𝑚;ℎ𝑢𝑚 = ∑ 𝑄ℎ𝑢𝑚;𝑖
𝑛𝑚𝑜𝑛𝑡ℎ;𝑝𝑒𝑟𝑖𝑜𝑑
𝑖=1
[𝐴84]
In which:
𝑄𝑝𝑟𝑖𝑚;ℎ𝑢𝑚 = total primary energy use per energy sector for humidification [MJ]
𝑛𝑚𝑜𝑛𝑡ℎ,𝑝𝑒𝑟 = number of months in the calculation period (=12)
𝑄ℎ𝑢𝑚;𝑖 = primary energy use for humidification in month i [MJ]
The energy use for humidification per month follows from Formula A85.
𝑄ℎ𝑢𝑚;𝑖 =𝑎ℎ𝑢𝑚 ∗ 𝑣𝑣;𝑚𝑒𝑐ℎ;ℎ𝑢𝑚 ∗ 𝑉𝑠𝑒𝑐𝑡𝑜𝑟 ∗ 𝑋ℎ ∗ 𝑦𝑖 ∗ 𝐴𝑢;ℎ𝑢𝑚
ℎ ∗ 𝐴𝑢;𝑠𝑒𝑐𝑡𝑜𝑟 [𝐴85]
In which:
𝑎ℎ𝑢𝑚 = weighting factor for the generation efficiency of the required heat and the efficiency of moisture
recovery [MJ.s/g.h]
𝑣𝑣;𝑚𝑒𝑐ℎ;ℎ𝑢𝑚 = mechanical ventilation rate for humidification [1/h]
𝑉𝑠𝑒𝑐𝑡𝑜𝑟 = net volume of the energy sector [m3]
𝑋ℎ= number of grams of moisture to be supplied per dm3 of dry air for the energy sector [g.h/dm3] (=5
for offices)
𝑦𝑖 = weighting factor for humidification in month i [-]
𝐴𝑢;ℎ𝑢𝑚 = surface area of the wetted part of the energy sector [m2]
ℎ = conversion factor from dm3/s to m3/h (= 3.6)
𝐴𝑢;𝑠𝑒𝑐𝑡𝑜𝑟 = area of use from energy sector [m2]
The weighting factor for humidification per month is presented in Table 63.

Master thesis - Energy Science Pam Engwirda (5549647)
107
Table 63: Weighting factor for humidification per month
Month i Weighting factor 𝒚𝒊
January 0.26 February 0.25
March 0.15
April 0.01
May 0
June 0
July 0
August 0
September 0
October 0
November 0.11
December 0.22
Total 1
D.7.1 Weighting factor ahum
The weighting factor ahum is depended on the presence of moisture recovery and the type of humidification,
see Table 64.
Table 64: Weighting factor for the generation efficiency with or without moisture recovery
Type humidification installation Type
With moisture recovery No moisture recovery
Electrically powered steam humidification
4𝜂𝑒𝑙
⁄ 9.5𝜂𝑒𝑙
⁄
Non-electrically powered steam humidification
4(𝜂𝑠𝑡𝑒𝑎𝑚 ∗ 𝑓𝑙𝑜𝑠𝑠;𝑠𝑡)⁄ 9.5
(𝜂𝑠𝑡𝑒𝑎𝑚 ∗ 𝑓𝑙𝑜𝑠𝑠;𝑠𝑡)⁄
Adiabatic humidification 4𝜂𝑔𝑒𝑛;ℎ𝑒𝑎𝑡
⁄ 9.5𝜂𝑔𝑒𝑛;ℎ𝑒𝑎𝑡
⁄
In which:
𝜂𝑒𝑙 = efficiency of the electricity supply [-]
𝜂𝑠𝑡𝑒𝑎𝑚 = the generation efficiency of a steam boiler to be used [-]
𝑓𝑙𝑜𝑠𝑠;𝑠𝑡 = factor for standstill losses for steam installations (=0.8)
𝜂𝑔𝑒𝑛;ℎ𝑒𝑎𝑡 = generation efficiency of heat generation determined [-]
D.8 Energy use for the preparation of hot tap water
The primary energy use for the preparation of hot tap water is calculated using Formula A86.
𝑄𝑝𝑟𝑖𝑚;𝑡𝑎𝑝 =
∑ (𝑄𝑡𝑎𝑝;𝑑𝑒𝑚;𝑖
𝜂𝑠𝑦𝑠;𝑡𝑎𝑝− 𝑄𝑠𝑢𝑛;𝑡𝑎𝑝;𝑖)
𝑛𝑚𝑜𝑛𝑡ℎ;𝑝𝑒𝑟
𝑖=1
𝜂𝑔𝑒𝑛;𝑡𝑎𝑝 [𝐴86]
In which:

Master thesis - Energy Science Pam Engwirda (5549647)
108
𝑄𝑝𝑟𝑖𝑚;𝑡𝑎𝑝 = primary energy use for the preparation of hot tap water [MJ]
𝑄𝑡𝑎𝑝;𝑑𝑒𝑚;𝑖 = heat demand for the preparation of hot tap water in month i [MJ]
𝜂𝑠𝑦𝑠;𝑡𝑎𝑝 = system efficiency for the distribution of hot tap water [-]
𝑄𝑠𝑢𝑛;𝑡𝑎𝑝;𝑖 = energy contribution of solar energy system to the preparation of hot tap water in month i
[MJ]
𝜂𝑔𝑒𝑛;𝑡𝑎𝑝 = generation efficiency of the preparation of hot tap water [-]
The total heat demand for the preparation of hot tap water per month is calculated using Formula A87.
𝑄𝑡𝑎𝑝;𝑑𝑒𝑚;𝑖 =𝑐ℎ𝑑;𝑡𝑎𝑝 ∗ 𝐴𝑢;𝑠𝑒𝑐𝑡𝑜𝑟
𝑛𝑚𝑜𝑛𝑡ℎ;𝑦𝑒𝑎𝑟 [𝐴87]
In which:
𝑐ℎ𝑑;𝑡𝑎𝑝 = net heat requirement for the energy sector to be considered [MJ/m2] (=5 for offices)
𝐴𝑢;𝑠𝑒𝑐𝑡𝑜𝑟 = use area of energy sector [m2]
𝑛𝑚𝑜𝑛𝑡ℎ;𝑦𝑒𝑎𝑟 = number of months per year (=12)
The system efficiency for the distribution of hot tap water follows from Table 65.
Table 65: System efficiencies for the distribution of hot tap water
Distribution system 𝜼𝒔𝒚𝒔;𝒕𝒂𝒑
All taps within a 3 m radius of the generating device 1
One or more taps at a distance of more than 3 m from the generating device
0.8
Circulation pipe 0.6
The total contribution of a solar energy system for the preparation of hot tap water per energy sector is
calculated using Formulas A88 and A89.
𝑄𝑠𝑢𝑛;𝑡𝑎𝑝 = ∑ 𝑄𝑠𝑢𝑛;𝑡𝑎𝑝;𝑖
𝑛𝑚𝑜𝑛𝑡ℎ𝑠;𝑝𝑒𝑟
𝑖=1
[𝐴88]
𝑄𝑠𝑢𝑛;𝑡𝑎𝑝;𝑖 = 𝑞𝑠𝑢𝑛;𝑖 ∗ 𝑧𝑠𝑢𝑛 ∗ 𝑧𝑠𝑒;𝑡𝑎𝑝 ∗ 𝐴𝑠𝑒 ∗ 𝜂𝑠𝑒;𝑎𝑣 [𝐴89]
With the additional requirement that:
𝑄𝑠𝑢𝑛;𝑡𝑎𝑝;𝑖 ≤ 𝜂𝑠𝑒;𝑚𝑎𝑥 ∗𝑄𝑡𝑎𝑝;𝑑𝑒𝑚;𝑖
𝜂𝑠𝑦𝑠;𝑡𝑎𝑝 [𝐴90]
In which:

Master thesis - Energy Science Pam Engwirda (5549647)
109
𝑄𝑠𝑢𝑛;𝑡𝑎𝑝 = energy contribution of solar energy system to the preparation of hot tap water in total period
[MJ]
𝑄𝑠𝑢𝑛;𝑡𝑎𝑝;𝑖 = energy contribution of solar energy system to the preparation of hot tap water in month i
[MJ]
𝑞𝑠𝑢𝑛;𝑖 = amount of solar energy per m2 on a horizontal surface with the relevant climate in month i [MJ]
𝑧𝑠𝑢𝑛 = orientation factor [-]
𝑧𝑠𝑒;𝑡𝑎𝑝 = slope angle number [-]
𝐴𝑠𝑒 = surface area of solar collector [m2]
𝜂𝑠𝑒;𝑎𝑣 = average utilization of the incident solar radiation (=0.5) [-]
𝜂𝑠𝑒;𝑚𝑎𝑥 = fraction of the maximum contribution of the solar energy system to the heat requirement
(=0.5) [-]
𝑄𝑡𝑎𝑝;𝑑𝑒𝑚;𝑖 = heat demand for the preparation of hot tap water in month i [MJ]
𝜂𝑠𝑦𝑠;𝑡𝑎𝑝 = system efficiency for the distribution of hot tap water [-]
The generation efficiency for the preparation of hot tap water follows from Table 66. For the values of the
given variables, see Section D.2.8.
Table 66: Generation efficiencies for the preparation of hot tap water per device
Type of device 𝜼𝒈𝒆𝒏;𝒕𝒂𝒑 Type of fuel [-]
Electric boiler 0.75 ∗ 𝜂𝑒𝑙 Electricity
VR boiler with central heating boiler, VR combi
0.45 Gas
Gas boiler, geyser, HR boiler with central heating boiler, HR combi
0.55 Gas
Combined heat 0.9 ∗ 𝜀𝐶𝐻𝑃;𝑡ℎ Gas
Heat supply by third parties 0.9 ∗ 𝜂ℎ𝑒𝑎𝑡;𝑡𝑎𝑝 Heat
Heat pump 1.4 ∗ 𝜂𝑒𝑙 Electricity
Steam 𝜂𝑠𝑡𝑒𝑎𝑚 ∗ 𝑓𝑙𝑜𝑠𝑠;𝑠𝑡 ∗ 𝑓𝑡𝑎𝑝 Gas
Hot water boiler 𝜂𝑠𝑡𝑒𝑎𝑚 ∗ 𝑓𝑙𝑜𝑠𝑠;ℎ𝑤 ∗ 𝑓𝑡𝑎𝑝 Gas
D.9 Energy contribution by photovoltaics
The primary energy contribution by building-related photovoltaic solar energy systems for the entire
building is calculated with Formulas A91 and A92.
𝑄𝑝𝑟𝑖𝑚;𝑝𝑣 = ∑ 𝑄𝑝𝑣;𝑖
𝑛𝑚𝑜𝑛𝑡ℎ𝑠;𝑝𝑒𝑟
𝑖=1
[𝐴91]
𝑄𝑝𝑣;𝑖 =𝑞𝑠𝑢𝑛;𝑖 ∗ 𝑧𝑠𝑢𝑛;𝑖 ∗ 𝑧𝑝𝑣 ∗ 𝐴𝑝𝑣 ∗ 𝑆𝑝𝑣 ∗ 𝑟𝑝𝑣
𝑆𝑝𝑣;𝑛𝑜𝑟 ∗ 𝜂𝑒𝑙 [𝐴92]

Master thesis - Energy Science Pam Engwirda (5549647)
110
In which:
𝑄𝑝𝑣;𝑖 = energy contribution of photovoltaic solar energy systems in month i [MJ]
𝑞𝑠𝑢𝑛;𝑖 = amount of solar energy per m2 on a horizontal surface with the relevant climate in month i [MJ]
𝑧𝑠𝑢𝑛;𝑖 = orientation factor [-]
𝑧𝑝𝑣 = slope angle number of solar panel [-]
𝐴𝑝𝑣 = surface area of solar panel [m2]
𝑆𝑝𝑣 = peak power of solar panel [W/m2]
𝑟𝑝𝑣 = reduction factor for the degree of insolation (=0.5) [-]
𝑆𝑝𝑣;𝑛𝑜𝑟 = standard radiation (=1000) [W/m2]
𝜂𝑒𝑙 = efficiency of electricity supply (=0.39) [-]
The peak power of a photovoltaic solar energy system depends on the type of pv-system. See Table 67.
Table 67: Peak power per pv system
Type of pv-system 𝑺𝒑𝒗 (𝑾/𝒎𝟐)
Amorphous cells 45
Mono or multi crystalline cells 120
D.10 Energy contribution through the application of cogeneration
The definition of cogeneration in the certification calculation is: “Combined generation of electricity and
heat where the heat consumers are also the buyers of the electricity.” The primary energy contribution
through the application of cogeneration is calculated with Formula A93.
𝑄𝑝𝑟𝑖𝑚;𝐶𝐻𝑃 = (∑ 𝑄ℎ𝑑;𝑔𝑟𝑜𝑠𝑠;𝑖
𝑛𝑚𝑜𝑛𝑡ℎ;𝑝𝑒𝑟
𝑖=1
𝜂𝑒𝑙;𝑚𝑎𝑟𝑔 ∗𝜀𝐶𝐻𝑃;𝑡ℎ
𝜀𝐶𝐻𝑃;𝑒𝑙
) [𝐴93]
In which:
𝑄𝑝𝑟𝑖𝑚;𝐶𝐻𝑃 = primary energy contribution through the application of cogeneration [MJ]
𝑄ℎ𝑑;𝑔𝑟𝑜𝑠𝑠;𝑖 = gross heat requirement that is covered by combined heat and power in month i [MJ]
𝜂𝑒𝑙;𝑚𝑎𝑟𝑔 = marginal return for separate generation with new power plants, considering grid losses [-]
𝜀𝐶𝐻𝑃;𝑡ℎ = thermal conversion number for CHP [-]
𝜀𝐶𝐻𝑃;𝑒𝑙 = electric conversion number for CHP [-]

Master thesis - Energy Science Pam Engwirda (5549647)
111
The monthly gross heat requirement that is covered by combined heat and power, is calculated by Formula
A94.
𝑄ℎ𝑑;𝑔𝑟𝑜𝑠𝑠;𝑖 = 𝑄ℎ𝑑;𝑔𝑟𝑜𝑠𝑠;ℎ𝑒𝑎𝑡;𝑖 + 𝑄ℎ𝑑;𝑔𝑟𝑜𝑠𝑠;𝑐𝑜𝑜𝑙;𝑖 + 𝑄ℎ𝑑;𝑔𝑟𝑜𝑠𝑠;𝑡𝑎𝑝;𝑖 [𝐴94]
In which:
𝑄ℎ𝑑;𝑔𝑟𝑜𝑠𝑠;ℎ𝑒𝑎𝑡;𝑖 = gross heat requirement for heating if covered by CHP in month i [MJ]
𝑄ℎ𝑑;𝑔𝑟𝑜𝑠𝑠;𝑐𝑜𝑜𝑙;𝑖 = gross heat requirement for cooling if covered by CHP in month i [MJ]
𝑄ℎ𝑑;𝑔𝑟𝑜𝑠𝑠;𝑡𝑎𝑝;𝑖 = gross heat requirement for the preparation of hot tap water in month i [MJ]
Heating
𝑄ℎ𝑑;𝑔𝑟𝑜𝑠𝑠;ℎ𝑒𝑎𝑡;𝑖 =𝑓𝑝𝑟𝑒𝑓;𝑖
𝜂𝑑𝑖𝑠𝑡𝑟∗ 𝑄ℎ𝑒𝑎𝑡;𝑑𝑒𝑚;𝑖 [𝐴95]
In which:
𝑓𝑝𝑟𝑒𝑓;𝑖 = share of CHP in primary energy use for heating in month i [-]
𝜂𝑑𝑖𝑠𝑡𝑟 = distribution efficiency for heating [-]
𝑄ℎ𝑒𝑎𝑡;𝑑𝑒𝑚;𝑖 = heat demand in month i [MJ]
Cooling
𝑄ℎ𝑑;𝑔𝑟𝑜𝑠𝑠;𝑐𝑜𝑜𝑙;𝑖 =𝑄𝑐𝑜𝑜𝑙;𝑑𝑒𝑚;𝑐;𝑖
𝜂𝑠𝑦𝑠;𝑐𝑜𝑜𝑙 [𝐴96]
In which:
𝑄𝑐𝑜𝑜𝑙;𝑑𝑒𝑚;𝑐;𝑖 = cooling demand at floor area in month i [MJ]
𝜂𝑠𝑦𝑠;𝑐𝑜𝑜𝑙 = system efficiency for cooling [-]
Hot tap water
𝑄ℎ𝑑;𝑔𝑟𝑜𝑠𝑠;𝑡𝑎𝑝;𝑖 =𝑄𝑡𝑎𝑝;𝑑𝑒𝑚;𝑖
𝜂𝑠𝑦𝑠;𝑡𝑎𝑝− 𝑄𝑠𝑒;𝑡𝑎𝑝;𝑖 [𝐴97]
In which:
𝑄𝑡𝑎𝑝;𝑑𝑒𝑚;𝑖 = heat demand for the preparation of hot tap water in month i [MJ]
𝜂𝑠𝑦𝑠;𝑡𝑎𝑝 = system efficiency for the distribution of hot tap water [-]
𝑄𝑠𝑒;𝑡𝑎𝑝;𝑖 = energy contribution of solar energy system to the preparation of hot tap water in month i [MJ]

Master thesis - Energy Science Pam Engwirda (5549647)
112
D.10.1 Cogeneration conversion figures
The electric and thermal conversion figures for cogeneration depend on the type of CHP, the electric or
thermal power of the CHP. See Table 68.
Table 68: Electric and thermal conversion numbers for cogeneration
Electric power (kW) Thermal power (kW) Type of CHP 𝜺𝑪𝑯𝑷;𝒆𝒍 𝜺𝑪𝑯𝑷;𝒕𝒉
𝑃𝐶𝐻𝑃;𝑒𝑙 < 20 𝑃𝐶𝐻𝑃 < 40 Mini CHP 0.28 0.57
20 < 𝑃𝐶𝐻𝑃;𝑒𝑙 < 200 40 < 𝑃𝐶𝐻𝑃 < 312 Gas motor 0.30 0.51
200 < 𝑃𝐶𝐻𝑃;𝑒𝑙 < 500 312 < 𝑃𝐶𝐻𝑃 < 629 Gas motor 0.32 0.52
500 < 𝑃𝐶𝐻𝑃;𝑒𝑙 < 1000 629 < 𝑃𝐶𝐻𝑃 < 1111 Gas motor 0.35 0.46
1000 < 𝑃𝐶𝐻𝑃;𝑒𝑙 < 25000 1111 < 𝑃𝐶𝐻𝑃 < 27778 CHP 0.37 0.41
D.10.2 Distribution efficiency for cogeneration by heating
The distribution efficiencies for the heating part of cogeneration depends on the heat transport through
pipes and is presented in Table 69.
Table 69: Distribution efficiencies for cogeneration
Type of distribution CHP 𝜼𝒅𝒊𝒔𝒕𝒓
Indoor heat transfer pipes 1.00
Heat transfer pipes (partially) outside the building 0.95

Master thesis - Energy Science Pam Engwirda (5549647)
113
Weather data
The weather data used in this research, are based on the Test Reference Year De Bilt (ISSO 75.3). The
monthly average outside temperature, the average outside temperature for ventilation in the cooling
demand and the solar irradiation on a horizontal surface are presented in Table 70.
Table 70: Monthly Te, Te;vent and qsun
Month i Te (˚C) Te;vent (˚C) qsun (MJ/m2)
January 2.5 16.0 43
February 2.7 16.0 117
March 5.6 16.0 254
April 8.0 16.0 373
May 11.9 16.0 503
June 15.5 17.0 574
July 17.0 18.5 504
August 16.4 17.9 489
September 13.8 16.0 295
October 11.2 16.0 166
November 6.0 16.0 63
December 3.4 16.0 35
Average/total 9.5 16.5 3416
For the solar irradiation on vertical surfaces with a different orientation, the conversion factors in Table 71
are used.
Table 71: Conversion factors solar irradiation
zsun;i (-)
Month i Slope angle βk
Vertical Horizontal
Orientation αk
South South-East
East North-East
North North-West
West South-West
January 0.95 0.93 0.91 0.91 0.91 0.91 0.91 0.95 1.00
February 1.22 0.90 0.50 0.41 0.41 0.42 0.62 1.08 1.00
March 1.04 0.78 0.51 0.37 0.35 0.39 0.66 0.96 1.00
April 0.82 0.69 0.52 0.37 0.33 0.43 0.65 0.82 1.00
May 0.61 0.60 0.55 0.42 0.37 0.53 0.70 0.71 1.00
June 0.55 0.56 0.52 0.41 0.40 0.60 0.73 0.66 1.00
July 0.58 0.57 0.52 0.41 0.38 0.55 0.69 0.67 1.00
August 0.75 0.71 0.59 0.40 0.33 0.49 0.68 0.76 1.00
September 0.93 0.72 0.52 0.37 0.36 0.55 0.84 1.00 1.00
October 1.22 0.92 0.52 0.39 0.39 0.40 0.63 1.05 1.00
November 1.16 0.92 0.57 0.52 0.52 0.52 0.63 1.02 1.00
December 0.63 0.63 0.63 0.63 0.63 0.63 0.63 0.63 1.00
For the slope angle of a surface, the conversion factors are presented in Table 72.

Master thesis - Energy Science Pam Engwirda (5549647)
114
Table 72: Conversion factors slope angle
Slope angle Slope angle number zse;tap and zpv
90 1.00 75 1.19
60 1.33
45 1.41
30 1.42
15 1.36
0 1.00
Lastly, the average orientation factor of the surface is used in some calculations. These are given in Table
73.
Table 73: Average orientation factor of a surface
zsun;nt (-)
Typeconstruct
Month i Facades Roofs
January 0.92 1
February 0.70 1
March 0.63 1
April 0.58 1
May 0.56 1
June 0.55 1
July 0.55 1
August 0.59 1
September 0.66 1
October 0.69 1
November 0.73 1
December 0.63 1

Master thesis - Energy Science Pam Engwirda (5549647)
115
Retrofit measures
This section describes the considered retrofit measures for office buildings in this research. They are
characterized using the Building Retrofit Classification described in Section 2.2.3. For each of the retrofit
measures, the costs (investment and maintenance), lifetime and installation time are determined.
F.1 Reduce energy demand
F.1.1 Building Envelope
The first retrofit measures aim to improve the building fabric insulation. This is done for the outside walls,
windows, the roof and the floor. Insulation for the inside walls and floors are not considered, since the
energy losses within the building are neglectable compared to the losses through the shell.
Walls
Table 74 shows the options for wall insulation. The U-values below are based on 10 mm thick isolation
material. Based on experience of SPIE, the assumption was made that no maintenance is required for the
insulation of walls, so the maintenance costs are equal to zero.
Table 74: Retrofit characteristics - wall insulation
Installation method
Material U-value (W/m2K)
Costs (€/m2) excl. installation
Costs (€/m2) incl. installation
Lifetime (years)
Source
Cavity wall Glass wool
0.32-0.40 1.75 15-20 45 Isolatie-info.nl (n.d.); Isolatiemateriaal.nl 1 (n.d.). EPS
pearls 0.32-0.36 5.02 20-25 45
PUR 0.23-0.35 11.77 25-30 45
Outside EPS 0.36 5.02 80-100 45 Isolatie-info.nl (n.d.); Plusisolatie.nl (n.d.) XPS 0.34-0.36 9.53 150 45
Inside PUR 0.22 11.77 120-130 45 Mijnbenovatie.be (n.d.); Baveco et al. (2015)
Glass wool
0.30 1.75 100-110 45
Rock wool
0.30 4.47 90-100 45
Roof
The most used roof insulation materials are glass wool, rock wool, PUR and PIR (Dakdek-gigant.nl, 2020).
The characteristics are shown in Table 75. Again, the U-values are based on 10 mm thick insulation material.
Furthermore, the estimation is made that installation costs are equal between each type of insulation and
are set at 20 €/m2 for insulation from the inside and 40 €/m2 for insulation from the outside (Dakisolatie-
advies.nl, n.d.). Again, no maintenance costs are assumed based on the experience of SPIE.
Table 75: Retrofit characteristics - roof insulation
Installation method
Material U-value (W/m2K)
Costs (€/m2) excl. installation
Costs (€/m2) incl. installation
Lifetime (years)
Source

Master thesis - Energy Science Pam Engwirda (5549647)
116
Inside Glass wool
0.32-0.40 7.50 27.50 45 Dakdek-gigant.nl (2020); Dakisolatie-advies.nl (n.d.); Isolatie-weetjes (n.d.).
Rock wool
0.32-0.40 8 28 45
PUR 0.23-0.35 25 45 45
Outside PIR 0.23-0.26 12 52 45
Floor
For the insulation of the floor, a distinction is made between two types of floors: wood and concrete. The
type of insulation material namely depends on the type of floor. The characteristics of these insulation
materials are shown in Table 76, again assuming 10 mm thick insulation material. Furthermore, the
estimation is made that installation costs are equal between each type of insulation and are set at 15 €/m2
and the maintenance costs are equal to zero (Verbouwkosten.com, n.d; Experience of SPIE).
Table 76: Retrofit characteristics - floor insulation
Type of floor
Installation method
Material U-value (W/m2
K)
Costs (€/m2) excl. installation
Costs (€/m2) incl. installation
Lifetime (years)
Source
Wood Below Glass wool
0.22 5.66 21 45 Isolatiemateriaal.nl 2 (n.d.); Verbouwkosten.com (n.d)
Rock wool
0.54 5.43 20 45 Isolatiemateriaal.nl 2 (n.d.); Verbouwkosten.com (n.d)
Concrete Below EPS 0.36 8.18 23 45 Isolatiemateriaal.nl 2 (n.d.); Verbouwkosten.com (n.d)
PIR 0.31 12.02 27 45 Isolatiemateriaal.nl 2 (n.d.); Verbouwkosten.com (n.d)
On top EPS 0.36 8.18 23 45 Isolatie-info.be 1 (n.d.); Isolatiemateriaal.nl 3 (n.d.); Verbouwkosten.com (n.d)
XPS 0.66 7.56 22 45 Isolatiemateriaal.nl 3 (n.d.); Verbouwkosten.com (n.d)
PIR 0.31 12.02 27 45 Isolatiemateriaal.nl 3 (n.d.); Verbouwkosten.com (n.d)
PUR 0.26 15 30-35 45 Isolatie-info.be 1 (n.d.); Isolatie-info.be 2 (n.d.); Verbouwkosten.com (n.d)
Windows
The next retrofit measures regard the outside windows of the building. They impact the energy use of the
building by their U-value and the ZTA-value. The ZTA-value is a characteristic of a glazing type and
represents the total amount of solar energy transmitted through the glass. This value lies between 0 and
1. The higher the ZTA-value, the more heat enters (help.vabi.nl, n.d.). The characteristics for the different
glazing types are shown in Table 77. Single clear glass is chosen as the base of installed glazing type, since
it is expected that this is the worst installed glazing possible and when considering a retrofit only better
glazing will be installed. Therefore, no data is collected for this type of glass. Again, no maintenance costs
are assumed (Experience of SPIE).

Master thesis - Energy Science Pam Engwirda (5549647)
117
Table 77: Retrofit characteristics - glazing
Glazing type U-value (W/m2
K)
ZTA-value
Costs (€/m2) excl installation
Costs (€/m2) incl installation
Lifetime (years)
Source
Single clear glass
5.37 0.73 Help.vabi.nl (n.d.); Ramen-weetjes.be (n.d.); Dubbelglas-weetjes.nl (n.d.); Dubbelglasprijzen.net (n.d.)
Double glazing
3.20 0.63 50-55 115 20
HR glass 2.00 0.59 55-60 120 20
HR + glass 1.52 0.56 60-65 125 20
HR ++ glass 1.10 0.52 65-75 130 20
Triple glazing 0.80 0.45 100-130 170 20
Awning
In addition to changing the glazing type, adding awning at outside of the building can reduce the incoming
solar irradiation. For office buildings, screens are best suited. Since these can be applied to every floor and
can stand strong winds (Zonweringgigant.nl 1., n.d.). In addition, only automatic screens are looked at since
manual screen are controlled from the outside which is not practical for an office building. The
characteristics of automatic awning are presented in Table 78.
Table 78: Retrofit characteristics - awning
Awning
Costs (€/m2)
Costs (€/sunscreen) control system
Total costs (€/m2) incl installation
Maintenance costs (€/year/sunscreen)
Lifetime (years)
Source
Automatic
170 - 270
160 - 230 300 - 450 20 15 Zonwering-weetjes.nl (n.d.); Unizon.nl (n.d.); Homedeal.nl (n.d.); Offerteadviseur.nl 1 (n.d.)
F.1.2 Equipment System
The equipment systems considered to be suitable for retrofit are the heat generators, cold suppliers,
lightning and ventilators.
Heat generators
The ISSO 75.3 describes multiple heat generators. In consultation with SPIE, the ones suitable for office
buildings are selected. The characteristics of these heat generators are shown in Table 79. Installation costs
are the same as the purchase costs as described in Section 3.1.3. The expected amount of installed Watts
needed per m3 for heating is usually set at 85 (CVketelkiezen.nl, n.d.).
Table 79: Retrofit characteristics - heat generators
Cost (€/unit)
Costs (€/unit) incl. installation
Maintenance costs (€/year)
Lifetime (years)
Source

Master thesis - Energy Science Pam Engwirda (5549647)
118
CHP (Cogeneration)
263-356 per kWth
619 (per kW)
7 – 25 €/MWh
15 ISSO 75.3 (2011); Emis (2020).
Electric installation
1,500 per 150 m2
20 per m2 0 15 Liander (n.d.); Verwarming-info.nl (n.d.); Electricaboiler.nl (n.d.).
Heat delivery by third parties
473 16 per m2 0 15 Schepers, Meyer & Burger (2018); CE Delft (2018)
Direct fired air heater
1,500 (per 43 kW)
70 per kW 130-175 15 SPIE; Bengshop.nl (n.d.); Cv-kosten.nl (n.d.)
HR-107 boiler 1,962 (35 kW)
112 per kW
130-175 15 Schepers, Meyer & Burger (2018); SPIE; Cv-kosten.nl (n.d.)
Heat pump
Soil / outside air
10,000 – 25,000 (12 kW)
584 per kW
125-175 10-15 Warmtepomp-info.nl 1 (n.d.); Comfort Klimaat (n.d.); Warmtepomp-info.nl 2 (n.d.); Cobouw Bouwkosten (n.d.).
Heat from return / exhaust air
4,000 – 7,000 (12 kW)
184 per kW
125-175 10-15 Warmtepomp-info.nl 1 (n.d.); Comfort Klimaat (n.d.); Warmtepomp-info.nl 2 (n.d.); Cobouw Bouwkosten (n.d.).
Ground water 10,000 – 25,000 (12 kW)
584 per kW
125-175 10-15 Warmtepomp-info.nl 1 (n.d.); Comfort Klimaat (n.d.); Warmtepomp-info.nl 2 (n.d.); Cobouw Bouwkosten (n.d.).
Surface water 15,000 (12 kW)
500 per kW
125-175
10-15 Warmtepomp-info.nl 1 (n.d.); Comfort Klimaat (n.d.); Warmtepomp-info.nl 2 (n.d.); Cobouw Bouwkosten (n.d.).
Cold supplier
The cold suppliers considered in this research are the ones mentioned in the ISSO 75.3. They were checked
by SPIE on their suitability for office buildings. For the cold storage, SPIE provided an indication for the
costs. This is the source for cold storage. These costs should also be considered with the Heat pump in
summer operation, including the investment of the heat pump (described in Table 79). Installation costs
are assumed to be the same as the costs for purchase, as described in Section 3.1.3. For the cooling
requirement, the amount of Watts needed is the total floor area to be cooled in m3 times 50 (Aircogroep.nl,
n.d.). See Table 80 for the characteristics of the cold suppliers.
Table 80: Retrofit characteristics - cold suppliers
Cold supplier Costs (€) Costs (€) incl. installation
Maintenance costs (€/year)
Lifetime (years)
Source
Compression cooling machine
233 per kW
466 per kW 14 per kW 25
Berliner Energieagentur GmbH (2009); Alrwashdeh & Ammari (2019)

Master thesis - Energy Science Pam Engwirda (5549647)
119
Absorption cooling machine on heat supply by third parties
229-458 per kWth
687 per kW 0.07 per kW 25 ISSO 75.3 (2011); U.S. Department of Energy (2017)
Absorption cooling machine on CHP
200 - 395 per kW
595 per kW 0.06 per kW 25 Berliner Energieagentur GmbH (2009); RVO (2011); U.S. Department of Energy (2017)
Cold storage 150,000 – 200,000 (Source 150 kW)
2333 per kW 93 per kW (4% of investment)
25 SPIE; Energie vastgoed (2015); RVO 7 (n.d.)
Heat pump in summer operation (in combination with cold storage)
150,000 – 200,000 (Source 150 kW) + heat pump
4333 per kW 243 per kW (4% of investment + 125-175 of heat pump)
15 SPIE; RVO 7 (n.d.)
Lighting
The improvement of lighting considered is from conventional to LED lighting. There are three types of lights
who are most used in office buildings according to SPIE. Namely, TL-D, PLC and TL-5 lights. The
characteristics of the LED lights are found in Table 81. Price for installation is 40 €/hour, 10 lights changed
per hour therefore: 4 €/unit installation costs (Bouwkosten.nl, n.d.).
Table 81: Retrofit characteristics - lighting
Type of light
Power [W]
Energy use incl. ballast [W]
Power LED [W]
Energy use LED [W]
Price [€/unit]
Costs (€/unit) incl. installation
Lifetime (years)
Source
TLD 18 21 9 9 3.42 – 7.18 9 15 Lampdirect.nl (n.d.); Technische Unie (n.d.); Ledlampen-fabriek.nl (n.d.); Bouwkosten.nl (n.d.)
36 42 18 18 3.91 - 8.94 10.50 15
58 68 20 20 7.99 12 15
72 84 ~37
116 135 ~58
PLC 9 11 4.5 4.5 10.50 14.50 15
13 15 4.5 4.5 10.50 14.50 15
18 21 6.5 6.5 12.00 16.50 15
26 30 9.5 9.5 15.00 19.00 15
36 42 ~18
TL5 14 16 8 8 14.99-15.49 19.00 15
21 25 12 12 13.94-24.94 22.00 15
28 33 16 16 22.00-27.94 29.50 15
42 49 20 20 18.21-36.54 30.00 15
56 65 26 26 18.21-37.23 31.00 15
Movement detection lights

Master thesis - Energy Science Pam Engwirda (5549647)
120
Adding movement detection can also save energy needed for lightning. Therefore, movement detection is
also added as a retrofit option. The costs of adding movement detection lies around €50,- per unit. One
movement detection device covers a space of 30m2 (Electrototaalmarkt.nl, n.d.). Therefore, the costs of
movement detection are set at 1.67 €/m2. The characteristics are shown in Table 82. The installation costs
are assumed to be twice as much as for installing lights, since it is expected that this takes more time.
Table 82: Retrofit characteristics - movement detection (lighting)
Costs (€/m2)
Costs (€/m2) incl. installation
Lifetime (years)
Source
Movement detection 1.67 9.67 15 Electrototaalmarkt.nl (n.d.)
Ventilators
For the ventilators, a distinction is made between the type of extraction and supply of air (mechanical or
natural). In addition, recirculation or heat recovery and the addition of flow control is considered. The
characteristics for ventilators are shown in Table 83.
Table 83: Retrofit characteristics - ventilators
Ventilator type 𝒕𝒚𝒑𝒆𝒗𝒆𝒏𝒕
Costs (€) per unit (Flowrate 350 m3/H)
Costs (€/m2) incl. installation
Maintenance costs (€/year)
Lifetime (years)
Source
Only mechanical extraction
3,000 19 65 15 Ventilatieysteemabcd.nl (n.d.); Abelenco.nl (n.d.); Binnenklimaat.be (n.d.)
Only mechanical supply
2,800 18 65 15 Ventilatieysteemabcd.nl (n.d.); Abelenco.nl (n.d.); Binnenklimaat.be (n.d.)
Mechanical supply and drain without recirculation or heat recovery
5,500 34 115 15 Ventilatieysteemabcd.nl (n.d.); Abelenco.nl (n.d.); Binnenklimaat.be (n.d.)
Mechanical supply and drain with recirculation or heat recovery
7,000 44 115 15 Ventilatieysteemabcd.nl (n.d.); Abelenco.nl (n.d.); Binnenklimaat.be (n.d.)
Arrangement
Flow control 500 3 0 15 Ventilatieysteemabcd.nl (n.d.); Abelenco.nl (n.d.)

Master thesis - Energy Science Pam Engwirda (5549647)
121
F.2 Apply sustainable energy resources
F.2.1 New/Renewable Technology
For the renewable technology systems, only solar energy systems are considered. These are most
applicable to office buildings. The other systems, link wind or biomass, are not considered since in most
cases there is no space around the office building to realize these solutions. For solar energy systems, two
types are chosen: a solar collector used for heating and solar panels to produce electricity. The
characteristics are shown in Table 84.
Table 84: Retrofit characteristics - solar energy systems
System Costs (€) excl. installation
Costs (€) incl. installation
Maintenance costs (€/year)
Lifetime (years)
Source
Solar collector (+boiler)
1500 2,200 (2.5 m2)
10-30 25 Zonnepanelen-weetjes.nl (n.d.); Zonneboiler-advies.nl 1 (n.d.); Zonneboiler-advies.nl 2 (n.d.); Zonneboiler-info.nl (n.d.); Zonnepaneelprijzen.nl (2020)
Solar panel with amorphous cells
300 400 (1.65 m2)
2-5 (per panel ~ 1.65 m2)
25-40 Subsidies-zonnepanelen.nl (n.d.); Zonneplan.nl (n.d.); Zonnepanelen.net (n.d.)
Solar panel with mono or multi crystalline cells
480 600-675 (1.65 m2)
2-5 (per panel ~ 1.65 m2)
25-40 Subsidies-zonnepanelen.nl (n.d.); Offerteadviseur.nl 2 (n.d.); Zonneplan.nl (n.d.); Zonnepanelen.net (n.d.)
F.3 Use fossil fuel effectively
F.3.1 Energy Management and Control System
A building energy management system (BEMS) can reduce the energy use of the building by controlling
and monitoring energy-related building service plants and equipment. When adding a BEMS, the following
reductions are assumed to be achieved: 39.5% for lightning (provided LED) and for HVAC between 14.07%
and 16.66% (Lee & Cheng, 2016). The assumption is made that 10% more solar energy can be used when
using the BEMS due to flexibility of the energy use. Table 85 shows the retrofit measure characteristics.
Cost for installation are around 50 €/hour (Bouwkosten.nl, n.d.). Since SPIE expects the costs for installation
to be the same as the price for purchase (as described in Section 3.1.3), this is assumed here as well.
Table 85: Retrofit characteristics - BEMS
Reduction lightning
Reduction HVAC
Increase solar energy
Costs (€/m2)
Costs (€/m2) incl. installation
Lifetime Source
BEMS 39.5% 15.0% 10% 25 - 70 95 20 Lee & Cheng (2016); Rawal (2016)

Master thesis - Energy Science Pam Engwirda (5549647)
122
Questionnaire Norit Amersfoort
Demografische informatie
Naam kantoorpand: Norit Amersfoort
Adres Textielweg 15 Amersfoort
Bouwjaar 1960
Aantal maanden pand is in gebruik 0 maanden
Kantoorpand constructie eigenschappen
Oppervlakten en maten
Totale vloeroppervlakte kantoorpand 2649 m2
Vloeroppervlakte begane grond 2649 m2
Kruipruimte aanwezig?
Hoogte kantoorpand 3.85 m
Hoogte per verdieping 3.85 m
Oppervlakte buiten muren (incl. ramen/deuren) 670 m2
Oppervlakte dak 1900 m2
Oppervlakte ramen grenzend aan buiten 201 m2
Issolatie waarden U Indien bekend, vul hier in
Vloer 5.882 W/m2K
Muren 2.326 W/m2K
Dak 1.163 W/m2K
Eventueel renovatie jaar
Type vloer, plafond en gevel
Massa van vloerconstructie [kg/m2] Meer dan 400 (steenachtig)
Type plafond Gesloten plafond
Gevel type Standaard gevel
Ramen
Type beglazing Enkel glas
Zonwering aanwezig (aan de buitenkant)?
Zo ja, type zonwering
Kantoorpand installaties
Klimaat systeem nr 3 Zie tab Climate system nr
Warmte en koude voorziening
Type verwarmingsinstallatie Conventionele ketel

Master thesis - Energy Science Pam Engwirda (5549647)
123
Individuele regeling verwarming
Koude leverancier Compressiekoelmachine
Oppervlakte van gekoelde zones 1800 m2
WKK
Aanwezig?
Elektrisch vermogen kW
Thermisch vermogen kW
Soort distributie
Gedetailleerde informatie warmte voorziening
Warmtepomp
Bron
Brandstof
Temperatuur niveau warmteaanvoer
Ketel
Type ketel Conventionele ketel
Temperatuur niveau warmteaanvoer ≤55
Een of meer centrale verwarmingstoestellen die warmte leveren voor een oppervlakte van 500 m2 of meer
Stoomketel
Economizer
Luchtvoorverwarmer
Heetwaterketel
Rookgascondensor
Ventilatoren
Type ventilatie systeem Alleen mechanische afzuiging
Provision in ventilation system Geen debietregeling of recirculatie
Regeling Geen regeling of smoorregeling
Systeem type warmte terugwinning Geen warmteterugwinning
Ventilatie voorziening voor koelbehoefte Te openen ramen
Bevochtiging
Type bevochtigingsinstallatie Geen bevochtiging
Vochtterugwinning
Warm tap water
Type toestel Gas boiler, geiser, HR-ketel met cv-boiler, HR combi
Distributie systeem Een of meerdere tappunten op een afstand van meer dan 3 m van het opwekkingstoestel
Zonne-energie systemen
Zonnepanelen

Master thesis - Energy Science Pam Engwirda (5549647)
124
Aanwezig
Type zonnepaneel
Indien anders, piekvermogen W/m2
Totaal oppervlakte panelen m2
Orientatie
Hellingshoek
Zonne collector
Aanwezig
Totaal oppervlakte panelen m2
Verlichting (zie box rechts)
Totaal geinstalleerd vermogen verlichting
Conventioneel 35.00 kW
LED kW
Armatuurtype Overige gevallen
Type regeling/schakeling Vertrekschakeling
Bewegingsmelders Geen aanwezigheidsdetectie
Voorkeuren renovatie
Verdeel 100 punten over de onderstaande criteria. Diegene die voor u het belangrijkste is, vul daar de meeste punten in. De tweede belangrijkste iets minder en zo verder.
Punten Voorbeeld
Laagste inversteringskosten 50
Snelste terug verdientijd 20
Laagste onderhoudskosten 0
Reductie van CO2 uitstoot 20 10
Reductie van energie gebruik 80 20
100
Als laatste wil ik u vragen de verschillende renovatie mogelijkheden te rangschikken op prioriteit. Zet op nummer 1 dat gene neer wat u het liefst aangepakt ziet worden. Op nummer 7 diegene die het laatste gedaan moet worden. Bijvoorbeeld als u net de insolatie heeft vervangen, heeft dit minder prioriteit.
1 Isolatie
2 Ramen
3 Warmte levering
4 Zonne-energie systemen
5 Verlichting
6 Koude levering
7 Ventilators

Master thesis - Energy Science Pam Engwirda (5549647)
125
Questionnaire Freudenthal UU
Demografische informatie
Naam kantoorpand: UU Freudenthal
Adres Princetonplein 5, Utrecht
Bouwjaar 1975
Aantal maanden pand is in gebruik 12 maanden
Kantoorpand constructie eigenschappen
Oppervlakten en maten
Totale vloeroppervlakte kantoorpand 4578 m2
Vloeroppervlakte begane grond
563 m2
Kruipruimte aanwezig?
Hoogte kantoorpand 28 m
Hoogte per verdieping 3.5 m
Oppervlakte buiten muren (incl. ramen/deuren) 2576 m2
Oppervlakte dak 563 m2
Oppervlakte ramen grenzend aan buiten 1288 m2
Issolatie waarden U Indien bekend, vul hier in
Vloer 1.923 W/m2K
Muren 0.769 W/m2K
Dak 0.769 W/m2K
Eventueel renovatie jaar
Type vloer, plafond en gevel
Massa van vloerconstructie [kg/m2] Meer dan 400 (steenachtig)
Type plafond Gesloten plafond
Gevel type Standaard gevel
Ramen
Type beglazing Dubbel glas
Zonwering aanwezig (aan de buitenkant)?
Zo ja, type zonwering Buitenzonwering met handbediening
Kantoorpand installaties
Klimaat systeem nr 3 Zie tab Climate system nr
Warmte en koude voorziening

Master thesis - Energy Science Pam Engwirda (5549647)
126
Type verwarmingsinstallatie Warmte levering door derden
Individuele regeling verwarming
Koude leverancier Compressiekoelmachine
Oppervlakte van gekoelde zones 1141 m2
WKK
Aanwezig?
Elektrisch vermogen kW
Thermisch vermogen kW
Soort distributie
Gedetailleerde informatie warmte voorziening
Warmtepomp
Bron
Brandstof
Temperatuur niveau warmteaanvoer
Ketel
Type ketel
Temperatuur niveau warmteaanvoer
Een of meer centrale verwarmingstoestellen die warmte leveren voor een oppervlakte van
Stoomketel
Economizer
Luchtvoorverwarmer
Heetwaterketel
Rookgascondensor
Ventilatoren
Type ventilatie systeem Mechanische toe- en afvoer zonder recirculatie of warmteterugwinning
Provision in ventilation system Geen debietregeling of recirculatie
Regeling Geen regeling of smoorregeling
Systeem type warmte terugwinning Geen warmteterugwinning
Ventilatie voorziening voor koelbehoefte Te openen ramen
Bevochtiging
Type bevochtigingsinstallatie Elektrisch gevoede stoombevochtiging
Vochtterugwinning Zonder
Warm tap water
Type toestel Elektrische boiler
Distributie systeem Een of meerdere tappunten op een afstand van meer dan 3 m van het opwekkingstoestel
Zonne-energie systemen

Master thesis - Energy Science Pam Engwirda (5549647)
127
Zonnepanelen
Aanwezig
Type zonnepaneel
Indien anders, piekvermogen W/m2
Oppervlakte paneel m2
Orientatie
Hellingshoek
Zonne collector
Aanwezig
Oppervlakte paneel m2
Verlichting (zie box rechts)
Totaal geinstalleerd vermogen verlichting
Conventioneel 64.35 kW
LED 0 kW
Armatuurtype Overige gevallen
Type regeling/schakeling Vertrekschakeling
Bewegingsmelders Geen aanwezigheidsdetectie
Voorkeuren renovatie – financele manager
Verdeel 100 punten over de onderstaande criteria. Diegene die voor u het belangrijkste is, vul daar de meeste punten in. De tweede belangrijkste iets minder en zo verder.
Punten Voorbeeld
Laagste inversteringskosten 20 50
Snelste terug verdientijd 0 20
Laagste onderhoudskosten 50 0
Reductie van CO2 uitstoot 10 10
Reductie van energie gebruik 20 20
100
Als laatste wil ik u vragen de verschillende renovatie mogelijkheden te rangschikken op prioriteit. Zet op nummer 1 dat gene neer wat u het liefst aangepakt ziet worden. Op nummer 7 diegene die het laatste gedaan moet worden. Bijvoorbeeld als u net de isolatie heeft vervangen, heeft dit minder prioriteit.
1 Installaties
2 Isolatie
3
4
5
6
7

Master thesis - Energy Science Pam Engwirda (5549647)
128
Voorkeuren renovatie – technisch onderhoudsmanager
Verdeel 100 punten over de onderstaande criteria. Diegene die voor u het belangrijkste is, vul daar de meeste punten in. De tweede belangrijkste iets minder en zo verder.
Punten Voorbeeld
Laagste inversteringskosten 0 50
Snelste terug verdientijd 30 20
Laagste onderhoudskosten 40 0
Reductie van CO2 uitstoot 20 10
Reductie van energie gebruik 10 20
100
Als laatste wil ik u vragen de verschillende renovatie mogelijkheden te rangschikken op prioriteit. Zet op nummer 1 dat gene neer wat u het liefst aangepakt ziet worden. Op nummer 7 diegene die het laatste gedaan moet worden. Bijvoorbeeld als u net de isolatie heeft vervangen, heeft dit minder prioriteit.
1 Warmte voorziening
2 Verlichting
3 Koude voorziening
4 Zonne-panelen
5
6
7

Master thesis - Energy Science Pam Engwirda (5549647)
129
Questionnaire Office SPIE
Demografische informatie
Naam kantoorpand: Kantoor SPIE
Adres Kobaltweg 59-61 Utrecht
Bouwjaar 1992
Aantal maanden pand is in gebruik 0 maanden
Kantoorpand constructie eigenschappen
Oppervlakten en maten
Totale vloeroppervlakte kantoorpand 4377 m2
Vloeroppervlakte begane grond 2935 m2
Kruipruimte aanwezig?
Hoogte kantoorpand 14 m
Hoogte per verdieping 3.25 m
Oppervlakte buiten muren (incl. ramen/deuren) 1821 m2
Oppervlakte dak 630 m2
Oppervlakte ramen grenzend aan buiten 486 m2
Issolatie waarden U Indien bekend, vul hier in
Vloer 0.395 W/m2K
Muren 0.395 W/m2K
Dak 0.395 W/m2K
Eventueel renovatie jaar
Type vloer, plafond en gevel
Massa van vloerconstructie [kg/m2] Meer dan 400 (steenachtig)
Type plafond Gesloten plafond
Gevel type Standaard gevel
Ramen
Type beglazing Dubbel glas
Zonwering aanwezig (aan de buitenkant)?
Zo ja, type zonwering Buitenzonwering met handbediening
Kantoorpand installaties
Klimaat systeem nr 3 Zie tab Climate system nr
Warmte en koude voorziening
Type verwarmingsinstallatie Locale gasverwarming of olieverwarming

Master thesis - Energy Science Pam Engwirda (5549647)
130
Individuele regeling verwarming
Koude leverancier Compressiekoelmachine
Oppervlakte van gekoelde zones m2
WKK
Aanwezig?
Elektrisch vermogen kW
Thermisch vermogen kW
Soort distributie
Gedetailleerde informatie warmte voorziening
Warmtepomp
Bron
Brandstof
Temperatuur niveau warmteaanvoer
Ketel
Type ketel Temperatuur niveau warmteaanvoer
Een of meer centrale verwarmingstoestellen die warmte leveren voor een oppervlakte van Stoomketel
Economizer
Luchtvoorverwarmer
Heetwaterketel
Rookgascondensor
Ventilatoren
Type ventilatie systeem Mechanische toe- en afvoer zonder recirculatie of warmteterugwinning
Provision in ventilation system Geen debietregeling of recirculatie
Regeling Geen regeling of smoorregeling
Systeem type warmte terugwinning Geen warmteterugwinning
Ventilatie voorziening voor koelbehoefte Ventilatieroosters
Bevochtiging
Type bevochtigingsinstallatie Geen bevochtiging
Vochtterugwinning
Warm tap water
Type toestel Gas boiler, geiser, HR-ketel met cv-boiler, HR combi
Distributie systeem Een of meerdere tappunten op een afstand van meer dan 3 m van het opwekkingstoestel
Zonne-energie systemen
Zonnepanelen

Master thesis - Energy Science Pam Engwirda (5549647)
131
Aanwezig
Type zonnepaneel
Indien anders, piekvermogen W/m2
Oppervlakte paneel m2
Orientatie
Hellingshoek
Zonne collector
Aanwezig
Oppervlakte paneel m2
Verlichting (zie box rechts)
Totaal geinstalleerd vermogen verlichting
Conventioneel 43.62 kW
LED kW
Armatuurtype Overige gevallen
Type regeling/schakeling Centraal aan/uit
Bewegingsmelders Aanwezigheidsdetectie
Voorkeuren renovatie
Verdeel 100 punten over de onderstaande criteria. Diegene die voor u het belangrijkste is, vul daar de meeste punten in. De tweede belangrijkste iets minder en zo verder.
Punten Voorbeeld
Laagste inversteringskosten 30 50
Snelste terug verdientijd 20 20
Laagste onderhoudskosten 20 0
Reductie van CO2 uitstoot 10 10
Reductie van energie gebruik 20 20
100
Als laatste wil ik u vragen de verschillende renovatie mogelijkheden te rangschikken op prioriteit. Zet op nummer 1 dat gene neer wat u het liefst aangepakt ziet worden. Op nummer 7 diegene die het laatste gedaan moet worden. Bijvoorbeeld als u net de insolatie heeft vervangen, heeft dit minder prioriteit.
1 Ramen
2 Verlichting
3 Zonne-energie systemen
4 Koude levering
5 Warmte levering
6 Ventilators
7 Isolatie

Master thesis - Energy Science Pam Engwirda (5549647)
132