Values and Goals - Sage Publications
86
Values and Goals 3 General Values 151 List of Values: LOV (Kahle 1983) Construct: The term value has been defined as an enduring prescriptive or proscriptive belief that a specific end state of existence or specific mode of conduct is preferred to an opposite end state or mode of conduct for living one’s life (Kahle 1983; Rokeach 1968, 1973). The List of Values (LOV) typology draws a distinction between external and internal values, and it notes the importance of interpersonal relations in value fulfillment, as well as personal factors (i.e., self-respect, self-fulfillment) and apersonal factors (i.e., fun, security, excitement) in value fulfillment. In essence, the LOV measures those values that are central to people in living their lives, particularly the values of life’s major roles (i.e., marriage, parenting, work, leisure, and daily consumptions). The LOV is most closely tied to social adaptation theory (Kahle, Beatty, and Homer 1986), and many studies suggest that the LOV is related to and/or predictive of consumer behavior and related activities (e.g., Homer and Kahle 1988; Kahle 1983). Description: The LOV is composed of nine values that can be scored in a number of ways. Each value can be evaluated on 9- or 10-point scales (very unimportant to very important), or the values can be rank ordered from most to least important. Also, some combina- tion of the two methods can be used where each value is rated on 9- or 10-point scales and then subjects are asked to circle the one or two values that are most important to them in living their daily lives (e.g., Kahle 1983; Kahle et al. 1986; Kahle and Kennedy 1988). Development: The LOV was developed from a theoretical base of values proposed by Feather (1975), Maslow’s (1954) hierarchy of values, Rokeach’s (1973) 18 terminal values, and various other contemporaries in values research. The LOV items were derived by culling the val- ues from the above sources from a much larger pool of values to the nine LOV items. For a more detailed discussion of the scale development procedures, see Kahle (1983, 1986) and Kahle et al. (1986).
-
Upload
khangminh22 -
Category
Documents
-
view
10 -
download
0
Transcript of Values and Goals - Sage Publications
Values and Goals3General Values
151
List of Values: LOV
(Kahle 1983)
Construct: The term value has been defined as an enduring prescriptive or proscriptive belief thata specific end state of existence or specific mode of conduct is preferred to an oppositeend state or mode of conduct for living one’s life (Kahle 1983; Rokeach 1968, 1973).
The List of Values (LOV) typology draws a distinction between external and internalvalues, and it notes the importance of interpersonal relations in value fulfillment, as wellas personal factors (i.e., self-respect, self-fulfillment) and apersonal factors (i.e., fun,security, excitement) in value fulfillment. In essence, the LOV measures those valuesthat are central to people in living their lives, particularly the values of life’s major roles(i.e., marriage, parenting, work, leisure, and daily consumptions). The LOV is mostclosely tied to social adaptation theory (Kahle, Beatty, and Homer 1986), and manystudies suggest that the LOV is related to and/or predictive of consumer behavior andrelated activities (e.g., Homer and Kahle 1988; Kahle 1983).
Description: The LOV is composed of nine values that can be scored in a number of ways. Eachvalue can be evaluated on 9- or 10-point scales (very unimportant to very important),or the values can be rank ordered from most to least important. Also, some combina-tion of the two methods can be used where each value is rated on 9- or 10-point scalesand then subjects are asked to circle the one or two values that are most important tothem in living their daily lives (e.g., Kahle 1983; Kahle et al. 1986; Kahle and Kennedy1988).
Development: The LOV was developed from a theoretical base of values proposed by Feather (1975),Maslow’s (1954) hierarchy of values, Rokeach’s (1973) 18 terminal values, and variousother contemporaries in values research. The LOV items were derived by culling the val-ues from the above sources from a much larger pool of values to the nine LOV items.For a more detailed discussion of the scale development procedures, see Kahle (1983,1986) and Kahle et al. (1986).
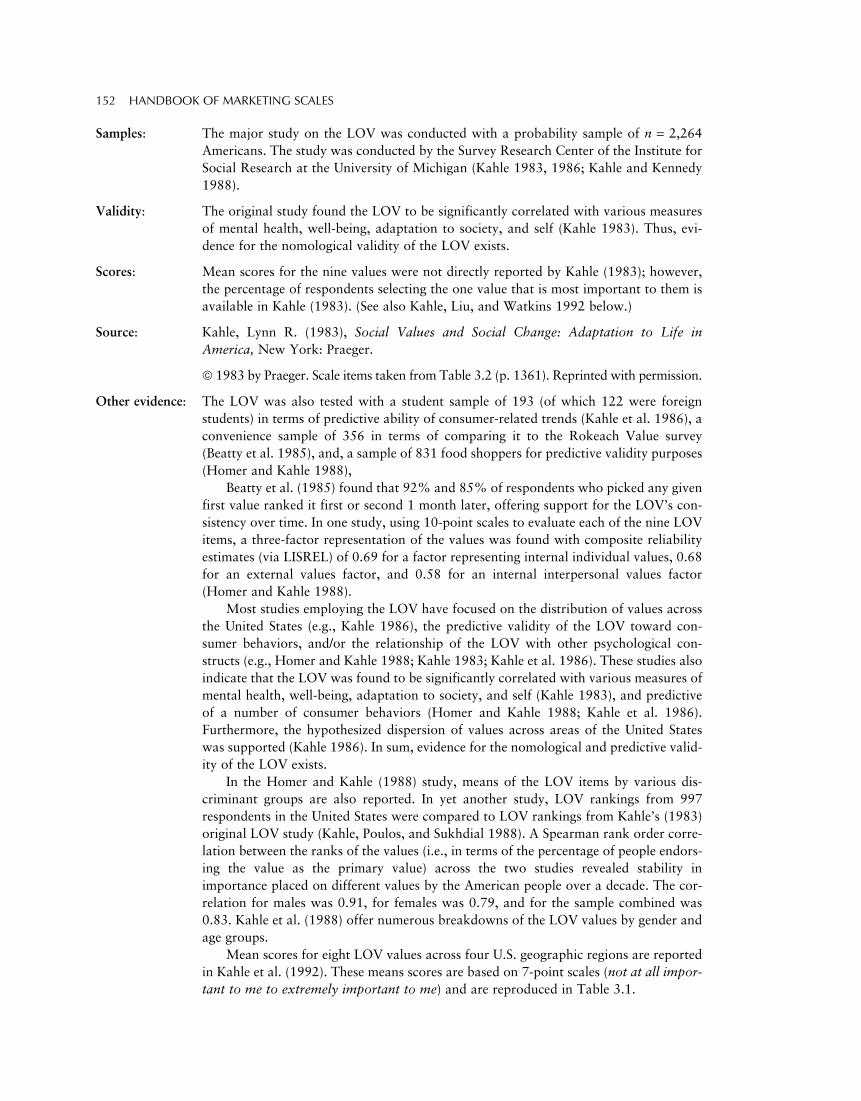
Samples: The major study on the LOV was conducted with a probability sample of n = 2,264Americans. The study was conducted by the Survey Research Center of the Institute forSocial Research at the University of Michigan (Kahle 1983, 1986; Kahle and Kennedy1988).
Validity: The original study found the LOV to be significantly correlated with various measuresof mental health, well-being, adaptation to society, and self (Kahle 1983). Thus, evi-dence for the nomological validity of the LOV exists.
Scores: Mean scores for the nine values were not directly reported by Kahle (1983); however,the percentage of respondents selecting the one value that is most important to them isavailable in Kahle (1983). (See also Kahle, Liu, and Watkins 1992 below.)
Source: Kahle, Lynn R. (1983), Social Values and Social Change: Adaptation to Life inAmerica, New York: Praeger.
1983 by Praeger. Scale items taken from Table 3.2 (p. 1361). Reprinted with permission.
Other evidence: The LOV was also tested with a student sample of 193 (of which 122 were foreignstudents) in terms of predictive ability of consumer-related trends (Kahle et al. 1986), aconvenience sample of 356 in terms of comparing it to the Rokeach Value survey(Beatty et al. 1985), and, a sample of 831 food shoppers for predictive validity purposes(Homer and Kahle 1988),
Beatty et al. (1985) found that 92% and 85% of respondents who picked any givenfirst value ranked it first or second 1 month later, offering support for the LOV’s con-sistency over time. In one study, using 10-point scales to evaluate each of the nine LOVitems, a three-factor representation of the values was found with composite reliabilityestimates (via LISREL) of 0.69 for a factor representing internal individual values, 0.68for an external values factor, and 0.58 for an internal interpersonal values factor(Homer and Kahle 1988).
Most studies employing the LOV have focused on the distribution of values acrossthe United States (e.g., Kahle 1986), the predictive validity of the LOV toward con-sumer behaviors, and/or the relationship of the LOV with other psychological con-structs (e.g., Homer and Kahle 1988; Kahle 1983; Kahle et al. 1986). These studies alsoindicate that the LOV was found to be significantly correlated with various measures ofmental health, well-being, adaptation to society, and self (Kahle 1983), and predictiveof a number of consumer behaviors (Homer and Kahle 1988; Kahle et al. 1986).Furthermore, the hypothesized dispersion of values across areas of the United Stateswas supported (Kahle 1986). In sum, evidence for the nomological and predictive valid-ity of the LOV exists.
In the Homer and Kahle (1988) study, means of the LOV items by various dis-criminant groups are also reported. In yet another study, LOV rankings from 997respondents in the United States were compared to LOV rankings from Kahle’s (1983)original LOV study (Kahle, Poulos, and Sukhdial 1988). A Spearman rank order corre-lation between the ranks of the values (i.e., in terms of the percentage of people endors-ing the value as the primary value) across the two studies revealed stability inimportance placed on different values by the American people over a decade. The cor-relation for males was 0.91, for females was 0.79, and for the sample combined was0.83. Kahle et al. (1988) offer numerous breakdowns of the LOV values by gender andage groups.
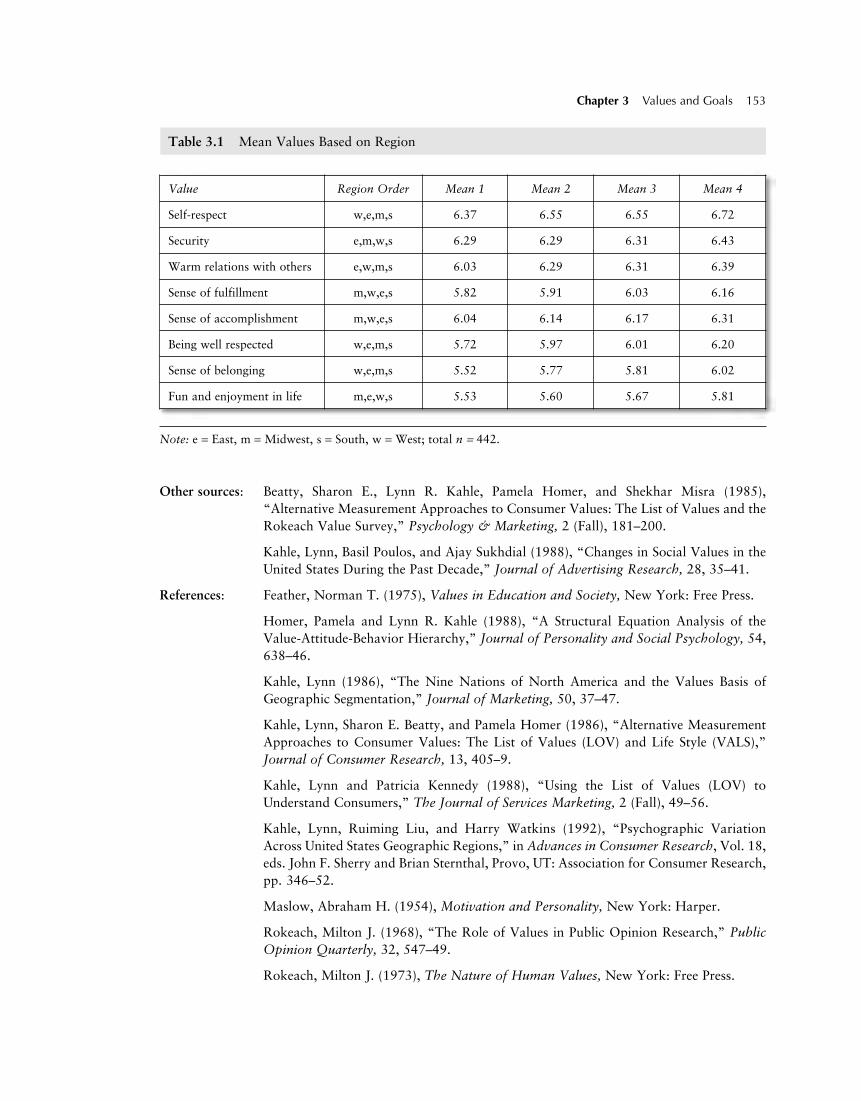
Mean scores for eight LOV values across four U.S. geographic regions are reportedin Kahle et al. (1992). These means scores are based on 7-point scales (not at all impor-tant to me to extremely important to me) and are reproduced in Table 3.1.
152 HANDBOOK OF MARKETING SCALES
Other sources: Beatty, Sharon E., Lynn R. Kahle, Pamela Homer, and Shekhar Misra (1985),“Alternative Measurement Approaches to Consumer Values: The List of Values and theRokeach Value Survey,” Psychology & Marketing, 2 (Fall), 181–200.
Kahle, Lynn, Basil Poulos, and Ajay Sukhdial (1988), “Changes in Social Values in theUnited States During the Past Decade,” Journal of Advertising Research, 28, 35–41.
References: Feather, Norman T. (1975), Values in Education and Society, New York: Free Press.
Homer, Pamela and Lynn R. Kahle (1988), “A Structural Equation Analysis of theValue-Attitude-Behavior Hierarchy,” Journal of Personality and Social Psychology, 54,638–46.
Kahle, Lynn (1986), “The Nine Nations of North America and the Values Basis ofGeographic Segmentation,” Journal of Marketing, 50, 37–47.
Kahle, Lynn, Sharon E. Beatty, and Pamela Homer (1986), “Alternative MeasurementApproaches to Consumer Values: The List of Values (LOV) and Life Style (VALS),”Journal of Consumer Research, 13, 405–9.
Kahle, Lynn and Patricia Kennedy (1988), “Using the List of Values (LOV) toUnderstand Consumers,” The Journal of Services Marketing, 2 (Fall), 49–56.
Kahle, Lynn, Ruiming Liu, and Harry Watkins (1992), “Psychographic VariationAcross United States Geographic Regions,” in Advances in Consumer Research, Vol. 18,eds. John F. Sherry and Brian Sternthal, Provo, UT: Association for Consumer Research,pp. 346–52.
Maslow, Abraham H. (1954), Motivation and Personality, New York: Harper.
Rokeach, Milton J. (1968), “The Role of Values in Public Opinion Research,” PublicOpinion Quarterly, 32, 547–49.
Rokeach, Milton J. (1973), The Nature of Human Values, New York: Free Press.
Chapter 3 Values and Goals 153
Table 3.1 Mean Values Based on Region
Value Region Order Mean 1 Mean 2 Mean 3 Mean 4
Self-respect w,e,m,s 6.37 6.55 6.55 6.72
Security e,m,w,s 6.29 6.29 6.31 6.43
Warm relations with others e,w,m,s 6.03 6.29 6.31 6.39
Sense of fulfillment m,w,e,s 5.82 5.91 6.03 6.16
Sense of accomplishment m,w,e,s 6.04 6.14 6.17 6.31
Being well respected w,e,m,s 5.72 5.97 6.01 6.20
Sense of belonging w,e,m,s 5.52 5.77 5.81 6.02
Fun and enjoyment in life m,e,w,s 5.53 5.60 5.67 5.81
Note: e = East, m = Midwest, s = South, w = West; total n = 442.
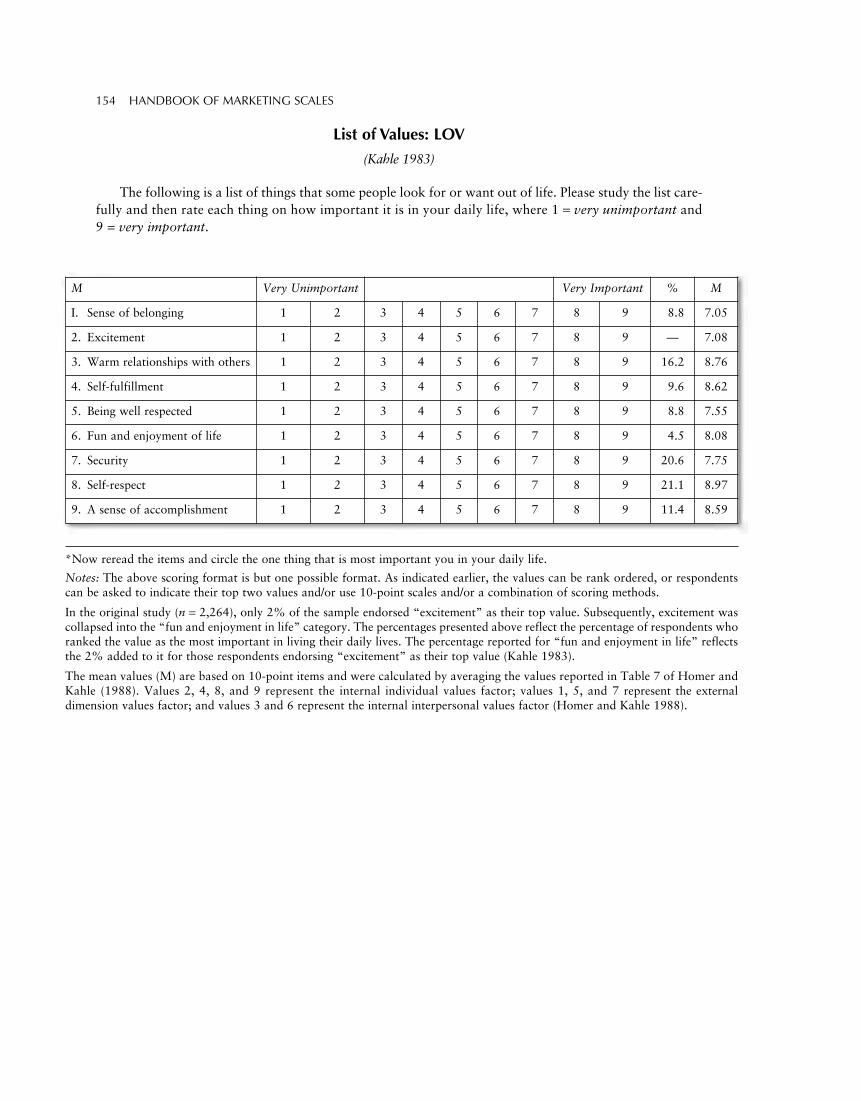
List of Values: LOV
(Kahle 1983)
The following is a list of things that some people look for or want out of life. Please study the list care-fully and then rate each thing on how important it is in your daily life, where 1 = very unimportant and9 = very important.
154 HANDBOOK OF MARKETING SCALES
M Very Unimportant Very Important % M
I. Sense of belonging 1 2 3 4 5 6 7 8 9 8.8 7.05
2. Excitement 1 2 3 4 5 6 7 8 9 — 7.08
3. Warm relationships with others 1 2 3 4 5 6 7 8 9 16.2 8.76
4. Self-fulfillment 1 2 3 4 5 6 7 8 9 9.6 8.62
5. Being well respected 1 2 3 4 5 6 7 8 9 8.8 7.55
6. Fun and enjoyment of life 1 2 3 4 5 6 7 8 9 4.5 8.08
7. Security 1 2 3 4 5 6 7 8 9 20.6 7.75
8. Self-respect 1 2 3 4 5 6 7 8 9 21.1 8.97
9. A sense of accomplishment 1 2 3 4 5 6 7 8 9 11.4 8.59
*Now reread the items and circle the one thing that is most important you in your daily life.
Notes: The above scoring format is but one possible format. As indicated earlier, the values can be rank ordered, or respondentscan be asked to indicate their top two values and/or use 10-point scales and/or a combination of scoring methods.
In the original study (n = 2,264), only 2% of the sample endorsed “excitement” as their top value. Subsequently, excitement wascollapsed into the “fun and enjoyment in life” category. The percentages presented above reflect the percentage of respondents whoranked the value as the most important in living their daily lives. The percentage reported for “fun and enjoyment in life” reflectsthe 2% added to it for those respondents endorsing “excitement” as their top value (Kahle 1983).
The mean values (M) are based on 10-point items and were calculated by averaging the values reported in Table 7 of Homer andKahle (1988). Values 2, 4, 8, and 9 represent the internal individual values factor; values 1, 5, and 7 represent the externaldimension values factor; and values 3 and 6 represent the internal interpersonal values factor (Homer and Kahle 1988).
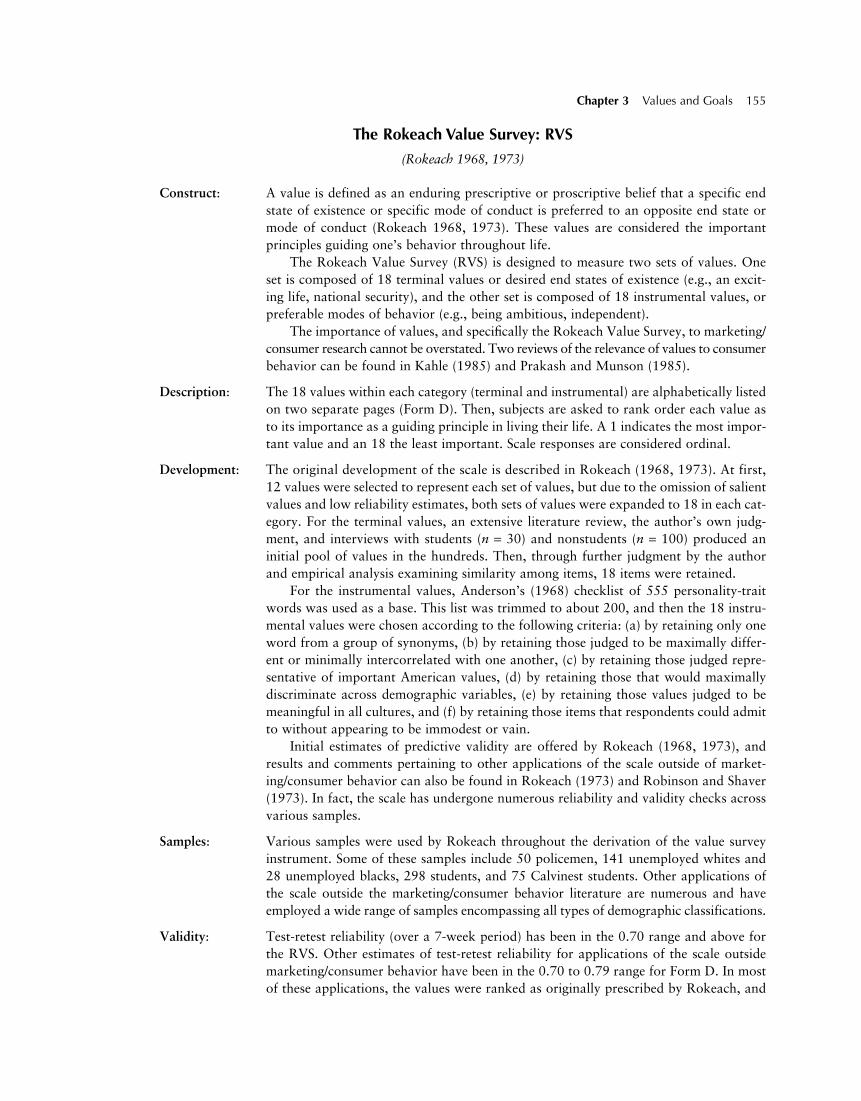
The Rokeach Value Survey: RVS
(Rokeach 1968, 1973)
Construct: A value is defined as an enduring prescriptive or proscriptive belief that a specific endstate of existence or specific mode of conduct is preferred to an opposite end state ormode of conduct (Rokeach 1968, 1973). These values are considered the importantprinciples guiding one’s behavior throughout life.
The Rokeach Value Survey (RVS) is designed to measure two sets of values. Oneset is composed of 18 terminal values or desired end states of existence (e.g., an excit-ing life, national security), and the other set is composed of 18 instrumental values, orpreferable modes of behavior (e.g., being ambitious, independent).
The importance of values, and specifically the Rokeach Value Survey, to marketing/consumer research cannot be overstated. Two reviews of the relevance of values to consumerbehavior can be found in Kahle (1985) and Prakash and Munson (1985).
Description: The 18 values within each category (terminal and instrumental) are alphabetically listedon two separate pages (Form D). Then, subjects are asked to rank order each value asto its importance as a guiding principle in living their life. A 1 indicates the most impor-tant value and an 18 the least important. Scale responses are considered ordinal.
Development: The original development of the scale is described in Rokeach (1968, 1973). At first,12 values were selected to represent each set of values, but due to the omission of salientvalues and low reliability estimates, both sets of values were expanded to 18 in each cat-egory. For the terminal values, an extensive literature review, the author’s own judg-ment, and interviews with students (n = 30) and nonstudents (n = 100) produced aninitial pool of values in the hundreds. Then, through further judgment by the authorand empirical analysis examining similarity among items, 18 items were retained.
For the instrumental values, Anderson’s (1968) checklist of 555 personality-traitwords was used as a base. This list was trimmed to about 200, and then the 18 instru-mental values were chosen according to the following criteria: (a) by retaining only oneword from a group of synonyms, (b) by retaining those judged to be maximally differ-ent or minimally intercorrelated with one another, (c) by retaining those judged repre-sentative of important American values, (d) by retaining those that would maximallydiscriminate across demographic variables, (e) by retaining those values judged to bemeaningful in all cultures, and (f) by retaining those items that respondents could admitto without appearing to be immodest or vain.
Initial estimates of predictive validity are offered by Rokeach (1968, 1973), andresults and comments pertaining to other applications of the scale outside of market-ing/consumer behavior can also be found in Rokeach (1973) and Robinson and Shaver(1973). In fact, the scale has undergone numerous reliability and validity checks acrossvarious samples.
Samples: Various samples were used by Rokeach throughout the derivation of the value surveyinstrument. Some of these samples include 50 policemen, 141 unemployed whites and28 unemployed blacks, 298 students, and 75 Calvinest students. Other applications ofthe scale outside the marketing/consumer behavior literature are numerous and haveemployed a wide range of samples encompassing all types of demographic classifications.
Validity: Test-retest reliability (over a 7-week period) has been in the 0.70 range and above forthe RVS. Other estimates of test-retest reliability for applications of the scale outsidemarketing/consumer behavior have been in the 0.70 to 0.79 range for Form D. In mostof these applications, the values were ranked as originally prescribed by Rokeach, and
Chapter 3 Values and Goals 155
thus more traditional estimates of internal consistency (i.e., coefficient alpha) are rarelyreported. As mentioned above, estimates of predictive validity can be found in Rokeach(1968, 1973). For example, the value “salvation” was found to be predictive of reli-gious affiliation and church attendance, and the values of “equality” and “freedom”were predictive of participation in civil rights demonstrations.
Scores: Since the Rokeach survey is a rank order scale, mean scores generally have not beenreported. However, a comprehensive table of the frequencies for all 36 values acrossselect demographic characteristics is available in Rokeach (1973, pp. 363–419).
Sources: Rokeach, Milton (1968), Beliefs, Attitudes, and Values. San Francisco: Jossey-Bass. 1968 by Jossey-Bass, Inc. Reprinted with permission.Rokeach, Milton (1973), The Nature of Human Values. New York: Free Press. 1973 by The Free Press. Scale items taken from Appendix A (pp. 355–61). Reprintedwith permission.
Other evidence: In the marketing/consumer behavior literature, samples have comprised both student(Munson and McQuarrie 1988; Reynolds and Jolly 1980; Shrum, McCarty, andLoeffler 1990; Vinson, Munson, and Nakanishi 1977) and nonstudent groups (e.g.,Beatty et al. 1985; McQuarrie and Langmeyer 1985; Munson and McQuarrie 1988).These applications of the scale have used all 18 terminal and all 18 instrumental values,as well as shortened versions of the scale where 12 instrumental and 12 terminal valuesare evaluated (Rokeach 1968, 1973). In addition, many of these applications have usedvarious scoring formats including Rokeach’s original ranking procedure, anchored end-point scoring, and Likert-type interval scoring. Several of these applications are brieflydiscussed below.
Based on the difficulty subjects have had in ranking all 18 terminal and 18 instru-mental values, many marketing researchers have attempted alternative scaling formatsfor the Rokeach values. Vinson et al. (1977) had subjects evaluate the 36 values on aninterval scaling format ranging from important to not important. They report that twodistinct dimensions were found (i.e., the terminal and instrumental value dimensionsas espoused by Rokeach). However, within the two dimensions, several subdimensionswere found. Six factors for the terminal values were found: social harmony, personalgratification, self-actualization, security, love and affection, and personal contented-ness. Four factors were found for the instrumental dimension: competence, compas-sion, sociality, and integrity. Estimates of internal consistency were not reported.
Munson and Mclntyre (1979) compared three different scaling formats of theRokeach values. The three formats were the original format proposed by Rokeach,Likert statements for each of the 36 values ranging from extremely important toextremely unimportant, and an anchored scaling format. Over a 2-week period, test-retest reliability was estimated via Spearman’s rho for each format. For Rokeach’s rankorder format, rho = 0.82 and 0.76 for the terminal and instrumental values, respec-tively. For the Likert format, rho = 0.76 and 0.74 for the terminal and instrumental val-ues, and for the anchored scaling, rho = 0.73 and 0.68 for the terminal and instrumentalvalues. Munson and Mclntyre concluded that the Likert format was an appropriatealternative to Rokeach’s rank order format.
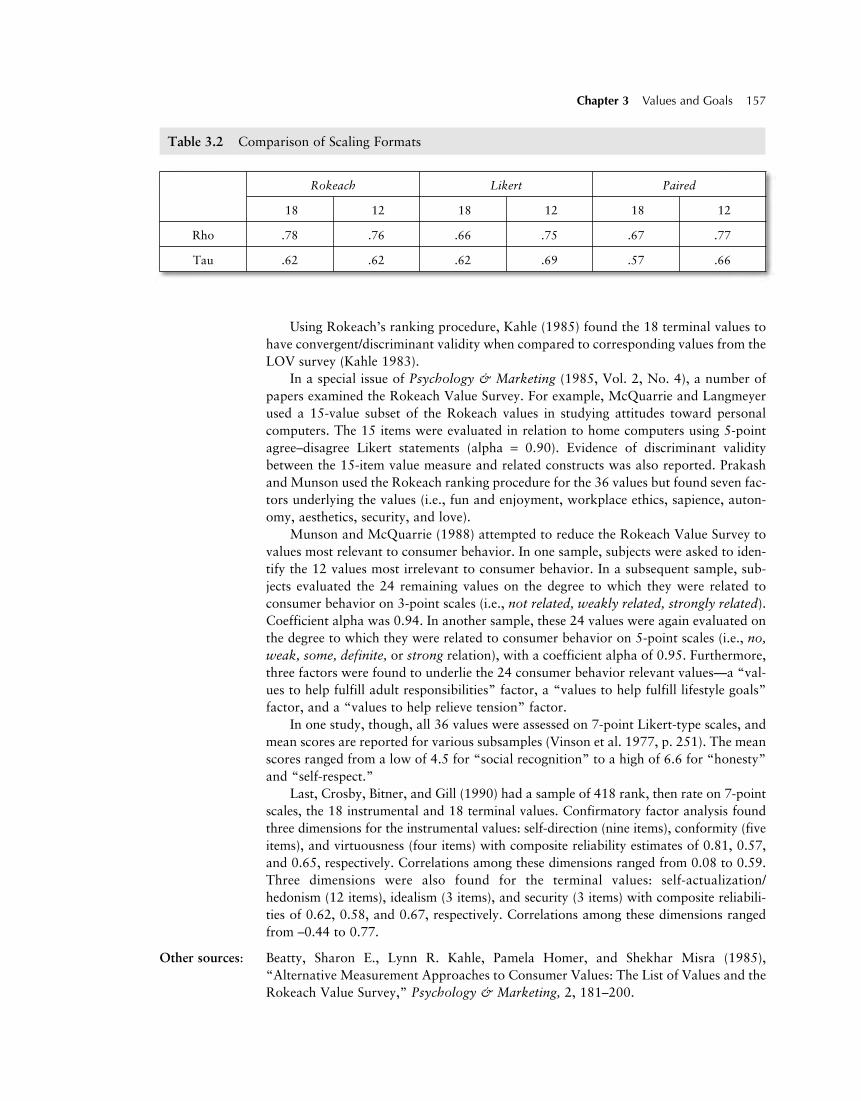
Reynolds and Jolly (1980) also compared three scaling formats includingRokeach’s rankings, a Likert-type format, and a paired comparison format for the 18terminal values and a 12-value subset of the terminal values. Over a 2-week period,test-retest reliability was computed across the formats via Spearman’s rho andKendall’s tau. They concluded that the Likert format may not be appropriate based onthe results in Table 3.2.
156 HANDBOOK OF MARKETING SCALES
Using Rokeach’s ranking procedure, Kahle (1985) found the 18 terminal values tohave convergent/discriminant validity when compared to corresponding values from theLOV survey (Kahle 1983).
In a special issue of Psychology & Marketing (1985, Vol. 2, No. 4), a number ofpapers examined the Rokeach Value Survey. For example, McQuarrie and Langmeyerused a 15-value subset of the Rokeach values in studying attitudes toward personalcomputers. The 15 items were evaluated in relation to home computers using 5-pointagree–disagree Likert statements (alpha = 0.90). Evidence of discriminant validitybetween the 15-item value measure and related constructs was also reported. Prakashand Munson used the Rokeach ranking procedure for the 36 values but found seven fac-tors underlying the values (i.e., fun and enjoyment, workplace ethics, sapience, auton-omy, aesthetics, security, and love).
Munson and McQuarrie (1988) attempted to reduce the Rokeach Value Survey tovalues most relevant to consumer behavior. In one sample, subjects were asked to iden-tify the 12 values most irrelevant to consumer behavior. In a subsequent sample, sub-jects evaluated the 24 remaining values on the degree to which they were related toconsumer behavior on 3-point scales (i.e., not related, weakly related, strongly related).Coefficient alpha was 0.94. In another sample, these 24 values were again evaluated onthe degree to which they were related to consumer behavior on 5-point scales (i.e., no,weak, some, definite, or strong relation), with a coefficient alpha of 0.95. Furthermore,three factors were found to underlie the 24 consumer behavior relevant values—a “val-ues to help fulfill adult responsibilities” factor, a “values to help fulfill lifestyle goals”factor, and a “values to help relieve tension” factor.
In one study, though, all 36 values were assessed on 7-point Likert-type scales, andmean scores are reported for various subsamples (Vinson et al. 1977, p. 251). The meanscores ranged from a low of 4.5 for “social recognition” to a high of 6.6 for “honesty”and “self-respect.”
Last, Crosby, Bitner, and Gill (1990) had a sample of 418 rank, then rate on 7-pointscales, the 18 instrumental and 18 terminal values. Confirmatory factor analysis foundthree dimensions for the instrumental values: self-direction (nine items), conformity (fiveitems), and virtuousness (four items) with composite reliability estimates of 0.81, 0.57,and 0.65, respectively. Correlations among these dimensions ranged from 0.08 to 0.59.Three dimensions were also found for the terminal values: self-actualization/hedonism (12 items), idealism (3 items), and security (3 items) with composite reliabili-ties of 0.62, 0.58, and 0.67, respectively. Correlations among these dimensions rangedfrom –0.44 to 0.77.
Other sources: Beatty, Sharon E., Lynn R. Kahle, Pamela Homer, and Shekhar Misra (1985),“Alternative Measurement Approaches to Consumer Values: The List of Values and theRokeach Value Survey,” Psychology & Marketing, 2, 181–200.
Chapter 3 Values and Goals 157
Table 3.2 Comparison of Scaling Formats
Rokeach Likert Paired
18 12 18 12 18 12
Rho .78 .76 .66 .75 .67 .77
Tau .62 .62 .62 .69 .57 .66
Crosby, Lawrence A., Mary Jo Bitner, and James D. Gill (1990), “OrganizationalStructure of Values,” Journal of Business Research, 20, 123–34.
Kahle, Lynn R. (1983), Social Values and Social Change: Adaptation to Life inAmerica, New York: Praeger.
McQuarrie, Edward F. and Daniel Langmeyer (1985), “Using Values to MeasureAttitudes Toward Discontinuous Innovations,” Psychology & Marketing, 2, 239–52.
Munson, J. Michael and S. H. Mclntyre (1979), “Developing Practical Procedures forthe Measurement of Personal Values in Cross-Cultural Marketing,” Journal ofMarketing Research, 16 (February), 48–52.
Munson, J. Michael and Edward F. McQuarrie (1988), “Shortening the Rokeach ValueSurvey for Use in Consumer Behavior,” in Advances in Consumer Research, Vol. 15,ed. Michael J. Houston, Provo, UT: Association for Consumer Research, pp. 381–86.
Reynolds, Thomas J. and James P. Jolly (1980), “Measuring Personal Values: AnEvaluation of Alternative Methods,” Journal of Marketing Research, 17, 531–36.
Shrum, L. J., John A. McCarty, and Tamara L. Loeffler (1990), “Individual Differencesin Value Stability: Are We Really Tapping True Values?” in Advances in ConsumerResearch, Vol. 17, eds. Marvin E. Goldberg, Gerald Gorn, and Richard W. Pollay,Provo, UT: Association for Consumer Research, pp. 609–15.
Vinson, Donald E., J. Michael Munson, and Masao Nakanishi (1977), “AnInvestigation of the Rokeach Value Survey for Consumer Research Applications,” inAdvances in Consumer Research, Vol. 4, ed. William E. Perreault, Provo, UT:Association for Consumer Research, pp. 247–52.
References: Anderson, N. H. (1968), “Likableness Ratings of 555 Personality-Trait Words,”Journal of Personality and Social Psychology, 9, 272–79.
Kahle, Lynn R. (1985), “Social Values in the Eighties: A Special Issue,” Psychology &Marketing, 2, 231–37.
Prakash, Ved and J. Michael Munson (1985), “Values, Expectations From theMarketing Systems, and Product Expectations,” Psychology & Marketing, 2, 279–98.
Robinson, J. P. and R. P. Shaver (1973), Measures of Social Psychological Attitudes,Ann Arbor, MI: Survey Research Center, Institute for Social Research.
158 HANDBOOK OF MARKETING SCALES
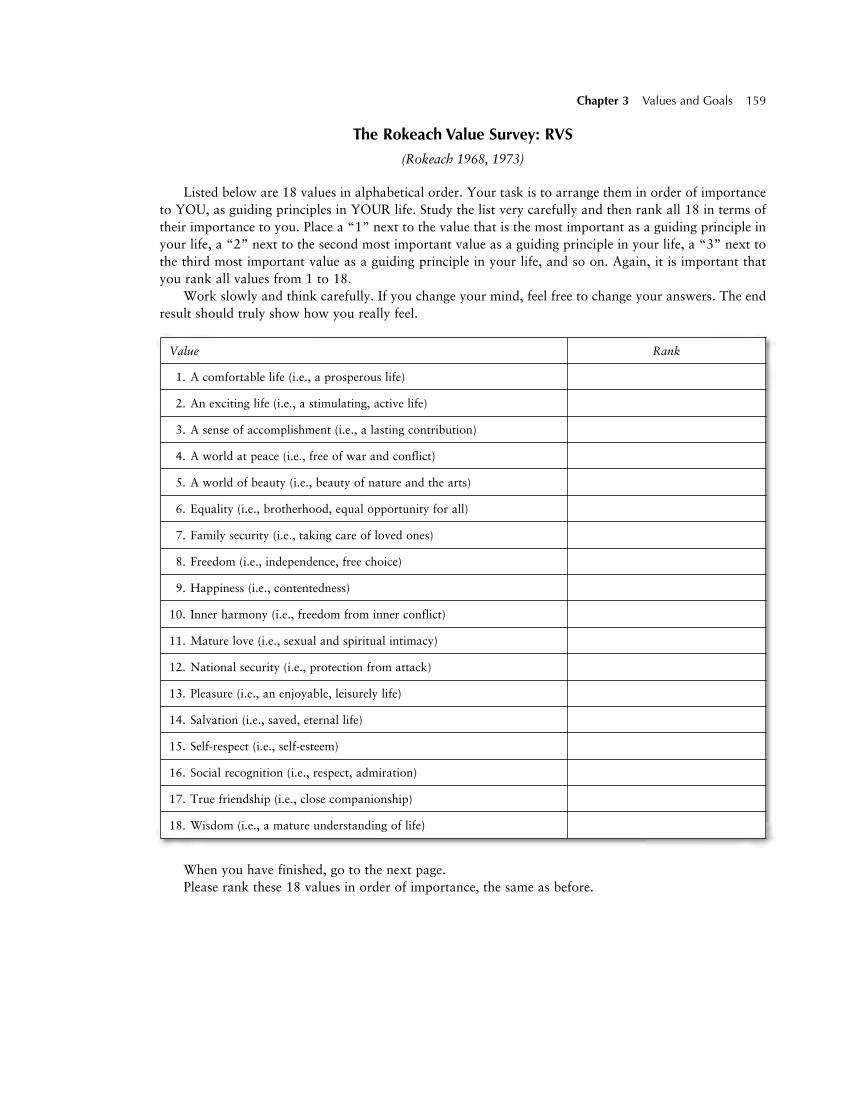
The Rokeach Value Survey: RVS
(Rokeach 1968, 1973)
Listed below are 18 values in alphabetical order. Your task is to arrange them in order of importanceto YOU, as guiding principles in YOUR life. Study the list very carefully and then rank all 18 in terms oftheir importance to you. Place a “1” next to the value that is the most important as a guiding principle inyour life, a “2” next to the second most important value as a guiding principle in your life, a “3” next tothe third most important value as a guiding principle in your life, and so on. Again, it is important thatyou rank all values from 1 to 18.
Work slowly and think carefully. If you change your mind, feel free to change your answers. The endresult should truly show how you really feel.
Chapter 3 Values and Goals 159
Value Rank
1. A comfortable life (i.e., a prosperous life)
2. An exciting life (i.e., a stimulating, active life)
3. A sense of accomplishment (i.e., a lasting contribution)
4. A world at peace (i.e., free of war and conflict)
5. A world of beauty (i.e., beauty of nature and the arts)
6. Equality (i.e., brotherhood, equal opportunity for all)
7. Family security (i.e., taking care of loved ones)
8. Freedom (i.e., independence, free choice)
9. Happiness (i.e., contentedness)
10. Inner harmony (i.e., freedom from inner conflict)
11. Mature love (i.e., sexual and spiritual intimacy)
12. National security (i.e., protection from attack)
13. Pleasure (i.e., an enjoyable, leisurely life)
14. Salvation (i.e., saved, eternal life)
15. Self-respect (i.e., self-esteem)
16. Social recognition (i.e., respect, admiration)
17. True friendship (i.e., close companionship)
18. Wisdom (i.e., a mature understanding of life)
When you have finished, go to the next page.Please rank these 18 values in order of importance, the same as before.
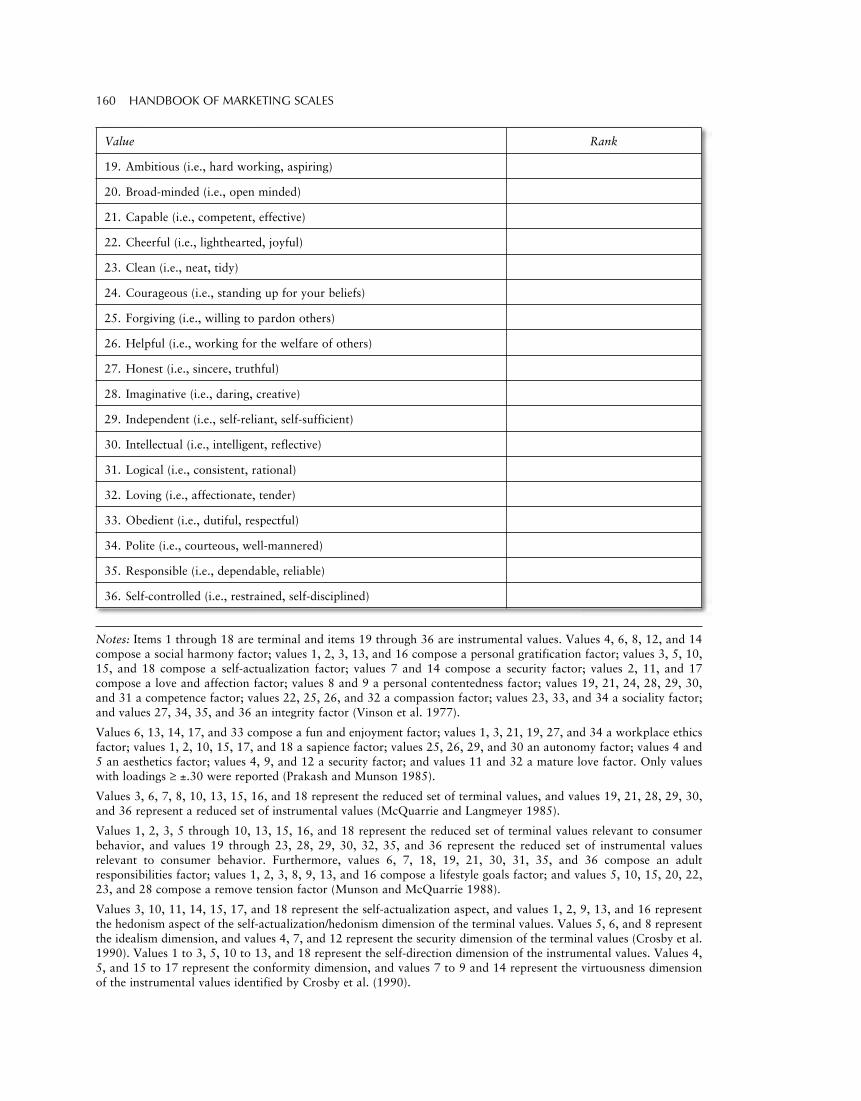
160 HANDBOOK OF MARKETING SCALES
Value Rank
19. Ambitious (i.e., hard working, aspiring)
20. Broad-minded (i.e., open minded)
21. Capable (i.e., competent, effective)
22. Cheerful (i.e., lighthearted, joyful)
23. Clean (i.e., neat, tidy)
24. Courageous (i.e., standing up for your beliefs)
25. Forgiving (i.e., willing to pardon others)
26. Helpful (i.e., working for the welfare of others)
27. Honest (i.e., sincere, truthful)
28. Imaginative (i.e., daring, creative)
29. Independent (i.e., self-reliant, self-sufficient)
30. Intellectual (i.e., intelligent, reflective)
31. Logical (i.e., consistent, rational)
32. Loving (i.e., affectionate, tender)
33. Obedient (i.e., dutiful, respectful)
34. Polite (i.e., courteous, well-mannered)
35. Responsible (i.e., dependable, reliable)
36. Self-controlled (i.e., restrained, self-disciplined)
Notes: Items 1 through 18 are terminal and items 19 through 36 are instrumental values. Values 4, 6, 8, 12, and 14compose a social harmony factor; values 1, 2, 3, 13, and 16 compose a personal gratification factor; values 3, 5, 10,15, and 18 compose a self-actualization factor; values 7 and 14 compose a security factor; values 2, 11, and 17compose a love and affection factor; values 8 and 9 a personal contentedness factor; values 19, 21, 24, 28, 29, 30,and 31 a competence factor; values 22, 25, 26, and 32 a compassion factor; values 23, 33, and 34 a sociality factor;and values 27, 34, 35, and 36 an integrity factor (Vinson et al. 1977).
Values 6, 13, 14, 17, and 33 compose a fun and enjoyment factor; values 1, 3, 21, 19, 27, and 34 a workplace ethicsfactor; values 1, 2, 10, 15, 17, and 18 a sapience factor; values 25, 26, 29, and 30 an autonomy factor; values 4 and5 an aesthetics factor; values 4, 9, and 12 a security factor; and values 11 and 32 a mature love factor. Only valueswith loadings ≥ ±.30 were reported (Prakash and Munson 1985).
Values 3, 6, 7, 8, 10, 13, 15, 16, and 18 represent the reduced set of terminal values, and values 19, 21, 28, 29, 30,and 36 represent a reduced set of instrumental values (McQuarrie and Langmeyer 1985).
Values 1, 2, 3, 5 through 10, 13, 15, 16, and 18 represent the reduced set of terminal values relevant to consumerbehavior, and values 19 through 23, 28, 29, 30, 32, 35, and 36 represent the reduced set of instrumental valuesrelevant to consumer behavior. Furthermore, values 6, 7, 18, 19, 21, 30, 31, 35, and 36 compose an adultresponsibilities factor; values 1, 2, 3, 8, 9, 13, and 16 compose a lifestyle goals factor; and values 5, 10, 15, 20, 22,23, and 28 compose a remove tension factor (Munson and McQuarrie 1988).
Values 3, 10, 11, 14, 15, 17, and 18 represent the self-actualization aspect, and values 1, 2, 9, 13, and 16 representthe hedonism aspect of the self-actualization/hedonism dimension of the terminal values. Values 5, 6, and 8 representthe idealism dimension, and values 4, 7, and 12 represent the security dimension of the terminal values (Crosby et al.1990). Values 1 to 3, 5, 10 to 13, and 18 represent the self-direction dimension of the instrumental values. Values 4,5, and 15 to 17 represent the conformity dimension, and values 7 to 9 and 14 represent the virtuousness dimensionof the instrumental values identified by Crosby et al. (1990).
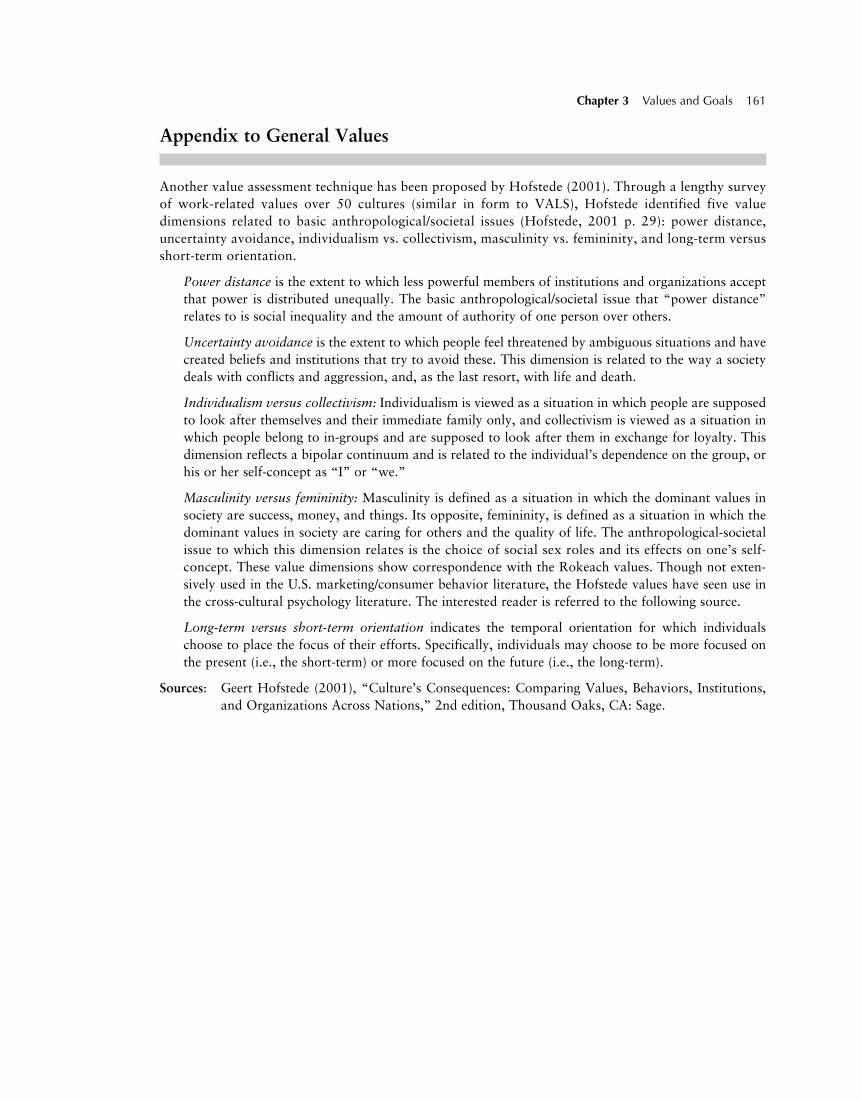
Appendix to General Values
Another value assessment technique has been proposed by Hofstede (2001). Through a lengthy surveyof work-related values over 50 cultures (similar in form to VALS), Hofstede identified five valuedimensions related to basic anthropological/societal issues (Hofstede, 2001 p. 29): power distance,uncertainty avoidance, individualism vs. collectivism, masculinity vs. femininity, and long-term versusshort-term orientation.
Power distance is the extent to which less powerful members of institutions and organizations acceptthat power is distributed unequally. The basic anthropological/societal issue that “power distance”relates to is social inequality and the amount of authority of one person over others.
Uncertainty avoidance is the extent to which people feel threatened by ambiguous situations and havecreated beliefs and institutions that try to avoid these. This dimension is related to the way a societydeals with conflicts and aggression, and, as the last resort, with life and death.
Individualism versus collectivism: Individualism is viewed as a situation in which people are supposedto look after themselves and their immediate family only, and collectivism is viewed as a situation inwhich people belong to in-groups and are supposed to look after them in exchange for loyalty. Thisdimension reflects a bipolar continuum and is related to the individual’s dependence on the group, orhis or her self-concept as “I” or “we.”
Masculinity versus femininity: Masculinity is defined as a situation in which the dominant values insociety are success, money, and things. Its opposite, femininity, is defined as a situation in which thedominant values in society are caring for others and the quality of life. The anthropological-societalissue to which this dimension relates is the choice of social sex roles and its effects on one’s self-concept. These value dimensions show correspondence with the Rokeach values. Though not exten-sively used in the U.S. marketing/consumer behavior literature, the Hofstede values have seen use inthe cross-cultural psychology literature. The interested reader is referred to the following source.
Long-term versus short-term orientation indicates the temporal orientation for which individualschoose to place the focus of their efforts. Specifically, individuals may choose to be more focused onthe present (i.e., the short-term) or more focused on the future (i.e., the long-term).
Sources: Geert Hofstede (2001), “Culture’s Consequences: Comparing Values, Behaviors, Institutions,and Organizations Across Nations,” 2nd edition, Thousand Oaks, CA: Sage.
Chapter 3 Values and Goals 161
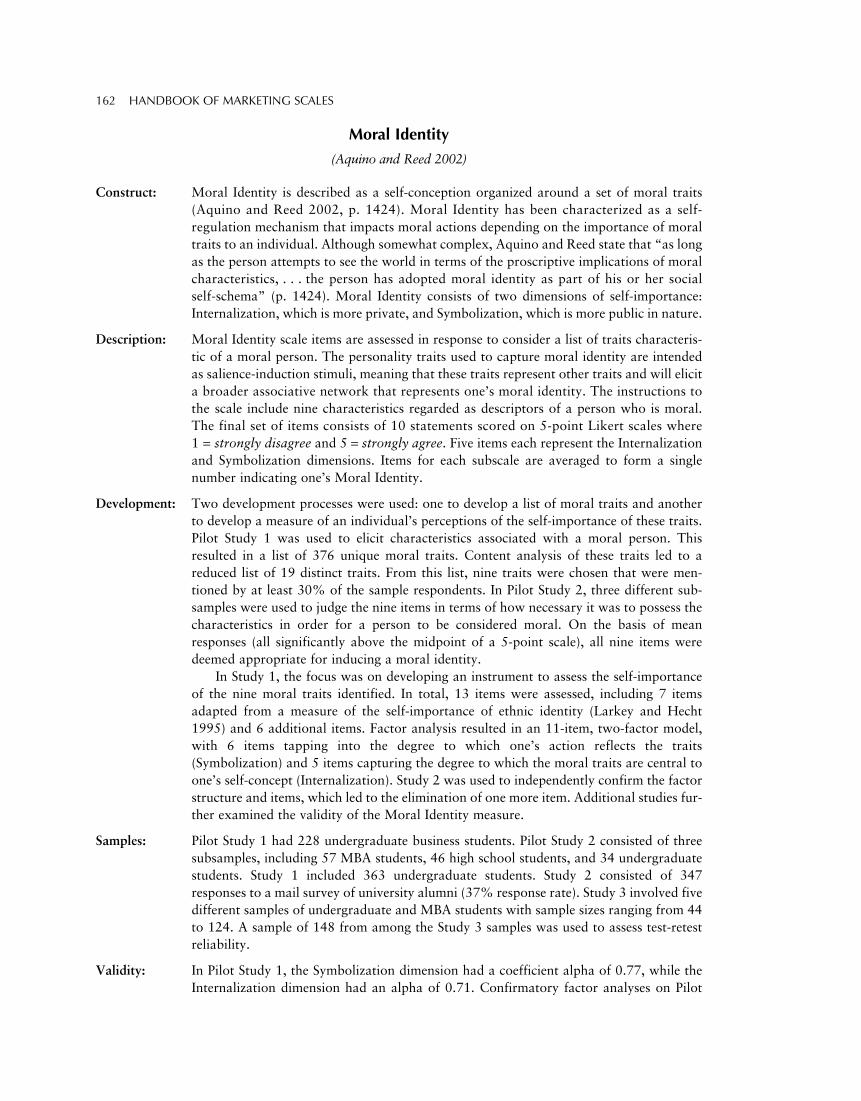
Moral Identity
(Aquino and Reed 2002)
Construct: Moral Identity is described as a self-conception organized around a set of moral traits(Aquino and Reed 2002, p. 1424). Moral Identity has been characterized as a self-regulation mechanism that impacts moral actions depending on the importance of moraltraits to an individual. Although somewhat complex, Aquino and Reed state that “as longas the person attempts to see the world in terms of the proscriptive implications of moralcharacteristics, . . . the person has adopted moral identity as part of his or her socialself-schema” (p. 1424). Moral Identity consists of two dimensions of self-importance:Internalization, which is more private, and Symbolization, which is more public in nature.
Description: Moral Identity scale items are assessed in response to consider a list of traits characteris-tic of a moral person. The personality traits used to capture moral identity are intendedas salience-induction stimuli, meaning that these traits represent other traits and will elicita broader associative network that represents one’s moral identity. The instructions tothe scale include nine characteristics regarded as descriptors of a person who is moral.The final set of items consists of 10 statements scored on 5-point Likert scales where1 = strongly disagree and 5 = strongly agree. Five items each represent the Internalizationand Symbolization dimensions. Items for each subscale are averaged to form a singlenumber indicating one’s Moral Identity.
Development: Two development processes were used: one to develop a list of moral traits and anotherto develop a measure of an individual’s perceptions of the self-importance of these traits.Pilot Study 1 was used to elicit characteristics associated with a moral person. Thisresulted in a list of 376 unique moral traits. Content analysis of these traits led to areduced list of 19 distinct traits. From this list, nine traits were chosen that were men-tioned by at least 30% of the sample respondents. In Pilot Study 2, three different sub-samples were used to judge the nine items in terms of how necessary it was to possess thecharacteristics in order for a person to be considered moral. On the basis of meanresponses (all significantly above the midpoint of a 5-point scale), all nine items weredeemed appropriate for inducing a moral identity.
In Study 1, the focus was on developing an instrument to assess the self-importanceof the nine moral traits identified. In total, 13 items were assessed, including 7 itemsadapted from a measure of the self-importance of ethnic identity (Larkey and Hecht1995) and 6 additional items. Factor analysis resulted in an 11-item, two-factor model,with 6 items tapping into the degree to which one’s action reflects the traits(Symbolization) and 5 items capturing the degree to which the moral traits are central toone’s self-concept (Internalization). Study 2 was used to independently confirm the factorstructure and items, which led to the elimination of one more item. Additional studies fur-ther examined the validity of the Moral Identity measure.
Samples: Pilot Study 1 had 228 undergraduate business students. Pilot Study 2 consisted of threesubsamples, including 57 MBA students, 46 high school students, and 34 undergraduatestudents. Study 1 included 363 undergraduate students. Study 2 consisted of 347responses to a mail survey of university alumni (37% response rate). Study 3 involved fivedifferent samples of undergraduate and MBA students with sample sizes ranging from 44to 124. A sample of 148 from among the Study 3 samples was used to assess test-retestreliability.
Validity: In Pilot Study 1, the Symbolization dimension had a coefficient alpha of 0.77, while theInternalization dimension had an alpha of 0.71. Confirmatory factor analyses on Pilot
162 HANDBOOK OF MARKETING SCALES
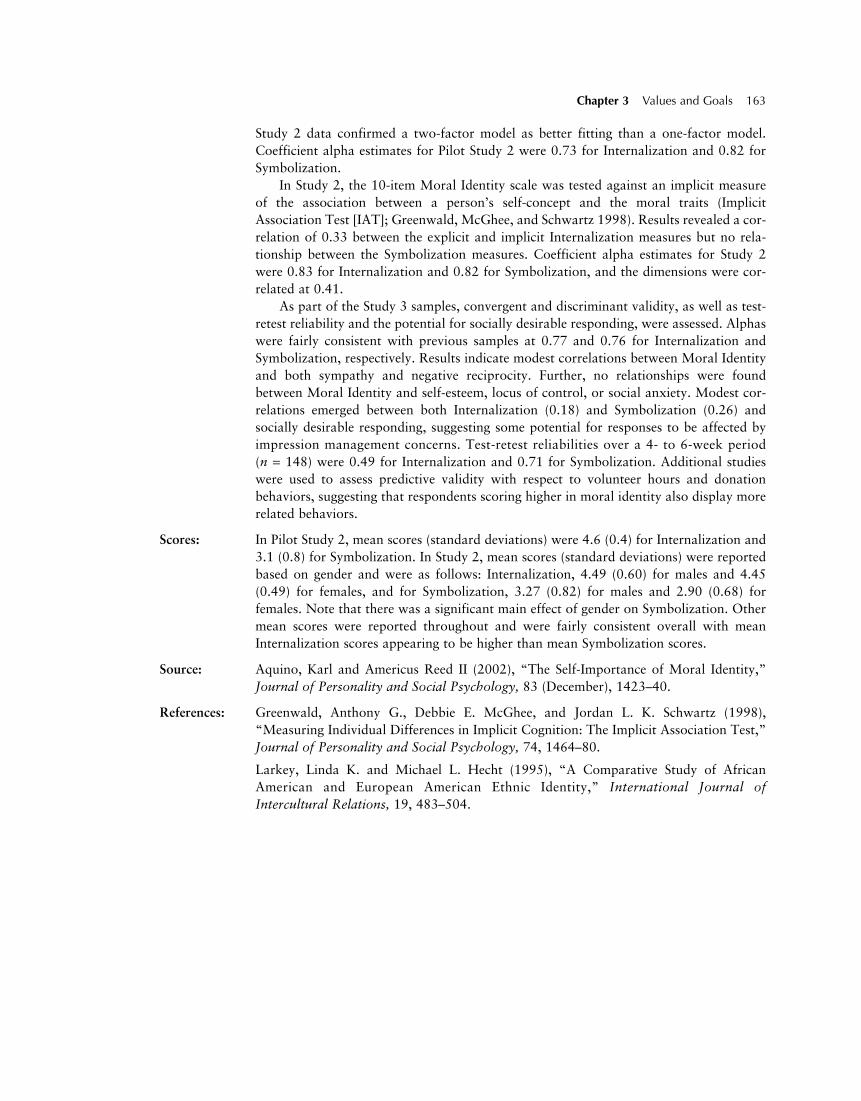
Study 2 data confirmed a two-factor model as better fitting than a one-factor model.Coefficient alpha estimates for Pilot Study 2 were 0.73 for Internalization and 0.82 forSymbolization.
In Study 2, the 10-item Moral Identity scale was tested against an implicit measureof the association between a person’s self-concept and the moral traits (ImplicitAssociation Test [IAT]; Greenwald, McGhee, and Schwartz 1998). Results revealed a cor-relation of 0.33 between the explicit and implicit Internalization measures but no rela-tionship between the Symbolization measures. Coefficient alpha estimates for Study 2were 0.83 for Internalization and 0.82 for Symbolization, and the dimensions were cor-related at 0.41.
As part of the Study 3 samples, convergent and discriminant validity, as well as test-retest reliability and the potential for socially desirable responding, were assessed. Alphaswere fairly consistent with previous samples at 0.77 and 0.76 for Internalization andSymbolization, respectively. Results indicate modest correlations between Moral Identityand both sympathy and negative reciprocity. Further, no relationships were foundbetween Moral Identity and self-esteem, locus of control, or social anxiety. Modest cor-relations emerged between both Internalization (0.18) and Symbolization (0.26) andsocially desirable responding, suggesting some potential for responses to be affected byimpression management concerns. Test-retest reliabilities over a 4- to 6-week period(n = 148) were 0.49 for Internalization and 0.71 for Symbolization. Additional studieswere used to assess predictive validity with respect to volunteer hours and donationbehaviors, suggesting that respondents scoring higher in moral identity also display morerelated behaviors.
Scores: In Pilot Study 2, mean scores (standard deviations) were 4.6 (0.4) for Internalization and3.1 (0.8) for Symbolization. In Study 2, mean scores (standard deviations) were reportedbased on gender and were as follows: Internalization, 4.49 (0.60) for males and 4.45(0.49) for females, and for Symbolization, 3.27 (0.82) for males and 2.90 (0.68) forfemales. Note that there was a significant main effect of gender on Symbolization. Othermean scores were reported throughout and were fairly consistent overall with meanInternalization scores appearing to be higher than mean Symbolization scores.
Source: Aquino, Karl and Americus Reed II (2002), “The Self-Importance of Moral Identity,”Journal of Personality and Social Psychology, 83 (December), 1423–40.
References: Greenwald, Anthony G., Debbie E. McGhee, and Jordan L. K. Schwartz (1998),“Measuring Individual Differences in Implicit Cognition: The Implicit Association Test,”Journal of Personality and Social Psychology, 74, 1464–80.
Larkey, Linda K. and Michael L. Hecht (1995), “A Comparative Study of AfricanAmerican and European American Ethnic Identity,” International Journal ofIntercultural Relations, 19, 483–504.
Chapter 3 Values and Goals 163
Moral Identity
(Aquino and Reed 2002)
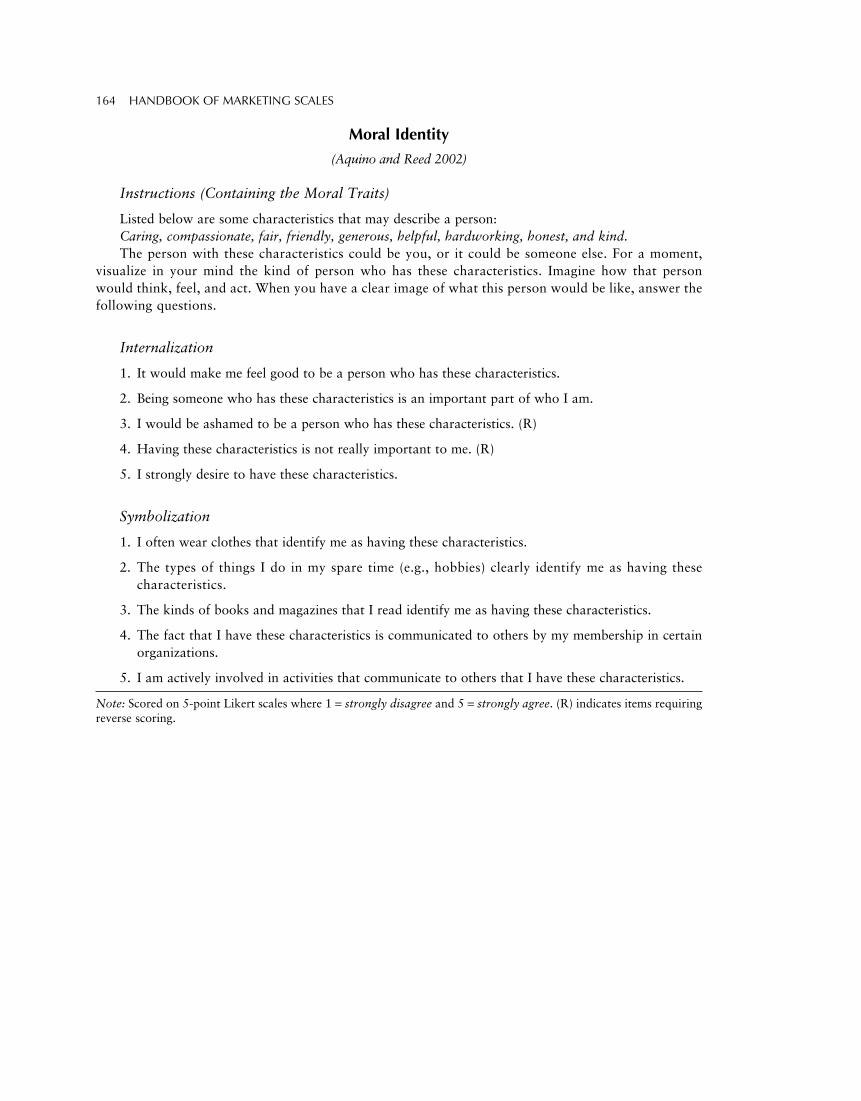
Instructions (Containing the Moral Traits)
Listed below are some characteristics that may describe a person:Caring, compassionate, fair, friendly, generous, helpful, hardworking, honest, and kind.The person with these characteristics could be you, or it could be someone else. For a moment,
visualize in your mind the kind of person who has these characteristics. Imagine how that personwould think, feel, and act. When you have a clear image of what this person would be like, answer thefollowing questions.
Internalization
1. It would make me feel good to be a person who has these characteristics.
2. Being someone who has these characteristics is an important part of who I am.
3. I would be ashamed to be a person who has these characteristics. (R)
4. Having these characteristics is not really important to me. (R)
5. I strongly desire to have these characteristics.
Symbolization
1. I often wear clothes that identify me as having these characteristics.
2. The types of things I do in my spare time (e.g., hobbies) clearly identify me as having thesecharacteristics.
3. The kinds of books and magazines that I read identify me as having these characteristics.
4. The fact that I have these characteristics is communicated to others by my membership in certainorganizations.
5. I am actively involved in activities that communicate to others that I have these characteristics.
Note: Scored on 5-point Likert scales where 1 = strongly disagree and 5 = strongly agree. (R) indicates items requiringreverse scoring.
164 HANDBOOK OF MARKETING SCALES
Values Related to Environmentalism andSocially Responsible Consumption
Attitudes Influencing Monetary Donations to Charitable Organizations
(Webb, Green, and Brashear 2000)
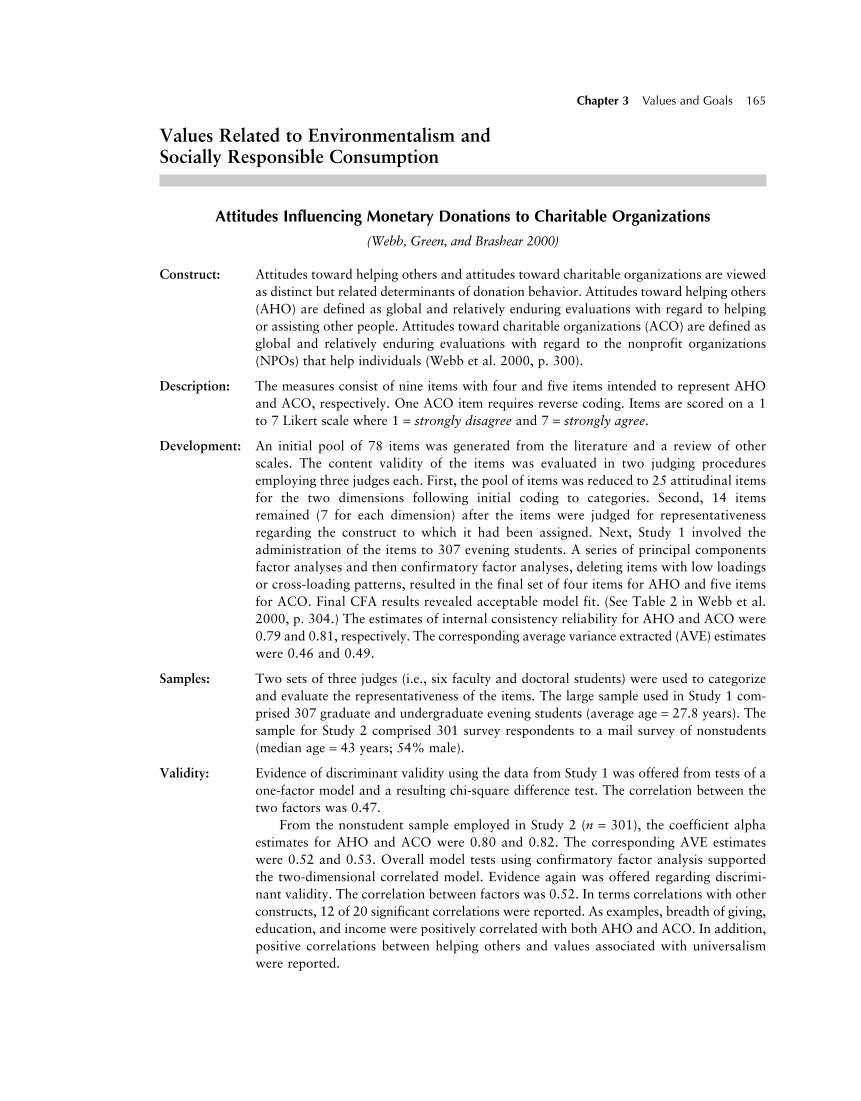
Construct: Attitudes toward helping others and attitudes toward charitable organizations are viewedas distinct but related determinants of donation behavior. Attitudes toward helping others(AHO) are defined as global and relatively enduring evaluations with regard to helpingor assisting other people. Attitudes toward charitable organizations (ACO) are defined asglobal and relatively enduring evaluations with regard to the nonprofit organizations(NPOs) that help individuals (Webb et al. 2000, p. 300).
Description: The measures consist of nine items with four and five items intended to represent AHOand ACO, respectively. One ACO item requires reverse coding. Items are scored on a 1to 7 Likert scale where 1 = strongly disagree and 7 = strongly agree.
Development: An initial pool of 78 items was generated from the literature and a review of otherscales. The content validity of the items was evaluated in two judging proceduresemploying three judges each. First, the pool of items was reduced to 25 attitudinal itemsfor the two dimensions following initial coding to categories. Second, 14 itemsremained (7 for each dimension) after the items were judged for representativenessregarding the construct to which it had been assigned. Next, Study 1 involved theadministration of the items to 307 evening students. A series of principal componentsfactor analyses and then confirmatory factor analyses, deleting items with low loadingsor cross-loading patterns, resulted in the final set of four items for AHO and five itemsfor ACO. Final CFA results revealed acceptable model fit. (See Table 2 in Webb et al.2000, p. 304.) The estimates of internal consistency reliability for AHO and ACO were0.79 and 0.81, respectively. The corresponding average variance extracted (AVE) estimateswere 0.46 and 0.49.
Samples: Two sets of three judges (i.e., six faculty and doctoral students) were used to categorizeand evaluate the representativeness of the items. The large sample used in Study 1 com-prised 307 graduate and undergraduate evening students (average age = 27.8 years). Thesample for Study 2 comprised 301 survey respondents to a mail survey of nonstudents(median age = 43 years; 54% male).
Validity: Evidence of discriminant validity using the data from Study 1 was offered from tests of aone-factor model and a resulting chi-square difference test. The correlation between thetwo factors was 0.47.
From the nonstudent sample employed in Study 2 (n = 301), the coefficient alphaestimates for AHO and ACO were 0.80 and 0.82. The corresponding AVE estimateswere 0.52 and 0.53. Overall model tests using confirmatory factor analysis supportedthe two-dimensional correlated model. Evidence again was offered regarding discrimi-nant validity. The correlation between factors was 0.52. In terms correlations with otherconstructs, 12 of 20 significant correlations were reported. As examples, breadth of giving,education, and income were positively correlated with both AHO and ACO. In addition,positive correlations between helping others and values associated with universalismwere reported.
Chapter 3 Values and Goals 165

Scores: Mean scores were reported for each item. The mean score (standard deviation) for AHOwas 5.55 (0.93) for Sample 1 and 5.08 (1.03) for Sample 2. For the ACO dimension, thesame scores were 5.22 (1.00) and 4.97 (1.12) for Samples 1 and 2, respectively.
Source: Webb, Deborah J., Corliss L. Green, and Thomas G. Brashear (2000), “Development andValidation of Scales to Measure Attitudes Influencing Monetary Donations to CharitableOrganizations,” Journal of the Academy of Marketing Science, 28 (March), 299–309.
166 HANDBOOK OF MARKETING SCALES
Attitudes Influencing Monetary Donations to Charitable Organizations
(Webb, Green, and Brashear 2000)
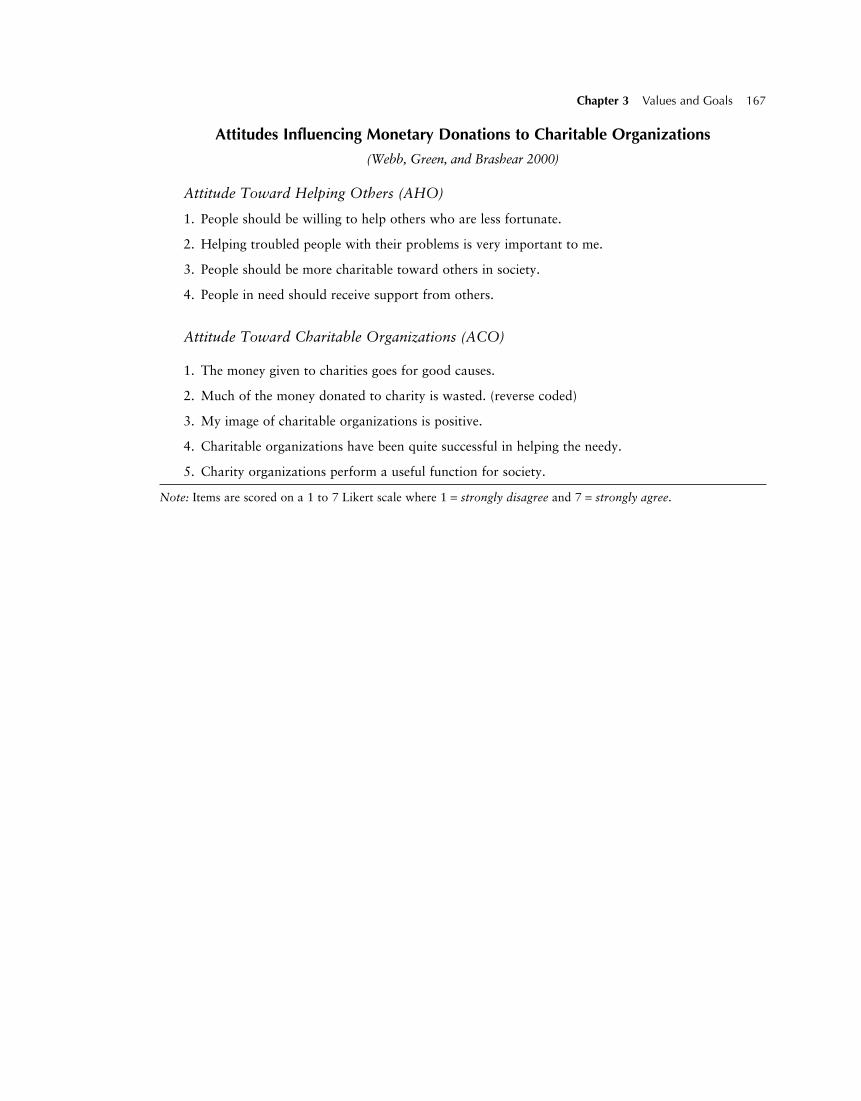
Attitude Toward Helping Others (AHO)
1. People should be willing to help others who are less fortunate.
2. Helping troubled people with their problems is very important to me.
3. People should be more charitable toward others in society.
4. People in need should receive support from others.
Attitude Toward Charitable Organizations (ACO)
1. The money given to charities goes for good causes.
2. Much of the money donated to charity is wasted. (reverse coded)
3. My image of charitable organizations is positive.
4. Charitable organizations have been quite successful in helping the needy.
5. Charity organizations perform a useful function for society.
Note: Items are scored on a 1 to 7 Likert scale where 1 = strongly disagree and 7 = strongly agree.
Chapter 3 Values and Goals 167
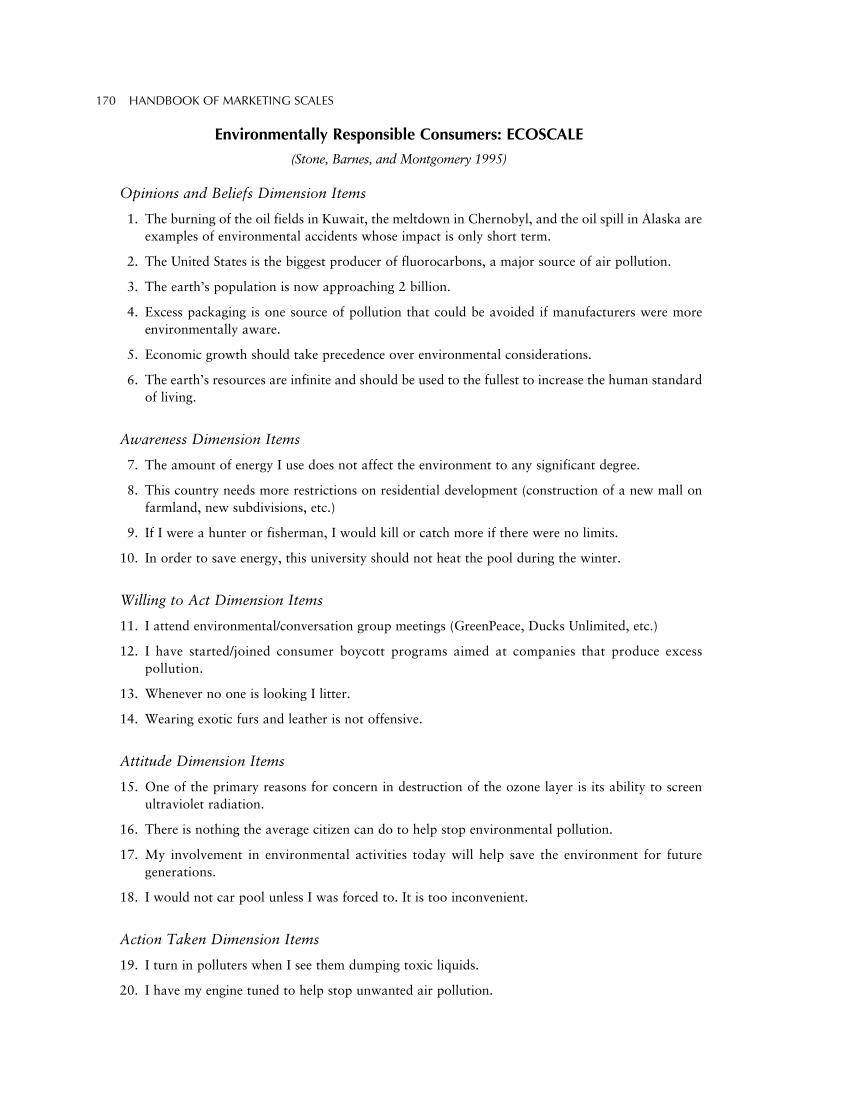
Environmentally Responsible Consumers: ECOSCALE
(Stone, Barnes, and Montgomery 1995)
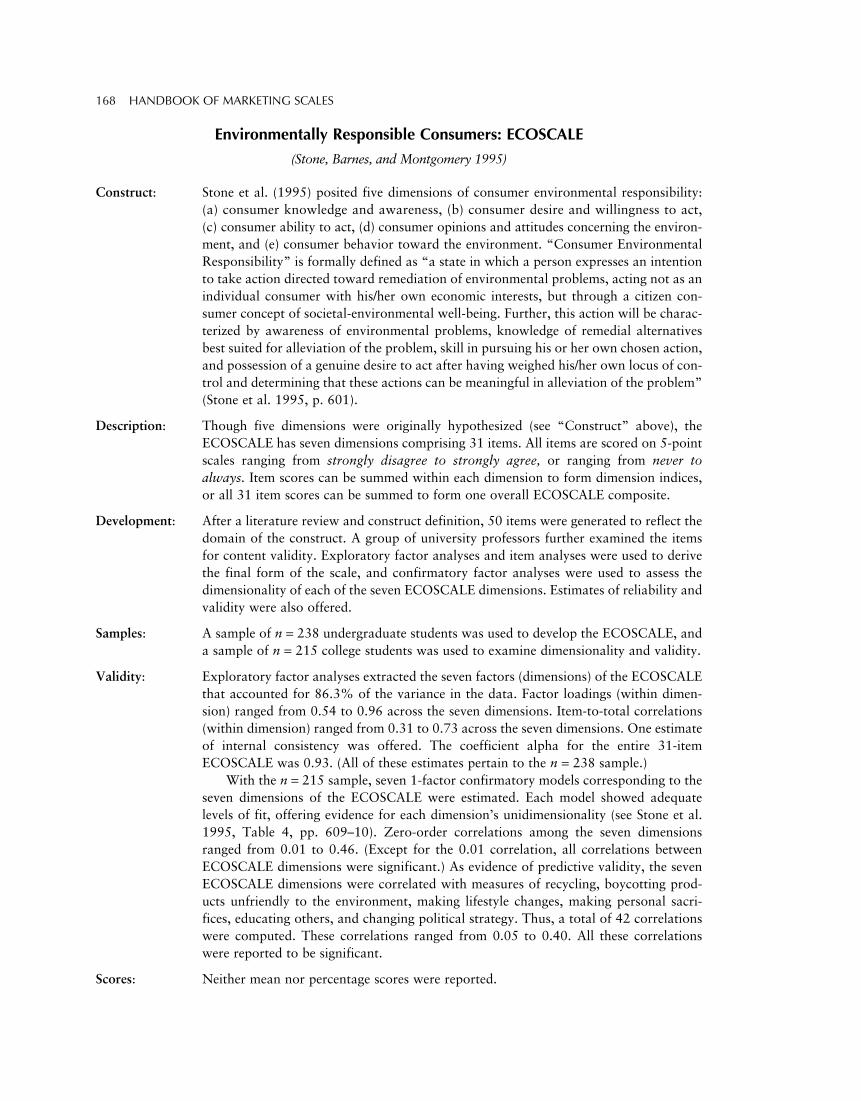
Construct: Stone et al. (1995) posited five dimensions of consumer environmental responsibility:(a) consumer knowledge and awareness, (b) consumer desire and willingness to act,(c) consumer ability to act, (d) consumer opinions and attitudes concerning the environ-ment, and (e) consumer behavior toward the environment. “Consumer EnvironmentalResponsibility” is formally defined as “a state in which a person expresses an intentionto take action directed toward remediation of environmental problems, acting not as anindividual consumer with his/her own economic interests, but through a citizen con-sumer concept of societal-environmental well-being. Further, this action will be charac-terized by awareness of environmental problems, knowledge of remedial alternativesbest suited for alleviation of the problem, skill in pursuing his or her own chosen action,and possession of a genuine desire to act after having weighed his/her own locus of con-trol and determining that these actions can be meaningful in alleviation of the problem”(Stone et al. 1995, p. 601).
Description: Though five dimensions were originally hypothesized (see “Construct” above), theECOSCALE has seven dimensions comprising 31 items. All items are scored on 5-pointscales ranging from strongly disagree to strongly agree, or ranging from never toalways. Item scores can be summed within each dimension to form dimension indices,or all 31 item scores can be summed to form one overall ECOSCALE composite.
Development: After a literature review and construct definition, 50 items were generated to reflect thedomain of the construct. A group of university professors further examined the itemsfor content validity. Exploratory factor analyses and item analyses were used to derivethe final form of the scale, and confirmatory factor analyses were used to assess thedimensionality of each of the seven ECOSCALE dimensions. Estimates of reliability andvalidity were also offered.
Samples: A sample of n = 238 undergraduate students was used to develop the ECOSCALE, anda sample of n = 215 college students was used to examine dimensionality and validity.
Validity: Exploratory factor analyses extracted the seven factors (dimensions) of the ECOSCALEthat accounted for 86.3% of the variance in the data. Factor loadings (within dimen-sion) ranged from 0.54 to 0.96 across the seven dimensions. Item-to-total correlations(within dimension) ranged from 0.31 to 0.73 across the seven dimensions. One estimateof internal consistency was offered. The coefficient alpha for the entire 31-itemECOSCALE was 0.93. (All of these estimates pertain to the n = 238 sample.)
With the n = 215 sample, seven 1-factor confirmatory models corresponding to theseven dimensions of the ECOSCALE were estimated. Each model showed adequatelevels of fit, offering evidence for each dimension’s unidimensionality (see Stone et al.1995, Table 4, pp. 609–10). Zero-order correlations among the seven dimensionsranged from 0.01 to 0.46. (Except for the 0.01 correlation, all correlations betweenECOSCALE dimensions were significant.) As evidence of predictive validity, the sevenECOSCALE dimensions were correlated with measures of recycling, boycotting prod-ucts unfriendly to the environment, making lifestyle changes, making personal sacri-fices, educating others, and changing political strategy. Thus, a total of 42 correlationswere computed. These correlations ranged from 0.05 to 0.40. All these correlationswere reported to be significant.
Scores: Neither mean nor percentage scores were reported.
168 HANDBOOK OF MARKETING SCALES

Source: Stone, George, James H. Barnes, and Cameron Montgomery (1995), “ECOSCALE: AScale for the Measurement of Environmentally Responsible Consumers,” Psychology &Marketing, 12, 595–612.
1995 by John Wiley & Sons, Inc. Scale items taken from Table 2 (pp. 603–4).Adapted by permission of John Wiley & Sons, Inc.
Chapter 3 Values and Goals 169
Environmentally Responsible Consumers: ECOSCALE
(Stone, Barnes, and Montgomery 1995)
Opinions and Beliefs Dimension Items
1. The burning of the oil fields in Kuwait, the meltdown in Chernobyl, and the oil spill in Alaska areexamples of environmental accidents whose impact is only short term.
2. The United States is the biggest producer of fluorocarbons, a major source of air pollution.
3. The earth’s population is now approaching 2 billion.
4. Excess packaging is one source of pollution that could be avoided if manufacturers were moreenvironmentally aware.
5. Economic growth should take precedence over environmental considerations.
6. The earth’s resources are infinite and should be used to the fullest to increase the human standardof living.
Awareness Dimension Items
7. The amount of energy I use does not affect the environment to any significant degree.
8. This country needs more restrictions on residential development (construction of a new mall onfarmland, new subdivisions, etc.)
9. If I were a hunter or fisherman, I would kill or catch more if there were no limits.
10. In order to save energy, this university should not heat the pool during the winter.
Willing to Act Dimension Items
11. I attend environmental/conversation group meetings (GreenPeace, Ducks Unlimited, etc.)
12. I have started/joined consumer boycott programs aimed at companies that produce excesspollution.
13. Whenever no one is looking I litter.
14. Wearing exotic furs and leather is not offensive.
Attitude Dimension Items
15. One of the primary reasons for concern in destruction of the ozone layer is its ability to screenultraviolet radiation.
16. There is nothing the average citizen can do to help stop environmental pollution.
17. My involvement in environmental activities today will help save the environment for futuregenerations.
18. I would not car pool unless I was forced to. It is too inconvenient.
Action Taken Dimension Items
19. I turn in polluters when I see them dumping toxic liquids.
20. I have my engine tuned to help stop unwanted air pollution.
170 HANDBOOK OF MARKETING SCALES
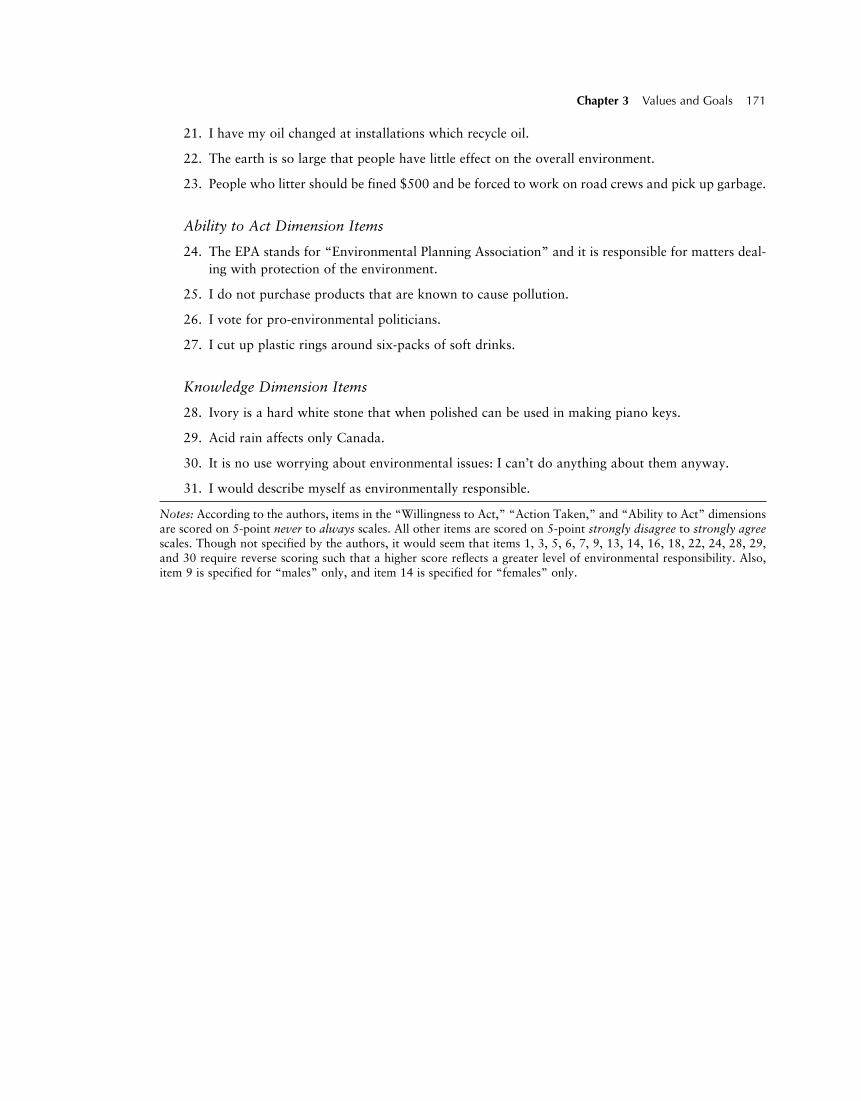
21. I have my oil changed at installations which recycle oil.
22. The earth is so large that people have little effect on the overall environment.
23. People who litter should be fined $500 and be forced to work on road crews and pick up garbage.
Ability to Act Dimension Items
24. The EPA stands for “Environmental Planning Association” and it is responsible for matters deal-ing with protection of the environment.
25. I do not purchase products that are known to cause pollution.
26. I vote for pro-environmental politicians.
27. I cut up plastic rings around six-packs of soft drinks.
Knowledge Dimension Items
28. Ivory is a hard white stone that when polished can be used in making piano keys.
29. Acid rain affects only Canada.
30. It is no use worrying about environmental issues: I can’t do anything about them anyway.
31. I would describe myself as environmentally responsible.
Notes: According to the authors, items in the “Willingness to Act,” “Action Taken,” and “Ability to Act” dimensionsare scored on 5-point never to always scales. All other items are scored on 5-point strongly disagree to strongly agreescales. Though not specified by the authors, it would seem that items 1, 3, 5, 6, 7, 9, 13, 14, 16, 18, 22, 24, 28, 29,and 30 require reverse scoring such that a higher score reflects a greater level of environmental responsibility. Also,item 9 is specified for “males” only, and item 14 is specified for “females” only.
Chapter 3 Values and Goals 171
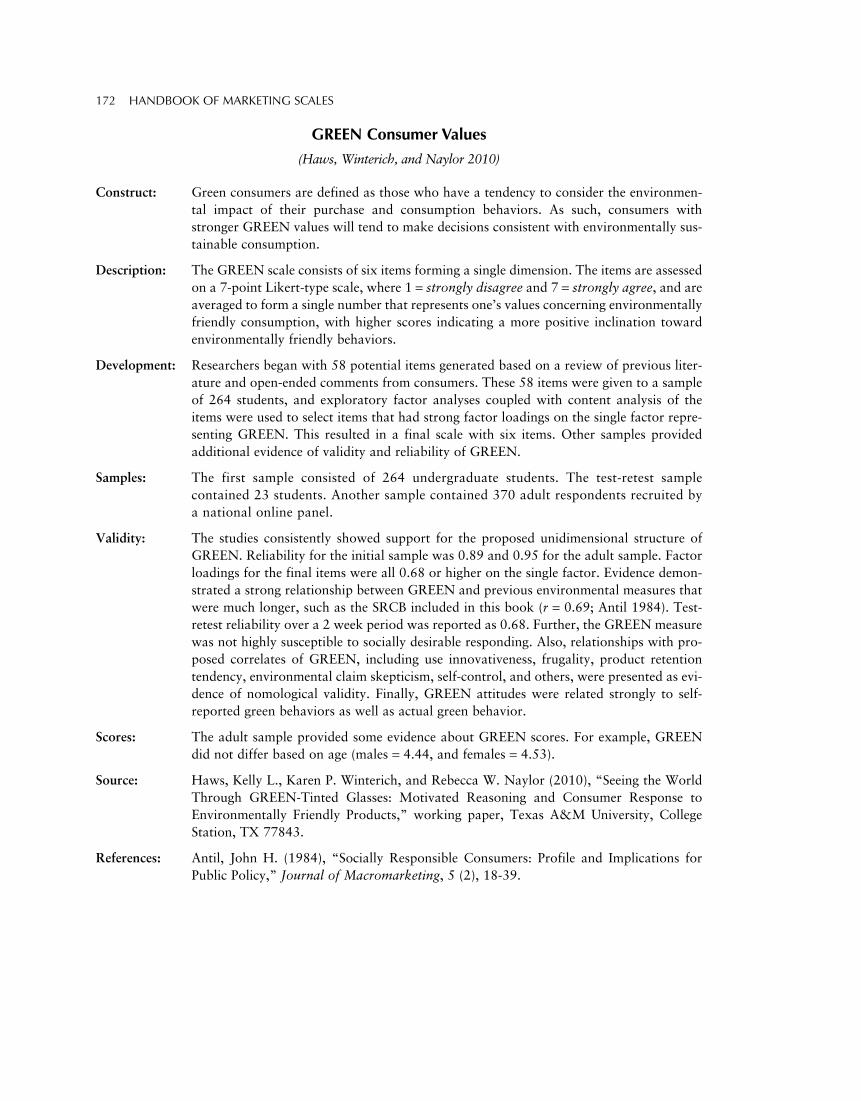
GREEN Consumer Values
(Haws, Winterich, and Naylor 2010)
Construct: Green consumers are defined as those who have a tendency to consider the environmen-tal impact of their purchase and consumption behaviors. As such, consumers withstronger GREEN values will tend to make decisions consistent with environmentally sus-tainable consumption.
Description: The GREEN scale consists of six items forming a single dimension. The items are assessedon a 7-point Likert-type scale, where 1 = strongly disagree and 7 = strongly agree, and areaveraged to form a single number that represents one’s values concerning environmentallyfriendly consumption, with higher scores indicating a more positive inclination towardenvironmentally friendly behaviors.
Development: Researchers began with 58 potential items generated based on a review of previous liter-ature and open-ended comments from consumers. These 58 items were given to a sampleof 264 students, and exploratory factor analyses coupled with content analysis of theitems were used to select items that had strong factor loadings on the single factor repre-senting GREEN. This resulted in a final scale with six items. Other samples providedadditional evidence of validity and reliability of GREEN.
Samples: The first sample consisted of 264 undergraduate students. The test-retest samplecontained 23 students. Another sample contained 370 adult respondents recruited bya national online panel.
Validity: The studies consistently showed support for the proposed unidimensional structure ofGREEN. Reliability for the initial sample was 0.89 and 0.95 for the adult sample. Factorloadings for the final items were all 0.68 or higher on the single factor. Evidence demon-strated a strong relationship between GREEN and previous environmental measures thatwere much longer, such as the SRCB included in this book (r = 0.69; Antil 1984). Test-retest reliability over a 2 week period was reported as 0.68. Further, the GREEN measurewas not highly susceptible to socially desirable responding. Also, relationships with pro-posed correlates of GREEN, including use innovativeness, frugality, product retentiontendency, environmental claim skepticism, self-control, and others, were presented as evi-dence of nomological validity. Finally, GREEN attitudes were related strongly to self-reported green behaviors as well as actual green behavior.
Scores: The adult sample provided some evidence about GREEN scores. For example, GREENdid not differ based on age (males = 4.44, and females = 4.53).
Source: Haws, Kelly L., Karen P. Winterich, and Rebecca W. Naylor (2010), “Seeing the WorldThrough GREEN-Tinted Glasses: Motivated Reasoning and Consumer Response toEnvironmentally Friendly Products,” working paper, Texas A&M University, CollegeStation, TX 77843.
References: Antil, John H. (1984), “Socially Responsible Consumers: Profile and Implications forPublic Policy,” Journal of Macromarketing, 5 (2), 18-39.
172 HANDBOOK OF MARKETING SCALES
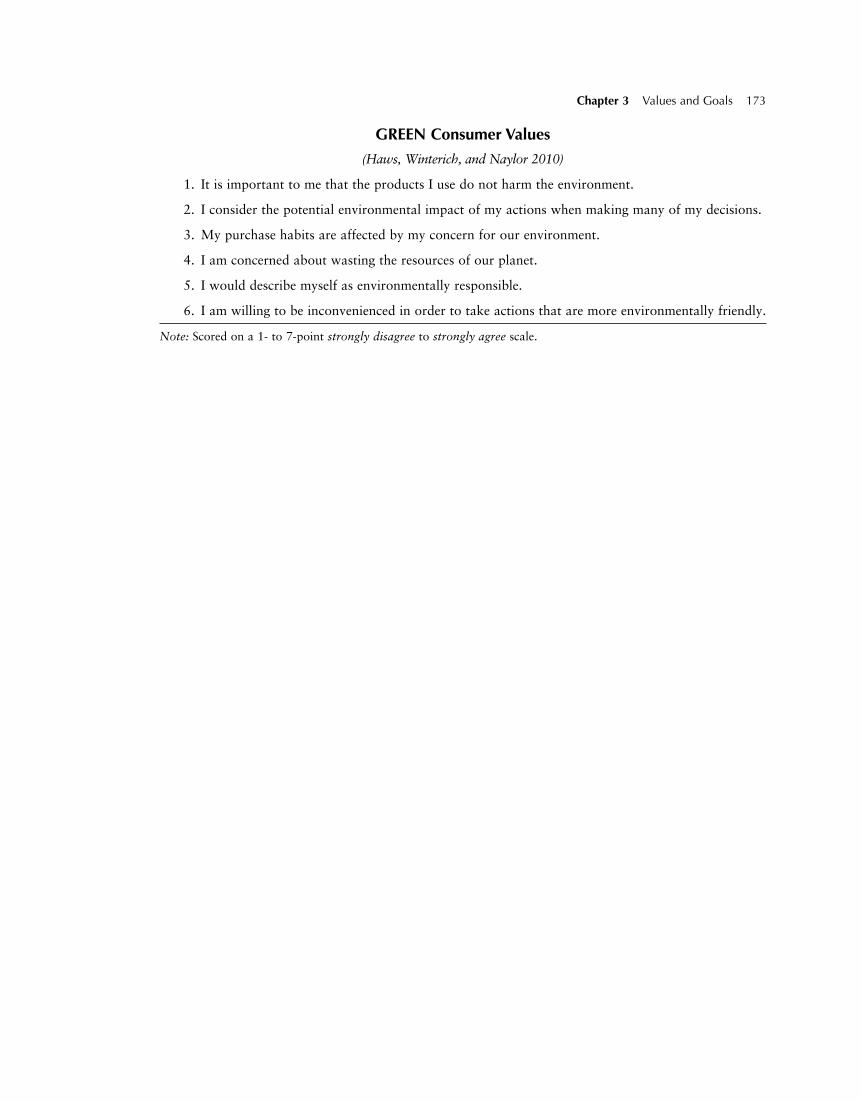
GREEN Consumer Values
(Haws, Winterich, and Naylor 2010)
1. It is important to me that the products I use do not harm the environment.
2. I consider the potential environmental impact of my actions when making many of my decisions.
3. My purchase habits are affected by my concern for our environment.
4. I am concerned about wasting the resources of our planet.
5. I would describe myself as environmentally responsible.
6. I am willing to be inconvenienced in order to take actions that are more environmentally friendly.
Note: Scored on a 1- to 7-point strongly disagree to strongly agree scale.
Chapter 3 Values and Goals 173
Health Consciousness Scale: HCS
(Gould 1988)
Construct: As specified by the author, the Health Consciousness Scale (HCS) seems to tap an over-all alertness, self-consciousness, involvement, and self-monitoring of one’s health.
Description: The HCS is composed of nine items scored on 5-point scales ranging from 0 to 4.Though four factors relating to HCS were empirically identified (i.e., overall alertness[HA], self-consciousness [HCSC], involvement [HI], and self-monitoring [HSM] ofone’s health), item scores can be summed to form an overall HCS score ranging from0 to 36.
Development: Using a sample of n = 343 adult respondents, the nine-item HCS was administered andchecked for internal consistency and validity. Via confirmatory factor analyses, relia-bility analyses, and several correlational and mean-level difference tests, the psychome-tric properties of the HCS were examined.
Samples: One sample of n = 343 adult consumers from the northeastern United States respondedto the HCS and other measures.
Validity: Confirmatory factor analyses revealed that a first-order 4-factor model and a higher-order model fit the data well. A decision was made to treat the nine HCS items as a sin-gle scale. A 0.93 coefficient alpha estimate of internal consistency was reported for thenine-item HCS. The total HCS score was split at the median to form two groups: highhealth consciousness and low health consciousness. Some evidence of validity for theHCS was found through t tests between these two groups across 40 health attitudestatements. These tests revealed 17 significant differences (p < 10 or better).
Scores: Means (std. dev.) were reported for the four factors of the HCS. These scores were 6.44(3.29) for HC SC, 3.78 (2.40) for HI, 5.51 (1.99) for HA, and 4.28 (2.25) for HSM.
Source: Gould, Stephen J. (1988), “Consumer Attitudes Toward Health and Health Care: ADifferential Perspective,” Journal of Consumer Affairs, 22, 96–118.
1988 by The University of Wisconsin Press. Scale items taken from Table 3 (p. 103).Used by permission of The University of Wisconsin Press.
174 HANDBOOK OF MARKETING SCALES
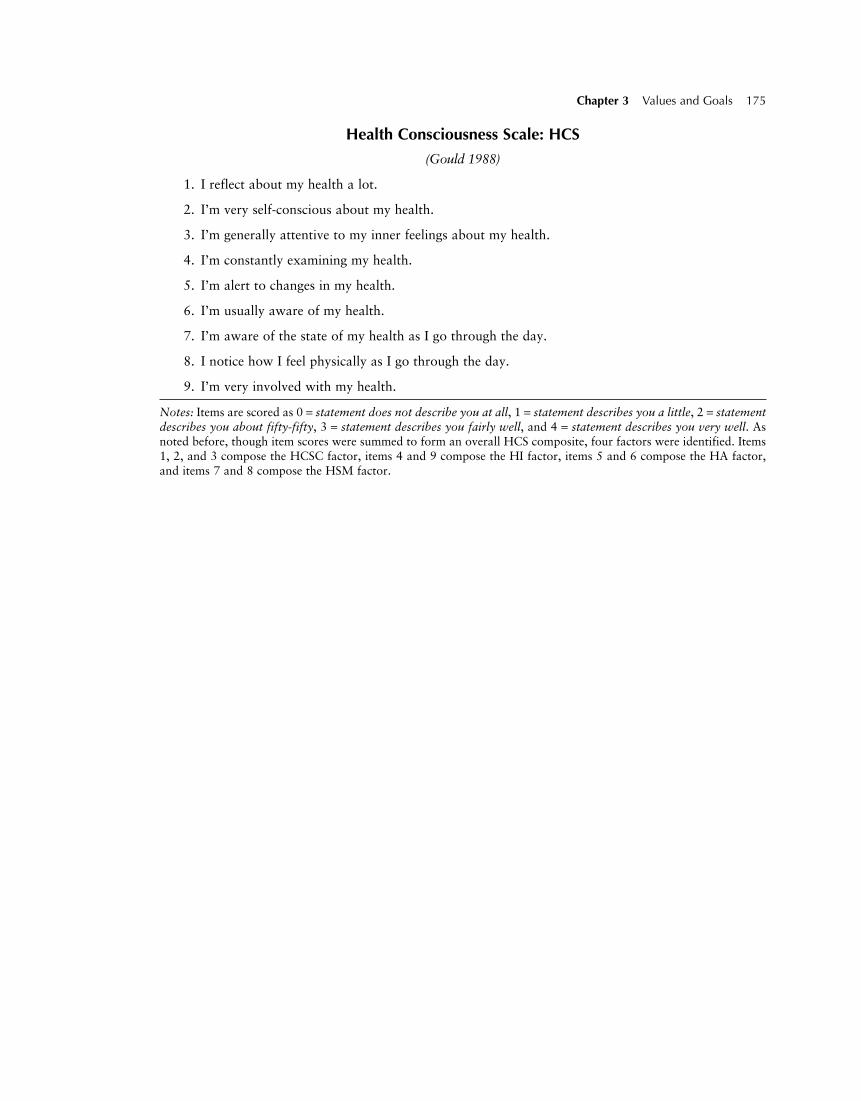
Health Consciousness Scale: HCS
(Gould 1988)
1. I reflect about my health a lot.
2. I’m very self-conscious about my health.
3. I’m generally attentive to my inner feelings about my health.
4. I’m constantly examining my health.
5. I’m alert to changes in my health.
6. I’m usually aware of my health.
7. I’m aware of the state of my health as I go through the day.
8. I notice how I feel physically as I go through the day.
9. I’m very involved with my health.
Notes: Items are scored as 0 = statement does not describe you at all, 1 = statement describes you a little, 2 = statementdescribes you about fifty-fifty, 3 = statement describes you fairly well, and 4 = statement describes you very well. Asnoted before, though item scores were summed to form an overall HCS composite, four factors were identified. Items1, 2, and 3 compose the HCSC factor, items 4 and 9 compose the HI factor, items 5 and 6 compose the HA factor,and items 7 and 8 compose the HSM factor.
Chapter 3 Values and Goals 175
Leisure: Subjective Leisure Scales: SLS
(Unger and Kernan 1983)
Construct: In their research, Unger and Kernan (1983) measure leisure from a subjective perspec-tive. Most definitional discussions of leisure from this perspective relate leisure to freetime, recreation, and play. From this theoretical base, Unger and Kernan (1983) pro-pose six determinants of leisure: intrinsic satisfaction, perceived freedom, involvement,arousal, mastery, and spontaneity.
Intrinsic satisfaction: Leisure is seen as an end unto itself rather than a means to an end.
Perceived freedom: Leisure is viewed as free, that is, perceived as voluntary, withoutcoercion or obligation.
Involvement: True leisure means total absorption in an activity, such that it is an escapefrom daily life.
Arousal: Arousal (i.e., novelty seeking, exploration, and risk taking) is present in leisurepursuits.
Mastery:One has the opportunity to test oneself or to conquer the environment throughleisure pursuits (i.e., mastery of the activity, mental or physical, is present).
Spontaneity: Unlike obligatory events, leisure activities are not routine, planned, oranticipated.
Description: The subjective leisure scale (SLS) is a six-factor measure designed to assess the six deter-minants of leisure discussed above. A total of 26 items are used to measure the six deter-minants, and all items are scored on 6-point formats from strongly disagree (1) tostrongly agree (6). Scores on items within each dimension can be summed to formindices of each dimension.
Development: Forty-two items were generated to reflect the six determinants of leisure. The items werechecked for face validity by a panel of 10 marketing professors and PhD students,resulting in 36 items retained. Various tests for reliability, validity, and factor structurewere then performed on the remaining items to derive the final scales over two samplesand six leisure scenarios.
Samples: Two samples were used in scale development. (Two other samples were also used togenerate the leisure scenarios for validity testing but did not respond to the leisureitems.) The first sample consisted of 132 students, and the second sample consisted of160 nonstudent adults. Three other samples (n = 10, 200, and 123) were also used inpreliminary stages (i.e., item editing and pretesting).
Validity: Using the student sample, responses to the 36 items were examined for internal consis-tency. Two items that decreased internal consistency (on the respective factors) weredeleted. Principal components analysis was also used to trim the number of items. Itemswith loadings lower than 0.40 on any factor in three or more of the scenarios weredeleted, resulting in the final 26-item, six-factor SLS. In the nonstudent sample, the SLSwas checked for dimensionality and validity. With this sample, factor analysis revealedthat the intrinsic satisfaction and perceived freedom dimensions were not distinct, andthe arousal and mastery dimensions were not distinct, suggesting that the hypothesizeddimensionality of the SLS requires further testing. Though reliability estimates were per-formed (i.e., coefficient alpha, split-halves), they were not reported in the article (Ungerand Kernan 1983). Numerous concurrent, construct, and nomological validity tests,
176 HANDBOOK OF MARKETING SCALES
however, did show support for the validity of the SLS. For example, using the SLS fac-tors as predictors across six different leisure scenarios produced multiple Rs rangingfrom 0.05 to 0.56, with most multiple Rs in the range of 0.30 and above (see Table 1,p. 389).
Scores: Mean or percentage scores were not reported.
Source: Unger, Lynette and Jerome B. Kernan (1983), “On the Meaning of Leisure: AnInvestigator of Some Determinants of the Subjective Experience,” Journal of ConsumerResearch, 9, 381–92.
1983 by University of Chicago Press. Scale items taken from Exhibit 3 (p. 387).Reprinted with permission.
Chapter 3 Values and Goals 177
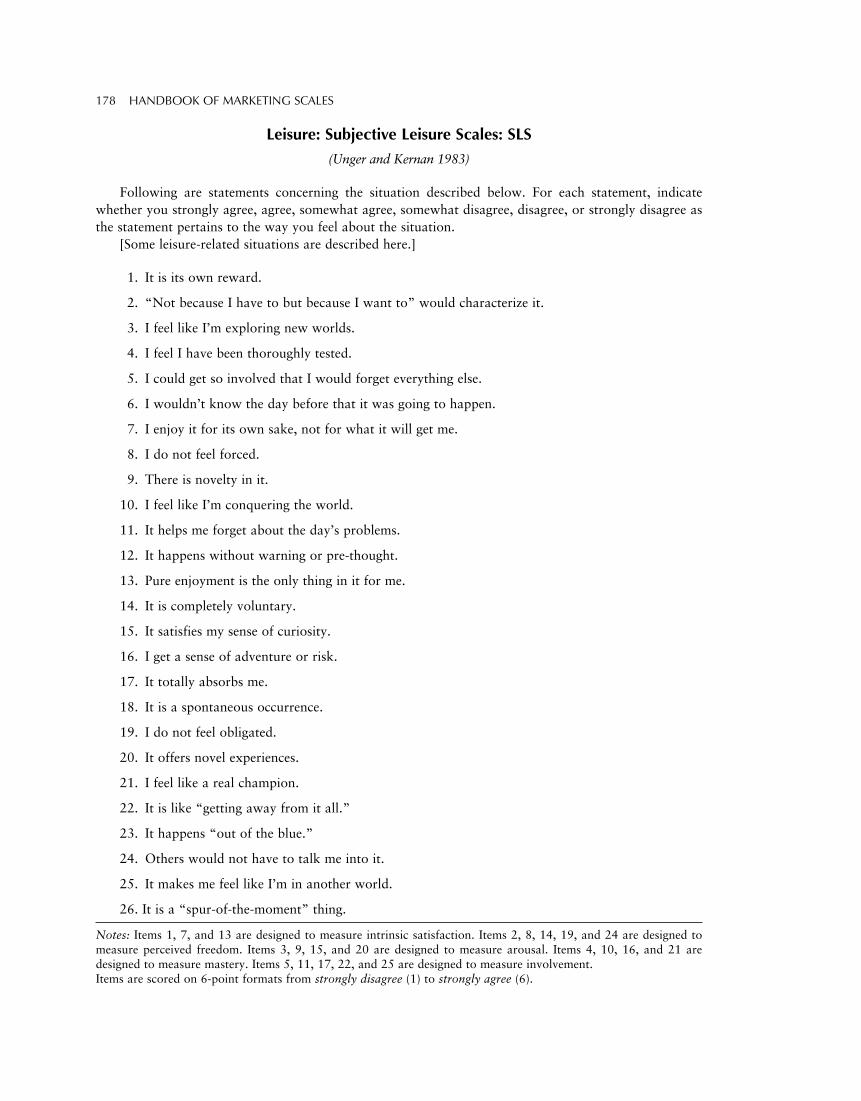
Leisure: Subjective Leisure Scales: SLS
(Unger and Kernan 1983)
Following are statements concerning the situation described below. For each statement, indicatewhether you strongly agree, agree, somewhat agree, somewhat disagree, disagree, or strongly disagree asthe statement pertains to the way you feel about the situation.
[Some leisure-related situations are described here.]
1. It is its own reward.
2. “Not because I have to but because I want to” would characterize it.
3. I feel like I’m exploring new worlds.
4. I feel I have been thoroughly tested.
5. I could get so involved that I would forget everything else.
6. I wouldn’t know the day before that it was going to happen.
7. I enjoy it for its own sake, not for what it will get me.
8. I do not feel forced.
9. There is novelty in it.
10. I feel like I’m conquering the world.
11. It helps me forget about the day’s problems.
12. It happens without warning or pre-thought.
13. Pure enjoyment is the only thing in it for me.
14. It is completely voluntary.
15. It satisfies my sense of curiosity.
16. I get a sense of adventure or risk.
17. It totally absorbs me.
18. It is a spontaneous occurrence.
19. I do not feel obligated.
20. It offers novel experiences.
21. I feel like a real champion.
22. It is like “getting away from it all.”
23. It happens “out of the blue.”
24. Others would not have to talk me into it.
25. It makes me feel like I’m in another world.
26. It is a “spur-of-the-moment” thing.
Notes: Items 1, 7, and 13 are designed to measure intrinsic satisfaction. Items 2, 8, 14, 19, and 24 are designed tomeasure perceived freedom. Items 3, 9, 15, and 20 are designed to measure arousal. Items 4, 10, 16, and 21 aredesigned to measure mastery. Items 5, 11, 17, 22, and 25 are designed to measure involvement.Items are scored on 6-point formats from strongly disagree (1) to strongly agree (6).
178 HANDBOOK OF MARKETING SCALES
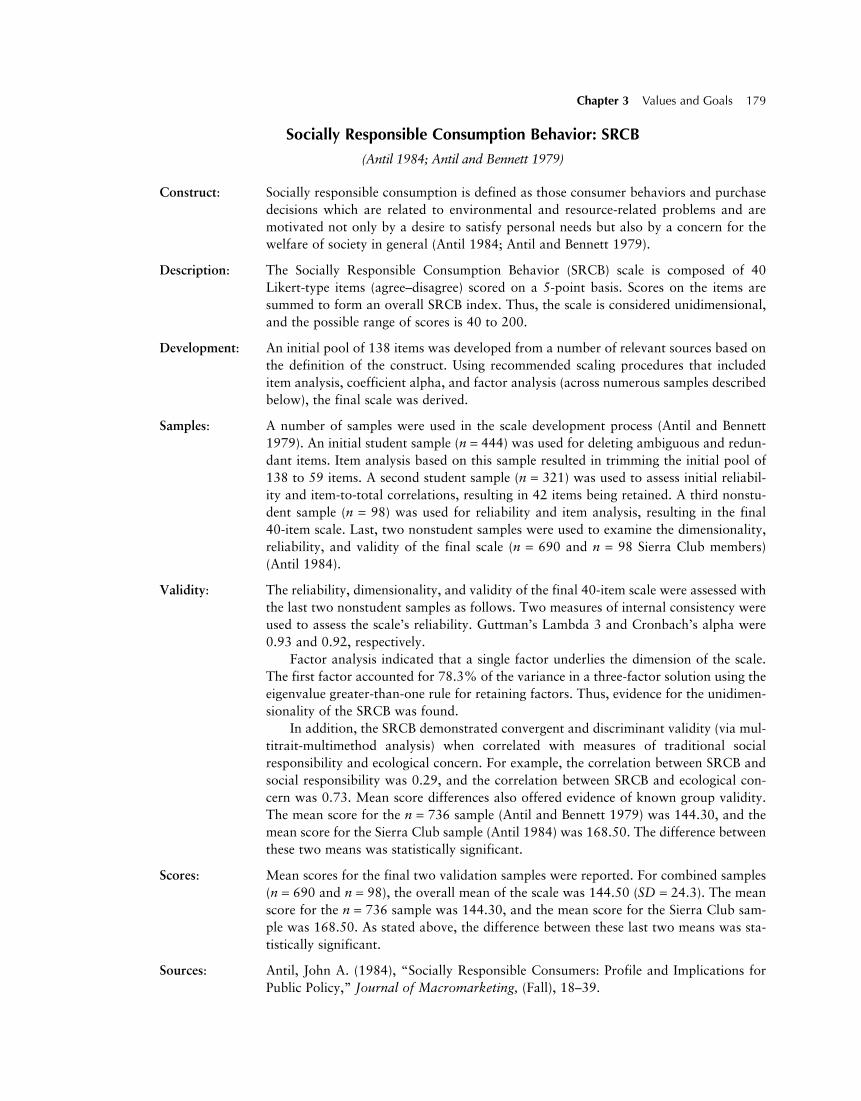
Socially Responsible Consumption Behavior: SRCB
(Antil 1984; Antil and Bennett 1979)
Construct: Socially responsible consumption is defined as those consumer behaviors and purchasedecisions which are related to environmental and resource-related problems and aremotivated not only by a desire to satisfy personal needs but also by a concern for thewelfare of society in general (Antil 1984; Antil and Bennett 1979).
Description: The Socially Responsible Consumption Behavior (SRCB) scale is composed of 40Likert-type items (agree–disagree) scored on a 5-point basis. Scores on the items aresummed to form an overall SRCB index. Thus, the scale is considered unidimensional,and the possible range of scores is 40 to 200.
Development: An initial pool of 138 items was developed from a number of relevant sources based onthe definition of the construct. Using recommended scaling procedures that includeditem analysis, coefficient alpha, and factor analysis (across numerous samples describedbelow), the final scale was derived.
Samples: A number of samples were used in the scale development process (Antil and Bennett1979). An initial student sample (n = 444) was used for deleting ambiguous and redun-dant items. Item analysis based on this sample resulted in trimming the initial pool of138 to 59 items. A second student sample (n = 321) was used to assess initial reliabil-ity and item-to-total correlations, resulting in 42 items being retained. A third nonstu-dent sample (n = 98) was used for reliability and item analysis, resulting in the final40-item scale. Last, two nonstudent samples were used to examine the dimensionality,reliability, and validity of the final scale (n = 690 and n = 98 Sierra Club members)(Antil 1984).
Validity: The reliability, dimensionality, and validity of the final 40-item scale were assessed withthe last two nonstudent samples as follows. Two measures of internal consistency wereused to assess the scale’s reliability. Guttman’s Lambda 3 and Cronbach’s alpha were0.93 and 0.92, respectively.
Factor analysis indicated that a single factor underlies the dimension of the scale.The first factor accounted for 78.3% of the variance in a three-factor solution using theeigenvalue greater-than-one rule for retaining factors. Thus, evidence for the unidimen-sionality of the SRCB was found.
In addition, the SRCB demonstrated convergent and discriminant validity (via mul-titrait-multimethod analysis) when correlated with measures of traditional socialresponsibility and ecological concern. For example, the correlation between SRCB andsocial responsibility was 0.29, and the correlation between SRCB and ecological con-cern was 0.73. Mean score differences also offered evidence of known group validity.The mean score for the n = 736 sample (Antil and Bennett 1979) was 144.30, and themean score for the Sierra Club sample (Antil 1984) was 168.50. The difference betweenthese two means was statistically significant.
Scores: Mean scores for the final two validation samples were reported. For combined samples(n = 690 and n = 98), the overall mean of the scale was 144.50 (SD = 24.3). The meanscore for the n = 736 sample was 144.30, and the mean score for the Sierra Club sam-ple was 168.50. As stated above, the difference between these last two means was sta-tistically significant.
Sources: Antil, John A. (1984), “Socially Responsible Consumers: Profile and Implications forPublic Policy,” Journal of Macromarketing, (Fall), 18–39.
Chapter 3 Values and Goals 179
1984 by American Marketing Association. Scale items taken from Appendix B (p. 35).Reprinted with permission.
Antil, John A. and Peter D. Bennett (1979), “Construction and Validation of a Scale toMeasure Socially Responsible Consumption Behavior,” in The Conserver Society, eds.Karl H. Henion II and Thomas C. Kinnear, Chicago: American Marketing Association,pp. 51–68.
1979 by the American Marketing Association. Scale items taken from Appendix(pp. 63–6). Reprinted with permission.
180 HANDBOOK OF MARKETING SCALES
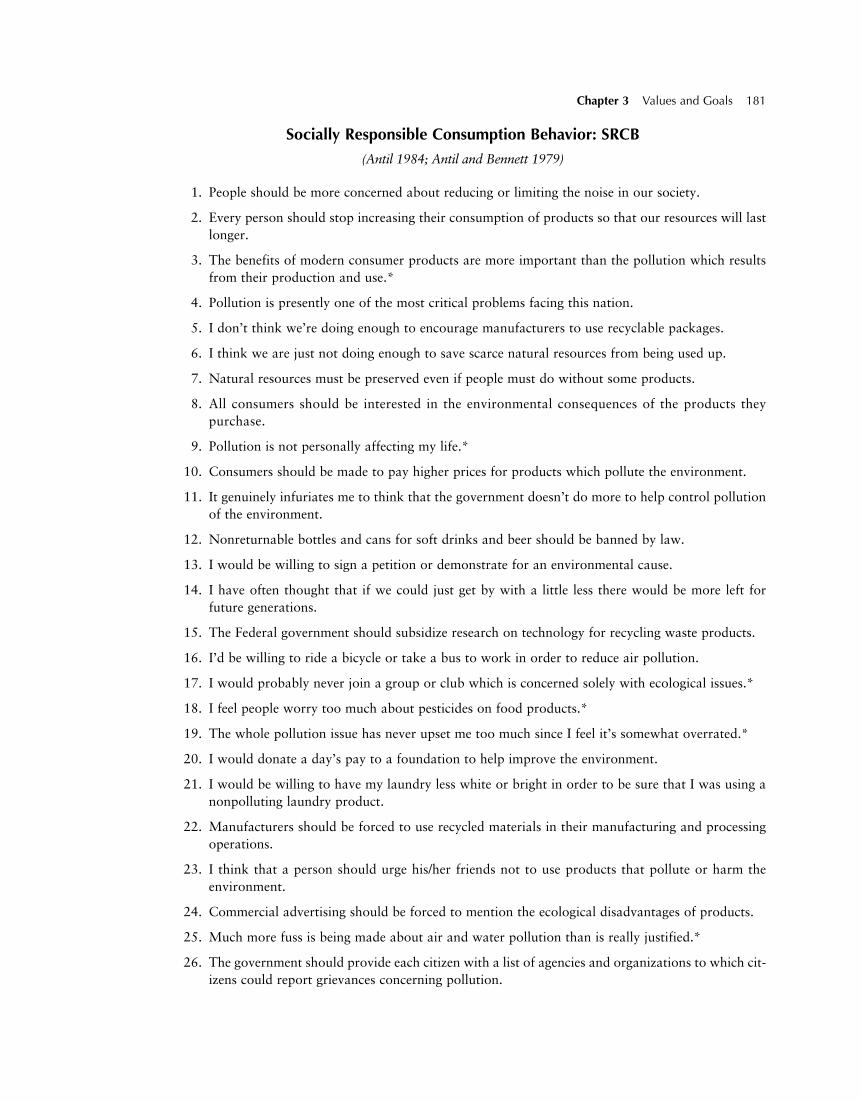
Socially Responsible Consumption Behavior: SRCB
(Antil 1984; Antil and Bennett 1979)
1. People should be more concerned about reducing or limiting the noise in our society.
2. Every person should stop increasing their consumption of products so that our resources will lastlonger.
3. The benefits of modern consumer products are more important than the pollution which resultsfrom their production and use.*
4. Pollution is presently one of the most critical problems facing this nation.
5. I don’t think we’re doing enough to encourage manufacturers to use recyclable packages.
6. I think we are just not doing enough to save scarce natural resources from being used up.
7. Natural resources must be preserved even if people must do without some products.
8. All consumers should be interested in the environmental consequences of the products theypurchase.
9. Pollution is not personally affecting my life.*
10. Consumers should be made to pay higher prices for products which pollute the environment.
11. It genuinely infuriates me to think that the government doesn’t do more to help control pollutionof the environment.
12. Nonreturnable bottles and cans for soft drinks and beer should be banned by law.
13. I would be willing to sign a petition or demonstrate for an environmental cause.
14. I have often thought that if we could just get by with a little less there would be more left forfuture generations.
15. The Federal government should subsidize research on technology for recycling waste products.
16. I’d be willing to ride a bicycle or take a bus to work in order to reduce air pollution.
17. I would probably never join a group or club which is concerned solely with ecological issues.*
18. I feel people worry too much about pesticides on food products.*
19. The whole pollution issue has never upset me too much since I feel it’s somewhat overrated.*
20. I would donate a day’s pay to a foundation to help improve the environment.
21. I would be willing to have my laundry less white or bright in order to be sure that I was using anonpolluting laundry product.
22. Manufacturers should be forced to use recycled materials in their manufacturing and processingoperations.
23. I think that a person should urge his/her friends not to use products that pollute or harm theenvironment.
24. Commercial advertising should be forced to mention the ecological disadvantages of products.
25. Much more fuss is being made about air and water pollution than is really justified.*
26. The government should provide each citizen with a list of agencies and organizations to which cit-izens could report grievances concerning pollution.
Chapter 3 Values and Goals 181
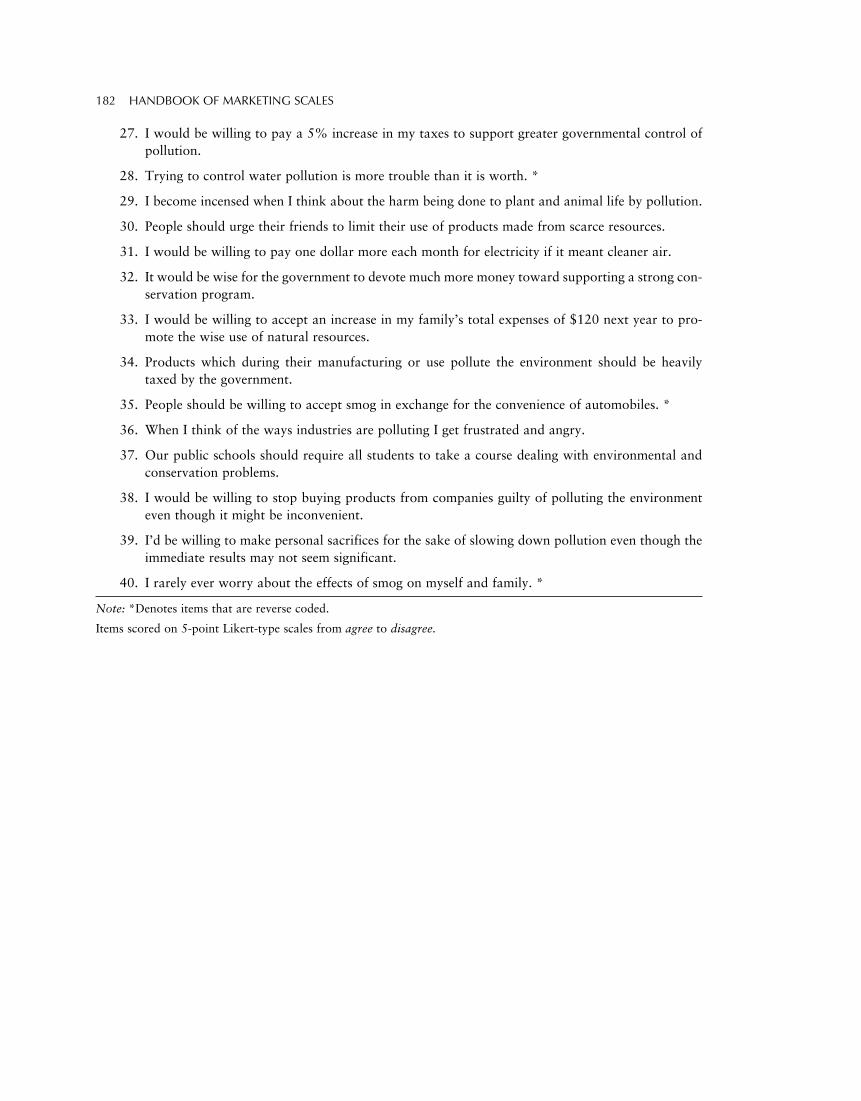
27. I would be willing to pay a 5% increase in my taxes to support greater governmental control ofpollution.
28. Trying to control water pollution is more trouble than it is worth. *
29. I become incensed when I think about the harm being done to plant and animal life by pollution.
30. People should urge their friends to limit their use of products made from scarce resources.
31. I would be willing to pay one dollar more each month for electricity if it meant cleaner air.
32. It would be wise for the government to devote much more money toward supporting a strong con-servation program.
33. I would be willing to accept an increase in my family’s total expenses of $120 next year to pro-mote the wise use of natural resources.
34. Products which during their manufacturing or use pollute the environment should be heavilytaxed by the government.
35. People should be willing to accept smog in exchange for the convenience of automobiles. *
36. When I think of the ways industries are polluting I get frustrated and angry.
37. Our public schools should require all students to take a course dealing with environmental andconservation problems.
38. I would be willing to stop buying products from companies guilty of polluting the environmenteven though it might be inconvenient.
39. I’d be willing to make personal sacrifices for the sake of slowing down pollution even though theimmediate results may not seem significant.
40. I rarely ever worry about the effects of smog on myself and family. *
Note: *Denotes items that are reverse coded.
Items scored on 5-point Likert-type scales from agree to disagree.
182 HANDBOOK OF MARKETING SCALES
Voluntary Simplicity Scale: VSS
(Cowles and Crosby 1986; Leonard-Barton 1981)
Construct: Voluntary simplicity is defined as the degree to which an individual selects a lifestyleintended to maximize his/her control over daily activities and to minimize his/her con-sumption and dependency (Leonard-Barton 1981). Five basic values underlie a volun-tary simplicity lifestyle: material simplicity, self-determination, ecological awareness,human scale, and personal growth.
Material simplicity is non-consumption-oriented patterns of use.
Self-determination is a desire to assume greater control over destiny.
Ecological awareness is recognition of the interdependency of people and resources.
Human scale is a desire for smaller-scale institutions and technology.
Personal growth is a desire to explore and develop the inner life.
Description: The voluntary simplicity scale (VSS) is a multidimensional scale comprising 18 state-ments that assess the degree to which respondents engage in voluntary simplicity behav-iors. Fourteen of the items provided by Leonard-Barton are scored on a 5-point basison the degree to which a behavior is performed. Two of the items offer six responsealternatives, and two are dichotomous (yes-no). Though exact scoring procedures arenot offered, scores on the VSS can range up to a high of 90 (Leonard-Barton 1981).
Several versions of the scale are tenable, including 6-, 9-, and 14-item scales(Leonard-Barton 1981), and a version proposed by Cowles and Crosby (1986).
Development: Initially, the scale consisted of nine items; it was subsequently expanded to 19 items andthen reduced to an 18-item format (Leonard-Barton 1981). Via a number of scalingprocedures, including factor analysis and internal consistency reliability across severalstudies, the 9- and 19-item versions of the scale were derived. The samples and studiesused to arrive at these versions are described below.
Samples: A number of samples were used in the scale development and validation process. Theoriginal nine-item version was tested on a sample from Palo Alto, California (n notreported). The expanded 19-item version was tested on data collected by Elgin andMitchell (1977) with a sample of 423. This 19-item version was also tested on anothersample (n = 215) of homeowners in California. (Half of this sample were users of solarenergy in their home.) Last, the 18-item version was administered to 812 Californiahomeowners (see Leonard-Barton 1981).
Validity: Reliability estimates of the 9- and 19-item versions of the scale ranged from alpha of0.52 to alpha of 0.70. (These were the only reliability estimates reported by Leonard-Barton 1981). It should be noted that these alpha estimates should be viewed with cau-tion as the VSS is composed of six factors and the alphas reported above representreliability estimates for the summed 9- and 19-item versions.
In the original article (Leonard-Barton 1981), factor analysis was used to determine thedimensionality of the scale, and across samples, a six-factor structure was found. The sixfactors underlying the five simplicity lifestyle values were labeled as (a) conservationthrough biking, (b) self-sufficiency in services, (c) recycling of resources, (d) self-sufficiencythrough making goods, (e) recycling of durable goods, and (f) closeness with nature.Leonard-Barton did not report direct estimates of factor internal consistency but providedfactor loadings ranging from 0.31 to 0.87 across factors (Leonard-Barton 1981, p. 245).
The 18-item VSS was found to be positively related to education (r =. 16) and neg-atively related to age (n = 812). The VSS was positively correlated with “mechanical
Chapter 3 Values and Goals 183
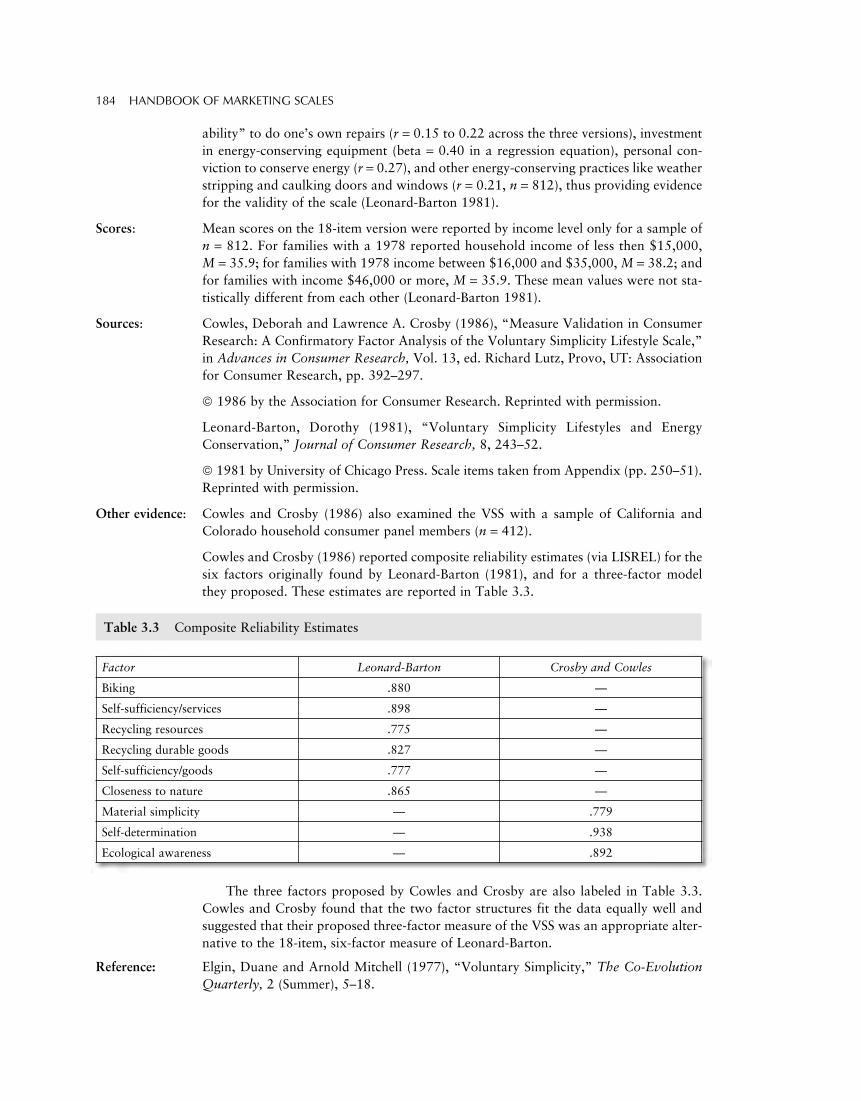
ability” to do one’s own repairs (r = 0.15 to 0.22 across the three versions), investmentin energy-conserving equipment (beta = 0.40 in a regression equation), personal con-viction to conserve energy (r = 0.27), and other energy-conserving practices like weatherstripping and caulking doors and windows (r = 0.21, n = 812), thus providing evidencefor the validity of the scale (Leonard-Barton 1981).
Scores: Mean scores on the 18-item version were reported by income level only for a sample ofn = 812. For families with a 1978 reported household income of less then $15,000,M = 35.9; for families with 1978 income between $16,000 and $35,000,M = 38.2; andfor families with income $46,000 or more, M = 35.9. These mean values were not sta-tistically different from each other (Leonard-Barton 1981).
Sources: Cowles, Deborah and Lawrence A. Crosby (1986), “Measure Validation in ConsumerResearch: A Confirmatory Factor Analysis of the Voluntary Simplicity Lifestyle Scale,”in Advances in Consumer Research, Vol. 13, ed. Richard Lutz, Provo, UT: Associationfor Consumer Research, pp. 392–297.
1986 by the Association for Consumer Research. Reprinted with permission.
Leonard-Barton, Dorothy (1981), “Voluntary Simplicity Lifestyles and EnergyConservation,” Journal of Consumer Research, 8, 243–52.
1981 by University of Chicago Press. Scale items taken from Appendix (pp. 250–51).Reprinted with permission.
Other evidence: Cowles and Crosby (1986) also examined the VSS with a sample of California andColorado household consumer panel members (n = 412).
Cowles and Crosby (1986) reported composite reliability estimates (via LISREL) for thesix factors originally found by Leonard-Barton (1981), and for a three-factor modelthey proposed. These estimates are reported in Table 3.3.
184 HANDBOOK OF MARKETING SCALES
Table 3.3 Composite Reliability Estimates
Factor Leonard-Barton Crosby and Cowles
Biking .880 —
Self-sufficiency/services .898 —
Recycling resources .775 —
Recycling durable goods .827 —
Self-sufficiency/goods .777 —
Closeness to nature .865 —
Material simplicity — .779
Self-determination — .938
Ecological awareness — .892
The three factors proposed by Cowles and Crosby are also labeled in Table 3.3.Cowles and Crosby found that the two factor structures fit the data equally well andsuggested that their proposed three-factor measure of the VSS was an appropriate alter-native to the 18-item, six-factor measure of Leonard-Barton.
Reference: Elgin, Duane and Arnold Mitchell (1977), “Voluntary Simplicity,” The Co-EvolutionQuarterly, 2 (Summer), 5–18.
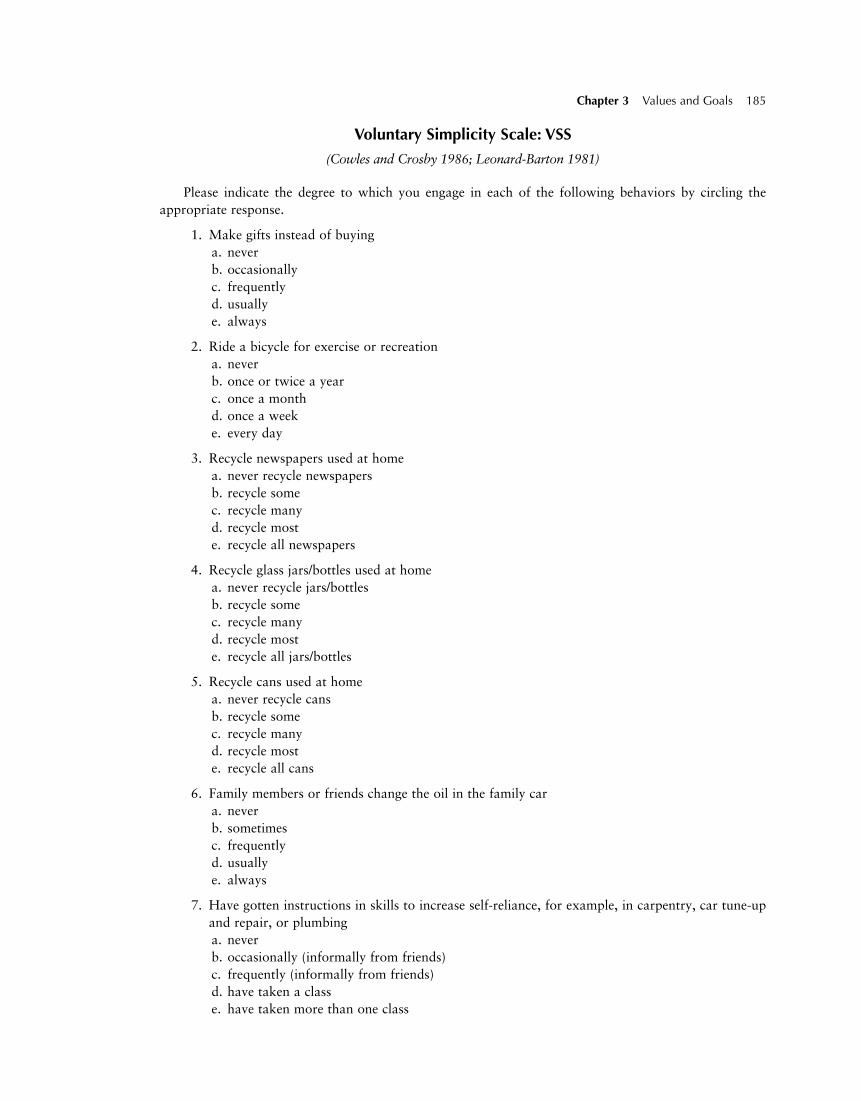
Voluntary Simplicity Scale: VSS
(Cowles and Crosby 1986; Leonard-Barton 1981)
Please indicate the degree to which you engage in each of the following behaviors by circling theappropriate response.
1. Make gifts instead of buyinga. neverb. occasionallyc. frequentlyd. usuallye. always
2. Ride a bicycle for exercise or recreationa. neverb. once or twice a yearc. once a monthd. once a weeke. every day
3. Recycle newspapers used at homea. never recycle newspapersb. recycle somec. recycle manyd. recycle moste. recycle all newspapers
4. Recycle glass jars/bottles used at homea. never recycle jars/bottlesb. recycle somec. recycle manyd. recycle moste. recycle all jars/bottles
5. Recycle cans used at homea. never recycle cansb. recycle somec. recycle manyd. recycle moste. recycle all cans
6. Family members or friends change the oil in the family cara. neverb. sometimesc. frequentlyd. usuallye. always
7. Have gotten instructions in skills to increase self-reliance, for example, in carpentry, car tune-upand repair, or plumbinga. neverb. occasionally (informally from friends)c. frequently (informally from friends)d. have taken a classe. have taken more than one class
Chapter 3 Values and Goals 185
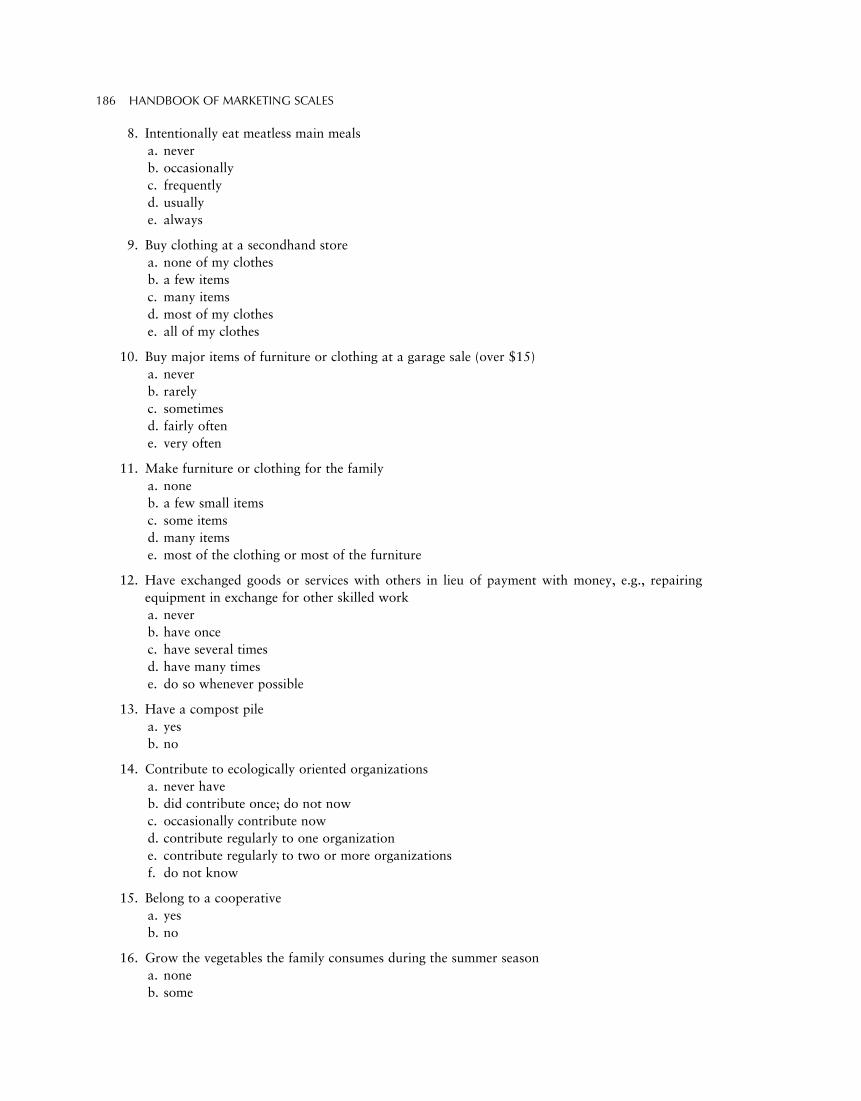
8. Intentionally eat meatless main mealsa. neverb. occasionallyc. frequentlyd. usuallye. always
9. Buy clothing at a secondhand storea. none of my clothesb. a few itemsc. many itemsd. most of my clothese. all of my clothes
10. Buy major items of furniture or clothing at a garage sale (over $15)a. neverb. rarelyc. sometimesd. fairly oftene. very often
11. Make furniture or clothing for the familya. noneb. a few small itemsc. some itemsd. many itemse. most of the clothing or most of the furniture
12. Have exchanged goods or services with others in lieu of payment with money, e.g., repairingequipment in exchange for other skilled worka. neverb. have oncec. have several timesd. have many timese. do so whenever possible
13. Have a compost pilea. yesb. no
14. Contribute to ecologically oriented organizationsa. never haveb. did contribute once; do not nowc. occasionally contribute nowd. contribute regularly to one organizatione. contribute regularly to two or more organizationsf. do not know
15. Belong to a cooperativea. yesb. no
16. Grow the vegetables the family consumes during the summer seasona. noneb. some
186 HANDBOOK OF MARKETING SCALES
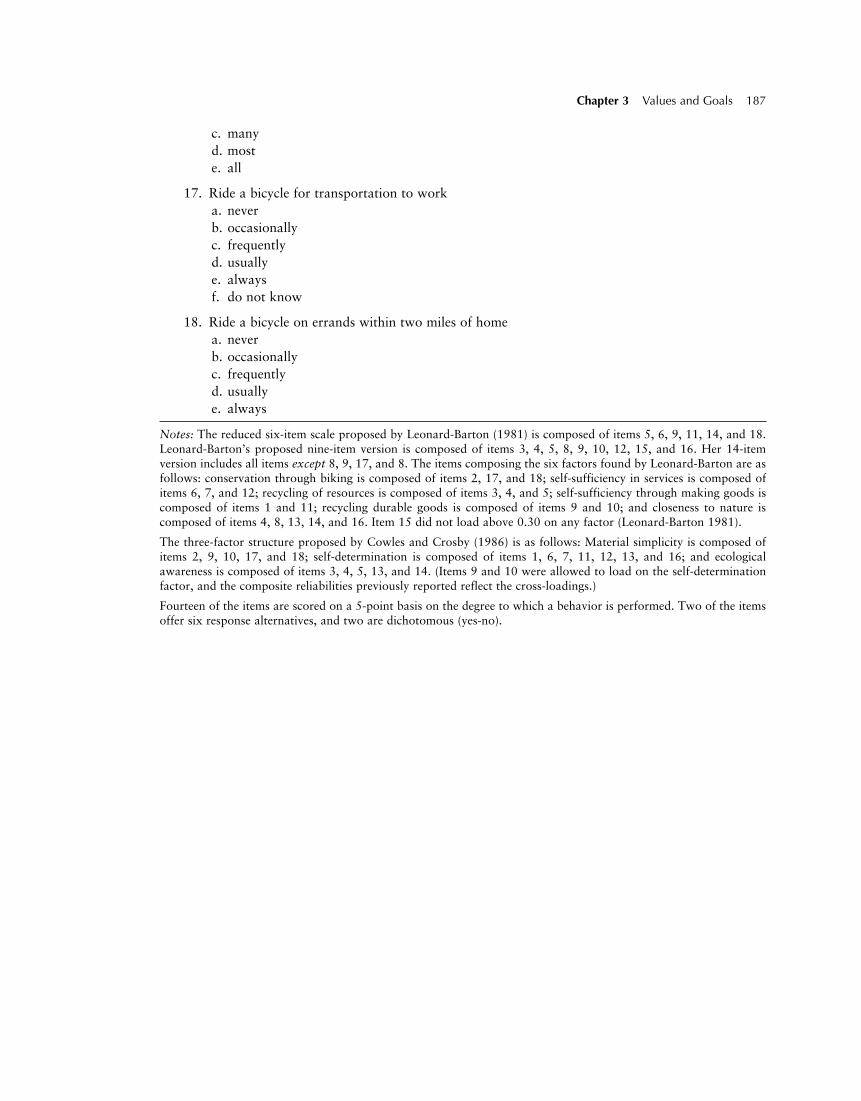
c. manyd. moste. all
17. Ride a bicycle for transportation to worka. neverb. occasionallyc. frequentlyd. usuallye. alwaysf. do not know
18. Ride a bicycle on errands within two miles of homea. neverb. occasionallyc. frequentlyd. usuallye. always
Notes: The reduced six-item scale proposed by Leonard-Barton (1981) is composed of items 5, 6, 9, 11, 14, and 18.Leonard-Barton’s proposed nine-item version is composed of items 3, 4, 5, 8, 9, 10, 12, 15, and 16. Her 14-itemversion includes all items except 8, 9, 17, and 8. The items composing the six factors found by Leonard-Barton are asfollows: conservation through biking is composed of items 2, 17, and 18; self-sufficiency in services is composed ofitems 6, 7, and 12; recycling of resources is composed of items 3, 4, and 5; self-sufficiency through making goods iscomposed of items 1 and 11; recycling durable goods is composed of items 9 and 10; and closeness to nature iscomposed of items 4, 8, 13, 14, and 16. Item 15 did not load above 0.30 on any factor (Leonard-Barton 1981).
The three-factor structure proposed by Cowles and Crosby (1986) is as follows: Material simplicity is composed ofitems 2, 9, 10, 17, and 18; self-determination is composed of items 1, 6, 7, 11, 12, 13, and 16; and ecologicalawareness is composed of items 3, 4, 5, 13, and 14. (Items 9 and 10 were allowed to load on the self-determinationfactor, and the composite reliabilities previously reported reflect the cross-loadings.)
Fourteen of the items are scored on a 5-point basis on the degree to which a behavior is performed. Two of the itemsoffer six response alternatives, and two are dichotomous (yes-no).
Chapter 3 Values and Goals 187
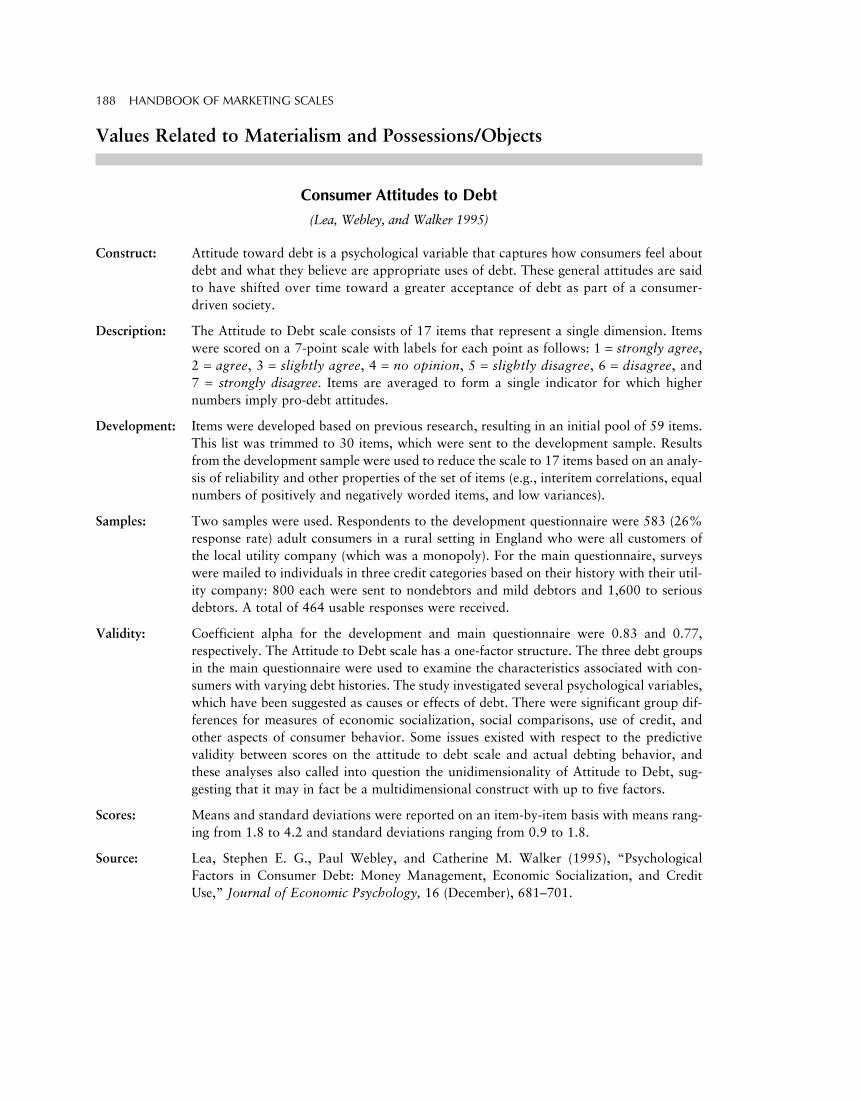
Values Related to Materialism and Possessions/Objects
Consumer Attitudes to Debt
(Lea, Webley, and Walker 1995)
Construct: Attitude toward debt is a psychological variable that captures how consumers feel aboutdebt and what they believe are appropriate uses of debt. These general attitudes are saidto have shifted over time toward a greater acceptance of debt as part of a consumer-driven society.
Description: The Attitude to Debt scale consists of 17 items that represent a single dimension. Itemswere scored on a 7-point scale with labels for each point as follows: 1 = strongly agree,2 = agree, 3 = slightly agree, 4 = no opinion, 5 = slightly disagree, 6 = disagree, and7 = strongly disagree. Items are averaged to form a single indicator for which highernumbers imply pro-debt attitudes.
Development: Items were developed based on previous research, resulting in an initial pool of 59 items.This list was trimmed to 30 items, which were sent to the development sample. Resultsfrom the development sample were used to reduce the scale to 17 items based on an analy-sis of reliability and other properties of the set of items (e.g., interitem correlations, equalnumbers of positively and negatively worded items, and low variances).
Samples: Two samples were used. Respondents to the development questionnaire were 583 (26%response rate) adult consumers in a rural setting in England who were all customers ofthe local utility company (which was a monopoly). For the main questionnaire, surveyswere mailed to individuals in three credit categories based on their history with their util-ity company: 800 each were sent to nondebtors and mild debtors and 1,600 to seriousdebtors. A total of 464 usable responses were received.
Validity: Coefficient alpha for the development and main questionnaire were 0.83 and 0.77,respectively. The Attitude to Debt scale has a one-factor structure. The three debt groupsin the main questionnaire were used to examine the characteristics associated with con-sumers with varying debt histories. The study investigated several psychological variables,which have been suggested as causes or effects of debt. There were significant group dif-ferences for measures of economic socialization, social comparisons, use of credit, andother aspects of consumer behavior. Some issues existed with respect to the predictivevalidity between scores on the attitude to debt scale and actual debting behavior, andthese analyses also called into question the unidimensionality of Attitude to Debt, sug-gesting that it may in fact be a multidimensional construct with up to five factors.
Scores: Means and standard deviations were reported on an item-by-item basis with means rang-ing from 1.8 to 4.2 and standard deviations ranging from 0.9 to 1.8.
Source: Lea, Stephen E. G., Paul Webley, and Catherine M. Walker (1995), “PsychologicalFactors in Consumer Debt: Money Management, Economic Socialization, and CreditUse,” Journal of Economic Psychology, 16 (December), 681–701.
188 HANDBOOK OF MARKETING SCALES
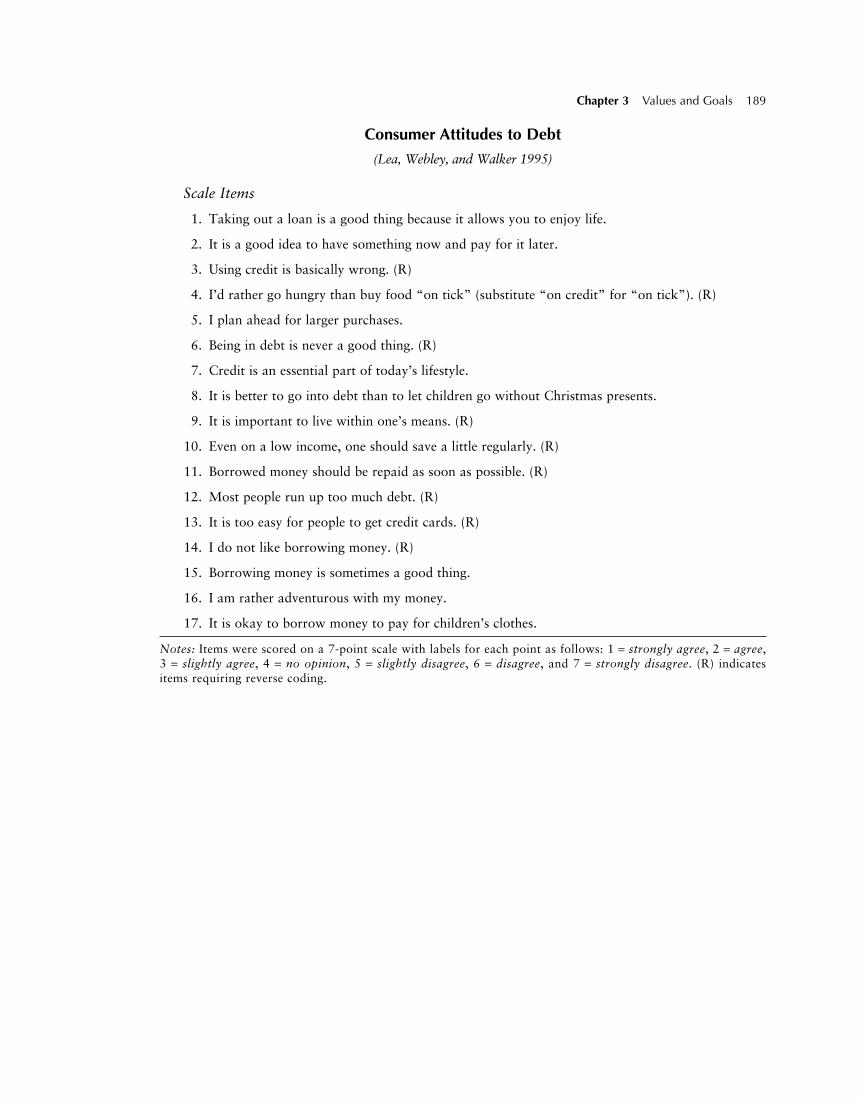
Consumer Attitudes to Debt
(Lea, Webley, and Walker 1995)
Scale Items
1. Taking out a loan is a good thing because it allows you to enjoy life.
2. It is a good idea to have something now and pay for it later.
3. Using credit is basically wrong. (R)
4. I’d rather go hungry than buy food “on tick” (substitute “on credit” for “on tick”). (R)
5. I plan ahead for larger purchases.
6. Being in debt is never a good thing. (R)
7. Credit is an essential part of today’s lifestyle.
8. It is better to go into debt than to let children go without Christmas presents.
9. It is important to live within one’s means. (R)
10. Even on a low income, one should save a little regularly. (R)
11. Borrowed money should be repaid as soon as possible. (R)
12. Most people run up too much debt. (R)
13. It is too easy for people to get credit cards. (R)
14. I do not like borrowing money. (R)
15. Borrowing money is sometimes a good thing.
16. I am rather adventurous with my money.
17. It is okay to borrow money to pay for children’s clothes.
Notes: Items were scored on a 7-point scale with labels for each point as follows: 1 = strongly agree, 2 = agree,3 = slightly agree, 4 = no opinion, 5 = slightly disagree, 6 = disagree, and 7 = strongly disagree. (R) indicatesitems requiring reverse coding.
Chapter 3 Values and Goals 189
Frugality Scale
(Lastovicka et al. 1999)
Construct: Based on a thorough review of the literature across numerous disciplines (e.g., economics,early American studies, religion, self-help, psychology) and a qualitative study of 84 sub-jects, Lastovicka et al. (1999) define frugality as “a unidimensional consumer lifestyle traitcharacterized by the degree to which consumers are both restrained in acquiring and inresourcefully using economic goods and services to achieve longer-term goals” (p. 88).
Description: The frugality scale is an eight-item single-factor (unidimensional) scale. All items arescored on 6-point definitely disagree to definitely agree scales. Item scores are summed toform an overall frugality score ranging from 8 to 48.
Development: Using numerous recommended scaling procedures across six studies and seven samples,the final form of the scale was derived and thoroughly tested for dimensionality, reliabil-ity, and various forms of validity. The first study generated a pool of 60 potential frugal-ity items, and 213 nonstudent adults responded to these items and several other measuresfor validity assessment purposes. Factor and item analyses trimmed this pool to the finaleight-item form. Studies 2 through 6 assessed discriminant, nomological, convergent, andknown-groups validity and established scale norms.
Samples: As stated above, seven samples (over six studies) were used to develop and validate thescale. Study 1, n = 213 nonstudent adults; Study 2, n = 57 participants from a universitysecretarial staff; Study 3, n = 90 nonstudent adults at an airport; Study 4, n = 101 mar-ried couples at an airport; Study 5, n = 39 undergraduate students; and Study 6, n = 164nonstudent adults from a probability sample and n = 215 subscribers from the TightwadGazette.
Validity: Studies 1, 3, and 6 strongly showed that a single unidimensional factor underlies the eightitems. Coefficient alpha across all studies ranged from 0.73 to 0.88, and factor loadingsranged from 0.53 to 0.77. In Studies 2 and 3, the frugality scale showed strong evidenceof discriminant and nomological validity with measures of compulsive buying (r = –0.25),coupon proneness (r = 0.14), value consciousness (r = 0.54), and price consciousness(r = 0.45). Further, the frugality scale showed no evidence of being tainted with socialdesirability bias or response set bias. In Studies 3, 4, and 6, the frugality scale was alsoshown to be predictive of “retrained use” above and beyond the effects of compulsivebuying, coupon proneness, value consciousness, and price consciousness. In Study 4, thefrugality scale showed a predicted pattern of correlations with materialism (r = –0.26) andsusceptibility to interpersonal influence (r =–0.10). Finally, Study 6 showed evidence ofknown-groups validity as Tightwad Gazette subscribers (M = 44.43) showed a higher fru-gality mean score than did the n = 164 probability sample (M = 40.43, t = 7.36, p < 0.05).In sum, strong evidence of validity for the frugality scale was found across samples.
Scores: As noted above, scores on the frugality scale can range from 6 to 48. Mean scores werereported for Study 5 (M = 36) and Study 6 (M = 40.43, n = 164 probability sample; andM = 44.43 Tightwad Gazette sample).
Source: Lastovicka, John L., Lance A. Bettencourt, Renee Shaw Hughner, and Ronald J. Kuntze(1999), “Lifestyle of the Tight and Frugal: Theory and Measurement,” Journal ofConsumer Research, 26 (June), 85–98.
190 HANDBOOK OF MARKETING SCALES
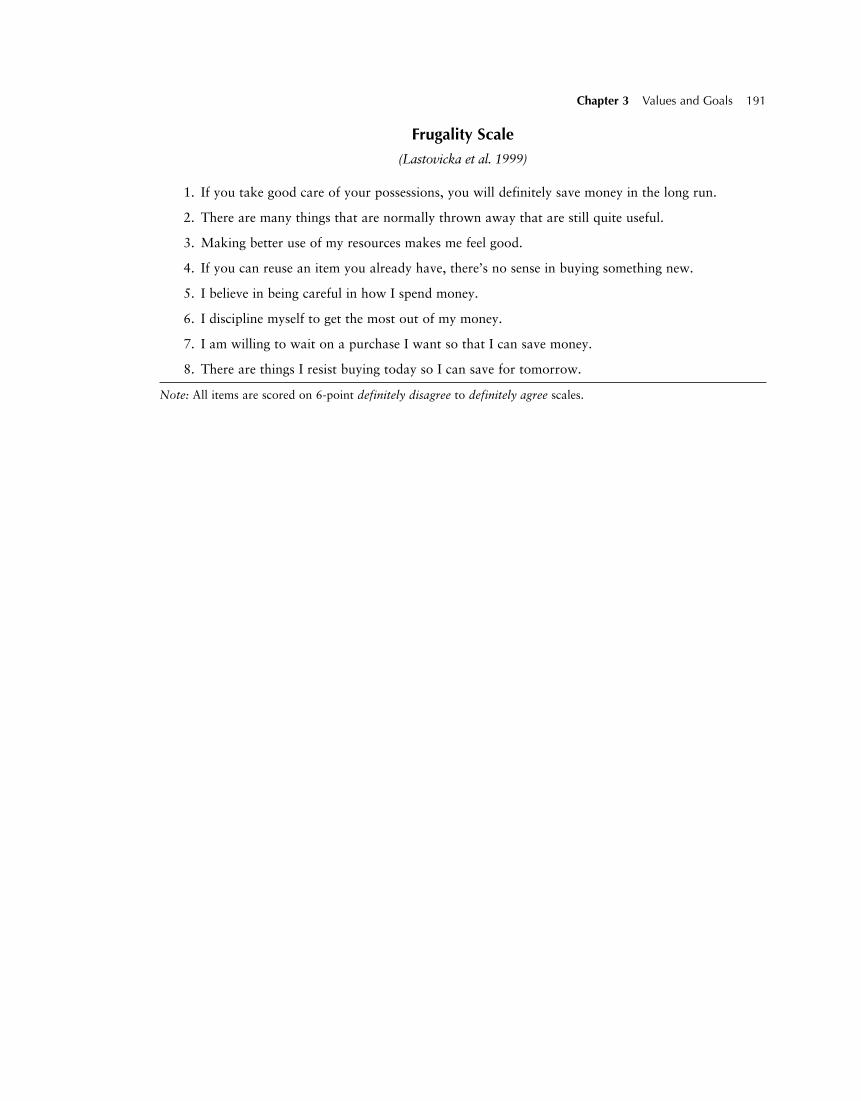
Frugality Scale
(Lastovicka et al. 1999)
1. If you take good care of your possessions, you will definitely save money in the long run.
2. There are many things that are normally thrown away that are still quite useful.
3. Making better use of my resources makes me feel good.
4. If you can reuse an item you already have, there’s no sense in buying something new.
5. I believe in being careful in how I spend money.
6. I discipline myself to get the most out of my money.
7. I am willing to wait on a purchase I want so that I can save money.
8. There are things I resist buying today so I can save for tomorrow.
Note: All items are scored on 6-point definitely disagree to definitely agree scales.
Chapter 3 Values and Goals 191
Materialism Measure
(Richins 1987)
Construct: Richins (1987) describes materialism in terms of its role in consumer culture as “theidea that goods are a means to happiness; that satisfaction in life is not achieved by reli-gious contemplation or social interaction, or a simple life, but by possession and inter-action with goods” (p. 352). This view is consistent with extant writings on materialism(e.g., Belk 1984, 1985).
Description: The scale is a six-item, two-factor measure. The items are scored on a 7-point Likert-type format from strongly disagree to strongly agree. Item scores are summed withinfactors to form indices for each factor.
Development: Scale development procedures consisted of generating seven items that tapped the con-tent domain of the construct. Then, based on factor analysis and coefficient alpha, thefinal six items were derived.
Samples: The sample consisted of a quota sample of 252 adults.
Validity: Factor analysis revealed that four items tapped a personal materialism factor (alpha = 0.73)and two items tapped a general materialism factor (alpha = 0.61). The two materialismfactors were correlated with measures of perceived realism of TV ads, media exposure,and life satisfaction. The resulting correlations show modest support for the validity ofthe measure.
Scores: Mean and/or percentage scores were not reported.
Source: Richins, Marsha L. (1987), “Media, Materialism, and Human Happiness,” in Advancesin Consumer Research, Vol. 14, eds. Melanie Wallendorf and Paul Anderson, Provo,UT: Association for Consumer Research, pp. 352–56.
1987 by the Association for Consumer Research. Scale items taken from Table 2(p. 354). Reprinted with permission.
References: Belk, Russell W. (1984), “Three Scales to Measure Constructs Related to Materialism:Reliability, Validity, and Relationships to Measures of Happiness,” in Advances inConsumer Research, Vol. 11, ed. Thomas C. Kinnear, Provo, UT: Association forConsumer Research, pp. 291–97.
Belk, Russell W. (1985), “Materialism: Trait Aspects of Living in the Material World,”Journal of Consumer Research, 12, 265–80.
192 HANDBOOK OF MARKETING SCALES
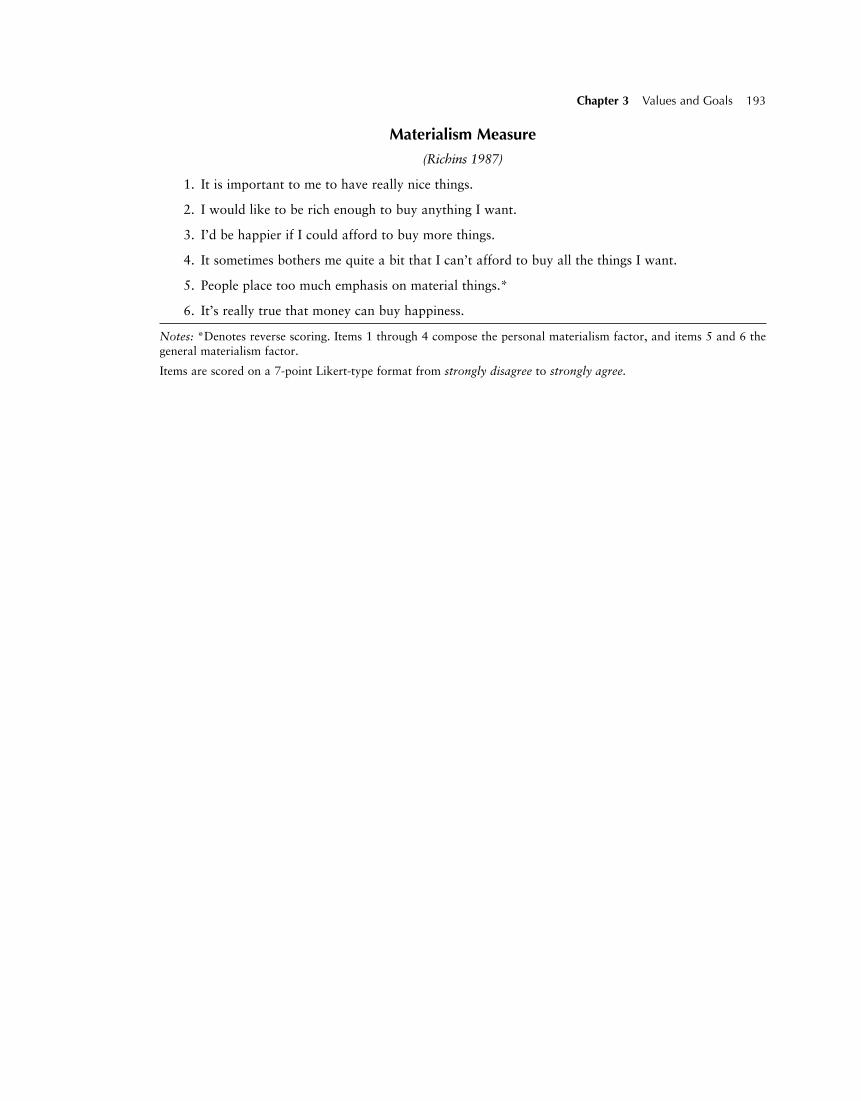
Materialism Measure
(Richins 1987)
1. It is important to me to have really nice things.
2. I would like to be rich enough to buy anything I want.
3. I’d be happier if I could afford to buy more things.
4. It sometimes bothers me quite a bit that I can’t afford to buy all the things I want.
5. People place too much emphasis on material things.*
6. It’s really true that money can buy happiness.
Notes: *Denotes reverse scoring. Items 1 through 4 compose the personal materialism factor, and items 5 and 6 thegeneral materialism factor.
Items are scored on a 7-point Likert-type format from strongly disagree to strongly agree.
Chapter 3 Values and Goals 193
Material Values (MVS): Short Forms
(Richins 2004)
Construct: As with Richins and Dawson (1992), Richins (2004) views materialism as a consumervalue that involves beliefs and attitudes so centrally held that they guide the conduct ofone’s life. The primary purpose of Richins (2004) was to develop shortened versions ofthe Richins and Dawson (1992) Material Values Scale(s) (MVS) that still reflect posses-sions as defining a success dimension, an acquisition centrality dimension, and an acqui-sitions as the pursuit of happiness dimension.
Description: Four short forms of the MVS scale(s) were developed: 15-item, 9-item, 6-item, and 3-itemscales encompassing the three dimensions above. All items are scored on a 5-point Likertformat from strongly disagree to strongly agree. Item scores can be summed withindimensions to form indices for each dimension and can be summed over all items to forman overall MVS score.
Development: The development of the short forms closely followed recommended psychometric scalingprocedures. Fifteen samples, several from the original development of the MVS (Richinsand Dawson 1992), were used. Via factor and item analyses and extensive validity test-ing over the samples, the final short forms of the MVS were derived. A cross-validationsample of n = 402 split into four subsamples was then gathered to further validate theshort forms of the scale.
Samples: As stated above, 16 samples were used, ranging in size from n = 110 to n = 639. Eight ofthe samples comprised college students, and eight comprised nonstudent adults from var-ious geographic areas in the United States. Across samples, a total of 4,736 participantswere surveyed.
Validity: Through factor analyses, item analyses, reliability analysis, and validity testing, the psy-chometric properties of the short-form scales were assessed. For the first 15 samples, asummed 15-item version of the overall scale showed an average coefficient alpha estimateacross samples of 0.86. For the success, acquisition centrality, and happiness dimensionshort forms of the 15-item version, alpha averaged 0.76, 0.70, and 0.78, respectively. Itshould be noted, though, that the 15-item version and its separate dimensions did showsignificant correlations with social desirability bias, and the three-dimension structure ofsuccess, acquisition centrality, and happiness did not always cleanly emerge across the 15samples.
The average coefficient alpha for a summed nine-item short-form version was 0.82;average coefficient alpha for a summed six-item short-form version was 0.75; and aver-age coefficient alpha for a summed three-item short-form version was 0.63.
Interestingly, nomological validity correlations for the 15-, 9-, 6-, and 3-item versionswith Belk’s (1985) materialism scales, numerous personal value measures, several “sourceof possession value” measures, and a windfall expenditures construct were highly similar.In general, these correlations showed strong evidence of validity for all short-form ver-sions of the MVS.
The cross-validation samples showed the following: The 15-item version of the over-all scale had a coefficient alpha of 0.87; the 9-item version had a coefficient alpha of 0.84;the 6-item version had a coefficient alpha of 0.81; and the 3-item version had a coefficientalpha of 0.64. With the exception of the three-item scale, validity correlations withnumerous related constructs were again quite strong. Richins (2004) cautioned againstusing the three-item version of the MVS.
194 HANDBOOK OF MARKETING SCALES
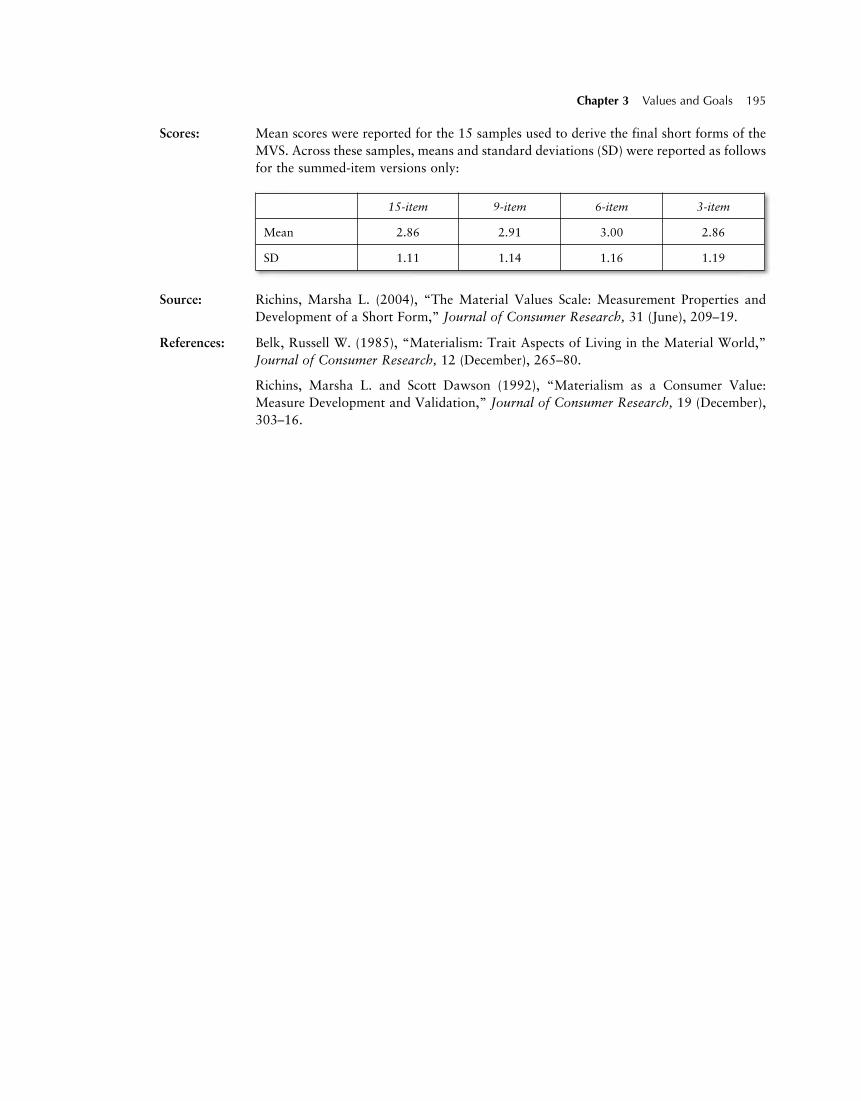
Scores: Mean scores were reported for the 15 samples used to derive the final short forms of theMVS. Across these samples, means and standard deviations (SD) were reported as followsfor the summed-item versions only:
Chapter 3 Values and Goals 195
15-item 9-item 6-item 3-item
Mean 2.86 2.91 3.00 2.86
SD 1.11 1.14 1.16 1.19
Source: Richins, Marsha L. (2004), “The Material Values Scale: Measurement Properties andDevelopment of a Short Form,” Journal of Consumer Research, 31 (June), 209–19.
References: Belk, Russell W. (1985), “Materialism: Trait Aspects of Living in the Material World,”Journal of Consumer Research, 12 (December), 265–80.
Richins, Marsha L. and Scott Dawson (1992), “Materialism as a Consumer Value:Measure Development and Validation,” Journal of Consumer Research, 19 (December),303–16.
Material Values (MVS): Short Forms
(Richins 2004)
Success
1. I admire people who own expensive homes, cars, and clothes. (15, 9, 6, 3)
2. Some of the most important achievements in life include acquiring material possessions. (15)
3. I don’t place much emphasis on the amount of material objects people own as a sign of success.* (15)
4. The things I own say a lot about how well I’m doing in life. (15, 9, 6)
5. I like to own things that impress people. (15, 9)
6. I don’t pay much attention to the material objects other people own.*
Acquisition Centrality
1. I usually buy only the things I need.*
2. I try to keep my life simple, as far as possessions are concerned.* (15, 9)
3. The things I own aren’t all that important to me.* (15)
4. I enjoy spending money on things that aren’t practical.
5. Buying things gives me a lot of pleasure. (15, 9, 6)
6. I like a lot of luxury in my life. (15, 9, 6, 3)
7. I put less emphasis on material things than most people I know.* (15)
Happiness
1. I have all the things I really need to enjoy life.* (15)
2. My life would be better if I owned certain things I don’t have. (15, 9, 6)
3. I wouldn’t be any happier if I owned nicer things.* (15)
4. I’d be happier if I could afford to buy more things. (15, 9, 6, 3)
5. It sometimes bothers me quite a bit that I can’t afford to buy all the things I’d like. (15, 9)
Notes: *denotes items that are reverse scored. Numbers in parentheses denote which items compose the 15-, 9-, 6-,and 3-item versions of the MVS. Items are scored on 5-point Likert scales from strongly disagree to strongly agree.
196 HANDBOOK OF MARKETING SCALES
Materialism Scales
(Belk 1984, 1985)
Construct: Materialism is defined as the importance a consumer attaches to worldly possessions.At the highest level of materialism, such possessions assume a central place in a person’slife and are believed to provide the greatest sources of satisfaction and dissatisfaction(Belk 1984, 1985). Furthermore, Belk identifies three subtraits of materialism: posses-siveness, nongenerosity, and envy.
Possessiveness is defined as the inclination and tendency to retain control or ownershipof one’s possessions.
Nongenerosity is defined as an unwillingness to give possessions or share possessionswith others.
Envy is defined as the displeasure and ill will at the superiority of another person inhappiness, success, reputation, or the possession of anything desirable.
Description: The Belk materialism scale is composed of 24 statements designed to measure the threesubtraits alluded to above. The items are scored on 5-point Likert-type scales fromagree to disagree. Item scores are summed within each subtrait to form an overall scorefor each subtrait, and all 24 items can be summed to form an overall index of materi-alism. The scales consist of nine items for possessiveness, seven items for nongeneros-ity, and eight items for envy.
Development: Based on the conceptual domains identified for materialism and its subtraits, initialpools of 30 to 35 items were generated for each subtrait. Through factor analysis, item-to-total correlations, and other measures of internal consistency, seven to nine itemswere selected for each subtrait based on a student sample of 237 (Belk 1984).
Samples: Two samples were used by Belk (1984) to initially examine the reliability and validity ofthe scales. For developing the scales, a student sample of 237 was used. Through a numberof statistical procedures, the final measures were derived. Belk (1984) also used anotherlarger sample composed of both students and nonstudents (n = 338) to validate the scale.
In another sample used to assess mean differences in materialism by generation, 99subjects from 33 different families responded to the scales (Belk 1985).
Validity: A number of reliability and validity estimates are reported for the scales. In the Belk (1984)study, coefficient alpha estimates for the possessiveness, nongenerosity, and envy subscaleswere 0.68, 0.72, and 0.80, respectively, for the student sample (n = 237). The overallsummed scale (24 items) had an alpha of 0.73. For the larger sample (n = 338), these esti-mates were 0.57 for possessiveness, 0.58 for nongenerosity, 0.64 for envy, and 0.66 for theoverall summed 24-item scale. Based on a subsample of 48 students (from the 338 sample),test-retest reliability estimates were 0.87 for possessiveness, 0.64 for nongenerosity, 0.70for envy, and 0.68 for the overall scale. By using multitrait-multimethod analysis, behav-ioral and photo indices of materialism were correlated with the materialism scales. In theseanalyses, Belk (1984) found the scales to have adequate levels of convergent and discrimi-nant validity. Also, all three materialism measures were found to be negatively correlatedwith measures of happiness and satisfaction in life (i.e., –0.26 and –0.24, respectively).In sum, the original Belk study showed support for the validity of the scale.
Scores: Mean scores for the summed 24-item scale and the original three subtraits are reportedfor the n = 338 sample (Belk 1984, 1985). The mean for the overall scale was 73.4. Themeans for the possessiveness, nongenerosity, and envy subtraits were 32.86, 18.74, and21.74, respectively. Mean scores are further broken down by occupation in Belk (1984,p. 294). Belk (1985, p. 271) also reports mean scores for the overall scale and the threeoriginal subtraits by family generation.
Chapter 3 Values and Goals 197
Sources: Belk, Russell W. (1984), “Three Scales to Measure Constructs Related to Materialism:Reliability, Validity, and Relationships to Measures of Happiness,” in Advances inConsumer Research, Vol. 11, ed. Thomas C. Kinnear, Provo, UT: Association forConsumer Research, pp. 291–97.
1984 by the Association for Consumer Research. Scale items taken from Table 1(p. 292). Reprinted with permission.
Belk, Russell W. (1985), “Materialism: Trait Aspects of Living in the Material World,”Journal of Consumer Research, 12, 265–80.
1985 by University of Chicago Press. Scale items taken from Exhibit 1 (p. 270).
Other evidence: In a cross-cultural context, Ger and Belk (1990) looked at a sample of 405 students fromseveral different countries (i.e., Germany, England, France, the United States, andTurkey). Ger and Belk (1990) modified and administered the scale cross-culturally and,based on factor analyses, found a fourth dimension, “tangiblization.” Coefficient alphaestimates for the four subscales and total scale were reported for the combined sample andby country subsample. For the combined sample (n = 405), alpha estimates were 0.67 forpossessiveness, 0.69 for nongenerosity, 0.52 for envy, 0.56 for tangiblization, and 0.58 forthe overall scale. (See Ger and Belk 1990, p. 188, for alpha estimates by country.)Furthermore, the four subscales were correlated with an index assessing the degree towhich 20 products/services were viewed as necessities versus luxury items. The pattern ofcorrelations supported the validity of the scales. For example, correlations of the posses-siveness, nongenerosity, envy, and tangiblization factors with the number of items viewedas necessities were 0.18, –0.13, 0.25, and 0.10, respectively. Ger and Belk (1990, p. 189)also report mean scores by country for the entire scale and all four subtraits.
In another study, Ellis (1992) examined the dimensionality of Belk’s scale by esti-mating numerous competing factor structures based on a sample of 148 respondents.Ellis concluded that a three-factor structure (i.e., possessiveness, nongenerosity, andenvy) appeared to offer the best specification of the materialism items. Although internalconsistency estimates were not provided, individual item-to-factor loadings were(see Table 2), and the correlations among the three factors ranged from –0.032 to 0.431.
More recently, Micken (1995), using a sample of n = 278 adults from a Mid-AtlanticMetropolitan Statistical Area (MSA), reported coefficient alpha estimates of 0.66, 0.38,0.64, 0.50, and 0.65 for the overall scale, the possessiveness subscale, the nongenerositysubscale, the envy subscale, and the “preservation” (i.e., “tangibility”) subscale, respec-tively (see “Notes”). Furthermore, a factor structure based on the four subdimensions andtheir intended items found very limited support with Micken’s data. Micken also reportsfew significant correlations between Belk’s measures and measures of education, age, gen-der, and income. In sum, she questions some of the psychometric properties of the scale.
Other sources: Ellis, Seth R. (1992), “A Factor Analytic Investigation of Belk’s Structure of theMaterialism Construct,” in Advances in Consumer Research, Vol. 19, eds. John F.Sherry and Brian Sternthal, Provo, UT: Association for Consumer Research, pp. 688–95.
Ger, Guliz and Russell W. Belk (1990), “Measuring and Comparing MaterialismAcross Countries,” in Advances in Consumer Research, Vol. 17, eds. Marvin E. Goldberg,Gerald Gorn, and Richard W. Pollay, Provo, UT: Association for Consumer Research, pp.186–92.
Micken, Kathleen (1995), “A New Appraisal of the Belk Materialism Scale,” inAdvances in Consumer Research, Vol. 22, eds. Frank Kardes and Mita Sujan, Provo,UT: Association for Consumer Research, pp. 398–405.
198 HANDBOOK OF MARKETING SCALES
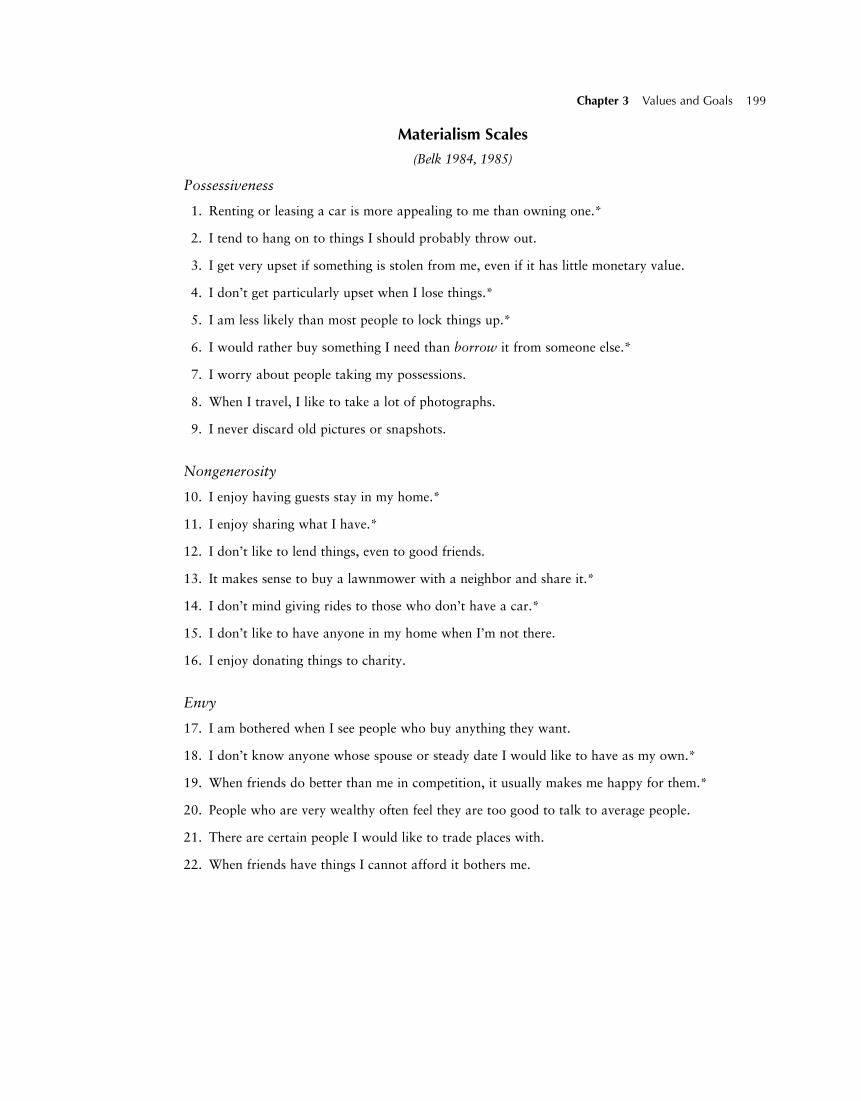
Materialism Scales
(Belk 1984, 1985)
Possessiveness
1. Renting or leasing a car is more appealing to me than owning one.*
2. I tend to hang on to things I should probably throw out.
3. I get very upset if something is stolen from me, even if it has little monetary value.
4. I don’t get particularly upset when I lose things.*
5. I am less likely than most people to lock things up.*
6. I would rather buy something I need than borrow it from someone else.*
7. I worry about people taking my possessions.
8. When I travel, I like to take a lot of photographs.
9. I never discard old pictures or snapshots.
Nongenerosity
10. I enjoy having guests stay in my home.*
11. I enjoy sharing what I have.*
12. I don’t like to lend things, even to good friends.
13. It makes sense to buy a lawnmower with a neighbor and share it.*
14. I don’t mind giving rides to those who don’t have a car.*
15. I don’t like to have anyone in my home when I’m not there.
16. I enjoy donating things to charity.
Envy
17. I am bothered when I see people who buy anything they want.
18. I don’t know anyone whose spouse or steady date I would like to have as my own.*
19. When friends do better than me in competition, it usually makes me happy for them.*
20. People who are very wealthy often feel they are too good to talk to average people.
21. There are certain people I would like to trade places with.
22. When friends have things I cannot afford it bothers me.
Chapter 3 Values and Goals 199
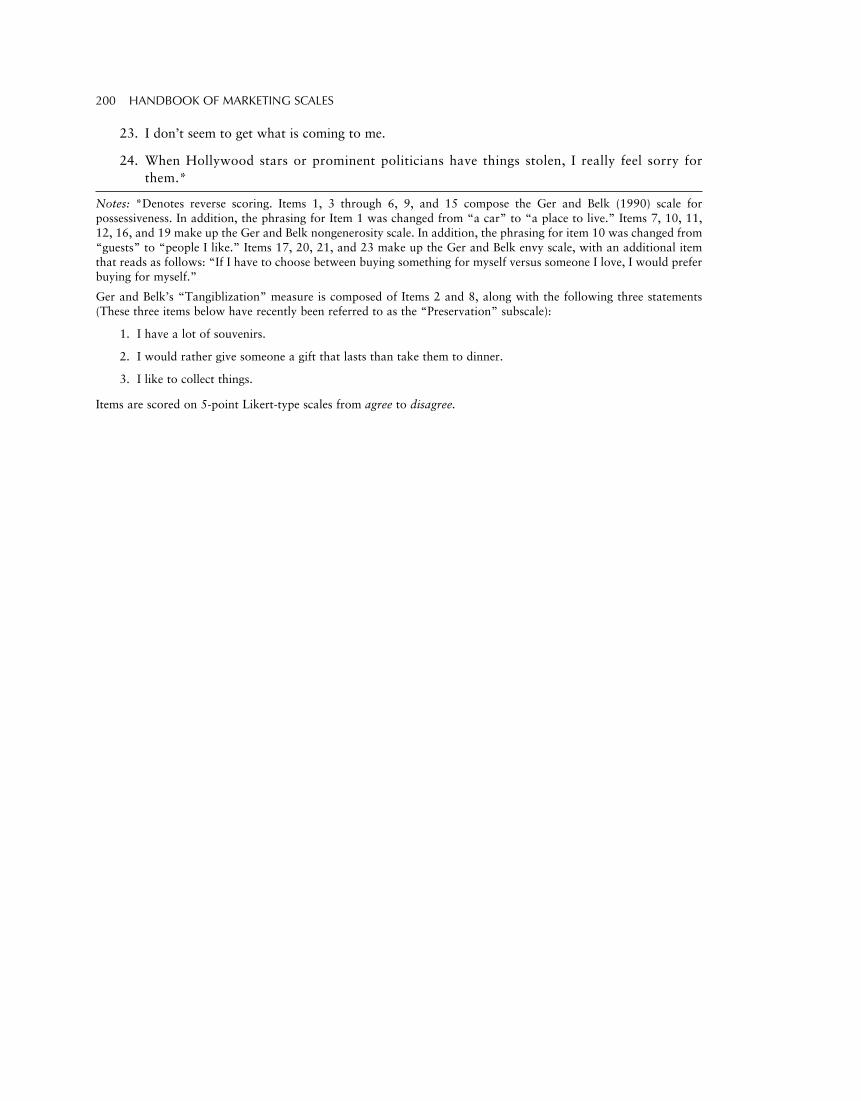
23. I don’t seem to get what is coming to me.
24. When Hollywood stars or prominent politicians have things stolen, I really feel sorry forthem.*
Notes: *Denotes reverse scoring. Items 1, 3 through 6, 9, and 15 compose the Ger and Belk (1990) scale forpossessiveness. In addition, the phrasing for Item 1 was changed from “a car” to “a place to live.” Items 7, 10, 11,12, 16, and 19 make up the Ger and Belk nongenerosity scale. In addition, the phrasing for item 10 was changed from“guests” to “people I like.” Items 17, 20, 21, and 23 make up the Ger and Belk envy scale, with an additional itemthat reads as follows: “If I have to choose between buying something for myself versus someone I love, I would preferbuying for myself.”
Ger and Belk’s “Tangiblization” measure is composed of Items 2 and 8, along with the following three statements(These three items below have recently been referred to as the “Preservation” subscale):
1. I have a lot of souvenirs.
2. I would rather give someone a gift that lasts than take them to dinner.
3. I like to collect things.
Items are scored on 5-point Likert-type scales from agree to disagree.
200 HANDBOOK OF MARKETING SCALES
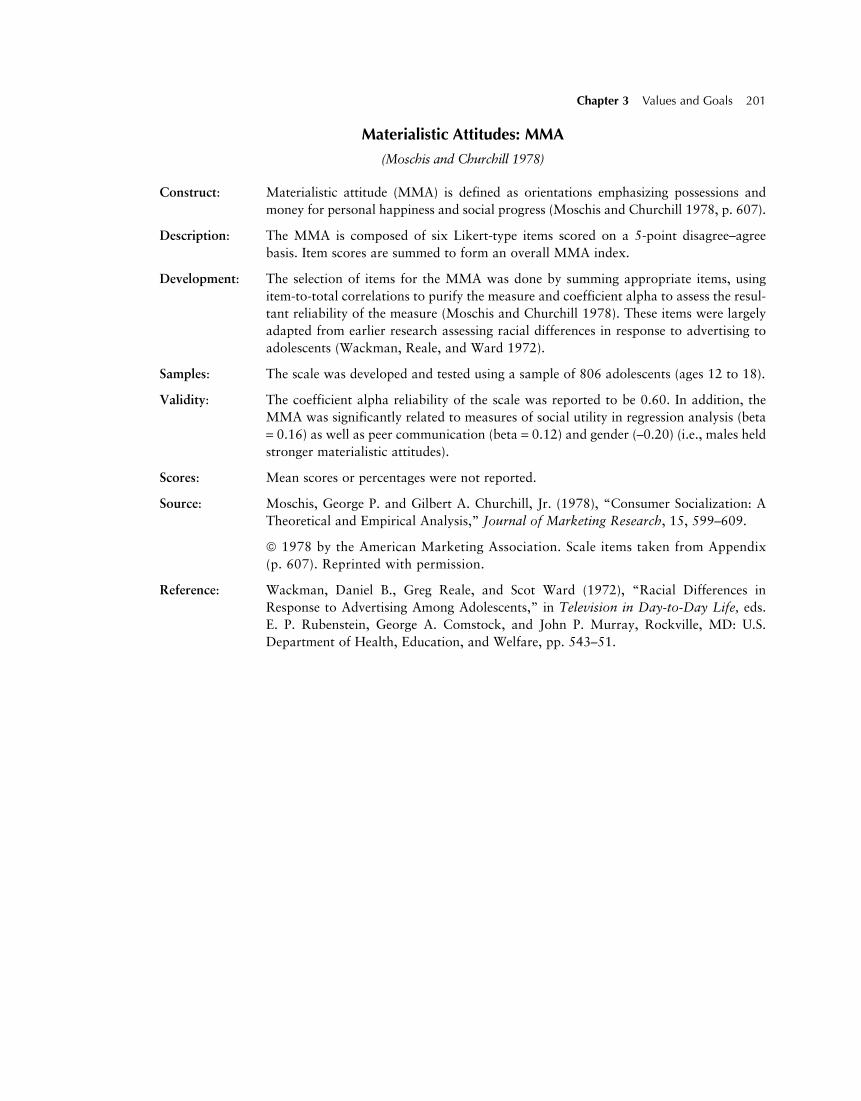
Materialistic Attitudes: MMA
(Moschis and Churchill 1978)
Construct: Materialistic attitude (MMA) is defined as orientations emphasizing possessions andmoney for personal happiness and social progress (Moschis and Churchill 1978, p. 607).
Description: The MMA is composed of six Likert-type items scored on a 5-point disagree–agreebasis. Item scores are summed to form an overall MMA index.
Development: The selection of items for the MMA was done by summing appropriate items, usingitem-to-total correlations to purify the measure and coefficient alpha to assess the resul-tant reliability of the measure (Moschis and Churchill 1978). These items were largelyadapted from earlier research assessing racial differences in response to advertising toadolescents (Wackman, Reale, and Ward 1972).
Samples: The scale was developed and tested using a sample of 806 adolescents (ages 12 to 18).
Validity: The coefficient alpha reliability of the scale was reported to be 0.60. In addition, theMMA was significantly related to measures of social utility in regression analysis (beta= 0.16) as well as peer communication (beta = 0.12) and gender (–0.20) (i.e., males heldstronger materialistic attitudes).
Scores: Mean scores or percentages were not reported.
Source: Moschis, George P. and Gilbert A. Churchill, Jr. (1978), “Consumer Socialization: ATheoretical and Empirical Analysis,” Journal of Marketing Research, 15, 599–609.
1978 by the American Marketing Association. Scale items taken from Appendix(p. 607). Reprinted with permission.
Reference: Wackman, Daniel B., Greg Reale, and Scot Ward (1972), “Racial Differences inResponse to Advertising Among Adolescents,” in Television in Day-to-Day Life, eds.E. P. Rubenstein, George A. Comstock, and John P. Murray, Rockville, MD: U.S.Department of Health, Education, and Welfare, pp. 543–51.
Chapter 3 Values and Goals 201
Materialistic Attitudes: MMA
(Moschis and Churchill 1978)
1. It is really true that money can buy happiness.
2. My dream in life is to be able to own expensive things.
3. People judge others by the things they own.
4. I buy some things that I secretly hope will impress other people.
5. Money is the most important thing to consider in choosing a job.
6. I think others judge me as a person by the kinds of products and brands I use.
Note: Items scored on a 5-point Likert-type scale from disagree to agree.
202 HANDBOOK OF MARKETING SCALES
Material Values
(Richins and Dawson 1992)
Construct: Richins and Dawson (1992) view materialism as a consumer value in that it involvesbeliefs and attitudes so centrally held that they guide the conduct of one’s life. Based ona review of the materialism literature in a variety of disciplines and on popular notionsconcerning materialism (Fournier and Richins 1991), three important themes concern-ing materialism were identified. These themes reflect the values consumers place onmaterial goods and the roles these goods play in their lives:
Possessions as defining “success” is the extent to which one uses possessions as indica-tors of success and achievement in life, both in judging oneself and others.
Acquisition “centrality” is the extent to which one places possession acquisition at thecenter of one’s life (i.e., this lends meaning to life and guides daily endeavors).
Acquisitions as the pursuit of “happiness” is the belief that possessions are essential tosatisfaction and well-being in life.
Description: The scale consists of 18 items encompassing the three factors above (six items for “suc-cess,” seven for “centrality,” and five for “happiness”). The items are scored on a 5-pointLikert-type format from strongly agree to strongly disagree. Item scores are summedwithin dimensions to form indices for each dimension, and they can be summed overallto form an overall materialism score.
Development: The development of the scale closely followed recommended psychometric scaling pro-cedures. First, a convenience sample of 11 consumers was asked to describe the char-acteristics of materialistic people they knew in an open-ended format. Items were thengenerated based on these responses. Items were also generated from previously devel-oped materialism scales and the materialism literature (Belk 1984, 1985; Richins 1987).More than 120 items were generated. These items were then screened for ambiguity andredundancy, resulting in further development samples examining either 50 or 66 poten-tial materialism statements (Richins and Dawson 1992). From these, a pool of 48 itemswas retained for further analysis. This pool was trimmed to 30 items via exploratoryfactor analysis, reliability analysis, and social desirability testing. Through a number ofother scaling procedures (i.e., factor analysis, reliability analysis, and validity checks)across several samples, a final scale consisting of 18 items was developed.
Samples: As stated above, a convenience sample of 11 consumers was used for item generation.Three samples of students (n = 448, 191, and 194) were used in preliminary tests of thescale (Richins and Dawson 1990). Four consumer samples were used in scale develop-ment, reliability, and validity checks. Sample sizes were 144, 250, 235, and 205. A sam-ple of 58 students was also used to assess test-retest reliability.
Validity: Through factor analyses and reliability analysis, three factors emerged. Over the lastthree samples, coefficient alpha estimates for the factors ranged from 0.71 to 0.75 forcentrality, from 0.74 to 0.78 for the success factor, and from 0.73 to 0.83 for the hap-piness factor (Richins and Dawson 1992). Alpha for the overall 18-item scale rangedbetween 0.80 and 0.88. Test-retest reliability over a 3-week interval (n = 58) was0.82, 0.86, 0.82, and 0.87 for the centrality, happiness, success, and overall scales,respectively.
Numerous tests of validity were performed. First, the scales were examined forsocial desirability bias. The correlations between social desirability and the subscales
Chapter 3 Values and Goals 203
and overall materialism scale ranged from –0.03 to –0.13, indicating virtually no cont-amination from social desirability bias.
The materialism factors were also correlated with measures of life satisfaction, val-ues, self-esteem, self-centeredness, and voluntary simplicity in some or all the samplesto examine the validity of the scales. Across samples, the patterns of correlationsshowed that the materialism factors exhibited construct validity (Richins and Dawson1992). For example, the correlation between the overall scale and an item assessing vol-untary simplicity was –0.21, the correlation between the overall scale and Belk’s (1985)nongenerosity scale was 0.25, and the correlation between the scale and a measure ofself-esteem was –0.12. These correlations support a priori hypotheses about the mate-rialistic individual. A number of other mean difference tests also add support for thescale’s validity.
Scores: Mean scores were reported for three samples for each subscale and the overall scale. Forthe centrality component, mean scores (std. dev.) ranged from 19.3 (4.0) to 19.8 (4.2).For the happiness component, mean scores ranged from 12.8 (4.1) to 13.3 (4.2). Forthe success component, mean scores ranged from 13.8 (4.1) to 14.7 (3.9), and for theoverall combined scale, mean scores ranged from 45.9 (9.8) to 47.9 (10.2).
Source: Richins, Marsha L. and Scott Dawson (1992), “Materialism as a Consumer Value:Measure Development and Validation,” Journal of Consumer Research, 19, 303–16.
1992 by University of Chicago Press. Scale items taken from Table 3 (p. 310).Reprinted with permission.
Other evidence: Richins (1994) used the material values scale in a study related to the public and pri-vate meanings of possessions. Using samples of n = 144 and n = 119 adults, she reportscoefficient alpha estimates for the entire 18-item scale of 0.86 and 0.84 for the two sam-ples, respectively. After pooling the two samples and performing quartile splits on the18-item scale, she found significant hypothesized differences between the top and bot-tom quartiles across numerous variables. For example, the “high” materialism group(top quartile) had valued possessions that were more socially visible, more expensive,and less likely to involve interpersonal associations than did the “low” materialismgroup (bottom quartile). Several other tests relating to materialism and private mean-ings of possessions supported the scales’ validity.
Rindfleisch, Burroughs, and Denton (1997) report a coefficient alpha estimate of0.87 for the 18-item material values scale. They report correlations of 0.21, –0.17, 0.15,and 0.36 with measures of family structure, family resources, family stressors, and com-pulsive buying, respectively (p < 0.05 or better). They also report that material valueswere predicted by “family-related” variables in several mediator and moderator regres-sion analyses.
Other sources: Richins, Marsha (1994), “Special Possessions and the Expression of Material Values,”Journal of Consumer Research, 21, 522–33.
Rindfleisch, Aric, James A. Burroughs, and Frank Denton (1997), “Family Structure,Materialism, and Compulsive Buying,” Journal of Consumer Research, 23, 312–25.
References: Belk, Russell W. (1984), “Three Scales to Measure Constructs Related to Materialism:Reliability, Validity, and Relationships to Measures of Happiness,” in Advances inConsumer Research, Vol. 11, ed. Thomas C. Kinnear, Provo, UT: Association forConsumer Research, pp. 291–97.
Belk, Russell W. (1985), “Materialism: Trait Aspects of Living in the Material World,”Journal of Consumer Research, 12, 265–80.
204 HANDBOOK OF MARKETING SCALES
Fournier, Susan and Marsha L. Richins (1991), “Some Theoretical and Popular NotionsConcerning Materialism,” Journal of Social Behavior and Personality, 6, 403–14.
Richins, Marsha L. (1987), “Media, Materialism, and Human Happiness,” in Advancesin Consumer Research, Vol. 14, eds. Melanie Wallendorf and Paul Anderson, Provo,UT: Association for Consumer Research, pp. 352–56.
Richins, Marsha L. and Scott Dawson (1990), “Measuring Material Values: APreliminary Report on Scale Development,” in Advances in Consumer Research,Vol. 17, eds. Marvin E. Goldberg, Gerald Gorn, and Richard W. Poliay, Provo,UT: Association for Consumer Research, pp. 169–75.
Chapter 3 Values and Goals 205
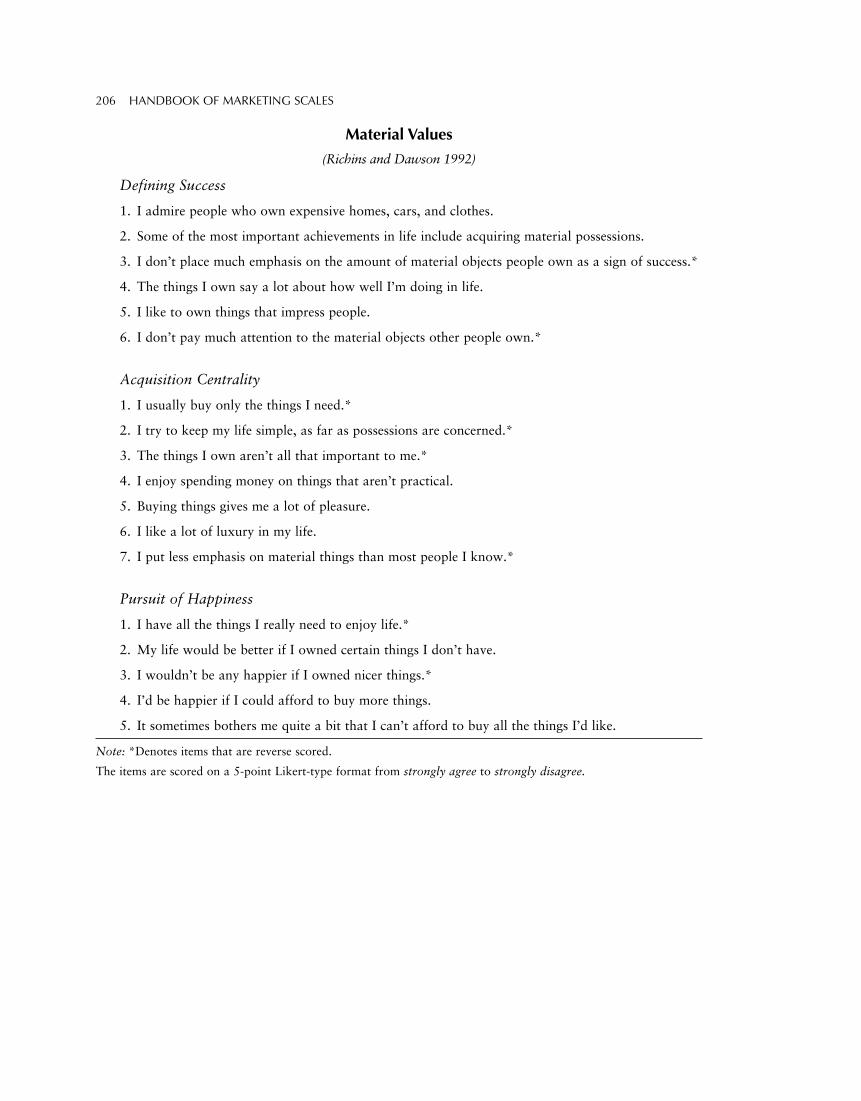
Material Values
(Richins and Dawson 1992)
Defining Success
1. I admire people who own expensive homes, cars, and clothes.
2. Some of the most important achievements in life include acquiring material possessions.
3. I don’t place much emphasis on the amount of material objects people own as a sign of success.*
4. The things I own say a lot about how well I’m doing in life.
5. I like to own things that impress people.
6. I don’t pay much attention to the material objects other people own.*
Acquisition Centrality
1. I usually buy only the things I need.*
2. I try to keep my life simple, as far as possessions are concerned.*
3. The things I own aren’t all that important to me.*
4. I enjoy spending money on things that aren’t practical.
5. Buying things gives me a lot of pleasure.
6. I like a lot of luxury in my life.
7. I put less emphasis on material things than most people I know.*
Pursuit of Happiness
1. I have all the things I really need to enjoy life.*
2. My life would be better if I owned certain things I don’t have.
3. I wouldn’t be any happier if I owned nicer things.*
4. I’d be happier if I could afford to buy more things.
5. It sometimes bothers me quite a bit that I can’t afford to buy all the things I’d like.
Note: *Denotes items that are reverse scored.
The items are scored on a 5-point Likert-type format from strongly agree to strongly disagree.
206 HANDBOOK OF MARKETING SCALES
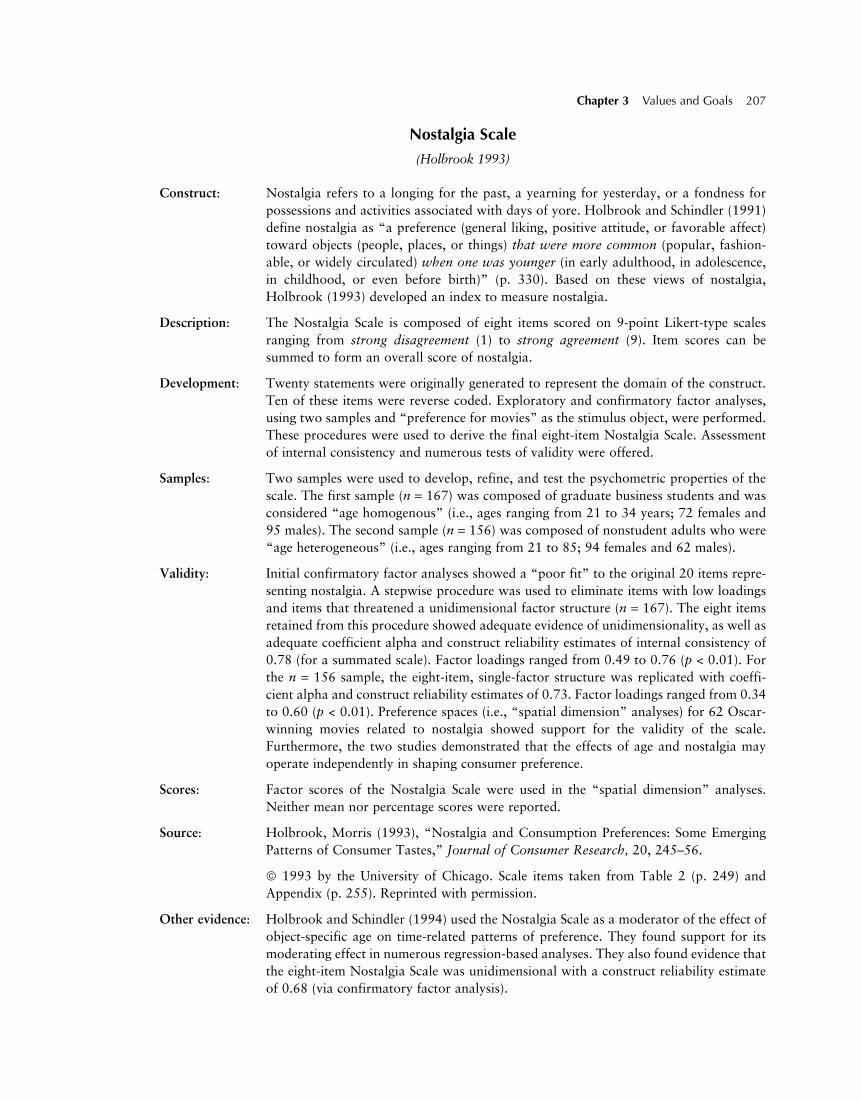
Nostalgia Scale
(Holbrook 1993)
Construct: Nostalgia refers to a longing for the past, a yearning for yesterday, or a fondness forpossessions and activities associated with days of yore. Holbrook and Schindler (1991)define nostalgia as “a preference (general liking, positive attitude, or favorable affect)toward objects (people, places, or things) that were more common (popular, fashion-able, or widely circulated) when one was younger (in early adulthood, in adolescence,in childhood, or even before birth)” (p. 330). Based on these views of nostalgia,Holbrook (1993) developed an index to measure nostalgia.
Description: The Nostalgia Scale is composed of eight items scored on 9-point Likert-type scalesranging from strong disagreement (1) to strong agreement (9). Item scores can besummed to form an overall score of nostalgia.
Development: Twenty statements were originally generated to represent the domain of the construct.Ten of these items were reverse coded. Exploratory and confirmatory factor analyses,using two samples and “preference for movies” as the stimulus object, were performed.These procedures were used to derive the final eight-item Nostalgia Scale. Assessmentof internal consistency and numerous tests of validity were offered.
Samples: Two samples were used to develop, refine, and test the psychometric properties of thescale. The first sample (n = 167) was composed of graduate business students and wasconsidered “age homogenous” (i.e., ages ranging from 21 to 34 years; 72 females and95 males). The second sample (n = 156) was composed of nonstudent adults who were“age heterogeneous” (i.e., ages ranging from 21 to 85; 94 females and 62 males).
Validity: Initial confirmatory factor analyses showed a “poor fit” to the original 20 items repre-senting nostalgia. A stepwise procedure was used to eliminate items with low loadingsand items that threatened a unidimensional factor structure (n = 167). The eight itemsretained from this procedure showed adequate evidence of unidimensionality, as well asadequate coefficient alpha and construct reliability estimates of internal consistency of0.78 (for a summated scale). Factor loadings ranged from 0.49 to 0.76 (p < 0.01). Forthe n = 156 sample, the eight-item, single-factor structure was replicated with coeffi-cient alpha and construct reliability estimates of 0.73. Factor loadings ranged from 0.34to 0.60 (p < 0.01). Preference spaces (i.e., “spatial dimension” analyses) for 62 Oscar-winning movies related to nostalgia showed support for the validity of the scale.Furthermore, the two studies demonstrated that the effects of age and nostalgia mayoperate independently in shaping consumer preference.
Scores: Factor scores of the Nostalgia Scale were used in the “spatial dimension” analyses.Neither mean nor percentage scores were reported.
Source: Holbrook, Morris (1993), “Nostalgia and Consumption Preferences: Some EmergingPatterns of Consumer Tastes,” Journal of Consumer Research, 20, 245–56.
1993 by the University of Chicago. Scale items taken from Table 2 (p. 249) andAppendix (p. 255). Reprinted with permission.
Other evidence: Holbrook and Schindler (1994) used the Nostalgia Scale as a moderator of the effect ofobject-specific age on time-related patterns of preference. They found support for itsmoderating effect in numerous regression-based analyses. They also found evidence thatthe eight-item Nostalgia Scale was unidimensional with a construct reliability estimateof 0.68 (via confirmatory factor analysis).
Chapter 3 Values and Goals 207

Other source: Holbrook, Morris B. and Robert M. Schindler (1994), “Age, Sex, and Attitude Towardthe Past as Predictors of Consumer’s Aesthetic Tastes for Cultural Products,” Journalof Marketing Research, 57, 412–22.
Reference: Holbrook, Morris and Robert M. Schindler (1991), “Echoes of the Dear Departed Past:Some Work in Progress on Nostalgia,” in Advances in Consumer Research, Vol. 18,eds. Rebecca Holman and Michael R. Solomon, Provo, UT: Association for ConsumerResearch, pp. 330–33.
208 HANDBOOK OF MARKETING SCALES
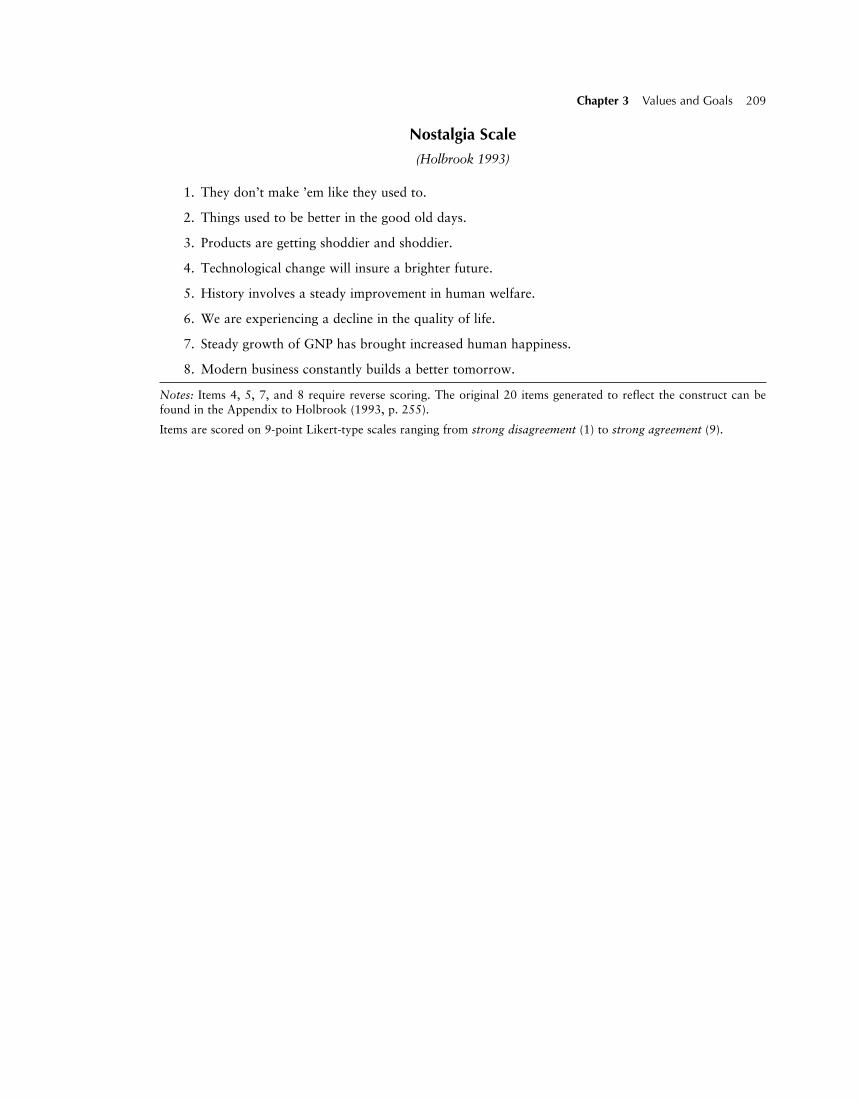
Nostalgia Scale
(Holbrook 1993)
1. They don’t make ’em like they used to.
2. Things used to be better in the good old days.
3. Products are getting shoddier and shoddier.
4. Technological change will insure a brighter future.
5. History involves a steady improvement in human welfare.
6. We are experiencing a decline in the quality of life.
7. Steady growth of GNP has brought increased human happiness.
8. Modern business constantly builds a better tomorrow.
Notes: Items 4, 5, 7, and 8 require reverse scoring. The original 20 items generated to reflect the construct can befound in the Appendix to Holbrook (1993, p. 255).
Items are scored on 9-point Likert-type scales ranging from strong disagreement (1) to strong agreement (9).
Chapter 3 Values and Goals 209
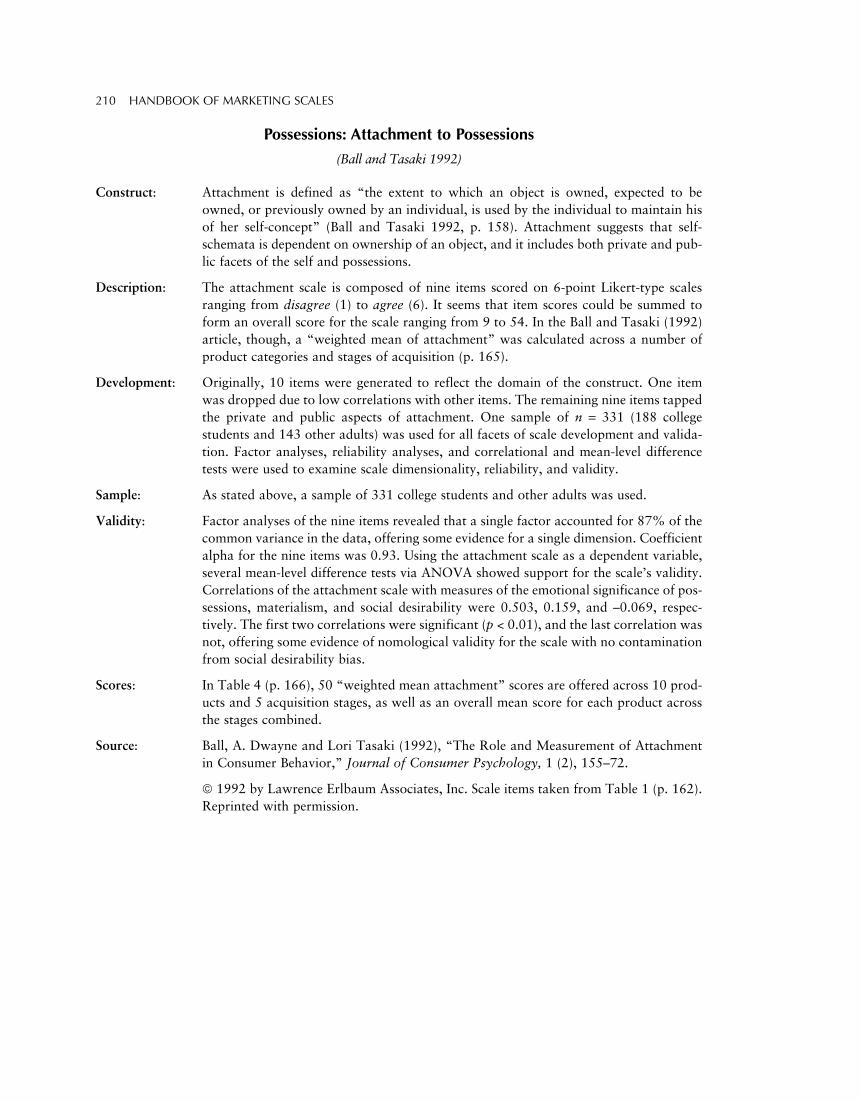
Possessions: Attachment to Possessions
(Ball and Tasaki 1992)
Construct: Attachment is defined as “the extent to which an object is owned, expected to beowned, or previously owned by an individual, is used by the individual to maintain hisof her self-concept” (Ball and Tasaki 1992, p. 158). Attachment suggests that self-schemata is dependent on ownership of an object, and it includes both private and pub-lic facets of the self and possessions.
Description: The attachment scale is composed of nine items scored on 6-point Likert-type scalesranging from disagree (1) to agree (6). It seems that item scores could be summed toform an overall score for the scale ranging from 9 to 54. In the Ball and Tasaki (1992)article, though, a “weighted mean of attachment” was calculated across a number ofproduct categories and stages of acquisition (p. 165).
Development: Originally, 10 items were generated to reflect the domain of the construct. One itemwas dropped due to low correlations with other items. The remaining nine items tappedthe private and public aspects of attachment. One sample of n = 331 (188 collegestudents and 143 other adults) was used for all facets of scale development and valida-tion. Factor analyses, reliability analyses, and correlational and mean-level differencetests were used to examine scale dimensionality, reliability, and validity.
Sample: As stated above, a sample of 331 college students and other adults was used.
Validity: Factor analyses of the nine items revealed that a single factor accounted for 87% of thecommon variance in the data, offering some evidence for a single dimension. Coefficientalpha for the nine items was 0.93. Using the attachment scale as a dependent variable,several mean-level difference tests via ANOVA showed support for the scale’s validity.Correlations of the attachment scale with measures of the emotional significance of pos-sessions, materialism, and social desirability were 0.503, 0.159, and –0.069, respec-tively. The first two correlations were significant (p < 0.01), and the last correlation wasnot, offering some evidence of nomological validity for the scale with no contaminationfrom social desirability bias.
Scores: In Table 4 (p. 166), 50 “weighted mean attachment” scores are offered across 10 prod-ucts and 5 acquisition stages, as well as an overall mean score for each product acrossthe stages combined.
Source: Ball, A. Dwayne and Lori Tasaki (1992), “The Role and Measurement of Attachmentin Consumer Behavior,” Journal of Consumer Psychology, 1 (2), 155–72.
1992 by Lawrence Erlbaum Associates, Inc. Scale items taken from Table 1 (p. 162).Reprinted with permission.
210 HANDBOOK OF MARKETING SCALES
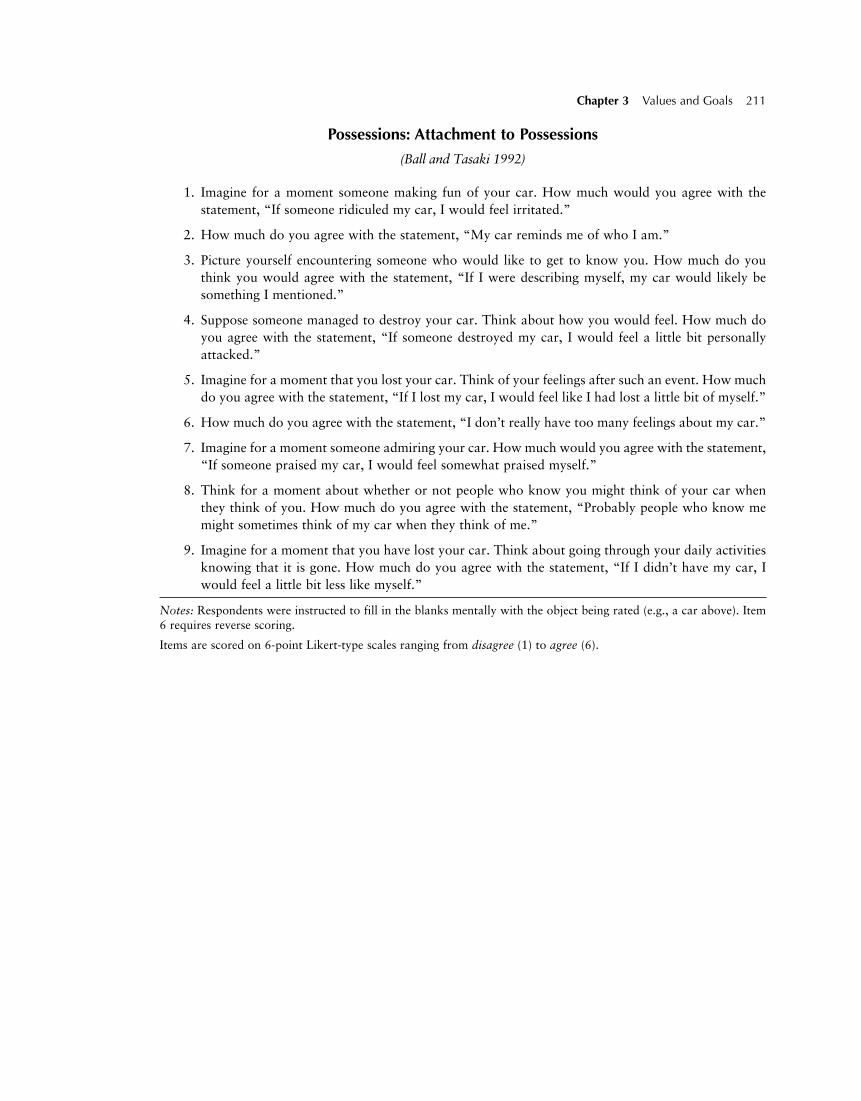
Possessions: Attachment to Possessions
(Ball and Tasaki 1992)
1. Imagine for a moment someone making fun of your car. How much would you agree with thestatement, “If someone ridiculed my car, I would feel irritated.”
2. How much do you agree with the statement, “My car reminds me of who I am.”
3. Picture yourself encountering someone who would like to get to know you. How much do youthink you would agree with the statement, “If I were describing myself, my car would likely besomething I mentioned.”
4. Suppose someone managed to destroy your car. Think about how you would feel. How much doyou agree with the statement, “If someone destroyed my car, I would feel a little bit personallyattacked.”
5. Imagine for a moment that you lost your car. Think of your feelings after such an event. How muchdo you agree with the statement, “If I lost my car, I would feel like I had lost a little bit of myself.”
6. How much do you agree with the statement, “I don’t really have too many feelings about my car.”
7. Imagine for a moment someone admiring your car. How much would you agree with the statement,“If someone praised my car, I would feel somewhat praised myself.”
8. Think for a moment about whether or not people who know you might think of your car whenthey think of you. How much do you agree with the statement, “Probably people who know memight sometimes think of my car when they think of me.”
9. Imagine for a moment that you have lost your car. Think about going through your daily activitiesknowing that it is gone. How much do you agree with the statement, “If I didn’t have my car, Iwould feel a little bit less like myself.”
Notes: Respondents were instructed to fill in the blanks mentally with the object being rated (e.g., a car above). Item6 requires reverse scoring.
Items are scored on 6-point Likert-type scales ranging from disagree (1) to agree (6).
Chapter 3 Values and Goals 211
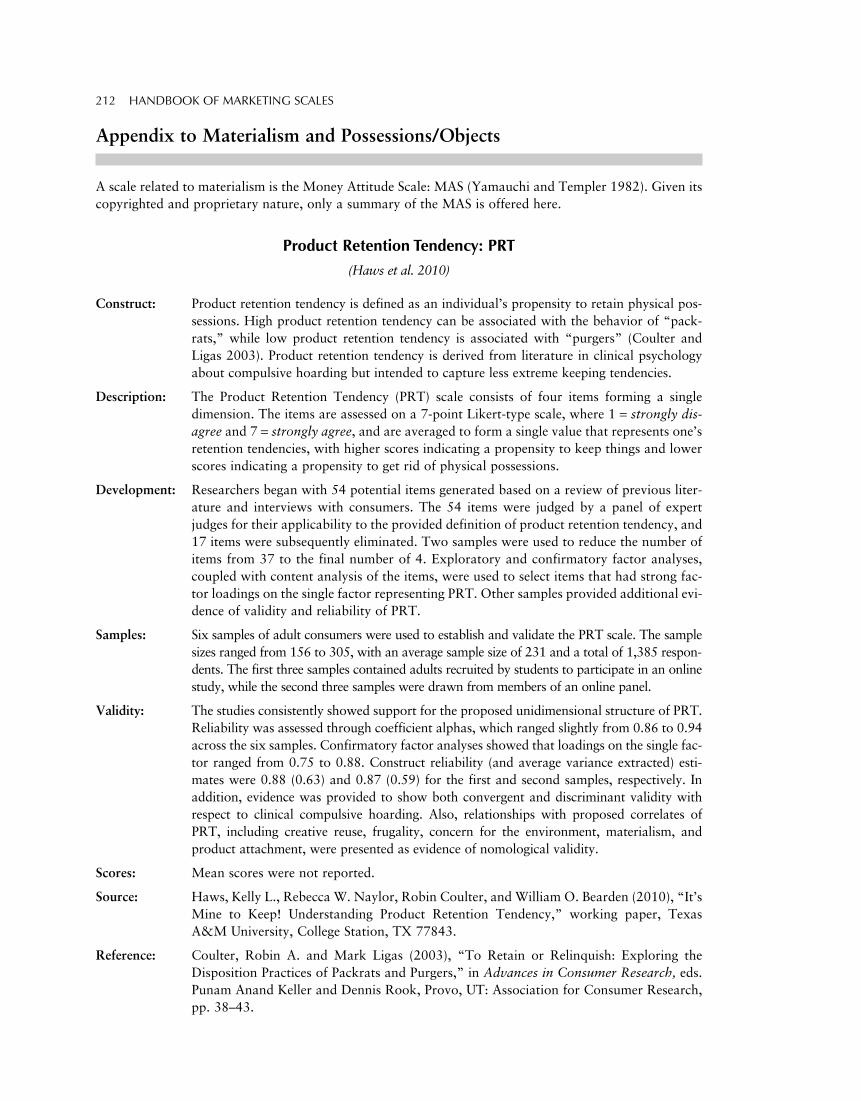
Appendix to Materialism and Possessions/Objects
A scale related to materialism is the Money Attitude Scale: MAS (Yamauchi and Templer 1982). Given itscopyrighted and proprietary nature, only a summary of the MAS is offered here.
Product Retention Tendency: PRT
(Haws et al. 2010)
Construct: Product retention tendency is defined as an individual’s propensity to retain physical pos-sessions. High product retention tendency can be associated with the behavior of “pack-rats,” while low product retention tendency is associated with “purgers” (Coulter andLigas 2003). Product retention tendency is derived from literature in clinical psychologyabout compulsive hoarding but intended to capture less extreme keeping tendencies.
Description: The Product Retention Tendency (PRT) scale consists of four items forming a singledimension. The items are assessed on a 7-point Likert-type scale, where 1 = strongly dis-agree and 7 = strongly agree, and are averaged to form a single value that represents one’sretention tendencies, with higher scores indicating a propensity to keep things and lowerscores indicating a propensity to get rid of physical possessions.
Development: Researchers began with 54 potential items generated based on a review of previous liter-ature and interviews with consumers. The 54 items were judged by a panel of expertjudges for their applicability to the provided definition of product retention tendency, and17 items were subsequently eliminated. Two samples were used to reduce the number ofitems from 37 to the final number of 4. Exploratory and confirmatory factor analyses,coupled with content analysis of the items, were used to select items that had strong fac-tor loadings on the single factor representing PRT. Other samples provided additional evi-dence of validity and reliability of PRT.
Samples: Six samples of adult consumers were used to establish and validate the PRT scale. The samplesizes ranged from 156 to 305, with an average sample size of 231 and a total of 1,385 respon-dents. The first three samples contained adults recruited by students to participate in an onlinestudy, while the second three samples were drawn from members of an online panel.
Validity: The studies consistently showed support for the proposed unidimensional structure of PRT.Reliability was assessed through coefficient alphas, which ranged slightly from 0.86 to 0.94across the six samples. Confirmatory factor analyses showed that loadings on the single fac-tor ranged from 0.75 to 0.88. Construct reliability (and average variance extracted) esti-mates were 0.88 (0.63) and 0.87 (0.59) for the first and second samples, respectively. Inaddition, evidence was provided to show both convergent and discriminant validity withrespect to clinical compulsive hoarding. Also, relationships with proposed correlates ofPRT, including creative reuse, frugality, concern for the environment, materialism, andproduct attachment, were presented as evidence of nomological validity.
Scores: Mean scores were not reported.
Source: Haws, Kelly L., Rebecca W. Naylor, Robin Coulter, and William O. Bearden (2010), “It’sMine to Keep! Understanding Product Retention Tendency,” working paper, TexasA&M University, College Station, TX 77843.
Reference: Coulter, Robin A. and Mark Ligas (2003), “To Retain or Relinquish: Exploring theDisposition Practices of Packrats and Purgers,” in Advances in Consumer Research, eds.Punam Anand Keller and Dennis Rook, Provo, UT: Association for Consumer Research,pp. 38–43.
212 HANDBOOK OF MARKETING SCALES
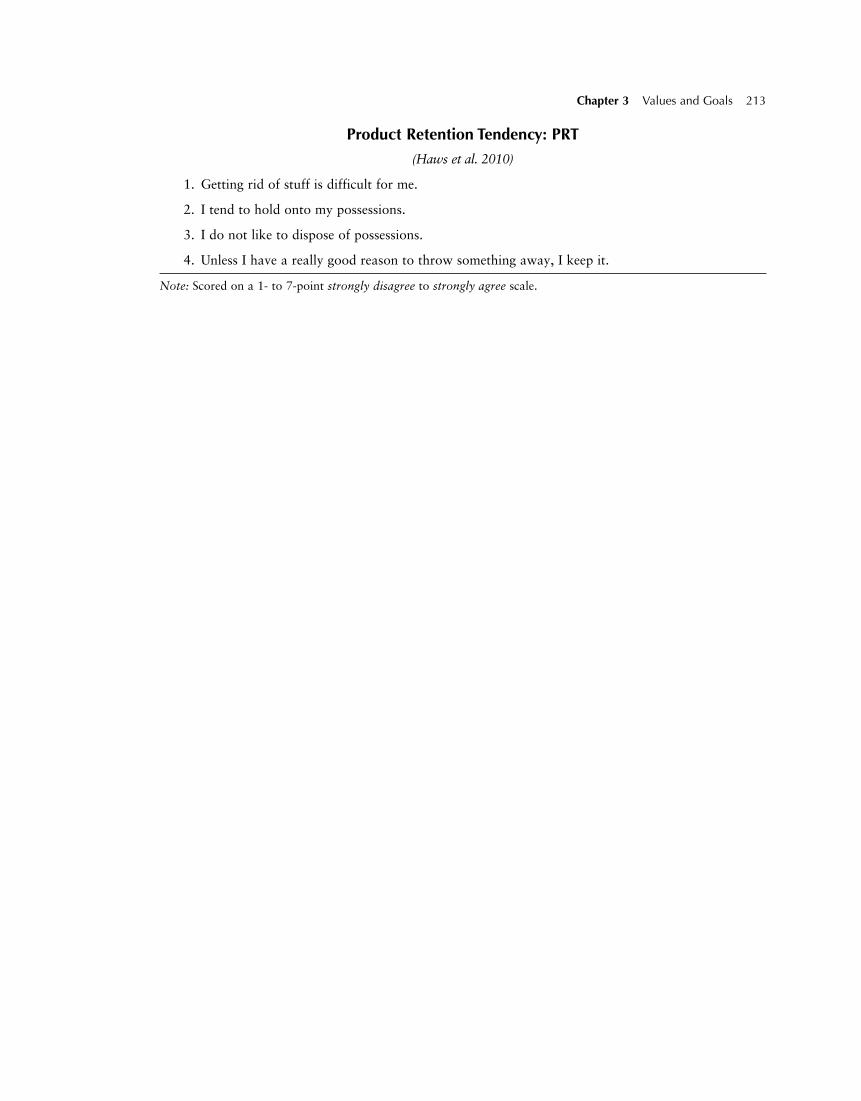
Product Retention Tendency: PRT
(Haws et al. 2010)
1. Getting rid of stuff is difficult for me.
2. I tend to hold onto my possessions.
3. I do not like to dispose of possessions.
4. Unless I have a really good reason to throw something away, I keep it.
Note: Scored on a 1- to 7-point strongly disagree to strongly agree scale.
Chapter 3 Values and Goals 213
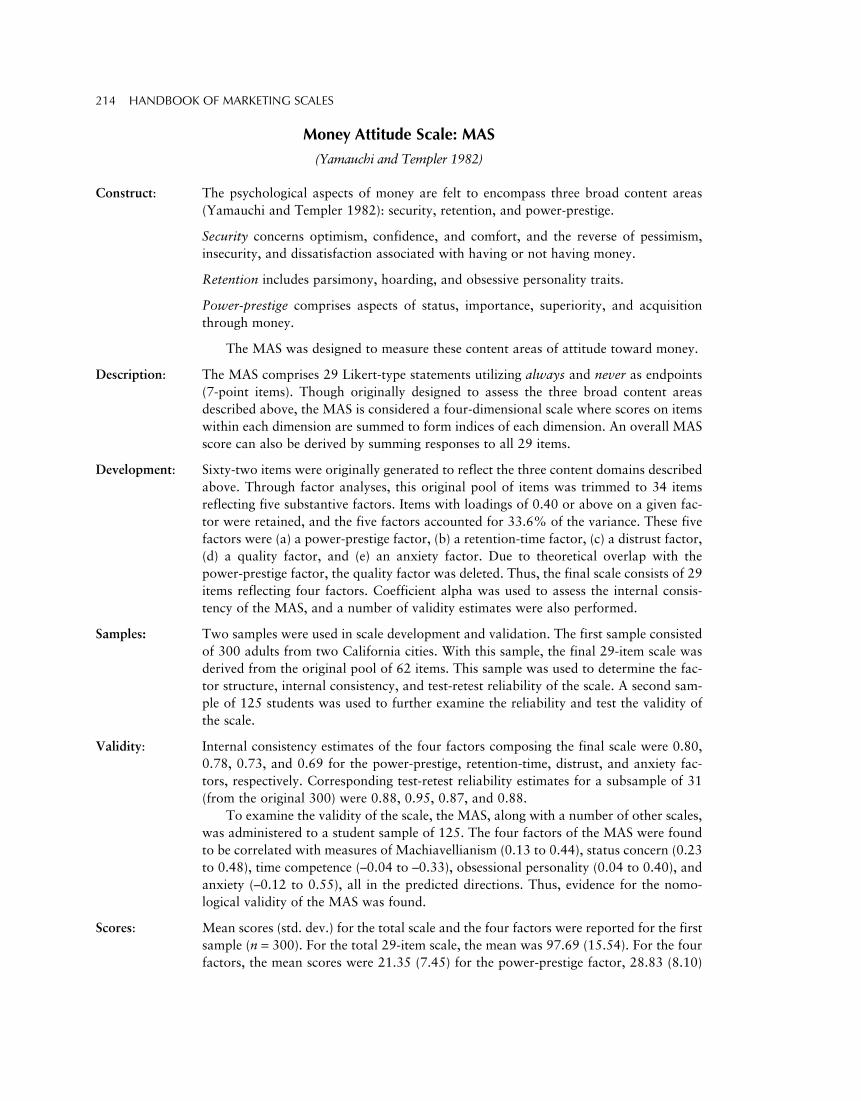
Money Attitude Scale: MAS
(Yamauchi and Templer 1982)
Construct: The psychological aspects of money are felt to encompass three broad content areas(Yamauchi and Templer 1982): security, retention, and power-prestige.
Security concerns optimism, confidence, and comfort, and the reverse of pessimism,insecurity, and dissatisfaction associated with having or not having money.
Retention includes parsimony, hoarding, and obsessive personality traits.
Power-prestige comprises aspects of status, importance, superiority, and acquisitionthrough money.
The MAS was designed to measure these content areas of attitude toward money.
Description: The MAS comprises 29 Likert-type statements utilizing always and never as endpoints(7-point items). Though originally designed to assess the three broad content areasdescribed above, the MAS is considered a four-dimensional scale where scores on itemswithin each dimension are summed to form indices of each dimension. An overall MASscore can also be derived by summing responses to all 29 items.
Development: Sixty-two items were originally generated to reflect the three content domains describedabove. Through factor analyses, this original pool of items was trimmed to 34 itemsreflecting five substantive factors. Items with loadings of 0.40 or above on a given fac-tor were retained, and the five factors accounted for 33.6% of the variance. These fivefactors were (a) a power-prestige factor, (b) a retention-time factor, (c) a distrust factor,(d) a quality factor, and (e) an anxiety factor. Due to theoretical overlap with thepower-prestige factor, the quality factor was deleted. Thus, the final scale consists of 29items reflecting four factors. Coefficient alpha was used to assess the internal consis-tency of the MAS, and a number of validity estimates were also performed.
Samples: Two samples were used in scale development and validation. The first sample consistedof 300 adults from two California cities. With this sample, the final 29-item scale wasderived from the original pool of 62 items. This sample was used to determine the fac-tor structure, internal consistency, and test-retest reliability of the scale. A second sam-ple of 125 students was used to further examine the reliability and test the validity ofthe scale.
Validity: Internal consistency estimates of the four factors composing the final scale were 0.80,0.78, 0.73, and 0.69 for the power-prestige, retention-time, distrust, and anxiety fac-tors, respectively. Corresponding test-retest reliability estimates for a subsample of 31(from the original 300) were 0.88, 0.95, 0.87, and 0.88.
To examine the validity of the scale, the MAS, along with a number of other scales,was administered to a student sample of 125. The four factors of the MAS were foundto be correlated with measures of Machiavellianism (0.13 to 0.44), status concern (0.23to 0.48), time competence (–0.04 to –0.33), obsessional personality (0.04 to 0.40), andanxiety (–0.12 to 0.55), all in the predicted directions. Thus, evidence for the nomo-logical validity of the MAS was found.
Scores: Mean scores (std. dev.) for the total scale and the four factors were reported for the firstsample (n = 300). For the total 29-item scale, the mean was 97.69 (15.54). For the fourfactors, the mean scores were 21.35 (7.45) for the power-prestige factor, 28.83 (8.10)
214 HANDBOOK OF MARKETING SCALES

for the retention-time factor, 24.71 (6.08) for the distrust factor, and 22.80 (5.51) forthe anxiety factor.
Source: Yamauchi, Kent T. and Donald I. Templer (1982), “The Development of a MoneyAttitude Scale,” Journal of Personality Assessment, 46, 522–28. Scale items taken fromTables 1–5 (pp. 523–25).
Chapter 3 Values and Goals 215
The Spendthrift-Tightwad Scale: ST-TW
(Rick, Cryder, and Loewenstein 2008)
Construct: The Spendthrift-Tightwad (ST-TW) scales assess “individual differences in the tendencyto experience the pain of paying” (Rick et al. 2008, p. 769).
Description: ST-TW is a four-item scale. Two of the items are assessed using 5-point never to alwaysscenario-based scales; one item is assessed using a 5-point scenario-based similarity scale;and one item is assessed using an 11-point “tightwad” to “spendthrift” scale. Item scoresare summed to form an overall ST-TW score ranging from 4 to 26. The overall ST-TWscale score is also trichotomized to form three groups of spenders: 1) “tightwads” areconsumers whose ST-TW score ranges from 4 to 11; 2) “unconflicted” are consumerswhose ST-TW score ranges from 12 to 18; and 3) “spendthrifts” are consumers who’sST-TW score ranges from 19 to 26.
Development: Based on a previous survey about consumer spending habits, the authors selected fouritems (based on face validity) to measure the ST-TW construct. Then, based on foursurvey samples totaling 13,327 respondents of both students and nonstudents over a31-month period, the psychometric properties (i.e., dimensionality, reliability, and valid-ity) of the ST-TW scale were established. Two more experimental studies further vali-dated the ST-TW scale.
Samples: The first four survey samples used to assess the scale’s psychometric properties were: 1)a readers of theGlobe and Mail sample, n = 154; 2) a readers of theNew York Times sam-ple, n = 10,331; 3) a sample of students, staff members, and parents from Carnegie Melonand Pittsburgh universities, n = 2,469; and 4) a sample of NBC nightly news viewers,n = 193. The two experimental studies used 538 Carnegie Melon students (Study 1) and1,087 nonstudent adults from the Globe and Mail, New York Times, and NBC samples(Study 2).
Validity: Across the four survey samples, both exploratory and confirmatory factor analysesshowed that the four items were best represented by a single-factor/unidimensional scale.Coefficient alpha for ST-TW was 0.75 with an average interitem correlation of 0.42.Test-retest reliability estimates (covering time frames between 2 to 539 days and 447respondents) ranged from 0.70 to 0.83, indicating a stable construct over time.Numerous measures for assessing validity were also included in the four survey samples;most notably measures of frugality (Lastovicka et al. 1999), materialism, price con-sciousness, value consciousness, deal proneness, compulsive buying, regret, the Big-Fivepersonality scales, and many others. The ST-TW showed discriminant validity from fru-gality (r = −0.46), price consciousness, (r = –0.40), and value consciousness (r = –0.33).The pattern of correlations with all other validity constructs showed strong evidence ofnomological validity. The ST-TW showed correlations with credit card debt/paymentsand savings consistent with the “pain of paying” (Rick et al. 2008).
The ST-TW was also free of social desirability bias (r = 0.04). Further, males wereshown to be two and a half times more likely than females to be classified as tightwadsrather than spendthrifts. As consumers age, their propensity to be tightwads becomesgreater (particularly past the age of 71), and education showed a modest positive corre-lation with being a tightwad.
The two experimental studies also demonstrated the validity of ST-TW. Spendthriftswere more willing to pay an overnight shipping fee than tightwads (Study 1), and tight-wads were less likely to buy a massage than spendthrifts (Study 2). Taken together, these
216 HANDBOOK OF MARKETING SCALES
two experimental studies showed that spending differences between spendthrifts andtightwads will be smallest when situational factors diminish the “pain of paying.”
Scores: As noted above, scores on the ST-TW scale can range from 4 to 26. The mean score forST-TW across the four survey samples was 14.38. Percentages by classification were asfollows: 24% of respondents were classified as tightwads (ST-TW ranges from 4–11);60% of respondents were classified as unconflicted (ST-TW ranges from 12–18); and15% of respondents were classified as spendthrifts (ST-TW ranges from 19–26).
Source: Rick, Scott I., Cynthia E. Cryder, and George Loewenstein (2008), “Tightwads andSpendthrifts,” Journal of Consumer Research, 34 (April), 767–82.
Reference: Lastovicka, John L., Lance A. Bettencourt, Renee Shaw Hughner, and Ronald J. Kuntze(1999), “Lifestyle of the Tight and Frugal: Theory and Measurement,” Journal ofConsumer Research, 26 (June), 85–98.
Chapter 3 Values and Goals 217
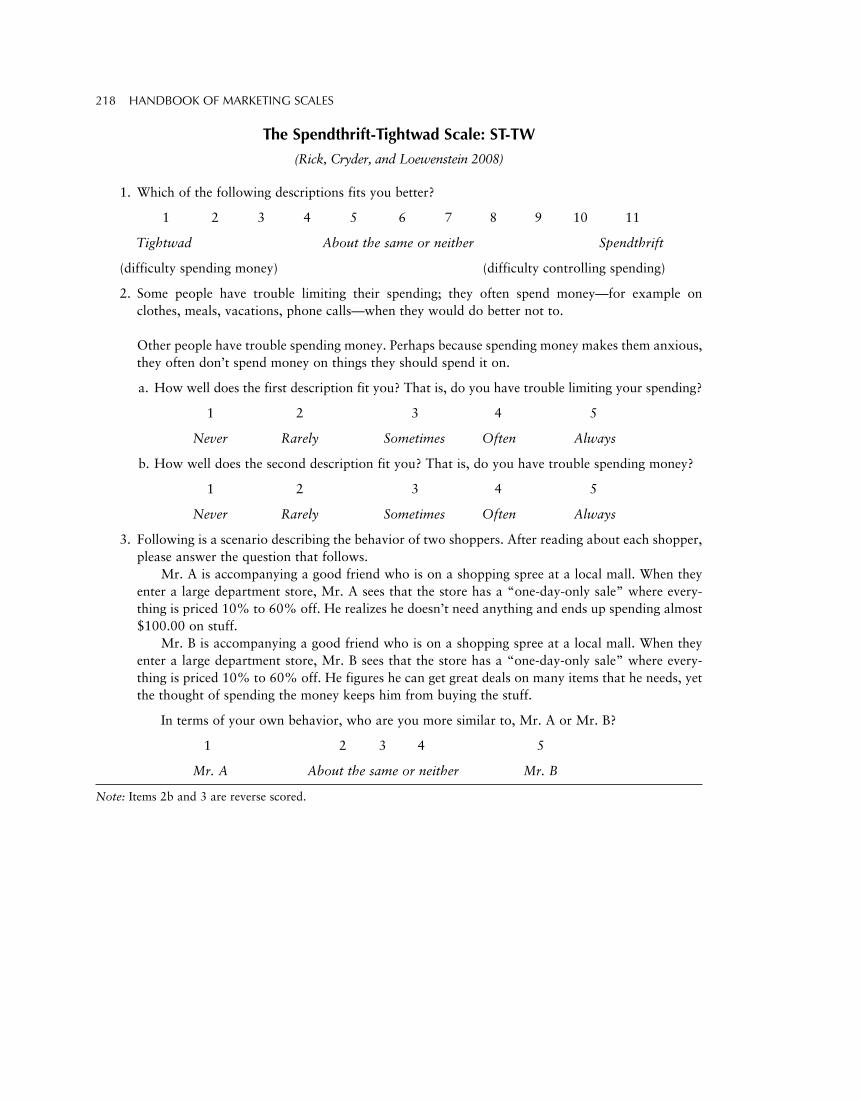
The Spendthrift-Tightwad Scale: ST-TW
(Rick, Cryder, and Loewenstein 2008)
1. Which of the following descriptions fits you better?
1 2 3 4 5 6 7 8 9 10 11
Tightwad About the same or neither Spendthrift
(difficulty spending money) (difficulty controlling spending)
2. Some people have trouble limiting their spending; they often spend money—for example onclothes, meals, vacations, phone calls—when they would do better not to.
Other people have trouble spending money. Perhaps because spending money makes them anxious,they often don’t spend money on things they should spend it on.
a. How well does the first description fit you? That is, do you have trouble limiting your spending?
1 2 3 4 5
Never Rarely Sometimes Often Always
b. How well does the second description fit you? That is, do you have trouble spending money?
1 2 3 4 5
Never Rarely Sometimes Often Always
3. Following is a scenario describing the behavior of two shoppers. After reading about each shopper,please answer the question that follows.
Mr. A is accompanying a good friend who is on a shopping spree at a local mall. When theyenter a large department store, Mr. A sees that the store has a “one-day-only sale” where every-thing is priced 10% to 60% off. He realizes he doesn’t need anything and ends up spending almost$100.00 on stuff.
Mr. B is accompanying a good friend who is on a shopping spree at a local mall. When theyenter a large department store, Mr. B sees that the store has a “one-day-only sale” where every-thing is priced 10% to 60% off. He figures he can get great deals on many items that he needs, yetthe thought of spending the money keeps him from buying the stuff.
In terms of your own behavior, who are you more similar to, Mr. A or Mr. B?
1 2 3 4 5
Mr. A About the same or neither Mr. B
Note: Items 2b and 3 are reverse scored.
218 HANDBOOK OF MARKETING SCALES
Values Related to Goal Orientations and Planning
Behavioral Inhibition and Behavioral Activation Systems: BIS/BAS Scales
(Carver and White 1994)
Construct: According to Gray (1990, among others), there are two general motivational systemsimpacting behavior and affect: the Behavioral Inhibition System (BIS) and the BehavioralActivation System (BAS). The BIS regulates reactions to aversive motivation and is sensi-tive to punishment, negative outcomes, and nonreward, and it causes inhibition frommoving toward goals. On the contrary, the BAS regulates reactions to appetitive motiva-tion and is sensitive to reward and nonpunishment and causes movement toward goals,although there is less overall consensus about the exact impact of the BAS than of the BIS.While the BIS is assumed to be related to negative affect, the BAS is related to positiveaffect.
Description: The final BIS/BAS scale consists of 20 items across four dimensions: one for BIS and threefor BAS, including BAS reward responsiveness, drive, and fun seeking. Items are assessedon a 4-point scale with 1 indicating strong agreement and 4 indicating strong disagree-ment. Scores are calculated for each dimension by summing the responses to all itemsassessing that dimension.
Development: Items were written by the authors based on the overall conceptualization of BIS and BAS,with the BIS items capturing concern over a possible bad occurrence or sensitivity to abad outcome when they do occur. BAS items were broader in capturing strong pursuit ofappetitive goals, responsiveness to reward, seeking out or acting quickly on rewardingexperiences. Items were tested through multiple iterations not reported in the paper, andthe final set of BIS/BAS items was tested in Study 1. Additional samples were used to fur-ther investigate reliability and validity.
Samples: Study 1 included 732 college students who responded to all the BIS/BAS items, and a sub-set of 113 of these participants completed the measures 8 weeks later to assess test-retestreliability. Study 2 examined correlations between the BIS/BAS scales using mostlynonoverlapping samples ranging from 107 to 498 undergraduate students in each analy-sis. Studies 3 (n = 69) and 4 (n = 90) also included undergraduate students and were usedto examine downstream consequences of BIS (anxiety) and BAS (happiness).
Validity: In Study 1, a confirmatory factor analysis supported the four-factor structure of theBIS/BAS measure. Coefficient alphas for the four dimensions were 0.74 for BIS, 0.73 forBAS-Reward Responsiveness, 0.76 for BAS-Drive, and 0.66 for BAS-Fun Seeking. Furtheranalysis demonstrated that all four dimensions were distinct but that the three BAS scalesstrongly loaded on a second-order factor distinct from BIS. Study 2 reports the conver-gent and discriminant validity with regard to a variety of measures, based on the correla-tions of the BIS/BAS scales with other measures such as extraversion, personality, lifeorientation, positive and negative affect, and optimism/pessimism scales. These analysesare said to demonstrate that the BIS/BAS scales are related as expected to other measuresbut are discriminant from other constructs. In Study 3, the predictive validity of BIS wasassessed based on the experience of anxiety. The BIS was compared to an anxiety scaleand was shown to have superior predictive validity with respect to ratings of nervousnessin response to punishment cues. Further, these outcomes were not predicted by any of theBAS dimensions, underscoring the lack of overlap between the BIS and BAS. Study 4was used to examine the predictive validity of BAS by introducing a situation in which
Chapter 3 Values and Goals 219
respondents anticipated receiving a positive reward. Reactions were compared based onthe BAS, the BIS, and a measure of extraversion. Drive and Reward Responsiveness werethe best predictors of midsession happiness.
Scores: Study 1 means (standard deviations) for each dimension were as follows: BIS = 19.99(3.79), BAS-Reward Responsiveness = 17.59 (2.14), BAS-Drive = 12.05 (2.36), and BAS-Fun Seeking = 12.43 (2.26). Gender differences were reported for two of the scales; specif-ically, both BIS and BAS-Reward Responsiveness scores were higher for women than formen (21.09 vs. 18.84 and 17.90 vs. 17.27, respectively). The mean score of the BIS inStudy 3 was 20.28 (4.02), and mean scores for the BAS measures were 12.03 (2.90) forDrive, 17.97 (1.76) for Reward Responsiveness, and 12.62 (2.09) for Fun Seeking.
Source: Carver, Charles S. and Teri L. White (1994), “Behavioral Inhibition, BehavioralActivation, and Affective Responses to Impending Reward and Punishment: The BIS/BASScales,” Journal of Personality & Social Psychology, 67 (August), 319–33.
Reference: Gray, Jeffrey A. (1990), “Brain Systems That Mediate Both Emotion and Cognition,”Cognition and Emotion, 4 (3), 268–88.
220 HANDBOOK OF MARKETING SCALES
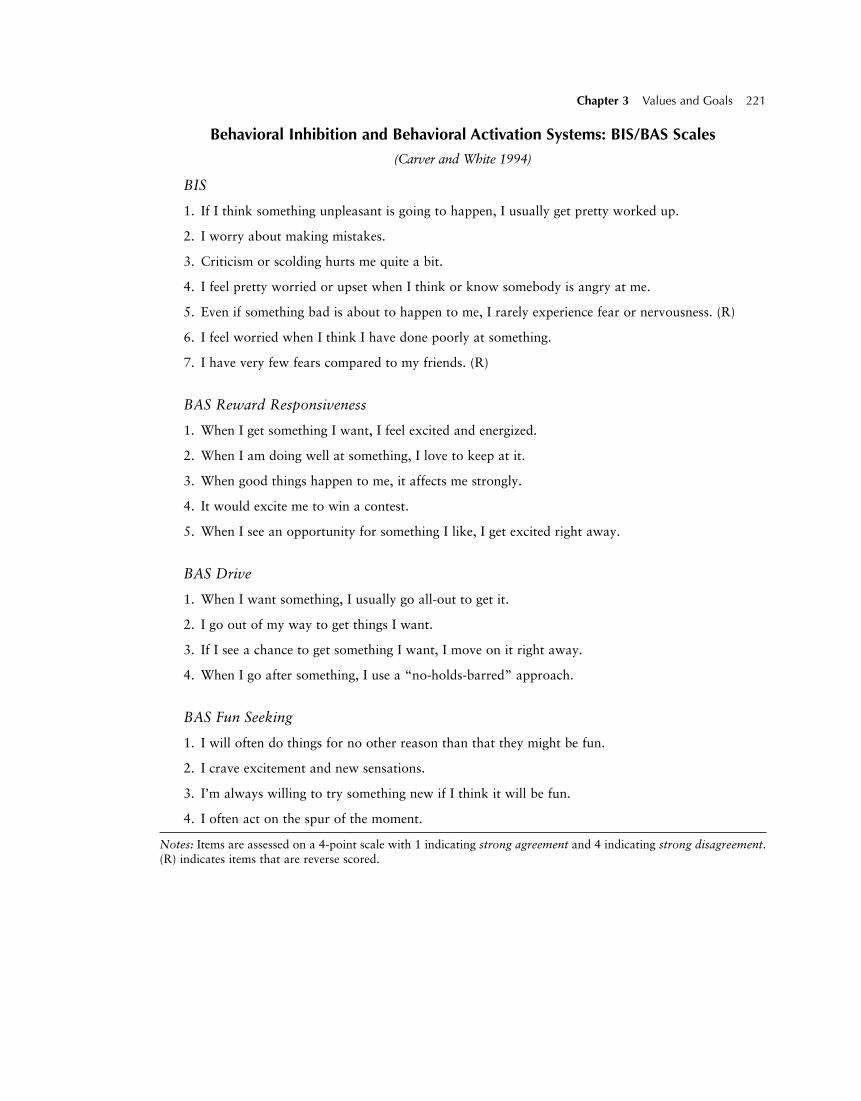
Behavioral Inhibition and Behavioral Activation Systems: BIS/BAS Scales
(Carver and White 1994)
BIS
1. If I think something unpleasant is going to happen, I usually get pretty worked up.
2. I worry about making mistakes.
3. Criticism or scolding hurts me quite a bit.
4. I feel pretty worried or upset when I think or know somebody is angry at me.
5. Even if something bad is about to happen to me, I rarely experience fear or nervousness. (R)
6. I feel worried when I think I have done poorly at something.
7. I have very few fears compared to my friends. (R)
BAS Reward Responsiveness
1. When I get something I want, I feel excited and energized.
2. When I am doing well at something, I love to keep at it.
3. When good things happen to me, it affects me strongly.
4. It would excite me to win a contest.
5. When I see an opportunity for something I like, I get excited right away.
BAS Drive
1. When I want something, I usually go all-out to get it.
2. I go out of my way to get things I want.
3. If I see a chance to get something I want, I move on it right away.
4. When I go after something, I use a “no-holds-barred” approach.
BAS Fun Seeking
1. I will often do things for no other reason than that they might be fun.
2. I crave excitement and new sensations.
3. I’m always willing to try something new if I think it will be fun.
4. I often act on the spur of the moment.
Notes: Items are assessed on a 4-point scale with 1 indicating strong agreement and 4 indicating strong disagreement.(R) indicates items that are reverse scored.
Chapter 3 Values and Goals 221
Elaboration on Potential Outcomes: EPO Scale
(Nenkov, Inman, and Hulland 2008)
Construct: Elaboration on potential outcomes (EPO) is a “generalized predisposition toward think-ing about consequences, encompassing four conceptually distinct dimensions. Specifically,it captures the degree to which individuals: 1) generate potential consequences of theirbehaviors; 2) evaluate the likelihood and importance of these consequences; 3) encodeanticipated end states with a positive focus; and 4) encode anticipated end states with anegative focus” (Nenkov et al. 2008, p. 126).
Description: Though conceptualized as a four-dimensional construct, scale development and valida-tion procedures provided strongest evidence for a three-dimensional (three factors) EPOscale. The generation of potential consequences of behaviors and evaluation of the likeli-hood and importance of these consequences dimensions were combined into one overallsix-item factor (a “generation/evaluation” dimension). The encoding anticipated endstates with a positive focus (a three-item “positive outcome focus” factor) and a negativefocus (a four-item “negative outcome focus” factor) dimensions emerged as separate fac-tors. Thus, the EPO is a 13-item, three-dimensional scale. All items are scored on 7-pointstrongly disagree to strongly agree scales, and item scores are then summed/averagedwithin each dimension to form individual dimension scores ranging from 1 to 7.
Items can also be scored to form two subscales: a six-item generation/evaluation sub-scale in which item scores are summed/averaged and a seven-item “relative outcomefocus” subscale. The relative outcome focus subscale score is formed by dividing the dif-ference between the positive and negative outcome focus scores by their sums (Nenkovet al. 2008, p. 130).
Development: Closely following recommended scaling procedures, the EPO was developed and vali-dated. Via an extensive literature review, the authors developed a pool of 76 items to taptheir four conceptualized dimensions and had these items judged for representativeness toa given dimension by four expert judges. Then, 260 University of Pittsburgh studentsresponded to the EPO items. Exploratory factor analyses (EFA) and author judgmentwere used to trim and then add more items to form a revised pool of 22 items total. These22 items were administered to 367 University of Pittsburgh students, and confirmatoryfactor analyses (CFA) refined the scale down to its final 13-item, three-factor (three-dimension) form. Four more survey-based studies and one experimental study were thenused to further test EPO dimensionality and establish its reliability and validity.
Samples: In total, the authors used seven samples to develop and validate the EPO scale: n = 260U. of Pittsburgh students; n = 367 U. of Pittsburgh students; n = 383 students (145) andnonstudent adults (283); n = 97 U. of Pittsburgh students; n = 160 students; n = 302 non-student adults; and n = 95 nonstudent adults (experimental study).
Validity: Using the n = 367 and n = 383 samples, CFA confirmed a strong fit to a three-factor EPOscale comprising a six-item generation/evaluation dimension, a three-item encoding antic-ipated end states with a positive focus dimension, and a four-item encoding anticipatedend states with a negative focus dimension. Across all samples, coefficient alpha estimatesof internal consistency ranged from 0.80 to 0.94 across the three dimensions, and factorloadings ranged from 0.61 to 0.89 across the three dimensions. Test-retest reliabilityusing the n = 97 sample over a 1-month interval showed test-retest estimates of r = 0.77for the generation/evaluation subscale and r = 0.81 for the relative outcome focus sub-scale. Correlations among the three dimensions of the EPO ranged from 0.01 to 0.64 inabsolute value across samples and showed evidence of discriminant validity (DV) from
222 HANDBOOK OF MARKETING SCALES
one another. The EPO dimensions also showed evidence of DV from numerous relatedconstructs.
Strong evidence of other forms of validity was found across samples. For example,for the n = 367 sample, the EPO generation/evaluation subscale showed correlations of–0.33 with impulsive buying, 0.30 with risk aversion, 0.13 with need for cognition, 0.43with consideration of future consequences, and –0.25 with compulsive buying. The rela-tive outcome subscale showed correlations of 0.61with optimism, 0.25 with promotionof regulatory focus, and –0.51 with defensive pessimism. All these correlations were inthe hypothesized directions, showing evidence of nomological validity. The EPO did showsome small, albeit significant, correlation with measures of social desirability bias.
The n = 160 and n = 302 samples further demonstrated EPO validity. The n = 160sample showed that the two EPO scales predicted the extent to which individuals thinkabout potential consequences in a given decision-making situation (LASIK surgery). Then = 302 sample showed the predicted pattern of relations among the two EPO subscalesand procrastination, alcohol abuse, eating a healthy diet, regular exercise, and credit cardabuse. As expected, the generation/evaluation subscale was predictive of all these behav-iors and the relative outcome subscale was not (with the exception of procrastination).Finally, the experimental study of n = 95 showed that EPO was predictive of a pattern ofbehaviors relating to investing money in stock, bond, and/or money market mutual funds.
Scores: Table 2 of Nenkov et al. (2008, p. 130) reports mean scores and standard deviations (SD)across samples for each dimension. Using a 7-point summed/averaged within dimensionapproach, mean scores ranged from 4.50 to 5.00 (SD range from 0.94 to 1.10) for thegeneration/evaluation dimension. Mean scores ranged from 4.70 to 5.00 (SD range from1.10 to 1.30) for the positive outcome focus dimension, and mean scores ranged from3.70 to 4.10 (SD range from 1.10 to 1.30) for the negative outcome focus dimension.(The experimental study used a 5-point scoring system.)
Source: Nenkov, Gergana Y., J. Jeffrey Inman, and John Hulland (2008), “Considering theFuture: The Conceptualization and Measurement of Elaboration on PotentialOutcomes,” Journal of Consumer Research, 35 (June), 126–41.
Chapter 3 Values and Goals 223
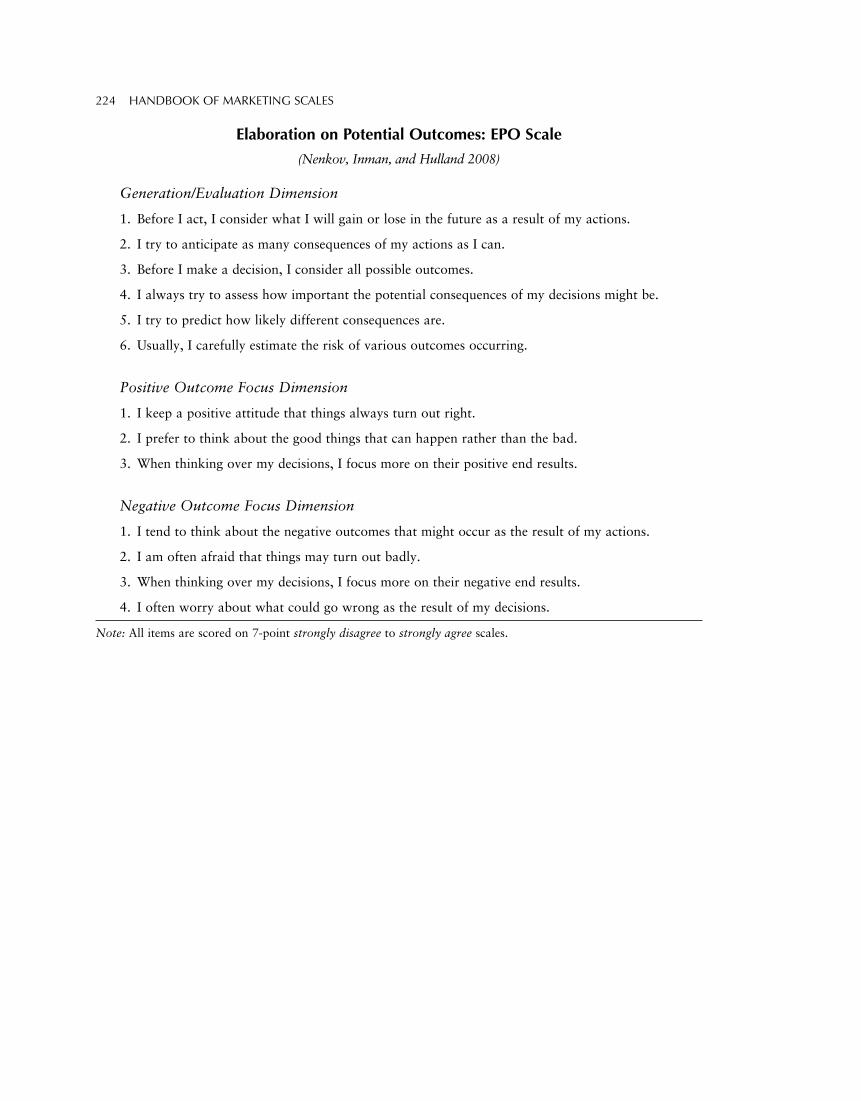
Elaboration on Potential Outcomes: EPO Scale
(Nenkov, Inman, and Hulland 2008)
Generation/Evaluation Dimension
1. Before I act, I consider what I will gain or lose in the future as a result of my actions.
2. I try to anticipate as many consequences of my actions as I can.
3. Before I make a decision, I consider all possible outcomes.
4. I always try to assess how important the potential consequences of my decisions might be.
5. I try to predict how likely different consequences are.
6. Usually, I carefully estimate the risk of various outcomes occurring.
Positive Outcome Focus Dimension
1. I keep a positive attitude that things always turn out right.
2. I prefer to think about the good things that can happen rather than the bad.
3. When thinking over my decisions, I focus more on their positive end results.
Negative Outcome Focus Dimension
1. I tend to think about the negative outcomes that might occur as the result of my actions.
2. I am often afraid that things may turn out badly.
3. When thinking over my decisions, I focus more on their negative end results.
4. I often worry about what could go wrong as the result of my decisions.
Note: All items are scored on 7-point strongly disagree to strongly agree scales.
224 HANDBOOK OF MARKETING SCALES
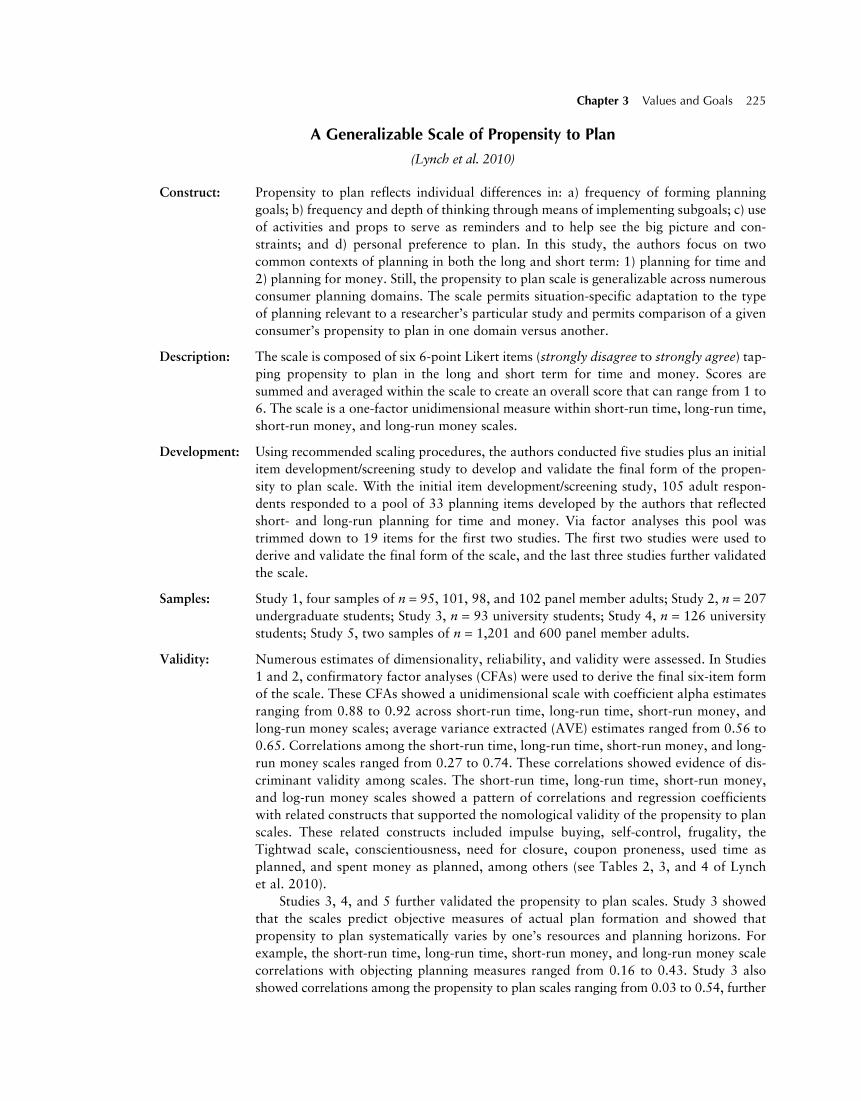
A Generalizable Scale of Propensity to Plan
(Lynch et al. 2010)
Construct: Propensity to plan reflects individual differences in: a) frequency of forming planninggoals; b) frequency and depth of thinking through means of implementing subgoals; c) useof activities and props to serve as reminders and to help see the big picture and con-straints; and d) personal preference to plan. In this study, the authors focus on twocommon contexts of planning in both the long and short term: 1) planning for time and2) planning for money. Still, the propensity to plan scale is generalizable across numerousconsumer planning domains. The scale permits situation-specific adaptation to the typeof planning relevant to a researcher’s particular study and permits comparison of a givenconsumer’s propensity to plan in one domain versus another.
Description: The scale is composed of six 6-point Likert items (strongly disagree to strongly agree) tap-ping propensity to plan in the long and short term for time and money. Scores aresummed and averaged within the scale to create an overall score that can range from 1 to6. The scale is a one-factor unidimensional measure within short-run time, long-run time,short-run money, and long-run money scales.
Development: Using recommended scaling procedures, the authors conducted five studies plus an initialitem development/screening study to develop and validate the final form of the propen-sity to plan scale. With the initial item development/screening study, 105 adult respon-dents responded to a pool of 33 planning items developed by the authors that reflectedshort- and long-run planning for time and money. Via factor analyses this pool wastrimmed down to 19 items for the first two studies. The first two studies were used toderive and validate the final form of the scale, and the last three studies further validatedthe scale.
Samples: Study 1, four samples of n = 95, 101, 98, and 102 panel member adults; Study 2, n = 207undergraduate students; Study 3, n = 93 university students; Study 4, n = 126 universitystudents; Study 5, two samples of n = 1,201 and 600 panel member adults.
Validity: Numerous estimates of dimensionality, reliability, and validity were assessed. In Studies1 and 2, confirmatory factor analyses (CFAs) were used to derive the final six-item formof the scale. These CFAs showed a unidimensional scale with coefficient alpha estimatesranging from 0.88 to 0.92 across short-run time, long-run time, short-run money, andlong-run money scales; average variance extracted (AVE) estimates ranged from 0.56 to0.65. Correlations among the short-run time, long-run time, short-run money, and long-run money scales ranged from 0.27 to 0.74. These correlations showed evidence of dis-criminant validity among scales. The short-run time, long-run time, short-run money,and log-run money scales showed a pattern of correlations and regression coefficientswith related constructs that supported the nomological validity of the propensity to planscales. These related constructs included impulse buying, self-control, frugality, theTightwad scale, conscientiousness, need for closure, coupon proneness, used time asplanned, and spent money as planned, among others (see Tables 2, 3, and 4 of Lynchet al. 2010).
Studies 3, 4, and 5 further validated the propensity to plan scales. Study 3 showedthat the scales predict objective measures of actual plan formation and showed thatpropensity to plan systematically varies by one’s resources and planning horizons. Forexample, the short-run time, long-run time, short-run money, and long-run money scalecorrelations with objecting planning measures ranged from 0.16 to 0.43. Study 3 alsoshowed correlations among the propensity to plan scales ranging from 0.03 to 0.54, further
Chapter 3 Values and Goals 225
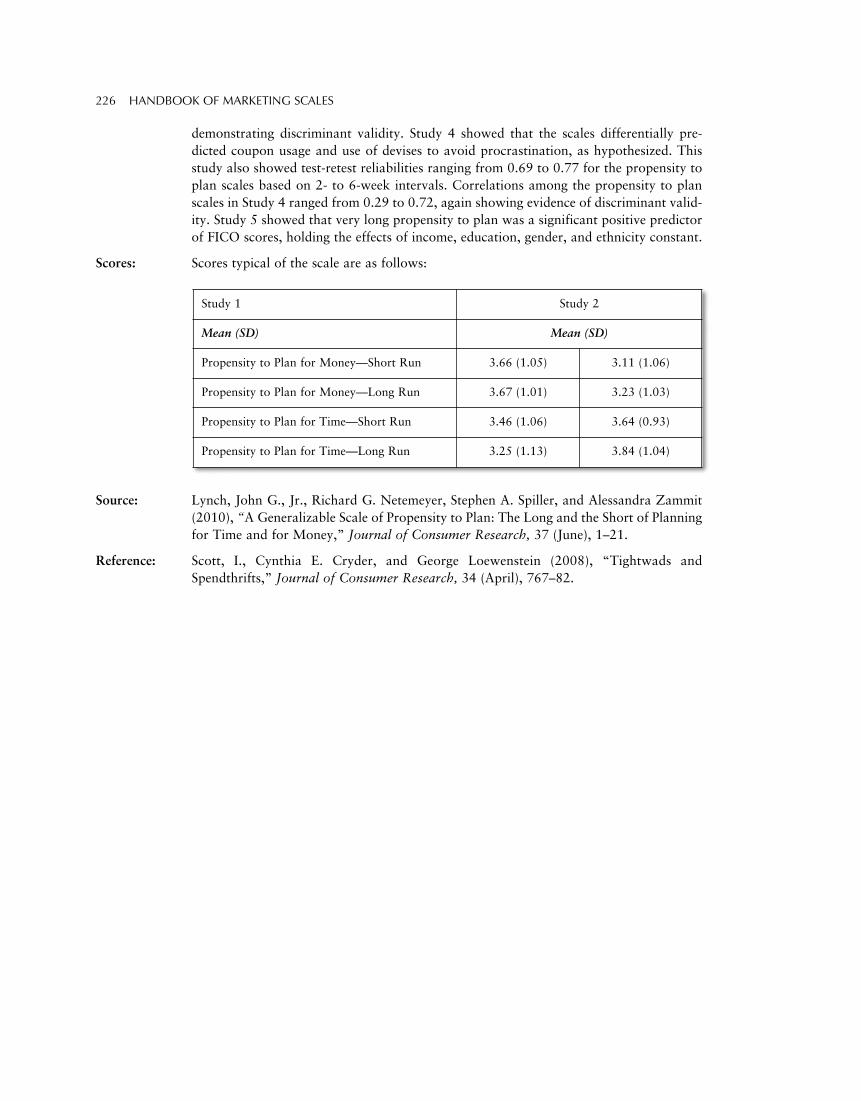
Source: Lynch, John G., Jr., Richard G. Netemeyer, Stephen A. Spiller, and Alessandra Zammit(2010), “A Generalizable Scale of Propensity to Plan: The Long and the Short of Planningfor Time and for Money,” Journal of Consumer Research, 37 (June), 1–21.
Reference: Scott, I., Cynthia E. Cryder, and George Loewenstein (2008), “Tightwads andSpendthrifts,” Journal of Consumer Research, 34 (April), 767–82.
demonstrating discriminant validity. Study 4 showed that the scales differentially pre-dicted coupon usage and use of devises to avoid procrastination, as hypothesized. Thisstudy also showed test-retest reliabilities ranging from 0.69 to 0.77 for the propensity toplan scales based on 2- to 6-week intervals. Correlations among the propensity to planscales in Study 4 ranged from 0.29 to 0.72, again showing evidence of discriminant valid-ity. Study 5 showed that very long propensity to plan was a significant positive predictorof FICO scores, holding the effects of income, education, gender, and ethnicity constant.
Scores: Scores typical of the scale are as follows:
226 HANDBOOK OF MARKETING SCALES
Study 1 Study 2
Mean (SD) Mean (SD)
Propensity to Plan for Money—Short Run 3.66 (1.05) 3.11 (1.06)
Propensity to Plan for Money—Long Run 3.67 (1.01) 3.23 (1.03)
Propensity to Plan for Time—Short Run 3.46 (1.06) 3.64 (0.93)
Propensity to Plan for Time—Long Run 3.25 (1.13) 3.84 (1.04)
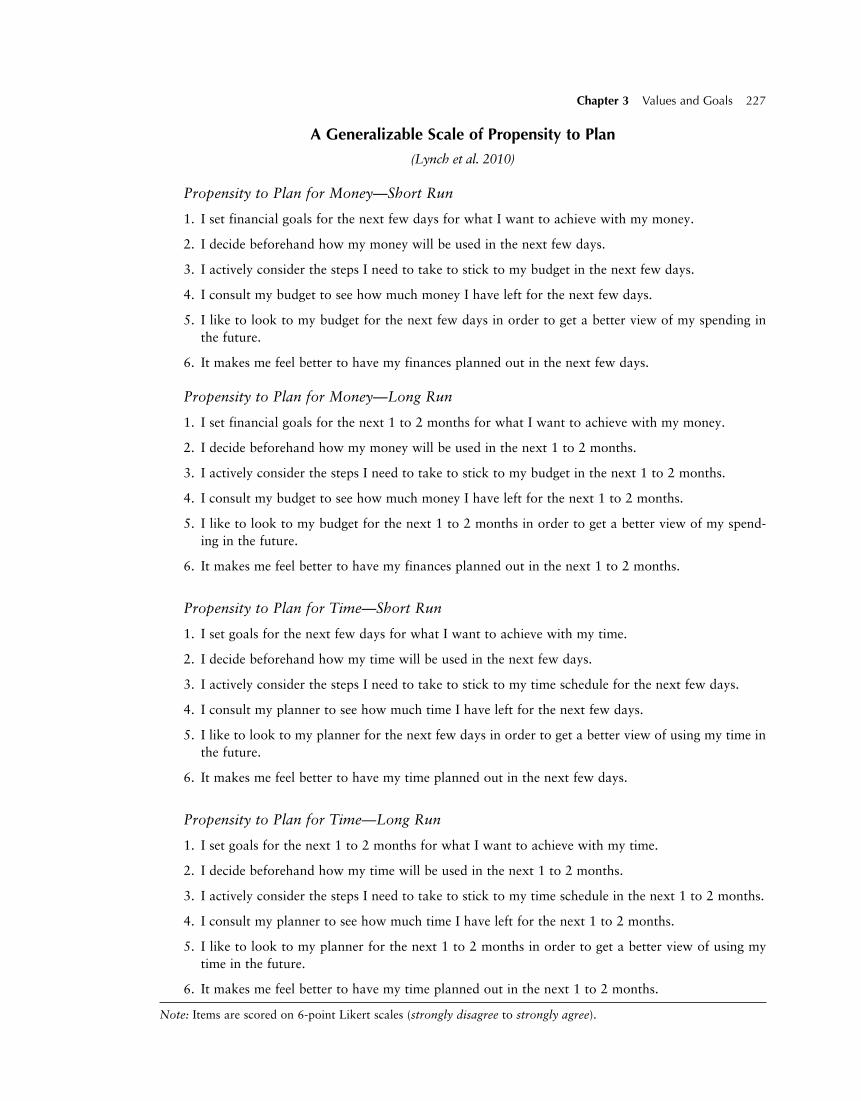
Chapter 3 Values and Goals 227
A Generalizable Scale of Propensity to Plan
(Lynch et al. 2010)
Propensity to Plan for Money—Short Run
1. I set financial goals for the next few days for what I want to achieve with my money.
2. I decide beforehand how my money will be used in the next few days.
3. I actively consider the steps I need to take to stick to my budget in the next few days.
4. I consult my budget to see how much money I have left for the next few days.
5. I like to look to my budget for the next few days in order to get a better view of my spending inthe future.
6. It makes me feel better to have my finances planned out in the next few days.
Propensity to Plan for Money—Long Run
1. I set financial goals for the next 1 to 2 months for what I want to achieve with my money.
2. I decide beforehand how my money will be used in the next 1 to 2 months.
3. I actively consider the steps I need to take to stick to my budget in the next 1 to 2 months.
4. I consult my budget to see how much money I have left for the next 1 to 2 months.
5. I like to look to my budget for the next 1 to 2 months in order to get a better view of my spend-ing in the future.
6. It makes me feel better to have my finances planned out in the next 1 to 2 months.
Propensity to Plan for Time—Short Run
1. I set goals for the next few days for what I want to achieve with my time.
2. I decide beforehand how my time will be used in the next few days.
3. I actively consider the steps I need to take to stick to my time schedule for the next few days.
4. I consult my planner to see how much time I have left for the next few days.
5. I like to look to my planner for the next few days in order to get a better view of using my time inthe future.
6. It makes me feel better to have my time planned out in the next few days.
Propensity to Plan for Time—Long Run
1. I set goals for the next 1 to 2 months for what I want to achieve with my time.
2. I decide beforehand how my time will be used in the next 1 to 2 months.
3. I actively consider the steps I need to take to stick to my time schedule in the next 1 to 2 months.
4. I consult my planner to see how much time I have left for the next 1 to 2 months.
5. I like to look to my planner for the next 1 to 2 months in order to get a better view of using mytime in the future.
6. It makes me feel better to have my time planned out in the next 1 to 2 months.
Note: Items are scored on 6-point Likert scales (strongly disagree to strongly agree).
Polychronic Attitude Index: PAI
(Kaufman, Lane, and Lindquist 1991)
Construct: Polychrome time use is defined in terms of combining activities such that several goalscan be attained at the same time. Thus, two or more activities are performed in the sametime block at the same time. Conceptually, it is proposed that polychrome time use is astrategic process whereby individuals enrich their time budgets producing the output ofmore than 24 hours of single, monochronic time use (Kaufman et al. 1991, p. 394). ThePAI was designed to measure attitudes toward polychronic time use.
Description: The PAI is composed of four items measured on 5-point strongly agree to strongly dis-agree Likert-type scales. The item scores are summed to form an overall PAI, and thePAI is considered unidimensional.
Development: Based on the conceptual description and a literature review, 15 statements were initiallygenerated to tap the domain of the construct. With two student sample pretests, item-to-total correlations were used to delete 11 items, resulting in the final four-item ver-sion of the PAI. Dimensionality, reliability, and validity checks were also performed ona later sample.
Samples: As stated above, the PAI items were initially pretested on two student samples (n notspecified). The final version of the scale was administered to a sample of 310 (42% maleand 58% female) in the Philadelphia metropolitan area.
Validity: Factor analysis revealed that the PAI was unidimensional and had a coefficient alpha of0.68. The PAI was negatively correlated with a measure of role overload (–0.15), andthe pattern of correlations of the PAI with activity statements reflecting polychronictime use showed modest evidence of validity (range of 0.02 to 0.13 in absolute value).The PAI was also found to be positively correlated with education, employment, andclub membership.
Scores: Neither mean nor percentage scores were reported.
Source: Kaufman, Carol Felker, Paul M. Lane, and Jay D. Lindquist (1991), “Exploring MoreThan 24 Hours a Day: A Preliminary Investigation of Polychronic Time Use,” Journalof Consumer Research, 18, 392–401.
1991 by University of Chicago Press. Scale items taken from Appendix A (p. 400).Reprinted with permission.
228 HANDBOOK OF MARKETING SCALES
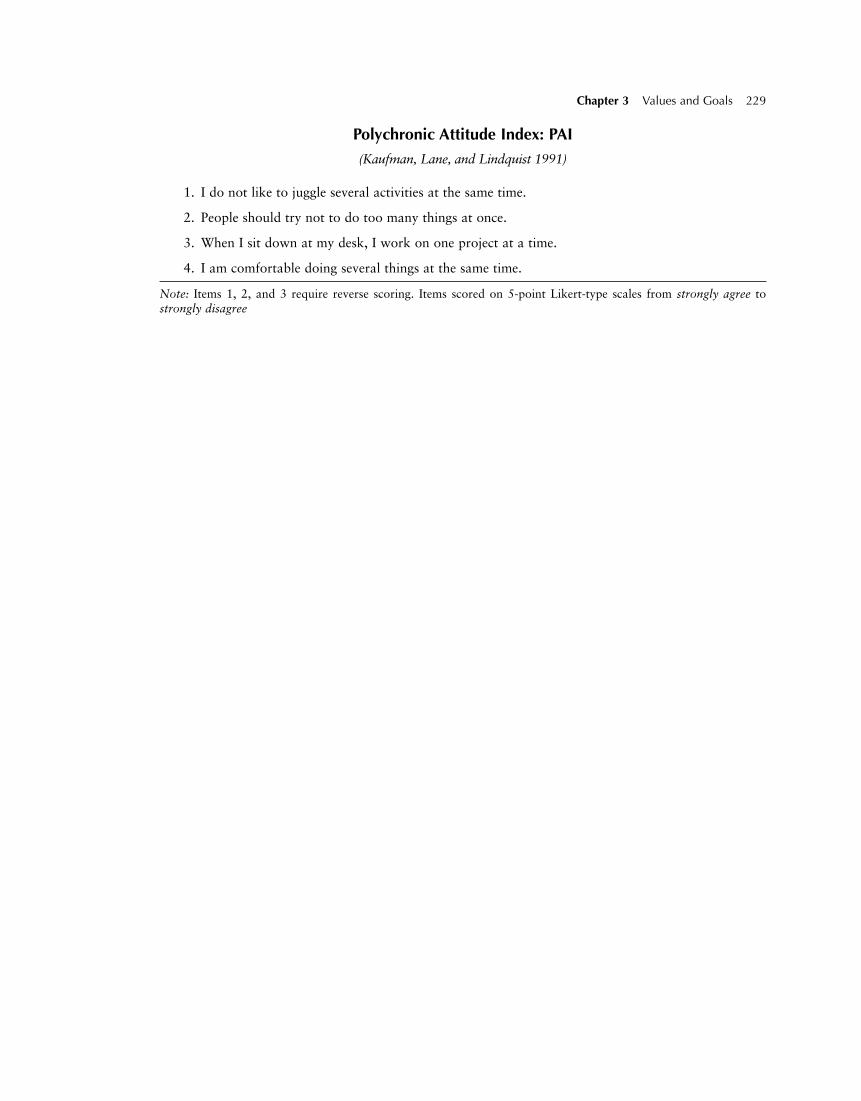
Polychronic Attitude Index: PAI
(Kaufman, Lane, and Lindquist 1991)
1. I do not like to juggle several activities at the same time.
2. People should try not to do too many things at once.
3. When I sit down at my desk, I work on one project at a time.
4. I am comfortable doing several things at the same time.
Note: Items 1, 2, and 3 require reverse scoring. Items scored on 5-point Likert-type scales from strongly agree tostrongly disagree
Chapter 3 Values and Goals 229
Regulatory Focus Composite Scale: RF-COMP
(Haws, Dholakia, and Bearden 2010)
Construct: Regulatory focus is a construct capturing goal motivations and means for self-regulationduring goal pursuit. Individuals can vary in both their level of promotion focus, whichemphasizes the ideal self and one’s hopes and aspirations, and prevention focus, whichemphasizes the ought self and one’s duties and obligations. These two components arepresented as orthogonal to each other and are best examined separately. They have beenused to describe and predict a wide range of attitudes and behaviors within consumerresearch and psychology.
Description: The Regulatory Focus Composite (RF-COMP) scale consists of 10 items derived fromprevious measures of regulatory focus, including the Regulatory Focus Questionnaire(RFQ) developed by Higgins et al. (2001), the BIS/BAS scale developed by Carver andWhite (1994), and Lockwood, Jordan, and Kunda’s (2002) measure of regulatory focus.The items are all measured on a 7-point Likert-type scale ranging from strongly disagreeto strongly agree and were selected to capture all key components of regulatory focustheory. The RF-COMP scale is suggested for use in any circumstances under which assess-ment of chronic goal orientations is desired or when regulatory focus is manipulated.
Development: The RF-COMP scale was developed as part of an investigation of the various measure-ment approaches to capture regulatory focus. Previous measures of regulatory focus wereassessed, and the measures were all analyzed using exploratory and confirmatory factoranalysis to arrive at a reduced set of items that sufficiently captured the complexities ofregulatory focus construct.
Samples: Qualitative data collection included 98 adult consumers. The scale purification sample(Study 1) included 266 adult respondents, while the validation sample (Study 2) included251 adult consumers; in both cases, respondents were recruited by students.
Validity: Across samples, coefficient alpha estimates ranged from 0.69 to 0.84 for the promotiondimension and from 0.67 to 0.77 for the prevention dimension. Study 2 data assessedtest-retest reliability, which was 0.67 for promotion and 0.64 for prevention over a 5-weekperiod. Other studies provide evidence of predictive validity using a variety of measurespreviously demonstrated to be related to regulatory focus, including the persuasiveness ofdifferently framed advertising messages and job preferences.
Scores: None were reported.
Source: Haws, Kelly L., Utpal M. Dholakia, and William O. Bearden (2010), “An Assessment ofChronic Regulatory Focus Measures,” Journal of Marketing Research, 47 (October),967–982.
References: Carver, Charles S. and Teri L. White (1994), “Behavioral Inhibition, BehavioralActivation, and Affective Responses to Impending Reward and Punishment: The BIS/BASScales,” Journal of Personality and Social Psychology, 67 (2), 319–33.
Higgins, E. Tory, Ronald S. Friedman, Robert E. Harlow, Lorraine C. Idson, Ozlem N.Ayduk, and Amy Taylor (2001), “Achievement Orientations from Subjective Histories ofSuccess: Promotion Pride Versus Prevention Pride,” European Journal of SocialPsychology, 31 (1), 3–23.
Lockwood, Penelope, Christian H. Jordon, and Ziva Kunda (2002), “Motivation byPositive or Negative Role Models: Regulatory Focus Determines Who Will Best InspireUs,” Journal of Personality and Social Psychology, 83 (4), 854–64.
230 HANDBOOK OF MARKETING SCALES
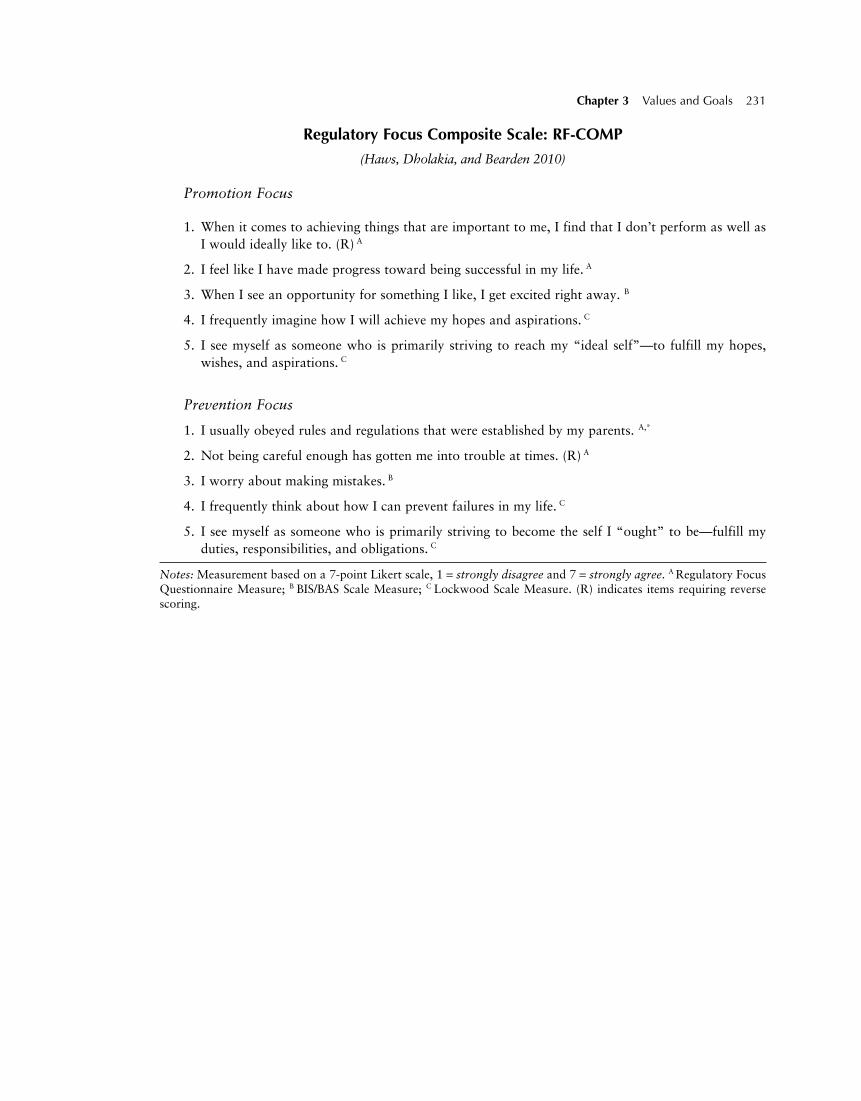
Regulatory Focus Composite Scale: RF-COMP
(Haws, Dholakia, and Bearden 2010)
Promotion Focus
1. When it comes to achieving things that are important to me, I find that I don’t perform as well asI would ideally like to. (R) A
2. I feel like I have made progress toward being successful in my life. A
3. When I see an opportunity for something I like, I get excited right away. B
4. I frequently imagine how I will achieve my hopes and aspirations. C
5. I see myself as someone who is primarily striving to reach my “ideal self”—to fulfill my hopes,wishes, and aspirations. C
Prevention Focus
1. I usually obeyed rules and regulations that were established by my parents. A,*
2. Not being careful enough has gotten me into trouble at times. (R) A
3. I worry about making mistakes. B
4. I frequently think about how I can prevent failures in my life. C
5. I see myself as someone who is primarily striving to become the self I “ought” to be—fulfill myduties, responsibilities, and obligations. C
Notes:Measurement based on a 7-point Likert scale, 1 = strongly disagree and 7 = strongly agree. A Regulatory FocusQuestionnaire Measure; B BIS/BAS Scale Measure; C Lockwood Scale Measure. (R) indicates items requiring reversescoring.
Chapter 3 Values and Goals 231
Regulatory Focus Questionnaire: RFQ
(Higgins et al. 2001)
Construct: Regulatory Focus Questionnaire (RFQ—but labeled as the Event Reaction Questionnaire)is designed to capture differences in regulatory focus orientation. Regulatory focus theoryinvolves understanding the means employed by individuals for self-regulation during goalpursuit and distinguishing between two regulatory orientations: a promotion focus and aprevention focus. A promotion focus emphasizes the “ideal” self, as reflected in the indi-vidual’s hopes and aspirations, and favors strategic means of achievement that areeagerness-oriented. In contrast, a prevention focus emphasizes the “ought” self, as reflectedin the person’s duties and obligations, and supports strategic means that are vigilance-oriented. In designing the RFQ, Higgins et al. (2001) conceptualizes promotion and pre-vention success via promotion pride and prevention pride respectively, which areanticipatory reactions to new task goals derived from the individual’s subjective history ofpast success in promotion and prevention goal attainment.
Description: The RFQ assesses both promotion and prevention regulatory orientations using11 items—6 to capture promotion and 5 to capture prevention. The items are assessedon 5-point scales with varying anchors, as shown with the scale items. Although manyresearchers have computed difference scores to derive a single measure to imply promotion-prevention orientation, these dimensions are intended to be orthogonal. Further, basedspecifically on results from Haws, Dholakia, and Bearden (2010) also see related regula-tory focus scale in this book), we strongly caution against combining promotion and pre-vention focus measures. Instead, the scores for the Promotion and Prevention itemsshould be averaged and used separately in analysis.
Development: A pool of items was generated with a balance between promotion- and prevention-oriented items as well as a mix of items with parental and nonparental content. Fulldetails are said to be in an unpublished manuscript by Harlow et al. (1997). Although itis not clear how many items were generated, several successive, large samples were usedto narrow the items down to 11. Subsequent samples were used to test the factor structureas well as to examine convergent and discriminant validity.
Samples: Many samples were used to develop the 11-item measure, but not all were described indetail. A sample of 207 undergraduate students was used to factor analyze the 11 items.An additional sample of 268 undergraduates was used for confirmatory factor analysis.A test-retest sample of 71 undergraduates assessed reliability over a 2-month time period.
Validity: Factor analysis of Study 1 data suggested a two-factor model for the 11 items, represent-ing the promotion and prevention dimensions, with items loading cleanly on the appro-priate factor. The correlation between the promotion and prevention items was 0.21.Coefficient alpha estimates were 0.73 for Promotion and 0.80 for Prevention. The con-firmatory factor analysis sample further supported the factor structure, and the test-retestreliability sample demonstrated correlations between administrations of the RFQ mea-sure over a 2-month period at 0.79 for Promotion and 0.81 for Prevention. In terms ofconvergent and discriminant validity, both dimensions were found to be related toachievement motivation, as they represent different manners of achieving goals. Further,RFQ was discriminated from the Selves measures of self-discrepancy (Higgins et al.1986). Several subsequent studies tested predictions regarding differences in decisionmaking that would result based on differences in Promotion and Prevention focus.
Scores: No mean scores were reported.
232 HANDBOOK OF MARKETING SCALES
Source: Higgins, E. Tory, Ronald S. Friedman, Robert E. Harlow, Lorraine C. Idson, Ozlem N.Ayduk, and Amy Taylor (2001), “Achievement Orientations from Subjective Histories ofSuccess: Promotion Pride Versus Prevention Pride,” European Journal of SocialPsychology, 30, 3–23.
References: Harlow, R., Ronald S. Friedman, and E. Tory Higgins (1997), “The Regulatory FocusQuestionnaire,” Unpublished manuscript, Columbia University.
Haws, Kelly L., Utpal Dholakia, and William O. Bearden (2010), “As Assessment ofChronic Regulatory Focus Measures,” Journal of Marketing Research, forthcoming.
Higgins, E. Tory, Ronald N. Bond, Ruth Klein, and Timothy Strauman (1986), “Self-Discrepancies and Emotional Vulnerability: How Magnitude, Accessibility, and Type ofDiscrepancy Influence Affect,” Journal of Personality and Social Psychology, 51 (July), 5–15.
Chapter 3 Values and Goals 233
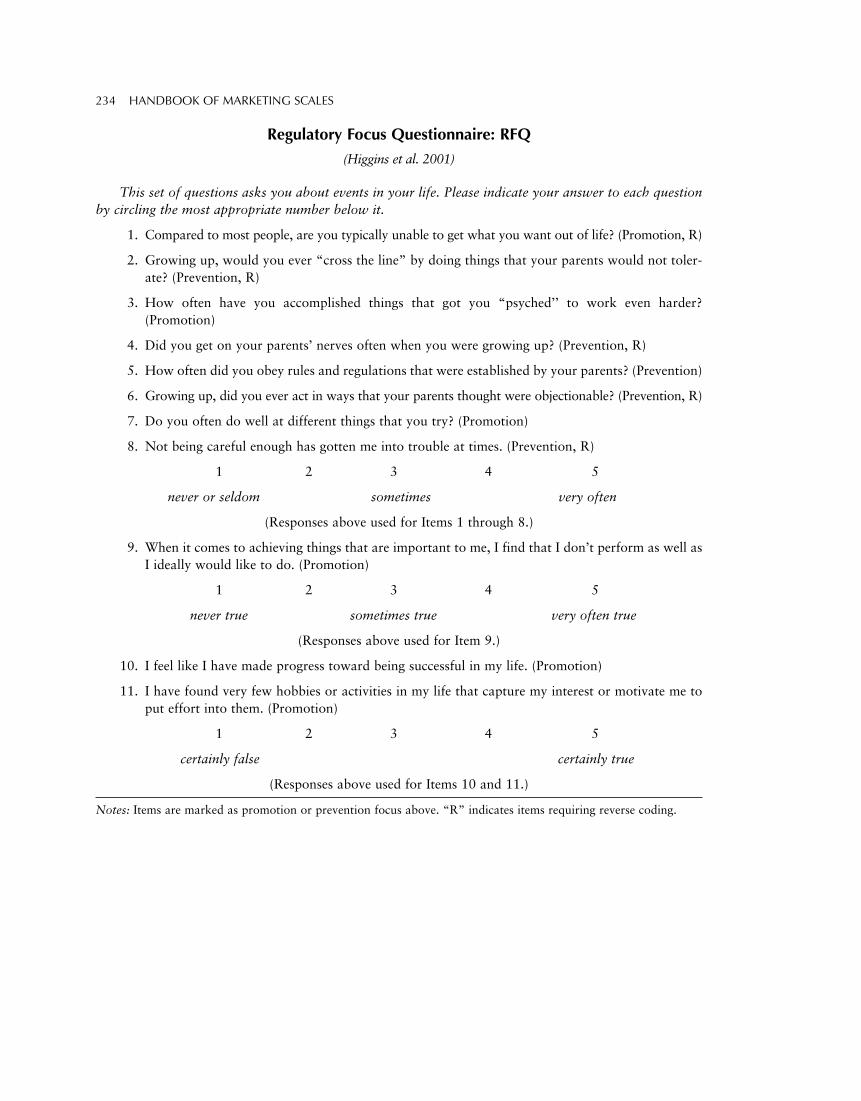
Regulatory Focus Questionnaire: RFQ
(Higgins et al. 2001)
This set of questions asks you about events in your life. Please indicate your answer to each questionby circling the most appropriate number below it.
1. Compared to most people, are you typically unable to get what you want out of life? (Promotion, R)
2. Growing up, would you ever “cross the line” by doing things that your parents would not toler-ate? (Prevention, R)
3. How often have you accomplished things that got you “psyched’’ to work even harder?(Promotion)
4. Did you get on your parents’ nerves often when you were growing up? (Prevention, R)
5. How often did you obey rules and regulations that were established by your parents? (Prevention)
6. Growing up, did you ever act in ways that your parents thought were objectionable? (Prevention, R)
7. Do you often do well at different things that you try? (Promotion)
8. Not being careful enough has gotten me into trouble at times. (Prevention, R)
1 2 3 4 5
never or seldom sometimes very often
(Responses above used for Items 1 through 8.)
9. When it comes to achieving things that are important to me, I find that I don’t perform as well asI ideally would like to do. (Promotion)
1 2 3 4 5
never true sometimes true very often true
(Responses above used for Item 9.)
10. I feel like I have made progress toward being successful in my life. (Promotion)
11. I have found very few hobbies or activities in my life that capture my interest or motivate me toput effort into them. (Promotion)
1 2 3 4 5
certainly false certainly true
(Responses above used for Items 10 and 11.)
Notes: Items are marked as promotion or prevention focus above. “R” indicates items requiring reverse coding.
234 HANDBOOK OF MARKETING SCALES
Temporal Focus Scale: TFS
(Shipp, Edwards, and Lambert 2009)
Construct: Temporal Focus captures the extent to which people devote their attention to the past,present, and future. This temporal focus impacts current attitudes and behaviors andemphasizes that people can shift their attention among these time periods. Further, think-ing about one time period does not preclude thinking about the others, and the same indi-vidual can have multiple temporal foci. The Temporal Focus Scale (TFS) helps clarifyresponses to explicit and implicit temporal information.
Description: TFS consists of 12 items, 4 each for the past, present, and future focus. Responses areassessed on a 7-point scale (1 = never; 3 = sometimes; 5 = frequently; 7 = constantly). Foreach factor, scale items are averaged to provide an overall score. Differences among thethree foci are emphasized, and therefore they should not be combined into an overall tem-poral focus.
Development: A domain sampling procedure was used to generate items that were consistent with thea priori definition of temporal focus as thinking about the past, present, and future. Theinitial pool consisted of 22 items spread across the three temporal foci. Trained codersassessed the items, and 12 final items were selected (4 past, 4 present, and 4 future). The12 items were subjected to confirmatory factor analysis, and the 3-factor structure wassupported. Modest correlations were found in some samples between the three foci.
Samples: Four samples were used to assess validity. Study 1 consisted of 181 graduate students,Study 2 had 360 responses and a mix of students and nonstudents, Study 3 had 195student respondents, and Study 4 was administered at two different time periods to assesstest-retest reliability and had 362 complete responses from members of a national onlinesurvey panel.
Validity: Coefficient alpha estimates were provided throughout and were consistently 0.74 orhigher. For example, in Studies 1 (2), alpha estimates were 0.89 (0.88), 0.74 (0.78), and0.86 (0.86) for past, current, and future, respectively. Test-retest reliability was assessedfor each dimension with the 362 respondents in Study 4 and a 6-week period betweenassessments: past = 0.73, current = 0.66, and future = 0.72. The three-factor model pro-vided good fit throughout the samples, and evidence suggested that individuals commonlyfocus on two or three of the temporal foci. TFS was distinguished from previous tempo-ral measures, and nomological validity was assessed through relationships with constructsrepresenting risk taking, optimism/pessimism, the Big-Five personality factors, and jobcharacteristics.
Scores: Means and standard deviations for the three subdimensions were provided across all sam-ples. Using Study 4 as an example, means (standard deviations) were as follows: past = 4.44(1.23), current = 5.18 (0.95), future = 4.97 (1.18).
Source: Shipp, Abbie J., Jeffrey R. Edwards, and Lisa Schurer Lambert (2009), “Conceptualizationand Measurement of Temporal Focus: The Subjective Experience of the Past, Present, andFuture,”Organizational Behavior and Human Decision Processes, 110 (September), 1–22.
Chapter 3 Values and Goals 235
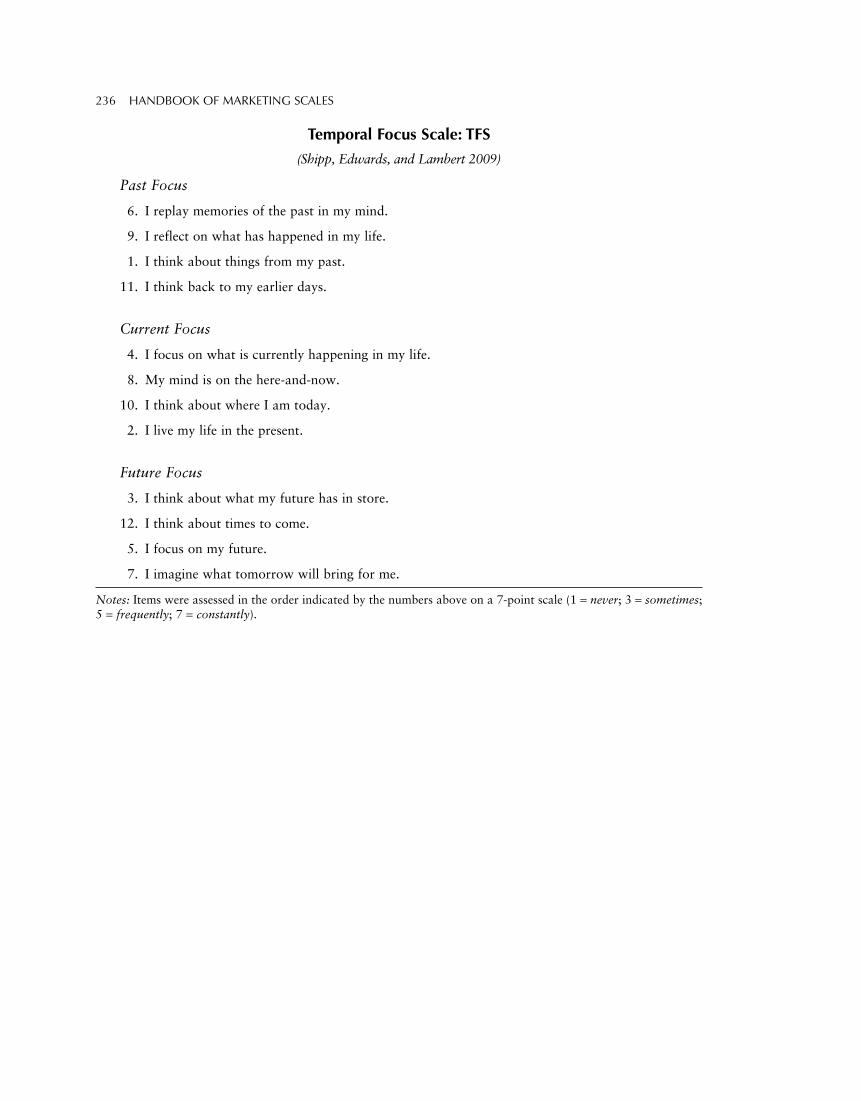
Temporal Focus Scale: TFS
(Shipp, Edwards, and Lambert 2009)
Past Focus
6. I replay memories of the past in my mind.
9. I reflect on what has happened in my life.
1. I think about things from my past.
11. I think back to my earlier days.
Current Focus
4. I focus on what is currently happening in my life.
8. My mind is on the here-and-now.
10. I think about where I am today.
2. I live my life in the present.
Future Focus
3. I think about what my future has in store.
12. I think about times to come.
5. I focus on my future.
7. I imagine what tomorrow will bring for me.
Notes: Items were assessed in the order indicated by the numbers above on a 7-point scale (1 = never; 3 = sometimes;5 = frequently; 7 = constantly).
236 HANDBOOK OF MARKETING SCALES