millennium development goals report
112
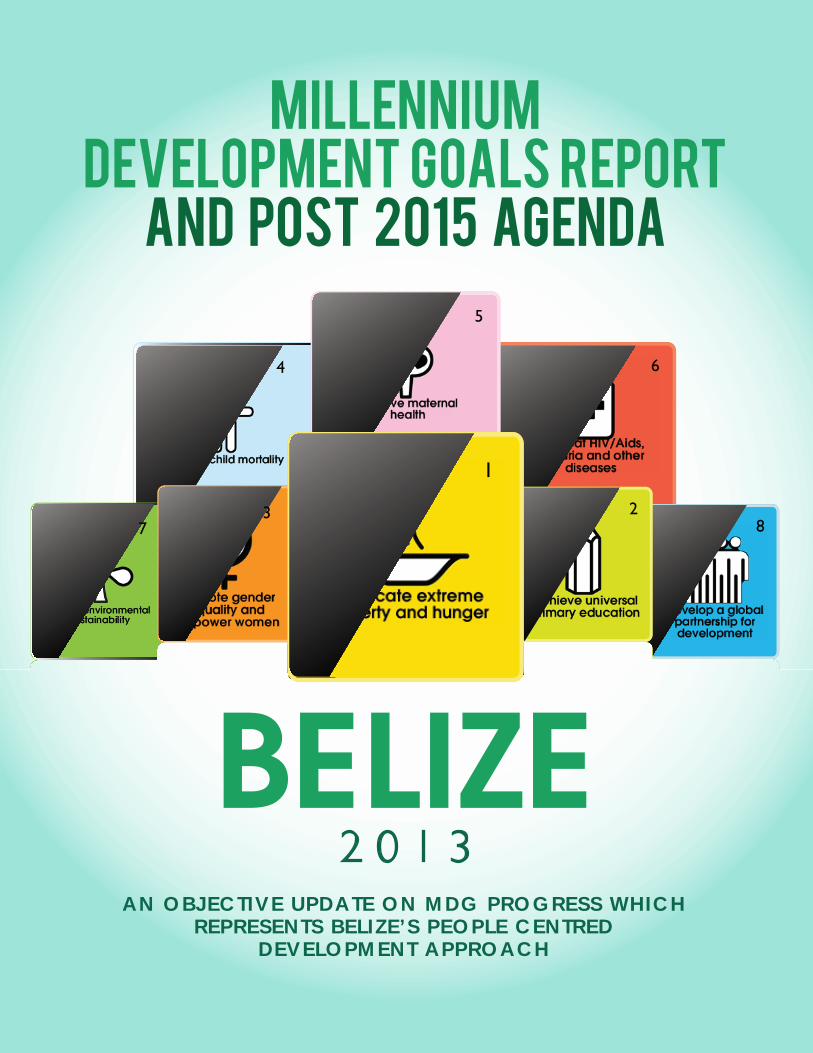
4 6 5 7 8 3 2 1 AN OBJECTIVE UPDATE ON MDG PROGRESS WHICH REPRESENTS BELIZE’S PEOPLE CENTRED DEVELOPMENT APPROACH MILLENNIUM DEVELOPMENT GOALS REPORT AND POST 2015 AGENDA
-
Upload
khangminh22 -
Category
Documents
-
view
1 -
download
0
Transcript of millennium development goals report
4 6
5
7 83 2
1
AN OBJECTIVE UPDATE ON MDG PROGRESS WHICHREPRESENTS BELIZE’S PEOPLE CENTRED
DEVELOPMENT APPROACH
MILLENNIUMDEVELOPMENT GOALS REPORT
AND POST 2015 AGENDA

September 2013
United Nations Development Programme Belmopan, Belize.
© UNDP 2013
UNDP is the UN’s global development network, advocating for change and connecting countries to knowledge, experience and resources to
help people build a better life.
United Nations Development Programme (UNDP)www.bz.undp.org
Copyright © Government of Belize and UNDP 2013
All rights reserved.
Designed By:McNab Design Ltd.
Belize City, Belize
Printed By:Dots Per Inch Ltd.Belize City, Belize

The publication was developed by the Government of Belize with support from the United Nations Development Programme. The report development process was led by the Ministry of Finance and Economic Development with convening assistance supported by UNDP. Gratitude is extended to Chief Executive Officer of Economic Development- Yvonne Hyde, Resident Representative- Roberto Valent, Deputy Resident Representative- Stefano Pettinato, and Assistant Resident Representative- Daniel Alemu.
The partners extend thanks to the Research Team from the University of Belize: Dr. Philip Castillo (Team Leader): MDG #1 - Poverty and Hunger; Dr. Priscilla Lopez: MDG #2 - Primary Education; Melanie Smith Santiago M.Sc.: MDG #3 - Gender and Women’s Empowerment; Lorita Haylock B.Sc.N, FNP, RN: MDG #4 - Child Mortality; Isidora Espadas MSN, RN, RM: MDG #5 - Maternal Health, Valerie Jenkins MPH, RN, RM: MDG #6 - HIV/AIDS, Malaria and Other Diseases; Dr. Pio Saqui, PhD.: MDG #7 - Environmental Sustainability; Romaldo Lewis MBA, Doctoral Candidate: MDG #8 - Global Partnership for Development; and Gustavo Perera of Summa Research Agency for data collection assistance.
Technical working group participation by representatives from each of the following ministries were invaluable to this process and recognition is extended to: Ministry of Health- Dr. Aisha Andrewin, Dr. Natalia Largaespada-Beer, Dr. Marvin Manzanero, Dr. Francis Morey; Ministry of Education- Dr. Neulin Villanueva; Ministry of Human Development- Judith Alpuche, John Flowers, Cynthia Williams; Ministry of Natural Resources and Agriculture- Dr. Fernando Tzib; Ministry of Forestry, Fisheries and Sustainable Development- Wiezsman Pat, Arlene Maheia-Young; Ministry of Labour, Local Government, Rural Development, NEMO and Immigration- Paulette Wagner, Ernest Banner; Ministry of Trade, Investment Promotion, Private Sector Development and Consumer Protection- Yashin Dujon, Richard Reid, Shawn Richards and Ministry of Energy, Science and Technology, Public Utilities - Dwight Gillett and editorial assistance, Ivory Kelly.
Recognition is extended to the United Nations Technical Review Group: Dr. Gerardo de Cosio (PAHO); Paulette Wade (UNICEF); Diane Wade (UNDP); Erika Goldson (UNFPA) and Melissa Sobers (UNAIDS).
Gratitude is also extended to Partner Agencies Representatives: Michelle Lindo Longsworth (Women’s Issues Network); Noriko Gamero (Belize Trade and Investment Development Service); Sylvia Cattouse (University of Belize), Sharon Lindo (Caribbean Community Centre for Climate Change); Ann-Marie Williams (Women’s Commission); and Jacqueline Small (Statistical Institute of Belize).
Acknowledgement and thanks are given to Jeanette Garcia- Economist/ MDG focal point (Ministry of Economic Development), Jay Coombs- Programme Analyst (UNDP) and Elishah St. Luce- Programme Associate (UNDP) who led and drove the process towards the production of this MDG report.
Finally, the MDG Report team thanks Gonzalo Pizarro, Regional Policy Adviser on Poverty, MDGs and Human Development, Orria Goni, Renata Rubian and Michael Moroz from Bureau for Development Policy, New York who supported the completion of this report.
ACKNOWLEDGEMENTS
MILLENNIUM DEVELOPMENT GOALS REPORT AND POST 2015 AGENDA 3
4 6
5
7 83 2
1
The Millennium Development Goals have provided Belize with a sound basis on which to measure and track its development progress. The eight (8) basic human development goals continue to serve as a platform on which poverty reduction and sustainable human development strategies remain aligned. From 2007, to present, the Government of Belize has been particularly deliberate in its strategies to make positive strides toward MDG achievement.
This report documents several successful initiatives, many of which have had direct impact on MDG achievement. Some critical initiatives however, are still in their early stages of implementation and must be given time before their full impact becomes evident. In this report, Belize gives an account of planned and targeted investments that have influenced progress toward goal achievement since its last report of 2010.
The results for Belize remain mixed. It documents that where investment strategies have been clear, deliberate and consistent, the progress toward goal achievement has been evident. Such advancement is manifested in the figures for the MDG 2 Goal, which shows that Belize is on track to meet primary education targets by 2015. The progress toward the education Goal has remained reasonably sound since the establishment of the baseline and the implementation of accompanying policies for greater primary school education access. Within the progress made in MDG 7B, Belize’s resolute commitment to maintaining its natural resource base, places its deforestation rate as one of the lowest in the region; this is a critical milestone for maintenance of national biodiversity. Similarly, for MDG 7C efforts toward consistent investments for potable water access, especially at the rural level, have placed Belize as an MDG Plus country, where access to an improved water source is close to 100%.
The chapeau for the entire MDGs process is poverty reduction, embodied in MDG 1 and tangible progress at the grass roots level continues to elude Belize. Despite the gains in education enrolment, Belize still has not harnessed its domestic capacity effectively to significantly grow its economy. Poverty in Belize is increasingly geographic specific, gendered and generational. The poverty safety nets are still in their early stages of implementation to directly show their influences on the poverty indicators that measure growing inequality, and vulnerability. Despite its high poverty rate, Belize has been able to weather the global financial and economic crises, exhibiting slight positive growth during a period of slow or no growth in the larger Central American and Caribbean regions.
The slow progress in the remaining MDGs underpins the effects of poverty, gender and health inequalities. Goals 3, 4, 5, 6 are not on track and require urgent attention to reduce and lessen the impacts of poverty and vulnerability which impede access to basic services (human, health and education) among the mostly poor, rural and female populations.
The 13 years of commitment to MDG have been pivotal in shaping development planning in Belize. The final push for 2015 requires greater national coordination, increased technical capacities, support from the international community and an intrepid commitment to combat poverty. The Belize Millennium Development Goals Report and Post 2015 Agenda highlights the country’s commitment to ensuring that all men, women and children have access to basic opportunities and services to ensure sustainable human development.
FOREWORD
Honourable Santiago Castillo, Minister of State in the Ministry of Finance and Economic Development (Economic Development)
Roberto ValentResident RepresentativeUNDP Belize and El Salvador
12 34 56 78
4
4 6
5
7 83 2
1
TABLE OF CONTENTS
LIST OF TABLESLIST OF FIGURESACRONYMSEXECUTIVE SUMMARYINTRODUCTIONSECTION 1 – THE BELIZE MDG SCORECARDSECTION 1.1 GOAL # 1: ERADICATE EXTREME POVERTY AND HUNGERMilestone AchievementsChallengesSECTION 1.2 GOAL #2: ACHIEVE UNIVERSAL PRIMARY EDUCATIONMilestone AchievementsChallengesSECTION 1.3 GOAL #3: PROMOTE GENDER EQUALITY AND EMPOWER WOMENMilestones AchievementsChallengesSECTION 1.4 GOAL #4: REDUCE CHILD MORTALITYMilestone AchievementsChallengesSECTION 1.5 GOAL #5: IMPROVE MATERNAL HEALTHMilestone AchievementsChallengesSECTION 1.6 GOAL #6: COMBAT HIV/AIDS, MALARIA AND OTHER DISEASESMilestone AchievementsChallengesSECTION 1.7 GOAL #7: ENSURE ENVIRONMENTAL SUSTAINABILITYMilestone AchievementsChallengesSECTION 1.8 GOAL #8: DEVELOP A GLOBAL PARTNERSHIP FOR DEVELOPMENTMilestone AchievementsChallengesSECTION 2 - MDG UNFINISHED BUSINESS & EMERGING PRIORITIESUnfinished Business & Emerging Priorities (MDG 1) Unfinished Business & Emerging Priorities (MDG 2) Unfinished Business & Emerging Priorities (MDG 3) Unfinished Business & Emerging Priorities (MDG 4) Unfinished Business & Emerging Priorities (MDG 5) Unfinished Business & Emerging Priorities (MDG 6) Unfinished Business & Emerging Priorities (MDG 7) Unfinished Business & Emerging Priorities (MDG 8) BIBLIOGRAPHY
678101213172526283333353840434646485556596464728687889394969798100102102103104104108
MILLENNIUM DEVELOPMENT GOALS REPORT AND POST 2015 AGENDA 5
4 6
5
7 83 2
1
LIST OF TABLES
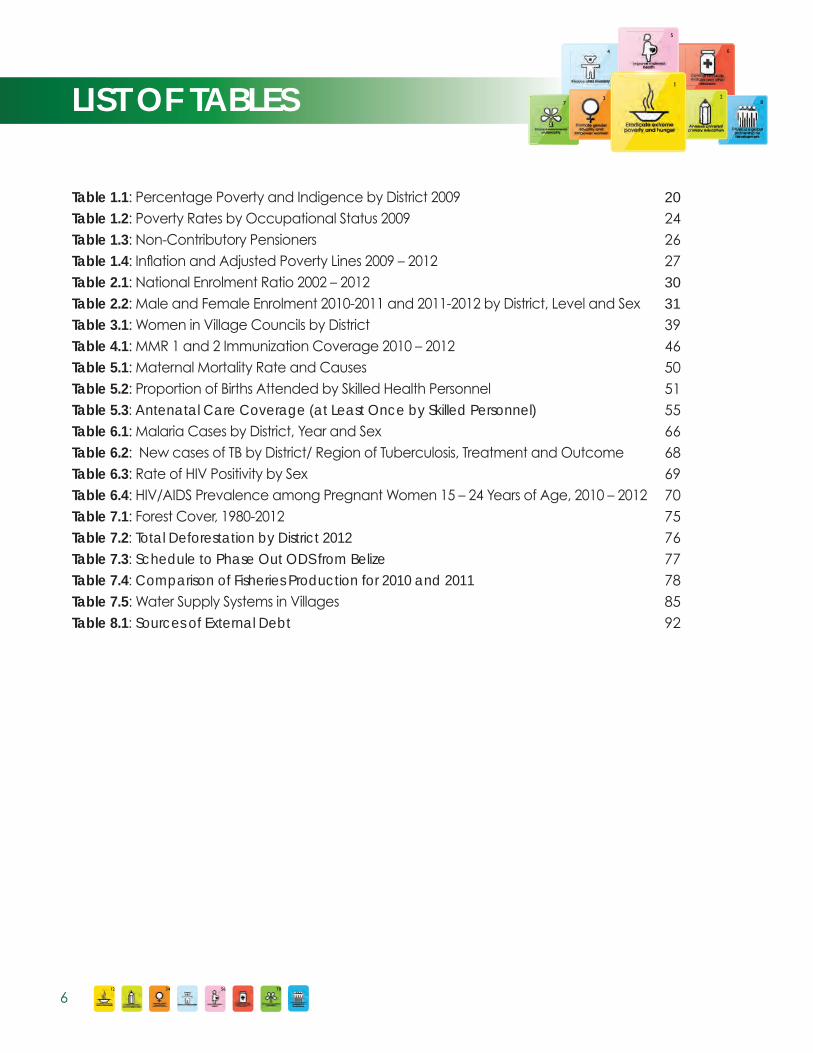
Table 1.1: Percentage Poverty and Indigence by District 2009Table 1.2: Poverty Rates by Occupational Status 2009Table 1.3: Non-Contributory PensionersTable 1.4: Inflation and Adjusted Poverty Lines 2009 – 2012Table 2.1: National Enrolment Ratio 2002 – 2012Table 2.2: Male and Female Enrolment 2010-2011 and 2011-2012 by District, Level and SexTable 3.1: Women in Village Councils by DistrictTable 4.1: MMR 1 and 2 Immunization Coverage 2010 – 2012Table 5.1: Maternal Mortality Rate and CausesTable 5.2: Proportion of Births Attended by Skilled Health PersonnelTable 5.3: Antenatal Care Coverage (at Least Once by Skilled Personnel)Table 6.1: Malaria Cases by District, Year and SexTable 6.2: New cases of TB by District/ Region of Tuberculosis, Treatment and OutcomeTable 6.3: Rate of HIV Positivity by SexTable 6.4: HIV/AIDS Prevalence among Pregnant Women 15 – 24 Years of Age, 2010 – 2012Table 7.1: Forest Cover, 1980-2012Table 7.2: Total Deforestation by District 2012Table 7.3: Schedule to Phase Out ODS from BelizeTable 7.4: Comparison of Fisheries Production for 2010 and 2011Table 7.5: Water Supply Systems in VillagesTable 8.1: Sources of External Debt
202426273031394650515566686970757677788592
12 34 56 78
6
4 6
5
7 83 2
1
LIST OF FIGURES
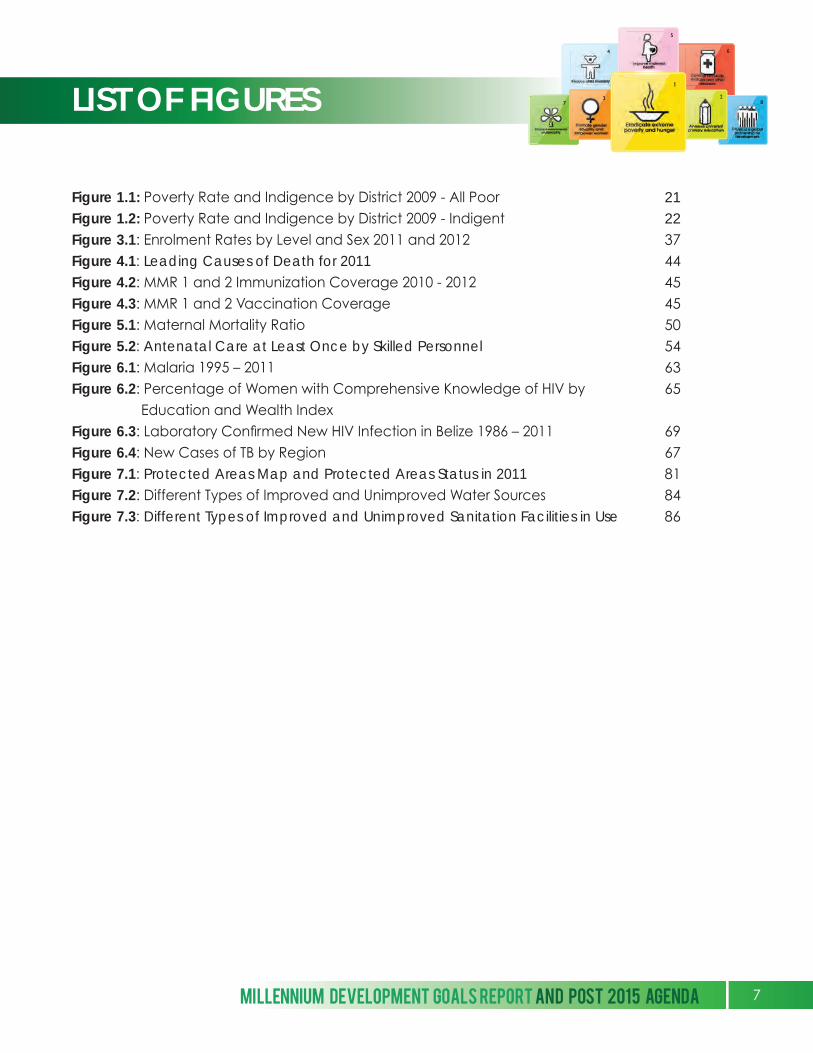
Figure 1.1: Poverty Rate and Indigence by District 2009 - All PoorFigure 1.2: Poverty Rate and Indigence by District 2009 - IndigentFigure 3.1: Enrolment Rates by Level and Sex 2011 and 2012Figure 4.1: Leading Causes of Death for 2011Figure 4.2: MMR 1 and 2 Immunization Coverage 2010 - 2012Figure 4.3: MMR 1 and 2 Vaccination CoverageFigure 5.1: Maternal Mortality RatioFigure 5.2: Antenatal Care at Least Once by Skilled PersonnelFigure 6.1: Malaria 1995 – 2011Figure 6.2: Percentage of Women with Comprehensive Knowledge of HIV by Education and Wealth IndexFigure 6.3: Laboratory Confirmed New HIV Infection in Belize 1986 – 2011Figure 6.4: New Cases of TB by RegionFigure 7.1: Protected Areas Map and Protected Areas Status in 2011Figure 7.2: Different Types of Improved and Unimproved Water SourcesFigure 7.3: Different Types of Improved and Unimproved Sanitation Facilities in Use
21223744454550546365
6967818486
MILLENNIUM DEVELOPMENT GOALS REPORT AND POST 2015 AGENDA 7
4 6
5
7 83 2
1
ACRONYMS
BELTRAIDE Belize Trade and Investment Development ServiceBOOST Building Opportunities for Our Social TransformationBSIF Belize Social Investment FundCARICOM Caribbean CommunityCARIFORUM Caribbean ForumCEDAW Convention on the Elimination of All Forms of Discrimination against WomenCCT Conditional Cash TransferCFC ChlorofluorocarbonsCO2 Carbon DioxideCPA Country Poverty AssessmentCSME Caribbean Single Market and EconomyDFT Department of Foreign TradeDOE Department of the EnvironmentEPA Economic Partnership AgreementFDI Foreign Direct InvestmentFPP Food Pantry ProgrammeFY Fiscal YearGDP Gross Domestic ProductGHG Greenhouse gasesGNI Gross National IncomeHIV/AIDS Human Immunodeficiency Virus/Acquired Immunodeficiency SyndromeIMF International Monetary FundIMR Infant Mortality RateIRS Indoor Residual SprayingITBs Insecticide Treated Bed-netsIUCN International Union for Conservation of NatureKWh Kilowatt HoursLFS Labour Force SurveyLIC Land Information CentreMARP Most at Risk PopulationMDG Millennium Development GoalMEA Multi-lateral Environmental AgreementsMED Ministry of Economic DevelopmentMHD Ministry of Human Development, Social Transformation and Poverty Alleviation)MICS Multiple Indicator Cluster SurveyMOH Ministry of HealthMOMS Midwives and Others with Midwifery SkillsMWRA Men and Women of Reproductive AgeNAP National AIDS Programme
12 34 56 78
8
NGO Non-governmental OrganizationNPES National Poverty Elimination StrategyODA Official Development AssistanceODP Ozone Depleting PotentialODS Ozone Depleting SubstancesOECD Organisation for Economic Co-operation and DevelopmentPAHO/WHO Pan American Health Organization/World Health OrganizationPPP Purchasing Power ParitySDG Sustainable Development GoalsSIB Statistical Institute of BelizeSICA Central American Integration SystemSISB Single Information System BeneficiariesSTI Sexually Transmitted InfectionsTB TuberculosisTWG Technical Working GroupUNCRC United Nations Convention on the Rights of the ChildUNECLAC United Nations Economic Commission for Latin America and the CaribbeanUNDP United Nations Development ProgrammeUNFCCC United Nations Framework Convention on Climate ChangeUNFPA United Nations Population FundUNICEF United Nations Children’s FundWB World BankWTO World Trade Organization$ Unless otherwise specified, $ refers to Belizean dollars
MILLENNIUM DEVELOPMENT GOALS REPORT AND POST 2015 AGENDA 9
4 6
5
7 83 2
1
EXECUTIVE SUMMARY
The current 2013 Belize MDGs Progress Report takes a stocktaking assessment of the country’s progress towards achieving the Millennium Development Goals documenting challenges that hindered progress and clearly identifying the ‘unfinished business’ or remaining and emerging priorities within the context of each MDG. Furthermore, the report also articulates a post 2015 development agenda building on the country’s experiences with the MDGs with a particular focus on lessons learnt and their implications on informed policy making. This is the more critical given the development of the new Growth and Poverty Reduction Strategy (GPRS) 2014-2017 that will essentially constitute the framework for both the country’s unfinished business with the MDGs, and the post-2015 agenda.
While national focus was placed on MDGs achievement since the Millennium Declaration in 2000, it had varying degrees of success. More specifically, in terms of progress on the MDGs, the country will meet the following targets: net primary education enrolment ratios and literacy rate (MDG 2); gender parity ratio in primary education (MDG 3); infant and child immunization rates (MGD 4); skilled birth attendance rate and antenatal care coverage(MDG 5)1 ; slowing of the prevalence of HIV/AIDS, providing universal access to anti-retrovirals, significant success in reduced mother to child transmission rates and eliminating malaria (MDG 6); maintaining a proportion of forest cover that remains highest in the region, increasing universal access to potable water sources and improved sanitation facilities (MDG 7); and expansion and diversity in communications technology (MDG 8).
Other targets and indictors are unlikely to be met by the 2015 deadline. The country will not meet its targets for poverty and hunger (MDG 1). There are multiple instances where aggregated national data on poverty masked substantial disparities at the sub-national level. Addressing these inequities will be a new challenge to the country, as it exemplifies instances where gains at the national level are not reflective of localized realities. Factors constraining achievement included disparate and interrelated resource constraints: the quantity and quality of the human capital, structural and socio-cultural constraints, and, the absence of favourable legislation to address tangent and emergent problems.
Belize’s real economic growth, which has consistently exceeded regional averages, has not necessarily translated into tangible reduction in the poverty levels, implying that tackling poverty necessitates a multi-dimensional approach, and measuring poverty is wider in scope than
1 According to Ministry of Health 2012 was the first calendar year in the history of Belize with no recorded maternal deaths.
12 34 56 78
10
income indicators. Specific interventions, such as the Conditional Cash Transfer and the Food Pantry programmes (MDG 1) were implemented to address poverty and hunger. These initiatives were aimed at simultaneously addressing poverty, while ensuring that other MDG indicators, notably in school attendance (MDG 2), gender equity (MDG 3) and child immunization (MDG 4) were being met.
Belize endorsed, for the most part, the MDGs including the globally set targets and indicators (where available) without necessarily attempting to set national targets. In the absence of Belizean specific indicators, primary schooling and literacy gains (MDG 2) are not reflected in indicators for functional literacy and numeracy, or pass levels in Mathematics and the Sciences that underpin technological development. Local proxy indicators could have been utilized in calculating the health targets where despite high poverty rates, the resultant high per capita costs of health care delivery did not unduly affect access. The challenge remains however, to maintain continued access without compromising quality since, the quality of human resources, medical equipment and infrastructure is important to the effective provision of care and coverage.
The emerging issue of citizen security is a major limitation impacting Belize’s final push towards MDG achievement. Belize’s homicide rates are among the highest in Central America at reported 41.4 homicides per 100,000 2. This high crime rate is likely to divert resources from other sectors, forcing expenditures in tertiary level health care for example to remain inordinately high and negatively impacting the enabling economic environment required for the productive sectors to thrive. In the context of a youth unemployment rate between ages 14-24 years (30% at September 2012) that is marginally less than four times the national average, initiatives to stimulate this sector will have enhanced likelihood of success in an environment with lower crime rates.
The national visioning framework, the Horizon 2030 and other strategic documents in the areas of energy, gender, education and health have been crafted. The agenda under Horizon 2030 bears broad similarity to the 10 thematic areas prepared for the United Nations Secretary General as the Action Agenda for Sustainable Development. As the end of the MDG era approaches, Belize’s policy makers, decision planners and all levels of the society have begun to craft a modest post-millennium 2015 agenda to which the country must remain focused on sustainable development objectives as the blueprint for people-centred development.
2 UNODC, Intentional homicide, count and rate per 100,000 population (1995 - 2011)
MILLENNIUM DEVELOPMENT GOALS REPORT AND POST 2015 AGENDA 11
4 6
5
7 83 2
1
INTRODUCTION
This is the third report that documents Belize’s progress towards achieving the Millennium Development Goals (MDGs). The first report was made in the mid-1990s; and a more comprehensive second report was made in 2010 with the Belize Outlook & Scorecard Report 2010. With 2015 fast approaching, Belize is faced with the twin tasks of making substantive progress on the MDGs, while articulating post 2015 priorities that build on progress in achieving national development and MDGs indicators. This third report documents progress made between 2010 and 2012, and assesses the momentum towards a final push to achievement. While highlighting lessons learnt and best practices, the report identifies additional measures required, and emphasises the implications for poverty reduction policies, programmes or projects, which will impact the prospects for targeted achievement by 2015. In terms of the timeliness of the report, the report immediately precedes Belize’s second national Medium-Term Development Strategy entitled the Growth and Poverty Reduction Strategy (GPRS) 2014-2017, and thus, would help inform the strategy to ensure it integrates targeted interventions to achieve the lagging MDGs, and integrate emerging priorities for the psot-2015 period.
Under Section 1, for each of the MDGs, the respective section commences with a display of the table and its indicators. Data cited will generally include the initial MDG baseline (1990) data, data from 2010 which forms the benchmark for this report (Status 2010), data at 2012, which marks the end point of this report (Actual 2012), and initial targets that were set to be achieved in 2015, regarded as the target deadline. The report elaborates extensively on the milestones and accomplishments under each MDG.
The report further articulates the new challenges that have inhibited progress towards initial target achievement and steps made to address those challenges. The analysis also includes a disaggregation of national data to highlight trends, geographical disparities, the rural-urban divide, and gender dichotomies in the country. It seeks to tease out instances when national data may not be reflective of localized realities. Finally, the focus shifts to the unfinished businesses of the MDGs, and the emerging priorities, including areas where targets will not be achieved by 2015.
Section 2 of the report provides an in-depth review of the unfinished business and emerging priorities, which are featured in a table enumerating the current development priorities that extend beyond 2015, sub-themes under those priorities, and indicators and timelines. These priorities derive from the Horizon 2030, and as such are overall and long-term priorities that will guide the country and inform policy makers and decision-makers in the post-2015 period when the MDGs ultimately morph into the Sustainable Development Goals (SDGs).
12 34 56 78
12
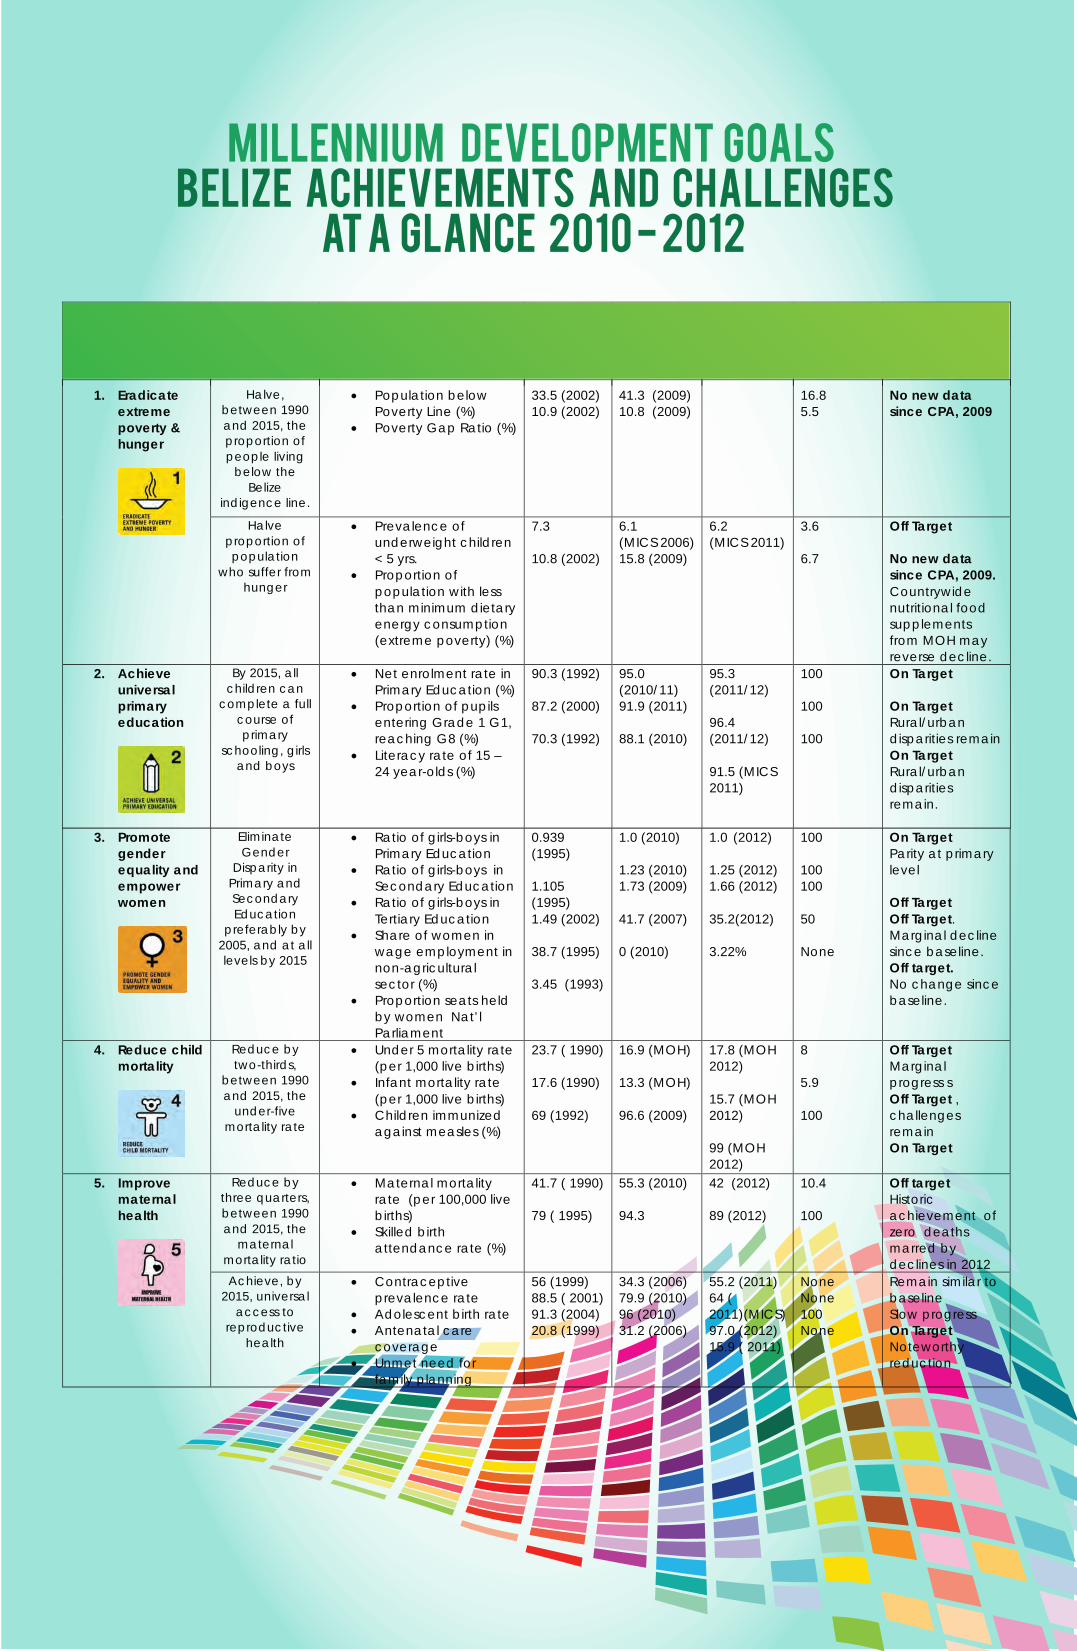
Millennium Development Goals Belize Achievements and Challenges
at a Glance 2010 - 2012
GOALS TARGETS INDICATORS BASELINE PROGRESS TARGET 2015
COMMENTS
2010 2012
1. Eradicate extreme poverty & hunger
Halve, between 1990 and 2015, the proportion of people living
below the Belize
indigence line.
• Population below Poverty Line (%)
• Poverty Gap Ratio (%)
33.5 (2002) 10.9 (2002)
41.3 (2009) 10.8 (2009)
16.8 5.5
No new data since CPA, 2009
Halve proportion of population
who suffer from hunger
• Prevalence of underweight children < 5 yrs.
• Proportion of population with less than minimum dietary energy consumption (extreme poverty) (%)
7.3 10.8 (2002)
6.1 (MICS 2006) 15.8 (2009)
6.2 (MICS 2011)
3.6 6.7
Off Target No new data since CPA, 2009. Countrywide nutritional food supplements from MOH may reverse decline.
2. Achieve universal primary education
By 2015, all children can
complete a full course of primary
schooling, girls and boys
• Net enrolment rate in Primary Education (%)
• Proportion of pupils entering Grade 1 G1, reaching G8 (%)
• Literacy rate of 15 – 24 year-olds (%)
90.3 (1992) 87.2 (2000) 70.3 (1992)
95.0 (2010/11) 91.9 (2011) 88.1 (2010)
95.3 (2011/12) 96.4 (2011/12) 91.5 (MICS 2011)
100 100 100
On Target On Target Rural/urban disparities remain On Target Rural/urban disparities remain.
3. Promote gender equality and empower women
Eliminate Gender
Disparity in Primary and Secondary Education
preferably by 2005, and at all levels by 2015
• Ratio of girls-boys in Primary Education
• Ratio of girls-boys in Secondary Education
• Ratio of girls-boys in Tertiary Education
• Share of women in wage employment in non-agricultural sector (%)
• Proportion seats held by women Nat’l Parliament
0.939 (1995) 1.105 (1995) 1.49 (2002) 38.7 (1995) 3.45 (1993)
1.0 (2010) 1.23 (2010) 1.73 (2009) 41.7 (2007) 0 (2010)
1.0 (2012)
1.25 (2012) 1.66 (2012) 35.2(2012) 3.22%
100 100 100 50 None
On Target Parity at primary level Off Target Off Target. Marginal decline since baseline. Off target. No change since baseline.
4. Reduce child mortality
Reduce by two-thirds,
between 1990 and 2015, the
under-five mortality rate
• Under 5 mortality rate (per 1,000 live births)
• Infant mortality rate (per 1,000 live births)
• Children immunized against measles (%)
23.7 ( 1990) 17.6 (1990) 69 (1992)
16.9 (MOH) 13.3 (MOH) 96.6 (2009)
17.8 (MOH 2012) 15.7 (MOH 2012) 99 (MOH 2012)
8 5.9 100
Off Target Marginal progress s Off Target , challenges remain On Target
5. Improve maternal health
Reduce by three quarters, between 1990 and 2015, the
maternal mortality ratio
• Maternal mortality rate (per 100,000 live births)
• Skilled birth attendance rate (%)
41.7 ( 1990) 79 ( 1995)
55.3 (2010) 94.3
42 (2012) 89 (2012)
10.4 100
Off target Historic achievement of zero deaths marred by declines in 2012
Achieve, by 2015, universal
access to reproductive
health
• Contraceptive prevalence rate
• Adolescent birth rate • Antenatal care
coverage • Unmet need for
family planning
56 (1999) 88.5 ( 2001) 91.3 (2004) 20.8 (1999)
34.3 (2006) 79.9 (2010) 96 (2010) 31.2 (2006)
55.2 (2011) 64 ( 2011)(MICS) 97.0 (2012) 15.9 ( 2011)
None None 100 None
Remain similar to baseline Slow progress On Target Noteworthy reduction
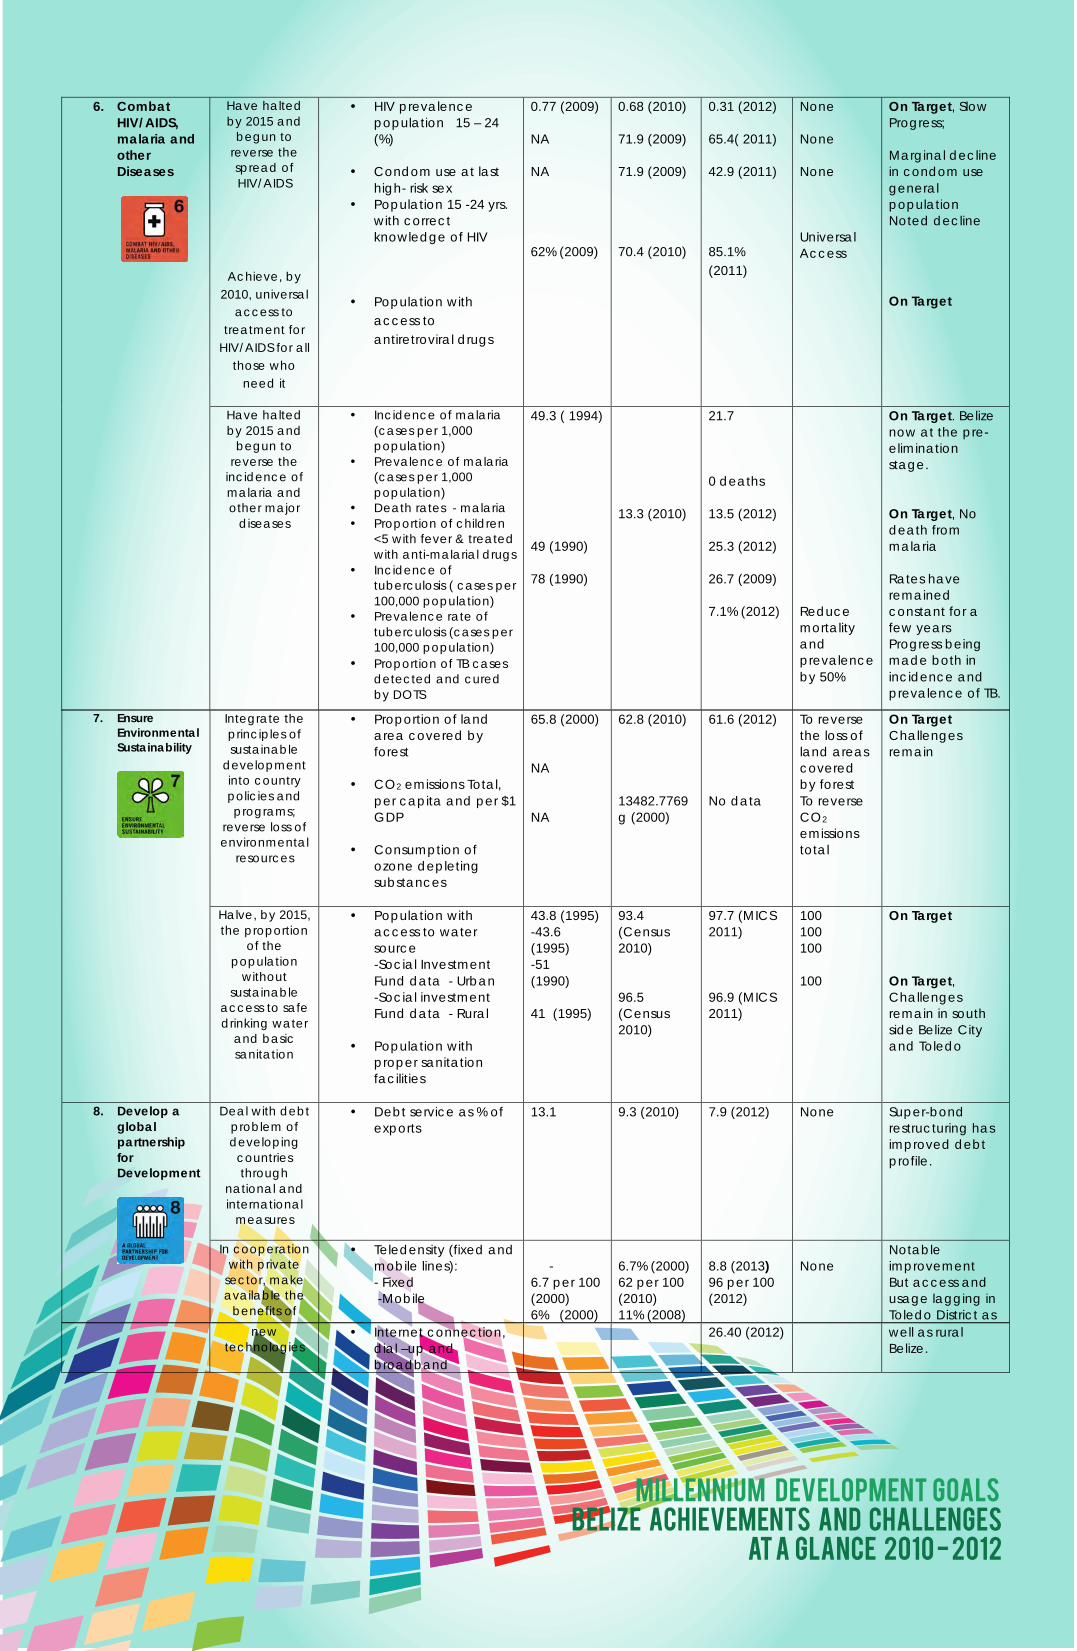
7. Ensure Environmental Sustainability
Integrate the principles of sustainable
development into country policies and programs;
reverse loss of environmental
resources
• Proportion of land area covered by forest
• CO2 emissions Total, per capita and per $1 GDP
• Consumption of ozone depleting substances
65.8 (2000) NA NA
62.8 (2010) 13482.7769 g (2000)
61.6 (2012) No data
To reverse the loss of land areas covered by forest To reverse CO2 emissions total
On Target Challenges remain
Halve, by 2015, the proportion
of the population
without sustainable
access to safe drinking water
and basic sanitation
• Population with access to water source -Social Investment Fund data - Urban -Social investment Fund data - Rural
• Population with proper sanitation facilities
43.8 (1995) -43.6 (1995) -51 (1990) 41 (1995)
93.4 (Census 2010) 96.5 (Census 2010)
97.7 (MICS 2011) 96.9 (MICS 2011)
100 100 100 100
On Target On Target, Challenges remain in south side Belize City and Toledo
8. Develop a global partnership for Development
Deal with debt problem of developing
countries through
national and international
measures
• Debt service as % of exports
13.1 9.3 (2010) 7.9 (2012) None Super-bond restructuring has improved debt profile.
In cooperation with private
sector, make available the
benefits of
• Teledensity (fixed and mobile lines): - Fixed -Mobile
- 6.7 per 100 (2000) 6% (2000)
6.7% (2000) 62 per 100 (2010) 11% (2008)
8.8 (2013) 96 per 100 (2012)
None
Notable improvement But access and usage lagging in Toledo District as
new technologies
• Internet connection, dial –up and broadband
26.40 (2012) well as rural Belize.
Millennium Development Goals Belize Achievements and Challenges
at a Glance 2010 - 2012
6. Combat HIV/AIDS, malaria and other Diseases
Have halted by 2015 and
begun to reverse the spread of HIV/AIDS
Achieve, by 2010, universal
access to treatment for
HIV/AIDS for all those who
need it
• HIV prevalence population 15 – 24 (%)
• Condom use at last high- risk sex
• Population 15 -24 yrs. with correct knowledge of HIV
• Population with access to antiretroviral drugs
0.77 (2009) NA NA
62% (2009)
0.68 (2010) 71.9 (2009) 71.9 (2009)
70.4 (2010)
0.31 (2012) 65.4( 2011) 42.9 (2011)
85.1% (2011)
None None None Universal Access
On Target, Slow Progress; Marginal decline in condom use general population Noted decline
On Target
Have halted by 2015 and
begun to reverse the
incidence of malaria and other major
diseases
• Incidence of malaria (cases per 1,000 population)
• Prevalence of malaria (cases per 1,000 population)
• Death rates - malaria • Proportion of children
<5 with fever & treated with anti-malarial drugs
• Incidence of tuberculosis ( cases per 100,000 population)
• Prevalence rate of tuberculosis (cases per 100,000 population)
• Proportion of TB cases detected and cured by DOTS
49.3 ( 1994) 49 (1990) 78 (1990)
13.3 (2010)
21.7 0 deaths 13.5 (2012) 25.3 (2012) 26.7 (2009) 7.1% (2012)
Reduce mortality and prevalence by 50%
On Target. Belize now at the pre-elimination stage. On Target, No death from malaria Rates have remained constant for a few years Progress being made both in incidence and prevalence of TB.
1
SECTION 1.1GOAL #1: ERADICATE POVERTY
AND HUNGER
This goal has three targets and nine indicators. Despite continued economic growth and Government’s safety net initiatives, Belize is off target. One pro-poor initiative is a Conditional Cash Transfer (CCT) programme detailed under the acronym BOOST (Building Our Opportunities for Social Transformation). A Food Pantry programme being undertaken, specifically targets malnutrition and other initiatives, and addresses poverty among the elderly. A more focused targeting mechanism such as the Single Information System of Beneficiaries (SISB) will likely ensure that assistance is efficiently directed to the poor and indigent as well as enhance efforts aimed at addressing the specific, underlying causes of poverty to eventually improve this indicator.
MILLENNIUM DEVELOPMENT GOALS REPORT AND POST 2015 AGENDA 17
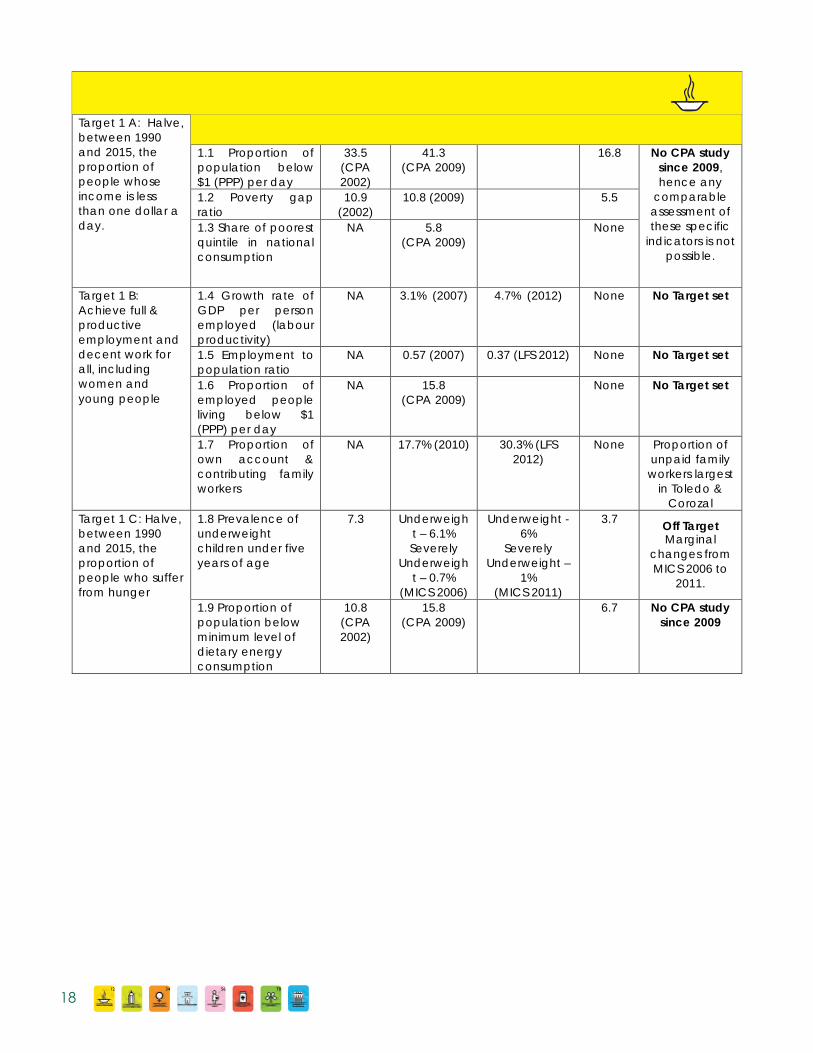
Goal #1: Eradicate Extreme Poverty And Hunger
Target 1 A: Halve, between 1990 and 2015, the proportion of people whose income is less than one dollar a day.
Indicators Baseline 1990
Status 2010
Actual 2012
Target 2015
Comments
1.1 Proportion of population below $1 (PPP) per day
33.5 (CPA 2002)
41.3 (CPA 2009)
16.8 No CPA study since 2009, hence any
comparable assessment of these specific
indicators is not possible.
1.2 Poverty gap ratio
10.9 (2002)
10.8 (2009) 5.5
1.3 Share of poorest quintile in national consumption
NA 5.8 (CPA 2009)
None
Target 1 B: Achieve full & productive employment and decent work for all, including women and young people
1.4 Growth rate of GDP per person employed (labour productivity)
NA 3.1% (2007)
4.7% (2012)
None No Target set
1.5 Employment to population ratio
NA 0.57 (2007) 0.37 (LFS 2012) None No Target set
1.6 Proportion of employed people living below $1 (PPP) per day
NA 15.8 (CPA 2009)
None No Target set
1.7 Proportion of own account & contributing family workers
NA 17.7% (2010)
30.3% (LFS 2012)
None Proportion of unpaid family workers largest
in Toledo & Corozal
Target 1 C: Halve, between 1990 and 2015, the proportion of people who suffer from hunger
1.8 Prevalence of underweight children under five years of age
7.3 Underweight – 6.1% Severely
Underweight – 0.7%
(MICS 2006)
Underweight - 6%
Severely Underweight –
1% (MICS 2011)
3.7
Marginal changes from MICS 2006 to
2011.
Off Target
1.9 Proportion of population below minimum level of dietary energy consumption
10.8 (CPA 2002)
15.8 (CPA 2009)
6.7 No CPA study since 2009
12 34 56 78
18
The study of poverty in Belize and the Caribbean is undertaken via a Country Poverty Assessment (CPA)3. Three Country Poverty Assessments (CPA) have been conducted in Belize, in 1995, in 2002 and in 2009 respectively.
A principal component of the CPA is the Living Standards Measurement Surveys (LSMS)4. The LSMS conducted as part of the 2009 CPA collected information on household expenditure and income, housing, labour force, education, disability and other characteristics germane to the analysis and assessment of poverty. It is surveys such as these that provide the objective basis for measuring the incidence of poverty among the population. Some of the indicators derived include the indigence line5, the poverty line6 and the poverty gap ratio7.
Target 1 A: Halve, between 1990 and 2015, the proportion of people whose income is less than one dollar per day.
Indicators: 1.1 Proportion of population below $1 (PPP) per day; 1.2 Poverty gap ratio; 1.3 Share of poorest quintile in national consumption.
In 2009, there were 41.3% of the population regarded as poor and that included the 15.8% classified as extremely poor or indigent (Table 1.1). Indigence in the Belizean context was defined as not having a consumption level that was at least equivalent to the minimum food basket of $5.50 per day for a household of 5. The poverty line adds a non-food component to the indigent line and increases it to $10.00 per day or $3,587.00 per annum. The 2015 target is to halve the proportion of the population that is indigent.
The poverty gap ratio in 2009 was estimated at 10.8, indicating a negligible change from 10.9 in 2002. The target is to half this gap to 5.5 in 2015.
3 The CPA’s primary objective is to identify the extent, severity, characteristics and causes of poverty and hence the factors, such as economic and social policies, unemployment and socio-cultural-legal characteristics which contribute to the generation, exacerbation and reduction of poverty in the country.4 Established by the World Bank in the 1980s and generally used to measure poverty and related indicators using income or consumption data gathered at the household level5 The indigence line focuses on extreme poverty and hunger and is regarded as the minimum amount of money required to provide a basic though balanced daily diet to an individual or a family.6 The poverty line adds a non-food component to the indigence line.7 The poverty gap ratio measures the average intensity of poverty (or of indigence) as the average distance at which persons consume below the poverty line (or the indigence line), taken as a proportion of the poverty line (or the indigence line). The mean is computed over the population as a whole, so that persons who consume above the poverty line (or the indigence line) are scored as having a gap of zero.
MILLENNIUM DEVELOPMENT GOALS REPORT AND POST 2015 AGENDA 19
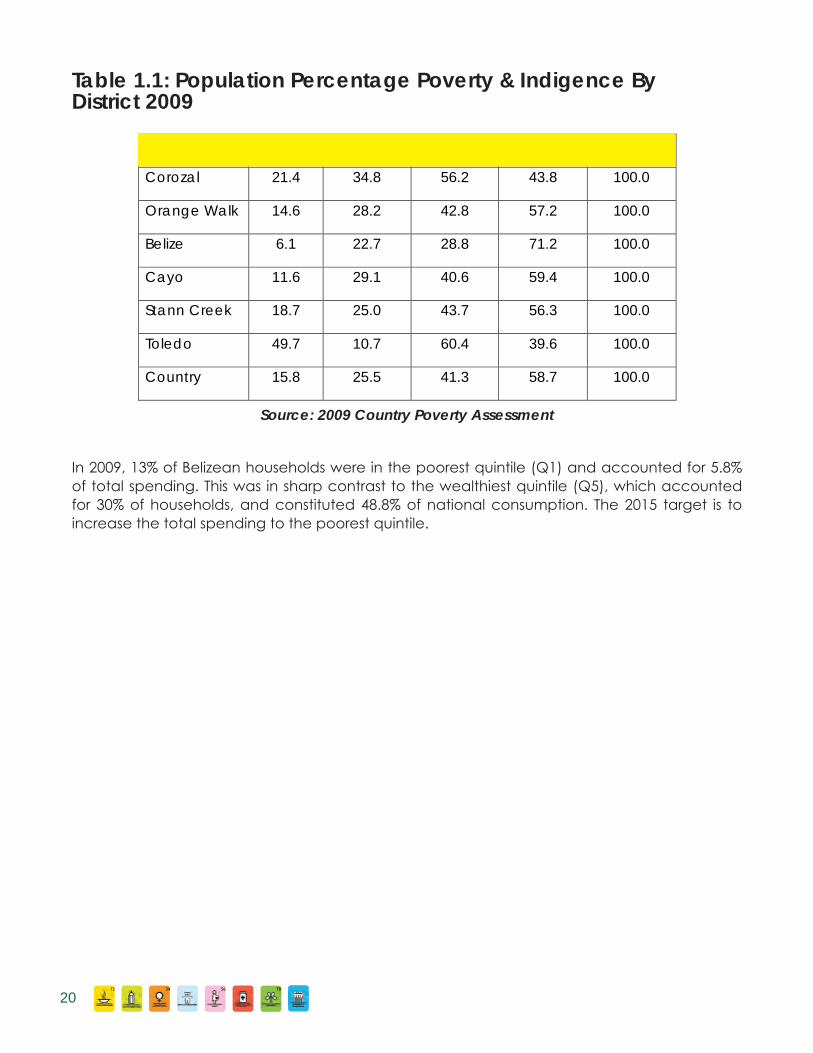
In 2009, 13% of Belizean households were in the poorest quintile (Q1) and accounted for 5.8% of total spending. This was in sharp contrast to the wealthiest quintile (Q5), which accounted for 30% of households, and constituted 48.8% of national consumption. The 2015 target is to increase the total spending to the poorest quintile.
Table 1.1: Population Percentage Poverty & Indigence By District 2009
District Indigent Poor All Poor Non-Poor Total
Corozal 21.4 34.8 56.2 43.8 100.0
Orange Walk 14.6 28.2 42.8 57.2 100.0
Belize 6.1 22.7 28.8 71.2 100.0
Cayo 11.6 29.1 40.6 59.4 100.0
Stann Creek 18.7 25.0 43.7 56.3 100.0
Toledo 49.7 10.7 60.4 39.6 100.0
Country 15.8 25.5 41.3 58.7 100.0
Source: 2009 Country Poverty Assessment
12 34 56 78
20
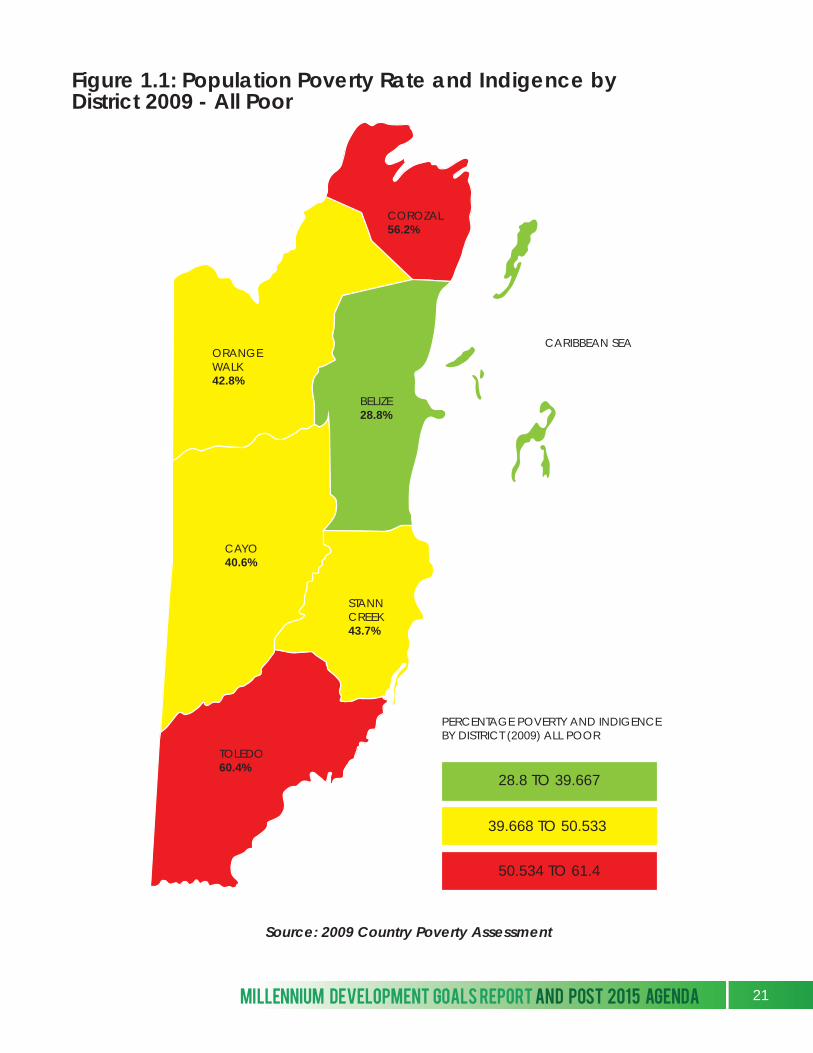
Figure 1.1: Population Poverty Rate and Indigence by District 2009 - All Poor
COROZAL56.2%
ORANGEWALK42.8%
BELIZE28.8%
CAYO40.6%
STANNCREEK43.7%
TOLEDO60.4%
CARIBBEAN SEA
28.8 TO 39.667
39.668 TO 50.533
50.534 TO 61.4
Source: 2009 Country Poverty Assessment
PERCENTAGE POVERTY AND INDIGENCEBY DISTRICT (2009) ALL POOR
MILLENNIUM DEVELOPMENT GOALS REPORT AND POST 2015 AGENDA 21
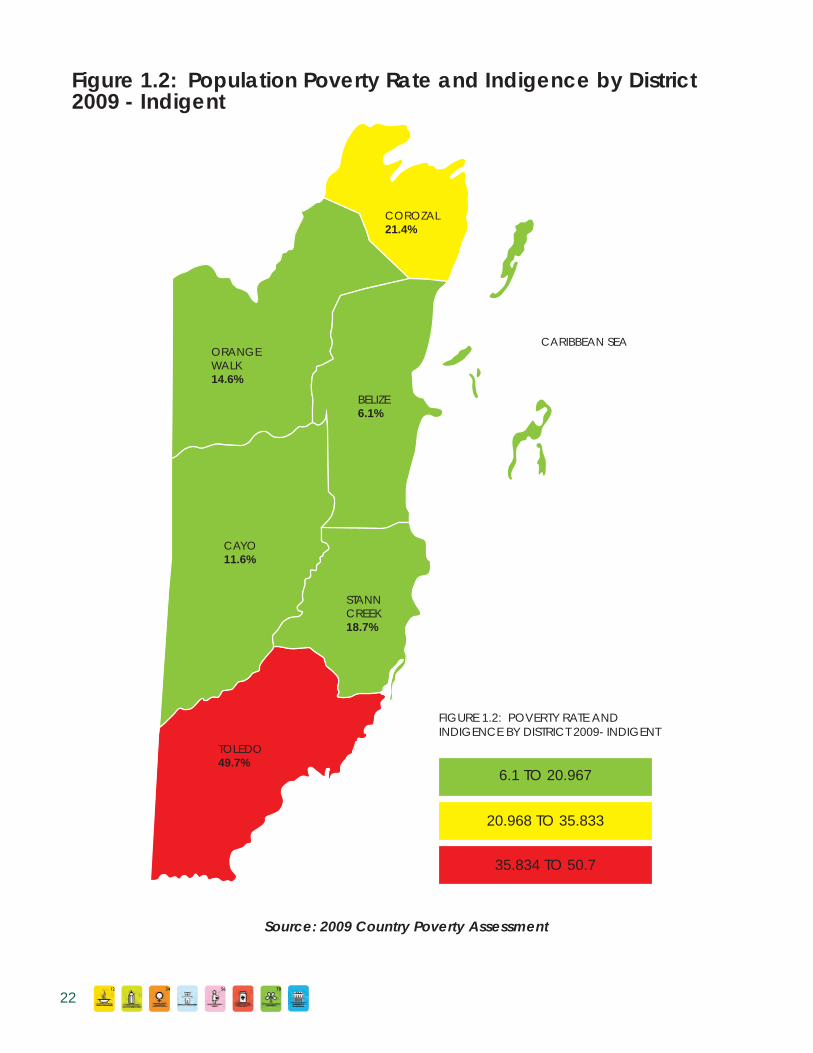
Figure 1.2: Population Poverty Rate and Indigence by District 2009 - Indigent
COROZAL21.4%
ORANGEWALK14.6%
BELIZE6.1%
CAYO11.6%
STANNCREEK18.7%
TOLEDO49.7%
CARIBBEAN SEA
6.1 TO 20.967
20.968 TO 35.833
35.834 TO 50.7
Source: 2009 Country Poverty Assessment
FIGURE 1.2: POVERTY RATE AND INDIGENCE BY DISTRICT 2009- INDIGENT
12 34 56 78
22
Target 1 B: Achieve full and productive employment and decent work for all, including women and young people
Indicator: 1.4 Growth rate of GDP per person employed
The Scorecard and Outlook Report 2010 indicated that the rate of growth of GDP per worker, measured at market prices, has trended downward since 2000, with the trend being even more noticeable since 2002. The 2010 Report measured the growth rate at 3.12% at the end of 2007 and noted that no targets were set for this indicator in the National Poverty Elimination Strategy (NPES). Using the most recent GDP data and LFS, this indicator was calculated at 4.7% in 2012. Increased labour productivity growth could be traced to increased efficiency in the use of labour or to a shift in the type of productive activities in the economy from those with low levels of productivity to those with higher levels of productivity. This latter explanation is more likely in the case of Belize since 2005 the country has become a petroleum exporter. Belize’s light sweet crude oil is a high value product and given the comparatively small amounts of employment in the petroleum sector, productivity gains are likely attributable to income returns from this sector.
Regarding decent work for women and young people, challenges remain in these areas as the LFS (September 2012) records unemployment among the youth (14 to 24 yrs old) at 30% and women unemployment at 22.4%. Both of these are substantially above the then national average of 14.4% (LFS 2012).
Indicator: 1.5 Employment to population ratio
The 2010 Report noted that this indicator has been increasing consistently since 1995. The simultaneous growth of poverty and indigence over the same period could imply that jobs are being created in areas where earnings are insufficient to lift persons out of poverty. The 2009 CPA reports that, “Poverty and indigence are much higher amongst agricultural workers and those in elementary (unskilled) occupations.” Once again, no targets were set for this indicator. While LFS (September 2012) indicates a reduction in unemployment to 14.4%, there continues to be high levels of gender disparity in unemployment with females recording higher levels than males. The employed/working age was 55.45% at September 2012.
Indicator: 1.6 Proportion of employed people living below $1 (PPP) per day
This indicator relates to the working poor. The 2009 CPA reports that one in every three persons who was poor was employed and earning median monthly incomes as specified in table down below.
MILLENNIUM DEVELOPMENT GOALS REPORT AND POST 2015 AGENDA 23
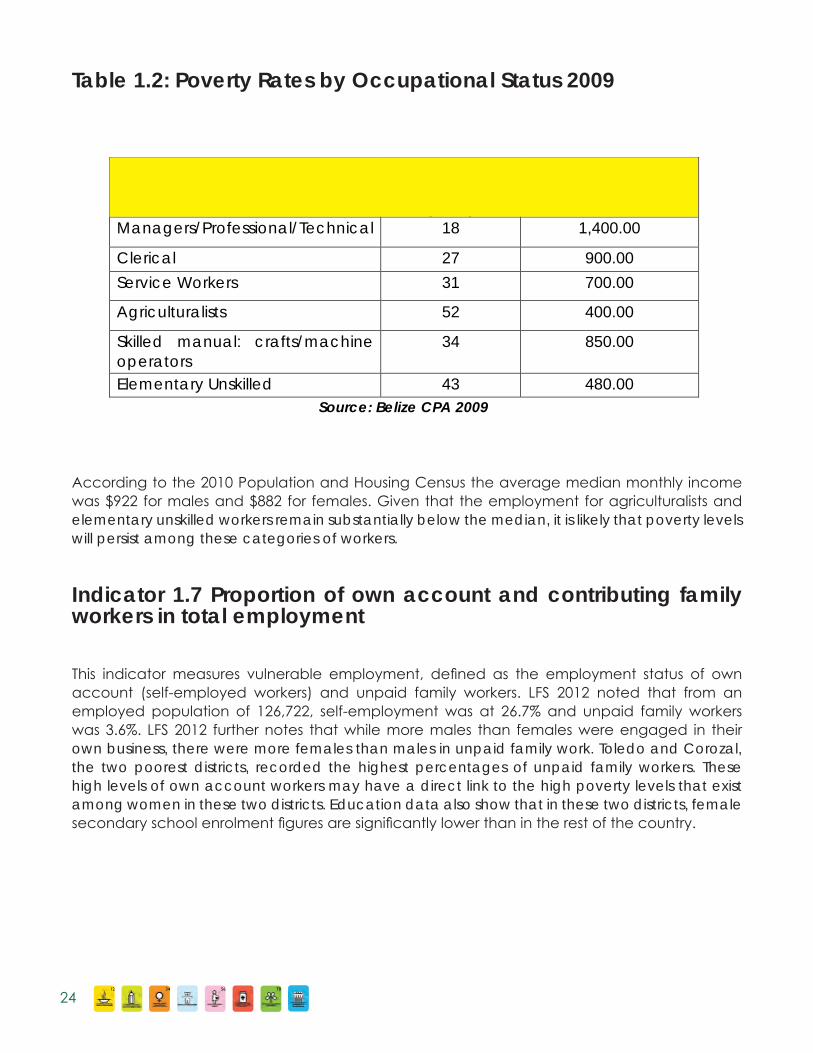
Table 1.2: Poverty Rates by Occupational Status 2009
According to the 2010 Population and Housing Census the average median monthly income was $922 for males and $882 for females. Given that the employment for agriculturalists and elementary unskilled workers remain substantially below the median, it is likely that poverty levels will persist among these categories of workers.
Indicator 1.7 Proportion of own account and contributing family workers in total employment
This indicator measures vulnerable employment, defined as the employment status of own account (self-employed workers) and unpaid family workers. LFS 2012 noted that from an employed population of 126,722, self-employment was at 26.7% and unpaid family workers was 3.6%. LFS 2012 further notes that while more males than females were engaged in their own business, there were more females than males in unpaid family work. Toledo and Corozal, the two poorest districts, recorded the highest percentages of unpaid family workers. These high levels of own account workers may have a direct link to the high poverty levels that exist among women in these two districts. Education data also show that in these two districts, female secondary school enrolment figures are significantly lower than in the rest of the country.
Occupation Percentage
Poverty (2009)
Median Monthly Income (Bz $)
Managers/Professional/Technical 18 1,400.00
Clerical 27 900.00
Service Workers 31 700.00
Agriculturalists 52 400.00
Skilled manual: crafts/machine operators
34 850.00
Elementary Unskilled 43 480.00 Source: Belize CPA 2009
12 34 56 78
24
Target 1 C: Halve, between 1990 and 2015, the proportion of people who suffer from hunger
Indicator 1.8 Prevalence of underweight children under five years of age
The Multiple Indicators Cluster Survey (MICS) 2006 found that 6.1% of children were moderately underweight and 0.7% were severely underweight. MICS (2006) also found approximately 18% of the children aged less than five years old were stunted or too short for their age and 1.4% were wasted or too thin for their height (MICS 2006). Five years later MICS (2011) found that the moderately underweight had decreased marginally to 6% and the severely underweight had increased to 1%. The MDG target requires a halving of these indicators of malnutrition. Based on the fact that CPA 2009 reported an increase in 7 percentage points in the poverty rate among the 0 to 4 year old cohort to 45% in 2009, from 38% in 2002, it would seem unlikely that the target would be achieved. The Ministry of Health has sought to address malnutrition among children by providing a protein food supplement, Incaparina. Families are encouraged to blend the food supplement with their existing cultural dishes so that it may be even more widely accepted.
Indicator 1.9 Proportion of population below minimum level of dietary energy consumption
This indicator bears substantial similarity to the indigence line and it is that line that is used as a proxy for this indicator in Belize. Indigence is measured by the cost of a minimum food basket per day for a family which was valued at $5.50 in 2009. Some 15.8% of the population were considered indigent, with the rates being highest in Toledo at 49.7% and lowest in Belize at 6.1%. The target of halving this indicator to average 7.9% nationally is unlikely to be achieved by 2015.
MILESTONE ACHIEVEMENTS
The outlook in 2010 for most of the indicators of MDG 1 was that these targets would not be achieved, since instead of trending downwards, indigence and poverty, had in fact increased since 2002. The negative outlook is, tempered by the fact that there have been a noted increase in government’s pro-poor expenditures and programmes, and real increases in the budgets of the social sector ministries of Education, Health and Human Development.
MILLENNIUM DEVELOPMENT GOALS REPORT AND POST 2015 AGENDA 25
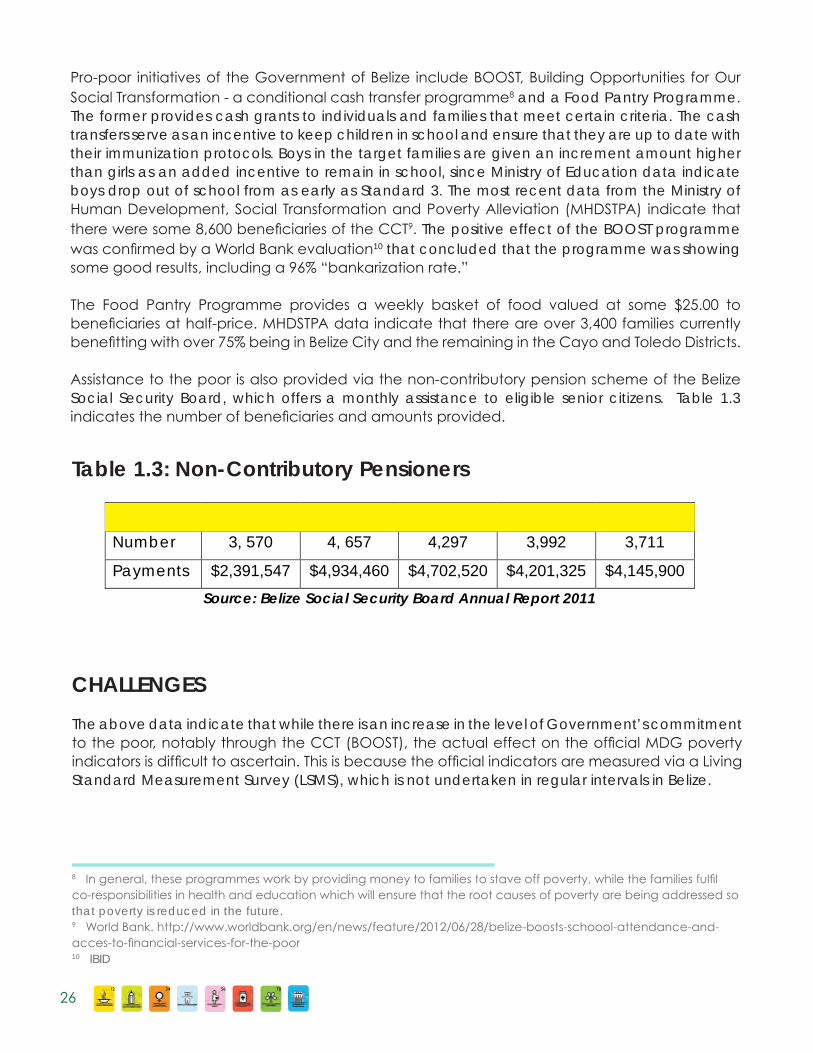
Pro-poor initiatives of the Government of Belize include BOOST, Building Opportunities for Our Social Transformation - a conditional cash transfer programme8 and a Food Pantry Programme. The former provides cash grants to individuals and families that meet certain criteria. The cash transfers serve as an incentive to keep children in school and ensure that they are up to date with their immunization protocols. Boys in the target families are given an increment amount higher than girls as an added incentive to remain in school, since Ministry of Education data indicate boys drop out of school from as early as Standard 3. The most recent data from the Ministry of Human Development, Social Transformation and Poverty Alleviation (MHDSTPA) indicate that there were some 8,600 beneficiaries of the CCT9. The positive effect of the BOOST programme was confirmed by a World Bank evaluation10 that concluded that the programme was showing some good results, including a 96% “bankarization rate.”
The Food Pantry Programme provides a weekly basket of food valued at some $25.00 to beneficiaries at half-price. MHDSTPA data indicate that there are over 3,400 families currently benefitting with over 75% being in Belize City and the remaining in the Cayo and Toledo Districts.
Assistance to the poor is also provided via the non-contributory pension scheme of the Belize Social Security Board, which offers a monthly assistance to eligible senior citizens. Table 1.3 indicates the number of beneficiaries and amounts provided.
Table 1.3: Non-Contributory Pensioners
Year 2007 2008 2009 2010 2011
Number 3, 570 4, 657 4,297 3,992 3,711
Payments $2,391,547 $4,934,460 $4,702,520 $4,201,325 $4,145,900
Source: Belize Social Security Board Annual Report 2011
CHALLENGES
The above data indicate that while there is an increase in the level of Government’s commitment to the poor, notably through the CCT (BOOST), the actual effect on the official MDG poverty indicators is difficult to ascertain. This is because the official indicators are measured via a Living Standard Measurement Survey (LSMS), which is not undertaken in regular intervals in Belize.
8 In general, these programmes work by providing money to families to stave off poverty, while the families fulfil co-responsibilities in health and education which will ensure that the root causes of poverty are being addressed so that poverty is reduced in the future.9 World Bank. http://www.worldbank.org/en/news/feature/2012/06/28/belize-boosts-schoool-attendance-and-acces-to-financial-services-for-the-poor10 IBID
12 34 56 78
26
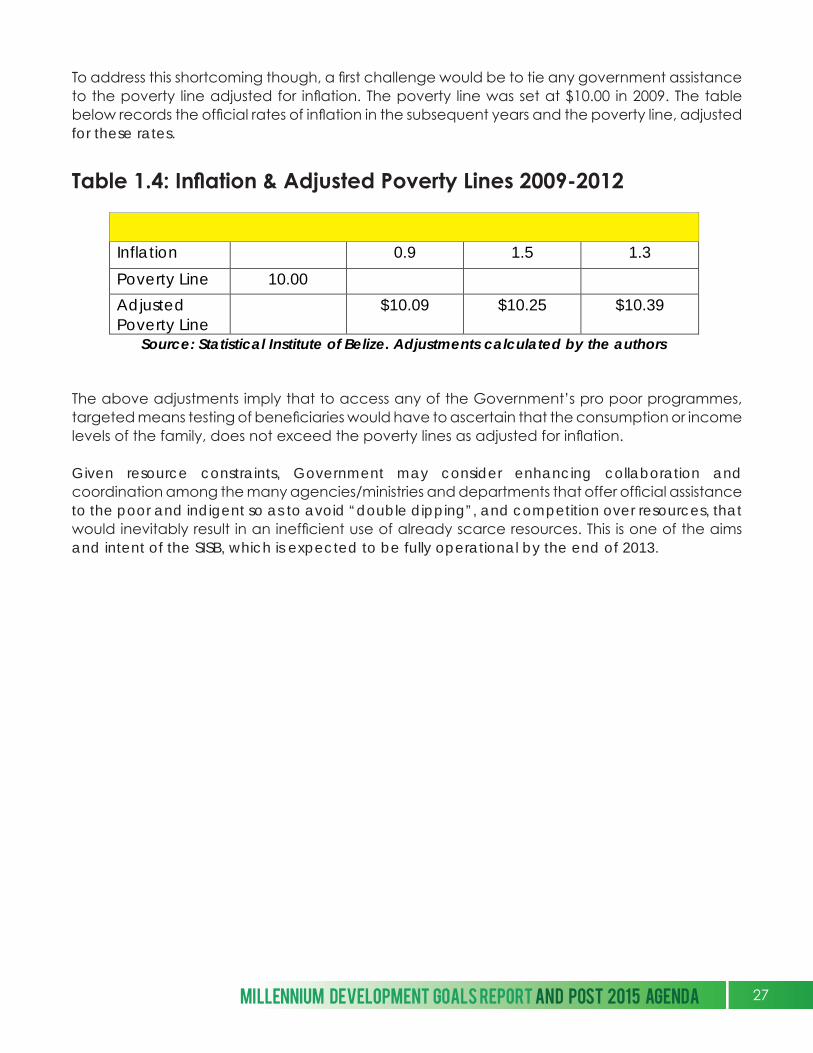
Table 1.4: Inflation & Adjusted Poverty Lines 2009-2012
Year 2009 2010 2011 2012
Inflation 0.9 1.5 1.3
Poverty Line 10.00
Adjusted Poverty Line
$10.09 $10.25 $10.39
Source: Statistical Institute of Belize. Adjustments calculated by the authors
To address this shortcoming though, a first challenge would be to tie any government assistance to the poverty line adjusted for inflation. The poverty line was set at $10.00 in 2009. The table below records the official rates of inflation in the subsequent years and the poverty line, adjusted for these rates.
The above adjustments imply that to access any of the Government’s pro poor programmes, targeted means testing of beneficiaries would have to ascertain that the consumption or income levels of the family, does not exceed the poverty lines as adjusted for inflation.
Given resource constraints, Government may consider enhancing collaboration and coordination among the many agencies/ministries and departments that offer official assistance to the poor and indigent so as to avoid “double dipping”, and competition over resources, that would inevitably result in an inefficient use of already scarce resources. This is one of the aims and intent of the SISB, which is expected to be fully operational by the end of 2013.
MILLENNIUM DEVELOPMENT GOALS REPORT AND POST 2015 AGENDA 27
2
2812 34 56 78
SECTION 1.2GOAL #2: ACHIEVE UNIVERSAL
PRIMARY EDUCATION
There are three indicators under this goal and Belize is on track to achieving all. Over the past 12 years, spending on all levels of the educational system, has consumed marginally in excess of a quarter of public resources. This spending has resulted in increased access to primary education in all districts, provision of textbooks to all primary schools through the Government’s textbook programme, increased assistance for the training of teachers, subsidized school feeding programs and direct transportation assistance to rural schools.
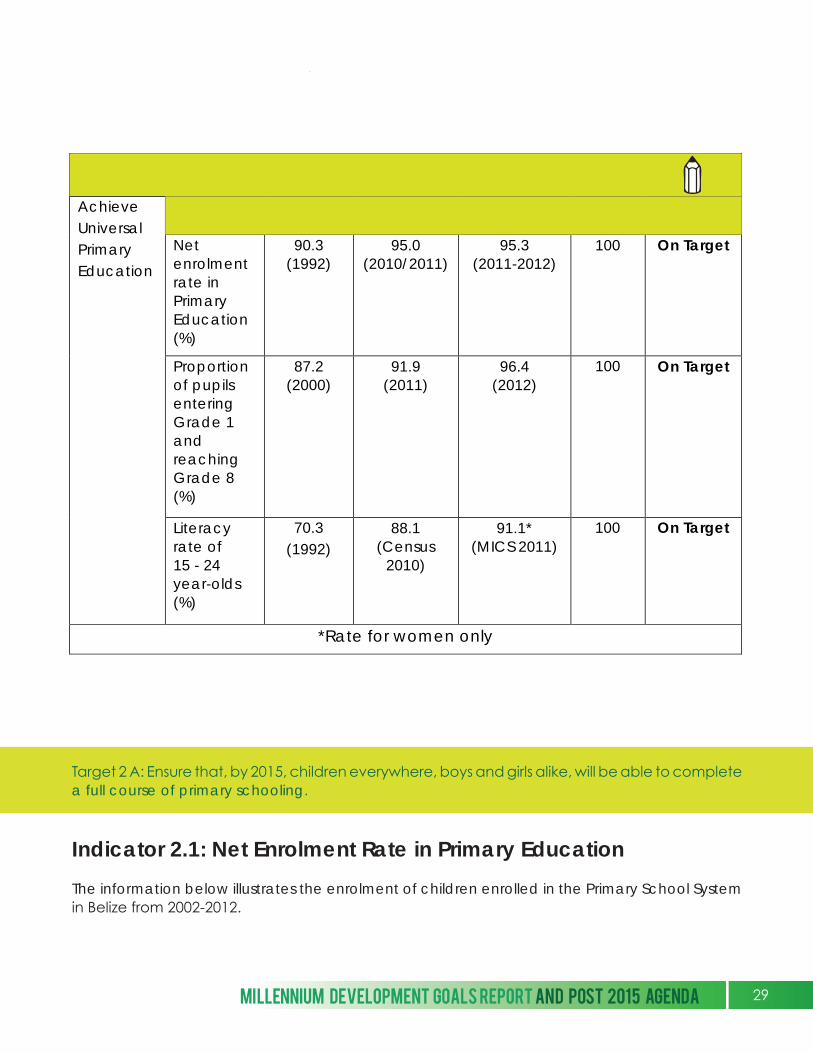
Target 2 A: Ensure that, by 2015, children everywhere, boys and girls alike, will be able to complete a full course of primary schooling.
Indicator 2.1: Net Enrolment Rate in Primary Education
The information below illustrates the enrolment of children enrolled in the Primary School System in Belize from 2002-2012.
GOAL #2: Achieve Universal Primary Education
Achieve Universal Primary Education
Indicators Baseline
1990 Status 2010
Actual 2012
Target 2015
Comments
Net enrolment rate in Primary Education (%)
90.3 (1992)
95.0 (2010/2011)
95.3 (2011-2012)
100
On Target
Proportion of pupils entering Grade 1 and reaching Grade 8 (%)
87.2 (2000)
91.9 (2011)
96.4 (2012)
100 On Target
Literacy rate of 15 - 24 year-olds (%)
70.3 (1992)
88.1 (Census
2010)
91.1* (MICS 2011)
100 On Target
*Rate for women only
MILLENNIUM DEVELOPMENT GOALS REPORT AND POST 2015 AGENDA 29
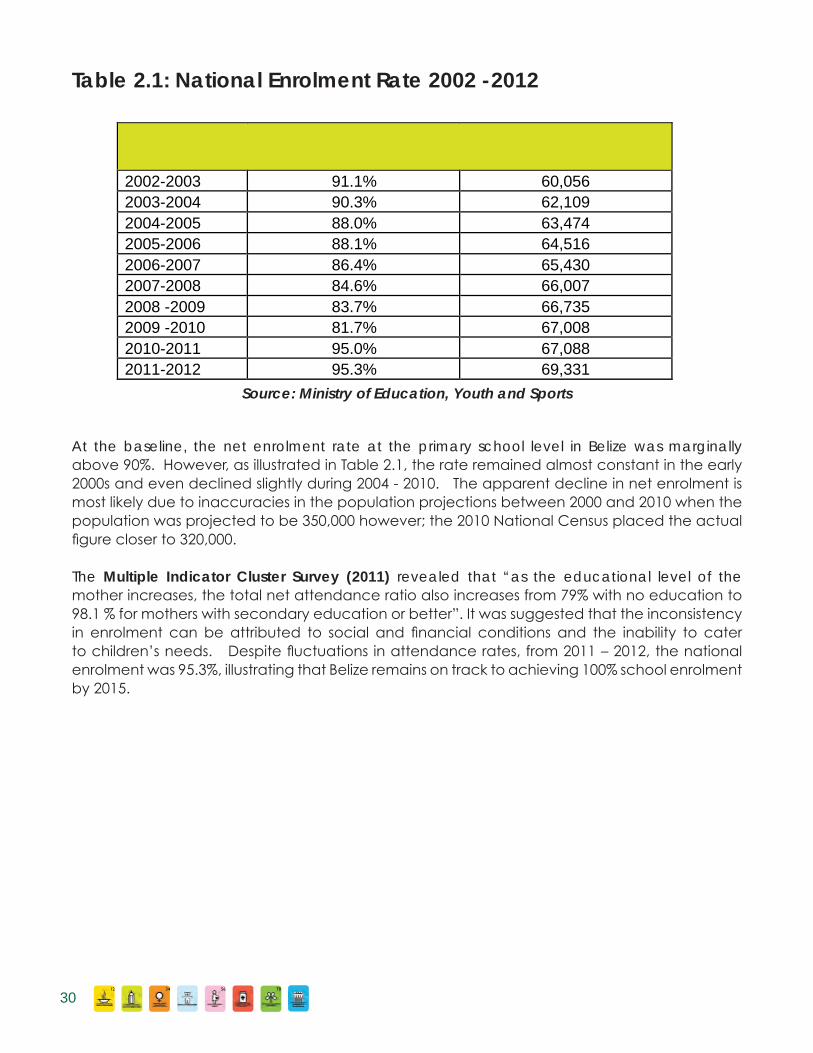
Table 2.1: National Enrolment Rate 2002 -2012
At the baseline, the net enrolment rate at the primary school level in Belize was marginally above 90%. However, as illustrated in Table 2.1, the rate remained almost constant in the early 2000s and even declined slightly during 2004 - 2010. The apparent decline in net enrolment is most likely due to inaccuracies in the population projections between 2000 and 2010 when the population was projected to be 350,000 however; the 2010 National Census placed the actual figure closer to 320,000.
The Multiple Indicator Cluster Survey (2011) revealed that “as the educational level of the mother increases, the total net attendance ratio also increases from 79% with no education to 98.1 % for mothers with secondary education or better”. It was suggested that the inconsistency in enrolment can be attributed to social and financial conditions and the inability to cater to children’s needs. Despite fluctuations in attendance rates, from 2011 – 2012, the national enrolment was 95.3%, illustrating that Belize remains on track to achieving 100% school enrolment by 2015.
Year Net Enrolment Rate Total Enrolment
2002-2003 91.1% 60,056 2003-2004 90.3% 62,109 2004-2005 88.0% 63,474 2005-2006 88.1% 64,516 2006-2007 86.4% 65,430 2007-2008 84.6% 66,007 2008 -2009 83.7% 66,735 2009 -2010 81.7% 67,008 2010-2011 95.0% 67,088 2011-2012 95.3% 69,331 Source: Ministry of Education, Youth and Sports
12 34 56 78
30
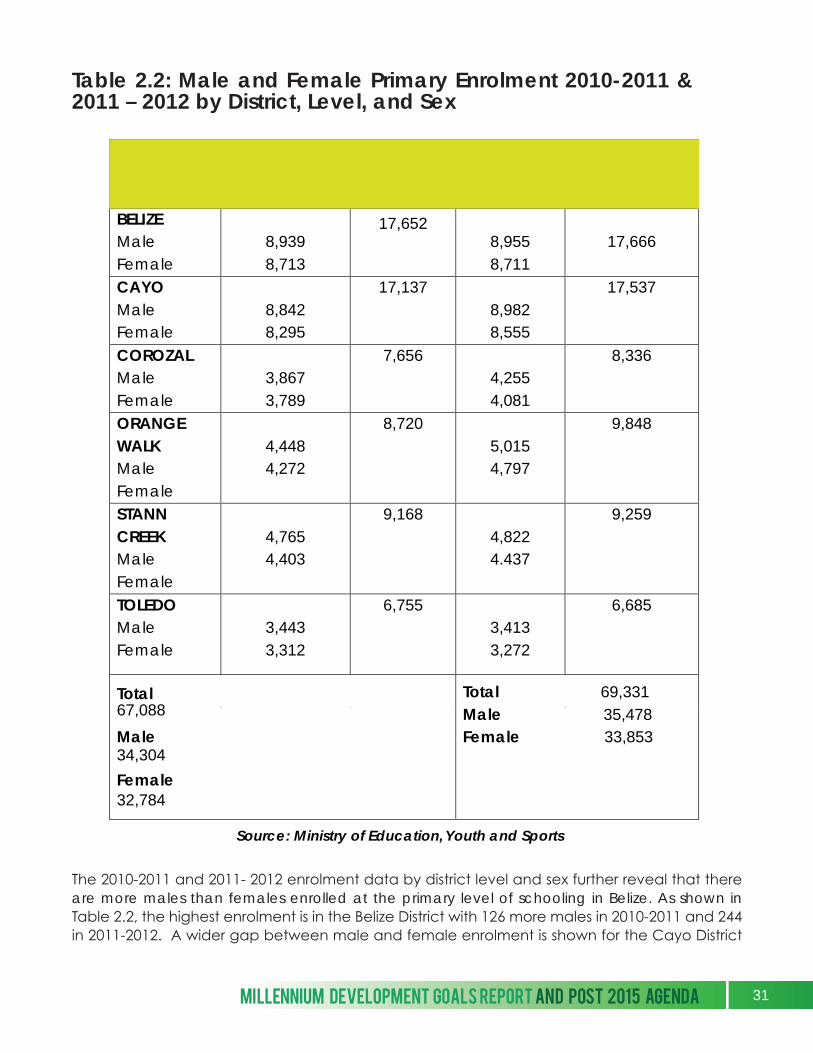
Table 2.2: Male and Female Primary Enrolment 2010-2011 & 2011 – 2012 by District, Level, and Sex
The 2010-2011 and 2011- 2012 enrolment data by district level and sex further reveal that there are more males than females enrolled at the primary level of schooling in Belize. As shown in Table 2.2, the highest enrolment is in the Belize District with 126 more males in 2010-2011 and 244 in 2011-2012. A wider gap between male and female enrolment is shown for the Cayo District
Districts Enrolment
by sex 2010 - 2011
Total Enrolment 2010-2011
Enrolment by sex
2011-2012
Total Enrolment 2011-2012
BELIZE Male Female
8,939 8,713
17,652
8,955 8,711
17,666
CAYO Male Female
8,842 8,295
17,137 8,982 8,555
17,537
COROZAL Male Female
3,867 3,789
7,656 4,255 4,081
8,336
ORANGE WALK Male Female
4,448 4,272
8,720 5,015 4,797
9,848
STANN CREEK Male Female
4,765 4,403
9,168 4,822 4.437
9,259
TOLEDO Male Female
3,443 3,312
6,755 3,413 3,272
6,685
Total 69,331 Male 35,478 Female 33,853
Source: Ministry of Education, Youth and Sports
Total 67,088
Male 34,304
Female 32,784
MILLENNIUM DEVELOPMENT GOALS REPORT AND POST 2015 AGENDA 31
which has the second highest enrolment of primary school students with 547 more males in 2010-2011 and 427 in 2011-2012. In The Toledo District which has the lowest number of students, from 2010-2011 there were 131 more males and 141 in 2011-2012. Although there were more male than female enrolment from 2010-2012, there were also increases in female enrolment in all districts. This shows that Belize has consistently retained and increased attendance at the primary level of schooling.
A closer examination of girls’ and boys’ participation in 2011 highlights some disparities when the data is disaggregated by sex and district. As illustrated in the 2011 national enrolment data in Table 2.2,a difference of 1% to 2% between the enrolment of boys and girls in the Orange Walk, Stann Creek, and Toledo and minor differences in the Corozal, Belize, and Cayo districts. This also indicates that efforts and initiatives in the Education Sector are consistent with Policy 1 of the Belize Education Sector Strategy 2011-2016 of 100%, “net enrolment by gender.”
Indicator 2.2: Proportion of Pupils Completing Primary Education
Belize is also on track to achieving targets for retaining the proportion of pupils who enter Grade 1 and exit at Grade 8. From a 2000 baseline of 87%, there were steady increases to 2012, at which time the rate was in excess of 96%. Although many students who enter the first level in the primary school system complete at the end of the eighth year, from 2009-2010 there was a notable 8.4 % repetition for males and 5.7% for females. From 2010 – 2011, the repetition for males was 7.9% and 5.6% for females. This points out that even as Belize is well on its way to achieving full enrolment at the primary level, there is need to assess the quality of schooling at the primary level and identify how best to attend to the needs of boys who are dropping out of the system at an early age.
Indicator 2.3: Literacy Rate 15 – 24 year olds
In the absence of a literacy survey, Wagner (2005) notes that literacy can be measured by a “means of a proxy variable utilizing the number of years of primary schooling (i.e., 5 or 6 or 8 years of primary schooling equals a ‘literate’ person)”. In Belize a literate person is considered as an individual who has attained successful completion in the seventh year of primary schooling or standard 5. From a baseline of marginally over 70% in 1992, the literacy rate had increased to 76.9% in Year 2000. The 2010 Census recorded the rate at 88.1%. The MICS survey of 2011 noted that the rate was over 91.1%, a caveat being that the MICS collected this data only for women 15-49 years.
The challenges that remain though are the disparity in educational access between rural and urban areas and the need to upgrade teacher training. An emerging issue is that increases in educational spending and access have yet to correlate with enhanced success rates in national examinations, notably in pass rates in English and Mathematics. While Belize is also on track towards achieving literacy targets, there are noted ethnic disparities that require policy initiatives. There is also a recognized need to enhance basic literacy skills and develop competencies required to effectively function in the labour market.
12 34 56 78
32
MILESTONE ACHIEVEMENTS
The high participation rates at the primary school level in Belize can be attributed to Government expenditure which has averaged about one–quarter of the national budget and which is the single largest item of public expenditure in Belize. A contributing factor has been the milestone achievement of compulsory education legislation that mandates that every Belizean child between the ages of 5 and 14 years should be in school, unless they have completed primary education. Government also finances a system of school bus transportation to improve access for all.
In addition to financial investments, there are continuous efforts to train teachers and to provide resources and support for children at the primary level of schooling. An increasing number of nutritional support programmes merit special mention. These are important given Belize’s high level of poverty, a rate that is especially high among children of school age, and is a key factor for non-attendance. The expansion of school-feeding programmes in places such as South side Belize City, the Belize River Valley and the Stann Creek district has positively influenced school attendance. School feeding programmes are undertaken with funding from the GoB and from community based organizations, civil society and the private sector.
CHALLENGES
While Belize appears poised to achieve Goal 2, challenges exist since there are regional disparities in achievement. Regarding enrolment in primary education, the School Attendance Policy of the Education and Training Act, 2010 mandates attendance for children between ages five and fourteen. Even as it is stipulated that children ages 5 to 14 should attend school, factors such as poverty and limited reinforcement of the mandatory school policy have resulted in absenteeism among primary school students.
The Belize Education Sector Strategy, 2011- 2016, speaks to an “increase enrolment and completion at the primary level of schooling”. Also projected is 100% enrolment of children in the 5 to 12 years age-group in rural and urban areas by 2016. This is critical since the final push to 100% will undoubtedly require considerable assessment and investment to fully understand the extent of the impediments that are ultimately keeping the remaining 5% of Belizean primary school-aged children out of school.
Further challenges also exist in the area of literacy. While the 2010 Census indicates that most people in Belize possess basic literacy and numeracy skills, the literacy rate was highest in the Belize District (95%) and lowest in the Orange Walk District (80.4%). In the remaining four districts
MILLENNIUM DEVELOPMENT GOALS REPORT AND POST 2015 AGENDA 33

the literacy rate ranged from 84% to 88%. Even as a significant number of persons within the 15 - 24 age range are literate, there are notable ethnic disparities with literacy rates being highest among Creoles, Garifuna, East Indians and Maya Yucatec and lowest among the Mennonites, Maya Ketchi and Maya Mopan. Evident is the need for immediate interventions to provide educational access and support to smaller ethnic groups, especially those living in remote areas of the country.
Another challenge is the professionalisation of teachers. In Belize, the term “trained teacher” is used to describe a teacher who has acquired a minimum of an Associate Degree in Primary Education, including persons who have obtained a Level 1 and 2 certificate and 2 years of face to face instruction and 1 year of practical teaching assessment. The 2011-12 Abstract of Statistics reveals that there are approximately 54.3 % of teachers trained at the primary level. Also reported is that only 57.5% of teachers in urban areas were trained, and even less in rural areas (51.6%). Belize’s education system is dependent on highly qualified and professional teachers and as such greater effort must be placed on strengthening the training and monitoring of teachers.
12 34 56 78
34
3
SECTION 1.3GOAL #3: PROMOTE GENDER EQUALITY
AND EMPOWER WOMEN
This goal features three indicators. There is evidence of gender disparity at the primary education level, likely due to a higher repetition rate among males. However, at the secondary education level, significant progress has been made in ensuring male enrolment and retention. Parity does not exist at the tertiary education level, where women outnumber men by approximately 2 to 1. However, the achievement of women in the educational sphere has not translated to greater employment statistics for females, and improved remuneration and political representation including in Parliament. Socio cultural perceptions regarding the role of women and other barriers continue to exist and hinder women’s participation in politics at the parliamentary level.
MILLENNIUM DEVELOPMENT GOALS REPORT AND POST 2015 AGENDA 35

Target 3 A: Eliminate gender disparity in primary and secondary education, preferably by 2005, and in all levels of education no later than 2015
Indicator 3.1 - Ratio of Girls to Boys in Primary, Secondary and Tertiary Education
In 2009, parity was achieved when the ratio of girls to boys in primary education reached 1.01. By 2012, however, it had decreased to 0.954, reversing previously achieved gains. This is perhaps due to the higher repetition rate for boys and a slightly higher number of school-aged boys than girls in the general population in Belize.
Goal # 3: Promote Gender Equality and Empower Women.
Target 3 A: Eliminate gender disparity in primary and secondary education, preferably by 2005 and in all levels of education no later than 2015.
Indicators Baseline
1990 Status 2010
Actual 2012
Target 2015
Comments
3.1 Ratios of girls to boys in primary, secondary and tertiary education
Primary 0.939 (1995)
Secondary 1.105 (1995)
Tertiary 1.49 (2002)
Primary 1.01 (2009)
Secondary 1.13 (2009)
Tertiary 1.73 (2009)
Primary 0.954 (2012) MoEYS
Secondary 1.07 (2012)
MoEYS
Tertiary: 1.66 (2012) MoEYS
1
1
1
Off Target. But more boys than girls at primary
level due mainly to higher
repetition rates for boys.
Challenges to ensure parity for
boys at the secondary and
tertiary levels
3.2 Share of women in wage employment in non-agricultural sector (%)
38.7 (1995) 41.7 (2007) 35.2 (2012) LFS-SIB
50 Off Target
3.3 Proportion of seats held by women in national parliament(%)
3.45 (1993) 0 (2010) 3.22 (2012) NWC
30 Off Target
12 34 56 78
36
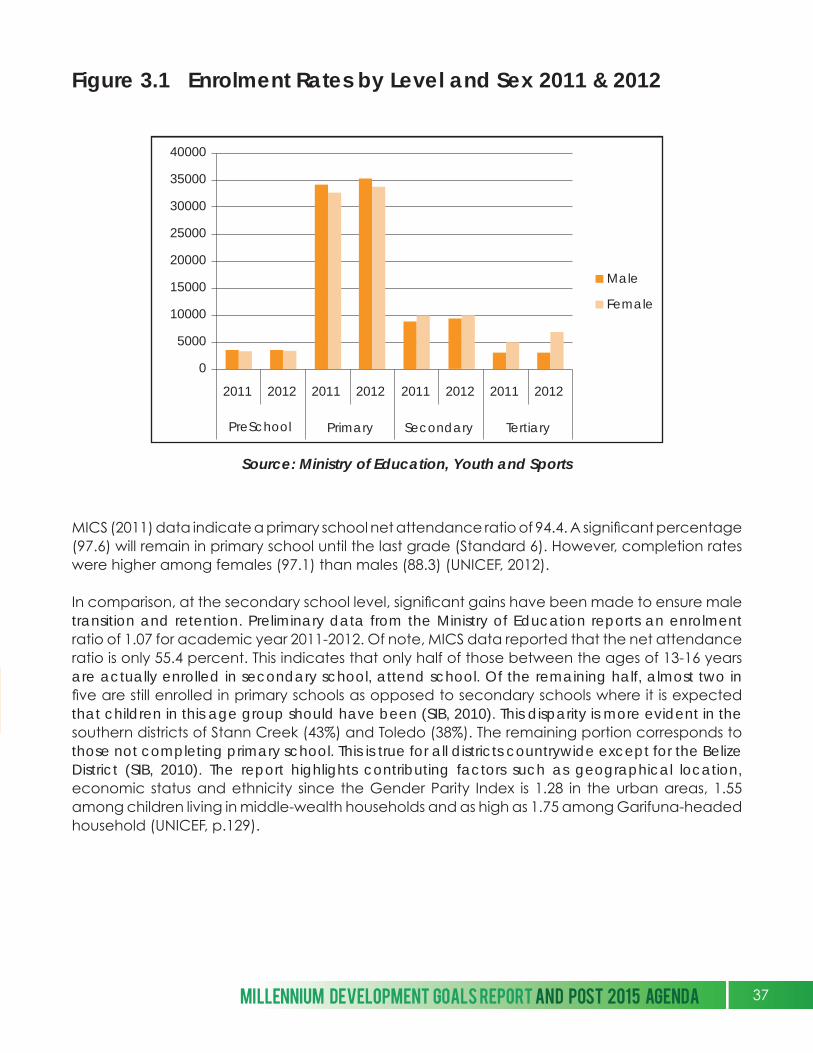
Figure 3.1 Enrolment Rates by Level and Sex 2011 & 2012
MICS (2011) data indicate a primary school net attendance ratio of 94.4. A significant percentage (97.6) will remain in primary school until the last grade (Standard 6). However, completion rates were higher among females (97.1) than males (88.3) (UNICEF, 2012).
In comparison, at the secondary school level, significant gains have been made to ensure male transition and retention. Preliminary data from the Ministry of Education reports an enrolment ratio of 1.07 for academic year 2011-2012. Of note, MICS data reported that the net attendance ratio is only 55.4 percent. This indicates that only half of those between the ages of 13-16 years are actually enrolled in secondary school, attend school. Of the remaining half, almost two in five are still enrolled in primary schools as opposed to secondary schools where it is expected that children in this age group should have been (SIB, 2010). This disparity is more evident in the southern districts of Stann Creek (43%) and Toledo (38%). The remaining portion corresponds to those not completing primary school. This is true for all districts countrywide except for the Belize District (SIB, 2010). The report highlights contributing factors such as geographical location, economic status and ethnicity since the Gender Parity Index is 1.28 in the urban areas, 1.55 among children living in middle-wealth households and as high as 1.75 among Garifuna-headed household (UNICEF, p.129).
40000
35000
30000
25000
20000
15000
10000
5000
0
2011
PreSchool Primary Secondary Tertiary
Male
Female
2012 2011 2012 2011 2012 2011 2012
Source: Ministry of Education, Youth and Sports
MILLENNIUM DEVELOPMENT GOALS REPORT AND POST 2015 AGENDA 37
Indicator 3.2: Share of Women in Wage Employment in the Non-Agricultural Sector
The share of women in non-agricultural wage employment decreased from 41.7% in 2007 to 37.5%. The gap between the male-female populations in the non-agricultural sector has widened in recent years. Previously (2007), the female population in the non-agricultural sector was 41.7%; the Labour Force Survey of September 2012 reports it at 35.2%, indicating a decrease of 12.5%. This high level of unemployment even in the non-agriculture sector reiterates that despite increasing success in educational achievement, females are still not satisfactorily participating in the productive sector.
Indicator 3.3: Proportion of Seats held by Women in National Parliament
This indicator measures the number of men and women involved in governing but extend to issues of representation, equality in national decision-making and equity in national development. Specifically, it focuses on the percentage of women in the lower house of Parliament. This is aligned with Belize’s commitment to build capacity among women to participate in the upper echelons of the political system, as well as to create access to opportunities which will ensure that women serve as elected representatives by 2015 (UNDP, 2010). While female representation increased from 0%, of the Lower House in 2008 to 3.22% in 2012, it is evident that progress has barely been made in this regard. In fact, it has reverted to almost the same proportion it was, one and two decades ago (3.45% in 1993 and 3.44% in 2003). In the 2012 election, no woman ran under the ruling party banner, while three were presented by the Opposition. Only one was successful (Lewis, 2012). Since, no election is scheduled before 2015; recommendations have been made to ensure greater female participation post-2015.
MILESTONE ACHIEVEMENTS
Milestone achievements under this MDG include achieving near parity at the primary level. So successful were the initiatives to attain this goal that girls are strongly represented at the higher levels of education; the challenge is now to ensure parity for boys while safeguarding the gains made by girls. This is evidenced in the design and ongoing implementation of BOOST, which has as a central feature a sex differentiated benefit scheme that favours boys. Other milestone achievements include gender related issues at the forefront of national discussions and these are reflected in legislation, in policy documents, and in specific actions designed to encourage women’s involvement in politics (Women in Politics Project). This growing enabling environment is reflected in women’s increasing participation and success, at the lower levels of electoral politics. A final milestone achievement for MDG 3 is that there has been concerted work done to ascertain the cost of achieving MDG 3 by 2015. This was done as part of an MDG Acceleration Framework. These milestone achievements are further detailed below.
12 34 56 78
38
Regarding gender parity, commitments have been made by the Ministry of Education to expand access to secondary education and to ensure completion at the secondary level. Specifically, it intends to increase the Gross Enrolment Rates to a minimum of 74% in each district; reduce both the repetition rate and dropout rate by 50% in each district; increase by 10% the number of Form 4 graduates in all districts (MoEYS, 2012). The Education Sector Strategy outlines these commitments to ensure that the MDG target is met.
To support the Education Sector Strategy, the Ministry of Education adopted a secondary school financing reform programme. The proposed interventions will finance secondary schools according to the number of students enrolled. Incentives will be offered to encourage higher transition and retention rates. A standardized fee structure is proposed in order to reduce the overwhelming financial burden of higher education. These proposals are in line with recommendations made by the Situation Analysis of Women and Children in Belize (2011) to focus on retaining boys in secondary (and tertiary) education and to address factors contributing to the high dropout and low transition rates.
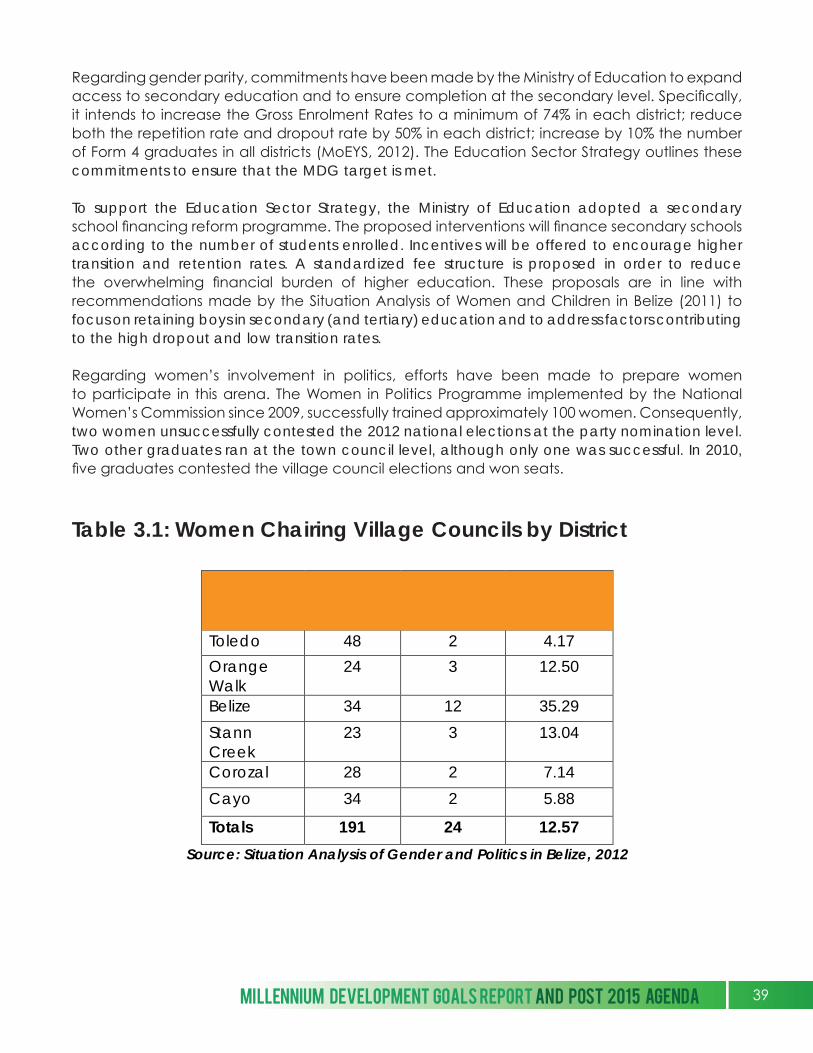
Regarding women’s involvement in politics, efforts have been made to prepare women to participate in this arena. The Women in Politics Programme implemented by the National Women’s Commission since 2009, successfully trained approximately 100 women. Consequently, two women unsuccessfully contested the 2012 national elections at the party nomination level. Two other graduates ran at the town council level, although only one was successful. In 2010, five graduates contested the village council elections and won seats.
Table 3.1: Women Chairing Village Councils by District
District # of
villages # of
women chairs
% of villages
Toledo 48 2 4.17
Orange Walk
24 3 12.50
Belize 34 12 35.29
Stann Creek
23 3 13.04
Corozal 28 2 7.14
Cayo 34 2 5.88
Totals 191 24 12.57
Source: Situation Analysis of Gender and Politics in Belize, 2012
MILLENNIUM DEVELOPMENT GOALS REPORT AND POST 2015 AGENDA 39
The progress has been slow in terms of having women elected to parliament; two women, which accounts for 13.3% of Cabinet, have received direct appointments by the Prime Minister to hold ministerial positions. One woman currently heads the Ministry of Forestry, Fisheries and Sustainable Development, while the other leads the Ministry of Science, Technology and Public Utilities. The Situational Analysis of Women in Politics (2012) indicates that this was the first instance where female Ministers were appointed via the Senate immediately following elections. It is noteworthy that both women hold full positions as Ministers, in very important ministries that are not related to a ‘social issue’, which has been the traditional portfolio that women were assigned.
A final milestone achievement focused on costing exercise for this MDG, which remains the only MDG where actual costs to achieve it have been calculated. Based on an assessment of Investment Needs for Cluster of Initiatives for the Achievement of Gender Equality and Women’s Empowerment, the Thematic Working Group produced a document entitled: ‘Belize: Aligning National Development Plans with Gender Equality and Women’s Empowerment Objectives,’ which proposes specific costed activities. The Situation Analysis of Politics recommends a list of activities to be carried out within these building blocks.
• Capabilities Domain: Improvement in women’s work and life skills; Retention of boys in school, full access to reproductive health services, maintaining gains by women whilst supporting and promoting advances for men.
• Opportunities Domain: Improved access to economic empowerment, removing barriers to women employment and self-employment; Improved women’s participation in decision-making, complementing Women in Politics (WIP) achievement with strategic inputs and supporting improved inter-family relationships.
• Security Domain: Reduce violence against women by supporting personal and social asset building to improve women voice in the home and work-life.
• Systemic Issues: Improved Data Collection and Monitoring including sex-disaggregated data and promotion of regular gender analysis using administrative data.
CHALLENGES
Regarding gender parity at the different levels of the educational system, various socio-cultural factors influence male attendance, from early childhood education to the tertiary education level. As indicated above however, most recent data from the Ministry of Education implies that Belize reflects a disparity for girls’ attendance at the primary level. This indicates a need to discuss this emerging issue with a focus towards identifying influencing factors and recommending ways to ensure that girls continue to access education at the primary level on par with boys.
12 34 56 78
40
Although primary education in Belize is compulsory, it is costly at the household level. When taking a cost-benefit approach to determine which child continues to stay in school, families may be forced to choose one child over the other. Secondary education in Belize is expensive, as school fees and transportation costs can impede enrolment (UNICEF, 2012). However, Government programmes such as a $300 grant-aid provided to students graduating from primary school and transitioning to secondary school help to offset the high cost of secondary school fees. This assistance when strategically targeted may ultimately be a strong determinant factor in increasing the number of boys continuing their secondary education.
There is need to acknowledge the gender dimension to boys’ school drop-out rates. Gayle & Mortis (2010) state that detachment from school result from minimal parental input and lack of adequate resources at home and contribute to boys’ under-representation in school. Disinterest, coupled with the perception of a strong disciplinary atmosphere and rigid teaching structure in educational institutions may make it difficult for boys to adapt when they have been socialised differently before entering into school. Often times, young men abandoning school seek immediate income-earning opportunities (legal and illegal); which foster an attitude that it is pointless to struggle in school in order to obtain the necessary merits and credentials to find a job.
At the tertiary education level, which includes the junior colleges and universities, the disparity is evident. While there was a decline in the ratio of females to males in tertiary school, from 1.73 in 2009 to 1.66 in 2012 (MoEYS, 2012), career choices are evidently gendered. Women chose traditional female-dominated courses such as Primary Education and Business while more males enrol in courses such as information technology, math and sciences. Other factors influencing low retention rates among males point to an inflexible, academic-focused curriculum. Diverse educational options such as careers in arts, sports and vocations that can be “stimulating and relevant to economic need” (Lewis, p.138) are limited. Educators note that young men prefer shorter term courses that provide them with skills they can use to generate income immediately. Gayle & Mortis (2010) point out that schools lack the adequate resources to address the needs of the students. Furthermore, they operate under an outdated education system that is ‘structurally flawed’, colonialist and determined to produce a few elites. As a result, many will be left behind, particularly those from poor urban communities.
In the Situation Analysis of Gender and Politics in Belize the idea of “male marginalization” is introduced where the theory suggest a displacement of values of the traditional patriarchal society. Debra Lewis (2012) explains “recognizing that men and boys experience particular problems does not mean that the system of gender inequality has suddenly been turned on its head and that men are no longer dominant in that system. In fact, gender analysis reveals that many of the problems experienced by men and boys result from a gender identity based on relations of dominance and how that translates into expectations about what it means to ‘be a man’.” Consequently, male identity is challenged by expectations evident in the education system.
MILLENNIUM DEVELOPMENT GOALS REPORT AND POST 2015 AGENDA 41
Women are not sufficiently engaged in the employment sector. UNDP Belize in its support to the Costing of MDG 3 note that in regards to increasing the share of women in wage employment in the non-agricultural sector, there are several initiatives that can be undertaken to accelerate progress towards achieving the target. Supporting a diverse range of businesses, beyond those focusing on production and service-oriented microenterprises can create greater opportunities for employment in the non-agricultural sector. In terms of fostering entrepreneurial thinking and entrepreneurship, there is need to provide services to women such as access to start-up financing including fiscal incentives to meet challenges at this stage (ABEN, 2011). There is need to strengthen existing support mechanisms and mentoring services that can help women develop their businesses (Peebles, 2012). Women-run enterprises need greater support in the areas of business enhancement, market access and product development. Thriving businesses result in opportunities for self-employment and employment for others thereby contributing to poverty reduction, food security and empowerment.
The Caribbean Development Bank’s Gender Analysis for Belize, 2012 points out that socio-cultural perceptions limiting women’s engagement in business in the non-agricultural sector stem from widely accepted traditional gender roles. Firstly, women are expected to perform unpaid domestic work and to undertake childrearing responsibilities alone. Even working women often find themselves doing household chores as a ‘double-shift’ after returning home from their daytime income earning job. In both the informal and formal economic institutions, women are expected to participate as employees but not expected in the roles of managers or employers. Women work harder to obtain upward mobility, prove their competence, overcome gender discrimination, and establish credibility among their peers, especially in non-traditional jobs (Peebles, 2012).
Women are under-represented in the Belize House of Assembly. The Inter-Parliamentary Union (2012) ranks Belize last in the Caribbean region, as it relates to the percentage of women in legislature. This low ranking suggests that the barriers for Belizean women are even more socially and culturally rooted than in other parts of the sub region. In general, Belize has received low ranking in terms of gender related indicators. In terms of The Gender Empowerment Measure (GEM)11 of 0.496, places Belize at 40 of 64 countries (Pebbles, 2011). This means that there is an urgent need to develop strategies to ensure that women take their rightful place in public decision-making and governance (Lewis, 2012). These measures include continued capacity building for women who have completed the Women in Politics programme (ABEN, 2011) and preparing women to be more visible in the 2017 elections.
11 The GII measures multidimensional inequalities to gender considering only the inequalities between women and men at the country level and captures the loss of achievement in key dimensions due to gender inequality. It captures the loss in human development due to inequality between female and male achievements in three (3) key areas: reproductive health, empowerment and the labour market.
12 34 56 78
42
4
SECTION 1.4GOAL #4: REDUCE CHILD
MORTALITY
This goal has three indicators related to reducing infant and child mortality and increasing coverage of vaccination against measles. Since the baseline in 1990, there have been declines in the under-five mortality rate. In the period 2010-2012 the under-five mortality rate remained constant; however, the infant mortality rate increased marginally. The country is on track for achieving the target set for immunization against measles.
MILLENNIUM DEVELOPMENT GOALS REPORT AND POST 2015 AGENDA 43
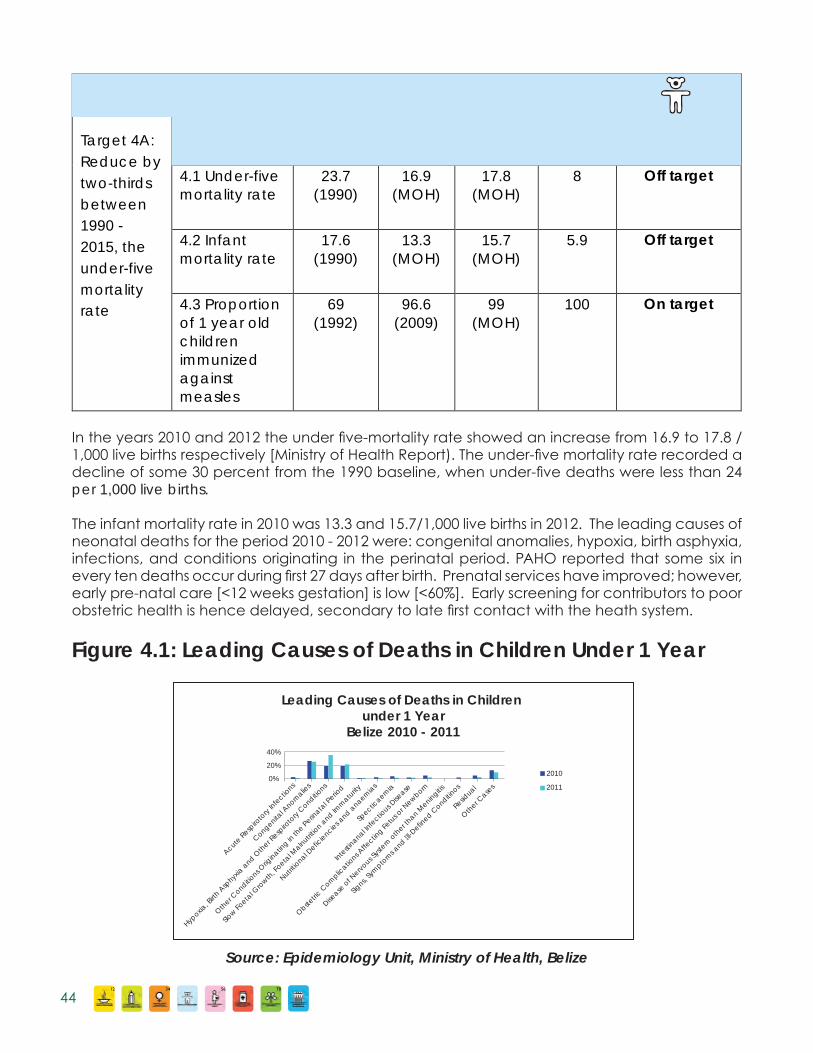
GOAL #4: Reduce Child Mortality
Target 4A: Reduce by two-thirds between 1990 - 2015, the under-five mortality rate
Indicators Baseline
1990 Status 2010
Actual 2012
Target 2015 Comments
4.1 Under-five mortality rate
23.7 (1990)
16.9 (MOH)
17.8 (MOH)
8
Off target
4.2 Infant mortality rate
17.6 (1990)
13.3 (MOH)
15.7 (MOH)
5.9
Off target
4.3 Proportion of 1 year old children immunized against measles
69 (1992)
96.6 (2009)
99 (MOH)
100 On target
Figure 4.1: Leading Causes of Deaths in Children Under 1 Year
In the years 2010 and 2012 the under five-mortality rate showed an increase from 16.9 to 17.8 / 1,000 live births respectively [Ministry of Health Report). The under-five mortality rate recorded a decline of some 30 percent from the 1990 baseline, when under-five deaths were less than 24 per 1,000 live births.
The infant mortality rate in 2010 was 13.3 and 15.7/1,000 live births in 2012. The leading causes of neonatal deaths for the period 2010 - 2012 were: congenital anomalies, hypoxia, birth asphyxia, infections, and conditions originating in the perinatal period. PAHO reported that some six in every ten deaths occur during first 27 days after birth. Prenatal services have improved; however, early pre-natal care [<12 weeks gestation] is low [<60%]. Early screening for contributors to poor obstetric health is hence delayed, secondary to late first contact with the heath system.
Source: Epidemiology Unit, Ministry of Health, Belize
Leading Causes of Deaths in Children under 1 Year
Belize 2010 - 201140%
20%
0%2010
2011
Acute R
espiro
tory
Infectio
ns
Congenital A
nomalie
s
Hypoxia
, Birth
Asp
hyxia
and O
ther R
espiro
tory
Conditions
Oth
er Conditio
ns Orig
inating in
the P
erinata
l Perio
d
Slow Fo
etal G
rowth
, Foeta
l Malnutrit
ion a
nd Imm
aturity
Nutritio
nal Defic
iencie
s and a
naemia
s
Spectic
aemia
Intesti
nanal Infe
ctious D
isease
Obste
tric C
omplic
ations A
ffectin
g Fetu
s or N
ewborn
Disease
of N
ervous S
yste
m o
ther t
han Meningitis
Signs,
Sym
ptom
s and Ill
-Defin
ed Conditin
os
Residual
Oth
er Case
s
12 34 56 78
44
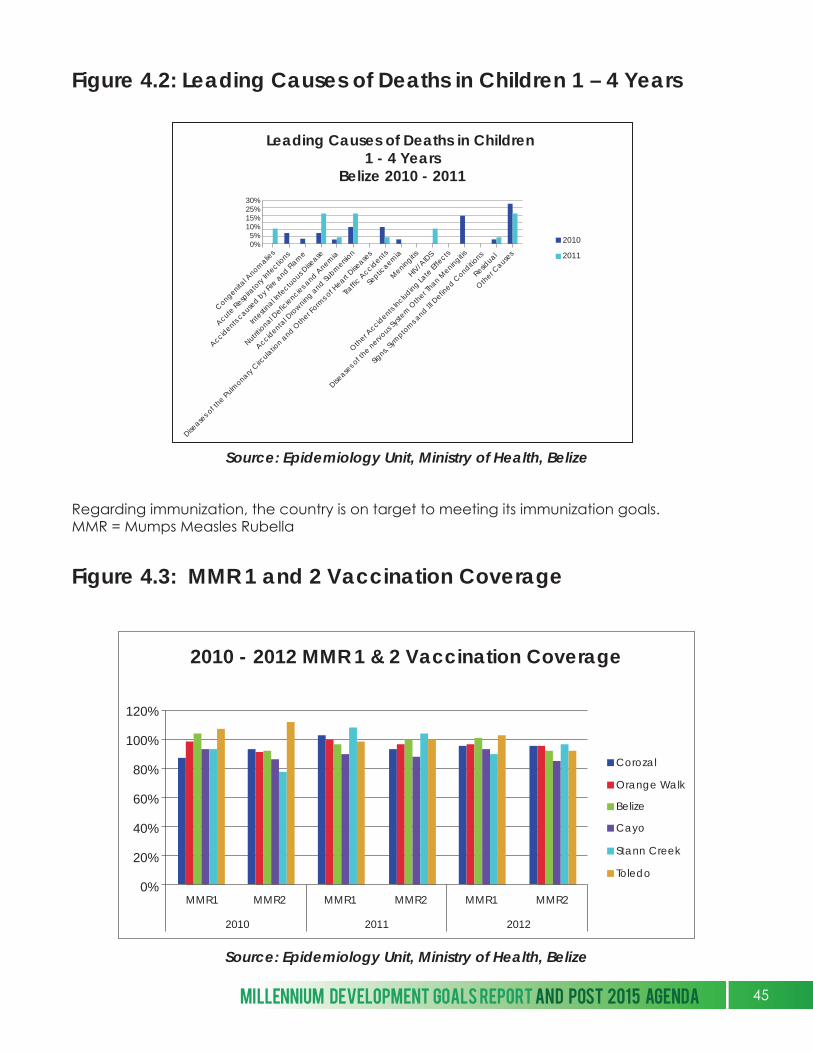
Figure 4.2: Leading Causes of Deaths in Children 1 – 4 Years
Figure 4.3: MMR 1 and 2 Vaccination Coverage
Source: Epidemiology Unit, Ministry of Health, Belize
Source: Epidemiology Unit, Ministry of Health, Belize
120%
100%
80%
60%
40%
20%
0%MMR1 MMR1MMR2 MMR2 MMR1 MMR2
2010 2011 2012
Corozal
Orange Walk
Belize
Cayo
Stann Creek
Toledo
2010 - 2012 MMR 1 & 2 Vaccination Coverage
Regarding immunization, the country is on target to meeting its immunization goals. MMR = Mumps Measles Rubella
Leading Causes of Deaths in Children 1 - 4 Years
Belize 2010 - 2011
2010
2011
30%25%15%10%5%0%
Congenital A
nomalie
s
Acute R
espira
tory
Infectio
ns
Accidents
caused b
y Fire
and Fl
ame
Intesti
nal Infe
ctuous D
isease
Nutritio
nal Defic
iencie
s and A
nemia
Accidenta
l Dro
wning and Su
bmersi
on
Disease
s of t
he Pulm
onary Circ
ulatio
n and O
ther F
orms o
f Heart
Disease
s
Traffic
Accid
ents
Septic
aemia
Meningitis
HIV/A
IDS
Disease
s of t
he nerv
ous Sys
tem
Oth
er Than M
eningitis
Signs,
Sym
ptom
s and Ill
Defin
ed Conditio
ns
Residual
Oth
er Accid
ents Including La
te Ef
fects
Oth
er Cause
s
MILLENNIUM DEVELOPMENT GOALS REPORT AND POST 2015 AGENDA 45
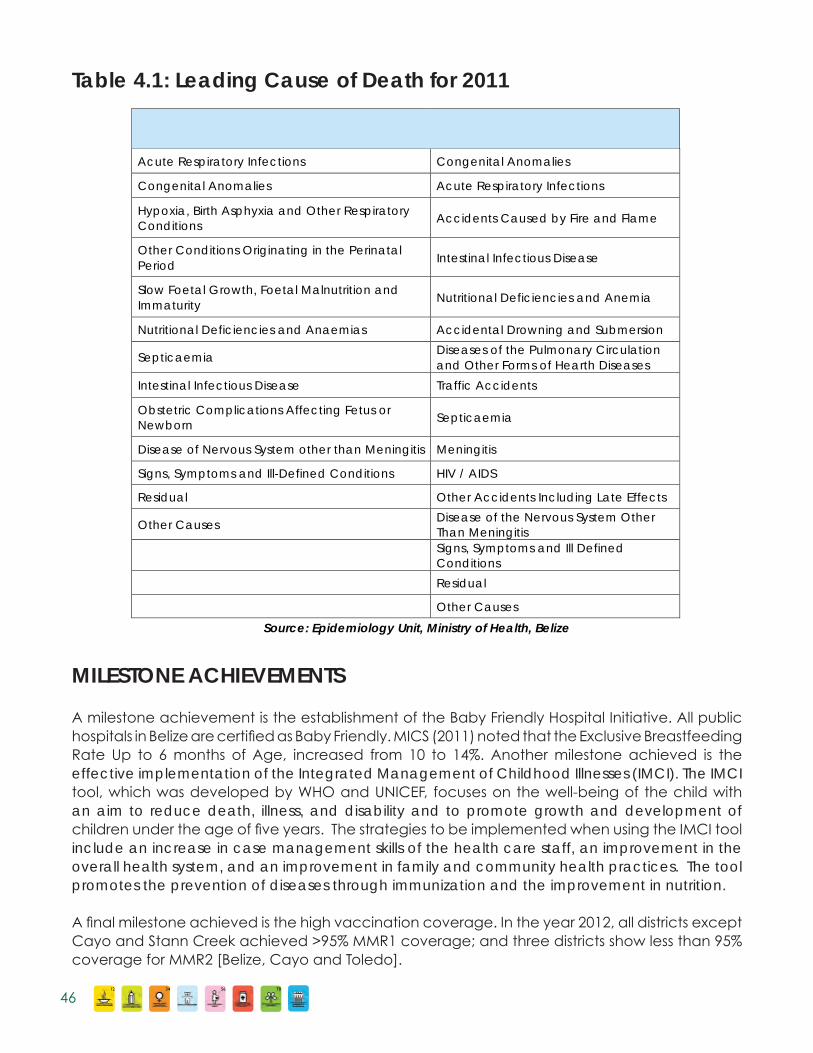
MILESTONE ACHIEVEMENTS
A milestone achievement is the establishment of the Baby Friendly Hospital Initiative. All public hospitals in Belize are certified as Baby Friendly. MICS (2011) noted that the Exclusive Breastfeeding Rate Up to 6 months of Age, increased from 10 to 14%. Another milestone achieved is the effective implementation of the Integrated Management of Childhood Illnesses (IMCI). The IMCI tool, which was developed by WHO and UNICEF, focuses on the well-being of the child with an aim to reduce death, illness, and disability and to promote growth and development of children under the age of five years. The strategies to be implemented when using the IMCI tool include an increase in case management skills of the health care staff, an improvement in the overall health system, and an improvement in family and community health practices. The tool promotes the prevention of diseases through immunization and the improvement in nutrition.
A final milestone achieved is the high vaccination coverage. In the year 2012, all districts except Cayo and Stann Creek achieved >95% MMR1 coverage; and three districts show less than 95% coverage for MMR2 [Belize, Cayo and Toledo].
Table 4.1: Leading Cause of Death for 2011
Children Under 1 Year Children 1 – 4 Years
Acute Respiratory Infections Congenital Anomalies
Congenital Anomalies Acute Respiratory Infections
Hypoxia, Birth Asphyxia and Other Respiratory Conditions
Accidents Caused by Fire and Flame
Other Conditions Originating in the Perinatal Period
Intestinal Infectious Disease
Slow Foetal Growth, Foetal Malnutrition and Immaturity
Nutritional Deficiencies and Anemia
Nutritional Deficiencies and Anaemias Accidental Drowning and Submersion
Septicaemia Diseases of the Pulmonary Circulation and Other Forms of Hearth Diseases
Intestinal Infectious Disease Traffic Accidents
Obstetric Complications Affecting Fetus or Newborn
Septicaemia
Disease of Nervous System other than Meningitis Meningitis
Signs, Symptoms and Ill-Defined Conditions HIV / AIDS
Residual Other Accidents Including Late Effects
Other Causes Disease of the Nervous System Other Than Meningitis
Signs, Symptoms and Ill Defined Conditions
Residual
Other Causes
Source: Epidemiology Unit, Ministry of Health, Belize
12 34 56 78
46

Table 4.2 : MMR 1 and 2 Immunization Coverage 2010-2012
Districts 2010 2011 2012
MMR 1
MMR 2
MMR 1 MMR 2 MMR 1 MMR 2
Corozal 87% 93% 102.8% 93.8% 96.4% 96.4%
Orange Walk 99% 92% 99.9% 97.2% 97.4% 96.4%
Belize 104% 92% 96.9% 100.6% 100.9% 93.1%
Cayo 93% 87% 90.2% 88.2% 94% 85.3%
Stann Creek 87% 78% 108.5% 104.4% 90.6% 97.3%
Toledo 108% 112% 98.7% 99.7% 102.7% 92.1% Source: Epidemiology Unit, Ministry of Health, Belize
CHALLENGES
The MDG targets for Goal 4 are not on track. The leading causes of neonatal deaths are infections (sepsis) and birth asphyxia. PAHO reports that these are largely preventable; of concern is the access to and quality of neonatal care. Special focus must be placed on the neonatal period where the greatest impact can be made.
Another challenge is the continued need for building institutional capacity within the MOH. The number and quality of medical personnel at all levels do impact health care delivery and what is regarded as Human Resources in Health (HRH) must be developed to adequately respond to the emerging health needs of the country.
Regarding immunization against measles, not all districts achieved the target of > 95%. The Cayo District shows the lowest coverage for MMR1. In 2010, coverage for MMR 2 in Cayo was at 87% and that level of coverage was above the 78% recorded in the Stann Creek District. One year later in 2011, coverage in Stann Creek had increased substantially while in Cayo, the increase was only marginal, but fell in the subsequent year (2012) to 85.3%. For districts reporting coverage greater than 100%, analysis of nominal data show that a possible cause is internal migration of the population e.g. seasonal workers moving from dwelling to work place community.
MOH reports that the challenges in this district emanate from cultural issues and religious based communities. Though Mennonites live in other districts, their largest communities are in Cayo, hence a greater ability to skew data in that district, since they are not likely to access immunization for their children. Continued efforts must be made to target this ethnic group to improve immunization rates.
Other possible causes for a lower uptake in the Cayo District as cited by the Ministry of Health include insufficient means of transportation in this largest district and a shortage of staff at primary health care setting [0.4 nurse / 1,000 population].
MILLENNIUM DEVELOPMENT GOALS REPORT AND POST 2015 AGENDA 47
5
SECTION 1.5GOAL #5: IMPROVEMATERNAL HEALTH
This goal has two targets and six indicators. Following a stellar year in 2011, with no maternal deaths recorded, there were three maternal deaths in 2012. While the country is on target for its skilled birth attendance rate, there are regional and ethnic disparities that need to be addressed. Progress has been made in public and private sector institutions that contribute to providing access to contraceptive methods, which improve the contraceptive use prevalence rate, but cultural barriers remain that stymie individual access. These barriers also pose a challenge for sustained reductions in the adolescent birth rate when coupled with the legal limitation of adolescents having to access sexual and reproductive health only with parental consent. Almost one out every five neonatal deaths is among adolescents. More positively, there have been notable accomplishments in reducing the unmet need for family planning and antenatal care coverage remained high.
12 34 56 78
48
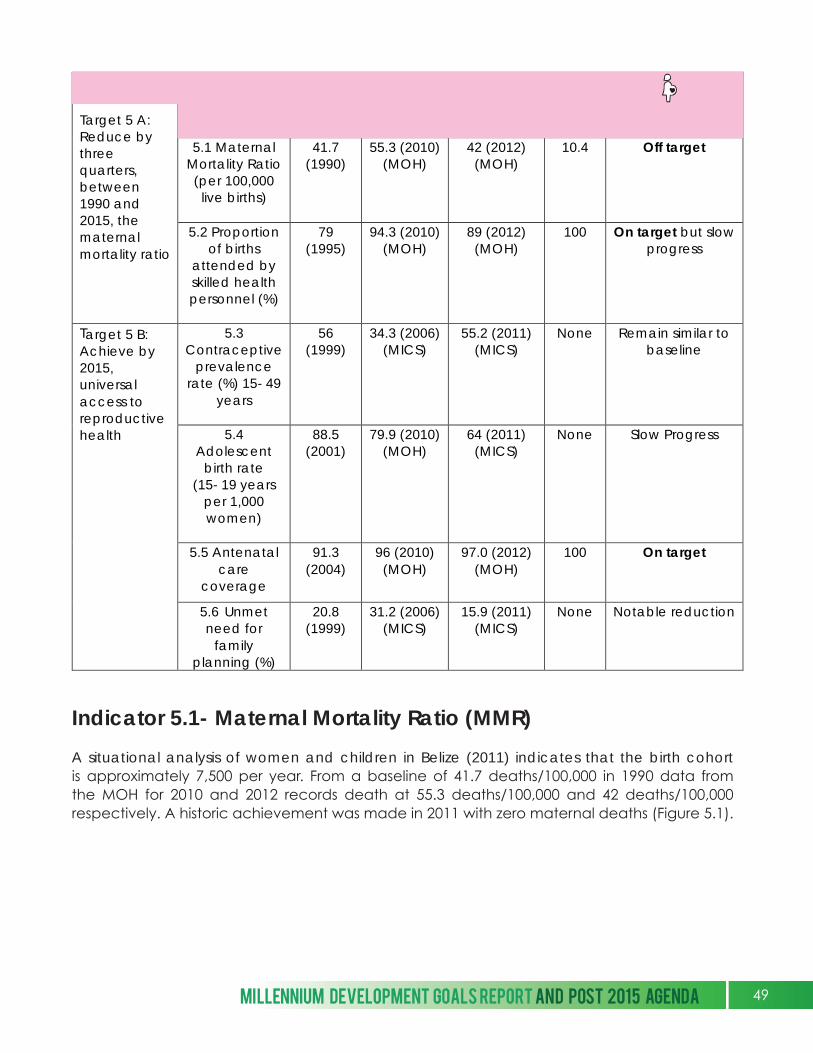
Goal # 5 – Improve Maternal Health
Target 5 A: Reduce by three quarters, between 1990 and 2015, the maternal mortality ratio
Indicators Baseline 1990
Status 2010
Actual 2012
Target 2015
Comments
5.1 Maternal Mortality Ratio (per 100,000
live births)
41.7 (1990)
55.3 (2010) (MOH)
42 (2012) (MOH)
10.4
Off target
5.2 Proportion of births
attended by skilled health personnel (%)
79 (1995)
94.3 (2010) (MOH)
89 (2012) (MOH)
100 On target but slow progress
Target 5 B: Achieve by 2015, universal access to reproductive health
5.3 Contraceptive
prevalence rate (%) 15- 49
years
56 (1999)
34.3 (2006) (MICS)
55.2 (2011) (MICS)
None Remain similar to baseline
5.4 Adolescent
birth rate (15- 19 years
per 1,000 women)
88.5 (2001)
79.9 (2010) (MOH)
64 (2011) (MICS)
None Slow Progress
5.5 Antenatal care
coverage
91.3 (2004)
96 (2010) (MOH)
97.0 (2012) (MOH)
100 On target
5.6 Unmet need for
family planning (%)
20.8 (1999)
31.2 (2006) (MICS)
15.9 (2011) (MICS)
None Notable reduction
Indicator 5.1- Maternal Mortality Ratio (MMR)
A situational analysis of women and children in Belize (2011) indicates that the birth cohort is approximately 7,500 per year. From a baseline of 41.7 deaths/100,000 in 1990 data from the MOH for 2010 and 2012 records death at 55.3 deaths/100,000 and 42 deaths/100,000 respectively. A historic achievement was made in 2011 with zero maternal deaths (Figure 5.1).
MILLENNIUM DEVELOPMENT GOALS REPORT AND POST 2015 AGENDA 49
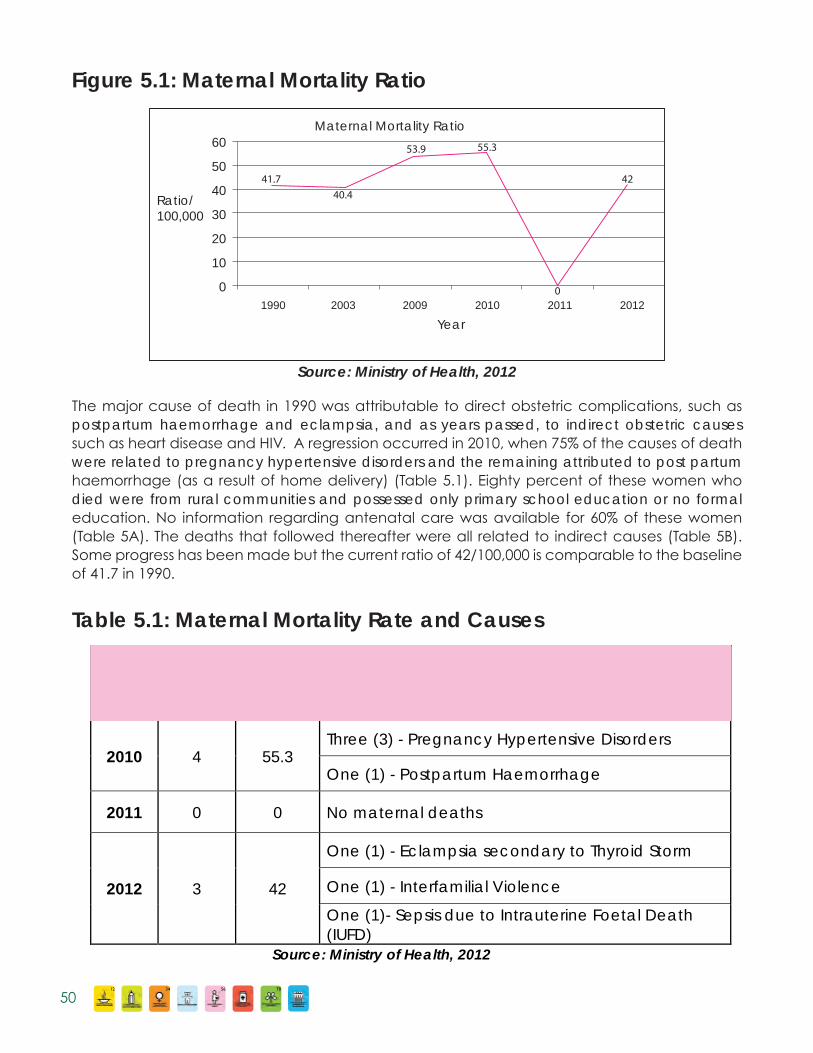
The major cause of death in 1990 was attributable to direct obstetric complications, such as postpartum haemorrhage and eclampsia, and as years passed, to indirect obstetric causes such as heart disease and HIV. A regression occurred in 2010, when 75% of the causes of death were related to pregnancy hypertensive disorders and the remaining attributed to post partum haemorrhage (as a result of home delivery) (Table 5.1). Eighty percent of these women who died were from rural communities and possessed only primary school education or no formal education. No information regarding antenatal care was available for 60% of these women (Table 5A). The deaths that followed thereafter were all related to indirect causes (Table 5B). Some progress has been made but the current ratio of 42/100,000 is comparable to the baseline of 41.7 in 1990.
Table 5.1: Maternal Mortality Rate and Causes
Source: Ministry of Health, 2012
Year Number
of Cases
Rates Causes
2010 4 55.3 Three (3) - Pregnancy Hypertensive Disorders
One (1) - Postpartum Haemorrhage
2011 0 0 No maternal deaths
2012 3 42
One (1) - Eclampsia secondary to Thyroid Storm
One (1) - Interfamilial Violence
One (1)- Sepsis due to Intrauterine Foetal Death (IUFD)
Figure 5.1: Maternal Mortality Ratio
Ratio/100,000
Maternal Mortality Ratio60
50
40
30
20
10
01990 2003 2009
Year
2010 2011 2012
41.740.4
53.9 55.3
42
0
Source: Ministry of Health, 2012
12 34 56 78
50
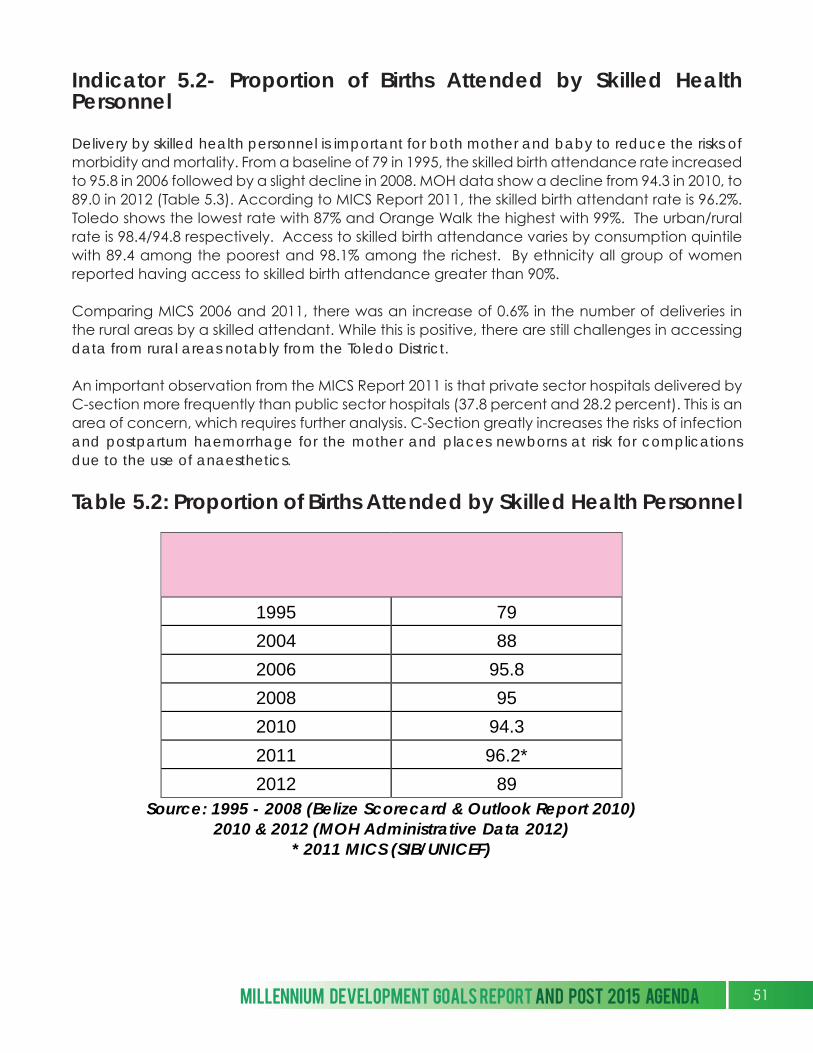
Indicator 5.2- Proportion of Births Attended by Skilled Health Personnel
Delivery by skilled health personnel is important for both mother and baby to reduce the risks of morbidity and mortality. From a baseline of 79 in 1995, the skilled birth attendance rate increased to 95.8 in 2006 followed by a slight decline in 2008. MOH data show a decline from 94.3 in 2010, to 89.0 in 2012 (Table 5.3). According to MICS Report 2011, the skilled birth attendant rate is 96.2%. Toledo shows the lowest rate with 87% and Orange Walk the highest with 99%. The urban/rural rate is 98.4/94.8 respectively. Access to skilled birth attendance varies by consumption quintile with 89.4 among the poorest and 98.1% among the richest. By ethnicity all group of women reported having access to skilled birth attendance greater than 90%.
Comparing MICS 2006 and 2011, there was an increase of 0.6% in the number of deliveries in the rural areas by a skilled attendant. While this is positive, there are still challenges in accessing data from rural areas notably from the Toledo District.
An important observation from the MICS Report 2011 is that private sector hospitals delivered by C-section more frequently than public sector hospitals (37.8 percent and 28.2 percent). This is an area of concern, which requires further analysis. C-Section greatly increases the risks of infection and postpartum haemorrhage for the mother and places newborns at risk for complications due to the use of anaesthetics.
Table 5.2: Proportion of Births Attended by Skilled Health Personnel
Year Percentage
1995 79
2004 88
2006 95.8
2008 95
2010 94.3
2011 96.2*
2012 89 Source: 1995 - 2008 (Belize Scorecard & Outlook Report 2010)
2010 & 2012 (MOH Administrative Data 2012) * 2011 MICS (SIB/UNICEF)
MILLENNIUM DEVELOPMENT GOALS REPORT AND POST 2015 AGENDA 51
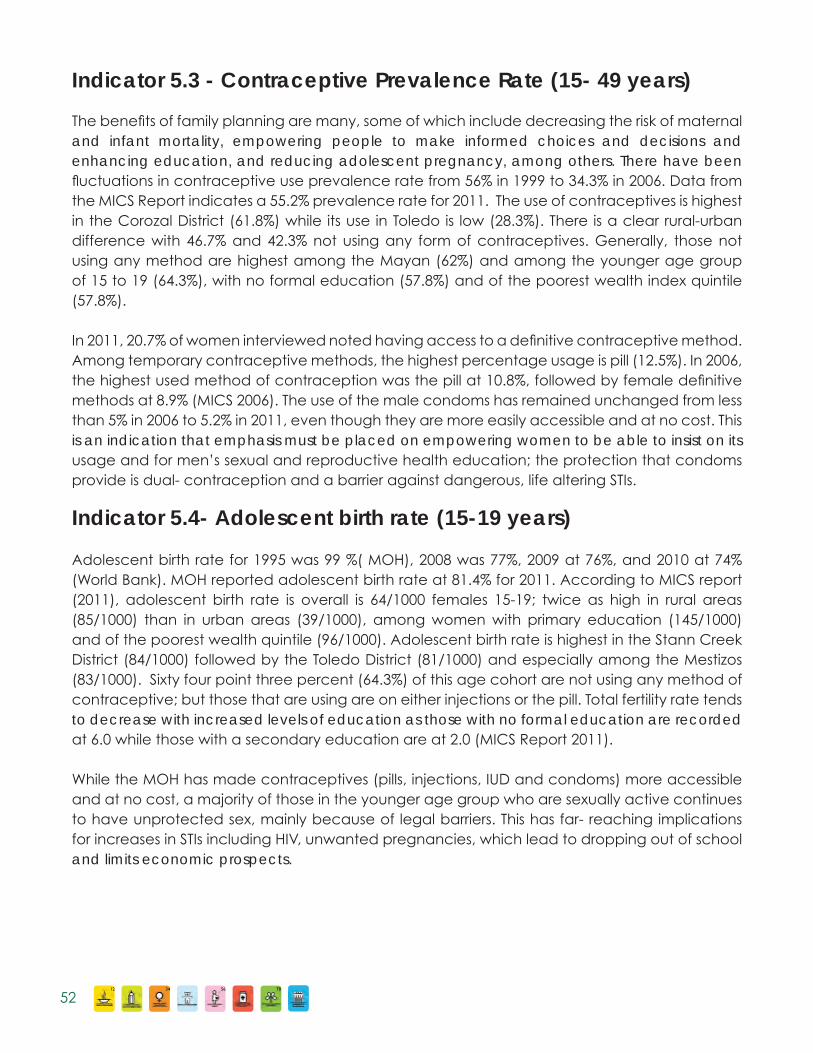
Indicator 5.3 - Contraceptive Prevalence Rate (15- 49 years)
The benefits of family planning are many, some of which include decreasing the risk of maternal and infant mortality, empowering people to make informed choices and decisions and enhancing education, and reducing adolescent pregnancy, among others. There have been fluctuations in contraceptive use prevalence rate from 56% in 1999 to 34.3% in 2006. Data from the MICS Report indicates a 55.2% prevalence rate for 2011. The use of contraceptives is highest in the Corozal District (61.8%) while its use in Toledo is low (28.3%). There is a clear rural-urban difference with 46.7% and 42.3% not using any form of contraceptives. Generally, those not using any method are highest among the Mayan (62%) and among the younger age group of 15 to 19 (64.3%), with no formal education (57.8%) and of the poorest wealth index quintile (57.8%).
In 2011, 20.7% of women interviewed noted having access to a definitive contraceptive method. Among temporary contraceptive methods, the highest percentage usage is pill (12.5%). In 2006, the highest used method of contraception was the pill at 10.8%, followed by female definitive methods at 8.9% (MICS 2006). The use of the male condoms has remained unchanged from less than 5% in 2006 to 5.2% in 2011, even though they are more easily accessible and at no cost. This is an indication that emphasis must be placed on empowering women to be able to insist on its usage and for men’s sexual and reproductive health education; the protection that condoms provide is dual- contraception and a barrier against dangerous, life altering STIs.
Indicator 5.4- Adolescent birth rate (15-19 years)
Adolescent birth rate for 1995 was 99 %( MOH), 2008 was 77%, 2009 at 76%, and 2010 at 74% (World Bank). MOH reported adolescent birth rate at 81.4% for 2011. According to MICS report (2011), adolescent birth rate is overall is 64/1000 females 15-19; twice as high in rural areas (85/1000) than in urban areas (39/1000), among women with primary education (145/1000) and of the poorest wealth quintile (96/1000). Adolescent birth rate is highest in the Stann Creek District (84/1000) followed by the Toledo District (81/1000) and especially among the Mestizos (83/1000). Sixty four point three percent (64.3%) of this age cohort are not using any method of contraceptive; but those that are using are on either injections or the pill. Total fertility rate tends to decrease with increased levels of education as those with no formal education are recorded at 6.0 while those with a secondary education are at 2.0 (MICS Report 2011).
While the MOH has made contraceptives (pills, injections, IUD and condoms) more accessible and at no cost, a majority of those in the younger age group who are sexually active continues to have unprotected sex, mainly because of legal barriers. This has far- reaching implications for increases in STIs including HIV, unwanted pregnancies, which lead to dropping out of school and limits economic prospects.
12 34 56 78
52
Indicator 5.5- Antenatal Care Coverage – at least one visit and at least four visits
Antenatal care is critical as interventions are provided with the aim of obtaining the best possible outcome for the mother and child. Early monitoring and on-going care during pregnancy is associated with more favourable birth outcomes. Antenatal care is an indicator of the access and use of health care resources during pregnancy. The service is offered at health facilities within the public sector (79.4%) and the private sector (13.5%) and during mobile clinics (7.1%) (Situation Analysis of Children & Women in Belize, 2011).
Since 2004, there have been fluctuations in the trend but with a greater tendency to increase by approximately 1% per annum. MOH data records a coverage rate of 96% in 2010, 99.7% in 2011 and 97% in 2012. The MICS Report 2011 indicates that 96.2% of women had antenatal care at least once by skilled personnel. The lowest level is in the Toledo District (91.5%) which shows improvement from 79.5% in 2006 (MICS 2006). The Belize District followed closely with low levels at 91.7%. In the Belize District, Belize City South Side had a high rate of 96.4% (Table 5.4). Women living in the poorest household reported four or more antenatal care visits (70.3%) compared with 89.0% among those living in richest household; Toledo reported the lowest rate for four or more visits at 57.2% while Cayo reported the highest (90.9%). Antenatal coverage was slightly higher in urban areas (97.3%) compared to rural areas (95.5%). Mothers who are older at birth were less likely to be seen at least once by skilled medical personnel.
Late prenatal care continues to be a concern. The number of women receiving prenatal care before the 12th week of pregnancy increased slightly to 28.5%, while 60% of women are accessing during the second trimester and 11.5% during the third trimester (Situation Analysis of Children & Women in Belize 2011).
MILLENNIUM DEVELOPMENT GOALS REPORT AND POST 2015 AGENDA 53

Figure 5.2: Antenatal Care at Least Once by Skilled Personnel
COROZAL99.1%
ORANGEWALK100.0%
BELIZE91.7%
CAYO97.5%
STANNCREEK97.6%
TOLEDO91.5%
CARIBBEAN SEA
97.834 TO 101
94.668 TO 97.833
91.5 TO 94.667
Source: UNDP, 2013
FIGURE 5.2: ANTENATAL CARE AT LEAST ONCE BY SKILLED PERSONNEL
12 34 56 78
54

Table 5.3: Antenatal Care at Least Once by Skilled Personnel
Indicator 5.6- Unmet Need for Family Planning
Unmet need for contraception refers to fecund12 women who are not using any method of contraception, but who wish to postpone the next birth (spacing) or who wish to stop bearing children altogether (limiting). The unmet need for 2006 and 2011 were 31.2% and 15.9% respectively. While there has been a general reduction in the contraceptive prevalence rate, there has also been a drastic reduction in the total unmet need indicator. The demand for contraception is least satisfied in the Toledo District (46.3%) and most satisfied in the Corozal District (84.5%). Mayan households had the least demand for contraceptives at 59% while Mestizo households had the highest demand at 81.6%.
There is slight difference in unmet need between urban (14.1%) versus rural areas (17.1%). The numbers presented for unmet need may be motivated by cultural or health reasons so it is therefore necessary to determine why.
MILESTONE ACHIEVEMENTS
A major milestone achieved in 2011 was zero maternal deaths. This great achievement may be attributable to the introduction of the Belize Health Information System in 2007, as real time data began to be used to aggressively monitor and continuously improve maternal health care
Region Percentage (%)
Corozal 99.1 Orange Walk 100.0 Belize (excluding Belize City South Side) 86.9
Belize City South Side 96.4
Belize District 91.7 Cayo 97.5 Stann Creek 97.6 SToledo 91.5
Source: MICS 2011 (SIB/UNICEF)
12 Proven fertile
MILLENNIUM DEVELOPMENT GOALS REPORT AND POST 2015 AGENDA 55
(Graven et al, 2012). In addition, the introduction of the Quality Improvement of Maternal and Neonatal Care Policy in August 2009 contributed to a standardisation of care. These included early diagnosis of pre-eclampsia, increased usage of WHO CLAP partograph to monitor labour progression and the active management of the third stage of labour, to prevent postpartum haemorrhage.
The certification of all seven public hospitals as Mother-baby Friendly hospitals between 2006 and 2012 may have also played a role in the prevention of postpartum haemorrhage as an exclusive breastfeeding protocol was encouraged. MICS 2011 reported an increase in the exclusive breastfeeding of newborns up to six months of age by mothers; up from 10% to 14.7%.
A final milestone achievement is that Belize recorded 39.7 health care professionals per 10,000 population meeting the target set in the Toronto Call to Action13. Human resources in health do matter and meeting this target is indicative of Government’s commitment to health for all.
CHALLENGES
An assessment of the six indicators that relate to the goal of improving maternal health has shown an approximately 50% progression rate. There have been noticeable geographic disparities in achieving the targets set by the indicators, mostly in southern part of the country. While much has been invested to achieve the goal, much still remains to be done. Health care services, goods, and facilities connected to preventing maternal mortality must be available physically and economically; accessible on the basis of non-discrimination; acceptable; and of good quality (Hunt & Bueno de Mezquita 2010). To meet the challenge of sustainably reducing maternal mortality requires the participation of all stakeholders in policy and service development targeting interventions to the most vulnerable - rural populations and the poor.
With regards to the indicator of skilled birth attendance, there has been a gradual decline since 2006 from a high rate of 95.8%. However, the current rate is 10% higher than the baseline of 79% in 1995. The reason for the decline in skilled attendance at birth is unclear and requires further comprehensive assessment. However, what is clear is that nurse/midwives continue to play an important role. Traditional birth attendants (TBAs) continue to assist with deliveries in the Corozal and Cayo districts, especially among older women and those with no formal education. Three percent of deliveries in Toledo were conducted by a friend or relative. One of the population groups with highest percent of deliveries attended by TBA is the Mennonites.
13 The Call to Action aims to mobilise institutional actors, both national and international, of the health sector and other relevant sectors and civil society, to collectively strengthen the human resources in health through both policies and interventions, in order to achieve the Millennium Development Goals and according to the national health priorities to provide access to quality health services for all the peoples of the Americas by the year 2015.
12 34 56 78
56
While Belize has met the target set in the Toronto Call to Action, an estimated 3.5% of these professionals are volunteer physicians from Cuba, placed in mostly rural areas (Health in the Americas, 2012). Policy changes in Cuba will severely affect Havana’s health contribution to CARICOM, as assistance will be at a cost and scholarships will be significantly reduced. At the same time, Belizean nurses continue to migrate out of country, causing depletion in the human resources staffing the health system. One strategy to increase the number of births attended by skilled health personnel is to increase the number of skilled birth attendants countrywide. Therefore the continuous training of nurses to serve in rural communities is important and their strategic deployment to needy areas is critical.
Various barriers to accessing the health services exist. This may include the physical distance that expectant mothers have to travel, the inability to pay for transportation or care, women wanting to observe cultural traditions, and the lack of confidence in the health system etc. The challenge is to make health care accessible for every community by having in place reliable transportation for early transfers. Another challenge is for health care facilities to provide more culturally sensitive services where possible to honour the family’s cultural practises when there is no evidence that such practises would be a health risk to the mother and baby.
The contraceptive use prevalence rate in Belize has declined from a baseline of 56% in 1999 to 53% in 2011. Challenges that may impede universal access to contraceptives include religious beliefs (e.g. opposition from family members), cultural norms (e.g. male partners having control over female partners’ choices), education (e.g. lack of knowledge of the types and usage of contraceptive methods), and legal barriers (e.g. restrictions to access based on age consent and parental rights issues). It is therefore important to determine the reasons for low usage as they may not be solely determined by the availability or the lack thereof of contraceptives and address the challenges through multisectoral dialogue, mutual respect and action.
Another challenge to decreasing the adolescent birth rate is the fact that persons less than 18 years are not legally allowed reproductive health counselling without parental or guardian consent and an entrenched reluctance of church managed schools to provide sexual-related education. One recommendation is for a formal introduction of a sexual education course in the high school curriculum which is balanced by an informed emphasis on prevention and protection through media campaigns, parents, churches and universities.
Regarding antenatal care coverage, the lowest level of antenatal care is found in the Toledo District (91.5%) while Belize City South Side had the highest rate at 96.4%. Nurse/Midwives continue to play an important role in the provision of antenatal care especially to women in the rural areas and of primary education level. The collaboration between the MOH and the University of Belize to provide training to rural health nurses and public health nurses needs to be strengthened and sustained. The National Health Insurance Scheme in South Side Belize City
MILLENNIUM DEVELOPMENT GOALS REPORT AND POST 2015 AGENDA 57

and southern Belize has contributed to the increased rate of antenatal care coverage. There is the need to continue with training of public health nurses to serve the population living in rural communities. Reliable transportation is key to increasing antenatal care coverage in rural areas as mobile clinics account for 7.1% of antenatal care services. Partnering with media in the dissemination of information regarding early prenatal care in various languages must be considered.
While postnatal care (PNC) coverage has not been addressed as an indicator for improving maternal health, its importance cannot be underestimated. The postnatal period, which is the first six weeks after birth, is critical to the health and survival of the mother and her newborn. This is a stressful time for new mothers and lack of care in this period may result in death or disability as well as missed opportunities to promote healthy behaviours affecting women, newborns, and children (Warren et al., n.d.) MICS 2011 shows that for 92.7 percent of live births, both the mothers and their newborns receive either a health check following birth or a timely PNC visit. Postnatal care visits within two days of birth was highest in the Corozal District (91.3%) among the Mestizo household (94.8%) while Toledo recorded the lowest (80.8%) among the Mayan household (86.5%). The poorest households were least likely to have both the mother and the child checked (88%) compared with the richest households, where coverage was close to 95%. Strategies for the delivery of postnatal care are important considerations.
Important in the realisation of the Goal to improve maternal health is the need for quality data. The Belize Health Information System has made great strides in this area; however health care providers must ensure that all relevant information is gathered and documented. Quality data plays a vital role in decision-making for the strengthening of existing policies and programmes or introduction of new ones.
The recent announcement of Belize participating in the Salud Mesoamérica 2015 Initiative (SM2015) provides an enabling environment to achieving the goals of improving maternal health and reducing child mortality. This initiative seeks to reach the most marginalized populations, to benefit the poor women and children thereby reducing the health equity gaps among the most vulnerable populations.
12 34 56 78
58
6
SECTION 1.6GOAL #6: COMBAT HIV/AIDS,
MALARIA AND OTHER DISEASES
This goal has three targets and ten indicators. Belize is on track in halting the spread of HIV. This is demonstrated by the significant decline of new HIV cases over the last five years largely due to the Prevention of Mother to Child Transmission (PMTCT) programme and voluntary counselling and testing (VCT). Services, including access to condoms and antiretroviral drugs coupled with other social actions may have impacted positively on the reduction in number of new cases. Data on young population with correct comprehensive knowledge of HIV & AIDS show a decline, but this data was collected via sample surveys where non- sampling errors could skew the results. Noted progress has also been made in reducing the incidence and death rate associated with Malaria such that Belize is poised to enter the pre-elimination stage. Similar successes are not forthcoming regarding tuberculosis.
MILLENNIUM DEVELOPMENT GOALS REPORT AND POST 2015 AGENDA 59
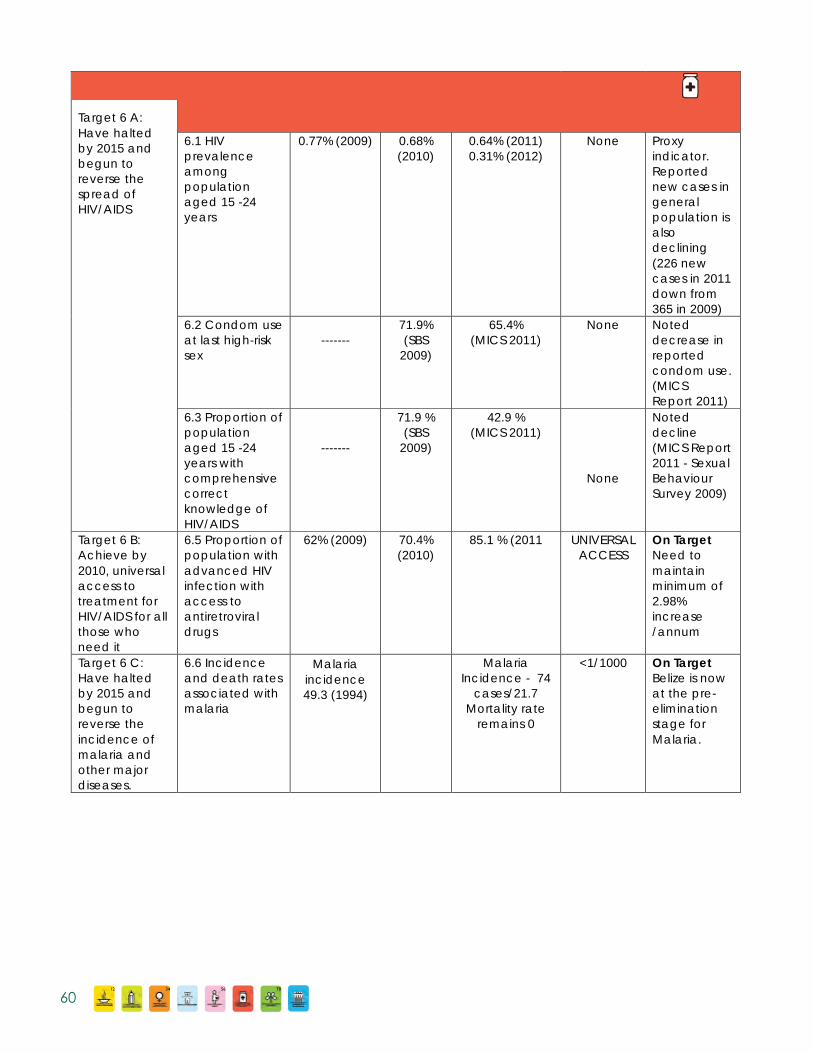
GOAL #6: Combat HIV/AIDS, Malaria and other Diseases Target 6 A: Have halted by 2015 and begun to reverse the spread of HIV/AIDS
Indicators Baseline
1990 Status 2010
Actual 2012
Target 2015
Comments
6.1 HIV prevalence among population aged 15 -24 years
0.77% (2009) 0.68% (2010)
0.64% (2011) 0.31% (2012)
None Proxy indicator. Reported new cases in general population is also declining (226 new cases in 2011 down from 365 in 2009)
6.2 Condom use at last high-risk sex
-------
71.9% (SBS
2009)
65.4% (MICS 2011)
None Noted decrease in reported condom use. (MICS Report 2011)
6.3 Proportion of population aged 15 -24 years with comprehensive correct knowledge of HIV/AIDS
-------
71.9 % (SBS
2009)
42.9 % (MICS 2011)
None
Noted decline (MICS Report 2011 - Sexual Behaviour Survey 2009)
Target 6 B: Achieve by 2010, universal access to treatment for HIV/AIDS for all those who need it
6.5 Proportion of population with advanced HIV infection with access to antiretroviral drugs
62% (2009) 70.4% (2010)
85.1 % (2011 UNIVERSAL ACCESS
On Target Need to maintain minimum of 2.98% increase /annum
Target 6 C: Have halted by 2015 and begun to reverse the incidence of malaria and other major diseases.
6.6 Incidence and death rates associated with malaria
Malaria incidence 49.3 (1994)
Malaria Incidence - 74
cases/21.7 Mortality rate
remains 0
<1/1000 On Target Belize is now at the pre-elimination stage for Malaria.
12 34 56 78
60
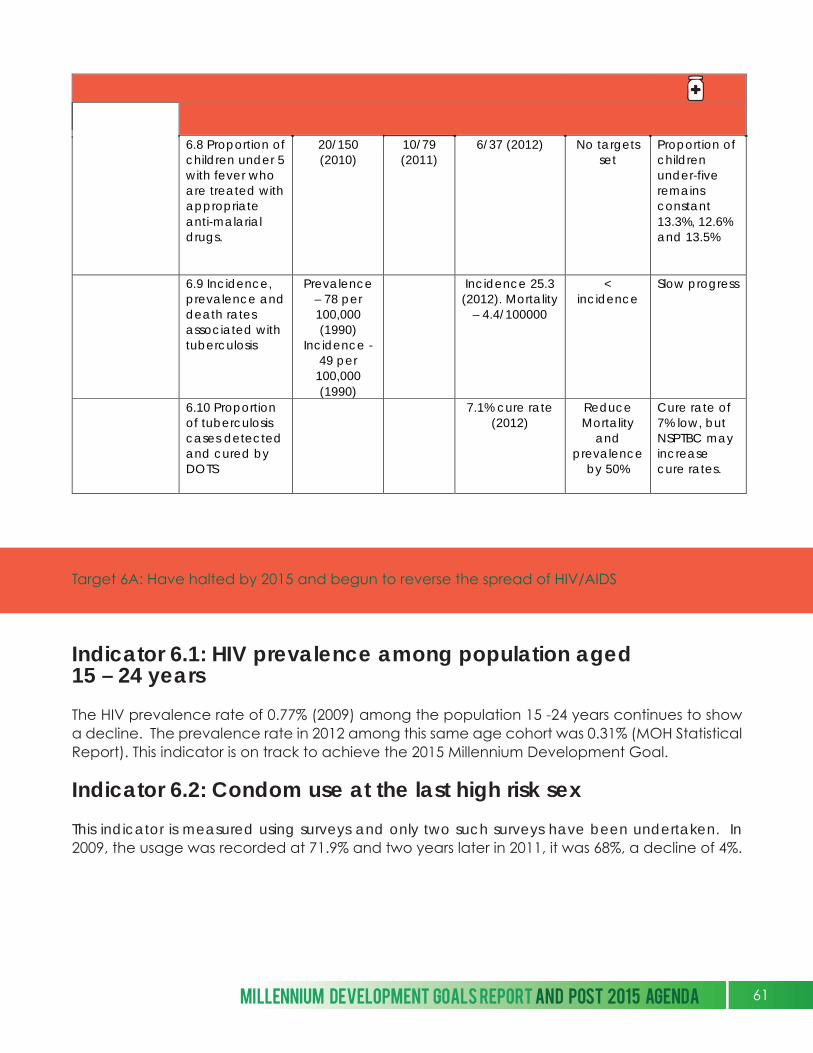
Target 6A: Have halted by 2015 and begun to reverse the spread of HIV/AIDS
Indicator 6.1: HIV prevalence among population aged 15 – 24 years
The HIV prevalence rate of 0.77% (2009) among the population 15 -24 years continues to show a decline. The prevalence rate in 2012 among this same age cohort was 0.31% (MOH Statistical Report). This indicator is on track to achieve the 2015 Millennium Development Goal.
Indicator 6.2: Condom use at the last high risk sex
This indicator is measured using surveys and only two such surveys have been undertaken. In 2009, the usage was recorded at 71.9% and two years later in 2011, it was 68%, a decline of 4%.
6.8 Proportion of children under 5 with fever who are treated with appropriate anti-malarial drugs.
20/150 (2010)
10/79 (2011)
6/37 (2012) No targets set
Proportion of children under-five remains constant 13.3%, 12.6% and 13.5%
6.9 Incidence, prevalence and death rates associated with tuberculosis
Prevalence – 78 per 100,000 (1990)
Incidence - 49 per
100,000 (1990)
Incidence 25.3 (2012). Mortality
– 4.4/100000
< incidence
Slow progress
6.10 Proportion of tuberculosis cases detected and cured by DOTS
7.1% cure rate (2012)
Reduce Mortality
and prevalence
by 50%
Cure rate of 7% low, but NSPTBC may increase cure rates.
GOAL #6: Combat HIV/AIDS, Malaria and other Diseases Target 6 A: Have halted by 2015 and begun to reverse the spread of HIV/AIDS
Indicators Baseline
1990 Status 2010
Actual 2012
Target 2015
Comments
6.1 HIV prevalence among population aged 15 -24 years
0.77% (2009) 0.68% (2010)
0.64% (2011) 0.31% (2012)
None Proxy indicator. Reported new cases in general population is also declining (226 new cases in 2011 down from 365 in 2009)
6.2 Condom use at last high-risk sex
-------
71.9% (SBS
2009)
65.4% (MICS 2011)
None Noted decrease in reported condom use. (MICS Report 2011)
6.3 Proportion of population aged 15 -24 years with comprehensive correct knowledge of HIV/AIDS
-------
71.9 % (SBS
2009)
42.9 % (MICS 2011)
None
Noted decline (MICS Report 2011 - Sexual Behaviour Survey 2009)
Target 6 B: Achieve by 2010, universal access to treatment for HIV/AIDS for all those who need it
6.5 Proportion of population with advanced HIV infection with access to antiretroviral drugs
62% (2009) 70.4% (2010)
85.1 % (2011 UNIVERSAL ACCESS
On Target Need to maintain minimum of 2.98% increase /annum
Target 6 C: Have halted by 2015 and begun to reverse the incidence of malaria and other major diseases.
6.6 Incidence and death rates associated with malaria
Malaria incidence 49.3 (1994)
Malaria Incidence - 74
cases/21.7 Mortality rate
remains 0
<1/1000 On Target Belize is now at the pre-elimination stage for Malaria.
MILLENNIUM DEVELOPMENT GOALS REPORT AND POST 2015 AGENDA 61
Indicator 6.3: Proportion of population aged 15 -24 years with comprehensive correct knowledge of HIV/AIDS
There is likely to be a correlation between condom use and knowledge. Therefore, the indicator of both the UNGASS and MDG for young people to have comprehensive, correct knowledge of HIV/AIDS is critical to the reduction of HIV. MICS (2011) stated that in women of child bearing age (15 - 49) years; knowledge of HIV was 44.5%.
Target 6B: Achieve by 2010 universal access to treatment for HIV/AIDS for all those who need it
Access to antiretroviral drugs is made possible through the distribution points at the Voluntary Counselling and Testing (VCT) centres country wide and more recently through national pharmacies. There will be a larger number of persons needing anti-retroviral drugs with the new guidelines14 for therapy initiation. This move will have cost implications for MOH that could potentially impact access.
Indicator 6.5: Proportion of population with advanced HIV infection with access to antiretroviral drugs
The proportion of persons with advanced HIV infections with access to anti- retroviral is 85.1% (2011) up from the 2010 figure of 70.4% a difference of 14.6%. Given the rapid one year increase of 14.6%, universal access is possible if the momentum is maintained.
Target 6C: Have halted by 2015 and begun to reverse the incidence of Malaria and other major diseases
Indicator 6.6: Incidence and deaths rates associated with Malaria
The number of cases of Malaria per annum is decreasing. In 2010 there were one hundred and fifty (150) cases and at 2012 there were only thirty seven (37) cases; two (2) of which were imported from El Salvador. Belize has made great strides in the control of Malaria and according to the Ministry of Health is poised to enter the pre-elimination stage (< 1case/ 100000).
Malaria is endemic in Belize but unlike other areas such as Africa, Belize has experienced a zero percent death rate since 2007. This phenomenon may be attributed to the predominant type of infection, Plasmodium Vivax. The number of Malaria cases continues to decrease (see Figure 6.1).
14 The Ministry of Health’s new guidelines dictates that therapy be initiated with a CD4 cell count of 500 instead of the previous level of 350.
12 34 56 78
62
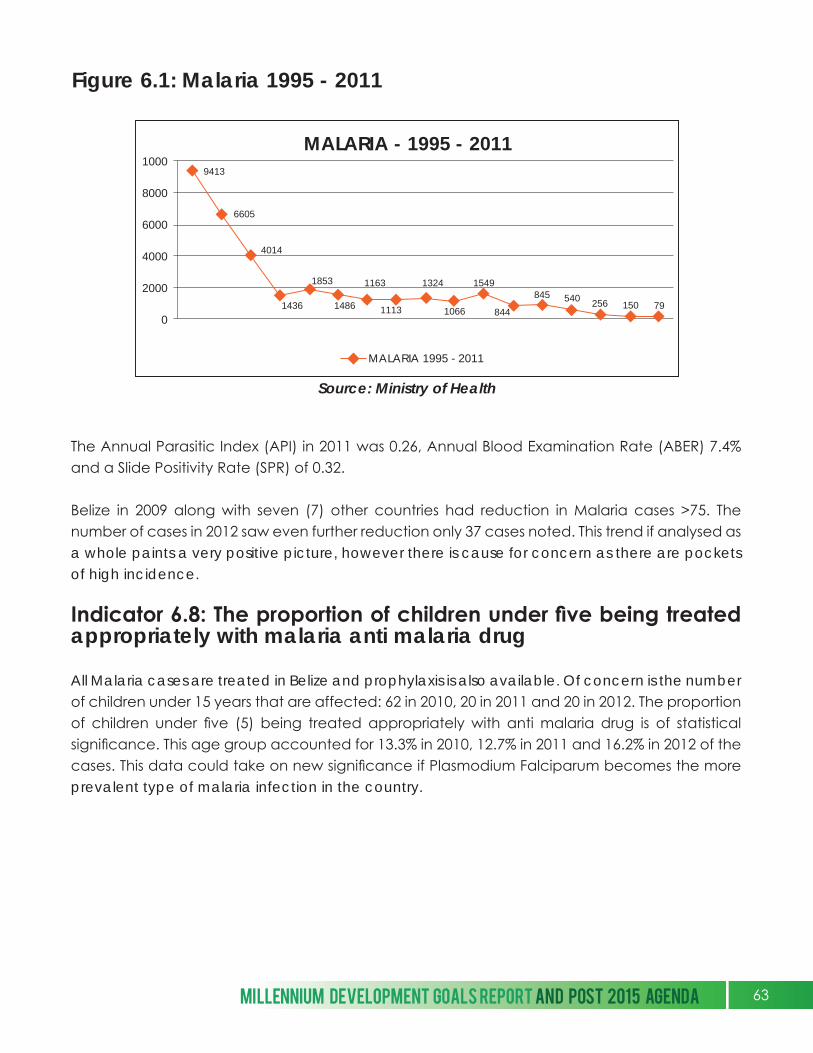
Figure 6.1: Malaria 1995 - 2011
The Annual Parasitic Index (API) in 2011 was 0.26, Annual Blood Examination Rate (ABER) 7.4% and a Slide Positivity Rate (SPR) of 0.32.
Belize in 2009 along with seven (7) other countries had reduction in Malaria cases >75. The number of cases in 2012 saw even further reduction only 37 cases noted. This trend if analysed as a whole paints a very positive picture, however there is cause for concern as there are pockets of high incidence.
Indicator 6.8: The proportion of children under five being treated appropriately with malaria anti malaria drug
All Malaria cases are treated in Belize and prophylaxis is also available. Of concern is the number of children under 15 years that are affected: 62 in 2010, 20 in 2011 and 20 in 2012. The proportion of children under five (5) being treated appropriately with anti malaria drug is of statistical significance. This age group accounted for 13.3% in 2010, 12.7% in 2011 and 16.2% in 2012 of the cases. This data could take on new significance if Plasmodium Falciparum becomes the more prevalent type of malaria infection in the country.
Source: Ministry of Health
MALARIA - 1995 - 2011
MALARIA 1995 - 2011
1000
8000
6000
4000
2000
0
9413
6605
4014
1436
1853
1486
1163
1113
1324
1066
1549
844
845 540 256 150 79
MILLENNIUM DEVELOPMENT GOALS REPORT AND POST 2015 AGENDA 63
Indicator 6.9: Incidence, prevalence and death rates associated with tuberculosis
Unlike malaria, which is regarded as a success story, similar successes are not forthcoming regarding tuberculosis. The achievement of the target to halt and stop the spread of tuberculosis by 2015 is at risk. The number of new cases was 49.0 per 100,000 persons in 1990. This was reduced to 24.7 cases per 100,000 population (2009) however; there has been no significant reduction since, possibly due to the absence of a national coordinator. Mortality from tuberculosis was marginally less than 18 per 100,000 in 2012.
Indicator 6.10: Proportion of Tuberculosis cases detected and cured under directly observed treatment short course
There was a reported 7.1 % cure rate in 2012 and 9.5% completing treatment that same year using the Directly Observed Treatment Strategy (DOTS). It is anticipated that the implementation of the National Strategic Plan for Tuberculosis Control (NSPTBC) 2013- 2017 will enhance both cure and treatment completion rates.
MILESTONE ACHIEVEMENTS
Reducing the prevalence of HIV/AIDS must be regarded as a major milestone achievement. Many other indicators regarding HIV/AIDS have recorded similar gains. These include expanding access to antiretroviral drugs, such that they are now available in district pharmacies. Significant success was also achieved in reducing mother to child HIV transmission rates.
Successes in placing Belize at the pre-elimination stage for malaria must also be considered as a milestone achievement. However there are challenges with Tuberculosis and possibly, Dengue.
CHALLENGES
Regarding this MDG and focusing specifically on the proportion of population aged 15 -24 years with comprehensive correct knowledge of HIV/AIDS, a challenge is to reduce the existing disparities noted – at the rural urban level, the district level, the socio-economic level and the educational level. MICS (2011) noted that women living in urban areas had a higher rate of knowledge (56.4%) that was more than 12 percentage points higher than rural women (34.0%).
12 34 56 78
64

When disaggregated by district, the Belize district had a higher knowledge level of 69.6% excluding Southside Belize City. Education attainment and wealth were also variables that impacted knowledge rates (see table.) As an indicator of both UNGASS and MDG, these finding point to the possible linkage between poverty and vulnerability of persons to acquire HIV. Furthermore, it calls for greater resource sharing in order to achieve this target that would maximise efforts and minimize duplication.
Figure 6.2: Percentage of Women with Comprehensive Knowledge of HIV by Education and Wealth Index
Source: MICS 2011 (SIB/UNICEF)
With regards to universal access to treatment for HIV/AIDS for those needing it, stigma and discrimination (real or perceived) may still be factors impeding access to treatment. This is not primarily in the form of discrimination in the service provision within healthcare facilities, but reflects the fear of marginalisation in the wider society, of those who would access these services, if their status became known. This fear is cited, but no scientific data has been collected to specifically determine how to address this challenge in a meaningful way. Other challenges, not directly preventing access but which impact treatment include: the inability to source food that must be taken with the antiretroviral medication; the lack of transportation to the nearest health centre; and failure to follow treatment compliance protocols especially among those with the co-infection of Tuberculosis. According to AIDSMAP, recent research done showed
Non Primary Secondary Poorest Second Middle Fourth Richest
70
60
50
40
30
20
10
0
MILLENNIUM DEVELOPMENT GOALS REPORT AND POST 2015 AGENDA 65

Table 6.1: Malaria Cases by District, Years & Sex
Year 2010 2011 2012
District M F Total M F Total M F Total
Corozal 0 0 0 0 0 0 1 1 2
Orange Walk 2 3 5 0 1 1 1 0 1
Belize 2 1 3 3 0 3 0 0 0
Cayo 14 8 22 2 6 8 0 0 0
Stann Creek 50 47 97 33 14 47 19 10 29
Toledo 10 13 23 13 7 20 4 1 5
Total 78 72 150 51 28 79 25 12 37
Source: Epidemiology Unit, Ministry of Health, Belize
Within the Stann Creek District is an area, Trio /Bladen that accounted for 62.1 % of the 29 cases in 2012. Trio/ Bladen, although not geographically in the Stann Creek District, because of its proximity it is included for health administrative purposes. It is known that Stann Creek has a high percentage of migrant workers in the citrus and banana plantation belts. The prevalence of malaria in intense farming regions need to be further assessed to reduce the likelihood of a re-emergence of malaria in Belize. Lack of information in this area can negatively influence Belize’s push to elimination of the disease.
early detection and treatment over a period of seven years can lead to remissions. Therefore access and appropriate behavioural changes are critical in the control of the disease. Early detection, access and adherence may contribute to the increases in the survival rate in females (as seen in the PMTCT); and is indicative that improved testing in the male population may contribute to an even greater impact on the reduction of national figures.
In the control of Malaria, the challenge is in the reduction of incidence in southern districts of Toledo and Stann Creek, which accounted for the highest number of cases in recent years. Note table below:
12 34 56 78
66
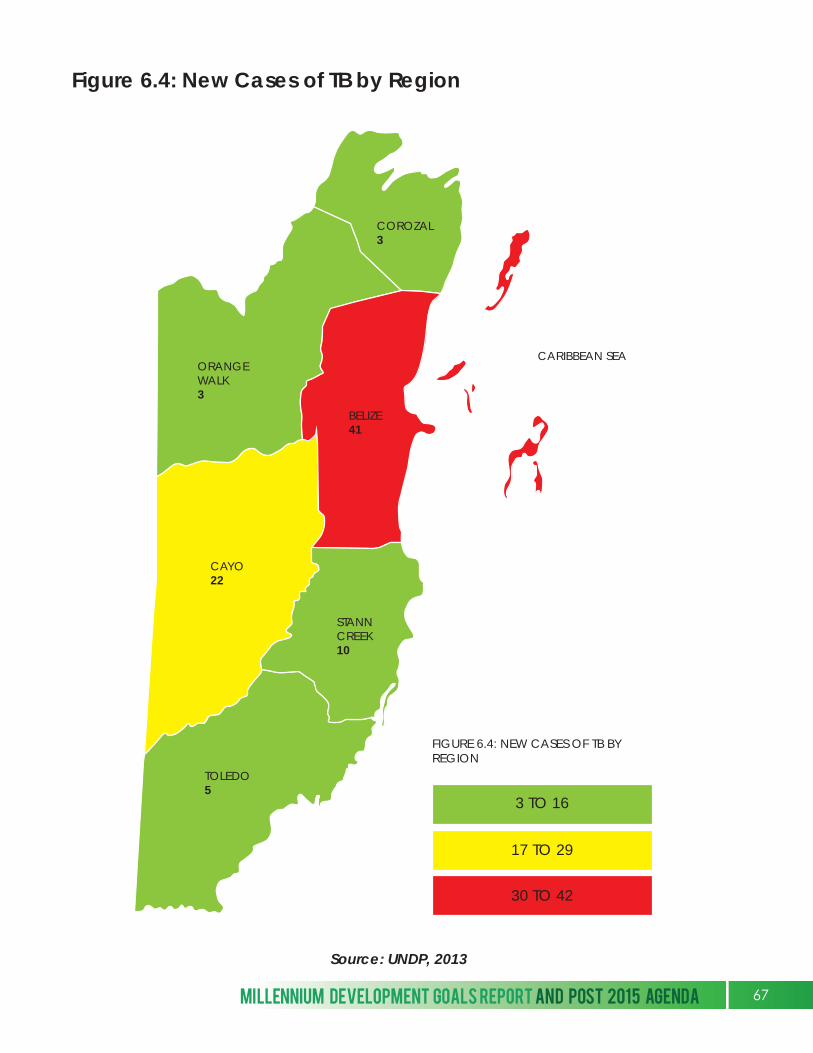
Figure 6.4: New Cases of TB by Region
COROZAL3
ORANGEWALK3
BELIZE41
CAYO22
STANNCREEK10
TOLEDO5
CARIBBEAN SEA
3 TO 16
17 TO 29
30 TO 42
Source: UNDP, 2013
FIGURE 6.4: NEW CASES OF TB BY REGION
MILLENNIUM DEVELOPMENT GOALS REPORT AND POST 2015 AGENDA 67
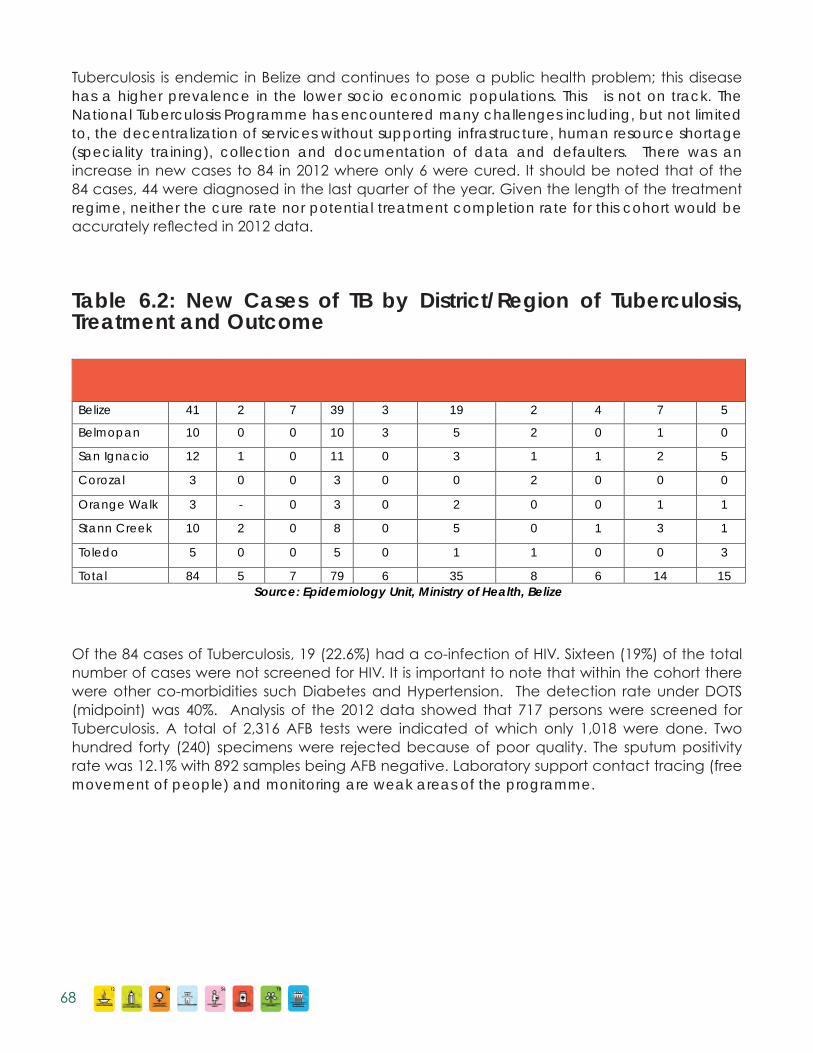
Source: Epidemiology Unit, Ministry of Health, Belize
District/Region TB
Cases EPTB
Cases Relapse cases
PTB Not on TB
drugs
Currently on
treatment
Completed treatment
Cured Defaulters Deaths
Belize 41 2 7 39 3 19 2 4 7 5
Belmopan 10 0 0 10 3 5 2 0 1 0
San Ignacio 12 1 0 11 0 3 1 1 2 5
Corozal 3 0 0 3 0 0 2 0 0 0
Orange Walk 3 - 0 3 0 2 0 0 1 1
Stann Creek 10 2 0 8 0 5 0 1 3 1
Toledo 5 0 0 5 0 1 1 0 0 3
Total 84 5 7 79 6 35 8 6 14 15
Table 6.2: New Cases of TB by District/Region of Tuberculosis, Treatment and Outcome
Tuberculosis is endemic in Belize and continues to pose a public health problem; this disease has a higher prevalence in the lower socio economic populations. This is not on track. The National Tuberculosis Programme has encountered many challenges including, but not limited to, the decentralization of services without supporting infrastructure, human resource shortage (speciality training), collection and documentation of data and defaulters. There was an increase in new cases to 84 in 2012 where only 6 were cured. It should be noted that of the 84 cases, 44 were diagnosed in the last quarter of the year. Given the length of the treatment regime, neither the cure rate nor potential treatment completion rate for this cohort would be accurately reflected in 2012 data.
Of the 84 cases of Tuberculosis, 19 (22.6%) had a co-infection of HIV. Sixteen (19%) of the total number of cases were not screened for HIV. It is important to note that within the cohort there were other co-morbidities such Diabetes and Hypertension. The detection rate under DOTS (midpoint) was 40%. Analysis of the 2012 data showed that 717 persons were screened for Tuberculosis. A total of 2,316 AFB tests were indicated of which only 1,018 were done. Two hundred forty (240) specimens were rejected because of poor quality. The sputum positivity rate was 12.1% with 892 samples being AFB negative. Laboratory support contact tracing (free movement of people) and monitoring are weak areas of the programme.
12 34 56 78
68
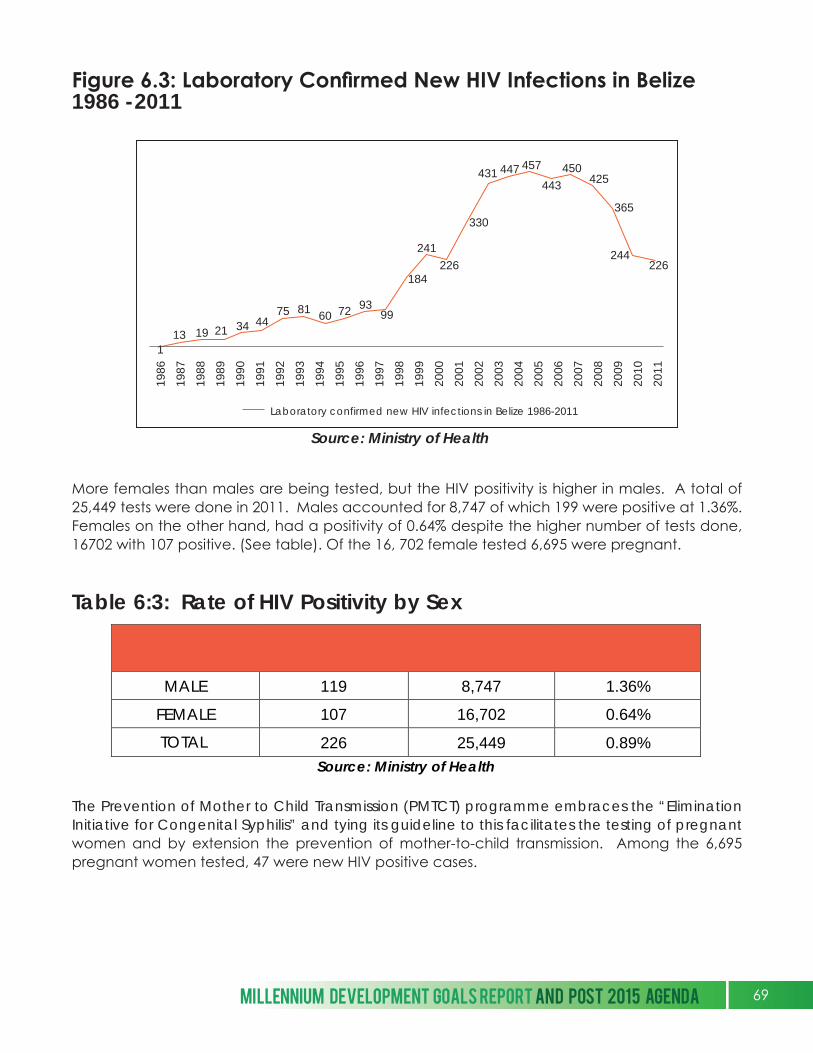
More females than males are being tested, but the HIV positivity is higher in males. A total of 25,449 tests were done in 2011. Males accounted for 8,747 of which 199 were positive at 1.36%. Females on the other hand, had a positivity of 0.64% despite the higher number of tests done, 16702 with 107 positive. (See table). Of the 16, 702 female tested 6,695 were pregnant.
Table 6:3: Rate of HIV Positivity by Sex
SEX POSITIVE CASES # TEST RATE
MALE 119 8,747 1.36%
FEMALE 107 16,702 0.64%
226 25,449 0.89% Source: Ministry of Health
TOTAL
Source: Ministry of Health
The Prevention of Mother to Child Transmission (PMTCT) programme embraces the “Elimination Initiative for Congenital Syphilis” and tying its guideline to this facilitates the testing of pregnant women and by extension the prevention of mother-to-child transmission. Among the 6,695 pregnant women tested, 47 were new HIV positive cases.
Figure 6.3: Laboratory Confirmed New HIV Infections in Belize 1986 -2011
1986
1987
1988
1989
1990
1991
1992
1993
1994
1995
1996
1997
1998
1999
2000
2001
2002
2003
2004
2005
2006
2007
2008
2009
2010
2011
113 19 21 34 44
75 81 60 72 9399
241226
184
330
431 447 457
443450
425
365
244226
Laboratory confirmed new HIV infections in Belize 1986-2011
MILLENNIUM DEVELOPMENT GOALS REPORT AND POST 2015 AGENDA 69
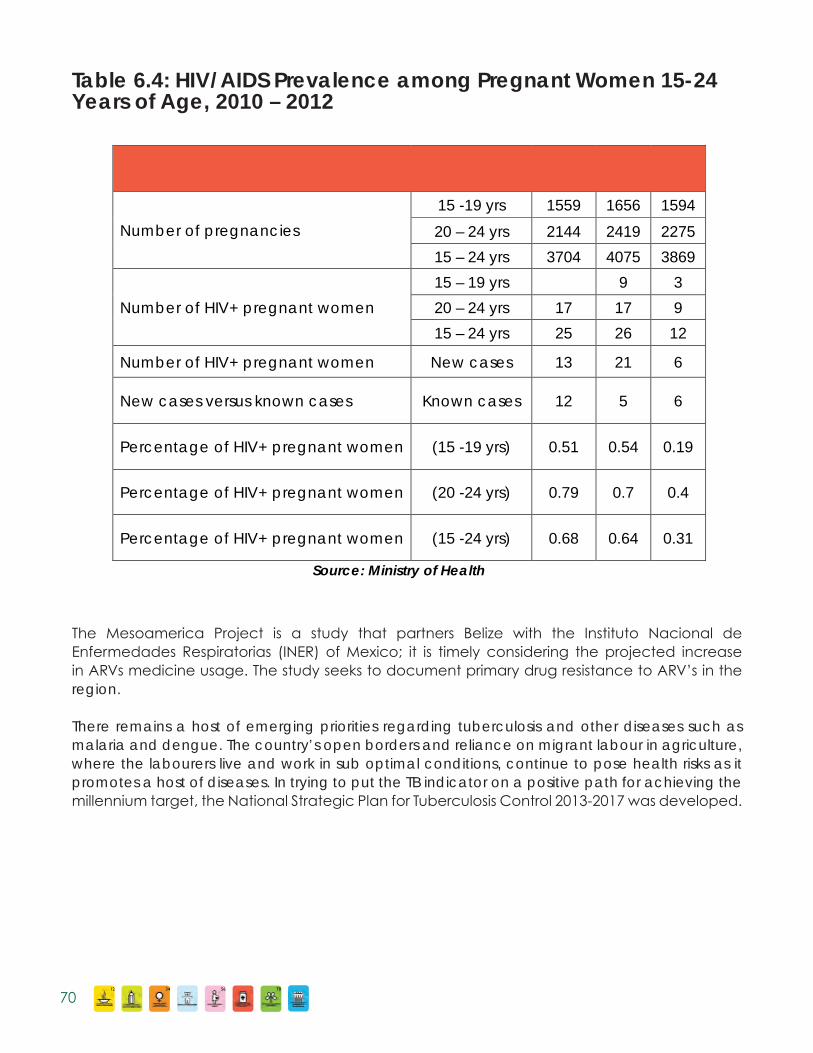
Table 6.4: HIV/AIDS Prevalence among Pregnant Women 15-24 Years of Age, 2010 – 2012
Age Group 2010 2011 2012
Number of pregnancies
15 -19 yrs 1559 1656 1594
20 – 24 yrs 2144 2419 2275
15 – 24 yrs 3704 4075 3869
Number of HIV+ pregnant women
15 – 19 yrs 9 3
20 – 24 yrs 17 17 9
15 – 24 yrs 25 26 12
Number of HIV+ pregnant women New cases 13 21 6
New cases versus known cases Known cases 12 5 6
Percentage of HIV+ pregnant women (15 -19 yrs) 0.51 0.54 0.19
Percentage of HIV+ pregnant women (20 -24 yrs) 0.79 0.7 0.4
Percentage of HIV+ pregnant women (15 -24 yrs) 0.68 0.64 0.31
Source: Ministry of Health
The Mesoamerica Project is a study that partners Belize with the Instituto Nacional de Enfermedades Respiratorias (INER) of Mexico; it is timely considering the projected increase in ARVs medicine usage. The study seeks to document primary drug resistance to ARV’s in the region.
There remains a host of emerging priorities regarding tuberculosis and other diseases such as malaria and dengue. The country’s open borders and reliance on migrant labour in agriculture, where the labourers live and work in sub optimal conditions, continue to pose health risks as it promotes a host of diseases. In trying to put the TB indicator on a positive path for achieving the millennium target, the National Strategic Plan for Tuberculosis Control 2013-2017 was developed.
12 34 56 78
70
The Plan incorporates the WHO recommended collaborative TB/HIV activities.
A. Establish and strengthen the mechanisms for delivering integrated TB & HIV services.
A.1 Set up and strengthen a coordinating body for collaborative TB/HIV activities
functional at all levels.
A.2 Determine HIV prevalence among TB patients and TB prevalence among people
living with HIV
A.3. Carry out joint TB/HIV planning to integrate the delivery of TB and HIV services
A.4. Monitor and evaluate collaborative TB/HIV activities.
B. Reduce the burden of TB in people with HIV and initiate early antiretroviral therapy
(the Three I’s for HIV/TB).
B.1 Intensify TB case-finding and ensure high quality anti-tuberculosis treatment.
B.2 Initiate TB prevention with Isoniazid preventive therapy and early antiretroviral therapy.
B.3 Ensure control of TB infection in health-care facilities and congregate settings.
C. Reduce the burden of HIV in patients with presumptive and diagnosed TB.
C.1 Provide HIV testing and counselling to patients with presumptive and diagnosed TB.
C.2 Provide HIV prevention interventions for patients with presumptive and diagnosed TB.
C.3 Provide co-trimoxazole preventive therapy for TB patients living with HIV.
C.4 Ensure HIV prevention interventions, treatment and care for TB patients living with HIV.
C.5 Provide antiretroviral therapy for TB patients living with HIV.
Since March 2013, the strengthening of the programme with regards to human resource began by training health care workers to develop the necessary network to support decentralization. District laboratories are able to support testing with the additional training of a microscopist, at that level. In the Belize District, more so in Belize City, active case finding and outreach services will be initiated using contact tracing. The development of a proper registry for Tuberculosis with clear indicators (data to be collected) is underway and collaborative activities of TB/HIV will allow both programmes to maximize on human and other resources. There is a TB/ HIV/AIDS and other STIs programme report for 2012, coming out of the Ministry of Health. In the future, it will be possible to examine reports at a glance, individually and possibly compare/cross reference data from across programmes.
MILLENNIUM DEVELOPMENT GOALS REPORT AND POST 2015 AGENDA 71

7
SECTION 1.7GOAL #7: ENSURE
ENVIRONMENTAL SUSTAINABILITY
This goal has four targets and ten indicators. Goal 7 recognises that growth must be both inclusive and environmentally sound to reduce poverty and build shared prosperity for people, today and for future generations. This goal is particularly important for Belize as a natural resource based economy. The Environmental Agenda for Belize 2008- 2013 prepared and presented by the Belize Audubon Society describes the Belizean condition where, “… natural resources are the engine and probably the wheels, of Belize’s economic vehicle.” Horizon 2030 which elaborates the long term vision of the country speaks of a future where, “the natural environment is valued and protected as the basis for all economic activity and therefore development planning is based on the principles of environmental sustainability.”
12 34 56 78
72
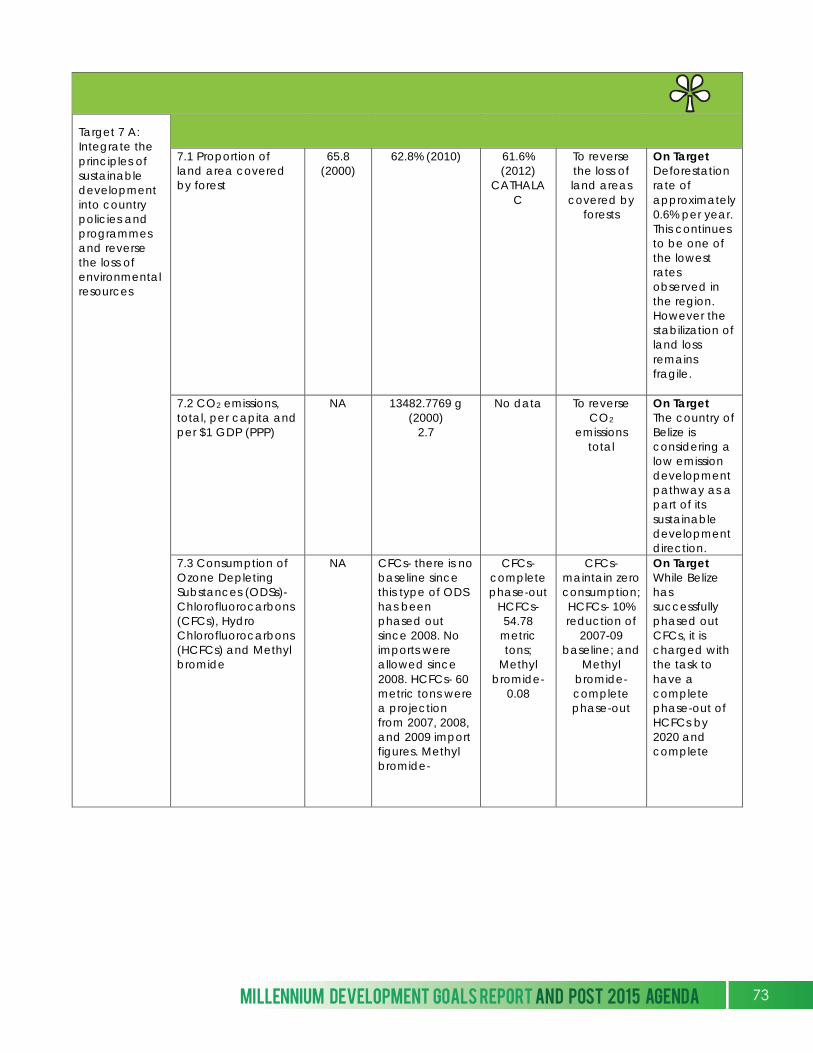
Goal #7: Ensure Environmental Sustainability
Target 7 A: Integrate the principles of sustainable development into country policies and programmes and reverse the loss of environmental resources
Indicators Baseline
1990 Status 2010
Actual 2012
Target 2015
Comments
7.1 Proportion of land area covered by forest
65.8 (2000)
62.8% (2010) 61.6% (2012)
CATHALAC
To reverse the loss of land areas covered by
forests
On Target Deforestation rate of approximately 0.6% per year. This continues to be one of the lowest rates observed in the region. However the stabilization of land loss remains fragile.
7.2 CO2 emissions, total, per capita and per $1 GDP (PPP)
NA 13482.7769 g (2000)
2.7
No data To reverse CO2
emissions total
On Target The country of Belize is considering a low emission development pathway as a part of its sustainable development direction.
7.3 Consumption of Ozone Depleting Substances (ODSs)- Chlorofluorocarbons (CFCs), Hydro Chlorofluorocarbons (HCFCs) and Methyl bromide
NA CFCs- there is no baseline since this type of ODS has been phased out since 2008. No imports were allowed since 2008. HCFCs- 60 metric tons were a projection from 2007, 2008, and 2009 import figures. Methyl bromide-
CFCs- complete phase-out
HCFCs- 54.78
metric tons;
Methyl bromide-
0.08
CFCs- maintain zero consumption; HCFCs- 10% reduction of
2007-09 baseline; and
Methyl bromide-complete phase-out
On Target While Belize has successfully phased out CFCs, it is charged with the task to have a complete phase-out of HCFCs by 2020 and complete
MILLENNIUM DEVELOPMENT GOALS REPORT AND POST 2015 AGENDA 73
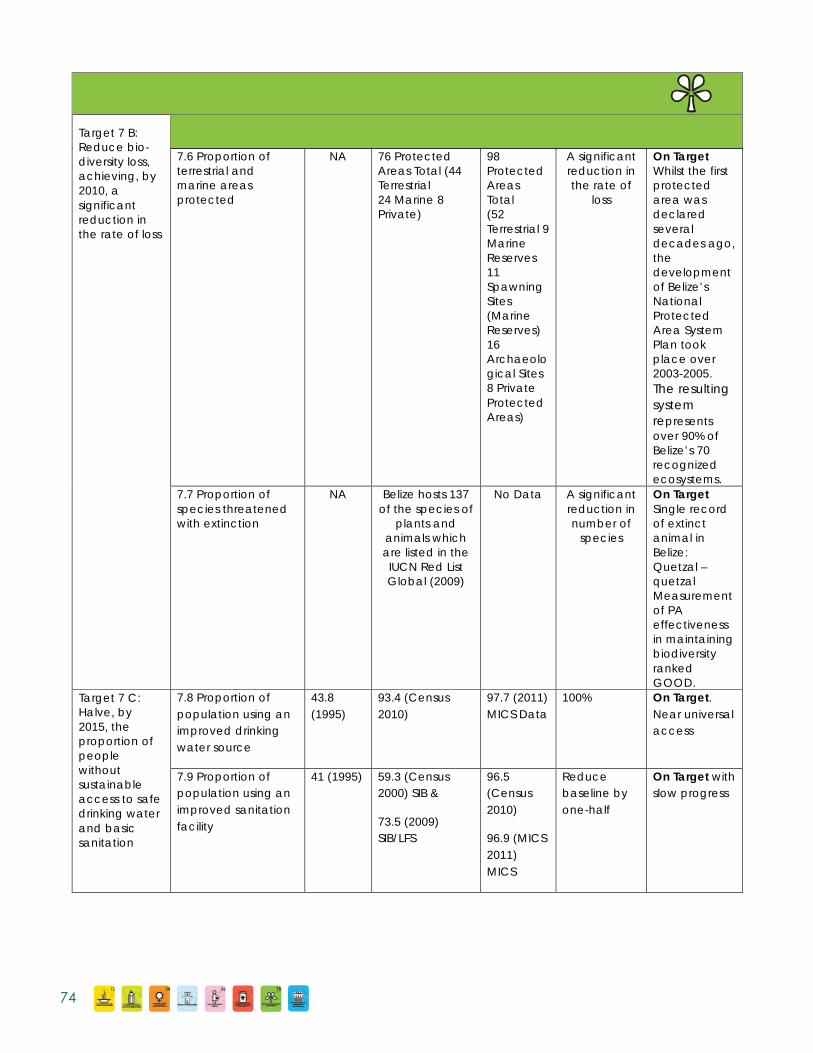
7.6 Proportion of terrestrial and marine areas protected
NA 76 Protected Areas Total (44 Terrestrial 24 Marine 8 Private)
98 Protected Areas Total (52 Terrestrial 9 Marine Reserves 11 Spawning Sites (Marine Reserves) 16 Archaeological Sites 8 Private Protected Areas)
A significant reduction in the rate of
loss
On Target Whilst the first protected area was declared several decades ago, the development of Belize’s National Protected Area System Plan took place over 2003-2005. The resulting system represents over 90% of Belize’s 70 recognized ecosystems.
7.7 Proportion of species threatened with extinction
NA Belize hosts 137 of the species of
plants and animals which are listed in the IUCN Red List Global (2009)
No Data A significant reduction in number of
species
On Target Single record of extinct animal in Belize: Quetzal – quetzal Measurement of PA effectiveness in maintaining biodiversity ranked GOOD.
Target 7 C: Halve, by 2015, the proportion of people without sustainable access to safe drinking water and basic sanitation
7.8 Proportion of population using an improved drinking water source
43.8 (1995)
93.4 (Census 2010)
97.7 (2011) MICS Data
100% On Target. Near universal access
7.9 Proportion of population using an improved sanitation facility
41 (1995) 59.3 (Census 2000) SIB &
73.5 (2009) SIB/LFS
96.5 (Census 2010)
96.9 (MICS 2011) MICS
Reduce baseline by one-half
On Target with slow progress
Goal #7: Ensure Environmental Sustainability
Target 7 A: Integrate the principles of sustainable development into country policies and programmes and reverse the loss of environmental resources
Indicators Baseline
1990 Status 2010
Actual 2012
Target 2015
Comments
7.1 Proportion of land area covered by forest
65.8 (2000)
62.8% (2010) 61.6% (2012)
CATHALAC
To reverse the loss of land areas covered by
forests
Deforestation rate of approximately 0.6% per year. This continues to be one of the lowest rates observed in the region. On Target However the stabilization of land loss remains fragile.
7.2 CO2 emissions, total, per capita and per $1 GDP (PPP)
NA 13482.7769 g (2000)
2.7
No data To reverse CO2
emissions total
The country of Belize is considering a low emission development pathway as a part of its sustainable development direction.
7.3 Consumption of Ozone Depleting Substances (ODSs)- Chlorofluorocarbons (CFCs), Hydro Chlorofluorocarbons (HCFCs) and Methyl bromide
NA CFCs- there is no baseline since this type of ODS has been phased out since 2008. No imports were allowed since 2008. HCFCs- 60 metric tons were a projection from 2007, 2008, and 2009 import figures. Methyl bromide-
CFCs- complete phase-out
HCFCs- 54.78
metric tons;
Methyl bromide-
0.08
CFCs- maintain zero consumption; HCFCs- 10% reduction of
2007-09 baseline; and
Methyl bromide-complete phase-out
While Belize has successfully phased out CFCs, it is charged with the task to have a complete phase-out of HCFCs by 2020 and complete On Target
Target 7 B: Reduce bio-diversity loss, achieving, by 2010, a significant reduction in the rate of loss
12 34 56 78
74
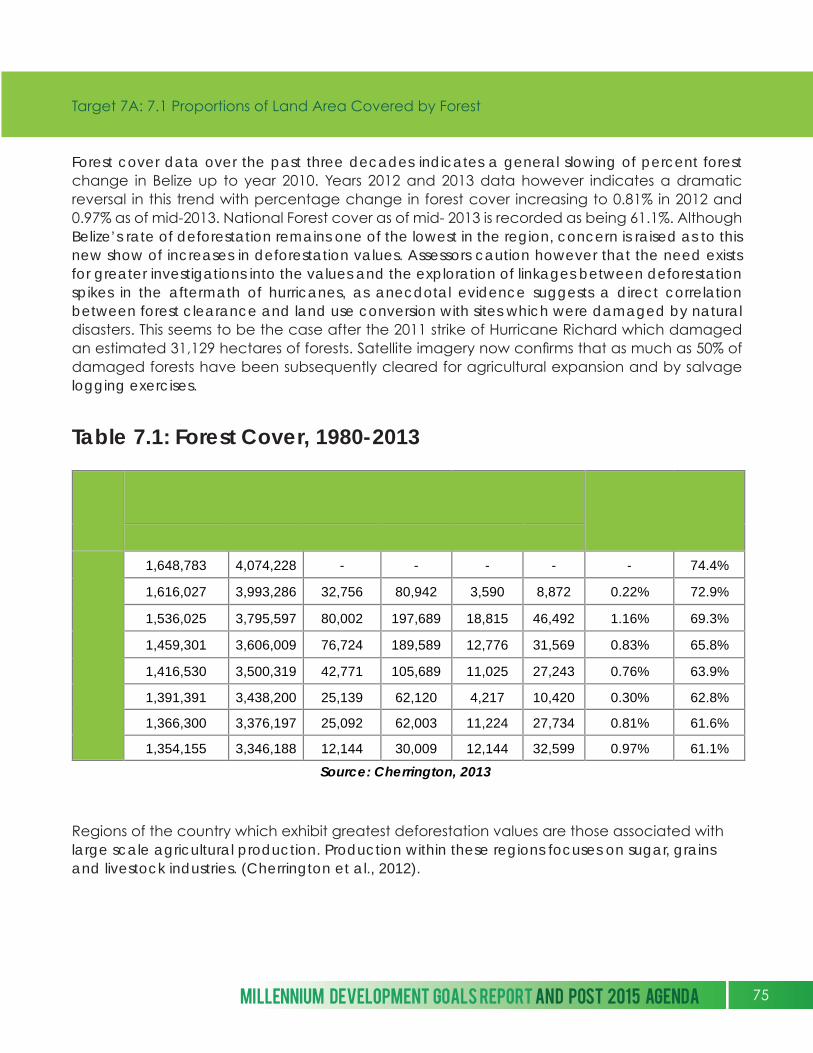
Target 7A: 7.1 Proportions of Land Area Covered by Forest
Forest cover data over the past three decades indicates a general slowing of percent forest change in Belize up to year 2010. Years 2012 and 2013 data however indicates a dramatic reversal in this trend with percentage change in forest cover increasing to 0.81% in 2012 and 0.97% as of mid-2013. National Forest cover as of mid- 2013 is recorded as being 61.1%. Although Belize’s rate of deforestation remains one of the lowest in the region, concern is raised as to this new show of increases in deforestation values. Assessors caution however that the need exists for greater investigations into the values and the exploration of linkages between deforestation spikes in the aftermath of hurricanes, as anecdotal evidence suggests a direct correlation between forest clearance and land use conversion with sites which were damaged by natural disasters. This seems to be the case after the 2011 strike of Hurricane Richard which damaged an estimated 31,129 hectares of forests. Satellite imagery now confirms that as much as 50% of damaged forests have been subsequently cleared for agricultural expansion and by salvage logging exercises.
Regions of the country which exhibit greatest deforestation values are those associated with large scale agricultural production. Production within these regions focuses on sugar, grains and livestock industries. (Cherrington et al., 2012).
Source: Cherrington, 2013
Year Forest cover Change Change / Yr.
% Change % Forest
cover
(ha.) (acres) (ha.) (acres) (ha.) (acres)
1980 1,648,783 4,074,228 - - - - - 74.4%
1989 1,616,027 3,993,286 32,756 80,942 3,590 8,872 0.22% 72.9%
1994 1,536,025 3,795,597 80,002 197,689 18,815 46,492 1.16% 69.3%
2000 1,459,301 3,606,009 76,724 189,589 12,776 31,569 0.83% 65.8%
2004 1,416,530 3,500,319 42,771 105,689 11,025 27,243 0.76% 63.9%
2010 1,391,391 3,438,200 25,139 62,120 4,217 10,420 0.30% 62.8%
2012 1,366,300 3,376,197 25,092 62,003 11,224 27,734 0.81% 61.6%
2013 1,354,155 3,346,188 12,144 30,009 12,144 32,599 0.97% 61.1%
Table 7.1: Forest Cover, 1980-2013
MILLENNIUM DEVELOPMENT GOALS REPORT AND POST 2015 AGENDA 75

Table 7.2: Total Deforestation by District 2012
Although 93.6% of deforestation occurred outside of protected areas, it must be noted that 6.4% of deforestation occurred within protected areas, totalling approximately 3,961 acres. Approximately 1489 acres was deforested just within the Caracol Archaeological site, the Chiquibul National Park, the Columbia River Forest Reserve and the Vaca Forest Reserve, along the western border of Belize (Cherrington et al., 2012). This western Bloc of the Maya Mountain Massif is under increasing pressures resulting from trans-boundary incursions as growing numbers of Guatemalan border settlements drives a steady expansion of the agricultural frontier and logging activities within Belizean territories.
Target 7A: 7.2 CO2 Emissions, Total, Per Capita and Per $1 GDP (PPP)
Belize’s total emissions amounts to approximately 425,000 tCO2e per year16 – by any measure a very limited amount. The CO2 emissions (metric tons per capita) in Belize were reported at 1.32 in 2008 by the World Bank. It is noteworthy that the rise in CO2 emissions is occurring in tandem with the countries growth, however this trend is observable in all developing countries and emissions is expected to level off as the country plateaus in its development. Belize is a Non- Annex 1 country recognized by the Convention as being especially vulnerable to the adverse impacts of climate change and does not yet have prescribed emission targets. Belize however may engage in voluntary mitigation of greenhouse gases emissions. It should be noted that avoiding deforestation, alone, in Belize has the potential to contribute to more than 1 million tons in CO2 emission reductions every year.
Source: Cherrington et al 2012
District Rate of Deforestation
Cayo 35.1% Orange Walk 23.9%
Corozal 17.7% Stann Creek 8.1%
Toledo 7.6% Belize 6.6%
16 UNEP- Profile of Emissions Reduction Potentials for 15 developing Countries (June 2013)
12 34 56 78
76
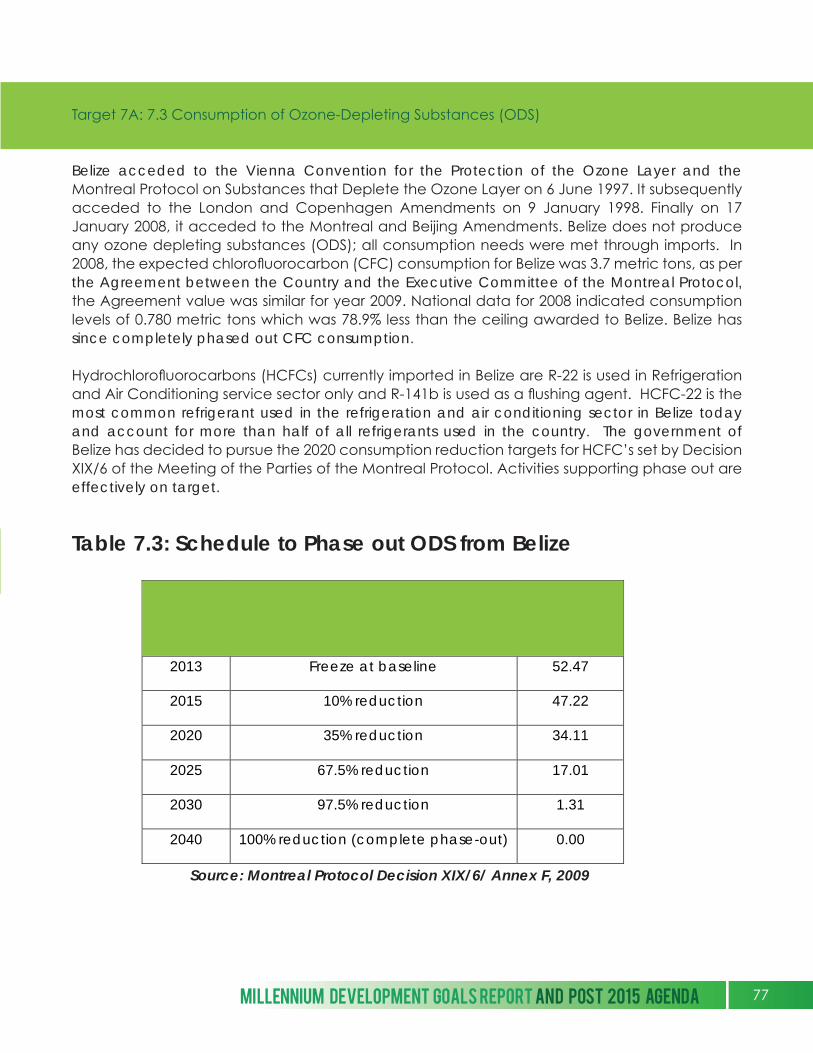
Target 7A: 7.3 Consumption of Ozone-Depleting Substances (ODS)
Belize acceded to the Vienna Convention for the Protection of the Ozone Layer and the Montreal Protocol on Substances that Deplete the Ozone Layer on 6 June 1997. It subsequently acceded to the London and Copenhagen Amendments on 9 January 1998. Finally on 17 January 2008, it acceded to the Montreal and Beijing Amendments. Belize does not produce any ozone depleting substances (ODS); all consumption needs were met through imports. In 2008, the expected chlorofluorocarbon (CFC) consumption for Belize was 3.7 metric tons, as per the Agreement between the Country and the Executive Committee of the Montreal Protocol, the Agreement value was similar for year 2009. National data for 2008 indicated consumption levels of 0.780 metric tons which was 78.9% less than the ceiling awarded to Belize. Belize has since completely phased out CFC consumption.
Hydrochlorofluorocarbons (HCFCs) currently imported in Belize are R-22 is used in Refrigeration and Air Conditioning service sector only and R-141b is used as a flushing agent. HCFC-22 is the most common refrigerant used in the refrigeration and air conditioning sector in Belize today and account for more than half of all refrigerants used in the country. The government of Belize has decided to pursue the 2020 consumption reduction targets for HCFC’s set by Decision XIX/6 of the Meeting of the Parties of the Montreal Protocol. Activities supporting phase out are effectively on target.
Table 7.3: Schedule to Phase out ODS from Belize
Time Horizon
Agreed Consumption (Decision XIX/6) Allowed
consumption (Mt)
2013 Freeze at baseline 52.47
2015 10% reduction 47.22
2020 35% reduction 34.11
2025 67.5% reduction 17.01
2030 97.5% reduction 1.31
2040 100% reduction (complete phase-out) 0.00
Source: Montreal Protocol Decision XIX/6/ Annex F, 2009
MILLENNIUM DEVELOPMENT GOALS REPORT AND POST 2015 AGENDA 77
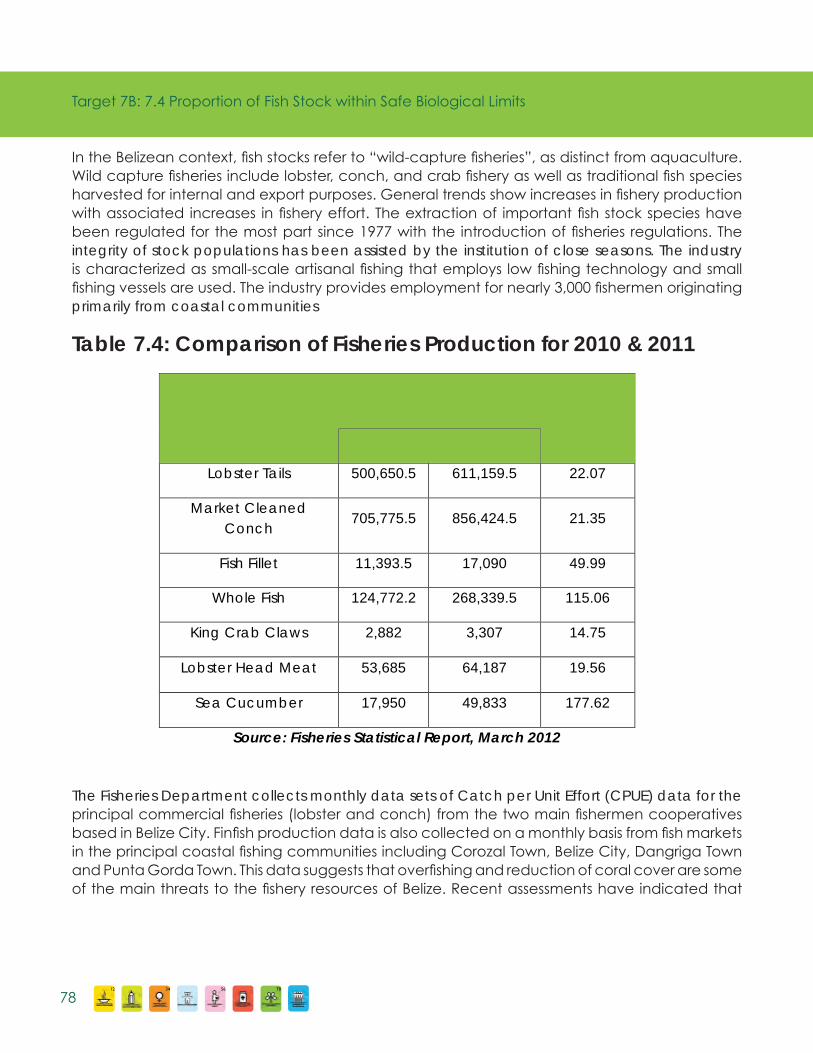
Target 7B: 7.4 Proportion of Fish Stock within Safe Biological Limits
In the Belizean context, fish stocks refer to “wild-capture fisheries”, as distinct from aquaculture. Wild capture fisheries include lobster, conch, and crab fishery as well as traditional fish species harvested for internal and export purposes. General trends show increases in fishery production with associated increases in fishery effort. The extraction of important fish stock species have been regulated for the most part since 1977 with the introduction of fisheries regulations. The integrity of stock populations has been assisted by the institution of close seasons. The industry is characterized as small-scale artisanal fishing that employs low fishing technology and small fishing vessels are used. The industry provides employment for nearly 3,000 fishermen originating primarily from coastal communities
Table 7.4: Comparison of Fisheries Production for 2010 & 2011
The Fisheries Department collects monthly data sets of Catch per Unit Effort (CPUE) data for the principal commercial fisheries (lobster and conch) from the two main fishermen cooperatives based in Belize City. Finfish production data is also collected on a monthly basis from fish markets in the principal coastal fishing communities including Corozal Town, Belize City, Dangriga Town and Punta Gorda Town. This data suggests that overfishing and reduction of coral cover are some of the main threats to the fishery resources of Belize. Recent assessments have indicated that
Commodity Annual Production in
Pounds Increase %
2010 2011
Lobster Tails 500,650.5 611,159.5 22.07
Market Cleaned Conch
705,775.5 856,424.5 21.35
Fish Fillet 11,393.5 17,090 49.99
Whole Fish 124,772.2 268,339.5 115.06
King Crab Claws 2,882 3,307 14.75
Lobster Head Meat 53,685 64,187 19.56
Sea Cucumber 17,950 49,833 177.62
Source: Fisheries Statistical Report, March 2012
12 34 56 78
78
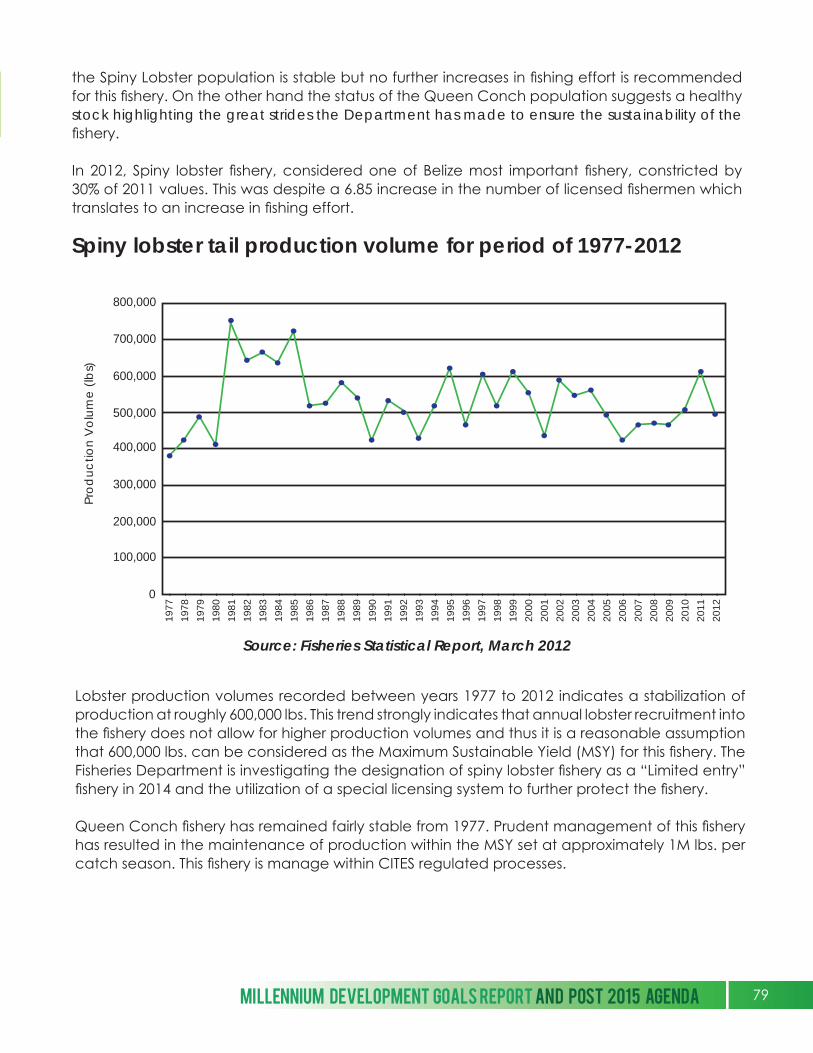
the Spiny Lobster population is stable but no further increases in fishing effort is recommended for this fishery. On the other hand the status of the Queen Conch population suggests a healthy stock highlighting the great strides the Department has made to ensure the sustainability of the fishery.
In 2012, Spiny lobster fishery, considered one of Belize most important fishery, constricted by 30% of 2011 values. This was despite a 6.85 increase in the number of licensed fishermen which translates to an increase in fishing effort.
Spiny lobster tail production volume for period of 1977-2012
Lobster production volumes recorded between years 1977 to 2012 indicates a stabilization of production at roughly 600,000 lbs. This trend strongly indicates that annual lobster recruitment into the fishery does not allow for higher production volumes and thus it is a reasonable assumption that 600,000 lbs. can be considered as the Maximum Sustainable Yield (MSY) for this fishery. The Fisheries Department is investigating the designation of spiny lobster fishery as a “Limited entry” fishery in 2014 and the utilization of a special licensing system to further protect the fishery.
Queen Conch fishery has remained fairly stable from 1977. Prudent management of this fishery has resulted in the maintenance of production within the MSY set at approximately 1M lbs. per catch season. This fishery is manage within CITES regulated processes.
800,000
700,000
600,000
500,000
400,000
300,000
200,000
100,000
0
1977
-
1978
-
1979
-
1980
-
1981
-
1982
-
1983
-
1984
-
1985
-
1986
-
1987
-
1988
-
1989
-
1990
-
1991
-
1992
-
1993
-
1994
-
1995
-
1996
-
1997
-
1998
-
1999
-
2000
-
2001
-
2002
-
2003
-
2004
-
2005
-
2006
-
2007
-
2008
-
2009
-
2010
-
2011
-
2012
-
Pro
du
ctio
n V
olu
me
(lb
s)
Source: Fisheries Statistical Report, March 2012
MILLENNIUM DEVELOPMENT GOALS REPORT AND POST 2015 AGENDA 79
In 2011, the Belize Fisheries Advisory Board and the Cabinet of Ministers authorized the use of Managed Access at two pilot sites to determine the viability and impact. Under this programme, fishermen are expected to personally benefit from an increased in their individual production; which should provide the incentive for their commitment to comply and conform to the fisheries management measures being instituted in line with sustainable livelihoods and the supporting bio-ecological stocks and ecosystems.
Target 7B: 7.6 Proportions of Terrestrial and Marine Areas Protected
The country of Belize has designated 36% of its terrestrial area for conservation purposes. The designation of fourteen (14) marine protected areas completes the existing system. A total of 22.6 % of all national territories currently benefit from some sort of protection designation. There are currently ninety eight (98) protected areas management units within the National Protected Areas System (NPAS), representing over 90% of Belize’s 70 recognized ecosystems. 60% of ecosystems have greater than 30% representation within the NPAS. The International Union for the Conservation of Nature (IUCN) recommends a minimum of 10% representation per ecosystem within a National Protected Areas System.
The national protected areas system is administered through three different Government Ministries whose mandates include the creation and management of national protected areas within Belize. These Ministries are the Ministry of Forestry, Fisheries and Sustainable Development (through the Forest and Fisheries Departments), the Ministry of Tourism and Culture (Archaeological Sites, through the National Institute of Culture and History /Institute of Archaeology, and the Ministry of Natural Resources and Agriculture (under the Lands Department).
Belize has some of the most intact, forested areas remaining in Central America. The Maya Mountains Massif forms a regionally important forest node in its own right. The identified highest priority biodiversity areas of global concern in Belize (Global Key Biodiversity Area 1) are adequately covered by the NPAS, occurring within the protected areas of the Maya Mountains Massif. Aguas Turbias National Park and the adjacent Rio Bravo Conservation and Management Area (one of eight private protected areas recognized as part of the National Protected Areas System) form part of the Selva Maya node, with trans-national linkages with Guatemala and Mexico. The Shipstern / Fireburn node of north east Belize forms the third such node. These forested areas and their high biodiversity values and continuing low human impacts, place Belize as one of the most important biodiversity refuges remaining in Mesoamerica, critical for maintenance of biodiversity not only on the national scale, but also on the regional scale17.
17 Protected Areas Rationalization Report 2012
12 34 56 78
80
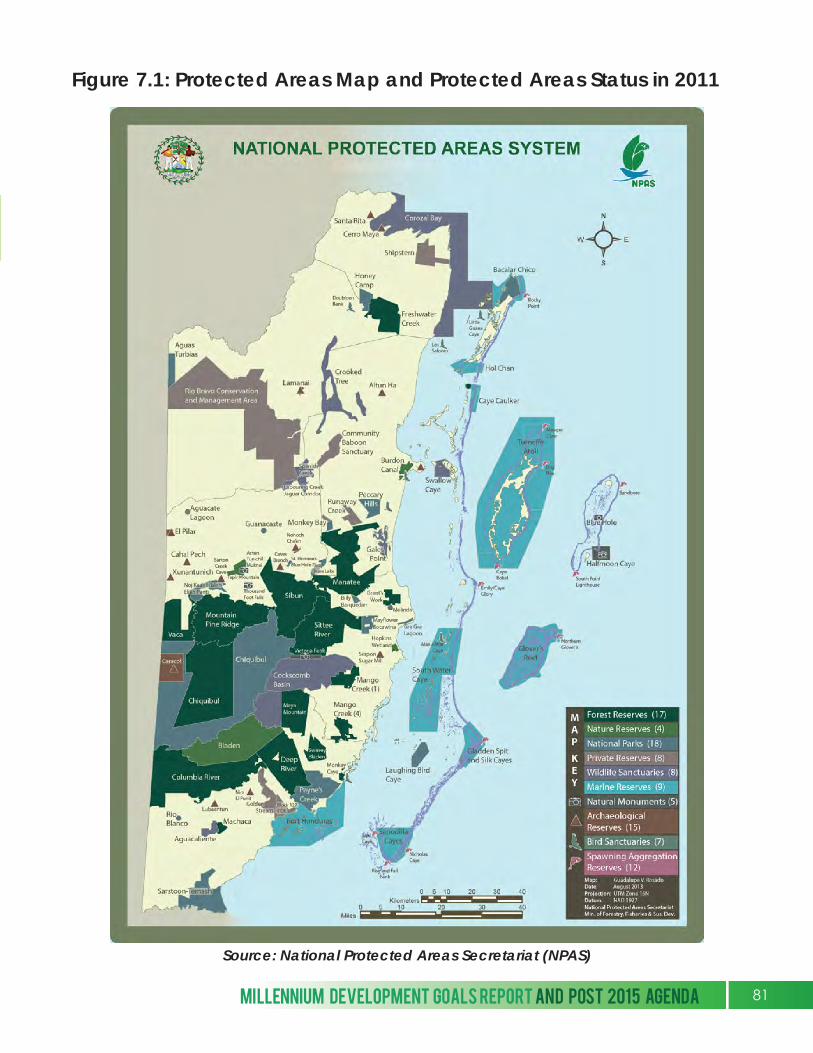
Figure 7.1: Protected Areas Map and Protected Areas Status in 2011
Source: National Protected Areas Secretariat (NPAS)
MILLENNIUM DEVELOPMENT GOALS REPORT AND POST 2015 AGENDA 81
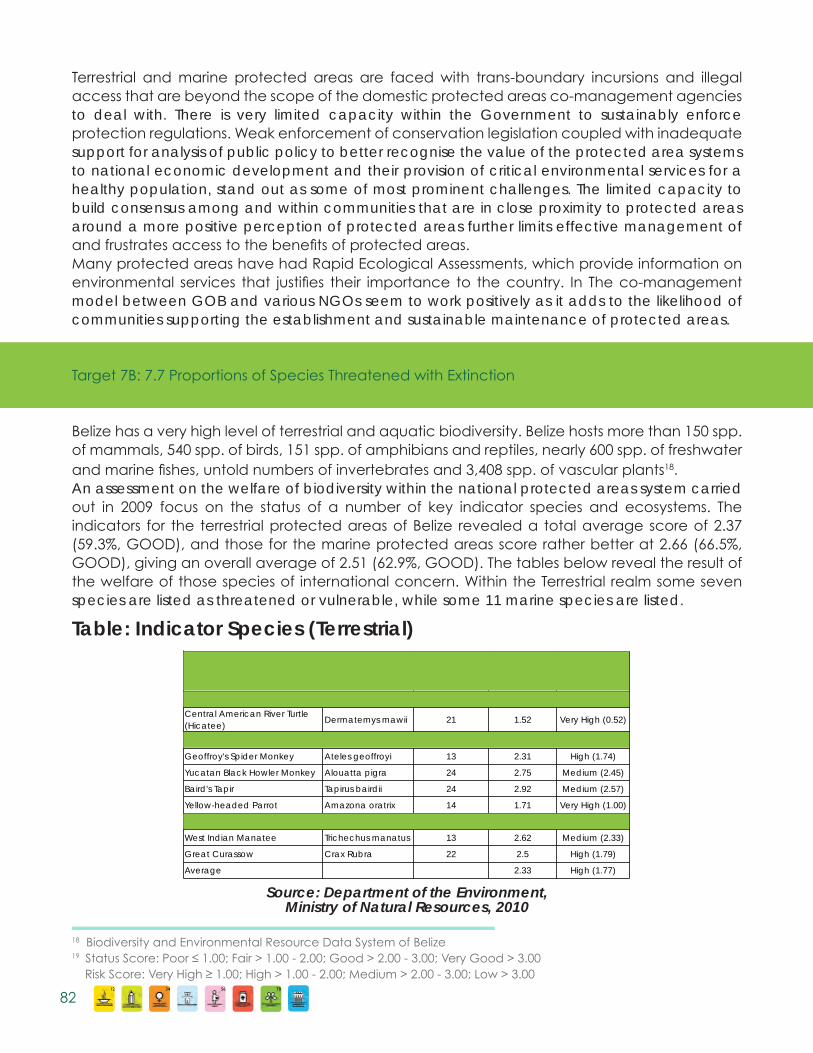
Terrestrial and marine protected areas are faced with trans-boundary incursions and illegal access that are beyond the scope of the domestic protected areas co-management agencies to deal with. There is very limited capacity within the Government to sustainably enforce protection regulations. Weak enforcement of conservation legislation coupled with inadequate support for analysis of public policy to better recognise the value of the protected area systems to national economic development and their provision of critical environmental services for a healthy population, stand out as some of most prominent challenges. The limited capacity to build consensus among and within communities that are in close proximity to protected areas around a more positive perception of protected areas further limits effective management of and frustrates access to the benefits of protected areas. Many protected areas have had Rapid Ecological Assessments, which provide information on environmental services that justifies their importance to the country. In The co-management model between GOB and various NGOs seem to work positively as it adds to the likelihood of communities supporting the establishment and sustainable maintenance of protected areas.
Target 7B: 7.7 Proportions of Species Threatened with Extinction
Belize has a very high level of terrestrial and aquatic biodiversity. Belize hosts more than 150 spp. of mammals, 540 spp. of birds, 151 spp. of amphibians and reptiles, nearly 600 spp. of freshwater and marine fishes, untold numbers of invertebrates and 3,408 spp. of vascular plants18. An assessment on the welfare of biodiversity within the national protected areas system carried out in 2009 focus on the status of a number of key indicator species and ecosystems. The indicators for the terrestrial protected areas of Belize revealed a total average score of 2.37 (59.3%, GOOD), and those for the marine protected areas score rather better at 2.66 (66.5%, GOOD), giving an overall average of 2.51 (62.9%, GOOD). The tables below reveal the result of the welfare of those species of international concern. Within the Terrestrial realm some seven species are listed as threatened or vulnerable, while some 11 marine species are listed.
Number pas with the data
Overall Status Score
Level of Risk
Critically Endangered
19
Central American River Turtle (Hicatee)
Dermatemys mawii 21 1.52 Very High (0.52)
Endangered
Geoffroy's Spider Monkey Ateles geoffroyi 13 2.31 High (1.74)
Yucatan Black Howler Monkey Alouatta pigra 24 2.75 Medium (2.45)
Baird's Tapir Tapirus bairdii 24 2.92 Medium (2.57)
Yellow-headed Parrot Amazona oratrix 14 1.71 Very High (1.00)
Vulnerable
West Indian Manatee Trichechus manatus 13 2.62 Medium (2.33)
Great Curassow Crax Rubra 22 2.5 High (1.79)
Average 2.33 High (1.77)
Indicator Species of International Concern
18 Biodiversity and Environmental Resource Data System of Belize 19 Status Score: Poor ≤ 1.00; Fair > 1.00 - 2.00; Good > 2.00 - 3.00; Very Good > 3.00 Risk Score: Very High ≥ 1.00; High > 1.00 - 2.00; Medium > 2.00 - 3.00; Low > 3.00
Source: Department of the Environment, Ministry of Natural Resources, 2010
Table: Indicator Species (Terrestrial)
12 34 56 78
82
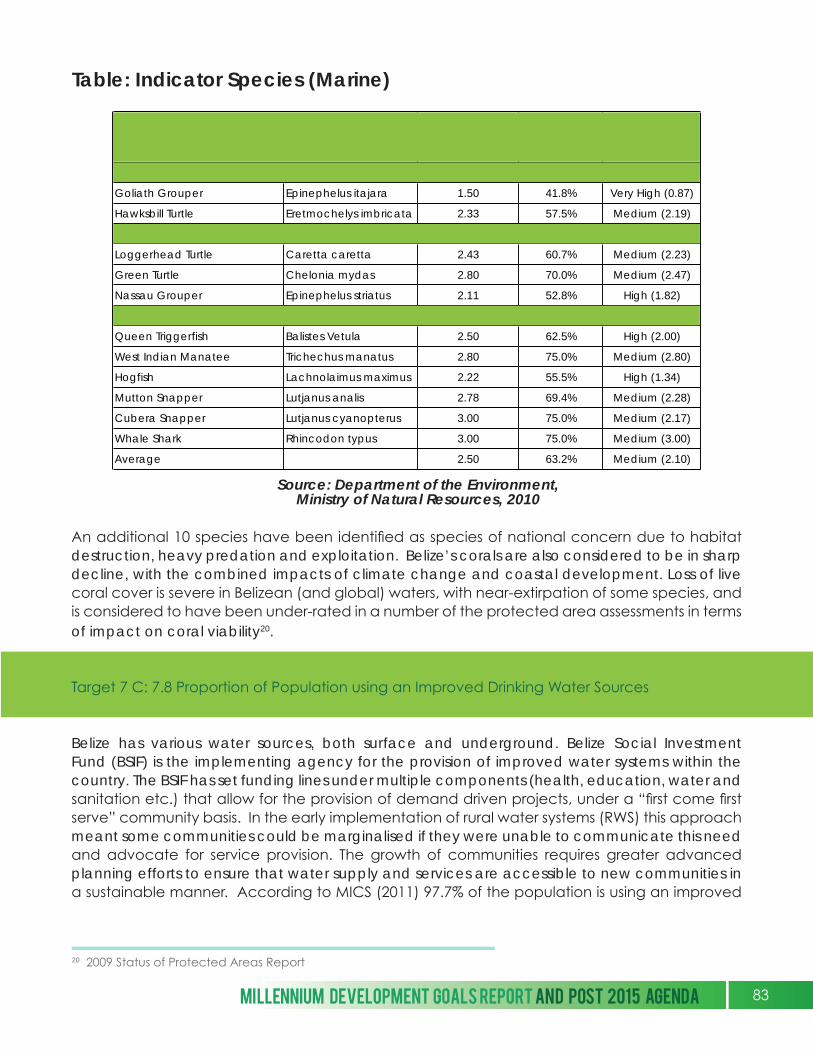
An additional 10 species have been identified as species of national concern due to habitat destruction, heavy predation and exploitation. Belize’s corals are also considered to be in sharp decline, with the combined impacts of climate change and coastal development. Loss of live coral cover is severe in Belizean (and global) waters, with near-extirpation of some species, and is considered to have been under-rated in a number of the protected area assessments in terms of impact on coral viability20.
Target 7 C: 7.8 Proportion of Population using an Improved Drinking Water Sources
Belize has various water sources, both surface and underground. Belize Social Investment Fund (BSIF) is the implementing agency for the provision of improved water systems within the country. The BSIF has set funding lines under multiple components (health, education, water and sanitation etc.) that allow for the provision of demand driven projects, under a “first come first serve” community basis. In the early implementation of rural water systems (RWS) this approach meant some communities could be marginalised if they were unable to communicate this need and advocate for service provision. The growth of communities requires greater advanced planning efforts to ensure that water supply and services are accessible to new communities in a sustainable manner. According to MICS (2011) 97.7% of the population is using an improved
Overall Status Score
Overall Rating ( %)
Level of Risk
Critically Endangered
Goliath Grouper Epinephelus itajara 1.50 41.8% Very High (0.87)
Hawksbill Turtle Eretmochelys imbricata 2.33 57.5% Medium (2.19)
Endangered
Loggerhead Turtle Caretta caretta 2.43 60.7% Medium (2.23)
Green Turtle Chelonia mydas 2.80 70.0% Medium (2.47)
Nassau Grouper Epinephelus striatus 2.11 52.8% High (1.82)
Vulnerable
Queen Triggerfish Balistes Vetula 2.50 62.5% High (2.00)
West Indian Manatee Trichechus manatus 2.80 75.0% Medium (2.80)
Hogfish Lachnolaimus maximus 2.22 55.5% High (1.34)
Mutton Snapper Lutjanus analis 2.78 69.4% Medium (2.28)
Cubera Snapper Lutjanus cyanopterus 3.00 75.0% Medium (2.17)
Whale Shark Rhincodon typus 3.00 75.0% Medium (3.00)
Average 2.50 63.2% Medium (2.10)
Indicator Species of International Concern
20 2009 Status of Protected Areas Report
Source: Department of the Environment, Ministry of Natural Resources, 2010
Table: Indicator Species (Marine)
MILLENNIUM DEVELOPMENT GOALS REPORT AND POST 2015 AGENDA 83

source of drinking water nationally. This represents an increase on marginally over 4% in one year, since SIB Census (2010), indicated that 93.4% of the population was using an improved source of drinking water making Belize an MDG plus country, well on its way to achieve the 2015 target of universal access to an improved water source. In order to maintain the gains made in water, Belize has been implementing the MDG Acceleration Framework (MAF) to focus on governance, gender and capacity building within the ministry responsible for Rural Development as part of the MAF recommendations to ensure the sustainability of national water coverage.
Figure 7.2: Different Types of Improved and Unimproved Water Sources
Frequency PercentValid
PercentCumulative
Percent
Public piped into dwelling 180525 56.0 56.0 56.0Public piped into yard only 67834 21.0 21.0 77.0Private piped into dwelling or yard
26080 8.1 8.1 85.1
Public standpipe 4074 1.3 1.3 86.4Tanker truck 127 .0 .0 86.4Protected dug well 14487 4.5 4.5 90.9Unprotected dug well 6211 1.9 1.9 92.8Neighbour 5392 1.7 1.7 94.5Private catchments, not piped 8069 2.5 2.5 97.0
River/Stream/Creek/Pond/Spring
7901 2.5 2.5 99.5
Other 1383 .4 .4 99.9Dont Know or Not Stated 371 .1 .1 100.0Total 322453 100.0 100.0
Recoded Main Water Source
Valid
0.0
10.0
20.0
30.0
40.0
50.0
60.0
Series1
Source: Census 2010: SIB
12 34 56 78
84
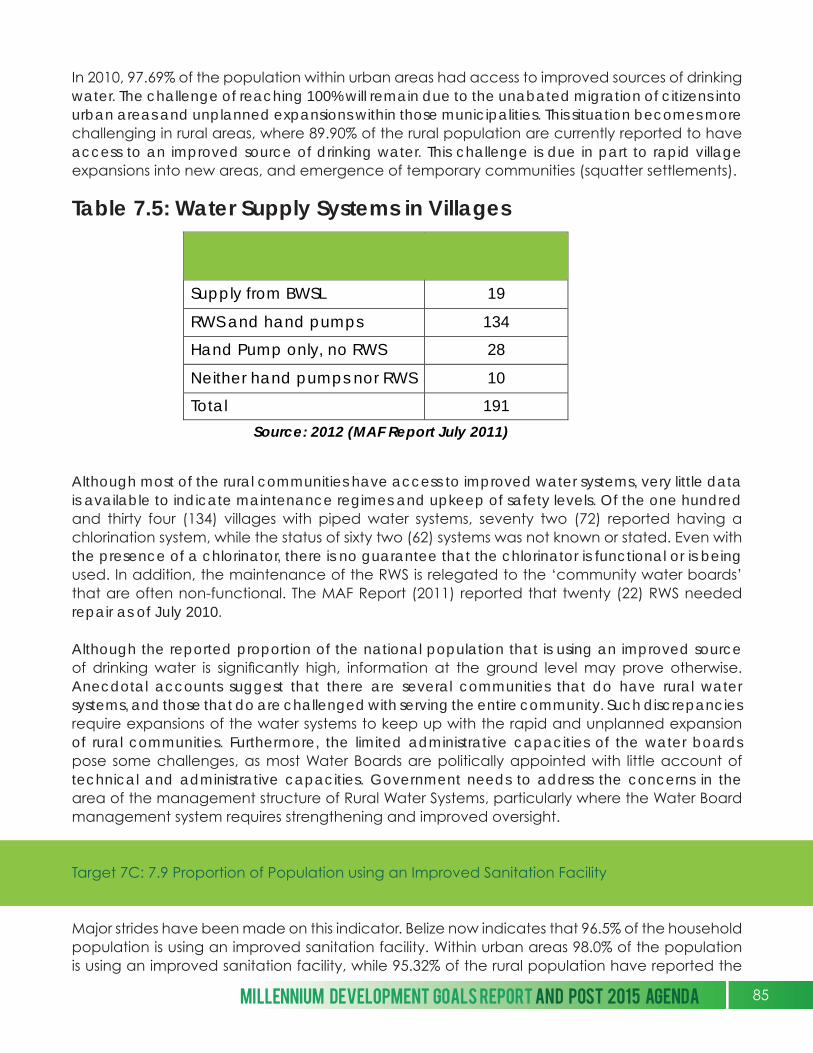
In 2010, 97.69% of the population within urban areas had access to improved sources of drinking water. The challenge of reaching 100% will remain due to the unabated migration of citizens into urban areas and unplanned expansions within those municipalities. This situation becomes more challenging in rural areas, where 89.90% of the rural population are currently reported to have access to an improved source of drinking water. This challenge is due in part to rapid village expansions into new areas, and emergence of temporary communities (squatter settlements).
Table 7.5: Water Supply Systems in Villages
Although most of the rural communities have access to improved water systems, very little data is available to indicate maintenance regimes and upkeep of safety levels. Of the one hundred and thirty four (134) villages with piped water systems, seventy two (72) reported having a chlorination system, while the status of sixty two (62) systems was not known or stated. Even with the presence of a chlorinator, there is no guarantee that the chlorinator is functional or is being used. In addition, the maintenance of the RWS is relegated to the ‘community water boards’ that are often non-functional. The MAF Report (2011) reported that twenty (22) RWS needed repair as of July 2010.
Although the reported proportion of the national population that is using an improved source of drinking water is significantly high, information at the ground level may prove otherwise. Anecdotal accounts suggest that there are several communities that do have rural water systems, and those that do are challenged with serving the entire community. Such discrepancies require expansions of the water systems to keep up with the rapid and unplanned expansion of rural communities. Furthermore, the limited administrative capacities of the water boards pose some challenges, as most Water Boards are politically appointed with little account of technical and administrative capacities. Government needs to address the concerns in the area of the management structure of Rural Water Systems, particularly where the Water Board management system requires strengthening and improved oversight.
Target 7C: 7.9 Proportion of Population using an Improved Sanitation Facility
Major strides have been made on this indicator. Belize now indicates that 96.5% of the household population is using an improved sanitation facility. Within urban areas 98.0% of the population is using an improved sanitation facility, while 95.32% of the rural population have reported the
Source: 2012 (MAF Report July 2011)
Sources of Drinking-water Number of
Villages
Supply from BWSL 19
RWS and hand pumps 134
Hand Pump only, no RWS 28
Neither hand pumps nor RWS 10
Total 191
MILLENNIUM DEVELOPMENT GOALS REPORT AND POST 2015 AGENDA 85
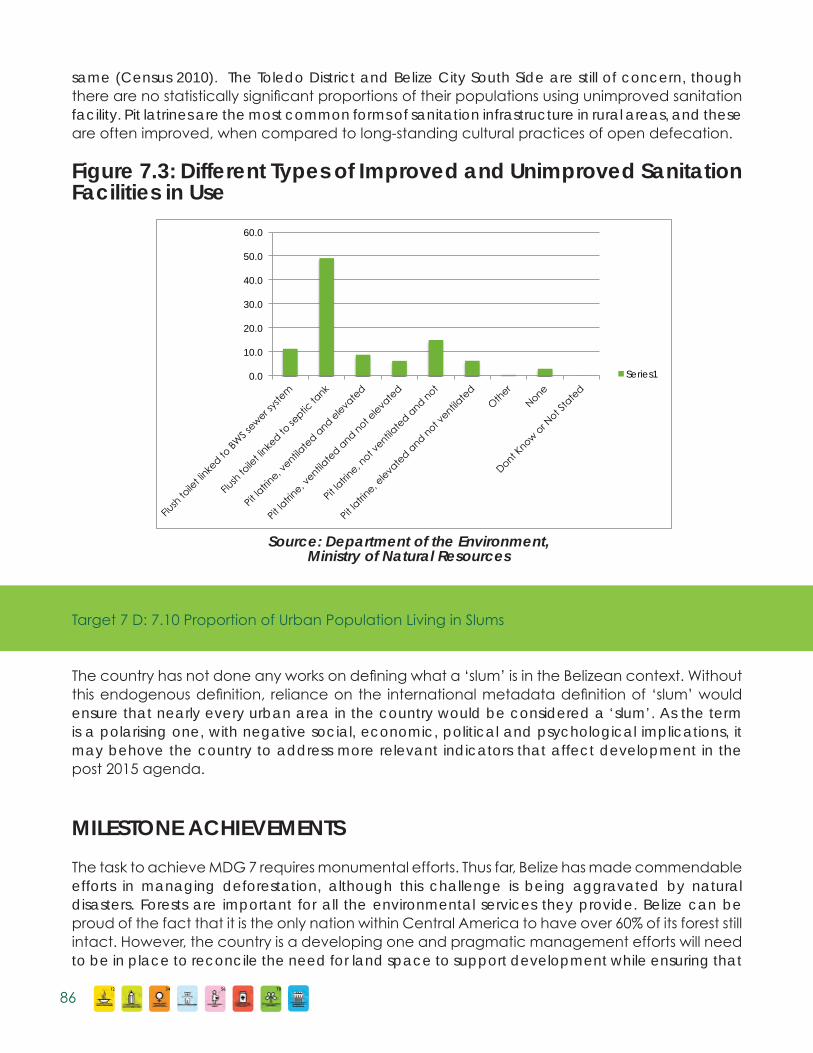
same (Census 2010). The Toledo District and Belize City South Side are still of concern, though there are no statistically significant proportions of their populations using unimproved sanitation facility. Pit latrines are the most common forms of sanitation infrastructure in rural areas, and these are often improved, when compared to long-standing cultural practices of open defecation.
Figure 7.3: Different Types of Improved and Unimproved Sanitation Facilities in Use
Target 7 D: 7.10 Proportion of Urban Population Living in Slums
The country has not done any works on defining what a ‘slum’ is in the Belizean context. Without this endogenous definition, reliance on the international metadata definition of ‘slum’ would ensure that nearly every urban area in the country would be considered a ‘slum’. As the term is a polarising one, with negative social, economic, political and psychological implications, it may behove the country to address more relevant indicators that affect development in the post 2015 agenda.
MILESTONE ACHIEVEMENTS
The task to achieve MDG 7 requires monumental efforts. Thus far, Belize has made commendable efforts in managing deforestation, although this challenge is being aggravated by natural disasters. Forests are important for all the environmental services they provide. Belize can be proud of the fact that it is the only nation within Central America to have over 60% of its forest still intact. However, the country is a developing one and pragmatic management efforts will need to be in place to reconcile the need for land space to support development while ensuring that
Frequency PercentValid
PercentCumulative
PercentFlush toilet linked to BWS sewer system
36433 11.3 11.3 11.3
Flush toilet linked to septic tank 158344 49.1 49.2 60.5Pit latrine, ventilated and elevated
28248 8.8 8.8 69.3
Pit latrine, ventilated and not elevated
20061 6.2 6.2 75.5
Pit latrine, not ventilated and not elevated
48087 14.9 14.9 90.5
Pit latrine, elevated and not ventilated
20097 6.2 6.2 96.7
Other 1114 .3 .3 97.1None 9328 2.9 2.9 100.0Dont Know or Not Stated 150 .0 .0 100.0Total 321861 99.8 100.0
Main Toilet Facility
Valid
0.0
10.0
20.0
30.0
40.0
50.0
60.0
Series1
Source: Department of the Environment, Ministry of Natural Resources
12 34 56 78
86
the most critical eco-systems are not endangered. CO2 emissions are regarded as negligible and with large expanses of green forested areas, Belize is, in fact, a sink for CO2. Belize does not produce any ozone depleting substances and those used are imported. Belize had done well in eliminating CFCs.
Even with limited fish stock estimates, on the ground efforts to protect and manage marine resources are on-going. This is evident by the large number of designated marine protected areas (24 sites) and aggregation sites. New management strategies such as ‘managed access’ are being put in place to further ensure the safe biological limits of fish stocks. Better results have occurred with terrestrial protected areas designation, as over 90% of the seventy (70) recognised ecosystems are represented within protected areas.
The access to improved water and sanitation has made huge leaps. Belize is an MDG plus country in this area. It is on track to reach a 100% access to all its population by 2015, but it is often the case that the last five percent is notoriously difficult to achieve. Water systems exist, which can benefit from minimal technical and administrative assistance. Even with the uncontrolled expansion of unplanned communities, Belize has managed to keep up with the service of providing safe water and sanitation services.
CHALLENGES
Challenges that impede Belize’s ability to meet its environmental targets are many and varied, and include weak enforcement of existing regulations caused by resource constraints at multiple levels. Although Belize has a healthy set of forest management and other regulations, the enforcement of those regulations remains lacking, with a large need for institutional and human resources capacity building. As the country continues to develop, it is likely that it will continue to reduce forest cover. However in comparison to global rates of deforestation this rate is regarded as low.
Terrestrial and Marine protected areas are faced with trans-boundary incursions and issues that are beyond the scope of the protected areas co-management agencies to deal with. There is very limited action by Government to enforce protection regulations within areas considered hotspots, along the western border. There is a rise in unregulated, unsustainable timber harvest which threatens vulnerable ecosystems. Weak enforcement of conservation legislation is a major challenge and there appears to be limited understanding among political leaders and the general public of the importance of the protected area system to national development. The contributions of critical environmental services for the wellbeing of a healthy population are not adequately valued and that further handicaps the effectiveness of protected areas.
Access to improved water services is high but it is vulnerable to poor administration and technical capacities. There are adequate anecdotal accounts of financial mismanagement that interrupts and threatens the access to improved drinking water sources. The challenge is to increase the efficiency and capacities of RWS.
MILLENNIUM DEVELOPMENT GOALS REPORT AND POST 2015 AGENDA 87
8
SECTION 1.8GOAL #8: DEVELOP A
GLOBAL PARTNERSHIP FORDEVELOPMENT
A successful debt renegotiation has placed Belize’s debt trajectory at a manageable level. Institutional upgrading at the Directorate of Foreign Trade is on-going and early results indicate that market access has been secured for new exports, notably cattle on the hoof and negotiations of partial scope agreements continue. Belize’s teledensity has been increasing. There is enhanced competition among service providers that is not yet being reflected in lower rates, on par with regional standards. Internet usage has increased but district disparities remain, as usage is still lowest in Toledo. Policy focus needs to be aimed at linking this most remote district to the information superhighway to assist in unleashing its development potentials.
12 34 56 78
88
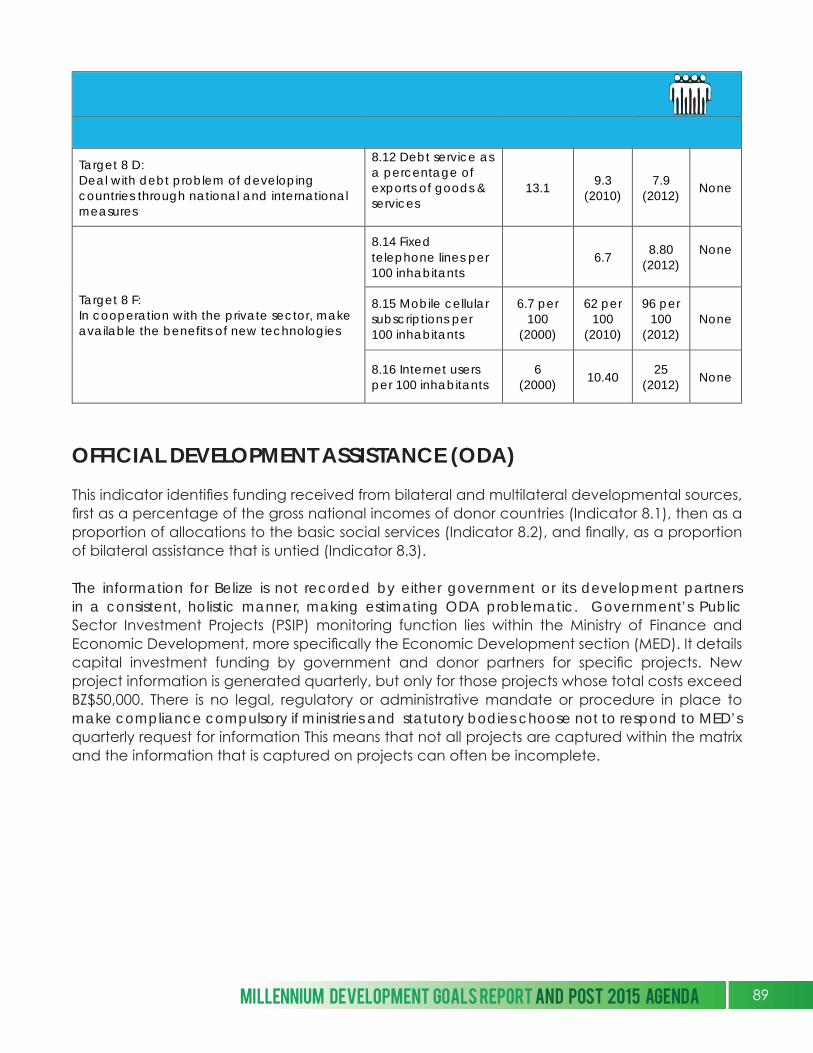
OFFICIAL DEVELOPMENT ASSISTANCE (ODA)
This indicator identifies funding received from bilateral and multilateral developmental sources, first as a percentage of the gross national incomes of donor countries (Indicator 8.1), then as a proportion of allocations to the basic social services (Indicator 8.2), and finally, as a proportion of bilateral assistance that is untied (Indicator 8.3). The information for Belize is not recorded by either government or its development partners in a consistent, holistic manner, making estimating ODA problematic. Government’s Public Sector Investment Projects (PSIP) monitoring function lies within the Ministry of Finance and Economic Development, more specifically the Economic Development section (MED). It details capital investment funding by government and donor partners for specific projects. New project information is generated quarterly, but only for those projects whose total costs exceed BZ$50,000. There is no legal, regulatory or administrative mandate or procedure in place to make compliance compulsory if ministries and statutory bodies choose not to respond to MED’s quarterly request for information This means that not all projects are captured within the matrix and the information that is captured on projects can often be incomplete.
GOAL #8: Develop A Global Partnership For Development
Target Indicators Baseline
1990 Status 2010
Actual 2012
Target 2015
Target 8 D: Deal with debt problem of developing countries through national and international measures
8.12 Debt service as a percentage of exports of goods & services
13.1 9.3
(2010) 7.9
(2012) None
Target 8 F: In cooperation with the private sector, make available the benefits of new technologies
8.14 Fixed telephone lines per 100 inhabitants
6.7 8.80
(2012) None
8.15 Mobile cellular subscriptions per 100 inhabitants
6.7 per 100
(2000)
62 per 100
(2010)
96 per 100
(2012) None
8.16 Internet users per 100 inhabitants
6 (2000)
10.40 25
(2012) None
MILLENNIUM DEVELOPMENT GOALS REPORT AND POST 2015 AGENDA 89

DEVELOP A RULE BASED, OPEN TRADING SYSTEM
As a small vulnerable economy, Belize has traditionally pursued its international trade policy activities as a part of the Caribbean Community (CARICOM). In the Revised Treaty of Chaguramas, countries within the grouping agreed to further deepen their integration efforts by establishing the CARICOM Single Market and Economy (CSME). The countries in CARICOM agreed to delay the work on establishing the single economy until 2015 so Belize continues to work towards the CARICOM Single Market (CSM). Under its Treaty obligations, Belize purses activities to complete the legal and institutional requirements to establish the single market. By the end of 2015, the Directorate of Foreign Trade (DFT) expects to have done work to develop a competition authority, address the treatment of goods produced in free zones, strengthen government procurement and work on outstanding e-commerce issues. Under CARICOM the country is to work towards the establishment of a national accreditation authority, which is tied to the free movement of skilled persons within the single market. Even though Belize passed the Act for the establishment of the Authority before the reporting period (2010-12) of this MDG report, the ministry with responsibility for implementation (Ministry of Education, Youths and Sports) has not yet constituted the Authority.
Though individual countries signed on to the World Trade Organisation (WTO), Belize and the rest of the Caribbean Community pool resources and address obligations through the medium of the CARICOM Secretariat. Under WTO, Belize has been trying to refine an Offer for the Services Agreement. When Belize first signed on to the WTO, it made very little commitments in the area of services; in the current Doha round of negotiations, Belize seeks to expand to types of services it is willing to open to international trade to include the areas of tourism and professional services etc. Sanitary and Phyto-Sanitary (SPS) issues and Technical Barriers to Trade (TBT) issues are channelled through the Belize Animal Health Authority (BAHA) and the Belize Bureau of Standards (BBS) respectively. These two bodies have over the last two years have been operating consistently as enquiry points for WTO notifications. Work is ongoing in revising issues with respect to the Subsidies and Countervailing Duties Agreement (SCD). The CARICOM Secretariat is drafting a model SCD legislation and has indicated its willingness to provide draughters to be located within the Attorney General’s Ministry to help amend the laws, regulations and programmes with respect to fiscal incentives, export processing zones and commercial free zones to be in compliance with WTO obligations before 2015; but there has been delays at the level of the Secretariat.
The CARIFORUM- European Union Economic Partnership Agreement (EPA)21 was signed in 2008 and Belize has worked to produce a detailed, two hundred (200) page EPA implementation Plan. As this plan involves all Articles of the agreement, for the sake of a practical workplan, the DFT has a priority twenty (20) page implementation plan. Under the Plan priorities include the financial sector (setting up businesses in Belize, including establishing bank accounts and the transfer of funds) and improve the practices that facilitate the financial sector; intellectual property (geographical indicators listing); spa and wellness (under tourism); medical tourism e-commerce and Information, Communication Technology (ICT) and trade in goods and services.
12 34 56 78
90
MARKET ACCESS
This indicator focuses on ODA that is geared towards enhancing trade capacity. Belize as a part of CARICOM is pursuing a Trade and Development Agreement between CARICOM and Canada. This is intended to lock in benefits available under CARIBCAN22. It is intended that the pursuit of trade be the vehicle to drive sustainable development for the CARICOM region. A similar traditional relationship exists with the USA with the Caribbean Basin Initiative (CBI). CARICOM is now trying to lock in the preferential treatment through a Trade and Investment Agreement (TIA) which has wider implications that the CBI.
As a member of CARICOM and the wider African, Caribbean, Pacific (ACP) group of countries, Belize continues to enjoy preferential access to markets in the United Kingdom and the European Union for primarily its agricultural exports. Ongoing initiatives are geared towards increasing the volume and diversity of exports, while improving domestic competitiveness in preparation of the withdrawal of preferential access status. In the north of Belize, the Accompanying Measures for Sugar (AMS) Programme addresses quality issues from the field to the mill for sugar cane production, road rehabilitation and provides economic diversification support for those individuals desirous of moving away from sugar cane cultivation. In the southern districts, the Banana Support Measures (BAMS) focuses on enhancing the performance of stakeholders in the industry to improve competitiveness, as well as to offer opportunities for economic diversification.
The DFT and the Belize Trade and Investment Development Services (BELTRAIDE), housed within the Ministry of Trade, Investment Promotion, Private Sector Development and Consumer Protection, are tasked with increasing and improving the country’s access to export markets and diversifying its export base. Currently the DFT is working towards strengthening the trading relationship between Belize, Central America and Mexico. There has been success in this regard, as a partial scope agreement has been signed with Guatemala, Belize is now exporting cattle on the hoof to Mexico and efforts to complete a partial scope agreement with El Salvador is underway. BELTRAIDE recently launched its Investment Guide and continues to be proactive in seeking potential investors.
21 The CARIFORUM-EU EPA represents a modern, comprehensive trade agreement that has development components. The CARIFORUM-EU EPA forms the basis of a mature trading relationship between the two sides, encompassing not just a trade in Goods regime, but also Trade in Services, Trade-Related Issues and Development Cooperation. CARIFORUM includes all member countries within the CARICOM plus the Dominican Republic.22 CARIBCAN is a country programme by Canada providing duty free access to the Canadian market for goods produced by CARICOM. It is subject to WTO waiver which authorizes the obligations for non-discrimination under the WTO. It has become more and more difficult to access the waiver, so CARICOM is pursuing the TDA.
MILLENNIUM DEVELOPMENT GOALS REPORT AND POST 2015 AGENDA 91
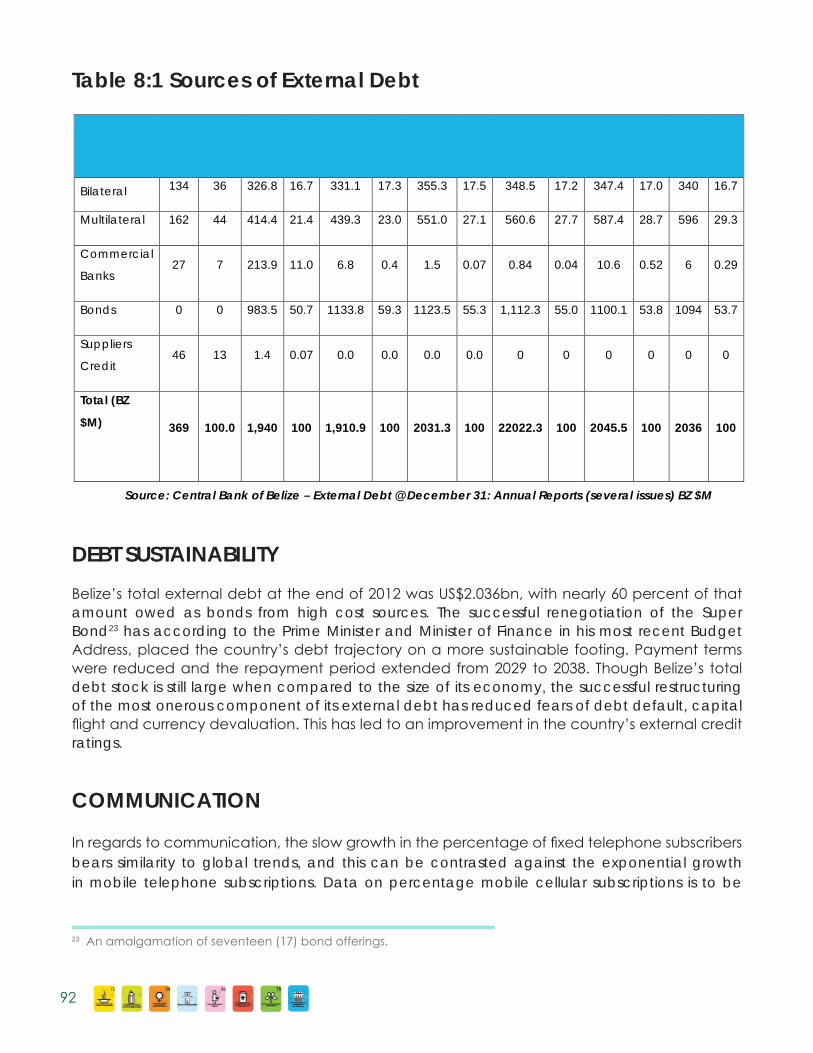
Source: Central Bank of Belize – External Debt @ December 31: Annual Reports (several issues) BZ $M
Sources of External Debt
1995 (%) 2005 (%) 2008 (%) 2009 (%) 2010 (%) 2011 (%) 2012 (%)
Bilateral 134 36 326.8 16.7 331.1 17.3 355.3 17.5 348.5 17.2 347.4 17.0 340 16.7
Multilateral 162 44 414.4 21.4 439.3 23.0 551.0 27.1 560.6 27.7 587.4 28.7 596 29.3
Commercial
Banks 27 7 213.9 11.0 6.8 0.4 1.5 0.07 0.84 0.04 10.6 0.52 6 0.29
Bonds 0 0 983.5 50.7 1133.8 59.3 1123.5 55.3 1,112.3 55.0 1100.1 53.8 1094 53.7
Suppliers
Credit 46 13 1.4 0.07 0.0 0.0 0.0 0.0 0 0 0 0 0 0
Total (BZ
$M)
369 100.0 1,940 100 1,910.9 100 2031.3 100 22022.3 100 2045.5 100 2036 100
Table 8:1 Sources of External Debt
DEBT SUSTAINABILITY
Belize’s total external debt at the end of 2012 was US$2.036bn, with nearly 60 percent of that amount owed as bonds from high cost sources. The successful renegotiation of the Super Bond23 has according to the Prime Minister and Minister of Finance in his most recent Budget Address, placed the country’s debt trajectory on a more sustainable footing. Payment terms were reduced and the repayment period extended from 2029 to 2038. Though Belize’s total debt stock is still large when compared to the size of its economy, the successful restructuring of the most onerous component of its external debt has reduced fears of debt default, capital flight and currency devaluation. This has led to an improvement in the country’s external credit ratings.
COMMUNICATION
In regards to communication, the slow growth in the percentage of fixed telephone subscribers bears similarity to global trends, and this can be contrasted against the exponential growth in mobile telephone subscriptions. Data on percentage mobile cellular subscriptions is to be
23 An amalgamation of seventeen (17) bond offerings.
12 34 56 78
92
MILESTONE ACHIEVEMENTS
Canada agreed to pursue an agreement with CARICOM focusing not only on trade but one that includes development issues. Negotiations were launched to agree on the scope and structure of the agreement; and unlike standard trade agreements it was agreed that there would be sections on the protection of workers’ rights and the protection of the environment (wider development issues). The CARIBCAN has expired and these negotiations are being driven to ensure the benefits are not lost all at once and create upheavals in vulnerable CARICOM markets. CARICOM and the US has revised and renewed the CBI agreement as the framework for their future economic relationship with the Caribbean. A final milestone achievement focuses on market access. The country’s development agencies, notably the DFT and BELTRAIDE continue to facilitate business development and export promotion.
Under the obligations for the EPA, Belize has to phase out duties under tariff concessions. The phase out period for duties range from five to twenty five years and is the direct responsibility of the Belize Customs Department and the Ministry of Finance and Economic Development (particularly the Finance section (MOF)). Work is on track to meet the obligations under the tariff phase out process.
As part of building services export capacity, the DFT has established the Services Coalition of Belize. Under CARICOM each country Coalition is to look at the services that a country wants to export and train the providers toward achieving exporting.
Another milestone achievement regarding this MDG is the country’s success in renegotiating its high cost external debt. As noted in Table 8.1, bonds were introduced as a source of external borrowing in 2005. Since that time, there has been a reliance on high cost private commercial debt sources (which increased substantially as a percentage of total external debt) over lower cost financing such as bilateral and multilateral sources. Belize is no longer challenged to access low cost funds from multilateral development agencies.
interpreted with caution since a recent survey commissioned by one of the companies found that 38% of the subscribers had one (1) mobile phone, 35% had two (2) mobile phones, 15% had three (3)and 12% had four (4).
Internet usage in Belize continues to grow. The 2010 Census reports that over one–quarter of persons five (5) years and older used the internet during the three months preceding the census interview. Usage was highest among the 15 to 24 year old age cohort at 45%. The census also reported that the vast majority of internet users accessed the internet with a computer and the use of mobile devices was very limited. This is expected to change with many new devices being aggressively marketed by the local telephone companies. While there were no significant differences in internet usage between the sexes, there were significant regional differences; use was highest in the Belize District and lowest in Toledo. Expanding internet coverage in Toledo is challenged by the high initial infrastructural costs and a lower than average population density.
MILLENNIUM DEVELOPMENT GOALS REPORT AND POST 2015 AGENDA 93
Competition between the two service providers for mobile telephone coverage may also be regarded as an achievement. Rates have been effectively lowered through frequent promotional campaigns by the Belize Telemedia Limited (BTL) and Smart. This has resulted in a vast expansion in ownership of mobile phone devices (cell phones). Noted however, is that Belize internet and telephone costs are still among the highest in the region.
CHALLENGES
This MDG differs from the others because it largely focuses on how the developed countries provide assistance to developing countries in achieving the Goals. There were no targets set and the indicators are descriptive rather than prescriptive. The developed countries have made a commitment to provide 0.7% of their Gross National Income (GNI) by 2015 to ODA. This commitment has gone unfulfilled and with the 2008 world financial crisis and the multiplying fall out, developed countries are less likely to attain this commitment goal. Their efforts towards ODA is often geared towards the least develop countries. Least developed country status is in part categorised through income levels. One of the obvious challenges in this regard occurs because of the middle income country status conferred upon Belize, which means a shifting of donor focus even though there are substantial development related issues that can only be addressed through donor assistance.
Under the CARICOM single market requirements, the Ministry of Education, Youths and Sports (MOEYS) is responsible to establish the national authority for accreditation. That ministry is reviewing its internal organisation structure and hence there has been no movement with respect to the establishment of the national authority for the accreditation of free movement of skilled nationals outside of the creation of the Act. The ministry has indicated that it wants to ensure that all university graduates (from any recognised university) can take advantage of the accreditation process. The national authority is of great importance as it would ensure that Belizean nationals can trade their services with greater ease within CARICOM. The definition for ‘skilled nationals’ is wider than only university graduates, it also includes artists, musicians etc. and implementation has stalled on the entire process because only the MOEYS has the implementation responsibility.
A challenge to the Canada/CARICOM agreement is that for CARICOM member partners there are mixed reactions to the proposed agreement. The MDCs of CARICOM (Trinidad, Barbados and Jamaica) have substantial interests in the agreement and the LDCs (which include Belize) do not have much economic interactions with Canada. How do the countries bridge the divide to ensure that all can benefit. The challenge for the proposed agreement with the US is that it has not expressed any interest in pursuing any trade agreement with CARICOM; it is content with simply extending the CBI.
12 34 56 78
94
With the volume of work to be done with the EPA implementation, there is a feeling at the DFT that there is a challenge concerning coordination of various private sector driven projects. The DFT is not an implementing agency, but a focal point for these projects. One suggestion was to use the Office of Public/Private sector dialogue as a clearing house/secretariat, as it is always aware of what is happening in the private sector. This would of course entail increased resources to properly coordinate.
Belize is working to urgently diversify its export base as well as enhance its competitiveness in preparation for the reduction preferential support. Some level of export diversification was achieved with the discovery and export of petroleum, which rapidly became the country’s most lucrative export. A well regulated petroleum sector is vital to the country’s export mix. However, there are acknowledged human resource constraints to properly regulate this sector in addition to environmental challenges of petroleum exploration, both onshore and possibly offshore.
MILLENNIUM DEVELOPMENT GOALS REPORT AND POST 2015 AGENDA 95
SECTION 2:MDG UNFINISHED BUSINESS
& EMERGING PRIORITIES
12 34 56 78
96
Whereas the first parts of this report provided a snapshot of Belize’s accomplishments to date (2010- 2012) inclusive of challenges that has hinder MDGs achievement, this last section focuses on the national development priorities that will extend beyond 2015. Many of these priorities are being articulated in various forums in country as well as in national deliberations.
MDG 1: UNFINISHED BUSINESS & EMERGING PRIORITIES
A national poverty rate of 41.3% and an indigence rate of 15.8% do not capture the sub-national and regional disparities across districts, between the rural and urban areas and across age cohorts. To more effectively target resources, a more strategic focus on the geographic areas where poverty is greatest, is required. Eighty (80) percent of poverty in Belize is concentrated in six areas: Belize urban (16%), Corozal and Orange Walk rural (14% each), Toledo rural (13%), Orange Walk rural (12%) and Cayo urban (10%). This dispersion of the poor population implies that straight geographical targeting will exclude significant portions of the poor population from targeted programmes (CPA 2009: 67). This forms the rational for Government’s current reorientation of its approach to social protection, which includes the introduction of modern social policy instruments such as SISB, BOOST and Secondary School Financing Reform.
After years without one and in recognition of its importance, the country developed, via the Ministry of Labour, Local Government, Rural Development, NEMO and Immigration (MLLRD) a rural development strategy and an accompanying five year action plan. The Belize Rural Area-based Development Strategy (BRADS) 2012-2030 provides a long term framework for rural development along nine strategic pillars. It is part of a larger regional (Central American) initiative called Central American Rural Area-based Development Strategy (ECADERT) 2010-203024. Though all three documents have been endorsed by Cabinet, resource mobilisation and implementation has been piecemeal. It will take the active and sustained efforts of the government, international development partners, the private sector, civil society and the citizens in the rural areas of Belize to truly bring the vision of the BRADS to life.
Yet another emerging priority is the focus on crime and citizen security. While there is a lack of data on any link between high levels of crime in Southside Belize City and high levels of poverty in that area, CPA 2009 established that urban poverty had dimensions similar to and also differing from rural poverty. GoB is currently addressing urban poverty via several projects including the
4 6
5
7 83 2
1
SECTION 2 - MDG UNFINISHED BUSINESS & EMERGING PRIORITIES
24 The 2010-2030 Central American Strategy for Rural Area-based Development (ECADERT) addresses the need by Central American societies to confront structural obstacles to attaining national development in a sustainable and inclusive manner. The Strategy is based on the urgent need to strengthen creative and innovative capabilities of the rural population, public institutions and organisations of civil society in the rural areas of the Region, to establish inclusive mechanisms for access to development, leading to social and territorial cohesion. The socio-geographical, historically constructed spaces referred to as rural areas are closely linked with the cultural identity of the people and communities who live there. Strengthening territorial cohesion in each country and social inclusion within rural areas offers diverse and important potential benefits for societies in the Isthmus including the achievement of greater food security, sovereignty, sustainability, improving democratic governance and fulfilment of citizenship.
MILLENNIUM DEVELOPMENT GOALS REPORT AND POST 2015 AGENDA 97
Community Action for Public Safety (CAPS) project as well as the Southside Poverty Alleviation Project and the Belize Municipal Development Project, all of which are also aimed at enhancing social infrastructure. In its efforts to improve the unemployment situation, the Government will need to strengthen its targeting of youth and female populations to benefit from such efforts especially as these groups have high unemployment rates.
Reducing the high levels of urban crime may positively impact on poverty in three ways: firstly, the overwhelming proportion of victims and perpetrators of crime are young males who may be heads of households or making an economic contribution to households. If they are victims and/or are perpetrators who are convicted and imprisoned, there is an immediate loss in family income which exacerbates poverty. Secondly, violent crime transfers scarce and already constrained government resources from primary and secondary health care to tertiary health care, since victims’ treatment impose high costs on the government run health system that are not recovered. Reducing crime provides an enabling environment for the emergence of small and micro enterprise sector encouraging budding entrepreneurs to enter the productive sector, which may lead to innovation and ultimately lead a community to thrive.
Enhanced targeting efforts to ensure that limited resources are directed towards the proper recipients, highlights the critical need for the improved collection of relevant data. Challenges in accessing data, conflicting data sources, outdated statistics and other challenges relating to data collection and usage, were evidenced across all the MDGs. There must be a renewed focus on reducing these challenges for effective planning purposes and informed decision making. One suggestion is the creation of a national Monitoring and Evaluation (M&E) framework, as alluded to in the Horizon 2030 that keeps track of all of Government’s policies for sustainable development in the long, medium and short term.
The ultimate unfinished business is to ensure that the effects of real economic growth translate into concrete poverty reduction measures. Economic growth has been marginal, even negative in other regional countries but the indicators for growth have been positive in Belize for several years. In his Budget Address, the Prime Minister and Minister of Finance and Economic Development reported that “Belize has been, and is, doing well economically. We have been able to maintain an average annual rate of GDP growth in excess of 2% since 2008 despite the global crises” (Budget Address 2012/2013). Measuring and counteracting structural poverty is a long term goal that will require the resources of the Government, and the people of Belize as well as the country’s national and international development partners. It underscores the need for continued targeted interventions to address poverty and indigence in Belize by all stakeholders at the domestic level and recognition at the international level that the dimensions of poverty cannot be categorically measured solely by income indicators. A classification of the county as a middle income country does not speak to inequalities at the sub-national level, which impact the individual’s and communities’ ability to access the resources that contribute to their transition out of poverty.
MDG 2: UNFINISHED BUSINESS & EMERGING PRIORITIES
Even as there are indications that progressive investments in education are now demonstrating gains towards attainment of Goal 2, for Belize to address its current educational challenges, there is a dire need to continually assess and address the quality of educational services and the target areas identified below.
12 34 56 78
98

Continuous weaknesses in English and Mathematics are evident in the annual Belize Junior Achievement Test administered at Standard 3 (Grade 5) and in the Primary School Examination administered at the end of Standard 6 (Grade 8). An assessment of students’ cognitive development, background knowledge, and use of effective pedagogy to address areas of weaknesses must be addressed. To address the urgent need for improved performance in national examinations, there is also need to ensure that teacher training institutions are providing teachers with the skills and abilities to address educational gaps.
Although there have been some gradual increases in the number of teachers trained at the primary level, approximately forty percent (40%) remain untrained. The urgent need to ensure that teachers acquire requisite competencies to effectively manage behaviour, plan for instruction, assess students’ learning, and to promote the development of critical thinking skills is required if Belize’s educational system is to be responsive to national development needs such that students obtain marketable skills that will enable them to be productive citizens. Additionally, efforts must be made to attract high achievers and quality professionals at all levels of the education system.
While there is no data to assess the extent to which teachers are supervised and supported, it is apparent that in many districts there is limited capacity to continuously monitor schools to ensure standardised and effective delivery of the national school curriculum. In addition to monitoring and supervising teachers there is also a need to monitor and support all levels of the education system. It is hoped that the current plans by the Ministry of Education to develop a monitoring and evaluation framework to assess quality of education in Belize will result in addressing areas of weakness.
Over the past five years there has been continuous revision of the primary school curriculum to include new content in specific areas such as Mathematics, Language Arts, and Social Studies. In addition to ensuring that the curriculum is revised, there is need to unpack many areas of the curriculum with a great deal of content which ordinarily cannot be effectively addressed within a given academic year. Furthermore, there is need to identify standards for each level of primary schooling to ensure that nationally, teachers are aware of the minimum achievement that must be attained before a child is promoted to a higher grade.
The extent to which the curriculum, even at the primary level, caters to authentic learning, national goals and assessment, problem solving, critical thinking, development of language competencies, and technological skills must also be examined. Emphasis on excellence in mathematics and science must become national priorities if Belizean children are to acquire requisite skills and competencies to compete in the labour market. Effective use of technology in teaching and learning should be viewed as a priority to foster meaningful changes in educational achievement. This calls for the development of a well-structured curriculum with specific standards and expected performance of teachers and students in Belize. The implementation of such a curriculum and a measurement of its success and challenges should be supported and assessed by all stakeholders in the education sector.
It was noted earlier that while the enrolment rate of boys and girls in primary school is close, boys still enter the education system in exceeding numbers when compared to girls of the same cohort. Of concern is that while boys enrol in primary school in greater numbers than girls, their
MILLENNIUM DEVELOPMENT GOALS REPORT AND POST 2015 AGENDA 99
retention, beyond Standard 6 (Grade 8) is a challenge. This situation is further exacerbated at high school level where boys have higher repetition and dropout rates than girls. This finding points to the urgent need to identify how best to motivate and support boys to remain in school and to complete their course of education, while at the same time ensuring the gains made by girls are not lost.
MDG 3: UNFINISHED BUSINESS & EMERGING PRIORITIES
In terms of ensuring parity for boys and girls in all levels of education, The Belize: Aligning National Development Plans with Gender Equality and Women’s Empowerment Objectives and MDG 3 Costing Initiative presents two important recommendations for achieving this indicator (1) Identify out of school girls and boys and secure their entry/re-entry into the system; and (2) effectively support efforts to complete primary and secondary education through adult and continuing education initiatives. It suggests addressing education related impediments to workforce readiness. This includes the introduction and expansion of vocational and technical training, as well as, better access to educational financing for both males and females. The current policy of auto-promotion (at the primary level) can be revisited so that students advance to subsequent levels only when they have acquired the appropriate skills. Curricular content can be strengthened to offer diverse programmes. A more dynamic curriculum that is relevant, updated, and responds positively to socio-cultural norms is needed. This is especially true for the tertiary level, where career options should be a bridge or pathway for entering the workforce (ABEN, 2011).
There needs to be further analysis of current programmes and practices to determine how they influence male retention in school. ‘Second chance’ programmes and support for incentives such as cash transfer/incentives for school could be scaled-up once their success is determined. (UNICEF,2012). Disciplinary practices should be examined and research conducted to determine if these practices affect dropout rates. Greater emphasis should be made on improving male access to, and retention in, secondary and tertiary education while at the same time ensuring continued gains for females.
Concerning the share of women in wage employment, the focus should be on reducing the number of unemployed women in general. The Labour Force Survey (2012), indicated that 59.4% of the labour force were men, whereas, less than half (40.6%) were women. Among the unemployed, women far outnumbered their male counterparts, with 11.9% and 22.4% unemployment rates, respectively (SIB, 2012). It is also of concern that women continue to earn less than men, evident in both the average and median income levels. When investments to improve earnings and job opportunities for women are limited, families’ upward mobility is restricted since women will inevitably have fewer assets to invest in their education and that of their family members, and will be unable to obtain necessary seed money to start a business (Peebles, 2012).
Another concern is the evidence of gender-based occupational segregation. More than half (58.7%) of the share of women in wage employment in the non-agricultural sector were women engaged in traditionally female, service-oriented jobs (SIB, 2012). For example, in the tourism sector which is a primary contributor to poverty reduction, the majority of jobs available to women continue to be low-paying jobs at the lower end of the service sector scale (Peebles, 2012).
12 34 56 78
100
There is great concern emerging from the realization that although males are underrepresented at both the secondary and tertiary levels of education, somehow, women do not seem to transition in similar numbers into the formal workforce. This has been an issue on the forefront since the previous MDG Scorecard and Outlook Report of 2010, “There is reason to be optimistic with regards to Belize’s progress in this MDG, despite the statistics, the benefits from the continued success of girls in school will become evident in the longer term, as more educated women, particularly those who have completed tertiary level education, will likely enter the work force (UNDP; p. 50)”. However, when analyzing the employed population by sex, only 16.2% indicated having obtained a tertiary level education, and a little over half (8.3%) were females (SIB, 2012).
Although some qualified women are slowly accessing managerial positions, it is widely believed there is a disconnect between the number of women completing higher education and those actually obtaining wage employment at the higher levels of the services sector. Essentially, it is as if the country is not currently benefiting from the potential of its qualified female workforce. Clearly, there is need for more in-depth analysis of this phenomenon in order to address the underlying causes of the high unemployment rates among women, even as more of them are seeking to become educated.
The particular concerns relating to the continued low number of seats held by Women in National Parliament extends to other sectors of the political arena. The Situational Analysis of Gender and Politics in Belize, 2012 which was supported by UNDP shows that while two (2) women were appointed Ministers, the other Cabinet members include fifteen (15) men and an additional six (6) men as Ministers of State. Among the National Assembly, of the thirty one (31) elected members, each representing a particular constituency, only one (1) is a woman. Apart from the House of Representatives, another important decision-making body is the Senate. Currently there are five (5) female senators and seven (7) males. Six (6) are recommended by the party in power, three (3) by the opposition and the remaining three (3) are appointed by the council of churches, the business community and trade unions. Since 2003, when the non-political organisations began to make appointments none have appointed women, thereby lowering the percentage of women represented in the Senate. At the town and city council levels, in 2003, women represented half of the people serving the municipalities.
While women may not be overwhelmingly present at the level of parliament nor elected office, they do participate in other sectors and levels of decision making. Many are at the forefront of advocacy groups, local non-governmental organizations, community-based organizations and faith-based organizations.
In fact, women are more represented in appointed positions. Currently, eight of the twenty-one (38.1%) Chief Executive Officers in the government ministries are women, up from 37.5% in the past administration. The number of women at this level would appear to reflect women’s overall level of success in the Public Service. Eighteen women serve as Heads of Departments in the various ministries; twenty-six of them holding senior management positions. Within the diplomatic missions appointed by government, currently 85.7% of head of missions are males and only two (14.3%) were women. It is noteworthy, that appointed bodies are still not considered to be gender-balanced. In 2011, the proportion of women appointed on quasi-governmental boards such as Social Security, Development Finance Corporation (DFC), Central Bank, Public Utilities, (BEL) actually decreased from 28.9 percent in 2011 to 19.2 percent in 2012. The number of female chairpersons declined from two to none (Lewis, 2012).
MILLENNIUM DEVELOPMENT GOALS REPORT AND POST 2015 AGENDA 101
The 2010 MDG Scorecard Report, states that “It is evident that women at the national level are not only far less likely to be voted into office, but are also far less likely to enter into public life (p. 49)”. This is still true today. The hesitance to enter the political arena is based on cultural norms and perceptions regarding the role of women. Even during political campaigns women serve the male candidates in the forefront acting as ‘foot soldiers’ and street captains, carrying out house to house campaigns. The nature of Belizean politics exposes women to a culture where their private life becomes of public fodder. While men’s private lives may also be put up to public scrutiny, voters generally place less importance on any perceived scandal in the lives of the male candidates revealing a double standard. Assertiveness in women is perceived as a negative trait (i.e. aggressiveness). On the other hand, aggressive men are seen as leaders, ambitious, assertive, and are more respected when exhibiting those traits (Peebles, 2012).
Civil society can provide a voice for women, through caucus, symposiums and/or seeking funding for related programmes. A long term strategy to establish women as a political block can be established in order to implement successful strategies for women’s political representation.
MDG 4: UNFINISHED BUSINESS & EMERGING PRIORITIES
One main emerging priority is to improve accessibility to health care services for those children and women living in rural areas. There are constraints in the provision of neonatal care at the Karl Huesner Memorial Hospital, which is the national referral hospital e.g. insufficient space and unavailability of service technical staff to accommodate and manage the increased population of neonates requiring neonatal intensive care services.
Although the adolescent birth rate fell from 99 in 1995 to 63 in 2011 (MICS 2011), the absolute number has remained unchanged. The adolescent birth rate remains high and it is known that there is increased risk for negative outcomes for the mother and the child when the mother is an adolescent. The implementation of family life curriculum in secondary schools as well as targeted messaging to teenagers and adolescents should be given priority.
The early detection and prevention of premature deliveries should also be a priority. Success in this regard requires multi-sectoral interventions beyond the scope of the Ministry of Health as causes include non-medical reasons, including the age of the mother, her socio-economic conditions, dietary deficiencies and possible drug use. Some of the medical causes may be addressed with frequent prenatal visits, and this also requires mothers to voluntarily attend clinic and comply with the medical advice and/or treatment regimen given. While upgrades in health facilities and infrastructure, including neonatal care must be prioritized, continued education and awareness campaigns/programmes for new and expectant mothers must continue at the forefront of efforts to bring about behavioural change.
MDG 5: UNFINISHED BUSINESS & EMERGING PRIORITIES
In order to better track the indicators for MDG5, realistic targets need to be set for post 2015, as none currently exists. While the general target may indicate “universal access to reproductive health” there is need to set specific targets for the contraceptive use prevalence rate and the adolescent birth rate.
12 34 56 78
102
Another emerging priority is to reduce the geographic disparities in the provision of services. For example, looking at the contraceptive use prevalence rate, there is a clear rural-urban difference with 46.7% and 42.3% of those who are sexually active not using any form of contraceptives. The lowest contraceptive use prevalence rate is in the Toledo district (23.4%) and among Mayan women (15.4%). Generally, those not using any method are highest among younger women with no formal education. 57.8% of those in the lowest wealth quintile are not using any method of contraception. The adolescent birth rate is more than 300 percent higher in poor families than in wealthier families. The lowest level of antenatal care coverage is found in Toledo. These represent pressing priorities to engage policy makers.
Attention must be drawn to the rate of C-Sections in the private sector as C-Sections can impose financial burden and clinical risks on the patient and health care system. National standards and clinical guidelines need strengthening and reinforcement to decrease variation in practice. Women and their families must be well informed on the risks of C-Sections and the need to utilise this method only if there is a medical necessity.
Training of Public Health Nurses (PHN)25 is a priority in improving the quality of services in the rural communities. Since most of the rural communities do not have a resident doctor, a PHN may be the most appropriate health care provider to serve in these areas. This requires a change from the previous model of staffing these areas with rural health nurses.
Two factors that may have lasting impact on the achievement of this Goal include the investment in a Teenage and Young Adult Clinic and the institution of pre-conception care. These new initiatives/programmes are increasingly being recognized as a critical component of health care for women of reproductive age.
The Teenage and Young Adult Clinic encompasses a wide array of services pertinent to the age group to help them stay well through all the changes and challenges of adolescence. It helps teens and especially males to begin taking responsibility for their own health. The introduction of this type of service may help to prevent teen pregnancy and the transmission of STIs including HIV.
The main goal of preconception care is to provide health promotion, screening, and interventions for women of reproductive age to reduce risk factors that might affect future pregnancies. Preconception care is part of a larger health-care model that results in healthier women, infants, and families. It seeks to address existing risks before pregnancy when they are likely to have the greatest impact on foetal development (Johnson et al, 2006). While maintaining the standards of prenatal care, there has to be a shift of focus on preconception care. Mothers need to begin their pregnancy in a healthy state. Policy changes at the national level will be necessary to support these recommendations.
MDG 6: UNFINISHED BUSINESSES & EMERGING PRIORITIES
While the incidence of HIV continues to decrease in the general population having plateaued
25 The Public Health Nurse is a registered nurse and midwife with training in public health. They integrate community involvement and knowledge about the entire population with personal, clinical understandings of the health and illness experiences of individuals and families within the population.
MILLENNIUM DEVELOPMENT GOALS REPORT AND POST 2015 AGENDA 103
between the years of 2002 to 2008, ranging from 431 and 425 documented new cases, an emerging priority must be to address the increasing incidences in males. The Behavioural Sero-prevalence Survey (BSS) found an increase in the population of men who have sex with men, which raises the question regarding a potential linkage between the increase in incidences with this pattern of behaviour. It is also possible that the new cases seen may be from an increase in the testing of males in general, but work has to be done to discover the reasons and address the situation.
MDG 7: UNFINISHED BUSINESSES & EMERGING PRIORITIES
The Caribbean Community Climate Change Centre (CCCCC), based in Belize, reports that the sea level is rising some 3 millimetres annually. This poses a threat to all of Belize’s coastal communities, and some are already under threat. The reality of vanishing coastlines is being experienced in many communities in southern Belize. Flash floods have imposed huge costs to otherwise poor, vulnerable and agrarian communities.
Yet another emerging priority of the foreseeable future requiring national attention is trans-border incursions. The problems they cause extend beyond environmental issues and include, but are not limited to, law enforcement problems, economic problems, and diplomatic/political problems that could easily conflagrate along an increasingly volatile border.
There is a need to strengthen data gathering within the many public agencies mandated to work on environmental issues. All agencies gather data but there is no centralised data storage location, or official and formalised channels through which effective exchange of data and data analysis occurs at regular intervals. As added environmental and sustainable development challenges emerge, there needs to be more efficient mechanisms to access the data already gathered to inform effective policy making.
MDG 8: UNFINISHED BUSINESS & EMERGING PRIORITIES
An emerging priority would be the establishment of a donor coordination mechanism to help track aid to Belize and assist in increasing coordination and synergies in donor assistance. This can allow current and future donors as well as the GoB to allocate material, technical and financial assistance deemed necessary according to national priorities, and forged partnerships across the donor community. Estimates would have to be made in instances where ODA is not provided in currency but as technical assistance contributions to projects.
Belize to date does not have a big picture approach to trade. There is no national Trade Policy that identifies the policy direction for the country. The CARICOM single economy (CSE) has been delayed until 2015 in order to better address issues concerning monetary convergence, such as how to handle cross border payments. It will have to address the harmonisation of laws, administrative and procedural practises pertaining to financial and monitory policies.Yet another priority may be the need to enhance the competitiveness of the country’s agricultural exports. Acknowledging that there are local constraints such as costs and availability of capital, focus ought to be on moving up the commodity chain to engage in enhanced processing to create value added products and garner larger revenues from exports.
12 34 56 78
104
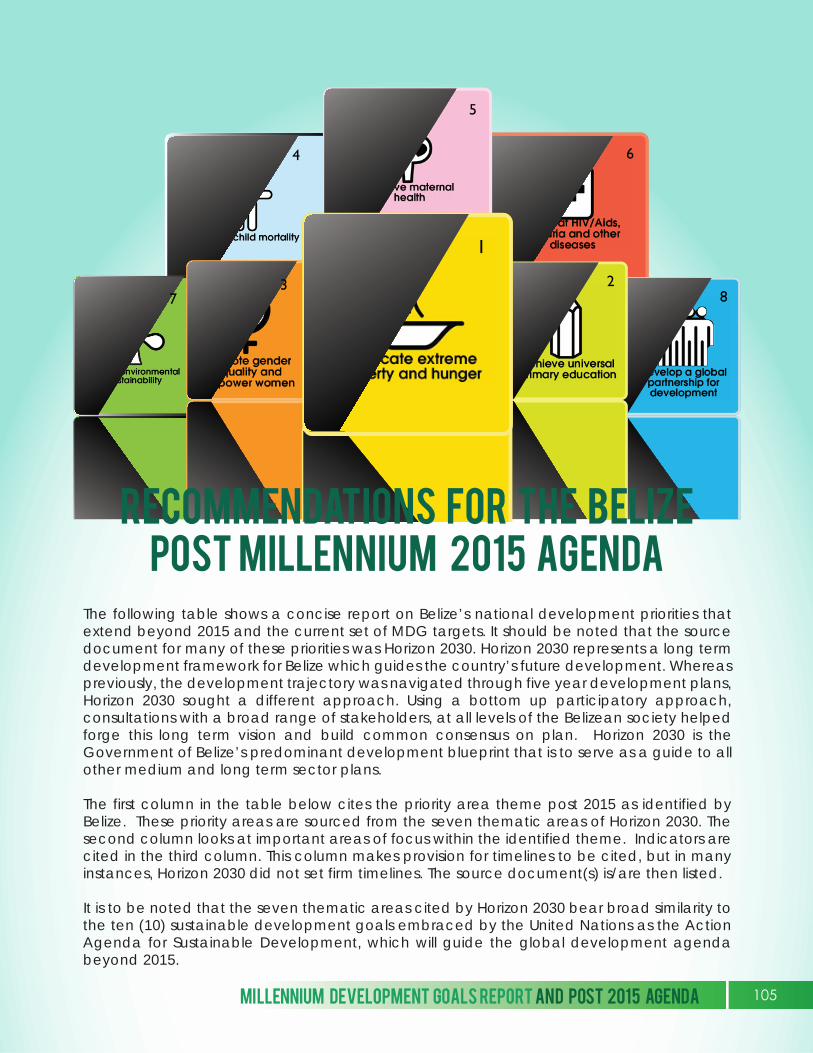
4 6
5
7 83 2
1
RECOMMENDATIONS FOR THE BELIZEPOST MILLENNIUM 2015 AGENDA
The following table shows a concise report on Belize’s national development priorities that extend beyond 2015 and the current set of MDG targets. It should be noted that the source document for many of these priorities was Horizon 2030. Horizon 2030 represents a long term development framework for Belize which guides the country’s future development. Whereas previously, the development trajectory was navigated through five year development plans, Horizon 2030 sought a different approach. Using a bottom up participatory approach, consultations with a broad range of stakeholders, at all levels of the Belizean society helped forge this long term vision and build common consensus on plan. Horizon 2030 is the Government of Belize’s predominant development blueprint that is to serve as a guide to all other medium and long term sector plans.
The first column in the table below cites the priority area theme post 2015 as identified by Belize. These priority areas are sourced from the seven thematic areas of Horizon 2030. The second column looks at important areas of focus within the identified theme. Indicators are cited in the third column. This column makes provision for timelines to be cited, but in many instances, Horizon 2030 did not set firm timelines. The source document(s) is/are then listed.
It is to be noted that the seven thematic areas cited by Horizon 2030 bear broad similarity to the ten (10) sustainable development goals embraced by the United Nations as the Action Agenda for Sustainable Development, which will guide the global development agenda beyond 2015.
MILLENNIUM DEVELOPMENT GOALS REPORT AND POST 2015 AGENDA 105
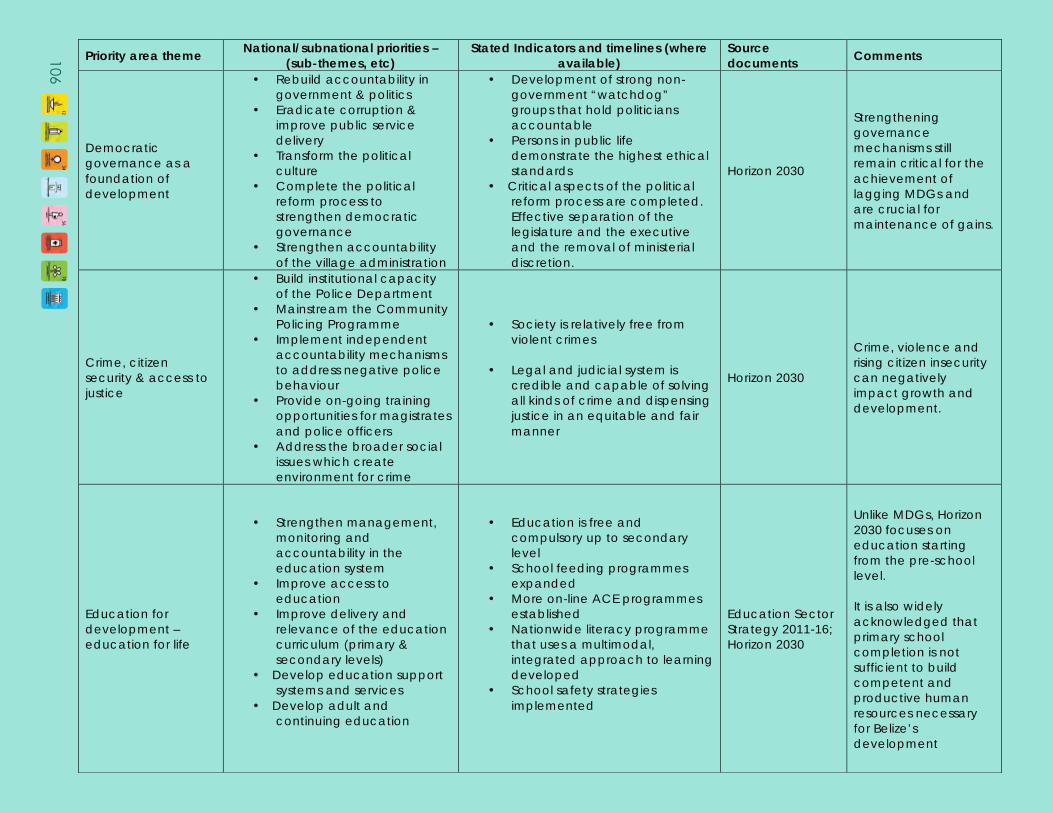
Priority area theme National/subnational priorities –
(sub-themes, etc) Stated Indicators and timelines (where
available) Source documents
Comments
Democratic governance as a foundation of development
• Rebuild accountability in government & politics
• Eradicate corruption & improve public service delivery
• Transform the political culture
• Complete the political reform process to strengthen democratic governance
• Strengthen accountability of the village administration
• Development of strong non-government “watchdog” groups that hold politicians accountable
• Persons in public life demonstrate the highest ethical standards
• Critical aspects of the political reform process are completed. Effective separation of the legislature and the executive and the removal of ministerial discretion.
Horizon 2030
Strengthening governance mechanisms still remain critical for the achievement of lagging MDGs and are crucial for maintenance of gains.
Crime, citizen security & access to justice
• Build institutional capacity of the Police Department
• Mainstream the Community Policing Programme
• Implement independent accountability mechanisms to address negative police behaviour
• Provide on-going training opportunities for magistrates and police officers
• Address the broader social issues which create environment for crime
• Society is relatively free from violent crimes
• Legal and judicial system is credible and capable of solving all kinds of crime and dispensing justice in an equitable and fair manner
Horizon 2030
Crime, violence and rising citizen insecurity can negatively impact growth and development.
Education for development – education for life
• Strengthen management, monitoring and accountability in the education system
• Improve access to education
• Improve delivery and relevance of the education curriculum (primary & secondary levels)
• Develop education support systems and services
• Develop adult and continuing education
• Education is free and compulsory up to secondary level
• School feeding programmes expanded
• More on-line ACE programmes established
• Nationwide literacy programme that uses a multimodal, integrated approach to learning developed
• School safety strategies implemented
Education Sector Strategy 2011-16; Horizon 2030
Unlike MDGs, Horizon 2030 focuses on education starting from the pre-school level. It is also widely acknowledged that primary school completion is not sufficient to build competent and productive human resources necessary for Belize’s development
Build a resilient economy
• Develop a strong small business sector to create jobs
• Develop the domestic market as springboard for exports
• Produce quality goods and services and expand exports
• Implement a coherent and consistent macroeconomic policy framework
• Support systems established for small businesses
• National Employment Agency & Small Business Development Programme established
• Key investments in economic infrastructure made
• Support standards & quality management & enforcement
• Pursue prudent fiscal policy and controlled growth of public debt
Horizon 2030
The MDG 1 targets and indicators have remained off target and poverty levels have steadily increased. However, the country is now embarking on the development of a Growth and Poverty Reduction Strategy 2014-2017.
Focus on key productive sectors
• Build a vibrant agriculture and strong rural communities
• Support sustainable fisheries • Build sustainable and
responsible tourism • Target selected new sectors
with growth potentials, such as cultural industries
• Agricultural insurance developed to cover crop losses
• Increased government investment in technology & technical support to farmers
• Provide incentives to encourage the export of cultural products
• Provide “Go Green” incentives to businesses
Horizon 2030
Agriculture sector remains a major income earner for the country and as such it is critical to build resilience among all stakeholders especially in the context of growing climate change and frequent external shocks.
Healthy citizens throughout the life cycle
• Universal access to health care
• Promote healthy lifestyle throughout the life cycle
• Establish family and community health care programmes across the country
• Implement effective accountability for delivery of health services
• Expanded NHI scheme countrywide
• Health system reoriented to focus on promoting healthy lifestyles
• Larger portion of Government investment in primary health care and on preventative health strategies
Horizon 2030
Belize’s primary resources remain its people. Access to basic social services including health and education are essential to productivity.
Care for the natural environment
• Incorporate environmental sustainability into development planning
• Strengthen protected areas management
• Promote green energy
• Natural resource accounting introduced into GDP
• Solid waste is being effectively managed
• “Energy Office” created to promote investments in renewable energy sources
Energy Sector Strategy; Horizon 2030
Belize’s natural resources are abundant and minimally exploited. The natural resources must be sustainably managed to ensure its positive contribution to growth and development of the country.
1234
5678
106
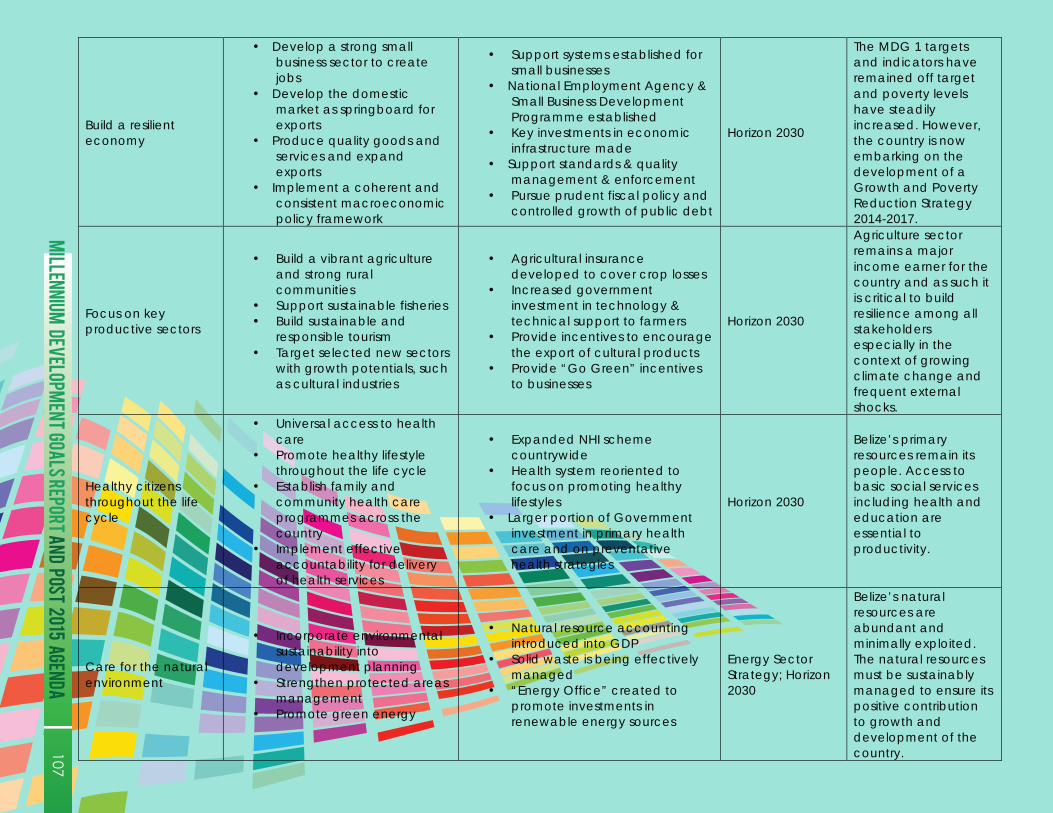
Priority area theme National/subnational priorities –
(sub-themes, etc) Stated Indicators and timelines (where
available) Source documents
Comments
Democratic governance as a foundation of development
• Rebuild accountability in government & politics
• Eradicate corruption & improve public service delivery
• Transform the political culture
• Complete the political reform process to strengthen democratic governance
• Strengthen accountability of the village administration
• Development of strong non-government “watchdog” groups that hold politicians accountable
• Persons in public life demonstrate the highest ethical standards
• Critical aspects of the political reform process are completed. Effective separation of the legislature and the executive and the removal of ministerial discretion.
Horizon 2030
Strengthening governance mechanisms still remain critical for the achievement of lagging MDGs and are crucial for maintenance of gains.
Crime, citizen security & access to justice
• Build institutional capacity of the Police Department
• Mainstream the Community Policing Programme
• Implement independent accountability mechanisms to address negative police behaviour
• Provide on-going training opportunities for magistrates and police officers
• Address the broader social issues which create environment for crime
• Society is relatively free from violent crimes
• Legal and judicial system is credible and capable of solving all kinds of crime and dispensing justice in an equitable and fair manner
Horizon 2030
Crime, violence and rising citizen insecurity can negatively impact growth and development.
Education for development – education for life
• Strengthen management, monitoring and accountability in the education system
• Improve access to education
• Improve delivery and relevance of the education curriculum (primary & secondary levels)
• Develop education support systems and services
• Develop adult and continuing education
• Education is free and compulsory up to secondary level
• School feeding programmes expanded
• More on-line ACE programmes established
• Nationwide literacy programme that uses a multimodal, integrated approach to learning developed
• School safety strategies implemented
Education Sector Strategy 2011-16; Horizon 2030
Unlike MDGs, Horizon 2030 focuses on education starting from the pre-school level. It is also widely acknowledged that primary school completion is not sufficient to build competent and productive human resources necessary for Belize’s development
Build a resilient economy
• Develop a strong small business sector to create jobs
• Develop the domestic market as springboard for exports
• Produce quality goods and services and expand exports
• Implement a coherent and consistent macroeconomic policy framework
• Support systems established for small businesses
• National Employment Agency & Small Business Development Programme established
• Key investments in economic infrastructure made
• Support standards & quality management & enforcement
• Pursue prudent fiscal policy and controlled growth of public debt
Horizon 2030
The MDG 1 targets and indicators have remained off target and poverty levels have steadily increased. However, the country is now embarking on the development of a Growth and Poverty Reduction Strategy 2014-2017.
Focus on key productive sectors
• Build a vibrant agriculture and strong rural communities
• Support sustainable fisheries • Build sustainable and
responsible tourism • Target selected new sectors
with growth potentials, such as cultural industries
• Agricultural insurance developed to cover crop losses
• Increased government investment in technology & technical support to farmers
• Provide incentives to encourage the export of cultural products
• Provide “Go Green” incentives to businesses
Horizon 2030
Agriculture sector remains a major income earner for the country and as such it is critical to build resilience among all stakeholders especially in the context of growing climate change and frequent external shocks.
Healthy citizens throughout the life cycle
• Universal access to health care
• Promote healthy lifestyle throughout the life cycle
• Establish family and community health care programmes across the country
• Implement effective accountability for delivery of health services
• Expanded NHI scheme countrywide
• Health system reoriented to focus on promoting healthy lifestyles
• Larger portion of Government investment in primary health care and on preventative health strategies
Horizon 2030
Belize’s primary resources remain its people. Access to basic social services including health and education are essential to productivity.
Care for the natural environment
• Incorporate environmental sustainability into development planning
• Strengthen protected areas management
• Promote green energy
• Natural resource accounting introduced into GDP
• Solid waste is being effectively managed
• “Energy Office” created to promote investments in renewable energy sources
Energy Sector Strategy; Horizon 2030
Belize’s natural resources are abundant and minimally exploited. The natural resources must be sustainably managed to ensure its positive contribution to growth and development of the country.
MILLENNIUM
DEVELOPMENT GOALS REPORT AND POST 2015 AGENDA
107
4 6
5
7 83 2
1
BIBLIOGRAPHY
ABEN Consulting. (2011). Belize: aligning national development plans with gender equality & women’s empowerment objectives. Belmopan, Belize: Thematic Working Group.
Alcorn, K. (2013, June). HIV cure: the long road ahead. Aidsmap.
Alonzo, H., Näslund-Hadley, E., & Martin, D. (2013). Challenges and opportunities in the Belize education sector. Retrieved from http://www.bz.undp.org/belize/en/home.html
Barnett, C., Catzim-Sanchez, A., & Humes, D. (2010). Horizon 2030: Planning our future together central bank of Belize. Annual Report. (various years). Belmopan BZ: Ministry of Economic Development
Barrow, Dean. (2013). Budget Address 2012/2013: Exercising discipline while preserving growth. Belmopan, BZ: Government of Belize
Caribbean Media Corporation (CMC) News (Producer). (2013, June 17). 2013 Policy Changes in Cuba will affect Havana’s health contribution to CARICOM [Television broadcast]. St. Michael, BB: Caribbean Media Corporation
Important, I. M. (Producer). (1990, November 1). The nightly news hour [Television broadcast]. New York, NY: Central Broadcasting Service.
Central Bank of Belize ( ). annual reports (1995-2012). Belize City: Belize.
Chicas, S. (2011) Belize Protection Areas Map. Belmopan, BZ: University of Belize
Cherrington, E. A., Cho, P. P., Waight, I., Santos, T. Y., Escalante, A. E., Nabet, J., & Usher, L. (2012). Executive Summary: Forest Cover and Deforestation in Belize, 2010-2012. Water Center for the Humid Tropics of Latin America and the Caribbean/NASA/Belize Ministry of Natural Resources and the Environment. Panama City, Panama.
Colbourne, D. (2009). Situation Report for Introduction of Hydrocarbon Refrigerants to Belize. Belmopan, BZ: Department of the Environment, Ministry of Natural Resources and the EnvironmentDovey, Samantha & Ransom, Elizabeth (2009) Adapting delivery rooms and national policies to women’s cultural preferences in Ecuador. Retrieved from http://www.urc-chs.com/news?newsItemID=17
Gayle, H. & Mortis, N.(2010). Male social participation and violence in urban Belize. Belmopan, BZ: Restore Belize
Government of Belize. (2013). Budget Presentation for Fiscal Year 2013/2014: Achieving debt sustainability: Stimulating economic expansion. Belmopan, BZ.
12 34 56 78
108
Government of Belize & United Nations Development Programme (2010). Belize scorecard and outlook report 2010: Millennium Development Goals. Belmopan, BZ: GOB & UNDP.
Graven, M., Allen, P., Allen, V., Smith, I., & MacDonald, N. (2012). Women’s health- achievement of the 2015 millenium development goal 5A (maternal mortality) by Belize in 2011. Retrieved from http://www.jogc.com/abstracts/full/201210_WomensHealth_3.pdf
Hunt, P. & Bueno de Mezquita, J. (2010). Reducing maternal mortality – the contribution of the right to the highest attainable standard of health.(University of Essex). Retrieved from http://www.unfpa.org
Inter-American Development Bank (2011). Improving maternal care in Belize. Retrieved from www.urc-chs.com http://www.iadb.org/en/salud-mesoamerica-2015/sm2015/belize-joins-the-salud-mesoamerica-2015-initiative,6020.html
Inter-Parliamentary Union (2013). Women in national parliaments. Retrieved from http://www.ipu.org/wmn-e/classif.htm
James V. et. al (2010). Belize Scorecard and Outlook Report, 2010, Belmopan, BZ: Ministry of Economic Development & UNDP
Johnson, K., Posner, S., Biermann, J., Cordero, J., Atrash, H., Parker, C., Boulet, S., & Curtis, M. (2006). Recommendations to improve preconception health and health care---United States. Retrieved from http://www.cdc.gov Leadership Council of the Sustainable Development Solutions Network (2013). Action agenda for sustainable development. Retrieved from http://unsdsn.org/files/2013/06/130613-SDSN-An-Action-Agenda-for-Sustainable-Development-FINAL.pdfLewis, D. (2012). Equality of opportunity for equality of results: A situation analysis of women in politics in Belize. Belmopan, BZ: National Women’s Commission & UNDP.
Mendoza, P. & National Human Development Advisory Committee. (2009). National poverty elimination strategy and action plan. (NPESAP 2009 – 2013). Belmopan, BZ: ABEN Consulting & National Human Development Advisory Committee.
Ministry of Economic Development (2009). Belize 2009 country poverty assessment.(Volume 1: Main Report). Belmopan, BZ: National Human Development Advisory Committee.
Ministry of Economic Development (2007).National poverty elimination strategy. (NPES 2007 – 2011). Belmopan, BZ: National Human Development Advisory Committee.
Ministry of Economic Development (2007). National poverty elimination action plan.(NPEAP 2007 – 2011). Belmopan, BZ: National Human Development Advisory Committee.
Ministry of Economic Development (2003). 2002 Belize Living Standards Measurement Survey (Report). Belmopan, BZ: National Human Development Advisory Committee
Ministry of Education, Youth & Sports. (2013). Belize Education Sector Strategy 2013. Belmopan, BZ: Author
MILLENNIUM DEVELOPMENT GOALS REPORT AND POST 2015 AGENDA 109
Ministry of Education, Youth & Sports. (2010). Education and Training Act 2011. Belmopan, BZ: Author
Ministry of Education, Youth & Sports. (year). Monitoring Education Indicators. Belmopan, BZ: Author
Ministry of Health.(2013) National TB, HIV/AIDS & other STIs Programme: Getting to Zero. (2011 Statistical Report). Belmopan, BZ: Author
Ministry of Health. (2012). Administrative Data. Belmopan: BZ: Author
Ministry of Health. (2011). Epidemiological Unit data (2011 Malaria Report /Indicators). Belmopan, BZ: Author
Ministry of Human Development, Social Transformation & Poverty Alleviation. (2013). Internal data.
Ministry of Natural Resources & the Environment.(2013). Rationalization exercise of the Belize national protected areas system. Belmopan, BZ: Author
Ministry of Natural Resources & the Environment.(2011). Second national communication to the conference of the parties of the nited nations framework convention on climate change. Belmopan, BZ: Author
Ministry of Natural Resources & the Environment. (2010 May). IV National Report to the United Nations Convention on Biological Diversity. Belmopan, BZ: Author.
Pan American Health Organization (PAHO). (2012). Health in the America’s 2012 edition, regional outlook & country profile”. Retrieved from http://www.paho.org/saludenlasamericas/index.php?option=com_content&view=article&id=9&Itemid=14&lang=en
Peebles, D. (2012). Country gender assessment- Belize. Toronto, OT: Kartini/Caribbean Development Bank.Rosenberg, Tina. (2011, January 3). To beat back poverty, pay the poor. The New York Times. Retrieved from http://www.nytimes.com.
Statistical Institute of Belize (2012). Abstract of statistics 2012. Belmopan, BZ: Author
Statistical Institute of Belize (2012). Labour force survey 2012. Belmopan, BZ: Author
Statistical Institute of Belize (2010). Census 2010. Belmopan, BZ: Author
Statistical Institute of Belize & United Nations Children’s Fund (UNICEF). (2011). Multiple Indicators Clusters Survey 2011. Belmopan, BZ: Author
Statistical Institute of Belize & United Nations Children’s Fund (UNICEF). (2006). Multiple indicators cluster survey 2006. Belmopan, BZ: Author
12 34 56 78
110
United Nations. (2013). 2013 addendum to the MDG country report guidelines: UNDG – Guidance Note. Retrieved from http://www.undp.org/content/dam/undp/library/MDG/UNDG%20MDG%20Country%20Report%20Guidelines_2%20May2013.pdf
United Nations Children’s Fund (UNICEF) & Government of Belize. (2011, July). The situation analysis of children and women in Belize 2011, an ecological review. Retrieved from http://www.unicef.org/sitan/files/SitAn_Belize_July_2011.pdf
United Nations Population Fund (UNFPA) & Ministry of Health.(2011, September). Improving maternal care in Belize. Retrieved from www.urc-chs.com University of Belize & UNICEF. (2013).Towards a compact for Belizean development compendium of papers. Belmopan, BZ: Authors
Villanueva, Jaime and Belize Fisheries Department. 2012. “Fisheries Statistical Report 2011.” Report prepared for the Belize Fisheries Department, Ministry of Agriculture and Fisheries.” March 2012
Wagner, D.A. (2005). Monitoring and measuring literacy: Background paper prepared for the Education for All Global Monitoring Report 2006. UNESCO, 2006/ED/EFA/MRT/PI/100.
Warren, C., Daly, P., Toure, L., & Mongi, P. (n.d.). Postnatal care in opportunities for Africa’s newborns. Retrieved from http://www.who.int
World Bank (2009, February 10th). Conditional cash transfer. Retrieved from http://go.worldbank.org/S1CNTP66N0
World Bank. (2010). Data 2010. Retrieved from http://www.iadb.org/en/salud-mesoamerica-2015/sm2015/belize-joins-the-salud-mesoamerica-2015-initiative,6020.html
World Bank. (2010). Data 2010. Retrieved from http://umm.edu/programs/childrens/services/adolescent-and-young-adult
World Bank. (2012). “Belize boosts school attendance and access to financial services for the poor.” Retrieved from http://www.worldbank.org/en/news/feature/2012/06/28/belize-boosts-schoool-attendance-and-acces-to-financial-services-for-the-poor
World Health Organisation (2012): Policy on collaborative TB/HIV guidelines for national programmes and other stake holders. Retrieved from http://www.who.int/tb/publications/2012/tb_hiv_policy_9789241503006/en/
MILLENNIUM DEVELOPMENT GOALS REPORT AND POST 2015 AGENDA 111

4 6
5
7 83 2
1


4 6
5
7 83 2
1
AN OBJECTIVE UPDATE ON MDG PROGRESS WHICHREPRESENTS BELIZE’S PEOPLE CENTRED
DEVELOPMENT APPROACH
MILLENNIUMDEVELOPMENT GOALS REPORT
AND POST 2015 AGENDA
1 2 3 4 5 6 7 8
The current 2013 Belize MDGs Progress Report examines the country’s progress towards achieving the Millennium Development Goals, documenting challenges that hindered progress and clearly identifying the ‘unfinished business’ and emerging priorities within the context of each MDG. Furthermore, the report also articulates recommendations for a post 2015 development agenda, building on the country’s experiences with the MDGs and their implications on informed policy making within the context of the Horizon 2030 framework.
In terms of progress on the MDGs, the country will meet the following targets: net primary education enrolment ratios and literacy rate (MDG 2); gender parity ratio in primary education (MDG 3); infant and child immunization rates (MGD 4); skilled birth attendance rate and antenatal care coverage(MDG 5); slowing of the prevalence of HIV/AIDS, providing universal access to anti-retroviral medication, significant success in reduced mother to child transmission rates and eliminating malaria (MDG 6); maintaining a proportion of forest cover that remains highest in the region, increasing universal access to potable water sources and improved sanitation facilities (MDG 7); and expansion and diversity in communications technology (MDG 8). Other targets and indictors are unlikely to be met by the 2015 deadline.
MILLE
NN
IUM
DE
VE
LOP
ME
NT G
OA
LS R
EP
OR
T AN
D P
OS
T 20
15
AG
EN
DA