Science-Policy Briefs - Sustainable Development Goals
285
1 Science-Policy Briefs on the impact of rapid technological change on the Sustainable Development Goals Contributions to the Technology Facilitation Mechanism by individual experts
-
Upload
khangminh22 -
Category
Documents
-
view
2 -
download
0
Transcript of Science-Policy Briefs - Sustainable Development Goals
1
Science-Policy Briefs on the impact of rapid technological change
on the Sustainable Development Goals
Contributions to the
Technology Facilitation Mechanism
by individual experts
1
Interagency Task Team on Science, Technology and Innovation for the Sustainable Development Goals
Science-Policy Briefs on the impact of rapid technological
change on the Sustainable Development Goals
Contributions to the Technology Facilitation Mechanism by individual experts
DRAFT
New York, May 2019
2
Disclaimer: The views expressed in this publication are those of the authors and do not necessarily reflect those
of the United Nations or its senior management. The terms ‘country’ and ‘economy’ as used in this Report also
refer, as appropriate, to territories or areas; the designations employed and the presentation of the material do
not imply the expression of any opinion whatsoever on the part of the Secretariat of the United Nations
concerning the legal status of any country, territory, city or area or of its authorities, or concerning the
delimitation of its frontiers or boundaries. In addition, the designations of country groups are intended solely for
statistical or analytical convenience and do not necessarily express a judgement about the stage of development
reached by a particular country or area in the development process. The major country groupings used in this
report follow the classification of the United Nations Statistical Division. Reference to companies and their
activities should not be construed as an endorsement by the United Nations of those companies or their
activities. The boundaries and names shown and designations used on the maps presented in this publication do
not imply official endorsement or acceptance by the United Nations.
Status: 10 May 209. This document is a DRAFT living document that will be updated periodically over the
coming year. Please provide your policy briefs and other relevant inputs to R.A. Roehrl at <[email protected]>.
Suggested citation: IATT (2019) (eds.). Science-Policy Briefs on the impact of rapid technological change on the
SDGs. Contributions to the Technology Facilitation Mechanism by individual experts. New York: Interagency Task
Team on Science, Technology and Innovation for the Sustainable Development Goals. May 2019.
http://sustainabledevelopment.un.org/tfm/
3
Contents
I. Artificial intelligence ........................................................................................................................................ 4
AI Geospatial Mapping Systems ................................................................................................................................... 5
Artificial Intelligence for Aid-NGOs ............................................................................................................................. 14
Towards Intergovernmental Collaboration on Responsible Artificial Intelligence ..................................................... 24
Artificial Intelligence and Development ..................................................................................................................... 36
Artificial Intelligence as a global game changer: three key challenges ...................................................................... 41
Is This Time Different? Impact of AI in Low, Middle and High-Income Countries Considering Structural Economic
Dynamics, Trade and Economic Diversification .......................................................................................................... 47
AI and Neurotechnology: Risks and Recommendations ............................................................................................. 51
Artificial Intelligence for Development: AI4D ............................................................................................................. 55
Automation and artificial intelligence – what could it mean for sustainable development? .................................... 59
II. New production revolution, inequality, and ethical aspects ............................................................................. 62
On Some Ethical Aspects of Artificial Intelligence and Automation ........................................................................... 63
The Next Production Revolution and Potential Impacts on Developing Economies .................................................. 69
Technology, inclusive growth and the future of work ................................................................................................ 72
Productive employment, current context, and future of work .................................................................................. 76
Future of work ............................................................................................................................................................ 79
Exponential Technology Growth and Reduction in Global Income Inequalities ........................................................ 84
Confronting the Implications of Globalization and the New Technological Revolution: The Need for a
Transformative Change in Development Strategy in Latin America .......................................................................... 93
III. Biotechnology .......................................................................................................................................... 100
Do-it-yourself biology: an open innovation movement or a threat? ....................................................................... 101
Open Access to Digital Sequence Information Benefits the Three Objectives of the Convention on Biological
Diversity .................................................................................................................................................................... 105
The promise of synthetic biology for sustainable development .............................................................................. 122
CRISPR/Cas9 - gene-editing technology takes off .................................................................................................... 125
Marine microbial ecology and bioreactors ............................................................................................................... 130
Biocatalysis in Sustainable Development ................................................................................................................. 133
IV. Nanotechnology ....................................................................................................................................... 136
Nanotechnology, Nanowaste and Their Effects on Ecosystems: A Need for Efficient Monitoring, Disposal and
Recycling ................................................................................................................................................................... 137
Nanotechnology in Water Treatment....................................................................................................................... 141
Nanotechnology in Agricultural Production ............................................................................................................. 153
4
V. Green nexus technology ............................................................................................................................... 164
Impacts of rapid technological change on the achievement of the Sustainable Development Goals – Focus Nexus
Technologies (Green-tech Cluster) ........................................................................................................................... 165
Progress Toward Achieving Sustainable Development ............................................................................................ 171
Urban climate research: potential and challenges ................................................................................................... 173
Artificial Intelligence and Renewable Energy System in Africa: Advancing Technological Innovations and SDGs .. 178
Responsible Consumption & Production and long-term sustainability impacts of a demand-side focus .............. 182
Does the sun hold the key to improving the lives and well-being of a growing older population in rural Africa? .. 187
E-waste (Waste Electrical and Electronic Equipment) – The Other Side of Rapid Technological Changes .............. 192
The Dynamics of E-waste .......................................................................................................................................... 197
A Horizon Scan on Aquaculture 2015: Traceability .................................................................................................. 200
VI. Big data .................................................................................................................................................... 208
Balancing Big Data and the Right to Health: Strategies for Maximising Ethical and Sustainable Impact ................ 209
Thoughts on Big Data and the SDGs ......................................................................................................................... 213
Individual Perception of Environmental Change as Supplement to Big Data .......................................................... 222
An Application of NASA MODIS Remote Sensing Images to A Comprehensive Estimation of Ecological Impacts of
Urban Development ................................................................................................................................................. 226
Big Data for Financial Inclusion, Examining the Customer Journey ......................................................................... 232
VII. Other ....................................................................................................................................................... 235
Three Frontier Suggestions for the UN in its Effort to Shape Technological Change Toward Meeting the SDGS .. 236
Impacts of disruptive technological change on the achievement of the Sustainable Development Goals – Focus on
Digital Revolution ..................................................................................................................................................... 239
Antibiotic resistance (ABR) - no sustainability without antibiotics .......................................................................... 243
Toxicology and the SDGs .......................................................................................................................................... 246
Governing Exponential and Disruptive Technologies, Key Issues and Implications. ................................................ 250
The Role of Mobile Phone Services in Development ................................................................................................ 256
Global A.I.: Computational Sustainability Platform for the United Nations Sustainable Development Goals ........ 265
Using Financial Transaction Data To Measure Economic Resilience To Natural Disasters ...................................... 276
Supporting Decision-making Through Analysis of Public Radio Content ................................................................. 280
I. Artificial intelligence
5
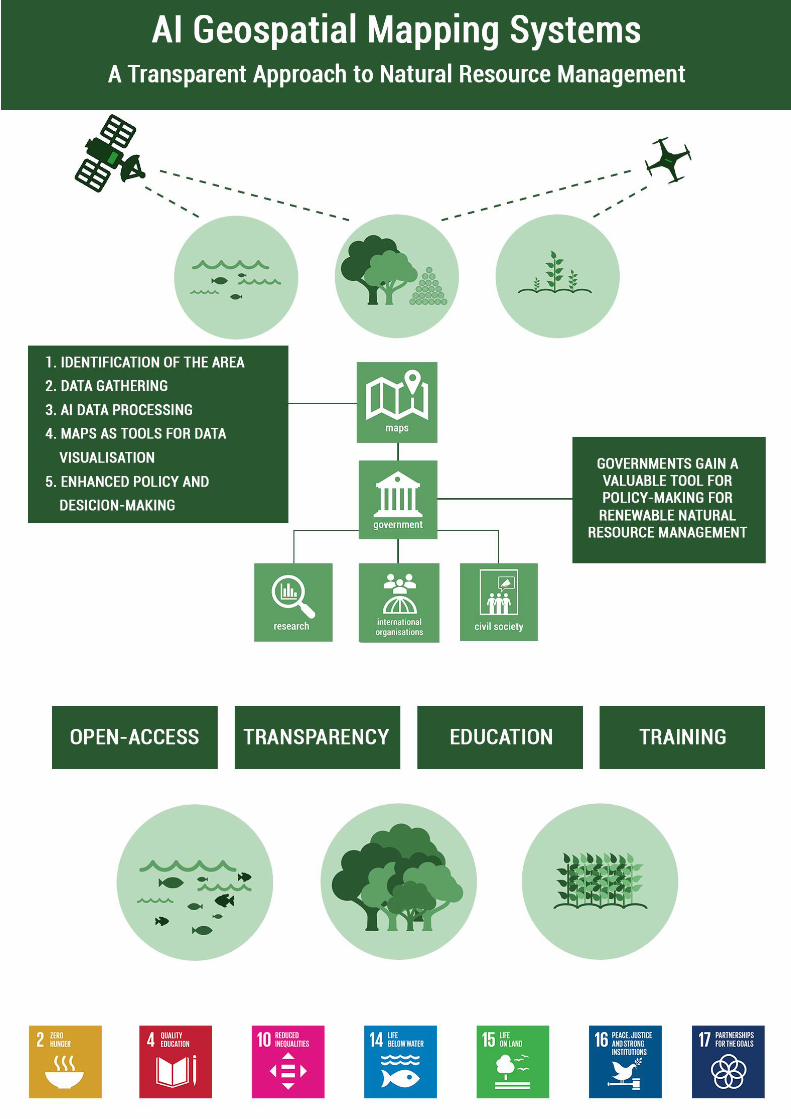
AI Geospatial Mapping Systems
6
By Claassen Myriam, Coluccia Chiara, Demozzi Tommaso, Schürer Drews Marco, and Slagter Lianne
Key Messages:
1. The unsustainable use of renewable natural resources has become an increasingly pressing issue in Least Developed Countries, Landlocked Developing Countries and Small Island Developing States.
2. Current technological breakthroughs and political drive invigorate the integration of Artificial Intelligence Geospatial Mapping Systems into decision-making on the sustainable use of renewable natural resources by providing scientific and up-to-date information.
3. The rapid development of Artificial Intelligence (AI) facilitates the enhancement of already existing Geospatial Mapping Systems by using Machine Learning algorithms in the image recognition process for faster and more efficient information gathering and analysis.
4. Artificial Intelligence Geospatial Mapping Systems provide a clear picture on the state of resources to users, policy-makers and other interest groups to support addressing inequalities over their access and use, thus contributing to sustainable management thereof. Fisheries, forestry and agriculture are used as illustrative cases in this policy brief.
5. Due to the unprecedented nature of Artificial Intelligence Geospatial Mapping Systems it is crucial to collectively develop transparent and accountable institutions, as well as participatory governance frameworks for the regulation and control over the application and outcomes thereof.
Introduction
Mismanagement of renewable natural resources, particularly in activities such as fisheries, forestry and agriculture, has steadily increased in recent years, contributing to their scarcity1,2,3. As a result, this dynamic has exacerbated competition over the access to and benefit sharing from these activities, particularly in Least Developed Countries (LDC)4, Landlocked Developing Countries (LLDC)5, and Small Island Developing States (SIDS)6. Mismanagement comprises misuse and overexploitation of resources, which prevents equal access and benefit sharing as well as the sustainable use.
Fisheries
The constant intensification of human activities and the urgent challenges posed by climate change severely threatens the delicate ecosystem balance of maritime fisheries7. The use and sharing of marine biological resources have shaped national and local stability throughout history8. Lack of basic capacities and differences in the implementation of technological instruments between and within countries perpetuate already existing inequalities in the access and benefit sharing of activities carried out in the oceans. Lower income nations are unable to efficiently compete in the global fishing market, indicated by the fact that they only account for 3% of trackable industrial fishing9. Furthermore, overexploitation and illegal, unregulated, and unreported (IUU) fishing have become pressing matters for governments and international organizations. Various sources estimate that the
amount of illegally caught fish ranges between 11 and 26 million tonnes of fish10.
Forestry
Forests are severely threatened by deforestation due to forestry activities, shifting agriculture and wildfires11. Illegal logging, as a forestry activity, by both companies and local communities currently accounts for at least 50% of all forestry activities in key producing tropical forests (examples being those of the Amazon Basin, Central Africa and Southeast Asia) and at least 15% of all timber traded globally12. This is due to increased market demand for forest-based products and services in addition to a lack of control over ownership13. Illegal logging has significant environmental, social and economic consequences. Forests also provide supporting, provisioning, regulating and cultural ecosystem services which are fundamental14 to local communities, indigenous peoples and other vulnerable groups. Illegal logging can thus pose a threat to their livelihoods15, undermine tax revenues for developing countries and force law abiding companies to lower the price of timber products to stay competitive in the market16.
Agriculture
The intensification of agricultural activities, particularly through the expansion of industrial farming, has accelerated land and soil degradation17. Researchers estimate that the loss of arable land each year ranges between 5-6 million hectares18. Furthermore, it has exacerbated water scarcity and
7
groundwater depletion due to increasing water demand19. Globally, agricultural activities account for more than 70% of total freshwater use20.
In LDCs and LLDCs, agriculture is the most vital economic sector21 with the livelihoods of more than 2 billion people reliant on smallholder farms22. As a result, land and soil degradation considerably undermine agricultural productivity and food security23.
The Innovative Potential of AI
Geospatial Mapping Systems is a type of analysis which gathers, displays and processes spatial imagery derived from aero spatial monitoring devices - such as satellites, small aircrafts, drones - as well as existing maps. Integrating AI in these already existing Geospatial Mapping Systems allows users to analyse vast amounts of data in a faster and more efficient manner24.
AI models are trained by spatial imagery inputs provided by aero spatial monitoring devices. The amount of information provided by these devices is far too large for humans to process and analyse25. Therefore, by implementing Machine Learning algorithms inputs can be rapidly interpreted, which reduces the analysis process and provides more precise and quick information26. Once data is processed through Machine Learning algorithms and validated by specialists, a detailed land cover map is developed, creating an ever-more precise visualization of an examined area27.
While acknowledging the advantages of this innovative technology there are some limitations that need to be accounted for. Since AI algorithms are trained on data submitted by developers, there is potential for data to be biased, which can hinder the entire Machine Learning process. Recognizing the risk of repetition and amplification of human biases28, it is of the utmost importance to consider necessary measures around the regulation and enabling of AI Geospatial Mapping Systems from different perspectives:
Existing legal frameworks on the use of aero spatial monitoring devices have to be standardized under an international guideline to align efforts towards transparency and open-data.
To further strengthen transparency in the collection and handling of data, overarching institutions responsible to monitor the process are necessary.
It is crucial that national and regional mechanisms are established to ensure that all levels of society are incorporated into the debates and decision-making.
The possibility of applying AI to existing mapping systems has already proven to be a promising tool in the management of renewable natural resources. Despite the current difficulties in predicting future developments, trends show that Machine Learning will soon be able to process complex sets of data and accurately create forecasting models to improve the implementation of spatial planning. If efficient regulatory mechanisms are set in place pre-emptively, this development could further enhance effective policy-making, the promotion of sustainable practices around the use of natural resources and equality for users and beneficiaries thereof.
High quality and updated maps designed to track vessels’ activity could provide decision makers and local communities a remarkable tool in the use of renewable maritime resources29. Modern developments in AI technologies allow models to monitor vessels through satellite imagery, enabling more effective analysis of sailing and fishing patterns30. Transparency, especially in areas beyond national jurisdiction, is crucial in tackling pressing issues such as IUU catch and overexploitation in open-ocean and deep-sea fisheries, which heavily threaten entire ecosystems31. Current Monitor, Control, and Surveillance (MCS) mechanisms can be greatly enhanced by AI through faster and more efficient data processing systems provided by the integration of tracking sensors and aerial imagery32.
At the moment, multilateral collaboration between governments, academia and non-governmental organisations has enabled the creation of open-access and transparent platforms33, where vessels identification signals (Automatic Identification Systems) are gathered and processed through AI algorithms34. The availability of this information will be beneficial to a wide spectrum of actors. Companies operating legally can present a traceable and sustainable product to their customers. Governments will be able to strengthen their current monitoring mechanisms and prevent the overexploitation of fisheries35. Furthermore, by analysing activities at sea, policy makers and wildlife conservation organisations will be able to more effectively ascertain which maritime regions are severely threatened by anthropogenic activities. The designation of well-governed Marine Protected Areas (MPA) and the promotion of equitable access to the resources therein have proved to be a valuable tool in strengthening local communities’ rights36,37,38, allowing them to thrive and compete in an increasingly competitive market.
It is important for governments to recognize the need to standardize regulation around MCS mechanisms, both in the high seas and coastal maritime areas. World nations are preparing an internationally binding treaty under the UN General Assembly
8
regarding biodiversity39 as a reaction to the necessity of strengthening the protection of high seas from overexploitation and IUU catch, as a further MCS mechanism besides MPAs. On a smaller scale it is also important to regulate and protect small and artisanal fisheries. While MPAs play a big role in allowing specific fish stocks to replenish over time, there is also a need for governments, especially at the local level, to establish tracking mechanisms for small vessels and to promote the use of information derived from AI Geospatial Mapping Systems, in order to build capacity for better and more effective sustainable fishing practices.
Mapping the forest
Together with the previously mentioned application of AI Geospatial Mapping Systems, forest monitoring and governance can drastically improve with the implementation of this innovative technology. Through satellite imagery and Machine Learning algorithms, researchers and policy makers can estimate tree cover loss over time as well as track changes in canopy density40. However, not only satellites are involved in AI Geospatial Mapping Systems for forests. In fact, specific areas that require immediate attention are monitored through mapping-drones, which provide high quality resolution maps of targeted zones. As a further development of these systems in the near future, the use of radar mapping tools will allow users to avoid disturbances in pictures created by clouds or other atmospheric obstacles41.
In order to tackle the social and economic consequences of illegal logging, there is an urgent need for governments in key producing countries to improve the legality and transparency of the timber trade, and to track illegal timber at the market. Governments are making efforts towards the regulation and equal sharing of the benefits of logging42,43,44,45, however further progress can be made. Comparing information regarding logging licences with the data provided by AI Geospatial Mapping Systems will enhance the transparency and real-life monitoring of logging and timber products. Through a transparent and publicly accessible database, local communities can better visualize the impact of forest activities in their surroundings. In addition, companies that are operating legally can present a more sustainable and traceable product, which will give them a market advantage.
Better data, better harvest
AI Geospatial Mapping Systems can be a ground-breaking tool to support farmers through basing agricultural governance policies on interpreted
information. Smallholder farmers, who greatly depend on land as an essential livelihood asset are currently being challenged by low productivity rates due to increasing soil infertility and water scarcity.
Mapping and processing data on the state of soil, water and crops can reduce scarcity while boosting the productivity rate of farmers. Through aerial imagery, vast areas of landscapes can be mapped and monitored, which provides data on soil fertility and on the current state of land degradation46. Inspection of access to and availability of water sources can become more efficient and accurate by mapping water infrastructure and usage47. Additionally, drone monitoring can support decisions in crop cycle management towards enhancing productivity48,49. Information it provides on different indicators can assist early season operations by determining the optimum amount of seeds for crops, monitoring crop development during the growing phase and efficiently managing harvesting plans50.
AI Geospatial Mapping Systems can offer an efficient and affordable approach for LDC, LLDC and SIDS governments to address unsustainable resource usage by facilitating better policy and decision-making in agricultural land and water management. A complete visualization of soil quality on a national scale simplifies land conservation and restoration planning, and enables monitoring the impact of implementation over time. Similarly, governments can easily detect inefficiencies in water use and structure a national water waste reduction strategy. Policies revolving around precautionary water allocation can be meticulously designed ahead of dry seasons.
In order to enhance the productivity of farmers while reducing scarcity in renewable natural resources, collaboration between agricultural and environmental authorities is desirable. The successful implementation of policies addressing sustainable intensification51 can lead to improved food security.
Farmer cooperatives have proven to empower farmers and strengthen their economic competitiveness. Functioning as sectoral knowledge-sharing platforms and providing members better access to information, cooperatives are a trusted entity and source of reference52, that can be an important channel53 to translate the results of regional mapping and monitoring to farmers in terms of concrete suggestions and best practices. In this sense, the use of AI Geospatial Mapping Systems can be applied from high level governance to day-to-day agricultural management.
9
Challenges
Inasmuch the use of AI Geospatial Mapping Systems relies upon an innovative technology, potential challenges need to be promptly addressed before they outweigh advantages and jeopardize objectives. If the access to and use of this technology are limited to a few powerful actors, there is a risk that benefits thereof will be unequally divided, which might exacerbate inequalities within and across societies54. Therefore, it is advisable for governments to take part in collective action in order to support existing open-access databases for the optimal deployment of AI Geospatial Mapping Systems across countries.
Moreover, AI integrated Geospatial Mapping Systems are the perfect platform to advocate for unifying international and national governance efforts on the use and monitoring of data for the purpose of improving mapping and policy making. This technology relies heavily on the availability of data to generate maps and spatially visualise information. Data sharing initiatives from governments and international organizations providing free satellite imagery already exist55, making it possible for all governments to access this information. Nonetheless, to ensure that all segments of society are reached, the spread of information needs to be institutionalised across authorities and local governments, in addition to being fostered through multilateral collaborations.
Enhancing factors Technology
Acquiring and using drones as well as AI technologies is becoming more affordable and cost-effective than ever56,57. However, inequalities in the application and distribution of this technology are not only limited to the monetary value of devices, but also to the required human resource capacity. Sustaining the cost of human expertise can be a constraint in the development and use of this technology.
Education To ensure sufficient carrying capacity for implementation, education is one of the key measures in tackling the unsustainable use of renewable natural resources and incorporating vulnerable populations into the sharing of benefits58,59,60. Education is a promising means by which to tackle social inequalities61. To avoid the risk of an uneven application of AI Geospatial Mapping Systems widening the gap between and within
countries, governments need to make preliminary investments in educational programmes on AI, in addition to fostering international collaborations and exchange programmes on the development of this technology62. Furthermore, training needs to be provided in order to enable local governance actors to use technology interfaces and to understand information coming from AI analyses, so that they can facilitate the process of designing policies around the sustainable and inclusive use of natural resources.
Transparency In order to create an international open access database to share information on the use of renewable natural resources, political commitment is needed from all parties involved. To optimally establish of this tool in the application of science-based data for decision-making, there is an imperative need to bring together different users and stakeholders under an international umbrella that ensures the transparency and quality of processed data. An international framework on the use of AI Geospatial Mapping Systems can help guarantee transparency in data processing, while building trust and ensuring equal terms between participating countries at the same time.
RECOMMENDATIONS
Improve coordination between international organizations, governments, and civil society in the creation of an open-access database where continuously updated maps are essential tools in the monitoring of specific areas.
Establish governance frameworks and institutions to ensure transparency of data gathered through AI Geospatial Mapping Systems.
Promote educational programmes on the use and programming of Machine Learning algorithms in order to engage youth in the development of AI technologies.
Encourage the use of AI Geospatial Mapping Systems by local governance actors in decision and policy making around renewable natural resources through specific professional training
10
References
1. United Nations Security Council. (2018). States Must
Transform Natural Resources from Driver of Conflict into Development Tool to Foster Peace, Cooperation, Secretary-General Tells Security Council. Retrieved from https://www.un.org/press/en/2018/sc13540.doc.htm
2. United Nations International Resource Panel. (2017). 2018-2021 IRP Work Programme. Retrieved from http://www.resourcepanel.org/sites/default/files/document
s/document/media/2018-
2021_irp_work_programme_v2.pdf 3. United Nations World Economic Forum. (2014). The
Future Availability of Natural Resources: A New Paradigm for Global Resource Availability. Retrieved from http://www3.weforum.org/docs/WEF_FutureAvailability
NaturalResources_Report_2014.pdf 4. List of Least Developed Countries. (2018). Retrieved
from
https://www.un.org/development/desa/dpad/wpcontent/up
loads/sites/45/publication/ldc_list.pdf 5. Landlocked Developing Countries, Country Profiles.
(2018). Retrieved from http://unohrlls.org/about-
lldcs/country-
profiles/&sa=D&ust=1544771331883000&usg=AFQjCN
G2cX1D6yYTgCY0_KOp9qOwRUuf2Q 6. List of Small Islands Developing States. (2018).
Retrieved from http://unohrlls.org/about-sids/country-
profiles/&sa=D&ust=1544771331975000&usg=AFQjCN
FS8i2FJe96o95NhEbMn7LT1_q4ng 7. GEF LME:LEARN, 2017. The Large Marine Ecosystem
Approach: An Engine for Achieving SDG 14. Paris, France. Retrieved from https://unesdoc.unesco.org/ark:/48223/pf0000249222
8. McCauley, D., Jablonicky, C., Allison, E., Golden, C., Joyce, F., Mayorga, J., & Kroodsma, D. (2018). Wealthy countries dominate industrial fishing. Science Advances, 4(8). Retrieved from
http://advances.sciencemag.org/content/4/8/eaau2161/tab-
e-letters 9. McCauley, D., Jablonicky, C., Allison, E., Golden, C.,
Joyce, F., Mayorga, J., & Kroodsma, D. (2018). Wealthy countries dominate industrial fishing. Science Advances, 4(8). Retrieved from
http://advances.sciencemag.org/content/4/8/eaau2161/tab-
e-letters 10. Agnew, D., Pearce, J., Pramod, G., Peatman, T., Watson,
R., Beddington, J., & Pitcher, T. (2009). Estimating the Worldwide Extent of Illegal Fishing. Plos ONE, 4(2).
11. Curtis, P., Slay, C., Harris, N., Tyukavina, A., & Hansen, M. (2018). Classifying drivers of global forest loss. Science, 361(6407).
12. Interpol. (2017). Project Leaf Global Forestry Enforcement (p. 4). Retrieved from https://www.interpol.int/Crime-areas/Environmental-
crime/Projects/Project-Leaf 13. World Economic Forum. (2015). Better Growth with
Forests: Partnerships for Sustainable Rural Development at the Forest Frontier. Retrieved from https://www.tfa2020.org/wpcontent/uploads/2015/12/WE
F_GAC15_Better_Growth_with_Forests.pdf&sa=D&ust=
154477133206700&usg=AFQjCNFEkL0PCRXBzt45xLI
DsgYJP05NUw 14. WWF. (2015). WWF Living Forests Report. Retrieved
from https://www.worldwildlife.org/publications/living-
forests-report-chapter-5-saving-forests-at-risk 15. World Economic Forum. (2015). Better Growth with
Forests: Partnerships for Sustainable Rural Development at the Forest Frontier. Retrieved from https://www.tfa2020.org/en/publication/better-growth-
with-forests-discussion-paper/ 16. WWF. (2016). 100% Sustainable timber markets; the
economic and business case. Retrieved from https://www.worldwildlife.org/publications/100-
sustainable-timber-markets-the-economic-and-business-
case 17. UNCCD. (2017). The Global Land Outlook. Bonn,
Germany. Retrieved from
https://knowledge.unccd.int/sites/default/files/2018-
06/GLO%20English_Full_Report_rev1.pdf 18. Hamdy, A., & Aly, A. (2014). Land Degradation,
Agriculture Productivity and Food Security. In Fifth International Scientific Agricultural Symposium „Agrosym 2014“. Jahorina, Bosnia and Herzegovina. Retrieved from
https://www.researchgate.net/publication/267865734_LA
ND_DEGRADATION_AGRICULTURE_PRODUCTIVI
TY_AND_FOOD_SECURITY 19. UNCCD. (2017). The Global Land Outlook. Bonn,
Germany. Retrieved from
https://knowledge.unccd.int/sites/default/files/2018-
06/GLO%20English_Full_Report_rev1.pdf 20. AQUASTAT - FAO's Information System on Water and
Agriculture. (2018). Retrieved from
http://www.fao.org/nr/water/aquastat/water_use/index.stm 21. UN-OHRLLS. (2018). State of the Least Developed
Countries: Financing the SDGs and IPoA for LDCs. Retrieved from http://unohrlls.org/custom-
content/uploads/2017/09/Flagship_Report_FINAL_V2.pd
f 22. International Telecommunication Union. (2018). AI
Breakthrough Tracks. Retrieved from
https://www.itu.int/en/ITU-
T/AI/2018/Pages/breakthrough-tracks.aspx 23. UNCCD. (2017). The Global Land Outlook. Bonn,
Germany. Retrieved from
https://knowledge.unccd.int/sites/default/files/2018-
06/GLO%20English_Full_Report_rev1.pdf 24. Altieri, E. (2018). Combining AI with Satellite Imagery
to Tackle SDSs. In AI for Good Summit. Geneva. Retrieved from https://www.itu.int/en/ITU-
T/AI/2018/Pages/default.aspx 25. Stanford University. (2016). Artificial Intelligence and
Life in 2030: One Hundred Year Study on Artificial Intelligence (AI100). Stanford, California. Retrieved from https://ai100.stanford.edu
26. Bosse, T. (2018). Radboud University [In person]. Nijmegen, The Netherlands.
27. Holtslag, M. (2018). ESRI [In person]. Rotterdam, The Netherlands.
28. International Telecommunications Union. (2018). Artificial Intelligence can help solve humanity’s greatest
11
challenges. In AI for Good Global Summit. Geneva, Switzerland. Retrieved from https://www.itu.int/en/ITU-
T/AI/Documents/Report/AI_for_Good_Global_Summit_
Report_2017.pdf 29. Robards, M., Silber, G., Adams, J., Arroyo, J., Lorenzini,
D., Schwehr, K., & Amos, J. (2016). Conservation science and policy applications of the marine vessel Automatic Identification System (AIS)—a review. Bulletin Of Marine Science, 92(1). Retrieved from
http://vislab-ccom.unh.edu/~schwehr/papers/2016-
RobardsEtAl-AIS-conservation.pdf 30. Kroodsma, D. (2018). Global Fishing Watch [In
person]. LOCATION, The Netherlands. 31. Dunn, D., Jablonicky, C., Crespo, G., McCauley, D.,
Kroodsma, D., & Boerder, K. et al. (2018). Empowering high seas governance with satellite vessel tracking data. Fish And Fisheries, 19(4), 729-739.
32. Souza de, E., Boerder, K., Matwin, S., & Worm, B. (2016). Improving Fishing Pattern Detection from Satellite AIS Using Data Mining and Machine Learning. PLOS ONE, 11(7). Retrieved from
https://journals.plos.org/plosone/article/file?id=10.1371/j
ournal.pone.0158248&type=printable 33. Bladen, S. (2018). Global Fishing Watch [In person].
UK. 34. Kroodsma, D., Mayorga, J., Hochberg, T., Miller, N.,
Boerder, K., & Ferretti, F. et al. (2018). Tracking the Global Footprint of Fisheries. Science, 359(6378). Retrieved from
http://science.sciencemag.org/content/359/6378/904 35. Bladen, S. (2018). Global Fishing Watch [In person].
UK. 36. WWF. (2018). Evaluating Europe's Course to
Sustainable Fisheries by 2020. Retrieved from
http://d2ouvy59p0dg6k.cloudfront.net/downloads/wwfep
o_cfpscorecardreport_dec2018.pdf 37. UNDP. (2017). Making Waves: Community Solutions,
Sustainable Oceans. New York, USA. Retrieved from
http://www.undp.org/content/undp/en/home/librarypage/p
overty-reduction/equator-initiative/making-waves--
community-solutions--sustainable-oceans.html 38. Ban, N., & Frid, A. (2018). Indigenous peoples' rights
and marine protected areas. Marine Policy, 87, 180-185. Retrieved from
https://www.sciencedirect.com/science/article/pii/S03085
97X17305547 39. UN Division on the Law of the Sea, (2017),
Preparatory Committee established by General Assembly resolution 69/292: Development of an international legally binding instrument under the United Nations Convention on the Law of the Sea on the conservation and sustainable use of marine biological diversity of areas beyond national jurisdiction.
40. Weisse, M. (2018). Global Forest Watch [In person]. Washington, USA.
41. Weisse, M. (2018). Global Forest Watch [In person]. Washington, USA.
42. Commission of the European Communities. (2003). Proposal for an EU action plan: forest law enforcement, governance and trade (FLEGT). Retrieved from
http://www.euflegt.efi.int/flegt-action-plan 43. European Union Timber Regulation (EUTR). (2010).
Regulation (EU) No 995/2010 of the European
Parliament and of the Council of 20 October 2010 laying down the obligations of operators who place timber and timber products on the market. Retrieved from
https://eur-lex.europa.eu/legal-
content/EN/TXT/?uri=CELEX%3A32010R0995 44. WWF. (2015). The Lacey Act: helping to keep the US
wood industry strong. Retrieved from
https://www.worldwildlife.org/publications/lacey-act-
fact-sheet 45. WWF. (2016). Transforming Peru's Forest Sector:
governments, businesses and civil society pave the way. Retrieved from
https://www.worldwildlife.org/publications/transforming-
peru-s-forest-sector 46. Castaldi, F., Casa, R., Castrignanò, A., Pascucci, S.,
Palombo, A., & Pignatti, S. (2014). Estimation of soil properties at the field scale from satellite data: a comparison between spatial and non-spatial techniques. European Journal Of Soil Science, 65(6).
47. Sharaf El Din, E., Zhang, Y., & Suliman, A. (2017). Mapping concentrations of surface water quality parameters using a novel remote sensing and artificial intelligence framework. International Journal Of Remote Sensing, 38(4).
48. Chandra, R. (2018). Microsoft Farm Beats [In person]. USA.
49. Levy, W. (2017). Precision Agriculture: A smart farming approach. Spore, 185. Retrieved from
https://www.jstor.org/stable/44242663 50. Levy, W. (2017). Precision Agriculture: A smart farming
approach. Spore, 185. Retrieved from
https://www.jstor.org/stable/44242663 51. UNCCD. (2017). The Global Land Outlook. Bonn,
Germany. Retrieved from
https://knowledge.unccd.int/sites/default/files/2018-
06/GLO%20English_Full_Report_rev1.pdf 52. Khasawneh, A. (2018). GEF UNDP [In person]. Amman,
Jordan. 53. Khasawneh, A. (2018). GEF UNDP [In person]. Amman,
Jordan. 54. Internet Society. (2017). Paths to Our Digital Future.
Retrieved from https://future.internetsociety.org/wp-
content/uploads/2017/09/2017-Internet-Society-Global-
Internet-Report-Paths-to-Our-Digital-Future.pdf 55. Voigt, S., Giulio-Tonolo, F., Lyons, J., Kučera, J., Jones, B.,
& Schneiderhan, T. et al. (2016). Global trends in satellite-based emergency mapping. Science, 353(6296).
56. Tang, L., & Shao, G. (2015). Drone remote sensing for forestry research and practices. Journal Of Forestry Research, 26(4).
57. McKinsey Global Institute. (2017). Artificial Intelligence: The Next Digital Frontier? Retrieved from
https://www.mckinsey.com/~/media/McKinsey/Industries
/Advanced%20Electronics/Our%20Insights/How%20artif
icial%20intelligence%20can%20deliver%20real%20valu
e%20to%20companies/MGI-Artificial-Intelligence-
Discussion-paper.ashx 58. UN-DESA. (2018). Education: Sustainable Development
Knowledge Platform. Retrieved from
https://sustainabledevelopment.un.org/topics/education 59. UNESCO. (2014). Global Education for All Meeting. In
2014 GEM Final Statement: The Muscat Agreement.

12
Muscat, Oman. Retrieved from
https://unesdoc.unesco.org/ark:/48223/pf0000228122 60. United Nations. (2017). Increased Support for
Education Crucial to Reaching Sustainable Development Goals, Speakers Tell High-Level General Assembly Event. Retrieved from
https://www.un.org/press/en/2017/ga11925.doc.htm 61. UNESCO. (2014). Shaping the Future We Want.
Retrieved from
https://sustainabledevelopment.un.org/content/documents/
1682Shaping%20the%20future%20we%20want.pdf
62. International Telecommunications Union. (2018). Artificial Intelligence can help solve humanity’s greatest challenges. In AI for Good Global Summit. Geneva, Switzerland. Retrieved from https://www.itu.int/en/ITU-
T/AI/Documents/Report/AI_for_Good_Global_Summit_
Report_2017.pdf
13
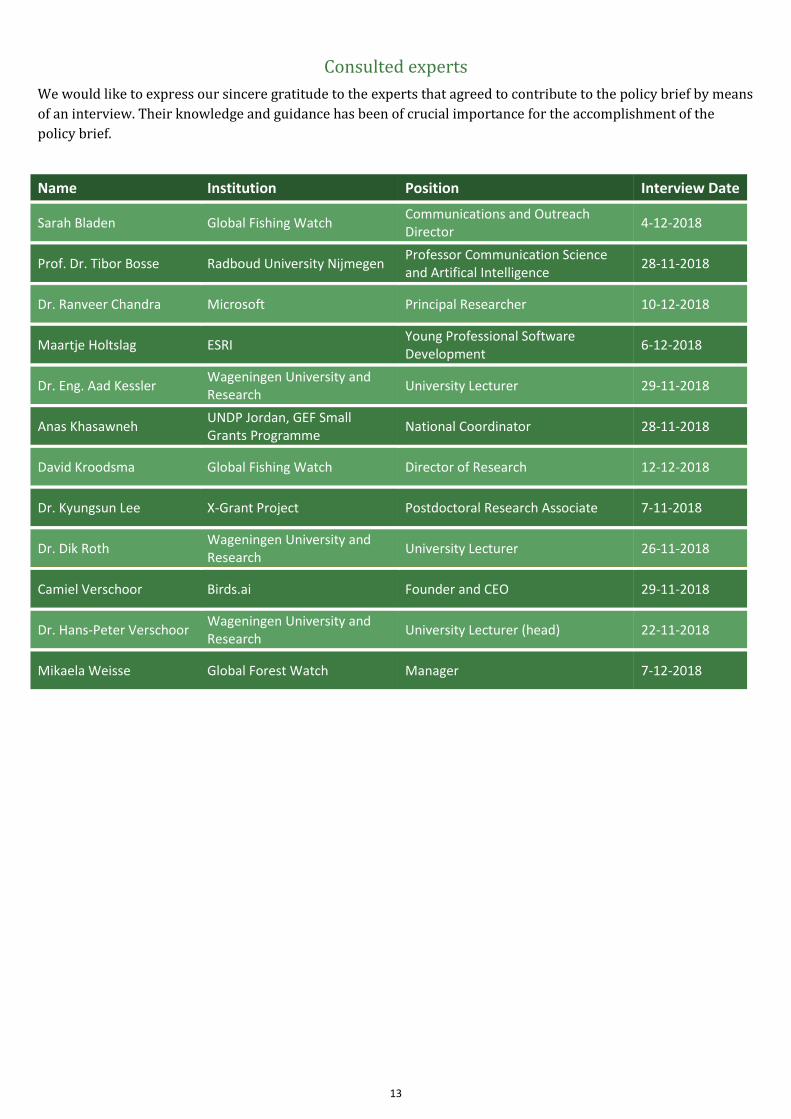
Consulted experts
We would like to express our sincere gratitude to the experts that agreed to contribute to the policy brief by means
of an interview. Their knowledge and guidance has been of crucial importance for the accomplishment of the
policy brief.
Name Institution Position Interview Date
Sarah Bladen Global Fishing Watch Communications and Outreach Director
4-12-2018
Prof. Dr. Tibor Bosse Radboud University Nijmegen Professor Communication Science and Artifical Intelligence
28-11-2018
Dr. Ranveer Chandra Microsoft Principal Researcher 10-12-2018
Maartje Holtslag ESRI Young Professional Software Development
6-12-2018
Dr. Eng. Aad Kessler Wageningen University and Research
University Lecturer 29-11-2018
Anas Khasawneh UNDP Jordan, GEF Small Grants Programme
National Coordinator 28-11-2018
David Kroodsma Global Fishing Watch Director of Research 12-12-2018
Dr. Kyungsun Lee X-Grant Project Postdoctoral Research Associate 7-11-2018
Dr. Dik Roth Wageningen University and Research
University Lecturer 26-11-2018
Camiel Verschoor Birds.ai Founder and CEO 29-11-2018
Dr. Hans-Peter Verschoor Wageningen University and Research
University Lecturer (head) 22-11-2018
Mikaela Weisse Global Forest Watch Manager 7-12-2018
14
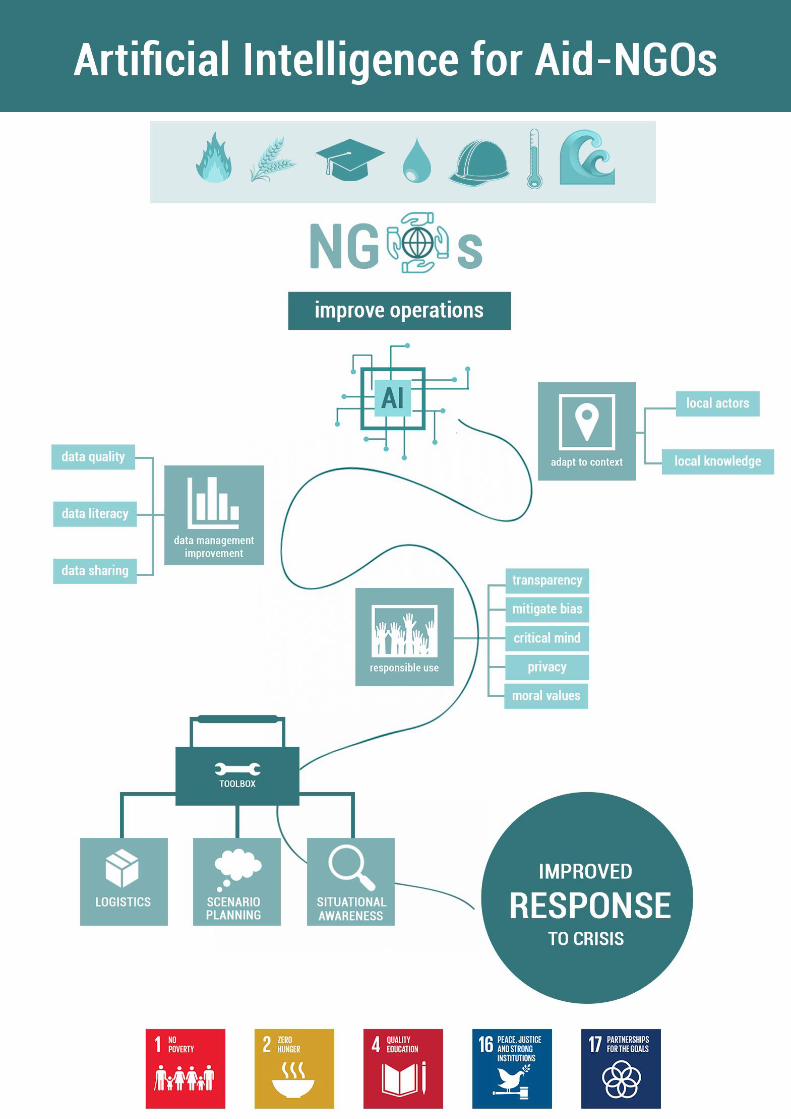
Artificial Intelligence for Aid-NGOs
15
Key Messages
1. There are a variety of Artificial Intelligence (AI) applications that show potential to be implemented to improve logistics, scenario planning and situational awareness of aid-NGOs.
2. Since AI applications require quality data and contextual awareness, feasible implementation within the aid community requires improvement in data quality, data collection and management.
3. Given the nature of AI, the limited experience of society with the technology, and the complexity of issues that aid-NGOs are dealing with, applications of AI cannot be implemented without addressing biases in data collection and ensuring privacy, trust, and transparency regarding the use of AI.
Introduction
The frequency and severity of worldwide crises is increasing, from natural disasters such as floods to global issues such as food security1. These developments underline the increasingly important role that humanitarian as well as development NGOs (could) play, and why it is crucial they make timely and accurate decisions. There are significant differences regarding the aid delivered by development and humanitarian NGOs (both encompassed under the term aid-NGOs), yet they are looking for ways to deliver aid in a more effective and efficient manner. In order to achieve this, aid-NGOs must continuously improve their decision-making process and operational strategies, especially while facing exacerbated threats due to climate change.
Technological innovations such as AI applications can assist aid-NGOs in their decision-making processes2. More specifically, AI can be used by aid-NGOs in a variety of ways, such as finding the fastest route to deliver aid or identifying the most vulnerable people during disasters. With this, AI also facilitates the implementation of the Sustainable Development Goals (SDGs)3.
Therefore, this policy brief is written for policy makers, researchers, and aid-NGOs alike to provide orientation on how AI applications could be applied for aid-NGOs.
The potential implementation of AI applications within the aid community requires the careful management of technical and societal considerations that are associated with potential benefits and drawbacks of utilizing AI technology. More specifically, poor data quality will cause the potential benefits of AI to be delayed, misused, or not implemented at all4. Feasible and responsible use of AI applications requires significant improvements in aid-NGOs’ data collection and management.
AI requires data, but good data AI applications require high quality data, in order to produce inclusive and trustworthy results. A variety of existing data sharing initiatives such as the
International Aid Transparency Initiative (IATI) and the Humanitarian Data Exchange (HDX) are already used by a number of organizations5,6.
While such initiatives have contributed to data sharing of aid-NGOs, experts indicate the collected data is often not sufficiently informative, in that they do not measure actual impact. Moreover, datasets are occasionally missing units (individual statistics), are not based on representative samples and are not up to date. Additionally, datasets are poorly structured at times. Furthermore, aid-NGOs often lack the technical expertise or financial capacity needed to address these issues.
AI applications for Aid-NGOs Aid-NGOs today could choose from several data-oriented software for data collection, visualisation, management and analysis, as well as AI applications. Aid-NGOs often lack the capacity to make informed choices regarding developing technologies, thus adequate expertise and guidance is needed.
Despite the current hype surrounding the capabilities and opportunities that AI applications offer, in many situations, a variety of alternative analytical techniques and human knowledge might offer more viable solutions. Additionally, aid-NGOs frequently operate in regions lacking internet, mobile service or electricity, which can render the implementation of some AI applications unfeasible. Therefore, it is important to further investigate the potential of utilizing AI applications within the aid community.
Potential of AI applications for aid-NGOs With improved data management, a variety of AI applications have the potential to be used in the near future and can assist with the implementation of the SDGs by 2030. This policy brief serves as an overview of this potential. As reflected in academic literature, professional briefs, and our expert interviews, potential applications of AI technologies can be divided into three categories: logistics, scenario planning and situational awareness.
By Engineer Nikita, van Kemenade Siert, Pech Lena, Sakellari Eirini, Stone Zeno
16
Category A: Logistics
Logistics, specifically supply chain management, is concerned with the delivery of goods from a point of origin to a destination. Research has estimated that up to 80% of aid-NGO expenditure falls under the domain of logistics7,8,9. Furthermore, improved data management and analysis will have significant potential to increase operational efficiency through using AI. Aid-NGO practitioners in the field confirm that AI applications are mostly absent, and that aid supply chains are currently volatile, unpredictable and slow10. Private sector applications of AI in logistics have proven that there is potential in improving supply chain management for aid-NGOs11. Considering accessibility and affordability, the following possible applications should be prioritised.
Intelligent Route Optimization Intelligent route optimization allows real-time routing algorithms to assist in determining the most efficient and cost-effective aid delivery route, thus freeing up more funds. These algorithms could be used in conjunction with satellite maps, social media data and traffic flows, for routes by land, sea and air.
Predictive Risk Management Predictive risk management can identify (indicators of) risks to aid-NGOs’ supply chains in advance, which could help these chains enhance continuity of their supply chain and avoid disruptions in their aid delivery. Through combined Machine Learning (ML) and Natural Language Processing (NLP), it identifies sources of risk by mining real-time data from Internet websites.
Aid-NGO supply chains differ greatly in their properties. For humanitarian aid, the rapid delivery of aid is crucial. However, because humanitarian supply chains have to be set under time pressure, they are particularly prone to inefficiencies, bottlenecks, and mistakes. Additionally, these supply chains are not intended to be implemented in the long term, yet require enormous amounts of aid to be moved at once. This makes dynamic intelligent route optimization using AI have significant potential in the context of a crisis prone future. Developmental supply chains could, similarly to humanitarian supply chains, benefit from intelligent route optimization since they are implemented long-term. Large organizations supplying large quantities of aid, such as food or medicine, would see their transportation costs fall. Such applications could be used in conjunction with predictive risk management in order to ensure supply chain continuity in volatile situations.
Category B: Scenario Planning
Scenario planning is used to analyse the different ways in which situations might evolve, in order to prepare and plan ahead for alternative future developments12. Scenario planning is already being used among aid-NGOs, but a variety of aspects can be improved13. Recent developments in AI have suggested its potential in enhancing scenario planning by providing both a dynamic analysis of data patterns as well as improving forecasting capabilities.
Scenario Generation & Selection AI can assist the generation of multiple scenarios for aid delivery by mining essential information from websites in real time using NLP applications. Scenarios that have the highest possibility to describe a future state can then be prioritised, saving time and resources.
Early Warning Systems & AI The goal of early warning systems in scenario planning is to estimate whether a stable situation is crisis prone14. Predictive Analytics using ML can enhance such an early warning system by learning which indicators are the strongest predictors of a crisis, in addition to assessing whether current conditions are similar to those of past crises15. Knowing when a crisis might occur before it does can greatly increase the effectiveness of aid delivery.
Humanitarian aid-NGOs deal with rapidly unfolding crises. Therefore, they need to make certain that any strategy is solidly built and sufficiently flexible to withstand changes in the operational environment. The development actors are required to maintain certain levels of aid in specific sectors, often working under unstable and sensitive conditions. An example of an AI application for scenario planning currently being developed is the Famine Action Mechanism16. Involved actors utilize AI and ML to build an Early-Warning System which will forecast and estimate food security crises in real-time as well as analyse early signs of food shortages, using indicators for conflicts, natural disasters and crop failures.
Despite opportunities for improvement in scenario planning utilizing AI, it is important to realize that no scenario is an exact prediction of the future. AI applications for scenario planning are still in early stages of development.
Category C: Situational Awareness Situational awareness is used in order to understand all aspects of a situation or environment, and is especially helpful in making complex and informed decisions in a time sensitive manner17. Applying situational awareness helps improve contextual understanding and finding the most vulnerable populations. Accurate, instant and complete
17
information that simultaneously bridges both the gap between perceptions of reality on the ground and high up in organizations is essential in improving the efficiency and quality of aid delivery by NGOs. Additionally, such information is crucial for the organization of different sources of aid simultaneously. AI can play a significant role in improving situational awareness, as it is capable of analysing large quantities of information much faster. There are several possible applications using AI for improving contextual understanding and finding the most vulnerable populations that show potential.
Aid-NGOs have experimented with applications improving situational awareness using ML. Unfortunately, applications for aid-NGOs are currently neither widespread nor feasible for organizations with limited resources.
ML for Priority Assistance To locate the most vulnerable populations, ML can be used to identify specific cases that require immediate attention. Specifically, ML could process information (e.g. language on social media), to assist in gaining an overview of the affected areas or individuals concerned. It is different from scenario planning, in that it is used to instantly identify the most vulnerable populations amongst a very large and complex set, without necessarily assessing likely future scenarios based on more general data.
Spatial awareness Situational awareness can be greatly improved with the help of AI combined with satellite imagery. Since satellite imagery is more readily available, it can be used by aid-NGOs to instantly identify affected areas in order to identify which region needs the most support. A drawback of this application is that vast collections of labelled images are required to ‘teach’ the algorithm how to recognize the patterns of interest. This problem is recently being tackled, however, by using crowdsourced data: an aid-NGO can rely on the support of people via the internet to label images.
In case of humanitarian disasters, aid-NGOs could make use of social media data to map affected populations, and potentially identify the most vulnerable cases among them. The Artificial Intelligence for Disaster Response (AIDR) is an existing platform that uses social media posts in crisis situations to create up-to-date maps of affected regions, supporting prioritization of aid delivery to severely impacted areas.
Satellite imagery combined with ML could be used to instantly identify areas affected by a natural disaster or identify human rights violations (e.g. based on livelihood destruction). Crowdsourced image labelling
is used by several aid-NGOs to manually identify patterns of affected areas. Such initiatives could feasibly consider trials to automate the labelling process with the help of ML. This could already considerably accelerate the process of identifying affected areas.
Recommendations Improve Data Quality Well-structured data sets without input errors, duplicated or missing data, are a requirement for the successful implementation of AI applications. Improvements in the quality of data should be made prior to AI implementation. Current data is not sufficiently informative. Thus, aid-NGOs should reinforce collaborative efforts to improve their methodologies in order to collect more inclusive and coherent data of better quality.
Coordinating methodologies on a global scale for all aid-NGOs simultaneously is, however, not feasible. There are simply too many variables that would need to be measured. NGOs should form groups in which methodologies are coordinated. Humanitarian aid-NGOs could for instance coordinate methodologies through the UNDAC (United Nations Disaster Assessment and Coordination), which already has a data collection structure for disaster relief. If an UNDAC structure is not available, e.g. in development aid, bundling methodologies based on the humanitarian UN Cluster Approach and geographical regions could assist aid-NGOs in enhancing their data collection and management. Practically, aid-NGOs should make lists of variables measured by every aid-NGO in their subgroup to make impact evaluations as informative as possible, while simultaneously enabling the triangulation of results.
During impact evaluations, aid-NGOs must ensure that variables added are as inclusive as possible, taking cultural and societal considerations into account. Additionally, data of higher quality can enhance the triangulation of observations among different aid-NGOs, thus allowing more effective responses. To improve effectiveness and inclusiveness, aid-NGOs should involve local actors such as universities or local organizations in the data collection and analysis process. Such actors could accelerate relevant variable selection and introduce new variables to look at. The United Nations could further act as a facilitator for regional and cluster-based coordination, by bringing relevant aid-NGOs together.
Mitigating Biases Data and data sets are not objective18. People set the variables, collect the data, define its meaning through interpretations and draw inferences from it. Taking hidden biases in both the collection and analysis stages into account, is as important to consider for
18
data quality as the selection of variables itself. Even high-quality data is not necessarily an accurate representation of society. There are cases where no, too little or too much input is coming from particular demographics or communities.
For aid-NGOs, it is also important to note that people familiar with the local context often have valuable, qualitative knowledge that might not be quantifiable. Therefore, an algorithm may be unable to integrate particular information, leading to biased outputs.
Recognizing the biased nature of data is a step towards adopting a healthy and critical perspective concerning the outputs of the AI applications. Most importantly, representative datasets should be used in order to capture the relationships that may exist within the datasets of the input, as well as between datasets and output results.
Responsible use of AI applications
Privacy Data management preceding the use of AI applications, requires data privacy19. Sensitive data inputs should not be traceable to individuals or demographics. Where individual variables are neutral, it is important to note that a set of variables can enable somebody to deduce that a group of data records is associated with a certain region or group. Furthermore, data sets used to train ML applications should be in line with data privacy regulations (e.g. General Data Protection Regulation (GDPR) by the European Union).
Trust The outcome of an algorithm is often as biased as the input of data itself. Therefore, applying the outcome to support a decision should be met with healthy, critical reflection. The use of AI needs a fair amount of mentoring. It is important to avoid relying solely on an AI application for making decisions20. The outcome must be continually evaluated under scientific knowledge, local knowledge, past experience and common sense. This incorporates accountability and the need for representation of moral values that are present in the context of a situation21.
Transparency Responsible AI use requires data transparency. This is a core principle of data protection since people have the right to know if and to what extent their personal data is collected, used or processed. It is also essential that aid-NGOs deliver feedback about the use of collected data and the results of any conducted research to the local people. This process can empower and benefit local communities as well as foster a collaborative relationship.
Looking forward It is essential for the workforce of aid-NGOs to
improve their data management skills to successfully work with AI applications. Data literacy can be achieved through training programs for the workforce, potentially funded by donors and in collaboration with existing infrastructure, an example being the Active Learning Network for Accountability and Performance in Humanitarian Action (ALNAP)22,23. Increased data literacy among aid-NGOs will help bridge gaps between aid-NGOs and the technological community. Furthermore, researchers and computer scientists could assist aid-NGOs in data collection and analysis in order to better facilitate AI integration. In the long run, this will enhance data sharing initiatives.
In order to assess the applicability of AI tools in a specific situation, the following two considerations should be taken into account. After a clear problem is defined, whether there is a more efficient and cost-effective alternative to the use of AI should be explored. Furthermore, local contextualities should not be underestimated; AI applications should be tailored to the situation. Individual technologies described above could for example be used to complement each other.
The Hakeem chatbot, for example, is an application developed to assist relief workers in educating young refugees in the local language24. It combines ML and NLP to provide educational advice for online studies, according to users’ interests. At the same time, the Hakeem chatbot improves as a ‘study advisor’, relying on users’ feedback. The pilot use of the application with conflict-affected youth in Lebanon, has brought education to individuals that did not have access to these advances before using AI.
Such applications can assist aid-NGOs to be more prepared for future crises and to provide aid more efficiently. This will facilitate aid-NGOs’ increasing role in implementing the SDGs.
KEEP IN MIND
Where possible, all stakeholders should com-mit to improving data quality and data sharing.
Actors involved should realize implementing AI in the decision-making process must never result in undignified treatment of human lives. Recalling that these decisions concern human lives is essential.
Involvement of local actors in the decision-making process, as well as in the implementation of AI applications is necessary to enhance the quality of action and community empowerment.
Not every problem is solved with (just) a technological solution. AI is not panacea, but rather one of the tools in the aid-NGOs’ toolbox.
19
References
1. Disaster trends and IFRC insights. (n.d.). In World
Disasters Report 2018.
2. Russell, S., & Norvig, P. (2009). Artificial Intelligence: A
Modern Approach (3 edition). Upper Saddle River:
Pearson.
3. Data ecosystems for sustainable development. (2017,
September 27). United Nations Development Program.
Retrieved from
http://www.undp.org/content/undp/en/home/librarypa
ge/poverty-reduction/data-ecosystems-for-sustainable-
development.html
4. Redman, T. C. (2018, April 2). If Your Data Is Bad, Your
Machine Learning Tools Are Useless. Harvard Business
5. About IATI | International Aid Transparency Initiative
- iatistandard.org. (n.d.). Retrieved December 17,
2018, from https://iatistandard.org/en/about/
6. The Centre for Humanitarian Data – Connecting
people and data to improve lives. (n.d.). Retrieved
December 17, 2018, from https://centre.humdata.org/
7. Griffith, D. A., Bradley, R. V., Boehmke, B. C., Hazen, B.
T., Johnson, A.W. (2017). Embedded analytics:
improving decision support for humanitarian logistics
operations. Annals of Operations Research.
https://doi.org/10.1007/s10479-017-2607-z
8. Tatham, P., & Spens, K. (2011). Towards a
humanitarian logistics knowledge management
system. Disaster Prevention and Management: An
International Journal, 20(1), 6–26.
https://doi.org/10.1108/09653561111111054
9. Van Wassenhove, L. N. (2006). Humanitarian aid
logistics: supply chain management in high gear.
Journal of the Operational Research Society, 57(5),
475–489.
https://doi.org/10.1057/palgrave.jors.2602125
10. Chiappetta Jabbour, C. J., Sobreiro, V. A., Lopes de
Sousa Jabbour, A. B., de Souza Campos, L. M., Mariano,
E. B., & Renwick, D. W. S. (2017). An analysis of the
literature on humanitarian logistics and supply chain
management: paving the way for future studies.
Annals of Operations Research.
https://doi.org/10.1007/s10479-017-2536-x
11. Gesing, B., Peterson, S. J., Dr. Michelsen, D. (2018).
Artificial Intelligence in Logistics: (Collaborative
report). Troisdorf, Germany: DHL Customer Solutions
& Innovation.
12. Amer, M., Daim, T. U., & Jetter, A. (2013). A review of
scenario planning. Futures, 46, 23–40.
https://doi.org/10.1016/j.futures.2012.10.003
13. Noori, N. S., Comes, T., Schwarz, P., Lukosch, H., &
Wang, Y. (2017). Behind the Scenes of Scenario-Based
Training: Understanding Scenario Design and
Requirements in High-Risk and Uncertain
Environments.
14. Reflecting the Past, Shaping the Future: Making AI
Work for International Development. (2018,
November 6). U.S. Agency for International
Development. Retrieved from
https://www.usaid.gov/digital-development/machine-
learning/ai-ml-in-development
15. Perol, T., Gharbi, M., & Denolle, M. (2018).
Convolutional neural network for earthquake
detection and location. Science Advances, 4(2),
e1700578. https://doi.org/10.1126/sciadv.1700578
16. United Nations, World Bank, and Humanitarian
Organizations Launch Innovative Partnership to End
Famine. (2018, September 23). The World Bank.
Retrieved from
https://www.worldbank.org/en/news/press-
release/2018/09/23/united-nations-world-bank-
humanitarian-organizations-launch-innovative-
partnership-to-end-famine
17. Willmot, H. (2017). Improving UN Situational
Awareness. The Stimson Center.
18. Crawford, K. (2013, April 1). The Hidden Biases in Big
Data. Harvard Business Review. Retrieved from
https://hbr.org/2013/04/the-hidden-biases-in-big-data
19. Bae, H., Jang, J., Jung, D., Jang, H., Ha, H., & Yoon, S.
(2018). Security and Privacy Issues in Deep Learning.
ArXiv:1807.11655 [Cs, Stat]. Retrieved from
http://arxiv.org/abs/1807.11655
20. Siau, K., Wang, W. (2018). Building Trust in Artificial
Intelligence, Machine Learning, and Robotics. Cutter
Business Technology Journal, 2(31).
21. Dignum, V. (2018). Responsible Artificial Intelligence:
Designing AI for Human Values. ITU Journal, 1(1).
22. Sternkopf, H., Mueller, R. M. (2018). Doing Good with
Data: Development of a Maturity Model for Data
Literacy in Non-governmental Organizations.
Presented at the Hawaii International Conference on
System Sciences, Hawaii, United States of America.
https://doi.org/10.24251/HICSS.2018.630
23. Baar, T., Stettina, C. J. (2016). Data-Driven Innovation
for NGO’s: How to define and mobilise the Data
Revolution for Sustainable Development. Presented at
the Data for Policy, Cambridge, United Kingdom.
24. Global refugee crisis: Refugee turned humanitarian
shares reasons for optimism – NetHope. (n.d.).
Retrieved December 14, 2018, from
https://nethope.org/2018/09/24/the-global-refugee-
crisis-former-refugee-turned-humanitarian-shares-
reasons-for-optimism/
20
Glossary
• Accountability in Artificial Intelligence: Who, or what, is held accountable when AI systems make decisions that affect individuals or the society.
• Artificial Intelligence (AI): 1. The field of computer science dealing with the ability of a computer program or a machine to think and learn. 2. The ability of a computer program or a machine to perform tasks that mimic human cognition.
• Aid-NGOs: A term used to encompass humanitarian and development (aid) Non-Governmental Organizations.
• Algorithm: A process or set of instructions and/or rules, that can be used in problem-solving operations and calculations.
• Bias: Normatives, stereotypes and opinions from the real-world are encoded and represented within AI systems.
• Chatbot: An AI computer system that convincingly simulates human behavior in a conversation via auditory or textual methods.
• Crowdsourced data: Information/ input on a particular theme, acquired via the participation of a large group of individuals
• Data literacy: The ability to obtain, understand and communicate meaningful information from data, as well as to handle the competencies of working with data.
• Development Aid: Delivering long-term aid to address structural problems in developing countries. • Humanitarian Aid: Delivering short-term aid immediately after a disaster to save lives under the humanitarian
principles of humanity, neutrality, impartiality and independence.
• Information (Data) Mining: The process of generating new information and discovering patterns from large data sets using statistics, Machine Learning and other methods.
• Intelligent route optimization: Improving the distribution network to enhance the real time delivery efficiency.
• Real time routing algorithms: Algorithms with the ability to handle real time network updates that can be used to compute shortest path.
• Machine Learning: A branch of the broader AI Technology, that explores the idea of machines processing data and learning on their own to improve their performance on a specific task, without requiring human supervision.
• Natural Language Processing: A sub-branch of computer science, information engineering, and artificial intelligence studying the ways computers can process and analyze large amounts of text and audio natural language data (human language).
• Panacea: A solution which solves every problem.
• Predictive Analytics: A method of examining historical and current facts to formulate predictions about future or otherwise unknown events.
• Real-Time Data: Information that is being delivered immediately after collection/generation. The data is analyzed using real-time computing or stored for later or offline data analysis.
• Triangulation: The method of collecting, comparing and combining data from two or more sources, in order to validate this information.
• UN Cluster Approach: A structurisation of the humanitarian sector into eleven clusters such as logistics, food security and education in order to increase coordination between (UN and non-UN) organizations to enhance the humanitarian response to a disaster.
Acronyms
• AI = Artificial Intelligence • AIDR = Artificial Intelligence for Disaster Response • ALNAP= Active Learning Network for
Accountability and Performance in Humanitarian Action
• GDPR= General Data Protection Regulation • HDX= Humanitarian Data Exchange
• IATI= International Aid Transparency Initiatives • ML = Machine Learning • NGO = Non-Governmental Organisation • NLP = Natural Language Processing • SDGs = Sustainable Development Goals • UNDAC = Netherlands United Nations Disaster,
Assessment and Coordination

21
22
Consulted Experts
We would like to express our gratitude to the people that agreed to be interviewed for this policy brief. Their guidance and feedback have been of crucial importance for the accomplishment of this brief. Furthermore, we are thankful to dr. Aalt-Jan van Dijk, prof. dr. ir. Hein A. Fleuren, Dilek Genc (PhD Candidate, International Development), dr. Bram J. Jansen, drs. ing. Kenny Meesters, prof. dr. ir. Dick de Ridder, and dr. Jeroen F. Warner for reviewing the information included in this brief, according to the field of their expertise.
Name Institution Position Interview Date
Renée van Abswoude Kuno - Platform for Humanitarian Knowledge Exchange
Intern 22-11-2018
Dr. Aalt-Jan van Dijk Wageningen University & Research
University Lecturer, Mathematical and Statistical Methods - Biometris
06-11-2018
Dilek Genc, PhD Candidate
University of Edinburgh PhD Candidate, International Development
15-11-2018
Sam de Greeve Plan International (Netherlands)
Humanitarian Fundraiser and Programme Officer
26-11-2018
Ankit Gupta Dasra (NGO, India) Associate, Systems & Operations 17-11-2018
Dr. Eng. Gemma van der Haar
Wageningen University & Research
University Lecturer, Sociology of Development and Change
09-11-2018
Dr. Bram J. Jansen Wageningen University & Research
University Lecturer, Sociology of Development and Change
13-11-2018
Daniel Kersbergen The Netherlands Red Cross, 510 team
Surge Information Management Officer
21-11-2018
Dr. Sanneke Kloppenburg Wageningen University & Research
University Lecturer, Environmental Policy
14-11-2018
Eng. Kenny Meesters, PhD Candidate
Delft University of Technology PhD Candidate, Policy Analysis group
28-11-2018
Prof. Dr. Eng. Dick de Ridder
Wageningen University & Research
Professor, Bioinformatics 09-11-2018
Andrea de Ruiter Ministry of Internal Affairs (Netherlands)
Senior Policy Officer 28-11-2018
Sjaak Seen Netherlands United Nations Disaster, Assessment and Coordination (UNDAC)
Multidisciplinary Operational Team Leader
14-12-2018
Prof. Dr. Devis Tuia Wageningen University & Research
Professor, Laboratory of Geo-information Science and Remote Sensing
09-11-2018
Dr. Harwin de Vries INSEAD Social Innovation Centre
Post-Doctoral Research Fellow 22-11-2018
Prof.Dr. Bartel A. Van de Walle
Delft University of Technology Professor of Policy Analysis and Head of the department Multi-Actor Systems.
23-11-2018
Dr. Jeroen F. Warner Wageningen University & Research
University Lecturer, Sociology of Development and Change
12-11-2018
Sven Warris, PhD Candidate
Wageningen University & Research
DLO Researcher, Bioscience 09-11-2018
Titia Wenneker Giro 555 Online Coordinator 22-11-2018

23
24
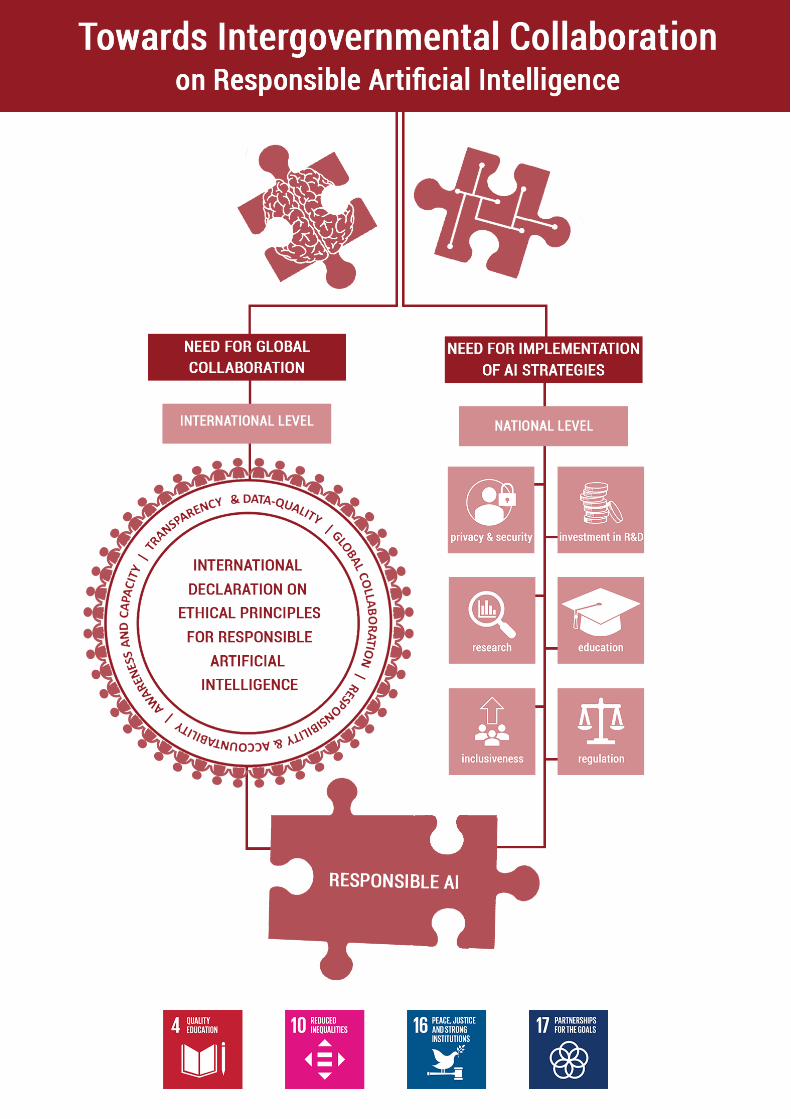
Towards Intergovernmental Collaboration on Responsible Artificial Intelligence
25
Key Messages 1. Challenges and opportunities brought about by the emergence of Artificial Intelligence (AI) are of a transboundary
nature and call for a global approach. The development of AI needs to be guided in such a way that its benefits are
distributed equally within and among countries.
2. The UN should consider aligning existing ethical values of national AI strategies through multilevel and multi-
stakeholder dialogue1. This will provide input for an International Declaration on Ethical Principles for Responsible
Artificial Intelligence (IDEPRAI).
3. Responsible AI can be put forward at an international and national level. The UN facilitates a platform for addressing
challenges, sharing knowledge and exchanging best practices of AI. An AI task force will be responsible for the national
implementation of Responsible AI policy.
This policy brief appeals for global collaboration to work towards Responsible AI. Structured by four core principles, it
provides practical implementation tools for the UN and national governments to effectively work towards this aim.
Artificial Intelligence (AI) is a cutting-edge technology that promises to improve the wellbeing of humanity1. However, the concentration of knowledge capital, economic capital and expertise on the development of AI could exacerbate vulnerabilities in economic and social structures2,3,4. Therefore, concerns are being raised as to whether the benefits of AI will be distributed equally within and between countries1,5. Besides that, current global development of AI technology is mainly limited to companies and therewith prevailingly reflecting private interests1. Consequently, the international community faces the challenge of ensuring that technological innovations are in line with the Sustainable Development Goals (SDGs)1.
In the current governmental playing field, a trend in creating national AI strategies can be observed34-46. This reflects the acknowledgement of potential dangers of AI developments for society, the need to take governmental responsibility in mitigating these risks and the opportunity to harness the potential of AI6. Since most of the expected risks of AI are global, they should be addressed at an appropriate scale7. Currently however, global cooperation on Responsible AI is mostly initiated by the private sector4,8. This brief identifies a gap in intergovernmental collaboration7. Many countries do not have an AI strategy and countries with AI strategies often lack practical approaches for implementation9.
Need for a common approach: A Declaration on Responsible AI A common vision is important for working towards responsible use and development of AI10,11. This means that humans need to deal with AI in a democratic and socially accountable manner, while guaranteeing human autonomy and values in conformity with international
standards (e.g. Human Rights and the SDGs)1,10,14. In terms of governance, this requires connecting common values from existing strategies and aligning them with Human Rights and the SDGs1. This brief regards the UN, with its experience in addressing transnational issues such as Human Rights12,14 and Climate Change13, as an institution capable of playing a leading role in intergovernmental collaboration on Responsible AI.
To organise intergovernmental collaboration and work towards a common vision, this brief proposes the creation of an ‘International Declaration on Ethical Principles for Responsible AI’ (further: IDEPRAI). Ethical principles are indispensable building blocks for Responsible AI and should therefore be the foundation of the IDEPRAI10. To define the content of these ethical principles, we conducted thorough research on existing AI strategies put forward by national governments34-46, companies and international institutions48-58(Annex II), in addition to academic literature review and expert consultation (Annex III). The core principles below reflect commonalities abstracted from this research, taking into account the underlying values of the SDGs. They provide the basis for both the content of the IDEPRAI and practical recommendations for the national level.
Core principles on Responsible AI 1. Global collaboration On ethical and Responsible AI 2. Responsibility & Accountability Concerning data security & liability 3. Awareness & Capacity Building resilience for the impact of AI on society. 4. Data quality & Transparency Enhancing explainability and data transparency of AI decision-making processes.
Justification
Alkema Judith, Bork Milena, Fabriek Jente, de Maat Sophie, Verheij Robin
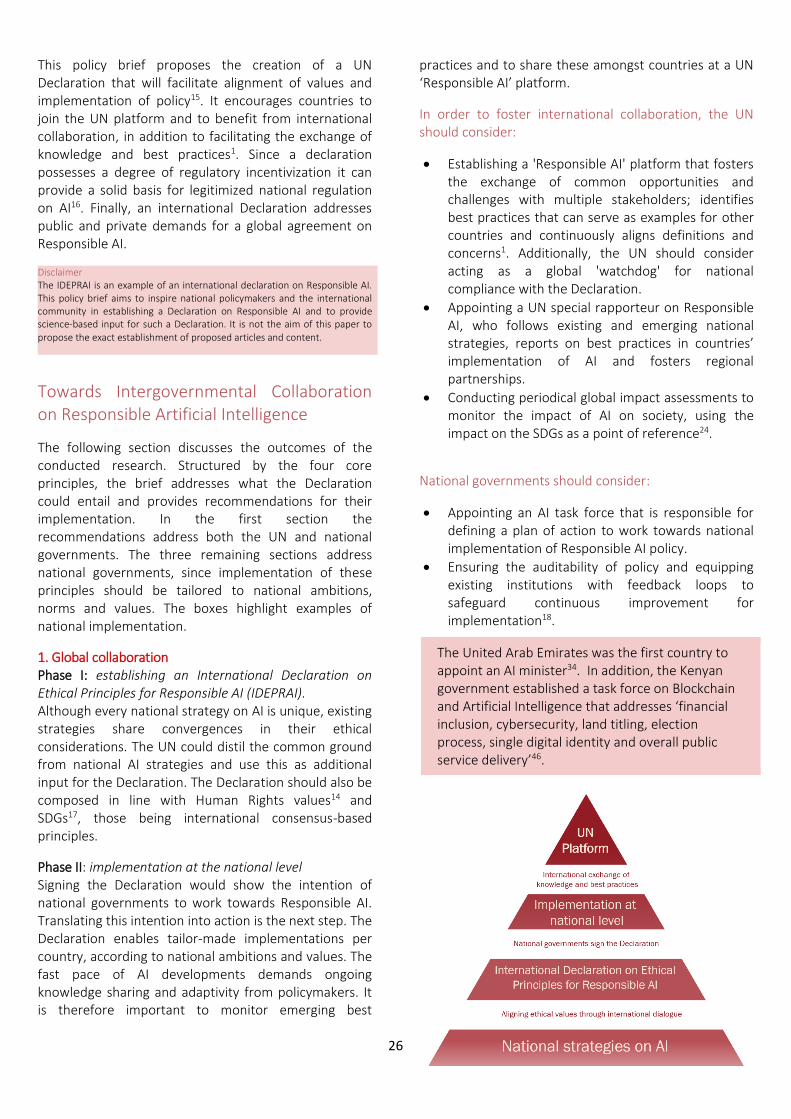
26
This policy brief proposes the creation of a UN Declaration that will facilitate alignment of values and implementation of policy15. It encourages countries to join the UN platform and to benefit from international collaboration, in addition to facilitating the exchange of knowledge and best practices1. Since a declaration possesses a degree of regulatory incentivization it can provide a solid basis for legitimized national regulation on AI16. Finally, an international Declaration addresses public and private demands for a global agreement on Responsible AI.
Disclaimer The IDEPRAI is an example of an international declaration on Responsible AI. This policy brief aims to inspire national policymakers and the international community in establishing a Declaration on Responsible AI and to provide science-based input for such a Declaration. It is not the aim of this paper to propose the exact establishment of proposed articles and content.
Towards Intergovernmental Collaboration on Responsible Artificial Intelligence
The following section discusses the outcomes of the conducted research. Structured by the four core principles, the brief addresses what the Declaration could entail and provides recommendations for their implementation. In the first section the recommendations address both the UN and national governments. The three remaining sections address national governments, since implementation of these principles should be tailored to national ambitions, norms and values. The boxes highlight examples of national implementation.
1. Global collaboration Phase I: establishing an International Declaration on Ethical Principles for Responsible AI (IDEPRAI). Although every national strategy on AI is unique, existing strategies share convergences in their ethical considerations. The UN could distil the common ground from national AI strategies and use this as additional input for the Declaration. The Declaration should also be composed in line with Human Rights values14 and SDGs17, those being international consensus-based principles.
Phase II: implementation at the national level Signing the Declaration would show the intention of national governments to work towards Responsible AI. Translating this intention into action is the next step. The Declaration enables tailor-made implementations per country, according to national ambitions and values. The fast pace of AI developments demands ongoing knowledge sharing and adaptivity from policymakers. It is therefore important to monitor emerging best
practices and to share these amongst countries at a UN ‘Responsible AI’ platform.
In order to foster international collaboration, the UN should consider:
• Establishing a 'Responsible AI' platform that fosters the exchange of common opportunities and challenges with multiple stakeholders; identifies best practices that can serve as examples for other countries and continuously aligns definitions and concerns1. Additionally, the UN should consider acting as a global 'watchdog' for national compliance with the Declaration.
• Appointing a UN special rapporteur on Responsible AI, who follows existing and emerging national strategies, reports on best practices in countries’ implementation of AI and fosters regional partnerships.
• Conducting periodical global impact assessments to monitor the impact of AI on society, using the impact on the SDGs as a point of reference24.
National governments should consider:
• Appointing an AI task force that is responsible for defining a plan of action to work towards national implementation of Responsible AI policy.
• Ensuring the auditability of policy and equipping existing institutions with feedback loops to safeguard continuous improvement for implementation18.
The United Arab Emirates was the first country to appoint an AI minister34. In addition, the Kenyan government established a task force on Blockchain and Artificial Intelligence that addresses ‘financial inclusion, cybersecurity, land titling, election process, single digital identity and overall public service delivery’46.
27
2. Responsibility & accountability
The IDEPRAI could include a section on liability and the protection of citizens’ privacy and safety. Researchers and developers should be aware of their own responsibility concerning the development and use of AI applications.
National governments should consider:
• Assessing how the Declaration would fit into existing regulations and institutions. Ensuring the existence of comprehensive privacy regulations18 - according to experts, the European General Data Protection Regulation (GDPR19) serves as an example of socially responsible privacy law.
• Assessing if existing institutions have the ability to address the harms inflicted by AI technology18. Additionally, national governments should develop a legal solidarity tool to deal with risks in AI. Part of this could be the installation of an ‘AI Ombudsperson’18. This could improve citizens’ trust in AI.
• Determining how issues of liability should be regulated. Approach this in concert with multiple stakeholders to enhance compliance1 and ensure that regulations do not hamper innovation.
• Incentivizing the use of tools for AI systems, including anonymised data and de-identification to protect personally identifiable information20. Users must trust that their personal and sensitive data is protected and handled appropriately.
• Ensuring human agency over algorithmic decision making: clearly define the role of ‘human in the loop’31 when using AI to increase accuracy. Assess which tasks and decision-making functionalities should not be delegated to AI systems by taking into account societal values and understanding of public opinion14,18.
• Promoting toolkits for ‘ethics by design’, which refers to the pre-emptive consideration of ethical principles by designers of AI technology21.
3. Awareness & capacity
The IDEPRAI could include a section on increasing both governmental and citizen awareness. Governments need to adapt to technological development and its impact on society18. Citizen awareness needs to be addressed in order to increase resilience against possible risks of AI4. Additionally, experts state that capacity-building could foster citizen control on social and democratic use of AI applications.
National governments should consider:
• Supporting Research & Development on the implications and possible benefits of AI for society.
• Investing in national research talent in order to avoid ‘brain drain’22.
• Developing education and training on what AI can do and what its limitations are.
• Monitoring the introduction of AI to the market and anticipating potential shifts in the labour market by offering voluntary (re-) skilling programmes to educate employees on the social, legal and ethical impact of working alongside AI18.
• Aiming for the participation and commitment of all stakeholders and active inclusion of the whole society23. This will ensure development and design of AI that takes into account “diversity of gender, class, ethnicity, discipline and other dimensions. Hence, it fosters inclusivity and richness of ideas and perspectives”18.
• Fostering public deliberation. This should result in the co-creation of policy standards and agreements18.
4. Data quality & transparency The IDEPRAI could include a section on transparency in algorithmic decision-making, which refers to the extent to which the output of an algorithm is explicable25. Experts state that since algorithms are inherently neutral yet adaptive to their input, technical transparency does not have the highest priority. Transparency of data provides insight into
Estonia is establishing a legal framework for AI. This framework grants a special legal status for robots. The so-called ‘Robot agent’ will be a legal identity apart from legal persons and private property47.
In Canada, CIFAR launched an open call for ‘AI & Society workshops’ to involve and inform policymakers, NGOs and the broader public9. The ‘Montreal Declaration for a Responsible Development of AI’ invited the Canadian public to co-create ethical AI values through an online questionnaire45. In Mexico, Oxford Insights and C Minds cooperated with local governments, aiming for a bottom up approach of crowdsourcing local values and needs, in order to incorporate these into a National AI Strategy41.
28
the input that precedes the outcome of algorithms26. Since biased outcomes are due to biased input, inclusive and open data is more relevant in this context33.
National governments should consider:
• Incentivizing users of AI applications to conduct an impact assessment before use. Moreover, periodically evaluating the impact on society using feedback loops and update the assessment. possibilities of incentivisation through trust labels. In the long term, consider the potential for hard law when incentivization appears to be insufficient over time24.
• Preventing biased data that can lead to discriminatory outcomes of algorithms, especially considering vulnerable groups. Acknowledging that bias is part of human nature and therefore a pertinent topic26; datasets are historically bound and not necessarily inclusive.
• Gathering inclusive data that is representative of the population, by working together with multiple stakeholders1.
• Incentivizing open access of data and technology to increase transparency, and developing methods to administer the origin and dynamics of data27.
Conclusion This policy brief aimed to fill two gaps: the need for intergovernmental collaboration on Responsible AI and the need to develop and implement national strategies on Responsible AI. Structured by four core principles, the brief addressed the two gaps by providing input for the UN and national governments on the possible content of a Declaration, and practical recommendations for implementation at the national level, according to national ambitions and values. The core principles embrace four key themes on Responsible AI: global collaboration, responsibility & accountability, awareness & capacity, and data quality & transparency.
With the establishment of the International Declaration on Ethical Principles for Responsible AI and consideration of the recommendations, we believe that the potential of AI can be harnessed to its fullest extent so that it will benefit the social good and facilitate the achievement of the SDGs1,10,14.
Recommendations To enhance global collaboration on AI, the UN should consider:
• Developing a UN International Declaration on Ethical Principles for Responsible AI.
• Installing a UN special rapporteur and a platform on Responsible AI to share knowledge and identify best practices1.
National governments should consider:
• Executing the national implementation of the Declaration and maintaining contact with the UN rapporteur.
• Installing a national AI task force that monitors the societal impact of implemented policy and enables periodical audits and feedback loops18.
Considering responsibility & accountability, national governments should consider:
• Assessing, through multi-stakeholder dialogue1, the capacity of existing institutions and regulations to address issues of liability18.
• Ensuring human agency over algorithmic decision-making and defining the role of ‘human in the loop’31.
Considering awareness & capacity, national governments should consider:
• Investing in Research & Development on the opportunities and implications of AI for society.
• Enhancing participation and commitment of society through voluntary education, training and reskilling18,23.
Considering data quality & transparency, national governments should consider:
• Incentivizing users (companies, institutions etc.) of AI applications to conduct an impact assessment before use, in addition to evaluating and adapting periodically23.
• Working together with multiple and multilevel stakeholders to collect representative data and stimulate open access of data & technology1,23.
In the Netherlands, the Platform for the Information Society (ECP) launched an ‘Artificial Intelligence Impact Assessment’ (AIIA) with a step-by-step scheme for organizations that plan to use an AI application. These steps include questioning the measures taken to secure the reliability, safety and transparency of the application, and the justification of AI use from an ethical and legal perspective24.
29
References
1. International Telecommunications Union. (2017). AI for
Global Good Summit; Artificial Intelligence can help solve
humanity’s greatest challenges. Retrieved from
https://www.itu.int/en/ITU-
T/AI/Documents/Report/AI_for_Good_Global_Summit_Re
port_2017.pdf
2. Lawrence, M., Roberts, C and King, L. (2017). Managing
Automation, Employment, Inequality and ethics in the
digital age. Retrieved from
https://www.ippr.org/files/2018-01/cej-managing-
automation-december2017.pdf
3. Bowser, A., Sloan, M., Michelucci, P., & Pauwels, E. (2017).
Artificial Intelligence: A Policy-Oriented Introduction.
Retrieved from:
https://www.wilsoncenter.org/publication/artificial-
intelligence-policy-oriented-introduction
4. Bengio, Y. (2018). Interview with Yoshua Bengio (interview
by Jasmina Šopova). Countering the monopolization of
research. Artificial Intelligence: The promises and the
threats. The UNESCO Courier, 3, 18-19.
5. International Telecommunications Union. (2018).
Assessing the Economic Impact of Artificial Intelligence.
Retrieved from https://www.itu.int/dms_pub/itu-
s/opb/gen/S-GEN-ISSUEPAPER-2018-1-PDF-E.pdf
6. UNCTAD. (2018). Harnessing Frontier Technologies for
Sustainable Development. Geneva, Switzerland. Retrieved
from:
https://unctad.org/en/pages/PublicationWebflyer.aspx?pu
blicationid=2110
7. United Nations. (2018). United Nations E-Government
Survey 2018: Gearing e-government to support
transformation towards sustainable and resilient societies.
Retrieved from:
https://publicadministration.un.org/egovkb/en-
us/Reports/UN-E-Government-Survey-2018
8. Azoulay, A. (2018). Interview with Audrey Azoulay
(interview by Jasmina Sopova). Making the most of
artificial intelligence Artificial Intelligence: The promises
and the threats. The UNESCO courier, 3, 36-39.
9. Dutton, T., Barron, B. & Boskovic, G. (2018). Building an AI
world: Report on National and Regional AI strategies.
Toronto: CIFAR. Retrieved from:
https://www.cifar.ca/docs/default-source/ai-
society/buildinganaiworld_eng.pdf?sfvrsn=fb18d129_4
10. Dignum, V. (2018). Responsible Artificial intelligence:
designing AI for human values. ITU journal: ICT Discoveries.
1(1), 1-8.
11. World Economic Forum. (2018). Fourth Industrial
Revolution for the Earth Series: Harnessing Artificial
Intelligence for the Earth. World Economic Forum, PWC,
Stanford Woods Institute for the environment. Retrieved
from:
http://www3.weforum.org/docs/Harnessing_Artificial_Int
elligence_for_the_Earth_report_2018.pdf
12. United Nations. (1948). Universal Declaration of Human
Rights. Retrieved from:
https://www.ohchr.org/EN/UDHR/Documents/UDHR_Tra
nslations/eng.pdf
13. UN. (2017). UN Climate Change Annual Report. Retrieved
from: https://unfccc.int/resource/annualreport/
14. Latonero, M. (2018). Governing Artificial Intelligence:
Upholding Human Rights & Dignity. Data&Society.
Retrieved from: https://datasociety.net/wp-
content/uploads/2018/10/DataSociety_Governing_Artifici
al_Intelligence_Upholding_Human_Rights.pdf
15. Abbott, K., & Snidal, D. (2000). Hard and Soft Law in
International Governance. International Organization,
54(3), 421-456.
16. UNESCO. (2018). Declaration. Retrieved from
http://www.unesco.org/new/en/social-and-human-
sciences/themes/international-
migration/glossary/declaration/
17. The Sustainable Development Goals. (2018). Retrieved
from: https://sustainabledevelopment.un.org/sdgs
18. Floridi et al. (2018). AI4People - An Ethical Framework for
a Good AI Society: Opportunities, Risks, Principles, and
Recommendations. Minds and Machines, 28(4), 689-707.
19. European Union. (2016). Regulation (EU) 2016/679 of the
European Parliament and of the Council of 27 April 2016
on the protection of natural persons with regard to the
processing of personal data and on the free movement of
such data, and repealing Directive 95/46/EC (General
Data Protection Regulation).
20. Information Technology Industry Council. (2017, October
24). AI Policy Principles. Retrieved from
https://www.itic.org/public-
policy/ITIAIPolicyPrinciplesFINAL.pdf
21. Institute of Electrical and Electronics Engineers. (2016).
Ethically Aligned Design. Retrieved from:
https://standards.ieee.org/content/dam/ieee-
standards/standards/web/documents/other/ead_v1.pdf
22. Elsevier. (2018). Artificial Intelligence: How knowledge is
created, transferred and used - Trends in China, Europe
and the United States. Retrieved from
https://www.elsevier.com/research-
intelligence/resource-library/ai-report#form
23. Brundage, M. et al. (2018). The Malicious Use of Artificial
Intelligence: Forecasting, Prevention, and Mitigation. The
Future of Humanity Institute. Retrieved from:
https://maliciousaireport.com/
24. ECP - Platform voor de InformatieSamenleving. (2018,
November 15). Artificial Intelligence Impact Assessment.
Retrieved from: https://ecp.nl/jaarcongres/artificial-
intelligence-impact-assessment/
25. Cowls, J., & Floridi, L. (2018). Prolegomena to a White
Paper on an Ethical Framework for a Good AI Society.
SSRN Electronic Journal, 1-15.
26. Gryn, R. & Rzeszucinsky, P. (2018, September 17). Bias in
AI is a real problem. Retrieved from
30
https://www.weforum.org/agenda/2018/09/the-biggest-
risk-of-ai-youve-never-heard-of/
27. Dignum, V. (2018, March 4). The ART of AI —
Accountability, Responsibility, Transparency. Retrieved
from: http://designforvalues.tudelft.nl/2018/the-art-of-
ai-accountability-responsibility-transparency/
28. Nilsson, Nils J. (2010). The Quest for Artificial Intelligence:
A History of Ideas and Achievements. Cambridge, UK:
Cambridge University Press.
29. United Nations Treaty Collection. (2018). Glossary of
terms relating to Treaty actions. Retrieved from
https://treaties.un.org/pages/overview.aspx?path=overvi
ew/glossary/page1_en.xml#declarations
30. Royal Academy of Engineering. (2017). Algorithms in
decision-making. Retrieved from:
https://www.raeng.org.uk/publications/responses/algorit
hms-in-decision-making
31. Figure Eight. (2018). What is Human-in-the-Loop Machine
Learning? Retrieved from: https://www.figure-
eight.com/resources/human-in-the-loop/
32. E-estonia. (October 2017). Estonia starts the debate
about robots as legal persons. Retrieved from: https://e-
estonia.com/data-embassies-robots-and-e-id-the-
ingredients-for-a-revolution/
33. Brookfield Institute. (March 2018). Intro to AI for
Policymakers: Understanding the shift. Retrieved from:
https://brookfieldinstitute.ca/wp-
content/uploads/AI_Intro-Policymakers_ONLINE.pdf
34. China: State Council, The Foundation for Law and
International Affairs. (2017). New Generation of Artificial
Intelligence Development Plan. Retrieved from:
https://flia.org/notice-state-council-issuing-new-
generation-artificial-intelligence-development-plan/
35. Denmark: The Danish Government - Ministry of Industry,
Business and Financial Affairs. (2018). Strategy for
Denmark's Digital Growth. Retrieved from:
https://investindk.com/insights/the-danish-government-
presents-digital-growth-strategy
36. Finland: Ministry of Economic Affairs and Employment of
Finland. (2018). Work in the age of artificial intelligence -
Four perspectives on the economy, employment, skills and
ethics. Retrieved from:
http://julkaisut.valtioneuvosto.fi/bitstream/handle/10024
/160391/TEMrap_47_2017_verkkojulkaisu.pdf
37. France: Villani, Cédric; French Parliament. (2018). For a
Meaningful Artificial Intelligence - Towards a French and
European Strategy. Retrieved from:
http://julkaisut.valtioneuvosto.fi/bitstream/handle/10024
/160391/TEMrap_47_2017_verkkojulkaisu.pdf
38. India: NITI Aayog. (2018). National Strategy for Artificial
Intelligence #AIFORALL. Retrieved from:
http://niti.gov.in/writereaddata/files/document_publicati
on/NationalStrategy-for-AI-Discussion-Paper.pdf
39. Italy: Task Force on Artificial Intelligence of the Agency for
Digital Italy. (2018). Artificial Intelligence at the Service of
Citizens. Retrieved from:
https://ia.italia.it/assets/whitepaper.pdf
40. Japan: Strategic Council for AI Technology. (2017).
Artificial Intelligence Technology Strategy. Retrieved from:
http://www.nedo.go.jp/content/100865202.pdf
41. Mexico: British Embassy in Mexico, Oxford Insights, C
Minds. (2018). Towards an AI Strategy in Mexico
Harnessing the AI Revolution. Retrieved from:
https://docs.wixstatic.com/ugd/7be025_e726c582191c49
d2b8b6517a590151f6.pdf
42. Sweden: Government Offices of Sweden. (2018). National
Approach to Artificial Intelligence. Retrieved from:
https://www.regeringen.se/4aa638/contentassets/a6488
ccebc6f418e9ada18bae40bb71f/national-approach-to-
artificial-intelligence.pdf
43. United Arab Emirates: National and International AI
Strategies. (n.d.). Retrieved from:
https://futureoflife.org/national-international-ai-
strategies/
44. HM Government. (2018). Industrial Strategy - Artificial
Intelligence Sector Deal. Retrieved from:
https://assets.publishing.service.gov.uk/government/uplo
ads/system/uploads/attachment_data/file/664563/indust
rial-strategy-white-paper-web-ready-version.pdf
45. Canada: Canada, an initiative of Université de Montréal.
(2018). Montreal Declaration for a Responsible
Development of Artificial Intelligence. Retrieved from:
https://docs.wixstatic.com/ugd/ebc3a3_c5c1c196fc1647
56afb92466c081d7ae.pdf
46. The Kenyan Wall Street. (2018, February 28). Kenya Govt
unveils 11 Member Blockchain & AI Taskforce headed by
Bitange Ndemo. Retrieved from:
https://kenyanwallstreet.com/kenya-govt-unveils-11-
member-blockchain-ai-taskforce-headed-by-bitange-
ndemo/
47. E-Estonia. (2017, October). Data embassies, robots and e-
ID: the ingredients for a (r)evolution. Retrieved from:
https://e-estonia.com/data-embassies-robots-and-e-id-
the-ingredients-for-a-revolution/
48. AI for Good. (2017). AI for Good Global Summit: Artificial
Intelligence can help solve humanity’s greatest challenges.
ITU, Xprize. Retrieved from: https://www.itu.int/en/ITU-
T/AI/Documents/Report/AI_for_Good_Global_Summit_R
eport_2017.pdf
49. Google (2018). Deep Mind Ethcis & Society Principles.
Retrieved from:
https://deepmind.com/applied/deepmind-ethics-
society/principles/
50. Future of Life. (2017). Asilomar AI Principles. Retrieved
from https://futureoflife.org/ai-principles/
51. Google. (2018). AI at Google: Our principles. Retrieved
from: https://www.blog.google/technology/ai/ai-
principles/
52. Intel. (2017). Artificial Intelligence - The Public Policy
Opportunity. Retrieved from
https://blogs.intel.com/policy/files/2017/10/Intel-
Artificial-Intelligence-Public-Policy-White-Paper-2017.pdf
53. IBM. (2018). Everyday Ethics for Artificial Intelligence.
Retrieved from:
31
https://www.ibm.com/watson/assets/duo/pdf/everydaye
thics.pdf
54. Institute of Electrical and Electronics Engineers. (2017).
Ethically Aligned Design: A Vision for Prioritizing Human
Well-being with Autonomous and Intelligent Systems,
Version 2. Retrieved from:
https://standards.ieee.org/industry-
connections/ec/autonomous-systems.html
55. Microsoft. (2018). The Future Computed - Artificial
Intelligence and its role in society. Retrieved
from:https://blogs.microsoft.com/uploads/2018/02/The-
Future-Computed_2.8.18.pdf
56. Telefonica. (2018). AI Principles of Telefonica. Retrieved
from:
https://www.telefonica.com/en/web/responsible-
business/our-commitments/ai-principles
57. Partnership on AI. (2018). About Us. Retrieved from
https://www.partnershiponai.org/about/#our-work
58. 58. World Economic Forum. (2018). Fourth Industrial
Revolution for the Earth Series: Harnessing Artificial
Intelligence for the Earth. World Economic Forum, PWC,
Stanford Woods Institute for the environment. Retrieved
from:
http://www3.weforum.org/docs/Harnessing_Artificial_Int
elligence_for_the_Earth_report_2018.pdf
32
Annex I: Glossary
• Artificial Intelligence (AI): Throughout this report, the definition of AI follows the one presented by Nils J. Nilsson: “Artificial intelligence is that activity devoted to making machines intelligent, and intelligence is that quality that enables an entity to function appropriately and with foresight in its environment28”.
• Responsible AI: Integrating ethical and moral values in the use and development of AI applications, which then become democratic, socially accountable, and guarantees human autonomy and values in conformity with Human Rights and the SDGs1,10,14.
• AI Taskforce: A governmental institution that aims to achieve implementation of ‘Responsible AI1,10,14’ policy by defining a plan of action, measurable goals and monitoring of these.
• AI strategies: Strategies, frameworks, guidelines or principles in which countries, organizations or companies state their opinion on how to achieve responsible and ethical use of AI.
• Declaration: Refers to multiple parties declaring their aspirations24, usually in the form of soft law.
• Algorithmic decision-making: Decision making based on algorithms and AI systems, that can inform human decision-making30.
• Human in the loop: Ensuring human agency. Placing importance on the involvement of humans in AI systems31.
• Robot-Agent: Granting robots a legal status. The Robot-Agent will be a legal identity on its own, apart from legal persons and private property32.
• Brain drain: Educated or professional people leaving a country, sector or field to apply their knowledge somewhere else, often because of better employment opportunities.
• Data bias: Data bias occurs when the data distribution is not representative enough of the natural phenomenon, or when biases from the real-world get perpetuated in AI systems33. Noted should be that AI algorithms are inherently neutral, and biased outcomes are dependent on biased input.
• Ethics by design: The pre-emptive consideration of ethical principles during the design phase of AI technology21.
• AI Ombudsperson: A person that represents the interests of the public, monitors and promotes the implementation of the declaration, and maintains dialogue with the relevant parties.
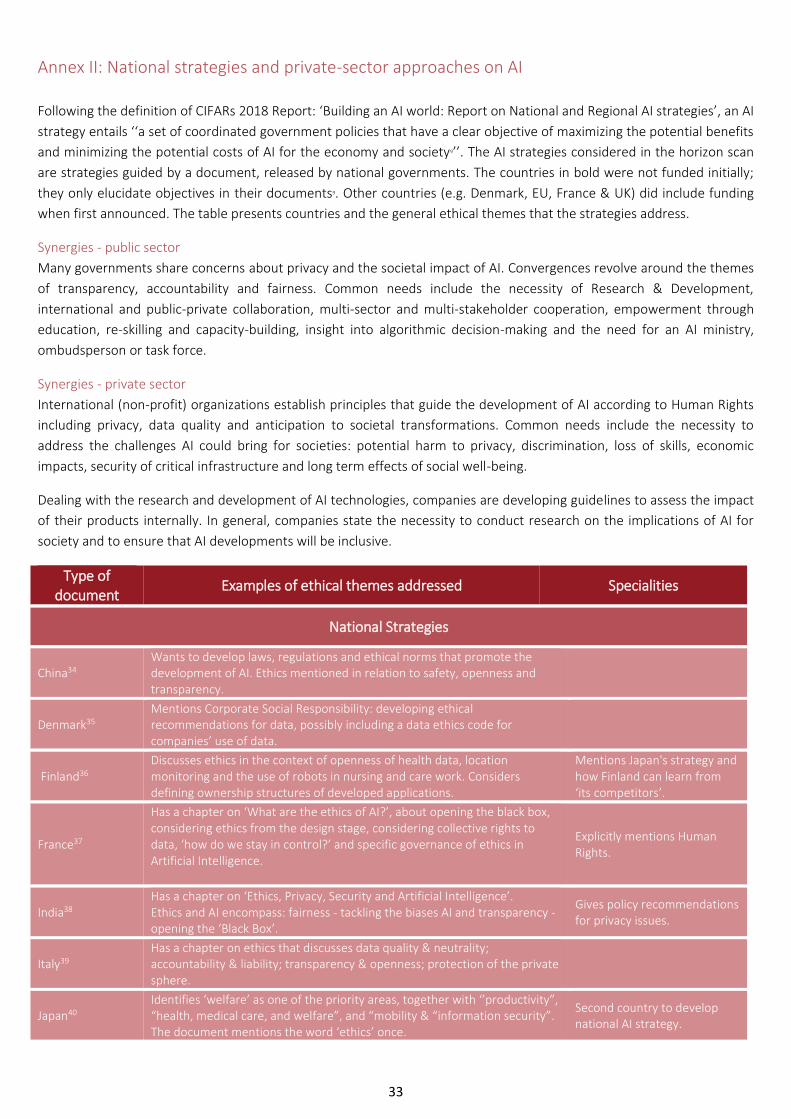
33
Annex II: National strategies and private-sector approaches on AI
Following the definition of CIFARs 2018 Report: ‘Building an AI world: Report on National and Regional AI strategies’, an AI
strategy entails ‘‘a set of coordinated government policies that have a clear objective of maximizing the potential benefits
and minimizing the potential costs of AI for the economy and society9’’. The AI strategies considered in the horizon scan
are strategies guided by a document, released by national governments. The countries in bold were not funded initially;
they only elucidate objectives in their documents9. Other countries (e.g. Denmark, EU, France & UK) did include funding
when first announced. The table presents countries and the general ethical themes that the strategies address.
Synergies - public sector
Many governments share concerns about privacy and the societal impact of AI. Convergences revolve around the themes
of transparency, accountability and fairness. Common needs include the necessity of Research & Development,
international and public-private collaboration, multi-sector and multi-stakeholder cooperation, empowerment through
education, re-skilling and capacity-building, insight into algorithmic decision-making and the need for an AI ministry,
ombudsperson or task force.
Synergies - private sector
International (non-profit) organizations establish principles that guide the development of AI according to Human Rights
including privacy, data quality and anticipation to societal transformations. Common needs include the necessity to
address the challenges AI could bring for societies: potential harm to privacy, discrimination, loss of skills, economic
impacts, security of critical infrastructure and long term effects of social well-being.
Dealing with the research and development of AI technologies, companies are developing guidelines to assess the impact
of their products internally. In general, companies state the necessity to conduct research on the implications of AI for
society and to ensure that AI developments will be inclusive.
Type of document
Examples of ethical themes addressed Specialities
National Strategies
China34 Wants to develop laws, regulations and ethical norms that promote the development of AI. Ethics mentioned in relation to safety, openness and transparency.
Denmark35 Mentions Corporate Social Responsibility: developing ethical recommendations for data, possibly including a data ethics code for companies’ use of data.
Finland36 Discusses ethics in the context of openness of health data, location monitoring and the use of robots in nursing and care work. Considers defining ownership structures of developed applications.
Mentions Japan's strategy and how Finland can learn from ‘its competitors’.
France37
Has a chapter on ‘What are the ethics of AI?’, about opening the black box, considering ethics from the design stage, considering collective rights to data, ‘how do we stay in control?’ and specific governance of ethics in Artificial Intelligence.
Explicitly mentions Human Rights.
India38 Has a chapter on ‘Ethics, Privacy, Security and Artificial Intelligence’. Ethics and AI encompass: fairness - tackling the biases AI and transparency - opening the ‘Black Box’.
Gives policy recommendations for privacy issues.
Italy39 Has a chapter on ethics that discusses data quality & neutrality; accountability & liability; transparency & openness; protection of the private sphere.
Japan40 Identifies ‘welfare’ as one of the priority areas, together with ‘’productivity”, “health, medical care, and welfare”, and “mobility & “information security”. The document mentions the word ‘ethics’ once.
Second country to develop national AI strategy.
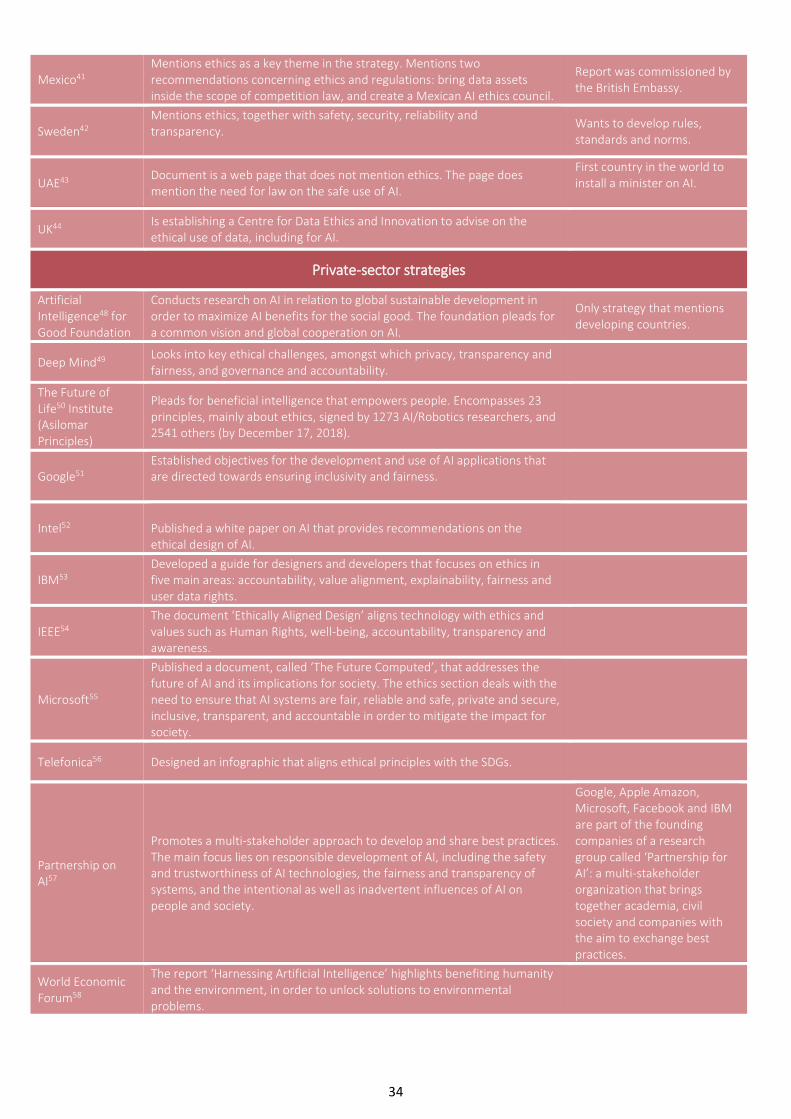
34
Mexico41 Mentions ethics as a key theme in the strategy. Mentions two recommendations concerning ethics and regulations: bring data assets inside the scope of competition law, and create a Mexican AI ethics council.
Report was commissioned by the British Embassy.
Sweden42 Mentions ethics, together with safety, security, reliability and transparency.
Wants to develop rules, standards and norms.
UAE43 Document is a web page that does not mention ethics. The page does mention the need for law on the safe use of AI.
First country in the world to install a minister on AI.
UK44 Is establishing a Centre for Data Ethics and Innovation to advise on the ethical use of data, including for AI.
Private-sector strategies
Artificial Intelligence48 for Good Foundation
Conducts research on AI in relation to global sustainable development in order to maximize AI benefits for the social good. The foundation pleads for a common vision and global cooperation on AI.
Only strategy that mentions developing countries.
Deep Mind49 Looks into key ethical challenges, amongst which privacy, transparency and fairness, and governance and accountability.
The Future of Life50 Institute (Asilomar Principles)
Pleads for beneficial intelligence that empowers people. Encompasses 23 principles, mainly about ethics, signed by 1273 AI/Robotics researchers, and 2541 others (by December 17, 2018).
Google51 Established objectives for the development and use of AI applications that are directed towards ensuring inclusivity and fairness.
Intel52 Published a white paper on AI that provides recommendations on the ethical design of AI.
IBM53 Developed a guide for designers and developers that focuses on ethics in five main areas: accountability, value alignment, explainability, fairness and user data rights.
IEEE54 The document ‘Ethically Aligned Design’ aligns technology with ethics and values such as Human Rights, well-being, accountability, transparency and awareness.
Microsoft55
Published a document, called ‘The Future Computed’, that addresses the future of AI and its implications for society. The ethics section deals with the need to ensure that AI systems are fair, reliable and safe, private and secure, inclusive, transparent, and accountable in order to mitigate the impact for society.
Telefonica56 Designed an infographic that aligns ethical principles with the SDGs.
Partnership on AI57
Promotes a multi-stakeholder approach to develop and share best practices. The main focus lies on responsible development of AI, including the safety and trustworthiness of AI technologies, the fairness and transparency of systems, and the intentional as well as inadvertent influences of AI on people and society.
Google, Apple Amazon, Microsoft, Facebook and IBM are part of the founding companies of a research group called ‘Partnership for AI’: a multi-stakeholder organization that brings together academia, civil society and companies with the aim to exchange best practices.
World Economic Forum58
The report ‘Harnessing Artificial Intelligence’ highlights benefiting humanity and the environment, in order to unlock solutions to environmental problems.
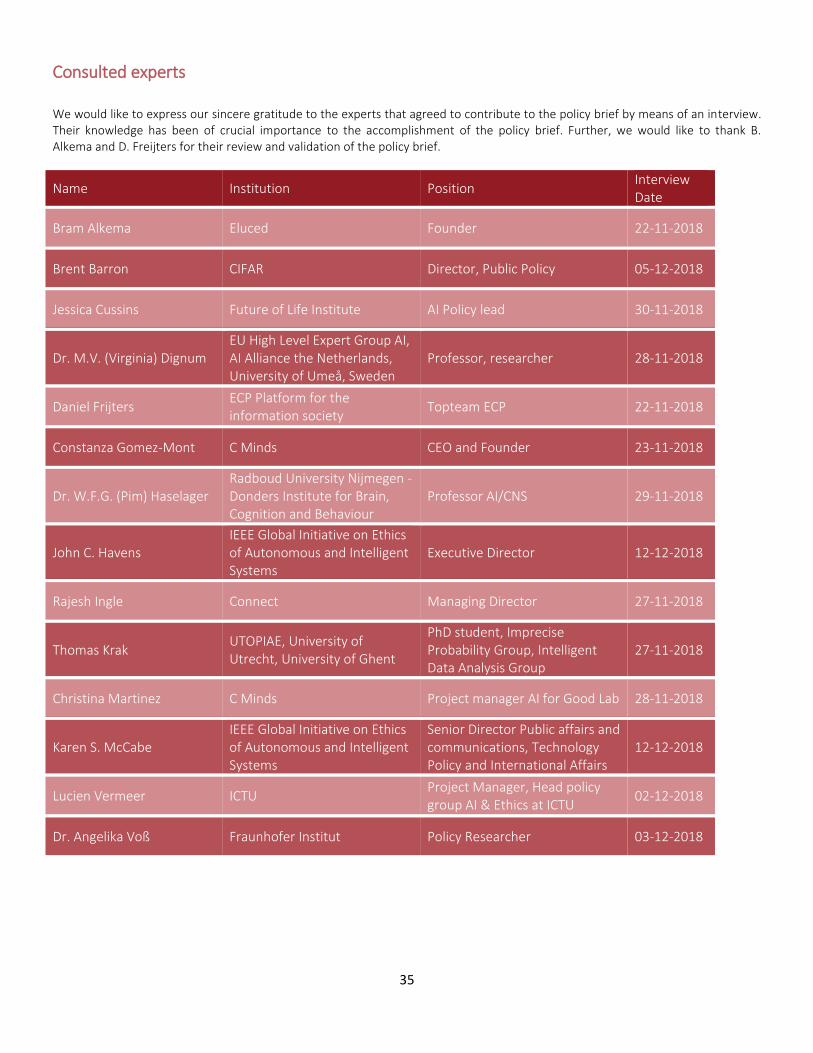
35
Consulted experts
We would like to express our sincere gratitude to the experts that agreed to contribute to the policy brief by means of an interview. Their knowledge has been of crucial importance to the accomplishment of the policy brief. Further, we would like to thank B. Alkema and D. Freijters for their review and validation of the policy brief.
Name Institution Position Interview Date
Bram Alkema Eluced Founder 22-11-2018
Brent Barron CIFAR Director, Public Policy 05-12-2018
Jessica Cussins Future of Life Institute AI Policy lead 30-11-2018
Dr. M.V. (Virginia) Dignum EU High Level Expert Group AI, AI Alliance the Netherlands, University of Umeå, Sweden
Professor, researcher 28-11-2018
Daniel Frijters ECP Platform for the information society
Topteam ECP 22-11-2018
Constanza Gomez-Mont C Minds CEO and Founder 23-11-2018
Dr. W.F.G. (Pim) Haselager Radboud University Nijmegen - Donders Institute for Brain, Cognition and Behaviour
Professor AI/CNS 29-11-2018
John C. Havens IEEE Global Initiative on Ethics of Autonomous and Intelligent Systems
Executive Director 12-12-2018
Rajesh Ingle Connect Managing Director 27-11-2018
Thomas Krak UTOPIAE, University of Utrecht, University of Ghent
PhD student, Imprecise Probability Group, Intelligent Data Analysis Group
27-11-2018
Christina Martinez C Minds Project manager AI for Good Lab 28-11-2018
Karen S. McCabe IEEE Global Initiative on Ethics of Autonomous and Intelligent Systems
Senior Director Public affairs and communications, Technology Policy and International Affairs
12-12-2018
Lucien Vermeer ICTU Project Manager, Head policy group AI & Ethics at ICTU
02-12-2018
Dr. Angelika Voß Fraunhofer Institut Policy Researcher 03-12-2018
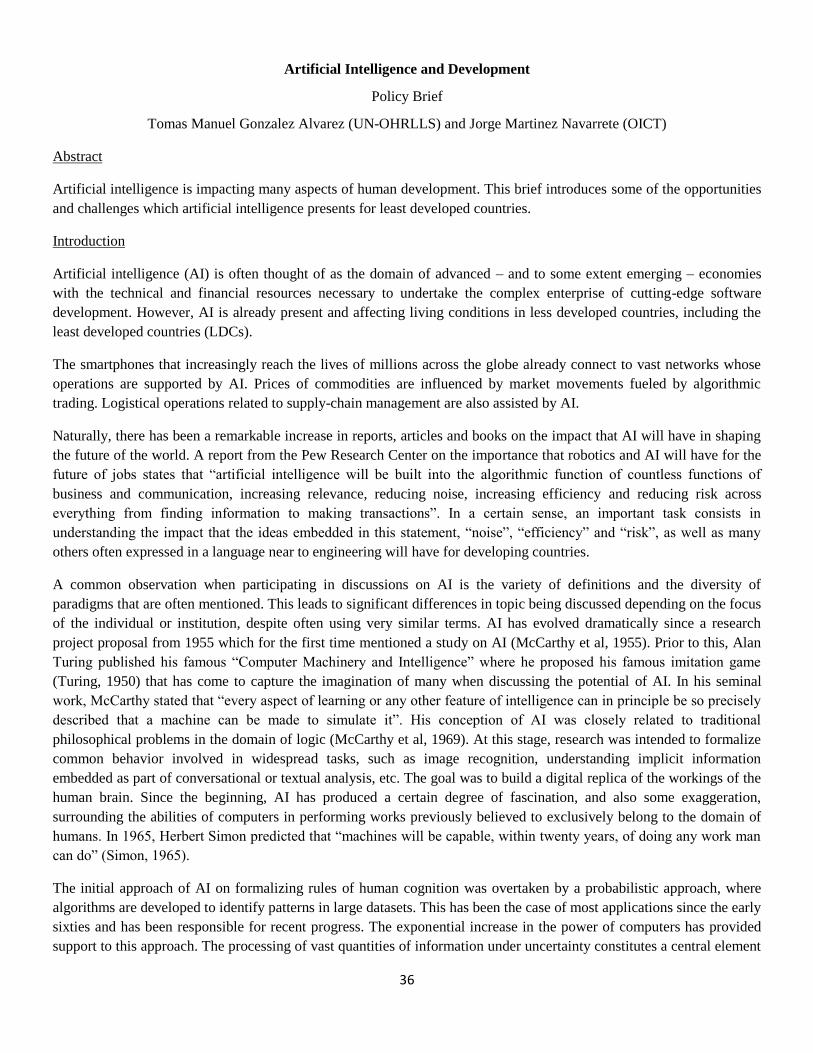
36
Artificial Intelligence and Development
Policy Brief
Tomas Manuel Gonzalez Alvarez (UN-OHRLLS) and Jorge Martinez Navarrete (OICT)
Abstract
Artificial intelligence is impacting many aspects of human development. This brief introduces some of the opportunities
and challenges which artificial intelligence presents for least developed countries.
Introduction
Artificial intelligence (AI) is often thought of as the domain of advanced – and to some extent emerging – economies
with the technical and financial resources necessary to undertake the complex enterprise of cutting-edge software
development. However, AI is already present and affecting living conditions in less developed countries, including the
least developed countries (LDCs).
The smartphones that increasingly reach the lives of millions across the globe already connect to vast networks whose
operations are supported by AI. Prices of commodities are influenced by market movements fueled by algorithmic
trading. Logistical operations related to supply-chain management are also assisted by AI.
Naturally, there has been a remarkable increase in reports, articles and books on the impact that AI will have in shaping
the future of the world. A report from the Pew Research Center on the importance that robotics and AI will have for the
future of jobs states that “artificial intelligence will be built into the algorithmic function of countless functions of
business and communication, increasing relevance, reducing noise, increasing efficiency and reducing risk across
everything from finding information to making transactions”. In a certain sense, an important task consists in
understanding the impact that the ideas embedded in this statement, “noise”, “efficiency” and “risk”, as well as many
others often expressed in a language near to engineering will have for developing countries.
A common observation when participating in discussions on AI is the variety of definitions and the diversity of
paradigms that are often mentioned. This leads to significant differences in topic being discussed depending on the focus
of the individual or institution, despite often using very similar terms. AI has evolved dramatically since a research
project proposal from 1955 which for the first time mentioned a study on AI (McCarthy et al, 1955). Prior to this, Alan
Turing published his famous “Computer Machinery and Intelligence” where he proposed his famous imitation game
(Turing, 1950) that has come to capture the imagination of many when discussing the potential of AI. In his seminal
work, McCarthy stated that “every aspect of learning or any other feature of intelligence can in principle be so precisely
described that a machine can be made to simulate it”. His conception of AI was closely related to traditional
philosophical problems in the domain of logic (McCarthy et al, 1969). At this stage, research was intended to formalize
common behavior involved in widespread tasks, such as image recognition, understanding implicit information
embedded as part of conversational or textual analysis, etc. The goal was to build a digital replica of the workings of the
human brain. Since the beginning, AI has produced a certain degree of fascination, and also some exaggeration,
surrounding the abilities of computers in performing works previously believed to exclusively belong to the domain of
humans. In 1965, Herbert Simon predicted that “machines will be capable, within twenty years, of doing any work man
can do” (Simon, 1965).
The initial approach of AI on formalizing rules of human cognition was overtaken by a probabilistic approach, where
algorithms are developed to identify patterns in large datasets. This has been the case of most applications since the early
sixties and has been responsible for recent progress. The exponential increase in the power of computers has provided
support to this approach. The processing of vast quantities of information under uncertainty constitutes a central element
37
of the probabilistic approach. This approach had led to important theoretical and practical developments (Pearl, 1988; Le
Cun et al, 1989). The work of authors within this paradigm has been so significant that AI based on probabilities has
provided contributions to the fields of statistics and probabilities. The statistical approach tends to be domain-focused,
unlike more general approaches oriented at simulating the brain, and it is behind, through a variety of algorithms and
approaches, many of the modern applications of AI.
Large Internet companies – such as Google, Facebook, Amazon, and Microsoft, among others – have pushed the
boundaries of the field in the process of developing applications to expand their businesses and building on vast data
repositories – unprecedented in the history of humankind – about a variety of behavioral and other data. This data was
initially generated through the digitization of data present in the world (websites, pictures) and later increasingly through
the behavioral patterns of their vast user base. The availability of data at such scale, combined with the use of AI to
analyze it, is placing these companies out of reach of their smaller competitors.
In 2014, Facebook unveiled DeepFace, a tool able to recognize the faces of specific individuals with an accuracy of 97%
(Taigman et al., 2014). The development of DeepFace attests to the exponential increase in computational capacity
which, tied with developments in the area of networked environments, data storage and processing, permitted Facebook
to use a Deep Learning approach - developing a deep neural network involving more than 120 million parameters built
on a dataset of 4 million identity labeled images. Deep Learning, as it’s often referred to by engineers and others, is one
of the branches of Machine Learning, a term first coined by Arthur Samuel in his groundbreaking work “Some Studies
in Machine Learning Using the Game of Checkers” (Samuel, 1959).
Before digging into Deep Learning, it is important to understand more about Machine Learning, its parent discipline.
Machine Learning constitutes an approach to data processing and analysis originally oriented at pattern recognition.
Since Samuel’s seminal paper, a variety of methods and approaches have been developed. They are often classified
under broad categories. These are: supervised Machine Learning, where the dataset used to train the model includes its
anticipated outputs. The idea is to calculate the error between the prediction performed by the model and the target
output; unsupervised learning, unlike supervised learning, there is no training data nor a test dataset against which the
output can be measured. The strategy here lies in an algorithmic classification where data is segmented into classes.
Recommendation systems, such as the ones used by the movie company Netflix and the on-line shopping giant Amazon,
can be considered examples of unsupervised learning.
An important development, which later led to the revolution in Deep Learning that we are currently witnessing, probably
can be traced back to the 80’s. The breakthrough in neural networks, an area that was stagnant after the work of Minsky
et al in the seventies (Minsky et al, 1969) where he demonstrated the incapability of the perceptron (Rosenblatt, 1961) of
approaching non-linear problems, arrived with an algorithmic technique known as backpropagation (Rumelhart et al,
1986), effectively opening the door to the developments leading to Deep Learning. The fundamental idea was to
overcome the problems of the perceptron by building a multi-layered neural network with hidden layers using an
algorithmic approach that back-propagate the error to update parameters using the derivative of the loss function of the
network. This led to important developments in convolutional neural networks (CNN). One of the challenges in the
eighties was that, despite the relative simplicity of the techniques involved, the amount of computing power and data
needed to effectively use them for real world applications was unavailable, which explains its limited use until much
later. An important theoretical development took place in 2012, when a number of papers and techniques started
surfacing. An example was the use of deep neural networks to perform relatively effective speech recognition (Hinton et
al.)
The applications based on Deep Learning are today ubiquitous. Developments in image recognition, such as the example
of Facebook cited earlier, give the developers of such algorithms vast power, particularly when this information is paired
with other datasets. Self-driving cars, healthcare diagnostics, voice assistants, music generation, real-time behavioral
38
analysis, automatic machine translation, automatic text recognition and generation are just a few examples. In finance,
various approaches are transforming markets and raising important questions about the roles of market actors and
regulators.
The exponential increase of health monitoring systems has led to the generation of vast datasets of increasingly larger
segments of the population. This is clear in particular with the adoption of activity trackers and wireless-enabled
wearable technology. This is an area where the most important developments are not happening exclusively in the
algorithmic techniques – although there are important developments in this area – but in the combination of existing
datasets, which shows the interaction between progress in AI and the important cultural changes leading to the
generation of additional data. People are, in a certain sense, creating the space for AI applications. Google and fitbit (a
company which produces wireless wearable devices), for example, have announced that they will collaborate to combine
data generated by individuals as a result of their physical activity and electronical medical records (EMR).1
A number of diagnosis applications are being developed and could help extend health services in communities with
limited resources. An example are the attempts to automate the diagnosis of tropical diseases, such as malaria, through
computer vision techniques (Saputra, 2017). More diagnosis would also contribute to better monitoring that would assist
public authorities in the management of health crises. The use of Machine Learning techniques coupled with more
diagnosis data-points could anticipate outbreaks and areas at risk, providing crucial lead-time that could save many lives.
Tracking the behavior of students constitutes one of the most salient developments in the area of education. Its basis is
not essentially different from the algorithms that present us with a variety of options based on our own history of actions
and other parameters related to our location, cultural background, economic status when we access social networks or
shop online. In the case of education, Machine Learning models identify the risk of students dropping out, best
responses and selection of content based on a range of behavioral factors, etc. Natural language processing is another
important area tied to the use of AI in education. The behavioral approach paired with natural language processing has
led to models that assess the cognitive and affective state of the student, interactively adapting content delivery to
increase motivation. Tracking learning achievements require the definition of adequate indicators that will shape the
dynamics of the algorithm. This must be done with great caution because giving preference to certain tracks or qualities
may lead to algorithmic techniques that reproduce social patterns of exclusion. Many communities in the LDCs lack
resources, including teachers, which constitutes a serious impediment to providing quality education and to ensuring
adequate schooling and skill developments for millions of children. AI cannot solve this problem but could potentially
assist as part of the solution, provided that the right resources and expertise from these countries is available.
Autonomous transportation has made substantial progress in recent years. The development of the TESLA autonomous
driver system is a well-known example, but in fact most automobile manufacturers have already incorporated some level
of assisted driving. The area of transportation provides a good example of the unforeseen consequences of widespread
adoption of AI – or any technology. The generalization of autonomous driving will undoubtedly impact urban
organization. In the case of developing countries, however, AI could support local authorities in managing complex
transport networks in a way that substantially differ from the use of this technique in developed countries. Identifying
growth areas in cities and predicting movement flows could be developed aggregating cellphone, satellite and other data
to build the models. This shows the importance of developing technical capabilities in developing countries as their
needs, and therefore their application, substantially differ from those of developed countries.
In the food production and agriculture sectors there are already applications that use satellite imagery processed by
image recognition algorithms based on artificial neural networks to make agricultural production forecasts. An example
is the work of Descartes Lab, a start-up whose predictions are consistently more accurate that the predictions of the
1 https://investor.fitbit.com/press/press-releases/press-release-details/2018/Fitbit-and-Google-Announce-Collaboration-to-Accelerate-Innovation-in-Digital-Health-and-Wearables/default.aspx
39
United States Department of Agriculture2. In developing countries, food shortages or variations in agricultural
productions could be predicted in advance. Satellite imagery provides information about areas that may be difficult to
access or lacking reliable data. Thus, AI could be used to identify the impact of droughts, changes in land patterns or the
degradation of arable land. In addition, similarly to some potential applications in the area of health, the widespread use
of mobile phones could facilitate the identification of plant diseases with potential devastating impacts on crops.
The developments in Deep Learning cannot be understood without taking into consideration the fundamental changes in
the computing paradigm and in information and communication technologies more broadly in recent decades. The
evolution of software and its relationship with production and consumption has dramatically changed in recent decades.
The age of the monolithic mainframe, consisting of a large, individual system - mostly used by large financial
corporations and transnational companies - gave rise to a far more decentralized architecture. This change in paradigm
led in the 90’s and early 2000’s to the digitalization of small businesses and the rise of the personal computer. More
recently, an emergence of giant clusters of computational power and storage which are available for hire by individuals
through the Internet – also known as Cloud Computing - has transformed the landscape yet again. This recent shift takes
place under a different computational paradigm composed of a network of huge data-centers, each of them internally
structured as a network of servers operating various instances of an operative system - literally, a virtuality inside the
virtual world. The emergence of the cloud and its immense computational power has made possible the articulation of
theoretical developments based on algorithmic approaches at the core of the developments in Machine Learning. This
algorithmic approach is used to estimate familiar metrics, such as “productivity, risk, compliance and contingency”
(Rossiter, 2016), which have transformed planning, from inventory management and transport to consumer demand.
The network is the definite feature of the computational paradigm of our time. Unlike in the past, where the last
architectural node was the computer, we are now an integral part of the network. The rise of the mobile phone, in the
developed and the developing world, constitutes a key development. Thus, addressing exclusion is often presented,
under a variety of policy recommendations, as incorporating the poor or excluded into the network. The vast
developments in AI, and more generally in the digital technologies that define our time, have taken place in a few places
and reside mostly in localized developed countries. This creates risk at multiple levels, including the amplification of
social inequalities and prejudices. As part of this effort, connecting underserved areas, particularly the LDCs, through
the development of adequate infrastructure and ensuring affordability, is crucial. In order to avoid bias, and also to
prevent the reproduction of the inequalities existing between countries in the digital space, we will need to stimulate the
articulation of the necessary conditions that ensure content creation and application development by the people of
communities currently underserved. The technology and know-how are in many cases freely available. As an example,
Google recently released TensorFlow, an open-source Machine Learning framework that can be downloaded and used
by everyone. Another example are the research and tools released by OpenAI, a non-profit AI research company, which
has received financial commitments of up to US$1 billion by 2018 to achieve its goal of discovering and enacting the
path to safe artificial general intelligence.
Conclusion
The evolution of computer science and engineering solutions is – like other human activities – influenced by the
political, social and cultural context. The relationship between science and the economy can move in a positive
direction, thus helping to reduce the gap between the poorest and the rest, or widen it. An important first step is to
understand dynamics, instruments and linkages between the technical and the political.
AI has a large potential to bring benefits to LDCs, however, a considerable effort needs to be made to empower
Governments and the Private Sector in these countries to be able to leverage it. Cloud computing gives scientists and
entrepreneurs computational power that was a few years ago only available to large corporations, for a fraction of the
2 www.bloomberg.com/news/articles/2015-09-08/descartes-labs-view-from-space-shows-shrinking-u-s-corn-crop
40
cost. Our task lies in making this knowledge available to everyone, in order to unleash the potential of creativity and
initiative of people in the countries and communities we serve.
References
Alan, M. (1950). Turing. Computing machinery and intelligence. Mind, 59 (236), 433–460.
https://doi.org/http://dx.doi.org/10.1007/978-1-4020-6710-5_3
LeCun, Y., Boser, B., Denker, J. S., Henderson, D., Howard, R. E., Hubbard, W., & Jackel, L. D. (1989). Backpropagation Applied
to Handwritten Zip Code Recognition. Neural Computation, 1(4), 541–551. https://doi.org/10.1162/neco.1989.1.4.541
Minsky, M. L. & Papert, S. Perceptrons (MIT, Cambridge, 1969).
Pearl, J. (1988). Probabilistic Reasoning in Intelligent Systems. Morgan Kauffmann (Vol. 88). https://doi.org/10.2307/2026705
Rosenblatt, F. Principles of Neurodynamics (Spartan, Washington, DC, 1961).
Rossiter, N. (2016). Software, infrastructure, labor. New York: Routledge.
Rumelhart, D. E., Hinton, G. E., & Williams, R. J. (1986). Learning representations by back-propagating errors. Nature, 323(6088),
533–536. https://doi.org/10.1038/323533a0
Samuel, A. L. (1959). Some Studies in Machine Learning Using the Game of Checkers. IBM Journal of Research and Development,
3(3), 210–229. https://doi.org/10.1147/rd.33.0210
Saputra, W. A., Nugroho, H. A., & Permanasari, A. E. (2017). Toward development of automated plasmodium detection for Malaria
diagnosis in thin blood smear image: An overview. In 2016 International Conference on Information Technology Systems and
Innovation, ICITSI 2016 - Proceedings. https://doi.org/10.1109/ICITSI.2016.7858228
Simon, H.A. (1965). The shape of automation for men and management. (Harper and Row, 1965)
Taigman, Y., Yang, M., Ranzato, M., & Wolf, L. (2014). DeepFace: Closing the gap to human-level performance in face
verification. In Proceedings of the IEEE Computer Society Conference on Computer Vision and Pattern Recognition (pp.
1701–1708). https://doi.org/10.1109/CVPR.2014.220

41
Artificial Intelligence as a global game changer: three key challenges
Policy Brief3
Anne Miroux, Faculty Fellow, Cornell University, and former Director, UNCTAD
In early 2017, PwC predicted that, by year 2030, artificial intelligence (AI) would boost global GDP by $16trn, and that
half of this would go to one single national economy, namely China4.
Clearly, some major shifts have started to affect the world economy, which will modify the way we look at production,
trade, employment and geo-politics altogether. The present paper will try to identify some of the directions that such
changes could take, consider their possible implications regarding the performance of various types of economies, and
anticipate some of the critical issues that should be considered most urgently if we want to maximize the global benefits
of AI and keep its possible negative implications under control.
As the CEO of IBM, Ginni Rometty, recently reminded us, ‘the term “artificial intelligence” was coined in 1955 to
convey the concept of general intelligence: the notion that all human cognition stems from one or more underlying
algorithms, and that by programming computers to think in the same way, we could create autonomous systems
modelled on the human brain.’5. In the report mentioned earlier, PwC used a slightly different definition, considering
that ‘AI is a collective term for computer systems that can sense their environment, think, learn, and take action in
response to what they’re sensing and their objectives’. Although such definitions vary, the general consensus would
currently converge to defining AI as including automated intelligence (automation of manual/cognitive and
routine/nonroutine tasks, typically found in equipment like robots), assisted intelligence (helping people to perform tasks
faster and better, for instance through adaptive software, imbedded in equipment such as cars, or included in search
engines), augmented intelligence (helping people to make better decisions, for instance through algorithms that will add
contextual data to that already gathered by the user, compare complex situations to similar ones – stored in large
memories, generally cloud-based, and turn this additional knowledge into proposals for action/decision), and finally
autonomous intelligence (going all the way to automating decision making processes without human intervention, which
is becoming more and more common in ‘smart management’ of airline and other transport traffic, or energy grids for
example).
Why and how is AI changing the game?
At the risk of oversimplifying a complex equation, one could consider that, although AI is not a new phenomenon, it has
recently reached a different level of visibility and impact because of what happens around it, both upstream and
downstream. Upstream, ‘big data’ has benefitted from the exponential growth of computing power, and the dramatic
reduction of costs regarding the transmission and storage of information. Downstream, the advent and democratization
of virtual and augmented reality (virtual reality - VR - and augmented reality – AR-) is de facto offering natural outlets
to practically every innovation in AI.
3 Published in “Human Decisions: Thoughts on AI”, Netxeplo-UNAB, UNESCO Publishing, Paris, 2018, (ISBN 978-92-3-100263-2) 4 See PWC (2017).
5 See Rometty (2017). In the same article, she also mentioned that ‘At the same time, other researchers were taking a different approach. Their method—which worked bottom up to find patterns in growing volumes of data—was called IA, short for “intelligence augmentation.” Ironically, the methodology not modelled on the human brain has led to the systems we now describe as cognitive. IA is behind real-world applications such as language processing, machine learning and human-computer interaction. The term “AI” won out in the end, despite being a misnomer.’
42
But why are businesses and governments so eager to invest billions of dollars into AI, and why do markets value AI
firms so much?6. The key word here is productivity. AI holds the promise not only of significant productivity gains in
manufacturing (through a better allocation of resources between capital and labor) but also of true ‘quantum leaps’ in a
wide range of industries and value chains that are likely to be transformed, displaced or replaced.
The reason why the anticipated impact of AI is so significant results from the fact that it allows three kinds of changes to
happen simultaneously, namely:
• Doing things faster: large amounts of data can be collected, analyzed and synthetized on a routine basis. Big
data applies massively to areas like law (millions of cases can be read and compared), scientific research
(multiple configurations and analyses are performed through simulated lab experiments), consumer behavior
(through the continuous gathering and analysis of buying patterns, and its application to customized/targeted
advertising), filtering of job applications (analysis of keywords in applications and resumés allow algorithms do
perform initial selections before any human eye has even seen the application).
• Doing things better: greater precision and safety levels can be reached in operations such as self-driven cars
(insurance companies have started offering discounts for equipped vehicles), and surveillance (drones,
movements and patterns analyses, face recognition, including emotion identification) for instance. Risk
evaluations (eg to grant loans) are already performed better by algorithms than by humans. 7
• Doing things differently: AI is rapidly moving into creative areas. Deep thinking (i.e. the use of self-improving
algorithms) has opened the door to adaptive robotics (i.e. machines endowed with the power to improve
constantly through software ameliorations, and – progressively – reconfiguration. In this regard, advances
provided by IBM (Deep Blue, Watson) and Google (AlphaGo) have pushed the frontier beyond what was
considered possible a decade or two ago.
The convergence of these three trends has massive implications for:
• Productivity: as flagged earlier, labor productivity will soar because of modified capital/labor ratios; this
will also be the case for total productivity, because of continuous (24/7) production, faster delivery, and
improved quality control.
• Security/safety: VR, AR will help a global relinquishing of repetitive and dangerous jobs.
• Competitiveness: both enterprises and nations will benefit, especially if they are among first-comers.
• Social organization: the future of work will be strongly influenced by the availability of life-long learning
tools; individual strategies (how to position oneself not to be competing with robots/AI) will rapidly
improve as a result.
• New goods and services will be developed: self-learning robots, operator-coaching/teaching equipment,
algorithm-based decision-making goods and services (self-driven cars, predictive software for retail,
advertising, entertainment, e.g.) will drive significant segments of the global economy.
Altogether, massive changes will affect how value is distributed along production and delivery chains, locally and
globally. Entire industries will be relocated, transformed or obliterated altogether while others will emerge as critical and
strategic.
6 From January 2009 to March 2017, the MSCI index (worldwide) appreciated by 40 %; the growth was 200 % for the S&P Global BMI (Information Technology), and 280% for the Robo Global Index (Robotics and Automation). See: Li, H. (2017).
7 Kai Fu Lee, a former executive at Microsoft and CEO of Google China, who has created his own venture capital company (Sinovation Ventures) predicts that ‘big banks will fall first to artificial intelligence’. See Kai Fu Lee (2017a).
43
The current geo-economics of AI – a growing divide
The world is currently divided between a handful of major players and potential players on one hand, and a majority of
countries with little or no ambition of capabilities in the field of AI. The threat of a ‘global AI divide’ is hence already a
reality.
• The incumbents: United States of America, Germany, Japan and the Republic of Korea. The United States is
spearheading the development of autonomous vehicles, led by companies like Google, Tesla and Uber. In
consumer markets, Google, Facebook, Microsoft, Amazon are making extensive use of A.I. and expanding
operations to other countries. Korea is still a leader in many semi-conductors segments, and companies like
Samsung or Hyundai are clearly benefitting from this situation in developing their own AI efforts. But this
situation may be under threat from China, since the Chinese current five-year plan (2016 – 2020) has
identified semi-conductors as a priority area. More tensions should be expected in this sector, as many AI
experts predict that an increasing proportion of basic AI algorithms will be hardwired inside chips, rather
than programmed ex-post.8 With leaders like Toyota, Japan has focused very much on robotics, and in
particular ‘human looking robots’ able to replace employees in hotels and various other sectors. It appears to
be a market with significant potential to rapidly adopt AI as a regular part of its consumer goods and
domestic services. Germany has also been spearheading AI efforts in areas such as on-board systems for
cars and machine-tools, with a high concentration of AI start-ups in the Berlin area. Those countries are
expected to remain among the leaders (and main beneficiaries) of the anticipated growth of AI, at least in
the coming decade.
• Possible contenders: a handful of advanced economies should be able to build respectable market shares in
AI goods and services. Such countries include France (where a company like Atos is granting priority to the
development of quantum computing, which may prove critical to the acceleration of deep thinking and deep
learning), Nordic countries and Switzerland (where relatively small companies - eg in Norway - and a
dense tissue of top universities and research centers - eg around Switzerland’s EPFL ‘Brain Project’ – could
combine into a dynamic AI ecosystem), and finally some visionary fast growing economies (such as that of
the UAE) where significant funding could accelerate the adoption of ambitious AI-related strategies.
• The upcoming giant: China. China is already a world leader in several key AI markets. For example, the
Chinese speech-recognition company iFlytek and several Chinese face-recognition companies such as
Megvii and SenseTime have the highest market capitalizations in their respective field. China is also
moving aggressively in AI for consumer markets, through companies like Baidu, Alibaba and Tencent.
Recently, Baidu (which can be regarded as the equivalent of Google in China) issued an academic paper
proposing to use a combination of AI and Baidu Maps to predict when and where dangerous crowds are
forming, and alert users in the area, as well as local authorities.9
The foreseeable future: China casts a long shadow
In the race to develop AI goods and services, five key ingredients will matter, namely: market size, data volumes,
technology (which is largely a function of R&D funding), talent and ambition.
In such a context, it is not difficult to see why China (and to some extent the United States) are enjoying both a head-
start and an increasing advantage. Kai Fu Lee summarizes it as follows: ‘A.I. is an industry in which strength begets
strength: The more data you have, the better your product; the better your product, the more data you can collect; the
more data you can collect, the more talent you can attract; the more talent you can attract, the better your product. It’s
8 Illustrated for example by the recent release of Googles new ‘neural network’ chip (TPU 2.0), which will not be sold to other companies. See Metz (2016 and 2017). 9 China Daily (2016).
44
a virtuous circle, and the United States and China have already amassed the talent, market share and data to set it in
motion’.10
China’s efforts are helped by a massive funding effort, which is not limited to support from its central government
agencies. As noted by J. Mozur and P. Markoff, ‘Quantifying China’s spending push is difficult, because authorities
there disclose little. But experts say it looks to be considerable’. 11 It is also interesting to note that, more and more, local
entities (such as municipalities) are taking a visible role in attracting talents12 and financing local innovative ventures,
especially in the field of AI, spending billions on developing robotics for example. Cities like Xiangtan (Hunan
province) has pledged $2 billion toward developing robots and artificial intelligence. In Suzhou (close to Shanghai),
leading artificial intelligence companies can get about $800,000 in subsidies for setting up shop locally. In Shenzhen (a
megacity close to Hong Kong, and host of Huawei’s headquarters) $1 million is offered to any A.I. project established
there. It is also interesting to note that Chinese tech giants like Baidu, Tencent and Didi Chuxing have opened artificial
intelligence labs in the United States, as have some Chinese start-ups. Over the past six years, Chinese investors helped
finance 51 American artificial intelligence companies, contributing to the $700 million raised.13
Recent progress made by China in innovation has attracted international attention: in 2016, China moved into the top 25
of the Global Innovation Index, and in 2017, its ranking improved even further (it is now 22nd)14. Growing talent should
reinforce this trend, especially in areas like AI. As The Economist recently noted, ‘As well as strong skills in maths, the
country has a tradition in language and translation research, says Harry Shum, who leads Microsoft’s AI efforts.
Finding top-notch AI experts is harder in China than in America, says Wanli Min, who oversees 150 data scientists at
Alibaba. But this will change over the next couple of years, he predicts, because most big universities have launched AI
programmes. According to some estimates, China has more than two-fifths of the world’s trained AI scientists.’15. Since
China is now the largest market for data collection and handling, its clearly has a growing advantage in terms of ability
to develop deep-learning, i.e. the process by which the quality of algorithms (i.e. the core of AI) improve through the
continuous identification of patterns across huge amounts of data.
Conclusion – AI’s three key challenges
Experts have long been warning us about the opportunities and challenges raised by AI. In his 1999 book ‘The age of
spiritual machines’, and even more so in ‘The singularity is near’ (2005)16, Ray Kurzweil spelt out the fundamentals of
today’s debates. In the movie version of that book (released in 2012) 17, Kurzweil – playing his own role - discussed
those with nineteen ‘big thinkers’ of the time. If that movie were produced today, the list would most probably include
business leaders such as Bill Gates, Elon Musk, Jeff Bezos or Mark Zuckerberg. 18
10 Kai Fu Lee (2017b). 11 Mozur, P. and Markoff, J. (2017). 12 Policies designed and implemented by cities to grow, attract and retain talents are becoming critically important in shaping the geo-economy of work in fields like AI. See for example Lanvin, B. (2017). 13 At his point in time, it is difficult to know what the future of such cooperation will be. The rapid development of China’s spending on AI is in stark contrast with the trend currently observed in the US. Mozur, P. and Markoff, J. (2017) also note that ‘President Trump’s proposed budget, meanwhile, would reduce the National Science Foundation’s spending on so-called intelligent systems by 10 percent, to about $175 million. Research and development in other areas would also be cut, though the proposed budget does call for more spending on defence research and some supercomputing. The cuts would essentially shift more research and development to private American companies like Google and Facebook.’ 14 Global Innovation Index (2017). 15 The Economist (2017). 16 Kurzweil, R. (1999, 2005). 17 See http://www.kurzweilai.net/the-singularity-is-near-movie-available-today . 18 Stephen Hawking, Bill Gates and Elon Musk have rightly raised concerns about the risks inherent with AI capable of equaling, or even surpassing, human intelligence. Anticipating the emergence of even more powerful and increasingly autonomous AI reinforced by quantum computing, they have been are asking for a collective reflection upon what could constitute a challenge to
45
There is no doubt that AI will continue to develop fast, attract significant investment and R&D spending, and
Infrastructure and equipment, and fundamentally alter the current bases of production, trade and value creation.
In this process, obstacles may lay in AI’s path, and in that of its champions. International cooperation and policy
attention will be required in at least three areas, namely:
• The design, implementation and surveillance of ‘fair competition rules’, preventing the emergence of
monopoly or dominance situations, which would create unsurmountable barriers to entry for those not
already in the AI race
• The formulation of the innovative mechanisms of concertation, regulation and governance that the world of
AI urgently requires. Such regulation will also be critically important for the governments and companies
that are ahead in the field, as they could mitigate some of the unavoidable backlash that the looming of an
AI-driven global economy will generate across public opinions because of its perceived and/or actual impact
on civil liberties, individual freedom, privacy and employment for instance.
• The immediate reform of education systems and life-long learning mechanisms to allow a constant re-
skilling of the workforce at all levels (from vocational to global knowledge skills, to use GTCI
terminology).
References
Chandran, N. (2016), ‘China's tech ambitions puts South Korea on alert’, CNBC, 9 Mar 2016. See
https://www.cnbc.com/2016/03/09/south-korea-tech-at-risk-as-china-steps-up-ambitions.
China Daily (2016), Baidu develops AI algorithm to predict crowds, avoid stampedes, chinadaily.com.cn, 25 Marc 2016
http://www.chinadaily.com.cn/china/2016-03/25/content_24093618.htm
Fay, P. (2017), La Bourse passe à l’ère de la robolution, Les Echos, 1er Juin 2017, https://www.lesechos.fr/finance-
marches/marches-financiers/030361740719-la-bourse-passe-a-lere-de-la-robolution-2090888.php
Global Innovation Index (2017), Cornell-INSEAD-WIPO. https://global-indices.insead.edu/gii.
Global Talent Competitiveness Index (2017), Adecco-INSEAD-HCLI. https://global-indices.insead.edu/gtci.
Gossett, D. (2016), Artificial intelligence and geopolitics, China Daily European Weekly 09/16/2016, page 10.
http://www.huffingtonpost.com/david-gosset/artificial-intelligence-a_2_b_10710612.html
Kai Fu Lee (2017a), Let Machines Invest your Money, interview to Quartz (16 Mai 2017). See https://qz.com/984709/kai-fu-lee-a-
former-google-china-ceo-predicts-big-banks-will-fall-first-to-artificial-intelligence/.
Kai Fu Lee (2017b), The real threat of artificial intelligence, New York Times, 24 June 2017.
https://www.nytimes.com/2017/06/24/opinion/sunday/artificial-intelligence-economic-inequality.html
Kurzweil, R. (1999), The age of spiritual machines – when computers exceed human intelligence, Viking
https://en.wikipedia.org/wiki/The_Age_of_Spiritual_Machines
Kurzweil, R. (2005), The singularity is near - When Humans Transcend Biology, Viking.
https://en.wikipedia.org/wiki/The_Singularity_Is_Near
Lanvin, B. (2017), Benchmarking Cities as Key Players on the Global Talent Scene (in Global Talent Competitiveness Index 2017),
INSEAD, Adecco, HCLI 2017. http://global-indices.insead.edu/gtci .
Lanvin, B. and Evans, P. ed. (2017), Talent and Technology, (in Global Talent Competitiveness Index 2017), INSEAD, Adecco,
HCLI 2017. http://global-indices.insead.edu/gtci .
mankind, a technology that could dominate its creator. Elon Musk recently launched his own ‘AI Initiative’. See https://openai.com/about/
46
Li, H. (2017), ‘Long-term Growth Investing - Robotics, Automation, Cyber Security’, ETF Securities, 23 March 2017.
http://www.etfexpress.com/2017/02/27/249065/etf-securities-reports-growth-cyber-security-and-robotics-etps.
Metz, C. (2016), ‘How AI Is Shaking Up the Chip Market’, Wired, 28 October 2016. See https://www.wired.com/2016/10/ai-
changing-market-computer-chips.
Metz, C. (2017), ‘Google Rattles the Tech World With a New AI Chip for All’, Wired, 24 April 2017. See
https://www.wired.com/2017/04/race-make-ai-chips-everything-heating-fast.
Mims, C. (2017), A Hardware Upgrade for the Human Brain, Wall Street Journal, 5 June 2017. https://www.wsj.com/articles/a-
hardware-update-for-the-human-brain-1496660400 .
Mozur, P. and Markoff, J. (2017), China gains on America in artificial intelligence, New York Times, 29 May 2017.
https://www.nytimes.com/2017/05/27/technology/china-us-ai-artificial-intelligence.html.
PWC (2017), Sizing the prize - PwC’s Global Artificial Intelligence Study: Exploiting the AI Revolution. http://www.pwc.com/ai.
Rometty, G. (2016), The natural side of A.I., The Wall Street Journal, 18 October 2016, https://www.wsj.com/articles/the-natural-
side-of-a-i-1476799723.
Rousseau, Y. (2017), Le japonais SoftBank s’offre les spectaculaires robots de Google, Les Echos, 12 Juin 2017.
https://www.lesechos.fr/tech-medias/hightech/030375701278-apres-pepper-le-japonais-softbank-soffre-les-robots-spectaculaires-
de-google-2093143.php.
The Economist (2017), China may match or beat America in AI, 15 June 2017.
https://www.economist.com/news/business/21725018-its-deep-pool-data-may-let-it-lead-artificial-intelligence-china-may-match-
or-beat-america.
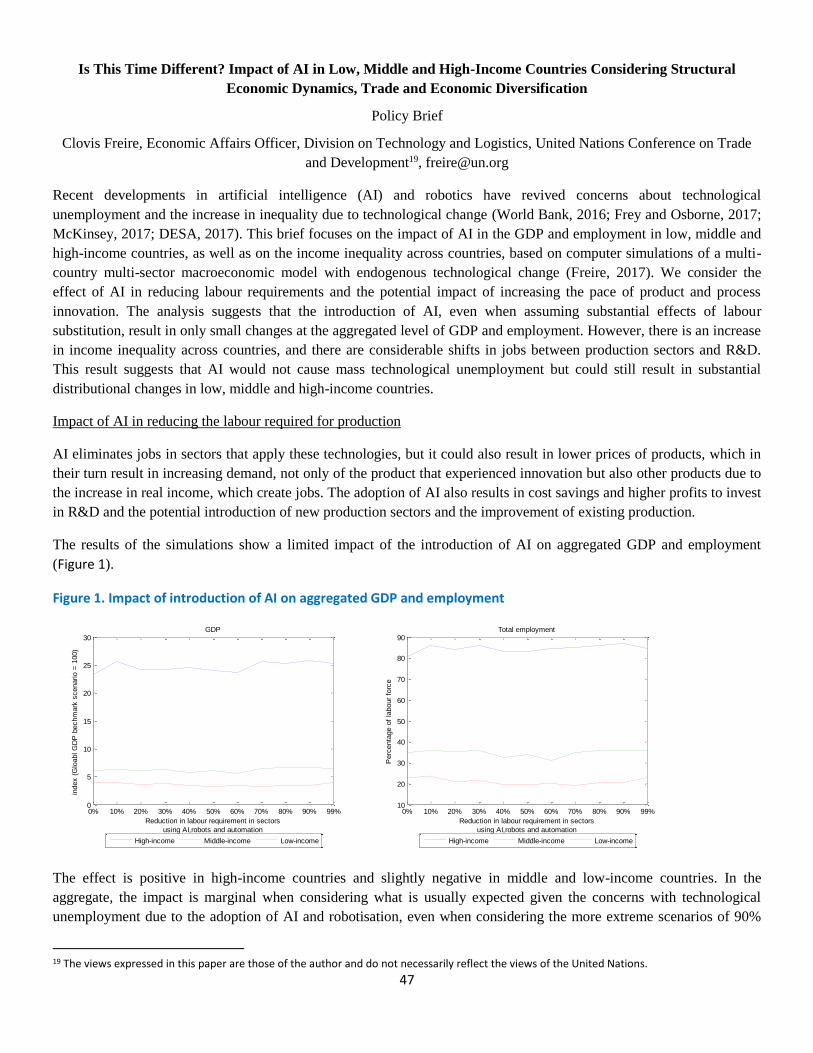
47
Is This Time Different? Impact of AI in Low, Middle and High-Income Countries Considering Structural
Economic Dynamics, Trade and Economic Diversification
Policy Brief
Clovis Freire, Economic Affairs Officer, Division on Technology and Logistics, United Nations Conference on Trade
and Development19, [email protected]
Recent developments in artificial intelligence (AI) and robotics have revived concerns about technological
unemployment and the increase in inequality due to technological change (World Bank, 2016; Frey and Osborne, 2017;
McKinsey, 2017; DESA, 2017). This brief focuses on the impact of AI in the GDP and employment in low, middle and
high-income countries, as well as on the income inequality across countries, based on computer simulations of a multi-
country multi-sector macroeconomic model with endogenous technological change (Freire, 2017). We consider the
effect of AI in reducing labour requirements and the potential impact of increasing the pace of product and process
innovation. The analysis suggests that the introduction of AI, even when assuming substantial effects of labour
substitution, result in only small changes at the aggregated level of GDP and employment. However, there is an increase
in income inequality across countries, and there are considerable shifts in jobs between production sectors and R&D.
This result suggests that AI would not cause mass technological unemployment but could still result in substantial
distributional changes in low, middle and high-income countries.
Impact of AI in reducing the labour required for production
AI eliminates jobs in sectors that apply these technologies, but it could also result in lower prices of products, which in
their turn result in increasing demand, not only of the product that experienced innovation but also other products due to
the increase in real income, which create jobs. The adoption of AI also results in cost savings and higher profits to invest
in R&D and the potential introduction of new production sectors and the improvement of existing production.
The results of the simulations show a limited impact of the introduction of AI on aggregated GDP and employment
(Figure 1).
Figure 1. Impact of introduction of AI on aggregated GDP and employment
The effect is positive in high-income countries and slightly negative in middle and low-income countries. In the
aggregate, the impact is marginal when considering what is usually expected given the concerns with technological
unemployment due to the adoption of AI and robotisation, even when considering the more extreme scenarios of 90%
19 The views expressed in this paper are those of the author and do not necessarily reflect the views of the United Nations.
0% 10% 20% 30% 40% 50% 60% 70% 80% 90% 99%0
5
10
15
20
25
30GDP
index (
Glo
abl G
DP
bechm
ark
scenario =
100)
Reduction in labour requirement in sectors
using AI,robots and automation
High-income Middle-income Low-income
0% 10% 20% 30% 40% 50% 60% 70% 80% 90% 99%10
20
30
40
50
60
70
80
90Total employment
Perc
enta
ge o
f la
bour
forc
e
Reduction in labour requirement in sectors
using AI,robots and automation
High-income Middle-income Low-income
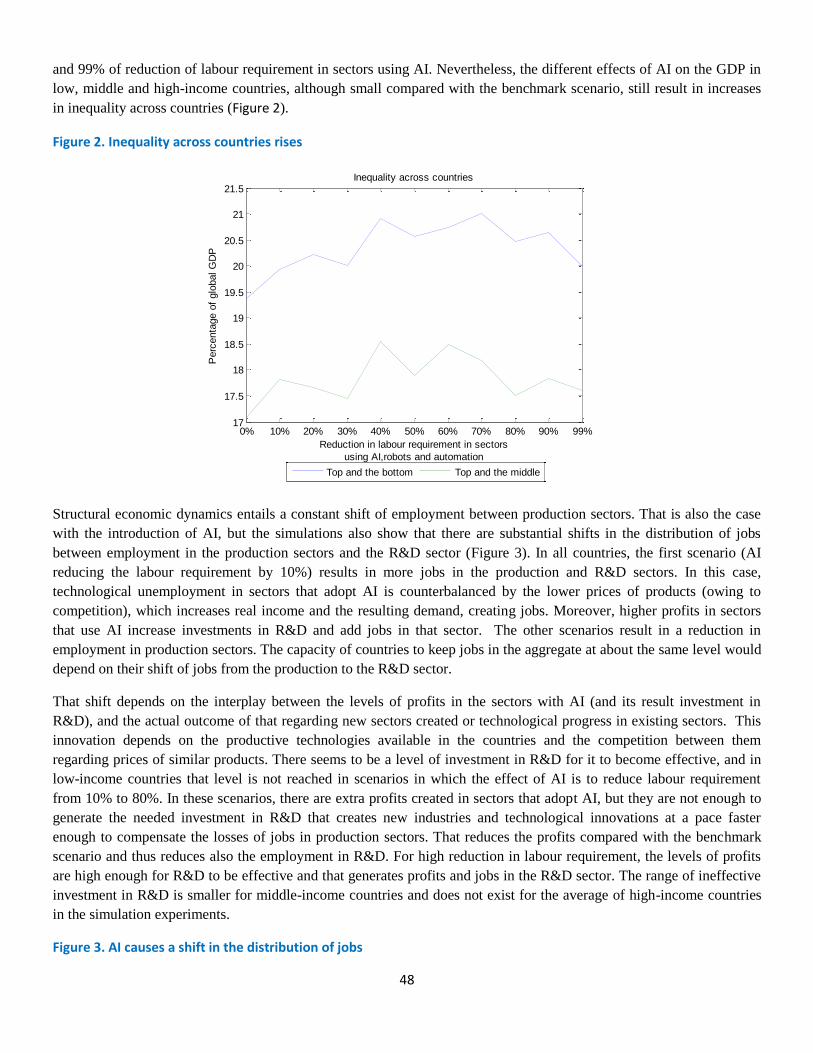
48
and 99% of reduction of labour requirement in sectors using AI. Nevertheless, the different effects of AI on the GDP in
low, middle and high-income countries, although small compared with the benchmark scenario, still result in increases
in inequality across countries (Figure 2).
Figure 2. Inequality across countries rises
Structural economic dynamics entails a constant shift of employment between production sectors. That is also the case
with the introduction of AI, but the simulations also show that there are substantial shifts in the distribution of jobs
between employment in the production sectors and the R&D sector (Figure 3). In all countries, the first scenario (AI
reducing the labour requirement by 10%) results in more jobs in the production and R&D sectors. In this case,
technological unemployment in sectors that adopt AI is counterbalanced by the lower prices of products (owing to
competition), which increases real income and the resulting demand, creating jobs. Moreover, higher profits in sectors
that use AI increase investments in R&D and add jobs in that sector. The other scenarios result in a reduction in
employment in production sectors. The capacity of countries to keep jobs in the aggregate at about the same level would
depend on their shift of jobs from the production to the R&D sector.
That shift depends on the interplay between the levels of profits in the sectors with AI (and its result investment in
R&D), and the actual outcome of that regarding new sectors created or technological progress in existing sectors. This
innovation depends on the productive technologies available in the countries and the competition between them
regarding prices of similar products. There seems to be a level of investment in R&D for it to become effective, and in
low-income countries that level is not reached in scenarios in which the effect of AI is to reduce labour requirement
from 10% to 80%. In these scenarios, there are extra profits created in sectors that adopt AI, but they are not enough to
generate the needed investment in R&D that creates new industries and technological innovations at a pace faster
enough to compensate the losses of jobs in production sectors. That reduces the profits compared with the benchmark
scenario and thus reduces also the employment in R&D. For high reduction in labour requirement, the levels of profits
are high enough for R&D to be effective and that generates profits and jobs in the R&D sector. The range of ineffective
investment in R&D is smaller for middle-income countries and does not exist for the average of high-income countries
in the simulation experiments.
Figure 3. AI causes a shift in the distribution of jobs
0% 10% 20% 30% 40% 50% 60% 70% 80% 90% 99%17
17.5
18
18.5
19
19.5
20
20.5
21
21.5Inequality across countries
Perc
enta
ge o
f glo
bal G
DP
Reduction in labour requirement in sectors
using AI,robots and automation
Top and the bottom Top and the middle
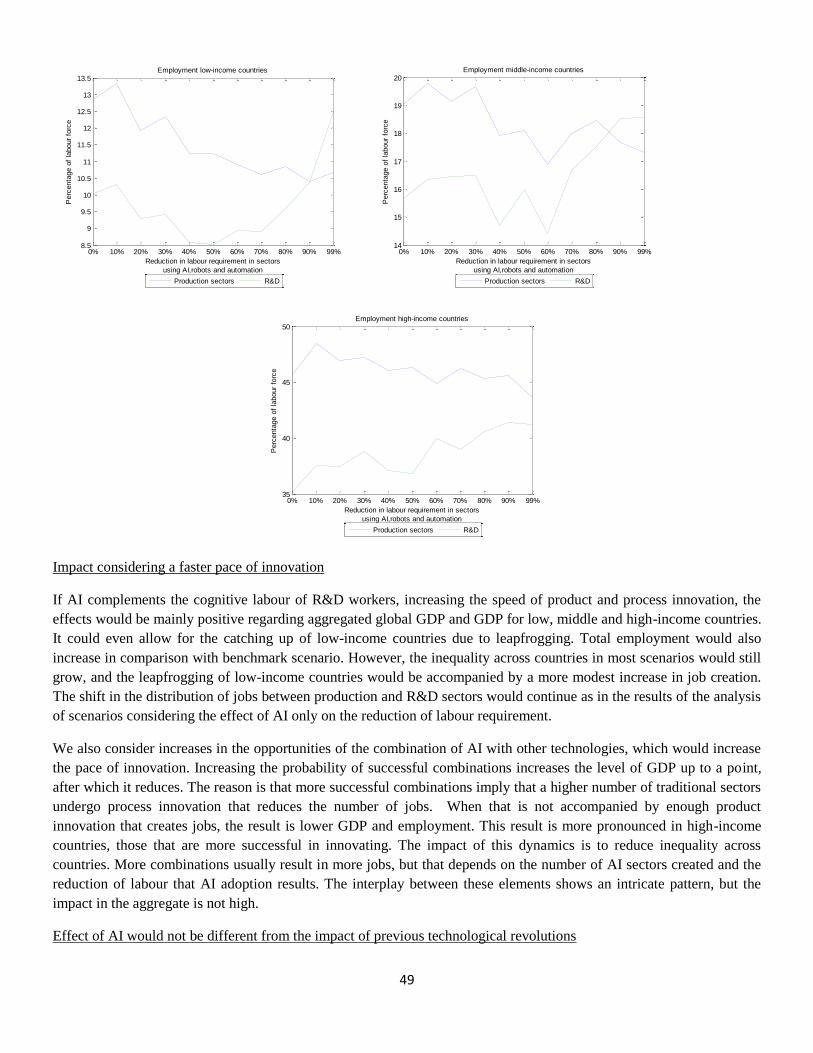
49
Impact considering a faster pace of innovation
If AI complements the cognitive labour of R&D workers, increasing the speed of product and process innovation, the
effects would be mainly positive regarding aggregated global GDP and GDP for low, middle and high-income countries.
It could even allow for the catching up of low-income countries due to leapfrogging. Total employment would also
increase in comparison with benchmark scenario. However, the inequality across countries in most scenarios would still
grow, and the leapfrogging of low-income countries would be accompanied by a more modest increase in job creation.
The shift in the distribution of jobs between production and R&D sectors would continue as in the results of the analysis
of scenarios considering the effect of AI only on the reduction of labour requirement.
We also consider increases in the opportunities of the combination of AI with other technologies, which would increase
the pace of innovation. Increasing the probability of successful combinations increases the level of GDP up to a point,
after which it reduces. The reason is that more successful combinations imply that a higher number of traditional sectors
undergo process innovation that reduces the number of jobs. When that is not accompanied by enough product
innovation that creates jobs, the result is lower GDP and employment. This result is more pronounced in high-income
countries, those that are more successful in innovating. The impact of this dynamics is to reduce inequality across
countries. More combinations usually result in more jobs, but that depends on the number of AI sectors created and the
reduction of labour that AI adoption results. The interplay between these elements shows an intricate pattern, but the
impact in the aggregate is not high.
Effect of AI would not be different from the impact of previous technological revolutions
0% 10% 20% 30% 40% 50% 60% 70% 80% 90% 99%8.5
9
9.5
10
10.5
11
11.5
12
12.5
13
13.5Employment low-income countries
Perc
enta
ge o
f la
bour
forc
e
Reduction in labour requirement in sectors
using AI,robots and automation
Production sectors R&D
0% 10% 20% 30% 40% 50% 60% 70% 80% 90% 99%14
15
16
17
18
19
20Employment middle-income countries
Perc
enta
ge o
f la
bour
forc
e
Reduction in labour requirement in sectors
using AI,robots and automation
Production sectors R&D
0% 10% 20% 30% 40% 50% 60% 70% 80% 90% 99%35
40
45
50Employment high-income countries
Perc
enta
ge o
f la
bour
forc
e
Reduction in labour requirement in sectors
using AI,robots and automation
Production sectors R&D
50
The results show that the economic system could be very robust to AI concerning the effects in the aggregated GDP and
employment. This result suggests a very different outcome of those in the recent literature that estimates the number of
jobs threatened by AI and robotization. Despite the small change in the aggregate, in general, high-income countries
benefit and middle and low-income countries are affected negatively, even if only slightly, and across country inequality
still increases in the most scenarios. Therefore, the effect of AI would not be different from the impact of previous
technological revolutions and that catching up by middle and low-income countries would continue to require the active
and strategic action of governments and the private sector in facilitating the increase of productive capacities of
economies.
Nevertheless, the analysis also shows that the potential of AI to reduce labour requirements to practically zero could
produce results that are indeed very different from reductions of lower magnitude. There seems to exists a non-linear
effect that is related to the interplay between the levels of profits of sectors that adopt AI, their use to invest in R&D and
the practical outcome of the innovation efforts. This outcome depends on the technological set available in the country
for combination into new products and processes and the number of people engaged in R&D. That combined with the
changes in prices due to changes in wages rates and labour productivity, and the competition between countries in the
global markets create complex outcomes that show the difficulty in assessing the impact of technological change without
considering the structural economic dynamics.
Need for an educated and skilled labour force
The results presented assume the mobility of labour between production sectors and R&D sectors. In reality that is
hardly the case, particularly in poorer countries. In addition to institutions that facilitate that labour mobility, this would
require a labour force prepared in terms of skills to make this shift. Those employed in the R&D sectors would be
searching for potential new products and for technological improvements in existing productions in a broader and
expanding technological space, which would require even more skills, perhaps across many domains. All that shows the
need for an educated and skilled labour force that is able and has the opportunity for continuous skills improvement.
References
DESA (2017). The impact of the technological revolution on labour markets and income distribution. Frontier Issues, 31 July 2017.
Freire (2017). Diversification and structural economic dynamics. PhD dissertation Maastricht University / United Nations
University. Boekenplan, Maastricht. Available from: https://www.merit.unu.edu/training/theses/FREIRE_CLovis.pdf
Frey, C.B., and Osborne, M.A. (2017). The future of employment: How susceptible are jobs to computerisation? Technological
Forecasting and Social Change 114 (January): 254–80. doi:10.1016/j.techfore.2016.08.019.
McKinsey Global Institute (2017). A future that works: automation, employment, and productivity. McKinsey Global Institute.
http://www.mckinsey.com/global-themes/digital-disruption/harnessing-automation-for-a-future-that-works.
World Bank (2016). World Development Report 2016: Digital dividends. The World Bank. doi:10.1596/978-1-4648-0671-1.
51
AI and Neurotechnology: Risks and Recommendations
Policy Brief
May Dobosiewicz and Philip Kidd, Laboratory of Neural Circuits and Behavior, The Rockefeller University, USA.
Correspondence to: [email protected]
AI is rapidly transforming research in neuroscience, particularly in the areas of neuroimaging and brain-computer
interface (BCI) technologies. Further advances in machine learning and AI-based brain modeling will lead to major
advances in neurotechnology in the near future. The privacy and human rights implications of neurotechnologies have
only just begun to be seriously discussed [1]. In order for AI’s impact on society to remain largely beneficial, we must
address how neural data are obtained, used, and managed. The human rights issues implicated in the current use of BCI
technologies in disabled individuals will provide a useful test case for understanding the ethical issues arising from
further development of neural imaging and measurement techniques.
A variety of neuroimaging techniques with different advantages and disadvantages are currently in use. Functional
magnetic resonance imaging (fMRI) uses powerful oscillating magnetic fields to elicit a resonance response in the
nuclear magnetic dipole of hemoglobin. fMRI measures the hemodynamic response, the increased oxygenation of blood
in regions of the brain experiencing increased neural activity. Magnetic fields are only weakly attenuated by tissue, so
fMRI is able to measure activity deep inside the brain. The spatial resolution of fMRI is set by the density of measurable
blood vessels, roughly a millimeter, much larger than a single neuron but relatively precise compared to other
techniques. However, the hemodynamic response is only an indirect reflection of neural activity, and it changes on a
time scale of tens of seconds, much slower than the underlying neural dynamics.
fMRI can be used to infer specific information about the mental states of individual test subjects. A 2008 study [2] used
fMRI to distinguish which image out of a set of 120 was being viewed by a subject, with better than 70% accuracy.
Subsequent studies have achieved similar results for identifying letters of the alphabet or musical pieces. All of these
studies require extensive training of a classifier model on each individual subject, and are only able to identify specific
stimuli out of relatively small sets of possibilities. fMRI and other hemodynamic techniques such as diffuse optical
tomography are only able to provide relatively blunt information about neural activity because they are limited by the
indirect nature of the measurements. However, models of brain function based on machine learning methods will enable
increasingly powerful inferences even from such indirect measurements. For example, a machine learning algorithm was
recently able to infer psychomotor impairment based only on subjects’ typing behavior [3].
Other techniques are able to provide more direct measurements of neural activity. Electroencephalography (EEG) uses
electrodes on the surface of the scalp to directly measure the electrical fields generated by neural activity with a time
resolution of a few milliseconds or less, comparable to the true time scales of information processing in the brain. These
electric fields are weak, so EEG can only detect the coherent activity of large numbers of neurons near the surface of the
brain. This means that the spatial resolution of EEG is on the scale of a centimeter or more, and that only broad features
of neural activity can be detected. Examples include identifying sleep/wake states, or the signature of focused attention
towards a task. The power of EEG measurements will be enhanced by studies of the correlation between fMRI signals
and simultaneously recorded EEG data [4], which will allow much more sophisticated models for the interpretation of
surface-level EEG signals.
Unlike EEG and fMRI, large electrode arrays can record activity from hundreds or thousands of individual neurons at
sub-millisecond time scales, allowing direct access to information transmission in the brain. Implanting these arrays
requires a nontrivial brain surgery, so their use is primarily restricted to research in BCIs. BCIs are used to restore
communication or motor capabilities in disabled individuals, such as amputees or tetraplegics. A recent study [5] used
implanted 96-channel arrays in motor cortex combined with a decoding algorithm and training procedure to allow
52
paralyzed patients to essentially type with their minds. Multi-electrode array recordings potentially present much more
significant ethical concerns than current fMRI and EEG technology, because in principle they allow direct access to the
fundamental substrates of thought.
Electrode array recording devices are fragile and require major surgery, making them unlikely to be used beyond a small
population of research subjects. However, it is likely that in the coming decades, the power of fMRI and EEG
measurements will come to be comparable to electrode recording. Additionally, improvements in the cost effectiveness
and portability of EEG and fMRI devices may greatly increase the frequency of their use. EEG measurements can
already be performed using a device with a physical profile comparable to a large hat, meaning that their routine use in
consumer devices is a real possibility. It is therefore crucial to consider the ethical and policy implications of BCI
technologies, as a means of preparing for the ethical and policy issues that will arise with coming improvements in other
areas of neurotechnology.
When deciding how neural data can be used, it is helpful to look to regulation of online data and biological sample.
Access to personal internet usage data is given by simply checking an often unread Terms and Conditions box [6],
granting companies broad consent, often including permission to share data with undisclosed third-party companies.
Selling these data has become routine; Facebook has recently come under scrutiny for sharing personal data with
companies that used them for ethically questionable purposes. Biological samples are more strictly regulated. In the
United States, biological samples are subject to the “Common Rule” [7] which ensures that an individual must consent
to the use of his/her sample for particular uses. A recent amendment to the Common Rule expands this consent to cover
unspecified future research without the need to gain further consent [8]. The existing regulations for internet usage data
and biological samples are insufficient for neural data. Instead, the sources of neural data should be asked for ongoing
consent; that is, they must consent to who can use the data and for what, and re-consent each time the data are
transferred.
Lawyers have attempted to submit neuroimaging data to courts as evidence of lying or lack of mens rea [9], and there is
enthusiasm for combining neuroimaging data and AI to predict criminal behavior [10]. However, presenting these data
to jurors and judges who do not understand the algorithms used to interpret them is dangerous, and the potential harm in
trusting these interpretations currently outweighs the benefits [11]. Neural data should thus be inadmissible in court.
Similarly, neural data could be used to diagnose psychiatric conditions or infer mental states and form the basis for
discrimination. Genetic information is protected from employers and insurance companies in several countries to curb
discrimination based on genetic predispositions [12]. Neural data should be similarly protected.
Regardless of how an individual’s neural data is eventually used, there must be safeguards in place to secure the data.
Several of the imaging technologies mentioned above have or will have wireless capabilities [13]. This marks a point of
vulnerability for privacy. Hackers routinely gain access to personal data (social security numbers, etc.). In 2017 alone,
328 U.S. health care firms reported data breaches [14] and ransomware hackers claim to have downloaded medical
records of 1.2 million British patients [15]. Neuroimaging technologies must be designed and optimized with data
security in mind. Neural data should be stored on-device whenever possible. Google’s “federated learning” AI approach
trains a machine learning algorithm on a device, improving it with personal data but sending only changes to the model
to the cloud [16]. The data never leave the device, keeping them private and secure.
AI algorithms are becoming sophisticated enough that they can use enormous aggregates of data to make predictions
about subjects who have themselves not disclosed data. For example, sexual orientation can be predicted based on
friendship networks [17], and data stripped of identifiers can be de-anonymized with no concrete data about an
individual [18]. This means that an individual’s data can be inferred regardless of consent. One way around this problem
of group harm is to prohibit the aggregation of neural datasets large enough to make such inferences. Federated learning
and related approaches could promote rapid neuroscience discovery without aggregating personal data in harmful ways.
53
AI has the potential to fundamentally change the way we understand our bodies and minds in ways we cannot predict.
However, without clear regulations about how neural data are used and stored, serious abuses are inevitable. We have
highlighted what we view as the major considerations to be addressed in order for AI to have a largely positive effect on
society as it pertains to neurotechnology. We as a society must firmly protect neural data and the private sanctity of the
mind, and thus treat it distinctly from internet usage data or biological samples. This piece focused on AI in the context
of using BCI to read brain activity or translate thought into action. Despite the lack of regulation surrounding BCI,
researchers are already trying to “close the loop,” or send data back into the brain in real-time. Two simple examples are
to give feeling to those using prosthetic limbs as though the limb were flesh and blood [19] or to prevent seizures at the
moment of detection [20]. The ethical and societal concerns surrounding writing data into the brain will be challenging
to address and highlight the urgent need to first establish firm regulations to protect neural data.
References:
1. Yuste R et al. (2017). Four ethical priorities for neurotechnologies and AI. Nature 551: 159-163.
2. Kay KN et al. (2008). Identifying natural images from human brain activity. Nature 452: 352-355.
3. Giancardo L et al. (2015). Psychomotor Impairment Detection via Finger Interactions with a Computer Keyboard During
Natural Typing. Scientific Reports 5(9678).
4. Pisauro MA et al. (2017). Neural correlates of evidence accumulation during value-based decisions revealed via
simultaneous EEG-fMRI. Nature Communications 8(15808).
5. Pandarinath C et al. (2017). High performance communication by people with paralysis using an intracortical brain-
computer interface. eLife 6: e18554.
6. Obar J and Oeldorf-Hirsch A. The Biggest Lie on the Internet: Ignoring the Privacy Policies and Terms of Service Policies
of Social Networking Services. (2016).TPRC 44: The 44th Research Conference on Communication, Information and
Internet Policy 2016. DOI: 10.2139/ssrn.2757465.
7. HHS 45 CFR part 46.
8. Federal Policy for the Protection of Human Subjects, 82 Fed. Reg. 12 (January 19, 2017).
9. Cookson J. (2017). How Neuroscience is Changing Law. Retrieved from http://bigthink.com/going-mental/how-
neuroscience-is-changing-the-law.
10. Poldrack RA et al. (2018). Predicting Violent Behavior: What Can Neuroscience Add? Trends in Cognitive Neuroscience
22:111-123.
11. Brown T and Murphy E. (2010). Through a Scanner Darkly: Functional Neuroimaging as Evidence of a Criminal
Defendant’s Past Mental States. Stanford Law Review Vol 62:1119-1208.
12. Genetic Information Nondiscrimination Act of 2008. Pub.L. 110-233. 122 Stat. 881. 21 May 2008.
13. Mullen TR et al. (2015). Real-Time Neuroimaging and Cognitive Monitoring Using Wearable Dry EEG. IEEE Trans
Biomed Eng. 62:2553-67.
14. Paul K. (2017). Fertility clinic hacked and held for ransom - why your hospital could be next. Retrieved from
https://www.marketwatch.com/story/hackers-are-stealing-more-patient-medical-records-from-hospitals-2017-05-12.
15. Wooler S. (2017). Anonymous hacker claims to have stolen private data on up to 1.2 million NHS patients. Retrieved from
https://www.thesun.co.uk/tech/4274225/anonymous-hacker-claims-to-have-stolen-the-nhs-medical-records-of-1-2million-
brits/.
16. McMahan B and Ramage D. (2017). Federated Learning: Collaborative Machine Learning without Centralized Training
Data. Google Research Blog. Retrieved from https://research.googleblog.com/2017/04/federated-learning-
collaborative.html.
17. Jernigan C and Mistree BFT. (2009). Gaydar: Facebook friendships expose sexual orientation. First Monday. 14(10).

54
18. Narayanan A and Shmatikov V. (2008). Robust De-anonymization of Large Spare Datasets. Proceedings of the 2008 IEEE
Symposium on Security and Privacy. pp 111-125.
19. Miranda RA et al. (2015). DARPA-funded efforts in the development of novel brain-computer interface technologies.
Journal of Neuroscience Methods 244:52-67.
20. Kozak G and Berenyi A. (2017). Sustained efficiency of closed loop electrical stimulation for long-term treatment of
absence epilepsy in rats. Scientific Reports 7:6300.
55
Artificial Intelligence for Development: AI4D
Policy Brief20,21
Martin Hilbert & Supreet Mann (Correspondence to: [email protected])
Abstract
In this report, we analyze how artificial intelligence is being used for development. We start with a review of the current
state of the art of artificial intelligence (AI) and continue with an assessment some of the fundamental concepts behind
modern AI. We distill three main concepts, which we refer to as the 4 Rs of deep learning: representation, reuse,
robustness, and regularization. This reveals some of the potential roles and solutions AI can provide for pressing
development challenges. After this theoretical evaluation, we continue with an empirical review of 24 case studies that
illuminate how AI is currently applied to contribute to the fulfillment of 9 out of the 17 Sustainable Development Goals
(SDGs) in practice. We crystalize four general characteristics of the application of artificial intelligence for development
(AI4D), namely (1) distance intelligence, (2) local intelligence, (3) augmented/ virtual/ replicated reality, (4) fine-
grained reality. All of them have obvious positive effects on development outcomes, but at second thought, they and
their combination could also lead to some fundamental threats to developing countries.
Artificial Intelligence: the Theory
By now, most individuals of the human species trust artificial intelligence with their lives on a daily basis through anti-
lock braking in cars (ABS) and autopilots in planes. Humanities main energy source (the electric grid) is in the hands of
artificial intelligence (Ramchurn, Vytelingum, Rogers, & Jennings, 2012); three out of four transactions on the largest
resource exchange of homo sapiens (U.S. stock markets) are executed by automated trading algorithms (Hendershott,
Jones, & Menkveld, 2011); and with one in three marriages in America beginning online (Cacioppo, et al. 2013), digital
algorithms have also started to take an undeniable role in sexual mating and humanity’s genetic inheritance. Living in a
society that outsourced almost all of its energy distribution decisions, 3/4 of its resource distribution decisions, and an
average 1/3 of its procreation decision to machines, it is hard to deny how indispensably dependent human development
has become to artificial intelligence.
Deep Learning Architectures: We review some of the theoretical characteristics at the core of today’s most important
implementation of artificial intelligence, so-called deep learning, or deep neural networks. This perspective on deep
learning is guided by two primary concepts: first, it suggests that the brain provides a model for artificial networks;
second, machine learning is useful for more than solving engineering applications as they can shed light on deeper
theoretical constructs of what we call intelligence (Goodfellow et al., 2016). We focus on three concepts, what we will
refer to as the 4 Rs of Deep Learning: representation, reuse, robustness, and regularization. The goal is to identify
technological characteristics that lend themselves to tackle development challenges.
Deep Layers: Representation: Representation learning is a set of methods that allows a machine to be fed raw input and
to discover, from this input, representations that are needed for classification (LeCun, Bengio, & Hinton, 2015). Deep-
learning methods are essentially representation-learning methods with multiple levels of representation that gradually
result in representation at increasingly abstract levels.
Multitask- and Transfer Learning: Reuse: The vast collection of methods referring to multitask learning shares those
parts of the model across tasks that capture a common pool of structure. The underlying assumption is that among the
20 This policy brief is a summary of: Hilbert, Martin & Supreet Mann (2018). Artificial Intelligence for Development: AI4D (SSRN Scholarly Paper). Rochester, NY: Social Science Research Network. Retrieved from https://papers.ssrn.com/sol3/cf_dev/AbsByAuth.cfm?per_id=1827058 21 Acknowledgements: We thank the Economic Commission for Latin America and the Caribbean (UN ECLAC, DDPE) for their support, as well as Amy Hoang, Shangzhen Li, Julia Morris, Jenna Rutledge, and Sruthi Sivanandan of the Computational Communication Research Lab (C^2) at the University of California, Davis, for their research input for the elaboration of the case studies in the appendix.
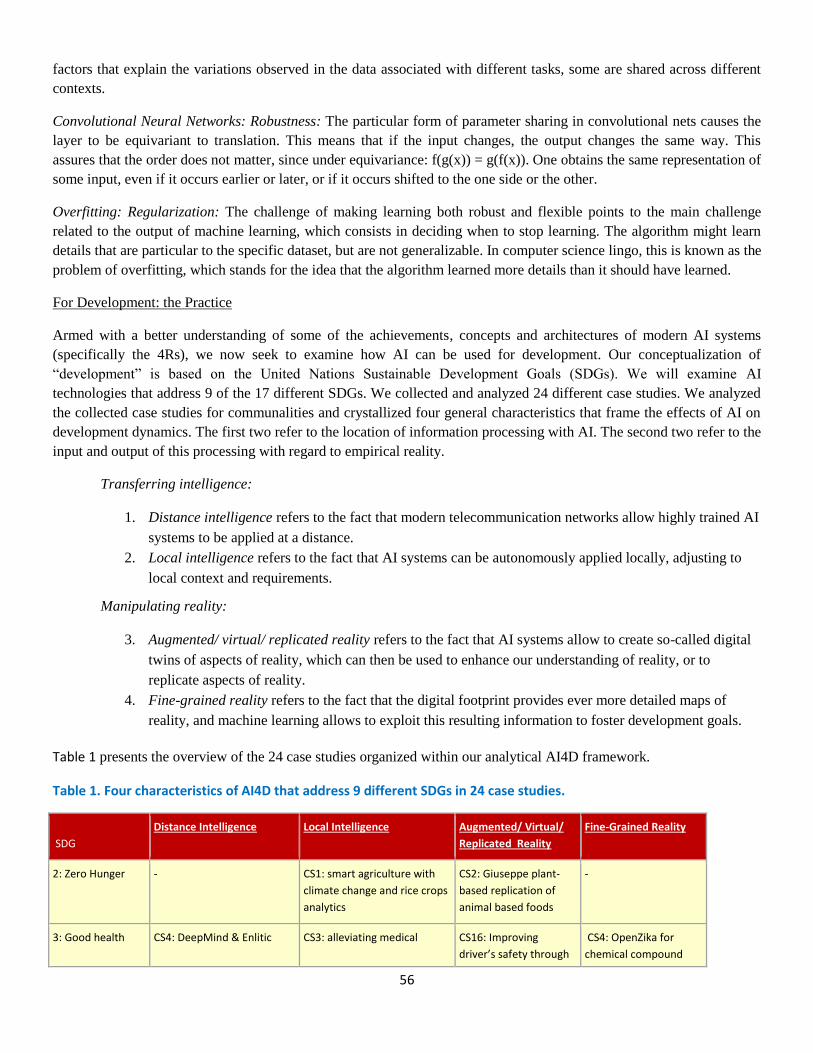
56
factors that explain the variations observed in the data associated with different tasks, some are shared across different
contexts.
Convolutional Neural Networks: Robustness: The particular form of parameter sharing in convolutional nets causes the
layer to be equivariant to translation. This means that if the input changes, the output changes the same way. This
assures that the order does not matter, since under equivariance: f(g(x)) = g(f(x)). One obtains the same representation of
some input, even if it occurs earlier or later, or if it occurs shifted to the one side or the other.
Overfitting: Regularization: The challenge of making learning both robust and flexible points to the main challenge
related to the output of machine learning, which consists in deciding when to stop learning. The algorithm might learn
details that are particular to the specific dataset, but are not generalizable. In computer science lingo, this is known as the
problem of overfitting, which stands for the idea that the algorithm learned more details than it should have learned.
For Development: the Practice
Armed with a better understanding of some of the achievements, concepts and architectures of modern AI systems
(specifically the 4Rs), we now seek to examine how AI can be used for development. Our conceptualization of
“development” is based on the United Nations Sustainable Development Goals (SDGs). We will examine AI
technologies that address 9 of the 17 different SDGs. We collected and analyzed 24 different case studies. We analyzed
the collected case studies for communalities and crystallized four general characteristics that frame the effects of AI on
development dynamics. The first two refer to the location of information processing with AI. The second two refer to the
input and output of this processing with regard to empirical reality.
Transferring intelligence:
1. Distance intelligence refers to the fact that modern telecommunication networks allow highly trained AI
systems to be applied at a distance.
2. Local intelligence refers to the fact that AI systems can be autonomously applied locally, adjusting to
local context and requirements.
Manipulating reality:
3. Augmented/ virtual/ replicated reality refers to the fact that AI systems allow to create so-called digital
twins of aspects of reality, which can then be used to enhance our understanding of reality, or to
replicate aspects of reality.
4. Fine-grained reality refers to the fact that the digital footprint provides ever more detailed maps of
reality, and machine learning allows to exploit this resulting information to foster development goals.
Table 1 presents the overview of the 24 case studies organized within our analytical AI4D framework.
Table 1. Four characteristics of AI4D that address 9 different SDGs in 24 case studies.
SDG
Distance Intelligence Local Intelligence Augmented/ Virtual/
Replicated Reality
Fine-Grained Reality
2: Zero Hunger - CS1: smart agriculture with
climate change and rice crops
analytics
CS2: Giuseppe plant-
based replication of
animal based foods
-
3: Good health CS4: DeepMind & Enlitic CS3: alleviating medical CS16: Improving
driver’s safety through
CS4: OpenZika for
chemical compound
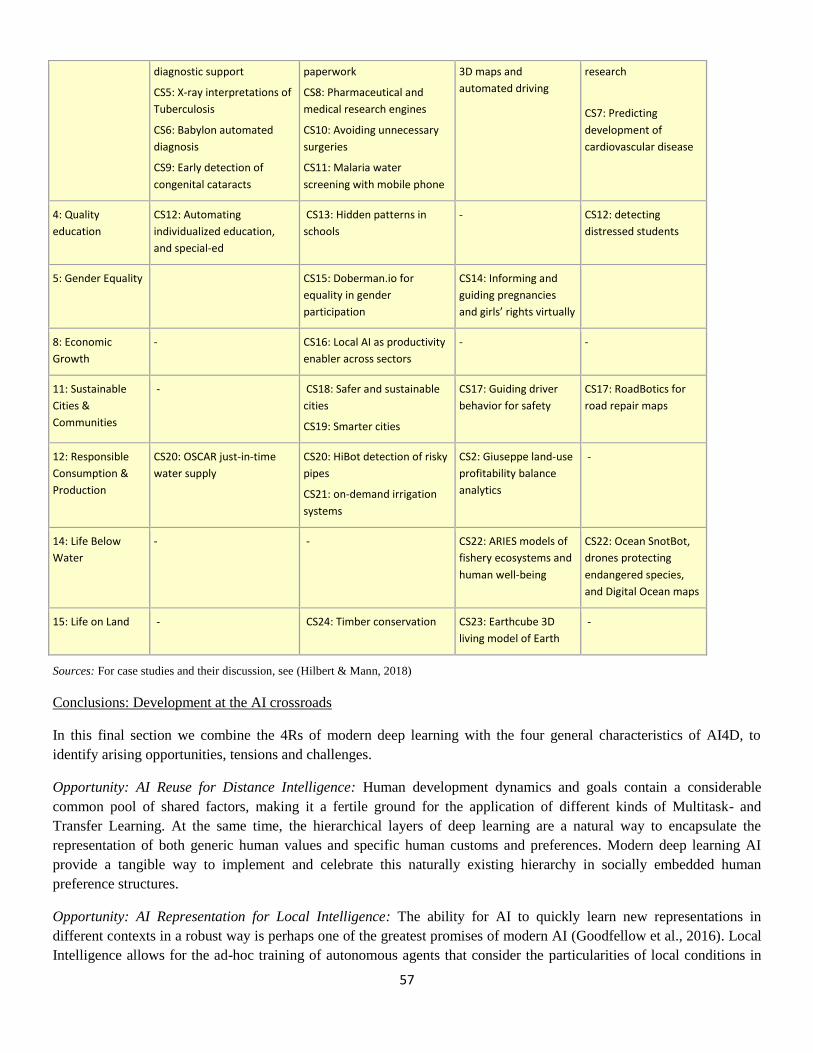
57
diagnostic support
CS5: X-ray interpretations of
Tuberculosis
CS6: Babylon automated
diagnosis
CS9: Early detection of
congenital cataracts
paperwork
CS8: Pharmaceutical and
medical research engines
CS10: Avoiding unnecessary
surgeries
CS11: Malaria water
screening with mobile phone
3D maps and
automated driving
research
CS7: Predicting
development of
cardiovascular disease
4: Quality
education
CS12: Automating
individualized education,
and special-ed
CS13: Hidden patterns in
schools
- CS12: detecting
distressed students
5: Gender Equality CS15: Doberman.io for
equality in gender
participation
CS14: Informing and
guiding pregnancies
and girls’ rights virtually
8: Economic
Growth
- CS16: Local AI as productivity
enabler across sectors
- -
11: Sustainable
Cities &
Communities
- CS18: Safer and sustainable
cities
CS19: Smarter cities
CS17: Guiding driver
behavior for safety
CS17: RoadBotics for
road repair maps
12: Responsible
Consumption &
Production
CS20: OSCAR just-in-time
water supply
CS20: HiBot detection of risky
pipes
CS21: on-demand irrigation
systems
CS2: Giuseppe land-use
profitability balance
analytics
-
14: Life Below
Water
- - CS22: ARIES models of
fishery ecosystems and
human well-being
CS22: Ocean SnotBot,
drones protecting
endangered species,
and Digital Ocean maps
15: Life on Land - CS24: Timber conservation CS23: Earthcube 3D
living model of Earth
-
Sources: For case studies and their discussion, see (Hilbert & Mann, 2018)
Conclusions: Development at the AI crossroads
In this final section we combine the 4Rs of modern deep learning with the four general characteristics of AI4D, to
identify arising opportunities, tensions and challenges.
Opportunity: AI Reuse for Distance Intelligence: Human development dynamics and goals contain a considerable
common pool of shared factors, making it a fertile ground for the application of different kinds of Multitask- and
Transfer Learning. At the same time, the hierarchical layers of deep learning are a natural way to encapsulate the
representation of both generic human values and specific human customs and preferences. Modern deep learning AI
provide a tangible way to implement and celebrate this naturally existing hierarchy in socially embedded human
preference structures.
Opportunity: AI Representation for Local Intelligence: The ability for AI to quickly learn new representations in
different contexts in a robust way is perhaps one of the greatest promises of modern AI (Goodfellow et al., 2016). Local
Intelligence allows for the ad-hoc training of autonomous agents that consider the particularities of local conditions in
58
remote areas. The increasing and increasingly automated fine-graining of observations provides constant input of a
steady pipeline that fuels new discoveries by exploiting regional variances, particularities and dynamics. This promises
the replacement of a ‘one-size-fits-all’ policy with context dependent intelligence worldwide.
Tension: Global Efficiency and Local Diversity: In isolation, both foregoing opportunities promise a bright future. In
combination, they provide a tension between global efficiency and local needs. Most training of artificial intelligence is
done within the industrialized context, since the process can be very costly. They then learn the patterns of the data they
were trained on. The cost advantage of centralized solutions over local training could lead to a trend where solutions and
recommendations are clearly tailored to historical and cultural contexts of the training sets. In the best case, their
application to developing countries problems is less useful, in the worst case, harmful.
Challenge: Regulating international AI Regularization: The design of global AI systems that balance the trade-off
between global efficiencies and local contexts comes down to finding the borderline between those results that are
generalizable and those that are not. Taking an AI that works in one context and trying to apply it to other contexts
without considering differences and limitations is a clear case of overfitting.
The result will be an implicit or explicit negotiation very similar in nature to the negotiation done by the machine
learning community when dealing with regularization issues. Both cases aim at learning generalizable insights and non-
generalizable particularities between different settings (in our case, different development settings). In this arising
negotiation, the only controllable variable for developing countries consists in the level of proactivity of their role. The
question is about the weight they will bring to the anecdotal negotiation table about the hegemony of artificial
intelligence. The combination of our theoretical and practical analyses results in the conclusion that developing countries
will have to start to invest aggressively into building their AI capacity if they want to avoid being swamped with
solutions that will in the best case be ill-fit and in the worst case damaging for them.
References
Cacioppo, J. T., Cacioppo, S., Gonzaga, G. C., Ogburn, E. L., & VanderWeele, T. J. (2013). Marital satisfaction and break-ups differ
across on-line and off-line meeting venues. Proceedings of the National Academy of Sciences, 110(25), 10135–10140.
https://doi.org/10.1073/pnas.1222447110
Goodfellow, I., Bengio, Y., & Courville, A. (2016). Deep Learning. MIT Press.
Hendershott, T., Jones, C. M., & Menkveld, A. J. (2011). Does Algorithmic Trading Improve Liquidity? The Journal of Finance,
66(1), 1–33. https://doi.org/10.1111/j.1540-6261.2010.01624.x
Hilbert, M., & Mann, S. (2018). Artificial Intelligence for Development: AI4D. Rochester, NY: Social Science Research Network,
SSRN Scholarly Paper. Retrieved from https://papers.ssrn.com/sol3/cf_dev/AbsByAuth.cfm?per_id=1827058
LeCun, Y., Bengio, Y., & Hinton, G. (2015). Deep learning. Nature, 521(7553), 436–444. https://doi.org/10.1038/nature14539
Ramchurn, S. D., Vytelingum, P., Rogers, A., & Jennings, N. R. (2012). Putting the “smarts” into the smart grid: a grand challenge
for artificial intelligence. Communications of the ACM, 55(4), 86. https://doi.org/10.1145/2133806.2133825
59
Automation and artificial intelligence – what could it mean for sustainable development?
Policy Brief - 2016 Update
Friedrich Soltau, United Nations Department of Economic and Social Affairs
Introduction
Concern about the societal implications of automation is nothing new. The textile workers destroying looms in
nineteenth century England provided the label – Luddites – for persons regarded as being against technological progress.
From the novel Frankenstein to the film 2001: A space odyssey, popular culture has warned of intelligent machines
turning against their makers. More recently academic studies and books have variously examined the potential of
intelligent machines to disrupt labour markets (Brinjolfsson & McAfee, 2011; Frey & Osborne, 2013; Ford, 2015), re-
define social interaction and relations (Carr, 2014), and even detailed, serious-minded study of its potential threat to
human existence (Bostrom, 2014).
Automation is of course nothing new; robots have been appearing on assembly lines for decades. The current wave of
automation benefits from the ubiquity of cheap computing power, pushing software into new areas, such as language
and image processing. One effect is that white collar occupations, unaffected by the hulking, prototypical industrial
robot, may become vulnerable to automation by a new generation of machines.
While this brief addresses the potential consequences of automation and artificial intelligence on employment, there are
of course also widespread implications for other areas. So the expansion of computing and machine intelligence is likely
to affect healthcare, education, privacy and cybersecurity, and
energy and environmental management. Already access to cheap bandwidth is changing how learning takes place, seen
in the availability of various online learning platforms, such as massive open online courses (MOOCs); as technology
advances, not only how, but also what is learnt may also change. In a future where more capable machines can carry an
ever greater share of routine tasks, learning that stimulates conceptual and creative capacities would appear increasingly
relevant. This could imply an education system shifting from a focus on mathematics and reading to a different set of
personal and intellectual skills that facilitate working in tandem with intelligent machines (Brinjolfsson & McAfee,
2014).
A sensor-driven world – the “internet of things” – also holds considerable potential to improve efficiency in a range of
process, thus promoting environmental sustainability. On the other hand, ubiquitous data-gathering and storage from
social media profiles through to commercial data, raises concerns about privacy. Cybersecurity is also regularly
identified as a key area of risk (UBS, 2015).
The impact of automatization is being felt primarily in developed economies. Going forward, it may be that the greater
deployment of computers, coupled with other changes in production methods, such as 3D printing, may invert the
competitive advantage that emerging markets have had in the form of low-cost labour (UBS, 2016).
Scientific debate
The debate around the impact of advanced computing on jobs has several strands. The concern that technology would
outpace the ability of the economy to absorb labour has long pedigree (Keynes, 1930). One side essentially takes the
view that this time it is different: the present and coming wave of artificial intelligence – unlike the industrial, electric
and digital revolutions that preceded it - will displace humans faster than we can adapt, through the acquisition of new
skills and education (Brynjolfsson and McAfee, 2011; Frey & Osborne, 2013). The robots are going to win the race. On
the other hand, there are those who, while perhaps a little less impressed by the march of technology, seek to emphasise
that the introduction of technologies – even disruptive ones – tends to lead to aggregate growth in employment, as the
60
economy adjusts and demand is created in new sectors (Autor, 2015). While admittedly there is no guarantee that this
relationship will hold for ever, its proponents can point to a strong track record.
There is also a line of thinking, advanced by Gordon, that the unprecedented economic growth and attendant
improvement in living standards was a once-off effect of the second industrial revolution, centred around electricity,
internal combustion engine, running water, indoor toilets, communications, entertainment, chemicals, and petroleum
(Gordon, 2012; Gordon, 2016).
It is worth considering an underlying reason why aggregate employment remains stable, even as sectors are disrupted
and replace by new ones. Suppose that the human want for new things – goods or services – is essentially unlimited. The
desire for new products drives technological innovation. Taking it further, more technology leads to yet more new
possibilities for products and services, entailing as yet unfathomed employment possibilities for workers. Taking it
to the level of a thought experiment, imagine that the expansion in consumption possibilities is driven by intelligent
machines, which produce like skilled workers but do not consume. The resulting breakdown in demand would disrupt
the process of labour absorption.
The following sub-sections seek to capture in summary form selected points in a complex debate.
Substitution and complementarity: Automation does substitute for labour, but it also complements labour and raises
output in ways that lead to a higher demand for labour (Autor, 2015). Examining the U.S. labour market, Bessen argues
that computers have not been replacing workers on net; instead, workers using computers are substituting for other
workers (2015). The expansion in high-skill employment can be explained by the falling price of carrying out routine
tasks by means of computers, which complements more abstract and creative services (Frey & Osborne, 2013). Autor
argues that experts and others fail consider the impact of complementarity (2015). If it is true that workers are in a race
against technology, the question is how long education can keep giving them an edge.
Susceptibility to automation: If jobs as understood as a collection of tasks, some will be more susceptible to being
broken down into explicit routines, which can be codified and performed by algorithms or robots, in the case of manual
occupations (Autor et al, 2003). This reasoning is supported by the decline in jobs distinguished by well-defined tasks,
for instance in manufacturing. By this analysis, jobs with a high share of tasks involving judgement, creativity and
persuasion, which are not easily quantified and codifies, are less suitable for automation. At the other end of the skill
spectrum, jobs requiring visual and language recognition, adaptability and in-person interactions, are also not susceptible
to automation (Autor et al, 2003). In their analysis of jobs susceptible to computerization, Frey and Osborne Hence,
concluded that while new developments in the fields of computing and big date will enable many non-routine tasks to be
automated, the same is not true for jobs that “...involve complex perception and manipulation tasks, creative intelligence
tasks, and social intelligence tasks” (2013, 27).
Polarization of the labour market: Automation changes the types of employment, with significant dislocation in some
sectors – a discernible trend is the so-called polarization, with job gains disproportionately going to high- skilled and
low-skilled workers, coupled with a hollowing-out of routine middle-income jobs (Goos & Manning, 2007). Autor
points out that the polarization documented across occupations is not unique to the United States, with comparable
findings for 16 European Union countries (2015). Managerial, professional and technical occupations have benefited
from computerization – the surge of technology into their workplaces has complemented the work of those engaged in
abstract jobs, with less time on acquiring and calculation and more time on interpretation and application (Autor, 2015).
Workers in these abstract-intensive occupations have made wage gains due to: (a) the combination of complementarity
of information technology with these occupations, (b) an elastic (growing) demand for their services, e.g. healthcare, and
(c) a relatively inelastic (scarce) labour supply. The same has not been true for workers in occupations that are intensive
61
in manual skills, which are only weakly complimented by computerization, do not benefit from a rising demand, and
where there is a relatively large labour pool.
It needs to be recognized that the dynamics of employment are also influenced by globalization and trade agreements
(Capaldo et al, 2016). Given that capital is highly mobile, but labour is not, employment in tradable sectors can be
eroded by unfavourable terms of trade. Polarization and other odd forms of segmentation of the work force could be an
effect of the production structure of the economy and the pattern of trade.
Redistribution: The dislocation caused by rapid technological change will pose challenges for social and political
systems, in order to ensure that the benefits to society do not exacerbate existing levels of inequality. Automation will
continue to put downward pressure on the wages of the low skilled and is starting to impinge on the employment
prospects of middle-skilled workers. By contrast, the potential returns to highly skilled and more adaptable workers are
increasing.
Issues for consideration by policymakers
A key question posed is whether the task model will hold true for the future, in the face of improvements in computing
power, rendering even non-routine task as subject to computerization. Some are more confident that computers will
acquire the ability to perform non-routine tasks (Frey & Osborne, 2013; Brynjolfsson & McAfee, 2011), than others
(Autor, 2015). Often left out of the debate is the question whether society will – or should – opt for computerization,
even if it is technically feasible.
Ultimately, the likelihood that a job will in the future be automated depends on: (a) certain attributes of a job, such as
whether it entails creativity or persuasion; (b) the capability of technology, in other words the degree to which machines
acquire or can mimic human intelligence; and (c) social and cultural norms. So, for while we may be willing to scan our
purchases at the grocery store, we may prefer to chat with a barista when ordering a coffee, or have a human take our
blood pressure and explain the implications of a medical diagnosis, even if the diagnosis itself was arrived at by a
machine, with sign-off only from a human hand, akin to situation in which computers largely fly today’s jetliners, with
the pilots assuming control for take-off and landing (Carr, 2014).
The future of automation is difficult to predict, as is society’s willingness to guide and steer its adoption. Given these
uncertainties, some of the issues that should be considered by policymakers could include: strengthening social
protection systems; implementing education policies that foster the skills required for a flexible, computer-literate work
force; policies that promote shifting the labour force from low to higher skilled jobs, with enhanced retraining and safety
nets for workers adversely affected by trade agreements; and policies that promote investment in R&D, fostering
innovation in developed countries and emulation in developing counties.
References
Autor, D., Levy, F. and Murnane, R.J. (2003). The skill content of recent technological change: An empirical exploration. The
Quarterly Journal of Economics, vol. 118, no. 4, pp. 1279–1333.
Autor, David. (2015). Why are there still so many jobs? The history and future of workplace automation. 29(3) Journal of Economic
Perspectives 3-30.
Bessen, James. (2016). How Computer Automation Affects Occupations: Technology, Jobs and Skills. Boston University School of
Law, Law & Economics Working Paper No. 15-49.
Bostrom, Nicholas. (2014). Superintelligence: Paths, Dangers, Strategies.
Brynjolfsson, Erik, and McAfee, Andrew. (2011). Race Against the Machine.
Brynjolfsson, Erik, and McAfee, Andrew. (2014). The Second Machine Age.

62
Capaldo, Jeronim, Izurieta, Alex, and Sundaram, Jomo Kwame. (2016). Trading Down: Unemployment, Inequality and Other Risks
of the Trans-Pacific Partnership Agreement. Global Development and Environment Working Paper No. 16-01. Tufts University.
http://www.ase.tufts.edu/gdae/Pubs/wp/16- 01Capaldo-IzurietaTPP.pdf
Carr, Nicholas. (2014). The Glass Cage: Automation and Us.
Ford, Martin. (2015). Rise of the Robots: Technology and the Threat of a Jobless Future.
Goos, M. and Manning, A. (2007). Lousy and lovely jobs: The rising polarization of work in Britain. The Review of Economics and
Statistics, 89 (1) 118–133.
Gordon, Robert J. (2012). Is U.S. Economic Growth over? Faltering Innovation Confronts Six Headwinds. NBER Working Paper
18315.
Gordon, Robert J. (2016). The Rise and Fall of American Growth: The U.S. Standard of Living since the Civil War.
Keynes, Maynard. (1963). Economic Possibilities for our Grandchildren, in Essays in Persuasion 358-373.
UBS. (2016). Extreme automation and connectivity: The global, regional, and investment implications of the Fourth Industrial
Revolution. UBS White Paper for the World Economic Forum Annual Meeting 2016
II. New production revolution, inequality, and ethical aspects
63
On Some Ethical Aspects of Artificial Intelligence and Automation
Policy Brief
Michael Zichy, University of Salzburg
This brief focuses on two different topics: it will first highlight some ethical aspects of artificial intelligence, and will
then give a generic ethical assessment of the impact automation will likely have on society.
Artificial Intelligence
Artificial intelligence (AI) has been under ethical observation for a number of years and has generated vast ethical
discussions (Wallach/Allen 2010; Anderson/Anderson 2011; Gunkel 2012; Lin/Abney/Bekey 2012;
Bostrom/Yudkowsky 2014; Boddington 2017; COMEST 2017; Lin/Jenkins/Abney 2017; Dignum 2018; see also the
proceedings of the “Annual International Conference on Robotic Ethics and Standards”). These discussions can be
sorted into two kinds: On the one hand, the ethical discussions deal with the applications of AI in different areas such as
healthcare and medicine (Luxton 2015; Stahl/Coeckelbergh 2016), smart homes (Lesa/Camp 2016), robotics
(Danaher/McArthur 2017), (social) media, etc. In this case, the ethical assessment is focused on the specific purpose AI
has or should have in the area in which it is applied, and the assessment derives the ethical criteria from that very area.
For example, an AI application that is used in medicine will be assessed with the established principles in medical
ethics.
On the other hand, the ethical discussions revolve around AI in general, independently from its applications in a specific
area. The issues discussed here are thus either related to AI as such (e.g. if AI showed human-like self-consciousness,
should it have human rights?) or are issues that are cross-cutting in nature, as they occur in all or most cases where AI is
applied. The issues causing ethical worries and debate are:
• AI decision-making in moral dilemmas (e.g.: Should an autonomous car risk the passenger or the driver’s life in
an accident?; Pereira/Saptawijaya 2016; Leben 2018)
• (Racial and gender) biases of AI-decisions
• Non-transparency of AI-decisions
• Responsibility and liability issues
• Data security and privacy issues
• Dual use
• Artificial general intelligence and super-human intelligence. This issue has gained the most ethical attention
(Bostrom 2014; Yampolskiy 2015).
Given the ever growing power, influence and impact AI has on mankind, tackling these issues is a high priority. In order
to deal with these issues in a morally sound way, it is necessary to
a) Develop ethical rules for AI decision making in morally dilemmatic situations
b) Eliminate racial and gender (and possible other) biases
c) Make AI-decisions transparent
d) Clarify responsibility and liability issues
e) Develop ethical rules for AI research and programming
f) Develop ethical rules for AI application (e.g. data and privacy issues)
Deciding on these ethical rules should not be left to the private sector because of three reasons: Firstly, the private sector
is not authorized to decide on such issues due to missing democratic legitimation. Secondly, if ethical rule-making is left
to the private sector a moral race to the bottom is to be feared, because the company setting the lowest moral standards is
64
most likely to be the economically most competitive. Thirdly, leaving the moral rule-making to the private sector could
result in a plurality of standards and regulations.
In order to reach the aforementioned goals, it therefore seems necessary that governments make sure that
a) public awareness of the ethical issues of AI is raised,
b) all stakeholders are involved especially in deciding on the ethical rules for AI-decisions in morally dilemmatic
situations, but also generally in debating and deciding on the ethical rules for AI,
c) stakeholders agree on common ethical standards,
d) engineers (as well as entrepreneurs and economists) are trained in ethics.
e) Additionally, it would also make sense to harmonize the rules and standards for AI at an international level. It
therefore is recommended to install an international body (similar to the UN International Bioethics Committee,
created 1993, which has then been complemented by the UN Intergovernmental Bioethics Committee and the
UN Inter-Agency Committee on Bioethics) to monitor and harmonize AI issues at an international level.
Automation
While AI and its various applications have been under ethical observation for a number of years, the issue of automation
has only recently found – scarce – ethical attention (Ramaswamy/Joshi 2009; IPPR 2018). Currently, it is still very
difficult to assess and judge automation from an ethical point of view, because the facts on which an ethical judgement
would have to be based are still rather unclear and unspecific. This is particularly true for a global assessment as it is
presented here. A more precise assessment could be gained through concentrating on a specific action (e.g. a policy, a
scenario) and on a specific country.
However, in the last two years, a lot of research on the societal impact of automation has been pursued, more reliable
data have been collected, new insights have been gained, and new studies have been published (BCG 2017; IPPR 2017;
McKinsey 2017a; McKinsey 2017b; Centre for Cities 2018; Nedelkoska/Quintini 2018; PwC 2018; UNCTAD 2017).
Based on these studies, a very generic ethical assessment of the impact automation will have on society can be made.
The following ethical assessment is based on
a) three fundamental ethical values: the value of freedom/autonomy, the value of wellbeing/quality of life, and the
value of justice/equality.
b) stakeholders that will be affected by automation: Companies that deploy or could deploy automation; high-
skilled workers, mid-skilled workers, low-skilled workers, developed countries, developing countries, least
developed countries
Having these values and these stakeholders, three questions need to be answered: What are the positive and what are the
negative effects of automation on a stakeholder’s freedom. What are the positive and what are the negative effects on a
stakeholder’s wellbeing? And what are the positive and what are the negative effects on a stakeholder’s equal
opportunities?
The assessment results in the following ethical matrix: positive effects are green, negative effects are red, severely
negative effects are dark red; yellow means that the effects are either unclear (i.e. the studies do not agree) or that the
effects strongly depend on specific circumstances.
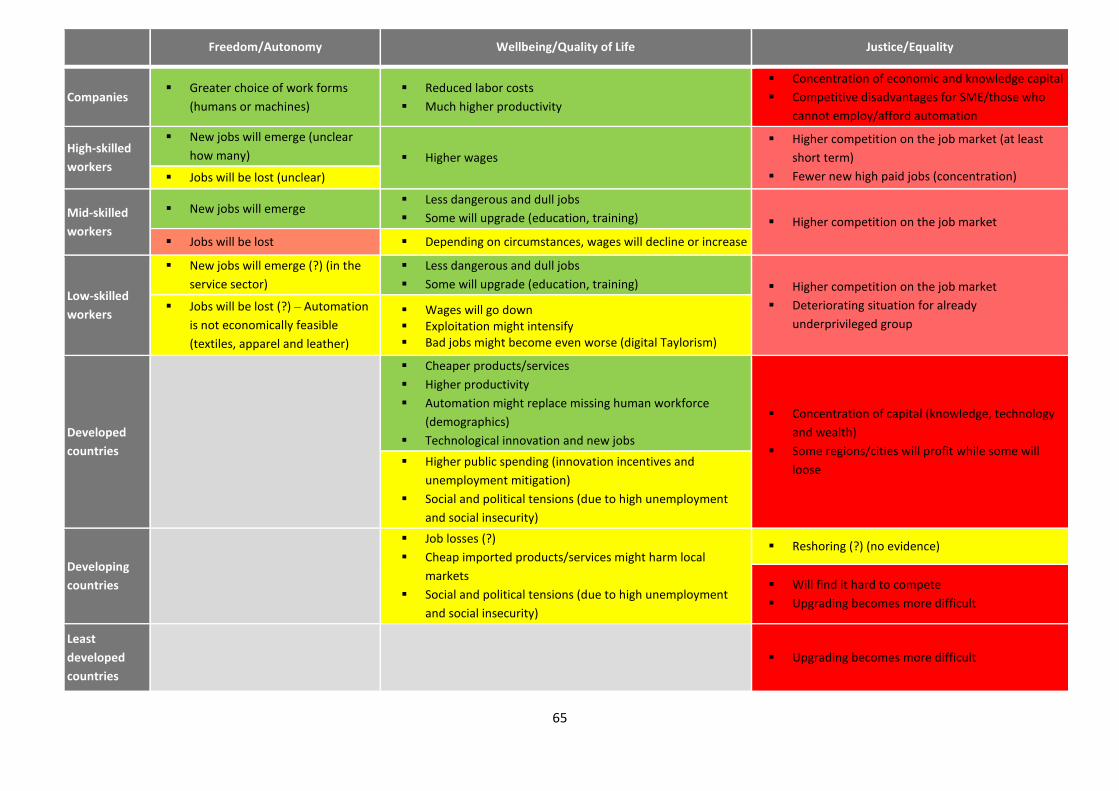
65
Freedom/Autonomy Wellbeing/Quality of Life Justice/Equality
Companies ▪ Greater choice of work forms
(humans or machines)
▪ Reduced labor costs
▪ Much higher productivity
▪ Concentration of economic and knowledge capital
▪ Competitive disadvantages for SME/those who
cannot employ/afford automation
High-skilled
workers
▪ New jobs will emerge (unclear
how many) ▪ Higher wages
▪ Higher competition on the job market (at least
short term)
▪ Fewer new high paid jobs (concentration) ▪ Jobs will be lost (unclear)
Mid-skilled
workers ▪ New jobs will emerge
▪ Less dangerous and dull jobs
▪ Some will upgrade (education, training) ▪ Higher competition on the job market
▪ Jobs will be lost ▪ Depending on circumstances, wages will decline or increase
Low-skilled
workers
▪ New jobs will emerge (?) (in the
service sector)
▪ Less dangerous and dull jobs
▪ Some will upgrade (education, training) ▪ Higher competition on the job market
▪ Deteriorating situation for already
underprivileged group
▪ Jobs will be lost (?) – Automation
is not economically feasible
(textiles, apparel and leather)
▪ Wages will go down
▪ Exploitation might intensify
▪ Bad jobs might become even worse (digital Taylorism)
Developed
countries
▪ Cheaper products/services
▪ Higher productivity
▪ Automation might replace missing human workforce
(demographics)
▪ Technological innovation and new jobs
▪ Concentration of capital (knowledge, technology
and wealth)
▪ Some regions/cities will profit while some will
loose ▪ Higher public spending (innovation incentives and
unemployment mitigation)
▪ Social and political tensions (due to high unemployment
and social insecurity)
Developing
countries
▪ Job losses (?)
▪ Cheap imported products/services might harm local
markets
▪ Social and political tensions (due to high unemployment
and social insecurity)
▪ Reshoring (?) (no evidence)
▪ Will find it hard to compete
▪ Upgrading becomes more difficult
Least
developed
countries ▪ Upgrading becomes more difficult
66
As the matrix shows, the issue of equality is the most pressing one. If nothing is done, it is likely that
• economic growth particularly benefits capital (the owners of robots and the owners of
intellectual property),
• manufacturing further concentrates in a small group of countries,
• high-skilled workers gain most, while mid- and low-skilled workers are at risk (at least long-
term),
• inequality between gender and ethnic groups aggravates because woman and non-whites are
overrepresented in jobs at risk,
• inclusiveness at the international level for less developed and particularly for the least
developed countries gets harder,
• existing regional inequalities aggravate, because some regions and cities will profit, while
other regions and cities will see decline (as can already be witnessed in the US).
The IPPR Commission on Economic Justice (2018) thus clearly states: “In the absence of policy
intervention, the most likely outcome of automation is an increase in inequalities of wealth, income
and power.” (24) They conclude that: “The distributional consequences […] would clearly be
catastrophic […]” (24) However, the same report states that „If managed well, this [automation] could
have profoundly positive effects: better, more ‚human‘ work, greater leisure time, improving living
standards, more efficient and less environmentally damaging forms of production, and increased non-
rivalrous consumption of goods and services.“ (31)
In order to achieve these goals, governments have to take action and manage automation. To do so, it
is recommended:
• to install an international forum – may be on the UN-level – for exchange and monitoring
automation and for pressing governments to prepare for automation
• that governments consider establishing an agency for the ethical use of automation, robotics
and AI at the national level (that would also deal with the ethical issues of AI mentioned in
the first part of this brief)
• to strongly support developing countries in preparing for and meeting the challenge of
automation
• to develop and implement policies that foster the ethical, socially and ecologically sustainable
use of automation technologies
• to invest in education (including education in ethics and arts)
• to develop and implement measures for advanced wealth distribution, such as collective
bargaining, linking worker earnings to firm profitability, universal basic income, increased
inheritance and wealth taxes, public or collective ownership of robots, etc.
References
Anderson, Michael/Anderson, Susan (ed.) (2011): Machine Ethics. Cambridge: Cambridge University Press.
BCG – The Boston Consulting Group (2017): Schöne neue Arbeitswelt 4.0? Was wir tun müssen, damit uns die
Arbeit nicht ausgeht, http://image-src.bcg.com/Images/27Nov_Report_Arbeitswelt4.0_tcm108-
178261_tcm108-179180.pdf (5.5.2018).
Boddington, Paula (2017): Towards a Code of Ethics for Artificial Intelligence. Cham: Springer.
Bostrom, Nick (2014): Superintelligence: Paths, Dangers, Strategies. Oxford: Oxford University Press.
Bostrom, Nick/Yudkowsky, Eliezer (2014): The Ethics of Artificial Intelligence. In:
67
Cambridge Handbook of Artificial Intelligence, edited by Keith Frankish and William Ramsey.
Centre for Cities (2018): Cities Outlook 2018, London, http://www.centreforcities.org/wp-
content/uploads/2018/01/18-01-12-Final-Full-Cities-Outlook-2018.pdf (5.5.2018).
Chung, Jane/Demiris, George/Thompson, Hilaire (2016): Ethical Considerations Regarding the Use of Smart
Home Technologies for Older Adults: An Integrative Review. In: Annual Review of Nursing Research 34/1,
155-181, DOI: 10.1891/0739-6686.34.155.
COMEST (World Commission on the Ethics of Scientific Knowledge and Technology, UNESCO) (2017):
Report of COMEST on Robotics Ethics. Paris, http://unesdoc.unesco.org/images/0025/002539/253952E.pdf
(4.5.2018).
Danaher, John/McArthur, Neil (ed.) (2017): Robot Sex: Social and Ethical Implications. Cambridge, MA: MIT
Press.
Dignum, Virginia (ed.) 2018: Ethics and Artificial Intelligence, Ethics and Information Technology 20/1,
Special Issue.
Gunkel, David (2012): The Machine Question: Critical Perspectives on AU, Robots, and Ethics. Cambridge,
MA: MIT Press.
Huber, Lesa/Camp, Jean (2016): User-Driven Design in Smart Homes: Ethical Aspects. In: Handbook of Smart
Homes, Health Care and Well-Being, edited by Joost van Hoof, George Demiris and Eveline J.M. Wouters.
Cham: Springer, 93-103.
IPPR Commission on Economic Justice (2017): Managing Automation: Employment, Inequality and Ethics in
the Digital Age, https://www.ippr.org/publications/managing-automation (5.5.2018).
Leben, Derek (2018, forthcoming): Ethics for Robots: How to Design a Moral Algorithm. London: Routledge.
Lin, Patrick/Abney, Keith/Bekey, George (ed.) (2012): Robot Ethics: The Ethical and Social Implications of
Robotics. Cambridge, MA: MIT Press.
Lin, Patrick/Jenkins, Ryan/Abney, Keith (ed.) (2017): Robot Ethics 2.0: From Autonomous Car to Artificial
Intelligence. New York: Oxford University Press.
McKinsey&Company (2017): A Future That Works? The Impact of Automation in Denmark, Copenhagen.
https://www.mckinsey.com/~/media/McKinsey/Locations/Europe%20and%20Middle%20East/Denmark/Ou
r%20Insights/A%20future%20that%20works%20The%20impact%20of%20automation%20in%20Denmark/
A-future-that-works-The-impact-of-automation-in-Denmark.ashx (5.5.2018).
McKinsey&Company (2017a): A Future that Works: Automation; Employment, and Produktivity.
https://www.mckinsey.com/~/media/McKinsey/Global%20Themes/Digital%20Disruption/Harnessing%20a
utomation%20for%20a%20future%20that%20works/MGI-A-future-that-works_Full-report.ashx (5.5.2018).
Nedelkoska. L./Quintini, G. (2018): Automation, Skills Use and Training, OECD Social, Employment and
Migration Working Papers 202. Paris: OECD Publishing, http://dx.doi.org/10.1787/1815199X (5.5.2008).
New York: Cambridge University Press.
Luxton, David (ed.) (2015): Artificial Intelligence in Behavioural and Mental Health Care. Amsterdam:
Elsevier.
Pereira, Luís/Saptawijaya, Ari (2016): Programming Machine Ethics. Cham: Springer.
PwC (2018): Will Robots Really Steal our Jobs? An International Analysis of the Potential Long Term Impact
of Automation. https://www.pwc.com/hu/hu/kiadvanyok/assets/pdf/impact_of_automation_on_jobs.pdf
(5.5.2018).
Ramaswamy, Srinivasan/Joshi, Hemant (2009): Automation and Ethics. In: Springer Handbook of Automation,
edited by Shimon Nof. Berlin: Springer.

68
Stahl, Bernd/Coeckelbergh, Mark (2016): Ethics of Healthcare Robotics: Towards Responsible Research and
Innovation. In: Robotics and Autonomous Systems 86, 152-161.
UNCTAD (2017): Trade and Development Report 2017: Beyond Austerity: Towards a Global New Deal,
Chapter III: Robots, Industrialization and Inclusive Growth. New York/Geneva,
http://unctad.org/en/PublicationChapters/tdr2017ch3_en.pdf (5.5.2018).
Wallach, Wendel/Allen, Collin (2010): Moral Machines: Teaching Robots Right from Wrong. Oxford: Oxford
University Press.
Wallach, Wendell/Asaro, Peter (ed.) (2016): Robot Ethics and Machine Ethics. London: Routledge.
Yampolskiy, Roman (2015): Artificial Superinelligence: A Futuristic Approach. Boca Raton: Talyor & Francis.
69
The Next Production Revolution and Potential Impacts on Developing Economies
Policy Brief
Robert D. Atkinson, President of the Information Technology and Innovation Foundation, and
author of Big is Beautiful: Debunking the Myth of Small Business (MIT Press, 2018)
Abstract: Over the last decade productivity growth rates have declined, including in most developing
economies. Thankfully, a “new production revolution,” (NPR) enabled in part by artificial intelligence
(AI), is emerging that has the potential to help developing economies achieve the UN Sustainable
Development Goal 8: “Decent Work and Economic Growth.” However, fully capturing the benefits of
the NPR will require policy makers to embrace, rather than resist, the rapid emergence of the NPR
and the transformation of most EU industries.
Over the last decade productivity growth rates have declined, including in many developing
economies. Thankfully, a “new production revolution,” (NPR) enabled in part by artificial intelligence
(AI), is emerging that has the potential to help developing economies achieve the UN Sustainable
Development Goal 8: “Decent Work and Economic Growth.” These technologies hold the potential
for developing nations to “Achieve higher levels of economic productivity through… technological
upgrading and innovation.” However, fully capturing the benefits of the NPR will require policy
makers to embrace the rapid emergence of the NPR.
Several technologies look like candidates to comprise the next innovation wave: the Internet of things,
advanced robotics, blockchain, new materials, autonomous devices, and artificial intelligence (AI).
Perhaps the most important is AI. AI has many functions, including but not limited to learning,
understanding, reasoning, and interaction.
While all six technologies are in the marketplace, they are only beginning to be adopted, even in
advanced economies, because they are too expensive and not powerful enough to drive economy-wide
productivity. For example, despite the excitement over “Industry 4.0” technologies, they do not
appear to have been adopted on a large scale, as evidenced in part by the fact that most manufacturers
in developed economies appear to be in the very early stages of adopting these systems. Fully
autonomous cars at a price point most consumers in rich nations can afford are likely at least 15 to 20
years away.22 And fully dexterous robotic hands are not likely to be in the market before 2030 or
even 2040.23 In short, there is little reason to believe that this emerging technology wave will be any
faster or more disruptive than past waves, such as the wave powered by steel and electricity in the
early 1900s.
If this next wave of innovation follows prior technological trajectories the technologies will likely
experience rapid price declines and significantly performance improvements over the next two
decades. As this occurs, they will be ready for, in the words of innovation scholar Carlota Perez,
widespread “installation,” where they provide enough of a compelling value proposition for a wide
range of organizations to scrap existing technologies that have not been fully depreciated and replace
them with more productive new technology systems.24
22. http://fortune.com/2017/12/06/ford-autonomous-cars/
23. Rodney Brooks, “Robots, AI, and Other Stuff,” Rodney Brooks Blog, January 1, 2018, https://rodneybrooks.com/my-dated-predictions/
24. Carlota Perez, “Technological Revolutions and Financial Capital”, (Northampton, MA: Edward Elgar, 2002).
70
However, there is a negative correlation between the adoption of advanced technologies and labor
costs. It is more compelling for an organization to invest in technologies to automate work if labor
costs savings are higher. We see this in the fact that studies of the expected employment impacts of
the NPR show higher impacts in economies with higher labor costs and lower in nations with lower
labor costs.25 This suggests that the productivity impacts of the NPR will initially be lower in
developing nations.
It does appear that the NPR will have a larger impact on more routine, lower-skill jobs. For example,
the Information Technology and Innovation Foundation estimated that the highest risk U.S.
occupations have the lowest median wage ($32,380), while the next-highest has the second-lowest
median wage ($34,990), and so on.26 Likewise, the OECD also estimated 44 percent of American
workers with less than a high school degree hold jobs made up of highly automatable tasks, while
only 1 percent of people with a bachelor’s degree or higher hold such a job.27 Because developing
nations on average have a higher share of lower-skill jobs, this dynamic could somewhat offset the
fact that automation makes more economic sense with higher wage costs. For example, next
generation robotics is more likely to automate routine “pick and place” assembly work of the kind
many developed nations specialize in than it is to automate more complex, higher skill manufacturing
operations (e.g., assembly of jet airplanes).
Regardless of when developing economies will begin to benefit from the productivity benefits of the
NPR, it is important to note that current and historical evidence, as well as economic theory and
research, strongly indicates this next innovation wave is extremely unlikely to lead to a large job
losses or a shortage of jobs. This is because productivity growth creates additional income that is
spent; in turn expanding demand for more goods and services and, hence, jobs. For example, in a
paper for the International Labour Organization’s 2004 World Employment Report, Van Ark,
Frankema, and Duteweerd find strong support for simultaneous growth in per-capita income,
productivity, and employment in the medium term.28
In short, there will still be plenty of work for humans to do. As such, faux “solutions” such as
universal basic income, a tax on “robots,” or regulations that shackle innovation are not only not
needed, but would be harmful, slowing income growth and keeping workers out of the labor market.
While there will be plenty of jobs, provided policy doesn’t get in the way of flexible labor markets,
workers will be faced with a more turbulent occupational labor market. As such nations needs better
policies and programs to help workers make successful adjustments.
Developing nations will need to take a number of steps to take full advantage of the NPR. The first,
and perhaps the most important, is to embrace, rather than fear and reject the NPR wave. In this
sense, any regulation of NPR technologies should not be based on the precautionary principle, which
focuses on pre-emptively guarding against the hypothetical risks a technology might pose. Imposing
restrictive regulations based on speculative fears would slow the deployment and development of
25. James Manyika, Susan Lund, Michael Chui, Jacques Bughin, Jonathan Woetzel, Parul Batra, Ryan Ko, and Saurabh Sanghvi, “Jobs Lost, Jobs Gained: Workforce Transitions In A Time Of Automation,” (McKinsey Global Institute, December 2017), https://www.mckinsey.com/global-themes/future-of-organizations-and-work/what-the-future-of-work-will-mean-for-jobs-skills-and-wages. 26. Ben Miller, “Automation Not So Automatic,” The Innovation Files, September 20, 2013, http://www.innovationfiles.org/automation-not-so-automatic/ 27. Melanie Arntz, Terry Gregory, Ulrich Zierahn, “The Risk of Automation for Jobs in OECD Countries: A Comparative Analysis,” OECD Library, OECD Social, Employment and Migration Working Papers, May 2016, http://www.oecd-ilibrary.org/social-issues-migration-health/the-risk-of-automation-for-jobs-in-oecd-countries_5jlz9h56dvq7-en. 28. Bart van Ark, Ewout Frankema, and Hedwig Duteweerd, “Productivity and Employment Growth: An Empirical Review of Long and Medium Run Evidence” (working paper, Groningen Growth and Development Centre, May 2004)
71
NPR technologies. Nations countries should instead embrace the innovation principle, which states
that policymakers should address risks as they arise, or allow market forces to address them, and not
hold back progress because of speculative concerns.29
Second, the biggest impact from NPR for G7 nations will come from the adoption, rather than the
development, of these next-wave technologies. Developing nations do not need to support the
emergence and growth of AI and robot firms to take advantage of the NPR. In fact, doing so could
harm overall benefits from the NPR if they are associated with restrictive innovation policies like
tariffs or other localization barriers to trade.30
Spurring adoption will require the right economy-wide policies and factors, such as taxation favorable
to capital investment and better skills, including digital skills. But factors determining adoption will
differ industry to industry. As such, developing nations should establish sector-based strategies for
NPR adoption, such as in transportation, health care and utilities. Government can play a key role in
helping systems adopt NPR technologies through public procurement, streamlining and aligning
regulation and funding pilot demonstration programs and compare outcomes in areas such as smart
cities, smart grid, and smart healthcare.
Third, governments should not resist increases in average firm size. As Atkinson and Lind find in Big
is Beautiful: Debunking the Myth of Small Business, average firm size in the United States has
increased over the last two decades, in part as ICT has enabled more firms to gain greater economies
of scale and market scope (e.g., e-commerce has increased the size of potential markets).31 NPR
technologies are likely to continue this positive trend: firm size in nations is strongly and positively
correlated with a set of economic indicators policymakers value: productivity, wages and benefits,
worker safety, and job creation.32 This means that developing economies should reduce, if not
eliminate, the vast array of policies unfairly favoring small and micro-sized enterprises.
Fourth, much of the next production revolution, particularly artificial intelligence, will depend on
data. To maximize the effectiveness of AI, nations will need to establish privacy regulations that
enable the use and reuse of data by organizations. It will also be important for cross-border data flows
to be enabled as firms in a wide array of industries, including mining, banking, retail, automobiles,
and health care, currently rely on cross-border data flows to drive innovation.33
In summary, if developing nations work together cooperatively, in a spirit of embracing the NPR, they
can look forward to a more prosperous economic future over the next several decades.
29. Daniel Castro, “Digital Decision-Making: The Building Blocks of Machine Learning and Artificial Intelligence” (Information
Technology and Innovation Foundation, December 2017), http://www2.itif.org/2017-digital-decision-making.pdf. 30. Ben Miller and Robert D. Atkinson, “Digital Drag: Ranking 125 Nations on Taxes and Tariffs on ICT Goods and Services, (Information Technology and Innovation Foundation, 2014), https://itif.org/publications/2014/10/24/digital-drag-ranking-125-nations-taxes-and-tariffs-ict-goods-and-services 31. Robert D. Atkinson and Michael Lind, Big is Beautiful: Debunking the Mythology of Small Business (The MIT Press: Cambridge, Massachusetts and London, England, April 2018). 32. Ibid. 33. Daniel Castro and Alan McQuinn, “Cross-Border Data Flows Enable Growth in All Industries,” (Information Technology and Innovation Foundation, February 2015), https://itif.org/publications/2015/02/24/cross-border-data-flows-enable-growth-all-industries.
72
Technology, inclusive growth and the future of work
Briefing note, prepared for the United Nations Expert Group Meeting in Geneva, April 2019
Jacques Bughin, Director, McKinsey Global Institute
Rapid technological change and rising inequality
are challenging countries worldwide. Automation
technologies will raise productivity but are
fundamentally altering the way we work. The
new dynamics of competition and the digital
economy seem to be widening disparities rather
than narrowing them. In developing and
advanced economies alike, workers will require
new skills and policy makers will need to forge a
new social contract so that the gains will be more
evenly distributed. This briefing note, which
draws on recent research from the McKinsey
Global Institute, highlights both the benefits and
the challenges of digital technologies, which are
exacerbating existing pressures and inequalities
in the labor market even as they offer potential
solutions.
1. Automation will affect every type of
occupation.
Our analysis of the impact of automation and AI
on work shows that certain categories of
activities are technically more easily automatable
than others. They include physical activities in
highly predictable and structured environments,
as well as data collection and data processing,
which together account for roughly half of the
activities that people do across all sectors. The
least susceptible categories include managing
others, providing expertise, and interfacing with
stakeholders. The density of highly automatable
activities varies across occupations, sectors, and,
to a lesser extent, countries. Our research finds
that about 30 percent of the activities in 60
percent of all occupations could be automated—
but that in only about 5 percent of occupations
are nearly all activities automatable. In other
words, more occupations will be partially
automated than wholly automated.
2. Even as it disrupts existing jobs, technology
can create new types of work.
Throughout history, as technology has eliminated
some types of jobs, it has both created new ones
and changed many existing occupations. For
example, we have estimated that the advent of
the personal computer destroyed about 3.5
million jobs in the United States between 1970 to
2015 but created 19.2 million in the same period,
for a net gain of 15.7 million. Two decades ago,
jobs such as app developer or social media
manager did not exist. The same kind of scenario
is likely to apply to the next wave of
technologies. New types of roles are often
needed to complement new tools, and those
technologies will generate wealth and
productivity gains that are reinvested back into
the economy.
3. Automation will not happen overnight.
The pace and extent to which automation will be
adopted and affect jobs will depend on several
factors besides technical feasibility. Among these
are the cost of deployment and adoption, and
the labor market dynamics, including labor
supply quantity, quality, and associated wages.
The labor factor leads to wide differences across
developed and developing economies. The
business benefits beyond labor substitution—
often involving use of AI for beyond-human
capabilities—are another factor. Social norms,
social acceptance, and various regulatory factors
will also determine the timing. How all these
73
factors play out across sectors and countries will
vary, and for countries will largely be driven by
labor market dynamics. For example, in
advanced economies with relatively high wage
levels, such as France, Japan, and the United
States, jobs affected by automation could be
more than double that in India, as a percentage
of the total.
4. The labor market may grow more polarized.
Skill requirements are changing in the
automation era and that will likely affect wages.
The demand for digital skills will continue to
accelerate in the years ahead. Social and
emotional skills such as leadership and managing
others will also be in much greater demand, as
will higher cognitive skills including creativity and
complex information processing. By contrast,
many of the current middle-wage jobs in
advanced economies are dominated by highly
automatable activities, in fields such as
manufacturing and accounting, which are likely
to decline. Moreover, a large portion of jobs
expected to grow, such as construction workers
and nursing aides, typically have lower wage
structures. The risk is that automation could
exacerbate wage polarization, income inequality,
and the lack of income advancement that has
characterized the past decade across advanced
economies.
5. Workforce transitions could be very large and
disruptive.
While there may be enough work to maintain full
employment to 2030 under most of the
scenarios we have modeled, the workforce
transitions will be large. Many jobs will be
displaced and almost all will change to some
extent. We estimate that between 75 and 375
million workers worldwide may need to switch
occupational categories by 2030. Many
economies are going into this new era at a
disadvantage, given existing skill mismatches,
strained education systems, and declining
corporate and state investment in training.
Meeting this challenge will require rethinking
safety nets and transition support; evolving
education and training systems to deliver the
skills that are in demand and provide lifelong
learning; stepping up private- and public-sector
investment in human capital; and improving
labor market dynamism though better
credentialing and matching.
6. Economies need to reverse a slowdown in
productivity growth.
At a time of aging and falling birth rates,
productivity growth becomes critical for long-
term economic growth. Yet, despite dazzling
advances in new technologies, productivity
growth has been sluggish in developed
economies, dropping to an average of 0.5
percent in 2010–14 from 2.4 percent a decade
earlier in the United States and major European
economies—a phenomenon that continues to
puzzle economists. Much like previous general-
purpose technologies, automation and AI have
the potential to contribute to reverse this
slowdown. One simulation we conducted using
McKinsey survey data suggests that AI adoption
could raise global GDP by as much as $13 trillion
by 2030, about 1.2 percent additional GDP
growth per year. This effect will build up only
through time, however, given that most of the
implementation costs of AI may be ahead of the
revenue potential.
7. Technology can be harnessed to bridge the
gender gap.
Even after decades of progress, the gender gap in
labor markets worldwide remains large. Our
research has estimated that making strides
74
toward gender parity in every region could add
some $12 trillion to global GDP. This will take
many years to achieve at the current pace of
change—and there is danger of losing ground
since women are under-represented in the STEM
fields that will be engines of job growth in the
future. Yet digital technologies can help women
advance, particularly in developing countries.
Today an estimated 57 percent of women are
financially excluded in South Asia, 54 percent in
China, and 49 percent in Southeast Asia. Mobile
finance can quickly bring them into the financial
system, increase their access to credit, and give
them more autonomy. More broadly, digital
technologies expand the range of options for
flexible work and give women new platforms for
their voices to be heard.
8. The workplace has a generation gap.
According to the ILO, the global youth
unemployment rate is roughly three times higher
than the adult unemployment rate. Without a
solid start to propel their careers forward, their
economic prospects will be lower over their
entire lifetimes. In a time of increased labor
market churn, the rift between generations may
grow. Some older workers may feel their skills
growing obsolete as more of the workforce is
made up of younger digital natives. Young people
may see their paths to advancement being
blocked as more older workers remain in their
roles and continue working past traditional
retirement ages. With the population rapidly
aging in many major economies, the public and
private sectors will need to redouble their focus
on productivity growth to counter the
demographic headwinds of a shrinking labor
pool.
9. Economies are increasingly dominated by
superstar companies and regions.
The global economy increasingly displays a
winner-take-most dynamic. Our research has
confirmed a so-called “superstar” effect not only
among firms but among sectors and cities as
well. They capture a greater (and growing) share
of income relative to their peers; they also have
higher levels of digitization, skills, and
innovation. Over the past 20 years, the
profitability gap between superstar firms and
median firms—and also between the bottom 10
percent of firms and median firms—has
widened. But superstars are not guaranteed to
stay that way forever; they can and are often
displaced. Their existence raises policy questions
regarding competition and market structure as
well as the implications for inclusive economic
growth and labor market polarization. These
types of disparities could widen, as AI adoption
turns into a competitive race that further
deepens digital gaps.
10. Entrepreneurship is an important
component of inclusive growth.
Small businesses are the engines of job
creation—and governments need to create a
level playing field and the kind of environment
where they can thrive. This may involve startup
incubators, VC funds, and carefully considered
competition policies. The growth of digital
platforms and marketplaces with global reach
has enabled small businesses to become
exporters and access capital, resources, and
talent from anywhere in the world. So-called
micro-multinationals can use online
marketplaces to reach far more customers than
ever before; Amazon and Alibaba host millions of
third-party sellers. The new era may thus well be
a time of “globalization for the small fry.”
Authors: Jacques Bughin is a director of the
McKinsey Global Institute and senior partner at
McKinsey & Company, based in Brussels; James

75
Manyika is chairman of the McKinsey Global
Institute and a McKinsey senior partner in San
Francisco; Tilman Tacke is a McKinsey partner
based in Munich.
References
McKinsey Global Institute research reports are
available on www.mckinsey.com/mgi. For this briefing
note, we have drawn on the following reports:
Jobs lost, jobs gained: Workforce transitions in a time
of automation, January 2018.
Notes from the AI frontier: Modeling the impact of AI
on the world economy, September 2018.
Skill shift: Automation and the future of the
workforce, May 2018.
Solving the productivity puzzle: The role of demand
and the promise of digitization, February 2018.
Superstars: The dynamics of firms, sectors, and cities
leading the global economy, October 2018.
Testing the resilience of Europe’s inclusive growth
model, December 2018.
The power of parity: How advancing women’s equality
can add $12 billion to global growth, September 2015.
McKinsey Global Institute, April 2019
Copyright © McKinsey & Company
www.mckinsey.com
@McKinsey @McKinsey
76
Productive employment, current context, and future of work
Short Note on SDG8
Rolph van der Hoeven, UN CDP and EUR-ISS, The Hague
SDG 8 and productive employment
The narrative of SDG 8 recognizes that economic growth and higher productivity are a precondition for
sustained welfare gains, and then turns to employment as a transmission mechanism through which
growth reaches people. The main innovation is the (albeit incomplete) recognition of labour rights.
Hence, goal 8 uses many of the key concepts of a heterodox economic frame. However, it mainly
reflects ‘agreed language’ of UN fora and ILO declarations, and contains nothing that is directly offensive
from an orthodox economic viewpoint. The underlying narrative of SDG 8 is broadly compatible with an
orthodox account of productivity as the driver behind social progress. By contrast, the question that
motivates heterodox inquiries – how and under what conditions productivity gains translate into higher
incomes – is given less prominence in goal 8. (Luebker 2017)
Figure 1 Employment concerns in the MDGs and SDGs
Source: Figure 8.1 in Luebker 2017
More radical departures from the orthodox account though are in SDG 10 ‘Reduce inequality within and
among countries. Target 10.1 aims to ‘achieve and sustain income growth of the bottom 40 per cent of
the population at a rate higher than the national average’. While it omits a reference to the worsening
of inequality due to ever-larger income shares at the very top of the distribution, it breaks with the idea
that growth is pro-poor as long as it (even to the slightest degree) benefits the poor. Target 10.3 goes
beyond the conventional promise to ensure equal opportunity, and calls for a reduction in inequalities
of outcome. Rather than seeing these inequalities as unavoidable, the SDG text alludes to institutions
that shape distributive outcomes and refers (albeit somewhat vaguely) to ‘legislation, policies and action
in this regard’. Target 10.4 singles out the role of fiscal, wage and social protection policies to
‘progressively achieve greater equality’. These are, in fact, some of the main levers for domestic
redistribution (Luebker, 2017 and 2015).
Target 10.5 goes into the need to ‘[i]mprove the regulation and monitoring of global financial markets
and institutions and strengthen the implementation of such regulations. In the aftermath of the global
financial crisis, this might no longer raise any eye-browns, but was controversial during the MDGs when
some argued that uncontrolled financial liberalization has little direct benefits for developing countries
but can have devastating outcomes for their labour markets (van der Hoeven and Luebker, 2007). Thus,
action on SDG 8 will only be transformative for development policies and for workers and their families if
the messages of SDG 10 are taken seriously – and that labour market institutions can play an important
role to achieve more equitable growth. The optimism implied by Figure 1 cannot be taken for granted:
productivity growth, even when combined with full and decent employment and some labour rights,
77
does not necessarily lead to equitable development. For this to happen, one needs to focus on
institutions and policies that shape the distribution of growth. (Luebker 2017).
What is the current context in which we should look at SDG8?
At the moment one observes slower overall global growth: the current growth cycle has peaked, while
exporting countries face a slow-down in external demand and, most likely, trade disputes will disrupt
global supply chains. Also changing monetary policy in large economies is leading to market volatility,
resulting in less FDI. Household, corporate debt and government is increasing in many economies. These
changing circumstances have important implications for economic policies creating employment.
Countries should boost domestic demand, through fiscal and other policies as a source of employment
growth. International organizations should provide especially developing countries policy space to make
full employment an overarching policy goal and to enact policies to raise minimum wages and other
wages, as well as strengthen labor’s bargaining rights. Furthermore, governments should redistribute
income to lower income households with higher propensity to spend and build social protection floors
as automatic stabilizers and to lessen the need for precautionary saving by households. Governments
should also draw lessons from the last great recession, when they acted as bankers of last resort but not
as employers of last resort (van der Hoeven, 2011). They should now seriously consider the role of the
state as the employer of last resort.
The international community should reassert the need for adequate national policy space in multilateral
and other cross-border agreements, including space for industrial policy, public enterprises, regulation
and other policies in the public interest. And also
Create new multilateral support and priority for policies of full employment, rights, wage increases,
redistribution
SDG 8 and the Future of Work
The current trends and challenges faced by developed and developing countries will put a heavy
mortgage on the Future of Work. Unfettered globalisation and financialization have increased insecurity
as well as income, wealth and social inequality (van Bergeijk and van der Hoeven, 2017). A technical
revolution, if unchecked, and demographic change may even reinforce these tendencies. New
technologies and societal development are so pervasive that the defining line between who is a worker
and who is an employer becomes hazier. Groups of citizens outside the classical triad of workers,
employers and governments need to be an integral part of the social contract, This puts more
responsibility in the hand of the governments, especially at times when in certain societies a notion
redevelops that government is perceived as the problem and not the solution. Such a notion, though, is
wholly erroneous in times of technological change and globalization, when more is expected of
governments in terms of managing change and globalization, and of dealing with distributional
consequences of these processes.
This requires in these times of globalization greater policy coherence between almost all aspects of
78
socio-economic policy: Macroeconomic policy, sectoral and structural policies, education policies and
social security policies. Attention for work and especially decent work is not only of concern to the
ministry of labour but needs to get attention at the highest political level, not only in word but also in
deed (van der Hoeven, 2011). National Governments and International Financial Agencies should not
only be accountable how they contribute to growth and stability, but also to how much decent jobs
have been created. It is imperative to have an integrated and global vision on labour markets and a
precise goal for that. It makes no sense anymore to speak of a national labour market. This requires
another way of thinking. Exact blue prints, as the various scenarios showed, are not available, but if
rethinking on the contours of a renewed social contract and acting in the spirit of the actualisation of a
social contract does not start now, it could be too late.
The Sustainable Development Goals (SDGs) agreed to by all members of the United Nations in 2015
provide the political impetus for this much-needed shift towards global macroeconomic policy
coordination. We need more exacting and encompassing policy measures to address global and national
asymmetries in resource mobilization, technological know-how, market power and political influence
caused by hyperglobalization that have generated exclusionary outcomes and will perpetuate them if no
action is taken. With the appropriate combination of resources, policies and reforms, the international
community has the tools available to galvanize the requisite investment push needed to achieve the
ambitions of the SDGs and promote decent work.
References:
Berg,J. (ed.) (2015) Labour Markets, Institutions and Inequality. Building Just Societies in the 21st Century,
Cheltenham, Edward Elgar
van Bergeijk, P.A.G. and R. van der Hoeven (eds.) (2017) Sustainable Development Goals and Income Inequality, Cheltenham, Edward Elgar
van der Hoeven, R. (2014) Full employment target: What lessons for a post-2015 development agenda? Journal of Human Development and Capabilities 15.2-3
van der Hoeven,R (ed.) (2011) Employment, Inequality and Globalization: A Continuous Concern,
Abingdon,Routledge
van der Hoeven R. and M.Luebker (2007) “Financial Openness and Employment: The Need for Coherent
International and National Policies ” Chapter 2 in Ocampo J,A, and Jomo,K,S, (eds.) Towards Full and
Decent Employment, London, Orient Longman
Luebker, M. (2015) ‘Redistribution policies’, Chapter 8 in Berg (2015)
Luebker, M. (2017) ‘Poverty, employment and inequality in the SDGs: heterodox discourse, orthodox
policies?’ Chapter 8 in van Bergeijk and van der Hoeven (2017)
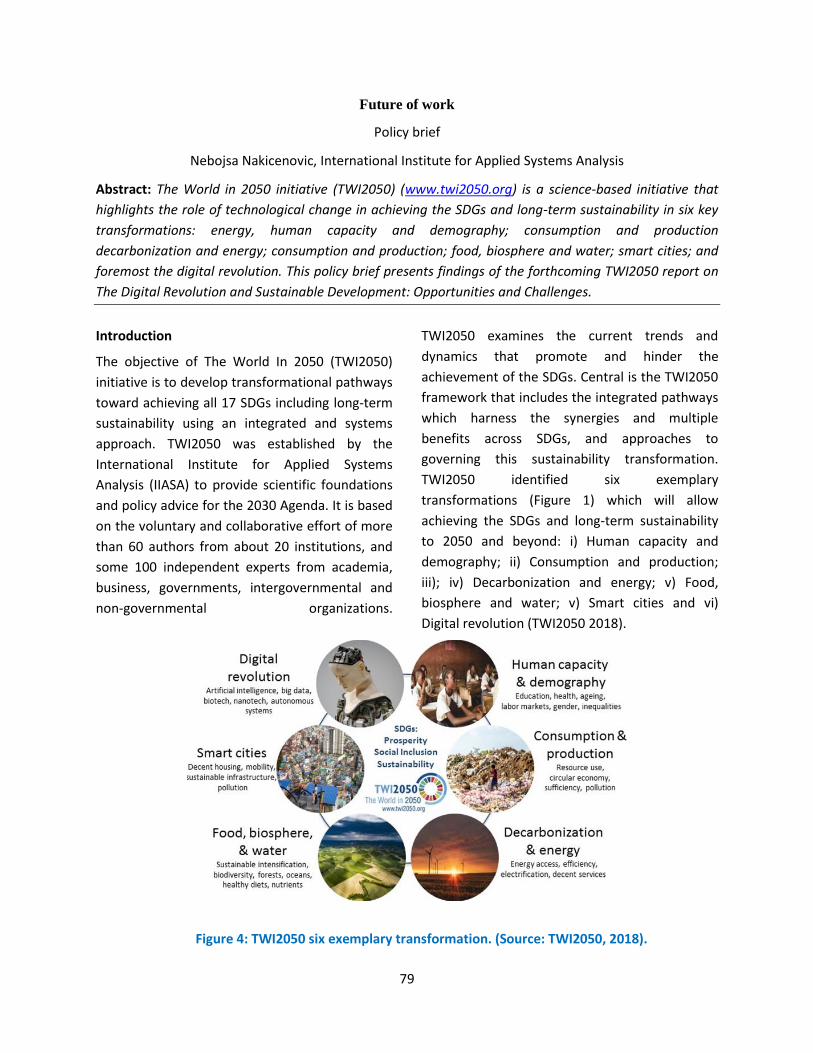
79
Future of work
Policy brief
Nebojsa Nakicenovic, International Institute for Applied Systems Analysis
Abstract: The World in 2050 initiative (TWI2050) (www.twi2050.org) is a science-based initiative that
highlights the role of technological change in achieving the SDGs and long-term sustainability in six key
transformations: energy, human capacity and demography; consumption and production
decarbonization and energy; consumption and production; food, biosphere and water; smart cities; and
foremost the digital revolution. This policy brief presents findings of the forthcoming TWI2050 report on
The Digital Revolution and Sustainable Development: Opportunities and Challenges.
Introduction
The objective of The World In 2050 (TWI2050)
initiative is to develop transformational pathways
toward achieving all 17 SDGs including long-term
sustainability using an integrated and systems
approach. TWI2050 was established by the
International Institute for Applied Systems
Analysis (IIASA) to provide scientific foundations
and policy advice for the 2030 Agenda. It is based
on the voluntary and collaborative effort of more
than 60 authors from about 20 institutions, and
some 100 independent experts from academia,
business, governments, intergovernmental and
non-governmental organizations.
TWI2050 examines the current trends and
dynamics that promote and hinder the
achievement of the SDGs. Central is the TWI2050
framework that includes the integrated pathways
which harness the synergies and multiple
benefits across SDGs, and approaches to
governing this sustainability transformation.
TWI2050 identified six exemplary
transformations (Figure 1) which will allow
achieving the SDGs and long-term sustainability
to 2050 and beyond: i) Human capacity and
demography; ii) Consumption and production;
iii); iv) Decarbonization and energy; v) Food,
biosphere and water; v) Smart cities and vi)
Digital revolution (TWI2050 2018).
Figure 4: TWI2050 six exemplary transformation. (Source: TWI2050, 2018).
80
Future of Work34
Human history has seen a slow change in occupation from one sector to the other: at first, the primary sector (agriculture) occupied most people, then as part of the industrial revolution the secondary sector (manufacturing) attracted more and more workers, offering higher productivity and less exposure to weather-related agricultural yield fluctuations. In the last century, we have seen a transition from manufacturing to the tertiary sector (services) favored by increased automation of manufacturing activities, increased wealth and new needs for immaterial goods to improve human welfare. The transformation from manufacturing to the service sector, referred to as deindustrialization, has been apparent even in low-income developing countries (with the exception of Asia) where it has been driven, among others, not by a rising income per capita or by technological change within their borders, but by technological changes taking place elsewhere and affecting these countries through globalization and trade (Dani 2016).
In the future, productivity in these sectors will certainly increase due to technological change and digital transformation, but at the same time there will be structural implications on the type of occupation and hours worked. Given the far-reaching transformation due to digitalization, exponentially increasing computing power and machine learning, giving rise to autonomous machines with cognitive and decision-making abilities, the impact on the work place will be disruptive.
On one side, it is foreseeable that these developments will help to automatize a significant portion of daily routines of workers guaranteeing more free time, rising consumption of recreational services and increasing their wellbeing. On the other side, many low-skill jobs in the primary, secondary and tertiary sectors
may become redundant in a future where artificial intelligence will effectively replace humans in performing cognitive tasks and some decision-making routines in the workplace. Some predict the disappearance of hundreds of millions of jobs. Robotics and artificial Intelligence alone, some say, could take some 800 million jobs by 2030 with a bulk of these in emerging and developing countries. (Manyika, J. et al, 2018).
Transforming jobs
Acknowledging the important role of work to provide individual income as well as identity, societal status and meaning, it is critically important to find solutions for the risk of an increasing number of workers being replaced by machines without offering them opportunities to pursue other meaningful and income generating occupations. Some argue that the focus should not be so much on the loss of jobs (most jobs cannot be fully automated) but on the transformation of jobs to the point of not being recognizable (Segal 2018).
Thus, the importance of reinventing and reengineering of jobs to benefit society. Learning the dynamics of these transformations is the key for allowing policy and decision makers to design coping and adaptation strategies that minimize the negative impact of the work place transformation. Norway is a good example where the risk of automation is said to be among the lowest in OECD (Arntz et al. 2016). And part of the reason is that Norway is more advanced than most in automation and many jobs have already been transformed to contain a greater social component (Nedelkoska and Quintini 2018).
Creation of a new service sector
The digital revolution will accelerate a decline of low skill jobs across sectors that is unlikely to be quickly absorbed by the market. This calls for governance and forward-looking policies to buffer the impact of the digital transformation on the workplace and steer it in the direction of achieving SDG8 (decent work for all). Nevertheless, jobs will be displaced and it is essential to provide new sources of meaningful

81
form of employment or at least some kind of ‘escape hatch’ through social security.
An obvious response to this issue is to boost workers’ skills through education, but this faces challenges as it
(i) takes time to retrain humans to the changed reality of the workplace,
(ii) requires substantial public investment at a time where public finance is severely constrained by large debt burdens, and
(iii) is subject to uncertainty about what skills will still be in demand in a world where many cognitive and decision tasks are being performed by machines.
The traditional development model which these countries have used as an engine for growth in the past was based on the following: manufacturing and domestic output that competed with cheap labor and that could easily be traded across borders and were therefore not inhibited by demand and incomes at home; the know-how for manufacturing was also relatively easy to transfer across borders (including from rich to poor countries); and manufacturing, in most cases, did not make immense demands on skills (Dani 2018).
The new technologies change this traditional model significantly in several ways including in terms of skills required and the ease (or not) of know-how transfer. Developing countries have greater challenges when it comes to designing and implementing strategies to cope with these changes.
The literature suggests that the most vulnerable jobs to be taken over by machines are low skill jobs centered on routine tasks (Acemoglu 2010). Those are prominent, e.g. in the mobility sector (threatened by autonomous vehicles), or on the office floor (threatened by automatized decision making, e.g. for administrative and accounting tasks). Up to half of the jobs are at risk of automization up to half in some mature economies (Frey et al 2016), and around two thirds in developing economies (World Bank 2016). But the impact could even be more far reaching, with machines taking over some high
skill jobs centered around analytic and diagnostic tasks (occupations such as brokers, pharmacists, programmers, and data analysts.)
On the other end of the spectrum, jobs that require perception and manipulation, creativity, inspiration and emotional bonding, seem to be most secure (Frey et al. 2016). Examples are teachers, nurses, social workers, scientists, actors, entertainers, politicians, civil society agents, managers, and leadership positions. Currently, those jobs constitute only a small fraction of the work force. Therefore, there is likely the need to broaden our concept of contractual work to include activities like child raising, care giving, community services, voluntary social work etc., which are deeply human in nature and therefore are unlikely to be taken over by machines (which does not mean they could not be assisted by machines, e.g. care giving, but humans will likely continue to play the central role). Those activities have always provided critical meaning to individuals and have a high value for society, but they are mostly not rewarded as contractual work and still discounted with regard to societal status (compared to their societal value).
A creation of a new service sector, remunerating these activities according to their societal value creation could allow absorbing redundant workers from other shrinking sectors, while offering these newly absorbed workers potentially even greater satisfaction with regards to a sense of identity, meaning, and belonging, in line with SDG8.
It would require a substantial redistribution of economic income from other sectors to these activities, which likely has to be organized by governments or other public institutions. It thus would require evolving the capitalist economy model which relies on private ownership of production factors and private consumption. The key will be to channel parts of the additional wealth generation from productivity gains of the digital revolution to public rather than private ownership and use it to fund the new service sector as well as broad education and life-long learning. Policy proposals like a robot tax have
82
already been developed that aim to work towards this goal or taxing ‘don’ts’ like resources or environmental externalities rather than the ’wants’, namely labor.
Specific needs of developing countries
In one way or another, most countries, including developing countries, are becoming increasingly aware of the challenges and the potential benefits of the digital revolution. And many are designing strategies to improve the chances of benefiting while mitigating the negative effects while they become ready to tap into these new technologies. But many developing countries need support in order not be left out or marginalized from this great transformation. This would have major impacts on inequality and social stability. With more research and more literature focusing on what developing countries need to do in to face the major challenges to
tapping into this new revolution, these dire predictions will hopefully turn more optimistic.
More and more of the recent literature focusing on the positive agenda of developing countries is starting to appear. While presenting a cautiously optimistic outlook on the digital transformation and the potential benefits for developing countries, the World Bank (2016) highlights the stark reality: the broader development benefits from the digital revolution are far from being realized. Some 6 billion people do not have the proper high-speed internet access that is required in order to benefit from the digital transformation. The needs for investments in infrastructure that are required are currently beyond the means of many developing countries other than the emerging economies. And the governance that is required to tap into this digital world with appropriate policies and regulations are weak at best.
83
References
Acemoglu, D (2010) Skills, Tasks, and Technologies: Implications for Employment and Earnings. NBER working paper.
Arntz, Melanie, Gregory, Terry & Zierhan, Ulrich (2016), The Risk of Automation for Jobs in OECD Countries, a comparative analysis, OECD Social, Migration, and Employment, Working Papers, OECD, Publishing, Paris.
Frey, C. B., Holmes, C., Osborne, M.A., Rahbari, E., Curmi, E., Garlick, R., Chua, J., Friedlander, G., Chalif, P., McDonald, G. and Martin Wilkie (2016). Technology at Work v2.0: the future is not what it used to be, Report by Oxford Martin School of Oxford University and Citi GPS Global Perspectives and Solutions, January 2016 .
Rodrick, Dani (2016), Premature Deindustrialization, Journal of Economic Growth, 21: 1-33,
Rodrik, Dani, (October 2018), Will new technologies in developing countries be a help or hindrance, World Economic
Forum in collaboration with Project Syndicate, 9 October 2018.
Manyika -Driemeler, M. and Nayyar, G. (2018). Jobs Lost, Jobs Gained: Workforce Transitions in a time of automation,
McKenzie Global institute.
Nedelkoska, L. and Quintini, G, (2018), “Automation, skills use and training”, OECD Social, Employment and Migration Working Papers, No. 202, OECD Publishing, Paris.
Segal, Michael (2018). Automatic Pilots: Automation will probably change your job, not destroy I, Nature, Volume 563, 29
November 2018 Outlook article.
TWI2050 - The World in 2050 (forthcoming). The Digital Revolution and Sustainable Development: Opportunities and
Challenge. Report prepared by the World in 2050 initiative. International Institute for Applied Systems Analysis (IIASA),
Laxenburg, Austria. www.twi2050.org
TWI2050 - The World in 2050 (2018). Transformations to Achieve the Sustainable Development Goals. Report prepared by
the World in 2050 initiative. International Institute for Applied Systems Analysis (IIASA), Laxenburg, Austria.
www.twi2050.org
84
Exponential Technology Growth and Reduction in Global Income Inequalities
Policy Brief
V.N Attri, Chair in Indian Ocean Studies
Indian Ocean Rim Association, University of Mauritius
Introduction
Amazing developments have occurred in the road map of international technology since Moore’s Law
(1965) which states that “the number of transistors in a dense integrated circuit doubles approximately
every two years. Since 1975 (when the law was revised by Moore), many studies confirmed the
continuation of this trend, though the period varies from 18 months to 36 months. Intel stated in
(2015) that the “pace of advancement has slowed starting at the 22 nm feature with around (2012) and
continuing at 14nm”. Further, Brian Krzanich, CEO of Intel announced, “Our cadence today is close
to two and a half years then two. Intel is expected to reach the 10nm node in 2018, a three year
cadence. He cited Moore’s 1975 revision as a precedent for the current deceleration, which results
from technical challenges and is a natural part of the history of Moore’s Law”. The prominent studies
are: Jain. K et al. (1982 – 1990); ITO Hiroshi (2000); Takhashi Dean (2005); Moore Gorden (2006);
Anderson Richard G. (2007); Nambiar Raghnath; Poess Meikel (2011); Mistry Kaizard (2011);
Hrusk, Joel (2012); McMenamm Adrain (2013); Jorgensen, Dale W; Ho Mins; Samuels John D.
(2014); Krzanich, Brain (2015); and Peter Bright (2017).
The big idea of the contemporary world is that technology grows exponentially and we may now talk
about “big think”. Technology may solve all the contemporary problems of the world: a belief –which
is not fully confirmed yet; and divergent views amongst scholars still prevails. There is a close link
between entrepreneurs and technology as well as innovation. An exponential entrepreneur is an
entrepreneur who is learning on exponentially accelerating technology – so network sensors, Artificial
Intelligence (AI), robotics, synthetic biology; 3D printing – these technologies that are all on
exponential growth curves. They are also relying on what we call exponential psychological tools.1
Diametrically opposite views are being expressed by the scholars on the efficacy of technological
progress in reducing incoming inequalities and promoting inclusive growth in developed developing
emerging and SIDs and LDCs. Even after the mild recovery in 2009 at global level, the world
economy has been experiencing a downward shift to its growth and a consequent decline. Milenko
Popovic in his paper, “technological progress, globalisation and secular stagnation” states that “graphs
and analysis for Africa, Latin American and Caribbean countries, and for particular region Asia and
Asia as a whole and for Oceania, do not show any signs of stagnation and, in that way, also show that
the rest of the world has not contributed to the stagnation of the world economy. The stagnation of the
world economy is therefore, totally attributable to the economics dynamics in the developed world.”2
In IORA, with exception to some countries the growth rates of GPD have been well above 5 percent
during the period 1998 – 2015 partly justifying the above view of Milenko Popovic.3
The World Bank (2018) in its report entitled “Education, Demographics and Global Inequality”,
states, “An expected shift in the skill composition of the global labour force will have important
consequences for the future of global income inequality. Specifically, a more educated labour force
from emerging market and developing economies will likely reduce inequality between countries. It
would also diminish inequality within countries, especially in emerging market and developing
economies.”
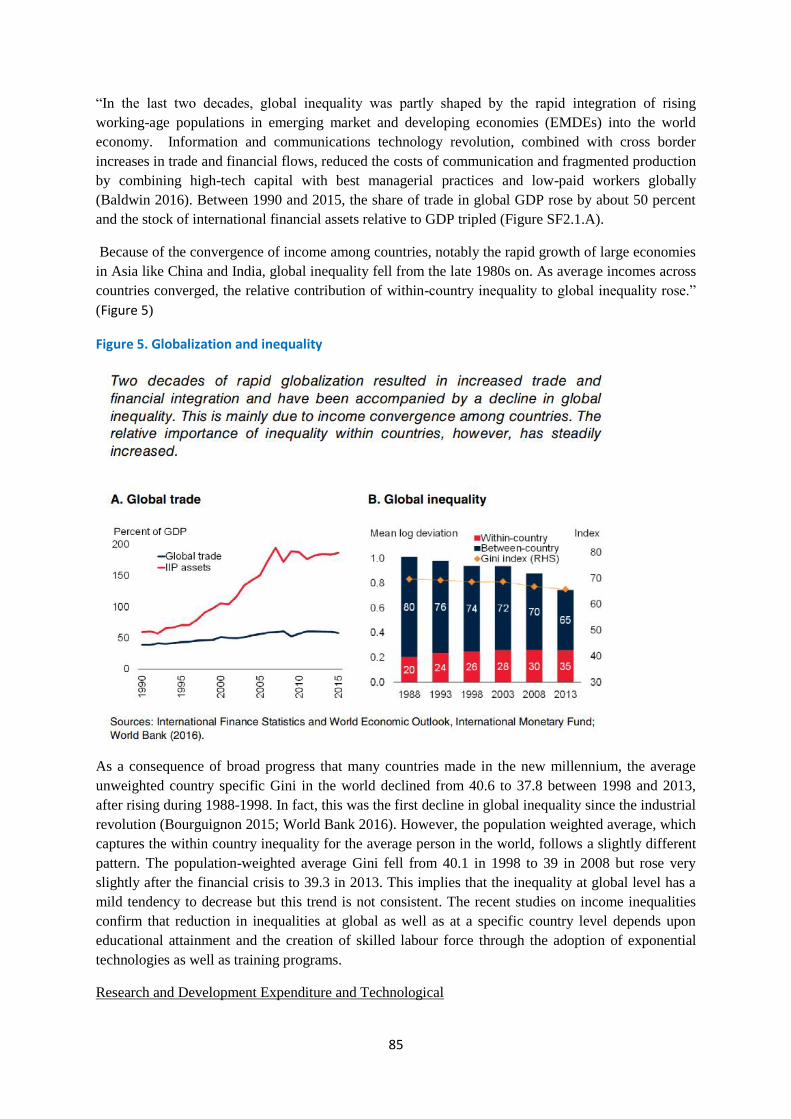
85
“In the last two decades, global inequality was partly shaped by the rapid integration of rising
working-age populations in emerging market and developing economies (EMDEs) into the world
economy. Information and communications technology revolution, combined with cross border
increases in trade and financial flows, reduced the costs of communication and fragmented production
by combining high-tech capital with best managerial practices and low-paid workers globally
(Baldwin 2016). Between 1990 and 2015, the share of trade in global GDP rose by about 50 percent
and the stock of international financial assets relative to GDP tripled (Figure SF2.1.A).
Because of the convergence of income among countries, notably the rapid growth of large economies
in Asia like China and India, global inequality fell from the late 1980s on. As average incomes across
countries converged, the relative contribution of within-country inequality to global inequality rose.”
(Figure 5)
Figure 5. Globalization and inequality
As a consequence of broad progress that many countries made in the new millennium, the average
unweighted country specific Gini in the world declined from 40.6 to 37.8 between 1998 and 2013,
after rising during 1988-1998. In fact, this was the first decline in global inequality since the industrial
revolution (Bourguignon 2015; World Bank 2016). However, the population weighted average, which
captures the within country inequality for the average person in the world, follows a slightly different
pattern. The population-weighted average Gini fell from 40.1 in 1998 to 39 in 2008 but rose very
slightly after the financial crisis to 39.3 in 2013. This implies that the inequality at global level has a
mild tendency to decrease but this trend is not consistent. The recent studies on income inequalities
confirm that reduction in inequalities at global as well as at a specific country level depends upon
educational attainment and the creation of skilled labour force through the adoption of exponential
technologies as well as training programs.
Research and Development Expenditure and Technological
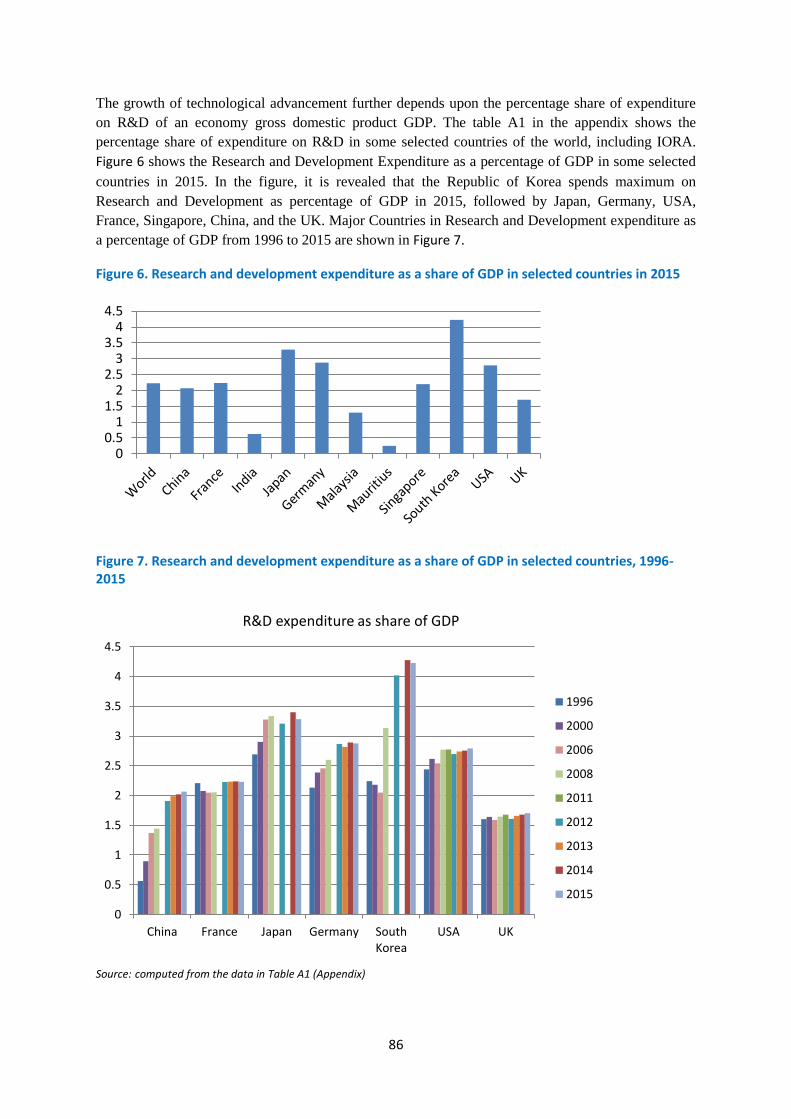
86
The growth of technological advancement further depends upon the percentage share of expenditure
on R&D of an economy gross domestic product GDP. The table A1 in the appendix shows the
percentage share of expenditure on R&D in some selected countries of the world, including IORA.
Figure 6 shows the Research and Development Expenditure as a percentage of GDP in some selected
countries in 2015. In the figure, it is revealed that the Republic of Korea spends maximum on
Research and Development as percentage of GDP in 2015, followed by Japan, Germany, USA,
France, Singapore, China, and the UK. Major Countries in Research and Development expenditure as
a percentage of GDP from 1996 to 2015 are shown in Figure 7.
Figure 6. Research and development expenditure as a share of GDP in selected countries in 2015
Figure 7. Research and development expenditure as a share of GDP in selected countries, 1996-2015
Source: computed from the data in Table A1 (Appendix)
00.5
11.5
22.5
33.5
44.5
0
0.5
1
1.5
2
2.5
3
3.5
4
4.5
China France Japan Germany SouthKorea
USA UK
R&D expenditure as share of GDP
1996
2000
2006
2008
2011
2012
2013
2014
2015

87
Real wages, productivity growth and innovation
The vast literature in economics supports that over a long period of time, increases in real wages –
adjusted for changes in consumer prices – reflect increases in labour productivity. The labour
productivity has increased significantly in mid-1990’s, compared to its anaemic pace during 1973 –
mid 1990’s. This acceleration in productivity has been attributed to technological innovations in the
production of semiconductors that sharply reduce the prices of such components and products that
contain them. Since 2000, many studies confirm that reengineering of business practises or what may
be termed as “blue business strategies” in contemporary times, when sustainable blue economy
paradigm is becoming increasingly and widely acceptable and is also simultaneously developed by the
scholars focuses on the increased “skill-bias”. The million-dollar question is “do we expect the
exponential growth technology growth in 2050 or even beyond”.
The efficiency of technology in reducing global income inequalities in the future depends on this; and
the adaptability of theses exponential technologies by emerging and developing market economies
(EDMEs); SIDs and LDCs- provided technology transfer happens smoothly from high innovative
countries to those countries which do not have enough resources to spend on R&D. The new
emerging global Science, Technology and Innovation policy (STI) should be based on mutually
beneficial collaboration and cooperation among ‘Developed’, Developing, SIDs and LDCs.
In the labour Market the premium is paid for the higher levels of technical, professional, and
managerial education and experience.
Global Perspective of Countries Experiences:
The World Bank Report (2018) , entitled,’ Mauritius : Addressing Inequality Through More
Equitable Labour Markets’, released in Port Louis on March 26,2018, highlights the success of the
Mauritian Economy in Diversification and its unprecedented structural transformation. The growth
has slowed down in 2010 and at the same time inequality increased, threatening the standard of living
of the poor. The report concludes that, ‘the active involvement and ownership of employers in skills
development and utilization are key and make the response more likely to be effective. Moreover,
with a view to enhancing efficiency, the government could review the exiting range of incentives
including collective training funds tax incentives, and payback clauses, as well as the international
evidence on what works’.
The World Bank’s Working papers of the Intra-Africa Talent Mobility Partnership Program (
March,2017) vol. 2 in reference to East African Community (ECA) discusses all aspects related with
the mobility of the working population in the region, emphasizing the role of exponential growth of
technology- digital technology, information and communication technology (ICT). It is evident from
the exiting literature that expenditure on education, including tertiary education is an important factor
in creating a strong ‘Skilled labour’ base in the countries aiming at inclusive growth- reducing income
inequalities. In this context, it is important to point out that IORA in its first and second ministerial
meetings on Blue Economy held on 2 – 3 September 2015 in Mauritius and in 8 – 10 May, 2017 in
Jakarta, Indonesia rightly emphasized the importance of science, technology and innovation in
achieving inclusive and sustainable development in IOR through harnessing the vast ocean resources.
It is also recommended that the cooperation and collaboration among the member states of IORA and
its Dialogue partners may be strengthened. This will help in reducing income inequalities in the
region by applying the latest exiting and newly emerging technologies by 2030 for which there is an
88
immense scope, based on the scientific studies on the exponential growth of the technology.
Educational attainments are closely linked with productive employment outcomes; and in some of the
countries like Argentina, India, Indonesia, Mexico, Brazil etc. (UNESCO, 2013). According to other
report on Education and Work, Australia, (May, 2017), out of 185,400 people aged 15-64 years who
were employed as apprentices or trainee and were part of the Australian Apprenticeship Scheme. Of
these, 81000 people (44 %) had commenced their apprenticeship or traineeship in the last twelve
months. In the last 12 months. This example shows that constant improvements in the skills of the
working force may be attained through apprenticeships and trainees programs by the governments is
an excellent way to reduce income inequalities. According to World Economic Forum (2017) it is
stated that in global transformations, such as achieving inclusive growth; reducing income
inequalities, education and skills plays an important role. The countries need to evolve a
mechanism(s) for promoting education and skills, focusing on relevant specializations and education;
education and innovation; quality education; 21 century curriculum (keeping in view of the
requirements of the sustainable blue economy). In addition to this digital fluency and STEM skills are
also relevant. In our opinion, the research intensive universities across the World determine the
exponential growth of the technology. The top ten World’s Innovative countries: Republic of Korea,
Sweden, Singapore, Germany, Switzerland, japan, Finland, Denmark, France and Israel (USA is out
for the first time among top ten in 2018, Bloomberg Innovation Index, 2018) need to transfer their
knowhow to other countries in order to promote skills, so crucial for reducing income inequalities.
Conclusions:
The study reveals that there is a greater scope in future for the exponential growth of technologies
which by reducing the cost component of the newly emerging technologies using transistors in a
dense integrated circuits, as implied in Moore’s Law (1975). These growing technologies have been
instrumental in raising the level of productivity in the successful countries. Innovations and Economic
Growth are closely linked and further that reductions in income inequalities may take place at global
and country levels by promoting and strengthening the skill biases through qualitative growth of
education and evolving a pragmatic and priority based Science, Technology and Innovation (STI)
policy at global, regional and country level. This will help in achieving sustainable developing goals
by 2030. The role of technology in reducing global income inequalities as well as countries’ income
inequalities is very important and well defined. The challenge is to ensure smooth transfer of newly
emerging technologies to the emerging developing and market economies (EDMEs), Small islands
developing states (SIDs); and Least Developed Countries (LDCs); and the Coastal Economies. The
attainments of high educational levels are closely linked with high wages; and helps in bridging the
gaps in income-levels across the world. In conclusion, it may be said that technology can play a big
role in achieving the Global Sustainable Goals by 2030.
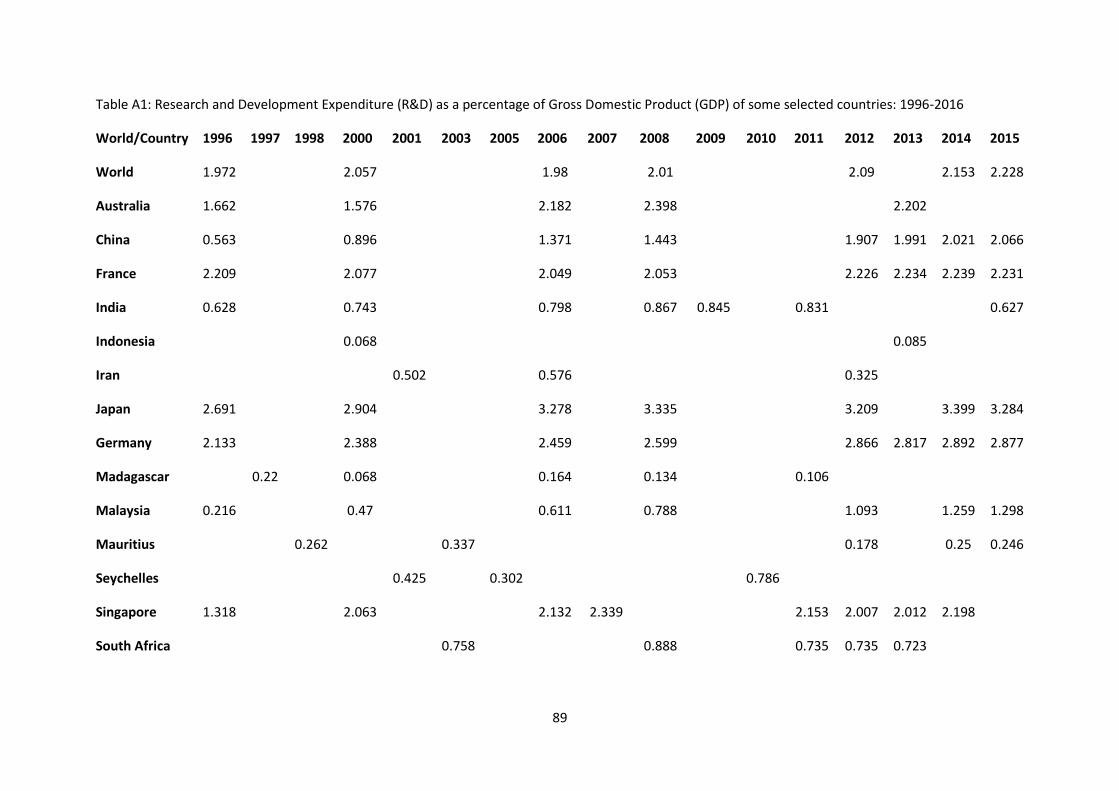
89
Table A1: Research and Development Expenditure (R&D) as a percentage of Gross Domestic Product (GDP) of some selected countries: 1996-2016
World/Country 1996 1997 1998 2000 2001 2003 2005 2006 2007 2008 2009 2010 2011 2012 2013 2014 2015
World 1.972 2.057 1.98 2.01 2.09 2.153 2.228
Australia 1.662 1.576 2.182 2.398 2.202
China 0.563 0.896 1.371 1.443 1.907 1.991 2.021 2.066
France 2.209 2.077 2.049 2.053 2.226 2.234 2.239 2.231
India 0.628 0.743 0.798 0.867 0.845 0.831 0.627
Indonesia 0.068 0.085
Iran 0.502 0.576 0.325
Japan 2.691 2.904 3.278 3.335 3.209 3.399 3.284
Germany 2.133 2.388 2.459 2.599 2.866 2.817 2.892 2.877
Madagascar 0.22 0.068 0.164 0.134 0.106
Malaysia 0.216 0.47 0.611 0.788 1.093 1.259 1.298
Mauritius 0.262 0.337 0.178 0.25 0.246
Seychelles 0.425 0.302 0.786
Singapore 1.318 2.063 2.132 2.339 2.153 2.007 2.012 2.198
South Africa 0.758 0.888 0.735 0.735 0.723
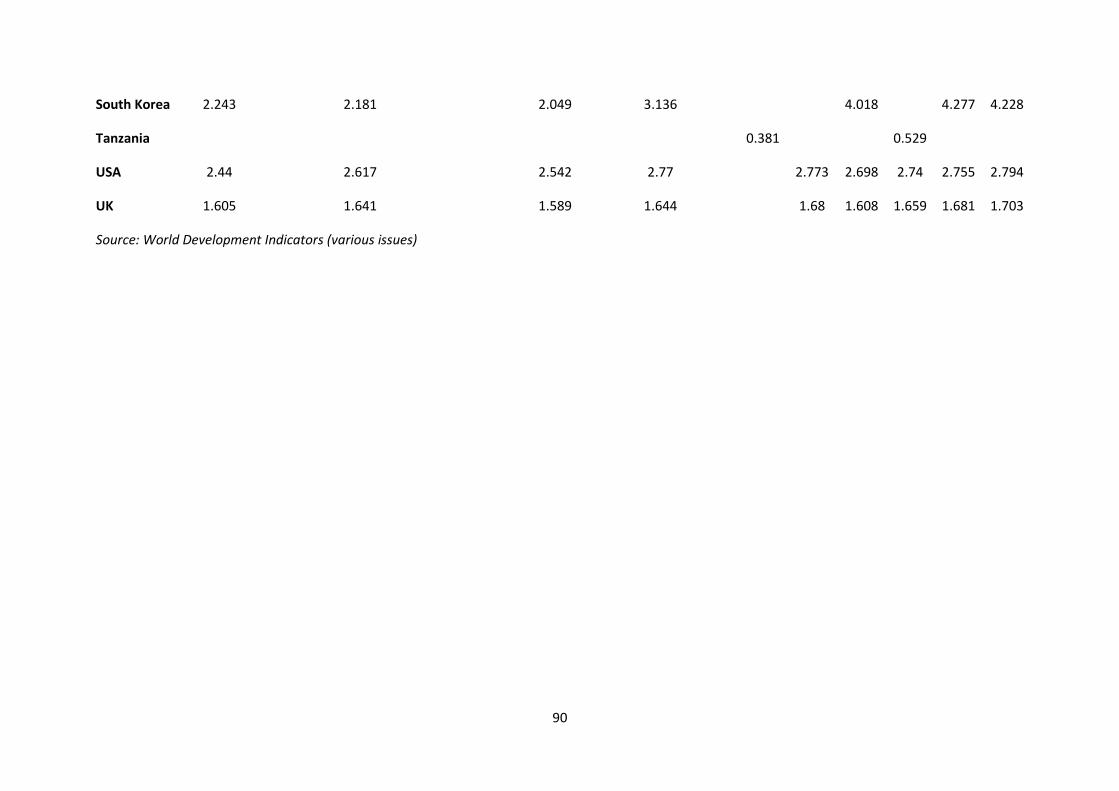
90
South Korea 2.243 2.181 2.049 3.136 4.018 4.277 4.228
Tanzania 0.381 0.529
USA 2.44 2.617 2.542 2.77 2.773 2.698 2.74 2.755 2.794
UK 1.605 1.641 1.589 1.644 1.68 1.608 1.659 1.681 1.703
Source: World Development Indicators (various issues)
91
References
1. Moore, Gordon E. (1965-04-19). "Cramming more components onto integrated circuits". Electronics.
Retrieved 2016-07-01.
2. The trend begins with the invention of the integrated circuit in 1958. See the graph on the bottom of page 3
of Moore's original presentation of the idea.[1]
3. Moore, Gordon E. (1965). "Cramming more components onto integrated circuits" (PDF). Electronics
Magazine. p. 4. Retrieved 2006-11-11.
4. Moore, Gordon. "Progress in Digital Integrated Electronics" (PDF). Retrieved July 15, 2015.
5. Krzanich, Brian (July 15, 2015). "Edited Transcript of INTC earnings conference call". Retrieved July
16, 2015. Just last quarter, we celebrated the 50th anniversary of Moore's Law. In 1965 when Gordon's
paper was first published, he predicted a doubling of transistor density every year for at least the next 10
years. His prediction proved to be right and in fact, in 1975, looking ahead to the next 10 years, he updated
his estimate to a doubling every 24 months.
6. Takahashi, Dean (April 18, 2005). "Forty years of Moore's law". Seattle Times. San Jose, CA.
Retrieved April 7, 2015. A decade later, he revised what had become known as Moore's Law: The number
of transistors on a chip would double every two years.
7. Moore, Gordon (2006). "Chapter 7: Moore's law at 40". In Brock, David. Understanding Moore's Law:
Four Decades of Innovation (PDF). Chemical Heritage Foundation. pp. 67–84. ISBN 0-941901-41-6.
Archived from the original (PDF) on 2016-03-04. Retrieved March 22, 2018.
8. "Over 6 Decades of Continued Transistor Shrinkage, Innovation"(Press release). Santa Clara, California:
Intel Corporation. Intel Corporation. 2011-05-01. Retrieved 2015-03-15. 1965: Moore's Law is born when
Gordon Moore predicts that the number of transistors on a chip will double roughly every year (a decade
later, revised to every 2 years)
9. "Moore's Law to roll on for another decade". Retrieved 2011-11-27. Moore also affirmed he never said
transistor count would double every 18 months, as is commonly said. Initially, he said transistors on a chip
would double every year. He then recalibrated it to every two years in 1975. David House, an Intel
executive at the time, noted that the changes would cause computer performance to double every 18
months.
10. Disco, Cornelius; van der Meulen, Barend (1998). Getting new technologies together. New York: Walter de
Gruyter. pp. 206–207. ISBN 3-11-015630-X. OCLC 39391108. Retrieved August 23, 2008.
11. Byrne, David M.; Oliner, Stephen D.; Sichel, Daniel E. (March 2013). Is the Information Technology
Revolution Over? (PDF). Finance and Economics Discussion Series Divisions of Research & Statistics and
Monetary Affairs Federal Reserve Board. Washington, D.C.: Federal Reserve Board Finance and
Economics Discussion Series (FEDS). Archived (PDF) from the original on 2014-06-09. technical
progress in the semiconductor industry has continued to proceed at a rapid pace ... Advances in
semiconductor technology have driven down the constant-quality prices of MPUs and other chips at a
rapid rate over the past several decades.
12. Myhrvold, Nathan (June 7, 2006). "Moore's Law Corollary: Pixel Power". New York Times.
Retrieved 2011-11-27.
13. Rauch, Jonathan (January 2001). "The New Old Economy: Oil, Computers, and the Reinvention of the
Earth". The Atlantic Monthly. Retrieved November 28, 2008.
14. Keyes, Robert W. (September 2006). "The Impact of Moore's Law". Solid State Circuits Newsletter.
Retrieved November 28, 2008.
15. Liddle, David E. (September 2006). "The Wider Impact of Moore's Law". Solid State Circuits Newsletter.
Retrieved November 28, 2008.
16. Kendrick, John W. (1961). Productivity Trends in the United States. Princeton University Press for NBER.
p. 3.
92
17. Jorgenson, Dale W.; Ho, Mun S.; Samuels, Jon D. (2014). "Long-term Estimates of U.S. Productivity and
Growth" (PDF). World KLEMS Conference. Retrieved 2014-05-27.
18. "Overall Technology Roadmap Characteristics". International Technology Roadmap for Semiconductors.
2010. Retrieved 2013-08-08.
19. Moore, Gordon (March 30, 2015). "Gordon Moore: The Man Whose Name Means Progress, The visionary
engineer reflects on 50 years of Moore's Law". IEEE Spectrum: Special Report: 50 Years of Moore's
Law (Interview). Interview with Rachel Courtland. We won't have the rate of progress that we've had over
the last few decades. I think that's inevitable with any technology; it eventually saturates out. I guess I see
Moore's law dying here in the next decade or so, but that's not surprising.
20. INTEL CORP, FORM 10-K (Annual Report), Filed 02/12/16 for the Period Ending 12/26/15
21. Hruska, Joel (August 16, 2017). "Details Leak on Intel's Upcoming Ice Lake CPU, 10nm
Schedule". ExtremeTech. Retrieved January 23, 2018.
22. Clark, Don (July 15, 2015). "Intel Rechisels the Tablet on Moore's Law". Wall Street Journal Digits Tech
News and Analysis. Retrieved 2015-07-16. The last two technology transitions have signalled that our
cadence today is closer to two and a half years than two
23. Bradshaw, Tim (July 16, 2015). "Intel chief raises doubts over Moore's law". Financial Times.
Retrieved 2015-07-16.
24. Waters, Richard (July 16, 2015). "As Intel co-founder's law slows; a rethinking of the chip is
needed". Financial Times.
25. Niccolai, James (July 15, 2015). "Intel pushes 10nm chip-making process to 2017, slowing Moore's
Law". InfoWorld. Retrieved 2015-07-16. It's official: Moore's Law is slowing down. ... "These transitions
are a natural part of the history of Moore's Law and are a by-product of the technical challenges of
shrinking transistors while ensuring they can be manufactured in high volume," Krzanich said.
26. World Bank. 2012. World Development Report 2013: Jobs. Washington DC: World Bank.
27. 6227.0 – Education and Work, Australia, May 2017.
28. IORA First Blue Economy Ministerial, 2 – 3 September, 2015, Port Louis, Mauritius
29. IORA Second Blue Economy Ministerial, 8 – 10 May, 2017, Jakarta, Indonesia
30. Working Papers of the Intra-Africa Talent Mobility Partnership Program, Volume 2@ Thematic Reports,
March, 2017.
31. Moore, Gordon E. (1995). "Lithography and the future of Moore's law" (PDF). SPIE. Retrieved 2014-05-
27.
32. Jorgenson, Dale W. (2000). "Information Technology and the U.S. Economy: Presidential Address to the
American Economic Association". American Economic Association. CiteSeerX 10.1.1.198.9555 .
33. Jorgenson, Dale W.; Ho, Mun S.; Stiroh, Kevin J. (2008). "A Retrospective Look at the U.S. Productivity
Growth Resurgence". Journal of Economic Perspectives. Retrieved 2014-05-15.
34. Grimm, Bruce T.; Moulton, Brent R.; Wasshausen, David B. (2002). "Information Processing Equipment
and Software in the National Accounts" (PDF). U.S. Department of Commerce Bureau of Economic
Analysis. Retrieved 2014-05-15.
35. "Nonfarm Business Sector: Real Output Per Hour of All Persons". Federal Reserve Bank of St. Louis
Economic Data. 2014. Retrieved 2014-05-27.
https://www.extremetech.com/computing/254209-details-leak-intels-upcoming-ice-lake-cpu-10nm-schedule
93
Confronting the Implications of Globalization and the New Technological Revolution: The Need for a
Transformative Change in Development Strategy in Latin America
Policy Brief
Eva Paus, Professor of Economics, Carol Hoffmann Collins Director, McCulloch Center for Global Initiatives,
Mount Holyoke College, USA, April 2019
Sustained per capita economic growth (SDG 8.1) and higher productivity growth through diversification,
technological upgrading and innovation (SDG 8.2) are ambitious goals. The globalization process of the past 30
years and the impending new technological revolution offer common challenges and opportunities for
developing countries on the path towards achieving these goals. Yet a country’s ability to respond to the
challenges and leverage the opportunities depends on the nature of its integration into the global economy
and country specific context shaped by path dependency and government policies.
This policy brief focuses on Latin America, a region where most economies are far from achieving goals 8.1.
and 8.2. Decades of market-led development strategies have generated dismal productivity growth, de-
industrialization, and large structural heterogeneity. Countries are in a middle-income trap.35 A new
development strategy is needed to reverse these trends and address the dual challenge of sustained growth
and decent employment creation, especially in the globally and technologically challenging context:
• At the core of a new transformative strategy has to be a focus on developing domestic firms’
technological and innovation capabilities.
• Governments have a crucial role to play in advancing an innovation-focused strategy.
• Governments need to use available policy, and the international rules and regulations that
circumscribe policy space (esp. WTO regulations and bi-lateral trade and investment treaties) have to
change to allow for the needed policy space at the national level.
Market-led Strategies in Latin America: Dismal Outcomes for SDG 8.1. and 8.2
Market-led strategies in Latin America have turned the region into the worst performer among developing
areas with respect to productivity growth. Productivity grew at an average annual rate of 0.43 percent during
the 1990s, 0.76 percent during the 2000s, and 0.33 percent between 2007 and 2017 (see Table 1).
Under the state-led development strategy of import substituting industrialization (ISI) in Latin America (1950s
to 1970s), tariff protection and access to subsidized credit, together with improvements in education and
infrastructure and incipient investments in a national innovation system, led to a reallocation of resources
from lower-productivity agricultural activities to higher-productivity manufacturing activities, with the
manufacturing sector accounting for over a quarter of GDP by the 1960s. But the failure to adopt measures
that simulated competition (e.g., export performance requirements like in some of the East Asian Tigers or
enforcement of sunset clauses for government support policies), in combination with overvalued real
exchange rates, undermined the achievement of international competitiveness of manufactured products,
which led to growing economic difficulties. And the manufacturing sector was not able to create enough jobs
given the labor supply, which resulted in the growth of the informal economy.
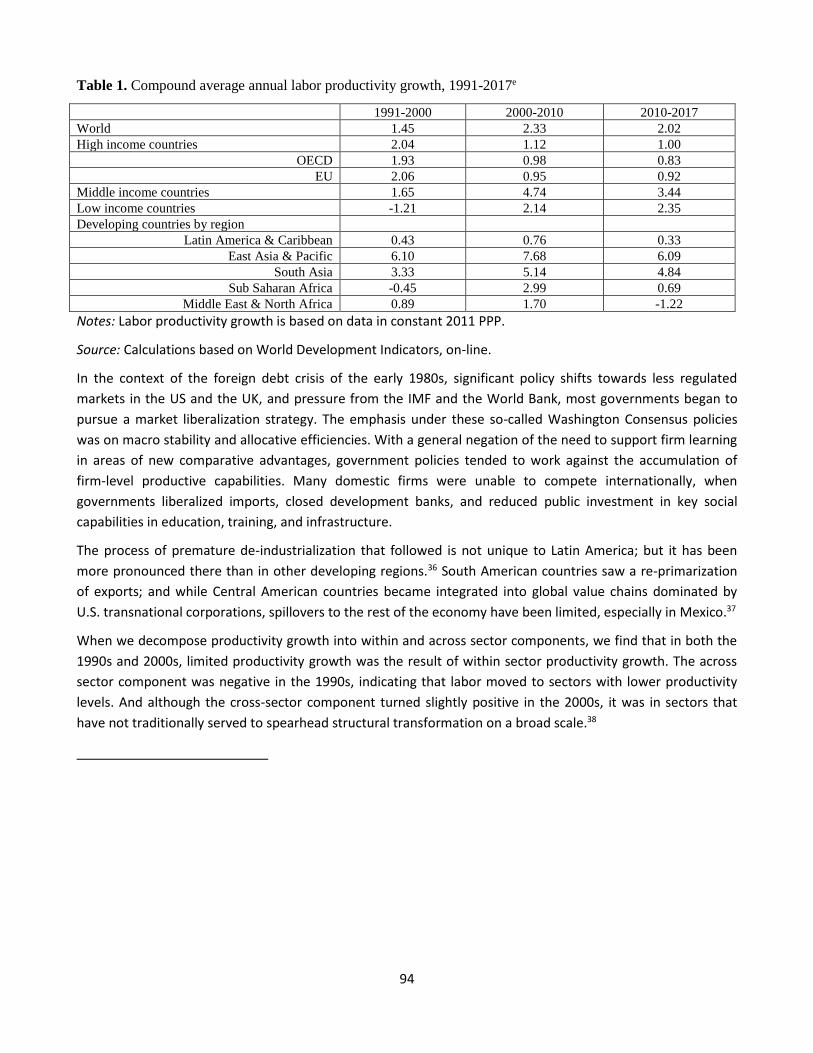
94
Table 1. Compound average annual labor productivity growth, 1991-2017e
1991-2000 2000-2010 2010-2017
World 1.45 2.33 2.02
High income countries 2.04 1.12 1.00
OECD 1.93 0.98 0.83
EU 2.06 0.95 0.92
Middle income countries 1.65 4.74 3.44
Low income countries -1.21 2.14 2.35
Developing countries by region
Latin America & Caribbean 0.43 0.76 0.33
East Asia & Pacific 6.10 7.68 6.09
South Asia 3.33 5.14 4.84
Sub Saharan Africa -0.45 2.99 0.69
Middle East & North Africa 0.89 1.70 -1.22
Notes: Labor productivity growth is based on data in constant 2011 PPP.
Source: Calculations based on World Development Indicators, on-line.
In the context of the foreign debt crisis of the early 1980s, significant policy shifts towards less regulated
markets in the US and the UK, and pressure from the IMF and the World Bank, most governments began to
pursue a market liberalization strategy. The emphasis under these so-called Washington Consensus policies
was on macro stability and allocative efficiencies. With a general negation of the need to support firm learning
in areas of new comparative advantages, government policies tended to work against the accumulation of
firm-level productive capabilities. Many domestic firms were unable to compete internationally, when
governments liberalized imports, closed development banks, and reduced public investment in key social
capabilities in education, training, and infrastructure.
The process of premature de-industrialization that followed is not unique to Latin America; but it has been
more pronounced there than in other developing regions.36 South American countries saw a re-primarization
of exports; and while Central American countries became integrated into global value chains dominated by
U.S. transnational corporations, spillovers to the rest of the economy have been limited, especially in Mexico.37
When we decompose productivity growth into within and across sector components, we find that in both the
1990s and 2000s, limited productivity growth was the result of within sector productivity growth. The across
sector component was negative in the 1990s, indicating that labor moved to sectors with lower productivity
levels. And although the cross-sector component turned slightly positive in the 2000s, it was in sectors that
have not traditionally served to spearhead structural transformation on a broad scale.38
95
In addition, structural heterogeneity is high. Labor productivity in micro and small enterprises - which make up
the vast majority of productive entities in Latin America –is only a fraction of large enterprises. In Peru and
Brazil, for example, the labor productivity of micro enterprises is reported to be 6 percent and 10 percent,
respectively, of that of large companies. In Spain, the comparable percentage is 46, and in France 71.39
Hyper-globalization: Increased Urgency to Increase Productivity Growth
The limited development of productive capabilities has particularly grave consequences in a global context
where the pressures to innovate have been rising relentlessly. Over the past 30 years, competition in
international markets has intensified considerably, product cycles have become shorter, and the pace of
technological change increased. In particular, China’s economic rise poses significant challenges for other
middle-income countries.
Since the 1980s, China has pursued a selective liberalization strategy in the context of a continued strong role
of the state in the economy, much in contrast to the sweeping market liberalization in most Latin American
countries. And the government adopted a strategic focus on innovation at a lower income level than the East
Asian development success stories like South Korea. In 2014, the R&D intensity in China was more than three
times higher than predicted for its income level.40
The trend in productivity growth in China has moved in the opposite direction from Latin America’s, at an
astounding 10 percent per year in the 2000s (see Table 2). A de-composition of China’s structural change into
within and across sector components shows that within sector productivity was the more significant driver of
overall productivity growth. But the across sector component was been positive and quite significant since the
1970s, indicating growth-enhancing structural change in China, compared to growth-reducing structural
change in Latin America in the 1980s and 1990s.41
Table 2. Average Annual Labor Productivity Growth: Latin America and China42
Latin America China
1950s 3.20 % 0.87 %
1960s 2.94 % 3.37 %
1970s 1.41 % 3.03 %
1980s -2.02 % 4.30 %
1990s 0.95 % 9.41 %
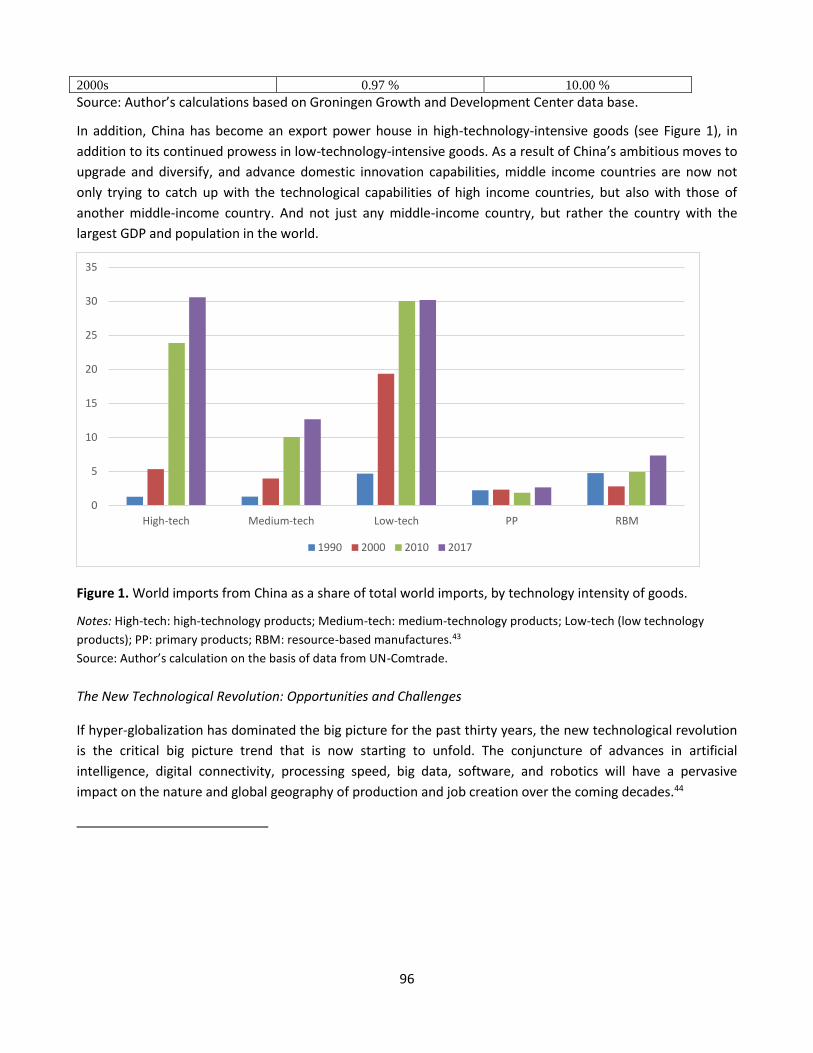
96
2000s 0.97 % 10.00 %
Source: Author’s calculations based on Groningen Growth and Development Center data base.
In addition, China has become an export power house in high-technology-intensive goods (see Figure 1), in
addition to its continued prowess in low-technology-intensive goods. As a result of China’s ambitious moves to
upgrade and diversify, and advance domestic innovation capabilities, middle income countries are now not
only trying to catch up with the technological capabilities of high income countries, but also with those of
another middle-income country. And not just any middle-income country, but rather the country with the
largest GDP and population in the world.
Figure 1. World imports from China as a share of total world imports, by technology intensity of goods.
Notes: High-tech: high-technology products; Medium-tech: medium-technology products; Low-tech (low technology
products); PP: primary products; RBM: resource-based manufactures.43
Source: Author’s calculation on the basis of data from UN-Comtrade.
The New Technological Revolution: Opportunities and Challenges
If hyper-globalization has dominated the big picture for the past thirty years, the new technological revolution
is the critical big picture trend that is now starting to unfold. The conjuncture of advances in artificial
intelligence, digital connectivity, processing speed, big data, software, and robotics will have a pervasive
impact on the nature and global geography of production and job creation over the coming decades.44
0
5
10
15
20
25
30
35
High-tech Medium-tech Low-tech PP RBM
1990 2000 2010 2017
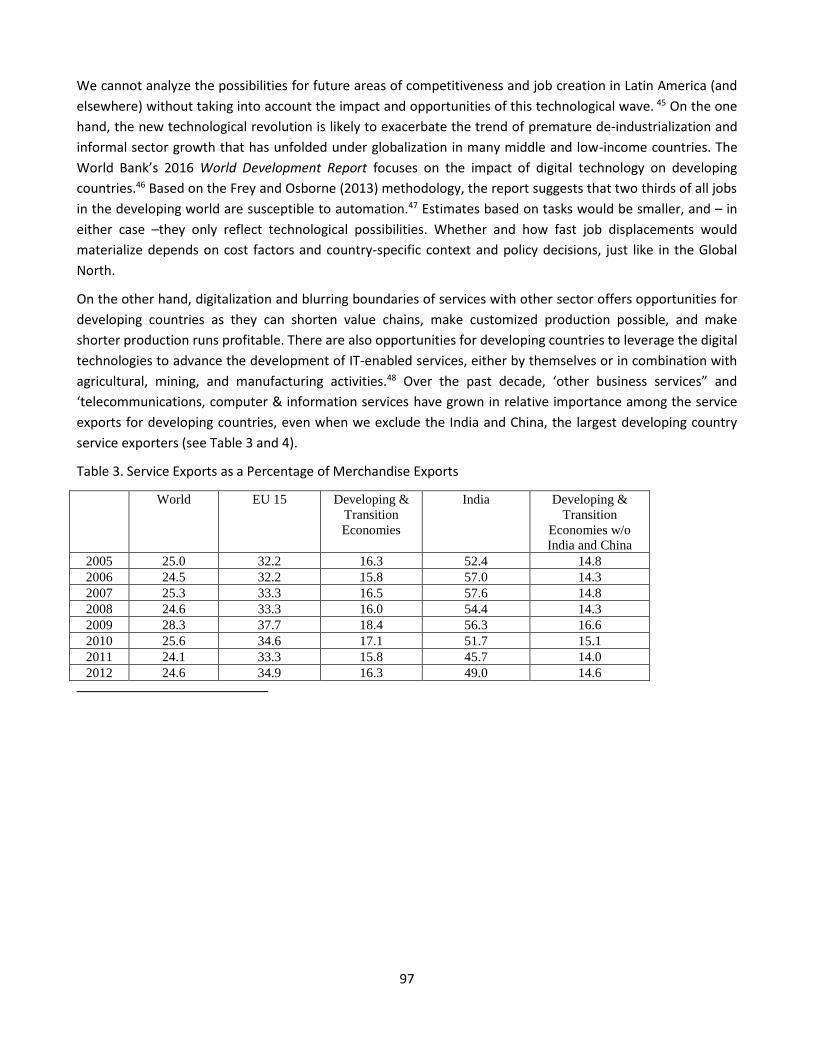
97
We cannot analyze the possibilities for future areas of competitiveness and job creation in Latin America (and
elsewhere) without taking into account the impact and opportunities of this technological wave. 45 On the one
hand, the new technological revolution is likely to exacerbate the trend of premature de-industrialization and
informal sector growth that has unfolded under globalization in many middle and low-income countries. The
World Bank’s 2016 World Development Report focuses on the impact of digital technology on developing
countries.46 Based on the Frey and Osborne (2013) methodology, the report suggests that two thirds of all jobs
in the developing world are susceptible to automation.47 Estimates based on tasks would be smaller, and – in
either case –they only reflect technological possibilities. Whether and how fast job displacements would
materialize depends on cost factors and country-specific context and policy decisions, just like in the Global
North.
On the other hand, digitalization and blurring boundaries of services with other sector offers opportunities for
developing countries as they can shorten value chains, make customized production possible, and make
shorter production runs profitable. There are also opportunities for developing countries to leverage the digital
technologies to advance the development of IT-enabled services, either by themselves or in combination with
agricultural, mining, and manufacturing activities.48 Over the past decade, ‘other business services” and
‘telecommunications, computer & information services have grown in relative importance among the service
exports for developing countries, even when we exclude the India and China, the largest developing country
service exporters (see Table 3 and 4).
Table 3. Service Exports as a Percentage of Merchandise Exports
World EU 15 Developing &
Transition
Economies
India Developing &
Transition
Economies w/o
India and China
2005 25.0 32.2 16.3 52.4 14.8
2006 24.5 32.2 15.8 57.0 14.3
2007 25.3 33.3 16.5 57.6 14.8
2008 24.6 33.3 16.0 54.4 14.3
2009 28.3 37.7 18.4 56.3 16.6
2010 25.6 34.6 17.1 51.7 15.1
2011 24.1 33.3 15.8 45.7 14.0
2012 24.6 34.9 16.3 49.0 14.6
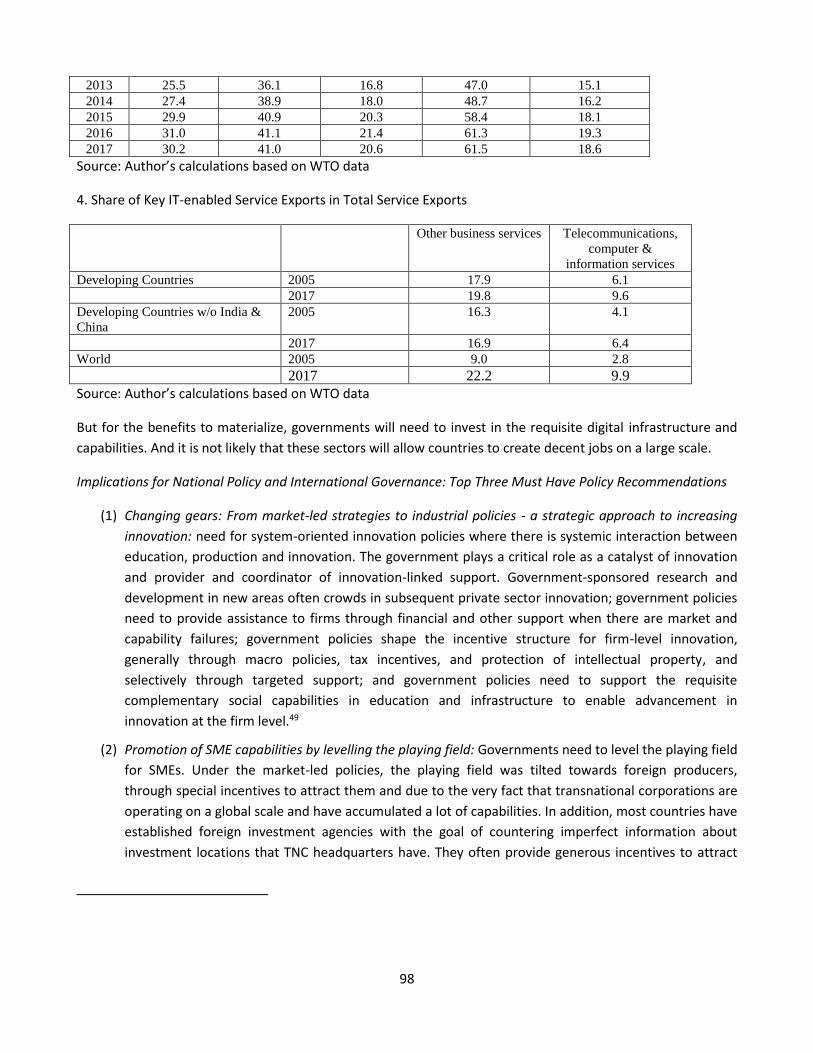
98
2013 25.5 36.1 16.8 47.0 15.1
2014 27.4 38.9 18.0 48.7 16.2
2015 29.9 40.9 20.3 58.4 18.1
2016 31.0 41.1 21.4 61.3 19.3
2017 30.2 41.0 20.6 61.5 18.6
Source: Author’s calculations based on WTO data
4. Share of Key IT-enabled Service Exports in Total Service Exports
Other business services Telecommunications,
computer &
information services
Developing Countries 2005 17.9 6.1
2017 19.8 9.6
Developing Countries w/o India &
China
2005 16.3 4.1
2017 16.9 6.4
World 2005 9.0 2.8
2017 22.2 9.9
Source: Author’s calculations based on WTO data
But for the benefits to materialize, governments will need to invest in the requisite digital infrastructure and
capabilities. And it is not likely that these sectors will allow countries to create decent jobs on a large scale.
Implications for National Policy and International Governance: Top Three Must Have Policy Recommendations
(1) Changing gears: From market-led strategies to industrial policies - a strategic approach to increasing
innovation: need for system-oriented innovation policies where there is systemic interaction between
education, production and innovation. The government plays a critical role as a catalyst of innovation
and provider and coordinator of innovation-linked support. Government-sponsored research and
development in new areas often crowds in subsequent private sector innovation; government policies
need to provide assistance to firms through financial and other support when there are market and
capability failures; government policies shape the incentive structure for firm-level innovation,
generally through macro policies, tax incentives, and protection of intellectual property, and
selectively through targeted support; and government policies need to support the requisite
complementary social capabilities in education and infrastructure to enable advancement in
innovation at the firm level.49
(2) Promotion of SME capabilities by levelling the playing field: Governments need to level the playing field
for SMEs. Under the market-led policies, the playing field was tilted towards foreign producers,
through special incentives to attract them and due to the very fact that transnational corporations are
operating on a global scale and have accumulated a lot of capabilities. In addition, most countries have
established foreign investment agencies with the goal of countering imperfect information about
investment locations that TNC headquarters have. They often provide generous incentives to attract
99
TNCs to their shores on the assumption that they would generate plenty of positive spillovers,
especially also in advancing technological capabilities.
The support for domestic companies has not been at the same level and has not compensated for the
fact that many companies had low levels of productive capabilities. Different institutional entities do
indeed provide different types of support, but often with limited coordination and financial support.
These coordination challenges could be overcome if governments established institutional entities on
par with the foreign investment promotion agencies.
(3) Open policy space for developing countries, and use the one that exists: There are limitations on policy
space for developing countries, under the rules of the World Trade Organization, and, more deeply,
under the many bi-lateral trade and investment agreements that many countries in the Global South
have signed. The rules regulating globalization are not written in stone, but were decided by national
governments. As such, they can be modified to respond to the need for greater policy space for
development and other legitimate concerns. Policy space for developing countries has to be expanded;
governments have to be able to adopt the policies needed to develop the domestic productive
capabilities that lead to a growth-inducing transformation of their economies and put them on a path
to convergence. That’s what the experiences of South Korea, China, and other latecomers have shown
us.

100
III. Biotechnology
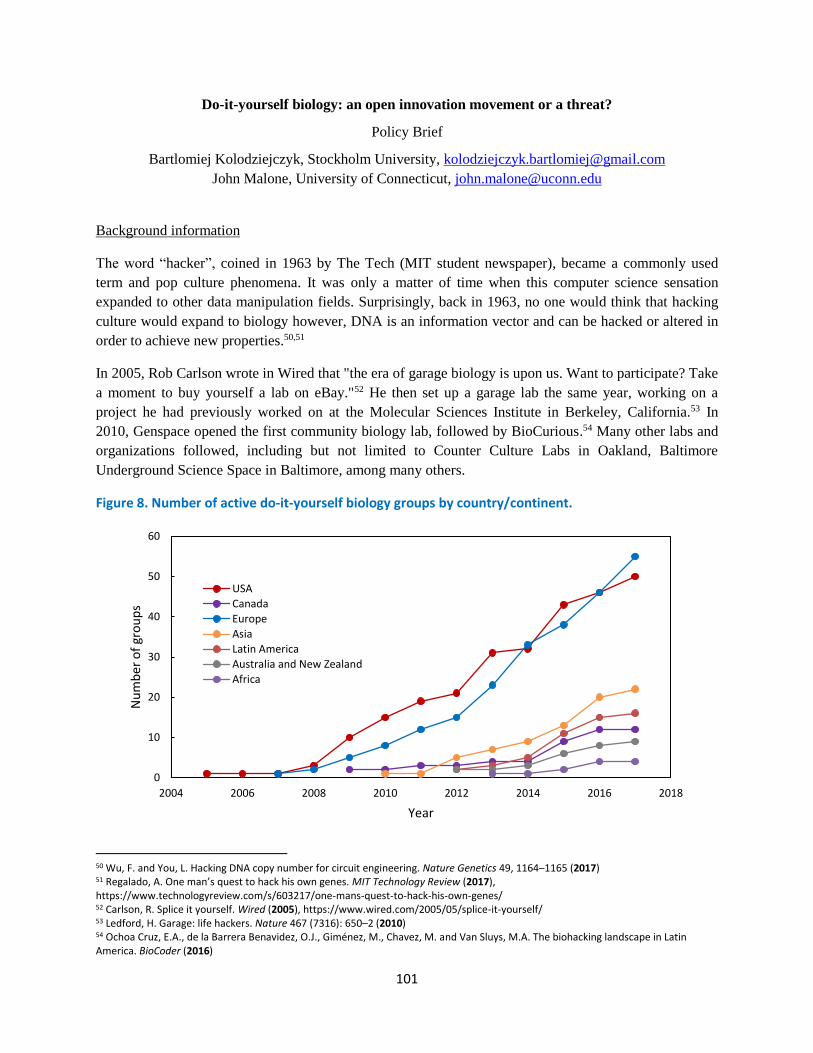
101
Do-it-yourself biology: an open innovation movement or a threat?
Policy Brief
Bartlomiej Kolodziejczyk, Stockholm University, [email protected]
John Malone, University of Connecticut, [email protected]
Background information
The word “hacker”, coined in 1963 by The Tech (MIT student newspaper), became a commonly used
term and pop culture phenomena. It was only a matter of time when this computer science sensation
expanded to other data manipulation fields. Surprisingly, back in 1963, no one would think that hacking
culture would expand to biology however, DNA is an information vector and can be hacked or altered in
order to achieve new properties.50,51
In 2005, Rob Carlson wrote in Wired that "the era of garage biology is upon us. Want to participate? Take
a moment to buy yourself a lab on eBay."52 He then set up a garage lab the same year, working on a
project he had previously worked on at the Molecular Sciences Institute in Berkeley, California.53 In
2010, Genspace opened the first community biology lab, followed by BioCurious.54 Many other labs and
organizations followed, including but not limited to Counter Culture Labs in Oakland, Baltimore
Underground Science Space in Baltimore, among many others.
Figure 8. Number of active do-it-yourself biology groups by country/continent.
50 Wu, F. and You, L. Hacking DNA copy number for circuit engineering. Nature Genetics 49, 1164–1165 (2017) 51 Regalado, A. One man’s quest to hack his own genes. MIT Technology Review (2017), https://www.technologyreview.com/s/603217/one-mans-quest-to-hack-his-own-genes/ 52 Carlson, R. Splice it yourself. Wired (2005), https://www.wired.com/2005/05/splice-it-yourself/ 53 Ledford, H. Garage: life hackers. Nature 467 (7316): 650–2 (2010) 54 Ochoa Cruz, E.A., de la Barrera Benavidez, O.J., Giménez, M., Chavez, M. and Van Sluys, M.A. The biohacking landscape in Latin America. BioCoder (2016)
0
10
20
30
40
50
60
2004 2006 2008 2010 2012 2014 2016 2018
Nu
mb
er o
f gr
ou
ps
Year
USA
Canada
Europe
Asia
Latin America
Australia and New Zealand
Africa
102
Source: Reproduced from Brookings Institution.55
Do-it-yourself (DIY) biology is now a rapidly evolving and emerging social biotechnology movement, in
which individuals, community groups, and small organizations study biology and life science using the
same or similar methods as traditional research institutions.2,3 DIY biology may be done as a hobby, as a
not-for-profit endeavour, an open-science innovation, or for-profit business. In recent years, maker spaces
and community do-it-yourself biology laboratories have been sprouting up across the globe, to harness an
interest in learning and working in non-academic settings.56 Data published by Brookings Institution
shows that in 2017 there were at least 168 do-it-yourself biology groups around the world, including 55
across Europe, 50 in the US, and 22 groups in Asia and these has been significant growth in the last six
years (Figure 1).6
Currently, DIY biology is primarily undertaken by individuals with extensive research training from
academia or biotech and pharmaceutical corporations, who then mentor and supervise novice do-it-
yourself biologists with little or no formal training.2,3,7 According to a report by the Woodrow Wilson
International Center for Scholars in Washington, DC, 36% of do-it-yourself biologists are under 35 years
of age, while 78% are below the age of 45.57 The community has coined the terms, biohacking, wetware
hacking, and biopunk to describe their movement and emphasizes links to hacker culture and ethic. These
terms, just like their archetypal conventional hacker counterpart, emphasize the intellectual challenge of
creatively overcoming limitations of biological systems to achieve novel and clever outcomes.
Additionally, the mentor/mentee relationship creates a novel educational experience at the forefront of
genetic science and synthetic biology, creating important opportunities for students and inspiring students
to pursue science as a career.
However, there are substantial concerns with this growing movement. One recent example, in 2016, an
iGEM (International Genetically Engineered Machine, a student DIY competition) team attempted to
build a gene drive system but failed.58 Environmental release of gene drives altered organisms is
potentially a scary scenario as these modified organisms can change the genetics of an entire population.
After this “accident”, the iGEM team updated their safety policies to include gene drives and a strict ‘do
not release policy’.9 If a group of students is able to attempt building a gene drive system, using “garage”
lab and equipment, it is only a matter of time when it will be possible for large-scale participation and
given the power of genetic and synthetic biology experiments, there are serious public health and safety
concerns.
Safety concerns
While do-it-yourself biology groups and their supporters argue that their experiments are safe, ethical and
don’t pose a threat to health or environment, governmental agencies and scientists are worried that
emerging synthetic biology technologies can cause damage.59 Todd Kuiken in his commentary for Nature
55 Kolodziejczyk, B. Do-it-yourself biology shows safety risks of an open innovation movement. Brookings Institution (2017), https://www.brookings.edu/blog/techtank/2017/10/09/do-it-yourself-biology-shows-safety-risks-of-an-open-innovation-movement/ 56 Mullin, E. Obama advisers urge action against CRISPR bioterror threat. MIT Technology Review (2016) 57 Grushkin, D., Kuiken, T. and Millet, P. Seven Myths and Realities about Do-It-Yourself Biology. Woodrow Wilson International Center for Scholars (2013) 58 Braverman, I. Gene editing, law, and the environment: life beyond the human. Routledge (2017) 59 Oye, K.A., Esvelt, K., Appleton, E., Catteruccia, F., Church, G., Kuiken, T., Bar-Yam Lightfoot, S., McNamara, J., Smidler, A. and Collins, J.P. Regulating gene drives. Science 1254287 (2014)
103
argues that “the citizen-science community has a responsible, proactive attitude that is well suited to
gene-editing.”60 However, recent accidents tend to disfavour the do-it-yourself community.
In January 2017, the German government (Federal Office for Consumer Protection and Food Safety),
concerned by the growing open science movement and availability of so-called DIY biology kits, issued a
statement banning practicing of genetic engineering outside of designated labs. Any science enthusiast
doing genetic engineering outside of a licensed facility can be fined of up to 50,000 Euros or sentenced up
to three years in prison.61 The statement was a surprise to the do-it-yourself biology community, although
it is only a reminder. These regulations were introduced back in 1990 when German Genetic Engineering
Act (Gentechnikgesetz) was issued.62 Only two months later, in March 2017, the German authorities
reported the contamination of a ‘do-it-yourself’ bacterial gene engineering CRISPR kit produced in the
US. The kit was contaminated with pathogenic multidrug-resistant bacteria. According to the producer the
kit was safe for home use and contained a harmless, non-hazardous and nonpathogenic strain of E. coli.63
In February 2018, Aaron Traywick injected himself in the thigh with an experimental herpes treatment
created by his startup, Ascendance Biomedical. The whole occurrence took place on stage in front of the
audience at a biohacking conference held in Austin, Texas and was broadcasted on Facebook Live.
Traywick later confessed that he did it as a political statement.64
The previously mentioned failed attempt by a team of students at an iGEM competition was alarming to
many experts. Meanwhile, the sophomore who attempted the project stated that the controversy around it
has only motivated him to further pursue his gene drive DIY experiments, even despite potentially serious
consequences.65
At the International Workshop on "assessing the security implications of genome editing technology"
held last year in Hannover, Germany, experts established that “it is essential to continue educating
scientists, including the DIY community, about codes of conduct”, and that “there is little evidence
available for defining the threat from DIY science; subsequent discussion explored how to engage better
with the DIY community.” On the other hand, experts stated that “the do-it-yourself (DIY) biology
community is probably unlikely to do human genome editing in the near future.” A summary report from
this workshop was published by the InterAcademy Partnership.66
Policy recommendations
60 Kuiken, T. Governance: learn from DIY biologists. Nature 531(7593):167-8 (2016) 61 Gentechnik mit Biologiebaukästen: Einfach, aber möglicherweise strafbar. Federal Office for Consumer Protection and Food Safety (2017), https://www.bvl.bund.de/DE/06_Gentechnik/04_Fachmeldungen/2017/2017_01_25_DIY-Kits.html 62 German Genetic Engineering Act (Gentechnikgesetz), http://web.uni-frankfurt.de/si/gentech/GenTGengl10-95c.pdf (Unauthorized English translation) 63 European Centre for Disease Prevention and Control, Risk related to the use of ‘do-it-yourself’ CRISPR-associated gene engineering kit contaminated with pathogenic bacteria (2017), https://ecdc.europa.eu/sites/portal/files/documents/2-May-2017-RRA_CRISPR-kit-w-pathogenic-bacteria_2.pdf 64 Mullin, E. A biotech CEO explains why he injected himself with a DIY herpes treatment on Facebook Live. MIT Technology Review (2018), https://www.technologyreview.com/s/610179/a-biotech-ceo-explains-why-he-injected-himself-with-a-diy-herpes-treatment-live-on-stage/ 65 Swetlitz, I. College students try to hack a gene drive — and set a science fair abuzz. STAT News (2016), https://www.statnews.com/2016/12/14/gene-drive-students-igem/ 66 Fears, R. Assessing the security implications of genome editing technology - report of an international workshop, Herrenhausen, Germany, 11-13 October 2017, IAP, https://www.volkswagenstiftung.de/sites/default/files/downloads/Summary_Report_Genome_Editing.pdf
104
Governance measures: It is unlikely that strict regulations like the German Genetic Engineering Act
introduced by the Federal Office for Consumer Protection and Food Safety in Germany will be effective.
Governments must acknowledge the value of this open science citizen movement but at the same time
they cannot underestimate the potential threats. It must be noted that self-governance is unlikely to
completely work within a community formed by enthusiasts, hobbyists and biohackers and there is
therefore an urgent need for adaptive policies and regulations. Specially designated government units and
offices should be created and be able to respond on a timely basis to any new developments in the field.
To do so, continuous engagement, and evaluation of do-it-yourself biology groups is required. Statements
like the one quoted previously, regarding motivation driven by project controversy are worrying, and are
most likely result of poor understanding of the potential threats and damages that release of gene drives
could cause. This is evidence that ongoing engagement and education in terms of biosafety and bioethics
is of high importance within the do-it-yourself community.
Safety by design: DIY research projects should ideally address potential security and safety issues at the
time of project inception and be part of the experimental design. Here, DIY practitioners would identify
safety issues and integrate solutions (safety by design) as part of the research project in a similar way to
how government and academic agencies provide safety oversight of academic laboratories. In addition,
there should be sufficient flexibility to change the course of a project if safety/security issues are
identified during the course of the project. It would be wise to require involvement of experts and
government agencies responsible for approving and monitoring any new community project. For that,
robust, effective and clear standards, norms and expectations must be set by the community of recognized
expert practitioners and it is recommended that standards and guidelines be produced and adopted. The
do-it-yourself community must be aware of these standards and regulations and would be required to
evaluate their projects against these criteria, before seeking formal approval from a governing body. This
initial self-evaluation of the project, doesn’t counter the statements mentioned in the “governance
measures” section of this paper but supports adaptive and multi-level governance, at the same time
putting potentially less burden on regulatory agencies. Addressing potential issues with the use of new
technologies before the work begins is needed to prevent hindering innovation and discouraging potential
citizen practitioners/scientists. The safety by design aspects of the project, have to be evaluated on a case-
by-case basis. Some projects may require light governance and oversight, while others would need to be
assessed in more detail.
105
Open Access to Digital Sequence Information Benefits the Three Objectives of the Convention on
Biological Diversity
Policy Brief
Ruth Bastow, Ph.D. The Earlham Institute, UK (Global Plant Council Committee Member)
Richard Bruskiewich, Ph.D. Dept. of Botany, Faculty of Science, University of British Columbia
Carolyn Lawrence-Dill, Ph.D. Dept. of Genetics, Development, and Cell Biology and Dept. of
Agronomy, Iowa State University, Ames, IA, USA
Shawn Dorius, Ph.D. Dept of Sociology, Iowa State University, Ames, IA, USA
Paul Kersey, Ph.D. EMBL-The European Bioinformatics Institute, UK
Emily Marden, J.D. Faculty of Law, University of British Columbia, Canada
Nicola Patron, Ph.D. The Earlham Institute, UK
Ruaraidh Sackville Hamilton, Ph.D. International Rice Research Institute, Los Baños, Laguna,
Philippines
Norman Warthmann, Ph.D. Departments of Plant Science and Ecology, Evolution, and Genetics, The
Australian National University, Canberra, Australia
Abstract
Article 17.1 of the Convention on Biological Diversity (CBD) places an obligation on Contracting Parties
to facilitate the exchange of information relevant to the conservation and sustainable use of biological
diversity. We argue that Digital Sequence Information is relevant to these purposes, and that the
objectives of the CBD are best served by encouraging the generation of digital sequence information on
genetic resources and fostering the open sharing of this information. By contrast, the restriction of access
to sequence information will impede global benefit sharing and the objectives of the CBD.
The Convention on Biological Diversity
The objectives of the Convention of Biological Diversity (CBD) are the conservation of biological
diversity, the sustainable use of its components, and the fair and equitable sharing of benefits arising out
of the use of genetic resources.
The CBD is clear that scientific information relevant to conservation and sustainable use should be
shared. Article 17.1 states, “[t]he Contracting Parties shall facilitate the exchange of information, from all
publicly available sources, relevant to the conservation and sustainable use of biological diversity.” In
addition, and relevant to this obligation, Article 12 states that Contracting Parties shall:
• Establish and maintain programmes for scientific and technical education and training in
measures for the identification, conservation and sustainable use of biological diversity and its
106
components and provide support for such education and training for the specific needs of
developing countries;
• Promote and encourage research which contributes to the conservation and sustainable use of
biological diversity, particularly in developing countries; and
• Promote and cooperate in the use of scientific advances in biological diversity research in
developing methods for conservation and sustainable use of biological resources.
The directives aim at inclusive sharing of scientific research by and between all Contracting Parties:
“Each Contracting Party shall endeavour to develop and carry out scientific research based on genetic
resources provided by other Contract Parties with the full participation of, and where possible in, such
Contracting Parties.” CBD Article 15.6.
The importance of shared research to support the goals of the CBD is also recognised by Article 8 of the
Nagoya Protocol to the CBD, which states that each party shall: “Create conditions to promote and
encourage research which contributes to the conservation and sustainable use of biological diversity,
particularly in developing countries, including through simplified measures on access for non-commercial
research purposes ...”
Benefits of Open Access to DSI
Over recent decades, the ability to assay biological systems has been transformed by the development of
new technologies. Researchers can now easily generate and analyze sequence information from polymeric
molecules such as DNA, RNA and proteins present in cells and organisms. Early techniques to generate
this information required extensive human involvement, and as a result, was typically generated in small
scale and published alongside its interpretation in scientific articles. Newer sensor and assay technologies
with lower cost and higher throughput have since emerged. The information they generate is necessarily
captured, stored, analysed, and disseminated in electronic, digital form. This digital sequence information
(DSI) has already had a significant impact on research and development in many fields, including
biomedicine, animal and plant breeding, and biodiversity conservation. In particular, it is now
inexpensive to quickly produce genome sequence information for large numbers of individual samples,
which enables new approaches for the characterisation, understanding, and sustainable use of biological
entities and their interactions.
Consistent with the CBD “aim of sharing in a fair and equitable way the results of research and
development and the benefits ... arising from the utilization of genetic resources” (Article 15.7), we
outline four benefits that arise from open access to DSI.
First, a single sequence has less value than a collection of sequences. This is true both in terms of relating
different measurements from the same biological system (for example, transcriptomic or proteomic data is
understood in the context of a genome); but also when comparing within or between populations and
species. The essential principle of molecular biology is that conservation of sequence implies
conservation of function, and conversely, that the origin of divergent biology lies in sequence variation.
The ability to access and compare sequences from multiple samples provides an opportunity for insight
into the function and novelty of differences.
107
As a sequence is refined, annotated with descriptive information, and made relational with other
sequences, its value and potential for use is increased. Shared data can be quality-controlled and (re-
)sequenced to create aggregate sequence assemblies which show genetic variants. These can be annotated
and linked to relevant metadata that add further value to the DSI. This process of annotating and
comparing sequence assemblies ultimately yields insights on differences that play a role in function. Open
access to DSI empowers continued third party annotation after initial public release in a manner that
benefits all users; closing off access deprives all users of these additional benefits.
Second, in contrast to physical materials, where sharing often diminishes value (i.e., the more broadly a
physical material is shared, the further it must be subdivided) the value of digital information is increased
by sharing.67 The use of digital information does not diminish its availability or value. In fact, the more it
is shared, the more broadly its benefits can be used. Indeed, the collection of huge sets of data, stored,
analysed and shared in digitized, electronic form, allows the use of statistical analysis techniques capable
of finding patterns (and the absence of patterns) and thereby generating and testing scientific hypotheses.
The separation of data into individual silos would likely contribute to a ‘tragedy of the anti-commons’, in
which fencing-off of a resources diminishes both the value of individual data items and the number of
people who can access them, reducing the potential for the productive use of the resource.68
Third, shared data can minimize duplication of efforts, improve research reproducibility, facilitate the
establishment of scientific collaborations beyond institutional and international boundaries, and help to
combat scientific fraud. It can also be argued that original generators of DSI do not truly “own” the data
unless the data are shared; without sharing, public attribution of “first across the line” cannot be
defensibly asserted and a second or third group could be attributed with DSI characterization of an
organism, thus ultimately staking the claim of ownership.
Fourth, open data can widen the research community, becoming part of a common infrastructure
encompassing both data, computational and biotechnological tools, which a diverse range of new actors,
including entrepreneurs, citizen scientists, and local researchers can draw on as capital to challenge the
monopolies of powerful incumbents. This process is analogous to the current global democratization of
information technology brought about by the expansion of open source software and affordable access to
inexpensive computing devices and performant internet connectivity, in particular, in the developing
world (e.g. see example below on Bioinformatic Capacity Building in Africa).
Open Access to DSI Benefits the Three Objectives of the Convention
Open DSI supports the stated aims of the CBD. Below we outline several examples where open access
and sharing of DSI have specifically enabled the goals of the CBD to be met. These examples provide
evidence of the benefits to broad and unimpeded access and availability to DSI by the global community.
Limiting or discouraging the generation or sharing of DSI would impede the application of these highly
successful models to other problems.
1. Conservation
67 Borgman, C. L. (2012), The conundrum of sharing research data. J Am Soc Inf Sci Tec 63: 1059–1078.. 2 68 Heller, Michael A. (1998) The Tragedy of the Anticommons: Property in the Transition from Marx to Markets, Harv. L. Rev. 111: 621-88.
108
The CBD defines “in situ conservation” as “the conservation of ecosystems and natural habitats and the
maintenance and recovery of viable population of species in their natural surroundings and, in the case of
domesticated or cultivated species, in the surroundings where they have developed their distinctive
properties.” Consistent with the CBD goal of conservation, the United Nation’s Sustainable Development
Goal (SDG) 2 (“End World Hunger”), urges that we “maintain the genetic diversity of seeds, cultivated
plants and farmed and domesticated animals and their related wild species”.
Raw sequence data can be annotated with information on evolutionary conservation and variation
(between individuals, populations or species) as well as with functional regions including, inter alia
protein-coding sequences, regulatory regions, and regions packed into structural proteins. This component
of DSI to is essential to interpret sequence data and use it to enhance conservation and sustainable use.
Comparative studies of DSI of different species and of different individuals of the same species,
commonly known as comparative genomics, is one of the primary methods for the identification of
specific sequences responsible for traits, described by biologists as the linking of genotypes to
phenotypes.
The conservation of biological diversity is critically dependent on inventory systems that collect, identify,
curate, and ultimately promulgate biological diversity. It will not be possible to immediately halt and
reverse the loss of biodiversity, but aggressive efforts to capture and digitize plant genetic material is
critical to preserve what remains of biological diversity. DSI directly informs conservation by cataloguing
the sequence variation that underpins biodiversity and is critical for conducting surveys of the genetic
variability of populations of organisms. Efforts to document and digitize plant genetic material is essential
for realizing the conservation objective of the CBD. At present, the lack of large-scale, interoperable data
systems makes it impossible to a) quantify how much genetic variation currently exists in wild and
cultivated species, and b) monitor progress on biodiversity.
These benefits are illustrated in the following examples:
NuNet - Global Collaboration to Identify Environmental Threats
Humans are impacting ecosystems through the combustion of fossil fuels, agricultural fertilization,
introductions of invasive species, destruction of habitat, and selective hunting and fishing.
However, there have been alarming few globally coordinated experiments to quantify the general
impacts to ecological systems. The Nutrient Network (NutNet)69 is a grassroots research effort to
address these questions within a coordinated research network comprised of more than 40
grassland sites worldwide. The network collects samples and data from multiple sites using
identical protocols. These data, including DSI, are shared and compared to ask general questions
like, 'What is controlling diversity and productivity?', 'How are human activities changing
diversity?' and 'How will these changes impact the environment further on down the road?' This
globally collaborative, data-sharing approach has allowed them to answer questions on the effects
of fertilization on the diversity and stability of ecosystems (it decreases diversity) and on the role
sunlight and herbivores play in controlling diversity of grassland plants (herbivore grazing allows
light to reach more species)70. Because of the large amount of data from diverse global
69 http://www.nutnet.org/home 70 Grace et al (2016) Nature 529, 390–393.

109
environments, the findings can be applied to inform conservation practices in a wide number of
countries.
Responding to the Ash Dieback outbreak
In mid-September 2012, conservation volunteers recognized that ash trees (the third most common
tree in Britain) in an ancient woodland in Norfolk, UK were showing unusual disease symptoms.
Following analysis of the diseased material, DNA sequencing confirmed that the infection was a
fungal pathogen spreading across Europe. Recognizing that Norfolk was likely at the edge of the
epidemic spreading from Europe, scientists at several research institutions formed an ad hoc
emergency response group to start sequencing the genomes of the pathogen and infected trees. In
the hope of encouraging a rapid response, they agreed to make all data immediately available with
Open Access. They built websites and software tools to make data available and accessible to
genomic scientists, biologists and the public, for who they built a Facebook game that received
over 63,000 plays in the first year enabling the public to be involved in the rapid assembly of the
genomes. The result of the ‘Open Dieback Project’ was an unprecedented speed of discovery. In
just a few years the consortium was able to identify genetic markers for trees with low
susceptibility to the disease and the fundamentals required to select and breed trees with enhanced
tolerance to the disease.71
2. Sustainable Use
The CBD defines “sustainable use” as “the use of the components of biological diversity in a way and at a
rate that does not lead to the long-term decline of biological diversity, thereby maintaining its potential to
meet the needs and aspirations of present and future generations.”
Sustainable use of biological systems requires approaches that go beyond political boundaries, since
biological systems, by their nature, do not respect such boundaries. Meeting global challenges relating to
sustainable use, including crop disease epidemics, alien species invasions, habitat loss, and climate
change adaptation, are better tackled with complete knowledge of the diversity and population structure.
DSI has numerous benefits for sustainable use, as illustrated in the following examples:
Understanding complex microbial ecosystems
Most members of the microbial communities e.g. of the gut, skin, soil and oceans belong to phyla
from which no isolates have been cultured owing to their unknown growth requirements. This
ignorance is problematic as alterations in these population and their ecology have implications for
human health, crop yields and the environment. DSI from these microbial communities is now
being captured and catalogued in metagenomics projects where all sequence information (of all
species) in a sample from a specific environment is collected. This information can help to identify
native, invasive and endangered species and track their dynamics. As an example, the microbial
communities which inhabit soils are some of the most complex but remain poorly understood
despite their economic importance in crop production including fixing atmospheric nitrogen,
71 NORNEX Consortium Final Report, available at http://oadb.tsl.ac.uk/wpcontent/uploads/2016/04/Nornex_Final_Report_April_2016.pdf.
110
nutrient cycling and sequestration, and suppressing diseases. Functional metagenomics strategies
are being used to explore the interactions between plants and microbes through cultivation-
independent study of microbial communities providing insights into the role of previously
uncultivated microbes in the promotion of plant growth. The success of such investigations relies
on access to DSI from the broadest number of possible environments. This will inform the
maintenance and creation of healthy soils for sustainable productivity and ecosystem health.
Sustainable Bioproduction of Taxol for Chemotherapies
The effort to develop a low-cost, sustainable source of paclitaxel provides a good example how
DSI can support sustainable use. Paclitaxel, currently sold under the brand name Taxol, is a
chemotherapy medication used to treat a number of types of cancer. Discovered in 1971 in the bark
of a tree, Pacific Yew (Taxus brevifolia), and approved for medical use in 1993, it is now
recognized by the WHO as one of the most effective and safe medicines needed in a healthcare
system. Clinical trials in the mid 1980s required the felling of thousands of trees and led to the
source trees becoming an endangered species. Since then paclitaxel has been produced via semi-
synthetic chemistry and plant cell culture. These advances have taken pressure off the Pacific Yew,
reducing the threat of species loss. However, supply and price vary, and the drug frequently
features on the Drug Shortages List compiled by the American Society of Health System
Pharmacists72. The biosynthetic pathway has now been mined from the T. brevifolia genome and,
because these data are shared in public databases, a large number of international research groups
are able to use these DSI to work towards the monumentally difficult task of reprogramming
species that are suitable for low-cost, large-scale production (e.g., yeast, bacteria) with the large
and complex paclitaxel biosynthetic pathway. As well as providing the potential for meeting global
demands through sustainable, low-cost production, this method has the potential to enable
bioproduction of novel chemical derivatives of the natural product – e.g., with reduced side-effects.
Improving the Sustainability of Agriculture
Up to 40% of crop losses are due to pests and diseases. A significant route to improving the
sustainability of agriculture is to limit the agrichemicals used to kills pests and pathogens by
improving the disease resistance of crops. Plants carry heritable resistance genes that protect them
against species strains of diseases; improving agriculture involves identifying the origins of strains
of pathogens so that cognate resistance genes can be found and bred into field varieties to provide
resistance. In 2016, Bangladesh's wheat crop suffered from an outbreak of an aggressive fungus
known as wheat blast. In some regions, losses were up to 70%. To rapidly determine the precise
identity and likely origin of the outbreak pathogen, scientists applied field pathogenomics
(transcriptome sequencing of symptomatic and asymptomatic leaf samples collected from infected
wheat fields in Bangladesh). To encourage more experts to use their resources and expertise to find
a solution, all raw sequence data was immediately and openly released on the project’s website73.
Phylogenomic and population genomic analyses revealed that the Bangladesh wheat blast outbreak
was likely caused by isolates belonging to the South American wheat-infecting lineage of M.
72 Elzawawy et al (2013) Variation in the availability of cancer drug generics in the United States of America, Annals of Oncology 24, Suppl 5, v17-v22. 73 Open Wheat Blast - http://www.wheatblast.net
111
oryzae. Data sharing drew together an international group of experts, who compared global data on
blast pathogens and identified that the new Bangladesh pathogen was most likely introduced into
Asia from South America74 (fungal pathogens are known to be transported across contents by
wind, as well as by trade). The result was that, in record time, the knowledge acquired to manage
wheat blast in Brazil using disease resistant cultivars and fungicides can be directly applied to treat
a Bangladeshi epidemic. This highlights the need for intensive monitoring and surveillance of crop
pathogens and also the power of making DSI open and accessible for rapidly addressing
sustainability of food production.
3. Fair and Equitable Sharing of Benefits
In increasing scientific knowledge of biodiversity, open access to DSI supports the benefits identified in
the Nagoya Protocol, the SDGs identified by the CBD as having particular relevance,75 and certain of the
Aichi Biodiversity Targets.76
Examples of these benefits include potential impacts on response to disease outbreaks and impacts for
global food security:
Monitoring and responding to outbreaks of infectious diseases
The first full genome sequence for a human bacterial pathogen, Haemophilus influenzae, was
completed in 1995. Since then, the development of sequencing technologies has made genomic
analysis of emerging pathogens easier, faster, and less expensive; instead of taking months or
weeks, such investigations can often be accomplished in days. For example, within days of the
initial identification of the first cases of 2009 pandemic influenza A (H1N1) in spring 2009,
scientists had identified the origin of all eight influenza virus gene segments. Within two weeks,
the US Center for Disease Control and Prevention (CDC) began to distribute RT-PCR diagnostic
test kits to public health laboratories. To build capacity for rapid responses to such outbreaks, in
2012, the United States Defense Advanced Research Projects Agency (DARPA) issued a challenge
for rapid production of influenza vaccine77. A Canadian company, Medicago, was able to respond,
and produced 10 million doses of the vaccine in a wild relative of tobacco within one month of
receipt of an emailed genetic sequence. This ability to utilize DSI to respond quickly is not limited
to human disease; for crops, a novel approach called “field pathogenomics” has recently been
implemented for pathogen population surveillance. This method, based on sequencing technology,
allows scientists to acquire data directly from field samples of pathogens, warning growers about
new races of disease emerging on previously resistant varieties78,79.
74 Islam et al (2017) BMC Biology 14:84 https://doi.org/10.1186/s12915-016-0309-7. 75 https://sustainabledevelopment.un.org/?menu=1300.These include SDGs 2.4, 2.5, 6.6, 8.4, 12.8, 14.2 and 15.9. 76 https://www.cbd.int/sp/targets/. These include Strategic Goal B (reduce the direct pressures on biodiversity and promote sustainable use), Strategic Goal C (improve the status of biodiversity by safeguarding ecosystems, species and genetic diversity), Strategic Goal D (enhance the benefits to all from biodiversity and ecosystem services), and Strategic Goal E (Enhance implementation through participatory planning, knowledge management and capacity building). 77 Lomonossoff and D’Aoust (2016) Plant-produced biopharmaceuticals: A case of technical developments driving clinical deployment. Science 353(6305): 1237-1240. 12 78 https://www.jic.ac.uk/news-and-events/news/2016/03/field-pathogenomics-cereal-killers/ 79 Meyer et al (2017) Quantifying airborne dispersal routes of pathogens over continents to safeguard global wheat supply. Nature Plants 329:1786. 14
112
Improvement of plants for global food security
All crop improvement practices aim to capture genetic variants that confer desirable traits.
Historically, genetic variation was recognised and tracked through visual assessment of variation.
Discovery was serendipitous and fixation took a long time; centuries to millennia in some cases80.
With current genomic analysis tools it is straightforward and cost-effective to ascertain and
accurately quantify the level of variation within and between crops. This is used to inform quality
control, maintenance, distribution, and use of ex-situ collections in seed banks. When linked to
measured traits, digital sequence information allows repositories to be searched for genetic
resources that likely exhibit desired characteristics, greatly accelerating our progress towards new,
more resilient and more diverse crops that will be key for the sustainable intensification of our
agricultural systems. Foregoing the step of linking phenotypes to causal individual loci, Genomic
Selection is being used to realise major performance gains in livestock, and it has similar potential
in plants. In either case, accurate prediction is enhanced not only by access to more data, but to
more variation in the data, which means it is important to sample the gene pool as extensively as
possible, and to assay under the widest range of environmental conditions, which will require
global collaborative efforts, for which data sharing is instrumental and digital sequence information
will be key to mainstream agricultural research81. Shared Digital Sequence Information has already
contribute to greatly reducing the number of required breeding cycles, but we need to accelerate
progress much more to meet current and future challenges.
Article 17.1 of the CBD requires that Contracting Parties’ actions to facilitate the exchange of information
take into account the special needs of developing countries. In the context of DSI, there is a “digital
divide” that must be closed to enable those in developing countries to gain the full benefits of DSI and to
allow for use of DSI to address local problems. Work on closing the digital divide is well underway:
Building Bioinformatics Capacity in Africa
Over the last decade, several international organisations82 and better-resourced African
establishments (e.g., The African Society of Human Genetics and the African Society for
Bioinformatics and Computational Biology) have focused efforts on building capacity in
bioinformatics. The popularity of bioinformatics is due to its versatility and infrastructure
requirements and these efforts have been incredibly successful. For example, there is now an
extensive Pan African Bioinformatics network, H3ABioNet83, comprising 32 bioinformatics
research groups distributed amongst 15 African countries84. In 2014, researchers in Kenya and
South Africa led the sequencing and genome assembly of the tsetse fly, the vector of human
African trypanosomiasis85. Nigerian bioinformatics research groups have applied bioinformatics
80 Fuller DQ. Contrasting Patterns in Crop Domestication and Domestication Rates: Recent Archaeobotanical Insights from the Old World. Ann Bot. Oxford University Press; 2007 Oct 1;100(5):903– 24. 81 Warthmann, N (2014) Plant Genetic Resources for Food and Agriculture and Genomics: Mainstreaming Agricultural Research through Genomics, ITPGRFA/FAO, Rome, www.fao.org/3/a-be655e.pdf. 82 http://planetearthinstitute.org.uk/the-genomics-revolution-building-bioinformatics-capacity-in-africa 83 http://h3abionet.org 84 http://h3abionet.org 85 International Glossina Genome Initiative. Genome sequence of the tsetse fly (Glossina morsitans): vector of African trypanosomiasis. Science. 2014; 344: 380–386. pmid:24763584
113
techniques to a number of domestic issues, including malaria86, while Ghanaian bioinformaticians
have contributed to and led projects to analyse the sequence diversity of a wide range of human and
plant pathogens and crop species87. These represent a considerable and rapidly-expanding
knowledge base in genomics and bioinformatics, poised to maximise the use of DSI and other
bioinformatic resources. Without access to open sequence databases and software, these knowledge
exchanges and capacity building exercises would not have been possible. Limiting access to DSI
would certainly curtail the expansion of these programs that rely on international collaborators
working together on large and Open DSI datasets.
Fast and Frugal Lab Tools for Developing Countries
The synthetic biology community aims to make software, hardware and wetware for biology and
biotechnology cheaper, easier to operate and internationally compatible. This is partly to facilitate
scaling for industry, but this so-called "frugal science" movement also aims to make open, cheap
and easy tools specifically to facilitate the adoption of biotechnologies that utilise DSI in
developing countries. Efforts in the development of low-cost, open-source laboratory hardware
have been particularly successful88 and include molecular biology essentials, e.g., OpenPCR89 and
Biropette90, the latter deployed in a range of workshops across several countries by TReND
(Teaching and Research in (Neuro)science for Development) in Africa91. Open source versions of
microscopes (e.g., The FlyPi92 and The Waterscope93) and even robotics e.g., OpenTrons94 are
enabling researchers in less- resourced institutions to thrive. For example, community platforms
such as Hackteria95 enable researchers in developing countries to equip biology labs from
OpenSource Hardware at less than 10% of the commercial price96. Similar efforts are underway to
equip researchers with Open-Source wetware (e.g., The BioBricks Foundation97 and OpenPlant98),
including molecular (DNA-based) tools to stimulate innovation and entrepreneurship.
DNA synthesis allows for the utilisation of DSI without access to physical genetic materials. For
example, several projects have been focused on adapting genetic sequence information for the expression
of high value natural products in organisms that are amenable for large-scale, low- cost bioproduction,
86 Fatumo et al (2014) Computational Biology and Bioinformatics in Nigeria. PLoS Comput Biol 10(4): e1003516. https://doi.org/10.1371/journal.pcbi.1003516, 87 Karikari TK (2015) Bioinformatics in Africa: The Rise of Ghana? PLoS Comput Biol 11(9): e1004308. https://doi.org/10.1371/journal.pcbi.1004308. 88 Baden et al (2015) Open Labware: 3-D Printing Your Own Lab Equipment. PLoS Biol 13(3): e1002086. https://doi.org/10.1371/journal.pbio.1002086. 89 http://openpcr.org 90 https://open-labware.net/projects/biropettes/ 91 http://trendinafrica.org 92 Chagas et al (2017) The €100 lab: A 3D-printable open-source platform for fluorescence microscopy, optogenetics, and accurate temperature control during behaviour of zebrafish, Drosophila, and Caenorhabditis elegans. PLoS Biol 15(7): e2002702. https://doi.org/10.1371/journal.pbio.2002702. 93 http://www.waterscope.org 94 http://opentrons.com 95 http://www.hackteria.org 96 Gibney (2016) Open Hardware pioneers push for low-cost lab kit. Nature 531, 147–148. 97 https://biobricks.org 98 Capacity Building for the Bioeconomy in Africa. An OpenPlant Report, https://static1.squarespace.com/static/54a6bdb7e4b08424e69c93a1/t/597bccff4402438918153c5c/15012 85648350/Bakubung-FinalReport-Web.pdf.
114
such as yeast. Well-known examples include the biosynthetic pathway for the antimalarial, artemisinin
from Artemisia annua, vanillin from Vanilla planifolia, and nootkatone from Citrus × paradisi
(grapefruit). While previously the requisite sequences may have been sourced and cloned from plant
material, rapid reductions in the cost of de novo gene synthesis and innovation in biological engineering
technologies means that new versions of sequences, specifically adapted for expression in new species,
are typically designed and ordered from a commercial provider negating the need for access to physical
materials. In the artemisinin, vanillin and nootkatone examples, the nature and source of the sequence
information is known, making any monetary benefit sharing relatively straightforward. However,
informed by available sequence information, synthetic biologists explicitly design novel sequences that
will code for novel molecules that are not known to exist in nature. This method is being utilized both for
the production of novel natural products as ingredients for industry (e.g., novel fragrances) and also to
produce libraries of novel drug-candidates for functional screens. In this case, no individual sequence
contributes more than another or anything specific. All sequences together serve as inspiration for a final,
human-designed sequence, are equal.
Norms for Data Sharing
Ultimately, information sharing is not a new idea: the sharing of ideas has always been a driver of human
progress. Sharing culture traces its roots to indigenous communities and traditional food production
systems. Today, there are many models for information sharing, ranging from open publication of data as
a public commons to publishing data under patent laws for licensing and commercial exploitation. Models
for open access to DSI (and associated software for data analysis) are arguably better aligned to
traditional norms of reciprocity and community than exclusionary access models.
Moreover, a culture of sharing has already been adopted by many producers and consumers of DSI in the
global academic community, particularly among biological researchers. The development of sequencing
technologies has been associated with the parallel development of open repositories for DSI, dating back
over five decades: the Protein Data Bank, a repository of 3-D structural information on protein sequences,
has been publicly searchable since 1971; the origins of the European Nucleotide Archive and GenBank
(the two oldest collections of nucleotide sequences) date from 1982. The expectation among funding
agencies, publishers of traditional scientific literature, and researchers themselves has been that deposition
of data in such repositories is an obligation on producers of data; and that the repositories should provide
access without charge to the global community of researchers.
In 1996, when international agencies were coordinating in the then-ambitious project to sequence a
human genome, they agreed on the Bermuda Principles99 to “make the entire sequence freely available in
the public domain for both research and development in order to maximise benefits to society”.
Subsequently, the genomics research community has been at the forefront of advancing best practice for
open data publication100. The success of these resources and associated scientific norms have helped lead
the wider scientific community to recognise the desirability of maintaining publicly accessible data for the
generation of knowledge and hypotheses101, leading to the development of an “Open Science” movement
99 Summary of Principles Agreed at the First International Strategy Meeting on Human Genome Sequencing, available at http://www.casimir.org.uk/storyfiles/64.0.summary_of_bermuda_principles.pdf. 100 Editorial (2009) Prepublication data sharing, Nature 461, 168-170. 101 Kaye et al (2009) Data sharing in genomics — re-shaping scientific practice, Nature Reviews Genetics 10, 331-335.

115
in many scientific domains102; and the growth of new publishing models for scientific literature, whereby
costs are covered by the authors, not by access charges.103 The development of an increasing, open body
of scientific information, especially in genomics, reflects the belief that longer-term societal benefits will
be found from harvesting the whole, not from hoarding the parts; the model promises to be particularly
advantageous to developing countries, which would otherwise stand to be priced out of access to
knowledge by the already-wealthy world.
Finally, it is worth noting that UNICEF’s principles for Innovation and Technology104 in Development
specifically promote the use of Open Standards, Open Data, Open Source Publications and the use of
Creative Commons.
Disadvantage of Treating DSI as “Genetic Resources” under the CBD
Open access to DSI offers tangible benefits for the three aims of the CBD in a manner that would not be
matched by seeking to apply the current model for access to and benefit sharing of physical genetic
resources. Indeed, the current model mixes both open and closed access systems, with mixed results.
Genetic resources are located in a varied assortment of public and private collections and fall under a
patchwork of access mechanisms, some of which fall outside the scope of access regulated by the CBD105.
The range of distinct systems for permitting access and use has allowed for extensive IP application,
encouraged protectionist responses from select nations, and exploited gaps in local, national, and
international laws and norms to further carve up the landscape of genetic resources.
Efforts to restrict or foreclose access to DSI would result in an analogous patchwork of mechanisms.
Researchers currently operate in a data environment where they can readily access DSI with high
environmental, scientific, and economic value from large (and growing) open-access data repositories
such as Genbank and Gramene. Private data is largely inaccessible. Further Restrictions on access to DSI
would result in higher transaction costs to generate additional DSI. The net result would likely be more
extensive use of existing open- access DSI, and in the absence of a commons of data and supporting
infrastructure, access would in practice be restricted to those sufficiently wealthy to develop an
environment to enable analysis and exploitation. Some take the position that access to DSI should be
restricted so that the holder of that DSI can benefit if that material provides the basis of a ‘blockbuster’
drug. However, this model has been shown not to be generalisable to the use of biodiversity as a whole106
which, in fact, requires a broad spectrum of data to generate any innovation, with the contribution of each
individual datum hard to ascertain and only a small portion of the whole.
102 See, e.g., GODAN (http://www.godan.info/pages/about-godan), Report of the National Academies (The Role of Scientific and Technical Data and Information in the Public Domain: Proceedings of a Symposium. Washington, DC: The National Academies Press. https://doi.org/10.17226/10785); EU Commission Recommendation on access to and preservation of scientific information (2012) (https://ec.europa.eu/digital-single-market/en/news/commission-recommendation-access-and- preservation-scientific-information). 103 Tennant et al (2016) The academic, economic and societal impacts of Open Access: an evidence- based review. F1000Research 5:632. 104 UNICEF Principles for Innovation and Technology in Development, https://www.unicef.org/innovation/innovation_73239.html 105 CBD Article 15.3: “For the purpose of this Convention, the genetic resources being provided by a Contracting Party, as referred to in this Article and Articles 16 and 19, are only those that are provided by Contracting Parties that are countries of origin of such resources or by the Parties that have acquired the genetic resources in accordance with this Convention” 106 Jefferson et al (2015) Gene patent practice across plant and human genomes, Nature Biotechnology 33,1033–1038..

116
117
Role of Modern Biotechnology in Sustainable Development; Addressing Social-Political Dispute of GMOs
that Influences Decision-Making in Developing countries
Policy Brief - 2015
Ademola A. Adenle (United Nations University & University of Oxford, UK)
Klaus Ammann (University of Bern)
Introduction
Genetically modified organisms (GMOs) technology has been widely used in agriculture in the last years
in several regions, and has diverse potentials in addressing the challenges of sustainable development
such as pest and diseases, drought, malnutrition and food insecurity, in developing countries. However,
controversies surrounding the possible risks of GM technology have also spread on public concern.
Despite potential risks, no reported case has been documented regarding negative impact from GMOs in
the country since 1996 when GM crops were first commercialized (James C., 2014). This is consistent
with a recent study based on 15 years of intense research and risk assessment, that GM crops do not pose
greater risks for human health or the environment than traditionally bred varieties (Fagerstrom et al.,
2012). Moreover, analyses have shown substantial socioeconomic and environmental benefits of GM
crops (Brookes & Barfoot, 2012; James C., 2014).
It will be advisable, to reconsider the original definitions of sustainability – strongly interconnected to
innovation – which has been advocated since the beginning of the Brundtland initiatives (Brundtland Gro
Harlem & NGO Committee on Education, 1987 and 2008). Deploringly, GMO opponents have
constructed a rift between GM crop and conventional/organic agriculture, clearly based on political
motivation (Ammann,
2012).
GM technology has yet to make any visible impact on food security almost two decades after the first
GMO products were released, partly due to lack of consensus as to how to regulate GMO products and
controversy surrounding the adoption of GMOs (Adenle et al., 2013). For example, the genetically
modified rice called 'Golden' rice, developed 20 years ago, aimed to address the problem of vitamin A
deficiency in developing countries including countries in Africa, has suffered another huge setback due to
a recent destruction of rice field trials in the Philippines as vandals claimed that the GMOs represent a
threat to health and biodiversity. Still, field trials continue with local landraces with Golden Rice crossed
in, it will be available in due time for distribution and free reproduction among the Philippine farmers and
later elsewhere in SE-Asia. (Ammann, 2014).
Social-political and scientific dispute between developed nations (e.g., the US and Europe) has influenced
the regulation and decision-making on GMO issues in many developing countries. This dispute has
spilled over to international regulation of GMOs, with the US aligning its GMO policy with the World
Trade Organization (WTO) whilst the EU strictly applies precautionary principle of the Convention on
Biological
118
Diversity (CBD) (Dibden et al., 2013). Canada and partly also the USA follow the science based product
oriented biosafety assessment with a pre-evaluation of all novel crops including the conventional new
traits, and Europe, including the Cartagena Protocol, still follows the process-oriented risk assessment of
GMOs alone, which is not based on sound science (Ammann, 2014).
Other important constraints for national regulatory frameworks are the local controversies around GMOs.
For example, many African countries are still in an early stage of elaborating their GMOs legal
frameworks and face enormous challenges in building adequate capacity to enforce them (Adenle et al.,
2013; Makinde et al., 2009). On the other hand, many Latin American countries have developed pioneer
and solid regulatory frameworks for GMOs, but its actions and mechanisms are under growing influence
by the public perception of risks (Burachik, 2010; Niosi and Reid, 2007). Furthermore, the lack of public
investigation in African governments is another problem with regard to GMOs. One of the primary
problems in developing countries is that they do not have the capacity or enough knowledge to make their
own decision with regard to GMOs, and as a result, many developed nations take advantage of such
constraints. Developed nations and their organizations invest money and provide facilities and trainings in
developing public investigation —that is the central core of the decision-making process in developing
countries with regard to GMOs. However, through such investments they are pointing decision-making
processes in the direction of developed nation's interests. For example, donors investments in the
development of capacity building in African countries are directing their decisionmaking towards the EU
interests and beneficiaries ((Adenle, 2014; Morris, 2011).
Developing countries are caught in the middle of the debate between the acceptance and rejection of
GMOs with regard to consumption, import and export while the sustainability of many developing
countries can be measured according to the practiced methods of agriculture. Many developed countries
have to respond to the trade pressure from GMOs exporters, meet the import regulations of export
markets, and follow the multilateral laws on trade and bio-safety while they are tackling with forming the
required policy, legal and institutional frameworks. Therefore, it is important to determine such trade-
related issues that significantly influence decision-making processes in developing countries. For
instance, many southern African nations primary rejected the GM food aid, partly as a health precaution,
and partly on the grounds that it could adversely affect their own crops, thus reducing possible exports to
Europe in the future. European NGOs like Greenpeace and GENOK also campaign against the use of
GMOs in Africa. And their negative bias toward GMOs continues to undermine possible application of
GMOs and organic agriculture all together (Ammann, 2008, 2009). From the US points of view, it is
because of the Europe's moratorium on GM foods and seed imports; contributing to more hunger in
southern Africa.
Moreover, lack of scientific expertise and limited capacity for risk analysis and safe evaluation of GM
cassava has been reported in Africa (Adenle, et al., 2012). Given the lack of clear criteria for determining
what represents health or environmental harm in the presence of scientific data (Kuiper & Davies, 2010;
Sanvido et al., 2012), one begins to wonder how scientists from developing countries, particularly
countries in Africa will be able to release the clearly beneficial GM cassava, GM Maize, GM sorghum or
any GM food in the future.
119
The application of modern biotechnology such as GMOs and the emerging biotechnology traits based on
many new transfer technologies (Ricroch & Hénard-Damave, 2015), particularly, in view of lack of
assessment of new innovation, thus, requires urgent attention from policymakers as described below:
1. Re-think and more pro-active debate is needed to resolve GMOs issues whilst its potential as a
relevant technological innovation to achieve sustainable development
2. The development and implementation of new policiesrelated to regulation and risk assessment of
GMOs in developing countries within the context of consistent international regulatory
framework is required as current scope of precautionary principle is controversial and limits the
cultivation and trade of GM crops. A shift towards a product-oriented risk assessment (including
process views) is recommended.
3. Encourage innovative farming practices that integrate GM, conventional breeding and organic
agriculture to address challenges of sustainable development, and develop common ground in all
agricultural practices for innovative precision farming.
4. Identify the most important contributing factors including public investigation and professional
long term discourse to the solution of GMO decisions in developing nations. For example, define
the role of public, scientists, social scientists and private sector in policy formulation process and
implementation respecting different kinds of experience and knowledge.
5. The partnership of national government, UN agencies, NGOs, private sector and other relevant
stakeholder group is required in structuring regulatory frameworks
6. While important sustainability issues surrounding GM technology adoption in developing
countries requires attention, international movement of GMOs should be governed
References
Adenle, A. A. (2014). Stakeholders' Perceptions of GM Technology in West Africa: Assessing the Responses of
Policymakers and Scientists in Ghana and Nigeria. Journal of Agricultural & Environmental Ethics, 27(2), pp.
241-263. <Go to ISI>://WOS:000333025800005 AND http://www.ask-force.org/web/Developing/Adenle-
Stakeholders-Perception-GM-Technology-W-Africa-2014.pdf
Adenle, A. A., Aworh, O. C., Akromah, R., & Parayil, G. (2012). Developing GM super cassava for improved
health and food security: Future challenges in Africa. Agr Food Sec, 1, pp. 1-15.
http://www.biomedcentral.com/content/pdf/2048-7010-1-11.pdf AND
http://www.askforce.org/web/Developing/Adenle-Developing-GM-Super-Cassava-2012.pdf
Adenle, A.A., Morris, E.J., Govindan, P., (2013). Status of development, regulation and adoption of GM agriculture
in Africa: Views and positions of stakeholder groups. Food Policy, 42: 159-166.
http://www.sciencedirect.com/science/article/pii/S0306919213001346
Ammann, K. (2008). Feature: Integrated farming: Why organic farmers should use transgenic crops, open source
citations. New Biotechnology, 25(2), pp. 101 - 107. http://www.ask-force.org/web/NewBiotech/Ammann-
Opinion-Integrated-Farming-20080825-names-links-edited.pdf
Ammann, K. (2009). Feature: Why farming with high tech methods should integrate elements of organic agriculture.
New Biotechnology, 25(6), pp. 378-388. http://www.sciencedirect.com/science/article/B8JG4-4WKTX50-
1/2/1698b7149ed724fd0a49b3ae49f234ab AND http://www.askforce.org/web/Organic/Ammann-High-Tech-
and-Organic-2009.pdf
Ammann, K. (2014). Genomic Misconception: a fresh look at the biosafety of transgenic and conventional crops. A
plea for a process agnostic regulation. New Biotechnology, 31(1), pp. 1-17.

120
http://dx.doi.org/10.1016/j.nbt.2013.04.008 AND open source:
http://www.sciencedirect.com/science/article/pii/S1871678413000605 AND
http://www.askforce.org/web/NewBiotech/Ammann-Genomic-Misconception-printed-2014.pdf
Ammann Klaus. (2012). Chapter 27: Advancing the cause in emerging economies, version from 20. June 2012. In
Bennett David & Jennings Richard (Eds.), Successful Agricultural Innovation in Emerging Economies (pp.27).
Cambridge: Cambridge University Press http://www.ask-force.org/web/CUP-Success-GMcrops/Ammann-
Advancing-Cause-Emerging-20120802.pdf
Ammann Klaus. (20140414). A Golden Opportunity. Judge GM crops on their properties, not the techniquethat
made them – and we can start saving lives. The Biologist, 61(3), pp. 2. http://www.askforce.org/web/Golden-
Rice/Ammann-Golden-Opportunity-final-fulltextref-20140414.pdf
Burachik, M. (2010). Experience from use of GMOs in Argentinian Agriculture, economy and environment. New
Biotechnology, Vol 27 (5) p588-592: http://www.sciencedirect.com/science/article/pii/S1871678410004462
Brookes, G., & Barfoot, P. (2012). The income and production effects of biotech crops globally 1996–2010. GM
crops & food, 3(4), pp. 265-272. http://dx.doi.org/10.4161/gmcr.20097
Brundtland Gro Harlem, & NGO Committee on Education. (1987 and 2008). Report of the World Commission on
Environment and Development: Our Common Future pp. 318 orig. and 223 print Oslo, Norway: U. Nations
ISBN/ISSN Transmitted to the General Assembly as an Annex to document A/42/427 - Development and
International Co-operation: Environment Retrieved from http://www.un-documents.net/ocf-acr.htm AND
http://www.ask-force.org/web/Sustainability/Brundtland-Report-Original-19870804.pdf AND http://www.ask-
force.org/web/Sustainability/Brundtland-Our-Common-Future-1987-2008.pdf
Dibden, J., Gibbs, D., & Cocklin, C. (2013). Framing GM crops as a food security solution. Journal of Rural
Studies, 29, pp. 59-70. <Go to ISI>://WOS:000315613200007 AND http://www.ask-
force.org/web/Regulation/DibdenFraming-GM-crpops-food-security-solution-2013.pdf
Fagerstrom, T., Dixelius, C., Magnusson, U., & Sundstrom, J. F. (2012). Stop worrying; start growing. EMBO Rep,
advance online publication, pp. http://dx.doi.org/10.1038/embor.2012.59 AND
http://www.askforce.org/web/Regulation/Fagerstroem-Stop-Worrying-Start-Growing-2012.pdf
James C. (2014). Global Status of Commercialized Biotech/GM Crops: 2014, executive summary. Dedicated to the
late Nobel Peace Laureate, Norman Borlaug,. (ISAAA Brief 49), pp. 32.
http://www.isaaa.org/resources/publications/briefs/49/executivesummary/default.asp AND top ten facts:
http://www.isaaa.org/resources/publications/briefs/49/toptenfacts/default.asp AND
http://www.askforce.org/web/ISAAA/ISAAA-Briefs-49-Executive-Summary-2014.pdf
Kuiper, H. A., & Davies, H. V. (2010). The SAFE FOODS Risk Analysis Framework suitable for GMOs? A case
study. Food Control, 21(12), pp. 1662-1676.
http://www.sciencedirect.com/science/article/pii/S0956713510000721 AND
http://www.askforce.org/web/Food/Kuiper-Save-Foods-Risk-Analysis-suitable-2010.pdf
Makinde, D., Mumba, L., & Ambali, A. (2009). Status of Biotechnology in Africa: Challenges and opportunities.
Asian Biotechnology and Development Review, 11(3), pp. 1-10.
http://www.askforce.org/web/Developing/Makinde-Status-Biotechnology-Africa-2009.pdf
Morris, E. J. (2011). Modern Biotechnology - Potential Contribution and Challenges for Sustainable Food
Production in Sub-Saharan Africa. Sustainability, 3(6), pp. 809-822. http://www.mdpi.com/2071-1050/3/6/809/
AND http://www.ask-force.org/web/Sustainability/Morris-Modern-Biotechnology-Potential-2011.pdf
Niosi, J., Reid, S.E. (2007). Biotechnology and Nanotechnology: Science-based Enabling Technologies as Windows
of
121
Opportunity for LDCs?. World Development, Volume 35, Issue 3, March 2007, Pages 426-438;
http://www.sciencedirect.com/science/article/pii/S0305750X06002154
Ricroch, A. E., & Hénard-Damave, M.-C. (2015). Next biotech plants: new traits, crops, developers and
technologies for addressing global challenges. Critical Reviews in Biotechnology, 0(0), pp. 1-16.
http://informahealthcare.com/doi/abs/10.3109/07388551.2015.1004521 AND
http://www.askforce.org/web/Genomics/Ricroch-Henard-Next-Biotech-Plants-2015.pdf
Sanvido, O., Romeis, J., Gathmann, A., Gielkens, M., Raybould, A., & Bigler, F. (2012). Evaluating environmental
risks of genetically modified crops: ecological harm criteria for regulatory decision-making. Environmental
Science & Policy, 15(1), pp. 82-91. http://www.sciencedirect.com/science/article/pii/S1462901111001390 AND
http://www.ask-force.org/web/Regulation/Sanvido-Evaluating-Environmental-Risks-2012.pdf AND
http://www.ask-force.org/web/Regulation/Sanvido-Evaluating-Supplement-2012.pdf
122
The promise of synthetic biology for sustainable development
Policy Brief 2015
Friedrich Soltau, Division for Sustainable Development, Dept. of Economic and Social Affairs
Introduction
The field of synthetic biology opens up the possibility of finding solutions to pressing sustainable
development challenges – water, energy, food, health – but at the same time raises novel questions about
appropriate regulation of new technologies.
Synthetic biology builds on the achievements and uses the techniques of genetic engineering, which
involves the alteration of an organism’s genetic material using biotechnology. Synthetic biology has been
defined as “the design and construction of new biological parts, devices, and systems, and the re-design of
existing, natural biological systems for useful purposes” (Nature). It has also been described as “the
construction of customized biological systems to perform new and improved functions, through the
application of principles from engineering and chemical synthesis” (ter Meulen, 2014). Synthetic biology
represents the convergence of technologies from the life sciences, such as DNA recombination, with other
fields like engineering, computational technology and nanotechnology (OECD, 2014).
In the near- to medium-term, synthetic biology has the potential to alter production processes of a range
of products, such as consumer goods, medicines, plastics and related chemicals. Already a laundry
detergent produced by a firm marketing “green” household products contains oil produced by modified
algae, replacing palm oil that is widely associated with deforestation (NYT, 2014). With respect to
biofuels, non-edible plant species are being adapted to increase biomass yield and to grow on marginal
lands. Other applications include amplifying or re-engineering metabolic pathways of yeast and other
organisms to boost fuel production. Most plastics - ubiquitous in our lives, think of everything from
paints to clothes - are derived from fossil fuel sources. Bio-engineered alternatives are beginning to be
introduced. Looking further into the future, the possibility of completely new, synthetic organisms may
herald an era of bio-production with vast potential, but one that is difficult to assess from the vantage
point of the present.
Issues for scientific debate
Artemisinin is a key ingredient in the leading drug combination used to treat the most lethal form of
malaria, a disease that afflicts more than 200 million people annually. Until the semi-synthetic version
was engineered, the sole source of the active ingredient came from the sweet wormwood plant. The
natural cultivation cycle caused lags in supply and price volatility, so the Bill & Melinda Gates
Foundation funded an initiative to apply synthetic biology to produce the active ingredient. Scientists
genetically engineered metabolic pathways in yeast cells to produce artemisinic acid, a precursor to
artemisinin (Ro et al, 2006). The process was further refined by a biotechnology company, so as to
facilitate large-scale production. The technology was then licensed royalty-free to a pharmaceutical
123
company, which in August 2014 shipped the first batches of drugs made with the semi-synthetic
artemisinin.
Concerns have been raised about the impact of semi-synthetic artemisinin, as well as other bio-engineered
products, on the livelihoods of the thousands of producers in developing countries cultivating the natural
crop (ETC, 2007; Peplow, 2013). Some have warned of a wide-spread disruption for farmers’ livelihoods,
highlighting the unintended social impacts of this new technology (Thomas, 2011).
While ultimately successful, the artemisinin example also demonstrates the high cost and long
development time before the bio-engineered product could be brought to market. The process was a far
cry from predictably harnessing biological parts for efficient production, as an engineer might design an
industrial process. One key reason is that the sheer complexity of biological systems makes engineering
approaches difficult; with the current state of knowledge biological systems are not easily reduced to
modules that function in predictable ways.
Several approaches are being used to advance synthetic biology as a predictable, reliable technology,
derived from the diverse scientific communities working in this field. Hailing predominantly from an
engineering and software background, researchers are seeking to modify and build organisms using a
library of standard biotechnology “components”, roughly akin to constructing with Lego blocks (Silva &
Way, 2014). Making this approach – known as rational design – work depends on more effectively
bringing together detailed knowledge from silo-like specialist domains, e.g. gene expression, enzymes,
protein structure and more. Other researchers, generally rooted in the life sciences, emphasise that
evolution is a powerful tool that can be put to work in the lab to come up with new organisms that possess
the desired functions. So-called directed evolution works by introducing random genetic variations in
large numbers of organisms, which are then rapidly screened for the desired characteristic (Arnold &
Meyerowitz, 2014). Overall, the complementarity of the two approaches is recognized – evolution may be
capable of solutions not possible through rational design, and harnessing both approaches dramatically
broadens the possibilities for new bio-processes (Ferry et al, 2012).
Synthetic biology researchers hailing from the engineering and software communities bring with them a
tradition of sharing and open source standards, with a prominent example being the Registry of Standard
Biological Parts, a collection of genetic parts that are used in the assembly of systems and devices in
synthetic biology. On the other hand, the practice of IPR protection is more entrenched in the life sciences
community, often being linked to the prevailing business model.
As yet another technology that is overwhelmingly being developed in US labs and a handful of other
Western countries, there is a risk that developing nations will feel that they will be excluded from
beneficial access to, and development of, this technology.
Synthetic biology, spanning a broad range of activities, brings with it great potential, but also risks such
as the possibility of harm to biodiversity (ETC, 2014). Proponents have suggested a number of means to
prevent gene contamination from the synthetic organism to wild or naturally occurring organisms, such as
genetic “kill switches” and other means of preventing synthetic organisms from propagating outside the
laboratory. The argument has also been made that existing regulatory frameworks are inadequate,
especially in light of the fact that script for DNA sequences can be stored and transmitted digitally, that is
without any living organisms changing hands.
124
There is a risk that control and regulation driven by exaggerated fears, as opposed to evidence, will stifle
a technology with great potential to advance sustainable development. The Convention on Biodiversity
has urged parties to adopt a precautionary approach, and there have also been calls for a moratorium
(CBDa, 2012; CBDb, 2014). Going forward, there is a considerable risk that the public’s inadequate
understanding or mis-perceptions about the technology could hamper its contribution to sustainable
development. Part of the responsibility will rest with scientists, who will need to couple technical skills
with a willingness to openly address ethical and moral questions.
Issues for further consideration
The following are among the issues suggested for further consideration by policy-makers:
• Promote open public engagement and evidence-based communication of benefits and risk.
• Promote open source development models and platforms that direct research and resources to
sustainable development challenges.
• Accelerate steps to move from discovery science towards more predictable, modular approaches.
• Address uncertainty about regulation of synthetic biology
References
Arnold, Frances H. and Meyerowitz, Joseph T. Evolving with Purpose. Nature 509, 166-167 (8 May 2014).
CBDa. Convention on Biodiversity. COP 11, Decision XI/11, New and emerging issues relating to the conservation
and sustainable use of biodiversity. UNEP/CBD/COP/DEC/XI/115 December 2012
CBDb. Convention on Biodiversity. Subsidiary Body on Scientific, Technical and Technological Advice,
Recommendation XVIII/7.New and emerging issues: synthetic biology. Eighteenth meeting, 23 - 28 June 2014.
ETC Group. Extreme Genetic Engineering: An Introduction to Synthetic Biology (2007).
ETC Group. Synthetic Biology: 10 key points for delegates (undated).
http://www.etcgroup.org/sites/www.etcgroup.org/files/synbio_ETC4COP11_4web_0.pdf
Ferry, Michael S, et al. Synthetic biology approaches to biofuel production. Biofuels (2012) 3(1), 9–12.
OECD. Emerging Policy Issues in Synthetic Biology, OECD Publishing (2014).
Peplow, Mark. Malaria drug made in yeast causes market ferment Synthetic biology delivers combination therapies
into an uncertain market. Nature 494, 160–161 (14 February 2013).
Ro, Dae-Kyun et al. Production of the antimalarial drug precursor artemisinic acid in engineered yeast Nature 440,
940-943 (13 April 2006).
Silver, Pamel A. and Way, Jeffrey C. Rationalizing nature. Nature 509, 166 (8 May 2014).
Strom, Stephanie. Changing the Science of Soap, New York Times, May 31, 2014, on page B1.
ter Meulen, Volker. Time to settle the synthetic controversy. Nature 509, 135 (08 May 2014).
Thomas, Jim. The Sins of Syn Bio: How synthetic biology will bring us cheaper plastics by ruining the poorest
nations on Earth. Slate, 2 February 2011.
http://www.slate.com/articles/technology/future_tense/2011/02/the_sins_of_syn_bio.html
125
CRISPR107/Cas9 - gene-editing technology takes off
Policy Brief - 2016 Update
Friedrich Soltau, United Nations Department of Economic and Social Affairs
Introduction
Recent years have seen rapid progress in the area of biotechnology and the life sciences, driven by factors
such as the sharply falling cost of DNA sequencing and the wider application of computational
approaches. In particular, it is a very new gene-editing technology called CRISPR1 that has caused
excitement among researchers with its potential applications in biotechnology and medicine. The
development of a rapid, reliable, and cost-effective technology for editing the genomes of living plants,
animals and humans holds out great promise. However, the new technology – especially the possibility of
editing the genome so that changes are passed down, so-called germline editing – raises ethical and safety
concerns (Ledford, 2015a). Reports that scientists had used CRISPR to engineer human embryos (albeit
ones unable to result in live births) have added urgency to the ethical debate about the use of the
technology (Cyranoski & Reardon, 2015). Safety concerns include the risk that the technique may cause
unintended and potentially risky edits, or that lack of adequate controls may lead to the escape of edited
organisms capable of disrupting ecosystems and harming biodiversity (Ledford, 2015a).
The very rapid adoption of the technology, and its relative simplicity, adds urgency to discussions around
how and when it should be used, as well as the need for monitoring and oversight.
Issues for scientific debate
The CRISPR technology involves the application of a defence mechanism developed by bacterial; cells
against viral invaders. In very simplified terms, what makes it useful is that it allows researchers to
precisely target a location on the DNA of a cell, make a “cut”, and then insert a custom-designed DNA
sequence. Or, alternatively, “cut” and thus delete the targeted genetic sequence, say a gene encoding an
undesirable trait associated with an illness. Unlike previous gene editing technologies, it is easy to use, in
that the various elements can be quickly and reliably assembled, without a process of tinkering and trial
and error. The process of gene-editing has essentially moved from being a very specialized, custom-
designed approach, to a powerful, reliable tool at the disposal of a wide range of scientists.
Like any new technology, there are different views about its application. Among the applications that
have been raised is the use of CRISPR to propagate so-called gene drives to eliminate diseases such as
malaria, by influencing the capacity of the mosquito vector to transmit the disease, or improving crops
varieties (Je Wook Woo et al, 2015). In human medicine, the CRISP could be used for a range of
purposes, including improving the function of genes, carrying out screening for new targets for
therapeutics, and direct therapeutics, i.e. gene therapy (Charpentier, 2015).
Outside the realm of human medicine, CRISPR is poised to accelerate efforts to use biotechnology to
create plants and animals with desirable traits. CRISPR has also made possible the realization of a “gene
drives”, which works by installing the gene-editing machinery in a living thing so that it will spread
107 CRISPR stands for “clustered, regularly inter- spaced palindromic repeats”. It often referred to as CRISPR/Cas9, with Cas9 being the enzyme that cleaves (cuts) the DNA strand.
126
specific DNA every time an organism reproduces (Gantz & Bier, 2015). This has it possible, for instance,
to engineer in the laboratory mosquitoes that resist malaria and spread this trait to their progeny (James et
al, 2015). A recent overview paper by leading authorities in the field states that gene drives have the
potential to prevent the spread of disease, improve agriculture by addressing pesticide and herbicide
resistance in insects and weeds, and help manage invasive species (Esvelt et al, 2014). The authors
caution, however, that “the possibility of unwanted ecological effects and near-certainty of spread across
political borders demand careful assessment of each potential application.”
It is important to distinguish the kinds of human gene therapy that can be carried out with CRISPR. One
involves targeting the therapy to body cells such as bone marrow or blood cells, so-called somatic cells.
Importantly, any changes made using this kind of gene therapy cannot be passed on to a person’s
children. A second form of gene therapy can targets egg and sperm cells, so- called germline cells.
Changes made to germline cells – deletions or insertions – would be passed on to future generations
(NHI, 2016). While such as therapy could, for instance potentially free future generations in a family
from a particular genetic disorder, there is also the risk of long-term side effects that are not yet known.
Thus it ought to be considered that the human genome reflects our evolution, and that there may be as yet
unknown reasons why favourable, protective genes are not more common (Lander, 2015). Related to this,
is the question of pleiotropy – a single gene may have multiple effects. Thus in deleting a gene a gene on
grounds of its deleterious effects, one would also need to consider other, protective effects (Lander,
2015).
In addition, from an ethical standpoint, there is the consideration that the since the people who would be
affected by germline gene therapy are not yet born, they are not in a position to decide whether to have
the treatment (NHI, 2016). Considerations such as this, together with appeal to some of genetic
enhancement (“designer babies”), underpin the call to secure through the United Nations a complete ban
on germline editing for reproductive purposes (Haker, 2015).
The argument has been made that there is no pressing need for making heritable modifications to the
human germline (Lander, 2015). First, diseases caused by a single errant gene are actually rare, and
germline gene editing is not applicable to common diseases like cancer or diabetes where the hereditary
component is caused by many different genes, in conjunction with environmental factors. Second, in most
cases pre-implantation genetic testing can be used during IVF to detect the egg cells carrying the disease-
related gene. An opposing view disputes the safety concerns related to “off-target” edits, pointing out that
CRISPR is very accurate (Church, 2015) and becoming more so (Ledford, 2015b). It is also argued that
genetic diseases where prenatal diagnosis would be of no assistance – e.g. where one parent has two
dominant copies of a disease-related gene – are more common than otherwise thought (Church, 2015).
A statement released by the Organizing Committee of the International Summit on Human Genome
Editing, held in December 2015, stated that germline editing in a clinical setting should not proceed
unless concerns regarding safety and effectiveness have been resolved, and there is broad social
consensus about the appropriateness of the use in this setting (NAS, 2015). The scientists concluded that:
“At present, these criteria have not been met for any proposed clinical use: the safety issues have not yet
been adequately explored; the cases of most compelling benefit are limited; and many nations have
legislative or regulatory bans on germline modification” (NAS, 2015). However, they added the clinical
127
use of germline editing ought to be revisited at regular intervals, recognizing that scientific knowledge
advances and as societal views evolved.
The Summit was notable in being organized by the U.S. National Academy of Sciences, the U.K. Royal
Academy, and the Chinese Academy of Sciences, thus spanning key domains of activity in the life
sciences. In addition, the gathering consciously featured participants outside the natural sciences, in order
to address ethical, institutional and regulatory dimensions of the issue.
The statement recognized that basic and clinical research will continue, including with human germline
cells, but that where in the “process of research, early human embryos or germline cells undergo gene
editing, the modified cells should not be used to establish a pregnancy” (NAS, 2015). The statement is an
attempt to establish a consensus among scientists and researchers –modelled on earlier initiatives from the
1970s relating to genetically modified organisms – and thus possesses persuasive, not legal significance.
In a 2014 article, of 39 countries surveyed, 29 had what were termed bans on clinical germline editing,
but in several cases such “bans” were more akin to non-binding guidelines that legal prohibitions (Araki
& Ishii, 2014). At the international level, the 1997 Convention for the Protection of Human Rights and
Dignity of the Human Being with regard to the Application of Biology and Medicine, adopted under the
umbrella of the Council of Europe, provides in Article 13 that: “An intervention seeking to modify the
human genome may only be undertaken for preventive, diagnostic or therapeutic purposes and only if its
aim is not to introduce any modification in the genome of any descendants”. The Convention, which has
been ratified by 29 European countries (Council of Europe, 2016), effectively prohibits germline
interventions and limits the use of somatic gene therapy (Adorno, 2005).
Among the applications that have been suggested somatic cells - where changes are not transmitted to
following generations – are sickle cell disease, haemophilia, and cystic fibrosis (Porteus, 2015). While
risks and benefits need to be weighed, such clinical applications can be evaluated within existing and
evolving regulatory frameworks for gene therapy (NAS, 2015). It also needs to be recognized that many
of the most important consequences of CRISPR are not the ones grabbing the headlines, but rather fact
that the technology makes many experiments easier to carry out, thus facilitating basic research on
diseases such as cancer and autism (Regalado, 2015). Another promising area of development is the
production of non-human organ donors. Scientists reported that they were able to use CRISPR to modify
a record number of genes in a pig embryo, opening the possibility of growing donor organs that would not
be rejected by the human immune system (Reardon, 2015).
Issues for policy consideration
For policymakers, it is worth bearing in mind the conclusion expressed at the International Summit on
Human Gene Editing that: “The international community should strive to establish norms concerning
acceptable uses of human germline editing and to harmonize regulations, in order to discourage
unacceptable activities while advancing human health and welfare” (NAS, 2015). In this regard,
Statement recommended that the three national academies that co-hosted the summit take the lead in
establishing an international forum to discuss potential clinical uses of gene editing, as well as inform
policy-makers, and draw up recommendation and guidelines.
Consideration could be given to what other action may be needed at the international level, whether in
regional forums or at the United Nations.
128
While the application of CRISPR with respect to human germline cells raises the most burning issues, the
technology also has implications for policy in relation to the plants and animals. Appropriate containment
and control of gene drive technology are an issue. CRISPR may also require reconsideration of
regulations governing genetically modified organisms (GMOs). For example, changes can be made to
organisms not by inserting foreign DNA, but simply by deleting undesirable genes, as was done
experimentally in the case of potatoes to remove genes that repress defences against the mildew.
Arguably, such a modified crop would not be transgenic.
Finally, there is a need to raise awareness among policy-makers and the public about the implications,
benefits, and potential ethical problems posed by gene-editing technologies.
References
Adorno, Roberto. The Oviedo Convention: A European Legal Framework at the Intersection of Human Rights and
Health Law, Journal of International Biotechnology Law 2005; 2(4):133-143.
Araki, M., and Ishii, T. Reproductive Biology and Endocrinology. 12, 108 (2014)
Charpentier, Emmanuelle. The transformative CRISPR-Cas9 technology: A bacterial
mechanism. Presentation, International Summit on Gene Editing, 1-3 December 2015, Washington, D.C.
Church, George. (2015). Perspective: Encourage the innovators. Nature 528 S 7.
Council of Europe: Chart of signatures and ratifications of Treaty 164. Convention for the protection of Human
Rights and Dignity of the Human Being with regard to the Application of Biology and Medicine: Convention on
Human Rights and Biomedicine. http://www.coe.int/en/web/conventions/full- list/-
/conventions/treaty/164/signatures?p_auth=0 4uN8E2G
Cyranoski, David, and Reardon, Sara. (2015). Embryo editing sparks epic debate. Nature 520, 593-595.
Esvelt, K.M., Smidler, A.L., Catteruccia, F., and Church, G.M. Concerning RNA-guided gene drives for the
alteration of wild populations. eLife (2014).
Gantz, Valentino M., and Bier, Ethan. The mutagenic chain reaction: A method for converting heterozygous to
homozygous mutations. Science 348 6233 442-444 (2015).
Haker, Hillie. Societal Implications of Emerging Technologies. Presentation, International Summit on Gene Editing,
1-3 December 2015, Washington, D.C.
James, Anthony A., Gantz, Valentino, A., Jasinskieneb, Nijole, Tatarenkova, Olga, Fazekas, Aniko Macias, Vanessa
M., and Bier, Ethan. Highly efficient Cas9-mediated gene drive for population modification of the malaria vector
mosquito Anopheles stephensi. Proceedings of the National Academies of Sciences 112 49 E6736–E6743
(2015).
Je Wook Woo, Jungeun Kim, Soon Il Kwon, Claudia Corvalán, Seung Woo Cho, Hyeran Kim, Sang-Gyu Kim,
Sang-Tae Kim, Sunghwa Choe & Jin-Soo Kim. DNA-free genome editing in plants with preassembled CRISPR-
Cas9 ribonucleoproteins. Nature Biotechnology 33, 1162–1164 (2015)
Lander, Eric. Genetic Basis of Human Disease and Implications for Germline Editing. Presentation, International
Summit on Gene Editing, 1-3 December 2015, Washington, D.C.
Ledford, Heidi. (2015a). CRISPR, the disruptor. A powerful gene-editing technology is the biggest game changer to
hit biology since PCR. But with its huge potential come pressing concerns. Nature, News Feature. 3 June 2015.
http://www.nature.com/news/crispr-the- disruptor-1.17673

129
Ledford, Heidi. (2015b). Biologists create more precise molecular scissors for genome editing: Engineered Cas9
enzyme makes fewer mistakes. Nature, News, 1 December 2015. http://www.nature.com/news/biologists-
create-more-precise-molecular-scissors-for- genome-editing-1.18932
National Institutes of Health. Handbook: Help me understand genetics (2016) http://ghr.nlm.nih.gov/handbook
Reardon, Sara. Gene-editing record smashed in pigs: Researchers modify more than 60 genes in effort to enable
organ transplants into humans. Nature, News, 5 October 2015 http://www.nature.com/news/gene-editing- record-
smashed-in-pigs-1.18525
Porteus, Matthew. Therapeutic Genome Editing of Primary Human Somatic Stem Cells (Personalized Definitive and
Curative Cell Based Therapies). Presentation, International Summit on Gene Editing, 1-3 December 2015,
Washington, D.C.
Regalado, Antonio. Everything You Need to Know About CRISPR Gene Editing’s Monster Year. MIT Technology
Review, 1 December (2015). http://www.technologyreview.com/news/543941/everything-you-need-to-know-
about-crispr- gene-editings-monster-year/
130
Marine microbial ecology and bioreactors
Policy Brief, 2014
Rogier “Justin” Reemer, Wageningen University and Research Centre
Introduction
The oil spill in the Gulf of Mexico in 2010, where the equivalent of 4.9 million barrels of oil was
released into the environment, attracted a lot of attention among policy makers and civil society.
However, the impacts on the ecosystem turned out to be less catastrophic than expected due to marine
microbes digesting the oil spill, even though there are signs of permanent damage.1 This is a clear
example of the adaptive properties of bacteria and the wide range of compounds they can feed on.2
Microbes also have a very diverse range of substances they can produce and are at the base of healthy,
stable, ecosystems all over the world. Marine Microbial Ecology, while still a relatively new field of
research, is rapidly uncovering the importance of microbial life in nutrient availability in ecosystems. This
is no different for marine environments in which, for example, processes such as nitrification3 and CO2-
fixation4 are mainly regulated by microorganisms. Seeing as how over 90% of the ocean’s biomass is
estimated to be microbial life5, it is no surprise that their role is crucial in ecosystems. However, because
this field has only become an important topic in the last 10 years or so6, in-depth research is still lacking
and only general findings exist in terms of marine biodiversity7 or in relation to human health.8
Scientific Debate
Within the scientific community there is still debate on the determination of microbial species due to
having only small amounts of genetic material to work with. 9 In addition, one of the difficulties is
determining marine microbial biodiversity, as the sheer number of species is very high and the data of
different areas is not properly integrated.10 There are also the technical difficulties of measuring a large
area like the ocean, which naturally comes forth from the trade-off of either covering a large area or
getting a detailed description.10 However, it is becoming clearer clear that a large microbial biodiversity
is not necessarily the main reason for a healthy ecosystem. Rather, the composition of a certain microbial
community may be a stronger indicator than biodiversity 11 and microbial community dynamics change
when influenced by other factors, such as an increase in CO2-levels.12 As such, a change in a microbial
community might have a big effect on the ecosystem’s nutrient cycles13 and, due to this, on the other
organisms living there as well.
There have been suggestions of connecting the current assessments of marine biodiversity into a single
global assessment on marine biodiversity. Such a systems approach is needed in order to establish the
importance and function of microbial communities in ecosystems. If this is known this knowledge can
possibly be applied in increasing ecosystem resilience or assisting in ecosystem restoration, such as the
oil spill.14 This would not only help in improving the current assessments on marine life but also in
linking the data on marine ecosystem health at all different levels “from microbes to whales, […] to entire
ecosystems”.10
Where on the one hand microbial communities are to be studied and researched in order to determine
their interactions with the ecosystem, on the other hand there is an ever growing interest in the scientific
131
community in bioreactors. A bioreactor is a machine that optimizes a natural environment for growth of
specific microbial species and communities. The marine bioreactors focus on microbial life that needs
such specific living conditions (high salt concentrations, high pressure, etc.), that they cannot be cultured
in a laboratory.15 By positioning the bioreactor off the coast on the sea floor, the bioreactor’s microbial
life is able to thrive under its natural conditions. These bioreactors could even lead to a system in which
the ocean is used in the sustainable production of medicine or other chemical substances, clean energy, or
even food.15 Moreover, increased use of bioreactors could lead to production of energy or biological
compounds in a sustainable manner without damaging the ecosystem where the bioreactor is positioned.
In short, more efficient research into microbial communities and their interactions with the environment
can be attained through biodiversity assessments. This could lead to better utilization of bioreactor
technology. Finally, a better understanding of microbial ecology can help us in many fields, from
ecosystem resilience and restoration to even a higher yield in seafood production.16
Food for Thought on Marine Microbial Ecology and Bioreactors
• Microbial communities, while not yet completely understood, are at the base of a healthy
ecosystem.
• A global biodiversity assessment network helps in understanding the dynamics in microbial
communities. A good understanding of microbial community dynamics can lead to new ways of
ecosystem restoration and resilience.
• Bioreactors combine the ‘special talents’ of certain microbial species with the native marine
environment to produce chemicals and energy without damaging the ecosystem.
• Stimulation of use of bioreactors can lead to enhanced a use of ocean for sustainable production.
Issues for Further Consideration
The following issues were suggested by the team of young researchers for consideration by policy
makers:
• Establishment of a global assessment on marine biodiversity, with special attention to microbial
biodiversity
• Stimulation and promotion of research in application of bioreactors in marine environments
• Improved understanding and functioning of marine microbial communities
Notes
1 Walsh, B. (2011). The BP Oil Spill, One Year Later: How Healthy Is the Gulf Now? From
http://content.time.com/time/health/article/0,8599,2066031,00.html
2 Löffler, F. E., & Edwards, E. A. (2006). Harnessing microbial activities for environmental cleanup. Current
opinion in biotechnology, 17(3), 274–84. doi:10.1016/j.copbio.2006.05.001
3 Baker, B. J., Lesniewski, R. A, & Dick, G. J. (2012). Genome-enabled transcriptomics reveals archaeal
populations that drive nitrification in a deep-sea hydrothermal plume. The ISME journal, 6(12), 2269–79.
doi:10.1038/ismej.2012.64
132
4 Emerson, D., Field, E. K., Chertkov, O., Davenport, K. W., Goodwin, L., Munk, C., Woyke, T. (2013).
Comparative genomics of freshwater Fe-oxidizing bacteria: implications for physiology, ecology, and
systematics. Frontiers in microbiology, 4(September), 254. doi:10.3389/fmicb.2013.00254
5 Ausubel, J. H., Trew Crist, D. & Waggonerirst, P. E. (2010). FIRST CENSUS OF MARINE LIFE 2010
HIGHLIGHTS OF A DECADE OF DISCOVERY. Census of Marine Life. From
http://www.coml.org/pressreleases/census2010/PDF/Highlights-2010-Report-Low-Res.pdf
6 Schoustra, S., personal communication.
7 Millennium Ecosystem Assessment, 2005. Ecosystems and Human Well-being: Biodiversity Synthesis.
8 Dunn, G., Harris, L., Cook, C., & Prystajecky, N. (2013). A comparative analysis of current microbial water
quality risk assessment and management practices in British Columbia and Ontario, Canada. The Science of the
total environment, 468-469C, 544–552. doi:10.1016/j.scitotenv.2013.08.004
9 Caron, D. A, Countway, P. D., Savai, P., Gast, R. J., Schnetzer, A., Moorthi, S. D., Jones, A. C. (2009). Defining
DNA-based operational taxonomic units for microbial-eukaryote ecology. Applied and environmental
microbiology, 75(18), 5797–808. doi:10.1128/AEM.00298-09
10 Duffy, J. E., Amaral-Zettler, L. A., Fautin, D. G., Paulay, G., Tatiana, A., Sosik, H. M., Rynearson, T. A. (2013).
Envisioning a Marine Biodiversity Observation Network. BioScience, 63(5), 350–361.
doi:10.1525/bio.2013.63.5.8
11 Amaral‐Zettler, L., Felipe Artigas, L., Baross, J., Bharathi, L., Boetius, A., Chandramohan, D., Herndl, G.,
Kogure, K., Neal, P., Pedrós‐Alió, C., Ramette, A., Schouten, S., Stal, S., Thessen, A., Leeuw, J., Sogin, M.,
(2010). A Global Census of Marine Microbes. Wiley-Blackwell, Life in the World’s Oceans: Diversity,
Distribution and Abundance. From http://comlmaps.org/mcintyre/ch12
12 Brussaard, C. P. D., Noordeloos, A. A. M., Witte, H., Collenteur, M. C. J., Schulz, K., Ludwig, A., & Riebesell,
U. (2013). Arctic microbial community dynamics influenced by elevated CO2 levels. Biogeosciences, 10(2),
719–731. doi:10.5194/bg-10-719-2013
13 Verdegem, M., personal communication
14 Schoustra, S., personal communication
15 Zhang, Y., Arends, J. B. A, Van de Wiele, T., & Boon, N. (2011). Bioreactor technology in marine microbiology:
from design to future application. Biotechnology advances, 29(3), 312–21.
doi:10.1016/j.biotechadv.2011.01.004
16 Verdegem, M., personal communications
133
Biocatalysis in Sustainable Development
Policy Brief 2014
Stan Willems (Wageningen University and Research Centre)
Background
Biocatalysis is the use of biological catalysts, such as enzymes, to perform chemical transformations on
organic compounds. A catalyst accelerates (bio)-chemical reactions. Enzymes that are used in these
biochemical transformations can be purified enzymes or those that still reside within living cells (using a
whole-cell culture) (Anthonsen et al., 2000).
The brewing of beer is an example of classical chemical transformation. Enzymes and whole cells (such
as yeasts) are used in the production of wine, beer and cheese which means their preparation is dependent
on enzymes (bio-catalysts) from microorganisms. Although the techniques in these processes have been
reproducibly worked out, their mechanism of action was not understood. In the last thirty years
biocatalysis has been used to produce fine chemicals, such as drugs in the pharmaceutical industry (Liese
et al., 2006).
Biocatalysis makes use of green chemistry to provide an overall, more sustainable chemical product. An
example of biocatalysis that is already being largely applied is the utilization of biomass for sustainable
fuels and chemicals. First generation of biofuels derived from starch, sucrose and vegetable oils are more
sustainable than fossil fuels but only in the short term. This is because their availability is limited and
competes with food production. A next generation of biofuels will utilize lingo-cellulosic biomass and
inedible oilseed crops, which is, at the moment, more difficult to degrade than first generation biomass
(Sheldon, 2008). Various products will be available such as biodegradable plastics and specialty
chemicals. Application of 2nd generation biomass will radically change the chemical industry in terms of
structure of supply chains, creating the need for innovative, sustainable chemicals based on green
catalytic methodologies (Sheldon, 2008).
Green chemistry is defined as follows: green chemistry efficiently uses raw materials (preferably
renewable), eliminates waste and avoids the use of toxic and/or hazardous reagents and solvents in the
manufacture and application of chemical products (Sheldon, 2008). Green chemistry is part of the
environmental movement in which the problem has been identified whereas in the sustainability
movement the common goal has been defined. Sustainability chemistry aims 1) to use natural resources at
rates that do not unacceptably deplete supplies over the long term and 2) to generate and dissipate
residues at rates no higher than can be assimilated by the natural environment. The environmental
movement did not have a broad industrial or societal impact because emphasis was placed on the
environmental problems instead of devising technological solutions. Green chemistry is responsible for
the products that are made and the process by which they are manufactured. It utilizes raw materials
efficiently and takes care of the elimination waste, health, safety and environmental aspects of chemicals
and their manufacturing process (Sheldon, 2008).
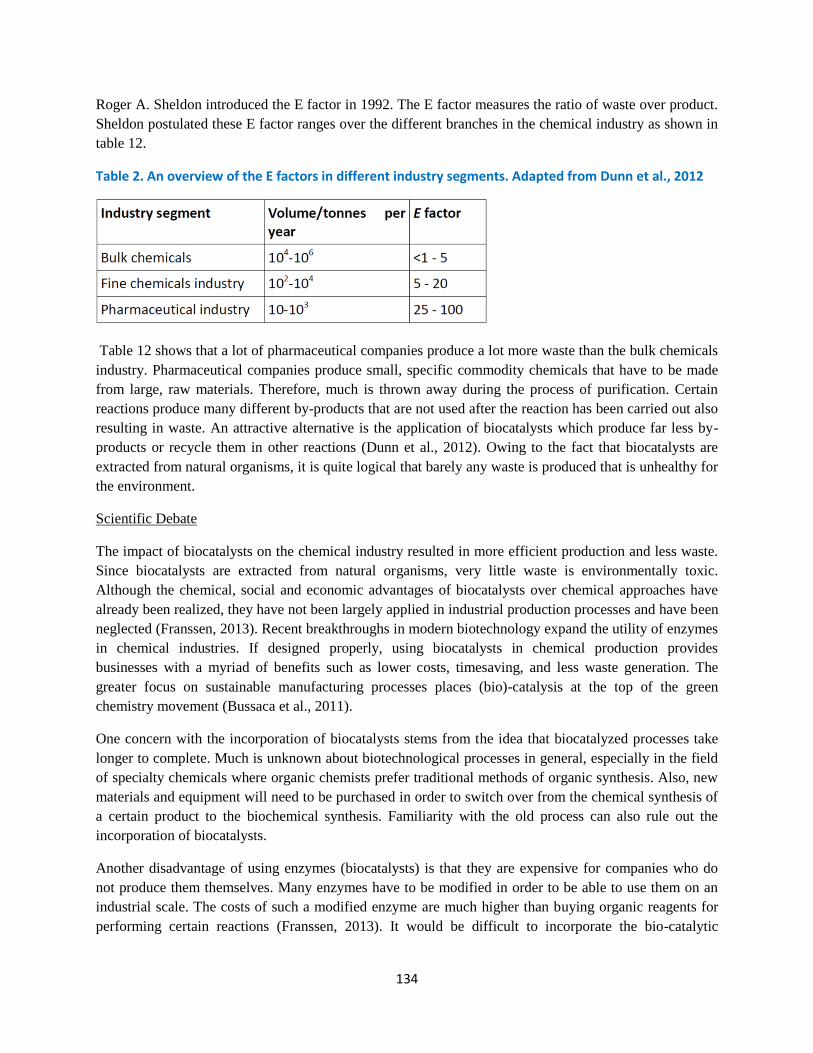
134
Roger A. Sheldon introduced the E factor in 1992. The E factor measures the ratio of waste over product.
Sheldon postulated these E factor ranges over the different branches in the chemical industry as shown in
table 12.
Table 2. An overview of the E factors in different industry segments. Adapted from Dunn et al., 2012
Table 12 shows that a lot of pharmaceutical companies produce a lot more waste than the bulk chemicals
industry. Pharmaceutical companies produce small, specific commodity chemicals that have to be made
from large, raw materials. Therefore, much is thrown away during the process of purification. Certain
reactions produce many different by-products that are not used after the reaction has been carried out also
resulting in waste. An attractive alternative is the application of biocatalysts which produce far less by-
products or recycle them in other reactions (Dunn et al., 2012). Owing to the fact that biocatalysts are
extracted from natural organisms, it is quite logical that barely any waste is produced that is unhealthy for
the environment.
Scientific Debate
The impact of biocatalysts on the chemical industry resulted in more efficient production and less waste.
Since biocatalysts are extracted from natural organisms, very little waste is environmentally toxic.
Although the chemical, social and economic advantages of biocatalysts over chemical approaches have
already been realized, they have not been largely applied in industrial production processes and have been
neglected (Franssen, 2013). Recent breakthroughs in modern biotechnology expand the utility of enzymes
in chemical industries. If designed properly, using biocatalysts in chemical production provides
businesses with a myriad of benefits such as lower costs, timesaving, and less waste generation. The
greater focus on sustainable manufacturing processes places (bio)-catalysis at the top of the green
chemistry movement (Bussaca et al., 2011).
One concern with the incorporation of biocatalysts stems from the idea that biocatalyzed processes take
longer to complete. Much is unknown about biotechnological processes in general, especially in the field
of specialty chemicals where organic chemists prefer traditional methods of organic synthesis. Also, new
materials and equipment will need to be purchased in order to switch over from the chemical synthesis of
a certain product to the biochemical synthesis. Familiarity with the old process can also rule out the
incorporation of biocatalysts.
Another disadvantage of using enzymes (biocatalysts) is that they are expensive for companies who do
not produce them themselves. Many enzymes have to be modified in order to be able to use them on an
industrial scale. The costs of such a modified enzyme are much higher than buying organic reagents for
performing certain reactions (Franssen, 2013). It would be difficult to incorporate the bio-catalytic
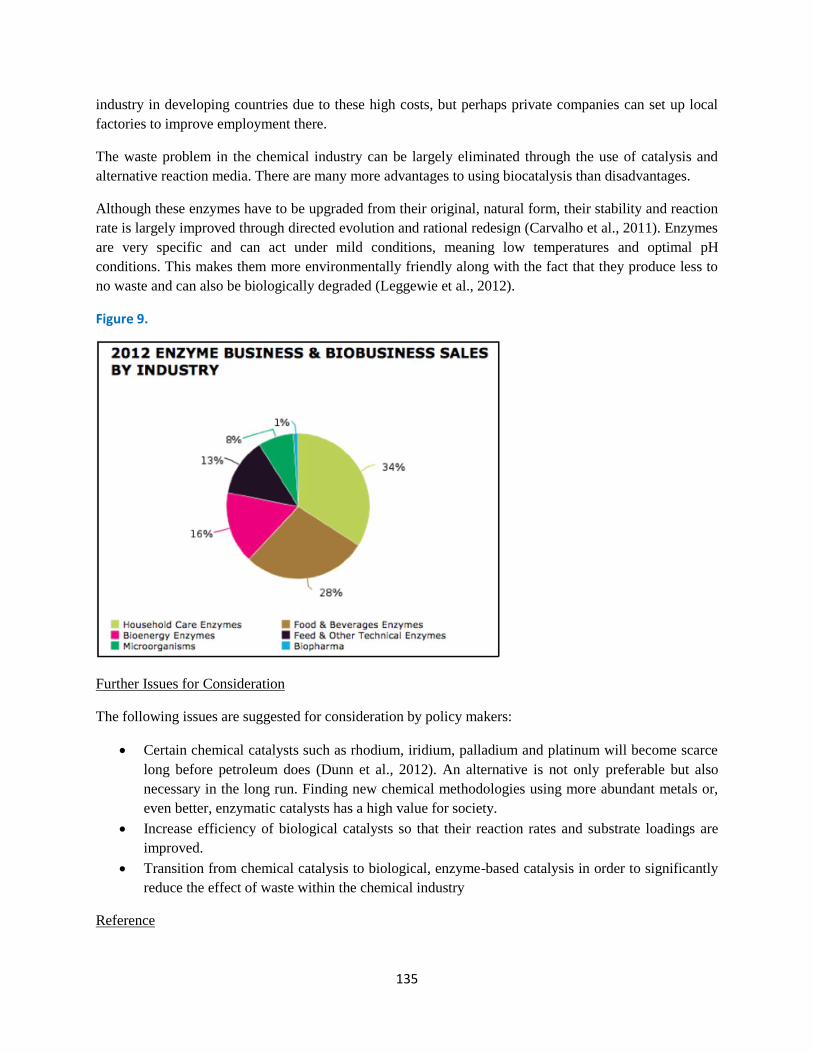
135
industry in developing countries due to these high costs, but perhaps private companies can set up local
factories to improve employment there.
The waste problem in the chemical industry can be largely eliminated through the use of catalysis and
alternative reaction media. There are many more advantages to using biocatalysis than disadvantages.
Although these enzymes have to be upgraded from their original, natural form, their stability and reaction
rate is largely improved through directed evolution and rational redesign (Carvalho et al., 2011). Enzymes
are very specific and can act under mild conditions, meaning low temperatures and optimal pH
conditions. This makes them more environmentally friendly along with the fact that they produce less to
no waste and can also be biologically degraded (Leggewie et al., 2012).
Figure 9.
Further Issues for Consideration
The following issues are suggested for consideration by policy makers:
• Certain chemical catalysts such as rhodium, iridium, palladium and platinum will become scarce
long before petroleum does (Dunn et al., 2012). An alternative is not only preferable but also
necessary in the long run. Finding new chemical methodologies using more abundant metals or,
even better, enzymatic catalysts has a high value for society.
• Increase efficiency of biological catalysts so that their reaction rates and substrate loadings are
improved.
• Transition from chemical catalysis to biological, enzyme-based catalysis in order to significantly
reduce the effect of waste within the chemical industry
Reference
136
Anthonsen, T. (2000). "Reactions Catalyzed by Enzymes". In Adlercreutz, Patrick; Straathof, Adrie J. J. Applied
Biocatalysis (2nd ed.). Taylor & Francis. pp. 18–59.
Busacca, C. A.., Fandrick, D. R., Song, J. J., & Senanayake, C. H. (2011). The Growing Impact of Catalysis in the
Pharmaceutical Industry. Advanced Synthesis & Catalysis, 353(11-12), 1825–1864.
Leggewie, C., & Duenkelmann, P. (2012). Biocatalysis: A solution to prevent resource dissipation and
environmental pollution, 30(December) Sustainability Green Chemistry. "Codexis enters detergent alcohols
market. Retrieved 03-04-2011”.
De Carvalho, C. C. C. R. (2011). Enzymatic and whole cell catalysis: finding new strategies for old processes.
Biotechnology advances, 29(1), 75–83.
Dunn, P. J. (2012). The importance of green chemistry in process research and development. Chemical Society
reviews, 41(4), 1452–61.
Franssen, M.C.R. (2013). Expertise in Biochemistry and Organic Chemistry, part of the Laboratory for Organic
Chemistry. Interview in Wageningen, on November 25, 2013.
Liese, A.; Seelbach, K.; Wandrey, C., ed. (2006). Industrial Biotransformations (2nd ed.). John Wiley & Sons. p.
556.
Novozymes (2012). Novozymes Report 2012. Retrieved on 6 December, 2013. http://report2012.novozymes.com/
Novozymes Leaflet 2013. Facts about Novozymes. Retrieved on [6 December, 2013.
http://www.novozymes.com/en/about-us/brochures/Documents/TodaysFacts-2013.pdf
Novozymes website 2012. ‘How plants and not petroleum will drive the future economy’. Retrieved on 12
December, 2013. http://www.novozymes.com/en/news/news-archive/Pages/how-plants-and-not-petroleum-will-
drive-the-future-economy.aspx
Sheldon, R. A. (2008). Why green chemistry and sustainability of resources are essential to our future. Journal of
environmental monitoring : JEM, 10(4), 406–7.
Zhang, J., Zhu, T., Wu, X., & Chen, Y. (2013). Enhancement of biocatalytic efficiency by increasing substrate
loading: enzymatic preparation of L-homophenylalanine. Applied microbiology and biotechnology, 97(19),
8487–94.
IV. Nanotechnology
137
Nanotechnology, Nanowaste and Their Effects on Ecosystems: A Need for Efficient Monitoring,
Disposal and Recycling
Policy Brief - 2016 Update
Bartlomiej Kolodziejczyk, Carnegie Mellon University and IUCN CEM
Introduction
Nanotechnology is the manipulation of matter at the nano scale. The National Nanotechnology Initiative
defines nanotechnology as the manipulation of matter with one or more external dimensions of less than
100 nanometres (one billionth of a metre). The field of nanotechnology (Figure 1) is a broad and
multidisciplinary area that includes a variety of scientific endeavours such as organic chemistry,
molecular biology, materials engineering, semiconductor physics and fabrication, to name a few.
Nanotechnology has the potential to create numerous new solutions to current social, economic and
technological challenges. Novel materials and devices manufactured using nanotechnology have
applications in medicine, electronics, energy conversion and storage, water purification and consumer
products. However, the implications of unethical and uncontrolled use of nanotechnology have created an
ongoing debate in the scientific community. For example, concerns about the toxicity and environmental
impact of these new solutions are fears commonly associated with this emerging field. The growing
number of applications that utilize nanotechnology has resulted in the generation of waste containing
synthetic (or engineered) nanomaterials. This so-called “nanowaste” is hard to monitor due to its
nanoscale dimensions. It is critical to ensure that the disposal of such waste does not cause adverse
environmental and health impacts. The rapidly growing nanotechnology field currently lacks policies and
frameworks related to the monitoring of products containing nanomaterials throughout their life cycle.
Clear and efficient strategies and procedures are required for disposal and, where possible, recycling of
these materials.
Current and Future Markets
Synthetic nanomaterials (Figure 1) are already widely used in commercially available products such as
cosmetics (hair products, skin hydration, cosmetic delivery agents and UV filters), paints and coatings
(anti-static, anti-mist, anti-corrosion and UV filters), textiles (water repellents and anti-bacterial agents)
and construction materials (self-cleaning materials, fire-resistant materials and self-healing materials). In
the near future, products based on nanotechnology and nanomaterials (material with at least one internal
or external dimension of less than 100 nm) will expand to other areas and will be used in, but not limited
to, medicine and pharmacology, energy and environmental technology, food, and the water and sanitation
industries. The most common nanomaterials include carbon compounds (carbon nanotubes, fullerenes,
graphene and carbon dots), oxides (zinc oxide, silicon oxide, titanium oxide, copper oxide, etc.), metal
nanoparticles (silver, gold, platinum, etc.), polymers and nanomaterials of biological origin (liposomes
and proteins).
Ecological and health impacts
Due to their tiny dimensions and different structures compared to their bulk counterparts,
engineered/synthetic nanomaterials can exhibit very different physical and chemical properties. Their
mechanical, optical, electrical and many other properties may differ significantly from the properties of
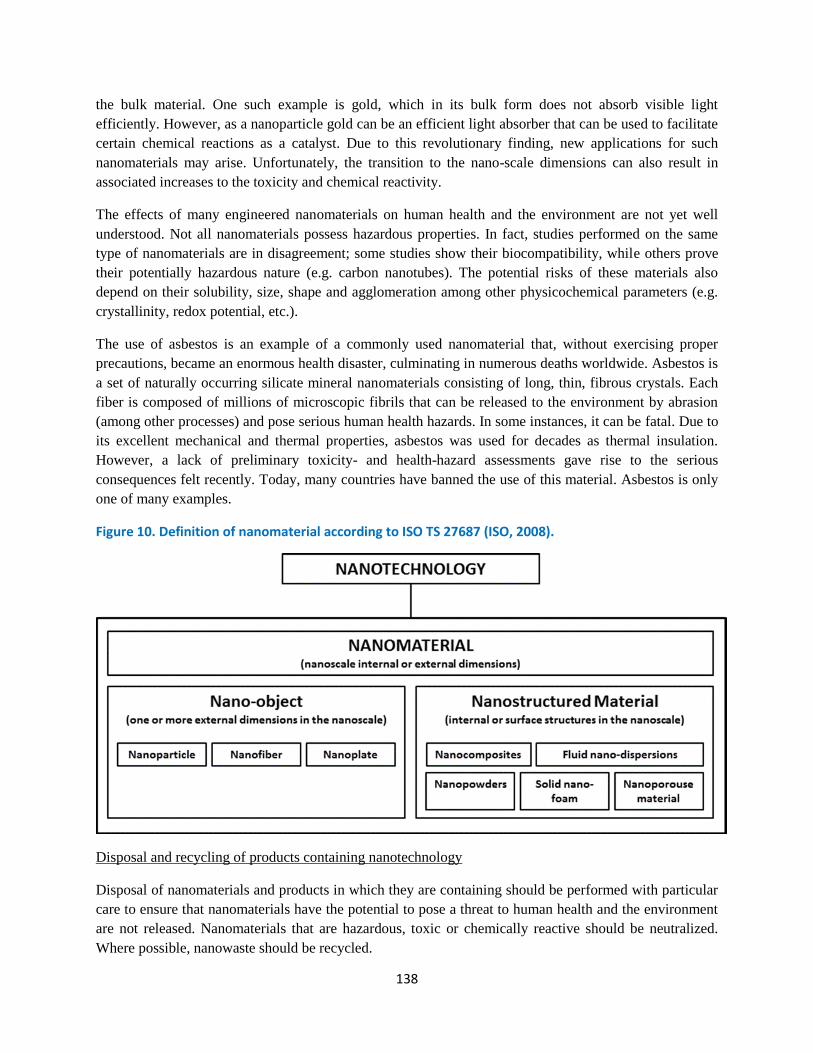
138
the bulk material. One such example is gold, which in its bulk form does not absorb visible light
efficiently. However, as a nanoparticle gold can be an efficient light absorber that can be used to facilitate
certain chemical reactions as a catalyst. Due to this revolutionary finding, new applications for such
nanomaterials may arise. Unfortunately, the transition to the nano-scale dimensions can also result in
associated increases to the toxicity and chemical reactivity.
The effects of many engineered nanomaterials on human health and the environment are not yet well
understood. Not all nanomaterials possess hazardous properties. In fact, studies performed on the same
type of nanomaterials are in disagreement; some studies show their biocompatibility, while others prove
their potentially hazardous nature (e.g. carbon nanotubes). The potential risks of these materials also
depend on their solubility, size, shape and agglomeration among other physicochemical parameters (e.g.
crystallinity, redox potential, etc.).
The use of asbestos is an example of a commonly used nanomaterial that, without exercising proper
precautions, became an enormous health disaster, culminating in numerous deaths worldwide. Asbestos is
a set of naturally occurring silicate mineral nanomaterials consisting of long, thin, fibrous crystals. Each
fiber is composed of millions of microscopic fibrils that can be released to the environment by abrasion
(among other processes) and pose serious human health hazards. In some instances, it can be fatal. Due to
its excellent mechanical and thermal properties, asbestos was used for decades as thermal insulation.
However, a lack of preliminary toxicity- and health-hazard assessments gave rise to the serious
consequences felt recently. Today, many countries have banned the use of this material. Asbestos is only
one of many examples.
Figure 10. Definition of nanomaterial according to ISO TS 27687 (ISO, 2008).
Disposal and recycling of products containing nanotechnology
Disposal of nanomaterials and products in which they are containing should be performed with particular
care to ensure that nanomaterials have the potential to pose a threat to human health and the environment
are not released. Nanomaterials that are hazardous, toxic or chemically reactive should be neutralized.
Where possible, nanowaste should be recycled.
139
Nanowaste can be the result or by-product of industrial or commercial processes. Due to the broad range
of existing nanomaterials, a single procedure for disposal will not suffice for all classes of nanomaterials.
Hence, it is important to understand the properties of specific nanowastes before developing effective
disposal practices. The developed safety measures and disposal procedures necessary for handling
nanowaste must be based on current knowledge and take into account existing legislation. The disposal
procedures must ensure that the waste is deactivated of its hazardous properties. Depending on the type of
the material, thermal, chemical or physical processing of nanotechnology-containing waste are possible
deactivation solutions.
Call to Action
The lack of strict policies and regulations related to the use and disposal of nanotechnology, in addition to
the recycling of nanomaterial-containing products, are critical issues. Nanowaste is notoriously difficult to
contain and monitor; due to its small size, it can spread in water systems or become airborne, causing
harm to human health and the environment. Legislation is required in order to regulate the sale of
products containing nanomaterials in the marketplace and their further disposal after use. Where possible,
recycling of nanomaterials is the most desirable outcome. Governments must implement assessments,
regulations and monitoring measures for nanotechnology manufacturers. Prior to placing nanomaterials-
based products on the market, extensive environmental and health impact studies must be performed;
these must include studies related to the toxicity and chemical reactivity of any new nanomaterials. From
this, safe disposal and recycling procedures can be established. Nanomaterial manufacturers (or an
independent body, or EPA) must also determine whether these substances or manufacturing techniques
could pose a risk to public health or the environment. Products should only be allowed into the
marketplace if there is no risk, or if the risk can be controlled through protective measures.
Concentrated industrial nanowaste should be diluted and deactivated prior to disposal. Additionally,
companies producing such waste as a by-product of their industrial operations must be required to prove
EPA that their nanowaste is non-hazardous to the environment and to human health. Newly developed
nanomaterials must not be released to the market in the absence of appropriate disposal procedures.
Newly developed nanowaste disposal procedures must be examined and approved by government
agencies based on undisputed evidence provided by the claim-lodging organization. To provide sufficient
evidence, the organization may carry out tests itself or refer to existing scientific procedures and claims.
Consumers and the broader community must understand that while nanotechnology can solve many
current challenges, when used inappropriately or irresponsibly it can pose serious, often irreversible
consequences to human health and the environment. Awareness-raising campaigns, communication and
education are key to building understanding and preventing hazardous situations.
Government funding, industry funding, and research grants should be allocated to accredited research
institutions in order to continuously evaluate existing protocols and develop new disposal and recycling
processes for nanowaste and/or products containing nanomaterials. The grants should also support the
identification of OHSE hazards related to use of these products. A substantial, and rapidly growing,
amount of funding is provided for development of new nanomaterials, but not enough attention is being
paid to the development of nanowaste disposal procedures.
140
Several governments and international organizations such as the OECD and IUCN are currently
investigating this growing problem in an attempt to develop suitable and efficient regulations and
policies. However, a more unified and collaborative approach at all levels is required to address this
growing and potentially very hazardous issue. Experience- and knowledge-sharing, coordinated research
activities, the development of guidelines for producers, users and waste-processing facilities, and the
examination of existing guidelines or policies are only a few of the ways to move the nanowaste
management agenda forward.
Nanotechnology is growing at an exponential rate, but it is clear that issues related to the disposal and
recycling of nanowaste will grow at an even faster rate if left unchecked.
References
Walser T., Limbach L.K., Brogioli R., Erismann E., Flamigni L., Hattendorf B., Juchli M., Krumeich F., Ludwig C.,
Prikopsky K., Rossier M., Saner D., Sigg A., Hellweg S., Gunther D. and Stark W.J. (2012) Persistence of
engineered nanoparticles in a municipal solid-waste incineration plant. Nature Nanotechnology, 7: 520-524.
Hincapie I., Caballero-Guzman A. and Nowack B. (2015) Nanomaterials in Landfills Module 3: Nanomaterials in
Construction Waste. EMPA, Swiss Federal Laboratories for Materials Science and Technology.
Muller N., Nowack B., Wang J., Ulrich A. and Bucha J. (2012) Nanomaterials in waste incineration and landfills.
EMPA, Swiss Federal Laboratories for Materials Science and Technology.
Hornyak G.L., Moore J.J., Tibbals H.F., Dutta J. (2008) Fundamentals of Nanotechnology. CRC Press
Part, F., Zecha, G., Causon, T., Sinner, E. and Humer, M. (2015). Current limitations and challenges in nanowaste
detection, characterisation and monitoring. Waste Management, 43: 407–420.
Vejerano E.P., Ma Y., Holder A.L., Pruden A., Elankumarana S. and Marr L.C. (2015) Toxicity of particulate matter
from incineration of nanowaste. Environmental Science: Nano, 2: 143 – 154.
Kim Y. (2014) Nanowastes treatment in environmental media. Environmental Health and Toxicology, 29:
e2014015.
Part F., Zecha G., Causon T., Sinner E.K., and Huber-Humer M. (2015) Current limitations and challenges in
nanowaste detection, characterisation and monitoring. Waste Management, 43: 407–420.
Boldrin A., Hansen S.F., Baun A., Bloch Hartmann N.I, Astrup T.F. (2014) Environmental exposure assessment
framework for nanoparticles in solid waste. Journal of Nanoparticle Research, 16:2394.
Musee N. (2011) Nanowastes and the environment: Potential new waste management paradigm. Environment
International, 37 (1): 112–128.
Amit Patwa A., Thiery A., Lombard F., Lilley M.K.S, Boisset C., Bramard J.F., Bottero J.Y. and Barthelemy P.
(2015) Accumulation of nanoparticles in “jellyfish” mucus: a bio-inspired route to decontamination of nano-
waste. Scientific Reports 5: 11387.
OECD Environment Policy Committee (2015) Landfilling of Waste Containing Nanomaterials and Nanowaste.
Organisation for Economic Co-operation and Development (OECD).
OECD Environment Policy Committee (2015) Incineration of Waste Containing Nanomaterials. Organisation for
Economic Co-operation and Development (OECD).
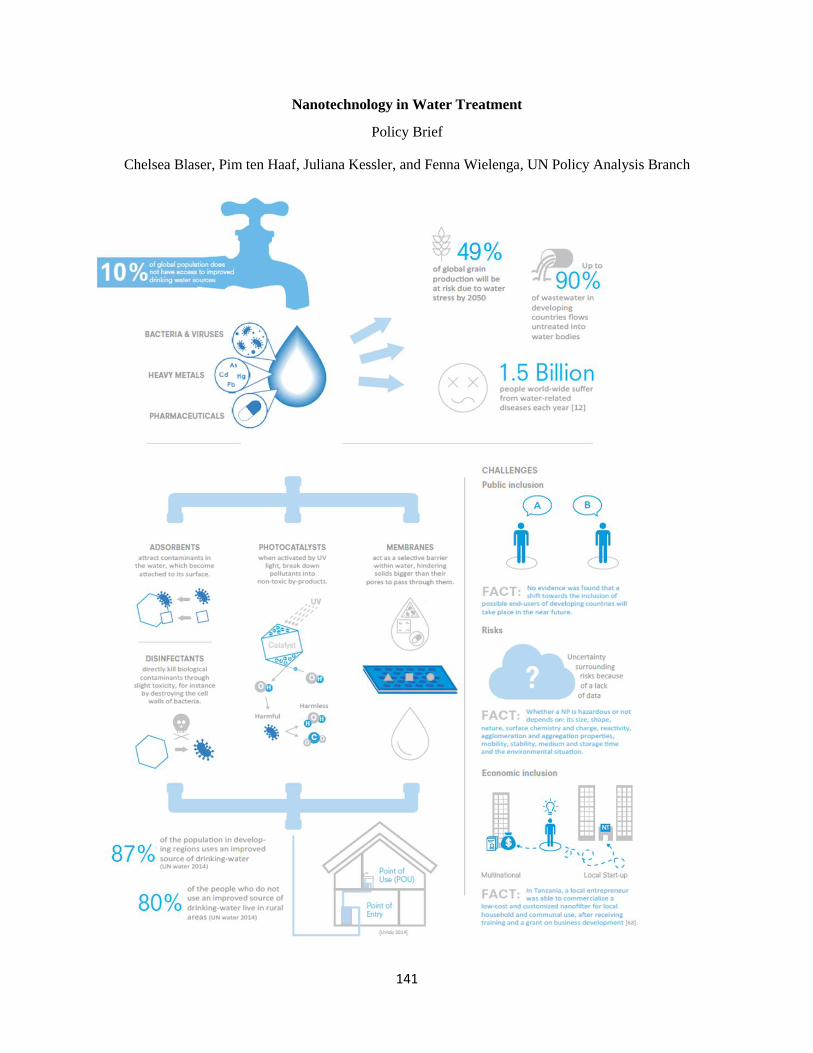
141
Nanotechnology in Water Treatment
Policy Brief
Chelsea Blaser, Pim ten Haaf, Juliana Kessler, and Fenna Wielenga, UN Policy Analysis Branch
142
Key Messages
– Nanotechnology (NT) can cost-effectively treat contaminants in water that are untreatable by
conventional methods.
– Adsorbents, disinfectants, catalysts and membranes have the potential to become widely applied
technologies in developing countries if the needs of these countries are reflected in the R&D and
investment strategies.
– Challenges formed by risk uncertainty, economic inclusion and public inclusion obstruct the large-scale
application of NT and an equal distribution of the related benefits.
Introduction
According to the World Economic Forum (WEF), a decline in the available quantity and quality of fresh
water is the main global risk that the world society will face the coming decade [1]. It is expected that by
2025, 1.8 billion people will live in countries or regions with absolute water scarcity [2]. The dependent
relationship between water quality and water availability is thus a topic that needs attention. This is
especially the case for developing countries where fresh water sources are often contaminated by bacteria,
viruses and heavy metals, due to inadequate sanitation infrastructures, mining activities and the disposal
of untreated industrial waste into water bodies [2],[3]. Since conventional methods are reaching their
limits to deal with these problems and adequate water infrastructures are often lacking in developing
countries, a new solution is needed [2],[4],[5].
The realization that NT could provide the answer has already been there since the beginning of the 2000s,
when the technology was formulated as a solution to the targets set for clean water in the Millennium
Development Goals [6]. However, the large scale application of NT in water treatment in both developed
and developing countries is still hampered by multiple issues, such as the uncertainty regarding the risks
of nanomaterials (NMs), the difference in involvement in the R&D of NT between developed and
developing countries and global disagreement about regulation standards on the usage of NMs [7]-[10].
Nevertheless, the potential for NT to address global water concerns is still strong [7],[11].
Bacteria, viruses and heavy metals, which cause 1.5 billion people world-wide to suffer from water-
related diseases each year, can be treated more efficiently and cost-effectively by NT (SDG 3: Good
Health and Well-Being) [7],[12],[13]. In a similar manner, the treatment of water by NT can improve the
production of agricultural crops, by preventing salinization and contamination of agricultural soils (SDG
2: Zero Hunger) [12],[14]. Finally, NT has the potential to create a new domestic industry in developing
countries, which can create new jobs, new knowledge and be a standard for creating new water
infrastructures (SDG 9: Industry, Innovation and Infrastructure) [12],[15],[16].
Within this policy brief nanotechnologies are defined as devices and systems with a size of 1 to 100
nanometres (1 billionth of a metre) in at least one dimension, which take advantage of the unique
properties of particles at this scale [17],[18]. However, one should be aware that there is an absence of an
internationally recognized working definition of NT [19].
143
Current Status
Although some commercialization of NT water applications has taken place, the majority is still in the
R&D
phase and upscaling applications is one of the major challenges [20]-[22]. R&D mostly takes place in the
United States, Europe, China, India and to a lesser extent in Brazil and South Africa [14],[22],[23].
Investments are made by both public and private sector, but unfortunately no detailed numbers are
available [9],[24],[25]. With regards to governance, NMs are mostly administered through the general
regulation on chemical production and distribution and through existing environmental and water
regulations [7],[26]. At present, amendments are being made to these regulations to regulate NMs
specifically [7],[27]. Yet, there is an international debate on whether this is sufficient or more specific
regulations on NMs should be implemented [7].
Benefits
Compared to other sectors, NT in water is perceived favourably due to its societal importance and
perceived necessity [28]. NMs remove contaminants, bacteria and viruses more efficiently due to their
increased specific surface area, reactivity and dissolution capacity and thus contribute to the improvement
of current disinfection, purification and desalination techniques [7],[29],[30]. The application of NTs
within water treatment leads to reduced use of chemicals compared to conventional disinfection
techniques (e.g. chlorination and ozonation) whose by-products can also have negative impacts on human
health and the environment [7], [30]. Because of the low concentrations of emerging pollutants
(micropollutants, pharmaceuticals, personal care products and hormones) present in wastewater, NT
solutions for more efficient treatment methods are needed [31],[32]. The same applies to industrial waste-
water which is often contaminated with heavy metals (e.g. chromium, mercury, lead and cadmium) [30].
Case Study: ‘Drinkwell’ and the first filter that can remove arsenic and fluoride from groundwater NT
applied: Polymeric ion exchangers doped with zirconium oxide NPs (adsorbents) which can within a
filtration column be attached to wells [35]. Contaminant removal: arsenic, fluoride, phosphate and lead.
Target group: people who live in affected areas in India, Laos, Cambodia, Bangladesh and Kenya.
Technical benefits: robust material, energy-efficient, can be re-used and regenerated for years, applicable
in local context. Socio-economic benefits: In comparison to the required installation for a similar water
purification result, the NPs are a cost-efficient treatment technology. The NPs are used in small
decentralized treatment systems which don’t require large investments, management structures and costly
maintenance [34]. The organization ‘Drinkwell’ thus empowers villagers to run their own plant in a
sustainable manner and allows them to make small profits [35]. A micro-franchise model is used which
foresees that the plant is owned by the village committee and maintained by one or two compensated
caretakers [36]. Apart from this, additional jobs are created since the NPs are produced in plants in India
[36],[37]. Besides, a waste management process was introduced in order to prevent that arsenic is
returned back into soils [37]. The risk emanating from remaining NPs in treated water is conceived of
secondary importance when considering the number of early deaths caused by arsenic-contaminated
water.
In affluent countries, NT upgrades to existing infrastructures can be implemented in a cost-effective
manner [4]. Once implemented, NTs increase the performance of many treatment systems. In general, NT
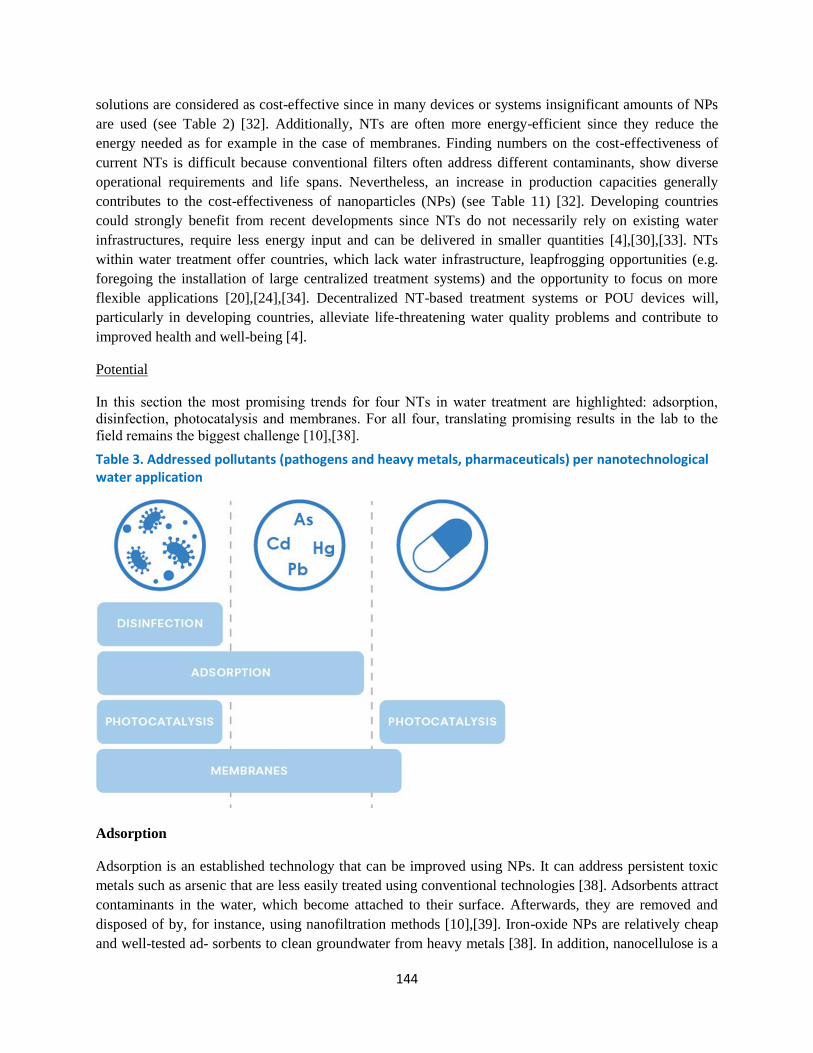
144
solutions are considered as cost-effective since in many devices or systems insignificant amounts of NPs
are used (see Table 2) [32]. Additionally, NTs are often more energy-efficient since they reduce the
energy needed as for example in the case of membranes. Finding numbers on the cost-effectiveness of
current NTs is difficult because conventional filters often address different contaminants, show diverse
operational requirements and life spans. Nevertheless, an increase in production capacities generally
contributes to the cost-effectiveness of nanoparticles (NPs) (see Table 11) [32]. Developing countries
could strongly benefit from recent developments since NTs do not necessarily rely on existing water
infrastructures, require less energy input and can be delivered in smaller quantities [4],[30],[33]. NTs
within water treatment offer countries, which lack water infrastructure, leapfrogging opportunities (e.g.
foregoing the installation of large centralized treatment systems) and the opportunity to focus on more
flexible applications [20],[24],[34]. Decentralized NT-based treatment systems or POU devices will,
particularly in developing countries, alleviate life-threatening water quality problems and contribute to
improved health and well-being [4].
Potential
In this section the most promising trends for four NTs in water treatment are highlighted: adsorption,
disinfection, photocatalysis and membranes. For all four, translating promising results in the lab to the
field remains the biggest challenge [10],[38].
Table 3. Addressed pollutants (pathogens and heavy metals, pharmaceuticals) per nanotechnological water application
Adsorption
Adsorption is an established technology that can be improved using NPs. It can address persistent toxic
metals such as arsenic that are less easily treated using conventional technologies [38]. Adsorbents attract
contaminants in the water, which become attached to their surface. Afterwards, they are removed and
disposed of by, for instance, using nanofiltration methods [10],[39]. Iron-oxide NPs are relatively cheap
and well-tested ad- sorbents to clean groundwater from heavy metals [38]. In addition, nanocellulose is a
145
promising future adsorbent for developing countries due to its biodegradability and potential cost-
effectiveness, but it still requires substantial R&D [24].
Disinfection
Disinfection using NPs can remove bacteria and viruses without using harmful chemicals, making them
superior to existing disinfection techniques [5],[7]. NP disinfectants kill biological contaminants through
slight toxicity, for instance by destroying the cell walls of bacteria [40]. Silver NPs are a suitable
disinfectant because they are non-toxic even under limited exposure [41]. Also, their production process
is simple, cheap, and the particles last long (up to 5 years) [5]. As a result, the technology is applied in
developing countries, such as South Africa and India [42],[43].
Photocatalysis
Photocatalysis is a relatively new NT for the treatment of water. Nano-catalysts are highly effective for
treating dangerous pathogens such as E.coli, and can remove compounds such as pharmaceuticals, which
are out of reach of conventional methods [10]. Although photocatalysis can theoretically remove toxic
metals like mercury, chromium and arsenic, it remains difficult to do this in the field [5],[44],[45].
Overall, photocatalysis is an effective, but highly specific method [20]. Photocatalysis uses nano-scale
particles that, when activated by UV light, break down pollutants such as viruses, bacteria and pesticides
into non-toxic by-products. After use, the NPs remain unchanged and can therefore be collected and re-
used [46]. The most common and cost-effective method for UV photo-catalysis involves the use of
Titanium Dioxide (TiO2) NPs [10]. Three major advantages of TiO2 photo-catalysis are the relatively
modest technical installation, minimal operating experience required, and low implementation cost. This
makes the technology especially useful in rural areas. Photocatalytic systems have been validated in
Trinidad and Tobago and Swaziland, where a pilot installation successfully removed 99.9% of viruses and
bacteria in only 60 seconds of treatment time [47],[48].
Membranes
Membranes act as a selective barrier within water, hindering solids bigger than their pores to pass through
them [30]. They are categorized according to their increasing filtration capacities with decreasing pore
sizes: microfiltration (MF), ultrafiltration (UF), nanofiltration (NF) and reverse osmosis (RO) membranes
[30]. The smaller the pore sizes, the higher the pressure and subsequently the energy required to push the
water through the membrane [49]. Therefore, research focuses on finding ways to improve cleaning
ability without reducing permeability or ease of fabrication [4],[7].
For potable water purification, multifunctional NF and UF membranes hold the greatest potential since
their permeability is increased due to a better cleaning process resulting from the incorporation of NPs
[4],[20],[50].
Multifunctional membranes incorporate NPs such as adsorbents and catalysts [20],[22]. These nanofillers
(e.g. nanosilver, carbon nanotubes, titanium dioxide, polymer coated NPs) increase the membrane’s
resistance to fouling and its selectivity [4],[22],[50],[51]. The properties of multifunctional membranes
depend on the specific NPs incorporated. Nano-enhanced membranes require a stronger focus on long-
term risk assessment since NPs might leach [50]. Due to the high energy requirements and the treatment
plant’s size necessary to operate NF and RO membranes, less developed countries should rather opt for
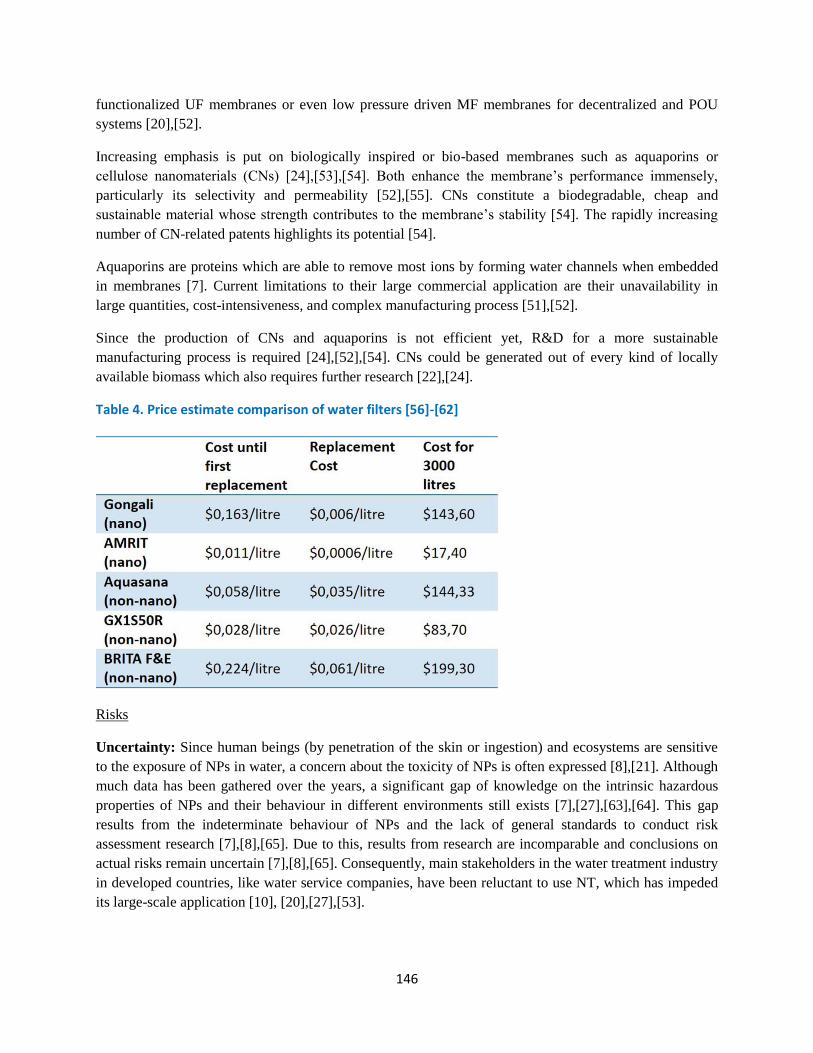
146
functionalized UF membranes or even low pressure driven MF membranes for decentralized and POU
systems [20],[52].
Increasing emphasis is put on biologically inspired or bio-based membranes such as aquaporins or
cellulose nanomaterials (CNs) [24],[53],[54]. Both enhance the membrane’s performance immensely,
particularly its selectivity and permeability [52],[55]. CNs constitute a biodegradable, cheap and
sustainable material whose strength contributes to the membrane’s stability [54]. The rapidly increasing
number of CN-related patents highlights its potential [54].
Aquaporins are proteins which are able to remove most ions by forming water channels when embedded
in membranes [7]. Current limitations to their large commercial application are their unavailability in
large quantities, cost-intensiveness, and complex manufacturing process [51],[52].
Since the production of CNs and aquaporins is not efficient yet, R&D for a more sustainable
manufacturing process is required [24],[52],[54]. CNs could be generated out of every kind of locally
available biomass which also requires further research [22],[24].
Table 4. Price estimate comparison of water filters [56]-[62]
Risks
Uncertainty: Since human beings (by penetration of the skin or ingestion) and ecosystems are sensitive
to the exposure of NPs in water, a concern about the toxicity of NPs is often expressed [8],[21]. Although
much data has been gathered over the years, a significant gap of knowledge on the intrinsic hazardous
properties of NPs and their behaviour in different environments still exists [7],[27],[63],[64]. This gap
results from the indeterminate behaviour of NPs and the lack of general standards to conduct risk
assessment research [7],[8],[65]. Due to this, results from research are incomparable and conclusions on
actual risks remain uncertain [7],[8],[65]. Consequently, main stakeholders in the water treatment industry
in developed countries, like water service companies, have been reluctant to use NT, which has impeded
its large-scale application [10], [20],[27],[53].
147
Management & Perception: The dynamic and rapid setting in which R&D takes place, together with the
lack of general standards on risk assessment has caused regulation on NPs to lag behind [66],[67].
Furthermore, due to differences in political interests, the governance of NPs mainly takes place on
national or regional level,whereas the transboundary nature of NPs requires international cooperation
[67]. While in the EU and the US risk assessment is an essential part of the commercialization strategy,
countries such as India and Brazil often neglect risk assessments as it is believed to hamper their
competitive position on the market [25],[63],[68]. The dilemma in place is to find a balance between
promoting innovation, so that the socio-economic benefits of NT in water treatment can be realized, while
simultaneously controlling the risks to such an extent that it prevents humans and ecosystems from being
harmed [20].
Addressing Risks: Risks of NTs in water treatment can be mitigated by immobilization, collection and
re-use of NPs through membranes or magnetic particles [5],[10]. Creating NMs based on biological
materials such as cellulose can also reduce risks, because NMs become more bioavailable and may be
broken down before they can cause significant harm [48],[53],[63]. Furthermore, current efforts are being
made to develop new analytical methods to assess the effects and the behaviour of NPs more extensively,
especially in the EU [27],[36].
Economic Inclusion
One of the opportunities of NT in water applications is that it can provide the base for a new industry in
developing countries, once applications developed in the laboratory are translated into commercial
products [15],[16]. However, at the moment it is challenging for researchers and entrepreneurs from
developing countries to realize this commercialization path [16],[66]. First, the access to financial
resources is limited, as funding for NT water applications is not a priority for governments [65],[69].
When small local start-ups do get the chance to emerge and enter the global market, they are often
outcompeted by large multinationals [5],[25]. Second, researchers involved in NT in water applications
often lack the skills to commercialize these applications. Intellectual property is already strongly defined
in Western countries, but a ‘patenting culture’ is not self-evident in most developing countries
[16],[25],[70]. Consequently, developing countries cannot gain a substantial share in the global market
and young, talented researchers move to developed countries for greater economic opportunities
[25],[70],[71]. This “brain-drain” further reinforces the weak position of developing countries in NT
development and commercialization, wherefore opportunities to reap the socio- economic benefits from
NT are missed [25],[71].
Public Inclusion
As for any new technology, public perception plays a crucial role in the acceptance and adoption of the
technology by end-users [36],[72]. Therefore, the commercialization of NT water applications developed
for end-users in developing countries is dependent on local opinions about the relevance of such an
application [68],[73]. Yet, the inclusion of this target group during the R&D phase of the application is
often lacking and the application is developed according to what researchers believe to be the solution
rather than on what possible end-users in developing countries think is needed [36],[68],[71],[74]. Due to
this approach, there is a risk that the implementation of the application will in the end be hampered and
valuable resources are wasted [68],[73],[75]. The challenge in this respect is to overcome the financial,
148
social and physical barriers between the location where the R&D takes place and there where the final
product is supposed to be implemented.
Policy Recommendations
Industrial Development:
• Global investments in NT should focus on low-tech applications for decentralized treatment
plants and POU devices which are affordable for local communities in developing countries.
• Financial support for local start-ups in developing countries working with NTs in water treatment
should be encouraged until they are able to compete with more established companies.
• Institutional investors should foster local entrepreneurship, by making funds available for
capacity building on how to commercialize new applications.
R&D:
• R&D should focus more on bio-based NMs (e.g. aquaporins, cellulose) in order to enable
sustainable applications.
• Future R&D should include cost-benefit analyses, and this information should be systematized to
enable comparison between NTs.
Risk Assessment:
• Global standards for the assessment of risks and the harmonization of existing risk assessment
tools should be realized as quickly as possible.
• Future risk assessment should focus on the development of analytical methods that address the
long-term effects of NPs on human health and environment.
Stakeholder Engagement:
• Social dialogue between researchers of NT water applications and targeted end-users should be
facilitated on a global level in a way that enables two-way responsiveness.
• Liaisons between relevant stakeholders from developing and developed countries, especially
research institutes and universities, should be established to stimulate transfer of knowledge.
Reference List
[1] World Economic Forum, “The Global Risks Report 2016, 11th Edition,” 11, 2016.
[2] “United Nations World Water Development Report 2012: Managing Water under Uncertainty and Riks,” United
Nations Educational, Scientific and Cultural Or- ganization (UNESCO), Paris, 2012.
[3] UN, “Water Quality.” [Online]. Available: http:// www.unwater.org/fileadmin/user_upload/unwater_
new/docs/water_quality.pdf. [Accessed: 12-Dec-2016].
[4] X. Qu, P. J. J. Alvarez, and Q. Li, “Applications of na- notechnology in water and wastewater treatment,” Wa-
ter Res., vol. 47, no. 12, pp. 3931–3946, Aug. 2013.
[5] T. Pradeep, “Private Interview,” 29-Nov-2016.
149
[6] S. Cozzens, R. Cortes, O. Soumonni, and T. Wood- son, “Nanotechnology and the Millennium Develop- ment
Goals: Water, Energy and Agri-Food,” J. Nanopar- ticle Res., vol. 15, p. 2001, Oct. 2013.
[7] I. Gehrke, A. Geiser, and A. Somborn-Schulz, “Inno- vations in nanotechnology for water treatment,” Nano-
technol. Sci. Appl., p. 1, Jan. 2015.
[8] M. Sajid et al., “Impact of Nanoparticles on Human and Environment: Review of Toxicity Factors, Exposures,
Control Strategies, and Future Prospects,” Env. Sci Pollut Res, vol. 22, no. 6, pp. 4122–4143, Mar. 2015.
[9] A. van Wezel, “Private Interview,” 01-Dec-2016.
[10] J. Brame, “Private interview,” 01-Dec-2016.
[11] M. Diallo and C. J. Brinker, “Nanotechnology for Sustainability: Environment, Water, Food, Minerals and
Climate,” in Nanotechnology Research Directions for Societal Needs in 2020: Respective and Outlook, M. C.
Roco, C. A. Mirkin, and M. C. Hersam, Eds. Dordrecht, Heidelberg, London and New York: Springer, 2011, pp.
221–260.
[12] United Nations, “Sustainable Development Report 2016,” United Nations Department of Economic and So-
cial Affairs, New York, Jul. 2016.
[13] World Health Organization and UNICEF, “Progress on Sanitation and Drinking Water – 2015 update and MDG
assessment,” 2015.
[14] N. Musee, L. Sikhwivhilu, and M. Gulumian, “Rel- evance of Nanotechnology to Africa: Synthesis, Appli-
cations, and Safety,” in Chemistry for Sustainable De- velopment in Africa, A. Gurib-Fakim and J. N. Eloff, Eds.
Berlin, Heidelberg: Springer Berlin Heidelberg, 2013, pp. 123–158.
[15] K. Beumer, “Broadening Nanotechnology’s Impact on Development,” Nat. Nanotechnol., vol. 11, pp. 398–
400, May 2016.
[16] D. C. Maclurcan, “Southern Roles in Global Nano- technology Innovation: Perspectives from Thailand and
Australia,” Nanoethics, vol. 3, pp. 137–156, Jul. 2009.
[17] OECD, “Considerations in moving towards a statistical framework for nanotechnology: findings from a
working party on nanotechnology pilot sur- vey of business activity in nanotechnology,” DSTI/STP/
NANO(2013)12/FINAL, Feb. 2014.
[18] “National Nanotechnology Initiative,” What it is and how it works, 15-Dec-2016. [Online]. Available:
https://www.nano.gov/nanotech-101/what. [Accessed: 15-Dec-2016].
[19] European Commission and Directorate-General for Research and Innovation, Nanotechnologies: princi- ples,
applications, implications and hands-on activities (a compendium for educators). Luxembourg: Publica- tions
Office, 2012.
[20] P. J. J. Alvarez, “Private Interview,” 02-Dec-2016.
[21] J. Gardner and A. Dhai, “Nanotechnology and Wa- ter: Ethical and Regulatory Considerations,” in Applica-
tion of Nanotechnology in Water Research, A. K. Mishra, Ed. Beverly: Scrivener Publishing, 2014, pp. 3–20.
[22] R. Liang, “Private Interview,” 06-Dec-2016.
[23] D. Azoulay, R. Senjen, and G. Foladori, “Social and Environmental Implications of Nanotechnology Devel-
opment in Asia-Pacific,” IPEN, 2012.
[24] B. S. Hsiao, “Private Interview,” 30-Nov-2016.
[25] G. Foladori, “Private Interview,” 01-Dec-2016.
150
[26] E. A. Corley, Y. Kim, and D. A. Scheufele, “The Cur- rent Status and Future Direction of Nanotechnology
Regulations: A View from Nano-scientists: Status and Future Direction of Nanotechnology Regulations,” Rev.
Policy Res., vol. 30, no. 5, pp. 488–511, Sep. 2013.
[27] A. van Wezel, “Private Interview,” 01-Dec-2016.
[28] N. Gupta, A. R. H. Fischer, and L. J. Frewer, “Ethics, Risk and Benefits Associated with Different Applications
of Nanotechnology: a Comparison of Expert and Con- sumer Perceptions of Drivers of Societal Acceptance,”
Nanoethics, vol. 9, pp. 93–108, Apr. 2015.
[29] C. A. Auplat, “The Challenges of Nanotechnology Policy Making PART 2. Discussing Voluntary Frameworks
and Options,” Glob. Policy, vol. 4, no. 1, pp. 101–107, Feb. 2013.
[30] S. Baruah, M. Najam Khan, and J. Dutta, “Perspec- tives and applications of nanotechnology in water treat-
ment,” Environ. Chem. Lett., vol. 14, no. 1, pp. 1–14, Mar. 2016.
[31] A. Hu and A. Apblett, Eds., Nanotechnology for Water Treatment and Purification, vol. 22. Cham: Springer
International Publishing, 2014.
[32] A. S. Adeleye, J. R. Conway, K. Garner, Y. Huang, Y. Su, and A. A. Keller, “Engineered nanomaterials for
water treatment and remediation: Costs, benefits, and applicability,” Chem. Eng. J., vol. 286, pp. 640–662, Feb.
2016.
[33] OECD, “Fostering Nanotechnology to Address Global Challenges: Water.” 2011.
[34] J. Brame, Q. Li, and P. J. J. Alvarez, “Nanotechnol- ogy-enabled water treatment and reuse: emerging op-
portunities and challenges for developing countries,” Trends Food Sci. Technol., vol. 22, no. 11, pp. 618–624,
Nov. 2011.
[35] K. Pfitzer, “Lehigh University,” A patented nano- technology for clean drinking water, 15-Dec-2016. [On-
line]. Available: http://www1.lehigh.edu/news/patent- ed-nanotechnology-clean-drinking-water. [Accessed: 15-
Dec-2016].
[36] A. Sengupta, “Private Interview,” 07-Dec-2016.
[37] Drinkwell, “drinkwell,” Transforming the global water crisis into entrepreneurial opportunity, 15-Dec- 2016.
[Online]. Available: http://drinkwellsystems. com/#landing-page. [Accessed: 15-Dec-2016].
[38] D. Rickerby, “Private Interview,” 13-Dec-2016.
[39] M. Grassi, G. Kaykioglu, V. Belgiorno, and G. Lof- rano, “Removal of Emerging Contaminants from Water
and Wastewater by Adsorption Process,” in Emerging Compounds Removal from Wastewater, G. Lofrano, Ed.
Dordrecht: Springer Netherlands, 2012, pp. 15–37.
[40] Q. Li et al., “Antimicrobial nanomaterials for wa- ter disinfection and microbial control: Potential applica- tions
and implications,” vol. 42, no. 18, pp. 4591–4602, 2008.
[41] M. Rai, A. Yadav, and A. Gade, “Silver nanoparti- cles as a new generation of antimicrobials,” Biotechnol.
Adv., vol. 27, no. 1, pp. 76–83, 2009.
[42] L. Mpenyana-Monyatsi, N. H. Mthombeni, M. S. Onyango, and M. N. Momba, “Cost-effective filter ma- terials
coated with silver nanoparti-cles for the removal of pathogenic bacteria in groundwater,” Int. J. Environ. Res.
Public. Health, vol. 9, no. 1, pp. 244–271, 2012.
[43] M. U. Sankar et al., “Biopolymer-reinforced syn- thetic granular nanocomposites for affordable point-of- use
water purification,” Proc. Natl. Acad. Sci., vol. 110, no. 21, pp. 8459–8464, 2013.
151
[44] M. I. Litter, N. Quici, J. M. Meichtry, and A. M. Senn, “Photocatalytic Removal of Metallic and Other
Inorganic Pollutants,” in Photocatalysis: Applications, Cambridge: RSC Publishing, 2016, pp. 35–71.
[45] M. A. Barakat, “New trends in removing heavy metals from industrial wastewater,” Arab. J. Chem., vol. 4, no.
4, pp. 361–377, 2011.
[46] L. A. Al-Rasheed, “Water treatment by heteroge- neous photocatalysis an overview,” presented at the 4th
SWCC acquired Experience Symposium, Jeddah, 2005.
[47] K. Tota-Maharaj and P. Paul, “Evaluation of the so- lar photocatalytic degradation of organochlorine com-
pound trichloroethanoic acid using titanium dioxide and zinc oxide in the Caribbean region,” Water Sci.
Technol. Water Supply, vol. 15, no. 3, pp. 559–568, 2015.
[48] J. Brame et al., “Water disinfection using nano- technology for safer irrigation: A demonstration project in
Swaziland,” Environ. Eng. Sci. Appl. Res. Pract., vol. 50, no. 2, pp. 40–46, 2014.
[49] M. Hamingerova, L. Borunsky, and M. Beckmann, “Membrane Technologies for Water and Wastewater
Treatment on the European and Indian Market,” Fraun- hofer Center for International Management and Knowl-
edge Economy, Leipzig, 2015.
[50] P. K. Tewari and A. K. Ghosh, “Next Generation Na- nocomposite Ultrafiltration Membranes for Water Puri-
fication,” in Nanotechnology: Recent Trends, Emerging Issues and Future Directions, New York: Nova Science
Publisher, 2014, pp. 349–363.
[51] M. M. Pendergast and E. M. V. Hoek, “A review of water treatment membrane nanotechnologies,” Energy
Environ. Sci., vol. 4, no. 6, p. 1946, 2011.
[52] I. Gehrke, “Private Interview,” 14-Dec-2016.
[53] B. Hofs, “Private interview,” 06-Dec-2016.
[54] A. W. Carpenter, C. F. Lannoy de, and M. R. Wiesner, “Cellulose Nanomaterials in Water Treatment
Technologies,” Environ. Sci. Technol., vol. 49, no. 9, pp. 5277–5287.
[55] R. Li, L. Zhang, and P. Wang, “Rational design of nanomaterials for water treatment,” Nanoscale, vol. 7, no.
41, pp. 17167–17194, 2015.
[56] Gongali Model, “Gongali Model Water Nano-fil- ter,” 20-Dec-2016. [Online]. Available: http://gongali-
model.com/. [Accessed: 20-Dec-2016].
[57] L. Gravotta, “Cheap Nanotech Filter Clears Hazard- ous Microbes and Chemicals from Drinking Water,” Sci-
entific American, 07-May-2013.
[58] S. Gopikrishna Warrier, “Indian scientists develop low-cost arsenic water filter,” The Third Pole, 22-Jan- 2016.
[59] N. Rao, “Walking on Water,” Immerse, Sci-ence Magazine of IIT Madras, 15-Jan-2014.
[60] Aquasana, “Powered Water Filtration System,” Drinking Water Filter Systems, 20-Dec-2016. [Online].
Available: http://www.aquasana.com/drinking-wa- ter-filter-systems. [Accessed: 20-Dec-2016].
[61] GE Appliances, “Single and Dual Stage Fil-ters,” Wa- ter Systems, 20-Dec-2016. [Online]. Availa-ble: https://
www.geapplianceparts.com/store/parts/category/wa- ter-systems?Part+Type=Single+and+Dual+Stage+Filters.
[Accessed: 20-Dec-2016].
[62] Brita, “Brita Shop,” Alle Producten, 20-Dec-2016. [Online]. Available: http://www.brita.nl/brita/nl-nl/
shop.grid. [Accessed: 20-Dec-2016].
[63] W. Peijnenburg, “Private Interview,” 02-Dec-2016.
[64] B. Koelmans, “Private Interview,” 15-Dec-2016.
152
[65] N. Islam, “Private Interview,” 30-Nov-2016.
[66] M. C. Roco, M. C. Hersam, and C. A. Mirkin, Na- notechnology Research Directions for Societal Needs in
2020. Dordrecht: Springer Netherlands, 2011.
[67] A. K. Read, G. S. Kass, H. R. Sutcliffe, and S. M. Hankin, “Foresight Study on the Risk Governance of New
Technologies: The Case of Nanotechnology,” Risk Anal., vol. 36, no. 5, pp. 1006–1024, 2016.
[68] N. Gupta, “Private Interview,” 08-Dec-2016.
[69] G. Foladori and N. Invernezzi, “Inequality Gaps in Nanotechnology Development in Latin Amer-ica,” J. Arts
Humanit., vol. 2, no. 3, pp. 35–45, 2013.
[70] S. E. Cozzens and J. Wetmore, Eds., Nano-technol- ogy and the Challenges of Equity, Equality and Develop-
ment. Dordrecht: Springer Netherlands, 2011.
[71] K. Beumer, “Private Interview,” 29-Nov-2016.
[72] H. van Dijk, A. R. H. Fischer, H. J. P. Marvin, and H. C. M. van Trijp, “Determinants of Stakehold-ers’ At-
titudes Towards a New Technology: Nanotech-nology Applications for Food, Water, Energy and Medicine,” J.
Risk Res., pp. 1–22, Jun. 2015.
[73] T. Hillie, M. Munasinghe, M. Hlope, and Y. Derani- yagala, “Nanotechnology, Water & Develop-ment.” Me-
ridian Institute, 2006.
[74] T. Saidi, “Private Interview,” 07-Dec-2016.
[75] A. Hilonga, “Private Interview,” 28-Nov-2016.
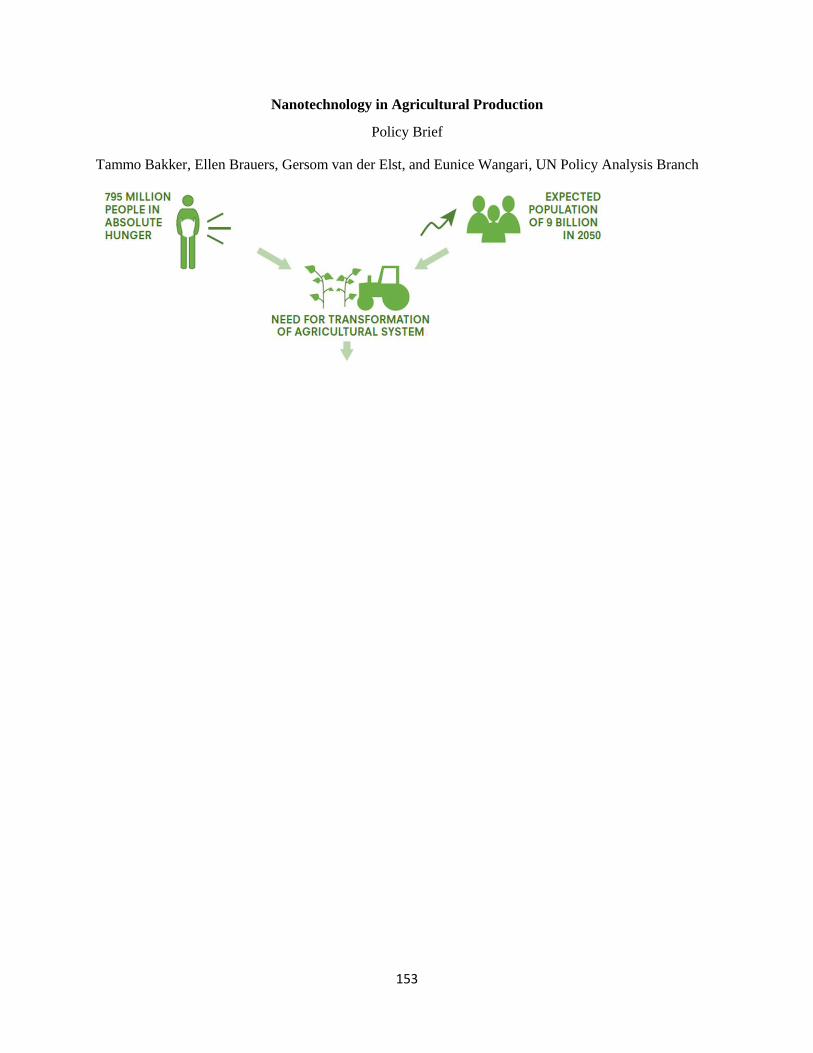
153
Nanotechnology in Agricultural Production
Policy Brief
Tammo Bakker, Ellen Brauers, Gersom van der Elst, and Eunice Wangari, UN Policy Analysis Branch
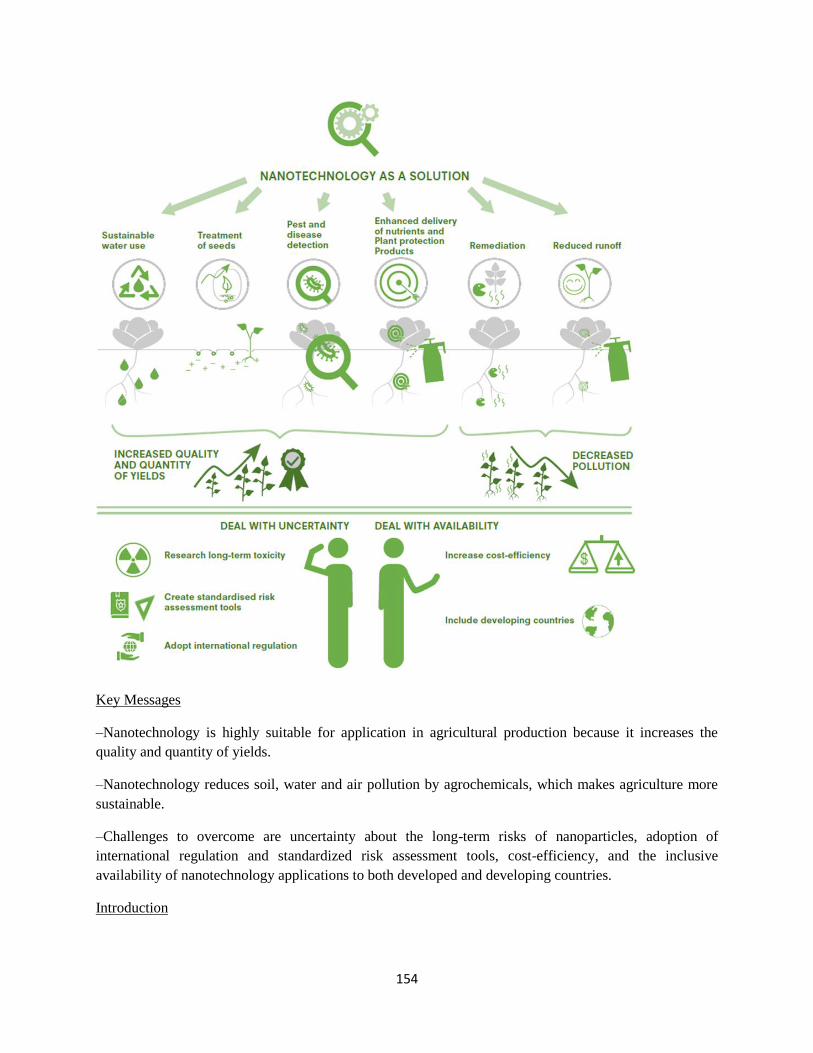
154
Key Messages
–Nanotechnology is highly suitable for application in agricultural production because it increases the
quality and quantity of yields.
–Nanotechnology reduces soil, water and air pollution by agrochemicals, which makes agriculture more
sustainable.
–Challenges to overcome are uncertainty about the long-term risks of nanoparticles, adoption of
international regulation and standardized risk assessment tools, cost-efficiency, and the inclusive
availability of nanotechnology applications to both developed and developing countries.
Introduction
155
According to the United Nations Food and Agricultural Organization, 795 million people worldwide lack
access to sufficient food to lead a healthy active life [1]. Climate change, population growth and land
degradation further challenge ending hunger [2]. To meet the projected demand for food of over nine
billion people in 2050, world agricultural production has to increase by approximately 60% [2].
Nanotechnology (NT) can increase the quality and quantity of agricultural production,[3],[4] and make it
more sustainable by decreasing pollution from agrochemicals [4],[5],[6], while improving climate
resilience (Sustainable Development Goal (SDG) 2: Zero Hunger [7]) [8],[9]. It also has the ability to add
valuable nutrients to plants [10] and detect and remediate heavy metals in the soil, and thus contribute to
better health (SDG 3: Health and well-being [7]) [11],[12]. Furthermore, NT can foster more sustainable
agricultural production (SDG 9: Industry, innovation & infrastructure [7]) [3],[4],[13].
There is a growing body of knowledge on the benefits of applying NT in agriculture, however it has
proven difficult to coordinate findings between important stakeholders and to integrate knowledge from
different fields and scientific disciplines [7]. Currently NT is not widely applied in agricultural production
because of uncertainty regarding environmental and health risks and low cost-efficiency [14],[15]. This
policy brief will provide an overview of the benefits and challenges regarding the use of NT in
agricultural production. It will also discuss its current status and give recommendations on what is needed
to apply NT in agricultural production successfully in the future.
Current Status
Research on agricultural NT has been ongoing for over a decade now [16] .Though the share of
publications on NT in agriculture is smaller than for other sectors, recognition of the potential of NT in
agriculture is growing [17],[18]. For instance, between 2005-2009 literature on NT in the agri-food sector
doubled [19]. Currently Europe, the USA, China and India produce the bulk of research and development
(R&D) on NT in agriculture [19]. Of all NT applications only 9% target agriculture [20]. Some
applications are already in use to increase the distribution, efficacy and controlled release of pesticides,
nutrients and agrichemicals, and to detect bacteria and viruses [21],[22].
Benefits
Increased Quality and Quantity of Yields
• Sustainable water use: In order to make agricultural production more sustainable and optimize
water use, nano-hydrogel can be applied. It is able to absorb and release water and nutrients in
cycles, leading to more efficient use of water [26]–[28]. A study on silver coated hydrogel
showed that soils to which this hydrogel is added can hold 7.5% more water than soils without
[26]. Furthermore, the hydrogel can store between 130 and 190 times its own weight of rainwater
or irrigation water [22],[26]. Bio- degradable hydrogels are especially promising since it
decreases the amount of contaminants [27]–[30]. Hence, NT can be especially useful in dry areas.
This is highly needed as drought is considered the largest environmental risk for crop production
[31].
• Treatment of seeds: Through treatment with NT seeds can germinate faster and steadier while
increasing their resilience to environmental stress [8]. NT also increases seedling strength, growth
and seed longevity [32]–[34]. A laboratory study showed that crops grown from seeds coated
with nanomaterials like nano-silver recorded increased water absorption [8]. Another study on
156
seeds treated with nanoparticles found a 73% increase in vegetable dry weight and a three times
higher vitamins content in seeds [23],[25],[31],[33],[35] which increases crops yields. Moreover,
seeds that had undergone treatment with nanoparticles indicated a 90% increase in drought
resistance [36]. In addition, a 16.5% increase in seed longevity during storage was recorded [34].
These advantages contribute to increased quality and quantity of yields and climate resilience
[32].
• Pest and disease detection: Pollutants, pests and plant diseases cause severe damage to crops. For
instance, insect pests cause 25% loss in rice yields and 50% for cotton [37],[38]. Bio-sensors,
consisting of an organic-based detection mechanism, such as enzymes, are able to detect these
specific threats [39],[40]. Due to their size-related properties, nano-biosensors show an increase
in accuracy, detection limits, sensitivity, selectivity, temporal response and reproducibility,
compared to conventional biosensors [41]. They are able to detect single viruses and
contaminants at the molecular level. These particles are smaller than is approved by EU standards
[42]. Therefore, nano-biosensors provide a very precise tool that can be used to prevent pest
outbreaks and monitor soil quality, which enhances quality and quantity of yields
[37],[41],[43],[44].
• Enhanced delivery of nutrients and plant protection products (ppp): Up to 70% of conventional
fertilisers and ppp’s do not reach their target because they are unstable in the environment and
difficult to be taken up [3],[45]. Nano-based smart delivery systems have the ability to provide
more efficient and targeted delivery to specific plant cells due to their size-related properties
[3],[4],[46],[47]. Also, they show enhanced stability in the environment, which improves the
availability of nutrients and ppp’s to crops [3],[37],[48],[49]. Smart delivery systems further
enhance the delivery of nutrients and ppp’s through their ability of slow or controlled release
[3],[48]. This is shown to extend the effectiveness of ppp’s from three to over thirty days [50]. In
addition, the effect of pesticides was found to be twice as strong with half the dose applied
[51],[52]. Enhanced delivery of nutrients and ppp’s improves the resistance of crops towards
threats like droughts, pests and pollution [6]. Therefore it improves the quality and quantity of
yields [3],[4],[17]. Nano-biosensors can enhance this process even further by enabling smart
delivery systems to precisely release nutrients and ppp’s in response to environmental triggers
and biological demands [3],[53]. This provides opportunities for real-time monitoring and control
[49],[54].ALLENGES
Decreased Pollution
• Reduced runoff: The application of NT in agricultural production has the potential to reduce
pollution resulting from fertilisers and ppp’s and remediate soils polluted with heavy metals
[6],[12],[14],[48],[55]. Up to 90% of agrochemicals (in)directly run-off in the environment due to
their uncontrolled application. Through increased efficiency, smart delivery systems also decrease
pollution and subsequently environmental and health risks [9],[56]–[60].
• Remediation: In addition, soils polluted with heavy metals can be remediated using NT, making
them productive again [12]. This is particularly promising for China and African countries, where
soil pollution with heavy metals is severe [61]. NT based soil remediation techniques are
proclaimed to be effective, of low cost and environmentally friendly [62]. A case study using iron
nanoparticles for remediation shows a 99% reduction of Trichloroethane (a solvent in pesticides)
within a few days [63].
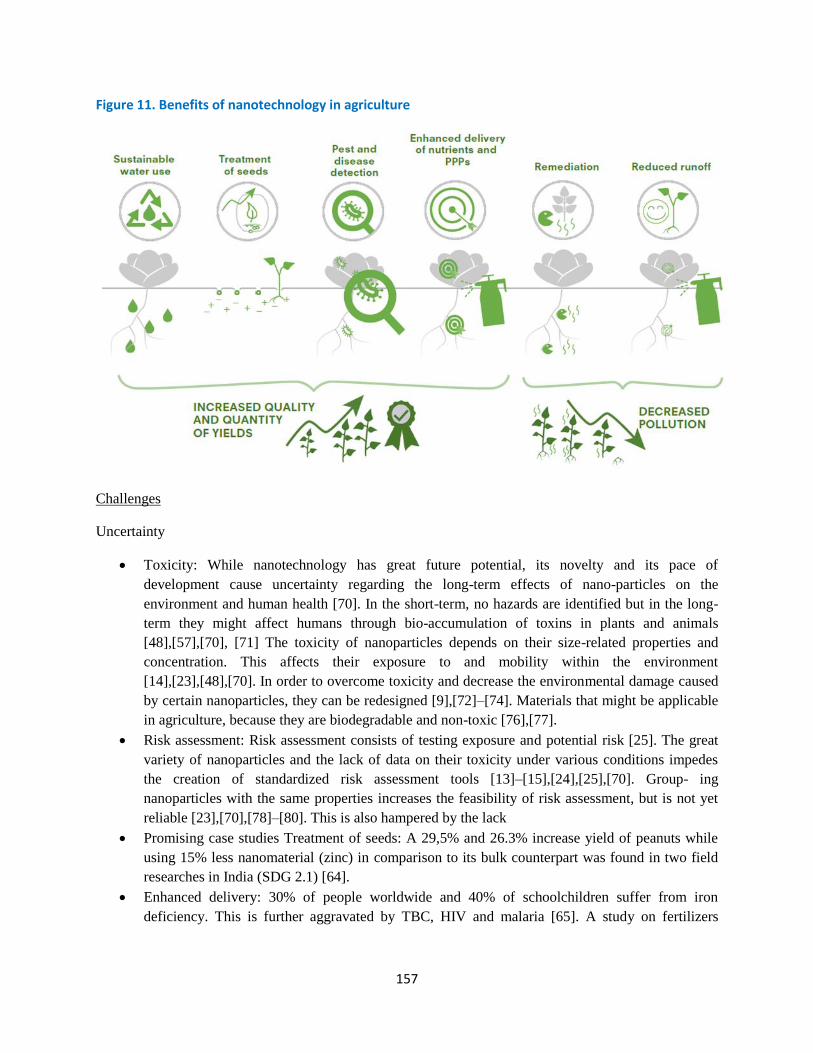
157
Figure 11. Benefits of nanotechnology in agriculture
Challenges
Uncertainty
• Toxicity: While nanotechnology has great future potential, its novelty and its pace of
development cause uncertainty regarding the long-term effects of nano-particles on the
environment and human health [70]. In the short-term, no hazards are identified but in the long-
term they might affect humans through bio-accumulation of toxins in plants and animals
[48],[57],[70], [71] The toxicity of nanoparticles depends on their size-related properties and
concentration. This affects their exposure to and mobility within the environment
[14],[23],[48],[70]. In order to overcome toxicity and decrease the environmental damage caused
by certain nanoparticles, they can be redesigned [9],[72]–[74]. Materials that might be applicable
in agriculture, because they are biodegradable and non-toxic [76],[77].
• Risk assessment: Risk assessment consists of testing exposure and potential risk [25]. The great
variety of nanoparticles and the lack of data on their toxicity under various conditions impedes
the creation of standardized risk assessment tools [13]–[15],[24],[25],[70]. Group- ing
nanoparticles with the same properties increases the feasibility of risk assessment, but is not yet
reliable [23],[70],[78]–[80]. This is also hampered by the lack
• Promising case studies Treatment of seeds: A 29,5% and 26.3% increase yield of peanuts while
using 15% less nanomaterial (zinc) in comparison to its bulk counterpart was found in two field
researches in India (SDG 2.1) [64].
• Enhanced delivery: 30% of people worldwide and 40% of schoolchildren suffer from iron
deficiency. This is further aggravated by TBC, HIV and malaria [65]. A study on fertilizers
158
containing nano-iron particles has shown nanotechnology can increase the iron level in water-
melons substantially [66].
• Pollution detection: Mercury is toxic in small amounts and identified by the WHO [67] as a
serious threat to the health of young children and especially fetuses. Nanosensors based on silver
particles are able to detect these small amounts of mercury in soil and plants [65],[66],[68],[69].
• Sustainable water use: Biodegradable hydrogels show an increased soil moisture of up to 400%
compared to soil that hasn’t been amended with hydrogel [29].
• of an internationally agreed upon workable definition of NT [14],[24]. Risk assessment differs
per region and sometimes per sector [25]. Currently, risk assessment becomes more holistic:
scientists, regulators, industries and non-governmental organisations work together in a
multidisciplinary setting [25],[80]. Risk assessment will continuously change and adapt as a result
of the continuous development of NT [23],[25], [70]. Standardized tools developed by the OECD
and the EU are expected in the next two years [70].
• Regulation: Due to their size-related properties, which may differ from their bulk counterpart,
adopting regulatory frameworks that adequately deal with NT can be challenging [81],[82]. While
some argue current regulatory frameworks are sufficient to deal with the risks and uncertainty of
NT [83], others state there is a need for nano-specific provisions and regulation [70],[82]. The
lack of an internationally agreed upon workable definition of NT makes this difficult however
[14],[24]. Adopt- ing nano-specific regulation and formulating a common definition is needed to
stimulate countries to share knowledge, trade in products containing nanomaterials and mitigate
associated risks [84].
Inclusive Availability
It needs to be ensured that the benefits of NT will be shared inclusively between a wide range of countries
and stakeholders [85],[86]. Currently most of the R&D is taking place in a select number of countries and
knowledge is unequally distributed [87]. Relatively little efforts are made to make products that benefit
the poorest countries as this is often unattractive from a financial point of view [86],[88]. Therefore, the
gap in production and innovativeness between developed and underdeveloped nations and between large
and small corporations may be widened [86]. Because large companies possess most patents, it is difficult
for small companies to gain entry to the market [86],[88]. However there are techniques to create NT that
are cheap and affordable for developing countries and small companies [20]. This can for instance be
achieved by lowering the administrative burden when registering products or establishing support
structures for small companies or underdeveloped nations [89]. In addition, NT needs to become more
cost-efficient and to be transferred to the field, to become relevant in agricultural production and for
developing countries [13],[90]. Because NT applications in agricultural production are entering the
market phase, it is important to look at this now.
Recommendations
Uncertainty
• Focus R&D on long-term toxicity and exposure of nanoparticles in the environment and their
implications for human health.
159
• Select non-toxic, environmentally friendly nanomaterials for their application in agricultural
production.
• Develop international standardized risk assessment methods in close collaboration with scientists
and private companies in order to reduce costs and integrate knowledge.
• Reach international consensus on a workable definition of NT in order to coordinate legislation
and risk assessment.
Availability
• Focus R&D on improvement of cost-efficiency of NT to make it more affordable for developing
countries.
• Form collaborations between countries that have advanced research and applications of NT and
those that could benefit from NT to ensure inclusive availability of NT.
Reference List
[1] FAO, “Goal 2. End Hunger, achieve food security and improved nutrition and promote sustainable agriculture.,”
Goal 2. End Hunger, achieve food security and improved nutrition and promote sustainable agriculture., 2014.
[Online]. Available: http://www.fao.org/ sustainable-development-goals/goals/goal-2/en/. [Accessed: 15-Dec-
2016].
[2] FAO, “Hunger Statistics, WFP, United Nations World Food Programme.,” Hunger Statistics, WFP, United
Nations World Food Programme., 2014. [Online]. Available: http://www.wfp.org/hunger/stats. [Accessed: 15-
Dec-2016].
[3] P. Solanki, A. Bhargava, H. Chhipa, N. Jain, and J. Panwar, “Nano-fertilizers and Their Smart Delivery System,”
in Nanotechnologies in Food and Agriculture, M. Rai, C. Ribeiro, L. Mattoso, and N. Duran, Eds. Cham:
Springer International Publishing, 2015, pp. 81–101.
[4] H. Chhipa and P. Joshi, “Nanofertilisers, Nanopesticides and Nanosensors in Agriculture,” in Nanoscience
in Food and Agriculture 1, vol. 20, S. Ranjan, N. Dasgupta, and E. Lichtfouse, Eds. Cham: Springer International
Publishing, 2016, pp. 247–282.
[5] K. Aschberger et al., “Nanomaterials in Food – Current and Future Applications and Regulatory Aspects,” J.
Phys. Conf. Ser., vol. 617, p. 12032, May 2015.
[6] M. Kah and T. Hofmann, “Nanopesticide research: Current trends and future priorities,” Environ. Int., vol. 63,
pp. 224–235, Feb. 2014.
[7] United Nations, “Sustainable Development Report 2016,” Sustainable Development Report 2016, 2016.
[Online]. Available: https://sustainabledevelopment.un.org/globalsdreport/2016. [Accessed: 15-Dec-2012].
[8] T. Adhikari, S. Kundu, and A. S. Rao, “Zinc delivery to plants through seed coating with nano-zinc oxide
particles,” J. Plant Nutr., vol. 39, no. 1, pp. 136–146, Jan. 2016.
[9] N. Dasgupta et al., “Thermal co-reduction approach to vary size of silver nanoparticle: its microbial and cellular
toxicology,” Environ. Sci. Pollut. Res., vol. 23, no. 5, pp. 4149–4163, Mar. 2016.
[10] P. Wang, E. Lombi, F.-J. Zhao, and P. M. Kopittke, “Nanotechnology: A New Opportunity in Plant Sciences,”
Trends Plant Sci., vol. 21, no. 8, pp. 699–712, Aug. 2016.
[11] F. A. Caliman, B. M. Robu, C. Smaranda, V. L. Pavel, and M. Gavrilescu, “Soil and groundwater cleanup:
160
benefits and limits of emerging technologies,” Clean Technol. Environ. Policy, vol. 13, no. 2, pp. 241–268, Apr.
2011.
[12] M. M. Rabbani, I. Ahmed, and S.-J. Park, “Application of Nanotechnology to Remediate Contaminated
Soils,” in Environmental Remediation Technologies for Metal-Contaminated Soils, H. Hasegawa, I. M. M. Rahman,
and M. A. Rahman, Eds. Tokyo: Springer Japan, 2016, pp. 219–229.
[13] S. Mukhopadhyay, “Private Interview,” 14-Dec-2016.
[14] M. Kah, “Private Interview,” 18-Nov-2016.
[15] V. Stone, “Private Interview,” 12-Dec-2016.
[16] C. Parisi, M. Vigani, and E. Rodríguez-Cerezo, Proceedings of a workshop on “Nanotechnology for the
agricultural sector: from research to the field.” Luxembourg: Publications Office of the European Union, 2014.
[17] S. S. Mukhopadhyay, “Nanotechnology in agriculture: prospects and constraints,” Nanotechnol. Sci. Appl., p.
63, Aug. 2014.
[18] C. Parisi, M. Vigani, and E. Rodríguez-Cerezo, “Agricultural Nanotechnologies: What are the current
possibilities?,” Nano Today, vol. 10, no. 2, pp. 124–127, Apr. 2015.
[19] S. Cozzens, R. Cortes, O. Soumonni, and T. Woodson, “Nanotechnology and the Millennium Development
Goals: Water, Energy and Agri-Food,” J. Nanoparticle Res., vol. 15, p. 2001, Oct. 2013.
[20] R. J. B. Peters et al., “Nanomaterials for products and application in agriculture, feed and food,” Trends
Food Sci. Technol., vol. 54, pp. 155–164, Aug. 2016.
[21] V. Amenta et al., “Regulatory aspects of nanotechnology in the agri/feed/food sector in EU and non-EU
countries,” Regul. Toxicol. Pharmacol., vol. 73, no. 1, pp. 463–476, Oct. 2015.
[22] S. Makama, “Private Interview,” 09-Dec-2016.
[23] H. Bouwmeester, “Private Interview,” 24-Nov-2016.
[24] A. Eftekhari, “Private Interview,” 12-Dec-2016.
[25] Fordsmand, “Private Interview,” 09-Dec-2016.
[26] R. Vundavalli, S. Vundavalli, M. Nakka, and D. S. Rao, “Biodegradable Nano-Hydrogels in Agricultural
Farming - Alternative Source For Water Resources,” Procedia Mater. Sci., vol. 10, pp. 548–554, 2015.
[27] F. F. Montesano and F. Serio, “Private Interview,” 05-Dec-2016.
[28] C. Demetri, “Private Interview,” 05-Dec-2016.
[29] F. F. Montesano, A. Parente, P. Santamaria, A. Sannino, and F. Serio, “Biodegradable Superabsorbent
Hydrogel IncreasesWater Retention Properties of Growing Media and Plant Growth,” Agric. Agric. Sci.
Procedia, vol. 4, pp. 451–458, 2015.
[30] A. S. G. Magalhães, M. P. Almeida Neto, M. N. Bezerra, and J. P. A. Feitosa, “Superabsorbent Hydrogel
Composite with Minerals Aimed at Water Sustainability,” J. Braz. Chem. Soc., vol. 24, no. 2, pp. 304–313, 2013.
[31] C. A. Jaleel et al., “Drought stress in plants: a review on morphological characteristics and pigments
composition,” Int J Agric Biol, vol. 11, no. 1, pp. 100–105, 2009.
161
[32] E. H. Dehkourdi and M. Mosavi, “Effect of Anatase Nanoparticles (TiO2) on Parsley Seed Germination
(Petroselinum crispum) In Vitro,” Biol. Trace Elem. Res., vol. 155, no. 2, pp. 283–286, Nov. 2013.
[33] M. Khodakovskaya et al., “Carbon Nanotubes Are Able To Penetrate Plant Seed Coat and Dramatically Affect
Seed Germination and Plant Growth,” ACS Nano, vol. 3, no. 10, pp. 3221–3227, Oct. 2009.
[34] T. Adak, J. Kumar, N. A. Shakil, and S. Pandey, “Role of nano-range amphiphilic polymers in seed quality
enhancement of soybean and imidacloprid retention capacity on seed coatings: Soybean seed quality
enhancement by amphiphilic nano-polymers,” J. Sci. Food Agric., vol. 96, no. 13, pp. 4351–4357, Oct. 2016.
[35] F. Yang et al., “The Improvement of Spinach Growth by Nano-anatase TiO2 Treatment Is Related to Nitrogen
Photoreduction,” Biol. Trace Elem. Res., vol. 119, no. 1, pp. 77–88, Sep. 2007.
[36] D. Rahimi, D. Kartoolinejad, K. Nourmohammadi, and R. Naghdi, “Increasing drought resistance of Alnus
subcordata C.A. Mey. seeds using a nano priming tech- nique with multi-walled carbon nanotubes,” J. For. Sci.,
vol. 62, no. No. 6, pp. 269–278, Jun. 2016.
[37] M. Rai and A. Ingle, “Role of nanotechnology in agriculture with special reference to management of in- sect
pests,” Appl. Microbiol. Biotechnol., vol. 94, no. 2, pp. 287–293, Apr. 2012.
[38] G. S. Dhaliwal, V. Jindal, A. K. Dhawan, and oth- ers, “Insect pest problems and crop losses: changing trends,”
Indian J. Ecol., vol. 37, no. 1, pp. 1–7, 2010.
[39] V. Perumal and U. Hashim, “Advances in biosen- sors: Principle, architecture and applications,” J. Appl.
Biomed., vol. 12, no. 1, pp. 1–15, Jan. 2014.
[40] S. Otles and B. Yalcın, “Strategic Role of Nanobio- sensor in Food: Benefits and Bottlenecks,” in Nanotech-
nologies in Food and Agriculture, M. Rai, C. Ribeiro, L. Mattoso, and N. Duran, Eds. Cham: Springer Interna-
tional Publishing, 2015, pp. 169–182.
[41] L. Huang, Y. Guo, Z. Peng, and A. L. Porter, “Charac- terising a technology development at the stage of early
emerging applications: nanomaterial-enhanced biosen- sors,” Technol. Anal. Strateg. Manag., vol. 23, no. 5, pp.
527–544, May 2011.
[42] S. Viswanathan, H. Radecka, and J. Radecki, “Elec- trochemical biosensor for pesticides based on acetyl-
cholinesterase immobilized on polyaniline deposited on vertically assembled carbon nanotubes wrapped with
ssDNA,” Biosens. Bioelectron., vol. 24, no. 9, pp. 2772– 2777, May 2009.
[43] P. Ram, K. Vivek, and S. P. Kumar, “Nanotechnology in sustainable agriculture: Present concerns and future
aspects,” Afr. J. Biotechnol., vol. 13, no. 6, pp. 705–713, Feb. 2014.
[44] H. Chen and R. Yada, “Nanotechnologies in agricul- ture: New tools for sustainable development,” Trends
Food Sci. Technol., vol. 22, no. 11, pp. 585–594, Nov. 2011.
[45] M. Arias-Estévez, E. López-Periago, E. Martín- ez-Carballo, J. Simal-Gándara, J.-C. Mejuto, and L. García-
Río, “The mobility and degradation of pesticides in soils and the pollution of groundwater resources,” Agric.
Ecosyst. Environ., vol. 123, no. 4, pp. 247–260, Feb. 2008.
[46] A. Gogos, K. Knauer, and T. D. Bucheli, “Nanomate- rials in Plant Protection and Fertilization: Current State,
Foreseen Applications, and Research Priorities,” J. Agric. Food Chem., vol. 60, no. 39, pp. 9781–9792, Oct.
2012.
[47] R. Nair, S. H. Varghese, B. G. Nair, T. Maekawa, Y. Yoshida, and D. S. Kumar, “Nanoparticulate material de-
livery to plants,” Plant Sci., vol. 179, no. 3, pp. 154–163, Sep. 2010.
[48] M. Kah, S. Beulke, K. Tiede, and T. Hofmann, “Na- nopesticides: State of Knowledge, Environmental Fate,
and Exposure Modeling,” Crit. Rev. Environ. Sci. Tech- nol., vol. 43, no. 16, pp. 1823–1867, Jan. 2013.
162
[49] R. Liu and R. Lal, “Potentials of engineered nano- particles as fertilizers for increasing agronomic produc-
tions,” Sci. Total Environ., vol. 514, pp. 131–139, May 2015.
[50] T. Adak, J. Kumar, D. Dey, N. A. Shakil, and S. Walia, “Residue and bio-efficacy evaluation of controlled re-
lease formulations of imidacloprid against pests in soy- bean (G lycine max ),” J. Environ. Sci. Health Part B,
vol. 47, no. 3, pp. 226–231, Mar. 2012.
[51] C. Xiang, A. G. Taylor, J. P. Hinestroza, and M. W. Frey, “Controlled release of nonionic compounds from
poly(lactic acid)/cellulose nanocrystal nanocomposite fibers,” J. Appl. Polym. Sci., vol. 127, no. 1, pp. 79–86,
Jan. 2013.
[52] M.-R. Song et al., “Dispersible silica nanoparticles as carrier for enhanced bioactivity of chlorfenapyr,” J.
Pestic. Sci., vol. 37, no. 3, pp. 258–260, 2012.
[53] H. Chhipa, “Private Interview,” 29-Nov-2016.
[54] G. N. Ramesiah, “NANO FERTILIZERS AND NANO SENSORS – AN ATTEMPT FOR DEVELOPING
SMART AG- RICULTURE,” pp. 314–320, Feb. 2015.
[55] B. Karn, T. Kuiken, and M. Otto, “Nanotechnology and in Situ Remediation: A Review of the Benefits and
Potential Risks,” Environ. Health Perspect., vol. 117, no. 12, pp. 1823–1831, Jun. 2009.
[56] M. Kah, “Nanopesticides and Nanofertilizers: Emerging Contaminants or Opportunities for Risk Mit- igation?,”
Front. Chem., vol. 3, Nov. 2015.
[57] M. Kah and T. Hofmann, “The Challenge: Carbon nanomaterials in the environment: New threats or won- der
materials?,” Environ. Toxicol. Chem., vol. 34, no. 5, pp. 954–954, 2015.
[58] D. Pimentel and M. Burgess, “Environmental and Economic Benefits of Reducing Pesticide Use,” in Inte-
grated Pest Management, D. Pimentel and R. Peshin, Eds. Dordrecht: Springer Netherlands, 2014, pp. 127– 139.
[59] V. Saharan and A. Pal, “Current and Future Pros- pects of Chitosan-Based Nanomaterials in Plant Protec- tion
and Growth,” in Chitosan Based Nanomaterials in Plant Growth and Protection, New Delhi: Springer India,
2016, pp. 43–48.
[60] H. Hasegawa, I. M. M. Rahman, and M. A. Rahman, Eds., Environmental Remediation Technologies for Met-
al-Contaminated Soils. Tokyo: Springer Japan, 2016.
[61] X. Qu, P. J. J. Alvarez, and Q. Li, “Applications of nanotechnology in water and wastewater treatment,” Water
Res., vol. 47, no. 12, pp. 3931–3946, Aug. 2013.
[62] Q. Wei, D. Yang, M. Fan, and H. G. Harris, “Appli- cations of Nanomaterial-Based Membranes in Pollution
Control,” Crit. Rev. Environ. Sci. Technol., vol. 43, no. 22, pp. 2389–2438, Jan. 2013.
[63] W. Zhang, “Nanoscale iron particles for environ- mental remediation: an overview,” J. Nanoparticle Res., vol.
5, no. 3–4, pp. 323–332, 2003.
[64] T. N. V. K. V. Prasad et al., “EFFECT OF NANOS- CALE ZINC OXIDE PARTICLES ON THE
GERMINATION, GROWTH AND YIELD OF PEANUT,” J. Plant Nutr., vol. 35, no. 6, pp. 905–927, Apr.
2012.
[65] WHO, “State of the art on the initiatives and the activities relevant to risk assessment and risk manage- ment of
nanotechnologies in thefood and agricultural sector.” WHO, 2013.
[66] Y. Wang, J. Hu, Z. Dai, J. Li, and J. Huang, “In vit- ro assessment of physiological changes of watermelon
(Citrullus lanatus) upon iron oxide nanoparticles expo- sure,” Plant Physiol. Biochem., vol. 108, pp. 353–360,
Nov. 2016.
163
[67] WHO, “World Health Organization,” World Health Organization, 2016. [Online]. Available: http://www.
who.int/mediacentre/factsheets/fs361/en/. [Accessed: 12-Dec-2016].
[68] Y. Ding, S. Wang, J. Li, and L. Chen, “Nanomateri- al-based optical sensors for mercury ions,” TrAC Trends
Anal. Chem., vol. 82, pp. 175–190, Sep. 2016.
[69] A. Jeevika and D. R. Shankaran, “Functionalized sil- ver nanoparticles probe for visual colorimetric sensing of
mercury,” Mater. Res. Bull., vol. 83, pp. 48–55, Nov. 2016.
[70] W. Peijnenburg, “Private Interview,” 02-Dec-2016.
[71] S. Rana and P. T. Kalaichelvan, “Ecotoxicity of Nan- oparticles,” ISRN Toxicol., vol. 2013, pp. 1–11, 2013.
[72] A. L. Neal, “What can be inferred from bacterium– nanoparticle interactions about the potential conse- quences
of environmental exposure to nanoparticles?,” Ecotoxicology, vol. 17, no. 5, pp. 362–371, Jul. 2008.
[73] S. babu Maddinedi, B. K. Mandal, S. Ranjan, and N. Dasgupta, “Diastase assisted green synthesis of size-
controllable gold nanoparticles,” RSC Adv, vol. 5, no. 34, pp. 26727–26733, 2015.
[74] A. Jain, S. Ranjan, N. Dasgupta, and C. Ramalingam, “Nanomaterials in Food and Agriculture: An overview on
their safety concerns and regulatory issues,” Crit. Rev. Food Sci. Nutr., no. just-accepted, pp. 0–0, 2016.
[75] K. W. Guo, “Nanomaterials Formed by Green Na- notechnology for Bioapplication,” in Nanotechnology:
Recent Trends, Emerging Issues and Future Directions, United Kingdom: Nazrul Islam, 2014, p. 525.
[76] G. B. Smith and C. G. Granqvist, Green nanotech- nology: solutions for sustainability and energy in the built
environment. Boca Raton, FL: CRC Press, 2011.
[77] A. Oomen et al., “Grouping and Read-Across Ap- proaches for Risk Assessment of Nanomaterials,” Int. J.
Environ. Res. Public. Health, vol. 12, no. 10, pp. 13415– 13434, Oct. 2015.
[78] R. Landsiedel, “Concern-driven integrated ap- proaches for the grouping, testing and assessment of
nanomaterials,” Environ. Pollut., vol. 218, pp. 1376– 1380, Nov. 2016.
[79] K. Rasmussen, M. González, P. Kearns, J. R. Sintes, F. Rossi, and P. Sayre, “Review of achievements of the
OECD Working Party on Manufactured Nanomaterials’ Testing and Assessment Programme. From exploratory
testing to test guidelines,” Regul. Toxicol. Pharmacol.,
vol. 74, pp. 147–160, Feb. 2016.
[80] D. Rickerby, “Private Interview,” 13-Dec-2016.
[81] M. Rai, C. Ribeiro, L. Mattoso, and N. Duran, Eds., Nanotechnologies in Food and Agriculture. Cham:
Springer International Publishing, 2015.
[82] R. S. Kookana et al., “Nanopesticides: Guiding Principles for Regulatory Evaluation of Environmental Risks,”
J. Agric. Food Chem., vol. 62, no. 19, pp. 4227– 4240, May 2014.
[83] Kobe, “Private Interview,” 09-Dec-2016.
[84] OECD, “Symposium on Assessing the Economic Im- pact of Nanotechnology Synthesis Report.” OECD, 2013.
[85] G. Foladori, “Private Interview,” 01-Dec-2016.
[86] F. Salamanca-Buentello and A. S. Daar, “Dust of Wonder, Dust of Doom: A Landscape of Nanotechnolo- gy,
Nanoethics, and Sustainable Development,” in Glob- al Bioethics: The Impact of the UNESCO International
Bioethics Committee, vol. 5, A. Bagheri, J. D. Moreno, and S. Semplici, Eds. Cham: Springer International Pub-
lishing, 2016, pp. 101–123.
[87] N. Islam, “Private Interview,” 30-Nov-2016.
164
[88] K. Beumer, “Broadening Nanotechnology’s Impact on Development,” Nat. Nanotechnol., vol. 11, pp. 398–
400, May 2016.
[89] European Commission, “Thematic studies for Re- view of REACH.” European Commission, 2011.
V. Green nexus technology
165
Impacts of rapid technological change on the achievement of the Sustainable Development Goals –
Focus Nexus Technologies (Green-tech Cluster)
Policy Brief
Nebojsa Nakicenovic, Deputy Director, International Institute for Applied Systems Analysis, Austria
Abstract
While technology has been at the core of human development, it has also led to diverse adverse impacts
on the environment and society. With the Sustainable Development Goals representing an integrated
agenda for the people and the planet, negative impacts of technology use on both need to be mitigated.
From peoples’ perspectives, end-use technologies have the most direct impact on their well-being. Being
small scale and granular they also benefit from potentially high diffusion rates with large transformative
potential. Nexus technologies connect several SDG domains (e.g. water, energy, and land) and present
ideal cases for integrated policy making with large leverage effects. This policy brief investigates lessons
learnt from historical technological change for end-use and nexus technologies, which are both key to
achieve long-term sustainability.
Introduction
Technological change is at the core of human development but also the cause of many challenges the
world is currently facing, such as environmental degradation. Technology is the main mediator between
the environment and humanity (Nakicenovic and Zimm 2017). There are high expectations on how
technology can support the achievement of the SDGs, with technology being the second most commonly
used noun in the UN 2030 agenda (UN 2015). Technology is key to expanding access to services
(electricity, bank accounts, telemedicine) but also to mitigate trade-offs between SDGs (e.g. energy and
climate).
The World in 2050 initiative (TWI2050) (www.twi2050.org) is a science-based initiative that highlights
the role of technological change in achieving the SDGs and long-term sustainability in six key
transformations areas: energy, food and biodiversity, cities, consumption and production, human
capacities and education, and foremost the digital revolution. This policy briefs looks into aspects of
technological change of end-use technologies of the energy-water-land-climate-change nexus.
Historic patterns of technological change and emerging technologies
Understanding historic patterns of technological change helps shaping policies that can create an enabling
environment to harness technologies’ full potential. Grubler et al (1999) identified three robust attributes
of technological change:
1. learning leading to cost reductions and performance improvements (e.g. individual experiences,
improvements in management, improvements in upstream technologies);
2. diffusion and substitution of technologies through regular patterns of dynamic competition
(diffusion of a technology into a new market, substitution of an existing technology with a new
one);
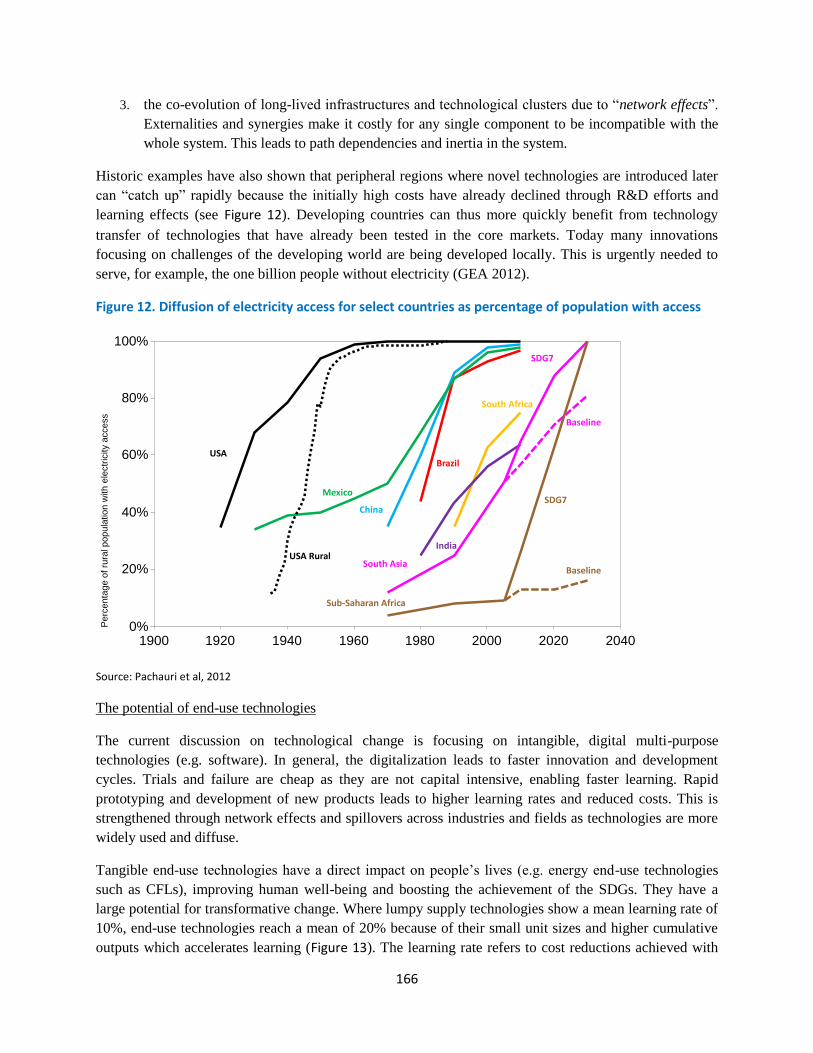
166
3. the co-evolution of long-lived infrastructures and technological clusters due to “network effects”.
Externalities and synergies make it costly for any single component to be incompatible with the
whole system. This leads to path dependencies and inertia in the system.
Historic examples have also shown that peripheral regions where novel technologies are introduced later
can “catch up” rapidly because the initially high costs have already declined through R&D efforts and
learning effects (see Figure 12). Developing countries can thus more quickly benefit from technology
transfer of technologies that have already been tested in the core markets. Today many innovations
focusing on challenges of the developing world are being developed locally. This is urgently needed to
serve, for example, the one billion people without electricity (GEA 2012).
Figure 12. Diffusion of electricity access for select countries as percentage of population with access
Source: Pachauri et al, 2012
The potential of end-use technologies
The current discussion on technological change is focusing on intangible, digital multi-purpose
technologies (e.g. software). In general, the digitalization leads to faster innovation and development
cycles. Trials and failure are cheap as they are not capital intensive, enabling faster learning. Rapid
prototyping and development of new products leads to higher learning rates and reduced costs. This is
strengthened through network effects and spillovers across industries and fields as technologies are more
widely used and diffuse.
Tangible end-use technologies have a direct impact on people’s lives (e.g. energy end-use technologies
such as CFLs), improving human well-being and boosting the achievement of the SDGs. They have a
large potential for transformative change. Where lumpy supply technologies show a mean learning rate of
10%, end-use technologies reach a mean of 20% because of their small unit sizes and higher cumulative
outputs which accelerates learning (Figure 13). The learning rate refers to cost reductions achieved with
1900 1920 1940 1960 1980 2000 2020 2040
Perc
enta
ge o
f to
tal popula
tion w
ith e
lectr
icity a
ccess
0%
20%
40%
60%
80%
100%
USA
Mexico
Brazil
India
South Africa
China
Baseline
Baseline
SDG7
SDG7
Sub-Saharan Africa
South AsiaUSA Rural
Perc
enta
ge o
f ru
ral popula
tion w
ith e
lectr
icity a
ccess
Source: Pachauri et al, 2012
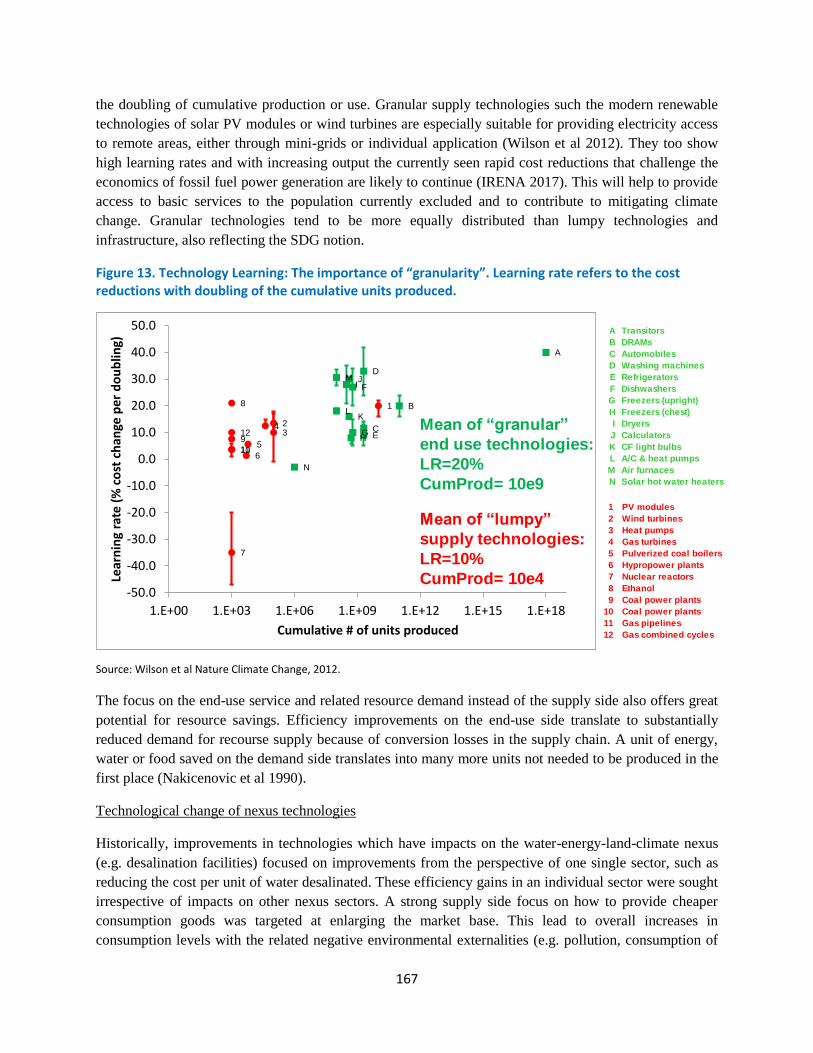
167
the doubling of cumulative production or use. Granular supply technologies such the modern renewable
technologies of solar PV modules or wind turbines are especially suitable for providing electricity access
to remote areas, either through mini-grids or individual application (Wilson et al 2012). They too show
high learning rates and with increasing output the currently seen rapid cost reductions that challenge the
economics of fossil fuel power generation are likely to continue (IRENA 2017). This will help to provide
access to basic services to the population currently excluded and to contribute to mitigating climate
change. Granular technologies tend to be more equally distributed than lumpy technologies and
infrastructure, also reflecting the SDG notion.
Figure 13. Technology Learning: The importance of “granularity”. Learning rate refers to the cost reductions with doubling of the cumulative units produced.
Source: Wilson et al Nature Climate Change, 2012.
The focus on the end-use service and related resource demand instead of the supply side also offers great
potential for resource savings. Efficiency improvements on the end-use side translate to substantially
reduced demand for recourse supply because of conversion losses in the supply chain. A unit of energy,
water or food saved on the demand side translates into many more units not needed to be produced in the
first place (Nakicenovic et al 1990).
Technological change of nexus technologies
Historically, improvements in technologies which have impacts on the water-energy-land-climate nexus
(e.g. desalination facilities) focused on improvements from the perspective of one single sector, such as
reducing the cost per unit of water desalinated. These efficiency gains in an individual sector were sought
irrespective of impacts on other nexus sectors. A strong supply side focus on how to provide cheaper
consumption goods was targeted at enlarging the market base. This lead to overall increases in
consumption levels with the related negative environmental externalities (e.g. pollution, consumption of
A
B
C
D
E
F
GH
IJ
KL
M
N
1
23
4
5
6
7
8
9
1011
12
-50.0
-40.0
-30.0
-20.0
-10.0
0.0
10.0
20.0
30.0
40.0
50.0
1.E+00 1.E+03 1.E+06 1.E+09 1.E+12 1.E+15 1.E+18
Lear
nin
g ra
te (
% c
ost
ch
ange
pe
r d
ou
blin
g)
Cumulative # of units produced
A Transitors
B DRAMs
C Automobiles
D Washing machines
E Refrigerators
F Dishwashers
G Freezers (upright)
H Freezers (chest)
I Dryers
J Calculators
K CF light bulbs
L A/C & heat pumps
M Air furnaces
N Solar hot water heaters
1 PV modules
2 Wind turbines
3 Heat pumps
4 Gas turbines
5 Pulverized coal boilers
6 Hypropower plants
7 Nuclear reactors
8 Ethanol
9 Coal power plants
10 Coal power plants
11 Gas pipelines
12 Gas combined cycles
Mean of “granular”
end use technologies:
LR=20%
CumProd= 10e9
Mean of “lumpy”
supply technologies:
LR=10%
CumProd= 10e4
Source: Wilson et al, Nature CC, 2012
168
non-renewable resources). This increased efficiency leads to cheaper products leading to increased use,
has contributed to development and prosperity. At the same time increasing production and consumption
has aggravated resource conflicts and environmental degradation and interference with the planetary
systems. This constitutes the paradox of technology that it is both a source and solution of major
challenges facing the world.
To achieve the SDGs novel technologies and approaches are needed. New nexus technologies and
policies connect multiple resource dimensions in their design, both in product development as well as in
their market implementation (e.g. R&D, taxes, eco-labeling). Increasing efficiency then ideally leads to
reduced consumption of multiple resources, lowering overall resource demand to alleviate the pressure on
the environment.
Recently, technologies such as solar PV or approaches of the green economy (e.g. car sharing) which
have multiple nexus-benefits, have seen strong growth and, supported by digitalization, the empowerment
of consumers. New actors and services are evolving which challenge the institutional status quo through
e.g. decentralized energy provision, sharing economy, prosumers and new entrepreneurial models.
Together this can further entice rapid change and productivity gains. The old dichotomy between
suppliers and consumers is breaking apart.
This poses policy makers in a difficult and complex position as the historical institutional landscape is not
ready yet for these new actor constellations and related shifts. While we need to accept the current lock-
ins created through historic infrastructure, we should do all we can to not support it further. This relates,
for example, to investments in R&D for large supply side technologies, which strengthens the lock-in into
carbon-intensive development and delays the transformation to zero-emissions energy technologies.
Policy makers need to react to these new forms of market organization and diverse actor-constellations
which are evolving with novel technologies. Several regulatory barriers need to be overcome to enable
these evolving technologies to harness their full potential (e.g. split incentive problem between principal
and agent in energy efficiency measures in buildings; grid access for decentral renewables and battery
storage capacity)
Policy recommendations
Technological, social and institutional changes are caught in a complex relationship as their rates of
changes differ with technology overtaking social and institutional changes. Successful examples of policy
driven technological change are rare. But policy can provide an enabling environment (see examples for
policy approaches in the Table).
Policy-makers need to acknowledge that innovation is associated with deep uncertainties, accepting its
unclear outcome and that the search for a silver bullet is misleading. Supporting a diverse technology
portfolio creates more resilient innovation strategies. A long-term transformation towards sustainability
will only be reached by a combination of incremental improvements of existing technologies and
disruptive technological change where winners evolve out of a wide technology portfolio. This increases
flexibility. Thereby policymakers can assure a stable, credible, well timed policy approach to support
innovation diffusion and strengthen long-term technology strategies to achieve sustainable futures. They
should increase political efforts to overcome vested interest of market incumbents and they can combine
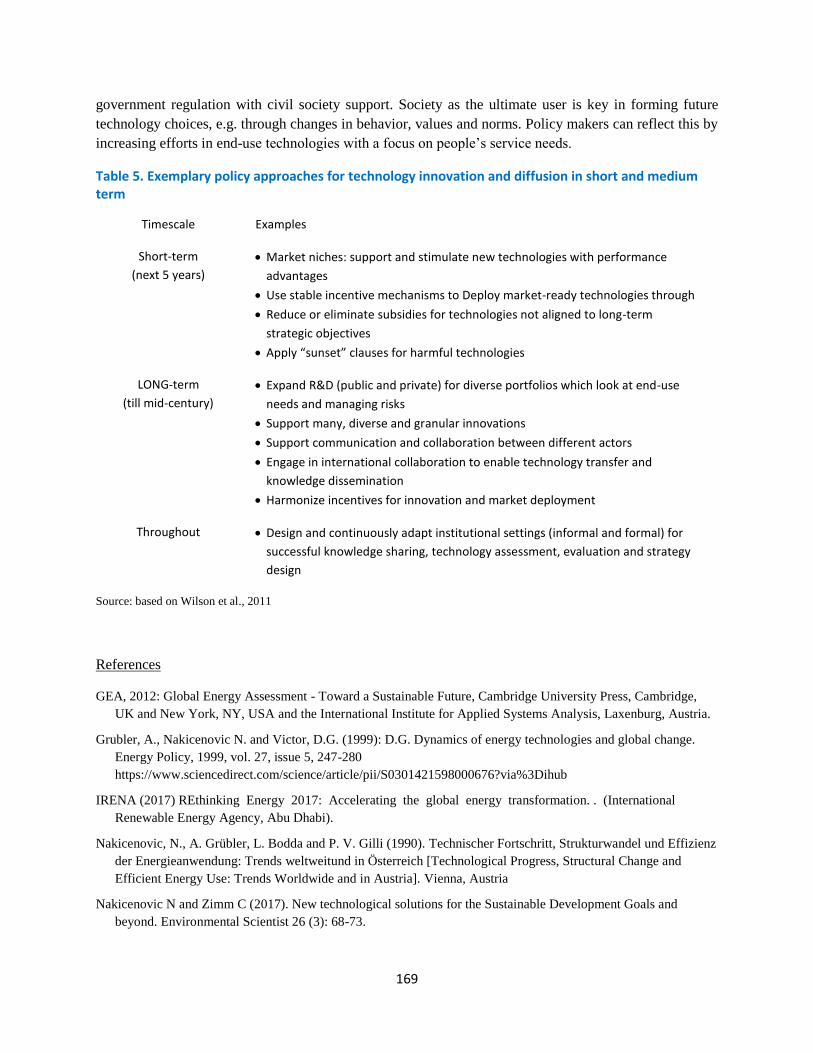
169
government regulation with civil society support. Society as the ultimate user is key in forming future
technology choices, e.g. through changes in behavior, values and norms. Policy makers can reflect this by
increasing efforts in end-use technologies with a focus on people’s service needs.
Table 5. Exemplary policy approaches for technology innovation and diffusion in short and medium term
Timescale Examples
Short-term
(next 5 years)
• Market niches: support and stimulate new technologies with performance
advantages
• Use stable incentive mechanisms to Deploy market-ready technologies through
• Reduce or eliminate subsidies for technologies not aligned to long-term
strategic objectives
• Apply “sunset” clauses for harmful technologies
LONG-term
(till mid-century)
• Expand R&D (public and private) for diverse portfolios which look at end-use
needs and managing risks
• Support many, diverse and granular innovations
• Support communication and collaboration between different actors
• Engage in international collaboration to enable technology transfer and
knowledge dissemination
• Harmonize incentives for innovation and market deployment
Throughout • Design and continuously adapt institutional settings (informal and formal) for
successful knowledge sharing, technology assessment, evaluation and strategy
design
Source: based on Wilson et al., 2011
References
GEA, 2012: Global Energy Assessment - Toward a Sustainable Future, Cambridge University Press, Cambridge,
UK and New York, NY, USA and the International Institute for Applied Systems Analysis, Laxenburg, Austria.
Grubler, A., Nakicenovic N. and Victor, D.G. (1999): D.G. Dynamics of energy technologies and global change.
Energy Policy, 1999, vol. 27, issue 5, 247-280
https://www.sciencedirect.com/science/article/pii/S0301421598000676?via%3Dihub
IRENA (2017) REthinking Energy 2017: Accelerating the global energy transformation. . (International
Renewable Energy Agency, Abu Dhabi).
Nakicenovic, N., A. Grübler, L. Bodda and P. V. Gilli (1990). Technischer Fortschritt, Strukturwandel und Effizienz
der Energieanwendung: Trends weltweitund in Österreich [Technological Progress, Structural Change and
Efficient Energy Use: Trends Worldwide and in Austria]. Vienna, Austria
Nakicenovic N and Zimm C (2017). New technological solutions for the Sustainable Development Goals and
beyond. Environmental Scientist 26 (3): 68-73.
170
Pachauri, S. Brew-Hammond, A., Barnes, D.F., Bouille, D.H., Gitonga, S., Modi, V., Prasad, G., Rath, A. and
Zerriffi, H. (2012) Chapter 19 - Energy access for development. In: Global Energy Assessment - Toward a
Sustainable Future. Cambridge and New York: Cambridge University Press and Laxenburg, Austria:
International Institute for Applied Systems Analysis. pp.1401-1458.
Wilson C and Grubler A (2011). Lessons from the history of technological change for clean energy scenarios and
policies. Natural Resources Forum 35 (3): 165-184. DOI:10.1111/j.1477-8947.2011.01386.x.
Wilson C, Grubler A, Gallagher KS, & Nemet GF (2012). Marginalization of end-use technologies in energy
innovation for climate protection. Nature Climate Change 2 (11): 780-788. DOI:10.1038/nclimate1576.
UN (2015) Transforming our world: the 2030 Agenda for Sustainable Development (United Nations General
Assembly, New York)
171
Progress Toward Achieving Sustainable Development
Policy Brief
Faye Duchin, Professor of Economics, Rensselaer Polytechnic Institute, Troy, NY USA
Design situation-specific systems
I propose four initiatives regarding technological innovation and resource security for facilitating the
achievement of sustainable development objectives. The first imperative is the need to design situation-
specific systems. I emphasize the concept of systems to suggest shifting the emphasis from general
technologies such as nano-materials to systems, which include the ensemble of infrastructure plus
maintenance and operations to provide, say, clean water and deal with human wastes. The latter may well
involve nano-filters, but the central challenge is to design the configuration of entire systems, comprised of
many individual components. System designs need to be customized to the needs and preferences of specific
communities of users while also responding to the imperatives of the physical opportunities and constraints.
One central concept for system design is decentralization of the production and maintenance, as well as the
use, of the services. When it is functional in a particular setting, this kind of design facilitates the generation
of local opportunities for entrepreneurship108 and jobs.
Establish social networks for technology transfer and problem solving
Local efforts are being undertaken in many disparate locations for providing water and sewage treatment,
renewable energy, assuring food supplies in a variety of ways including restoring soil fertility in different
kinds of communities around the world. The power of social networking should be energetically harnessed,
utilizing new technologies to encourage local engagement and create structures for informal interactions and
collective problem solving. These channels provide the opportunity to achieve technology transfers in an
open-source environment. The networks would be global in membership and bottom-up in that the
participants represent community efforts. Existing communication capabilities provide an immediate starting
point for what could become a significantly expanded system design.
Assure access to resources
Achieving sustainable development objectives clearly requires resource inputs including arable land, clean
water, energy sources, food, and the full range of metals and other materials. In many parts of the
developing world, foreign investment in these domestic resources is substantial and growing for two distinct
motives: for the profit it promises and to satisfy the future demand in the investing countries. Today
international law asserts that the country where resources are located holds the property rights to them, yet
many contractual arrangements relinquish this access. Sample contracts need to be drafted to serve as
templates for such contracts.
Create a framework to stimulate relevant research
The research program my colleagues and I work on investigates the likely requirements and implications of
alternative strategies for achieving a range of sustainable development objectives, in specific locations and
globally. We represent collaboration mainly between economists and engineers. More broadly, it is part of a
108 See the caveats regarding entrepreneurship expressed by Duflo and Banerjee (2011).
172
substantial and growing collaboration between two professional societies, the International Input-Output
Association (IIOA, of input-output economists) and the International Society for Industrial Ecology (ISIE,
mainly engineers and applied physical scientists). Resulting papers are published in the journals of the two
professional societies as well as a number of other journals, mainly ones with roots in engineering and
technology more generally. Many of the studies in question are explicitly focused on the SDG efforts and
have a strong technology component as well as the capability to address the economic concerns of jobs,
costs, prices, material standards of living and income distribution. Our joint community can address
engineering challenges like design of new systems taking account of user requirements and physical
attributes.
In my opinion what is in shortest supply is the articulation of the strategic options to be considered, that is,
the questions to be addressed. Input from the social networks described earlier would provide a great deal of
relevant raw material on perceived needs, approaches to meeting them, and variations that have been
developed to suit different communities and physical sites. One kind of contribution from the professional
societies could be organizing that kind of information into taxonomies of solution concepts, being put in
place on the ground, that are particularly suited to specific types of settings.
I attach two recent conceptual articles coming out of our research program. An overview is provided in
(Duchin, 2017), and the focus is on water and sanitation in particular in (Duchin, 2016). Finally, Duchin
and Levine (2018) propose a next stage in the collaboration between economists and engineers: a dynamic
economic perspective on investment in built capital coupled with the empirical content of specific
engineering designs. (These three are conceptual papers: a number of full-scale empirical studies have been
carried out within this framework.) These ideas could become part of a much broader pedagogical effort for
providing relevant training at various levels.
List of References
Bannerjee, A. and E. Duflo, 2011, Poor Economics: A Radical Rethinking of the Way to Fight Global Poverty, New
York: Public Affairs.
Duchin, F., 2016. “A Global Case-Study Framework Applied to Water Supply and Sanitation,” Journal of Industrial
Ecology, 20(3): 387-395.
Duchin, F. 2017. “Resources for Sustainable Economic Development: A Framework for Evaluating Infrastructure
System Alternatives,” Sustainability, 9(11), doi:10.3390/su9112105.
Duchin, F. and S. Levine, 2018. “The Recovery of Products and Materials for Reuse: The Global Context of Resource
Management,” Resources, Conservation, and Recycling (invited for Special Issue on Material Recovery and Waste
Recycling).
173
Urban climate research: potential and challenges
Policy Brief
Mukherjee, M., Rahul, A. Edupuganti, S, Department of Architecture and Planning, IIT Roorkee, INDIA
Introduction
Climate change is global phenomenon and no country is immune to it. Weather patterns have become more
erratic and has led to multiple extreme events. Ever increasing sea level rise around the world is putting
many cities at risk. These changes are attributed mainly to increase in anthropogenic greenhouse gas
emissions and unsustainable urbanization. The Intergovernmental Panel on Climate Change (IPCC),
forecasts a global mean surface temperature change by the end of 21st century relative to 1986-2005 is likely
to be 1.4°C to 3.1°C under RCP6.0 and 2.6°C to 4.8°C under RCP8.5(IPCC 2014). The Global urban
population is projected to grow 60% by 2030(United Nations 2016). Research has shown that cities are the
prime consumers of energy and water and main contributor to waste generation along with carbon emissions
(UN-Habitat 2011, World Bank 2010). In addition to the Sustainable Development Goals (SDGs) 3, 6, 7 and
12, SDG11 (Sustainable Cities and communities) and SDG13 (Climate Action) (UNDP, 2015) are essential
to achieve sustainability for future. Building safer and resilient built environment and infrastructure, is
priority agenda in Sendai Framework Disaster Risk Reduction (UNISDR, 2015). Owing to these recent
developments, Urban Climate research has come to the forefront to make people understand our cities better
and to provide sustainable solutions for further development.
In the field of climatology research, coarseness and lack of data availability was always a handicap. Since
1965, when Chandler investigated heat island effect in the city of London (Chandler 1965) by developing a
climate-based classification of the city, he obtained climate data from meteorological stations placed at
different locations. Urban local scale data is still the prime hindrance in most of the cases. In India urban
climate research is still at a nascent stage. Application of research findings are further limited.
Impact of Energy-water-Cities-Infrastructure-Climate-Society Nexus
Energy-Water-Cities-Infrastructure-Climate nexus is an essential perspective to be taken into consideration
while developing sustainable solutions and strategies for cities (Figure 11). The development strategies in
developing countries are thematic and delve on elements of this nexus in isolation rather than an interlinked
ecosystem. Cities are increasingly looked at as organic whole by the ecology scientists and urban
metabolists. This approach is essential in framing the strategies as this will not only save resources due to
integrated planning but also pertain to the organic nature of the cities unlike the older rigid linear approach.
This approach was adapted in a case study done by Gondhalekar and Ramsauer in Munich. This study
researched on the Water-Energy- Food Nexus approach and concluded that urban agriculture can account for
66% of local demand for fruit and 246% of local demand for vegetables; biogas generation can save 20% of
electrical supply and waste water recycling and rainwater harvesting saves 26% fresh water supply
(Gondhalekar & Ramsauer 2017). Hence it is imperative to adapt an integrated approach with the Energy
water cities infrastructure climate nexus in mind.
Global intervention in this nexus is primarily focused in the infrastructure realm. If sustainable solutions can
be identified for infrastructure growth, it will impact all the other players in this nexus (i.e. energy, water,
climate change).
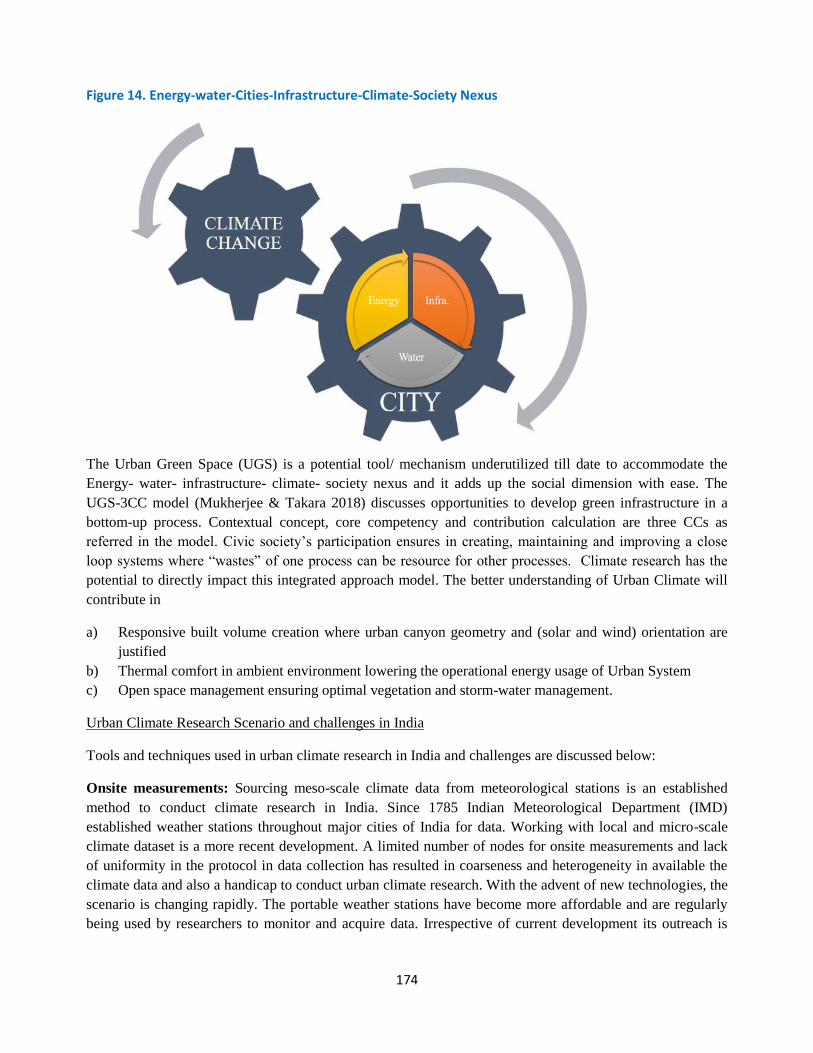
174
Figure 14. Energy-water-Cities-Infrastructure-Climate-Society Nexus
The Urban Green Space (UGS) is a potential tool/ mechanism underutilized till date to accommodate the
Energy- water- infrastructure- climate- society nexus and it adds up the social dimension with ease. The
UGS-3CC model (Mukherjee & Takara 2018) discusses opportunities to develop green infrastructure in a
bottom-up process. Contextual concept, core competency and contribution calculation are three CCs as
referred in the model. Civic society’s participation ensures in creating, maintaining and improving a close
loop systems where “wastes” of one process can be resource for other processes. Climate research has the
potential to directly impact this integrated approach model. The better understanding of Urban Climate will
contribute in
a) Responsive built volume creation where urban canyon geometry and (solar and wind) orientation are
justified
b) Thermal comfort in ambient environment lowering the operational energy usage of Urban System
c) Open space management ensuring optimal vegetation and storm-water management.
Urban Climate Research Scenario and challenges in India
Tools and techniques used in urban climate research in India and challenges are discussed below:
Onsite measurements: Sourcing meso-scale climate data from meteorological stations is an established
method to conduct climate research in India. Since 1785 Indian Meteorological Department (IMD)
established weather stations throughout major cities of India for data. Working with local and micro-scale
climate dataset is a more recent development. A limited number of nodes for onsite measurements and lack
of uniformity in the protocol in data collection has resulted in coarseness and heterogeneity in available the
climate data and also a handicap to conduct urban climate research. With the advent of new technologies, the
scenario is changing rapidly. The portable weather stations have become more affordable and are regularly
being used by researchers to monitor and acquire data. Irrespective of current development its outreach is
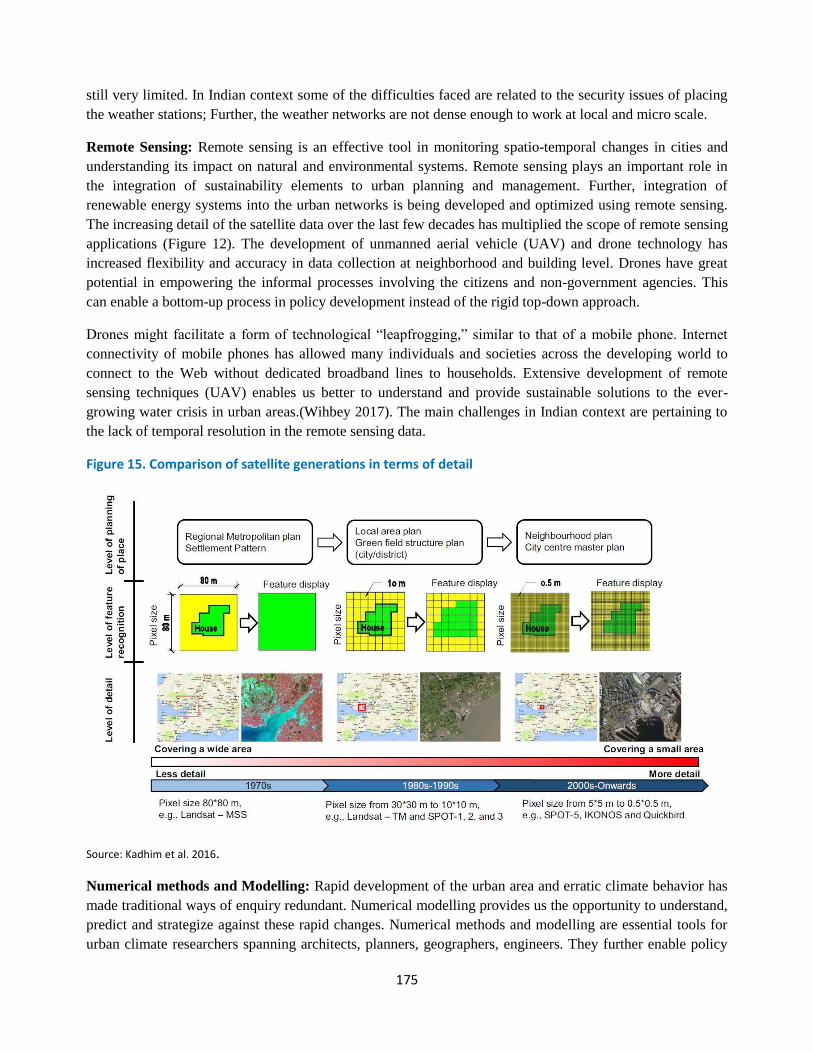
175
still very limited. In Indian context some of the difficulties faced are related to the security issues of placing
the weather stations; Further, the weather networks are not dense enough to work at local and micro scale.
Remote Sensing: Remote sensing is an effective tool in monitoring spatio-temporal changes in cities and
understanding its impact on natural and environmental systems. Remote sensing plays an important role in
the integration of sustainability elements to urban planning and management. Further, integration of
renewable energy systems into the urban networks is being developed and optimized using remote sensing.
The increasing detail of the satellite data over the last few decades has multiplied the scope of remote sensing
applications (Figure 12). The development of unmanned aerial vehicle (UAV) and drone technology has
increased flexibility and accuracy in data collection at neighborhood and building level. Drones have great
potential in empowering the informal processes involving the citizens and non-government agencies. This
can enable a bottom-up process in policy development instead of the rigid top-down approach.
Drones might facilitate a form of technological “leapfrogging,” similar to that of a mobile phone. Internet
connectivity of mobile phones has allowed many individuals and societies across the developing world to
connect to the Web without dedicated broadband lines to households. Extensive development of remote
sensing techniques (UAV) enables us better to understand and provide sustainable solutions to the ever-
growing water crisis in urban areas.(Wihbey 2017). The main challenges in Indian context are pertaining to
the lack of temporal resolution in the remote sensing data.
Figure 15. Comparison of satellite generations in terms of detail
Source: Kadhim et al. 2016.
Numerical methods and Modelling: Rapid development of the urban area and erratic climate behavior has
made traditional ways of enquiry redundant. Numerical modelling provides us the opportunity to understand,
predict and strategize against these rapid changes. Numerical methods and modelling are essential tools for
urban climate researchers spanning architects, planners, geographers, engineers. They further enable policy
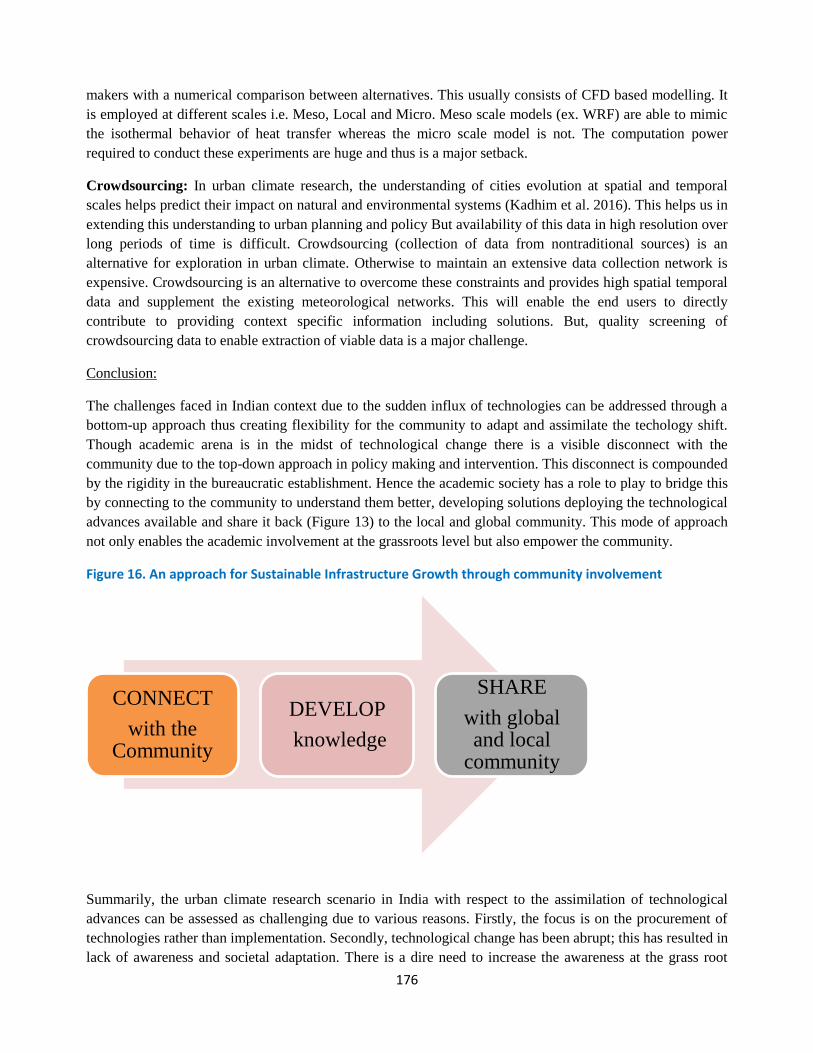
176
makers with a numerical comparison between alternatives. This usually consists of CFD based modelling. It
is employed at different scales i.e. Meso, Local and Micro. Meso scale models (ex. WRF) are able to mimic
the isothermal behavior of heat transfer whereas the micro scale model is not. The computation power
required to conduct these experiments are huge and thus is a major setback.
Crowdsourcing: In urban climate research, the understanding of cities evolution at spatial and temporal
scales helps predict their impact on natural and environmental systems (Kadhim et al. 2016). This helps us in
extending this understanding to urban planning and policy But availability of this data in high resolution over
long periods of time is difficult. Crowdsourcing (collection of data from nontraditional sources) is an
alternative for exploration in urban climate. Otherwise to maintain an extensive data collection network is
expensive. Crowdsourcing is an alternative to overcome these constraints and provides high spatial temporal
data and supplement the existing meteorological networks. This will enable the end users to directly
contribute to providing context specific information including solutions. But, quality screening of
crowdsourcing data to enable extraction of viable data is a major challenge.
Conclusion:
The challenges faced in Indian context due to the sudden influx of technologies can be addressed through a
bottom-up approach thus creating flexibility for the community to adapt and assimilate the techology shift.
Though academic arena is in the midst of technological change there is a visible disconnect with the
community due to the top-down approach in policy making and intervention. This disconnect is compounded
by the rigidity in the bureaucratic establishment. Hence the academic society has a role to play to bridge this
by connecting to the community to understand them better, developing solutions deploying the technological
advances available and share it back (Figure 13) to the local and global community. This mode of approach
not only enables the academic involvement at the grassroots level but also empower the community.
Figure 16. An approach for Sustainable Infrastructure Growth through community involvement
Summarily, the urban climate research scenario in India with respect to the assimilation of technological
advances can be assessed as challenging due to various reasons. Firstly, the focus is on the procurement of
technologies rather than implementation. Secondly, technological change has been abrupt; this has resulted in
lack of awareness and societal adaptation. There is a dire need to increase the awareness at the grass root
CONNECT
with the Community
DEVELOP
knowledge
SHARE
with global and local
community
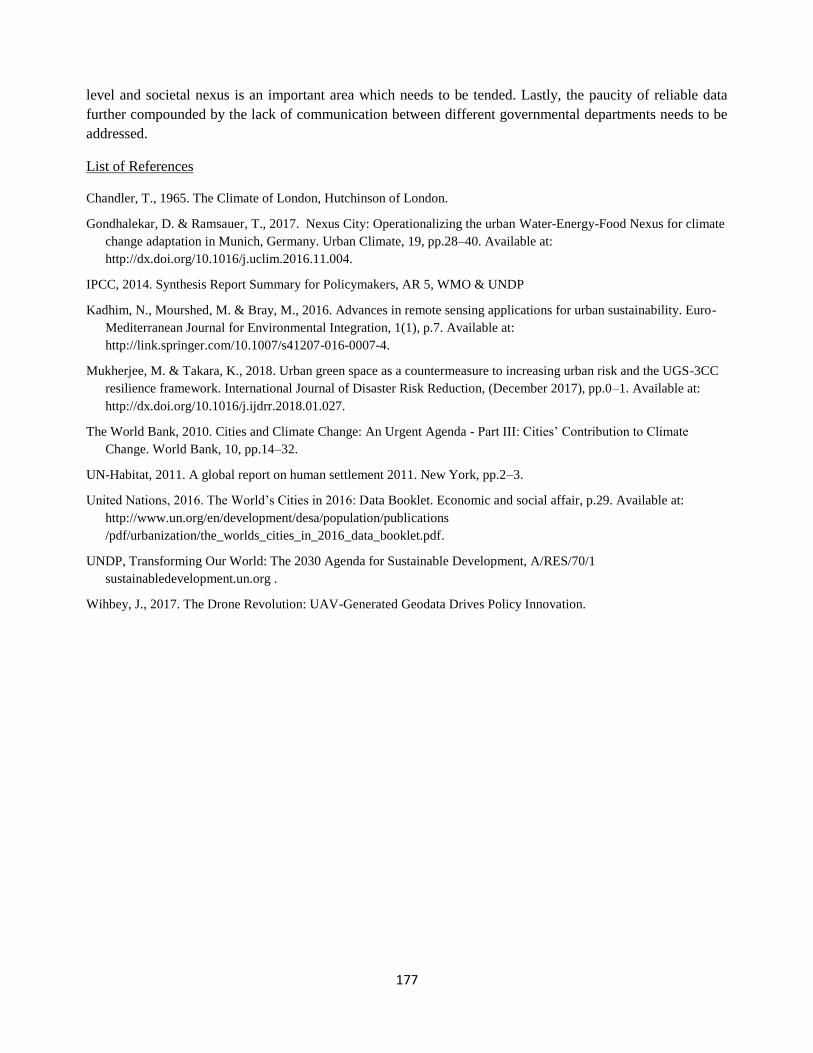
177
level and societal nexus is an important area which needs to be tended. Lastly, the paucity of reliable data
further compounded by the lack of communication between different governmental departments needs to be
addressed.
List of References
Chandler, T., 1965. The Climate of London, Hutchinson of London.
Gondhalekar, D. & Ramsauer, T., 2017. Nexus City: Operationalizing the urban Water-Energy-Food Nexus for climate
change adaptation in Munich, Germany. Urban Climate, 19, pp.28–40. Available at:
http://dx.doi.org/10.1016/j.uclim.2016.11.004.
IPCC, 2014. Synthesis Report Summary for Policymakers, AR 5, WMO & UNDP
Kadhim, N., Mourshed, M. & Bray, M., 2016. Advances in remote sensing applications for urban sustainability. Euro-
Mediterranean Journal for Environmental Integration, 1(1), p.7. Available at:
http://link.springer.com/10.1007/s41207-016-0007-4.
Mukherjee, M. & Takara, K., 2018. Urban green space as a countermeasure to increasing urban risk and the UGS-3CC
resilience framework. International Journal of Disaster Risk Reduction, (December 2017), pp.0–1. Available at:
http://dx.doi.org/10.1016/j.ijdrr.2018.01.027.
The World Bank, 2010. Cities and Climate Change: An Urgent Agenda - Part III: Cities’ Contribution to Climate
Change. World Bank, 10, pp.14–32.
UN-Habitat, 2011. A global report on human settlement 2011. New York, pp.2–3.
United Nations, 2016. The World’s Cities in 2016: Data Booklet. Economic and social affair, p.29. Available at:
http://www.un.org/en/development/desa/population/publications
/pdf/urbanization/the_worlds_cities_in_2016_data_booklet.pdf.
UNDP, Transforming Our World: The 2030 Agenda for Sustainable Development, A/RES/70/1
sustainabledevelopment.un.org .
Wihbey, J., 2017. The Drone Revolution: UAV-Generated Geodata Drives Policy Innovation.
178
Artificial Intelligence and Renewable Energy System in Africa: Advancing Technological Innovations
and SDGs
Policy Brief
Chijike J. Evoh, Ph.D, Sustainability and Livelihood Research Organization (Suliver), New York
Introduction
As the population of sub-Saharan African (SSA) countries grows, they face increasing demand for electric
energy, rising environmental challenges, especially worsening air pollution and threats of climate
changes. This policy brief explores the potential of Artificial Intelligence (AI) for the realization of
Sustainable Development Goals (SDGs), with a particular focus on renewable electric energy systems in
Africa. The applicability of AI in social and economic development is rapidly evolving. Unfortunately, some
regions of the world, especially sub-Saharan Africa, are not positioned to take advantages of the of AI and
other emerging technologies to further its objective of producing stable and sustainable energy. AI offers an
extraordinary possibility of enhancing solutions to most of these development challenges. AI is a technology
that is presently being used to realize various social goods by leveraging the vast amount of available data.
Paucity of Electric Energy in Africa
Lack of a reliable and sustainable source of electric energy remains a bane of development in most countries
in SSA. Over half of the population in the region does not have access to electricity. Those that have access
to electricity in the region consume over average 200 kilowatt-hours (kWh) per year. This pales in
comparison to the European Union, where 1600 kWh is used per year (IEA, 2017). Clean and reliable
electricity is at the heart of many SDGs, especially poverty reduction and hunger. The centrality of a clean
and stable source of electricity falls under the SDG 7, which aims to ensure access to affordable, reliable,
sustainable and modern energy for all by the end of next decade.
Data from the International Energy Agency’s World Energy Outlook shows that 590 people are still without
electricity in SSA – more than half of the global total (IEA, 2017). The implication is that more than half of
the population of sub-Saharan Africa is without electricity. More than 80 percent of those without electricity
in the region live in rural areas, which has about 25 percent electrification rate, while urban areas in the
region have about 71 percent (IEA, 2017). Despite the fact that 26 million people gain access to electricity
annually in Africa, the region still lags behind when compared with other regions of the world. The IEA
estimates that 90 percent of the 674 million people without electricity in 2030 will live in SSA (ibid). Despite
progress in the last few years, the electrification rate in the region is currently 43 percent, making it the
lowest among all regions in the world (IEA, 2017). The lack of a reliable source of electric power has some
social, economic and environmental implications. The absence of electricity in rural and urban Africa has
caused many to use many alternatives such as candles, kerosene, generators and different polluting fuels,
which have serious health implications (Morrissey, 2017).
Using AI to Expand Access to Clean Electricity in Africa
179
Despite some progress made in recent years, grid expansion remains the primary system of expanding access
to electricity in Africa. To increase the number of people with access to sustainable electricity in Africa,
electricity supply should increase through decentralized renewable energy solutions. This is significant as the
cost of renewable energy technology continues to decline. One of such smart technologies is Artificial
Intelligence (AI) popularly known as machine learning. Conceptually, AI falls within the framework of
Actor-network theory (ANT)109, which involves the construction of computers, “algorithms and robots that
mimic the intelligence observed in humans, such as learning, problem-solving and rationalizing” (Latour,
2007; UN Global Impact, n.a). The intelligence of these super machines come from the fact that they can
make decisions in a range of situations that have not been pre-programmed into it by a human. In essence,
these machines can learn and evolve through experiences. Machine-learning capabilities have become
essential to simultaneously process a significant amount of data based on thousands of variables. Emerging
computers can handle, track and draw insights from millions of development data points very quickly for
development decisions and policy (Kalogirou, 2002). Artificial Intelligence technique of artificial neural
networks (ANNs) can assist in increasing access to renewable electricity system in Africa through modeling
and prediction of the performance of renewable energy systems (Natsheh, 2013).
Presently, most electricity in Africa is generated from polluting and centralized fossil fuel sources.
Renewable energy sources such as wind, water and solar have excellent prospects for sustainable and reliable
electricity in the region for inclusive and broad-based socio-economic growth. Besides, these renewable
energy sources are non-polluting and free in their availability. However, the unpredictability of these sources
of energy, coupled with their dependency on weather conditions, makes their integration into a hybrid and
decentralized energy system difficult for communities in Africa. In essence, by depending on weather
conditions such as the direction of the wind and the intensity of sunshine, renewable energy sources can
hardly meet surges in demand for electric power, especially as African population increases. AI can enhance
access to renewable electricity in three different ways, namely: energy forecasting or prediction, energy
identification, energy efficiency, control and accessibility (Thiaw, et. al, 2014; Sennaar, 2017).
Electricity sources that depend on weather are subject fluctuations in their strength and delivery. However,
AI can be used to forecast the demand and supply of electric energy within a given community and country.
Thiaw et al (2014) demonstrates that hybrid neural network approach, can be used in two major functions: a)
Maximum Power Point Tracking (MPPT) of Photovoltaic Generators, and b) wind energy resource
assessment. These are essential for generating and assessing of wind energy potential.
Smart machines address challenges associated with renewable energy sources by mining national and
regional atmospheric data available in each country. Such data, which come in the form of weather reports,
local satellite reports, are used to program machines and code computers to perform specific tasks in the
estimation, flow, and performance of energy system in a given region or community. This is known as the
logic of predictive analytics. Under this system, algorithms behind the system are trained to identify patterns
within the historical data sets and make predictions about future weather situations or suggest actions for
optimal outcomes based on those data points (Kalogirou, 2002). In essence, AI can be leveraged to advance
renewable electric power within the context of Big Data and connected systems within and across countries.
109 The Actor-network theory argues that technology and the social environment interact with each other, forming complex
networks. These networks consist of multiple relationships between the social, the technological or material, and the semiotic.
ANT stresses the capacity of technology to be an actor in and of itself in shaping social outcomes.
180
From another perspective, AI can be used to improve energy usage ensure efficiency by tracking
consumption. AI can also be leveraged to advance energy accessibility by modeling utility cost savings and
provide recommendations for smart home investments (Sennaar, 2017).
Policy and AI Technology Innovation
AI is one of the smart technologies, which can be leveraged to realize the SDGs in Africa, especially in the
area of renewable energy and climate-friendly electricity. What are the policy challenges involved in
promoting and deploying AI in renewable energy system in Africa? The integration of smart machines across
the emerging renewable energy industry in the region faces some persistent barriers, particularly concerning
data capacity and technology policy implementation. A vibrant ecosystem of AI, which can be used to
advance SDGs and renewable sources of electricity in Africa, is dependent on some factors among which
are: universities and research institutions, large companies in the private sector, policymakers, and multi-
stakeholder partnerships.
Much of the knowledge needed to address sustainable electrification in the region can be developed and
implemented through local research by universities and other tertiary institutions of learning in Africa. In line
with the tradition in other parts of the world, governments and startups in Africa need to sponsor AI research
in universities. Efforts should be made to increase funding for research for the advancement of AI in the
region. The increase in funding will require measurable financial strength and business experience. The
implication is that African countries need to create an investment-friendly environment for potential
investors in the industry. From the policy perspective, African governments have a critical role to play in
crafting policies that will improve access to the essential elements of successful AI innovation in the
region. In addition to providing adequate funding for AI in universities and research institutions,
governments can provide subsidies and tax incentives to companies to support AI projects. Finally, success
in AI industry requires a well-coordinated multi-stakeholder partnership. This will involve both public and
private entities that have interest in the development of AI ecosystem in Africa.
Conclusion
Emerging technologies such as Artificial Intelligence have the potential to drive transformative changes in
sustainable and climate-friendly energy system in Africa. AI provides the technological opportunity to
address electric energy poverty in the region. AI-powered technologies promise to empower communities
with more stable and sustainable electricity by modeling and predicting the performance of a renewable
energy system. AI will also ensure the actualization of the other aspects of the Sustainable Development
Goals (SDGs) in the region. Despite ethical challenges associated with the integration of AI in socio-
economic development, communities in Africa will exploit the full potential of AI technologies by
addressing the policy challenges associated with its deployment. This includes the funding of universities and
research institutions for research in AI, granting of subsidies and tax breaks to companies in AI industry and
the promotion of public-private partnership among all stakeholders in the AI industry. Using a smart
technology such as AI to realize SDGs requires a high degree of organizational agility and strategic planning.
References
International Energy Agency (2017) Energy Access Outlook 2017: From Poverty to Prosperity.
Kalogirou, S.A (2002), Artificial Intelligence in Renewable Energy Systems Modeling and Prediction.” Paper presented
at the World Renewable Energy Congress VII (WREC 2002).
181
Latour, B. (1987), Science in Action: How to Follow Scientists and Engineers Through Society. Milton Keynes: Open
University Press.
Morrissey, J. (2017) “The energy challenge in sub-Saharan Africa: A guide for advocates and policy makers Part 2:
Addressing energy poverty.” Oxfam Research Backgrounder series.
Natsheh (2013) “Hybrid Power Systems Energy Management Based on Artificial Intelligence.” A thesis submitted for
the fulfillment of the requirements of the Manchester Metropolitan University for the degree of Doctor of
Philosophy
Sennaar, K. (2017) “Artificial Intelligence for Energy Efficiency and Renewable Energy – 6 Current Applications” in
Techemergence, Retrieved on March 26, 2018 from https://www.techemergence.com/artificial-intelligence-for-
energy-efficiency-and-renewable-energy/
Thiaw, L., Sow, G., Fall, S., (2014) “Application of Neural Networks Technique in Renewable Energy Systems.” Paper
presented at the 2014 First International Conference on Systems Informatics, Modeling and Simulation. IEEE
Computer Society.
UN Global Impact (N.A) “Project Breakthrough: Disruptive Technology Executive Briefs. Retrieved on March 28,
2018 from http://breakthrough.unglobalcompact.org/site/assets/files/1454/hhw-16-0017-
d_c_artificial_intelligence.pdf
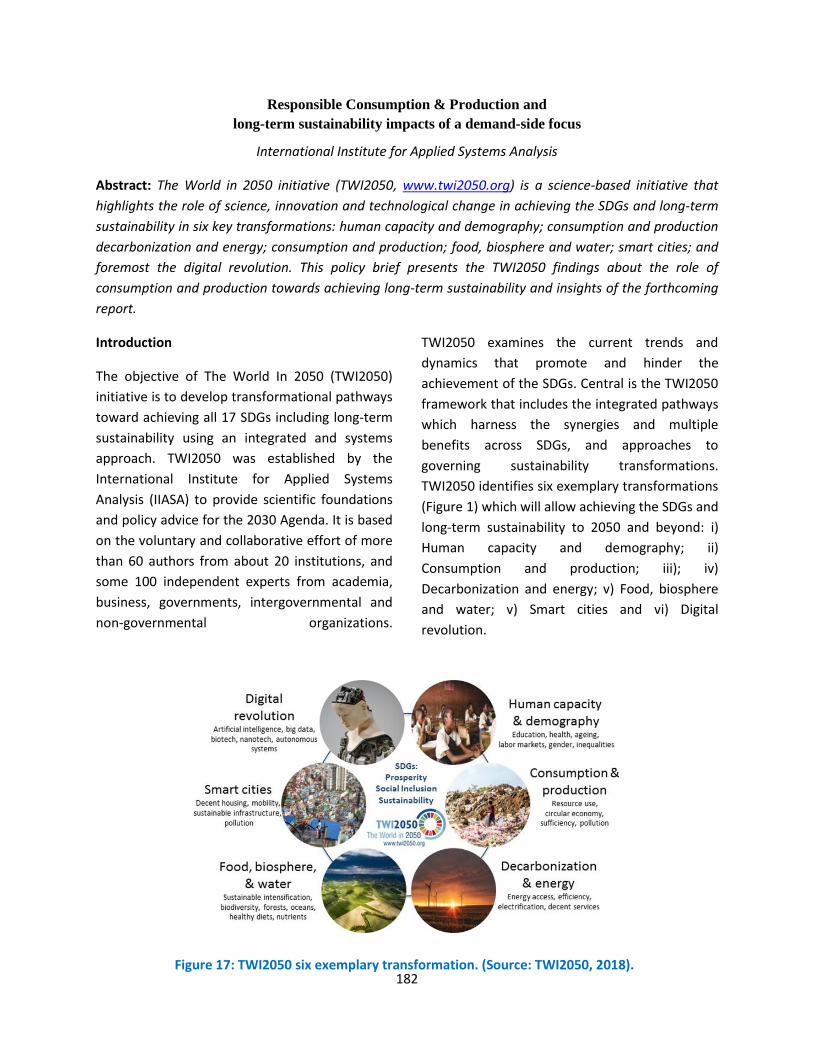
182
Responsible Consumption & Production and
long-term sustainability impacts of a demand-side focus
International Institute for Applied Systems Analysis
Abstract: The World in 2050 initiative (TWI2050, www.twi2050.org) is a science-based initiative that
highlights the role of science, innovation and technological change in achieving the SDGs and long-term
sustainability in six key transformations: human capacity and demography; consumption and production
decarbonization and energy; consumption and production; food, biosphere and water; smart cities; and
foremost the digital revolution. This policy brief presents the TWI2050 findings about the role of
consumption and production towards achieving long-term sustainability and insights of the forthcoming
report.
Introduction
The objective of The World In 2050 (TWI2050)
initiative is to develop transformational pathways
toward achieving all 17 SDGs including long-term
sustainability using an integrated and systems
approach. TWI2050 was established by the
International Institute for Applied Systems
Analysis (IIASA) to provide scientific foundations
and policy advice for the 2030 Agenda. It is based
on the voluntary and collaborative effort of more
than 60 authors from about 20 institutions, and
some 100 independent experts from academia,
business, governments, intergovernmental and
non-governmental organizations.
TWI2050 examines the current trends and
dynamics that promote and hinder the
achievement of the SDGs. Central is the TWI2050
framework that includes the integrated pathways
which harness the synergies and multiple
benefits across SDGs, and approaches to
governing sustainability transformations.
TWI2050 identifies six exemplary transformations
(Figure 1) which will allow achieving the SDGs and
long-term sustainability to 2050 and beyond: i)
Human capacity and demography; ii)
Consumption and production; iii); iv)
Decarbonization and energy; v) Food, biosphere
and water; v) Smart cities and vi) Digital
revolution.
Figure 17: TWI2050 six exemplary transformation. (Source: TWI2050, 2018).
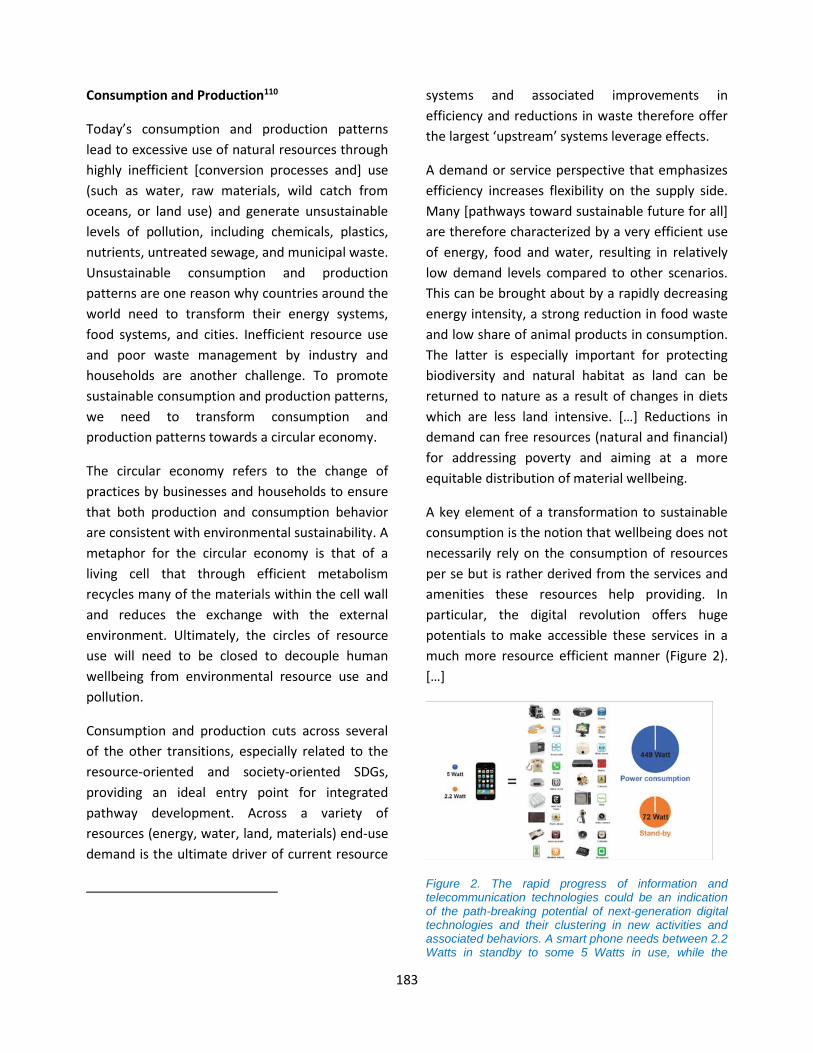
183
Consumption and Production110
Today’s consumption and production patterns
lead to excessive use of natural resources through
highly inefficient [conversion processes and] use
(such as water, raw materials, wild catch from
oceans, or land use) and generate unsustainable
levels of pollution, including chemicals, plastics,
nutrients, untreated sewage, and municipal waste.
Unsustainable consumption and production
patterns are one reason why countries around the
world need to transform their energy systems,
food systems, and cities. Inefficient resource use
and poor waste management by industry and
households are another challenge. To promote
sustainable consumption and production patterns,
we need to transform consumption and
production patterns towards a circular economy.
The circular economy refers to the change of
practices by businesses and households to ensure
that both production and consumption behavior
are consistent with environmental sustainability. A
metaphor for the circular economy is that of a
living cell that through efficient metabolism
recycles many of the materials within the cell wall
and reduces the exchange with the external
environment. Ultimately, the circles of resource
use will need to be closed to decouple human
wellbeing from environmental resource use and
pollution.
Consumption and production cuts across several
of the other transitions, especially related to the
resource-oriented and society-oriented SDGs,
providing an ideal entry point for integrated
pathway development. Across a variety of
resources (energy, water, land, materials) end-use
demand is the ultimate driver of current resource
systems and associated improvements in
efficiency and reductions in waste therefore offer
the largest ‘upstream’ systems leverage effects.
A demand or service perspective that emphasizes
efficiency increases flexibility on the supply side.
Many [pathways toward sustainable future for all]
are therefore characterized by a very efficient use
of energy, food and water, resulting in relatively
low demand levels compared to other scenarios.
This can be brought about by a rapidly decreasing
energy intensity, a strong reduction in food waste
and low share of animal products in consumption.
The latter is especially important for protecting
biodiversity and natural habitat as land can be
returned to nature as a result of changes in diets
which are less land intensive. […] Reductions in
demand can free resources (natural and financial)
for addressing poverty and aiming at a more
equitable distribution of material wellbeing.
A key element of a transformation to sustainable
consumption is the notion that wellbeing does not
necessarily rely on the consumption of resources
per se but is rather derived from the services and
amenities these resources help providing. In
particular, the digital revolution offers huge
potentials to make accessible these services in a
much more resource efficient manner (Figure 2).
[…]
Figure 2. The rapid progress of information and telecommunication technologies could be an indication of the path-breaking potential of next-generation digital technologies and their clustering in new activities and associated behaviors. A smart phone needs between 2.2 Watts in standby to some 5 Watts in use, while the
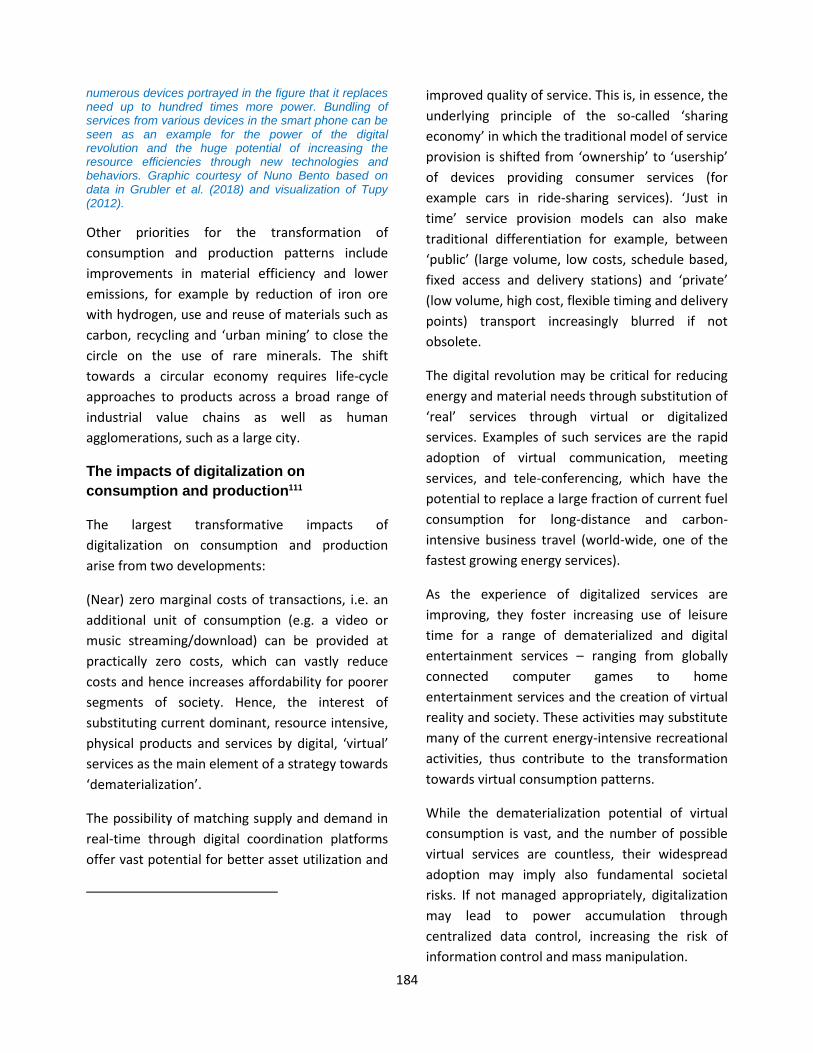
184
numerous devices portrayed in the figure that it replaces need up to hundred times more power. Bundling of services from various devices in the smart phone can be seen as an example for the power of the digital revolution and the huge potential of increasing the resource efficiencies through new technologies and behaviors. Graphic courtesy of Nuno Bento based on data in Grubler et al. (2018) and visualization of Tupy (2012).
Other priorities for the transformation of
consumption and production patterns include
improvements in material efficiency and lower
emissions, for example by reduction of iron ore
with hydrogen, use and reuse of materials such as
carbon, recycling and ‘urban mining’ to close the
circle on the use of rare minerals. The shift
towards a circular economy requires life-cycle
approaches to products across a broad range of
industrial value chains as well as human
agglomerations, such as a large city.
The impacts of digitalization on
consumption and production111
The largest transformative impacts of
digitalization on consumption and production
arise from two developments:
(Near) zero marginal costs of transactions, i.e. an
additional unit of consumption (e.g. a video or
music streaming/download) can be provided at
practically zero costs, which can vastly reduce
costs and hence increases affordability for poorer
segments of society. Hence, the interest of
substituting current dominant, resource intensive,
physical products and services by digital, ‘virtual’
services as the main element of a strategy towards
‘dematerialization’.
The possibility of matching supply and demand in
real-time through digital coordination platforms
offer vast potential for better asset utilization and
improved quality of service. This is, in essence, the
underlying principle of the so-called ‘sharing
economy’ in which the traditional model of service
provision is shifted from ‘ownership’ to ‘usership’
of devices providing consumer services (for
example cars in ride-sharing services). ‘Just in
time’ service provision models can also make
traditional differentiation for example, between
‘public’ (large volume, low costs, schedule based,
fixed access and delivery stations) and ‘private’
(low volume, high cost, flexible timing and delivery
points) transport increasingly blurred if not
obsolete.
The digital revolution may be critical for reducing
energy and material needs through substitution of
‘real’ services through virtual or digitalized
services. Examples of such services are the rapid
adoption of virtual communication, meeting
services, and tele-conferencing, which have the
potential to replace a large fraction of current fuel
consumption for long-distance and carbon-
intensive business travel (world-wide, one of the
fastest growing energy services).
As the experience of digitalized services are
improving, they foster increasing use of leisure
time for a range of dematerialized and digital
entertainment services – ranging from globally
connected computer games to home
entertainment services and the creation of virtual
reality and society. These activities may substitute
many of the current energy-intensive recreational
activities, thus contribute to the transformation
towards virtual consumption patterns.
While the dematerialization potential of virtual
consumption is vast, and the number of possible
virtual services are countless, their widespread
adoption may imply also fundamental societal
risks. If not managed appropriately, digitalization
may lead to power accumulation through
centralized data control, increasing the risk of
information control and mass manipulation.
185
The positive impacts of digitalization on the SDGs
can be summarized as follows: better and lower
cost services improve access and affordability
hence contribute towards poverty and inequality
reduction. Better asset utilization and
‘virtualization’ increase resource efficiency and
can reduce the resource and ecological footprint
of human activities, thus positively contributing to
a range of SDGs.
Potential risks
Four groups of potential negative effects arise:
1. Lack of access to digital infrastructure and
services compounds the negative impacts of the
‘digital divide’ potentially opening up a ‘digital
consumption divide’. For example, a person that
does not own a smart-phone, could no longer use
public transport options organized under a
pervasive ‘shared mobility’ model.
2. Big data applications centered around private
consumption and services raise data privacy
concerns and represent risks in terms of social
control from governments and/or large
multinational firms. The fundamental nature of
network externalities (benefits grow exponentially
with the degree of interconnectedness and
information sharing) leads to ‘natural
monopolies’.
3. Cost reductions in services could lead to so-
called ‘take-back’ (or economic ‘rebound’) effects
in which cost savings lead to further increases in
the same or substitute demands.
4. Negative impacts on employment through
lower demand for devices, vehicles, and physical
goods, and hence negatively impact employment.
Also increasing digitalization of service provision,
e.g. autonomous vehicles in public transport
fleets, reduces the need for human labor, again
negatively impacting employment. Concerns are
also voiced that continued digitalization in
manufacturing could render the traditional
comparative advantage of emerging economies in
manufacturing (lower labor costs) increasingly
obsolete, potentially leading to a relocation of
industrial and manufacturing activities back to
industrialized countries or constituting an
additional entry barrier for industrialization and
benefitting from the international division of
labor, for currently largely primary resource-based
economies aiming for industrialization.
The role of policies
Neither positive, nor negative impacts of
digitalization on consumption and production are
preordained. Public policy is instrumental,
particularly in the early formative phase of the
development of new technologies and business
models, in terms of regulating standards, data
access and privacy, monopolies and competition,
and above all in infrastructure development and
assuring equitable access. The failure of timely
regulatory and other policies may render digital
revolution to be no longer amiable to ‘social
steering’.
References
Grubler, A., Wilson, C., Bento, N., Boza-Kiss, B., Krey, V.,
McCollum, D. L., Rao, N. D., Riahi, K., Rogelj, J., De Stercke, S.,
Cullen, J., Frank, S., Fricko, O., Guo, F., Gidden, M., Havlík, P.,
Huppmann, D., Kiesewetter, G., Rafaj, P., Schoepp, W. &
Valin, H. 2018. A low energy demand scenario for meeting the
1.5 °C target and sustainable development goals without
negative emission technologies. Nature Energy, 3, 515-527.
TWI2050 - The World in 2050 (forthcoming). The Digital
Revolution and Sustainable Development: Opportunities and
Challenge. Report prepared by the World in 2050 initiative.
International Institute for Applied Systems Analysis (IIASA),
Laxenburg, Austria. www.twi2050.org
TWI2050 - The World in 2050 (2018). Transformations to
Achieve the Sustainable Development Goals. Report prepared
by the World in 2050 initiative. International Institute for
Applied Systems Analysis (IIASA), Laxenburg, Austria.
www.twi2050.org

186
Tupy, M. L. 2012. Dematerialization (update) [Online]. Available: https://www.cato.org/blog/dematerialization-update [Accessed 25 June 2018].
187
Does the sun hold the key to improving the lives and well-being of a growing older population in rural
Africa?
Policy Brief
Purity Mwendwa, PhD, Center for Global Health, Trinity College, the University of Dublin, Ireland
Thilo Kroll, PhD, School of Nursing Midwifery and Health Systems, University College Dublin, Ireland
Globally the number of older people is rising. In Africa the number of people over 60 years is expected to
increase from just under 50 million to nearly 200 million by 2050 (UNDESA, 2017). Generally the number
of older persons is growing faster in urban areas than in rural areas (UNDESA, 2017) however, a large share
of the elderly reside in rural areas, where support and services are more difficult to find (Bloom & Luca,
2016). Many older people across sub-Saharan Africa (SSA) live in chronic and profound poverty.
Increasingly, older people also live alone or are disconnected from their families who may have moved into
the cities or even abroad (Help Age International, 2012). Preparing for an ageing population is vital to
achieving the goals of poverty eradication, good health, gender equality, economic growth and decent work,
reduction of inequalities and creation of sustainable cities set out in the Agenda 2030 (UNDP, 2017)
Despite the changing demographics of Africa, the older population has largely remained invisible in
international development initiatives and related policy discourses. As a result, SSA is lagging in investment
and development of infrastructure and support programs to meet the needs of their ageing citizens. A
particular challenge for the older population, especially those living in rural areas of SSA is the access to safe
and affordable energy (HelpAge International, 2015). As fossil fuel prices increase while resources (eg coal,
oil) dwindle, the poorest and most marginalised people, including the older population , will be the hardest
hit (HelpAge International, 2015). Not being able to afford coal, gas or oil will make them particularly
vulnerable to health and wellbeing risks. Globally, it has been estimated that 1.3 billion people are living in
energy poverty (OECD, 2014). Rural homes in Africa without access to electricity often rely on paraffin/
kerosene fuel for lighting, and coals for cooking leading to indoor and outdoor air pollution and even house
fires. Data from 2012 showed that household air pollution from cooking with unclean fuels and inefficient
technologies led to an estimated 4.3 million deaths globally (United Nations, 2017) Besides, for older people
who live on their own or in isolated areas it means that their physical safety may be compromised by poor
lighting conditions, which in turn increases the risk of falls and may make them targets for robberies and
burglaries. During the colder months of the year older people may also have increased heating needs, which
require ready access to safe heating technologies.
Expanding reliable access to electricity and safe technologies, as well as improving energy efficiency is
essential to enhance the quality of life for older people and their ability to live independently (United
Nations, 2017). Evidence suggests that most of the energy needs of poor people in rural areas in developing
countries can be met by harnessing local, clean energy resources with minimum environmental impact on
climate change (Practical Action, 2012). It would reduce reliance on wood fuels for cooking and thereby
improve older people’s health, safety and their overall well-being.
The energy policy literature (Ailawadi & Bhattacharyya, 2006; Bhattacharyya, 2006; DFID, 2002; IEA,
2002; UNDP, 2005; WEC, 2001) points to the large potential of renewable energy to mitigate climate
change, and contribute to social and economic development. Renewable energies encompass a range of
188
different approaches to generate electricity and/or heat through harnessing solar, wind, wave, hydropower,
biomass, geothermal resources, as well as biofuels and hydrogen. On the African continent, the use of solar
power appears to be particularly promising in this regard. Unlike diesel operational costs, solar technologies
are not dependent on volatile international oil markets, (Owen, Inderwildi, & King, 2010). To date, off-grid
energy production options hold a great potential for rural and unconnected Africans (DFID & Shapps, 2015;
Power Africa, 2016). For example, M-KOPA Solar, a Kenyan company, partnered with the mobile operator
Safaricom in 2010 to provide off-the-grid solar electricity to poor households (Watkins, 2015). The company
sells solar-powered battery systems, which contain a torch and a mobile-phone charger. Customers secure
loans and make repayments through Safaricom’s mobile phone based money system known as M-Pesa (The
Economist, 2016). After completing payments, customers own the product. In addition to providing
affordable and a clean energy source, M-KOPA solar company is generating employment for the local
communities (M-Kopa Solar, 2018).
Globally, installed capacity for solar-powered electricity has seen an exponential growth (World Energy
Council, 2016). The two main types of solar energy technologies are photovoltaic (PV) and thermal
collectors. Boosted by a strong solar PV market, renewables accounted for almost two-thirds of net new
power capacity around the world in 2016 (IEA, 2017).Globally, Germany has led PV capacity installations
over the last decade and continues as the front-runner followed by China, Japan, Italy and the United States.
Africa, however is lagging behind; Total solar capacity installed in the region represented less than 1% of the
world’s solar capacity for the same period with countries like South Africa, Kenya and Uganda leading the
way (World Energy Council, 2016). Yet, previous estimates suggest that if the cost of solar is reduced by 30
percent, PV technology will spread across Africa (The Economist, 2007).
Thus far, as evidence suggests, it is mostly the rural middle class that has enjoyed the benefits of solar power.
Its principal use is for TV, radio, mobile telephones and other such ‘‘connective’’ applications (Jacobson,
2007). In addition to providing basic lighting and the ability to charge individual gadgets such as mobile
phones, access to solar energy can also accrue other benefits for entire communities by enabling income
generating projects (Roche & Blanchard, 2018). Renewable energy off-grid systems that are designed to
generate power for an entire community as part of a local mini-grid generation and distribution system – can
offer 24 hour service and the ability to be used to power a range of electrical applications, comparable to
those available to customers serviced by the grid (Yadoo & Cruickshank, 2012). With growing markets in
the North and a shift of production to China solar PV prices have been falling (Nygaard, 2009) making the
technology more widely available. In many countries of SSA and South Asia, substantial solar markets
already exist allowing customers to buy certain PV technologies in local shops (Yadoo & Cruickshank,
2012).
We would like to conclude with 5 key areas for recommendations.
Recognizing the older population as key stakeholders, beneficiaries and change makers
While faced with global ageing trends, governments clearly need to focus more on the needs and assets of
their older citizens. Specifically, in lower and middle income settings (LMICs) older people’s roles in
achieving sustainable development goals have to be emphasised more. Governments have a primary
responsibility to promote the well-being of older people while working together other key stakeholders and
local community groups including with older people themselves, and hence allowing them to have a voice
and effective opportunities to shape the course of development (HelpAge International, 2015). Older people
have considerable skills and knowledge that are often not recognised or under-utilized. As part of
189
community-based solar projects, for example, older people could be trained as system operators thereby
improving local skill sets and providing additional employment for them. Substantial poverty reduction can
only be achieved if a wide range of productive and wellbeing-enhancing uses of electricity are established
(Yadoo & Cruickshank, 2012).
Addressing cultural preconceptions and promoting acceptability of solar energy
Acceptance of renewable energy is not universal and in some quarters harbour perceptions that these new
energy sources are inferior or far less reliable. Such notions have hampered progress. Communities need to
be closely involved in the local development and implementation of power supplies that may make them less
dependent on national power monopolies.
Creating the political will and economic investment into solar energy
There has to be the political will to challenge power companies’ monopoly and reliance on traditional energy
sources and to support the development of local renewable energy projects. Countries may embrace private-
public partnerships to fund pilot schemes and provide grants to local communities to set up solar power
grids.
Overcoming technological challenges and facilitating knowledge transfer
Clearly, many challenges persist in relation to solar power and other renewables. As with any new
technology at present there is no infrastructure in place that would allow the rollout of solar power at scale.
Per-unit costs for energy generation are still too high, which make this technology not affordable to low
income households.
As solar power cannot be produced in the evenings, an alternative fuel source or storage system may be
required to provide an on-going supply. Seasonal weather variations may also affect how much solar power
can be generated and the requirement for batteries to run PV technologies raises the sustainability question
(Yadoo & Cruickshank, 2012). Another challenge is the on-going maintenance and support for renewable
technologies, especially in rural and remote areas.
With new storage systems coming on the market and with growing competence and knowledge about solar
power these challenges are not insurmountable but require effective knowledge sharing strategies and
processes.
Accruing and synthesising evidence
At present there is a paucity of evidence on how renewable energy, especially solar power can play a role on
achieving sustainable development goals and improve the health and wellbeing of ageing populations in
SSA. There is need to develop and synthesise expertise from pilot programmes, particularly on what works
in terms of solar energy needs in a particular context, and specifically for older people whose needs and
circumstances continue to change.
References
Ailawadi, V. S., & Bhattacharyya, S. C. (2006). Access to energy services by the poor in India: Current situation and
need for alternative strategies. Natural Resources Forum, 30(1), 2–14. https://doi.org/10.1111/j.1477-
8947.2006.00153.x
190
Bhattacharyya, S. C. (2006). Energy access problem of the poor in India: Is rural electrification a remedy? Energy
Policy, 34(18), 3387–3397. https://doi.org/10.1016/j.enpol.2005.08.026
Bloom, D. E., & Luca, D. L. (2016). The Global Demography of Aging: Facts, Explanations, Future, 66.
DFID. (2002). Energy for the poor: underpinning the millennium development goals | Eldis. Retrieved May 10, 2018,
from http://www.eldis.org/document/A10869
DFID, & Shapps, G. (2015). Energy Africa campaign. Retrieved May 10, 2018, from
https://www.gov.uk/government/news/energy-africa-campaign
Help Age International. (2012). Ageing in the Twenty-First Century: A Celebration and A Challenge. Retrieved from
http://www.helpage.org/resources/ageing-in-the-21st-century-a-celebration-and-a-challenge/
HelpAge International. (2015). Climate change in an ageing world;Help Age Position Paper. Retrieved from
https://reliefweb.int/sites/reliefweb.int/files/resources/COP21_HelpAge_PositionPaper_Final_0.pdf
IEA. (2002). Energy and Poverty. In World Energy Outlook. International Energy Agency, Paris.
IEA. (2017). Renewables 2017. Retrieved May 10, 2018, from https://www.iea.org/publications/renewables2017/
Jacobson, A. (2007). Connective Power: Solar Electrification and Social Change in Kenya. World Development, 35(1),
144–162. https://doi.org/10.1016/j.worlddev.2006.10.001
M-Kopa Solar. (2018). Our Impact. Retrieved May 11, 2018, from http://solar.m-kopa.com/about/our-impact/
Nygaard, I. (2009). The compatibility of rural electrification and promotion of low-carbon technologies in developing
countries - the case of Solar PV for Sub-Saharan Africa, 3(2), 34.
OECD. (2014). World Energy Outlook 2014. Washington: Organisation for Economic Co-operation and Development.
Retrieved from http://public.eblib.com/choice/PublicFullRecord.aspx?p=4961657
Owen, N. A., Inderwildi, O. R., & King, D. A. (2010). The status of conventional world oil reserves—Hype or cause for
concern? Energy Policy, 38(8), 4743–4749. https://doi.org/10.1016/j.enpol.2010.02.026
Power Africa. (2016). Power Africa Roadmap: A Guide to Creating 30,000 Megawatts and 60 Million Connections.
Retrieved May 10, 2018, from https://www.usaid.gov/powerafrica/roadmap
Practical Action. (2012). Climate Change and the Challenge of Energy Poverty.
Roche, O. M., & Blanchard, R. E. (2018). Design of a solar energy centre for providing lighting and income-generating
activities for off-grid rural communities in Kenya. Renewable Energy, 118, 685–694.
https://doi.org/10.1016/j.renene.2017.11.053
The Economist. (2007). The dark continent. The Economist. Retrieved from https://www.economist.com/node/9660077
The Economist. (2016). Power hungry - Electricity in Africa. Retrieved May 11, 2018, from
https://www.economist.com/news/middle-east-and-africa/21685504-electrification-plans-are-stalling-because-
distributors-wont-pay-power-hungry
UNDP. (2005). The Energy Challenge for Achieving the Millennium Development Goals. Retrieved May 10, 2018,
from http://www.undp.org/content/undp/en/home/librarypage/environment-
energy/sustainable_energy/the_energy_challengeforachievingthemillenniumdevelopmentgoals.html
UNDP. (2017). Ageing, Older Persons and the 2030 Agenda for Sustainable Development. Retrieved May 10, 2018,
from http://www.undp.org/content/undp/en/home/librarypage/poverty-reduction/ageing--older-persons-and-the-
2030-agenda-for-sustainable-develo.html
United Nations. (2017a). The Sustainable Development Goals Report 2017. Retrieved from
https://unstats.un.org/sdgs/files/report/2017/TheSustainableDevelopmentGoalsReport2017.pdf
191
UNDESA. (2017b). World Population Prospects: The 2017 Revision Key Findings and Advance Tables (Working
Paper). Retrieved from https://esa.un.org/unpd/wpp/publications/Files/WPP2017_KeyFindings.pdf
Watkins, K. (2015). DfID’s new Energy Africa campaign is right to look to off-grid solar power | Overseas
Development Institute (ODI). Retrieved May 10, 2018, from https://www.odi.org/comment/10039-dfid-energy-
africa-solar-power-electricity-access
WEC. (2001). Living in one world,. World Energy Council, London.
World Energy Council. (2016). Energy Resources-Solar. Retrieved May 10, 2018, from
https://www.worldenergy.org/data/resources/resource/solar/
Yadoo, A., & Cruickshank, H. (2012). The role for low carbon electrification technologies in poverty reduction and
climate change strategies: A focus on renewable energy mini-grids with case studies in Nepal, Peru and Kenya.
Energy Policy, 42, 591–602.
192
E-waste (Waste Electrical and Electronic Equipment) – The Other Side of Rapid Technological
Changes
Policy Brief
Sigrid Kusch-Brandt, Department for Civil, Environmental and Architectural Engineering, University of
Padua, Italy, contact: [email protected]
Abstract
Occurrence of WEEE (waste electrical and electronic equipment), or e-waste, is closely linked to the
economic development stage of a country. Economic growth is today reliably accompanied by rising WEEE
quantities. E-waste represents one of the fastest-growing waste steams worldwide. In addition to rising
quantities, contents of e-waste merit high attention. Precious and hazardous components are both relevant.
Major e-waste quantities today do not enter formal management and valorisation schemes. Where recycling
is implemented, it often focuses on recovery of bulk components, while materials with low concentrations
remain largely without recuperation. This includes rare earth elements (REE) and other minority components
which at the same time represent critical raw materials of an economy, especially with view to more
widespread implementation of green technologies. One challenge is the large diversity of technical
equipment on the market and continuously occurring alterations of characteristics of WEEE material flows as
result of rapid technological changes.
Achieving the Sustainable Development Goals (SDGs) will to a significant extent be based on technological
innovation and more widespread usage of key modern technologies. In addition to further growing e-waste
quantities, all rapid technological change will result into even higher diversity of e-waste. Significantly more
attention is required to advance high-value valorisation of e-waste streams and to end planned obsolescence.
At the same time, e-waste is characterised by high mobility. I particular, WEEE is often subject to
transboundary movements, with partially low levels of transparency. This calls for an urgent response in the
form of coordinated action at a global level both under the scope of a circular economy and to limit
detrimental health and environmental effects caused by hazardous substances present in electrical and
electronic equipment.
Introduction
WEEE (waste electrical and electronic equipment), or e-waste, is one of the fastest-growing waste streams
worldwide. WEEE is a major challenge due to the rapidly increasing quantities, and due both to its hazardous
and precious components [1,2,3,4]. A very strong coupling between e-waste quantities and economic
development stages of countries exist, as was shown in detail for countries of the pan-European region
(Figure) [5]. The Sustainable Development Goals (SDGs) among others aim to achieve economic growth.
Considering the high economic elasticity of WEEE (strong coupling between WEEE quantities and
economic development stage of a country), rapid further increase in WEEE quantities will occur throughout
the coming years and decades worldwide.
Figure 18. Linear correlation of domestic e-waste generation and GDP PPP (year 2014, 49 countries of pan-European region) [5]
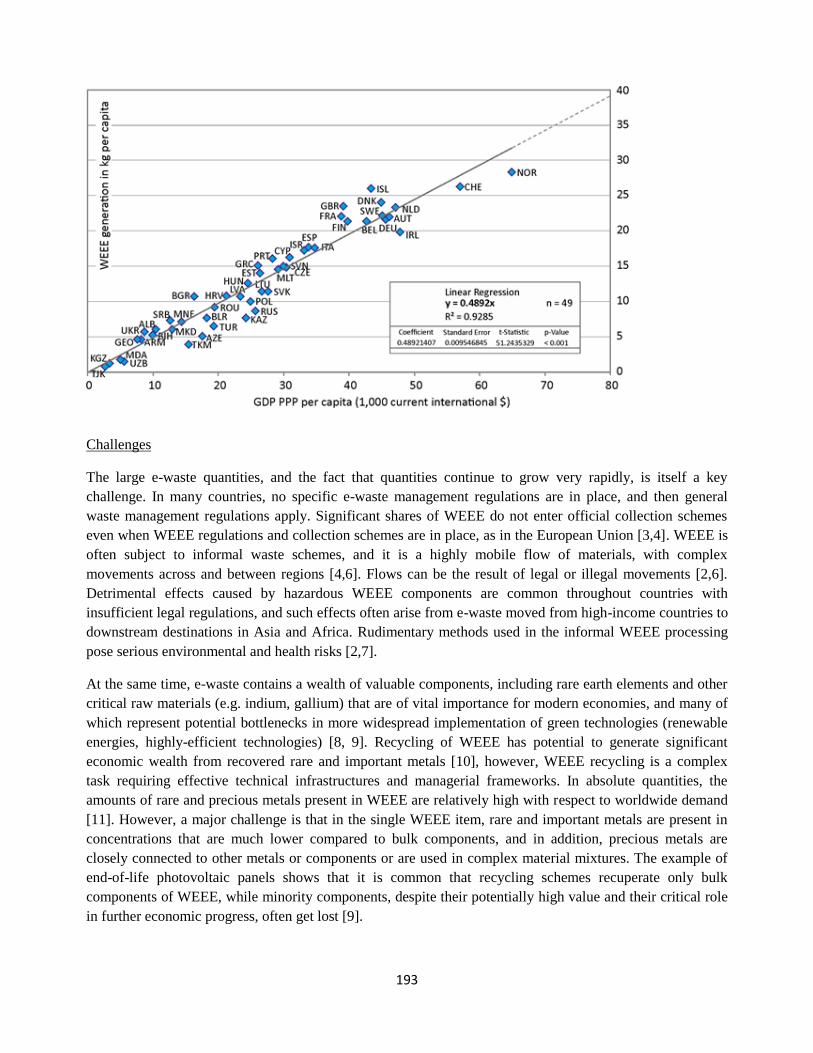
193
Challenges
The large e-waste quantities, and the fact that quantities continue to grow very rapidly, is itself a key
challenge. In many countries, no specific e-waste management regulations are in place, and then general
waste management regulations apply. Significant shares of WEEE do not enter official collection schemes
even when WEEE regulations and collection schemes are in place, as in the European Union [3,4]. WEEE is
often subject to informal waste schemes, and it is a highly mobile flow of materials, with complex
movements across and between regions [4,6]. Flows can be the result of legal or illegal movements [2,6].
Detrimental effects caused by hazardous WEEE components are common throughout countries with
insufficient legal regulations, and such effects often arise from e-waste moved from high-income countries to
downstream destinations in Asia and Africa. Rudimentary methods used in the informal WEEE processing
pose serious environmental and health risks [2,7].
At the same time, e-waste contains a wealth of valuable components, including rare earth elements and other
critical raw materials (e.g. indium, gallium) that are of vital importance for modern economies, and many of
which represent potential bottlenecks in more widespread implementation of green technologies (renewable
energies, highly-efficient technologies) [8, 9]. Recycling of WEEE has potential to generate significant
economic wealth from recovered rare and important metals [10], however, WEEE recycling is a complex
task requiring effective technical infrastructures and managerial frameworks. In absolute quantities, the
amounts of rare and precious metals present in WEEE are relatively high with respect to worldwide demand
[11]. However, a major challenge is that in the single WEEE item, rare and important metals are present in
concentrations that are much lower compared to bulk components, and in addition, precious metals are
closely connected to other metals or components or are used in complex material mixtures. The example of
end-of-life photovoltaic panels shows that it is common that recycling schemes recuperate only bulk
components of WEEE, while minority components, despite their potentially high value and their critical role
in further economic progress, often get lost [9].
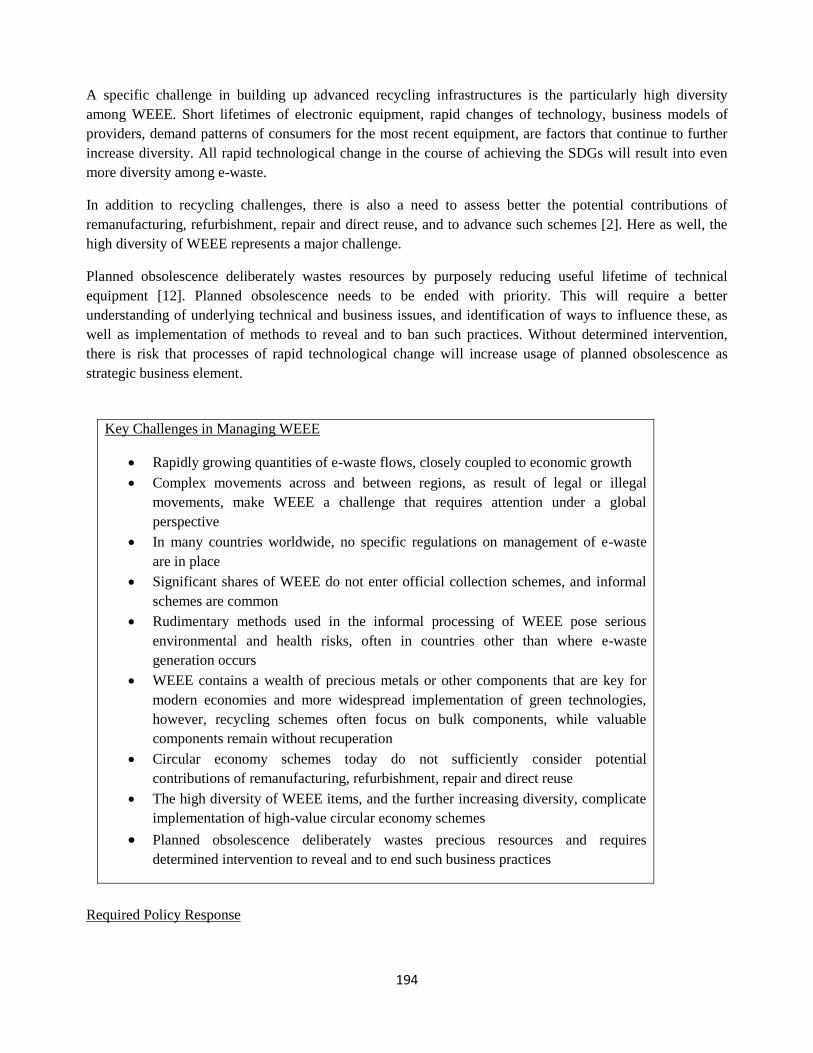
194
A specific challenge in building up advanced recycling infrastructures is the particularly high diversity
among WEEE. Short lifetimes of electronic equipment, rapid changes of technology, business models of
providers, demand patterns of consumers for the most recent equipment, are factors that continue to further
increase diversity. All rapid technological change in the course of achieving the SDGs will result into even
more diversity among e-waste.
In addition to recycling challenges, there is also a need to assess better the potential contributions of
remanufacturing, refurbishment, repair and direct reuse, and to advance such schemes [2]. Here as well, the
high diversity of WEEE represents a major challenge.
Planned obsolescence deliberately wastes resources by purposely reducing useful lifetime of technical
equipment [12]. Planned obsolescence needs to be ended with priority. This will require a better
understanding of underlying technical and business issues, and identification of ways to influence these, as
well as implementation of methods to reveal and to ban such practices. Without determined intervention,
there is risk that processes of rapid technological change will increase usage of planned obsolescence as
strategic business element.
Key Challenges in Managing WEEE
• Rapidly growing quantities of e-waste flows, closely coupled to economic growth
• Complex movements across and between regions, as result of legal or illegal
movements, make WEEE a challenge that requires attention under a global
perspective
• In many countries worldwide, no specific regulations on management of e-waste
are in place
• Significant shares of WEEE do not enter official collection schemes, and informal
schemes are common
• Rudimentary methods used in the informal processing of WEEE pose serious
environmental and health risks, often in countries other than where e-waste
generation occurs
• WEEE contains a wealth of precious metals or other components that are key for
modern economies and more widespread implementation of green technologies,
however, recycling schemes often focus on bulk components, while valuable
components remain without recuperation
• Circular economy schemes today do not sufficiently consider potential
contributions of remanufacturing, refurbishment, repair and direct reuse
• The high diversity of WEEE items, and the further increasing diversity, complicate
implementation of high-value circular economy schemes
• Planned obsolescence deliberately wastes precious resources and requires
determined intervention to reveal and to end such business practices
Required Policy Response
195
WEEE is a global challenge, due to both the quantities involved and the transboundary nature of material
flows. Rapid technological changes on the pathway towards achieving the SDGs will not only result into
further increasing e-waste quantities, but they will also further raise diversity among end-of-life electrical
and electronic equipment, with potentially negative impacts on implementation of high-value circular
economy schemes, such as recycling, remanufacturing, refurbishment and repair. The scale of WEEE
challenges calls for an urgent response in the form of coordinated action at a global level and the
establishment of transnational WEEE governance principles and structures. The scope of the circular
economy and the need to limit detrimental health and environmental effects caused by hazardous substances
in electrical and electronic equipment need to be both integrated. Business practices of planned obsolescence
need to be ended with priority.
In addition to efforts focusing on the global dimension of the e-waste challenge, globally connected regional
circular economy centres could function not only as key knowledge institutions and contact points for public
entities, the private sector and civil society, but could also ensure that coordination of WEEE management
can indeed be achieved at a global level, while implementation in practice is in line with individual regional
circumstances.
References
[1] UNEP (2012): GEO5 Global Environment Outlook. United Nations Environment Programme, Nairobi, Kenya
[2] UNEP, UNECE (2016): GEO-6 Assessment for the pan-European region. United Nations Environment Programme,
Nairobi, Kenya
[3] Baldé C.P., Wang F., Kuehr R., Huisman J. (2015): The Global E-waste Monitor 2014, United Nations University
(UNU), AS – SCYCLE, Bonn, Germany
[4] Baldé C.P., Forti V., Gray V., Kuehr R., Stegmann, P. (2017): The Global E-waste Monitor 2017, United Nations
University (UNU), International Telecommunication Union (ITU) & International Solid Waste Association (ISWA),
Bonn/Geneva/Vienna
[5] Kusch S., Hills C.D. (2017): The Link between e-Waste and GDP—New Insights from Data from the Pan-European
Region. Resources 2017, 6, 15
[6] Rucevska I., Nellemann C., Isarin N., Yang W., Liu N., Yu K., Sandnæs S., Olley K., McCann H., Devia L.,
Bisschop L., Soesilo D., Schoolmeester T., Henriksen R., Nilsen R. (2015): Waste crime – waste risks: gaps in
meeting the global waste challenge. UNEP and GRID-Arendal, Nairobi, Arendal
[7] ILO (2014): Tackling informality in e-waste management: the potential of cooperative enterprises. International
Labour Organization, Geneva
[8] Bakas I., Fischer C., Hardi A,; Haselsteiner S., McKinnon D., Kosmol J., Milios L., Plepys A., Tojo N., Wilts H.,
Wittmer D. (2014): Present and potential future recycling of critical metals in WEEE. Copenhagen Resource
Institute: Copenhagen, Denmark
[9] Kusch S., Alsheyab M. (2017): Waste electrical and electronic equipment: A closer look at photovoltaic panels.
SGEM 2017 Conference Proceedings, Vol. 17, Issue 41, 317-324
[10] Cucchiella F., D’Adamo I., Koh S.C.L., Rosa P. (2015): Recycling of WEEEs: An economic assessment of present
and future e-waste streams. Renewable and Sustainable Energy Reviews, 51, 263–272
[11] Friege H. (2012): Review of material recovery from used electric and electronic equipment – alternative options for
resource conservation. Waste Management & Research 30, 3-16

196
[12] Amankwah-Amoah J. (2017): Integrated vs. add-on: A multidimensional conceptualisation of technology
obsolescence. Technological Forecasting and Social Change 116, 299-307
197
The Dynamics of E-waste
Policy Brief, 2014
Carmen Chan (Wageningen University and Research Centre)
Background
E-waste112, or electronic waste, is one of the fastest growing waste streams, due to the rapid obsolescence of
electronic goods and contemporary consumption patterns.
A portion of E-waste can be sold and reused as second-hand products, effectively expanding the lifespan of
electronic products and bridging the digital gap between countries (Ejiogu, 2012). Moreover, E-waste
contains valuable metals, such as copper, silver and gold, that can be extracted (Herat & Agamuthu, 2012;
see also Schluep et al., 2009). On the downside, E-waste also contains numerous toxic substances (Robinson,
2009).
Each year, large quantities are transferred between countries. Exporting countries often violate international
treaties on the transfer of hazardous waste (Robinson, 2009). Receiving countries often lack legislation or an
overview of what is coming into the country and the know-how to safely process E-waste (Herat &
Agamuthu, 2012). When handled improperly, E-waste pollutes the water, soil and air, and affects human
health (for an overview, see Herat & Agamuthu, 2012; Ejiogu, 2012; Robinson, 2009). There is evidence that
some (agricultural) export products are contaminated as well (Robinson, 2009).
For all these reasons, E-waste has received lots of attention in the receiving countries and in the scientific
community. This peer-reviewed Science Digest provides a brief overview of E-waste research, and recent
findings.
Scientific Debate
In the past five years alone, there were more than 1,500 scientific articles dealing with E-waste. Research on
this topic is mostly done in the areas of environmental sciences and engineering. Corsini et al. (2013,
forthcoming) reviewed E-waste research from 2001 to 2011. Management and policy issues were
predominant areas of research in Europe, during the period going from 2001 to 2006. Chemical pollution of
the environment and related health issues in developing countries gained a predominant role from 2006 to
2011. Recycling activities are present in the different areas of studies mentioned above. In comparison to
other research areas, E-waste logistics have been a small area (Corsini et al., 2013, forthcoming).
Two of the few scientists who did conduct research on the logistics of E-waste, are Lepawsky & McNabb
(2010). They mapped international flows of E-waste (see Figure). Contrary to what is commonly thought,
Lepawsky & McNabb found that: 1) the international trade in E-waste is a more complex story than being
one about ‘rich’ countries dumping waste in ‘poor’ countries, 2) the trade in E-waste occurs mainly within
regions, instead of between regions, 3) the Pollution Haven Hypothesis113 is an important, but partial,
112 E-waste and WEEE (Waste Electrical and Electronic Equipment) describe discarded appliances that use Electricity. E-waste describes discarded electronic goods, such as computers, televisions and cell phones, while WEEE also includes traditionally non-electronic goods such as refrigerators and ovens (Robinson, 2009). 113 The Pollution Haven Hypothesis is the proposition that pollutionintensive economic activity will tend to migrate to those jurisdictions where costs related to environmental regulation are lowest (Lepawsky & McNabb, 2010).
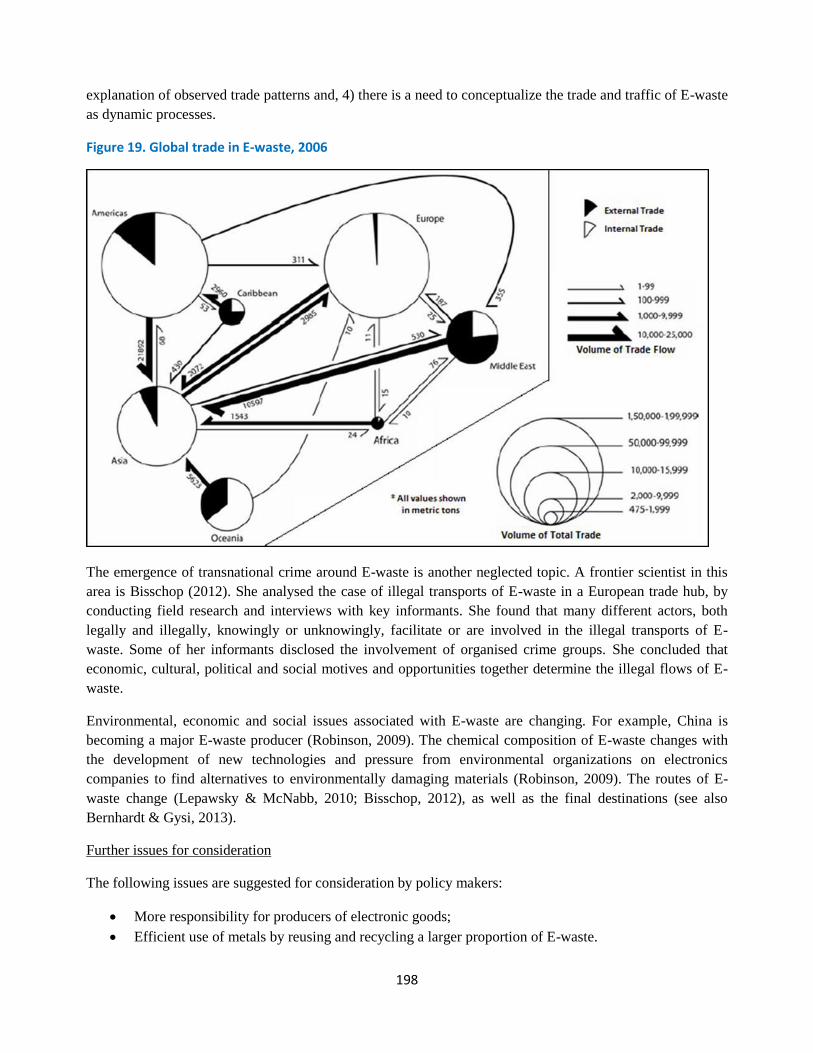
198
explanation of observed trade patterns and, 4) there is a need to conceptualize the trade and traffic of E-waste
as dynamic processes.
Figure 19. Global trade in E-waste, 2006
The emergence of transnational crime around E-waste is another neglected topic. A frontier scientist in this
area is Bisschop (2012). She analysed the case of illegal transports of E-waste in a European trade hub, by
conducting field research and interviews with key informants. She found that many different actors, both
legally and illegally, knowingly or unknowingly, facilitate or are involved in the illegal transports of E-
waste. Some of her informants disclosed the involvement of organised crime groups. She concluded that
economic, cultural, political and social motives and opportunities together determine the illegal flows of E-
waste.
Environmental, economic and social issues associated with E-waste are changing. For example, China is
becoming a major E-waste producer (Robinson, 2009). The chemical composition of E-waste changes with
the development of new technologies and pressure from environmental organizations on electronics
companies to find alternatives to environmentally damaging materials (Robinson, 2009). The routes of E-
waste change (Lepawsky & McNabb, 2010; Bisschop, 2012), as well as the final destinations (see also
Bernhardt & Gysi, 2013).
Further issues for consideration
The following issues are suggested for consideration by policy makers:
• More responsibility for producers of electronic goods;
• Efficient use of metals by reusing and recycling a larger proportion of E-waste.
199
References
Benebo, N.S. (2009). Status of E-waste control in Nigeria. Paper presented at the International Network For
Environmental Compliance and Enforcement – US Environmental Protection Agency’s Workshop on E-waste in
West Africa, Accra, Ghana, 24-25 June.
Bernhardt, A., Gysi, N. (2013). The world’s worst 2013: The top ten toxic threats. Blacksmith Institute and Green Cross
Switzerland.
Bisschop, L. (2012). Is it all going to waste? Illegal transports of e-waste in a European trade hub. Crime Law Soc
Change 58, 221-249.
Corsini, F., Rizzi, F., Gusmerotti, N.M., Frey, M. (2013, forthcoming). Extended Producer Responsibility and the
Evolution of Sustainable Specializations: Evidences From the e-Waste Sector. Business Strategy and the
Environment.
Ejiogu, A.R. (2012). E-waste economics: a Nigerian perspective. Management of Environmental Quality: An
International Journal 24(2), 199-213.
European Commission (2011). Recast of the WEEE Directive. Accessed 6 December 2013.
http://ec.europa.eu/environment/waste/weee/index_en.htm.
Herat, S., Agamuthu, P. (2012). E-waste: a problem or an opportunity? Review of issues, challenges and solutions in
Asian countries. Waste Management & Research 30(11), 1113-1129.
Kraan, S., Nijssen, C., Dols, N., Huijbregts, C. (2006). Is what you see, what you get? European Union Network for the
Implementation and Enforcement of Environmental Law.
Lepawsky, J., McNabb, C. (2010). Mapping international flows of electronic waste. The Canadian Geographer 54(2),
177-195.
Osibanjo, O., Rae, I., Scheringer, M., Have, C. ten (2012). Chapter 6: Chemicals and Waste. In: Ullstein, B., Mattos, H.
de, Hawkins, C., McMullen, C.P., Jabbour, J., Scharlemann, J. (eds.). Global Environment Outlook-5. Environment
for the future we want, 168-192.
Robinson, B.H. (2009). E-waste: An assessment of global production and environmental impacts. Science of the Total
Environment 408, 183-191.
Schluep, M., Hagelüken, C., Meskers, C.E.M., Magalini, F., Wang, F., Müller, E., Kuehr, R., Maurer, C., Sonnemann,
G. (2009). Market potential of innovative e-waste recycling technologies in developing countries. Accessed 9
December 2013. http://ewasteguide.info/files/Schluep_2009_R09.pdf
Smidt, C.W. (2006). Unfair trade e-waste in Africa. Environ Health Perspect 114(4), A232-235.
UNEP (2006). Call for Global Action on E-waste. Accessed 6 December 2013.
http://www.unep.org/Documents.Multilingual/Default.asp?ArticleID=5447&DocumentID=496&l=e.
Widmer, R., Oswald-Krapf, H., Sinha-Khetriwal, D., Schnellmann, M., Böni, H. (2005). Global perspectives on e-
waste. Environmental Impact Assessment Review 25(5), 436-458.
Wielenga, K. (2010). Waste without frontiers. Global trends in generation and transboundary movements of hazardous
wastes and other wastes. Analysis of the data from national reporting to the secretariat of the Basel convention for
the years 2004–2006. Châteleine: Secretariat of the Basel Convention.
200
A Horizon Scan on Aquaculture 2015: Traceability
Policy Brief - 2016 Update
R. Winkelhuijzen, M. Van Burik
In our globalized world, food supply chains have become complex. To track and trace the food along every
step of this chain can be difficult or even impossible. Food safety crises and sustainability concerns have led
to an emerging interest in traceability. Low traceability in the supply chain can lead to various problems: (1)
mislabeling, (2) illegal practices and (3) lower consumer trust. Benefits of high traceability are (1) food
safety, (2) sustainability and (3) transparency. Three possibilities for improving traceability are: coherence
and governance by aligning standards through knowledge exchange. Certification as they tend to improve
traceability and control via new technologies and traceability systems.
Traceability is the ability to trace the origin of a product at any step of the supply chain, in order to ensure
food safety, support sustainable fish farms and fisheries and to fight illegal activities and fraud [1, 2, 3]. As a
result of the complex, globalized supply chains and the many different species in aquaculture, it becomes
increasingly difficult to ensure traceability.
Global attention for traceability in the food sector is relatively recent. It first emerged because businesses
wanted to keep track of their products [3]. In the mid-1990s, traceability became a key issue because of
several crises with food safety, most notably the appearance of BSE, or “mad-cow disease” [1,4]. In recent
years however, concerns about social and environmental problems and the need to prevent illegal practices
have also led to an increased attention for traceability [1,5,6,7].
Supply chains tend to be very complex in the seafood sector. The simplest practices to test traceability are
‘one up, one down’ business-to- business systems, where the product is traced one step up and one step down
the supply chain. More difficult to achieve is full-chain traceability, where the entire supply chain has to be
checked entirely for traceability [3,6] (see figure 41).
Implementing traceability remains difficult. In the seafood sector, scientific studies have shown that low
traceability results in mislabeling and lacking knowledge about the source [8,9]. Aquaculture and wild
fisheries are facing the same problems for traceability because processors and retailers often handle both
types [10]. Furthermore, implementation of traceability is costly and requires coordination. As a result, most
utilized systems up to now are located in the global North [3]. In developed countries like the EU, the US
and Japan, traceability in food is already strongly regulated, while in many developing countries there still is
low traceability [1].
This policy brief takes a look at the problems and benefits of traceability in aquaculture and discusses ways
to improve.
Figure 20. Aquaculture Supply Chain

201
Benefits of High Traceability
Food Safety
The Food and Agriculture Organization (FAO) states that there is a “need to identify responsibilities as well
as to make sure that the source of, for example contamination, is identified and removed” [12]. Traceability
does not confirm food safety but strengthens food safety management through increased pressure on the
supply chain. The demand for food safety is growing globally.
Transparency
There is an increasing concern of consumers about where their food is coming from [12]. Food chains need
to be traceable from farm to fork. The EU and the USA introduced regulation that ensures that consumer and
buyers can trace seafood along the supply chain. Without the transparency, seafood cannot be exported to the
EU [13]. In addition, transparency benefits the entire supply chain.
Sustainability
Consumers are increasingly aware of sustainability issues in the sourcing or production of food.
Sustainability in seafood can stem from social, economic or environmental aspects.
Problems with Low Sustainability
Mislabeling
Mislabeling is a global problem related to voluntary and involuntary misconduct when labeling fish
according to origin and species. The mislabeling of fish can occur at any stage in the supply chain, from the
producer to the retailer. Research suggests that 30% of the global seafood market is mislabeled [9]. In
restaurants and specialized fish stores the percentage mislabeled products is higher than in supermarkets
[9,14]. Many species are similar in taste and texture, so restaurants and other retailers can substitute a high-
value species with a cheaper variant, and making economic profit [8]. A report in December 2015 suggests
that the percentage of mislabeled fish in Europe has decreased to 5%, so there are positive developments
[15].
Illegal practices and fraud
Traceability is an important issue in wild fisheries to prevent Illegal, Unreported and Unregulated (IUU)
practices. Illegal, Unreported and Unregulated fishing threats about 85% of global fish stocks [16].
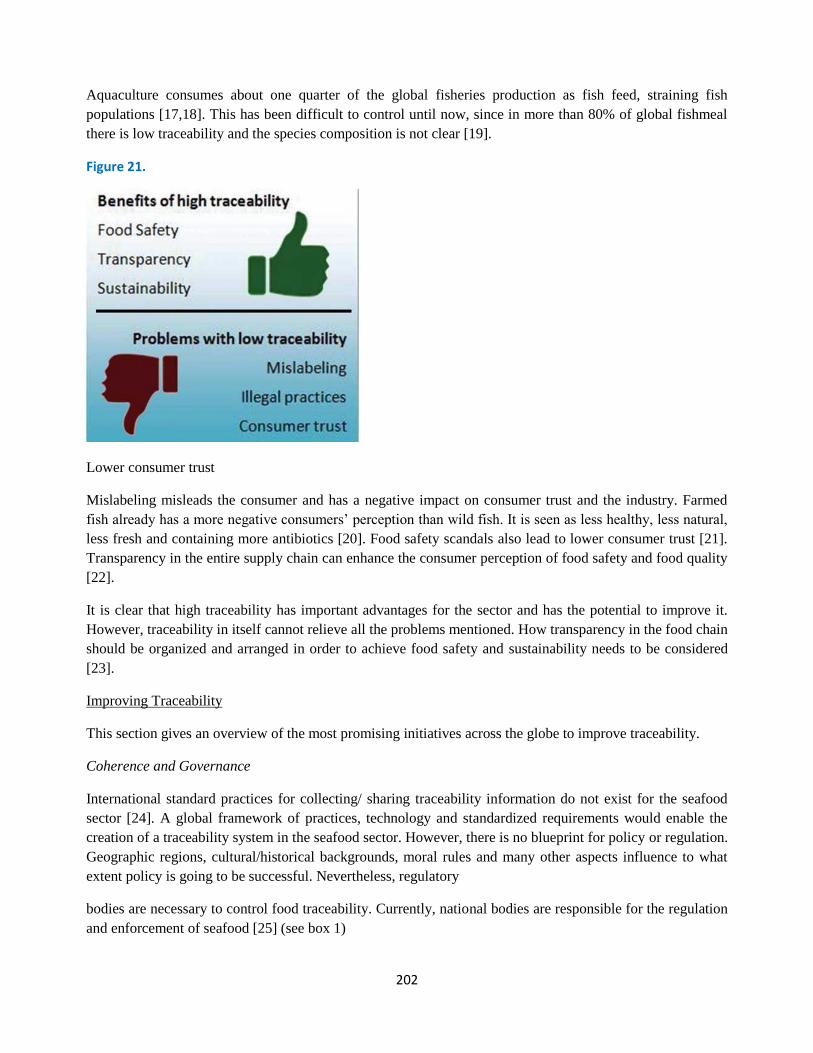
202
Aquaculture consumes about one quarter of the global fisheries production as fish feed, straining fish
populations [17,18]. This has been difficult to control until now, since in more than 80% of global fishmeal
there is low traceability and the species composition is not clear [19].
Figure 21.
Lower consumer trust
Mislabeling misleads the consumer and has a negative impact on consumer trust and the industry. Farmed
fish already has a more negative consumers’ perception than wild fish. It is seen as less healthy, less natural,
less fresh and containing more antibiotics [20]. Food safety scandals also lead to lower consumer trust [21].
Transparency in the entire supply chain can enhance the consumer perception of food safety and food quality
[22].
It is clear that high traceability has important advantages for the sector and has the potential to improve it.
However, traceability in itself cannot relieve all the problems mentioned. How transparency in the food chain
should be organized and arranged in order to achieve food safety and sustainability needs to be considered
[23].
Improving Traceability
This section gives an overview of the most promising initiatives across the globe to improve traceability.
Coherence and Governance
International standard practices for collecting/ sharing traceability information do not exist for the seafood
sector [24]. A global framework of practices, technology and standardized requirements would enable the
creation of a traceability system in the seafood sector. However, there is no blueprint for policy or regulation.
Geographic regions, cultural/historical backgrounds, moral rules and many other aspects influence to what
extent policy is going to be successful. Nevertheless, regulatory
bodies are necessary to control food traceability. Currently, national bodies are responsible for the regulation
and enforcement of seafood [25] (see box 1)
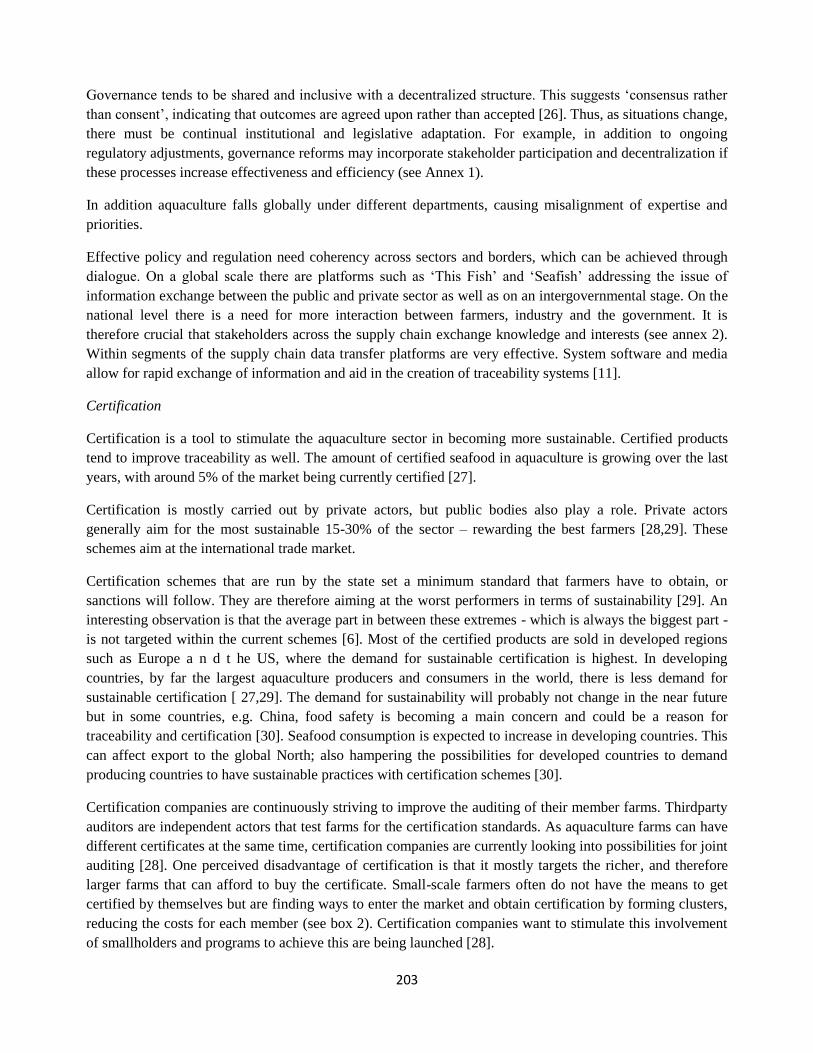
203
Governance tends to be shared and inclusive with a decentralized structure. This suggests ‘consensus rather
than consent’, indicating that outcomes are agreed upon rather than accepted [26]. Thus, as situations change,
there must be continual institutional and legislative adaptation. For example, in addition to ongoing
regulatory adjustments, governance reforms may incorporate stakeholder participation and decentralization if
these processes increase effectiveness and efficiency (see Annex 1).
In addition aquaculture falls globally under different departments, causing misalignment of expertise and
priorities.
Effective policy and regulation need coherency across sectors and borders, which can be achieved through
dialogue. On a global scale there are platforms such as ‘This Fish’ and ‘Seafish’ addressing the issue of
information exchange between the public and private sector as well as on an intergovernmental stage. On the
national level there is a need for more interaction between farmers, industry and the government. It is
therefore crucial that stakeholders across the supply chain exchange knowledge and interests (see annex 2).
Within segments of the supply chain data transfer platforms are very effective. System software and media
allow for rapid exchange of information and aid in the creation of traceability systems [11].
Certification
Certification is a tool to stimulate the aquaculture sector in becoming more sustainable. Certified products
tend to improve traceability as well. The amount of certified seafood in aquaculture is growing over the last
years, with around 5% of the market being currently certified [27].
Certification is mostly carried out by private actors, but public bodies also play a role. Private actors
generally aim for the most sustainable 15-30% of the sector – rewarding the best farmers [28,29]. These
schemes aim at the international trade market.
Certification schemes that are run by the state set a minimum standard that farmers have to obtain, or
sanctions will follow. They are therefore aiming at the worst performers in terms of sustainability [29]. An
interesting observation is that the average part in between these extremes - which is always the biggest part -
is not targeted within the current schemes [6]. Most of the certified products are sold in developed regions
such as Europe a n d t he US, where the demand for sustainable certification is highest. In developing
countries, by far the largest aquaculture producers and consumers in the world, there is less demand for
sustainable certification [ 27,29]. The demand for sustainability will probably not change in the near future
but in some countries, e.g. China, food safety is becoming a main concern and could be a reason for
traceability and certification [30]. Seafood consumption is expected to increase in developing countries. This
can affect export to the global North; also hampering the possibilities for developed countries to demand
producing countries to have sustainable practices with certification schemes [30].
Certification companies are continuously striving to improve the auditing of their member farms. Thirdparty
auditors are independent actors that test farms for the certification standards. As aquaculture farms can have
different certificates at the same time, certification companies are currently looking into possibilities for joint
auditing [28]. One perceived disadvantage of certification is that it mostly targets the richer, and therefore
larger farms that can afford to buy the certificate. Small-scale farmers often do not have the means to get
certified by themselves but are finding ways to enter the market and obtain certification by forming clusters,
reducing the costs for each member (see box 2). Certification companies want to stimulate this involvement
of smallholders and programs to achieve this are being launched [28].
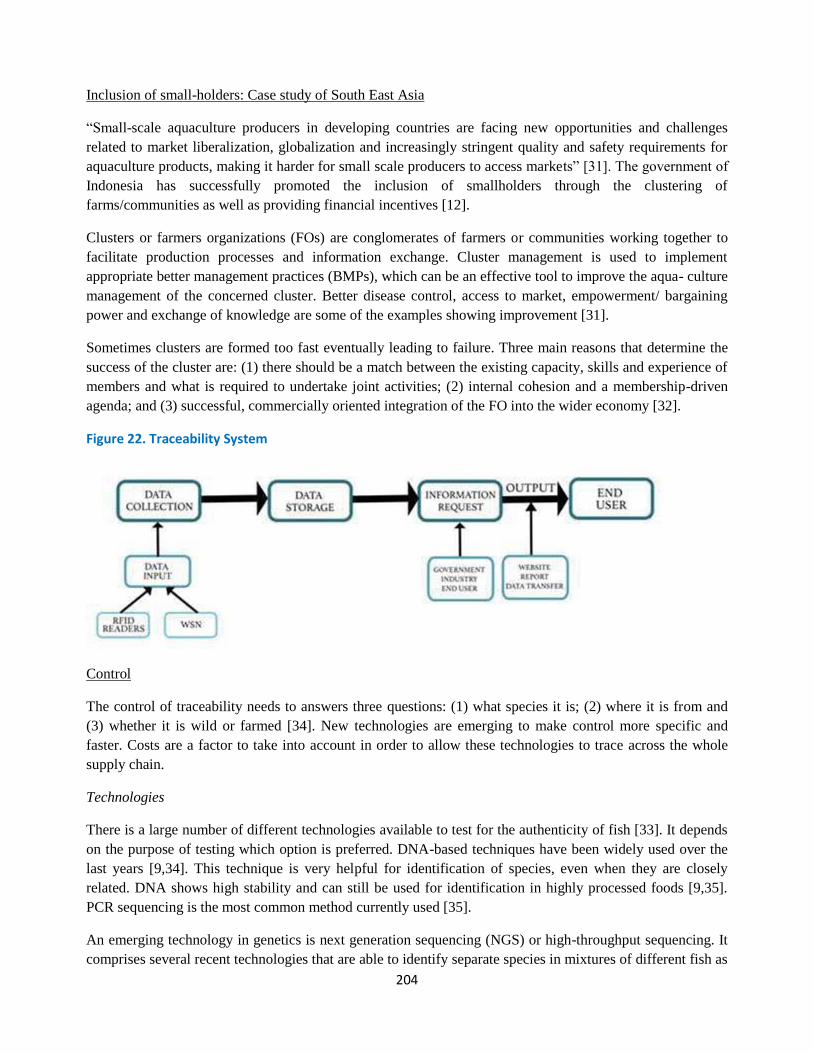
204
Inclusion of small-holders: Case study of South East Asia
“Small-scale aquaculture producers in developing countries are facing new opportunities and challenges
related to market liberalization, globalization and increasingly stringent quality and safety requirements for
aquaculture products, making it harder for small scale producers to access markets” [31]. The government of
Indonesia has successfully promoted the inclusion of smallholders through the clustering of
farms/communities as well as providing financial incentives [12].
Clusters or farmers organizations (FOs) are conglomerates of farmers or communities working together to
facilitate production processes and information exchange. Cluster management is used to implement
appropriate better management practices (BMPs), which can be an effective tool to improve the aqua- culture
management of the concerned cluster. Better disease control, access to market, empowerment/ bargaining
power and exchange of knowledge are some of the examples showing improvement [31].
Sometimes clusters are formed too fast eventually leading to failure. Three main reasons that determine the
success of the cluster are: (1) there should be a match between the existing capacity, skills and experience of
members and what is required to undertake joint activities; (2) internal cohesion and a membership-driven
agenda; and (3) successful, commercially oriented integration of the FO into the wider economy [32].
Figure 22. Traceability System
Control
The control of traceability needs to answers three questions: (1) what species it is; (2) where it is from and
(3) whether it is wild or farmed [34]. New technologies are emerging to make control more specific and
faster. Costs are a factor to take into account in order to allow these technologies to trace across the whole
supply chain.
Technologies
There is a large number of different technologies available to test for the authenticity of fish [33]. It depends
on the purpose of testing which option is preferred. DNA-based techniques have been widely used over the
last years [9,34]. This technique is very helpful for identification of species, even when they are closely
related. DNA shows high stability and can still be used for identification in highly processed foods [9,35].
PCR sequencing is the most common method currently used [35].
An emerging technology in genetics is next generation sequencing (NGS) or high-throughput sequencing. It
comprises several recent technologies that are able to identify separate species in mixtures of different fish as
205
well [25,36,37]. Also, NGS can be used for species identification in fish feed, to test whether endangered
species were used and prevent illegal fishing [37]. A disadvantage of using DNA is the relatively high price,
but this is already decreasing and is expected to decrease further [38].
The DNA of species within a region often does not show enough differences to ascertain the exact
geographical origin. Biochemical techniques are better suited for this purpose, testing hard tissues, mostly the
fish ear-stones (otoliths), for chemical properties that are unique to a geographical area [38,39]. Even over
relatively short geographical distances, the discrimination power of otolith chemistry has been shown [34].
To test for antibiotic and pesticide residues, mass spectrometry is used. With this very accurate technology
quantities up to picogram levels are detected[25].
Traceability systems
The concept of traceability systems is relatively new, especially regarding the marine environment. Internal
traceability systems are simpler and cheaper to implement as they focus on a specific part of the supply
chain. External systems are more extensive but allow tracing along the whole supply chain.
New technologies allow for increased efficiency. One important trend in the food sector is the use electronic
traceability and monitoring using Radio Frequency Identification (RFID) and Wireless Sensor Networks
(WSN) [40]. RFID and WSN technologies are in use in all stages, starting from fish farms up to the delivery
to the retail [41].
RFID in traceability systems improves management by tracking quality problems, improving management
recalls, improving visibility of products and processes, automate scanning, reduce labor, enhance stock
management and reduce operational costs [42,43,44].
Traceability systems can process a lot of information/ data, necessary to create output. This is an advantage
for companies who can afford this system. For smallholders and smaller companies this is not always the
case. In addition the processing of data requires infrastructure and technical knowledge, which is not always
available.
Key Messages
• Traceability is an emerging topic, relatively new to the seafood sector. Complex supply chains in a
globalized world pose challenges for tracking and tracing seafood.
• High traceability helps to achieve food safety, transparency and sustainability
• Demand for traceability is increasing but demand for sustainable certification will not grow
substantially. However, food safety will become more important globally
• Consumption will increase in producing countries, limiting export to the global North. This can have
implications for the influence certification schemes of developed countries can have
• Traceability should be tackled from a technical as well as policy angle in order to address the whole
supply chain effectively
• More communication and cooperation within the sector is vital for coherent and effective policy
outcomes (interplay between industry and public bodies).
• Traceability is a means to achieve sustainable aquaculture but traceability in itself is not enough.
References
206
[1] FAO (2014). The state of world fisheries and aquaculture. 243 p.
[2] Helyar, S. J., Lloyd, H. A. D., de Bruyn, M., Leake, J., Bennett, N., & Carvalho, G. R. (2014). Fish product mis-
labelling: failings of traceability in the production chain and implications for illegal, unreported and unregu- lated
(IUU) fishing.
[3] Bailey, M., Bush, S. R., Miller, A., & Kochen, M. (2016). The role of traceability in transforming seafood gov-
ernance in the global South. Current Opinion in Environmental Sustainability, 18, 25-32.
[4] Jensen, H.H. and D.J. Hayes (2006). Private sector approaches to secure traceability, transparency and quality
assurance in food chains. IATRC Summer Symposium “Food Regulation and Trade: Institutional Framework,
Concepts of Analysis and Empirical Evidence”, Bonn, Germany.
[5] Boyle, M. D. (2012). Without a Trace II: An Updated Summary of Traceability Efforts In the Seafood Indus- try.
[6] Interview Doddema, M. 11 December 2015, Skype call, interviewees: Burik, van, M., Winkelhuijzen, R.
[7] Panel discussion Richter, A. 2 December 2015, Wageningen, the Netherlands. Interviewees: Winkelhui- jzen, R.,
Stoffelen, T., Kempchen, L.
[8] Warner, K., Timme, W., Lowell, B., & Hirshfield, M. (2013). Oceana study reveals seafood fraud nationwide.
Oceana. Retrieved on August, 11, 2014.
[9] Pardo, M. Á., Jiménez, E., & Pérez-Villarreal, B. (2015). Misdescription incidents in seafood sector. Food Control.
[10] Panel discussion, 2 December 2015, Wageningen, the Netherlands. Interviewees: Winkelhuijzen, R., Stof- felen,
T., Kempchen, L.
[11] McEntire, J.C. (2010) Traceability (Product Tracing) in Food Systems: An IFT Report Submitted to the FDA,
Volume 1: Technical Aspects and Recommendations.
[12] FAO (2014) Policy and governance in aquaculture Lessons learned and way forward. [13] Lewis, S. (2015) Latest
round of IUU red and yellow cards issued by the European Commission. FishWise.
[14] Panel discussion Schram, E., 25 November 2015, Wageningen, the Netherlands. Interviewees: Stoffelen, T.,
Winkelhuijzen, R., Kempchen, L., Ching, A.
[15] Mariani, S., Griffiths, A. M., Velasco, A., Kappel, K., Jérôme, M., Perez-Martin, R. I., ... & Boufana, B. (2015).
Low mislabeling rates indicate marked improvements in European seafood market operations. Frontiers in Ecology
and the Environment, 13(10), 536-540.
[16] WWF (2015). Illegal Fishing: Which fish species are at highest risk from illegal and unreported fishing?
[17] FAO, 2007, The State of World Fisherie and Aquaculture, Rome
[18] Diana, J. S. (2009). Aquaculture production and biodiversity conservation.Bioscience, 59(1), 27-38.
[19] Tacon, A. G. J. (2004). Use of fish meal and fish oil in aquaculture: a global perspective. Aquatic Re- sources,
Culture and Development, 1(1), 3-14.
[20] Claret, A., Guerrero, L., Ginés, R., Grau, A., Hernández, M. D., Aguirre, E., ... & Rodríguez-Rodríguez, C. (2014).
Consumer beliefs regarding farmed versus wild fish. Appetite, 79, 25-31.
[21] Wognum, P. N., Bremmers, H., Trienekens, J. H., van der Vorst, J. G., & Bloemhof, J. M. (2011). Systems for
sustainability and transparency of food supply chains– Current status and challenges. Advanced Engineer- ing
Informatics, 25(1), 65-76.
[22] Van Rijswijk, W., & Frewer, L. J. (2008). Consumer perceptions of food quality and safety and their rela- tion to
traceability. British Food Journal, 110(10), 1034-1046.

207
[23] Mol, A.P.J., and Oosterveer, P. (2015) Certification of Markets, Markets of Certificates: Tracing Sustain- ability in
Global Agro-Food Value Chains. Sustainability through the Lens of Environmental Sociology
[24] Olsen, P., & Borit, M. (2013). How to define traceability. Trends in Food Science & Technology, 29(2), 142-150.
[25] Interview Kannuchamy, N., 15 December 2015, written response to questionnaire, interviewee: Winkel- huijzen, R.
[26] Gray, T. (2005). Participation in fisheries governance (Vol. 4). Springer Science & Business Media.
[27] Bush, S. R., Belton, B., Hall, D., Vandergeest, P., Murray, F. J., Ponte, S., ... & Kruijssen, F. (2013). Certify sus-
tainable aquaculture. Science, 341(6150), 1067-1068.
[28] Interview Geerts, B., 1 December 2015, Utrecht, the Netherlands, interviewees: Stoffelen, T., Burik, van, M.,
Winkelhuijzen, R.
[29] Interview Staniford, D., 16 November 2015, Skype interview, interviewees: Huisman, Y., Winkelhuijzen, R.,
Schmitz, L.
[30] Panel discussion, 2 December 2015, Wageningen, the Netherlands. Interviewees: Winkelhuijzen, R., Stof- felen,
T., Kempchen, L.
[31] Kassam, L., Subasinghe, M., Phillips, M. (2011) Aquaculture farmer organizations and cluster manage- ment
Concepts and experiences. FAO Fisheries and aquaculture technical paper 563.
[32] Stringfellow, R., Coulter, J., Hussain, A., Lucey, T., & McKone, C. (1997). Improving the access of small- holders
to agricultural services in sub-Saharan Africa. Small Enterprise Development, 8(3), 35-41.
[33] Martinsohn, J. T. (2011). Deterring illegal activities in the fisheries sector.European Commission-Joint Re- search
Centre, 72.
[34] Martinsohn, J., & Brereton, P. (2013). Using new analytical approaches to verify the origin of fish. New Analytical
Approaches for Verifying the Origin of Food, 189.
[35] Griffiths, A. M., Sotelo, C. G., Mendes, R., Pérez- Martín, R. I., Schröder, U., Shorten, M., ... & Mariani, S.
(2014). Current methods for seafood authenticity testing in Europe: Is there a need for harmonisation?. Food
Control, 45, 95-100.
[36] De Battisti, C., Marciano, S., Magnabosco, C., Busato, S., Arcangeli, G., & Cattoli, G. (2013). Pyrose- quencing as
a Tool for Rapid Fish Species Identification and Commercial Fraud Detection. Journal of agri- cultural and food
chemistry, 62(1), 198-205.
[37] Galal-Khallaf, A., Osman, A. G., Carleos, C. E., Garcia- Vazquez, E., & Borrell, Y. J. (2016). A case study for
assessing fish traceability in Egyptian aquafeed formulations using pyrosequencing and metabarcoding. Fisheries
Research,174, 143-150.
[38] Interview Leal, M., 11 December 2015, Skype interview, interviewees: Winkelhuijzen, R., Burik, van, M.
[39] Campana, S. E. (2005). Otolith science entering the 21st century. Marine and Freshwater Research.
[40] Myhre, B., Netland, T., Vevle, G., (2009) The footprint of food – a suggested traceability solution based on EPCIS.
In: Proceedings of the 5th European Workshop on RFID Systems and Technologies (RFID SysTech 2009), Bremen,
Germany.
[41] Mol, A. P., & Oosterveer, P. (2015). Certification of Markets, Markets of Certificates: Tracing Sustainability in
Global Agro-Food Value Chains.Sustainability, 7(9), 12258- 12278.
[42] Sarac, A., Absi, N., & Dauzère-Pérès, S. (2010). A literature review on the impact of RFID technologies on supply
chain management. International Journal of Production Economics, 128(1), 77-95.
[43] Regattieri, A., Gamberi, M., & Manzini, R. (2007). Traceability of food products: General framework and
experimental evidence. Journal of food engineering,81(2), 347-356.

208
[44] Michael, K., & McCathie, L. (2005, July). The pros and cons of RFID in supply chain management. In Mo- bile
Business, 2005. ICMB 2005. International Conference on (pp. 623-629). IEEE
VI. Big data
209
Balancing Big Data and the Right to Health: Strategies for Maximising Ethical and Sustainable
Impact
Policy Brief - 2016 Update
Lucy Fagan, Global Health Next Generation Network
Introduction
In the field of health care, the question of who – frontline doctors or data – should decide which patients
receive what kinds of care has been the subject of many debates in recent years (Pulitzer Center, 2016).
Meanwhile, the advent of “big data” has transformed the volume, velocity, and character of the information
that we are able to procure regarding virtually every aspect of human life (Boyd & Crawford, 2012). These
large datasets, along with dramatic advances in computational power, have allowed us the capacity to collect
and analyse data on an unprecedented scale, linking and comparing vast quantities of previously
incomparable data that can now be used to provide evidence to inform policies and practices (Lazer, 2009;
Boyd & Crawford, 2012).
Big data provides an opportunity to reduce cost and time of monitoring and evaluation by transforming the
ways in which we assess policies and programs (Raghupathi & Raghupathi, 2014; Groves, 2013). It also
offers the opportunity to create efficiencies and identify trends and opportunities that would otherwise go
unnoticed (Murdock & Detsky, 2013). This data, which is drawn from our mobile phones, web searches,
health records, and beyond, seeps into nearly every facet of our digital lives (Klauser & Albrechslund, 2013).
But not all persons live digital lives, and for these individuals, the era of big data can mean their fall into
obscurity. As the world advances scientifically and technologically, countries face a difficult challenge in
thinking beyond automated data and cost-effectiveness findings to ensure that no one is left behind.
Arguments have been made that big data should not be the sole basis for priority-setting and decision-
making. Context matters too, but this may be lost in datasets where the value of life has been reduced to
statistics and numerical values. Using big data requires critical thought on the quality of our sources, the
assumptions inherent in the questions
we ask and the conclusions we draw, and how the available information fits within the goals and objectives
of the program or policy in question (Boyd & Crawford, 2012). Perhaps more importantly than what the data
captures is what it doesn’t capture: groups of people who are excluded from collection mechanisms because
of circumstances of poverty, geography, or culture.
To maximise the positive impact of big data, it is important to know both the potential and the bounds of
these datasets, the methods used to gather and analyse them, and the ways in which they are interpreted. By
prioritising the universal right to health, leveraging the expertise of multi-sectoral teams through team
science and translational science, and using data wisely, it is possible to advance our capacity to make data-
driven decisions in a way that is equitable, ethical, just, and sustainable.
Limitations of Big Data for Health Policymaking
Using big data has many advantages: these datasets are often integrated into existing systems, thus reducing
the burden of collection, and the algorithm-based functioning of many analytic processes allows for vast
quantities of data to be gathered and reported in real-time. The advantages of this type of information are not
to be understated.
210
However, this readily accessible data may not always capture the variables that we want or need to know in
order to draw accurate and representative conclusions, and quantity of data does not necessarily equate to
quality of data (Boyd & Crawford, 2012). Automatically aggregated data or poorly constructed analytic
frames may be susceptible to biases, weaknesses, and inferences (Lazer et al., 2014).
More importantly, we must consider what - and whom - is obscured by our usage of these large-scale
datasets. Country-level data, for example, may obscure dramatic regional or socioeconomic variations;
similarly, if analytic frames are not sufficiently calibrated to account for important subgroups, big data may
miss subtle trends. Certain segments of the population may not contribute to the data pool, including those
without access to the technology used to collect data. Others, such as minority populations or those
experiencing rare health conditions, may not register as significant in the scope of all of the data collected,
and thus, may not garner the appropriate attention. Though they are not unique to big data, these absences
and failures in representation pose serious concerns.
Ethical Dilemmas at the Nexus of Big and Small Data
Consent, privacy, and security are among the primary issues with implementation of these data collection and
analytic schemes; these concerns extend to the implementation of predictive analytic models (Cohen et al,
2014). Individuals may not always comprehend the extent to which they are providing data, or anticipate
how that data will be used, and health information is a particularly sensitive subject (Cate & Mayer-
Shönberger, 2014). As these datasets become increasingly detailed and connected, and thus data points
become increasingly personally identifiable, security becomes an even larger concern. Information in these
datasets has high black-market value. If data cannot be collected with truly informed consent, and protected
sufficiently, it is irresponsible and unethical to gather and use this data.
These datasets are frequently used to prioritise issues and make programming decisions; cost- effectiveness
is a major aspect of these conversations and the subject of many discussions on ethics (Pinkerton et al.,
2002). The means by which we determine whether or not a policy, program, or procedure is cost-effective
are complicated, and the determinations we make are ultimately heavily entrenched within our own value
systems. When a program is more effective, but more expensive (or alternatively, less effective but less
expensive), a value judgement must be made on whether or not to allocate resources to that program or to an
alternative. These evaluations come with
their own set of ethical quandaries, and the fact that an initiative is determined to be cost-effective does not
mean that funds are available to operationalise it. Ultimately, cost-effectiveness may not always be the best
measure for determination of whether a program or policy should be implemented; there may be times when
a cost-ineffective measure is critical for development of infrastructure or simply for providing high-quality
care to patients.
However, these value judgements, which are made on a macro-scale, do not always translate well to health
care providers making decisions about care on the ground. These health care providers have a professional
mandate to heal and provide healthcare to care-seeking patients, a value system which may lead to actions
which are inconsistent with what is indicated based on a big data driven decision-making strategy.
Recommendations
Foremost, keep people at the centre of health policymaking and decisions: health is a UN-affirmed human
right, and should be prioritised as such (United Nations, 1948). While strategic resource allocation is
211
important, policymaking should focus more on how to provide health care than for which types of health
issues to provide care. There is a fundamental difference between choosing the most cost-effective strategy
for targeting a particular health problem, and choosing which health problem is most cost-effective to target.
Ultimately, all humans have a right to health irrespective of their socioeconomic status, their geographic
location, or the cost-effectiveness of their condition. In denying the universal right to human health, we
purposefully exclude certain groups of people from accessing the care they need.
Second, leverage multi-sectoral expertise: collaborative expertise is critical in designing comprehensive data
collection and analytic systems, in ensuring equitable analytic frames, and developing actionable and
sustainable evidence- based policy. Team science, in which teams are comprised of scientists from across a
variety of fields, will be especially critical in ensuring that big data is collected, analysed, and interpreted in a
way which is equitable, particularly because scientists and program managers from a diverse array of
backgrounds have a stake in the development and use of these data systems. Translational science, which
focuses on strategically applying innovative research to meaningful and actionable policy, is likewise an
essential area of focus for both scientists and policymakers. Training for young scientists should emphasise
not only cross-disciplinary engagement but also tools for the application and dissemination of research to
policymakers and program managers.
Finally, be attentive: big data needs to be gathered, analysed, and used wisely. These datasets should be used
to supplement existing data collection mechanisms rather than to substitute for them, not only as a means of
maintaining quality of data but also as a mechanism for inclusion of all populations. Strengthening measures
to protect patient consent and privacy are critical. To manage the ethical dilemmas which permeate the
process of health care decision making, data collection, and analytics, as well as policy development,
rigorous ethics training will be valuable not only for young scientists but also for seasoned professionals and
policymakers. Application of data-drawn conclusions should be done with an awareness of the assumptions
inherent in the mechanisms of collection, the analytic methods, and the inherent biases in conclusions drawn.
Big data is transforming the ways in which we engage with human health; in order to ensure that it is done in
a way which is equitable and sustainable, we must be conscious of the way in which we gather, analyse, and
utilise the information we glean.
References
Boyd & Crawford (2012) Critical Questions for Big Data (http://www.tandfonline.com/doi/pdf/10.1080/136
9118X.2012.678878)
Cate & Mayer-Shönberger (2014). Notice and Consent in a World of Big Data
(http://idpl.oxfordjournals.org/content/3/2/67.abstr act)
Cohen et al. (2014) The Legal and Ethical Concerns that Arise from Using Complex Predictive Analytics in Health Care
(http://content.healthaffairs.org/content/33/7/1139 .abstract)
Groves et al. (2013) The ‘Big Data’ Revolution in Healthcare: Accelerating Value and Innovation
(http://www.pharmatalents.es/assets/files/Big_Data _Revolution.pdf)
Klauser & Albrechtslund (2014) From Self-Tracking to Smart Urban Infrastructures: Towards an Interdisciplinary
Research Agenda on Big Data (http://library.queensu.ca/ojs/index.php/surveillanc e-and-
society/article/view/infrastructures/infrastructure)
Lazer et al. (2014) The Parable of Google Flu: Traps in Big Data Analysis
(http://gking.harvard.edu/files/gking/files/0314polic yforumff.pdf?m=1394735706)
212
Lazer et al. (2009) Computational Social Science (http://science.sciencemag.org/content/323/5915/7 21)
Murdoch & Detsky (2013) The Inevitable Application of Big Data to Health Care
(http://jama.jamanetwork.com/article.aspx?articleid =1674245)
Pinkerton et al. (2002) Ethical Issues in Cost- Effectiveness Analysis (https://www.uic.edu/sph/prepare/courses/chsc433
/pinkerton.pdf)
Pulitzer Center (2016) The Life Equation (http://pulitzercenter.org/project/life-equation)
Raghupathi & Raghupathi (2014) Big Data Analytics in Healthcare: Promise and Potential
(http://www.hissjournal.com/content/2/1/3)
United Nations (1948) Universal Declaration on Human Rights, Article 25 (http://www.un.org/en/universal-declaration-
human-rights/)
213
Thoughts on Big Data and the SDGs
Policy Brief, 2015
Emmanuel Letouzé
In recent months the broad question of whether and how Big Data could contribute to the SDGs—in other
words the intersection of these two hot topics in the public development discourse—has received significant
attention. Much of this attention focuses on ways in which Big Data may help monitor the SDGs—with
examples of such uses being routinely put forward, in the area of poverty monitoring using cell-phone
activity for instance.
Measuring human outcomes using new kinds of data emitted by humans—the bulk of which corresponds to
what Sandy Pentland has referred to as ‘digital breadcrumbs’, passively emitted structured data like credit
card of phone transactions—is indeed an area with considerable promise. But it also carries significant
challenges and uncertainties, risks even, and this approach alone does not cover the whole spectrum of ways
in which Big Data as a new ecosystem could contribute to or hamper human progress as called for by the
SDGs.
To get a good understanding of the full scope of the question, it is useful to unpack its terms and expose and
discuss its underlying assumptions first, and limitations then.
For the most part, the ‘Big Data and SDG’ question is framed as a measurement issue—a monitoring issue. It
reflects the argument that new kinds of digital data, structured (such as call detail records) and unstructured
(like the content of tweets) could be analyzed to ‘say something’—complement, substitute—other more
traditional ways of measuring facets of human reality, be it mortality, violence, hunger, etc. As hinted above,
there is already a non-insignificant body of evidence that Big Data indeed holds this potential—as the
examples listed in the attached table summarizes quite well.
Some sectors and related SDGs seem more amenable than others to being monitored through Big Data—
notably those that are (1) correlated with data production of some kind (we all pay greater attention to our
phone of electricity consumption when facing financial constraints) and (2) that are currently monitored
through traditional means (providing ground truth). It is also possible if not probable that SDGs deemed
‘important’ will receive greater attention. At the same time it is also acknowledged that social media chatter
and use hold potential in the realm of social cohesion analysis falling under goal 16, for instance, as does
criminality prediction. In that sense Big Data could be quite applicable to ‘new’ kinds of sectors and goals. It
is also worth noting that other uses—such as the tracking of Illegal, Unreported and Unregulated (IUU)
fishing through satellite imagery analysis—is already a reality, and could become standard practice in the
next few years in some regions.
By and large, the measurement approach further suggests—is based on the assumption, rather—that one can
only manage what one can measure, and that measuring goes a long way towards impacting. This double
assertion of course comes with lots of caveats in terms of what is necessary vs. sufficient etc., but the SGDs,
as the MDGs before them, would not exist in the absence of a broad consensus on the fact that monitoring a
variable (measuring and tracking) has a causal although indirect effect on what is measured, because it can
be used for advocacy purposes, shapes incentives and policies etc. This is of course best evidenced by the
214
case of GDP, which since its invention in the 1930s following the Great Depression, has become the alpha of
omega of economic policies—making its presence so central it need not be mentioned (rather we talk about
‘growth’, or ‘the economy’). And indeed governments have since the designed policies primarily meant to
increase a variable created because it was easy to measure in an industrial era.
An example of the importance of measurement is what happens to outcomes that are cannot or are not
measured—which are by definition or design statistically invisible: the ecologically detrimental effects of pro
(GDP) growth policies are now well known, and led to the development of sustainability indicators (some of
which capturing fiscal sustainability that take into account national savings and investment). And so it is hard
to deny that measuring matters, or can matter. But it is neither a sufficient—which everybody agrees with—
nor a necessary condition, which I will come back to, and it also very much depends on the quality of the
measurement—where ‘quality’ refers to the ‘qualitative nature’ of the measurement, including but beyond its
being accurate vs. inaccurate, considering process and agent issues.
If we stay for a moment in this realm of ‘SDG monitoring through Big Data’, a few technical and
institutional considerations are worth making. First, it is well know and understood now that not everybody
has a cell phone, or uses Twitter, such that Big Data streams and sets, even with huge N, are typically non
representatives samples of the entire populations of interest. Sample bias correction methods are being
developed, which typically require ground truthing data to be tested. This stream of work will use a blending
of statistical hypothesis based approaches (we can assume that Twitter data is even less representative in
Niger than in Norway) and machine-learning techniques (we may find that geographic elevation plays a
significant role in determining the size and sign of sample bias when using cell-phone data activity to infer
population density for instance). A lot of investments and work will need to go into developing robust
methods of that kind if Big Data is to be used widely for monitoring purposes on a sustained basis.
Another related challenge is access to the data—to the ‘Big Data’—in a sustainable and stable manner. At
the minute, a large chunk of what is commonly referred to as Big Data is ‘owned’—or rather, ‘held’, by
private sector companies. The data provided to outside organizations and individuals are often aggregated
and ‘anonymized’ (although we also know the concept itself is problematic2) as part of data challenges, or
through personal connections; in some cases they can only be accessed on site.
There are of course good reasons not to share all personal data publically, but the point is that the current
way data sharing is done is ad hoc, unstable (in the sense that it offers little predictability on future data
access) and unsustainable (it will not last). The development community is already eager to develop and test
innovative approaches to SGD monitoring, and this will be done through dedicated, small, pilots in most
cases. It will be important to ensure that issues of data access and stability are ‘internalized’ in developing
and planning for the uptake of these pilots.
Another important and also related consideration that veers into political territories is that of rights to the
data. Holding and owning are different concepts; a bank holds our money but does not own it. It can use and
generate value from it by investing it, but it stays ours (hopefully). The analogy is not water-tight but there is
currently a great deal of thinking around the future of the global data system’s legal architecture, starting
with a greater recognition that people should have greater control of the rights to their data—the data they
emit. What a ‘New Deal on Data’ may exactly look like is yet unclear, but what is certain is that it won’t
look like today’s patchy and blurry landscape. Either because ‘we’ have collectively found ways to collect,
store and share people’s data in ways they are broadly happy with, or because the system will shut down, or
implode.
215
Let’s reiterate the initial question and turning to the other side of the coin, or rather to other pieces of the
puzzle: How can/could Big Data contribute to the SDGs; i.e. how could Big Data improve the outcomes
measured by the SDGs. One way is by contributing to monitoring these SDGs, as we have just discussed.
But as mentioned too, monitoring alone is not sufficient, and the specific question of how and by whom
measurements can be leveraged to influence policies is still largely open, and part of the larger question.
For one, there will or could still be tensions between SDGs that simply monitoring all of them in the best of
ways won’t address. Groups will also denigrate some of the goals and play on these tensions (arguing that
environmental protection comes at the expense of poverty eradication for instance). So, politics will still be
part of the picture, in ways that will be even more complex if and as ‘we’ have more goals and (possibly)
better measures of progress towards them. Arbitrating will not be smooth, for sure.
There is also the added and centrally important fact that Big Data is not just big data—but also tools and
techniques that are largely developed and mastered outside the reach and realm of traditional policymaking. I
have argued that Big Data is best captured through its 3Cs of Crumbs (data), Capacities (tools and methods)
and Community (that of emitters, analysts and users—the human element). Considering Big Data as that
(complex) system made up of these interlaced interacting elements—the data, the tools and methods and the
people—adds depth and breath to the question. It brings up other questions.
A first subsequent question is who will be using Big Data to do the monitoring? Will it still be governments?
UN agencies? Private companies? Specialized NGOs? A combination of all under new Public-Partner (or
Public-Partner-People) Partnerships? How, when? This clearly gets to the institutional shift that may arise
with the rise of Big Data as an ecosystem; not just making is possible and/or easier to monitor better using
the same actors and channels as before, the same system, but by bringing out a whole new system.
Another related question is: how could Big Data contribute directly to the SDGs—irrespective of their
exogenous monitoring, endogenously, so to speak? It is often assumed, as discussed above, that poverty can
be to a good extent causally attributed to poor poverty data, such that getting better poverty data would
contribute to reducing the object or outcome it measures—poverty—through some channels. But—and this is
where the unnecessity argument comes in—measuring is not the only way to incentivize and spur change; if
Norway stopped measuring children mortality rates for 10 years it is doubtful that it would increase, and it
may keep decreasing as it has for decades.
There are several ways in which Big Data—both as data and more importantly as an ecosystem—could
contribute to socioeconomic changes that would positively affect the outcomes captured in the SDGs. One is
by leading to changes in traffic laws and behaviors that would curb congestion for instance. This example
shows that it is not all about policies but can affect change through people’s behaviors directly. Although
hard if not impossible to quantify, it is likely that a good share of the direct positive effect of Big Data on
outcomes measured by the SDGs will be attributable to non-policy actions—simply by people using insights
and suggestions derived from Big Data (Google Maps estimates, algorithmic recommendations of when to
see a doctor..) that are largely unrelated to policies. Still, these are in the realm of ‘applications’—ways in
which Big Data helps ‘do stuff, concrete tasks, more effectively etc.
Another means through which Big Data will impact outcomes is through is effect on people’s empowerment.
Big Data can definitely disempower people—with the technocrato-technological notion that it will provide a
36,000-foot and 360-degree solution to all of the world’s problems, and that ‘people’ cannot and need not
understand Big Data, which enlightened leaders will best know how to use for the greater good (a real issue
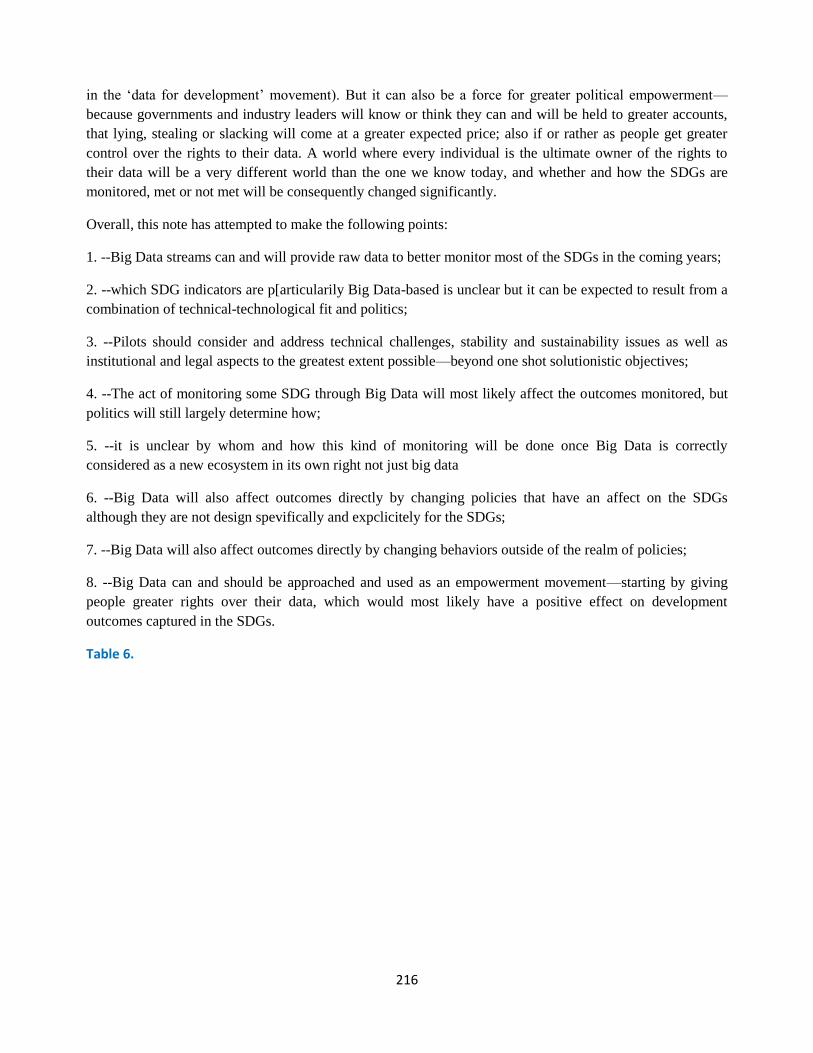
216
in the ‘data for development’ movement). But it can also be a force for greater political empowerment—
because governments and industry leaders will know or think they can and will be held to greater accounts,
that lying, stealing or slacking will come at a greater expected price; also if or rather as people get greater
control over the rights to their data. A world where every individual is the ultimate owner of the rights to
their data will be a very different world than the one we know today, and whether and how the SDGs are
monitored, met or not met will be consequently changed significantly.
Overall, this note has attempted to make the following points:
1. --Big Data streams can and will provide raw data to better monitor most of the SDGs in the coming years;
2. --which SDG indicators are p[articularily Big Data-based is unclear but it can be expected to result from a
combination of technical-technological fit and politics;
3. --Pilots should consider and address technical challenges, stability and sustainability issues as well as
institutional and legal aspects to the greatest extent possible—beyond one shot solutionistic objectives;
4. --The act of monitoring some SDG through Big Data will most likely affect the outcomes monitored, but
politics will still largely determine how;
5. --it is unclear by whom and how this kind of monitoring will be done once Big Data is correctly
considered as a new ecosystem in its own right not just big data
6. --Big Data will also affect outcomes directly by changing policies that have an affect on the SDGs
although they are not design spevifically and expclicitely for the SDGs;
7. --Big Data will also affect outcomes directly by changing behaviors outside of the realm of policies;
8. --Big Data can and should be approached and used as an empowerment movement—starting by giving
people greater rights over their data, which would most likely have a positive effect on development
outcomes captured in the SDGs.
Table 6.
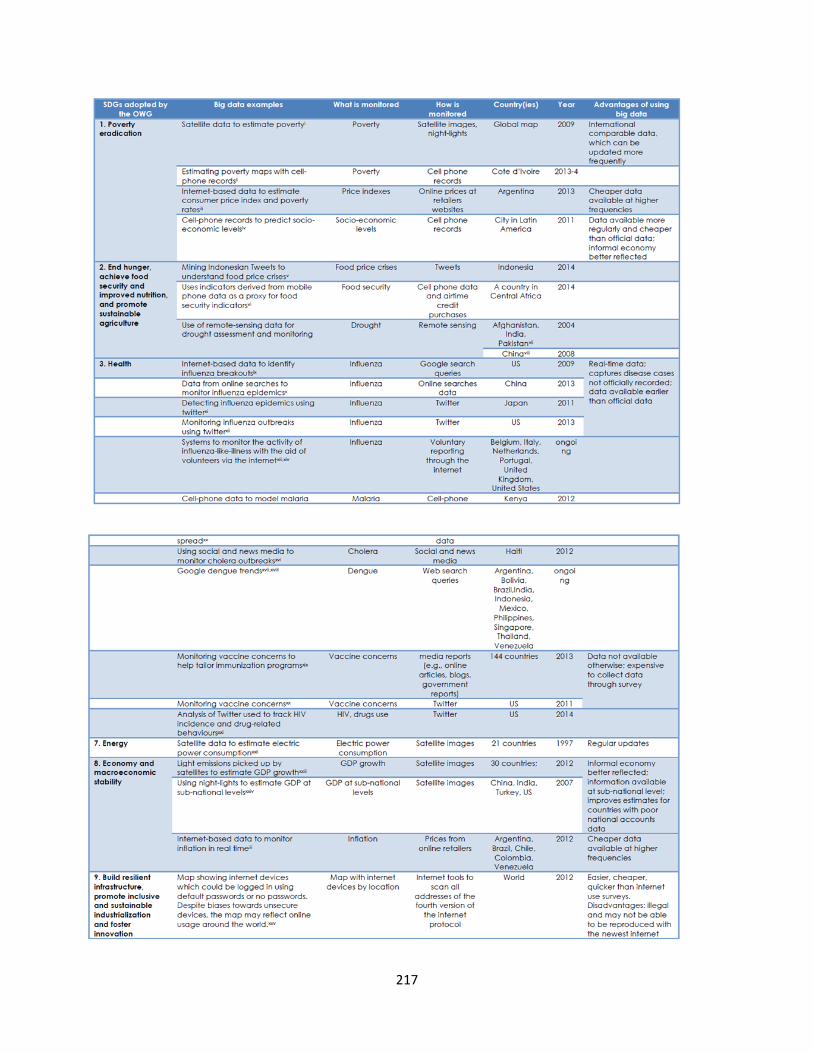
217
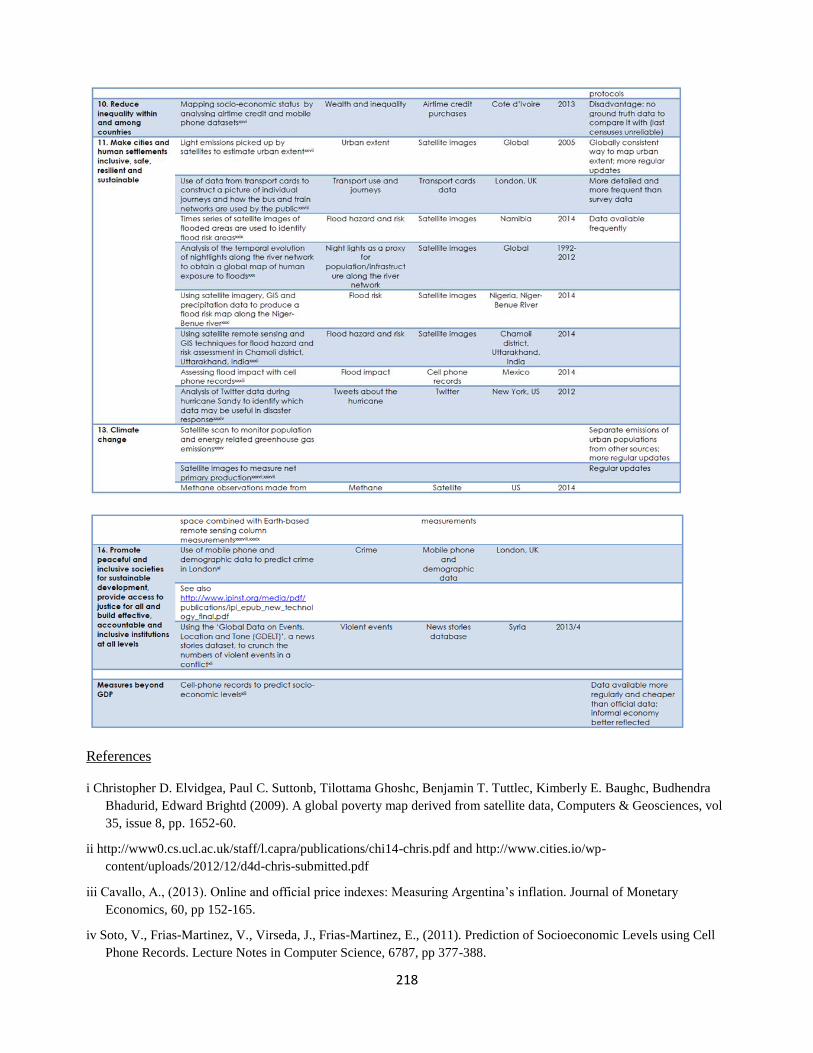
218
References
i Christopher D. Elvidgea, Paul C. Suttonb, Tilottama Ghoshc, Benjamin T. Tuttlec, Kimberly E. Baughc, Budhendra
Bhadurid, Edward Brightd (2009). A global poverty map derived from satellite data, Computers & Geosciences, vol
35, issue 8, pp. 1652-60.
ii http://www0.cs.ucl.ac.uk/staff/l.capra/publications/chi14-chris.pdf and http://www.cities.io/wp-
content/uploads/2012/12/d4d-chris-submitted.pdf
iii Cavallo, A., (2013). Online and official price indexes: Measuring Argentina’s inflation. Journal of Monetary
Economics, 60, pp 152-165.
iv Soto, V., Frias-Martinez, V., Virseda, J., Frias-Martinez, E., (2011). Prediction of Socioeconomic Levels using Cell
Phone Records. Lecture Notes in Computer Science, 6787, pp 377-388.
219
v http://www.unglobalpulse.org/sites/default/files/Global-Pulse-Mining-Indonesian-Tweets-Food-Price-
Crises%20copy.pdf
vi A Decuyper, A Rutherford, A Wadhwa, JM Bauer, G Krings, T Gutierrez, ... (2014). Estimating Food Consumption
and Poverty Indices with Mobile Phone Data. http://arxiv.org/pdf/1412.2595.pdf
vii Thenkabail,P.S., Gamage,M.S.D.N.and Smakhtin,V.U. (2004). The Use of Remote Sensing Data for Drought
Assessment and Monitoring in Southwest Asia. International Water Management Institute, Research Report 85.
http://www.iwmi.cgiar.org/Publications/IWMI_Research_Reports/PDF/pub085/RR85.pdf
viii Renhua Zhang, Hongbo Su, Jing Tian, Zhaoliang Li, Shaohui Chen, Jinyan Zhan, Xiangzheng Deng, Xiaomin Sun,
and Jianjun Wu (2008). Drought Monitoring in Northern China based on Remote Sensing Data and Land Surface
Modeling. Geoscience and Remote Sensing Symposium, 2008. IGARSS 2008. IEEE International, Volume: 3.
https://www.researchgate.net/publication/224383482_Drought_Monitoring_in_Northern_China_based_on_Remote_
Sensing_Data_and_Land_Surface_Modeling
ix Ginsberg, J. , Mohebbi, M. H., Patel, R. S., Brammer, L., Smolinski, M. S., Brilliant, L., 2009. Detecting influenza
epidemics using search engine query data. Nature, 457, pp 1012-1014.
x Yuan, Q., et al. (2013). "Monitoring influenza epidemics in china with search query from baidu." PLoS One 8(5):
e64323.
xi Aramaki E, Maskawa S, Morita M. Proceedings of the conference on empirical methods in natural language
processing. Edinburgh: Association for Computational Linguistics; 2011. Twitter catches the flu: detecting influenza
epidemics using Twitter. Available at: http://www.aclweb.org/anthology/D/D11/D11-1145.pdf
xii Lamb, A., et al. (2013). "Separating Fact from Fear: Tracking Flu Infections on Twitter." North American Chapter of
the Association for Computational Linguistics (NAACL), 2013.
xiii www.influenzanet.eu
xiv www.flunearyou.org
xv Wesolowski, A., Eagle, N., Tatem, A. J., Smith, D. L., Noor, A. M., Snow, R. W., Buckee, C. O., (2012).
Quantifying the impact of human mobility on malaria. Science, 338(6104), pp 267-270.
xvi Chunara, R., et al. (2012). "Social and news media enable estimation of epidemiological patterns early in the 2010
Haitian cholera outbreak." Am J Trop Med Hyg 86(1): 39-45.
xvii http://www.google.org/denguetrends/intl/en_us/
xviii Emily H. Chan, Vikram Sahai, Corrie Conrad, John S. Brownstein (2011). Using web search query data to monitor
dengue epidemics: a new model for neglected tropical disease surveillance. PLOS Neglected Tropical Diseases,
DOI: 10.1371/journal.pntd.0001206.
xix Larson, H. J., et al. (2013). Measuring vaccine confidence: analysis of data obtained by a media surveillance system
used to analyse public concerns about vaccines. Lancet Infect Dis 13(7): 606-613.
xx Salathe, M. and S. Khandelwal (2011). Assessing vaccination sentiments with online social media: implications for
infectious disease dynamics and control. PLoS Comput Biol 7(10): e1002199.
xxi Sean D. Young, Caitlin Rivers, Bryan Lewis (2014). Methods of using real-time social media technologies for
detection and remote monitoring of HIV outcomes, Preventive Medicine, Volume 63, Pages 112-115.
xxii Elvidge, C. et al., 1997. Relation between satellite observed visible-near infrared emissions, population, economic
activity and electric power consumption. International Journal of Remote Sensing, 18(6), pp. 1373-1379.
xxiii Henderson, V., Storeygard, A. & Weil, D., 2012. Measuring Economic Growth from Outer Space. American
Economic Review, 102(2), pp. 994-1028.
220
xxiv Sutton, P., Elvidge, C. & Ghosh, T., 2007. Estimation of Gross Domestic Product at Sub-National Scales using
Nighttime Satellite Imagery. International Journal of Ecological Economics & Statistics, 8, pp. 5-21.
xxv Anonymous (2012). Internet Census 2012 Port scanning /0 using insecure embedded devices. Available at:
http://internetcensus2012.bitbucket.org/paper.html
xxvi http://arxiv.org/pdf/1309.4496.pdf
xxvii Small, C., Pozzi, F. & Elvidge, C., 2005. Spatial analysis of global urban extent from DMSP-OLS night lights.
Remote Sensing of Environment, Volume 96, pp. 277-291.
xxviii Mark Say (2014). Transport for London builds customer profiles using RFID data analytics. RFID Data
Analytics. Available at: http://www.computerweekly.com/feature/Transport-for-London-builds-customer-profiles-
using-RFID-data-analytics
xxix Skakun S1, Kussul N, Shelestov A, Kussul O. (2014). Flood hazard and flood risk assessment using a time series
of satellite images: a case study in Namibia. Risk Anal. 2014 Aug;34(8):1521-37. doi: 10.1111/risa.12156.
xxx Serena Ceola, Francesco Laio and Alberto Montanari (2014). Satellite nighttime lights reveal increasing human
exposure to floods worldwide. Geophysical Research Letters
Volume 41, Issue 20, pages 7184–7190.
xxxi A. Akinbobola, E. C. Okogbue and O. Olajiire (2014). A GIS-based flood risk mapping along the Niger-Benue
river basin in Nigeria using watershed approach. 20th International Congress of Biometeorology (28 September–2
October 2014). Available at: https://ams.confex.com/ams/ICB2014/webprogram/Paper251796.html
xxxii G.D. Bhatt, Komal Sinha, P.K. Deka, Ajay Kumar (2014). Flood hazard and risk assessment in Chamoli District,
Uttarakhand using satellite remote sensing and GIS techniques. I
Nternational Journal of Innovative Research in Science, Engineering and Technology, Vol. 3, Issue 8. Available at:
http://www.ijirset.com/upload/2014/august/39_Flood.pdf
xxxiii D Pastor-Escuredo, A Morales-Guzmán, Y Torres-Fernández, JM Bauer, ... (2014) Flooding through the lens of
mobile phone activity. Global Humanitarian Technology Conference (GHTC), 2014 IEEE, 279-286.
http://arxiv.org/ftp/arxiv/papers/1411/1411.6574.pdf
xxxiv Statistics Without Borders and Humanity Road (2013). Analysis of Twitter data during hurricane Sandy.
Available at: http://www.slideshare.net/CatGraham/swb-hr-hurricane-sandy-twitter-analysis
xxxv D.E. Elvidge et al., “Satellite inventory of human settlements using nocturnal radiation emissions: a contribution
for the global toolchest”, Global Change Biology, vol. 3 (1997), pp. 387–395. Available from
http://www.as.wvu.edu/biology/bio463/Elvidge%20et%20al%201997%20satellite%20night%20pictures.pdf
xxxvi Net primary production refers to how much carbon dioxide vegetation takes in during photosynthesis minus how
much carbon dioxide the plants release during respiration.
xxxvii See section 5.3, figure 16.
xxxviii Eric A. Kort, Christian Frankenberg, Keeley R. Costigan, Rodica Lindenmaier, Manvendra K. Dubey and Debra
Wunch (2014). Four corners: The largest US methane anomaly viewed from space. Geophysical Research Letters,
Volume 41, Issue 19, pages 6898–6903.
xxxix Oliver Schneising, John P. Burrows, Russell R. Dickerson, Michael Buchwitz, Maximilian Reuter and Heinrich
Bovensmann (2014). Remote sensing of fugitive methane emissions from oil and gas production in North American
tight geologic formations. Earth's Future, Volume 2, Issue 10, pages 548–558.

221
xl Andrey Bogomolovy, Bruno Leprix, Jacopo Staianoy, Nuria Oliverz, Fabio Pianesix, Alex Pentland (2014). Once
Upon a Crime: Towards Crime Prediction from Demographics and Mobile Data. ACM International Conference on
Multimodal Interaction (ICMI 2014). Available at: http://arxiv.org/abs/1409.2983
xli http://syria.newscientistapps.com/index.html and https://dartthrowingchimp.wordpress.com/2013/05/16/challenges-
in-measuring-violent-conflict-syria-edition/
xlii Soto, V., Frias-Martinez, V., Virseda, J., Frias-Martinez, E., 2011. Prediction of Socioeconomic Levels using Cell
Phone Records. Lecture Notes in Computer Science, 6787, pp 377-388.
222
Individual Perception of Environmental Change as Supplement to Big Data
Policy Brief - 2016 Update
Roeschel, Leibniz Centre for Agricultural Landscape Research (ZALF); Humboldt University of Berlin
Dr. Frieder Graef, ZALF, Institute of Land Use Systems
Dr. Ottfried Dietrich, ZALF, Institute of Landscape Hydrology
Meike Pendo SchaeferZALF, Institute of Landscape Hydrology
Introduction
Big datasets undeniably provide large and unprecedented opportunities for identifying, measuring, and
monitoring regional to global environmental risks. They are a fundamental asset of new technologies in
implementing SDGs to reduce vulnerabilities on a global scale. However, certain aspects of big data need to
be taken into account and reevaluated in order for the SDGs’ intention of ‘leaving no one behind’ to take
effect. A study prepared by the authors on individual perceptions of climatic and environmental change in
rural semi-arid and sub-humid Tanzania which this brief is based on showed strong deviations between
climatic and environmental data measured by regional weather stations and satellites, and local experiences
of changes in the environment (Roeschel, 2016). The interviewed individuals almost unanimously indicated
that they had perceived climatic and environmental changes in their surroundings that had affected their
water availability as well as their food security. However, scientific data showed no evident trends for
precipitation or temperature within the regions.
Environmental Perception
Changes in the environment are not only recorded by advanced technology, but also perceived by the
individual. Environmental perception has been adopted as a diagnostic tool since the UNESCO's Man and
the Biosphere program of 1968, which declared the study of environmental perception as a fundamental tool
for the management of places and landscapes (UNESCO 1968). It is an advantageous tool for diagnosing
socio-environmental issues and interlinkages (Whyte, 1977). Studies have shown that perceived changes in
the environment are instrumental towards policy design and sustainable resource management (Ayeni &
Olorunfemi, 2014; GESAMP, 1996; Weber, 2006). Even though environmental perceptions may be
categorized as subjective judgments– because they are not based on scientific quantitative methods– they are
highly important due to the incorporation of factors other methods neglect (Elliot et al. 1999). Individual
characteristics affect perceptions, but they also affect the individual’s actual food and water availability, and
consequently matter in terms of necessary political action (Eduful & Shively, 2015; Ngo & Isaacowitz 2015).
Key Findings
This brief uses the findings of empirical qualitative research conducted in six villages in rural Tanzania. In a
survey conducted by Trans-SEC, 899 male and female household heads were asked to describe climatic and
environmental changes they had perceived in their immediate surroundings over the past 20 years.
223
Region Specific Perceptions
Site-specific variables are important components that affect environmental perception (Brehm et al. 2012).
The study conducted showed that individual perception was significantly correlated to the case study site that
the respected interviewee originated from. While scientific environmental data showed highly similar trends
for both regions, individuals had a different experience of changes on the local level.
Present environmental risks within a region increase the individual's perception of other environmental
changes when a person’s livelihood highly depends on environmental stability. Those individuals from case
study sites depending on river water levels for field flooding were much more likely to perceive changes in
river water levels. Thus, information about local individual perception can help identify risks and issues
hidden in big data.
Income Specific Perceptions
It was determined that for subsistence farmers in Tanzania, the economically wealthier individual was more
likely to perceived environmental changes, but was less likely to reduce their vulnerability to these perceived
environmental changes through utilization of coping activities. This counter-intuitively implied that
household and agricultural production related assets are marginally negatively correlated with the likelihood
of a household making a change. Due to more diversified sources of income, wealthier households may
perceive themselves as more resilient to environmental shocks. Perception of environmental change rises
with income, perhaps due to a higher level of education, but the consequences of environmental change are
considered less of a risk. The less a livelihood depends on the environment for food security, the less
environmental perception will act as a warning for a critical change. As a result, the opportunity for timely
and sustainable adaptation activities may be missed.
Gender Specific Perceptions
Consistent with other studies, the results of this study support that female household heads engaged in
subsistence farming perceive environmental changes more intensely than male subsistence farmers (IFAD
2003, UN 2009). Constraints and opportunities for women's livelihood strategies and adaptive capacities are
linked to their assets and their levels of access to income and common property resources (Perez et al. 2015).
Female household heads have a workload in agricultural crop production exceeding the one of males,
increasing their vulnerability to environmental changes, and thus their perception of these changes. Because
women are deprived of certain major resources, they have different perspectives and perceptions of
constraints. Although female farmers are primary contributors to the world's food production and security,
they are frequently underestimated and overlooked in development strategies (IFAD 2003).
Limits of Big Data and the Opportunity of Individual Perceptions
While using big data presents an opportunity for environmental research and policy building in the face of
climate change, it also has its challenges and limits that could be overcome by taking into account individual
perceptions. Recording and accessing big data is subject to funding, and developing countries such as
Tanzania may not have the possibility to invest in highly advanced data collection and processing. This
would give LDC’s another disadvantage in achieving sustainable development. Recording individual
perceptions of environmental changes would be a cost-effective solution to enable policy-makers to act
without having to access big data first. Whether scientific data is available or not, vulnerabilities to
environmental changes are still present and perceived within the local community. Information on local
224
environmental perceptions could help policy makers identify pressing issues within communities that could
then be further explored with the help of big data. Due to the rapid decline in costs associated with cloud-
based computing, local research facilities have the opportunity to analyse identified perceptions of risks
further without needing access to a supercomputer.
Furthermore, certain variables may not be sufficiently measured by scientific tools, but can only be
determined through personal interaction with affected individuals. In this survey, subsistence farmers were
asked to rank how wealthy they were in comparison to others from their village. It would be difficult to
metrically measure the income of a subsistence farmer. An individual survey makes that possible.
Finally, vulnerability to climate change is subject to a multitude of factors. Climate risk cannot solely be
determined by projecting how a region will be affected by climate change in terms of temperature increase or
land-use change. Perception and the respective individual reaction must be taken into account in order to
enable the design of effective policy interventions. Only then can the implementation of SDGs hope to ‘leave
no one behind’.
Conclusion
Based on the discussion above, this brief advocates the utilization of big data for SDG implementation
together with using local data of individual perceptions and reactions to ongoing social, economic, and
environmental changes. In order to leave no one behind in the decision making process, sustainable
development needs to be implemented on the local scale in addition the regional and global level. Big
datasets have the potential to give unprecedented insight on global challenges, but are typically available for
broad regions. Meanwhile, the effects of global challenges occur on the local level and are subject to a whole
new set of variables that cannot be considered on an extensive scale. Big data should be used to support the
implementation process of SDGs, but the considered datasets should be supplemented by local data that
reflects individual vulnerabilities and challenges. Recording perceptions of i.e. climatic and environmental
change is an advantageous method to gain insight on the effects of climate change on local individuals,
especially in rural regions, where funding for big data is usually limited.
References
Ayeni, A. & F. Olorunfemi (2014): Reflections on environmental security, indigenous knowledge and the implications
for sustainable development in Nigeria. Jorind 12 (1): 46-57.
Brehm, J. et. al. (2014): Environmental concern: Examining the role of place meaning and place attachment. Society
and Natural Resources: 1-17.
Edeful, M. & D. Shively (2015): Perceptions of urban land use and degradation of water bodies in Kumasi, Ghana.
Habitat International, Accepted for publication.
Elliot, A. et. al. (1999): Acheivement goals, study strategies and exam performance: A mediational analysis. Journal of
Educational Psychology 91(3): 549-563.
GESAMP. (1996). The contributions of science to integrated coastal management. Rome. Retrieved from
http://www.fao.org/3/contents/dc824e26- b1b7-568d-8770-1f9347ecb063/W1639E00.HTM
IFAD (2003): Women as Change Agents. Report.
Ngo, N. & D. Isaacowitz (2015): Use of context in emotion perception: The role of top-down control, cue type, and
perceiver’s age. Emotion 15 (3): 292- 302.
225
Perez, C. et. al. (2015): How resilient are farming households and communities to a changing climate in Africa? A
gender-based perspective. Global Environmental Change 34: 95-107.
Roeschel, L. (2016): Perception of Environmental Changes and its Effects on Food Security and Water Availability
(Master Thesis). Humboldt University of Berlin.
UN (2009): Women, Gender Equality and Climate Change. UN Women Watch
http://www.un.org/womenwatch/feature/climate_c hange/downloads/Women_and_Climate_Change_Fa ctsheet.pdf
UNESCO (1968): UNESCO Biosphere Conference. Paris.
Weber, E. U. (2006). Experience-based and description-based perceptions of long-term risk: why global warming does
not scare us (yet). Climate Change, 77, 103–120. http://doi.org/10.1007/s10584-006-9060-3
Whyte, A. V. T. (1977). Guidelines for field studies in environmental perception. Paris. Retrieved from
http://unesdoc.unesco.org/images/0002/000247/02 4707eo.pdf
226
An Application of NASA MODIS Remote Sensing Images to A Comprehensive Estimation of
Ecological Impacts of Urban Development
Policy Brief 2015
Eigo Tateishi, Lund University
Introduction
United Nations (2014) predicts that the share of global urban population will increase from 50 % today to
approximately 70 % by 2050. Alongside with this rapid urbanization of the human society, it is estimated
that, by 2030, cities will physically expand by 1.2 million km2, which is almost same size as the Republic of
South Africa (Seto, Güneralp, and Hutyra 2012). While this outstanding growth of cities can contribute to
more economic growth as well as mitigation of global warming by promoting law-carbon, sustainable, and
climate-resilient city development (Grimm et al 2008; Rosenzweig et al 2010; Hodson & Marvin 2010; Ho et
al 2013), rapid physical expansions of cities at the expense of vegetation will not only decrease CO2
absorption capacity of the planet but also vitiate global ecosystem services (Seto, Güneralp, and Hutyra
2012).
Thus, in order to make evidence-based policies for future sustainable cities, one of the important tasks is to
grasp accurate and comprehensive pictures of urban expansions and their impacts on surrounding
environments. However, quality of data about urban expansions is not always same in all countries, political,
or institutional bodies. This can be due to the lack of financial and human resources for urban surveys, the
lack of comprehensive observation of the urban area, and/or arbitrariness of administrative borders (such as
size and definition). In this sense, developing cheaper, easier, more comprehensive, and more objective ways
of observing urban expansions and estimating their impacts is quite significant for development of
sustainable urban policies. This brief introduces one of such methods, which utilizes Moderate Resolution
Imaging Spectroradiometer (MODIS) images provided by National Aeronautics and Space Administration
(NASA) and Geographical Information Systems (GIS). This brief first explicates the method, secondly
shows its application to the case of Iskandar Malaysia urban project, Johor Bahru (J.B.), Malaysia, then
concludes the entire discussion with exploring challenges of the method.
Method
NASA provides many MODIS data products observing different features such as land cover, atmospheric
aerosol, total precipitable water, etc114. We can utilize these scientifically reliable and comprehensive data
sets free. In the method, “MOD 13 - Gridded Vegetation Indices (NDVI & EVI)” data is utilized. This set of
remote sensing images enables us to study global-wide vegetation changes with 250-m2 spatial resolution
and 16-day temporal resolution during 2000 and 2013 (currently). This data set contains two different
indices: Normalized Difference Vegetation Index (NDVI) and Enhanced Vegetation Index (EVI). Although
these two indices are complement each other (Vegetation Index & Phenology Lab n.d), EVI has some
advantages over NDVI such as reduction of atmospheric distortion and sensitivity for slight vegetation
change (Solano et al 2010). Thus, the method uses EVI images. After all images have been downloaded
using MODIS Reprojection Tool Web Interface (MRTWeb115) with required treatments, raw images are
114 http://modis.gsfc.nasa.gov/data/dataprod/index.php 115 https://mrtweb.cr.usgs.gov/
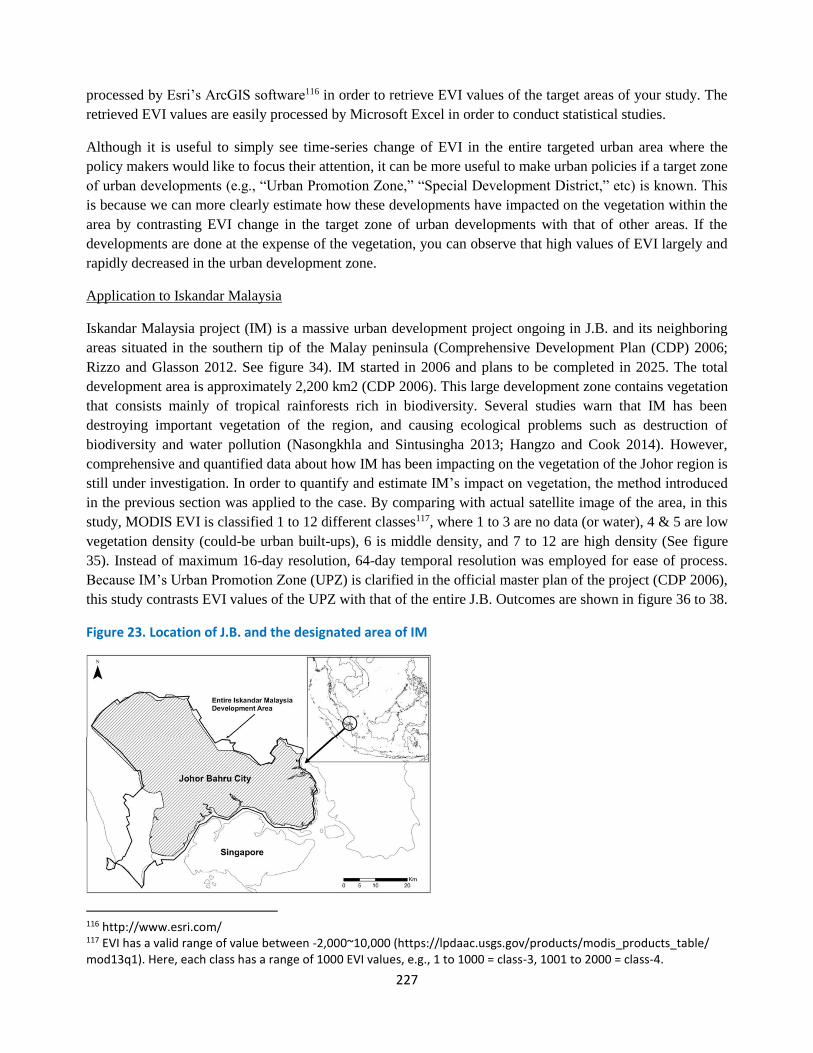
227
processed by Esri’s ArcGIS software116 in order to retrieve EVI values of the target areas of your study. The
retrieved EVI values are easily processed by Microsoft Excel in order to conduct statistical studies.
Although it is useful to simply see time-series change of EVI in the entire targeted urban area where the
policy makers would like to focus their attention, it can be more useful to make urban policies if a target zone
of urban developments (e.g., “Urban Promotion Zone,” “Special Development District,” etc) is known. This
is because we can more clearly estimate how these developments have impacted on the vegetation within the
area by contrasting EVI change in the target zone of urban developments with that of other areas. If the
developments are done at the expense of the vegetation, you can observe that high values of EVI largely and
rapidly decreased in the urban development zone.
Application to Iskandar Malaysia
Iskandar Malaysia project (IM) is a massive urban development project ongoing in J.B. and its neighboring
areas situated in the southern tip of the Malay peninsula (Comprehensive Development Plan (CDP) 2006;
Rizzo and Glasson 2012. See figure 34). IM started in 2006 and plans to be completed in 2025. The total
development area is approximately 2,200 km2 (CDP 2006). This large development zone contains vegetation
that consists mainly of tropical rainforests rich in biodiversity. Several studies warn that IM has been
destroying important vegetation of the region, and causing ecological problems such as destruction of
biodiversity and water pollution (Nasongkhla and Sintusingha 2013; Hangzo and Cook 2014). However,
comprehensive and quantified data about how IM has been impacting on the vegetation of the Johor region is
still under investigation. In order to quantify and estimate IM’s impact on vegetation, the method introduced
in the previous section was applied to the case. By comparing with actual satellite image of the area, in this
study, MODIS EVI is classified 1 to 12 different classes117, where 1 to 3 are no data (or water), 4 & 5 are low
vegetation density (could-be urban built-ups), 6 is middle density, and 7 to 12 are high density (See figure
35). Instead of maximum 16-day resolution, 64-day temporal resolution was employed for ease of process.
Because IM’s Urban Promotion Zone (UPZ) is clarified in the official master plan of the project (CDP 2006),
this study contrasts EVI values of the UPZ with that of the entire J.B. Outcomes are shown in figure 36 to 38.
Figure 23. Location of J.B. and the designated area of IM
116 http://www.esri.com/ 117 EVI has a valid range of value between -2,000~10,000 (https://lpdaac.usgs.gov/products/modis_products_table/ mod13q1). Here, each class has a range of 1000 EVI values, e.g., 1 to 1000 = class-3, 1001 to 2000 = class-4.
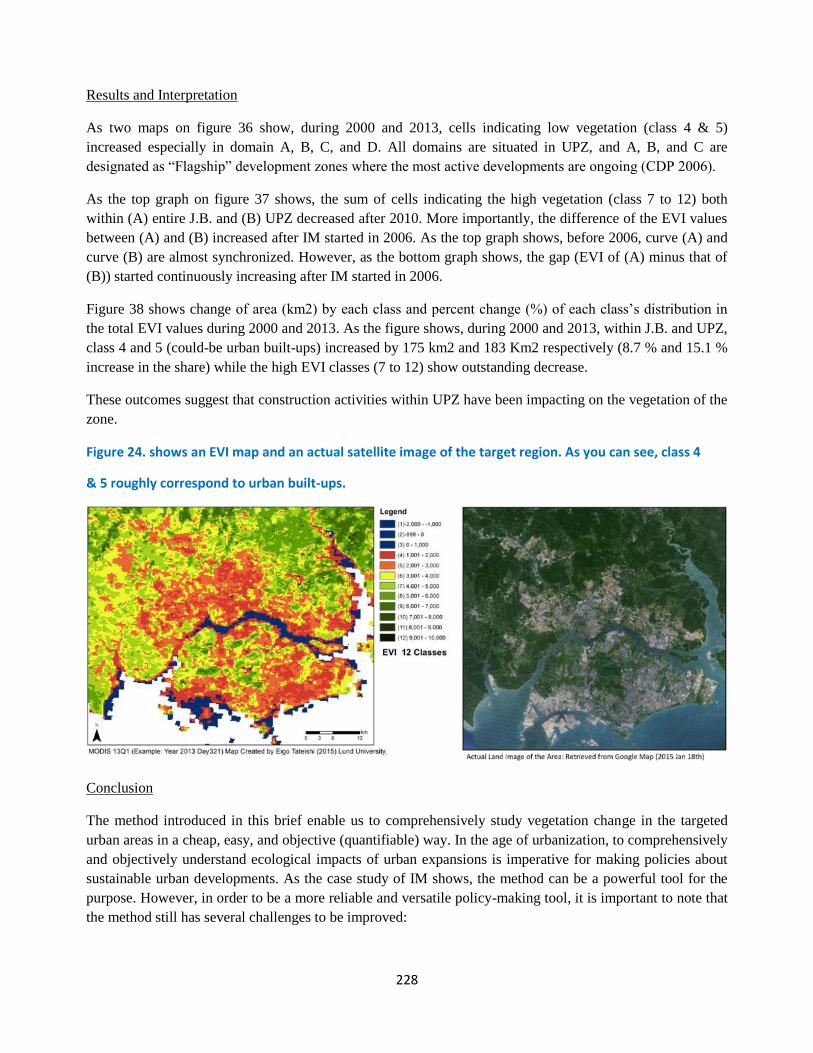
228
Results and Interpretation
As two maps on figure 36 show, during 2000 and 2013, cells indicating low vegetation (class 4 & 5)
increased especially in domain A, B, C, and D. All domains are situated in UPZ, and A, B, and C are
designated as “Flagship” development zones where the most active developments are ongoing (CDP 2006).
As the top graph on figure 37 shows, the sum of cells indicating the high vegetation (class 7 to 12) both
within (A) entire J.B. and (B) UPZ decreased after 2010. More importantly, the difference of the EVI values
between (A) and (B) increased after IM started in 2006. As the top graph shows, before 2006, curve (A) and
curve (B) are almost synchronized. However, as the bottom graph shows, the gap (EVI of (A) minus that of
(B)) started continuously increasing after IM started in 2006.
Figure 38 shows change of area (km2) by each class and percent change (%) of each class’s distribution in
the total EVI values during 2000 and 2013. As the figure shows, during 2000 and 2013, within J.B. and UPZ,
class 4 and 5 (could-be urban built-ups) increased by 175 km2 and 183 Km2 respectively (8.7 % and 15.1 %
increase in the share) while the high EVI classes (7 to 12) show outstanding decrease.
These outcomes suggest that construction activities within UPZ have been impacting on the vegetation of the
zone.
Figure 24. shows an EVI map and an actual satellite image of the target region. As you can see, class 4
& 5 roughly correspond to urban built-ups.
Conclusion
The method introduced in this brief enable us to comprehensively study vegetation change in the targeted
urban areas in a cheap, easy, and objective (quantifiable) way. In the age of urbanization, to comprehensively
and objectively understand ecological impacts of urban expansions is imperative for making policies about
sustainable urban developments. As the case study of IM shows, the method can be a powerful tool for the
purpose. However, in order to be a more reliable and versatile policy-making tool, it is important to note that
the method still has several challenges to be improved:
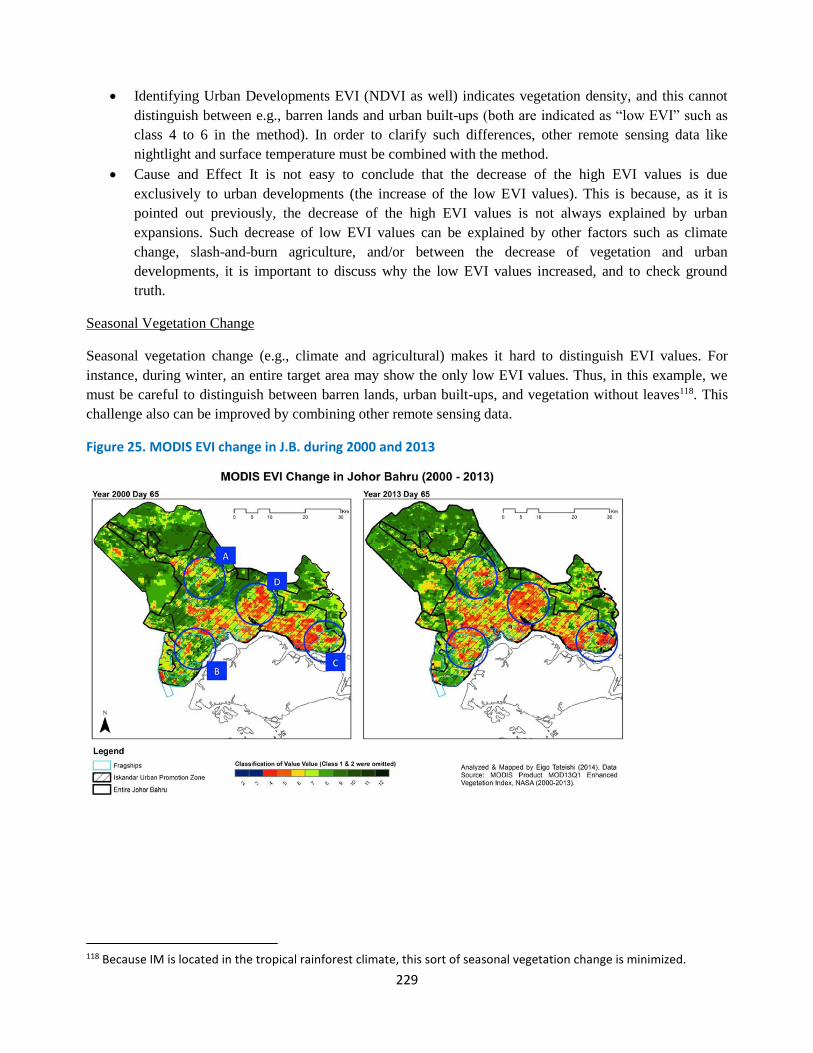
229
• Identifying Urban Developments EVI (NDVI as well) indicates vegetation density, and this cannot
distinguish between e.g., barren lands and urban built-ups (both are indicated as “low EVI” such as
class 4 to 6 in the method). In order to clarify such differences, other remote sensing data like
nightlight and surface temperature must be combined with the method.
• Cause and Effect It is not easy to conclude that the decrease of the high EVI values is due
exclusively to urban developments (the increase of the low EVI values). This is because, as it is
pointed out previously, the decrease of the high EVI values is not always explained by urban
expansions. Such decrease of low EVI values can be explained by other factors such as climate
change, slash-and-burn agriculture, and/or between the decrease of vegetation and urban
developments, it is important to discuss why the low EVI values increased, and to check ground
truth.
Seasonal Vegetation Change
Seasonal vegetation change (e.g., climate and agricultural) makes it hard to distinguish EVI values. For
instance, during winter, an entire target area may show the only low EVI values. Thus, in this example, we
must be careful to distinguish between barren lands, urban built-ups, and vegetation without leaves118. This
challenge also can be improved by combining other remote sensing data.
Figure 25. MODIS EVI change in J.B. during 2000 and 2013
118 Because IM is located in the tropical rainforest climate, this sort of seasonal vegetation change is minimized.
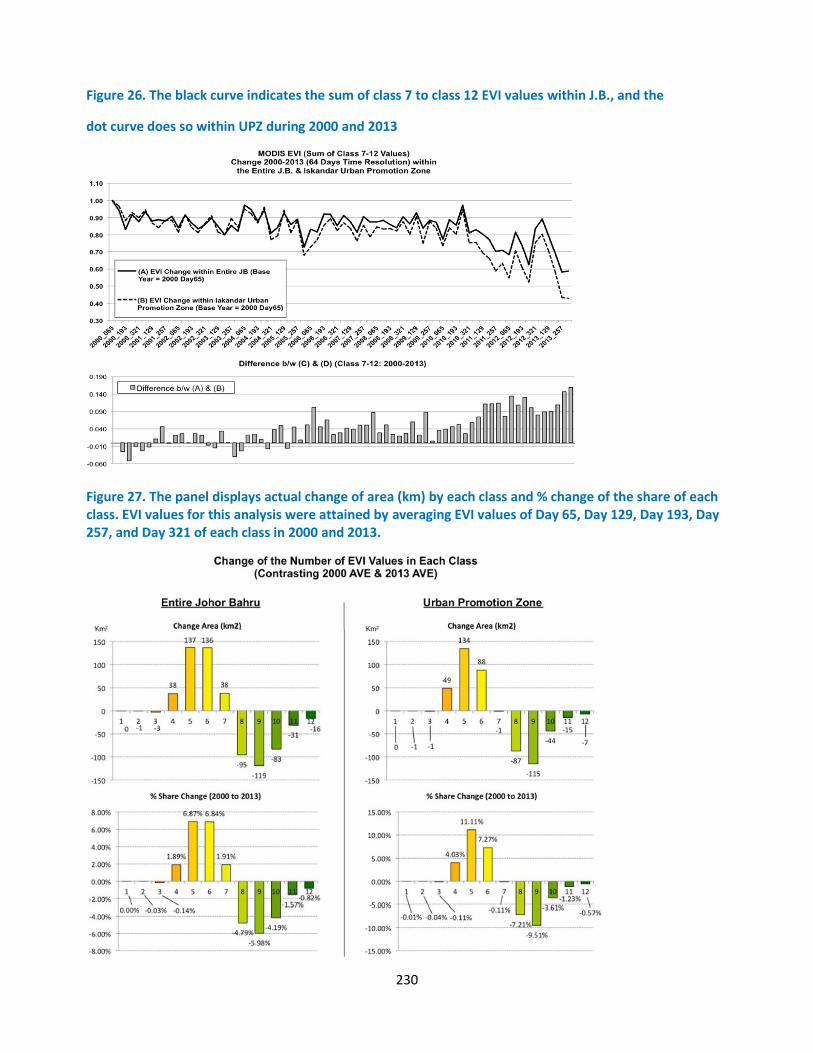
230
Figure 26. The black curve indicates the sum of class 7 to class 12 EVI values within J.B., and the
dot curve does so within UPZ during 2000 and 2013
Figure 27. The panel displays actual change of area (km) by each class and % change of the share of each class. EVI values for this analysis were attained by averaging EVI values of Day 65, Day 129, Day 193, Day 257, and Day 321 of each class in 2000 and 2013.
231
References
Collins, J.P. et al., 2000. A New Urban Ecology: Modeling human communities as integral parts of ecosystems poses
special problems for the development and testing of ecological theory.
American Scientist, 88(5), pp.416–425.
Grimm, N.B. et al., 2008. Global change and themecology of cities. Science (New York, N.Y.), 319(5864), pp.756–60.
Available at: http://www.ncbi.nlm.nih.gov/pubmed/18258902 [Accessed November 6, 2013].
Hangzo, P.K.K. & Cook, A.D.B., 2014. The rise of Iskandar Malaysia : Implications for Singapore ’ s marine and
coastal, Singapore. Available at: http://www.rsis.edu.sg/rsis-publication/nts/2449-th e-rise-of-iskandar-
malaysia/#.VL41YWSsUqc.
Ho, C.S. et al., 2013. Low carbon urban development strategy in Malaysia – The case of Iskandar Malaysia
development corridor. Habitat
International, 37, pp.43–51. Available at: http://linkinghub.elsevier.com/retrieve/pii/S0197397511001159 [Accessed
June 11, 2014].
Kahzanah Nasional, 2006. Comprehensive Development Plan: for South Johor economic region 2006-2025.
Nasongkhla, S. & Sintusingha, S., 2013. Social Production of Space in Johor Bahru. Urban Studies, 50(9), pp.1836–
1853.
Rizzo, A. & Glasson, J., 2012. Iskandar Malaysia. Cities, 29(6), pp.417–427. Available at:
http://linkinghub.elsevier.com/retrieve/pii/S0264275111000382 [Accessed June 3, 2014].
Rosenzweig, C. et al., 2010. Cities lead the way in climate-change action. Nature, 467(7318), pp.909–11. Available at:
http://www.ncbi.nlm.nih.gov/pubmed/20962822.
Seto, K.C., Güneralp, B. & Hutyra, L.R., 2012. Global forecasts of urban expansion to 2030 and direct impacts on
biodiversity and carbon pools. Proceedings of the National Academy of Sciences of the United States of America,
109(40), pp.16083–8. Available at:
http://www.pubmedcentral.nih.gov/articlerender.fcgi?artid=3479537&tool=pmcentrez&rendertype=abstract
[Accessed November 8, 2013].
Solano, R. et al., 2010. MODIS Vegetation Index User’s Guide (MOD13 Series). , 2010(May). Available at:
http://vip.arizona.edu. The University of Arizona, Vegetation Index & Phenology Lab: Nasa MODIS Project. The
University of Arizona. Available at: http://vip.arizona.edu/MODIS_Project.php[Accessed January 15, 2015].
United Nations, 2014. World Urbanization Prospects The 2014 Revision, New York.
232
Big Data for Financial Inclusion, Examining the Customer Journey
Policy Brief
UN Global Pulse, United Nations Capital Development Fund (UNCDF), Bangkok
Summary
Pulse Lab Jakarta collaborated with the UNCDF Shaping Inclusive Finance Transformations (SHIFT)
programme to undertake an analysis of financial services usage, particularly among women in the ASEAN
region. The project analysed customer savings and loan data from four Financial Service Providers (FSPs) in
Cambodia to understand the factors that affect savings and loans mobilisation, as well as how usage of these
products explains economic issues in Cambodia. Although women and men in Cambodia have equal access
to financial services, women have a lower level of financial service usage. The first phase of analysis showed
that for all FSPs, women had lower average loans and savings mobilised. The Lab is conducting a second
phase of analysis to gain further insights into women’s financial service usage and broader socioeconomic
issues.
Background
UNCDF is the UN’s Capital Development Fund. UNCDF’s Shaping Inclusive Finance Transformations
programme aims to improve the level of financial inclusion in the ASEAN region by connecting the poorest
and most vulnerable – especially women and small businesses owned, managed or predominantly serving
women – to formal financial services in Cambodia, Lao PDR, Myanmar and Viet Nam.
Globally, there has been great progress on financial inclusion. In the ASEAN region, the gender finance
access gap is very small. For example, in the ASEAN countries where a MAP Financial Inclusion diagnostic
has been conducted, there exists only a slight gender gap in Myanmar, no gender gap in Thailand and, in
Laos and Cambodia, women are marginally better served. Both Findex and FinScope tell a similar story of a
very small, if at all, gender gap in the region. Women’s financial inclusion is important in the ASEAN
context. It is estimated that if women are able to achieve their full economic potential, they could add as
much as US$ 1 trillion to the South East Asian economies by 2025, contributing an extra 8 per cent to the
regional GDP. The reality, however, is that there exists a significant gender gap in the economy. In addition,
women in South East Asian countries generally have lower levels of formal employment, labour participation
ratios, literacy rates, and financial literacy.
Throughout the ASEAN region, formal financial services are not reaching low-income, rural and/or
marginalised populations. According to Finscope data, less than 60 per cent of people in Cambodia (59 per
cent), Laos (47 per cent), Myanmar (30 per cent) and Viet Nam (31 per cent) have a financial account. While
men and women in the Asian economies have somewhat equal access to formal financial services, much less
is known about the actual usage of financial services by men and women. Thus, there is a need for gender,
age and other household disaggregated data analysis on financial service usage, which is the data gap that
this research aimed to address. Financial service providers capture significant amount of customer data
through regular banking operations. This data can enable FSPs to better understand the behaviour of their
clients, and could help inform product innovation or provide improved services. Customers, and especially
women and low-income groups, can therefore receive products tailored to their needs, thereby promoting
financial inclusion and contributing to the achievement of the Sustainable Development Goals (SDGs).
233
Pulse Lab Jakarta collaborated with UNCDF to analyse customer data from four FSPs in Cambodia in order
to understand the factors affecting savings and loans mobilisation and how savings and loan data can explain
economic issues.
Analysing Customer Data Journey to Explore Financial Inclusion in Cambodia
This project is part of the Customer Journey Action Research (CJAR) data analytics training and research
programme utilized by UNCDF-SHIFT’s Data Hub to capacitate FSPs and regulators with technical and
analytical support to track and manage their financial inclusion objectives. UNCDF provided training to four
Cambodian FSPs in analysing and utilising customer data to help inform product innovation and financial
inclusion policies. This included a data analytics training workshop for FSP staff from various departments
and a knowledge management workshop with FSP management to discuss further action on data analytics
findings. Over a six-month period, SHIFT trained and engaged 68 managers on how to analyse and use
customer data journey. Pulse Lab Jakarta analysed customer savings and loan data provided by the four FSPs
for the period 2010-2016. The project curated around 6.5 million savings and loan records for 2.6 million
customers to help examine savings account dormancy and borrower exit, as well as improve financial service
usage. With a total adult population of 9.9 million people, this data represents almost a quarter of
Cambodia’s adult population.
During the first phase of analysis, the four datasets were analysed separately for comparative purposes and
the data was disaggregated by gender. The data was analysed using various statistical methods, such as
descriptive analysis, distribution analysis and simple survival analysis using hazards ratio. Analysis of the
datasets included:
• Average loan and savings mobilised (US$) by gender, marital status, provinces.
• Customer retention for savings (probability for men and women to stop saving <US$ 5 and
borrowing).
• Customer retention for savings and loan (probability for men and women to stop saving and
borrowing (<US$ 5 account & not taking follow-up loan).
Pulse Lab Jakarta is undertaking the second phase of analysis on the FSP datasets, which utilises a gendered
financial inclusion and economic vulnerability lens by disaggregating data by gender, age and marital status,
voluntary and compulsory deposits, and different types of savings and loan products. The Lab plans to
develop a survival model to investigate risk-to-exit by incorporating socio-demographic variables (gender,
age and marital status) together. The project will also be extended to other Cambodian FSPs.
Insights and Outcomes
The first phase of data analysis revealed the following key findings:
• Despite having equal access to savings and credit services, women in Cambodia had US$ 658 lower
savings balances and US$ 825 lower loan amounts on average compared to men.
• 70 per cent of the customers had low value or dormant deposit balances below US$ 5, and women
more often had dormant accounts (75 per cent) compared to men (59 per cent). Savings mobilisation
remains a challenge in Cambodia, particularly outside of Phnom Penh (30 per cent gap) and for older
people (31-42 per cent gap between young people below 25 and older people above
• 55).

234
• The majority of borrowers (78 per cent) exit the FSPs within the first 3 years, which implies there is
a limited long-term borrowing relationship. While women stay longer in the borrowing relationship
for individual loans, they received lower individual loan amounts compared to men.
• The typical depositor in Cambodia is a female (69 per cent of depositors), married (80 per cent),
older than 25 years (92 per cent), who lives outside Phnom Penh (92 per cent) and has a savings
account as opposed to a term deposit (97 per cent). Amongst borrowers, 82 per cent are female, 98
per cent live outside of Phnom Penh, 84 per cent are married and 95 per cent are older than 25 years.
However especially, older male depositors and young male borrowers living in Phnom Penh had
stronger customer journeys.
• The study estimates that reducing savings account dormancy and borrower exit by 10 per cent could
add an additional 52-172 million US$ deposit portfolio (+10 to +33 per cent for 2015 portfolio
levels) and 304 million US$ loan portfolio (+24 per cent) for the 4 FSPs as well as reduce operating
expenses by US$ 54 Million.
Implications and Recommendations for FSPs
• Develop financial services that are linked to the profile and needs of customers, specifically to
increase savings account usage among older women in rural areas, and improve borrower retention
particularly for individual loans for men in Phnom Penh.
• Launch and promote digital saving wallets and link remittances and domestic payments to those
savings accounts. Link savings accounts to regular income streams including wages and pensions.
An example is the AMRET Family savings product, a digital e-wallet that links income streams to a
family savings and payment account.
• Design different savings products; promote term deposits and develop commitment savings products.
Avoid the offer of compulsory savings accounts, since the majority of them are not utilised by
customers. Look into commitment savings as an alternative to simple open savings account.
• Offer financial literacy services and awareness campaign to promote savings and loans. FSPs can
send push SMS- and other messages to existing depositors that have low value savings account to get
them to actively mobilise savings. With approximately 62 per cent of adults requiring information on
how to save, there is a need for increasing financial awareness of customers through financial
literacy programs and consultations on benefits of savings product.
• With 89 per cent of Cambodians describing managing their personal finances as stressful, and 50 per
cent of the population spending more money than is available to them (Finscope 2015), offering
financial literacy and business management trainings to borrowers and savers can support FSPs in
controlling costly customer exit rates.
• Design customer loyalty programmes and, among others, reduce interest rates for follow up loans
and borrowers that actively mobilise deposits. Retained customers are more cost-effective and take
up larger loans and savings compared to new customers, yet pricing models or staff incentive
systems of banks do not always reflect this pattern.
• Improve data analysis capacity of FSPs by setting up a product development data team. FSPs can
benefit from additional data analytics on clients’ loan and savings usage to improve customer
satisfaction and retention. FSPs can use demographic and geographic disaggregated customer data to
tailor saving, credit and payment products to customers.
235
Conclusions
The project showed the potential for using FSP customer journey data to understand gender dynamics related
to savings and loan mobilisation. For FSPs, this provides valuable insights into how their customers are using
products and services. It also informs efforts to improve customer retention, particularly for women, and later
can give insights to increase access to formal financial services for low-income, rural and/or marginalised
populations.
The project also highlighted the benefit of data partnerships. Access to this wealth of financial data, for
instance, provided a valuable entry point for examining financial issues more broadly, such as understanding
economic resilience and recovery.
References
http://cenfri.org/map
http://www.worldbank.org/en/programs/globalfindex
http://www.finmark.org.za
McKinsey & Company (2015) The Power of Parity: How Advancing Women’s Equality Can Add $12 Trillion To
Global Growth. McKinsey Global Institute.
UN Women (2015) Progress of the World’s Women 2015-2016: Transforming Economies, Realizing Rights.
Blog: http://cenfri.org/blog/completing-the-picture-in-asean
Klapper L., Lusardi A., Van Oudheusden (2015) Financial Literacy Around the World: Insights from the Standard &
Poor’s Ratings Services Global Financial Literacy Survey.
Vietnam data is from Findex: http://www.worldbank.org/en/programs/globalfindex
VII. Other
236
Three Frontier Suggestions for the UN in its Effort to Shape Technological Change
Toward Meeting the SDGS
Proposal made at IATT EGM in Mexico city, 26-27 April 2018
David Edwards, Harvard University, World Frontiers Forum
I’d like to begin by thanking ambassador Gomez Camacho, ambassador Sandoval, and the entire Mexican
leadership for the invitation, and for organizing what has been for me a fascinating event.
I work today mostly in Cambridge Massachusetts, in a neighborhood that is by far the most dense and
diverse square mile of technology activity in the world. Within a five-minutes walk Google, Microsoft,
Facebook, and IBM share sidewalk space with Pfizer, Novartis, Shire, Sanofi, and Servier, who share
sidewalk space with biotech and information tech stars born in the area, Biogen, Alnylam, Akamai, and
hundreds of other start-ups. One of the reasons for this beehive of inventive activity is the convergence of
biology, information technology, and consumer practice to redefine what healthcare will mean tomorrow.
Medicine has historically focused on the management of sickness to death. Medical doctors know far more
about the physiological states of illness and disease than they do about the physiology of living well. Among
consequences, most healthcare dollars are expended on the last few years of human life, the cost of the best
healthcare is growing inaccessible to many, and human wellness has become one of the major crises of our
time.
Our bodies simply did not evolve in the conditions we now live; this has led to major neurologic and
metabolic dis-regulation, with problems ranging from depression to obesity. With our brains hacked by an
increasingly synthetic environment, creators (scientists, engineers, designers, biostatisticians, artists, chefs,
and more creators than I can name) are converging to give us access to an extended brain that helps us lead
better lives, a form of artificial intelligence.
My work belongs to this larger effort, and relates to sensory design, and particularly to the shaping of subtle
signals, as perceived scent or as flavor, which help us sleep, eat and live better. We explore these new
sensory experiences with major corporations, academic labs and even the general public in an innovation
restaurant and culture lab we run next to MIT.
I share this perspective to highlight some of the features of frontiers that may not be so obvious to those who
do not spend their lives there, and to frame three specific recommendations that I believe will be essential to
the UN effort toward meeting the SDGs:
1. The UN should be engaged at the frontiers of science and technology as a constructive partner to
have the perspective and ultimately the legitimacy to shape policy and regulation. This engagement
might involve a kind of UN discovery lab where a highly diverse array of creators — not just
scientists and engineers, but also designers, chefs, perfumers, artists, and entrepreneurs— move in
and out, toggling between frontier labs, where they bring needed skills and perspectives, and the UN
lab. Meetings like this one might happen there. These would not be as curated, but they would bring
into the UN a fresh and evolving perspective of what is inevitably an evolving reality. Beyond this
such a lab would give to the UN a voice all along the pathway of discovery and invention. Ethics,
237
inclusion, motivations, decision-making — so much of what we are discussing stretch across the
entire discovery and invention pathway.
2. Not only should the UN be at the frontier — it is really essential that young people around the world
be there too. The UN should empower young pioneers to dream at frontiers of science and
technology and be able to receive resources to realize dreams. Innovation that radically changes how
we think and live — from the Green Revolution to The Beatles — has always come about through
the minds of those who are at the start of their careers. This can be today young people of 15 years of
age, or young adults of 30. The best way to ensure that the developing world participates in the
radical changes that will sustain the human condition is to empower young people everywhere as
pioneering creators. This begins by helping young people, whoever and wherever they are, gain the
belief that what they do and think matters, that what they create can matter not just to themselves but
to many others. The Grassroots Creator Movement — the global movement that includes members
of the Maker Movement and all of us involved in user-generated content whose expression diffuses
in a second around the world — is a dramatic recent change in human agency, one that is changing
the workplace. Shaped in part by AI forces, the GCM makes it possible for a young creator in Kenya
to make a biobrick just as effectively as a research scientist in Cambridge Massachusetts. What I call
in my new book transient culture labs are appearing all over the world — in classrooms, in homes, in
weekend retreats and competitions — to help young people, and those of any age, create,
experiment, and exhibit — the three critical phases of the Creator’s Cycle. In so doing they learn
critical dimensions of creating that are essential to meeting a world in transition and thriving in it.
Yes, we need to learn digital skills, and more skills than any of us can identify here in this room, but
a lesson from the frontier is that passionate creators learn what they need to learn in the pursuit of
dreams, while those who only learn what they need to learn do not necessarily dream as a
consequence. The UN should encourage grassroots creating in the developing world at frontiers of
science and technology and engage those who are animating the 4th technology revolution to help
mentor.
3. Finally, the public should be invited to frontiers as well. The UN should embrace and encourage the
arts as an ally in the fostering of shared empathy and other pioneering values that transcend ethnicity,
religion, geography and age. It has always been true that the arts — painting, photography, film,
music, theater and more —have helped humanity confront uncertainty, process fear, advance against
the unknown, and in a way understand on an emotional level new and evolving circumstances that no
amount of cognition can unravel. It is not a coincidence that eras of renaissance are not only eras of
immense technological and scientific discovery — they are often in the first instance eras of fresh
new cultural expression. Over the last fifteen years — not surprisingly since around the time of the
first tweet — artists have begun to appear in leading science labs around the world. At the Broad
Institute, an institute for genetics shared by MIT and Harvard, there is an entire floor dedicated to a
resident artist. This artist is not asked to do science. She is asked to make art, and to mix with
scientists in the lab, to bring a fresh frontier perspective. As a pioneer, almost nothing matters more
than to have fresh sensitive eyes at your side, which see what you do not see. Pioneering is far more
intuitive than you can imagine. There are no google maps, no recipes. The process of pioneering
discovery is fundamentally an aesthetic process, one that merges the process of the cutting edge artist
with the process of the cutting-edge scientist. It is also by the way familiar to the least educated
amongst us. Fiction writing has become an increasing ally to technologists, as a way of exploring
possible futures in the public domain. Food has become one of the most fascinating cultural domains

238
of our time. It is in a way our generation’s Internet. People come together in restaurants, around
campfires or wherever they happen to gather, to experience new aesthetic forms, and in a sense
dialog with creators, leading to new behavior that has consequences to the future of human health,
the environment, and how we will eventually eat sustainably on the planet. Leading biologists and
medical scientists are now working with the entertainment industry, exploring how sensory signals
of light, sound, scent, touch and taste change brain activity, and human physiology, and not only
make entertainment more engaging — actually change human wellness. An effective way for the
message of the SDGs to enter into global discourse, and finally into the lives of us all, like a meme,
is to empower artists to experience the challenges, hopes, risks, and opportunities of today, and to
express their experiences in forms that make us care.
Finally, I would like to add that as co-founder of the World Frontiers Forum, a new forum created in
partnership with Harvard University, and in dialog with the United Nations Secretary General’s Office, I
welcome the opportunity to engage you all in thinking through how we make together the experience of the
frontier compelling and catalytic to creating a future we actually want.
Thank you.
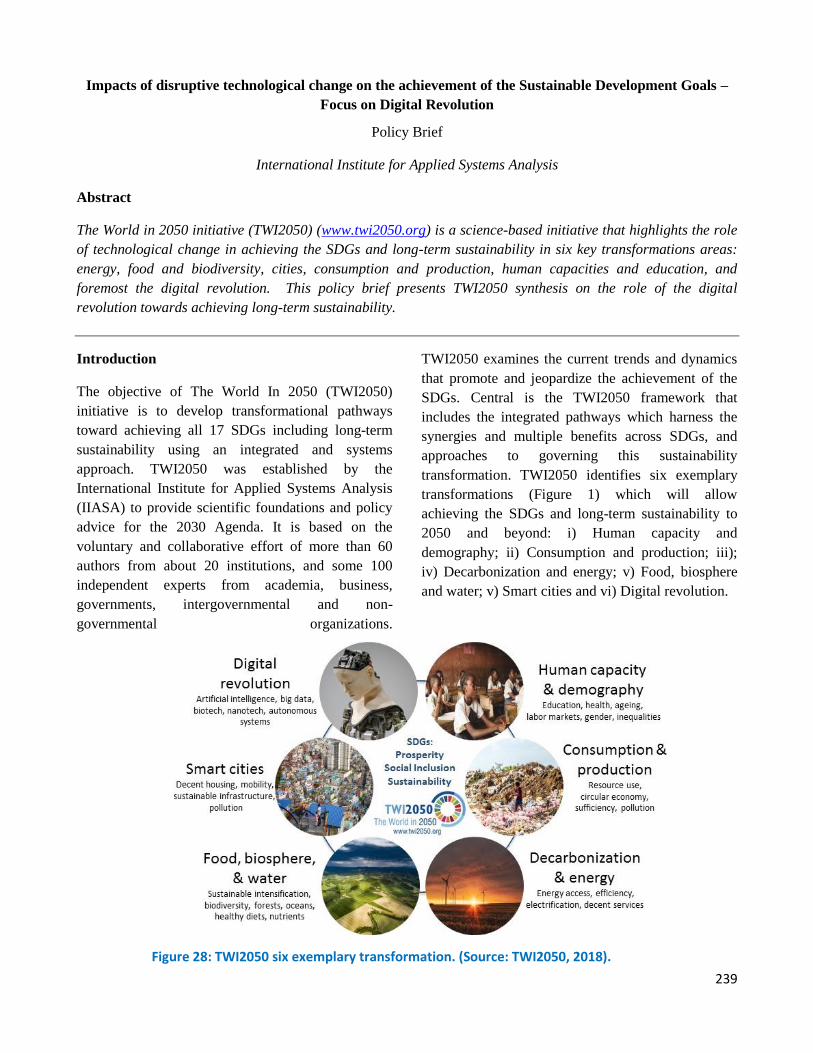
239
Impacts of disruptive technological change on the achievement of the Sustainable Development Goals –
Focus on Digital Revolution
Policy Brief
International Institute for Applied Systems Analysis
Abstract
The World in 2050 initiative (TWI2050) (www.twi2050.org) is a science-based initiative that highlights the role
of technological change in achieving the SDGs and long-term sustainability in six key transformations areas:
energy, food and biodiversity, cities, consumption and production, human capacities and education, and
foremost the digital revolution. This policy brief presents TWI2050 synthesis on the role of the digital
revolution towards achieving long-term sustainability.
Introduction
The objective of The World In 2050 (TWI2050)
initiative is to develop transformational pathways
toward achieving all 17 SDGs including long-term
sustainability using an integrated and systems
approach. TWI2050 was established by the
International Institute for Applied Systems Analysis
(IIASA) to provide scientific foundations and policy
advice for the 2030 Agenda. It is based on the
voluntary and collaborative effort of more than 60
authors from about 20 institutions, and some 100
independent experts from academia, business,
governments, intergovernmental and non-
governmental organizations.
TWI2050 examines the current trends and dynamics
that promote and jeopardize the achievement of the
SDGs. Central is the TWI2050 framework that
includes the integrated pathways which harness the
synergies and multiple benefits across SDGs, and
approaches to governing this sustainability
transformation. TWI2050 identifies six exemplary
transformations (Figure 1) which will allow
achieving the SDGs and long-term sustainability to
2050 and beyond: i) Human capacity and
demography; ii) Consumption and production; iii);
iv) Decarbonization and energy; v) Food, biosphere
and water; v) Smart cities and vi) Digital revolution.
Figure 28: TWI2050 six exemplary transformation. (Source: TWI2050, 2018).
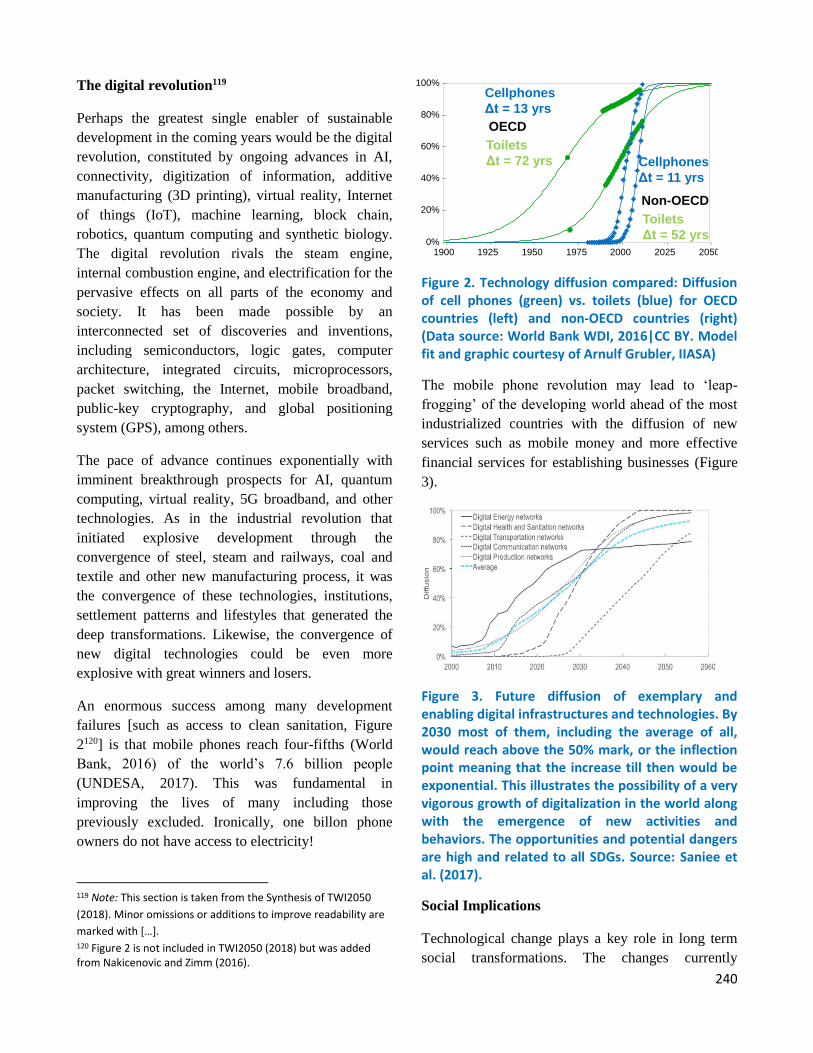
240
The digital revolution119
Perhaps the greatest single enabler of sustainable
development in the coming years would be the digital
revolution, constituted by ongoing advances in AI,
connectivity, digitization of information, additive
manufacturing (3D printing), virtual reality, Internet
of things (IoT), machine learning, block chain,
robotics, quantum computing and synthetic biology.
The digital revolution rivals the steam engine,
internal combustion engine, and electrification for the
pervasive effects on all parts of the economy and
society. It has been made possible by an
interconnected set of discoveries and inventions,
including semiconductors, logic gates, computer
architecture, integrated circuits, microprocessors,
packet switching, the Internet, mobile broadband,
public-key cryptography, and global positioning
system (GPS), among others.
The pace of advance continues exponentially with
imminent breakthrough prospects for AI, quantum
computing, virtual reality, 5G broadband, and other
technologies. As in the industrial revolution that
initiated explosive development through the
convergence of steel, steam and railways, coal and
textile and other new manufacturing process, it was
the convergence of these technologies, institutions,
settlement patterns and lifestyles that generated the
deep transformations. Likewise, the convergence of
new digital technologies could be even more
explosive with great winners and losers.
An enormous success among many development
failures [such as access to clean sanitation, Figure
2120] is that mobile phones reach four-fifths (World
Bank, 2016) of the world’s 7.6 billion people
(UNDESA, 2017). This was fundamental in
improving the lives of many including those
previously excluded. Ironically, one billon phone
owners do not have access to electricity!
119 Note: This section is taken from the Synthesis of TWI2050
(2018). Minor omissions or additions to improve readability are
marked with […]. 120 Figure 2 is not included in TWI2050 (2018) but was added from Nakicenovic and Zimm (2016).
Figure 2. Technology diffusion compared: Diffusion of cell phones (green) vs. toilets (blue) for OECD countries (left) and non-OECD countries (right) (Data source: World Bank WDI, 2016|CC BY. Model fit and graphic courtesy of Arnulf Grubler, IIASA)
The mobile phone revolution may lead to ‘leap-
frogging’ of the developing world ahead of the most
industrialized countries with the diffusion of new
services such as mobile money and more effective
financial services for establishing businesses (Figure
3).
Figure 3. Future diffusion of exemplary and enabling digital infrastructures and technologies. By 2030 most of them, including the average of all, would reach above the 50% mark, or the inflection point meaning that the increase till then would be exponential. This illustrates the possibility of a very vigorous growth of digitalization in the world along with the emergence of new activities and behaviors. The opportunities and potential dangers are high and related to all SDGs. Source: Saniee et al. (2017).
Social Implications
Technological change plays a key role in long term
social transformations. The changes currently
1900 1925 1950 1975 2000 2025 20500%
20%
40%
60%
80%
100%
OECD
Toilets
Δt = 72 yrs
Non-OECD
Toilets
Δt = 52 yrs
Cellphones
Δt = 13 yrs
Cellphones
Δt = 11 yrs
Source: Grubler, 2016
241
underway – such as the digital or sharing economy –
are significant. With the advent of ‘knowledge
societies’, many current technological transitions
favour non-material benefits that support human
wellbeing. […]
The digital revolution is already reshaping work,
leisure, behavior, education, and governance. Digital
technologies are disrupting production processes in
nearly every sector of the economy, from agriculture
(precision agriculture), transport (self-driving cars),
mining (autonomous vehicles), manufacturing
(robotics. 3D printing), retail (e-commerce), finance
(e-payments, AI trading strategies), media (social
networks), health (AI diagnostics, telemedicine),
education (online learning), public administration (e-
governance, e-voting) and the IoT.
In general, these contributions of digital technology
can raise labor, energy, resource, and carbon
productivity, lower production costs, expand access,
dematerialize production (from physical books to e-
books, for example), improve matching in markets
(such as on electronic market places), enable the use
of big data (disease epidemiology and drug design),
and make public services more readily available
(online voter registration, licenses and permits).
Challenges and trade-offs
Yet there are also clear dangers and downsides to the
digital revolution, including the loss of jobs, rising
inequality, and the further shift of income from labor
to capital. Processes of automation have been
underway for decades, and one important
consequence, it appears, is the net reduction of
demand for lower-skilled workers. With advances in
AI and robotics, many more workers, even those
highly skilled, may find their jobs and earnings under
threat. While new jobs might replace old ones, the
new jobs may come with lower real earnings and
working conditions. The fears about rising
inequalities have given rise to a new interest in a
guaranteed minimum income.
There are several other perceived threats from the
digital revolution. Digital identities can be stolen, or
artificial identities can be created. Digital information
can be stolen especially with the diffusion of 3D
printing where complete information about
manufacturing is stored digitally. At the same time,
this information can be used to circumvent export
and import barriers by simply manufacturing locally
with 3D printing.
Governments and private businesses can invade
privacy and monitor individuals against their will or
without their knowledge and in extreme cases destroy
real identities. A few digital portals may use their
advantages in amassing big data to gain a dominant
monopoly position in their respective markets (e-
commerce, digital advertising, social media, cloud
services, etc.). Cyberattacks can interrupt or degrade
private and public service delivery. Cyberwarfare can
paralyze a society by disrupting the flows of
information, or destroy machinery connected to the
Internet. Social media can be manipulated,
undermining democratic processes.
The personal use of online technologies can be
addictive and cause the onset of depressive disorders.
AI codes can incorporate statistical discrimination
that may be hard to identify. Instructions for 3d
printing in the additive manufacturing can be stolen
and applied elsewhere to produce identical parts and
products.
Special danger relates to advanced weapons. The
most fundamental question is whether the digital
revolution as a self-evolving evolutionary process
that has generated huge global monopolies is even
amenable to ‘social steering’.
The digital revolution will have even deeper impacts
on our societies, creating a next generation of
sustainability challenges. General purpose AI will be
used in more and more decision making processes
embedded in devices (like self-driving cars), in our
economies (in banks, trading firms, stock markets)
and in our societies (in courts, in parliaments, in
health care organizations, in security organizations
such as police and army), complementing,
substituting, challenging human driven decision
making processes. We need to learn to manage and
242
control the next generations of AI, machine learning,
and semi) autonomous technical systems and to align
those with our normative settings. Moreover, the
digital transformation will redefine our concept of us
as humans.
The way forward
In the Anthropocene humans became the main
drivers of Earth system changes. In the digital
Anthropocene humans also start to transform
themselves, enhancing cognitive and brain capacities,
thinking about how to program brains, how to
enhance human capacities. Humanity is moving
toward new civilizational thresholds. Super-
intelligent machines might even develop a life of
their own, with the capacity to harm human agents.
The digital transformation calls for a comprehensive
set of regulatory standards and normative
frameworks, physical infrastructure, and digital
systems, to capture the benefits of the digital
revolution while avoiding the many potential
downsides. An essential priority should be to develop
science, technology and innovation roadmaps to
better understand the potential benefits and dangers
of digitalization. The principles of digital
transformation for sustainable development have yet
to be written.
Research is needed to further the understanding of
technology systems; studying the patterns, drivers,
constraints, and impacts of technological change is
needed to identify viable options and policies that
will accelerate the transformation of society toward a
sustainable future. While technological change will
always occur, high uncertainties remain about which
technologies succeed.
References
Nakicenovic N and Zimm C (2017). New technological solutions
for the Sustainable Development Goals and beyond.
Environmental Scientist 26 (3): 68-73.
Saniee, I., Kamat, S., Prakash, S. & Weldon, M. 2017. Will
productivity growth return in the new digital era? An analysis of
the potential impact on productivity of the fourth industrial
revolution. Bell Labs Technical Journal, 1-1.
TWI2050 - The World in 2050 (2018). Transformations to
Achieve the Sustainable Development Goals. Report prepared by
the World in 2050 initiative. International Institute for Applied
Systems Analysis (IIASA), Laxenburg, Austria. www.twi2050.org
UNDESA 2017. World Population Prospects: The 2017 Revision
Key Findings and Advance Tables. New York: United Nations,
Department of Economic and Social Affairs, Population Division
World Bank (2016) World Development Indicators.
http://data.worldbank.org/data-catalog/world-development-
indicators
World Bank 2016. World Development Report 2016: Digital
Dividends. Washington, DC World Bank Group.
243
Antibiotic resistance (ABR) - no sustainability without antibiotics
Policy Brief 2015
Otto Cars & Dusan Jasovsky, ReAct – Action on Antibiotic Resistance, reactgroup.org
Introduction
Antimicrobial resistance (AMR) is a missing topic in the Sustainable Development Goals (SDGs). One can
visualize easily terrifying consequences on mankind by not attributing this issue global attention it deserves.
It threatens to undermine the effectiveness of modern medicine and with ever- rising number of resistant
bacterial strains (WHO, 2014; CDC 2013) it could mean the undoing of much of the progress made under the
MDGs. Resistance to antimicrobial drugs already causes an estimated 700 000 deaths annually and – without
effective action – is predicted to cause 10 million deaths annually and cost up to US $ 100 trillion by 2050
(Review on Antimicrobial Resistance, 2014). Thus it is not only a public health issue but it is also critical to
the global development progress.
The SDGs should emphasize antimicrobial resistance as a threat to global health that must be overcome. As
an example, several of the planned targets in the health-dedicated goal three from the SDGs current list will
be impossible to achieve without effective antimicrobials, e.g. maternal mortality ratio, newborn and under-
five children mortality, communicable diseases epidemics, and a significant part of NCDs (Laxminarayan et
al., 2013). Health systems will not be sustainable without effective antimicrobials, specifically antibiotics
(Tomson & Vlad, 2014).
Analogies with other fundamental global concerns such as climate change can help us understand the actual
scope and irreversible consequences man can face if radical action is not taken (Laxminarayan et al., 2013).
The golden era of effective antibiotics is today history and the world has to deliver one holistic solution
(Nathan & Cars, 2014).
Challenges of Tackling ABR
There are several obstacles to finding solutions to the problem of antibiotic resistance (ABR).
First, is the challenge of the complexity of the problem. One reason for the global complacency of reacting to
ABR is that it is a concept rather than a disease. Yet is undermines effective treatment of many common
infections such as pneumonia, wound infections, urinary tract infections, as well as procedures, namely
cancer treatment, organ transplants and complicated deliveries (Laxminarayan et al., 2013).
Furthermore, ABR is part of a larger ecological phenomenon and thus not amenable to easy technical
interventions. All use of antibiotics contributes to resistance, so the exact role of antibiotic use in human
health or animals and food production in driving the spread of resistance in the ecosystem must be properly
understood and addressed. Also, a vast majority of bacteria are essential for life and the health of humans,
animals and the ecosystem and only a very small percentage of them cause disease. This implies that
treatment of infectious diseases should be optimized in a way that they do not make the cure worse than the
disease. (ReAct, 2014a)
244
Secondly, antibiotic resistance is a problem on a global scale, with resistance originating in one part of the
world spreading rapidly, in some cases in a matter of weeks (Cars et al., 2008).
Intensified human mobility and food trade accelerate the spread of ABR across national borders, across
different bacterial species and from bacteria in animals to those in humans. Responding to outbreaks of
resistant infections involves coordination of efforts across national boundaries, varied health systems and
involving international agencies like the WHO. (MacPherson et al., 2009)
Along with the scale of the issue there is also the great diversity of social, economic, political and cultural
contexts in which ABR emerges or spreads. For instance, while legal regulation of antibiotic sales or usage
has worked well enough in certain parts of the world, in other parts such restrictions are difficult to
implement in practice (ESRC Working Group, 2014). Abuse or overuse of antibiotics in just a few regions of
the world is enough to overturn achievements in containing ABR elsewhere (Nathan & Cars, 2014).
Next is the issue of financial and scientific roadblocks to the development of new classes of effective
antibiotics. Developing new drugs is highly resource intensive and private industry does not seem to have the
incentives to get involved beyond a point. Partnerships between the private and public sector for such drug
development are too few and far between. Even if a new drug is developed, currently there are no strategies
to minimize unnecessary use to keep it effective for as long as possible (ReAct, 2014b).
The absence of efficient and low cost diagnostics is also an obstacle to the ability of physicians to prescribe
appropriate antibiotics or even take a decision not to prescribe at all (Okeke et al., 2011).
While excessive use of antibiotics remains a major problem it is also the fact that in the poorer parts of the
world there is a lack of access to essential and effective life-saving antibiotics. Increasing resistance levels
also result in older, cheaper antibiotics losing their efficacy, while newer and significantly more expensive
drugs are unavailable due to high costs. (ReAct, 2014a)
Unifying Factor
Globally, the MDGs dealt with only developing countries, and only development issues while in a near
future, the SDGs will deal with all countries and sustainable development. Spread of AMR in both low- and
middle-income countries (LMICs) and high-income countries (HICs) endangers continuity of such
international mid- and long-term sustainability efforts. Being considered as a concept – not a disease - AMR
lacks the global attention it certainly deserves. This in turn creates obstacles in positioning it centrally in
international development agenda.
From the aid and development perspective, AMR strikes hardest on the poor. Lack of access to water and
sanitation, and to affordable and effective antibiotics significantly affects women and children in Sub-
Saharan Africa and other low-income countries (LICs) as well as poorer sections of middle and higher
income countries. (Etyang & Scott, 2013)
Weak health systems and unstable central drug distribution systems contribute to shortage of essential
antibiotics. ABR should be a priority health concern in LMICs where resistance is at appallingly high levels.
In many countries antibiotics are available without any prescription, regulation is weak and counterfeit
medicines sometimes account for more than 1/3 of the medicines market (Buckley et al., 2013). These
aspects, in combination with poor sanitation, aggravate the problem.
245
Antimicrobial resistance implies a health, social, and economic problem that LMICs, and the world at large
cannot afford.
Issue for Consideration
Access: Ensure that effective and appropriate prevention tools, diagnostics and therapies are available and
affordable to everyone, everywhere;
Conservation: Reduce the need for antimicrobials and ensure their appropriate use, through disease
surveillance and prevention, infection control, and appropriate use of antimicrobials;
Innovation: Invest in the next generation of antimicrobials, vaccines, diagnostics, and infection control
technologies funded by novel business mechanisms; Lasting political will: Include AMR in SDGs in both
targets and indicators to assure long- term global collective action.
References
Buckley, G.J. et al., 2013. Causes of Falsified and Substandard Drugs.
Cars, O. et al., 2008. Meeting the challenge of antibiotic resistance. BMJ (Clinical research ed.), 337(sep18_3), p.a1438.
CDC, 2013. Antibiotic resistance threats in the United States, Atlanta.
ESRC Working Group, 2014. Anti-Microbial Resistance: Setting the Social Science Agenda, London.
Etyang, A.O. & Scott, J.A.G., 2013. Medical causes of admissions to hospital among adults in Africa: a systematic
review. Global health action, 6, pp.1–14.
Laxminarayan, R. et al., 2013. Antibiotic resistance-the need for global solutions. The Lancet infectious diseases,
13(12), pp.1057–98.
MacPherson, D.W. et al., 2009. Population mobility, globalization, and antimicrobial drug resistance. Emerging
Infectious Diseases, 15, pp.1727–1732.
Nathan, C. & Cars, O., 2014. Antibiotic Resistance -Problems, Progress, and Prospects. The New England journal of
medicine, 371(19), pp.1761– 1763.
Okeke, I.N. et al., 2011. Diagnostics as essential tools for containing antibacterial resistance. In Drug Resistance
Updates. pp. 95–106.
ReAct, 2014a. ReAct Strategic Plan 2015 - 2019,
ReAct, 2014b. The World s Collective Responsibility to Conserve Antibiotic Effectiveness, Uppsala.
Review on Antimicrobial Resistance, 2014. Review on Antimicrobial Resistance: Tackling a crisis for the health and
wealth of nations,
Tomson, G. & Vlad, I., 2014. The need to look at antibiotic resistance from a health systems perspective. Upsala journal
of medical sciences, 119(2), pp.117– 24.
WHO, 2014. Antimicrobial resistance: global report on surveillance 2014, Geneva, Switzerland.
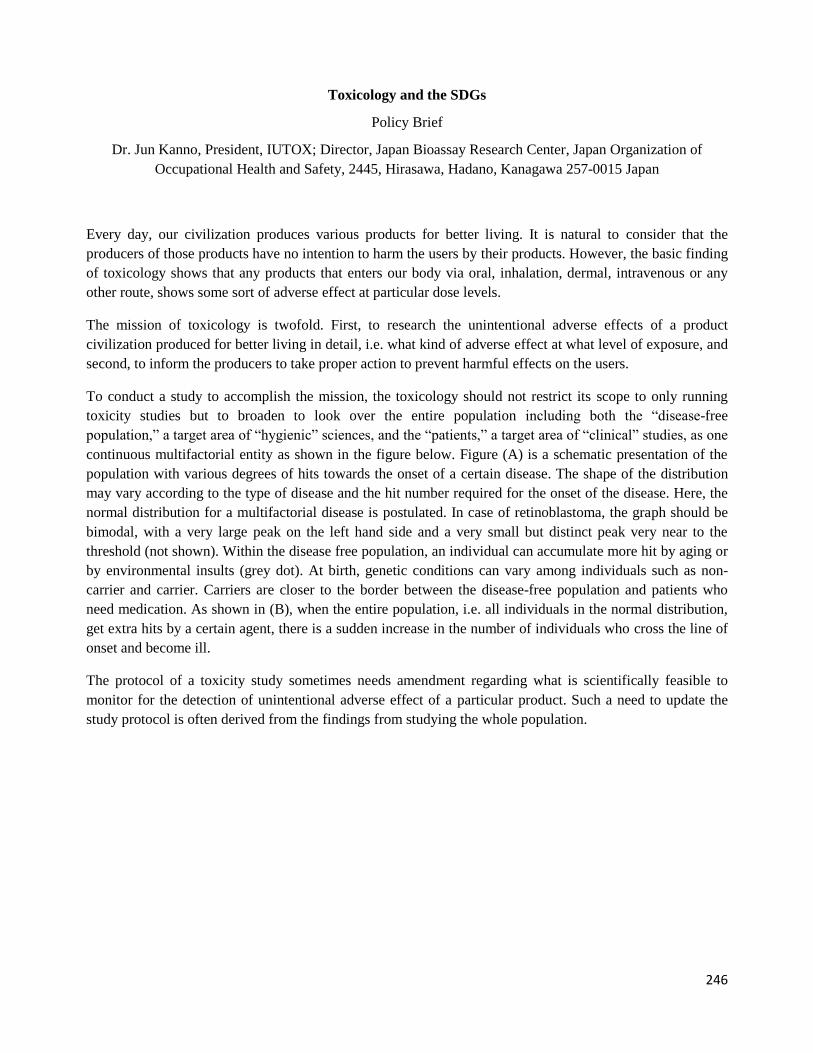
246
Toxicology and the SDGs
Policy Brief
Dr. Jun Kanno, President, IUTOX; Director, Japan Bioassay Research Center, Japan Organization of
Occupational Health and Safety, 2445, Hirasawa, Hadano, Kanagawa 257-0015 Japan
Every day, our civilization produces various products for better living. It is natural to consider that the
producers of those products have no intention to harm the users by their products. However, the basic finding
of toxicology shows that any products that enters our body via oral, inhalation, dermal, intravenous or any
other route, shows some sort of adverse effect at particular dose levels.
The mission of toxicology is twofold. First, to research the unintentional adverse effects of a product
civilization produced for better living in detail, i.e. what kind of adverse effect at what level of exposure, and
second, to inform the producers to take proper action to prevent harmful effects on the users.
To conduct a study to accomplish the mission, the toxicology should not restrict its scope to only running
toxicity studies but to broaden to look over the entire population including both the “disease-free
population,” a target area of “hygienic” sciences, and the “patients,” a target area of “clinical” studies, as one
continuous multifactorial entity as shown in the figure below. Figure (A) is a schematic presentation of the
population with various degrees of hits towards the onset of a certain disease. The shape of the distribution
may vary according to the type of disease and the hit number required for the onset of the disease. Here, the
normal distribution for a multifactorial disease is postulated. In case of retinoblastoma, the graph should be
bimodal, with a very large peak on the left hand side and a very small but distinct peak very near to the
threshold (not shown). Within the disease free population, an individual can accumulate more hit by aging or
by environmental insults (grey dot). At birth, genetic conditions can vary among individuals such as non-
carrier and carrier. Carriers are closer to the border between the disease-free population and patients who
need medication. As shown in (B), when the entire population, i.e. all individuals in the normal distribution,
get extra hits by a certain agent, there is a sudden increase in the number of individuals who cross the line of
onset and become ill.
The protocol of a toxicity study sometimes needs amendment regarding what is scientifically feasible to
monitor for the detection of unintentional adverse effect of a particular product. Such a need to update the
study protocol is often derived from the findings from studying the whole population.
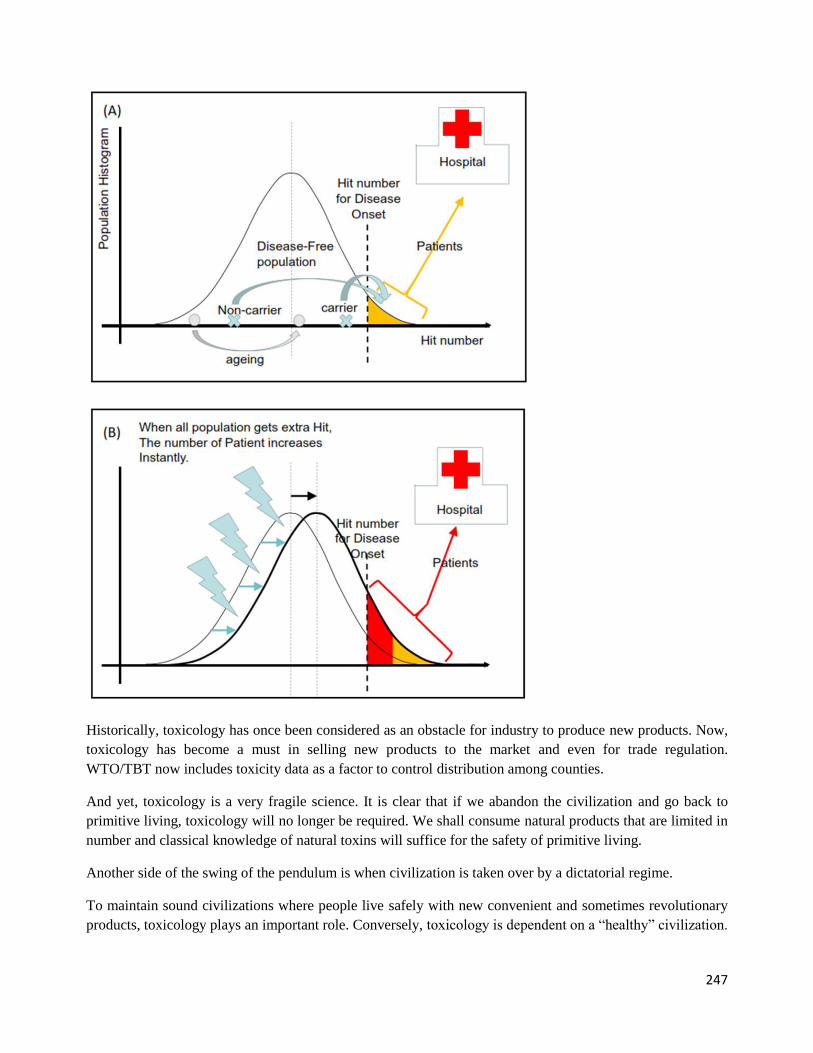
247
Historically, toxicology has once been considered as an obstacle for industry to produce new products. Now,
toxicology has become a must in selling new products to the market and even for trade regulation.
WTO/TBT now includes toxicity data as a factor to control distribution among counties.
And yet, toxicology is a very fragile science. It is clear that if we abandon the civilization and go back to
primitive living, toxicology will no longer be required. We shall consume natural products that are limited in
number and classical knowledge of natural toxins will suffice for the safety of primitive living.
Another side of the swing of the pendulum is when civilization is taken over by a dictatorial regime.
To maintain sound civilizations where people live safely with new convenient and sometimes revolutionary
products, toxicology plays an important role. Conversely, toxicology is dependent on a “healthy” civilization.

248
IUTOX might work together on SDGs with other organizations to find ways to maintain healthy civilizations
undergoing rapid technological changes.
Reference: Genes Environ. 2015; 37: 9. doi: 10.1186/s41021-015-0008-6

249
250
Governing Exponential and Disruptive Technologies, Key Issues and Implications.
Policy Brief
Jim Thomas, Neth Daño and Silvia Ribeiro. ETC Group, 2018. [email protected]
Executive Summary
The current discussion about the challenge of governing exponential technological change is exactly in line
with predictions from the turn of the century that ‘converging technologies’ of nano-bio-info-cogno will
unleash multiple disruptions (including social, economic, justice) from the nano-scale to the geo-scale. In this
light, ETC Group encourages the EGM to learn from policy debates over nano and biotechnologies and be
broad in the scope of technologies under consideration. The interlinked, new disruptive technologies include
not only data-driven and algorithmic technologies but also molecular technologies and Earth-system
engineering approaches (DAME). We also see developments in fintech (e.g. blockchains) as relevant.
ETC Group encourages the EGM to address not only the direct but also indirect (including telecoupled)
impacts of the new suite of exponential and disruptive technologies and to ask what governance can
anticipate, assess and mitigate against harmful indirect effects of technological change which may be most
severe.
We also remind participants that underlying the current technological transformations is a rapidly expanding
and pervasive data storage and distribution infrastructure whose growing impact (politically, economically
and environmentally) must also be properly weighed against the realization of the Sustainable Development
Goals.
As transnational data platforms increasingly take on powers and functions more usually familiar to states,
any consideration of exponential technologies for sustainable development also has to maintain a human
rights perspective.
Most importantly the UN Technology Facilitation Mechanism and other bodies should move to realize the
charge of Rio+20 and recommendations by UN Environment to develop national, regional and international
technology assessment mechanisms. Civil Society is already contributing to that process through the
development of regional Technology Assessment Platforms (TAPS).
Context: From converging technologies to Exponential technologies
Today’s preoccupation with ‘exponential technologies’ concerns substantially the same technological
grouping that first came to prominence at the turn of the millennium when the US National Science
Foundation (NSF) began to identify the phenomenon of ‘converging technologies’ arising out of new
nanotechnology capabilities. In 2001, NSF referred to this coming convergence as NBIC (Nanotechnology,
Biotechnology, Information Technology and Cognitive Science) (Roco and Bainbridge, 2003), but other
descriptive acronyms included GRAIN (Genetics, Robotics, Artificial Intelligence and Nanotechnology) as
well as BANG (Bits, Atoms, Neurons and Genes) (ETC Group, 2009), describing how the platform aims at
flexible manipulation and interoperability between the bits of information, the atoms of matter, the neurons
of the brain and the genes that code for life. Current technological developments in automation and AI may
be focusing on the interoperability between bits, neurons and atoms but it would be a mistake to forget the
251
genes as we move towards molecular communication (nor indeed can we overlook the dollars or crypto-
coins.)
Technology Assessment
The UN Environment Program (now UN Environment) first identified the need for the multilateral
environmental system to address this group of technologies in its 2011 Foresight process and were prescient
in proposing some form of foresight and assessment needs to be established:
We are fixed in a pattern by which society first produces new technologies and chemicals and then ex
post facto tries to evaluate the impacts of what it has produced. The latest examples are the questions
raised by applications of synthetic biology and nanotechnology. With the accelerated pace by which
novel technologies and chemicals are being deployed, a new approach should be considered by which
their implications are systematically and comprehensively assessed before they reach the production
phase with the aim to minimize their risks to society and nature. (UN Environment, 2013, vii).
In 2012, this proposal for systematic assessment of emerging technologies found voice in the outcome
declaration from the Rio+20 Summit, “The Future We Want,” where paragraph 275 recognized “the
importance of strengthening international, regional and national capacities in research and technology
assessment, especially in view of the rapid development and possible deployment of new technologies that
may also have unintended negative impacts, in particular on biodiversity and health, or other unforeseen
consequences” (UNCSD, 2012).
We encourage the participants of the EGM and the STI forum to address this charge of how to strengthen
technology assessment capabilities at different levels. ETC Group, in collaboration with regional networks of
civil society organizations is in the process of establishing regional Technology Assessment Platforms to
lead participative technological assessment and horizon scanning exercises from the bottom-up. To be
effective top-down technology policy and analysis from the UN system needs to be met by a movement of
‘futurology from below’ (Thomas, 2015). The first regional TAP, Red TECLA (Red de Evaluación Social de
Tecnologías en América Latina) is already undertaking collaborative Technology Assessment activities
between a dozen civil society groups and a network of academic scholars. More information is available at
http://www.redtecla.org . Additional civil society-led TAPS are under construction in the South East Asian
and African region. The STI Forum could endorse and offer support to the development of citizen-led
movement and networks for social, economic, ecological and cultural technology assessment of exponential
technologies.
Which Exponential and Disruptive Technologies?
We encourage the participants at the EGM to keep in their discussion the following interlocking
technological platforms:
Nanotechnology – Engineering at the scale of atoms and molecules, exploiting quantum effects and
self-assembly of nanostructures.
Biotechnology, Genome Editing and Synthetic Biology – Technologies derived from understanding
and deliberate manipulation of genetic systems.
252
Artificial intelligence, Neural Nets and Machine Learning – Algorithmic processes and
computerized agents and networks able to learn, process and respond autonomously to their
environment without being programmed.
Quantum and Biological Computing and Molecular Communication – Nonlinear, non-binary and
combinatorial approaches to computation and communication that harness quantum phenomena and/or
biological molecules instead of electronic components.
Robotics and Automation (including drones and additive manufacturing) – Data-driven
mechanical (and biomechanical) systems, including manufacturing devices.
Sensors and the Internet of Things – Networks of electronic devices that can sense the environment
around them and/or co-ordinate between each other.
Blockchains and smart contracts – A distributed online digital ledger that is able to record and co-
ordinate trusted exchanges between third parties without an intermediary.
Geoengineering and Earth Systems Engineering – Large scale deliberate interventions in
ecosystems or planetary systems (e.g. carbon cycle, water cycle, nitrogen cycle).
Clustering Major trends: Data, Automation, Molecular, Earth (DAME)
We observe four clustered technological trends that may be of use to classify exponential and disruptive
technologies: (1) Digital and Data Driven technologies; (2) Automation including systems of robotics and
sensing; (3) Molecular–level technologies; and (4) Earth systems and ecosystem-level engineering. These
four clusters can be summed up by DAME (Data, Automation, Molecular, and Earth)
Clustering innovations into this DAME taxonomy is not to claim these are distinct and separate clusters; as
convergent technologies, they radically overlap.
Trend 1: D – Digital and Data-driven technologies
Examples: Computer Assisted Organic Synthesis (CAOS), synthetic biology and cell factories,
blockchains and fintech tools, molecular communication, Earth System modelling, digital DNA
storage and redesign, 5G and wireless mesh systems, and quantum computing.
Trend 2: A – Automation, Robotics and Sensing
Examples: Precision agriculture applications: use of drones, robotics, 3D printing and additive
manufacturing, sensors and remote sensing technologies, e.g. LIDAR, molecular communication, new
satellite tech (e.g. CubeSats and SmallSats), smart dust, and Internet of Things.
Trend 3: M – Molecular-level technologies
Examples: Nanomaterials, nanocoatings, nanoparticles, taste/sensory modification technologies,
synthetic biology, gene editing, molecular communication, metabolic engineering, cell culture
engineering (e.g. meats and animal proteins), biosynthesis, epigenetic engineering, gene drives, RNAI
sprays, microbiome engineering, photosynthesis engineering, nutrigenetics/nutrigenomics, animal
vaccines, biologicals, and CAOS.
253
Trend 4: E – Earth systems and ecosystem engineering
Examples: Weather and climate intervention, nutrient/nitrogen cycle engineering, water/hydrological
cycle engineering, microbiome engineering /biologics, photosynthesis engineering, sunlight radiation
modification/geoengineering, soil carbon technologies, biochar, agroecology, biofuels, metagenomics,
and gene drives (population engineering).
Three Key Aspects: Convergence, Data-Driven, and Scale
Looking across the range of exponential technological innovations three consistent factors cut across all
platforms:
Convergence – The notion that separate technical domains are now converging into hybrid technological
forms has been expected since the turn of the century but is now highly evident. Many of the more powerful
new technological platforms can equally be regarded as nanotechnology, information technology,
biotechnology and even cognitive technologies at the same time (e.g. synthetic biology).
Data-Driven – It follows from the convergent nature of disruptive technologies, that many of the new
platforms are enabled by big data capabilities. The convergence has made data fungible with matter: atoms
can now be used as data storage media and at the same time recorded and re-ordered in digital computer
models to be translated into new nanostructures in the physical world. Since genes, knowledge processes,
ecosystems and matter can all seemingly be reduced to data, the ability to store, screen, compute and
manipulate large sets of data (genomic data, biodiversity data, climate data, and soil data) makes it possible
to manipulate material systems in more complex ways
Scale – A significant feature of the new disruptive technologies is the range of scales at which technologists
now endeavor to simultaneously intervene. Nanotechnology and nano-scale imaging has opened up the
molecular scale to the attempt to precisely see, engineer and manipulate nature from the bottom up while big
data and global sensing capabilities have simultaneously emboldened technologists to attempt artificial
interventions on an ecosystem or even geo-scale. Some technological approaches simultaneously approach
from below and from above (For example, the field of metagenomics).
Indirect effects and telecoupling—a severe challenge for governance
Increasingly, new technological and economic developments may intentionally or unintentionally disrupt
activities at a distance, driving economic or cultural changes elsewhere that transform the context for
sustainable development. This ‘telecoupling’ of distant socio-economic drivers with specific local changes in
land use or resource management is being recognized as an increasingly acute challenge for policy. A recent
review of the implications of telecoupling for biodiversity noted that the two major drivers of indirect,
telecoupled changes in conservation were around trade and sharing of information through technology.
New disruptive technologies further complicate this. For example, even as new ‘advanced manufacturing’
technologies such as 3D printing or synthetic biosynthesis are shifting which feedstocks and raw materials
make up global trade increasingly the feedstocks can be brewed in synthetic biology vats or synthesized with
the aid of new CAOS (Computer-Aided Organic Synthesis) algorithms that find routes to better transform
one molecule into another. At the same time, finance and trade itself is being rapidly reinvented to be carried
out on the blockchain mediated by smart contracts that enable rapid financialization of biodiversity or labour.
254
The Hidden Iceberg: The Impact of Enabling Infrastructure and Planetary Computation
While much of the discussion on ‘disruptive’ or exponential technologies focuses on applications, platforms
and devices (e.g. drones, 3D printers, precision automation, etc.), the converging technological platforms are
networked and supported by a growing data and computation infrastructure. This includes data storage and
processing centers, as well as hundreds of millions of computational devices networked through the internet
and eventually through the ‘Internet of Things.’
Storage: It is estimated that by 2025, the world will be generating approximately 163 zettabytes of digital
data per year (a zettabyte is trillion gigabytes). That is ten times the 16.1 zettabytes of data generated in
2016. Physically storing those zettabytes of data in 2025 would require 16 billion of the world’s largest
commercial hard drives (almost two multi-terabyte drives per person on the planet by then). These storage
media in turn are comprised of rare and mined minerals, synthetic chemicals, large amounts of embedded
energy per device – e.g. to produce silicon wafers, processing chemicals and metal components and cooled
by fans and coolant systems that require energy and chemical use.
‘Moveage’: According to Kevin Kelly (appropriately, the founder of ‘Wired’ magazine), when the new
information technologies first came of age in the late 1990s, industry was laying cable at a rate of 350 meters
per second – the speed of sound (Kelly, 2014). Today’s race to create the digital infrastructure needed for the
next set of disruptive technologies has likely far exceeded the sound barrier. As big data and
telecommunications companies push to extend broadband connectivity to the most remote parts of the planet
and to blanket rural and agricultural lands with new 5G networks, the real costs include the impact of widely
and finely distributed electromagnetic frequency (EMF) radiation on biodiversity and human health; the high
demand that wireless communication places on energy systems; and the voracious demand for rare earths and
conflict minerals that are used in receiving and transmitting devices. These costs should be set against the
benefits of more efficient resource use due to data-driven efficiencies.
Usage: Some of the exponential technologies under consideration appear to have surprisingly high
environmental footprints. A recent study, for example, has pointed to the enormous energy requirements to
run blockchain applications: a single exchange of currency on the blockchain (e.g. the cryptocurrency
bitcoin) requires enough energy to run a large American house for two weeks (Malmo, 2017). The bitcoin
blockchain alone is currently consuming the same energy as a medium-sized developed country such as
Ireland (Digiconomist.net, 2018).
‘Stack’ing costs: Unfortunately, the outsize impact of this substantial underlying infrastructure may often be
inadvertently rendered invisible. Benjamin Bratton has referred to the totality of this planetary digital
infrastructure as ‘the stack,’ describing it as the largest ‘accidental megastructure’ that humanity has ever
built (Bratton, 2016). Bratton and others point to how the stack exerts its own political and physical impact
on the world, including on biological diversity, while reshaping power relations and handing immense power
to digital platforms such as Amazon, Google, and Facebook. In the coming decades, the politics and cost of
the stack will likely lead to strong interest in implementing radical low energy computation and
communication technologies, such as new nano-computation approaches or molecular communication where
messages are sent encoded in molecules such as pheromones or DNA rather than electrical pulses (Nakano,
2012). These molecular computing and communication platforms, which use living components that interact
with biological signaling, may in turn create new dilemmas for ecosystem functioning. Assessing the
ecological viability and implications of new computation infrastructures when brought to scale may be an
urgent but under-recognized challenge for sustainable development.

255
References
Bratton, Benjamin. Feb 2016. “The Stack: On software and Sovereignty.” MIT Press.
Carrasco, L. R., J. Chan, F. L. McGrath, and L. T. P. Nghiem. 2017. Biodiversity conservation in a telecoupled
world. Ecology and Society 22(3):24. https://doi.org/10.5751/ES-09448-220324
Digiconomist.net. Bitcoin Energy Consumption Index. Web page. https://digiconomist.net/bitcoin-energy-consumption
ETC Group. 2009. BANG (Bits Atoms Neurons and Genes)/ Converging Technology. Web page.
http://www.etcgroup.org/content/bang-bits-atoms-neurons-and-genes-converging-technology
Kelly, K, 2014. "Technium Unbound.” Talk given to the Long Now Foundation Seminars About Long Term Thinking.
12 November 2014, San Francisco, California. http://longnow.org/seminars/02014/nov/12/technium-unbound/
Malmo, Christopher. Nov 2017. One Bitcoin Transaction Now Uses as Much Energy as Your House in a Week.
https://motherboard.vice.com/en_us/article/ywbbpm/bitcoin-mining-electricity-consumption-ethereum-energy-
climate-change
Nakano T, Moore MJ, Wei F, Vasilakos AV, & Shuai J. (2012). Molecular communication and networking:
opportunities and challenges. IEEE Transactions on Nanobioscience. 11, 135-48.
Roco, M.C. & Bainbridge, W.S (eds). 2003. Converging Technologies for Improving Human Performance
Nanotechnology, Biotechnology, Information Technology and Cognitive Science. NSF/DOC-sponsored report.
Dordrecht, The Netherlands. http://www.wtec.org/ConvergingTechnologies/Report/NBIC_report.pdf
Thomas, J. 2015 “Constructing a ‘futurology from below’ – A Civil Society contribution to a research agenda. Journal
of Responsible Innovation, Vol 2, 2015 issue 1.
https://www.tandfonline.com/doi/abs/10.1080/23299460.2014.1002176
UN Environment. 2013, “21 Issues for the 21st Century”,
http://www.grid.unep.ch/products/3_Reports/Foresight_Report-21_Issues_for_the_21st_Century.pdf
UNCSD. 2012. The Future We Want. United Nations Conference on Sustainable Development, Rio + 20.
A/RES/66/288. https://sustainabledevelopment.un.org/futurewewant.html
United Nations Sustainable Development. 1992. “Agenda 21.” United Nations Conference on Environment &
Development. Rio de Janeiro, Brazil, 3-14 June 1992.
https://sustainabledevelopment.un.org/content/documents/Agenda21.pdf
Winerip, M. (2013, June 24). You Call That a Tomato? New York Times. Retrieved from
http://www.nytimes.com/2013/06/24/booming/you-call-that-a-tomato.html
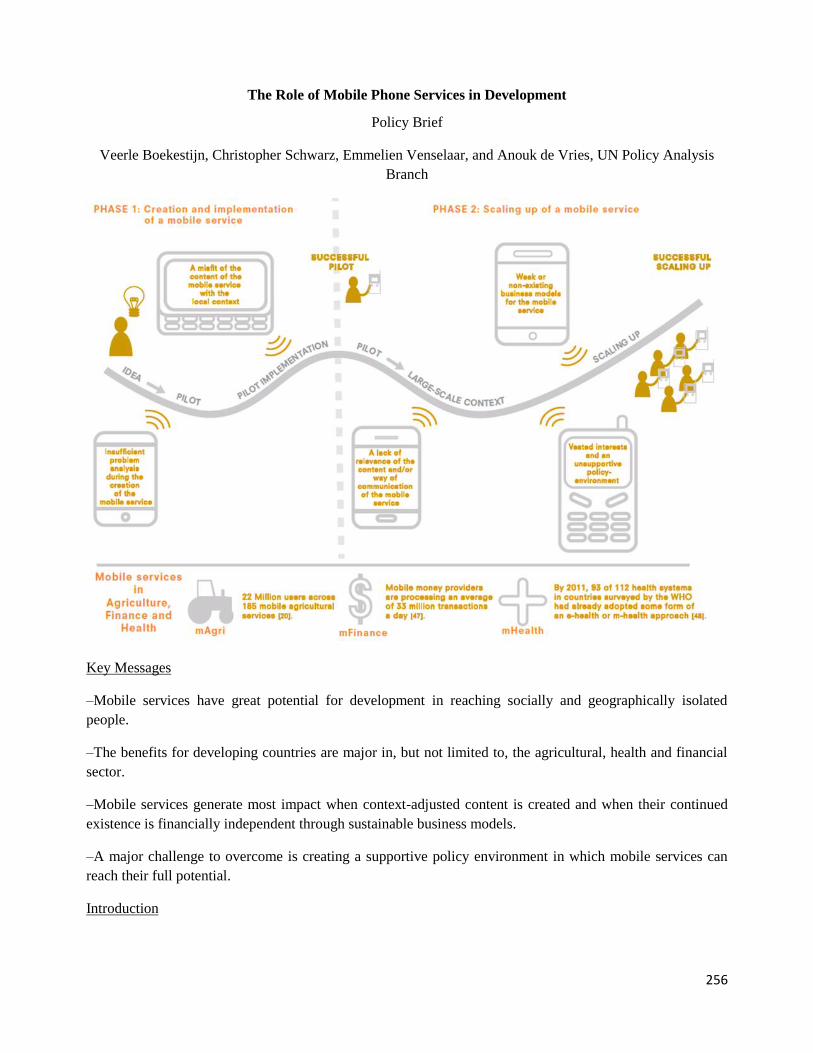
256
The Role of Mobile Phone Services in Development
Policy Brief
Veerle Boekestijn, Christopher Schwarz, Emmelien Venselaar, and Anouk de Vries, UN Policy Analysis
Branch
Key Messages
–Mobile services have great potential for development in reaching socially and geographically isolated
people.
–The benefits for developing countries are major in, but not limited to, the agricultural, health and financial
sector.
–Mobile services generate most impact when context-adjusted content is created and when their continued
existence is financially independent through sustainable business models.
–A major challenge to overcome is creating a supportive policy environment in which mobile services can
reach their full potential.
Introduction
257
Farmers checking the weather forecast, health workers receiving advice on the best treatment methods or
factory employees transferring their salary to their families at home: All of it can be done with a feature
phone. Over the last years, a whole new world of mobile technology has opened up for a great number of
people. Currently, 95% of people worldwide live in an area with mobile network coverage [2]. There are
about 4.7 billion individual subscribers. Almost 70% of these subscribers are located in the developing world
and it is expected that between now and 2020, over 90% of the new subscriptions are obtained there [1]. This
revolutionary development is toppling the status quo of global information and communication methods and
goes hand in hand with the rapid spread of mobile services. As mobile services are becoming increasingly
popular, their potential as a tool for development is widely recognized [3]-[7].
However, mobile services are not always as successful as expected from their pilots [8]- [10]. If they want to
live up to their potential as a tool for development, the process of creation, implementation and scaling-up is
vital. In order to improve this process, the focus should be on how policy makers and other public and private
stakeholders can amplify the effects of mobile services for development, rather than focusing on technical
issues [9],[11]. The exact role of stakeholders, ranging from governments, NGOs, private companies and
policy makers, differs per case. This policy brief will assess the potential and barriers of mobile services,
ending with recommendations, important considerations and a glimpse ahead. Good practices from the
financial, health, and agricultural sector will be shared, presenting how mobile services can serve as a tool
for development.
Potential
Mobile services have the potential to positively affect sustainable development, acting as a tool to decrease
information gaps and empower individuals [7]. Beyond basic connectivity, the technology allows
overcoming the lack of physical infrastructure such as roads and landlines [13]. Mobile services can
empower people by reaching out to those geographically or socially isolated from information [14],[15]. Not
only do more people then have access to information, it is also accessible around the clock [16]. In this way
the increase of availability and accessibility of mobile technology aligns with the leave no-one behind ideal
of sustainable development.
One of the first success stories was M-Pesa, a mobile phone-based money transfer and (micro)financing
service launched in Kenya in 2007, which has had and still has great economic developmental impacts [17].
Prior to M-Pesa, only 18.9% of the Kenyan population had access to conventional financial services, whereas
by 2011, over 70% of the Kenyans reported using M-Pesa [18]. M-Pesa is one successful example of a
mobile service, as it has connected millions of people to a well-functioning financial service [19].
The opportunities of mobile services, such as M-Pesa, offer many chances for development in general as well
as in relation to the Sustainable Development Goals [10],[20]. Production and profitability of farmers can be
advanced through mobile services (SDG 2, Zero Hunger). Mobile services can support emergency
communication and(in)formal medical advice to remote areas with a lack of health care facilities. (SDG 3,
Good Health and Well-Being). Lastly, economic growth and resilience of infrastructure can be catalysed
through provision of data connectivity and financial inclusion (SDG 9, Industry, Innovation and
Infrastructure) [20].
Good Practices
258
From the agricultural, health and financial sector one case has been selected. The cases depicted have been
launched relatively recently, show potential for scaling up beyond one country and are overall considered to
be promising. This selection is only a snapshot of many available mobile services.
mAgri Agriculture is still the major source of employment in developing countries, despite the challenges farmers
face due to climate change, hunger and a growing population [21]. Small-scale farmers often face a
knowledge gap in regards to agricultural best practices [22]. Mobile services aimed at agriculture, or mAgri,
are for instance aimed at providing technical farming advice or location based weather updates [8]. MAgri
services can contribute to bridging the knowledge gap, thereby increasing agricultural production and
profitability [20].
Case: iCow, launched in 2011.
• Goal: Assist dairy farmers in maximizing their return by, among other things, advising on feeding
schedules and market rates on cattle prices.
• Country of origin: Kenya, now expanding to Tanzania, Ethiopia, Uganda and Rwanda.
• Target users: Small-scale dairy farmers with access to feature phones.
• Stakeholders: Mobile network operator Safaricom, the Kenyan government, professional services
company Accenture, elea Foundation, Indigo Trust, Infonet Biovision, US government agency
USAID and small-scale farmers [23],[24].
• Accessibility: The service is designed for feature phones and therefore requires no internet
connection [23].
• Policy: The Kenyan government has developed a supportive environment for innovators in this
sector [24].
• Business model: The information on cows provided via the service is standardized. Adding new
farmers to the system is not an expense and only brings in subscription charges [25].
mHealth In 2015, 400 million people did not have access to essential health services [26]. In general, there are
problems, both with the physical as well as financial access to and general lack of good quality health care.
For example, there is an unequal spread of doctors around the world, leading to a lack of qualified
professionals in the developing world. It is estimated that by 2035 there will be deficit of around 12.9 million
skilled health workers [27]. mHealth, which is the use of mobile services for the delivery of health services
and information, has great potential contribute to overcoming these issues and transform the health sector.
Especially in remote rural areas which are otherwise hard to reach, mHealth can be revolutionary in solving
the pressing need for health care [4],[5],[28],[29].
Case: Leap, launched in 2013.
• Goal: Increasing the number of well-trained community health workers and facilitating
communication among them.
• Country of origin: Kenya, with the ambition to spread to 30 other countries in Africa before 2020.
• Target users: Community health workers.
• Stakeholders: NGO Amref Health Africa (owner), Mobile network operators Safaricom and
Vodafone,
259
• the Kenyan government, the M-Pesa Foundation, professional services company Accenture and
community
• health workers (partners) [30].
• Quality of Content: The content of the service is accredited by the Kenyan Ministry of Health,
increasing
• the reliability of the information that is distributed [3].
• Partnerships: The social venture business model behind Leap has allowed for different types of
investors as well as other partners to become involved. This contributes to a strong and sustainable
business model [3].
mFinance Approximately 2 billion working-age adults globally do not use formal financial services [31]. mFinance, or
financial services accessible through mobile phones, contribute to bridging this gap and allow the formerly
‘unbanked’ access to services. mFinance can digitally enhance the process of financial inclusion and
supplement consisting financial infrastructures. Services currently on the market let individuals, micro- and
small enterprises pay with their mobile devices, transfer, save, borrow without credit history and insure
themselves against risks [32] Services that enable low cost, cross-border remittance transactions are rapidly
growing, through which migrants can support their friends and family abroad. Already in 2014, more than
250 mFinance services were deployed in 85+ countries, all contributing to digital financial [32].
Case: Hello Paisa, launched in 2012.
• Goal: Live, low-cost and secure digital remittances.
• Country of origin: Nepal.
• Target Users: Migrants, to send money to their friends and family back home.
• Stakeholders: Numerous banks and financial institutions, several mobile network operators, retail
stores, migrants [33].
• Partnerships: Collaboration of public and private partners, both on the global and national level [33].
• Evidence-based Feedback loop: A close engagement with users to improve the mobile service to
meet their demands [33].
• Cyber security: Actively examines financial consumer protection [33].
Barriers and Recommendations
The implementation process of mobile services consists of two subsequent phases, namely 1) the creation
and development of a mobile service and 2) the scaling-up of mobile services. In both phases, several
barriers are identified.
Phase 1: Creation and Implementation of a Mobile Service The goal of phase 1 is to first identify and
analyse challenges that hold target users back in their development. After that, it is to be determined how a
mobile service can be used as a tool to overcome the challenge.
Barrier - Insufficient problem analysis during the creation of the mobile service: A mobile service can be
unsuccessful when the challenge that the mobile service aims to address and context in which the challenge
is situated are not thoroughly analysed before creation and implementation of the service [11],[34].
260
Recommendation: A thorough problem analysis exists out of three parts. Firstly, a stakeholder and target user
analysis needs to be done. It needs to be determined which group(s) that the mobile service will be targeting.
The diversity within this target user group also needs to be taken into consideration [3]. Also, the
stakeholders should be identified and it should be determined which stakeholders will be included in the
process of creating and implementing the service [35]. It needs to be ensured that all stakeholders are aligned
regarding the problem definition. Furthermore, the availability, affordability and accessibility of mobile
services in the local context should be analysed [36]. Aspects such as reception, battery charging
possibilities, the resources available to add credit to one’s phone and the level of digital (il)literacy of the
target users are all potentially limiting factors to the successful implementation of mobile services
[6],[15],[24],[37]. Moreover, the larger context has to be analysed. A close look needs to be taken at the
competition in and possible saturation of the market in order to avoid unnecessary creation and
implementation of services [34]. Also, local laws and regulations regarding mobile services have to be taken
into account, so that a service is designed in accordance to those [34],[38]-[40].
Barrier - A misfit of the content of the mobile service with the local context: A mobile service can be
unsuccessful because it fails to present its content, for example weather forecasts or methods of medical
treatment, in a way that is either reliable, understandable and/or acceptable for the target users [3],[37].
Getting people to trust the information provided to them can be especially difficult when it can significantly
influence their livelihood [25].
Recommendation: The reliability of the content of a mobile service should at all times be ensured. It is
important to include all stakeholders in the iterative process of shaping the content. For example, a
representative sample of the target users together with the government and research institutes can validate
content to ensure its reliability [3],[15]. This sample of target users can also help to determine the appropriate
communication style, by which it can then be ensured that the way in which the content is delivered is
appealing and trustworthy to the target users [3],[25]. The results of evidence-based feedback loops should
be included in the creation of the service. In this way, things such as the service’s content and
communication style can be adjusted based on the evidence already available and thereby help to increase its
relevance and trustworthiness for the target audience [34].
Phase 2: Scaling-up of Mobile Services The goal of phase 2 is for mobile services to scale up from a pilot to
implementation on a larger scale with a bigger group of target users.
Barrier - Weak or non-existing business models: A coherent business model (for-profit or non-profit) which
allows the mobile service to exist independently of any external funding in the long run is regularly forgotten
and thereby forms a barrier in scaling-up [9],[15],[25],[40].
Recommendation: During the creation and implementation phase it is important that a good business model
is designed. In the pilot-phase, a mobile service can still be supported by external funding but in the long run,
it needs to be able to survive independently. Donors, such as governments or NGOs, should make clear from
the start that one of the criteria for funding the mobile service is that there should be a viable business model.
It is recommended to involve multiple stakeholders in the creation of a coherent business model, especially
experts from the private sector [3],[25],[35].
Barrier - A lack of relevance of the content and/or way of communication of the mobile service: When a
mobile service is scaled-up to a larger context, it is not always checked thoroughly whether the content is still
261
relevant and/or the communication style is still appropriate. There is a lack of (academic) research that could
otherwise provide evidence on the impact and effectiveness of the service [3],[10],[29],[34],[41].
Recommendation: In the process of scaling up, the relevance of the content and the effectiveness of
communication style of a mobile service should constantly be monitored to ensure its relevance [3]. A
recommended strategy is to make better use of evidence-based feedback loops. In these loops, evidence is
gathered from practical experience with and impact of mobile services, on issues such as the level of
understanding of the content by the target users and whether or not the service still fits with the users that
were originally targeted. This evidence is then used for improving the service both for the new as well as the
current context. To create stronger feedback loops, several different stakeholders, such as academia, research
institutes, NGOs and governments should do more research in partnerships [34],[35].
Barrier: Vested interests and an unsupportive policy-environment: Vested interests of parties that oppose the
development of mobile services can hold back the process of scaling-up. The vested interests are aggravated
in a situation of an unsupportive policy environment, in which the potential of mobile services is not
recognized [8],[11].
Recommendation: Ideally, governments can take the lead in overcoming these vested interests. They can
create awareness among policy makers about the large range of possibilities of mobile services, so that policy
makers are not led by vested interests [15]. Also, partnerships and information sharing between other
stakeholders and the government will enable policy makers to take informed decisions on supportive
frameworks and regulations for mobile services [8],[11]. Depending on the specific context, other methods
can be used to further enhance a supportive policy environment, such as innovations grants for mobile
service start-ups, conferences and forums on this topic and adaptation of regulations that hold back mobile
service development [9],[23],[25],[37].
Important Considerations
Policy makers and other stakeholders should be aware of several aspects that can complicate the creation,
implementation and scaling-up of mobile services.
Cybersecurity and privacy: Mobile phones, especially smartphones, collect an increasing amount of
information, which is valuable and therefore vulnerable to cyberattacks and data abuse
[1],[15],[34],[40],[42].
Mobile services are a tool, not a solution: Mobile services offer a new way to address old problems, but
should not be perceived as a silver bullet for development. Mobile services do, for instance, not replace the
need for appropriate policies and stable governance systems [3],[6],[34].
Internet can increase inequality and divergence: Although the internet can help low-income countries and the
poor by providing access to information, it can also widen the gap between those who have access to internet
and those who have not [25],[43]. For example, internet penetration rates around the world are higher for
men than for women [16].
A Glimpse Ahead
There are plenty of future opportunities for mobile services reaching beyond the possibilities and sectors
discussed above.
262
A first promising trend is the Internet of Things: a term used to indicate that personal mobile devices can be
linked to one another and with physical things, hereby increasing connectivity between people, data and
devices [25],[37],[44]. Mobile services can benefit from the Internet of Things by incorporating sensors or
drones in for instance agriculture. Examples are wireless sensors that can track crop growth, thereby
gathering data for farmers [44],[45]. This could be the next step for mobile services: moving beyond mobile
phones and instead focusing on any mobile technology [25].
Another promising trend is the use of mobile services in other sectors, such as m-governance: the use of
mobile to support governance processes and increase people’s participation, especially of the marginalized
groups. Possibilities have also been recognized in other sectors, such as climate change adaptation and
education [6],[46].
Key Recommendations
–Policy makers need to recognize the potential of mobile services as a tool for development in reaching
previously socially and geographically isolated people.
–Perform a thorough problem analysis during the creation phase of mobile services, by paying attention to,
among other factors, the target users, stakeholders and the general context.
–Ensure that the content of mobile services is reliable, trustworthy and relevant for target users.
–Private and public stakeholders, such as mobile operators, governments and NGOs, need to form
partnerships to gain and share in- sights.
–Fund mobile services in the pilot phase, but force them to develop viable business models so that in the long
run they can scale up and become financially independent.
–Policy makers need to create a supportive policy environment in which mobile services can reach their full
potential.
–Perform more research on thorough impact assessments of mobile services.
Reference List
[1] ‘e-agriculture FAO Mobile Telephony in Rural Areas’. Food & Agriculture Organization, 2011.
[2] GSMA, ‘The Mobile Economy’, GSMA, London, Unit- ed Kingdom, 2016.
[3] D. Jansen, ‘Private Interview’, 22-Nov-2016.
[4] P. N. Mechael, ‘The Case of mHealth in Developing Countries’, Innovations, vol. 4, no. 1, pp. 103–118, 2009.
[5] S. Akter and P. Ray, ‘mHealth - an ultimate platform to serve the unserved’, Yearb. Med. Inform. 2010, pp. 94–100,
Jan. 2010.
[6] UNDP, ‘Mobile Technologies and Empowerment: Enhancing Human Development through Participation and
Innovation’, UNDP, New York, USA, 2012.
[7] J. C. Aker and I. M. Mbiti, ‘Mobile Phones and Eco- nomic Development in Africa’, J. Econ. Perspect., vol. 24, no.
3, pp. 207–232, 2010.
[8] P. Walhof, ‘Private Interview’, 22-Nov-2016.
263
[9] R. Bhatia, ‘Private Interview’, 28-Nov-2016.
[10] A. T. Rashid and L. Elder, ‘Mobile phones and de- velopment: An analysis of IDRC-supported projects’, Electron.
J. Inf. Syst. Dev. Ctries., vol. 36, 2009.
[11] J. Poldermans, ‘Private Interview’, 25-Nov-2016.
[12] D. A. V. Zhdanova, ‘Mobile Services – Towards Se- mantics, Web Service Technologies Lecture at Universi- ty of
Innsbruck’. Telecommunications Research Center Vienna.
[13] A. Hartman, ‘Mobile Services for Development: An Opportunity for Academic Co-Creation’, Afeka College of
Engineering and University of Haifa, Haifa, 2013.
[14] A. Bhavnani, R. Won-Wai Chiu, S. Janakiram, and P. Silarszky, ‘The Roles of Mobile Phones in Sustainable Rural
Poverty Reduction’, ICT Policy Division, Global In- formation and Communications Department (GICT) - The
World Bank, Working Paper 44678, Jun. 2008.
[15] E. K. Kangethe, ‘Private Interview’, 29-Nov-2016.
[16] ITU, ‘ICT Facts and Figures 2016’, International Telecommunication Union, Geneva, Switzerland, Jun. 2016.
[17] W. Jack and T. Suri, ‘Mobile money: The econom- ics of M-PESA’, National Bureau of Economic Research,
Cambridge, MA, USA, NBER Working Paper Series 16721, Jan. 2011.
[18] ‘Why does Kenya lead the world in mobile mon- ey?’, The Economist, 23-May-2013.
[19] I. Mas and D. Radcliffe, ‘Mobile Payments go Vi- ral: M-PESA in Kenya’, in Yes Africa Can: Success Stories
from a Dynamic Continent, P. Chuhan-Pole and M. An- gwafo, Eds. Washington DC, USA: Work Bank, 2011, pp.
353–370.
[20] GSMA, ‘2016 Mobile Industry Impact Report: Sus- tainable Development Goals’, GSMA, London, United
Kingdom, 2016.
[21] FAO, ‘Climate change, agriculture and food securi- ty’, FAO, Rome, 2016.
[22] ‘Finding and Filling the Knowledge Gaps on Agri- cultural Biodiversity and Smallholder Farmer livelihoods -
Report of the Thika Meeting, 10 - 12 October 2011’, Oxfam Novib.
[23] ‘iCow’. [Online]. Available: www.icow.co.ke. [Ac- cessed: 15-Nov-2016].
[24] S. K. Stephanou, ‘Private Email Contact’, 17-Nov- 2016.
[25] H. Baumüller, ‘Private Interview’, 28-Nov-2016.
[26] World Health Organization and The World Bank, ‘Tracking Universal Health Coverage: First Global Mon- itoring
Report’, World Health Organization, Geneva, 2015.
[27] WHO and GHWA, ‘A Universal Truth: No Health Without a Workforce’, World Health Organization and Global
Health Workforce Alliance, Geneva, Switzerland, Nov. 2013.
[28] D. M. West, ‘Using Mobile Technology to Improve Maternal Health and Fight Ebola: A Case Study of Mo- bile
Innovation in Nigeria’, Brookings Institute, Washing- ton DC, Mar. 2015.
[29] M. Tomlinson, M. J. Rotheram-Borus, L. Swartz, and A. C. Tsai, ‘Scaling Up mHealth: Where Is the Evi- dence?’,
PLoS Med., vol. 10, no. 2, p. 1e1001382, Feb. 2013.
[30] ‘Leap: the mHealth Platform’. [Online]. Available: http://www.leaphealthmobile.com/. [Accessed: 12- Jan-2016].
[31] A. Demirgüç-Kunt, L. F. Klapper, D. Singer, and P. Van Oudheusden, ‘The Global Findex Database 2014:
measuring financial inclusion around the world’, World Bank, Washington DC, USA, Policy Research Working Pa-
per 7255, Apr. 2015.
264
[32] C. Scharwatt, A. Katakam, J. Frydrych, A. Murphy, and N. Naghavi, ‘2014 State of the Industry: Mobile Fi-
nancial Services for the Unbanked’, GSMA, 2015.
[33] J. Persson and A. Torbiörnsson, ‘Banking the Un- banked–The Case of Mobile Money in Nepal’, 2013.
[34] B. Kumpf, ‘Private Interview’, 28-Nov-2016.
[35] C. Z. Qiang, S. C. Kuek, A. Dymond, S. Esselaar, and I. S. Unit, ‘Mobile applications for agriculture and rural
development’, World Bank Wash. DC, 2011.
[36] S. Wyche and C. Steinfield, ‘Why Don’t Farmers Use Cell Phones to Access Market Prices? Technology
Affordances and Barriers to Market Information Servic- es Adoption in Rural Kenya’, Inf. Technol. Dev., vol. 22,
no. 2, pp. 320–333, Apr. 2016.
[37] B. Bosire, ‘Private Interview’, 30-Nov-2016.
[38] M. de Bruijn, Ed., SideWays: mobile margins and the dynamics of communication in Africa. Mankon, Bamenda,
Cameroon: Langaa, 2013.
[39] T. van Deursen, ‘Private Interview’, 23-Nov-2016.
[40] K. Valkx, ‘Private Interview’, 17-Nov-2016.
[41] J. Donner, ‘Mobile-based livelihood services in Af- rica: pilots and early deployments’, Commun. Technol. Lat.
Am. Afr. Multidiscip. Perspect., pp. 37–58, 2009.
[42] Internet for Development, ‘WORLD DEVELOP- MENT REPORT’, 91877, 2014.
[43] M. Kirk et al., ‘Connected Agriculture: The role of mobile in driving efficiency and sustainability in the food and
agriculture value chain’, Oxfam Policy Pract. Agric. Food Land, vol. 11, no. 6, pp. 85–106, 2011.
[44] ITU, ‘Measuring the information society report 2015’, ITU, Geneva, 2015.
[45] H. Baumüller, ‘Mobile technology trends and their potential for agricultural development’, Center for De-
velopment Research (ZEF), Bonn, Germany, ZEF Work- ing Paper Series No. 123, Nov. 2013.
[46] E. Yonazi, T. Kelly, N. Halewood, and C. Blackman, ‘The transformational Use of Information and Commu-
nication Technologies in Africa’, World Bank, African De- velopment Bank, African Union, Washington DC, USA
& Tunis, Tunesia, 2012.
[47] Global System Mobile Association, ‘State of the In- dustry Report - Mobile Money’, GSMA, 2015.
[48] World Bank Group, ‘World Development Report 2016: Digital Dividends’, The World Bank, Washington DC,
USA, 102725, 2016.
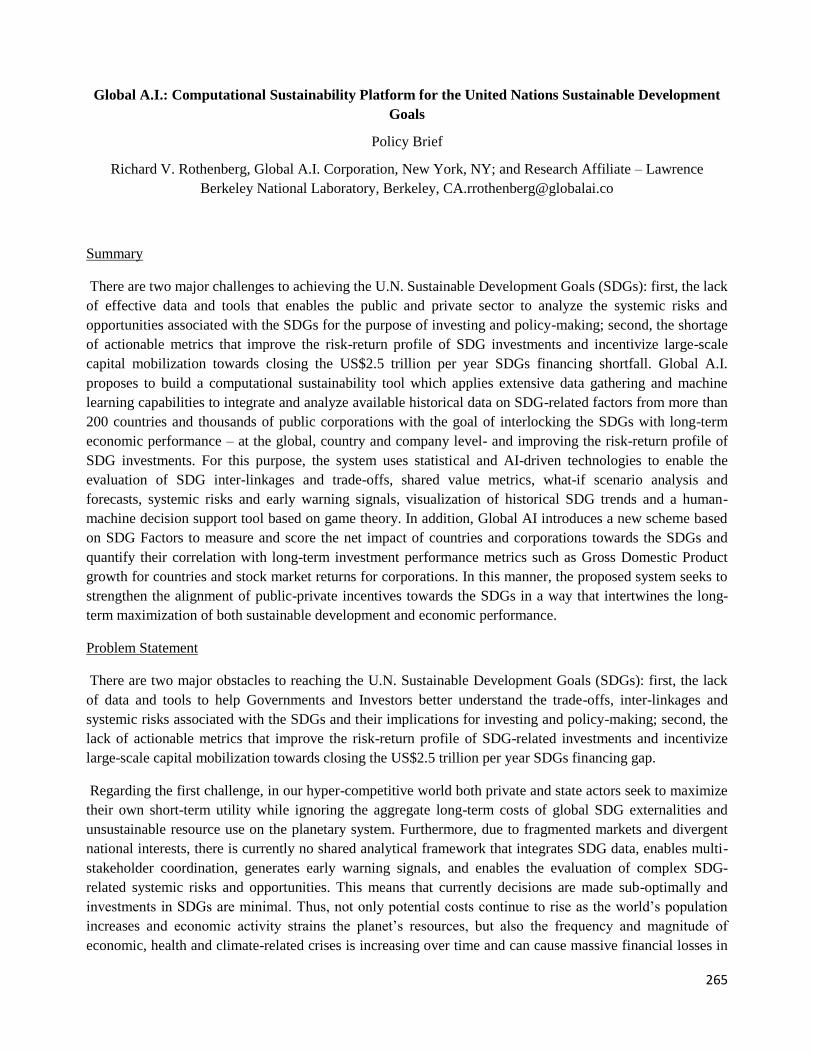
265
Global A.I.: Computational Sustainability Platform for the United Nations Sustainable Development
Goals
Policy Brief
Richard V. Rothenberg, Global A.I. Corporation, New York, NY; and Research Affiliate – Lawrence
Berkeley National Laboratory, Berkeley, [email protected]
Summary
There are two major challenges to achieving the U.N. Sustainable Development Goals (SDGs): first, the lack
of effective data and tools that enables the public and private sector to analyze the systemic risks and
opportunities associated with the SDGs for the purpose of investing and policy-making; second, the shortage
of actionable metrics that improve the risk-return profile of SDG investments and incentivize large-scale
capital mobilization towards closing the US$2.5 trillion per year SDGs financing shortfall. Global A.I.
proposes to build a computational sustainability tool which applies extensive data gathering and machine
learning capabilities to integrate and analyze available historical data on SDG-related factors from more than
200 countries and thousands of public corporations with the goal of interlocking the SDGs with long-term
economic performance – at the global, country and company level- and improving the risk-return profile of
SDG investments. For this purpose, the system uses statistical and AI-driven technologies to enable the
evaluation of SDG inter-linkages and trade-offs, shared value metrics, what-if scenario analysis and
forecasts, systemic risks and early warning signals, visualization of historical SDG trends and a human-
machine decision support tool based on game theory. In addition, Global AI introduces a new scheme based
on SDG Factors to measure and score the net impact of countries and corporations towards the SDGs and
quantify their correlation with long-term investment performance metrics such as Gross Domestic Product
growth for countries and stock market returns for corporations. In this manner, the proposed system seeks to
strengthen the alignment of public-private incentives towards the SDGs in a way that intertwines the long-
term maximization of both sustainable development and economic performance.
Problem Statement
There are two major obstacles to reaching the U.N. Sustainable Development Goals (SDGs): first, the lack
of data and tools to help Governments and Investors better understand the trade-offs, inter-linkages and
systemic risks associated with the SDGs and their implications for investing and policy-making; second, the
lack of actionable metrics that improve the risk-return profile of SDG-related investments and incentivize
large-scale capital mobilization towards closing the US$2.5 trillion per year SDGs financing gap.
Regarding the first challenge, in our hyper-competitive world both private and state actors seek to maximize
their own short-term utility while ignoring the aggregate long-term costs of global SDG externalities and
unsustainable resource use on the planetary system. Furthermore, due to fragmented markets and divergent
national interests, there is currently no shared analytical framework that integrates SDG data, enables multi-
stakeholder coordination, generates early warning signals, and enables the evaluation of complex SDG-
related systemic risks and opportunities. This means that currently decisions are made sub-optimally and
investments in SDGs are minimal. Thus, not only potential costs continue to rise as the world’s population
increases and economic activity strains the planet’s resources, but also the frequency and magnitude of
economic, health and climate-related crises is increasing over time and can cause massive financial losses in
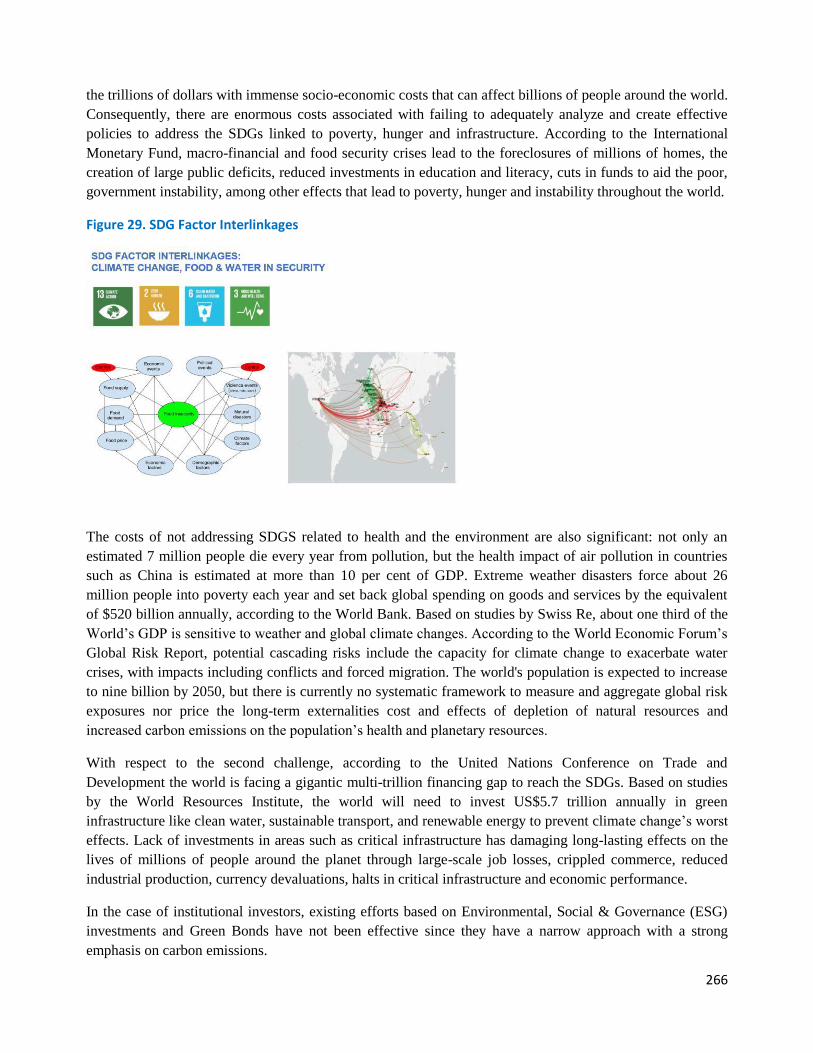
266
the trillions of dollars with immense socio-economic costs that can affect billions of people around the world.
Consequently, there are enormous costs associated with failing to adequately analyze and create effective
policies to address the SDGs linked to poverty, hunger and infrastructure. According to the International
Monetary Fund, macro-financial and food security crises lead to the foreclosures of millions of homes, the
creation of large public deficits, reduced investments in education and literacy, cuts in funds to aid the poor,
government instability, among other effects that lead to poverty, hunger and instability throughout the world.
Figure 29. SDG Factor Interlinkages
The costs of not addressing SDGS related to health and the environment are also significant: not only an
estimated 7 million people die every year from pollution, but the health impact of air pollution in countries
such as China is estimated at more than 10 per cent of GDP. Extreme weather disasters force about 26
million people into poverty each year and set back global spending on goods and services by the equivalent
of $520 billion annually, according to the World Bank. Based on studies by Swiss Re, about one third of the
World’s GDP is sensitive to weather and global climate changes. According to the World Economic Forum’s
Global Risk Report, potential cascading risks include the capacity for climate change to exacerbate water
crises, with impacts including conflicts and forced migration. The world's population is expected to increase
to nine billion by 2050, but there is currently no systematic framework to measure and aggregate global risk
exposures nor price the long-term externalities cost and effects of depletion of natural resources and
increased carbon emissions on the population’s health and planetary resources.
With respect to the second challenge, according to the United Nations Conference on Trade and
Development the world is facing a gigantic multi-trillion financing gap to reach the SDGs. Based on studies
by the World Resources Institute, the world will need to invest US$5.7 trillion annually in green
infrastructure like clean water, sustainable transport, and renewable energy to prevent climate change’s worst
effects. Lack of investments in areas such as critical infrastructure has damaging long-lasting effects on the
lives of millions of people around the planet through large-scale job losses, crippled commerce, reduced
industrial production, currency devaluations, halts in critical infrastructure and economic performance.
In the case of institutional investors, existing efforts based on Environmental, Social & Governance (ESG)
investments and Green Bonds have not been effective since they have a narrow approach with a strong
emphasis on carbon emissions.
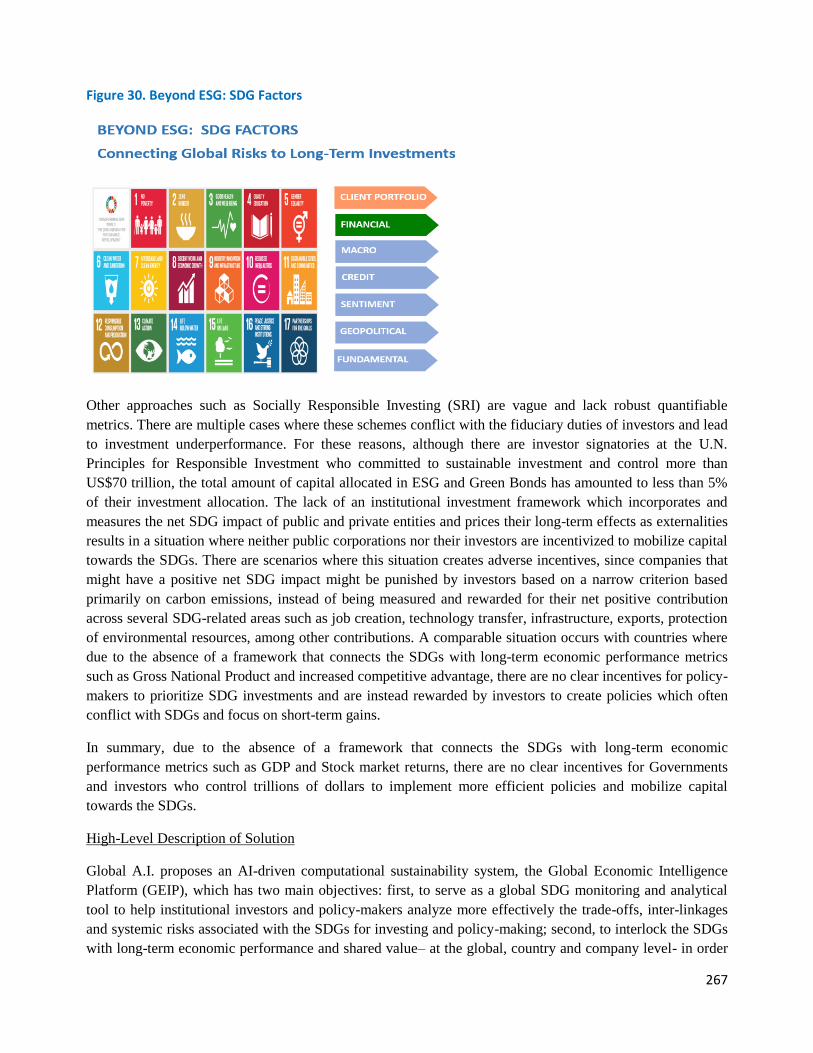
267
Figure 30. Beyond ESG: SDG Factors
Other approaches such as Socially Responsible Investing (SRI) are vague and lack robust quantifiable
metrics. There are multiple cases where these schemes conflict with the fiduciary duties of investors and lead
to investment underperformance. For these reasons, although there are investor signatories at the U.N.
Principles for Responsible Investment who committed to sustainable investment and control more than
US$70 trillion, the total amount of capital allocated in ESG and Green Bonds has amounted to less than 5%
of their investment allocation. The lack of an institutional investment framework which incorporates and
measures the net SDG impact of public and private entities and prices their long-term effects as externalities
results in a situation where neither public corporations nor their investors are incentivized to mobilize capital
towards the SDGs. There are scenarios where this situation creates adverse incentives, since companies that
might have a positive net SDG impact might be punished by investors based on a narrow criterion based
primarily on carbon emissions, instead of being measured and rewarded for their net positive contribution
across several SDG-related areas such as job creation, technology transfer, infrastructure, exports, protection
of environmental resources, among other contributions. A comparable situation occurs with countries where
due to the absence of a framework that connects the SDGs with long-term economic performance metrics
such as Gross National Product and increased competitive advantage, there are no clear incentives for policy-
makers to prioritize SDG investments and are instead rewarded by investors to create policies which often
conflict with SDGs and focus on short-term gains.
In summary, due to the absence of a framework that connects the SDGs with long-term economic
performance metrics such as GDP and Stock market returns, there are no clear incentives for Governments
and investors who control trillions of dollars to implement more efficient policies and mobilize capital
towards the SDGs.
High-Level Description of Solution
Global A.I. proposes an AI-driven computational sustainability system, the Global Economic Intelligence
Platform (GEIP), which has two main objectives: first, to serve as a global SDG monitoring and analytical
tool to help institutional investors and policy-makers analyze more effectively the trade-offs, inter-linkages
and systemic risks associated with the SDGs for investing and policy-making; second, to interlock the SDGs
with long-term economic performance and shared value– at the global, country and company level- in order
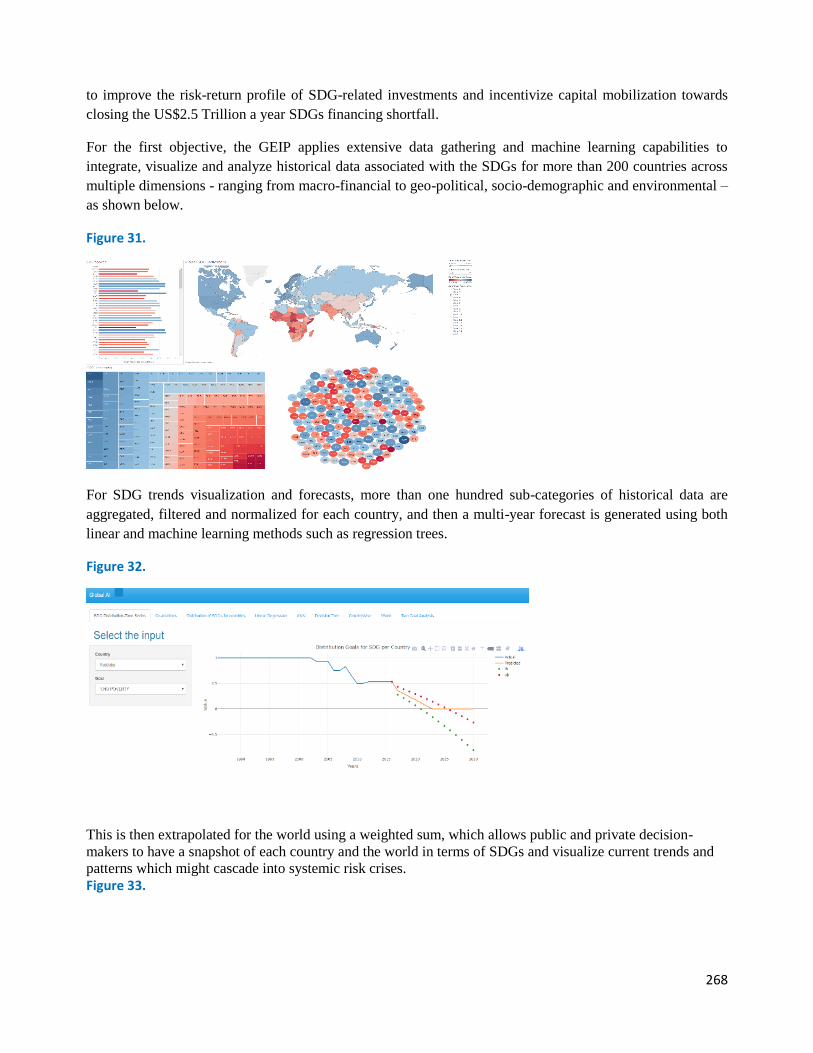
268
to improve the risk-return profile of SDG-related investments and incentivize capital mobilization towards
closing the US$2.5 Trillion a year SDGs financing shortfall.
For the first objective, the GEIP applies extensive data gathering and machine learning capabilities to
integrate, visualize and analyze historical data associated with the SDGs for more than 200 countries across
multiple dimensions - ranging from macro-financial to geo-political, socio-demographic and environmental –
as shown below.
Figure 31.
For SDG trends visualization and forecasts, more than one hundred sub-categories of historical data are
aggregated, filtered and normalized for each country, and then a multi-year forecast is generated using both
linear and machine learning methods such as regression trees.
Figure 32.
This is then extrapolated for the world using a weighted sum, which allows public and private decision-
makers to have a snapshot of each country and the world in terms of SDGs and visualize current trends and
patterns which might cascade into systemic risk crises.
Figure 33.
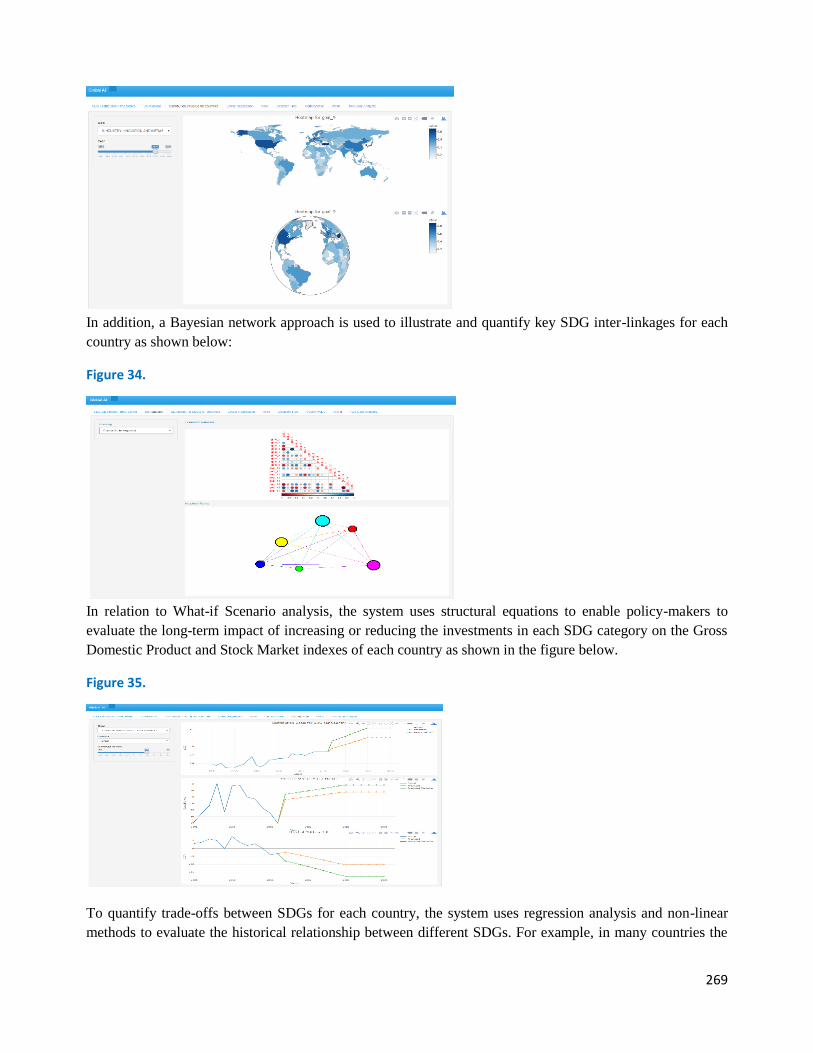
269
In addition, a Bayesian network approach is used to illustrate and quantify key SDG inter-linkages for each
country as shown below:
Figure 34.
In relation to What-if Scenario analysis, the system uses structural equations to enable policy-makers to
evaluate the long-term impact of increasing or reducing the investments in each SDG category on the Gross
Domestic Product and Stock Market indexes of each country as shown in the figure below.
Figure 35.
To quantify trade-offs between SDGs for each country, the system uses regression analysis and non-linear
methods to evaluate the historical relationship between different SDGs. For example, in many countries the
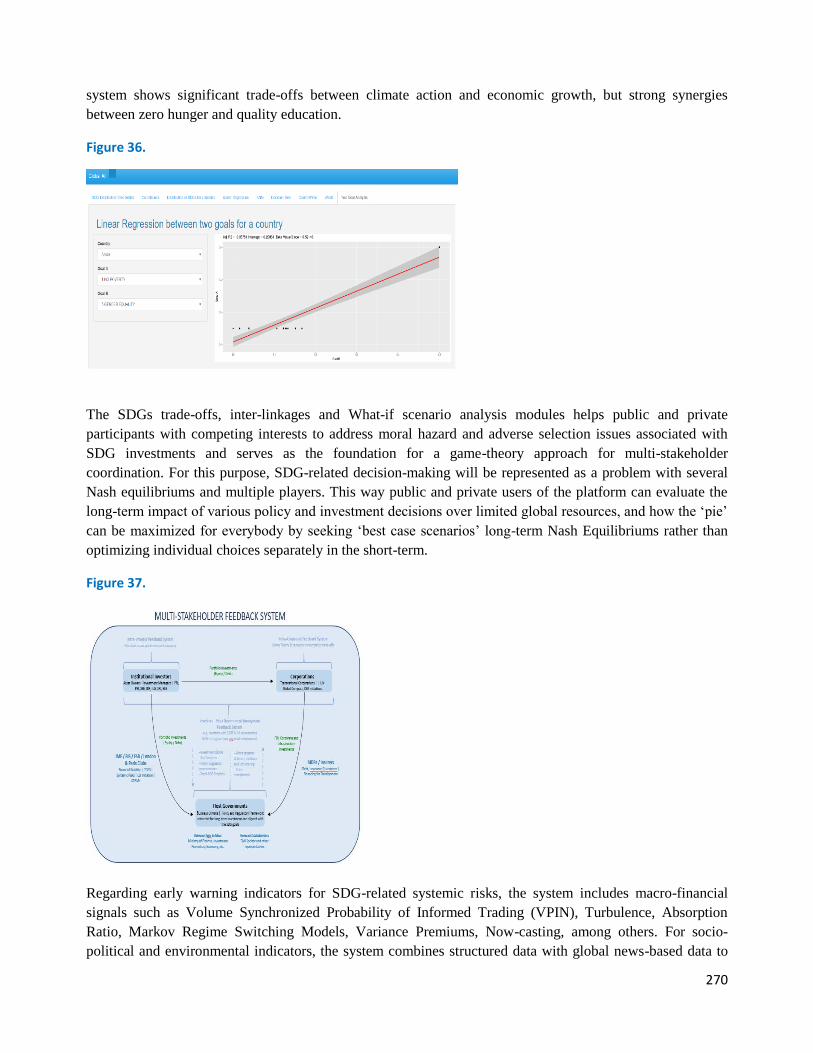
270
system shows significant trade-offs between climate action and economic growth, but strong synergies
between zero hunger and quality education.
Figure 36.
The SDGs trade-offs, inter-linkages and What-if scenario analysis modules helps public and private
participants with competing interests to address moral hazard and adverse selection issues associated with
SDG investments and serves as the foundation for a game-theory approach for multi-stakeholder
coordination. For this purpose, SDG-related decision-making will be represented as a problem with several
Nash equilibriums and multiple players. This way public and private users of the platform can evaluate the
long-term impact of various policy and investment decisions over limited global resources, and how the ‘pie’
can be maximized for everybody by seeking ‘best case scenarios’ long-term Nash Equilibriums rather than
optimizing individual choices separately in the short-term.
Figure 37.
Regarding early warning indicators for SDG-related systemic risks, the system includes macro-financial
signals such as Volume Synchronized Probability of Informed Trading (VPIN), Turbulence, Absorption
Ratio, Markov Regime Switching Models, Variance Premiums, Now-casting, among others. For socio-
political and environmental indicators, the system combines structured data with global news-based data to
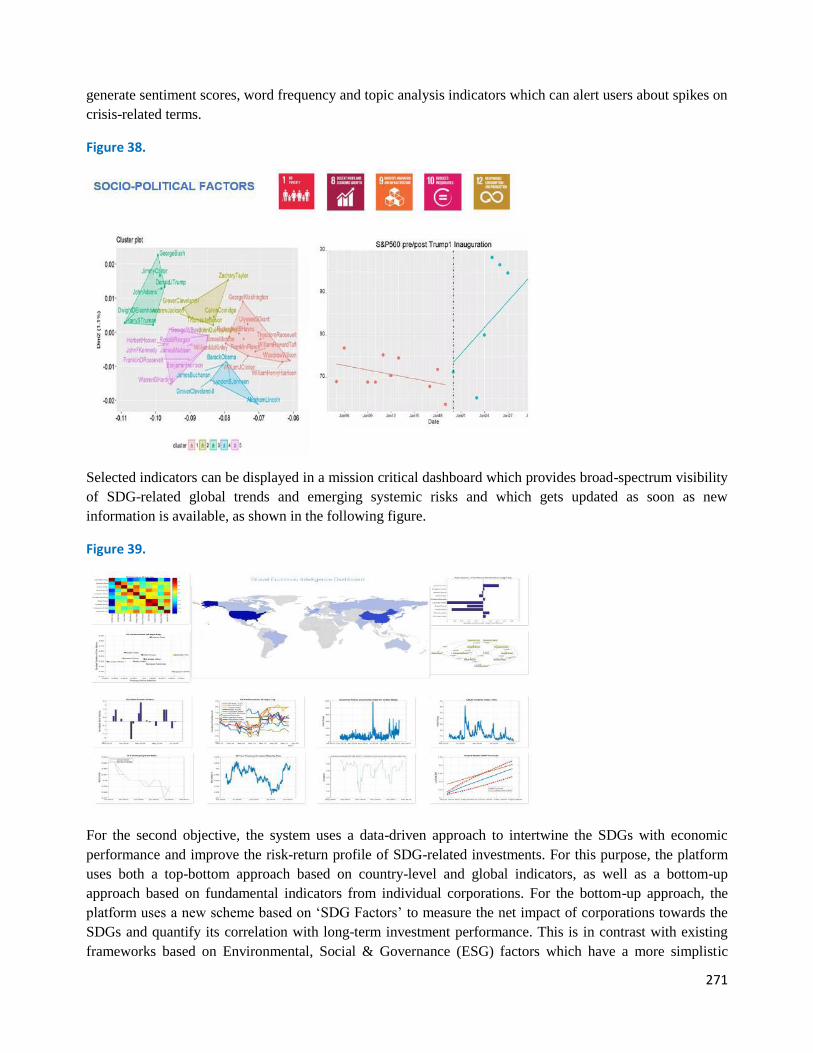
271
generate sentiment scores, word frequency and topic analysis indicators which can alert users about spikes on
crisis-related terms.
Figure 38.
Selected indicators can be displayed in a mission critical dashboard which provides broad-spectrum visibility
of SDG-related global trends and emerging systemic risks and which gets updated as soon as new
information is available, as shown in the following figure.
Figure 39.
For the second objective, the system uses a data-driven approach to intertwine the SDGs with economic
performance and improve the risk-return profile of SDG-related investments. For this purpose, the platform
uses both a top-bottom approach based on country-level and global indicators, as well as a bottom-up
approach based on fundamental indicators from individual corporations. For the bottom-up approach, the
platform uses a new scheme based on ‘SDG Factors’ to measure the net impact of corporations towards the
SDGs and quantify its correlation with long-term investment performance. This is in contrast with existing
frameworks based on Environmental, Social & Governance (ESG) factors which have a more simplistic
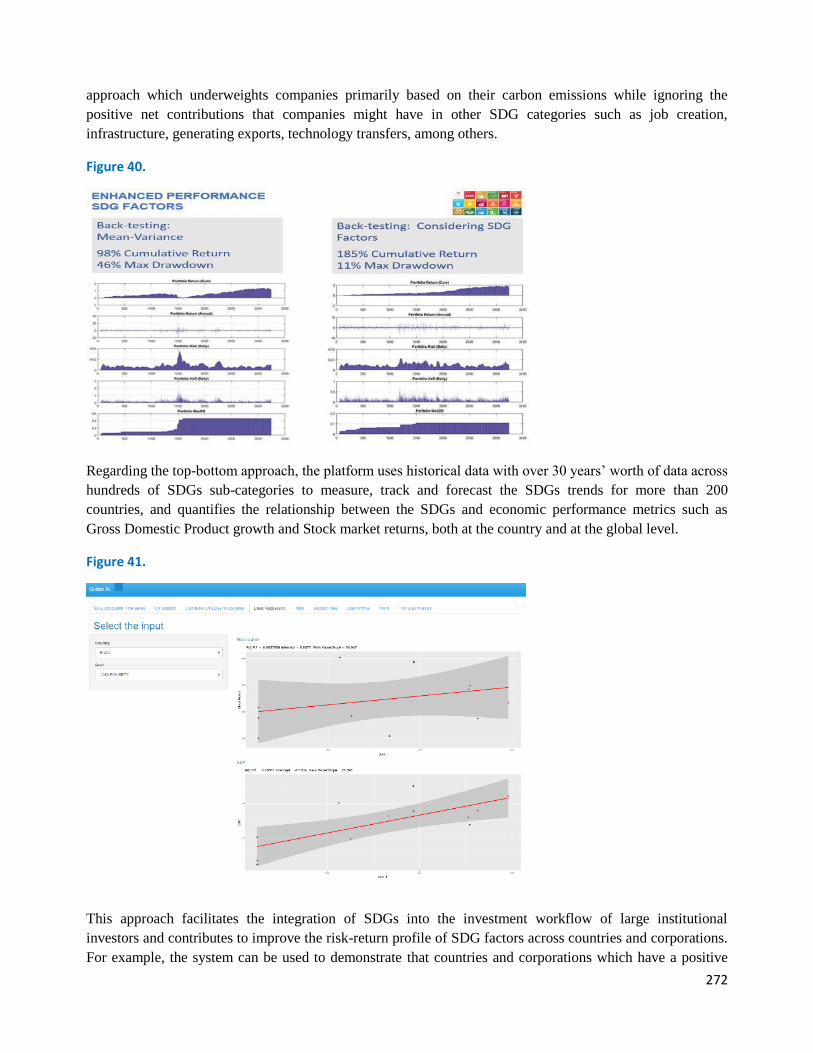
272
approach which underweights companies primarily based on their carbon emissions while ignoring the
positive net contributions that companies might have in other SDG categories such as job creation,
infrastructure, generating exports, technology transfers, among others.
Figure 40.
Regarding the top-bottom approach, the platform uses historical data with over 30 years’ worth of data across
hundreds of SDGs sub-categories to measure, track and forecast the SDGs trends for more than 200
countries, and quantifies the relationship between the SDGs and economic performance metrics such as
Gross Domestic Product growth and Stock market returns, both at the country and at the global level.
Figure 41.
This approach facilitates the integration of SDGs into the investment workflow of large institutional
investors and contributes to improve the risk-return profile of SDG factors across countries and corporations.
For example, the system can be used to demonstrate that countries and corporations which have a positive
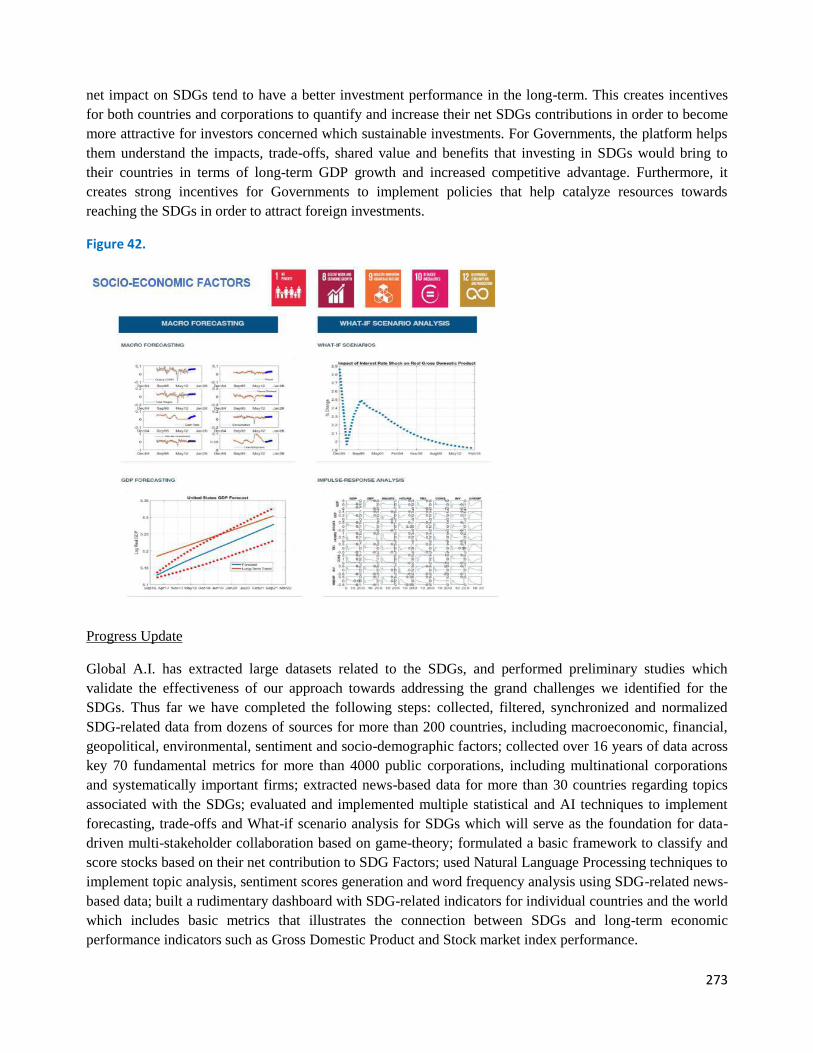
273
net impact on SDGs tend to have a better investment performance in the long-term. This creates incentives
for both countries and corporations to quantify and increase their net SDGs contributions in order to become
more attractive for investors concerned which sustainable investments. For Governments, the platform helps
them understand the impacts, trade-offs, shared value and benefits that investing in SDGs would bring to
their countries in terms of long-term GDP growth and increased competitive advantage. Furthermore, it
creates strong incentives for Governments to implement policies that help catalyze resources towards
reaching the SDGs in order to attract foreign investments.
Figure 42.
Progress Update
Global A.I. has extracted large datasets related to the SDGs, and performed preliminary studies which
validate the effectiveness of our approach towards addressing the grand challenges we identified for the
SDGs. Thus far we have completed the following steps: collected, filtered, synchronized and normalized
SDG-related data from dozens of sources for more than 200 countries, including macroeconomic, financial,
geopolitical, environmental, sentiment and socio-demographic factors; collected over 16 years of data across
key 70 fundamental metrics for more than 4000 public corporations, including multinational corporations
and systematically important firms; extracted news-based data for more than 30 countries regarding topics
associated with the SDGs; evaluated and implemented multiple statistical and AI techniques to implement
forecasting, trade-offs and What-if scenario analysis for SDGs which will serve as the foundation for data-
driven multi-stakeholder collaboration based on game-theory; formulated a basic framework to classify and
score stocks based on their net contribution to SDG Factors; used Natural Language Processing techniques to
implement topic analysis, sentiment scores generation and word frequency analysis using SDG-related news-
based data; built a rudimentary dashboard with SDG-related indicators for individual countries and the world
which includes basic metrics that illustrates the connection between SDGs and long-term economic
performance indicators such as Gross Domestic Product and Stock market index performance.
274
To implement the functionality described above we are testing multiple statistical and Artificial Intelligence
technologies such as random forests, clustering and classification models, Natural Language Processing
techniques, Recommender systems, dynamic Bayesian Networks, Transfer Entropy, Stochastic Flow
Diagrams, Hidden Markov Models, Principal Components analysis, Neural Networks and Deep Learning.
References
[1] International Monetary Fund. 2017. Global Financial Stability Report: Getting the Policy Mix Right. Washington,
DC, April
[2] Hallegatte, Stephane, Adrien Vogt-Schilb, Mook Bangalore, and Julie Rozenberg. 2017. “Unbreakable: Building the
Resilience of the Poor in the Face of Natural Disasters.” Climate Change and Development Series. Overview
booklet. World Bank, Washington, DC.
[3] United Nations Conference on Trade and Development (UNCTAD). World Investment Report, 2014. Investing in
the SDGs: An Action Plan
[4] BlackRock, ViewPoint, Exploring ESG, a Practitioner’s Perspective (June 2016), available at
https://www.blackrock.com/corporate/en-us/literature/whitepaper/viewpoint-exploring-esg-a-practitioners-
perspective-june-2016.pdf
[5] Matt Orsagh, CFA Institute, CFA Institute Survey: How Do ESG Issues Factor into Investment Decisions? (Aug.
17, 2015), available at https://blogs.cfainstitute.org/marketintegrity/2015/08/17/cfa-institute-survey-how-do-esg-
issues-factor-into-investment-decisions/
[6] BlackRock and Ceres, 21st Century Engagement: Investor Strategies for Incorporating ESG Considerations into
Corporate Interactions (2015), available at http://www.blackrock.com/corporate/en-us/literature/publication/blk-
ceres-engagementguide2015.pdf
[7] DB Climate Change Advisors, Deutsche Bank Group, Sustainable Investing: Establishing Long-Term Value and
Performance (Jun. 2012), available at https://www.db.com/cr/en/docs/Sustainable_Investing_2012.pdf
[8] UN Global Compact is a voluntary initiative based on CEO commitments to implement universal sustainability
principles and to take steps to support UN goals, with over 8,000 signatories in almost 170 countries. See United
Nations Global Compact, https://www.unglobalcompact.org/
[9] Indrani De and Michelle Clayman, The Benefits of Socially Responsible Investing: An Active Manager's
Perspective, Journal of Investing (Jul. 9, 2014), available at http://ssrn.com/abstract=2464204
[10] International Capital Market Association, The Green Bond Principles, 2015: Voluntary Process Guidelines for
Issuing Green Bonds (Mar. 27, 2015). http://www.icmagroup.org/assets/documents/Regulatory/Green-
Bonds/GBP_2015_27-March.pdf
[11] Fay, M., A. Iimi, and B. Perrissin-Fabert, 2010. Financing Greener and Climate Resilient Infrastructure in
Developing Countries: Challenges and Opportunities., EIB Papers 15 (2): 35–59.
[12] Atisophon V., J. Bueren, G. De Paepe, C. Garroway and J. P. Stijns. 2011. Revising MDG Cost Estimates from a
Domestic Resource Mobilization Perspective. OECD Development Centre Working Paper No. 306, OECD.
[13] Organisation for Economic Co-operation and Development (OECD), 2012, Can we still Achieve the Millennium
Development Goals? From Costs to Policies. Development Centre Studies, OECD Publishing.
[14] World Economic Forum. Global Risks Report, 2017.
[15] World Bank and International Monetary Fund, 2011, Global Monitoring Report 2011. Improving the Odds of
Achieving the MDGs. Heterogeneity, Gaps and Challenges. Washington, DC.

275
276
Using Financial Transaction Data To Measure Economic Resilience To Natural Disasters
Policy Brief
UN Global Pulse, BBVA Data & Analytics
Summary
This project explored how financial transaction data can be analysed to better understand the economic
resilience of people affected by natural disasters. The project used the Mexican state of Baja California Sur
as a case study to assess the impact of Hurricane Odile on livelihoods and economic activities over a period
of six months in 2014. The project measured daily Point of Sale transactions and ATM withdrawals at high
geospatial resolution to gain insight into the way people prepare for and recover from disaster. The study
revealed that people spent 50% more than usual on items such as food and gasoline in preparation for the
hurricane and that recovery time ranged from 2 to 40 days depending on characteristics such as gender or
income. Findings suggest that insights from transaction data could be used to target emergency response and
to estimate economic loss at local level in the wake of a disaster.
Background
Resilience is the capacity of individuals, communities and systems to adapt and survive in the face of stress
and disruption. It ensures that external pressures do not have long-lasting adverse consequences for
development. With an abundance of new sources of real-time data, quantitative frameworks for measuring
resilience could be enhanced by the ongoing data revolution. This project used data analytics to derive
quantitative proxy indicators of the economic impact and market resilience of populations affected by natural
disaster. The first major, and most destructive, hurricane to hit the Mexican state of Baja California Sur
(BCS) in 25 years, tropical cyclone Odile made landfall near Cabo San Lucas in September 2014. This
project used transactional data from Point of Sale (POS) card payments and ATM cash withdrawals to
understand how people in BCS behaved prior to, during and in the wake of hurricane Odile. Analysis of the
transactional data provided an opportunity to understand behavioural patterns displayed when people are
subject to external shocks such as natural disasters.
Mapping Disaster Response With Transactions
The project analysed POS payment and ATM cash withdrawal data produced by more than 100,000 clients
(out of an estimated population of 637,000), which totalled a number of 25,000 transactions per day. Data
was aggregated into three categories with a similar number of transactions distributed throughout BCS
according to income: low (bottom 50% of population), medium (next 30%) and high (top 20%). The income
level was calculated taking into account the median Mexican income. In addition, each of the subsets was
disaggregated by gender. The total number of card transactions was divided into ATM and POS transactions
and POS expenditures were further split into categories such as food, gasoline or entertainment (bars and
restaurants).
The study created a ‘normality model’ to estimate what the economic activity in BCS would be under normal
conditions. The model was created based on the activity of other Mexican regions not impacted by the
hurricane. This ‘normality model’ was compared to the number of recorded transactions to measure both the
‘recovery time’ and the ‘relative impact’ on affected populations. A disaster-affected community’s
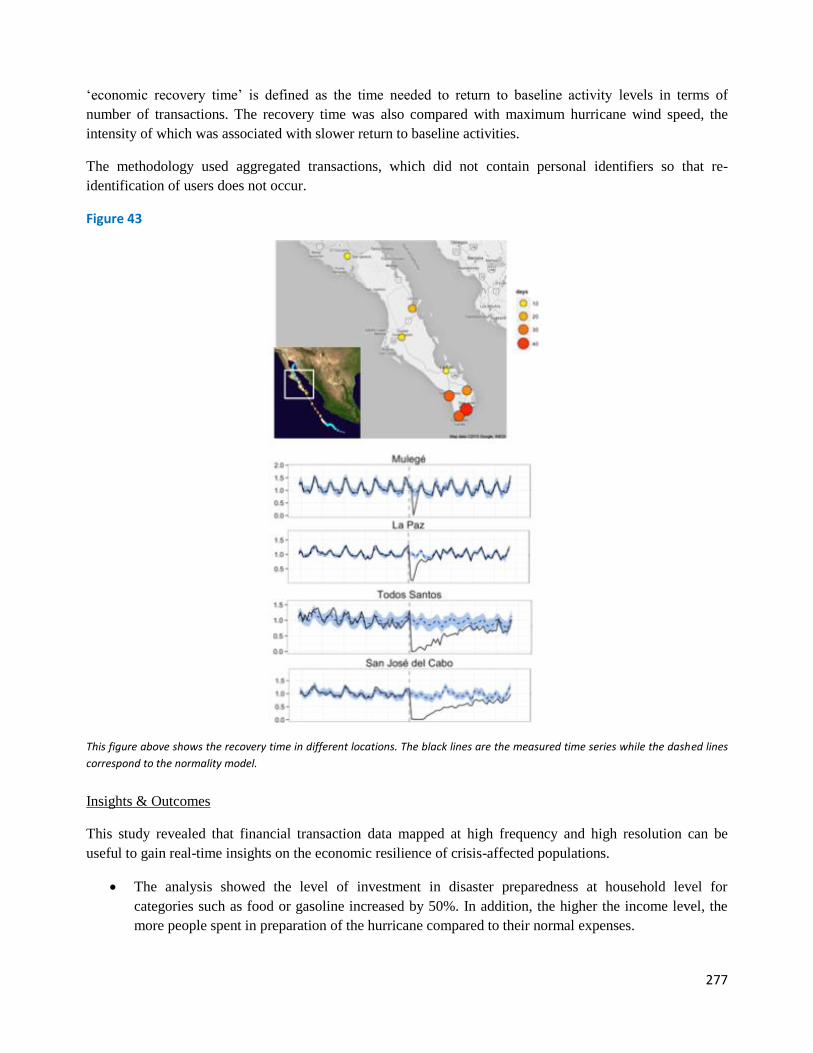
277
‘economic recovery time’ is defined as the time needed to return to baseline activity levels in terms of
number of transactions. The recovery time was also compared with maximum hurricane wind speed, the
intensity of which was associated with slower return to baseline activities.
The methodology used aggregated transactions, which did not contain personal identifiers so that re-
identification of users does not occur.
Figure 43
This figure above shows the recovery time in different locations. The black lines are the measured time series while the dashed lines
correspond to the normality model.
Insights & Outcomes
This study revealed that financial transaction data mapped at high frequency and high resolution can be
useful to gain real-time insights on the economic resilience of crisis-affected populations.
• The analysis showed the level of investment in disaster preparedness at household level for
categories such as food or gasoline increased by 50%. In addition, the higher the income level, the
more people spent in preparation of the hurricane compared to their normal expenses.
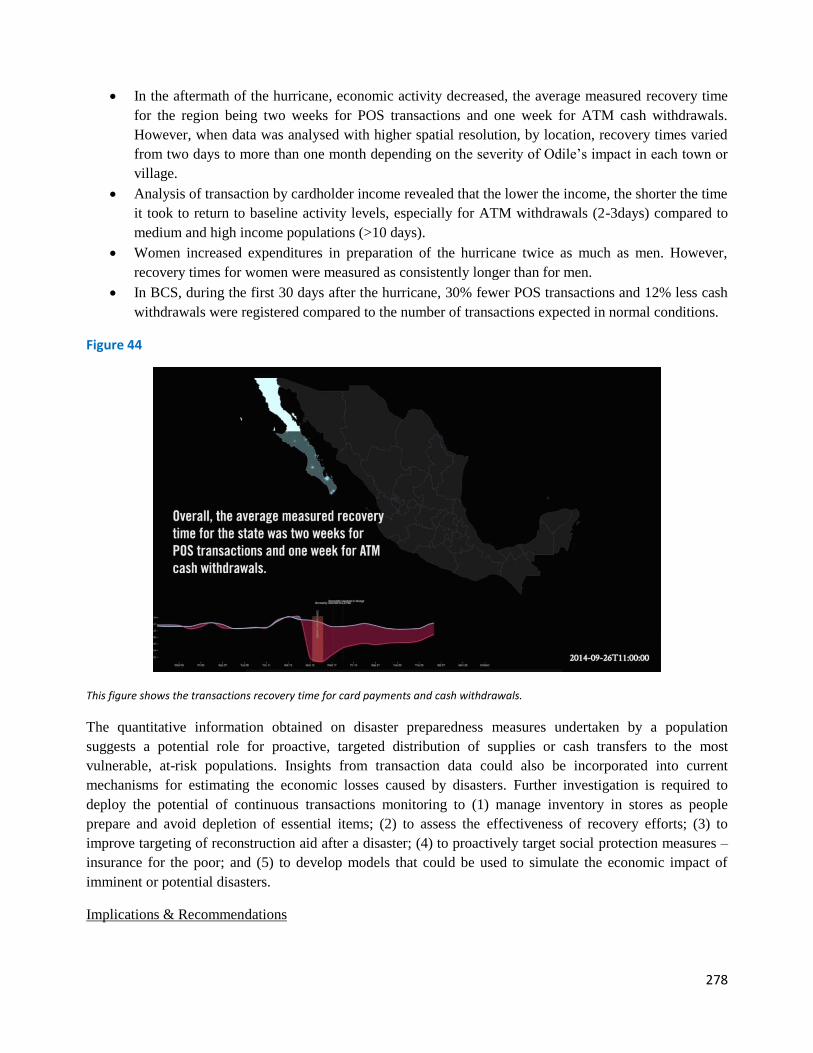
278
• In the aftermath of the hurricane, economic activity decreased, the average measured recovery time
for the region being two weeks for POS transactions and one week for ATM cash withdrawals.
However, when data was analysed with higher spatial resolution, by location, recovery times varied
from two days to more than one month depending on the severity of Odile’s impact in each town or
village.
• Analysis of transaction by cardholder income revealed that the lower the income, the shorter the time
it took to return to baseline activity levels, especially for ATM withdrawals (2-3days) compared to
medium and high income populations (>10 days).
• Women increased expenditures in preparation of the hurricane twice as much as men. However,
recovery times for women were measured as consistently longer than for men.
• In BCS, during the first 30 days after the hurricane, 30% fewer POS transactions and 12% less cash
withdrawals were registered compared to the number of transactions expected in normal conditions.
Figure 44
This figure shows the transactions recovery time for card payments and cash withdrawals.
The quantitative information obtained on disaster preparedness measures undertaken by a population
suggests a potential role for proactive, targeted distribution of supplies or cash transfers to the most
vulnerable, at-risk populations. Insights from transaction data could also be incorporated into current
mechanisms for estimating the economic losses caused by disasters. Further investigation is required to
deploy the potential of continuous transactions monitoring to (1) manage inventory in stores as people
prepare and avoid depletion of essential items; (2) to assess the effectiveness of recovery efforts; (3) to
improve targeting of reconstruction aid after a disaster; (4) to proactively target social protection measures –
insurance for the poor; and (5) to develop models that could be used to simulate the economic impact of
imminent or potential disasters.
Implications & Recommendations
279
• This study allowed the measurement of very different impacts and recovery scenarios across close
geographies, suggesting the potential of using such information to inform highly targeted responses
to the most affected communities and to estimate economic loss at the local level in the wake of a
natural disaster.
• Access to a stream of objective, real-time information on economic recovery could be used to design
feedback loops into reconstruction programmes and policies.
• Further research is needed to understand the similarities and differences of different disasters through
the lens of transaction data. Potential next steps could also involve developing the tools and
approaches needed to transition from case studies to operational use on-site during disasters, and
exploring the potential of such tools and insights to inform humanitarian aid or relief efforts.
References
Brodersen K. et al (2015) Inferring causal impact using Bayesian structural time-series models. The Annals of Applied
Statistics, 9(1), 247-274.
Food Security Information Network Resilience Measurement Technical Working Group. (2014, January). Resilience
measurement principles: Toward an agenda for measurement design.
Cangialosi, J.P., and Kimberlain, T.B. (2015, March 4). National Hurricane Center tropical cyclone report: Hurricane
Odile (EP152014).
Sobolevsky, et al (2015, June). Scaling of city attractiveness for foreign visitors through big data of human economical
and social media activity. 2015 IEEE International Congress on Big Data, 600-607
280
Supporting Decision-making Through Analysis of Public Radio Content
Policy Brief
UN Global Pause
Pulse Lab Kampala developed the prototype of a tool that can analyze public radio content to reveal a
detailed picture of the priorities of Ugandans. The Radio Content Analysis tool works by converting public
discussions that take place on radio into text using ‘speech-to-text’ technology. Once converted, the text can
be searched by topics of interest related to the Sustainable Development Goals (SDGs) such as health,
education or employment. The topics can be further broken down by location and timeline. The new
capability afforded by this tool could help policymakers better understand, in real-time, Ugandans’ priorities,
as voiced publicly on the radio. The prototype was built in collaboration with Makerere University and South
Africa’s Stellenbosch University.
Why Radio?
In Uganda, where some 90% of the population lives in rural areas, radio serves as a vital platform for public
discussion, information sharing and news. Radio broadcasts have the advantage of easily conveying
information in local languages, strengthening community values and the sense of belonging. There are
currently over 250 FM radio stations across Uganda, which are often open to contributions from listeners and
used for a variety of purposes such as information sharing, discussion, advocacy and capacity building.
The radio content analysis tool is designed to leverage public radio content as a new source of data that can
help measure progress towards achieving the Sustainable Development Agenda and inform emergency
response in case of natural disasters.
What Are the Objectives?
Develop a tool that uses speech-to-text technology to convert words into text for “Ugandan English,”
Luganda and Acholi, which are dialects spoken widely across the country.
Analyse radio content by searching for topics of interest for development and humanitarian action such as
health, education, or the impact of localised disasters such as floods, landslides or crop failures.
Break down topics relevant to sustainable and humanitarian contexts by location and timeline.
How Does the Tool Work?
Approximately 7.5 million words are spoken daily on Ugandan radio.
Speech-to-text technology trains software to recognize and convert recorded speech into text. For radio
content, the technology implies the following steps: (1) manually transcribe audio files to create in-context
examples of words that are spoken on radio; (2) the words are entered into a ‘pronunciation dictionary,’
which shows the most common sequences of sounds people make as they utter each word. This dictionary
represents the basis for an acoustic model of all sounds recorded for a particular subject of interest; (3) a
language model, which is an estimate of how likely each word is to be spoken, is built into the software.
Currently, the model has been completed for English as spoken in Uganda and is
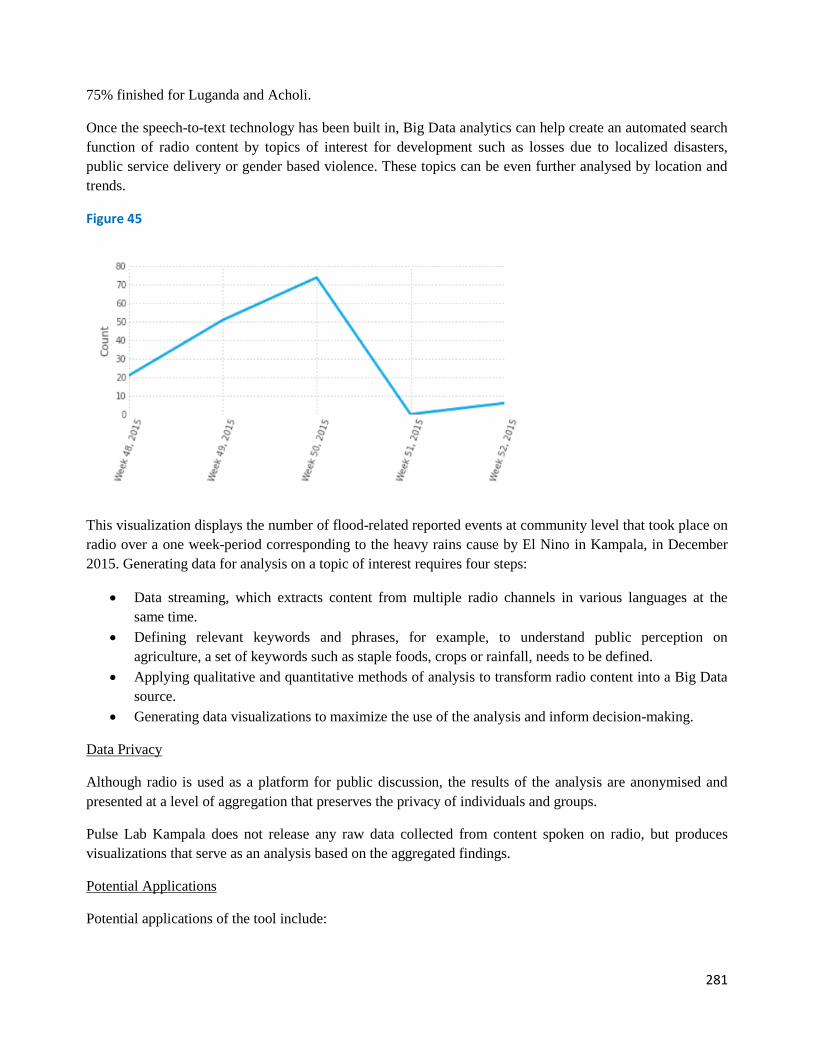
281
75% finished for Luganda and Acholi.
Once the speech-to-text technology has been built in, Big Data analytics can help create an automated search
function of radio content by topics of interest for development such as losses due to localized disasters,
public service delivery or gender based violence. These topics can be even further analysed by location and
trends.
Figure 45
This visualization displays the number of flood-related reported events at community level that took place on
radio over a one week-period corresponding to the heavy rains cause by El Nino in Kampala, in December
2015. Generating data for analysis on a topic of interest requires four steps:
• Data streaming, which extracts content from multiple radio channels in various languages at the
same time.
• Defining relevant keywords and phrases, for example, to understand public perception on
agriculture, a set of keywords such as staple foods, crops or rainfall, needs to be defined.
• Applying qualitative and quantitative methods of analysis to transform radio content into a Big Data
source.
• Generating data visualizations to maximize the use of the analysis and inform decision-making.
Data Privacy
Although radio is used as a platform for public discussion, the results of the analysis are anonymised and
presented at a level of aggregation that preserves the privacy of individuals and groups.
Pulse Lab Kampala does not release any raw data collected from content spoken on radio, but produces
visualizations that serve as an analysis based on the aggregated findings.
Potential Applications
Potential applications of the tool include:
282
• Real-time reporting of the impact of local natural disasters (such as floods and landslides). In rural
areas, radio is the main platform for dynamic reporting of the occurrence and effects of natural
disasters. People share information on the most affected areas, where populations are moving to
escape disaster or what sort of assistance they are in need of. The content radio analysis tool could
help identify in real-time population needs and inform emergency response.
• Monitoring in real time the programmes designed to improve public service delivery. Call-in talk
shows are used by many people to express their concerns about the quality of the service at health
centres. Such insights gathered in real time can help policy makers address these issues.
• Providing an early warning system of emerging public health challenges (such as disease outbreaks).
Analysis of radio broadcasts can help identify instances where communities are misinformed or the
degree with which a rumour is spread. Detecting such trends at an early stage can inform strategic
communication.
• Tracking in real time the effectiveness of campaigns on cultural related behaviours. UN agencies and
government entities use radio as a platform to broadcast campaigns on cultural related behaviour
such as child marriage and involve listeners in discussion. The radio content analysis tool could help
monitor and evaluate the effectiveness of such campaigns.
Piloting the Radio Content Analysis Tool
Pulse Lab Kampala initiated a pilot with the Department of Political Science at the University of Gothenburg
to use public radio content analysis to support local governance processes. The focus of the pilot is to use the
analysis to better understand public discourse about public health service delivery in Uganda. The objective
is to use the results to inform strategies to address bottlenecks in quality of health service delivery at local
level.
What’s Next
The radio content analysis tool could provide real-time insights on the priorities voiced publicly by Ugandans
on radio. Further case studies will be identified together with development partners to test the use of the radio
tool in various contexts. Pulse Lab Kampala will continue to work on improving the precision and speed of
the tool. The Lab will also analyse, together with its partners, the potential and benefits of adding one or
more dialects to the tool to provide for a more comprehensive view of content expressed on radio.

283

284