MALAWI MILLENNIUM DEVELOPMENT GOALS ENDLINE ...
68
MALAWI MILLENNIUM DEVELOPMENT GOALS ENDLINE REPORT
-
Upload
khangminh22 -
Category
Documents
-
view
0 -
download
0
Transcript of MALAWI MILLENNIUM DEVELOPMENT GOALS ENDLINE ...

MALAWI MILLENNIUM DEVELOPMENT GOALS
ENDLINE REPORT


HIS EXCELLENCYPROF. ARTHUR PETER MUTHARIKAPRESIDENT OF THE REPUBLIC OF MALAWI

FOREWORD
Malawi signed the United Nations Declaration in September 2000, with the aim of reducing poverty and achieving sustainable development. By signing the Millennium Declaration, the country committed itself to achieving all the eight Millennium Development Goals, namely: Eradicating Extreme Poverty and Hunger; Achieving Universal Primary Education; Promot-ing Gender Equality and Empowerment of Women; Reducing Child Mortality; Improving Maternal Health; Combating HIV and AIDS, Malaria and other Diseases; Ensuring Environ-mental Sustainability; and Developing a Global Partnership for Development.
The Government of Malawi localized the implementation of the Millennium Development Goals (MDGs) through the country’s National Development Strategy, known as the Malawi Growth and Development Strategy (MGDS). This strategy was developed to reduce poverty and create wealth for the citizens through sustainable economic growth and infrastructure development.
The Malawi Millennium Development Goals End-line Report has been developed to take stock of the achievements that the country has made towards attaining the MDG targets. The report also highlights the challenges that were faced in the course of implementing the MDGs. In respect of the progress that has been made, the report shows that Malawi has achieved four out of the eight goals. While this is enough reason for concern, the Govern-ment, in collaboration with its development partners, will continue implementing interven-tions aimed at meeting some of the targets beyond 2015.
The Government of Malawi conducted national consultations on the Post 2015 Develop-ment Agenda regarding the “Malawi we Want”, out of which focus areas were identified in line with the priorities as set in the Malawi Growth and Development Strategy and the Sustainable Development Goals (SDGs). Going forward, the country will localise the SDGs into the successor National Development Strategy, which is currently under development, to enhance the implementation of the SDGs. I am optimistic that, beyond 2015, the Govern-ment and all its stakeholders will continue to collaborate and redouble their efforts in order to ensure that significant progress is made on the goals that are lagging behind.
Goodall E. GondweMINISTER OF FINANCE, ECONOMIC PLANNING AND
DEVELOPMENT
iv

TABLE OF CONTENTS
FOREWORD .................................................................................................................... iv
TABLE OF CONTENTS .................................................................................................... v
LIST OF ACRONYMS .................................................................................................. vi
STATUS AT A GLANCE ................................................................................................ viii
EXECUTIVE SUMMARY ........................................................................................ 1
INTRODUCTION ............................................................................................................. 3
GOAL 1: ERADICATING EXTREME POVERTY AND HUNGER ........................... 5
GOAL 2: ACHIEVE UNIVERSAL PRIMARY EDUCATION .................................. 13
GOAL 3: PROMOTE GENDER EQUALITY AND EMPOWER WOMEN ............... 18
GOAL 4: REDUCE CHILD MORTALITY .................................................................. 24
GOAL 5: IMPROVE MATERNAL HEALTH ........................................................ 29
GOAL 6: COMBAT HIV AND AIDS, MALARIA AND OTHER DISEASE ................ 33
GOAL 7: ENSURE ENVIRONMENTAL SUSTAINABILITY .................................. 41
GOAL 8: DEVELOP GLOBAL PARTNERSHIP FOR DEVELOPMENT .................. 49
CONCLUSION ........................................................................................................... 55
BIBLIOGRAPHY............................................................................................................. 56
vv

LIST OF ACRONYMSAIDS Acquired Immune Deficiency SyndromeARV Anti-Retroviral drugs BCC Behavioral Change and Communication CBE Complementary Basic EducationCBO Community Based OrganisationCDSS Community Day Secondary SchoolsCFCs ChlorofluorocarbonsCLTS Community Led Total SanitationDAS Development Assistance StrategyDCS Development cooperation strategyDOTS Direct Observable Treatment ShortEHP Essential Health PackageEU European UnionEPI Expanded Programme for ImmunizationFAO Food and Agricultural Organization GAVI Global Alliance for Vaccine and ImmunizationGDP Gross domestic productGHG Green House GasHESSEA Household Expenditure and Small Scale Economic ActivitiesHIPC Highly Indebted Poor CountriesHIV Human Immuno-deficiency Virus HSA Health Surveillance AssistantHTC HIV Testing and CounselingICT Information Communication TechnologyIFE Information Education and CommunicationIHS Integrated Household SurveyIMCI Integrated Management of Child IllnessIMR Infant mortality rateIMS Information Management SystemIPD In-Patient DepartmentIRI Interactive Radio InstructionIT Information TechnologyITN Insecticide Treated NetIVL Interactive Video LearningLA Artemether LumefantrineLFS Labour Force SurveyLLINs Long Lasting Insectide NetsMACOHA Malawi Council for the HandicappedMAF MDG Acceleration Framework MASEDA Malawi Social Economic DatabaseMARDEF Malawi Rural Development FundMAREP Malawi Rural Electrification Programme
vi

MDRTB Multi-Drug Resistance TuberculosisMIE Malawi Institute of EducationMDG Millennium Development GoalMDHS Malawi Demographic and Health SurveyMDRI Multilateral Debt Relief Initiative MES MDG Endline SurveyMGDS Malawi Growth and Development StrategyMICS Multiple Indicator Cluster SurveyMNH Maternal and Neonatal Health (MNH)MPRS Malawi Poverty Reduction StrategiesMPVA Malawi Poverty Vulnerability AssessmentMTEF Medium Term Expenditure FrameworkNER Net Enrolment RateNESP National Education Sector PlanPHC Population and Housing CensusODA Overseas Development AssistanceODF Open Defecation FreeOPD Out-Patient DepartmentOVOP One Village One ProductPCAR Primary Curriculum Assessment ReviewPPP Public Private PartnershipPSIP Public Sector Investment ProgrammeRBM Roll Back Malaria ProgrammeSADC Southern Africa Development CommunitySRH Sexual Reproductive HealthSTDs Sexually Transmitted DiseasesSWAp Sector Wide ApproachTB Tuberculosis TTCs Teacher Training CollegesUN United Nations UNICEF United Nation Children’s FundUNDP United Nations Development ProgrammeUNEP United Nations Environment ProgrammeUNFPA United Nations Fund for PopulationUPE Universal Primary EducationWHO World Health OrganizationWMS Welfare Monitoring Survey
iivii

viii

EXECUTIVE SUMMARYHaving signed the Millennium Declaration in September, 2000, the Government of Malawi and its collaborating partners have, in the past 15 years, been implementing a number of interventions in order to achieve the Millennium Development Goals (MDGs) targets. The MDGs End-line Report shows progress that has been made towards the achievement of the MDGs. The Report highlights that the country has achieved four out of the eight goals. The targets, on the other four, have not been met, not because of lack of effort to achieve them, but due to the fact that the country had a much lower starting base compared to other coun-tries. The four MDGs that have been met are: Reducing Child Mortality; Combating HIV and AIDS, Malaria and other diseases; Ensuring Environmental Sustainability; and Devel-oping Global Partnership for Development. The four that have not been met are: Eradicating Extreme Poverty and Hunger; Achieving Universal Primary Education; Promoting Gender Equality and Empowerment of Women and Improving Maternal Health. Although four of the goals have not been met, the Country has still registered some improvements compared to where it had started from in the base year.
Based on the current statistics, progress on Reducing Child Mortality has been impressive. Under-five mortality rate is estimated at 85 deaths per 1,000 in 2014 live births compared to 234 deaths per 1,000 live births in 1990. Similarly, infant mortality has gone down from 134 deaths per 1,000 live births in 1990 to 53 deaths per 1,000 live births in 2014. These achievements are a testimony of marked improvements made in the provision of health ser-vices during the implementation period of the MDGs.
Combating HIV and AIDS, Malaria, and other diseases has also been met. Significant de-clines have been registered in the incidence of Malaria and TB since 2005. Estimates of the national HIV prevalence rate have been reduced by over 50 percent from about 24 percent to 10.6 percent between 1998 and 2012. On the other hand, HIV infection has almost stabilized at around 12 percent. The increase in the awareness programmes on HIV prevention and behavioral change is among the factors that have led to this decline. Similarly, the country has managed to reduce death rates associated with Malaria and Tuberculosis.
The goal of Ensuring Environmental Sustainability has also been attained. The number of households with sustainable access to improved water sources has increased significantly from 47 percent in 1990 to 86.2 percent in 2014, exceeding the MDG target of 74 percent. Similarly, the proportion of population with access to basic sanitation has jumped from 72 percent in 2012 to 95.1 percent in 2014. However, significant challenges still remain in the management of Malawi’s precious forest resources. The land area covered by forest has declined steadily over the years, from 41.4 percent in 1990 to 36.2 percent in 2005 largely as a result of continued use of wood for fuel by most rural households.
The goal of Developing Global Partnership for Development has also been achieved. Data on cellular phone subscribers per 100 people indicates that there has been an increase in subscribers from 4 percent in 2004 to 39.8 percent in 2014. This rapid increase can be at-tributed to low-cost cell phone handsets and an increased demand for faster communication.
1111

For landline subscribers, there has been a slight increase from 0.8 percent in 2013 to 1.9 percent in 2014. However, data shows that youth unemployment is still high at 27.5 percent according to the Malawi Labour Force Survey of 2013.
On the goal of eradicating extreme poverty and hunger, the country has made significant progress in reducing the prevalence of underweight children below five years of age, from about 25 percent in 2000 to about 17 percent in 2014. Similarly, the proportion of ultra-poor in urban areas has been reduced from 7.5 percent in 2000 to about 4.3 percent in 2012, even though there are still challenges with respect to reducing ultra-poor population in rural ar-eas. The reduction in underweight prevalence can be attributed to improved food security at household level as a result of subsidized inputs that Government is providing to smallholder farmers. Overall, the country’s poverty levels are still high in both urban and rural areas. Nevertheless, the Government with all its stakeholders will continue implementing policies and programmes aimed at reducing poverty through interventions that will, among others, help boost household incomes and improve quality of life, increase agriculture productivity and improve access to gainful employment.
Achievement of Universal Primary Education is one of the four goals that has not been achieved. Even though primary school education is free, the net enrolment rate is not yet 100 percent. In 2014, primary school net enrolment was estimated at 85 percent from 78 percent in 2000. The proportion of pupils starting grade one who reach grade five without repeating a grade has also increased from 69 percent in 2000 to 87.8 percent in 2014. In recognition of significant challenges still being faced to achieve this goal, the Government, alongside its Development Partners, is committed to increasing resources towards primary education in Post 2015 interventions.
Promotion of Gender Equality and Women Empowerment has not been attained. Gender inequalities exist in accessing productive resources, development opportunities and in deci-sion making positions. Significant progress has, however, been made on the ratio of girls to boys enrolled in primary school which is currently at 1.001:1, surpassing the 1:1 MDG target. On the other hand, the ratio of girls to boys in secondary school has only increased from 0.60 in 2000 to 0.88 in 2014 and as such, the MDG target has not been met. The un-even ratio at secondary school level has direct effect on the ratio of girls to boys at the ter-tiary level. In the long run, this is affecting the ratio of literate women to men and continues to perpetuate the inequality between women and men.
Malawi is still among the countries that have high Maternal Mortality Rate in the world. The MDGs Endline Survey of 2014 estimates Maternal Mortality Rate at 574 deaths per 100,000 live births, which is below the MDG target of 155. Births attended by skilled health personnel have been increasing steadily from 56 percent in 2000 to 87.4 percent in 2014. Although the country has not been able to meet this goal, there has been a general reduction in the trend of maternal deaths over the past few years due to deliberate interventions such as Safe Motherhood initiative. Beyond 2015, the country will continue implementing initia-tives to improve the quality of health services, before delivery and at the time of giving birth to sustain the progress that has been made on this goal.
2 2

INTRODUCTIONBuilding on the United Nations global conferences of the 1990s, the United Nations Millen-nium Declaration of September 2000, which was adopted by the Heads of States and Gov-ernments, marked a global partnership for creating an environment conducive to eliminating poverty and promoting sustainable human development at national and global levels. The Declaration committed member states to achieve a set of eight Millennium Development Goals (MDGs) by 2015. These Goals are: Eradicating extreme poverty and hunger; Achiev-ing universal primary education; Promoting gender equality and empowerment of women; Reducing child mortality; Improving maternal health; Combating HIV/AIDS, malaria and other diseases; Ensuring environmental sustainability; and Developing a global partnership for development. These MDGs were adopted as a common set of indicators against which socio- economic development and promotion of human rights in member countries could be measured and compared. Malawi localized and implemented the Millennium Development Goals through its medium term development strategies, which were translated into annual budgets. Since the introduc-tion of Malawi Poverty Reduction Strategies (MPRS) during early 2000, Malawi has strived to reduce poverty through prioritisation of programmes and interventions which have direct impact on the poor in the national budgets. The implementation of the MPRS provided the country with important lessons which informed the formulation of the Malawi Growth and Development Strategy (MGDS). The current MGDS II (2012 to 2016), is the second genera-tion poverty reduction strategy, which provides an improved framework for implementing the MDGs. The strategy emphasises on wealth creation and poverty reduction through sus-tainable economic growth and infrastructure development.
Through the Medium Term Expenditure Framework (MTEF) and the Public Sector Invest-ment Programme, Government makes sure that financial resources are directed to the priori-ties of the MGDS. Government has also set up an implementation, monitoring and evalu-ation framework to provide regular feedback on progress made towards the attainment of MGDS and MDGs targets.
Realizing that achievement of MGDS and MDG targets required enormous resources which could not be mobilized by Government alone, a Development Cooperation Strategy (DCS) for Malawi was developed in collaboration with the country’s cooperating partners. The strategy advocates for inclusive partnerships, government leadership and country ownership of the national development agenda and alignment of donor assistance and systems around national strategies and systems. The DCS is in line with principles encapsulated in the Paris Declaration on aid effectiveness, Accra Agenda for Action and the Busan Global Partnership for Effective Development Cooperation. Government recognized that improved coordina-tion of financial support from its development partners will improve the implementation and achievement of the development outcomes and ultimately result in the attainment of the MDGs. Government is optimistic that the Development Cooperation Strategy would help it mobilize adequate resources towards implementation of its programmes beyond 2015.
The Malawi Millennium Development Goals Endline Report is the last report on MDGs implementation. The Report has been developed to take stock of the achievements that the
3333

country has made towards attaining the MDG targets, since implementation of the same started in September, 2000. Besides the MDG Endline Report, the country, has over the past years, been producing MDG progress reports annually to determine whether the country was on course to achieve the MDG targets by 2015 or not.
4 4

ERADICATING EXTREME POVERTY AND HUNGER

GOAL 1: ERADICATING EXTREME POVERTY AND HUNGER
GOAL ACHIEVEMENT : NOT METIndicator Baseline (2000) MDG Target AchievementPoverty Head Count (%) 53.9 27 50.7Poverty Gap Ratio (%) 18.6 8 18.9Poorest Quintile Share in National Consump-tion (%)
10 20 5.5
Prevalence of underweight children (%) 25.4 14 16.7Proportion of Ultra-poor (%) 23.6 11.8 25.7
Extreme poverty is defined as the inability to meet basic minimum food requirements based on the monthly cost of the food basket. Eradicating extreme poverty is the first of the eight MDGs and two main targets were set to achieve the goal by the year 2015. The first target was to halve, between 1990 and 2015, the proportion of people whose income is less than one dollar a day. To monitor progress towards achieving the target, three indicators were used which are: proportion of population below national poverty line; poverty gap ratio; and share of the poorest quintile in national consumption. The second target was to halve, between 1990 and 2015, the proportion of people who suffer from hunger. This had two indicators which were; prevalence of underweight children under five years of age; and the proportion of population below the minimum level of dietary energy consumption.
Target 1: Halve between 1990 and 2015 the Proportion of People whose Income is less than one Dollar per day
Indicator 1: Proportion of people living on less than one US dollar a day (Poverty Head Count)
Malawi is one of the countries which adopted the Poverty Reduction Strategy which was first introduced for highly indebted Poor Countries (HIPC) in 1999. The onset of the Mil-lennium Development Goals coincided with the implementation of Malawi Poverty Reduc-tion Strategy (MPRS). The MPRS was a country’s driven policy setting out a medium term strategy for fighting poverty. The MPRS was succeeded by the Malawi Growth and Devel-opment Strategy (MGDS) in 2005 and later the MGDS II in 2011. Currently, the country is implementing the second Phase of the MGDS, whose objective is to reduce poverty through sustainable economic growth and infrastructure development. Over years of implementa-tion for these strategies poverty has been reduced, however, not to the rate of achieving the intended MDG target of 27 percent.
6

Figure 1.1: Poverty Head Count
Sources: HESSEA 1991, IHS 2000, 2005 and 2012
Figure 1.1 shows poverty incidence in the country. The poverty levels in Malawi remain high at 50.7 percent as estimated by Integrated Household Survey (IHS) of 2012, even though there has been a slight reduction from 52 percent in 2005. This means that over half of the population in Malawi is currently poor and living on less than a dollar a day.
Figure 1.2: Poverty Head Count by Location
Sources: IHS 2005 and 2012
7

With respect to place of residence, Figure 1.2 shows that poverty in rural areas has almost remained the same whereas that of urban areas has declined between 2005 and 2012. Rural poverty increased marginally from 55.9 in 2005 to 56.6 in 2012, where as urban poverty de-clined from 25.4 percent to 17.3 percent during the same period. Overall, the number of poor people in rural areas is significantly higher than in urban areas. It must be noted, however, that over 80 percent of the population lives in rural areas. While the share of urban poor in the most recent household surveys has declined, the absolute number of poor people has increased due to rapid population growth and urbanization.
In terms of regional disaggregation, only the Southern region has registered a reduction in poverty head count by 1.1 percentage points between 2005 and 2012. Poverty levels have worsened in the Central and Northern regions by 2 percentage points and almost 4 percent-age points respectively over the same period.
Indicator 2: Incidence of Depth of Poverty as Measured by the Poverty Gap Ratio
Figure 1.3: Poverty Gap Ratio
Sources: HESSEA 1991 and IHS 2000, 2005 and 2012
The poverty gap ratio measures the average distance separating the poor from the poverty line expressed as a percentage of the poverty line. Figure 1.3 shows that there was a slight increase in the poverty gap ratio from 17.8 percent in 2005 to 18.9 in 2012. In terms of lo-cation, poverty gap ratio is higher in rural than urban areas. Poverty gap ratio in rural areas increased from 19.2 percent in 2005 to 21.4 percent in 2012. On the other hand, poverty gap in urban areas declined from 7.1 percent to 4.8 percent during the same period. All the three regions of the country have experience an increase in the poverty gap ratio between 2005 and 2012.
8

Indicator 3: Share of Poorest Quintile in National Consumption.
Figure 1.4: Poorest Quintile Share in National Consumption
Sources: IHS 2000, 2005 and 2012
Income inequality as measured by the share of poorest quintile in national consumption has worsened over the years. Figure 1.4 shows that the share of the poorest quintile in national consumption has declined by almost half between 2005 and 2012. As of 2012, the poorest 20 percent of the population controlled 5.5 percent of national consumption from 10.1 per-cent in 2005. This implies that although the economy has grown over this period, inequality has increased as is the case with poverty levels. At this rate, the MDG target of doubling the share of the poorest quintile in national consumption to 20 percent has not been achieved. Target 2: Halve, between 1990 and 2015, the Proportion of People who Suffer from Hunger
Measures of income are not sufficient to understand fully the level of poverty. It is for this reason that levels of hunger are also used. The two main indicators for monitoring hunger are the prevalence of underweight children under five years of age and the proportion of the population living below the minimum level of dietary energy consumption.
Indicator 1: Prevalence of underweight children (under five years of age)
Despite the country enjoying food surpluses between 2005 and 2014, malnutrition remains a challenge and the single biggest contributor to child mortality. Children’s nutritional status is a reflection of their overall health and development. The nutritional wellbeing of young
9

children is proxy indicator of the household, community and national investment in chil-dren’s health.
Figure 1.5: Prevalence of Underweight Children
Sources: MDHS 1992; 2000, 2004 and MES 2014
Figure 1.5 shows that there has been progress in reducing underweight prevalence in chil-dren under five years of age from about 25 percent in 2000 to 17 percent in 2014. Particu-larly steep declines were registered from 2004 to 2014, the years where Farm Input Subsidy Program was implemented.
In terms of location, there has been significant drop in underweight prevalence in urban areas between 2004 and 2012 compared to rural areas. In terms of regions, underweight prevalence is almost the same in the Northern and Southern Regions with the Central regis-tering relatively lower rate as of 2012.
Indicator 2: Proportion of Population below Minimum level of Dietary Energy Consumption.
The proportion of population below the minimum level of dietary energy requirement is estimated by defining a food poverty line. All persons below this line are deemed as ultra-poor. Proportion of ultra-poor in the population is used as a proxy indicator for the propor-tion of population below minimum level of dietary energy consumption.
10 10

Figure 1.6: Proportion of Ultra-Poor
Sources: HESSEA 1991; IHS 2000 and 2012; MES 2014
Figure 1.6 shows that the ultra-poor population has increased from about 22 percent in 2000 to about 26 percent in 2014. In terms of regions, ultra poverty rates are high in Southern Region followed by Northern Region with the Central Region registering lowest rate.
CHALLENGES
There are several challenges that the country is facing with respect to eradicating extreme poverty and hunger, some of which include the following:
• High illiteracy rates that limit the adoption of new skills and methods to improve pro-ductivity;
• Inadequate knowledge on food storage, processing and utilization that result in high post harvest losses;
• Inadequate knowledge and skills on household dietary diversification, and off-farm economic empowerment to increase access to high nutritive value foods for varied and nutritious diet;
• Inadequate marketing infrastructure in rural communities, which discourages individu-als from growing cash crops and engaging in meaningful economic empowerment activities; and
• High unemployment rates in the country.
POLICY FRAMEWORK AND STRATEGIES
In an effort to reduce extreme poverty and hunger the government would be implementing a number of strategies, among them: • Promotion of advocacy for proper storage of food crops through use of metallic storage
facilities i.e. silos to reduce post-harvest losses;
11
• Implementation of the Green-Belt Irrigation scheme to increase crop production Con-tinuation of the farm input subsidy to increase agriculture productivity among Small-holder farmers;
• Improving the marketing infrastructure; and• Establishing Community Technical Colleges to equip the youths with skills in different
trade to enable them secure decent job or engage in self-employment.
12 12

ACHIEVE UNIVERSAL PRIMARY EDUCATION

GOAL 2: ACHIEVE UNIVERSAL PRIMARY EDUCATION
ACHIEVEMENT OF THE GOAL: NOT METIndicator Baseline
(2000)2015 MDG
TargetAchievement
Net Enrolment in Primary Education (%) 78 100 85Proportion of pupils who start grade 1 reaching 5 (%)
69 100 87.8
Literacy Rate of 15 – 24 year olds (%) 68.1 100 75.2
Universal access to basic education and the achievement of primary education by the world’s children is one of the most important goals. Education is a vital prerequisite for combating poverty, empowering women, protecting children from hazardous and exploitative labour and sexual exploitation, promoting human rights and democracy, protecting the environ-ment, and influencing population growth (MICS, 2006). In an effort to increase access to primary education, the government of Malawi removed tuition fees in all public schools in 1994 which led to over 50 percent increase in enrolment. Over time Government has been increasing its funding to the sector and within the sector, primary education gets the biggest share.
Target 3: Ensure that by 2015, all Boys and Girls Should be Able to Complete a Full Course of Primary Schooling
Indicator 1: Net Enrolment Rate (NER) in Primary Education
Net Enrolment Rate (NER) in primary education indicates the extent to which primary school going age (6-13) is enrolled in schools. It is calculated by weighing down the num-ber of school going age enrolled in schools as a proportion of the school going age in the population.
Figure 2.1: Net Enrolment Rate in Primary Education
Sources: MDHS 1992, 2000; 2004; MICS 2006, WMS 2007, 2009; IHS 2012 and MES 2014
14 14
Net primary school enrolment has increased from 73 percent in 2006 to 85 percent in 2014. Urban areas have a higher net enrollment at primary school level compared to rural areas, even though the gap has narrowed over the years. The differences in net enrolment between the rural and urban areas might be attributed to easy access to education facilities in urban areas as compared to rural areas. Despite the country registering improvements in net enrol-ment at primary school level, the MDG target of 100 percent has not been reached.
Indicator 2: Proportion of Pupils Starting Grade 1 who reach Grade 5
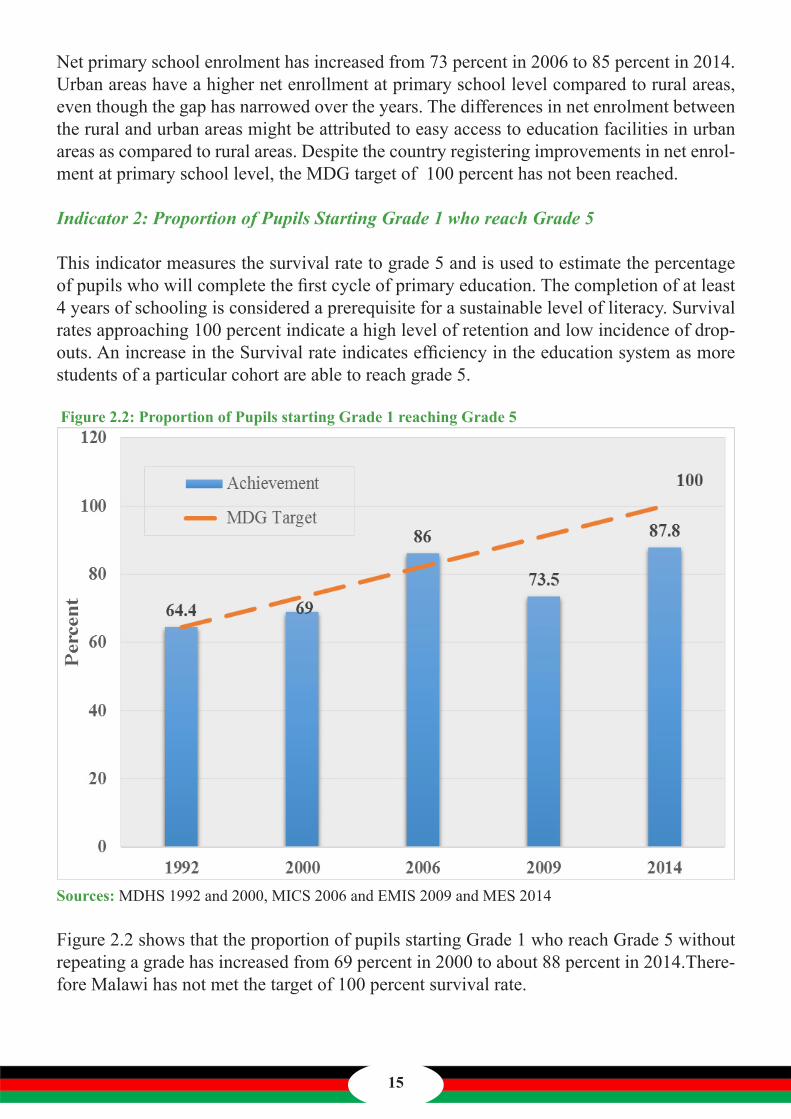
This indicator measures the survival rate to grade 5 and is used to estimate the percentage of pupils who will complete the first cycle of primary education. The completion of at least 4 years of schooling is considered a prerequisite for a sustainable level of literacy. Survival rates approaching 100 percent indicate a high level of retention and low incidence of drop-outs. An increase in the Survival rate indicates efficiency in the education system as more students of a particular cohort are able to reach grade 5.
Figure 2.2: Proportion of Pupils starting Grade 1 reaching Grade 5
Sources: MDHS 1992 and 2000, MICS 2006 and EMIS 2009 and MES 2014
Figure 2.2 shows that the proportion of pupils starting Grade 1 who reach Grade 5 without repeating a grade has increased from 69 percent in 2000 to about 88 percent in 2014.There-fore Malawi has not met the target of 100 percent survival rate.
15

Indicator 3: Literacy Rate of 15 – 24 year-olds
The literacy rate is defined as the proportion of the population aged 15-24 years old who can write and read with understanding a short simple statement in their everyday life. The Youth Literacy Rate reflects the outcomes of primary education over the previous 10 years or so. As a measure of the effectiveness of the primary education system, it is often seen as a proxy measure of social progress and economic achievement.
Figure 2.3: Literacy Rate of 15-24 Year Olds
Sources: MDHS 2000, 2004; WMS 2009; IHS 2012; and MES 2014
Figure 2.3 highlights the trend of literacy rate of 15 - 24 year olds. The literacy rate has in-creased from 68.1 in the year 2000 to 75.2 percent in 2014, peaking at 84 percent in 2009. In terms of gender, literacy rate for males is higher than that for females but the gap between the two gender has narrowed. This could be a result of increased initiatives that promote girls education, especially in primary school. Currently the Literacy Rate is at 75.2 percent, which means Malawi has not met the MDG target of 100 percent.
CHALLENGES
Despite the positive developments in the education sector, the country still faces a number of challenges which continue to undermine full realization of quality education service delivery. These include:
• Shortage of qualified primary school teachers;• Inadequate physical infrastructure;• Inadequate teaching and learning materials;• Poor access for children with special needs; and • Poor retention of girls mainly from standards five to eight;
16 16

POLICY FRAMEWORK AND STRATEGIES
Government of Malawi initiated the Universal Primary Education (UPE) in 1994/ 95 with the main objective of increasing access to quality primary education. Government removed primary school fees and abolished school uniform as a requirement to attend classes to en-sure that many boys and girls are able to enroll in school. In order to mitigate the emerging challenges on UPE, the education sector has been implementing the National Education Sector Plan (NESP) since 2008 to improve education outcomes. Some of the strategies out-lined in the NESP include:
• Construction of primary schools and teacher’s houses;• Expansion of existing Teacher Training Colleges and construction of additional col-
leges in order to improve on the quality and number of qualified teachers in primary schools;
• Replenishment of textbooks for additional pupils in each Standard at the beginning of the plan and thereafter replenishment of textbooks every three years;
• Introduce the double shift system on a bigger scale in some selected primary school and Secondary school to give an opportunity to many people to access formal educa-tion; and
• Scale up school feeding programmes to increase enrollment and retention.
17

PROMOTE GENDER EQUALITY AND EMPOWER WOMEN

GOAL 3: PROMOTE GENDER EQUALITY AND EMPOWER WOMEN
ACHIEVEMENT OF THE GOAL: NOT METIndicator Baseline
(2000)MDG Target
Achievement
Ratio of Girls to Boys in Primary Education 0.91 1.00 1.001Ratio of Girls to Boys in Secondary Education 0.60 1.00 0.88Ratio of Literate Women to Men 15 – 24 Years Old 0.82 1.00 0.92Share of Women in Wage Employment in non-Agriculture Sector (%)
13.1 50 30.1
Proportion of Seats Held by Women in Parliament (%) 9.3 50 16.6
Target 4: Eliminate Gender Disparity in Primary and Secondary Education, Preferably by 2005 and all levels of Education no later than 2015
Women comprise about 52 percent of the Malawian population hence they are instrumental if the country is to achieve its Development Agenda. Despite the fact that women are the majority of the population, they are mostly marginalized in social and economic spheres, and as such, they are unable to effectively contribute social, economic and political develop-ment. This situation has been exacerbated by high illiteracy level among women as a result of high girl drop-out rates from the formal schooling system.
Indicator 1: Ratio of Girls to Boys in Primary Education
This indicator is also referred to as Gender Parity Index (GPI), which represents the ratio of female to male pupils in primary school. In a situation of equality between male to female enrolment rates, GPI is 1, while 0 indicates the highest disparity.
Figure 3.1: Ratio of Girls to Boys in Primary Education
Sources: MDHS 1992, 2000; EMIS 2005, 2009, 2010; MES 2014
19
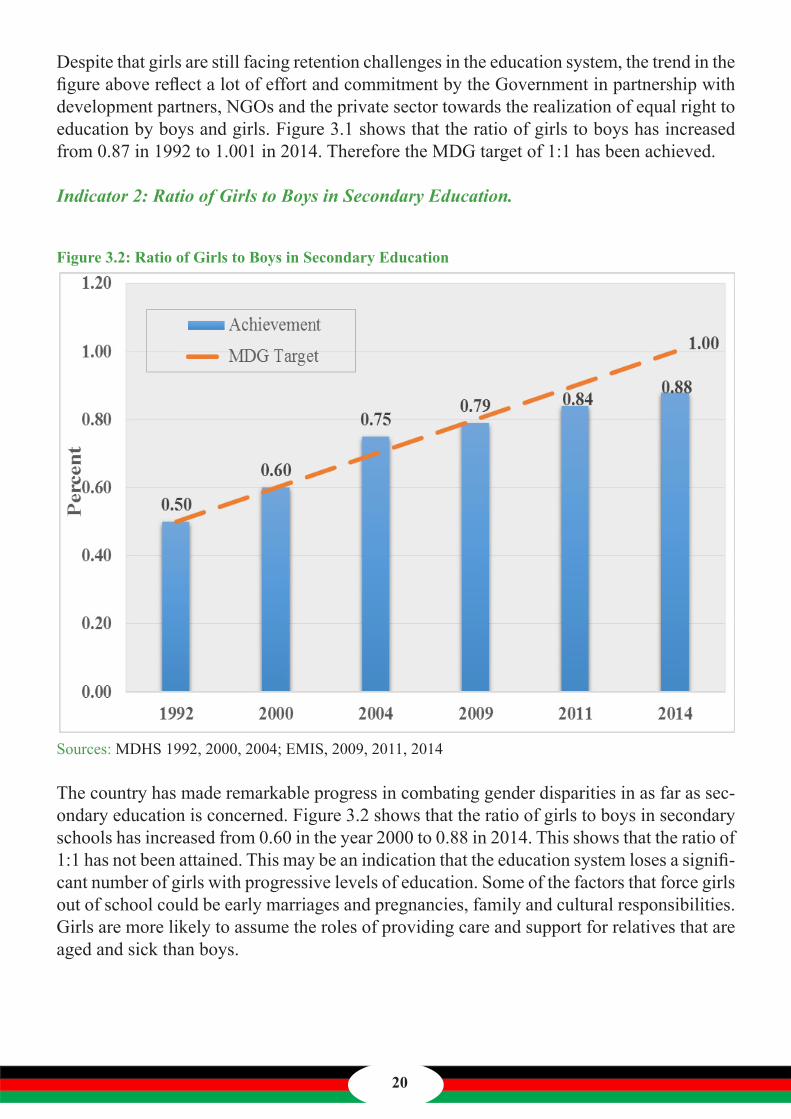
Despite that girls are still facing retention challenges in the education system, the trend in the figure above reflect a lot of effort and commitment by the Government in partnership with development partners, NGOs and the private sector towards the realization of equal right to education by boys and girls. Figure 3.1 shows that the ratio of girls to boys has increased from 0.87 in 1992 to 1.001 in 2014. Therefore the MDG target of 1:1 has been achieved.
Indicator 2: Ratio of Girls to Boys in Secondary Education.
Figure 3.2: Ratio of Girls to Boys in Secondary Education
Sources: MDHS 1992, 2000, 2004; EMIS, 2009, 2011, 2014
The country has made remarkable progress in combating gender disparities in as far as sec-ondary education is concerned. Figure 3.2 shows that the ratio of girls to boys in secondary schools has increased from 0.60 in the year 2000 to 0.88 in 2014. This shows that the ratio of 1:1 has not been attained. This may be an indication that the education system loses a signifi-cant number of girls with progressive levels of education. Some of the factors that force girls out of school could be early marriages and pregnancies, family and cultural responsibilities. Girls are more likely to assume the roles of providing care and support for relatives that are aged and sick than boys.
20 20

Indicator 3: Ratio of Literate Women to Men 15-24 Year Olds
Figure 3.3: Ratio of Literate women to men 15-24 years Old
Sources: MDHS,1992,2004,2010; EMIS 2013; MES 2014
The literacy rate of 15–24 year-olds is defined as the proportion of the population aged 15–24 years who can write and read with understanding a short simple statement in their everyday life. Figure 3.3 shows that ratio of literate women to men aged 15 to 24 years has increased from 0.82 in 2000 to 0.92 in 2014, which is close to the MDG target. To consoli-date the gains that have been realised so far, Government has renewed its commitment to reduce illiteracy among women.
Indicator 4: Share of Women in Wage Employment in the Non- Agriculture Sector
Share of women in wage employment in non-agricultural sector is a measure of employ-ment opportunities. If men and women are given equal opportunities, then it would be ex-pected that there would be equal proportion of men and women in formal employment. However, this is not the case. More women participate in the Agriculture sector than in the formal wage employment, especially in jobs that require professional qualification.
21
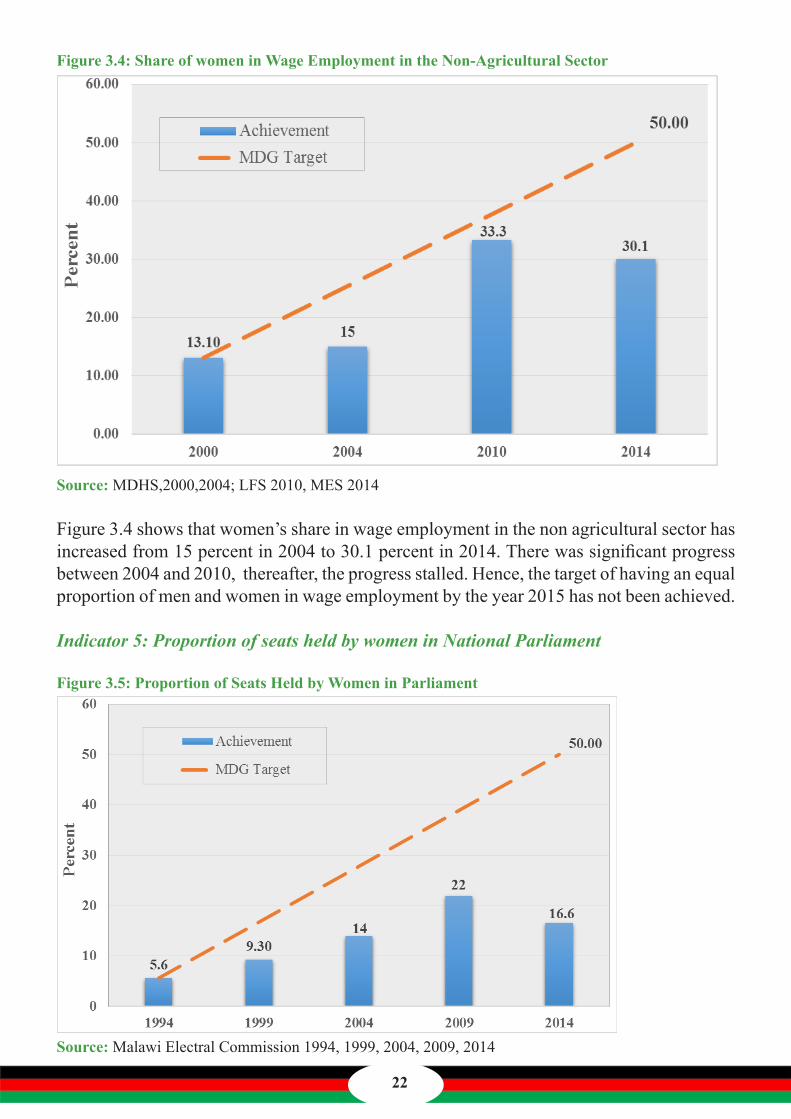
Figure 3.4: Share of women in Wage Employment in the Non-Agricultural Sector
Source: MDHS,2000,2004; LFS 2010, MES 2014
Figure 3.4 shows that women’s share in wage employment in the non agricultural sector has increased from 15 percent in 2004 to 30.1 percent in 2014. There was significant progress between 2004 and 2010, thereafter, the progress stalled. Hence, the target of having an equal proportion of men and women in wage employment by the year 2015 has not been achieved.
Indicator 5: Proportion of seats held by women in National Parliament
Figure 3.5: Proportion of Seats Held by Women in Parliament
Source: Malawi Electral Commission 1994, 1999, 2004, 2009, 2014
22 22
Malawi has been registering increases in the proportion of seats held by women in national assembly from 14 percent in 2004 to 22 percent in 2009. However, the percentage has de-clined in 2014 parliamentary election to around 17 percent. This is below the MDG target of 50 percent.
CHALLENGES
These are some of the challenges faced in promoting gender equality and women empow-erment, some of which include:
• Limited capacity in terms of human and material resources to facilitate adult literacy and continuing education;
• Early marriages influenced by socio-economic factors; • Socio–cultural factors that make people believe that men should be leaders and
women followers; and• Poor learning environment which affects girls in primary and secondary schools e.g.
sanitary facilities, long distance to education facilities, extra burden from domestic chores especially for adolescent girls resulting into high dropout rate.
POLICY FRAMEWORK AND STRATEGIES
While recognizing important efforts that are being made in the area of gender equality and empowerment, there is still need to streamline gender concerns in all Government policies and strategies. Government has therefore put in place a number of strategies in an effort to eliminate gender disparities and these include:
• Construction and expansion of girls boarding facilities in secondary schools and teacher training institutions to improve learning enviroment;
• Revision of the re-admission policy in 2006, which makes it friendly for students who withdraw on pregnancy grounds to go back and continue with their education;
• Encouraging girls to pursue education in fields that have traditionally been domi-nated by men;
• Introducing equitable selection policy at secondary schools and higher education institutions for girls and boys to share 50 percent of places;
• Introduction of 50: 50 programme that focuses on increasing women participation in politics at all levels; and,
• Taking affirmative action to increase number of women in decision making positions in the public and private sectors.
23
REDUCE CHILD MORTALITY

GOAL 4: REDUCE CHILD MORTALITY
ACHIEVEMENT OF THE GOAL: METIndicator Baseline
(2000)2015 MDG
TargetAchievement
Under-five mortality rate (per 1000 live births)
189 78 85
Infant Mortality rate (per 1000 live births) 103 44.7 53Proportion of 1 year children immunized against measles (%)
83.2 100 85
Target 5: Reduced by Two Thirds the Mortality Rate among Under-Five Children
The Government of Malawi remains highly committed to reduce child mortality. As a mani-festation to this commitment, government intensified investment in child survival interven-tions. Government has also increased the budgetary allocation towards the health sector to boost investment in essential health care services, human resources development and reten-tion as well as procuring of essential basic equipment, drugs and other medical supplies. Implementation of the Health Sector Wide Approach (SWAp) Programme of Work, 2004 - 2010 provided an opportunity for improved collaboration between Ministry of Health, Development Partners and Non State Actors. In process of reducing child mortality, special focus has been on immunization, Integrated Management of Childhood Illnesses (IMCI) programs, prevention of mother to child transmission of HIV, malaria prevention as well as improving availability of health personnel.
Indicator 1: Under- Five Mortality Rate
Figure: 4.1: Under- Five Mortality Rate
Sources: MDHS 1992, 2000, 2004, 2010; MICS 2006; MES 2014
Despite major challenges in reducing child mortality rate, the Government of Malawi has managed to reduce Under Five Mortality from 234 deaths per 1,000 live births in 1992 to
25

85 deaths per 1,000 live births in 2014. This is a result of government efforts in implemen-tation of significant investments in child Survival interventions such as vaccines for vari-ous preventable diseases, effective treatment of malaria and diarrhoea diseases, Vitamin A supplementation, Prevention of Mother to Child Transmission of HIV and exclusive breast feeding for the first six months.
Indicator 2: Infant Mortality Rate
Figure 4.2: Infant Mortality Rate
Sources: MDHS 1992,2000,2004,2010; MICS 2006; MES 2014
Malawi has made significant progress in reducing the infant mortality rate. Figure 4.2 shows that the infant mortality has declined from 134 deaths per 1000 live births in 1992 to 53 deaths per 1000 live births in 2014.
Figure 4.3: Under-Five and Infant Mortality rates by Wealth Quintiles and Mothers Education
Sources: MICS 2006, MDHS 2010
Figure 4.3 shows that irrespective of the socio-economic status of a household, there has been an increase in the prevalence of under-five mortality between 2006 and 2010. High levels of educational attainment are generally associated with lower mortality rates. Preva-
26 26
lence of under-five mortality and infant mortality is high among mothers with no education compared to mothers with education.
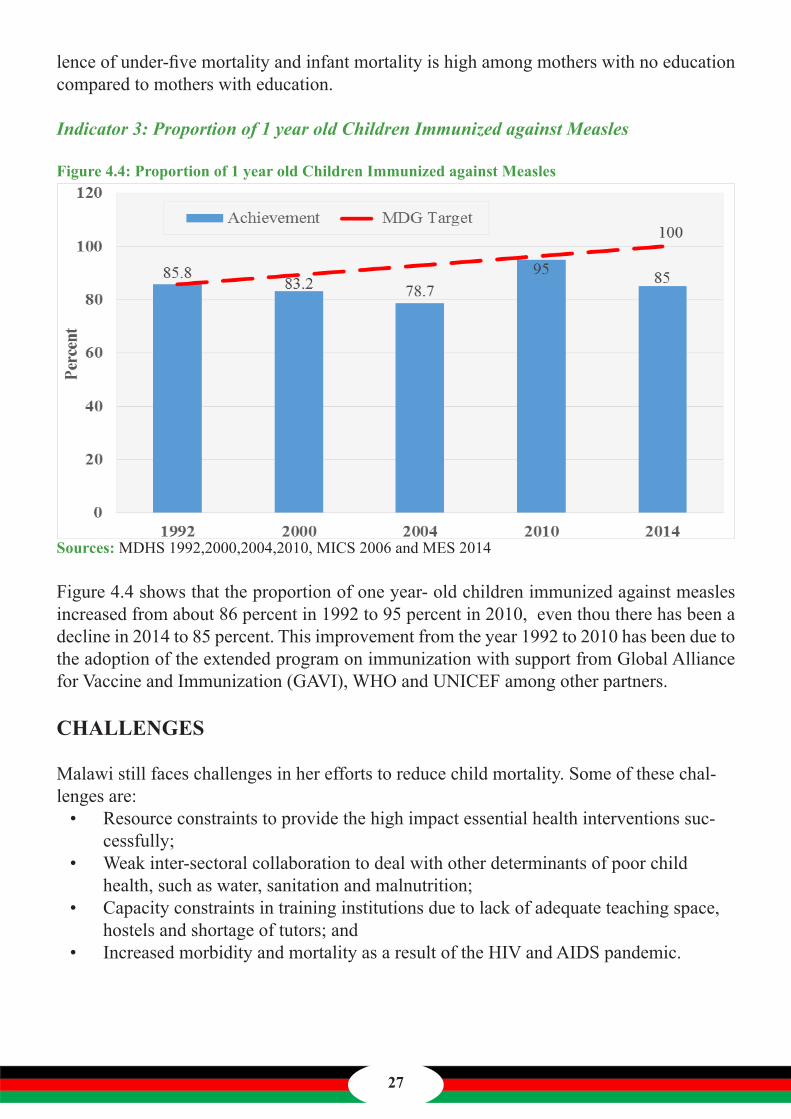
Indicator 3: Proportion of 1 year old Children Immunized against Measles
Figure 4.4: Proportion of 1 year old Children Immunized against Measles
Sources: MDHS 1992,2000,2004,2010, MICS 2006 and MES 2014
Figure 4.4 shows that the proportion of one year- old children immunized against measles increased from about 86 percent in 1992 to 95 percent in 2010, even thou there has been a decline in 2014 to 85 percent. This improvement from the year 1992 to 2010 has been due to the adoption of the extended program on immunization with support from Global Alliance for Vaccine and Immunization (GAVI), WHO and UNICEF among other partners.
CHALLENGES
Malawi still faces challenges in her efforts to reduce child mortality. Some of these chal-lenges are:
• Resource constraints to provide the high impact essential health interventions suc-cessfully;
• Weak inter-sectoral collaboration to deal with other determinants of poor child health, such as water, sanitation and malnutrition;
• Capacity constraints in training institutions due to lack of adequate teaching space, hostels and shortage of tutors; and
• Increased morbidity and mortality as a result of the HIV and AIDS pandemic.
27

POLICY FRAMEWORK AND STRATEGIES:
There are a number of initiatives that are being implemented in the health sector which include:
• Implementation of the Sector Wide Approach ( SWAp) which has focused on both the implementation of interventions as well as development and strengthening of related health systems;
• Integrated Management of Childhood Illnesses (IMCI) Approach and implementa-tion of the Essential Health Package (EHP);
• Continuous and accelerated training of health workers such as Health Surveillance Assistants (HSA);
• Implementation of baby friendly initiative and child health days campaigns where de-worming, vitamin A vaccination, distribution of insecticides treated mosquito nets and promotion of improved sanitation are undertaken; and
• Implementation of targeted nutrition support through community based therapeutic care, positive deviants (P- Hath) initiatives and supplementary feeding at all levels.
28 28

IMPROVE MATERNAL HEALTH
GOAL 5: IMPROVE MATERNAL HEALTH
ACHIEVEMENT OF THE GOAL: NOT METIndicator Baseline
(2000)2015 MDG Target
Achievement
Maternal mortality ratio (per 100,000 live births) 1120 155 574Proportion of births attended to by skilled health personnel (%)
55.6 100 87.4
In Malawi, women constitute a high proportion of the population estimated at around 52 percent, and hence their contribution to socio economic development of the country is vital. Unfortunately the country still faces more deaths among women of reproductive ages due to the challenges in the health sector. Coupled with the budgetary requirements of the health sector, the government usually faces a limited fiscal space to deal with challenges of ma-ternal mortality. Maternal health indicators for Malawi have generally remained poor, even though significant progress has been made over the past years. Target 6: Reduce by Three Quarters the Maternal Mortality Ratio
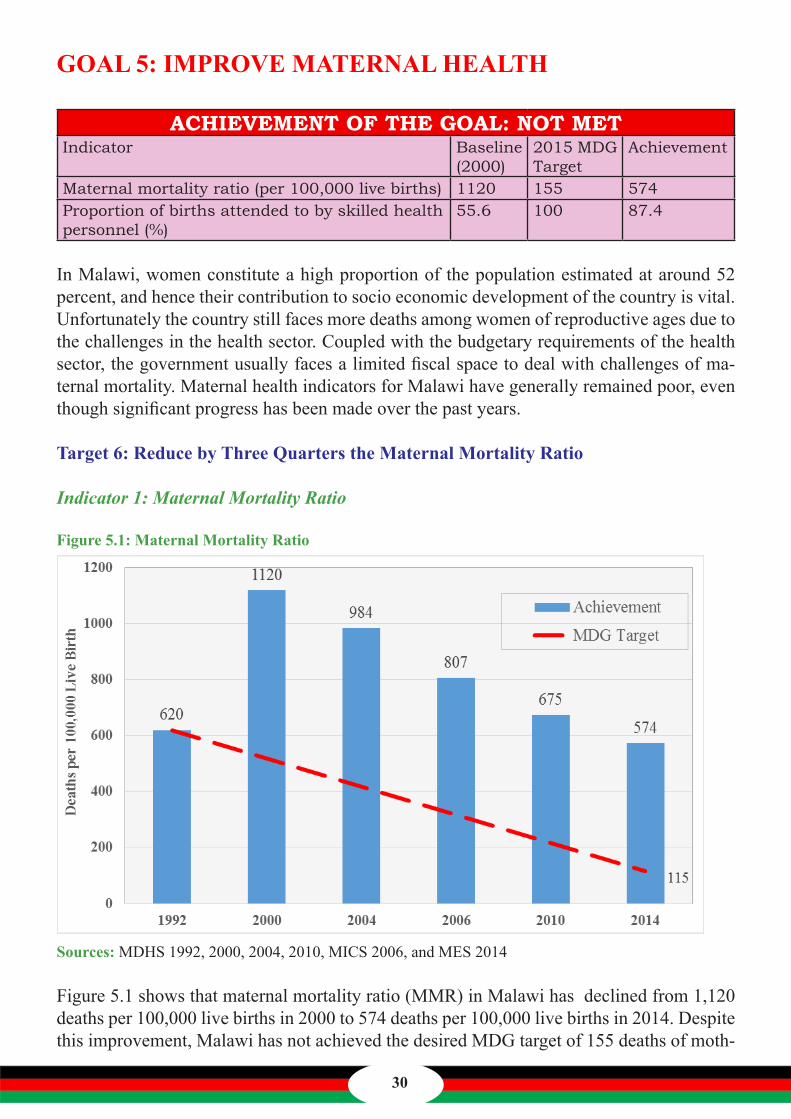
Indicator 1: Maternal Mortality Ratio
Figure 5.1: Maternal Mortality Ratio
Sources: MDHS 1992, 2000, 2004, 2010, MICS 2006, and MES 2014 Figure 5.1 shows that maternal mortality ratio (MMR) in Malawi has declined from 1,120 deaths per 100,000 live births in 2000 to 574 deaths per 100,000 live births in 2014. Despite this improvement, Malawi has not achieved the desired MDG target of 155 deaths of moth-
30 30

ers per 100,000 live births.
Indicator 2: Proportion of Births Attended by Skilled Health Personnel
Figure 5.2: Proportion of Births Attended by Skilled Health Personnel
Sources: MDHS 1992, 2000, 2004, 2010, MICS 2006, and MES 2014
Figure 5.2 shows that deliveries conducted by skilled health personnel has increased from about 56 percent in 2000 to 87 percent in 2014. This shows that the MDG target of 100 per-cent has not been met. Nevertheless, Government is implementing a number of initiatives to ensure that all births are attended by skilled health personnel.
CHALLENGES
There are a number of challenges that the health sector is facing. Some of these challenges include:
• Critical insufficient health personnel;• Poor access to essential health care services;• Inadequate and poorly equipped health infrastructure or facilities;• High population growth;• Prevalence of diseases such as HIV, Malaria and Tuberculosis; and • Cultural practices that discourage use of modern contraceptives and delivery
with the assistance of the skilled health personnel.
POLICY FRAMEWORK AND STRATEGIES
In order to address the challenges, the Government developed a roadmap to accelerate reduction of maternal mortality. The strategy aims at:
31

• Increasing the availability and accessibility of antenatal services;• Utilization of skilled health personnel during pregnancy, childbirth and postnatal pe-
riod at all levels of the health system;• Strengthening the capacity of individuals, institutions and Government to improve
maternal and neonatal health;• Increasing the number of health personnel;• Constructing and upgrading health facilities to offer essential health services particu-
larly focusing on rural and underserved areas; and • Provision of ARVs and micronutrients to women during pregnancy.
32 32

COMBAT HIV AND AIDS,MALARIA AND OTHER DISEASES

GOAL 6: COMBAT HIV AND AIDS, MALARIA AND OTHER DISEASES
ACHIEVEMENT OF THE GOAL: METIndicator Baseline
(2000)2015 MDG
TargetAchievement
HIV Prevalence among 15 – 24 year old Preg-nant women
24.1 0 10.6
Ratio of Orphans to non-orphans in School 0.121 - 0.09Prevalence and Deaths Rates Associated with Malaria
3.6 - 3.3
Access to Malaria Treatment (%) 8 - 31Proportion of Household with at least one ITN 31 - 71Death rates associated with Tuberculosis (%) 22 - 8Proportion of TB Cases Cured under DOTS (%) 57 - 84
Target 7: Halt and Begin to Reverse the Spread of HIV and AIDS
Indicator 1: HIV Prevalence Among 15 to 24 Year Old Pregnant Women
Malawi is committed to reduce the spread of HIV and AIDS pandemic through coordinated national response. Meanwhile, the country is implementing strategies under the 90-90-90 treatment targets (Diagnosed 90 percent of all people living with HIV (PLHIV); Started and retained 90 percent of those diagnosed on antiretroviral therapy (ART) and achieved viral suppression for 90 percent of individuals on ART). The country is making good progress in the fight against HIV and AIDS despite not reducing the prevalence rate among 15-24 preg-nant women to zero as depicted in Figure 6.1 below.
Figure 6.1: HIV Prevalence among 15-24 Year Old Pregnant Women
Sources: National AIDS Commission
34 34
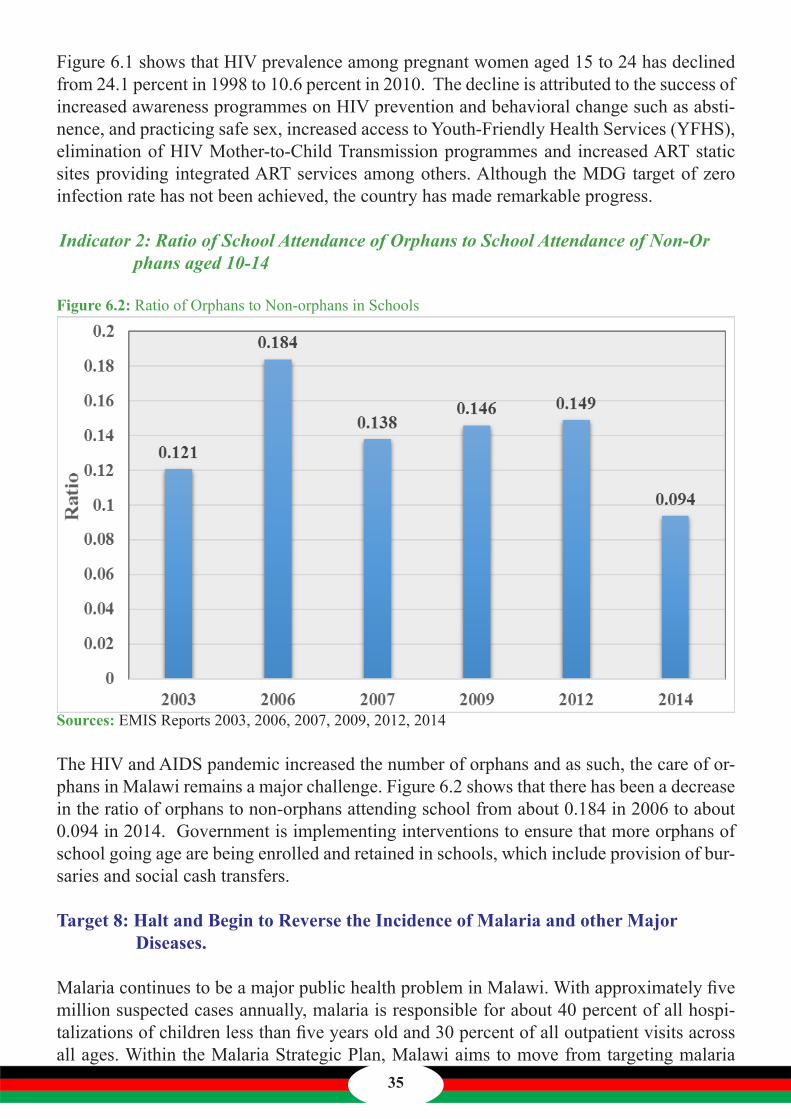
Figure 6.1 shows that HIV prevalence among pregnant women aged 15 to 24 has declined from 24.1 percent in 1998 to 10.6 percent in 2010. The decline is attributed to the success of increased awareness programmes on HIV prevention and behavioral change such as absti-nence, and practicing safe sex, increased access to Youth-Friendly Health Services (YFHS), elimination of HIV Mother-to-Child Transmission programmes and increased ART static sites providing integrated ART services among others. Although the MDG target of zero infection rate has not been achieved, the country has made remarkable progress. Indicator 2: Ratio of School Attendance of Orphans to School Attendance of Non-Or
phans aged 10-14
Figure 6.2: Ratio of Orphans to Non-orphans in Schools
Sources: EMIS Reports 2003, 2006, 2007, 2009, 2012, 2014
The HIV and AIDS pandemic increased the number of orphans and as such, the care of or-phans in Malawi remains a major challenge. Figure 6.2 shows that there has been a decrease in the ratio of orphans to non-orphans attending school from about 0.184 in 2006 to about 0.094 in 2014. Government is implementing interventions to ensure that more orphans of school going age are being enrolled and retained in schools, which include provision of bur-saries and social cash transfers.
Target 8: Halt and Begin to Reverse the Incidence of Malaria and other Major Diseases.
Malaria continues to be a major public health problem in Malawi. With approximately five million suspected cases annually, malaria is responsible for about 40 percent of all hospi-talizations of children less than five years old and 30 percent of all outpatient visits across all ages. Within the Malaria Strategic Plan, Malawi aims to move from targeting malaria
35

control interventions to provision of universal access of proven interventions under which all Malawians at risk of malaria should have equitable access to malaria prevention, care and treatment.
Figure 6.3: Malaria Fatality Rate
Sources: National Malaria Control Programme
Figure 6.3 shows that deaths associated with Malaria has declined from 4.7 percent in 2006 to 3.3 percent in 2012. The continued use of Artemisinin-based combination therapies (ACTs), through Lumefantrine Artemether (LA), an anti-malaria drug, indoor residual spraying, and increased distribution and use of (ITNs) has contributed to the decline in deaths associated with malaria, especially among the under-five children and pregnant women.
Indicator 2: Access to Malaria Treatment
Access to treatment within 24 hours of onset of symptoms of malaria for under five children and pregnant women is very key in treating Malaria. Overall there has been an increased access to Malaria Treatment since the year 2000.
36 36
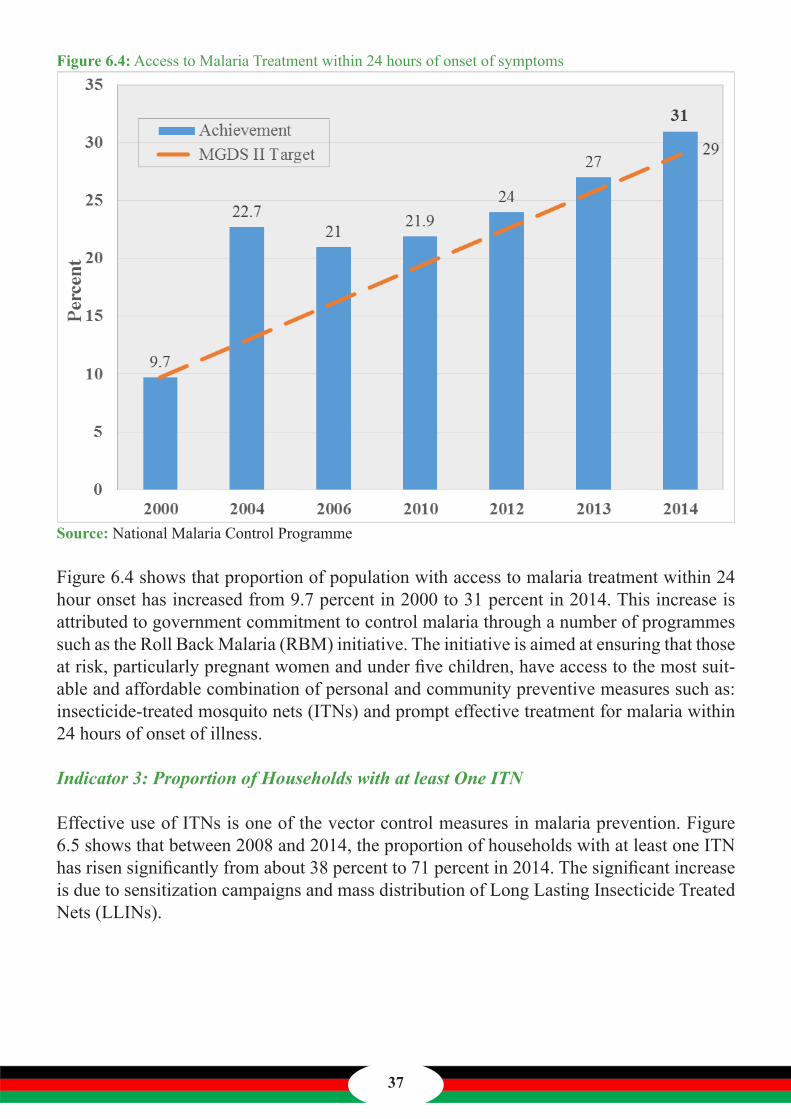
Figure 6.4: Access to Malaria Treatment within 24 hours of onset of symptoms
Source: National Malaria Control Programme
Figure 6.4 shows that proportion of population with access to malaria treatment within 24 hour onset has increased from 9.7 percent in 2000 to 31 percent in 2014. This increase is attributed to government commitment to control malaria through a number of programmes such as the Roll Back Malaria (RBM) initiative. The initiative is aimed at ensuring that those at risk, particularly pregnant women and under five children, have access to the most suit-able and affordable combination of personal and community preventive measures such as: insecticide-treated mosquito nets (ITNs) and prompt effective treatment for malaria within 24 hours of onset of illness.
Indicator 3: Proportion of Households with at least One ITN
Effective use of ITNs is one of the vector control measures in malaria prevention. Figure 6.5 shows that between 2008 and 2014, the proportion of households with at least one ITN has risen significantly from about 38 percent to 71 percent in 2014. The significant increase is due to sensitization campaigns and mass distribution of Long Lasting Insecticide Treated Nets (LLINs).
37

Figure 6.5: Proportion of households with at least one ITN
Source: National Malaria Control Programme
Indicator 4: Death Rate Associated with Tuberculosis
Tuberculosis (TB) remains one of the major public health problems in Malawi and is among the top killer diseases in the country. Its greatest impact is on the poor who live in overcrowd-ed environments and have poor nutrition. These conditions provide favorable environment for transmission and development of active disease from latent infection. This situation has been worsened with HIV infection which accelerates the progression of infection.
38 38

Figure 6.6: Death Rate associated with Tuberculosis
Source: National TB Control Programme
There has been a steady decline in the deaths associated with TB for the past decade. Fig-ure 6.6 shows that death rate associated with tuberculosis has decreased from 22 percent in 1998 to 8 percent in 2013. This success in reduction of TB case fatality is attributed to government’s effort in the implementation of the Directly Observed Treatment Short-course (DOTS) and integration of TB and HIV services especially for the ones co-infected with the two diseases. The existing TB associated deaths are mainly due to lack of compliance to drugs by patients.
Indicator 5: Proportion of TB cases cured under DOTS
Figure 6.7: Proportion of TB cases cured under DOTS
Source: National TB Control Programme39

Since Malawi began implementing the DOTS strategy, TB case notification has increased steadily and the country continues to register successes in the fight against TB. Figure 6.7 shows that the proportion of TB cases cured under DOTS has increased consistently from 57 percent in 2001 to 84 percent in 2013. This is mainly attributed to a clear policy on TB control, improved case detection, standardized TB treatment, adequate effective drugs, and universal access to treatment, even in the most remote areas.
CHALLENGES
There are a number of challenges that are being faced in attaining this goal, some of which are:
• Increased demand for care due to high HIV and AIDS prevalence; • negative socio-cultural attitudes towards abstinence and safe sex, including con-
dom use; • Inadequate knowledge and skills on the relationship between nutrition and HIV
and AIDS; and,• Shortages and pilferage of essential commodities e.g. ITNs, drugs and supplies.
POLICY FRAMEWORK AND STRATEGIES
The country is implementing a number of strategies in an effort to address the above chal-lenges which include the following:
• Improving peoples’ access to comprehensive and correct knowledge on HIV preven-tion and transmission;
• HIV counseling on behavior change including testing; • Promotion of adequate nutrition, equitable and sustainable access to ARVs and nutri-
tion supplements;• Introduction of subsidies on mosquito nets distribution and use of ITNs to high risk
groups, particularly to the poor; and• Involvement of stakeholders in the provision of universal access to TB diagnosis,
monitoring and evaluation of TB trends.
40 40

ENSURE ENVIRONMENTAL SUSTAINABILITY

GOAL 7: ENSURE ENVIRONMENTAL SUSTAINABILITY
ACHIEVEMENT OF THE GOAL: METIndicator 2000 2015 MDG
TargetAchievement
Proportion of land area covered by forest (%) 37.9 50 36.2Proportion of area protected to maintain biologi-cal diversity (%)
0.16 0.18 0.16
Proportion of population using solid fuel (%) 97.9 0 98.3Proportion of population with sustainable access to an improved water source (%)
47 74 86.2
Proportion of population with access to basic sanitation (%)
81.4 86.2 95.1
Slum population as percentage of urban popula-tion (%)
94.6 - 65.1
Target 9: Integrate the Principles of Sustainable Development into Country Policies and Programmes; Reverse Loss of Environmental Resources
Indicator 1: Proportion of Land Area Covered by Forest
Malawi is well endowed with environmental resources. However, degradation of the envi-ronment and natural resources has been on the increase. Extensive forests, which previously covered vast areas of the country, have, over the years, been subjected to considerable pres-sure. This is being caused by combination of poverty, increasing population growth, inad-equate alternative livelihoods and affordable energy technologies.
Figure 7.1: Proportion of Land Area Covered by Forest
Sources: FAO Global Forest Resources Assessment, 1990, 2000 and 2005
42 42

Figure 7.1 shows that proportion of land area covered by forest has declined from 41.4 per-cent to 36.2 percent between 1990 and 2005. This implies that the country has not met the MDG target of having 50 percent of the land area covered by forest. The country continues to face challenges of deforestation because of heavy reliance on timber as a source of fuel, in particular, among the rural poor. The Government, is nevertheless implementing a number of initiatives to reverse the situation. Some of these initiatives include: intensifying refor-estation, afforestation, promotion of natural regeneration as well as forest protection and management programmes.
Indicator 2: Ratio of Area Protected to Maintain Biological Diversity to Surface Area
Malawi has not made progress in increasing the ratio of the area protected to maintain bio-logical diversity to surface area but has managed the existing areas. The Area Protected to Maintain Biological Diversity has remained at 10585 km2 since 1990, this amount to 9 per-cent of the total surface area.
Figure 7.2: Proportion of Area Protected to Maintain Biological Diversity to Surface Area
Source: UNEP (Online Databank)
Figure 7.2, Shows that the ratio of surface area protected to maintain biological diversity has remained constant. However, the country has experienced biodiversity loss over the years because of loss of habitats, increased poaching and expansion of agriculture. Despite this the country has been on the right track as it has managed to protect its areas to maintain biodiversity, despite the challenges that are being faced.
43
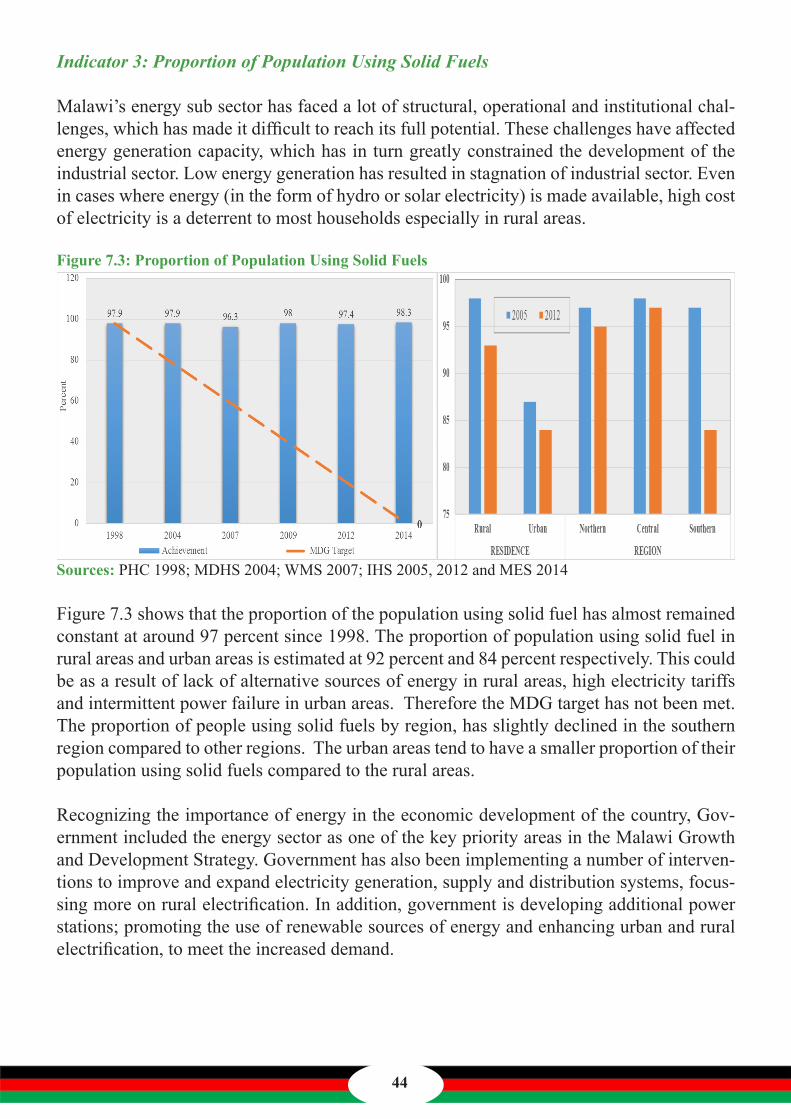
Indicator 3: Proportion of Population Using Solid Fuels
Malawi’s energy sub sector has faced a lot of structural, operational and institutional chal-lenges, which has made it difficult to reach its full potential. These challenges have affected energy generation capacity, which has in turn greatly constrained the development of the industrial sector. Low energy generation has resulted in stagnation of industrial sector. Even in cases where energy (in the form of hydro or solar electricity) is made available, high cost of electricity is a deterrent to most households especially in rural areas.
Figure 7.3: Proportion of Population Using Solid Fuels
Sources: PHC 1998; MDHS 2004; WMS 2007; IHS 2005, 2012 and MES 2014
Figure 7.3 shows that the proportion of the population using solid fuel has almost remained constant at around 97 percent since 1998. The proportion of population using solid fuel in rural areas and urban areas is estimated at 92 percent and 84 percent respectively. This could be as a result of lack of alternative sources of energy in rural areas, high electricity tariffs and intermittent power failure in urban areas. Therefore the MDG target has not been met. The proportion of people using solid fuels by region, has slightly declined in the southern region compared to other regions. The urban areas tend to have a smaller proportion of their population using solid fuels compared to the rural areas.
Recognizing the importance of energy in the economic development of the country, Gov-ernment included the energy sector as one of the key priority areas in the Malawi Growth and Development Strategy. Government has also been implementing a number of interven-tions to improve and expand electricity generation, supply and distribution systems, focus-sing more on rural electrification. In addition, government is developing additional power stations; promoting the use of renewable sources of energy and enhancing urban and rural electrification, to meet the increased demand.
44 44

Target 10: Reduce by half the Proportion of People without Sustainable Access to Safe Drinking Water
Indicator 1: Proportion of population with sustainable access to an improved Water Source
Access to an improved water source refers to the percentage of the population using an improved drinking water source. The improved drinking water source includes piped water on premises (piped household water connection located inside the user’s dwelling, plot or yard). Other improved drinking water sources include public taps, boreholes, protected dug wells and protected springs. Malawi is one of a few countries in the Sub-Saharan Africa that have performed above the regional average, with respect to proportion of the popula-tion that have access to improved water source. This owes to the government placing a high priority in water resources management and development, considering that it is an important resource for life, agriculture and industrial development.
Figure 7.4: Household with Sustainable Access to Improved Water Source
Sources: MDHS 1992, 2004, 2010 MICS 2006 and WMS 2007, 2008 and 2009, 2012 and MES 2013
Figure7.4 shows that the proportion of households with sustainable access to improved wa-ter resources has increased from 47 percent to about 86 percent between 1990 and 2014.This, therefore means that the country has surpassed the MDG target of 74 percent. Despite this achievement, the Government will continue implementing a number of strategies to increase access to improved water sources in rural, peri–urban and urban areas.
Indicator 2: Proportion of Population with Access to Basic Sanitation
Malawi, relative to many other Sub Saharan countries, has a high level of access to some form of basic excreta disposal facilities. However, disparities in latrine coverage exist throughout the country. Such disparities, especially in rural areas, range from 95 percent in areas where some sanitation projects have been active in promoting sanitation and hygiene in an integrated manner to as low as 40 percent in areas where such projects are non existent.
45

Figure 7.5: Proportion of the Population with Access to Basic Sanitation
Sources: MDHS 1992, 2004; MICS 2006; WMS 2009 and IHS 2005, 2012, MES 2014.
Between 1990 and 2014, the country has registered an increase in the proportion of the population with access to basic sanitation from about 72 percent to 95 percent, even though there has been a drop between 2008 and 2012 as shown in Figure 7.5. With respect to geo-graphical location, both rural and urban areas registered an increase in proportion of popula-tion with access to basic sanitation. Similarly, access to basic sanitation has increased in all the three Regions of the country. This increase in the access to basic sanitation is attributed to interventions in the Water Sanitation and Hygiene (WASH) among them: construction of sanitation facilities in schools and communities as well as sensitization campaigns by various stakeholders on the importance of basic sanitation. Regarding open defecation, the country has also made tremendous progress. Government will continue implementing strat-egies aimed at making Malawi Open Defecation Free.
Figure 7.6: Population without any form of fecal disposal facilities (Open Defecation)
Source: Water Sector Performance Reports
46 46

Target 11: Achieve Significant Improvement in the Lives of at Least 100 Million Slum Dwellers
Indicator 1: Slum Population as a Percentage of Urban Population A slum household is a family in an urban area that lacks at least durable housing, sufficient living area, access to improved water, access to sanitation and secure land tenure. Mala-wi has faced an increasing number of slum dwellers mainly because of high urbanization, which is exacerbated by high rural-urban migration and population growth. The increase in slum dwellers compromises sustainability of the environment as it increases deforestation due to increased demand for arable land. There is poor quality of surface and ground water and inequitable access to improved sanitation facilities. Government has implemented a number of strategies to improve and sustain urbanization system, control population growth and reduce rural-urban migration, with the view of reducing slums.
Figure 7.7: Proportion of population living in Slums
Sources: UN-HABITAT State of the World Cities Report 2011/2012
Figure 7.7 shows that the percentage of population living in slums has declined from about 90 percent in 2005 to 65.1 percent in 2012. To achieve this decrease in the number of slum dwellers, government, has over the years, implemented a number of programmes, one which is the low cost housing initiative. Through this programme, a number of people were able to afford modest accommodation. In addition, the Government has also reviewed National Housing Policy which has helped in upgrading slums and reducing slum formation in cities.
Government also developed the National Slum Upgrading Programme in order to improve the conditions of life in slums in the country’s major cities of Blantyre, Lilongwe, Mzuzu
47

and Zomba. In addition, the ‘Cities without Slums’ initiative, has been implemented with support from Cooperation Partners to help reviewing the slum challenge and develop cit-ies without slums. Government has also improved access to safe water and sanitation by strengthening and building capacity for common water resources management, monitoring systems, rehabilitation and construction of small community earth dams. However, lack of adequate resources to effectively implement the initiatives, has slowed progress with respect to reducing the population in slums.
CHALLENGES
While some progress has been made with respect to sustainability of the environment, there are a number of challenges that the sector is facing. Some of these challenges in-clude:
• Dwindling of water resources due to climate change;• Aging water infrastructure coupled with theft and vandalism thereby affecting func-
tionality of water infrastructure;• Increased deforestation due to increased demand for arable land;• Lack of community participation in environment and natural resources management;
and • Inequitable promotion of improved sanitation facilities.
POLICY FRAMEWORK AND STRATEGIES
Several initiatives have been put in place to address the challenges, and these include:• Revision of environmental and natural resources legislation to strengthen the legal and
regulatory framework governing environment and natural resources with the aim of halting the rate of environmental degradation.
• Promotion of community participation in environmental and natural resources man-agement.
• Development of the National Adaptation Programme of Action to climate change which seeks to enhance the resilience of vulnerable communities to climate change.
• Development of the National Climate Change Investment Programme as an overarch-ing national investment strategy to govern climate change investments.
• Review of the National housing policy to help upgrade slums and reduce slum forma-tion in the cities.
48 48

DEVELOP GLOBAL PARTNERSHIP FOR DEVELOPMENT

GOAL 8: DEVELOP GLOBAL PARTNERSHIP FOR DEVELOPMENT
ACHIEVEMENT OF THE GOAL: METIndicator 2000 2005 2011 MDG
Target Achievement
Net ODA as a percentage of Real Gross Domestic Product (%)
11 13 15 - 21.34
Unemployment of 15 – 24 year old (ur-ban) (%)
1 9 15.2 - 27.5
Telephone lines subscribers per 100 population
0.57 0.63 0.8 - 1.9
Cellular subscribers per 100 population 1.81 2.01 36.3 46 39.8Internet users per 1,000 population 0.01 0.1 2.5 - 6.8
Target 18: In Cooperation with the Private Sector, make available the benefits of New Technologies, especially Information and Communications
Develop global partnership for development is the last of eight millennium development goals and has one main target that was set to achieve the goal by the end of year 2015. The target set is cooperation with private sector to make available benefits of the new technolo-gies especially information and communications to the society. Specifically, the target has four main indicators namely, net ODA as a percentage of real GDP, unemployment of 15-24 year olds, telephone lines and cellular subscribers per 100 population and personal comput-ers in use and internet users per 1000 population.
Indicator 1: Net ODA as a percentage of real Gross Domestic Product
Figure 8.1: Net ODA as a Percentage of Real Gross Domestic Produce
Sources: Ministry of Finance
50 50
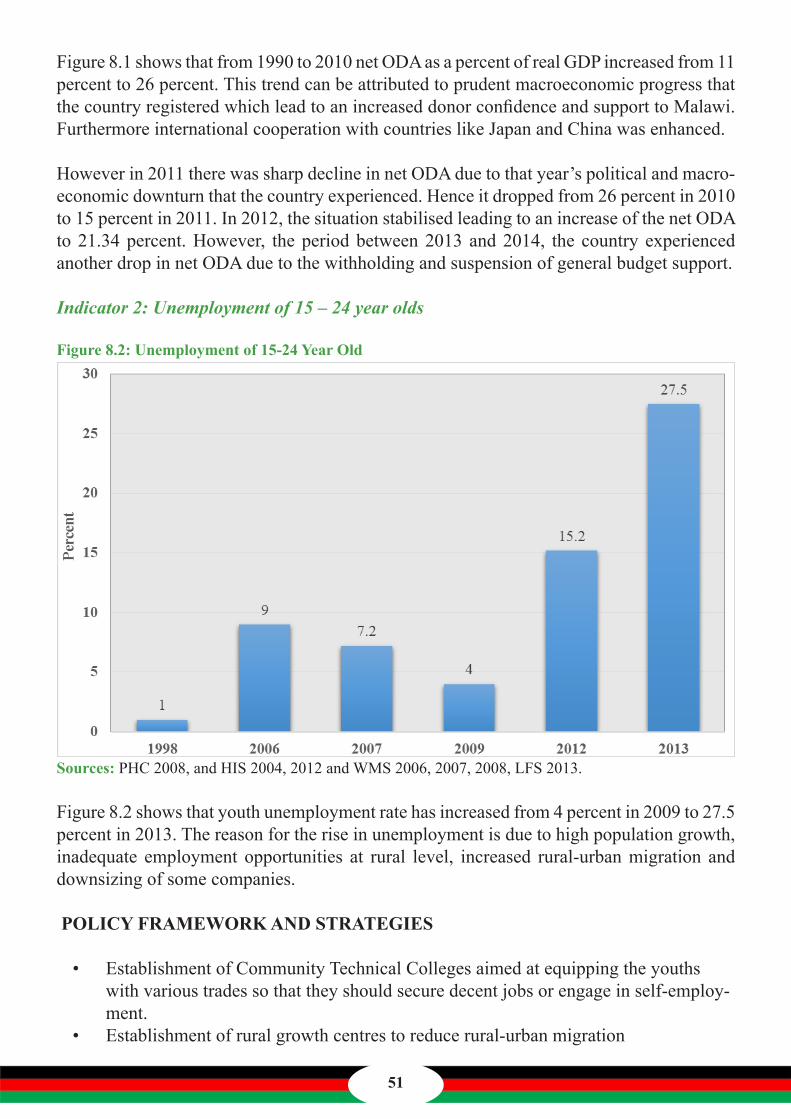
Figure 8.1 shows that from 1990 to 2010 net ODA as a percent of real GDP increased from 11 percent to 26 percent. This trend can be attributed to prudent macroeconomic progress that the country registered which lead to an increased donor confidence and support to Malawi. Furthermore international cooperation with countries like Japan and China was enhanced.
However in 2011 there was sharp decline in net ODA due to that year’s political and macro-economic downturn that the country experienced. Hence it dropped from 26 percent in 2010 to 15 percent in 2011. In 2012, the situation stabilised leading to an increase of the net ODA to 21.34 percent. However, the period between 2013 and 2014, the country experienced another drop in net ODA due to the withholding and suspension of general budget support.
Indicator 2: Unemployment of 15 – 24 year olds
Figure 8.2: Unemployment of 15-24 Year Old
Sources: PHC 2008, and HIS 2004, 2012 and WMS 2006, 2007, 2008, LFS 2013.
Figure 8.2 shows that youth unemployment rate has increased from 4 percent in 2009 to 27.5 percent in 2013. The reason for the rise in unemployment is due to high population growth, inadequate employment opportunities at rural level, increased rural-urban migration and downsizing of some companies.
POLICY FRAMEWORK AND STRATEGIES
• Establishment of Community Technical Colleges aimed at equipping the youths with various trades so that they should secure decent jobs or engage in self-employ-ment.
• Establishment of rural growth centres to reduce rural-urban migration
51

• Rehabilitation of abandoned irrigation schemes to encourage rural people to engage in agriculture production throughout the year.
• Implementation of One Village One Product Programme to promote value addition and market penetration thereby creating employment opportunities.
• Implementation of Public Works Programme
Indicator 3: Telephone Lines and Cellular Subscribers per 100 population.
Figure 8.3: Cell phone Subscribers
Sources: Malawi Communication Regulatory Authority
The expansion of number of firms in the telecommunication industry has led to an increase in the country’s mobile phones subscribers. Cell phone subscribers have increased from 4 percent in 2004 to 39.8 percent in 2014. This increase could be attributed to availability of increased network coverage, cheap cellphone handsets and increased demand for faster communication. Furthermore the provision of new services and products such as ‘’mobile banking’’ in the industry has also contributed to an increase in cellphones subscription.
52 52

Figure 8.4: Landline Subscribers
Sources: Malawi Communication Regulatory Authority
Figure 8.4 shows an oscillating trend in the percentage of landline subscribers. However, there has been an increase in the percentage of landline subscribers from 0.8 percent to 1.9 percent between 2013 and 2014. The slow growth in the number of landline subscribers could be attributed to greater preference for cellular phones as opposed to fixed lines.
Indicator 4: Personal computers in use and internet users per 1000 population
Figure 8.5: Internet Subscribers
Sources: Malawi Communication Regulatory Authority
53
Figure 8.5 shows that internet usage has increased, from 0.1 percent in 2005 to 6.8 percent in 2014. This increase is attributed to an increase in participation of private ICT Service providers and opening of numerous village internet centers countrywide.
CHALLENGES
There are several challenges that the country is facing with respect to provision of ICT, including the following:
• Vandalism of telecommunication equipment; • Inadequate distribution of ICT services and infrastructure;• High cost of ICT equipment and services; • Poor internet and IT support infrastructure; and • Underdeveloped regulatory framework in the telecommunication sector.
POLICY FRAMEWORK AND STRATEGIES
The MGDS recognized the creation of a conducive environment to attract investment in ICT if the country is to enhance economic growth, which is important for poverty reduction. As such, a number of policy measures and programmes have been put in place to achieve this end. These include;
• Development of a reliable, fast, adaptive and robust national IT infrastructure;• Enhancing the capacity of the communications regulatory body, to act as a compe-
tent referee in order to level the playing field;• Improving IT and internet access by all communities;• Developing connectivity to the Indian Ocean marine cable link;• Instituting monitoring mechanisms to ensure speedy implementation of donor fund-
ed projects for more resource inflows; and • Developing a Development Cooperation Strategy in line with the principles of the
Global Partnership for Effective Development Cooperation.
54 54

CONCLUSION
The Malawi Government signed the UN Declaration in September, 2000 committing it-self to attaining the Millennium Development Goals (MDGs). Government localized the implementation of the MDGs through its medium term national development strategies. A number of initiatives have been implemented aimed at attaining the objectives outlined in the MDGs.
The MDGs End-line Report has assessed Malawi’s progress in the achievement of the Mil-lennium Development Goals (MDGs), since implementation of the same started in Septem-ber, 2000. The assessment has shown that Malawi has achieved four out of the eight MDGs. The goals that have been achieved are on Reducing Child Mortality, Combating HIV and AIDS, Malaria and Other Diseases; Ensuring Environment Sustainability; and Developing Global Partnership for Development. On the other hand, the four MDGs that have not been met are on Eradicating Extreme Poverty and Hunger; Achieving Universal Primary Educa-tion; Promoting Gender Equality an Empowerment of Women; and Improving Maternal Health. The failure to attain these MDGs is not attributed to lack of effort but due to the fact that the country started off with a very low baseline compared to other UN countries. De-spite the failure to meet the four MDGs, it is encouraging and worth noting that remarkable progress has been made in these goals when compared to where the country started from.
Malawi will continue to implement programmes and interventions aimed at sustaining prog-ress made. Government therefore, welcomes the Sustainable Development Goals (SDGs) that heads of State and Government will sign to in September 2015 at the United Nations General Assembly, which sets development agenda beyond 2015. Just like the MDGs, Government recognizes that the achievement of the SDGs will depend on the availability of adequate resources. It is for this reason, that the Government will continue to harness efforts of all the stakeholders, including the Private Sector, Development Partners, and Civil Soci-ety Organization (CSOs) in order to achieve the goals that have been outlined in the SDGs.
55

BIBLIOGRAPHY
Food and Agricultural Organization: Global Forest Resources Assessment, 2000, 2005.
Government of Malawi: National Statistical Office. Integrated Household Survey, 1998, 2005 and 2011.
Government of Malawi: National Statistical Office. Malawi Demographic and Health Sur-vey, 1992, 2000, 2004 and 2010.
Government of Malawi: National Statistical Office. Malawi labour force survey, 2013.
Government of Malawi: National Statistical Office. Millennium Development goals Endline survey. 2014
Government of Malawi: Malawi Electoral Commission Report, 2009 and 2014.
Government of Malawi: Ministry of Finance, Economic Planning and Development. Ma-lawi Growth and Development Strategy (MGDS I), 2006.
Government of Malawi: Ministry of Finance, Economic Planning and Development. Ma-lawi Growth and Development Strategy (MGDS II), 2011.
Government of Malawi: National Statistical Office, Malawi Population and Housing Cen-sus, 1998 and 2008.
Government of Malawi: Ministry of Finance Economic Planning and Development. Malawi Millennium Development Goals Report,2003, 2005, 2007, 2008, 2009, 2010, 2011, 2012, 2013 and 2014.
Government of Malawi: National Statistical Office, Welfare Monitoring Survey, 2005, 2006, 2007, 2008 and 2009.
National AIDS Commission: National AIDS Commission Sentinel Report, 1994, 1999, and 2005.
National Statistical Office and UNICEF: Malawi Multiple Indicator Cluster Survey, 2006.
United Nations Habitat: State of the World Cities Report, 2005, 2009 and 2010.
UNEP, online databank: http//unstats.un.org/unsd/…
UNICEF, Photography, 2012 and 2013.
National Aids Commission; Photography, 201556 56

NOTES
________________________________________________________________________
________________________________________________________________________
________________________________________________________________________
________________________________________________________________________
________________________________________________________________________
________________________________________________________________________
________________________________________________________________________
________________________________________________________________________
________________________________________________________________________
________________________________________________________________________
________________________________________________________________________
________________________________________________________________________
________________________________________________________________________
________________________________________________________________________
________________________________________________________________________
________________________________________________________________________
________________________________________________________________________
________________________________________________________________________
________________________________________________________________________
________________________________________________________________________
________________________________________________________________________
________________________________________________________________________
________________________________________________________________________
________________________________________________________________________
________________________________________________________________________
________________________________________________________________________
________________________________________________________________________
________________________________________________________________________
________________________________________________________________________
57

58
NOTES
________________________________________________________________________
________________________________________________________________________
________________________________________________________________________
________________________________________________________________________
________________________________________________________________________
________________________________________________________________________
________________________________________________________________________
________________________________________________________________________
________________________________________________________________________
________________________________________________________________________
________________________________________________________________________
________________________________________________________________________
________________________________________________________________________
________________________________________________________________________
________________________________________________________________________
________________________________________________________________________
________________________________________________________________________
________________________________________________________________________
________________________________________________________________________
________________________________________________________________________
________________________________________________________________________
________________________________________________________________________
________________________________________________________________________
________________________________________________________________________
________________________________________________________________________
________________________________________________________________________
________________________________________________________________________
________________________________________________________________________
________________________________________________________________________
58

59
NOTES
________________________________________________________________________
________________________________________________________________________
________________________________________________________________________
________________________________________________________________________
________________________________________________________________________
________________________________________________________________________
________________________________________________________________________
________________________________________________________________________
________________________________________________________________________
________________________________________________________________________
________________________________________________________________________
________________________________________________________________________
________________________________________________________________________
________________________________________________________________________
________________________________________________________________________
________________________________________________________________________
________________________________________________________________________
________________________________________________________________________
________________________________________________________________________
________________________________________________________________________
________________________________________________________________________
________________________________________________________________________
________________________________________________________________________
________________________________________________________________________
________________________________________________________________________
________________________________________________________________________
________________________________________________________________________
________________________________________________________________________
________________________________________________________________________
60