MALAWI DROUGHT 2015-2016 - PreventionWeb.net
224
MALAWI DROUGHT 2015-2016 POST-DISASTER NEEDS ASSESSMENT (PDNA)
-
Upload
khangminh22 -
Category
Documents
-
view
0 -
download
0
Transcript of MALAWI DROUGHT 2015-2016 - PreventionWeb.net
MALAWI DROUGHT 2015-2016POST-DISASTER NEEDS ASSESSMENT (PDNA)

MALAWI DROUGHT 2015–2016

Table of ContentsI. Foreword viII. Foreword viiIII. Acknowledgements viiiIV. List of Figures xV. List of Tables xiiVI. List of Acronyms xivVII. Executive Summary xvii1 Introduction 12 Country Profile 33 The 2015-2016 Drought 5
3.1 Overview 53.2 Rainfall Analysis 63.3 Humanitarian Consequences of the Drought 83.4 Immediate Response 9
4 Undertaking the PDNA – Approach and Methodology 115 Sector Analysis 17
5.1 Agriculture 175.2 Food Security 205.3 Water 21
5.3.1 Irrigation 215.3.2 Water Resources 235.3.3 Water Supply and Sanitation (WASH) 24
5.4 Social Protection 25 5.5 Health 26 5.6 Nutrition 28
5.7 Education 305.8 Environment 315.9 Industry and Commerce 335.10 Transport 345.11 Energy 34

MALAWI PDNA | iv
6 Macroeconomic Analysis 37 6.1 Economic Context 37 6.2 Impact of the Drought on the Macroeconomic Indicators 39 6.2.1 Effect on Gross Domestic Product 39 6.2.2 Effects on Inflation 40
6.2.3 Effects on the External Position 41 6.2.4 Effects on the Fiscal Position 417 Human and Social Impact Analysis & Gender Recommendations 43 7.1 Introduction 43 7.2 Methodology 44 7.3 Socio-economic Impact 45 7.3.1 Impact on Livelihoods & Food Security 45 7.3.2 Coping Strategies and Livelihood Adaptations 47 7.4 Social Relations and Cohesion 49 7.5 Community Needs for Drought Management 50 7.6 Gender Analysis and Mainstreaming Recommendations 50 7.6.1 Gender Analysis 50
7.6.2 Gender Mainstreaming Recommendations 518 Drought Recovery Strategy 55 8.1 Guiding Principles for Recovery 56 8.2 Strategic Pillars of Recovery 57
8.2.1 Increasing Productivity in Agriculture & Irrigation Development 58 8.2.2 Improving Food Security, Nutrition and Health Services 58 8.2.3 Enhancing People’s Capacity to Withstand Risk and Building Resilience 58 8.2.4 Strengthening Water Resources Management and Enhancing Water Supply 59 8.2.5 Strengthening Disaster Risk Reduction and Drought Resilience 59 8.2.6 Integration of Gender Concerns into All Recovery Interventions 599 Disaster Risk Reduction, Risk Financing and Drought Resilience 61 9.1 Mainstreaming and Adequate Resourcing of the DRR Agenda 61
MALAWI PDNA | v
9.2 Performance of the DRR System & Lessons Learnt from the Drought Event 62 9.3 DRR Strategy for Facilitating Resilient and Sustainable Drought Recovery 64 9.4 Disaster Risk Financing 65 9.4.1 Overview of International Risk Financing Options 65 9.4.2 Current State of Risk Financing in Malawi 67 9.4.3 Suggestions for Moving Forward on Risk Financing 6810 The Way Forward 71 10.1 Key Stakeholders 71 10.2 Institutional Framework 71 10.3 Geographical Coverage and Timeline 72 10.4 Next Steps in Follow-up to the PDNA 72
Annex I: Drought Recovery Action Plan 73Annex II: Detailed Sector Reports 81 Agriculture 83 Food Security 97 Irrigation 103 Water Resources 115 Water Supply and Sanitation 121 Social Protection 127 Health 137 Nutrition 147 Education 157 Environment 163 Industry and Commerce 171 Transport 177 Energy 181 Disaster Risk Reduction, Risk Financing and Drought Resilience 187Annex III - Methodology to Calculate Impact of Drought on GDP 216

MALAWI PDNA | vi
I | Foreword Government of Malawi
The dramatic increase in the frequency, intensity and impact of natural disasters in recent decades has been well documented. But few could have predicted what has befallen Malawi in the last two years. A once-in-500-years flood in 2015, which impacted more than 1.1 million people, has now been followed by a devastating drought that is expected to leave at least 6.5 million people food insecure during the 2016/17 season.
The Government of Malawi (GoM) has taken immediate steps to provide emergency relief to millions of its citizens in collaboration with its domestic and international partners. And with an eye toward building future resilience, the GoM also asked the World Bank, United Nations and European Union to support a comprehensive Post-Disaster Needs Assessment (PDNA) to assess the impact of the drought and identify a multi-sectoral recovery strategy aimed at building long-term resilience to future risks.
As you will read in this report, the drought has caused damages and losses across a number of sectors totaling US$ 365.9 million and requiring recovery interventions estimated at US$ 500.2 million. Just over half of the total recovery needs are associated with the food security sector.
As Malawi knows all too well from recent experience, natural hazards cannot be prevented. However, their impacts can be minimized through a multi-sectoral approach to strengthening resilience to these types of shocks. We look forward to working with our international partners to leverage the findings of the PDNA and the resulting support for the recovery strategy contained in this report to help Malawi take important steps toward breaking the cycle of food insecurity.
Saulos Klausse Chilima, PhDVice President of the Republic of Malawi and
Minister Responsible for Disaster Management Affairs

MALAWI PDNA | vii
II | Foreword World Bank, United Nations and European Union
The projections of the Malawi Vulnerability Assessment Committee released in June 2016 are overwhelming. A minimum of 6.5 million Malawians – 39 percent of the population – will not have enough food in the 2016-17 consumption period because of the ongoing drought provoked by an unusually strong El Niño effect.
When the Government of Malawi asked the World Bank, United Nations and European Union to support a comprehensive assessment of the drought, we immediately joined a team of dozens of Government staff across 17 sectors working on the Post-Disaster Needs Assessment (PDNA).
In fewer than three weeks, the PDNA team sifted through data, travelled to some of the most impacted areas to discuss recovery strategies at district and community level, and validated findings using innovative remote sensing technology. What emerges is a PDNA that goes beyond determining the damages, losses and resulting needs; it aims for a multi-sectoral, phased recovery strategy focused on strengthening resilience to future disasters.
It is our hope that the recommendations in this PDNA can inform efforts by the Government of Malawi and its many partners to break the cycle of disasters and the food insecurity that too often results.
Lluis NavarroHead of Cooperation, EU Delegation
Amakobe SandeUN Resident Coordinator a.i.
Laura KullenbergWorld Bank Country Manager

MALAWI PDNA | viii
III | Acknowledgements The Malawi Drought Post Disaster Needs Assessment (PDNA) was made possible through an intensive collaborative effort led by the Government of Malawi and supported by the World Bank, the United Nations and the European Union.
The PDNA was prepared under the overall leadership of the Ministry of Finance, Economic Planning and Development (MoFEPD) and the Dept. of Disaster Management Affairs (DoDMA).
Nearly 100 national and international experts collaborated intensively to complete the PDNA, including the following sector ministries, departments and agencies: Ministry of Agriculture, Irrigation and Water Development; Ministry of Education, Science and Technology; MoFEPD; Ministry of Health; Ministry of Industry, Trade and Tourism; Ministry of Lands, Housing and Urban Development; Ministry of Transport and Public Works; Dept. of Climate Change and Meteorological Services; DoDMA; Dept. of Energy Affairs; Dept. of Engineering Services; Dept. of Environmental Affairs; Dept. of Fisheries; Dept. of Irrigation; Dept. of Livestock Development; Dept. of Nutrition, HIV & AIDS; Dept. of Surveys; Dept. of Water Resources; Dept. of Water Supply; Local Development Fund; National Aquaculture Centre; National Spatial Data Centre; National Statistics Office; Poverty Reduction and Social Protection Division
Support for the assessment was provided by a team of technical experts from the World Bank and the United Nations System —UNDP, UNICEF, UN Women, WFP, FAO and WHO—in addition to other partners including the European Union, Catholic Education Commission, Malawi Red Cross Society, OXFAM and World Vision International.
The Government of Malawi would like to acknowledge the financial support of the Global Facility for Disaster Reduction and Recovery.
This PDNA was undertaken with strategic guidance from Bella Bird, Laura Kullenberg, Idrissa Dia and Christoph Pusch (World Bank), Mia Seppo (United Nations) and Lluis Navarro (European Union). The core technical team for this assessment consisted of Chiara Mellucci (UNDP), Ayaz Parvez, Francis Samson Nkoka, Veronique Morin, Atishay Abbhi, Alexander Agosti, Diane Baik, Allen Baumgardner-Zuzik, Carl Dingel, Ivan Drabek, Boyenge Isasi Dieng, Matilda Mtambo, Tamara Mwafongo, Chamwisangah Msachi and Chalida Chararnsuk (World Bank). Courage Services Inc. provided remote sensing and mapping support.
The following team members contributed towards the drafting of the sector annexes and provided valuable inputs pertaining to various sectors and cross cutting issues:Agriculture: Time Hapana Fatch, Blessings Botha, and Valens Mwumvaneza (World Bank), Samuel Khosa, Tasira Mwaupighu, Enock Matale, Precious Chitsulo (Ministry of Agriculture), William Ngwira, Gift Kamwamba (Dept. of Livestock Development), Hassib Sainan (Fisheries Research Issues), Mary Khozomba (OXFAM), Dickxie Kampani (MFERP), Luis Amaya Ortiz (FAO)Water: Josses Mugabi, (World Bank), Chisomo Kumbuyo, Eshiperancar Kampini, and James Chikungu (Dept. of Irrigation), Aaron Mapsere (Dept. of Water Supply), Gertrude Makuti (Dept. of Sanitation), Laison Mseu, Patrick Mlomba and Solomon Kalima (Dept. of Water Resources)

MALAWI PDNA | ix
Social Protection: Ivan Drabek (World Bank), Macmillan Bonomali, Lukes Kalilombe (Poverty Reduction and Social Protection Division), John Ngambi (Local Development Fund).Health: Casbey Banda, Flora Dimba, Emmanuel Mbawa (Ministry of Health),Nutrition: Diane Baik (World Bank), Maria Chidumu, Blessings Muwalo (Dept. of Nutrition, HIV & AIDS), Vitowe Harazi (UNICEF)Food Security: Melania Tasila Kanyama, Precious Chitsulo (Ministry of Agriculture), Benjamin Banda and Lazarus Gonani (WFP)Education: Innocent Mulindwa (World Bank), Pickmore Swira, Shanever Chamba (Ministry of Education, Science and Technology), and Cresensia Kansale (Catholic Education Commission)Environment: Raymond Von Culin (World Bank), Emmanuel Nkomwa, Hannah Kasongo and Christopher Manda (Dept. of Environmental Affairs)Industry and Commerce: Efrem Zephnath Chilima (World Bank), Raphael Misi Nkhondiwa, Joseph Chimseu Phiri, and Patricia Dzikolidaya (Ministry of Industry, Trade and Tourism).Transport: Chikondi Nsusa-Chilipa (World Bank), Wax Ligomba (Ministry of Transport and Public Works), Florence Ndenguma (Roads Authority)Energy: Greshom Sinchinga (World Bank), Cornwell Chisale (Dept. of Energy Affairs), and Charles Kagona (Dept. of Engineering Services)Macroeconomic Analysis: Priscilla Kandoole, Sunganani Kalemba (World Bank), Adwell Zembele, Wilkes Silema, Elsie Salima, Betty Ngoma, Hamilton Kamwana, Ellie Stylianou (MoFEPD), Yona Phiri (DoDMA), Jonathan Mkungudza, Kingsley Manda, and Timothy Mwanga (National Statistics Office).Human and Social Impact & Gender: Boyenge Isasi Dieng (World Bank), Edfas Mkandawire (UN Women), Charles Mazinga (Ministry of Gender).Disaster Risk Reduction, Risk Financing and Drought Resilience: Julie Dana (World Bank), Fyawupi Mwafongo, Samuel Gama, and Maria Chidumu (DoDMA), Sobhuza Sibande (WVI), Welton Phalira (MFERP), Patricia Gadi (Malawi Red Cross Society)Meteorological Services and Mapping: Gumbi Gumbi (Dept. of Surveys), Clement Boyce, Stanley Chabvunguma (Dept. of Cilmate Change and Meteorological Services)Photo Credits: Mike Kambalame
The PDNA team acknowledges the people interviewed for the insights they provided to the team as well as the staff of the many local government offices that provided data and support without which the PDNA would not have been possible.
There are many others who contributed to the PDNA who have not been mentioned here. Their contributions are duly acknowledged.
Ben BotoloSecretary and Commissioner for Disaster Management Affairs
MALAWI PDNA | x
IV | List of FiguresFigure 1: Distribution of Damages Across Sectors (in USD million) xixFigure 2: Distribution of Losses Across Sectors (in USD million) xixFigure 3: Distribution of Needs Across Sectors (in USD million) xixFigure 4: Geographic Distribution of Drought Recovery Needs xxiFigure 5: Distribution of Needs by District xxiFigure 6: Average Against Observed Rainfall Across Districts (Oct – Dec 2015) 6Figure 7: Average Against Observed Rainfall Across Districts(Jan – Mar 2016) 7Figure 8: Spatial Distribution of Normal (left) Against 2015/2016 (right) Observed Seasonal Rainfall (mm) 7Figure 9: Drought Affected Period and Extended Period of Losses Based on a Simplified Cropping Calendar for Malawi (FEWS Net) 8Figure 10: Population Food Security Comparison Under Best and Worst Case Scenarios Due to Drought (FEWSNET, 2016) 8Figure 11: Timeline of the PDNA 13Figure 12: Loss Distribution by Crops (USD) 18Figure 13: Chezi Dam (Cultivation Right Inside the Dam Reservoir) April 2016 23Figure 14: Total Monthly New Admissions of MAM and SAM Children U5 in 24 Most Affected Districts 29Figure 15: (left) GDP Shares (Percentage of Total, 2015); (right) Malawi’s GDP Growth (%) 2010-2017 38Figure 16: Children Carrying Bricks During a Youth FGD in Balaka 47Figure 17: A Bowl of Nyika Being Sold at a Local Market in Nsanje 48Figure 18 Strategic Pillars of Drought Recovery 57Figure 19: DRM Institutional Arrangements 62Figure 20: Disaster Risk Financing Framework 67Figure 21 Malawi’s Disaster Risk Financing Framework (Current State) 68 Figure 22: Effects of Drought on Areas Under Irrigation 103Figure 23: Maise Production Before and After Drought 104Figure 24: Area Under Rice Cultivation Through Irrigation 105Figure 25: Categorized Percentages of the Needs 105Figure 26: Structure of the Water Sector in Malawi 113Figure 31: Malawi's Two Largest SP Program: SCT & MASAF-PWP 115Figure 32: Share of Losses in the Health Sector Due to Drought by Region 115Figure 33: Higher Cost of Treatment (Losses) in MWK by Top 5 Diseases Affected by Drought 141Figure 34: Comparison of New Cases of Malaria in 24 Districts at Baseline vs. Period of the Drought 141

MALAWI PDNA | xi
Figure 35: Comparison of New Cases of Skin Infection in 24 Districts at Baseline vs. Period of the Drought 141Figure 36: Trends of Under-Nutrition in Malawi 148Figure 37: Trends in Post-Harvest GAM Prevalence 148Figure 38: Total Monthly New Admissions of MAM & SAM Children U5 in 25 Most Affected Districts 149Figure 39: Total Monthly New Admission of Pregnant & Lactating Women izn Supplementary Feedins Programs in the 25 Most Affected Districts 150Figure 39: Distribution of Recovery & Reconstruction Needs 150Figure 40: Categorization of Needs According to Programs 159Figure 41: Distribution of the Needs by Type 161Figure 42: Percentage Share of Losses bby Product for the Agro-Processing Sub-Sector 165Figure 44: DRM Institutional Arrangements 188

MALAWI PDNA | xii
V | List of Tables
Table 1: Summary Of Damages, Losses and Needs Across All Sectors xxTable 2: Summary Of Losses in the Agriculture Sector Per Region 18Table 3: Distribution of Needs Across Crops, Livestock and Fisheries 19Table 4: Distribution of Food Securtity Needs by Region 20Table 5: Recovery and Reconstruction Needs in Water Resoucres Sector 23Table 6: Distribution of Losses in the Health Sector, by Region 27Table 7: Distribution of Needs in the Health Sector, by Region 27Table 8: Recovery Needs in the Nutrition Sector by Region 29Table 9: Distribution of the Impact of Drought on Education Sector, by Region 30Table 10: Distribution of Recovery and Resilience Needs in the Education Sector by Region 31Table 11: Distribution of Damage and Losses in the Environment Sector by Region 32Table 12: Distribution of Needs in the Environment Sector by Region 32Table 13: Distribution of Losses in the Agro-Processing Industry by Region 33Table 14: Loss Estimates Based on Load Shedding from October 2015 to December 2016 35Table 15: Key Macroeconomic Indicators, 2010-2017 39Table 16: Estimated Losses Per Sector in 2016 40Table 17: Recommendations for a Gender Sensitive Recovery from the Drought 53Table 18: Interventions for Strengthening the Drr System 65Table 19: Drought Recovery Action Plan 73-79Table 20: Agriculture Sector Losses Per Sub-Sector/Per Region 86Table 21: Summary of Dried Ponds 86Table 22: Summary of Estimated Losses Incurred 87(Both Capture and Aquaculture)Table 23: Crop Recovery Needs 89Table 24: Livestock Recovery Interventions 90Table 25: Livestock Recovery Needs 91Table 26: Fisheries Recovery Needs 93Table 27: Food Security Sector Needs 96Table 28: Summary of Losses in the Sector 101Table 29: Proposed Recovery Needs in the Sector 106Table 30: Area Under Conventional Irrigation in the Eight Irrigation Service Divisions 107

MALAWI PDNA | xiii
Table 31: List of Proposed Schemes for Reconstruction 108Table 32: List of Proposed Schemes for Reconstruction 109Table 33: Estimates of Recovery and Reconstruction Needs for 110Irrigation Sector in Mwk.Table 34: Distribution of Damages to Dams by Region 116Table 35: Estimates of Recovery and Reconstruction Needs for the Sub-Sector 116Table 36: Existing Number of Rural Water Supply Points by Technology by District 120Table 37: Distribution of Damages in Water Supply and Sanitation Infrastructure by Region 122Table 38: Distribution of Losses by Region 123Table 39: Case of Rural Water Supplies –Summary of Losses Incurred by Rural Gravity Fed Piped Water Suuply Systems 123Table 40: Distribution of Needs in Recovery and Reconstruction of Water Supply Infrastructure by Region 124Table 41: Distribution of Damages to Dams by Region 130Table 42: Public Works Programme 130Table 43: Distribution of Damages to Dams by Region 131Table 44: Current Coverage of the Social Cash Transfer Programme 133Table 45: Scaling Up Social Cash Transfers 133Table 46: No. of Households and Costs of Providing Social Cash Transfers in Affected Districts 134Table 47: Total Losses of the Health Sector by Region 140Table 48: Estimates 143Table 49: Total Losses for the Nutrition Sector Due to the Drought (October 2015 to December 2016) 151Table 50: Nutrition Sector Needs 152Table 51: Summary of Damages and Losses in the Education Sector 159Table 52: Forest Sector Damages 164Table 53: Wildlife Sector Damages 164Table 54: Losses for Wildlife Sector 165Table 55: Implementation of the Needs Against Timeframe 166Table 56: Distribution of Needs by Region 167Table 57: Distribution of Losses by Product – Region Wise 173Table 58: Distribution of Industry Sector Needs by Region 175Table 59: Estimates 180Table 60: Losses to the Energy Sector Based on Load Shedding for the Period from October 2015 to June 2016 183Table 61: Estimated Recovery Needs for Energy Sector 184Table 62: Interventions for Strengthening the Dry System 193

MALAWI PDNA | xiv
VI | List of Acronyms ADMARC Agricultural Development and Marketing CorporationAPES Agricultural Production Estimates SurveyARI Acute Respiratory InfectionART Ant-Retroviral Therapy ASWAp Agriculture Sector Wide Approach BOP Balance of PaymentsCHAM Christian Health Associations of MalawiCMAM Community Management of Acute Malnutrition COM College of MedicineCPC Civil Protection CommitteeCSB Corn Soya Blend CSO Civil Society OrganizationDHIS District Health Information SystemDHO District Health OfficeDHS Demographic Household SurveyDNHA Department of Nutrition, HIV and AIDSDoDMA Department of Disaster Management AffairsDRR Disaster Risk ReductionEHP Essential Health PackageENSO El Nino Southern OscillationEU European UnionEWS Early Warning SystemFAO Food and Agriculture OrganizationFEWS Famine Early Warning SystemFIRP Food Insecurity Response PlanFP Family PlanningGDP Gross Domestic ProductGoM Government of MalawiHIV/AIDS Human Immune-deficiency Virus/ Acquired immune deficiency SyndromeHSSP Health Sector Strategic PlanHTH Hyper chloriteIMCI Integrated Management of Childhood IllnessesIMF International Monetary FundIPC Integrated Food Security Phase ClassificationIRS Indoor Residual SprayingITCZ Inter-Tropical Convergence ZoneITN Insecticide Treated NetIWRM Integrated Water Resources ManagementIYCF Infant and Young Child Feeding LQAS Lots Quality Assurance SurveyMAIWD Ministry of Agriculture, Irrigation and Water DevelopmentMAM Moderately Acute Malnutrition MASAF Malawi Social Action FundMASDAP Malawi Spatial Data Portal
MALAWI PDNA | xv
MDG Millennium Development GoalsMDHS Malawi Demographic and Health Survey MGDS Malawi Growth Development StrategyMICS Micronutrients Indicator Survey MoFEPD Ministry of Finance, Economic Planning and Development MW MegawattMWK Malawi KwachaMoH Ministry of HealthMRCS Malawi Red Cross SocietyMSME Micro, Small and Medium EnterpriseMVAC Malawi Vulnerability Assessment CommitteeNCST Nutrition Care, Support and Treatment NDPRC National Disaster Preparedness and Relief CommitteeNDRF National Disaster Recovery FrameworkNDVI Normalized Difference Vegetation IndexNGO Non-Governmental OrganizationNHP National Health PolicyNRU Nutrition Rehabilitation UnitO5 Over five years of ageOCHA Organisation for the Coordination of Humanitarian AffairsOFSP Orange Fleshed Sweet PotatoORS Oral Rehydration SaltsOTP Outpatient Therapeutic Program PDNA Post-Disaster Needs AssessmentPLHIV People Living with HIVPLW Pregnant and Lactating WomenPSD Private Sector DevelopmentSAM Severe Acute MalnutritionSDG Sustainable Development GoalsSFP Supplementary Feeding Program SHN School Health and Nutrition SIA Social Impact Assessment SLA Service Level AgreementSMART Standardized Monitoring and Assessment of Relief and TransitionSMP School Meals ProgrammeTNP Targeted Nutrition Programs U5 Under five years of ageUNDP United Nations Development ProgramUNICEF United Nations Children’s Education FundUNSCN United Nations Standing Committee for NutritionUSD United States Dollars WASH Water, Sanitation and Hygiene WB World BankWFP World Food Program

MALAWI PDNA | xvi
MALAWI PDNA | xvii
Malawi’s Exposure and Vulnerability to Floods and Droughts • Malawi is highly exposed to natural disasters, such as floods and droughts. Available records indicate
that in the last 100 years, the country has experienced about 20 droughts. In the last 36 years alone, the country has experienced eight major droughts, affecting over 24 million people in total. The impact, frequency and spread of drought in Malawi have intensified in the past four decades and are likely to worsen with climate change, compounded by other factors, such as population growth and environmental degradation. Droughts and dry spells in Malawi cause, on average, a 1 percent loss of Gross Domestic Product (GDP) annually. Most drought episodes have occurred in El Niño years, during which the country experiences rainfall deficits.
The Present Drought • The 2015/2016 agricultural season was greatly affected by strong El Nino conditions and resulted
in erratic rains and prolonged dry spells across most parts of the country. In particular, the country experienced a delayed start of the 2015-16 agricultural season by two to four weeks followed by erratic and below average rains in November and December 2015. Prolonged dry spells have resulted in severe crop failure, particularly in the Southern Region and parts of the Central Region. The drought has been characterized as an agricultural drought, as in large parts of the country precipitation commenced too late and was too erratic or occurred over a short period of time. In response to the dry spells, the Government of Malawi declared a state of disaster in April 2016, and a Post Disaster Needs Assessment (PDNA) was initiated in mid-May under the leadership of the Government of Malawi, with the assistance of the World Bank and the United Nations (UN).
VI. EXECUTIVE SUMMARY

MALAWI PDNA | xviii
Humanitarian Consequences and Response • At least 6.5 million people (or 39 percent of the population) in Malawi’s 24 drought-affected districts
will not be able to meet their food requirements during the 2016/17 consumption period, according to the 2016 Malawi Vulnerability Assessment Committee (MVAC) Report on food security. It is projected that in the first quarter of 2017, 28 percent of the population will not receive or have access to the minimum food and non-food requirements.
• In the declaration of the ‘state of national disaster’, President of Malawi made an appeal for humanitarian relief assistance from the international donor community, the UN, non-governmental organizations (NGOs), the private sector as well as individuals. The total amount of financial assistance mobilized to date by the government and international partners is USD 149.36 million and has covered the following areas in 24 districts: food security, agriculture, nutrition, protection and education. In response to the current situation and in preparation for the 2016/2017 lean season, the Department of Disaster Management Affairs (DoDMA) has led the preparation of a Food Insecurity Response Plan (FIRP), on behalf of the government under the cluster system and in collaboration with key UN agencies. The main strategic objective of the FIRP is to provide immediate life-saving and life-sustaining assistance to the drought-affected population. The total required amount by the FIRP to cover all the 6.5 million affected people across the 24 districts has been estimated at USD 380.056 million.
PDNA Objectives and Scope • The main objectives of the PDNA are to estimate the physical, socio-economic, and human impacts
of the drought, develop sector recovery strategies and identify the corresponding recovery needs. These needs are based on a broad 6-pillared Drought Recovery Strategy that underpins and shapes all sector needs analyses. Sector needs have been further summarized, prioritized and sequenced in the form of a Drought Recovery Action Plan that provides a multi-sector framework of recovery interventions over the next three years. This Action Plan is a results framework for monitoring recovery in various sectors that will be further expanded into a programmatic monitoring and evaluation system during implementation.
• The PDNA also analyzes the challenges faced and lessons learnt from the ongoing drought response and provides a recommendations for improved future drought resilience through a risk reduction strategy that builds upon existing instruments, institutional mechanisms, and provisions for risk reduction in the country.
• The sectoral scope of the assessment includes: agriculture (rain-fed crops, livestock and fisheries); food security; water ( – including irrigated crops, water resources, and water supply and sanitation); health; nutrition; energy; environment; education; transport; social protection; industry and commerce; disaster risk reduction (DRR). An analysis of the overall human and social impact as well as the macroeconomic impact of the drought was also undertaken.
• The geographical scope of assessment includes all 24 drought-affected districts in the Southern, Central and Northern Regions, while the temporal scope to assess damages and losses from the drought is from October 2015 to March 2016, with losses projected up to March 2017.
Summary of PDNA Results • With damages amounting to USD 36.6 million and losses (projected to March 2017) amounting to
USD 329.4 million, the total effect of the drought is estimated at USD 365.9 million. The productive sectors account for 81 percent of the effects, while the social and physical sectors account for 10 percent and 9 percent, respectively. The agriculture sector - including crops, livestock and fisheries - was the most affected, with damages and losses accounting for 70 percent of the total. Just over

MALAWI PDNA | xix
60 percent of the losses can be attributed to crops. The irrigation and water supply and sanitation sectors are the second and third most affected, making up 8.7 and 5.4 percent of the total effects, respectively. A summary of damages, losses and recovery needs across sectors is provided in the table and figures below.

MALAWI PDNA | xx
• Recovery needs across all sectors, including food security, have been estimated at USD 500.2 million. As shown in Figure 3, the food security needs make up just over half (54 percent) of the total recovery costs. Excluding food security, the social sectors account for 44.0 percent, the productive sectors for 30.3 percent, and the physical sectors for 56.5 percent of all recovery needs. Agriculture (22.0 percent), social protection (18.5 percent) and nutrition (14.4 percent) constitute the sectors with the highest recovery needs over the next three-year period
TABLE 1: SUMMARY OF DAMAGES, LOSSES AND NEEDS ACROSS ALL SECTORS
Cost (USD)
Damages
Losses Recovery Needs Productive Sectors
Crops - 198,758,638 40,545,252
Livestock 15,772,527 31,186,832 10,067,379
Fisheries - 10,783,990 527,571
Irrigation - 31,876,168 14,101,063
Trade & Industries - 8,768,583 4,997,417
Productive Sectors Total 15,772,527 281,374,212 70,238,682
Physical Sectors
Energy - 5,888,561 2,893,521
Environment & Forestry 4,245,524 1,501,786 6,560,350
Transport - - 15,331,000
Water Resources 1,400,000 - 10,707,143
Water Supply & Sanitation 11,803,071 7,377,773 20,991,643
Physical Sectors Total 17,448,596 14,768,119 56,483,656
Social Sectors
Food Security - - 268,459,014
Education 3,358,929 6,946,445 12,285,922
Health - 14,303,878 13,514,120
Nutrition - 11,970,568 33,425,537
Social Protection - - 42,908,343
Human & Social Impact - - -
Social Sectors Total 3,358,929 33,220,892 370,592,937
Cross-cutting issues
DRR - - 2,926,609
Contingency Financing - - -
Cross-cutting Issues Total - - 2,926,609
Total with Food Security 36,580,052 329,363,222 500,241,884
Total without Food Security 36,580,052 329,363,222 231,782,869
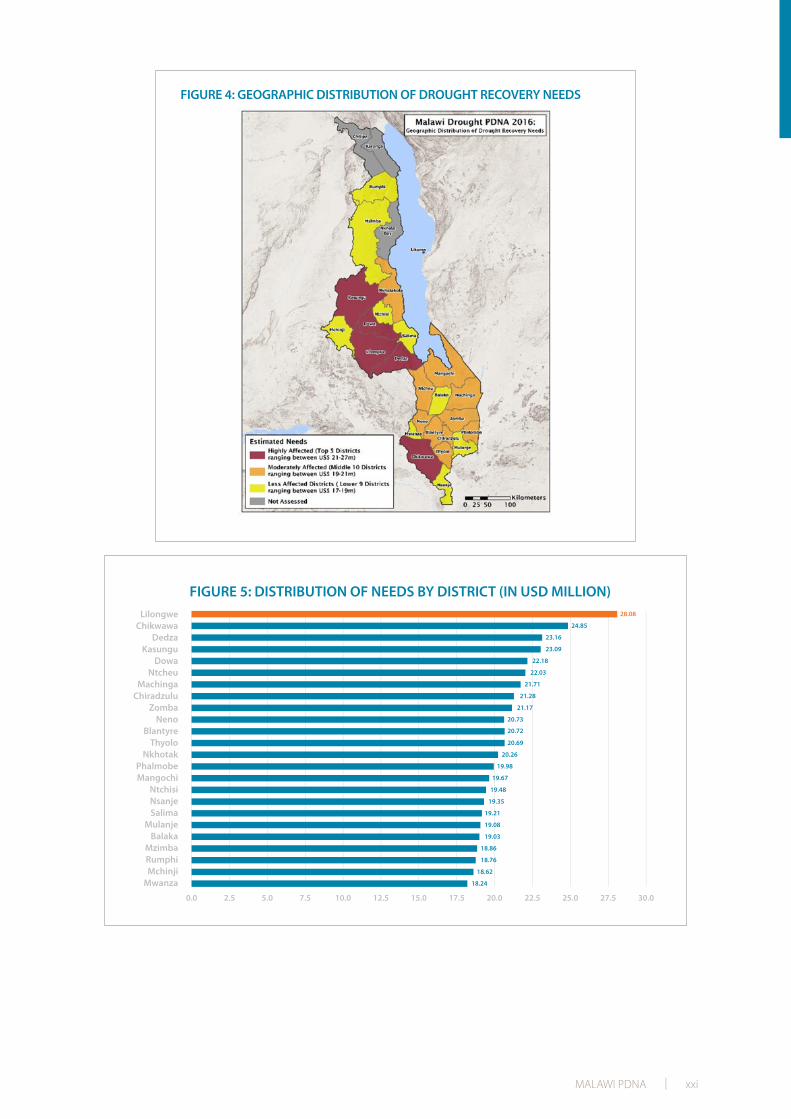
• The map below also presents an indicative geographical distribution of drought recovery needs. However, it is important to note that these values are only indicative as several assumptions were made for sectors that did not have recovery needs disaggregated by district. Based on these indicative figures, the districts where needs have been identified as the highest include Lilongwe, Chikwawa, Kasungu, Dowa and Dedza. Needs vary across the districts from USD 18.2 million in Mwanza to USD 28.1 million in Lilongwe.
MALAWI PDNA | xxi
FIGURE 4: GEOGRAPHIC DISTRIBUTION OF DROUGHT RECOVERY NEEDS

MALAWI PDNA | xxii
Macroeconomic Impact of the Drought • The drought hit Malawi at a time when the country’s economy was particularly vulnerable due to
consecutive effects of the 2015 floods and 2015/2016 drought. The cumulative impact of drought directly related to GDP is estimated at USD 295.2 million, which is equal to 5.6 percent of Malawi’s GDP. Agriculture has by far been the hardest hit sector experiencing the largest economic cost due to a significant loss in crop production. The second most affected sectors, electricity and water, experienced an 8.0 percent loss, which is equivalent to MWK 9,286 million (USD 13.3 million).
• As a supply shock to Malawi’s predominately agrarian economy, the drought drove up food prices notably for maize resulting in food price inflation. The overall inflation is expected to remain high during 2016, mainly driven by food price inflation. Non-food inflation is likely to be indirectly affected through a possible exchange rate depreciation and higher public domestic borrowing. In order to finance immediate food purchases, the International Monetary Fund (IMF) has allowed the government augmented access to borrow beyond program limits.
• Malawi’s trade balance is expected to deteriorate due to a moderate decrease in exports as a result of the fall in agricultural output owing to the drought, combined with an increase in food imports for recovery. Export volumes are expected to moderately decline as a result of the drought following the decline in agricultural output during the 2015-16 growing season.
• During recovery, it is expected that, as more aid flows into the country, the current account and financial account would be positively affected. The overall impact on the Balance of Payments would depend on the relative magnitudes of the deterioration in the trade deficit and aid inflows. The Government's fiscal position is estimated to be negatively affected as the drought exerts further pressure on the national budget.
Socio-economic Impacts of the Drought • Farm and non-farm livelihoods have been severely disrupted and are expected to be further affected
in the coming months. There has been a notable increase in the vulnerability to food security and general decline in living conditions at household and community levels associated with significant crop losses, notably maize. Drought induced food shortages have also affected children and youth, primarily disrupting their education cycle.
• Health Surveillance Extension Workers also indicated an increase of defaulter rates in health care programs, such as supplementary feeding programs for Children Under 5 (U5) and Anti-Retroviral Therapy (ART).
• Households are generally failing to cope against food insecurity despite being engaged in some sort of alternative livelihood and coping mechanisms to mitigate the effects of the drought. Significant changes in meal composition quality, quantity, and frequency were also found to be critical coping mechanisms used by communities to deal with food insecurity. There were, however, no reports of households taking out loans to cope with the effects of the drought.
• All Focus Group Discussions (FGDs) with both women and men indicated that the drought, and food insecurity in particular, are negatively affecting social relations and family units in their communities. In terms of social cohesion, substantial changes in inter-group relationships and in community dynamics are directly attributable to the drought.
• Provision of food relief has yet to reach the majority of communities included in the Social Impact Assessment (SIA), but CSOs and private sector foundations present in selected areas have brought in significant relief. Immediate needs for recovery emerging out of discussions with communities focus on food assistance and distribution to communities and repair and/or provision of community infrastructures, such health centres, schools and increased availability of maize.

MALAWI PDNA | xxiii
Gender Analysis and Mainstreaming Recommendations • Women and children, particularly girls, were disproportionately affected by the drought as the
loss of livelihoods is impacting existing gender-roles, thus increasing their vulnerability and socio-economic burden.
• Women in the affected communities must be central to building the resilience of communities, and gender equality as well as women empowerment must be actively promoted. Without this, building resilience of communities to future disasters will be difficult to achieve. In the initial relief stage, consultations on gender-specific relief will need to be held as women report discrimination and lack of opportunities to leverage most relief interventions.
Overall Drought Recovery Strategy • The Government of Malawi is adopting a risk-reduction and people-centred approach to drought
recovery with the vision of strengthening the resilience of the population and promoting sustainable development. The goal of this Drought Recovery Strategy is not only to promote recovery from the current drought but also to encourage the adoption of risk-reducing measures that mitigate the impact of future drought events. This is in line with the Government’s National Resilience Strategy currently under development.
• The PDNA Recovery Strategy is also complementary to and builds on the 2016/2017 FIRP that the Government has developed in collaboration with the UN system. While the FIRP’s objective is to address the humanitarian needs generated by the crisis and set the basis for recovery, the PDNA focuses more on those medium to long-term measures that will ensure full recovery of the affected population and support resilience building. Such strategic alignment between the FIRP and the PDNA ensures that there are no critical overlaps between the two plans and that no gaps remain uncovered.
• The Government of Malawi and its partners recognize that recovery has to be a multi-sectorial and multi-pronged effort. Therefore, interventions will be planned and implemented simultaneously in all those sectors and aspects of life that have been affected by the drought according to the level of impact of the event.
• Accordingly, the risk-reduction and people-centred approach has manifested in a 6-pillar Recovery Strategy that underpins the sector needs analysis and recovery strategies. The six pillars include: i) increased productivity in agriculture and irrigation development; ii) improvements in food security, nutrition and health services; iii) enhancement in people’s capacity to withstand risk and build resilience; iv) strengthening of water resources management and enhancement of water supply; v) strengthening of DRR and drought resilience; and vi) integration of gender concerns into all recovery interventions.
Disaster Risk Reduction, Risk Financing and Drought Resilience • The DRR system in Malawi did not experience direct damages and losses caused by the drought,
but it has encountered challenges and the drought response will increase demands on the system. DRR needs to be a key cross-cutting theme for drought recovery across all sectors. However for it to be more effectively and sustainably implemented in the medium to long term, it needs to be meaningfully mainstreamed across broader sector policies and development planning.
• Building the capacity of the national DRR system and providing it with the necessary financial resources and implementation capacity will be critical towards the effective implementation of Malawi’s overall DRR strategy, as well as the drought-focused risk reduction measures proposed in this assessment. DRR capacities and coordination functions need to be improved at both the national and district levels.

MALAWI PDNA | xxiv
• Malawi could benefit from improved early warning, risk identification and risk assessment systems. Emergency preparedness also needs to be drastically strengthened and contingency plans need to be updated, reviewed, exercised and better aligned to the budget cycle.
• Response capacity could benefit from more dedicated sources of domestic funding, better coordination and strengthened Emergency Operations Centres (EOCs). Disaster Recovery could be improved through a more systematic, multi-sectoral approach modelled on the recovery to the 2015 floods. It is envisioned that the National Disaster Recovery Framework (NDRF) can be a model for guiding future recovery efforts, including those related to the 2015-16 drought.
• Based on past lessons learnt and on an analysis of the challenges of its DRR system highlighted by the recent drought, a four-pronged strategic approach to further strengthen the DRR system is recommended, including: (a) strengthening the early warning systems (EWSs) promote risk identification and assessments; (b) strengthening emergency preparedness, response and recovery consist of the following elements; (c) mainstreaming risk reduction, and; (d) strengthening institutional capacity.
• The extensive history of work on risk management for drought and food security in Malawi, combined with work that has been done on flood risk management, create a strong foundation for moving forward with the design and implementation of a National Disaster Risk Financing Strategy. This will help improve the government’s ability to clarify and meet obligations arising from shocks while minimizing threats to development progress and fiscal stability.
• It is important to recognize, however, that such an effort is not likely to have a material financial impact on the current short-term response plan. Additionally, development of new products and tools, such as contingency funds or contingent loans, will take time and will therefore be more appropriate as part of efforts to build financial resilience over the medium and long term.
Next Steps in Follow-up to the PDNA • The government has played a leading role in conducting the PDNA and will be leading the
development and implementation of the recovery interventions and facilitating the participation and coordination of all other relevant national and international stakeholders. The Government of Malawi will implement its Drought Recovery Strategy and associated action plan through relevant line departments, and designate a lead coordination agency for coordination purposes.
• Key next steps will likely include: (a) programming review of existing interventions and programs in each of the assessed areas to determine optimal utilization of existing resources and identification of financing gaps; (b) coordination towards drought recovery programming to ensure harmonization between agencies involved in needs planning and execution; (c) prioritization of needs between and across sectors, districts and over time based on objective impact proportionate criteria through a comprehensive drought recovery framework, and; (d) setting up a program level monitoring and evaluation framework for recovery with clear results indicators and progress benchmarks.

MALAWI PDNA | 1
The highly variable climate of Malawi significantly influences the amount, timing, and frequency of precipitation resulting in frequent droughts and floods. The country has one of the most erratic rainfall patterns in Africa. Rainfall varies considerably both seasonally and from year to year. Since 1980 the country has experienced eight major droughts, affecting over 24 million people in total. Droughts and dry spells in Malawi cause, on average, a one percent loss of GDP annually. Most drought episodes have occurred in El Niño years, during which the country experiences rainfall deficits. Droughts have been increasing in frequency and severity due to the impacts of climate change, and compounded by other factors as population growth and environmental degradation.
In the 2015/2016 rainfall season Malawi was hit again by prolonged dry spells. The country has experienced a delayed start of the 2015-16 agricultural season by two to four weeks followed by erratic and below average rains in November and December 2015. Prolonged dry spells have resulted in severe crop failure, particularly in the Southern Region and parts of the Central Region. In addition, the Northern parts of the country have received above average rainfall, causing floods in a number of districts. The recently released agricultural crop estimates show that overall food production has declined by 12.4 percent from the 2014/15 season, which was already down by about 30 percent (due to 2015 floods) compared to the 2013/14 season.
In response to the dry spells, the Government of Malawi declared a state of disaster in April 2016, and a Post Disaster Needs Assessment (PDNA) was initiated in mid-May under the leadership of the Government of Malawi, with the assistance of the World Bank and the United Nations (UN). The main objectives of the PDNA are to estimate the physical, socio-economic, and human impacts of the drought, define sector recovery strategies and identify the corresponding recovery needs. The PDNA also developed a Recovery Strategy for the 2015/2016 drought by defining and aligning a national recovery vision to long-term development objectives and by formulating a multi-sector framework of
1. INTRODUCTION
MALAWI PDNA | 2
recovery interventions, while ensuring building-back-better and integrating gender and environmental considerations in the recovery strategy. The assessment process utilized a combination of secondary data from similar assessments that were ongoing at that time, along with primary data collection to fill in gaps and validate impacts.
The PDNA defines a strategy for recovery, including its financial implications, while making recommendations to improve future drought resilience. It identifies needs and priorities in support of short (< one year), and medium to long-term (2-3 years and onwards) recovery. The report is structured as follows:
• Chapter 1 explains the background and objective of the PDNA;
• Chapter 2 describes the country profile;
• Chapter 3 provides an analysis of the drought and an overview of the humanitarian consequences and the government’s immediate response;
• Chapter 4 describes the approach and methodology of the PDNA;
• Chapter 5 summarizes the overall damages and losses caused by the drought, as well as the recovery strategies and needs for each of the sectors considered in the assessment;
• Chapter 6 describes the overall macroeconomic impact of the drought;
• Chapter 7 presents the human and social impact of the drought, including a gender analysis of specific sector recommendations for recovery;
• Chapter 8 provides details for the Drought Recovery Strategy on the basis of the sector analysis;
• Chapter 9 analyses the challenges and lessons learned from the ongoing drought and recommendations for drought risk reduction and resilience;
• Chapter 10 summarizes the next steps and the way forward.

MALAWI PDNA | 3
The Republic of Malawi is a largely agricultural country, with about 85 percent of its population living in rural areas, and ranking as the 16th least developed country in the world according to the 2015 UNDP Human Development Report. It is a landlocked country neighbouring Tanzania, Zambia, and Mozambique. Its surface area is approximately 118,484 square kilometres, of which 20 percent is covered by Lake Malawi. Over 70 percent of the population lives below the income poverty line, and 29.8 percent are considered in severe poverty1. Although poverty is more widespread in rural than urban areas, income inequality is significantly more pronounced in urban areas. Almost 80 percent of the population is employed, with 85.7 percent men and 74.3 percent women constituting Malawi’s labour force. Malawi’s economy is predominantly agrarian, with 85.1 percent of households engaged in agricultural activities and agriculture accounting for 30 percent of Malawi’s GDP as well as 80 percent of its exports (mainly tobacco). In 2013 and 2014, growth remained positive at 6.3 and 6.2 percent respectively. Growth in 2015 slowed down to 2.8 percent following the challenges of macroeconomic instability, late arrival of rains and the severe floods experienced in January 2015. Annual average inflation rates have hovered around 20 percent in recent years, reaching a peak of 27.3 percent in 2013 and declining to 21.3 percent in 2015. Current development policies and strategies for Malawi are reflected in the “Vision 2020”, which was developed in 1998 and presents the country’s development goals by the year 2020.
The country’s topography is highly varied, with a sub-tropical climate and a rainy season from November to April. In the mountainous sections of Malawi surrounding the Rift Valley, plateaus rise generally 800 to 1,200 m above sea level, although some rise as high as 3,000 m in the north. Shire Highlands are located to the south of Lake Malawi, gently rolling land at approximately 900 m above
¹ United Nations Development Programme (2015). Human development report 2015: Work for human development: Malawi briefing note for countries on the 2015 Human Development Report.
2. COUNTRY PROFILE

MALAWI PDNA | 4
sea level. In this area the Zomba and Mulanje mountain peaks rise to respective heights of over 2,000 and 3,000 m. The country’s climate is sub-tropical, but the influence of its high elevation means that temperatures are relatively cool. The warm-wet season stretches from November to April, during which 95 percent of the annual precipitation takes place. Average annual rainfall varies from 725 mm to 2,500 mm with Lilongwe having an average of 900 mm, Blantyre 1,127 mm, Mzuzu 1,289 mm and Zomba 1,433 mm. A cool, dry winter season is evident from May to August with mean temperatures varying between 17 and 27 degrees Celsius, and temperatures falling between 4 and 10 degrees Celsius. A hot, dry season lasts from September to October with average temperatures varying between 25 and 37 degrees Celsius.
The climate in Malawi is largely decided by the oscillations of the Inter-Tropical Convergence Zone (ITCZ) and inter-annual variability is further influenced by the El Nino Southern Oscillation (ENSO). Wet season rainfalls depend on the position of the ITCZ, which can vary in its timing and intensity from year to year. Inter-annual variability in wet-season rainfall in Malawi is also strongly influenced by the Indian Ocean sea surface temperatures, which can vary from one year to another due to variations in patterns of atmospheric and oceanic circulation, such as the ENSO. The influence of the ENSO on the climate of Malawi is difficult to predict as it is located between two regions of opposite response to the El Niño phenomenon. Eastern equatorial Africa tends to receive above average rainfall during El Niño conditions, whilst south-eastern Africa often experiences below average rainfall. The opposite response pattern occurs during La Niña episodes. The response of the climate in these two regions and the extent of the area affected vary with each El Niño or La Niña year.
Malawi is exposed to a number of hydro-meteorological hazards, including floods, droughts, hailstorms, strong winds and landslides, and also geo-hazards, notably earthquakes. Between 1979 and 2008, disasters have affected nearly 21.7 million people and have resulted in over 2,500 casualties. Malawi’s vulnerability to hydro-meteorological hazards is primarily linked to specific geo-climatic factors: (i) the influence of the El Niño and La Niña phenomena on the country’s climate; and (ii) the tropical cyclones developing in the Mozambique Channel resulting in highly erratic rainfall patterns and unequal distribution of rainfall causing localized dry spells as well as floods. The intensity and frequency of climate-related hazards in Malawi have been increasing in recent decades and factors like population growth, urbanization and environmental degradation continue to increase the country’s vulnerability to these hazards. The impact of these hazards has severely disrupted food production, led to the loss of life, and destroyed public and private assets. In fact, when shocks like droughts occur, households with low resilience resort to coping mechanisms that are destructive and increase their vulnerability to future shocks.

MALAWI PDNA | 5
3.1 OverviewThe impact of drought in Malawi has intensified over the years and is likely to worsen with climate change. In the past four decades, droughts have become more frequent, widespread, and intense. Available records indicate that in the last 100 years the country has experienced about 20 droughts. Major droughts were recorded in the 1983/1984, 1991/1992, 1996/1997, 1999/2001, 2006/08 and 2014/16 agricultural years. With regard to floods, Malawi faced one of the worst floods in decades in 2015 that affected over 1.1 million people and destroyed both public and private infrastructure in 15 districts. The PDNA estimated the impact of the disaster in terms of damages and losses at around USD 335 million, which was approximately 5 percent of Malawi’s GDP2, while the recovery and reconstruction needs amounted to USD 494 million. Following the January 2015 floods, rainfall in the 2015/2016 season was more than 30 percent less than the average, resulting in the current drought conditions. Based on econometric modelling figures, droughts have been estimated to increase poverty by 1.3 percentage points annually, but this might rise to almost 17 percentage points during a 1-in-25 year drought (roughly equal to an additional 2.1 million people falling below the poverty line)3.
The 2015/2016 agricultural season was greatly affected by strong El Nino conditions and resulted in erratic rains across most parts of the country. The President, His Excellency Arthur Peter Mutharika, declared a ‘state of disaster’ on 13th April, 2016 in all the ‘most-affected’ districts in the southern and central regions and some parts of the northern region for a total of 24 districts out of the 28 that constitute the country. The season has been characterized by late onset of rains in the planting time,
² Malawi Government (2015). Malawi 2015 Floods Post Disaster Needs Assessment Report
³ http://sdwebx.worldbank.org/climateportalb/doc/GFDRRCountryProfiles/wb_gfdrr_climate_change_country_profile_for_MWI.pdf
3. THE 2015-2016 DROUGHT
MALAWI PDNA | 6
between three to four weeks for the Southern Region and two to three weeks for the Central Region. After the late onset of the rains, most areas, especially in the Southern Region, were receiving sporadic rains interspaced with prolonged dry spells resulting in the drying, scorching and permanent wilting of crops. These prolonged dry spells have resulted in severe crop failure, particularly in the Southern Region and parts of the Central Region.
The drought has been characterized as an agricultural drought4 as in large parts of the country precipitation commenced too late and it was too erratic or occurred over a short period of time. The exact geographic and temporal extent of the drought5 is often difficult to define as they may stretch over several months and different regions at a time.
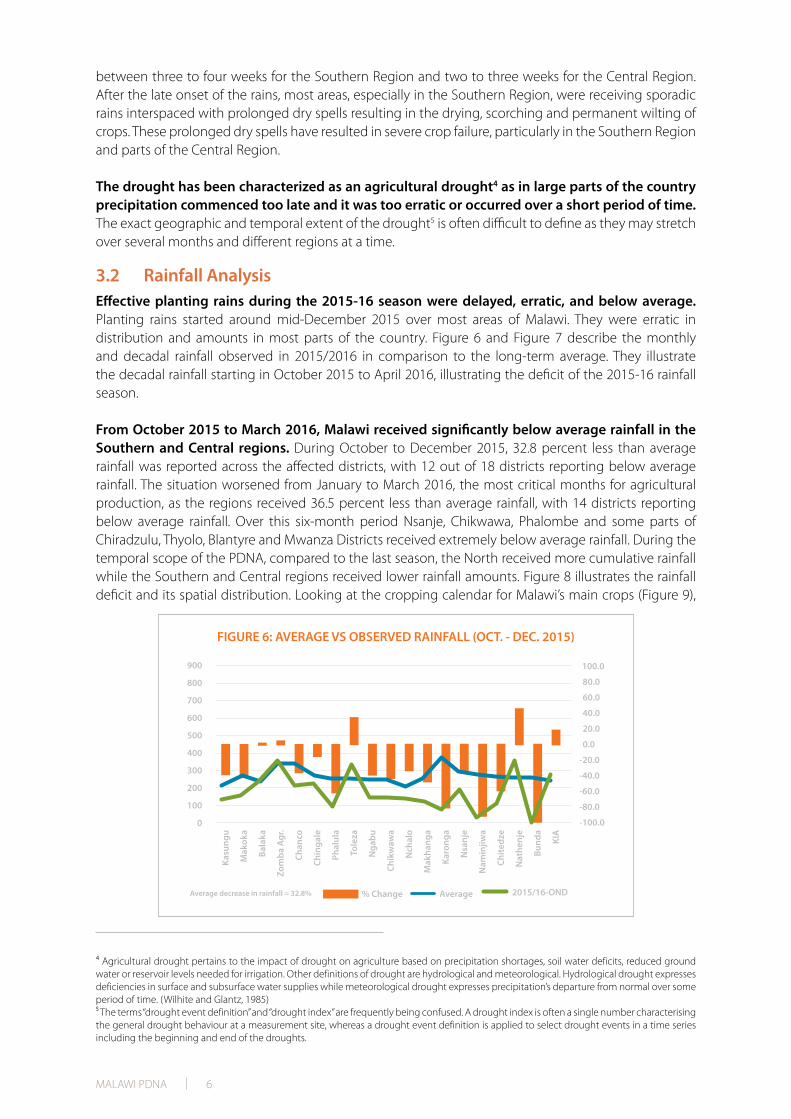
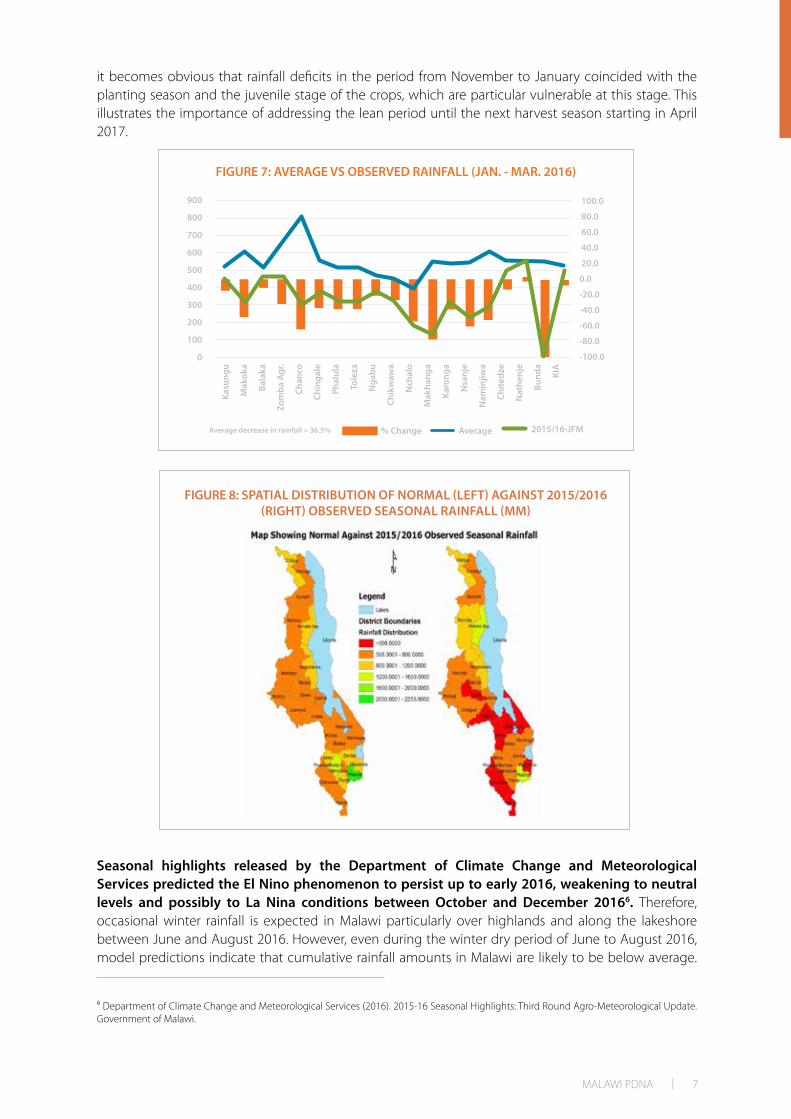
3.2 Rainfall AnalysisEffective planting rains during the 2015-16 season were delayed, erratic, and below average. Planting rains started around mid-December 2015 over most areas of Malawi. They were erratic in distribution and amounts in most parts of the country. Figure 6 and Figure 7 describe the monthly and decadal rainfall observed in 2015/2016 in comparison to the long-term average. They illustrate the decadal rainfall starting in October 2015 to April 2016, illustrating the deficit of the 2015-16 rainfall season.
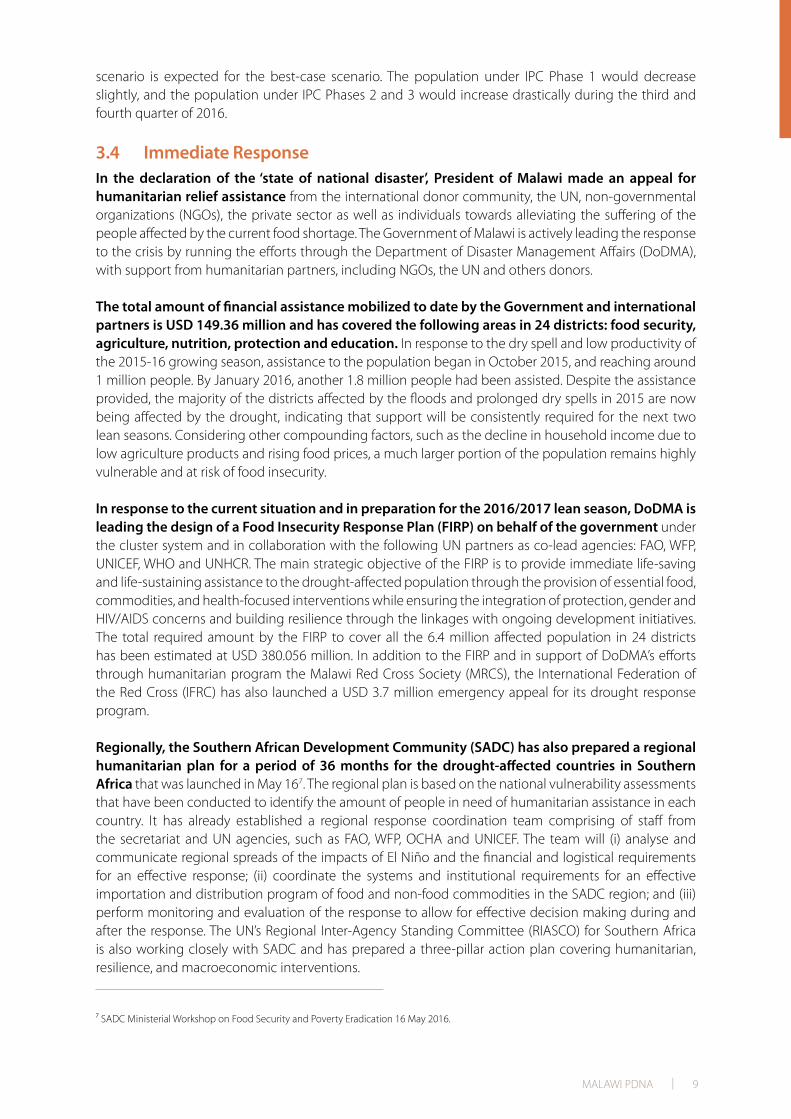
From October 2015 to March 2016, Malawi received significantly below average rainfall in the Southern and Central regions. During October to December 2015, 32.8 percent less than average rainfall was reported across the affected districts, with 12 out of 18 districts reporting below average rainfall. The situation worsened from January to March 2016, the most critical months for agricultural production, as the regions received 36.5 percent less than average rainfall, with 14 districts reporting below average rainfall. Over this six-month period Nsanje, Chikwawa, Phalombe and some parts of Chiradzulu, Thyolo, Blantyre and Mwanza Districts received extremely below average rainfall. During the temporal scope of the PDNA, compared to the last season, the North received more cumulative rainfall while the Southern and Central regions received lower rainfall amounts. Figure 8 illustrates the rainfall deficit and its spatial distribution. Looking at the cropping calendar for Malawi’s main crops (Figure 9),
⁴ Agricultural drought pertains to the impact of drought on agriculture based on precipitation shortages, soil water deficits, reduced ground water or reservoir levels needed for irrigation. Other definitions of drought are hydrological and meteorological. Hydrological drought expresses deficiencies in surface and subsurface water supplies while meteorological drought expresses precipitation’s departure from normal over some period of time. (Wilhite and Glantz, 1985)⁵ The terms “drought event definition” and “drought index” are frequently being confused. A drought index is often a single number characterising the general drought behaviour at a measurement site, whereas a drought event definition is applied to select drought events in a time series including the beginning and end of the droughts.
MALAWI PDNA | 7
it becomes obvious that rainfall deficits in the period from November to January coincided with the planting season and the juvenile stage of the crops, which are particular vulnerable at this stage. This illustrates the importance of addressing the lean period until the next harvest season starting in April 2017.
Seasonal highlights released by the Department of Climate Change and Meteorological Services predicted the El Nino phenomenon to persist up to early 2016, weakening to neutral levels and possibly to La Nina conditions between October and December 20166. Therefore, occasional winter rainfall is expected in Malawi particularly over highlands and along the lakeshore between June and August 2016. However, even during the winter dry period of June to August 2016, model predictions indicate that cumulative rainfall amounts in Malawi are likely to be below average.
⁶ Department of Climate Change and Meteorological Services (2016). 2015-16 Seasonal Highlights: Third Round Agro-Meteorological Update. Government of Malawi.
FIGURE 8: SPATIAL DISTRIBUTION OF NORMAL (LEFT) AGAINST 2015/2016 (RIGHT) OBSERVED SEASONAL RAINFALL (MM)

MALAWI PDNA | 8
3.3 Humanitarian Consequences of the DroughtAt least 6.5 million people (or 39 percent of the population) in Malawi’s 24 drought-affected districts will not be able to meet their food requirements during the 2016/17 consumption period, according to the 2016 Malawi Vulnerability Assessment Committee (MVAC) Report on food security. According to FEWSNET’s Integrated Food Security Phase Classification (IPC) that ranges from Phase 1 to Phase 5, Malawi is currently only ranked as having populations in Phase 1 through Phase 3 on the IPC. Phase 1 means households are able to meet basic food and nonfood requirements while Phase 5 has households with nearly complete lack of food and nonfood requirements with evident starvation, death, and destitution. Overtime, the total percentage of the population that is considered Phase 2 or Phase 3 will increase.
It is projected that in the first quarter of 2017, 28 percent of the population will not receive or have access to the minimum food and non-food requirements. In the worst-case scenario this percentage would exceed 38 percent of the population. The population would become more stressed as less availability of food items and higher prices becomes apparent. This is evidence that the drought is not a geographically isolated event, but has the potential to affect a wider area. A similar, but “milder”
FIGURE 10: POPULATION FOOD SECURITY COMPARISON UNDER BEST & WORST SCENARIOS DUE TO DROUGHT (FEWSNET, 2016)
Total Population in IPC Phase 2 or 3 (Stressed or Crisis) - Worst Case
Total Population in IPC Phase 2 or 3 (Stressed or Crisis) - Best Case
Total % of Population in IPC Phase 2 or 3 (2016 Projections)
Total % of Population in IPC Phase 2 or 3 (2016 Projections)
6,000,000
5,000,000
4,000,000
3,000,000
2,000,000
1,000,000
0
40%35%30%25%20%15%10%5%0%
Jan - March2016
Apr - June2016
July - Sep2016
Oct - Dec2016
Jan - March2017
FIGURE 9: DROUGHT AFFECTED PERIOD & EXTENDED PERIOD OF LOSSESBASED ON A SIMPLIFIED CROPPING CALENDAR FOR MALAWI (FEWS NET)
SEP OCTN OV DEC FEB MAR APR MAY JUN JUL AUG SEP OCTN OV DEC FEB MAR APR MAY JUN JUL AUGJAN JAN
PEAK LABOR DEMAND
RAINY SEASON
PLANTING
LEAN SEASON
WINTER HARVEST
PEAK LABOR DEMAND
PEAK LABOR DEMAND
RAINY SEASON
WINTER PLANTING
MAIN HARVESTGREEN HARVEST
LEANSEASON TOBACCO SALES & AUCTION
PEAK LABOR DEMAND
RAINY SEASON
PLANTING
LEANSEASON
WINTER HARVEST
WINTER PLANTING
RAINY SEASON
GREEN HARVEST MAIN HARVEST
LEANSEASON TOBACCO SALES & AUCTION
DROUGHT AFFECTED PERIOD: OCT 2015 – MAR 2016EXTENDED PERIOD OF LOSSES FOR AGRICULTURE
UNTIL THE FOLLOWING HARVEST: APR 2016 – MAR 2017
MALAWI PDNA | 9
scenario is expected for the best-case scenario. The population under IPC Phase 1 would decrease slightly, and the population under IPC Phases 2 and 3 would increase drastically during the third and fourth quarter of 2016.
3.4 Immediate ResponseIn the declaration of the ‘state of national disaster’, President of Malawi made an appeal for humanitarian relief assistance from the international donor community, the UN, non-governmental organizations (NGOs), the private sector as well as individuals towards alleviating the suffering of the people affected by the current food shortage. The Government of Malawi is actively leading the response to the crisis by running the efforts through the Department of Disaster Management Affairs (DoDMA), with support from humanitarian partners, including NGOs, the UN and others donors.
The total amount of financial assistance mobilized to date by the Government and international partners is USD 149.36 million and has covered the following areas in 24 districts: food security, agriculture, nutrition, protection and education. In response to the dry spell and low productivity of the 2015-16 growing season, assistance to the population began in October 2015, and reaching around 1 million people. By January 2016, another 1.8 million people had been assisted. Despite the assistance provided, the majority of the districts affected by the floods and prolonged dry spells in 2015 are now being affected by the drought, indicating that support will be consistently required for the next two lean seasons. Considering other compounding factors, such as the decline in household income due to low agriculture products and rising food prices, a much larger portion of the population remains highly vulnerable and at risk of food insecurity.
In response to the current situation and in preparation for the 2016/2017 lean season, DoDMA is leading the design of a Food Insecurity Response Plan (FIRP) on behalf of the government under the cluster system and in collaboration with the following UN partners as co-lead agencies: FAO, WFP, UNICEF, WHO and UNHCR. The main strategic objective of the FIRP is to provide immediate life-saving and life-sustaining assistance to the drought-affected population through the provision of essential food, commodities, and health-focused interventions while ensuring the integration of protection, gender and HIV/AIDS concerns and building resilience through the linkages with ongoing development initiatives. The total required amount by the FIRP to cover all the 6.4 million affected population in 24 districts has been estimated at USD 380.056 million. In addition to the FIRP and in support of DoDMA’s efforts through humanitarian program the Malawi Red Cross Society (MRCS), the International Federation of the Red Cross (IFRC) has also launched a USD 3.7 million emergency appeal for its drought response program.
Regionally, the Southern African Development Community (SADC) has also prepared a regional humanitarian plan for a period of 36 months for the drought-affected countries in Southern Africa that was launched in May 167. The regional plan is based on the national vulnerability assessments that have been conducted to identify the amount of people in need of humanitarian assistance in each country. It has already established a regional response coordination team comprising of staff from the secretariat and UN agencies, such as FAO, WFP, OCHA and UNICEF. The team will (i) analyse and communicate regional spreads of the impacts of El Niño and the financial and logistical requirements for an effective response; (ii) coordinate the systems and institutional requirements for an effective importation and distribution program of food and non-food commodities in the SADC region; and (iii) perform monitoring and evaluation of the response to allow for effective decision making during and after the response. The UN’s Regional Inter-Agency Standing Committee (RIASCO) for Southern Africa is also working closely with SADC and has prepared a three-pillar action plan covering humanitarian, resilience, and macroeconomic interventions.
⁷ SADC Ministerial Workshop on Food Security and Poverty Eradication 16 May 2016.

MALAWI PDNA | 10
MALAWI PDNA | 11
The PDNA is a methodology for joint assessment and recovery planning assessing the impact of a disaster and defining a strategy for recovery, including the estimation of the required financial resources. The assessment evaluates the disaster effects, pulling together information on the physical damages of the disaster and its socio-economic aspects (economic losses, changes in service delivery and governance caused by the disasters, and increased risks and vulnerabilities) as well as the overall impact the disaster has on the macro-economic and human development context of a country. On the basis of this information, the PDNA determines the needs and recovery priorities in relation to the disaster and produces a consolidated report that lends to a resilient recovery strategy.
The PDNA is a government-led and government-owned process. Technical support and facilitation may be provided by the European Union (EU), World Bank and the UN based on the joint declaration of 2008 on post-crisis response8. The PDNA process involves the participation of the affected population, local authorities, NGOs, donors, civil society and the private sector. Given the broad range of organizations, individuals and communities that need to be involved, cooperation and coordination are essential for achieving a participatory and comprehensive PDNA.
⁸ EU, UNDG and World Bank- Joint Declaration on Post-Crisis Assessment and Recovery Planning, 25 September, 2008. The UNDP’s Administrator signed the Declaration on behalf of the UNDG in its function of chair of the UNDG.
4. UNDERTAKING THE PDNA – APPROACH AND METHODOLOGY
MALAWI PDNA | 12
The PDNA produces four core deliverables:
• A consolidated assessment report based on sector reports that present a cross cutting, comprehensive assessment of the impact of the disaster;
• A Recovery Strategy that defines the vision for national recovery and outlines recovery actions for each sector and affected region. The strategy clarifies objectives and interventions, expected results, the timeframe, and the expected cost for the recovery process;
• A basis for resource mobilization in support of the country’s recovery; and
• An outline for a country-led recovery process through the formulation of a recovery strategy. The PDNA produces four core deliverables:
• A consolidated assessment report based on sector reports that present a cross-cutting, comprehensive assessment of the impact of the disaster;
• A Recovery Strategy that defines the vision for national recovery and outlines recovery actions for each sector and affected region. The strategy clarifies objectives and interventions, expected results, timeframe, and expected costs for the recovery process;
• A basis for resource mobilization in support of the country’s recovery; and
• An outline for a country-led recovery process through the formulation of a Recovery Strategy.
Following the Government of Malawi’s declaration a state of disaster in April 2016, a Post Disaster Needs Assessment (PDNA) was initiated in mid-May 2016 with the overall aim to conduct an assessment of the impacts of the recent dry spells. Context specific details regarding the methodology used in the Malawi drought are described below, including the assessment scope, approach, data collection and validation techniques, and harmonization with sectoral policies and humanitarian assessments.
Sectoral Scope of the Assessment: As agreed between the government and PDNA partners, the scope of the assessment covered: agriculture (rain-fed crops, livestock and fisheries); food security; water (irrigation – including irrigated crops, water resources, and water supply and sanitation); health; nutrition; energy; environment; education; transport; social protection; industry and commerce; DRR. An analysis of the overall human and social impact and the macroeconomic impact of the drought was also undertaken.
Geographical and Temporal Scope: All 24 drought-affected districts in the Southern, Central and Northern Regions were part of the assessment:
i. Southern region: Balaka, Blantyre, Chikhwawa, Chiradzulu, Machinga, Mangochi, Mulanje, Mwanza, Neno, Nsanje, Phalombe, Thyolo, and Zomba.
ii. Central region: Dedza, Dowa, Kasungu, Lilongwe, Mchinji, Nkhotakota, Ntcheu, Ntchisi, and Salima.
iii. Northern region: Rumphi and Mzimba.
The presidential declaration of April 12, 2016 made reference to the 2015-16 rainfall season from October 2015 to March 2016, with a specific reference to the maize production season. As agreed with the government, the temporal scope to assess damages and losses from the drought covers the time period from October 2015 to March 2016, with losses projected up to March 2017.

MALAWI PDNA | 13
Approach and Timeline of the PDNA: The assessment process commenced in late May 2016 with orientation and training for Government, World Bank and UN sector experts and selected civil society organizations in Lilongwe. Data collection templates were finalized, baseline data was collected, and the PDNA report structure was prepared. The PDNA team, comprising of over 50 Government, World Bank and UN staff moved to Blantyre and commenced the PDNA process. This included the collection and analysis of sector impact and needs data, field visits to the drought-affected districts focusing on data validation, limited household survweys and coordination with districts on recovery strategies. Through consultation with district-level officials and community members in the affected areas, the PDNA process combined both bottom-up and top-down approaches. The timeline of the assessment is shown in Figure 11.
Damages and Losses Quantification: The effects of the drought on each sector have been evaluated in terms of damages and losses.
• Damage is defined as total or partial destruction of physical assets existing in the affected area. Damages occur during and immediately after the disaster and are measured in physical units (i.e. number of damaged boreholes, head of livestock, hectares of land, etc.). Their monetary values are expressed as the replacement costs according to prices prevailing just before the event.
• Losses are defined as changes in economic flows arising from the disaster. They occur until full economic recovery and reconstruction is achieved, in some cases lasting for several years, but for the purpose of this assessment, losses were projected up to March 2017. Typical losses include the decline in output in productive sectors (agriculture, livestock, and fisheries).
Classification and Quantification of Recovery Needs: Recovery needs are the costs of recommended interventions that include: (i) the reconstruction needs estimated as the requirements for financing reconstruction and replacement or repairing of the physical assets that were destroyed by the disaster; and (ii) recovery needs estimated on the basis of the financial resources required for the rehabilitation of basic services, reactivation of productive activities, or immediate reactivation of personal or household income. Recovery needs also include capacity building and operational costs for service delivery that are necessary for the implementation of interventions. Costing for recovery needs include differentials for building-back-better to consider quality improvements and DRR measures to be implemented in order to increase resilience against future disasters. For the purpose of this assessment, recovery needs were classified in terms of (i) short term for up to a 1-year term; and (ii) medium to long term for a period between 2 to 3 years and onwards.

MALAWI PDNA | 14
Remote sensing applications were used to delineate the geographic and temporal extent of the drought and to provide an objective tool to quantify the impacts in key sectors, such as agriculture, water resources and environment. With the support of Courage Services INC and the Malawi Spatial Data Portal (MASDAP), high-resolution remote sensing images, relevant indicators such as the Normalized Difference Vegetation Index (NDVI) and spatial information were analyzed to provide critical information on the affected populations, areas under drought stress, and sector-specific impact information at the district level. Baseline Information and Delineating the Edges of the DroughtThe United States Geological Survey’s (USGS) NDVI provides a widely accepted and well-documented methodology for drought assessments, among others used by the Famine Early Warning System (FEWS). The NDVI shows the distribution of active vegetation. The difference between the average NDVI for a particular month of a given year and the average NDVI for the same month over the last 10-year period (2001-2010) is called NDVI anomaly. The NDVI anomaly provides an alternative measure of the relative vegetation health, which can be used to monitor areas where vegetation may be stressed as a proxy to detect drought.
The percentage based (negative) anomaly derived for 2016 was distributed in five bands showing values of increasing severity and was produced for two scenarios:
• Malawi Drought Edge Definition – Crisis, capturing the average cumulative effect from October 2015 to April 2016. Those areas are where drought impacts are estimated to be highest and which also correspond with the minimum geographic extent.
• Malawi Drought Edge Definition – Stressed, capturing the two most extreme months (December 2015 and January 2016). While these areas may have received rain in other periods in the drought timeframe, they suffered significant water stress during a key period in the agricultural cycle.
Box 1: Remote Sensing in Support of the 2016 Malawi Drought PDNA

MALAWI PDNA | 15
Population AffectedThe NDVI-generated “edge of drought” outputs were intersected with population figures to generate estimates on the drought-affected population. Baseline population numbers were extracted from the 2014 LandScan global population database, on a 1 square kilometer raster grid that models population distribution. The resultant LandScan population point dataset was overlaid with the two separate drought outputs (“stressed” and “crisis”) to determine the range of impact on the population for both scenarios.
Crop Production ImpactsFor the agriculture sector three main aspects were identified (i) the severity of the damage to the 2015/2016 maize growth, (ii) estimation of the 2016 maize crop yield deficit, and (iii) estimation of the drought impacts to arable land. Accomplishing these tasks required cloud free multi-spectral data of the entire country at the end of the drought period (April 2016) and the same time period in the baseline year (April 2014). Maize was selected as the index crop and the basis for growth areas that were subset from the supplied land-cover dataset. Values from harvest years 2012-13, 2013-14, 2014-15 were used to develop year over year relationship differential between the statistical mean of these datasets and historical crop yield data and then projected forward to harvest year 2015-16. The analysis provided areas of maize yield affected by the drought. To determine the area of arable land affect by the drought, the arable land sub-set was intersected with the stressed drought output.
Livestock ImpactsIn order to estimate livestock losses, information was derived from a 2012 study that examined the impact of 116 drought events on indigenous livestock production in rural Malawi from 1967 until 2003 as well as incorporated ground-based interviews with impacted farmer populations. The study provided mean loss accumulated by farmers as a result of the drought events for multiple forms of livestock, including oxen, dairy cows, goats, pigs, indigenous chicken, sheep and breeding bulls among others. The estimated mean loss for each livestock type was applied to the Malawian livestock five-year average baseline figure. The analysis allowed the livestock sector to project losses up to March 2017.
Water ResourcesThe impacts to water resources were based on borehole data available through MASDAP. The threshold to identify drought-affected boreholes was those that did not meet the minimum yield of 12 liters per minute. “Clean water deficient areas” were identified by applying a 1 km buffer to each drought-affected borehole, assuming an average travel distance of 1 km to access water. The percent population impacted by drought-affected boreholes was then calculated by intersecting the 1 km buffer with the LandScan 2014 population. Population values were aggregated to the district level to determine the percent population for each district potentially facing problems accessing clean water as a result of the drought. The water sector used this input to obtain the percent of boreholes and population affected.
ForestryThe forestry analysis was conducted to show the stress effects of the current drought on the protected forest reserves of Malawi. The forested areas were extracted using data sets from MASDAP with effects being calculated based on the NDVI analysis. The data was aggregated to the district level to determine the percent of forests affected by drought for each of the impacted districts.
Box 1: Remote Sensing in Support of the 2016 Malawi Drought PDNA

MALAWI PDNA | 16
Data Collection and Validation: The key source of information for the estimation of damages and needs were data provided by government sector focal points. Baseline and secondary data were collected from the respective ministries and departments and the data on food-insecure populations by MVAC. Data validation techniques included field visits to affected districts, interviews with relevant stakeholders, Focus Group Discussions (FGDs) and desk reviews. This was followed by remote sensing based validation of key impact data for crops, livestock, water resources, and environment (see Box 1). Further validation of data was performed using process verification techniques and empirical plausibility checks. Using such techniques, a drought reduction factor was applied to many of the sectors to ensure that damages and losses captured by the PDNA were those attributable to the drought. For example, in the crops sector, analysis from remote sensing data indicated that 62 percent of the maize loss in 2015/2016 could be attributed to the drought.
Alignment with Humanitarian Assessments and Sector Planning Documents: the PDNA complements the national and international rapid humanitarian assessments, where the 2016/2017 FIRP informed and reinforced the PDNA exercise. Sector teams (particularly food security, agriculture, health, nutrition, water supply and sanitation, and education) liaised with counterparts working on the FIRP to ensure that: (i) there are no overlaps between the FIRP and the PDNA; (ii) there are no gaps uncovered by the FIRP and the PDNA; and (iii) there is strategic alignment between the FIRP and the PDNA.
The Government of Malawi provided existing documentation prepared by some ministries such as master plans and investments plans. These documents were distributed to the corresponding sector teams to ensure alignment with the sector reports and proposed interventions to these existing documents.This section provides an overview of the effects of the drought in each of the assessed sectors. The detailed sector reports can be found in the annexes to this report.
MALAWI PDNA | 17
5.1 Agriculture
Agriculture is the hardest hit sector experiencing the largest economic impact due to a significant loss in crop production9. The sector, which accounts for nearly 30 percent of Malawi’s GDP, has suffered estimated losses of up to USD 240.7 million across rain-fed crops, fisheries and livestock. Crop production alone accounts for 83 percent of these losses (USD 198.7 million) due to poor yields and production levels caused by moisture stress (Figure 12). Cereals (maize, rice, sorghum, and millet) accounted for nearly 60 percent of all crop losses, followed by 39 percent incurred by cash crops (tobacco, groundnuts, cotton and chilies). Due to preparatory measures against drought, a number of projects were implemented by the government and other stakeholders through the provision of a diverse number of crop inputs, including pulses, cassava, sweet potato and Irish potatoes that led to the sector experiencing gains in the mentioned crops. Such gains helped to offset some of the losses in crop production.
Dry spells have led to the distress sale of livestock by farmers as a coping mechanism in order to access food. More animals have been sent to the market for slaughter than breeding, depleting the livestock national herd. This has largely affected the value of livestock on the market, incurring losses up to an estimated USD 47.0 million. This includes USD 15.7 million in anticipated damages, i.e. death of animals due to poor conditions (increased emaciation, increased incidences of livestock diseases, and reduction in milk production due to inadequate feed availability and water).
Fish production has also been affected by the drought due to decreased water levels in many water bodies and complete drying of some ponds, affecting fish habitats. It has also disturbed
⁹ Note that this refers only to rain-fed crops. Losses for irrigated crops are accounted under irrigation.
5. SECTOR ANALYSIS

MALAWI PDNA | 18
breeding sites for most fish species, which in the medium term is going to affect the availability of fish stocks. Overall, losses in the fisheries sub-sector have amounted to an estimated USD 10.8 million, representing 4 percent of the losses in the agriculture sector.
TABLE 2: SUMMARY OF LOSSES IN THE AGRICULTURE SECTOR PER REGION
SUB-SECTOR
Southern Region Central Region Northern
Region TOTAL TOTAL*
(All Districts) (All Districts)(Rumphi & Mzimba)
(MWK) (USD)(MWK) (MWK) (MWK)
Crops 46,010,107,738 73,102,333,090 20,018,605,957 139,131,046,786 198,758,638
Livestock 11,632,197,500 5,441,139,725 4,757,445,000 21,830,782,225 31,186,832
Fisheries 3,378,867,900 4,169,925,075 0 7,550,547,900 10,783,990
TOTAL 61,021,173,138 82,713,397,890 24,776,050,957 168,510,621,986 240,729,460 Recovery of the agriculture sector aims to uplift the national and household level food availability and build greater drought resilience for smallholder farmers. This would require increasing crop, fisheries and livestock production by utilizing available water resources, “climate-smart” agriculture, crop diversification, as well as exploring innovative financing mechanisms. In order to increase the capacity of farming households to cope with droughts, the following recommendations have been made to promote recovery and resilience building:
a. Intensifying the dissemination of technologies and best practices on crop, livestock and fish production that withstand adverse weather conditions;
b. Enhance livestock breeding programs especially for small stocks;
c. Enhance animal disease control programs;
d. Promote small-scale agro-processing;
e. Promote agricultural research in the development of varieties for selected crops as well as livestock and fish breeds;
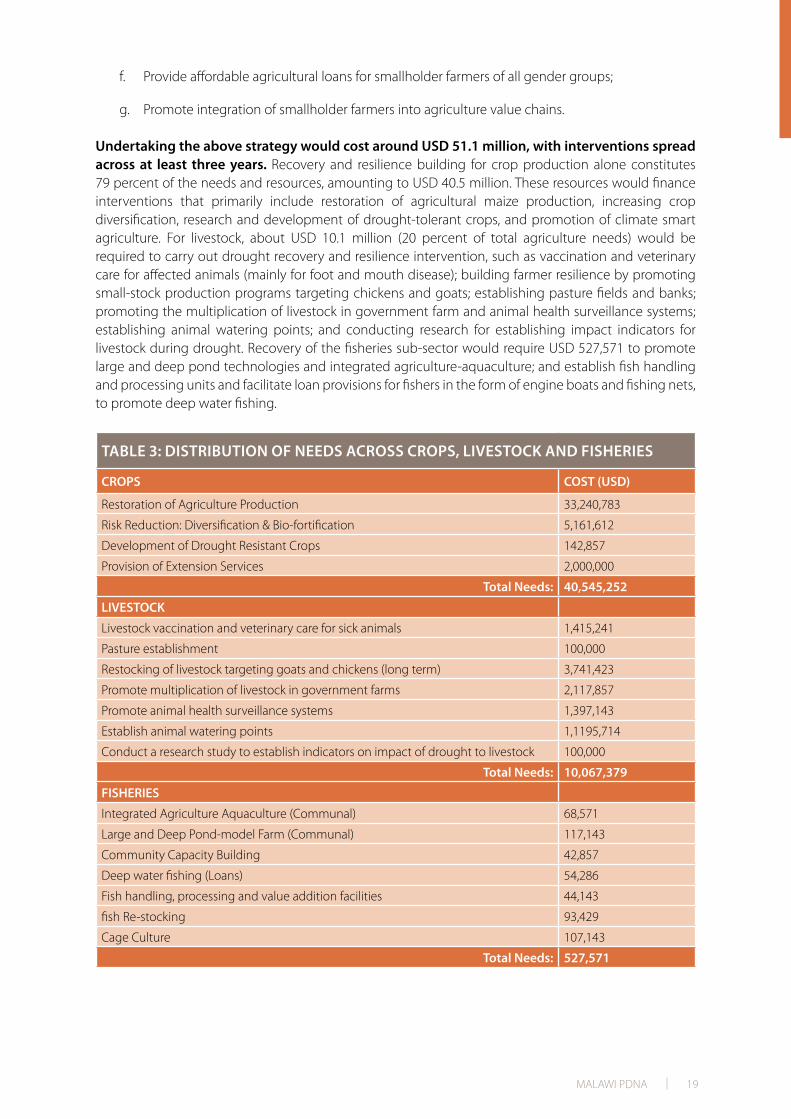
MALAWI PDNA | 19
f. Provide affordable agricultural loans for smallholder farmers of all gender groups;
g. Promote integration of smallholder farmers into agriculture value chains.
Undertaking the above strategy would cost around USD 51.1 million, with interventions spread across at least three years. Recovery and resilience building for crop production alone constitutes 79 percent of the needs and resources, amounting to USD 40.5 million. These resources would finance interventions that primarily include restoration of agricultural maize production, increasing crop diversification, research and development of drought-tolerant crops, and promotion of climate smart agriculture. For livestock, about USD 10.1 million (20 percent of total agriculture needs) would be required to carry out drought recovery and resilience intervention, such as vaccination and veterinary care for affected animals (mainly for foot and mouth disease); building farmer resilience by promoting small-stock production programs targeting chickens and goats; establishing pasture fields and banks; promoting the multiplication of livestock in government farm and animal health surveillance systems; establishing animal watering points; and conducting research for establishing impact indicators for livestock during drought. Recovery of the fisheries sub-sector would require USD 527,571 to promote large and deep pond technologies and integrated agriculture-aquaculture; and establish fish handling and processing units and facilitate loan provisions for fishers in the form of engine boats and fishing nets, to promote deep water fishing.
TABLE 3: DISTRIBUTION OF NEEDS ACROSS CROPS, LIVESTOCK AND FISHERIES
CROPS COST (USD)
Restoration of Agriculture Production 33,240,783
Risk Reduction: Diversification & Bio-fortification 5,161,612
Development of Drought Resistant Crops 142,857
Provision of Extension Services 2,000,000
Total Needs: 40,545,252
LIVESTOCK
Livestock vaccination and veterinary care for sick animals 1,415,241
Pasture establishment 100,000
Restocking of livestock targeting goats and chickens (long term) 3,741,423
Promote multiplication of livestock in government farms 2,117,857
Promote animal health surveillance systems 1,397,143
Establish animal watering points 1,1195,714
Conduct a research study to establish indicators on impact of drought to livestock 100,000
Total Needs: 10,067,379
FISHERIES
Integrated Agriculture Aquaculture (Communal) 68,571
Large and Deep Pond-model Farm (Communal) 117,143
Community Capacity Building 42,857
Deep water fishing (Loans) 54,286
Fish handling, processing and value addition facilities 44,143
fish Re-stocking 93,429
Cage Culture 107,143
Total Needs: 527,571

MALAWI PDNA | 20
Implementation of the above recovery interventions will be undertaken by the Ministry of Agriculture, Irrigation and Water Development (MAIWD), supported by other departments and ministries, NGOs, CGIAR centers and other stakeholders. The agriculture cluster will lead stakeholder coordination. The cluster which is represented by all implementing agencies and Donor Partners is chaired by MOAIWD and co-chaired by a donor representative).
5.2 Food Security
The drought has rendered 6.5 million people food insecure, adding another 14 percent of Malawians to the food insecure population, according to the MVAC. These populations will not be able to meet their food requirements in the 2016/17 consumption season primarily due to food unavailability, increase in prices and diminishing purchasing power, and all of this further compounded by other vulnerability factors, such as general poverty levels. Many households, especially in the southern region, will not have maize from their own production. It must be noted that food security is a cross-cutting issue and the effects are determined by the effects of the drought on the relevant sectors.
Availability and accessibility of food to all affected populations is the primary objective of all recovery and resilience building interventions in the food security sector, which total USD 268.5 million in recovery needs. Interventions in the short term include supporting the FIRP by importing 375,000 metrics tons of maize equivalent10 for humanitarian needs and 150,000 metric tons for non-humanitarian needs, engaging commercial farmers in utilizing their irrigation facilities to produce irrigated maize for the Strategic Grain Reserve, and rehabilitating storage warehouses. Short-term food assistance will be accompanied by medium to long-term interventions that improve access to food through diversification of livelihoods and increase agricultural production of smallholders to build resilience to future shocks. A critical intervention would be to encourage change in food consumption behaviour – moving away from overreliance on maize towards a more diversified and nutritional diet – accompanied by agricultural diversification. Interventions over the medium to long term also entail improving food security data collection and early warning systems (EWSs) to provide crop failure alerts, supply demand projections, and market monitoring information etc.
TABLE 4: DISTRIBUTION OF FOOD SECURITY NEEDS BY REGION
Cost (USD)
Southern Districts
Central Districts
Northern Districts TOTAL
Importation of 375,000 mt Maize equivalent for the Vulnerable Population
101,562,500 70,312,500 15,625,000 187,500,000
Additional Food Supply needed for non-humanitarian consumption (150,000 mt)
40,625,000 28,125,000 6,250,000 75,000,000
Rehabilitate Storage Warehouse 154,762 107,143 23,810 285,714
Rehabilitation of 15 metallic maize storage silos
2,155,299 1,492,130 331,585 3,979,014
Promotion of food diversification in the country through implementation of various communication strategies
851,190 589,286 130,952 1,571,429
Improving food security early warning systems
66,548 46,071 10,238 122,857
Total Needs 145,415,299 100,672,130 22,371,585 268,459,014
10 Maize equivalent includes cereals, pulses, super-cereal, super-cereal plus and vegetable oil.
MALAWI PDNA | 21
The overall implementation of the above interventions would be carried out by the Ministry of Agriculture, Irrigation and Water Development (MoAIWD), the Department of Disaster Management (DoDMA) and the World Food Programme. The MoAIWD would also lead the strengthening of data collection, EWS and the diversification communication campaign in close collaboration with the Ministries of Health, Education, and Environment.
5.3 Water
The water sector comprises of three sub-sectors, which were considered in this assessment: (i) irrigation, (ii) water resources, and (iii) water supply and sanitation and agricultural water resources management.
5.3.1 Irrigation
The effects of the drought on the irrigation sector centre around the losses of production and increases in costs associated with irrigated crops11, and amount to a total of USD 31.9 million. and amount to a total of USD 31.9 million. The majority of losses can be attributed to the loss of maize (83 percent) and rice (16 percent) production. To calculate the losses associated with irrigated maize, a 75 percent drought reduction factor was applied to the irrigated area (assuming that 25 percent of the area would not be cultivated due to factors other than drought), and it was assumed that production would only be possible for one irrigation cycle rather than two. Rice is normally grown once in an irrigation year, and it was estimated that there will be a 50 percent reduction in the area of irrigated rice this growing season due to the drought. The remaining 1 percent of losses in the irrigation sector are attributed to increased production costs due to increase in pumping, digging of new shallow wells, changes in water abstraction points and losses due to crop failure. Finally, while the irrigation sector did not experience damages as a result of the drought, it is important to note that extensive damages took place during the 2014/15 flood, and many of the irrigation schemes are yet to be reconstructed.
11 Note that while rain-fed crops fall under the agriculture sector, irrigated crops fall under the irrigation sector.
Box 2: Poor harvest deprives communities of adequate food
Eveline Mikandi lives in Nsanje District in southern Malawi. She says her community has been hard hit by the 2015-16 drought. The poor rains mean farmers were unable to harvest much of anything, so this mother of eight sons is relying on the generosity of her adult children to make ends meet. Community members started rationing food late last year, Eveline says, noting that some families are making do with one meal a day. Men sometimes leave their families behind in search of work elsewhere in Malawi or in neighboring Mozambique. Children who do not get enough to eat see the negative impacts on their health and education, sometimes skipping school. But she is not asking for a handout. She says in the short term, maize subsidized by the Government through the parastatal Agricultural Development and Marketing Corporation (ADMARC) will help. And looking at the longer term, she asks for additional pumps to irrigate their fields to ensure a better harvest next year. Her views are shared by many men and women around the country who feel that ADMARC should be sufficiently replenished so that people can turn to it when they have enough resources to purchase maize. Others are also hoping that the Government initiates cash-for-work programs to receive income for food while contributing to the development of their villages.

MALAWI PDNA | 22
The irrigation sector recovery strategy is guided by the Irrigation Master Plan and Investment Framework (2015) and the Draft National Irrigation Policy, which focus on: (i) increasing the area of irrigation; (ii) rehabilitating and modernizing old irrigation schemes; and (iii) conducting capacity building for staff and farmers. The total recovery needs for the sector are USD 14.1 million. The short term needs in the sector include: (i) the provision of hybrid maize seeds and fertilizers to improve crop production, (ii) the distribution of treadle pumps, and (iii) the promotion of river impoundments for water storage and utilization of new and existing schemes. The medium-term strategies cover the procurement, distribution and installation of drip kits to maximize water productivity. The department will also scale up the existing drip irrigation promotion and installation program, facilitate the procurement and distribution of treadle pumps, and build the capacity of farmers, staff and non-state actors to improve on resilience and sustainability of irrigation investments. The long-term recovery needs cover: (i) the reconstruction of irrigation schemes that were damaged by the 2014/15 floods but have no funds for reconstruction, (ii) the procurement and installation of solar pumps, and (iii) the construction of dams to improve water harvesting and facilitate catchment management activities to safeguard against future disasters.
The Agriculture Sector Wide Approach secretariat at the MoAIWD will take an
oversight role at the ministry level for the implementation of the irrigation sector recovery, while the Department of Irrigation will be the technical lead and manage the day-to-day implementation of related activities. The Irrigation Services Divisions will provide technical backstopping of the District Irrigation Offices that will be responsible for implementation of activities through the District Councils. The communities will be responsible for the implementation of activities,
Box 3: Sustainable solution for crop irrigation Lawrence Guta and other farmers in Mlolo (Chikwawa District) depend on rains to irrigate their crops, and rain has been in short supply this season. District officials say farmers in the Chikwawa District have lost up to 90 percent of their crops due to the dry spells. Lawrence notes that farmers have tried to cope with the drought by constructing water harvesting dams and diversifying their crops. But without sufficient water, what they need right now is food. Some have resorted to casual labour to earn money to buy food, but the farmers in Mlolo say a sustainable solution to their current condition is to provide them with hand pumps and motorized pumps to irrigate their crops. Others have suggested the use of more sustainable resources, such as solar-powered irrigation systems.

MALAWI PDNA | 23
and monitoring and evaluation at the lower level. Collaboration with non-state actors will be encouraged, as some of them are already implementing some of the activities outlined in the strategy. A multi-stakeholder implementation steering committee will therefore have to be established to harness the efforts of all the stakeholders. The Ministry of Finance, Economic Planning and Development (MoFEPD) should chair this committee.
5.3.2 Water Resources
The 2015/16 drought conditions have severely stressed the water resource availability in the country, and the situation is likely to worsen in the months ahead. The sector has not experienced any losses as a result of the drought, but damages amount to a total cost of USD 1.4 million. These effects are largely a result of damage to dam embankments, both as a result of farmers encroaching the edge of reservoirs for cultivation purposes, and livestock attempting to access scarce water resources. Such an activity has weakened the soil structure of embankments and has led to siltation. Field assessments have revealed that 35 dams across the Southern, Central and Northern districts have experienced some level of damage.
The recovery strategy for the water resources sector consists of increasing the availability of water resources and improving watershed management, with needs amounting to USD 10.7 million. Increasing the availability of water resources is crucial for socio-economic growth as well as development, and activities in the recovery strategy include the rehabilitation and maintenance of partially damaged small earth dams, the construction of small earth dams, and the construction of excavated tanks. Similarly, medium to long-term drought recovery for the sector will necessitate that water resources be managed in an integrated and sustainable manner through adaptive watershed management, which restore and increase the forest cover in water catchment areas in the country through the planting of trees, and implementing other soil and land management interventions. Recovery needs are summarized in the table below.
TABLE 5: RECOVERY AND RECONSTRUCTION NEEDS IN WATER RESOURCES SECTOR
RECOVERY NEED (USD)
Construction of 50 small earth dams 4,428,571Construction of 50 excavated tanks 3,571,429Rehabilitation of 35 mildly damaged dams 1,400,000Adaptive watershed management programs in 24 districts 1,307,143
SUB TOTAL
GRAND TOTAL (MWK) 10,707,143
FIGURE 13: CHEZI DAM (CULTIVATION RIGHT INSIDE THE DAM RESERVOIR), APRIL

MALAWI PDNA | 24
The MoAIWD will oversee the implementation of the water resources sector recovery at the Ministerial level, while the Department of Water Resources will be the technical lead and manage the day-to-day implementation of related activities. Collaboration with non-state actors will be encouraged. The recovery strategy for the sector will be in alignment with recent government interventions to improve the management of water resources, include: (i) improved policy environment through the adoption of a National Water Policy (2005); (ii) improved legal and regulatory framework enshrined in the Water Resources Act (2013) to replace the 1969 Water Resources Act which provides for the establishment of the National Water Resources Authority to replace the Water Resources Board to ensure effective water resources management; (iii) completion of the Integrated Water Resources Management (IWRM) Plan that will facilitate inter-sectoral water resources management and development,
in the medium to long term; (iv) a dam development program to improve the availability of water for multi-purpose use as well as to improve groundwater recharge; and (v) preparation of a comprehensive Water Resources Investment Strategy to guide future investments.
5.3.3 Water Supply and Sanitation
Reduction in water availability and accessibility due to drought has adversely impacted water supply and sanitation, and the sector has experienced USD 11.8 million in damages and USD 7.4 million in losses. Damages to the sector have incurred as a result of dried up water supply sources (intakes), the need for relocation of the conveyance systems resulting from the relocation of intakes and sources, drying up of some boreholes and vandalism to the water supply infrastructure due to struggle over scarce water sources. At the household level, economic activities have been disrupted as a
Box 4: Water Woes Catalyzed by Drought
Water is life, so they say. Over the past years, people of Chiwaula 2 have enjoyed portable water within a short distance in the village. However, the 2015-16 drought is about to change things for the worse for the villagers. Following the drought, the borehole is slowly drying up. Narrating her ordeal, 61-year-old Enelesi Kapito explained: “Water is scarce these days. We have to wake up as early as 3am and queue for our turn at the borehole. The water yield is very low. Previously this low level of water yield would only become apparent at the end of the dry season in September. But now, we fear the borehole will dry up before August.” Enelesi’s story is common amongst many women in the village from the 38 households that draw water from the borehole.
MALAWI PDNA | 25
result of family members spending long hours in search of water. Water service providers have incurred losses in revenue due to the reduction in the amount of water supplied to consumers. Furthermore, low water levels at intake points have affected water quality, resulting in increased water treatment costs. Finally, the scarcity of water has affected the sanitation and hygiene conditions in the communities, especially in urban areas where the use of water borne systems is predominant. There is also an increased risk of water-washed diseases as households prioritize water for drinking purposes over water for personal hygiene. It is anticipated that the impacts of the drought on this sector will be become more severe as the drier months of September to December approach.
The recovery strategy for the water supply and sanitation sector revolves primarily around medium to long-term measures aimed at increasing water supply for both rural and urban areas, and is in full alignment with the Malawi Rural Water Supply Investment plan (2015). The total needs for the water supply and sanitation sector amount to USD 21.0 million. First, this will entail sustainable development of water supply infrastructure through rehabilitation and/or construction of new gravity fed water supply systems (rural). Secondly, new boreholes (both rural and urban) will be constructed to complement the dwindling water supply source. And third, community capacity will be strengthened through formation of community management structures to oversee recovery and reconstruction at the district level.
The MoAIWD will provide oversight to the sector’s recovery, as it is the central ministry that facilitates the development and management of water resources in Malawi and formulates policies that regulates different players in the sector, while the Department of Water Supply Services will lead the implementation of activities. Local contractors will be hired to carry out actual works while supervision of the activities will be done at district as well as central levels. Communities will be responsible for the implementation of activities, as well as monitoring and evaluation at the local level. The MoFEPD will be responsible for monitoring and evaluation of the recovery and reconstruction process at the central level. Implementation of activities will also be guided by a number of policies, such as the National Decentralization Policy (1998), the National Water Policy (2005), the National Sanitation Policy (2008), the Water Resource Policy (2005), and the Water Resources Act (2013). Similarly, the implementation of recovery activities will be coordinated with a number of relevant programs that are currently being implemented by the Ministry, such as the Shire River Basin Management Program, the Mzimba Water Supply Project (Northern Region Water Board), the Lilongwe Water Program (Lilongwe Water Board), National Water Development Program, and the Sustainable Rural Water Sanitation for Improvement of Health and Livelihoods.
5.4 Social Protection
Social protection programs play a fundamental role in protecting the poor from shocks and the effects of disasters and will thus be a key building block to safeguard the livelihoods of the more than 200,000 affected households. There is empirical evidence that the poor are less able to respond to crises than the non-poor in the face of disasters. Social safety nets have been used across the world to protect the poor from the effects of disasters. These are particularly implemented ex-ante, i.e. after the disaster has already struck. Social protection programs including the Public Works Program, Social Cash Transfers and Savings and Investment Promotion have been proposed to be used to protect those affected by droughts, assist in their recovery efforts, and build their resilience to disasters. These programs should particularly target vulnerable groups such children, women/female-headed households, HIV/AIDS affected population and the disabled.
In order to extend social protection coverage to the most vulnerable households affected by the drought, it has been estimated that the Public Works program should be scaled up by 15 percent to cover an additional 208,637 households across the 24 districts, and that the Social Cash Transfer Program be extended to include an additional 107,465 households in nine of the
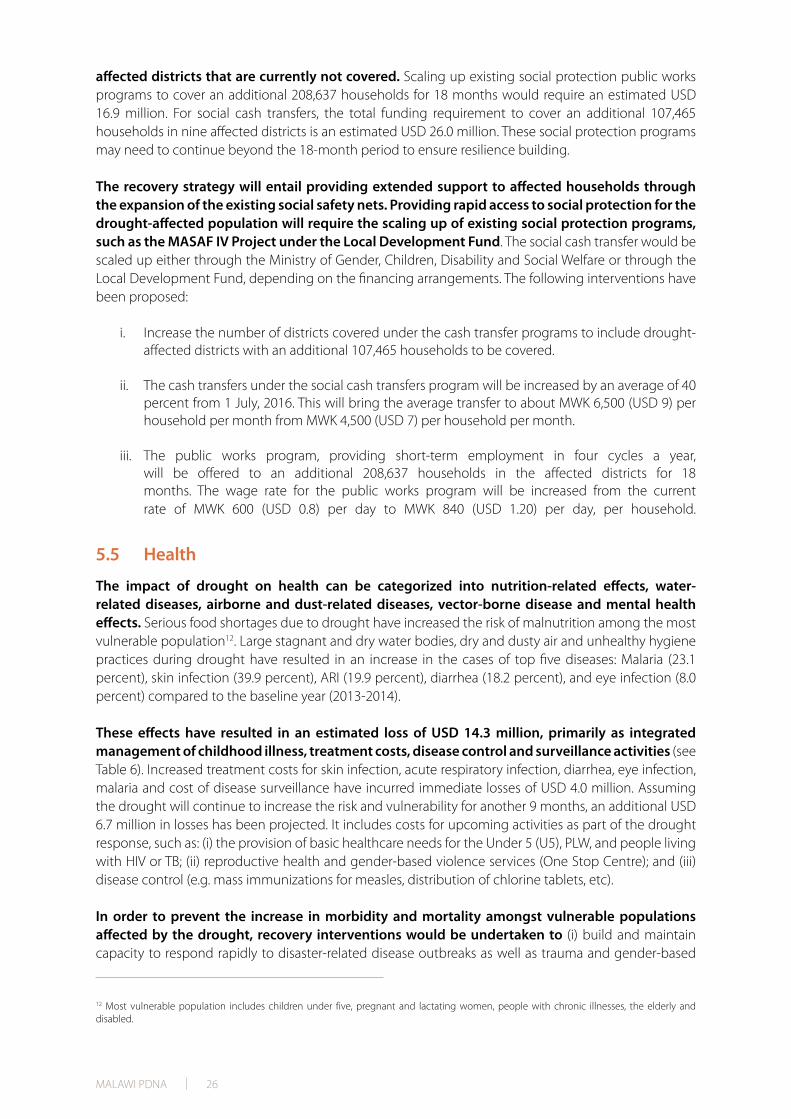
MALAWI PDNA | 26
affected districts that are currently not covered. Scaling up existing social protection public works programs to cover an additional 208,637 households for 18 months would require an estimated USD 16.9 million. For social cash transfers, the total funding requirement to cover an additional 107,465 households in nine affected districts is an estimated USD 26.0 million. These social protection programs may need to continue beyond the 18-month period to ensure resilience building.
The recovery strategy will entail providing extended support to affected households through the expansion of the existing social safety nets. Providing rapid access to social protection for the drought-affected population will require the scaling up of existing social protection programs, such as the MASAF IV Project under the Local Development Fund. The social cash transfer would be scaled up either through the Ministry of Gender, Children, Disability and Social Welfare or through the Local Development Fund, depending on the financing arrangements. The following interventions have been proposed:
i. Increase the number of districts covered under the cash transfer programs to include drought-affected districts with an additional 107,465 households to be covered.
ii. The cash transfers under the social cash transfers program will be increased by an average of 40 percent from 1 July, 2016. This will bring the average transfer to about MWK 6,500 (USD 9) per household per month from MWK 4,500 (USD 7) per household per month.
iii. The public works program, providing short-term employment in four cycles a year, will be offered to an additional 208,637 households in the affected districts for 18 months. The wage rate for the public works program will be increased from the current rate of MWK 600 (USD 0.8) per day to MWK 840 (USD 1.20) per day, per household.
5.5 Health
The impact of drought on health can be categorized into nutrition-related effects, water-related diseases, airborne and dust-related diseases, vector-borne disease and mental health effects. Serious food shortages due to drought have increased the risk of malnutrition among the most vulnerable population12. Large stagnant and dry water bodies, dry and dusty air and unhealthy hygiene practices during drought have resulted in an increase in the cases of top five diseases: Malaria (23.1 percent), skin infection (39.9 percent), ARI (19.9 percent), diarrhea (18.2 percent), and eye infection (8.0 percent) compared to the baseline year (2013-2014).
These effects have resulted in an estimated loss of USD 14.3 million, primarily as integrated management of childhood illness, treatment costs, disease control and surveillance activities (see Table 6). Increased treatment costs for skin infection, acute respiratory infection, diarrhea, eye infection, malaria and cost of disease surveillance have incurred immediate losses of USD 4.0 million. Assuming the drought will continue to increase the risk and vulnerability for another 9 months, an additional USD 6.7 million in losses has been projected. It includes costs for upcoming activities as part of the drought response, such as: (i) the provision of basic healthcare needs for the Under 5 (U5), PLW, and people living with HIV or TB; (ii) reproductive health and gender-based violence services (One Stop Centre); and (iii) disease control (e.g. mass immunizations for measles, distribution of chlorine tablets, etc).
In order to prevent the increase in morbidity and mortality amongst vulnerable populations affected by the drought, recovery interventions would be undertaken to (i) build and maintain capacity to respond rapidly to disaster-related disease outbreaks as well as trauma and gender-based
12 Most vulnerable population includes children under five, pregnant and lactating women, people with chronic illnesses, the elderly and disabled.
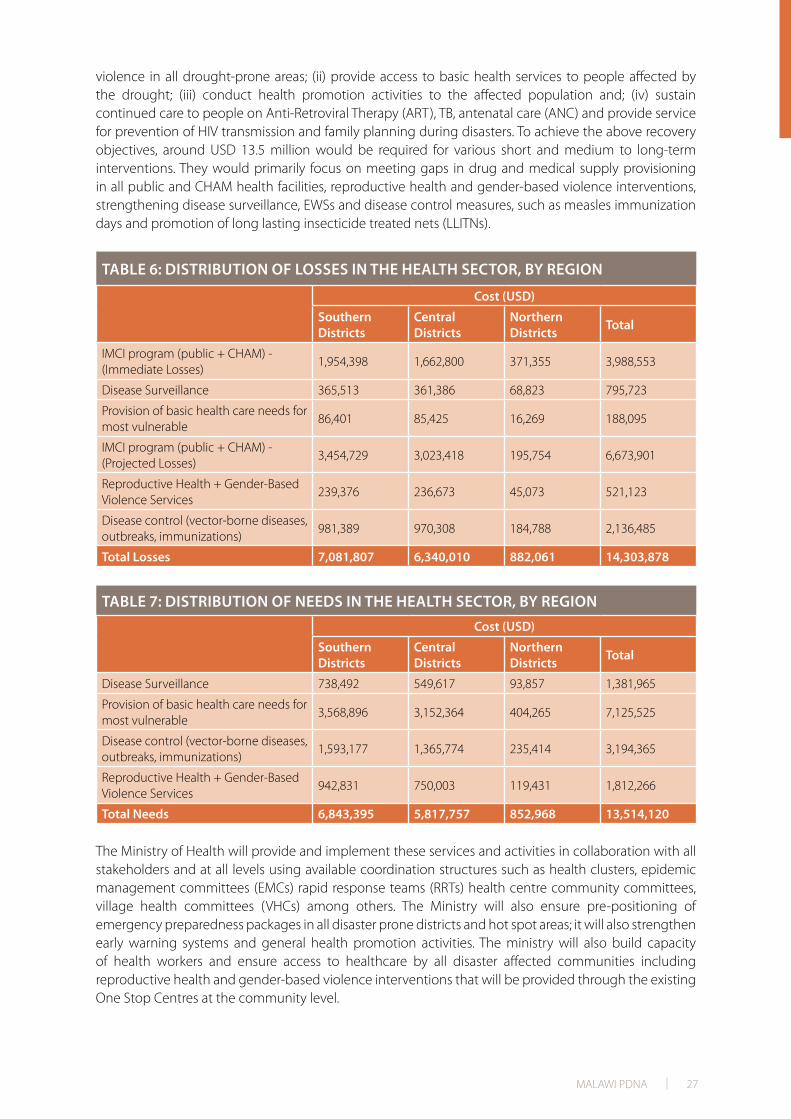
MALAWI PDNA | 27
violence in all drought-prone areas; (ii) provide access to basic health services to people affected by the drought; (iii) conduct health promotion activities to the affected population and; (iv) sustain continued care to people on Anti-Retroviral Therapy (ART), TB, antenatal care (ANC) and provide service for prevention of HIV transmission and family planning during disasters. To achieve the above recovery objectives, around USD 13.5 million would be required for various short and medium to long-term interventions. They would primarily focus on meeting gaps in drug and medical supply provisioning in all public and CHAM health facilities, reproductive health and gender-based violence interventions, strengthening disease surveillance, EWSs and disease control measures, such as measles immunization days and promotion of long lasting insecticide treated nets (LLITNs).
TABLE 6: DISTRIBUTION OF LOSSES IN THE HEALTH SECTOR, BY REGION
Cost (USD)
Southern Districts
Central Districts
Northern Districts Total
IMCI program (public + CHAM) - (Immediate Losses)
1,954,398 1,662,800 371,355 3,988,553
Disease Surveillance 365,513 361,386 68,823 795,723
Provision of basic health care needs for most vulnerable
86,401 85,425 16,269 188,095
IMCI program (public + CHAM) - (Projected Losses)
3,454,729 3,023,418 195,754 6,673,901
Reproductive Health + Gender-Based Violence Services
239,376 236,673 45,073 521,123
Disease control (vector-borne diseases, outbreaks, immunizations)
981,389 970,308 184,788 2,136,485
Total Losses 7,081,807 6,340,010 882,061 14,303,878
TABLE 7: DISTRIBUTION OF NEEDS IN THE HEALTH SECTOR, BY REGIONCost (USD)
Southern Districts
Central Districts
Northern Districts Total
Disease Surveillance 738,492 549,617 93,857 1,381,965
Provision of basic health care needs for most vulnerable
3,568,896 3,152,364 404,265 7,125,525
Disease control (vector-borne diseases, outbreaks, immunizations)
1,593,177 1,365,774 235,414 3,194,365
Reproductive Health + Gender-Based Violence Services
942,831 750,003 119,431 1,812,266
Total Needs 6,843,395 5,817,757 852,968 13,514,120
The Ministry of Health will provide and implement these services and activities in collaboration with all stakeholders and at all levels using available coordination structures such as health clusters, epidemic management committees (EMCs) rapid response teams (RRTs) health centre community committees, village health committees (VHCs) among others. The Ministry will also ensure pre-positioning of emergency preparedness packages in all disaster prone districts and hot spot areas; it will also strengthen early warning systems and general health promotion activities. The ministry will also build capacity of health workers and ensure access to healthcare by all disaster affected communities including reproductive health and gender-based violence interventions that will be provided through the existing One Stop Centres at the community level.
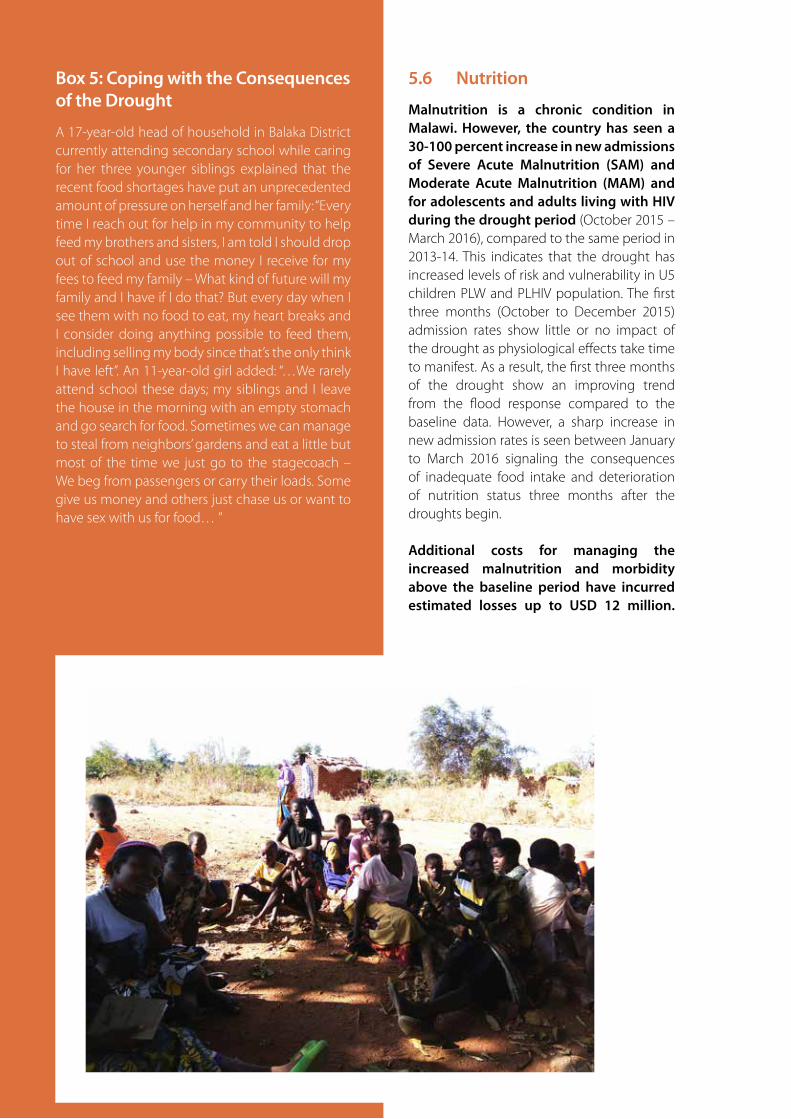
MALAWI PDNA | 28
5.6 Nutrition
Malnutrition is a chronic condition in Malawi. However, the country has seen a 30-100 percent increase in new admissions of Severe Acute Malnutrition (SAM) and Moderate Acute Malnutrition (MAM) and for adolescents and adults living with HIV during the drought period (October 2015 – March 2016), compared to the same period in 2013-14. This indicates that the drought has increased levels of risk and vulnerability in U5 children PLW and PLHIV population. The first three months (October to December 2015) admission rates show little or no impact of the drought as physiological effects take time to manifest. As a result, the first three months of the drought show an improving trend from the flood response compared to the baseline data. However, a sharp increase in new admission rates is seen between January to March 2016 signaling the consequences of inadequate food intake and deterioration of nutrition status three months after the droughts begin.
Additional costs for managing the increased malnutrition and morbidity above the baseline period have incurred estimated losses up to USD 12 million.
Box 5: Coping with the Consequences of the Drought
A 17-year-old head of household in Balaka District currently attending secondary school while caring for her three younger siblings explained that the recent food shortages have put an unprecedented amount of pressure on herself and her family: “Every time I reach out for help in my community to help feed my brothers and sisters, I am told I should drop out of school and use the money I receive for my fees to feed my family – What kind of future will my family and I have if I do that? But every day when I see them with no food to eat, my heart breaks and I consider doing anything possible to feed them, including selling my body since that’s the only think I have left”. An 11-year-old girl added: “…We rarely attend school these days; my siblings and I leave the house in the morning with an empty stomach and go search for food. Sometimes we can manage to steal from neighbors’ gardens and eat a little but most of the time we just go to the stagecoach – We beg from passengers or carry their loads. Some give us money and others just chase us or want to have sex with us for food… ”
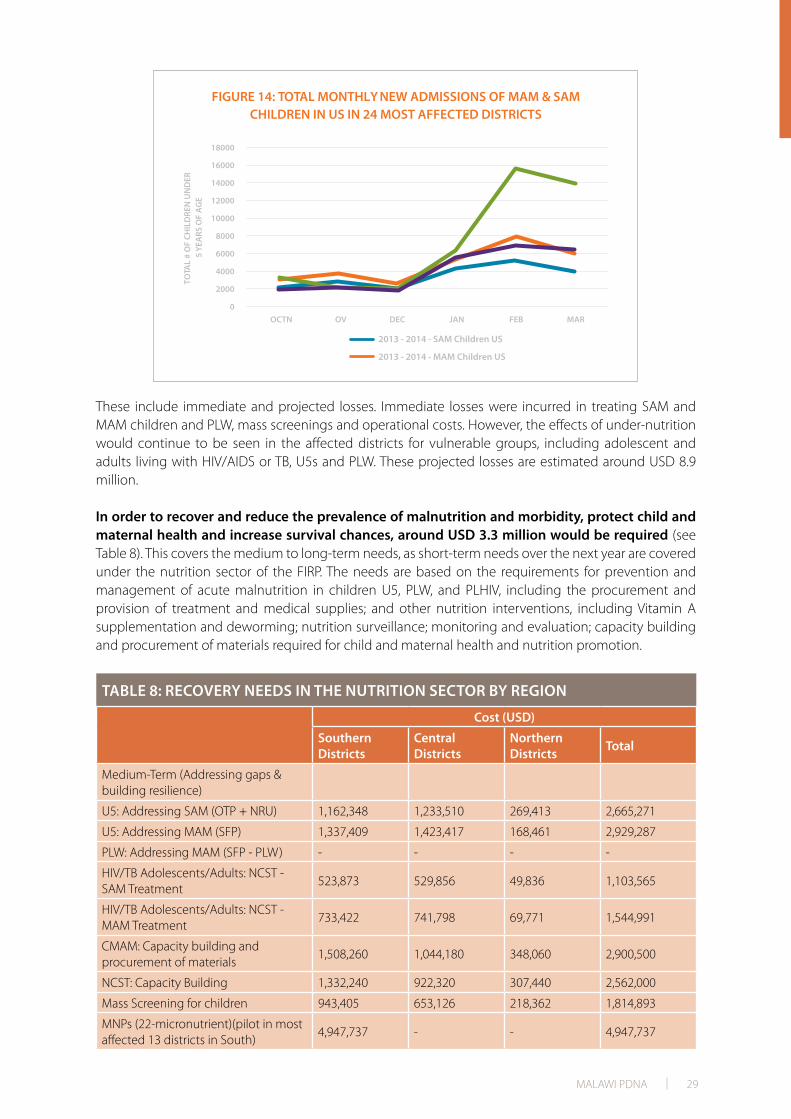
MALAWI PDNA | 29
These include immediate and projected losses. Immediate losses were incurred in treating SAM and MAM children and PLW, mass screenings and operational costs. However, the effects of under-nutrition would continue to be seen in the affected districts for vulnerable groups, including adolescent and adults living with HIV/AIDS or TB, U5s and PLW. These projected losses are estimated around USD 8.9 million.
In order to recover and reduce the prevalence of malnutrition and morbidity, protect child and maternal health and increase survival chances, around USD 3.3 million would be required (see Table 8). This covers the medium to long-term needs, as short-term needs over the next year are covered under the nutrition sector of the FIRP. The needs are based on the requirements for prevention and management of acute malnutrition in children U5, PLW, and PLHIV, including the procurement and provision of treatment and medical supplies; and other nutrition interventions, including Vitamin A supplementation and deworming; nutrition surveillance; monitoring and evaluation; capacity building and procurement of materials required for child and maternal health and nutrition promotion.
TABLE 8: RECOVERY NEEDS IN THE NUTRITION SECTOR BY REGION
Cost (USD)
Southern Districts
Central Districts
Northern Districts Total
Medium-Term (Addressing gaps & building resilience)
U5: Addressing SAM (OTP + NRU) 1,162,348 1,233,510 269,413 2,665,271
U5: Addressing MAM (SFP) 1,337,409 1,423,417 168,461 2,929,287
PLW: Addressing MAM (SFP - PLW) - - - -
HIV/TB Adolescents/Adults: NCST - SAM Treatment
523,873 529,856 49,836 1,103,565
HIV/TB Adolescents/Adults: NCST - MAM Treatment
733,422 741,798 69,771 1,544,991
CMAM: Capacity building and procurement of materials
1,508,260 1,044,180 348,060 2,900,500
NCST: Capacity Building 1,332,240 922,320 307,440 2,562,000
Mass Screening for children 943,405 653,126 218,362 1,814,893
MNPs (22-micronutrient)(pilot in most affected 13 districts in South)
4,947,737 - - 4,947,737
FIGURE 14: TOTAL MONTHLY NEW ADMISSIONS OF MAM & SAMCHILDREN IN US IN 24 MOST AFFECTED DISTRICTS
2013 - 2014 - SAM Children US
2013 - 2014 - MAM Children US
18000
16000
14000
12000
10000
8000
6000
4000
2000
0OCTN OV DEC JAN FEB MAR
TOTA
L #
OF
CHIL
DRE
N U
ND
ER
5 YE
ARS
OF
AG
E

MALAWI PDNA | 30
Monitoring and Evaluation 152,100 105,300 35,100 292,500
Long-Term:
U5: Addressing SAM (OTP + NRU) 1,935,543 2,120,632 232,199 4,288,374
HIV/TB Adolescents/Adults: NCST - SAM Treatment
785,809 794,784 74,755 1,655,347
Nutrirtion Promotion: Positive Deviance/Hearth (BCC program)
1,040,000 720,000 240,000 2,000,000
Biofortification pilot in 6 districts (integrate with Agriculture sector)
1,560,000 1,080,000 360,000 3,000,000
Monitoring and Evaluation 152,100 105,300 35,100 292,500
Refurbishment of NRUs - 1,428,571 - 1,428,571
Total Needs 18,114,245 12,902,795 2,408,497 33,425,537
To implement the above interventions, the Department of Nutrition, HIV & AIDS of the Ministry of Health will take the lead in providing oversight, strategic leadership, policy direction, coordination, monitoring and evaluation of the national nutrition response, supported by UNICEF as co-lead and other stakeholders as part of the Scaling Up Nutrition vision. The Ministry of Health will provide leadership and technical direction in programming and delivery of the nutrition interventions. A successful drought response will include shared cost and responsibility of managing and improving child and maternal nutrition, effective joint planning and coordination of nutrition development and emergency response programs, as agreed upon through nutrition forums with various development partners and stakeholders.
5.7 Education
In terms of the education sector, 41.6 percent of primary schools in Malawi have been affected by the drought, forcing over 137,489 boys and girls to drop out of schools in 24 districts and thus severely disrupting enrolments. Prolonged dry spells have also led to low or no production in almost 100 percent of schools with gardens, severely affecting the ability of schools to provide meals to students. Schools that were able to provide meals saw an increase in enrolments whereas those facing meal and school garden yield shortage saw drastic increase in dropouts. Students are also suffering from psychosocial issues due to reduced meal frequency, water and nutrition, leading to severe attention deficit. Losses, assessed as the cost for restoring meal consumption for students in affected schools during the drought period have amassed up to an estimated USD 6.9 million. On the other hand, siltation and forceful manual water pumping due to low water tables has resulted in the malfunctioning of school’s water sources like water pipes and boreholes, amounting to over USD 3.3 million (see Table 9).
TABLE 9: DISTRIBUTION OF THE IMPACT OF DROUGHT ON EDUCATION SECTOR, BY REGION
DAMAGESCost (USD)
Southern Districts
Central Districts
Northern Districts Total
Non-functional Water Taps 12,357 1,857 6,143 20,357
Non-function Boreholes 2,387,143 561,429 390,000 3,338,571
Total 2,399,500 563,286 396,143 3,358,929
LOSSESCost (USD)
Southern Districts
Central Districts
Northern Districts Total
Restoring student meal consumption (6 months)
4,089,918 2,587,875 268,652 6,946,445
Total 4,089,918 2,587,875 268,652 6,946,445
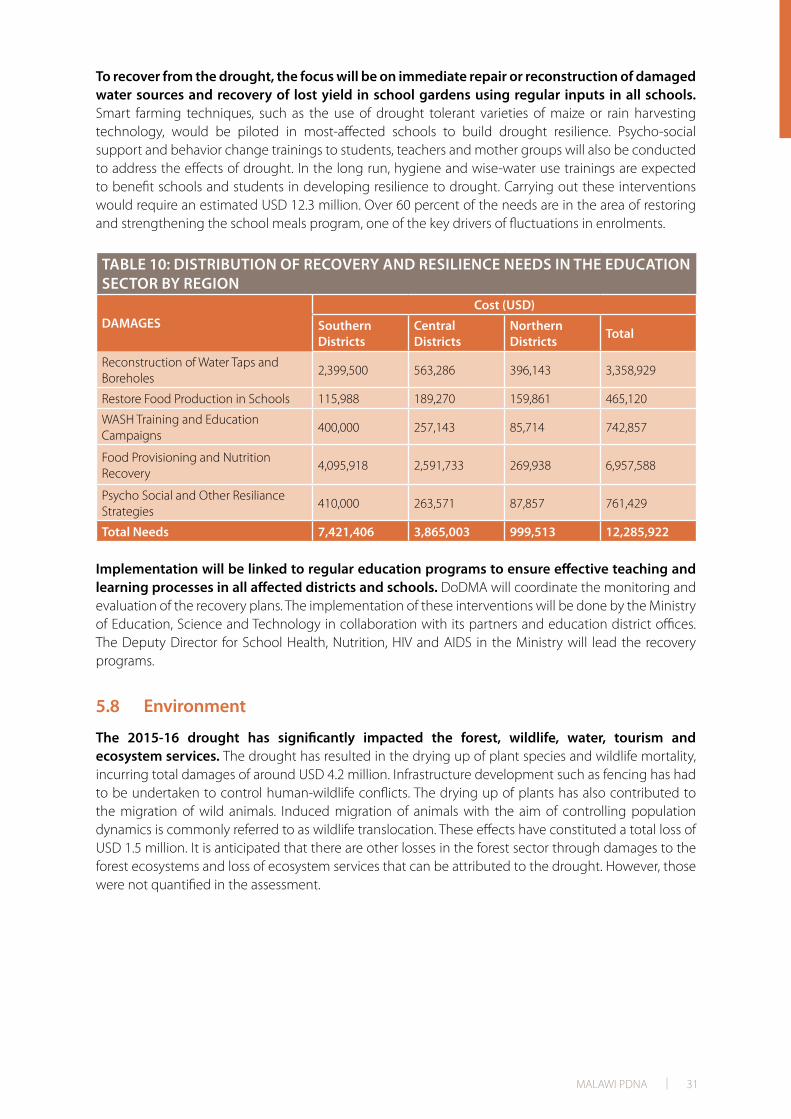
MALAWI PDNA | 31
To recover from the drought, the focus will be on immediate repair or reconstruction of damaged water sources and recovery of lost yield in school gardens using regular inputs in all schools. Smart farming techniques, such as the use of drought tolerant varieties of maize or rain harvesting technology, would be piloted in most-affected schools to build drought resilience. Psycho-social support and behavior change trainings to students, teachers and mother groups will also be conducted to address the effects of drought. In the long run, hygiene and wise-water use trainings are expected to benefit schools and students in developing resilience to drought. Carrying out these interventions would require an estimated USD 12.3 million. Over 60 percent of the needs are in the area of restoring and strengthening the school meals program, one of the key drivers of fluctuations in enrolments.
TABLE 10: DISTRIBUTION OF RECOVERY AND RESILIENCE NEEDS IN THE EDUCATION SECTOR BY REGION
DAMAGESCost (USD)
Southern Districts
Central Districts
Northern Districts Total
Reconstruction of Water Taps and Boreholes
2,399,500 563,286 396,143 3,358,929
Restore Food Production in Schools 115,988 189,270 159,861 465,120
WASH Training and Education Campaigns
400,000 257,143 85,714 742,857
Food Provisioning and Nutrition Recovery
4,095,918 2,591,733 269,938 6,957,588
Psycho Social and Other Resiliance Strategies
410,000 263,571 87,857 761,429
Total Needs 7,421,406 3,865,003 999,513 12,285,922
Implementation will be linked to regular education programs to ensure effective teaching and learning processes in all affected districts and schools. DoDMA will coordinate the monitoring and evaluation of the recovery plans. The implementation of these interventions will be done by the Ministry of Education, Science and Technology in collaboration with its partners and education district offices. The Deputy Director for School Health, Nutrition, HIV and AIDS in the Ministry will lead the recovery programs.
5.8 Environment
The 2015-16 drought has significantly impacted the forest, wildlife, water, tourism and ecosystem services. The drought has resulted in the drying up of plant species and wildlife mortality, incurring total damages of around USD 4.2 million. Infrastructure development such as fencing has had to be undertaken to control human-wildlife conflicts. The drying up of plants has also contributed to the migration of wild animals. Induced migration of animals with the aim of controlling population dynamics is commonly referred to as wildlife translocation. These effects have constituted a total loss of USD 1.5 million. It is anticipated that there are other losses in the forest sector through damages to the forest ecosystems and loss of ecosystem services that can be attributed to the drought. However, those were not quantified in the assessment.

MALAWI PDNA | 32
TABLE 11: DISTRIBUTION OF DAMAGE AND LOSSES IN THE ENVIRONMENT SECTOR BY REGION
DAMAGESCost (USD)
Southern Districts
Central Districts
Northern Districts Total
Wildlife Mortality 10,000 5,000 - 15,000
Seeding death 1,530,912 2,230,238 469,375 4,230,524
Total 1,540,912 2,235,238 469,375 4,245,524
LOSSESCost (USD)
Southern Districts
Central Districts
Northern Districts Total
Wildlife translocation 1,200,000 - - 1,200,000
Human Wildlife conflicts 1,786 - - 1,786
Protective Fencing 300,000 - - 300,000
Total 1,501,786 - - 1,501,786
A multi-sectoral and multi-pronged recovery and resilience strategy would be required to protect the environment and build resilience within the rural communities living around national parks. Guided by the National Biodiversity Strategy and Action Plan II (NBSAP II), the recovery strategy would aim to strengthen the institutional capacity to manage ecosystems and implement biodiversity conservations programs. In the short term, the focus would be to construct water points, wildlife translocation, fire management for wildlife and forests as well as afforestation and reforestation. As part of the drought response for better managing the wildlife population, 500 elephants will be moved from Liwonde National Park to Nkhotakota Game Reserve and some ante-lopes will be moved from Majete Game Reserve to Liwonde National Park. Over the next two years, the aim would be to harmonize conflicting sector policies and improve EWSs. Long-term interventions include natural regeneration of forests, capacity building, awareness and sensitization campaigns for forest sector and capacity building, and awareness and sensitization campaigns for the wildlife sub-sector. Undertaking these recovery and resilience interventions would require an estimated USD 6.6 million (Table 12).
TABLE 12: DISTRIBUTION OF NEEDS IN THE ENVIRONMENT SECTOR BY REGION
DAMAGESCost (USD)
Southern Districts
Central Districts
Northern Districts Total
Wildlife Relocation 1,380,000 - - 1,380,000
Construction of Water Points 42,857 28,571 14,286 85,714
Afforestation 1,020,608 1,486,825 312,917 2,820,350
Natural Regeneration 100,000 57,143 12,857 170,000
Fire management Improvement 300,000 257,143 42,857 600,000
Awareness and Outreach Programs 107,143 154,286 25,714 287,143
Capacity Building 450,000 312,857 111,429 874,286
Improving Early Warning Systems 171,429 137,143 34,286 342,857
Total Needs 7,421,406 3,865,003 999,513 12,285,922
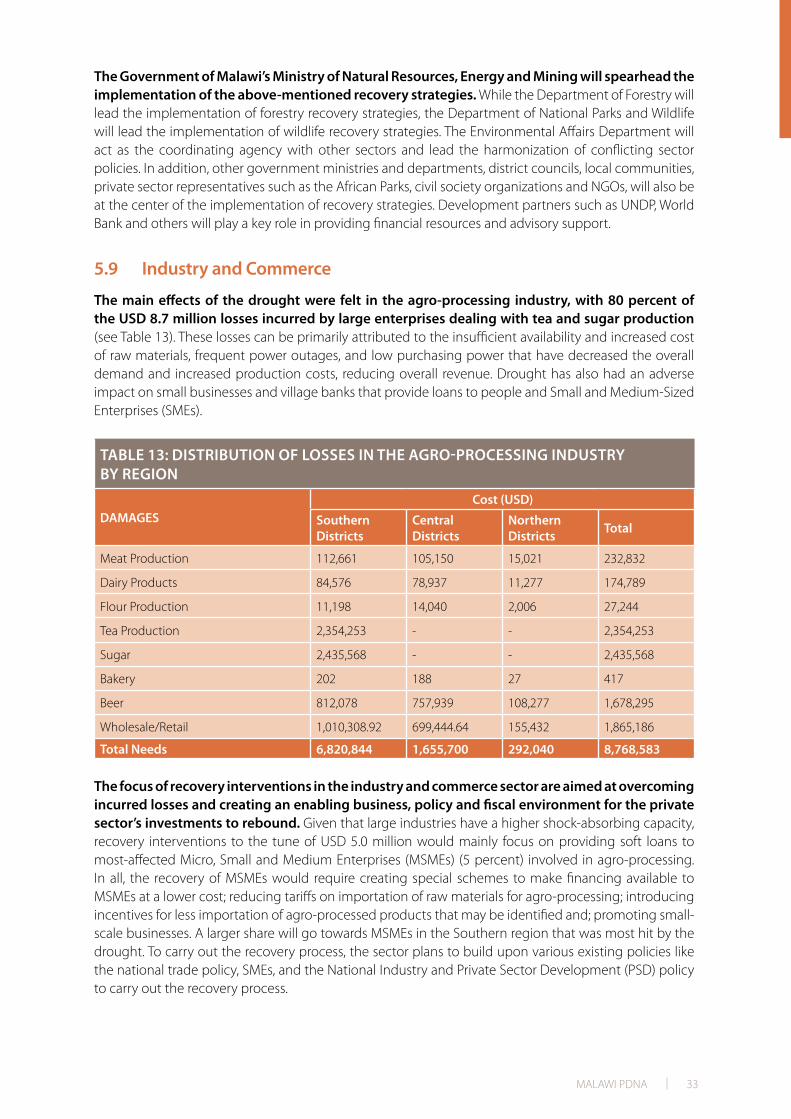
MALAWI PDNA | 33
The Government of Malawi’s Ministry of Natural Resources, Energy and Mining will spearhead the implementation of the above-mentioned recovery strategies. While the Department of Forestry will lead the implementation of forestry recovery strategies, the Department of National Parks and Wildlife will lead the implementation of wildlife recovery strategies. The Environmental Affairs Department will act as the coordinating agency with other sectors and lead the harmonization of conflicting sector policies. In addition, other government ministries and departments, district councils, local communities, private sector representatives such as the African Parks, civil society organizations and NGOs, will also be at the center of the implementation of recovery strategies. Development partners such as UNDP, World Bank and others will play a key role in providing financial resources and advisory support.
5.9 Industry and Commerce
The main effects of the drought were felt in the agro-processing industry, with 80 percent of the USD 8.7 million losses incurred by large enterprises dealing with tea and sugar production (see Table 13). These losses can be primarily attributed to the insufficient availability and increased cost of raw materials, frequent power outages, and low purchasing power that have decreased the overall demand and increased production costs, reducing overall revenue. Drought has also had an adverse impact on small businesses and village banks that provide loans to people and Small and Medium-Sized Enterprises (SMEs).
TABLE 13: DISTRIBUTION OF LOSSES IN THE AGRO-PROCESSING INDUSTRY BY REGION
DAMAGESCost (USD)
Southern Districts
Central Districts
Northern Districts Total
Meat Production 112,661 105,150 15,021 232,832
Dairy Products 84,576 78,937 11,277 174,789
Flour Production 11,198 14,040 2,006 27,244
Tea Production 2,354,253 - - 2,354,253
Sugar 2,435,568 - - 2,435,568
Bakery 202 188 27 417
Beer 812,078 757,939 108,277 1,678,295
Wholesale/Retail 1,010,308.92 699,444.64 155,432 1,865,186
Total Needs 6,820,844 1,655,700 292,040 8,768,583
The focus of recovery interventions in the industry and commerce sector are aimed at overcoming incurred losses and creating an enabling business, policy and fiscal environment for the private sector’s investments to rebound. Given that large industries have a higher shock-absorbing capacity, recovery interventions to the tune of USD 5.0 million would mainly focus on providing soft loans to most-affected Micro, Small and Medium Enterprises (MSMEs) (5 percent) involved in agro-processing. In all, the recovery of MSMEs would require creating special schemes to make financing available to MSMEs at a lower cost; reducing tariffs on importation of raw materials for agro-processing; introducing incentives for less importation of agro-processed products that may be identified and; promoting small-scale businesses. A larger share will go towards MSMEs in the Southern region that was most hit by the drought. To carry out the recovery process, the sector plans to build upon various existing policies like the national trade policy, SMEs, and the National Industry and Private Sector Development (PSD) policy to carry out the recovery process.
MALAWI PDNA | 34
The implementation of the proposed sector strategy will require the participation and cooperation of several parties, including the Government of Malawi, NGOs, the financial sector, as well as development partners. In order to ensure that the proposed loan scheme is effectively and efficiently operationalized, the government will need to make special arrangements with NGOs and financing institutions to provide soft loans to MSMEs. This intervention will also require the support from development partners.
5.10 Transport
The transport sector has suffered no direct infrastructure damages attributable to the drought; however, previous damage caused by the 2015 floods has rendered many roads impassable and reduced accessibility to areas in need of drought relief. The road network of Malawi is the major mode of transport, handling 70 percent of freight and 99 percent of passenger traffic. The country’s classified road network comprises 15,451 km of which about 28 percent are paved with the rest being unpaved and mostly earth standard. The road network is divided into five categories: main (3,357 km), secondary (3,125 km), tertiary (4,121 km), district (3,500 km) and urban (1,348 km) roads. The floods of 2015 affected and seriously damaged these roads, rendering many of them impassable. While efforts were made to rehabilitate and maintain them, it was not possible for the available resources to cater to all the damaged roads. Effective delivery of drought relief items can only be realized if there is good accessibility, which will not be easy considering the current condition of the rural roads.
Although there were no direct damages directly connected to the drought, the transport sector incurred losses, which are related to the overall impacts on key sectors that depend on transportation services. However, secondary impacts on the transport sector due to the limited availability of goods to be transported (such as agricultural commodities) are difficult to be quantified across the country.
The main objective in the transport sector is to maintain and rehabilitate roads that are in bad condition to allow for assistance to reach the victims. This includes 368 km of roads at a cost of USD 15.3 million. Such interventions will also have positive cascading effects in providing improved connection to the population to social services and markets, thereby allowing for better opportunities for socio-economic exchanges and livelihoods. This maintenance and rehabilitation will have to follow a building-back-better concept in order to build resilience to future climate shocks. Priority for rehabilitation and maintenance will be given to areas that are hard hit by the drought and which will require various relief initiatives from the respective sectors, more especially for food and water supply.
The reconstruction interventions for the transport sector can be seen as medium to long-term measures that provide the necessary infrastructure to allow for a timely and rapid delivery of relief items in the event of future disasters. Short-term interventions for the transport sector might relate to the provision of additional trucking capacity to deliver relief items on time to affected communities. All transport sector interventions related to the construction of basic transport infrastructure should involve high manual labor public work schemes to create additional employment opportunities for affected communities. Those schemes can be integrated and coordinated with the safety net schemes like cash-for-work programs.
5.11 Energy
The 2015-16 drought has affected electricity generation, as Malawi’s electricity is largely generated by hydropower. The Electricity Supply Corporation of Malawi (ESCOM) Limited is the only power utility company that is engaged in the generation, transmission and distribution of electricity in the country. The drought has led to a loss in: (i) revenues from electricity generation, (ii) fuel sales
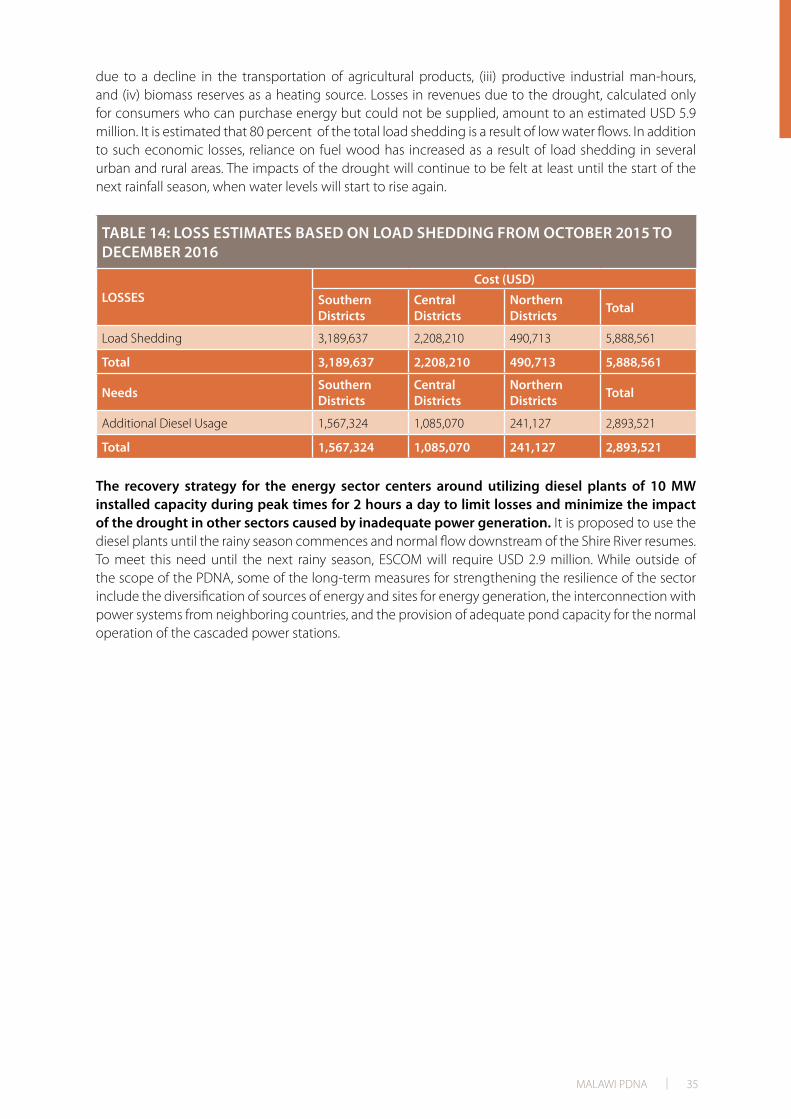
MALAWI PDNA | 35
due to a decline in the transportation of agricultural products, (iii) productive industrial man-hours, and (iv) biomass reserves as a heating source. Losses in revenues due to the drought, calculated only for consumers who can purchase energy but could not be supplied, amount to an estimated USD 5.9 million. It is estimated that 80 percent of the total load shedding is a result of low water flows. In addition to such economic losses, reliance on fuel wood has increased as a result of load shedding in several urban and rural areas. The impacts of the drought will continue to be felt at least until the start of the next rainfall season, when water levels will start to rise again.
TABLE 14: LOSS ESTIMATES BASED ON LOAD SHEDDING FROM OCTOBER 2015 TO DECEMBER 2016
LOSSESCost (USD)
Southern Districts
Central Districts
Northern Districts Total
Load Shedding 3,189,637 2,208,210 490,713 5,888,561
Total 3,189,637 2,208,210 490,713 5,888,561
Needs Southern Districts
Central Districts
Northern Districts Total
Additional Diesel Usage 1,567,324 1,085,070 241,127 2,893,521
Total 1,567,324 1,085,070 241,127 2,893,521
The recovery strategy for the energy sector centers around utilizing diesel plants of 10 MW installed capacity during peak times for 2 hours a day to limit losses and minimize the impact of the drought in other sectors caused by inadequate power generation. It is proposed to use the diesel plants until the rainy season commences and normal flow downstream of the Shire River resumes. To meet this need until the next rainy season, ESCOM will require USD 2.9 million. While outside of the scope of the PDNA, some of the long-term measures for strengthening the resilience of the sector include the diversification of sources of energy and sites for energy generation, the interconnection with power systems from neighboring countries, and the provision of adequate pond capacity for the normal operation of the cascaded power stations.

MALAWI PDNA | 36

MALAWI PDNA | 37
The drought hit Malawi at a time when the country’s economy was particularly vulnerable due to the consecutive effects of the 2015 floods and 2015/2016 drought. The impact of the drought is estimated at USD 295.2 million, which is equal to 5.6 percent of Malawi’s GDP. This chapter describes the macroeconomic impact of the drought, specifically the effects on the GDP, the inflation rate, and the external and fiscal positions. Part 1 gives a background on the overall economic context of Malawi in recent years and part 2 describes the impact on the macroeconomic indicators. The analysis focuses on the first and second stage effects of the disaster. In the first stage, only the isolated effects of the disaster in terms of changes in economic flows are considered, assuming no recovery and reconstruction interventions. In the second stage, the economic impact of recovery activities is estimated.
6.1 Economic Context
Malawi’s economy is largely agrarian, with the sector contributing about 30 percent to GDP, making Malawi’s economy particularly vulnerable to climate shocks. While Malawi was on a strong growth path in 2013 and 2014, the consecutive disasters in 2015 and 2016 substantially affected the economy. Since 2010, the pattern of growth has been volatile. The economy experienced a slump in 2011-2012 mainly owing to fuel and exchange rate shortages. In 2013 and 2014 growth was strong at 6.3 and 6.2 percent respectively. This was premised on growth in agriculture, a good harvest arising from a generally favorable weather pattern in the 2013/14 growing season, as well as the availability of foreign exchange and fuel, which bolstered growth in the industry and service sectors.
Annual average inflation rates have hovered above 20 percent in recent years, reaching a peak of 27.3 percent in 2013 and declining to 21.3 percent in 2015. The inflation rate shot up in 2012,
6. MACROECONIMIC ANALYSIS

MALAWI PDNA | 38
following the liberalization of the exchange rate, which was fixed at an overvalued rate. On the one hand, non-food inflation has been driven by exchange rate depreciation, making imported goods more expensive, despite the recent decrease in international fuel prices. This has been compounded by an abundant liquidity in the market caused by the government’s domestic borrowing. On the other hand, high maize prices following a poor harvest in 2015 exerted pressure on food inflation.
Malawi has run a large current account balance deficit over time, attributed to the dominance of the merchandise trade balance as import growth continually outweighs the growth in exports. However, the overall Balance of Payments has generally been positive and the country has been accumulating reserves, due to the inflow of foreign direct investments and loans taken by the government. Over the period 2011 to 2015, the current account balance registered a deficit of 13.7 percent of GDP recorded in 2011 and 15.2 percent of GDP in 2015. The worsening in the merchandise trade balance between 2011 and 2015, is largely attributed to the growth in the import bill as the exchange rate depreciated significantly over the period following its liberalization in 2012. On the other hand, the financial account has been in surplus13 mainly due to foreign direct investment inflows and foreign loans taken by Government.
The country’s fiscal position has deteriorated registering a fiscal deficit of 5.8 percent of GDP in 2014/15. This has been driven by a rise in the domestic debt stock with reduced financing from development partners compounded by high interest rates. The fiscal deficit (including grants) in 2013/14 was broadly the same at 5.7 percent of GDP. The loss of budget support in 2013 placed Government’s fiscal accounts under enormous pressure. This resulted in an enlarged budget deficit and a spike in domestic public sector borrowing. Expenditure overruns in the midst of dwindling revenue performance exerted further pressure on the fiscal position. With the suspension of budget support, grants continue to come in the form of project and dedicated grants and domestic revenues are modest with a deceleration in economic activity.
The 2014/2015 rainfall season was characterized by a late onset of rains and disastrous floods followed by dry spells, leading to a significant decline in agricultural output and a subsequent drop in annual GDP growth. Agricultural output contracted by 3.9 percent while the production of
13 According to the BPM5 accounting method.
FIGURE 15: (LEFT) GDP SHARES (PERCENTAGE OF TOTAL, 2015);(RIGHT) MALAWI’S GDP GROWTH (%) 2010-2017
10.0
9.0
8.0
7.0
6.0
5.0
4.0
3.0
2.0
1.0
02010 2011 2012 2013 2014 2015 2016 2017
9.5
3.5
2.1
6.3 6.2
3.1
5.1
7.0
OTHER 44%
AGRICULTURE,FORESTRY &
FISHING
29%
MANUFACTURING10%
ELECTRICITY, GAS & WATER SUPPLY 1%
WHOLESALE &RETAIL TRADE
16%
Source: National Statistical Office and Ministry of Finance, Economic Planning and Development data*Figure 1 indicates the sectors directly affected by the drought according to the analysis on the Effect on GDP below. “Other” includes the following: Mining; Construction; and Services excluding Wholesale and retail trade. **2016 and 2017 growth rates are preliminary estimate and forecast respectively

MALAWI PDNA | 39
maize in particular, the country’s staple food, declined by an average of 30 percent compared to 2014. Even though the human cost of the January 2015 floods was relatively large, its net effect on GDP was estimated to be small at 0.6 percent (Government of Malawi, 201514).
TABLE 15: KEY MACROECONOMIC INDICATORS, 2010-2017
2010 2011 2012 2013 2014 2015 2016e 2017f
GDP Growth (%) 9.5 3.5 2.1 6.3 6.2 3.1 5.1 7.0
Inflation (%) annual average 7.4 7.6 21.3 27.3 23.8 21.8 19.8 14.9
Exchange rate (average US/MWK) 150.5 156.5 249.1 369.2 424.4 499.6 753.8 --
Current account balance incl transfers (% of GDP)
(5.7) (13.7) (13.4) (23.3) (17.7) (15.2) (12.0) --
Fiscal balance, including grants (% of GDP)/1
(0.5) (1.1) (6.1) (1.7) (5.7) (5.8) (3.9) (3.9)
Fiscal balance, excluding grants (% of GDP)/1
(10.1) (8.5) (9.2) (12.2) (9.1) (8.7) (7.5) (8.4)
External debt, public sector (% of GDP)
13.8 14.3 29.5 31.8 33.5 36.9 -- --
Domestic debt, Central Government (% of GDP)
14.2 16.3 19.2 20.6 19.3 19.4 -- --
Gross reserves in months of import cover
2.2 1.5 1.1 2.1 3.1 3.2 -- --
Average interest rate (91 days T-bill) 6.2 7.7 20.0 32.3 26.8 23.9 -- --
6.2 Impact of the Drought on the Macroeconomic Indicators
6.2.1 Effect on Gross Domestic Product
Malawi is experiencing a second consecutive year of disasters, which has lowered growth prospects and worsened the food security situation, resulting in 2016 losses associated with GDP of MWK 206,666 million (USD 295.2 million), which is equal to 5.6 percent of GDP. In comparison, in 2015 losses amounted to 0.6 percent of GDP. The typical effect of a natural disaster on GDP is usually a fall in the year of the event or the one after with a rebound expected in successive years as investment and capital flows increase with recovery efforts. The results of the quantitative analysis outlined in the table below focused on the first stage effects of the disaster. This is the isolated effect of economic losses caused directly by the drought. Implemented recovery activities are expected to offset part of the losses in GDP. The estimated losses, however, have not taken into account interventions for recovery. The losses are primarily driven by a slow-down in the agriculture and electricity and water sectors (see table below).
Agriculture has by far been the hardest hit sector experiencing the largest economic cost due to a significant loss in crop production. Crop and animal production loss is estimated at 10.0 percent, which is equivalent to MWK 183,275 million (USD 261.8 million). The loss in crops is estimated at MWK 161,444 million (USD 230.6 million), with maize as the most affected crop registering 73.2 percent of total crop production losses. This is consistent with the third round of the Agricultural Production Estimates Survey (APES), which estimates maize production to fall by 14.7 percent. However, other crops such as pulses, sweet potatoes, Irish potatoes and cassava registered an increase of 16.4 percent, 17.4 percent,
14 Government of Malawi, 2015: Post Disaster Needs Assessment
Source: Ministry of Finance, Economic Planning and Development; National Statistical Office; Reserve Bank of Malawi data/1 Reported on a fiscal year basisNate: e is estimate, f is forecast

MALAWI PDNA | 40
9.9 percent and 9.0 percent, respectively. These were not significantly affected as they were in the early stages of development that do not require a lot of water. Losses in livestock are a result of lower prices at which animals were sold as a coping mechanism due to the drought. The animal census appears to be unaffected but impacts might be felt at a later stage. Fisheries and aquaculture experienced a 6.0 percent loss in growth, with the loss relatively higher in fishponds as compared to natural water bodies.
TABLE 16: ESTIMATED LOSSES PER SECTOR IN 2016
Losses (MWK Million) Percentage Loss in Sector Growth
1. Agriculture, forestry and fishing: 190,824 7.3
Crop and Animal Production 183,275 10.0
Fishing and Aquaculture 7,551 6.0
2. Manufacturing (agro-processing) 4,835 1.4
3. Electricity and water supply 9,702 8.0
4. Wholesale and retail trade 1,305 0.2
Total estimated production losses 206,666 As percentage of GDP: 5.6
The utilities sector is the second most affected sector. The electricity and water sectors experienced a 8.0 percent loss, which is equivalent to MWK 9,702 million (USD 13.9 million). The drought directly impacted the provision of water by Water Boards and other sources. As electricity is hydro-generated, there were also reductions in generating capacity and shut down of machines partly due to low water levels. The loss in electricity which has been captured in this analysis, represents what is attributable to the drought, recognizing that reduced capacity and shut downs are also experienced due to other factors, such as low loads and maintenance.
The manufacturing sector saw modest production losses related to agro-processing. Most manufacturing companies in the country process agricultural produce. As such, low agricultural output has negatively affected their activities. The sector recorded a 1.35 percent loss, which is equivalent to MWK 4,835 million (USD 6.9 million). Wholesale and retail trade is estimated to show a marginal decline. The sector is estimated to experience a loss of 0.21 percent equivalent to MWK 1,306 million (USD 1.9 million). Trade is expected to have revenue losses with a slow-down in activity. With a contraction in agricultural output, the purchasing power of consumers would also be eroded as households’ disposable incomes are affected.
6.2.2 Effects on Inflation
As a supply shock to Malawi’s predominately agrarian economy, the drought drove up food prices notably for maize resulting in food price inflation. The overall inflation is expected to remain high during 2016, mainly driven by food price inflation. Food constitutes 50.2 percent of the consumption basket in the Consumer Price Index (CPI). Given that the drought has led to lower agricultural production, in particular maize, this would drive up food prices and create persistence in food inflation. During recovery, the government and development partners are expected to address the food deficit mainly through food imports. Greater food availability would ease food prices, creating a counteracting effect to the initial supply shock. However, if the food deficit were not sufficiently addressed, food inflation would remain persistently high.
Non-food inflation is likely to be indirectly affected through a possible exchange rate depreciation and higher public domestic borrowing. In order to finance immediate food purchases, the
Source: PDNA Macro Team Calculations

MALAWI PDNA | 41
International Monetary Fund (IMF) has allowed the government augmented access to borrow beyond program limits. The exchange rate would depreciate if the negative impact on the trade balance, associated with lower agricultural export earnings and higher food imports, outweighs the positive effect of aid inflows in the Balance of Payments. A depreciated exchange rate would make imports more expensive and drive up non-food inflation. In addition, the government may increase its domestic borrowing in order to finance food imports and other recovery efforts, which could create additional pressure to overall inflation through a liquidity injection. The IMF’s allowed augmented access to borrowing increased the lower limit of Net Domestic Financing from MWK 25 billion set in the 2015-16 budget to MWK 60 billion in the 2016/17 budget.
6.2.3 Effects on the External Position
Malawi’s trade balance is expected to deteriorate due to a moderate decrease in exports as a result of the fall in agricultural output resulting from the drought, combined with an increase in food imports for recovery. Export volumes are expected to moderately decline as a result of the drought following the decline in agricultural output during the 2015-16 growing season. With the exception of tobacco, Malawi’s main export commodities, including sugar and tea, have experienced production losses due to the drought. Given such production losses, it is expected that export volumes will also decrease, though not to a great extent as tobacco has not been as negatively impacted. In addition, due to carry over stocks, the decline may not be felt immediately during 2016. A moderate reduction in export earnings is thus expected, which would translate into a larger trade deficit and hence a worsening in the current account position of the country. It is important to note that any reduction in export values would not only be accountable to drought. Lower international commodity prices and the loss of preferential prices for sugar in the European market would also contribute to a decline. During recovery, food imports will increase, leading to a further deterioration in the trade deficit.
During recovery, it is expected that, as more aid flows into the country, the current account and financial account would be positively affected. The overall impact on the Balance of Payments would depend on the relative magnitudes of the deterioration in the trade deficit and aid inflows. Grants are likely to increase in order to finance recovery, impacting the transfer component of the current account positively. The overall effect on the current account would depend on the relative magnitudes of the positive impact due to an increase in unrequited transfers, including grants and remittances, and the negative impact of the expected trade balance deterioration. A positive impact is also expected on the financial account, assuming that the government will receive funds in the form of loans from foreign partners in order to finance recovery. The negative effect on the trade balance and the positive effect on transfers and the financial account counteract each other. If aid inflows are larger than the combined effect of lower exports and higher imports, the effect on the Balance of Payments would be positive and vice versa.
6.2.4 Effects on the Fiscal Position
The government's fiscal position is estimated to be negatively affected as the drought exerts further pressure on the national budget. The current estimate on the impact of the drought on the fiscal balance takes into account the potential losses in revenue due to decreased economic activity as well as an increase in expenditure allocated for disaster response and the relief process. The decline in aggregate demand and economic output as a result of the drought is expected to result in lower tax collections mainly in terms of value added tax (VAT). The government has allocated a significant amount of resources towards disaster response. In the 2016/17 budget, the government has allocated MWK 35.5 billion15 (USD 50.7 million) for maize purchases in response to the drought. In addition, the
15 The Government has allocated MWK 29.5 billion for maize purchases and MWK 6 billion for winter cropping.

MALAWI PDNA | 42
unforeseen expenditures vote, used for disaster response, has been allocated MWK1.8 billion (USD 2.5 million). These resources will be combined with funds from development partners, who are also in the process of mobilizing resources towards post-disaster needs. An estimated USD 57 million has been pledged to support disaster response.
MALAWI PDNA | 43
7.1 Introduction
Disasters negatively affect income, assets, health, education, inequity, social cohesion, gender inequality, child welfare, human rights, security, and psychological well-being, which are all dimensions of human development and people’s general well-being. Negative impacts in these areas can have long-term consequences on the capacity of people to fully achieve and enjoy human development gains and to be resilient in the face of hazard stress and shocks. This is even truer in situations of chronic vulnerability and poverty such as in Malawi.
The vulnerability of the ultra-poor, especially female-headed families, is a serious concern during disasters as food insecurity and malnutrition remain alarmingly high. A significant proportion of the Malawian population lives below the poverty line – measured at USD 1.00 a day (Integrated Household Surveys (IHS)), 2011). Among the 50.6 percent of the population considered poor, 24.5 percent are considered ultra-poor meaning that they cannot afford to meet the minimum standard for daily-recommended food requirement. Poverty varies across regions, with the Southern part of the country having the largest poverty rates followed by the North and the Center. The World Bank reports that nearly 89 percent of the population has access to safe drinking water (2015). Male adults are more literate than female adults at 74 percent and 57 percent respectively and literacy rates among the youth remain low with 74.3 percent for males and 70 percent for females (Human Development report (HDR), 2015).
7. HUMAN AND SOCIAL IMPACT ANALYSIS & GENDER RECOMMENDATIONS
MALAWI PDNA | 44
Gender equality and child protection remain a challenge, especially during disasters. Women’s access to and control over means of production – including inputs, land, credit and extension services – is limited. Although 25 percent of Malawi’s households are female headed and provide the majority of agricultural labor (women perform between 50-70 percent of all agricultural tasks and produce about 70 percent of the household food according to ASWAP, 2011). This situation is compounded by gender unbalanced socio-cultural norms on resource management16 (ASWAP, 2011) and it is worsened by the weakness of women’s associations and cooperatives. Child abuse remains widespread at a rate of 39.3 percent among children aged 5-17 and, 63.9 percent of young people age 15-19 years are married with high number of girls dropping out of schools due to early marriages (MDG Endline Survey, 2014). Government statistics further show that between 2010 and 2013, 27,612 girls in primary and 4,053 girls in secondary schools dropped out due to marriage. During the same period, another 14,051 primary school girls and 5,597 secondary school girls dropped out because they were pregnant.
To provide an indication of the impacts of the drought on people’s well-being and social dynamics, primary field surveys were carried out in selected sample districts. Sample surveys had to be undertaken because measuring the impact of the drought on human development indicators remains challenging mainly since the impacts only show up in the medium to long-term and there are other non-drought factors affecting these indicators. This report recognizes that the analysis provided here is not exhaustive due to the limited geographical coverage of the survey and that therefore its results cannot be extended to a national scale. However, the picture provided is a direct indication of the reality faced by the affected people and validates the analysis of the sectorial assessments on the human and social consequences that the drought is causing.
The Social Impacts Assessment (SIA) aims at providing an overview of the impact of the drought in these three key areas and to put forward a set of recommendations for the recovery process. The recommendations presented have a specific focus on putting in place a response mechanism that will take into account the insights provided by communities and existing gender dynamics in the affected areas.
7.2 Methodology
The SIA was carried out in the Chikwawa, Nsanje, and Balaka Districts, at a time when the full impact of the drought was yet to be felt. The teams collected insights from a mix of seven sites (two urban, two peri-urban, and three rural areas across the three districts) to understand how the impact of the drought may have varied across sites. The three districts were selected mainly because of their geographic spread (North - Balaka, Center - Chikwawa, and South – Nsanje) throughout the Southern region of the drought-affected area. In addition, it is worth noting that a number of the visited communities, notably in Chikwawa and Nsanje, were still reeling from the effects of the 2015 floods. Moreover, the team was relatively small (four members for Chikwawa and three for Nsanje and Balaka) and had a short window of time not only to mobilize relevant agencies and personnel at the district level but also to collect data.
Focus group discussions (FGDs) and key informant interviews (KIIS) were held with extension workers, village and group village heads, heads of households, and women, youth and members of vulnerable groups (people living with HIV and AIDS, and the elderly). Extension workers (agriculture, child protection services, health surveillance and social welfare) were included primarily because of the relevance of their work to the assessment, their access to affected communities, and wide coverage area (up to 50 villages) that all contributed to a more general overview of issues faced by communities
16 The June 2015 MVAC Market Assessment established that of the 901 traders reached nationwide, 705 were male accounting for 78 percent while only 195 were women constituting 22 percent.

MALAWI PDNA | 45
because of the drought. The village heads and group village heads were included for similar reasons. KIIS were used for these two groups while FGDs were conducted for the rest. Women, men, and the youth were consulted separately; with members of vulnerable groups generally preferring to be included in the larger groups rather than being interviewed on their own. The questionnaire developed for the SIA focused on collecting data on the November 2015 to March 2016 drought’s impact in the following four areas using qualitative methodologies: (i) livelihoods, food security, and coping strategies; (ii) social cohesion and gender/inter-generational relations; (iii) communities immediate and medium-term needs for drought management; and (iv) gender analysis and recommendations for future interventions.
7.3 Socio-economic Impact
7.3.1 Impact on Livelihoods & Food Security
Farm and non-farm livelihoods have been severely disrupted and are expected to further be affected in the coming months in all the visited locations, likely without significant variations between rural, urban, or peri-urban areas. Small scale and subsistence farmers (maize, cotton, rice, and sorghum) however, emerge as some of the most affected groups in the visited communities. They have been particularly hard hit due to: (i) the challenging 2015 planting season conditions associated with recent floods, (ii) the overwhelming crop failure – up to 90% in some sites, and (iii) the scarcity of alternatives livelihood options. A large number of these farmers relied on sale of agricultural products income prior to the drought, and the ongoing crisis has significantly reduced their income-generating opportunities. In focus group discussions with women in Chikwawa, most participants indicated that apart from cultivation, they also engaged in petty trading, selling fish, small groceries, and other foodstuff. However, with the increased food insecurity, sales have declined - as people prefer purchasing maize and have little or nothing to spend on “luxuries."
“I used to make MWK 3,000 from my business of selling fish, but now people can forgo the fish and buy maize to make porridge. These days, most of the fish goes bad before I can sell it and I have just decided to abandon that business altogether”.
Female FGD Participant
There has been a notable increase in the vulnerability to food security and general decline in living conditions at household and community levels associated with significant crop losses, notably maize. Interviews in all seven sites indicated that food scarcity and lack of resources for its purchase was their biggest challenge. Even in cases where households have available resources, access to maize remains an issue, especially for women who normally visit the Agricultural Development and Marketing Corporation’s (ADMARC) distribution centers to purchase it. Women in a FDG in Chikwawa expressed frustrations in dealing with “corrupt” practices by ADMARC staff and frequently being brutalized by members of the police forces there in charge of security.
Drought induced food shortages have also affected children and youth, primarily disrupting their education cycle. Child Protection Extension Workers in Chikwawa indicated an increase in boys’ and girls’ dropout rates and irregular attendance in schools due to pressure on children to contribute to the survival of the families, and free up meager resources for family survival, including food and medical attention. This was confirmed during FDGs conducted with household heads and youths in all three districts. In addition, dropout rates for secondary school students were also reported to be on the increase because of lack of resources to cover school fees. Children Welfare Extension Workers
MALAWI PDNA | 46
also reported an increase in the number of small children (6-12 years old) being engaged in begging, petty sales at bus stops, and daily labor. The team observed a number of children carrying bricks to a construction site during a youth FDG in Million Village in Balaka District (see Figure 16).
“ADMARC staff prefer selling the maize to vendors who in turn sell to us at exorbitant prices. In addition, ADMARC staff asks us to bribe them in order to get the maize faster. We are asked to pay MWK 500 or sometimes MWK 1000 and sometimes they even ask for sex from us. There is not much we can do, as it is the only way to get maize, otherwise we have to spend nights in queues with no guarantees of getting anything when we reach the counter”.
Female FGD Participant
“My son was due to start his form one and the intention was to send him to a self-boarding school but because of hunger, I have no maize to give him and I don’t have anything to sell to give him for school fees and pocket money, he is now at home”.
Male FGD Participant
Health Surveillance Extension Workers also indicated an increase in all three districts of defaulter rates in health care programs, such as supplementary feeding programs for Children U5 and ART. The situation has the potential to increase the vulnerability of people living with HIV, as it would effectively exclude them from any potential recovery programs requiring some level of physical activity. Specific drought impacts on women and girls are discussed in the gender analysis and recommendation section.
As a woman living with HIV/AIDS stated during a FGD: “the medical advice is that I eat nutritious food while taking my medication. However, I don’t have food and I have been taking it on an empty stomach. I feel stomachaches and my head feels like I am drunk when I take them on an empty stomach. I’m in pain because soon I will lose my two sons. They are also HIV/Positive and are refusing to take ART without food. I see them getting thiner every day. I see them slowly dying”. She lamented, with tears in her eyes.
She continued to say, “When their weight goes down, they give us soya to make porridge but lately, the hospital has been running out of soya. There is too much hunger and the hospitals

MALAWI PDNA | 47
system is overwhelmed. Each time we go, they tell us to come again and when we go, nothing happens, as there is no food.”
7.3.2 Coping Strategies and Livelihood Adaptations
Households are generally failing to cope with food insecurity despite being engaged in some sort of alternative livelihood and coping mechanisms to mitigate the effects of the drought. A majority engages in informal labor (ganyu) – particularly in Ncholo where seasonal work to harvest sugar cane in the Ilovo plantations can be available – but many complain about its unsustainability and very low pay. In rural areas, household heads, particularly men, have resorted to sand harvesting in dry river beds and charcoal burning17 to earn some income outside agriculture. This is exposing the already delicate eco-systems to soil erosion and further environmental degradation. Some are coping with the effects of drought by learning new skills. For example, in Nsanje, men are increasingly turning to fishing on the Shire River as a mean to provide for their families. Fishing on the Shire, however, presents its dangers, as highlighted by a widower during a FGD:
“My husband had to learn to do fishing. This is something that he has never done in his life and last week we lost him as crocodiles attacked him. He has left me with four children, two of whom are HIV positive”.
Female FGD Participant
17 Sand harvesting is a common practice in the region – The sand is sold to be mixed with cement for brick making.Charcoal burning is the process used to manufacture the wood charcoal used for cooking.
FIGURE 16: CHILDREN CARRYING BRICKS DURING A YOUTH FGD IN BALAKA

MALAWI PDNA | 48
A small number of community members in Chikwawa and Nsanje also benefited from the public works program but indicated that payments were not always prompt. In T.A. Mgabu, some men explained that they took part in these work programs in January 2016 and are yet to be paid. Social Cash Transfers have also provided relief to few selected community members in the visited districts. However FGD participants complained of untimely withdrawal of programs when people had not harvested and crops were drying up. Furthermore, they indicated that, though public works program can be helpful, they target very few people. Distress sale of livestock has also been reported in Chikwawa District, as FGD participants have said that many households are selling their livestock to minimize mortalities, which in turn is leading to oversupply and lower prices in the markets.
“The program only targeted 8 people out of 504 households in my village. It becomes meaningless if it cannot be brought to scale. Targeting 8 people out of 1,000 is like denying people development. This brings in more conflicts than real change in the lives of the individuals”.
Male FGD Participant
Significant changes in meal composition quality, quantity, and frequency were also found to be critical coping mechanisms used by communities to deal with food insecurity. All youth interviewed during FDGs indicated that their households went from three meals a day to a single one because of the lack of food and diminishing cash availability caused by the drought. In Nsanje, local communities have resorted to substituting maize with “nyika” (Nymphaea petersiana), an indigenous root tuber that grows abundantly in the wild in the extensive swamps of the lower Shire River in Chikwawa and Nsanje Districts. They have commonly been used as sources of food in times of famine and/or poor harvests, but when not cooked and processed correctly, can cause digestive problems, especially in children.
There were no reports of households taking out loans to cope with the effects of the drought, as interviewees indicated that small-loan facilities were either non-existent or had failed due to non-payment from members affected by poor harvests. A number of women in the communities visited by the team also indicated that they belonged to saving and loan groups but admitted to having loans averaging MWK 25,000 that they all had failed to repay, mostly because of the effects of
FIGURE 17: A BOWL OF NVIKA BEING SOLD AT A LOCAL MARKET IN NSANJE
MALAWI PDNA | 49
the drought. In addition, men in T.A. Lundu indicated that most village savings and loans had stopped operating owing to non-repayment of loans. As one male FDG participant explained: “We started with one group in 2013, and by 2014, we had 12 groups that were started by the evangelical association. However, all but one group has died owing to non-payment of loans”.
7.4 Social Relations and Cohesion
“Family relations, care, support, and love for each other are slowly dying, as each family member is struggling to survive on his own.”
Group Village Head, Million
All FGDs with both women and men indicated that the drought, and food insecurity in particular, are negatively affecting social relations and family units in their communities. In TA Mulilima for instance, 10 out of 13 participants indicated that their husbands had abandoned them. In Tidzola village of TA Lundu in Chikwawa, village statistics showed more female-headed than male-headed households (235/218). Women also highlighted instances of family disputes due to stress over food leading to violence towards them. For instance, a female FGD participant in TA Kasisi shared her experience, “When I told my husband that there was no food and that I wanted to give the little that we had to our child, he beat me up severely telling me that I had stopped caring for him”. Some participants also mentioned increased conflicts between husbands and wives over land usage. Child Protection Extension Workers also reported an increase in the number of young girls (12-18 years old) being married off by families seeking or freeing up resources to cope with the drought. The drought has also increased the vulnerability of female and child-headed households. During an FDG in the Million village, a Child Head of Household (17 years of age) indicated that she would likely drop out of secondary school and get involved in commercial sex in order to be able to continue caring for her siblings. Some young people also admitted to having resorted to theft from neighbors’ gardens and fields in order to feed themselves – often leading to disputes between families.
“Men are continuously leaving the responsibility of looking after kids to women. Most of them will hide money they gain from piecework and use it to buy food they eat at trading centers before they reach home. They feel like the money will not be enough to feed the whole family so they just eat alone.”
Female FGD Participant
In terms of social cohesion, substantial changes in inter-group relationships and in community dynamics are directly attributable to the drought. Drought has caused lapses in customs practices, especially those requiring food. Female and male FGD participants also all indicated that food insecurity is changing their communities’ social cohesion dynamics. Some have blamed the drought and food insecurity for decreased church attendance and offerings. Participants reported that even funeral ceremonies are being cut short and if food is available, it is only given to the gravediggers.

MALAWI PDNA | 50
7.5 Community Needs for Drought Management
The provision of food relief has yet to reach the majority of communities included in the SIA, but CSOs and private sector foundations present in selected areas have brought in significant relief. Existing social cash transfers and cash-for-work programs funded by the Local Development Fund and other international organizations are helpful but inadequate to address the growing needs of communities affected by the drought.
Immediate community needs for recovery emerging out of discussions with communities focus on food assistance and distribution to communities and repair and/or provision of community infrastructures, such health centers, schools, as well as increased availability of maize. In the medium to long-term, communities consulted during the SIA suggested the repair/establishment of water harvesting and irrigation facilities (treadle pumps, solar irrigation systems, etc.); agriculture extension services for crop diversification, organic manure manufacturing, and inputs for the next planting season; access to small loans, business management and vocational training, and recreational facilities for the youth, including psychosocial support services. There were also suggestions for additional coverage for social cash transfers and food-for-work programs.
To undertake the suggested recovery interventions, it is recommended that
• food assistance/relief coordination should make use of the existing traditional authority (village and group village heads) structures for better targeting of needy communities and community members;
• efforts should be made to make ADMARC distribution centers more accessible and safer for women since they are the ones doing the bulk of maize purchases;
• extension workers should provide a combination of improved training and technical assistance to assist households’ transition to more diversified livelihoods;
• special attention should be given to (rural) women, who are likely to require different types of skills and learning curriculum if they want to move into different occupations to diversity their livelihoods options and strengthen their resilience to future droughts. In addition, given their heavy workloads, the manner in which training or technical support will be delivered will need to be adapted to both men and women’s schedules to ensure both are able to benefit equitably from these opportunities;
• more detailed needs assessment would be required to identify exact numbers of beneficiaries through the existing local government structures in the affected districts. Existing training budgets from the MoAIWD and those from the Ministry of Gender, Children, Disability, and Social Welfare could be re-programmed with minimal additional costs and technical assistance provided through the current network of extension workers.
7.6 Gender Analysis and Mainstreaming Recommendations
7.6.1 Gender Analysis
Women and children, particularly girls, were disproportionately affected by the drought as the loss of livelihoods is impacting existing gender roles, thus increasing their vulnerability and socio-economic burden. Increased risk of physical insecurity for women and girls due to constantly augmenting travel distances to collect firewood and other resources is heightening their vulnerability, safety, and security. In addition, they are being forced to seek negative coping mechanisms (commercial sex work, sex for food, and etc.) due to their high levels of illiteracy, historically low status in society, and limited role in decision-making. These negative coping mechanisms are leading to increased risk of

MALAWI PDNA | 51
gender-based violence, including sexual exploitation and abuse, and early marriage and early pregnancy in these areas. Social Affairs Extension Workers and the youth across all three districts confirmed this trend during interviews.
“Our girls are always out. When coming home they do bring some jumbos (grocery bags) with foodstuffs. Our fear is infectious disease. We do suspect that they do engage in prostitution because they do not explain their sources of income.”
Group Village Head, Namila
7.6.2 Gender Mainstreaming Recommendations
a. Social Impact Assessment
The SIA has confirmed that women and children have been the hardest hit and the drought is impacting gender roles in the agricultural sector. Despite women’s central role in agricultural production in Malawi, in both the formal and informal agriculture sector, limited land ownership by women and their role in decision-making over income and finance makes them especially vulnerable during the drought. Gender roles in agricultural production are different in each community of Malawi. In general, men control cash crop farming like cotton, tobacco18, and commercial maize farming while women control subsistence farming, which includes maize, pigeon peas, and millet. Although women make up the bulk of the agricultural labor force19 in cash crop farming, women interviewed confirm they often have little or no control in decisions to sell produce and have limited access to markets, making it hard to sustain household food security.
As a result, women have limited access to extension services20, credit, or to the selling or marketing of produce. Reported cases of drought-induced male household abandonment compound this situation, because women are then unable to access such services or markets. A number of women interviewed stated that some men are not sending money or resources home after they find alternative livelihoods in urban areas, increasing the economic and social burden on women. As men migrate and move to urban areas for work or engage in informal mining, such as in Nsanje, women take on the full responsibility of feeding households, caring for the elderly and the sick, and in many cases have to seek high-risk survival strategies, including begging, transactional sex and prostitution.
Women in the affected communities must be central to building the resilience of communities, and gender equality and women empowerment must be actively promoted. Without this, building resilience of communities to future disasters will be difficult to achieve. The PDNA must ensure that all short, medium and long-term economic recovery programs are sensitive, respond to the needs of both women and men, and do not increase the risks for women. They must address the above-mentioned issues, and ensure a sustainable recovery for all from the drought. Special efforts must also be made to promote women’s participation in planning DRR measures. PDNA recovery frameworks must also be
18 In Malawi, the gender gap in agricultural productivity is estimated at 28 percent, which is higher than Tanzania (16 percent ) and Uganda (13 percent). Among the contributing factors is the differential in cultivation of cash crops, with 3 percent for women and 10 percent for men (tobacco).19 Differential in access to male family labor explains 45 percent of the estimated gender gap in agricultural productivity in Malawi (World Bank, UN Women and UNDP, 2015).20 More men (18 percent ) compared to women (14 percent ) access agricultural extension services in Malawi (Gender and HIV and AIDS, 2012).
MALAWI PDNA | 52
aligned with existing government sector policies, including gender policies that aim to reduce gender discrimination and its impact on economic growth.
b. Gender Mainstreaming in Relief Operations
In the initial relief stage, consultations on gender-specific relief will need to be held as women report discrimination and lack of opportunities to leverage most relief interventions. For example, women in the visited villages reported that the cash for work scheme tend to be very labor intensive and focused on heavy work usually done by men. As a result, women believe that they are not able to benefit much from these programs, and thus may be unable to access these temporary work opportunities, particularly during the relief and recovery periods. Moreover, gender-disaggregated data was mostly not collected and this will likely make targeted support more challenging unless these recommendations are mainstreamed into relief operations. Single or female-headed households have reported discrimination during food distribution processes carried out by male-dominated food distribution committees. It was also noted that nursing and expectant mothers were disadvantaged as they could not queue for food and relied on other women to get them the food allocation or share what they got. Moreover, there is a risk of women’s voices being absent from high-level decisions and coordination of government’s response to the disaster. Implementing agencies should be using gender-sensitive approaches for disaster relief. The distribution of support, such as seeds and inputs for farms or cash for work programs will need to take into account gender-specific needs. For example, the training on disaster risk mitigation should specifically include a gender dimension in the planning and mitigation sessions.
In the initial relief stage, consultations on gender-specific relief will need to be held as women report discrimination and lack of opportunities to leverage most relief interventions. For example, women in the visited villages reported that the cash for work scheme tend to be very labor intensive and focused on heavy work usually done by men. As a result, women believe that they are not able to benefit much from these programs, and thus may be unable to access these temporary work opportunities, particularly during the relief and recovery periods. Moreover, gender-disaggregated data was mostly not collected and this will likely make targeted support more challenging unless these recommendations are mainstreamed into relief operations. Single or female-headed households have reported discrimination during food distribution processes carried out by male-dominated food distribution committees. It was also noted that nursing and expectant mothers were disadvantaged as they could not queue for food and relied on other women to get them the food allocation or share what they got. Moreover, there is a risk of women’s voices being absent from high-level decisions and coordination of government’s response to the disaster. Implementing agencies should be using gender-sensitive approaches for disaster relief. The distribution of support, such as seeds and inputs for farms or cash for work programs will need to take into account gender-specific needs. For example, the training on disaster risk mitigation should specifically include a gender dimension in the planning and mitigation sessions.

MALAWI PDNA | 53
TABLE 17: RECOMMENDATIONS FOR A GENDER SENSITIVE RECOVERY FROM THE DROUGHTSector Short, Medium and Long Term
Social Protection and Safety nets
- Any planned social safety-net measures (cash transfer) that target vulnerable groups, should also be targeted at women and girls, in particular female and child - headed households. They should however be linked to longer-term programs that provide life skills and build the confidence of women and girls, thereby reducing their dependence on sexually exploitative opportunities as alternative sources of livelihoods.
- Existing social protection programs for vulnerable children and the elderly should be expanded to ensure all vulnerable drought affected families receive support, thereby reducing family separation.
- There is also a need for protection programs in drought-affected areas, (Prevention, psychosocial, legal and medical) particularly for girls and women who fall victim to sexual exploitation and sexual violence as they seek for coping mechanisms during the drought.
- The role of government Gender Officers in drought affected services needs to be increased and training of police on how to deal with cases of SGBV is critical.
- Increased investments to life skills for young and adolescent girls affected by the crisis (school drop outs, victims if SEA and GBV).
- Sexual and reproductive health education, services and awareness to women and adolescent girls are essential, and access to these services must be urgently addressed.
- Targeted economic and livelihood options to vulnerable female headed households and survivors of violence.
Livelihood Restoration Programmes
- A gender analysis must be central to the design of recovery programs in all sectors, to exnsure they meets the needs of men, women, boys, and girls, for better delivery of planned initiatives.
- The participation of both men and women in the identification of priority recovery interventions is critical, so that these are cognizant to their individual capacities, coping mechanisms, thereby mitigating further risks and vulnerabilities.
- All programs should take note of changing gender roles in the targeted communities and to put strategies in place to address these roles without further burdening men, women and boys and girls.
- Programs that target women’s livelihood, must also ensure that men are involved and aware of initiatives, to ensure programs do not negatively impact on gender relations within the household, and increase risks to women.
All Sectors Interventions
- Initiatives such as those to support farm workers in drought affected areas, including the provision of inputs, irrigation facilities, and training, must take into account the primary role of women farmers in agricultural production in Malawi, and ensure that women and young people are targeted accordingly.
- Ensure that all agricultural training and extension services are given to communities (with equal participation of men and women) and do not just engage with landowners who are predominantly men.
- Any initiatives to boost agricultural production must respond to women’s limited role in decision-making and empower them (community focused recovery projects), as community driven programs including men and women will mitigate discrimination against women.
- Agricultural technologies and veterinary services for livestock need to also target women, boys and girls.
- Cash for work programs for example, should be used to encourage men and young men to return to the agricultural farm as work is created by the recovery initiatives.
- Socio-cultural issues have great bearing on the decisions especially with regard to the girl and boy’s education. It is therefore important that program design takes into account community cultural aspects to ensure that programs designed meet the needs of different socio-economic groups in targeted communities.
MALAWI PDNA | 54
MALAWI PDNA | 55
The formulation of a recovery strategy should take into consideration that the drought hit the country right around when it was on the heels of recovering from the impacts of the devastating floods of 2015. The occurrence of these two events in such a short time span has further undermined the coping capacity of the affected population and increased their vulnerability to future shocks. The underlying principle of the PDNA is that the recovery interventions will complement and build on existing strategies and programs in order to limit the duplication of efforts but rather create synergies among the different ongoing interventions and relevant stakeholders in order to maximize impact. Consistent with the above, the recovery interventions articulated in this PDNA are also fully aligned with sector development and investments plans. In so doing, the PDNA Recovery Strategy will concurrently provide guidance for the re-programming of existing initiatives to areas where the strengthening of programs is required and identify “gap areas” not already being covered by current and pipeline activities where the development of new interventions is necessary.
The Government of Malawi is adopting a risk-reduction and people-centered approach to drought recovery with the vision of strengthening the resilience of the population and promoting sustainable development. The goal of this Drought Recovery Strategy is not only to promote recovery from the current drought but also to encourage the adoption of risk-reducing measures that mitigate the impact of future drought events. This approach is in line with the Government’s Breaking the cycles of food insecurity in Malawi for greater development impacts plan, which is currently being developed under the leadership of DoDMA as the National Resilience Strategy for Malawi. In fact, the recovery interventions identified by this PDNA are in full alignment with the plan’s overall objective to “help make Malawi resilient to disasters and break the cycle of food insecurity”, and directly linked to the three broad objectives of the plan to: (i) promote irrigation for food security and nutrition and drive export; (ii) reduce the effects of floods and occurrence of drought; and (iii) enhance effective EWSs.
8. DROUGHT RECOVERY STRATEGY

MALAWI PDNA | 56
The PDNA Recovery Strategy is also complementary to and builds on the 2016/2017 Food Insecurity Response Plan (FIRP) that the government has developed in collaboration with the UN and that was launched on June 28, 2016. While the FIRP’s objective is to address the humanitarian needs generated by the crisis and set the basis for recovery, the PDNA focuses more on those medium to long-term measures that will ensure the full recovery of the affected population and support resilience building. Such strategic alignment between the FIRP and PDNA ensures that there are no critical overlaps between the two plans and that no gaps remain uncovered. The Government of Malawi and its partners recognize that the recovery has to be a multi-sectorial and multi-pronged effort. Therefore, interventions will be planned and implemented simultaneously in all those sectors and aspects of life that have been affected by the drought according to the level of impact of the event. While the government will lead the recovery, this process will also be supported by other stakeholders of Malawian society, including the private sector, NGOs, philanthropic organizations and international partners, including bilateral agencies and INGOs. The PDNA sectorial assessments identify the recovery needs and strategy for each affected sector and provide the basis for developing detailed recovery interventions. The overall recovery strategy is outlined in this chapter, including guiding principles, key stakeholders, institutional framework, geographical coverage and timeline, sector strategies, and next steps after the PDNA. Priorities in the interventions need to be established on the basis of the resilience of the districts in terms of differences in poverty and vulnerability, in addition to the degree of effects that they have suffered.
8.1 Guiding Principles for Recovery
The recovery strategy will be guided by a number of principles aimed at improving the quality and impact of recovery, emphasizing equity and inclusion, and promoting risk reduction. These guiding principles are as follows:
• Integration of DRR concerns in all sectorial recovery initiatives with the aim of building back better;
• Implementation of the recovery interventions in a way that links them to both the humanitarian efforts and to ongoing development policies and interventions in order to promote resilience;
• Prioritization of people-centered interventions and community inclusion and use of local knowledge and skills. This principle further promotes community participation in all aspects of the recovery process and encourages community decision-making, ownership and empowerment to ensure solutions are locally appropriate;
• Focus on the most vulnerable and most affected socially disadvantaged groups such as children, women/female-headed households, HIV/AIDS affected population and the disabled. Disasters increase the vulnerability of all, but especially of those who are already disadvantaged;
• Addressing underlying vulnerabilities and risks in order to be able to create lasting impact for drought-affected communities. Recovery will also provide an opportunity to reduce the vulnerability of women and increase gender equality;
• Strengthening people’s livelihoods by restoring capacities and capabilities and creating assets and skills for the people affected by the disaster as a way of reducing their vulnerability and promoting their resilience towards future shocks;
• Ensuring the inclusion of sustainable environmental considerations in all investments and interventions;
• Strengthening national capacities in preparedness and response and in planning and managing the recovery process;

MALAWI PDNA | 57
• Clear communication and transparency within government at all levels and with the affected population;
• Integrity, transparency, and accountability in the management of funds made available for recovery;
• Promotion of coordination among all sectorial ministries and relevant partners involved in recovery.
8.2.1 Increasing Productivity in Agriculture and Irrigation Development
The agriculture sector – including rain-fed crops, livestock and fisheries – accounts for 70 percent of the total effects caused by the drought. This percentage increases to 79 percent if irrigated crops are included (assessed under the irrigation sector in this report). Considering the key role of this sector as the provider of livelihoods and food, agriculture and the necessary irrigation are primary areas of recovery.
The objective is to increase productivity and sustainability of the sector by promoting diversified and climate-smart agriculture and enhancing irrigation, both through infrastructure development and intensified use of dry season crop production, to bring more cultivated area under assured irrigation. Crop diversification will have the additional benefit of reducing the degradation of agricultural land and sector diversification will also include increased promotion of livestock and fisheries as a source of livelihoods and food. These measures will also be accompanied by increased investments in research and promotion of new sustainable technologies as well as market development. In the long term, it is hoped that this integrated approach will diminish the reliance on rain-fed agricultural production with little diversification considering the exposure of such crops to climate variability and that it will expand people’s livelihood and food sources.
FIGURE 18: STRATEGIC PILLARS OF DROUGHT RECOVERY

MALAWI PDNA | 58
8.2.2 Improving Food Security, Nutrition and Health Services
The most immediate need is the guarantee of food availability. The recovery interventions for food security will therefore first prioritize the availability of food through the import of food commodities and their distribution to the population. However, in order to guarantee the sustainability of the recovery and resilience building for food security, the sector will rely on the recovery interventions of sectors such as agriculture in increasing food production and availability as well as larger sectorial interventions in expanding livelihoods options for vulnerable people and increasing their purchasing power for better accessibility. Additionally, encouraging change in food consumption will also be a key intervention under the food security sector as food habits will be critical to improve food utilization of Malawians and their nutrition levels. A nation-wide communication campaign will be implemented, building on existing efforts targeting specific groups such as farmers, mothers, and children in school that are being implemented by relevant sectorial ministries. Nutrition and health conditions are directly linked to food insecurity and are being severely affected by the drought. Although malnutrition is a chronic issue in Malawi, it is observed that the ongoing drought has resulted in increases in malnutrition levels. While emergency needs are addressed by the FIRP, the PDNA Drought Recovery Strategy recognizes the need for continuing regular interventions for reducing malnutrition, such as the provision of treatment for acute and moderate malnutrition as well as the need for the expansion of school meals programs. Additionally, long-term improvement and resilience building for nutrition will require increasing the support to existing health systems and policies. Therefore, the nutrition recovery strategy will also concentrate on the promotion of nutrition-sensitive programs in collaboration with the food security and agriculture sectors, nutrition education, and strengthening surveillance and EWSs for improved timeliness of treatment and prevention.
The health sector’s first recovery priority will be to address the demands of an increased patient inflow in the drought-affected areas due to a higher incidence of vector-borne diseases and infections resulting from lowered hygiene standards connected to to water scarcity. However, the sector will also concurrently implement a more comprehensive plan aimed at strengthening the capacity in provision of services and continued treatment, particularly for vulnerable groups, and disease surveillance for better prevention and early mitigation of risk factors.
8.2.3 Enhancing People’s Capacity to Withstand Risk and Building Resilience
The objective of social protection is to help households manage risks and cope with adverse events. Social protection programs have been established in Malawi but they are still at an initial stage and have limited coverage. Following the drought, Malawian households have been facing food and income shocks resulting in a greater need for social protection. Excluding food support under the food security sector, social protection interventions comprise the largest need (more than 20 percent) and span across the social protection and agriculture sectors. The Drought Recovery Strategy seeks to promote the adoption and expansion of social protection where it is absent or where coverage and levels of benefits are low in terms of social assistance and work-related measures. The social protection interventions proposed under the PDNA include: (i) social cash transfers (under social protection); (ii) public works – cash-for-work programs (under social protection); and (iii) public works – input-for-assets programs (under agriculture). While sustaining their recovery from the drought, these interventions are expected to reduce the vulnerability of Malawians in the long term and strengthen their ability to withstand future shocks.
MALAWI PDNA | 59
8.2.4 Strengthening Water Resources Management and Enhancing Water SupplyThe objective of recovery in the water sector is to improve water resources management to ensure the adequacy of water availability and address the challenges posed by seasonal variability in run-off, increased population, and industrial production and irrigation requirements. Structural measures will focus on the rehabilitation and/or construction of water infrastructure as well as improving capacity in watershed management and water conservation through the promotion of water harvesting for both surface and rain water. These measures will enhance ongoing sector policies and programs aimed at encouraging the improved management and sustainable use of water resources. An equally important goal of the sector recovery strategy will be to increase water availability and accessibility to the population through the construction of emergency boreholes, the rehabilitation of existing boreholes that have dried due to the drought, and the construction of new transmission pipelines to affected communities.
8.2.5 Strengthening Disaster Risk Reduction and Drought Resilience DRR has been mainstreamed throughout interventions across all sectors. However, in view of the key role that the national disaster management system plays in providing directions to risk reduction interventions of the country and support all sectors in doing so, a separate detailed strategy for this sector and its specific contribution to drought risk mitigation has been prepared.
8.2.6 Integration of Gender Concerns into all Recovery Interventions For recovery interventions to be successful and effectively contributing to resilience building, it is essential that all programs are gender sensitive and respond to the needs of both women and men and, equally important, do not increase risks for women. Special efforts must also be made to promote women’s participation in planning with regard to DRR measures and to use this recovery as an opportunity to promote empowerment of women and gender equality. Recommendations to this end are provided in the Human and Social Impact Chapter of this report.

MALAWI PDNA | 60

MALAWI PDNA | 61
9.1 Mainstreaming and Adequate Resourcing of the DRR Agenda
DRR is a key cross-cutting theme for drought recovery across all sectors, but for it to be more effectively and sustainably implemented in the medium to long term, it needs to be meaningfully mainstreamed across broader sector policies and development planning. The upcoming drought response provides an opportunity and potential impetus for such mainstreaming and implementation of the DRR agenda, as it is already embedded in key strategies, policies and frameworks in Malawi such as the Malawi Growth and Development Strategy 2011-2016 (MGDS II), the Disaster Preparedness and Relief (DPR) Act of 1991 and the 2015 National Disaster Risk Management (NDRM) Policy.
Building the capacity of the national DRR system21 and providing it with the necessary financial resources and implementation capacity will be critical towards the effective implementation of Malawi’s overall DRR strategy, as well as the drought-focused risk reduction measures proposed in this assessment. The institutional framework for DRR is comprised of the Secretary to the Vice President and Commissioner for Disaster Management Affairs, the National Disaster Preparedness and Relief Committee (NDPRC), Civil Protection Committees (CPCs) and DoDMA, which were created through the DPR Act of 1991. Without commensurate financial and implementation resources, the existing DRR-related institutional and policy frameworks will not be able to extend the support needed to pull Malawi out of the vicious cycle of droughts and floods in the years to come.
21 The DRR system comprises national institutions specifically responsible for DRR, national policies on DRR, and specialized emergency response institutions.
9. DISASTER RISK REDUCTION, RISK FINANCING AND DROUGHT RESILIENCE

MALAWI PDNA | 62
9.2 Performance of the Disaster Risk Reduction System and Lessons Learnt from the Drought Event
The DRR system in Malawi did not experience direct damages and losses caused by the drought, but it has encountered challenges and the drought response will increase demands on the system. Losses incurred by mechanisms contributing to the DRR system have been computed under the respective sectors. However, the recovery from the drought will entail more demand for and pressure on the DRR system as affected households and communities endeavor to recover and build their resilience. This increased demand will be associated with increased costs for the system.
MALAWI PDNA | 63
Malawi could benefit from improved early warning, risk identification, and risk assessment systems. The key challenges experienced in the area of early warning, risk identification, and risk assessment include: (i) inadequacy of existing monitoring tools in terms of restricted data availability for specific locations, such as the lack of evaporation monitoring plans; (ii) outdated, dysfunctional, and insufficient equipment and processes for gathering early warning data leading to poorly integrated and limited information; (iii) unreliability of the EWSs, including inconsistent dissemination of information and lack of capacity to trigger the relevant actions; and (iv) inadequate coordination between stakeholders involved in early warning, risk identification, and risk assessment.
Emergency preparedness needs to be drastically strengthened and contingency plans need to be updated, reviewed, exercised, and better aligned to the budget cycle. The Multi-hazard National Contingency Plan is annually reviewed to consider the prospects of a particular rainy season. District multi-hazard contingency plans have also been developed in the 15 disaster-prone districts. However, some of the district contingency plans are not reviewed annually as required and, currently, the following 13 districts do not have up-to-date contingency plans: Ntchisi, Lilongwe, Dowa, Mwanza, Neno, Mzimba, Kasungu, Mchinji, Mulanje, Chiradzulu, Thyolo, Likoma and Chitipa. A critical issue in the development and review of the national contingency plan is that this is generally done at the onset of the rainy season in September or October, by which time the national budget has been already approved. The unavailability of a direct allocation of funds to the plan makes resources to be requested dependent upon the “National Disaster Appeal Fund”, a process that does not guarantee adequate and timely disbursement of the resources required to operationalize the plan. Furthermore, the contingency plans are rarely tested and strengthened through execution of scheduled emergency simulations and drills. DRM structures such as the CPCs exist at the district, area and village levels to undertake preparedness, response, and recovery interventions. However, the lack of adequate capacity and resources to support the implementation of the activities has been a limiting factor.
The response capacity could benefit from more dedicated sources of domestic funding, better coordination and strengthened Emergency Operations Centers (EOCs). The unpredictability and inadequacy of funds specifically for preparedness and response further hampers the response capacity as the country perpetually relies on the financial support of the international community. Sometimes, there are considerable delays in responding to disasters due to delayed and inadequate funding, logistical limitations, and limited capacity in assessment. Disaster response is also affected by the lack of adequate coordination, which results in the duplication of efforts, among other problems. Furthermore, not all stakeholders that have clear DRM responsibilities carry out disaster preparedness, response, and recovery roles, with most of them mainly focusing on response. While EOCs were established during the 2015 floods, there is still no fully equipped physical EOC, and centers mostly operate on an ad hoc basis with limited space to accommodate all the necessary officers performing all the necessary functions of standard EOCs.
Disaster recovery could be improved through a more systematic, multi-sectoral approach modeled on the recovery to the 2015 floods. Response operations do not generally translate into long-term recovery interventions. Besides the provision of immediate livelihoods support, interventions are typically planned in an emergency “single-dose” mode and fail to produce any long-lasting results or build resilience of the affected population. With the exception of the 2015 floods, systematic planning of multi-sectoral recovery interventions is generally missing, as is the coordination of interventions among different actors involved, further hampered by the lack of an established monitoring mechanism for ongoing interventions. Finally, the absence of guidelines defining clear roles and responsibilities and providing guidance on how interventions should be planned and their related standards makes it more difficult for government officials to effectively engage in this area, especially at the district level where capacities are most limited.
MALAWI PDNA | 64
The current National Disaster Recovery Framework (NDRF) set up for the 2015 floods can be explored as a mechanism for the drought and future recovery efforts. In response to the 2015 floods, the Government of Malawi led a PDNA that recommended a multi-sectoral approach to recovery. As a follow up to the PDNA, DoDMA led the development of a NDRF to guide the implementation of recovery interventions. Since the launch of the NDRF in October 2015, DoDMA has mainstreamed it in the implementation of the Malawi Floods Emergency and Recovery Project (MFERP) recovery activities across all 15 disaster-affected districts. It has also incorporated the NDRF as a central tool for prioritization of flood recovery interventions. Additionally, DoDMA’s efforts to disseminate and mainstream the NDRF at the national and district levels are improving coordination, oversight mechanisms, financial management systems, and implementation processes for recovery.
Inadequate institutional and legal frameworks have impacted the integration of DRR concerns into development strategies and programs. The Preparedness and Relief Act enacted in 1991 is not comprehensive enough as it only makes provision for response measures to be taken once a disaster has occurred. The institutional set up of the country remains in fact mostly geared to response and it has not supported a shift from a culture of response to a culture of preparedness and risk mitigation. Additionally, the Preparedness and Relief Act is by now outdated as it does not adequately address the emerging needs for DRR and climate change adaptation (CCA), and it does not provide guidance on the integration of these two. The Act is however undergoing a review to ensure alignment to the recently approved NDRM Policy, which in turn prioritizes the need to reduce disaster risks and their underlying factors. Nonetheless, there has been limited investment in the medium to long term toward this goal, and although a number of additional policies, regulations, and frameworks have been developed, there has been laxity in enforcement. Moreover, most initiatives in this regard have been on pilot basis, over a short project life span with low geographical scope, and are thus unsustainable. Given the absence of dedicated regular funds for DRR, most ongoing DRR activities are supported by short-term funding arrangements and suffer from a lack of continuity.
DRR capacities and coordination functions need to be improved at the national, and sub-district levels. A main challenge for DoDMA in carrying out its mandate is the inadequacy of human resources. Each of the two divisions has five technical personnel based at the Department’s headquarters in Lilongwe. At the local authority level, only 11 out of the 28 districts in the country have DRM officers that are directly responsible to DoDMA whereas the other districts only have desk officers on delegated authority from other sectors. Furthermore, the positions for the ADRM officers are non-established and not permanent. DRR capacity is skewed towards technical personnel at the national level as DRR knowledge and skills are still lacking at the district and sub-district levels and there have been inconsistent capacity building programs. The district and sub-district level institutions experience the following challenges in the provision of DRR support: (i) limited knowledge and skills to integrate and execute DRR in programs; (ii) limited operational resources for DRR; (iii) limited availability of DRR personnel delegated from other line ministries at the district level rather than specialized DRR staff; and (iv) the contractual nature of the ADRM positions leading to discontinuity and frequent staff rotation.
9.3 Disaster Risk Reduction Strategy for Facilitating Resilient and Sustainable Drought Recovery
Strengthening the DRR system is an essential pre-condition for resilient recovery that generates sustainable and longer-term developmental outcomes. The recovery process should be used as an opportunity and catalyst to promote changes and improvements in how DRR is planned, organized, coordinated, and implemented in Malawi. Based on previous lessons learnt and on an analysis of the challenges of its DRR system highlighted by the recent drought, the Government of Malawi has developed a four-pronged strategic approach to further strengthen the DRR system. These include short, medium and long-term interventions in the areas of: (i) strengthening the EWSs, promote risk
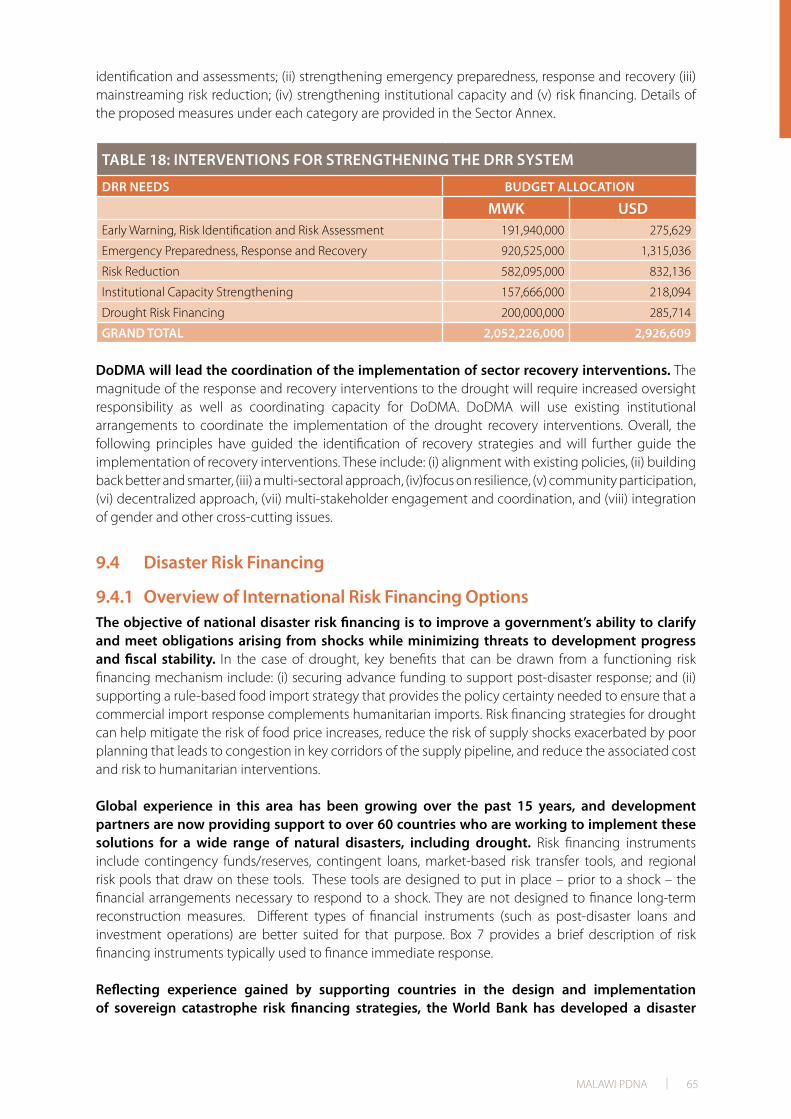
MALAWI PDNA | 65
identification and assessments; (ii) strengthening emergency preparedness, response and recovery (iii) mainstreaming risk reduction; (iv) strengthening institutional capacity and (v) risk financing. Details of the proposed measures under each category are provided in the Sector Annex.
TABLE 18: INTERVENTIONS FOR STRENGTHENING THE DRR SYSTEM
DRR NEEDS BUDGET ALLOCATION
MWK USDEarly Warning, Risk Identification and Risk Assessment 191,940,000 275,629
Emergency Preparedness, Response and Recovery 920,525,000 1,315,036
Risk Reduction 582,095,000 832,136
Institutional Capacity Strengthening 157,666,000 218,094
Drought Risk Financing 200,000,000 285,714
GRAND TOTAL 2,052,226,000 2,926,609
DoDMA will lead the coordination of the implementation of sector recovery interventions. The magnitude of the response and recovery interventions to the drought will require increased oversight responsibility as well as coordinating capacity for DoDMA. DoDMA will use existing institutional arrangements to coordinate the implementation of the drought recovery interventions. Overall, the following principles have guided the identification of recovery strategies and will further guide the implementation of recovery interventions. These include: (i) alignment with existing policies, (ii) building back better and smarter, (iii) a multi-sectoral approach, (iv)focus on resilience, (v) community participation, (vi) decentralized approach, (vii) multi-stakeholder engagement and coordination, and (viii) integration of gender and other cross-cutting issues.
9.4 Disaster Risk Financing
9.4.1 Overview of International Risk Financing OptionsThe objective of national disaster risk financing is to improve a government’s ability to clarify and meet obligations arising from shocks while minimizing threats to development progress and fiscal stability. In the case of drought, key benefits that can be drawn from a functioning risk financing mechanism include: (i) securing advance funding to support post-disaster response; and (ii) supporting a rule-based food import strategy that provides the policy certainty needed to ensure that a commercial import response complements humanitarian imports. Risk financing strategies for drought can help mitigate the risk of food price increases, reduce the risk of supply shocks exacerbated by poor planning that leads to congestion in key corridors of the supply pipeline, and reduce the associated cost and risk to humanitarian interventions.
Global experience in this area has been growing over the past 15 years, and development partners are now providing support to over 60 countries who are working to implement these solutions for a wide range of natural disasters, including drought. Risk financing instruments include contingency funds/reserves, contingent loans, market-based risk transfer tools, and regional risk pools that draw on these tools. These tools are designed to put in place – prior to a shock – the financial arrangements necessary to respond to a shock. They are not designed to finance long-term reconstruction measures. Different types of financial instruments (such as post-disaster loans and investment operations) are better suited for that purpose. Box 7 provides a brief description of risk financing instruments typically used to finance immediate response.
Reflecting experience gained by supporting countries in the design and implementation of sovereign catastrophe risk financing strategies, the World Bank has developed a disaster

MALAWI PDNA | 66
risk financing framework (see Figure 20) which recommends the use of multiple tools to design a National Disaster Risk Financing Strategy based on an approach that combines a mix of risk retention (through reserves/contingency budget and contingent credit) and risk transfer (such as insurance):
• Low risk layer: Budget allocations for recurrent disasters (e.g.; frequent droughts, localized floods, landslides, or minor earthquakes).
• Medium risk layer: Contingent credit mechanisms to finance less frequent, more severe disasters, and to allow a government to draw down funds quickly after an event.
• High risk layer: Market-based risk transfer instruments (e.g.: disaster insurance) to finance major disasters like earthquakes, tropical cyclones and serious droughts.
In the case of droughts, risk financing strategies need to be closely integrated with policies and investment decisions related to agriculture and food security. Governments concerned about the risk of drought-related impacts on national food security generally face challenges with (i) the inflationary impact of rising food prices and the pass-through of these costs to consumers, particularly vulnerable populations; (ii) the risk of financial losses and/or negative impacts on commercial markets associated with policy interventions managed by national food agencies, national food reserve programs, and protectionist trade policies; and (iii) the need to finance, but also to potentially supply, subsidies or social safety nets for vulnerable populations and, in extreme cases, humanitarian responses. In all cases, the financial costs of policy uncertainty become high in the midst of a crisis.
Reflecting experience gained by supporting countries in the design and implementation of sovereign catastrophe risk financing strategies, the World Bank has developed a disaster risk financing framework (see Figure 20) which recommends the use of multiple tools to design a National Disaster Risk Financing Strategy based on an approach that combines a mix of risk retention (through reserves/contingency budget and contingent credit) and risk transfer (such as insurance):
Box 6: Risk-financing instruments used to finance immediate response
• Post-disaster budget re-allocations involve re-assigning funds that have been programmed for other purposes to meet more immediate needs. While opportunity costs can be high, particularly if funds are not replaced and re-programmed, this is a fairly standard way of accessing the immediate liquidity needed to finance early response.
• Contingency / reserve funds are generally used to finance relief, rehabilitation, reconstruction and prevention activities for national emergencies.
• Contingent loans have been used by Multilateral Development Banks such as IBRD, and the Inter-American Development Bank (IDB), to give countries access to liquidity immediately following exogenous shocks such as natural disasters. This instrument provides a source of immediate liquidity, which can be used for budget support and/or to finance early responses. It has a “soft” trigger, as opposed to “parametric” triggers, and funds become available for disbursement after the declaration of a state of emergency due to a natural disaster and can be accessed within days
• Market-based risk transfer solutions, such as insurance, are financial contracts based on an underlying weather index that transfer the risk to the financial markets. In return for payment of a premium, countries are insured against the risk of adverse weather events as defined by the performance of the underlying index. Payments are triggered by adverse weather events according to pre-specified conditions of this index (e.g. levels of rainfall, seasonal temperatures, etc.).
• Regional risk pools are providing countries access to market-based insurance through a pool, thereby helping to lower the cost of insurance for individual countries. Examples include the Caribbean Catastrophe Risk Insurance Facility (CCRIF), the Pacific Catastrophe Risk Insurance Facility (PCRAFI), and African Risk Capacity (ARC). Regional risk pools are able to leverage insurance coverage from the market.
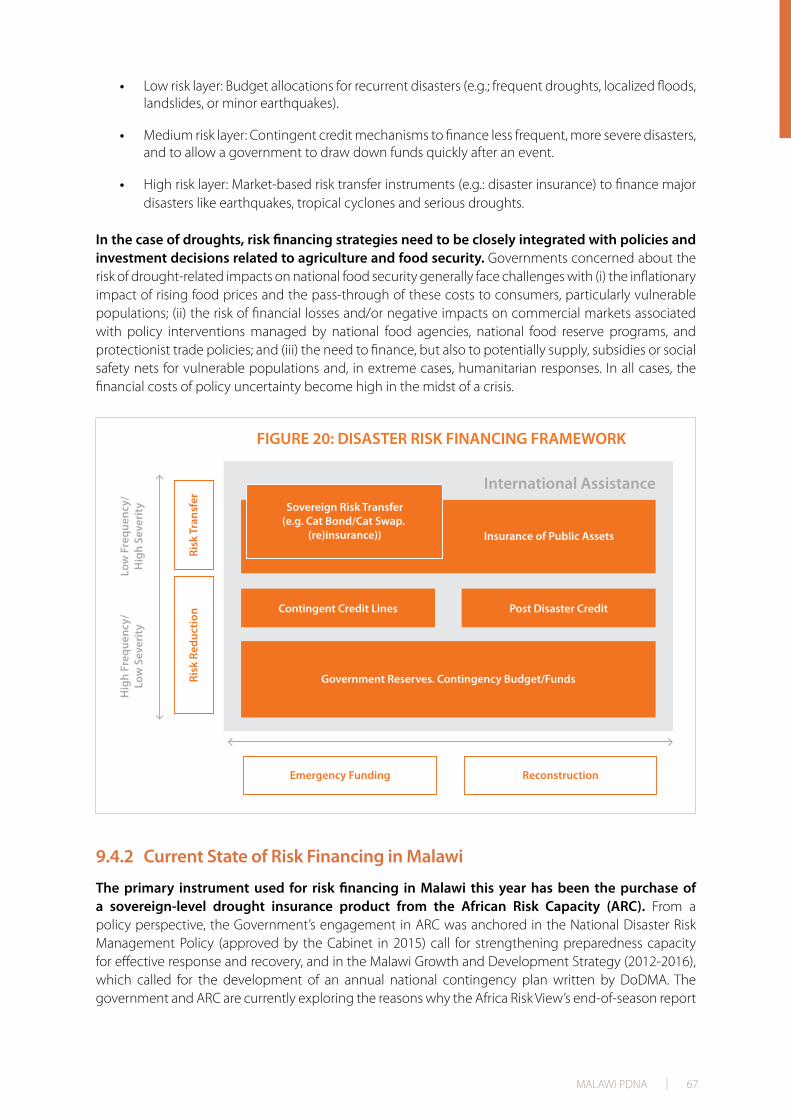
MALAWI PDNA | 67
• Low risk layer: Budget allocations for recurrent disasters (e.g.; frequent droughts, localized floods, landslides, or minor earthquakes).
• Medium risk layer: Contingent credit mechanisms to finance less frequent, more severe disasters, and to allow a government to draw down funds quickly after an event.
• High risk layer: Market-based risk transfer instruments (e.g.: disaster insurance) to finance major disasters like earthquakes, tropical cyclones and serious droughts.
In the case of droughts, risk financing strategies need to be closely integrated with policies and investment decisions related to agriculture and food security. Governments concerned about the risk of drought-related impacts on national food security generally face challenges with (i) the inflationary impact of rising food prices and the pass-through of these costs to consumers, particularly vulnerable populations; (ii) the risk of financial losses and/or negative impacts on commercial markets associated with policy interventions managed by national food agencies, national food reserve programs, and protectionist trade policies; and (iii) the need to finance, but also to potentially supply, subsidies or social safety nets for vulnerable populations and, in extreme cases, humanitarian responses. In all cases, the financial costs of policy uncertainty become high in the midst of a crisis.
9.4.2 Current State of Risk Financing in Malawi
The primary instrument used for risk financing in Malawi this year has been the purchase of a sovereign-level drought insurance product from the African Risk Capacity (ARC). From a policy perspective, the Government’s engagement in ARC was anchored in the National Disaster Risk Management Policy (approved by the Cabinet in 2015) call for strengthening preparedness capacity for effective response and recovery, and in the Malawi Growth and Development Strategy (2012-2016), which called for the development of an annual national contingency plan written by DoDMA. The government and ARC are currently exploring the reasons why the Africa Risk View’s end-of-season report
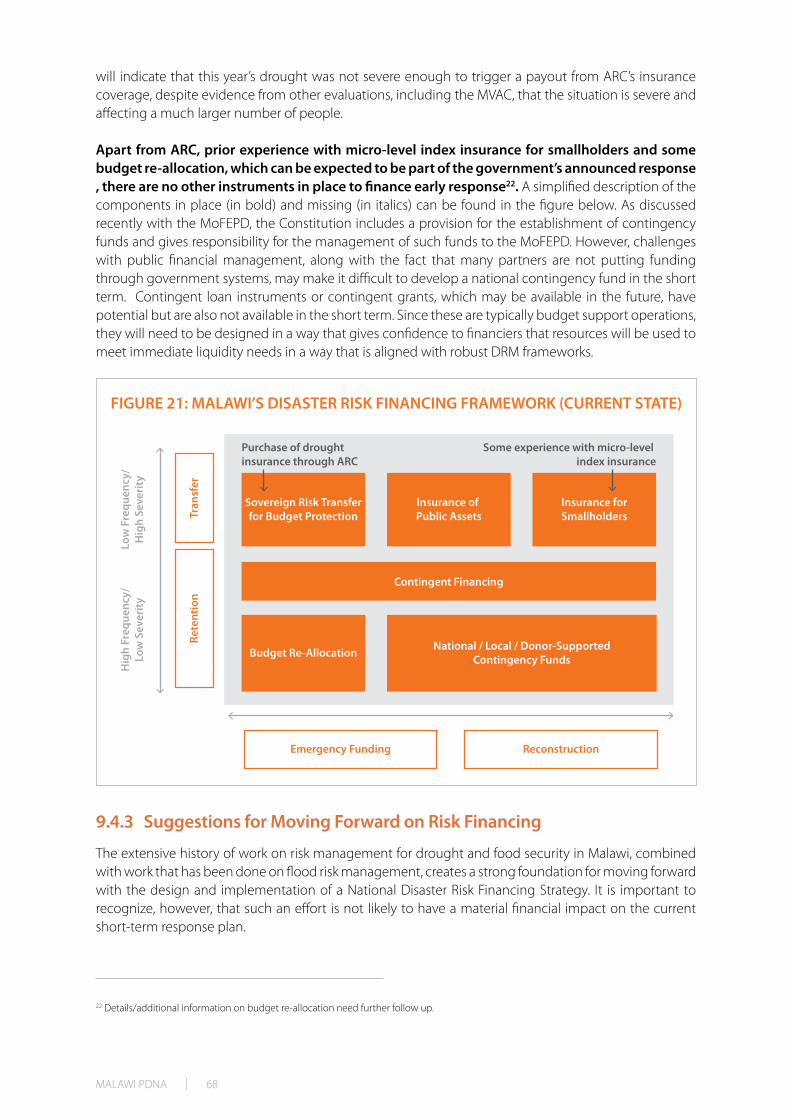
MALAWI PDNA | 68
will indicate that this year’s drought was not severe enough to trigger a payout from ARC’s insurance coverage, despite evidence from other evaluations, including the MVAC, that the situation is severe and affecting a much larger number of people.
Apart from ARC, prior experience with micro-level index insurance for smallholders and some budget re-allocation, which can be expected to be part of the government’s announced response , there are no other instruments in place to finance early response22. A simplified description of the components in place (in bold) and missing (in italics) can be found in the figure below. As discussed recently with the MoFEPD, the Constitution includes a provision for the establishment of contingency funds and gives responsibility for the management of such funds to the MoFEPD. However, challenges with public financial management, along with the fact that many partners are not putting funding through government systems, may make it difficult to develop a national contingency fund in the short term. Contingent loan instruments or contingent grants, which may be available in the future, have potential but are also not available in the short term. Since these are typically budget support operations, they will need to be designed in a way that gives confidence to financiers that resources will be used to meet immediate liquidity needs in a way that is aligned with robust DRM frameworks.
9.4.3 Suggestions for Moving Forward on Risk Financing
The extensive history of work on risk management for drought and food security in Malawi, combined with work that has been done on flood risk management, creates a strong foundation for moving forward with the design and implementation of a National Disaster Risk Financing Strategy. It is important to recognize, however, that such an effort is not likely to have a material financial impact on the current short-term response plan.
22 Details/additional information on budget re-allocation need further follow up.
MALAWI PDNA | 69
Additionally, the development of new products and tools, such as contingency funds or contingent loans, will take time and will therefore be more appropriate as part of efforts to build financial resilience over the medium and long term. Guiding principles for the development of such a strategy are included in the Box below.
Box 7: Guiding Principals for the development of a national Risk financing strategy
• A risk financing strategy for Malawi should draw on a number of tools and make an effort to crowd in solutions for better financial planning on the part of all stakeholders.
• Risk financing strategies for drought need to be part of the framework for agriculture and food security policy and investments, designed and supported by the existing Donor Committee on Agriculture and Food Security.
• Risk financing strategies for drought need to incorporate tools that support a rules-based approach to managing food imports in times of shortage. This is critical since the role of commercial imports is essential to food security. Commercial actors need certainty about what government and humanitarian and development partners are going to do; without it they will be unable to make the investments they need to make to buy and move food.
• A risk financing strategy for Malawi will need to involve pre-negotiated agreements with donors and partners. The costs of uncertainty, delay, and time needed to raise funding ex post are extremely high, particularly in the case of drought since food prices rise weekly in times of shortage.
• A risk financing strategy for Malawi will need to take into consideration a candid analysis of the difference between situations of chronic household vulnerability (populations which need support every year), chronic geographic vulnerability to floods/droughts, and exposure to more infrequent shocks. The costs of financial measures to provide support in each of these cases needs to be assessed independently, and then analyzed as part of a comprehensive approach.
• Risk financing strategies should recognize the interaction between drought and flood, and the contingency planning that is needed to manage the risk of one following the other (potentially in a constant cycle).

MALAWI PDNA | 70
MALAWI PDNA | 71
10. THE WAY FORWARD
10.1 Key Stakeholders
The government has played a leading role in conducting the PDNA and will be leading the development and implementation of the recovery interventions and facilitating the participation and coordination of all other relevant national and international stakeholders. The government will also ensure the management of the financial resources allocated to recovery and the monitoring of the outcomes of the interventions. The government will be involved through its sector-line ministries at both the national and district levels. District-level authorities will play a key role in the delivery of interventions at the community level. Such a responsibility would entail local governments to augment their capacity to take on additional roles. International partners present in Malawi will support the efforts of the government in the implementation of the recovery process as per their respective sector-specific roles. The government will ensure that these interventions are coordinated and that they align to existing government plans and strategies and that they do not duplicate and/or overlap with existing strategies.
10.2 Institutional Framework
The Government of Malawi will implement its drought recovery plan through relevant line departments, with a designated lead coordination agency in charge of coordination. The DRR elements will be coordinated by DODMA, as the Government of Malawi’s agency responsible for coordinating and directing the implementation of DRM programs in the country.
A monitoring and evaluation system will be established while building capacity to carry out this task. Line ministries will be implementing interventions in their own sectors and the MoFEPD will be managing the resources mobilized for the recovery interventions.

MALAWI PDNA | 72
10.3 Geographical Coverage and Timeline
The recovery plan will be implemented in all 24 drought-affected districts and will be prioritized based on impact proportionality and other criteria. In addition to these districts, certain components of the recovery interventions will be implemented at the national level. The timeframe considers the period that will be sufficient to complete the necessary short-term interventions in response to the current drought and medium to long-term measures aimed at strengthening the resilience of the people to future crisis with an overarching expected duration of three years.
10.4 Next Steps in Follow-up to the PDNA
• Programming Review: While the recovery interventions for each sector are articulated in the respective chapters, this PDNA recognizes that a more thorough analysis of existing interventions and programs in each of the assessed areas and of existing funding is required to avoid overlaps and the inefficient use of resources. Due to time limitations of this exercise, such an analysis could not be undertaken and it is recommended that the Government of Malawi leads this process upon the termination of the PDNA.
• Coordination: Going forward towards drought recovery programming, it will be important to ensure the harmonization between agencies involved in needs planning and execution and the government, coordinating and prioritizing fund flows. There is a need to bridge efforts from relief and recovery, and DRR and the organizations working in this area.
• Prioritization: The PDNA also recognizes that the analysis provided will support and inform the discussion on resilience building that the government is currently leading by providing further focus on areas that need to be prioritized to ensure sustainable development and resilience building in the country.
• Recovery Framework: A comprehensive drought recovery framework will need to be developed, in line with the guiding principles of this PDNA, with clear budgets and timelines for drought recovery activities.
• Monitoring and Evaluation: Clear results indicators and progress benchmarks can be established to evaluate success. A program level monitoring and evaluation framework for recovery will need to be developed to track the progress of implementation.

MALAWI PDNA | 73
ANNEX I: DROUGHT RECOVERY ACTION PLAN
TABLE 19: DROUGHT RECOVERY ACTION PLAN
INTERVENTION LEVEL OF ACTIVITY
TIMEFRAME
SUGGESTED INDICATORS
RESPONSIBILITY FOR
IMPLEMENTA-TION
COST (USD)
Short Term
Medium to Long Term
(Year 1)
(Year 2)
(Year 3 and
on-wards)
AGRICULTURE
Restore agriculture production National x
# inputs distributed# of farmers engaged
DCD 33,240,782
Provide livestock vaccination and veterinary care for sick animals
District x# animals vaccinated
DAHLD 1,415,241
Establish pasture District x# hectares planted
DAHLD 100,000
Construct animal watering points National x # watering points DAHLD 1,195,714
Conduct a research study to establish indicators on impact of drought on livestock
National xResearch report produced
DAHLD 100,000
Promote large & deep water pond technology
District x# model communal ponds established
Dept of Fisheries 117,143
Promote integrated aquaculture District x# model farms established
Dept of Fisheries 68,571
Provide extension services District x x x# services provided
MOAIWD 2,000,000

MALAWI PDNA | 74
Reduce risks of vulnerable farmers through crop diversification and bio-fortification
District x# inputs distributed
DCD (Department of Crop Development)
5,161,612
Development drought tolerant crop varieties
National x x# crop varieties developed
DARS 142,857
Promote small stock production District x# small stock distributed
DAHLD 3,741,423
Promote animal health surveillance systems
District x # staff trained DAHLD 1,397,143
Promote fish handling, processing and value addition
District x# fish handling and processing units established
DFOs 44,143
Build community capacity District x# training sessions
DFOs 42,857
Promote fish restocking District x# fingerlings of different fish species produced
DFOs 93,429
Promote Climate Smart Agriculture
District x # fields improvedDistrict Land Resources office
2,000,000
Promote multiplication of animal breeding in Government farms
National x# livestock procured
DAHLD 2,117,857
FOOD SECURITY
Engage commercial farmers to produce for the SGR
National x
# farmers engaged# MT maize produced
Ministry of Agriculture, Irrigation and Water Development (MOAIWD)
-
Import maize for humanitarian consumption by vulnerable population (375K MT)
National x# MT maize acquired
MOAIWD 187,500,000
Acquire additional food supply needed for non-humanitarian consumption (100K MT)
National x# MT maize acquired
MOAIWD 75,000,000
Rehabilitate storage warehousesNational, district
x# warehouses rehabilitated
MOAIWD 285,714
Construct and/or rehabilitate maize storage silos
National, district
x# silos constructed or rehabilitated
MOAIWD 3,979,014
Promote food diversification through implementation of various communication strategies
National, district
x# strategies implemented
MOAIWD 1,571,429
Improve food security early warning systems
National x# systems improved
MOAIWD 122,857
WATER
IRRIGATION
Construct river impoundmentsDistrict,Community x
# impoundments made
District Irrigation Offices
205,714
Utilize new and existing schemes
National,District,Community
x# hectares under irrigation
District Irrigation Offices
120,000
Distribute and install drip kitsNational,District x
# drip kits installed and operational# farmers practicing drip irrigation
DoI HQsIrrigation Service DivisionsDistrict Irrigation Offices
2,940,571

MALAWI PDNA | 75
Procure and distribute 11,000 treadle pumps
National x x
# treadle pumps distributed# hectares nder treadle pump irrigation
DoI HQsIrrigation Service DivisionsDistrict Irrigation Offices
684,343
Build capacity of farmersNational,District x x # farmers trained
Irrigation Service DivisionsDistrict Irrigation Offices
43,206
Reconstruct irrigation schemesNational,District x
# schemes reconstructed
DoI HQsIrrigation Service DivisionsDistrict Irrigation Offices
1,626,429
Procure and install solar pumpsNational,District x
# solar pump based schemes developed
DoI HQsIrrigation Service DivisionsDistrict Irrigation Offices
8,260,000
Strengthen catchment management
National,District,Community
x
# catchment management committees formed
DoI HQsIrrigation Service DivisionsDistrict Irrigation Offices
220,800
WATER RESOURCES
Construct 50 small community earth dams
National x# small earth dams constructed
Water Resources Dept.
4,428,571
Construct 50 excavated tanks National x # excavated tanksWater Resources Dept.
3,571,429
Rehabilitate 35 mildly damaged dams
National x# dams rehabilitated
Water Resources Dept.
1,400,000
Design and implement Adaptive Watershed Management program
National xSuccessful implementation of AWM program
Water Resources Dept.
1,307,143
WATER SUPPLY & SANITATION
Relocate and construct new water supply intakes
National, district
x x# water supply intakes constructed
Water Supply & Sanitation Dept.
336,714
Install conveyance pipe lines District x x# conveyance pipes installed
Water Supply & Sanitation Dept
1,114,286
Rehabilitate and drill new rural boreholes
District x# new boreholes rehabilitated/drilled
Water Supply & Sanitation Dept
10,352,071
Drill new emergency boreholes for five Water Boards: Northern, Central, Southern, Lilongwe and Blantyre
National, district
x# new boreholes drilled
Water Supply & Sanitation Dept
7,188,573
Desilt Malingunde Dam reservoir District xSuccessful desilting of dam
Water Supply & Sanitation Dept
3,000,000
Desilt Mpira Dam reservoir District xSuccessful desilting of dam
Water Supply & Sanitation Dept
2,000,000
SOCIAL PROTECTION
Scale up public works programmes in districts affected by drought
District, community
x x% population added to the programme
GoM 16,941,991
Scale up social cash transfer programme
District, community
x x% population added to the programme
GoM 25,966,352
HEALTH
Build capacity of health workers on disease surveillance
District x x# health workers trained
MoH 15,477

MALAWI PDNA | 76
Strengthen coordination and disaster management, including supervision
National, district
x x# meetings conducted
MoH 10,160
Conduct surveillance on early warning and information systems
District, community
x x# systems surveilled
MoH 6,083
Provide drugs and medical supplies -including ORS, HTH
District x x x # people served MoH 19,200
Conduct mobile clinics and outreach including additional village clinics
District, community
x x x
# clinics and outreach services; # people served
MoH 12,615
Refer/transport patients to district hospitals from peripheral health facilities, including pregnant women
District, community
x x x# patients referred
MoH 4,714
Provide health care by Christian Health Association of Malawi (CHAM) facilities to pregnant women and under 5 children
District x x# CHAM health facilities signing SLA with GoM
MoH 3,750
Control disease outbreaks District x x x MoH 7,984
Conduct vector control and health promotion/IEC campaigns (IRS/ITNs & immunization) and immunization days
District, community
x x x
# campaigns and immunization days; # people immunized
MoH 89,000
Provide health management of gender-based violence and services for women and girls including FP
District, community
x x x # trainings held MoH 42,809
Provide psychosocial support and reproductive health services
District, community
x x x# services provided; # people served
MoH 11,058
NUTRITION
Provide Severe Acute Malnutrition (SAM) and Moderate Acute Malnutrition (MAM) Treatment to children under 5 years of age (OTP+NRU)
National, district
x x x
# supplies procured and distributed;# children treated with SAM/MAM
Ministry of Health and DNHA
3,992,549
Provide Nutrition Care, Support and Treatment (NCST) – SAM & MAM – to adolescents & adults with HIV/TB
National, district
x x x
# supplies procured and distributed;# HIV/TB adolescents/adults treated with SAM/MAM
Ministry of Health and DNHA
4,608,566
Conduct nutrition surveillanceNational, district, community
x x# children screened, referred and treated
Ministry of Health and DNHA
5,881,724
Conduct monitoring and evaluation
National, district, community
x x x
Compiled monthly program performance and supervision reports
Ministry of Health and DNHA
380,250
Provide children under 5 and pregnant/lactating women Moderate Acute Malnutrition (MAM) Treatment (SFP+SFP-PLW)
National, district
x
# supplies procured and distributed; # children and PLW treated with MAM
Ministry of Health and DNHA
2,929,287
Build capacity of and procure materials for Community-based Management of Acute Malnutrition (CMAM) program
National, district
x
# materials procured and distributed; # staff trained in CMAM
Ministry of Health and DNHA
2,900,500
Build capacity for NCSTNational, district, community
x# staff trained in and offering NCST services
Ministry of Health and DNHA
2,562,000
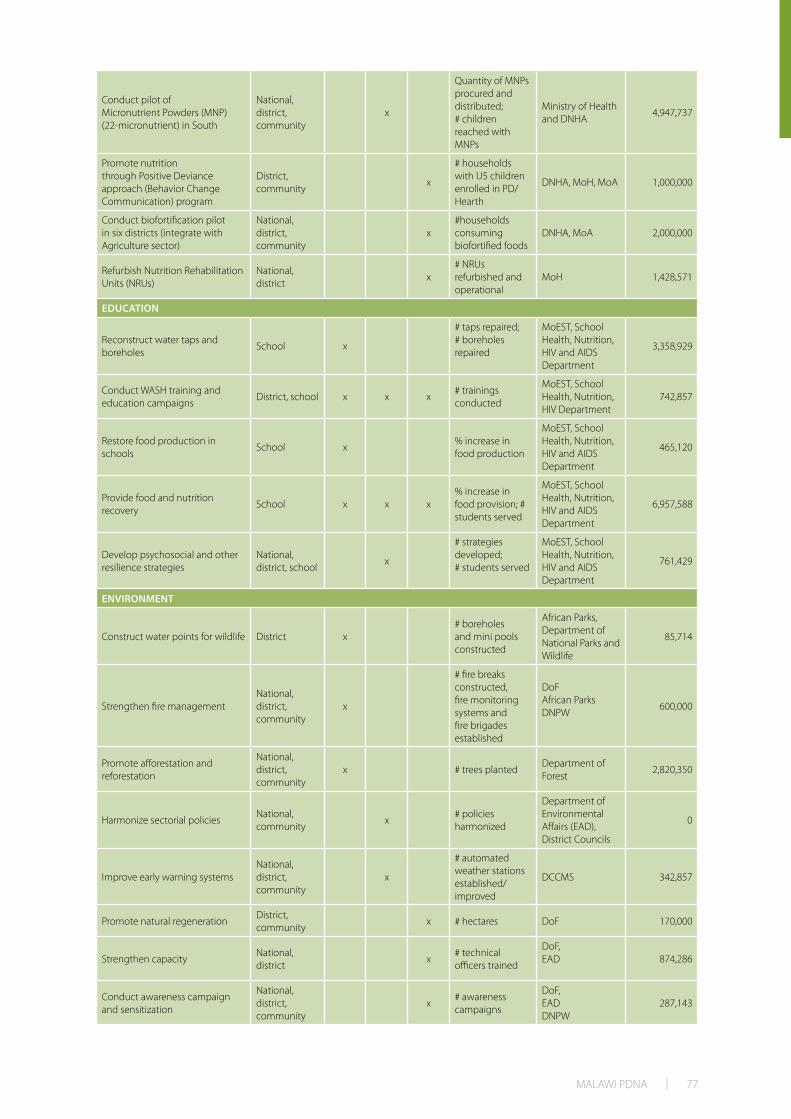
MALAWI PDNA | 77
Conduct pilot of Micronutrient Powders (MNP) (22-micronutrient) in South
National, district, community
x
Quantity of MNPs procured and distributed;# children reached with MNPs
Ministry of Health and DNHA
4,947,737
Promote nutrition through Positive Deviance approach (Behavior Change Communication) program
District, community
x
# households with U5 children enrolled in PD/Hearth
DNHA, MoH, MoA 1,000,000
Conduct biofortification pilot in six districts (integrate with Agriculture sector)
National, district, community
x#households consuming biofortified foods
DNHA, MoA 2,000,000
Refurbish Nutrition Rehabilitation Units (NRUs)
National, district
x# NRUs refurbished and operational
MoH 1,428,571
EDUCATION
Reconstruct water taps and boreholes
School x
# taps repaired;# boreholes repaired
MoEST, School Health, Nutrition, HIV and AIDS Department
3,358,929
Conduct WASH training and education campaigns
District, school x x x# trainings conducted
MoEST, School Health, Nutrition, HIV Department
742,857
Restore food production in schools
School x% increase in food production
MoEST, School Health, Nutrition, HIV and AIDS Department
465,120
Provide food and nutrition recovery
School x x x% increase in food provision; # students served
MoEST, School Health, Nutrition, HIV and AIDS Department
6,957,588
Develop psychosocial and other resilience strategies
National, district, school
x
# strategies developed; # students served
MoEST, School Health, Nutrition, HIV and AIDS Department
761,429
ENVIRONMENT
Construct water points for wildlife District x# boreholes and mini pools constructed
African Parks, Department of National Parks and Wildlife
85,714
Strengthen fire managementNational,district,community
x
# fire breaks constructed, fire monitoring systems and fire brigades established
DoFAfrican ParksDNPW
600,000
Promote afforestation and reforestation
National,district,community
x # trees plantedDepartment of Forest
2,820,350
Harmonize sectorial policiesNational,community
x# policies harmonized
Department of Environmental Affairs (EAD), District Councils
0
Improve early warning systemsNational,district,community
x
# automated weather stations established/improved
DCCMS 342,857
Promote natural regenerationDistrict,community
x # hectares DoF 170,000
Strengthen capacityNational,district
x# technical officers trained
DoF,EAD 874,286
Conduct awareness campaign and sensitization
National, district, community
x# awareness campaigns
DoF, EADDNPW
287,143

MALAWI PDNA | 78
INDUSTRY AND COMMERCE
Create financing scheme making financing available to micro, small and medium enterprises (MSMEs) and farmers at a lower cost
Community, district
x# schemes developed
Ministry of Industry and Trade, microfinance institutions and NGOs
4,997,417
Promote small scale enterprisesCommunity, district
x
# promotion campaigns launched, # entrepreneurs reached/trained
Business support services providers and NGOs
0
Provide incentives to enterprises that produce and sell products available in the country
National x# enterprises assisted
Ministry of Industry and Trade, Malawi Revenue Authority
0
Encourage enterprises to diversify their products
Community, district
x# enterprises assisted
Ministry of Industry and Trade, SMEDI, NGOs and business services support providers
0
TRANSPORT
Rehabilitate and maintain 368km of roads to improve access to rural communities
District, community
x x x# Km of roads repaired
Roads Authority 15,331,000.00
ENERGY
Generate additional electricity National x% reduction in load shedding
GoM 2,893,521
DRR
Develop and disseminate key messages for drought preparedness and recovery interventions using a variety of media (Audio-visual, drama, print, internet etc)
National, district
x x
# messages delivered;# people reached
DoDMA 798,907
Disseminate vulnerability profiles across the sectors and in districts to guide planning and resource allocation
National, district
x x# profiles disseminated
DoDMA 231,786
Build capacity in and conduct multi-hazard risk assessment in 8 districts affected by the drought but not yet supported through other interventions (Ntchisi, Lilongwe, Dowa, Mwanza, Neno, Mzimba, Kasungu, Mchinji)
District x
# trainings in MHA; # hazard profiles produced and disseminated
DoDMA 43,843
Develop contingency plans in 8 district affected by the drought but not yet supported through other interventions
District x
# contingency plans developed; # trainings/exercises held
DoDMA 200,750
Develop M & E Framework for DRR across sectors and in districts
National xFramework developed and implemented
DoDMA 185,436
Develop a profile of institutions engaged in drought recovery interventions at national and district levels
National, district
x Profile developed DoDMA 32,659
Mainstream DRR in District Development Plans of the 8 district affected by the drought but not yet supported through other interventions
District x
# trainings in DRR integration; # District Development Plans reviewed with DRR approaches integrated
DoDMA 33,229

MALAWI PDNA | 79
Conduct joint monitoring and evaluation of drought recovery interventions
National, district
x x xBest practices and lessons learned shared
DoDMA 510,086
Establish purpose-built emergency coordination centres in strategic locations (National Centre in LL and 2 regional centres in BT and Mzuzu)
National, district
x x # EOCs built DoDMA 1,114,286
Advocate for the establishment of a DRR Insurance and Transfer Scheme
National x x DoDMA 285,714
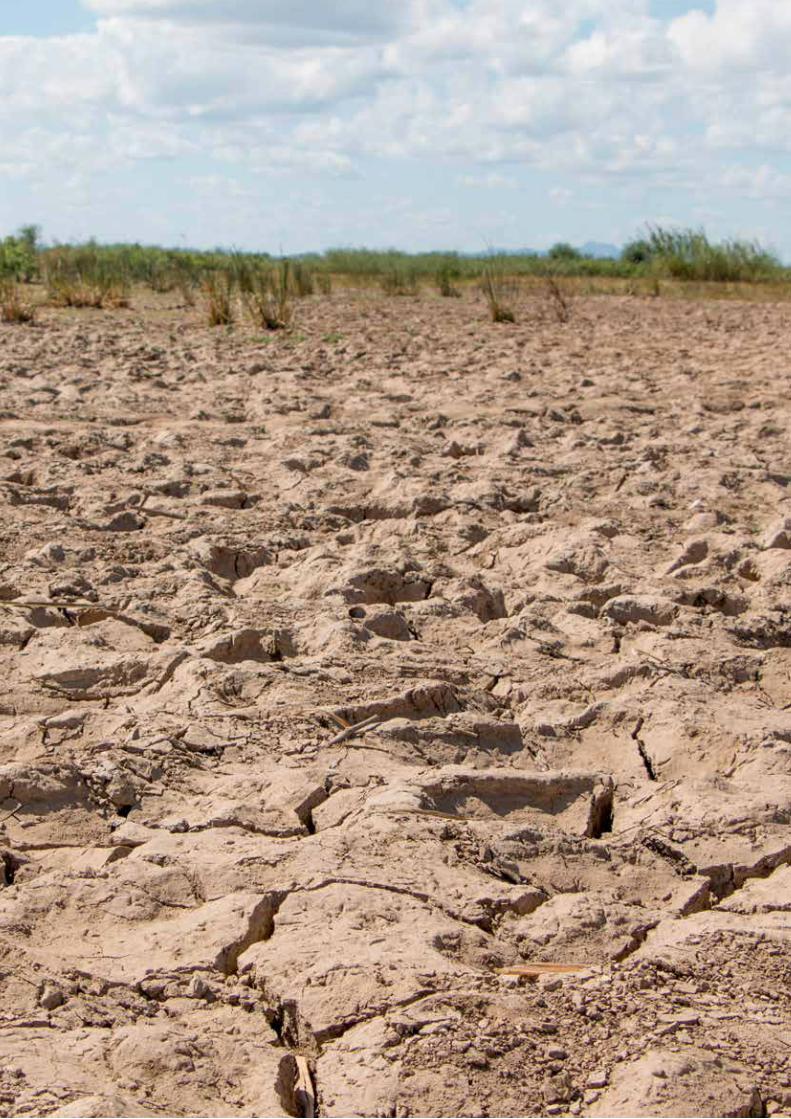
MALAWI PDNA | 80

MALAWI PDNA | 81
ANNEX II: DETAILED SECTOR REPORTS
The following section details the sector specific drought impact and needs analysis. Each sector provides a brief overview followed by the damage and loss quantification, socio-economic impact, existing sectoral policies and priorities and major programs, challenges, objectives of recovery and resilience building in the sector, needs estimation, sector priorities, and methodologies and limitations.
The following sectors have been covered: Agriculture (crops, fisheries and livestock), Food Security, Water (irrigation, water resources, and water supply & sanitation), Social Protection, Health, Nutrition, Education, Environment, Industry and Commerce, Transport, Energy and DRR.

MALAWI PDNA | 82
MALAWI PDNA | 83
BackgroundMalawi’s agriculture sector remains an important component of the country’s economy and is key to several country development objectives including economic growth and poverty reduction; contributing to food security by ensuring sufficient availability and reliable access to food for all. The sector accounts for nearly 30 percent of gross domestic product (GDP), employs over 80 percent of the country’s workforce, and provides over 80 percent of the country’s export earnings (GoM, Annual Economic Report 2014).
The country’s agricultural sector is composed of two main sub-sectors namely the smallholder subsector and the estate subsector which contribute 70 percent and 30 percent to national agriculture GDP respectively (GoM 2011). The majority of smallholders in Malawi produce maize on a subsistence basis on an average land holding size of around 0.5ha. The country’s high population density has placed intense pressure on average farm-holdings for smallholders necessitating the importance of productivity. Smallholder food crop production also includes cassava, sweet potato, groundnut, pigeon pea, and a range of vegetable and condiment crops. The remaining 30 percent of farm operators are found in the larger-scale, more commercially-oriented estate farm subsector, which contributes significantly to agricultural growth, especially in terms of agricultural exports.
Despite the relevance of agriculture to Malawi’s economy, the agricultural sector faces other numerous and important challenges that impede its transformation. Some of these challenges include:
i. Unavailability of breeding stock and limited regulatory animal health services;
ii. Over-dependence on rain-fed farming which leads to uncertainty in the face of climate change, limited access to finance;
AGRICULTUTRE
MALAWI PDNA | 84
iii. Low overall technological capability in the sector, with insufficient development of value chains, low adoption of improved technologies;
iv. Poor infrastructure support, including inaccessible roads for a large proportion of the rural population;
Inadequate input and output markets, with a highly underdeveloped structure;
i. Weak private sector participation, with a limited number of players, with some unscrupulous actors unduly benefiting from market failures and distortions, at the expense of the smallholder farmer producers;
ii. Low level of irrigation infrastructure development, with massive unexploited potential;
iii. Inadequate levels of investment in agriculture research and mechanization;
iv. The agricultural gross domestic product has been highly volatile from year to year over the past 10 year period suggesting serious weaknesses and a lack of resilience in the agricultural sector (MoAIWD, 2014).
Methodology of the Assessment The assessment focused on all districts from the Southern, Central regions and two districts in the northern region of Malawi where the disaster hit most and were declared disaster areas. The districts include: Dedza, Kasungu, Lilongwe, Mchinji, Nkhotakota, Ntcheu, Ntchisi, Dowa and Salima in central region and Balaka, Blantyre, Chikhwawa, Chiradzulu, Machinga, Mangochi, Mulanje, Mwanza, Neno, Nsanje, Phalombe, Thyolo, and Zomba in the southern region: Mzimba and Rumphi in the northern region.
The Agricultural Production Estimates Survey (APES), which the Ministry of Agriculture conducts annually in three rounds, was the major source of production data covering the crops, livestock and fisheries sub-sectors. The APES data was compared to the Remote Sensing data and the two were used to rationalize the crop losses attributed to drought. Other sources include: the Malawi Vulnerability Assessment Committee report, Extent of El Niño Report, Agricultural Market Assessment Report and others. The sector took into consideration likely scenarios that might be caused by the country experiencing another drought through continuation of the EL Nino phenomenon, floods due to La Niña or a normal agricultural season hence the recovery needs have been based on increasing resilience of the farming households against these natural hazards. Four year crop production averages from 2010 to 2014 were compiled and used as baseline data to establish the pre-disaster situation while the 2015/2016 APES data was used to establish the production gap and determine the production losses that came about as a result of the drought. The 2014/15 crop production data was not considered for this assessment since it was also affected by another disaster (floods). Minimum commodity prices, which the Ministry of Agriculture releases to regulate prices on the market, were used as proxy farm-gate price to estimate the values of the losses. In other words, the loss values are the product of loss quantities at the farm-gate prices. It is important to note that the assessment assumed that the impact of other factors to crop production over the years were constant therefore taking the gap between the average and 2016 crop production as the impact of the drought. All losses to crop production were considered while increases in production in other crops such as those promoted by disaster risk reduction programs (Cassava, sweet potatoes, Irish potatoes and pulses) in anticipation of the drought were noted separately. The recovery needs per district were based on target population figures provided by the most recent Malawi Vulnerability Assessment Committee (June 2016) survey. The PDNA team visited Chikwawa and Machinga districts and carried out interviews with the district agricultural officials and farmers and also observed agricultural fields and markets in order to validate secondary data and confirm the impact of the drought on human and socio-economic factors.
MALAWI PDNA | 85
To determine the impact of drought to livestock, time series data was collected for years 2010/11 to 2015-16, used as baseline and was compared to 2015-16 livestock estimates figures. The 2014 livestock commodity prices were used as base price. The year was chosen due to high disparities that were observed in the computed average five year price. Some disparities were attributed to devaluation of the kwacha in late 2014. The projected damages in livestock were calculated using the estimations from the remote sensing predictions, which used the ADD data from the past five years from 2010/11 to 2014/15 seasons.
Data for the fisheries sub-sector was collected from six districts (Chikwawa, Machinga, Phalombe and Zomba in the Southern Region and Nkhotakota and Salima in the Central Region). The districts were selected for they have a good record of fish farming activities, as they represent both the capture fisheries as well as the fish farming components and have been heavily hit by the drought as far as aquaculture and capture fisheries are concerned. Five-year production averages from 2010/11to 2014/15 seasons were compiled and used as baseline data to establish the pre-disaster situation. The aquaculture sector however had not yet documented the production data for the year 2015-16 by the time of this report writing most smallholder fish farmers begin harvesting in late May to September. Therefore, estimation of losses in production was done using the data on the number of ponds that have dried out and the total pond area. On the other hand losses in capture fisheries were calculated by determining the difference in production between the average for the previous year and that of this year. The figure was then multiplied by the average fish prices to determine the monetary value of the loss. In addition, field visits were organized to appreciate the extent to which the drought has affected the sector. Key informant interviews were organized with the district fisheries officers to establish the most recent quantitative as well as qualitative data.
Some of the limitations to the methodology used include i) use of proxy data in the absence of real data - for instance, minimum commodity prices as set by the Ministry of Agriculture in place of real farm-gate prices; Ii) failure to disaggregate data for the report to some required level - for example, it was not possible to disaggregate livestock data to district level and instead the Agricultural Development Division aggregates were used.
Effects of the DroughtThe sector had a total loss valued at USD 240,729,460 (MWK 168,510,621,986) due to reduction in crop production as a result of the dry spells experienced during the season; reduction in market value of livestock due to distress selling of livestock by farmers in order to get food and reduction in fish production due to drying up of water bodies.
The crop production sub-sector accounted for 83 percent of the agriculture sector losses (USD 198,758,638) as crops suffered from poor yields and production levels due to moisture stress. The drought had serious effects on crops especially cereals impacting directly on size of production. Cereals (maize, rice, sorghum and millet) accounted for nearly 60 percent of all crop losses, followed by 39 percent incurred by cash crops (tobacco, groundnuts, cotton and chilies) and 1 percent from other crops. Due to preparatory measures against drought a number of projects were implemented through government and other stakeholders through provision of a diverse number of crop inputs including pulses, cassava, sweet potato and Irish potatoes that led to the sector experiencing gains in the mentioned crops. This helped to upset some of the losses in crop production.
The value of livestock on the market has been affected by the demand and supply principle as, due to poor crop production, many farmers have resorted to distress sale of livestock as a coping mechanism in order to access food on the market. The loss in value of livestock accounts for 20 percent of the agriculture sector damages and losses amounting to USD 46,959,359 (MWK 32,871,551,236) including anticipated damages. The anticipated damages in livestock accounted for USD 15,772,527 (MWK 11,040,769,236).

MALAWI PDNA | 86
Soon after the drought there were more animals for slaughter on the market than those for breeding therefore depleting the livestock national herd. The livestock sub-sector anticipates death of animals and increases in livestock production losses due to poor condition of animals (increased emaciation, increased incidences of livestock diseases and reduction in milk production) because of inadequate feed availability and water during the greater part of the year if no timely interventions are undertaken. For commercial livestock producers, there are anticipated losses that will come from higher production costs through supplementary feeding, watering and disease treatment and prevention costs.
The fisheries sub-sector losses amounted to USD 10,783,990 (MWK 7,548,792,975) due to reduction in fish production which is attributed to decreased water levels for many water bodies affecting the habitat for fish. Fish living in shallow areas disturb breeding sites for most fish species, which in the medium term will affect the availability of fish stock.
TABLE 20: AGRICULTURE SECTOR LOSSES PER SUB-SECTOR/PER REGION
SUB-SECTOR
SOUTHERN DISTRICTS
CENTRAL REGION
NORTHERN REGION TOTAL TOTAL*
(All Districts) (All Districts) (Rumphi & Mzimba) (MWK) (USD)
(MWK) (MWK) (MWK)
Crops 46,010,107,738 73,102,333,090 20,018,605,957 139,131,046,786 198,758,638
Livestock 11,632,197,500 5,441,139,725 4,757,445,000 21,830,782,225 31,186,832
Fisheries 3,378,867,900 4,169,925,075 0 7,548,792,975 10,783,990
TOTAL 61,021,173,138 82,713,397,890 24,776,050,957 168,510,621,986 240,729,460
Drought in production year 2015/2016 has caused many ponds to dry out. As of June 2016, a total of 322 ponds from the 6 districts sampled have completed dried covering a total pond area of 36,806.00 square meters. This has left many fish farmers not raising fish. In addition, the drought has resulted to the decrease in water level for many natural water bodies. Lake Chilwa is an example of a water body that has been observed to be drastically decreasing in water level. This has affects the habitat for fish that live in shallow areas. Of much importance is the disturbance in the breeding sites for most fish species which in the medium term is going to affect availability of fish stocks. In Machinga and Zomba a decrease in 35% and 30% of number of fishers respectively has been observed as of June. This has occurred because some fishing gears such as traps and beach seine nets are meant to catch fish in the shallow waters hence when the water level drops they are suspended.
TABLE 21: SUMMARY OF DRIED PONDS
DISTRICT NUMBER OF PONDS DRIED OUT TOTAL POND AREA (SQUARE METERS)
Chikwawa 13 5,150.0
Machinga 30 25,000.00
Phalombe 21 1,282,640.00
Zomba 90 936,108.00
Salima 83 2,760,980.00
Nkhotakota 77 14,230.05
In the capture fisheries sector, there has been an observable scarcity of some fish species. There has also been a decrease in production levels in the capture fisheries sector from the month of January to May.

MALAWI PDNA | 87
When average fish production levels were compared between average production in the present year and past years, a total loss of 5,024,108 kg was observed in the six districts, corresponding to a monetary amount of MWK 7,548,792,975. A consideration for the usual decline in caches was made during the calculations, and an average percentage of 9.03 was used.
TABLE 22: SUMMARY OF ESTIMATED LOSSES INCURRED (BOTH CAPTURE AND AQUACULTURE)
DISTRICT QUANTITY OF FISH LOST (KG) ESTIMATED VALUE OF TOTAL LOSS OF FISH (MWK)
Chikwawa 5,150.0 8,370,000
Machinga 25,000.00 38,400,000
Phalombe 1,282,640.00 1,924,737,000
Zomba 936,108.00 1,407,360,900
Salima 2,760,980.00 4,143,960,000
Nkhotakota 14,230.05 25,965,075
Key Objectives of Recovery and Resilience Building in the Sector and Recovery & Reconstruction Needs Recurrent low food production exacerbated by El Nino occurrences and other weather related catastrophes, and over reliance on rain-fed agricultural production with little diversification, pose a high risk for the country in terms of food and nutrition security. This calls for appropriate measures to ensure food availability at household and national level, by utilizing the available water resources to increase food production; enhancing climate smart agriculture; promotion of fisheries and livestock production; and exploring innovative ways of financing agricultural investments.
The interventions would uplift the country’s food crop production and productivity that has suffered from natural disasters as resilience levels, especially for smallholder farmers, are limited. The country’s resilience to weather-related calamities in the wake of climate change need to be enhanced, since diversification alongside the predominant crops and beyond crop based agriculture could be a solution to reduce food and income insecurity. Promotion of fisheries and livestock production would also ensure resilience if there is unsuccessful crop production for a particular year.
In this regard, a number of interventions are proposed for the sectors as follows:
There is minimal agricultural diversification at both household and national level. This reduces the ability of both households and the nation to cope with natural disasters. The government will therefore promote agriculture diversification to enhance resilience to natural disasters through spreading the risk among agricultural enterprises through:
• Promotion of agricultural research in the development of varieties for selected crops as well as livestock and fish breeds;
• Intensifying the dissemination of technologies and practices on crop, livestock and fish that withstand adverse weather conditions;
• Develop a robust seed and market system for selected crops that can be grown in the country:
a. Enhance livestock breeding programs especially for small stocks;
b. Establish pasture fields for animal feed;

MALAWI PDNA | 88
c. Establish/revamp community animal watering points;
d. Enhance animal disease control and surveillance programs;
e. Promote small scale agro-processing;
f. Provide affordable agricultural loans for smallholder farmer of all gender groups;
g. Promote integration of smallholder farmers into agriculture value chains.
Crop production Sub-sector Recovery NeedsAssumptions were made by the crops production sub-sector in costing the recovery needs. The MVAC reported that about 6.5 million people, or 1.3 million households will not be in a position to meet the annual food requirement in the 2016/17 consumption year. Calculation of the targeted population for the recovery program has used the MVAC figures (converted to households) to calculate the number of smallholder farmers that will be targeted for recovery. In order to avoid duplication of interventions on the same population with other sectors such as Social protection and FISP, the crop production sub-sector will target 30 to 40 percent, which is about 390 to 520,000 of the households identified by MVAC as most vulnerable. This is also consistent with the reports filed by the Ministry of Agriculture in March 2016, which showed that about 500,000 households were severely affected by the dry spells. The following short term interventions are being proposed:
• Restoration of Agricultural maize production: In order to increase maize production seed and fertilizer will be distributed to 30% of the affected 1.3 million households23. Sixty percent of the targeted households will be supported through Farm Input Subsidy Program (FISP) during rain fed cropping season and 40% during winter maize production through the Input for Assets (IFA) program.
• Increase crop diversification: The PDNA has indicated that there were positive gains in some of the crops that were promoted by crop diversification programs such as Cassava, Sweet Potatoes, Irish Potatoes, Sorghum, Millet and Pulses. Therefore the recovery plan is to provide planting materials for pulses to all target households (361,313) and sweet potato and cassava planting materials to half of the targeted households. These interventions are expected to build the resilience of the affected households against drought and possible floods.
• Development of drought –tolerant crops through research: Department’s Agricultural Research services will be engaged in developing and disseminating drought tolerant crop cultivars and also improve the fortification of some cultivars like sweet potatoes especially orange fleshed sweet potatoes and quality protein maize in order to improve nutrition of farm families.
• Promotion of Climate Smart Agriculture (CSA): The department of land resources, through the district agricultural offices, will promote CSA to increase resilience as the technology improves soil moisture retention. In addition, farmers will be encouraged to increase use of organic fertilizers, including manure and agroforestry, as a way of improving soil texture and restoring soil fertility.
23 MVAC figures used (June 2016).

MALAWI PDNA | 89
TABLE 23: CROP RECOVERY NEEDS
CROP PRODUCTION SECTOR SOUTHERN CENTRAL NORTH TOTAL TOTAL*
Duration Needs All Districts All Districts (Rumphi & Mzimba) (MWK) (USD)
Short Term
Restoration of agricultural maize production through Distribution of seed & fertilizer
8,214,809,042 6,705,966,565 1,844,140,805 23,268,547,779 33,240,782
Increase crop diversification
1,770,432,983 1,445,251,415 397,444,139 3,613,128,537 5,161,612
Medium Term
Development of drought –tolerant crops research
49,000,000 40,000,000 11,000,000 100,000,000 142,857
Long TermPromotion of Climate Smart Agriculture
686,000,000 560,000,000 154,000,000 1,400,000,000 2,000,000
TOTAL COST 10,720,242,025 8,751,217,980 2,406,584,944 21,878,044,949 31,254,350
Livestock Sector Recovery NeedsThe loss of value in livestock observed during the assessment was due to reduced livestock commodity prices. This was because farmers were selling their livestock as a coping strategy to mitigate food shortages, some selling livestock in anticipation of shortage of livestock feed. This meant that the immediate impact of drought in livestock was noticeable due to low livestock commodity prices. However, using remote sensing data the livestock sector is projecting damages amounting to MWK 10,616,600,247 (USD 15,166,572) up to March 2017. These anticipated damages in livestock were due to deaths predicted by using the remote sensing data results. However, as the season is progressing, it is anticipated that impact of drought on livestock will result in increased livestock deaths and low productivity, due to acute shortage of feed, reduced fertility, increased disease incidences and shortage of drinking water.
The country needs to recover from the losses and anticipated damages, build resilience among farmers and the nation, and come up with actions that would enable the livestock sector overcome the persistent El-Niño effects. The following interventions were proposed for the sector:

MALAWI PDNA | 90
TABLE 24: LIVESTOCK RECOVERY INTERVENTIONS
ID PROPOSED INTERVENTION
TYPE OF INTERVENTION DESCRIPTION OF THE INTERVENTION
1Livestock vaccination and veterinary care for affected animals
Short term
• This targets Foot and Mouth Disease (FMD) vaccinations to be done in Nsanje and Chikhwawa Districts where the disease is endemic and of the would be affected animals that would travel some long distances in search of food and water
• Newcastle disease control programme targeting all the Agriculture Development Divisions, in order to contain the spread and death of indigenous chickens. This would ensure increased production and births of the chickens. Hence increased chicken numbers and productivity hence food improved food security
2
Promote small stock production program targeting chickens and goats
Medium Term
• The action is to help the sector recover from the losses, building farmer household resilience due to drought shocks. Through broadening ownership of livestock and the pass-on programmes, it is expected that livestock numbers shall increase and productivity improved. This shall help farmers to use the small stocks as a coping strategy to food shortage through sales of livestock in organised market platforms at recommended prices.
• The action will target all the assessed districts, with 10 groups per district of 15 farmers. Each beneficiary of goat groups shall receive 1 buck and 4 does, of chicken groups shall receive 1 cock and 9 cockerels.
3Pasture Establishment
Short Term
• The action targets farmers with livestock to establish pasture fields. As the natural grasses are depleting, this would ensure animal feed availability. This target farmer to establish pasture fields with an average of 100 hectares per district which could be intercropped. This would protect environmental degradation by animal grazing
• The action would see farmers establishing village pasture seed banks, as the initial seed injection would be repaid in order to be used by other farmers.
• Farmers will also be trained on how to manage fodder at community level
4
Promote multiplication of livestock in government farms
Long term
• The action is to restock government breeding farms with improved breeds and recapitalize with improved machinery. The farms would act as breeding centers for the more drought tolerant animals and a gene bank. The technologies at the farms would be taught to the livestock communities in order establish their own livestock community gene banks to build resilience due to continuance of El nino effects
5Promote animal health surveillance systems
Medium Term
• The action targets improved veterinary service delivery to improve animal health and protect the nation from zoonotic diseases. The target will be to train field staff in animal health surveillance systems, improve staff mobility, mobilize and train community animal health workers.
6Establish animal watering points
Short Term
• To build resilience in the continued drought effects, watering points would help to curb water shortages and increased disease incidences. The action aims at drilling community boreholes, construction of the watering troughs and standby tanks and installation of solar power in community designated watering points.
• Communities shall be expected to contribute to this through provision of sand and bricks for the construction work.
7
Conduct a research study to establish indicators on impact of drought to livestock
Short Term
• Currently the country does not have standard indicators of projecting effects of livestock due to drought. The action shall help in establishing baseline indicators for the effect of drought to livestock.
• Consultants shall be involved with the Department of Animal Health and Livestock Development coordinating. This will also involve the major stakeholders in the subsector including the Academia and private sector.

MALAWI PDNA | 91
TABLE 25: LIVESTOCK RECOVERY NEEDS
Crop Production Sector Southern Central North TOTAL TOTAL*
Duration10.4.1.1.1 Recovery Needs
All Districts (MWK)
All Districts (MWK)
(Rumphi & Mzimba) (MWK)
(MWK) (USD)
Short Term
Control of animal parasites & diseases
762,393,853 181,454,327 46,820,663 990,668,843 1,415,241
Pasture establishment
30,000,000 30,000,000 10,000,000 70,000,000 100,000
Establish animal watering points
418,500,000 325,500,000 93,000,000 837,000,000 1,195,714
Medium Term
Conduct research study to establish indicators on impact of drought on livestock
70,000,000 70,000,000 100,000
Promotion of small stock production
1,329,675,829 1,043,368,322 245,952,124 2,618,996,275 3,741,423
Promote animal health surveillance system
506,378,000 378,000,000 94,000,000 978,378,000 1,397,683
Long Term
Promotion of multiplication of animal breeding in Government farms
442,500,000 805,000,000 235,000,000 1,482,500,000 2,117,857
TOTAL COST 3,489,447,682 2,833,322,649 724,772,787 7,047,165,118 10,067,379
Fisheries Sub-sector Recovery NeedsThe country’s dependence on rainfall in fish production is a major challenge affected the country’s food security and economic status. Over the past years, climate change has been observed to affect fish production from both aquaculture and capture fisheries. Development and implementation of interventions that can promote the sector’s resilience to drought can be a factor that can help increase fish production.
Promotion of production from the fisheries department would ensure that households have access to animal protein thereby uplifting the nutritional status of many people. This would also uplift the economic status of people who directly and indirectly take part in fish production. The nation would also improve its economic status through exportation of fish to other countries.
In this regard, a number of interventions are proposed for the sector follows including promotion of large and deep pond technologies, integrated agriculture aquaculture, establishing fish handling and processing units, deep water fishing and re-stocking of fish stocks in the natural water bodies.
MALAWI PDNA | 92
• Promotion of large and deep pond technologies There is a need to adopt technologies that enable fish farmers to attain high fish production during normal or drought conditions. This technology offers a drought resilient way of producing fish for the ponds keep water for a longer period of time. Its stocking densities and feeding regime ensures that there is high fish productivity. The technology which has already been developed and verified by the national aquaculture centre would provide a relief to farmers whose farms are vulnerable to dry spells. This would be done through establishment of model communal ponds in selected areas.
• Promotion of Integrated Agriculture aquacultureIntegrated agriculture aquaculture is a form of diversification in fish farming which allows farmers to indulge in various agricultural enterprises within a unit piece of land. Then system combines raising fish, livestock as well as cultivating crops within the same piece of land, with each enterprise depending on the other in terms of inputs. The system offers an opportunity for the farmer to realize yields even in hard weather conditions. This would also be done at community level as a model farm.
• Establishment of fish handling and processing unitsPost–harvest losses have been seen to be one of the factors affecting fish accessibility to the country’s population. A great percentage of fish captured or harvested is lost due to poor handling and unprocessed form of fish. It is therefore important to establish a system that will allow fishermen and fish farmers to preserve the little fish products they realize in times of droughts. This can be done through construction of energy efficient smoking kilns and solar driers. This equipment has been proven to be environmental friendly for the kilns uses less energy while the solar dry maximizes the use of sunlight energy. These would be established in various beaches and areas where fish farmers are clustered
Intensifying the dissemination of technologies and practices on crop, livestock and fish that withstand adverse weather conditions
• Deep water fishingShallow water areas are the most preferable habitants for fish breeding. A decrease in the water levels disrupts breeding for many fish species. There is therefore a need to provide an alternative that would provide a relief to the fish species that breed in such areas. This can be achieved by promoting off shore-deep water fishing. However, most fishers do not afford this kind of fishing because of the limitations with their capital for this requires high levels of investments. Provision of loans to fishers would serve as a catalyst to the promotion of deep- water fishing. The loans could be in form of engine boats and fishing nets.
• Fish Re-stockingFish stocks have observably decreased in Lake Chilwa and other natural water bodies due to the drought. Drought has caused a disturbance to the aquatic ecosystem thereby causing a threat to some fish stocks. In Lake Chilwa there has been a decrease in the number of fish species that are caught. Some species like Oreochromis shiranus (Makumba) and Tilapia rendalli (Chilunguni) have indicated to register decreased catch. There is a need to restock these species before they come into extinction. This exercise will involve production of fingerlings of the targeted species and re-stock them in the natural water bodies.

MALAWI PDNA | 93
TABLE 26: FISHERIES RECOVERY NEEDS
Fisheries sub-sector Southern Central TOTAL TOTAL*
Duration Recovery Needs (Ck, Mhg, Za, Pe & Mh.
Lilongwe and Nkhotakota (MWK) (USD)
Short Term
Promote large & deep water pond technology
44,000,000 38,000,000 82,000,000 117,143
Promote integrated aquaculture
24,000,000 24,000,000 48,000,000 68,571
Medium Term
Promote fish handling, processing and value addition
20,600,000 10,300,000 30,900,000 44,143
Community capacity building
18,000,000 12,000,000 30,000,000 42,857
Promote fish restocking 20,400,000 45,000,000 65,400,000 93,429
Long Term
Promote deep water fishing
19,000,000 19,000,000 38,000,000 54,286
Promote cage culture 50,000,000 25,000,000 75,000,000 107,143
TOTAL COST 196,000,000 173,300,000 369,300,000 527,571
Socio-economic Impact of the Drought In the face of the drought, alternative livelihoods and coping strategies will become important to lessen the impact on the affected households. However, the most vulnerable groups such as women, children, the elderly, the chronically sick and people with disabilities due to their limited coping strategies will most likely engage in destructive coping strategies that jeopardize their future livelihoods. The pre-harvest assessment carried out by MVAC indicates that negative coping strategies such as collection and sale of firewood, wild foods and charcoal will increase, posing adverse effects on the environment and future sustainable livelihoods. Increased costs in food and other basic household commodities will compromise gains in social services such as health and education at household level increasing the likelihood of malnutrition and disease prevalence, more so, for children and women. Communities that participated in a rapid assessment carried by Oxfam in Mulanje, Balaka, Phalombe and Kasungu districts in May 2016 focusing on the impact of the 2015-16 drought reported that violence against women and girls increases in times of food insecurity and the following were cited as some of the acts: Spouse physical battery: Men eating out at local tea room/restaurants leaving women and children at home hungry: Men abandoning their households in search of employment: Sexual harassment and abuse especially for young girls for favours of food and money: Parents forcing girls to get married to wealthy men who have food(Economic exploitation): Sexual exploitation by providers of services and girls dropping out of school to get employment in order to support their households.
Challenges in the SectorThe major challenge of the sector is the drying up of water sources. This is likely to hinder many recovery options. Treadle pumps distribution, irrigation production, aquaculture or fish farming, livestock production, thus most of the activities to tackle the drought issues will be effective in the medium term.
Existing Sectoral Policies and Major ProgramsMalawi’s agricultural development agenda is driven by a number of national and international policies and cooperative commitments and agreements. Internationally, Malawi is committed to implementing commitments and agreements including the Malabo Declaration, the Sustainable Development Goals (SDGs), the Common Market for Eastern and Southern Africa (COMESA) and the Southern Africa

MALAWI PDNA | 94
Development Community Regional Indicative Strategic Development Plan (SADC RISDP). Domestically, the country’s agricultural development agenda is largely driven by the Vision 2020 framework, the Malawi Growth and Development Strategy (MGDS), and the Agriculture Sector Wide Approach (ASWAp). In the Vision 2020 framework, agriculture and food security are identified as priority areas to foster economic growth and development. This long-term development strategy supports a high level of agricultural productivity, diversification and commercialization to ensure equity, household food security, income, employment, and sustainable utilization of natural resources by the year 2020 (GoM, 1998).
The importance of agriculture to national economic growth is well recognized in the national development plan – the Malawi Growth and Development Strategy (MGDS). The MGDs prioritizes agriculture and food security through increased agricultural growth and diversification for sustainable economic growth. The Strategy focuses on increasing agricultural productivity and integrating smallholder farmers into commercial activities.
The MGDS vision has been translated into a Sector Strategic Plan called the Agricultural Sector Wide Approach (ASWAp) which articulates Malawi’s ambition to transform, modernize and diversify the agricultural sector. The target is to improve food security and generate agricultural growth through increased productivity of food and cash crops, while ensuring sustainable use of land and water based natural resources. The ASWAp targets a harmonized investment program in three focus areas: Food Security and Risk Management; Commercial Agriculture, Agro-processing and Market Development; and Sustainable Agricultural Land and Water management.
The Ministry of Agriculture, Irrigation and Water Development has developed the National Agricultural Policy (NAP) to harmonize all coherent policies in the sector that are yet to be implemented. In the absence of the NAP, the ASWAp has and is still acting as the de facto overarching policy framework for the agricultural sector in Malawi. The sub-sector specific policies and strategies include the livestock policy, the fisheries policy, the national irrigation policy and development strategy and the crop production policy.
The MoAIWD has a number of projects and programmes that aim at increasing production and productivity in the short term while contributing to economic growth and national development in the long term.
• Agriculture Sector Wide Approach –Support Project (ASWAp-SP). The goal of this project, funded by the IDA and the Multi Donor Trust Funds, is to improve the effectiveness of investments aimed at food security and sustainable agricultural growth. The ASWA-SP focuses on institutional development and capacity building in support of ASWAp; promoting sustainable food security, agricultural growth and diversification in agriculture as well as improvement and maintenance of unpaved rural roads to improve accessibility to input and output markets
• Agricultural Productivity Programme for Southern Africa (APPSA) - This project has identified and will develop Malawi as a centre of excellence. Malawi has received funds amounting to USD 29.8 from the World Bank to finance project activities to run until 2019. The project will enhance regional specialization in research and development, enhance regional collaboration in research, technology dissemination and training and will facilitate transfers of agricultural technology, information and knowledge across regional borders.
• Smallholder Irrigation and Value Addition Project (SIVAP) - The goal of the project is to contribute to food security and increase income levels among the smallholder farmers through intensification of irrigation, crop diversification, value addition and capacity building. The project is to four new schemes covering 2,050 ha and will rehabilitate five old schemes covering 1,295 ha. The project is also promoting seed selection and multiplication of groundnuts, rice, pigeon peas, soybeans and cassava among farmers under rain-fed production. It is further upgrading 100 km of road network in selected areas to improve access to agricultural inputs and output.
MALAWI PDNA | 95
• Sustainable Agricultural Production Programme (SAPP) - The goal of the program is to contribute to reduction of poverty and improved food security among the rural population and the specific objective is to achieve a viable and sustainable smallholder agricultural sector employing good agricultural practices.
• Farm Income Diversification Programme (FIDP) - The purpose of the program is to improve livelihood of rural households through conservation of natural resources, diversification of Agricultural production and increased agribusiness.
• Climate Smart Agriculture (CSA) - implemented in collaboration with FAO, the project aims to strengthen the institutional capacity in implementation and scale up of CSA options to increase community resilience. This will be achieved through four outputs: Establishing an evidence base for planning, developing CSA options and review of CSA related policies; Formulation of country owned CSA frameworks; Development of CSA investment proposals and identification of financing mechanisms, and; Building capacity in planning and implementation of CSA initiatives.
• Farm Input Subsidy Programme - The programme helps farmers with subsidized inputs accessed using a coupon. Programme was initiated in 2005/06 and has improved the food security situation at both national and household levels and has demonstrated the value of investing in food crops as a step towards sustained economic growth and poverty alleviation. Currently, the programme is the largest within the MoAIWD, estimated at MWK40 billion in the 2015-16 agricultural season
• Cotton production and Marketing Up-scaling Programme - It aims at increasing cotton production and productizing in Malawi and is implemented under Private Public Partnership (PPP)
• Promotion of Small Stock livestock – the programme aims at improving the livelihoods of vulnerable groups (particularly women) through sustainable small stock production and marketing production capacity of the Board.
• Promotion of Strategic Crops for Import substitution and Exports - Government has identified oilseeds, sugar, rice, livestock and fishery products as part of the agricultural diversification and export drive. As outlined in the National Export Strategy, the aim is to engage both large-scale corporate farmers and rural smallholder farmers in increasing production, value addition and marketing of a diverse set of finished agricultural products. Ultimately this will contribute to enhanced agricultural incomes, poverty reduction, food security and nutrition.
Agriculture Sector Implementation Arrangements • Government will lead and coordinate implementation of the recovery activities;
• Implementation will be done by government Departments and Ministries, NGOs, CGIAR centres and other stakeholders;
• The agriculture cluster will lead stakeholder coordination. The cluster which is represented by all implementing agencies and Donor Partners is chaired by MOAIWD and co-chaired by a Donor Partner representative).

MALAWI PDNA | 96
MALAWI PDNA | 97
Background Food insecurity in Malawi remains alarmingly high with 25 percent of the population being food insecure, even in the absence of shocks. The cyclical lean season responses have grown to an average of over one million people per year since 2012, reaching a high of 2.86 million, 18 percent of the population, in 2016. Meanwhile, malnutrition remains at 42 percent, with stunting of children under 5 reaching 53 percent, the 5th highest in the world. Child under-nutrition remains a key challenge according to the 2015 Cost of Hunger report which indicates that 10 percent of GDP is lost due to stunting. Reducing the caseload of food insecure Malawians, while creating more resilient food systems that are able to make food available, accessible and safe for all people in a sustainable manner remains a major challenge in the country.
The agricultural sector in Malawi is characterized by low productivity, lack of predictability with high risks of climactic and external shocks. This is particularly critical in a country where the 90 percent of national food production and availability rely on a single rain-fed cropping season and most farmers are small-holders practicing subsistence agriculture. Despite the investments in the sector, low productivity remains constrained by limited access to improved inputs and by depletion of soil quality due lack of crop rotation.
Maize is the main cereal produced in Malawi and also the main staple food of the country. Smallholder farmers usually cultivate on less than 1 hectare of land, producing 60 percent food and 40 percent cash crops. Other cereals such as millet, sorghum, and rice are also produced and consumed as well as potatoes, beans and cassava, which is regarded as a staple food in most parts of the northern region. However, despite many calls to food and agriculture diversification, maize remains Malawians’ main consumption and production. Most of the maize produced in the country is for household consumption and to meet subsistence needs. In fact, only about 15 percent of the maize that is produced in the country is actually marketed. According to reports from the Ministry of Agriculture, Irrigation and Water Development (MoAIWD) the country has been able to produce the above-mentioned crops more than their requirement in most years during the past ten years.
FOOD SECURITY

MALAWI PDNA | 98
However, the erratic weather conditions in recent years, coupled with the effects of the 2016 El Nino in particular have reduced food availability over the years with a 30 percent decline in maize production in 2016. This occurred after a sensible maize deficit already registered in the 2014/2015 agriculture season. The prolonged dry spells and below normal rains, which especially affected the southern region, resulted in the country’s agricultural production for the 2015-16 season being the lowest compared to the past 5 years. Particularly for maize, the final Agricultural Production Estimates Survey (APES) released by the Ministry of Agriculture, Irrigation and Water Development in June 2016, estimates a decline from 2,776,277 metric tons (mt) in 2014/15 to about 2,369,493 mt in 2015-16. This represents a 14.7 percent decline compared to the previous year. The estimates have also registered declines in almost all other food and cash crops. Food unavailability is in turn is driving maize prices to historic highs24. Already in January 2016, national prices were about 111 percent above those recorded in 2015 and 137 percent above the five-year average. The pace of increases in maize prices is partly attributed to unavailability of the commodity in most ADMARC depots and therefore, increasing numbers of households trying to access food through the markets. While there have been some inflows of maize from across the borders, informal supply from neighbouring countries has slowed due to the extended lack of rainfall.
The unavailability of food and rising prices against people’s diminishing purchasing power make the situation even more critical for Malawi’s vulnerable communities. In fact, even during non-crisis situations, a primary driver of food insecurity in Malawi is being unable to access food due to poverty. According to the IHS3, over 50 percent of the population lives below the poverty line, with 25 percent below the food poverty line - considered ultra-poor. Note that nationally, 55 percent of male-headed rural households are poor, vs. 63 percent of female-headed rural households. The two poorest districts are Chikwawa and Nsanje with about 81 percent of people in these districts living below the poverty line, and with almost three out of five people (59 percent and 56 percent respectively) living in ultra-poverty. The poverty levels in the country mostly affect food accessibility. Thus, most rural people produce maize for own consumption.
In terms of food sources, the 2012 Comprehensive Food Security and Vulnerability Analysis (CFSVA) Report, using IHS3 data, indicates that the two main sources of food are purchase (49 percent national average) and own production (45 percent). For rural households specifically, 42 percent of food is accessed through purchase and 51 percent through own production. There are strong seasonal variations in patterns of food access; most smallholder farmers rely on their own production until around October, and transition to greater reliance on markets until the harvest in March. The limited availability during this period contributes to higher food prices; the peak of the lean season is generally in January/February. The MVAC livelihoods baseline explains that across livelihood zones of Malawi, about one third of the population is perpetually in food production deficit and relies on agricultural labour (ganyu) between 2 and 6 months each year.
Another critical aspect of the food security situation in Malawi is food utilization. The 2012 CFSVA indicates that on average, Malawians derive 74 percent of food energy from maize, while proteins are regarded as complementary to maize. Nationally, one in four people are classified as having poor or borderline food consumption (inadequate food consumption) according to the Food Consumption Score, using the IHS3 data. Female-headed households are twice as likely to have poor food consumption. There is significant regional variation, with inadequate food consumption peaking at over 40 percent in Chikwawa and Phalombe. According to the IHS3, 36 percent of children in Malawi are stunted - a strong indicator of chronic food insecurity. Stunting levels are over 50 percent in Mulanje, Phalombe, Mchinji, Dowa, and Nkhotakota. Acute malnutrition cases have also increased, as evidenced by a significant growth in the number of admissions to CMAM treatment facilities across the country from 1,966 in October 2015 to 7,034 in March, 2016.
24 AMIS data - Ministry of Agriculture, Irrigation and Water Development - February 2016, WFP m VAM price reports and FAO field data.

MALAWI PDNA | 99
Methodology for the Assessment of the SectorThe data included in the Food Security sector have been provided by the MVAC in June 2016 as it relates to the number of people who are not able to meet their food requirements (survival threshold) and to the number of people who have fallen below the livelihood threshold. MVAC has also indicated the food needs to overcome the national food gap. However, the analysis of the food security sector has been informed of the results of the assessment conducted in other sectors relevant to food security – namely: agriculture, irrigation for irrigated crops, nutrition, and education as it relates to access to school meals.
Effects of the Drought There are no direct damages and losses due to the 2015/15 drought in the food security sector. Food security is a cross-cutting issue and the effects on this are determined by the effects of the drought on relevant sectors, particularly on agriculture as the primary sector determining food availability and as the basis of people’s livelihoods.
Due to limited food supplies and increased prices due to drought, there are steep increases in the levels of food insecurity in the country. This is compounded by vulnerability factors including increased poverty levels. Following the dry spells caused by the El Nino phenomenon during the winter agricultural season (October 2015-March 2016), the Malawi Vulnerability Assessment Committee (MVAC) results of June 2016 indicate that about 6.5 million people in the country will not be able to meet their food requirements for the 2016/2017 consumption season as a result of the 2015/2016 drought. Households, especially in the south, will not have maize from own production (MoAIWD APES reports).
MVAC has recommended a phased approach to assistance that focuses on reaching the hardest hit areas first, with the peak of the assistance from January until the next harvest, expected in March 2017. The market assessment conducted by the MVAC, recommended that a total of 1,728,563 people (26.6 percent) will need to be assisted through cash based transfers while 4,763,284 people (73.4 percent) are to be assisted with in-kind food. Furthermore, the 2016 MVAC results indicate that, in descending order, more than 300,000 of the population in these areas would require food assistance both in terms of cash transfers to buy food and also in-kind food assistance: Mangochi (655,585), Chikwawa (498,988), Zomba (473,497), Machinga (456,225), Lilongwe (427,627), Thyolo (404,354), Mulanje (354,304), Balaka (333,943), Blanytre (326,360) and Ntcheu (315,589).
Recovery Needs & Strategy The key recovery and resilience building objectives of the food security sector is to ensure that there is availability of food in the country and that the food is accessible to all people in need. While in the short term this would entail provision of food assistance, this measure will be accompanied, in the medium and long term, with activities improving food access through expansion of livelihoods options and agricultural production output of small-holders to build resilience against future shocks. Simultaneously, it will be critical to encourage a change in food consumption not only by promoting agricultural diversification but also by encouraging a change in the general perception of households that maize is not the only food crop option available. The adoption of a more diversified and nutritional diet can be encouraged. This promotes the long-term objective of decreasing dependency on a single food and improving the nutritional status of most Malawians. Additionally, the food security sector will focus on strengthening its capacity for analysing and delivering warnings on the food security status in the country to better support the timing and tailoring of interventions.
Given that food security is multi-sectorial, interventions will be undertaken by all those sectors contributing to food security. The interventions related to expansion of livelihoods options and enhancement of agricultural production will be addressed mostly by agriculture and irrigation and a detailed description of these can be found in the respective sector reports.

MALAWI PDNA | 100
In terms of short-term measures related to food availability, the food security sector will concentrate on food import supporting the implementation of the national Food Insecurity Response Plan to address the current national food gap and ensure that food is available for humanitarian and non-humanitarian assistance. The rehabilitation of storage warehouses will be part of the short term measures implemented by the sector to ensure that availability of correct food storage spaces. Other recommended activities such as provision of nutrition support and expansion of school feeding programs will be undertaken by, respectively, the Ministry of Health and the Ministry of Education - details on the activities in this sector can be found in the nutrition sector report
In the medium-long term, the food security sector will implement nation-wide communication campaign to promote food diversification with the use of different communication strategies to reach to different groups of the population, particularly the youth and those in rural areas. Such campaign will strengthen and complement ongoing efforts of advocacy in this area taken forward by the Ministry of Agriculture through their extension officers, Ministry of Education through school programmes and Ministry of Health through nutrition education of mothers.
Immediate/ Short-term Interventions
• Engage commercial farmers to utilize their irrigation facilities to produce irrigated maize for the SGR. About 4,500 hectares under private sector could be deployed for irrigated maize production enabling the country to realize about 25,000 tons of maize. The cost of this initiative is to be financed by GoM.
• Support the food insecurity response plan by importing 375,000 metric tons of maize equivalent to offset the existing food gap - including response to humanitarian needs.
• Import 150,000 metric tons of maize for non-humanitarian needs. This procurement of maize is also a necessity to ensure that the population not on MVAC and the urban population are able to buy maize for food.
• Rehabilitation of storage warehouses. It is anticipated that rehabilitation of these warehouses/silos will ensure good storage conditions of maize thereby reducing the cost of transporting maize to areas affected by the drought.
Medium to Long-Term Interventions
• Rehabilitation of 15 metallic maize storage in Mzuzu, Luchenza and Mangochi.
• Improving food and nutrition security through various communication strategies to promote food diversification in the country and ensure that people are informed of various foods (including non-conventional livestock) available and alternate ways of preparing food to ensure maximum nutrients utilization.
• Improving food security data collection and early warning system – this is to ensure that the nation and international community is provided with advance information on food security prospects in the country through assessments of expected food production, food supplies and requirements. Specifically, early warning and food security information will focus on:
a. Food crop performance; especially providing alerts in cases of crop failure; and other factors affecting food supplies;
b. Food supply and demand assessments and projections, including imports and exports;
c. Food insecure areas and populations involved.
d. Monitoring of Market information in the country for early alerts.
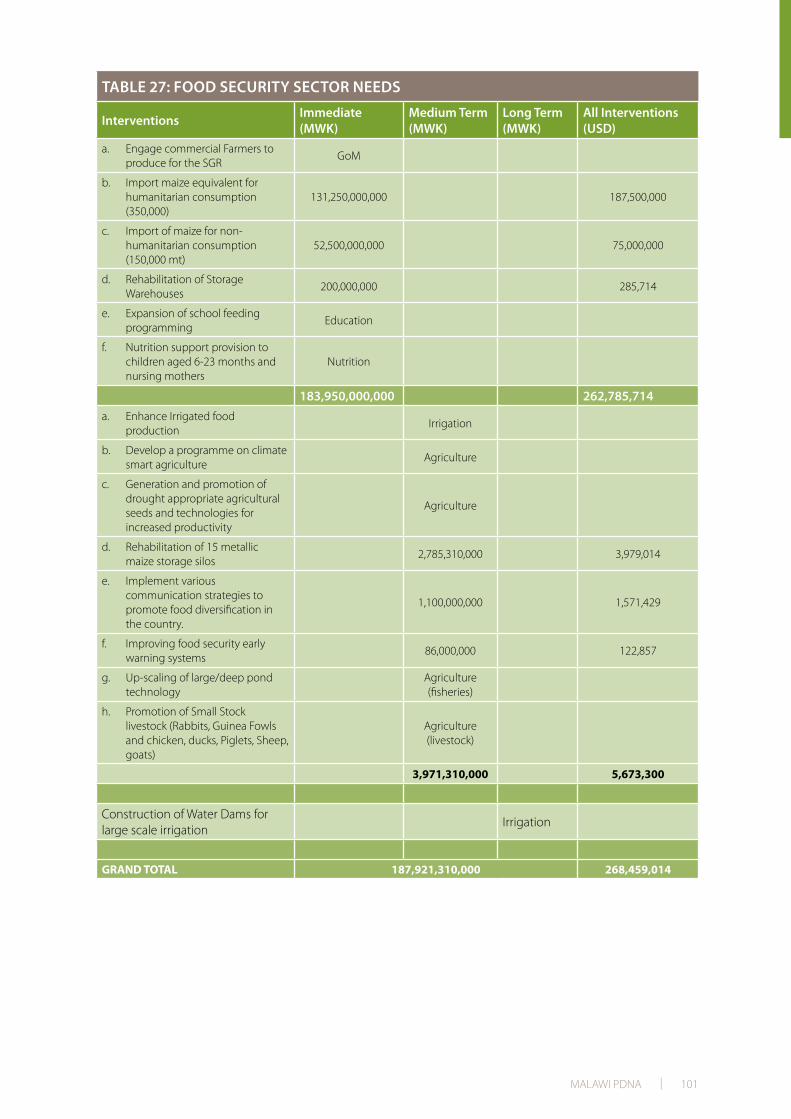
MALAWI PDNA | 101
TABLE 27: FOOD SECURITY SECTOR NEEDS
Interventions Immediate (MWK)
Medium Term (MWK)
Long Term (MWK)
All Interventions (USD)
a. Engage commercial Farmers to produce for the SGR
GoM
b. Import maize equivalent for humanitarian consumption (350,000)
131,250,000,000 187,500,000
c. Import of maize for non-humanitarian consumption (150,000 mt)
52,500,000,000 75,000,000
d. Rehabilitation of Storage Warehouses
200,000,000 285,714
e. Expansion of school feeding programming
Education
f. Nutrition support provision to children aged 6-23 months and nursing mothers
Nutrition
183,950,000,000 262,785,714a. Enhance Irrigated food
productionIrrigation
b. Develop a programme on climate smart agriculture
Agriculture
c. Generation and promotion of drought appropriate agricultural seeds and technologies for increased productivity
Agriculture
d. Rehabilitation of 15 metallic maize storage silos
2,785,310,000 3,979,014
e. Implement various communication strategies to promote food diversification in the country.
1,100,000,000 1,571,429
f. Improving food security early warning systems
86,000,000 122,857
g. Up-scaling of large/deep pond technology
Agriculture (fisheries)
h. Promotion of Small Stock livestock (Rabbits, Guinea Fowls and chicken, ducks, Piglets, Sheep, goats)
Agriculture (livestock)
3,971,310,000 5,673,300
Construction of Water Dams for large scale irrigation
Irrigation
GRAND TOTAL 187,921,310,000 268,459,014

MALAWI PDNA | 102
Challenges in the SectorThe main challenge in the sector is to ensure that food production is enhanced and that diversification is adopted at household level. There have been many communication strategies to enhance food diversion, but with little success as most people in Malawi still regard maize as their main food.
There is low agricultural productivity due to overreliance on rain fed production in the country. This being the case, the drought has affected the food security status of the country. This requires resilience building in the medium to long term to ensure food self-sufficiency. Additionally, low adoption levels of improved agricultural technologies due to inaccessibility, unaffordability and high illiteracy levels among the farming community.
Implementation Strategy The Ministry of Agriculture will implement interventions in the food security sector. Communication campaigns, data collection strengthening and EWS will be taken forward under the lead of the Ministry of Agriculture, in close collaboration with sectorial ministries such as Health, Education, Environment and the Department of Disaster Management (DoDMA).
Existing Sectoral Policies and Major ProgramsThere are no specific sectorial policies for Food Security given that this is a cross-cutting sector to which agriculture, irrigation, nutrition, health and – to an extent – education policies and programmes contribute. Therefore, the reference for existing policies and major programmes is given under the respective reports of these sectors.
List of data sources:
1. Agricultural Production Estimates Survey (APES)2. Agricultural Market Information System (AMIS)3. Malawi Vulnerability Assessment Committee (MVAC) – 2016 Report4. Annual Economic Report 2014/155. Integrated Household Survey 3 (IHS)6. Integrated Household Survey 3 (IHS)7. 2012 Comprehensive Food Security and Vulnerability Assessment (CSFSVA) Report8. Oxfam El Nino Impact Rapid Needs Assessment, May 20169. Extent of El Niño Report

MALAWI PDNA | 103
Background Malawi’s agricultural sector employs about 80 percent of the workforce, accounts for a third of GDP and underpins national food security and exports. About 4 percent of cropland is currently irrigated with about 104,000 ha developed as of 2014. Forty six percent of these were estates, 54 percent smallholder-owned, and mainly grow maize, rice and vegetables. The contribution of irrigation to agricultural sector GDP is about 7-12 percent, and about 2 - 4 percent to the entire economy. This represents between USD 80 million and USD 140 million or between about USD 850 and USD 1,550 per irrigated hectare. Produce under irrigation makes up the bulk of Malawi’s exports and smallholder irrigation is of significance to food and nutrition security, rural income generation and rural poverty reduction. Challenges facing the sector are; irrigation development is capital intensive; lack of good water storage facilities such as dams; weak institutional capacity at both central and district levels; land tenure laws; high operation and maintenance costs resulting in declining system functionality over time; growing of low-value staple food crops by farmers which limit economic performance; high erosion rates in catchment areas due to inappropriate agricultural practices and significant marketing challenges. An El Nino induced drought was experienced in Malawi during the 2015-16 rainfall season. The impacts of drought on the sector are; reduction of available water resources for irrigation resulting in reduced cultivated area; increased production costs in terms of expenses for pumping of water, water conflicts, food shortages as a result of reduced yields and returns.
Methodology of the Assessment Due to El Nino that was experienced during the 2015-16 cultivating season, on April 12, 2016, the President of Malawi declared a state of disaster in all the the central and southern districts. PDNA therefore covered Dedza, Dowa, Kasungu, Lilongwe, Mchinji, Nkhotakota, Ntcheu, Ntchisi, and Salima in central region and Balaka, Blantyre, Chikhwawa, Chiradzulu, Machinga, Mangochi, Mulanje, Mwanza, Neno, Nsanje, Phalombe, Thyolo, and Zomba in the southern region. Additionally, Mzimba and Rumphi Districts in the northern region were also considered in the PDNA.
IRRIGATION

MALAWI PDNA | 104
Data was collected using both primary and secondary sources. A data collection template was developed and used for collection of primary data. Primary data was collected from district irrigation staff and farmers from irrigation schemes in selected districts. Field visits were undertaken to Chikwawa, Machinga, Nsanje and Zomba where the drought impact was deemed to be high. Visits were also conducted data validation. Secondary data was collected from the Department of Irrigation database, annual reports and annual agriculture production estimates from the Department of Crop Production. Data on area, production and income were collected for the period 2010 to 2015 and five year averages calculated for these in order to establish a baseline condition. This was then compared with projected 2016/17 figures in order to find the losses. The strategy for second cropping cycle for the year 2016, Irrigation Master Plan and Investment Framework and Draft Revised Irrigation Policy (2015) were some of the reference materials used in the Drought PDNA process. The limitation of the methodology was that it did not isolate the impact of other factors on the drought e.g. poor catchment management, poor water management and agricultural practices.
Effects of the Drought The 2015-16 drought did not cause any damage to irrigation infrastructure. However, the drought has potential of reducing river base flows, dam and groundwater levels. This situation will likely affect the farmers’ capacity to produce an irrigated crop as a mitigation measure. The situation has also been compounded by the effects of the 2014/15 floods, which caused damage to irrigation infrastructure. The financial resources, which the World Bank made for rehabilitation of irrigation infrastructure through the Malawi Floods Emergency Recovery Project (MFERP) do not cover the cost of reconstructing the entire infrastructure that was damaged. The recovery needs of the sector are therefore incorporating the cost of rehabilitating some of the schemes that were damaged by the 2014/15 floods but are not covered under MFERP. Losses in the sector due to the drought will be felt in the course of the irrigation season, towards July and August. However, the anticipated losses are; reduced production and yields from irrigated crops leading to food insecurity and reduced incomes. Reduced incomes from water fees and increased operating costs.
Damage analysis The irrigation sector did not experience any damages due to the drought. However, damages that were incurred during the 2014/15 floods and have no recovery programme were considered in the analysis and have been incorporated in the sector needs under reconstruction of irrigation schemes.
Loss Analysis The total losses anticipated in the sector due to the drought are MWK22, 313,317,847.81 (USD31, 876,168.35). The losses were calculated considering loss of production of Maize and Rice, losses due to increased cost of production due to increased pumping costs, digging of new shallow wells and change of intake positions and losses due to crop failure. Maize and Rice are the main crops that have been considered in the loss analysis because they are the main crops grown under irrigation.
TABLE 28: SUMMARY OF LOSSES IN THE SECTOR
Id No. Description Northern
Region (MWK)Central Region (MWK)
Southern Region (MWK) Total MWK Total USD
1Loss of production (Maize)
1,613,959,875 6,709,585,410 10,190,666,970 18,514,212,255 26,448,874.65
2Loss of production (Rice)
0 1,828,085,310 1,716,928,898 3,545,014,207.50 5,064,306.01
3Loss due to increased production

MALAWI PDNA | 105
Due to increase in pumping
3,336,000 15,012,000 21,684,000 40,032,000.00 57,188.57
Due to digging of new shallow wells
13,200,000 25,119,857 39,275,528 77,595,385.31 110,850.55
Due to change of intake position
1,992,000 8,964,000 12,948,000 23,904,000.00 34,148.57
4Loss due to crop failure
9,380,000 42,210,000 60,970,000 112,560,000.00 160,800.00
Total Loss 1,641,867,875 8,628,976,577 12,042,473,395 22,313,317,847 31,876,168.35
The total area for irrigated maize is 114,064 ha, considering the use of residual moisture and dambo cultivation. Assuming that 25 percent of the area will not be cultivated due to other factors other than drought then the area under cultivation reduces to 85,548 ha. If production is done in 2 irrigation cycles, the area irrigated in real terms is 171,096 ha. Due to the drought, it is assumed that production will only be possible on one irrigation cycle, meaning that only 85,548 ha will be utilized for maize production. However, 34 percent of the available area will not be fully utilized due to water stress resulting in 65.58 percent loss of irrigated area in real terms. The area under cultivation is will therefore be 43,768 hectares. Due to the reduction in area under cultivation, there will be a 75 percent decrease in production translating to MWKW18, 514,212,255 (USD 26,448,875) worth of losses.
The average cost of production for Maize is about MWKW 234,000/ha. However, the cost of production is anticipated to increase this year due to the following:
i. Pumping: in other gravity irrigation schemes which use water stored in reservoirs, the water has gone down drastically such that it’s not possible to irrigate by gravity and farmers have opted to using motorized pumps. The running cost of a motorized pump per hectare for maize production in a year is MWK168, 000.00 for Malawi (according to FAO Publication). Thus in case of using motorized pump, the cost of production increases to MWK368, 000/ha. Another cost related to pumping includes an increase in fuel consumption of pumps due to an increase of the suction head. However, this loss was not quantified.
ii. Change of Intake: Due to the drought which has reduced water levels in rivers, farmers are changing water intake points by going further upstream to get water which has not yet entered below ground level as base flow. This change of intake entails procurement of pipes and sand bags. On average, it is estimated that every district will require about MWK 996,000 for this activity, and this translates to MWK 23,904,000 in all the affected districts.
FIGURE 22: EFFECTS OF DROUGHT ON AREAS UNDER IRRIGATION
30,000
25,000
20,000
15,000
10,000
5,000
0
Lilo
ngw
e
Ntc
heu
Ded
za
Kasu
ngu
Mch
inji
Dow
a
Ntc
hisi
Salim
a
Nkh
otak
ota
Blan
tyre
Thyo
lo
Mul
anje
Nen
o
Phal
ombe
Mw
anza
Chir
adzu
la
Nsa
nje
Chik
waw
a
Bala
ka
Zom
ba
Man
goch
i
Mac
hing
a
Mzi
mba
Rum
phi
Average Irrigated Area (Two times in a year) Irrigated Area Due to Drought
Irrigated area during normal irrigation season vs 2015-2016 season in Hectares
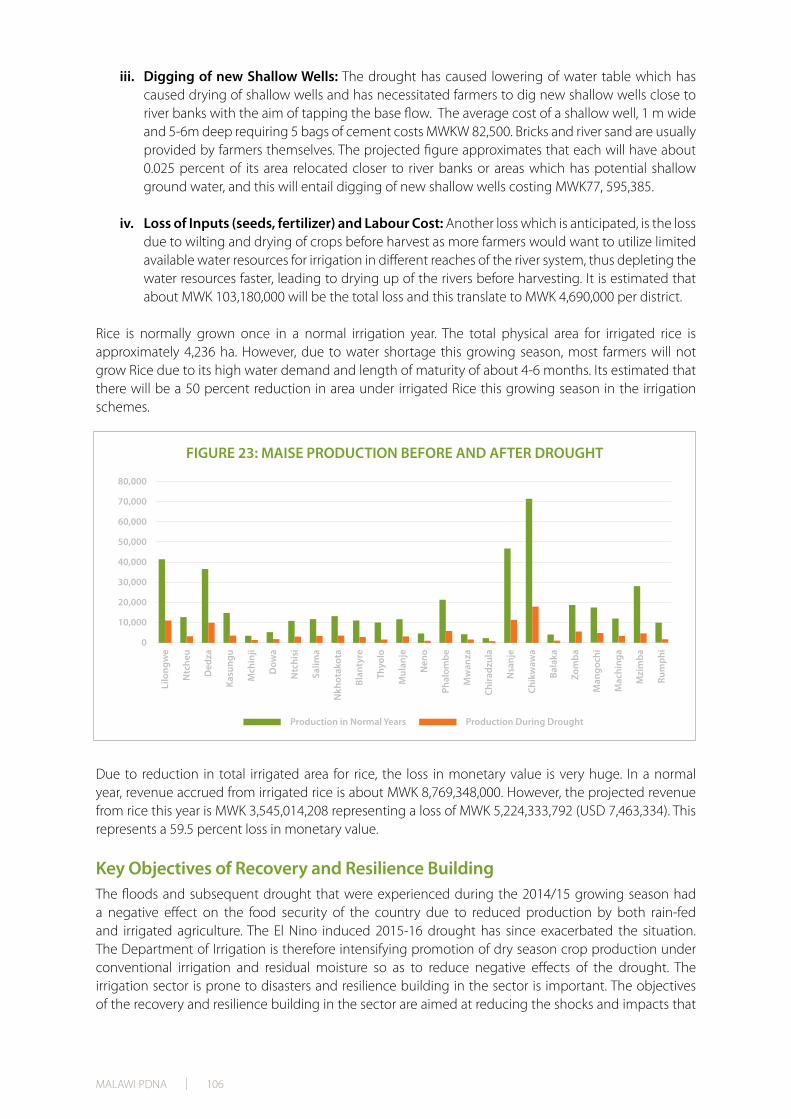
MALAWI PDNA | 106
iii. Digging of new Shallow Wells: The drought has caused lowering of water table which has caused drying of shallow wells and has necessitated farmers to dig new shallow wells close to river banks with the aim of tapping the base flow. The average cost of a shallow well, 1 m wide and 5-6m deep requiring 5 bags of cement costs MWKW 82,500. Bricks and river sand are usually provided by farmers themselves. The projected figure approximates that each will have about 0.025 percent of its area relocated closer to river banks or areas which has potential shallow ground water, and this will entail digging of new shallow wells costing MWK77, 595,385.
iv. Loss of Inputs (seeds, fertilizer) and Labour Cost: Another loss which is anticipated, is the loss due to wilting and drying of crops before harvest as more farmers would want to utilize limited available water resources for irrigation in different reaches of the river system, thus depleting the water resources faster, leading to drying up of the rivers before harvesting. It is estimated that about MWK 103,180,000 will be the total loss and this translate to MWK 4,690,000 per district.
Rice is normally grown once in a normal irrigation year. The total physical area for irrigated rice is approximately 4,236 ha. However, due to water shortage this growing season, most farmers will not grow Rice due to its high water demand and length of maturity of about 4-6 months. Its estimated that there will be a 50 percent reduction in area under irrigated Rice this growing season in the irrigation schemes.
Due to reduction in total irrigated area for rice, the loss in monetary value is very huge. In a normal year, revenue accrued from irrigated rice is about MWK 8,769,348,000. However, the projected revenue from rice this year is MWK 3,545,014,208 representing a loss of MWK 5,224,333,792 (USD 7,463,334). This represents a 59.5 percent loss in monetary value.
Key Objectives of Recovery and Resilience Building The floods and subsequent drought that were experienced during the 2014/15 growing season had a negative effect on the food security of the country due to reduced production by both rain-fed and irrigated agriculture. The El Nino induced 2015-16 drought has since exacerbated the situation. The Department of Irrigation is therefore intensifying promotion of dry season crop production under conventional irrigation and residual moisture so as to reduce negative effects of the drought. The irrigation sector is prone to disasters and resilience building in the sector is important. The objectives of the recovery and resilience building in the sector are aimed at reducing the shocks and impacts that

MALAWI PDNA | 107
result from drought and floods. The total recovery needs for the sector are MWKW 9,870,744,000 (USD 14,101,063) covering short term needs worth MWKW 905,838,000 (USD 1,294,054.30), medium term needs worth MWKW 2,567,684,000 (USD 3,688,121) and long term needs of about MWKW7 ,075,060,000 (USD 10,107,229).
The proposed sector recovery needs are geared towards recovery, reconstruction and disaster risk reduction. The recovery needs are river impoundments, procurement and distribution of treadle pumps, and utilization of new and existing schemes. These interventions are worth MWKW 707,040,000 (USD
1,010,057.14). The reconstruction needs are estimated at MWKW 1,138,500,000 (USD 1,626,429) and are mainly covering reconstruction of irrigation schemes. The disaster risk reduction needs are estimated at MWKW 8,205,204,000 (USD 11,464,577.14) covering catchment management, procurement and installation of solar driven drip kits, installation of solar powered surface irrigation systems and capacity building of farmers and staff.
The recovery needs interventions that have been designed to reduce drought impact and build resilience in the sector are summarized in the table below.

MALAWI PDNA | 108
TABLE 29: PROPOSED RECOVERY NEEDS IN THE SECTOR
Short Term Recovery Medium Term Recovery Long Term Recovery Remarks
River impoundmentsDistribution and installation of Drip Kits
Facilitate catchment management activities
Distribution of Treadle Pumps
Utilizing existing and new irrigation infrastructure
Reconstruction of small scale irrigation schemes
Provision of inputs (fuel, seeds, fertilizer)
Procurement and distribution of Treadle pumps
Procurement and installation of solar pumps
Construction of medium to large scale dams
This is a long term need but will not be costed in this recovery strategy
Below is a summary description of the proposed interventions.
Short- Term Recovery Needs• River impoundmentsDue to the drought, most water bodies have reduced flows that cannot sustain irrigation farming and this will lead to reduced irrigation cycles and area that can be put under irrigation. River impoundment aims at storing water for irrigation to ensure that enough water is available for the irrigation season (at least for one cycle of irrigation after the rainy season).
• Distribution of treadle pumpsTreadle pumps play a significant role in small scale irrigation farming as it replaced the watering can. Farmers use treadle pumps to convey water from shallow wells and rivers to their fields. The suction of the treadle pump is about 5m and delivery pipe is about 50m which means that water can be conveyed to a distance of about 50m from the source. One treadle pump can irrigate up to 0.3 hectare. 3500 treadle pumps will be procured and distributed in 9 districts benefiting 10,500 people and covering 1050 hectares.
• Provision of inputsDue to the drought, farmers might not have enough money to buy inputs such as seeds and fertilizers as they will opt to use the money to buy food. In most cases farmers resort to recycling of seeds, which results in low production. In order ensure maximum productivity from the limited land and water resources, supporting farmers through provision of hybrid seeds and fertilizers will be key. 1,500 tonnes of Maize seed and 15,000 tonnes of fertilizer targeting 300,000 households will be procured by the Department of Crop Production in the Ministry.
• Utilization of new and existing schemesThe Government of Malawi with assistance from several development partners has constructed irrigation schemes aiming at improving smallholder farmer’s food security. Schemes developed under Agriculture Infrastructure Support Program, Smallholder Irrigation and Value Addition Project, Climate Adaptation for Rural Livelihoods and Agriculture and the already existing irrigation schemes under smallholder and commercial farmers will be utilized for irrigation farming. The Department is planning to mobilize smallholder farmers towards production of second crop (mainly maize production) to supplement rain fed crop. A total area of about 35,000 ha out of developed 54,000 ha (due to dwindling water resources) of land under conventional irrigation would be planted with the second crop to benefit 285,000 farming households and is estimated to produce 122,500 metric tonnes of Maize.
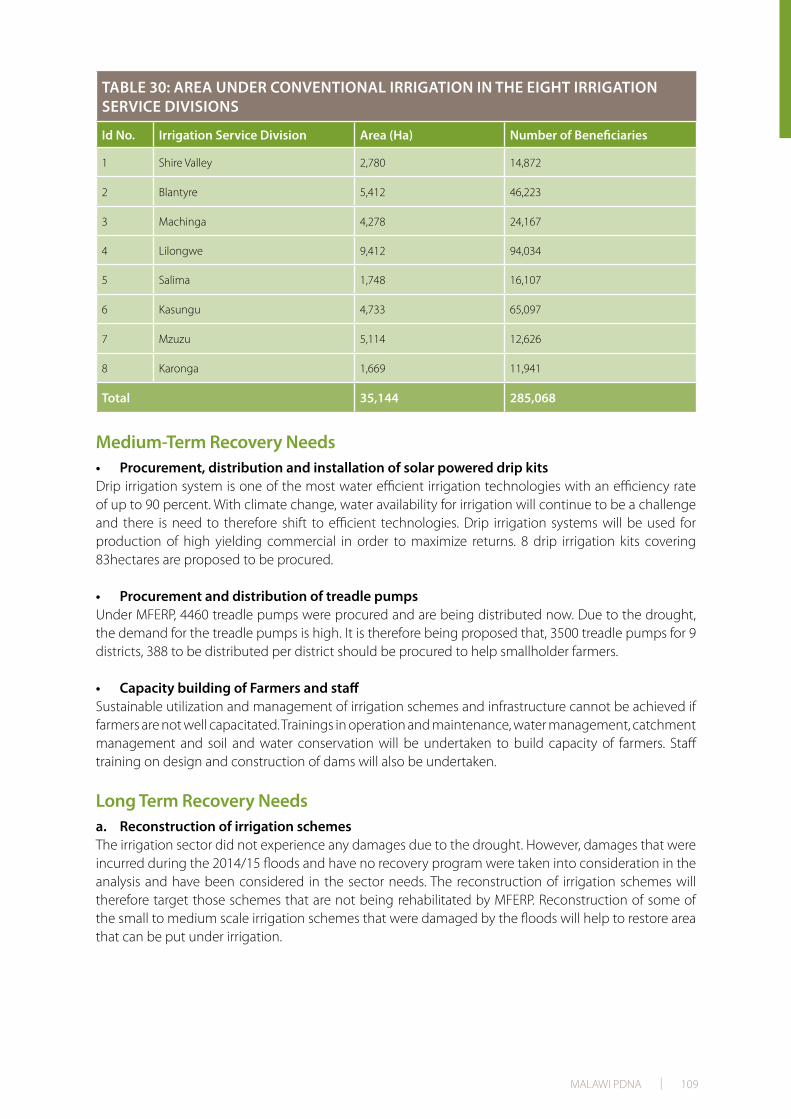
MALAWI PDNA | 109
TABLE 30: AREA UNDER CONVENTIONAL IRRIGATION IN THE EIGHT IRRIGATION SERVICE DIVISIONS
Id No. Irrigation Service Division Area (Ha) Number of Beneficiaries
1 Shire Valley 2,780 14,872
2 Blantyre 5,412 46,223
3 Machinga 4,278 24,167
4 Lilongwe 9,412 94,034
5 Salima 1,748 16,107
6 Kasungu 4,733 65,097
7 Mzuzu 5,114 12,626
8 Karonga 1,669 11,941
Total 35,144 285,068
Medium-Term Recovery Needs• Procurement, distribution and installation of solar powered drip kitsDrip irrigation system is one of the most water efficient irrigation technologies with an efficiency rate of up to 90 percent. With climate change, water availability for irrigation will continue to be a challenge and there is need to therefore shift to efficient technologies. Drip irrigation systems will be used for production of high yielding commercial in order to maximize returns. 8 drip irrigation kits covering 83hectares are proposed to be procured.
• Procurement and distribution of treadle pumpsUnder MFERP, 4460 treadle pumps were procured and are being distributed now. Due to the drought, the demand for the treadle pumps is high. It is therefore being proposed that, 3500 treadle pumps for 9 districts, 388 to be distributed per district should be procured to help smallholder farmers.
• Capacity building of Farmers and staffSustainable utilization and management of irrigation schemes and infrastructure cannot be achieved if farmers are not well capacitated. Trainings in operation and maintenance, water management, catchment management and soil and water conservation will be undertaken to build capacity of farmers. Staff training on design and construction of dams will also be undertaken.
Long Term Recovery Needsa. Reconstruction of irrigation schemesThe irrigation sector did not experience any damages due to the drought. However, damages that were incurred during the 2014/15 floods and have no recovery program were taken into consideration in the analysis and have been considered in the sector needs. The reconstruction of irrigation schemes will therefore target those schemes that are not being rehabilitated by MFERP. Reconstruction of some of the small to medium scale irrigation schemes that were damaged by the floods will help to restore area that can be put under irrigation.

MALAWI PDNA | 110
TABLE 31: LIST OF PROPOSED SCHEMES FOR RECONSTRUCTION
Id No. District Scheme nameBeneficiaries Area
(Ha) Cost Estimate (MWKW)Male Female
1 Blantyre Ndemanje 21 14 14 15,290,660.00
2 Phalombe Tithaniwa 46 71 16 38,810,193.69
3 Mulanje Tipindule 60 80 50 75,664,250.00
4 Mulanje Gibison 60 133 20 43,441,500.00
5 Chiradzulu Kachere 36 57 22 82,379,470.72
6 Salima Ngalande 24 34 58 22,970,200.00
7 Salima Mzangaulinazo 9 11 20 89,946,200.00
8 Chikwawa Matabwa 51 66 117 34,530,300.00
9 Chikwawa Namigoza 106 109 215 10,321,800.00
10 Balaka Luwani 22 28 7 20,304,914.30
11 Balaka Lifumba 22 28 77 32,997,834.10
12 Machinga Chanyungu 48 41 10 69,904,981.00
13 Zomba Chikumbutso 80 120 20 53,269,265.00
14 Zomba Maera 25 17 12 98,813,648.62
15 Mangochi Kangulete 26 39 6 16,949,518.00
16 Mangochi Matope 17 31 5 19,167,772.00
17 Rumphi Jambuko 45 53 54 41,088,575.00
18 Zomba Limbikani 65 65 46 107,990,735.00
Total 763 997 769 873,841,817.43
• Procurement and installation of solar pumpsSolar pump based irrigation schemes are being championed as mitigation measures to climate change impacts as they will look to exploit groundwater resources as source of water for irrigation and help build resilience in the sector due to use of alternate source of water other than surface water. Solar based schemes are also good alternatives to pump based systems that use fossil fuel or electricity. The solar based systems can be a combination of either Solar and gravity system and Solar and drip irrigation system. Solar pump based irrigation schemes will be developed in areas that have irrigation potential and have high potential groundwater yield of between 5-15 litres/second exists (areas along Lake Malawi littoral and the Shire Valley basin). Sites with a potential of 10 ha or more will be targeted. 29 pumps with potential to irrigate about 590 ha and to benefit 5,900 farm families will be procured and installed.
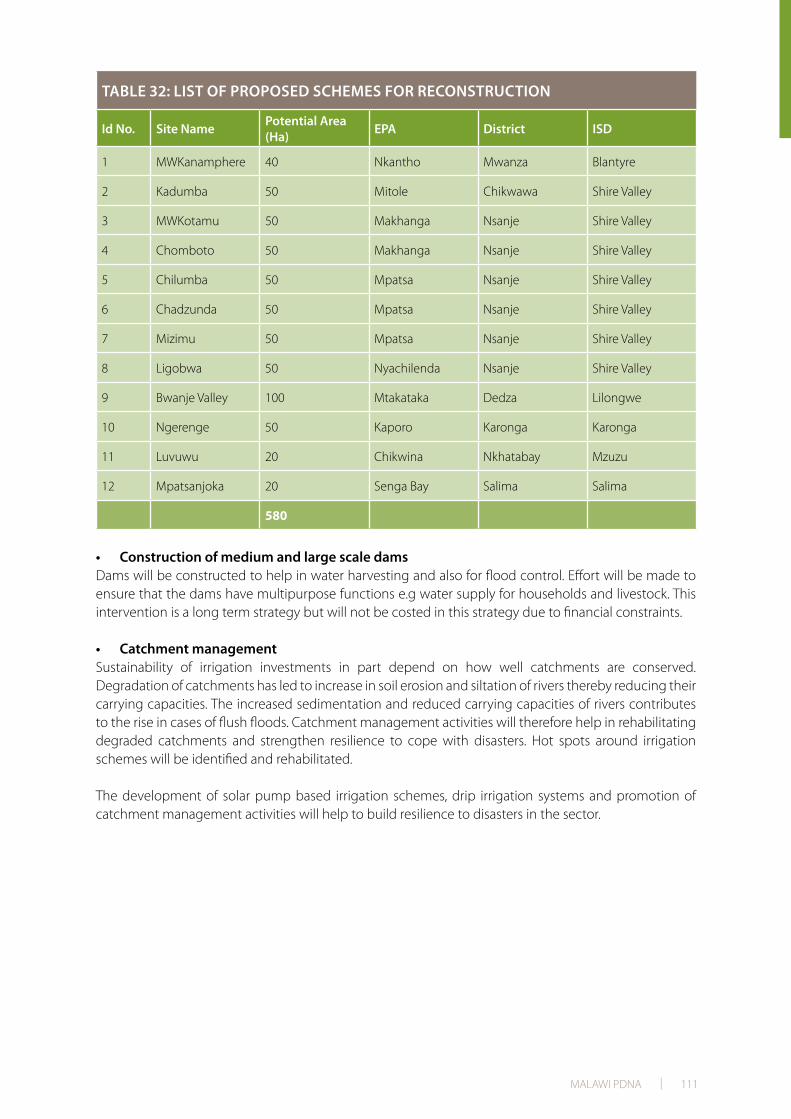
MALAWI PDNA | 111
TABLE 32: LIST OF PROPOSED SCHEMES FOR RECONSTRUCTION
Id No. Site Name Potential Area (Ha) EPA District ISD
1 MWKanamphere 40 Nkantho Mwanza Blantyre
2 Kadumba 50 Mitole Chikwawa Shire Valley
3 MWKotamu 50 Makhanga Nsanje Shire Valley
4 Chomboto 50 Makhanga Nsanje Shire Valley
5 Chilumba 50 Mpatsa Nsanje Shire Valley
6 Chadzunda 50 Mpatsa Nsanje Shire Valley
7 Mizimu 50 Mpatsa Nsanje Shire Valley
8 Ligobwa 50 Nyachilenda Nsanje Shire Valley
9 Bwanje Valley 100 Mtakataka Dedza Lilongwe
10 Ngerenge 50 Kaporo Karonga Karonga
11 Luvuwu 20 Chikwina Nkhatabay Mzuzu
12 Mpatsanjoka 20 Senga Bay Salima Salima
580
• Construction of medium and large scale damsDams will be constructed to help in water harvesting and also for flood control. Effort will be made to ensure that the dams have multipurpose functions e.g water supply for households and livestock. This intervention is a long term strategy but will not be costed in this strategy due to financial constraints.
• Catchment managementSustainability of irrigation investments in part depend on how well catchments are conserved. Degradation of catchments has led to increase in soil erosion and siltation of rivers thereby reducing their carrying capacities. The increased sedimentation and reduced carrying capacities of rivers contributes to the rise in cases of flush floods. Catchment management activities will therefore help in rehabilitating degraded catchments and strengthen resilience to cope with disasters. Hot spots around irrigation schemes will be identified and rehabilitated.
The development of solar pump based irrigation schemes, drip irrigation systems and promotion of catchment management activities will help to build resilience to disasters in the sector.

MALAWI PDNA | 112
TABLE 33: ESTIMATES OF RECOVERY AND RECONSTRUCTION NEEDS FOR IRRIGATION SECTOR IN MWK.
Short Term Medium Term Long Term Total Recovery Needs Remarks
Recovery Needs
River impoundment 144,000,000
Distribution of treadle pumps
0Cost to be covered by MFERP
Provision of inputs 0To be covered by Crops Department
Utilization of new and existing schemes
84,000,000
Distribution and installation of drip kits
2,058,400,000
Procurement and distribution of 3500 treadle pumps
479,040,000
Capacity building of farmers, staff
30,244,000
Reconstruction Needs
Reconstruction of schemes
1,138,500,000
installation of solar pumps
5,782,000,000
Construction of dams
0
Catchment Management
154,560,000
Human and Socio-economic Impact of the Drought on the SectorThe socio economic impact of the drought in the sector are that there will be food insecurity at household level due to reduced farmer capacity to produce a crop under irrigation, loss of income for farmers who grow cash-crops under irrigation, loss of man-hours as people will be travelling long distances to access water, increased cases of water conflicts among users, catchment degradation as farmers look at alternatives to irrigation and river bank cultivation as farmers try to cultivate close to water sources. This will lead to increase in food prices, more severe water shortages and food insecurity. The number of months which households are food insecure will be increased and will lead to women spending more time looking for food leading to increased risk and vulnerabilities for women. The increased food insecurity might lead to increased cases of malnutrition in farm families thereby affecting peoples’ livelihood.
Challenges in the SectorThe main challenges facing the irrigation sector are that; Irrigation development is capital intensive, and has to compete with many other investment needs for the limited funding available; farmers have very limited capacity to invest their own capital, or to borrow money for investment, and most of the investment therefore needs to come from the private sector, GoM and its development partners; Lack

MALAWI PDNA | 113
of water storage facilities such as dams; limited funding in the sector; weak institutional capacity at both central and district levels; responsibility for irrigation is dispersed among various ministries and departments, and lack of good land tenure system; high erosion rates in catchment areas due to inappropriate agricultural practices; and low access to markets.
Existing Sectoral Policies and Major ProgramsIncreased investment in irrigation is consistent with Malawi’s higher level development plans and aspirations articulated in Vision 2020 and the Malawi Growth and Development Strategy II. The Agricultural Sector-Wide Approach (ASWAp) (2011-15) presents a priority investment programme that aims to accelerate agricultural development based on the priority agricultural elements of MDGS II. Development of irrigation can make a significant contribution to the ASWAp objectives. Irrigation also occupies a prominent position in a number of sectoral and sub-sectoral strategies including: (i) the National Water Policy (2005); (ii) the Water Resources Investment Strategy (2011); (iii) the Malawi Water, Sanitation and Irrigation Sector Strategic Plan (2013); (iv) the Department of Irrigation Strategic Plan (2011-16); (v) the draft National Irrigation Policy (2014); (vi) the National Export Strategy (2013-2018); and (vii) the Draft National Water Resources Master Plan.
Major programs being undertaken in the sector are; feasibility studies for the development of the Shire Valley Irrigation project which aims at developing about 42,600 ha in Chikwawa and Nsanje Districts; African Development Bank funded Smallholder Irrigation and Value Addition project aimed at developing and rehabilitating about 3345 ha in 7 districts in Malawi; Construction of a 42 meter dam with support from the European Union; IFAD funded Programme for Rural Irrigation Development that will develop about 51300 ha in 7 districts in Malawi; Government of Malawi funded Malawi Irrigation Development Support Project which will develop about 900 ha of irrigated land across the country; European Union funded Support to Agriculture Sector Wide Approach and Green Belt Initiative which among other things is modernizing medium scale irrigation schemes and developing solar powered irrigation schemes; World Bank funded Malawi Floods Emergency Recovery Project aimed at reconstructing infrastructure and livelihood restoration in areas that were affected by the January 2015 floods. The Department of Irrigation has also developed a National Irrigation Master Plan and Investment Framework; the National Irrigation Policy; the 2016 strategy for irrigation to mitigate the effects of the 2015-16 drought aimed at increasing food production through irrigation. Overall, the main objective of the sector is to contribute to sustainable national economic growth and development through enhanced irrigated agricultural production.
Sector PrioritiesThe irrigation sector has three (3) priorities which have been elaborated in the National Irrigation master Plan and Investment Framework as well as the (Draft) National Irrigation Policy. The priorities are as follows:
i. Sustainable Irrigation Development in which emphasis is put on increasing area developing for irrigation
ii. Sustainable Irrigation Management in which focus is made on rehabilitating and modernizing old irrigation schemes
iii. Capacity building of irrigation members of staff and farmers (i.e. through establishment of Water Users’ associations)

MALAWI PDNA | 114
Implementation StrategyThe recovery interventions being proposed in the sector are aimed at providing immediate relief to the affected communities by using irrigation as a mitigation measure, building resilience against future disasters by using irrigation as a mitigation measure. Development will take oversight role at Ministry level; the Department of Irrigation will be the technical lead and look at day to day implementation and management of the activities. The Irrigation Services Divisions will provide technical backstopping of the District Irrigation Offices that will be responsible for implementation of activities through the District Councils. The communities will be responsible for implementation of activities, monitoring and evaluation at the lower level. Collaboration with Non State Actors will be encouraged realizing that some of them are already implementing some of the activities outlined in the strategy. A multi stakeholder implementation steering committee therefore has to be established to harness the efforts of all the stakeholders. Ministry of Finance, Economic Planning and Development should chair this committee. The sector recovery and reconstruction needs implementation action plan is presented in the Table 7 on the next page. It will also be important to coordinate with the agriculture cluster as irrigation related issues including decisions on providing inputs for winter production, treadle pumps and maintenance of schemes are also usually discussed under the agriculture cluster.

MALAWI PDNA | 115
BackgroundThe water sector covers water and sanitation services provided across the country. Ministry of Agriculture, Irrigation and Water Development facilitates the development and management of water resources in Malawi. (See Figure 23 for structure of the Ministry)
WATER RESOURCES

MALAWI PDNA | 116
Water Resources Availability BaselineSurface WaterMalawi has a large network of surface water bodies covering 21 percent of the country’s 120,000 km2 area. About 94 percent of the land area in Malawi is part of the Zambezi River Basin which drains into the Indian Ocean in Mozambique. The remaining 6 percent falls within the Congo and Rovuma Basins or the small internal drainage basin of Lake Chilwa. The Zambezi River Basin is the second largest in the SADC region; 8 percent of the basin is in Malawi. The most prominent water body is Lake Malawi which is 567 km long and 28,900 km2 in area (of which 4,540 km2 is in Mozambique) making it the third largest lake in Africa, and the 10th largest in the world. More than ten rivers drain into Lake Malawi from two of the three riparian countries including Ruhuhu (Tanzania), Songwe (Tanzania and Malawi), N. Rukuru, N. Rumphi, S. Rukuru, Dwangwa, Bua, Linthipe, and Livulezi.
GroundwaterGroundwater resources are widespread throughout the country. The total potential groundwater yield is estimated at 1.4 km3/year (44 m3/s), based on an average recharge rate of 15mm/year; however, the groundwater potential has not been comprehensively determined. The last significant hydro-geological mapping was done in 1986, and even this was based on limited borehole information. Groundwater abstraction is generally unregulated and uncontrolled. There are two areas within the Shire basin which are vulnerable. The area around Blantyre, as a result of high population and growth rate, experiences poor water quality and low recharge rates. Areas in the north western part of the basin (Water Resource Unit 1R), based on high population rate, poor water quality and low recharge rates. Other areas of interest are east and north of Blantyre, which are recognized as highly vulnerable. Refer to the figure below showing the ground water situation.
2015-16 drought conditions have severely stressed the water resource availability in the country, and the situation is likely to get worse in the months ahead. The current situation of major water bodies of the country such as Lake Malawi and the Shire River have negatively been affected as reported by Nor Plan. Figure 25 below showing a decreasing trend in historical Lake Malawi levels especially in 2016. Remote sensing gives us a clear indication of the areas affected by drought (see Figure 28).
FIGURE 27: HISTORIC LAKE LEVEL

MALAWI PDNA | 117
Methodology for Assessment of SectorTwo trained officials from the department of Water Resources undertook field trips to collect data and carry out ground surveys on selected districts. Interviews were conducted with the water district heads, disaster management officers and the local residents. Visits were carried out to worst affected areas to inspect infrastructural damage resulting from the drought. The calculation of damage was based on the following assumptions - maintenance cost for dam embankment and de-siltation pegged at 45 percent of the actual construction cost. The actual estimated construction cost for the small earth dam is MWK 62, 00,000 (including environment screening, survey, designs, and construction) and hence estimated maintenance cost as a percentage of actual cost is MWK 28,000,000 per dam.
Effects of the DroughtDamagesThe damages that resulted from the drought arose from destruction of infrastructure. In case of water resources the damage mainly included dam embankments destruction by large number of livestock while accessing the little water inside the few remaining dams and also by some farmers who cultivates right inside the reservoir area following the edge of the water level resulting into weakening the soil structure leading to siltation. The above situation is projected to worsen as water levels continue to decrease. Field assessments have revealed that 35 dams have been partially damaged, translates into a total damage of USD 1.4 million.
FIGURE 28: MALAWI'S DROUGHT AFFECTED AREAS

MALAWI PDNA | 118
TABLE 34: DISTRIBUTION OF DAMAGES TO DAMS BY REGION
Cost (USD)
Southern Districts
Central Districts
Northern Districts Total
Repair of Mildly Damaged Dams 480,000 760,000 160,000 1,400,000
Total Damages 480,000 760,000 160,000 1,400,000
TABLE 35: ESTIMATES OF RECOVERY AND RECONSTRUCTION NEEDS FOR THE SUB-SECTOR
RECOVERY NEEDS
RECONSTRUCTION NEEDS (MWK)
RECONSTRUCTION NEEDS (USD)
WATER RESOURCES
Construction of 50 Small earth dams 3,100,000,000.00 4,428,571
Construction of 50 Excavated tanks 2,500,000,000.00 3,571,429
Rehabilitation of 35 mildly damaged dams
980,000,000.00 1,400,000
Rehabilitation of 35 mildly damaged dams
915,000,000.00 1,307,143
-
SUB TOTAL 980,000,000.00 6,515,000,000.00
-
GRAND TOTAL (MWK) 7,495,000,000.00 10,707,143
Challenges in the Sector• Insufficient Funding: There are currently significant challenges in gathering and maintaining
quality data, particularly on ground water data, water levels/flows and water quality. The current systems for monitoring water resources are inadequate as it is on ad hoc basis. The development of infrastructures has also not been spared. The subsector lacks funds to strengthen the above mechanisms, construction of dams, boreholes and inadequate laboratory equipment. Rehabilitation of hydrometric stations is also affected by inadequate funding.
• Uncoordinated Efforts: For example, there is no single database for all drilled boreholes in the country. This poses challenge of inadequate coordination among relevant actors in groundwater development, which may lead to duplication of efforts.
• Floods and droughts: There are inadequate water resources to meet demand due to increased seasonal variability in run-off, increases in population and demand for industrial production and irrigation requirement. This problem has arisen because of droughts and unreliable dry season flows due to climate change.

MALAWI PDNA | 119
• Water Demand Management: The wastage of water and water resources, particularly during floods and droughts, exacerbate the water scarcity and inhibit equitable access to water for essential and basic human needs in times of droughts. During wet season, millions of cubic meters of water pass through to the Lake and eventually the Shire and Zambezi rivers then into the Indian Ocean. This is the time when water demand is low and when it is high in the dry season most rivers run dry and there is considerable water scarcity across the country, even in river basins where there are flow-regulating facilities such as Liwonde Barrage on Shire River.
• Water Pollution: Pollution of surface and groundwater resources is a growing problem and is making water resources unavailable for use without expensive pre-treatment. Pollution is increasing from point sources such as discharges of unacceptable effluent quality from industrial and domestic wastewater treatment facilities and from non-point sources such as solid waste dumping sites, silts and agrochemicals from gardens, storm water drains and nutrients from animal farms etc.
• Catchment Degradation: Encroachment of protected catchments, through deforestation, human settlement, mining, and cultivation of marginal lands is an issue of major concern in Malawi. This nature of pressure exerted on the water resources brings about declining base flows, siltation and deterioration of water quality (e.g. increased suspended solids and turbidity) resulting in high water treatment costs, reduced groundwater recharged rates, and increased incidences of flood disasters.
• Vandalism of Water Monitoring Equipment and Water Supply facilities: Vandalism of monitoring equipment for both surface and ground water and water supply boreholes is a common problem.
Recovery Needs and Strategy• Construct small multipurpose dams: Water loss in the existing dam and medium-sized dams
is attributed to excessive evaporation and seepage. While undertaking repairs of dams and pans damaged/dried as a result of drought, it is important to deepen them to reduce the effect of evaporation and where possible, to introduce linings to eliminate seepage. Protection of the existing dams by fencing and constructing water points and animal watering troughs away from the structure will prevent further damage to these facilities.
Undertake adaptive watershed management programme to restore catchments: Degradation of catchment areas has significantly reduced the capacity of the available water sources. To re-generate them, there is need to restore and increase the forest cover in all water catchment areas in the country through planting of trees, and implementing other soil and land management interventions (such as check dams, gully control, etc.)
Promote rainwater harvesting: The impact of droughts is magnified due to limited water harvesting structures in the country. Water or rain water harvesting is the process of capturing and storing surface/rain water for its efficient utilization and conservation. It is an effective tool to utilize a large quantity of fresh water which otherwise goes as runoff. It is important in the country to promote rainwater harvesting to ensure collection of Rain Water for Surface Storage and Recharge to Ground Water Aquifers which can be used later. Rainwater harvesting is important in water resources sector for the following reason: to augment the availability of water resources for meeting various demands; to arrest the declining trend in water levels of an area; to conserve and store excess surface water for future requirements, since these requirements often change with time; to reduce runoff, which otherwise chokes the storm water drains in the urban areas; to prevent/ reduce flooding; and to prevent depletion of ground water reservoir in over exploited areas.

MALAWI PDNA | 120
Campaigns for prioritization of critical water uses in 7 affected rivers: Major rivers have been affected as a result of drought. Critical among them are Lilongwe which supplies water to Lilongwe water Board, Mpira River, which is a source of water for Mpira Gravity Fed Water Supply Scheme. Shire River which is a source of water for Blantyre water board and Hydropower generation by ESCOM, which is used for irrigation. These rivers need to be regulated now by of prioritizing critical water uses such as domestic as outlined in the Water Resources Policy of 2005. Campaigns need to be carried out to sensitize different water uses on the importance of fair allocation of the water resources in these important rivers.
Setting up a drought monitoring system (low flow monitoring in 7 affected rivers): The system for monitoring low flows need to be set in the selected affected rivers, this will aid in decision making in proper allocation of the scarce resource by different uses.
Preparation of drought contingency plans for major rivers: There is a need to prepare drought contingency plans for the major rivers in the country. Drought contingency planning, is a way to ensure that critical water needs are met during a dry period, minimizing the economic, social, and environmental impacts of a drought. Government in collaboration with water utilities should prepare for such occasions by developing tactical plans, called drought contingency plans, to reduce peak demands and extend water supplies during a drought.
Existing Sectoral Policies and Major ProgramsRecent government interventions to improve the management of water resources include the following:
i. Improved policy environment, through the adoption of a National Water Policy in 2005.
ii. Improved legal and regulatory framework enshrined in the Water Resources Act (2013) to replace the 1969 Water Resources Act which provides for establishment of the National Water Resources Authority to replace the Water Resources Board to ensure effective water resources management.
iii. Completion of the Integrated Water Resources Management (IWRM) Plan that will facilitate inter-sectoral water resources management and development, in the medium to long term.
iv. A dam development program, to improve availability of water for multi-purpose use as well as to improve groundwater recharge; and
v. Preparation of a comprehensive Water Resources Investment Strategy to guide future investments.

MALAWI PDNA | 121
WATER SUPPLY AND SANITATION
BackgroundThe Ministry of Agriculture, Irrigation and Water Development is the central ministry that facilitates the development and management of water resources in Malawi as well as formulating policies that regulates different players in the sector. The main objective is to ensure access to safe water and sanitation and hygiene practices. This is done to prevent the outbreak of water-borne and water related diseases. The vision for the Ministry is water and sanitation for all, always. The sector goal is to ensure sustainable provision of adequate quantity and quality of water and adequate sanitation services to Malawians so as to ensure healthier population with easier access to water supply and sanitation.
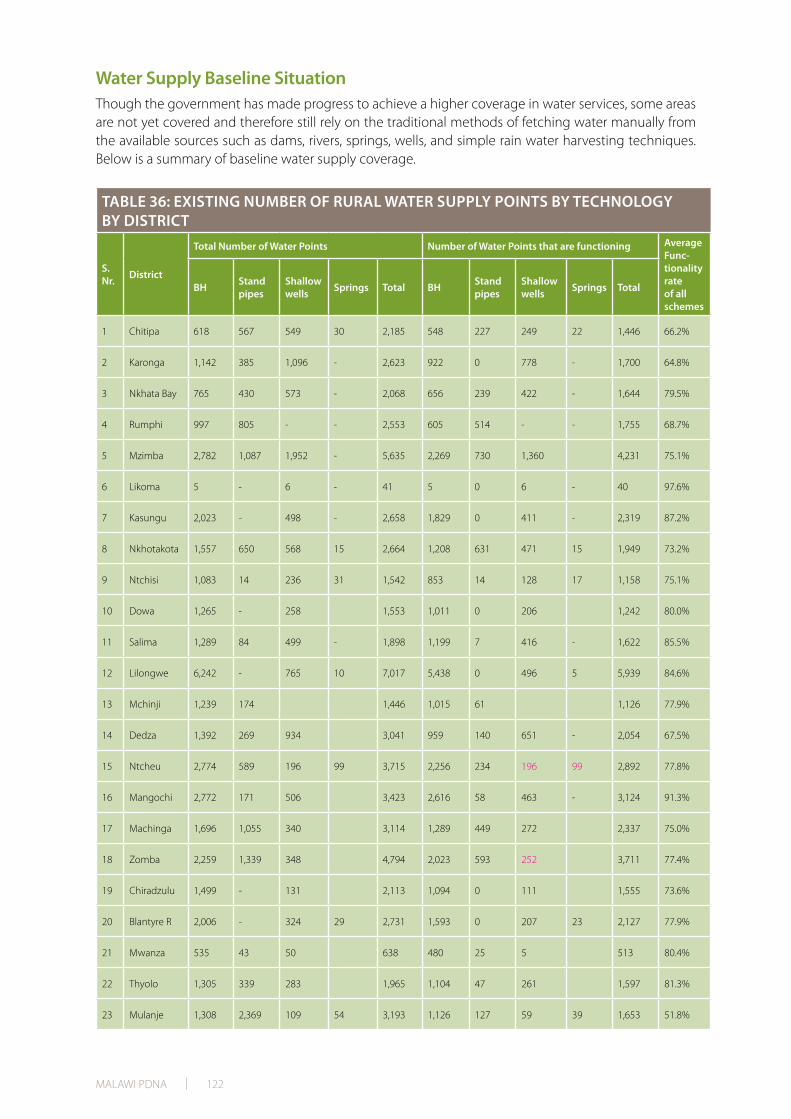
MALAWI PDNA | 122
Water Supply Baseline SituationThough the government has made progress to achieve a higher coverage in water services, some areas are not yet covered and therefore still rely on the traditional methods of fetching water manually from the available sources such as dams, rivers, springs, wells, and simple rain water harvesting techniques. Below is a summary of baseline water supply coverage.
TABLE 36: EXISTING NUMBER OF RURAL WATER SUPPLY POINTS BY TECHNOLOGY BY DISTRICT
S. Nr. District
Total Number of Water Points Number of Water Points that are functioning Average Func-tionality rate of all schemes
BH Stand pipes
Shallow wells Springs Total BH Stand
pipesShallow wells Springs Total
1 Chitipa 618 567 549 30 2,185 548 227 249 22 1,446 66.2%
2 Karonga 1,142 385 1,096 - 2,623 922 0 778 - 1,700 64.8%
3 Nkhata Bay 765 430 573 - 2,068 656 239 422 - 1,644 79.5%
4 Rumphi 997 805 - - 2,553 605 514 - - 1,755 68.7%
5 Mzimba 2,782 1,087 1,952 - 5,635 2,269 730 1,360 4,231 75.1%
6 Likoma 5 - 6 - 41 5 0 6 - 40 97.6%
7 Kasungu 2,023 - 498 - 2,658 1,829 0 411 - 2,319 87.2%
8 Nkhotakota 1,557 650 568 15 2,664 1,208 631 471 15 1,949 73.2%
9 Ntchisi 1,083 14 236 31 1,542 853 14 128 17 1,158 75.1%
10 Dowa 1,265 - 258 1,553 1,011 0 206 1,242 80.0%
11 Salima 1,289 84 499 - 1,898 1,199 7 416 - 1,622 85.5%
12 Lilongwe 6,242 - 765 10 7,017 5,438 0 496 5 5,939 84.6%
13 Mchinji 1,239 174 1,446 1,015 61 1,126 77.9%
14 Dedza 1,392 269 934 3,041 959 140 651 - 2,054 67.5%
15 Ntcheu 2,774 589 196 99 3,715 2,256 234 196 99 2,892 77.8%
16 Mangochi 2,772 171 506 3,423 2,616 58 463 - 3,124 91.3%
17 Machinga 1,696 1,055 340 3,114 1,289 449 272 2,337 75.0%
18 Zomba 2,259 1,339 348 4,794 2,023 593 252 3,711 77.4%
19 Chiradzulu 1,499 - 131 2,113 1,094 0 111 1,555 73.6%
20 Blantyre R 2,006 - 324 29 2,731 1,593 0 207 23 2,127 77.9%
21 Mwanza 535 43 50 638 480 25 5 513 80.4%
22 Thyolo 1,305 339 283 1,965 1,104 47 261 1,597 81.3%
23 Mulanje 1,308 2,369 109 54 3,193 1,126 127 59 39 1,653 51.8%
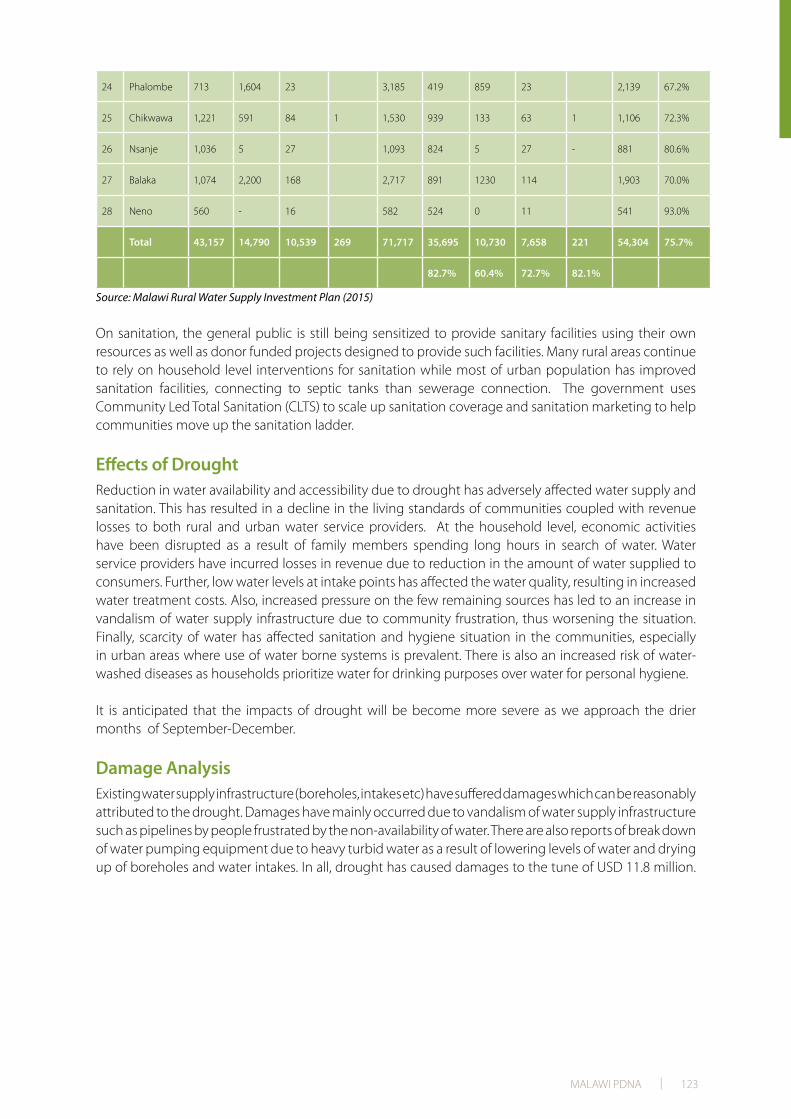
MALAWI PDNA | 123
24 Phalombe 713 1,604 23 3,185 419 859 23 2,139 67.2%
25 Chikwawa 1,221 591 84 1 1,530 939 133 63 1 1,106 72.3%
26 Nsanje 1,036 5 27 1,093 824 5 27 - 881 80.6%
27 Balaka 1,074 2,200 168 2,717 891 1230 114 1,903 70.0%
28 Neno 560 - 16 582 524 0 11 541 93.0%
Total 43,157 14,790 10,539 269 71,717 35,695 10,730 7,658 221 54,304 75.7%
82.7% 60.4% 72.7% 82.1%
Source: Malawi Rural Water Supply Investment Plan (2015)
On sanitation, the general public is still being sensitized to provide sanitary facilities using their own resources as well as donor funded projects designed to provide such facilities. Many rural areas continue to rely on household level interventions for sanitation while most of urban population has improved sanitation facilities, connecting to septic tanks than sewerage connection. The government uses Community Led Total Sanitation (CLTS) to scale up sanitation coverage and sanitation marketing to help communities move up the sanitation ladder.
Effects of DroughtReduction in water availability and accessibility due to drought has adversely affected water supply and sanitation. This has resulted in a decline in the living standards of communities coupled with revenue losses to both rural and urban water service providers. At the household level, economic activities have been disrupted as a result of family members spending long hours in search of water. Water service providers have incurred losses in revenue due to reduction in the amount of water supplied to consumers. Further, low water levels at intake points has affected the water quality, resulting in increased water treatment costs. Also, increased pressure on the few remaining sources has led to an increase in vandalism of water supply infrastructure due to community frustration, thus worsening the situation. Finally, scarcity of water has affected sanitation and hygiene situation in the communities, especially in urban areas where use of water borne systems is prevalent. There is also an increased risk of water-washed diseases as households prioritize water for drinking purposes over water for personal hygiene.
It is anticipated that the impacts of drought will be become more severe as we approach the drier months of September-December.
Damage AnalysisExisting water supply infrastructure (boreholes, intakes etc) have suffered damages which can be reasonably attributed to the drought. Damages have mainly occurred due to vandalism of water supply infrastructure such as pipelines by people frustrated by the non-availability of water. There are also reports of break down of water pumping equipment due to heavy turbid water as a result of lowering levels of water and drying up of boreholes and water intakes. In all, drought has caused damages to the tune of USD 11.8 million.

MALAWI PDNA | 124
TABLE 37: DISTRIBUTION OF DAMAGES IN WATER SUPPLY AND SANITATION INFRASTRUCTURE BY REGION
Cost (USD)
Southern Districts Central Districts
Northern Districts Total
Boreholes 5,419,357 4,326,214 606,500 10,352,071
Piped Water Supply 265,000 57,357 14,357 336,714
Conveyance System 1,114,286 0 0 1,114,286
Total Damages 6,798,643 4,383,571 620,857 11,803,071
Loss AnalysisReduced production due to low water levels has resulted in low revenue collection. At the same time, there has been an increase in water treatment and quality monitoring costs.
TABLE 38: DISTRIBUTION OF LOSSES BY REGION
Cost (USD)
Southern Districts Central Districts Northern Districts Total
Lilongwe Water board - 577,643 - 577,643
Northern Region Water Board
- - 635,714 635,714
Central Region Water Board
- 593,196 - 593,196
Southern Region Water Board
573,200 - - 573,200
FIGURE 30: PICTURE OF DRIED UP WATER INTAKE IN MACHINGA
FIGURE 31: AREAS WITH DROUGHT-AFFECTED BOREHOLES IDENTIFIED THROUGH
REMOTE SENSING

MALAWI PDNA | 125
Blantyre Water Board 4,973,848 - - 4,973,848
Revenue Loss * 13,093 9,064 2,014 24,171
Total Losses 5,560,141 1,179,903 637,729 7,377,773
TABLE 39: CASE OF RURAL WATER SUPPLIES –SUMMARY OF LOSSES INCURRED BY RURAL GRAVITY FED PIPED WATER SUUPLY SYSTEMS
DISTRICT SCHEME LOSS in production % Loss in revenue %
June 2015 June 2016 June 2015 June 2016
Balaka Mpira-dam 5 15 10 20
Machinga Nkula 10 30 20 50
Kawinga 15 25 20 40
Zomba Zomba East 10 20 17 22
Chikwawa Chapananga - - - -
East Bank - 40 - 50
Nsanje Chididi -
Rumphi Nkhamanga 10 15 15 20
MethodologyTwo trained officials drawn from the department of water supply services undertook field trips to collect data on selected districts. Interviews were conducted with the district water officers, local utility operators, public health officers, drought management officers as well as local residents. Visits were carried out to areas where drought impact was most adverse to inspect infrastructural damage resulting from the drought disaster and photographs were taken. The districts which were visited were; Chikhwawa, Nsanje, Balaka, Machinga and Zomba. The districts that were not visited phone calls and emails were used to get data.
TABLE 40: DISTRIBUTION OF NEEDS IN RECOVERY AND RECONSTRUCTION OF WATER SUPPLY INFRASTRUCTURE BY REGION
Cost (USD)
Southern Districts
Central Districts
Northern Districts Total
Construction and relocation of new intake structures (using improved designs)
182,387 126,268 28,060 336,714
Procurement and installation of new pipelines for relocated water supply intakes
603,571 417,857 92,857 1,114,286
rehabilitation of rural boreholes 5,607,372 3,882,027 862,673 10,352,071
Southern Region Water Board: Drilling of emergency boreholes for northern region water
571,429 - - 571,429
Central Region Water Board: drilling of boreholes
- 571,429 - 571,429
Lilongwe Water Board: drilling of boreholes - 571,429 - 571,429
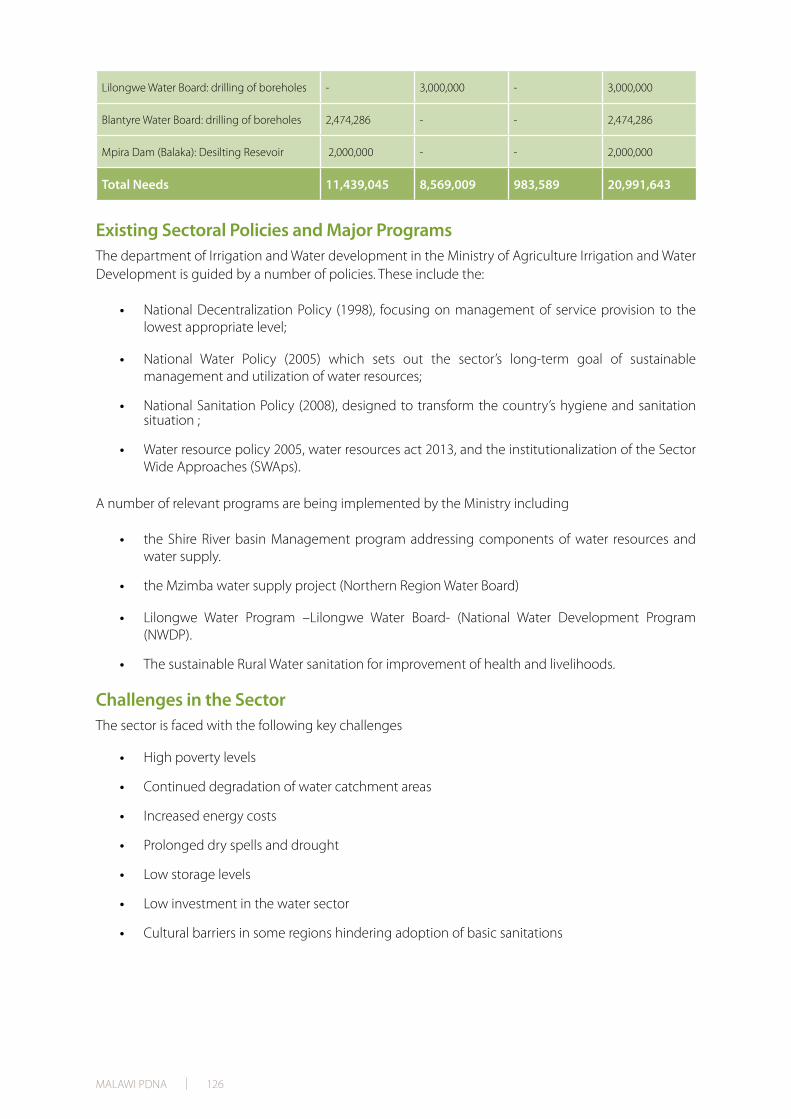
MALAWI PDNA | 126
Lilongwe Water Board: drilling of boreholes - 3,000,000 - 3,000,000
Blantyre Water Board: drilling of boreholes 2,474,286 - - 2,474,286
Mpira Dam (Balaka): Desilting Resevoir 2,000,000 - - 2,000,000
Total Needs 11,439,045 8,569,009 983,589 20,991,643
Existing Sectoral Policies and Major ProgramsThe department of Irrigation and Water development in the Ministry of Agriculture Irrigation and Water Development is guided by a number of policies. These include the:
• National Decentralization Policy (1998), focusing on management of service provision to the lowest appropriate level;
• National Water Policy (2005) which sets out the sector’s long-term goal of sustainable management and utilization of water resources;
• National Sanitation Policy (2008), designed to transform the country’s hygiene and sanitation situation ;
• Water resource policy 2005, water resources act 2013, and the institutionalization of the Sector Wide Approaches (SWAps).
A number of relevant programs are being implemented by the Ministry including
• the Shire River basin Management program addressing components of water resources and water supply.
• the Mzimba water supply project (Northern Region Water Board)
• Lilongwe Water Program –Lilongwe Water Board- (National Water Development Program (NWDP).
• The sustainable Rural Water sanitation for improvement of health and livelihoods.
Challenges in the SectorThe sector is faced with the following key challenges
• High poverty levels
• Continued degradation of water catchment areas
• Increased energy costs
• Prolonged dry spells and drought
• Low storage levels
• Low investment in the water sector
• Cultural barriers in some regions hindering adoption of basic sanitations
MALAWI PDNA | 127
SOCIAL PROTECTION
Background Poorer parts of the world are more vulnerable to the negative impacts of natural disasters. There is empirical evidence that the poor are less able to respond to crises than the non-poor in the face of disasters (Vakis et al.2004). Social safety nets (social assistance programs) are one type of programs that have been used across the globe to protect the poor from the effects of disasters. These are particularly implemented ex ante, i.e. after the disaster has already struck. Social protection refers to noncontributory transfers (in cash or kind), targeted at the poor and vulnerable to catch those falling towards economic destitution, or at the permanently poor above a minimum income level.
In Malawi social protection programs such as public works, social cash transfer, starter packs have been widely used to protect the poor from shocks. In 2012, social protection was used to protect the poor from the effects of rising food and fuel prices and the effect of devaluation through the MASAF Public Works Programme and the IRLAD under the Input for Assets Programme (IFA). Implementation of safety nets (ex-post) concerns the adjustments that need to be made with respect to deciding the type of safety net to administer and at what level, targeting procedures, an appeals process, a distribution mechanism and a monitoring and evaluation system.
Social Cash Transfers (direct assistance in the form of cash to the poor) and Public Works Programme (provision of unskilled manual workers with short-term employment on projects such as road construction and maintenance, irrigation infrastructure, reforestation, and soil conservation) have been widely used in many parts of the world to offer protection to the poor and vulnerable population that have been affected by disasters.
After disasters, public works programs can provide a number of benefits. First, they provide direct income transfers to affected households, which can allow households meet consumption shortfalls as well as use it for other immediate needs. The labor intensive nature of workfare programs also provides employment

MALAWI PDNA | 128
relief that can be used to create and restore infrastructure in the affected areas hit by a natural disaster. In addition, their relatively administrative simplicity makes them easy to be adapted in various other existing delivery mechanisms such as being implemented under social fund arrangements. That implies that resources can be quickly mobilized and benefits those affected.
The Government of Malawi (GoM) is already implementing the Public Works and the Social Cash Transfer programmes. These are part of the National Social Support Policy and the Malawi National Social Support Programme (MNSSP) which has prioritized five social protection sub-programmes: Social Cash Transfer, Public Works Programme, School Meals, Village savings and Loans, and Microfinance.
The amount of public spending on social protection in Malawi is, however, low by international standards. GoM’s annual budget for social protection (SP) programs was USD 53.2 million in 2014–1525. This spending accounted for only 2.9 percent of total government expenditure and represented approximately 0.8 percent of GDP. Based on international standards, Malawi’s SP budget is less than one-third of the Africa Region (SSA)’s average and one-sixth of the world average (World Bank 2013).
As of 2014–15, the two largest SP programs in terms of budget were the Social Cash Transfer Program (SCTP) and Malawi’s Social Action Fund-Public Works Program (MASAF-PWP). Together, these two programs accounted for more than 60 percent of the SP budget. However, the sizes of SCTP and MASAF-PWP were relatively small in terms of GDP share, at 0.3 percent and 0.2 percent, respectively. The other social support program is the Village Savings and Loans program. The Community Savings and Investment Programme (COMSIP) is one of the largest players in this sub sector reaching out to a total of 220,206, households across the country.
The School Meals Program is another important part of the SP budget. Although there are several programs operated across Malawi, the biggest ones are funded by the World Food Program (WFP) and by Mary’s Meals. Figure 31 provides the relative sizes of major SP programs as shares of the social protection budget.
Currently government is implementing the Public Works Program in all districts across the country, largely through the Local Development Fund (LDF) with support from the World Bank under the MASAF IV Project. Under this program, a total of 450,000 households representing over 2.4 million people are being offered temporally employment on public assets for cash for a total of 48 days a year. Through the
25 Excluding pension budget.

MALAWI PDNA | 129
MASAF IV, the public works program is being offered in catchment areas that is expected to rehabilitate river catchments in order to reduce surface run off, increase water retention in the soil, improve soil fertility and improve agricultural productivity in the long run. Public works program is also being offered under the Malawi Floods and Emergency Recovery Project to households that were affected by the January 2015 Floods in 15 districts of the country. A total of 172,000 households are benefiting from this Public Works Programme. Other organizations such as the World Food Programme are offering public works program in selected districts that were affected by hunger in Malawi. The WFP program is covering a total of 8,165 households and Care Malawi is covering a total of 23,000 households.
The Social Cash Transfer Programme is implemented by Ministry of Gender, Disability, Children and Social Welfare (with support from KfW, EU and UNICEF) and the Local Development Fund through the MASAF IV project with funding from the World Bank. The program is in 18 districts out of 28 districts in the country. Currently, a total of 170,150 households or nearly 1 million people are benefitting from the program through average monthly cash transfers of MWK4, 500 (USD 7) per month per household. The transfer levels will increase to an average of MWK 6,500 per month per household from 1st July 2016.
Effects of the DroughtThe detailed assessment of the impact of the 2016 drought is not yet finalized at the time of undertaking the Post Disaster Needs Assessments (PDNA). However, the closest indication of the extent of the impact is the draft Malawi Vulnerability Assessment Report (MVAC, 2016). According to the report, over 6.5 million people have been affected by drought in 24 out of 28 districts in Malawi. These people have missing food entitlements and would require an estimated 493,000 metric tons of maize. Based on the integrated household survey (IHS3) report, a total of 15 percent of the population in Malawi are very- poor with labour. Based on the National Statistical Office (NSO) projected population for 2016 of 16, 477,272 people, this translates to about 2,471,590 people or 450,000 households.
Recovery Needs and Strategy The simplest and easiest approach to use social cash transfer in a disaster response is to scale up pre-existing safety nets. Currently the most widely used social protection programs in Malawi are Social Cash Transfer and Public Works Programme.
Coverage of Public Works The public works program was already being implemented in all the disaster affected districts before the disaster happened. A total of 362, 407 households were already being covered by PWP in these districts through the Local Development Fund. In addition to these households, World Food Programme is providing public works program to a total of 8,165 or 44,908, beneficiaries in Balaka, Karonga, Zomba and Phalombe districts. WFP plans to scale up the public works program to an additional 4, 500 households in Chikhwawa, Blantyre and Nsanje districts. With the scale up, WFP will cover a total of about 21,000 households or 69,658 beneficiaries. Care Malawi is also implementing Public Works Programme through UBALE Project in Nsanje, Chikwawa (CADECOM) and Blantyre Rural (Save the Children) districts, reaching out to 23 000 households.
Scaling up the Public Works ProgrammeUnder the MASAF IV public works program, all the eligible households based on the above criteria are covered. However, given the drought that have been experienced in the 2015-16 growing season, a further 15 percent of the population in the drought affected districts may have fallen into the category of ultra- poverty with labor via transient food insecurity.

MALAWI PDNA | 130
TABLE 41: DISTRIBUTION OF DAMAGES TO DAMS BY REGION
District No. of PWP Beneficiaries in MASAF IV
1 Rumphi 8,941
2 Mzimba 16,983
3 Kasungu 13,040
4 Nkhotakota 13,445
5 Ntchisi 9,044
6 Dowa 12,430
7 Salima 20,491
8 Lilongwe Rural 24,918
9 Mchinji 11,521
10 Dedza 19,811
11 Ntcheu 13,044
12 Mangochi 20,261
13 Machinga 20,452
14 Balaka 19,932
15 Zomba Rural 18,594
16 Chiradzulu 12,374
17 Blantyre Rural 12,972
18 Neno 7,098
19 Mwanza 3,056
20 Thyolo 20,785
21 Mulanje 17,453
22 Phalombe 13,372
23 Chikwawa 17,370
24 Nsanje 15,020
Totals 362,407
Source: Local Development Fund, 2016
TABLE 42: PUBLIC WORKS PROGRAMME
No Description Value
1 Affected Population 6,500,000
2 No. of households affected 1,379,483
3 Targeted population for PWP 15% 208, 637

MALAWI PDNA | 131
4 Cash Requirement for additional PWP beneficiaries per year USD 11,294,660
5 Current PWP Coverage under MASAF IV 450,000 households
6 Total Scaled up PWP coverage 658, 637
Source: PDNA Calculations
According to the draft MMVAC report, over 6.5 million people or 1,379,483 households have been affected by drought. Depending on their initial conditions, not all these people may be suitable for public works program. Others would be best suited for other social support programmes such as social cash transfers, humanitarian food assistance or inputs subsidy. For public works, it is estimated that the programme may need to be scaled up by 15 percent in the affected districts to cover those households with labour that may have fallen into the ultra-poverty quintile as a result of the drought. In this respect, the public works programme would need to be scaled up to cover an additional 208,637 households in the affected districts.
TABLE 43: DISTRIBUTION OF DAMAGES TO DAMS BY REGION
District Number of additional Beneficiaries
Required Funding (MWK) Required Funding (USD)
1 Rumphi 3,586 135,898,444 194,141
2 M'mbelwa 8,369 317,140,802 453,058
3 Kasungu 11,306 428,454,875 612,078
4 Nkhotakota 5,413 205,114,225 293,020
5 Ntchisi 3,967 150,330,015 214,757
6 Dowa 8,877 336,396,584 480,567
7 Salima 8,330 315,672,237 450,960
8 Lilongwe Rural 15,259 578,236,374 826,052
9 Mchinji 9,029 342,152,845 488,790
10 Dedza 8,992 340,756,659 486,795
11 Ntcheu 9,363 354,822,134 506,889
12 Mangochi 15,745 596,645,449 852,351
13 Machinga 12,903 488,950,935 698,501
14 Balaka 9,119 345,570,771 493,673
15 Zomba Rural 11,592 439,261,916 627,517
16 Chiradzulu 7,315 277,211,651 396,017
17 Blantyre Rural 7,986 302,613,097 432,304
18 Neno 4,472 169,471,376 242,102
19 Mwanza 1,877 71,142,107 101,632
20 Thyolo 10,892 412,765,170 589,665
21 Mulanje 10,088 382,293,990 546,134
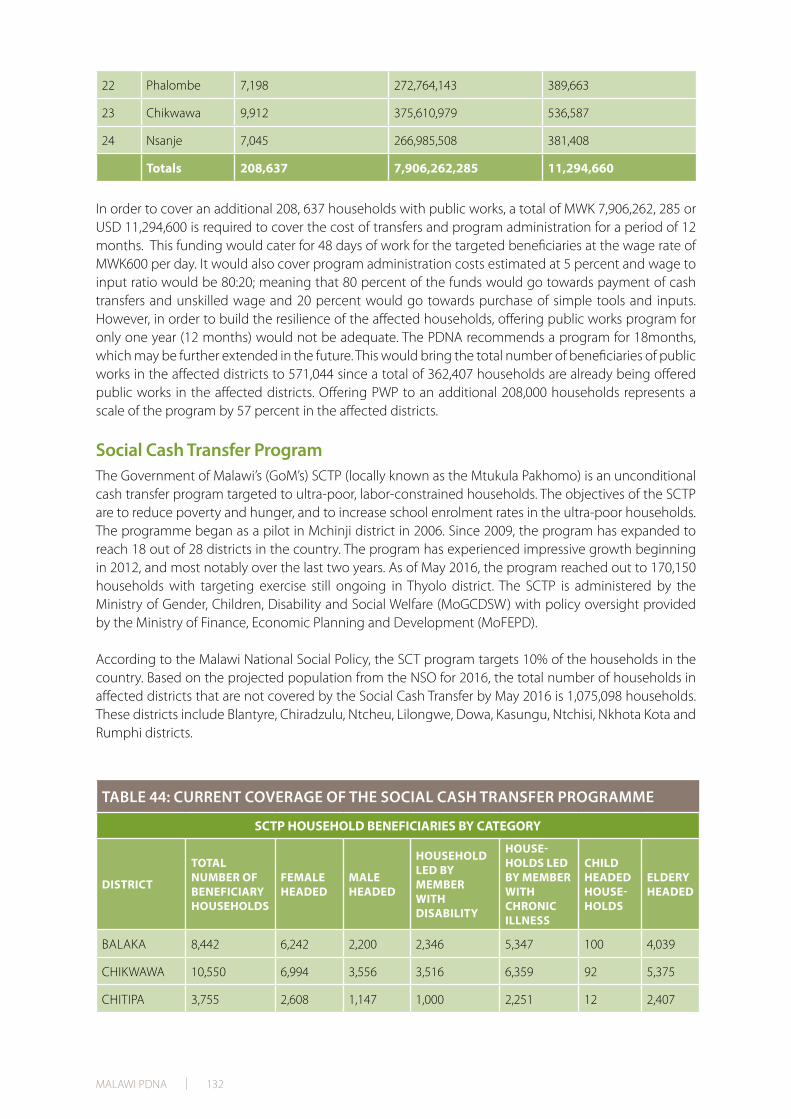
MALAWI PDNA | 132
22 Phalombe 7,198 272,764,143 389,663
23 Chikwawa 9,912 375,610,979 536,587
24 Nsanje 7,045 266,985,508 381,408
Totals 208,637 7,906,262,285 11,294,660
In order to cover an additional 208, 637 households with public works, a total of MWK 7,906,262, 285 or USD 11,294,600 is required to cover the cost of transfers and program administration for a period of 12 months. This funding would cater for 48 days of work for the targeted beneficiaries at the wage rate of MWK600 per day. It would also cover program administration costs estimated at 5 percent and wage to input ratio would be 80:20; meaning that 80 percent of the funds would go towards payment of cash transfers and unskilled wage and 20 percent would go towards purchase of simple tools and inputs. However, in order to build the resilience of the affected households, offering public works program for only one year (12 months) would not be adequate. The PDNA recommends a program for 18months, which may be further extended in the future. This would bring the total number of beneficiaries of public works in the affected districts to 571,044 since a total of 362,407 households are already being offered public works in the affected districts. Offering PWP to an additional 208,000 households represents a scale of the program by 57 percent in the affected districts.
Social Cash Transfer Program The Government of Malawi’s (GoM’s) SCTP (locally known as the Mtukula Pakhomo) is an unconditional cash transfer program targeted to ultra-poor, labor-constrained households. The objectives of the SCTP are to reduce poverty and hunger, and to increase school enrolment rates in the ultra-poor households. The programme began as a pilot in Mchinji district in 2006. Since 2009, the program has expanded to reach 18 out of 28 districts in the country. The program has experienced impressive growth beginning in 2012, and most notably over the last two years. As of May 2016, the program reached out to 170,150 households with targeting exercise still ongoing in Thyolo district. The SCTP is administered by the Ministry of Gender, Children, Disability and Social Welfare (MoGCDSW) with policy oversight provided by the Ministry of Finance, Economic Planning and Development (MoFEPD).
According to the Malawi National Social Policy, the SCT program targets 10% of the households in the country. Based on the projected population from the NSO for 2016, the total number of households in affected districts that are not covered by the Social Cash Transfer by May 2016 is 1,075,098 households. These districts include Blantyre, Chiradzulu, Ntcheu, Lilongwe, Dowa, Kasungu, Ntchisi, Nkhota Kota and Rumphi districts.
TABLE 44: CURRENT COVERAGE OF THE SOCIAL CASH TRANSFER PROGRAMME
SCTP HOUSEHOLD BENEFICIARIES BY CATEGORY
DISTRICT
TOTAL NUMBER OF BENEFICIARY HOUSEHOLDS
FEMALE HEADED
MALE HEADED
HOUSEHOLD LED BY MEMBER WITH DISABILITY
HOUSE-HOLDS LED BY MEMBER WITH CHRONIC ILLNESS
CHILD HEADED HOUSE-HOLDS
ELDERY HEADED
BALAKA 8,442 6,242 2,200 2,346 5,347 100 4,039
CHIKWAWA 10,550 6,994 3,556 3,516 6,359 92 5,375
CHITIPA 3,755 2,608 1,147 1,000 2,251 12 2,407

MALAWI PDNA | 133
DEDZA 15,860 10,916 4,944 2,512 5,402 151 6,678
LIKOMA 224 166 58 66 110 - 125
MACHINGA 14,141 11,585 2,556 2,972 7,344 132 5,912
MANGOCHI 20,013 15,728 4,285 4,609 11,122 109 9,871
MCHINJI 10,275 7,306 2,969 2,908 6,115 54 5,811
MULANJE 13,609 10,774 2,835 3,616 7,480 171 6,733
MWANZA 1,941 1,472 469 555 1,087 30 1,108
MZIMBA NORTH
5,572 3,579 1,993 1,453 3,004 36 3,263
MZIMBA SOUTH
9,353 5,971 3,382 2,649 4,802 75 4,913
NENO 2,077 1,541 536 744 1,480 27 1,016
NKHATABAY 5,856 3,439 2,417 1,585 3,227 48 2,843
NSANJE 5,908 4,114 1,794 2,140 3,849 71 3,374
PHALOMBE 8,041 6,285 1,756 2,245 4,839 129 4,110
SALIMA 8,889 6,473 2,416 2,133 4,678 101 4,073
THYOLO 9,615 6,895 2,720 3,973 7,113 110 4,885
ZOMBA 16,029 11,904 4,125 4,995 9,873 326 7,989
Grand Total 170,150 123,992 46,158 46,017 95,482 1,774 84,525
TABLE 45: SCALING UP SOCIAL CASH TRANSFERS
No Description Quanity/Amount
1 Current coverage of SCT 170,150 households
2 Policy limit on coverage 10% of the households
3 No. of households in affected districts 1,075,098
4 Targeted households in affected districts 107, 465
5 Cost of Targeting USD 1,365, 203
6 Cost of other materials and equipment USD 1,584,771
7 Transfer requirement for 18 months USD 25,966,352
If the program would be extended to the 9 districts that have been affected by drought, only Karonga district would not be covered. The estimated requirement for scaling up Social Cash Transfers is based on the projected household population in the affected districts and the current cost structure of the cash transfer program in the beneficiary districts. Table outlines the detailed costing for each district for 18 months.
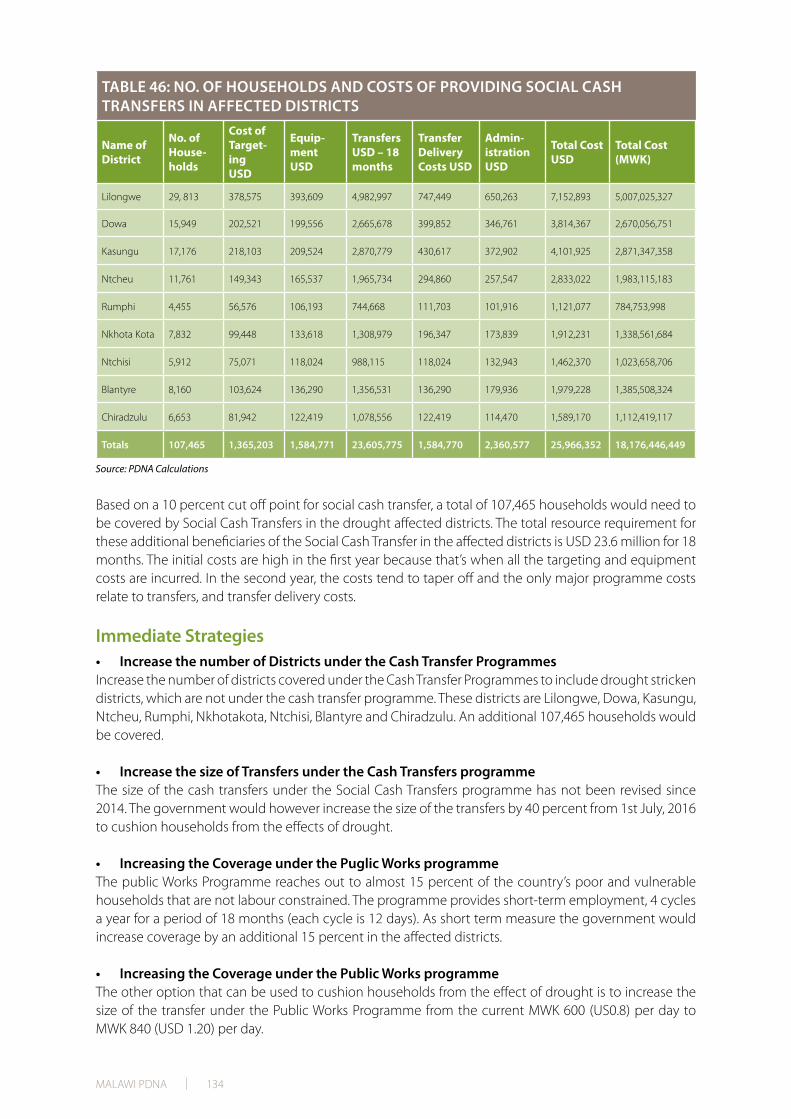
MALAWI PDNA | 134
TABLE 46: NO. OF HOUSEHOLDS AND COSTS OF PROVIDING SOCIAL CASH TRANSFERS IN AFFECTED DISTRICTS
Name of District
No. of House-holds
Cost of Target-ing USD
Equip-ment USD
Transfers USD – 18 months
Transfer Delivery Costs USD
Admin-istration USD
Total Cost USD
Total Cost (MWK)
Lilongwe 29, 813 378,575 393,609 4,982,997 747,449 650,263 7,152,893 5,007,025,327
Dowa 15,949 202,521 199,556 2,665,678 399,852 346,761 3,814,367 2,670,056,751
Kasungu 17,176 218,103 209,524 2,870,779 430,617 372,902 4,101,925 2,871,347,358
Ntcheu 11,761 149,343 165,537 1,965,734 294,860 257,547 2,833,022 1,983,115,183
Rumphi 4,455 56,576 106,193 744,668 111,703 101,916 1,121,077 784,753,998
Nkhota Kota 7,832 99,448 133,618 1,308,979 196,347 173,839 1,912,231 1,338,561,684
Ntchisi 5,912 75,071 118,024 988,115 118,024 132,943 1,462,370 1,023,658,706
Blantyre 8,160 103,624 136,290 1,356,531 136,290 179,936 1,979,228 1,385,508,324
Chiradzulu 6,653 81,942 122,419 1,078,556 122,419 114,470 1,589,170 1,112,419,117
Totals 107,465 1,365,203 1,584,771 23,605,775 1,584,770 2,360,577 25,966,352 18,176,446,449
Source: PDNA Calculations
Based on a 10 percent cut off point for social cash transfer, a total of 107,465 households would need to be covered by Social Cash Transfers in the drought affected districts. The total resource requirement for these additional beneficiaries of the Social Cash Transfer in the affected districts is USD 23.6 million for 18 months. The initial costs are high in the first year because that’s when all the targeting and equipment costs are incurred. In the second year, the costs tend to taper off and the only major programme costs relate to transfers, and transfer delivery costs.
Immediate Strategies• Increase the number of Districts under the Cash Transfer ProgrammesIncrease the number of districts covered under the Cash Transfer Programmes to include drought stricken districts, which are not under the cash transfer programme. These districts are Lilongwe, Dowa, Kasungu, Ntcheu, Rumphi, Nkhotakota, Ntchisi, Blantyre and Chiradzulu. An additional 107,465 households would be covered.
• Increase the size of Transfers under the Cash Transfers programmeThe size of the cash transfers under the Social Cash Transfers programme has not been revised since 2014. The government would however increase the size of the transfers by 40 percent from 1st July, 2016 to cushion households from the effects of drought.
• Increasing the Coverage under the Puglic Works programmeThe public Works Programme reaches out to almost 15 percent of the country’s poor and vulnerable households that are not labour constrained. The programme provides short-term employment, 4 cycles a year for a period of 18 months (each cycle is 12 days). As short term measure the government would increase coverage by an additional 15 percent in the affected districts.
• Increasing the Coverage under the Public Works programmeThe other option that can be used to cushion households from the effect of drought is to increase the size of the transfer under the Public Works Programme from the current MWK 600 (US0.8) per day to MWK 840 (USD 1.20) per day.

MALAWI PDNA | 135
Long Term Strategies• Establishment of a Social Support Fund Establishing a common and coordinated funding mechanism for social protection would enable a more harmonized implementation of the various instruments. The fund once established would transfer funds directly to Councils for execution of the programs. All development partners and the Government should then use this fund for effective program delivery and increased impact. The fund would ensure that there is predictable funding for social policies and quick response in times of disasters.
• LinkagesReviewing of the current social support program to take into account synergies within the Malawi National Social Support Program and linkages with other programs such as disaster risk management and humanitarian support will be important. The Ministry of Finance Economic Planning and Development has already started this process. One of the key strategies for linkages is to link beneficiaries of both cash transfers and public works to savings and investment activities. By participating in savings and investment activities, the beneficiaries of the social protection programs be transformed from social capital into economic capital among themselves to improve their livelihoods.
The beneficiaries of the social protection programs would be organized in groups of 10 to 40 members to form Community Savings Groups (COMSIGs). An amalgamation of 4-5 groups (COMSIGs) in a workable distance shall form a cluster. These groups would be strengthened as self-managed groups to enable them deal with future shocks. In the long run, these groups would become self-reliant and can easily get access to financial services that would assist them to add value to their produce and earn higher incomes.
Activities Under Savings and InvestmentAll activities in savings and investment would focus on strengthening and development of community savings and investment groups to become self-reliant and self-managed affinity groups. Some of the activities that would be implemented include;
• Building and strengthening the groups and networks of these groups into clusters;
• Promoting information dissemination, awareness raising and knowledge sharing among and between community groups;
• Promoting knowledge sharing and technical assistance;
• Strengthening linkages for value addition, finance, marketing and private sector’s and civil society’s participation in enhancing livelihood opportunities for the rural poor; and
• Creating synergies with other community level livelihoods support interventions.
Costs of Facilitating the ComponentThe component would be managed by COMSIP cooperative union funded under the MASAF Project and benefits all districts in the country. Traditionally about 15 percent of PWP beneficiaries participate in this initiative and recent data from Dedza and Nkhatabay has shown that about 10 percent of SCT beneficiaries have expressed interest to participate in savings and investment initiatives. This would entail that there would be 40,000 participants (30,000 from PWP and 10,000 from SCT). The unit cost for delivery of savings and investment services is MWK 150,000 (USD 214) implying that COMSIP would need a total of MWK6 billion (USD 8,571, 428) for 3 years.

MALAWI PDNA | 136
Unified Social RegistryUnified Social Beneficiary, best referred to as Unified Beneficiary registry (UBR) will enable social protection programmes to have a common database that would be used to identify beneficiaries. This would help in harmonizing programs at national level, and help to achieve better targeting of intended households. The development of such a database is currently underway with support from various partners.
Mobile payment on Social Cash TransfersMobile payment would support strengthening of cash delivery in a speedy, secure, transparent and accountable manner. Pilot studies have been carried out in three districts to look at the effectiveness of this payment method. The Government of Malawi is planning to scale up this mode of payment to ensure timely payment of transfers.
Policy RecommendationsThere are a number of policy recommendations that the government can consider to enhance the role of Social Protection in responding to disasters. These policy options include:
• Increasing the transfer amount under the Public Works ProgramSince the public works wage rate in Malawi is highly linked to the statutory minimum wage for unskilled workers, there is limited scope of quickly adjusting the public works wage rate in light of disasters. As such, the Public Works wages remain very low to offer any meaningful protection to people who have been affected by disaster. Government should consider pegging the PWP wage rate to a dollar equivalent (which was USD 1.20 during the design of MASAF 4) so that any losses in value for the Malawi Kwacha and immediately be compensated for by a wage increase.
• Removing the 10% cap on the SCT beneficiariesThere is a policy direction that only 10 percent of the ultra-poor population in Malawi should be covered by Social Cash Transfer Program. In times of disaster like the one at hand, more people fall into the ultra-poverty category that may require social cash transfers to meet their consumption needs. In districts that are already covered by social protection and even in districts that are not covered by social protection, the ultra- poverty rates may have increased necessitating that more people need to be covered by social support protection. Government should consider providing a wider range of the number of people that should be provided social protection, particularly in times of disasters.
• Increasing the number of days for Public Works ProgramThe government could consider increasing the number of days for a longer period of up to 90 days than the 48 days that are currently being offered under PWP. This would provide some employment guarantee for the people that have been affected by disasters and increase their recovery and resilience to disasters.

MALAWI PDNA | 137
HEALTH
Background Malawi is characterized by a high prevalence of diseases such as tuberculosis (TB), malaria, HIV/AIDS, lower respiratory infections, diarrheal diseases, and other tropical diseases (COM, 2006) and high levels of child and maternal mortality rates. Malawi has seen considerable improvements in child survival and maternal health with malaria prevalence reduced from 43 percent in 2010 to 33 percent in 201426. Average life expectancy has also improved from 46 years (1987) to 54.6 years (2010) as a result of management of HIV/AIDS27. However, the impact of HIV/AIDS in Malawi is still estimated at 1-2% per year on the national GDP. Maternal mortality is still among the highest in Africa and despite significant progress towards achieving Millennium Development Goal (MDG) 4, neonatal mortality still remains high and the country is lagging behind in the Sustainable Development Goals (SDG) 5 on maternal mortality28. Substantial efforts are required especially to mitigate the effects of frequent natural disasters that can pose serious threats to the wellbeing of communities and the most vulnerable populations.
Methodology for Assessment of SectorFor drought-impact analysis on health, secondary data was reviewed using several health sector reports, including Malawi’s online DHIS2 system, Malawi DHS, and Malawi MICS for all affected districts29. The District Health Office (DHO) contingency plan reports for Chiradzulu and Chikwawa districts were used to estimate the gaps required in the on-going development plan. Field visits were conducted for data validation and gathering further primary data on the impact of the drought from 2015-2016 on the health sector. Primary data was collected on the cost of treatment of in-patient and out-patient care and
26 Malawi Demographic and Health Survey (2010). Government of Malawi, National Statistics Office, Zomba.27 National Statistics Office (NSO) (2014). Multiple Indicator Cluster Survey (2014). Zomba.28 International Food Policy Research Institute (IFPRI). 2015. The Global Nutrition Report. Accessed on 6 Jun 2016 in: http://globalnutritionreport.org/the-report/technical-notes/.29 See Chapter 3 for geographical scope of the PDNA
MALAWI PDNA | 138
the additional health personnel required for drought response, from Chiradzulu and Blantyre’s public and private health facilities and central medical store in the Southern region.
A desk review and detailed analysis was conducted for the pre-disaster (Oct 2013 to March 2014) baseline data and data for the period of the drought (Oct 2015 to March 2016). The data was obtained through the online DHIS2 system for the historical morbidity rates of different diseases in the 24 most affected districts. It was agreed that drought related morbidity would be determined only from the top five diseases normally reported through the Integrated Management of Childhood Illness (IMCI) program. The selected top five diseases in children under the age of five years (U5) include: skin infection, acute respiratory infection (ARI), diarrhea, eye infection, and malaria. Differential number of cases was determined and compared by district and month for the periods October 2013 to March 2014 versus October 2015 to March 2016. Due to a crash in the DHIS2 system in 2015 and data not being fully recovered, some data for certain districts were flagged or missing. Thus, an average increase in morbidity rate was calculated per disease using the data from districts that were complete. The average rate of increase in morbidity was applied to the baseline data to estimate the total caseloads for the districts with missing data. The estimated immediate loss was calculated using the unit treatment cost per disease including the cost for increased in-patient health personnel time for treating in-patient cases. Unit treatment cost per disease was determined by primary data collection at the health facilities and central medical stores trust and the average treatment cost was derived. The treatment cost was assumed to be equal across all districts. The projected loss was calculated using the average increase in morbidity rate per disease using the caseload data for the baseline for an additional 9 months (Apr 2016 to Dec 2016), assuming the drought will continue to increase risk and vulnerability in children U5 for this time.
One of the key weaknesses of the case data available was that it did not disaggregate out-patient morbidity with in-patient case data as health districts combine the cases on the DHIS2 system even if separate indicators exist on the standardized formats and system. Thus, an average percentage of in-patient ratio was assumed for each disease after comparing a public and private hospital caseload trend between October 2013 to March 2014 in Chiradzulu district. On average, the in-patient cases cost 30 times more than that of out-patient.
A second limitation was the underreporting due to the DHIS2 system crash in 2015, especially for diarrhea. An alternative information system, LMIS, recorded an increase in diarrhea cases during the period of the drought compared to the baseline data. Also, a lack of standardized definitions for the indicators DHIS2 system was another limitation with the main data set as various districts reported to have included pneumonia cases under the ARI indicator, while many did not.
A third limitation was that the immediate losses only captured the U5 children and not the over 5 population and other vulnerable groups, such as PLW, people living with chronic illnesses, such as HIV/AIDS or TB, the elderly and disabled population, which would have increased the total immediate losses significantly as treatment costs for the over 5 (O5) population is more costly.
Furthermore, as the full impact of the drought on the health sector had not manifest during the assessment, the projection made over a nine month duration was another significant assumption. Recovery needs were estimated at the district and regional level. Six districts with the highest losses were prioritized (Chiradzulu, Rumphi, Salima, Lilongwe, Dedza, and Zomba). Recovery of the total losses during the drought was included as short-term needs. However, a discount factor of 50 percent was applied to the overall short-term needs (Jun 2016 to Mar 2017) as the Food Insecurity Response Plan (FIRP) also included some of the same interventions in its plans. To calculate the additional resources required per person in the district, the average financial gap in on-going health services has been estimated using the District Contingency Plan budgets for Chiradzulu and Chikwawa district. The average gap has been divided by the 2010 Malawi DHS report’s 2017 and 2018 estimated population size for Chiradzulu district to calculate the additional health expenditure per person required for the medium-term (Apr
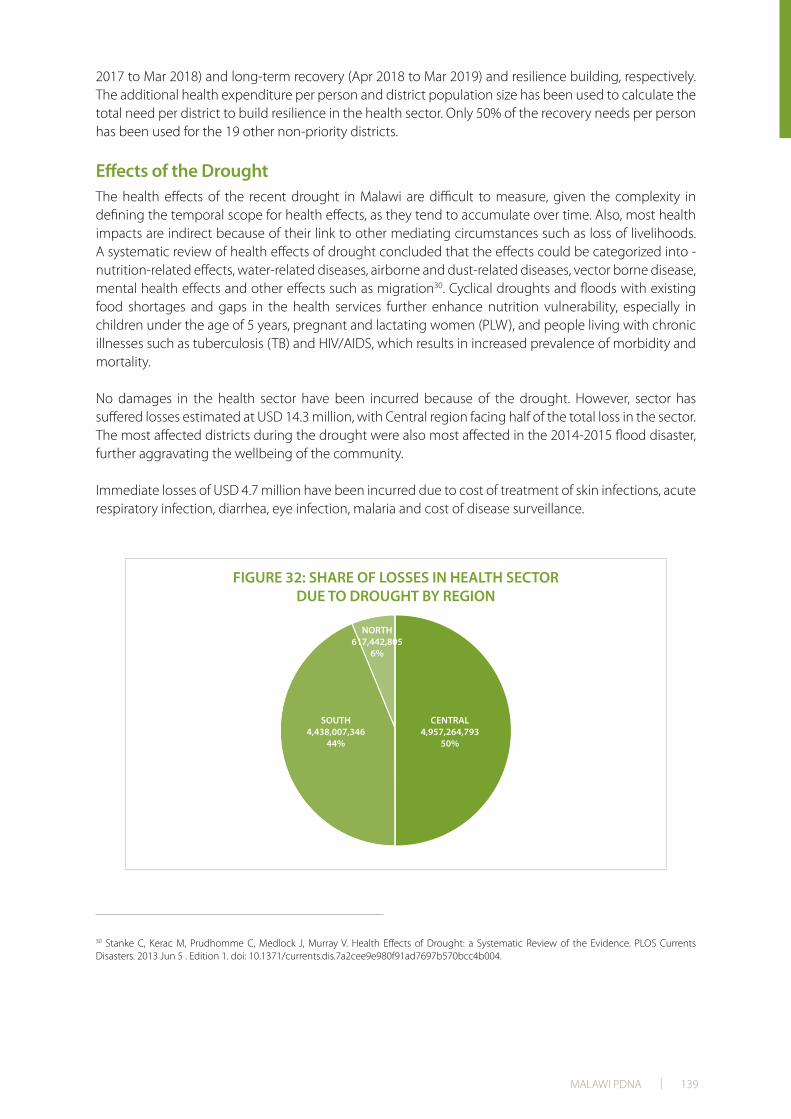
MALAWI PDNA | 139
2017 to Mar 2018) and long-term recovery (Apr 2018 to Mar 2019) and resilience building, respectively. The additional health expenditure per person and district population size has been used to calculate the total need per district to build resilience in the health sector. Only 50% of the recovery needs per person has been used for the 19 other non-priority districts.
Effects of the Drought The health effects of the recent drought in Malawi are difficult to measure, given the complexity in defining the temporal scope for health effects, as they tend to accumulate over time. Also, most health impacts are indirect because of their link to other mediating circumstances such as loss of livelihoods. A systematic review of health effects of drought concluded that the effects could be categorized into - nutrition-related effects, water-related diseases, airborne and dust-related diseases, vector borne disease, mental health effects and other effects such as migration30. Cyclical droughts and floods with existing food shortages and gaps in the health services further enhance nutrition vulnerability, especially in children under the age of 5 years, pregnant and lactating women (PLW), and people living with chronic illnesses such as tuberculosis (TB) and HIV/AIDS, which results in increased prevalence of morbidity and mortality.
No damages in the health sector have been incurred because of the drought. However, sector has suffered losses estimated at USD 14.3 million, with Central region facing half of the total loss in the sector. The most affected districts during the drought were also most affected in the 2014-2015 flood disaster, further aggravating the wellbeing of the community.
Immediate losses of USD 4.7 million have been incurred due to cost of treatment of skin infections, acute respiratory infection, diarrhea, eye infection, malaria and cost of disease surveillance.
30 Stanke C, Kerac M, Prudhomme C, Medlock J, Murray V. Health Effects of Drought: a Systematic Review of the Evidence. PLOS Currents Disasters. 2013 Jun 5 . Edition 1. doi: 10.1371/currents.dis.7a2cee9e980f91ad7697b570bcc4b004.

MALAWI PDNA | 140
TABLE 47: TOTAL LOSSES OF THE HEALTH SECTOR BY REGION
CENTRAL SOUTH NORTH TOTAL (MWK) TOTAL (USD)
Immediate Losses (Oct 2015-Mar 2016)
IMCI program (public + CHAM)
Skin Infections 30,167,182 28,590,794 4,249,054 63,007,030 90,010
ARI 55,114,550 44,579,780 12,762,993 112,457,323 160,653
Diarrhea 10,139,677 7,627,020 1,921,124 19,687,821 28,125
Eye Infection 1,165,835 1,328,714 185,765 2,680,314 3,829
Malaria 1,271,491,451 1,081,833,631 240,829,286 2,594,154,368 3,705,935
Disease Surveillance
255,859,283 252,970,160 48,176,311 557,005,754 795,723
SUB-TOTAL of Immediate Losses
1,623,937,978 1,416,930,097 308,124,534 3,348,992,610 4,784,275
Projected Losses (Apr 2016-Dec 2016)
Provision of basic health care needs for most vulnerable
60,480,631 59,797,693 11,388,032 131,666,355 188,095
IMCI program (public + CHAM)
-
Skin Infections 53,439,567 61,811,933 8,361,568 123,613,067 176,590
ARI 87,643,408 71,313,194 9,328,616 168,285,218 240,407
Diarrhea 15,150,027 12,813,855 1,543,767 29,507,649 42,154
Eye Infection 1,941,097 1,979,958 121,279 4,042,334 5,775
Malaria 2,260,136,078 1,968,473,896 117,672,531 4,346,282,505 6,208,975
Reproductive Health + Gender-Based Violence Services
167,563,491 165,671,390 31,550,901 364,785,781 521,123
Disease control (vector-borne diseases, outbreaks, immunizations)
686,972,517 679,215,330 129,351,577 1,495,539,425 2,136,485
SUB-TOTAL of Projected Losses
3,333,326,815 3,021,077,248 309,318,271 6,663,722,335 9,519,603
TOTAL LOSS 4,957,264,793 4,438,007,346 617,442,805 10,012,714,944 14,303,878
The largest proportion of treatment costs were incurred by increase of malaria cases (6.94 billion MWK [93 percent]), ARI (280 million MWK [4 percent]), and skin infections (187 million MWK [2 percent]) between Oct 2015-Dec 2016 .
As with the usual seasonal trend, malaria cases peaked from January to March, during the rainy season,

MALAWI PDNA | 141
FIGURE 34: COMPARISON OF NEW CASES OF MALARIA IN 24 DISTRICTS AT BASELINE VS. PERIOD OF DROUGHT

MALAWI PDNA | 142
but the number of new cases of malaria increased by 23.1 percent during the drought period (Oct 2015 to Mar 2016) compared to the baseline period (Oct 2013 to Mar 2014).
In addition, there was a 39.9 percent increase in the number of new cases of skin infections during the drought period compared to the baseline period. There were also increases in the number of new cases for ARI (19.9 percent), eye infection (8.0 percent), and diarrhea (18.2 percent), but not as high of an increase as malaria and skin infections. Several districts reported that their outreach clinics were not operational for the previous 12 months (including the period of the drought) due to insufficient resources available for transportation into the communities, which could have resulted in underreporting of all five diseases.
As a result of increased number of new cases for the top five most-prevalent childhood diseases during the drought, additional health personnel were required at public and CHAM facilities for integrated management of childhood illness (IMCI) services, increased provision of treatment and drugs and a disease surveillance was conducted to control for disease outbreaks.
Furthermore, losses have been projected at an estimated USD 9.5 million that include costs for upcoming activities as part of the drought response, like: i) provision of basic healthcare needs for the U5, PLW, and people living with HIV or TB, ii) reproductive health and gender-based violence services (One Stop Centre) and iii) disease control (e.g. mass immunizations including measles, distribution of chlorine tablets, etc).
Additional unexpected costs to monitor, prevent, and control higher rates of disease and corresponding vectors were also considered and estimated using the 2016 funding gaps identified by the District Health Office Contingency Plan Reports for Chiradzulu and Chikwawa Health Districts and extrapolated to all districts for the projected losses.
Overall losses estimated for the health sector include cost of treatment for drought-related morbidity, increase in regular workload of the sector, additional disease surveillance and disease control activities and reproductive health services. A 90 percent drought discount factor has been applied, based on the assumption that 90 percent of the increased cases of diseases for immediate and projected losses over the coming 9 months will be linked to drought. Hence, the overall losses due to drought, from October 2015 to December 2017, have been estimated at USD 14.3 million.
Key Objectives of Recovery and Resilience Building in the Sector and Recovery & Reconstruction Needs The overall objective of the recovery is to prevent the increase in morbidity and mortality of vulnerable population affected by the disasters. Specifically, the objectives are to:
• build and maintain rapid response capacity during disaster-related disease outbreaks, trauma and gender- based violence (GBV) in all disaster-prone areas.
• provide access to basic health services for people affected by disasters
• provide health promotion activities to the affected population and
• sustain continuum of care to people on ART, TB, Antenatal care (ANC) and provide service for prevention of HIV transmission and family planning during disasters
The overall recovery needs for the sector are USD 13.5 million. This is based on requirements for provision of basic health services, includes cost of provisioning drugs and other medical supplies in all public and CHAM health facilities; cost of reproductive health and GBV interventions focused on promotion of healthy lifestyles and behavior change through community mobilization, information, Education and Communication (IEC) and advocacy; ‘healthy-setting’ programs and promotion of integrated family planning through different entry points.

MALAWI PDNA | 143
Recovery needs are also based on requirements for disease surveillance, which will focus on cost for early warning, surveillance and information systems as well as capacity building of health workers. Disease control will include: cost of implementation of the integrated vector control measures that will include the promotion of long lasting insecticide treated nets (LLITNs) use and Indoor Residual Spray (IRS) services to all the high risk areas; the cost on promotion of safe water, sanitation and hygiene.
To avoid overlap with the FIRP, this assessment focused the required interventions for recovery in the most affected districts not covered under the FIRP and on the resilience interventions for the medium- and long-term recovery needs, including strengthening the four components: i) disease surveillance; ii) provision of basic health services to the most vulnerable population (e.g. PLW, PLHIV/TB, elderly, and the disabled); iii) disease control; and iv) reproductive health and GBV counselling services.
TABLE 48: ESTIMATES
Interventions Recovery Term (S, M, L*)
Total Needs (MWK)
Total Needs (USD)
1. Disease Surveillance S,M,L 967,375,500 1,381,965
2.Provision of basic health care needs for most vulnerable
S,M,L 4,987,867,187 7,125,525
3.Disease control (vector-borne diseases, outbreaks, immunizations)
S,M,L 2,236,055,344 3,194,365
4.Reproductive Health + Gender-Based Violence Services
S,M,L 1,268,585,903 1,812,266
TOTAL 9,459,884,000 13,514,120
Challenges in the SectorThe main constraints and challenges to the health sector include i) inadequate financial resources to implement some of high impact interventions - outreach clinic programs could not be conducted and insufficient resources has also resulted in suspending Service Level Agreements with half of the CHAM facilities in the country; ii) inadequate referral and communication systems; iii) inadequate human resource; iv) frequent stock-outs of essential drugs and medical supplies in Government facilities; v) unavailability of data on the impacts of drought and other disasters. As such it is hard to establish the level impact of these factors on morbidity and mortality.
Slow progress in the health sector’s surveillance, referral, and access to basic healthcare services to the vulnerable could severely impact the economy many African countries, including Malawi. U5 children are the future of Malawi and the people (between 15-49 years of age) mostly affected by chronic illness, including HIV/AIDS and/or TB belong to the most productive age group. Increase in morbidity and mortality will increase loss of productivity and increase costs for disease treatment.
In addition, current staffing of health workers in Malawi is the lowest in Sub Saharan Africa with 1.9 physicians per 100,000 population and 34.3 Nurses and midwives per 100,000 populations (WHO, 2009). The number of the Health Surveillance Assistants who are the grass root Community Health workers also fall short of the recommended ratio of 1:1000.
Malawi’s public health system is funded through a tax based system and external funding. The per capita total expenditure on health stands at USD24 in 201431a figure short of the estimated USD 60 per capita for strengthening health systems and providing essential services in low-income countries. In 2011/12 external sources contributed 65.4 percent to the Total Health Expenditure (THE) while the government’s
31 World Bank. (2014). Health expenditure per captia. Accessed on 7 Jun 2016 in: http://data.worldbank.org/indicator/SH.XPD.PCAP.

MALAWI PDNA | 144
share was 20.3 percent32. The national Health Management Information System (HMIS) in Malawi is paper based at facility level but is computerized at district and national levels using the web based DHIS2. The health system frequently experiences shortages of essential medicines and supplies due to shortage of funds, increasing morbidity and mortality risk. These challenges are likely to exacerbate the impact of the drought and hinder recovery and individual’s resilience.
Existing Sector Policies and Major ProgramsThe Ministry of Health of Malawi has an Essential Health Package (EHP), covering diseases and conditions affecting the majority of the population and especially the poor. This package is free of charge to Malawians in the public health facilities (e.g. hospitals, health centers, village clinics, and health posts). The package of cost-effective interventions include: vaccines for preventable diseases, treatment for acute respiratory infections (ARI), malaria, TB, sexually transmitted infections (STIs) including HIV/AIDS, diarrheal diseases, schistomiasis, malnutrition, ear, nose and skin infections, perinatal conditions and common injuries.
The health facilities under the Christian Health Association of Malawi (CHAM) are the main private not-for-profit providers of health services. The District Councils are responsible for the delivery of health services at district (secondary level care) and lower levels (primary level care). The Central Hospitals (tertiary level facilities) report directly to the MOH at central level. According to the Service Provision Assessment in 2014, of the 663 health facilities, the government owns 69 percent, CHAM 24 percent, private sector 4 percent, company (employers) 2 percent and NGOs 1 percent.
There are several policies and strategies that govern the health sector. The overall policy document is Malawi Growth Development Strategy (MGDS II). The National Health Policy is in its final draft and the National Public Health Act is in the process of being reviewed. The Health Sector Strategic Plan (HSSP) 2011-2016 provides a framework for design of service delivery programs, resource mobilization and health financing. The plan aims to increase coverage of high quality Essential Healthcare Package (EHP) service, strengthening performance of the health system to support delivery of EHP services, reducing risk factors to health (child and maternal health) and improving equity and efficiency in the delivery of free quality EHP services in Malawi.
The current HSSP has identified the following sector priorities that, if well implemented, would serve well to reduce the health effects of drought and other disasters.
• Health Promotion and Disease Prevention – continued free healthcare services through EHP as majority of the diseases affecting Malawians are preventable
• Community mobilization and participation in disease surveillance and referrals
• Integration of EHP service delivery at all levels of health services and capacity building of health workers with frequent staff turnover
• Increase coverage of Service Level of Agreements to encompass all CHAMs
• Reformation of central hospitals
• Improve coordination and alignment of all levels of health services to reduce transaction costs
• Continued free healthcare services through the EHP to improve access to basic health services
32 Xu, K and Saksena, P. (2011). The determinants of health expenditure. World Health Organization. Accessed on 9 Jun 2016 in: http://www.who.int/health_financing/documents/report_en_11_deter-he.pdf.
MALAWI PDNA | 145
• Additional interventions to be partly included in the EHP, including: Integrated Management of Childhood Illnesses (IMCI), water and sanitation, and school health; recognizing the health sector’s partial responsibility in partnership with the Ministry of Agriculture and Water Development.
Other programs being currently implemented are - Expanded program on Immunization (EPI), Integrated Management for Childhood Illnesses (IMCI), National Malaria Control program, Tuberculosis program, Nutrition, EMTCT, PMTCT and Pediatric ART, Water and Sanitation and Neglected Tropical Diseases.
The government has signed the SLA Memorandum of Understanding with 48 percent of CHAM facilities. Every district in the country has a CHAM facility that has entered into this agreement. These facilities are obliged to offer maternal, neonatal and child health interventions free of charge to Under 5 children, pregnant and lactating women. The country has also adopted ‘Scaling up Nutrition’(SUN) as one of the strategies to curb malnutrition.
Implementation Strategy/Action PlanTo recover from the impacts of drought and build resilience of the most vulnerable populations, the central Ministry of Health will work closely with the Department of Health Technical Support Services and Department of Planning to support the Regional and Zonal offices, having a cascading effect on the District Health Offices (DHOs), health facilities, CHAMs, and village clinics. The implementation strategy includes:
• Capacity building of health workers at the district and community-level, which will be led by the Department of Health Technical Support Services (HTSS);
• Strengthening the early warning system and response system and disease control interventions to reduce increased risk from disasters such as outbreaks will be led by the central MoH with strong coordination with the health cluster, DHOs, community health workers, and other development partners;
• Improved access to basic healthcare and improved provision of drugs and supplies will be led by the Department of HTSS with the Central Medical Stores at the regional-level and district health offices to ensure both public health facilities and CHAM do not experience stockouts and have sufficient support for immunization days and child health days; and
• Reproductive health and gender-based violence interventions will be strengthened through the existing One Stop Centers at the community-level, which provides counseling and support for women.
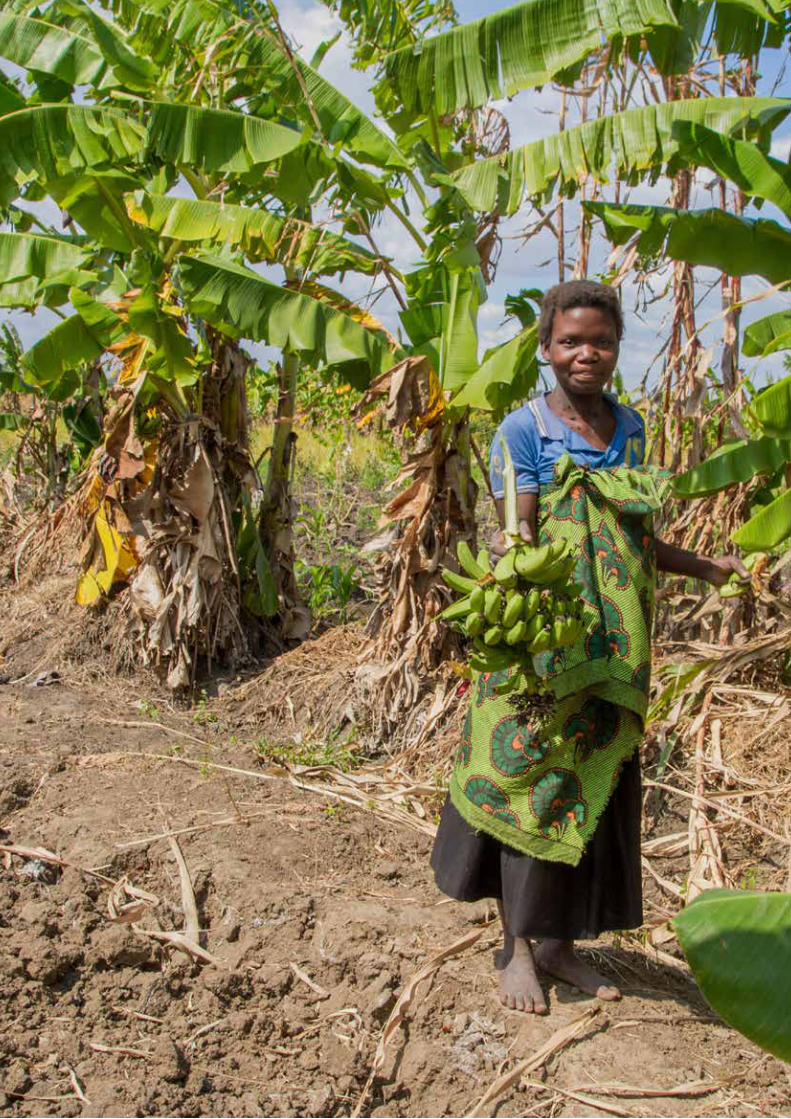
MALAWI PDNA | 146

MALAWI PDNA | 147
NUTRITION
Background Adequate nutrition is a prerequisite for human growth and development. It plays an important role in one’s physical and intellectual development, and consequentially work productivity and higher earnings to support macroeconomic and societal growth. Undernourishment can result in high national and individual productivity loss. The 2015 cost of Hunger in Malawi Report states that Malawi loses 10 percent of its GDP annually due to chronic malnutrition alone.
Drought aggravates food insecurity and increases malnutrition. Thus malnutrition, if not controlled early-on is responsible for growth faltering, increased susceptibility to disease, increases the cost of disease management, impairs mental development and significantly contributes to early childhood death.
Furthermore, malnutrition affects the productivity of the people working in the agriculture and food systems. It is through the acknowledgement of the importance of a multi-sector approach that the government placed nutrition as a top priority in the ‘Malawi Growth and Development Strategy’. A multi-sectoral platform was initiated by the Department of Nutrition, HIV and AIDS (DNHA) involving various development partners, donors, international and local NGOs and CSOs.
Over the past two decades, Malawi has reported a decline in the rates of undernutrition, an indication that the increased investments in nutrition are paying off. However, continued efforts are needed to address the high rates of stunting to ensure a reduction to the national target of 27 percent.
Drought of 2015-16 has compounded the challenges already posed by the 2014-15 flooding, which saw an increased case load of undernourished most vulnerable population, including children under 5 (U5) and pregnant and lactating women (PLW). Interventions put in place to mitigate the impact of floods have minimized the impact of drought on the nutrition sector. However, gaps still exist and there

MALAWI PDNA | 148
remains a need to strengthen the systems for nutrition service delivery at community and facility levels. A drought response plan has been developed, although the full effects of the drought are yet to be experienced as physiological processes take time to manifest in the most vulnerable populations.
Methodology for Assessment of SectorTo estimate the total losses and recovery needs, pertinent secondary data was obtained from several nutrition sector reports, including Malawi’s online CMAM database (80-96 percent completeness of report), Malawi DHS, and Malawi MICS. Field visits were conducted for data validation and gathering further primary data on the impact of the drought from 2015-2016 on the nutrition sector. For primary data collection, teams visited Phalombe, Mulanje, and Mwanza in the Southern region. Telephonic interviews were conducted for other affected regions, in the interest of time.
Data on prevalence of under-nutrition from 2000-2015 was gathered and compared using MDHS reports. Data for the period October 2013 to March 2014 was considered as the baseline data since it was the comparable period just before the 2014-2015 flooding. The assessment period of the drought took place October 2015 to March 2016. The same months (October to March) were selected for the purpose of accurate comparison of seasonality, which significantly affects trends of global acute malnutrition (GAM) rates. The observed trends in Severe Acute Malnutrition (SAM) and Moderate Acute Malnutrition (MAM) new admissions of children U5 from baseline were compared to the drought period for twenty-four most affected districts.
One key weakness of the nutrition sector loss estimation was that the immediate losses only captured the acutely malnourished U5 children and PLW population and other vulnerable groups, such as people living with chronic illnesses, such as HIV/AIDS or TB, the elderly, and disabled population were not considered as data was limited and the NCST program was not active during the period of the drought. The immediate losses would have significantly increased the total losses if there were additional services targeting the most vulnerable groups during the period of the drought.
Some of the additional assumptions made in the overall calculations are as follows:
• All losses in the nutrition sector are captured in the form of acute malnutrition, assuming the drought will only have a short-term impact on the most vulnerable population.
• Projection factor estimating effects of drought for projected losses assumes same effect of drought across all districts.

MALAWI PDNA | 149
• Anecdotal correction stating that, of the 30 percent increase in admissions of SAM children into OTP+NRU from October 2015-March 2016, 25 percent of the increase is due to indirect causes of the drought.
Effects of the Drought Drought has resulted in higher treatment costs due to increased morbidity and malnutrition of U5, PLW and people living with HIV (PLHIV) above the baseline period. U5, PLW and PLHIV are relatively more vulnerable to malnutrition since they have higher daily nutrient requirements and have smaller bodily reserves than men. Food insecurity due to drought has also caused rapid weight loss in a short period of time. These effects have manifested into additional activities required for the drought response, such as increased nutrition surveillance activities, operational costs, capacity building, and community mobilization. The worsened situation was reflected in results of the 2016 SMART Survey, which showed significant deterioration in the nutrition situation especially in the Southern Region (comparing the 2015 and 2016 post-harvest seasons surveys) (see Figure 35). Overall, the SMART Survey showed that the GAM Prevalence for the 5 livelihood zones where the SMART Survey was implemented in 201533 and again in 2016 had increased from 1.7% in 2015 to 4.8% in 2016.
* Livelihood Zone NOT surveyed in 2015The increase in new admissions from October 2015 to March 2016 in OTP, NRU, and SFP was subtracted by the baseline admissions from October 2013 to March 2014 and the cost to treat a SAM ($85) and MAM ($25) child and PLW in Malawi34 was used to estimate the immediate loss due to drought among the children U5 and PLW. In addition, costs incurred for the drought response period October 2015 to March 2016, such as mass screening and operational costs were added to the total immediate losses.
33 In 2015, the SMART Survey was implemented the following livelihood zones: Lower Shire, Shire Highlands, Thyolo-Mulanje Tea Estates, Lake Chirwa Phalombe Plain and Rift Valley Escarpment. In 2016, 2 more livelihood zones were included i.e. Kasungu-Lilongwe Plan and Chitipa-Karonga/Mzimba. However, comparison was only possible for the five livelihoods surveyed in 2015 and 201634 Malawi Ministry of Health Report
FIGURE 38: TRENDS IN POST-HARVEST GAM PREVALENCE (2015 AND 2016)
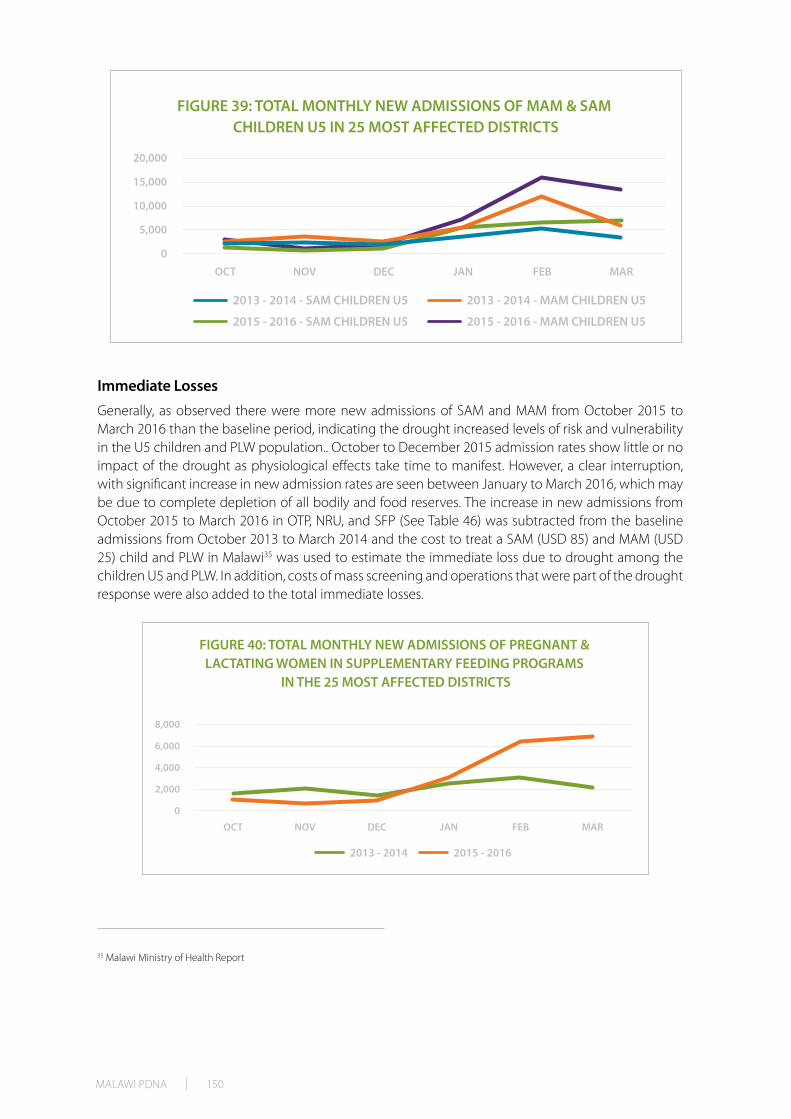
MALAWI PDNA | 150
Immediate LossesGenerally, as observed there were more new admissions of SAM and MAM from October 2015 to March 2016 than the baseline period, indicating the drought increased levels of risk and vulnerability in the U5 children and PLW population.. October to December 2015 admission rates show little or no impact of the drought as physiological effects take time to manifest. However, a clear interruption, with significant increase in new admission rates are seen between January to March 2016, which may be due to complete depletion of all bodily and food reserves. The increase in new admissions from October 2015 to March 2016 in OTP, NRU, and SFP (See Table 46) was subtracted from the baseline admissions from October 2013 to March 2014 and the cost to treat a SAM (USD 85) and MAM (USD 25) child and PLW in Malawi35 was used to estimate the immediate loss due to drought among the children U5 and PLW. In addition, costs of mass screening and operations that were part of the drought response were also added to the total immediate losses.
35 Malawi Ministry of Health Report
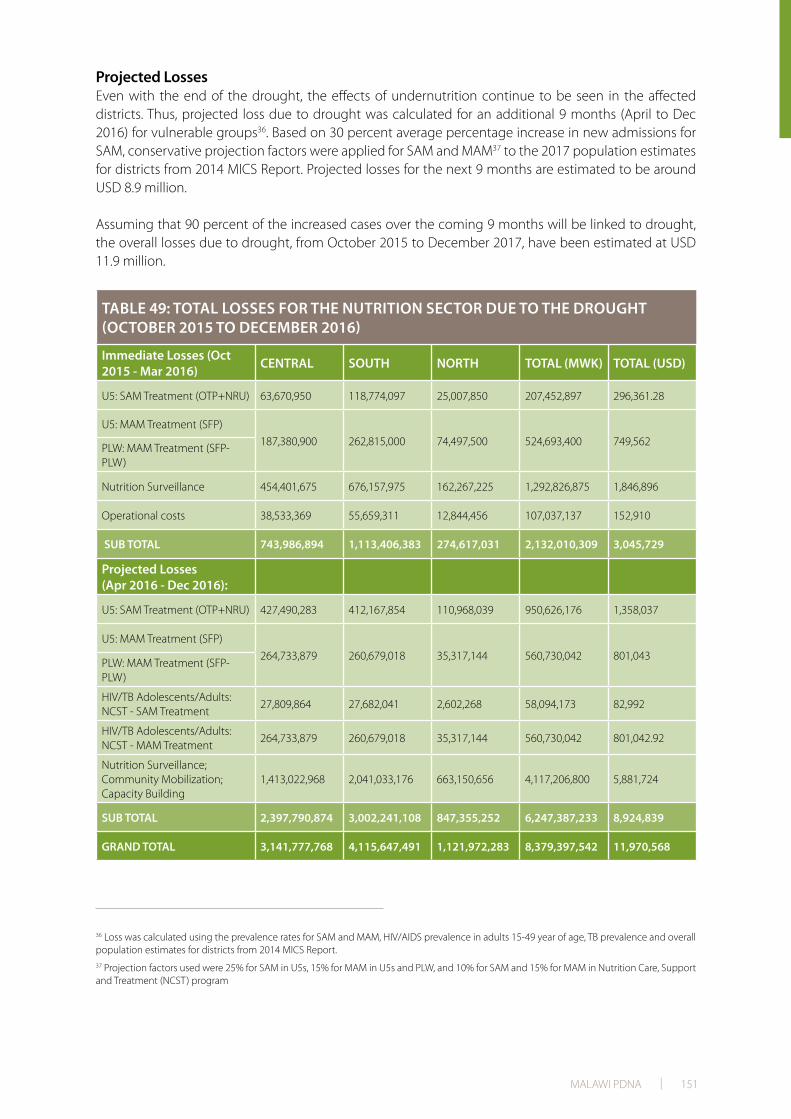
MALAWI PDNA | 151
Projected LossesEven with the end of the drought, the effects of undernutrition continue to be seen in the affected districts. Thus, projected loss due to drought was calculated for an additional 9 months (April to Dec 2016) for vulnerable groups36. Based on 30 percent average percentage increase in new admissions for SAM, conservative projection factors were applied for SAM and MAM37 to the 2017 population estimates for districts from 2014 MICS Report. Projected losses for the next 9 months are estimated to be around USD 8.9 million.
Assuming that 90 percent of the increased cases over the coming 9 months will be linked to drought, the overall losses due to drought, from October 2015 to December 2017, have been estimated at USD 11.9 million.
TABLE 49: TOTAL LOSSES FOR THE NUTRITION SECTOR DUE TO THE DROUGHT (OCTOBER 2015 TO DECEMBER 2016)
Immediate Losses (Oct 2015 - Mar 2016) CENTRAL SOUTH NORTH TOTAL (MWK) TOTAL (USD)
U5: SAM Treatment (OTP+NRU) 63,670,950 118,774,097 25,007,850 207,452,897 296,361.28
U5: MAM Treatment (SFP)187,380,900 262,815,000 74,497,500 524,693,400 749,562PLW: MAM Treatment (SFP-
PLW)
Nutrition Surveillance 454,401,675 676,157,975 162,267,225 1,292,826,875 1,846,896
Operational costs 38,533,369 55,659,311 12,844,456 107,037,137 152,910
SUB TOTAL 743,986,894 1,113,406,383 274,617,031 2,132,010,309 3,045,729
Projected Losses (Apr 2016 - Dec 2016):
U5: SAM Treatment (OTP+NRU) 427,490,283 412,167,854 110,968,039 950,626,176 1,358,037
U5: MAM Treatment (SFP)264,733,879 260,679,018 35,317,144 560,730,042 801,043
PLW: MAM Treatment (SFP-PLW)
HIV/TB Adolescents/Adults: NCST - SAM Treatment
27,809,864 27,682,041 2,602,268 58,094,173 82,992
HIV/TB Adolescents/Adults: NCST - MAM Treatment
264,733,879 260,679,018 35,317,144 560,730,042 801,042.92
Nutrition Surveillance; Community Mobilization; Capacity Building
1,413,022,968 2,041,033,176 663,150,656 4,117,206,800 5,881,724
SUB TOTAL 2,397,790,874 3,002,241,108 847,355,252 6,247,387,233 8,924,839
GRAND TOTAL 3,141,777,768 4,115,647,491 1,121,972,283 8,379,397,542 11,970,568
36 Loss was calculated using the prevalence rates for SAM and MAM, HIV/AIDS prevalence in adults 15-49 year of age, TB prevalence and overall population estimates for districts from 2014 MICS Report.37 Projection factors used were 25% for SAM in U5s, 15% for MAM in U5s and PLW, and 10% for SAM and 15% for MAM in Nutrition Care, Support and Treatment (NCST) program
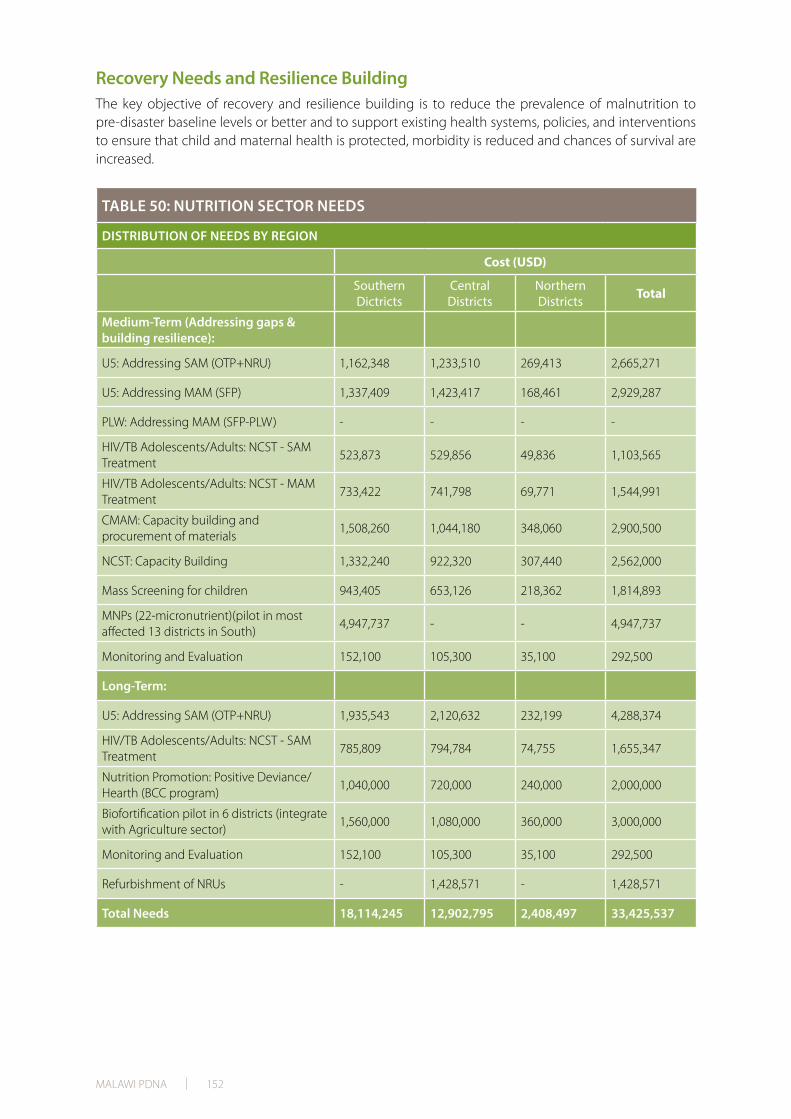
MALAWI PDNA | 152
Recovery Needs and Resilience Building The key objective of recovery and resilience building is to reduce the prevalence of malnutrition to pre-disaster baseline levels or better and to support existing health systems, policies, and interventions to ensure that child and maternal health is protected, morbidity is reduced and chances of survival are increased.
TABLE 50: NUTRITION SECTOR NEEDS
DISTRIBUTION OF NEEDS BY REGION
Cost (USD)
Southern Dictricts
Central Districts
Northern Districts Total
Medium-Term (Addressing gaps & building resilience):
U5: Addressing SAM (OTP+NRU) 1,162,348 1,233,510 269,413 2,665,271
U5: Addressing MAM (SFP) 1,337,409 1,423,417 168,461 2,929,287
PLW: Addressing MAM (SFP-PLW) - - - -
HIV/TB Adolescents/Adults: NCST - SAM Treatment
523,873 529,856 49,836 1,103,565
HIV/TB Adolescents/Adults: NCST - MAM Treatment
733,422 741,798 69,771 1,544,991
CMAM: Capacity building and procurement of materials
1,508,260 1,044,180 348,060 2,900,500
NCST: Capacity Building 1,332,240 922,320 307,440 2,562,000
Mass Screening for children 943,405 653,126 218,362 1,814,893
MNPs (22-micronutrient)(pilot in most affected 13 districts in South)
4,947,737 - - 4,947,737
Monitoring and Evaluation 152,100 105,300 35,100 292,500
Long-Term:
U5: Addressing SAM (OTP+NRU) 1,935,543 2,120,632 232,199 4,288,374
HIV/TB Adolescents/Adults: NCST - SAM Treatment
785,809 794,784 74,755 1,655,347
Nutrition Promotion: Positive Deviance/Hearth (BCC program)
1,040,000 720,000 240,000 2,000,000
Biofortification pilot in 6 districts (integrate with Agriculture sector)
1,560,000 1,080,000 360,000 3,000,000
Monitoring and Evaluation 152,100 105,300 35,100 292,500
Refurbishment of NRUs - 1,428,571 - 1,428,571
Total Needs 18,114,245 12,902,795 2,408,497 33,425,537

MALAWI PDNA | 153
Recovery Needs Food Insecurity Response Plan (FIRP) Discount Factor: The calculation for short-term recovery needs for June 2016 to March 2017 included the recovery of the overall losses with the addition of monitoring and evaluation costs. As the FIRP includes cost estimations to address the same interventions with a coverage of 65 percent for both SAM and MAM programs over the same 9 months period in the 24 affected districts, a FIRP discount factor of 50 percent (SAM) and 45 percent (MAM) was applied to the overall short-term needs to cover the remaining 35 percent (SAM) and 30 percent (MAM) coverage, while including a 15 percent margin.
Interventions: Around USD 33.4 million would be required to carry out these recovery and Disaster Risk Reduction (DRR) interventions in order to return to pre-disaster levels. This is based on the requirements for prevention and management of acute malnutrition in children U5, PLW, and PLHIV, including procurement and provision of treatment and medical supplies; and other nutrition interventions, including: Vitamin A supplementation and deworming; nutrition surveillance; monitoring and evaluation; capacity building and procurement of materials required for child and maternal health and nutrition promotion. These additional nutrition interventions are considered as requirements for routine programming for Nutrition promotion under normal development programs for the vulnerable groups to build resilience in the population. Thus, the identified financial gaps in the districts were included in the short- and medium-term recovery needs.
The medium- and long-term recovery and disaster risk reduction (DRR) needs are based on the requirements for building resilience through promotion of maternal and child health, prevention of malnutrition and reduction of prevailing Global Acute Malnutrition (GAM) rates to pre-disaster levels and better. The four main DRR interventions included in the mid- or long-term recovery needs are: i) Administration of micronutrient powders (MNPs) in the 13 districts in the Southern region, ii) Nutrition promotion through behavior change communication (BCC) using the Positive Deviance approach, iii) Biofortification in six districts, and iv) Refurbishment of Nutrition Rehabilitation Units (NRUs) in the Central region. The nutrition promotion intervention will be using the Positive Deviance approach targeting households with U5 children, aimed at increasing nutrition sensitization, education and awareness to improve food preservation techniques, dietary diversity and cooking methods to increase absorbable nutrients in meals. The use of micronutrient powders (MNPs) with 22-micronutrients combined with WASH messages will be piloted in all 13 districts in the Southern region to improve levels of micronutrient deficiencies and reduce chronic malnutrition in contexts with limited food security. Biofortification will be used to increase production and consumption of nutrient-rich foods as biofortified crops are drought resistant and high in select vitamins and minerals. As orange-fleshed sweet potato (OFSP) are already accessible in Malawi, the biofortification interventions will focus on sensitizing and bringing awareness to communities on the importance of consuming OFSPs. Increased production of biofortified foods in U5 households will also be carried out in coordination with and support from the Ministry of Agriculture. Lastly, most-affected NRUs will be renovated in the Central region during the three year recovery period, with a goal to improve health facilities available to the most vulnerable SAM children. Financial gaps identified by the Ministry of Health and all other nutrition stakeholders to treat SAM and MAM children U5 , PLW, PLHIV, TB have also been included in the medium and long-term recovery needs as overlooked acutely malnourished cases are directly associated with mortality.

MALAWI PDNA | 154
Challenges in the SectorA number of challenges stand in the way of implementation of the above strategy, overcoming which may require a multi-sectoral approach.
• The sector has been overwhelmed with emergencies from the 2013 drought, 2014 floods and the most recent 2015-2016 drought whose impact will be felt in the months to come. These disasters have highlighted the inadequate resources available for implementation of nutrition related drought-response interventions such as frequent stock-outs of medication and supplies in the public facilities.
• There is inadequate capacity and knowledge deficit among health workers with regards to implementation of nutrition interventions, both at treatment and prevention level. High turnover is reported among nurses and clinicians and there is overwhelming work load on health workers due to other programs.
• Community members lack knowledge with regards to dietary diversification, locally available nutrient-rich foods and nutrient-preserving cooking methods. This is critical since drought effects are strongly felt by communities because of their overreliance on maize.
• Logistical challenges hinder timely access and reach to all affected mothers and children.
• Poor communication infrastructure leads to poor accessibility to remote communities. There are very few outreach program providing primary health services in remote communities.
• The assessment also revealed poor referral, monitoring and reporting systems from the community to facility level.
Existing Sectoral Policies and Major ProgramsCurrently, the Department of Nutrition and HIV/AIDS (DNHA) provides oversight, strategic leadership, policy direction, coordination, monitoring and evaluation of the national nutrition response. . The Ministry of Health (MoH) provides leadership and technical direction in programming and delivery of the curative and preventive nutrition interventions in partnership with stakeholders. The MoH is further responsible for the delivery of quality and cost effective nutrition-specific and sensitive interventions. These interventions are based on the National Health Policy, the EHP, the Health Sector Strategic Plan, IYCF policy, SHN policy, food security policy and other relevant policies. They are implemented by government and development partners across Malawi, with special focus on the worst-affected districts. These interventions primarily focus on promotion of optimal maternal infant and young child nutrition, prevention of micronutrient deficiencies, integrated management of acute malnutrition (including CMAM and NCST), de-worming, prevention of diarrheal diseases and nutrition education. More emphasis has been placed in drought prone areas that contribute to the high national averages for stunting, wasting and underweight among children.
Coordination committees like the National nutrition committee also known as the scaling-up nutrition (SUN) platform, National Nutrition Cluster, Targeted Nutrition Programs (TNP) committee and the nutrition technical working group all which are led by the government provide policy guidance, technical support and coordination of all nutrition activities in the country. A successful drought response will have to include shared cost and responsibility of managing and improving child and maternal nutrition, effective joint planning and coordination of nutrition development and emergency response programs, agreed upon through nutrition forums with various development partners and stakeholders.

MALAWI PDNA | 155
Sector PrioritiesThe National Nutrition Policy (NNP) of Malawi has identified eight priority areas that consolidate aspirations contained in the goal and the major policy objectives, including:
• Prevention of undernourishment • Gender equality, protection, participation and empowerment • Treatment and control of acute malnutrition • Overnutrition and nutrition-related NCDs • Social mobilisation and behaviour change communication • Nutrition during emergency situations • Creating an enabling environment for nutrition • Nutrition research and surveillance
Implementation Strategy/Action PlanThe DNHA has already identified key objectives that will guide the nutrition sector. However, in response to the recovery from the drought and resilience building from disasters, there is need to cost and operationalize the existing National Nutrition strategic plan in addition to the FIRP. The micronutrient powders will be distributed through existing Care Groups, procured by the DNHA; nutrition promotion will also be implemented through Care Groups, targeting households with U5 children through development partners and NGOs; bio-fortification will be rolled out through the “Strengthening Agriculture and Nutrition Extension” (SANE) initiative in close partnership with the Ministry of Health, Ministry of Agriculture, and FAO; and refurbishment of the NRUs will be initiated through the national MoH and district health offices.

MALAWI PDNA | 156
MALAWI PDNA | 157
EDUCATION
Background The Malawi Government adopted the Universal School Feeding Programme in all its public primary schools as a panacea to improving enrolment, retention and performance for quality basic education in Malawi. School Meals Programme is implemented using a number of models that elicit strong community participation in the education sector. Despite such efforts to increase overall national enrollment ratio, challenges in the sector have contributed to fluctuations in the net enrollment ratios over the years.
Education disruptions are regarded as a loss to the education sector as the school completion and retention rates are adversely affected for the impact districts and national indicators. However, national statistics does not capture the actual situation on the ground largely arising from learner mobility. There is also poor capture of drought statistics at the subnational levels to enable amplification of the impact of drought to the education subsector. Nevertheless, school specific discussions revealed massive disruptions to teaching-learning processes further undermining the country efforts for equitable access to quality education for all.
Methodology for Assessment of SectorThe PDNA for education sector targeted all the districts in Central and Southern Regions including Mzimba and Rumphi districts in the North. A total of 28 education districts in all regions were affected by the drought. Secondary data routinely collected through EMIS38 from 2012/13-2014/15 was used as baseline. Data capture forms were electronically sent to all districts affected to collect 2015/2016 drought specific impact data. Site visits were made to selected districts for data validation and further qualitative data collection.
38 EMIS refers to the Education Management Information System an official tool for Monitoring quality Education in Malawi through the Ministry of Education, Science and Technology. It publishes the education statistics through annual censuses

MALAWI PDNA | 158
25 out of 28 education districts provided data representing 89 percent response rate. Ntchisi, Neno and Lilongwe Urban education districts did not provide their data. A 50 percent drought impact discounting rate was factored in for all affected districts whilst 40 percent discounting rate was used specifically for the School Meals Programme. The unit costs employed during costing were sourced from the Ministry of Agriculture, Irrigation and Water Resources and UN agencies.
Effects of the Drought Drought has affected 28 out of 34 education districts representing 82 percent of Malawi with an aggregate of 41.56 percent schools affected by drought. Primary education was the worst hit as compared to secondary and tertiary education. There is a noticeable drop in the primary education enrolment figures for the drought period compared to 2014-2015. During the drought period of Oct 2015 to March 2016, enrolments were reported to be 4,185,201. Most learners during this period withdrew from school to assist their households to cope with food shortages caused by crop failure and low productivity due to hazards of drought disaster. For parents, loss of crops and livestock meant losing their primary income and thus being unable to provide for basic needs of children including quality education. High food prices are further exacerbating the situation as schools are having to increase their food budget but fixed governments grants have been unable to cushion cash-strapped schools.
While enrolments have been decreasing due to food shortages, schools that are providing are seeing an increase in enrolments because children are running away from home for food in schools. This has reduced amount of ration per learner per day as well as feeding frequency. The high food prices have affected the quantity of food purchases to feed learners during the drought. Drought has also affected the Water and Sanitation (WASH) systems in schools. More than 45 percent of the boreholes in primary schools have been reported as dysfunctional due to drought. Qualitative information from school management personnel interviewed during the assessment further validates the negative impact of drought on both teaching and learning in the form of learner attendance, shift from non-feeding to feeding schools and dropout of rural adolescent girls and boys in search of improved household welfare modalities other than farming.
Damage AnalysisThe sector experienced damages in terms of malfunctioning of water sources in schools. These include blocked water pipes due to siltation and broken boreholes due to forceful manual water pumping as a result of low water Almost 100 percent schools with gardens, used for feeding programs, have experience low to no production due to prolonged dry spells. Total damage due to drought in education sectors is estimated at USD3.4 million
Loss AnalysisMost of the losses in the education sector due to drought, estimated at around USD 6.9 million, include disruptions in the school feeding program, that have had strong impact on enrolments. There have been increased enrollments in schools where meals are provided and drastic drop-outs in schools that are not on school feeding. Students also reportedly are suffering from psychosocial issues due to reduced meal frequency and quantity due to low production and escalated food prices (leading to lower calorie count and nutrition) and reduced availability of water, leading to severe attention deficit.

MALAWI PDNA | 159
TABLE 51: SUMMARY OF DAMAGES AND LOSSES IN THE EDUCATION SECTOR
SOUTHERN CENTRAL NORTHERN TOTAL TOTAL*
(All Districts) (All Districts) (Rumphi & Mzimba) (MWK) (1SD =
700MWK)
LOSSES
WASH (Taps and Boreholes) 1,679,650,000 394,300,000 277,300,000 2,351,250,0000 3,358,929
LOSSES
School Meals (Cost of restoring meal consumption for students in affected schools for (6months)
2,862,942,574 1,811,512,761 188,056,285 4,862,511,621 6,946,445
TOTAL 7,213,761,621 10,305,374
Key Objectives of Recovery and Resilience Building The objectives of the recovery and resilience building in the sector are aimed at reducing the shocks and impacts that result from drought and any other disaster that may affect schools. In light of the impact of drought on drop-outs and enrolments correlated with the school feeding program, the Ministry of Education, Science and Technology will therefore scale up School Meals Programme under centrally procured approach as well as Home Grown models in order to reduce effects of the drought on learners. Water and Sanitation (WASH) in schools will also be promoted to ensure that learners have access to safe water within their campuses. Psychosocial support and resilience building will be part of the recovery plans so that learners should acquire life skills that they need to bounce back when such shocks happen again. The proposed recovery and reconstruction needs are based on build back better and smarter principles. Recovery and reconstruction needs for the sector are estimated at USD 12.3 million, covering short term needs of around USD 10.3 million, medium term needs around USD 1.1 million and long term needs of USD 0.9 million.
Recovery interventions will be carried out in three broader program categories of WASH in schools, School Meals Programme and Psychosocial Support and resilience building.
FIGURE 41: DISTRIBUTION OF RECOVERY & RECONSTRUCTION NEEDS BY TYPE

MALAWI PDNA | 160
Short Term Recovery and Reconstruction Needs • Restoration of safe water sources and capacity development in operations and maintenance.
This will embrace two elements.a. Repair and reconstruct damaged safe water school resources including taps and boreholes. b. Capacity development program in operation, maintenance and conservation of school safe
water resources including efficient water use.
This program is an extension of attitude and behavioral change and communication efforts. Focus will be on capacity development of district and school management structures and learners in appropriate water use. This will be complemented by a basic tool-kit to enable regular maintenance of water sources by the school management teams. Water conservation techniques will also be utilized in order to demonstrate this concept. Learners and school governance structures such as Parents and Teachers Associations, School Management Committees and Mother Groups, will also act as change agents to carry the knowledge back to their communities and utilize it accordingly.
• Improvement in hygiene promotion activities during disaster situationsCapacity of teachers and secondary schools structures in WASH will be enhanced by both district and zonal officers joining hands with teachers and School Management Committees to form hygiene school clubs that will promote hygiene and sanitation in schools.
• School grants to improve productivityBased on current input cost per hectare, schools with production land will be given grants to recover the lost yield. Deliberate effort will be applied in disbursement of grants to make sure that good husbandry technics are applied in order to build back better and smarter. In view of this, recommended crop varieties suitable for specific weather and topographic conditions will be used as well as corresponding fertilizers, pesticides and herbicides. This intervention would involve the scale up of the ongoing efforts under the UN Joint Program on Girls Education; which provides grants to schools in four districts of the country. Increasing productivity will also contribute to strengthen schools’ capacity to deal with influx of pupils from neighboring schools that might not be able to offer meals during crises periods by increasing the availability of food in schools.
• Restoration of meal consumptionSchool Meals Programme (SMP) efforts will be expanded to all schools in the drought affected districts and also improved in schools under the program to ensure that recommended meal quantities of 100g per learner per day are provided at the right frequency of 5 days per week instead of the current 3 days per week. This will enable learners regularly attend school and avoid migration from one school to another for optimal utilization of the education inputs. This intervention will ensure equitable access to education irrespective of drought effects.
Medium Term Recovery and Reconstruction Needs (Up to 24 Months)
• Nutrition Education ProgramNutrition education is another behavior change approach where learners will be given nutrition and health talks before feeding. Schools teachers, School management Committees, Parents and Teachers Associations as well as school feeding committees will be trained in food diversification among other nutrition sensitive topics. Through capacity building, and cooking demonstrations, this program will ensure that school teachers, governance structures and learners have changed mind sets towards food choices. The knowledge of six-food groups and utilization of locally available foodstuffs will be enhanced.

MALAWI PDNA | 161
• Train teachers and mother groups for provision of psychosocial supportPsychosocial support will be provided through school based structures to address needs of learners with attention deficiency. Mother groups, School Management Committees, Parents and Teachers Associations, and other available school structures will be trained by District and Zonal Officers in guidance and counseling skills so that they provide basic psychosocial support to affected learners including adolescent girls. To mitigate the stress experienced through lack of food in the households, deliberate efforts will be employed to form school clubs so that learners should maximise peer sharing of best practices and recreation.
• Provision of teaching and learning spaces The Ministry of Education, Science and Technology will also undertake a programme to capacitate schools of additional temporary structures for students and teachers to face the increasing
Long Term Recovery and Reconstruction Needs (Up to 36 Months)• Improvement of yield across districtThis will involve introduction of high yield drought resistant varieties with adoption of low cost technologies in schools to enable them restore the lost food during the drought. This will be employed on long-term basis to set a sustainable and all-weather home-grown school meals model that will be emulated by all schools with production land in future, drawing from the ongoing UN Joint initiative. Such low cost production technologies will include use of drought tolerant crop varieties, use of compost manure, agro-forestry and rain-water harvesting. This interventions will be piloted in 50 percent of affected schools as a build-back-better and smart agriculture strategy towards food production in schools.
• Water conservation behavior change interventionWater conservation behavior will be reinforced through practical demonstrations in schools. For instance, use of wastewater to grow vegetables using water-conserving and locally acquired technologies, growing vegetables in sacks, establishing woodlots and orchards that would help conserve soil moisture.

MALAWI PDNA | 162
Challenges in the Sector • Lack of reliable data as most indicators related to drought are not routinely collected at the
national and district levels for evidence based programming.
• Unavailability of safe water in schools due to the lowering of the water table poses a challenge especially for WASH related activities.
• The low water table deprives soil of residual moisture thereby creating unfavorable conditions for school vegetable gardening.
• Inadequate funding to meet the recovery and reconstruction needs of the education sector
• Knowledge gap among school governance structures and community members with regards to dietary diversification. Locally available nutrient-rich foods and nutrient-preserving cooking methods are ignored.
Existing Sector Policies and Major ProgramsThe proposed recovery and reconstruction plans are in line with and build upon existing universal and national educational policies. The Education sector is working towards achieving the Millennium Development Goal 2, the National Education Sector plan, basic education policy, the National Education Sector Implementation Plan II (2013/14 – 2017/18), The Readmission Policy 1993, the Gender Policy 2013, the national school health and nutrition strategic plan 2009-2018 and the National Youth Policy.
Sector PrioritiesThe priority of Education sector is to ensure learners access to education is not hindered due to natural disasters, specifically drought. To achieve this objective, priority will be to restore the capacity of schools to provide school meals since disruption in school feeding has been one of primary factors behind dropouts and decreased enrolment.
Implementation Strategy/Action PlanImplementation will be linked to regular education programmes to ensure effective and efficient teaching and learning processes in all affected districts and schools. Department of Disaster Management Affairs (DoDMA) will coordinate monitoring and evaluation of the recovery plans. The strategies discussed above will be implemented by the Ministry of Education, Science and Technology in collaboration with its partners and Education district office. The Deputy Director for School Health, Nutrition, HIV and AIDS in the Ministry, will lead the recovery programmes. The Table below presents the Action Plan:

MALAWI PDNA | 163
ENVIRONMENT
Background Malawi is endowed with diverse and abundant natural resources. These resources form a basis for sustainable economic growth and development. Natural resources include forest, wildlife, water and fish resources. Over 80 percent of Malawians depend on natural resources for their subsistence, energy needs and household income. Over, 90 percent of the value of Malawian’s exports is accounted for by natural resource sector including land and water resources. However, climate change mainly drought has adverse effects and impacts on various sectors of environment and natural resources.
Forest resources cover about 30 percent of the total land in Malawi. These are categorized as natural and plantation forest. Natural forests are on customary land under the control of local authorities. Natural forests also include both protected forest and wildlife reserves, covering approximately 0.87 million hectares and representing 22 percent of the total forest cover in Malawi. Plantation forests cover 0.09 million hectares, about 1.8 percent of the total forest area. According to Economic Valuation of Natural Resources Report (2011), the forest sector contributes of the 6.1 percent GDP. Wildlife is closely linked to tourism and contributes to socio-economic development of the nation. Wildlife and tourism contributes 2.7 percent and 12 percent of the GDP respectively (Economic Valuation of Natural Resources Report, 2011).
Lake Malawi, the third largest and fresh water lake in Africa, occupies about 20 percent of total area of the nation. Malawi’s water resources provide for various uses including water supply, irrigation, electricity generation and habitat for more than 1,000 species. Lake Chilwa also provides a number of critical ecosystem services and directly or indirectly supports the livelihoods of the surrounding population.
Ministry of Natural Resources, Energy and Mining is mandated to ensure sustainable management of the environment, climate change, forestry and other natural resources. Despite efforts by the Departments, degradation of natural resources continues to be a major threat to social and economic development of

MALAWI PDNA | 164
Malawi. Malawi’s high population density and dependence of Malawians on agricultural production in the absence of other economic opportunities has led to alarming rates of environmental degradation. The results have been deforestation; decreasing soil fertility and increasing erosion; water depletion, loss of biodiversity; and increasing pollution. These poor environmental conditions have been exacerbated by poverty, protein and energy demands as high proportion of the population relies on the exploitation of natural resources such as firewood, fish stocks and bush meat.
Methodology for Assessment of SectorThe PDNA assessment focused on the impacts of drought with a sample of the districts to represent the whole country. Field visits were made to four districts namely, Machinga, Zomba, Blantyre and Lilongwe. Information for impact of 2015/2016 drought was collected through the officers in the field. Baseline data for the sub-sectors in environment sector were collected through a variety of sources but the main source was Malawi State of Environment and Outlook Report (MSEOR), Economic Evaluation Report for Natural Resources in Malawi and it was collected by the EAD team. Secondary data was collected through desk review while the primary data was collected through interviews and telephone conversations. The data collected was used to extrapolate the assessment results to the entire country. Data was analysed using excel to gate tables of damages and losses. The two major limitations include; limited time allocated to conduct the PDNA Assessment and the numbers of districts visited were too few hence the majority of the districts that were affected could not be visited. The lack of reliable and updated estimates of natural resource’s contribution to the economy. This indicates severe weaknesses in the national income accounting system and related valuation systems in Malawi.
Effects of the DroughtDamage analysisMost of the damage was caused to forests (USD 4.2 million), while wildlife only incurred damages worth USD 15,000 than wildlife. These include drying up of the newly planted seedlings in 24 districts and wildlife mortality in one National park and two wildlife reserves.
TABLE 52: FOREST SECTOR DAMAGES
INDICATOR SOUTHERN (MWK)
CENTRAL (MWK)
NORTHERN (MWK) TOTAL (MWK) TOTAL (USD)
Drying of seedlings
1,071,638,200 1,561,166,366 328,562,543 2,961,367,109 4,230,524
Total 2,961,367,109 4,230,524
TABLE 53: WILDLIFE SECTOR DAMAGES
INDICATORSOUTHERN REGION TOTAL (MWK)
CENTRAL REGION TOTAL (MWK)
NORTHERN REGION (MWK) TOTAL (MWK) TOTAL (USD)
Wildlife mortality
7,000,000 3,500,000 - 10,500,000 15,000
Total 10,500,000 15,000
Loss AnalysisUnlike the damages, most losses were incurred in the wildlife sector (USD 1.5 million) and currently there are no losses in forest sector. The losses in wildlife sector were calculated based on human –wildlife conflicts and loss of production of winter crops emanating wildlife including herbivores such

MALAWI PDNA | 165
as elephants, hippo will opt for consuming succulent winter crops in the nearby dambo's for the communities around protected, and infrastructure development such as fencing to control human wildlife conflicts. The 2015/2016 drought has resulted in drying up of plants species which has led to migration of wild animals and increased wildfires. Migrations of animals can be by their own or moved by humans as well. This is also called wildlife translocation. 500 Elephants will be moved from Liwonde National Park to Nkhotakota Wildlife Reserve and some antelopes will be moved from Majete Wildlife Reserve to Liwonde National Park.
TABLE 54: LOSSES FOR WILDLIFE SECTOR
INDICATOR SOUTHERN REGION (MWK)
CENTRAL REGION (MWK)
NORTHERN REGION (MWK)
TOTAL (MWK) TOTAL (USD)
Wildlife mortality 840,000,000.00 - - 840,000,000.00 1,200,000.00
Human Wildlife conflicts
1,250,000.00 - - 1,250,000.00 1,785.71
Protective fence 210,000,000.00 - - 210,000,000.00 300,000.00
Total 1,051,250,000.00 1,501,785.71
It is anticipated that there are losses in the forest sector through damages to forest ecosystems and loss of ecosystem services that have been caused by drought. However, there is limited if not no data that is readily available to be used to quantify the losses.
Key Objectives of Recovery and Resilience Building in the Sector and Recovery & Reconstruction Needs The environment and natural resources form the basis of socio-economic activities in Malawi. However, climate change and extreme weather events such as drought, has disrupted and negatively affected socio-economic benefits realized from natural resources and environment. Hence, a call for more reliable and resilient options to sustainable environmental management at large. Following the drought experienced in the season 2015-16 agricultural year, forestry and wildlife, water sectors and ecosystem services were affected and experienced heavy damages and losses resulting from drying up of newly planted seedlings, wildlife mortalities and human –wildlife conflicts. Therefore, various strategies that fall within recovery, reconstruction and disaster risk reduction have been put in place to restore and rehabilitate the environment and natural resources. The main objective is to conserve the environment and promote sustainable use of natural resources while building resilience to the rural communities living around and depend on the protected areas and their ecosystems.

MALAWI PDNA | 166
The needs will be implemented in the short, medium and long term as shown in Figure 39. Short term refers to the strategies that will be implemented within the period of 1 month to 12 months (I year) while medium term are the strategies that will be from now and be completed after two to three years and long term are strategies that will be implemented from now and completed after three to four years. Despite the plans and call for individual needs, there is need for a multi-sectoral management approach to disaster management. This will ensure effective and efficient recovery, reconstruction and resilience building because the environment crosscuts between the other sectors such energy, transport, agriculture, water. Around USD 6.5 million would be require to undertake the below recovery interventions.
TABLE 55: IMPLEMENTATION OF THE NEEDS AGAINST TIMEFRAME
SN SECTOR NEEDS STRATEGIESTIME FRAME
SHORT MEDIUM LONG
1 Wildlife
Recovery Wildlife translocation
Reconstruction Construction of water points
DRR
Awareness and outreach campaigns
Capacity building (Technical staff and Communities)
2 Forestry
Recovery
Afforestation and reforestation
Natural Regeneration
ReconstructionFire management improvement
DRR
Awareness and Outreach campaigns
Harmonization of conflicting sectoral policies
Capacity Building (technical and Communities)
Improving Early Warning Systems
Recovery Needs and Resilience BuildingThe Government through the Ministry of Natural Resources, Energy and Mining in collaboration with other key stakeholders in turns to promote afforestation, reforestation and natural regeneration of trees a way to fill gap in the forestry damaged areas. It is expected that natural regeneration for the rich native species will be done through capacity building and sensitization campaigns. With support from other key stakeholders and development partners, the government targets to recover 50 percent of the affected planted areas. This will cost MWK 2,093,244,739 (USD 2,990,350). In relation to the damages and losses incurred in the wildlife sector, Government through its concession with African Parks, is in the process of translocating some wild animals to sister national parks and wildlife reserve to minimize the direct and indirect impact of drought on the protected ecosystems. A total of 500 elephants is targeted to be translocated from Liwonde National park in Machinga district to Nkhotakota Wildlife Reserve in Nkhotakota district. These strategies are valued at MWK966,000,000 (USD 1,380,000).
In both wildlife and forest sectors the government also plans to improve fire management through construction of fire breaks in the forest reserves and protected areas. It will also procure and install fire
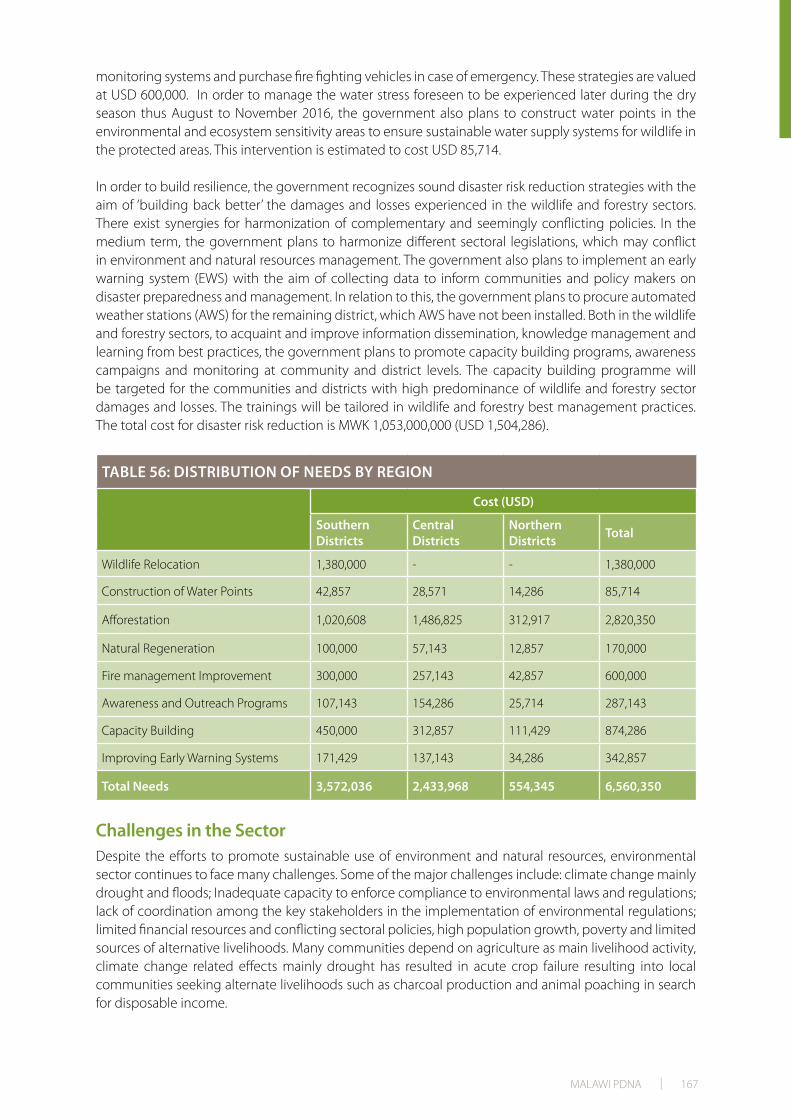
MALAWI PDNA | 167
monitoring systems and purchase fire fighting vehicles in case of emergency. These strategies are valued at USD 600,000. In order to manage the water stress foreseen to be experienced later during the dry season thus August to November 2016, the government also plans to construct water points in the environmental and ecosystem sensitivity areas to ensure sustainable water supply systems for wildlife in the protected areas. This intervention is estimated to cost USD 85,714.
In order to build resilience, the government recognizes sound disaster risk reduction strategies with the aim of ‘building back better’ the damages and losses experienced in the wildlife and forestry sectors. There exist synergies for harmonization of complementary and seemingly conflicting policies. In the medium term, the government plans to harmonize different sectoral legislations, which may conflict in environment and natural resources management. The government also plans to implement an early warning system (EWS) with the aim of collecting data to inform communities and policy makers on disaster preparedness and management. In relation to this, the government plans to procure automated weather stations (AWS) for the remaining district, which AWS have not been installed. Both in the wildlife and forestry sectors, to acquaint and improve information dissemination, knowledge management and learning from best practices, the government plans to promote capacity building programs, awareness campaigns and monitoring at community and district levels. The capacity building programme will be targeted for the communities and districts with high predominance of wildlife and forestry sector damages and losses. The trainings will be tailored in wildlife and forestry best management practices. The total cost for disaster risk reduction is MWK 1,053,000,000 (USD 1,504,286).
TABLE 56: DISTRIBUTION OF NEEDS BY REGION
Cost (USD)
Southern Districts
Central Districts
Northern Districts Total
Wildlife Relocation 1,380,000 - - 1,380,000
Construction of Water Points 42,857 28,571 14,286 85,714
Afforestation 1,020,608 1,486,825 312,917 2,820,350
Natural Regeneration 100,000 57,143 12,857 170,000
Fire management Improvement 300,000 257,143 42,857 600,000
Awareness and Outreach Programs 107,143 154,286 25,714 287,143
Capacity Building 450,000 312,857 111,429 874,286
Improving Early Warning Systems 171,429 137,143 34,286 342,857
Total Needs 3,572,036 2,433,968 554,345 6,560,350
Challenges in the SectorDespite the efforts to promote sustainable use of environment and natural resources, environmental sector continues to face many challenges. Some of the major challenges include: climate change mainly drought and floods; Inadequate capacity to enforce compliance to environmental laws and regulations; lack of coordination among the key stakeholders in the implementation of environmental regulations; limited financial resources and conflicting sectoral policies, high population growth, poverty and limited sources of alternative livelihoods. Many communities depend on agriculture as main livelihood activity, climate change related effects mainly drought has resulted in acute crop failure resulting into local communities seeking alternate livelihoods such as charcoal production and animal poaching in search for disposable income.

MALAWI PDNA | 168
Existing Sectoral Policies and Major ProgramsEnvironmental management issues are enshrined in several legislative pieces in Malawi. These policy documents call for the sustainable management, use and protection of the environment and natural resources. Notable policies relating to drought affected sectoral areas include:
Environment: The National Environmental Policy (NEP) of 2004 postdate the Environmental Management Act of 1996 which provides for creation of a legal framework for environmental impact assessment (EIA) and environmental auditing. NEP adequately covers aspects of environmental degradation including desertification, land degradation and biodiversity losses.
Wildlife: National Wildlife Policy of 2000 provides for proper conservation and management of the wildlife resources in Malawi. The policy addresses fire management in support for environmental management. It also calls for private sector participation and involvement in the management of wildlife resources. The National Parks and Wildlife (Amendment) Act, 2004 provides for the declaration of protected areas of public land; national parks, wildlife reserves or nature sanctuaries and creates the necessary governance and funding frameworks for their management.
Forestry: The Forestry policy of 2006 emphasizes the management of tree and forest resources. However, the does not adequately to incorporate immerging issues such as payment for ecosystem services (PES), reducing emissions from forest deforestation and degradation and (REDD+). The Forestry Act, 1997, antedate of the policy, regulate management of trees and forests under customary and private land as well as in protected areas.
Water: The newly enacted Water Resources Act of 2013, provides the legal basis for the management of water resources. The Act provides for the establishment of a water resources authority to effectively manage the resource through basins in an effective and independent manner. National Irrigation Policy and Development Strategy 2011, in spite of promoting irrigation emphasizes EIAs to precede irrigation development.
Land: The National Land Policy (2002), the Land Resource Management Policy and Strategy (2000) provide for land use planning designating relevant land uses according to land characteristics. These policies link with water policies through catchment conservation, which benefit agriculture in adjoining land and promote fish conservation and fisheries management downstream.
Shire River Basin Management Programme, National Climate Change Programme (NCCP), Environment and Natural Resources Management (ENRM) Project, Social Cash Transfer (SCT) through Public Works Programme (PWP), Protecting Ecosystems and Restoration Forests in Malawi (PERFOM) Project are some of the programmes that being implemented to build resilience and conserve the environment and natural resources in Malawi.
Sector Priorities The main sector priorities are aimed at protecting the environment and promote sustainable utilization of natural resources while building resilience to the rural communities and ecosystems through strengthening institutional capacity to manage the ecosystems, implementation of biodiversity conservations programs. The biodiversity conservation programs will include translocation of the animals, improvement of fire management in both wildlife and forest sectors. Development of integrated national early warning systems and harmonization of conflicting sector policies. The achievement of the set priorities will depend on a number of assumptions mainly the availability of adequate resources and good political will.

MALAWI PDNA | 169
Implementation Strategy The Government of Malawi through Ministry of Natural Resources, Energy and Mining will spearhead the implementation of the recovery strategies. The Department of Forestry will spear head the implementation of Forestry Recovery Strategies, Department of National Parks and Wildlife and will lead the implementation of Wildlife Recovery strategies while Environmental Affairs Department will lead the harmonization of conflicting sector policies and will be a coordinating agent for the other sectors. In addition other government ministries and departments, district councils, local communities, private sector such as African Parks, civil society organizations and non-governmental organizations will also be at center in the implementation of recovery strategies. The Development partners such as United Nations Development Programme (UNDP), World Bank and other donor funding agencies will play a key role in providing financial resources and advisory support. The following work plan and budget shall be used to ensure timely implementation of the recovery strategies.
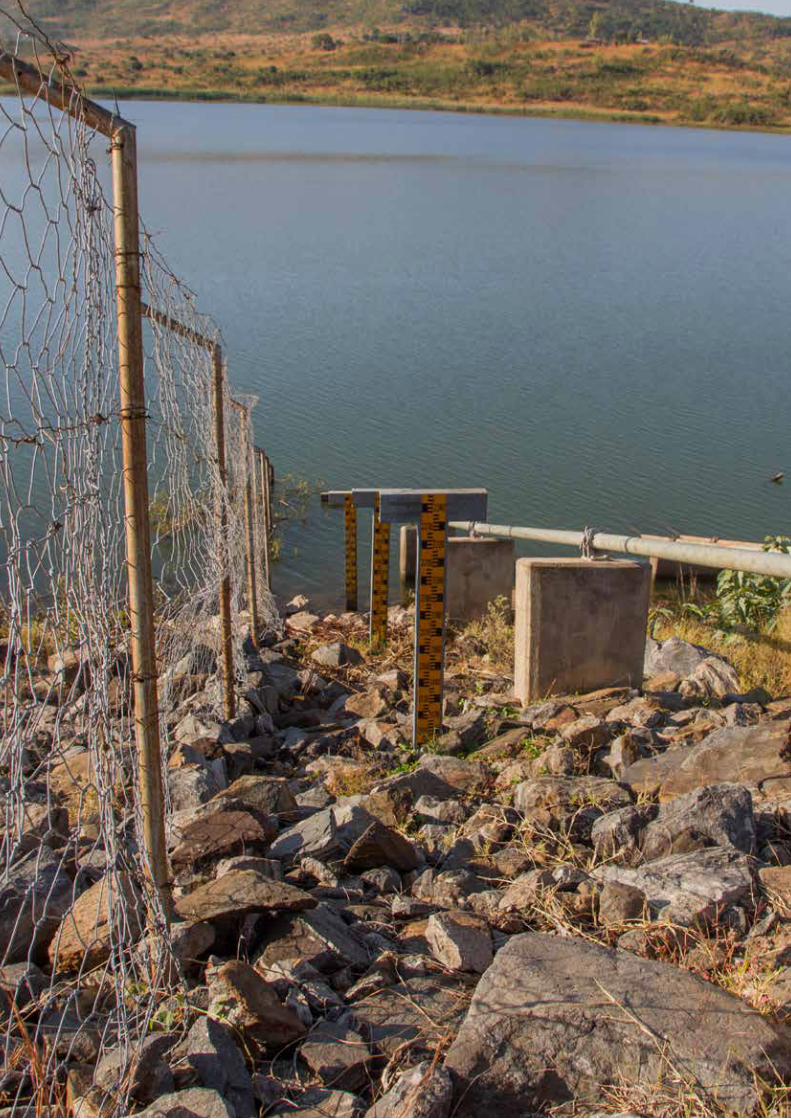
MALAWI PDNA | 170

MALAWI PDNA | 171
INDUSTRY AND COMMERCE
Background Industry and Commerce is not only the engine of growth in a country but also plays a key role in contributing substantially to employment and ensuring access to services and goods. Medium and large-scale enterprises provide access to formal sector employment opportunities, but a substantially large number of jobs in Malawi are provided by micro and small enterprises which also con-stitute the largest share of the whole sector, majority of which are informal. It is recognised that without trade in the country, Malawi may not grow to its full potential and that industrialization and structural transformation of the economy would not be there to create rapid long-term economic growth that is needed to raise per capita income, create sufficient rural and urban jobs, and widen the tax base to finance Malawi’s budgetary requirements. The sector currently constitutes 15 percent of the Gross Domestic Product (GDP), while industry alone contributes 9 percent. According to the 2012 Fin scope report, there are about 1 million MSMEs in the country, 42 percent in the Central region, 45 percent from the South and 13 percent in the northern region. The drought affected all the regions in the southern and central region, and two districts (Rumphi & Mzimba) in the northern region. MSMEs in the affected areas constitute 93 percent of the total number of MSMEs in the country. 35 percent of the manufacturing sector of the country is mainly agro-processing.
The trade sector also contributes towards raising the living standards of people by economically empowering youths, women, and smallholder farmers, job seekers, micro and small businesses through establishment of businesses and employment creation.
Focus of this analysis is mainly on agro processing industries, as they were the ones that were felt to be more heavily impacted by the drought. The assessment covered all districts in the Southern and Central regions and two districts (Rumphi and Mzimba) in the Northern region of the country (24 districts) where drought was more prevalent during 2015-16. The analysis concentrated on a number of categories of the agro processing sector namely: meat production; dairy products; flour production, tea production,
MALAWI PDNA | 172
sugar production, beer production and bakery products as they are they contribute a larger percentage to the GDP of the country.
The research methods included a desk review of existing material on drought and secondary data such as from the national accounts. The team conducted interviews with large scale industries, MSME and cooperative owners to validate some of the available data, and to determine the proportion of the losses that were attributed to the drought.
Challenges Faced by the Industry and Commerce Sector • The sector faces a number of challenges which include (i) lack of appropriate skills and uptake of
technology, (ii) high costs of doing business and deficient support infrastructure, (iii) market access to export markets and macroeconomic instability. . The drought has further increased the stress on the industry and trade sector and specifically affected the agro-processing sector. Low agricultural productivity, higher costs of agricultural raw materials, water and energy combined with decreased domestic demand and reduced purchasing power of the population hit the sector. Many of the underlying challenges faced by the sector have further aggravated the drought impacts on the sector.
• Poor business environment. The poor business environment related to unreliable supply of electricity and vulnerable infrastructure further exacerbated the impacts of the drought. The drought impacted hydro-power generation and many of the manufacturers and suppliers have faced further power outages, reducing productivity, impacting storage and negatively affecting revenues for the industries.
• Low levels of competitiveness. A large portion of the industries involved in agro-processing are MSMEs, usually with limited access to capital and financial resources and thus unable to buffer shocks. This makes MSME particularly vulnerable for drought impacts as they will likely be unable to buffer any shocks and compete with larger industries, which have more access to capital to remain competitive.
• Limited investment in physical and human capital. The drought and related higher production costs has limited the capital and ability of most companies to invest and acquire appropriate skills as most of their resources are taken up by the increase in the cost of production.
• Macroeconomic instability. The drought has likely increased the inflation rate in the country. The high production costs coupled with low revenues, led to an increase in the price of agro-processed products in country.
Effects of the Drought on the Industry and Commerce Sector • The drought has negatively affected the industry and commerce sector, which is linked to the low
productivity of the agriculture and impacts on energy (hydro-power) and water resources sectors. The direct impacts on the industry and commerce sector can be specified as follows:
• Insufficient and increased cost of raw materials. The drought had a direct impact on the water supply, not just in the affected areas, but in the country as a whole. This in turn affected the production of the water- dependent economic sectors including the agro-processing industries. The drought led to low productivity and low yields of agro-products, which has resulted in scarcity of raw materials for the agro processing industries. The higher costs of inputs and raw material resulted in increased production costs and higher wholesale and retail prices. However, not all costs were passed through to the consumer so that many SMSE had to burden the costs directly.
• Low purchasing power causing low demand for products and loss of business. The drought has led to an increase in the inflation rate, which has also led to a decrease in the purchasing power of consumers. A reduced demand of products led to low revenues for the SMSE.
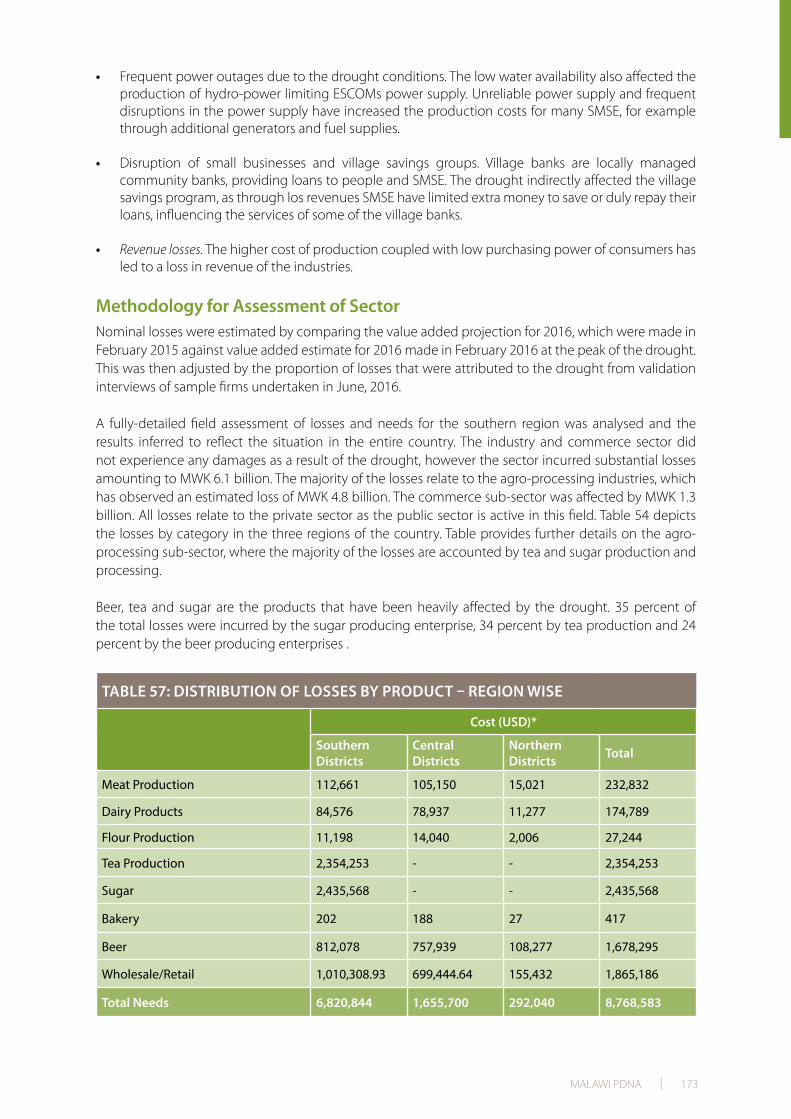
MALAWI PDNA | 173
• Frequent power outages due to the drought conditions. The low water availability also affected the production of hydro-power limiting ESCOMs power supply. Unreliable power supply and frequent disruptions in the power supply have increased the production costs for many SMSE, for example through additional generators and fuel supplies.
• Disruption of small businesses and village savings groups. Village banks are locally managed community banks, providing loans to people and SMSE. The drought indirectly affected the village savings program, as through los revenues SMSE have limited extra money to save or duly repay their loans, influencing the services of some of the village banks.
• Revenue losses. The higher cost of production coupled with low purchasing power of consumers has led to a loss in revenue of the industries.
Methodology for Assessment of SectorNominal losses were estimated by comparing the value added projection for 2016, which were made in February 2015 against value added estimate for 2016 made in February 2016 at the peak of the drought. This was then adjusted by the proportion of losses that were attributed to the drought from validation interviews of sample firms undertaken in June, 2016.
A fully-detailed field assessment of losses and needs for the southern region was analysed and the results inferred to reflect the situation in the entire country. The industry and commerce sector did not experience any damages as a result of the drought, however the sector incurred substantial losses amounting to MWK 6.1 billion. The majority of the losses relate to the agro-processing industries, which has observed an estimated loss of MWK 4.8 billion. The commerce sub-sector was affected by MWK 1.3 billion. All losses relate to the private sector as the public sector is active in this field. Table 54 depicts the losses by category in the three regions of the country. Table provides further details on the agro-processing sub-sector, where the majority of the losses are accounted by tea and sugar production and processing.
Beer, tea and sugar are the products that have been heavily affected by the drought. 35 percent of the total losses were incurred by the sugar producing enterprise, 34 percent by tea production and 24 percent by the beer producing enterprises .
TABLE 57: DISTRIBUTION OF LOSSES BY PRODUCT – REGION WISE
Cost (USD)*
Southern Districts
Central Districts
Northern Districts Total
Meat Production 112,661 105,150 15,021 232,832
Dairy Products 84,576 78,937 11,277 174,789
Flour Production 11,198 14,040 2,006 27,244
Tea Production 2,354,253 - - 2,354,253
Sugar 2,435,568 - - 2,435,568
Bakery 202 188 27 417
Beer 812,078 757,939 108,277 1,678,295
Wholesale/Retail 1,010,308.93 699,444.64 155,432 1,865,186
Total Needs 6,820,844 1,655,700 292,040 8,768,583

MALAWI PDNA | 174
Recovery and Reconstruction Needs Objectives The objectives of the recovery strategy for the industry and commerce sector are to ensure that the businesses stay in operation despite the drought impacts, overcome losses incurred due to the drought and create an enabling, conducive and competitive environment for the private sector to rebound investments and rebuilding a strong private sector in Malawi with both direct assistance to MSME and creating the policy and fiscal environment for the private sector to overcome the impacts as soon as possible. To mitigate these negative impacts and allow for the sectors to recover and contribute to overall recovery efforts, a strategy comprising both policy measures and practical assistance to the most affected micro, small and medium enterprises (MSME) is proposed.
Short term strategiesCreate a special scheme making financing available to MSMEs at a lower cost. Cost of production has increased due to scarcity of (agricultural) raw materials, which has further reduced the available capital of MSME to investment and remain competitive. It was therefore suggested to assist MSME by providing preferential access to loans and finance to keep up with investments and overcome the impacts of the drought. A government facilitated and NGO supported scheme to access financing ad preferential terms was therefore proposed.
Scale up existing loan schemes to reach the MSMEs affected by the drought: The country already has some ongoing loan schemes agreements with several financial providers. It is suggested that these should be scaled up in order to reach the districts that have been mostly affected by the drought. Promotion of small scale businesses: Since the drought has affected the livelihood of people in the affected districts, it is suggested that government should encourage households to engage in small scale enterprises to improve their livelihoods.
Medium term strategyEncourage enterprises to diversify their products to mitigate impacts of natural disasters. It is proposed that government should encourage enterprises in the country to diversify their products in order to mitigate impacts of any natural disasters that may occur in the future. This will be done through sensitization campaigns and trainings on how to diversify.

MALAWI PDNA | 175
Long term strategyIncreased amount of government budget to be allocated to high priority target groups. It is proposed that in the long term, the government should increase the budgetary allocations towards the high priority target groups seeking support, such as women and youth to support women and youth owned enterprises and making them more resilient to market and disaster relate shocks.
To cover the short, medium and long-term interventions in support of the industry and commerce sector approximately USD 4.9 million would be required. The needs are based on an estimation of preferential financing and credits to be provided for the most affected MSME in the country. It is estimated that short-term loans will be provided to the 5 percent most affected MSME on a pro-rata basis according to the size of the MSME. It is proposed that at least 6 percent of this budget be allocated to high-priority target groups needing specific support, namely women and the youth. Although women’s participation in the sector is lower in comparison to men, women are over represented in the informal micro enterprise subsector due to its low capital requirement and low entry barriers. However, women may also be the hardest hit as the informal sector is often uninsured, characterized by limited assets, and is less resilient to disasters. The table below provides an overview of the sector needs and financial requirements to achieve them.
TABLE 58: DISTRIBUTION OF INDUSTRY SECTOR NEEDS BY REGION
Cost (USD)
Southern Districts
Central Districts
Northern Districts Total
Business Loan Scheme 2,248,838 2,098,915 649,664 4,997,417
Total Needs 2,248,838 2,098,915 649,664 4,997,417
Existing Sector Policies and Major ProgramsThe industry and Commerce sector has a number of policies and strategies which will help in mitigating the effects of the drought. These include:
• National Export Strategy (NES) which provides a clearly prioritized roadmap for building Malawi’ productive base and to generate sufficient exports to match the upward pressure on Malawi’s imports. The NES aims to maximise the direct contribution of exports to economic and social development.
• National Industrial policy whose goal is to increase the proportion of manufacturing in GDP through structural transformation of the Malawian economy.
• PSD Policy, which aims to ensure conducive business environment is create and aims to promote and increase investment into the country.
• Buy Malawi strategy which promotes and encourages consumers to purchase and use locally produced products.
• National Trade Policy, which aims to provide an expanded market access both domestic and international and support. This includes access to imported inputs; access to export markets and access to boarder markets for small-scale producers which are otherwise too high considering the value of good being traded.

MALAWI PDNA | 176
• SMEs Policy which aims to ensure enhanced participation of Malawians in economic activities through the development of MSMEs and Cooperatives
• Trade information portal, which has been designed to significantly reduce the financial and time cost that has for so long restricted trade between Malawian producers and the rest of the world.
• One Stop Service Centre, which accommodates officers from Immigration Department, Malawi Revenue Authority, Registrar of Companies and Ministry of Lands and Housing under one roof. The One Stop Center aims at making investing in Malawi faster, simpler and cheaper and contributes to the Ease of Doing Business in the country by reducing the period investors take to obtain Investment Certificate and Business Resident Permits.

MALAWI PDNA | 177
TRANSPORT
Background Transport sector in Malawi caters for the mobility of goods and people, facilitating trade within the country and with the international market. It also provides access to social services (health facilities and schools) at both international and local level. As a landlocked country Malawi relies on overland transportation by road and rail to gain access to the sea for imports and exports.
Road transport is the major mode of transport in Malawi handling more than 70 percent of the internal freight traffic and 99 percent of passenger traffic. The country’s classified road network comprises 15,451 km of which about 28 percent are paved with the rest being unpaved and mostly earth standard. The road network is divided into 5 categories: main (3,357 km), secondary (3,125 km), tertiary (4,121 km), district (3,500 km) and urban (1,348 km) roads. The main, secondary, and tertiary roads effectively make up the country’s primary road network, with district and other undesignated roads acting as a feeder system to the primary network. However, reclassification study carried out in 2006 also identified an additional 9,478 km of undesignated road network that serves rural communities.
The Ministry of Transport and Public Works (MoTPW) regulates the transport sector under respective departments and agencies with the Roads Authority being mandated to oversee the infrastructure needs of the road sector. Other major stakeholders of the transport sector are the road transport operators, who provide transportation services for goods domestically and internationally. These have formed a body named the Road Transport Operators Association, which regulates and lobbies for the local transporters in the country and liaises closely with the Ministry of Transport and Public Works. This report aims to analyze the infrastructure problems that will be faced for accessibility of relief items to victims in affected areas and the effects of the drought in general on the road transporters in Malawi.

MALAWI PDNA | 178
Challenges Faced by the Transport SectorThe road sector in Malawi is currently experiencing challenges in maintaining its road network effectively due to inadequate funding. The funds available cannot effectively cater for all the demand of rehabilitation and maintenance. The recent floods worsened the condition of the roads worsening accessibility and mobility problems in the rural areas. The January 2016 floods affected and seriously damaged these roads rendering most of them impassable. While efforts were made to rehabilitate and maintain them, it was not possible for the available resources to carter for all the damaged roads. Effective delivery of drought relief items can only be realized, if there is good accessibility, which would not be easy considering the current condition of the rural roads.
Taxation is also a challenge for the private road transport enterprises in Malawi, as taxes are levied on spare parts and vehicle maintenance services. Combined with high fuel costs makes some local transport enterprises being less competitive on the market than transport enterprises from neighboring countries. This requires in addition foreign exchange to mobilize external transport capacity.
Effects of the Drought on the Transport SectorThere are no direct damages of the transport infrastructure related to the drought. The transport sector incurred losses, which are related to the overall impacts of the drought on key sectors of the economy, which depend on transportation services. However, secondary impacts on the transport sector due to the limited availability of goods to be transported (such as agricultural commodities) are difficult to be quantified across the country. In addition, it needs to be noted that some of the losses by transporters might be compensated when government imports food items and relief items need to be distributed to the rural areas requiring the services of the transport sector enterprises.
• Road transporters have lost a lot of business hauling tobacco for sale from estates and farms to auction floors. There were and still are fewer quantities of tobacco unlike preceding seasons due to drought. Less quantities of maize, groundnuts, sugarcane, beans, rice and cotton to be trans-ported from farms to homes and markets have incurred losses on indigenous transport owners;
• There are concerns that transportation costs may increase as scarce commodities need to be
transported from further away or importing commodities translates into increased distances to haul and thus higher fuel costs for the transportation enterprises.
• Transport enterprises have also reported challenges in repaying loans due to the low number of transportation jobs available and impacts on the availability of seasonal jobs as the transport-ation sector has limited seasonal jobs to offer during this drought season. There is a concern that transporter enterprises have to lay off some workers e.g. truck drivers, assistants, transport labourers and mechanics.
• 4n terms of road infrastructure, the scarcity of water will force contractors to source water over longer distances increasing their operating costs. This will in turn translate into higher costs of construction, rehabilitation and maintenance of works transferred to the client and thereby the end-user.
Assessment MethodologyThe recovery and reconstruction plans are focusing on the need to provide relief to the victims affected by the drought by providing proper access especially to the rural areas with bad access roads and reducing the direct effects of the same on the road transporters. This assessment covers all districts in the Southern and Central Regions which have been hard hit by the drought namely Nsanje, Chikhwawa, Thyolo, Mulanje, Phalombe, Chiradzulu, Blantyre, Zomba, Machinga, Mangochi, Balaka, Neno and

MALAWI PDNA | 179
Mwanza in the South; Ntcheu, Dedza, Salima, Nkhotakota, Ntchisi, Dowa, Kasungu, Mchinji and Lilongwe in the Centre; and finally Mzimba and Rumphi in the North.
Transport Sector data has been collected from concerned districts and coordinated with World Food Programme (WFP) according to the recent update. Visits to some sites were also done by the team in order to ascertain the extent of the problems.
Existing Sector Policies and Major ProgramsIn order to increase the available funding for road maintenance the Government of Malawi converted the collection of road-taxes from a fixed rate per litre to a percentage ranging between 7 and 11 percent. This significantly improved the amount allocated for maintenance of roads.
Several programmes have supported the roads subsector targeting rural roads like the Income Generating Public Works Program (IGPWP) and Rural Infrastructure Development Program (RIDP) funded by the European Union. District Councils also take part through the Local Development Fund (LDF). Currently the Agriculture Sector Wide Approach Support Project (ASWAp-SP) and the Malawi Flood Emergency Recovery Project (MFERP) have tried to address the needs of the rural road infrastructure as well. However despite these interventions, the needs are still eminent as they require a lot more funding in order to be adequately addressed.
Recovery and Reconstruction NeedsThe main objective of recovery in the transport sector is to provide access to drought affected areas by maintaining and rehabilitating roads that are in bad condition to allow for relief items to reach the victims. This maintenance and rehabilitation will have to follow a Building Back Better concept in order to build resilience to future climate shocks.
Sector PrioritiesPriority for rehabilitation and maintenance will be given to areas that are hard hit by the drought and which will require various relief from the respective sectors, more especially for food and water supply. The sector intends to rehabilitate and maintain 368km of roads for an approximate amount of USD 15.3 million or MWK 10.7 billion.
Recovery NeedsFor the transport sector, there will be no recovery needs for any direct damage to the infrastructure. However there may be recovery needs for the transport operators who have lost business due to the drought. These needs would have to be synchronized with those of other sectors especially for the trade and agriculture sectors.
Reconstruction NeedsThere will be huge reconstruction needs in the transport sector in order to adequately address the needs of other sectors especially agriculture, water and irrigation. This is very eminent for food security, water and health sectors, which will require urgent response to counteract the famine and its related effects. The total needs are estimated at USD 15.3 million or MWK 10.7 billion.
DRR NeedsThe disaster risk reduction needs with regard to building back better of the transport infrastructure have already been included in the cost assumption spelled out for the 10 districts. Risk reduction measures would include a climate resilient construction of the roads to ensure that the network remains intact during future floods and that relief items can be distributed during disasters.

MALAWI PDNA | 180
TABLE 59: ESTIMATES
District Road Length to be repaired Kms Total USD
Zomba 42 2,100,000
Phalombe 42 1,077,000
Chikwawa 30 1,500,000
Thyolo 42 2,077,000
Machinga 41 1,538,500
Balaka 11 38,500
Dedza 60 3,000,000
Mwanza 15 750,000
Neno 65 3,250,000
TOTAL 368 KM 15,331,000
Implementation Strategy Interventions for reconstruction of the transport sector can be seen as medium to long-term measures providing the necessary infrastructure to allow a timely and rapid delivery of relief items in the case of future floods. Short-term interventions for the transport sector might relate to the provision of additional trucking capacity to deliver relief items on time to affected communities. All transport sector interventions related to the construction of basic transport infrastructure should involve high manual labour public work schemes to create additional employment opportunities for affected communities. Those schemes can be integrated and coordinated with the safety net schemes like cash for work programs.
Implementation of the various interventions will be carried out through District Councils. The Councils will be responsible for identifying roads that need intervention and mobilizing labor to carry out the maintenance and rehabilitation from the local communities for both skilled and unskilled labor. The responsibility for implementation will remain with the Roads Authority (RA) who will liaise closely and monitor the District Councils.
Funds for implementation will be disbursed to the Road Fund Administration (RFA) who will disburse monthly to the District Councils. RFA will replenish monthly funds to the District upon receipt of monthly expenditure reports of two months prior to the payment date. Meanwhile the overall responsibility of the activities under the transport sector remain with the MoTPW who will liaise and coordinate with all stakeholders for the smooth implementation.
MALAWI PDNA | 181
ENERGY
Background The 2015-16 drought has also affected the electricity supply in Malawi. The Electricity Supply Corporation of Malawi (ESCOM) Limited is the only power utility company in Malawi engaged in the generation, transmission and distribution of electricity in the country. Generation: Generation is done at 11 kV and stepped up to 66 kV and 132 kV for transmission. The utility’s generation installed capacity is 351 Megawatts. Of this capacity, about 346 Mega-watts are generated in power stations cascaded along the Shire River the only outlet of Lake Malawi. Under normal operating conditions, available generation capacity in the system was 341MW allowing for a spinning reserve of 10MW. Below are stations downstream of Shire River:
• Nkula A and B with a total capacity of 124 MW
• Tedzani I, II and III with total capacity of 92 MW and
• Kapichira with capacity of 129 MW.
The electrical power system in Malawi is not presently interconnected to any other power system from neighbouring countries, though from the Malawi system, border towns of Mozambique and Zambia are supplied. However, plans are underway to interconnect Malawi with Mozambique, Zambia and Tanzania.
Transmission: The transmission lines total route length is 2,395km of which 1121km are operated at 66kV and 1274km are operated at 132kV. The lines are constructed on both wood structures and steel structures.
Distribution: Distribution is done at 11kV and 33 kV across the country. The network does not provide load centres in all political districts. This means that the demand for specific political districts and regions cannot be easily quantified.

MALAWI PDNA | 182
Challenges in the Sector The 2016 drought is happening at a time the sector has not recovered from the 2015 flood disaster. The flood of 2015 destroyed infrastructure in the sector and happened downstream of shire river and hence did not contribute positively to the water levels in the lake. The fact that all generation is run-of-the-river and done along one river, makes it very difficult to conceive of a recovery strategy before normal river flow resumes.
The utility itself operates on a non-commercial tariff such that the energy sector is not yet attractive to private investors, as such financing for any recovery options will pose a big challenge.
Assessment MethodologyThe assessment for the losses in the sector comprised interviews with critical sections of the utility. These included:
• Operations at Nkula Power Stations,
• The National Dispatch Centre and
• Marketing
It should be noted that the power system in Malawi cannot be analyzed by political districts or regions as each political district does not have a load centre. Using the available data capturing tools at the National Dispatch Centre, the only feasible way of estimating the losses was by using load shedding details. This however posed a challenge as there have been several factors that affected the behavior of the power system in most recent months that made it difficult to attribute every change in system to the drought.
The National Dispatch Centre provided details of load shedding for eight months from October, 2015 to June, 2016. Data losses in energy sales were calculated and a monthly average of these losses was used to project the losses for the coming months up to December of 2016.
Effects of the Drought on the Energy SectorThe effects of the drought are limited to losses only, since the energy infrastructure (generation, transmission, distribution) was not directly affected by the drought. In terms of losses, the following losses are attributable to the drought;
• Loss of revenue for the utility. Of the various losses identified, losses incurred in terms of lost revenue for the utility are more pronounced. There has not been increased running cost as the diesel units (five in Lilongwe and one in Mzuzu) have been operated within their prescribed durations. The losses in revenue are calculated from the actual customers that are available to buy the energy, but cannot be supplied due to load shedding. 80 percent of the total load shedding is estimated to be the proportion caused by low water flows; overall system inefficiency is estimated at 24 percent and an average tariff of MWK57.72 per kWh is used. This brings the losses in revenue at MWK 4,121,992,561 (USD 5,888,561) for the period between October 2015 to December 2016.
• Loss of fuel sales resulting from loss of business for transporters of agricultural products. The transport sector reported of grounded vehicles due to lack of business as most of the local transporters rely on transporting agricultural products. This has an indirect impact on fuel sales. However, since fuel is imported into the country, the effect on fuel sales is very negligible and not quantified in this assessment.
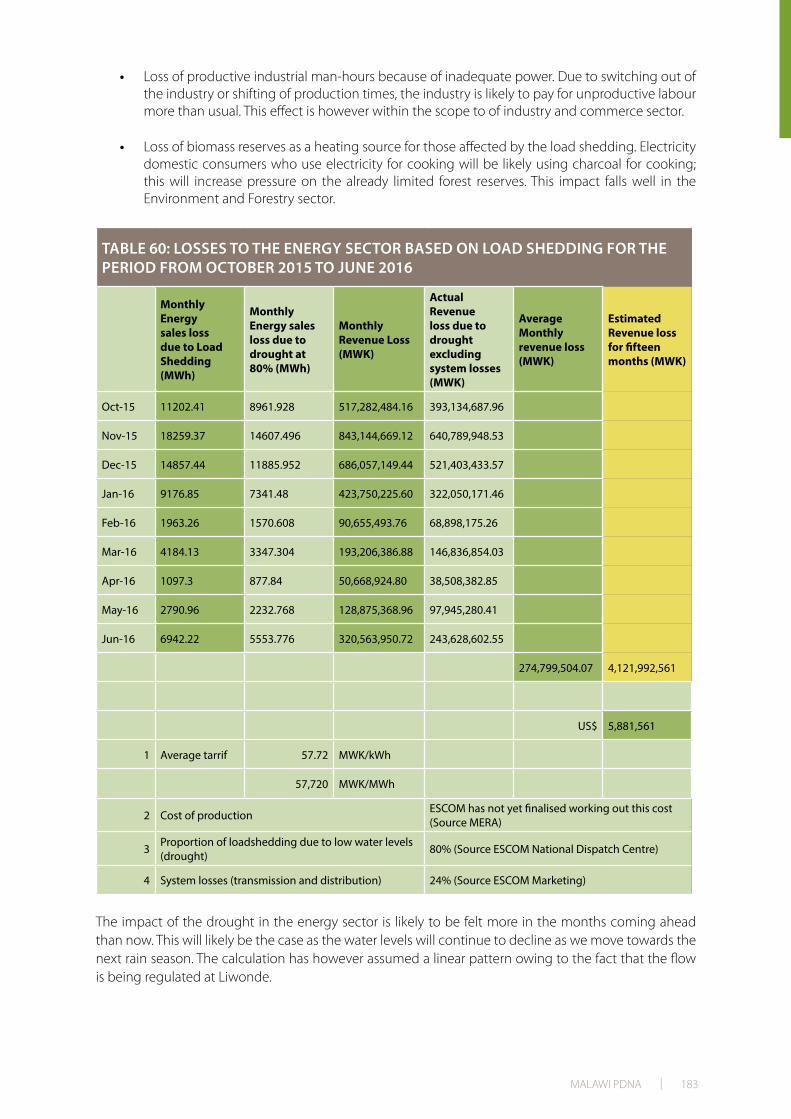
MALAWI PDNA | 183
• Loss of productive industrial man-hours because of inadequate power. Due to switching out of the industry or shifting of production times, the industry is likely to pay for unproductive labour more than usual. This effect is however within the scope to of industry and commerce sector.
• Loss of biomass reserves as a heating source for those affected by the load shedding. Electricity domestic consumers who use electricity for cooking will be likely using charcoal for cooking; this will increase pressure on the already limited forest reserves. This impact falls well in the Environment and Forestry sector.
TABLE 60: LOSSES TO THE ENERGY SECTOR BASED ON LOAD SHEDDING FOR THE PERIOD FROM OCTOBER 2015 TO JUNE 2016
Monthly Energy sales loss due to Load Shedding (MWh)
Monthly Energy sales loss due to drought at 80% (MWh)
Monthly Revenue Loss (MWK)
Actual Revenue loss due to drought excluding system losses (MWK)
Average Monthly revenue loss (MWK)
Estimated Revenue loss for fifteen months (MWK)
Oct-15 11202.41 8961.928 517,282,484.16 393,134,687.96
Nov-15 18259.37 14607.496 843,144,669.12 640,789,948.53
Dec-15 14857.44 11885.952 686,057,149.44 521,403,433.57
Jan-16 9176.85 7341.48 423,750,225.60 322,050,171.46
Feb-16 1963.26 1570.608 90,655,493.76 68,898,175.26
Mar-16 4184.13 3347.304 193,206,386.88 146,836,854.03
Apr-16 1097.3 877.84 50,668,924.80 38,508,382.85
May-16 2790.96 2232.768 128,875,368.96 97,945,280.41
Jun-16 6942.22 5553.776 320,563,950.72 243,628,602.55
274,799,504.07 4,121,992,561
US$ 5,881,561
1 Average tarrif 57.72 MWK/kWh
57,720 MWK/MWh
2 Cost of production ESCOM has not yet finalised working out this cost (Source MERA)
3 Proportion of loadshedding due to low water levels (drought) 80% (Source ESCOM National Dispatch Centre)
4 System losses (transmission and distribution) 24% (Source ESCOM Marketing)
The impact of the drought in the energy sector is likely to be felt more in the months coming ahead than now. This will likely be the case as the water levels will continue to decline as we move towards the next rain season. The calculation has however assumed a linear pattern owing to the fact that the flow is being regulated at Liwonde.

MALAWI PDNA | 184
Human and Socio-economic Impact of the drought on the sector. Around 80 percent of the population, which is mostly very poor is found in rural areas, in these areas women do more work than men in maintaining households. Electricity plays a very vital in running maize mills used in milling grains into floor and this is a women’s job. Women often walk long distances to access maize mills. It is hardly possible for these rural women to access load shedding programs that are produced by the electricity utility company as the channels used do not target this class of electricity beneficiaries. The rampant load shedding is keeping women very long on milling cues and drastically reducing their productive time.
For those women in urban households, which use electricity for cooking, the rampant load shedding will increase exposure of women and children to fumes as many households rely on wood fuel and charcoal as a source of energy when electricity supply fails.
Recovery and Reconstruction NeedsObjectives and proposed recovery interventionsConsidering that the power system is almost entirely based on hydro-power the impacts of the drought will be felt at least until the start of the next rainfall season, when water levels will be rising again. Even at the onset of the rains, it may not be immediate that the water levels will improve to cater for optimal generation. ESCOM has 10MW installed capacity of diesel plants for peaking. These plants are operated during peak times only, in most cases 2 hours a day. If these peaking plants were to be run as base load for the recovery period, there would be a reduction in the customers switched off from the system. This would in turn minimize both the direct and indirect impact of the drought. However that would lead to higher operating costs. Recovery and reconstruction needs. The sector does not require reconstruction as the effects of the drought are limited to losses. To minimize the impact of the drought in other sectors caused by inadequate power generation, ESCOM can run the its peaking plants as base load for the recovery period, until normal flow downstream of Shire river resumes. To meet this need until the next rain season, ESCOM will require MWK 2,025,464,618 (USD 2,893,521).
TABLE 61: ESTIMATED RECOVERY NEEDS FOR ENERGY SECTOR
Extra Generation Costs (Running 10MW Diesel Generators for 5 more hours daily)
Energy (kWh)
Fuel Required (litres)
Unit Cost of Fuel (MWK/L)
Daily cost of fuel (MWK)
Total fuel cost from Jul to Dec
2016 (MWK)
Total fuel cost from Jul to Dec
2016 (USD)
10000 14705.88235 687.97 10,117,205.88 2,025,464,618 2,893,521
Power (kW)
Unit Cost of Energy (MWK/kWh)
Daily Revenue from Energy sales (MWK)
Total Revenue from Energy Sales
from Jul to Dec 2016 (MWK
Total Revenue from Energy
Sales from Jul to Dec 2016
(USD)
10000 57.72 - - -
Higher generation cost (fuel only) (MWKW) 2,025,464,618 2,893,521

MALAWI PDNA | 185
*Fuel consumption (kWh/litre) 3.4
**Duration of Extra operation (h) 5
***Overhead costs (10% of total) 110%
Existing Sector Policies and Major ProgramsThe government of Malawi together with the national electricity utility is already engaging governments of Mozambique, Zambia and Tanzania together with their respective utilities to have their power systems interconnected. Government is finalizing review of Energy Laws to make the sector attractive to investors so that more players can be roped in to do electrical power generation from different sources and indifferent locations. Some Power Purchase Agreements (PPAs) may be signed before the end of 2016. Government is also speeding up the development and operationalization of a thermal coal fired power plant to carry the base load. All the above sector programs are priority government interventions in the energy sector.
Action PlanActions that can bring resilience in the sector are well beyond the scope of this report as they are more of development programs to make the power system robust than a direct reaction to disaster. If the sum of MWK 2,025,464,618 USD 2,893,521 can be identified and made available however, the impact of the drought can be lessened until the next rain season as discussed above.
Resilience Building in the Sector Diversification of sources of energy and sites for energy generation, interconnection with power systems from neighboring countries and provision of adequate pond capacity for normal operation of the cascaded power stations are all beyond the scope of this report.
Prioritized Strategies for Resilience Building for the Energy Sector Are;• iDiversification of energy sources and in some cases sites.
The country needs to explore other sources of generating electrical power apart from hydro. Of the hydro sites yet to be developed consideration should be made to move away from the Shire River to avoid the cascade effect.
• Interconnection with power systems of neighboring countries
• Provision of reservoirs for base operation of the power stations
• Introducing incentives for decentralized distributed generation (DDG)
• Rolling out Energy Efficiency promotion programs

MALAWI PDNA | 186
MALAWI PDNA | 187
DISASTER RISK REDUCTION, RISK FINANCING AND DROUGHT RESILIENCE
Disaster risk reduction (DRR) is a crosscutting theme and, to be effective, it needs to be mainstreamed across sector policies and development plans to ensure that risks are effectively reduced and addressed. The national DRR system plays a key role in supporting all sectors to reduce risks and in providing policy direction and coordination for Malawi’s overall DRR strategy. The capacity of the national DRR institutional, policy and financial framework is essential to such support. This chapter is dedicated to identifyng interventions required to strengthen the DRR system and its capacity to contribute to building drought resilience.
DRR System in MalawiLegal and Policy FrameworkDRR is embedded in key strategies, policies and frameworks in Malawi. The Malawi Growth and Development Strategy 2011-2016 (MGDS II) is the overarching development agenda for the country. “Disaster Risk Management” is sub-theme 2 under theme 3 ‘Social Support and Disaster Risk Management’ in MGDS II.
The Disaster Preparedness and Relief (DPR) Act of 1991 is the key legislation that provides guidance to disaster management in Malawi and its institutional framework. The Secretary to the Vice President and Commissioner for Disaster Management Affairs, the National Disaster Preparedness and Relief Committee (NDPRC), Civil Protection Committees (CPC) and Department of Disaster Management Affairs (DoDMA) were created through the Act.
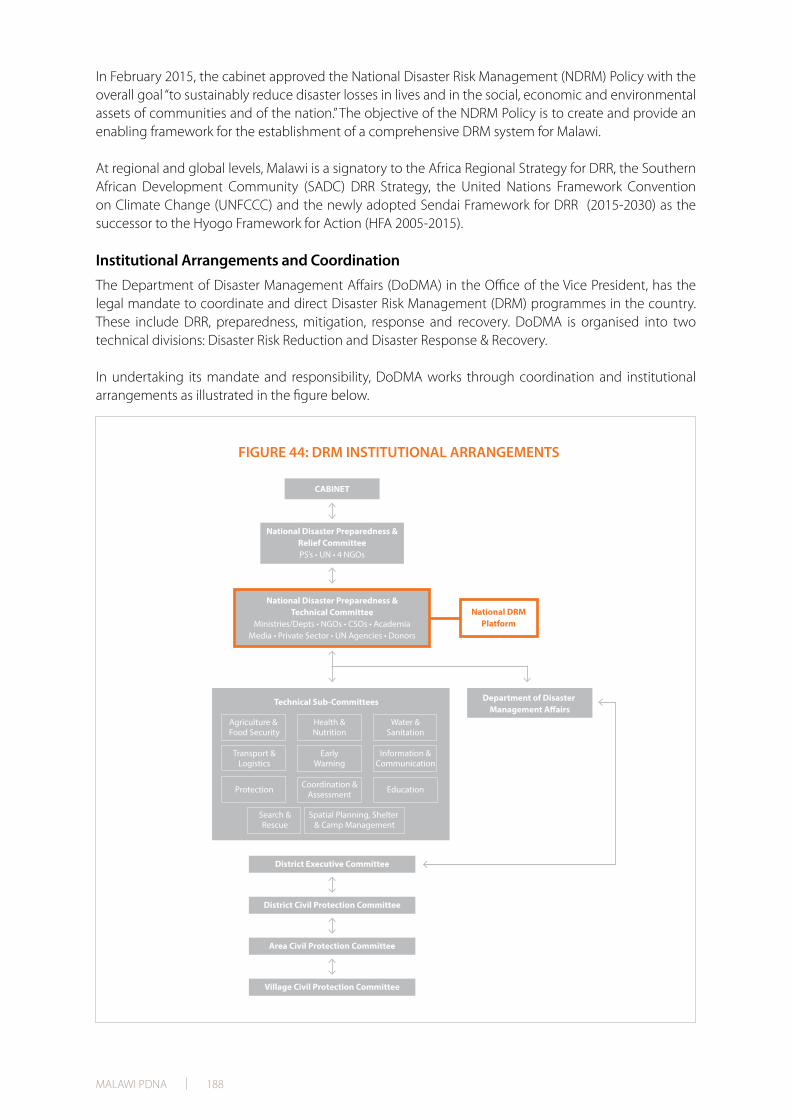
MALAWI PDNA | 188
In February 2015, the cabinet approved the National Disaster Risk Management (NDRM) Policy with the overall goal “to sustainably reduce disaster losses in lives and in the social, economic and environmental assets of communities and of the nation.” The objective of the NDRM Policy is to create and provide an enabling framework for the establishment of a comprehensive DRM system for Malawi.
At regional and global levels, Malawi is a signatory to the Africa Regional Strategy for DRR, the Southern African Development Community (SADC) DRR Strategy, the United Nations Framework Convention on Climate Change (UNFCCC) and the newly adopted Sendai Framework for DRR (2015-2030) as the successor to the Hyogo Framework for Action (HFA 2005-2015).
Institutional Arrangements and Coordination The Department of Disaster Management Affairs (DoDMA) in the Office of the Vice President, has the legal mandate to coordinate and direct Disaster Risk Management (DRM) programmes in the country. These include DRR, preparedness, mitigation, response and recovery. DoDMA is organised into two technical divisions: Disaster Risk Reduction and Disaster Response & Recovery.
In undertaking its mandate and responsibility, DoDMA works through coordination and institutional arrangements as illustrated in the figure below.

MALAWI PDNA | 189
Other key DRM institutions:
• National Disaster Preparedness and Relief Committee (NDPRC), comprising the Principal Secretaries of all line ministries and departments, the Malawi Red Cross Society, four Non-Governmental Organisations (NGOs) and United Nations (UN) agencies.
• National Disaster Preparedness and Relief Technical Committee (NDPRTC), comprising the directors of key government line ministries, departments and agencies, heads of UN Agencies, and NGOs and the private sector.
• National Disaster Platform, chaired by DoDMA and comprising government line ministries and departments, civil society organisations, the faith community, scientific and academic institutions, the private sector, UN agencies, development partners and the media.
• Technical subcommittees and cluster system. Adopted in 2008 to improve coordination for the disaster assessment and emergency response, the clusters include coordination, communication and assessment, food security, agriculture, water and sanitation, health, nutrition, education, shelter and camp management, protection, and transport and logistics. Ten technical sub-committees also function as clusters (see figure 21). The clusters comprise representation from the government, UN System, civil society, donors and other key humanitarian actors and they are led by the government and co-led by UN agencies, and the Malawi Red Cross Society.
• Humanitarian Country Team, comprising heads of UN Agencies, international and local NGOs, government, and the Malawi Red Cross Society.
• District level coordination structures, through the District Commissioner with technical assistance provided by the District Executive Committees and the Civil Protection Committees at district, area and village levels.
Early Warning System (EWS)Malawi has a number of early warning systems (EWSs) in place. The Department of Climate Change and Meteorological Services (DCCMS) provides key weather and climate related early warning information to various stakeholders from time to time. The DCCMS’s EWS comprises various sub-systems that address different subsectors of the economy, and comprise EWSs for extreme weather events such as droughts, floods, severe-storms, lightning, flash flood, strong winds and Mwera winds on Lake Malawi, Lake Chilwa and Lake Malombe. The department produces and issues a rainfall seasonal forecast in early September and continually monitors its performance using Medium Range Forecast (MERAFO) and Agro-meteorological bulletins.
A drought EWS is managed by the Climate Section of the department as part of Agro-meteorology in which weather and crop analyses and projected performances are provided every ten days through 10-day Agro-meteorological Bulletins. During the past 2015-16 rainfall season, such information was disseminated through various communication channels such as Common Alert Protocol (CAP), which encompasses WhatsApp, Facebook, Twitter, YouTube and email. The Department of Water Resources also provides early warnings on flooding through their water-monitoring network in major rivers across the country. The Department of Geological Surveys monitors seismic hazards. The Famine Early Warning Systems Network (FEWS NET) offers technical assistance in the examination of drought effects. FEWS NET is a leading provider of early warning and analysis information on acute food insecurity. In addition to the scientific EWS, the country also has a traditional drought monitoring and EWS that uses behaviour of plants or animals as predictors, although this system is not well developed.

MALAWI PDNA | 190
Drought Effects and Overall Performance of the DRR System The DRR system in Malawi did not experience direct damages and losses caused by the drought, but it has encountered challenges and the drought response will increase demands on the system. Losses incurred by mechanisms contributing to the DRR system have been computed under the respective sectors However, the recovery from the drought will entail more demand for and pressure on the DRR system as affected households and communities endeavour to recover and build their resilience. This increased demand will be associated with increased costs for the system.
The following analysis outlines the main challenges experienced by the DRR system, followed by specific interventions to face those challenges in the recovery strategy.
Early Warning, Risk Identification and Risk AssessmentMalawi could benefit from improved early warning, risk identification and risk assessment systems. The drought forecasts released by the DCCMS triggered responses from various players, including DoDMA, to facilitate development of a Multi-hazard National Contingency Plan for addressing the likely impacts as well as sensitisation of districts and local stakeholders on the implications of the forecasts. While the season progressed, the Ministry of Agriculture, Irrigation and Water Development also undertook crop assessments. The Malawi Vulnerability Assessment Committee (MVAC) in the Ministry of Finance, Economic Planning and Development carried out its annual food security assessments for comprehensive understanding of the food security situation in the country. The assessment helped to determine the number of people who are likely to be food insecure during the next consumption period.
The following challenges were experienced in early warning, risk identification and risk assessment of droughts:
• Inadequate monitoring tools because there are still some areas which are blind in terms of data availability for specific locations, which is necessary for determination of impact of drought. For instance, the DCCMS does not have enough evaporation monitoring plans, which means some of the data that is used is only based on calculations;
• Outdated, dysfunctional and/or insufficient equipment and processes for gathering early warning data led to poorly integrated and limited information for drought DRM;
• Reliability of the warning;
• Inconsistent dissemination of the information and incapacity triggering relevant actions;
• Coordination of different of stakeholders involved in early warning, risk identification and risk assessment.
Lack of a comprehensive system for disaster risk identification, assessment and monitoring, unavailability of baseline information to establish benchmarks including gaps in and priorities for mainstreaming DRR in both key and high-risk social, economic and environmental sectors have led to delayed integration of DRR into sustainable development plans and programmes. There is a need for development of hazard-specific or multi-hazard risk assessment and mapping at sub-national level, and preparation of vulnerability assessments (people-centred and sector specific).
Emergency Preparedness, Response and Recovery PreparednessContingency plans should be updated, reviewed, exercised and better aligned to the budget cycle. The Multi-hazard National Contingency Plan is annually reviewed to consider the prospects of

MALAWI PDNA | 191
a particular rainy season. District multi-hazard contingency plans have also been developed in the 15 disaster prone districts. However, some of the district contingency plans are not reviewed annually as required and, currently, the following 13 districts do not have up-to-date contingency plans: Ntchisi, Lilongwe, Dowa, Mwanza, Neno, Mzimba, Kasungu, Mchinji, Mulanje, Chiradzulu, Thyolo, Likoma and Chitipa. Out of these, only the last two, Likoma and Chitipa, are not among the districts severely affected by the recent drought.
A critical issue in the development and review of the national contingency plan is that this is generally done at the onset of the rainy season in September or October, by which time the national budget has been already approved. The unavailability of a direct allocation of funds to the plan makes resources to be requested ad hoc to the “National Disaster Appeal Fund”, a process that does not guarantee adequacy and timely disbursement of the resources required to operationalise the plan.
Furthermore, the contingency plans are rarely tested and strengthened through execution of scheduled emergency simulations and drills. DRM structures such as the Civil Protection Committees exist at district, area and village levels to undertake preparedness, response and recovery interventions. However, the lack of adequate capacity and resources to support the implementation of the activities has been the limiting factor for implementation of interventions and their preparedness capacity.
ResponseResponse capacity could benefit from more dedicated sources of domestic funding, better coordination and strengthened Emergency Operations Centres.
The unpredictability and inadequacy of funds specifically for preparedness and response further hampers the response capacity as the country perpetually relies on the financial support of the international community. Sometimes, there are considerable delays in responding to disasters due to delayed and inadequate funding, logistical limitations and limited capacity in assessment. Disaster response is also affected by lack of adequate coordination which results in duplication of efforts, among other problems. Furthermore, not all stakeholders that have clear DRM responsibilities carry out disaster preparedness, response and recovery roles, with most of them mainly focusing on response.
Emergency Operations Centres (EOCs) were established during the 2015 floods for coordination of emergency response interventions. Through the MFERP and the UNDP’s DRM Support Programme, efforts have been made to train more officers at national and district level in operations of EOCs as well as to establish them at national, regional and district level in some disaster prone districts. However, there is still no fully equipped physical EOC, and they mostly operate on an ad hoc basis with limited space to accommodate all the necessary officers performing all the necessary functions of the EOCs.
RecoveryRecovery could be improved through a more systematic andmulti-sectoral approach. Response operations do not generally translate into long-term recovery interventions. Besides provision of immediate livelihoods support, interventions are typically planned in an emergency mode “single-dose” and fail to produce any long-lasting results or build resilience of the affected population. With the exception of the 2015 floods, systematic planning of multisectorial recovery interventions is generally missing as is the coordination of interventions among different actors involved, further hampered by the lack of an established monitoring mechanism for ongoing interventions. Finally, the absence of guidelines defining clear roles and responsibilities and providing guidance on how interventions should be planned and their related standards makes it more difficult for government officials, especially at district level where capacities is most limited, to effectively engage in this area.
In response to the 2015 floods, the Government conducted a PDNA that recommended a multi-sectoral
MALAWI PDNA | 192
approach to recovery, which in turn led to the World Bank-supported MFERP. As a follow up to the PDNA, DoDMA led the development of a National Disaster Recovery Framework (NDRF) to guide the implementation of recovery interventions. Since the launch of the NDRF in October 2015, DoDMA has mainstreamed it in the implementation of MFERP recovery activities across all 15 disaster-affected districts. DoDMA has incorporated the NDRF as a central tool for prioritisation of flood recovery interventions. Additionally, DoDMA’s efforts to disseminate and mainstream the NDRF at the national and district level are improving coordination, oversight mechanism, financial management systems, and implementation processes for recovery. The government could explore how the NDRF can be a possible mechanisms on which to build for future recovery efforts, including those related to the 2015-16 drought.
As far as post-disaster assessments are concerned, the cluster system is generally used to conduct inter-agency assessments, depending on the magnitude of the disaster. A national disaster rapid assessment tool is in place and was recently reviewed. Efforts are underway to translate it into local languages for use by the local committees since they normally conduct initial assessments following rapid onset disasters. However, capacity at district and local level for disaster assessments remains limited as very few personnel have been trained in only 15 districts.
Risk ReductionInadequate institutional and legal frameworks have impacted the integration of DRR concerns into development strategies and programmes. The Preparedness and Relief Act, enacted in 1991, is not comprehensive enough as it only makes provision for response measures to be taken once a disaster has occurred. The institutional set-up of the country remains in fact mostly geared to response and it has not supported a shift from a culture of response to a culture of preparedness and risk mitigation.
Additionally, the Preparedness and Relief Act of 1991 is by now outdated as it does not adequately address the emerging needs for DRR and climate change adaptation (CCA), and it does not provide guidance on the integration of these two. The Preparedness and Relief Act is however undergoing a review to ensure alignment to the recently approved NDRM Policy, which in turn prioritise the need to reduce disaster risks and their underlying factors. However, there has been limited investment in the medium to long term toward this end and, although a number of additional policies, regulations and frameworks have been developed, there has been laxity in enforcement. Moreover, most initiatives in this regard have been on pilot basis, over a short project life span, with low geographical scope and thus not sustainable. Given the absence of dedicated regular funds for DRR, most ongoing DRR activities are supported by short term funding arrangements and thus suffer from lack of continuity.
Institutional Capacity Strengthening Capacity and coordination can be improved at the national, and sub-district levels. A main challenge for DoDMA carrying out its mandate is the inadequacy of human resources. Each of the two divisions has five technical personnel based at the department’s headquarters in Lilongwe. At the Local Authority level, only 11 out of the 28 districts in the country have ADRM officers that are directly responsible to DoDMA whereas the other districts only have desk officers on delegated authority from other sectors; furthermore, the positions for the ADRM officers are non-established and not permanent. DRR capacity is skewed towards technical personnel at national level as DRR knowledge and skills are still lacking at district and sub district levels and there have been inconsistent capacity building programmes to this end.
The district and sub-district level institutions experience the following challenges in the provision of DRR support:
• Limited knowledge and skills to integrate and execute DRR in programmes and activities;

MALAWI PDNA | 193
• Limited operational resources for DRR as DRR functions are not fully devolved and the activities are not supported by operational resources at the district;
• As some district level DRR personnel are only delegated, their dedication to DRR is limited as they are responsible to their line ministries;
• The ADRM positions are on contract basis, which leads to discontinuity in the capacity of local institutions. The Ministry of Local Government and Rural Development is yet to change these into permanent positions and recruit professional staff.
An additional challenge lies in the coordination of stakeholders engaged in DRR. While coordination mechanisms and standard operating procedures are in place, some organisations diverge from these and use their own procedures in the implementation of DRR activities. This also points to a weakness in the legal framework for DRR in terms of enforcement capacity and lack of accountability to the coordinating DRR body.
Drought Risk FinancingEfficient and appropriate financial allocation to disaster risk financing is a key part of disaster preparedness. Malawi is an affiliate of the African Risk Capacity of the African Union. During the 2015-16 season the country bought an insurance cover which did not result into a pay-out in response to the drought. Government and ARC are currently reviewing the performance of the season and the indications given by African Risk Capacity (ARC)’s African Risk View software, which determines the parametric payout. There are also pilot crop insurance schemes run by some stakeholders in targeted districts. UNDP also facilitated a small-scale insurance initiative under the R4 resilience project. There is need to sustain the initiative while scrutinizing the terms for payout. For a detailed discussion on disaster risk financing suggestions and mechanisms, please see Section 9.4 of the main report.
DRR Needs and StrategyStrengthening the DRR system is an essential pre-condition for resilient recovery. The recovery process should also be used as an opportunity to promote changes and improvements in how DRR is planned, organised, coordinated and implemented in Malawi. Based on past lessons learnt and on an analysis of the challenges of its DRR system highlighted by the recent drought, the Government of Malawi has identified a series of interventions required to further strengthen the DRR system as follows:
TABLE 62: INTERVENTIONS FOR STRENGTHENING THE DRR SYSTEM
DRR Needs BUDGET ALLOCATION
MWK USD
Early Warning, Risk Identification and Risk Assessment 191,940,000 275,629
Emergency Preparedness, Response and Recovery 920,525,000 1,315,036
Risk Reduction 582,095,000 832,136
Institutional Capacity Strengthening 157,666,000 218,094
Drought Risk Financing 200,000,000 285,714
GRAND TOTAL 2,052,226,000 2,926,609
MALAWI PDNA | 194
Early Warning, Risk Identification and Risk AssessmentShort, medium and long-term interventions for strengthening the EWSs, promote risk identification and assessments consist of the following elements:
• Improve EWSs through:i. Expand the automated weather monitoring network in areas not conducive to human
monitoring;ii. Replace and/or repair equipment and optimisation of processes for gathering early warning
data;iii. Improve systems for dissemination of early warning information;iv. Improve messaging and education of district level officials and communities to EWS.
• Encourage local authorities to establish (and advocate for the establishment of ) community-based EWSs.
• Enhance risk identification and risk assessment through the development of standardised risk assessment tools and guidelines.
• Conduct detailed vulnerability assessments to identify prevalent and emerging drought related risks across the country in light of changing climatic conditions and better integrate food security related assessments such as FEWS and MVAC with the disaster disaster-related EWS.
• Increase human capacity in drought forecasting and other matters related to drought risk identification and assessment in key sectors at national, local authority and community level.
Emergency Preparedness, Response and RecoveryShort-, medium and long-term interventions for strengthening emergency preparedness, response and recovery consist of the following elements:
• Lobby for a dedicated budget line for DRM in the national budget.• Support the development and operationalisation of the multi-hazard preparedness and
contingency plans at national, district and local level:
i. Provide resources for the development and implementation of contingency plans;ii. Review plans annually as required;iii. Test and improve plans through emergency simulations and drills;
• Support Civil Protection Committees at district, area and village levels by providing adequate resources to fund preparedness, response and recovery interventions.
• Institutionalise the cluster system at district level.• Create more robust EOCs by providing adequate resources to establish permanent structures• Build national capacity to conduct PDNAs in the wake of future disasters and to design and
maintain monitoring and evaluation systems to track progress of recovery interventions.• Ensure DRR is effectively integrated into across the response and recovery continuum;• Reinforce recovery management capacities of DoDMA and relevant institutions:
i. Prepare guidelines for recovery interventions - including roles and responsibilities, standards and operations modalities;
ii. Harmonise post-disaster assessment tools and build capacities of government officials at national and district level to conduct assessment;
iii. Establish a monitoring and evaluation system to track recovery programmes and their progress.
MALAWI PDNA | 195
Risk Reduction Short, medium and long-term interventions for risk reduction consist of the following elements: Building drought resilience needs to be part of long-term development considerations and an integral part of policies related to agriculture, water, housing, construction, food security and hazard risk management, among other sectors, and ideally, in accord with community-based practices, encouraging practices that reduce vulnerability to drought. This requires a commitment to:
• Mainstream DRR into sustainable development policies, across central departments and at central and district levels– and ensuring adequate financing for this important initiative.
• Review and updating existing DRR policies and legislation to ensure that risk reduction and recovery concerns are included and that they respond to current challenges. For example, the current review of the Preparedness and Relief Act of 1991 would go a long way toward addressing current needs for DRR given the impact of climate variability and climate change.
• Harmonise existing policies and strategies for risk reduction and resilience building under a common framework of interventions.
• Strengthen community resilience through the introduction of strategic DRR interventions at the community level.
Institutional Capacity StrengtheningShort, medium and long-term interventions for strengthening institutional capacity consist of the following elements:
• Expedite the recruitment of qualified DRM technical personnel in all Local Authorities to coordinate the integration of DRR activities in development planning
• Strengthen the DRR coordination capacity of DoDMA through increased staffing and training.• Increase knowledge and skills in DRR especially at the district and sub district level. In addition,
build the capacity of DoDMA personnel and other DRR stakeholders for improved holistic and collaborative approach to planning and management of DRR operations and interventions.
• Educate and inform the public about DRM and its linkage with climate change adaptation, particularly with regard to drought resilience.
• Build institutional capacity at district, traditional authority and village level by sensitising CPCs on their roles and responsibilities
• Support communities to form or strengthen CPCs. Government should develop a standardised DRM training manual for CPCs to ensure uniformity and consistency.
Coordination Arrangements for Recovery DoDMA will lead the coordination of the implementation of sector recovery interventions. The magnitude of the response and recovery interventions to the drought will require increased oversight responsibility as well as coordinating capacity for DoDMA. DoDMA will use existing institutional arrangements to coordinate the implementation of the drought recovery interventions. Overall, the following principles have guided the identification of recovery strategies and will further guide the implementation of recovery interventions. These include, (i) alignment with existing policies, (ii) building back better and smarter, (iii) a multi-sectoral approach, (iv) focus on resilience, (v) community participation, (vi) decentralised approach, (vii) multi-stakeholder engagement and coordination, and (viii) integration of gender and other cross-cutting issues.
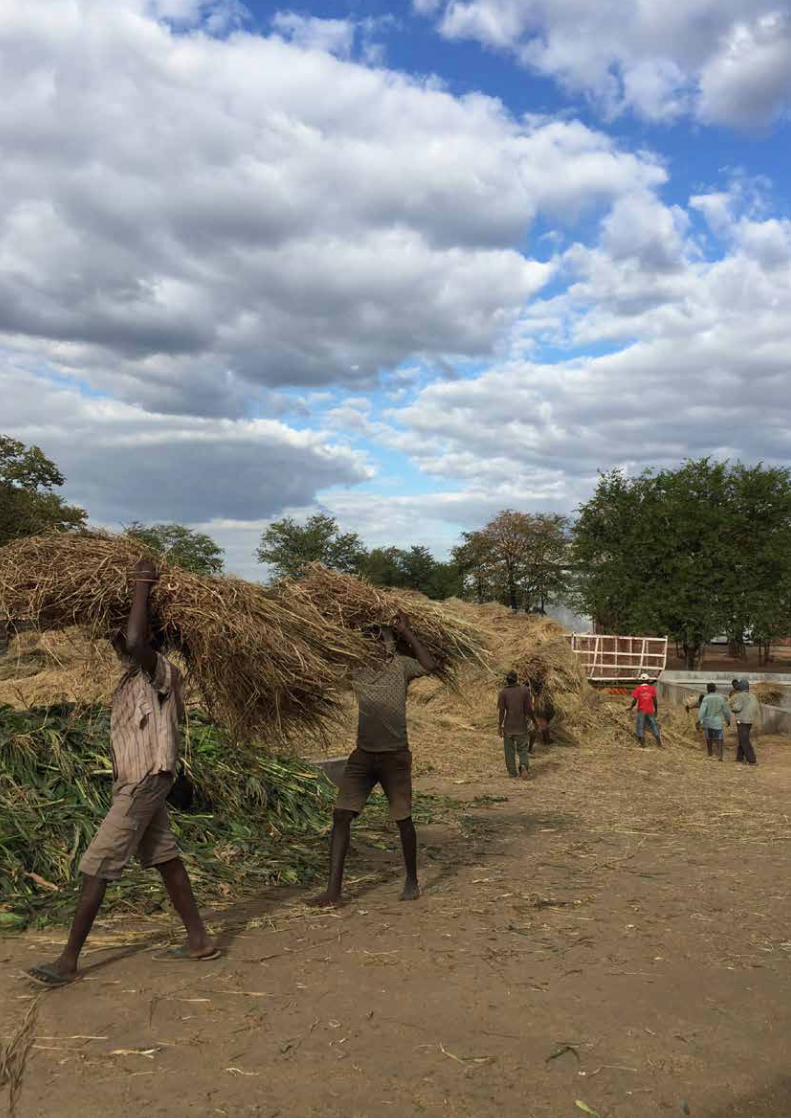
MALAWI PDNA | 196

MALAWI PDNA | 197
ANNEX III – METHODOLOGY TO CALCULATE IMPACT OF DROUGHT ON GDP
In order to estimate the effect of drought on macroeconomic performance, Malawi’s National Accounts, which measure overall economic production and growth as per United Nations standard guidelines (SNA 2008), were used. The Malawi Government normally updates its national accounts in February and September each year, following a business interviews survey. Thus, a forecast of annual GDP and economic growth for 2016 was available in February 2015, as companies surveyed provided their expectations of output for the following year. This 2016 forecast was used as a baseline for assessing the losses on GDP, as it presented the expected 2016 performance prior to any knowledge of the disaster occurring. A forecast for 2016 is also available from the September 2015 Survey, however, the February 2015 forecast was preferred. In the September 2015 forecast, El Niño was already on the horizon and hence the 2016 forecast already included some of the effects of the expected drought.
The sectors that have experienced the greatest production disruptions and losses are agriculture; manufacturing; electricity and water supply and wholesale and retail trade. The analysis focused on the direct losses experienced by these sectors, as isolating the impact of indirect losses through lower demand due to the lower purchasing power of consumers would be difficult to quantify. Given that most losses are expected to be found in the agricultural sector, the assessment centred around sectors whose performance largely depends on this primary sector. These include agro-processing and wholesale and retail traders of agricultural products. In addition, the assessment focused on losses in the energy sector as well as losses in the provision of losses by Water Boards and other sources, since drought directly affects water levels and electricity is hydro-generated.
MALAWI PDNA | 198
After receiving the nominal losses from all sectors, the ones relevant to GDP were selected and converted to real values in order to assess the impact of the drought on real GDP. Emphasis on real GDP enabled the assessment to isolate the real effects of the drought on the productive capacity of the economy, exclusive of the distortion of prices.
The human cost of this disaster should not be underestimated. The PDNA has revealed that the drought has also negatively affected the social sectors of the economy including health, education, nutrition and food security. One of the limitations of the current approach was that it was difficult to incorporate such losses from the social sectors in the GDP impact assessment as they cannot be directly translated into losses in the productive economy. With reference to SNA 2008, public sector health and education output is estimated using wages and salaries while the indicator for the private sector output is revenue. In particular, production of the non-market sector (government and non-profit institutions servicing households (NPISH)) is obtained by summing up values for production cost and wages/salaries using the following equations:
i. Output = wages/salaries + production cost, andii. Value added = Output – production cost, hence iii. Value added = Wages/salaries
In Malawi, the health and education sectors are dominated by the public sector and NPISH and as such the same methodology is applied to calculate the value-added of these sectors in GDP. In the drought period it is assumed that there was no increase in wages/salaries for civil servants or NPISH workers and hence it follows that value addition from these sectors was not affected, with reference to the equations above. Nevertheless, there is recognition that losses in human development and human capital, if not addressed immediately, would have a significant and negative impact in the long-run development of the country.