
Managing Water for Drought
210
U.S. ARMY CORPS OF ENGINEERS INSTITUTE FOR WATER RESOURCES MANAGING WATER FOR DROUGHT NATIONAL STUDY OF WATER MANAGEMENT DURING DROUGHT SEPTEMBER 1994 IWR REPORT 94-NDS-8
-
Upload
khangminh22 -
Category
Documents
-
view
4 -
download
0
Transcript of Managing Water for Drought

U.S. ARMY CORPS OF ENGINEERS
INSTITUTE FOR WATER RESOURCES
MANAGING WATER FOR DROUGHT
NATIONAL STUDY OF WATER MANAGEMENT DURING DROUGHT
SEPTEMBER 1994 IWR REPORT 94-NDS-8

BLANK PAGE
(Click here to skip page)

MANAGING WATER FOR DROUGHT
PREPARED BY
WILLIAM J. WERICK
AND
WILLIAM WHIPPLE, JR.
U.S. ARMY CORPS OF ENGINEERS
WATER RESOURCES SUPPORT CENTER
INSTITUTE FOR WATER RESOURCES
NATIONAL STUDY OF WATER MANAGEMENT DURING DROUGHT

BLANK PAGE
(Skip)

iii
Findings of the National Drought Study
The nature of drought
1. Definition. Droughts are periods of time when natural or managed water systems do not provideenough water to meet established human and environmental uses because of natural shortfalls inprecipitation or streamflow.
2. Drought management is a subset of water supply planning. The distinction between a “drought”problem and a “water supply” problem is essentially defined by the nature of the best solution. Urbanareas that persistently use more than the safe yield of their water supply systems may have frequent oreven standing drought declarations that could only be eliminated through strategic water supplymeasures. Those measures can be structural, such as the construction of new reservoirs, or non-structural, such as conservation.
3. Drought response problems are water management problems. Participants at a National Science Foundation Drought Workshop concluded that attempts to understand and address the failingsof water management during drought would be unsuccessful unless shortcomings in the larger context of water management are also understood and addressed. This was also one of the conclusions drawn by the Corps of Engineers in the first year of the National Drought Study (IWR, 91-NDS-1), and thepremise upon which the DPS method was built.
The seriousness of the problem
4. Concern is widespread. Fifty percent of all water supply utilities asked their customers to reduceconsumption during the 1988 drought (Moreau, 1989). In a 1990 poll, forty-one percent of U.S. mayors anticipated water shortages in the next several years, caused by drought, growing population,water pollution, and leaks from distribution lines (Conserv90).
5. Water use is stable nationally. Several reports in the 1970s forecast rapid increases in Americanwater use, creating an impression that lingers to this day that water use is increasing. But theNational Council on Public Works Improvement reviewed several nationwide studies and concludedthat each “faced several problems in developing a comprehensive and reliable estimate” of futurewater supply needs. In fact, total American water use is less now than it was in 1980, although thereis growth and more intense competition for water in some regions.
6. Several states reported that water quality suffered during drought because low flows affected theirability to dilute effluents from wastewater treatment plants and sustain the aquatic ecosystem.
7. Drought impacts are difficult to measure. This is because:
! They are often reported as reductions from the benefits a water system can support whenwater is plentiful; this approach often overstates the problem because these drought “costs”are usually based on sizing the water system so as to maximize return on the economic andenvironmental investments in the water system and is not necessarily based on efficient use ofthe water resource.

iv
! Impacts caused by drought are difficult to separate from impacts that occur coincidentallyduring a drought. Because droughts continue for much longer than floods, earthquakes, or wind storms, external factors (such as recessions, market changes, land management, and fishing practices) may also contribute to the impacts associated with drought, as was the caserecently in California.
! Regional drought impacts are often more than offset at the national level by gains inproduction somewhere else in the country.
8. Drought impacts understate our aversion to droughts. Despite the overestimation of impactsinduced by the above factors, the level of conflict and anxiety droughts stimulate is still apt to be fargreater than the magnitude of impacts would suggest. On a national and even a state level, the impacts to agriculture and urban areas from the California drought were relatively small, but the drought was newsworthy for years and played a significant role in the passage of new state and newfederal laws. Observations of droughts in the 1980's suggest that turmoil will be greater when the losses are felt more personally and when long term entitlements to water use are threatened.
Shortcomings in the way we have dealt with droughts
9. Learning from the past. Lessons learned during ongoing droughts are too rarely documented,critically analyzed, and shared with other regions;
10. Price and efficient use. Water is almost always priced below its economic value to users or fullcost to produce. This tends to impede efficient use of water.
11. Assessing risk. Information about expected drought severity and duration is not readily available,so risk assessments cannot be quantified as well.
12. The problems are integrated, solutions are not. Management responsibilities for problems thatare physically integrated in a river basin are fragmented by agency missions and political boundaries. The many disciplines required to analyze drought problems and develop and institute solutions arepoorly coordinated.
13. Typical problems with traditional drought plans include (IWR, 91-NDS-1):
! they may not recognize newer uses of water
! they are usually designed for the drought of record, without consideration of the rarity of that drought
! they often are not understood or endorsed by those who will suffer the impacts of the drought
! they may not sufficiently address equity issues or economic differences in the use of water
! they are often triggered by indicators not related in a known way to impacts.

v
! they are better characterized as documents rather than ways of behaving, and so theireffectiveness diminishes as staff changes occur and time passes between plan preparation anddrought.
14. There are three time frames for response planning. Drought responses can be classified asstrategic, tactical, and emergency measures. Strategic measures are long term physical and institutional responses such as water supply structures, water law, and plumbing codes. Tacticalmeasures, like water rationing, are developed in advance to respond to expected short term waterdeficits. Emergency measures are implemented as an ad hoc response to conditions that are too specific or rare to warrant the development of standing plans.
15. Technology transfer. Methods for managing water for multiple objectives have been developedand tested over decades, but that tradition resides in the agencies that built the extensive complex offederal dams, not in the organizations responsible for preparing tactical drought plans. This expertisemust be transferred before that institutional memory is retired.
16. Law and drought. Law sometimes drives and sometimes constrains water management duringdrought. Basic appropriations doctrine discourages water conservation, because water not put tobeneficial use may be lost, but many western states have modified the basic doctrine to accommodateconservation. In addition, sixteen eastern states have legislation recognizing the need to conserve watersupplies.
17. Basin transfers and drought. Diversions are strategic measures designed to increase water supply reliability. During a severe drought, if the necessary facilities exist and the state law allows,temporary interbasin diversions may be authorized to meet the needs of the most severely affected areas.
Lessons from the Case Studies
18. Domestic water users are willing and able to curtail water use during a drought. During thefirst two years of the drought, a mixture of voluntary and mandatory conservation in California’scities reduced water use from 10 to 25%. In the last three years of the drought, urban conservationefforts were generally more intense. Similar savings were recorded in Seattle and Tacoma,Washington in their 1992 drought.
19. Investments in infrastructure can increase the options for adaptive behavior. Water banking,storage for instream flow maintenance, conjunctive use of groundwater and surface water, regionalinterdependence, and economies of scale require a water storage, allocation and distribution system. California’s storage and distribution system provided the flexibility and resiliency to withstand severedroughts, even in the face of rapidly growing population and increasing urban and environmentaldemands on a fixed supply of water.
20. Droughts act as catalysts for change. Complex sociopolitical systems, which reflect a multitudeof competing and conflicting needs, are not particularly well suited for crisis management. Yet despitethese well understood and accepted deficiencies in the democratic decision making process, the overallconclusion is that communities not only weathered the drought in a reasonably organized manner, butalso introduced a series of useful water management reforms and innovations that will influence futurewater uses in a positive manner.

vi
21. Conservation may or may not reduce drought vulnerability. To the extent that methods ofreducing water use during droughts, such as discouragement of outdoor use and physicalmodifications to toilets and faucets to reduce water use, are used as long term water conservationmeasures that allow the addition of new customers to a water supply system, drought vulnerabilityis increased. When normal use becomes more efficient, efficiency gains are harder to realize during adrought. But it is not always that simple. In the Boston Metropolitan area, for example, long termconservation will reduce drought vulnerability because some of the water saved will also be stored foruse during droughts and because some of the most effective long term conservation savings (such asthe detection and repair of leaks) cannot be implemented quickly enough to be as effective as a droughtresponse.
The DPS Method
22. The lineage of the DPS method. The DPS method is derived from the traditional strategic waterresources planning framework, but addresses two common shortcomings in water management: theseparation between stakeholders and the problem solving process, and the subdivision of naturalresources management by political boundaries and limited agency missions.
23. Drought responses are primarily behavioral. The DPS method reflects the fact that, likeresponses to earthquakes and fires, drought responses are largely behavioral, and their successdepends on people understanding their role, and knowing how their actions fit into a larger response.
24. Collaboration between agencies and stakeholders can make planning much more effective. This collaborative approach:
! harnesses the knowledge and creativity of stakeholders near the beginning of problem solving efforts;
! makes it more likely that stakeholders can take actions unilaterally to reduce their droughtvulnerability;
! builds broader, deeper stakeholder support for water management plans.
25. Lessons learned from past efforts at collaborative planning are abundant and must be heeded. The benefits of participatory planning are not guaranteed by simply making the planningprocess accessible. There is a substantial body of research and practical experience with participatoryplanning, especially in water resources, that is often overlooked. The temptation is to believe thathonesty and common sense will suffice. The participatory methods used and developed during theDrought Study recognized and managed these potential liabilities:
! public involvement can involve considerable expense.
! the “public” that gets involved in planning may be self-selected and unrepresentative of thepublic that will be affected by drought.
! if the public is actually involved in the study process (as opposed to just expressing problems and goals in workshops or surveys), then additional efforts may be required to provide technical training and to coordinate the work of public task forces.

vii
! the misapplication of the techniques of group process can result in the use of stakeholderopinions on issues that should be addressed by experts.
! broader citizen participation increases the risk that the planning process will be slowed orstopped.
26. The problem solving team should be appropriate to the problem set. Rarely will there be oneagency or political entity whose responsibilities include all the problems a region will face during future droughts. The creation of the DPS team, then, is the creation of a new entity whose collectiveinterests and responsibilities are pertinent to the set of problems addressed. Thus, the DPS teamconstitutes a new, integrated community that more closely reflects the integrated nature of theproblemshed.
27. The objectives for the drought response must be articulated early and clearly. The DPSmethod uses 5 management parameters including the criteria decision makers will use in approving orrejecting new plans, planning objectives, constraints, measures of performance, and environmental,economic, and social effects. Developing good planning objectives early is paradoxically the mostimportant and most often ignored step in the drought planning process.
28. Innovations. The DPS method takes advantage of several innovations developed in parallel during the National Drought Study:
! The shared vision model (see Finding 29)
! Circles of influence and decision maker interviews
! Water Conservation Management
! Trigger Planning
! The National Drought Atlas
! Virtual Drought Exercises
29. Shared vision models are computer simulation models of water systems built, reviewed, and tested collaboratively with all stakeholders. The models represent not only the water infrastructureand operation, but the most important effects of that system on society and the environment. Sharedvision models take advantage of new, user-friendly, graphical simulation software to bridge the gapbetween specialized water models and the human decision making processes. Shared vision modelshelped DPS team members overcome differences in backgrounds, values, and agency traditions.
30. A Virtual Drought Exercise is a realistic simulation of a drought using the shared vision model to simulate that experience without the risk associated with real droughts. Virtual Drought Exercises can be used to exercise, refine and test plans, train new staff, and update plans to reflect newinformation.
31. The National Drought Atlas (IWR, 94-NDS-4) is a compendium of statistical information designed to help water managers and planners answer questions about the expected frequency,

viii
duration and severity of droughts. The Atlas provides a national reference for precipitation andstreamflow statistics that will help planners and manage assess the risks involved in alternativemanagement strategies.
32. Water conservation management is the prioritization and selection of water conservation measures based on their estimated benefits and costs. A new version of a widely used water useforecasting model, IWR-MAIN, provides a powerful new tool for linking water savings with specificcombinations of water savings measures.
33. Trigger Planning is a collaborative and continuous process for updating water supply needsassessments and responding in time, but just in time, with the necessary economic and environmentalinvestments necessary to address those needs. Trigger planning uses a shared vision model and the DPS method to minimize those investments while reducing the frequency of drought declarations caused by inadequate water supply. Trigger planning was tested and refined in the Boston metropolitan area. 34. There are simple ways to improve agency collaboration with elected officials and stakeholders. The DPS method used “circles of influence” to effectively and efficiently involvestakeholders in the development of plans. The circles created new ways for people to interrelate andinteract, without destroying the old institutions, their responsibilities or advantages. In addition,during the DPS’s, political scientists conducted interviews with elected officials and other influentialpolitical agents. The interviews were included in reports available to the entire study team, and wereused to assure the planning process addressed issues critical to the public and elected officials.

ix
NATIONAL DROUGHT STUDY
ACKNOWLEDGEMENTS
This guidebook was produced as part of the National Study of Water Management DuringDrought, which was managed by the Institute for Water Resources (IWR) of the U.S. Army Corps of Engineers. The guidebook is based on the experiences, research, and critical analysis of the over one hundred professionals who worked directly on the National Drought Study, and the many others who criticized and improved the case studies in which these methods were tested.
The principal authors of this report are Mr. William Werick, the National Drought Study manager,and Brigadier General (Ret.) William Whipple, Jr. Material contained in the annexes was alsoprovided by Dr. Hanna Cortner, Ms. Allison Keyes, Mr. Charles Lancaster, Dr. Merle Lefkoff, Dr.William Lord, Dr. Richard Palmer, Mr. Van Dyke Polhemus, Dr. Robert Waldman, Dr. GeneWilleke, and Dr. Charles Yoe.
The ideas presented in the report owe much to the work of Dr. Eugene Z. Stakhiv, Chief of IWR’s Policy and Special Studies Division. Dr. Stakhiv had made the case in previous papers that federal planning principles were unique in that they constituted a comprehensive set ofprinciples for water resources planning and management that had been established and tested in anunprecedented coalition of researchers and practioners. Moreover he demonstrated that they couldbe used to address regional objectives. Under his direction, the National Drought Study developed these concepts one step further, applying these principles to what were primarilyregional and operational water resources matters.
Mr. Zoltan Montvai, of the Corps’ Headquarters Planning Directorate, oversaw the NationalDrought Study from its inception to its final products. He assiduously reviewed and offered advice on making this report (and others) understandable and responsive to users’ real needs. TheDirector of Planning for the Corps is Dr. G. Edward Dickey.
Dr. Richard Palmer’s contribution to this study was inestimable. Without him, there would be noshared vision models, and the systemic planning process we present here, no matter how sound,would be more difficult to use, and thus, less effective. His scholarship, enthusiasm, andinventiveness motivated the rest of the Drought Study team. The intellectual influence andexperience of General Whipple, Dr. Bill Lord, and Dr. Gene Willeke are reflected in diffuse andnumerous ways in this report. David Getches offered review and counsel at critical junctures, buteven more importantly inspired the Drought Study team and others with his leadership of the ParkCity Workshops sponsored by the Western Governors Association and the Western States WaterCouncil. Dr. Robert Brumbaugh, Dr. Gene Willeke, Ms. Germaine Hofbauer, and Mr. Gene Lillyhave formed the central core of the drought study team over the years.
Thanks also to those who reviewed earlier versions of this report and gave good advice on itsultimate direction: Dr. Richard Punnett (ORH), Dr. Palmer, Dr. Lord, Dr. Donald Wilhite

x
(International Drought Information Center), Augustine J. Fredrich (University of Southern Indiana), Professor Harry Schwarz, Dr. Pete Loucks (Cornell University), Mr. Darryl Davis, Dr.Robert Brumbaugh, Mr. Paul Pronovost, Mr. Gene Lilly and Mr. Chris Erickson. Mr. Erickson and the case study managers, Mr. Steve Babcock, Mr. Ronald Meade, Mr. Charles Joyce, and Mr.Tom Lochen reviewed and revised Annex M. And finally, thanks to the many state water directors and federal agency contacts who provided their thoughts on how this guide could be most useful to them.
The report, of course, is a product of the National Drought Study. The report on the first year ofthe study (NDS-1) acknowledges the many professionals who set the course and collaborative tonefor the study. Of those, however, three people deserve to be acknowledged again since they shaped the study in its infancy. Harry Kitch (Headquarters, U.S. Army Corps of Engineers), Randy Hanchey and Kyle Schilling (past and current directors of IWR) shaped the basic studydirection, making sure the scope and subject matter of the study would include non-Corps and non-federal problems and viewpoints.
William J. WerickStudy Manager

Table of Contents
xi
FINDINGS OF THE NATIONAL DROUGHT STUDY . . . . . . . . . . . . . . . . . . . . . . . . . iii
ACKNOWLEDGEMENTS . . . . . . . . . . . . . . . . . . . . . . . . . . . . . . . . . . . . . . . . . . . . . . . . ix
FOREWORD . . . . . . . . . . . . . . . . . . . . . . . . . . . . . . . . . . . . . . . . . . . . . . . . . . . . . . . . xvii
INTRODUCTION . . . . . . . . . . . . . . . . . . . . . . . . . . . . . . . . . . . . . . . . . . . . . . . . . . . . . . 1
The larger context for water management during drought; Who should usethis guide?; How should this guide be used?; When should the DPS method be used?; What are these methods based on?
1 WATER MANAGEMENT AND DROUGHT . . . . . . . . . . . . . . . . . . . . . . . . . . . . . . . . . 5
The Meaning of the Word “Drought”; A water resources planner’s view ofdrought; A water manager’s view of drought; The rules for makingdecisions, including decisions about water management during drought; Goals and objectives for managing water; Other common concepts in water management
2 THE DPS METHOD . . . . . . . . . . . . . . . . . . . . . . . . . . . . . . . . . . . . . . . . . . . . . . . . . . . . 11
Major features of the DPS method; Organization of a DPS; Levels of detail and cost; The Seven Steps of the DPS Method; Computer modelbuilding and stakeholder involvement; Group processes
3 BUILD A TEAM, IDENTIFY PROBLEMS . . . . . . . . . . . . . . . . . . . . . . . . . . . . . . . . . . 17
Makeup of the team; Starting the DPS; Finding stakeholders; PotentialProblems of Broad Involvement; Circles of influence; The problems
4 OBJECTIVES AND METRICS . . . . . . . . . . . . . . . . . . . . . . . . . . . . . . . . . . . . . . . . . . . 25
Management; Decision criteria; Goals and planning objectives; Constraints; Performance Measures; Effects of the alternatives; Accounts; Resistance to the use of estimated effects in the evaluation ofalternatives; Advantages of the measuring effects by account
5 THE STATUS QUO . . . . . . . . . . . . . . . . . . . . . . . . . . . . . . . . . . . . . . . . . . . . . . . . . . . . 33
Modelling the status quo; Selecting design drought(s); The National Drought Atlas; Specialized Computer Models

Table of Contents
xii
6 FORMULATING ALTERNATIVE PLANS . . . . . . . . . . . . . . . . . . . . . . . . . . . . . . . . . . 41
What is an alternative?; Three types of alternatives; Initial list of alternatives; Elements of a tactical drought plan; Integrating strategic andtactical plans
7 EVALUATING ALTERNATIVES . . . . . . . . . . . . . . . . . . . . . . . . . . . . . . . . . . . . . . . . . . 51
Initial screening of alternatives; Modeling; Estimating effects; Tradeoffs acrossaccounts; Decision Support Software
8 INSTITUTIONALIZING THE PLAN . . . . . . . . . . . . . . . . . . . . . . . . . . . . . . . . . . . . . . . 59
Recommending a plan; Changes in laws and regulations; Environmentalreview; Negotiating Closure; The Agreement
9 EXERCISE, UPDATE, AND USE THE PLAN . . . . . . . . . . . . . . . . . . . . . . . . . . . . . . . . 65
Virtual Drought Exercise; Using the plan
10 CONCLUSION . . . . . . . . . . . . . . . . . . . . . . . . . . . . . . . . . . . . . . . . . . . . . . . . . . . . . . . . . 69
DPS Planning Process Checklist . . . . . . . . . . . . . . . . . . . . . . . . . . . . . . . . . . . . . . . . . . . . . . . 70
INDEX . . . . . . . . . . . . . . . . . . . . . . . . . . . . . . . . . . . . . . . . . . . . . . . . . . . . . . . . . . . . . . . . . . 75
LIST OF ANNEXES . . . . . . . . . . . . . . . . . . . . . . . . . . . . . . . . . . . . . . . . . . . . . . . . . . . . . . . . 77
Annexes Following the Main Report
A - ORIGINS OF FEDERAL WATER RESOURCES PLANNING GUIDANCEB - POLITICS, ADVOCACY GROUPS, AND WATER AGENCIESC - COMPUTER MODELS OF WATER AND RELATED SYSTEMSD - WATER LAW AND DROUGHTE - ENVIRONMENTAL EVALUATIONS: KEY ISSUES FROM THE CASE STUDIESF - ECONOMIC EVALUATIONS: KEY ISSUES FROM THE CASE STUDIESG - HYDROLOGYH - ALTERNATIVE DISPUTE RESOLUTIONI - DROUGHT AND THE PUBLICJ - CONCEPTUAL BASIS FOR CIRCLES OF INFLUENCEK - FORECASTING WATER USE TO MANAGE WATER CONSERVATIONL - LESSONS LEARNED FROM THE CALIFORNIA DROUGHT 1987-1992M - THE PRINCIPAL NATIONAL DROUGHT STUDY CASE STUDIESN - THE NATIONAL DROUGHT ATLAS

Table of Contents
xiii
Figures
FIGURE 1. A GRAPHIC DEFINITION OF DROUGHT . . . . . . . . . . . . . . . . . . . . . . . . . . . . . . . . 6FIGURE 2. CIRCLES OF INFLUENCE . . . . . . . . . . . . . . . . . . . . . . . . . . . . . . . . . . . . . . . . . . 20FIGURE 3. A SHARED VISION MODEL CAN ILLUSTRATE HOW STAKEHOLDER
CONCERNS ARE CONNECTED TO MANAGEMENT OF THE WATER SYSTEM . . . . . 35FIGURE 4. THE RELATIONSHIP BETWEEN WATER AND PRODUCTION FOR ONE
STAKEHOLDER. . . . . . . . . . . . . . . . . . . . . . . . . . . . . . . . . . . . . . . . . . . . . . . . . 36FIGURE 5. THE QUANTIFIED RELATIONSHIP BETWEEN COOLING WATER AND
PRODUCTION. . . . . . . . . . . . . . . . . . . . . . . . . . . . . . . . . . . . . . . . . . . . . . . . . . 36FIGURE 6. THE RELATIONSHIP BETWEEN SYSTEM AND STAKEHOLDER WATER. . . . . . . . . . . 37FIGURE 7. THE CENTRAL WATER SUPPLY SYSTEM. . . . . . . . . . . . . . . . . . . . . . . . . . . . . . . 37FIGURE 8. COUNTING THE NUMBER OF DAYS WITHOUT PROCESSING WATER. . . . . . . . . . . . 38FIGURE 9. THE DEFINITION OF DAILY PRODUCTION LOSS. . . . . . . . . . . . . . . . . . . . . . . . . . 38FIGURE 10. CONJUNCTIVE USE OF GROUNDWATER FOR DROUGHT . . . . . . . . . . . . . . . . . . . 46FIGURE 11. TRIGGER PLANNING KEEPS ECONOMIC AND ENVIRONMENTAL INVESTMENTS
IN WATER SUPPLY LOW WHILE AVOIDING CATASTROPHIC WATER SUPPLY
FAILURES. . . . . . . . . . . . . . . . . . . . . . . . . . . . . . . . . . . . . . . . . . . . . . . . . . . . . 48FIGURE 12. THE COST EFFECTIVENESS FRONTIER. . . . . . . . . . . . . . . . . . . . . . . . . . . . . . . . . 56FIGURE 13. IT COSTS $25 PER UNIT TO INCREASE OUTPUTS FROM 0 TO 80 UNITS, BUT
$50 PER UNIT TO GO FROM 100 TO 120 UNITS. . . . . . . . . . . . . . . . . . . . . . . . . . 56FIGURE 14. A SAMPLE PARTNERING AGREEMENT. . . . . . . . . . . . . . . . . . . . . . . . . . . . . . . . 64
FIGURE F-1. ECONOMIC BENEFITS FROM MARKET TRANSACTIONS . . . . . . . . . . . . . . . . . . . . F-3FIGURE F-2. IN A DROUGHT, CONSUMER AND PRODUCER SURPLUS ARE REDUCED BY $20
MILLION. . . . . . . . . . . . . . . . . . . . . . . . . . . . . . . . . . . . . . . . . . . . . . . . . . . . . . F-3FIGURE H-1. THE ADR CONTINUUM . . . . . . . . . . . . . . . . . . . . . . . . . . . . . . . . . . . . . . . . . . H-1FIGURE H-2. INTEREST BASED NEGOTIATION CAN PRODUCE AGREEMENT ON “WIN-WIN”
ALTERNATIVES THAT MIGHT NOT BE IDENTIFIED IN POSITION BASED
BARGAINING. . . . . . . . . . . . . . . . . . . . . . . . . . . . . . . . . . . . . . . . . . . . . . . . . . H-2FIGURE L-1. TRENDS IN CALIFORNIA WATER USE . . . . . . . . . . . . . . . . . . . . . . . . . . . . . . . . L-2FIGURE L-2. TWO SIX YEAR CALIFORNIA DROUGHTS OF THE 20TH CENTURY . . . . . . . . . . . L-3FIGURE L-3. PRECIPITATION 1987-92 . . . . . . . . . . . . . . . . . . . . . . . . . . . . . . . . . . . . . . . . . L-3FIGURE L-4. RESERVOIR STORAGE 1987-92 . . . . . . . . . . . . . . . . . . . . . . . . . . . . . . . . . . . . L-3FIGURE L-5. RUNOFF IN WATER YEARS 1987-92 . . . . . . . . . . . . . . . . . . . . . . . . . . . . . . . . . L-3FIGURE L-6. EAST BAY MUD WATER USE 1982-91. . . . . . . . . . . . . . . . . . . . . . . . . . . . . . . L-4FIGURE L-7. WATER USE AND POPULATION GROWTH, LOS ANGELES . . . . . . . . . . . . . . . . . L-4FIGURE L-8. SAN DIEGO PER CAPITA CONSUMPTION, WATER YEAR ENDING JUNE 30 . . . . . L-4FIGURE L-9. CUMULATIVE CHANGE IN GROUNDWATER STORAGE FROM 1970-1992 . . . . . . L-5FIGURE L-10. WATER BANK ALLOCATIONS: 1991-1992 . . . . . . . . . . . . . . . . . . . . . . . . . . . . L-5FIGURE L-11. NATURAL FALL-RUN CHINOOK SPAWNING SALMON (1980-91) . . . . . . . . . . . . L-6

Table of Contents
xiv
Figures (continued)
FIGURE M-1. THE LOCATIONS OF TEN NATIONAL DROUGHT STUDY CASE STUDIES. . . . . . . . M-1FIGURE M-2. THE KANAWHA RIVER BASIN . . . . . . . . . . . . . . . . . . . . . . . . . . . . . . . . . . . . M-4FIGURE M-3. DROUGHT PROBLEMS IN THE JAMES RIVER BASIN ARE CONCENTRATED IN A
5 CITY AREA. . . . . . . . . . . . . . . . . . . . . . . . . . . . . . . . . . . . . . . . . . . . . . . . . . M-7FIGURE M-4. THE MARAIS DES CYGNES-OSAGE RIVER BASIN . . . . . . . . . . . . . . . . . . . . . . M-9FIGURE M-5. THE CEDAR AND GREEN RIVER BASINS . . . . . . . . . . . . . . . . . . . . . . . . . . . . M-11FIGURE M-6. THE MWRA SERVICE AREA . . . . . . . . . . . . . . . . . . . . . . . . . . . . . . . . . . . . M-14FIGURE N-1. PRECIPITATION QUANTILES FOR 3 CLUSTERS IN THE SOUTHEAST . . . . . . . . . . . N-5FIGURE N-2. QUANTILES FOR 60 MONTH DROUGHTS IN 3 CLUSTERS . . . . . . . . . . . . . . . . . . . N-5
Tables
TABLE I. THE SEVEN STEPS OF THE DROUGHT PREPAREDNESS METHOD . . . . . . . . . . . . 13TABLE II. THE FIRST WORKSHOP: EXPERTS’ UNQUANTIFIED SPECULATION ABOUT
EXPECTED IMPACTS FROM FUTURE DROUGHTS . . . . . . . . . . . . . . . . . . . . . . . . 22TABLE III. THE TYPES OF PEOPLE THAT MIGHT WORK IN EACH OF THE CIRCLES OF
INFLUENCE . . . . . . . . . . . . . . . . . . . . . . . . . . . . . . . . . . . . . . . . . . . . . . . . . . . 23TABLE IV. WRITING A PLANNING OBJECTIVE. . . . . . . . . . . . . . . . . . . . . . . . . . . . . . . . . . . 27TABLE V. PLANNING OBJECTIVES FOR A TYPICAL DPS . . . . . . . . . . . . . . . . . . . . . . . . . . 28TABLE VI. TYPICAL MEASURES OF PERFORMANCE . . . . . . . . . . . . . . . . . . . . . . . . . . . . . . 30TABLE VII. A CHECKLIST OF WATER USES, PROBLEMS, PLANNING OBJECTIVES AND
PERFORMANCE MEASURES . . . . . . . . . . . . . . . . . . . . . . . . . . . . . . . . . . . . . . . . 32TABLE VIII. THREE TYPES OF RESPONSES TO WATER SHORTAGES. . . . . . . . . . . . . . . . . . . . . 42TABLE IX. A LIST OF TYPICAL STRATEGIC AND TACTICAL MEASURES. . . . . . . . . . . . . . . . . 49TABLE X. AN INITIAL SCREENING OF ALTERNATIVES . . . . . . . . . . . . . . . . . . . . . . . . . . . . 52TABLE XI. THE COSTS PER UNIT OF OUTPUT (FOR EXAMPLE, ACRES OF WETLAND) . . . . . . . 56TABLE XII. A MORE DETAILED EVALUATION OF ALTERNATIVES. . . . . . . . . . . . . . . . . . . . . . 57TABLE XIII. FINAL PRESENTATIONS TO DECISION MAKERS SHOULD MAKE THE RESULTS
AS CLEAR AS POSSIBLE. . . . . . . . . . . . . . . . . . . . . . . . . . . . . . . . . . . . . . . . . . . 62TABLE F-I. THE METHODS PRESCRIBED IN P&G FOR ESTIMATING THE ECONOMIC
EFFECTS OF WATER MANAGEMENT IN NON-MARKET CONDITIONS. . . . . . . . . . . . F-4TABLE K-I WATER CONSERVATION REPORTS FROM THE IWR CONSERVATION
PROGRAM . . . . . . . . . . . . . . . . . . . . . . . . . . . . . . . . . . . . . . . . . . . . . . . . . . . . K-6TABLE L-I. LESSONS FROM THE 1987-1992 DROUGHT . . . . . . . . . . . . . . . . . . . . . . . . . . . . L-1TABLE L-II LESSONS FROM PREVIOUS DROUGHTS CONFIRMED IN THE 1987-1992
DROUGHT . . . . . . . . . . . . . . . . . . . . . . . . . . . . . . . . . . . . . . . . . . . . . . . . . . . . L-2TABLE L-III ESTIMATES OF ECONOMIC IMPACTS . . . . . . . . . . . . . . . . . . . . . . . . . . . . . . . . . L-7TABLE M-IV. PERFORMANCE MEASURES FOR TRIGGER PLANNING IN THE BOSTON AREA . M-17

Table of Contents
xv
Tables (continued)
TABLE N-I. STATION DESCRIPTIONS IN CLUSTER 35 . . . . . . . . . . . . . . . . . . . . . . . . . . . . . . N-3TABLE N-II. QUANTILES FOR CLUSTER 35, NATIONAL DROUGHT ATLAS. . . . . . . . . . . . . . . . N-3TABLE N-III. QUANTILES FOR CLUSTERS 105 AND 106 . . . . . . . . . . . . . . . . . . . . . . . . . . . . . N-4TABLE N-IV MEAN PRECIPITATION FOR STATIONS IN CLUSTER 35. . . . . . . . . . . . . . . . . . . . . N-6TABLE N-V. EXPECTED PRECIPITATION IN A 50 YEAR DROUGHT, CLUSTER 35. . . . . . . . . . . . N-6TABLE N-VI A FEW SOUTHEASTERN STREAMGAGE STATIONS LISTED IN THE ATLAS . . . . . . . N-7TABLE N-VII STATISTICS FOR SELECTED STREAMGAGE STATIONS . . . . . . . . . . . . . . . . . . . . . N-7TABLE N-VIII THE PERCENTAGE OF THE HISTORIC RECORD THAT THE PDSI WAS -3 OR
DRIER FOR CLUSTER 35 STATIONS IN ALABAMA. . . . . . . . . . . . . . . . . . . . . . . . N-8

xvi
BLANK PAGE
(Skip)

xvii
FOREWORD
Damaging, prolonged droughts in various parts of the country in the 1980'sand ’90’s have been disruptive to normal living patterns. Experience hasshown that although many states and federal agencies possess droughtcontingency plans, these plans are not as effective as they should be;droughts still cause substantial turmoil. In response to the Droughts of 1988, Congress authorized the Corps of Engineers to make a nationwidesurvey of this situation, with the goal of finding a better way to manage water during drought. This effort was titled the National Study of WaterManagement During Drought. This report represents the collaborative work of over 100 researchers and practioners whose model approach towater management during drought was tested and refined in several casestudies across the country.
The approach is derived from general water resources planning andmanagement principles, but has been broadened to accommodate the non-structural, regional centered nature of drought management. Because of this, the approach can be used for water resources issues beyond justdroughts.

xviii
BLANK PAGE
(Skip)

INTRODUCTION 1
INTRODUCTION
This report summarizes the method of Many components of the DPS approach areimproving water management during drought time-proven methods and ideas derived fromdeveloped during the four year National federal water planning experience andStudy of Water Management During research, modified to reflect the importance Drought. The method was tested and refined of non-federal, non-structural responses toin four field studies in different parts of the droughts. The most visible innovation of country, in which teams of water managers the National Drought Study is the use ofand users worked together to reduce drought stakeholders collaboratively built “sharedimpacts. In each case, the situations are vision (computer) models” of their watercomplex, involving many different uses of management environments. The DPS water. Because such important state and method also encourages the use of alternativelocal responsibilities are involved, only a joint dispute resolution techniques and newcooperative approach between state and statistical methods that can provide additionalfederal agencies could provide satisfactory information on the expected severity andanswers. These cooperative field studies were frequency of droughts. What is mostcalled “Drought Preparedness Studies” significant is that all of this has been(DPS) and the approach, the “DPS method.” integrated into a uniform, consistent
A DPS can develop the best means of work.minimizing adverse impacts of droughtsituations with existing infrastructure and The purpose of this report is to explain theinstitutions. However, in many cases, the procedure for cooperative federal-statebest management of existing facilities and Drought Preparedness Studies, to indicate institutions could still result in unacceptably how these studies relate to the longstandingdestructive impacts during a severe drought, principles and guidance for federal waterparticularly as water demand increases with resources investigations, and to indicate thefuture population growth. In such cases, the means of implementing conclusions arrived DPS approach can identify the need for and at in any given region. Certain parts of thisbegin the process of developing agreement report will be useful to municipalities andon the long-range water resources actions other entities engaged in drought planningnecessary to increase the capacity of the within the scope of their own responsibilities. region to withstand drought. Such actions However, the more important use is in should include full consideration of many dealing with problems which overlapalternatives, such as conjunctive use of jurisdictions.ground and surface water, inter-systemmanagement coordination, other means ofachieving water quality, long range demandmanagement, and even new or enlargedreservoirs.
approach that has been tested and shown to

2 INTRODUCTION
THE LARGER CONTEXT FOR WATER
MANAGEMENT DURING DROUGHT
WHO SHOULD USE THIS GUIDE?
HOW SHOULD THIS GUIDE BE USED?
WHEN SHOULD THE DPS METHOD BE
USED?
Most communities that suffered impacts from drought managementthe droughts of the 1980's said they couldhave been better prepared, including those The DPS method may also be useful incommunities that had prepared contingency dealing with emergency water shortages, plans which specified how the operations of such as those caused by infrastructurewater systems should change during a problems or system contamination. The DPSdrought. method is based on long term water planning
Federal water management agencies have naturally to both federal feasibility studies established sound principles and guidelines and non-federal water supply planning.applicable to water resources studies. However, these principles have not beenwidely applied to plans for water management during drought. This is becauseso much of the responsibility for actions todeal with drought rests in the states andmunicipalities rather than in the federalagencies. The National Drought Study teamdeveloped and tested a method for developing drought contingency plans whichtakes advantage of federal background andexpertise. This guide explains how a regioncan develop practical drought preparednessplans using those methods, while maintainingthe flexibility needed for local, non-federaldecision making.
This guide can be used by anyone concernedabout reducing the vulnerability of a watersystem to drought impacts. It is meant mainly for regional problems, from quickreviews of drought vulnerability to long andinvolved preparedness efforts. The method is suitable for:
! federal and non-federal droughtpreparedness planning
! water systems operation duringdrought
! regulatory permitting related to
principles, so it can be applied quite
The main body of this guide explains adrought preparedness process in sevensequential, iterative steps. None of the stepsshould be skipped, but the amount of time and money spent on each step depends on the particular situation in a region and howmuch information is already available.
The annexes to this report address the mostcommon issues raised during the case studiesin each of several professional areas. Theannexes are not meant to be summaries ofthese subjects, but in some cases (such as theannex on alternative dispute resolution) a brief overview of the subject was alsoprovided.
There are five characteristic situations whichcall for the use of this method:

INTRODUCTION 3
WHAT ARE THESE METHODS BASED ON?
! If you just don’t know whether yourcommunity or your region is well prepared for a severe drought. It is unusual for one person to be responsible forregional drought preparedness, so it may be resources planning or in the resolution ofnecessary to ask several people if (and why) water resources conflicts, orthey are confident that the region is wellprepared. This guide can be used to develop ! If you have been faced with a droughtan inexpensive preliminary estimate of drought vulnerability.
! If you know there is a drought plan, but resources management principles, so most ofyou don’t know if it is adequate. Only alittle more than half the states have droughtpreparedness plans. About half of thecountry’s urban water suppliers have droughtcontingency plans, but in 1988, fewer than30% of the urban water utilities had any kindof quantitative data to support decisionmaking during droughts. In many cases, theplans were based on little research andunrealistic expectations of consumerresponses. tested in the National Study of Water
! If you are in the process of developing a 1993), a study led by the U.S. Army Corps ofdrought preparedness plan. It has becomemore commonplace to require drought plansfor utilities and reservoirs. The regulationsoften require a document which lists thecurtailment actions that will be taken whendrought indicators reach certain values, thewater savings expected from these actions, and the coordination with agencies that would be initiated. These sorts of “plans”offer some benefit and typically require aminimum of public process and staff time. The disadvantages of these plans is that theytypically do not establish the real objectivesfor water management, nor do they comparealternative drought plans to find the plan thatbest addresses those objectives. The lack ofpublic process may mean that water users(especially new users such as recreators) will
be less well prepared and more adversarialwhen the drought occurs.
! If you are involved in any water
which raised concerns about the adequacyof future water supply. The methods of theNational Drought Study are based on water
what is written in this report is applicable tothe rest of the hydrologic spectrum and tostrategic planning.
The methods described in this guide are based on longstanding, well accepted waterresources planning principles, updated and
Management During Drought (1990-
Engineers. The study team consisted of more than one hundred water managers, orconsultants, and researchers from the Corpsand other federal and state agencies, leadinguniversities, cities, consultants, privateindustries, and environmental groups. Themethods described in this guide were testedand refined in several case studiesrepresenting many of the conditions across the U.S. A brief comparison of the DPSmethod to traditional ways of responding todrought is provided in Chapter 2.

4 INTRODUCTION
BLANK PAGE
(Skip)

1
WATER MANAGEMENT AND DROUGHT 5
The real need is to institutionalize drought management into improved overall watermanagement systems
- Conclusions from a National Science Foundation Drought Water ManagementWorkshop, February 1990 (NSF, 1990)
The NSF workshop participants concluded that attempts to understand and address droughtproblems will be unsuccessful unless the larger context of which they were an inseparable part isalso understood and addressed. This was also one of the conclusions drawn by the Corps ofEngineers in the first year of the National Drought Study (NDS-1), and the premise upon whichthe DPS method was built. This chapter provides a conceptual structure for understanding thewhole into which water management during drought fits, and briefly illustrates linkages betweenwater management issues.
THE MEANING OF THE WORD
“DROUGHT”
WATER MANAGEMENT AND DROUGHT
water management literature (NDS-3). SomeThere are many definitions of drought. The authors restrict its use to what others callNational Drought Study team sought a meteorological drought (less precipitation definition that was consistent with historic than usual, with “less” sometimes quantified). scholarly usage and accepted usage in water Others use “drought” to refer to agriculturalmanagement operations so that water drought (not enough precipitation for crops),managers and planners perceptions of this or hydrologic drought (less water availablephenomenon could be integrated. than usual, typically defined statistically in
A community is often asked to make water systems that use distant sources ofsacrifices while a drought continues, and so water or large reservoirs, declarations ofdifferences in the operational definition drought may be unrelated to the amount ofchange the answers to important, practical local rainfall. Because this is a guide toquestions such as, “should we begin to managing water to reduce impacts fromsacrifice now?” and “can we stop sacrificing “drought”, the definition used to guide thenow?” The next few paragraphs show the development of the DPS approach had torange of meanings “drought” can have, and include social and economic considerations,then suggests a basis for creating a definition as well as the meteorological. In many which can be used in regional planning. cases, the connection between meteorological
There are at least 10 meteorological, 4agricultural, 3 hydrologic, and 3socioeconomic definitions of drought used in
terms of less than normal streamflow). But in
and socioeconomic droughts is obvious. The definition also had to be meaningful to

6 WATER MANAGEMENT AND DROUGHT
FIGURE 1. A GRAPHIC DEFINITION OF DROUGHT
A WATER RESOURCES PLANNER’S
VIEW OF DROUGHT
water supply managers and water system management adjustments until supplies returnoperators. Finally, there are also some types to normal. Water supply planners can makeof water shortages that are not called adjustments so that drought impacts will be“droughts.” For example, although many of less severe and less frequent over time. the planning procedures might be the same,most water managers agree that a pipe break Water supply planners accept residual risks or an oil spill, either of which can cause a of very infrequent droughts because thesevere water deficit, should not be called a environmental, social, or economic costs“drought.” Thus, for the purposes of this required to completely eliminate those risks text, droughts are periods of time when is too great.natural or managed water systems do notprovide enough water to meet establishedhuman and environmental uses because ofnatural shortfalls in precipitation orstreamflow.
If a system is said to have a safe yield of 300 million gallons of water a day at 98%reliability, it means that it can supply 300million gallons per day (mgd) 98% of the time. The other 2% of the time, the watermanager will declare a drought and make
Over the last several decades, water resources planning has become moresophisticated in response to greater publicconcern about the environment, recreation, and the integrity and effectiveness ofgovernment. Consequently, moresophisticated procedures for estimatingimpacts, evaluating alternatives, listening toand informing the public, and making tradeoffs among dissimilar impacts have beendeveloped and tested. Much of this work iscaptured in the series of summary reports onfederal water resources planning andevaluation: Proposed Practices for EconomicAnalysis of River Basin Projects (May 1950,revised in May 1958 and referred to as “The

WATER MANAGEMENT AND DROUGHT 7
A WATER MANAGER’S
VIEW OF DROUGHT
THE RULES FOR MAKING DECISIONS,INCLUDING DECISIONS ABOUT WATER
MANAGEMENT DURING DROUGHT
Green Book”), Senate Document 97 (1962), Principles and Standards for Planning Waterand Related Land Resources (the P&S) (1973) and Economic and EnvironmentalPrinciples and Guidelines for Water andRelated Land Resources ImplementationStudies (the P&G) (1983). (See Annex A for a discussion of these reports).
Figure 1 represents water use as a single line, suggesting that if a new reservoir werebuilt, increasing supply, the frequency andseverity of future drought impacts would bereduced. In practice, however, new reservoirs often bring new recreational usesthat become firmly established whenprecipitation and streamflow are normal. When a drought does occur, planners may find that those who have a stake in lakerecreation will resist drawing the reservoirdown. The new uses bring new benefits, butadd to the complexity of drought response.
The definition of drought for short-termmanagement is consistent with the writtendefinition on page 6 and Figure 1, but moreconcrete. It can be more precise becausecurrent stores of surface and groundwater and current use patterns can be determinedfairly accurately. It must be more specificbecause coordinated responses to droughtrequire a common view of whether the region is in a drought, how bad the drought is, and how long it is likely to last. Initiatingdrought responses too early, too late, orunnecessarily can be costly. Because anofficial drought declaration may be necessaryto initiate some response measures, watermanagers typically declare the time thedrought started and ended.
Integration. A simple and meaningfulcriticism of most plans for drought response is that they do not resemble real responses todroughts; the furor caused by droughts israrely foreshadowed in drought planning(NDS-1, NDS-5).
When a drought occurs, water managers willface the same question planners addressed inthe design of the water system: which planproduces the most desirable level andallocation of beneficial effects?Like the long term planner, the real timemanager will have to listen to and inform thepublic, deal with other governments, agencies, and private organizations, andconfront criticism. And like the planner, themanager will deal with risk and uncertaintysurrounding the consequences of any proposed action.
A principal finding of the National DroughtStudy was that as a rule, water managementduring drought has not benefited much fromthe research, development and testing that has improved strategic water resourcesplanning over the past four decades, despitethe fact that practioners in both fields try toassure efficiency and equity in the allocationand use of water and related land resources.
Simplifying assumptions make it easier to deal with things in the abstract. So long as the domain of the problem area is restricted,the loss of realism may not be important. For example, so long as the surveyed piece of the earth’s surface is small enough, it makes more sense for surveyors to disregardthe curvature of the earth’s surface when

8 WATER MANAGEMENT AND DROUGHT
they measure elevations. The error induced collective choice, and constitutional. by this simplification is unacceptable when Physical characteristics, such as reservoirlarger pieces of real estate are traversed, so a capacity, are included as part of “scope more complicated (and realistic) view of the rules” that define the physical domain of theworld is necessary. decision making. Water managers make day
As long as water conditions are close enough rule. Operational rules are changed from to average, it makes sense for water time to time to reflect changed managers to assume that water allocation and circumstances, such as the growth inuse are established by operating policies. population, or new use for water. TheseBut severe droughts can cause significant changes in operational rules are made at thechanges in water allocations and impacts, collective choice level. An example of such often years or decades after operating a rule change would be an interagencypolicies have been set. The premise of this agreement on a new drought response plan, introduction, supported by the testimony of or Federal legislative and executive actions water managers who have gone through to construct a water project. Collectivesevere droughts, is that drought plans that choice rules can be changed only at thedisregard this complexity will not be constitutional level. The U.S. Constitution iseffective during a drought. a good example of such a rule set. It
Decisions made about water during drought the right of governments to manage water, are affected by how decisions are made and the division of that responsibility under normal circumstances. This includes between the federal government and the how concerns about water use, quality and states.supply are balanced, what water sources areused, and how the infrastructure for treating, A team developing a plan to improve thestoring and distributing water is financed and regional response to future droughts works atmaintained. Those water related decisions the collective choice level to define theare in turn affected by the way decisions are operational rules for water management made about governance, commerce, and during future droughts. The team’s work ispersonal behavior. Even these overarching authorized and funded under broaddecision processes can have an obvious constitutional level rules about therelevance to drought issues, such as responsibility and power to manage water. consumer response to demand managementmeasures, jurisdiction on water allocation The linkage of operating rules to higher leveldecisions, and the use of water markets. rules illustrates why elected officials are
A useful structure for the rules of decision suffer the impacts of drought. Watermaking has been proposed (Ostrum, 1977) managers who have gone through droughtsand used in the study of water management, experience this linkage through increasedincluding the National Drought Study (94- political interest in their decisions. TheNDS-13). In this structure, water methods developed during the Nationalmanagement decisions are formed according Drought Study help elected officials andto three levels of rules: operational, agency staff share information before
to day decisions according to operational
establishes fundamental concepts regarding
ultimately held responsible by citizens who

WATER MANAGEMENT AND DROUGHT 9
GOALS AND OBJECTIVES
FOR MANAGING WATER
OTHER COMMON CONCEPTS
IN WATER MANAGEMENT
drought, when both groups are under less aimed or striven for more immediately. Thepressure and have more time to develop ultimate goals for managing water are found better ideas. in concepts like health and happiness. To
Many social scientists refer to the sets of objectives such as greater environmentalrules for making rational decisions as quality, economic efficiency, social wellinstitutions (not to be confused with another, being, equity, national security, and betterrelated meaning of the word, organizations). international relations. The concept ofInstitutional analysis is the study of these sustainability is often seen as a direction,rule sets and their consequences on the rather than a destination. Sustainabilityattainment of human goals. recognizes the importance of environmental
The phrase “institutional study” has a use of natural resources. It places greaternarrower common usage in the water importance on future economic output thanresources field. It typically refers to efforts traditional economic theory, which discountsthat analyze whether changes in collective the value of goods received in the future choice rules (such as agency jurisdiction and (Lee, 1992).mission, interagency coordination, and law)will allow improvements in water Multiobjective water management is themanagement that could not be obtained by process of making decisions about water fine tuning the operational rules. Much of the after consideration of the consequences withcriticism of current American water respect to these objectives. (Major, 1977).management focuses on institutional (Annex A briefly discusses the origins ofproblems (NDS-1, Rogers 1993). multiobjective water management. Chapter 7
Changes in the way water is managed, for tradeoffs between objectives.) These drought or any other circumstance, can be national objectives become goals for regionalexpressed and analyzed as changes in this water management efforts, such as droughtstructure of rules for making decisions about preparedness studies, while still more water. specific planning objectives are developed to
Goal and objective are often usedsynonymously, but the derivation of eachword suggests a useful distinction between the two words. “Goal” is derived from a Multipurpose water management is not theMiddle English word gol (“a boundary”). same as multiobjective water management. Objective is derived from two Latin words, The most common purposes for waterob (“towards”) and jacere (“to throw”). In management are navigation, recreation,their root sense, then, a goal is an ultimate municipal and industrial use, dilution ofpurpose, whereas an objective is something effluents, instream biological requirements,
direct us towards those goals, we define
objectives for long term human (economic)
discusses how to account for and make
address regional desires. Regional planningobjectives are discussed in more detail inChapter 4.

10 WATER MANAGEMENT AND DROUGHT
hydropower, irrigation and livestock Water can be supplied from surface orwatering, flood damage reduction, and ground sources. In the physical domain,coastal and streambank erosion damage groundwater and surface water are linked. reduction. Multipurpose refers to structures But the institutions for managing surface andor practices involving more than one of these groundwater are usually different andpurposes. Integrated water management has separate, and that can make it difficult tobeen used recently in different ways, manage the two sources conjunctively sometimes referring to the analysis of water (ACIR, 1991). supply and demand options together, sometimes to the coordination of waterquantity and quality options.
A watershed is a geographic area in which water drains to a common outlet. A riverbasin can contain many watersheds. Watershed management and river basinmanagement are both based on a desire tomanage holistically. However, the potentialdifference in scale may make watershedmanagement more feasible and the relationship between stakeholders andmanagement groups more effective. The term problemshed is a play on words thatreflects the fact that in some cases, theproblem area may not be the same as the river basin area. Reductions in hydropower,for example, may affect power users outsidethe river basin where the power is producedbecause power grids allow utilities to sharepower over a wide geographic area.
The DPS method is based on principles drawn from and consistent with this broader context. It is that consistency that makes the method appropriate for water resources planning andmanagement in general. The next chapter provides an overview of this method.

2
THE DPS METHOD 11
Bad water management often occurs when facts are confused with values, when means areconfused with ends, and when technical judgments are made by citizens and politicians while value judgments are made by scientists and professionals.
- William B. Lord (Water Resources Bulletin,1984)
“In the last twenty years, there has been a proliferation of government reports, scholarlyliterature, and popular works favoring changes in water policy. Common themes abound ... theyoften observe that broader planning and basin management are preferable to present approaches. Lawyers, economists, political scientists, geographers, citizen groups, and governmentcommissions all have reached remarkably similar conclusions.”
- David Getches (Water Resources Update, Winter 1993)
The DPS method is an embodiment of these common themes. Its strength is not that it includes somuch that is new, but that it makes practical and whole what is well regarded in theory. Undergirding the well established planning, evaluation, and implementation steps is the innovation of the shared vision model, a method of visualizing future droughts that would havebeen impossible before recent advances in personal computers. This chapter describes the DPSapproach in general terms, followed by more detailed explanations of the various steps inChapters 3 through 9.
MAJOR FEATURES OF THE DPS METHOD
THE DPS METHOD
Drought Preparedness Studies: ! are result-oriented. Reports and written
! are joint efforts requiring changes that reduce environmental,intergovernmental cooperation with those economic, and social impacts fromwho have a stake in how water is drought.allocated and used.
! constitute a more general version of the and expertise from across the country.planning methods and evaluation principles of federal Principles and ! integrate long and short term responses.Guidelines (P&G) (See Annex A formore information). The DPS methodaccommodates the extensive
responsibilities of non-federal entities indrought situations.
plans are by-products of behavioral
! take advantage of experience, research,

12 THE DPS METHOD
ORGANIZATION OF A DPS
LEVELS OF DETAIL AND COST
! are dynamic, because plans are If the preliminary review suggests that itexercised in regularly conducted virtual would be worthwhile, funding of $100,000-droughts. $500,000 should be sufficient to evaluate
Although a DPS is a joint cooperative effort the status quo and under alternative plans. between interested parties, it needs a The model would also show how well eachsponsor(s) to provide funding, and a leader to plan met the criteria established by decisioninitiate it. The leader must assure that makers. The model would be developed appropriate state officials, regional agencies, using existing data (updated where sensitivityand important municipalities are adequately analysis shows that uncertainty in existing represented on the working group, as well as data translates to significant differences inimportant industrial, commercial, and public management decisions) and interviews with interest groups. all major players. At least four workshops
A DPS can be carried out at various levels ofdetail and cost. Funding of $15-$50,000might suffice for a regional review led by astate water resources agency or environmental agency, a large urban wateragency, or a council of governments. At thislevel, two to four workshops would typicallybe held, a preliminary shared vision modeldeveloped (see page 14), with data providedfrom readily available sources and frominterviews with stakeholders, researchers andinterest groups in the region.
alternative drought response plans in somedetail. A study of this magnitude wouldinclude a detailed shared vision model thatshows how water would be allocated under
would be held. The studies would take from12-36 months, and would be officiallysupported by agreements signed by the studypartners.

THE DPS METHOD 13
1. Build a team and identify problems. (Chapter 3)
2. Develop objectives and metrics for evaluation (Chapter 4)
3. Describe the status quo; that is, what will happen in future droughts if the community does nothing more to prepare itself? (Chapter 5)
4. Formulate alternatives to the status quo. (Chapter 6)
5. Evaluate alternatives and develop study team recommendations. (Chapter 7)
6. Institutionalize the plan. (Chapter 8)
7. Exercise and update the plan and use it during droughts. (Chapter 9)
TABLE I. THE SEVEN STEPS OF THE DROUGHT PREPAREDNESS METHOD
THE SEVEN STEPS
OF THE DPS METHOD
The seven steps are shown in Table I. The the extent of the problems. As the number approach is derived from federal planning of iterations increase, the number ofprinciples, but the DPS method adds two alternatives decreases, the level of plan detailsteps to the P&G planning and evaluation should increase, and the scrutiny of theprocess, reflecting the importance of the non- evaluation process should become morefederal role and the predominance of non- intense.structural solutions in water managementduring drought. Iteration should be used to husband study
The federal process has one principal development of details on the status quo untilobjective - to reasonably maximize net a little is done on plan formulation andnational economic development benefits evaluation, a study team can develop a betterconsistent with protecting the nation’s sense of where details about the status quo environment. In Step 2 of the DPS method, are likely to make a difference in studythe relevant objectives are developed as part recommendations. Without this iteration, aof the study. Step 7 recognizes that hydrologist might be tempted to recreate thesolutions requiring coordinated actions entire period of historic flows; but ifsometime in the future will not work unless agreement is reached upon use of two pastthey are exercised and updated occasionally. droughts as target droughts, with an assumed
The first five steps to drought preparedness basis.are performed iteratively, that is, the sequence of steps is repeated as more Probably the most common planning mistakeinformation becomes available for evaluation. is to skip the development of planning
It is not unusual for new planning objectivesto be added, or existing objectives revised,after the DPS team more clearly understands
resources. For example, by delaying
frequency, planning can proceed on that

14 THE DPS METHOD
COMPUTER MODEL BUILDING AND
STAKEHOLDER INVOLVEMENT
objectives and evaluation criteria (Step 2) The compounding of these trends has greatlyand start by examining possible alternative increased the difficulty in making timely andsolutions (Steps 4 and 5). In theory, it informed changes in water managementseems obvious that a drought preparedness policies. It has become more and morestudy can not be managed for success if the difficult for water managers, and nearlystakeholders have not agreed what success is. impossible for stakeholders to synthesize theIn practice, though, working groups usually information generated for an entire waterassume that everyone understands what the system and use it to make decisions.objectives are, and that it would be a waste of valuable time to articulate and debate There is a gap between the way people them. These “practical” decisions fly in theface of decades of planning experience. Without clearly stated planning objectives and evaluation criteria, effective decisions onthe allocation of study funds and time canonly be accidental, and conflicts over differing aims cannot be resolved efficiently.
Projections of how scarce water will beallocated to a variety of stakeholders clearlyrequire mathematical computations. Ideally,these calculations would accurately reflect allthe things that would happen during adrought, and at the same time be easilyunderstood by water use groups.
This goal had become more and more elusivebecause of three trends in water management:
! New water uses and environmentalconcerns have made multiobjective,multipurpose analyses more complex.
! There are more data and the complexity ofdata analysis is increasing.
! There is a general trend to broader publicparticipation in water management.
make decisions and the informationspecialized water models can produce. TheDPS's used new computer software to create “shared vision models” that bridgethat gap.
The National Drought Study used a newmethod of building computer models of water systems to accomplish this goal. The“black box” computer models typically usedin the past were supplemented with new,site-specific planning models created byindividuals representing the Corps, local water supply agencies, water managers, andstakeholders who would be impacted by theplans. These models captured the expertiseand experience of people in the region andbecame a shared vision upon which to basenegotiation.
This integration of planning and modelingdiffers significantly from previous approaches and has only recently been madepossible by extraordinary advances incomputer hardware and software. In the past, computer models used in waterresources planning were created byindividuals specially trained in computerprogramming. Today, because of theavailability and power of personal computersand new simulation software, more peoplecan become involved in building models andthe models can be more easily understood byall stakeholders.

THE DPS METHOD 15
GROUP PROCESSESThe computer software used in these effortscan be described as a user-friendly, graphicalsimulation tool. This software makes use oficons to represent simple, physical objects or The conduct of a DPS requires the successfulconcepts. The model builder selects from a interaction of people with different values palette of icons to describe the system, such and backgrounds. In recent years, processesas reservoirs, streams, and uses. After the have been developed that (when usedbasic system configuration is defined, the properly) can make this interaction muchmodeler defines system operating policies more efficient.and provides site specific information such as streamflows, demands, and economic and There will be several workshops held in theenvironmental relationships. course of even a simple DPS. There are
The specific software used to implement how to run effective workshops. Here is awater resource system models developed in summary of some of that advice that isthe National Drought Study is STELLA II®. directly applicable to water managementSTELLA II® is most simply described as a workshops.visual spreadsheet for systems analysis wherethe process being modeled can be pictured as Agendas should be established in advance ofa process rather than equations. STELLA meetings and workshops. If a group meetsII® was selected over other available regularly, development of the agenda software because of its unique combination for the following meeting can be the last taskof simplicity, power, and cost-effectiveness. of the current meeting. Each agenda item
Because the new software is so user-friendly,members of the working group and Facilitators are useful in most meetings andstakeholders can participate in the should be used in all workshops. Becausedevelopment and testing of the model, and in facilitation requires training, and goodits application to estimating the effect of communication and interpersonal skills, andvarious alternative plans considered. This because the facilitator should not participateprocess builds confidence in the model in the substance of the discussion, it is results (see Annex C for more information). usually better to hire a professional facilitator
In the National Drought Study experience, group. The facilitator's job is to make thethis collaboration gave team members a meeting effective. chance to appreciate and understand eachothers perspectives. Concepts that had been Facilitators make sure that the purpose ofvaguely understood such as safe yield and each agenda item is fulfilled; help the groupprimary water right were explained and to manage their meeting time; manageillustrated in models, so that non-experts dominant and passive participants; could understand the implications these clarify miscommunication among meetingconcepts carried for their concerns. participants; and assure that necessary
many good books offering suggestions on
should have a set time and discussion leader.
than to ask for volunteers from within the
follow-up actions are assigned to aresponsible party.

16 THE DPS METHOD
Brainstorming is a process which has been Brainstorming with stakeholders alone willused extensively in value engineering and not produce solutions that are technicallyother areas where innovative alternatives adequate. During the fourth step of the DPSmust be found. It is best done in small process, stakeholders should be encouraged groups led by a recorder who simply lists to express their ideas for alternatives, but theevery idea that is offered by any member of preliminary screening process should allowthe group. experts to use their knowledge to explain
The key to successful brainstorming is to further.withhold criticism until the group hasexhausted its creativity. This can be very A Delphi process can accomplish some of difficult, especially when water experts the same purposes over a longer period ofbrainstorm with stakeholders, because many time, but without a physical meeting. In aof the ideas will have technical flaws or will Delphi process, experts are asked to respondbe unresponsive to the planning objectives. to a series of questionnaires about problems
Encouraging all participants to freely offer answers, then develops another questionnairesolutions achieves many ends: it can allay if needed to clarify or resolve disputes fears that possible solutions have been among the experts, or to address new issuesoverlooked; provide the insight of a fresh suggested by the previous round of responsesperspective to an expert; force the (Delli Priscoli, 1986).examination of good ideas that experts knowhave powerful foes; or allow interesting, but Chapter 7 explains how teams can screen aultimately unsuitable ideas to be raised and long initial list of alternatives to produce arejected in an equitable and public manner. manageable number for more detailed
After the uncritical brainstorming,participants should eliminate redundant ideas, The remaining alternatives can then beand then use preliminary screening criteria to organized if that serves a purpose. The use reduce the number of alternatives. of 8½”× 11" paper rather than flip chartsBrainstorming can be used to assemble a allows participants to group ideas beforecollective response better than the best ideas having to agree on category names.of any participant. But if none of theparticipants know much about a subject, the Breakout sessions. Research and experiencecollective answer will also be uninformed. show that it is very difficult for groups ofUnfortunately, it has become much more more than a dozen or so people to workcommon to see brainstorming used in this effectively on an intellectual product. Anway. Brainstorming with agency staff alone hour provides only 5 minutes of is not sufficient to identify stakeholders’ verbalization each to 12 people! Largerneeds. Especially during the first step of the groups are acceptable if individualDPS process, brainstorming with contributions are less important, in suchstakeholders is a valuable supplement to a activities as listening to a speaker or voting.review of previous reports on water resources problems in the basin.
why some ideas should not be studied
or solutions. A central analyst reviews their
analysis.

3
STEP 1: BUILD A TEAM, IDENTIFY PROBLEMS 17
Decision making should include all affected interest groups.
- Long's Peak Working Group (America's Waters: A New Era of Sustainability, 1992)
Efforts to deal with water geographically typically encounter strong resistance frombureaucracies that are functionally organized for different purposes.
- Peter Rogers (America's Water; 1993)
There is a natural, physical integration of water problems in a river basin; the challenge is toassemble a problem solving team that can work with a corresponding wholeness. The firststep in the DPS method was designed to overcome two common shortcomings in watermanagement: the separation between stakeholders and the problem solving process, and thesubdivision of natural resources management by limited agency missions. Each problem willaffect a group of stakeholders and be managed by one or more agencies. This chapterexplains how to assemble such a team.
BUILD A TEAM, IDENTIFY PROBLEMS
The first step in the DPS method is to new entity whose makeup reflects the set ofassemble a planning team and determine the problems: the stakeholders that will be hurt nature of drought problems the region faces. by drought; the agencies that have will makeThe discussions of study process in this and decisions related to the drought; the other chapters assumes that there is a lead advocates whose concerns are elevated byagency (see Chapter 2) that invites drought; and the independent experts whoseparticipation on a DPS team and facilitates life studies are applicable to drought.an initial problem identification workshop.
DPS's are meant to produce behavioral work together to specify problems and changes that will reduce regional develop solutions. Compared to the morevulnerability to drought. One of the most common approach in which water managersimposing roadblocks to such action is the develop plans and then present them tofragmentation of responsibility caused by the stakeholders in public meetings, thismismatch between political and hydrologic collaborative approach:boundaries and between agency missionsand water resources problems. ! harnesses the knowledge and creativity of
Rarely will there be one agency or political problem solving efforts;entity that can tackle these problems alone(See Chapter 1). The DPS team will be a
In a DPS, water managers and stakeholders
stakeholders near the beginning of

18 STEP 1: BUILD A TEAM, IDENTIFY PROBLEMS
MAKEUP OF THE TEAM
STARTING THE DPS
! makes it more likely that stakeholders Advocacy groups support positions oncan take actions unilaterally to reduce particular issues such as protection of thetheir drought vulnerability; environment or growth management. The
! builds broader, deeper stakeholder diverse interests from the beginning, in ordersupport for water management plans. to reduce the chance of litigation that has
Water managers do not surrender their collaboration requires advocates to assumeresponsibility or authority because of this some responsibility for achieving regionalcollaboration. In fact, the water management goals, and requires agencies to sharedecisions are less likely to be challenged if information and power. Annex B managers develop public understanding, summarizes the results of a study by the U.S.input, and support prior to the drought. Advisory Commission on Intergovernmental
The planning team should include four typesof people: stakeholders, water managers,advocacy groups, and independent experts. Depending on the problems involved, team The DPS will typically begin when amembers of each of the four types should be convening agency writes to the heads of selected to represent national, regional, or other agencies and organizations representinglocal interests, and may be drawn from the the four types of participants and invites themprivate as well the public sector. Water to send representatives to a workshop. At themanagers make or implement decisions. workshop, the convening agency shouldThey include agency staff involved in facilitate the initial effort at defining the rangeplanning, operation, and regulation, and and severity of drought problems facing theelected officials ultimately responsible to region. Participants at this workshop shouldcitizens for drought responses. also consider who is not at the workshop but
A conscious effort should be made to involve those with long term management It is essential that decision makers make aresponsibility and oversight, even if their commitment to empower the DPS process. Inparticular interest is not drought. Because of extreme cases, when a collaborative study isthe integrated nature of a DPS, its an alternative to litigation, the decision makers'recommendations may need to be woven into commitment to act according to the findings ofprocesses and cultures beyond drought the study should be formally established at themanagement. Examples include legislative beginning of the study. Less formalaides with water policy oversight, water commitments are acceptable, but the samesupply and wastewater planners, and concept applies: stakeholders have no reasonregulatory staff. to participate in a process that will change
DPS method encourages participation of
characterized past studies. Such a
Relations (ACIR) on methods of effectingbetter cooperation among agencies, electedofficials, and advocacy groups.
should be involved in the study.
nothing. The DPS should be launched withletters of support from the decision makers.

STEP 1: BUILD A TEAM, IDENTIFY PROBLEMS 19
FINDING STAKEHOLDERS
POTENTIAL PROBLEMS OF
BROAD INVOLVEMENT
CIRCLES OF INFLUENCE
During the study, the support of decision efforts may be required to provide technicalmakers must be manifest at least through the training and to coordinate the work of publiccommitment of agency staff time. The goal task forces.of this collaboration should be an agreementby agencies and stakeholders to manage ! the misapplication of the techniques ofwater according to the findings of the study. group process (see page 16) can result in the
Unless they have recently been personally stopped by recalcitrant or distrustfulinvolved in a drought, stakeholders are often participants, and broader citizen participationunaware of their vulnerability and will not increases that risk by adding more participants.make individual preparations to reduce theirvulnerability. Stakeholders competing for The methods described below are designed towater often make their first contact with allow broad representation and effectiveness.water managers and competing stakeholdersduring drought, when they are most threatened by drought impacts.
Table V lists the primary water management The DPS teams used a simple approach calledpurposes likely to be affected by drought. It “circles of influence” to help strike a balancecan be used as a checklist for identifying between the effectiveness of small teams anddrought problems and building a study team. the representativeness of large teams. This
Broadening study participation may alsopose some problems: Although there is no formal “membership”,
! money spent on public involvement will as belonging to one of three circles, Anot be available for technical studies. through C. Each successive circle from A
! the “public” that gets involved in planning personal involvement. If one were to developmay be self-selected and unrepresentative of a composite of the four DPS’s of the Nationalthe public that will be affected by drought. Drought Study, Circle A managed the study
! if public representatives are actually included the Corps study leader, as well as 2involved in the study process (as opposed to to 4 others from outside the Corps. Theyjust expressing problems and goals in spoke several times a week, managedworkshops or surveys), then additional contracts, arranged meetings of larger groups,
use of stakeholder opinions on issues thatshould be addressed by experts.
! all group processes can be slowed or
approach is built on the common themes inthree very different examples of organizationaleffectiveness (none water related) and isconsistent with research on how people worktogether well. (For more information, seeAnnex J).
individuals involved in a DPS can be described
through C has broader representation but less
and did most of the actual work. Circle A

20 STEP 1: BUILD A TEAM, IDENTIFY PROBLEMS
FIGURE 2. CIRCLES OF INFLUENCE
THE PROBLEMS
built models, did research, and wrote letters, Regional decision makers (agency heads andpapers, and reports. elected officials) constituted a fourth circle,
Circle B includes Circle A as well as one beginning and end of the DPS’s, and were representative for each major stakeholder kept informed during the study through theirgroup (such as industrial users). Circle B study representatives.will probably need to meet a few times a year. They may review and revise draft Every stakeholder and decision maker outsidepapers from Circle A. Circle A was connected to “A” in an
The ideal circle B participant will be active in professional or issues orientedorganizations. They would also be trusted and respected by others whose interests he orshe represents. The activity of the participant outside the DPS is importantbecause it takes advantage of existingchannels of communication. And if the Circle B participant was trusted andrespected, stakeholders outside Circle Bwere more willing to support the studydespite their decision to be less directlyinvolved in the study.
Circle C included a representative from eachmajor stakeholder, each managementagency, and each advocacy group. Circle C numbered from 20 to 60, and met twice a year in fairly formal workshop settings.
“D”. They were involved formally at the
identifiable chain. These connections wereusually through common work places, relatedwork groups, or professional organizations. The connections were based on a combination of trust and communication. Individuals who wanted more influence oroversight were free to move into the centralcircles if they were able to contribute moretime to study tasks.
When existing organizations are toorestrictive to deal with water issues in aholistic way, circles of influence can createnew ways for people to interact, withoutdestroying the old organizations or theirresponsibilities and advantages.
Circles of influence supplement, but do notreplace procedures that require consultationwith other agencies or public hearings.
Existing reports written by researchers andmanagement, data and regulatory agenciesshould be used as the basis for problemidentification. Participants at the firstworkshop should describe past impacts andthe efforts to mitigate those impacts,addressing the following questions:
! What problems have they experienced inthe past?

STEP 1: BUILD A TEAM, IDENTIFY PROBLEMS 21
! What efforts to prepare for future advantage of the opportunities provided by thedroughts are they aware of? DPS to manage water shortages caused by
! What changes in hydrology or water use treatment plants, and aqueduct breaks. since the last drought have affected the Responses to these emergencies often requireregion's vulnerability to drought? collaboration among the same agencies
! Are they still vulnerable individually? emergency procedures are already in place,
! Is the region still vulnerable? can be used for the drought study. If
! Can the DPS help or be helped by other may decide to improve them during the DPS. ongoing work?
! How can regional vulnerability be group they represent is prepared for futurereduced without their personal commitment? droughts, and if they feel that the region as a
! What benefits could the region realize if is that there are serious problems, then theits vulnerability to drought were reduced? group must ask if there is an organized effort
! What is the appropriate geographic There may be an opportunity for mutualscope? The starting point should be the river benefit if long range water supply studies,basin or watershed. If problems exist and federal feasibility or reservoir reallocationcan be managed in a portion of the basin, studies, legislative reviews of existing waterthen the study should focus its attention laws and regulations, or urban planning there. If there are out of basin diversions, studies are underway. Even if efforts outsideor if hydropower produced within the basin the DPS do not address drought issuesis used elsewhere, then the team may directly, there may be an opportunity to sharedecide to broaden the study area. None of data, computer models, and even politicalthis may be apparent at the first workshop, support.but as the study progresses, the team shouldrevisit this question to assure that study Finally, the participants should ask themselvesefforts are explicitly shaped to the problems. whether these problems will be addressed
A simple table such as Table II can be the DPS successful.constructed at this first workshop to describethe participants' best sense of how vulnerable Moreover, because history has shown thatthey are to mild, severe, and very severe concerns about drought dissipate soon afterdrought. droughts are over, participants must also
The second column in Table II describes change, the change will not occur.how the various groups believe they would be affected by a non-drought water shortage. Once the basic team structure has been set upParticipants should also consider taking and the major problems identified, the next
polluting spills, earthquakes, flooded water
involved in drought management. If
then some of the coordination mechanisms
emergency plans are inadequate, participants
Each participant should be asked whether the
whole is prepared. If the general consensus
outside the DPS to address these problems.
without their personal commitment for making
realize that unless they become advocates for
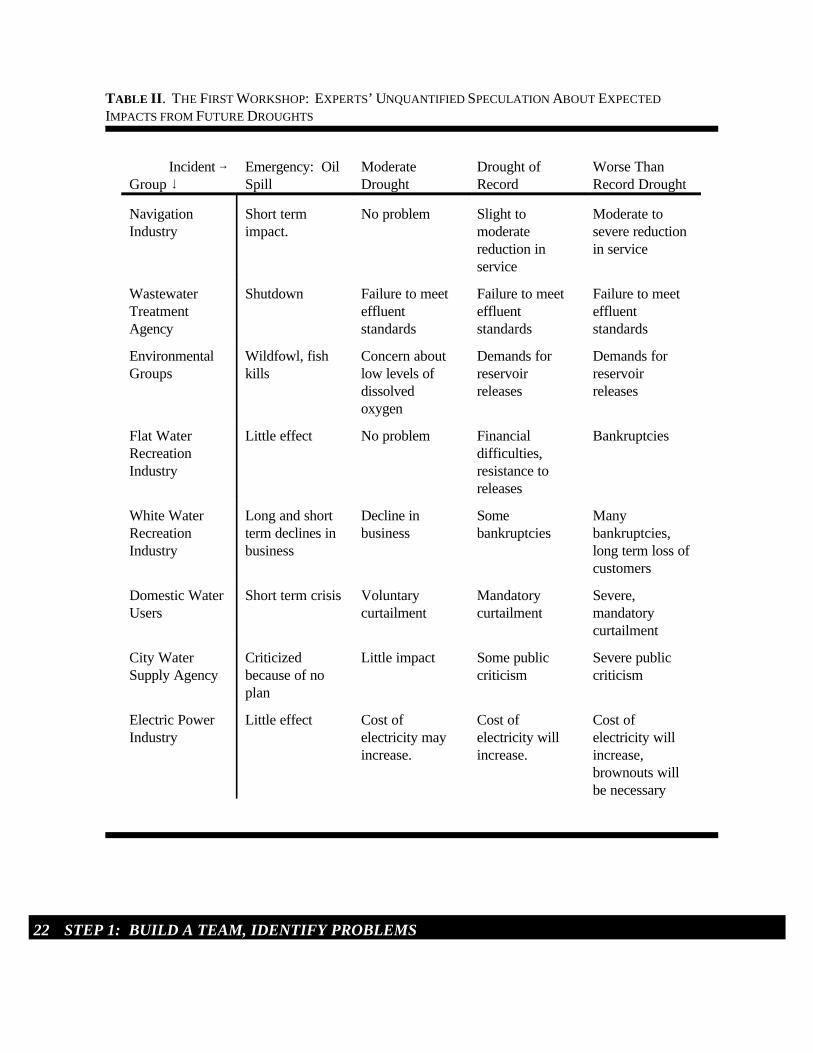
22 STEP 1: BUILD A TEAM, IDENTIFY PROBLEMS
Incident 6Group 9
Emergency: OilSpill
ModerateDrought
Drought ofRecord
Worse ThanRecord Drought
NavigationIndustry
Short termimpact.
No problem Slight to moderatereduction inservice
Moderate tosevere reductionin service
WastewaterTreatmentAgency
Shutdown Failure to meeteffluentstandards
Failure to meeteffluentstandards
Failure to meeteffluentstandards
EnvironmentalGroups
Wildfowl, fishkills
Concern aboutlow levels ofdissolved oxygen
Demands forreservoirreleases
Demands forreservoirreleases
Flat WaterRecreationIndustry
Little effect No problem Financialdifficulties,resistance toreleases
Bankruptcies
White WaterRecreationIndustry
Long and shortterm declines inbusiness
Decline inbusiness
Somebankruptcies
Manybankruptcies,long term loss ofcustomers
Domestic WaterUsers
Short term crisis Voluntarycurtailment
Mandatorycurtailment
Severe, mandatorycurtailment
City WaterSupply Agency
Criticizedbecause of noplan
Little impact Some publiccriticism
Severe publiccriticism
Electric PowerIndustry
Little effect Cost of electricity mayincrease.
Cost ofelectricity willincrease.
Cost ofelectricity willincrease,brownouts willbe necessary
TABLE II. THE FIRST WORKSHOP: EXPERTS’ UNQUANTIFIED SPECULATION ABOUT EXPECTED
IMPACTS FROM FUTURE DROUGHTS

STEP 1: BUILD A TEAM, IDENTIFY PROBLEMS 23
Circle 6Categories 9
A B - includes A,adds:
C - includes B,adds:
D: DecisionMakers
Agencies Corps, City andState WaterDepartment Staff
State Fisheriesstaff
Other Corps,State offices, city waterdepartments.
Mayor,Governor, Chiefof Engineers orauthorizeddesignate
Users Hydropowerindustry staffer
One professionalfrom eachpurpose(e.g., theHydropowerIndustry)
Technicalrepresentativesfrom all corporate users
CEO’s,Electorate
Advocates Professionalcitizenrepresentative
EnvironmentalGrouprepresentative
Onerepresentativefrom all relevantenvironmentalgroups
Experts University:Hydrologist/EnvironmentalEngineer/ResourceEconomist
Politicalscientists,engineers
Legislators may occasionally be Circle D decision makers if new laws are required to effect reduced drought impacts. More universally, though, they are an important medium through whichthe goals for managing water are articulated; they are directly responsible to the public. Whilethey may not be included in a circle, their views on the appropriate goals for a drought responseplan can be solicited in an issues study (see page B-3.)
TABLE III. THE TYPES OF PEOPLE THAT MIGHT WORK IN EACH OF THE CIRCLES OF INFLUENCE
step is to define what the team is trying to The composition of the team may change asdo in measurable terms. As the well, with some individuals comfortable with preparedness effort progresses, though, the a smaller role, while others decide to do moreproblems may be restated (new problems work and secure more influence in an innerdiscovered, other problems de-emphasized). circle.

24 STEP 1: BUILD A TEAM, IDENTIFY PROBLEMS
BLANK PAGE
(Skip)

4
STEP 2: DETERMINE OBJECTIVES AND EVALUATION CRITERIA 25
The success of drought response plans should be measured in terms of the minimization andequitable redistribution of the impacts of shortages, as opposed to the shortages themselves,but there is much to be learned about the best ways of accomplishing that.
Lessons Learned from the California Drought (1987-1992) (NDS-5)
A successful DPS team will reduce drought impacts through the implementation of theirrecommended measures. But what makes one plan better than another? And what criteriawill those who must approve the plan demand that it meet? Until the DPS team identifies thecriteria that define a successful study, they cannot manage to succeed. This chapter explainshow DPS teams can use five kinds of objectives and measures.
MANAGEMENT DECISION CRITERIA
OBJECTIVES AND METRICS
The DPS team should identify and articulate No matter how well the DPS management guidelines in five categories: recommendations work on paper, they will
! decision criteria that define broad goals and implemented. As part of the consciousand must be satisfied for the DPS effort to improve their chance ofrecommendations to be implemented; implementation, DPS teams should identify
! planning objectives that spell out how and recommendations and what criteria they willwhen the DPS team hopes to affect specific use in making that decision.water uses;
! constraints that specify what are water projects are told what the criterion is:undesirable, prohibited, or physically they are directed to recommend the plan thatimpossible outputs from the DPS; reasonably maximizes net National Economic
! performance measures of the water environmental constraints. The evaluation ofsystem, and alternatives in federal studies is designed to
! effects of alternatives on the environment,the economy, and social well being. But non-federal decision makers will use
not reduce impacts unless they are approved
who will need to approve their
Planners studying the feasibility of federal
Development (NED) benefits while meeting
address that criterion.
other criteria. In some cases, the criteria willbe very difficult to determine. For example,

26 STEP 2: DETERMINE OBJECTIVES AND EVALUATION CRITERIA
GOALS AND PLANNING OBJECTIVES
in deciding how early to declare a drought, To spell out specifically what the communitydifferent decision makers may favor different hopes to achieve by preparing for drought, tradeoffs between the risk of catastrophe and the DPS team must identify drought relatedthe frequency of inconvenience. problems to be solved and opportunities that
Some criteria will not be acknowledged orshared with the DPS team; they may constitute a hidden agenda or may be difficult to articulate.
The difficulty of defining all of these criteriadoes not diminish the need to address thosethat decision makers are willing to share withthe DPS team. Determining the criteria thatelected officials will use may be especiallydifficult for agency staff. In two of theNational Drought Study DPS’s (the James is paradoxically the most important andRiver and the Cedar and Green River),political scientists were hired to identify andinterview the political and agency leaders that would ultimately have to approve (orveto) plans developed by the DPS’s. Theinterviewers were well informed on the DPSplanning, modelling, and evaluation process,enabling them to share information about theDPS with the elected officials. The interviews and subsequent summary reportshelped to close the perspective gap betweenagency staff and elected officials.
The goals of a DPS will probably change only in degree from place to place; inevitably, people will be concerned abouteconomic efficiency, environmental quality,and fairness. (See page 9 for a discussion ofthe difference between goals and objectives).
could be realized. The team will developregional planning objectives related to thoseproblems and opportunities. Examples ofproblems and planning objectives are shown in Table V.
A planning objective is a concise, formallystructured statement which explains how andwhen a study will try to affect a specific water use in a specific place.
Developing good planning objectives early
most often ignored step in the planningprocess. How can a team manage toachieve objectives if they have not agreed on what those objectives are?
Planning objectives will often conflict withone another because they reflect thecompetition for water. Although objectivesshould be quantifiable, so improvement canbe measured, a specific numerical goal should not be specified as part of theobjective. Doing so implies that conflictingobjectives must be sacrificed until that level is met. The degree to which each objective is met must be determined by the evaluationprocess in which each plan’s economic,social, and environmental outputs arecompared.

STEP 2: DETERMINE OBJECTIVES AND EVALUATION CRITERIA 27
Describe the problems in a sentence or two. During a recent drought, thenumber of whitewater raftingdays was severely restricted,with millions of dollars inlost regional revenue.
Use a verb or action phrase which expresses what the team is trying to do (increase, enhance, reduce,mitigate, etc.) regarding a resource (water withdrawal,instream flows, etc.) in the context of the perceivedvalue of the resource (M&I uses, fish habitat, etc.).
increase the number of days of whitewater rafting
Add to that clause (verb, resource and context), thegeographic area of concern (in the lower JamesBasin).
between Ogle Point andDeadman’s Whirlpool
Finally, say whether this is a dynamic or static change. If demand is not expected to change in the future, then the problem strikes whenever a meteorological droughtoccurs. But if demand is increasing, or becoming more complex, then the problem may occur more often or to a greater degree in the future. The formercondition can often be remedied completely with atactical drought contingency plan. The latter may bebetter addressed in strategic planning because demand is outgrowing the structures, institutions and laws which were once adequate.
during droughts would be static; if conditions wereexpected to change for better or worse, then that should bestated as part of the objective:
during droughts until theOglethorpe water supply project is completed
Verbs commonly used in the action phrase include: advance, compensate for, conserve,contribute to, control, create, destroy, develop, eliminate, enforce, enhance, establish, exchange, improve, maintain, manage, minimize, mitigate, preserve, produce, promote, protect, provide, reclaim, reconstruct, recover, recreate, rectify, reduce, rehabilitate, repair,replace, restore, retire, stabilize, or substitute.
TABLE IV. WRITING A PLANNING OBJECTIVE.

28 STEP 2: DETERMINE OBJECTIVES AND EVALUATION CRITERIA
Kanawha River Basin DPS Planning Objectives
Problems: During a drought ... Planning Objectives
1. Whitewater rafting on the Gauley River isrestricted.
1. Increase the reliability and value of the Gauley River whitewater rafting experience during drought conditions.
2. Corps reservoirs are drawndown to meetdownstream water needs. In-lake recreation suffers when drawdown is significant.
2. Increase reliability of the recreationalopportunities on lakes in the Kanawha River basin during drought.
3. Normal navigation pools could be difficult tomaintain resulting in disruptions to navigationtraffic.
3. Maintain navigation on the Kanawha Riverduring drought.
4. Flows in the Kanawha River could decrease such that losses to hydropower generation at the 3 Corps of Engineers lock and dam projects could occur.
4. Maximize hydropower generation in theKanawha River basin during drought.
TABLE V. PLANNING OBJECTIVES FOR A TYPICAL DPS
Examples of things which are not planning objectives:
! To increase economic benefits (this is a ! Reduce groundings in the channel is toobroad goal at the regional level, and cuts narrow; this could be achieved by across several objectives - see Chapter 1 banning navigation. The objective couldfor a discussion of goals and objectives). be to improve navigation between (point
! Build a desalting plant (This is a means,not an objective). ! Maintain instream flows between river
! Eliminate water supply shortfalls a constraint, rather than an objective. (Measures should be “sized” after But a complementary objective may beconsideration of their costs). more useful; a team may find a way to
! Assess the impacts of droughts (This is between river miles 300 and 305 duringa study procedure, not an end in itself.) droughts other than enforcing a minimum
A and B) during drought.
miles 300 and 305 at 800 cfs or above is
enhance water quality fish habitat
flow at all times.

STEP 2: DETERMINE OBJECTIVES AND EVALUATION CRITERIA 29
CONSTRAINTS PERFORMANCE MEASURES
EFFECTS OF THE ALTERNATIVES
Constraints express what may not be done statistical measures of the performance of theunder existing institutions. Typical water system relative to the needs of the constraints include requirements to maintain user. The development of these measures isa specific rate of instream flow, or to satisfy essentially a technical assignment, but thelaws regarding priorities in the right to use acceptance and relevance of performancewater. Although not generally characterized measures can be confirmed in workshops andas planning constraints, the physical stakeholder interviews. Examples oflimitations of storage and transmission performance measures are shown on facilities are conceptually no different from Table VI.legal constraints. Constraints that prohibitcertain alternatives are antithetical to theconcept of multiobjective evaluation, and DPS teams should consider challenging them if they stand in the way of meeting Performance measures do not provide a basisobjectives. There will be an additional for tradeoffs among conflicting objectives. burden of proof, however, imposed on a DPS For example, reducing the frequency ofteam that recommends a plan that violates navigation restrictions through increasedconstraints that constitute clearly stated, releases from a reservoir may increase thepublicly resolved decisions. amount of time boat ramps around the
Planning objectives and constraints are used: water. To what degree should each be
! as screening criteria in the initialevaluation of alternatives. Plans that In a multiobjective analysis, the effects of theaddress only some of the objectives or loss of each activity on the basic objectivesfail to meet constraints may be (regional goals) for managing water areeliminated or force a reformulation of the estimated. The most commonly consideredobjectives. objectives are economic efficiency,
! as management criteria used in deciding equity. The usefulness of this approach ishow to allocate study resources among most obvious when the effects of thegeographical and topical areas. alternatives accrue against only one
! as a basis for identifying quantifiable differences between preserving navigation measures of system performance. For and recreation were economic, then it wouldexample, the number of days when flows make sense to balance the level of navigationare above 1200 cfs and number of days and recreation to maximize economic with flows above 800 cfs might be useful benefits. Chapter 7 discusses ways ofmeasures of the degree to which the informing the negotiation of multiobjectiveobjective “increase the number of tradeoffs.whitewater rafting days during drought” is met.
The study team should also develop
perimeter of the reservoir are out of the
sacrificed?
environmental quality, social well being and
objective. If, in the example above, the only

30 STEP 2: DETERMINE OBJECTIVES AND EVALUATION CRITERIA
Water UseCategory
Typical Performance Measure
Municipal Frequency of failure to meet unconstrained demand.
Industrial Frequency and duration of supply failures.
Navigation Frequency and duration of channel closing or imposition of lightloading requirement.
Lake Recreation Frequency and duration that boat ramps are out of the water.
River Recreation Frequency and duration of depths or flows too low for recreation.
Hydropower Power produced, or frequency of failure to meet minimum levels ofproduction.
Fish Habitat Frequency of failure to meet minimum flow targets.
Irrigation Probability of failure to supply water need for this year’s plantings.
TABLE VI. TYPICAL MEASURES OF PERFORMANCE
ACCOUNTS
An alternative may produce economic effects different stakeholders who support the sameby changing the level of activity in several means. For example, a team may be water purposes. For example, changing the working under a constraint to provide rules for reservoir releases may change the instream flows for fish. The constraint may level of hydropower production, navigation be managed by an state fish and game and several forms of lake and riverine agency and supported by a Native Americanrecreation. The change in each activity will tribe, an environmental group, and anhave economic consequences. association of small businesses that outfit
Establishing an account for these economic days that streamflows fell below the effects allows the total economic effect of an minimum standard would be a simple, usefulalternative to be summed and compared to performance measure, but it would not the total economic effect of other reflect the complexity of the effects of failingalternatives. Accounts can also be to meet the standard.established for environmental quality, socialwell being, and equity, although (unlike the The environmental group might support theeconomic account) there is almost certain to minimum flow standard because it helpsbe more than one unit of measurement for preserve a threatened or endangered speciesthe effects within any one of these accounts. (an environmental effect). The tourists may
The use of the accounts not only helpsorganize the effects, it can help plannersunderstand distinctions between the ends of
tourists who come to fish. The number of

STEP 2: DETERMINE OBJECTIVES AND EVALUATION CRITERIA 31
RESISTANCE TO THE USE OF ESTIMATED
EFFECTS IN THE EVALUATION OF
ALTERNATIVES ADVANTAGES OF THE MEASURING
EFFECTS BY ACCOUNT
be concerned about the decreased opportunity Changes in the operating policies of a federalto fish, an impact that can be measured in reservoir require an environmental economic terms according to their assessment.willingness to pay for that experience. Theoutfitters would have a special concern for ! will tradeoffs between regional planningtheir own viability. If reducing instream objectives be necessary? In the Kanawhaflows would bankrupt a class of businesses, River DPS, an alternative was identified thatthat alternative might be judged inequitable. helped many stakeholders and hurt no one. The tribal concern could be for the But if no such alternative can be found, thenmaintenance of a traditional, formal social alternatives can only be compared to oneactivity. Knowing the ultimate objectives of another using estimated effects.each stakeholder group can help DPS teamsdevelop and estimate the acceptability of ! are financial costs involved? If so, then alternative management plans. the estimation of effects can be used to
It may be difficult and expensive to estimatethe effects of alternatives. DPS teams must The impossibility of defining and measuringcarefully consider the following questions these effects perfectly may frustrate some before deciding what effects should be DPS teams and preclude them from thesemeasured: benefits of imperfect estimations:
! do the decision criteria demand an ! estimates of economic effects can suggestestimation of effects? In federal feasibility the underlying value of water use andstudies, the selected plan must reasonably encourage the use of water markets, dry yearmaximize net NED benefits. If one of the options, or other similar alternatives in whichalternatives in a DPS involves the the use of water is traded for money. modification of a federal water project, then Similarly, differences in economic benefitsNED evaluation is essential. among plans can be used to justify different
determine an appropriate level of investment.
levels of investment.

32 STEP 2: DETERMINE OBJECTIVES AND EVALUATION CRITERIA
CHECKLIST OF WATER USES, PROBLEMS, AND EVALUATION MEASURES
WaterUse
Problem PlanningObjectives
Measures ofPerformance
DecisionCriteria
RelatedEconomic,
Social,Environmental
Impacts
Irrigation
LivestockWatering
MunicipalWater
IndustrialWater
Hydropower
LakeRecreation
RiverRecreation
Water Quality(Dilution)
Fish &WildlifeHabitat
Flood Control
Navigation
TABLE VII. A CHECKLIST OF WATER USES, PROBLEMS, PLANNING OBJECTIVES AND
PERFORMANCE MEASURES
Off
stre
amIn
stre
am

5
PREDICTING THE STATUS QUO 33
A drought preparedness study goes beyond a simple determination of future resourceconflicts; it serves as a motivator for conflict resolution. Without knowing your status quofuture, you lack a basis for motivation. After all, if you don’t know where you’re going, whyplan any changes?
Richard Punnett (Huntington district, Corps of Engineers)
The status quo is simply a collective best estimate of what future droughts will be like if theDPS fails to make a difference. It serves as the baseline from which to measure the strengthsand weaknesses of alternative drought responses, and a consensus view of the problemsstakeholders will face if they fail to agree on an alternative. Dr. Punnett’s reflection is drawnfrom his own experience leading a DPS workshop of stakeholders who had competed forwater in a 1988 drought. He had presented a clear vision of what would happen in futuredroughts under existing operating rules. The stakeholders, who had participated in theconstruction of the computer model of that vision, supported a combination of two alternativeplans that hurt no one, and helped many. Whitewater rafting outfitters rejected a plan thatwould have provided them with even more water because the shared vision model showed thatit would decrease lake recreation. The outfitters acknowledged that it made little sense tohold out for the alternative that maximized their gain while hurting other stakeholders, theyalmost certainly would have been left with the status quo. This chapter explains how thestatus quo should be defined and modeled.
THE STATUS QUO
Whether the subject is property lines, things as additional water supplies, droughtmountain elevations, or drought impacts, contingency plans, and external conditionsmeasurements cannot be compared unless such as projected increases in population andthey are referenced to a baseline. The third economic activity. step of the DPS planning method is to create a baseline by describing the future without The status quo can also provide motivation the DPS; that is, how the region would to a DPS team to produce results, because respond to and how it would be affected by the status quo is a thoughtful, detailed, anddroughts if no actions are taken as a result of collective forecast of what the future willthe DPS. This future without the DPS is bring if they do not.referred to as the status quo.
The status quo should reflect developments agree on aspects of the status quo they arethat will change drought impacts so long astheir implementation is not related to theDPS. These developments include such
In some cases, stakeholders may refuse to
contesting outside the DPS. For example, two stakeholders may have opposing positions on a permit application for a new

34 PREDICTING THE STATUS QUO
water supply source, and may feel that to The DPS team must now try to quantify thepublicly accept an outcome opposite their problems that were identified in general position as “most likely” will be considered a terms in step 1 (Table II). To do that, theyreflection on the merits of their case. In such will:cases, DPS teams can fulfill the baselinerequirement by selecting one of the possible ! Build a model of the water managementfutures without claiming it is the most likely and allocation system with involvement fromscenario. stakeholders. The model should include the
The effects of drought contingency plans, deliveries or levels and the impact onwater laws and institutions as they currently stakeholders.! Make hydrologic estimates ofexist should be reflected in the status quo. drought frequency, and select the designThis should include the basic water droughts.allocation system, of either riparian orappropriation type, any site-specific ! Measure the performance of the waterprograms, provisions for public trust and system during the design droughts.instream flows, water conservation, transbasin diversions, and ground water The next several pages illustrate how thatmanagement (all are discussed in Annex D). might be done.Some of these provisions are of particularimportance, as indicated in the followingparagraphs.
The DPS team should carefully define thethresholds for implementation of extrememeasures. For example, every westerngovernor has the authority to “condemn” water rights during a drought, which is to take the right to use water from private owners if it is needed for the public good.However, this is an extreme measure,however, and has never been used(Willardson, 1986).
relationship between shortfalls in water

Stream: Inflow rates
Reservoir:Quantity of water stored
Reservoir Releases
Reservoir Release Rules
Instream flow requirements
Stream flow
Water Surface Elevation
Supply of processing water
Production
EmploymentDeliveries
PREDICTING THE STATUS QUO 35
MODELLING THE STATUS QUO
FIGURE 3. A SHARED VISION MODEL CAN ILLUSTRATE HOW STAKEHOLDER CONCERNS ARE
CONNECTED TO MANAGEMENT OF THE WATER SYSTEM
! The shared vision model of the status quo process. In a severe drought, stream watershould define the relationship between water surfaces may drop so low that the intake is and the stakeholders ultimate purposes for no longer submerged. using water. These relationships can bedeveloped though interviews with principal Figure 3 illustrates how the relationshipstakeholders. The specific situation of each between stakeholders’ ultimate needs and thestakeholder may even be modeled during the water management system can be interview. In the example illustrated below, diagrammed.one stakeholder is an industry that uses waterdrawn from a stream as part of its production

Supply of Processing Water
Production
EmploymentDeliveries
36 PREDICTING THE STATUS QUO
MODELLING THE STATUS QUO (CONTINUED)
FIGURE 4. THE RELATIONSHIP BETWEEN WATER
AND PRODUCTION FOR ONE STAKEHOLDER.FIGURE 5. THE QUANTIFIED RELATIONSHIP
BETWEEN COOLING WATER AND PRODUCTION.
In this example, employment and deliveries - function relating production to the supply ofthe factors most directly related to processing water by “double-clicking” thestakeholder profitability and viability - are computer mouse when the computer cursordependent on production, which in turn points to the icon representing “production”. requires processing water. The same icons These functions can be defined based onused to diagram these relationships existing and new studies, including (Figure 4) are used to quantify them interviews with the stakeholders during the (Figure 5). The modeler defines the DPS.

Supply of Processing Water
Stream Surface Elevation
Stream Flow
Reservoir Releases
Stream: Inflow rates
Reservoir:Quantity of water stored
Reservoir Releases
Reservoir Release Rules
Instream flow requirements
PREDICTING THE STATUS QUO 37
MODELLING THE STATUS QUO (CONTINUED)
FIGURE 6. THE RELATIONSHIP BETWEEN
SYSTEM AND STAKEHOLDER WATER.FIGURE 7. THE CENTRAL WATER SUPPLY
SYSTEM.
! The water supply system and its Figure 3 depicts the reservoir storage,relationship to stakeholders’ needs is also inflow, release and the rules governingmodelled. Figure 6 shows how the supply of releases. The shared vision model nowprocessing water is a function of surface includes all the relationships necessary towater elevations at the water intake, which is determine how changes in inflows to thein turn a function of streamflows at that reservoir or reservoir releases will affectpoint. (These relationships may have been employment and deliveries.developed by observation or separatehydraulic modelling efforts).

Daily Production Loss
Production
Cumulative Production Loss
Hourly loss = Maximum production minus actual production
- from interview with W.C., Acme Products, 11/3/93. (RP)
Daily production loss =
24 * (80000 - PRODUCTION)
38 PREDICTING THE STATUS QUO
MODELLING THE STATUS QUO (CONTINUED)
FIGURE 8. COUNTING THE NUMBER OF DAYS
WITHOUT PROCESSING WATER.FIGURE 9. THE DEFINITION OF DAILY
PRODUCTION LOSS.
! Performance measures should be included Figure 9 shows the equation that quantifiesin the status quo model. Figure 8 shows that daily production loss, revealed by “clicking”one performance measure, “Cumulative when the computer cursor points to the iconProduction Loss” is defined based on Daily named “daily production loss”.Production Loss which is in turn a function of “Production”.

PREDICTING THE STATUS QUO 39
SELECTING DESIGN DROUGHT(S)
In flood damage reduction studies, the statistical population, it is obvious that theexpected value of future damages are design will become distorted (Maass, 1962).estimated using a series of increasinglylarger and rarer floods. In many cases, large Record low precipitation in the early andand small floods have the same shape middle 1960's created a drought emergency (defined by the onset, peak, and subsidence in New England and the mid-Atlantic states.of high streamflows over time); only the Planners had designed water systems on themagnitude is different. Flood magnitudes drought of record, but the 1960's drought can often be characterized in terms of one was more severe (Holmes; 1979). At theparameter; streamflow. A sixty year period beginning of the National Drought Study, aof stream flow records constitutes a large number of well informed conference speakerssample size - thousands of short duration stressed how improbable a three year flooding events - from which to estimate the drought in California would be, although thatprobability that floods will exceed a given drought eventually lasted six years. Thepeak. National Drought Atlas can be used to
But droughts are not as easily characterized thus enhance planners confidence in the use as floods. No one can predict the form of a of the historic drought to test drought plans. future drought; droughts have different But the use of the historic drought cannotseverities, durations, and patterns of severity. provide answers concerning the vulnerability(They may be moderately severe for years or of the region to more severe droughts orvery severe for a season). In many regions, droughts with different patterns.multi-year droughts are of major concern. For some interests, the deficiency of flow in An alternative approach, easilya given year causes the main economic accommodated by modern computer softwareimpact whereas for other interests, carryover and hardware, is to consider a variety ofstorage can provide for one year’s synthetically defined droughts, and to worrydeficiency. The cumulative effect over less about proving they could happen andseveral years is most important. In some worry more about the consequences if theyforms of agriculture, farmers can reduce did happen. This will provide additionaleconomic impacts of a prolonged drought by information for the DPS team. If the impactschanging crops or letting fields lie fallow of drought increase precipitously for until the drought is over. droughts greater than the drought of record,
Because the sequence of events within a benefits of preparing plans for these severedrought is important and at the same time droughts. The desire to prove that a beyond our ability to forecast, planners often sequence of low flows could happen may betest drought plans by using the precipitation expensive and time consuming. If agreementand runoff recorded during historic droughts, can be reached, further study of frequency either the worst on record, or the worst in can be curtailed. See Annex G, Hydrology,recent memory. for more information on analyzing drought
The primary disadvantage to this approach has been the inability to estimate the
probability of a similar drought occurring inthe future. If the most severe droughts orfloods on record are not representative of the
determine the rarity of historic droughts, and
the DPS team should consider the costs and
frequencies.

40 PREDICTING THE STATUS QUO
THE NATIONAL DROUGHT ATLAS
SPECIALIZED COMPUTER MODELS
The National Drought Atlas is acompendium of statistics designed to helpwater managers and planners answerquestions about the expected frequency,duration and severity of droughts. The Atlaswas developed collaboratively by the Corpsof Engineers, Miami University (Ohio), theNational Climate Data Center (NCDC), andInternational Business Machines (IBM). TheAtlas is based on recently refined nationalprecipitation and streamflow data sets. Thestatistics were generated using a method(referred to as l-moment analysis) developedat IBM by J.R. Hosking and J.R. Wallis. The method permits greater confidence inestimating drought frequencies from therelatively small number of droughts for which there are precipitation and streamflowrecords.
The Atlas includes statistics in threecategories:
! Precipitation. There are tables and graphs showing the percentage of normalprecipitation that can be expected for a variety of durations, starting months, andfrequencies for 111 “clusters” covering thecontiguous 48 states. The recurrence intervals range from a 50 year dry to a 50 year wet event.
! Streamflow. The Atlas includes tablesand graphs showing the percentage ofnormal streamflow that can be expected atvarious frequencies for durations of up to 12months at individual gaging stations in the 48contiguous states. The return intervals are the same as for precipitation.
! Palmer Index. The Atlas includes tablesshowing the percentage of time in the
historic record that the Palmer DroughtSeverity Index (PDSI) fell below -3, -4, and -5. The PDSI was calculated at 1,135precipitation stations and are displayed stateby state. These are at-site sample statistics.
Annex N has more information on the Atlas,including a description of how it might beused.
The evaluation of alternative drought plansrequires an understanding of the relationshipsbetween precipitation, streamflow, waterwithdrawals, operating rules, consumptive use, water rights, return flows, and consumerresponses to drought. In many regions, watermanagers have already developed models ofone or more of these sub-systems.
The National Drought Study Report NDS-7,Water Resources Models summarizes brandname models in eight categories:
! general purpose software (such asspreadsheets)! municipal and industrial water useforecasting! water distribution systems (pipe networks)! groundwater! watershed runoff! stream hydraulics! river and reservoir water quality! river and reservoir system operations
Economic models and less well known, veryspecialized models may be used in a DPS.Once the planning objectives have beenidentified, existing regional computer modelsthat can answer questions pertinent to theplanning objectives should be identified.

6
STEP 3: FORMULATE ALTERNATIVES 41
Genius is one percent inspiration and ninety-nine percent perspiration.
Thomas Alva Edison, 1932
Edison’s light bulb, shining in a thought balloon, has become the image associated with the discovery of better ideas. But, as Edison’s famous quotation suggests, this is not how inventionworks, and certainly not how new water management ideas are developed. What will prevent a DPS team from overlooking the good alternatives? In what detail should an alternative beformulated before it is evaluated? And how do group dynamics influence the formulation ofalternatives? This chapter provides a conceptual framework for classifying and understandingalternatives.
WHAT IS AN ALTERNATIVE?
THREE TYPES OF ALTERNATIVES
FORMULATING ALTERNATIVE PLANS
The status quo describes how a region would such as pollution of water supply, ordeal with drought without the help of the disruption of water delivery by floods,DPS. This scenario should include any earthquakes, and cold.changes that would occur over the planningperiod without the DPS. Conversely, Some alternatives are on the border of twoanything that the DPS could change can be categories. While it is not important for aan alternative. study team to label an alternative as being
Measures to reduce water shortage impacts responses can be much more effective if thecan be categorized as strategic, tactical, or coordination mechanism is exercised alongemergency. Strategic measures are long- with the tactical drought response. And theterm responses, such as the provision of effectiveness of some drought contingencywater supply storage, or codes requiring the measures may be helped or hurt by theinstallation of drought resistant landscaping implementation of strategic measures. in new homes. They are usually established Table VIII lists the three types of in law and supported by considerable alternatives. Flood responses can be gearedinvestment. Drought responses (often called to one parameter, peak flow. However,drought contingency plans) are tactical because droughts are multi-dimensional,measures. Tactical measures are short term tactical measures may be specified in generaland deal with problems within the framework terms during the DPS, but applied in moreset by strategic measures. Emergency specific terms during a drought.measures are responses to circumstances that
exceeded expectations, such as droughts more intense or prolonged than any on record, or events with a very rapid onset,
exclusively in one of these three categories, it is necessary for a team to consciouslyconsider the relationships between the threetypes of measures. For example, emergency

42 STEP 3: FORMULATE ALTERNATIVES
THE THREE TYPES OF ALTERNATIVES
TYPES EXAMPLES
Strategic measures are long-term responses. They are more likely to beestablished in law andsupported by considerableinvestment.
Strategic measures include long term conservation programs,conjunctive management of surface and groundwater, assurancedistricts, construction of new reservoirs, changes in state law, the reassignment of water responsibilities among water agencies, and increasing water prices or adjusting rate schedules.
Tactical measures are short term responses planned within a strategicframework
Response measures (conservation or supply); triggers for thoseresponses; methods of collaboration on decisions; new decisionprocesses; new ways of dealing with and involving the public.
Emergency measures areresponses to unexpectedcircumstances.
Emergency drought responses may be required when a drought is much more severe or long lasting than had been thoughtpossible. Emergency measures might include plant closings or the condemnation of water rights. A drought planning team might also want to consider emergency responses to watershortages not caused by drought, such as a city’s response to an oil spill which will require the closure of its main water intakes, or an earthquake which destroys water supply lines.
TABLE VIII. THREE TYPES OF RESPONSES TO WATER SHORTAGES.
INITIAL LIST OF ALTERNATIVES
An initial list of alternatives should be how these initial ideas can be evaluateddeveloped by brainstorming (see page 16) quickly so that only the most promisingearly in the DPS, but after first statements of alternates are developed in detail.problems and planning objectives have beendeveloped. Brainstorming can be Drought response plans are composed ofsupplemented with the generic alternatives tactical measures. Tactical plans can oftenlisted in Table IX, page 49. Brainstorming is greatly reduce a region’s vulnerability toapt to include a number of preconceived drought, and are usually easier to implementalternatives to the status quo, some advanced than strategic alternatives.by the stakeholders it will benefit. DPS
teams should focus on the ends, not the means, and should avoid using the DPS tojustify any group’s idea. Chapter 7 describes

STEP 3: FORMULATE ALTERNATIVES 43
ELEMENTS OF A TACTICAL
DROUGHT PLAN
A drought response plan is a series of severe it would be, and how effective tactical measures that will be implemented at demand management measures would be, the time of the drought to reduce the residual they could optimize the magnitude, timing drought vulnerability left by strategic and duration of the response measures tomeasures. minimize the negative impacts to
A tactical response plan should have the cannot be known until the drought is over,following elements: managers use forecasting techniques to
! triggers! forecasts Case study experience during the National! monitoring Drought Study suggested three ways that ! enforcement DPS teams might be able to improve the! public affairs strategy usefulness of forecasts. First, the forecasts! management measures should be used as inputs to the shared vision! coordination mechanism model to evaluate the probable impacts of
An overview of each element follows. A Second, the agencies in a DPS study shoulddiscussion of how strategic and tactical pool forecasting sources and data analysismeasures can be integrated begins on page during the DPS to provide the most 47. consistent and complete basis for individual
Triggers. Because a drought does not beginwith a climatic event, like a flood, its onsetmay be difficult for stakeholders to recognize. A drought indicator is an objective measure of the system status thatcan help agencies identify the onset, increasing or decreasing severity, andconclusion of a drought.
Plans generally call for certain measures to be initiated when a drought indicator reaches a predefined level, a trigger. Trigger levelscan be refined through computer modelling to strike an acceptable balance between thefrequency of drought declarations and theeffectiveness of an early response. The nature of the indicator and the level at whichresponses are triggered should be selected to
reduce economic and environmentalconsequences.
Forecasts. If water managers knew inadvance how long a drought would last, how
stakeholders. Because these things generally
estimate supply and demand functions.
alternative measures during a drought.
agency responses. Third, public informationspecialists should discuss the form of theforecast information with technical specialists. The media and the public willinsist on simply stated predictions, and it willtake a deliberate effort by technicians andpublic information specialists to developlanguage that is simple and meaningful (NDS-5). The team may need to seek newsources of forecast data. The NationalWeather Service and the U.S. GeologicalSurvey are the prime sources nationwide forforecast data, and the Soil ConservationService’s cooperative snow survey is animportant source in 11 western states. TheCorps of Engineers, the Bureau ofReclamation, and most states also haveprograms to collect or process forecast data.

44 STEP 3: FORMULATE ALTERNATIVES
Demand forecasts may also be important. decision making processes during a droughtMunicipal consumers will greatly reduce can help avoid (but does not guarantee) thewater use if they are convinced that the communication of confusing and discordantdrought is a real threat (NDS-5). But the information to the public. The public willpercent reduction is difficult to predict unless want to know the answers to the mosta city has recent experience or is using a fundamental questions in the mostsophisticated disaggregated water use straightforward terms: “Are we in a forecasting model. drought?”, “How bad is it?”, “How does this
Monitoring. Monitoring mechanisms must be used to determine if the drought responseplan is having its intended effect. In theSeattle drought of 1992, the amount of waterconsumed was published daily in a localnewspaper.
Enforcement. Demand reduction programsmust be enforced if public support for them is to be maintained (AWWA, 1992). Enforcement rules can be codified in city,county, or state ordinances. Violators willoften be turned in by water users who arecomplying, but in some cases, cities have used “drought police” to enforce demandreduction ordinances. Scofflaws may beissued warnings with educational pamphlets,or fined.
Public Affairs Strategy. The phrase publicinvolvement has generally been used to refer modification. Most major cities in the to efforts that include the public in planning, United States have instituted some form ofwhereas public relations is more often used strategic demand modification programs, andto describe the methods an organization uses nearly all rely on short term demandto promote a favorable image with the modification to address temporary, droughtpublic. Public information or affairs is induced shortfalls. In some communities,somewhere in the middle, but it is the public due to the difficulty of finding new sourcesaffairs staff that should communicate and the general environmental opposition toinformation to the public during a drought. new dams, demand management alternatives
Previous droughts and public affairs sources are tapped. The term waterexperience in other areas have shown the conservation is generally used to describeworth of having a public affairs strategy strategic demand management measures,developed by a team of water and public and curtailment to refer to tactical measures. affairs specialists (Opitz, 1989). The Specific measures include public informationagreement to use the collaborative DPS campaigns, changes in outdoor landscaping
affect me?”, and “When will it be over?”(NDS-5). In a region with multiple watersupply systems, people may live in acommunity with no drought problems andwork in another that must impose water userestrictions. The media are not droughtexperts and may not have time to learn whatthey need to know during a drought. Thisproblem can be reduced by inviting the media, especially meteorologists and sciencereporters, to demonstration workshops thatshow highlights from virtual droughts (seepage 65). More information on public affairsis available in Annex I.
Management measures. A variety oftactical response measures is listed in Table IX. The most common are discussedbelow.
! Municipal and industrial demand
must be exhausted before new supply

STEP 3: FORMULATE ALTERNATIVES 45
practices, changes in the price of water, Hydropower production may or may notregulations and incentives that increase the reduce the availability of water for otheruse of more efficient water fixtures, critical needs. Hydropower production can prohibitions on certain uses, and growth be replaced by thermal power duringmanagement. The use of water conservation droughts, but at a financial cost and with ahas become more widespread because it can potential impact on air quality.be the least expensive way to accommodatenew demands. It can also reduce the costs of Shippers can light-load barges if normalmeeting stable demands by reducing long channel depths are not available, but thisand short term energy, water treatment and increases shipping costs. wastewater treatment costs.
Water conservation may paradoxically generally set at threshold levels, so furtherincrease drought vulnerability. In the Boston reductions will generally have environmentalarea, long term water conservation has effects (NDS-5). However, in some casesreduced not only per capita, but total water (such as the Kanawha River DPS), existinguse (NDS-10 and 12). At the same time, the instream flow requirements may not reflectwater supply storage system can store biological needs because of reductions inseveral years of normal inflows. As a result, effluents since the standard was established. conservation allows higher average reservoir Flat water recreation may suffer from astorage levels, and reduces drought decrease in demand during drought becausevulnerability. of aesthetics (mud flats replace shoreline),
However, the Boston case is atypical. be accommodated with boat ramp extensionsAbsent multi-year storage, water saved from and dock modifications. Whitewater rafterslong term conservation may only be can use a greater number of smaller rafts. conserved for that year. When droughts dooccur, storage will be about the same and thepercent reduction in water use possible fromcurtailment will be less.
The question of whether and to what degreewater conservation and drought vulnerabilityare interdependent can be answered using asystem analysis such as the MassachusettsWater Supply Authority’s “Trigger Planning”, a system of data and models builtaround a shared vision model (NDS-12).
! Modification of other demands. drought provided that proper arrangementsFarmers adapt to market trends and water are made with respect to safe yields.availability before planting, but after plantinghave a limited ability to curtail water useduring a drought (NDS-5).
In-stream environmental water needs are
but the visitors that do come may be able to
! Conjunctive use. Although surface andground water supplies have usually beendeveloped separately, the increasing difficulty in finding new sources of watersupply is causing increased interest inconjunctive use, or joint development ofground and surface sources. The potentialfor increasing safe yield by this approach isconsiderable.
In large, deep aquifers, withdrawals fromgroundwater can be increased during
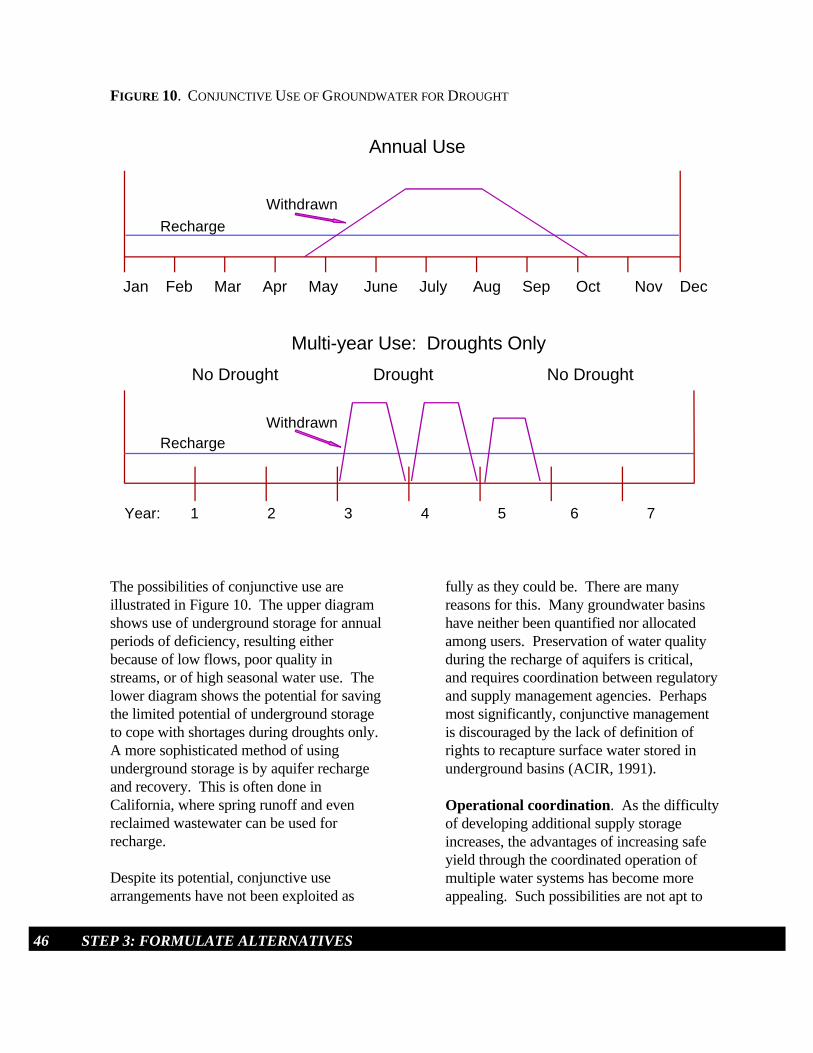
Annual Use
Multi-year Use: Droughts Only
Jan Feb Mar Apr May June July Aug Sep Oct Nov Dec
Year: 1 2 3 4 5 6 7 8
No Drought Drought No Drought
Recharge
Recharge
Withdrawn
Withdrawn
46 STEP 3: FORMULATE ALTERNATIVES
FIGURE 10. CONJUNCTIVE USE OF GROUNDWATER FOR DROUGHT
The possibilities of conjunctive use are fully as they could be. There are manyillustrated in Figure 10. The upper diagram reasons for this. Many groundwater basinsshows use of underground storage for annual have neither been quantified nor allocatedperiods of deficiency, resulting either among users. Preservation of water qualitybecause of low flows, poor quality in during the recharge of aquifers is critical, streams, or of high seasonal water use. The and requires coordination between regulatorylower diagram shows the potential for saving and supply management agencies. Perhapsthe limited potential of underground storage most significantly, conjunctive management to cope with shortages during droughts only. is discouraged by the lack of definition ofA more sophisticated method of using rights to recapture surface water stored inunderground storage is by aquifer recharge underground basins (ACIR, 1991).and recovery. This is often done in California, where spring runoff and evenreclaimed wastewater can be used forrecharge.
Despite its potential, conjunctive usearrangements have not been exploited as
Operational coordination. As the difficultyof developing additional supply storageincreases, the advantages of increasing safeyield through the coordinated operation ofmultiple water systems has become moreappealing. Such possibilities are not apt to

STEP 3: FORMULATE ALTERNATIVES 47
INTEGRATING STRATEGIC AND
TACTICAL PLANS
be among the first to be suggested. In fact, over time. Again, position analysis using theadministrators and operators of water shared vision model can help the DPS teamsystems are usually very reluctant to consider develop general relationships between such an alternative, which would deprive triggers and the degree of drought responseeach system of a part of its operating measures. The model should also be usedautonomy in the interest of overall efficiency during a drought to reanalyze the benefits,and total aggregate safe yield. However, as costs and risks of shifting to the next the other disadvantages of alternatives are response stage too soon or too late.evaluated, intersystem operationalcoordination may become the only practicalanswer.
Depending on the circumstances, operationalcoordination of the facilities of two or more The DPS method of preparing for drought iswater systems can usually provide a safe based on sound principles for water yield of water greater than the total available. resources planning and management for allThis can happen if the systems are operated meteorological conditions. The frequency ofseparately, each maximizing its own financial drought declarations, and the effectiveness ofreturn. The classic example is in the tactical and strategic measures arePotomac River Basin. Coordinated operation interdependent.of the upstream and downstream facilities ofthe various public and private utilities can As part of the National Drought Study, theproduce a total safe yield 45% higher than Massachusetts Water Resources Authoritythat of the same utilities operated separately (MWRA), the Water Supply Citizens(Eastman, 1986). In other river basins such Advisory Committee (WSCAC), and the large savings are not usually possible. New England division of the Corps ofHowever, a study made for the State of New Engineers collaborated on a project to relateJersey for public and private systems on the strategic and tactical water resourcesPassaic River showed that a 25% increase in measures. Collectively referred to as triggertotal safe yield could be gained by an planning, it is an attempt at what might beintegrated operational control (David, 1989). called “just in time” water supplyOn a smaller scale, regional use of reservoir enhancement; an operational system that cansystems is being developed in Texas. reduce economic and environmental
Staging management measures. Droughtresponse measures come at a cost, so theirimposition should come in stagescommensurate with the seriousness of thethreat of drought damages. Early invocationof moderate demand reduction measures candelay or prevent the implementation of morerestrictive responses. Still, the decision tointervene earlier in a drought is a decision toincrease the number of drought declarations
investments in supply and demand measureswhile maintaining necessary water supplyreliability.
Droughts in the 1960's in New England andthe mid-Atlantic and in the 1980's and 90's in Atlanta, California, and Seattle broughtrenewed public interest and support forstrategic changes to balance water supply anddemand. Even if studies of strategic measures begin before water shortages occur,

48 STEP 3: FORMULATE ALTERNATIVES
FIGURE 11. TRIGGER PLANNING KEEPS ECONOMIC
AND ENVIRONMENTAL INVESTMENTS IN WATER
SUPPLY LOW WHILE AVOIDING CATASTROPHIC
WATER SUPPLY FAILURES.
there is no assurance that the study will solve ! the use of a shared vision modelthe problem. Supporters and
opponents of various supply and demand Because water use forecasts can be easilymanagement alternatives may contest each adjusted as new population and employmentothers positions in planning, regulatory, forecasts become available, trigger points forlegislative and judicial forums. If theplanning later stages of implementation can be keptrecommendations are rejected in a permitting current. If new forecasts call for slowerprocess or judicial review, more time will be growth, trigger points are moved into therequired to develop an acceptable alternative future and implementation of the next step isplan to an implementable level of detail. delayed.
Trigger planning is a new approach to urban water management. MWRA’s triggerplanning system is built from traditional datasources and models, but with three additionaland unusual building blocks:
! the close collaboration of WSCAC andMWRA. MWRA pays for two full-time staff positions and office expenses forWSCAC. WSCAC has complete onlineaccess to MWRA’s computer files. WSCACis respected for its independence and supportfor environmental and fiscal values. However, its closeness to MWRA allows it to contribute earlier in the planning process,before an agency position has been taken andwhile there is time and money to change plans.
! the use of IWR-MAIN 6.0 to develop water use forecasts that can reflect a variety of potential water conservation plans.
The resulting system allows WSCAC andMWRA to continuously monitor water useforecasts, present use, safe yield, and costeffectiveness. The point in the future whenwater use is forecasted to exceed the safeyield of the system is called a “critical point”. Estimates can be made of the amount of time and the separable incrementsfor implementing a solution that will avoidwater supply shortfalls, so that the date andminimum requirement of the first step in thesolution can be identified. The date for firstrequired action is called the “trigger point”.
Trigger planning is expected to reduce the risk of water supply shortfall and the risk ofover-investment of environmental andeconomic resources to create an unnecessarily generous supply.
In addition, the family of models integrateslong term and drought water management,allowing estimation of the effect of long-termconservation measures on water curtailmentprograms used during drought.
After the difficulties of implementing the more obvious alternatives are explored(Chapters 8 and 9), it may be found that some of the other alternatives may have to be reconsidered more seriously.

STEP 3: FORMULATE ALTERNATIVES 49
Supply AlternativesSTRATEGIC TACTICAL
New storage TT
Reallocation of supplies TT
New system interconnections TT
Desalinization, importation by barge, reuse TT TT
Operational Changes
Conjunctive use management TT TT
Water banking TT
Long-term changes in reservoir release rules TT
Conditional reservoir operation and in-steam flows TT
Water marketing TT TT
Institutional changes TT
Legal changes TT
Operational coordination between systems TT TT
Demand Modification
Voluntary and mandatory use restrictions TT TT
Pricing changes TT TT
Public awareness TT TT
Changes in plumbing codes TT
Conservation credits TT TT
Changes in irrigation methods TT
Industrial conservation techniques TT TT
Alternatives to water consuming activities TT
Environmental and Water Quality Changes
Reductions in required low flows TT
Alternative means of achieving water quality TT
TABLE IX. A LIST OF TYPICAL STRATEGIC AND TACTICAL MEASURES.

50 STEP 3: FORMULATE ALTERNATIVES
BLANK PAGE
(Skip)

7
STEP 4: EVALUATING THE ALTERNATIVES 51
Once the objective has been determined, our methodology leads to the selection of that combination of structures, levels of development for different water uses, and operatingprocedures that will best achieve the objective.
- Arthur Maass (Design of Water Resources Systems, 1962)
The methods of water system design developed by an interdisciplinary team at HarvardUniversity are best known for their influence on the study of the feasibility of new water projects. However, as the quotation from Professor Maass, the principal author of Design of WaterResource Systems shows, the concept of objective based design can be applied to operatingprocedures as well. In this step, the team compares proposed alternatives against the status quo,measuring how well they meet the objectives developed in step 2. The team will eliminate orredesign alternatives that do not measure up, until they are ready to recommend a plan todecision makers. This chapter describes how to conduct such an evaluation.
INITIAL SCREENING OF ALTERNATIVES
EVALUATING ALTERNATIVES
Evaluation is the process of estimating how The P&G list four characteristics of goodwell alternatives perform in the five plans. These characteristics are generalcategories of measurement described in enough that they are appropriate for federal Chapter 4. In each category, the alternatives or non-federal planning efforts:are measured against the common baseline ofthe status quo. In order to make the best use ! completeness (all the elements required toof study resources and be responsive to those make the plan work are included in the who have suggested alternatives to the status plan);quo, the evaluation process should begin with brief, documented reviews of many ! effectiveness (the alternative addresses thealternatives and end with more thorough planning objectives); reviews of just a few alternatives.
The preliminary screening of alternative ! efficiency (the ratio of plan outputs toplans can be done by determining whether inputs). they address the planning objectives, how they perform (according to the accepted Alternatives should first be examined to see measures of performance), and how well if they are complete. Completeness does notthey satisfy decision makers’ criteria. Plans imply a high degree of detail; at this point,that meet these preliminary tests can then be alternatives should not be developed in evaluated according to their economic, social detail. Completeness simply means that theand environmental impacts. basic components have been identified.
! acceptability (the plan satisfies decisioncriteria and does not violate planningconstraints); and

52 STEP 4: EVALUATING THE ALTERNATIVES
AlternativePlan Number
Is the planComplete?
Acceptability Effectiveness
Meets decisioncriteria?
Violatesconstraints?
Meets planning objectives?
1 No N/A N/A N/A
2 Yes No Yes Does not meet water qualityobjective.
3 Yes Maybe Yes Does not increasehydropower production
4 Yes Yes No Yes
...
11 Yes Yes No Yes
12 Yes Yes No Should greatly help M&I,may hurt river recreation
The initial screening focuses on the characteristics that are necessary and more easily assessed: completeness and acceptability. An incomplete alternative can be reformulated and assessed again.This initial assessment takes place before any alternatives are modeled, so neither the performanceor effects of alternatives can be estimated at this stage.
TABLE X. AN INITIAL SCREENING OF ALTERNATIVES
MODELING
For example, an alternative that calls for the objectives and criteria. The initial screeningjoint operation of independent water systems permits the focusing of study resources on is incomplete if it fails to include the the detailed evaluation of the most promisingconstruction of the necessary physical alternatives. connection between systems.
The initial screening should emphasizeeffectiveness and acceptability. As Table Xillustrates, this can be done using decision Each of the alternatives being seriouslycriteria, planning objectives and constraints. The goal of the initial screening is to eliminate some alternatives, and develop aranking of the remaining alternatives. Theprocess of ranking may help in the continuing effort to communicate and clarify
considered should now be modeled. In somecases, teams may decide that each alternativeshould be represented by a separate model (amodification of the status quo model savedwith a different file name). In other cases,teams may decide that alternatives can be

STEP 4: EVALUATING THE ALTERNATIVES 53
ESTIMATING EFFECTS
more effectively represented by internal is the difference between what a producer“switches” in the status quo model which would have been willing to sell for and theeffects the desired change in water actual revenue received.management procedures. The models provide the plan performance and outputs But most water transactions are not based onrequired for detailed evaluation. market forces; they are typically based on
Using the model, the next level of evaluation calculation of changes in consumer andcan be on the basis of performance producer surpluses among five or sixmeasures. For example, the model can be competing uses cannot be doneused to estimate how much more frequently straightforwardly. The application ofwould a city have to impose curtailment economic principles to drought is fraughtunder an alternative than under the status with conceptual difficulties. There are somequo. (See page 38 for a display of how these generally accepted methods of estimatingperformance measures would be modeled, these benefits, however, and these areand page 57 to see what the outputs for an explained in Annex F.alternative might look like.)
Sometimes an evaluation using just between financial (benefit/cost ratio) orperformance measures is enough. If opportunity costs (the benefit lost becauseoperational changes can be made that benefit water was shifted from one use to another).many users and hurt none (including theenvironment), and the value of the benefits Like all components of a DPS, the extent ofclearly outweigh the administrative costs of the economic analysis is constrained by instituting the changes, then an evaluation of study budgets and schedules, and must the economic and social effects of each reflect how important economic effects will alternative is unnecessary. But what if there be to decision makers.is an alternative that benefits some users andhurts others? Or what if an alternative helps If an alternative includes changes in theeveryone, but has a significant financial cost? operation of a federal project, then anIn those cases, an evaluation of the evaluation of NED may be necessary. Ineconomic, environmental, and social effects general, there will be greater interest inof the alternatives is the only way to regional economic development (RED)determine which alternative best addresses benefits (regional efficiency) and impactsthe goals and decision criteria. (distribution of benefits, employment).
Economic benefits can be defined in market Environmental and social impacts of thetransactions as the sum of producer and various alternatives should be evaluatedconsumer surplus. Both are based on the quantitatively as far as practicable. Thisvolume of transaction(s) at a price. means evaluation in terms such as theConsumer surplus is the difference between number of fish killed or criteria of waterwhat consumers would have been willing to quality affected by a given stream flow. pay and what they did pay; producer surplus This may be very difficult to estimate.
past use and regulation. Hence, the
An analysis of the economic impacts ofdroughts creates a rational basis for makingmonetary tradeoffs to reduce the net impact of a drought. These tradeoffs may be made

54 STEP 4: EVALUATING THE ALTERNATIVES
TRADEOFFS ACROSS
ACCOUNTS
There is considerable information concerning By definition, there can be no pre-existing the general relationship between the rate of trade between effects from differentpreservation of aquatic habitat for different accounts. That does not mean that societyspecies and water characteristics such as assigns an infinitely large or small economicflow velocity, stage, temperature, wetted value to social and environmental impacts. area, and concentration of dissolved oxygen It does mean that trading among the accounts(Arnette, 1976). Fish populations in a given will be difficult. If tradeoffs must be madeyear, however, may be a function of a across accounts, they will be negotiated andsequence of events within the river basin constrained by law and politics. (Miller, 1976) as well as factors unrelatedto water management, such as the number of However, cost-effectiveness frontiers andanadromous fish caught off shore (NDS-5). incremental (marginal) cost analysis can beThe effects of droughts that last as long as used to minimize the costs associated withthe entire reproductive period of a species producing a given level of social orare also not well known (NDS-5). The U.S. environmental impacts, and to associateFish and Wildlife Service (Department of the costs and impacts as the basis forInterior) and the National Marine Fisheries negotiation. The goal of these methods is toService (Department of Commerce) should reveal how much environmental output isbe consulted to determine if there are generated per incremental dollar spent perthreatened or endangered species in the alternative. A description of how anstudy area. If so, the DPS team should incremental cost analysis is done is shown onidentify constraints on operating policies page 56 (Hansen).which would affect those species. Section7 of the Endangered Species Act of 1973(Public Law 93-205) requires all Federalagencies to seek to conserve threatened andendangered species, and to insure that theactions of Federal agencies do not jeopardizethe continued existence of any threatened orendangered species or result in the destruction or adverse modification of thehabitat determined by the Secretaries ofInterior or Commerce to be critical unless anexemption has been granted by the Endangered Species Committee (EP 1165-2-1).
The discussion of accounts on page 30explains their usefulness in organizing theeffects of an alternative in a meaningful way.
Risk and Uncertainty. The definitions ofthese terms as they are applied to waterresources management have changed a littleover time. Risk refers to some negativeconsequence with an associated probability,even if that probability is difficult to calculate. Risk in water resourcesmanagement has until recently been defined as the product of the consequence of eventsmultiplied by the probability of the events,that is to say, as an expected value of damages (Guidelines For Risk, 1992). Theclassic definition of uncertainty involvedthose unknowns that could not be expressed in probablistic terms.In flood damage reduction studies, risk which is an expected value of the damagefrom extreme, but rare floods can becompared to annual or present day costs todetermine if it would be cost effective toreduce residual flood damages even further by increasing the size of the flood control

STEP 4: EVALUATING THE ALTERNATIVES 55
DECISION SUPPORT SOFTWARE
project. In strategic water supply studies, simulations with the shared vision modelthe “rare, large event” is the drought, and the can develop a better informed sense of the risk associated with any strategic supply risk that can be more clearly communicatedplan is the product of the expected to decision makers and elected officials.consequences of future droughts times theirprobability.
But research and experience has shown thatpeople react differently to the risks of a low There is a sound theoretical base and a probability, high consequence events (a 500 variety of computer software packages foryear flood, for example) and a high modeling decision processes. The softwareprobability, low consequence events (a 2 packages create mathematical models thatyear flood), even though they may have the require a listing and ranking or weighting ofsame expected value (Guidebook for Risk the decision criteria. Use of decision supportPerception and Communication, 1993). software may help:Thus a more useful definition of risk hascome into use, that does not multiply ! focus attention on the criteria during thedamage by probability: risk is the expression evaluation of alternatives;an undesirable consequence in terms of theprobability of it happening. ! the DPS team think about the relative
The concept of risk in tactical drought fulfillment of each criterion;contingency plans has much in common withthe risks associated with flood warning ! document the evaluation of alternativessystems that are used to minimize damage leading to the selection of the recommendedfrom floods larger than the design flood. plan.Risks in drought management include:
the risk that a very severe drought will understanding of the process that will be cause a catastrophe; used when regional leaders decide whether
risk that the drought response plan will teams should consider using sociologists,be triggered too often (risking reduced political scientists, conflict resolutioneffectiveness of public participation in specialists, or other professionals withsubsequent droughts) or too late experience in this area.(eliminating water savings that would have been possible had the response The evaluation of alternatives should lead tobeen initiated sooner). tentative recommendations from the DPS
Both of these risks can be assessed using the secure the commitment of decision makers toshared vision model. No simple a plan.quantification, however, will generally bepossible, because of the variouscombinations of severities and durations ofdroughts. Nonetheless, the use of theDrought Atlas (see Annex G) and
importance of the criteria, and degrees of
These packages can enrich a DPS team’s
to accept their recommendations. DPS
team. The next chapter describes how to

2000
3000
4000
5000
6000
7000
70 80 90 100 110 120 130 140
Units of Output
Total Cost ($)
AB
C D
E
Cost EffectivenessFrontier
56 STEP 4: EVALUATING THE ALTERNATIVES
PlanElement
Units ofOutput Total Cost
A 80 $2,000
B 100 $2,600
C 110 $3,400
D 120 $3,600
E 140 $7,000
TABLE XI. THE COSTS PER UNIT OF
OUTPUT (FOR EXAMPLE, ACRES OF
WETLAND)
FIGURE 11. THE COST EFFECTIVENESS FRONTIER.
FIGURE 12. IT COSTS $25 PER UNIT TO INCREASE
OUTPUTS FROM 0 TO 80 UNITS, BUT $50 PER
UNIT TO GO FROM 100 TO 120 UNITS.
Steps in anIncremental Cost Analysis
These four steps offer a simplified example of howincremental cost analysis is done.
1. State the planning objectives in such a way thata metric for environmental or social outputs can beused relative to these objectives. For example, theteam might want to “increase wetland functions”compared to the status quo. One metric might bethe number of wetted acres added (over the statusquo) by Alternatives A-E.
2. Create a table that shows the costs and outputsof each alternative (Table XI).
3. Plot a cost-effectiveness frontier, as shown inFigure 11, that corresponds to the data in Table XIby connecting (or smoothing) the most cost-effective points. Alternative “C” is above thefrontier because it offers less environmental outputper dollar than the B-D frontier suggests ispossible. The frontier can be useful as a screeningmechanism because no plan above the frontier planis as cost-efficient in producing a given output asthe plan on the frontier at the same output.
4. Graph the incremental cost per unit (Change incost ÷ change in output) as shown in Figure 12.This graph gives a clear picture of how costsincrease incrementally as greater outputs arepursued. The graph simply displays some of theinformation included in Table XI more clearly, andby doing so, may help teams decide what level ofoutput is economically acceptable.
Combinations of measures can be compared byadding a few more steps. (Hansen, 1993).
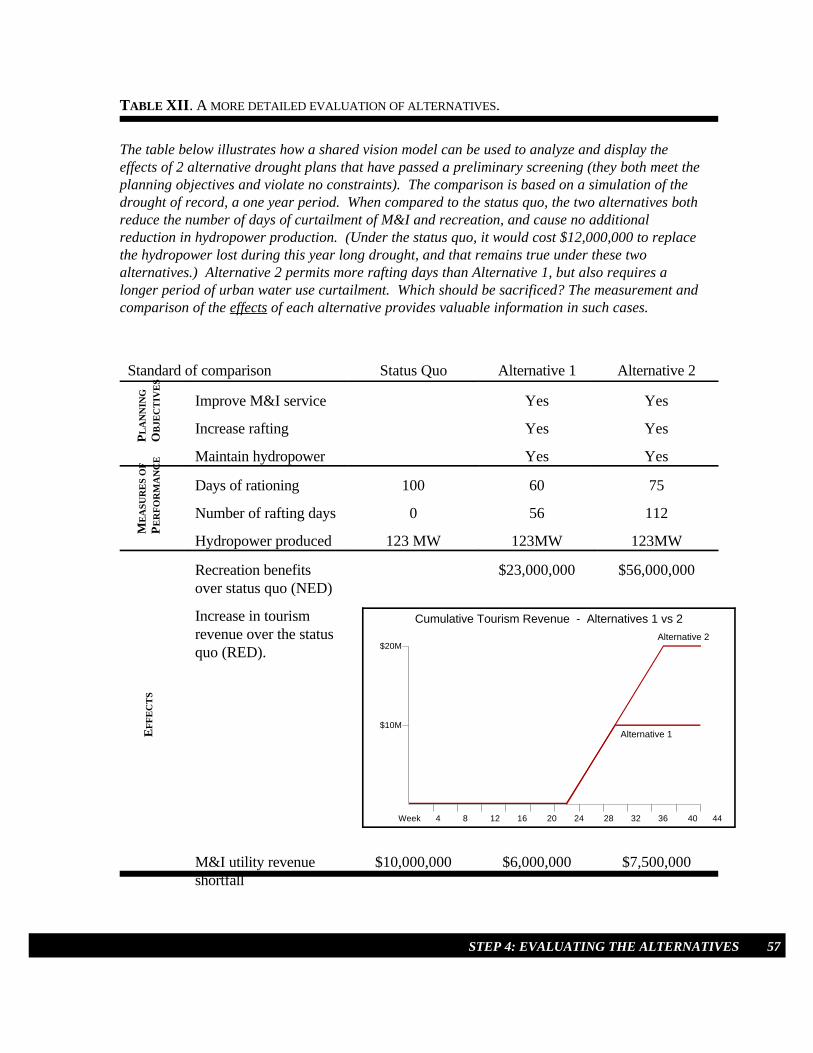
Week 4 8 12 16 20 24 28 32 36 40 44 48
$20M
$10M
Cumulative Tourism Revenue - Alternatives 1 vs 2
Alternative 1
Alternative 2
STEP 4: EVALUATING THE ALTERNATIVES 57
PL
AN
NIN
G
OB
JEC
TIV
ES
ME
ASU
RE
S O
F
PE
RF
OR
MA
NC
EE
FF
EC
TS
The table below illustrates how a shared vision model can be used to analyze and display theeffects of 2 alternative drought plans that have passed a preliminary screening (they both meet theplanning objectives and violate no constraints). The comparison is based on a simulation of thedrought of record, a one year period. When compared to the status quo, the two alternatives bothreduce the number of days of curtailment of M&I and recreation, and cause no additionalreduction in hydropower production. (Under the status quo, it would cost $12,000,000 to replacethe hydropower lost during this year long drought, and that remains true under these twoalternatives.) Alternative 2 permits more rafting days than Alternative 1, but also requires alonger period of urban water use curtailment. Which should be sacrificed? The measurement andcomparison of the effects of each alternative provides valuable information in such cases.
Standard of comparison Status Quo Alternative 1 Alternative 2
Improve M&I service Yes Yes
Increase rafting Yes Yes
Maintain hydropower Yes Yes
Days of rationing 100 60 75
Number of rafting days 0 56 112
Hydropower produced 123 MW 123MW 123MW
Recreation benefitsover status quo (NED)
$23,000,000 $56,000,000
Increase in tourismrevenue over the statusquo (RED).
M&I utility revenueshortfall
$10,000,000 $6,000,000 $7,500,000
TABLE XII. A MORE DETAILED EVALUATION OF ALTERNATIVES.

58 STEP 4: EVALUATING THE ALTERNATIVES
BLANK PAGE
(Skip)

8
STEP 5: INSTITUTIONALIZING A PLAN 59
The danger in not formalizing the plan is that a change in political or administrative leadershipmay lead to decay of the plan’s infrastructure. It must be emphasized that political interest indrought quickly wanes when the crisis is over.
- Donald A. Wilhite (Drought Assessment, 1993)
The DPS team constitutes a new, integrated community that more closely mirrors the integratednature of the problemshed. But as the team’s planning work nears completion, it must find away to institutionalize the integrated problem solving approach so that it can outlive the DPSfor use in the next drought. To do that, decision makers must approve the recommendations ofthe DPS team and agree to change the institutions of the entities they manage to reflect thatagreement. This chapter offers some ways to negotiate that approval.
RECOMMENDING A PLAN
INSTITUTIONALIZING THE PLAN
The findings of the DPS are presented as a the organizations which these individualswritten report; but the most important represent.product of the DPS is the new process ofwater management. A successful DPS is To help secure commitment from decisioninstitutionalized by agreement among the makers, the DPS team should organizeresponsible agencies to act according to the evaluation data and prepare presentations infindings of the DPS. such a way that the “bottom line” is clear to
In this step, the DPS team recommends a not have the benefit of immersion in theplan to decision makers, specifies necessary evaluation process with the shared visionchanges in laws and regulations, completes model that the DPS team members enjoyed.environmental assessments or impactstatements, and facilitates negotiations on the A process which was used in the planagreement(s) decision makers must approve selection workshop in the Kanawha River to institutionalize the new processes. DPS proved to be very useful for building
The final selection process must include economic and non-economic. First, thenegotiations, bearing in mind that what is distinct features of each plan were reviewedmost important is not the personal opinion of and their shared vision model was used tothe individuals around the table but general estimate how each alternative would affect public opinion and the political influence of the interests of stakeholders. Next, the
decision makers. These decision makers will
confidence in the selection process. As partof the workshop, a “Decision Matrix” wasprepared, (Table XIII), which illustratedcomparison of impacts, including both
workshop facilitator, using a table showing

60 STEP 5: INSTITUTIONALIZING A PLAN
CHANGES IN LAWS AND REGULATIONS
each of the planning objectives as column support an alternative plan before negotiatingheadings and each of the alternatives as in plenary sessions.rows, scored each alternative from “---”(very negative impact) to “+++” (very When stakeholders believe that no alternativepositive) for each objective. As he did so, reduces impacts enough, the options thatworkshop participants were encouraged to remain are:debate the rating based on the model outputs,and to assign their own ratings on a similar ! to accept the fact that, even with theblank score sheet each had received. These best plan, impacts of a severe drought simplified ratings merged the performance of will be very damaging;the plan on the two design droughts that hadbeen considered, and took account of all the ! to decide that the interests of the measures for each objective. region would be best protected by
The scoring showed that two alternatives new infrastructure or one of the non-improved the performance of the system in structural long-range alternatives;several objective categories, and matched the performance of the status quo in all other ! to agree to pursue the plan that helpsobjectives. The analysis showed that Plans 4 most stakeholders;and 5 helped water quality, rafting, and lakerecreation, and did not affect hydropower or ! to agree to pursue the plan that helpsnavigation. Plan 2 helped rafters, but hurt most stakeholders, but with payments tolake recreation; Plan 3 did just the opposite. those who are hurt;Because plans 4 and 5 were not mutuallyexclusive, the workshop participants agreed ! to accept a plan in principle, but agreethat a plan that combined the advantages of to proceed with it during a drought only both should be used during the next drought. if possible losses by some stakeholders
In many cases, the choice will not be as conditions or uncertainties about theclear. In those cases, Circle B and C estimates of harm).participants can enter into a process ofnegotiation supported by the shared visionmodel and evaluation data. Thesenegotiations are most likely to be successful if the participants have been given specific If the recommended plan includes changes inauthority to make agreements for decision existing laws, regulations, or structures, thenmakers. Otherwise, no participant will know the team should develop a plan to effect if further concessions will be needed. those changes. The team should be mindful Further modifications to alternatives or new of the fact that these changes will probably conditions for their use may be considered to not occur until sometime after the DPS isdevelop a consensus on a recommendation. complete, and must be budgeted and staffedIt may be useful to break into smaller groups separately. Now the early effort to includeto determine if the small groups could those involved in long term management
pushing for a long-range solution, either
do not materialize (because of changed
processes (see page 18) will pay dividends.

STEP 5: INSTITUTIONALIZING A PLAN 61
ENVIRONMENTAL REVIEW
NEGOTIATING CLOSURE
THE AGREEMENTAs the choice between alternatives narrows, it is desirable to make final checks upon cost, financing, legality, and public Institutionalization requires written agreementacceptability. The adoption of the plan will to act according to the findings of the DPS.be manifested by publication of the report; Operating policies (reservoir or pump stationbut the effectiveness of the plan depends operating plans, or individual droughtupon agreement by the responsible agencies contingency plans) may have to be revisedto implement it. within the collaborating agencies near or
If the recommended plan involves changes in is encompassed by a River Basinthe operation of federal water projects, the Commission, with responsibilities related toNational Environmental Policy Act (NEPA) drought. Otherwise, interstate agreements orrequires an environmental review. The memoranda of understanding will beminimum required response is an necessary.Environmental Assessment (EA) andFinding of No Significant Impact (FONSI). The DPS should have involvedenvironmental representatives andinvestigated potential environmental impacts,making it easy, fast and inexpensive toproduce the formal EA and FONSI. If thereare significant impacts, an EnvironmentalImpact Statement must be prepared andcirculated for approval.
The connections from Circle A, B, and C toCircle D must now be exercised. Thedecision makers who will sign the agreementto institutionalize the recommended plan must be approached and any remainingconditions for their signing negotiated.
The DPS team may decide to present theirprocess and findings to decision makers in afinal workshop. The purpose of thisdemonstration workshop is to showcase thecollaborative analytic efforts and the supportfor the recommended plan among those mostaffected by it.
after the completion of the DPS.
Implementation is greatly simplified if the area of concern lies in a single state, or if it
Partnering agreements, which have beenused by the Corps of Engineers to improve the quality and productivity of the Corpsconstruction contracts, may be helpful inpublicizing the intent of the agencies to actaccording the findings and spirit of the DPS. A partnering agreement does not legally bindthe signers to a set of actions, but simplyexpresses the mutual advantage desire inacting in a particular collaborative fashion. An example of a partnering agreement isshown in Figure 13. A partnering agreementcan:
! establish a continuing collaborativeprocess;
! support the maintenance and use of theshared vision model;
! name those involved in droughtcommittees;
! establish legal bounds on the agreement;
! specify when Virtual Drought Exerciseswill be held.

62 STEP 5: INSTITUTIONALIZING A PLAN
Simple matrices like this can be used to starkly and clearly portray the DPS team evaluationprocess to decision makers after the team has used more sophisticated and quantitative analyses toselect a recommended plan. This table made it clear to the participants of the Kanawha RiverDPS workshop that delaying the start of water quality releases and varying the amounts of thosereleases hurt no one and benefited many. Even water quality was improved, since dissolvedoxygen levels were high at the beginning of a drought, and delaying augmentation releasesconserved water that could be released later in the summer when dissolved oxygen levels werelower.
Objective6
Alternative 9
Increase thequality of river
water in theKanawha River
basin duringdrought
Increase thereliability andvalue of the Gauley River
whitewater raftingexperience during
drought
Increase thereliability of lakerecreation in theKanawha River
Basin duringdrought
Increase thereliability ofhydropower
generation in theKanawha River
basin duringdrought
Increase thereliability of
navigation on the KanawhaRiver during
drought
Status Quo 0 0 0 0 0
IncreaseSummer Pool by 17 feet
0 + + 0 +
Reduce targetflows
0 +++ -- 0 0
Override rule toconserve waterin Summersville
0 - + 0 0
Delay start ofWQ releases
+ ++ ++ 0 0
Vary the amount of WQreleases
+ ++ + 0 0
KEY: - means an adverse impact; + a positive impact; the more +’s or -’s, the greater theeffect of the plan
TABLE XIII. FINAL PRESENTATIONS TO DECISION MAKERS SHOULD MAKE THE RESULTS AS
CLEAR AS POSSIBLE.

STEP 5: INSTITUTIONALIZING A PLAN 63
Once the agreement is signed, the greatest threat to its effectiveness will be the passage of time and the press of other concerns. As time passes, the threat of drought will seem more distant, thestaff members and stakeholders will work on other projects, change careers, or retire. The nextchapter describes how to exercise and update the plan.

64 STEP 5: INSTITUTIONALIZING A PLAN
This agreement expresses our recognition of common goals and shared responsibilities in themanagement of water in the __________ basin during drought. This agreement builds upon themutually beneficial relationships which already exists among the stakeholders and agenciesinvolved in the management of the _________ system.
A shared vision model of the _______ system was developed during the recent _______ DPS to help resolve conflicts and reach consensus among resource managers as mutually acceptableoperating plans are developed during periods of water shortage.
In recognition of the threat water shortages present to us all, and to provide a foundation formanagement of the shared vision model, we agree to:
! Work together as regional partners, in an atmosphere of cooperation, open communication andtrust, to encourage a problem-solving attitude.
! Use the shared vision model to enhance and improve resource management in the _________system. The model will be available for use by all parties involved in making water resourcemanagement decisions, to facilitate independent evaluation and development of alternative operating scenarios. _____________ will maintain the official version of the model.
! Participate in virtual drought exercises in the spring of even numbered years. The purpose of the VDE is to exercise and update our collective drought response.
! Convene a meeting of the signatory groups whenever any of us requests to determine whether to implement a drought response.
To ensure that the official version of the model contains current and accurate information, streamflow data will be updated as needed by _____________. Changes which affect modeloperation and/or outputs (i.e. addition of system components or correction of errors) will bedocumented and reported to all of us for consideration.
Resource managers are encouraged to modify the model, to aid them in identifying and evaluatingmanagement strategies and to develop new insights. They are also encouraged to inform others ofsuch modifications and their effects on model operation.
___________ will maintain a list of agencies involved in the management process that have beengiven access to the model. This list will be distributed to all signatories.
Designated points of contact for each signatory agency will meet regularly, in conjunction withscheduled interagency coordination meetings, to review the model, its use, and changes to the model.
FIGURE 13. A SAMPLE PARTNERING AGREEMENT.

9
EXERCISE, UPDATE AND USE THE PLAN 65
A drought plan, like a fire evacuation plan, will be most effective if exercised regularly. Like a fire drill, a drought exercise can show new people and remind veterans what the plan is. But unlike a fire drill, water managers are apt to find the corridors have changed; water uses diversify and intensify in the years between droughts, and new stakeholders must bebrought into the process. When droughts do occur, the plan will be tested, and managerswill have a unique and valuable opportunity to learn if they consciously record the eventsduring the drought and compare them to their expectations.
VIRTUAL DROUGHT EXERCISE
EXERCISE, UPDATE,AND USE THE PLAN
Some of the good work done in the preceding steps can be undone by the passage of time. It may be several years after a DPS before another drought occurs. During that time, professional staff may During the conduct of the four demonstrationchange jobs, water uses may change in studies, Dr. Richard Palmer, a University ofnature and quantity, and new laws may be Washington researcher and the developer ofpassed that affect the way the water system the simulation model used in the first can be operated. The result is that the trust Potomac exercise, suggested that the sharedand familiarity developed during the DPS vision models and close collaboration amongwill diminish, and the region’s vulnerability stakeholders in a DPS would make it to drought will gradually return. possible to simulate a drought more
The solution is to exercise the plan. It is a Virtual Drought Exercise could be used insimple concept, used quite commonly in the years after a tactical drought plan had other areas of hazards management from fire been designed to exercise a regional droughtdrills to military maneuvers. The idea of a preparedness strategy. This would let drought exercise has been used since the agencies address new water uses and train early 1980's by the Interstate Commission on new staff and stakeholders. The first virtualthe Potomac River Basin (ICPRB), which drought was held in Tacoma, Washington oncoordinates water management in the August 4, 1993 as part of the Cedar andWashington Metropolitan Area (WMA). An Green River Basins DPS. It was wellannual exercise is important for the Potomac received by the participants and can be usedbecause coordinated management of several as a model for other regions interested inwater systems was used in lieu of additional exercising water plans.storage to increase the safe yield of thecollective system. A Virtual Drought Exercise should have the
realistically than ever before. The resultant
following elements:

66 EXERCISE, UPDATE AND USE THE PLAN
USING THE PLAN
! a facilitator, to explain the rules of the called for a “forecast”. After theVDE and manage the time spent on participants questioned the forecaster, theynegotiations; used a second version of the shared vision
! participants, namely the people who different policies. The sensitivity of thewould represent water agencies and impacts to forecast errors was alsostakeholder groups during a drought; analyzed by using a range of forecasts
! a member of the press or a public affairs Participants then negotiated decisions asperson to represent the needs and influence they would during a drought on suchof the media; issues as minimum flow requirements, the
! data synthesized for the exercise, including the supplementation of surface suppliesforecasts, initial storage amounts, inflows, with groundwater, and changes in reservoirand demand variables. Virtual droughts operating policies. should require participants to confront theuncertainties of real droughts concerning Debriefing discussions were held future precipitation, streamflow, and immediately following the exercise. Theconsumer responses to drought measures. universally high level of attention andAlthough the designers of the VDE will occasional signs of irritation brought outknow all the hydrologic data for the exercise, during the exercise offered testimony tothey should not share them with the the realism of the exercise.participants except as they are revealed during the unfolding of the virtual events.
! two versions of the shared vision model,modified for this specific application. The The difficulties of using the recommendedfirst is used by the facilitator to track the plan during a drought should be greatlyperformance of the system as decisions are reduced by regular exercise. In only one made. The second is used by the case (the Kanawha River) has a drought participants to estimate the impacts from threat occurred since a DPS plan was alternative management decisions; adopted. The use of the shared vision
! a scoring system (optional) to measure the developed during the DPS would haveperformance of the participants. avoided millions of dollars in losses to
The Tacoma virtual drought took place continued. The DPS team in the Kanawhaduring one seven-hour session in a large was pleased that the DPS process workedconference area. Each segment began when so well, but the real test will be whetherthe facilitator ran his version of the shared the advances from the DPS will be asvision model to simulate from 2 to 6 weeks effective in ten years.of system operation. The facilitator thenannounced the new system states (reservoir There could still be a problem recognizing levels, release patterns, shortfalls, etc.) and that a drought has begun. Although the
model to estimate drought impacts under
centered around the published forecast.
imposition of water curtailment measures,
model and the coordination mechanisms
regional tourism had the 1993 drought

EXERCISE, UPDATE AND USE THE PLAN 67
DPS plan should have well defined triggers A drought focuses public and politicalfor each phase of a drought response, using attention in a way no exercise could, andthem still requires human monitoring and reveals physical, environmental, andjudgement. economic interconnections that planners
When droughts do occur, it is important to primary drawbacks of experiential learningdiscuss and record what was learned about are that it requires loss or failure, and it isthe weaknesses of the planned response. based on one specific event. AgenciesDrought preparedness can be improved may be reluctant to document theirthrough both drought simulation and learning because to do so might seem to experience. The first has the advantage of them the admission of error. Alternativesallowing the consideration of a broad range unacceptable before a drought may now beof droughts, but the disadvantage that it will implementable.never have the urgency of a real drought.
might have been unable to imagine. The
Water resources experts have advocated multidisciplinary, multiobjective, multipurpose waterresources planning on a watershed basis for decades. The DPS method is built on the principles of water resources planning developed by leading universities and tested by federal agencies since1936. The DPS method updates and modifies those principles to make them more suitable forregional and tactical studies. The usefulness of the method should be expanded as experience innon-drought water management cases increases, and new developments in software make itpossible to fulfill the promise of “shared vision models” at an even higher plane.

68 EXERCISE, UPDATE AND USE THE PLAN
BLANK PAGE
(Skip)

10
CONCLUSION 69
There are at least twenty-five separate water programs, governed by more than two hundredfederal rules, regulations and laws.
Peter Rogers (America’s Water, 1993)
Traditional responses to water supply problems, such as construction of major water projects, are limited today by economic, environmental, and social concerns ... there is a shift in emphasis to improved operations and management of the existing facilities and systems andtransfers of rights to new, more efficient uses.
Western Governors Association, Report on the May 16-18, 1991 Park City Workshop
(Natural resources policy making is) “... a fluid, anarchic world of professionals, unmoored from the voters, seeking ideas that will solve problems, many of which lack clear outlines ...”
Kai Lee (Compass and Gyroscope, 1993)
CONCLUSION
To produce more from our existing water professions can improve the chances that theinfrastructure, we must pursue more team will be successful.sophisticated policies and operationalprocedures, coordinated among many To overcome the fractiousness of multipleagencies. The cleverness that secures these agencies and stakeholders, individual teamgains will probably mean that water members must be results oriented. Thatmanagement policies will be more difficult means that staff professionals must accept afor the average citizen to understand. personal responsibility for regional progress
The DPS method can help. It adds the agency missions. And it means thatillustrative and analytical power of the shared stakeholders and advocates must comparevision model to water resources principles possible but imperfect solutions to the statussolidly established in theory and practice. quo - the no improvement alternative. But a good method does not obviate the needfor excellent water managers; the DPS In the near term, this means that DPS teammethod cannot work without them. members must be carefully selected to obtain
A truly interdisciplinary team is necessary; integrity. In the longer term, it means thatthat means not only a team well schooled in schools and agencies must work together tothe many requisite fields of learning, but one make sure that people of this caliber willin which each professional recognizes that apply themselves to these problems.the perspectives and analytic tools of other
while fulfilling their obligation to pursue
this mix of leadership, scholarship, and
70 CHECKLIST
DPS PLANNING PROCESS CHECKLIST
The seven steps of the DPS process are conducted iteratively; that is, the team will go through thesequence of steps more than once, decreasing the breadth but increasing the depth of their analysis ineach iteration. The checklist below portrays the DPS study process as it might occur over time. Thesequence of events will vary from study to study because some tasks (such as new environmental andeconomic studies) may not be instituted until a need for them is demonstrated. Evidence for that maycome in the initial workshop of one DPS, but may not come until the preliminary analysis of alternatives is done in another DPS.
Clearly, steps one and two dominate the early part of the study, and the seventh step occurs at the end and after the study is complete. But team members will discuss alternatives from the first day, andredefine decision criteria and planning objectives as they learn more about the status quo and the nature of alternatives. Steps 4 and 5 are by nature the most iterative. The generation of a very long list of alternatives is important because it helps assure that no options have been overlooked and helpsbroaden “ownership” of the process because it allows all DPS members to submit their ideas forconsideration. But before any alternative is developed in more detail, the DPS team should applyscreening criteria to all alternatives. Screening is the first iteration of Step 5, evaluation of alternatives. Screening will eliminate the ideas that do not address the planning objectives, or that have been shown to be ineffective. It will also identify alternatives that are incomplete and need further development to be evaluated at any level. The alternatives that pass through the screen can beformulated (second iteration of Step 4) in more detail.
9 A DPS begins with a precipitating event that establishes the need and provides the resources toconduct a DPS. The initiative can begin with a political mandate, leadership within a managementagency, or inquiries from stakeholders or advocacy groups
9 The convening agency makes a preliminary identification of decision makers, stakeholders, advocacygroups, and independent experts and writes letters inviting them to attend an initial problem identification workshop. In the letter, the agency asks for a commitment from decision makers toempower the DPS process
9 An initial workshop is held. The purposes of the workshop are to:
! define the range and severity of drought problems facing the region
! list additional decision makers, stakeholders, advocacy groups and independent experts thatshould be involved in the DPS (the list can be compiled by filling in Table II, page 22).
! identify the conditions necessary to secure the necessary commitment from decision makers toempower the DPS process
! establish that drought impacts constitute a significant regional problem and that it is the actions ofthe workshop participants that will reduce drought impacts in future droughts (if the facts do notsupport that finding, then the DPS may not be required)

CHECKLIST 71
! identify additional sources for information, both in the form of written reports and personalexpertise
! develop an initial organization of workshop participants into circles of influence
! define the geographic limits and time horizons (planning period) of the study
! determine if there are other strategic or emergency water management efforts
9 Review existing reports on regional droughts and the subject of water management for drought (agency reports, news stories, university research papers, journal articles, publications and proceedings of organizations such as the American Water Resources Association (AWRA), American Water WorksAssociation (AWWA), American Society of Civil Engineers (ASCE).
At the first or second workshop, the DPS team would:
9 Determine the broad goals for managing water during drought (such as economic efficiency, equity,environmental protection) and make a preliminary determination of the criteria decision makers will use to determine whether the recommended plan from the DPS team meets these broad goals
9 Develop specific planning objectives and constraints (if any) related to each of the applicable watermanagement purposes
9 Identify the performance measures that managers and stakeholders use to judge the adequacy ofwater management systems
9 List the types of effects of water management decisions, how they are related to decision criteria, and how they could be measured
9 At this point, in more intensive DPS’s, the team may initiate an issues study. The purpose of thestudy is to document the political issues that underlie the criteria that decision makers will use to accept, reject or modify the DPS team’s recommendations.
9 develop a shared vision model of the status quo based on existing reports, specialized water resources models, and interviews with DPS team members. The model should diagram and quantify the relationships between stakeholders’ and advocacy groups’ concerns and the availability of water at a specific place and time. It should also diagram and quantify the relationship between the availability of water and water management decisions under the current set of institutions and infrastructure. Thestatus quo includes the current set of water management institutions and infrastructure and probablefuture changes initiated outside the DPS (for example, the effects of national plumbing codes onmunicipal water use, or the effects on water supply from future infrastructure investments justified andimplemented outside the DPS).
9 consult the National Drought Atlas and other sources to gauge how likely it is that the drought ofrecord will be eclipsed by larger droughts within the planning horizon

72 CHECKLIST
9 consult the Atlas and other sources to determine how likely it is that future droughts will have adifferent geographic focus or starting month, or longer duration.
9 select the appropriate design drought(s) to test the adequacy of existing and proposed drought plans
9 model the performance measures, constraints, objectives identified in step 2.
9 In more intensive DPS’s, the team may commission new surface and ground water modelling studies that use specialized computer models distinct from the shared vision model. The team may also commission demand element studies to determine potential future use of water for each watermanagement purpose. If the team expects that some alternatives may hurt some stakeholders and helpothers, environmental and economic studies should be instituted now. The studies can determine thechange in the magnitude and distribution of economic and environmental effects associated with changes (from the amounts provided under the status quo) in the quantity of water delivered for eachwater management purpose.
9 commission hydrologic studies to develop more elaborate synthetic inflow data sets, or “natural flow” data sets
9 At a workshop, or through another group process such as the Delphi process (page 16):
9 generate an exhaustive (uncensored and uncriticized) list of alternatives
9 screen the alternatives to determine if they are complete and meet minimum standards ofeffectiveness and acceptability
9 determine whether the alternatives are strategic, tactical and emergency responses
9 develop one or more tactical drought response plans, combining elements of the tactical alternativessuggested. Tactical plans may differ from one another in degree or type. For example, two plans maydiffer only in the trigger levels at which water use curtailment is imposed. But other alternatives might be radically different, such as the imposition of temporary price increases or water banks in lieu of curtailment plans. Early draft plans can be evaluated and reformulated though workshops or theDelphi process.
9 develop a shared vision model of each alternative plan that will be seriously considered.
9 run the model(s) to measure the performance and effects of the alternatives under the conditions of the design drought(s).
9 compare the effectiveness, acceptability, performance and effects of all the alternatives. Publish these results for review.
9 hold a workshop to select the plan the DPS team will recommend. This may require more than onemeeting. If there is an alternative that requires little or no expense, hurts no stakeholder but helps some stakeholders, recommending a plan may be relatively easy. If that is not the case, then the DPSteam must compare the effects of each alternative within each account. If an alternative takes

CHECKLIST 73
something from a stakeholder but is more economically efficient and environmentally sound, then theDPS team may decide to recommend the alternative, after modifying it to mitigate the loss or compensate the losing stakeholder to assure the goal of equity is met. If an alternative is mosteconomically efficient but has adverse environmental impacts (or vice versa), then an additional round of reformulation and negotiation will be required, or the DPS team may elect to accept the status quo. The team may elect to do an incremental cost analysis of environmental mitigation measures to develop a more acceptable tradeoff between environmental and economic effects than either the statusquo or the previous alternatives produce.
9 write a report that clearly explains the recommendations of the DPS team. The report should display the findings according to the steps in the process: problems and team members; criteria andmetrics; the status quo; alternatives; and the evaluation process.
9 identify the actions that will be required to institute the recommended plan, including environmentalassessments, and the ratification necessary to institutionalize tactical and emergency plans.
9 develop a clear, powerful presentation of the study team findings and present as a team to the decision makers who must approve the recommendations of the DPS team.
9 given the approval of decision makers, develop partnering agreements and new regulations. It would be unusual for strategic changes to be implemented as a direct result of a DPS, but the team can identify the processes (such as legislative action) that would be required to institute strategic changes.
9 negotiate and institutionalize an agreement to exercise and update the new plan on a regular basis
After the end of the study, the DPS team will:
9 use an updated version of the shared vision model to conduct Virtual Drought Exercises
9 implement the plan when droughts occur and document and record the lessons learned from theapplication of these measures in a real drought.

74 CHECKLIST
BLANK PAGE
(Skip)

Index
75
agriculture . . . . . . . . . . . . . iv, 39, F-3-4, L-6-7Alabama . . . . . . . . . . . . . . . . . B-5, N-2, N-7-8Apalachicola . . . . . . . . . . . . . . . . . . . B-5, N-4appropriation . . . . . . . . 34, D-1, D-3, H-5, M-8Arizona . . . . . . . . . . . . . . . D-1, D-3, M-18-19Atlanta . . . . . . . . . . . . . . . . . . . . . . . . . . . . 47Atlas, National Drought . . . . . vii-viii, 39-40, 55
71, 75, G-1-2, G-4-5, L-3, M-18, Annex N G-1, M-10AWRA . . . . . . . . . . . . . . . . . . . . . . . . . . . . 71AWWA . . . . . . . . . . . . . . . . . . . . . . . . . 44, 71Best Management Practices . . . . . . . . . . . . L-5Boston . . . . . . . . . . . . . vi, 45, B-5, K-6, M-1-3
M-13, M-17 Georgia . . . . . . . . . . . . . . . . . . . . . . . . . . . B-5Bureau of Reclamation . . . . 43, A-3, B-4, M-19
N-8 Green . . . . . . . 6, 26, 65, A-2, B-3, C-2, L-6-7California . . . . . . . . . . iv, v, 25, 39, 46-47, 75
D-1-3, F-5, H-5, I-4, I-5 groundwater . . . . . . . v, 7, 10, 40, 42, 45-46, 66K-1, K-4, L-1-6, M-1-3, M-18 B-2, D-1-2, L-1-2, L-5-6, M-6, M-18
Cedar . . . . . . . . . . . . . 26, 65, M-1-3, M-11-14Chatahoochee . . . . . . . . . . . . . . . . . . . . . . N-7Clean Water Act . . . . . . . . . . . . . . . A-3, M-20Colorado . . . . . . . . . . . . . . . . M-1-3, M-18-20communication . . . 15, 20, 44, 55, 64, B-5, H-2
H-6, I-1-4, J-1, M-8 H-7Connecticut River . . . . . . . . . . . . . . . . . . . B-5conservation . . . . . . . . . . . . . . . . . . . iii-viii, 34
42-45, 48-49, 74, A-3, B-1, B-4 Kanawha . . . . . . 28, 31, 45, 59, 62, 66, M-1-5D-1-2, F-4, I-5, K-1-6, L-4-6, M-7, M-10, N-8 Kennedy . . . . . . . . . . . . . . . . . . . . . . . . . . A-2
cooling water . . . . . . . . . . . . . . . . . . . . 36, M-8coordination . . . . . 1, 3, 9, 21, 41, 43, 46-47, 49
64, 66, A-2, K-4, M-11 Los Angeles . . . . . . . . . . . . . . . . . . . . . . . L-4-5Corps of Engineers . . . . . . i, iii-iv, ix-x, xvii, 3
5, 28, 33, 40, 43 MAIN 6.0 . . . . . . . . . . . . . 48, K-4, K-6, M-1347, 61, A-3-4, B-4-5 Marais des Cygnes-Osage . . . . M-1-3, M-8-10
C-1, E-2, H-1, H-3-4, I-2 Massachusetts . . . . . . . 45, 47, B-5, K-2, M-13K-1, M-4, M-6-7, M-10-11, N-1, N-8 minimum flow . . . . . . . . . . . . . . . . . 28, 30, 66
Delaware . . . . . . . . . . . . . . . . . . . . . . . . . M-20demand . . . . . 1, 8, 25, 27, 30-31, 43-45, 47, 49
66, 72, F-2, H-2, I-2, J-3, K-1, K-3 National Weather Service . . . . . . 43, G-4-5, K-3 K-6, L-4, M-7, M-13-17 M-5, N-8
diversion . . . . . . . . . . . . . . . . . . . . . D-1-2, G-2drainage . . . . . . . . . . . . . . . . . . . . . . . . . . . M-8
emergency . . . . . . v, 2, 21-22, 39, 41-42, 71-73 D-1, I-5, L-5, M-5, M-7
Extended Streamflow Forecasting . . . . . G-4-5EPA . . . . . . . . . . . . . . . . . . . . . . . . . . . . . A-3fish and wildlife . . . . . . . . . . . . . 54, M-5, M-12Flint . . . . . . . . . . . . . . . . . . . . . . . . . . . . . B-5flood . . . . . . 9, 32, 39, 41, 43, 54, 55, A-2, A-4
Florida . . . . . . . . . . . . . . . . . . . . . . . . B-5, N-2frequency . . . . . . . . viii, 1, 7, 13, 26, 29-30, 34
39, 40, 43, 47, F-5, G-1-2G-5, K-2, N-2-5, N-7
Getches . . . . . . . . . . . . . . . . . . . . . . . . . . . . 11
M-1, M-10-13
hydropower . . . 9, 10, 21, 23, 28, 30, 32, 45, 52 57, 60, 62, E-2, F-2, F-5, L-6-7
M-3, M-5, M-8-9-10, M-16, M-19-20indicators . . . . . . . . . . . . . . . . . . v, 3, M-14-16infrastructure . . . . . v, vii, 1, 2, 8, 59-60, 69, 71
Interior . . . . . . . . . . . . . . . . . . . . . . . 54, M-19James . . . . . . . . . 26-27, B-3, M-1, M-6-8, N-1
law . . . . . . . . . . . v, 9, 41-42, 54, 74, B-4, C-1D-1-3, H-4, H-5, M-8, M-20
Los Angeles Times . . . . . . . . . . . . . . . . . . . L-4
Mississippi . . . . . . . . . . . . . . . . . . . . M-3, N-2Missouri . . . . . . . . . . . . . . . B-4, M-3, M-8-10
navigation . . . . . . . . . . 9, 22, 28-30, 32, 60, 62B-2, F-4 F-5, M-5, M-10
New Mexico . . . . . . . . . . . . . . . . . . . . . . . D-3

Index
76
NOAA . . . . . . . . . . . . . . . . . . . . . . . . . . . . N-2North Carolina . . . . . . . . . . . iii, D-1, M-3, M-5North Dakota . . . . . . . . . . . . . . . . . . . . . . . B-4Ohio . . . . . . . . . . . . . . . . . . 40, G-5, M-3, N-1Palmer Drought Index . . . . . . . . . . . . 40, N-7-8politics . . . . . . . . . . . . . . . . . . . 54, 74, B-1, I-1Potomac . . . . . . . . . . . . . . . . 47, 65, A-2, N-8probability . . . . . . . . . . . . . . 30, 39, 54-55, B-5
G-5-6, H-2, N-1-2 Virginia . . . . . . . . . B-2, B-3, D-1, M-3, M-6-8problemshed . . . . . . . . . . . . . . . . . . vii, 10, 59public . . . . . . . . . . . . . iii, vi-viii, 3, 6-7, 12, 14
16-20, 22-23, 34, 42-44 45, 65, B-2, M-6, M-8. M-12, M-1847, 49, 54-55,59, 61, 66 Washington . . . . . . . v, 65, B-3, M-6, M-10-13
74, A-2, B-3, C-3, D-2, G-5, H-3 wastewater . . . iii, 18, 22, 45, 46, B-1, K-3, K-4H-5-7, I-1-5, J-2, K-3-5, M-8, M-14, M-18 water bank . . . . . . . . . . . . . . . 72, D-2-3, L-4-5
Public Trust Doctrine . . . . . . . . . . . . . . . . . D-2recreation . . . . . . . . . . . . . . . . 6-7, 9, 22, 28-30
32-33, 45, 52, 57, 60, 62 water supply . . . . . . . . . . . iii-v, viii, 2-3, 5-6, 9D-2, E-2, F-1, F-4, M-3, M-5, M-8-19 14, 18, 21-22, 27-28, 33, 37, 41-42
riparian . . . . . . . . . 34, D-1, M-8, M-17, M-19river basins . . xiv, 47, 65, A-2, B-5, M-1, M-6
M-11-12 L-1, M-6, M-8, M-10, M-12-15, M-18Rogers . . . . . . . . . . . . . . . . . . . . . . . . . . 17, 69roles . . . . . . . . . . . . . . . . . . H-3, L-1, M-18-19Savannah . . . . . . . . . . . . . . . . . . . . . . . . . . . . ivSeattle . v, 44, 47, B-3, H-6, K-1, M-10-13, N-8Section 22 . . . . . . . . . . . . . . . . . . . . . . . . M-18Severe Sustained Drought . . . . . . . M-3, M-18shared vision model . . . . . . . . vii-viii, 11-12, 33
35, 37, 43, 45, 47-48, 5557, 59-61, 64, 66, 69, 71-74
B-3, C-2-3, H-6-7, M-5, M-7-9, M-18South Carolina . . . . . . . . . . . . . . . . . . . . . . D-1South Dakota . . . . . . . . . . . . . . . . . . . . . . . B-4STELLA II® . . . 15, C-1, C-3, H-7, M-6, M-13
M-15-16, M-19Susquehanna . . . . . . . . . . . . . M-1, M-3, M-18
Tacoma . . . . . . . . . . . . . . . v, 65, 66, M-10-13Tennessee . . . . . . . . . . . . . . . . . . . . . . . . . A-3Texas . . . . . . . . . . . . . . . . . . . . . . . . . . . . . 47U.S. Geological Survey . . 43, M-3, M-5, M-18
N-7-8Utah . . . . . . . . . . . . . . . . . . . . . . . . . . . . . B-4utilities . . . . . iii, 3, 10, 47, F-4, K-1, K-4, L-6
M-6, M-18
Virginia Beach . . . . . . . . . . . . . . . . . . . . M-6-7vulnerability . . . . vi, 2-3, 17, 19-21, 39, 42-43
water quality . . . iii, 1, 28, 32, 40, 46, 49, 52-53 60, 62, K-6, M-3, M-5-6, M-17-18
44, 45, 47-48, 54, 69, 71, A-2, A-4 B-1, B-5, F-4-5, I-4, K-1-2, K-6
watershed . 9, 10, 21, 40, 67, G-1, G-2-5, M-14West Virginia . . . . . . . . . . . . . . . . . M-3, M-6Western Governors Association . . . . . . . . ix, 69Western States Water Council . . . . . . . . . . . . ixwetlands . . . . . . . . . . . . . . . . . . . . . . . . . M-19White . . . . . . . . . . . . . . . . . . . . . . . . . 22, M-3Wilhite . . . . . . . . . . . . . . . . . . . . . . . . . . . . 59

List of Annexes
A - ORIGINS OF FEDERAL WATER RESOURCES PLANNING GUIDANCE is a very brief overview of the decades of debate, research, and practical experience with Federal waterpolicy that produced comprehensive, usable guidance about how to meet conflicting watermanagement goals.
B - POLITICS, ADVOCACY GROUPS, AND WATER AGENCIES describes the difficultieswater agencies have in melding their analysis with the perspectives of elected officials andadvocacy groups, and offers practical advice for doing better.
C - COMPUTER MODELS OF WATER AND RELATED SYSTEMS raises and responds tokey issues in developing shared vision models.
D - WATER LAW AND DROUGHT lists eight significant water law issues, and the waysdifferent states are dealing with them.
E - ENVIRONMENTAL EVALUATIONS: KEY ISSUES FROM THE CASE STUDIES andF - ECONOMIC EVALUATIONS: KEY ISSUES FROM THE CASE STUDIES are nottreatises on economics or environmental sciences; these annexes address some practicalquestions that were raised most frequently in the National Drought Study case studies abouthow these fields fit into drought management.
G - HYDROLOGY explains basic concepts in drought hydrology
H - ALTERNATIVE DISPUTE RESOLUTION is a primer on the subject, with a description of how a shared vision model can help an ADR process.
I - DROUGHT AND THE PUBLIC includes a brief history of public involvement in waterresources and some practical lessons learned.
J - CONCEPTUAL BASIS FOR CIRCLES OF INFLUENCE describes the theory and practice that inspired this simple but effective idea.
K - FORECASTING WATER USE TO MANAGE WATER CONSERVATION explains what disaggregated water use forecasting is and how it can be used to make sure conservationprograms are more cost effective.
L - LESSONS LEARNED FROM THE CALIFORNIA DROUGHT 1987-1992 is a 7 pagesummary of longer reports (NDS-5 and 6), with some additional new information.
M - THE PRINCIPAL NATIONAL DROUGHT STUDY CASE STUDIES includes thumbnail sketches of each case study.
N - THE NATIONAL DROUGHT ATLAS depicts the type of data in the Atlas and shows one way it can be used.

BLANK PAGE
(Skip)

A-1
A - ORIGINS OF FEDERAL WATER RESOURCES PLANNING GUIDANCE
The DPS method is a hybrid. Although based This contradicted the premise of multiobjectiveon planning tools that have been used primarily water resources management, which is that to evaluate the feasibility of federal water water should be managed to produce the bestprojects, the DPS method was used to evaluate balance of the intended objectives. the advisability of one short term operational Multiobjective evaluation procedures had beenplan over another, usually with a fairly modest integrated into the principles which guided federal interest. This annex will explain why federal water resources feasibility studies. In the federal guidelines were so influential and fact, scholars and water managers had tested will state how the DPS method differs from and applied several generations of water and co-exists with the latest federal planning resources planning methods; no other planningprinciples. approaches had anywhere near the amount of
In the first year of the National Study of WaterManagement During Drought, several The current federal method (Principles andexperienced water planners were asked to Guidance), however, had a very narrow planreview the literature on water resources selection process; P&G call for the selection planning and propose specific drought planning of the plan that reasonably maximizesapproaches. In addition, published and National Economic Benefits (NED). Sinceunpublished preparedness methods developed there might or might not be a significantspecifically for drought were reviewed. There federal interest in regional droughts, it waswere two basic critical questions used in clear that this would be an inappropriateevaluating these approaches: condition for plan selection. But, absent the
! Was the approach internally consistent and rules should be embedded in the DPScomplete? planning method?
! Would the method reduce the negativeeffects from drought?
The negative impacts of drought were the subject of television news almost nightly in1988. The impacts cut across all the purposes of water management. Many could be expressed in economic terms, but others werepurely environmental or social. Investigationsconducted by the National Drought Study teamand others showed that most drought plans hadnot been designed to reduce the effects ofdrought; most were intended to ration shortages without regard to the impactproportionate reductions would have on different water users.
testing and thought invested.
simple NED objective, what decision making
The advantage of the federal planningprinciples. The very brief history of federalwater resources planning that follows is meant to introduce readers unfamiliar with that history to the investment, testing, and high level criticism that have shaped and refined thefederal water resources planning andevaluation procedures. Accordingly,developments related to these aspects areemphasized in what follows. Other matters,(which were of great national interest andconcern at one time), such as proposedrealignment of water resources responsibilitiesin government and/or creation of additionalvalley authorities, are omitted because they areirrelevant to the purposes of this report.

A-2
The requirement to perform a benefit-cost discrepancies in such matters as the methodsanalysis in a federal water resource project of estimating benefits and allocating costsstudy originated in the 1936 Flood Control among project functions. There was also aAct. The federal government was authorized perceived need for greater coordinationto participate in the construction of flood between agencies in the planning of watercontrol projects if “the benefits to whomsoever resources development in large river basins.they may accrue are in excess of the estimatedcost.” This was a clear expression of the In May 1950, the Interagency Committee onfederal interest. This requirement of Water Resources issued a report known as “economic justification” was subsequently “The Green Book,” which, although notextended to other water resource project mandatory, was influential among the agenciespurposes. Interpretation of the economic concerned in establishing sounder policies onjustification requirement resulted in the controversial matters such as benefit development and evolution of various estimation, discount rates, and allocation ofanalytical procedures and the promulgation of costs. It also stated in general terms that “Fora number of policy statements, both formal federal projects, a comprehensive publicand informal. viewpoint should be taken.”
During the New Deal era, executive branch In the late 1950's, the Harvard Water Programpolicies favored the use of secondary and developed a body of thinkers who consideredintangible benefits to evaluate projects. These the basic economic approach to waterbenefits were believed to embody the social resources project feasibility to be too narrow,reasons why water resource projects were and favored multiobjective project evaluation. wanted. As the recession, and later the war This method required trade-offs between allcame to an end, the Bureau of the Budget no classes of benefits. This intellectual stimuluslonger accepted the use of these benefits. By had far-reaching effects. President Kennedy,the early 1950's, economic justification after only seven months in office, sentprocedures relied almost entirely on “national proposed legislation to Congress creating theeconomic efficiency,” i.e., a favorable benefit- Water Resources Council, with extensivecost ratio using benefits as identified from the powers. An ad hoc Water Resources Councilnational economy’s perspective. in 1962 helped develop Senate Document 97,
There was soon a perceived need for analysis in ways expected to justify morecoordinating activity between the federal projects.agencies and the states. This was doneinitially by river basin committees, created by In the field of flood control, the simple interstate compact. These were the paradigm of continually building more floodforerunners of the later river basin protection as flood damages increased wascommissions. However, new ideas now began replaced nationally by the concept of providingto arise. This was an era of rapid, large-scale flood plain management to minimize floodwater resources development. Interest in water damages, and of resorting to flood controlresources rose both in government and in construction only when necessary. The Northacademic circles. There was competition Atlantic Regional study of the Corps provided among federal water agencies, and significant a testing ground for multiobjective planning.
which revised standards for benefit-cost

A-3
And finally, a long-standing controversy on of the Harvard Water Program. The P&Sproposed water supply improvements on the required a six step iterative planning process,Potomac River had showed that operational as follows: (1) Specify problems andcoordination between various systems opportunities; (2) inventory and assess waterconcerned could make very large and related land conditions; (3) formulateimprovements in safe yield, obviating the need alternative plans; (4) evaluate effects of eachin this case for a whole series of additional alternative; (5) compare the alternatives basedreservoirs. on effects; and (6) make recommendations. Of
On the national political level, the great closely to the recommended approach for DPSenvironmental movement starting in the sixties as described in Chapter 2 of this report.led to passage of the National EnvironmentalPolicy Act of 1969, and the Federal Water Beginning in the late 1970's, federal waterPollution Control Act of 1972 (now known as resource development programs came underthe Clean Water Act). Under the Clean Water criticism, especially within the ReaganAct, the programs of EPA were made administration. In 1983, the P&S wascompletely independent of the planning criteria replaced by “Economic and Environmentalof the Water Resources Council and of the Principles and Guidelines for Water andgeneral idea of balancing benefits against Related Land Resources Implementationcosts. Studies” (P&G). The P&G apply in all Corps
For water agencies other than EPA, in 1973, Conservation Service, and Tennessee Valleythe now formally constituted Water Resources Authority implementation studies for civilCouncil issued “Principles and Standards for works water project plans. Planning Water and Related Land Resources”(P&S). The principal new feature of this Most of the principles of the P&S were carrieddocument was to require that project plans be over into the P&G, except that, under the prepared separately to emphasize national P&G, National Economic Development (NED)economic development and to enhance the benefits are more important in plan selectionquality of the environment. Other objectives to than in the P&S. Under the P&G, planners arebe recognized were regional development and not required to develop an Environmentalsocial well-being, but specific plans for those Quality plan. The recommended plan is purposes were not required. Both positive and (unless an exception is granted by thenegative effects upon each purpose were to be Assistant Secretary of the Army for Civildisplayed. Works) the one that reasonably maximizes
There was no clear concept as to how to the nation’s environment). The selection ofreconcile divergences between environmental projects which maximize NED is subject toand economic goals. The main policy was that environmental laws and constraints in athey should be explicitly recognized, process best described as constrainedcompared, and considered in project optimization.formulation. Specifically, for reasons ofenvironmental quality, agencies could select a The four accounts into which project effects plan other than the one that maximized are to be classified are:national economic benefit. This P&Srepresented the further extension of the ideas ! National Economic Development (NED)
course, this general process corresponds
of Engineers, Bureau of Reclamation, Soil
net NED benefits (consistent with protecting

A-4
! Environmental Quality (EQ) Besides the issuance of the P&G, two other! Regional Economic Development (RED) developments have considerably changed the! Other Social Effects (OSE) conduct of water resources planning. First, the
The P&G and its four accounts system of the Water Resources Council and inactivateddisplaying information provide a most of the River Basin Commissions. Thiscomprehensive, consistent, and systematic change increased the difficulties of assuringmethodology for evaluating plan impacts. Its effective interagency cooperation. Secondly, basic theory is very similar to that of the P&S. the passage of the Water ResourcesIn either case, the undoubtedly sound Development Act in 1986 increased the cost-principles do not avoid the inherent difficulties sharing requirements of most non-federalof quantifying many of the non-economic partners, including non-federal contributions tovalues encountered in water resources feasibility studies. Non-federal interests areplanning, particularly in drought planning. now required to assume the full cost of water
There is a conceptual problem related to DPS the form of construction or reconstruction ofwhich remains unresolved. The Corps of federal reservoirs. Although it may be arguedEngineers, and most other water agencies, use that the regional effects of a major drought arethe maximization of NED as the objective analogous to those of a major flood, the federalwhen planning a new or revised federal government has not assumed the sameproject. This is mandatory. However, the responsibility for drought control that it hasstates and municipalities, which between them for flood control. Therefore, federal planningwill be required to pay for water supply costs for DPS must be undertaken without any (including federal construction costs), are substantial federal financial contribution tojustifiably concerned with regional economic remedial projects.development (RED), as explained in the mainreport and Annex F. For impacts on whichevaluation of NED and RED differ markedly,this difference may have to be recognized andcovered in negotiation, since the P&Gprocedures cannot be held to be automaticallyapplicable to planning by states and theirsubdivisions. With respect to federalparticipation, the principles of the P&G are fully applicable in the DPS, although thecooperative procedures used are somewhatdifferent from those used in project planning by the Corps.
Reagan administration eliminated funding for
supply improvements, even though they take

B-1
B - POLITICS, ADVOCACY GROUPS, AND WATER AGENCIES
There are characteristic differences in the way applies in legislative action, which requireselected officials, advocacy groups (such as majorities to be assembled through environmental or growth management groups), negotiation among members on many and water agency staffs engage in the conduct collateral issues. This might include budgets,of water management. The way these taxes, crime prevention, education, air dissimilar patterns mesh can itself influence pollution, growth, traffic management, firethe effectiveness of water management and fighting, trash collection, waste management,drought preparedness. Two hypothetical health care, and relations with otherexamples help illustrate this: governments.
Agencies and elected officials. A regulatory The importance of intergovernmental andagency might refuse to grant a permit for a interagency “meshing” has been recognized bynew city reservoir, arguing that the same the creation of commissions to manage thoselevel of water service reliability can be relationships. However, the choreography ofachieved at less cost through water elected officials, environmentalists and waterconservation. But the mayor of the city agency staffs in water management is often left might support the reservoir, because it to chance. Successful interactions are would also provide the city bargaining celebrated because of their rarity. Anecdotalpower in negotiations to secure regional evidence indicates that successful interaction is cooperation on wastewater, transportation a function of the personalities involved.and police protection. In this case, thedifference in approach is in This annex highlights some types of situationsconceptualization; because of their more that were most often described as problematic narrowly focused role, some water resources by water managers, elected officials and agencies may not consider the mayor’s political appointees, and environmentalistsdecision criteria. Is there a solution which during the National Drought Study. Thecan address the concerns of both the agency discussion of typical situations is followed byand the mayor? If there is, it is unlikely to suggestions for addressing those situationsbe identified unless a conscious effort is developed with the U.S. Advisory Commissionmade to bridge the two ways of seeing the on Intergovernmental Relations (ACIR) and problem. other social science experts.
Agencies and advocacy groups. Agencies and elected officials.Environmental groups gained their initialleverage in water resources through Situation 1. Citizens turn to elected officialslegislative lobbying and the courts to stop for help during drought, but the officials water projects, not through collaborative have not been involved in agency planningplanning for water supply solutions and the efforts. operation of existing projects. But, gettingnew laws and court rulings can take a long Political involvement in water management istime and a lot of money, and the results may most intense during the authorization of capitalnot please any stakeholders. A similar risk intensive water projects or the imposition of

B-2
regulatory statutes. Years may pass between agency fails to fulfill its mission, but becausethe signing of a bill and the next severe agency missions encompass pieces of waterdrought. During that time, water uses may management, and the vulnerability is oftenbecome more diverse and intense. Drought apparent only when a water system is viewedplans, if any are developed, may be done holistically. Division of responsibility typicallyagency by agency. Too often, it requires the reflects one or more of three fundamentalonset of a drought for these issues to be raised conceptual divides: surface water andto a political level, and as a consequence, groundwater, water quantity and quality, and elected officials learn of the insufficiencies just the water management purposes (such asafter their constituents ask them to make the irrigation and navigation).system address their needs. Elected officialscannot defend a non-responsive system, but Droughts reintegrate these conceptualtheir criticism, often seen as scapegoating by distinctions. A shortage of surface water couldagency staff, may hurt agency morale. be addressed by pumping groundwater; lowMoreover, water management decisions flows reduce the capacity to dilute effluents; developed and implemented at a primarily irrigators and navigators must find a way topolitical level during a drought may not serve share scarce water. Where and how is thethe best long term interests of the region. problem managed holistically? Organizational
Situation 2. Elected officials have notcommunicated broad water managementgoals to agency staff. This is the least true atthe federal level. The Economic andEnvironmental Principles and Guidelines forWater and Related Land ResourcesImplementation Studies (the P&G) spell outwhat the President and Congress want federalagencies to consider in evaluating water Solutionsprojects. These are general principles andguidelines; planning objectives are developedfor each study. But few cities and counties have developed analogous guidelines. Howthen, can a regional drought preparedness teamdetermine the criteria that several mayors,state senators, city council members, and the governor will use in determining whether tosupport and implement a drought plan? Thetraditional method is to rely on the politicalacumen and articulateness of the agencystaffer reporting to each elected official, butthose skills vary from staffer to staffer, as doestheir access to political leaders.
Situation 3. Agencies have not kept electedofficials advised of new droughtvulnerability. This occurs not because an
charts show where integration of the missions of individual agencies occurs. It is generally at a political level, such as the President’s Cabinet or a legislative water commission. Butthe small staffs at this level are often too farremoved from field data or too engaged in thepressure of other issues to analyze trends forpotential problems.
As with most studies, the agency staff engaged in the DPS’s were asked to keep their politicalbosses informed of the team’s efforts, and letters were sent to officials at critical juncturesin the studies by the study leaders. Twomeasures were used to address the three typicalsituations described above, and the DPS teamsfelt that they improved the effectiveness of therelationship between agencies and electedofficials:
1. Political scientists were asked to conductsurveys to determine what elected officialsexpected from drought preparedness efforts. The U.S. Advisory Commission onIntergovernmental Relations (ACIR) conductedtwo such studies. In Virginia, Vivian Watts (a

B-3
former Virginia state legislator and Secretary There were still concerns about whether electedof Transportation) met with the Virginia officials had spoken openly about hot regionallegislature and Virginia water experts and issues, but the information from these politicalwrote a report that explained the position of studies was used to supplement information theeach side on the issue of the development of a DPS team received from more general sourcesstate water policy. Her study increased the such as the local press and agency briefings.understanding each side had of the other’sposition, and helped support movement within 2. In the Green River DPS, a “demonstration”the Virginia water community to revisit the workshop was held at the close of the study,issue of a state water policy. The Virginia after technical experts had engaged in a VirtualWater Commission, a group of state Drought. The demonstration workshop, shorterlegislators, met on July 21, 1993 to consider and less technical than previous DPS ideas - including those of the James River DPS workshops, was meant to show the broadteam - for a more proactive state water role. implications of the DPS agreements to staffTestimony was offered by National Drought directly engaged with mayors and governors. Study representatives, and the shared vision Whereas the technical workshops had focused model was demonstrated. on hydrology and technical models, the
In the Seattle area, David Harrison, Helen public relations and regional cooperation andBirss, and Dean Ruiz of the University of showed how technical staff had been able toWashington’s Northwest Policy Center create a working, regional partnership.interviewed the mayor of Seattle and SeattleCouncil Members, as well as water agency staff in an effort to describe political and water Agencies and Advocacy Groupsagency perspectives on regional watermanagement. Other DPS team members were Situation 4. Advocacy groups and agenciespleased with these study reports because they: are not used to working together. Prior to
described the regional political context more of 1969, water agencies had much less legalfully than any individual agency staffer obligation to disclose environmental impacts tounderstood it; the public, including environmental groups.
represented the views of each elected official Despite the considerable investment of time,evenly, avoiding the problem of political dollars, and personnel that participation effortsinterpretations by misinformed, biased, received during the 1970's and 1980's, manyinarticulate, or unempowered agency conflicts over resource management issuesstaffers; continued to land in court. Collaborative
brought the DPS to the attention of the and agencies are still unusual. In some cases,officials. The interviews provided an environmental groups may consider it in the opportunity for a limited, but informal best interests of the world and their briefing on the study in progress. (The organization to avoid collaboration, fearing thatpolitical scientists had been thoroughly financial and personal relationships couldbriefed on the study before conducting the diminish their role as critics.interviews.)
demonstration workshop addressed issues of
the National Environmental Policy Act (NEPA)
planning efforts between environmental groups
Solution

B-4
While legislative and judicial intervention may solutions that require neither collaboration orhave been the best use of limited advocacy confrontation. Unless there is an ongoing orresources in the dam building era, some imminent adjudicative relationship, DPS environmental groups are changing their teams should reach out to environmentalmethod of operation. For example, Edward groups that can help or block a study andOsann and David Conrad, then with the negotiate a suitable level of involvement.National Wildlife Federation, developed theconservation plans for the latest increment of The DPS method names advocacy groups as the Central Utah Project, a Bureau of one of the four types of participants that shouldReclamation project first authorized in 1956 be involved in any drought study. The (Monberg, May 14, 1992) DPS teams should “Circles of Influence” method of managing recognize three things: study participation permits advocacy groups to
1. Planning collaboratively with the main requirement for membership in the environmental groups is the only way to inner Circle A is the ability and willingness tofully consider their points of view. work on the study. Alternative points of view raised late in astudy must not only prove themselves, butovercome the momentum that establishedideas have developed within the team. Moreover, time and funding constraintsdiscriminate against the consideration of lastminute ideas.
2. Planning collaboratively withenvironmental groups is a good way to assure that environmentalists understandnon-environmental planning objectives andshare the responsibility for addressing thoseobjectives.
3. Environmentalists generally offer a broader perspective on river basinmanagement issues because they have not had to pursue agency objectives, which areusually fairly narrow. Because of this, theymay help a DPS team think holistically andbecome results oriented, rather than processoriented.
4. Environmental groups are not all the same. Some have deliberately chosen tobecome collaborative, some to stay within the role of critic, and some, like the NatureConservancy, which buys land and sets itaside for environmental purposes, to find
become as involved as their resources allow;
Situation 5. Collaborative planning isimpeded because an advocacy group could be a potential adversary in court. This applies to adversaries who are not advocacygroups, as well. The DPS and othercollaborative planning processes are rationalmethods; the “best” decision requires trust and a full sharing of information and objectives,including uncertainties about data andrelationships. The judicial process isadversarial; a champion for each adversarypresents one side as vigorously as possible anddiminishes opposing views through whateverlegal means that champion can muster. The“best” decision is made by a third party who has heard all sides and been informed of pastcase law. Information sharing in a judicialprocess is called “discovery” and involves court ordered access to an adversary’s files. Thus, pursuing a DPS can diminish the chance of success in an adversarial process, and viceversa. Alternatives that stakeholders choosingbetween collaboration and lawsuits shouldconsider include:
1. Do both. In some cases, stakeholders have pursued both approaches at once. During the recent drought on the MissouriRiver, Corps of Engineers and the Missouri

B-5
River basin states collaborated in a review of of Engineers in its Northeastern United Statesthe operation policies of the Corps Main Water Supply Study) to divert water from theStem Missouri River reservoirs, while at the Connecticut River to supply Boston. Theysame time North Dakota, South Dakota and argued that it was unfair for Boston to createMontana brought suit on related issues in transbasin diversions before managing its waterfederal court in Billings, Montana. No study demands. The opponents metamorphosedhas been done to estimate the effect one through several organizations from 1969 approach has on the other. (Connecticut River Information Clearinghouse)
2. Formally discontinue the suit. Alabamaand Florida agreed to stop pursuing ajudicial solution and signed a memorandumwith Georgia and the Corps of Engineers toconduct the Alabama-Coosa-Tallapoosa andApalachicola-Chattahoochee-Flint RiverBasins Comprehensive Study. If theparticipants in an active or imminent water suit believe that a collaborative process would increase the probability of a mutually desirable outcome at a lower transactionalcost, then they might consider a formalprocess, developed with the help of alternative dispute resolution experts, thatdefines the conditions of a cooperative jointstudy. The study process can then proceeddeliberately until one or the other partnerfeels that judicial proceedings areunavoidable.
3. Create a new relationship. The WaterSupply Citizens Advisory Committee inMassachusetts is a model for howadversarial relationships can become moreproductive without a loss in the diversity ofvalues represented in water managementdecisions. In brief, a group ofenvironmentalists, citizen activists andacademicians sought to block the plans ofthe Metropolitan District Commission(MDC) (supported by the Corps
to the Water Supply Citizens AdvisoryCommittee (WSCAC) in 1980. WSCAC played an important role in the creation of theMassachusetts Water Resources Authority(MWRA) in 1984, which took over theresponsibility for delivery and distribution ofwater for 46 communities from the MDC.
Of greatest interest to other communities is thecurrent relationship between MWRA andWSCAC. MWRA provides funding for officespace, expenses and staff for WSCAC. The staff is answerable only to WSCAC, notMWRA. WSCAC directors can access MWRA computer files using a WSCACcomputer. MWRA consults with WSCAC while developing management strategies, so that published strategies have already receivedthe benefit of an environmental perspective. WSCAC has its own network of advocates andexperts, so a pattern of communication and trust similar to the Circles of Influence has been established.

BLANK PAGE
(Skip)

C-1
C - COMPUTER MODELS OF WATER AND RELATED SYSTEMS
The most visible innovation of the National simulation languages for use in business andDrought Study is the way computers were academics. The first copies of STELLA II®used in developing strategic and tactical plans. were shipped in late 1985. STELLA II® is This innovation continues the long tradition of most simply described as a visual spreadsheetcomputer usage within the Corps of Engineers for systems analysis where the process beingthat began in the early 1950's. Conversations modeled can be presented as pictures as well asbetween William Whipple, who was then equations. STELLA II® is one of manyexecutive officer to the Assistant Chief of object-oriented simulation modelingEngineers, and John von Neumann, a environments available commercially. mathematician at Princeton’s Institute for STELLA II® was selected over other availableAdvanced Study, resulted in the Corps using software because of its unique combination ofcomputers to calculate river stages and simplicity, power, and cost-effectiveness.reservoir operating plans. Computers have since been applied by the Corps to all aspects This shift in modeling paradigm raised a of their multi-disciplinary analysis, including number of issues that were addressed in thehydraulics, hydrology, economics, ecology, National Drought Study and which will impactlaw, and decision making. computer usage in the future.
The contribution of the National DroughtStudy to this tradition is the use of newsoftware to bridge the gap between specializedwater models and the decision making process The development of tactical and strategicused by people. The computer software used drought plans requires carefully defining thein these efforts can be described as a objectives and constraints of stakeholders anduser-friendly, graphical simulation tool. This decision makers in a region, evaluation of thesoftware makes use of icons to represent status quo, generation of alternatives, andsimple, physical objects or concepts. The selection of alternatives based upon themodel builder selects from a palette of icons to objectives and constraints. Although these construct the objects required to describe the tasks can be accomplished without computerssystem, such as reservoirs, streamflows, (as they often were in the past), planners can releases, and demands. When the basic system be aided significantly by developing computerconfiguration is defined, the modeler then models. Such models allow planners to defines system operating policies and provides evaluate a larger number of variables and moresite specific information such as streamflows, complex relationships than would otherwise bedemands, and economic impacts. possible. Computer models allow planners to incorporate important information and data The specific computer program used to such as long streamflow sequences, hydrologicimplement water resource system models and hydraulic concerns, economic impacts,developed in the National Drought Study is biological impacts and other concerns.STELLA II®, produced by High Performance Computers allow large amounts of informationSystems of Hanover, New Hampshire. and data to be efficiently organized andSTELLA II® grew out of a need for better retrieved, and perform calculations quickly.
Issue 1: When are computer modelsappropriate for drought planning?

C-2
Issue 2: What is a “shared vision model”?
The term “shared vision model” is used to planning and management is to assembledescribe a model constructed in a process in individuals representing these interests, which stakeholders and decision makers work generate agreement on which problems tocooperatively to include factors and elements address, and then develop ways in which theof interest to them. It can be contrasted with status quo can be improved. Shared visionmodeling efforts in which a small number of models provide an ideal tool for this process. technical experts develop models without truly Other characteristics that suggest the use ofconsidering who will use their model and how shared vision models in water planning includeit would be used. The construction of shared the need to: gain the confidence of vision models requires computing stakeholders and decision makers; provide aenvironments that are extremely user-friendly productive negotiation environment to aid inand easy to learn, yet powerful enough to resource planning and allocation; obtain capture interactions between the elements detailed information about resource operationbeing modeled. and management; convey technical information
Shared vision models allow stakeholders and and develop, document, and maintain a decision makers to better understand a water dynamic and flexible vision of resourceresource by cooperatively developing and management.exploring management alternatives. Thesemodels provide a computing environment inwhich model assumptions can be easilyunderstood and modified, impacts of decisionscan be evaluated, and alternative futures can The experience generated during the Nationalbe explored in real time. They allow Drought Study suggests that a variety ofstakeholders and decision makers to influence approaches to building shared vision models the planning and modeling process from the can work. The approach that was used in theoutset and to share their understanding of Green River DPS typifies the process.resource management. When a shared visionis created, inaccuracies, improper ! First, stakeholders and decision makers whoassumptions, and misconceptions can be would be impacted by the DPS effort wereidentified, thus preventing their incorporation identified. These individuals pointed outinto the planning process. problems in the region, the institutions and
Issue 3. When should “shared visionmodels” be used?
Shared vision models should be used in every objectives.important water resources evaluation where there is a gap between what stakeholders and ! Training in model construction was provideddecision makers need to know and what they to individuals representing the stakeholders andare capable of learning from specialized decision makers. This training occurred in twomodels and databases that address parts of the steps: instructors traveled to each DPS site todecision domain. Drought planning today introduce basic modeling concepts and a week
requires the consensus of an ever growingnumber of often competing and conflictinginterests. A key to successful water resources
to a large number of non-technical participants;
Issue 4. How are shared vision modelsdeveloped?
individuals that were responsible for addressingthese problems, and constructive steps that could be taken to address the problems. Theseproblems were then translated into study

C-3
long workshop was held introducing more A number of potential actions were suggested advanced topics. in the National Drought Study to address these
! Interviews were conducted with each developed by affected parties regarding modelagency representing stakeholders and decision use and distribution. A single agency should makers. At these interviews, participants were be responsible for model distribution andasked to define their role in water management maintenance. This agency should be viewed and their relationship with other agencies. by all party members as unbiased and They were encouraged to define their technically competent. Permanent changes to particular uses of models and describe how the model would occur only when themodels could benefit their agency. stakeholders and decision makers agreed that
! Based on these responses, a prototype representation. The model would be reviewed model was constructed. When the prototype at frequent intervals to ensure its was complete (including the concerns of appropriateness and correctness and newstakeholders and decision makers), this model versions distributed. Procedures should bewas demonstrated to each group. developed to provide guidance on interpretationModifications to the models were made to of model results. Interpretation of model incorporate the comments and suggestions. results for consumption by the general public
! Finally, a group workshop was held to members of the partnering agreement. Partiesdemonstrate and test the model and to ensure not respecting the agreement or using the that the interests and concerns of the affected model in an unconstructive fashion would loseparties were contained in the model. access to the model.
Issue 5: What are the potential liabilities of Issue 6: How do shared vision modelsshared vision models? interface with existing models?
A concern of some stakeholders and decision Shared vision models, such as those built withmakers associated with the National Drought STELLA II® in the National Drought Study, Study was that shared vision models could be will not replace many of the existing modelsmisused by groups or individuals. Because the used for water management. In professionalmodels are easy to use and to modify, results settings dealing with public projects and publicgenerated by altered or “infected” models impacts, many important issues remain that could be used to misinform the public or to must be evaluated by experts and for whichobscure the true implications of water public debate can add little. A role will remainmanagement issues. Although these concerns for less user-friendly models that addressare real, a purpose of developing a shared specific technical issues and whose results andvision model is to include a wider range of implications do not need to be explained toindividuals in the planning process and to non-experts.increase the level of understanding of allparties. To limit access significantly would However, many important questions must bereduce the value of the model. Instead, the addressed in a more public forum and themodel would be distributed to all interested development of shared vision models mustand appropriate parties, but with access to the facilitate the necessary public debate. Themodel would come responsibilities. output of more conventional models may well
issues. First, a partnering agreement should be
the changes allowed a more accurate
or press should be coordinated with all

C-4
prove valuable as input for shared vision models.
BLANK PAGE
(Skip)

D - WATER LAW AND DROUGHT
A drought preparedness study, which includes in the east. It provides for the allocation ofjoint action by Federal, state and municipal water use privileges by the state, superseding agencies, necessarily involves a complex legal the original rights of riparian owners. More context. This context includes not only the than half of the eastern states now have amajor types of water law differentiated regulatory permit system. between the eastern and the western states, butthe cases where the river basin in question The prior appropriation system is simple incomprises states using both systems. Also, it principle, but rigid in application, particularlyincludes conditions of water management not with respect to drought conditions. If anonly during normal times, but also during appropriator is junior, he will lose his water intimes of drought emergency, when, in many favor of the senior, with no consideration givenstates, emergency powers of some agency of to the value to society of the use of the water. government may become effective. Drought As water needs change, the strict priorplanning must start with a tentative appropriation doctrine does not work well toassumption that the existing legal structure accommodate new or better requirements. will continue; but if circumstances warrant, Also, how do we deal with water uses whichchanges in law may be recommended. Water need no diversion, such as instream flows? law is changing and evolving across the United Further, the basic appropriations systems doesStates. Some tendencies of change in not encourage water conservation, since waterapplicable law are noted in this annex and rights not fully used may be lost. However,may suggest the desirability and practicability despite these deficiencies, the water rights ofof change in any particular case. users are so firmly established in the western
Water law to be taken into account includes any changes are initiated.constitutional and statutory provisions of bothFederal and state judicial decisions andmunicipal ordinances.
Basic Systems of Water Law
There are two basic water law systems in the sufficiently obvious to warrant political action. United States: the riparian law theory which In Virginia, recent statutes allow the State prevails east of the 100th meridian, and the Water Control Board to designate managementprior appropriation system which areas within which restrictions may bepredominates in the west. Some western states imposed to meet emergency conditions. have systems which combine elements of the Indiana, North Carolina, South Carolina andriparian doctrine in their prior appropriation New Jersey allow restrictions on groundwatersystems (California is the most familiar use in specific areas. In the west, the Arizonaexample). These are called hybrid water law Groundwater Management Act establishessystems. Emerging in the eastern United special use restrictions in certain areas.States is a system of water use permittingwhich might be called regulated riparianism,and which represents the trend in water lawdevelopment
states that it is only with great difficulty that
Site Specific Programs
The trend of water law both in the east and thewest is to apply new, improved approaches tospecific geographic areas, where problems are

D-2
Quantification of Water Allocations
Some western states are taking steps to intensifies.adjudicate existing water rights in order todetermine how much water is really needed. Alarge source of uncertainty regarding water usecomes from unquantified claims of the Indian The term water conservation refers to methods tribes and certain Federal reservations. Some of reducing consumption of water (although inwestern states are encouraging the transfer of the west the term traditionally means water rights to provide for more efficient use conserving seasonally available water by damsof water during time of drought. However, and reservoirs).water management during drought should not be limited by an assessment of legally Water conservation is an essential tool ofrecognized water allocations. Water managers drought management. The priorshould push for flexibility of water use where appropriations allocations procedureneeded during drought, without waiting for discourages water conservation to the extentadoption of basic improvements in water that water not put to beneficial use may beallocation systems statewide. lost. A few western states have laws which
Public Trust Doctrine and Instream Flows
The full extent of the public interest in water is recognizing the need to conserve waternot always recognized by water allocation supplies.decisions. The public trust doctrine holds thatthe sovereign retains control of the waterresource to serve public trust purposes, whichmay include recreation and ecological values. The diversion of water from one basin to The public trust doctrine has been explicitly another is almost always controversial,recognized in some form in nine eastern and whether in the east or the west. Suchwestern states. In California, a court decision proposals relate primarily to long-range waterrequires California water managers to take the planning rather than to drought management. public trust into account in planning and However, during a severe drought, if themanaging water resources. As a practical necessary facilities exist and the state lawmatter, any drought management plan must allows, temporary interbasin diversions may beinclude consideration of the instream values of authorized to meet the needs of the mostwater, in order to avoid a challenge based upon severely affected areas.the public trust doctrine.
In most states, instream flows are, to someextent, explicitly protected. A 1989 survey lists eight western states with instream flow In most states, allocation of ground water islaws, and four which protect instream flows by handled differently from that of surface water. means other than allocation. In the east, many In some states there is no provision at all forstates have authorized agencies to establish state allocation of ground water. Thisminimum stream flows or water levels. situation complicates the preparation ofInstream flows must always be considered as drought contingency plans, which, in principle,
an important factor in drought managementplanning, particularly as the drought
Water Conservation
favor water conservation, by use of watersalvage, water marketing or water banking;but sixteen eastern states have legislation
Transbasin Diversions
Groundwater Law and Conjunctive UseManagement

D-3
should provide for most effective use during It is apparent that the control and management times of drought of ground and surface water of ground water by the different states is combined, or conjunctive use. Only two states highly diverse. In most respects, the physicalin the east have expressly provided for surface and institutional arrangements for handlingand ground water resources to be managed as ground water are relatively difficult to modifya single system. Arizona has a broad-based when a drought occurs. Drought managementcentralized program of ground water studies must be framed in the context of management, which was devised to meet a existing arrangements. However, changes maychronic and continuing ground water shortage. be recommended in advance if the potentialNew Mexico has a system of prior drought situation forecast on that basisappropriation for ground water resources. The appears to be too unfavorable.main development of conjunctive usemanagement in the west has been on anincremental, site-specific basis, rather than astatewide program, especially in California. Drought management planning requires fullTo meet the difficulties caused by the recent information in reference to legal authoritiesdrought in California, a water bank was and restrictions, including knowledge oforganized to facilitate water transfers from changing trends nationally, which may suggestwilling sellers to water districts in need. Loans particular changes that might improve droughtare used to allow water districts to develop conditions. If the situation is sufficientlynew supplies, including new wells devoted to serious, changes in law may beaugmenting stream flows. In the Orange recommended.County Water District in California, the District chose not to regulate ground waterwithdrawals directly, but to impose fees and use the money to import new water.
Conclusions

BLANK PAGE
(Skip)

E-1
E - ENVIRONMENTAL EVALUATIONS: KEY ISSUES FROM THE CASE STUDIES
During the case studies and support studies But the “status quo” is merely the situationconducted as part of the National Drought that would occur if the recommendations of the Study, a few issues regarding the evaluation of DPS were not implemented, and that meaningthe environmental impacts of drought response applies no matter what type of impacts are plans frequently caused debate. This annex being considered. In this example, the status discusses those issues and provides some quo would be defined by the current operation suggestions as to how they might be addressed. of the reservoirs. The environmental impacts
Issue 1: The use of the status quoin the management of environmental impacts during drought
In the study of the feasibility of a federalreservoir, the definition of what is referred to as the “Status Quo” in the DPS method, or the Environmental impacts become harder to“existing conditions and most probable future measure the longer the period of analysis and without a Federal plan” in federal planning the farther from the stream. A short term guidance is clear: the basin without a federal drought might affect one breeding cycle, orreservoir. All changes in the basin that are destroy a segment of a population of animals expected to occur outside the federal action are or plants. These impacts are well known; theyincluded in this scenario. The definition of are the familiar subject of most drought that baseline isolates the effects that will be planning efforts. The greatest difficulty lies generated by the recommendations of the not in identifying the impacts, but in institutingfeasibility study from the effects from the solutions and the necessary trade-offs decisions made outside the feasibility study. among interests.This evaluation approach is widely understoodand accepted. Medium and long term droughts (longer than
But during the National Drought Study case are harder to identify. As a result, defining studies and in other forums in which National the mitigating effect of a set of managementDrought Study members participated, there measures is equally difficult. In addition,were many debates rooted in the definition of medium and long term drought conditions the status quo for tactical responses. Many present issues of cumulative impact which arebelieved that environmental demands for water poorly understood. For example, what will beduring drought should be tempered by the fact the cumulative impact of a drought which that without the reservoirs, the natural system hinders fish spawning for an entire generation would have had even less water. Because the of fish? Similarly, what will be the cumulativenatural condition was no reservoir, they argued, effect on the environment of changes in land this should be the status quo for the use, human population and pollution, and howenvironment, and water beyond that should be will severe drought affect this changing statusconsidered an improvement. quo? Such problematic questions have led
of alternative plans should be compared to thestatus quo.
Issue 2: The limits of knowledge on theenvironmental impacts of drought
one year) have environmental impacts which
some to suggest “adaptive management”

E-2
guided by large scale system-wide controlled Thus, the effects of changes to these experiments (Holling, 1978). This is a recreational opportunities are essentiallyrecognition of the lack of knowledge about the economic.long term effects of human intervention in natural systems. The unknown environmental The suspension of cultural traditions isimpacts of medium and long term drought considered a social effect. Tribal fishingcould be candidates for such an analysis. customs which call for taking fish in a (For a discussion of cumulative impact particular way at a certain time of the yearanalysis, see Stakhiv, E., “An Evaluation embody fundamental, self-defining values for Paradigm for Cumulative Impact Analysis,” the tribe. The fishing may have religious andU.S. Army Corps of Engineers: IWR Policy cultural components as a ritual time whenStudy 88-PS-3, 1988. Stakhiv differentiates families reunite. This fishing is more thanaccumulating impacts of human actions (the recreation, and should be accounted forimpacts of taking a number of small, accordingly.incremental actions) from the multiobjectiveplanning perspective where the cumulative The same reduction in flows may also affect effect of a number of factors is considered.) the health of the natural ecosystem, and these
Issue 3: Multiobjective analysis of changes to an ecosystem
The same physical changes (for example, techniques (Olsen, 1993), the willingness ofreductions of instream flows) induced by water society to pay for environmental health is mostmanagement decisions may have impacts in the often determined case by case after a trade-offeconomic, environmental, and social well being across accounts has been made. For example, accounts. Trading across accounts is not if society forgoes $1,000,000 in hydropowerimpossible, but (by definition) no common benefits to save a pair of nesting birds, then wecurrency exists for the three accounts. can say after the fact that there was an implied
Reductions in instream flows can reduceecosystem based recreation, creating an Each of these three impact areas is likely to economic impact which can be given a dollar have individual proponents. Alternatives whichvalue and potentially traded for other economic mitigate recreational impacts may not addressimpacts. For example, studies have the concerns of environmentalists or tribes.investigated a process for determining how much sport fishermen would be willing to pay The three examples show that though instreamfor a healthy fishery (Olsen, 1992). Other flow seems to be a common denominator, thekinds of outdoor recreation activities, such as three interests are fundamentally different inboating and swimming, can also be valued in economic, social, and environmental terms. monetary terms. These are elective activities Actions which are directed at one interest mayfor which individuals are willing to pay. Their not be viewed as appropriate by otherdecision to recreate at a stream or lake is, to a interests.great degree, a consumer’s decision about how to spend time and money recreating.
effects should be tracked as environmentalimpacts. Though methods have been used toreach a <nonuser’ inherent value for the existence of a natural resource by using survey
economic value in preserving that pair.

F-1
F - ECONOMIC EVALUATIONS: KEY ISSUES FROM THE CASE STUDIES
In each of the Drought Preparedness Studies criteria, and measures of performance. It isthere was a debate about whether and to what during this step that this question should beextent economics could be used to develop and answered. DPS teams should ask themselves:evaluate alternative plans. The issues mostfrequently raised in the case studies are ! if economic efficiency or the equitableexamined in this annex. distribution of economic impacts are goals of
Historically, economic analysis has played aminor role in the formulation and evaluation of ! whether alternative plans could increaseplans to mitigate or avoid the impacts of economic efficiency or effect more equitabledrought. This is a result of: distribution of economic impacts;
! the difficulty in defining and describing a ! whether the measures of performance ofdrought event in terms of recurrence interval competing alternatives favor differentand spatial and duration characteristics; stakeholders (for example, one alternative
! the lack of reliable information from rafting).previous droughts;
! the limitations of available analytic tools questions is “yes”, the DPS teams are affirmingthat are available; that economic assessments will be necessary to
! the nature of tactical drought response The team must then decide how to conduct theplans, which tend to include a variety of non- assessment, considering the generic problemsstructural measures by more than one listed at the beginning of this annex, the agency; interest of decision makers, study funding, and
! custom. The use of economic analyses in economically efficient alternatives.the evaluation of federal water projects, where it is now required, evolved over a period of decades and was spurred bycritical reviews of federal policy by experts Benefit-cost analyses evaluate the preferences outside the federal government. Regional of individuals, backed by their willingness todrought responses have not engendered the pay, for the outputs of a water system assame sustained criticism. compared to their preferences for the resources
Issue 1: Should the evaluation of alternativedrought contingency plans includeconsideration of economic impacts?
The second step of the DPS method (Chapter or another, or using water now rather than 4) is to develop planning objectives, decision saving it for later use.
regional water management;
increasing days of lake recreation, the other,
To the degree that their answer to these
determine which plans best meet their goals.
institutional barriers to implementing
Issue 2. What is a benefit-cost analysis?
used to provide those outputs (Major, 1977). In strategic water resources planning, thosechoices are often between water and non-waterinvestments. In a drought, the choices will often be between using water for one purpose

F-2
Those preferences are most visible in a market $75 million, the buyers total willingness to situation, where individuals are free to pay, but there was a $25 million opportunity determine the level of resources they will cost to achieve it. Total surplus is the sum ofexchange in return for specific outputs. In that consumer and producer surpluses. case, the economic benefit society reaps from aset of transactions is the sum of the consumerand producer surplus from those transactions. The following simplified example (illustrated in Figure F-1 and Figure F-2) shows howbenefits would be calculated in a market drivenallocation of water.
If hydropower producers can get all the waterthey want (20 million acre-feet), and they arewilling to pay $100 million for it, the area under the demand curve:
½ X ($10/acre-foot) X (20,000,000 acre feet)
Water providers will accept no less than $100million (the area under the supply curve) for 20 million acre-feet, presumably becausesomeone else besides hydropower producers will pay them that much for the water.
The optimal amount to allocate is where the two curves intersect, at a price of $5 an acre-foot, and a quantity of 10 million acre feet, a sale worth $50 million. This is depicted inFigure F-1. Power producers would have beenwilling to pay $75 million, and water supplierswilling to accept $25 million (the areas under the demand and supply curves from 0 to 10million acre-feet).
Consumer surplus is the difference between what power producers were willing to pay andwhat they did pay ($75-50 = $25 million). Producer surplus is the amount of money water suppliers received ($50 million) minus the amount they were willing to take ($25million) = $25 million. Hence the economicbenefit from this transaction is $50 million. Producer surplus is an increase in seller’s income and a decrease in consumer’s income. The gross value of the water to society was
A drought would move the supply curve up; water suppliers would ask for a higher price per acre-foot for a given volume of water. InFigure F-2, the optimal solution is the sale of 8million acre-feet of water at $6 an acre-foot, asale of $48 million. The sum of consumer andproducer surplus is now $30 million (½ * $(10-2.5)/Acre feet* 8 million acre feet), so theeconomic effect of the drought under the statusquo is $20 million ($50-$30 million). If analternative plan could be developed thatproduced a consumer surplus of $40 millionduring a drought, a benefit of $10 million could be attributed to the plan.
Estimating changes in economic benefits innon-market conditions. However, markets may not capture all economic effects if somecosts or benefits are not accounted for byproducers or consumers. Moreover, many water transactions are not driven by marketforces. In those cases other methods forestimating the economic benefits of one planversus another must be used. There is extensive literature on the estimation ofeconomic effects in non-market conditions. The P&G include a comprehensive set ofprocedures for the full range of water purposes,and these are summarized below. DPS teamsmay face situations in which the P&G estimates are not acceptable to decision makerswho nonetheless are interested in estimatingeconomic impacts. In those cases, teams should call an expert for help. Sources includethe Corps Institute for Water Resources, andWaterways Experiment Station. In addition,experts can be found through state waterresources research centers.
The P&G has step by step measures forestimating benefits in each of several purposes.

$0.00
$5
$10
0 10 20
Supply and DemandDemand
Millions of Acre-feet of water
Consumer Surplus
Willingness to payProducer Surplus
$0.00
$5
$10
0 10 20
Supply and Demand in DroughtDemand
Millions of Acre-feet of water
Consumer Surplus
Producer Surplus
F-3
FIGURE F-1. ECONOMIC BENEFITS FROM
MARKET TRANSACTIONS
FIGURE F-2. IN A DROUGHT, CONSUMER AND
PRODUCER SURPLUS ARE REDUCED BY $20MILLION.
Although designed to be used primarily in the losses result from dry soils, dehydration,calculation of NED benefits, they are also impaired productivity of the land, insect
useful for estimating RED of plant disease. Wildlife, denied their natural
benefits - only the area of measurement When perennial crops, like vines and fruit changes. In the federal accounting system, trees, are damaged by drought, the impacts caneconomic impacts (which track the distribution last beyond the drought.of effects) such as employment are also included in the RED account. Because With drought impacts comes a reduction inemployment is not a component of economic agricultural income and jobs. Losses inefficiency, these RED impacts cannot be agricultural income are RED losses. Whethercalculated directly from RED benefits. these impacts are NED losses (whether the loss
A full presentation of how to use the P&G supply of agricultural products, reducingfour-account method in drought planning is American society’s total surplus), depends on available in Drought Impacts in a P&G the severity, duration and extent of a drought Planning Context (NDS-8). Additional and the uniqueness of the crop and its growing
information can be found in NationalEconomic Development Procedures Manual -Overview Manual for Conducting NationalEconomic Development Analysis, October 1991 and National Economic DevelopmentProcedures Manual - National EconomicDevelopment Costs, June 1993.
Issue 3: How can the economic impacts toagriculture be measured when irrigationwater is provided at a subsidy or the sale price of crops is subsidized?
It is very difficult to measure the true economic impacts of changes in the allocation of water to farmers when the price of water and crops are both subsidized. The existence of double subsidies itself may be an indicationthat no significant national economic impactswill occur. But DPS teams should considerregional economic effects if that is a decisioncriterion.
Agriculture is the sector of the economy that ismost frequently and severely affected bydrought. Water is a critical input in agricultural production. Drought-related crop
infestation, and increased incidence and spread
forage, graze on and damage agricultural crops.
of crops in one region decreases the national

F-4
area. If drought occurs at a point in time thatprecludes offsetting increases in production
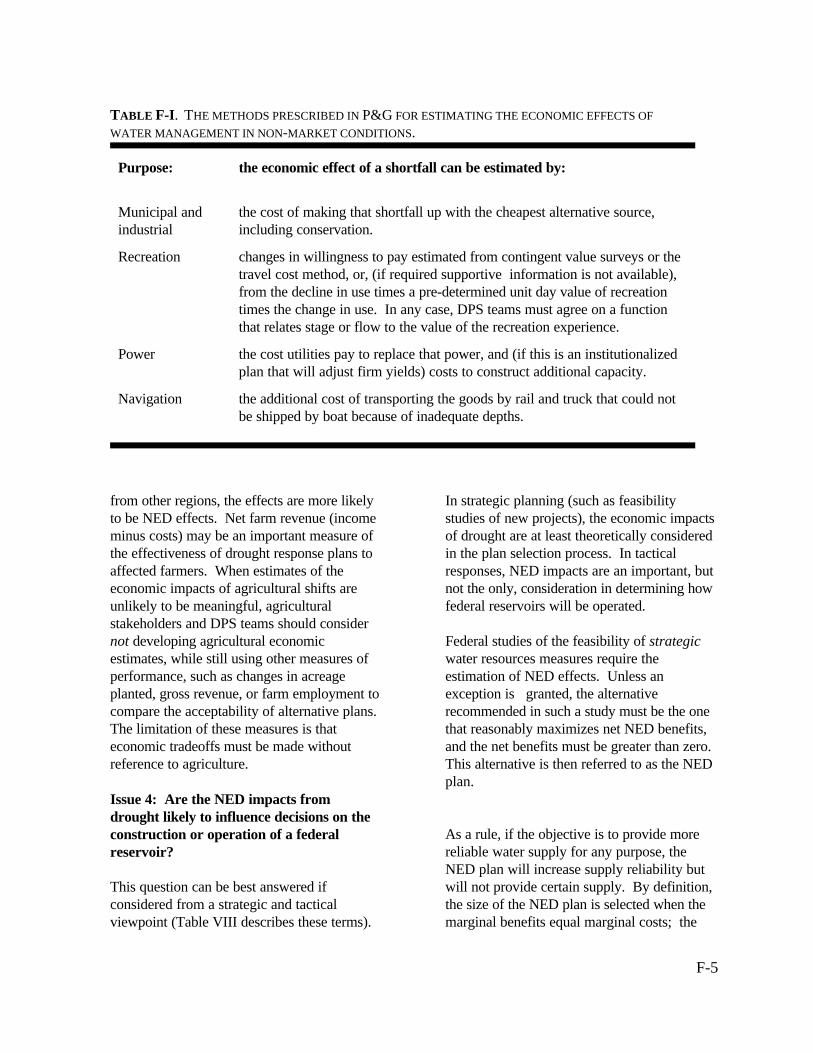
F-5
Purpose: the economic effect of a shortfall can be estimated by:
Municipal andindustrial
the cost of making that shortfall up with the cheapest alternative source,including conservation.
Recreation changes in willingness to pay estimated from contingent value surveys or thetravel cost method, or, (if required supportive information is not available),from the decline in use times a pre-determined unit day value of recreationtimes the change in use. In any case, DPS teams must agree on a function that relates stage or flow to the value of the recreation experience.
Power the cost utilities pay to replace that power, and (if this is an institutionalizedplan that will adjust firm yields) costs to construct additional capacity.
Navigation the additional cost of transporting the goods by rail and truck that could notbe shipped by boat because of inadequate depths.
TABLE F-I. THE METHODS PRESCRIBED IN P&G FOR ESTIMATING THE ECONOMIC EFFECTS OF
WATER MANAGEMENT IN NON-MARKET CONDITIONS.
from other regions, the effects are more likely In strategic planning (such as feasibilityto be NED effects. Net farm revenue (income studies of new projects), the economic impactsminus costs) may be an important measure of of drought are at least theoretically consideredthe effectiveness of drought response plans to in the plan selection process. In tactical affected farmers. When estimates of the responses, NED impacts are an important, buteconomic impacts of agricultural shifts are not the only, consideration in determining howunlikely to be meaningful, agricultural federal reservoirs will be operated. stakeholders and DPS teams should consider not developing agricultural economic Federal studies of the feasibility of strategicestimates, while still using other measures of water resources measures require theperformance, such as changes in acreage estimation of NED effects. Unless anplanted, gross revenue, or farm employment to exception is granted, the alternativecompare the acceptability of alternative plans. recommended in such a study must be the oneThe limitation of these measures is that that reasonably maximizes net NED benefits,economic tradeoffs must be made without and the net benefits must be greater than zero. reference to agriculture. This alternative is then referred to as the NED
Issue 4: Are the NED impacts fromdrought likely to influence decisions on theconstruction or operation of a federalreservoir?
This question can be best answered if will not provide certain supply. By definition,considered from a strategic and tactical the size of the NED plan is selected when theviewpoint (Table VIII describes these terms). marginal benefits equal marginal costs; the
plan.
As a rule, if the objective is to provide morereliable water supply for any purpose, theNED plan will increase supply reliability but

F-6
next increment of reliability will not be worththe incremental costs required to provide thatreliability. If in the NED plan, for example, anavigation and water supply reservoir is built, it is safe to assume that in a fairly rare dryperiod, the reservoir will not be able to meetunconstrained demands for water. This isexactly the definition of a drought in a managed water system.
Theoretically, then, federal projects are sizedto eliminate those drought impacts for which itis cost efficient to do so, and to leave the restto be attenuated by tactical plans, includingdrought contingency plans for reservoirs. Ofcourse the implied precision of this optimization is misleading, because potentialimpacts are projected over a 50 to 100 planning period, and assumptions about theseverity, duration, and frequency of droughts are simplified so that the calculations aremanageable.
The situation is quite different in thedevelopment of a tactical plan that specifieshow a federal project will be operated during adrought, or in the evaluation of specificdecisions by federal reservoir managers during a drought. In that case, NED losses areimportant, but are not the only criteria indetermining federal actions. Corps managerswill also consider applicable laws and contracts, and whether there are substitute forthe output from the Corps reservoir (such asthermal power to replace hydropower).
Issue 5: Droughts last for months, even years. How can the impacts of drought bedistinguished from impacts caused bysocioeconomic changes?
The first question planners should ask iswhether they need to determine what the impacts of the drought were or how alternativeresponses could reduce impacts. The secondanswer is usually sufficient and easier toestimate.

F-7
Isolating the effects of a drought from othereconomic activities that may be occurringsimultaneously is very difficult. The attempt to measure these effects during the recentCalifornia drought and recession (NDS-5)illustrates this difficulty.
Commercial/industrial surveys were developedand administered by the California Departmentof Water Resources (DWR) during 1991/92 inpart to identify the impacts of drought onCalifornia’s commercial and industrial sectors. These surveys included telephone and mailsurveys, newspaper article searches, and thereview of other surveys conducted by wateragencies and business associations. Thepurpose was to identify the specific businessesaffected by drought and to gain a betterunderstanding of how they were affected.
It was hoped that the results of this researchcould be appropriately extrapolated to the entire business community. Impacts, identifiedduring the survey, were to be used with theDWR input-output models to identify direct and indirect changes in regional income andemployment. With very few exceptions, thecommercial/industrial survey did not discoversignificant drought effects on businesses, and the proposed extrapolation and input-outputanalysis were not conducted.
Other surveys were conducted during the sametime period by twenty-four (24) water agenciesand thirteen (13) chambers of commerce. Theresults were mixed. Many indicated loss ofrevenues, layoffs, and impacts frommoratoriums on new water connections. Theinterviewees, however, did not aid indetermining how much of these impacts weredue to drought and how much was due torecession.
But in general, only the incremental economiceffects of alternatives, as compared to the status quo, are important in a DPS. These aresomewhat easier to define and discern.

F-8
BLANK PAGE
(Skip)

G-1
G - HYDROLOGY
Fundamental Principles
This discussion of drought hydrology is limited than normal temperatures and winds.)to consideration of droughts with durations of Interception is eliminated or reduced because one month or more. While much of what is of reduced precipitation. Infiltration may besaid could also be applied to durations shorter altered because of soil surface conditions.than one month, some factors come into play for durations of less than a month that fall Measurement of streamflow during both highoutside the scope of this discussion. These flood and drought conditions tends to be moredifferences relate primarily to soil conditions, difficult and less accurate because of poorinterception, and movement of water through definition of the rating curve and inaccuracies channels. in measuring stage. In drought conditions,
To a surface water hydrologist, drought exists increased importance of small diversions fromwhen any of several parameters, such as the stream above the gage. As a consequence,streamflow, precipitation, and soil moisture, are the precision of measured low flows is likely in the lower region of their frequency to be lower in percentage terms, except duringdistributions. To a ground water hydrologist, periods when streamflow is zero.the water table elevation may be the parameterof concern. To a water manager, reservoircontents may be the important factor inhydrologic analysis.
The physical system and its inputs and outputs The conventional wisdom is that the longer thegive rise to the frequency distributions referred record length, the better. This premise isto above. ln the usual depiction of the based on an assumption that the longer recordhydrologic cycle, precipitation falls to the earth better defines the frequency distribution. In theor on vegetation; is intercepted, infiltrated, Drought Atlas, we have calculatedevaporated, or runs off; and moves through or distributions based on the entire length ofacross soil and rocks to the stream system record, in accord with that assumption. For awhich ultimately carries the water to the first approximation, it is probably notoceans, where it evaporates to complete the unreasonable. However, some factors havecycle. When precipitation falls as snow, it may been ignored that a hydrologist should takeremain in the snow pack until enough energy into account in preparing analyses ofhas been absorbed to cause it to melt, after streamflow for a particular situation.which it moves through soil, rocks, and streams as described above. In drought A longer record will define a distribution betterconditions, discontinuities or abnormal than a short record only if the distribution doesbehavior can be seen in the hydrologic not change during the period. Such conditionssystems. Actual evapotranspiration will usually are likely in watersheds that have notbe lower because of the reduced amount of experienced major changes in land use,available soil moisture. (Potential diversions from or into the watershed, or
evapotranspiration may be higher, if the drought conditions are accompanied by higher
these problems are exacerbated by the
Length of Streamflow Record andProcedures for Adjustment andAugmentation

G-2
changing errors in gage measurements. There of the rating curves and station location are watersheds like this in the United States, changes.but not all gages meet these criteria. Streamgages are often placed on streams where water Among the possible outcomes of this analysisresources development is anticipated or where are conclusions that:water management decisions are influenced bystreamflow information. These tend to be the ! The changes are so significant that only thekinds of locations where land use changes and most recent portion of the record can be used; watershed diversions are likely. If a longerrecord doesn’t necessarily guarantee higher ! The changes over part of the record wereaccuracy, what steps should a hydrologist take sufficiently minor that these portions of theto prepare accurate analyses? The general record can be used along with the most recentapproaches available are as follows: record; or
! Determine what portion of the streamflow ! Even though the changes were significant record is sufficiently representative of current and definitely affect record quality, theconditions to use in the analysis; alternatives for augmentation and adjustment
! Use the measured streamflow record for existing record is likely to be superior to thefrequency and other hydrologic analyses alternatives. This is most likely to be usefulwithout augmentation, and with or without where the principal effect on the record is flowadjustment; diversion. The effects of land use changes are
! Compare the existing record with nearby changes in evapotranspiration and timing oflonger-record stations considered to be in the runoff. It should be possible, however, tosame hydrologic regime, and adjust or extend estimate at least the direction of these changes. the existing record accordingly;
! Generate an augmented streamflow record augmentation is the standard approach used byfrom recorded precipitation and one or more hydrologists. It can be enhanced by certainprecipitation-runoff models; statistical analyses. For frequency analysis, the
! Generate synthetic flows by statistical procedures used in the National Drought Atlas.procedures from the portion of the record The accuracy of such parameters as the mean,considered representative of current conditions. median, and measures of variance can be
Determining what portion of the streamflow known as bootstrap analysis, in which therecord is representative involves both recorded values in the streamflow series arequalitative and quantitative analysis. The repeatedly sampled, with replacement, and qualitative analysis is a review of watershed these parameters are calculated from thehistory to determine whether there have been resulting synthetic series.significant changes in land use or land cover.The principal dimensions of the quantitative A particular issue in dealing with streamflowanalysis are examining the diversions of flow during drought conditions is that there areinto and out of the watershed, and evaluation situations in which streamflow is consistently
of the record are inferior. Adjusting the
harder to estimate, because they involve
Using the measured streamflow record without
best available methods use the L-moment
estimated more precisely by a procedure
below or above normal for a decade or more.

G-3
If most of a streamflow record occurs during or predictor variable and streamflow is thesuch a period, the record may not be as dependent or predicted variable.representative as it should be for accuratedrought analyses. Comparable data series of precipitation or
The practice of comparing a record with a graphs or subjected to a statistical correlationlonger record on a nearby stream is widely procedure. The relationship could be a simpleused by hydrologists. In principle, this is a linear or curvilinear relationship, or one in reasonable procedure. In practice, one must which one or both variables have beendecide which nearby streams, if any, have a transformed, often by a logarithmichydrologic regime similar to the one in transformation.question.
At best, objective measures and procedures are these relationships. For example, instead ofused to make this determination. The measures relating this month’s precipitation to this used include such things as similarity in basin month’s streamflow, one could use two geology, similarity in annual or seasonal predictor variables, such as this month’sprecipitation, similarity in timing and precipitation and last month’s precipitation. distribution of flow, and similarity of moisture Such a practice would recognize the sources. Double mass curves and statistical importance of antecedent conditions thatcorrelations may be used to help decide influence soil moisture. Other variables thatwhether another record should be considered might be included are monthly mean sufficiently similar to merit use in record temperature or measured soil moisture at anextension (Linsley et al., 1982, p. 117). index station.
The value of augmenting a streamflow record In watersheds where streamflow depends uponwith precipitation-runoff models is predicated snowmelt, regional or watershed relationshipson the assumptions that a) precipitation is between such predictor values as snowpackinfluenced less by land use changes than is indices, temperature and predicted streamflowstreamflow, and b) that reliable relationships have usually been developed and would be between precipitation and streamflow can be used to estimate streamflow (Linsley et al.,developed. The first assumption is nearly 1982, pp 256-258).always a good one, and tends to be better forlarge areas than for small ones. The second A more deterministic approach to estimatingassumption is essentially empirical in nature runoff from precipitation is to use a waterand models of these relationships can be balance that includes major components of thedeveloped to different degrees of hydrologic cycle. This approach has been usedapproximation. by Thornthwaite and Mather at scales ranging
The simplest relationships between watersheds. At its simplest, an estimate ofprecipitation and streamflow at time scales of actual monthly evapotranspiration is made byone month or more are statistical correlations using a procedure proposed by Thornthwaiteor graphical relationships (Linsley et al., 1982, and Mather. The procedure first estimates anpp. 254-256). Such relationships are relatively unadjusted potential evapotranspiration as aeasy to explain to a non-hydrologist. In these function of temperature. These estimates arerelationships, precipitation is the independent then adjusted for day length, which is
streamflow are prepared and either plotted on
Additional variables may be added to improve
from the entire earth to individual small

G-4
expressed as a function of latitude. The even in those instances where minimalequations use a formula in which the principal information is available, such as precipitationvariables are monthly mean temperature and and temperature, these models can provide day length. Estimates of soil moisture good estimates for durations of one month orretention capacity are then made for the area more. For practical applications, the results under analysis. Then, using a spreadsheet may often be as accurate as they need to be toformat, potential evapotranspiration is make water management decisions (Linsley etsubtracted from monthly precipitation. The al., 1982, pp 339-356). monthly deficit or surplus is then used tocalculate the monthly change in soil moisture HEC-1 is one of the most widely used and storage. In months when precipitation exceeds most complete models for relating streamflowpotential evapotranspiration, actual and precipitation (Bedient and Huber, 1992). evapotranspiration is considered to be equal to It is event based, and would require adjustmentpotential evapotranspiration. Runoff is of monthly values derived from the Atlas tocalculated as half of the surplus water in each obtain the short duration events necessary asmonth (Mather, 1978). input to the model.
The Thornthwaite-Mather approach is crude in Generating synthetic streamflows by statisticalits estimates, and somewhat difficult to follow procedures has been done since the 1960's, andin applying it. High precision cannot be precursors of these procedures have been in expected. However, it has the advantage of use since the 1920's. Statistical syntheticbeing usable with a minimum of information, hydrology was impractical before powerfuland can be regarded as a suitable first digital computers became available in theapproximation, if no other rainfall-runoff 1960's, because of the large amount ofmodel has been developed. If more elaborate calculation required. The earliest methodsand well-tested models have been developed involved writing numbers that represented for a watershed, they should, almost without single items in an existing data series on cardsexception, be employed instead of the and repeatedly shuffling and drawing from Thornthwaite-Mather approach. these cards to generate synthetic data series of
More complex precipitation-streamflow water from the existing distribution and randomlybalance models are based on simulations that generate many new sequences from that use time steps shorter than one month, and existing distribution. The existing distributioncalculate values for several of the variables in may be represented by parameters of thethe hydrologic cycle. Typically, such models distribution or, alternatively, the measureduse short-period precipitation (one day or less), values may be repeatedly sampled to developdaily temperature, and land use characteristics long series, as was done in the bootstrapto estimate evapotranspiration, soil moisture at analysis, described above (Linsley et al., 1982,one or more levels, and volume of streamflow. pp. 388-411).Timing of streamflow is based on travel timesthrough the soil, over land, and in the channels A particularly effective modelling approach for(a function of stream channel characteristics). forecasting “streamflow volume over a long-Such models have the potential to provide term (seasonal) duration and a short term (5-highly precise and accurate simulations of 90 days) duration and providing associatedstreamflow, where there is considerable probabilities of occurrence and statisticalinformation on the input parameters. However, evaluations of the predictions” is the National
streamflow. The methods in use now work

G-5
Weather Service Extended Streamflow practice was to make worst-case estimates,Predication Procedure. This procedure has e.g., the lowest flow ever recorded for the been tested for several years in different parts subsequent month or year, and one can of the country, and has yielded useful establish that the upper and lower boundaries forecasts. on expected flow are materially different from
The Extended Streamflow Prediction Procedure improved. Because drought flows and drought(ESP) uses historical meteorological data and precipitation values are at the low end of theassumes that each year of historical data is a frequency distribution, the numericalpossible representation of the future. ESP difference between values with substantiallyforecasts use the National Weather Service different frequency may be small. ForRiver Forecast System Operational Forecast example, for precipitation, the differenceSystem, which “generates short-range between the .02 quantile and the .10 quantilestreamflow forecasts by inputting observed and for Cluster 20 (Ohio) in the month of July isforecast precipitation and temperature data into only about 20% of the median precipitationconceptual hydrologic and hydraulic models for the month (Atlas).that simulate the snow accumulation andablation, rainfall/runoff, watershed routing, andchannel routing processes to produce simulatedstreamflow.” (Day, 1985).
While the ESP procedure uses historical tracesof meteorological variables, it would also bepossible to use elements of the procedure withprecipitation amounts derived from the National Drought Atlas. Among the difficulties faced in using monthly precipitationwith the conceptual models for relating rainfalland runoff in the NWSRFS Operation ForecastSystem is estimating shorter durationprecipitation from the monthly values. Asummary of some of the approaches to makingthese short duration estimates is given byEssenwanger (1986).
It is tempting to think that the inherentinaccuracies of making runoff estimates are sohigh that there is little point in doing them at all. This temptation should be resisted. Thepoint of making estimates is to make decisions.Those decisions often entail setting upper andlower boundaries on the expected future state of a system at a given probability of occurrence. If the lower bound is zero, and theupper bound is also near zero, higher precisionwill not enhance the decision. If previous
the worst-case estimate, the decision has been
Questions of Interest. In drought hydrology, it isn’t always obvious what questions need tobe answered. Some would say that what isultimately desired is a) the frequency analysisof streamflow for some duration and b) procedures for estimating future streamflowfrom estimates of future precipitation. These are some, but not all, of the relevant questions.
Water managers are often required to answerquestions posed by members of the lay public,such as government officials, industrial andbusiness managers, members of environmentalgroups, the press, etc. Their questions areoften expressed in probability terms, such as:
! what is the likelihood that we will get enough precipitation to be out of this droughtnext month or in the next two months? Or,
! what is the likelihood that streamflow willremain below normal over the next 6 months?Or,
! if we have another month of below normalprecipitation, what will happen to streamflow?

G-6
Only the second of these three questions can occurrence. This is because the streamfloweven potentially be answered by an probability is the result of factors other thanexamination of streamflow statistics alone. The precipitation, which have differentothers, and many like it, ultimately can only be probabilities of occurrence.addressed by considering multiple parameters.The first and third questions are among the more likely questions to be posed by the laypublic and are grounded in the common-sensenotion that precipitation is the driving forcebehind streamflow. In fact, the probability ofoccurrence of streamflow deriving from aonce-in-fifty year low precipitation will almostcertainly not have the same probability of

H-1
COOPERATIVE ADVERSARIAL
UNASSISTEDPROCEDURES
InformedDiscussion
Negotiation
THIRD PARTYASSISTANCE
Conciliation
Facilitation
Mediation
Mini Trial
Non-bindingArbitration
SettlementJudge
THIRD PARTYDECISIONMAKING
AdministrativeHearing
BindingArbitration
Litigation
NONVIOLENTCOERCION
CivilDisobedience
VIOLENTCONFLICT
Terrorism
Revolution
War
Partnering DisputeReview Board
FIGURE H-1. THE ADR CONTINUUM
H - ALTERNATIVE DISPUTE RESOLUTION
Alternative dispute resolution (ADR) is the according to the level of hostility. This name given to interventions in the decision version of the continuum is taken from a newmaking process which use a variety of methods Corps of Engineers handbook (Creighton, developed in legal, labor relations, and other 1993). The preferred method is one that is fields. more likely to produce better outcomes at a
The original context of ADR was as an considered the most hostile resolution inalternative to litigation. This annex includes a American water management disputes, war orbrief introduction to ADR methods and their physical violence is the extreme disputeapplicability within the context of water resolution technique.planning and management, especially regardingdroughts. In ADR, the term “stakeholder” describes
ADR Methods
The ADR continuum (Figure H-1) has been outcomes of the process. DPS teams willused for some time to display the range of generally prefer ADR options to the left andmethods for resolving disputes arranged towards the top of the ADR continuum as
lower transaction cost. While lawsuits are
those parties to a problem solving process whohave the ability to affect the outcome of thesolution or are impacted significantly by the

0
5
10
5 10More satisfaction for Party "B"
Avoidance orImpasse
A solution created by the partiesthrough interest based negotiations.
Traditional "best" compromisebased on positional bargaining.
H-2
FIGURE H-2 INTEREST BASED NEGOTIATION
CAN PRODUCE AGREEMENT ON “WIN-WIN”ALTERNATIVES THAT MIGHT NOT BE
IDENTIFIED IN POSITION BASED
BARGAINING.
shown in Figure H-1. Those options give negotiation is different from traditionalstakeholders greater “ownership” of solutions positional bargaining.(that is, the stakeholders assume greater controlover products and process and hence minimize Positional bargaining embodies a strategy inconcern about manipulation by outside interests which a series of positions are presented toor factors). In addition, options to the left and other parties in a dispute in an effort to reachtop generally have lower transaction costs, agreement. The positions are developedmeasured in dollars, time and intensity of independently by each party in the negotiation,conflict. based on their interests and their perception of
Informed discussion refers to communicationamong parties involved in a potential conflict in which information is shared and perceptions are measured separate from any declared intentto reach a formal agreement on resolution of the issues. Informed discussion reduces pressure on the discussants, and may be helpfulin avoiding problems.
Interest based negotiation is a type of formalnegotiation by parties who have the authority to make commitments for the organizations they represent. Interest based bargaining or
the other party’s interests. The first (opening)position represents the maximum gains theproponent hopes for, and subsequent positionsdemand less from the opponent and result infewer benefits for the proponent. Agreement isreached when the parties positions converge. In Figure H-2, this movement occurs along thediagonal defining the shaded area.
In interest based bargaining, the partiescollaborate to meet each others needs andsatisfy mutual interests. Interests of theparties are identified prior to the developmentof solutions, and solutions are developed andevaluated jointly to meet real, not perceivedinterests. The creativity of all parties can bebrought to the development of alternatives. The solution drawn outside the shaded area in Figure H-2 depicts the advantage of interestbased negotiation, which is the increasedprobability of agreeing on solutions in whicheach party does better than the bestcompromise.
Cooperative Decision Making. Virtually allgroup process can be helped by some kind ofstructure. Too often, negotiations which involve decision making or problem solvinginvolving parties in disagreement are free-for-all’s, with everyone loudly stating their positions and no one listening to anyone else. If one party offers suggestions for ground rulesand structured process, the negotiations mightproceed with a better chance of success. Theintervention takes place within the group itself,and does not require the assistance of a neutral

H-3
third party who is not a stakeholder in thenegotiations.
Conciliation. This is a very informal process, first use in the Corps of Engineers was inwhereby a third party may come in to assist in construction contracting. The Corps and its“fact finding” or helping the disputants form construction contractors recognize that the job the relationships necessary to “come to the is supposed to be done well and the contractortable.” Generally, however, the parties still is supposed to make money, and they workconduct the negotiations and decision making together to make both happen. In general,themselves. partnering is an attempt by such
Facilitation. Facilitators are used to help make group processes more effective andefficient. The facilitator is neutral on thesubstance of the dispute, and assumesresponsibility for a structured process that helps the group achieve agreement andresolution of the problem. Facilitators areskilled in providing a “safe” setting for the airing of differences, keeping the meeting on Third Party Decision Making. Unliketrack, insuring equal time for all participants, facilitation and mediation which uses third instilling a sense of fairness in the process, party intervention only to assist stakeholders inoffering optional processes and approaches, and finding agreement, there are a range of thirdmoving parties toward consensus. party intervention options which remove the
Mediation. The use of a neutral third-partymediator to assist parties in conflict may be used with as few as two parties or, likefacilitation, in a group setting. Unlike thefacilitator, the mediator has permission to caucus with stakeholders outside the groupsetting, shuttle back and forth among parties, and offer solutions or strategies for breakingdeadlocks. Mediators are trained to movedisputants past their “positions” to a discussionof the underlying “interests” that may providecommon ground for joint gains for allstakeholders. Stakeholders in the mediationshould be willing participants in the process,with a shared intent to reach agreement ifpossible.
Mini-trial. A structured settlement processduring which authorized neutrals hear a case and deliver findings upon which the partiesmake a decision.
Partnering is a formal, but non-bindingagreement among parties playing different, butinterdependent roles in an undertaking. Its
interdependent groups to create a workingrelationship conducive to trust, understandingand the pursuit of mutually acceptable goals. Parties make agreements in principle to sharerisks and promote cooperation. Partneringagreements were used in the National DroughtStudy DPS’s to formalize the relationshipsthat the DPS had developed.
power of decision making from the disputantsand transfers this control to the third partyinterveners. Examples of these techniques aremandatory, non-binding arbitration andvoluntary, binding arbitration. Arbitration is aquasi-judicial process involving a judgementon the facts of the dispute.
The DPS method and public involvementprinciples in general stress the importance ofstakeholder “ownership” of the finalagreement. For that reason, the processes upto and including mediation on the ADRcontinuum are most appropriate forapplication to drought contingency planning. Within this realm, the decision making resideswith the stakeholder group, even thoughassistance may be offered by outside parties.
However, the reality of the world ofstakeholders in drought planning is often one of a history of ritualized conflict and

H-4
competition with water management agencies remedial action so that the answer can be and among different agencies with overlapping “yes”. jurisdiction. The use of third-party assistance in the form of either facilitation (when the parties are able to handle substantive issueswithout too much conflict), or mediation (whenmoving the process and the substance along areboth required) is useful, and often essential tothe resolution or management of stakeholderconflicts in drought contingency planning.
ADR, Litigation, and Planning taking place or being effective. Conflicts in a
ADR versus litigation. Any party considering power, data, interests, values, and elements oflitigation should consider ADR after discussing the study structure itself (such as time,both avenues with counsel. An Executive institutions, unequal control or geographicOrder and the policies of many agencies balance). ADR experts can help in a planning(including the Corps of Engineers) encourage study if:its use. Among the most important issues toconsider when faced with a choice between ! decision makers or important stakeholderslitigation and ADR are: have not invested authority with the DPS
! Are there persons from each potential entity outcomes from the DPS process.in the conflict who can participate in the ADRprocess and who have the authority to make ! there are conflicts among study participantscommitments for that entity? not related to the study issues.
! Can the issue be resolved independently, ! interpersonal working relationships andwithout resolution of a larger, overarching communications are ineffective.dispute?
! Is resolution of the issue on the facts rational-analytic framework that does notacceptable, without the establishment of a identify or address underlying needs.precedent that clarifies a point of law?
! Is there a mechanism available to enforce planners when study conflicts are aggravated or implement a decision reached through by human factors. For example, a team ADR? member used to gathering and analyzing data
! Can the dispute be resolved without the study, and that person’s technical prowessendangering the parties needs for may divert team members from designing aconfidentiality? study that will achieve the planning objectives.
If the answer to any of these questions is “no”, ways to define an appropriate scope for datadisputants may prefer to litigate, or to take gathering while preserving the commitment of
ADR and planning. Some elements ofalternative dispute resolution (ADR)techniques are synonymous with good planningand evaluation, such as the development ofclearly stated objectives, openness toalternatives, and the use of defensible,replicable evaluation procedures. Butsometimes conflicts can prevent planning from
DPS can be over human relationships, political
process, that is, have not agreed to accept the
! there is a rigid adherence to a specific
In addition, ADR experts can work with
may try to make data gathering the whole of
ADR experts can work with planners to find
the data analyst to the study process.

H-5
Perhaps as important as the body of research 1. When the stakeholder considers only theand case studies, ADR experts can bring to a outcomes offered by positional bargainingDPS the human skills for which ADR (solutions within the shaded triangle). Inprofessionals are noted. Just as the engineering drought, positional bargaining is often tied toprofession is associated with pragmatism and the quantity of water a stakeholder will mathematical proficiency, ADR professionals receive when water is in short supply. often have a special capacity (enhanced by However, bargainers should consider whyeducation and training) for effective listening, the water is needed and how a refusal todirect expression, and insight into the ways participate in a DPS will affect the reluctantpersonalities affect study processes. participant in areas not directly related to the
Getting to the table
Good water resources planning and sell water at a profit in a water market.management practice demands collaborative Indirectly related issues include the decision making and the sharing of information possibility of negotiation among the sameamong four primary stakeholder groups: water groups on non-water issues, or a reduction inusers, water managers, advocacy groups, and water management costs.others with special interests not included in thefirst three groups. If an important stakeholder 2. When the stakeholder overlooks theboycotts the planning process, the process will possibility that its current advantage could not be effective. Hence, the most important be taken from it (Figure 2 could be redrawnADR contribution to a drought study process by a third party over the objections of themay be getting stakeholders groups “to the stakeholder, creating a “compromise” at atable.” A stakeholder that has dominant legal lower degree of satisfaction for therights to water use, or that has the staff and stakeholder). That was one of the mostfunding to control water management important lessons learned in the recentinformation may believe that negotiation can California drought (see the annex on that only reduce their standing, and may refuse to study beginning on page L-1): droughts canbe involved in a DPS, or worse, pretend to be rearrange what was thought to be a stablecommitted to the process. This is a balance of power in a regional water setting. demonstration of rational self interest, no Although many western water experts different in kind than a refusal to accept a believed that appropriation law and water“heads you lose, tails you lose” gamble. The contracts guaranteed farmers a certainimpasse can only be broken if it can be allocation of water during drought, they demonstrated that there is a potential for the failed to consider the public pressure toreluctant participant to gain from participation. change collective choice allocation rules if
Referring to the diagram shown in Figure H-2, It may be true that the reluctant stakeholder there are two general types of situations in has correctly assessed the situation or cannot which a stakeholder group can mistakenly be persuaded to disbelieve its incorrectassume that negotiating offers no opportunity assessment. DPS teams confronted with thefor improving its position: refusal of an important stakeholder to
DPS. For example, if the reluctant stakeholder uses water to make profit, thestakeholder could be given an opportunity to
those rules do not seem to serve the public.
participate should consider ending the study ordecreasing its scope to preclude the need for

H-6
involvement of the reluctant participant. To resolution is what is often called “building acontinue when there is no indication that the shared intent” to solve the problem. This is stakeholder will participate may be a waste of not as easy as it sounds. People can assembletime and money, and may sour other for a problem solving exercise and then participants on the concept of collaborative withhold or distort information, resistplanning. A joint and public decision by other communication and negotiation, and mistruststakeholders to end a DPS may persuade the others in the group. The role of the workshop“pretend” participant to truly engage in the facilitator at this point is to prod the study process. participants, probing the reasons for resistance
ADR and the Shared Vision Model
Shared vision models are a first attempt at expert knowledge each stakeholder adds duringcreating a collective consciousness, where the model building process. In the DPS’s, aabstractions are all included, remembered in three stage model building process was used toevery evaluation, and are on display for every build trust in the model. First, each one to examine. A shared vision model can stakeholder group was interviewed, and generally be as expert in each abstraction as portions of the model were built that pertainedeach person can make it, and it insists on to the outputs and values of interest to them. including each abstraction in every evaluation These interviews also gave them an it produces. Hence, all are assured that they opportunity to see other parts of the model. are important and that their knowledge and Second, a joint workshop was held, and a concerns are connected to decisions. series of exercises was used to determine if the
A shared vision model is not just a and understandably. Finally, the model wascombination of hardware and software; not just used in evaluating alternatives and virtualnew tool for manipulating data in creative droughts, which allowed another opportunity ways. A shared vision model is also a for challenge and refinement. In the virtualPROCESS for dispute resolution. It can entice drought held in Seattle, six challenges werestakeholders to the table, but it also enhances made to the model’s verity, but in each case,the opportunity for moving through the stages discussions within the group showed that theof dispute resolution to a durable and challenger was wrong, the model right. implementable agreement. If the shared visionmodeling process is used in combination with Data conflicts are at the heart of the kinds offacilitation in a workshop setting, such as in a processes that are often stymied by an inability“Virtual Drought”, the results can be to agree on water management plans. Theexceptionally powerful in forging consensus on ability of stakeholders in a planning process todrought contingency plans. enter, display and manipulate data as a team,
The first agreement in the dispute resolution in problem solving. To the extent thatprocess is reached when people come together knowledge is power, allowing stakeholders toand have a look. The second stage of dispute
and lack of trust, working through past historyand issues of turf, status and competition.
The role of a shared vision model as a disputeresolution partner, and one of the keys to itspower as a public consultation and negotiationtool, is its ability to assimilate and display the
model replicated behavior of the system well
provides a powerful incentive to move forward

H-7
access system models directly can re-balance The time it takes to reach agreement iswater policy dialogue. shortened, and the agreements are likely to be
And the problem of “who has expert status?” isalso quickly solved, because all stakeholders In summary, attempts at inclusive and creativesitting in teams at the computer have equal public involvement in public issues like how tostatus as “expert” generators, repositories and respond appropriately to drought conditions,manipulators of shared information. even using the art and science of dispute
Once participants in the DPS process come to methods to deal with the technical problemsthe table and agree on a common goal to enter inherent in decisions involving large, the process and move toward solutions, the competing data sets. But the application ofwork of negotiation begins. At this stage, the dispute resolution techniques, such as workshop facilitator assists stakeholders in facilitated problem solving workshops, indefining problems and laying out issues, as combination with computer-assisted decisionthey work together at computer terminals, making (using a tool such as STELLA II®),playing “what if...” games and exploring shows great promise for resolving long- scenarios. As mentioned above, workshop standing disputes over the preparation andparticipants are all working from the same data management of drought.base (what the dispute resolution professionalscall “single text negotiations”), generating,refining, testing out, and narrowing the issues.
The workshop facilitator will begin to moveparticipants in the negotiations toward a hardlook at the basic interests and values whichunderlie the stated issues. Many of theseinterests are “non-negotiable”, for exampleretention of present infrastructure for watermanagement (reservoir), even when an issue may have arisen suggesting the benefit of achange in infrastructure. But the shared visionmodel anchors the possibility of finding common ground. Options are generated morequickly, and the evaluation of those optionstakes place almost instantaneously with theshared vision model.
more durable.
resolution, often fail because of the absence of

BLANK PAGE
(Skip)

I-1
I - DROUGHT AND THE PUBLIC
The public will be involved in droughts, and public involvement can be extended withoutshould be involved in drought preparedness losing the technical effectiveness of the efforts. The interactions with the public during planning process. In the conduct of Droughtplanning and during droughts are different Preparedness Studies, public involvement isenough that different names have been applied necessarily an integral part of the basic to each, and different offices within water process, as well as being required by agencies assigned to each function. The phrase legislation and policy designed for generalpublic involvement has generally been used to application. refer to efforts at including the public inplanning, whereas public relations is more often used to describe the methods anorganization uses to promote a favorable image The following brief history of publicwith the public. Public affairs is somewhere in involvement is a summary from Hanna the middle, but it is the public affairs staff that Cortner’s essay on public involvement inwill be (or should be) in charge of Governance and Water Management Duringcommunication of information to the public Drought (NDS-14).during a drought.
Many water managers believe they practice studies of participation programs in watergood “public involvement” because they resources, four eras can be identified: the era conduct regular meetings at which agency of closed participation; the era of maximumpolicies are explained and questions from the feasible participation; the era ofpublic answered. But this approach may not environmentalism; and the era of collaborativebe effective in developing support for agency decision building.decisions or inducing changes in water usersbehavior that can reduce drought impacts. ! The Era of Closed Participation. WaterWater managers can compare their programs to politics during this era was a closed system ofthe historical development of public decision making, controlled by local water involvement that follows. The annex users, federal water development agencies, andconcludes with a summary of conclusions from the authorizing committees in Congress, whosetwo studies concerning public information patterns of relationships were marked by campaigns during droughts. clearly identifiable rules. Often described as
Public Involvement
Requirements for public involvement in water Maass, 1951; Ferejohn 1974; Morgan 1971). resources decision making have generally Participation, as well as analysis, served thebecome more important within recent years. political purpose of rationalizing projectsThis situation presents problems to the planner, (Ingram 1972; Lord 1979). Participation wasbecause there is no clearly defined established marked by one-way communication flow; itsmethodology, and there are limits to which purpose was largely educational and
History of Public Involvement
By examining legal developments and case
“iron triangles”, the policy outputs of thissystem were often said to be overbuilt,expensive, environmentally damaging andunnecessary water projects (Reisner, 1986;

I-2
informational, designed to sell plans and gain but also about the preservation of land and local support (Daneke 1977). The public was water resources. These public concerns wereviewed as clients who had a mutual interest in also coupled with an increasing distrust ofpursuing water development. experts, and a growing skepticism over the
! The Era of Maximum Feasible Langton 1987).Participation. After World War II twosignificant policy trends would converge and The decade began with the signing of Nationalprofoundly affect water policy: (1) the growth Environmental Policy Act (NEPA) of 1969,of legislation and policies designed to protect which declared a national environmental policythe environment; and (2) an increase in legal for the nation, and greatly expanded the requirements and programs designed to broaden public’s right to have environmental impactsthe participation of the public in governmental disclosed and to participate in the disclosuredecision making. Some of the earliest programs process. NEPA requires agencies that made specific attempts to broaden the contemplating actions that will significantlyparticipation of affected and interested public’s affect the environment to prepare occurred in the area of social welfare policy. environmental impact statements. It alsoSoon the expectations and demands for public specifies that those statements will be participation carried over to other policy areas. assembled by interdisciplinary teams, considerA 1965 presidential order directed all federal non-commodity as well as commodity values,agencies to improve their communication with and afford the public an opportunity for reviewthe public (Langton 1993). In the area of and comment.water, the Water Resources Planning Act of1965, for example, required that “water related Despite the considerable investment of time,initiatives be conducted on a comprehensive dollars, and personnel that participation effortsand coordinated basis by the federal received during the 1970's and 1980's,government, state, localities, and private controversies persisted and sometimes evenenterprise with the cooperation of all affected escalated. Many conflicts over resourcefederal agencies, states, local governments, management issues continued to land in court. individuals, corporations, business enterprises, Attempts to devise ways to resolve conflictsand others concerned.” In response to the without resorting to litigation spawned thegrowing public demand for public access to development of alternative dispute resolutiondecision making and amidst growing techniques, including for example: negotiation,environmental controversies, the Corps of mediation, arbitration, and partnering (providesEngineers began to implement methods of for a joint planning approach between agenciesinforming and involving a greater range of failing to reach agreement by normal means.interests. The goal of participation still Partnering was adopted as a policy by the remained largely educational and informational Chief of Engineers in March 1993.) However,and relied heavily on formal, e.g., public such procedures still would fall far short of a hearing, techniques (Daneke 1977). full collaborative approach.
! The Era of Environmentalism. The 1970's ! The Era of Collaborative Decisionsaw an explosion of environmental legislation, Building. There have been approximately threeas well as mandates for public involvement. decades of experimentation with publicThe public became increasingly concerned participation methods and techniquesabout the environmental impacts of pollution, (Creighton et al. 1983; Advisory Commission
validity of technological decisions (Desario and

I-3
on Intergovernmental Relations 1979). Based of Alternative Dispute Resolution may beon numerous evaluations of past public applied as appropriate (see Appendix H).involvement efforts, a set of performancecriteria has emerged. Public participation may help to:Generally, effective public involvement has thefollowing characteristics: ! increase administrative accountability;
! two-way communication; ! to supply pertinent information;
! involvement early and through the entire ! to evaluate methodological approaches andprocess; use priorities;
! deliberation involving informal and ! to raise broad but related value questions;personal processes; and
! representation of all interests (Blahna and problems;Yonts-Shepard 1989)
Despite all of our experiences in public acceptable.involvement, meeting these standards has beenan elusive goal. They will remain challenges More generally, it has been stated that publicfor the future. involvement represents the move from
Forms of Public Involvement
There are many different forms of public However, such theories should not be taken tooinvolvement, all geared toward the interrelated far. Public involvement is a remedial goals of changing government behavior or technique, designed to correct abuses, andchanging citizen behavior. Most successful increase the credibility of decisions, but leavingmethods seem to involve a series of informal intact the basic responsibility of officials. contacts between groups, two-way There is clearly no unified theory of publiccommunication, and shared decision making. involvement which would satisfy everybody. The difficulty comes in sharing decision Approaches employed must be appropriate tomaking. If agency officials (or other leaders) the specific situation and be perceived as fair really do not intend to let their decisions be by the principal participants, but can varyinfluenced by outsiders, and if the other widely.interests are unwilling to compromise withopinions of the agency, no amount of skilled There are considerable differences of opinionpublic involvement techniques will provide an regarding the extent to which the general agreed solution. However, with care, better public should be involved in planning rather results can be achieved, by using working than dealing only with representatives ofgroups of diverse membership, oriented identified key interests. The persons involved, initially towards the problems, and, on in addition to legally constituted decisionoccasion, by open public meetings and surveys makers, must include “stake holders” whoseof citizens’ attitudes and opinions. Procedures interests are affected, even though legally they
! to call planners’ attentions to immediate
! and to make plans more politically
representative democracy to participatorydemocracy, with the responsible officialsconveners and facilitators rather than managers.
have no power of decision.

I-4
Special Characteristics of the DPS
The Drought Preparedness Study is not atraditional project planning study, but, asbrought out in the main report, is a cooperativeundertaking between responsible federal andnon-federal agencies. Cooperation between the During a drought, the effectiveness of droughtCorps and other decision makers is not only a responses is often a function of the trust,matter of policy, but is an essential part of the knowledge, and commitment of the public. structure of the Study. The completion of the Two examinations of how agencies and thestudy is in the form of an agreement. Usually public communicated during California the participating agencies include federal droughts highlight the issues that water agencies, one or more states, and large managers should consider in developing the municipalities. Therefore public involvement part of their tactical plan that deals with publicfor a DPS inherently includes collaboration and information.agreement with specified decision makers. Italso includes a more general responsibility to Analysts drew three conclusions about the the general public, in accordance with laws, media from the recent California drought policies and directives applicable to water (NDS-5):resources planning generally.
Public involvement, mandated or encouraged by numerous laws and directives, is not a clearly specified process or technique, but onedependent upon particular circumstances. Anopen cooperative approach is desirable, but itshould be one that recognizes the basicresponsibilities of officials, and the importanceof a well-focused planning process.
Public involvement features two-waycommunication, use of informal contacts andwork groups, more citizen participation, moresensitivity to environmental impacts, and achairman functioning as a facilitator (as well asa manager).
In DPS, collaboration is two-fold. The Corpsworks collaboratively with other key agencies in formulating the agreements which togetherform the framework of the plan. However, theCorps also works cooperatively with otherstakeholders and the general public inimplementing laws and policies applicable topublic involvement in water resources planningin general. In preparing for a DPS, careful
attention must be given to both aspects of thepublic involvement process.
Public Affairs
! The role of the media is not wellunderstood by water managers. Themedia are governed by their own rulesof objective reporting, newsworthiness,and perceptions of what the publicwants to know. They cannot bemanaged by water agencies. If theywere, they would not be able to sellnews. The questions like, “Are we in a drought?” or “Is the drought over?” are not silly questions from the media’spoint of view. Reporters understand the thinking modes and perceptions ofthe general public much better thanwater professionals. For them, once the water supply situation is called adrought, it automatically implies thatbehavior has to be changed from normal behavior to crisis behavior. Such a change is newsworthy.
! The media cannot improve onimprecise and ambiguous messages. Most likely, the statements will becomeeven more confusing after they arereported in the press. Only

I-5
unambiguous and complete answers to 2. Even after the campaign, water usersquestions that are asked by the press greatly underestimated the amount of watercan be communicated clearly to the they used, but the error was less than beforepublic. the campaign.
! Media cannot explain complex watermanagement issues. What is veryinteresting to water professionals isusually “too dry” for newspapers, radio, and television. Long featurearticles on water issues do not sellnewspapers, but timely, well-writtenarticles during a drought emergency will be read by concerned people.
Consumer Response to the Drought MediaCampaign in Southern California reports theresults of surveys to evaluate the effects of theMetropolitan Water Districts large scale mediacampaign to inform the public about the drought and to recommend water savingmeasures. Here are some of the key findingsfrom the study:
1. There was a statistically significantincrease in the public’s awareness of thedrought after the campaign, and those whobecame aware of the drought through thecampaign were more likely to believe in theseriousness of the drought and to conservewater. Television appeared to be the mosteffective medium for increasing awareness.
3. The people most willing to reduce wateruse were also the most likely to report theyneeded more information on how to do so.
4. The campaign increased trust that theagencies call for conservation was necessaryand should be supported.
5. Support for farmers use of water wasgreater after the campaign, while support forcommercial and industrial use declined. It isgenerally accepted in social behavior researchthat conservation campaigns will be moreeffective if the sacrifices are fairly shared. This suggests that publicizing the equity ofdrought restrictions may be effective inreducing water use.

BLANK PAGE
(Skip)

J-1
J - CONCEPTUAL BASIS FOR CIRCLES OF INFLUENCE
From the outset, accomplishing the NationalStudy of Water Management during Droughtinvolved confronting an organizational The circles of influence concept can bedilemma: how can planning be timely, summarized in terms of two basic assumptions.technically sophisticated, cost effective and First, in attempting to bring together in a also inclusive of the hundreds of thousands and common ongoing effort the many varied andeven millions of people impacted by a more or less organized segments of a drought? community, many different modes of
The organizational concept dubbed “Circles of building links among these different modes ofInfluence” was used during the National participation typically requires the creation ofDrought Study and is recommended for use in new community institutions.other water resources studies. The concept isexplained in Chapter 3 of this report. This Five key elements define the circles of annex describes the origins of the concept. influence concept.
The planning dilemma
The principal objective of a Drought in the broader community is needed to Preparedness Study (DPS) is to effect changes spearhead community change.in a regional water management that reduce theimpacts of drought. Because such changes ! Second, everyone in the community affectedmost often take the form of behavior by a target problem has to have their modifications, the changes will be more fingerprints on a viable solution. Varied levelseffective if the impacted community is engaged and types of participation are needed toin the solution to drought problems. accomplish this inclusive involvement.
Drought conditions themselves, however, ! Third, the development of the circles ofcomplicate the realization of this community influence has to be opportunistic, i.e., it iscommitment. The drought community - the necessary to exploit the salient problems andmass of people who share the impact of resources on the table at a given point in time. drought conditions - typically overlaps or ! Fourth, communication among the circles isoutruns established jurisdictional boundaries. necessary to build a sense of a cause everyone Drought conditions, in addition, intensify the is working on, has a stake in, and is going to multiple short-run competing interests of get credit or blame for.different community segments. The work ofdeveloping a drought plan, in contrast to this ! Fifth, a criterion for the effectiveness of thecompetitive perspective, involves taking a circles of influence is their efficiency inlong-term perspective, accepting cost and producing the decisions needed to advance thebenefit tradeoffs among interests, and risking implementation of plans.free-rider exploitation.
Concepts behind circles
participation have to be utilized. Second,
! First, a cadre with the appropriate mix ofskills, time, and the necessary influence/utility

J-2
These key elements of the circles of influence him material on Viet Cong organizationconcept underlie the two basic working strategies.assumptions stated above. Assumption one(many different modes of participation have to It struck Dr. Waldman that, for all thebe utilized) emphasizes the need to build an fundamental differences among these organization on the base of the varied movements and even their inconsistentcapacities and constraints of community awareness of each other, many of their basicmembers required for a solution. These varied concepts were similar. The circles of influencecapacities and constraints can include time, theory is based on these similarities.skills, interests, other commitments, andcommunity positions. Although based on the intuition of practiced
Assumption two (building links among these Influence can be related to some of thedifferent modes of participation typically fundamental ideas influencing current socialrequires the creation of new community science research. The work of four individuals,institutions) emphasizes the need in organizing, in particular, grounded these research to move beyond ad hoc contacts to new traditions.patterns of working together. It is necessary toleave something behind which endures because Morton Deutsch initiated, in the 1950's, the the community has experienced its value. main tradition of social psychological conflict
These assumptions suggest a basic hypothesis: on the identification of the conditions underbreaking community patterns and creating new which participants will evolve a cooperative or patterns occurs when community members a competitive relationship in a situation whichrealize through their actions and experience of permits either. The findings of this traditionother people’s actions that they are part of support the idea that successful experience withsomething that makes gut sense, that works, cooperation leads to the development of moreand that is generally recognized as successful. general and long-range cooperative
This circles of influence theory did not evolveout of study and research but rather out of Mansur Olson, an economist, initiated in thepractical experience of Dr. Robert Waldman, 1940's a tradition of interdisciplinary socialan organizational expert who developed the science research on the conditions of collectiveconcept for the DPS’s. In the late 1960's, Dr. action. The key idea in this tradition is that theWaldman worked as a community organizer in mass of people make the commitments a west Baltimore neighborhood troubled by required to effect social or structural changehousing speculation, crime, and a lack of primarily on the basis of their awareness of thepublic services, including police who did not individual benefits and costs associated withrespond to calls. In trying to work out a way to their commitments. The findings of this deal with this situation, he got ideas from three tradition support the need for inclusivesources: Alinski community organizers who involvement in the process to develop a were in Baltimore at the time, a friend who personal stake in movement outcomes.was involved with Steelworkers Unionorganizers, and his brother who was at Da Charles Tilley, a historical sociologist, initiatedNang in psychological operations and had left in the 1960's a tradition of research using
organizers, the advantages of Circles of
resolution research. This tradition has focused
orientations.
secondary data on the historical development

J-3
and impact of social movements. The key idea The origins of the concept are offered as morein this research is that social structural change than an intellectual exercise. The underlyingis a function of the interaction of long-term concepts discussed above can be turned intohistorical trends and purposeful efforts to affect questions managers can use to assess the the course of change. The findings of this degree of support they have achieved from thetradition support the importance of the DPS team:opportunistic exploitation of the circumstancesat a point in time to move beyond planning to ! do team members rate early, short termactual change. experiences such as the first workshop as
Finally, Richard Emerson, a sociologist, leading to committed cooperation) initiated in the 1970's a tradition whichintegrated ideas from behaviorist psychology, ! do team members have and perceive amarket economics, and the anthropology of personal stake in the process? nonindustrial cultures.
A key insight of this tradition is a broadening unique opportunity to address these problemsof the concept of exchange beyond collaboratively and that it must be exploited? supply-demand or benefit-cost transactions toinclude commitments to an exchange system in ! do team members see both long term,spite of transactions which might be widespread benefits and the short term risks unfavorable to an individual at a point in time. and costs of participating in a collaborativeIn the context of a DPS, the commitment to an study?exchange system would mean cooperation with a long-term drought strategy in spite of unevenimmediate benefits and costs. The commitment would still occur because of a stake in the strategy itself and the belief thatrules for distributing costs and benefits over time are fair.
successful? (experience with cooperation
! do they understand that the DPS may be a

BLANK PAGE
(Skip)

K-1
K - FORECASTING WATER USE TO MANAGE WATER CONSERVATION
Sophisticated water use forecasting methods (Howe and Linaweaver 1967). A number ofare now commonly used to size future water subsequent studies have used information fromsupply projects, and are being used more often this early research project. The project wasas the basis for measuring the potential savings sponsored by the Federal Housingfrom long term conservation measures. Administration in cooperation with 16Algorithms have been available to estimate the participating utilities from throughout the savings from combinations of curtailment United States. Master-meter, punched tapemeasures that reduce water use just during recorder systems were installed to continuouslydroughts. Although this use is far less monitor water flow into 39 homogeneouscommon, the latest version of the most widely residential areas served by the 16 water known water forecasting model should make utilities. The 39 study areas ranged in size the practice much more common. from 34 dwelling units to 2,373 dwelling units.
The purpose of this annex is to present the During the late 1970's and early 1980's, theimportance of water use forecasting methods in Institute for Water Resources (IWR) of the designing drought curtailment plans and U.S. Army Corps of Engineers conducteddetermining the relationship between long term research to develop methods for evaluatingconservation measures and the potential to municipal and industrial water conservationsecure additional demand management savings plans, including improving water use during drought. In addition, this annex forecasting capabilities. Probably the best provides a brief explanation of disaggregated known product of this body of research is thewater use forecasting. series of computerized water use forecasting
History. Simple per capita projections of future water use were used to size city watersupply systems until the 1960's, when concernsabout water supply limitations and theenvironmental impacts of structural waterprojects stimulated the development ofdisaggregated water use forecasts. “Disaggregated” forecasts identify componentvariables such as climate, price and householdsize that can be related mathematically to wateruse; water use forecasts are then based onprojections of those variables.
A classic study of residential water use wasconducted at Johns Hopkins University from1961 to 1966 to determine the water use patterns and demand rates imposed on watersystems in residential areas and to define themajor factors influencing residential water use
models called IWR-MAIN (Institute for WaterResources Municipal And Industrial Needs). A recently developed computer program calledIWRAPS correlates water use on military baseswith the area of dozens of facility types such as hospitals, bachelor housing, andadministration.
IWR-MAIN has been used in many fast growing cities in the western United States,including the metropolitan areas of SouthernCalifornia, Las Vegas and Phoenix. Disaggregated forecasts not incorporatingIWR-MAIN have been done in other cities,such as Seattle, and still others cities have usedhybrid systems, usually spreadsheet modelswith some, but not all of IWR-MAIN’sequations.
K-2
Applications in long term planning.Disaggregated forecasts allow more reliableforecasts of unconstrained water use, that iswater use that would take place if there were no limit on supply. But disaggregation can also help planners estimate the effectiveness of Application in balancing long term waterwater conservation programs. The newest conservation and the “cushion” ofversion of IWR-MAIN, in beta testing as this curtailment during a drought. Waterreport goes to press, includes two separate and managers have often expressed the concern thatindependent water use forecasting strategies. long term conservation eliminates the “fat” thatThe first is more similar to earlier versions of can be cut into when cutbacks are necessary toMAIN, although the indicator variables have survive a drought. William Elliott, of the been changed (for example household income Water Supply Citizens Advisory Committee inis now used instead of housing prices). The Massachusetts, debunks the notion thatsecond forecast approach is based on estimates conservation is the villain by pointing out that of twenty end uses, such as toilets, urinals, if it were good to have “fat” to cut into, the showers, and evaporative coolers. Each end best preparation for drought would be to leaveuse itself has several component factors that faucets running all the time. Mathematically it affect how much water will be used in that is clear that, to the extent that water saved intype of fixture throughout the study area. This conservation programs can be stored, it can “ultimate” disaggregation offers the greatest even reduce the frequency and impacts of promise for evaluating the effects of specific urban water shortages.conservation programs, such as rebates toretrofit toilets that use less than 2 gallons of But although water conservation can reducewater per flush. water and energy costs, one of its primary
Applications in drought curtailmentplanning. Disaggregated water use forecastingmethods can also aid in designing droughtcurtailment programs. For example, sprinklingbans are among the most commonly usedcurtailment measures; a city that has developedlong term water forecasts using the usecategories of IWR-MAIN would have calibrated estimates of outdoor water use foreach of several classes of residential single andmulti-family homes. The calibration ofdisaggregated forecasts requires the closeexamination and allows the careful accounting of water use by category, including water lost to leaks. The more reliable the estimate ofoutdoor water use, the better the estimate of the savings provided by sprinkling bans. These estimates are not just important forassuring that competing uses can be met; theycan also be used to adjust water prices to Water Use Forecasting Methods
assure that utility revenue can cover expensesduring the drought.
purposes is to spread available supplies amongmore customers. In fact, it is often touted as the least cost method of meeting the water needs of an expanding population. When longterm conservation is used in lieu of additionalsupplies, there is a potential for reducing theeffectiveness of curtailment measures. Forexample, as a city converted from turf toxeriscaping and used that water inside thehomes of new residents, sprinkling bans wouldlose their effectiveness as curtailment measures. On the other hand, water saved from leak detection programs, even if used tosupply new customers, would not affect shortterm curtailment plans, since water savings from leak detection and repair takes much more time to realize than saving from banninglawn watering.

K-3
Water use forecasting can be characterized by include: resident and seasonal population;(1) the level of complexity of the mathematical personal income; number, market value, andrelationships between water use and types of housing units; employment;explanatory variables or determinants of water manufacturing output; water and wastewateruse, and (2) the level of sectoral, spatial, prices and rate structures; irrigated acreage;seasonal, and other disaggregation of water climate (arid or humid); weather conditions; users. Disaggregation refers to making and water conservation programs. Aseparate estimates for categories and disaggregated forecast may involve any numbersubcategories of water use. For example, of equations representing various categories sectoral disaggregation involves separate water and subcategories of water use. Up to a point, use predictions for residential, commercial, greater forecast accuracy and greater flexibilityindustrial, institutional, and public uses which, in representing alternative future scenarios andin turn, can each be divided into numerous management strategies can be achieved bysubcategories. The separate water use forecasts increased disaggregation and inclusion of moreare aggregated or added together to obtain the explanatory variables in the forecast equations.total water use. The exact form of each forecast equation and
In the simplest disaggregated forecasts, water from regression analyses of past water use datause per customer coefficients are estimated for for the particular study area. Alternatively,each customer class. Thus, water use forecasts generic equations have been developed based can reflect varied growth rates among the on data from many study areas representative customers. Commercial and industrial water of geographic regions or the entire nation. use is commonly forecast on a per employee Water use forecasting methods are sometimesbasis. Disaggregated forecasts for specific differentiated as being either requirementssectoral categories are frequently expressed as models or demand models. Requirements a single coefficient function of other variables, models do not include the price of water, or such as number of hotel rooms or hospital other economic factors as explanatory beds. variables, thus implying that water use is an
Water use forecasting models are often based choice. Demand models include the price ofon regression equations which relate mean or water to the user as an explanatory variable, aspeak water use rates to one or more well as related economic variables such asdeterminants of water use (explanatory income.variables). A typical general form of theregression equations is as follows: The water use forecasting methods noted above
Q = " + $X + (X + ... + +>X the determinants of water use. Data is also1 2 na b m
where: regression equations. Thus, data availability is Q = forecasted water use rate a key consideration in water use forecasting.
X = explanatory variables Data are available from a variety of sources. n = number of explanatory variables For example, historical data and future
" - > = regression coefficients or projections related to population, personalparameters income, housing, and employment can be
Typical examples of explanatory variables
value for the coefficients can be determined
absolute requirement unaffected by economic
are based on projections of future values for
required to develop the coefficients in the
obtained from published census data and

K-4
OBERS regional projections, local and state commercial/institutional, industrial, andplanning agencies, econometric firms, and state public/unaccounted sectors. Within these majorand national statistical abstracts. Climate data sectors, water use estimates are furtheris available from National Weather Service disaggregated into categories such as meteredpublications as well as from various federal, and sewered residences, commercialstate, and local agencies. Water use data for the establishments, and three-digit SICstudy area and information regarding local manufacturing categories. A maximum of 284water and wastewater pricing and water categories can be accommodated, but mostconservation programs are obtained from water forecasts utilize approximately 130 specificutilities and local agencies. categories of water use.
IWR-MAIN
The IWR-MAIN Water Use Forecasting users, number of employees in nonresidentialSystem is a software package which provides a categories, price of water and sewer service,variety of forecasting models, socioeconomic climate and weather conditions, and parameter generating procedures, and data conservation programs.management capabilities.
IWR-MAIN was originally based on the MAIN forecast requires: (1) verification of themodel developed by Hittman Associates, Inc., empirical equations and coefficients forin the late 1960's for the U.S. Office of Water estimating water use and (2) projection of Resources Research, which was in turn based future values of determinants of water use.on earlier work by Howe and Linaweaver Model verification is accomplished by (1967) and others. In the early 1980's, the preparing independent estimates of water use Institute for Water Resources (IWR) adopted for one or more historical years and comparingand modified MAIN and renamed the revised these estimates with actual water use model IWR-MAIN. During the 1980's, conditions. If necessary, the model can beIWR-MAIN evolved through several versions calibrated. The base year is the year from representing major modifications. Version 5.1 which values of explanatory variables arehas recently been replaced by Version 6.0. The projected. A calendar year that coincides with model is available by contacting IWR or the U.S. Census of Population and Housing isPlanning and Management Consultants, Ltd. typically selected as the base year. One or (PMCL). PMCL periodically offers a training more subsequent years are selected as thecourse on application of IWR-MAIN, in forecast years for which water use is predicted.coordination with IWR and the American Public Works Association.
IWR-MAIN is a flexible municipal andindustrial water use forecasting system. IWR-MAIN 6.0 and the previous version, 5.1,Forecasts are made for average daily water use, are both disaggregated forecasting models, butwinter daily water use, summer daily water differ in several significant ways:use, and maximum-day summer water use.IWR-MAIN provides capabilities for highly ! Both versions forecast residential use bydisaggregated forecasts. Water requirements are correlating it to several variables such as estimated separately for the residential, price and housing density. There is one
Water use is estimated as a function of one ormore explanatory variables such as number of
Preparation of an IWR-MAIN water use
Comparing IWR-MAIN Version 5.1 andVersion 6.0

K-5
important change in the set of variables: statistical purposes, and forecasts ofVersion 6.0 forecasts based on household employment in each are made by the U.S.income, whereas 5.1 uses housing values. A Census.)comparative study in the Metropolitan WaterDistrict of Southern California showed that aforecast based on household income is lesslikely to be skewed by regional housinglocational premiums.
! Version 6.0 has a supplemental forecastingsystem by “end-use” categories (faucets,toilets, washing machines, etc.) that can be used to estimate the effectiveness of waterconservation measures. Version 6.0 is able to use these forecasts to estimate thebenefit/cost ratio for various conservationstrategies.
! Version 6.0 uses more standardizeddemographic information than Version 5.1, and it is easier to input.
! Version 6.0 divides residential use intodifferent categories from Version 5.1. Theadvantage of the change is that there areCensus data to support the percentages ofresidences in each category Version 6.0 uses. In 5.1, the number of residences in eachcategory could be estimated only afterconsiderable research.
! Version 6.0 can forecast non-residentialwater use based on major industry groups and 2 or 3 digit Standard Industrial Code (SIC) employment forecasts. This allowsforecasters to make the forecast more or lessdisaggregated, depending on the need to do so versus the costs and availability of data. (A note of explanation: SIC’s create a nested classification of commercial, industrial, and public water users. Forexample, all construction activities have a code that starts with a “1”; “15” is for general building contractors, and “152” is forresidential building construction. These SICdesignations are used for a wide variety of

K-6
! Version 5.1 and 6.0 create and manipulatedata bases in the process of developingforecasts, but Version 6.0 has greater database management handling capability.
! Version 6.0 embodies the current state ofknowledge of water use behavior in residential and non-residential sectors. Allversions of MAIN include default coefficients that correlate water use with many explanatory variables. These defaultcoefficients are based on studies of therelationship between water use and theselected parameters. Version 6.0 benefitsfrom many new studies across the country that have been published since Version 5.1was inaugurated.
! Version 6.0 uses a “friendlier” userinterface.
These changes mean that 6.0 will produce better forecasts with less work. Perhaps moreimportantly, the new IWR-MAIN is much more helpful in determining the effectiveness of long term conservation measures.

K-7
Changing Water Use in Selected Manufacturing Industries October 1974
The Role of Conservation in Water Supply Planning April 1979
An Annotated Bibliography on Water Conservation April 1979
The Evaluation of Water Conservation for Municipal and Industrial Water Supply, Procedures Manual
April 1980
Selected Works in Water Supply, Water Conservation and Water QualityPlanning
May 1981
An Annotated Bibliography on Techniques of Forecasting Demand for Water
May 1981
An Assessment of Municipal and Industrial Water Use ForecastingApproaches
May 1981
The Evaluation of Water Conservation for Municipal and Industrial WaterSupply, Illustrative Examples (Volume II)
February 1981
Analytical Bibliography for Water Supply and Conservation Techniques January 1982
The State of the States in Water Supply/Conservation Planning and Management Programs
January 1983
Forecasting Municipal and Industrial Water Use - IWR Main System
User’s Guide for Interactive Processing and User’s Manual
July 1983
Forecasting Municipal and Industrial Water Use: A Handbook of Methods July 1983
Influence of Price and Rate Structures on Municipal and Industrial Water Use
June 1984
Handbook of Methods for the Evaluation of Water Conservation forMunicipal and Industrial Water Supply
October 1985
IWR-Main Water Use Forecasting System Version 5.1 June 1988
Water Use Forecasts for the Boston Area Using IWR-MAIN 6.0 August 1994
TABLE K-I. WATER CONSERVATION REPORTS FROM THE IWR CONSERVATION PROGRAM

L-1
! The complexity of impacts of a sustaineddrought demands more sophisticated planning.
! Severe drought can change longstandingrelationships and balances of power in thecompetition for water.
! Irrigation can provide complementaryenvironmental benefits.
! Drought can force water supply solutions on a community that they would not haveotherwise accepted.
! The success of drought response plans shouldbe measured in terms of the minimization and equitable redistribution of the impacts (as opposed to shortages), but there is much to be learned about the best ways ofaccomplishing this goal.
! Severe droughts can expose inadequacies in the existing roles and performance of state and federal water institutions, causingsignificant institutional and legal changes.
! Increases in water rates should precede oraccompany rationing plans.
! Mass media can play a positive role in drought response, but only if water managershelp design the message.
! Market forces are an effective way ofreallocating restricted water supplies.
TABLE L-I. LESSONS FROM THE 1987-1992DROUGHT
L - LESSONS LEARNED FROM THE CALIFORNIA DROUGHT 1987-1992
One of the most valuable sources of information about how to prepare for drought is the experiences of those who have survived a severe drought. The full value of theseexperiences, though, can be realized only if thelessons are recorded, critically analyzed, andcommunicated to others who can use theinformation. That was the objective of theNational Drought Study analysis of theCalifornia drought. This “Lessons Learned”study captured the views of some 100 keymembers of the California water community,representing 57 organizations. Theparticipating organizations included federal,state, regional, and local water supply agenciesas well as environmental, private, andgovernmental entities that control andinfluence water management in the state.
The approach used to identify the importantlessons of the drought consisted of threeactivities:
@ Literature review of published andunpublished documents
@ Field interviews, and
@ Critical review of the draft findings by survey participants and other waterprofessionals.
The lessons are shown in Table L-I. Lessonslearned in previous droughts and confirmed inthe 1987-92 drought are displayed in TableL-II.
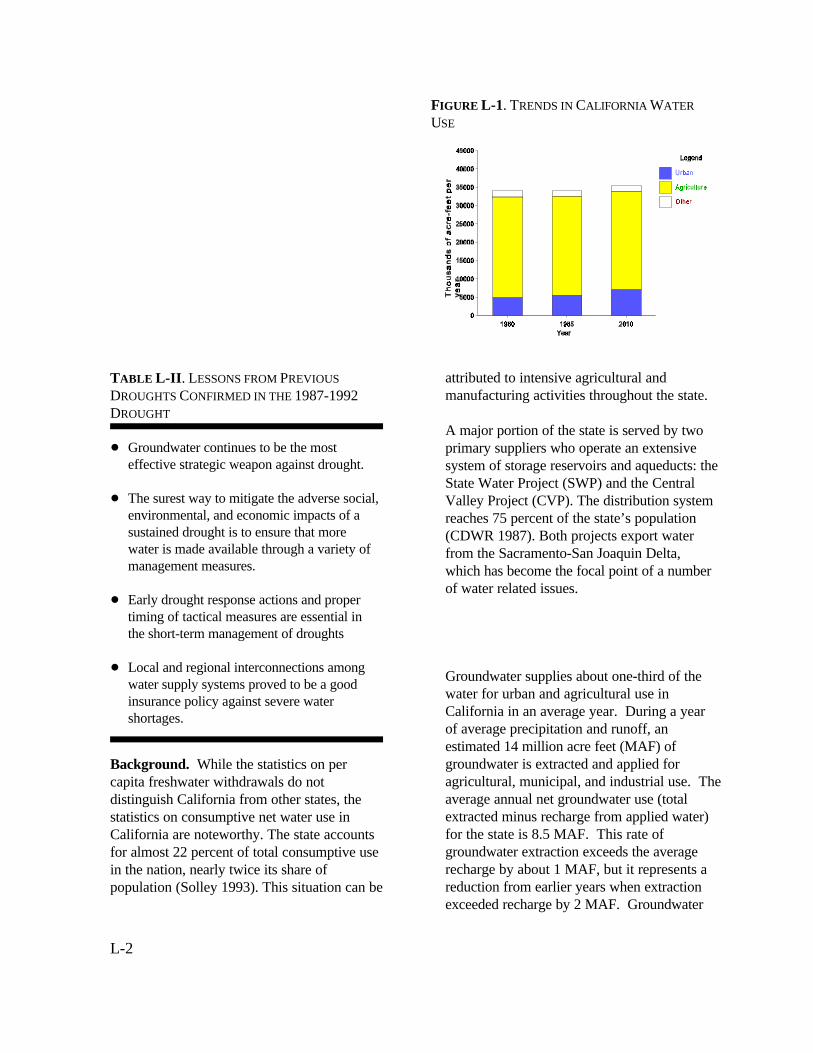
L-2
! Groundwater continues to be the most effective strategic weapon against drought.
! The surest way to mitigate the adverse social,environmental, and economic impacts of asustained drought is to ensure that more water is made available through a variety ofmanagement measures.
! Early drought response actions and propertiming of tactical measures are essential in the short-term management of droughts
! Local and regional interconnections amongwater supply systems proved to be a goodinsurance policy against severe watershortages.
TABLE L-II. LESSONS FROM PREVIOUS
DROUGHTS CONFIRMED IN THE 1987-1992
DROUGHT
FIGURE L-1. TRENDS IN CALIFORNIA WATER
USE
Background. While the statistics on percapita freshwater withdrawals do notdistinguish California from other states, thestatistics on consumptive net water use inCalifornia are noteworthy. The state accountsfor almost 22 percent of total consumptive usein the nation, nearly twice its share ofpopulation (Solley 1993). This situation can be
attributed to intensive agricultural andmanufacturing activities throughout the state.
A major portion of the state is served by twoprimary suppliers who operate an extensivesystem of storage reservoirs and aqueducts: theState Water Project (SWP) and the CentralValley Project (CVP). The distribution systemreaches 75 percent of the state’s population(CDWR 1987). Both projects export water from the Sacramento-San Joaquin Delta, which has become the focal point of a number of water related issues.
Groundwater supplies about one-third of thewater for urban and agricultural use in California in an average year. During a year of average precipitation and runoff, an estimated 14 million acre feet (MAF) ofgroundwater is extracted and applied foragricultural, municipal, and industrial use. Theaverage annual net groundwater use (totalextracted minus recharge from applied water) for the state is 8.5 MAF. This rate ofgroundwater extraction exceeds the averagerecharge by about 1 MAF, but it represents areduction from earlier years when extractionexceeded recharge by 2 MAF. Groundwater

L-3
FIGURE L-2. TWO SIX YEAR CALIFORNIA
DROUGHTS OF THE 20TH CENTURY
use varies from 20 to 90 percent of applied water withdrawn, depending on the region.
California’s $20 billion dollar agricultural sector (CDWR 1990) uses much more water than other sectors, although in recent years thepercentage has declined. In 1980, netagricultural water use was 80.1 percent oftotal net water use. By 1985, that had declinedto 78.8 percent. California’s projectedpopulation growth is expected to result in anincrease in net urban water use between 1985and 2010 (Figure L-1). This increase will takeplace largely in the state’s coastal regions,where 80 percent of California’s currentpopulation is concentrated. The urbanpercentage of total net water use is alsoexpected to increase during that period byabout four percent.
SEVERITY OF THE 1987-1992
DROUGHT
The 1987-1992 Drought was not “the big one”. The National Drought Atlas (NDS-4) does notestimate probabilities of droughts longer than 5
years in duration, so an estimate of the rarity of this 6 year drought cannot be made directly. However, according to the Atlas, no five yearprecipitation total (i.e., 1987-1991 or 1988-1992) in any of California’s ten hydrologicregions was more rare than a fifty year drought. By at least one important measure (the Sacramento River Index) this drought wasvery similar to another six year drought thatoccurred from 1929 to 1934 (Figure L-2). Finally, as Figures L-3 through 6 show, noindividual year from 1987 to 1992 was nearly as severe as the 1977 water year. In short,although this was a severe drought, plannersshould expect one as bad or worse in the nextcentury.

0
10
20
30
40
50
60
70
80
90
100
1987 1988 1989 1990 1991 1992Year
Percent
Reservoir storage during 1977 record low one year precipitation
L-4
FIGURE L-4. 1987-1992 RESERVOIR STORAGE
FIGURE L-5. 1987-1992 WATER YEAR RUNOFF
FIGURE L-3. PRECIPITATION 1987-1992DROUGHT RESPONSES

L-5
Water Allocation and Deliveries
Those entitled to water from the SWP and CVP did not suffer any significant reductions in deliveries until 1990. These two majorprojects supply water for agricultural andmunicipal water uses, with the SWP accountingfor 7.4 percent and the CVP providing 21.7percent of California’s supplies during the firstthree years of the drought. However in 1990,drawdown in project reservoirs prompted thefirst major cutbacks in CVP and SWP deliveries. The drought conditions intensified in 1991, necessitating even more drasticreductions in water deliveries.
Urban Water Conservation
Figures L-7 to L-9 display how Oakland, LosAngeles, and San Diego reduced water useduring the drought. The East Bay MunicipalUtility District (EBMUD) which supplies waterto urban customers in the Oakland area, initiated conservation measures in 1988. LosAngeles and San Diego started to conserve in1990. Across the state, demand managementefforts consisted of both voluntary andmandatory conservation programs during thefirst three years of the drought, with targetreductions in water use ranging from 10 to 25percent.
A survey of local governments in SouthernCalifornia conducted by the Los Angeles Times (April 1990), indicated that there werevoluntary conservation programs in 45communities, whereas conservation wasmandated in only 17 communities. As thedrought progressed into the fifth year (1991), the “Miracle March” rains and the success of the Water Bank (below) helped mostcommunities cope with water shortages. Theresults of a survey conducted in May 1991

100
110
120
130
140
150
160
170
180
190
200
210
220
80-8181-82
82-8383-84
84-8585-86
86-8787-88
88-8989-90
90-9191-92
92-93
GALLONS
Conservation EffortStarted Summer 1990
Fiscal Years
L-6
FIGURE L-6. EAST BAY MUD WATER USE 1982-91
(EBMUD, 1994).
FIGURE L-7. WATER USE AND POPULATION
GROWTH FOR THE CITY OF LOS ANGELES
(LADWP, 1994).
FIGURE L-8. SAN DIEGO PER CAPITA
CONSUMPTION, WATER YEAR ENDING JUNE 30(CITY OF SAN DIEGO. 1992).
showed water use reduction goals among the 11 members of the California Urban Water

L-7
FIGURE L-9. CUMULATIVE CHANGE IN
GROUNDWATER STORAGE FROM 1970-1992
FIGURE L-10. WATER BANK ALLOCATIONS:1991-1992 (CDWR 1993)
Agencies (CUWA) varied from a low of 10percent for the Los Angeles Department ofWater and Power, to a high of 31 percent forMWD.
One important development at the end of thefifth year (September 1991) was the signing ofthe Best Management Practices (BMP’s),statewide agreement monitored by the California Urban Water Council. Theconservation program pursued by the wateragencies in the sixth year (1992) included some of the 16 BMP’s advocated in theMemorandum of Understanding agreement. Components of this program includededucational publications, technical workshops,business conferences, training courses, water use surveys, water management studies, and atelephone hotline.
Groundwater Withdrawals
California’s groundwater basins provided areliable source of water during the 1987-1992drought, similar to its role during previousdroughts. Increased extraction in combination with other factors such as reduced rechargeresulted in decreased groundwater storageduring the drought. The change in groundwater storage during the drought for No. W-3-91 that established the Drought three different regions of the Central valley is Action Team. The executive order established ashown in Figure L-9. These regions are State Drought Emergency Water Bank. Theimportant because they are the largest Bank provided water for environmental, urban,agricultural producers in California, and and agricultural use (Figure L-10). Therepresent 65% of the average net groundwater establishment of the Emergency Water Bank used in the state (CDWR 1993). was a major innovation. It created a voluntary
The State Drought Emergency Water Bank would not have been possible without the of 1991
The fifth year of drought (1991) brought greater water shortages (following the firstsignificant SWP and CVP cutbacks in the fourth year of drought), and on February 1,1991, the Governor signed Executive Order
market for the transfer of water on an economic basis. The Emergency Water Bank
CVP-SWP conveyance facilities.
Other Responses
Discussions among representatives from theagricultural, urban, and environmental groups

L-8
FIGURE L-11. NATURAL FALL-RUN CHINOOK
SPAWNING SALMON (1980-91)referred to as the “Three-Way Process” beganbefore the drought, but received considerablemedia attention as the drought intensified. Theprocess did not produce tangible productsduring the drought; in fact, it became boggeddown by the conflicting agendas of the variousinterest groups, just as it has for decades. However, respondents in this study felt that theprocess improved working relationships between competing interest groups, formingrelationships which continue today.
IMPACTS
Impacts from the long drought were felt to some degree in many water use sectors. According to many observers, including theCalifornia Department of Water Resources(1991b), probably the most severe impacts of $460 million in gross revenue, a 7% declinethe drought were suffered by fisheries and from 1990. The lack of impacts in otheraquatic resources, particularly species such as industrial and commercial industries has beensalmon. The population of the fall-run chinook attributed to a number of factors, includingsalmon declined to its lowest numbers in the exemptions for some industries fromlast two decades (Figure L-11) despite mandatory water allocation rules,consistent hatchery production. How much of implementation of new water conservationthis population decline might be attributed to practices, and in a few cases, substitution ofdrought is not known, since the population groundwater for surface water. The droughtdecline might also have been affected by reduced hydroelectric power generation. record catches of salmon off the nearby Pacific Hydroelectric plants typically provide 33-40%Coast. Agriculture did not suffer substantial of the total electrical energy produced inimpacts until 1991, the fifth year of the California. From 1987 through 1990, thatdrought, when revenue declined slightly from a percentage was never more than 20%. Therecord of $18.3 billion in 1990. Direct drought cost state ratepayers about $3 billionagricultural revenue losses during the drought (increase in marginal cost) as a result of lostwere about $250 million (CDWR, 1992). The energy production. Utilities replaced this powerloss in consumer and producer surplus, a truer by natural gas and out-of-state power purchasesmeasure of the impact to society, was $276.3 (CDWR 1991b). Table L-III summarizesmillion in California, but only $80 million some of the economic loss estimates.nationally because of the increases in farmproduction elsewhere in the country. The only Given the sustained turmoil and press coverageindustry that was significantly affected by the surrounding the California drought, it isdrought was the “Green Industry” (Cowdin surprising to see how small the economicand Rich 1994, in prep), including landscaping impacts of the drought were. And in the sectorand gardening. Drought-induced economic with the largest economic impacts by far,losses in 1991 were estimated to include the hydropower, there was little controversy. loss of about 5,630 full-time jobs, and about Somewhere therein lies perhaps the most

L-9
Sector Duration Loss ($) Sector Revenue in1990
Study
Agriculture 1991 $276 million $18 billion NDS-10
Hydropower 1987-1992 $3.8 billion $62 billion U.S.E.L.A. 1993
Table L-II. Estimates of Economic Impacts
fundamental lesson for drought planners among stakeholders than the absolute reductionelsewhere in the country: that the degree of of the expected value of impacts. That in turnconflict is not necessarily a function of the argues for involvement of stakeholders in thelikely value of impacts. The uncertainty that is planning process, because that allows them tointellectually recognized by water managers is understand the risks and prepare for themfelt more personally by those who “hold stake” personally while there is still time to do so.in the allocation of scarce water, even by thosewho advocate a philosophy of use. It suggeststhat reductions in drought conflicts are morelikely to come from the reduction of anxiety

L-10
BLANK PAGE
(Skip)

4
1 2
5
6
89
3 2189
4
87
6
59
10
Figure M-1. Case Studies Conducted During the National Drought Study
M - A Summary of the Principal National Drought Study Case Studies
Four river basins were chosen to test and refine 1. Kanawha River DPS (WV, NC, VA)the “DPS Method” of managing water during 2. James River DPS (VA)drought. In addition, smaller studies were 3. Marais des Cygnes-Osage Rivers DPS (KA-conducted in the Boston and Harrisburg areas. MO)The National Drought Study collaborated with 4. Cedar-Green Rivers DPS (WA)a team of western universities on a gaming 5. The Boston Area (MA)exercise in which the Colorado River States 6. Susquehanna River Basin (PA)experienced a severe (computer simulated) 7. Colorado River (7 states)drought. The DPS method is now being tested 8. California (Lessons Learned, Impacts fromat two Corps lakes (9 and 10) to determine its the Drought)effectiveness as a method to develop reservoir 9. Rogue River, Lost Creek Lake (OR)drought contingency plans under limited 10. Youghiogheny River Lake (PA)budgets and time.

M-2
BLANK PAGE
(Skip)

M-3
The planning methods described in this report The Kanawha drains 12,300 square miles inwere first published in 1991 (NDS-1) and have North Carolina, Virginia and West Virginia. since been tested and refined in four Drought The Kanawha main stem is formed by thePreparedness Studies (DPS’s) across the junction of the New and Gauley Rivers, andUnited States. The study sites were chosen flows northwest 97 miles before emptying intofrom 28 nominated sites to represent a cross the Ohio River at Point Pleasant, West section of issues in American water Virginia. Other major tributaries are themanagement. To supplement that experience, Greenbriar and the Elk. The Corps is thesmaller studies that focused on specific issues primary water manager, operating locks andwere conducted in Boston and the multi-purpose reservoirs at Lakes SummersvilleSusquehanna River Basin. Finally, many of (Elk River), Bluestone and Sutton (on the Newthese methods were used in a collaboration River). The Appalachian Power Company,between the National Drought Study and the which runs the hydropower plants on all three“Study of Severe Sustained Drought in the Corps reservoirs, also owns and operates Southeastern United States”, a comprehensive Claytor Lake, on the upper New River. Claytoranalysis of what would happen in the Lake also supports lake recreation.Colorado basin and California if an extremedrought were to occur in the near future. The most recent drought started with below
Each of these studies lasted over two years. persisted through the fall of 1988, withThe DPS’s will be described more fully in temperatures several degrees above normal in Lessons Learned from the National Drought the summer of 1988. During that drought,Study Case Studies (NDS-15). Colorado River releases from Summersville and Sutton wereGaming Exercise (NDS-14) describes that kept high enough through August to meetwork in more detail. The summaries of these minimum instream flows established to dilutestudies that follow describe the primary downstream effluents. By August, there was conflicts, the participants, and the changes that no longer enough water in the reservoir tooccurred, or are in the process of occurring. support daily pulsed releases for whitewaterOne DPS, the Marais des Cygnes-Osage, was rafting or meet minimum instream flowsuspended during the summer of 1993 requirements. The restriction of rafting because the entire “Circle A” of the study team releases to just weekends cost the region became involved in the efforts to control and millions in tourism revenue. For the touristsmonitor the flooding damage on the Missouri coming from all over the world, it created, for and Mississippi Rivers. That DPS is the first time, doubts about the dependability expected to resume in March 1994 and of the rafting experience. Releases from Corpsconclude in the fall of 1994. reservoirs kept dissolved oxygen levels above 5
The Drought Preparedness Studies
1. The challenge for the Kanawha River DPSteam was to strike a better balance between water quality, lake boating, and white waterrafting below Lake Summersville on the Gauley River, a tributary to the Kanawha.
average rainfall in the summer of 1987, and
mg/l, the state minimum, until August 1988. Then, with the reservoirs running out of water,and temperatures at their highest, the levels ofdissolved oxygen dropped, sometimes to lessthan 3.5 mg/l.
Circles A and B in the Kanawha included theHuntington District Corps of Engineers (planning and water control), the West VirginiaDivision of Water Resources, the U.S.

M-4
Geological Survey, the West Virginia Geological Survey, and representatives from the whitewater outfitters. Circle “C” included

Summersville Lake
Charleston
BluestoneLake
Gauley River
Sutton Lake
Claytor
Lake
North Carolina
Little River
VirginiaVirginiaWest
M-5
FIGURE M-2. THE KANAWHA RIVER BASIN

M-6
1. Increase the reliability and value of theGauley River whitewater rafting experienceduring drought conditions.
2. Increase reliability of the recreationalopportunities in-stream and on lakes in theKanawha River basin during drought.
3. Increase the reliability of navigation on theKanawha River during drought.
4. Increase the reliability of hydropowergeneration in the Kanawha River basin duringdrought.
THE PLANNING OBJECTIVES FOR THE
KANAWHA RIVER DPS
natural and water resources departments from month in 1988 when releases were cut to 400 all three states, including departments of cfs because of the lower limiting rule curve).fisheries, the U.S. Fish and Wildlife Service,Trout Unlimited, the Isaak Walton League,regional councils of government, the NationalWeather Service, Offices of Emergency Service, the North Carolina Regional Council of Governments, the Kanawha ValleyChemical industry, and municipal watersuppliers.
Changes as a result of this DPS. The studyteam first quickly looked at a broad range oftactical and strategic plans, up to andincluding the construction of additionalreservoirs. Almost all but the tacticalalternatives were eliminated early in the studyprocess as improbable because of the amountof time necessary to develop solutions andbecause of environmental concerns. After the collaborative planning model was developed, the remaining alternatives were screened to seehow well they addressed the planning objectives. Planners found that modifications to Claytor Lake, Bluestone, and Sutton did notsignificantly address the planning objectives. In a workshop in the spring of 1993, Circle Bteam members compared five alternatives forSummersville Lake to the status quo plan.
Plan 1 was to modify the dam at Summersvilleto allow the summer pool level to be 17 feethigher. Plan 2 called for relaxation of waterquality target flows. (A USGS survey showedthat BOD loadings had been dramaticallyreduced since the standards were set). Plan 3was to ignore the rules that limited releases from Summersville in the fall (lower limiting rule curve) in order to maintain a presetminimum level of storage. Plan 4 delayed thestarting date for water quality releases from June 15 to July 15th unless water samplesshowed a need for the releases. Plan 5 was tovary the maximum water quality release fromSummersville, starting at 500 cfs (instead of1000 cfs) and increasing through August (the
Workshop participants watched as the sharedvision model was run to demonstrate the impacts of each alternative during a one and two year drought. Measures of performance for each objective were compared. After threehours of model runs, Dr. Richard Punnett, headof the water control section of the HuntingtonDistrict Corps of Engineers, led a workshopexercise designed to facilitate the transition from individual plan evaluations to theendorsement and implementation of a plan. This exercise is described in Chapter 8 of thisreport because of its general usefulness as a tool for clarifying the final decision makingprocess.
The analysis showed that Plans 4 and 5 helpedwater quality, rafting, and lake recreation, while not affecting hydropower or navigation. Plan 2 helped rafters, but hurt lake recreation; Plan 3 did just the opposite. Because plans 4 and 5 were not mutually exclusive, the workshop participants agreed that a plan that

M-7
1. Increase the reliability and level ofmunicipal water service in the lower Jamesbasin during drought conditions.
2. Increase the population of the nine indicator species along various reaches of theJames River during severe droughts.
3. Increase water quality reliability in theJames River basin during drought.
PLANNING OBJECTIVES - JAMES RIVER DPS
combined the advantages of both should be area and greater Richmond area will probablyused during the next drought. have problems in the future. The problem is
In August 1993, the Huntington District used growth is the greatest at the coast, wherethe shared vision model and the close groundwater pumping can lead to saltwatercollaborative ties it had developed with intrusion.stakeholders to react to a potential drought. An alternative release strategy was agreed to by the DPS team consistent with the general form of alternatives 4 and 5. The drought watch was lifted after heavier than normalrainfall. Participants agreed that had the drought continued, these operational changeswould have preserved fall water quality andavoided several million dollars loss in WestVirginia tourist revenue derived from whitewater rafting.
2. The James River DPS. The primary DPS methods on other river basins. Earlyobjective of the James River DPS was to interest from environmental groups came reduce urban drought vulnerability in a five mostly from the Isaac Walton League and thecity region near where the James flows into Lower James River Association. Circles “B” Chesapeake Bay. The cities, in order from included about 50 organizations includingmost to least vulnerable, are Virginia Beach, municipal water utilities, environmental groups,Chesapeake, Suffolk, Norfolk and Portsmouth. other state and Federal agencies, industries andThey do not use James River water, but industrial groups, and Universities. Circle “C”instead rely on a mixture of groundwater, local included a mailing list of about 400 agencies runoff, and withdrawals from the Nottoway and individuals.and Blackwater Rivers. The James River DPS team developed a simulation model of thefive city region using the STELLA II®software, and supported a new role for thestate of Virginia.
The James River is located almost entirely inVirginia (less than 0.1 percent of the basin is in West Virginia). The James flows 340 milessoutheast from the Allegheny Mountains onthe West Virginia border to Chesapeake Bay. About a fourth of Virginia - 11,000 square miles - is in the James River basin. The majortributaries are the Maury, Rivanna, Appomattox, and Chickahominy Rivers. Of the five cities, Virginia Beach is the mostWorkshops held throughout the basin showed vulnerable. Virginia Beach will have no waterthat the worst drought problems were in the supply of its own until 1996, when the Gastonfive-city area, although the Lower Peninsula pipeline, now under construction, is scheduled
not an uncommon one in the U.S.; population
Circle A of the James River DPS team wasmade up of staff from the Norfolk District, Corps of Engineers, Virginia Department ofEnvironmental Quality, U.S. AdvisoryCommission on Intergovernmental Relations,Institute for Water Resources, the Virginia Water Resources Research Center (VirginiaPolytechnical Institute and State University), the city of Virginia Beach, the Appomattox River Water Authority, and the University ofWashington. The state has begun to use the

M-8
to carry water from the Roanoke River eastacross Virginia. Until then, Virginia Beach will rely entirely on water from the city ofNorfolk, which also supplies some water to thecity of Chesapeake.

Chesapeake Bay
Atlantic Ocean
SuffolkChesapeake
Virginia
Beach
Norfolk
Newport
Portsmouth
News
Drainage Boundary
N
M-9
FIGURE M-3. DROUGHT PROBLEMS IN THE JAMES RIVER BASIN ARE CONCENTRATED IN A 5 CITY
AREA.
A shortage situation during a non-drought The U.S. Navy, a major economic force in thisperiod now exists in the city of Virginia Beach. area, at one point owed more than $140,000 inIn 1986, Virginia Beach initiated voluntary fines. It is thought unlikely that Norfolk conservation, and in 1991, mandatory use would restrict Navy water use before reducingrestrictions were enforced. Then, in 1992, the amount of water transferred to Virginiawhen Norfolk limited Virginia Beach’s demand Beach. The potential impact to the localto 30 MGD, Virginia Beach instituted year- economy from additional base closures willround mandatory water use restrictions and a intensify the pressure on Norfolk to assurelimited construction moratorium. Conservation reliable water service to the Navy.measures have long been implemented inVirginia Beach, resulting in the very low percapita water use rate of about 82 GPD.
But the amount of “surplus” water available toNorfolk during a severe drought may be less than 30 mgd. In a 1980-81 drought, Norfolk had to institute penalties for water users whoconsumed more than 75% of normal amounts.
Changes as a result of this DPS. In August of 1993, the five cities and the Corps participated in a workshop in which the sharedvision model of the five city region was used to simulate what would happen if the drought of 1980-81 were to happen under today’swater demand and allocation rules. Alternatives including regional management

M-10
and conjunctive use of emergency wells were ! dispute adjustment - using state law andexamined, but were rejected in favor of the regulation to support parties whose success instatus quo. As of the date of this report, water negotiations would benefit the public.although it appears unlikely that the DPS willeffect a reduction is short term vulnerability, the ! arrangement of technical assistance fromfive cities are considering using the shared outside the state.vision model to manage droughtscollaboratively in the region. ! a written state water policy.
The potential for strategic changes is somewhat ! a uniform set of principles for making watergreater. The Virginia Water Commission, a management decisions (used with local needsgroup of state legislators and gubernatorial and data to develop solutions appropriate to aappointees, met on July 22, 1993 to consider community).ideas - including those of the James River DPSteam - for a more proactive state water role. ! the provision of people, facilities, or moneyTestimony was offered by National Drought for planning and data collection.Study representatives, and the shared visionmodel was demonstrated. The VirginiaDepartment of Environmental Quality made apresentation on components that should beincluded in a state water policy. At the end ofthe DPS, most observers believed that the stateof Virginia would develop a comprehensive state water policy. The New Role for theCommonwealth of Virginia might include:
! providing technical and political analysis, orinterpreting the needs and perspectives ofvarious water management groups wherecommunication among those groups is poor now.
! stronger protection of the state’s interest inlocal and interstate water issues.
! integration of institutional perspectives across regulatory, supply planning, and use; across Federal and state responsibilities; andacross legal, engineering, biological, andeconomic professional perspectives.
! dispute resolution, either as a facilitator or aregulator. In the regulatory role, the state could readjust power balances among water uses by new, or newly enforced regulation.
3. Marais des Cygnes - Osage. The primary objective in the Marais des Cygnes-Osage was to create an interstate working group to avoid interstate conflicts over waterduring drought. The river is officially designated as the Marais des Cygnes from itssource in east-central Kansas to its confluencewith the Little Osage River near Schell City,Missouri where it becomes the Osage River and flows in an easterly direction into theMissouri River downstream of Jefferson City,Missouri. The basin is about 250 miles long, as much as 100 miles wide, with a drainage area of 15,300 square miles. A little less than a third of that area is in Kansas.
The Corps has six reservoirs in the basin; Melvern, Pomona, and Hillsdale in Kansas,Stockton, Pomme de Terre, and Harry S. Truman in Missouri. Union Electric’s Lake ofthe Ozarks is located behind Bagnell dam, justdownstream from Harry S. Truman. UnionElectric uses Lake of the Ozarks for hydropower and recreation. Occasionally, in the winter months, Lake of the Ozarkssupplements cooling water to a fossil fuel plantlocated on the Missouri River.

Pomme de Terre River
Kansas City
Stockton Lake
Melvern Lake
Hillsdale Lake
Lake of the Ozarks
Dam and Reservoir
Topeka
OttawaPaola
Osawatomie
Harrisonville
Butler
RichHill
FortScott
NevadaStockton
Springfield
Bolivar
Clinton
HermannJefferson City
Missouri River
Kansas Missouri
M-11
FIGURE M-4. THE MARAIS DES CYGNES-OSAGE RIVER BASIN
Kansas is an appropriation state with proactive a severe drought to provide electrical power to water supply planning, which includes updating a region that includes St. Louis, Missouri. of a yearly water plan and partnership with the Most people in the region, however, know U.S. Army Corps of Engineers pursuing water Lake of the Ozarks as a recreational lake and storage in several Corps reservoirs. Missouri is an attraction that induces tourists to spend asa riparian state in which local management has much as $5 million per week in the region. historically been favored over state direction. Funding for Missouri’s state water program During a sustained severe drought there arewas threatened during the DPS because of potential negative impacts to municipal andoverall state budget pressures. industrial users in Kansas and Missouri.
The potential problems in a drought situation Ottawa, Osawatomie, Paola, and Ft. Scott. are major impacts on power production and the Municipal users in Missouri include the cities recreation industry. For example, a major of Clinton, Springfield, Nevada, Stockton, andrecreation and hydropower issue revolves various Lake of the Ozarks communities. around the operation of a private reservoir, Kansas City Power and Light in Kansas uses Lake of the Ozarks, the most downstream the water to cool steam generators. reservoir in the basin. Created by Union Additionally, hydropower generation exists in Electric, the lake could be drawn down during the Harry S. Truman and Stockton Reservoirs.
Municipal users in Kansas include the cities of

M-12
1. Increase the reliability of municipal andindustrial water service in the Marais desCygnes - Osage River basin.
2. Increase the reliability of recreationopportunities during drought at the 6 Federalreservoirs and 1 non-Federal reservoir in theMarais des Cygnes - Osage River Basin.
3. Increase the reliability of hydropowergeneration during drought at the 2 Federal and 1 non-Federal reservoirs in the Maraisdes Cygnes - Osage River basin.
4. Increase the dependability of agriculturalproduction during drought in the Marais desCygnes - Osage River basin.
PLANNING OBJECTIVES FOR THE MARAIS DES
CYGNES-OSAGE RIVER BASIN DPS.
Circles A and B in the Marais des Cygnes -Osage included the Corps’ Kansas City District, the Kansas Water Office and theMissouri Department of Natural Resources. Each of these entities developed a portion of D. Cedar & Green Rivers DPS. Thethe shared vision model. Circle C included Muckleshoot and Tulalip tribes fish these twoKansas City Power and Light, Union Electric, rivers that supply water for the cities of SeattleKansas Department of Wildlife and Parks, and Tacoma. Droughts in 1987 and 1992 (theMissouri Department of Conservation, latter occurring during this DPS) sensitized economic development commissions and water these communities to the limits on water district managers within the basin. supply even in this northwestern rain forest.
Changes as a result of this DPS. This DPS was suspended during the summer of 1993because the entire region became involved inefforts to minimize and monitor the floodingdamage on the Missouri River and its tributaries.
This DPS is expected to resume in March 1994. At the time of this writing, participantsfrom both states reported that the DPS processhad helped improve understanding and
cooperation between the states and the Corps,but there has been no determination ofalternative plans.
The Cedar and Green Rivers never flow together. The Cedar River drains about 188square miles south and east of Seattle. Itsheadwaters are on the western slope of theCascade Mountains, from which it flowswestward into Chester Morse Lake. Seattledraws about two-thirds of its municipal andindustrial water from this lake. From there, theCedar flows through Renton into LakeWashington. The Lake is used to operate theCorps of Engineers’ Hiram Chittendon navigation locks (connecting Lake Washington to Puget Sound). The Cedar River providesabout 70% of the total inflow into LakeWashington.
The Green River basin is south of the Cedar, and drains more than twice as much area (about 483 square miles). Like the Cedar, theGreen starts on the western slopes of theCascades and flows west. The Corps’ HowardHansen dam impounds up to 106,000 acre feet in the upper part of the basin, before the riverflows through the Green River Valley, settlednow by the communities of Auburn, Kent,Renton, and Tukwila, where it finally flows into the Duwamish River, which in turn empties into Elliott Bay in the city of Seattle.
The Corps built Howard Hansen in 1962 toprovide a 100 year level of flood control, watersupply for the city of Tacoma, irrigation, fishconservation and pollution abatement.

M-13
Commercial fisheries join the Muckleshoot andTulalip tribes in a harvest of salmon and

Lake Washington
Lake Sammamish
Green RiverRiver
Howard A. Hanson Dam
Seattle's Masonry Dam
Puget Sound
Seattle
Tacoma
M-14
FIGURE M-5. THE CEDAR AND GREEN RIVER BASINS
steelhead trout. Releases from Howard Hansen Following the 1987 drought, several efforts are adjusted to supply sufficient instream flows were made statewide to improve regionalto maintain dissolved oxygen levels, and drought preparedness. A state droughtsufficient depths to keep fertilized fish eggs contingency plan was developed and droughtlaid along the riverbank covered. relief legislation was enacted. Studies wereThe region was ill-prepared to meet this goal initiated by the Seattle Water Department when drought occurred in 1987. At this time, (SWD) and Tacoma Water Division (TWD) toexisting guidance for management was either examine ways of improving water use limited or outdated and most personnel lacked efficiency. Structural changes were made to experience in handling water shortages. the system to increase the quantity of water Thus, it was difficult for agencies to resolve that could be delivered. When the DPS wasconcerns, come to consensus on an appropriate initiated in 1991, stakeholders were identifiedcourse of action, and respond to drought in a and encouraged to become involved.timely manner. This experience clearlydemonstrated that improved mechanisms forinteragency coordination during drought wereneeded.
Circles A and B in the Cedar and Green DPSwere drawn from the Corps’ Seattle District, the University of Washington, the city ofTacoma, the Muckleshoot Tribe, and the

M-15
Washington Departments of Ecology and establishing a refill strategy has become moreFisheries. Circle C included the other cities in open, and an opportunity for interagency policythe region, including Seattle, county dialogue is now provided at an annual “refillgovernments, and the Puget Sound Regional meeting”.Council of Governments. The Cedar and Green River basins are distinct hydrologically, Typically, representatives from the but in almost every other way they are one. Muckleshoot Indian Tribe, WashingtonMost of the principal participants in the Cedar- Departments of Ecology, Fisheries and Green DPS have a direct stake in each basin. Wildlife, the Tacoma Water Division, and U.S.The Corps Seattle District manages structures Fish and Wildlife are present. This meetingon both basins, although its role is much enables agencies to jointly assess the currentgreater on the Green. The Muckleshoot and water supply situation based on precipitation,Tulalip tribes fished both rivers for centuries, runoff, snowpack and temperatures. It alsoand, for the most part, the same state Fisheries provides an opportunity for fisheries agencies and Ecology staff monitor both rivers. to suggest target instream flow levels to protectAlthough Seattle currently obtains no water resource needs. The process of establishing afrom the Green, and Tacoma none from the refill strategy is typically very time consuming,Cedar, the cities have discussed creating an occurring over a period of several weeks. intertie between the two river basins to reduce When modifications are suggested to the Corpsdrought vulnerability. Moreover, because the initial proposal, the Corps must carefullytwo cities each deal with the Muckleshoot’s examine their potential impacts of a proposedand Tulalip’s, and with the same state change. This had been done using a largeagencies, each is attentive to the others water mainframe model. Corps personnel reported management programs. that typically, only a few target instream flow
Changes Resulting from this DPS. The Cedar basin model still awaits review andendorsement by the Seattle Water Department,but the contributions from the DPS have already been successfully used on the Green. The Green River basin model was first used tohelp agencies establish an agreed upon policy for the refill of Howard A. Hanson reservoirduring March, 1993. During the spring of eachyear, the Corps selects a refill strategy forHoward H. Hanson Dam. Their primaryobjective is to refill the reservoir to achieve 98% reliability. Traditionally, the refill strategy was developed independently by theCorps, without explicit consideration of theinterests of other stakeholders. However, thisstrategy can significantly impact the welfare ofdifferent anadromous fish species at various life stages. It can also potentially impact thewater supply situation later in the season.Because of these impacts, the process for
scenarios or release strategies would beanalyzed, due to time constraints. Furthermore,there was no automated approach for testingsystem sensitivity to different instream flowtarget levels.
This year, the DPS Green River basin model was used as a tool to facilitate interagency policy dialogue. Prior to the initial refill meeting several runs of the model were made to assess the impacts of:
1) different instream flow targets; and
2) different refill start dates on reservoir refillreliability.
This output was translated into a histogram toconvey the potential implications of differentpotential policies to stakeholders. A wide range of instream flow target scenarios for thespring and summer months from agency

M-16
comments at this meeting were tested using the parties are now formalizing an agreement tomodel. The model was run over the historic extend the collaborative efforts of the DPS into record to examine the potential impact of these a permanent regional water management group. policies on refill. During the interagency Efforts to do the same on the Cedar are working group meeting that followed, frustrated by the fact that the city of Seattle isstakeholders used the model to fine-tune the about 15 months behind other study most promising policies, by iteratively testing participants in reviewing and correcting thethe impact of their modifications. In this way, model of their system.they were able to develop an agreed uponmanagement strategy within a few hours. This study was especially useful in
Overall, the model greatly facilitated the players to accept a collaborative process. Most process of establishing a refill strategy. Corps of the same players that enthusiastically representatives were extremely pleased with the accepted the DPS process on the Green were model’s ability to answer questions of concern key players on the Cedar. The same modelersto stakeholders during this process. They and managers were used on both basins. But reported that use of the object oriented model the city of Seattle’s failure to review a Cedaroffered several benefits in comparison to River model effectively stymied adoption of aprevious years: collaborative approach on the Cedar.
! First, it enabled a greater number of scenarios to be investigated, and increased theamount of fine tuning that could be done.
! It provided participants with access to theentire historical streamflow database.
! It enhanced stakeholder insight to systemsensitivities, and the relationship betweenproposed policies and their likely impacts.
! Finally, it enabled them to come to aconsensus on an appropriate strategy in astraightforward manner. Because of thesebenefits the use of DPS Green River basin model to facilitate refill strategy development is likely to continue.
In August 1993, about twenty regional watermanagers representing the city of Tacoma, theMuckleshoot tribe, the state of Washington(Departments of Fisheries and Ecology) and the Corps’ Seattle District used a computermodel of the Green River water managementsystem to simulate a drought so realistically that it was termed a Virtual Drought. These
demonstrating the importance of getting critical
Circles A and B in the Cedar and Green DPSwere drawn from the Corps’ Seattle District, the University of Washington, the city ofTacoma, the Muckleshoot Tribe, and theWashington Departments of Ecology andFisheries. Circle C included the other cities inthe region, including Seattle, countygovernments, and the Puget Sound RegionalCouncil of Governments.
Other Case Studies
Boston Metropolitan Studies The NewEngland Division of the Corps of Engineersworked with the Massachusetts Water Resources Authority (MWRA) and the WaterSupply Citizens Advisory Committee (WSCAC) on three projects:
! the development of trigger planning using asimulation model of the MWRA system builtusing STELLA II.
! use of a beta version of IWR-MAIN 6.0 todetermine the cost effectiveness of current andfuture demand management measures.

Quabbin Tunnel
Wooster
Boston Metropolitan Area
Atlantic O.
Quaboaq Pond
Quabbin Reservoir
Wachusset Reservoir
Sudbury Reservoir
Weston Aq.
Wachusset Aq.
City
M-17
FIGURE M-6. THE MWRA SERVICE AREA
! a history of the MWRA, WSCAC, and otherMassachusetts agencies. The purpose of the
history is to develop a basis for recommending actions are postponed, the options to addressmanagement solutions that have worked here the problems that exist at the end of thefor other areas in the U.S. planning period may be extremely limited. A
Trigger Planning. For many years, MWRA that it is often divorced from tactical planningand WSCAC have been concerned that the efforts. For example, the effectiveness ofexisting strategic planning framework does not adopted drought management plans may not beprovide sufficient flexibility to adequately considered when evaluating strategicassess a wide range of alternative solutions. alternatives.Two primary shortcomings of the existingplanning approach have been cited. First, once Trigger Planning provides for continuousadopted, MWRA’s strategic plans are typically monitoring of indicators of future water supplynot reviewed until the end of a specified conditions under existing management policy. planning period, often 15 to 20 years. This Trigger planning identifies a mechanism forepisodic approach does not allow the system to determining when a change in this strategy isrespond to changes in demand, regulatory needed. It also accounts for the impacts ofrequirements, and social concerns that occur existing tactical response plans in evaluatingduring the planning period. Because corrective system performance from a strategic
second criticism of existing strategic planning is

M-18
perspective. It should provide greater lead alternatives may progress through the design,time to adequately scope and evaluate a wide environmental impact assessment, andrange of potential alternatives, both strategic implementation phases. During this assessmentand tactical. and evaluation process, however, leading
In the Trigger Planning Process, monitoring Estimates of critical points and trigger points moves through three stages defined by pre- will also be readjusted to reflect this updateddefined leading indicators, critical points and information. These estimates, in turn, maytriggers. Each year, a series of leading impact the decision to proceed with theindicators are monitored including the implementation of an alternative. In this way,conditions of local sources, events and implementation will be postponed as late into proposed projects, laws, regulations and the time horizon as possible.agreements, watershed conditions andoperational procedures, climate precipitation and streamflow, public views, and buildingpermits. Although portions of this informationare available in existing databases, thisinformation must be better coordinated toeffectively implement trigger planning. Next,these leading indicators are used to forecastscenarios describing future system supply anddemand conditions.
Forecasts are used to estimate when the system is likely to reach a “critical” state ofunacceptable performance. Currently, thiscritical state is defined as the condition whendemand reaches a specified percentage of thesystem’s safe yield. Eventually, multiple critical points may be defined to reflect MWRA’s preferences to pursue demandmanagement and non-structural options. Thecritical state for these options would occursooner than that for non-structural options. Trigger points are then estimated bybacktracking from the critical points by theestimated lead time required to implement eachof the alternatives under consideration. Thesetrigger points indicate when activities toinvestigate, design and implement eachalternative must be initiated in order to preventthe system from reaching the critical state.
If these analyses indicate that a trigger isimpending, evaluation of a wide range ofalternatives would be initiated. Promising
indicators will be continuously monitored.
Required Tools. Several computerized toolswill be needed to implement the trigger planning process. Databases tracking trends inleading indicators will be established. Forecasting models will be needed for reliableestimates of demand. Other simulation modelswill be used to estimate system safe yield andother performance measures and to evaluate theeffectiveness of alternatives at forecasteddemand levels. Simulation may also be used toestimate critical points and trigger points in thetime horizon.
MWRA has developed a simulation model of the system before the National Drought Studycollaboration. This model was originallydeveloped to estimate the water supply systemsafe yield. (Thus it has commonly becomeknown as the Safe Yield Model). It is written in FORTRAN, and much of its logic ishard-coded in batch data files rather thanspecified as heuristics. The primary strength ofthis model is that it is trusted by stakeholders. This is because considerable effort was spent in establishing consensus among stakeholders on the model’s validity.
However, the Safe Yield Model has limitedpotential as a trigger planning tool for a varietyof reasons. Current users report that it is verydifficult to modify. Thus, it would be difficult to incorporate changes in system configurationand operation that may occur over time.

M-19
Furthermore, it would also be difficult to made at working group meetings. During thisformulate and test alternatives with this tool. time, model development was not the primaryFinally, Safe Yield Model output is reported in focus of the monthly group meetings. Rather,terms of a single performance measure: the issues related to specific components of the number of shortfalls that occur during the trigger planning process, such as demandsimulation period. This greatly limits the forecasting and the definition of critical pointsperspective from which alternatives can be were emphasized in group discussion. Thus,evaluated. Because of the perceived changes to the model were made gradually, asshortcomings of the Safe Yield model, the the requirements of trigger planning werestudy group decided to use STELLA II® to clarified.create a customized trigger planning tool.
The primary focus at the early stages of model appropriate measures of system performance development was to replicate the existing was one of the most difficult and time system configuration and logic expressed in the consuming aspects of model development. Safe Yield Model. This required translation of They devoted a great deal of effort in trying tothe hard-coded data files into heuristics reach agreement on which measures were mostdefining functional relationships among icons appropriate, how they should be defined andin the object oriented environment. Most of what new information they would provide. the information required to develop the object The modeling environment was extremely oriented model was found in the Safe Yield useful in facilitating these discussions. ItModel. A working model was completed enabled different measures to be quicklywithin four months after the introductory formulated, tested, and discarded ifworkshop. Model validation was a two week inappropriate.process which was critical for establishing trustin the model. During this time, output data The current model can perform simulations offrom the Safe Yield Model was added to the system response under the current systemSTELLA II® model for direct comparison of configuration using 30 years of monthlyresults. Refinements of functional relationships streamflow data, containing the 1960's drought were made until the STELLA II® model of record. The existing model would obtained an acceptable level of agreement with potentially be suitable for evaluating both the safe yield model output. supply and demand management alternatives in
Once model validation was achieved, the alternatives have not yet been incorporated intoworking group began to explore means of the model.enhancing the model’s usefulness as a triggerplanning tool. The visual clarity of the model Finally, although study participants arewas refined, through the use of intermediate enthusiastic about STELLA II, they recognizevariables and ghosts. The drought response some limitations. STELLA II’s lack of ability plan, previously developed by MWRA, was to iterate may complicate the analysis of someincorporated into the model. Measures of problems, such as hydropower sequencing. system performance were also added to the They also found the graphical capabilities of model. the environment to be quite limited.
These enhancements were made over a period Currently, five system performance measuresof several months, in response to suggestions have been incorporated into the model (see
Study participants reported that the selection of
a strategic planning context. However, specific

M-20
Category Performance Criterion Description
Water Quantity Shortfall Number of times where supply is less than theunconstrained demand. Alternatively, thevolume of such a water deficit.
EnvironmentalQuality*
Severity The maximum number of consecutive monthsQuabbin reservoir is below the target pool.
Maximum Pool Descent The elevation of the maximum deviation ofQuabbin reservoir elevation from target pool.
Resiliency A ratio expressed as a percentage of durations:the tolerable stay below target pool/particularstay below target pool.
Consumer Impacts Drought Actions The number of months at each droughtrestriction level.
* - as Quabbin is drawn down, there is an impact on riparian areas and water quality within Quabbin for fish habitat. Deep draw downs reduce municipal water quality.
TABLE L-III. PERFORMANCE MEASURES FOR STRATEGIC TRIGGER PLANNING IN THE BOSTON AREA
Table L-IV). These measures were chosen asindicators of environmental quality, consumerimpacts, and the quantity of water available. The performance measures were easilyrepresented within the STELLA II® model. Incontrast, it was much more difficult to establishconsensus on which measures were mostvaluable.
During the course of the study, the model has participants reported that their model-aidedbeen used to examine the impact of drought investigation of performance measures greatlymanagement on system performance and to enhanced their understanding of the trade-offspredict system performance for the year 2012 involved in system operation. under four different demand scenarios.
The model has also influenced the formulation used in the definition of the trigger planningof performance measures in the trigger framework. For example, it may help planning framework. Had the model not been participants reach consensus on the points available it is unlikely that the same measures when these measures indicate an unacceptablewould have been chosen. Furthermore it is level of system performance. Such discussionsunlikely that the implications of these measures will likely lead to the refinement of thewould be as well understood. Study definitions used for critical points, and will
It is likely that the model will continue to be

M-21
provide guidance for future assessment of surface and groundwater, and the development alternatives within the trigger planning of a preliminary shared vision model of theframework. Susquehanna River in collaboration with the
Activities Anticipated Beyond the Study. Although Corps involvement in the triggerplanning effort ceased upon completion of theNational Drought Study, much work remains. Both MWRA and WSCAC are confident thatboth the trigger planning paradigm and modelcontent will continue to be refined, largelybecause of the success of the efforts so far. Likely activities include further enhancements to equation documentation and model clarity.Demonstrations of the trigger planning conceptand the object oriented model to a largeraudience within MWRA, WSCAC and theCorps, and other interested agencies will occur. IWR-MAIN will be brought on line to improvethe quality of the demand forecasts required ofthe trigger planning process.
Trigger planning will begin to be integrated technique of placing subjects in an into future planning documents and is environment which requires them to make jointanticipated to become the accepted agency or collective decisions among hypotheticalplanning approach. The existing model will be options. The subjects are shown the used annually to perform the trigger planning prospective consequences of their decisions asanalyses. As trigger points are approached, the the game proceeds. Playing the game canmodel will be adapted to analyze a wide range improve one’s understanding of how a waterof potential alternatives. WSCAC has also system responds to different water managementexpressed an interest in using this model to decisions, and may reveal changes in operatingreevaluate the adequacy of the triggering rules which improve the performance of themechanisms in MWRA’s existing drought system.response plan.
Susquehanna River Basin Studies. This work was a series of small efforts done inparallel with an ongoing Section 22 study ofwater supply in Harrisburg area. The collective work had five components: anexamination of the condition of small watersupply systems; an investigation of differencesbetween public and investor owned utilities’drought contingency plans; a brief review ofvulnerability to drought; a look at thepossibilities for conjunctive management of
Susquehanna River Basin Commission(SRBC). The studies found that regionalizationof water supplied would help efforts to meetwater quality and drought preparedness needs. There were few differences between the droughtpreparedness plans of public and private waterutilities; all were formulaic. SRBC has sincepurchased computer equipment and software tocontinue the development of the shared visionmodel. The Baltimore District is aiding thiseffort as part of the Planning Assistance to States (Section 22). The objective in this work is unusual; the SRBC feels that current drought management techniques may be toofrequently imposed, and intend to use a sharedvision model and Atlas statistics to demonstratethat.
Colorado River Gaming. Gaming is the
The Colorado River Gaming study was part of a larger effort called the Study of SevereSustained Drought in the Southwestern UnitedStates (the SSD Study), which was conducted by a consortium of western U.S. universities. The purpose of the SSD research program was to identify feasible changes in operating rules for allocating and managing Colorado Riverwater. The SSD Study was supported by fundsfrom the USGS, the Metropolitan Water District of Southern California, the UpperColorado River Commission, the National

M-22
Drought Study and the participating AZCOL was developed using STELLA II®. universities. The SSD Study grew out of the The choices the students could make wereU.S. State Department’s “Man and Biosphere limited; some were intrastate, others wereProgram”. interstate and required two or more students to
The Colorado Gaming Study was a played nine times, each time with unique set ofcollaborative effort between the SSD and the rules.National Drought Study teams. Bill Lord(University of Arizona) was the principal A second game was played in June 1993 witharchitect and proponent for the game. Like the university professors from each state playing Drought Study, the Gaming Study was the role of water directors, and study advisordesigned to connect research and practice, and playing the role of the Secretary of the Interior. both kinds of water experts participated. State The game was based on a very severe 38 yearwater officials from the Colorado basin served drought (on the order of a 500 year event), andas study advisors, while students and professors was played three times under three collectiveplayed the roles of officials and applied the choice alternatives:research and findings from the SSD Study to the game.
The objectives of this gaming exercise were toscreen alternative operating rule sets before amore detailed evaluation, and to comparealternative collective choice rule sets. (See page8 in the main report for definitions of the threelevels of rules). An analysis using game theory helped define the three collective choicerule sets which distinguished the 3 games.(Gaming is distinct from, but can be used inconjunction with the mathematical theory ofgames. John von Neumann and OskarMorganstern developed game theory as a method for analyzing competitive situations ineconomics, warfare, and other areas ofconflicting interest (Glicksman).)
The gaming exercise was first done as a graduate seminar in the Spring term of 1992 atthe University of Arizona. Seven graduatestudents assumed the roles of state waterofficials from the seven states of the ColoradoRiver Basin, and chose how they would respond to a severe drought as it unfoldedthrough the simulation of AZCOL. AZCOL was a model of the hydrology, watermanagement facilities, water allocationinstitutions, and water demands of the basin.
come to an agreement to act. The game was
! The Status Quo Game, in which operatingdecisions for water management facilities weremade by the Department of the Interior inaccordance with existing rules. Any changes in the rules required unanimous agreement byDOI and the seven states. This alternative ismarked by limited information aboutconsequences, especially to other states. Theplayers used e-mail to conduct this game so as to prevent face to face bilateral negotiations.
! Colorado River Basin Commission Game.A river basin commission would provide manyof the advantages of an interstate compact, butcould be established more easily, so this optionwas simulated in the second game. The rules for the Commission Game were identical to theStatus Quo game except that the “Commission”shared more information and analyses with thestates, and the players assembled in one location for this game. This meant they couldtake part in group discussions (no bi-lateraldiscussions were allowed) on decision makingand alternative decision rules. Given thisframework, players developed an alternative tothe “equalization rule”, the status quo method of balancing hydropower production from GlenCanyon Dam and water deliveries to the LowerColorado Basin.

M-23
! Water Banking and Marketing Game. This differed from the Commission Game in that any two states could exchange unlimitedamounts of information, and could make bilateral agreements (including interstate sale of water) so long as the other 5 states were notharmed. The judgement of no harm was made by the “Secretary of the Interior”.
In each game, participants had freedom to make changes in operating rules within theapplicable collective choice rule set. Playersidentified the important measures of performance (primarily, amounts of waterdelivered) and decision criteria. Before thegames were played, decision criteria wereevaluated for relative importance using theBureau of Reclamation’s MATS software. Ingeneral, the pre-game subjects rated economicimpacts twice as important as equity, andendangered species preservation more important than maintenance of wetlands andriparian areas. These inferences were importantfor the game, but have little significance out ofthat context, since these values were elicitedfrom professors playing the role of state waterdirectors.
This study showed that:
! In this simulation, water managers were mostinterested in satisfying diversions forconsumptive use and avoiding impacts thatwould trigger action under the EndangeredSpecies Act. Hydropower production,recreation, salinity, and most non-ESAenvironmental impacts were less important.
! There is sharp competition among water useson the Colorado, and the Status Quo does notprovide clear decision criteria for allocation. The water use priorities of the “Law of the River” are further complicated by independentrules implicit in the Endangered Species Act, the Clean Water Act, and federal reserved rights. And, in these three games, the economic
value of hydropower was not matched by anequivalent priority for waters. (See page L-6 for a real world verification of this discrepancybetween economic impact and water management priority).

M-24
! Consumptive water uses are well protectedfrom drought, but non-consumptive uses are not. Drought risk is the highest in the upperbasin.
! Only minor changes can be made underexisting rules, and only minor improvements can be made with the other two collective choice rule sets, so long as changes in federallegislation or court decisions are ruled out.
! Intrastate drought management is moreeffective in limiting drought losses than areeasily adopted changes in interstate waterallocation.
The games suggest the value of a compactcommission, perhaps similar to the DelawareRiver Basin Commission, that would examine are-balancing of consumptive and non-consumptive uses facilitated by water bankingand marketing.
Finally, the gaming exercise demonstrated acomplete method for testing and reporting oninstitutional changes.

N-1
N - The National Drought Atlas
The National Drought Atlas is a compendium precipitation map since 1962, and is based on of statistical information. It was designed to the HCN.)help regional analysts answer certain questionsmore quickly and with more confidence than ! A United States map showing theever before. The Atlas can be used for to help precipitation clustersdetermine how long and intense droughts arelikely to be, both for the sake of long term ! A United States map showing theplanning and operational decisions during a precipitation stationsdrought.
The development of the Atlas was a streamflow stationscollaborative effort among the Corps ofEngineers, Miami University (Ohio), the ! Explanations of the methods and data, andNational Climate Data Center (NCDC), and a summary of implications for water policyInternational Business Machines (IBM). The and management.Atlas team was headed by Dr. Gene Willeke,Institute of Environmental Sciences, Miami A short description of the Atlas’ information University, Oxford, Ohio. The principal on precipitation, streamflow and Palmer Indexresearchers were Nathaniel Guttman, National follows, with examples. Climatic Data Center, Asheville, N.C., Jonathan Hosking and James Wallis, both of the I.B.M. Thomas J. Watson ResearchCenter, in Yorktown Heights, N.Y.
The Atlas is based on recently refined nationalprecipitation and streamflow data sets. Precipitation and streamflow statistics weregenerated using a method (referred to as l-moment analysis) developed at IBM by J.R.Hosking and J.R. Wallis. The method permitsgreater confidence in estimating droughtfrequencies from the relatively small numberof droughts for which there are precipitationand streamflow records.
The Atlas includes statistics in threecategories: precipitation, streamflow andPalmer Index. To aid the user in applying thesestatistics, the Atlas includes:
! A map of the U.S. showing average annualprecipitation. (The map is the first national
! A United States map showing the
! Precipitation. The Atlas has tables andgraphs showing the percentage of normalprecipitation that can be expected for a variety of durations and starting months at variousfrequencies for 111 “clusters” covering thecontiguous 48 states. The frequencies are0.02, 0.05, 0.10, 0.20, 0.5, 0.80, 0.90, 0.95,0.98. The expected frequencies ofhydrologic events are also expressed in termsof return or recurrence intervals, such as “a 50year event”. The implication of the phrase isnot that the event will return, comet-like, on a50 year schedule, but that over a very longperiod of time, there would be an average oftwo events at least that large per century. The Atlas frequencies span a range from 0.02,a “50 year dry period”, to 0.98, a “50 year wetperiod.” The probability of greater thannormal precipitation can help estimate thelikelihood that soil moisture or reservoir levelswill recover within a given amount of time. The durations are 1, 2, 3, 6, 12, 24, 36, and 60

N-2
months. For durations of 1, 2, 3 and 6 36 to the median for those stations. Assume months, the percentage of normal precipitation for this illustration that the ratio of the twois provided for each starting month from varied at different precipitation stations fromJanuary through December. Researchers 0.84 to 0.88. (That is, 83-86% of the medianfound that for longer durations, quantiles (the 5 year precipitation fell during the 30's drought ratio of the extreme to the median event of the at those stations.) The analyst would thenmeasured statistic, such as volume of compare these ratios to the quantiles for precipitation) were about the same no matter various recurrence intervals shown in thethe starting month. Atlas. In the process outlined below, the
These statistics represent the estimated quantile for 60 month duration is 0.83; the 20population based on a regional frequency and 10 year droughts are 0.86 and 0.89,analysis of the 1,119 stations in the Historical respectively. That would mean thatClimatology Network (HCN). The HCN is precipitation amounts as small or smaller thancomposed of verified data for precipitation the 30's drought should be expected every 10stations with long historic records, and was to 50 years, depending on the station. Thedeveloped by the National Oceanographic and implication for a planner in this hypotheticalAtmospheric Administration (NOAA) for use situation is that a more severe 60 monthin climate change studies. drought is probable within any fifty year
Example. This illustration is meant to show the practical use of the Atlas data, not todemonstrate their mathematical soundness. Statistical explanations for the developmentmethods are discussed in the Atlas and in thepeer reviewed papers that preceded itspublication.
Drought planners often use the worst drought on record to test the merits of their plans. Buthow likely is it that there will be a more intense or a longer drought than the drought ofrecord? The Atlas would allow an analyst toestimate the probability that there will be lessprecipitation during future droughts thanduring the drought of record.
To do that, the analyst would first characterizethe drought of record in terms comparable to the durations and starting months in the Atlas. For example, if the worst drought on recordoccurred from 1932 to 1936, the analyst wouldcollect precipitation records for all sites ofinterest, and then calculate the median 5 yearprecipitation (in inches), the 1932-36precipitation totals, and the ratio of the 1932-
analyst would find that the Atlas 50 year
period.
To develop the Atlas quantiles, the analystwould first look at the Atlas’ U.S. map thatshows the 111 precipitation clusters, and selectthe clusters that spanned the study area inquestion. For this illustration, assume that those clusters are 35, 105, and 106. Cluster 35covers the western panhandle of Florida,Southwestern Alabama, Coastal Mississippi, and Southeastern Louisiana. It is made up of 17 precipitation stations.
Table N-I lists the defining characteristics of the 17 stations in Cluster 35. The Atlas includes these characteristics for all clusters.
Each precipitation station in a cluster has thesame population distribution about the median. For example, the ratio of the 50 year to themedian precipitation for any station in Cluster 35 is the same for each duration. The quantiles for Cluster 35 are shown in Table N-II. For example, the amount of precipitation that can be expected in a 60 month drought with a 50 year recurrence interval is 83% of the median precipitation for

N-3
the year. This would apply to all stations inCluster 35. An analyst would usually want toestimate probable precipitation amounts atstations not included in the Atlas. The Atlas

N-4
StationNumber
Station Name State Latitude Longitude Elevation
11084 Brewton 3SSE AL 31.07 87.05 85128132 Fairhope AL 30.55 87.88 2380211 Apalachicola WSO AP FL 29.73 85.03 2082220 DeFuniak Springs FL 30.73 86.12 23086997 Pensacola FAA AP FL 30.47 87.20 112
160205 Amite LA 30.70 90.53 170160549 Baton Rouge LA 30.53 91.13 64162151 Covington 4 NNW LA 30.53 90.12 40162534 Donaldsonville LA 30.07 91.03 30163313 Franklin 3 NW LA 29.92 91.55 12164407 Houma LA 29.58 90.73 15164700 Jennings LA 30.20 92.67 25165026 Lafayette LA 30.20 91.98 38166664 New Orleans Audubon LA 29.92 90.13 6169013 Thibodaux LA 29.77 90.78 15220792 Pascagoula MS 30.40 88.95 12227128 Poplarville EXP STN MS 30.85 89.55 313
TABLE N-I. STATION DESCRIPTIONS IN CLUSTER 35
501 20 10 5 7 Dry Wet 6 5 10 20 500.02 2 0.05
0.10 0.20 0.50 0.80 0.90 0.95 0.98 Mean
123 0.65 4 0.71 0.77 0.85 1 1.19 1.28 1.37 1.47 1.01 24 0.75 0.80 0.84 0.89 1 1.12 1.19 1.24 1.30 1.01 36 0.79 0.83 0.87 0.91 1 1.09 1.14 1.18 1.23 1.00 60 0.83 0.86 0.89 0.92 1 1.07 1.12 1.12 1.19 1.00
1 - recurrence interval, in years (up to 50 year dry or wet events)2 - the non exceedance frequency; the percentage of time it will not precipitate more than this3 - duration, in months (from 12 to 60)4 - the values in the table are quantiles, the ratio of the precipitation in the extreme event to the
median event. In the case of the quantile footnoted, the table implies that in only 2% of all years will less than 65% of the median precipitation fall in stations associated with Cluster 35.
TABLE N-II. QUANTILES FOR CLUSTER 35, NATIONAL DROUGHT ATLAS.

N-5
Cluster 105
501 20 10 5 7 Dry Wet 6 5 10 20 500.02 2 0.05
0.10 0.20 0.50 0.80 0.90 0.95 0.98 Mean
123 0.70 4 0.75 0.80 0.87 1 1.18 1.27 1.35 1.45 1.01 24 0.78 0.82 0.87 0.92 1 1.14 1.21 1.27 1.32 1.01 36 0.81 0.84 0.88 0.92 1 1.10 1.15 1.20 1.25 1.01 60 0.84 0.87 0.89 0.92 1 1.07 1.12 1.12 1.21 0.99
Cluster 106
501 20 10 5 7 Dry Wet 6 5 10 20 500.02 2 0.05
0.10 0.20 0.50 0.80 0.90 0.95 0.98 Mean
123 0.70 0.75 0.80 0.87 1 1.18 1.27 1.35 1.45 1.01 24 0.77 0.81 4 0.85 0.90 1 1.12 1.19 1.24 1.31 1.01 36 0.80 0.83 0.86 0.91 1 1.10 1.15 1.18 1.21 1.00 60 0.84 0.87 0.90 0.93 1 1.07 1.10 1.10 1.17 1.00
1 - recurrence interval, in years (up to 50 year dry or wet events)2 - the non exceedance frequency; the percentage of time it will not precipitate more than this3 - duration, in months (from 12 to 60)4 - the values in the table are quantiles, the ratio of the precipitation in the extreme event to the
median event. In the case of the quantile footnoted, the table implies that in only 5% of alltwo year periods will less than 81% of the median precipitation fall in stations associated withCluster 106.
TABLE N-III. QUANTILES FOR CLUSTERS 105 AND 106
quantiles would also apply to most of those with the “wrong” cluster, the estimatedstations. The analyst would make a precipitation would still be about the same. professional judgement about which This is evident when the quantiles for the 3precipitation stations not included in the Atlas clusters in this example are compared for 12should be associated with Cluster 35, 105, or month long events (Figure N-1) and 60 month106. In most areas of the country, there will events (Figure N-2). The 60 month durationbe little difference in the quantiles of adjoining quantiles for the 20 and 50 year recurrenceclusters for similar events of the same duration intervals are 0.01 higher for Clusters 105 andand rarity. The practical implication is that if 106 than for Cluster 35, equivalent to about the analyst were to associate a non-Atlas two inches of precipitation in five years.station

N-6
FIGURE N-1. PRECIPITATION QUANTILES FOR 3 CLUSTERS IN THE SOUTHEAST
FIGURE N-2. QUANTILES FOR 60 MONTH DROUGHTS IN 3 CLUSTERS

N-7
Precipitation Station No.
Mean Precipitation for a period of:
12 months 24 months 36 months 60 months11084 62.23 124.42 186.64 311.27 128132 64.79 129.59 194.33 323.97 80211 56.25 112.44 168.67 280.76 82220 66.73 133.13 200.02 333.28 86997 60.42 120.84 180.53 302.11 160205 63.65 127.30 190.84 317.33 160549 57.72 115.45 173.18 286.18 162151 61.99 124.28 185.01 303.14 162534 59.29 118.81 177.50 296.36 163313 64.11 128.61 191.79 320.92 164407 62.22 124.05 187.45 311.37 164700 58.77 117.49 176.18 293.58 165026 57.61 114.95 172.58 287.91 166664 61.29 122.34 183.53 305.11 169013 63.14 126.29 190.51 315.92 220792 59.73 118.68 177.52 295.95 227128 62.5 124.10 186.73 308.96
TABLE N-IV. MEAN PRECIPITATION FOR STATIONS IN CLUSTER 35.
Expected amounts of precipitation for each The frequencies are the same as for frequency, duration, and starting month can precipitation: 0.02, 0.05, 0.10, 0.20, 0.5, 0.80,also be calculated. Table N-IV lists the mean 0.90, 0.95, and 0.98. These statisticsprecipitation for 12, 24, 36, and 60 months for represent the estimated population based onthe stations in cluster 35. This information is an at-site frequency analysis for a subset ofalso included in the Atlas. Multiplying the the Historical Climatological Data Networkmean by the product of the 50 year quantile (HCDN), developed by the U.S. Geologicaland the ratio of the median to the mean (which Survey. Table N-VI and Table N-VII show ais often 1.00) produces the expected depth of sampling of streamflow stations and data inprecipitation for a 60 month duration, 50 year the same geographic region used for the recurrence interval drought. These depths are precipitation example. The analysis would beshown in Table N-V. performed in essentially the same way as the
! Streamflow. The Atlas includes tables andgraphs showing the percentage of normalstreamflow that can be expected at variousfrequencies for durations of up to 12 months atindividual gaging stations in the 48 contiguousstates.
precipitation example. The resultant flowswould be equivalent to unregulated flows, andwould have to be adjusted to reflect recent changes in the water management regime.

N-8
Station Number 12 month 24 month 36 month 60 month
11084 40.4 93.3 147.4 258.4128132 42.1 97.2 153.5 268.9 80211 36.6 84.3 133.2 233.082220 43.4 99.8 158.0 276.686997 39.3 90.6 142.6 250.8160205 41.4 95.5 150.8 263.4160549 37.5 86.6 136.8 237.5162151 40.3 93.2 146.2 251.6162534 38.5 89.1 140.2 246.0163313 41.7 96.5 151.5 266.4164407 40.4 93.0 148.1 258.4164700 38.2 88.1 139.2 243.7165026 37.4 86.2 136.3 239.0166664 39.8 91.8 145.0 253.2169013 41.0 94.7 150.5 262.2220792 38.8 89.0 140.2 245.6227128 40.6 93.1 147.5 256.4
TABLE N-V. EXPECTED PRECIPITATION IN A 50 YEAR DROUGHT, CLUSTER 35.
50 year (dry) 50 year (wet)1 month(March)
12 month 1 month(November)
12 month
Number Description
2411800 Little River NearBuchanan, GA
0.13 1 0.50 2.52 1.41
2414500 Tallapoosa River atWadley AL
0.18 0.52 2.90 1.72
2331000 Chatahoochee Rivernear Leaf, GA
0.39 0.58 2.65 1.59
2331600 Chatahoochee Rivernear Cornelia, GA
0.28 0.32 2.40 1.42
1 - implies that in only 2% of all March’s (50 year recurrence interval) will there be less than 13% of themedian precipitation for March.
TABLE N-VI. STATISTICS FOR SELECTED STREAMGAGE STATIONS

N-9
Jan Feb Mar Apr May Jun July Aug Sep Oct Nov Dec Mean
2.9 1.4 4.3 4.31 5.8 4.3 7.2 8.7 7.2 8.7 7.2 4.4 5.5
1 - implies that the Palmer Drought Severity Index was -3 or lower in 4.3% of all April-May periodson record for this Cluster in Alabama. Unlike streamflow and precipitation, the PDSI percentages inthe Atlas are sample, rather than population statistics.
TABLE N-VIII. THE PERCENTAGE OF THE HISTORIC RECORD THAT THE PDSI WAS -3 OR DRIER FOR
CLUSTER 35 STATIONS IN ALABAMA.
StationNumber
DrainageArea (Sq.mi.)
Elevation AnnualPrecipitation
Latitude Longitude
2411800 20.2 1230 51 33.8 85.12
2414500 1675 930 52 33.12 85.56
2331000 150 1950 62 34.58 83.64
2331600 315 1871 62 34.54 83.62
TABLE N-VII. SOME SOUTHEASTERN STREAMGAGE STATIONS LISTED IN THE ATLAS
! Palmer Index. The Atlas includes tablesshowing the percentage of time in the historicrecord that the Palmer Drought Severity Index(PDSI) fell below -3, -4, and -5. The PDSI was calculated at 1,135 precipitation stations,including all of the HCN stations. These are at-site sample statistics; no populationdistributions were estimated. As an example ofthe PDSI information in the Atlas, Table N-VIII shows the percentage of time thePDSI was below -3 in Cluster 35 for at least two months.
Interagency cooperation on design of the Atlas. A number of scientists and engineershelped guide the initial design of the Atlas,including Robert Brumbaugh, IWR; ErnieCarlson, IWR; Dick DiBuono, Corps ofEngineers; Michael Fosberg and WilliamSommers, Forest Fire & Atmospheric Sciences
Research, US Forest Service; Ken Kunkel,Director, Midwest Climate Center, Champaign,IL; Lou Moore, Bureau of Reclamation; Arlene Nurthen, Director of Publications, IWR; Tom Ross, USGS; Norton Strommen, Chief,Climatology; Wilbert Thomas, USGS; JohnVogel, National Weather Service; Ann Carey,Chief Science Advisor, Soil Conservation Service, and Gene Stallings, Office of Hydrology, National Weather Service. An early version of the Atlas was presented to a group of water managers who recommended that the frequencies of extreme wet as well as dry periods be estimated so that they would have additional information to help respond toquestions about recovery from a drought. Those managers include Richard Punnett(Huntington district Corps of Engineers), BrianSpindor (Seattle Water Department) Chris Lynch (Seattle district Corps of Engineers), and

Bib-1
Stu Schwartz (Interstate Conference on thePotomac River Basin).
Bibliography
Abrams, Robert H., Water Allocation by Comprehensive Permit Systems in the Eastern United States:Considering a Move Away from Orthodoxy: 9 Va. Environmental L. J. 255 (1990).
American Water Works Association, 1992; Drought Management Planning; 6666 West Quincy Ave.;Denver, CO 80235
Advisory Commission on Intergovernmental Relations. Citizen Participation in the American FederalSystem. Washington, D. C.: ACIR, 1979.
Advisory Commission on Intergovernmental Relations. Coordinating Water Resources in the FederalSystem: The Groundwater-Surface Water Connection. Washington, D. C.: ACIR, 1991.
Arnette; Joseph L., Methodologies for Determining Instream Flows for Fish and Other Aquatic Life: Overview and Outlook; a paper in “Instream Flow Needs, Volume I”; American Fisheries Society; 5410 Grosvenor Lane; Bethesda, MD 20014.
Axelrod, Robert; 1984; The Evolution of Cooperation; New York: Basic Books.
Beck, Robert E., ed., Waters and Water Rights. Charlottesville Virginia: The Michie Co., 1991Edition.
Bedient, Philip B., and Wayne C. Huber, Hydrology and Floodplain Analysis, Second Edition,Addison-Wesley, 1992.
Blahna, Dale J. and Susan Yonts-Shepard. 1989. Public Involvement in Resource Planning: TowardBridging the Gap Between Policy and Implementation. Society and Natural Resources 2(3):209-227.
Blomquist, William. Exploring State Differences in Groundwater Laws and Policy Innovations: Publius - The Journal of Federalism (Spring 1991): 101-115.
California Department of Water Resources, November 1987; California Water: Looking to the Future. Bulletin 160-87. Sacramento, CA.
California Department of Water Resources, January 1991a; California’s Continuing Drought. Sacramento, CA.
California Department of Water Resources, December 1991b; California’s Continuing Drought,1987-1991: A Summary of Impacts and Conditions as of December 1, 1991. Sacramento, CA.
California Department of Water Resources, January 1992a; The 1991 Drought Water Bank. Sacramento, CA.

Bib-2
California Department of Water Resources, 1992b; Contract for Water Service from a 1992California Drought Emergency Water Bank.
California Department of Water Resources, 1992d; Economic Impact of Drought on CaliforniaAgriculture in 1991; Division of Planning, Internal note. Sacramento, CA. July 1992.
California Department of Water Resources, November 1993; The California Water Plan Update,Draft Bulletin 160-93. Sacramento, CA.
Cannon, Lou, Drought “Battle Plan” Announced: Washington Post, Feb. 16, 1991.
Cassidy, William, Chief of Engineers; A letter to the Chairman of the Subcommittee on PublicWorks, Committee on Appropriations, United States Senate, February 4, 1969: and the response fromHouse Appropriations Chairman Michael J. Kirwan, March 29, 1969.
Cowdin, S. and J. Rich, 1994; Economic Impacts of Drought upon California’s Commercial andIndustrial Sectors in 1991; in preparation as part of Impacts of the California Drought; U.S. ArmyEngineers Institute for Water Resources. Working Paper, Fort Belvoir, VA.
Creighton, James L., Jerry Delli Priscoli, and C. Mark Dunning, 1983. Public InvolvementTechniques: A Reader of Ten Years Experience at the Institute for Water Resources. IWR ResearchReport 82-R1. Fort Belvoir, VA; U.S. Army Corps of Engineers Institute for Water Resources.
Creighton, James L. and Wetherall, Trudie; Overview of Alternative Dispute Resolution (ADR): AHandbook for Corps Managers (Draft, November 1993).
David, R.; Aquifer Storage Recovery: A New Water Supply Alternative; Water; Laws andManagement. AWRA; Sept.1989.
Daneke, Gregory A. 1977. Public Involvement in Natural Resource Development: A Review of Water Resource Planning. Environmental Affairs 6(1):11-31.
Day, Gerald N., “Extended Streamflow Forecasting Using NWSRFS”, Journal of the WaterResources Planning and Management Division, American Society of Civil Engineers, Vol. 111, No. 2,1985.
Dellapenna, Joseph W., Owning Surface Water in the Eastern United States : 6 Proceedings of the E.Mineral Law Foundation, 1-1 (1985).
Delli Priscoli, Jerome; 1986; Group Process Techniques; “Societal and Environmental Objectives inWater Resources Planning and Management”, Edited by Warren Viessmann, Jr. and Kyle E.Schilling, American Society of Civil Engineers, 345 East 47th Street, New York, NY 10017-2398.
Delli Priscoli, Jerome; Collaboration, Participation, and Alternative Dispute Resolution (ADR); Process Concepts for the Bank’s Role in Water Resources; 20 March 1992.
Bib-3
Desario, Jack and Stuart Langton, 1987; Citizen Participation in Public Decision Making. New York;Greenwood Press.
Deutsch, Morton; 1978; The Resolution of Conflict; New Haven: Yale University Press.
Deutsch, Morton; 1985; Distributive Justice; New Haven: Yale University Press.
Dracup, J.A., Lee K.S., and Paulson, E.G. Jr.; 1980; On the Definition of Droughts, WaterResources Research, 16(2): 297-302.
Driver, Bruce, Western Water Law: Fine Tuning the System : Western Governor’s Association, 1986.
Eastman, Paul W.; Metropolitan Washington Area Water Supply, May 1986, Proceedings of anEngineering Foundation Conference, Santa Barbara, California, Warren Viessman, Jr. and Kyle E.Schilling, editors.
Eckstein, Otto, and Krutilla, John V.; Multiple Purpose River Development; published for Resourcesfor the Future, Johns Hopkins Press, 1958. Krutilla worked at RFF, a Ford Foundation establishmentwhich at the time had William Paley, Charles F. Luce, and Gilbert White (among others) on its Boardof Directors. Eckstein was a Professor of Economics at Harvard University.
Economic and Environmental Principles and Guidelines for Water and Related Land ResourcesImplementation Studies Paragraph 6, March 10, 1983.
Emerson, Richard M; 1981; Social Exchange Theory; Pp. 30-65 in Social Psychology: SociologicalPerspectives, edited by M. Rosenberg and R. H. Turner. New York: Basic Books.
Essenwanger, O.M., “Elements of Statistical Analysis”, General Climatology, Volume 1B, in theWorld Survey of Climatology, Elsevier, 1986.
Getches, David H. Controlling Groundwater Use and Quality: A Fragmented System, 17 Nat.Resources Law 623 (1984).
Getches, David H. Water Law in a Nutshell, 2d ed. St. Paul, Minn.: West Publishing Co., 1990.
Getches, David H. “Water Reform: Ideas Whose Time Has Come”, Water Resources Update, Winter1990, Issue Number 90, The Universities Council on Water Resources, D. Baumann and W. Werick, eds.
Glicksman, A.M. An Introduction to Linear Programming and the Theory of Games; John Wiley & Sons, Inc. 1963.
Gottlieb, Robert. A Life of Its Own: The Politics and Power of Water. San Diego: Harcourt, Brace,Jovanovich, 1988.

Bib-4
Gray, Barbara; 1989; Collaborating: Finding Common Ground for Multiparty Problems; London:Jossey-Bass.
Grigg, Neil and Vlachos, Evan; Drought Water Management, Proceedings of a National Workshop,Washington, D.C.; November 1988; A Report for the Natural and Man-Made Hazards Mitigation Program of the National Science Foundation; 232 pp.
Hansen, William; Evaluating Environmental Projects; May, 1993. 20th Annual Water ManagementConference, ASCE Proceedings.
Hardin, Russell; 1982; Collective Action; Baltimore: The Johns Hopkins University Press.
Harris, L. and Hampton, T.; Large Scale Conjunctive Use of the San Gabriel Basin; Water Management for the 90's; ASCE 1993; page 609.
Holling, C.S.; The Resilience of Terrestrial Ecosystems: Local Surprise and Global ClimateChange; Sustainable Development of the Biosphere; 1986; W.C. Clark and T.E. Munn, eds; Cambridge: Cambridge University Press.
Holmes, Beatrice Hort; History of Federal Water Resources Programs and Policies, 1961-1970; U.S.Department of Agriculture; Miscellaneous Publication No. 1379; September, 1979.
Howe, Charles W., and F.P. Linaweaver, Jr. 1967; “The Impact of Price and Residential Water Demand and Its Relation to System Design and Price Structure”; Water Resources Research 3:12-32.
Hrezo, Margaret, Phyllis Bridgeman, and William Walker, Integrating Drought Planning Into WaterResources Management; 26 Natural Resources Journal 141 (1986).
Ingram, Helen. 1972. The Changing Decision Rules in the Politics of Water Development. WaterResources Bulletin 8:1177-1188.
Johnson, Norman K. and Charles T. DuMars, A Survey of the Evolution of Western Water Law inResponse to Changing Economic and Public Interest Demands; 29 Natural Resources Journal 347(1989).
Johnson, David W. and Roger T. Johnson. 1989. Cooperation and Competition: Theory and Research.Edina, MN: Interaction.
Kressel, Kenneth and Dean G. Pruitt; 1989; Mediation Research; London: Jossey-Bass.
Langton, Stuart; Historical Milestones: Public Involvement in the Corps of Engineers. Fort Belvoir,VA; U.S. Army Corps of Engineers, Institute for Water Resources; 1993; mimeo.
Lee, Kai N., Compass and Gyroscope, Island Press, Washington, D.C., 1993.
Linsley, Ray K., Max A. Kohler, and Joseph L.H. Paulhus, Hydrology for Engineers, 3rd ed.,

Bib-5
McGraw-Hill, NY, 1982.
Long’s Peak Working Group; America’s Waters: A New Area of Sustainability; Report of the Long’sPeak Working Group on National Water Policy; The Natural Resources Law Center; University ofColorado, Boulder; December, 1992.
Lord, William R., 1979. Conflict in Federal Water Resource Planning. Water Resources Bulletin 15(5):1226-1235. American Water Resources Association.
Lord, William R., 1981. Objectives and Constraints in Federal Water Resources Planning; WaterResources Bulletin, December. American Water Resources Association.
Lord, William R, 1984. “Institutions and Technology: Keys to Better Water Management.” WaterResources Bulletin, 20(5): 653, October. American Water Resources Association.
Luce, R. Duncan and Howard Raiffa; 1957; New York: Wiley.
Maass, Arthur, Maynard M. Hufschmidt, Robert Dorfman, Harold Thomas, Jr., Stephen A. Marglin,Gordon Maskew Fair; Blair Bower, William W. Reedy, Deward F. Manzer, Michael P. Barnett,MyronB. Fiering, Peter Watermeyer; Design of Water Systems; Harvard University Press; Cambridge, MA1966.
Major, David; Multiobjective Water Resource Planning; 1977; American Geophysical Union,Washington, D.C.
Maloney, Frank E., Richard C. Ausness and J. Scott Morris. A Model Water Code with Commentary.Gainesville: University of Florida Press, 1972.
Mather, John R., The Climatic Water Budget in Environmental Analysis, Lexington Books,Lexington,MA, 1978.
Miller, James W.; Relating Fish Production to Streamflow Levels Using Fish and Water ManagementModels; a paper in “Instream Flow Needs, Volume II”; American Fisheries Society; 5410 GrosvenorLane; Bethesda, MD 20014.
Moreau, David and Little, Keith; 1989; Managing Public Water Supplies During Droughts,Experiences in the United States in 1986 and 1988; Water Resources Research Institute Report No.250; University of North Carolina; 119 pp.
Olsen, D; and J. Richards, “Summary Report: Rogue River Summer Steelhead and Fall ChinookSport Fisheries Economic Valuation Study” (Lake Oswego OR: Pacific Northwest Project, 1992).
Olsen, D;, “Nonmarket economic values for salmon and wildlife resources,” in Water Management in

Bib-6
the 90's: A Time for Innovation. Proceedings of the 20th Anniversary Conference, Katherine Hon,ed. (New York: American Society of Civil Engineers, 1993) 51.
Olson, Mansur. 1971. The Logic of Collective Action. Cambridge, MA: Harvard University Press.
Opitz, Eva and Benedykt Dziegielewski, Consumer Response to the Drought Media Campaign inSouthern California; March 1989. A report by Planning and Management Consultants, Ltd. for theMetropolitan Water District of Southern California.
Ostrom, Elinor, ed. Strategies of Political Inquiry, Beverly Hills, Sage Publications, 1982.
Palmer, Tim. The Snake River: Window to the West. Washington, D.C.: Island Press, 1991.
Pike, Douglas. 1967. Viet Cong. Cambridge, MA: M.I.T. Press.
Proposed Practices for Economic Analysis of River Basin Projects; 1950, rev. 1958; a Report to theInter-Agency Committee on Water Resources by the Subcommittee on Evaluation Standards.
Rapoport, Anatol. 1974. Fights, Games, and Debates. Ann Arbor: The University of Michigan Press.
Reisner, Marc. Cadillac Desert: The American West and Its Disappearing Water. New York: VikingPenguin, Inc., 1986.
Rice, Leonard, and Michael White. Engineering Aspects of Water Law. John Wiley & Sons, 1987.
Rogers, Peter, 1993. America’s Water: Federal Roles and Responsibilities. The Twentieth CenturyFund. MIT Press. Cambridge, MA.
Rressel, Renneth and Dean G. Pruitt. 1989. Mediation Research. London: Jossey-Bass.
Sax, Joseph L., The Limits of Private Rights in Public Water; 19 Environmental Law Journal 473(1989).
Sax, Joseph L., Robert H. Abrams, and Barton H. Thompson, Jr. Legal Control of Water Resources,2d Edition. St. Paul: West Publishing Co., 1991.
Sax, Joseph L., The Constitution, Property Rights and the Future of Water Law:,” 61 University ofColorado Law Review 257 (1990).
Schelling, Thomas C. 1980. The Strategy of Conflict. Cambridge, MA: Harvard University Press.
Schwarz, Harry E. (Clark University, Worcester, MA, and David C. Major, Social Science ResearchCouncil, New York, NY; letter to the editor, Water International, 18, Journal of the InternationalWater Resources Association; 1993.

Bib-7
Sherk, George William, Eastern Water Law: Trends in State Legislation; 9 Va. Environmental L. J. 287 (1990).
Sherk, George William, Meetings of Waters: The Conceptual Confluence of Water Law in the Easternand Western States; 5 Natural Resources & Environment 3 (Spring 1991).
Smith, Paula K., Coercion and Groundwater Management: Three Case Studies and a “Market”Approach; 16 Environmental Law 797 (1986).
Smith, Zachary A., ed. Water and the Future of the Southwest. Albuquerque: University of NewMexico Press, 1989.
Solley, W. B., R. R. Pierce, H. A. Perlman, 1993; Estimated Use of Water in The United States in1990, pp. 11. U.S.G.S. Circular 1081, Denver, CO.
Stakhiv, Eugene Z.; Achieving Social and Environmental Objectives in Water Resources Planning:Theory and Practice; Social and Environmental Objectives in Water Resources Planning andManagement; 1986; Proceedings of and Engineering Foundation Conference sponsored by ASCE; Edited by Warren Viessman, Jr. and Kyle E. Schilling; p. 107-125.
Tarlock, A. Dan. Law of Water Rights and Resources. New York: Clark Boardman, 1988.
Tilly, Charles. 1981. As Sociology Meets History. New York: Academic Press.
U.S. Army Corps of Engineers, 15 February 1989: Digest of Water Resources Policies andAuthorities; EP 1165-2-1.
U.S. Army Corps of Engineers, Institute for Water Resources, May 1991: The National Study ofWater Management During Drought; Report on the First Year of Study; IWR Report 91-NDS-1.
U.S. Army Corps of Engineers, Institute for Water Resources, September 1993; Lessons LearnedFrom the California Drought (1987-1992); IWR Report 94-NDS-5.
U.S. Army Corps of Engineers, Institute for Water Resources, September 1993; Lessons LearnedFrom the California Drought (1987-1992); Executive Summary IWR Report 94-NDS-6.
U.S. Army Corps of Engineers, Institute for Water Resources, March 1994: Computer Models forWater Resources Planning and Management (IWR Report 94-NDS-7)
U.S. Army Corps of Engineers, Institute for Water Resources, Drought Impacts in a P&G PlanningContext, April 1994; The National Study of Water Management During Drought; IWR Report 94-NDS-9.
U.S. Army Corps of Engineers, Institute for Water Resources, April 1994: Water Use Forecasts forthe Boston Area Using IWR-MAIN 6.0 (IWR Report 94-NDS-11).

Bib-8
U.S. Army Corps of Engineers, Institute for Water Resources, (to be published in 1994) TriggerPlanning for the MWRA Service Area (IWR Report 94-NDS-12).
U.S. Army Corps of Engineers, Institute for Water Resources, October 1985, Handbook of Methodsfor the Evaluation of Water Conservation for Municipal and Industrial Water Supply.
U.S. Army Corps of Engineers, Institute for Water Resources, June 1988: Lessons Learned From the1986 Drought; IWR Policy Study 88-PS-1. William Johnson’s (Hydrologic Engineering Center)analysis of the actions taken during the 1986 drought in the Southeast.
U.S. Army Corps of Engineers, Institute for Water Resources, June 1988, IWR-Main Water UseForecasting System Version 5.1.
U.S. Army Corps of Engineers, Institute for Water Resources, March 1992; Guidelines For Risk andUncertainty Analysis in Water Resources Planning; Volume 1; IWR Report 92-R-1.
U.S. Army Corps of Engineers, Institute for Water Resources, October 1993; Guidebook For RiskPerception and Communication in Water Resources Planning; Part 1, Underpinnings and PlanningApplications; IWR Report 93-R-13.
U.S. Energy Information Administration, 1994. Electric Power Annual 1992. Washington, DC.
Willardson, Anthony G., October 1986, Western State Drought Management; The Western StatesWater Council; Creeekview Plaza; Suite A-201; 942 East 7145 South; Midvale, UT 84047
Wright, Kenneth R., ed. Water Rights of the Fifty States and Territories. Denver: American WaterWorks Association, 1990.

Bib-9
National Study of Water Management During Drought Reports
Previously published reports include:
The National Study of Water Management During Drought: Report on the First Year of Study (IWR Report 91-NDS-1) preparedby the Institute for Water Resources, U.S. Army Corps of Engineers, Fort Belvoir, Virginia.
A Preliminary Assessment of Corps of Engineers Reservoirs, Their Purposes and Susceptibility to Drought (IWR Report 91-NDS-2), prepared by the Hydrologic Engineering Center, U.S. Army Corps of Engineers, Davis, California.
An Assessment of What is Known About Drought (IWR Report 91-NDS-3) prepared by Planning Management Consultants, Ltd.,Carbondale, Illinois.
Lessons Learned from the California Drought (1987-1992) (IWR Report 93-NDS-5) prepared by Planning and ManagementConsultants, Ltd., Carbondale, Illinois.
Executive Summary: Lesson Learned from the California Drought 1987-1992 (IWR Report 94-NDS-6) is a concise summaryof NDS-5 (above), with some new information that became available after NDS-5 was published.
Computer Models for Water Resources Planning and Management (IWR Report 94-NDS-7) summarizes brand name modelsin eight categories: general purpose software (such as spreadsheets), municipal and industrial water use forecasting, waterdistribution systems (pipe networks), groundwater, watershed runoff, stream hydraulics, river and reservoir water quality,and river and reservoir system operations.
National Study of Water Management During Drought: Report to Congress (IWR Report 94-NDS-12) summarizes the resultsof the entire study.
Other reports will be published:
The National Drought Atlas (IWR Report 94-NDS-4) is a compendium of statistics which allows regional water managers todetermine the probability of droughts of a certain magnitude and duration.
Drought Impacts in a P&G Planning Context (IWR Report 94-NDS-9) Human and Environmental Impacts: California Drought 1987-92 (IWR Report 94-NDS-10) NDS-9 is a collection of papersby California researchers who attempted to measure the impacts of the drought on the California economy and environment.NDS-10 shows how drought impacts can be measured in the accounting system of Principles and Guidelines. It uses the resultsof NDS-8 as an example.
Water Use Forecasts for the Boston Area Using IWR-MAIN 6.0 (IWR Report 94-NDS-11) demonstrates one of the first usesof a beta test version of the new generation of MAIN. The objective of this study was to determine the relative effectivenessof long term water conservation measures.
Trigger Planning for the MWRA Service Area (IWR Report 94-NDS-13) documents the development of what might be called“just in time” water supply enhancement; a management system that can reduce economic and environmental investmentsin supply and demand measures while maintaining necessary water supply reliability.
Governance and Water Management During Drought (IWR Report 94-NDS-14). Prepared by the Advisory Commission onIntergovernmental Relations (ACIR). NDS-14 addresses the general subject of technical water management within theAmerican democratic process. It includes papers on law, decision making, public involvement, and two case studies thatprovided information on political decision criteria to water managers.

Bib-10
William J. Werick Dr. Eugene Z. StakhivStudy Manager Chief, Policy and Special Studies Div.Institute for Water Resources Institute for Water ResourcesCasey Building Casey Building7701 Telegraph Road 7701 Telegraph RoadAlexandria, VA 22315-3868 Alexandria, VA 22315-3868Telephone: (703) 428-9055 Telephone (703) 428-6370
Colorado River Gaming Exercise (IWR Report 94-NDS-15) documents the use of a shared vision model in a gaming exerciseto evaluate operational and institutional alternatives for the management of the Colorado River. This report was preparedas a joint project with the Study of Severe Sustained Drought in the Southwest United States.
Shared Vision Models and Collaborative Drought Planning (IWR Report 94-NDS-16), prepared by the University ofWashington for the Corps of Engineers, documents the use of the shared vision model in the National Drought Study casestudies.
Lessons Learned from the National Drought Study Case Studies will be published contingent on the completion of the Maraisdes Cygnes-Osage DPS, which was delayed by the flooding on the Missouri River during the Summer of 1993.
For further information on the National Drought Study, contact either:
Reports may be ordered by writing (above address), faxing a request to Arlene Nurthen, IWR Publications, at (703) 428-9042,or by e-mail using [email protected]. Some reports are available on the IWR Homepage:http://www.wrc-ndc.usace.army.mil/iwr/index.htm