Energy and water sector policy strategies for drought mitigation
72
SAND REPORT SAND 2009-1360 Unlimited Release Printed March 2009 Energy and Water Sector Policy Strategies for Drought Mitigation Andjelka Kelic, Verne Loose, Vanessa Vargas, and Eric Vugrin Prepared by Sandia National Laboratories Albuquerque, New Mexico 87185 Sandia is a multiprogram laboratory operated by Sandia Corporation, a Lockheed Martin Company, for the United States Department of Energy’s National Nuclear Security Administration under Contract DE-AC04-94AL85000. Approved for public release; further dissemination unlimited.
-
Upload
alaspeuanas -
Category
Documents
-
view
1 -
download
0
Transcript of Energy and water sector policy strategies for drought mitigation

SAND REPORT SAND 2009-1360 Unlimited Release Printed March 2009
Energy and Water Sector Policy Strategies for Drought Mitigation
Andjelka Kelic, Verne Loose, Vanessa Vargas, and Eric Vugrin Prepared by Sandia National Laboratories Albuquerque, New Mexico 87185
Sandia is a multiprogram laboratory operated by Sandia Corporation, a Lockheed Martin Company, for the United States Department of Energy’s National Nuclear Security Administration under Contract DE-AC04-94AL85000.
Approved for public release; further dissemination unlimited.

Issued by Sandia National Laboratories, operated for the United States Department of Energy by Sandia Corporation.
NOTICE: This report was prepared as an account of work sponsored by an agency of the United States Government. Neither the United States Government, nor any agency thereof, nor any of their employees, nor any of their contractors, subcontractors, or their employees, make any warranty, express or implied, or assume any legal liability or responsibility for the accuracy, completeness, or usefulness of any information, apparatus, product, or process disclosed, or represent that its use would not infringe privately owned rights. Reference herein to any specific commercial product, process, or service by trade name, trademark, manufacturer, or otherwise, does not necessarily constitute or imply its endorsement, recommendation, or favoring by the United States Government, any agency thereof, or any of their contractors or subcontractors. The views and opinions expressed herein do not necessarily state or reflect those of the United States Government, any agency thereof, or any of their contractors.
Printed in the United States of America. This report has been reproduced directly from the best available copy.
Available to DOE and DOE contractors from
U.S. Department of Energy Office of Scientific and Technical Information P.O. Box 62 Oak Ridge, TN 37831 Telephone: (865)576-8401 Facsimile: (865)576-5728 E-Mail: [email protected] Online ordering: http://www.osti.gov/bridge
Available to the public from
U.S. Department of Commerce National Technical Information Service 5285 Port Royal Rd Springfield, VA 22161 Telephone: (800)553-6847 Facsimile: (703)605-6900 E-Mail: [email protected] Online order: http://www.ntis.gov/help/ordermethods.asp?loc=7-4-0#online
2

SAND 2009-1360 Unlimited Release
Printed March 2009
ENERGY AND WATER SECTOR POLICY STRATEGIES FOR DROUGHT
MITIGATION
Andjelka Kelic Infrastructure Modeling and Analysis
Verne Loose, Vanessa Vargas, and Eric Vugrin Infrastructure and Economic Systems Analysis
Sandia National Laboratories P.O. Box 5800
Albuquerque, NM 87185-0826
Abstract
Tensions between the energy and water sectors occur when demand for electric power is high and water supply levels are low. There are several regions of the country, such as the western and southwestern states, where the confluence of energy and water is always strained due to population growth. However, for much of the country, this tension occurs at particular times of year (e.g., summer) or when a region is suffering from drought conditions. This report discusses prior work on the interdependencies between energy and water. It identifies the types of power plants that are most likely to be susceptible to water shortages, the regions of the country where this is most likely to occur, and policy options that can be applied in both the energy and water sectors to address the issue. The policy options are designed to be applied in the near term, applicable to all areas of the country, and to ease the tension between the energy and water sectors by addressing peak power demand or decreased water supply.
3

ACKNOWLEDGEMENTS The authors would like to thank Ken Friedman and Alice Lippert from the U.S. Department of Energy, and Kevin Stamber, Suzanne Pierce, Mike Hightower and Nancy Brodsky of Sandia National Laboratories for their assistance and guidance for the direction of this work. The authors also wish to thank Doug Kluck from the National Oceanic and Atmospheric Administration and Laura Hussey from the Edison Electric Institute for review of the initial results and providing some valuable insights. Last, but not least, thank you to Judy Jones for her perseverance in the editing of the document.
The research described in this report was funded by the U.S. Department of Energy, National Energy Technology Laboratory, under agreement numbers M6743224 and M68008879
4

TABLE OF CONTENTS 1. Background............................................................................................................................... 9 2. Previous Studies on Energy and Water................................................................................... 11
2.1. Energy Demands on Water Resources........................................................................... 11 2.1.1. Energy and Water Interdependencies ................................................................ 12 2.1.2. Impacts of Water Shortages ............................................................................... 13 2.1.3. Technologies to Increase Water Efficiency in Power Generation ..................... 14
2.2. The Energy-Water Research Roadmap.......................................................................... 15 3. Factors Affecting Drought Resiliency .................................................................................... 17
3.1. Water Use in Electricity Production .............................................................................. 17 3.1.1. Thermoelectric Power Plant Operation.............................................................. 20 3.1.2. Cooling Options for Thermoelectric Power Plants............................................ 23 3.1.3. Water Use Intensity for Thermoelectric Power Generation .............................. 25 3.1.4. Hydroelectric Power Plants................................................................................ 26 3.1.5. Water as a Means of Transportation .................................................................. 29
4. Water Shortage Risks.............................................................................................................. 31 4.1. Drought .......................................................................................................................... 31
4.1.1. Focus of Effort Based on Drought Analysis ...................................................... 41 4.2. Water Markets and Water Banks ................................................................................... 42
4.2.1. Western State Water Markets and Banks........................................................... 43 5. Assessing the Drought Resilience of Power plants................................................................. 47 6. Mitigating Policy Options....................................................................................................... 51
6.1. Price and Non-price Restrictions on Water Use ............................................................ 51 6.2. Improve Agricultural Efficiency through Changes in Agricultural
Techniques and New Technology.................................................................................. 52 6.3. Use Reclaimed Water in Electric Power Generation as a Substitute for Traditional
Sources of Water............................................................................................................ 54 6.4. Actions that Conserve Electricity and Water................................................................. 54 6.5. A Changing Future for Investor-owned Utilities ........................................................... 57 6.6. Summary ........................................................................................................................ 58
6.6.1. A New Business Model for Electric Utilities .................................................... 59 7. References............................................................................................................................... 61 Appendix A: Discussion of Recent Southeast Drought................................................................ 65
LIST OF TABLES Table 2-1: Technologies for Improving Water Use Efficiency in Power Generation .................. 15 Table 3-1: 2006 Electricity Generating Capacity in Megawatts (EIA 2007) ............................... 18 Table 3-2: Water Usage for Steam Condensing in Thermoelectric Power Plants
(Adapted from Table B-1 in DOE 2007) .................................................................... 26 Table 4-1: Potential Impacts of Drought Severity ........................................................................ 31 Table 4-2: Transaction Costs by Policy Type............................................................................... 44 Table 4-3: Total Number of Change-of-Water-Right Applications by State, 1975 – 1984 ........ 44 Table 5-1: Power Plants in Risk Area by Prime Mover and Primary Fuel................................... 48
5
LIST OF FIGURES Figure 2-1: Water Shortages and Population Growth (Figure I-2 in DOE 2007)......................... 11 Figure 2-2: Projected Freshwater Consumption for Thermoelectric Power Generation
(Figure IV-7 in DOE 2007) ....................................................................................... 14 Figure 3-1: Coal-Fired Power Plant Locations in the United States............................................. 18 Figure 3-2: Natural Gas- and Petroleum-Fired Power Plant Locations in the United States ....... 19 Figure 3-3: Nuclear Power Plant Locations in the United States ................................................. 19 Figure 3-4: Hydroelectric Power Plant Locations in the United States ........................................ 20 Figure 3-5: Schematic of Conventional Thermoelectric Steam Power Plant Operations............. 21 Figure 3-6: Schematic of Combustion Power Plant Operations ................................................... 21 Figure 3-7: Schematic of Combined-Cycle Thermoelectric Power Plant Operations.................. 22 Figure 3-8: Locations of Combined Cycle Plants in the United States ........................................ 23 Figure 3-9: Open-loop Cooling System Schematic (adapted from Figure II-2 in DOE 2007)..... 24 Figure 3-10: Closed-loop Cooling System with a Cooling Pond (adapted from
Figure II-3 in DOE 2007) ........................................................................................ 24 Figure 3-11: Closed-loop Cooling System with Wet Cooling Towers (adapted from
II-3 in DOE [2007]) ................................................................................................. 25 Figure 3-12: Schematic of an Impoundment Hydroelectric Power Plant (adapted from
TVA 2008a) ............................................................................................................. 28 Figure 3-13: Schematic of a Pumped Storage Hydroelectric Power Plant (adapted from
TVA 2008b) ............................................................................................................. 28 Figure 4-1: Moderate, Severe, and Extreme Drought Frequency by Percent of
Observations, 1895-2008........................................................................................... 32 Figure 4-2: Severe and Extreme Drought Frequency by Percent of Observations, 1895-2008 ... 33 Figure 4-3: Severe and Extreme Drought Frequency by Percent of Observations, 1895-1924 ... 34 Figure 4-4: Severe and Extreme Drought Frequency by Percent of Observations, 1925-1954 ... 35 Figure 4-5: Severe and Extreme Drought Frequency by Percent of Observations, 1955-1984 ... 36 Figure 4-6: Severe and Extreme Drought Frequency by Percent of Observations, 1985-2008 ... 37 Figure 4-7: Severe Drought Frequency by Percent of Observations, 1985-2008......................... 38 Figure 4-8: Extreme Drought Frequency by Percent of Observations, 1985-2008 ...................... 38 Figure 4-9: Rescaled Severe and Extreme Drought Frequency by Percent of Observations,
1895-1924.................................................................................................................. 39 Figure 4-10: Rescaled Severe and Extreme Drought Frequency by Percent of Observations,
1925-1954 ................................................................................................................ 40 Figure 4-11: Rescaled Severe and Extreme Drought Frequency by Percent of Observations,
1955-1984 ................................................................................................................ 41 Figure 5-1: Nationwide Power Plants ........................................................................................... 47 Figure 5-2: Power Plants in Frequent Severe and Extreme Drought Regions, 1985 – 2008........ 48 Figure 5-3: Example Results for Assessment of a Power Plant’s Resilience to Droughts ........... 49 Figure A-1: Severe and Extreme Drought Frequency by Percent of Observations, 1995-2008... 66 Figure A-2: Severe and Extreme Drought Frequency by Percent of Observations, 1995-1999... 67 Figure A-3: Severe and Extreme Drought Frequency by Percent of Observations, 2000-2004... 68 Figure A-4: Severe and Extreme Drought Frequency by Percent of Observations, 2005-2008... 69
6

ACRONYMS AND ABBREVIATIONS Acronym Definition
οF degrees Fahrenheit AIC administratively induced cost CCR Code of California Regulations CEER Center for Energy and Environmental Resources DOE U.S. Department of Energy DSM demand-side management DWP Department of Water and Power EIA Energy Information Administration EPRI Electric Power Research Institute FY fiscal year IOU investor-owned utility IPP independent power producer MW megawatt(s) MWh megawatt-hour NCDC National Climactic Data Center NGCC natural gas-fired, combined-cycle PHDI Palmer Hydrological Drought Index PIC policy-induced cost PURPA Public Utility Regulatory Policy Act RFW Recycled Water Facility (Watsonville) SNL Sandia National Laboratories U.S.C. United States Code
7

8
This page intentionally left blank.

1. BACKGROUND Tensions between the energy and water sectors occur when demand for electric power is high and water supply levels are low. There are several regions of the country, such as the western and southwestern states, where the confluence of energy and water is always strained due to population growth. However, for much of the country, this tension occurs at particular times of year (e.g., summer) or when a region is suffering from drought conditions. In response to the concern of population growth straining resources (such as water) that are used in the generation of electric power, the chairmen and ranking members of the House and Senate Subcommittees on Energy and Water Development Appropriations issued a letter to the Secretary of Energy on December 9, 2004, requesting “a report on energy and water interdependencies, focusing on threats to national energy production that might result from limited water supplies” (Visclosky et al. 2004).
In 2007, the U.S. Department of Energy (DOE) issued the report “Energy Demands on Water Resources: Report to Congress on the Interdependency of Energy and Water” (DOE 2007). A consortium of DOE national laboratories and the Electric Power Research Institute (EPRI), under the direction of DOE, developed the congressional report that highlights many of the issues and challenges that have been identified by energy and water officials and managers across the country. DOE, in cooperation with several national laboratories, is also currently finalizing another report that provides an “Energy-Water Research Roadmap” (Sandia National Laboratories [SNL] 2007). The roadmap discusses research and development efforts necessary to reduce water used by energy production.
Technological solutions to the problem, as described in the roadmap, will take years to achieve and implement. Drought conditions are occurring now and will continue to occur. The study described in this report identifies the types of power plants that are most likely to be susceptible to water shortages, the regions of the country where this is most likely to occur, and policy options that can be applied in both the energy and water sectors to address the issue. The policy options are designed to be applied in the near term, applicable to all areas of the country, and to ease the tension between the energy and water sectors by addressing peak power demand or decreased water supply.
9

This page intentionally left blank.
10

2. PREVIOUS STUDIES ON ENERGY AND WATER Because the work conducted in this report builds off of prior efforts on energy and water, this section provides a general overview of “Energy Demands on Water Resources: Report to Congress on the Interdependency of Energy and Water” (DOE 2007) and the “Energy-Water Research Roadmap” (SNL 2007). Unless otherwise stated, all data and conclusions presented in this section are taken from those reports. The reports provide a general discussion of water use in the electric power industry, along with conclusions and future directions that serve as a background for understanding the policy options that are presented in this report.
2.1. Energy Demands on Water Resources
In response to Congress’s request for an assessment of energy and water interdependencies, the DOE submitted “Energy Demands on Water Resources: Report to Congress on the Interdependency of Energy and Water” on January 17, 2007 (DOE 2007). The congressional report provides statistics indicating that water resources are already limited (Figure 2-1) and that the available resources have the potential to become even more scarce if the U. S. population grows, as projected, and current trends and policies in energy and water use efficiency do not change. Given this context, the congressional report focuses on three key areas:
• Energy and water interdependencies,
• Water shortage impacts on energy infrastructure, and
• Technologies and policies to make better use of water resources in the context of energy production.
Figure 2-1: Water Shortages and Population Growth (Figure I-2 in DOE 2007)
11

2.1.1. Energy and Water Interdependencies
Water Uses for Energy Extraction and Production
The energy sector uses water resources in four major categories:
• Electric power generation,
• Energy extraction and fuel production,
• Refining and processing, and
• Energy transportation and storage.
DOE (2007) discusses both the quantities of water used for power generation processes and the impacts of those processes on water quality.
Thermoelectric power generation uses surface and groundwater for cooling and scrubbing. The quantities of water used and consumed1 in these processes are dependent upon the type of cooling system. For example, open-loop cooling systems use much larger quantities of water than do closed-loop cooling systems. Open-loop systems lose only a small percentage of the entire volume to evaporation, while closed-loop systems lose most of the withdrawn water to evaporation. Consequently, open-loop systems withdraw more water than closed-loop systems, but both systems actually consume similar amounts. Water is also used in hydroelectric power generation. There are many different types of hydroelectric power generation plants, but the largest source of water loss from this process occurs from water evaporation when hydroelectric power generation involves large reservoirs. The congressional report further states that surface waters and ecology are affected by the thermal and air emissions from both thermoelectric and hydroelectric power generation processes.
The congressional report also discusses the many different ways that water is used for energy extraction and fuel production. For example, water is required in the growing of feedstocks for biofuels, and the quantity of water consumed per gallon of fuel produced can be very high. Alternatively, drilling and mining industries use water to cool and lubricate drilling equipment when drilling for natural gas and oil. Consumption of water in this process is not as intensive as it is in the production of biofuels; however, drilling regulations require appropriate treatment and disposal of the water to minimize environmental impacts. Water is also required to refine and process oil, gas, and other fuels. These processes can result in wastewater that must be treated. The congressional report lists many other uses of water in the energy-extraction and fuel-production processes and indicates that the methods in which water is used greatly affect both the quantity and the quality of the water.
Finally, the congressional report details many different methods that use water for the transportation and storage of energy resources. For example, coal is often transported by barges on rivers, and the movement of barges through locks can affect water levels. Water is also used
1 In this document and DOE (2007), water consumption refers to the process of removing water from the hydrologic system in such a manner that it cannot be reused. Water “use” and “withdrawal” are terms that do not differentiate whether the water can be reused.
12

for transportation in the hydrostatic testing of oil and gas pipelines. Before a new pipeline can be used to transport natural gas or oil, it must be tested by pumping pressurized water through it. This process results in wastewater requiring treatment. Additional uses of water for transportation and storage of energy resources are listed in the congressional report.
Energy Required for Supplying Water
The congressional report indicates that the waste water treatment and water supply sectors are significant consumers of electric power. In fact, the EPRI reports that water treatment and distribution consumes approximately 4 percent of all electricity generated in the United States (EPRI 2002a). The cost of electricity accounts for approximately 75 percent of the total cost of municipal water processing and distribution (Powicki 2002). As population growth continues, limited water supplies will require that water be transported from farther distances and extracted from greater depths. Transportation over greater distances will result in a higher energy requirement per unit volume of water. Additionally, more stringent water requirements may emerge, increasing energy consumption.
2.1.2. Impacts of Water Shortages
The congressional report provides a brief, introductory discussion of how water shortages could affect energy production. Private citizens and public officials are becoming more concerned and aware of the potential ramifications that power generation can have on water supplies. Instances have been documented in which power plants have had to limit power production due to water limitations.2 In some cases, the development of new power plants has been opposed because of the impacts they would have upon water supplies. In short, limitations on water supplies are leading to conflicts between water managers and electric power production. The potential consequence of water-imposed power generation restrictions is a less stable and less reliable power grid.
The congressional report further analyzes how future power generation could affect water supplies. Projected thermoelectric power plant retirements and additions (Hoffman et al. 2004) were analyzed to assess future water requirements by thermoelectric power generation. While water withdrawals are not expected to change significantly over the next 20 years, water consumption could increase drastically if evaporative closed-loop cooling systems are used for new and replacement plants (Figure 2-2).
2 Chapter IV of the congressional report provides several examples of these occurrences.
13

Note: “High Consumption Case” refers to the scenario in which closed-loop cooling systems are used for new and replacement plants.
Figure 2-2: Projected Freshwater Consumption for Thermoelectric Power Generation (Figure IV-7 in DOE 2007)
2.1.3. Technologies to Increase Water Efficiency in Power Generation
The congressional report identifies a number of technologies that could be employed to increase water usage efficiency in the process of generating power. Table 2-1 provides a summary of the technologies and pros and cons associated with each of the technologies. The congressional report notes that these technologies will likely not be employed until they are economically feasible, and the feasibility will be determined by the scarcity of water resources.
Each of the technologies has drawbacks and must overcome significant hurdles before being implemented on a large scale in the energy sector. The congressional report concludes that the technologies’ drawbacks must be addressed by a complete evaluation of how water policies affect energy supplies and demands and how energy policies affect water supplies and demands. To do this, the following steps are recommended:
• Collaboration on water and energy resource planning among federal, regional, and state agencies with industry and other stake holders;
14

• Evaluation of natural resource policies and regulations to determine potential, unintended consequences on energy and water sectors(science-based, system-level approaches can be used to advise policy makers); and
• Coordinated development of energy and water infrastructures to reduce conflicts between the two sectors.
Table 2-1: Technologies for Improving Water Use Efficiency in Power Generation
Technology Examples Pros Cons Advanced cooling for thermoelectric power plants
Dry (air) cooling, hybrid (wet and dry) cooling
Reduces water use Cost, complexity, performance in hot weather, scalability to large plants
Combined-cycle gas turbines
Natural-gas-fired, combined-cycle gas turbines, integrated gasification, combined-cycle power plants
Reduces water use by half High cost of gas and increased dependence in gas imports
Renewable electric power Wind, solar, run-of-river hydroelectric, ocean energy systems
Reduces water use, provides peak power needs, carbon free
Cost, manufacturing/ deployment capacity, need for storage at high penetration (for some technologies)
Oil shale Recovering oil from oil shale deposits
Large domestic supplies Cost, potential water demand from extraction process, technology required to mitigate environmental impacts
Renewable and alternative fuels
Biofuels, synfuels, hydrogen
Renewable, carbon-neutral domestic fuels and fuels from domestic coal and gas
Technology development required, cost, high water use for current biofuel production techniques
Increasing and stretching water supplies
Use of degraded water, coordinated energy, and water conservation
Improve water supply understanding and usage
Lack of data, water storage needs to be increased, climate variability, new policies required, coordination needed
2.2. The Energy-Water Research Roadmap
Beginning in fiscal year (FY) 2005, Congress began to provide funding for the development of an energy-water science and technology research roadmap. A roadmap is defined as
…a strategic plan to identify and implement the research and development needed to address technical and programmatic issues and challenges associated within a specific area from a system-level context in order to maximize the valued outputs, such as cost effectiveness, reliability, security, and sustainability, and improve overall performance and support public welfare. (SNL 2007)
15

16
A consortium of DOE national laboratories, led by SNL, has applied this concept to the energy-water resource issue, and a report documenting their work is currently being finalized. Because the roadmap is not yet complete, details of the analysis are not presented in this section; however, the section does include a general discussion of the methodology for the analysis and the resulting conclusions.
A series of regional workshops was held to identify and assess major regional and national issues, challenges, and concerns associated with energy and water needs and development. More than 500 participants from a spectrum of sectors attended the workshops, including representatives from energy and water utilities and industries, water and energy managers, regulatory agencies, environmental groups, researchers, and tribal organizations. Based upon the information gathered from these workshops, four recommendations were made concerning science and technology research and development efforts. They are
• Reduce water use in electric power generation,
• Reduce water use in alternative fuels production,
• Use non-traditional water sources in electric power generation processes, and
• Initiate further integrated resources planning and management.
If these recommendations are implemented, the roadmap asserts that future energy reliability, sustainability, and cost-effectiveness will be improved by reducing water demands from the energy sector.

3. FACTORS AFFECTING DROUGHT RESILIENCY A goal of this analysis was to determine what characteristics make a given type of power plant resilient to water shortages. We have concluded that a plant’s resiliency is primarily determined by two factors:
• The quantity of water required for plant operation: The quantity of water required for plant operation significantly affects a plant’s resiliency because plants that need large volumes of water are likely to be affected by water shortages before plants that require lesser amounts of water.3 The manner in which the plant uses water determines the volume required for plant operation.
• The availability and stability of the plant’s water source: Some water sources are rather sensitive to drought, so plants drawing from these sources could be affected by fluctuations in water levels caused by droughts. For example, a plant drawing water from a river is more likely to be affected by drought than a plant drawing water from the ocean.
The following section analyzes how the most common types of electric power plants in the United States use water in the electricity production process. Water use is typically determined by the type of plant in operation, so we will focus on how differences between types of plants affect their water requirements.
3.1. Water Use in Electricity Production
The manner in which an electric power plant uses water is determined by the type of power plant in operation. Thermoelectric and hydroelectric power plants accounted for more than 97 percent of all electricity production in the United States (EIA 2007), so this analysis focuses on how these types of plants use water.
On average, nuclear power plants have the largest capacity per generator (approximately 1,000 megawatts [MW]/generator), followed by coal-fired generators (220 MW/generator), and natural gas-fired generators (80 MW/generator) (Table 3-1). In general, coal-fired and nuclear generators provide the base load electricity and run fairly continuously. Natural gas-fired generators are typically used to provide intermediate load, so they generally are not in continuous operation. The other fuel types tend to provide electricity only during peak load times.
3 While the quantity of water needed for plant operation is taken into account during plant-siting processes, the
amount of water needed and the quantity of water available are not always correlated. This event may occur when other sources of water demand increase, thus decreasing the availability of water.
17
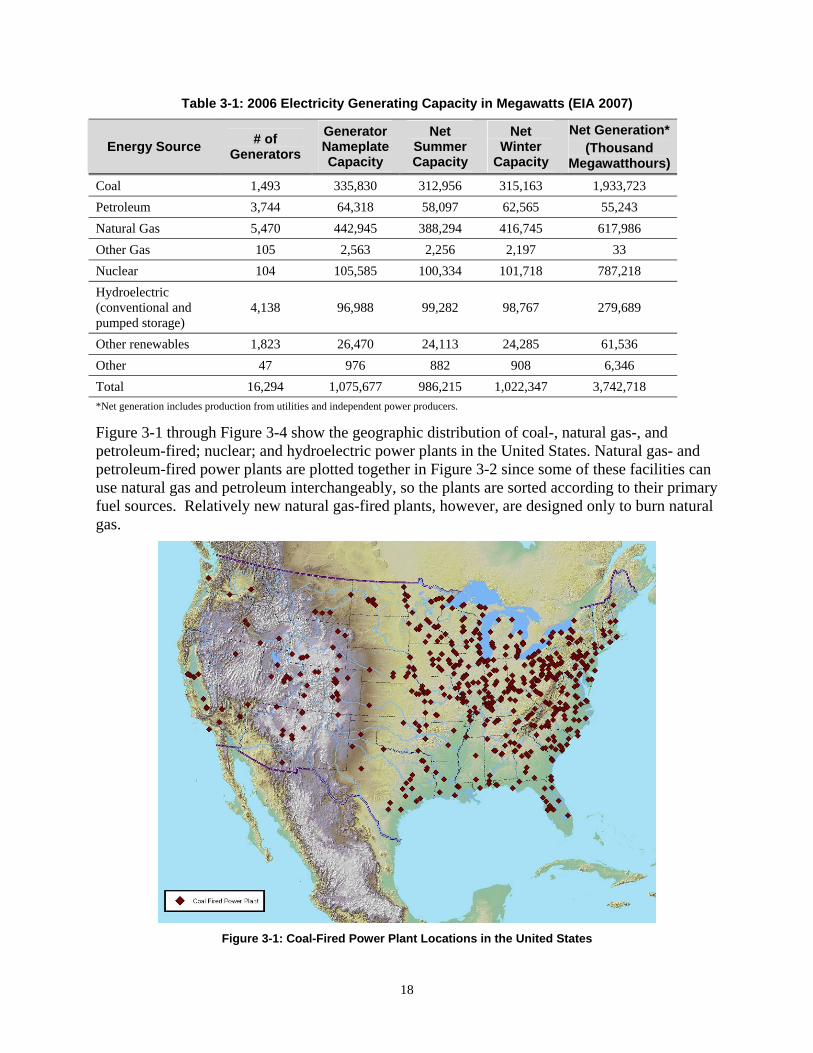
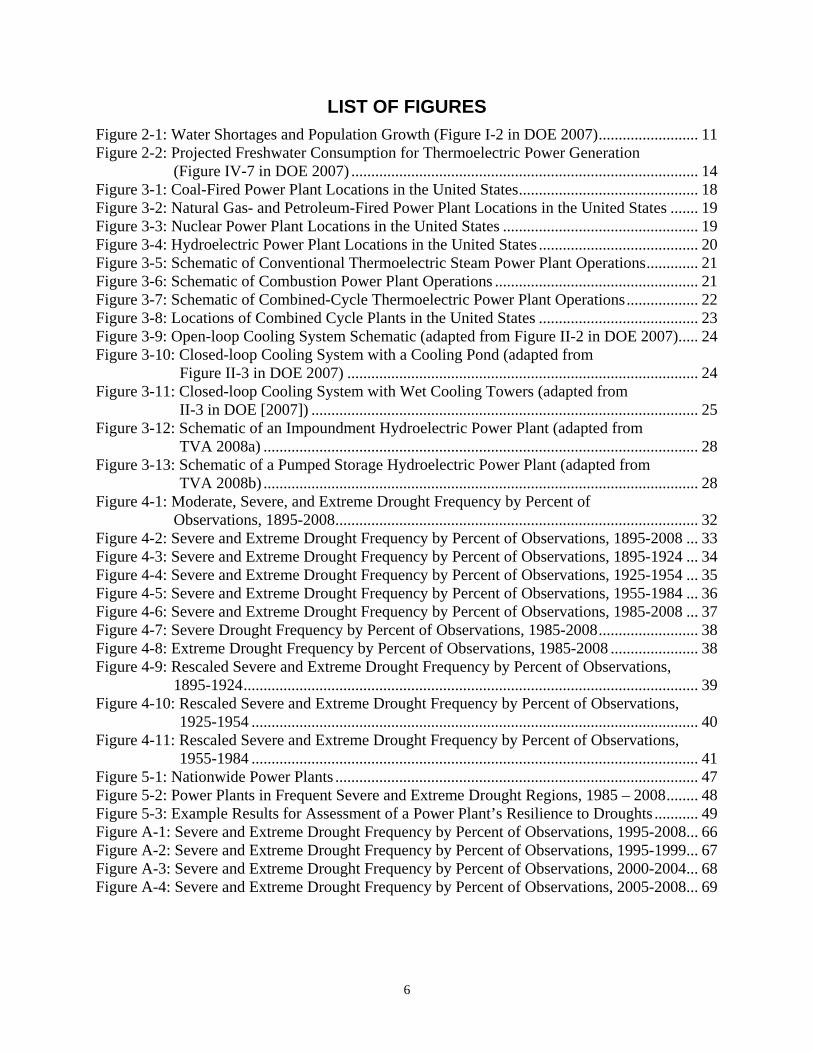
Table 3-1: 2006 Electricity Generating Capacity in Megawatts (EIA 2007)
Energy Source # of Generators
Generator Nameplate Capacity
Net Summer Capacity
Net Winter
Capacity
Net Generation* (Thousand
Megawatthours)Coal 1,493 335,830 312,956 315,163 1,933,723 Petroleum 3,744 64,318 58,097 62,565 55,243 Natural Gas 5,470 442,945 388,294 416,745 617,986 Other Gas 105 2,563 2,256 2,197 33 Nuclear 104 105,585 100,334 101,718 787,218 Hydroelectric (conventional and pumped storage)
4,138 96,988 99,282 98,767 279,689
Other renewables 1,823 26,470 24,113 24,285 61,536 Other 47 976 882 908 6,346 Total 16,294 1,075,677 986,215 1,022,347 3,742,718 *Net generation includes production from utilities and independent power producers.
Figure 3-1 through Figure 3-4 show the geographic distribution of coal-, natural gas-, and petroleum-fired; nuclear; and hydroelectric power plants in the United States. Natural gas- and petroleum-fired power plants are plotted together in Figure 3-2 since some of these facilities can use natural gas and petroleum interchangeably, so the plants are sorted according to their primary fuel sources. Relatively new natural gas-fired plants, however, are designed only to burn natural gas.
Figure 3-1: Coal-Fired Power Plant Locations in the United States
18

Figure 3-2: Natural Gas- and Petroleum-Fired Power Plant Locations in the United States
Figure 3-3: Nuclear Power Plant Locations in the United States
19

Figure 3-4: Hydroelectric Power Plant Locations in the United States
Electric power plants primarily use water for one of three purposes:
• Water is used as the primary coolant for thermoelectric power plants,
• Water is the source of energy that is converted to electric power at hydroelectric power plants, or
• Barge transport on waterways is a significant means of transportation for coal, one of the primary energy sources.
Water plays other direct roles in the production of electric power, but the volumes used in those processes are minor in comparison to the quantities required in the three primary processes. Thus, the following subsections discuss how the electric power industry uses water for thermoelectric power plant cooling, hydroelectric power generation, and transportation.
3.1.1. Thermoelectric Power Plant Operation
A basic understanding of how thermoelectric power plants operate can illustrate how water is used. Many fossil-fueled (coal, petroleum, etc.) and nuclear power plants generate electricity with a steam turbine. Water is heated in a boiler and becomes pressurized steam. This steam passes through a steam turbine, powering an electric generator. Afterwards, the steam enters a condenser where it is cooled, and the steam returns to its liquid form. The water then circulates back to the boiler, and the entire process is continuously repeated. Water is generally used as the coolant in the condensers. Figure 3-5 illustrates this process.
20

Figure 3-5: Schematic of Conventional Thermoelectric Steam Power Plant Operations
Most gas-fired and some oil-fired plants often operate in a manner that does not require steam. Rather than burning fuel to heat water into steam, some plants burn a mixture of air and natural gas, thus forming what is termed “combustion gas.” This combustion gas expands through a turbine, causing the turbine to turn and power the electric generator. Gas and internal combustion turbines operate in this manner (Figure 3-6).
Figure 3-6: Schematic of Combustion Power Plant Operations
21

One of two things can then be done with the combustion gas after it passes through the turbine. It can either be released, or as is done in natural gas-fired, combined-cycle (NGCC) plants, the excess heat in the combustion gas can be used to heat water into steam. This steam can then be used to power a steam turbine generator, as in conventional steam turbine power plants. This additional step increases the overall efficiency of the generator. Figure 3-7 demonstrates how NGCC plants operate. The water used to turn the steam turbines is circulated in both the steam and the combined-cycle plants, so this quantity of water is preserved.
Figure 3-7: Schematic of Combined-Cycle Thermoelectric Power Plant Operations
In addition to increasing the electricity generation per unit of natural gas, NGCC generators also increase efficiency in terms of MW of electricity generated per gallon of coolant water. NGCC generators derive about two-thirds of their electricity production from the gas turbine and one-third of their production from the steam turbine, so they require approximately a third as much water as fossil-fueled plants for cooling. Thus, NGCC withdrawal and consumption rates are approximately one-third those of fossil-fueled plants (see Section 3.1.3 for further discussion).
22

Combined-cycle plants have a combined operating capacity of 224,000 MW, comprising approximately 20 percent of the entire U.S. generating capacity. Figure 3-8 shows the geographic distribution of combined-cycle generators in the United States.
Figure 3-8: Locations of Combined Cycle Plants in the United States
3.1.2. Cooling Options for Thermoelectric Power Plants
Water is used as the primary coolant in the condensers in both steam plants and combined-cycle plants, and the amount of water used for cooling in these plants is significant. It is estimated that 59 billion gallons of seawater and 136 billion gallons of fresh water are used every day by thermoelectric plants (Hutson, et al. 2004).
Two classes of cooling systems are used. Plants that use “once-through” or “open-loop” cooling systems withdraw large amounts of water from nearby surface water sources, typically a river (Figure 3-9). This water passes through a condenser as the coolant and, in doing so, transfers heat energy from the hot steam to the coolant water, raising the temperature of the water by 12 – 30 degrees Fahrenheit (οF) (EPRI 2002b). After moving through the condenser, the water is released back to the river.
The elevated temperature of the discharged water affects the hydrologic system in several different ways. Increasing the temperature in a river can adversely affect flora and fauna, so the Federal Water Pollution Control Act was introduced in 1972 to regulate the impact of open-loop cooling on the environment (33 U.S.C. §§ 1251 – 1387). The increased temperature of the discharge water also increases the rate of evaporation from the river. The quantity of water lost from the hydrologic system by evaporation caused by the elevated temperatures is said to be “consumed.”
23

Figure 3-9: Open-loop Cooling System Schematic (adapted from Figure II-2 in DOE 2007).
Prior to 1970, most power plants used open-loop cooling systems, but the enactment of environmental regulations such as the Federal Water Pollution Control Act of 1972, Section 316(b) (33 U.S.C. §§ 1251 – 1387), has virtually halted the installation of open-loop cooling systems in new power plants under construction (DOE 2007). Many power plants with open-loop cooling systems remain in operation, but closed-loop cooling systems that have a lesser impact on the environment have become more prevalent in newly constructed power plants.
Closed-loop cooling systems withdraw smaller volumes of water than open-loop systems because they involve a mechanism for circulating a portion of the coolant water. Closed-loop cooling systems that use cooling ponds withdraw cool water from the bottom of the ponds. After the water is passed through the condenser and heated, the water is discharged in a shallow portion of the pond where the heat is allowed to dissipate and the water cools. As happens in the open-loop cooling systems, the addition of heated water to the cooling pond results in some evaporation, and this evaporated volume is considered to be consumed, as well. Eventually, the water cools, its density increases, and it returns to the bottom of the pond where it can be reused for cooling (Figure 3-10).
Figure 3-10: Closed-loop Cooling System with a Cooling Pond (adapted from Figure II-3 in DOE 2007)
24

Some closed-loop systems use cooling towers (Figure 3-11). In wet cooling towers, hot water that is discharged from the condenser is sprayed over metal plates while a fan blows cool air up the tower. The water that evaporates is considered to be consumed, and the remaining water falls down the tower and can be returned to the condenser. Dry cooling towers pump the hot water in small pipes down the tower as fans blow cool air over the pipes. The water eventually cools as it passes through the pipes, and it can be returned to the condenser. No water is lost to evaporation in this process, but dry cooling is not commonly used. Dry cooling relies on the ambient temperature of the air and, thus, can reduce power plant efficiency and output by 25 percent in the summer (DOE 2002). This cooling approach is particularly inefficient in hot, arid climates.
Figure 3-11: Closed-loop Cooling System with Wet Cooling Towers (adapted from II-3 in DOE [2007])
3.1.3. Water Use Intensity for Thermoelectric Power Generation
Table 3-2 shows the efficiency (in terms of water volume/megawatt-hour (MWh) of electricity generated) of various power plant/cooling system combinations. Because they “employ thermodynamically lower steam conditions than do fossil plants, and thus produce less electricity per pound of circulating steam” (EPRI 2002b), nuclear power plants generally withdraw and consume larger volumes of water per MWh than do fossil-fueled plants and NGCC plants. As previously discussed, NGCC plants derive about two-thirds of their electricity production from the gas turbine and one-third of their production from the steam turbine, so they require approximately a third as much water as do fossil-fueled plants for cooling. Thus, NGCC withdrawal and consumption rates are approximately one-third those of fossil-fueled plants.
Across all plant types, water withdrawals for closed-loop cooling systems are approximately 1 percent of those for open-loop cooling systems. However, consumption levels for open-loop and closed-loop systems (cooling ponds and wet cooling towers) are similar. Dry cooling towers require no withdrawals and do not consume any water.
25

Table 3-2: Water Usage for Steam Condensing in Thermoelectric Power Plants (Adapted from Table B-1 in DOE 2007)
Plant Type Cooling Process Withdrawal (gal/MWh) Consumption (gal/MWh)
Open-loop 20,000-50,000 ~300 Cooling pond 500-600 480 Wet cooling tower 300-600 300-480
Fossil
Dry cooling tower 0 0 Open-loop 25,000-60,000 ~400 Cooling pond 800-1,100 ~720 Wet cooling tower 500-1,100 400-720
Nuclear
Dry cooling tower 0 0 Open-loop 7,500-20,000 100 Wet cooling tower ~230 ~180
Natural-Gas, Combined-Cycle
Dry cooling tower 0 0
Source: Table B-1 in DOE 2007, cites EPRI (2002b), CEC (2002), CEC (2006), Leitner (2002) and Cohen (1999)
3.1.4. Hydroelectric Power Plants
Hydroelectric power plants convert the potential and kinetic energy stored in water into electricity. Three different types of hydroelectric power plants have been developed to perform this conversion: impoundment power plants, pumped storage facilities, and diversion facilities.
Impoundment facilities (Figure 3-12) are the most common type of hydroelectric power plant. Typically, a dam is built on a lake or river that has a steep drop in elevation, and the water stored behind the dam is called the “reservoir.” The dam raises the water’s height and increases its depth, creating water pressure that is termed “head.” Water enters the dam through the intake valve and decreases in elevation as it travels through the penstock. A turbine is located at the end of the penstock, and electricity is generated as water passes through the turbine.
Impoundment facilities were typically built by the U.S. Army Corps of Engineers or the Bureau of Land Management and most such facilities were federal projects. Cost/benefit analysis was used to provide the economic justification for such facilities, in part because the facilities were built on federal land. Application of cost/benefit analysis techniques improved over the years such that some benefits (e.g., recreation) that previously were not considered could, by virtue of the improved methods, now be evaluated; many facilities could now be conceived and justified as multi-use facilities, providing a variety of benefits including flood control, electric power, and recreation opportunities. While the flood control and recreation opportunities were considered non-market benefits, electric power was conceived as a market good that would be sold to consumers.
The price at which hydroelectric power was sold typically did not reflect the value of land and the amount of financial outlay provided by the federal government. The only element included in the price of the electricity was the marginal operating cost which, for hydroelectric facilities, is very low. This pricing mechanism has left a lasting impression on the population and on
26

policymakers that hydroelectricity is cheap. This is not, in fact, the case; if the cost of capital, permanent inundation of large swaths of land, and closing off of other recreational opportunities, plus the value of free-flowing rivers, were to be included in the electricity cost, it is likely that hydroelectricity would be among our most expensive generation technologies. For these reasons, dams are no longer being built and there is currently a national discussion regarding the possibility and desirability of removing some of the existing dams.
In addition to these considerations, it has become clear that some of the multi-use benefits may, in fact, be in conflict with one another. For example, in times of drought, it is necessary to spill water to provide for irrigation and for municipal water use, even though it may not be the best time to produce electricity. Also, the level of the impoundment drops in drought conditions, thereby, reducing the hydraulic head and the potential energy that is stored in the reservoir. In fact, during a drought, the “shadow price” of water becomes very high, making hydroelectricity more expensive.
The value of water varies generally between the eastern and western U.S. and between specific water basins, and also between uses of the water. Frederick (1996) states that
The potential value of water for hydropower within a basin varies widely with the location of the water on the river because the power produced by an acre-foot of water is determined by the developed head (the height of a retained body of water) above the generating turbines. For instance, an acre-foot of water at the headwaters of the Snake River in the Pacific Northwest could pass through 16 dams before joining up with the Columbia River and then through another 4 dams before reaching the Pacific Ocean. The cumulative developed head of these dams is 2,159 feet. In contrast, the developed head of Bonneville Dan, the last dam along the Columbia River, is 59 feet. Consequently, the value for hydropower of an acre-foot of water at the headwaters of the Snake is more than 36 times the value just above Bonneville Dam....Hydropower is an important, although not the highest value, water user in these four water resources regions.
Pumped storage facilities also use dams to store water, and two reservoirs are used (Figure 3-13). One reservoir, located above the dam, has a higher elevation, and the second reservoir is located at a lower elevation below the dam. When there is a high demand for electricity, the pumped storage plant releases water from the upper reservoir to the lower reservoir. As happens in impoundment facilities, the water flows downward through a turbine, and electricity is generated in this process. When the electricity demand is low, the plant pumps water from the lower reservoir to the upper reservoir, and the facility uses some of its own electricity to pump the water.
27

Figure 3-12: Schematic of an Impoundment Hydroelectric Power Plant (adapted from TVA 2008a)
Figure 3-13: Schematic of a Pumped Storage Hydroelectric Power Plant (adapted from TVA 2008b)
None of these plants generate steam or combustion gas, so water is not required as a coolant at hydroelectric plants. Additionally, each of these types of plants requires that sufficient water levels (or depths) must be maintained to generate an appropriate head for electricity production. Electricity production can be restricted or even halted at any of these types of plants if water levels drop too low.
The differences in the designs of these plants determine how their electricity production is affected by water shortages. Once water passes through turbines in impoundment and diversion facilities, it cannot be reused for power generation, so these types of plants are dependent upon precipitation to replenish their sources of water. Consequently, in times of drought when precipitation levels are reduced, water levels can decrease to the point where electricity production is severely limited or halted. For example, in 1988, hydroelectric power generation was reduced by 25 percent along the Mississippi River, following one of the worst U. S. droughts in the past century (Changnon 1989). Furthermore, because water use by
28

municipalities often increases in times of drought, dams may be required to release additional quantities of water, further reducing water levels and hindering power production. Hence, electric power production at impoundment and diversion hydroelectric power plants is sensitive to precipitation levels. In contrast, electricity production at pumped storage facilities is more resistant to drought because the water at these plants can be reused. These plants are more expensive to build, though, and they can be difficult to sight because two reservoirs must be considered.
Diversion, or run-of-river, plants do not require the use of a dam. Rather, the facility diverts a portion of a river through a penstock, into a turbine. The turbine turns as water passes through it, and electricity is generated. Because diversion plants depend entirely on landscape and there is no dam to artificially increase the water’s height, diversion plants generally produce a limited amount of power (Schlumberger Limited 2008).
3.1.5. Water as a Means of Transportation
Railroad and barge transport are the primary modes of transporting coal. Transportation of coal by barge on rivers is a critical component of the coal distribution system in the United States. Barge transport is often used to transport coal from the initial source to a railroad, from a railroad to the coal-fired power plant, or the entire distance from the mine to the plant.
Barge transport is typically the cheapest mode of transportation, so when that option is available, it is preferred. However, barge transport and the amount transported on a single barge are dependent upon the depth of the river on which the barge travels. For example, during ideal conditions on the lower Mississippi River, barges sit at a depth of 12 feet below the surface, and barges are lashed together 5 wide and 8 long. In the Fall of 2006, when river depths along the lower Mississippi dropped due to drought conditions, the Lower Mississippi River Committee limited barge depths to 9 1/2 feet and a 4 by 8 lashing configuration (U. S. Water News Online 2006). As a result, the capacity for a string of barges was reduced from 60,000 tons to 28,800 tons. So droughts have the potential to reduce the rate at which all goods, including coal, can be transported by barge.
Some river systems, like the Missouri River, have a system of reservoirs that are used to control river depths. When river levels are low, water is released from the reservoirs to increase river depths and permit barge travel. Additionally, rivers can be dredged if river depths decrease to the point where barge traffic is halted. However, even these river-management techniques may not be sufficient to ensure barge flow continues. An extensive drought beginning in 2006 caused the Missouri River and its aforementioned reservoirs depths to drop to the point where the U.S. Army Corps of Engineers was considering canceling the entire 2008 barge season (Wolken 2006).
Nevertheless, low water levels are unlikely to significantly disrupt electric power generation at coal-burning plants for the following reasons:
• Most coal-burning plants with barge access also can receive coal shipments by rail. Thus, if these plants are unable to receive coal via barge, they will likely be able to receive shipments by rail. During the record-setting drought of 1988, barge traffic was halted twice on the Ohio and lower Mississippi rivers in June and July. Even when barge traffic resumed, it was at a below-average rate (Changnon 1989). Consequently, rail
29

30
transport was substituted for some of the coal that would normally be transported by barge, but because barge is the cheapest mode of transportation, utilities were paying a higher rate for transportation.
• To offset fluctuations in the ability to receive coal, coal plants generally keep some reserve coal onsite. A rule of thumb is that coal plants keep 1 month’s worth of coal onsite. Plants that have access to only a single mode of coal transport likely keep more onsite, perhaps up to 3 months worth in the winter. Plants that have access to multiple modes of coal transport may attempt to keep less onsite because, if one mode of transport is disrupted, they can use the other mode(s) to continue to receive coal.

4. WATER SHORTAGE RISKS Water shortage risks to power plants are heavily dependent on not only the way the water is used, but the source of the water itself. For example, groundwater sources (such as aquifers) are not likely to be affected by drought, whereas surface water sources (such as lakes and rivers) are likely to have water restrictions imposed in the event of a drought.
4.1. Drought
For power plants that rely on surface water for their operations, either for cooling or for hydroelectric generation, drought can be a major concern. Drought impacts can range from the need to adjust water release schedules to de-rating or even ceasing the operation of plants.
Drought, from the standpoint of hydrological impacts that include reservoir and groundwater levels, is measured using the Palmer Hydrological Drought Index (PHDI). 4 The PHDI is based on the balance of moisture supply and demand for a given climate division, without including manmade changes such as increased irrigation or new reservoirs. PHDI data are available from the National Climatic Data Center, on a monthly basis dating back to 1895, for the 344 contiguous U.S. climate divisions (excluding Alaska and Hawaii). The data used in this report run from January 1895 through April 2008.5
The PHDI and other indices classify drought (or wetness) in degrees of severity ranging from normal to extreme. Table 4-1 shows the potential impacts of moderate, severe, and extreme drought as they pertain to water availability in streams and reservoirs (National Drought Mitigation Center).6
Table 4-1: Potential Impacts of Drought Severity
Drought Category Possible Impacts Moderate Streams, reservoirs, or wells low; some water shortages developing or imminent Severe Water shortages common; water restrictions imposed Extreme Widespread water shortages or restrictions
Figure 4-1 shows the moderate, severe, or extreme drought conditions, as a percent of observations, for the climate. The data range runs from January 1895 through April 2008, with observations collected monthly. The western states, including southern California, northern Nevada, eastern Oregon, and western and central Arizona, see some form of drought or pending drought from 30 percent to 40 percent of the time. Portions of eastern South Dakota, central Pennsylvania, and the northeastern lower peninsula of Michigan also fall into this category.
4 National Climactic Data Center (NCDC), Time Bias Corrected Divisional Temperature-Precipitation-Drought
Index, http:://www1.ncdc.noaa.gov/pub/data/cirs/drought.README 5 NCDC Climate Monitoring Data, http://www1.ncdc.noaa.gov/pub/data/cirs/ 6 Explanation of the US Drought Monitor, http://drought.unl.edu/dm/classify.htm
31

Figure 4-1: Moderate, Severe, and Extreme Drought Frequency by Percent of Observations, 1895-2008
Because moderate drought does not necessarily result in water shortages, it is more of an indicator that water shortages may occur. Therefore, this analysis focused more closely on instances of severe or worse drought levels. Levels of drought that are considered severe or extreme are likely to require some sort of action from power providers that rely on surface water sources for cooling. Depending on the severity of the drought, those actions could range from different water release timing or waivers for temperature of release to de-rating or even shutting down the plant.
Figure 4-2 shows severe or worse drought conditions for the entire data range from January 1895 through April 2008. As can be seen in this figure, severe or worse drought conditions occur with much less frequency than moderate or worse drought conditions. More frequent occurrences are seen in northeastern Oregon, southwestern Wyoming, and northwestern Arizona. As in the moderate and worse drought conditions, the western states see more frequent occurrences of severe or worse drought than the Midwest or Eastern states.
32

Figure 4-2: Severe and Extreme Drought Frequency by Percent of Observations, 1895-2008
The data presented in Figure 4-3 through Figure 4-8 are graphed using the same color and frequency scale, with the high point on the color scale being 51 percent to 60 percent of observations as severe or extreme drought. Dividing the data up in 30-year increments allows tracking of drought across the country over time. Figure 4-3 through Figure 4-8 provide this timeline.
33

Figure 4-3: Severe and Extreme Drought Frequency by Percent of Observations, 1895-1924
From the years 1895 to 1924, as seen in Figure 4-3, the most frequent occurrences of severe or extreme drought were in northeastern Michigan, central Pennsylvania, and southern Alabama. This is an unusual set of observations, and drought in those regions does not recur in any of the subsequent 30-year periods.
34

Figure 4-4: Severe and Extreme Drought Frequency by Percent of Observations, 1925-1954
The years 1925 to 1954, as shown in Figure 4-4, include the dustbowl years of the 1930s with drought in the Great Plains. Drought is also prevalent in the west during this 30-year period.
35

Figure 4-5: Severe and Extreme Drought Frequency by Percent of Observations, 1955-1984
From the years 1955 to 1984, as shown in Figure 4-5, instances of severe or extreme drought were infrequent, with occasional instances in the west and plains and slightly more frequent instances in Wyoming.
36

Figure 4-6: Severe and Extreme Drought Frequency by Percent of Observations, 1985-2008
The final set of data, shown in Figure 4-6, is not a complete 30-year set and spans the remaining 23 years and several months of observations from 1985 to 2008. This period sees a very high frequency of severe or extreme drought in the western states. Even if the remaining 7 years of observations see no drought at all, the percentage of drought occurrences in those states will still be high.
Figure 4-7 and Figure 4-8 examine severe and extreme drought separately for the period 1985 to 2008 to determine what kind of drought is causing the frequent occurrence in the Western states.
37

Figure 4-7: Severe Drought Frequency by Percent of Observations, 1985-2008
Figure 4-8: Extreme Drought Frequency by Percent of Observations, 1985-2008
38

As can be seen from these figures, extreme drought is occurring with more frequency than severe drought in the Western states from the period 1985 to 2008. This is an unusual trend compared to the occurrence of extreme drought in the years since data collection began (Appendix A contains the graphs of severe and extreme drought for the 30-year intervals from 1895 to 1984.). If this trend continues, the Western states are likely to see the need for drastic changes in their water-usage patterns. This period is the cause of the high point on the color scale being set to 51 percent to 60 percent of observations. To continue the analysis of the other periods, this period was removed, and the color scale for graphing purposes was recalibrated to a high of 31 percent to 40 percent of the observations being severe or extreme drought.
Figure 4-9, for the period 1895 to 1924, again shows the number of instances of severe and extreme drought. Northeastern Michigan, central Pennsylvania, and southern Alabama still see more frequent occurrences of drought than the rest of the country for this time period. The rescaling of the data also shows that western Pennsylvania, portions of New York, northern Alabama, South Dakota, and New Mexico also see drought about 25 percent of the time during this 30-year period.
Figure 4-9: Rescaled Severe and Extreme Drought Frequency by Percent of Observations, 1895-1924
39

Figure 4-10 covers the period of time that includes the drought and dust bowl of the 1930s. The plains states and the western states see the most frequent occurrences of drought during this timeframe, ranging from 21 percent to 40 percent of the monthly readings.
Figure 4-10: Rescaled Severe and Extreme Drought Frequency by Percent of Observations, 1925-1954
40

In Figure 4-11, we again see the western states and the plain states with more instances of drought than the rest of the country, but significantly less than in the prior 30-year period.
Figure 4-11: Rescaled Severe and Extreme Drought Frequency by Percent of Observations, 1955-1984
4.1.1. Focus of Effort Based on Drought Analysis
The Western states, in both the most recent data ranges and since data collection began in 1895, have seen more frequent occurrences of drought than the rest of the country. For the period from 1924 through 1955, the Plains states joined their western counterparts and also experienced frequent occurrences of severe and extreme drought.
The southeast saw unusual levels of drought conditions from May 2007 through March 2008, with the Atlanta area seeing its second driest year on record.7 These conditions do not appear in the graphics due to the duration of the drought (shorter than drought conditions that are endemic to the west and southwest). Also, the metric used, PHDI, only accounts for the moisture balance in the region and not for manmade changes. The method developed in this section, along with the policies that are recommended later in this report can be applied to any region including the southeast. For a discussion of how the recent drought conditions in the southeast compare to those seen in the West, see Appendix A.
7 http://www.usatoday.com/weather/drought/2008-03-28-southeast-drought-eases_N.htm
41

The Western region appears to be much more likely to experience and potentially continue to experience conditions of severe or extreme drought. This is also the region with increasing population growth with corresponding increasing demand for energy and water use. This analysis will focus on the Western region to explore possible near-term mitigation strategies for the effects of drought on the energy and water sectors. The next section discusses water management in the Western states as an example to focus the analysis; however the mitigation strategies that are developed can be applied nationwide.
4.2. Water Markets and Water Banks
Preparation for periods of drought is an important problem for urban water service agencies in the western and southwestern United States. Even under normal weather conditions, rapidly growing populations and increasing environmental demands (in-stream flows and wildlife habitats) are putting pressure on local water supplies. Municipal water suppliers have often used water storage and water delivery projects to deal with drought. Both these efforts require capital, energy, and environmentally expensive sites.
The scarcity of water in the western United States led to the development of a doctrine of water allocation termed “prior appropriation,” and that doctrine governs water allocation in this area of the country. This doctrine was intended to promote the buying and selling of water in the western United States. In the prior-appropriation doctrine, water rights are not subordinate to the land, as they are in the riparian doctrine and, therefore, can be sold independent of the sale of land. Claims are established by being the first to put water, which has a yearly quantity and appropriation date, to a “beneficial use.”
Interest in water markets has recently increased, reflecting growing pressures on limited water supplies, realization that institutional change will be needed to improve water use efficiency, and the shift toward privatization and market mechanisms to address resource-allocation problems. Some proponents of water markets suggest that water markets promote water-use flexibility, establish a recognized water value, and provide incentives for more efficient water use (Gardner 1985). The majority of existing water market literature deals with transactions among agricultural users or between agriculture and urban users.
A water-supply contract is defined as a formal contract or agreement between a farmer or a group of farmers and an urban or industry water user. The contract allows the farmer to transfer water temporarily from agriculture to urban use, during occasional critical drought periods, allowing the urban or industry user to secure a source of drought water supply. The farmer does not necessarily relinquish ownership of the water rights (although the farmer could choose to permanently transfer water rights) and retains access to the water supply during normal water-supply situations.
Water-supply contracts can be similar to stock and commodity exchange market options. In financial terminology this means that the holder of an option contract has the right to buy the commodity (in this case water) at a specified price, termed the strike or exercise price, from the seller of the option. The seller of the option is guaranteeing future delivery under specified conditions and price. In exchange for guaranteeing future delivery of the commodity at a set price, a further premium above the exercise price, called an option price, may be paid to the
42

seller. Water-supply contracts can also take the form of a complete transfer of water rights, temporary transfer of water rights, or rental of a water supply.
Most states operate their water banks at a regional level. Regional banks require fewer resources and are likely to provide an opportunity to identify methods to meet local market requirements. These banks operate mainly as an exchange broker between willing sellers and interested buyers and not as a mechanism by which they can increase in-stream flows.
Market participation is dependent on federal and local policies. Federal policy may prohibit some holders of water rights from participating as sellers. Buyers may be limited to only those with “critical” water needs, as defined by state regulators. Transaction costs can be aggregated into two groups, administratively induced costs (AICs) and policy-induced costs (PICs). AICs include the costs of searching for trading partners and negotiating the terms of the exchange and other contract provisions. PICs include the costs of obtaining approval for water transfers.
4.2.1. Western State Water Markets and Banks
Arizona
The Arizona Water Banking Authority’s bank is based on storage credits. It is a market-driven bank in which water rights are leased or purchased, held, sold, and transferred. The bank stores unused Colorado River water and it is either directly recharged into the ground to be held in underground storage facilities or used instead of pumped groundwater.
California
A 6-year drought, from 1987 to 1992, highlighted the tight supply of water across the state of California. In 1991, one of the recommendations of the Governor’s Drought Action Team was to establish a state-sponsored water bank operated by the California Department of Water Resources (Hanek 2002). In 1991, inter-basin trades accounted for 101 million cubic meters (m3) of water, with a value of $111 million (Howitt et al. 1992). The California water bank also operated in 1992 and 1994 to facilitate water trades during drought and expanded its operations to include a variety of water trades that changed with water availability. In advance of an expected dry season in 1995, the California Department of Water Resources prepared to operate its water bank by purchasing water supply options from sellers. No options were exercised due to increased water supplies.
California’s water bank experience has been fairly limited to informal intra-season spot markets and annual lease markets. In California, between 1982 and 1996, only 1.7 million acre feet of water have been transferred. All transfers were spot or short-term (annual lease) transfers (Hanak 2002). No long-term or permanent transfers were arranged by the California water bank; although, since its inception (1982, 1991, 1992, 1993, and 1995), it has handled 40 percent of all of the water transfers that have occurred in the state. In the years the water bank was active, water transfers rarely occurred between agricultural users and commercial or urban users; the majority of transfers were between agricultural users.
In the California water market, AICs and PICs are a function of transaction type as well as property rights. Table 4-2 shows that transaction costs falls asymmetrically between buyers and
43

sellers in the California water market. Heterogeneous property rights and differential rates of market access work to accentuate these asymmetries.
Table 4-2: Transaction Costs by Policy Type
Type of Transaction Cost Seller Buyer Administratively Induced Search for trading partners X X Establish price, quantity, and quality X X Negotiate payment terms X X Establish delivery dates X X Negotiate physical transfer X X Policy-Induced Identify legal characteristics of water use X Identify hydrological characteristics of rights X Comply with state and federal law of transfer application and approval process
X
Conduct project approval process X Conduct water district approval process X Adjust costs of changing resource base: X Third-party impacts X X Litigation for damages X X Litigation/risk X
Source: Archibald and Renwick 1998a
The California Department of Water Resources is currently preparing for the establishment of California’s 2009 Drought Water Bank (Christie 2008). The bank will buy water primarily from local water agencies and farmers upstream of the San Joaquin-Sacramento River Delta and make it available for sale to public and private water systems expecting to run short of water in 2009. The California Department of Water Resources mandated that agencies buying water through the water bank have to commit to a 20 percent reduction in overall water use (Christie 2008).
Colorado
Colorado has long had active water markets. The data in Table 4-3 show that Colorado, Utah, and New Mexico have had large numbers of permanent water transfers.
Table 4-3: Total Number of Change-of-Water-Right Applications by State, 1975 – 1984
State Number of Applications Filed
Arizona 30 California 3 Colorado 858 New Mexico 1,133 Utah 3,853 Wyoming 40
Source: MacDonnell 1990
44

In addition to permanent sales of water rights, there have been many temporary transfers to accommodate short-term needs, especially in times of drought. During periods of drought, water banks of various types have been organized to facilitate short-term transfers. With regards to permanent water rights transfers, these types of transfers have primarily been from agriculture to municipal and commercial users.
Colorado’s water transfers are processed through a water court system, under which proposed transfers must be advertised and can be challenged by parties that perceive themselves to be injured by the transfer. Colorado’s reliance on a water court system for administering transfers results in high transaction costs associated with transfers; the transferor bears the burden of the transaction costs.
The establishment of a system to facilitate transfer of water rights, regardless of high transaction costs, has been beneficial to Colorado. It has allowed water to move from lower-valued agricultural uses to higher-valued urban and commercial/industrial uses.
Similar to the California water market, transaction costs fall asymmetrically between sellers and buyers, with sellers/transferors responsible for the majority of transaction costs.
Idaho
Idaho has the longest running water-supply bank, which was authorized in 1979. Idaho has a state-wide water supply bank and three separate rental pools that operate as separate banks. The Idaho Water Resource Board determines the rental rate for the bank and pools to lease water. The three rental pools are situated in watersheds where water is stored in reservoirs and can be released as it is rented. The water-supply bank deals with natural flow water rights and groundwater, as compared with stored water that is rented from the rental pools.
New Mexico
Prior to 2003, in contrast to Colorado and California, applications for new appropriations and for permanent water right transfers were made through the Office of the State Engineer. This office has the technical skills to determine whether or not the new appropriation of the requested transfer will adversely affect other water users. The state engineer’s office can then approve or modify the request; buyer and sellers can appeal decisions through the courts if they disagree with the determination of the state engineer. Typically, the determinations of the state engineer are accepted without appeal. The New Mexico system has relatively low transactions costs when compared to the Colorado water transfer system. Legislation in 2003 authorized two pilot water banks, one to be managed by the state engineer and the other by the New Mexico Interstate Stream Commission.
Transaction costs for the buyer or seller/transferor depend on the system each region or state adopts. Regions that rely on courts to facilitate water transfers will incur higher transaction costs than those that operate through state engineers’ offices or state-managed water banks. Regardless of the type of organization used to match sellers and buyers of the natural resource, it is likely the seller will incur the largest portion of transaction costs.
45

46
This page intentionally left blank.

5. ASSESSING THE DROUGHT RESILIENCE OF POWER PLANTS
As described in Section 3, the resilience of power plants to drought is a combination of two primary factors: the availability and stability of the plant’s water supply and the quantity of water required for plant operations. Section 4 assessed the water supply by analyzing drought frequency data to determine the vulnerability of plants to drought, and in this section, that analysis is combined with power plant data to further analyze drought resilience.
Figure 5-1 shows the distribution of power plants around the country, by prime mover,8 along with the frequency of severe and extreme drought from the period 1985 to 2008. The West and Northeast contain many hydroelectric plants, while the Midwest is dominated by fossil fuel plants. Both of these types of plants are vulnerable to drought conditions. Hydroelectric plants rely on water levels either in reservoirs or run-of-river waters to be able to produce power. In many cases, these plants are used primarily for peaking power or providing additional electrical generation when demand is high. Demand is likely to be high during summer months, which is precisely when drought will be more prevalent, creating a tension between the need to produce additional power and the need to cut back on water usage.
Figure 5-1: Nationwide Power Plants
8 The primary technology that drives an electric generator, or converts energy to electricity
47

Figure 5-2 shows the power plants in regions that suffered from severe or extreme drought in at least 20 percent of the observations from 1985 to 2008. This region contains 784 power plants. Several of the power plants in the region have little to no dependency on water usage, including solar and wind turbine plants. Once these plants are removed from the analysis, 656 plants remain at risk. The details of the types of at-risk plants in region at risk can be found in Table 5-1.
Figure 5-2: Power Plants in Frequent Severe and Extreme Drought Regions, 1985 – 2008
Table 5-1: Power Plants in Risk Area by Prime Mover and Primary Fuel
Prime Mover Number of Plants Primary Fuel Combined cycle 69 Natural gas Fuel cell electrochemical 3 Hydrogen Gas combustion turbine 102 Natural gas Geothermal steam turbine 44 Geothermal steam Hydro 279 Water Internal combustion 75 Natural gas Nuclear 2 Uranium Solar 25 Solar Steam turbine 85 Coal/natural gas Wind 100 Wind
48

Additional water usage data, or at least data on cooling mechanisms, are necessary for Sandia to complete the resilience assessment of the power plants. These data are needed to cross link with the plant type and drought information. Sandia was only able to acquire water usage data on a few dozen of the more than 650 plants in high-frequency severe and extreme drought regions; therefore, we are not able to recommend specific plants for more in-depth analysis. With additional data either from DOE or from power plant personnel, Sandia would be able to make recommendations on which specific power plants merit further analysis.
In place of specific plant recommendations, Figure 5-3 contains examples of different types of power plants and their relative resilience to drought. This figure is intended only to be illustrative of possible assessment results.
Figure 5-3: Example Results for Assessment of a Power Plant’s Resilience to Droughts
49

50
This page intentionally left blank.

6. MITIGATING POLICY OPTIONS Preparation for periods of drought is an important problem for water service agencies, households, and industry. Even under normal weather conditions, rapidly growing populations, environmental concerns, and expanding industries are increasing pressure on local water supplies. State and local governments are searching for policies to deal with the risks linked with uncertainty in water supplies and increasing demands.
6.1. Price and Non-price Restrictions on Water Use
Demand-side management (DSM) policies can be used to manage existing water supplies during drought. These non-price policies do not affect the residential price of water, but place direct controls on water use, such as rationing through varied means. Rationing, instituted as a strict policy where households are entitled to a fixed amount of water and then cut off from service, would likely prove unacceptable because water is considered a basic necessity. Non-price policies that decrease household demand for water are include water restrictions on selected uses, education campaigns to encourage voluntary conservation, and subsidies for adoption of water-efficient technologies. Water agencies could ban selected uses of water by prohibiting landscape irrigation or restricting watering of landscaping to selected days or times of day. Education campaigns could encourage particular types of watering techniques such as the use of hand irrigation or drip systems. Education could also inform households of the ideal time of day for outdoor water use as well as encourage overall changes to water-use behavior. Subsidy programs could offer rebates for the installation of low-flow toilets and low-flow showerheads, and, in the desert southwest, switching from swamp coolers to refrigerated air conditioners, using high Center for Energy and Environmental Resources (CEER)-rated compressors.
Price policies could be effective in curbing household water use by providing a monetary penalty/incentive for amounts of water use. Water agencies could implement a price policy that would move households from fixed, per unit, uniform rates to a moderately increasing block-price schedule. Another option would be to give each household a specific water allocation, with penalties for noncompliance. Price policies are considered regressive, because lower income households have a larger portion of their income allocated for water consumption than higher income households. Higher income households could also choose to simply pay penalties for non-compliance.
Demand-side water management non-price and price restrictions were implemented in California during the statewide drought from 1985 to 1992. Many policy instruments were used during this time, allowing for observation of consumer behavior to various policy instruments. Analyses of consumer behavior have been conducted for the communities of Santa Barbara and Goleta, selected for their differing policy regimes and socio-economic characteristics (MacDonnell 1990). Both communities used increasingly strict price and non-price policies to reduce demand. Household survey data, utility water use data, and price data were collected for these communities.
In 1986, Goleta promoted rebates for substituting new low-flow toilets for traditional toilets in homes and businesses; in 1987, the program was expanded to include low-flow showerheads. In 1988, Santa Barbara introduced a program dispensing free low-flow showerheads and rebates for replacing traditional toilets for low-flow toilets. In 1989, as the drought progressed, DSM price
51

restrictions were introduced in both Santa Barbara and Goleta. Santa Barbara moved away from fixed per-unit uniform water rates to a moderately increasing block-price schedule. The pricing strategy for Goleta was based upon historical usage patterns; each household was entitled to a base water allocation per year, with marginal price penalties for households exceeding their allotment. In 1990, as water shortages grew more severe, more aggressive policies were needed to curb water demand. Santa Barbara prohibited some water uses such as all landscape irrigation and drip systems; a second price strategy of steeply increasing price blocks replaced the prior pricing strategy. Goleta responded to increased water scarcity by returning to uniform pricing rates, but at higher rates; specific water users were not penalized for their water usage.
During the 1985 – 1990 drought and DSM period, water demand trended downward. In Goleta, lower income households reduced their water consumption the most, while in Santa Barbara, higher income households reduced their consumption the most. For both Goleta and Santa Barbara, water demand declined for households with large yards. In the short run, it was found that a 10-percent increase in water price reduced aggregate demand by 3.3 percent. Because of the price changes, average household demand over the drought period fell 9.3 percent in Santa Barbara and 26.2 percent In Goleta. In the long run, for both Santa Barbara and Goleta, a 10-percent increase in prices resulted in a 3.9-percent reduction in demand (Archibald and Renwick, 1998b).
Across both locations, households with lower incomes responded more to higher water prices than wealthier household groups. For low income households, a 10-percent increase in water prices resulted in a 5.3-percent reduction in demand for water. Moderate to high income households decreased their demand by 2.2 percent. Wealthy households decreased their demand by the smallest amount, 1.1 percent.
In both Goleta and Santa Barbara rebate programs promoting low-flow showerheads and toilets decreased household water demand by 8 percent. Changes in irrigation technology reduced household water demand by 11 percent (Anderson 2008).
Non-price and price restrictions on water use for residential consumers will not have a cost impact for industrial users of water supplies.
6.2. Improve Agricultural Efficiency through Changes in Agricultural Techniques and New Technology
Drought and shrinking groundwater and surface water supplies are pressing consumers of water to make water supplies go further. As much as 70 percent of water used by farmers never makes it to the crops (The Economist 2008). The amount of water applied to crops can be adjusted, irrigation efficiency can be increased by better irrigation management, and land can be left idle. Farms with abundant and inexpensive water supplies often substitute water use for labor, management, or irrigation system investment.9 Farms can switch from being completely reliant on groundwater or surface water sources to reliance on recycled water; recycling facilities can be
9 When water is less expensive than labor and management, farming operations will choose not to employ laborers
or farm management to monitor when crops and soil are in need of water and will, instead, water whether it is necessary or not.
52

built onsite and are typically complete within 2 years, which satisfies the 3-year-or-less criteria for our definition of short-term policy options.
Water is often lost by leaking irrigation channels, draining into rivers, or seeping back into groundwater. Improved irrigation efficiency would result in increased groundwater and surface water supplies for all users. Irrigation efficiency is a measure of the effectiveness of an irrigation system in delivering water to a crop and the effectiveness of irrigation in increasing crop yields. Water losses can be easily averted by switching to drip irrigation or repairing irrigation systems. All irrigation is subject to some amount of water loss; the intent of improved agricultural efficiency is to promote low-cost mitigating technologies that benefit agricultural, urban, and industrial users of water supplies.
Interruptible water markets would allow some water to move from irrigation to hydropower use in critical flow periods. Typically, irrigation use has priority regardless of how little remains for other uses when stream/river flow is low. Irrigation could still use the water in most years, but in dry periods, irrigation users would give up some water to maintain stream/river flows and power supplies. Hamilton and others believe interruptible water markets would require long-term contractual commitments, 20 to 25 years, to produce the most hydropower benefits (Hamilton, et al. 1989). Hamilton and others explain that these are long-term contracts because water supplies can range from normal to only half of normal consumptive use; for farmers, market participation would be an added source of uncertainty.
Recycled water is used in agriculture in many different parts of the world. The levels of treatment vary from almost no treatment to water that meets standards for drinking water. Recycled water comes from the urban sewer system and it goes through several purification treatments. The number and types of treatments the water receives determine the final quality of the water. Typically, water is put through two processes (secondary treatments) or three processes (tertiary treatments) and is then disinfected with chlorine, ultraviolet light, or reverse osmosis. California law (CCR Title 22, Chapter 3) currently allows tertiary-treated water and disinfected water to be used on all edible food crops.
In 2006 Watsonville, California, began building the Watsonville Recycled Water Facility (RWF) for agricultural use. The Watsonville RWF project is a joint project of the city of Watsonville and the Pajaro Valley Water Management Agency to reduce current levels of groundwater pumping and associated problems of seawater intrusion, while maintaining existing agricultural uses in the Pajaro Valley (Santa Cruz and Monterey counties). The Watsonville RWF was completed in December of 2008; it will provide 1.7 billion gallons of treated wastewater to local farmers every growing season (Anderson 2008). The planning for this project took approximately 8 years; with construction being complete in just 15 months. The combined cost of the RWF and its coastal distribution system was $65 million, with half paid through grants (Anderson 2008).
Improved agricultural efficiency is a relatively expedient way to lessen the impact of droughts. The associated costs of improved efficiency are the burdens of farmers or local municipalities. Those that benefit from improved agricultural efficiency are farmers, urban communities, and commercial/industrial users, particularly those reliant on water supplies for their processes. Commercial and industrial users incur no costs from improved agricultural efficiency; in fact, their water supply costs may decrease if improved agricultural efficiency results in increased groundwater and surface water supplies.
53

6.3. Use Reclaimed Water in Electric Power Generation as a Substitute for Traditional Sources of Water
The original source of reclaimed water is treated waste water that was once potable water. The significant difference being, total dissolved solids, which are typically higher in reclaimed water than in potable water. Differences in fresh water and reclaimed water qualities could make direct substitution for process cooling problematic. Potential users of reclaimed water would have to evaluate the possible effects of using reclaimed water on cooling system equipment protection and life expectancy because of cooling water-related corrosion, scaling, deposition, and bio-fouling (ANL 2007).
The City of Burbank Generating Station in Burbank, California, has six generating units. Cooling tower systems are used to cool the steam surface condensers. The City of Burbank Generating Station has used reclaimed water from the City of Burbank Waste Treatment Plant since 1966 (CCR Title 22, Chapter 3). Five of the six generating units use reclaimed water. Failures of copper tubing have reportedly been minimal; however, the use of reclaimed water at the City Burbank Generating Station has resulted in a chemical cost increase of approximately 20 percent (Selby 1996).
The Los Angeles Department of Water and Power’s (DWP’s) Scattergood Generating Station has three generating units. All three units use seawater for condenser cooling, but use an evaporating cooling tower system for service water. Scattergood makes use of seawater rather than potable water and is investigating incorporating the use of reclaimed water.
The costs for a cooling water treatment program, when supplied by a water treatment service company, depend upon a number of factors, including site-specific water equipment qualities, cooling system operation, and special client-vendor arrangements. A general cost estimate can be developed based on knowledge of the chemical costs, obtained from chemical suppliers, and chemical usage relative to cooling system water and equipment requirements. Reclaimed water contains phosphate and nitrate; these excessive phosphate levels could increase polymer costs by 20 to 50 percent (Selby 1996). Another factor is the cost of reclaimed water, which may be lower than potable water. In general, the entity responsible for generating electric power will also be responsible for the cost of using reclaimed water in the electric power generation process. The time required for switching technologies and the cost of implementing this technology may prove prohibitive.
6.4. Actions that Conserve Electricity and Water
Electric generation facilities that use water for cooling and/or for raising steam to produce electricity can conserve water by directly reducing the demand for or consumption of electricity.10 In a short-term scarce water environment, electric utilities may need to examine all the options available to satisfy customer demand. There are several options that can be used to reduce electricity demand or consumption within the relevant 3-year timeframe. Many of these
10 There is also an opportunity to change to technologies that don’t use water in the production of electricity and that
is one of the options suggested below. However, for some technologies, the planning and construction lead times are too long to fit the maximum three year criterion.
54

options can be implemented relatively rapidly and at relatively modest cost. Several of these options are discussed in the following sections:
While the savings for each individual residential, commercial, or industrial location might be modest, when added up across the community, service territory of a utility, or the whole country, these savings can add up to significant savings of electricity.
• Managing the Demand Side: During the 1980s and 1990s, the concept of DSM was widely discussed among electric utilities and energy experts, leading to implementation of DSM programs by electric utilities. The fundamental idea behind DSM is that reducing overall electricity demand and, in particular, the timing of that demand over the day or season, could be achieved at lower cost-per-unit output than the alternative strategy of increasing supply. This idea emanates from the significant peak in demand evidenced for electricity. Capacity is required to service peak demand during 4 to 8 hours each day and sits idle at other times. If the difference between peak and average demand could be reduced, not only could electric utilities be more profitable, but less capacity would be required.
DSM programs include a wide array of possible actions that can be taken by end-use consumers of electricity. These actions, often induced by changes in utility policies and procedures and prices, include everything from window replacement and insulation programs to peak-load pricing of electricity to shift demand from peak consumption times to off-peak times. Some states forced the implementation of these programs as early as the mid-1970s in response to the first energy crisis (Eto 1996). While these programs fell out of favor towards the late 1990s and early 2000s, they may now be returning to favor, but in a different form. Regulated electric utilities were not particularly enthusiastic adherents to DSM programs, possibly because a reduction in consumption reduced revenues and the need for new plant capacity. In a rate-of-return regulatory environment, the more capital that is in the rate base, the more profits that are earned by the utility.
• Extending and/or Reauthorizing Federal Tax Credits for Installation of Alternative Energy Technologies: Solar power and wind power are rapidly coming closer to being cost-competitive with traditional coal-fired, natural gas-fired, and nuclear power generation. In fact, if full-cost accounting for carbon emissions were to be added to traditional electricity generation technology costs, it is likely that some alternative energy technologies would already be economically competitive. Nevertheless, given that there is no carbon-emissions legislation for traditional fossil fuels, tax credits could be used to accelerate implementation of alternative energy technologies. Already, many residential and commercial customers are installing photovoltaic solar collectors on businesses and homes (Rosenbloom 2008). Wal-Mart, Kohl’s, Safeway, and Whole Foods Market are among the retailers already installing such systems. This trend was accelerating during late 2008, even considering the (then) uncertainty surrounding the continuation of incentive programs.11 Some commentators have indicated that the possibility of loss of incentives is what is motivating the acceleration. However, the rate of implementation is
11 Federal incentives have since been renewed.
55

indicative of the potential to make significant contributions to electricity supply with no increase in water consumption is readily apparent.12
• Promoting and Creating Incentives for Electricity Conservation: Electric utility companies may already have incentive programs to encourage their customers to weatherize and winterize their homes and businesses. Expanding and extending programs for window replacement, insulation, and installation of shades and shutters could pay dividends by direct reductions of electricity and natural gas consumption. These programs have the potential to reduce electric consumption within the timeframe of interest. Weatherizing and winterizing can save energy in both summer and winter. In summer, less leakage of cool air through window and door openings will save cooling costs. Shading windows from summer sun, by using special sun screens on the outside of windows, awnings, or overhangs, helps to conserve cooling costs. In winter, improved windows and doors save mostly natural gas and oil for home heating, but can also save electricity as fans for furnaces that distribute warm air run less.
• Promoting conversion of incandescent to fluorescent light bulbs: Incandescent light bulbs use only about 20 percent of the electricity they consume to produce light. The remaining electricity becomes heat, which then adds to space cooling load. In winter, the excess heat may actually displace some natural gas or other space-heating fuel consumption. Accordingly, significant electricity can be conserved by making the substitution. Incentives and promotions can be developed to encourage people to make the replacements.
• Promoting lower thermostat settings in winter and higher settings in summer: Natural gas is a main fuel for home heating in winter. Dropping the thermostat a few degrees can save significant energy. In summer, electricity drives the compressors that provide air conditioning. Increasing thermostat settings can significantly reduce peak electricity consumption during summer afternoons and early evenings. Shaving the peak demand reduces the marginal capacity requirement for a summer peaking system.
For example, each lower degree setting of a thermostat in the winter and higher degree setting in the summer is approximately equivalent to 1 percent of a typical energy bill (Bond 1999). The following steps result in an estimate of the potential electric energy saved:
1. The Energy Information Administration (EIA) estimates that U.S. national average residential monthly energy consumption is 920 kilowatt-hours for 122.5 million customers, for a total national monthly consumption of 112.6 trillion kilowatt-hours of electricity (EIA 2009).13
2. One percent of the national monthly consumption calculated in step 1 is the potential savings from reducing thermostats by 1 degree, or 11.3 billion kilowatt-hours of electric consumption.
12 In September 2008, Congress authorized the extension of the existing tax credits. 13The average price was 10.4 cents per kWh in 2006 and average monthly expenditure was $95.66.
56

3. Dividing 11.3 billion kilowatt-hours from step 2 by the number of hours in a month (720) yields 156.5 million kilowatts; this is the number of kilowatts of output per month that could be saved by reducing all residential thermostats 1 degree.
4. This is equivalent to 156.5 thousand megawatts, which is the customary metric in which electric plant capacities are frequently quoted. At an assumed 75-percent average duty factor for each electric plant, over 200 electric plants (each with 1,000 megawatts of capacity) would be required to produce this instantaneous quantity of output.
Seemingly minor adjustments to consumption can have enormous effects when aggregated over millions of consumers. Additional savings in the commercial and industrial consumer sectors would add significantly to this total.
6.5. A Changing Future for Investor-owned Utilities
The decade of the 1990s was an exceptional period of consistently steady economic growth for the U.S. economy and monetary management that kept a fairly stable price level during this period of growth. This era has been identified as one of the truly remarkable periods in U.S. economic history.14 World crude petroleum prices remained steady at reasonably comfortable low levels and energy prices generally were moderate. However, in the latter half of the decade, two issues arose that were to have a significant impact on investor-owned utilities (IOUs): “stranded costs” and the emerging recognition of global climate change and its root causes in the burning of fossil fuels.
The stranded-cost issue arose from the new technology of natural gas-fired combustion turbines that, at the time compared to coal and nuclear plants, were much easier to permit and faster to construct and, due to low natural gas prices, relatively low in fuel cost as well. These electric generation facilities were being planned by independent power producers (IPPs) whose existence had been contemplated by changes to energy policy regulations in the early part of the decade. In fact, IPPs were allowed to form precisely because the industry and energy policy makers expressed serious concern about the ability of the regulated utilities to increase generation capacity in response to increasing demand. IPPs are backed by private capital and exist outside the state electric utility regulatory environment. Nevertheless, regulated electric utilities were required, under the law, to purchase power from these facilities to avoid the cost of building coal and nuclear plants. The regulated utilities were concerned that these lower cost plants would “strand” their own coal and nuclear plants, which would become too expensive to operate. Therefore, utilities would be unable to pay off the debt incurred to build these plants. There is a direct correlation between the debate about stranded costs and the political forces demanding deregulation of the electric utility industry, including “unbundling” of generation, transmission, and distribution facilities to permit competition in parts of the industry. The Public Utility Regulatory Policies Act (PURPA) (16 U.S.C. §§ 2601 – 2645) was an additional factor causing IOUs concern for the financial soundness of their businesses. PURPA required alternative energy
14 Some analysts might argue that the seeds of the current financial troubles were sown in too liberal monetary
policies and lack of regulatory oversight of the financial industry that began at the start of the 90s decade. Nevertheless, inflation during this period was moderate.
57

technologies, such as wind and solar power, to compete as supply sources based on the concept of “avoided cost.” Avoided cost is defined as the marginal total cost of the next power plant facility in the utility’s stack of available generation technologies.
More or less concurrently, the debate among scientists regarding global climate change emerged from the scientific literature and made its way into the public media. The causes of climate change are ascribed largely to carbon emissions caused by burning of fossil fuels. Pressure built to require electric utilities to take action to reduce carbon emissions with wide discussion of the possibility of a carbon tax. The difficulty, and therefore cost, of building large coal plants increased accordingly. Alongside difficulties in building commercial nuclear power plants due to concerns about their safety, utilities were left with relatively few viable options to increase plant capacity to meet increasing demand. The 1990s closed with a number of states undertaking serious efforts to deregulate their electric power industries and to establish markets to permit competition in the generation sector and in the retailing of electricity. Problems arose with many of these deregulation plans, and today, there is a confusing mix of traditional rate-of-return regulation and the use of markets, particularly at the wholesale level, in the supply and distribution of electricity.
Early in the 2000s, the increased use of natural gas-fueled combustion turbines began to increase the demand for natural gas. In response, the price of natural gas rose. Historically, the bulk of natural gas consumption was for space heating and the fuel consumption was seasonal, peaking in the winter. More recently, a larger portion of consumption is attributable to electric power generation, leading to a more level yearly consumption. This has caused prices to increase and changed the relative economics of combustion turbines, coal-fired, and nuclear plants.
The concern about global climate change, sustainability, and improvement in the engineering economics of alternative energy sources, primarily wind and solar, is combining with several of these other trends to create a sort of perfect storm for regulated electric utilities. Because it is difficult to get new coal and nuclear plants permitted, IPPs are developing large wind energy projects and contracting with utilities for the power these facilities will produce. Several new solar plants developed under the IPP business structure are under construction or in the planning stages.
Meanwhile, the concept of “net metering,” which was required as a feature of the electricity deregulation provisions, has provided an opening for end-use customers to install photovoltaic cells and produce their own electricity, selling any excess into the grid. Thus, traditional electric utilities are squeezed from both ends and are becoming more like middle men who provide largely the transmission and distribution network to connect the IPPs that produce the supply and the end users. However, as more end users install photovoltaic cells, growth in demand for grid power is likely to decline.
6.6. Summary
It may appear that these policy options, which encourage conservation and energy efficiency, do not serve the interests of rate-of-return regulated electric utilities. After all, such business entities make their profits from the sale of electricity, and, the more electricity they sell, the greater their profits. While this may appear to be the case in the short term, in the long term, improving
58

energy efficiency probably works to the advantage of the utility companies. Several factors lead to this possibility:
• Increased volume of profits in dollar terms might not necessarily mean an increased rate of profit. Profit rate increases depend both on the growth curve of total cost as well as of total revenue. In the short term, especially if there is excess capacity, it may be possible to increase the rate of profits by expanding output at little or no increase in average cost. Thus, the spread between average total revenue and average total cost might be maintained and the profit rate maintained. Eventually, however, demand and consumption will grow, requiring the installation of new capacity. This will increase marginal cost as well as average cost and reduce the profit rate. This is precisely the factor that makes conservation and energy efficiency the most economical strategy for electric utilities, as well as for the economy as a whole. So long as new capacity is higher in marginal cost than the average cost of the plants currently on the system, delaying the installation of new capacity will be profitable for the firm and beneficial for the economy.
• Energy inefficiency is likely to never be a viable or sustainable long-term strategy for a firm or an economy. To find verification for this requires looking no further than the current status of the U.S. auto industry. For years, U.S. automakers persisted in producing large, heavy, fuel-inefficient vehicles that, nevertheless, appeared to be profitable in the short term. Meanwhile, many foreign manufacturers pursued a strategy of smaller and more fuel-efficient autos and were inexorably stealing market share in the domestic U.S. market. When gasoline prices spiked, the resulting dramatic decline in demand for the large vehicles brought U.S. auto companies to the brink of bankruptcy. Thus, what appeared to be a profitable short-term strategy was unsustainable when considered in light of the long term. Because we can expect energy prices to increase on a trend basis, it is unlikely that energy inefficiency would ever be a viable long-term strategy.
• Beyond the possibilities outlined in the previous two bullets, an emerging recognition by utility regulators of the need to provide incentives to utilities to promote electricity conservation is leading to the implementation of mechanisms to decouple utility sales (from selling electric power) from earnings (McCarthy 2005). A number of states, including Connecticut, California, Oregon, Maine, and New York, have modified their regulatory statutes to encourage electric utilities to promote conservation and renewable energy technologies by providing financial rewards when a utility increases consumer education and promotes investments in conservation programs and distributed generation. In California, an electric rate adjustment mechanism was developed to adjust actual revenues to a (presumably higher) amount that would reflect the effect of electricity not consumed as a result of conservation programs. The mechanisms vary, but an increasing number of states recognize that implementation of conservation and renewable results will be improved by aligning the utility’s interests with the interests of the wider jurisdiction.
6.6.1. A New Business Model for Electric Utilities
The business model for a successful and profitable electric utility industry has been evolving for at least the last decade and probably longer. The evolution of this model received a significant boost from the passage of PURPA in 1997. This opened the market for independent power
59

60
producers to develop electric generation facilities using private capital on a for-profit, non-regulated basis, and then enter contracts to sell the electricity to electric utilities. Today, many additions to generating capacity are developed by private capital, even those employing traditional steam-based technologies, using coal. Whether new nuclear generation capacity would be developed in this way isn’t clear, due primarily to the significant technology risk associated with the open nature of the nuclear fuel cycle. Generally, private capital would have a preference for technologies that have less risk associated with them, particularly when there are a number of viable alternatives.
Most of the alternative energy generation sites developed in recent years and currently under development use this business model, involving IPPs who then sell the electricity to IOUs for transmission and distribution. Firms adept at planning, developing, and managing wind farms, for example, seek markets for the electric power output and sign contracts with utilities to purchase some minimum level of output from the planned facility. They then use these contracts to obtain financing for the project. The output of the facility, over and above the contracted amount, can then be sold on a merchant basis.
A new arrangement and opportunity for installation of solar photovoltaic cells is currently emerging across the country. Some progressive electric utilities are, in effect, renting the rooftops of residential, commercial, and industrial buildings (Galbraith 2008). Frequently, an unregulated subsidiary of an electric utility holding company will engage these contracts, paying the owners a periodic rental for the space. A variation on this theme could have the subsidiary front the capital to purchase and install the cells, thereby earning interest on the loan. Other aspects of the business opportunity could be to charge the building owner a fee to manage the cells. A key aspect of this large area of infrastructure development is that new transmission and distribution lines do not have to be constructed. Connectivity of producers and consumers of electricity is already an aspect of this system and the distribution of production and consumption locations around a wide area can promote system stability as well as a system security benefit.
It seems likely that many similar opportunities will emerge in the future as the nation makes a concerted effort to reformulate its energy system across the board. Most of the policy and technology options discussed in this paper are applicable to steam-powered plants, using water-based cooling technology located anywhere in the country. Sandia’s focus has been predominantly on the western United States because that is where the drought conditions normally seem to exist. However, the drought maps contained in this report clearly indicate that droughts are possible east of the Mississippi River. While water-allocation mechanisms are somewhat different in the eastern United States, it is likely that mechanisms for transfer and re-allocation are available and would simply need to be exercised.

7. REFERENCES Anderson, Eric, 2008, “Water Recycling Project about 95 Percent Complete,” Pajaro Valley
Register, October 9
ANL (Argonne National Laboratory), 2007, “Use of Reclaimed Water for Power Plan Cooling,” August
Archibald, Sandra O., and Mary Renwick, 1998a, “Expected Transaction Costs and Incentives for Water Market Development,” in Easter, William K., et al., Markets for Water: Potential and Performance, Kluwer Academic Publishers, 95-117
Archibald, Sandra O. and Mary Renwick, 1998b, “Demand Side Management Policies for Residential Water Use: Who Bears the Conservation Burden?” Land Economics, 74(3): 343-359
Bond, Annie B., 1999, “10 Tips for the Thermostat: Your Key to Savings,” Care2, August 21, 8:23 am, http://www.care2.com/greenliving/10-thermostat-tips-save-money.html
CCR Title 22, Chapter 3, Safe Drinking Water and Toxic Enforcement Act of 1986, California Code of Regulation
CEC (California Energy Commission), 2002, “Comparison of Alternate Cooling Technologies for California Power Plants: Economic, Environmental and Other Tradeoffs, Public Interest Energy,” 500-02-079F, February
CEC (California Energy Commission), 2006, “Cost and Value of Water Use at Combined cycle Power Plants,” CEC-500-2006-034, April
Cohen, G.E., D.W. Kerney, and G.J. Kolb, 1999, “Final Report on the Operation and Maintenance Improvement Program for Concentrating Solar Power Plants,” SAND99-1290, Sandia National Laboratories, Albuquerque, New Mexico, June
Changnon, S.A., 1989, “The 1988 Drought, Barges, and Diversion,” Midwestern Climate Center Illinois State Water Survey, Champaign, Illinois, 1989
Christie, Jim, 2008, “California water bank in works amid drought.” Reuters Online Edition, September 4, 2008
DOE (U. S. Department of Energy), 2002, “Energy Penalty Analysis of Possible Cooling Water Intake Structure Requirements on Existing Coal-Fired Power Plants,” National Energy Technology Laboratory, Argonne National Laboratory, October
DOE (U. S. Department of Energy), 2007, “Energy Demands on Water Resources: Report to Congress on the Interdependency of Energy and Water,” U. S. Department of Energy, Washington D.C., January
EPRI (Electric Power Research Institute), 2002a, “U.S. Electricity Consumption for Water Supply and Treatment- the Next Half Century,” Water and Sustainability (Volume 4), No. 1006787, Electric Power Research Institute, Palo Alto, California
EPRI (Electric Power Research Institute), 2002b, “U.S. Water Consumption for Power Production- the Next Half Century,” Water and Sustainability (Volume 3), No. 1006786, Electric Power Research Institute, Palo Alto, California, March
61

EIA (Energy Information Administration), 2006, “Annual Energy Outlook 2006: With Projections to 2030,” Energy Information Administration, Washington, D.C., February
EIA, (Energy Information Administration), 2007, “Electric Power Annual with Data for 2006,” Energy Information Administration, Washington, D.C., October
EIA (Energy Information Administration), 2009, “Table 5. U.S. Average Monthly Bill by Sector, Census Division, and State 2007,” report released January 2009, http://www.eia.doe.gov/cneaf/electricity/esr/table5.html
Eto, Joseph, 1996, “Utility Demand-Side Management Programs,” Environmental Energy Technologies Division, Ernest Orlando Lawrence Berkeley National Laboratory, University of California, Berkeley, California, December
Explanation of the US Drought Monitor, http://drought.unl.edu/dm/classify.htm
Silviera, Ken, “Final RWF Project Statement,” Ken Silviera, Manager, Wastewater Treatment Facilities, City of Watsonville, City Manager, Carlos Palacios
Galbraith, Kate, 2008, “Duke Energy to Rent Rooftops,” Green, Inc. Energy, the Environment and the Bottom Line, December 11, http://greeninc.blogs.nytimes.com/2008/12/11/duke-energy-to-rent-rooftops/
Gardner, R.L., “The Potential for Water Markets in Idaho,” Idaho Economic Forecast 7(1985):27-34
Hamilton, Joel R., Norman K. Whittlesey, and Philip Halverson, 1989, “Interruptible Water Markets in the Pacific Northwest,” American Journal of Agricultural Economics, 71(1): 63-75
Hanak, Ellen, 2002. “California’s Water Market, by the Numbers,” Public Policy Institute of California, prepared for the Department of Water Resources, October
Hoffman, J., S. Forbes, and T. Feeley, 2004, “Estimating Freshwater Needs to Meet 2025 Electricity Generating Capacity Forecasts,” National Energy Technology Laboratory, June
Howe, Charles W., 1998, “Spot Prices, Option Prices, and Water Markets: An Analysis of Emerging Markets in California,” William K., et al. Markets for Water: Potential and Performance, Kluwer Academic Publishers, 11-140
Howitt, Richard, N. Moore, and R.T. Smith, 1992, “A Retrospective on California’s 1991 Emergency Drought Water Bank,” California Department of Water Resources, Sacramento, Caifornia
Howitt, Richard, 1998, “Expected Transaction Costs and Incentives for Water Market Development,” In Easter, William K., et al. Markets for Water: Potential and Performance, Kluwer Academic Publishers, 95-117
Hutson, S.S., N.L. Barber, J.F. Kenny, K.S. Linsey, D.S. Lumia, and M.A. Maupin, 2004, “Estimated Use of Water in the United States in 2000,” Circular 1268, United States Geological Survey, Washington, D.C., March
Leitner, A., 2002, “Fuel from the Sky: Solar Power’s Potential for Western Energy Supply,” NREL/SR-550-32160, National Renewable Energy Laboratory, Golden, Colorado, July
62

MacDonnell, Lawrence J., 1990, “The Water Transfer Process as a Management Option for Meeting Changing Water Demands,” Natural Resources Law Center, School of Law, University of Colorado, Boulder, Colorado
McCarthy, Kevin E., 2005, “Decoupling Utility Sales and Earnings,” OLR Research Report, 2005-R-0702, October 3, http://www.cga.ct.gov/2005/rpt/2005-R-0702.htm
Michelsen, Ari M., and Robert A. Young, 1993, “Optioning Agriculture Water Rights for Urban Water Supplies During Drought,” American Agriculture Economics Association, 75: 1010-1020
NCDC (National Climactic Data Center), “Time Bias Corrected Divisional Temperature-Precipitation-Drought Index,” http:://www1.ncdc.noaa.gov/pub/data/cirs/drought.README
NCDC Climate Monitoring Data, “Index of Pub/Data/Cirs,” http://www1.ncdc.noaa.gov/pub/data/cirs/
Nieswiadomy, Michael L., and David J. Molina, 1989, “Comparing Residential Water Demand Estimates under Decreasing and Increasing Block Rates Using Household Data,” Land Economics 65(3): 281-289.
Powicki, C.R., 2002, “The Water Imperative,” in EPRI Journal, July.
Renwick, Mary, Richard Green, and Chester McCorkle, 1998, “Measuring the Price Responsiveness of Residential Water Demand in California’s Urban Areas,” Prepared for the California Department of Water Resources, May
Rosenbloom, Stephanie, 2008, “Giant Retailers Look to Sun for Energy Savings,” NY Times Online Edition, August 11
“Running Dry,” The Economist, September 18, 2008, website http://www.economist.com/world/international/displaystory.cfm?story_id=12260907
Schlumberger Limited, 2008, “Global Climate Change and Energy, Alternative Energy Sources: Hydroelectric Power,” website http://www.seed.slb.com/en/scictr/watch/climate_change/alt_hydroelectric.htm, accessed May 19
Selby, Anthony K., Paul R. Puckorius, and Kris R. Helm, 1996, “The Use of Reclaimed Water in Electric Power Stations and Other Industrial Facilities,” Water, Air, and Soil Pollution, 90: 183-193, July
SNL (Sandia National Laboratories), 2007, working draft of “Energy Water Challenges and Research and Development Priorities,” Albuquerque, New Mexico, August 8
TVA (Tennessee Valley Authority), 2008a, “Hydroelectric Dam Diagram,” website http://www.tva.gov/power/hydroart.htm, accessed May 19
TVA (Tennessee Valley Authority), 2008), “Pumped Storage Facility Diagram,” website http://www.tva.gov/power/pumpstorart.htm, accessed May 19
U. S. Water News Online, 2006, “Low Water Levels Starting to Affect Mississippi River,” website http://www.uswaternews.com/archives/arcsupply/6lowxwate9.html, accessed May 27
63

64
Visclosky, P.J., D.L. Hobson, H. Reid, and P. Domenici, 2004, Letter to Secretary of Energy Spencer Abraham, dated December 9, 2004, Washington, D.C., December
Wolken, L., 2006, “On-going Drought Threatens Missouri River Navigation,” Missouri Digital News website http://www.mdn.org/2006/stories/barge2.htm, accessed May 27
33 U.S.C. (United States Code) §§ 1251-1387, Federal Water Pollution Control Act (Clean Water Act), October 18, 1972, as amended 1973-1983, 1987, 1988, 1990-1992, 1994, 1995 and 1996
16 U.S.C. (United States Code) §§ 2601 – 2645, Public Utility Regulatory Policies Act, Title 16, Chapter 46, 1978, as amended

APPENDIX A: DISCUSSION OF RECENT SOUTHEAST DROUGHT From May 2007 through March 2008, much of the southeastern region of the United States saw an unusual level of drought, with Alabama seeing its driest year on record and the Atlanta area the second-driest on record.15 Analysis of drought data from 1995 through 2008 shows that even in recent years, as the west saw very high levels of severe and extreme drought, very few regions in the southeast were affected. Table A-1 shows the climate regions in Alabama, Florida, Georgia, Mississippi, and Tennessee that saw severe and extreme drought at least 20 percent of the time at some point between 1995 and 2008. With the exception of the highlighted regions (North Central Florida and West Central Georgia), the area saw very little severe or extreme drought until the 2005 to 2008 period. The majority of the regions saw little to no instances of severe or extreme drought before that period.
Table A-1: Southeast climate regions with at least 20-percent severe or worse observations
from 1995 to 2008 by percent of observation per time period
Name State 1995-2008 1995-1999 2000-2004 2005-2008 Appalachian Mountain AL 11% 0% 5% 35% Northern Valley AL 11 0 7 35 Eastern Valley AL 11 0 5 35 Upper Plains AL 9 0 5 28 Piedmont Plateau AL 10 0 7 30 Gulf AL 13 0 22 18 North FL 15 5 12 35 Northwest FL 11 2 5 33 North Central FL 28 27 25 35 Northeast GA 16 0 20 35 North Central GA 6 0 0 23 Northwest GA 11 0 5 35 East Central GA 9 3 20 0 West Central GA 30 18 35 40 South Central GA 11 0 5 35 East Central MS 9 0 8 23 Coastal MS 13 0 20 20 Eastern TN 7 0 0 28 Cumberland Plateau TN 8 0 0 33 Middle TN 8 0 5 23
Figure A-1 through Figure A-4 show the frequency of severe and extreme drought across the United States from 1995 to 2008 and broken up into five year increments, this data set
15 http://www.usatoday.com/weather/drought/2008-03-28-southeast-drought-eases_N.htm
65

is a subset of the data discussed in Section 4.1. Even the two climate regions that saw the most frequent occurrences of drought in the southeast are eclipsed by the frequency of drought in the west and barely visible in the data set.
Figure A-1: Severe and Extreme Drought Frequency by Percent of Observations, 1995-2008
66

Figure A-2: Severe and Extreme Drought Frequency by Percent of Observations, 1995-1999
67

Figure A-3: Severe and Extreme Drought Frequency by Percent of Observations, 2000-2004
68

Figure A-4: Severe and Extreme Drought Frequency by Percent of Observations, 2005-2008
69

This page intentionally left blank.
70

71
DISTRIBUTION 1 Kenneth Friedman US Department of Energy (electronic distribution) 1 Alice Lippert US Department of Energy (electronic distribution) 1 Carissa Vandermey US Department of Energy (electronic distribution) 2 MS0899 Technical Library 9536