flood mitigation
121
Flood Disaster and Its Impacts In Malaysia Department of Irrigation and Drainage Malaysia 13 October 2008 2 nd International Course on Flood Mitigation and Stormwater Management 2008
-
Upload
independent -
Category
Documents
-
view
5 -
download
0
Transcript of flood mitigation

Flood Disaster and Its ImpactsIn Malaysia
Department of Irrigation and DrainageMalaysia
13 October 2008
2nd International Course on Flood Mitigation andStormwater Management 2008

CONTENTS OF PRESENTATION
1. Flooding scenario – world perspective2. Flooding scenario – local3. Causes of Flooding4. Flood solution currently practised5. Conclusion

Floods are normal occurrences for the people of south Asia.Every year, floods destroy crops and displace the region'sinhabitants. Floods are both a hazard and an asset. While thefloods are drowning crops and livestock, and damagingproperty, they are also fertilizing the soil in the form ofdissolved and suspended solids.

FLOOD SITUATION IN THE WORLDCURRENT FLOODING
Source: Dartmouth Flood Observatory

2007 Global Register of Major Flood Events
Country Locations Rivers Dead Displaced Damage(USD)
mainCause
Affected sqkm
Notes andComments
Bolivia Central andeasternBolivia -Santa Cruz,Tarija,Cochabamba, Potosí,Chuquisaca, Beni(Trinidad),La Paz,Oruro,Pando.
Rio Grande,Pilcomayo,San Juan delOro, Bermejo,Pirai.Mamore,Secure,Isiboro, Beni,Maniqui
41 62687 90,000,000 Heavyrain
801,000
Harsh rainy seasondue to El Ninocauses flooding -Bolivian governmentdeclares a nationalemergency onJanuary 18. 52,687homeless. 350,000affected by floods asof February 23.Thousands homesdestroyed ordamaged.Santa Cruz- At least 7 deathssince December.210,000 hectareshectares of cropsdestroyed.Beni -22,000 cattledrowned. Capital cityTrinidad under water.Most of Beniinundated. Worstfloods in Trinidad in25 years.
Source: http://www.dartmouth.edu/~floods/Archives/2007sum.htm

Country Locations Rivers Dead DisplacedDamage(USD)
mainCause
Affectedsq km
Notes andComments
Malaysia Johor -KotaTinggi,BatuPahat,Kluang,JohorBaru,Segamat,Mersing,Muar andPontian.--Pahang -Rompin,Raub,Lipis,Kuantan,Temerloh.
Johor - SungaiJohor. Bekokand Sembrongdams. SungaiSemberong.--Pahang -SungaiSetajam andSungaiKampungBukit Seruk
2 148,000 425,000,000 Monsoonal Rain
26,380 January 15 - 72hours of torrentialrain rain causessecond wave offlooding in Johor,just as floodsfrom event 2006-229 werereceding.110,000evacuated. KotaTinggi under 3meters of water,worst floods intowns history.January 21 - thenumber ofevacuatedpeople in Pahangrises to 672.Agriculturedamage from2nd wave offloods expectedto be worse thanfirst wave (2006-229)
Cont’d 2007 Global Register of Major Flood Events
Source: http://www.dartmouth.edu/~floods/Archives/2007sum.htm

Source: Dartmouth Flood Observatory

No. ofEvents Killed Total Affected DamageUS (000s)
Drought Drought 1 - 5000 -
ave. per event - 5000 -
Earthquake (seismic activity) Tsunami 1 80 5063 500000
ave. per event 80 5063 500000
Epidemic Bacterial Infectious Diseases 4 19 662 -
ave. per event 4.8 165.5 -
Viral Infectious Diseases 7 491 28765 -
ave. per event 70.1 4109.3 -
Flood Unspecified 16 193 790396 75100
ave. per event 12.1 49399.8 4693.8
Flash flood 6 36 151600 23000
ave. per event 6 25266.7 3833.3
General flood 15 134 325307 978000
ave. per event 8.9 21687.1 65200
Mass movement dry Landslide 4 152 285 -
ave. per event 38 71.3 -
Storm Local storm 1 2 155 -
ave. per event 2 155 -
Tropical cyclone 2 272 6291 53000
ave. per event 136 3145.5 26500
Wildfire Forest fire 4 - 3000 302000
ave. per event - 750 75500
Source: "EM-DAT: The OFDA/CRED International Disaster Database
SUMMARIZED TABLE OF NATURAL DISASTERS IN MALAYSIA FROM1900-2008

A PARAMILITARY POLICEMAN RESCUES A MAN TRAPPED DURING A FLOOD INGUANG'AN, SOUTHWEST CHINA'S SICHUAN PROVINCE. SUMMER FLOODS HAVE
KILLED MORE THAN 500 PEOPLE AND DISPLACED HUNDREDS OF THOUSANDS.[REUTERS]JULY 2007
500 dead in flood-ravaged China

RESIDENTS SURVEY THE DAMAGE TO HOUSES THAT COLLAPSED DURING THEFLOODING IN GUANGAN.

WOMAN IN FLOOD IN BANGLADESH

THIS SHOPKEEPER IN DHAKA, BANGLADESH, DECIDED TO STAY OPENED
DESPITE HIS SHOP BEING AWASH WITH FLOOD WATER.

MILLIONS OF PEOPLE HAVE BEEN DISPLACED BY FLOODING AFTERHEAVIER-THAN-USUAL MONSOON RAINS BATTERED SOUTH ASIA. LARGEAREAS OF BANGLADESH WERE UNDER WATER. AUGUST,2007

SOUTHERN NEPAL HAS ALSO SUFFERED, WITH PADDY FIELDSSUBMERGED BENEATH FLOOD WATERS IN RAUTAHAT.

EUROPE COUNTS COST OF FLOOD CHAOS
AUGUST, 2005

MONDAY, 19 AUGUST, 2002, 14:49 GMT 15:49 UK EUROPE'S FLOOD LESSONS
POOR PLANNING IS PARTLY TO BLAME, SAY ENGINEERS

A HOUSE IS PARTIALLY EMERGED IN FLOOD WATERS JULY 13, 2004 IN SANJO,NIGITA AND FUKUSHIMA PREFECTURES, LEAVING AT LEAST TWO PEOPLEDEAD, ONE INJURED AND TWO OTHERS MISSING.

FLOODS IN KOREARESIDENTS ARE STRANDED IN FLOOD WATER FROM TYPHOON RUSA IN GANGNEUNG,SOUTH KOREA. AT LEAST 47 PEOPLE WERE KILLED AND 33 OTHERS ARE MISSING INFLOODS AND LANDSLIDES CAUSED BY THE TYPHOON (SUNDAY, SEPTEMBER 1, 2002)

FLOODS IN NORTH KOREA AUGUST 14, 2007UP TO 300,000 MAY BE HOMELESS IN DPRK FLOODS

DAMAGED BOATS AND CARS FLOATING IN SEA WATER AT MARINABEACH MADRAS, IN THE SOUTH INDIAN STATE OF TAMIL NADU ONDECEMBER 28, 2004.

THAIS USE A BOAT TO GET AROUND DURING A FLOOD IN AYUTTHAYA, 70KM NORTH OF BANGKOK, OCT. 10, 2006. THE DEATH TOLL BY FLOODHAS REACHED 39 WITH FOUR OTHERS MISSING UNTIL TUESDAY.
Serious flood hits Thailand

AN INDONESIAN YOUTH SITS AMID THE RUINS OF HOUSES DESTROYED BY THE FLOOD IN JAKARTA,INDONESIA, YESTERDAY. BOATS FERRIED EMERGENCY SUPPLIES TO DESPERATE RESIDENTS OFINDONESIA'S FLOOD-STRICKEN CAPITAL AS OVERFLOWING RIVERS AGAIN BURST THEIR BANKSFOLLOWING DAYS OF RAIN. AT LEAST 25 PEOPLE HAVE BEEN KILLED AND ALMOST 340,000 OTHERSMADE HOMELESS, OFFICIALS SAID.JUN, 2007

FRIDAY, 30 MARCH, 2001, 18:45 GMT 19:45 UKFLOOD IN AMERICA. EXTREME WEATHER: ONE CLAIMED EFFECT OF GLOBAL
WARMING

Types of FloodingFlooding can be divided into different categories according
to their duration:
1. Slow-Onset FloodsSlow-Onset Flood usually lasts for a relatively longerperiod, one or more weeks, or even months. Due to longduration of inundation, damages may be due to loss ofstock, damage to agricultural products, roads and raillinks.
2. Rapid-Onset FloodsRapid-Onset Floods last for a relatively shorter period,they usually last for one or two days only. Although theflood lasts for a shorter period, it can cause more damagesand pose a greater risk to life and property as peopleusually have less time to take any preventive action
3. Flash FloodsFlash Floods may occur within minutes or a few hoursafter heavy rainfall, tropical storm, failure of dams orlevees or releases of ice jams.

Types of Flooding
Flooding can also be divided into different categories according totheir location:
1. Coastal FloodsCoastal Floods usually occur along coastal areas. When there arehurricanes and tropical storms which will produce heavy rains,or giant tidal waves created by volcanoes or earthquakes, oceanwater may be driven onto the coastal areas and cause coastalfloods.
2. Arroyos FloodsA arroyo is river which is normally dry. When there are stormsapproaching these areas, fast-moving river will normally formalong the gully and cause damages.
3. River FloodsThis is the most common type of flooding. When the actualamount of river flow is larger than the amount that the channelcan hold, river will overflow its banks and flood the areasalongside the river. And this may cause by reasons like snow meltor heavy spring rain.
4. Urban FloodsIn most of the urban area, roads are usually paved. With heavyrain, the large amount of rain water cannot be absorbed into theground and leads to urban floods.

Impacts of FloodImpacts of FloodIt may seem hard to believe that a small, slow-flowingstream or gentle river could cause serious damage topeople and the places in which they live and work, butlooks can be deceptive!People love to live near to rivers - in the past mainly forfood, water, transport and protection. Even today peopleenjoy the peace and tranquility flowing water can offer.Flooding can turn even the most harmless lookingwatercourse into a raging torrent of large-scaledestruction - buildings may prove no obstacle to itspower; food crops may be ruined leading to foodshortages and even starvation; peoples lives may belost through drowning disease and homelessness.

Types of flood losses [Hekal,2000]

FLOOD SITUATION IN MALAYSIAFLOOD SITUATION IN MALAYSIA

Flood In 1926Flood In 1926

Royal Selangor Club…. 1949

Kuala Lumpur, January 1971

Flooding in Kuala Lumpur in 1971Flooding in Kuala Lumpur in 1971
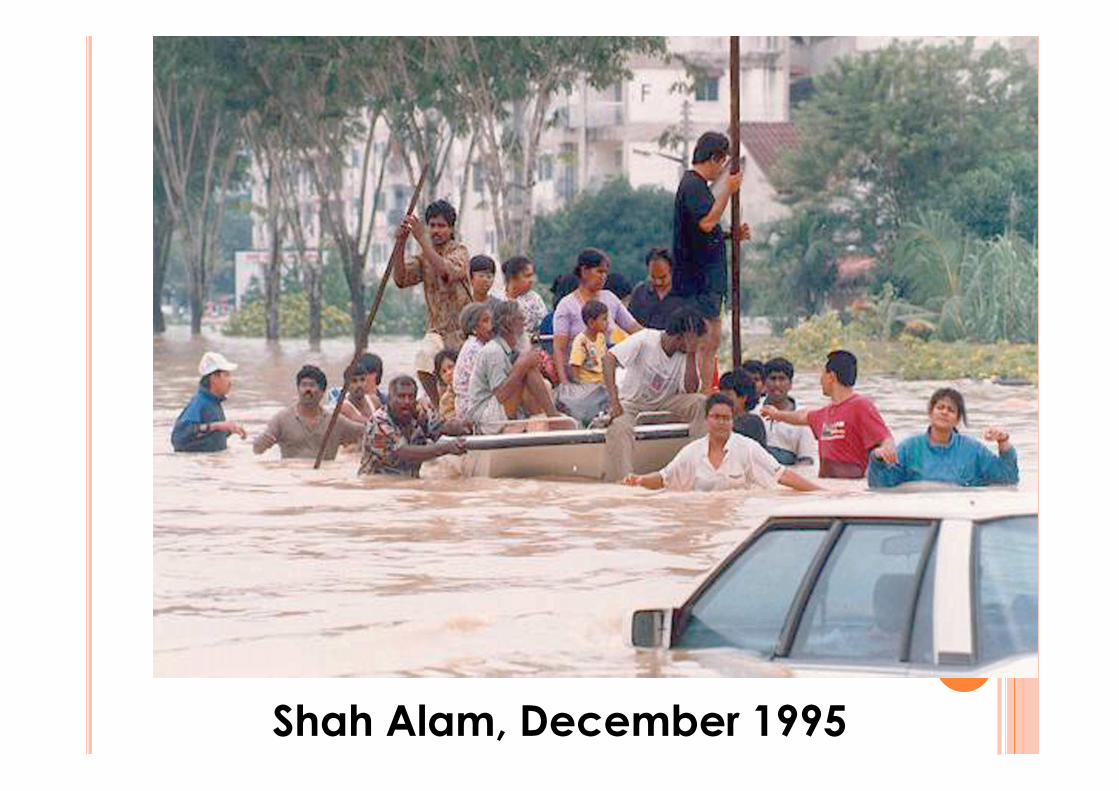
Shah Alam, December 1995

Federal Highway, January 2000

The Star 30/10/2001

17 July 2004

Feb 2001 : Sibu

Oct 2004 : Pulau Pinang

Dis 2004 : Kota Bharu

Feb 2006 : Shah Alam

FLOOD EVENTS (1996-2006)FLOOD EVENTS (1996-2006)YEAR AREAS AFFECTED
1996 WP Kuala Lumpur (Sg. Klang), Pulau Pinang, Perak, Selangor, Sabah dan Sarawak
1997 WP Kuala Lumpur (Sg. Klang), Pulau Pinang(Seb. Perai Utara), Kedah Terengganudan Sabah
1998 -
1999 Pahang, Terengganu, Perlis, Kedah, Pulau Pinang, Perak dan Selangor
2000 WP Kuala Lumpur (Sg. Klang), Perlis, Kedah, Pahang (Cameron Highland),Selangor(Kajang, Serdang), Negri Sembilan, Kelantan dan Sabah
2001 Sg. Perak, Sg. Klang, Pahang, Selangor, Johor, Terengganu, Kelantan, Sarawak danSabah
2002 WP Kuala Lumpur, Melaka, Sarawak dan Negeri Sembilan
2003WP Kuala Lumpur, Pulau Pinang dan Kedah (Lembangan Sg. Muda), Sarawak, Johor
2004 WP Kuala Lumpur, Selangor, Melaka, Negeri Sembilan, Kelantan, Terengganu danSarawak
2005 Perlis, Kedah, Kelantan, Terengganu, WP Kuala Lumpur (Sg. Kerayong), dan Sabah
2006 Selangor (Shah Alam), Kelantan, Terengganu dan Pahang, Johor, Melaka, N.Sembilan,Sabah, Sarawak

FLOODS IN MALAYSIAFLOODS IN MALAYSIA
• Heavy Rainfall during North EastMonsoon affecting East Coast States(Widespread floods)
• Intense rainstorms during inter monsoonperiods of April-May and August-October(causing flash floods in major towns)
Climate and TopographyClimate and Topography

FLOODSFLOODS ININ MALAYSIAMALAYSIA
Annual Average Rainfall
Peninsular Malaysia 2,500 mmSabah 3,000 mmSarawak 3,500 mm
Extreme Events
600 mm in 24 hours100 – 200 mm in 1-2 hours
ClimateClimate

Monsoon and Convective Rainfall Pattern
KELANTAN
KEDAH
PERAK
THAILAND
SEMBILAN
JOHOR
SELANGOR
PAHANG
NEGERI
TERENGGANU
PERLIS
MELAKA
Monsoon
Convective
0
100
200
300
400
500
600
1 2 3 4 5 6 7 8 9 10 11 12
Month
Kelantan
0
100
200
300
400
500
600
1 2 3 4 5 6 7 8 9 10 11 12
Month
mm

• Hilly upper reaches
• Normal sloping middle reaches(1 in 2,000)
• Gentle sloping lower reaches(less than 1 in 5,000)
• Mostly subject to tidal influencedownstream
FLOODS IN MALAYSIAFLOODS IN MALAYSIATopographyTopography


S.Rejang
S.Sadong
S.Rejang
S.Sadong
S.SarawakS.SarawakKucingKucing
SARAWAK
S.BaramS.Baram
LABUAN
Kota KinabaluKota Kinabalu
SABAH
S.KinabatanganS.Kinabatangan
EAST MALAYSIA

•Shallow river bed in flood plain dueto sedimentation
•High tidal influence can causeflooding in coastal areas
FLOODS INFLOODS IN MALAYSIAMALAYSIATopographyTopography

i) Extensive basin flood(Riverbank overflow)
ii) Inundation basin flood(Backwater effect from tidalinfluence affecting lower reaches)
Types of FloodingTypes of Floodingand Reasons for Floodingand Reasons for Flooding
FLOODS IN MALAYSIAFLOODS IN MALAYSIA

Types of FloodingTypes of Floodingand Reasons for Floodingand Reasons for Flooding
iii) Inland flood(poor drainage from inlandflood prone area)
iv) Urban flash flood(inadequate drainage and storagesystems to cater for rapidurbanization)
FLOODS IN MALAYSIAFLOODS IN MALAYSIA

• Flood-prone area - 29,799 km²• 9% of Malaysia’s land area• 4.819 million people affected• Annual flood damage estimated to
be RM915 million
IMPACT OF FLOODINGFLOODS IN MALAYSIAFLOODS IN MALAYSIA

S. Rej ang
S. Sadong
S. Rej ang
S. Sadong
S. Sar awakS. Sar awakKuci ngKuci ng
SARAWAK
S. Bar amS. Bar am
LAB UAN
Kot a Ki nabal uKot a Ki nabal u
SABAH
S. Ki nabat anganS. Ki nabat angan
LumpurKuala
S.Linggi
KELANTAN
Ipoh
Shah Alam
S.Perak
S.Bernam
Seremban
S.Klang
SELANGOR
Kangar
Alor Setar
George Town
PINANGPULAU
LANGKAWIPULAU
S.Muda
KEDAH
PERLIS
PERAK
THAILAND
S.Rompin
SINGAPORE
Kuantan
S.Pahang
S.Cukai
S.Muar
S.Batu Pahat
S.Benut
PAHANG
SEMBILANNEGERI
MELAKA
MelakaS.Melaka
JOHOR
S.Kuantan
S.Johor
BahruJohor
S.Endau
S.Dungun
Kuala Terengganu
Kota Bharu
TERENGGANU
S.Kelantan
S.Terengganu
Flooded areasFlooded areas-- 29,799 km²29,799 km²
** -- Based on theBased on thestudystudy ‘Updating‘Updating
of Floodingof FloodingConditions’Conditions’

4.8 million peopleaffected

FLOOD TRENDS
1982 2002
Flooded area(km2)
29,021 29,799
Peopleaffected(million)
2.736 4.819

CAUSES OF FLOODCAUSES OF FLOOD
Natural causes
Human activities
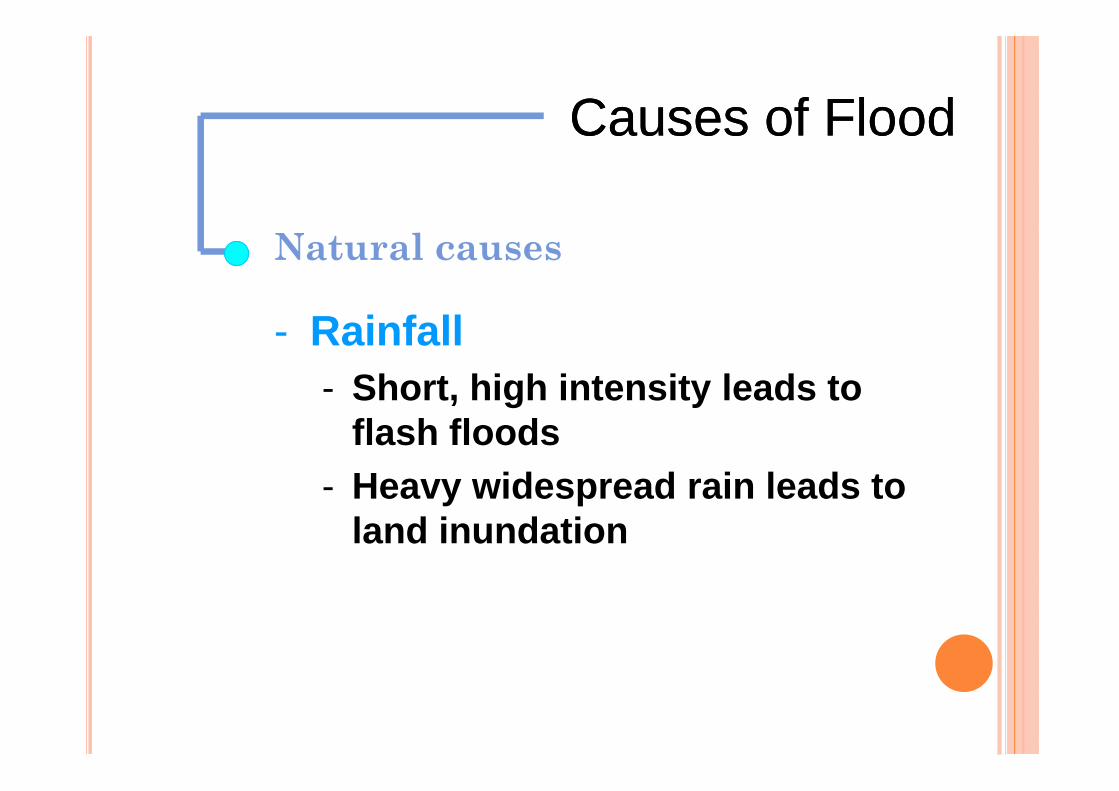
Natural causes
- Rainfall- Short, high intensity leads to
flash floods- Heavy widespread rain leads to
land inundation
Causes of FloodCauses of Flood

FLOOD EVENT IN KUALA LUMPUR
ON 10 JUNE 2007

Rain Histogram in Kuala Lumpur on 10 June 2007
Histrogram Hujan di Kuala Lumpur pada 10 Jun 2007
0
5
10
15
20
25
30
35
4018:3
1
18:4
6
19:0
1
19:1
6
19:3
1
19:4
6
20:0
1
20:1
6
20:3
1
20:4
6
21:0
1
21:1
6
21:3
1
21:4
6
22:0
1
22:1
6
22:3
1
Masa (Jam)
Hu
jan
(m
m)
JPS Ampang Jinjang Genting Sempah Gombak Simpang Tiga Pandan IndahAir Panas Air Terjun Sungai Batu Kuala Seleh Empangan Batu Empangan KlangLeboh Pasar JPS Wilayah Jalan Cheras Taman Sungai Besi

RAINFALL DISTRIBUTION IN THE KLANG RIVERBASIN ON 10 JUNE 2007
1-jam 2-jam
Empangan G. Kelang 59 61 Normal
JPS Ampang 74 122 52Kuala Seleh 31 32 Normal
Empangan Batu 54 59 Normal
Air Terjun Sg. Batu 21 42 Normal
SMK Kepong 32 51 Normal
Genting Sempah 15 17 Normal
Simpang Tiga 38 42 Normal
Bukit Antarabangsa 3 104 18Pandan Indah 33 56 Normal
Air Panas 68 108 21
JPS Wilayah KL 48 76 2Jalan Cheras 43 63 Normal
Tmn Sungai Besi 41 50 Normal
Lembah Sungai Klang /Kuala Lumpur
Tempoh Ulang LebatHujan (2-jam)
Jumlah LebatHujan (mm)Kawasan Nama Stesen Hujan

Nama StesenHujan
Jumlah Hujan Harian Pada 1 Jun 2007 hingga 11 Jun 2007 (mm)
1-Jun 2-Jun 3-Jun 4-Jun 5-Jun 6-Jun 7-Jun 8-Jun 9-Jun10-Jun
11-Jun
JPSAmpang 26 95 68 14 18 0 10 5 3 127 0
Jinjang 51 7 35 32 3 3 22 2 0 54 0
GentingSempah 21 0 4 5 0 0 4 4 0 31 0
GombakSpgTiga 1 21 77 4 5 19 52 9 0 43 4
PandanIndah 1 113 41 28 40 0 1 1 11 79 0
AirPanas 29 26 67 53 1 0 60 71 1 109 1
ATSg.Batu 0 9 12 46 22 0 3 10 0 43 1
KualaSeleh 0 56 13 17 0 7 2 13 2 33 0
EmpanganBatu 0 11 68 4 21 5 26 1 0 59 0
EmpKlang 0 90 22 8 1 4 13 12 1 61 1
LebohPasar 13 15 64 18 2 0 1 38 1 81 0
JamPetaling 0 0 0 0 0 0 0 0 0 0 0
JPSWilayahKL 35 8 113 17 1 0 0 46 1 79 0
JalanCheras 0 116 31 40 38 0 1 2 10 72 0
TmnSgBesi 0 34 71 32 9 0 1 3 7 54 0
Purata HujanTadahan (mm) 12 40 46 21 11 3 13 14 2 62 0
Rainfall from 1 June 2007 to 11 June 2007

60
Genting Sempah (17)
20mm
20mm40mm
40mm
Empangan Klang (61)
Kuala Seleh (32)
Air Panas (108)
Jln Ampang (122)
Pandan Indah (56)
Leboh Pasar (77)
Empangan Batu (59)Gombak Smpg. Tiga (42)
Sentul
Jinjang (50)
JPS WP KL (76)
A.T Sg. Batu (42)
Bukit Antarabangsa (104)
TTDI Jaya (10)
40mm
40mm
Kuala Lumpur Isohyets Map
For two hours Maximum rain on 10 Jun 2007

Hidrograf Aras Air Sungai Bunus di Tun Razak Pada10 hingga 11 Jun 2007
26
28
30
32
34
36
38
40
15:0
1
16:0
1
17:0
1
18:0
1
19:0
1
20:0
1
21:0
1
22:0
1
23:0
1
0:01
1:01
2:01
3:01
4:01
5:01
6:01
7:01
8:01
9:01
10:0
1
11:0
1
Masa (Jam)
Aras
Air
(m)
10 Jun 2007 11 Jun 2007
Aras Bahaya : 36.00 m36.62

Hidrograf Aras Air Sungai Batu di Sentul Pada10 hingga 11 Jun 2007
29
30
31
32
33
34
351
5:0
0
15
:45
16
:30
17
:15
18
:00
18
:45
19
:30
20
:15
21
:00
21
:45
22
:30
23
:15
0:0
0
0:4
5
1:3
0
2:1
5
3:0
0
3:4
5
4:3
0
5:1
5
6:0
0
6:4
5
7:3
0
8:1
5
9:0
0
9:4
5
10
:30
Masa (Jam)
Ara
s A
ir (
m)
10 Jun 2007 11 Jun 2007
Aras Bahaya : 33.00 m 33.29

Hidrograf Aras Air Sungai Klang di Jambatan Sulaiman Pada10 hingga 11 Jun 2007
20
22
24
26
28
30
15
:01
16
:06
17
:06
18
:01
19
:05
20
:00
21
:00
22
:00
23
:04
0:0
4
1:0
1
2:0
6
3:0
0
4:0
4
5:0
1
6:0
4
7:0
4
8:0
5
9:0
2
10
:03
11
:05
Masa (Jam)
Ara
s A
ir (
m)
10 Jun 2007 11 Jun 2007
Aras Bahaya : 27.00 m
28.29

Water Level when Flood occur : 31.06 m
Water Level Station in Klang River atTun Perak Bridge

-30 -20 -10 0 10 20 30
22
24
26
28
30
32
Ele
vatio
n (m
)
Side Elevation of Klang River at Leboh Pasar
Water Level during Flood = 30.50m
Dangerous Water Level = 29.50m
Klang River Water Level at Leboh Pasar on 10Jun 2007

-15 -10 -5 0 5 10 15
22
24
26
28
30
32
34
36 Klang River Side Elevation at Tun Perak Bridge
Ele
vatio
n (m
)
Water level during flood = 31.06mDangerous Water Level = 29.50m
Klang River Water Level at Tun Perak Bridge on10 Jun 2007

-30 -20 -10 0 10 20 30
20
22
24
26
28
30
32
34
Ele
vatio
n (m
)
Klang River Side Elevation at Sulaiman Bridge
Water Level During Flood = 28.29m
Dangerous Water Level = 27.00m
Klang River Water Level at Sulaiman Bridge on 10Jun 2007

Masjig Jamek @ Leboh Pasar

STAR LRT down stream to Leboh Pasar

Leboh Pasar to Sg Gombak @ Sg Klang upstream


FLOOD EVENT IN JOHOR DURINGDECEMBER 2006 TO JANUARY 2007

Rainfall station Total rainfall (mm) Return period(year)
24 hr 48 hr 24 hr 48 hr
Air Panas 535 693 > 100 > 100
Labis 320 499 > 100 > 100
Segamat 288 447 > 100 > 100
Ldg Chan Wing 257 395 > 100 > 100
KompleksPenghulu Chaah
234 419 > 100 > 100
Buluh Kasap 241 350 30 6075
Rainfall event between 18-21 Dec. 2006

RAINFALL DISTRIBUTION BETWEEN18-21 DEC 2006
76
1 Segamat 66 239 162 48 515 1872 Air Panas 98 477 149 58 782 2053 Labis 96 301 130 23 550 2054 K.Penghulu Chaah 103 251 84 9 447 2325 Ladang Chan Wing 92 245 101 2 440 2386 Empangan Sembrong 120 193 70 23 406 2087 Bandar Kluang 58 251 101 21 431 2438 JPSLarkin 80 292 66 23 461 227
Purata Jumlah Hujan BagiBulan Disember
Jumlah hujan 4hari (mm)Bil Nama Stesen 18/12/2006 19/12/2006 20/12/2006 21/12/2006
3.8X

RAINFALL DISTRIBUTION BETWEEN11-14 JAN. 2007
77
11/1/2007 12/1/2007 13/1/2007 14/01/2007
1 Air Panas Segamat 81 204 129 17 431 164
2 Empangan Bekok Batu Pahat 85 237 88 52 462 191
3 SgBekokB77 Segamat 99 247 93 32 471 168
4 Ladang ChanWing Segamat 110 240 100 19 469 168
5 Ulu Sebol Kota Tinggi 124 290 76 42 532 176
6 Bukit Besar Kota Tinggi 147 234 42 35 458 176
7 Bandar Kluang Kluang 121 182 105 15 423 143
Purata JumlahHujan Bagi
Bulan Januari
Jumlah Hujan4 hari (mm)Bil Nama Stesen Daerah


FLOOD AREAS IN JOHOR DURING DEC2006-JANUARY 2007
80

81
i) Johor Bahru 48 2,373 11,724 0
ii) Kota Tinggi 35 1,161 5,227 2
iii) Kluang 70 3,147 13,828 3
iv) Muar 126 6,432 30,441 3
v) Batu Pahat 116 5,948 27,971 5
vi) Pontian 32 710 3,286 0
vii) Segamat 72 2,442 10,286 3
viii) Mersing 9 277 1,260 0
Jumlah 508 22,490 104,023 16
1 Johor
JumlahTerkumpul
Mangsa
JumlahTerkumpulKeluarga
Bil. MangsaKes
Kematian /kehilangan
Jumlah PusatPemindahan Yang
DibukaDaerahBil Negeri
Death : 16
Population displaced : 104,023 orang
FLOOD IMPACTS

Natural causes
- Rain- Tidal effect
Causes of FloodCauses of Flood

Port Klang, October 1999

Natural Causes
- Rain- Tidal effect- Topography
Causes of FloodCauses of Flood

Kesan topografi dan kawasan lembangan yangbesar seperti lembangan Sungai Kelantan
LumpurKuala
S.Linggi
KELANTAN
Ipoh
Shah Alam
S.Perak
S.Bernam
Seremban
S.Klang
SELANGOR
Kangar
Alor Setar
George Town
PINANGPULAU
LANGKAWIPULAU
S.Muda
KEDAH
PERLIS
PERAK
THAILAND
S.Rompin
SINGAPORE
Kuantan
S.Pahang
S.Cukai
S.Muar
S.Batu Pahat
S.Benut
PAHANG
SEMBILANNEGERI
MELAKA
MelakaS.Melaka
JOHOR
S.Kuantan
S.Johor
BahruJohor
S.Endau
S.Dungun
Kuala Terengganu
Kota Bharu
TERENGGANU
S.Kelantan
S.Terengganu

Human Activities
- Land Development with no /littlecontrol
Causes of FloodCauses of Flood

Uncontrolled land clearing

Human Activities
- Land Development- Development Effect (Increase in
Discharge)
Causes of FloodCauses of Flood

Agricultural Area Urbanization Area
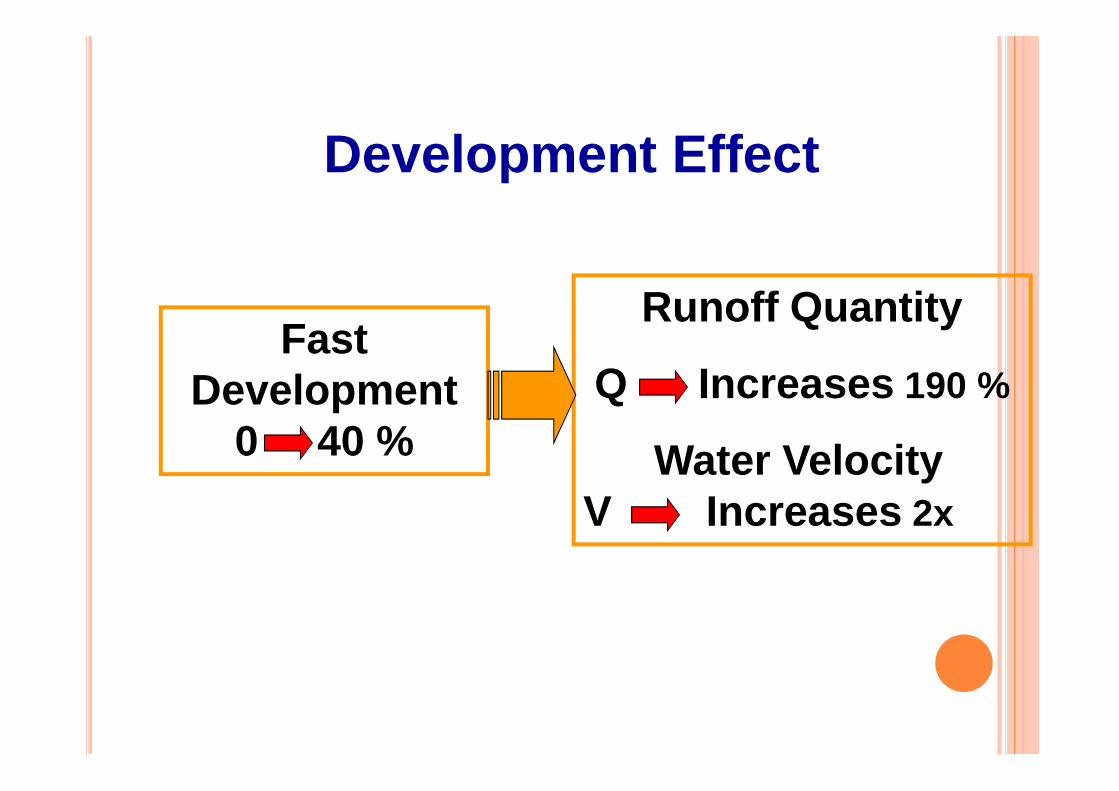
Development Effect
FastDevelopment
0 40 %
Runoff Quantity
Q Increases 190 %
Water VelocityV Increases 2x


TEPU BINA 1988

TEPU BINA 1990

TEPU BINA 1994

TEPU BINA 1996

TEPU BINA 1998

3116430 KLANG RIVER AT SULAIMAN BRIDGETEST FOR STATIONARITY OF SERIES OF ANNUAL MAXIMUM DISCHARGES
0
2,000
4,000
6,000
8,000
10,000
12,000
14,000
16,000
1910 1915 1920 1925 1930 1935 1940 1952 1957 1963 1968 1974 1979 1986 1991 1996
YEAR
CU
MU
LATI
VE M
ASS
OF
AN
NU
AL
MA
XIM
UM
DIS
CH
AR
GE
(m3/
s)
Mean annual flood = 148m3/s
Mean annual flood = 440 m3/s
Annual flooddischarge of Sg.Klang @Jamb.
Sulaiman increasefrom 148 → 440
cumecs (3X)
River discharge trendRiver discharge trend(measurement at Sulaiman Bridge)(measurement at Sulaiman Bridge)

Human Activities
- Fast Development with no control- Development Effect- Insufficient Drainage
Infrastructure
Causes of FloodCauses of Flood

InsufficientDrainage
Infrastructure

Human Activities
Causes of FloodCauses of Flood
- Fast Development with no control- Development Effect- Insufficient Drainage
Infrastructure- Obstacle in River

LRTLRT

Klang River Condition near Yap Kwan Seng Road

Construction thatobstruct the flowof water

Human Activities
Causes of FloodCauses of Flood
- Fast Development with nocontrol
- Development Effect- Insufficient Drainage
Infrastructure- Obstacle in River- Rubbish Dumping Area


Rubbish

Human ActivitiesCauses of FloodCauses of Flood
- Fast Development with nocontrol
- Development Effect- Insufficient Drainage
Infrastructure- Obstacle in River- Rubbish Dumping Area- Poor Maintenance


Stack of Drainagesystem
Human Activities
Causes of FloodCauses of Flood
- Fast Development with no control- Development Effect- Insufficient Drainage Infrastructure- Obstacle in River- Rubbish Dumping Area- Construction in Flood Plains

River Corridor Encroachment

CURRENT FLOOD MANAGEMENT INMALAYSIA
Establishment of the Permanent FloodControl Commission
Carrying out river basin studies Implementation of structural measures Implementation of non-structural
measures Flood forecasting and warning systems Establishment of flood disaster relief
machinery

FLOOD MANAGEMENT IN MALAYSIA
Established on 21 December 1971 followingthe big flood of 1971
Presently chaired by the Minister of NaturalResources and Environment
Terms of Reference To carry out flood mitigation measures and
reduce flood occurences In the event of floods, to reduce damages,
loss of lives and properties
The Permanent Flood Control Commission

ROLE OF THE PERMANENT FLOODCOMMISSION
i. To review and evaluate the flood situation forthe year
ii. To formulate short term and long termstrategies to mitigate floods
iii. To minimise damage to properties and loss oflives, in the event of flood
iv. To integrate and coordinate the variousagencies which are related in handling flood

FLOOD MANAGEMENT IN MALAYSIA
River Basin Study
•For sustainable development andmanagement of water resources•Related to water issues, quality,quantity and floods•26 studies have been carried out•Presently to include Integrated RiverBasin Management (IRBM) concept

FLOOD MANAGEMENT IN MALAYSIA
Urban Drainage Master Plan Study
• To plan and design urban drainagemaster plan in line with the towndevelopment planning
• 32 studies completed• Presently, being reviewed to include
recommendations in the StormwaterManual (MSMA) concept

FLOOD MANAGEMENT IN MALAYSIA
Structural Measures
• Flood Mitigation Dams• Detention Ponds• Pump Stations• Flood diversion channels• River bunds• Widening and Deepening of rivers

FLOOD MANAGEMENT IN MALYSIA
Policies, Guidelines,Laws Controlled development in flood
plains Flood proofing Relocation of population Flood forecasting and warning
Non-Structural Measures

FLOOD MANAGEMENT IN MALYSIA
Policies, Guidelines,LawsNon-Structural Measures
Urban Stormwater Manual (MSMA) Integrated River Basin Management River Act – to revise

THANK YOU


![.Noah's Flood WTJ2004[1]](https://static.fdokumen.com/doc/165x107/631c39e73e8acd997705cf6b/noahs-flood-wtj20041.jpg)