2016 LUMBERTON, NORTH CAROLINA FLOOD
141
N IST SP 1230-2 Community Resilience-Focused Technical Investigation of the 2016 LUMBERTON, NORTH CAROLINA FLOOD COMMUNITY RECOVERY ONE YEAR LATER EDIT ORS Elaina J. Sutley Maria K. Dillard John W. van de Lindt This publication is available free of charge from: https://doi.org/10.6028/NIST.SP.1230-2
-
Upload
khangminh22 -
Category
Documents
-
view
2 -
download
0
Transcript of 2016 LUMBERTON, NORTH CAROLINA FLOOD

N I S T SP 1 2 3 0 - 2
Community Resilience-Focused Technical Investigation of the 2016 LUMBERTON, NORTH CAROLINA FLOOD
C O M M U N ITY R EC O VER Y O N E YEA R LA TER
E D I T O R S Elaina J. Sutley Maria K. Dillard John W. van de Lindt
This publication is available free of charge from: https://doi.org/10.6028/NIST.SP.1230-2

NIST Special Publication 1230-2
Community Resilience-Focused Technical Investigation of the 2016 Lumberton,
North Carolina Flood Community Recovery One Year Later
Editors
Elaina J. Sutley University of Kansas
Maria K. Dillard National Institute of Standards and Technology
John W. van de Lindt Colorado State University
This publication is available free of charge from: https://doi.org/10.6028/NIST.SP.1230-2
April 2021
U.S. Department of Commerce Gina M. Raimondo, Secretary
National Institute of Standards and Technology James K. Olthoff, Performing the Non-Exclusive Functions and Duties of the Under Secretary of Commerce
for Standards and Technology & Director, National Institute of Standards and Technology
2
Disclaimer No. 1
Certain commercial entities, equipment, or materials may be identified in this document in order to describe an experimental procedure or concept adequately. Such identification is not intended to imply recommendation or endorsement by the National Institute of Standards and Technology, nor is it intended to imply that the entities, materials, or equipment are necessarily the best available for the purpose.
Disclaimer No. 2
The information contained herein is provided as a public service with the understanding that Colorado State University makes no warranties, either expressed or implied, concerning the accuracy, completeness, reliability, or suitability of the information. Nor does Colorado State University warrant that the use of this information is free of any claims of copyright infringement.
Disclaimer No. 3
In compliance with the Paperwork Reduction Act, this information collection was completed under the OMB Control number 0693-0078 with an expiration date of July 31, 2019.
Disclaimer No. 4 All maps in the report, except where noted, were created using ESRI ArcGIS.
3
Author Credits and Acknowledgements Each section within each chapter of this report was prepared and edited by a number of different authors from the field study team and leadership. In addition, the entire study team is grateful to all those in and around Lumberton and within the State of North Carolina who shared their knowledge and perspective through interviews and meetings with our researchers. The field study team acknowledges the generous contributions of many individuals in the public and private sectors to this study and associated reports. Chapter 1 Authorship: Elaina Sutley, Maria Dillard, John van de Lindt, Walter Gillis Peacock, and Judith Mitrani-Reiser
Chapter 2 and associated Appendices Authorship: Elaina Sutley, Sara Hamideh, Maria Dillard, Donghwan Gu, with contributions from Walter Gillis Peacock, Nathanael Rosenheim, Shane Crawford, Kijin Seong, and Shannon Van Zandt
Chapter 3 and associated Appendices Authorship: Maria Watson, Yu Xiao, Jennifer Helgeson, Kai Wu
Chapter 4 and associated Appendices Authorship: Maria Dillard, Jennifer Tobin, Ken Harrison, and John van de Lindt
Chapter 5 Authorship: John van de Lindt, Elaina Sutley, Maria Dillard
Appendices 1A-B and 5A-C Authorship: Field Study Team
Funding Acknowledgement This research was conducted as part of the NIST Center of Excellence for Risk-Based Community Resilience Planning under Cooperative Agreement 70NANB15H044 between the National Institute of Standards and Technology (NIST) and Colorado State University. The content expressed in this report are the views of the authors and do not necessarily represent the opinions or views of NIST or the U.S Department of Commerce.
Suggested Citation Sutley, E.J., Dillard, M.K., and van de Lindt, J.W. (Eds.). (2021). Community Resilience-Focused Technical Investigation of the 2016 Lumberton, NC Flood: Community Recovery One Year Later. NIST Special Publication 1230-2.
4
Field Study Team Members The Lumberton Wave 2 Field Study Team consisted of 18 people. As described in this report there were three major teams and many people participated on more than one team; these included the Housing Team, the Business Team, and the Public Sector Team. Team affiliations are listed as of the time of Wave 2 (January 2018). Field Study Leadership Elaina J. Sutley, University of Kansas Maria K. Dillard, National Institute of Standards and Technology John W. van de Lindt, Colorado State University Field Study Team Members Badeaux, Lauren, University of Kansas Barbosa, Andre, Oregon State University Crawford, Shane, University of Alabama Dillard, Maria, National Institute of Standards and Technology Gu, Donghwan, Texas A&M University Hamideh, Sara, Iowa State University Harrison, Kenneth, National Institute of Standards and Technology Helgeson, Jennifer, National Institute of Standards and Technology Khajehei, Sayma, Iowa State University Koliou, Maria, Texas A&M University Memari, Mehrdad, Colorado State University Mitrani-Reiser, Judith, National Institute of Standards and Technology Seong, Kijin, Texas A&M University Sutley, Elaina, University of Kansas Tobin, Jennifer, University of Colorado, Boulder van de Lindt, John, Colorado State University Watson, Maria, Texas A&M University Wu, Kai, Texas A&M University Other Contributors Cutler, Harvey, Colorado State University Farokhnia, Karim, Colorado State University Fung, Juan, National Institute of Standards and Technology Nofal, Omar, Colorado State University Peacock, Walter, Texas A&M University Peek, Lori, University of Colorado Boulder Rosenheim, Nathanael, Texas A&M University Tomiczek, Tori, U.S. Naval Academy Van Zandt, Shannon, Texas A&M University Xiao, Yu, Portland State University Zahran, Sammy, Colorado State University
5
Executive Summary In early October 2016 Hurricane Matthew crossed North Carolina as a category 1 storm with some areas receiving 15 in. to 18 in. (38 cm to 46 cm) of rainfall on already saturated soil. The NIST-funded Center for Risk-Based Community Resilience Planning (Center) teamed with researchers from NIST’s Community Resilience, Disaster Failure Studies, and Applied Economics programs to conduct a quick response field study focused on the small city of Lumberton, NC and the flooding experienced from the Lumber River. Approximately one year later, the Center and NIST team returned to Lumberton to document and better understand the community’s recovery progress with an emphasis on housing, businesses, schools, community and state-level decisions, and the intersection of these sectors in community recovery. This type of investigation is critical for the study of community resilience as it will ultimately provide comprehensive longitudinal recovery data and analyses to support guidance and recommendations on what is needed to afford communities the ability to recover more quickly and equitably, and more generally, what attributes make most communities more resilient to natural hazards. This second in a series of community resilience-focused field studies is presented herein as Wave 2 of the on-going Lumberton, North Carolina Flood of 2016 report series. Recall that Wave 1 documented the initial physical and socio-economic impacts of the flooding on the community, particularly for housing, households, schools, and other parts of the public sector. In January 2018, Wave 2 began the assessment of recovery with two major objectives: first, to document community interdependencies1; and secondly, to document the point-in-time progress of Lumberton’s recovery. Wave 2 data collection dealt primarily with the recovery process of the most heavily-affected housing and businesses through two systematic surveys, as well as interviews and meetings with select public officials. Analysis revealed that even after 14 months, Lumberton was only in the early stages of recovery. Thus, recovery indicators will be used in Waves 3 and beyond to document the recovery trajectories for housing and businesses, as well as provide multi-sector insight to the community’s recovery trajectory. The team returned to the same housing units from Wave 1 to continue to assess recovery from Hurricane Matthew. The Wave 2 housing surveys documented that 60 % of households who completed their survey reported being dislocated for at least one day, including 39 % dislocated for less than 30 days, 21% dislocated for more than 30 days, 11 % of households dislocated for longer than one year, and 3 % reported themselves as still being dislocated. This does not include the 26 % of the weighted sample that were abandoned residences. Given that surveys could not be completed by these households, it is unclear when the household left and why they had not returned. Only 64 % of households who completed the survey reported that their housing repairs were complete. While recovery was still an active process, 90 % of surveyed households reported that they planned to remain in their present housing unit for at least one year, and 91 % indicated that their access to essential needs, including work, school, and healthcare, had reached pre-flood levels. Unlike Wave 1, the Wave 2 field study included questions about financing repairs; 78 % of homeowners had homeowners’ insurance, 25 % had flood insurance, and 29 % of renters had renter’s insurance. Across participants with these three types of insurance, less
1 Community interdependencies are defined here as the intersections of the population, housing, business, education, and healthcare sectors, utility and lifeline systems, and local governance.
6
than half received payouts. Approximately 50% of surveyed households applied for external recovery resources, and slightly over half who applied received at least one type of financial assistance. A sample of businesses was added as part of Wave 2 to document business disruption and recovery from Hurricane Matthew. Business surveys revealed that 45 % of those surveyed reported damage to their building, 51 % reported damage to building contents, and 28 % reported damage to machinery. In total, 98 % lost power for an average of 10 days, and 88 % ceased operation for at least one day. Nine in ten businesses experienced interruption in operations. At the time of Wave 2, 24 % of businesses were operating below capacity while 34 % reported that they were in “survival mode”, “still recovering”, or “may never recover”. During Wave 2 data collection, the team met with nine school district representatives including one superintendent, two principals, two school counselors, three administrators, and one custodial staff member. The team also met with four city representatives, including two government officials, two infrastructure managers, and four state representatives—including three emergency managers and one foundation officer representing the organization that was selected to support distribution of federal funds. Interviews and subsequent virtual learning uncovered that reconstruction on the primary wing of W.H. Knuckles Elementary went on for nine months after the flooding, and ultimately, West Lumberton Elementary was permanently closed. At the time of Wave 2, officials reported that they had lost over 500 students across the district which they anticipated to have ripple effects on the level of federal funding. Much of the student loss was attributed to the loss of affordable housing, including public housing. School counselors reported many students at elementary and high school levels still experiencing high levels of anxiety during inclement weather. The Lumberton water treatment plant (WTP) was operating largely as it had before the flooding and water treatment plant operators had seen the water demand return to pre-event levels despite some households having been permanently dislocated. Public Works was considering floodproofing individual buildings (e.g., pumphouses) and generators, and installing a berm around the WTP. At the broader community level, a flood gate at the VFW Road and CSX Railroad underpass at I-95 was under consideration by the City, according to Public Works representatives. Public Works decided to pursue the construction of the WTP berm based on assessments and recommendations from FEMA and with input of city officials. In addition to the berm and flood gate, water supply and stormwater management decisions were made to increase the resilience of the local hospital. Several major sources of federal disaster assistance had not reached Lumberton. This included CDBG-DR funds through the Department of Housing and Urban Development (HUD). The absence of these funds meant that several recovery activities at the community level could not yet take place. One major exception was the FEMA public assistance program funds, which were processed quickly, and distributed to the state and in turn to the local communities via the Golden LEAF Foundation. Overall, the field team concludes that 14 months after the flooding, recovery was underway with a long road ahead for the people of Lumberton. The timing and breadth in the distribution of

7
financial recovery resources was identified as the primary factor delaying recovery progress. This Wave 2 report summarizes the longitudinal study design and the results obtained through the housing and business surveys, as well as semi-structured public sector interviews and meetings. Collectively, these findings quantitatively and qualitatively document the impacts and early recovery process for the community of Lumberton, NC. The report provides conclusions across all data collection efforts, as well as methodological considerations, and next steps for the longitudinal study.
8
TABLE OF CONTENTS
CHAPTER 1: INTRODUCTION .............................................................................................. 12
1.1 The NIST Center of Excellence for Risk-Based Community Resilience Planning ................ 12
1.2 The Engineering Laboratory at NIST ..................................................................................... 13
1.3 Hurricane Matthew and the 2016 (Wave 1) Field Study Overview ....................................... 15
1.4 Overview of the 2018 (Wave 2) Lumberton Field Study ....................................................... 17
1.5 The Scope and Audience for this Report ................................................................................ 18
CHAPTER 2: HOUSING DISRUPTION AND RECOVERY ............................................... 20
2.1 Goals and Objectives .............................................................................................................. 20
2.2 Sampling Procedure ................................................................................................................ 22
2.3 Survey Instrument ................................................................................................................... 23
2.4 Data Collection Methodology ................................................................................................. 26 2.4.1 Daily Operations .............................................................................................................. 26 2.4.2 Data Management ............................................................................................................ 27
2.5 Survey Results ........................................................................................................................ 28 2.5.1 Data Cleaning ................................................................................................................... 29 2.5.2 Survey Response Rates .................................................................................................... 30 2.5.3 Findings: Flood Impacts and Recovery ........................................................................... 31
CHAPTER 3: BUSINESS INTERRUPTION AND RECOVERY ......................................... 40
3.1 Goals and Objectives .............................................................................................................. 40
3.2 Sampling procedures ............................................................................................................... 41
3.3 Survey instrument ................................................................................................................... 43
3.4 Data Collection Methodology ................................................................................................. 46 3.4.1 Daily Operations .............................................................................................................. 47 3.4.2 Data Management ............................................................................................................ 51 3.4.3 Follow-up Work: Phone Calls and Determining Closure ................................................ 51
3.5 Survey results .......................................................................................................................... 52 3.5.1 Data cleaning ................................................................................................................... 52 3.5.2 Survey Response Rates .................................................................................................... 53 3.5.3 Findings: Flood Impacts and Recovery ........................................................................... 55
CHAPTER 4: PUBLIC SECTOR IMPACTS AND RECOVERY ........................................ 65
4.1 Introduction ............................................................................................................................. 65
4.2 Data Collection Methodology ................................................................................................. 65
4.3 Findings .................................................................................................................................. 68 4.3.1 Education ..................................................................................................................... 68 4.3.2 Water Infrastructure ..................................................................................................... 72
9
4.3.3 State and Local Government ........................................................................................ 75
CHAPTER 5: CONCLUSIONS AND NEXT STEPS ............................................................. 83
5.1 Conclusions for Housing Disruption and Recovery ............................................................... 83
5.2 Conclusions for Business Interruption and Recovery ............................................................. 84
5.3 Conclusions for Public Sector Impacts and Recovery ............................................................ 85
5.4 Concluding Methodological Considerations ........................................................................... 85
5.5 Next Steps for the Lumberton Longitudinal Field Study ........................................................ 86
REFERENCES ............................................................................................................................ 88
APPENDICES .......................................................................................................................... A-1
Appendix 1B: Mental Health Resources ..................................................................................... A-3
Appendix 2A: Housing Survey ................................................................................................... A-4
Appendix 2B: Residential Damage States and Income Levels ................................................... A-9
Appendix 2C: Housing Consent Script ..................................................................................... A-11
Appendix 2D: Description of External Recovery Funding Programs ...................................... A-13
Appendix 3A: Business Survey ................................................................................................ A-14
Appendix 3B: Business Damage States .................................................................................... A-19
Appendix 3C: Business Consent Script .................................................................................... A-20
Appendix 4A: Public Sector Consent Form .............................................................................. A-21
Appendix 4B: Semi-Structured Interview Guide for School Representatives .......................... A-24
Appendix 4C: Semi-Structured Interview Guide for Other Representatives ............................ A-27
Appendix 5A: Technology in Field Studies .............................................................................. A-30
Appendix 5B: Safety Protocols ................................................................................................. A-38
Appendix 5C: Training Protocol ............................................................................................... A-41
10
LIST OF TABLES Table 2-1. Housing Survey Completion Rates……………………...…………………...31 Table 2-2. Residential Building Damage………………………………………………..32 Table 2-3. Household Dislocation Duration Across Housing Type and Tenure…..……33 Table 2-4. Missed Work Due to Dislocation……………………………………………34 Table 2-5. External Influences on Return Decision-Making………………...………….35 Table 2-6. Progress towards Housing Recovery………………………………………...36 Table 2-7. Householder’s Perception of Children’s Educational Recovery………….....37 Table 2-8. Insurance Coverage and Claims Received..…………………………………37 Table 2-9. Recovery Assistance Application……..……………………………………..38 Table 2-10. Recovery Assistance Receipt and Timing………………………………….38 Table 2-11. Unmet Needs from Insurance and Recovery Assistance…………………...39 Table 2-12. Coverage from Unmet Needs from Insurance and Recovery Assistance…..39 Table 2-13. Race and Ethnicity of Survey Households.………………………………...39 Table 2-14. Maximum Household Education Level of Survey Households.…………...40 Table 2-15. Annual Household Income of Survey Households ………………………..40 Table 3-1. Sector Distribution of Sample……………………………………………….44 Table 3-2. Example of Team and Zone Assignments…………………………………...49 Table 3-3. Survey Codes used for In-Field Business Survey Coordination…………….50 Table 3-3. Sector Representation of Original Sample, Ineligible Business, and Final Number of Eligible Businesses………………………………………………………….55
Table 3-4. Sector Representation by Data Collection and Operating Status……………56 Table 3-5. Extent of Damage……………………………………………………………57 Table 3-6. Utility Loss…………………………………………………………………..57 Table 3-7. Interruption by Damage……………………………………………………...59 Table 3-8. Utility Outage and Interruption in Undamaged Businesses…………………59 Table 3-9. Recovery Indicator: Perceived Recovery Status…………………………….60 Table 3-10. Recovery Indicator: Change in Revenue…………………………………...61 Table 3-11. Recovery by Days of Interruption………………………………………….61 Table 3-12. Interruption and Revenue…………………………………………………..62 Table 3-13. Recovery Status Change……………………………………………………63 Table 3-14. Insurance Coverage………………………………………………………...63 Table 3-15. Insurance Claims Received by Those Who Filed…………………………..63 Table 3-16. Number of Businesses Applying for External Assistance………………….64 Table 3-17. Number of Businesses that Received External Assistance out of Those that Applied…………………………………………………………………………………..64
Table 3-18. Racial Makeup of the Respondents………………………………………...65 Table 3-19. Educational Attainment of the Respondents………………………………..65
11
LIST OF FIGURES Figure 1-1. Path and Intensity Timeline of Hurricane Matthew………………….……..17 Figure 2-1. Sampled Housing Units……………………………………………………..24 Figure 2-2. Household Dislocation Time for all Responses ..…………………………..34 Figure 2-3. Number of Missed Work Days Due to Flood-Induced Housing Issues…….35 Figure 3-1. Business Sample Maps……………………………………………………...43 Figure 3-2. Business Outcome Conceptual Model………………………………………45 Figure 3-3. Field Map Example…………………………………………………………47 Figure 3-4. Process Flow for Data Collection used by the Teams………………………48 Figure 3-5. Frequency of Length of Interruption (Days)………………………………..58 Figure 3-6. Recovery Indicator: Current Operational Capacity…………………………60 Figure 3-7. Recovery Status by Revenue Change……………………………………….62
12
Chapter 1: Introduction The longitudinal study of Lumberton, North Carolina described in this report is a collaboration between researchers from the National Institute of Standards and Technology (NIST)-funded Center of Excellence for Risk-Based Community Resilience Planning (Center), and researchers in the Engineering Laboratory at NIST.
1.1 The NIST Center of Excellence for Risk-Based Community Resilience Planning Community resilience depends on the performance of the built environment and social, economic and public institutions which, individually and collectively, are essential for immediate response and for long-term recovery of communities following a disaster. The interactions between community needs and objectives, including post-disaster recovery goals, are not well reflected in codes, standards, and other regulatory documents applied to the design of individual facilities. This necessitates an approach which reflects the complex interdependencies among the physical, social, and economic systems on which a healthy community depends. Thus, modeling the resilience of communities to the impacts of natural hazards and disasters depends on many disciplines, including engineering, social sciences, and information sciences. The Center, headquartered at Colorado State University in Fort Collins, Colorado and involving ten additional universities at the time of Wave 2, was established by NIST in 2015. The multi-university Center’s overarching goal is to establish the measurement science for community resilience assessment and risk-informed decision-making. To accomplish this goal, the Center is engaged in three major research thrusts aimed at: (1) developing a community resilience modeling environment – the “Interdependent Networked Community Resilience Modeling Environment” or IN-CORE – to quantitatively assess alternative community resilience strategies, (2) developing a standardized data ontology, robust architecture, and management tools to support IN-CORE, and (3) performing a comprehensive set of disaster hindcasts to validate IN-CORE’s advanced modeling environment. Data collection for a longitudinal field study is planned and executed approximately every 12 months in the same location with the same sample of housing units and businesses to support the following phases of resilience model development within IN-CORE: impact, disruption, dislocation, recovery, and interdependency. The Lumberton, NC field study will introduce comprehensive datasets under Thrust 2 to provide the information needed for validation of the full architecture in Thrust 3. The Center works to accelerate the development of system-level models and databases that will provide the technology for enhancing community resilience. Team members include noted resilience experts from the University of Oklahoma, Oregon State University, Rice University, Texas A&M University, the University of Illinois, the University of Washington, the University of South Alabama, California Polytechnic University-Pomona, the University of Kansas, and Iowa State University. Ultimately, the decision framework created in the Center will provide decision-makers with a unique set of tools that can be tailored to the needs of specific communities. These tools will optimize the design and subsequent management of individual facilities and interdependent infrastructure systems to achieve resilience goals while managing life-cycle costs. Its use will provide a basis for targeting public investments and incentives for private investments, thus making it possible to establish a “business case” for achieving community resilience.
13
1.2 The Engineering Laboratory at NIST The Engineering Laboratory (EL) at NIST promotes U.S. innovation and industrial competitiveness by advancing measurement science, standards, and technology for engineered systems in ways that enhance economic security and improve quality of life. Some of the ways the EL carries out its mission is by undertaking activities in community resilience, disasters and building failure investigations, economic analysis and life cycle assessment, wind and seismic hazard impact reduction, fire prevention and control, engineering, and manufacturing materials. Several researchers from the Applied Economics Office and the Community Resilience Program from the EL participated in the Lumberton field study to advance the disaster metrology research of the EL’s Disaster and Failure Studies Program as well as to advance the measurement and modeling work needed to support community resilience planning. Hazard events test buildings and infrastructure in ways and on a scale that cannot be easily replicated in a laboratory – buildings and infrastructure are built without being tested at full scale. The study of disaster and failure events is essential to improving the performance of buildings and infrastructure, the safety of building occupants, and associated evacuation and emergency response procedures. NIST leads a multi-disciplinary Disaster and Failure Studies (DFS) Program within the Engineering Laboratory intended to standardize disaster field deployment, assessment, and reporting protocols to ultimately improve building and infrastructure performance. This program implements these goals through the following means: (1) monitoring events using a screening tool to evaluate whether decision criteria merits the establishment and deployment of a study team, (2) coordinating the establishment, deployment, operations and reporting of study teams, (3) ensuring that the study team’s safety, health and environmental requirements are met including relevant hazard reviews, training, and personal protective equipment prior to deployment, (4) building and maintaining effective partnerships and communications with other federal agencies, state/local governments, stakeholders and the general public, (5) establishing and executes standard operating procedures and criteria for disaster and failure studies, (6) promoting the implementation of recommendations from all DFS investigations, (7) creating and maintaining an archival data repository for DFS, (8) carrying out the statutory requirements of the National Construction Safety Team (NCST) Act, which includes providing the Secretariat for the NCST Advisory Committee and annual reports to Congress, and (9) oversees a disaster metrology research program that interacts with other groups in EL, to directly inform best practices for (1)-(7). NIST manages a multi-faceted program, assisting communities and stakeholders on issues related to buildings and the interdependencies of physical infrastructure systems. The Community Resilience Program, part of NIST's broader disaster resilience work, complements efforts by others in the public and private sectors. NIST focuses on research, community planning and guidance, and stakeholder engagement. In addition to improvements to standardized field study protocols, three projects within the Community Resilience Program are directly supported by the field study in Lumberton, NC.
Development of a First-Generation Community-Resilience Systems Model – The main challenge confronting design or planning for community resilience is the need to address the large scale of the resilience system in question and the need to address social, political, budgetary and other constraints. In the development of community plans (e.g., land use
14
management, emergency response, economic development), the formidable challenges inherent in both the analysis and design of the resilience system must be addressed. The analysis must account for or include: a) stochastic phenomena (e.g., timing and severity of hazards, component failure); b) dependencies between and among the resilience subsystems; c) time aspects of resilience (e.g., preparedness through long-term recovery, aging infrastructure); d) connection of the built environment to the social services it supports; e) significant uncertainties in knowledge; f) metrics to quantify community resilience, and; g) the large amount and diversity of data needed to characterize a community’s resilience system. In this project a model is being developed to support community resilience decision-making. This model will be accessible to planners and others with a need to identify alternative options for resilience. The NIST Alternatives for Resilient Communities (NIST ARC) model and its methods will first be tested in a research version of the model (NIST ARC-R). Data collected during field studies for past hazard events will be used to both inform and validate NIST ARC. NIST ARC is being developed as a screening tool for identifying sets of alternatives that could be analyzed in greater detail with IN-CORE. The results of the NIST ARC model are being systematically compared with IN-CORE simulation models to ensure both models can provide accurate results for their intended use. To address these significant challenges, the research plan adopts an operations research (OR) approach to the problem of community resilience planning. OR is a quantitative approach that is uniquely suited to large scale problems. A main tool of operations research, mathematical programming, is applied here. Formulations (“math programs”) that describe community resilience problems are developed and then are solved using available optimization solvers. The interactive formulation and solution of these models effectively provides decision-makers the ability to identify cost-effective, resilience-improving alternatives that can be the basis of the solutions ultimately adopted.
Development of a First-Generation Community Resilience Assessment Methodology –NIST released the Community Resilience Planning Guide for Buildings and Infrastructure Systems to help communities plan and implement prioritized measures for the built environment to strengthen their resilience to hazard events. The next step is to provide communities with the tools necessary to evaluate and measure their resilience over time. A more resilient community will have, among many other characteristics, improved functionality of buildings and infrastructure systems and a shorter recovery time of community functions following disruption.
This project is developing the methodology required to build a community-scale resilience assessment tool. The methodology is based on a foundational understanding that community functions are linked to buildings and infrastructure systems. Examples of community functions are the following: housing/shelter, the economy, health, education, sustenance, public safety, communication, transportation, religion/culture, and recreation/entertainment. Each function is delivered through interconnected components of the social system (e.g., the banking system, health care system, personnel/staff, consumers) and the physical system (e.g., building clusters, transportation networks, communication networks). Both social and physical systems influence community resilience – or a community’s ability to function after a disruptive hazard event.
15
The final methodology and accompanying Tracking Community Resilience (TraCR) tool will include the following: selected priority indicators, the analytical approach(es) for computing each indicator over time in a relevant manner for at least one spatial scale, best practices for how the approach can be replicated for different spatial scales, public data sources for all indicators, data visualization for the indicators, multivariate analyses to examine relationships between indicators, sensitivity and uncertainty analysis, and validation studies.
Developing Cost-Effective Resource Allocation Strategies to Enhance Community Resilience - Advancements in measurement science are needed to estimate the economic impact associated with community resilience planning for natural and human-made hazards. Currently, disaster-related loss (damage) estimates are available, although they tend to focus on direct loss only and are at aggregated levels; these estimates often fail to consider down-stream, indirect, and sustained effects, such as business interruption, which can be large and have a significant effect on the short- and long-term stability of a local or regional economy. Also missing are estimates of the cost of prevention, protection, and mitigation of hazards and potential disaster events, as well as the expenditures required during the response and recovery phases. A methodology to value the economic impact and avoided costs is needed to evaluate the return-on-investment of community resource allocation decisions made to reduce future economic damages from disturbances and disasters, while recognizing the need to achieve balance with other community goals, and to account for uncertainty. This project includes five major activities: (1) the creation and formal acceptance of draft standard practices to formalize, publish, and make available an economic toolkit facilitating decision making for communities; (2) measurement of disturbance and disaster-related costs and potential linkages to achieve other community goals; (3) measurement of disaster losses, focusing on major indirect losses, such as business interruption, and distributional effects—through the use of both data gathered in the field through surveys and interviews as well as secondary data sources; (4) quantification of the uncertainty affecting economic decisions, and understanding how uncertainty should be communicated to decision makers; and (5) measure the ‘resilience dividend,’ the (non-disaster related) community co-benefits from investing in disaster resilience, and provide tractable guidance to communities on approaches to assessing the net co-benefits associated with resilience planning.
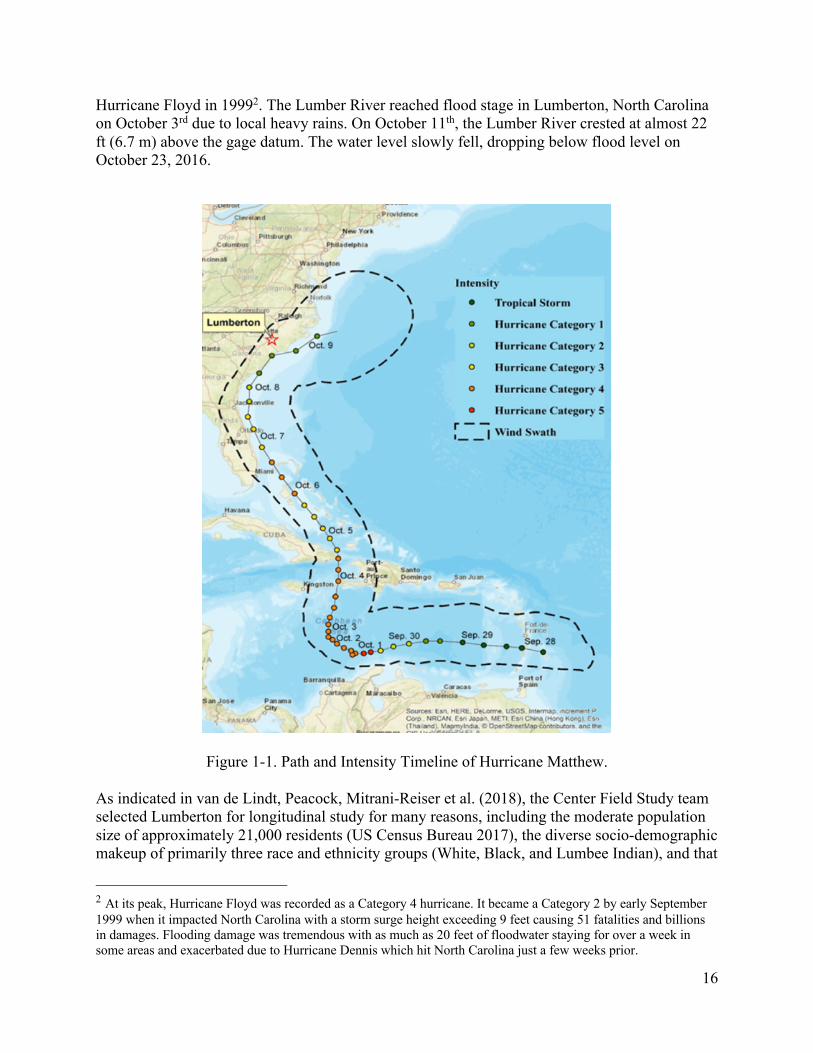
1.3 Hurricane Matthew and the 2016 (Wave 1) Field Study Overview In early October 2016, after already devastating parts of the Caribbean, Hurricane Matthew struck Florida, and continued up the eastern seaboard before turning out into the Atlantic Ocean off the coast of North Carolina and Virginia (see Figure 1-1). More than 170 counties in Florida, Georgia, South Carolina, and North Carolina were included in Presidential Emergency Declarations and/or Presidential Disaster Declarations between October 6th and 11th, 2016. Economic loss estimates exceed $10 billion (NOAA 2018). More than a week after the storm turned out to sea, parts of North Carolina had yet to experience flood crests, with many communities experiencing flood levels at or higher than those for
16
Hurricane Floyd in 19992. The Lumber River reached flood stage in Lumberton, North Carolina on October 3rd due to local heavy rains. On October 11th, the Lumber River crested at almost 22 ft (6.7 m) above the gage datum. The water level slowly fell, dropping below flood level on October 23, 2016.
Figure 1-1. Path and Intensity Timeline of Hurricane Matthew.
As indicated in van de Lindt, Peacock, Mitrani-Reiser et al. (2018), the Center Field Study team selected Lumberton for longitudinal study for many reasons, including the moderate population size of approximately 21,000 residents (US Census Bureau 2017), the diverse socio-demographic makeup of primarily three race and ethnicity groups (White, Black, and Lumbee Indian), and that
2 At its peak, Hurricane Floyd was recorded as a Category 4 hurricane. It became a Category 2 by early September 1999 when it impacted North Carolina with a storm surge height exceeding 9 feet causing 51 fatalities and billions in damages. Flooding damage was tremendous with as much as 20 feet of floodwater staying for over a week in some areas and exacerbated due to Hurricane Dennis which hit North Carolina just a few weeks prior.
17
flood waters entered the City through a gap in the levee system that 13 years prior was reported to not meet the current FEMA regulations. The impact of the hazard event on the community, including public school closures in the county, was also a significant factor in the decision. The NIST-funded Center for Risk-Based Community Resilience Planning teamed with researchers from NIST’s Engineering Laboratory, specifically the Community Resilience, Disaster Failure Studies, and Applied Economics programs, to conduct a quick response field study focused on the small city of Lumberton, NC and the flooding Lumberton experienced from the Lumber River. The quick response field study was performed during the week of November 29, 2016. Denoted here as Wave 1, it was the first of a series of annual field studies to document and better understand Lumberton’s recovery. Data collection during Wave 1 focused on the residential housing sector with two primary objectives, including: to establish and document initial conditions for the longitudinal resilience field study of Lumberton’s recovery, with a focus on the most heavily affected area located within a particular school zone; and secondly, to facilitate and document the development and first application of a combined engineering-social science field study protocol that provides a quantitative linkage between flood damage and socio-economics including race, ethnicity, income, tenancy status, and education level. The study concluded that flood inundation levels and subsequent flood damage were not evenly distributed for the people of Lumberton, but rather trends of intersecting physical and social vulnerability were observed. Population dislocation probabilities were found to be higher for Black and Native American households than for White households, given the presence of the same residential housing damage state following the flood. See van de Lindt, Peacock, Mitrani-Reiser, et al. (2018) for the Wave 1 field investigation report.
1.4 Overview of the 2018 (Wave 2) Lumberton Field Study Approximately one year after Hurricane Matthew, during the dates of January 19 to 29, 2018, the Center and NIST researchers returned to Lumberton for Wave 2 of the longitudinal study. The overall purpose of the longitudinal field study was to (1) support on-going research in the Center and NIST through the collection of the necessary data to build and/or validate community-resilience models for business, housing, social institutions, and building functionality; and (2) advance understanding on the factors that influence recovery for two specific community sectors, namely housing and business, as well as to gain information on the recovery status of schools, households, public works, and the community as a whole. While Wave 1 documented the initial physical and socio-economic impacts of the flooding on the community, particularly for housing, households, schools, and other parts of the public sector, Wave 2 began the assessment of recovery. A variety of recovery indicators were employed in Wave 2 to support the measurement of Lumberton’s progress in recovery. These metrics will be used in Waves 3 and beyond to document the trajectory for housing and businesses, as well as provide multi-sector insight to the community’s recovery trajectory. In support of the overall purpose of the longitudinal study, the housing sample of 567 housing units from Wave 1 was maintained in Wave 2 with a continued focus on the housing unit.3 Of the total of 567 housing units in the sample, the team surveyed 221 households with additional
3 For housing, one housing unit was dropped from the sample due to a hard refusal from the residents in Wave 1, resulting in a sample of 567 housing units for surveys in Wave 2.
18
responses provided by a neighbor for a response rate of 50 %. In Wave 2, a new component of the data collection was added to study business interruption and recovery. Similar to returning people to their homes, restoring the local economy following a disaster is one of the most important collective goals for a community. The Lumberton business community has a mixture of franchise-based and locally-owned businesses across many sectors. Knowing how these businesses were impacted, if they closed and why, and if and when they re-opened was critical to understanding Hurricane Matthew and the flood’s impact on the community. During the Lumberton Wave 1 field study it was clear that many businesses were damaged or otherwise disrupted; the research team determined that there is a need in resilience modeling to better understand the impact of long household dislocation durations on business interruption and recovery and vice versa, i.e. interdependency. Although Wave 1 data collection did not include engineering damage assessments for this sample of businesses, the Wave 2 business survey instrument assessed the damage from Hurricane Matthew through a series of questions built on damage state descriptions specific to commercial buildings. For the business interruption and recovery study, a sample consisting of 453 businesses was added for Wave 2.4 Of the total of 453 businesses, the team surveyed 164 business owners and managers for an overall response rate of 36 %. Both the housing and business surveys included questions on physical repair and sector-specific recovery indicators to document recovery progress and asked about the availability and timing of a range of financial recovery resources. For the public sector data collection, meetings were held with four city representatives and four state representatives, including both government and the water utility, to understand the context for recovery of the community. Likewise, to understand the context for school recovery, interviews were conducted with nine school district representatives.
1.5 The Scope and Audience for this Report The purpose of this second community resilience field study is to provide measurement of recovery of post-disaster conditions, both physical and non-physical, for one community. To achieve this, more than 200 households and more than 150 businesses were surveyed, and several interviews and meetings were conducted with local, state and federal officials during January 2018 by the field study team. This report summarizes the results of the data collected by an interdisciplinary team of engineers, social scientists, and economists. The instruments developed for Wave 2 along with the data collected will be used in Waves 3 and beyond to track and present the recovery progress for Lumberton. This field study is intended to provide data required to calibrate models within IN-CORE and other community resilience modeling tools. The data will ultimately be used to help validate the complex and coupled physical and non-physical modeling processes being developed within the Center of Excellence. It is envisioned that this report can also provide objective information on the impacts, response, and recovery processes as documented by an outside research team to the relevant local, state, and federal officials. These purposes provide a mechanism by which to learn from the events in Lumberton
4 For businesses, a random stratified sampling approach resulted in a sample of 350 businesses drawn from the ReferenceUSA database (InfoGroup 2016). While in the field, an additional sample of 103 businesses was drawn to address possible coding errors in ReferenceUSA, business closures, and a low response rate. The final sample resulted in 453 businesses.
19
and to identify mechanisms to help other communities plan, prepare for, and recover from natural hazards such as floods. Therefore, this report is aimed at an audience of researchers and practitioners interested in resilience, including those in academia, governmental labs, industry, local and state planning, and community officials working toward improved resilience. Overall, there were a number of key takeaways from Wave 2, including that recovery was still an on-going process for Lumberton 14 months after flood water receded. The majority of households did not report their dislocation time being influenced by changes to work, school, or other businesses; their primary decision factors to reoccupy their home were physical repair of their home and utility service restoration. A quarter of the housing sample was documented as being abandoned; the reasons these households had not returned remain unknown but could be due to the factors listed above. A very low percentage of at-risk households carried flood insurance and the small percentage that applied for external assistance must be able to wait a substantial period of time to receive the resources. Wave 2 results also documented clear differences in how businesses were recovering including their perception of future recovery with a quarter operating below capacity to approximately a third still being in survival mode; almost half of businesses reported a decrease in revenue since the flood. Federal relief funds were found to be notably slower than other state and private funds which was apparent from discussions at both the state and local government levels. Finally, schools within Robeson County continue to struggle as students leave the district resulting in funding decreases and officials indicate that repair funds are scarce. Wave 3, and all subsequent data collection waves, will continue to survey the same samples of housing units and businesses to continue documenting recovery trajectories for these sections, as well as for Lumberton as a whole. The longitudinal comparison of the recovery metrics reported above will, especially at such a fine resolution of housing unit- and business-level scales, contextualized with community sector interviews, provide a rich and holistic depiction of community recovery that has never been documented before. The Wave 3 report, as well as future reports, will also include documenting intervening events that might impact recovery from Hurricane Matthew. This report is organized as follows: three chapters focused on distinct samples, data collection instruments, and approaches with a final chapter presenting conclusions. In Chapter 2, the study of housing disruption and recovery are presented, including specific study goals, team training and deployment, and descriptive results. In Chapter 3, the study of business interruption and recovery are introduced, with an emphasis on the business survey methodology and descriptive results. Chapter 4 details the study of public-sector impacts and the recovery process, which utilized semi- and un-structured stakeholder interviews and meetings, including at the city- and state-levels, as well as semi-structured interviews with school officials and staff. Finally, in Chapter 5, conclusions on the findings of the previous chapters are provided along with next steps for the longitudinal field study.
20
Chapter 2: Housing Disruption and Recovery 2.1 Goals and Objectives The housing component of Wave 2 supports the on-going research in the Center, including modeling housing damage, household dislocation, household relocation, and housing repair and recovery in place. Specific goals across these efforts are summarized and then discussed in greater detail below. The primary goal of the housing data collection for Wave 2 was to continue the longitudinal study with data collection one year out from the initial data collection with a focus on the measurement of recovery indicators for housing and households. Corresponding with changes in the disaster timeline for Lumberton households, the objectives of the housing data collection for Wave 2 included:
1. Filling in missing information on initial housing damage not captured during Wave 1; 2. Improving documentation on households’ repair timelines for their homes considering
different initial damage levels, income levels, available recovery resources, and socio-demographic characteristics;
3. Developing a better understanding of what interdependent infrastructures and services were considered in the households’ timing and decision to return to their home;
4. Obtaining household-level data on a range of factors that are hypothesized to influence housing recovery, including incoming financial resources.
Housing Damage. Physical damage to housing is a primary cause for household dislocation in the aftermath of a disaster. The primary goal of Wave 1 data collection was to validate a proposed set of flood-induced damage classifications, and capture information on initial damage, utility outage, and dislocation for the housing sample. Wave 1 documentation on the initial impact to the housing sample provided the necessary context for Wave 2. During Wave 1, detailed damage evaluations were performed successfully for a large portion of the housing sample using an engineering methodology. Given the widespread and long-lasting dislocation of many households in Lumberton, interior damage was assessed for only a limited number of sample units which could lead to over- or underestimating true damage. Due to the importance of knowing initial damage to every sample, Wave 2 re-assessed damage using social science methodology to ensure this information was collected for all sample units for which recovery information was obtained. The Wave 2 damage classification approach differed accordingly since initial physical damage was no longer apparent. The Wave 2 damage questions sought information from the households on the level of damage their home experienced using the same damage classification descriptions as Wave 1, enabling the field study team to fill in, confirm, or expand the initial damage evaluations on the sample units. Household Dislocation. The dislocation of the population is both an immediate, and, in some cases, a lasting impact of a disaster. The Wave 1 household survey (Peacock et al. 2020) focused on the social and economic impacts of the flooding, including dislocation. The Wave 2 survey has the potential to improve household dislocation models in two ways. First, Wave 2 addressed documenting dependencies. This was achieved by collecting additional data on dislocation and factors shaping dislocation, such as household socio-demographics, tenancy status, insurance and other financial recovery resources, and access to work, school, and retail establishments. Secondly, Wave 2 extended the dislocation period captured in the surveys from up to 1 month in
21
Wave 1 to 15 months. The data collected in Wave 2 therefore enables the continued analysis of dislocation time and factors influencing when and why dislocated households return home. Household Relocation. Wave 2 leveraged the longitudinal study design by revisiting the same housing sample to document when a former household moved following Hurricane Matthew. This information is being used to investigate the relationship between household relocation, initial damage level of the unit, dislocation time, and access to social, economic, and public institutions, including work, school, and essential needs. This work fits into the larger Center research which examines how permanent residential relocation after disasters has led to the change of demographic characteristics of impacted areas. Therefore, in addition to the household-level assessment, future Center research will include a community-level assessment that will compare the aggregate socio-demographic data across field study waves to investigate whether there is a relationship between the housing relocation rate and neighborhood demographic change. This analysis will inform an understanding of how housing and household recovery fit into community recovery. Housing Repair and Recovery In-Place. Similar to housing damage, the speed of repair is a primary factor in explaining why households return or relocate after a disaster. Limited information is available in the literature about the time and overall process for repairing damaged structures. As pointed out by Mitrani-Reiser (2007), the repair process is complex and includes much more than reconstruction; it also includes the time to understand and evaluate damage, hire a contractor, get materials on site, develop a design, obtain a permit, and reconstruct or repair the structure. The time to repair is lengthened when considering that the portfolio of damaged buildings and other infrastructure in the community all need repair at the same time with limited resources available. Furthermore, homeowners or landlords can spend a considerable amount of time deciding whether they want to rebuild or relocate or neither rebuild nor relocate a rental home (Nejat and Damnjanovic 2012). The Wave 2 survey documented how long it took households to repair their homes considering different initial damage levels, income levels, available recovery resources, and socio-economic and demographic characteristics. Additionally, the influence of interdependent infrastructures, including electric power and water, and community-level social and economic institutions on household recovery in-place was examined. Housing recovery is an unequal and complex dynamic process with many dependencies and interdependencies (Sutley and Hamideh 2017). Access to financial resources, including personal savings, insurance, federal assistance, and non-government organization (NGO) funds, is a primary contributor to how households experience housing recovery. Quantifying the effect of a household’s ability to access financial resources on housing recovery has not yet been achieved. This lack of empirical modeling and/or validation is the result of a dearth of data to support such investigations. Therefore, Wave 2 obtained household-level data on a range of factors expected to influence housing recovery in-place including financial resources, amount of damage, socio-demographic characteristics, tenure status, repair time, decision making, and access to infrastructure and essential community functions. The research-to-practice intentions of the housing component of Wave 2 data collection include (1) measuring the unique contribution each physical, social, demographic, and economic factor (while controlling for the other factors) in a household’s ability to reach a state of permanent
22
housing; and (2) using the housing recovery measurement to inform on-going research and modeling efforts, including identifying policy levers (e.g., policies that speed up or change the distribution of financial and other recovery resources) in decision algorithms that could reduce housing recovery inequities (Sutley and Hamideh 2020).
2.2 Sampling Procedure To continue the longitudinal study, Wave 2 utilized the same housing sample as Wave 1. The study area for Lumberton was defined by the school attendance zone for Lumberton Junior High, which includes the attendance zones for the two elementary schools (W.H. Knuckles and Tanglewood Elementary Schools). A two-stage non-proportional cluster sample was designed to capture a representative random sample of the study area, which included areas inundated by 2016 Hurricane Matthew flooding as well as areas not directly impacted by the flooding. Within this design the penultimate sampling units were census blocks, and primary sampling units were housing units and households residing in those units. The penultimate sampling units (blocks) were selected utilizing a probability proportion to size (PPS) random sampling procedure, with blocks in areas with a high probability of flooding selected 3-to-1 over areas with low flooding probability. Areas with a high probability of flooding were identified as those inside the team’s predicted flood inundation area from aerial imagery. Additionally, a 100-m buffer was added to the floodplain areas to account for uncertainty. Housing units within the sampled blocks were then selected on a fixed rate of 10 random units per block, with 8 units identified as primary with 2 alternates. The combination of selection PPS with a fixed number of housing units selected, after weighting, assures a representative sample of the area. Among the 830 blocks with 5 or more occupied housing units in the school attendance zone, the sampling process drew a random sample of 80 blocks based on a probability of selection proportionate to size, oversampling for high probability flooding (56 census blocks in the high probability areas and 24 in the low probability areas). In the final analysis, 75 of 80 census blocks were visited in the final sample (54 census blocks in the high probability areas and 21 in the low probability areas), including 568 valid primary housing units5, yielding an average of 7.6 housing units per block. For more detailed information about the sampling procedures for Wave 1, please refer to section 3.2.1 in the Wave 1 report (van de Lindt, Peacock, Mitrani-Reiser, et al. 2018). The 568 housing units, and the households living in these units, were the primary sample units for Wave 1 damage assessment and household data collection and the target sample units for the Wave 2 household survey. During Wave 1, 13 of the 568 selected households were refusals of some nature, two were households new to original housing units, one did not have an adult available to answer the survey, and 259 were either not occupied or presented some other problem for undertaking an interview. Among the 13 refusals, one household showed a very explicit rejection and accordingly, this housing unit was dropped entirely from the Wave 2 housing sample, while “soft refusals” and temporarily unoccupied houses were re-visited. Therefore, Wave 2 consisted of a selected sample of 567 housing units. Figure 2-1 shows the locations of these 567 housing units alongside flood and school zone information.
5 Invalid housing units included housing units where a gate or other barrier prevented access and where response was documented as a “hard refusal”.
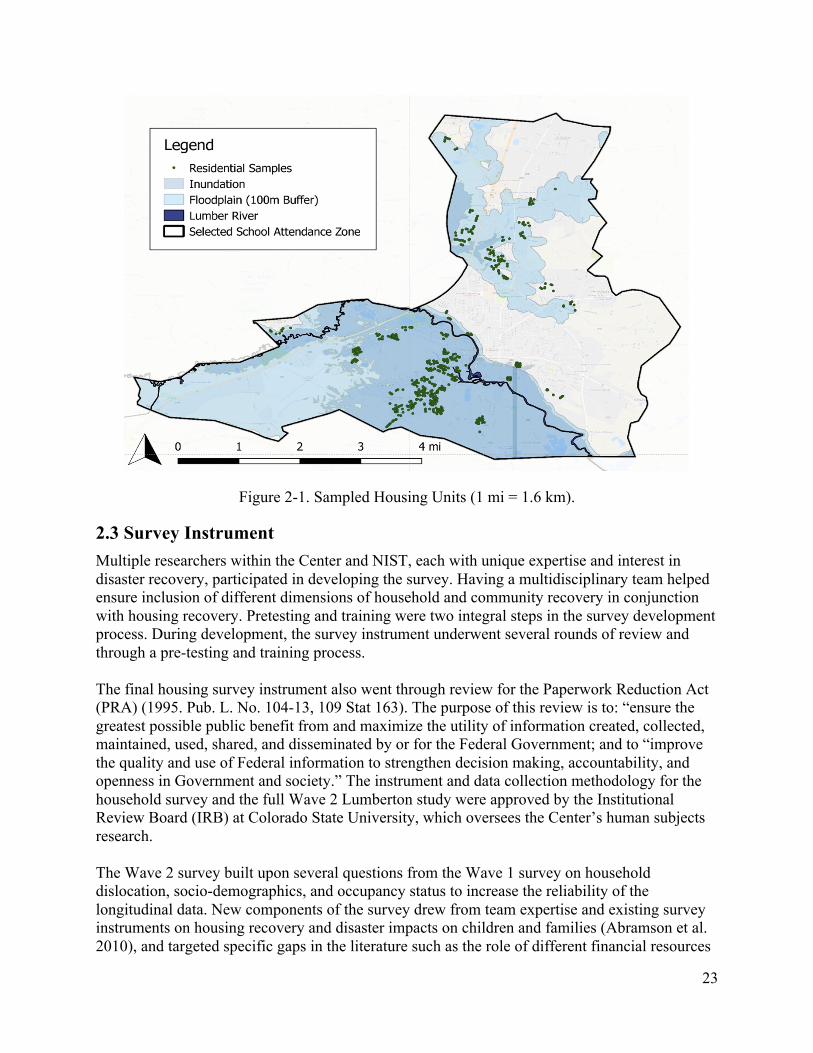
23
Figure 2-1. Sampled Housing Units (1 mi = 1.6 km).
2.3 Survey Instrument Multiple researchers within the Center and NIST, each with unique expertise and interest in disaster recovery, participated in developing the survey. Having a multidisciplinary team helped ensure inclusion of different dimensions of household and community recovery in conjunction with housing recovery. Pretesting and training were two integral steps in the survey development process. During development, the survey instrument underwent several rounds of review and through a pre-testing and training process. The final housing survey instrument also went through review for the Paperwork Reduction Act (PRA) (1995. Pub. L. No. 104-13, 109 Stat 163). The purpose of this review is to: “ensure the greatest possible public benefit from and maximize the utility of information created, collected, maintained, used, shared, and disseminated by or for the Federal Government; and to “improve the quality and use of Federal information to strengthen decision making, accountability, and openness in Government and society.” The instrument and data collection methodology for the household survey and the full Wave 2 Lumberton study were approved by the Institutional Review Board (IRB) at Colorado State University, which oversees the Center’s human subjects research. The Wave 2 survey built upon several questions from the Wave 1 survey on household dislocation, socio-demographics, and occupancy status to increase the reliability of the longitudinal data. New components of the survey drew from team expertise and existing survey instruments on housing recovery and disaster impacts on children and families (Abramson et al. 2010), and targeted specific gaps in the literature such as the role of different financial resources
24
in housing recovery outcomes that were critical for inclusion in IN-CORE housing recovery models. In general, there are seven main sections of the survey, including establishing occupancy and study eligibility, housing damage, housing repair and recovery in place, household dislocation, household relocation decision, educational recovery, and household socio-demographic characteristics. See Appendix 2A for the Wave 2 housing survey. Establishing Occupancy and Study Eligibility. Upon approaching a housing sample, surveyors observed the landscape for safety6, accessibility, and occupancy. There were two places to record information based on these initial observations and based on the result of the survey. The first of these was titled ‘Result / Completion Codes’, and included options for survey completion; incomplete or partial completion; no answer or response but appears occupied; ineligibility because no eligible person was available; ineligible because the structure is not a residence; bad address; no access; or not occupied and appears abandoned or destroyed. Refusals were recorded as “no response but appears occupied” and a note was written in the comments to document the refusal. The second item was titled ‘Housing Unit Occupancy Status’ and included options similar to the previous but wholly focused on occupancy, rather than survey completion. If the household was not present but their neighbor or landlord was outside, or their neighbor was residing in a housing unit that was part of the sample, then the neighbor or manager was asked five questions related to occupancy and dislocation caused by the flooding.
If the household was present and provided oral consent to being surveyed, then the first question was to determine whether the household had been living in that housing unit since before Hurricane Matthew. If a household had moved in since Hurricane Matthew, denoted as ‘new household’ throughout, they were asked 10 questions. If the household had lived in the housing unit since before Hurricane Matthew, denoted as ‘continuous household’, they were asked 25 questions. The housing survey was administered via single mode of a surveyor reading the questions aloud to the respondent. The scope of these questions is as follows: Housing Damage. Damage questions were intended to capture the extent of damage from Hurricane Matthew from the perception of the household and provide a point of comparison with the expert damage assessments conducted during Wave 1. It is important to note, the occupant may exaggerate or underestimate damage, or not remember specific water heights, so only obtaining damage information from this single source may introduce measurement bias. Conversely, people are generally able to remember exactly how much repair work was required which captures information beyond a damage evaluation driven by an external watermark, and obtains information on what had to be gutted, repaired, and replaced. In cases of low damage, water marks may not be visible. In Lumberton, where the flood water remained stagnant for many days and residents were dislocated for long periods of time (leading to a slow start to repairs), the initial damage observed in Wave 1 may not have been the peak damage for some
6 Safety is a consideration in any field deployment and is an important part of any field training. See Appendices 5B-5C.
25
housing units. The follow up in Wave 2 enabled a comparison of methods and results when possible, or to otherwise supplement missing information from Wave 1. Housing Repair and Recovery in Place. The repair and recovery in place portion of the survey was designed to document how long it took households to repair their homes, and what financial resources they had available for that purpose. The survey did not capture when repairs were initiated. Questions on housing recovery resources posed during Wave 2 were one of the first attempts to capture household level data on a comprehensive range of resources from insurance, government assistance programs, and households’ social networks (Sutley and Hamideh 2017). The survey captures information about the timing of application and receipt of each type of resource, as well as adequacy of all combined resources received. Four indicators of housing recovery were incorporated into the survey, including repair completion, re-occupancy, restored stability, and restored accessibility, where stability means the household intends to stay in that home for at least one year, and accessibility means the household has at least the same access to essential needs in the community as they did before the event. Household Dislocation. Longitudinal data enables the modeling of household initial displacement, whether there was a return to the pre-disaster home, the timing of return, as well as permanent relocation and the arrival of new households who move into housing units after the disaster, while limiting the introduction of measurement bias that may occur when only asking about these items once recovery is complete. Of particular importance is gathering information on the length of time for household return. Household dislocation questions covered the length and reasons for the dislocation, such as whether or not jobs, restoration of infrastructure, or different community functions such as schools and shopping facilities affected the household length of dislocation. Household Relocation Decision. Relocation questions were designed for all households in the data collection effort. Upon approaching a housing unit, when no one answers the door, a neighbor or potential apartment manager is sought. During these engagements, the survey asks whether the residents lived in the housing unit at the time of Hurricane Matthew, and if not currently living in the unit, where they had permanently relocated to (staying in the city, within the State, or out of State). Similarly, when someone did answer the door to a housing unit, one of the first survey questions asks households when they moved into the present home, and whether there was Hurricane Matthew-induced damage to the home. If the household moved in after Hurricane Matthew, the survey asks questions about occupancy before Hurricane Matthew and general whereabouts of the former household. Finally, when a household member answers the door and indicates that he/she is a resident of the same home before Hurricane Matthew, the survey asks about future relocation decisions to examine whether households have reached permanent housing recovery in the current location. This is followed by a group of questions that document whether access to different infrastructure and community functions might affect the household’s decision to stay or leave that housing unit (i.e., stability). Educational Recovery. The survey made distinctions between children and adult members of households in order to collect data on the links between housing and school recovery.
26
Households with school-aged children were asked about their children’s progress towards educational recovery relative to their situation before the flood disaster. These questions were motivated by the temporary and permanent school closures in Lumberton after Hurricane Matthew. Household Socio-demographics Characteristics. Most questions on household characteristics were repeated from the Wave 1 survey, and included categorizing respondents as renters or owners, and obtaining information to categorize the highest education level of any member in the household, racial makeup, ethnicity, and combined household annual income. These types of questions serve to document whether the sample matched the distribution of socio-demographics indicated in census data. Demographics also support examining dislocation, relocation, repair, and recovery processes that may differ due to household socio-demographics, as is expected due to social vulnerability theory (Fothergill and Peek 2004).
2.4 Data Collection Methodology The surveys were conducted face-to-face by teams of two. A consent script was used to obtain verbal consent prior to surveying (see Appendix 2C for the consent script). The surveying took place across both weekends of the field visit from January 19 to 29, 2018, as well as during the weekdays with a more limited team. In addition to required IRB human subjects ethics training, all surveyors received team training on ethics, survey use, planned field coordination, and best practices for in-field safety prior to being in the field, and additional guidance and training when in the field (see Appendix 5B for field study safety protocols). This section describes daily operations and data management.
2.4.1 Daily Operations Daily Process. Each morning, the full Wave 2 data collection team convened to review logistics for the coming day, including arranging teams, vehicles, drivers, creating a check-in schedule, distributing packets of data collection materials (e.g., surveys, photo release forms, supplemental information for respondents, interview guides, personal protective gear; see Appendix for details), and preparing for the day’s data collection. As needed, training sessions would be folded into this schedule to accommodate new team member arrivals or shifts in team composition. Researchers responsible for the public sector interviews (see Chapter 4) checked in with the full team at lunch or at another designated time during the day. Survey preparation included review of the survey instrument, review of the sample cluster, preparation of packets for each sample cluster, and discussion of issues with survey questions, answer options, data recording in the field, or data entry. Each evening, the full field study team met to enter and back up data, including audio recordings, photos, video, and laser scan imagery, update the sample status based on housing units visited, conduct any necessary correspondence to confirm upcoming interviews, and review any issues encountered from the day. At the end of each day, new data was entered into Qualtrics survey software by the survey team. The decision to adopt a protocol that included daily data entry was aimed at increasing the accuracy of the data entry and easing the time required for the data cleaning process after the field work concluded. Similarly, the sample database was updated each evening with information pertaining to the visits from that day as mentioned above –

27
specifically, daily updates to the sample map, generated through Google MyMaps3, guided the team’s survey work (similar to what was done in Wave 1; see Appendix 5A for more details, including a supporting figure). Although resources (e.g., staff, time, and funds) were limiting factors, several actions were taken to improve the outcomes of the field study and data collection. To ensure a higher response rate to the housing survey, the team:
● Trained surveyors for maximum efficiency in the field; ● Concentrated surveying on weekends and evenings; ● Made repeat visits to housing units; ● Arranged scheduled follow up times for households not available for surveying during the
initial visit (if willing to participate); ● And, adjusted the field work plan and team composition based upon daily evaluation of
results.
Driving Assessments. Prior to surveying in a new cluster, and as time permitted, the teams performed driving assessments of the clusters to identify housing units that were clearly unoccupied or abandoned. This assessment allowed for increased survey efficiency on the ground, as time was better concentrated on the housing units for which a response was likely. The process was as follows: teams of at least 2, ideally 3, individuals would travel in a single vehicle with one person driving, one navigating a route through the cluster, and a third (or the navigator) documenting the housing unit ID of each unoccupied or abandoned housing unit and capturing a photo of the housing unit. Times of Day. Emphasis was placed on concentrating surveyor capacity on days and times when response rates would be highest. Weekend days, afternoons, and evenings were the focus of the effort, although there were teams that covered weekdays throughout the field study period. Early mornings (before 9am), and Sunday mornings (before noon) were avoided to respect cultural norms of the area. Teams completed their data collection before dusk. Team Composition. Representation of multiple disciplines was a primary focus of Wave 1 team composition. In Wave 2, the focus was on experience with surveying, knowledge of the area, and gender. With the exception of survey experience, the other factors were driven by an awareness of the importance of safety and matching best practices for field research in any location. Teams of four would travel in a single vehicle and work through one cluster together. Pairs of surveyors worked opposite sides of a street so that they were almost always within view of one another. A vehicle would be moved when the team would complete a small geographic area (e.g., half of a block).
2.4.2 Data Management Following the field work, all physical data was stored in a locked file cabinet and all electronic media was saved on password protected computers of the principal investigators that were kept in locked offices. A linked-list was created where all identifiable information was replaced with code numbers. The same codes were used for the field notes and photographs from each site. No names were attached to this documentation. Original data access was limited to project investigators from the Center and NIST who have completed the IRB training and whose
28
universities signed the Interagency Agreement (IAA). The data will be maintained by the Center for the three-year archive period following the conclusion of the study and will then be archived with NIST. Documenting survey responses. Data collection was completed using paper-based survey forms, which were read aloud and responses were recorded by the surveyors for respondents. Data collectors carried all survey materials on clipboards including answer cards for select items (e.g., damage states and income levels, see Appendix 2B), resources for respondents (e.g., mental health services and housing recovery information, see Appendix 1B), and project information sheets (see Appendix 1A). The survey forms included the housing unit ID as the primary identifier; surveyors recorded the ID on each page of the form in the event that pages were separated. Before beginning the next survey, survey teams would capture any additional notes and clean up data entered on the survey form. Surveyor guidance was included in the survey form to support the proper elicitation and recording of responses when in the field. Photographs. Photographs of the housing units taken during Wave 1 were used to note differences over time. In general, less damage and debris were visible during the Wave 2 field collection. As a result, fewer photographs were taken as part of Wave 2 data collection. Exceptions include capturing the unoccupied housing units, many of which had not experienced any repair or reconstruction; field team members photographed any housing unit that appeared to be unoccupied as additional evidence of its status. Additionally, as was done in Wave 1, Wave 2 vehicles drove around Lumberton with ‘streetview’ style 360-degree cameras to capture imagery of the community’s physical recovery. Streetview imagery is being compared across waves to document changes in debris cleanup and physical repair and reconstruction and to supplement photographs by survey teams and to document recovery progress. Daily procedures of entry and back up. A number of steps were completed each day to ensure that all data were managed appropriately and in accordance with the IRB protocol [15-6003H]. Each evening upon return from the field, the team would complete the data entry of all survey forms recorded on that day, which included complete surveys as well as incomplete surveys. The information was entered either by a member that directly recorded the data, or by a member that was working in the same cluster and traveled in the same vehicle. The data were entered using Qualtrics and stored on a cloud server. All hardcopies of the survey collection forms were then stored in locked cabinets by the field study leads. As with the surveys, all photographs taken while surveying or during any of the driving assessments were downloaded and backed up to a server. This back up procedure was the same for photos, video taken with the vehicle mounted 360-degree camera, and LiDAR scans. NIST researchers also backed up all photo and video data on an external hard drive and immediately transferred data to secure file storage locations at NIST following the field study.
2.5 Survey Results The data for housing recovery were analyzed independently, though they will later contribute to a broader suite of analyses as part of the longitudinal study for Lumberton, NC. This section presents the housing survey summary statistics resulting from Wave 2. Detailed, comprehensive analyses are being performed and presented outside of this report.
29
2.5.1 Data Cleaning As discussed in Section 2.4, at the end of each day the new data was entered into Qualtrics by the survey team. As with all data collection, the data required some cleaning over a period of four months. This included double-checking each entry for obvious typographical errors with the original hard copy of the survey and updating or newly entering data to correspond to any changes in the data entry form that were not available at the time of original data entry (e.g., items where programming was adjusted for improved consistency of data entry while in the field required cleaning after the field visit). Changes and decisions adopted during data cleaning are detailed below. There were some issues collecting accurate and consistent data on dislocation and recovery timing. In addition, memory bias of the interviewees could not be avoided. For example, some of the temporal data was specified to be in a calendar date format, while other temporal data was specified to be a number of days, weeks, or months after the disaster. This latter type of question risks error from not knowing exactly when the disaster “starts” from each household’s perspective and count. For example, some households dislocated before the flood waters rose to high levels; some households were out of town for unrelated purposes; other households were rescued via boat once the flood waters got too high for them to safely leave on their own. As was discovered through implementing the surveys, not every household remembered the exact day the flood waters reached high levels, or what calendar date they left town. Most households did exhibit confidence in identifying a number of days (for short durations), weeks (for moderate durations), and months (for long durations) that they were dislocated or were waiting on their home to be fully repaired. Temporal data recorded on the survey or in Qualtrics as “1 week” was converted to equate to “7 days”. Similarly, temporal data recorded as “1 month” was converted to equate to “30 days” (obviously not all months are 30 days, but this approach provided an appropriate balance of computational time to measurement certainty). When a date was provided (DD/MM/YY), October 10, 2016 was used as the disaster start date to be consistent with the 2016 field study. Other issues for data cleaning included new categories for “refusal” to be a documented outcome of a survey attempt and new occupancy options. When refusals were received, they were recorded into the comments section. A new option for refusal as the survey completion code was added into Qualtrics and to the data while cleaning. Similarly, there were houses that appeared to be in good condition but also unoccupied, sometimes with a ‘for sale’ sign present. The printed survey did not have an option to mark “unoccupied, but not abandoned,” so again interviewers recorded this in the comments section. This occupancy option was added to Qualtrics and to the data while cleaning. In one instance, the data collection team learned from neighbors that the resident had passed away either before or after the flooding. The printed survey did not have an option for a resident that will not return because they are deceased, but notes were made by the surveyor in the comments section. This occupancy and relocation option was added to Qualtrics and to the data while cleaning. Lastly, although the surveyor training required that answers must be specified per the respondent’s best estimate, sometimes a range was recorded for the timing of events or for the income category. In all cases where a range was given, the higher value was taken (e.g., 2 to 3 months = 3 months).
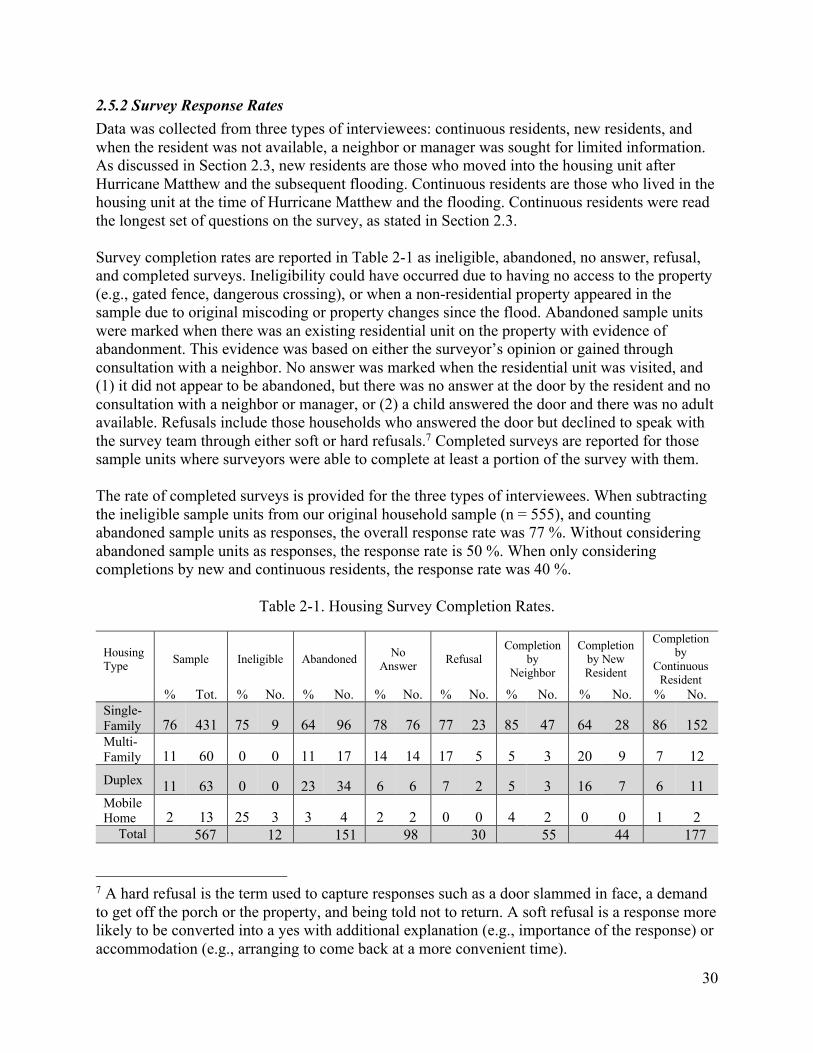
30
2.5.2 Survey Response Rates Data was collected from three types of interviewees: continuous residents, new residents, and when the resident was not available, a neighbor or manager was sought for limited information. As discussed in Section 2.3, new residents are those who moved into the housing unit after Hurricane Matthew and the subsequent flooding. Continuous residents are those who lived in the housing unit at the time of Hurricane Matthew and the flooding. Continuous residents were read the longest set of questions on the survey, as stated in Section 2.3. Survey completion rates are reported in Table 2-1 as ineligible, abandoned, no answer, refusal, and completed surveys. Ineligibility could have occurred due to having no access to the property (e.g., gated fence, dangerous crossing), or when a non-residential property appeared in the sample due to original miscoding or property changes since the flood. Abandoned sample units were marked when there was an existing residential unit on the property with evidence of abandonment. This evidence was based on either the surveyor’s opinion or gained through consultation with a neighbor. No answer was marked when the residential unit was visited, and (1) it did not appear to be abandoned, but there was no answer at the door by the resident and no consultation with a neighbor or manager, or (2) a child answered the door and there was no adult available. Refusals include those households who answered the door but declined to speak with the survey team through either soft or hard refusals.7 Completed surveys are reported for those sample units where surveyors were able to complete at least a portion of the survey with them. The rate of completed surveys is provided for the three types of interviewees. When subtracting the ineligible sample units from our original household sample (n = 555), and counting abandoned sample units as responses, the overall response rate was 77 %. Without considering abandoned sample units as responses, the response rate is 50 %. When only considering completions by new and continuous residents, the response rate was 40 %.
Table 2-1. Housing Survey Completion Rates.
Housing Type Sample Ineligible Abandoned No
Answer Refusal Completion
by Neighbor
Completion by New Resident
Completion by
Continuous Resident
% Tot. % No. % No. % No. % No. % No. % No. % No. Single-Family 76 431 75 9 64 96 78 76 77 23 85 47 64 28 86 152 Multi-Family 11 60 0 0 11 17 14 14 17 5 5 3 20 9 7 12 Duplex 11 63 0 0 23 34 6 6 7 2 5 3 16 7 6 11 Mobile Home 2 13 25 3 3 4 2 2 0 0 4 2 0 0 1 2
Total 567 12 151 98 30 55 44 177
7 A hard refusal is the term used to capture responses such as a door slammed in face, a demand to get off the porch or the property, and being told not to return. A soft refusal is a response more likely to be converted into a yes with additional explanation (e.g., importance of the response) or accommodation (e.g., arranging to come back at a more convenient time).
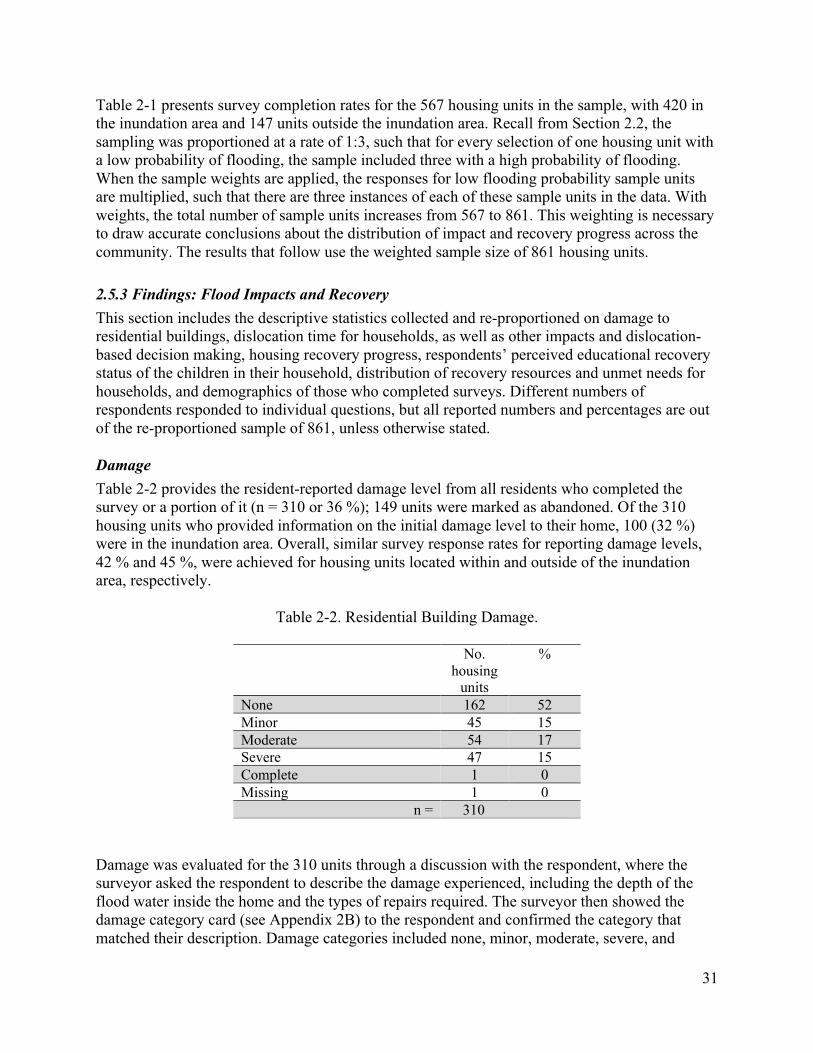
31
Table 2-1 presents survey completion rates for the 567 housing units in the sample, with 420 in the inundation area and 147 units outside the inundation area. Recall from Section 2.2, the sampling was proportioned at a rate of 1:3, such that for every selection of one housing unit with a low probability of flooding, the sample included three with a high probability of flooding. When the sample weights are applied, the responses for low flooding probability sample units are multiplied, such that there are three instances of each of these sample units in the data. With weights, the total number of sample units increases from 567 to 861. This weighting is necessary to draw accurate conclusions about the distribution of impact and recovery progress across the community. The results that follow use the weighted sample size of 861 housing units.
2.5.3 Findings: Flood Impacts and Recovery This section includes the descriptive statistics collected and re-proportioned on damage to residential buildings, dislocation time for households, as well as other impacts and dislocation-based decision making, housing recovery progress, respondents’ perceived educational recovery status of the children in their household, distribution of recovery resources and unmet needs for households, and demographics of those who completed surveys. Different numbers of respondents responded to individual questions, but all reported numbers and percentages are out of the re-proportioned sample of 861, unless otherwise stated.
Damage Table 2-2 provides the resident-reported damage level from all residents who completed the survey or a portion of it (n = 310 or 36 %); 149 units were marked as abandoned. Of the 310 housing units who provided information on the initial damage level to their home, 100 (32 %) were in the inundation area. Overall, similar survey response rates for reporting damage levels, 42 % and 45 %, were achieved for housing units located within and outside of the inundation area, respectively.
Table 2-2. Residential Building Damage.
No. housing
units
%
None 162 52 Minor 45 15 Moderate 54 17 Severe 47 15 Complete 1 0 Missing 1 0
n = 310 Damage was evaluated for the 310 units through a discussion with the respondent, where the surveyor asked the respondent to describe the damage experienced, including the depth of the flood water inside the home and the types of repairs required. The surveyor then showed the damage category card (see Appendix 2B) to the respondent and confirmed the category that matched their description. Damage categories included none, minor, moderate, severe, and

32
complete. The full description of these categories is provided in Appendix 2B and is identical to what was used in Wave 1. Of the 100 sample units in the inundation area that indicated whether or not their home was damaged, 9 % had no damage, 25 % reported minor damage, 27 % reported moderate damage, 37 % reported severe damage, less than 1 % (one respondent) reported complete damage, and less than 1 % (one respondent) did not indicate the level of damage (reported as missing in Table 2-2). Of the 210 sample units outside of the inundation area who provided information on the initial damage to their home, approximately 73 % reported no damage, 10 % reported minor damage, 13 % reported moderate damage, and 5 % reported severe damage.
Dislocation Time, Impacts, and Decision Making A total of 296 households reported information on dislocation, including 40 % who indicated they did not dislocate, and 60 % who reported that their household dislocated for at least one day. Table 2-3 provides the number and percent of households dislocated by housing type and tenure, as well as the average and median number of days dislocated for each category. As shown in Table 2-3, 57 % of households living in single-family dwellings dislocated; 59 % of households living in multi-family dwellings dislocated; all households whom we surveyed living in duplexes or mobile homes dislocated; 75 % of renters and 56 % of owners dislocated. Thus, as past disaster studies have highlighted, MFD residents and renters were more likely to dislocate. Larger multi-family dwellings (with three or more units) experienced the longest average dislocation time, followed by single-family dwellings although the median days of dislocation were similar for all categories. In Table 2-3, average and median day estimates do not include those households who did not dislocate or who are still dislocated. It is important to note that the average dislocation time for homeowners (93 days) was over twice as long as the average dislocation time for renters (39 days). This finding is counter to what has been commonly observed in the literature from past hurricane and flood events, where renters are typically displaced for longer periods of time than homeowners. The differences are explained through a reporting of the difference in number of homeowner versus renter respondents, and the median days of dislocation. Overall, there were nearly three times more owners who responded to the dislocation question, and the median dislocation time was one day shorter for renters than owners.
Table 2-3. Household Dislocation Duration Across Housing Type and Tenure for Households who Dislocated and Returned Home by Wave 2.8
No. HHs dislocated
% HHs dislocated
Average (days)
Median (days)
Std. Dev. (days)
Housing Type Single-Family 143 57 86 7 126 Multi-Family 13 59 105 5 73 Duplex 20 100 11 7 119 Mobile Home 2 100 9 9 14
Tenure Renter 51 75 39 13 121 Owner 127 56 93 14 8
8 The abbreviation HHs is used to denote “households” in the tables displayed in this section.
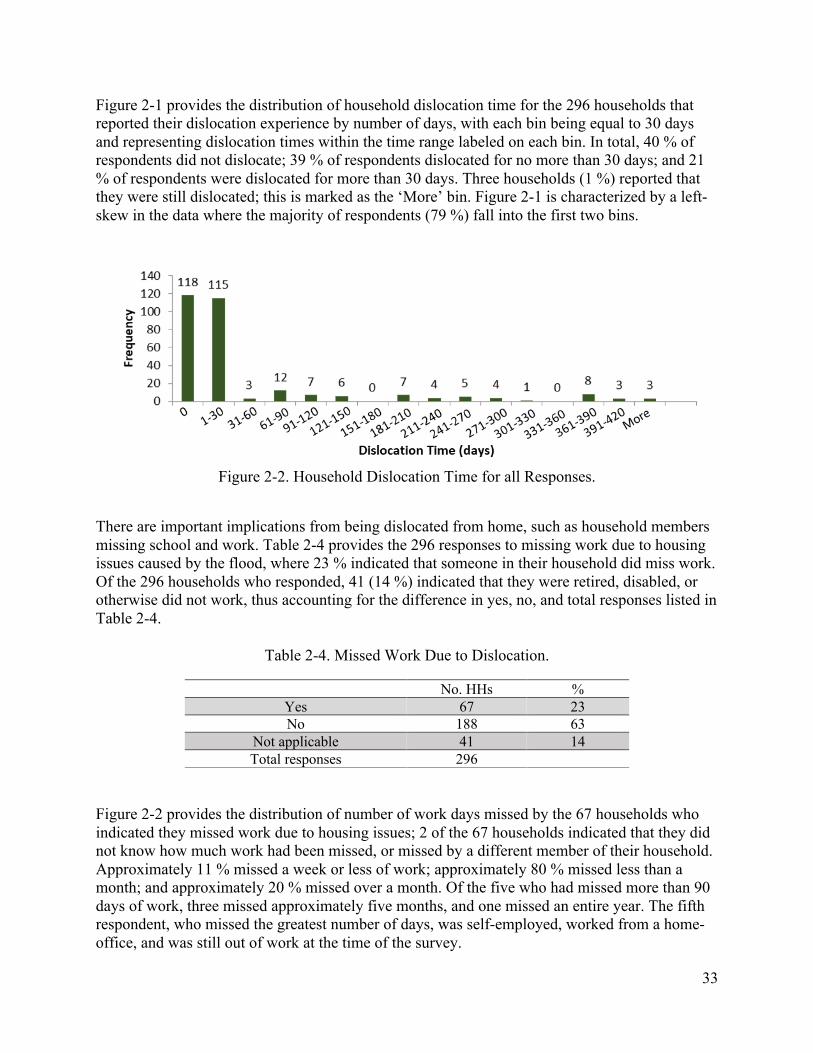
33
Figure 2-1 provides the distribution of household dislocation time for the 296 households that reported their dislocation experience by number of days, with each bin being equal to 30 days and representing dislocation times within the time range labeled on each bin. In total, 40 % of respondents did not dislocate; 39 % of respondents dislocated for no more than 30 days; and 21 % of respondents were dislocated for more than 30 days. Three households (1 %) reported that they were still dislocated; this is marked as the ‘More’ bin. Figure 2-1 is characterized by a left-skew in the data where the majority of respondents (79 %) fall into the first two bins.
Figure 2-2. Household Dislocation Time for all Responses.
There are important implications from being dislocated from home, such as household members missing school and work. Table 2-4 provides the 296 responses to missing work due to housing issues caused by the flood, where 23 % indicated that someone in their household did miss work. Of the 296 households who responded, 41 (14 %) indicated that they were retired, disabled, or otherwise did not work, thus accounting for the difference in yes, no, and total responses listed in Table 2-4.
Table 2-4. Missed Work Due to Dislocation.
No. HHs % Yes 67 23 No 188 63
Not applicable 41 14 Total responses 296
Figure 2-2 provides the distribution of number of work days missed by the 67 households who indicated they missed work due to housing issues; 2 of the 67 households indicated that they did not know how much work had been missed, or missed by a different member of their household. Approximately 11 % missed a week or less of work; approximately 80 % missed less than a month; and approximately 20 % missed over a month. Of the five who had missed more than 90 days of work, three missed approximately five months, and one missed an entire year. The fifth respondent, who missed the greatest number of days, was self-employed, worked from a home-office, and was still out of work at the time of the survey.
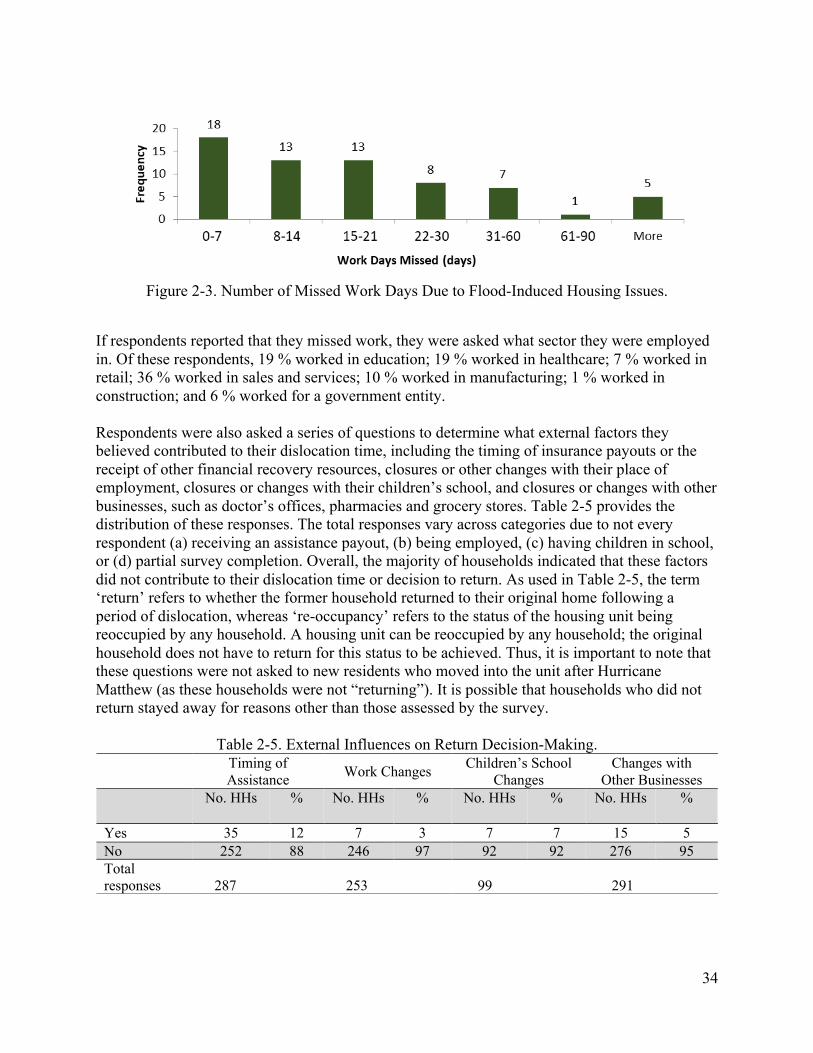
34
Figure 2-3. Number of Missed Work Days Due to Flood-Induced Housing Issues.
If respondents reported that they missed work, they were asked what sector they were employed in. Of these respondents, 19 % worked in education; 19 % worked in healthcare; 7 % worked in retail; 36 % worked in sales and services; 10 % worked in manufacturing; 1 % worked in construction; and 6 % worked for a government entity. Respondents were also asked a series of questions to determine what external factors they believed contributed to their dislocation time, including the timing of insurance payouts or the receipt of other financial recovery resources, closures or other changes with their place of employment, closures or changes with their children’s school, and closures or changes with other businesses, such as doctor’s offices, pharmacies and grocery stores. Table 2-5 provides the distribution of these responses. The total responses vary across categories due to not every respondent (a) receiving an assistance payout, (b) being employed, (c) having children in school, or (d) partial survey completion. Overall, the majority of households indicated that these factors did not contribute to their dislocation time or decision to return. As used in Table 2-5, the term ‘return’ refers to whether the former household returned to their original home following a period of dislocation, whereas ‘re-occupancy’ refers to the status of the housing unit being reoccupied by any household. A housing unit can be reoccupied by any household; the original household does not have to return for this status to be achieved. Thus, it is important to note that these questions were not asked to new residents who moved into the unit after Hurricane Matthew (as these households were not “returning”). It is possible that households who did not return stayed away for reasons other than those assessed by the survey.
Table 2-5. External Influences on Return Decision-Making. Timing of
Assistance Work Changes Children’s School Changes
Changes with Other Businesses
No. HHs % No. HHs % No. HHs % No. HHs %
Yes 35 12 7 3 7 7 15 5 No 252 88 246 97 92 92 276 95 Total responses 287 253 99 291
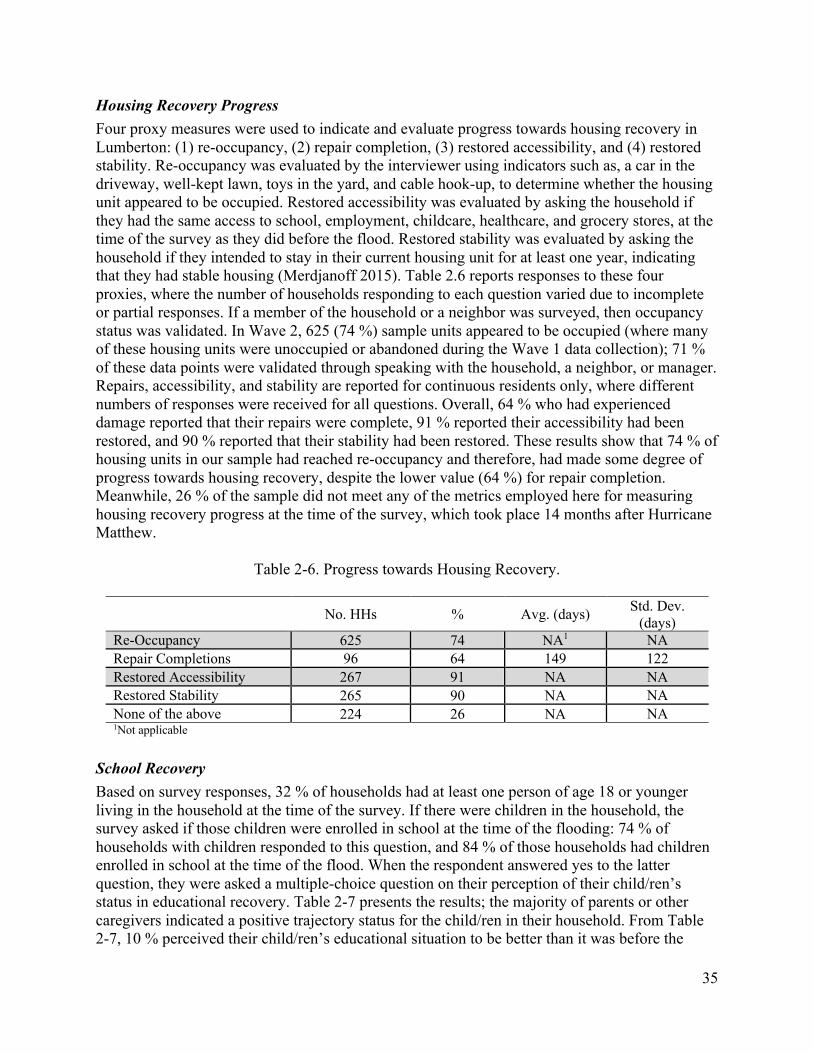
35
Housing Recovery Progress Four proxy measures were used to indicate and evaluate progress towards housing recovery in Lumberton: (1) re-occupancy, (2) repair completion, (3) restored accessibility, and (4) restored stability. Re-occupancy was evaluated by the interviewer using indicators such as, a car in the driveway, well-kept lawn, toys in the yard, and cable hook-up, to determine whether the housing unit appeared to be occupied. Restored accessibility was evaluated by asking the household if they had the same access to school, employment, childcare, healthcare, and grocery stores, at the time of the survey as they did before the flood. Restored stability was evaluated by asking the household if they intended to stay in their current housing unit for at least one year, indicating that they had stable housing (Merdjanoff 2015). Table 2.6 reports responses to these four proxies, where the number of households responding to each question varied due to incomplete or partial responses. If a member of the household or a neighbor was surveyed, then occupancy status was validated. In Wave 2, 625 (74 %) sample units appeared to be occupied (where many of these housing units were unoccupied or abandoned during the Wave 1 data collection); 71 % of these data points were validated through speaking with the household, a neighbor, or manager. Repairs, accessibility, and stability are reported for continuous residents only, where different numbers of responses were received for all questions. Overall, 64 % who had experienced damage reported that their repairs were complete, 91 % reported their accessibility had been restored, and 90 % reported that their stability had been restored. These results show that 74 % of housing units in our sample had reached re-occupancy and therefore, had made some degree of progress towards housing recovery, despite the lower value (64 %) for repair completion. Meanwhile, 26 % of the sample did not meet any of the metrics employed here for measuring housing recovery progress at the time of the survey, which took place 14 months after Hurricane Matthew.
Table 2-6. Progress towards Housing Recovery.
No. HHs % Avg. (days) Std. Dev. (days)
Re-Occupancy 625 74 NA1 NA Repair Completions 96 64 149 122 Restored Accessibility 267 91 NA NA Restored Stability 265 90 NA NA None of the above 224 26 NA NA 1Not applicable
School Recovery Based on survey responses, 32 % of households had at least one person of age 18 or younger living in the household at the time of the survey. If there were children in the household, the survey asked if those children were enrolled in school at the time of the flooding: 74 % of households with children responded to this question, and 84 % of those households had children enrolled in school at the time of the flood. When the respondent answered yes to the latter question, they were asked a multiple-choice question on their perception of their child/ren’s status in educational recovery. Table 2-7 presents the results; the majority of parents or other caregivers indicated a positive trajectory status for the child/ren in their household. From Table 2-7, 10 % perceived their child/ren’s educational situation to be better than it was before the
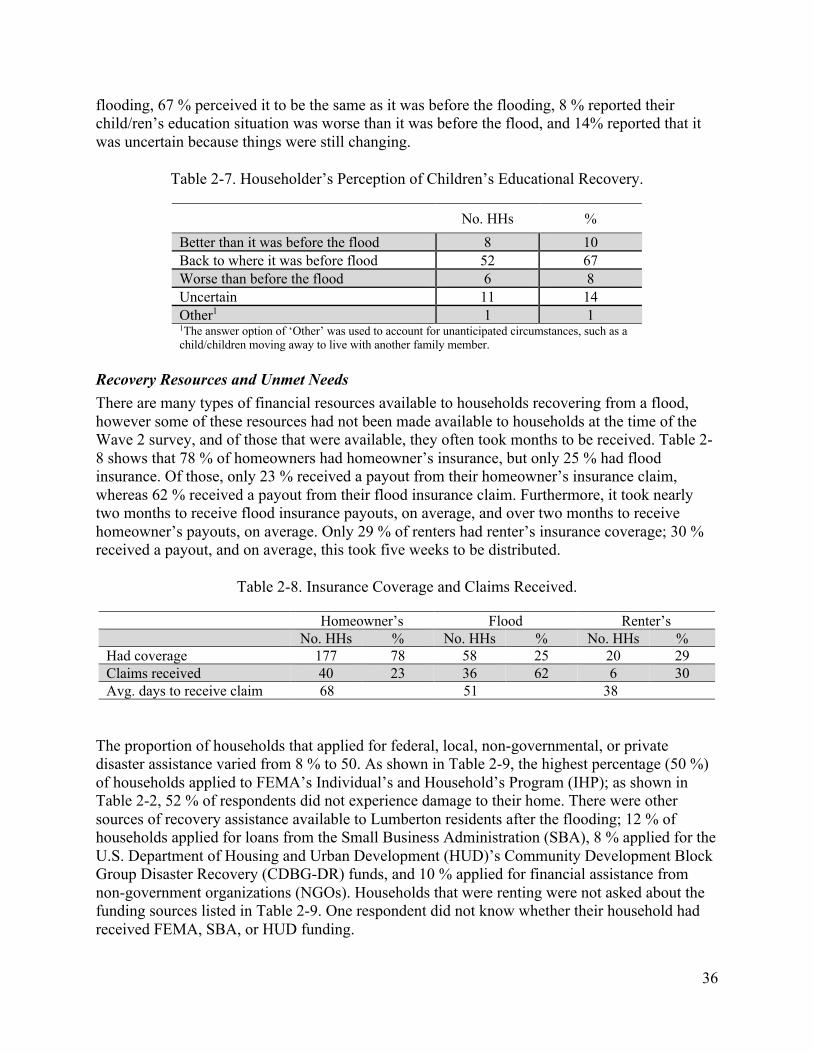
36
flooding, 67 % perceived it to be the same as it was before the flooding, 8 % reported their child/ren’s education situation was worse than it was before the flood, and 14% reported that it was uncertain because things were still changing.
Table 2-7. Householder’s Perception of Children’s Educational Recovery.
No. HHs % Better than it was before the flood 8 10 Back to where it was before flood 52 67 Worse than before the flood 6 8 Uncertain 11 14 Other1 1 1 1The answer option of ‘Other’ was used to account for unanticipated circumstances, such as a child/children moving away to live with another family member.
Recovery Resources and Unmet Needs There are many types of financial resources available to households recovering from a flood, however some of these resources had not been made available to households at the time of the Wave 2 survey, and of those that were available, they often took months to be received. Table 2-8 shows that 78 % of homeowners had homeowner’s insurance, but only 25 % had flood insurance. Of those, only 23 % received a payout from their homeowner’s insurance claim, whereas 62 % received a payout from their flood insurance claim. Furthermore, it took nearly two months to receive flood insurance payouts, on average, and over two months to receive homeowner’s payouts, on average. Only 29 % of renters had renter’s insurance coverage; 30 % received a payout, and on average, this took five weeks to be distributed.
Table 2-8. Insurance Coverage and Claims Received.
Homeowner’s Flood Renter’s No. HHs % No. HHs % No. HHs % Had coverage 177 78 58 25 20 29 Claims received 40 23 36 62 6 30 Avg. days to receive claim 68 51 38
The proportion of households that applied for federal, local, non-governmental, or private disaster assistance varied from 8 % to 50. As shown in Table 2-9, the highest percentage (50 %) of households applied to FEMA’s Individual’s and Household’s Program (IHP); as shown in Table 2-2, 52 % of respondents did not experience damage to their home. There were other sources of recovery assistance available to Lumberton residents after the flooding; 12 % of households applied for loans from the Small Business Administration (SBA), 8 % applied for the U.S. Department of Housing and Urban Development (HUD)’s Community Development Block Group Disaster Recovery (CDBG-DR) funds, and 10 % applied for financial assistance from non-government organizations (NGOs). Households that were renting were not asked about the funding sources listed in Table 2-9. One respondent did not know whether their household had received FEMA, SBA, or HUD funding.
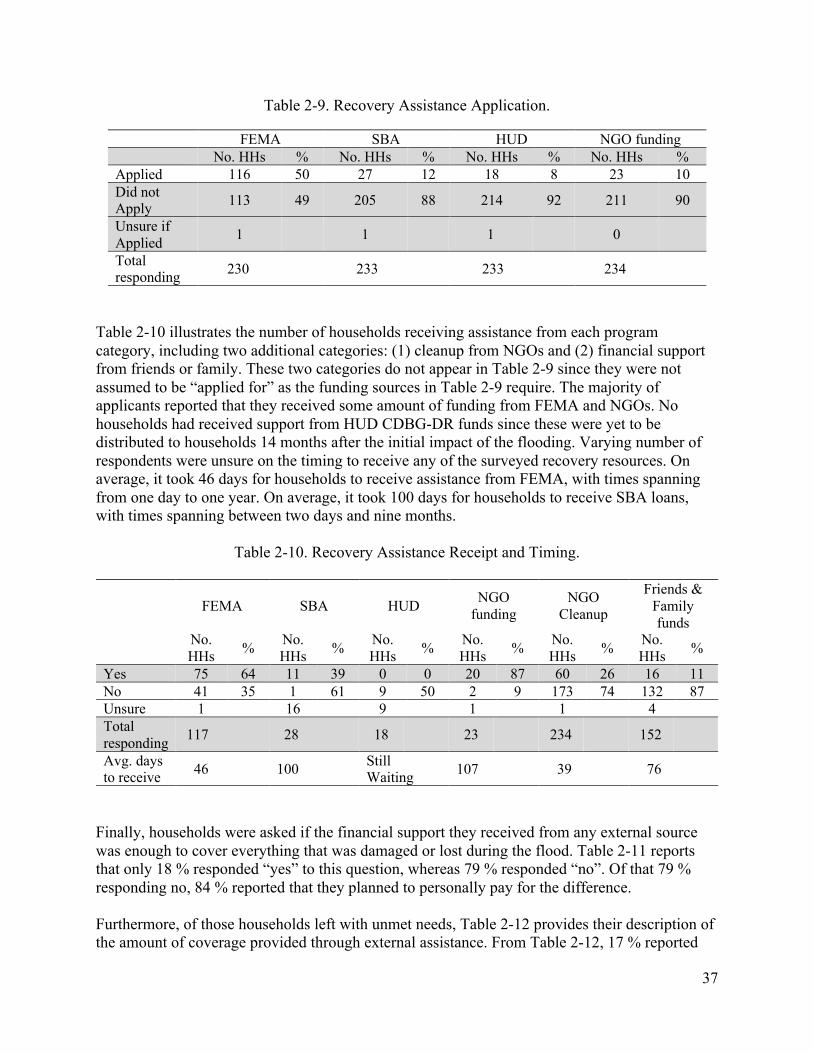
37
Table 2-9. Recovery Assistance Application.
FEMA SBA HUD NGO funding No. HHs % No. HHs % No. HHs % No. HHs % Applied 116 50 27 12 18 8 23 10 Did not Apply 113 49 205 88 214 92 211 90
Unsure if Applied 1 1 1 0
Total responding 230 233 233 234
Table 2-10 illustrates the number of households receiving assistance from each program category, including two additional categories: (1) cleanup from NGOs and (2) financial support from friends or family. These two categories do not appear in Table 2-9 since they were not assumed to be “applied for” as the funding sources in Table 2-9 require. The majority of applicants reported that they received some amount of funding from FEMA and NGOs. No households had received support from HUD CDBG-DR funds since these were yet to be distributed to households 14 months after the initial impact of the flooding. Varying number of respondents were unsure on the timing to receive any of the surveyed recovery resources. On average, it took 46 days for households to receive assistance from FEMA, with times spanning from one day to one year. On average, it took 100 days for households to receive SBA loans, with times spanning between two days and nine months.
Table 2-10. Recovery Assistance Receipt and Timing.
FEMA SBA HUD NGO
funding NGO
Cleanup
Friends & Family funds
No. HHs % No.
HHs % No. HHs % No.
HHs % No. HHs % No.
HHs %
Yes 75 64 11 39 0 0 20 87 60 26 16 11 No 41 35 1 61 9 50 2 9 173 74 132 87 Unsure 1 16 9 1 1 4 Total responding 117 28 18 23 234 152
Avg. days to receive 46 100 Still
Waiting 107 39 76
Finally, households were asked if the financial support they received from any external source was enough to cover everything that was damaged or lost during the flood. Table 2-11 reports that only 18 % responded “yes” to this question, whereas 79 % responded “no”. Of that 79 % responding no, 84 % reported that they planned to personally pay for the difference. Furthermore, of those households left with unmet needs, Table 2-12 provides their description of the amount of coverage provided through external assistance. From Table 2-12, 17 % reported
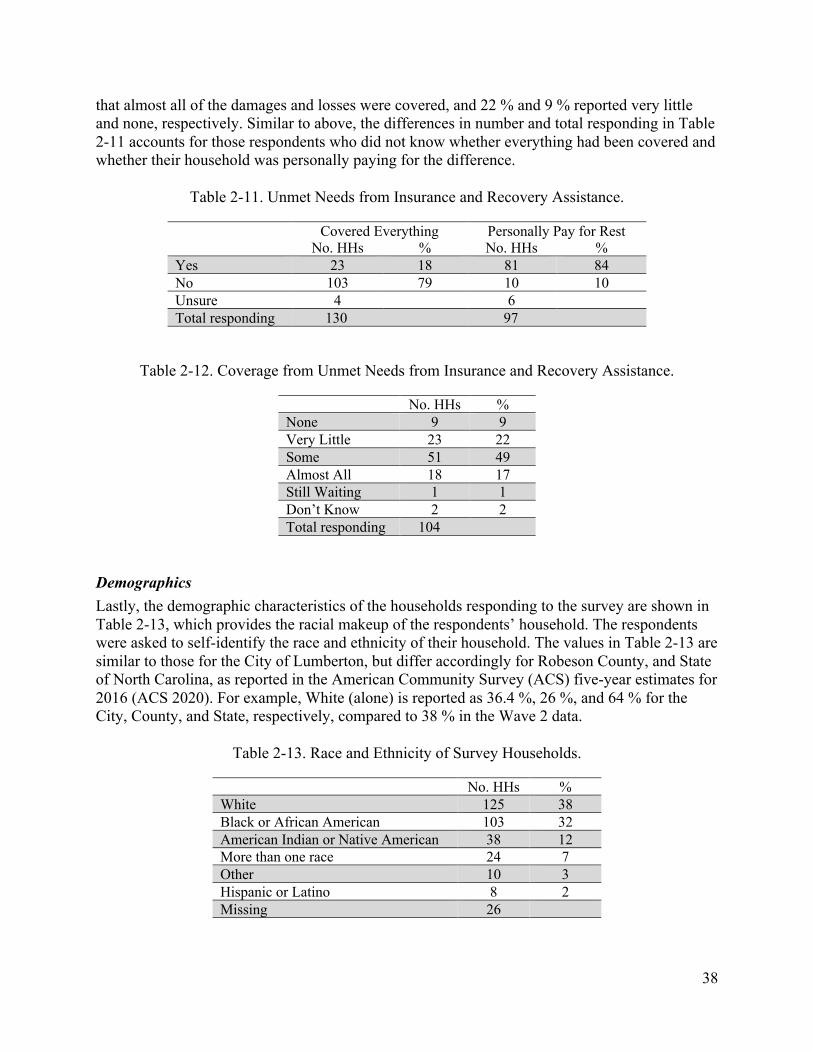
38
that almost all of the damages and losses were covered, and 22 % and 9 % reported very little and none, respectively. Similar to above, the differences in number and total responding in Table 2-11 accounts for those respondents who did not know whether everything had been covered and whether their household was personally paying for the difference.
Table 2-11. Unmet Needs from Insurance and Recovery Assistance.
Covered Everything Personally Pay for Rest No. HHs % No. HHs % Yes 23 18 81 84 No 103 79 10 10 Unsure 4 6 Total responding 130 97
Table 2-12. Coverage from Unmet Needs from Insurance and Recovery Assistance.
No. HHs % None 9 9 Very Little 23 22 Some 51 49 Almost All 18 17 Still Waiting 1 1 Don’t Know 2 2 Total responding 104
Demographics Lastly, the demographic characteristics of the households responding to the survey are shown in Table 2-13, which provides the racial makeup of the respondents’ household. The respondents were asked to self-identify the race and ethnicity of their household. The values in Table 2-13 are similar to those for the City of Lumberton, but differ accordingly for Robeson County, and State of North Carolina, as reported in the American Community Survey (ACS) five-year estimates for 2016 (ACS 2020). For example, White (alone) is reported as 36.4 %, 26 %, and 64 % for the City, County, and State, respectively, compared to 38 % in the Wave 2 data.
Table 2-13. Race and Ethnicity of Survey Households.
No. HHs % White 125 38 Black or African American 103 32 American Indian or Native American 38 12 More than one race 24 7 Other 10 3 Hispanic or Latino 8 2 Missing 26
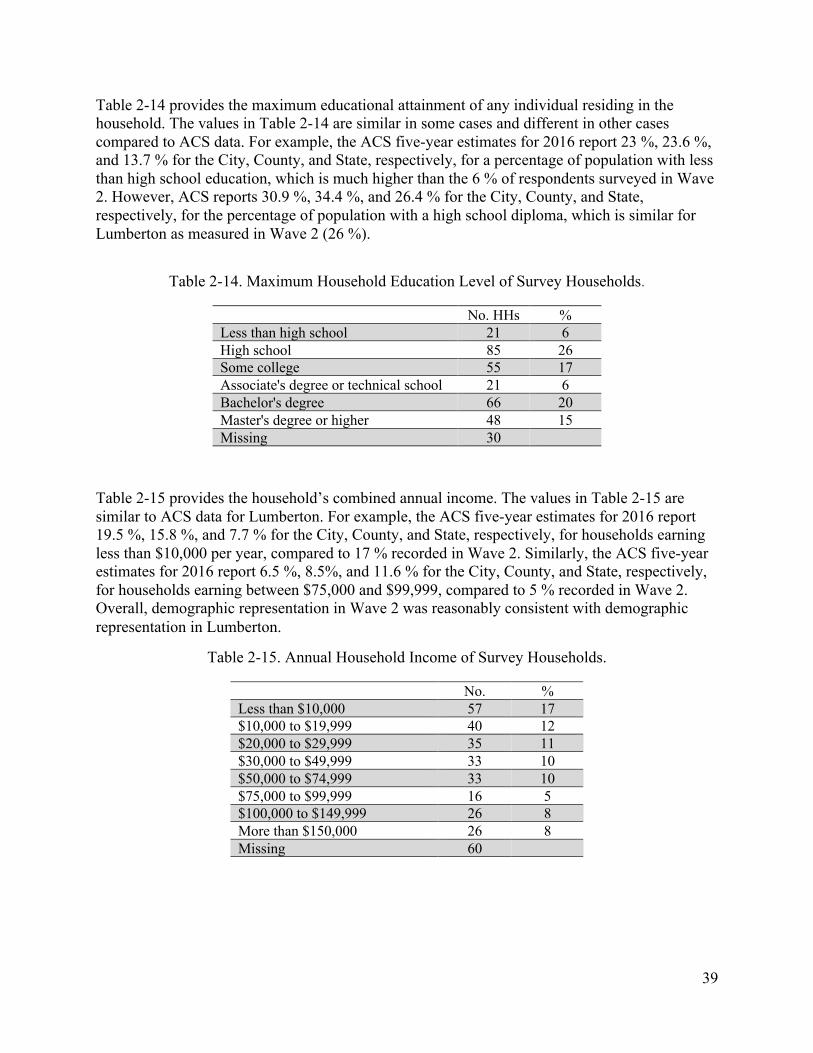
39
Table 2-14 provides the maximum educational attainment of any individual residing in the household. The values in Table 2-14 are similar in some cases and different in other cases compared to ACS data. For example, the ACS five-year estimates for 2016 report 23 %, 23.6 %, and 13.7 % for the City, County, and State, respectively, for a percentage of population with less than high school education, which is much higher than the 6 % of respondents surveyed in Wave 2. However, ACS reports 30.9 %, 34.4 %, and 26.4 % for the City, County, and State, respectively, for the percentage of population with a high school diploma, which is similar for Lumberton as measured in Wave 2 (26 %).
Table 2-14. Maximum Household Education Level of Survey Households.
No. HHs % Less than high school 21 6 High school 85 26 Some college 55 17 Associate's degree or technical school 21 6 Bachelor's degree 66 20 Master's degree or higher 48 15 Missing 30
Table 2-15 provides the household’s combined annual income. The values in Table 2-15 are similar to ACS data for Lumberton. For example, the ACS five-year estimates for 2016 report 19.5 %, 15.8 %, and 7.7 % for the City, County, and State, respectively, for households earning less than $10,000 per year, compared to 17 % recorded in Wave 2. Similarly, the ACS five-year estimates for 2016 report 6.5 %, 8.5%, and 11.6 % for the City, County, and State, respectively, for households earning between $75,000 and $99,999, compared to 5 % recorded in Wave 2. Overall, demographic representation in Wave 2 was reasonably consistent with demographic representation in Lumberton.
Table 2-15. Annual Household Income of Survey Households.
No. % Less than $10,000 57 17 $10,000 to $19,999 40 12 $20,000 to $29,999 35 11 $30,000 to $49,999 33 10 $50,000 to $74,999 33 10 $75,000 to $99,999 16 5 $100,000 to $149,999 26 8 More than $150,000 26 8 Missing 60
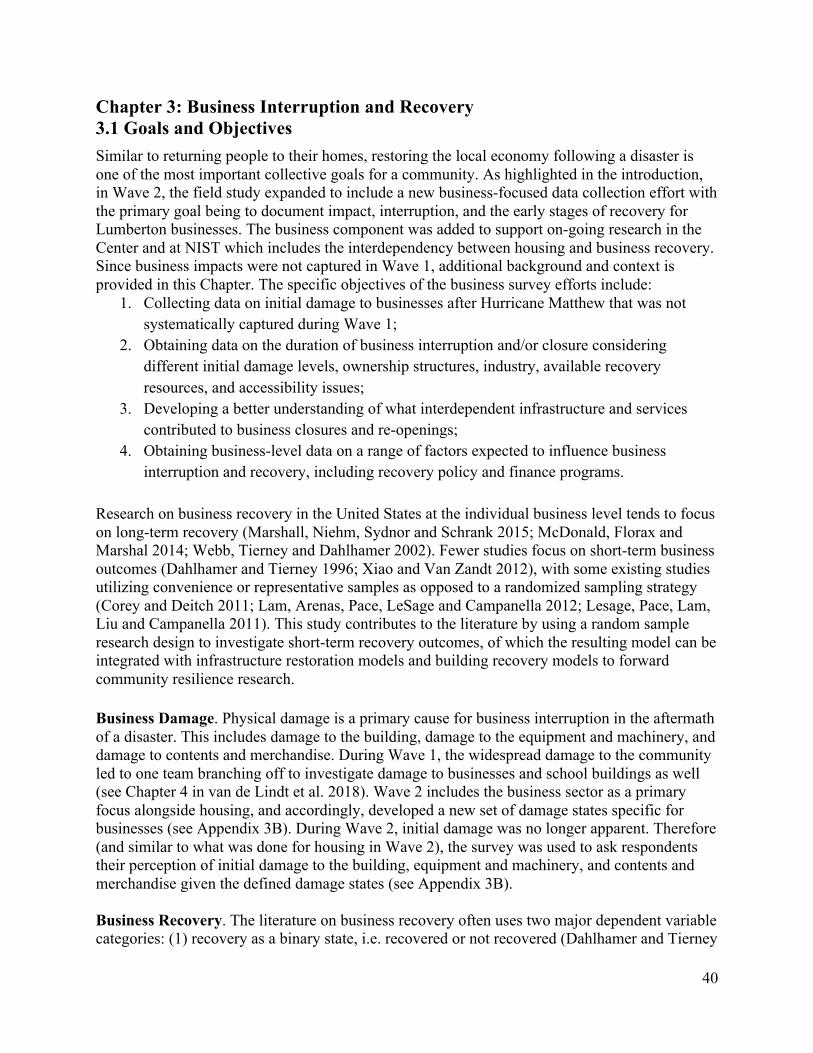
40
Chapter 3: Business Interruption and Recovery 3.1 Goals and Objectives Similar to returning people to their homes, restoring the local economy following a disaster is one of the most important collective goals for a community. As highlighted in the introduction, in Wave 2, the field study expanded to include a new business-focused data collection effort with the primary goal being to document impact, interruption, and the early stages of recovery for Lumberton businesses. The business component was added to support on-going research in the Center and at NIST which includes the interdependency between housing and business recovery. Since business impacts were not captured in Wave 1, additional background and context is provided in this Chapter. The specific objectives of the business survey efforts include:
1. Collecting data on initial damage to businesses after Hurricane Matthew that was not systematically captured during Wave 1;
2. Obtaining data on the duration of business interruption and/or closure considering different initial damage levels, ownership structures, industry, available recovery resources, and accessibility issues;
3. Developing a better understanding of what interdependent infrastructure and services contributed to business closures and re-openings;
4. Obtaining business-level data on a range of factors expected to influence business interruption and recovery, including recovery policy and finance programs.
Research on business recovery in the United States at the individual business level tends to focus on long-term recovery (Marshall, Niehm, Sydnor and Schrank 2015; McDonald, Florax and Marshal 2014; Webb, Tierney and Dahlhamer 2002). Fewer studies focus on short-term business outcomes (Dahlhamer and Tierney 1996; Xiao and Van Zandt 2012), with some existing studies utilizing convenience or representative samples as opposed to a randomized sampling strategy (Corey and Deitch 2011; Lam, Arenas, Pace, LeSage and Campanella 2012; Lesage, Pace, Lam, Liu and Campanella 2011). This study contributes to the literature by using a random sample research design to investigate short-term recovery outcomes, of which the resulting model can be integrated with infrastructure restoration models and building recovery models to forward community resilience research. Business Damage. Physical damage is a primary cause for business interruption in the aftermath of a disaster. This includes damage to the building, damage to the equipment and machinery, and damage to contents and merchandise. During Wave 1, the widespread damage to the community led to one team branching off to investigate damage to businesses and school buildings as well (see Chapter 4 in van de Lindt et al. 2018). Wave 2 includes the business sector as a primary focus alongside housing, and accordingly, developed a new set of damage states specific for businesses (see Appendix 3B). During Wave 2, initial damage was no longer apparent. Therefore (and similar to what was done for housing in Wave 2), the survey was used to ask respondents their perception of initial damage to the building, equipment and machinery, and contents and merchandise given the defined damage states (see Appendix 3B). Business Recovery. The literature on business recovery often uses two major dependent variable categories: (1) recovery as a binary state, i.e. recovered or not recovered (Dahlhamer and Tierney
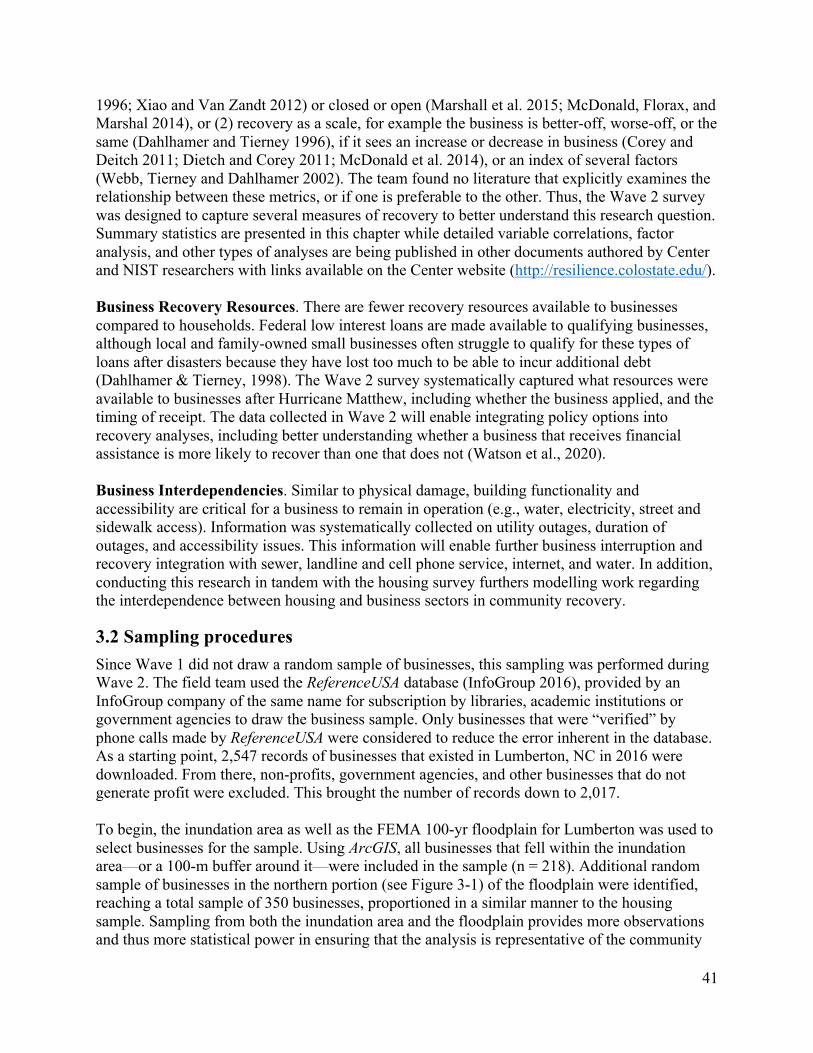
41
1996; Xiao and Van Zandt 2012) or closed or open (Marshall et al. 2015; McDonald, Florax, and Marshal 2014), or (2) recovery as a scale, for example the business is better-off, worse-off, or the same (Dahlhamer and Tierney 1996), if it sees an increase or decrease in business (Corey and Deitch 2011; Dietch and Corey 2011; McDonald et al. 2014), or an index of several factors (Webb, Tierney and Dahlhamer 2002). The team found no literature that explicitly examines the relationship between these metrics, or if one is preferable to the other. Thus, the Wave 2 survey was designed to capture several measures of recovery to better understand this research question. Summary statistics are presented in this chapter while detailed variable correlations, factor analysis, and other types of analyses are being published in other documents authored by Center and NIST researchers with links available on the Center website (http://resilience.colostate.edu/). Business Recovery Resources. There are fewer recovery resources available to businesses compared to households. Federal low interest loans are made available to qualifying businesses, although local and family-owned small businesses often struggle to qualify for these types of loans after disasters because they have lost too much to be able to incur additional debt (Dahlhamer & Tierney, 1998). The Wave 2 survey systematically captured what resources were available to businesses after Hurricane Matthew, including whether the business applied, and the timing of receipt. The data collected in Wave 2 will enable integrating policy options into recovery analyses, including better understanding whether a business that receives financial assistance is more likely to recover than one that does not (Watson et al., 2020). Business Interdependencies. Similar to physical damage, building functionality and accessibility are critical for a business to remain in operation (e.g., water, electricity, street and sidewalk access). Information was systematically collected on utility outages, duration of outages, and accessibility issues. This information will enable further business interruption and recovery integration with sewer, landline and cell phone service, internet, and water. In addition, conducting this research in tandem with the housing survey furthers modelling work regarding the interdependence between housing and business sectors in community recovery.
3.2 Sampling procedures Since Wave 1 did not draw a random sample of businesses, this sampling was performed during Wave 2. The field team used the ReferenceUSA database (InfoGroup 2016), provided by an InfoGroup company of the same name for subscription by libraries, academic institutions or government agencies to draw the business sample. Only businesses that were “verified” by phone calls made by ReferenceUSA were considered to reduce the error inherent in the database. As a starting point, 2,547 records of businesses that existed in Lumberton, NC in 2016 were downloaded. From there, non-profits, government agencies, and other businesses that do not generate profit were excluded. This brought the number of records down to 2,017. To begin, the inundation area as well as the FEMA 100-yr floodplain for Lumberton was used to select businesses for the sample. Using ArcGIS, all businesses that fell within the inundation area—or a 100-m buffer around it—were included in the sample (n = 218). Additional random sample of businesses in the northern portion (see Figure 3-1) of the floodplain were identified, reaching a total sample of 350 businesses, proportioned in a similar manner to the housing sample. Sampling from both the inundation area and the floodplain provides more observations and thus more statistical power in ensuring that the analysis is representative of the community
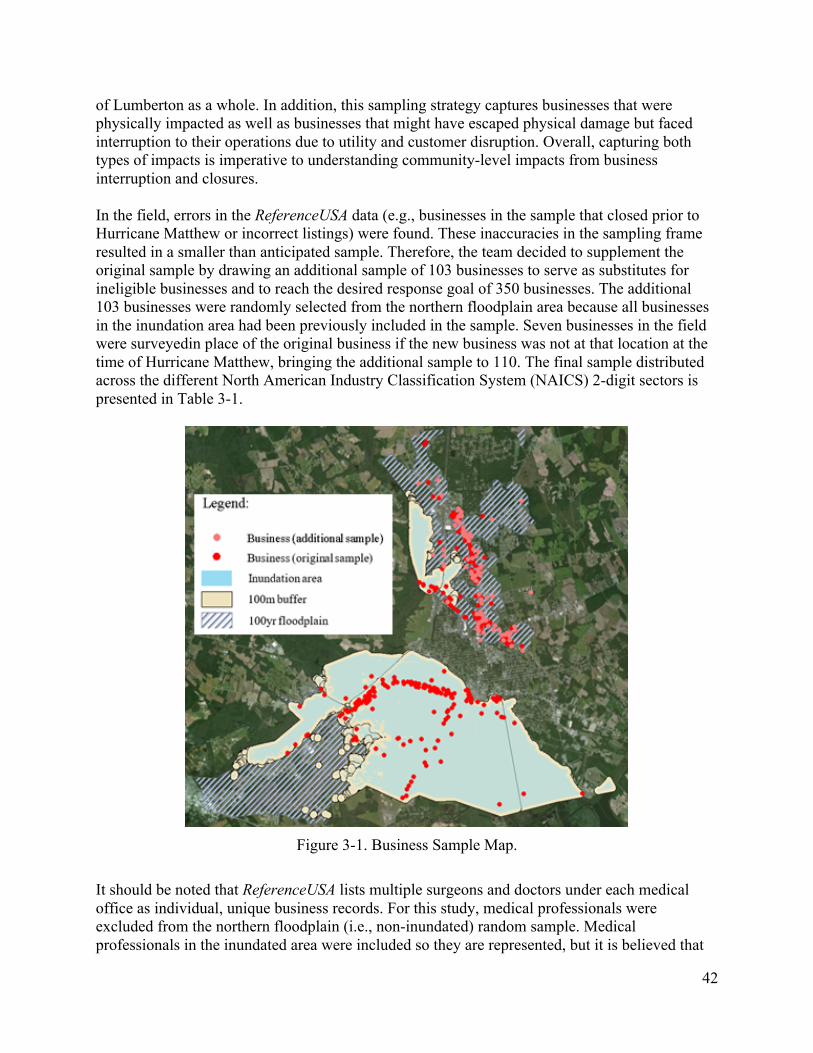
42
of Lumberton as a whole. In addition, this sampling strategy captures businesses that were physically impacted as well as businesses that might have escaped physical damage but faced interruption to their operations due to utility and customer disruption. Overall, capturing both types of impacts is imperative to understanding community-level impacts from business interruption and closures. In the field, errors in the ReferenceUSA data (e.g., businesses in the sample that closed prior to Hurricane Matthew or incorrect listings) were found. These inaccuracies in the sampling frame resulted in a smaller than anticipated sample. Therefore, the team decided to supplement the original sample by drawing an additional sample of 103 businesses to serve as substitutes for ineligible businesses and to reach the desired response goal of 350 businesses. The additional 103 businesses were randomly selected from the northern floodplain area because all businesses in the inundation area had been previously included in the sample. Seven businesses in the field were surveyedin place of the original business if the new business was not at that location at the time of Hurricane Matthew, bringing the additional sample to 110. The final sample distributed across the different North American Industry Classification System (NAICS) 2-digit sectors is presented in Table 3-1.
Figure 3-1. Business Sample Map.
It should be noted that ReferenceUSA lists multiple surgeons and doctors under each medical office as individual, unique business records. For this study, medical professionals were excluded from the northern floodplain (i.e., non-inundated) random sample. Medical professionals in the inundated area were included so they are represented, but it is believed that
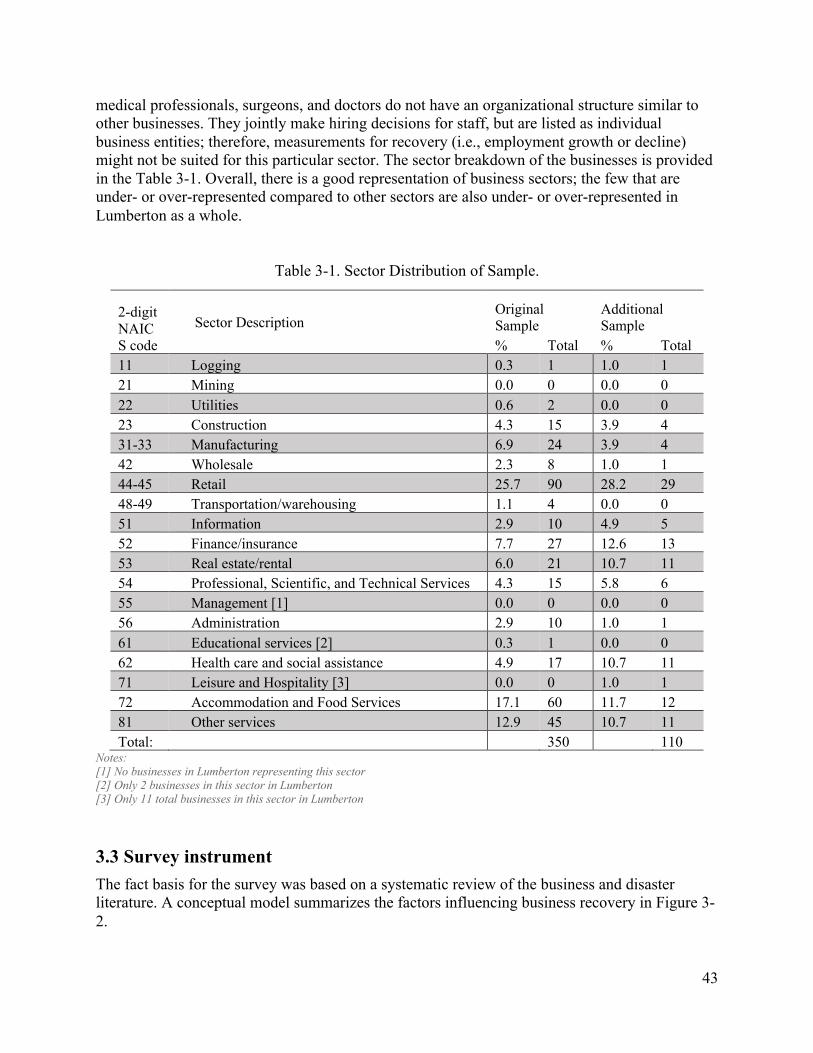
43
medical professionals, surgeons, and doctors do not have an organizational structure similar to other businesses. They jointly make hiring decisions for staff, but are listed as individual business entities; therefore, measurements for recovery (i.e., employment growth or decline) might not be suited for this particular sector. The sector breakdown of the businesses is provided in the Table 3-1. Overall, there is a good representation of business sectors; the few that are under- or over-represented compared to other sectors are also under- or over-represented in Lumberton as a whole.
Table 3-1. Sector Distribution of Sample.
2-digit NAICS code
Sector Description Original Sample
Additional Sample
% Total % Total 11 Logging 0.3 1 1.0 1 21 Mining 0.0 0 0.0 0 22 Utilities 0.6 2 0.0 0 23 Construction 4.3 15 3.9 4 31-33 Manufacturing 6.9 24 3.9 4 42 Wholesale 2.3 8 1.0 1 44-45 Retail 25.7 90 28.2 29 48-49 Transportation/warehousing 1.1 4 0.0 0 51 Information 2.9 10 4.9 5 52 Finance/insurance 7.7 27 12.6 13 53 Real estate/rental 6.0 21 10.7 11 54 Professional, Scientific, and Technical Services 4.3 15 5.8 6 55 Management [1] 0.0 0 0.0 0 56 Administration 2.9 10 1.0 1 61 Educational services [2] 0.3 1 0.0 0 62 Health care and social assistance 4.9 17 10.7 11 71 Leisure and Hospitality [3] 0.0 0 1.0 1 72 Accommodation and Food Services 17.1 60 11.7 12 81 Other services 12.9 45 10.7 11 Total: 350 110
Notes: [1] No businesses in Lumberton representing this sector [2] Only 2 businesses in this sector in Lumberton [3] Only 11 total businesses in this sector in Lumberton
3.3 Survey instrument The fact basis for the survey was based on a systematic review of the business and disaster literature. A conceptual model summarizes the factors influencing business recovery in Figure 3-2.
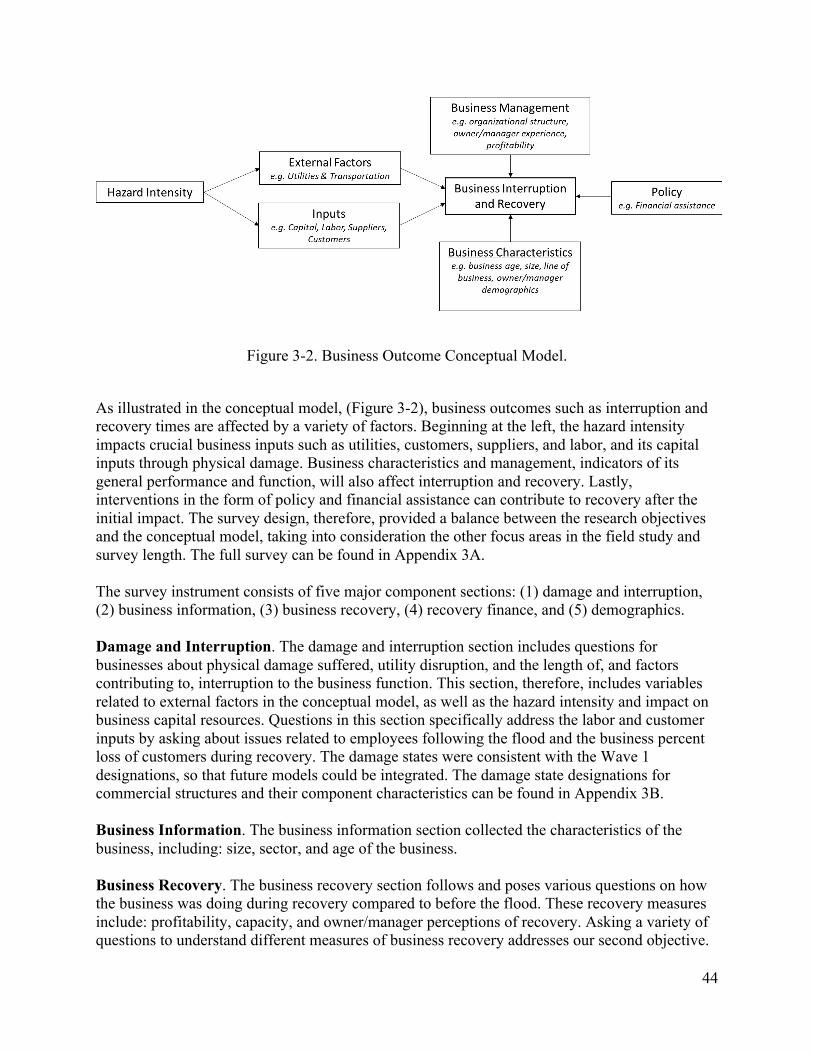
44
Figure 3-2. Business Outcome Conceptual Model.
As illustrated in the conceptual model, (Figure 3-2), business outcomes such as interruption and recovery times are affected by a variety of factors. Beginning at the left, the hazard intensity impacts crucial business inputs such as utilities, customers, suppliers, and labor, and its capital inputs through physical damage. Business characteristics and management, indicators of its general performance and function, will also affect interruption and recovery. Lastly, interventions in the form of policy and financial assistance can contribute to recovery after the initial impact. The survey design, therefore, provided a balance between the research objectives and the conceptual model, taking into consideration the other focus areas in the field study and survey length. The full survey can be found in Appendix 3A. The survey instrument consists of five major component sections: (1) damage and interruption, (2) business information, (3) business recovery, (4) recovery finance, and (5) demographics. Damage and Interruption. The damage and interruption section includes questions for businesses about physical damage suffered, utility disruption, and the length of, and factors contributing to, interruption to the business function. This section, therefore, includes variables related to external factors in the conceptual model, as well as the hazard intensity and impact on business capital resources. Questions in this section specifically address the labor and customer inputs by asking about issues related to employees following the flood and the business percent loss of customers during recovery. The damage states were consistent with the Wave 1 designations, so that future models could be integrated. The damage state designations for commercial structures and their component characteristics can be found in Appendix 3B.
Business Information. The business information section collected the characteristics of the business, including: size, sector, and age of the business. Business Recovery. The business recovery section follows and poses various questions on how the business was doing during recovery compared to before the flood. These recovery measures include: profitability, capacity, and owner/manager perceptions of recovery. Asking a variety of questions to understand different measures of business recovery addresses our second objective.
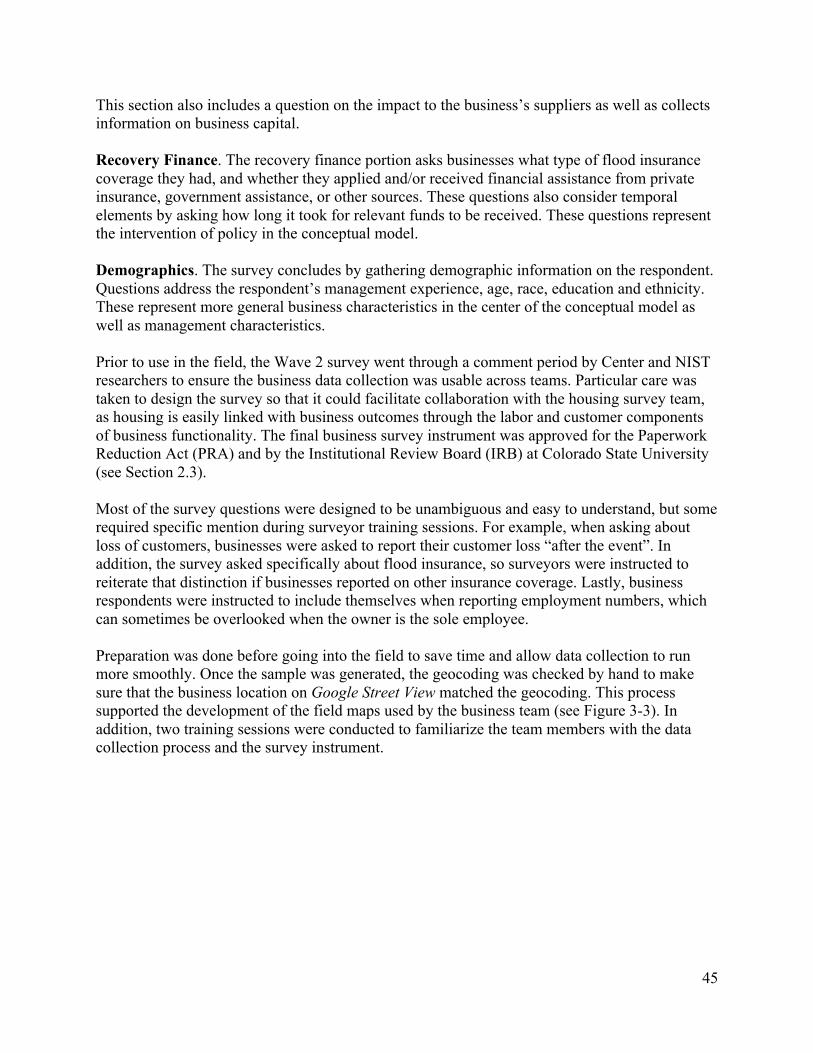
45
This section also includes a question on the impact to the business’s suppliers as well as collects information on business capital. Recovery Finance. The recovery finance portion asks businesses what type of flood insurance coverage they had, and whether they applied and/or received financial assistance from private insurance, government assistance, or other sources. These questions also consider temporal elements by asking how long it took for relevant funds to be received. These questions represent the intervention of policy in the conceptual model. Demographics. The survey concludes by gathering demographic information on the respondent. Questions address the respondent’s management experience, age, race, education and ethnicity. These represent more general business characteristics in the center of the conceptual model as well as management characteristics.
Prior to use in the field, the Wave 2 survey went through a comment period by Center and NIST researchers to ensure the business data collection was usable across teams. Particular care was taken to design the survey so that it could facilitate collaboration with the housing survey team, as housing is easily linked with business outcomes through the labor and customer components of business functionality. The final business survey instrument was approved for the Paperwork Reduction Act (PRA) and by the Institutional Review Board (IRB) at Colorado State University (see Section 2.3). Most of the survey questions were designed to be unambiguous and easy to understand, but some required specific mention during surveyor training sessions. For example, when asking about loss of customers, businesses were asked to report their customer loss “after the event”. In addition, the survey asked specifically about flood insurance, so surveyors were instructed to reiterate that distinction if businesses reported on other insurance coverage. Lastly, business respondents were instructed to include themselves when reporting employment numbers, which can sometimes be overlooked when the owner is the sole employee. Preparation was done before going into the field to save time and allow data collection to run more smoothly. Once the sample was generated, the geocoding was checked by hand to make sure that the business location on Google Street View matched the geocoding. This process supported the development of the field maps used by the business team (see Figure 3-3). In addition, two training sessions were conducted to familiarize the team members with the data collection process and the survey instrument.
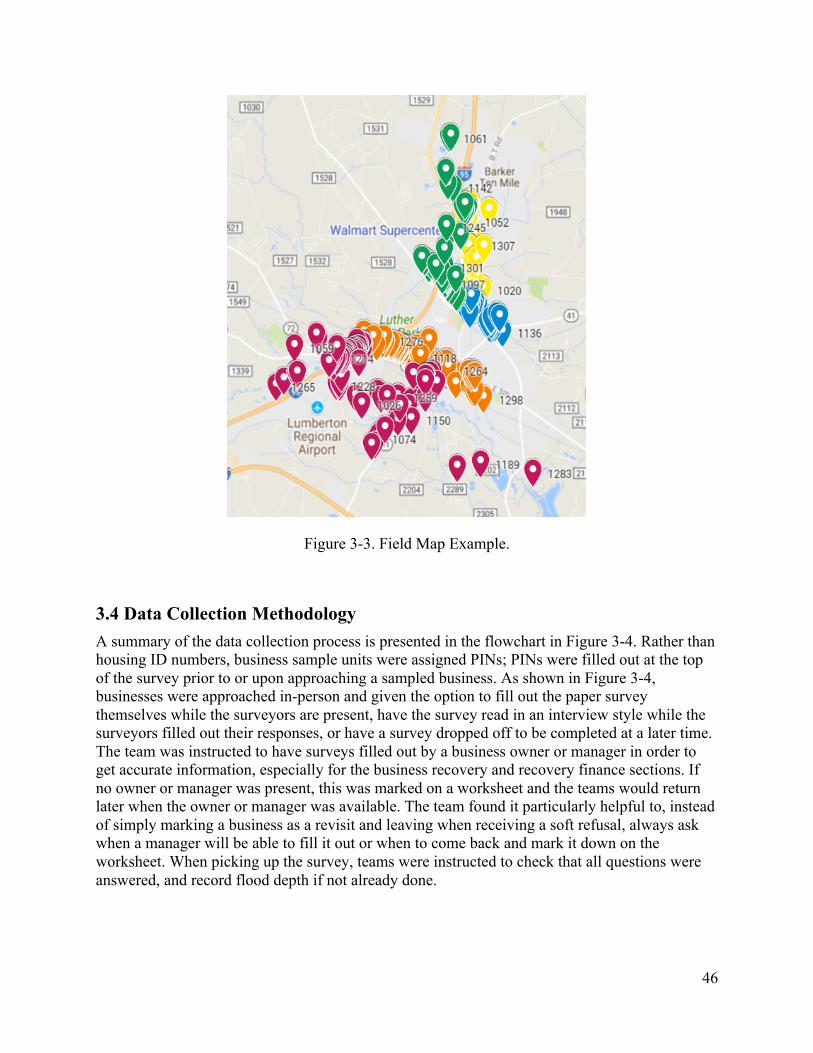
46
Figure 3-3. Field Map Example.
3.4 Data Collection Methodology A summary of the data collection process is presented in the flowchart in Figure 3-4. Rather than housing ID numbers, business sample units were assigned PINs; PINs were filled out at the top of the survey prior to or upon approaching a sampled business. As shown in Figure 3-4, businesses were approached in-person and given the option to fill out the paper survey themselves while the surveyors are present, have the survey read in an interview style while the surveyors filled out their responses, or have a survey dropped off to be completed at a later time. The team was instructed to have surveys filled out by a business owner or manager in order to get accurate information, especially for the business recovery and recovery finance sections. If no owner or manager was present, this was marked on a worksheet and the teams would return later when the owner or manager was available. The team found it particularly helpful to, instead of simply marking a business as a revisit and leaving when receiving a soft refusal, always ask when a manager will be able to fill it out or when to come back and mark it down on the worksheet. When picking up the survey, teams were instructed to check that all questions were answered, and record flood depth if not already done.
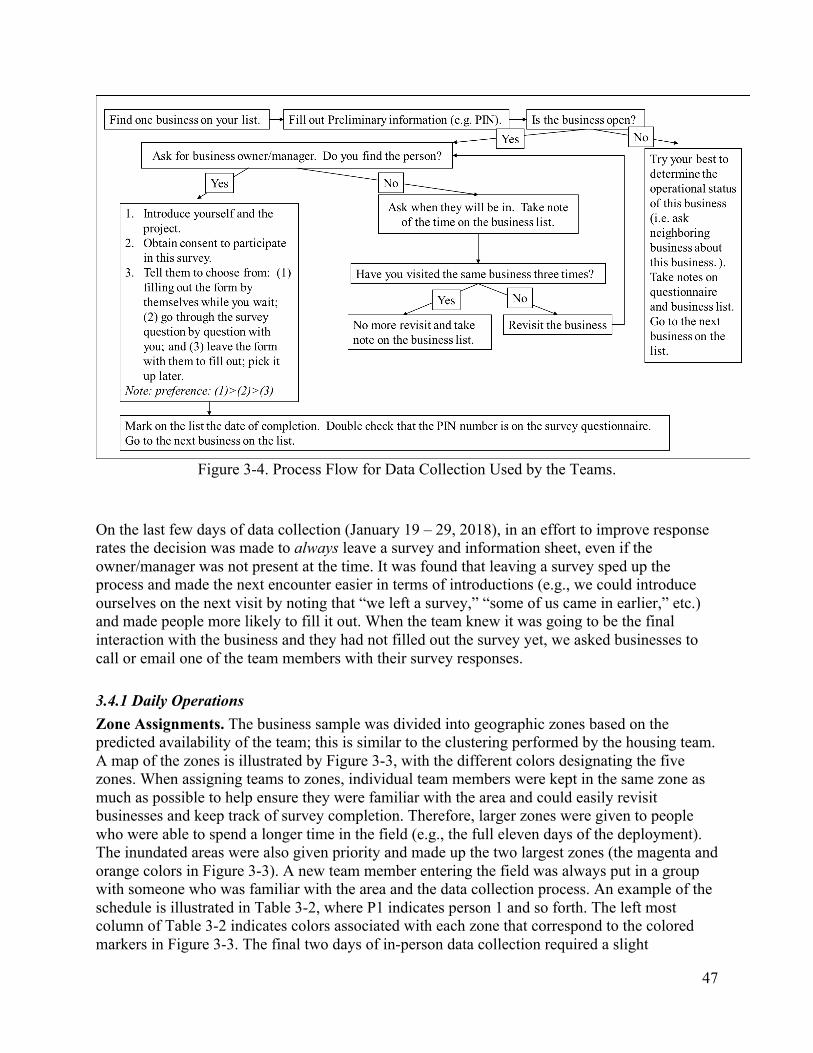
47
Figure 3-4. Process Flow for Data Collection Used by the Teams.
On the last few days of data collection (January 19 – 29, 2018), in an effort to improve response rates the decision was made to always leave a survey and information sheet, even if the owner/manager was not present at the time. It was found that leaving a survey sped up the process and made the next encounter easier in terms of introductions (e.g., we could introduce ourselves on the next visit by noting that “we left a survey,” “some of us came in earlier,” etc.) and made people more likely to fill it out. When the team knew it was going to be the final interaction with the business and they had not filled out the survey yet, we asked businesses to call or email one of the team members with their survey responses.
3.4.1 Daily Operations Zone Assignments. The business sample was divided into geographic zones based on the predicted availability of the team; this is similar to the clustering performed by the housing team. A map of the zones is illustrated by Figure 3-3, with the different colors designating the five zones. When assigning teams to zones, individual team members were kept in the same zone as much as possible to help ensure they were familiar with the area and could easily revisit businesses and keep track of survey completion. Therefore, larger zones were given to people who were able to spend a longer time in the field (e.g., the full eleven days of the deployment). The inundated areas were also given priority and made up the two largest zones (the magenta and orange colors in Figure 3-3). A new team member entering the field was always put in a group with someone who was familiar with the area and the data collection process. An example of the schedule is illustrated in Table 3-2, where P1 indicates person 1 and so forth. The left most column of Table 3-2 indicates colors associated with each zone that correspond to the colored markers in Figure 3-3. The final two days of in-person data collection required a slight
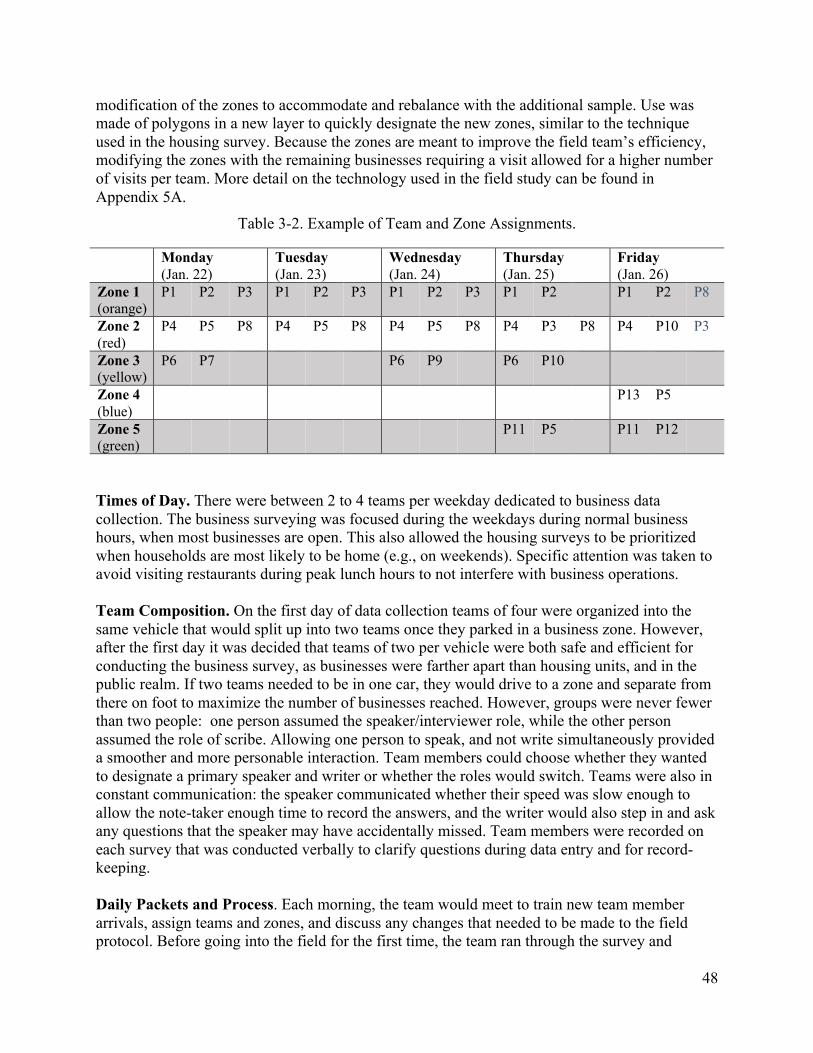
48
modification of the zones to accommodate and rebalance with the additional sample. Use was made of polygons in a new layer to quickly designate the new zones, similar to the technique used in the housing survey. Because the zones are meant to improve the field team’s efficiency, modifying the zones with the remaining businesses requiring a visit allowed for a higher number of visits per team. More detail on the technology used in the field study can be found in Appendix 5A.
Table 3-2. Example of Team and Zone Assignments.
Monday (Jan. 22)
Tuesday (Jan. 23)
Wednesday (Jan. 24)
Thursday (Jan. 25)
Friday (Jan. 26)
Zone 1 (orange)
P1 P2 P3 P1 P2 P3 P1 P2 P3 P1 P2 P1 P2 P8
Zone 2 (red)
P4 P5 P8 P4 P5 P8 P4 P5 P8 P4 P3 P8 P4 P10 P3
Zone 3 (yellow)
P6 P7 P6 P9 P6 P10
Zone 4 (blue)
P13 P5
Zone 5 (green)
P11 P5 P11 P12
Times of Day. There were between 2 to 4 teams per weekday dedicated to business data collection. The business surveying was focused during the weekdays during normal business hours, when most businesses are open. This also allowed the housing surveys to be prioritized when households are most likely to be home (e.g., on weekends). Specific attention was taken to avoid visiting restaurants during peak lunch hours to not interfere with business operations. Team Composition. On the first day of data collection teams of four were organized into the same vehicle that would split up into two teams once they parked in a business zone. However, after the first day it was decided that teams of two per vehicle were both safe and efficient for conducting the business survey, as businesses were farther apart than housing units, and in the public realm. If two teams needed to be in one car, they would drive to a zone and separate from there on foot to maximize the number of businesses reached. However, groups were never fewer than two people: one person assumed the speaker/interviewer role, while the other person assumed the role of scribe. Allowing one person to speak, and not write simultaneously provided a smoother and more personable interaction. Team members could choose whether they wanted to designate a primary speaker and writer or whether the roles would switch. Teams were also in constant communication: the speaker communicated whether their speed was slow enough to allow the note-taker enough time to record the answers, and the writer would also step in and ask any questions that the speaker may have accidentally missed. Team members were recorded on each survey that was conducted verbally to clarify questions during data entry and for record-keeping. Daily Packets and Process. Each morning, the team would meet to train new team member arrivals, assign teams and zones, and discuss any changes that needed to be made to the field protocol. Before going into the field for the first time, the team ran through the survey and
49
anticipated questions, some of which were addressed in Section 3.3. For example, the types of funding available to businesses, reminded teams to clarify assistance reported by home businesses, and reminded the team that businesses were to report their lifetime experience as a manager, not just their time with the current business. It was reiterated that many of the businesses had significant challenges, lost revenue, and potentially received no support. When interviewing businesses, teams were encouraged to be friendly, empathetic, and respectful. It was also stressed that the importance of sharing understanding of how hard it has been to start to recover, and that the point of this survey work is to help recommend more resources for businesses in the future. For these types of businesses, an information sheet was always left with additional recovery resources. There were seven essential materials for each team prepared in packets and handed out daily: a zone map, worksheet, Google My Maps printout, information sheet, consent form, damage state card, and survey questionnaires. The teams were also given access to the digital Google My Maps on their smartphone. The zone map is similar to the Google My Maps in Figure 3-3 but is specific to each survey zone; it is a printed map that displays each business in the team’s assigned zone. The information sheet, consent form, damage state card, and survey can be found in the Appendix.
The worksheet was a list of businesses in the team’s zone, corresponding to a marker on the zone map. The worksheet provided a table with the business PIN, address, company name, owner’s name and position, phone number, and description of the sector. Blank fields to be filled include the survey code (indicating whether the survey was completed, needs pickup, etc.), surveyor notes (for example, when to return or reason for response refusal), date the business was visited, and the flood depth during Hurricane Matthew. The survey codes used are defined in Table 3-3.
Table 3-3. Survey Codes used for In-Field Business Survey Coordination
Survey Code Description
1 Completed: confirmed closed business or completed survey
2 Revisit: need to conduct survey
3 Revisit Priority 2: will not be able to complete survey because manager is out of town; needs time to check with corporate office; other
3* Follow-up: need to Follow up via Phone; left an email to receive a scanned survey when completed
4 Pickup: dropped off as survey at the business and we need to pick it up once the manager has completed it
99 Remove: remove from sample; ineligible business; closed before the hurricane; could not locate business in-person
Every day, the teams and zones were written on a large sheet of paper for team coordination. New worksheets were printed with the previous day’s notes and the names of team members on the top. This tracked the remaining business codes through the week and reduced the number of error corrections that needed to be made later on by eliminating handwritten notes about follow
50
up times and contact points, as well as streamlining the field teams’ daily work. Teams coordinated routes and a plan for the order of businesses they would visit prior to heading out each day. The worksheets were organized by address in order to minimize any issues with businesses occupying the same physical location. Sometimes there were two businesses listed at one address, for example a convenience store and a gas station may occupy the same address, or a catering business and a full-service restaurant. Teams were instructed to survey both businesses at the address if the owner was unique for each. If the owner was the same, the owner could choose which business (s)he preferred to respond for in order to minimize the research burden on them. In some cases, a business that had formerly been there and then closed was listed at the same location as the new business (i.e., currently occupying business). In that case, the current business was asked which business was at the location during the time of Hurricane Matthew. If it was the previous business, teams would ask if the current business knew what happened to the previous business and marked the response on the worksheet. The field study teams would go to each business on the daily list and determine its operating status and record their observations on the worksheet and survey header. If the business was permanently closed the team would move on to the next business. If the business was closed due to business hours, the teams would make note of when to return on the worksheet. If the business was open, the teams would proceed to attempt to collect the survey data, following consent. For businesses that appeared permanently closed or if a business was not at the location provided on the worksheet, it helped the researchers confirm whether or not the business was in that location and open for business before Hurricane Matthew by checking with a neighboring business. If there was no neighboring business, Google Street View and the business’ web presence was used to approximate its closure date. In the field, these instances were always coded both “permanently closed” and “other” (with “need to check” in the text entry) in Qualtrics unless it was certain that the business was permanently closed. Even for those businesses confirmed closed, some research following the Wave 2 data collection was needed to determine whether the business had also moved. This research was used to ensure that the closure data was accurate. Lastly, certain types of businesses presented unique challenges for data collection that led to an evolution of training throughout the week. These businesses included restaurants, tax businesses, and large chain stores. As stated previously, restaurants were far more likely to be able to talk between 2PM and 4PM when there were fewer customers. Additionally, tax businesses were often very busy due to the field study dates coinciding with the beginning of the tax season. For large chains, some managers felt less comfortable than others with filling out a survey when there is a corporate office. In these cases, it was often possible to visit again the next day and attempt to speak to someone less risk averse. In cases of corporations, franchises, and large chains, a regional manager or an individual at the corporate level was more likely to have insurance and assistance information for the company and that specific location. Due to the difficulty of contacting these types of representatives, teams talked with store managers if they worked there before Hurricane Matthew and left disaster recovery assistance information blank if they were unaware or unsure.
51
3.4.2 Data Management In the evening, the entire field study team entered the survey responses that were collected during the day into Qualtrics, an online survey platform. This was done so that individuals could ask questions, confirm handwriting, and validate responses with their other team members. When entering data, it was decided to always write down exactly what was said by participants during the survey or what was written on the survey instrument in lieu of making frequent coding decisions. This was done to avoid real-time data cleaning decisions while pressed for time or tired. For example, often a business would answer in a range (e.g. “10-15 employees”, established “20-25 years ago”), which we would record directly into Qualtrics instead of having different groups take the maximum, midpoint, or some variation. Decisions on how these will be coded were made all at once during the data cleaning process post data collection. Similar to the housing survey, after the field study all physical data was stored in a locked file cabinet and all electronic media was saved on the password protected computers of the principal investigators that were kept in locked offices. A linked-list has been created where all identifiable information was replaced with code numbers. The same codes are used for the field notes and photographs from each site. No names are attached to this documentation. Original data access is limited to project investigators within the Center and at NIST who have completed the Institutional Review Board (IRB) training and whose universities have signed the Interagency Agreement (IAA). The data will be maintained for the three-year archive period following the conclusion of the study and archived with NIST at the end of that period.
3.4.3 Follow-up Work: Phone Calls and Determining Closure When the study team left the field, there were approximately 150 businesses that could still have potential follow-up. This included businesses that had not completed surveys before the field study team left Lumberton, businesses whose managers or owners were out of town, or other similar reasons for not filling-out the survey. The team decided to address these remaining surveys through follow-up phone calls and translating the paper survey to an online version. The phone number that was publicly available through ReferenceUSA was used to contact businesses. When contacted, the business was given several options for participation. The first option was to verbally go through the survey over the phone while we record their responses. If the business already had a survey dropped off with them, we would encourage sending it through the mail to NIST or scanning it and sending it to the email address of principal investigators. Lastly, we gave an option to complete the survey online if the business was willing to provide us with a business/work email. This additional methodology required an amendment to the original IRB submission through Colorado State University. The calls took place during the month of April after this amendment was approved. Of the approximately 150 businesses that were called, none requested that the interview be done over the phone and 22 were willing to give an email address for an online version, but the team was only able to get one additional response completed. This underscores the effectiveness of conducting the business surveys in-person rather than by phone. Additional research was conducted to determine whether businesses that appeared closed in the field: (1) had closed after Hurricane Matthew or (2) had moved to another location. These businesses were copied to an additional spreadsheet where various forms of evidence were gathered. This includes the current status of the record in ReferenceUSA, notes from the field, Google images, news articles, Facebook pages and other official business web pages. From
52
there, two researchers made independent judgements about the status of the business. This process allowed us to have additional confidence in the validity of the field observations given the amount of ineligible businesses in the original sample. Once data collection was complete, the data was then cleaned and coded (as described in the next section).
3.5 Survey results The data for business recovery were analyzed independently and will later contribute to a broader suite of analyses as part of the longitudinal study for Lumberton, NC. This section presents the business survey summary statistics resulting from Wave 2. More detailed, comprehensive analyses are being performed and presented outside of this report.
3.5.1 Data cleaning The data cleaning process was completed using a combination of Qualtrics, Stata, a statistical software tool, and Nesstar, an open-source software that creates codebooks following Data Documentation Initiative (DDI) data standards. As described previously, the business survey team decided to always write down exactly what was said during the interview or what was written on the survey and then electronically record this response to avoid real-time data cleaning decisions. Therefore, these decisions were documented at the post-field data cleaning stage of the research. The data was first downloaded from Qualtrics and imported into Stata, and a description of any decision that was made was attached as a note for that particular variable. Nesstar, because of its ability to import Stata data (.dta) files and the associated variable information, reports the notes in the final codebook under Variable Descriptions. Here, users could find the variable, cleaning notes, associated survey question, variable type, and a data summary of the variable, where applicable. Coding and data cleaning information is therefore easily accessible and transparent for those using the data. The data cleaning took place in the four months following the field study to take advantage of the surveyors’ fresh memories; the paper surveys were consulted for outliers, typographical issues, or any input that needed to be double-checked. Some data cleaning decisions were overarching across multiple variables, whereas some were specific to particular survey questions. The business protocol was similar to the housing protocol when it came to temporal variables, where months and weeks were converted to days. The midpoint was taken for all ranges that were reported, with the exception of two-year age ranges, where the lower value was taken. If a survey question had an “other” option, one variable captures these responses as a count (e.g. a numeric/categorical variable with an example code of 1=yes, 2=no, and 3= other) and the same variable with a “_txt” suffix will follow that captures the write-in response (e.g. a string variable with “yes” “no” and “other: sometimes”). Again, the team recorded whatever was said during the interview, so often some judgements had to be made on unclear responses. Some example include “a few inches” for flood depth (coded as three inches), “a couple days” for days of electricity loss (coded as two days), and "water on but muddy for 2 weeks" for water loss (coded as fourteen days, since the water was unusable). This was most notable in the business age variable, where respondents knew the general timeframe but not the exact year of business establishment. More specific cases can be found in the notes for each variable.
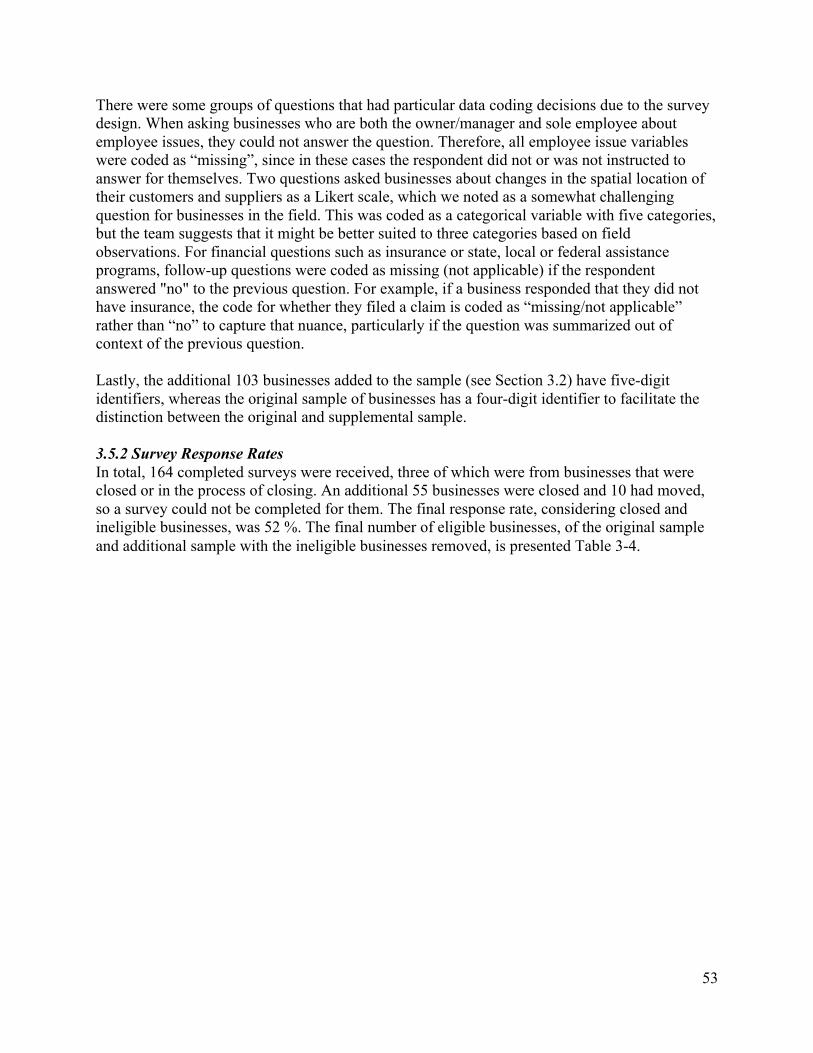
53
There were some groups of questions that had particular data coding decisions due to the survey design. When asking businesses who are both the owner/manager and sole employee about employee issues, they could not answer the question. Therefore, all employee issue variables were coded as “missing”, since in these cases the respondent did not or was not instructed to answer for themselves. Two questions asked businesses about changes in the spatial location of their customers and suppliers as a Likert scale, which we noted as a somewhat challenging question for businesses in the field. This was coded as a categorical variable with five categories, but the team suggests that it might be better suited to three categories based on field observations. For financial questions such as insurance or state, local or federal assistance programs, follow-up questions were coded as missing (not applicable) if the respondent answered "no" to the previous question. For example, if a business responded that they did not have insurance, the code for whether they filed a claim is coded as “missing/not applicable” rather than “no” to capture that nuance, particularly if the question was summarized out of context of the previous question. Lastly, the additional 103 businesses added to the sample (see Section 3.2) have five-digit identifiers, whereas the original sample of businesses has a four-digit identifier to facilitate the distinction between the original and supplemental sample. 3.5.2 Survey Response Rates In total, 164 completed surveys were received, three of which were from businesses that were closed or in the process of closing. An additional 55 businesses were closed and 10 had moved, so a survey could not be completed for them. The final response rate, considering closed and ineligible businesses, was 52 %. The final number of eligible businesses, of the original sample and additional sample with the ineligible businesses removed, is presented Table 3-4.
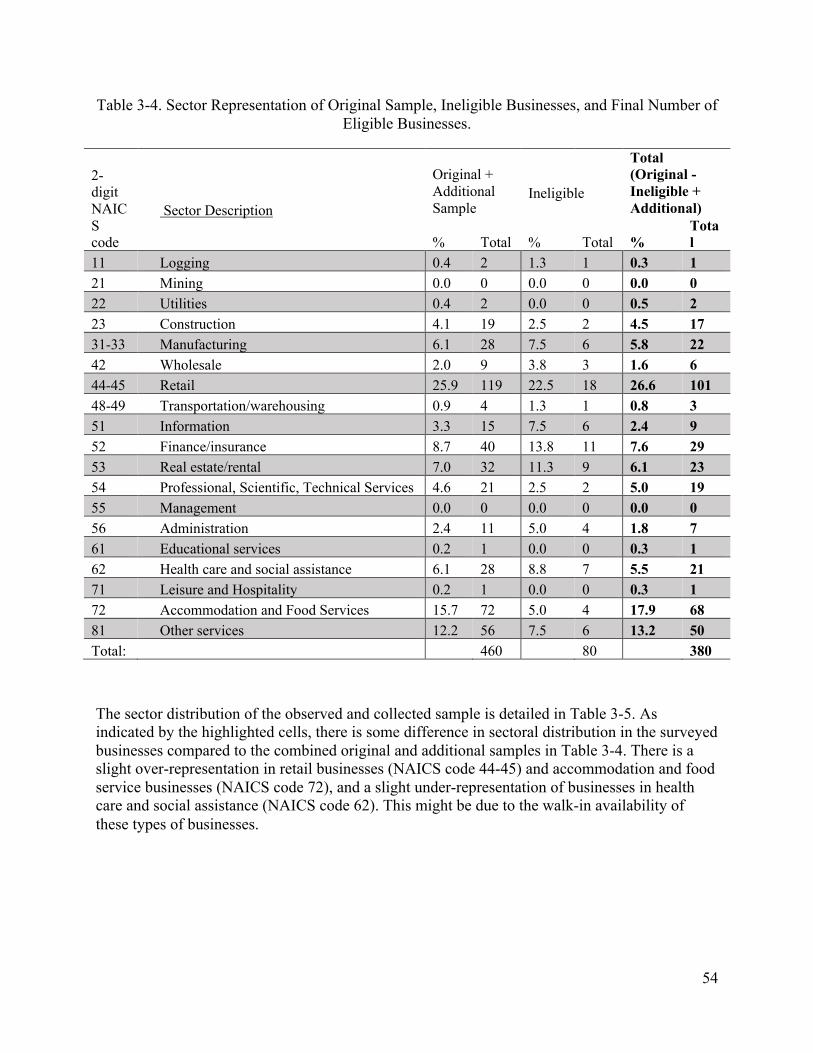
54
Table 3-4. Sector Representation of Original Sample, Ineligible Businesses, and Final Number of Eligible Businesses.
2-digit NAICS code
Original + Additional Sample
Total (Original - Ineligible + Additional) Sector Description
Ineligible
% Total % Total % Total
11 Logging 0.4 2 1.3 1 0.3 1 21 Mining 0.0 0 0.0 0 0.0 0 22 Utilities 0.4 2 0.0 0 0.5 2 23 Construction 4.1 19 2.5 2 4.5 17 31-33 Manufacturing 6.1 28 7.5 6 5.8 22 42 Wholesale 2.0 9 3.8 3 1.6 6 44-45 Retail 25.9 119 22.5 18 26.6 101 48-49 Transportation/warehousing 0.9 4 1.3 1 0.8 3 51 Information 3.3 15 7.5 6 2.4 9 52 Finance/insurance 8.7 40 13.8 11 7.6 29 53 Real estate/rental 7.0 32 11.3 9 6.1 23 54 Professional, Scientific, Technical Services 4.6 21 2.5 2 5.0 19 55 Management 0.0 0 0.0 0 0.0 0 56 Administration 2.4 11 5.0 4 1.8 7 61 Educational services 0.2 1 0.0 0 0.3 1 62 Health care and social assistance 6.1 28 8.8 7 5.5 21 71 Leisure and Hospitality 0.2 1 0.0 0 0.3 1 72 Accommodation and Food Services 15.7 72 5.0 4 17.9 68 81 Other services 12.2 56 7.5 6 13.2 50 Total: 460 80 380
The sector distribution of the observed and collected sample is detailed in Table 3-5. As indicated by the highlighted cells, there is some difference in sectoral distribution in the surveyed businesses compared to the combined original and additional samples in Table 3-4. There is a slight over-representation in retail businesses (NAICS code 44-45) and accommodation and food service businesses (NAICS code 72), and a slight under-representation of businesses in health care and social assistance (NAICS code 62). This might be due to the walk-in availability of these types of businesses.
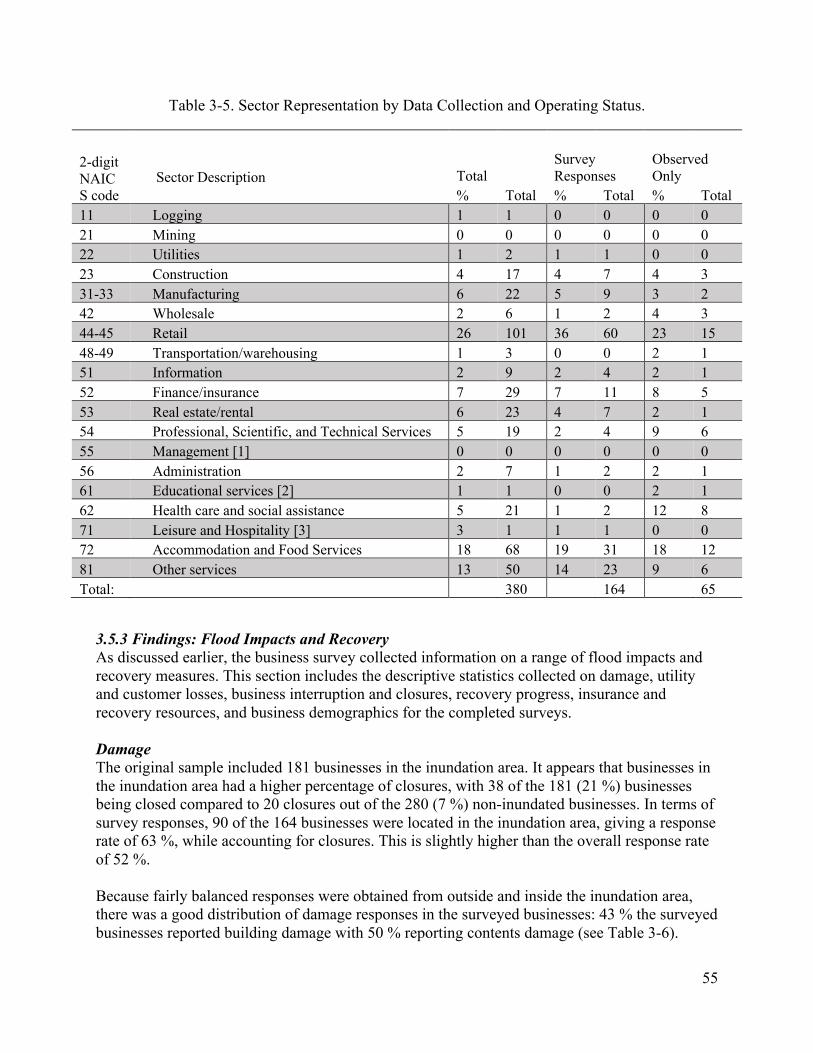
55
Table 3-5. Sector Representation by Data Collection and Operating Status.
2-digit NAICS code
Sector Description Total Survey Responses
Observed Only
% Total % Total % Total 11 Logging 1 1 0 0 0 0 21 Mining 0 0 0 0 0 0 22 Utilities 1 2 1 1 0 0 23 Construction 4 17 4 7 4 3 31-33 Manufacturing 6 22 5 9 3 2 42 Wholesale 2 6 1 2 4 3 44-45 Retail 26 101 36 60 23 15 48-49 Transportation/warehousing 1 3 0 0 2 1 51 Information 2 9 2 4 2 1 52 Finance/insurance 7 29 7 11 8 5 53 Real estate/rental 6 23 4 7 2 1 54 Professional, Scientific, and Technical Services 5 19 2 4 9 6 55 Management [1] 0 0 0 0 0 0 56 Administration 2 7 1 2 2 1 61 Educational services [2] 1 1 0 0 2 1 62 Health care and social assistance 5 21 1 2 12 8 71 Leisure and Hospitality [3] 3 1 1 1 0 0 72 Accommodation and Food Services 18 68 19 31 18 12 81 Other services 13 50 14 23 9 6 Total: 380 164 65
3.5.3 Findings: Flood Impacts and Recovery As discussed earlier, the business survey collected information on a range of flood impacts and recovery measures. This section includes the descriptive statistics collected on damage, utility and customer losses, business interruption and closures, recovery progress, insurance and recovery resources, and business demographics for the completed surveys. Damage The original sample included 181 businesses in the inundation area. It appears that businesses in the inundation area had a higher percentage of closures, with 38 of the 181 (21 %) businesses being closed compared to 20 closures out of the 280 (7 %) non-inundated businesses. In terms of survey responses, 90 of the 164 businesses were located in the inundation area, giving a response rate of 63 %, while accounting for closures. This is slightly higher than the overall response rate of 52 %. Because fairly balanced responses were obtained from outside and inside the inundation area, there was a good distribution of damage responses in the surveyed businesses: 43 % the surveyed businesses reported building damage with 50 % reporting contents damage (see Table 3-6).
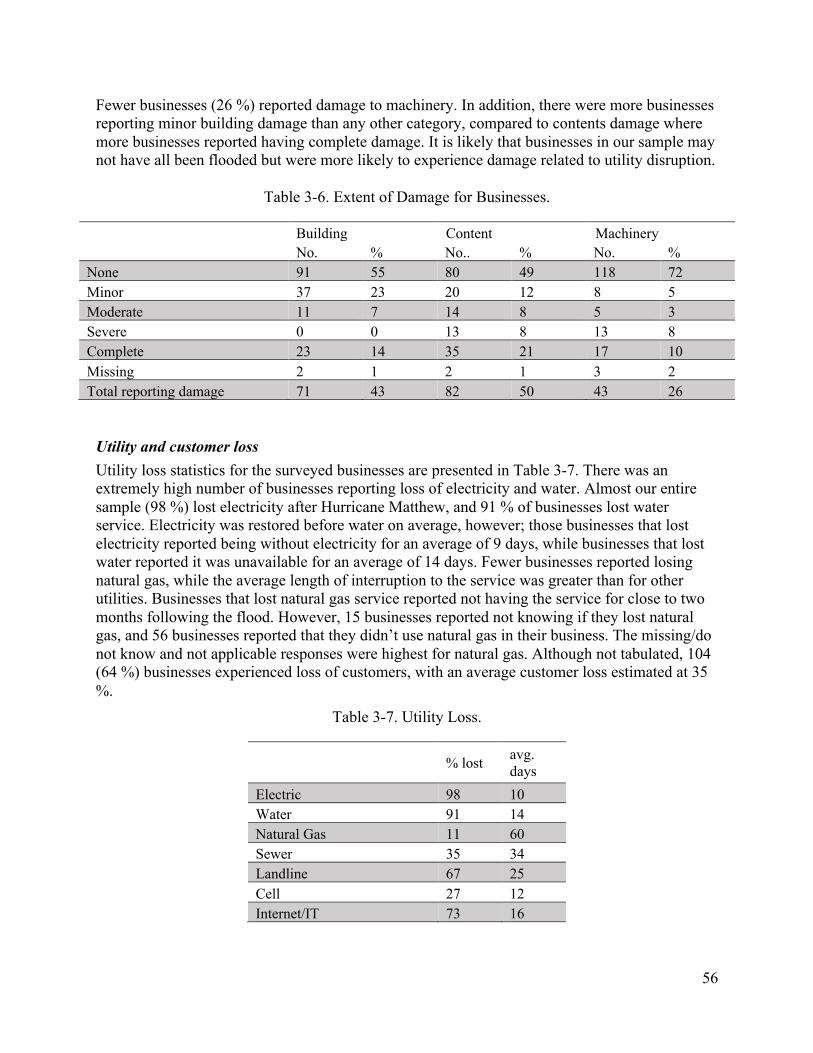
56
Fewer businesses (26 %) reported damage to machinery. In addition, there were more businesses reporting minor building damage than any other category, compared to contents damage where more businesses reported having complete damage. It is likely that businesses in our sample may not have all been flooded but were more likely to experience damage related to utility disruption.
Table 3-6. Extent of Damage for Businesses.
Building Content Machinery No. % No.. % No. % None 91 55 80 49 118 72 Minor 37 23 20 12 8 5 Moderate 11 7 14 8 5 3 Severe 0 0 13 8 13 8 Complete 23 14 35 21 17 10 Missing 2 1 2 1 3 2 Total reporting damage 71 43 82 50 43 26
Utility and customer loss Utility loss statistics for the surveyed businesses are presented in Table 3-7. There was an extremely high number of businesses reporting loss of electricity and water. Almost our entire sample (98 %) lost electricity after Hurricane Matthew, and 91 % of businesses lost water service. Electricity was restored before water on average, however; those businesses that lost electricity reported being without electricity for an average of 9 days, while businesses that lost water reported it was unavailable for an average of 14 days. Fewer businesses reported losing natural gas, while the average length of interruption to the service was greater than for other utilities. Businesses that lost natural gas service reported not having the service for close to two months following the flood. However, 15 businesses reported not knowing if they lost natural gas, and 56 businesses reported that they didn’t use natural gas in their business. The missing/do not know and not applicable responses were highest for natural gas. Although not tabulated, 104 (64 %) businesses experienced loss of customers, with an average customer loss estimated at 35 %.
Table 3-7. Utility Loss.
% lost avg.
days Electric 98 10 Water 91 14 Natural Gas 11 60 Sewer 35 34 Landline 67 25 Cell 27 12 Internet/IT 73 16
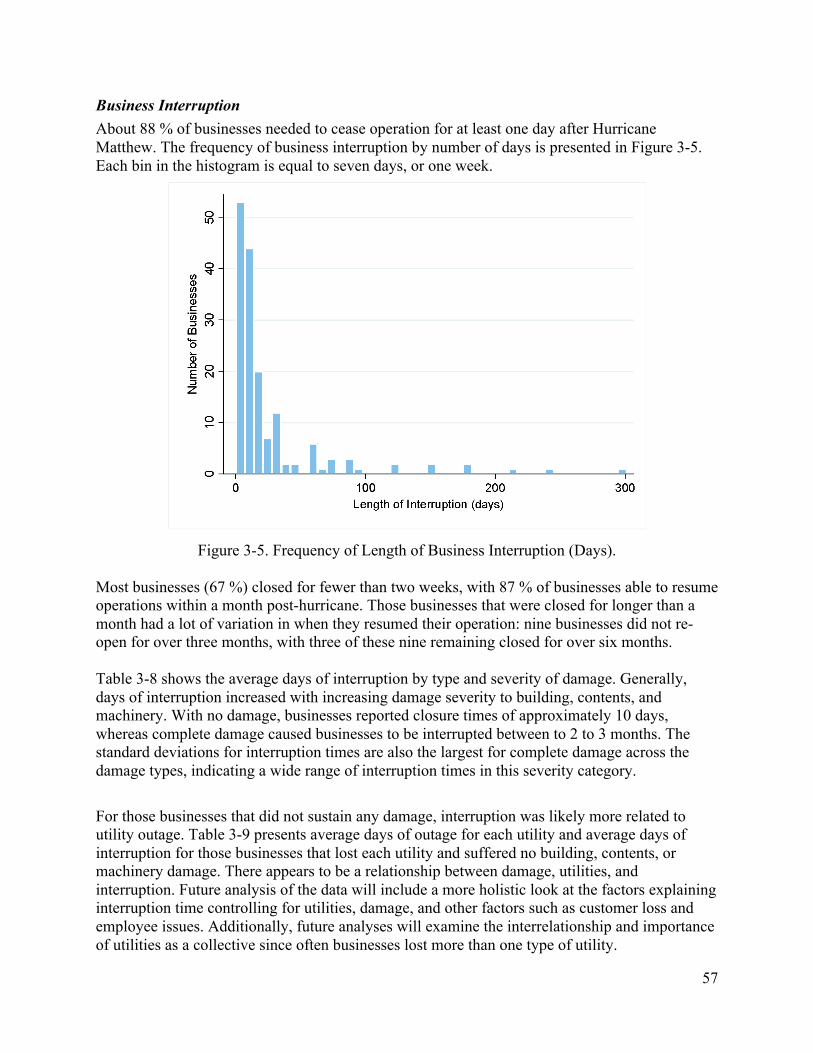
57
Business Interruption About 88 % of businesses needed to cease operation for at least one day after Hurricane Matthew. The frequency of business interruption by number of days is presented in Figure 3-5. Each bin in the histogram is equal to seven days, or one week.
Figure 3-5. Frequency of Length of Business Interruption (Days). Most businesses (67 %) closed for fewer than two weeks, with 87 % of businesses able to resume operations within a month post-hurricane. Those businesses that were closed for longer than a month had a lot of variation in when they resumed their operation: nine businesses did not re-open for over three months, with three of these nine remaining closed for over six months. Table 3-8 shows the average days of interruption by type and severity of damage. Generally, days of interruption increased with increasing damage severity to building, contents, and machinery. With no damage, businesses reported closure times of approximately 10 days, whereas complete damage caused businesses to be interrupted between to 2 to 3 months. The standard deviations for interruption times are also the largest for complete damage across the damage types, indicating a wide range of interruption times in this severity category.
For those businesses that did not sustain any damage, interruption was likely more related to utility outage. Table 3-9 presents average days of outage for each utility and average days of interruption for those businesses that lost each utility and suffered no building, contents, or machinery damage. There appears to be a relationship between damage, utilities, and interruption. Future analysis of the data will include a more holistic look at the factors explaining interruption time controlling for utilities, damage, and other factors such as customer loss and employee issues. Additionally, future analyses will examine the interrelationship and importance of utilities as a collective since often businesses lost more than one type of utility.
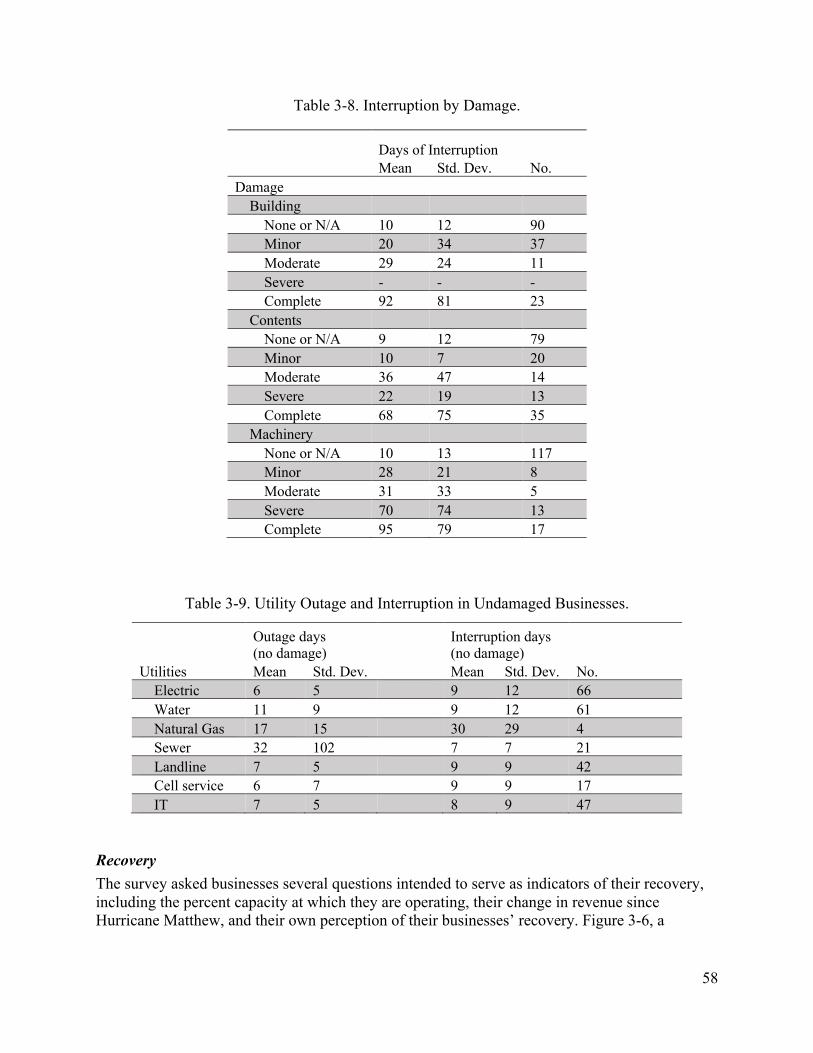
58
Table 3-8. Interruption by Damage.
Days of Interruption Mean Std. Dev. No. Damage
Building None or N/A 10 12 90 Minor 20 34 37 Moderate 29 24 11 Severe - - - Complete 92 81 23
Contents None or N/A 9 12 79 Minor 10 7 20 Moderate 36 47 14 Severe 22 19 13 Complete 68 75 35
Machinery None or N/A 10 13 117 Minor 28 21 8 Moderate 31 33 5 Severe 70 74 13 Complete 95 79 17
Table 3-9. Utility Outage and Interruption in Undamaged Businesses.
Outage days (no damage)
Interruption days (no damage)
Utilities Mean Std. Dev. Mean Std. Dev. No. Electric 6 5 9 12 66 Water 11 9 9 12 61 Natural Gas 17 15 30 29 4 Sewer 32 102 7 7 21 Landline 7 5 9 9 42 Cell service 6 7 9 9 17 IT 7 5 8 9 47
Recovery The survey asked businesses several questions intended to serve as indicators of their recovery, including the percent capacity at which they are operating, their change in revenue since Hurricane Matthew, and their own perception of their businesses’ recovery. Figure 3-6, a
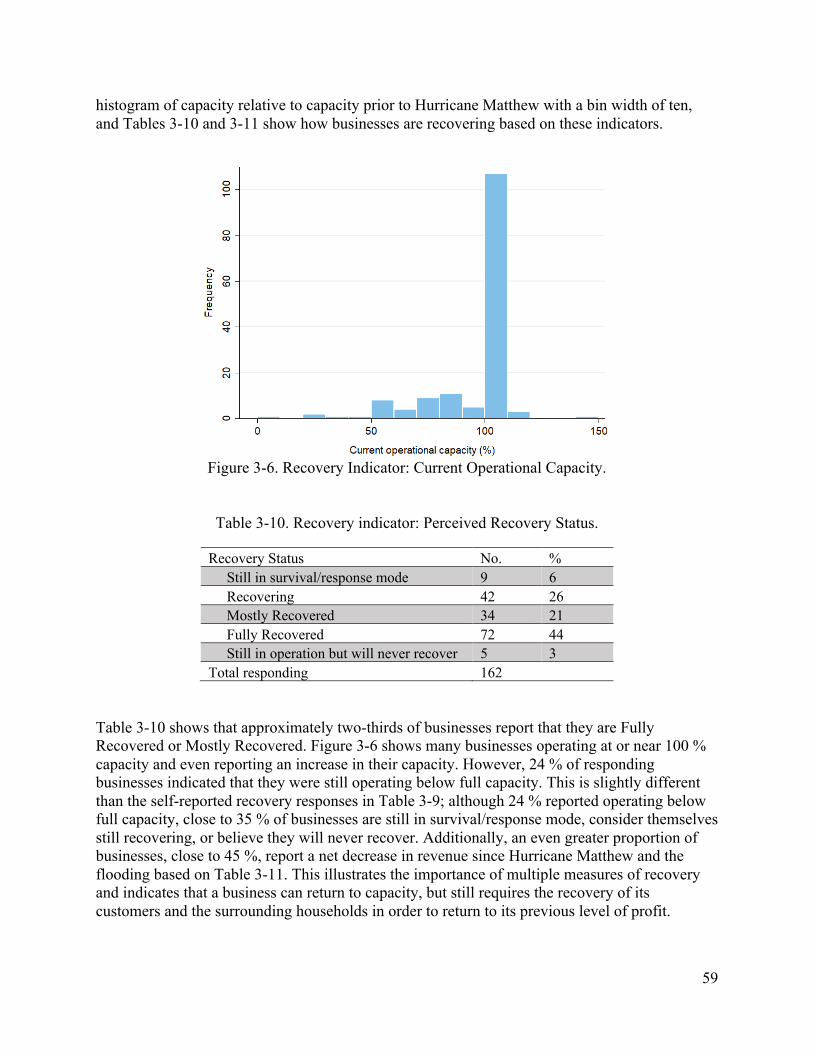
59
histogram of capacity relative to capacity prior to Hurricane Matthew with a bin width of ten, and Tables 3-10 and 3-11 show how businesses are recovering based on these indicators.
Figure 3-6. Recovery Indicator: Current Operational Capacity.
Table 3-10. Recovery indicator: Perceived Recovery Status.
Recovery Status No. % Still in survival/response mode 9 6 Recovering 42 26 Mostly Recovered 34 21 Fully Recovered 72 44 Still in operation but will never recover 5 3 Total responding 162
Table 3-10 shows that approximately two-thirds of businesses report that they are Fully Recovered or Mostly Recovered. Figure 3-6 shows many businesses operating at or near 100 % capacity and even reporting an increase in their capacity. However, 24 % of responding businesses indicated that they were still operating below full capacity. This is slightly different than the self-reported recovery responses in Table 3-9; although 24 % reported operating below full capacity, close to 35 % of businesses are still in survival/response mode, consider themselves still recovering, or believe they will never recover. Additionally, an even greater proportion of businesses, close to 45 %, report a net decrease in revenue since Hurricane Matthew and the flooding based on Table 3-11. This illustrates the importance of multiple measures of recovery and indicates that a business can return to capacity, but still requires the recovery of its customers and the surrounding households in order to return to its previous level of profit.
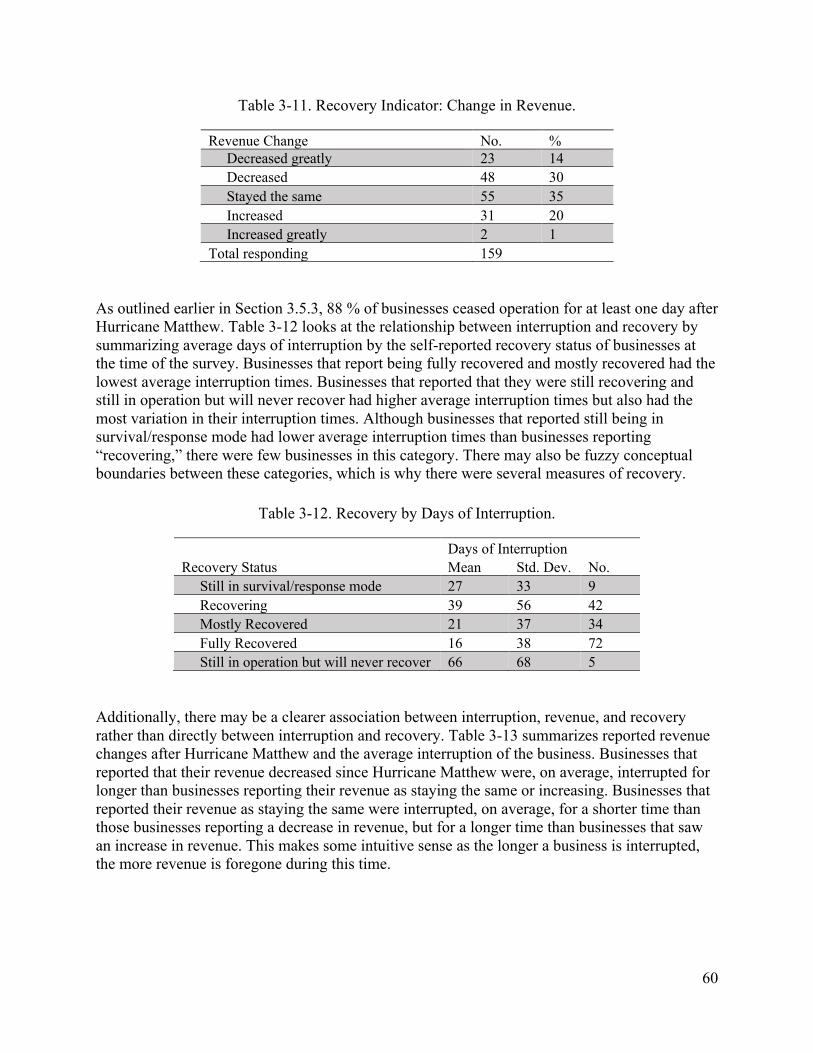
60
Table 3-11. Recovery Indicator: Change in Revenue.
Revenue Change No. % Decreased greatly 23 14 Decreased 48 30 Stayed the same 55 35 Increased 31 20 Increased greatly 2 1 Total responding 159
As outlined earlier in Section 3.5.3, 88 % of businesses ceased operation for at least one day after Hurricane Matthew. Table 3-12 looks at the relationship between interruption and recovery by summarizing average days of interruption by the self-reported recovery status of businesses at the time of the survey. Businesses that report being fully recovered and mostly recovered had the lowest average interruption times. Businesses that reported that they were still recovering and still in operation but will never recover had higher average interruption times but also had the most variation in their interruption times. Although businesses that reported still being in survival/response mode had lower average interruption times than businesses reporting “recovering,” there were few businesses in this category. There may also be fuzzy conceptual boundaries between these categories, which is why there were several measures of recovery.
Table 3-12. Recovery by Days of Interruption.
Days of Interruption Recovery Status Mean Std. Dev. No. Still in survival/response mode 27 33 9 Recovering 39 56 42 Mostly Recovered 21 37 34 Fully Recovered 16 38 72 Still in operation but will never recover 66 68 5
Additionally, there may be a clearer association between interruption, revenue, and recovery rather than directly between interruption and recovery. Table 3-13 summarizes reported revenue changes after Hurricane Matthew and the average interruption of the business. Businesses that reported that their revenue decreased since Hurricane Matthew were, on average, interrupted for longer than businesses reporting their revenue as staying the same or increasing. Businesses that reported their revenue as staying the same were interrupted, on average, for a shorter time than those businesses reporting a decrease in revenue, but for a longer time than businesses that saw an increase in revenue. This makes some intuitive sense as the longer a business is interrupted, the more revenue is foregone during this time.
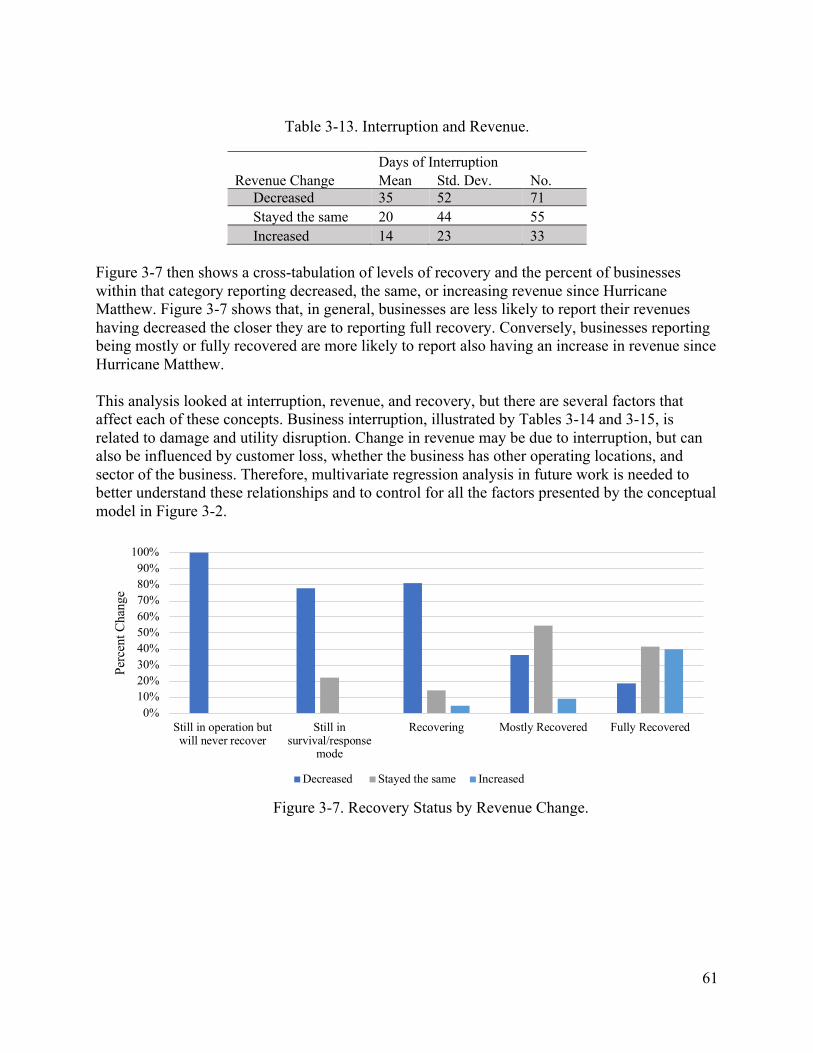
61
Table 3-13. Interruption and Revenue.
Days of Interruption Revenue Change Mean Std. Dev. No. Decreased 35 52 71 Stayed the same 20 44 55 Increased 14 23 33
Figure 3-7 then shows a cross-tabulation of levels of recovery and the percent of businesses within that category reporting decreased, the same, or increasing revenue since Hurricane Matthew. Figure 3-7 shows that, in general, businesses are less likely to report their revenues having decreased the closer they are to reporting full recovery. Conversely, businesses reporting being mostly or fully recovered are more likely to report also having an increase in revenue since Hurricane Matthew. This analysis looked at interruption, revenue, and recovery, but there are several factors that affect each of these concepts. Business interruption, illustrated by Tables 3-14 and 3-15, is related to damage and utility disruption. Change in revenue may be due to interruption, but can also be influenced by customer loss, whether the business has other operating locations, and sector of the business. Therefore, multivariate regression analysis in future work is needed to better understand these relationships and to control for all the factors presented by the conceptual model in Figure 3-2.
Figure 3-7. Recovery Status by Revenue Change.
0%10%20%30%40%50%60%70%80%90%
100%
Still in operation butwill never recover
Still insurvival/response
mode
Recovering Mostly Recovered Fully Recovered
Perc
ent C
hang
e
Decreased Stayed the same Increased
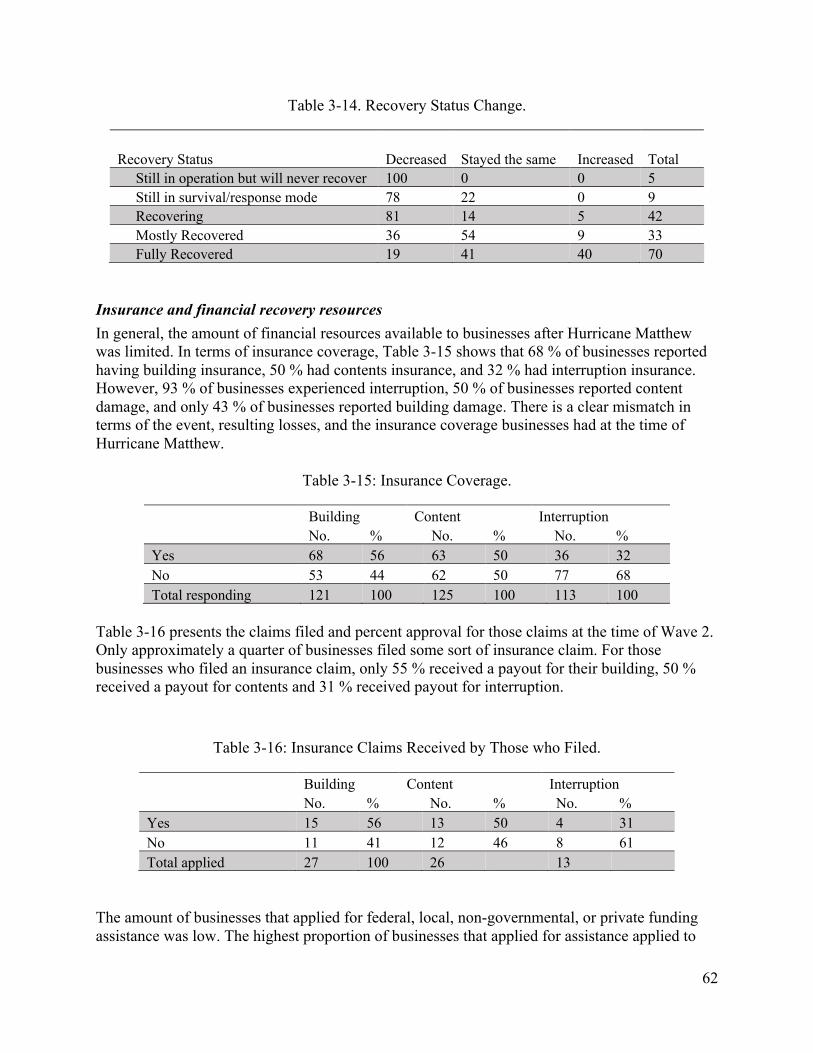
62
Table 3-14. Recovery Status Change.
Recovery Status Decreased Stayed the same Increased Total Still in operation but will never recover 100 0 0 5 Still in survival/response mode 78 22 0 9 Recovering 81 14 5 42 Mostly Recovered 36 54 9 33 Fully Recovered 19 41 40 70
Insurance and financial recovery resources In general, the amount of financial resources available to businesses after Hurricane Matthew was limited. In terms of insurance coverage, Table 3-15 shows that 68 % of businesses reported having building insurance, 50 % had contents insurance, and 32 % had interruption insurance. However, 93 % of businesses experienced interruption, 50 % of businesses reported content damage, and only 43 % of businesses reported building damage. There is a clear mismatch in terms of the event, resulting losses, and the insurance coverage businesses had at the time of Hurricane Matthew.
Table 3-15: Insurance Coverage.
Building Content Interruption No. % No. % No. % Yes 68 56 63 50 36 32 No 53 44 62 50 77 68 Total responding 121 100 125 100 113 100
Table 3-16 presents the claims filed and percent approval for those claims at the time of Wave 2. Only approximately a quarter of businesses filed some sort of insurance claim. For those businesses who filed an insurance claim, only 55 % received a payout for their building, 50 % received a payout for contents and 31 % received payout for interruption.
Table 3-16: Insurance Claims Received by Those who Filed.
Building Content Interruption No. % No. % No. % Yes 15 56 13 50 4 31 No 11 41 12 46 8 61 Total applied 27 100 26 13
The amount of businesses that applied for federal, local, non-governmental, or private funding assistance was low. The highest proportion of businesses that applied for assistance applied to
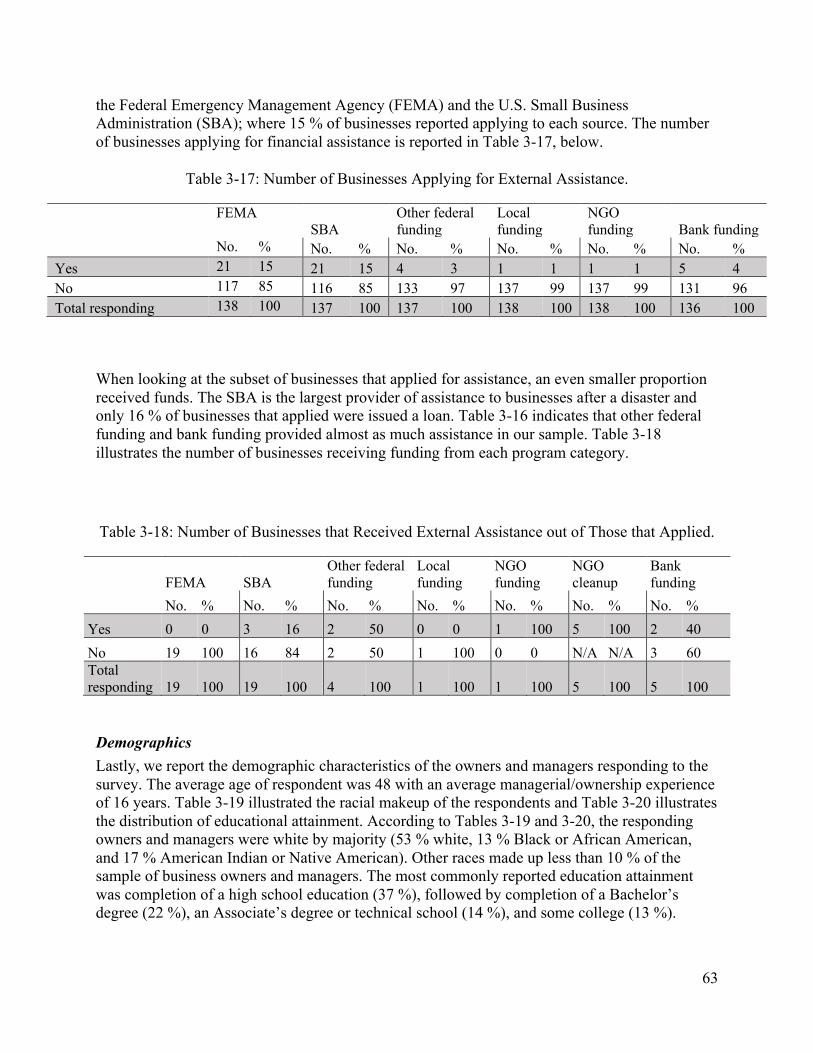
63
the Federal Emergency Management Agency (FEMA) and the U.S. Small Business Administration (SBA); where 15 % of businesses reported applying to each source. The number of businesses applying for financial assistance is reported in Table 3-17, below.
Table 3-17: Number of Businesses Applying for External Assistance.
FEMA
SBA Other federal funding
Local funding
NGO funding Bank funding
No. % No. % No. % No. % No. % No. % Yes 21 15 21 15 4 3 1 1 1 1 5 4 No 117 85 116 85 133 97 137 99 137 99 131 96 Total responding 138 100 137 100 137 100 138 100 138 100 136 100
When looking at the subset of businesses that applied for assistance, an even smaller proportion received funds. The SBA is the largest provider of assistance to businesses after a disaster and only 16 % of businesses that applied were issued a loan. Table 3-16 indicates that other federal funding and bank funding provided almost as much assistance in our sample. Table 3-18 illustrates the number of businesses receiving funding from each program category.
Table 3-18: Number of Businesses that Received External Assistance out of Those that Applied.
FEMA SBA Other federal funding
Local funding
NGO funding
NGO cleanup
Bank funding
No. % No. % No. % No. % No. % No. % No. % Yes 0 0 3 16 2 50 0 0 1 100 5 100 2 40 No 19 100 16 84 2 50 1 100 0 0 N/A N/A 3 60 Total responding 19 100 19 100 4 100 1 100 1 100 5 100 5 100
Demographics Lastly, we report the demographic characteristics of the owners and managers responding to the survey. The average age of respondent was 48 with an average managerial/ownership experience of 16 years. Table 3-19 illustrated the racial makeup of the respondents and Table 3-20 illustrates the distribution of educational attainment. According to Tables 3-19 and 3-20, the responding owners and managers were white by majority (53 % white, 13 % Black or African American, and 17 % American Indian or Native American). Other races made up less than 10 % of the sample of business owners and managers. The most commonly reported education attainment was completion of a high school education (37 %), followed by completion of a Bachelor’s degree (22 %), an Associate’s degree or technical school (14 %), and some college (13 %).
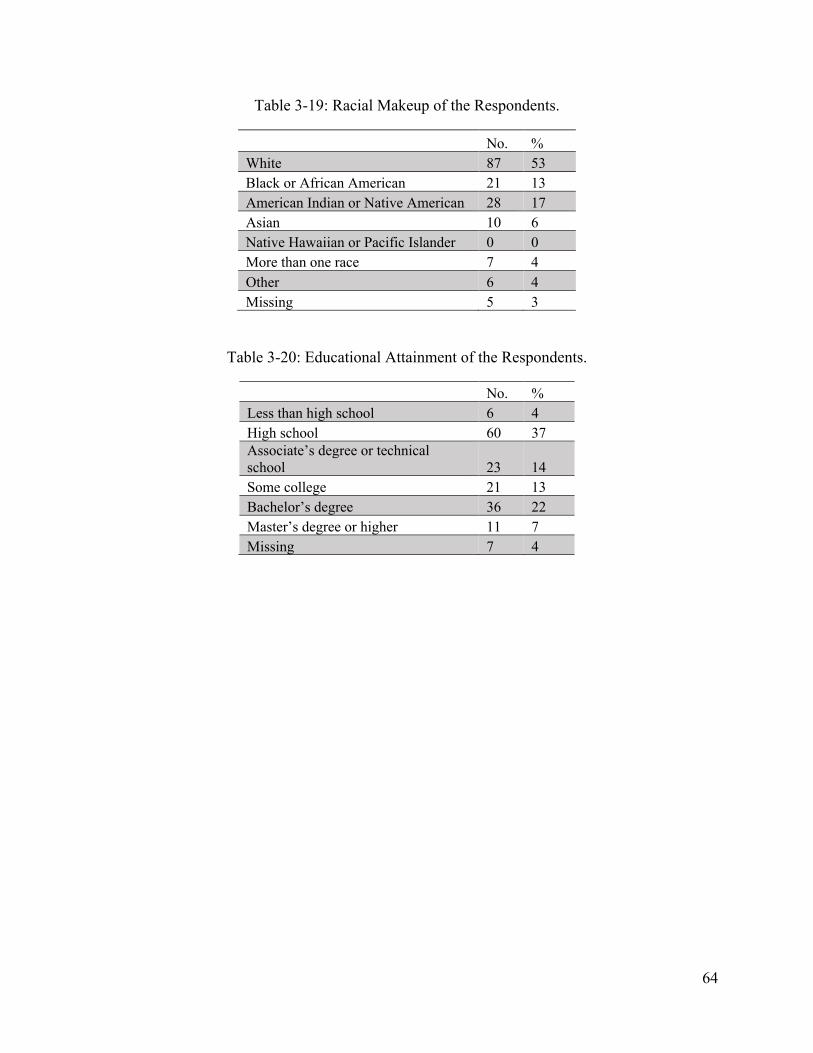
64
Table 3-19: Racial Makeup of the Respondents.
No. % White 87 53 Black or African American 21 13 American Indian or Native American 28 17 Asian 10 6 Native Hawaiian or Pacific Islander 0 0 More than one race 7 4 Other 6 4 Missing 5 3
Table 3-20: Educational Attainment of the Respondents.
No. % Less than high school 6 4 High school 60 37 Associate’s degree or technical school 23 14 Some college 21 13 Bachelor’s degree 36 22 Master’s degree or higher 11 7 Missing 7 4
65
Chapter 4: Public Sector Impacts and Recovery 4.1 Introduction Disaster impacts are experienced by all sectors of society, including by local, county, state and other public entities. Understanding the response of the public sector to the impacts of Hurricane Matthew is necessary to understand the recovery process for Lumberton. In Wave 2, the team returned to Lumberton to follow up with a number of the representatives from Wave 1 with the primary goal of documenting the way the public sector is working through the recovery process and where its representatives identified challenges to moving forward. The objectives of the Wave 2 community representative interviews and meetings were to:
1. Build and maintain relationships with key stakeholders to facilitate data collection efforts
and document the recovery process into the future.
2. Improve understanding of how administrators in the public school system responded to the flooding and subsequent challenges.
3. Qualitatively document, from the perspective of school representatives, how students, staff, and families were impacted by the event and what decisions were made by school district leaders over the past year to begin the recovery process.
4. Gather information from key stakeholders regarding recovery of the built environment, including infrastructure and public, residential, and commercial buildings. Also, document decision making processes by key stakeholders that are influencing community recovery.
5. Better understand the social context of Lumberton, the economic and political challenges faced by community leaders over the past year, and the communication between the city, state, and the federal government.
This chapter provides contextual information for the recovery of select portions of the public sector that provide services to the community of Lumberton, North Carolina. The public sector services considered in the field study include K12 education, government, and water infrastructure.
4.2 Data Collection Methodology In order to better understand business, housing, and household recovery within the context of the broader community in which it unfolds, our research team met with key stakeholders at the state, county, and city level. During Wave 1, 22 representatives were interviewed from state and local government, public works, transportation, faith-based and non-profit organizations, and the school district. In Wave 2, the field team returned to Lumberton to follow up with a number of the same individuals to discuss the solutions that had been considered and decisions that were made over the past year, and to document progress toward recovery as well as any delays experienced, such as the timeline for the distribution of recovery funding. Meetings with key stakeholders provided an important supplement to the survey data collection efforts and help to understand factors that influence recovery for schools, public works, and at
66
the community-level. The public sector team conducted meetings with community leaders and school district officials between the dates of January 19 to 29, 2018. Prior to re-entering the field for Wave 2, the public sector team developed semi-structured interview guides to support the meetings with community representatives (see Appendix 4B). For example, an interview guide focused on school recovery was developed for use with school officials. Similarly, an interview guide was developed for meetings with water infrastructure officials. These guides were aligned to address broader themes of recovery, including delays, resources, and key decisions. The researchers also participated in weekly conference calls with all members of the field study team to solidify the data collection plan, ethics requirements, and fieldwork training. These frequent team calls helped to prepare the researchers and develop a consistent protocol for meetings with school administrators and community leaders. During this time, the interview team also contacted key stakeholders to arrange the days and times of the in-person meetings. 4.2.1 Daily Operations For the qualitative component of the field study, a subset of the research team, the public sector team, were assigned to schedule and attend meetings with key stakeholders and school administrators. When not in meetings, these individuals were part of either housing or business survey teams. Meetings arrangements were normally made in advance of the field study, although some final confirmations occurred while in the field. All meetings were held in person. Each morning, the public sector team convened to review logistics for the day, which involved arranging teams, vehicles, and drivers, creating a check-in schedule, retrieving packets of data collection materials (e.g., interview guides, consent forms, photo release forms, supplemental information for respondents, personal protective gear), and preparing for the day’s data collection. When necessary, the public sector team separated from the housing and business survey teams and checked back in with the full team at the designated time during the day. Pre-meeting preparation included review of information obtained from the previous year, review of the interview guide, and discussion of key questions and issues to address during the meeting that would support a broader understanding of community recovery (e.g., plans for public housing, student displacement and retention, building recovery). Each evening, the full field study team met to enter and back up data, including audio recordings, meeting notes, and photos. During this meeting, the team followed up on correspondence to confirm upcoming meetings and reviewed any issues encountered from the day. 4.2.2 Data Collection Prior to returning to Lumberton for Wave 2 data collection, the public sector team reached out to all 22 of the public sector participants who were interviewed in Wave 1. In addition, to fill gaps in our knowledge the public sector team contacted individuals who were either unavailable in Wave 1 or who were identified as being key stakeholders as the recovery process unfolded. As stated in goal 1 above, key stakeholder meetings helped to build relationships with people whose jobs are critical to disaster recovery. Therefore, the field team ensured that follow-up meetings were conducted by at least one of the same members of the team that interviewed each person (or group of people) in Wave 1. In total, the public sector team met with nine school district representatives including one superintendent, two principals, two school counselors, three
67
administrators, and one custodial staff member during the dates of January 19 to 29, 2018. The team also met with four city representatives (two government officials and two infrastructure managers) and four state representatives (three emergency managers and one foundation officer representing the organization that was selected to support distribution of federal funds). Prior to conducting interviews, a written consent form, provided in Appendix 4A, was reviewed and signed by the interviewee when the interview was to audio recorded. A verbal consent script was used when the interview was documented in written notes only. School staff interviews were conducted using a semi-structured interview guide (see Appendix 4B), that included questions about disaster impacts, response efforts, organizational decision-making, student displacement, and the recovery process for students, parents, teachers, staff, and the larger community of Lumberton. These interviews provided important context for the household and business survey findings as well as real-time documentation of decision-making processes that influence recovery outcomes. Each meeting lasted between 30 minutes and one hour, and interviews were captured through audio recordings and field notes. In most cases, one researcher conducted these meetings. Key stakeholder meetings with city and state representatives were also conducted using a semi-structured interview guide (see Appendix 4B). Questions were focused on the current status of operations, including resilience actions and investments being considered; the process of decision-making; delays, challenges and issues in the recovery process; and progress in recovery for the city and the state. Each of these meetings lasted approximately 90 minutes, on average, and were documented with detailed field notes instead of audio recordings. In all except one case, these meetings were conducted by at least two researchers from the field study team. 4.2.3 Data Management Similar to the housing and business survey data, all interview data was stored in a locked file cabinet and all electronic media was saved on the password protected computers of the lead investigators that were kept in locked offices. Upon returning from the field, all audio recordings were transcribed verbatim and written field notes were typed out for analysis. Transcripts and notes were then uploaded in Atlas.ti, qualitative analysis software. All physical data was de-identified, and a linked-list was created to replace names with code numbers. The same code was used for the audio recording, field notes, and related photographs from each site. No names are attached to this documentation. Materials provided by the participants (e.g., project lists and budgets, design specifications, photos) were scanned and saved as supporting data files. Original data access is limited to project investigators who have completed the Institutional Review Board (IRB) training and whose universities have signed the Interagency Agreement (IAA). The data will be maintained for the three-year archive period following the conclusion of the study.
4.2.4 Data Analysis The purpose of stakeholder interviews in Wave 2 was to continue to build relationships and supplement survey data collection with personal narratives and contextual information about community recovery. As a result, the interview transcripts and field notes were reviewed and coded for important information about the community context and specific disaster recovery
68
processes. The meeting and interview data were triangulated9 through the analysis of news stories, peer-reviewed and gray literature, and findings from the survey data focused specifically on children, schools, and community recovery. The qualitative analysis, while limited, serves as a basis for new survey questions and associated quantitative analysis in future waves, as well as semi-quantitative modeling, where qualitative data is used to inform a quantitative model. This is particularly true as the research team worked to expand on valuable themes that arise from a small purposive sample to statistically significant findings for a larger, representative sample.
4.3 Findings
The findings of each area of data collection conducted as part of the public sector component of the field study are presented below. The field team used different approaches to the presentation of findings per section. Section 4.3.1 is focused on education; here, the audio recordings were analyzed for themes and quotes are presented alongside discussion of these themes. Section 4.3.2 examines Lumberton’s water infrastructure utility and Section 4.3.3 focuses on the State and Local Government. In these sections, the meeting notes were similarly analyzed for themes and additional data sources are used by the team to supplement information provided by the representatives of the water utility, local government, and state government. In all cases, triangulation was used to combine the meeting and interview data with other sources of information, including findings from the survey focused specifically on children, schools, and community recovery, in the analysis.
4.3.1 Education It is critical that schools are included in studies focused on community recovery and resilience. In their research on children following Hurricane Katrina and other extreme events, Redlener and Schlegelmilch (2017) assert that following children who have experienced a disaster can serve as a community's “bellwether of recovery.” Decades of research have shown that displacement or disruption in education services can have long-term consequences for children’s academic achievement and delays in reopening schools can prolong recovery for children, staff, families, and the broader communities where they operate (Fothergill and Peek 2015). Schools are also an important social institution in communities that are interconnected with other critical community functions. When schools close, business activities can be disrupted throughout the community while parents are unable to arrange for alternative childcare. Altogether, it becomes very important to closely document how child-serving institutions, like schools, prepare for and recover from disruptive events to better understand the complex process of recovery that ultimately results in a community’s ability to be more or less resilient to disasters. The Wave 1 report described the immediate social and physical impacts of Hurricane Matthew on the community of Lumberton (van de Lindt, Peacock, Mitrani-Reiser, et al. 2018). This included a detailed account of the physical and social impacts to the Public Schools of Robeson County, such as damage to school buildings and administrative offices, the evacuation, displacement, and sheltering of children and families, the initial efforts to reopen schools and
9 The term triangulation refers to the practice of combining multiple sources of data or methods of data analysis to improve the credibility of a research study. The term originates in surveying contexts where multiple perspectives are aligned through triangulation to arrive at a more comprehensive understanding (Salkind 2010).
69
resume daily district operations, and the challenges that were faced in the first month following the storm. In this section, findings from Wave 1 are expanded to document recovery decision-making processes, and the physical and social recovery of the most heavily impacted Lumberton schools during the first year following Hurricane Matthew.
Physical Impacts and Response for Schools In 2016, the Public School System of Robeson County was serving approximately 24,000 students in North Carolina. Flooding from Hurricane Matthew caused extensive damage to school district offices and impacted eight schools across Lumberton. W. H. Knuckles and West Lumberton Elementary Schools experienced the most severe damage and all schools were closed for at least three weeks following the flood. As documented in Wave 1, W.H. Knuckles reopened after some minor repairs and West Lumberton was closed indefinitely, with students and staff being displaced to a temporary location at Lumberton Junior High School (van de Lindt, Peacock, Mitrani-Reiser, et al. 2018). According to interviews with members of the Public Schools of Robeson County district, in the first year following the flood W.H. Knuckles Elementary continued to repair damages to their flooded building. When the school reopened (on October 31, 2016), they kept the most severely flooded parts of the building–the gym, the kindergarten/first grade wing, and the cafeteria–closed for ongoing repairs. Of these, the gymnasium was the first to be repaired and reopen. Reconstruction on the primary wing took nine months, with kindergarten and first grade students returning to those classrooms in August, just a few days after classes began for the 2017/2018 school year. The cafeteria reopening followed in October of 2017. During the one year that the cafeteria remained closed, students were served breakfast and lunch in the gymnasium. Food was prepared off-site and brought to the school each day. Interviews and news stories revealed that West Lumberton Elementary was never repaired or re-opened. The school was completely flooded, and although work began immediately to clean out the school and prepare for repairs, reconstruction came to a halt when the district realized that they may not be able to repair the school because of its location in the floodplain. The cost of bringing the building up to current standards for construction in floodplains would have been too high, and it was unclear how much of this cost would be covered by insurance or Federal Emergency Management Agency (FEMA) assistance. At the time of Wave 2, the future of West Lumberton Elementary was reported as uncertain. Students and staff remained displaced at Lumberton Junior High School and the district did not have plans to repair the school or to reopen it in a new location. However, on June 12, 2018 the Board of Education of the Public Schools of Robeson County made a unanimous decision to permanently close West Lumberton Elementary School and absorb students into W.H. Knuckles Elementary for the 2018/2019 school year (Bigelow 2018).
Social Impacts and Response for Schools As reported in the Wave 1 report, when schools re-opened after 3 weeks of being closed, district officials were celebrating the level of student retention at their schools (van de Lindt, Peacock, Mitrani-Reiser, et al. 2018). For example, even though 90 % to 95 % of the students from West
70
Lumberton Elementary were still displaced from their homes, 127 out of 151 students returned to school by the end of November 2016. Representatives from W.H. Knuckles and Lumberton High School reported a similar return to normal student body size immediately following the flood. However, over the course of the following year, student retention dropped. At the time of Wave 2, officials reported that they had lost over 500 students across the district. West Lumberton Elementary attendance dropped from 151 to less than 90 students and W.H. Knuckles Elementary had more than 100 students transfer to other schools. One W.H. Knuckles employee explained:
Once the flood damage arrived from Hurricane Matthew, we went from a school that had approximately two hundred seventy-five students, from Pre-K to fourth grade, to a school of about a hundred and seventy students.
District officials reported that they were not able to track the displacement trajectory of individual students as they moved out of the district. At the time of the interview, the district did not have data showing where students moved when they left their home schools. The team’s focus on student displacement has revealed how closely school recovery is tied to housing recovery. The explanation for the attrition of students over the first-year post-flood is as follows. Initially, when schools reopened three weeks following Hurricane Matthew, parents needed to get their children back to school. This return to school allowed parents to start assessing their losses and begin their own recovery process. Even if families were living in temporary shelters or hotels at the time, they were still situated locally, and schools provided busing from many of the temporary housing facilities. However, as time went on, housing options became more difficult to find. Families were facing challenges that included completely flooded homes that were unrepairable, living in unsafe housing that had not been fully repaired, lack of funds to begin and/or complete home repairs, and an immediate shortage in low-income housing options due to the closure of public housing units and skyrocketing rent. W.H. Knuckles families were greatly affected by the loss of public housing, as one school representative explained:
There were four federal housing areas that are closely attached to enrollment at the school. From November until the Spring, all four of those housing areas were completely shut down. Even to this day, two of them are back up to almost full capacity and two are still being worked on. I can't tell you the exact numbers, but a large number of our students came from those four areas.
These challenges forced families to move out of Lumberton to seek housing elsewhere. One school district representative described it this way:
We had more students return directly after the flood than we realized would come back. We were truly surprised. As the year wore on we started to see some kids move out of state, moving to other parts of the county because there was no, at that point, it didn't seem like there was any kind of urgency to fix homes or the public housing, which supplied a lot of the housing for kids that attend school here.
71
District representatives indicated that they were concerned about the decrease in funding that would be associated with student displacement. Much of a school district’s funding comes directly from student enrollment numbers that are assessed each year in October. For Robeson County, funding for the 2017/2018 school year remained stable given that the majority of students returned to school immediately following the floods. However, with the loss of students over the following year, district representatives anticipate a decrease in funding that would become effective for the 2018/2019 school year. Such a decrease of funds would greatly impact the district’s ability to continue recovery projects, invest in mitigation and disaster planning, and ultimately would serve as a limiting factor in helping students recover and in protecting them from future hazards.
Challenges Remaining for Schools Since Hurricane Matthew made landfall in 2016, the Public Schools of Robeson County have been trying to recover with the resources available. However, with parts of the school district still operating in temporary locations, post-disaster financial resources still being sought, and with students and staff still striving to reach stability, many challenges remain. First, at the time of Wave 2, the school district was still operating out of temporary offices. Although district officials had been actively working to identify a new location to build a permanent district office, one representative explained the challenges they were facing:
There's a lot of confusion about redoing our admin. You know, several different sides. Another kicker is when you're looking at trying to stay centrally located… when you look at Lumberton, the bulk of it is in a flood zone, so how do you plan for that trying to acquire property or find a building that's suitable?
Interviewees also expressed that the absence of a permanent office was difficult for them personally and made their work lives more challenging, as another district official said:
You don't have a home, because work is your home away from home really. And, you want to be comfortable in your surroundings. You're really not when you're in a temporary location. You really don't know about how long you're going to be here or where you’re going.
Many aspects of reestablishing a permanent district office remain uncertain; these include a safe physical location for the district office and funding options to cover the rebuilding of the office. Although the school district was able to begin and complete many of the minor repairs to buildings across the district, by January 2018 they were still waiting to hear back from FEMA on an application for assistance, as well as insurance companies who had yet to make a decision about reimbursement for the loss of West Lumberton Elementary. Delays related to funding were the subject of a school board meeting in April 2017, during which the interim school superintendent, Shanita Wooten, told the school board that project worksheets containing requests for more than $412,000 in repairs to West Lumberton Elementary had been submitted to FEMA. Approximately 6 months post-flood, the district had only received $164,000 from FEMA (Hunter 2017). The lack of clarity about the budget for additional recovery projects delayed action and decision making.
72
A number of challenges related to students were documented. Fifteen months post-hurricane, students were still in need of additional tutoring and counseling services. Counselors reported that many students at both the elementary and high school levels were still experiencing high levels of anxiety during inclement weather. One high school counselor explained:
I can see them sitting in a room getting ready to take an important test in biology and lightning pops in the corner and he's distracted the rest of the time now because all he's thinking about is “I'm ready to go home and hope the flood don't come back.” It's tough.
Although interviewees reported that standardized test scores did not drop following the flood, they explained that for the students that were already underperforming, keeping up their grades and schoolwork became even more challenging. When asked what students would need to achieve full recovery, an elementary counselor stated:
I don't know. Just the notion of being fully recovered is kind of foreign to me. If I could bring all these families out of poverty, if I could bring all these families out of abusive situations or broken homes, I think that I could see some recovery. It did place a toll on the community, but there were issues before Hurricane Matthew.
Interviews with local representatives highlighted that the public schools of Robeson County are still struggling to recover. Student displacement along with unstable and/or decreasing funding have magnified the preexisting social issues that were already being faced by a district with many low-income students in need of assistance. Schools can and do support student and community recovery in the aftermath of a disaster if they are provided with the resources to do so. For this school district however, recovery is still unfolding and uncertain.
4.3.2 Water Infrastructure Restoration of the community’s infrastructure systems is a key part of a community’s recovery from a disaster. The Wave 1 report provided an accounting of the loss of power and water, with more attention on the water system given its prolonged recovery time. In Wave 2, the team continued to focus on the water supply system and related recovery decision-making. This study is timely as water infrastructure is being recognized nationally as needing more attention in community resilience planning. In an after-action report for Hurricanes Harvey and Irma, the American Water Works Association (AWWA) recommended elevating water to an Emergency Support Function at the federal level (AWWA 2018). Additionally, FEMA and the Department of Energy (DOE) reports following the active 2017 hurricane season emphasized the importance of the water sector in community resilience (DOE 2018). New federal legislation (America's Water Infrastructure Act of 2018) authorizes more investment in drinking water infrastructure resilience to natural hazards. This study thus presents an opportunity to understand how water system managers prepare for and respond to extreme flooding. This study also provides an opportunity to understand in detail the interdependencies of critical infrastructure at the community level, which has been recognized as an important research and planning gap. The DOE has noted that the dynamics of cascading failures across various essential services are “not fully understood, and infrastructure planning does not yet effectively
73
incorporate interdependency considerations” (DOE 2018). Information gathered in this longitudinal study of Lumberton’s water infrastructure as it relates to impacts, recovery, and decision-making, including interdependencies with other sectors, will help to close this gap. In this section, we expand on findings from Wave 1 to document the decision-making processes in the recovery of Lumberton’s water utility in the first year following Hurricane Matthew.
Impacts and Response for Water Infrastructure Water service in Lumberton was severely impacted by the flooding caused by Hurricane Matthew. Lumberton’s water service relied on groundwater (40 %) and surface water (60 %) sources. The sole 16 MGD (60 MLD) with a 24 MGD (90 MLD) capacity water treatment plant (WTP) was built in 1992 and designed to withstand a 100-yr flood (van de Lindt, Peacock, Mitrani-Reiser, et al. 2018). The water treatment plant was under 4 ft (1.2 m) of water for several days, compromising both the water treatment and electrical equipment (Whittaker 2017), and the surface water intake ceased functioning, resulting in a loss of water service to the community. During Wave 1, the immediate recovery actions taken were documented and the team gained insight into planning to avoid similar damage from future flooding events. During the Hurricane Matthew event, water service to the public ceased due to inundation of the electrical control systems and pumps. When Water World Magazine conducted this 2017 interview with North Carolina Emergency Management (NCEM) Area Coordinator Eric Wiseman, he described the plant: “When I arrived, here was a plant that had gone from making about 7 million gallons of water a day (7 MGD, 26 MLD) to making zero. Nothing was coming out of it whatsoever” (Whittaker 2017). By the time the field study team visited during Wave 1, water service had largely been restored. The restoration was achieved with exclusive reliance on groundwater sources to compensate for the loss of the surface water intake, and with delivery and installation of portable water treatment plant trailers, yielding 6 MGD (22 MLD) of treated water (van de Lindt, Peacock, Mitrani-Reiser et al. 2018). During Wave 1, the team also learned that individual WTP components were being gradually restored. Various parties (e.g., the city, public works, FEMA, state officials) were discussing how to guard against another major flood that would disrupt water service for an extended period of time. Largely, these discussions were limited to the elevation of control systems, the installation of a flood gate at the VFW Road and CSX railroad overpass, and placement of additional groundwater wells. Important considerations included the type of post-disaster assistance provided, sources of funding, and limitations associated with each. For example, FEMA communicated that the Public Assistance Program could not be used to fund the flood gate, despite this being the point of failure for the levee. Per the Public Assistance Program policy, FEMA only provides funding for repairs of facilities that were in existence (including, in some cases, those under construction) at the time of the event (FEMA 2016). In Wave 1, the team reported that water service restoration was largely dictated by the time required to secure temporary water treatment capability. Quick decision-making on the part of public works and other city officials shortened this time. However, in Wave 2, the team was interested in understanding the transition from temporary to permanent solutions, as well as the specifics of the permanent solutions being considered in and around the water treatment plant.
74
Decision-Making and Challenges in the Recovery Phase for Water Infrastructure By January 2018, the time of Wave 2 data collection, the water treatment plant was operating largely as it had before the hurricane. Water treatment plant operators had seen the water demand return to pre-event levels despite some households having been permanently dislocated. However, while plant operations had returned to normal in the months following the flood, public works representatives discussed changes in staffing roles and responsibilities, as well as the utilization of Lumberton Public Works resources as a result of the flood. Public Works personnel, including personnel from the WTP, provided recovery services to the city. For example, when the city’s official debris removal contract ended, Public Works provided staffing, vehicles, and other resources for debris removal (e.g., as a result of continued building repairs and construction or tree removal) throughout Lumberton. The restoration of the water intake and treatment plant components was well underway in January 2018, but mitigation planning had changed. Some alternatives that were under consideration at the time of Wave 1 had been ruled out and replaced by others. The elevation of many of the control systems, for example, had been ruled out on the basis of cost. Instead, the options entertained were floodproofing of individual buildings (e.g., pumphouses) and generators, and the installation of a berm around the WTP. A flood gate at the VFW Road and CSX Railroad underpass at I-95 continued to be strongly desired by the City according to Public Works representatives, even while other options were being pursued between Waves 1 and 2. Public Works decided to pursue the construction of the WTP berm, based on assessments and recommendations from FEMA and the input of city officials. The berm was to encircle the WTP; this included both the WTP and supporting components (e.g., generators, pumphouse). Within the protection area of the berm a groundwater well would also be installed to ensure a groundwater supply in the event of loss of the surface water intake. In addition, the city identified a variety of funding sources for flood gates at the VFW Road and CSX railroad underpass at I-95. The decision to pursue flood gates resulted from active dialogue between the Department of Transportation, CSX, NC Emergency Management, the city government, and the water treatment plant. In addition to the berm and flood gates, water supply and stormwater management decisions were made to increase the resilience of the local hospital. The attention to the hospital was prompted by flash flooding during Hurricane Matthew that caused the hospital to be inaccessible for several hours. The actions to improve accessibility included three miles of stormwater drainage improvements in the northern part of town near the hospital. This project was aimed at preventing a prolonged period of inaccessibility to the hospital in future flood events, though it was also recognized as providing the added benefit of relief from minor flooding of roadways from average rain events. This drainage project was funded by the Golden LEAF Foundation. With the attention on the hospital, a decision was also made to employ an auxiliary well to provide the hospital with its own backup water in the event of a future emergency.
Challenges Remaining for Water Infrastructure Many important repair and recovery decisions were at various stages of completion in January 2018. By that time, funding had either been secured or was being identified for key water infrastructure resilience actions throughout the community. Public processes for decision making
75
regarding these actions were well underway. Despite the progress in enacting decisions, identifying funds, and developing project plans with input from relevant agencies (e.g., FEMA, US Army Corps of Engineers), there were delays in the use of disaster assistance funding for restoration, repairs, and flood mitigation. One such example is the time required for construction of the berm around the water treatment plant. Public engagement challenges, inherent in the recovery process, were also an issue. It is rare for all actions to have complete support from the local population or those directly impacted (e.g. public works personnel or city government staff), particularly when local officials must balance normal operations and capital improvements with recovery activities. Finally, there was the ongoing challenge reported by Public Works representatives related to the US Army Corps of Engineers’ certification of the levee, which had yet to be resolved as of January 2018. Levee certification is the process that deals with the design and physical condition of the levee and is the responsibility of either the levee owner or community that operates and maintains the levee. Certification must be completed for the levee to be eligible for accreditation by FEMA, and FEMA’s accreditation affects insurance and building requirements (USACE 2012). Despite these challenges, fifteen months after Hurricane Matthew impacted Lumberton, important decisions were being made to increase the resilience of the water infrastructure. This took the form of increased resistance to future flooding (e.g., the WTP berm and hospital area stormwater improvements) but also increased redundancy (e.g., the additional groundwater well behind the berm and the backup water storage at the hospital). In certain cases, there were other co-benefits unrelated to Hurricane Matthew recovery such as relief from frequent, low severity flood events that routinely impacted roadways. When considering community resilience, co-benefits10 are the short-term benefits experienced as a result of “investments in financing and resourcing long-term resilience” (Fung and Helgeson 2017).
4.3.3 State and Local Government In Wave 1, the public sector team conducted meetings with representatives of city and state government to understand the broader context of the event, its impacts, early response, and to form a better overall understanding of recovery challenges faced by various parts of the city and state governments. In Wave 2, researchers returned to meet with many of the same representatives to follow up on the ongoing impacts of Hurricane Matthew and the process of recovery, including decision-making, the status of those decisions, and challenges that remain. Researchers were also interested in identifying the existence of any co-benefits brought about by recovery actions.
Local Government The city government, while leading many aspects of the overall recovery of the community, also experienced significant losses. These losses included public buildings, public utility equipment and functions, and more than $500,000 in contents. In order to recover these losses, post-disaster financial assistance and other resources were required. As with individuals and establishments who sought assistance, the requirements of individual programs dictate eligibility for the local
10 This concept is central to the ‘resilience dividend’, which is “the net benefit that accrues from investments aimed at increasing resilience when a hazard event does not occur, in the absence of a disruptive incident over the planning horizon” (Fung and Helgeson 2017).
76
government. For example, city officials described that due to a lack of flood insurance coverage on public buildings, FEMA’s Public Assistance Program reduced the funds awarded to the city by 75% (FEMA 2016). According to city officials, the public buildings did not have insurance coverage because of the understanding that given the buildings’ location behind the levee, there was minimal flood risk. Unfortunately, the FEMA funding rule was not widely known by city officials prior to the event. In addition to the impacts to the city’s public buildings, four of Lumberton’s public housing buildings were also lost (Colman and Cusick 2018). At the city level, a range of options were considered to improve the resilience of various sectors, including water system redundancy, stormwater drainage improvements, purchasing flood insurance for all public buildings in Lumberton, and creating emergency response plans for future events. Fortunately, many of the decisions led to recovery actions that provided important co-benefits, which will be discussed further below.
Impacts and Response for Local Government Disaster impacts are experienced by all sectors of society, including local government. Understanding the response of city officials to the impacts of Hurricane Matthew is vital to a holistic understanding of the recovery process for Lumberton. The response included a range of actions, some of which were led by city officials while others were dependent on external entities. Communities often hire consultants to identify solutions and administer complex projects; this becomes particularly true following a disaster. This is also attributed to the expertise needed to navigate the disaster assistance and recovery process, as well as the need to maintain existing functions while taking on new activities associated with the recovery. Unlike several nearby communities and schools, Lumberton officials decided not to hire a disaster consultant to support the application and administration of funds. City government representatives identified that they perceived this as a positive decision made early in the recovery process and have since learned of problems in the communities and institutions where external consultants were employed. Without a consultant to lead the process, the city directed its own application and administration of disaster aid. The federal government provides various types of disaster assistance funding, including funds awarded through FEMA’s Hazard Mitigation Grant Program (HMGP). The HMGP is designed to help communities implement hazard mitigation measures following a Presidential Major Disaster Declaration. The primary goal is to “enact mitigation measures that reduce the risk of loss of life and property from future disasters” (FEMA 2018a). In February 2017, initial public meetings regarding the HMGP were held in Lumberton – both in city hall and in the community. These funds are often used for a range of mitigation actions including actions focused on residential structures, as was the case in Lumberton. Actions included buyouts of homes, elevation of homes, and structural retrofits. In September 2017, eight months following the initial public engagement, letters of notification were sent out to the property owners who were deemed to be eligible for these funds. This lag between the public engagement and the notification letters is indicative of the type of delay, dependent on an external action (i.e., federal funds had to be awarded to the state and then distributed to impacted communities), that challenged city officials in their efforts to support community recovery.
77
Non-governmental organizations (NGOs) often play a significant role in disaster recovery; this was certainly true in Lumberton. City government representatives expressed awareness of the time-limited nature of the services being provided by religious organizations such as the United Methodist Committee on Relief (UMCOR), Latter Day Saints (LDS) Charities, and NC Baptist Men. When the field study team was on the ground in January 2018, church organizations were still working, but the number of volunteers had diminished and there were waiting lists of households needing assistance. Most of these organizations were operating on a case by case fundraising method, often raising funds for one household at a time. City officials elected to support the ongoing work of these NGOs, recognizing the valuable service being provided to the community along with the absence of alternative service providers. As a result, money the city received from a crowdsourced fundraising effort was split among the religious organizations that were still working in Lumberton several months after the flooding.
Decision-Making and Challenges in the Recovery Phase for Local Government During meetings with community leaders, recovery delays were attributed to the availability of federal funds, housing repairs, staffing issues, and debris removal. The top item mentioned in nearly all discussions with government representatives was the flow of post-disaster assistance into the community. The timeline of this flow was repeatedly cited as the factor most impacting recovery progress in a negative direction. For housing, the challenge arose with the time required to make housing repairs. Households did not have funds to make repairs independently and therefore, were waiting on receipt of post-disaster assistance. For the funds to reach households, they first have to move from the federal government to the state and then to the counties and ultimately to the impacted communities. As a result, many basic housing repairs were not made by January 2018. When basic repairs are combined with the costly nature of changes like elevating a structure, the limited ability to improve resilience by “building back better” is highlighted. A further challenge to home repairs includes the variation in a local and federal version of the 50 % rule. This rule is used to determine whether, given the level of damage, a building requires repair or full replacement in order to resume pre-disaster function. At the federal level, FEMA applies 44 C.F.R. § 206.226(f)(1) (FEMA 2018b), which defines the 50 % rule as:
(f) Repair vs. replacement. (1) A facility is considered repairable when disaster damages do not exceed 50 percent of the cost of replacing a facility to its pre-disaster condition, and it is feasible to repair the facility so that it can perform the function for which it was being used as well as it did immediately prior to the disaster. (2) If a damaged facility is not repairable in accordance with paragraph (f)(1) of this section, approved restorative work may include replacement of the facility. The applicant may elect to perform repairs to the facility, in lieu of replacement, if such work is in conformity with applicable standards. However, eligible costs shall be limited to the less expensive of repairs or replacement.
78
Alternately, at the local level, Lumberton adopts the state building codes (NC State Building Code Council 2014) where the 50 % rule is defined as:
For repairs to substantial damage (which immediately equate to substantial improvement), if the anticipated cost exceeded 50 percent of the building’s market value before the damage, then all aspects of the entire building, not just portions affected by damage, need to be upgraded to meet new construction requirements.
City officials expressed that when funds were made available for housing, such as through the HMGP, the need was greater than that which could be met by the federal funding criteria. For example, city officials had funds for approximately four times more housing units than would meet the stringent guidelines of the HMGP. Out of approximately 400 applications, only a quarter were identified in the HMGP. Of these, a little more than a third were approved for acquisition, and about a third were approved for both elevation and demolition/rebuild. Funds were also made available for repairs and restoration of public buildings damaged by the flooding. Six million dollars of FEMA Public Assistance funding was awarded by the Golden LEAF Foundation to the city of Lumberton to address such repairs (see Section on State Government for a discussion of the Foundation’s role). The repair or replacement of public buildings provided significant benefits to the community in terms of modernization and general improvement to the spaces from which city government services are provided. Other sources of delay arose from challenges associated with staffing, particularly in areas of employment related to disaster recovery. These issues included a lack of appropriately trained staff and the need for financial resources to hire consultants. However, even when funds were available, there was an absence of people with the necessary skills and expertise to serve as consultants. The shortage of human capital in areas of housing inspection and grants administration specifically presented significant challenges for those in Lumberton. According to city officials, additional needs included planners and engineers with experience in the areas of rehabilitation, elevation, demolition, and rebuild - all activities covered by the HMGP awards. Finally, incomplete debris removal from contractors required follow-up action by the City to complete the process, resulting in longer debris removal times than were anticipated. Challenges Remaining for Local Government As is often the case in disaster recovery, the flow of financial resources represents an ever-present concern for local government officials aiming to speed up the recovery of their community. As of January 2018, several major sources of federal disaster assistance had not yet reached Lumberton. This included CDBG-DR funds through the Department of Housing and Urban Development (HUD).11 The absence of these funds meant that several identified recovery activities could not take place. One major exception is the FEMA public assistance program
11 For more information about the process of acquiring CDBG-DR funding, see https://www.hudexchange.info/programs/cdbg-dr/
79
funds, which were processed quickly, distributed to the state and then to the local communities via the Golden LEAF Foundation.12 The city officials quickly encountered the lack of flexibility of disaster recovery programs, where there are strict requirements for the use of funds and what can and cannot be addressed with those funds. One example of inflexibility was during the debris removal process. Given the stringent requirements of each assistance program, Lumberton’s floodplain manager recognized that he must play an essential role. Namely, that floodplain managers must educate municipality officials who in turn, benefit from improved awareness of the rules and regulations regarding floods. One such example where knowledge of the rules and regulations would have been important for Lumberton is with the FEMA penalty for public buildings that lack flood insurance (FEMA’s Public Assistance Program reduces the funds awarded to the city by 75%). In the midst of these challenges, city government representatives identified several actions that would speed up recovery of the community, if the bureaucratic structures were present to support these actions. The first would be to develop and implement a single application to cover all types and sources of post-disaster assistance for which an individual or household may be eligible. The next two actions related to the recovery of housing and the delay it creates for community recovery. City government representatives identified the importance of improving existing housing, as opposed to rebuilding and relocation, as one of the most critical aspects of recovering the community. This recognition arose in part from the understanding of the community – residents wanted to remain in their homes as opposed to moving elsewhere. Likewise, it was cited by city government representatives as critical to repair houses, regardless of ownership, to achieve recovery of the community. Given current limitations in disaster assistance program requirements, these actions are not possible and therefore, caused significant delays in the recovery process.
State Government In Wave 2, researchers on the field study team followed up with many of the same representatives of the state government originally contacted during Wave 1. The aim of this ongoing interaction was to further advance an understanding of the broader context of the event, its impacts, and ongoing response, as well as the process of recovery, including decision-making and the status of those decisions. At the state level, the team sought to understand how the community of Lumberton was faring in relation to the rest of the state. The challenges being experienced on the state scale were expected to inform the team’s interpretation of the results of the household and business surveys at the local scale.
Impacts and Response for State Government Initially, the state of NC anticipated the flooding of Hurricane Matthew to be comparable to Hurricane Floyd, but unfortunately it was much worse. Approximately 2,000 evacuations were issued, fifty counties were declared disasters, and the damage estimate at the time of Wave 2 was $1.5B (NC Department of Public Safety 2016). While a large number of counties in the state had
12 For more information about the process of acquiring FEMA Public Assistance funds, see https://www.fema.gov/assistance/public
80
disaster declarations, 80 % of the funding was being concentrated in the four most impacted counties – Robeson, Cumberland, Edgecomb, and Wayne. In NC, the state office of emergency management was responsible for overseeing the distribution of federal disaster assistance funds from programs such as the Community Development Block Grant - Disaster Relief (CDBG-DR). Hurricane Matthew impacted many of the state’s lowest-income residents occupying the lowest-lying land (Quillin 2016). As a result, a long recovery timeline was expected. FEMA was not able to help persons who did not have insurance. Instead, homeowners in this category often relied upon donations and faith-based groups for assistance. Renters were another story altogether. In Robeson County, 18,546 households registered with FEMA; of these, 6,744 were renters who are not eligible for most disaster assistance funds (Quillin 2017). Further complicating the recovery process, many of these renters were residents of public housing units which were lost as a result of Hurricane Matthew. The federal government denied NC Governor Roy Cooper’s $15.2 million request to repair flood-damaged public housing in May 2017. According to 2018 Picture of Subsidized Households data, the average HUD Program household in the City of Lumberton has a household income of less than $10,000 per year (HUD 2018). Nearly one out of every 10 public housing units in the US are in the combined 100- and 500-year floodplain designations (104,497 units total) (Furman Center 2017); in North Carolina, nearly 10 % of public housing units fall in this category (Colman and Cusick 2018). The state utilized several partnerships to advance recovery from Hurricane Matthew across the impacted communities. Of note was the state’s selection of the Golden LEAF Foundation to serve as the subcontractor to the state of North Carolina to manage the distribution of significant amounts of recovery assistance. The Golden LEAF Foundation is a nonprofit originally founded in 1999 to use North Carolina’s share of the 1998 settlement with cigarette manufacturers to increase economic opportunity in the state’s tobacco-dependent, economically distressed, and rural communities (Golden LEAF 2018). The challenges facing these communities such as high crime rate, high poverty rate, and low educational attainment were substantial before Hurricane Matthew hit North Carolina (van de Lindt, Peacock, Mitrani-Reiser et al. 2018). In response to the new disaster facing the state, Governor Pat McCrory and the NC legislature crafted an aid package to supplement federal and private dollars. They requested that the Golden LEAF Foundation “take on the stewardship of the resources to aid local government repair and restoration, and small business disaster loans to fill the gaps unmet by others” (Gerlach 2017). State representatives described Golden LEAF as an already trusted partner in the impacted communities, so they were an ideal choice for the State. In addition, the state formalized a partnership with the Voluntary Organizations Active in Disaster (VOADs) to improve distribution of voluntary assistance to those who need it most right after a disaster. Coordination was emphasized by several individuals as central to both the response and recovery. The North Carolina Disaster Recovery Framework was the foundation for the state’s level of coordination following Hurricane Matthew. For example, the staff conducted regular planning and tabletop exercises, all plans were already in place, and there was regular communication between those who would need to coordinate during the response and recovery phases. For the recovery phase specifically, strong relationships and an effective Federal Coordinating Officer were highlighted as necessary components for the progress that had been made, according to state government representatives. As in Lumberton, the state government is also working to build resilience for future events. A newly created Office of Recovery and
81
Resiliency within the Department of Public Safety is just one of the approaches the state is taking.
Decision-Making and Challenges in the Recovery Phase for State Government The range of disaster assistance funds created their own opportunities and challenges at the state level. FEMA Public Assistance funds moved very fast, according to the state government representatives that we spoke with. Compared to past events experienced, these funds were distributed with great efficiency. FEMA’s Public Assistance Program received nearly 450 applications for more than 2,000 projects and totaling more than $413 million. As of April 2017, 377 projects had been obligated for over $32 million in federal funding. In NC, mitigation staff identified 28 projects, totaling more than $1.5 million, for additional mitigation funding through programs like FEMA’s Hazard Mitigation 406 program (FEMA 2017). The HMGP implemented a new streamlined application process which was intended to expedite the submission of proposals and the subsequent awarding of funds. A range of projects were funded, including many for infrastructure. In order to bring more funding through the HMGP, additional flood studies of six river basins were being conducted. Neither the speed with the FEMA Public Assistance funds nor the efficiency of the HMGP awards were echoed by the CDBG-DR funds. As of the time of Wave 2, the CDBG-DR funds had not reached the state for distribution/award to the impacted communities. This was despite the $198 million in funding having been approved at the federal level in January 2017 (NC Department of Public Safety 2017). Once received by the state, 80 % of these funds ($159M) must be awarded to the four counties with the highest impact; these counties include Robeson. The remaining 20 % is available by application and competition to the remaining 46 counties in NC with a disaster declaration. Additional FEMA grant funds totaling $4.5 million were awarded to NC to match trained case managers with Hurricane Matthew survivors to help them navigate the long and often complicated recovery process (NC Governor Roy Cooper 2017). Previously, CDBG-DR funds were not handled by NCEM, but instead were managed through the NC Department of Commerce. The new division of responsibility allowed for the realization of benefits from existing relationships and coordination spurred by the North Carolina Disaster Recovery Framework. This is best evidenced in the process of decision-making, which involved all partners, federal, state, and foundation level, coming to the table together. The state representative’s description of the process included all parties sitting around the table with their spreadsheets of projects for “horse trading” (i.e., having unofficial discussions to arrive at agreements with benefits for both sides, often used in reference to political negotiations). The repeated meetings involved discussion and trading of projects, finding ways to collaborate to fully fund specific projects, and determining which projects would be better funded by one partner versus another. State partners included NCEM, Department of Environmental Quality, Department of Agriculture, among others. Additionally, the foundation partner, Golden LEAF Foundation, was a key participant in this process. After all, part of the work of Golden LEAF Foundation was to use state funds to fill gaps that could not be addressed by federal funds. Overall, state representatives describe the funds from the state as having been distributed faster and with greater flexibility. To this point, the first grants were awarded by the Golden LEAF Foundation
82
in April 2017. The state had obligated 93 % of the available funds at the one-year post-event mark. As of Wave 2, state representatives were projecting a total of more than $375M to be distributed for Hurricane Matthew. Many agencies, offices, groups, and individuals were involved in the recovery effort, each with a different role, and coordination across the agencies with funding was identified as particularly critical to the recovery effort. In order to measure progress in the recovery phase, the state is using a number of approaches, including tracking projects and grants. A Customer Relationship Management (CRM) software was being used in an innovative way to track grant funds through the implementation process. This tool was used for a variety of project types including those funded through CDBG-DR and HMGP. The state’s resilience office was further tracking the HMGP projects. This monitoring supported the state’s assessment of the recovery progress over time. Moving forward, the state’s office of emergency management stated that increasing the portfolio of affordable housing is the number one issue. Representatives also see this as key to improving the post-disaster outcomes of communities. To highlight this dedication, a NC Community Development Initiative was pursued in partnership with UNC-Chapel Hill’s School of Government, Development Finance Initiatives with the aim of rehabilitating public housing units and creating a land bank to purchase properties that are abandoned or in disrepair (NC Community Development Initiative 2017). In light of disagreements between the state and federal government about who has responsibility for the people living in public housing, the state made the call that they had to move things forward independent of federal government agencies. Challenges Remaining for State Government At the state level, more than 80,000 households had registered with FEMA for some type of disaster assistance (NCDPS 2016a). NOAA estimated that Hurricane Matthew cost the state $1.5 billion in property damage (NHC NOAA 2017). Statistics like these represent the challenging road ahead of the state. As of May 2017, the federal government had authorized $6.1 million of the more than $900 million originally requested by the state of NC. The NC governor indicated that these funds were intended to cover everything from housing and business repairs, elevation of homes, agriculture losses, public facilities repairs, and physical and mental health services (Jarvis 2017). The timing of grants and other funding reaching the state was a major issue. Of particular concern were releases of the CDBG-DR and Hazard Mitigation Grant Program funds; according to state government representatives, the delays in distributing these funds represented a challenge for the state’s recovery path. The data collection and analysis of Wave 2 made clear that this challenge was being experienced at multiple levels - from the state to the county to the city to the household.
83
Chapter 5: Conclusions and Next Steps The field study team conducted Wave 2 as part of the longitudinal community resilience field study in Lumberton, North Carolina. The Wave 2 data collection represents documentation of housing data 14 months following the major flooding damage due to Hurricane Matthew in early October 2016. The business survey, a new addition in Wave 2, measures business recovery using a variety of indicators alongside housing recovery indicators documented via the housing survey instrument. The results of the data collection show clear differences across the community in impacts to businesses and recovery. The public sector interviews and meetings represented an ongoing effort to understand the broader context of community recovery by taking into account state and city government, public schools, and water infrastructure. The variety of recovery indicators employed in Wave 2 to support the measurement of Lumberton’s progress in recovery for housing and businesses will be used in Waves 3 and beyond to document the trajectory for housing and businesses to progress understanding in longitudinal community resilience and recovery. The information collected in Wave 2 augment findings from Wave 1 to contribute to the on-going IN-CORE modeling efforts, as well as to NIST research on community resilience. This chapter provides conclusions related to the housing survey findings, business survey findings, and public sector interview findings.
5.1 Conclusions for Housing Disruption and Recovery The housing survey collected data on housing recovery, as well as household dislocation and its impacts on work and school in Lumberton, NC. The findings of the household survey conducted in Wave 1 indicated that structural damage had a significant impact on population dislocation and associated social and economic consequences (see van de Lindt et al. 2018). Through the Wave 2 housing recovery data collection, some respondents shared anecdotally that they were originally dislocated and remained dislocated because of damage, utility disruption, and the timing of repairs to their homes. The majority of households did not report their dislocation time being influenced by the four factors we asked households about, namely changes to work, school, other businesses, or timing of resources. This finding does not discredit the importance of these factors; instead, it raises an important question about the factors that do determine timing and the decision to return home following a disaster. The findings also raise the question about whether some households return to their original housing unit despite unrepaired damage. The relationships that were not observed between dislocation time and return decision with changes to work, school, other businesses, and timing of resources, may be a result of the limitation of surveying households that did return. Perhaps these factors are more influential to those households who do not return, and therefore, who were not surveyed as a part of this effort. As of the time of Wave 2, January 2018, CDBG-DR funds had not been distributed in Lumberton. As one would expect, it was apparent that funding delays to households had a significant impact on the ability of Lumberton to begin their recovery. Furthermore, findings from this study demonstrate the low percentage of at-risk households who carry flood insurance as well as the low percentage of households that apply for external resources following a disaster event. Finally, the households that do apply for assistance must be able to wait, in most cases, a substantial period of time to receive the resources. The high percentage (26 %) of households not making any progress towards housing recovery 14 months after the flooding was alarming; these
84
housing units are recorded as abandoned. The status of these housing units and households has significant implications for community recovery and neighborhood change. Through survey responses from households with school-aged children and semi-structured interviews with school representatives (see Chapter 4 of this report and van de Lindt et al. 2018), it was clear that children and their education were differentially impacted. One school permanently closed in Lumberton following Hurricane Matthew, requiring the children to be absorbed into other schools. During the surveys, when parents were asked about their children’s educational recovery, 14 % of parents were still uncertain because of these changes. Other parents (10 %) indicated positive changes because their children were better off in their new school. This can be viewed as a type of unexpected consequence occurring through disaster and recovery resulting in a positive impact for some, whether or not that is immediately recognized.
5.2 Conclusions for Business Interruption and Recovery The business survey team collected data on the impacts of Hurricane Matthew and the resulting interruption; the team also began a longitudinal effort to document recovery. The Lumberton business survey was successful in that the in-person response rate was quite high (52 %) when compared to other social science survey collections, giving the team a robust dataset to work with in drawing the following conclusions. First, the team identified differences in the number of closures based on whether the business was in the inundation zone. Businesses in the inundation area had a higher percentage of closures, with 38 of the 181 (21%) businesses being closed compared to 20 closures out of the 280 (7%) non-inundated businesses that were drawn in the sample. Future models can statistically test these differences, controlling for other factors, through logistic regression. In addition, the business team was able to get detailed information on recovery status for 164 businesses in the sample. Although this report includes cross-tabulations, future work will account for more variables and utilize more sophisticated statistical approaches to better understand the factors influencing business recovery a year after the event. The business team also sought to understand how to best measure business recovery using a variety of indicators. The results of the data collection show clear differences in how businesses respond to different recovery indicators: 24% of businesses indicated that they were still operating below 100% capacity, whereas close to 34% of businesses are still in survival/response mode, consider themselves still recovering, or believe they will never recover. Additionally, an even greater proportion of businesses, close to 45%, report a decrease in revenue since the Hurricane. Looking at the relationships between these indicators will bring researchers closer to understanding business recovery on a deeper level. For businesses, only a fraction of low-interest loans applied for were approved, which is likely to cause further delay in business recovery. Although many businesses did not apply for or receive funding, there is still a story to be told in the data. To cover flood events, 68 % of businesses reported having building insurance, 50 % had contents insurance, and 32 % had interruption insurance--however, 93 % of businesses experienced interruption, 50 % of businesses reported contents damage, and only 43 % of businesses reported building damage indicating a coverage mismatch for this event. Although one might expect additional funding sources to fill the gap, this was not observed for the businesses in the sample.
85
5.3 Conclusions for Public Sector Impacts and Recovery The opportunities described in Chapter 4 to interview local and state officials provided insight into the layers of communication and funding that must be synchronized to ensure disaster relief (and other) funds make their way to the households, businesses, and public sector - the people and groups that need them. In many cases, federal post-disaster assistance funds were slower than state and private funds, according to discussions at both the state and local government levels. However, by January 2018, various sources of funds have been identified and provided by sources including FEMA Public Assistance, the state, and others, and were being distributed through the Golden LEAF Foundation for key projects, such as public building repair, installation of a berm around the water treatment plant, and flood gates at the VFW Road and CSX Railroad underpass. The progress is countered by challenges. One third of public housing in Lumberton was lost as a result of the flooding and the application to replace these buildings had been denied. As a result, the state has identified affordable housing as one of the most significant challenges currently facing Lumberton. In addition, the Public Schools of Robeson County are continuing to face challenges as students leave the district, annual funding decreases, and money for repairs and mitigation and preparedness efforts is scarce. With the threat of future hazard events on the horizon, the lag in recovery increases the concern about the resilience of Lumberton to the next disaster.
5.4 Concluding Methodological Considerations Several methodological findings also arose from this work that are expected to inform future waves of data collection in Lumberton, as well as other longitudinal studies of community resilience and recovery. First, two-person teams should be assigned to in-person data collection and fieldwork. This provides for improved efficiency and surveyor-respondent rapport by allowing one individual to speak directly with the respondent, observe nonverbal cues, and demonstrate good listening behaviors while the other individual records notes during the survey or interview. In the two-person team, one person assumes the speaker/interviewer role, while the other person assumes a recorder role. Allowing one person to speak, and not write simultaneously, provides for smoother interactions. A two-person team also improves safety from individual assignments. Second, the flexibility of having two teams work through nearby neighborhood streets for housing, but not for businesses surveys, was also important for the efficiency of the data collection. The businesses are separated by much greater distance and involve substantial driving time between locations. Meanwhile, the housing units are often located in areas where two teams can effectively work within sight of one another and still share a car for transportation between sampling areas. Third, a clear final day protocol is necessary for wrapping up surveys to any remaining businesses or housing units in the sample, especially those businesses that had surveys dropped off with them without any way for them to return it. One option might be to bring pre-stamped envelopes to provide to participants for mailing surveys back. Another option is to leave an information sheet with a QR code or URL to an online version of the survey. Either way, this process should be written into the IRB submission(s) in order to minimize time between survey observations. Relatedly, before departing, the field team should confirm that the business phone number in the ReferenceUSA database is correct and obtain the contact information or name of the owner or manager most likely to have knowledge about the business and Hurricane Matthew, for later follow-up.
86
Lastly, experienced, attentive, and prepared surveyors are key to the increased success rate of the number of completed surveys. Many of the households and businesses were under duress and received little to no support following Hurricane Matthew. Field team members should thus be prepared to discuss the ways in which the information collected can improve the post-disaster situation for households and business. Empathy should be part of the surveyor’s tools. The surveyor should clearly communicate that they are cognizant of hardships caused by the event, and that the survey work, and study in general, are intended to contribute to the more equitable distribution of resources for households and businesses in the future. Having supplemental materials on hand in all cases (e.g., mental health resources, financial assistance resources) is also critical to provide to residents or business owners/managers who want or may need this information. This is a small way of giving back to the community. Other forms of giving back to the community should be discussed and intentionally addressed in future longitudinal studies.
5.5 Next Steps for the Lumberton Longitudinal Field Study Wave 2 of the Lumberton Field Study represents the next step in the development of a longitudinal dataset; in this case, a dataset that systematically documented recovery trajectories, infusion of federal, state, and other recovery assistance, and began to augment the types of data being collected. The second wave was conducted 15 months after the first wave and represents the first temporal documentation of housing and business recovery for Lumberton. The team quantified the distribution of the types of assistance (both financial and in-kind) households and businesses sought. In addition, in Wave 1 engineering assessments of building damage were provided by multi-disciplinary teams (see van de Lindt, Peacock, Mitrani-Reiser et al. 2018 for details) which were compared with respondent’s reports of damage in the housing survey as part of Wave 2. Although this may result in some discrepancies, multiple measurements of damage provide the study team the ability to ascertain the full damage for housing units as well as to better quantify the differences between the two types of data. Both of these outcomes are of value from a disaster metrology perspective. One of the initial objectives from Wave 1 of the Lumberton longitudinal field study was to advance the area of field study metrology with a focus on community resilience. In Wave 2, the study was expanded from households to include business surveys to evaluate the current status of recovery for business within Lumberton. The ability to systematically document inflow of disaster relief funds and observed recovery at the household and individual business level over time will provide a seminal dataset for community resilience researchers. A number of methodological lessons and recommended improvements are also being identified and outlined in a subsequent report of field study best practices to ensure benefit to those engaging in field studies and to communities like Lumberton. As the Lumberton longitudinal field study continues and the dataset is built over time, it is anticipated that the field study will provide major contributions to efforts to model community resilience and recovery. In order to accomplish the longer-term objectives set out by the team, these next steps are recommended:
1. Both the housing and business survey collections should be continued every 12-16 months with improvements and appropriate temporally-based changes made as needed.
87
The surveys should not, however, be lengthened, in an effort to maintain response rates and minimize population burden and survey fatigue.
2. Temporal analyses should be conducted in order to compare results across time points,
e.g., compare dislocation across time, influence of level of damage (Wave 1) on recovery status of housing (Wave 2 and subsequent datasets).
3. A comprehensive analysis should be conducted to ensure that the surveys align with what
is needed to model community resilience in IN-CORE and IN-CORE validation. This should include, but not be limited to, housing recovery, business recovery, mitigation and behavioral actions, but also validation of the full architecture as the Lumberton study progresses.
4. Ongoing analysis should be conducted to ensure that the field study continues to align
with what is needed for NIST measurement and modeling, and improvements to standardized field study protocols. This includes the use of data in the development of the Alternatives for Resilient Communities (ARC) model, a web-based tool to assist in community resilience planning, for recovery measurement to inform the Tracking Community Resilience (TraCR) Methodology, and accounting for disaster losses with a focus on major indirect losses, such as business interruption, and distributional effects.
5. Housing and business survey instruments and collected data should be published and
receive a Digital Object Identifier (DOI). Care should be taken to ensure that those contributing to the survey development receive proper credit for their work. Likewise, the field of disaster research should benefit from instruments that support the collection of standardized data.
6. A Lumberton Field Study workshop, held independently of the field study itself, should
be planned and executed. This workshop can help satisfy two pressing needs: (a) the first half of the workshop should include discussion on how IN-CORE models can be validated with data from Lumberton, data storage and sharing protocols including the need to protect identifiable information, and publication of survey instruments and supporting documentation for DOI’s related to those publications; (b) the second half of the workshop should focus on developing the white papers associated with each of these topics to ensure progress is made and lessons learned are shared beyond the study team.
88
References Abramson, D. M., Stehling-Ariza, T., Park, Y. S, Walsh, L., and Culp, D. (2010). Measuring
individual disaster recovery: A socio-ecological framework. Disaster Medicine and Public Health Preparedness, 4, S46-S54.
[ACS] American Community Survey. (2020). “2016: ACS 5-Year Estimates Data Profiles”.
United States Census Bureau.
American Water Works Association/ Water/Wastewater Agency Response Network. (2018). Hurricanes Harvey and Irma After-Action Report. (https://www.awwa.org/Portals/0/AWWA/Government/HarveyIrmaAARFINAL.pdf?ver=2018-05-17-153257-720)
America's Water Infrastructure Act of 2018, S.3021 — 115th Congress (2017-2018). Section 1433, Public Law No: 115-270.
Bigelow, S. (2018). It’s official: West Lumberton to close. Robesonian. (https://www.robesonian.com/news/112078/its-official-west-lumberton-to-close)
Colman, Zack and Daniel Cusick. (2018). 2 towns, 2 storms and America's imperiled poor. E&E News reporters Climatewire. (https://www.eenews.net/stories/1060100111/)
Corey, C. M., and Deitch, E. A. (2011). Factors Affecting Business Recovery Immediately after
Hurricane Katrina. Journal of Contingencies and Crisis Management, 19(3), 169-181. doi:10.1111/j.1468-5973.2011.00642.x
Dahlhamer, J. M., and Tierney, K. J. (1996). Winners and losers: predicting business disaster
recovery outcomes following the Northridge earthquake. Dahlhamer, J. M., & Tierney, K. J. (1998). Rebounding from disruptive events: Business
recovery following the Northridge earthquake. Sociological Spectrum, 18(2), 121-141. Department of Energy (2018). Energy Resilience Solutions for the Puerto Rico Grid, Final
Report Dietch, E. A., and Corey, C. M. (2011). Predicting long-term business recovery four years after
Hurricane Katrina. Management Research Review, 34(3), 311-324. doi: 10.1108/01409171111116321
[FEMA] Federal Emergency Management Agency. 2016, 2016 PA Program and Policy Guide
(PAPPG) [V1.0], (https://www.fema.gov/media-library/assets/documents/111781)
89
[FEMA] Federal Emergency Management Agency. 2017. Six Months Following Hurricane Matthew. FEMA News Release. (https://www.fema.gov/news-release/2017/04/06/six-months-following-hurricane-matthew-government-partners-volunteers-work)
[FEMA] Federal Emergency Management Agency. 2018a. Hazard Mitigation Assistance Grants.
(https://www.fema.gov/hazard-mitigation-grant-program) [FEMA] Federal Emergency Management Agency. 2018b. Codes and Standards – 50 Percent
Rule, Appeal Brief. (https://www.fema.gov/appeal/335606?appeal_page=analysis#_ftn33) Fothergill, A., and Peek, L. A. (2004). Poverty and disasters in the United States: A review of
recent sociological findings. Natural Hazards, 32(1), 89-110. Fothergill, A. and L. Peek. (2015). Children of Katrina. Austin: University of Texas Press. Furman Center 2017. Housing in the U.S. Floodplains. Data Brief, May 2017.
(http://furmancenter.org/files/NYUFurmanCenter_HousingInTheFloodplain_May2017.pdf)
Gerlach (2017). Hurricane Matthew: The Aftermath. Opinion-Editorial, The News and Observer. October 06, 2017 10:47 AM. (https://www.newsobserver.com/opinion/op-ed/article177468181.html)
Golden LEAF Foundation. (2018). About Golden LEAF Foundation. Retrieved from
(https://www.goldenleaf.org/about/) [HUD] Housing and Urban Development. (2018). Picture of Subsidized Households 2018.
(https://www.huduser.gov/portal/datasets/assthsg.html) Hunter, T. C. (2017). West Lumberton pupils to stay put. Robesonian.
(https://www.robesonian.com/news/97923/west-lumberton-pupils-to-stay-put) InfoGroup Inc. (2016). U.S. Historical Businesses: All businesses in Lumberton, NC in year
2016 [Data file]. Retrieved from http://referenceusa.com/UsHistoricalBusiness Jarvis, Craig. (2017). Cooper ‘shocked, disappointed’ in federal storm recovery funds from
Trump administration. The News and Observer, May 11, 2017. (https://www.newsobserver.com/news/politics-government/state-politics/article149676019.html)
Koenig, T.A., Bruce, J.L., O’Connor, J.E., McGee, B.D., Holmes, R.R., Jr., Hollins, Ryan,
Forbes, B.T., Kohn, M.S., Schellekens, M.F., Martin, Z.W., and Peppler, M.C. (2016). Identifying and preserving high-water mark data: U.S. Geological Survey Techniques and Methods, book 3, chap. A24, 47 p. (http://dx.doi.org/10.3133/tm3A24)
Lam, N. S. N., Arenas, H., Pace, K., LeSage, J., and Campanella, R. (2012). Predictors of
Business Return in New Orleans after Hurricane Katrina. PLoS One, 7(10). doi:10.1371/journal.pone.0047935
90
Lesage, J., Pace, R. K., Lam, N., Liu, X., and Campanella, R. (2011). Do what the neighbours
do: Reopening businesses after Hurricane Katrina. Significance, 8(4), 160-163. doi:10.1111/j.1740-9713.2011.00520.x
Marshall, M. I., Niehm, L. S., Sydnor, S. B., and Schrank, H. L. (2015). Predicting small
business demise after a natural disaster: an analysis of pre-existing conditions. Natural Hazards, 79(1), 331-354. doi:10.1007/s11069-015-1845-0
McDonald, T. M., Florax, R., and Marshall, M. I. (2014). Informal and Formal Financial Resources and Small Business Resilience to Disasters. St. Louis: Federal Reserve Bank of St Louis.
Merdjanoff, A. (2015). Weathering the storm: the long-term effects of Hurricane Katrina on
mental health, mobility, and recovery. Ph.D. dissertation, Rutgers University. Mitrani-Reiser, J. (2007). “An ounce of prevention: Probabilistic loss estimation for
performance-based earthquake engineering.” Ph.D. thesis, California Institute of Technology, Pasadena, CA.
[NHC NOAA] National Hurricane Center, National Oceanic and Atmospheric Administration.
(2017). Hurricane Matthew, National Hurricane Center Tropical Cyclone Report. April 7, 2017. (https://www.nhc.noaa.gov/data/tcr/AL142016_Matthew.pdf)
Nejat, A. and Damnjanovic, I. (2012). Agent-based modeling of behavioral housing recovery
following disasters. Computer-Aided Civil and Infrastructure Engineering, 27, 748-763. [NOAA] National Oceanic and Atmospheric Association. (2018). National Centers for
Environmental Information’s U.S. Billion-Dollar Weather and Climate Disasters. (https://www.ncdc.noaa.gov/billions/)
NC Community Development Initiative. 2017. “Second Emergency Management Loan to Create
Affordable Housing in Lumberton”, October 11, 2017. (https://ncinitiative.org/2017/10/11/second-emergency-management-loan-to-create-affordable-housing-in-lumberton/)
[NCDPS] NC Department of Public Safety. (2017) Governor Cooper announces $198 million
grant for Hurricane Matthew recovery: Funds will help survivors with housing, rebuilding, jobs in hardest hit counties. Press Release, January 26, 2017. (https://www.ncdps.gov/governor-cooper-announces-198-million-grant-hurricane-matthew-recovery)
NC Governor Roy Cooper (2017) Gov. Cooper Announces $4.5M Federal Grant to Help
Matthew Survivors. Press Release, January 18, 2017. (https://governor.nc.gov/news/gov-cooper-announces-45m-federal-grant-help-matthew-survivors)
91
NC State Building Code Council. (2014). 2015 North Carolina Existing Building Code. (https://www.ncosfm.gov/2015-north-carolina-existing-building-code-changes-only-2012-iebc-140401-rrc-140522-icc/open)
Olsen, M. J., Barbosa, A., Burns, P., Kashani, A., Wang, H., Veletzos, M., Chen, Z., Roe, G., and Tabrizi, K. (2016). Assessing, Coding, and Marking of Highway Structures in Emergency Situations, Volume 2: Assessment Process Manual (No. Project NCHRP 833). (https://doi.org/10.17226/24610)
Peacock, W. Rosenheim, N. Gu, D. Van Zandt, S. Peek, L. Dillard, M. Tobin, J. Hamideh, S. (2020). "Household Survey Instrument, November 26, 2016: Wave 1", in A Longitudinal Community Resilience Focused Technical Investigation of the Lumberton, North Carolina Flood of 2016. DesignSafe-CI. (https://doi.org/10.17603/ds2-pmt9-1s33)
Quillin, Martha. (2016). A month after Hurricane Matthew, many in Lumberton despair of ever
getting back to normal. News and Observer. Updated November 16, 2016 10:07 AM. (https://www.newsobserver.com/news/state/article114997813.html)
Quillin, Martha. (2017). Sleeping on floors and in boarded up hotels. 7 months after Matthew,
renters still mired in misery. News and Observer. Updated April 10, 2018 03:38 PM. (https://www.newsobserver.com/news/state/article150367937.html)
Redlener, I and Schlegelmilch, J (2017, October 18) Launching the Children’s Disaster
Resiliency and Recovery program (CDRR). National Center for Disaster Preparedness. (http://ncdp.columbia.edu/ncdp-perspectives/launching-childrens-disaster-resiliency-recovery-program-cdrr/)
Salkind, Neil J. (2010). “Triangulation”, In Encyclopedia of Research Design. Thousand Oaks,
CA: Sage Publishing. (http://dx.doi.org/10.4135/9781412961288) Sutley, E.J. and Hamideh, S. (2017). An Interdisciplinary System Dynamics Model for Post-
Disaster Housing Recovery. Sustainable and Resilient Infrastructure, DOI 10.1080/23789689.2017.1364561.
Sutley, E.J., and Hamideh, S. (2020). “Postdisaster Housing Stages: A Markov Chain Approach
to Model Sequences and Duration Based on Social Vulnerability.” Risk Analysis. (https://doi.org/10.1111/risa.13576)
[USACE] US Army Corps of Engineers. (2012). Levee Certification vs. Accreditation.
(https://www.mvk.usace.army.mil/Portals/58/docs/LSAC/LeveeCertification.pdf) US Census Bureau (2017). “Population and Housing Unit Estimates.” United States Census
Bureau. (https://www.census.gov/programs-surveys/popest.html) van de Lindt, J.W., W. G. Peacock, J. Mitrani-Reiser, N. Rosenheim, D. Deniz, M. Dillard, T.
Tomiczek, M. Koliou, A. Graettinger, S. Crawford, K. Harrison, A. Barbosa, J. Tobin, J. Helgeson, L. Peek, M. Memari, E. Sutley, D. Gu, S. Cauffman, and J. Fung. (2018).
92
Community Resilience-Focused Technical Investigation of the 2016 Lumberton, North Carolina Flood: Multi-Disciplinary Approach. van de Lindt, J.W., W. G. Peacock, and J. Mitrani-Reiser (Eds). National Institute of Standards and Technology (NIST SP 1230). (https://doi.org/10.6028.NIST.SP.1230)
Watson, M., Xiao, Y., Helgeson, J., & Dillard, M. (2020). Importance of Households in Business
Disaster Recovery. Natural Hazards Review, 21(4), 05020008. Webb, G. R., Tierney, K. J., & Dahlhamer, J. M. (2002). Predicting long-term business recovery
from disaster: a comparison of the Loma Prieta earthquake and Hurricane Andrew. Global Environmental Change Part B: Environmental Hazards, 4(2), 45-58.
Whittaker, S. (2017). Mobile Water Units Help Recovery Efforts in Lumberton, N.C.
(https://www.waterworld.com/articles/print/volume-33/issue-6/departments/case-studies/mobile-water-units-help-recovery-efforts-in-lumberton-n-c.html)
Xiao, Y., and Van Zandt, S. (2012). Building Community Resiliency: Spatial Links between
Household and Business Post-disaster Return. Urban Studies, 49(11), 2523-2542. doi:10.1177/0042098011428178
A-1
Appendix 1A: Study Information Sheets INFORMATION SHEET FOR HOUSEHOLDS
Hurricane Matthew Community Recovery Study for Lumberton, NC Center for Risk-Based Community Resilience Planning
A U.S. National Institute of Standards and Technology-funded Center of Excellence _______________________________________________________________________
The Center for Risk-Based Community Resilience Planning is based at Colorado State University in Fort Collins, Colorado, and includes collaborations with researchers from universities across the United States. The National Institute of Standards and Technology’s Community Resilience Program is based in Gaithersburg, Maryland and includes engineers, economists, and sociologists. Collectively, we are working to understand what makes a community “resilient” – or able to bounce back – in the face of disaster. Our research in Lumberton focuses on community recovery following the flooding that occurred due to Hurricane Matthew in early October 2016. We are returning to Lumberton this year to follow up our initial study in November 2016. We will be collecting information from households like yours to gain knowledge on the impacts and the recovery from Hurricane Matthew and the flooding. We hope to learn from your experiences to help communities better prepare for similar events in the future. This research is part of a five-year project that will be carried out by experts from engineering, the social sciences, economics, and many other disciplines. This community was selected as one of our five research locations around the country that we hope to learn from. Our field team will be in Lumberton from January 19 through 29, 2017. Because NIST is part of the federal government, this research was reviewed through a special process. This collection of information contains Paperwork Reduction Act (PRA) requirements approved by the Office of Management and Budget (OMB). Notwithstanding any other provisions of the law, no person is required to respond to, nor shall any person be subject to a penalty for failure to comply with, a collection of information subject to the requirements of the PRA unless that collection of information displays a currently valid OMB control number. For this collection, the OMB Control number is:0693-0078 with an expiration date: July 31, 2019. Public reporting burden for this collection is estimated to be 10 minutes per survey, including the time for reviewing instructions, searching existing data sources, gathering and maintaining the data needed and completing and reviewing the collection of information. Send comments regarding this burden estimate or any aspect of this collection of information, including suggestions for reducing this burden, to the National Institute of Standards and Technology, Attn: Dr. Jennifer Helgeson, NIST, 100 Bureau Drive, MS 8603, Gaithersburg, MD 20899-1710, telephone 301-975-6133, or via email:[email protected] If you have more general questions about the project or the Center for Risk-Based Community Resilience Planning, please contact: Dr. John van de Lindt at 970-218-4076 or via email: t [email protected].
A-2
INFORMATION SHEET FOR BUSINESSES Hurricane Matthew Community Recovery Study for Lumberton, NC
Center for Risk-Based Community Resilience Planning A U.S. National Institute of Standards and Technology-funded Center of Excellence _______________________________________________________________________
The Center for Risk-Based Community Resilience Planning is based at Colorado State University in Fort Collins, Colorado, and includes collaborations with researchers from universities across the United States. The National Institute of Standards and Technology’s Community Resilience Program is based in Gaithersburg, Maryland and includes engineers, economists, and sociologists. Collectively, we are working to understand what makes a community “resilient” – or able to bounce back – in the face of disaster. Our research in Lumberton focuses on community recovery following the flooding that occurred due to Hurricane Matthew in early October 2016. We are returning to Lumberton this year to follow up our initial study in November 2016. We will be collecting information from businesses like yours to gain knowledge on the impacts and the recovery from Hurricane Matthew and the flooding. We hope to learn from your experiences to help communities better prepare for similar events in the future. This research is part of a five-year project that will be carried out by experts from engineering, the social sciences, economics, and many other disciplines. This community was selected as one of our five research locations around the country that we hope to learn from. Our field team will be in Lumberton from January 19 through 29, 2017. Because NIST is part of the federal government, this research was reviewed through a special process. This collection of information contains Paperwork Reduction Act (PRA) requirements approved by the Office of Management and Budget (OMB). Notwithstanding any other provisions of the law, no person is required to respond to, nor shall any person be subject to a penalty for failure to comply with, a collection of information subject to the requirements of the PRA unless that collection of information displays a currently valid OMB control number. For this collection, the OMB Control number is:0693-0078 with an expiration date: July 31, 2019. Public reporting burden for this collection is estimated to be 15 minutes per survey, including the time for reviewing instructions, searching existing data sources, gathering and maintaining the data needed and completing and reviewing the collection of information. Send comments regarding this burden estimate or any aspect of this collection of information, including suggestions for reducing this burden, to the National Institute of Standards and Technology, Attn: Dr. Jennifer Helgeson, NIST, 100 Bureau Drive, MS 8603, Gaithersburg, MD 20899-1710, telephone 301-975-6133, or via email:[email protected] If you have more general questions about the project or the Center for Risk-Based Community Resilience Planning, please contact: Dr. John van de Lindt at 970-218-4076 or via email: [email protected].
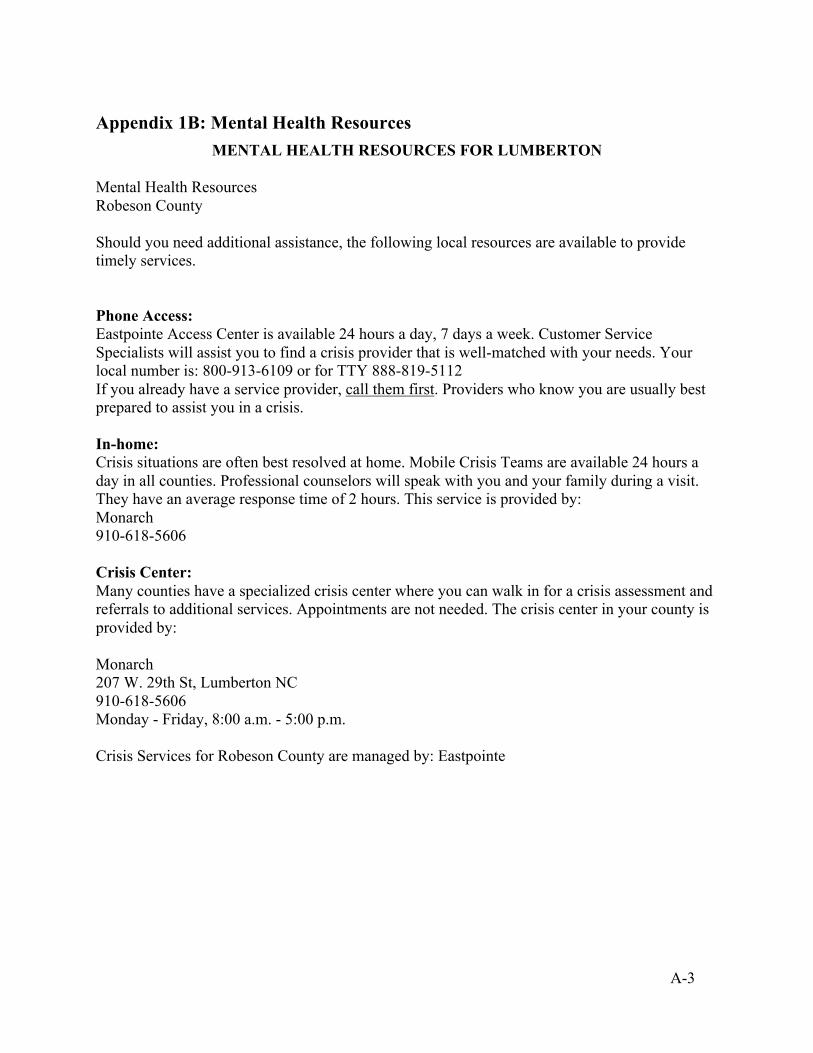
A-3
Appendix 1B: Mental Health Resources MENTAL HEALTH RESOURCES FOR LUMBERTON
Mental Health Resources Robeson County Should you need additional assistance, the following local resources are available to provide timely services. Phone Access: Eastpointe Access Center is available 24 hours a day, 7 days a week. Customer Service Specialists will assist you to find a crisis provider that is well-matched with your needs. Your local number is: 800-913-6109 or for TTY 888-819-5112 If you already have a service provider, call them first. Providers who know you are usually best prepared to assist you in a crisis. In-home: Crisis situations are often best resolved at home. Mobile Crisis Teams are available 24 hours a day in all counties. Professional counselors will speak with you and your family during a visit. They have an average response time of 2 hours. This service is provided by: Monarch 910-618-5606 Crisis Center: Many counties have a specialized crisis center where you can walk in for a crisis assessment and referrals to additional services. Appointments are not needed. The crisis center in your county is provided by: Monarch 207 W. 29th St, Lumberton NC 910-618-5606 Monday - Friday, 8:00 a.m. - 5:00 p.m. Crisis Services for Robeson County are managed by: Eastpointe

A-4
Appendix 2A: Housing Survey One-Year Post-Hurricane Matthew Field Study in Lumberton, North Carolina Housing/Household Recovery Survey OMB CONTROL NO. 0693-0078 Expiration date: 07/31/2019 Surveyor(s):_____________________________________ Date:____________________ Building ID: _____________________________________Unit Address:______________ Building Type: 1, Single family 2, Multi-family, # housing units _______ 3, Mobile home 4, Other, __________ Comments:_________________________________________________________________________________________
Result/ Completion Codes
1. Completed interview 2. Ineligible, no adult or eligible person to answer questions 3. Bad address, could not locate HU 4. Incomplete/partial 5. Not occupied residence, abandoned; home destroyed 6. Ineligible, structure not a residence 7. No Answer or response, but evidence or confirmed occupied 8. No access, gated community, fence preventing entry
Housing Unit (HU) Occupancy status:
YES: household present interviewed or attempted
YES, evidence of current habitation
DK: Indeterminate/ uncertain
NO: not occupied, appears abandoned
YES, occupied confirmed by neighbor
YES, occupied, confirmed by management
NO: not occupied, under repair/reconstruction.
NO, damaged and not habitable
If interview not possible but neighbors, apartment managers, or others can provide information,
record here:
Mark type of
informant:
Neighbor Manager Other: (specify) ________________
Was the HU occupied at time of HM?
YES, #HH members_______ NO DK
If NO: Do you know where the former
household lives now? Lumberton NC Out of State DK
Is household still living there? YES NO DK
If NO: Will former HH return at any point? YES NO DK
Did household leave because of the flooding? YES NO DK
[The following questions are to be answered upon consent of a HH member over 18 years of age.] 1. Was your household living in this home at the time of Hurricane Matthew (October 2016)?
Yes No
2. How many people are in your household? Adults (over 18)_______ Children (under
18)_______
[If NO to Q1, ask Q3 – Q7, Q27-Q30 and then close survey. If YES to Q1, ask Q2 and then skip to Q8.]
3. When did you move to this housing unit? DD/MM/YY____________________________
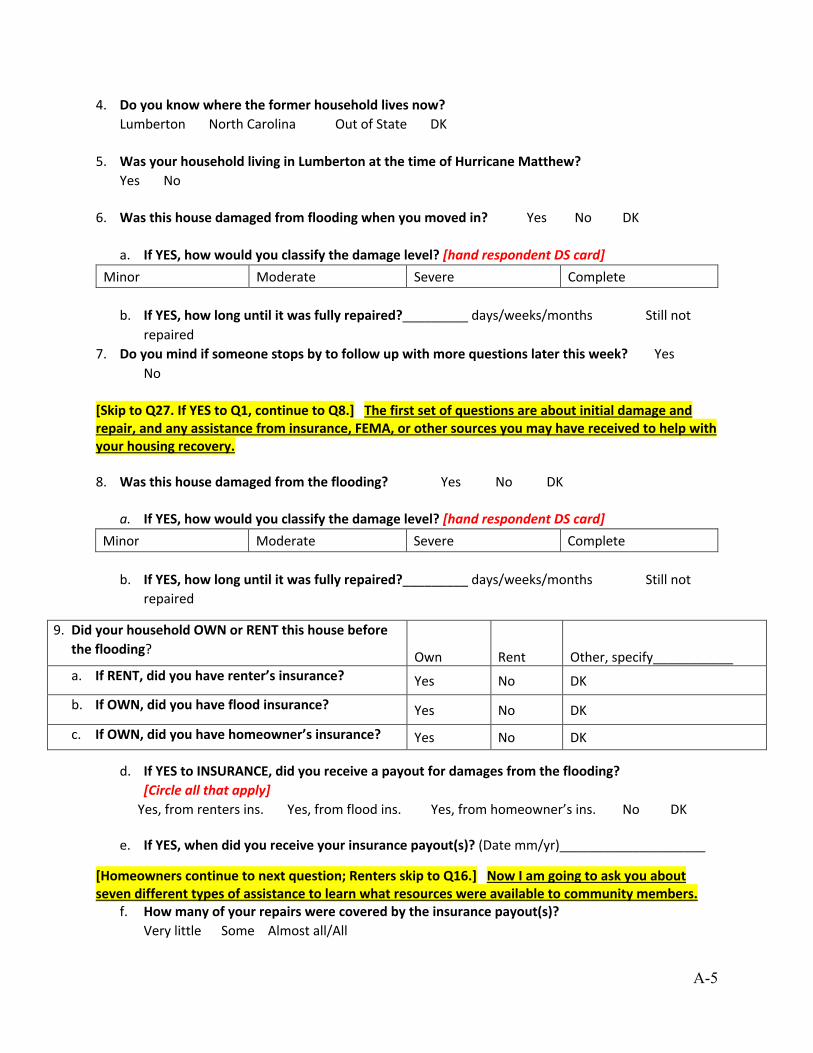
A-5
4. Do you know where the former household lives now? Lumberton North Carolina Out of State DK
5. Was your household living in Lumberton at the time of Hurricane Matthew?
Yes No 6. Was this house damaged from flooding when you moved in? Yes No DK
a. If YES, how would you classify the damage level? [hand respondent DS card] Minor Moderate Severe Complete
b. If YES, how long until it was fully repaired?_________ days/weeks/months Still not
repaired 7. Do you mind if someone stops by to follow up with more questions later this week? Yes
No [Skip to Q27. If YES to Q1, continue to Q8.] The first set of questions are about initial damage and
repair, and any assistance from insurance, FEMA, or other sources you may have received to help with
your housing recovery.
8. Was this house damaged from the flooding? Yes No DK a. If YES, how would you classify the damage level? [hand respondent DS card]
Minor Moderate Severe Complete
b. If YES, how long until it was fully repaired?_________ days/weeks/months Still not
repaired
9. Did your household OWN or RENT this house before
the flooding? Own Rent Other, specify___________ a. If RENT, did you have renter’s insurance? Yes No DK
b. If OWN, did you have flood insurance? Yes No DK
c. If OWN, did you have homeowner’s insurance? Yes No DK
d. If YES to INSURANCE, did you receive a payout for damages from the flooding? [Circle all that apply]
Yes, from renters ins. Yes, from flood ins. Yes, from homeowner’s ins. No DK
e. If YES, when did you receive your insurance payout(s)? (Date mm/yr)____________________
[Homeowners continue to next question; Renters skip to Q16.] Now I am going to ask you about
seven different types of assistance to learn what resources were available to community members. f. How many of your repairs were covered by the insurance payout(s)?
Very little Some Almost all/All
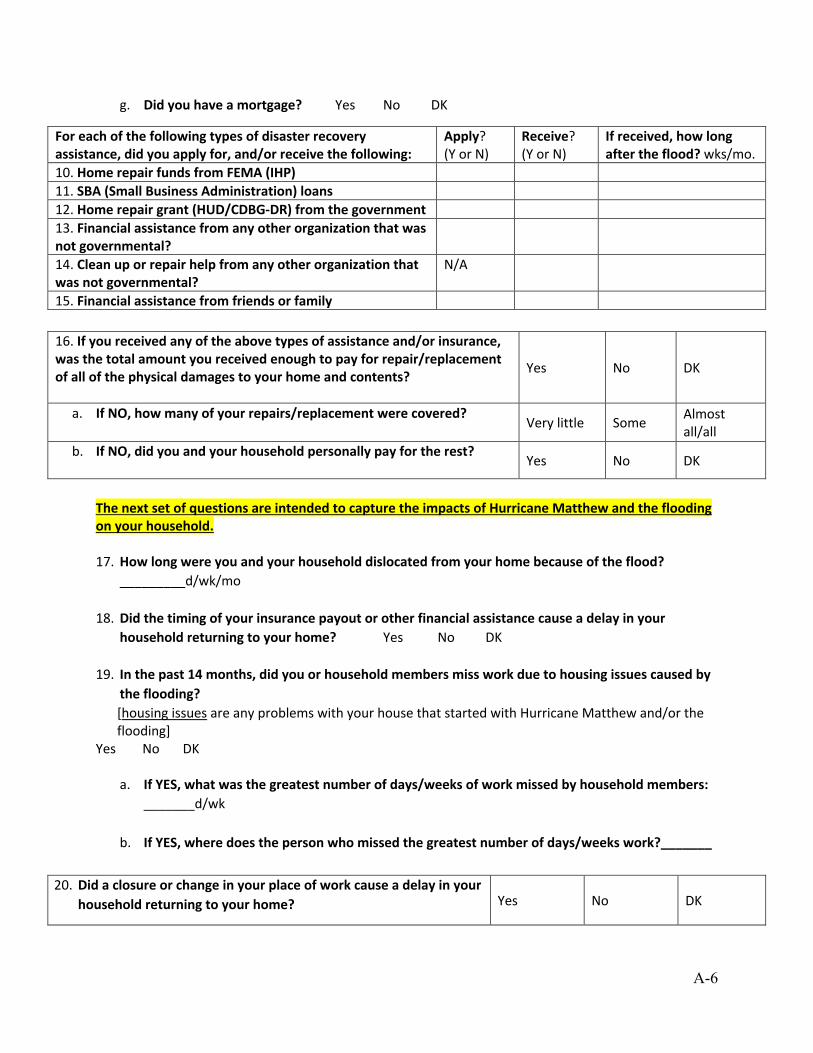
A-6
g. Did you have a mortgage? Yes No DK
For each of the following types of disaster recovery
assistance, did you apply for, and/or receive the following:
Apply? (Y or N)
Receive? (Y or N)
If received, how long
after the flood? wks/mo. 10. Home repair funds from FEMA (IHP) 11. SBA (Small Business Administration) loans 12. Home repair grant (HUD/CDBG-DR) from the government 13. Financial assistance from any other organization that was
not governmental?
14. Clean up or repair help from any other organization that
was not governmental?
N/A
15. Financial assistance from friends or family
16. If you received any of the above types of assistance and/or insurance,
was the total amount you received enough to pay for repair/replacement
of all of the physical damages to your home and contents? Yes No DK
a. If NO, how many of your repairs/replacement were covered? Very little Some
Almost all/all
b. If NO, did you and your household personally pay for the rest? Yes No DK
The next set of questions are intended to capture the impacts of Hurricane Matthew and the flooding
on your household.
17. How long were you and your household dislocated from your home because of the flood?
_________d/wk/mo
18. Did the timing of your insurance payout or other financial assistance cause a delay in your
household returning to your home? Yes No DK
19. In the past 14 months, did you or household members miss work due to housing issues caused by
the flooding? [housing issues are any problems with your house that started with Hurricane Matthew and/or the flooding]
Yes No DK
a. If YES, what was the greatest number of days/weeks of work missed by household members:
_______d/wk
b. If YES, where does the person who missed the greatest number of days/weeks work?_______
20. Did a closure or change in your place of work cause a delay in your
household returning to your home? Yes No DK
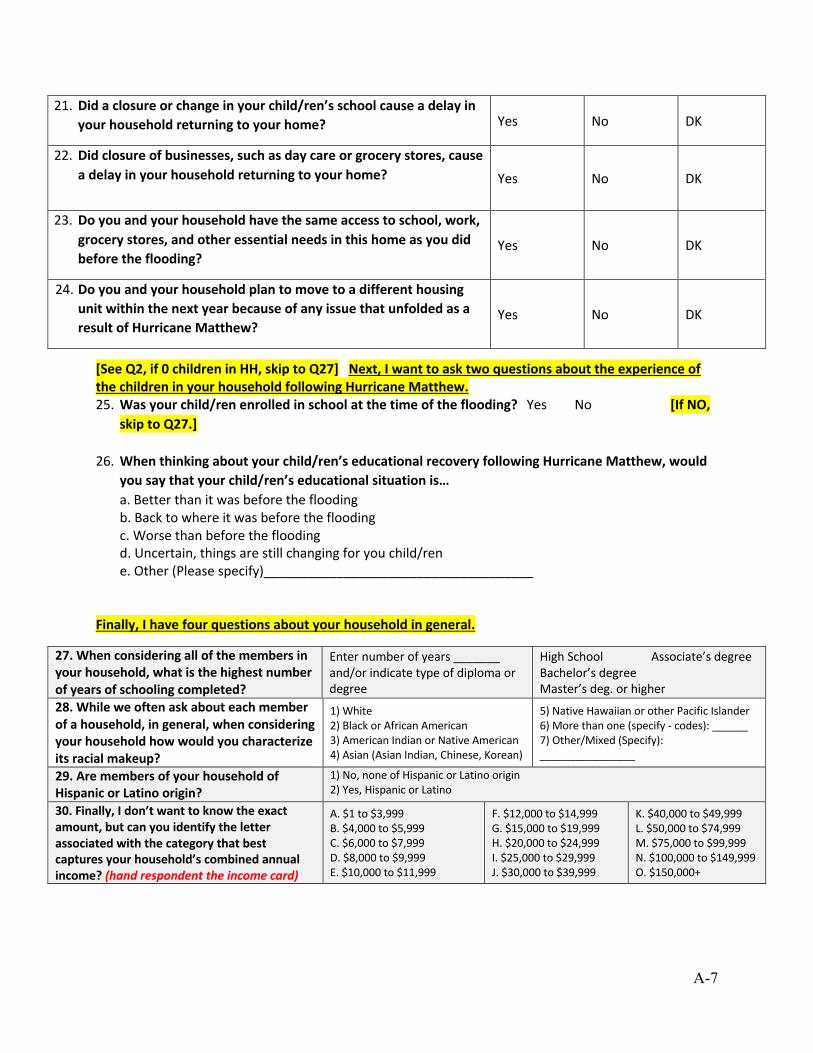
A-7
21. Did a closure or change in your child/ren’s school cause a delay in
your household returning to your home? Yes No DK
22. Did closure of businesses, such as day care or grocery stores, cause
a delay in your household returning to your home? Yes No DK
23. Do you and your household have the same access to school, work,
grocery stores, and other essential needs in this home as you did
before the flooding? Yes No DK
24. Do you and your household plan to move to a different housing
unit within the next year because of any issue that unfolded as a
result of Hurricane Matthew? Yes No DK
[See Q2, if 0 children in HH, skip to Q27] Next, I want to ask two questions about the experience of
the children in your household following Hurricane Matthew. 25. Was your child/ren enrolled in school at the time of the flooding? Yes No [If NO,
skip to Q27.]
26. When thinking about your child/ren’s educational recovery following Hurricane Matthew, would
you say that your child/ren’s educational situation is…
a. Better than it was before the flooding b. Back to where it was before the flooding c. Worse than before the flooding d. Uncertain, things are still changing for you child/ren e. Other (Please specify)_____________________________________
Finally, I have four questions about your household in general.
27. When considering all of the members in your household, what is the highest number of years of schooling completed?
Enter number of years _______ and/or indicate type of diploma or degree
High School Associate’s degree Bachelor’s degree Master’s deg. or higher
28. While we often ask about each member of a household, in general, when considering your household how would you characterize its racial makeup?
1) White 2) Black or African American 3) American Indian or Native American 4) Asian (Asian Indian, Chinese, Korean)
5) Native Hawaiian or other Pacific Islander 6) More than one (specify - codes): ______ 7) Other/Mixed (Specify): ________________
29. Are members of your household of Hispanic or Latino origin?
1) No, none of Hispanic or Latino origin 2) Yes, Hispanic or Latino
30. Finally, I don’t want to know the exact amount, but can you identify the letter associated with the category that best captures your household’s combined annual income? (hand respondent the income card)
A. $1 to $3,999 B. $4,000 to $5,999 C. $6,000 to $7,999 D. $8,000 to $9,999 E. $10,000 to $11,999
F. $12,000 to $14,999 G. $15,000 to $19,999 H. $20,000 to $24,999 I. $25,000 to $29,999 J. $30,000 to $39,999
K. $40,000 to $49,999 L. $50,000 to $74,999 M. $75,000 to $99,999 N. $100,000 to $149,999 O. $150,000+
A-8
Thank you for your time!
This collection of information contains Paperwork Reduction Act (PRA) requirements approved by the Office of Management and Budget (OMB). Notwithstanding any other provisions of the law, no person is required to respond to, nor shall any person be subject to a penalty for failure to comply with, a collection of information subject to the requirements of the PRA unless that collection of information displays a currently valid OMB control number. For this collection, the OMB Control number is:0693-0078 with an expiration date: July 31, 2019. Public reporting burden for this collection is estimated to be 15 minutes per survey, including the time for reviewing instructions, searching existing data sources, gathering and maintaining the data needed and completing and reviewing the collection of information. Send comments regarding this burden estimate or any aspect of this collection of information, including suggestions for reducing this burden, to the National Institute of Standards and Technology, Attn: Dr. Jennifer Helgeson, NIST, 100 Bureau Drive, MS 8603, Gaithersburg, MD 20899-1710, telephone 301-975-6133, or via email:[email protected].
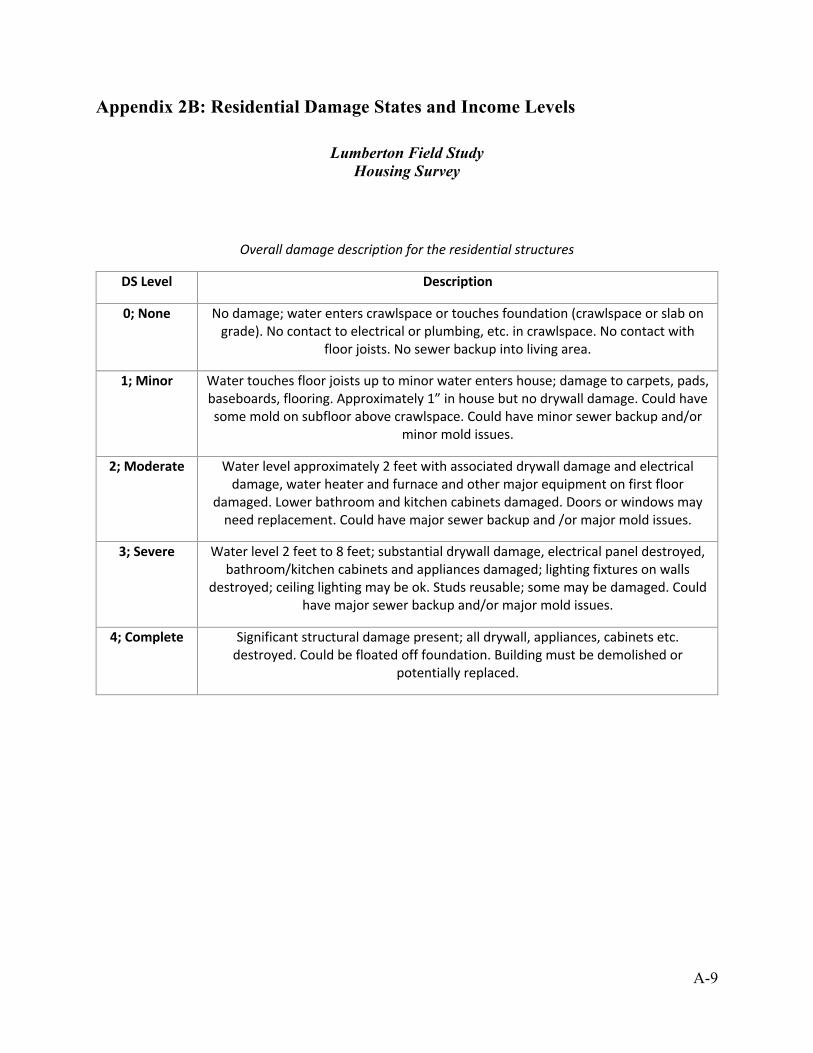
A-9
Appendix 2B: Residential Damage States and Income Levels
Lumberton Field Study Housing Survey
Overall damage description for the residential structures
DS Level Description
0; None No damage; water enters crawlspace or touches foundation (crawlspace or slab on grade). No contact to electrical or plumbing, etc. in crawlspace. No contact with
floor joists. No sewer backup into living area.
1; Minor Water touches floor joists up to minor water enters house; damage to carpets, pads, baseboards, flooring. Approximately 1” in house but no drywall damage. Could have some mold on subfloor above crawlspace. Could have minor sewer backup and/or
minor mold issues.
2; Moderate Water level approximately 2 feet with associated drywall damage and electrical damage, water heater and furnace and other major equipment on first floor
damaged. Lower bathroom and kitchen cabinets damaged. Doors or windows may need replacement. Could have major sewer backup and /or major mold issues.
3; Severe Water level 2 feet to 8 feet; substantial drywall damage, electrical panel destroyed, bathroom/kitchen cabinets and appliances damaged; lighting fixtures on walls
destroyed; ceiling lighting may be ok. Studs reusable; some may be damaged. Could have major sewer backup and/or major mold issues.
4; Complete Significant structural damage present; all drywall, appliances, cabinets etc. destroyed. Could be floated off foundation. Building must be demolished or
potentially replaced.
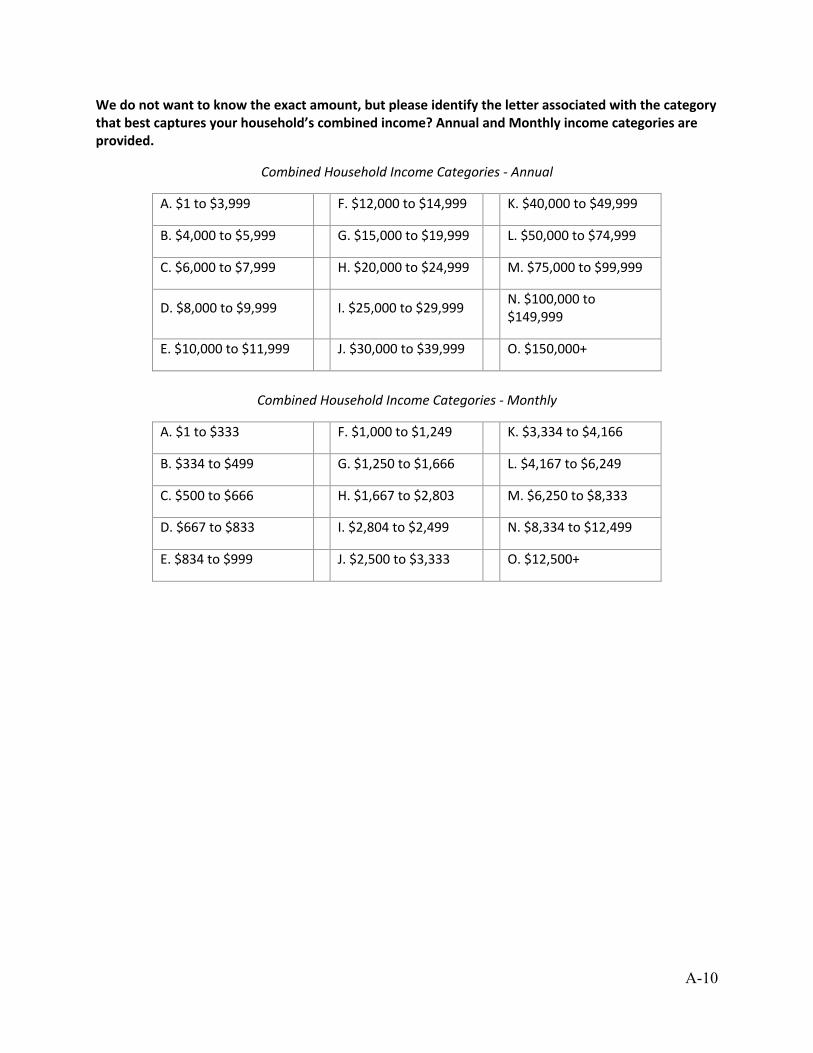
A-10
We do not want to know the exact amount, but please identify the letter associated with the category
that best captures your household’s combined income? Annual and Monthly income categories are
provided.
Combined Household Income Categories - Annual
A. $1 to $3,999 F. $12,000 to $14,999 K. $40,000 to $49,999
B. $4,000 to $5,999 G. $15,000 to $19,999 L. $50,000 to $74,999
C. $6,000 to $7,999 H. $20,000 to $24,999 M. $75,000 to $99,999
D. $8,000 to $9,999 I. $25,000 to $29,999 N. $100,000 to $149,999
E. $10,000 to $11,999 J. $30,000 to $39,999 O. $150,000+
Combined Household Income Categories - Monthly
A. $1 to $333 F. $1,000 to $1,249 K. $3,334 to $4,166
B. $334 to $499 G. $1,250 to $1,666 L. $4,167 to $6,249
C. $500 to $666 H. $1,667 to $2,803 M. $6,250 to $8,333
D. $667 to $833 I. $2,804 to $2,499 N. $8,334 to $12,499
E. $834 to $999 J. $2,500 to $3,333 O. $12,500+
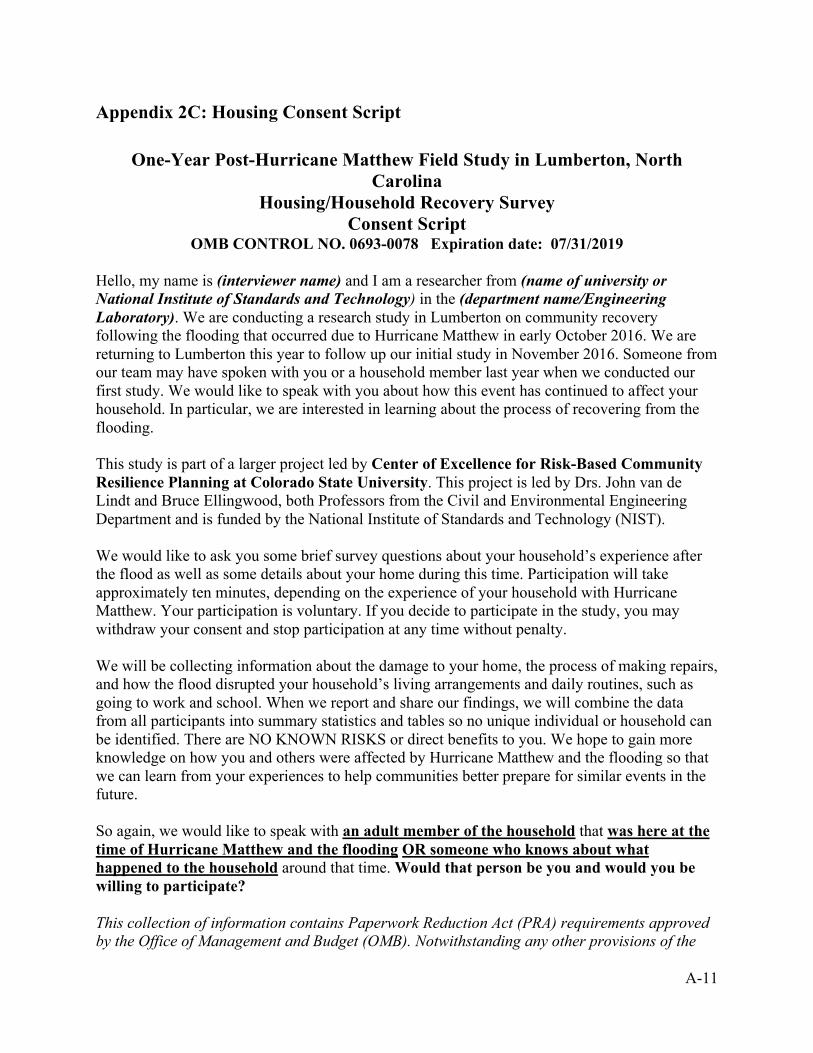
A-11
Appendix 2C: Housing Consent Script
One-Year Post-Hurricane Matthew Field Study in Lumberton, North Carolina
Housing/Household Recovery Survey Consent Script
OMB CONTROL NO. 0693-0078 Expiration date: 07/31/2019 Hello, my name is (interviewer name) and I am a researcher from (name of university or National Institute of Standards and Technology) in the (department name/Engineering Laboratory). We are conducting a research study in Lumberton on community recovery following the flooding that occurred due to Hurricane Matthew in early October 2016. We are returning to Lumberton this year to follow up our initial study in November 2016. Someone from our team may have spoken with you or a household member last year when we conducted our first study. We would like to speak with you about how this event has continued to affect your household. In particular, we are interested in learning about the process of recovering from the flooding. This study is part of a larger project led by Center of Excellence for Risk-Based Community Resilience Planning at Colorado State University. This project is led by Drs. John van de Lindt and Bruce Ellingwood, both Professors from the Civil and Environmental Engineering Department and is funded by the National Institute of Standards and Technology (NIST). We would like to ask you some brief survey questions about your household’s experience after the flood as well as some details about your home during this time. Participation will take approximately ten minutes, depending on the experience of your household with Hurricane Matthew. Your participation is voluntary. If you decide to participate in the study, you may withdraw your consent and stop participation at any time without penalty. We will be collecting information about the damage to your home, the process of making repairs, and how the flood disrupted your household’s living arrangements and daily routines, such as going to work and school. When we report and share our findings, we will combine the data from all participants into summary statistics and tables so no unique individual or household can be identified. There are NO KNOWN RISKS or direct benefits to you. We hope to gain more knowledge on how you and others were affected by Hurricane Matthew and the flooding so that we can learn from your experiences to help communities better prepare for similar events in the future. So again, we would like to speak with an adult member of the household that was here at the time of Hurricane Matthew and the flooding OR someone who knows about what happened to the household around that time. Would that person be you and would you be willing to participate? This collection of information contains Paperwork Reduction Act (PRA) requirements approved by the Office of Management and Budget (OMB). Notwithstanding any other provisions of the
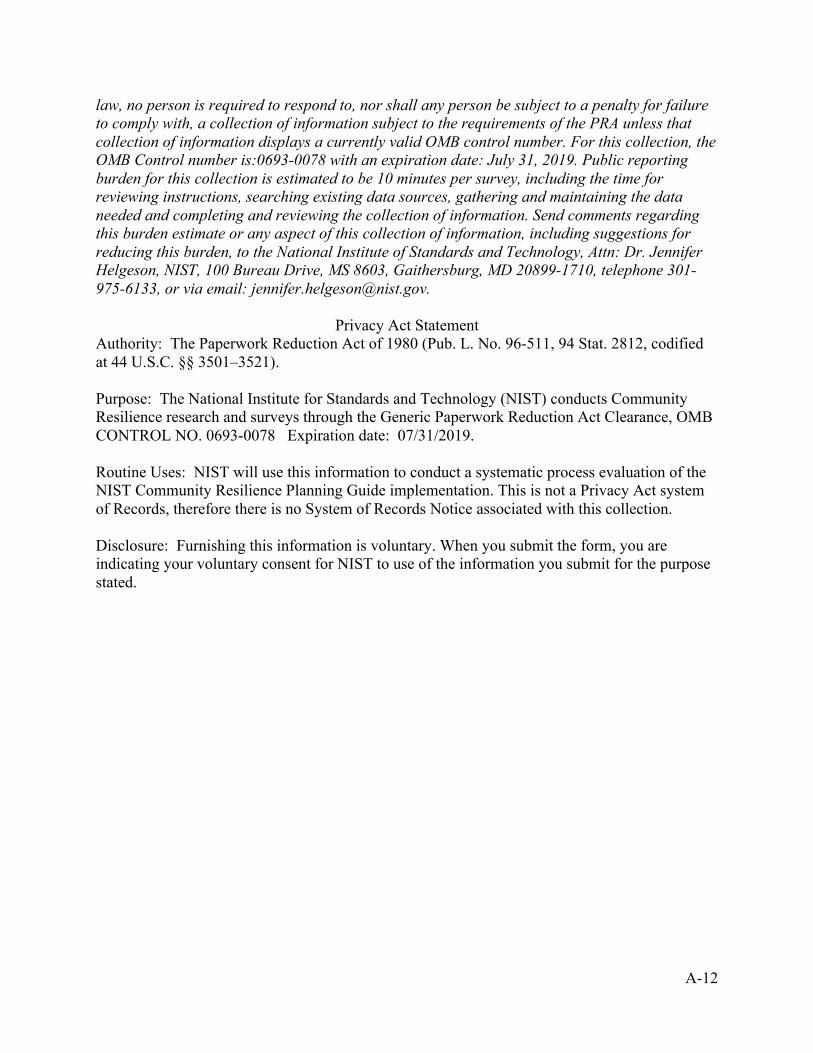
A-12
law, no person is required to respond to, nor shall any person be subject to a penalty for failure to comply with, a collection of information subject to the requirements of the PRA unless that collection of information displays a currently valid OMB control number. For this collection, the OMB Control number is:0693-0078 with an expiration date: July 31, 2019. Public reporting burden for this collection is estimated to be 10 minutes per survey, including the time for reviewing instructions, searching existing data sources, gathering and maintaining the data needed and completing and reviewing the collection of information. Send comments regarding this burden estimate or any aspect of this collection of information, including suggestions for reducing this burden, to the National Institute of Standards and Technology, Attn: Dr. Jennifer Helgeson, NIST, 100 Bureau Drive, MS 8603, Gaithersburg, MD 20899-1710, telephone 301-975-6133, or via email: [email protected].
Privacy Act Statement
Authority: The Paperwork Reduction Act of 1980 (Pub. L. No. 96-511, 94 Stat. 2812, codified at 44 U.S.C. §§ 3501–3521). Purpose: The National Institute for Standards and Technology (NIST) conducts Community Resilience research and surveys through the Generic Paperwork Reduction Act Clearance, OMB CONTROL NO. 0693-0078 Expiration date: 07/31/2019. Routine Uses: NIST will use this information to conduct a systematic process evaluation of the NIST Community Resilience Planning Guide implementation. This is not a Privacy Act system of Records, therefore there is no System of Records Notice associated with this collection. Disclosure: Furnishing this information is voluntary. When you submit the form, you are indicating your voluntary consent for NIST to use of the information you submit for the purpose stated.
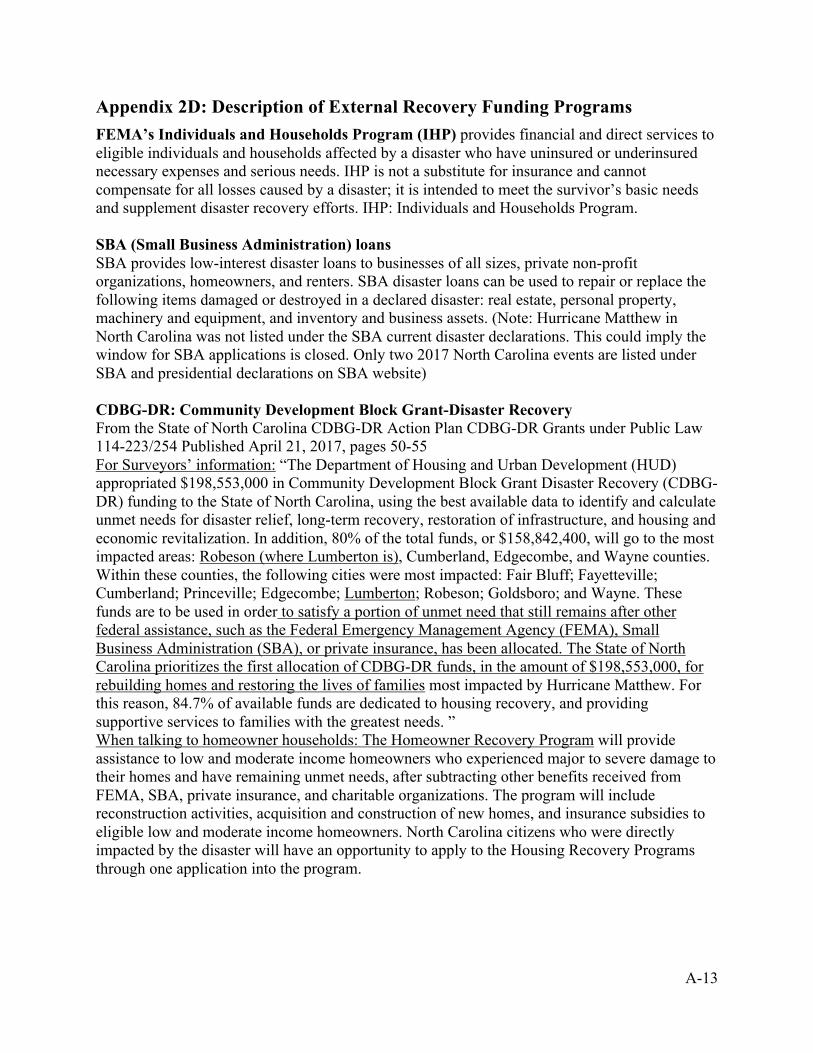
A-13
Appendix 2D: Description of External Recovery Funding Programs FEMA’s Individuals and Households Program (IHP) provides financial and direct services to eligible individuals and households affected by a disaster who have uninsured or underinsured necessary expenses and serious needs. IHP is not a substitute for insurance and cannot compensate for all losses caused by a disaster; it is intended to meet the survivor’s basic needs and supplement disaster recovery efforts. IHP: Individuals and Households Program. SBA (Small Business Administration) loans SBA provides low-interest disaster loans to businesses of all sizes, private non-profit organizations, homeowners, and renters. SBA disaster loans can be used to repair or replace the following items damaged or destroyed in a declared disaster: real estate, personal property, machinery and equipment, and inventory and business assets. (Note: Hurricane Matthew in North Carolina was not listed under the SBA current disaster declarations. This could imply the window for SBA applications is closed. Only two 2017 North Carolina events are listed under SBA and presidential declarations on SBA website) CDBG-DR: Community Development Block Grant-Disaster Recovery From the State of North Carolina CDBG-DR Action Plan CDBG-DR Grants under Public Law 114-223/254 Published April 21, 2017, pages 50-55 For Surveyors’ information: “The Department of Housing and Urban Development (HUD) appropriated $198,553,000 in Community Development Block Grant Disaster Recovery (CDBG-DR) funding to the State of North Carolina, using the best available data to identify and calculate unmet needs for disaster relief, long-term recovery, restoration of infrastructure, and housing and economic revitalization. In addition, 80% of the total funds, or $158,842,400, will go to the most impacted areas: Robeson (where Lumberton is), Cumberland, Edgecombe, and Wayne counties. Within these counties, the following cities were most impacted: Fair Bluff; Fayetteville; Cumberland; Princeville; Edgecombe; Lumberton; Robeson; Goldsboro; and Wayne. These funds are to be used in order to satisfy a portion of unmet need that still remains after other federal assistance, such as the Federal Emergency Management Agency (FEMA), Small Business Administration (SBA), or private insurance, has been allocated. The State of North Carolina prioritizes the first allocation of CDBG-DR funds, in the amount of $198,553,000, for rebuilding homes and restoring the lives of families most impacted by Hurricane Matthew. For this reason, 84.7% of available funds are dedicated to housing recovery, and providing supportive services to families with the greatest needs. ” When talking to homeowner households: The Homeowner Recovery Program will provide assistance to low and moderate income homeowners who experienced major to severe damage to their homes and have remaining unmet needs, after subtracting other benefits received from FEMA, SBA, private insurance, and charitable organizations. The program will include reconstruction activities, acquisition and construction of new homes, and insurance subsidies to eligible low and moderate income homeowners. North Carolina citizens who were directly impacted by the disaster will have an opportunity to apply to the Housing Recovery Programs through one application into the program.
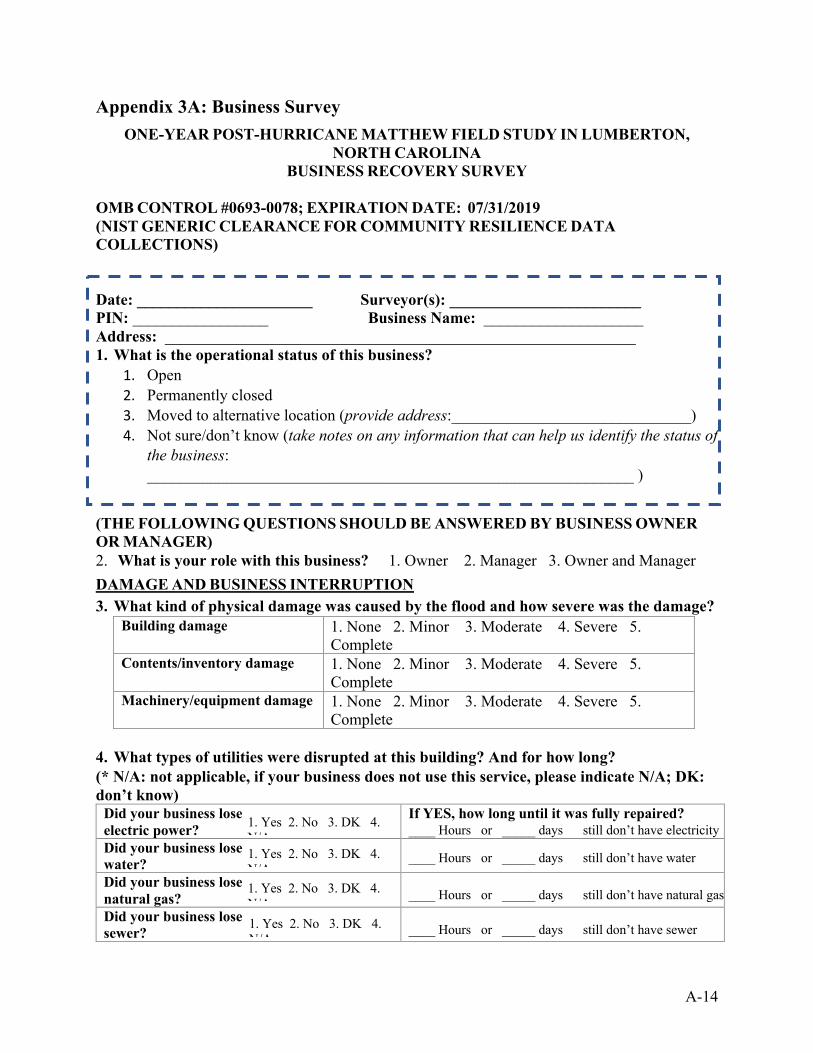
A-14
Appendix 3A: Business Survey ONE-YEAR POST-HURRICANE MATTHEW FIELD STUDY IN LUMBERTON,
NORTH CAROLINA BUSINESS RECOVERY SURVEY
OMB CONTROL #0693-0078; EXPIRATION DATE: 07/31/2019 (NIST GENERIC CLEARANCE FOR COMMUNITY RESILIENCE DATA COLLECTIONS) Date: ______________________ Surveyor(s): ________________________ PIN: _________________ Business Name: ____________________ Address: ___________________________________________________________ 1. What is the operational status of this business?
1. Open 2. Permanently closed 3. Moved to alternative location (provide address:______________________________) 4. Not sure/don’t know (take notes on any information that can help us identify the status of
the business: _____________________________________________________________ )
(THE FOLLOWING QUESTIONS SHOULD BE ANSWERED BY BUSINESS OWNER OR MANAGER) 2. What is your role with this business? 1. Owner 2. Manager 3. Owner and Manager
DAMAGE AND BUSINESS INTERRUPTION
3. What kind of physical damage was caused by the flood and how severe was the damage? Building damage 1. None 2. Minor 3. Moderate 4. Severe 5.
Complete Contents/inventory damage 1. None 2. Minor 3. Moderate 4. Severe 5.
Complete Machinery/equipment damage 1. None 2. Minor 3. Moderate 4. Severe 5.
Complete
4. What types of utilities were disrupted at this building? And for how long? (* N/A: not applicable, if your business does not use this service, please indicate N/A; DK: don’t know)
Did your business lose electric power?
If YES, how long until it was fully repaired?
Did your business lose water?
Did your business lose natural gas?
Did your business lose sewer?
1. Yes 2. No 3. DK 4. N/A ____ Hours or _____ days still don’t have electricity
____ Hours or _____ days still don’t have water
____ Hours or _____ days still don’t have natural gas
____ Hours or _____ days still don’t have sewer
1. Yes 2. No 3. DK 4. N/A 1. Yes 2. No 3. DK 4. N/A 1. Yes 2. No 3. DK 4. N/A
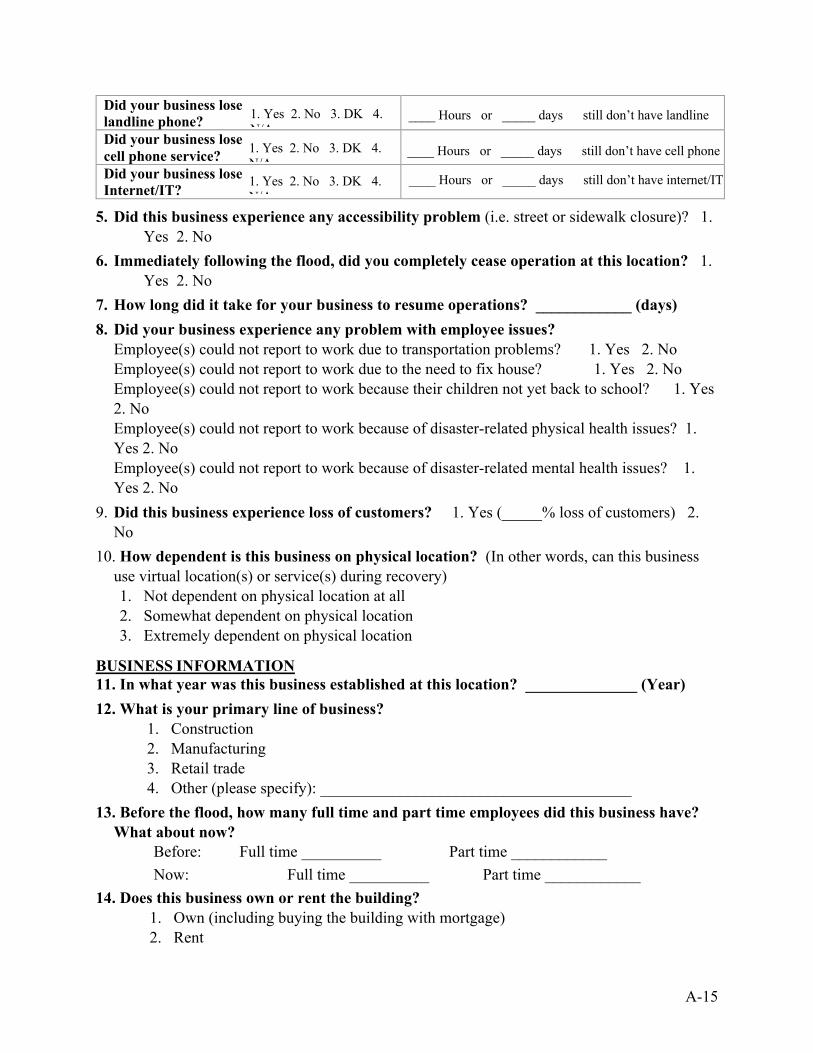
A-15
Did your business lose landline phone?
Did your business lose cell phone service?
Did your business lose Internet/IT?
5. Did this business experience any accessibility problem (i.e. street or sidewalk closure)? 1. Yes 2. No
6. Immediately following the flood, did you completely cease operation at this location? 1. Yes 2. No
7. How long did it take for your business to resume operations? ____________ (days)
8. Did your business experience any problem with employee issues? Employee(s) could not report to work due to transportation problems? 1. Yes 2. No Employee(s) could not report to work due to the need to fix house? 1. Yes 2. No Employee(s) could not report to work because their children not yet back to school? 1. Yes 2. No Employee(s) could not report to work because of disaster-related physical health issues? 1. Yes 2. No Employee(s) could not report to work because of disaster-related mental health issues? 1. Yes 2. No
9. Did this business experience loss of customers? 1. Yes (_____% loss of customers) 2. No
10. How dependent is this business on physical location? (In other words, can this business use virtual location(s) or service(s) during recovery) 1. Not dependent on physical location at all 2. Somewhat dependent on physical location 3. Extremely dependent on physical location
BUSINESS INFORMATION 11. In what year was this business established at this location? ______________ (Year)
12. What is your primary line of business? 1. Construction 2. Manufacturing 3. Retail trade 4. Other (please specify): _______________________________________
13. Before the flood, how many full time and part time employees did this business have? What about now? Before: Full time __________ Part time ____________
Now: Full time __________ Part time ____________
14. Does this business own or rent the building? 1. Own (including buying the building with mortgage) 2. Rent
____ Hours or _____ days still don’t have landline
1. Yes 2. No 3. DK 4. N/A
____ Hours or _____ days still don’t have cell phone
1. Yes 2. No 3. DK 4. N/A 1. Yes 2. No 3. DK 4. N/A
____ Hours or _____ days still don’t have internet/IT
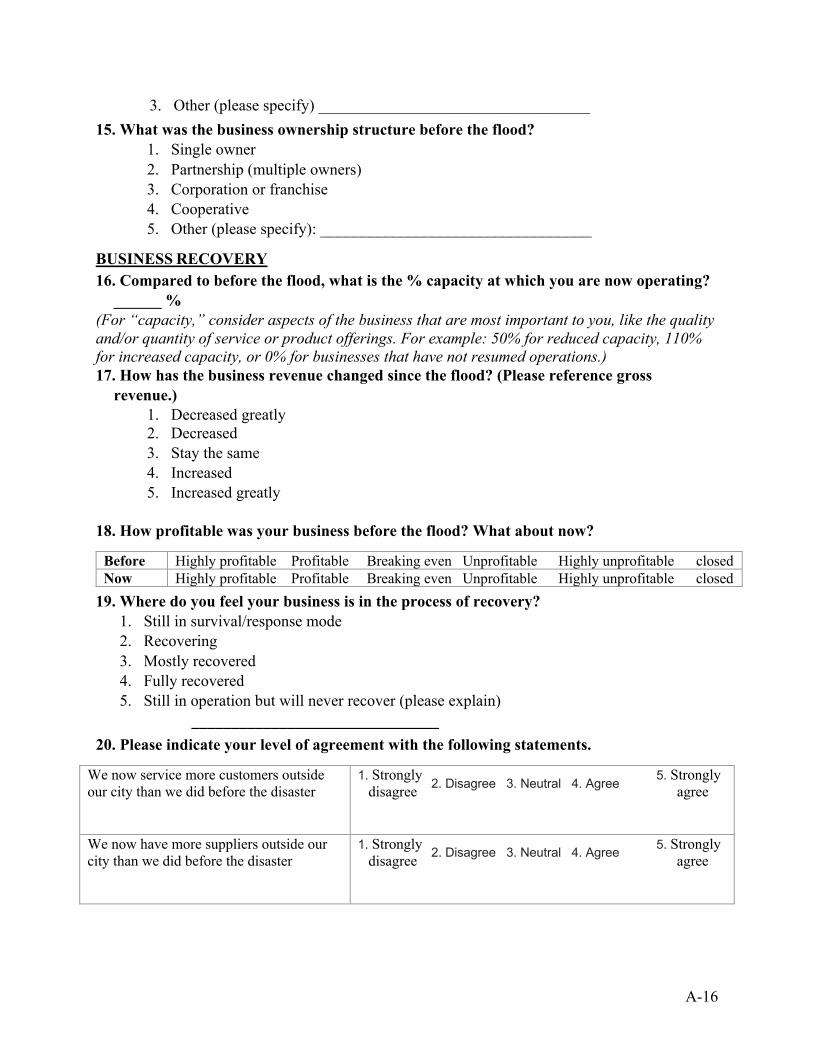
A-16
3. Other (please specify) __________________________________
15. What was the business ownership structure before the flood? 1. Single owner 2. Partnership (multiple owners) 3. Corporation or franchise 4. Cooperative 5. Other (please specify): __________________________________
BUSINESS RECOVERY
16. Compared to before the flood, what is the % capacity at which you are now operating? ______ %
(For “capacity,” consider aspects of the business that are most important to you, like the quality and/or quantity of service or product offerings. For example: 50% for reduced capacity, 110% for increased capacity, or 0% for businesses that have not resumed operations.) 17. How has the business revenue changed since the flood? (Please reference gross
revenue.) 1. Decreased greatly 2. Decreased 3. Stay the same 4. Increased 5. Increased greatly
18. How profitable was your business before the flood? What about now?
Before Highly profitable Profitable Breaking even Unprofitable Highly unprofitable closed Now Highly profitable Profitable Breaking even Unprofitable Highly unprofitable closed
19. Where do you feel your business is in the process of recovery? 1. Still in survival/response mode 2. Recovering 3. Mostly recovered 4. Fully recovered 5. Still in operation but will never recover (please explain)
_______________________________
20. Please indicate your level of agreement with the following statements.
We now service more customers outside our city than we did before the disaster
1. Strongly 5. Strongly disagree agree
We now have more suppliers outside our city than we did before the disaster
1. Strongly 5. Strongly disagree agree
2. Disagree 3. Neutral 4. Agree
2. Disagree 3. Neutral 4. Agree
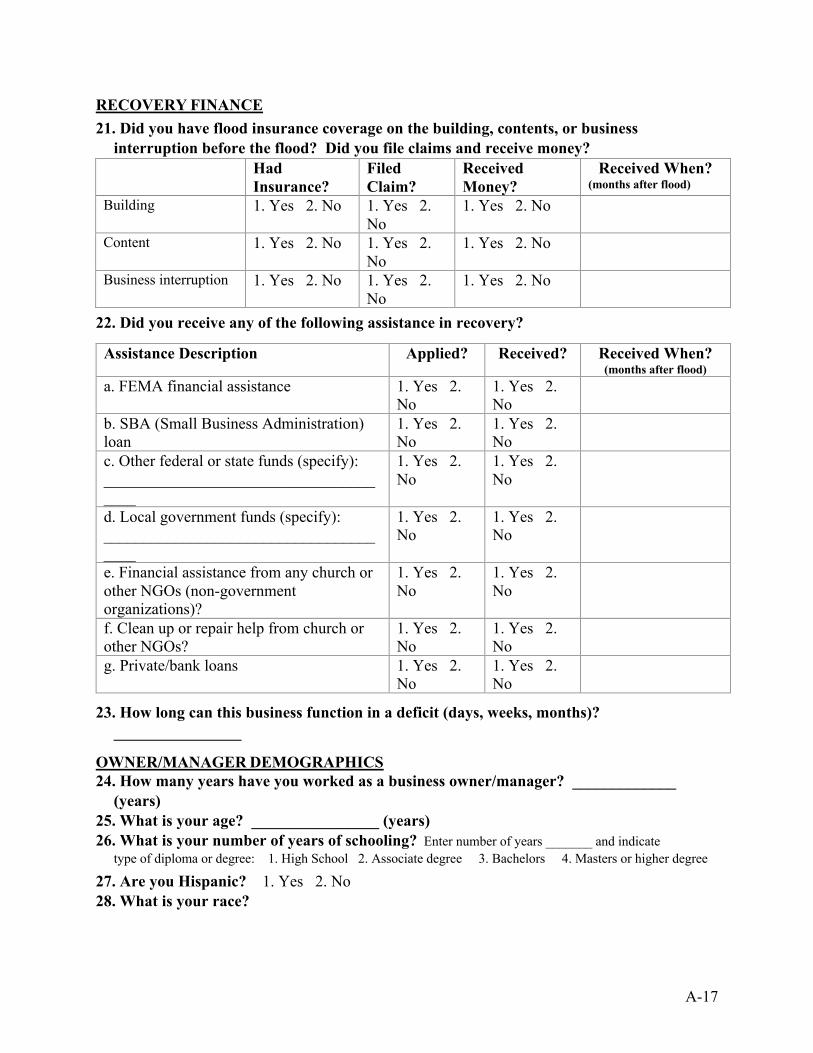
A-17
RECOVERY FINANCE
21. Did you have flood insurance coverage on the building, contents, or business interruption before the flood? Did you file claims and receive money?
Had Insurance?
Filed Claim?
Received Money?
Received When? (months after flood)
Building 1. Yes 2. No 1. Yes 2. No
1. Yes 2. No
Content 1. Yes 2. No 1. Yes 2. No
1. Yes 2. No
Business interruption 1. Yes 2. No 1. Yes 2. No
1. Yes 2. No
22. Did you receive any of the following assistance in recovery?
Assistance Description Applied? Received? Received When? (months after flood)
a. FEMA financial assistance 1. Yes 2. No
1. Yes 2. No
b. SBA (Small Business Administration) loan
1. Yes 2. No
1. Yes 2. No
c. Other federal or state funds (specify): ______________________________________
1. Yes 2. No
1. Yes 2. No
d. Local government funds (specify): ______________________________________
1. Yes 2. No
1. Yes 2. No
e. Financial assistance from any church or other NGOs (non-government organizations)?
1. Yes 2. No
1. Yes 2. No
f. Clean up or repair help from church or other NGOs?
1. Yes 2. No
1. Yes 2. No
g. Private/bank loans 1. Yes 2. No
1. Yes 2. No
23. How long can this business function in a deficit (days, weeks, months)? ________________
OWNER/MANAGER DEMOGRAPHICS 24. How many years have you worked as a business owner/manager? _____________
(years) 25. What is your age? ________________ (years) 26. What is your number of years of schooling? Enter number of years _______ and indicate
type of diploma or degree: 1. High School 2. Associate degree 3. Bachelors 4. Masters or higher degree
27. Are you Hispanic? 1. Yes 2. No 28. What is your race?
A-18
1) White 2) Black or African American 3) American Indian or Native American 4) Asian (Asian Indian, Chinese, Korean, etc.)
5) Native Hawaiian or other Pacific Islander 6) More than one race: ______________ 7) Other (Specify): ________________
If you have any comments about the survey and/or business recovery after the flood, please write them down in the space below.
THANK YOU VERY MUCH FOR COMPLETING THE SURVEY! This collection of information contains Paperwork Reduction Act (PRA) requirements approved by the Office of Management and Budget (OMB). Notwithstanding any other provisions of the law, no person is required to respond to, nor shall any person be subject to a penalty for failure to comply with, a collection of information subject to the requirements of the PRA unless that collection of information displays a currently valid OMB control number. For this collection, the OMB Control number is:0693-0078 with an expiration date: July 31, 2019. Public reporting burden for this collection is estimated to be 15 minutes per survey, including the time for reviewing instructions, searching existing data sources, gathering and maintaining the data needed and completing and reviewing the collection of information. Send comments regarding this burden estimate or any aspect of this collection of information, including suggestions for reducing this burden, to the National Institute of Standards and Technology, Attn: Dr. Jennifer Helgeson, NIST, 100 Bureau Drive, MS 8603, Gaithersburg, MD 20899-1710, telephone 301-975-6133, or via email: [email protected].
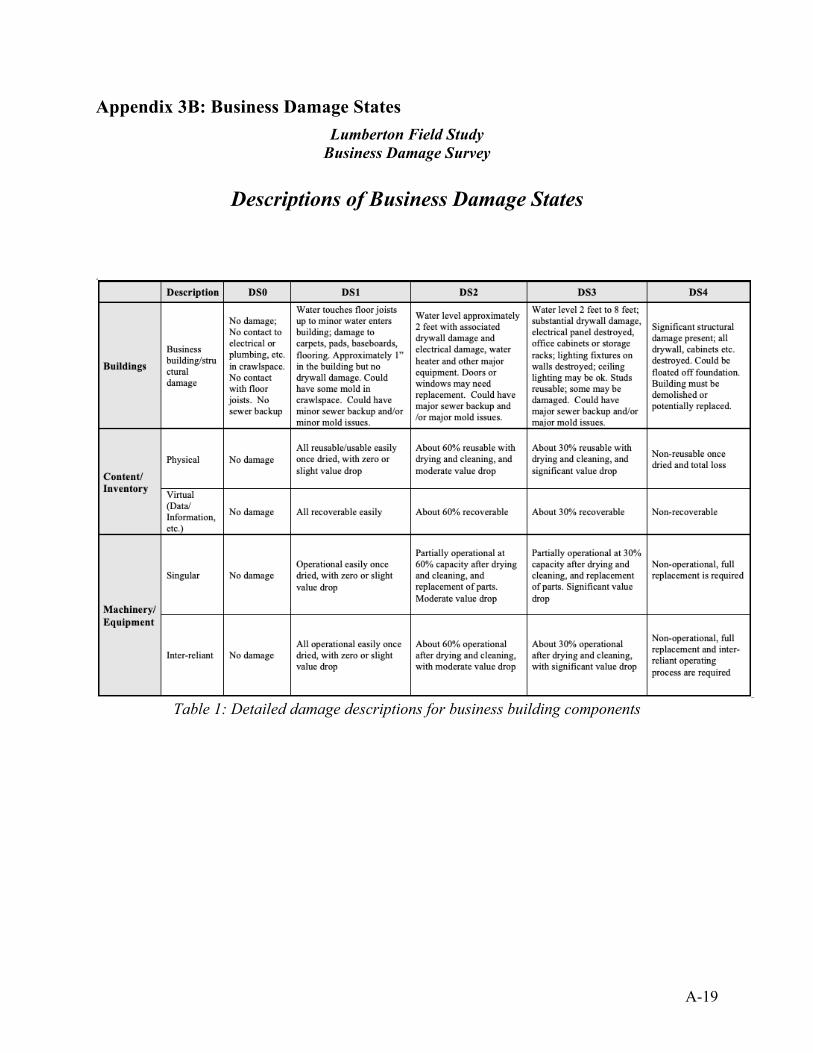
A-19
Appendix 3B: Business Damage States Lumberton Field Study
Business Damage Survey
Descriptions of Business Damage States
Table 1: Detailed damage descriptions for business building components
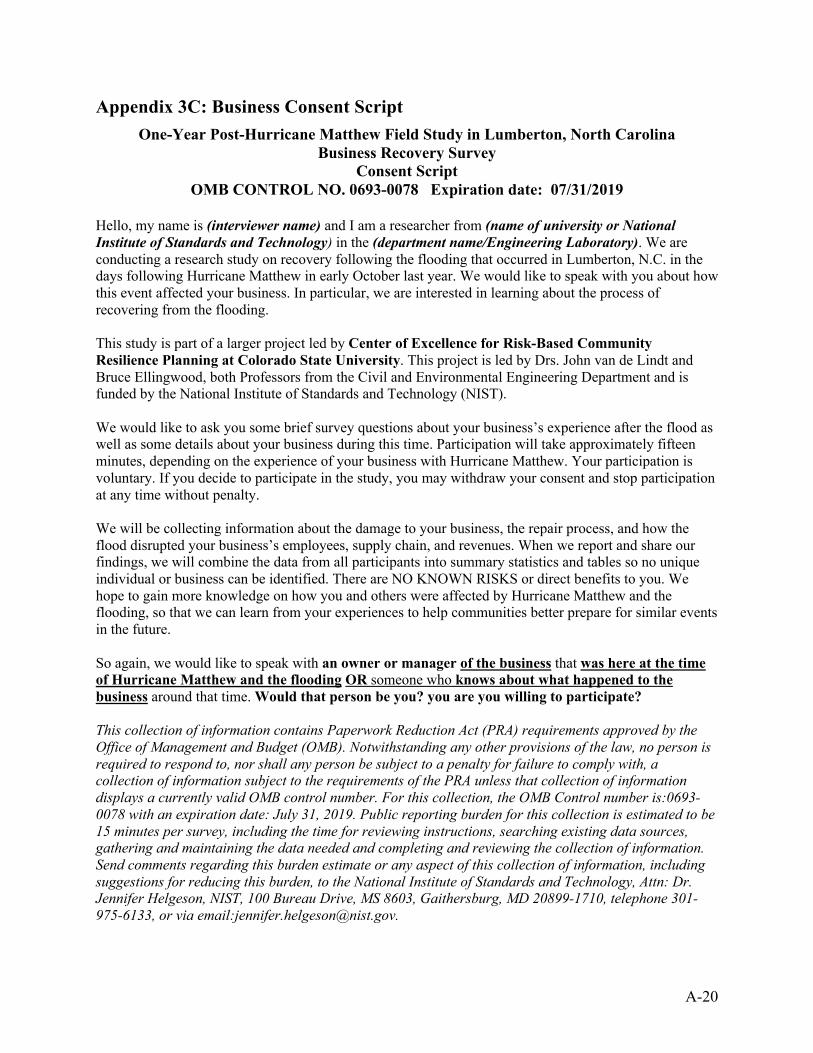
A-20
Appendix 3C: Business Consent Script One-Year Post-Hurricane Matthew Field Study in Lumberton, North Carolina
Business Recovery Survey Consent Script
OMB CONTROL NO. 0693-0078 Expiration date: 07/31/2019 Hello, my name is (interviewer name) and I am a researcher from (name of university or National Institute of Standards and Technology) in the (department name/Engineering Laboratory). We are conducting a research study on recovery following the flooding that occurred in Lumberton, N.C. in the days following Hurricane Matthew in early October last year. We would like to speak with you about how this event affected your business. In particular, we are interested in learning about the process of recovering from the flooding. This study is part of a larger project led by Center of Excellence for Risk-Based Community Resilience Planning at Colorado State University. This project is led by Drs. John van de Lindt and Bruce Ellingwood, both Professors from the Civil and Environmental Engineering Department and is funded by the National Institute of Standards and Technology (NIST). We would like to ask you some brief survey questions about your business’s experience after the flood as well as some details about your business during this time. Participation will take approximately fifteen minutes, depending on the experience of your business with Hurricane Matthew. Your participation is voluntary. If you decide to participate in the study, you may withdraw your consent and stop participation at any time without penalty. We will be collecting information about the damage to your business, the repair process, and how the flood disrupted your business’s employees, supply chain, and revenues. When we report and share our findings, we will combine the data from all participants into summary statistics and tables so no unique individual or business can be identified. There are NO KNOWN RISKS or direct benefits to you. We hope to gain more knowledge on how you and others were affected by Hurricane Matthew and the flooding, so that we can learn from your experiences to help communities better prepare for similar events in the future. So again, we would like to speak with an owner or manager of the business that was here at the time of Hurricane Matthew and the flooding OR someone who knows about what happened to the business around that time. Would that person be you? you are you willing to participate? This collection of information contains Paperwork Reduction Act (PRA) requirements approved by the Office of Management and Budget (OMB). Notwithstanding any other provisions of the law, no person is required to respond to, nor shall any person be subject to a penalty for failure to comply with, a collection of information subject to the requirements of the PRA unless that collection of information displays a currently valid OMB control number. For this collection, the OMB Control number is:0693-0078 with an expiration date: July 31, 2019. Public reporting burden for this collection is estimated to be 15 minutes per survey, including the time for reviewing instructions, searching existing data sources, gathering and maintaining the data needed and completing and reviewing the collection of information. Send comments regarding this burden estimate or any aspect of this collection of information, including suggestions for reducing this burden, to the National Institute of Standards and Technology, Attn: Dr. Jennifer Helgeson, NIST, 100 Bureau Drive, MS 8603, Gaithersburg, MD 20899-1710, telephone 301-975-6133, or via email:[email protected].

A-21
Appendix 4A: Public Sector Consent Form
Signed consent form used with School Representatives (verbal consent was used with all other public sector representatives)
Consent to Participate in a Research Study Colorado State University
______________________________________________________________________________ Title of study:
Center of Excellence for Risk-Based Community Resilience Planning
Principal Investigators:
This project is led by Dr. John van de Lindt and Dr. Bruce Ellingwood, both Professors from the Civil and Environmental Engineering Department at Colorado State University. Dr. van de Lindt can be reached at 970-491-6697 or via email at [email protected] and Dr. Ellingwood can be reached at 970-491-5354 or via email at [email protected].
Who is doing the study?
This five-year project is funded by the National Institute of Standards and Technology (NIST). Our research team is made up of professors, postdoctoral fellows, and graduate students across 14 universities. Two or more of our field research team members will be interviewing you for this project.
What is the purpose of this research and why am I being invited to take part in this study?
You have been chosen to be part of this research study because of your experience with the 2016 flooding that occurred in Lumberton, N.C. following Hurricane Matthew. We would like to speak with you about the choices that you made before, during, and after the flood so we can learn more about how people responded to and are beginning to recover from the event. Up to 200 people from your community may be invited to be interviewed for this study; however, the team will begin interviews, initially, with a smaller group of community leaders and key informants.
What will I be asked to do and how long will it take? You will be asked to answer questions about what happened before, during, and after the flood. We are interested in your experiences with preparedness, evacuation, damage, loss, and rebuilding. The interview will be held in a mutually agreeable, private location. With your permission, each interview will be audiotaped and will take about 30 minutes of your time. We would also like to speak to you in the future to learn more about your experiences as they unfold. Also with your permission, the research team may take photos or videotape of you or your home. What will it cost me to participate? There is no cost to you for being part of this study and you will not be paid for your time.

A-22
What are the possible risks, discomforts, and benefits? It is not possible to identify all potential risks during a research project, but our team has taken reasonable safeguards to minimize any known and potential risks. The potential risks associated with this study are difficult emotions such as anger and sadness. There is no known benefit in participating. We hope, however, this will provide a space for reflection and an opportunity to make a difference for others by sharing your knowledge and experiences. Do I have to take part in the study? Your participation in this project is completely voluntary. You may withdraw your consent and stop participating at any time. You have the right to refuse to answer any question(s) for any reason. You also have the right to refuse to be photographed or audio/video recorded. Who will see the information that I give? We will keep private all research records that identify you, to the extent allowed by law. Anything that you share during our interview will be kept confidential. In addition, your privacy will be maintained in all written and published documents resulting from this study. However, if any abuse or illegal activity is discussed, we will have to report that information to the authorities. Any reports created from this study will use fake names in place of real names of people and organizations. Other identifying features may be altered as well to protect your confidentiality. Audio files will be stored in a secure location. They will be marked with an interview number separate from your name. At the end of the study, all audio files will be erased and all other written materials will be permanently stored in a secure location. This data will be kept for future use. We may be asked to share the research files for audit purposes with the CSU Institutional Review Board and the NIST Human Subjects Protection Office. If you have questions about this study, you should ask the researcher before you sign this consent form. If you have questions regarding your rights as a participant, any concerns regarding this project, or any dissatisfaction with any aspect of this study, you may contact the Colorado State University Institutional Review Board at: [email protected]; or 970-491-1381. A signed copy of this three-page consent form and Photo/Video-release form will be provided to you at the time of the interview. Participant’s Initials ______ Date ______ I agree to be audio recorded for this study (please initial): Yes No If you are willing, we may want to conduct 1-2 more interviews with you over the next two years so that we can follow changes in recovery. We have asked for your address below so that we may contact you again. I am willing to be contacted again to participate in similar studies related to disaster recovery (please initial):
A-23
Yes No I have read this paper about the study or it was read to me. I know the possible risks and benefits. I know that being in this study is voluntary. I choose to be in this study. I know that I can withdraw at any time. I know that it is my choice to be audio taped. I know that any contact information I provide is optional and will only be used to follow up on the community recovery process following Hurricane Matthew. I have received, on the date signed, a copy of this document containing two pages. Signed: Date: Name: Phone: Address: Email: _______________________________________ _____________________ Signature of Research Staff Date Please direct follow-up questions to: Dr. van de Lindt, Department of Civil Engineering Room A201, Colorado State University, Fort Collins, CO 80523-1301, 970-491-6697
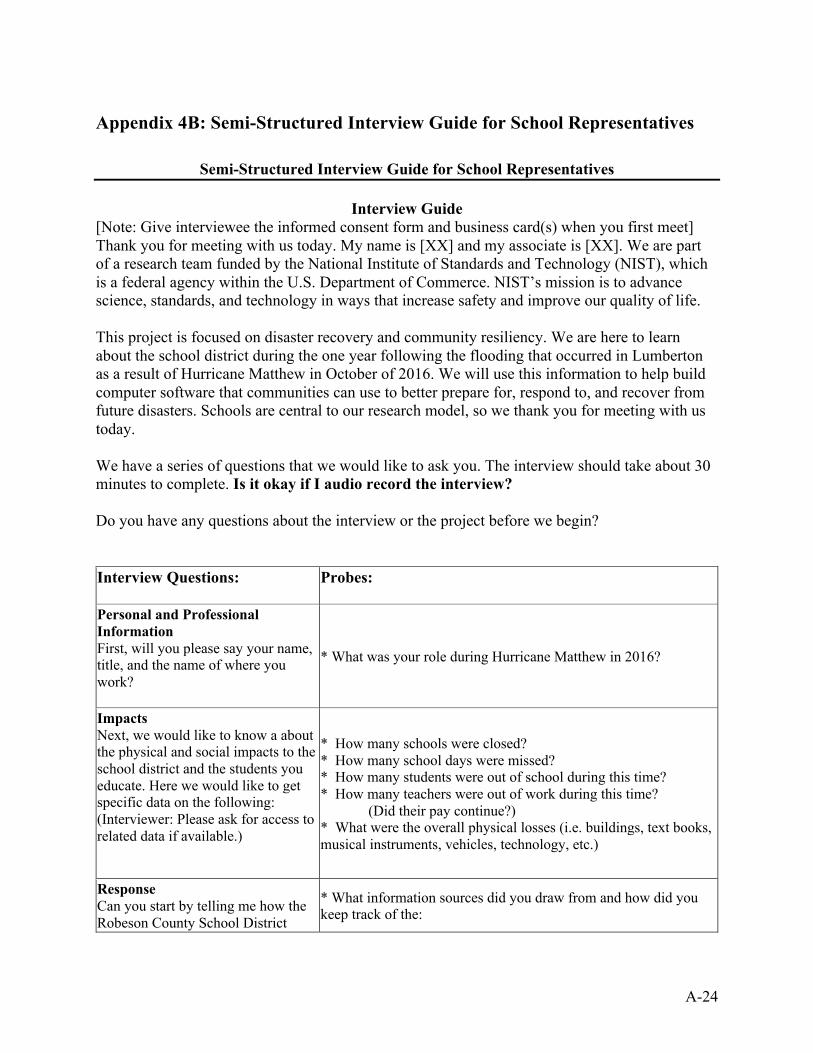
A-24
Appendix 4B: Semi-Structured Interview Guide for School Representatives
Semi-Structured Interview Guide for School Representatives
Interview Guide [Note: Give interviewee the informed consent form and business card(s) when you first meet] Thank you for meeting with us today. My name is [XX] and my associate is [XX]. We are part of a research team funded by the National Institute of Standards and Technology (NIST), which is a federal agency within the U.S. Department of Commerce. NIST’s mission is to advance science, standards, and technology in ways that increase safety and improve our quality of life. This project is focused on disaster recovery and community resiliency. We are here to learn about the school district during the one year following the flooding that occurred in Lumberton as a result of Hurricane Matthew in October of 2016. We will use this information to help build computer software that communities can use to better prepare for, respond to, and recover from future disasters. Schools are central to our research model, so we thank you for meeting with us today. We have a series of questions that we would like to ask you. The interview should take about 30 minutes to complete. Is it okay if I audio record the interview? Do you have any questions about the interview or the project before we begin? Interview Questions:
Probes:
Personal and Professional Information First, will you please say your name, title, and the name of where you work?
* What was your role during Hurricane Matthew in 2016?
Impacts Next, we would like to know a about the physical and social impacts to the school district and the students you educate. Here we would like to get specific data on the following: (Interviewer: Please ask for access to related data if available.)
* How many schools were closed? * How many school days were missed? * How many students were out of school during this time? * How many teachers were out of work during this time?
(Did their pay continue?) * What were the overall physical losses (i.e. buildings, text books, musical instruments, vehicles, technology, etc.)
Response Can you start by telling me how the Robeson County School District
* What information sources did you draw from and how did you keep track of the:

A-25
responded to the flooding that occurred in 2016? Here we are interested in learning about what kind of information and data was gathered to inform decision-making during the response period of the disaster. (Interviewer: Please ask for access to related data if available.)
• location of children
• possible shifts in family status for the child (e.g., parent out of household)
• road conditions for safe bus travel
• condition and safety of school buildings
• teacher location and availability
• condition of technology and IT infrastructure
• administrative documents and/or data
* Were there any specific guidelines or thresholds used to decide when schools would reopen? (e.g. % of staff back, a teacher or admin in every classroom, minimum teacher-student ratio, % students back, minimum hours of instruction, or maximum hours of transportation to school) * Did you track students by where they were living (home, hotels, shelters, with family, etc.)?
Recovery Can you please describe the recovery process for Lumberton schools over the past year?
* Were there any students who were permanently displaced? How many? * Are any students not back in permanent housing? How many? * Were any special accommodations made for students (or families) who were seriously impacted? * Are any schools still closed? If so, which ones and for how much longer? * What resources did the district use to repair and/or recover school buildings and lost supplies such as books, instruments, technology, district vehicles, etc.? * Would you say that there have been specific phases of recovery for schools over the past year? How would you characterize those? * What were the main causes of delay for key recovery activities? (e.g. assessing schools, locating staff, repairing and reopening schools, restoring bus routes, etc.)? * How would you describe what it would like for the district to be fully recovered? * What resources are still needed to achieve a full recovery? * How are resources being prioritized for school recovery? * What was the role of the school in terms of family and overall community recovery? * What have been the greatest challenges during the recovery process?
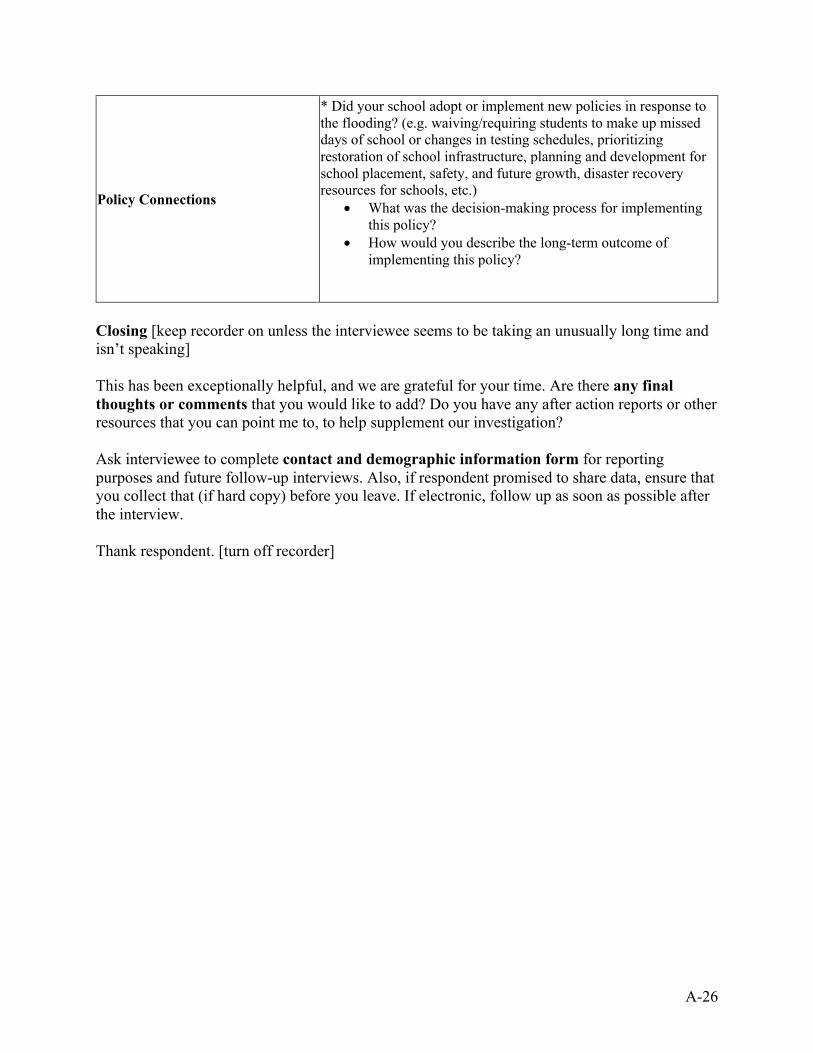
A-26
Policy Connections
* Did your school adopt or implement new policies in response to the flooding? (e.g. waiving/requiring students to make up missed days of school or changes in testing schedules, prioritizing restoration of school infrastructure, planning and development for school placement, safety, and future growth, disaster recovery resources for schools, etc.)
• What was the decision-making process for implementing this policy?
• How would you describe the long-term outcome of implementing this policy?
Closing [keep recorder on unless the interviewee seems to be taking an unusually long time and isn’t speaking] This has been exceptionally helpful, and we are grateful for your time. Are there any final thoughts or comments that you would like to add? Do you have any after action reports or other resources that you can point me to, to help supplement our investigation? Ask interviewee to complete contact and demographic information form for reporting purposes and future follow-up interviews. Also, if respondent promised to share data, ensure that you collect that (if hard copy) before you leave. If electronic, follow up as soon as possible after the interview. Thank respondent. [turn off recorder]
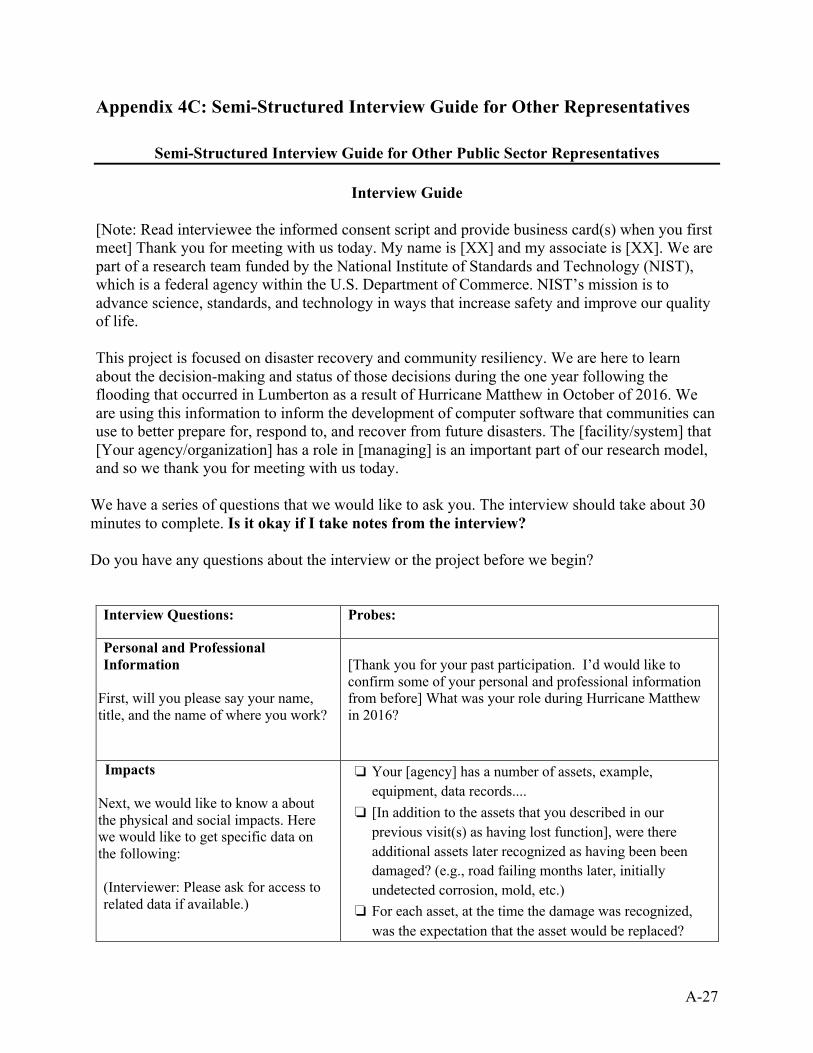
A-27
Appendix 4C: Semi-Structured Interview Guide for Other Representatives
Semi-Structured Interview Guide for Other Public Sector Representatives
Interview Guide [Note: Read interviewee the informed consent script and provide business card(s) when you first meet] Thank you for meeting with us today. My name is [XX] and my associate is [XX]. We are part of a research team funded by the National Institute of Standards and Technology (NIST), which is a federal agency within the U.S. Department of Commerce. NIST’s mission is to advance science, standards, and technology in ways that increase safety and improve our quality of life. This project is focused on disaster recovery and community resiliency. We are here to learn about the decision-making and status of those decisions during the one year following the flooding that occurred in Lumberton as a result of Hurricane Matthew in October of 2016. We are using this information to inform the development of computer software that communities can use to better prepare for, respond to, and recover from future disasters. The [facility/system] that [Your agency/organization] has a role in [managing] is an important part of our research model, and so we thank you for meeting with us today.
We have a series of questions that we would like to ask you. The interview should take about 30 minutes to complete. Is it okay if I take notes from the interview?
Do you have any questions about the interview or the project before we begin? Interview Questions: Probes:
Personal and Professional Information
First, will you please say your name, title, and the name of where you work?
[Thank you for your past participation. I’d would like to confirm some of your personal and professional information from before] What was your role during Hurricane Matthew in 2016?
Impacts
Next, we would like to know a about the physical and social impacts. Here we would like to get specific data on the following: (Interviewer: Please ask for access to related data if available.)
❏ Your [agency] has a number of assets, example, equipment, data records....
❏ [In addition to the assets that you described in our previous visit(s) as having lost function], were there additional assets later recognized as having been been damaged? (e.g., road failing months later, initially undetected corrosion, mold, etc.)
❏ For each asset, at the time the damage was recognized, was the expectation that the asset would be replaced?
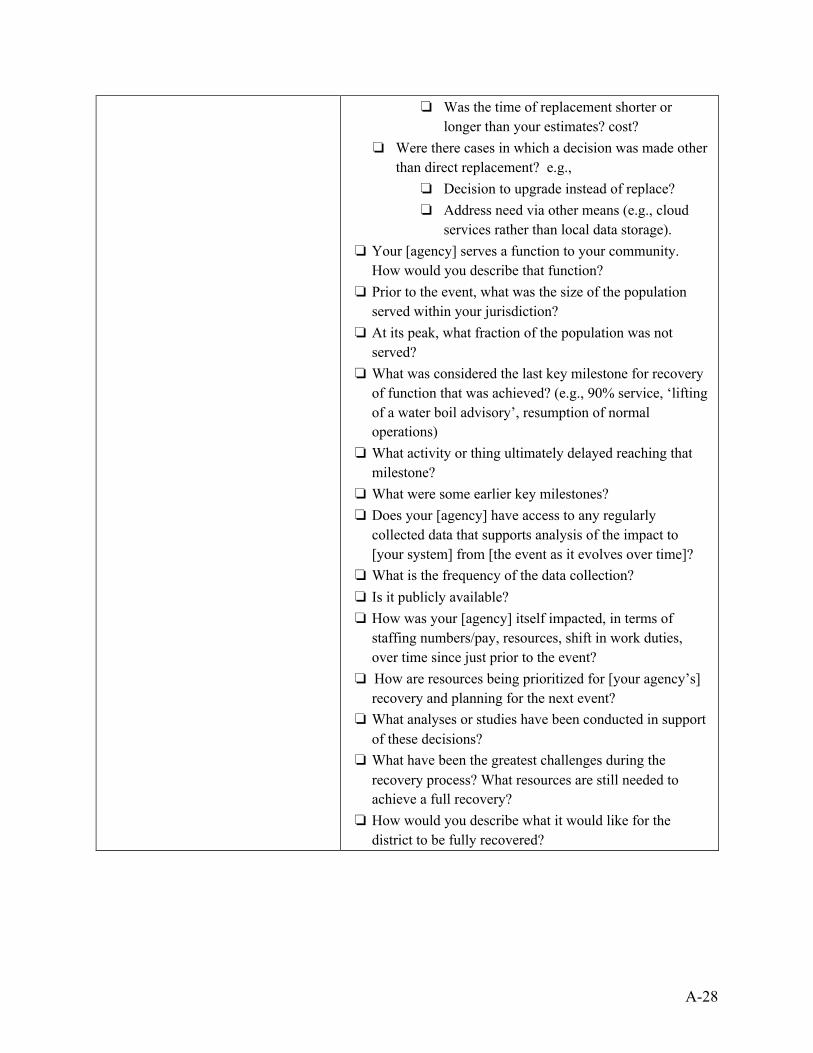
A-28
❏ Was the time of replacement shorter or longer than your estimates? cost?
❏ Were there cases in which a decision was made other than direct replacement? e.g.,
❏ Decision to upgrade instead of replace? ❏ Address need via other means (e.g., cloud
services rather than local data storage). ❏ Your [agency] serves a function to your community.
How would you describe that function? ❏ Prior to the event, what was the size of the population
served within your jurisdiction? ❏ At its peak, what fraction of the population was not
served? ❏ What was considered the last key milestone for recovery
of function that was achieved? (e.g., 90% service, ‘lifting of a water boil advisory’, resumption of normal operations)
❏ What activity or thing ultimately delayed reaching that milestone?
❏ What were some earlier key milestones? ❏ Does your [agency] have access to any regularly
collected data that supports analysis of the impact to [your system] from [the event as it evolves over time]?
❏ What is the frequency of the data collection? ❏ Is it publicly available? ❏ How was your [agency] itself impacted, in terms of
staffing numbers/pay, resources, shift in work duties, over time since just prior to the event?
❏ How are resources being prioritized for [your agency’s] recovery and planning for the next event?
❏ What analyses or studies have been conducted in support of these decisions?
❏ What have been the greatest challenges during the recovery process? What resources are still needed to achieve a full recovery?
❏ How would you describe what it would like for the district to be fully recovered?
A-29
Policy Connections □ Did your [agency] adopt or implement new policies in response to the flooding? (e.g. waiving/requiring students to make up missed days of school or changes in testing schedules, prioritizing restoration of school infrastructure, planning and development for school placement, safety, and future growth, disaster recovery resources for schools, etc.)
□ What was the decision-making process for implementing this policy?
Co-benefits □ Was the recovery planning taken as an opportunity for addressed other issues?
Closing: This has been exceptionally helpful, and we are grateful for your time. Are there any final thoughts or comments that you would like to add? Do you have any after action reports or other resources that you can point me to, to help supplement our investigation? If respondent promised to share data, ensure that you collect that (if hard copy) before you leave. If electronic, follow up as soon as possible after the interview. Thank respondent.
A-30
Appendix 5A: Technology in Field Studies
TECHNOLOGY IN FIELD STUDIES
Spatial information support by Google web mapping service Google mapping services, Google My Maps and Google Street View, were extensively employed to develop the housing unit and business samples and ultimately to develop a mapping tool that could be used by field teams to navigate and locate housing units and businesses to conduct interviews. More specifically Google My Maps provided a platform to create web-accessible, detailed sample maps of Lumberton, allowing each team member to use their personal internet-enabled smartphone to view the locations of their assigned housing units and businesses. The first field study team members responded positively to using the Google My Maps tool; thus, it was decided to adopt the tool for the second field study. In general, most team members were familiar with using Google Maps on their smartphone and found that the Google My Maps tool had a similar interface. Consequently, the tool only required minimal training yet increased the overall effectiveness of surveying process. Before the 2016 survey, the University of Alabama (UA) team created spatially data identifying the locations of all structures within the study area to develop the housing unit sample for the field mapping tool. The Texas A&M University (TAMU) team visually confirmed the location of structures that were identified by the UA team by using Google Street View and Google My Maps to estimate the “roof top” locations of housing units. Among the final analysis sample from Wave 1, 567 of those housing units were then selected for Wave 2. These spatial data provided the sample frame for selected primary housing units as described in section 2.2. To develop the business sample for the field mapping tool, the TAMU team imported businesses data from the InfoUSA database into ArcMap. The population of businesses that fell within the inundation area or its 100-meter buffer (n = 218) was taken for the sample. To reach the desired sample size of 350, the team also drew a random sample of businesses outside the inundation area but within the northern portion of the FEMA 100-year floodplain (n = 240). The sample was then checked for geocoding errors and exported into Google My Maps. For more detailed information about the sample frame, please refer to section 3.2. For both the household and business surveys, a Google Sheet (i.e., a Google Spreadsheet) was created. These spreadsheets included details about each housing unit and business such as location, address, latitude and longitude, and information about the data collection disposition. The spreadsheets were then imported into Google My Maps, which mapped each point based on its latitude and longitude. Once Google My Maps were generated, a link to these maps could can be shared providing access using a smartphone or laptop with internet access. If the device also has GPS, the location of the device can be displayed on the map. Figure A5-1 shows examples of the Google My Maps displays. While these are the displays on a PC, the displays on a smart phone were essentially the same. This feature provides field team members with internet and GPS access with additional situational awareness. The satellite image overlay also provides visual evidence for team members to determine the location of the sampled housing unit and business. Within the Google My Maps application, a user can select an individual data point to see a list of all of the variables from the imported spreadsheet.
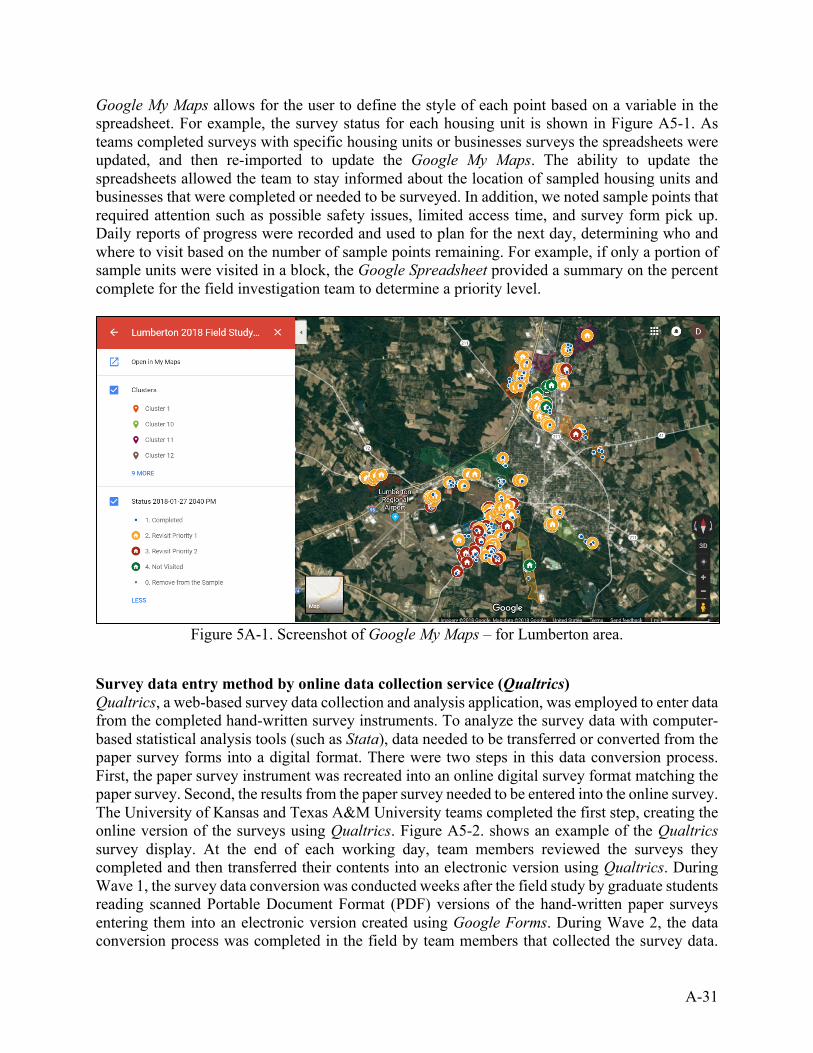
A-31
Google My Maps allows for the user to define the style of each point based on a variable in the spreadsheet. For example, the survey status for each housing unit is shown in Figure A5-1. As teams completed surveys with specific housing units or businesses surveys the spreadsheets were updated, and then re-imported to update the Google My Maps. The ability to update the spreadsheets allowed the team to stay informed about the location of sampled housing units and businesses that were completed or needed to be surveyed. In addition, we noted sample points that required attention such as possible safety issues, limited access time, and survey form pick up. Daily reports of progress were recorded and used to plan for the next day, determining who and where to visit based on the number of sample points remaining. For example, if only a portion of sample units were visited in a block, the Google Spreadsheet provided a summary on the percent complete for the field investigation team to determine a priority level.
Figure 5A-1. Screenshot of Google My Maps – for Lumberton area.
Survey data entry method by online data collection service (Qualtrics) Qualtrics, a web-based survey data collection and analysis application, was employed to enter data from the completed hand-written survey instruments. To analyze the survey data with computer-based statistical analysis tools (such as Stata), data needed to be transferred or converted from the paper survey forms into a digital format. There were two steps in this data conversion process. First, the paper survey instrument was recreated into an online digital survey format matching the paper survey. Second, the results from the paper survey needed to be entered into the online survey. The University of Kansas and Texas A&M University teams completed the first step, creating the online version of the surveys using Qualtrics. Figure A5-2. shows an example of the Qualtrics survey display. At the end of each working day, team members reviewed the surveys they completed and then transferred their contents into an electronic version using Qualtrics. During Wave 1, the survey data conversion was conducted weeks after the field study by graduate students reading scanned Portable Document Format (PDF) versions of the hand-written paper surveys entering them into an electronic version created using Google Forms. During Wave 2, the data conversion process was completed in the field by team members that collected the survey data.
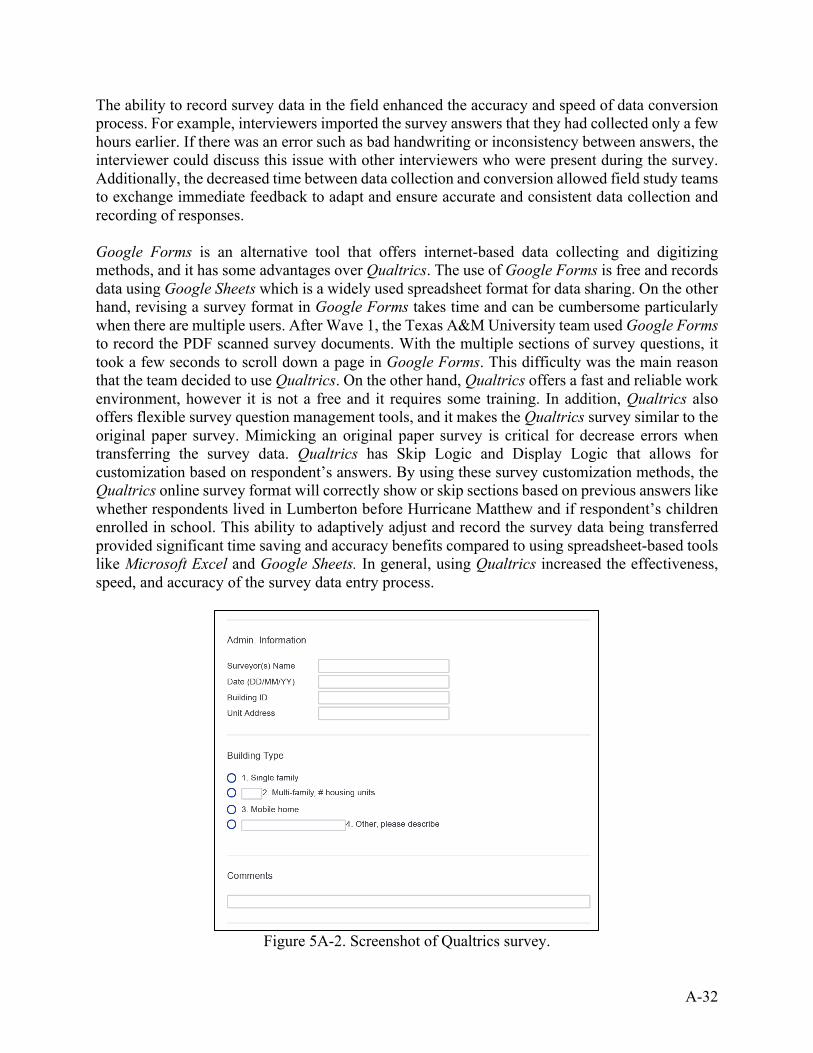
A-32
The ability to record survey data in the field enhanced the accuracy and speed of data conversion process. For example, interviewers imported the survey answers that they had collected only a few hours earlier. If there was an error such as bad handwriting or inconsistency between answers, the interviewer could discuss this issue with other interviewers who were present during the survey. Additionally, the decreased time between data collection and conversion allowed field study teams to exchange immediate feedback to adapt and ensure accurate and consistent data collection and recording of responses. Google Forms is an alternative tool that offers internet-based data collecting and digitizing methods, and it has some advantages over Qualtrics. The use of Google Forms is free and records data using Google Sheets which is a widely used spreadsheet format for data sharing. On the other hand, revising a survey format in Google Forms takes time and can be cumbersome particularly when there are multiple users. After Wave 1, the Texas A&M University team used Google Forms to record the PDF scanned survey documents. With the multiple sections of survey questions, it took a few seconds to scroll down a page in Google Forms. This difficulty was the main reason that the team decided to use Qualtrics. On the other hand, Qualtrics offers a fast and reliable work environment, however it is not a free and it requires some training. In addition, Qualtrics also offers flexible survey question management tools, and it makes the Qualtrics survey similar to the original paper survey. Mimicking an original paper survey is critical for decrease errors when transferring the survey data. Qualtrics has Skip Logic and Display Logic that allows for customization based on respondent’s answers. By using these survey customization methods, the Qualtrics online survey format will correctly show or skip sections based on previous answers like whether respondents lived in Lumberton before Hurricane Matthew and if respondent’s children enrolled in school. This ability to adaptively adjust and record the survey data being transferred provided significant time saving and accuracy benefits compared to using spreadsheet-based tools like Microsoft Excel and Google Sheets. In general, using Qualtrics increased the effectiveness, speed, and accuracy of the survey data entry process.
Figure 5A-2. Screenshot of Qualtrics survey.
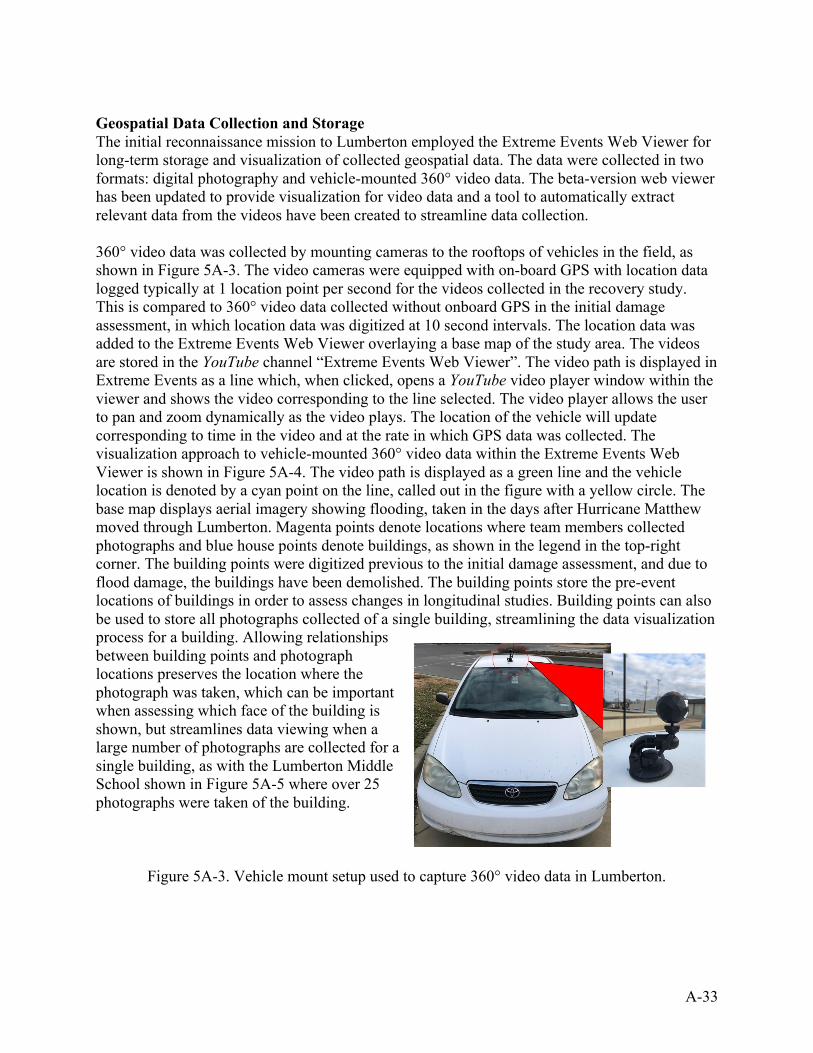
A-33
Geospatial Data Collection and Storage The initial reconnaissance mission to Lumberton employed the Extreme Events Web Viewer for long-term storage and visualization of collected geospatial data. The data were collected in two formats: digital photography and vehicle-mounted 360° video data. The beta-version web viewer has been updated to provide visualization for video data and a tool to automatically extract relevant data from the videos have been created to streamline data collection. 360° video data was collected by mounting cameras to the rooftops of vehicles in the field, as shown in Figure 5A-3. The video cameras were equipped with on-board GPS with location data logged typically at 1 location point per second for the videos collected in the recovery study. This is compared to 360° video data collected without onboard GPS in the initial damage assessment, in which location data was digitized at 10 second intervals. The location data was added to the Extreme Events Web Viewer overlaying a base map of the study area. The videos are stored in the YouTube channel “Extreme Events Web Viewer”. The video path is displayed in Extreme Events as a line which, when clicked, opens a YouTube video player window within the viewer and shows the video corresponding to the line selected. The video player allows the user to pan and zoom dynamically as the video plays. The location of the vehicle will update corresponding to time in the video and at the rate in which GPS data was collected. The visualization approach to vehicle-mounted 360° video data within the Extreme Events Web Viewer is shown in Figure 5A-4. The video path is displayed as a green line and the vehicle location is denoted by a cyan point on the line, called out in the figure with a yellow circle. The base map displays aerial imagery showing flooding, taken in the days after Hurricane Matthew moved through Lumberton. Magenta points denote locations where team members collected photographs and blue house points denote buildings, as shown in the legend in the top-right corner. The building points were digitized previous to the initial damage assessment, and due to flood damage, the buildings have been demolished. The building points store the pre-event locations of buildings in order to assess changes in longitudinal studies. Building points can also be used to store all photographs collected of a single building, streamlining the data visualization process for a building. Allowing relationships between building points and photograph locations preserves the location where the photograph was taken, which can be important when assessing which face of the building is shown, but streamlines data viewing when a large number of photographs are collected for a single building, as with the Lumberton Middle School shown in Figure 5A-5 where over 25 photographs were taken of the building.
Figure 5A-3. Vehicle mount setup used to capture 360° video data in Lumberton.
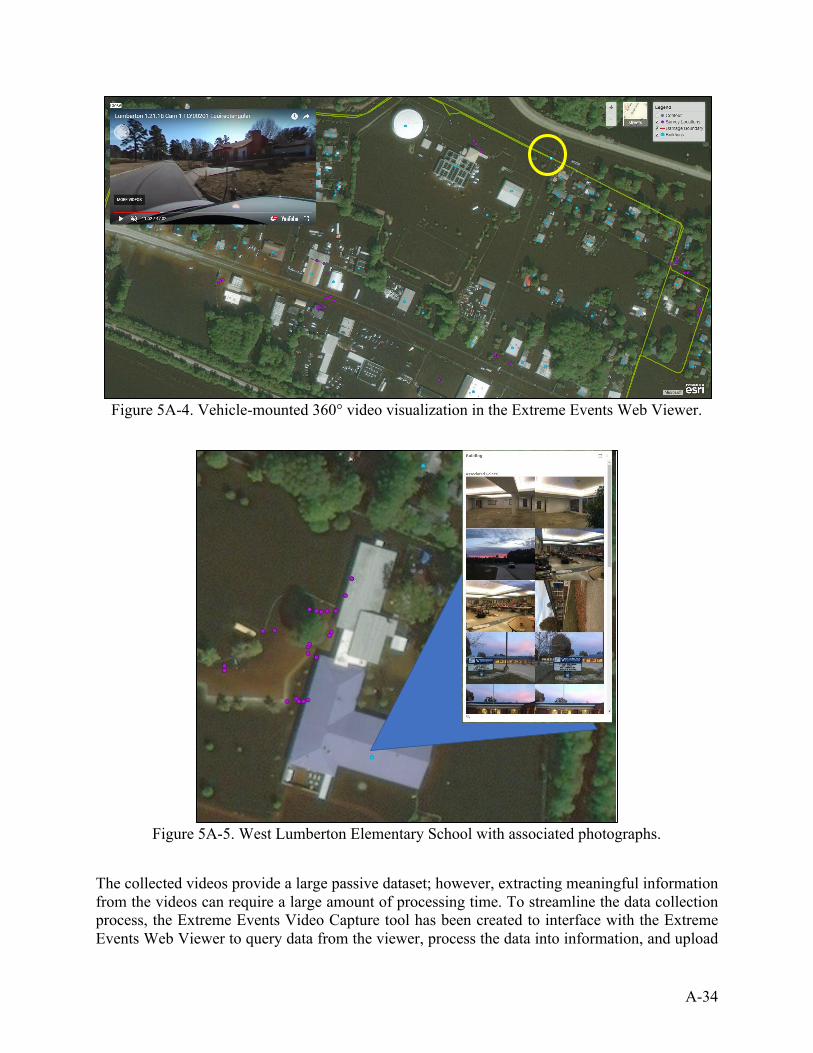
A-34
Figure 5A-4. Vehicle-mounted 360° video visualization in the Extreme Events Web Viewer.
Figure 5A-5. West Lumberton Elementary School with associated photographs.
The collected videos provide a large passive dataset; however, extracting meaningful information from the videos can require a large amount of processing time. To streamline the data collection process, the Extreme Events Video Capture tool has been created to interface with the Extreme Events Web Viewer to query data from the viewer, process the data into information, and upload

A-35
the new data to the viewer in a manageable format. The process is carried out through an offline application which requires input parameters for 360° video selection, video centerline buffer distance, camera direction relative to direction of travel, and one of multiple processing methods provided. The tool opens a video stored in the Extreme Events Web Viewer, selects all building points located within the video centerline buffer distance provided. A geometric function is executed to select the closest video point location to each building, rotate the video window to the building and extract a photograph from the video. As 360° videos show data by panning the viewing window, the tool must know the proper pan amount for an object of interest to be shown in the view window. This pan function is provided by rotating the video a certain amount of degrees from the 0° axis of the video. Providing the initial camera direction relative to direction of travel will calibrate the video so that the 0° axis will be set at the forward direction of travel. This process is useful as 360° cameras often do not specify which direction is forward, as it typically is not relevant, and so cameras are often mounted without directionality. When the camera is not mounted correctly, the tool will not know where the 0° axis is set, and the rotation geometry of the tool will be incorrect, leading to extracted photographs which do not include the building of interest. The different processing methods provided by the tool allow the user to select whether they would like to extract a photograph at each building at a 90° angle from the street, looking straight at the building from the nearest video point, or at oblique angles which can be used capture side profiles of the buildings. Multiple angles can be input to the tool, and multiple photographs will be extracted if selected. Once all requisite photographs have been extracted from the selected video, the tool allows the user to view the photos for quality assurance and, if desired, add them to the web viewer. If the user decides to add the photographs to the viewer, the tool will create photo locations in the Extreme Events Web Viewer, shown as magenta points in Figure 5A-4, at half the distance between the video centerline location where the photograph was taken and the building location. Photographs corresponding to each video will be automatically related in the Extreme Events Web Viewer. Figure 5A-5 shows photograph locations where data extracted from the video centerline shown in Figure 5A-4 are stored. Light Detection and Ranging (LiDAR) Point Cloud Data As documented in the Wave 1 report, much of the flooding in Lumberton occurred due to the gap in the Lumber River levee system at the CSX railway underpass of Interstate 95. This gap allowed riverine flooding to surge through the underpass, wash out the railroad tracks and an adjacent access road, and flow into the southern region of Lumberton where hundreds of homes and businesses were inundated, along with a water treatment plant. Figure A5-6(a) shows the locations of the river, levee system, intestate, railroad, and underpass. Figure A5-6(b) provides an aerial view of the underpass while flooding was occurring.
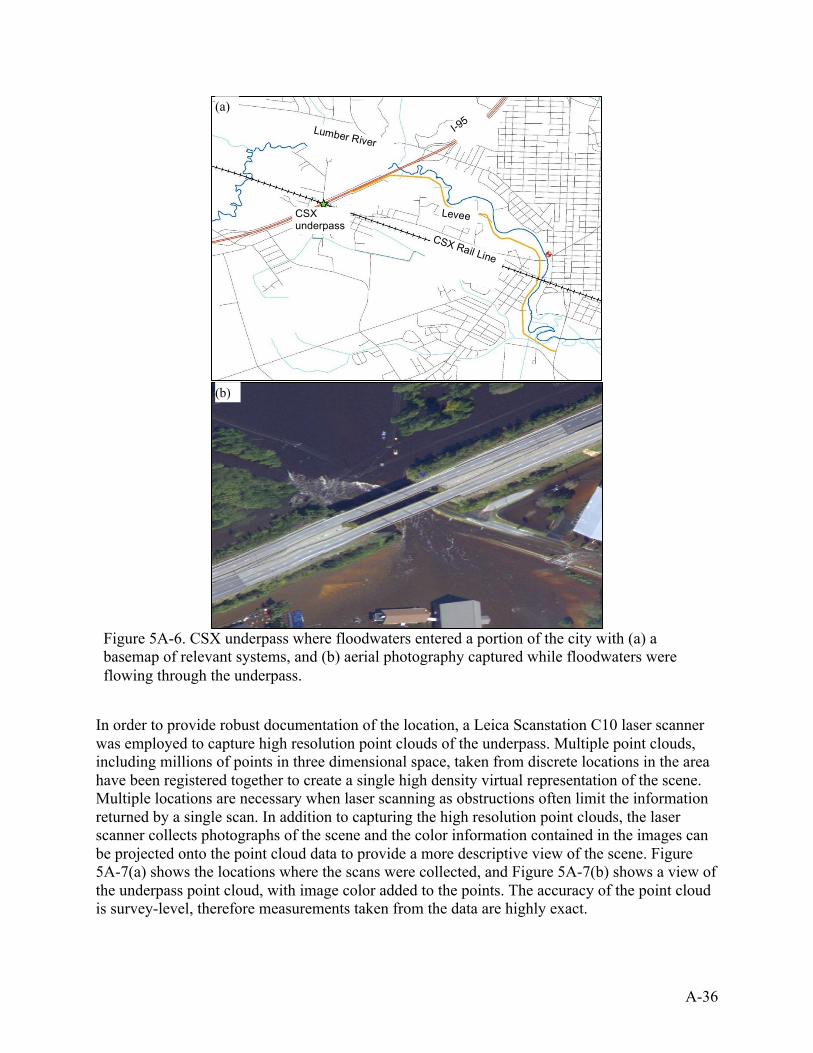
A-36
Figure 5A-6. CSX underpass where floodwaters entered a portion of the city with (a) a basemap of relevant systems, and (b) aerial photography captured while floodwaters were flowing through the underpass.
In order to provide robust documentation of the location, a Leica Scanstation C10 laser scanner was employed to capture high resolution point clouds of the underpass. Multiple point clouds, including millions of points in three dimensional space, taken from discrete locations in the area have been registered together to create a single high density virtual representation of the scene. Multiple locations are necessary when laser scanning as obstructions often limit the information returned by a single scan. In addition to capturing the high resolution point clouds, the laser scanner collects photographs of the scene and the color information contained in the images can be projected onto the point cloud data to provide a more descriptive view of the scene. Figure 5A-7(a) shows the locations where the scans were collected, and Figure 5A-7(b) shows a view of the underpass point cloud, with image color added to the points. The accuracy of the point cloud is survey-level, therefore measurements taken from the data are highly exact.
CSX underpass
CSX Rail Line
I-95
Levee
Lumber River
(a)
(b)
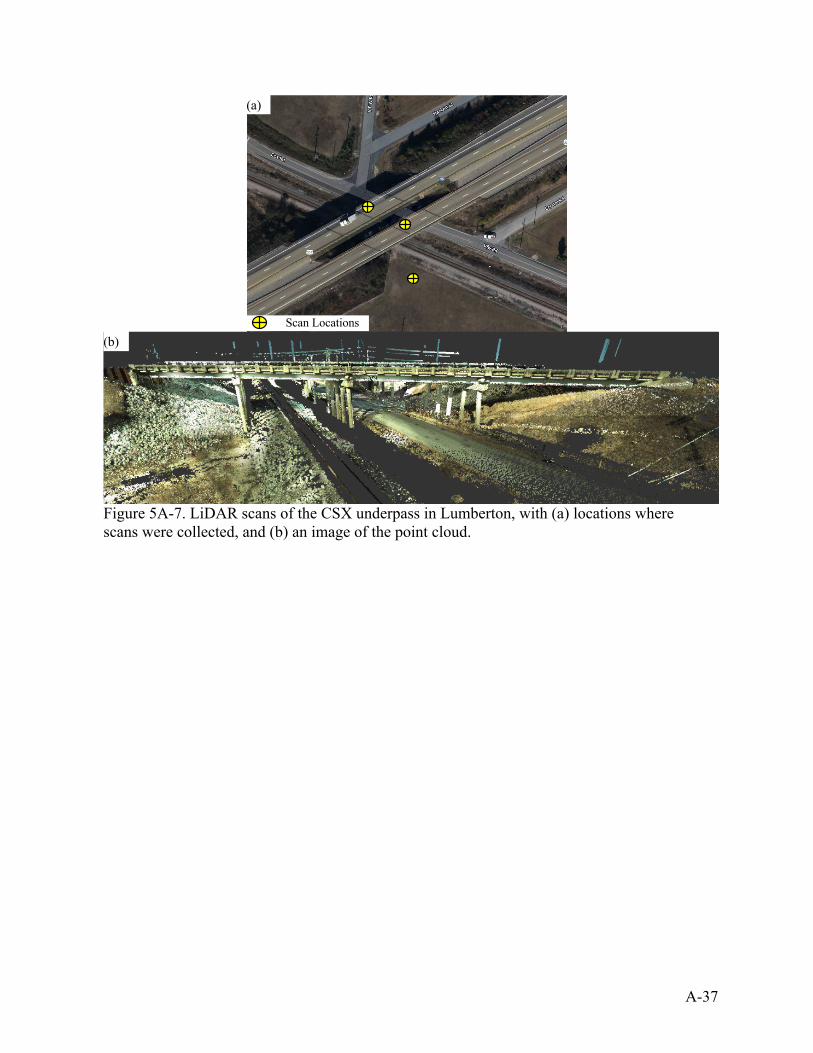
A-37
Figure 5A-7. LiDAR scans of the CSX underpass in Lumberton, with (a) locations where scans were collected, and (b) an image of the point cloud.
Scan Locations
(a)
(b)
A-38
Appendix 5B: Safety Protocols
SAFETY PROTOCOLS
NIST Disaster and Failure Studies Safety Protocols The National Institute of Standards and Technology promotes a culture of safety across the agency. The Office of Safety, Health, and Environment (OSHE) leads and supports NIST in carrying out their mission safely. OSHE’s vision is for safety to be an integral core value and vital part of NIST culture. The Divisions and Laboratories hold quarterly and annual safety meetings, respectively, to disseminate safety materials and best practices. The Disaster and Failure Studies (DFS) Program in the Materials and Structural Systems Division (Engineering Laboratory) follows standard operating procedures for all field deployments, including the Lumberton longitudinal field campaigns. Deployments following disaster events constitute working in an unstructured environment with possibly changing exposures to hazards. Therefore, awareness and avoidance of potential hazards are the greatest tools for mitigating risk in the field. First-Level Hazard Review: NIST personnel operating in the field must be alert to the potential hazards present in the immediate environment and take the appropriate steps to mitigate or eliminate the risk posed by a hazard. A first-level hazard review (FLHR) for the DFS Program is updated and reviewed regularly by a panel of experts to identify common hazards (e.g., downed power lines, damaged structures, debris, heat stress, violence, etc.) that are encountered during field work and associated mitigation controls (e.g., personal protective equipment, training courses, first-aid kits, etc.). Personal Protective Equipment: NIST personnel are responsible for acquiring, storing, and carrying personal safety equipment (e.g., steel-toed safety shoes, eye protection, and safety vests) that are required to comply with the FLHR. The DFS Operations Center in Gaithersburg, MD stocks PPE (e.g., hard hats, gloves, dust masks, etc.) and other supplies (e.g., first-aid kits, flashlights, hand sanitizer, etc.) that may be needed for a broad range of hazard missions. NIST personnel that are missing any PPE before deployment are required to visit the DFS Operations Center to comply with all mitigation controls required for the specific deployment. Table-Top Exercise: A table-top exercise, simulating typical DFS activities was developed to review existing safety protocols, identify gaps in the safety protocols, and recommend potential changes to the FLHR. The most recent DFS table-top exercise was held at NIST in Gaithersburg, MD on January 3, 2018. The participants included the Engineering Laboratory’s Safety Officer, the DFS Director, EL Group Leaders and Division Chief, and DFS deployment team leaders. The exercise began with a review of DFS emergency procedures and the roles of the individuals in the room during a typical deployment. The scenarios practiced during the exercise included: (1) interacting with members from other federal agencies, the private sector, and the academic sector in the field; (2) accessing damaged buildings to collect data; and (3) interacting with the public in the field. The outcome of the table-top exercise was a list of best practices for safety in the field with some recommendations for minor updates to the FLHR.
A-39
Tailored SOP to Specific Deployments: Since DFS deployments and associated risks vary by hazard type (e.g., wildland-urban interface fires, building fires, hurricanes, floods, windstorms, earthquakes, and construction failures), safety standard operating procedures (safety SOP) are created for each deployment. The tailored safety SOP one-pager includes training, safety requirements, supplies, and PPE required by the specific deployment. This one-pager is reviewed and discussed with the entire team during a safety briefing at NIST prior to deployment. During the deployment, NIST personnel meet prior to each day’s field activities to discuss the technical activities for the day, to discuss the anticipated hazards, to review the safety SOP, to inventory the safety-related equipment, and to decide upon the time and location the team will reconvene throughout the day. An example of a safety SOP is provided below.
Safety Standard Operating Procedures for a Windstorm Preliminary Assessment Deployment Training - Complete all required safety training before deployment, including tetanus shots Safety Requirements
● Designate a field safety officer for each team or sub-team. ● Always use buddy system and travel in no less than pairs, maintaining visual contact. ● Cell phone for each person. Have phone numbers for all team members available and
Gaithersburg contacts. ● Consider using walkie-talkies for team communication. If the team splits up into smaller
teams are in area, also consider routine radio/communication checks with other teams and/or virtual team members when field teams change locations.
● Hold daily morning briefings that include safety. ● Know the location of the nearest local hospital, police station and fire department. ● Don’t walk in areas which have standing water. ● Structurally damaged buildings – Do not enter, stay 1.5 times height of building away
from severely damaged buildings. ● Know where hazardous waste sites and damaged chemical plants are located and do not
enter. ● Downed power lines watch out for them and stay away. Do not drive over them. ● Driver should be focused on driving and have the assistance of a dedicated navigator –
signs / landmarks may be damaged or missing and driver should be scanning for debris and pedestrians.
● Before and after entering a structure, record names, location, and time (consider Slack), and/or have team members outside structure.
● If possible, clearly identify your team as working damage assessment teams – NIST logo, hard hat, reflective vest, and badge are all helpful.
● Be aware of heavy construction equipment near you. ● Wash or disinfect hands after removal of PPE.
Supplies
● Insect repellant with at least 25% DEET. ● First aid kit (at least one per vehicle).
A-40
● Clorox disinfectant wipes (for shoes and clothing) ● Plastic bags for contaminated shoes and clothing. ● “Tekwipes” or similar to keep hands clean and free of grease/oils ● Sunscreen ● Flashlight ● Personal medications. ● NIST badge and/or Center identification
Personal Protective Equipment (PPE)
● Hard hat ● Safety glasses with side shield ● Safety shoes (ASTM conformance) with puncture resistant soles or puncture resistant
inserts for personal shoes (with closed toes). ● Reflective safety vests. ● N95 disposable respirators for voluntary use. Keep several in a clean, plastic bag until
needed. ● Disposable ear plugs for hearing protection. Keep several in a clean, plastic bag until
needed. ● Gloves (suede or leather and nitrile). ● Disposable coveralls.
A-41
Appendix 5C: Training Protocol
FIELD TEAM TRAINING PROTCOL The Center developed a Survey Training Guide to ensure uniform field protocols across all members deploying to collect post-disaster data. The Survey Training Guide is provided below and includes: (1) background of the surveys being administered during the deployment; (2) comprehensive description of the role of the interviewer; (3) a safety policy for field teams inspired by Paterson et al.’s (1999) protocol for researcher safety; (4) moving in the community; (5) a checklist of required survey materials; (6) best practices for approaching respondents; and (7) data management plans. These protocols are reviewed and discussed with the entire team during a web-based training prior to deployment. During the deployment, Center personnel shall meet prior to each day’s field activities to discuss the technical activities for the day, to discuss the anticipated hazards and best practices for survey work, to review the safety and surveying protocols, to inventory the safety-related equipment, and to decide upon the time and location the team will reconvene throughout the day.
A-42
SURVEY TRAINING GUIDE BACKGROUND OF THE SURVEY AND YOUR ROLE AS THE INTERVIEWER:
□ Overview of Interviewer Responsibilities
*The cardinal rule of interviewing is to remember you are acting as an objective recorder of each participant’s experiences. Your personal beliefs and judgments have no place in the interview setting if you expect to do your job. As difficult as it may sound, leaving your convictions and criticisms at the door is imperative to the success of the interview. It doesn’t matter how the situation appears to you, showing disdain or contempt will lead to refusals. You see this person at one brief moment in his/her life, and his/her story is far longer than we could record in the time allotted for a survey.
*The second principle for successful interviewing is to thoroughly know the purpose of the project. Your confidence in the work and your abilities will be as apparent as the light of day. In the first 15 seconds of your encounter, potential participants decide whether or not they want to continue to be a part of the study. If you don’t know why you are there, or what your efforts will yield neither will the respondents. This first impression is very difficult to change. Know the Center’s and the field study’s purpose and know their value before you knock on the door.
□ Handling of Confidential Information and the Oath of Confidentiality
□ Introduction to Interviewing Techniques
□ How to Conduct a Survey
*Ask all questions on the form unless you have been instructed on the form to “skip.” If you know the answer to a question (e.g. because you know the Respondent or because you have heard the information via casual conversation with him or her before the interview), confirm the answer with the Respondent and record the answer in the proper place. Blanks left on forms cannot be coded for evaluation research and the Respondent’s story - his/her needs, challenges, and successes, would be lost.
*Ask all questions in the order in which they appear in the form. The questions follow one another in a sequence that has been established by researchers; any changes can destroy the intent of the questions. Once established, the order of questioning must be preserved. *You must be alert to interviewer instructions. Text that is to be spoken - questions to be asked of the respondent - are in bold type, while instructions to the interviewer are always in italics and often in [square brackets].
*You must follow instructions as to which parts of a question need to be asked in what order. You must follow “skip to” instructions. Following skips is necessary not only for accuracy of information gathering, but will make the interview go faster. Ignoring skips can be very annoying to respondents.
A-43
*The goal is to accurately record the Respondent’s answers to the questions. Never interpret a Respondent’s answer—instead, probe to get him or her to clarify what s/he means. Further explanation on proper probing techniques is supplied in the manual. For numeric responses, it is important that the answer is recorded properly in the space provided. Be aware of the units used in a question, for example, if the question is asking how many weeks; be sure to enter weeks or fractions of weeks, not the number of days. “Don’t know” and “not sure” are legitimate answers, but they should be avoided. Often with some assistance the interviewer can help the Respondent clarify his or her answer to fit within a category given (see probing hierarchy). If after probing and attempting to assist the respondents in remembering, the answer is still, “Don’t know,” be sure to record this. Do not leave the question blank.
□ Safety Policy for Field Teams
1. The number 1 safety rule is: Trust your instincts! If you feel uncomfortable about going into any area, or into a building, or an elevator, do not go there. If you feel uncomfortable about being in an area or inside a building or a respondent's apartment or other living space, leave immediately.
2. Carry important phone numbers with you everywhere. If something emerges and you
need help, call one of the Team Leads. 3. The general rule is: Check it out first. Be alert to the type of people and activities in
the area, the location of the buildings, trailers or rooms you will enter. 4. You will be working in pairs or teams. 5. Some interviews or cases may require two team members to be present for the interview.
One will act as an escort while the other interviews the respondent. Since privacy is important for conducting the interview, the escort should try to find a space within the apartment, trailer, house or interview setting that is away from the actual interview. Field staff must use their own judgment.
6. Develop a code or signal to use with your team that will alert others of a potentially
dangerous situation. You must practice this before entering the field together. Develop a word or phrase to indicate that you should not enter or that you should leave an area or that you should leave a respondent’s household. This signal is used to discontinue an interview that is in progress if this is warranted by safety considerations.
7. Check in when you have completed your work in the field for the day. 8. Never enter a building whose entrance is blocked by a group of people or objects. Never
enter a building where there is apparent police activity.
A-44
9. Before beginning an interview in a respondent's home, take a moment to survey the situation. Know where the entrances and exits are. Do not allow the respondent to lock the door from the inside and remove the key. You can give some reason such as, “my escort/team members are here so it is not necessary, and s/he may have to leave for a bit to report to the office. I wouldn't want him to disturb our interview.” If respondent or anyone in the household wants to lock the door from the inside, a team member should definitely stay with you.
10. If there is an elevator in the building, use it - even to go up or down one floor. However,
do not enter an elevator with someone who appears suspicious. When you use stairways, listen first to see if anyone else is there. If you hear others, you and your escort should talk with each other to let others know that there are two of you (casual conversation, “how 'bout those Hornets?”). Of course, if the sounds make either of you uncomfortable, use your exit signal and leave.
12. Wearing your NIST Center shirt will help to identify you to participants. Otherwise your
attire should be casual, but professional. Do not visibly carry valuables or display large amounts of money. You should not carry a small purse that looks made to carry money but rather a large bag that looks like it contains work materials. Canvas bags are good.
13. Always carry your ID and a small amount of cash in case of an emergency.
14. If you are going into dark halls or stairways bring a flashlight. If you are working at
night, field staff should always carry a flashlight for poor lit areas. In an emergency situation you will attract the most attention by yelling "FIRE!" repeatedly as loud as you can. In an emergency situation, you should dial 911 immediately to get assistance and then contact project staff.
15. If you are carrying a handheld device for data collection, keep it in a nondescript bag. If
someone challenges you for the equipment, hand it over. Your safety is more important than the tablet!
A. Moving in the Community:
ALWAYS wear your shirt and ID badge so that it can easily be seen. This will give people some sense of why you are there.
1. If there are "block watchers" in the neighborhood, speak to them. These are folks who take it upon themselves to watch out for strangers and possible misdeeds on the block. If anyone informs you that you are not to proceed into a given area or apartment, take their advice. Report this to your Team Leads.
2. Act like you know where you are going, as if you belong. It must be clear that you are
there for a purpose and you know what you are doing, not that you are lost and stumbling around.
□ Size of Field Teams (2-4 persons per team)
A-45
SURVEY, SAMPLING, AND IRB:
□ Review of Sample
□ Introduction to Consent and Survey Instrument
□ Field Protocol
□ Interviewer Checklist – List of Materials that All Survey Interviewers Need to Have *surveys *mental health / resource referral form *ink pens *legal size clipboard *shirt / badge *car magnet
QXQ:
□ Review and Practice Questions with Family / Friends / Colleagues
□ Send Revisions / Comments to Survey Leads
□ Send “How Long it Took to Do the Survey” to Team Leads
APPROACHING RESPONDENTS:
□ Script for Approaching Respondents: “My name is X and this is X. We are here with a brief survey regarding Hurricane Matthew and its effects. It will take about X minutes to complete. You were selected through a random process to represent your larger community. Do you have time to answer these questions now?” *Hand respondent information sheet.
□ Convincing a Respondent to Talk to You *Show Confidence *Smile *Express Enthusiasm *Underscore Importance of the Study
□ Converting a Soft Refusal *Don’t Take a Soft No for a Hard No! *Emphasize that the Survey is Brief *Underscore Importance of Participation
□ What to do after a Hard Refusal – Replacement protocol *What is a Hard NO? (Door slammed in face. Get off my porch. NO don’t come back… These are hard NO’s and you should take them as a No.) *Replacement protocol…
A-46
□ What to do if Someone Doesn’t Answer Door (but it looks like they are back living in the home)
□ Coding Sheet
□ End of the Interview *After the survey, thank the respondent for his/ her time. *Give the respondent a copy of the Resource sheet. If you forgot to give them the brochure, do that now. DATA:
□ After the interview, save all paper surveys
□ Upload paper surveys back at the hotel

FIELD STUDY TEAM AFFILIATION
LAUREN BADEAUX University of Kansas ANDRE BARBOSA Oregon State University SHANE CRAWFORD University of Alabama MARIA DILLARD National Institute of Standards and Technology DONGHWAN GU Texas A & M University SARA HAMIDEH Iowa State University KENNETH HARRISON National Institute of Standards and Technology JENNIFER HELGESON National Institute of Standards and Technology SAYMA KHAJEHEI Iowa State University MARIA KOLIOU Texas A & M University MEHRDAD MEMARI Colorado State University JUDITH MITRANI-REISER National Institute of Standards and Technology KIJIN SEONG Texas A & M University ELAINA SUTLEY University of Kansas
JENNIFER TOBIN University of Colorado, Boulder JOHN W. VAN DE LINDT Colorado State University MARIA WATSON Texas A & M University KAI WU Texas A & M University
This publication is available free of charge from: https://doi.org/10.6028/N
IST.SP.1230-2


![North Carolina register [serial] - NC OAH](https://static.fdokumen.com/doc/165x107/633bb631a24651471c0221d8/north-carolina-register-serial-nc-oah.jpg)