North Carolina Coastal Habitat Protection Plan - NC.gov
659
North Carolina Coastal Habitat Protection Plan By Anne S. Deaton 1 , William S. Chappell 1, Kevin Hart 1 , Jessi O’Neal 1 , and Brian Boutin 2 1 North Carolina Department of Environment and Natural Resources, Division of Marine Fisheries 2 The Nature Conservancy December 2010 Sandra Hughes Doug Kesling NC DENR
-
Upload
khangminh22 -
Category
Documents
-
view
1 -
download
0
Transcript of North Carolina Coastal Habitat Protection Plan - NC.gov

North
Carolina
Coastal
Habitat
Protection
PlanBy
Anne S. Deaton1, William S. Chappell1, Kevin Hart1,
Jessi O’Neal1, and Brian Boutin2
1 North Carolina Department of Environment and Natural
Resources, Division of Marine Fisheries2 The Nature Conservancy
December 2010
Sandra Hughes
Doug Kesling
NC DENR
NORTH CAROLINA
COASTAL HABITAT PROTECTION PLAN
By
Anne S. Deaton,
William S. Chappell, Kevin Hart, Jessi O’Neal, and Brian Boutin
North Carolina Department of Environment and Natural Resources
Division of Marine Fisheries
Morehead City, NC 28557
December 2010
Copyright 2010 by the North Carolina Department of Environment and Natural Resources
This document should be cited as follows:
Deaton, A.S., W.S. Chappell, K. Hart, J. O‘Neal, B. Boutin. 2010. North Carolina Coastal Habitat
Protection Plan. North Carolina Department of Environment and Natural Resources. Division of
Marine Fisheries, NC. 639 pp.
Cover page photo credits:
Egret in marsh - NC DENR website
Marsh at sunset – Sandra Hughes, S.Hughes Photography, http://photosbyhughes.wordpress.com/
Rock beauties at NC reef – Doug Kesling, National Marine Fisheries Service, Beaufort NC
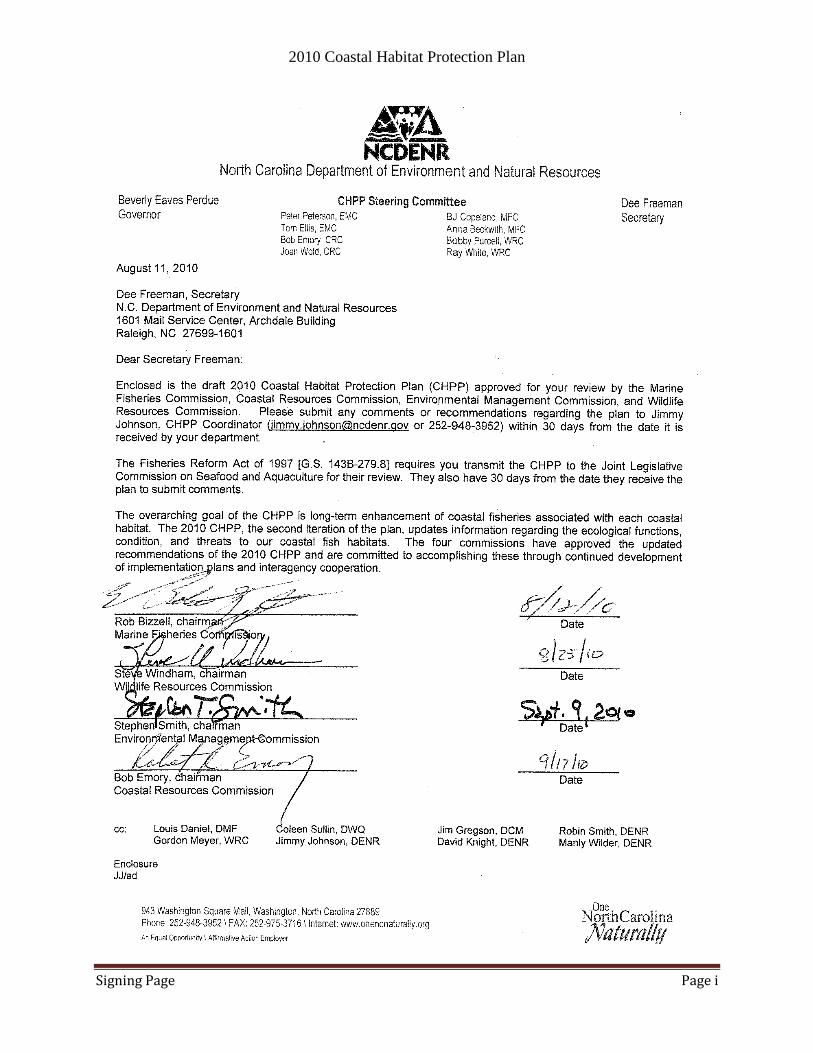
2010 Coastal Habitat Protection Plan
Signing Page Page i
2010 Coastal Habitat Protection Plan
Acknowledgements Page ii
ACKNOWLEDGEMENTS
In the process of obtaining updated information for the plan, and discussing priority issues and solutions
related to CHPP implementation, a large number of people contributed information and reviewed drafts.
This document would not have been possible without the assistance of these state and federal agency
staff, university researchers, members of various NC regulatory commissions and advisory committees,
nonprofit organizations and volunteers. Special thanks are given to Jimmy Johnson, CHPP coordinator,
for providing support and advice, coordinating numerous CHPP Team and Steering Committee meetings,
and keeping the plan on schedule. Also deserving special recognition are the CHPP Team, CHPP
Steering Committee, and reviewers who contributed their time and knowledge to this plan.
CHPP Team: Katy West (DMF), Mike Lopazanki (DCM), Tancred Miller (DCM), Scott Geis (DCM),
Steve Underwood (DCM), Matt Matthews (DWQ), Bill Diuguid (DWQ), Peter Caldwell (DWQ),
Maria Dunn (WRC), Patti Fowler (DEH-SS&RWQ)
Extended CHPP Team: Bill Swartley (DFR), Kristina Fischer (DSWC), Rob Breeding (EEP), Rebecca
Ellin (DCM-NEERS), Dean Carpenter (APNEP)
CHPP Steering Committee: Pete Peterson (EMC), Tom Ellis (EMC), Bob Emory (CRC), Joan Weld
(CRC), B.J. Copeland (MFC), Anna Beckwith (MFC), Ray White (WRC), Bobby Purcell (WRC)
DENR administrative review: David Knight
Additional DENR reviewers:
Water column – Shannon Jenkins (DEH-SS&RWQ), Linda Willis (DWQ), Kipp Glazier (DWQ), K.
Merritt (DWQ), Tom Gerow (DFR)
Shell bottom – Stopher Slade (DMF), Mike Marshall (DMF), Tina Moore (DMF), Brian Conrad (DMF)
Wetlands – John Dorney (DWQ), Amanda Mueller (DWQ), Marc Rectenwald (EEP), Bonnie Bendell
(DCM), Sara Winslow (DMF), Rich Carpenter (DMF), Ted Tyndall (DCM), Tom Gerow (DFR)
Soft bottom – Jeff Warren (DCM)
SAV – Danielle Mir (DWQ), Brian Conrad, Ted Tyndall
Hard bottom – Gregg Bodnar (DMF)
Overall editorial – Christine Jensen (DMF)
Outside reviewers:
Water column – Tim Spruill (USGS), Mike Wicker (USFWS), JoAnn Burkholder (NCSU), Robert
Christian ECU), Ben Peierls (UNC-IMS), Mike Mallin (UNC-W), Bill Kirby-Smith (Duke), Brian
Boutin (TNC)
Wetlands – Mark Brinson (ECU), Carolyn Currin (NOAA), Reide Corbett (ECU), Brian Boutin
Soft bottom – Douglas Piatkowski (USACE), John Richter (USACE), Brian Boutin
SAV – Steve Mitchell (DOT), Jud Kenworthy (NOAA), Brian Boutin
Ecosystem management and Strategic Habitat Areas – Brian Boutin
Overall editorial – Mike Street
Unpublished data providers:
Cam McNutt (DWQ), David Rayno (DWR), Kipp Glazier (DWQ), Brad Pogue (DEH-SS&RWQ), Scott
Ensign (UNC-IMS), Tom Gerow (DFR), Elizabeth Brinker (ECSU), Ed Schwartzman (DWQ), Carolyn
Currin (NOAA)
2010 Coastal Habitat Protection Plan
Executive Summary Page iii
EXECUTIVE SUMMARY
This document is intended as a resource and guide for implementation of the goals and recommendations
included at the end of this summary and in Chapter 9 (Table 9.1).
North Carolina‘s coastal fisheries are among the most productive in the United States because of the
diversity of habitats available in the largest estuarine system (2.3 million acres) of any single Atlantic
coast state. The state‘s coastal fisheries also benefit from the location of North Carolina at the transition
between mid-Atlantic and south Atlantic regions and a management system that supports active citizen
participation. The current management system was developed following the decline of some important
fish stocks during the late 1980s and early 1990s (for example, river herring, weakfish, and summer
flounder) as fish kills and water-borne disease outbreaks increased. Protection and enhancement of fish
habitats utilized by such species was considered especially beneficial in supporting stock recovery.
Recognizing the critical importance of healthy and productive habitats to produce fish for human benefits,
the North Carolina General Assembly included a provision in the Fisheries Reform Act of 1997
instructing the Department of Environment and Natural Resources (DENR) to prepare Coastal Habitat
Protection Plans (CHPPs). The legislative goal of the plans is long-term enhancement of coastal
fisheries associated with each habitat. Unlike other planning efforts, the Fishery Reform Act mandated
that three environmental regulatory commissions (Environmental Management, Coastal Resources, and
Marine Fisheries Commissions) must adopt and implement the plan, thus requiring a coordinated
management approach.
The purpose of the CHPP is to compile the latest scientific information on each habitat so that
management needs can be identified to protect, enhance, and restore associated fish populations. The
CHPP area includes all habitats within the coastal draining river basins in North Carolina. Because the
Fall Line is the upper limit for migration of almost all coastal fisheries species, emphasis is placed on the
area downstream from that point. The plan is organized by six fish habitat categories: water column, shell
bottom, submerged aquatic vegetation, wetlands, soft bottom, and hard bottom. Each habitat chapter
includes information on the distribution, ecological function, status and trends, and threats to those
habitats; and management needs to address the threats. The interdependence of these habitats and the
need to manage them at an ecosystem level is discussed in the Ecosystem Management and Strategic
Habitat Areas Chapter. CHPP goals and recommendations are included in the final chapter.
The first edition of the CHPP was adopted in December 2004, and published in January 2005. The
recommendations provide the framework to guide CHPP implementation. Each participating division,
commission and the Department agreed to develop bi-annual implementation plans. Implementation
plans have been developed for the 2005-07, 2007-09, and 2009-2011 fiscal years. The Intercommission
Review Committee (IRC), consisting of two members of each commission, was transformed into the
CHPP Steering Committee (CSC) following CHPP adoption. The CSC‘s new charge was to meet
quarterly and discuss progress in implementation, how to resolve complex habitat issues and exchange
information on emerging issues. The CSC was also responsible for carrying back CHPP related
information to their full commissions to enhance communication and coordination. The CSC asked the
WRC to join their committee in 2009 as they saw increasing implementation actions that required
coordination and cooperation with them. Other agencies participate in a non-obligatory manner,
including the Division of Forestry, Ecosystem Enhancement Program (EEP), and Soil and Water
Conservation Districts.
During the first five years of CHPP implementation, the CHPP was an active part of the decision making
process for DENR, the divisions, and regulatory commissions. Numerous implementation actions were
accomplished or begun. In the first year, most of the implementation work involved securing funding and
2010 Coastal Habitat Protection Plan
Executive Summary Page iv
positions to support implementation work. In the second year, many implementation actions were
initiated and substantially advanced in the following year. Budget shortfalls somewhat constrained
implementation success in 2008-2009. The CSC, in reviewing CHPP progress, concluded that the six
most significant accomplishments and advancements of the CHPP were:
Interagency coordination/cooperation – established a CHPP coordinator position, CHPP Steering
Committee and interagency quarterly meetings
Stormwater runoff management – adopted and implemented EMC Phase 2 and coastal stormwater
rules
Habitat mapping – initiated coastwide SAV mapping organized by APNEP workgroup, shellfish and
shellfish closures mapping with new positions, SHA process to prioritize habitat areas, and shoreline
mapping through grant funding
Compliance monitoring – established new positions in multiple divisions, cross training marine
patrol, increased permit fees and fines
Beach nourishment management – drafted the Beach and Inlet Management Plan through grant
funding, and adopted CRC sediment criteria rules
Oyster reef restoration – established new positions and funding for sanctuary development and
monitoring, construction of a shellfish hatchery, and creation of an oyster shell recycling program
The FRA required that the CHPP be reviewed and updated every five years. The updated CHPP follows
the same organizational format as the initial plan, with additional focus on fisheries ecosystem
management. The following information is a brief summary of the 2010 CHPP, highlighting new
information, status, accomplishments, and priority research and management needs.
Habitat maps throughout the plan were updated to include newly mapped areas (foldout map). While
much progress has been made on mapping, about 10% of shell bottom remains to be mapped, updated
SAV maps are incomplete, more detailed mapping of nearshore hard bottom is needed, and wetland and
bathymetry maps are in need of updating.
Since 2005, land-use patterns continued to change with population growth along the coast. During and
just after completion of the first CHPP, there was a coastal boom in development. Rapidly accelerating
property values made once small coastal mainland counties targets for large new developments.
Marketed as the ―Inner Banks‖, Pamlico, Chowan, Bertie, Washington, Brunswick, and Down East
Carteret counties experienced rapid increase in population and subsequent decline in farmland, fish
houses, and water access. While coastal North Carolina has historically supported a strong commercial
fishing industry, the past five years showed a decline of about 10% in the number of licensed commercial
fishermen (~ 8565 in 2008) and a 13% decline in fish dealers (~738 in 2008). Although commercial
fishing has declined, recreational fishing has increased (~ 1.9 million anglers in 2007). The economic
recession beginning in 2008 has greatly slowed new development. However, because population along
the coast has been growing for decades, pollutants and habitat stressors from a diversity of sources remain
a significant threat to coastal fish habitat.
The water column is the habitat in which all fish live, and the physicochemical characteristics of
specific water bodies determine the fish assemblages that will utilize it. The DWQ use support
assessments are used to assess status of water quality. The last available assessment (2004-2006)
indicated little change in impairment. However, DWQ ambient monitoring coverage for estuaries
remains low and only about 30% of freshwater streams are assessed where the majority of ambient
stations are located. Fish kill events, which can be an indication of eutrophication, hypoxia, or toxic
chemical issues, did not show an increasing trend over the past five years, though total mortality of fish
was greater in recent years. Drought conditions from 2006-2008, reducing stormwater runoff, could have

2010 Coastal Habitat Protection Plan
Executive Summary Page v
contributed to good water quality during the past few years. There was however an increase in reported
wastewater treatment plant Notices of Violation and sewage spills, which contribute substantially to
pollutant loading in coastal waters. Completion of several studies indicates that sea level rise is expected
to increase in North Carolina at least 1 m per 100 yr. The effect of this rise, along with other weather
changes associated with climate change will have a great influence on water quality, salinity, water depth,
and temperature, all of which will alter fish distribution and abundance. Accomplishments of the CHPP
which will benefit the water column include adoption of coastal stormwater rules by EMC, designation of
Anadromous Fish Spawning Areas by MFC and WRC, additional DWQ, DCM, and Forestry compliance
positions, advancements in swine farm wastewater management, and removal of two dams and USACE
funding for dam modification to allow fish passage past Lock and Dam 1 on the Cape Fear River.
Continued priority management needs include removing obstructions to anadromous fish passage,
improving water monitoring coverage in gap areas identified by modeling, and developing tools (i.e.,
TMDLs) to address cumulative impacts. Emerging management needs include reducing pollutant loading
from wastewater (including endocrine disrupting chemicals) through increased treatment and prevention
of spills and violations, conducting research on rapid infiltration systems before further use, developing
rules to enhance physical and water quality characteristics for designated Anadromous Fish Spawning
Areas, and expanding the implementation of a drug take-back program to reduce endocrine disrupting
chemicals in surface waters.
Shell bottom is both an important fish habitat and a historical fishery, requiring a careful balance in
management. The ecological value of shell bottom has been recognized to be as or more significant than
the fishery, due to the many species it supports and the ecosystem services it provides. Subtidal shell
bottom habitat significantly declined in the 1900s due to previous oyster dredging practices and has not
substantially recovered due to disease, sedimentation, declining water quality, and fishing gear impacts.
Since the 2005 CHPP was completed, additional habitat was mapped by DMF (90% complete), but no
comparisons were done to assess change. However oyster spatfall in northern areas improved slightly
from 2003-2006 and spatfall in the southern areas continues to be stable. Fishery rules currently restrict
all bottom disturbing gear from 36% of the shell bottom area year-round, Over 70% of shell bottom area
have either trawling, dredging , mechanical shellfish harvest or a combination of these restrictions.
Accomplishments of the 2005 CHPP regarding shell bottom include accelerated oyster shell recycling
program, additional oyster sanctuary habitat designation/creation (from state appropriated funds and
federal stimulus project), and several research studies on larvae dispersal and oyster restoration.
Continued priorities include completing baseline mapping, refining programs for determining status and
trends in shell bottom resources, and continuing scientifically based shell bottom restoration efforts. An
emerging issue is the need for research on the effect and prevalence of endocrine disruptor chemicals on
shellfish.
Submerged aquatic vegetation is another important fish habitat known to support a high diversity of
invertebrates and fish, and provides valuable ecosystem services as a primary producer and water quality
enhancer. New ecological information in the plan includes information on the light and optical water
quality conditions needed and available for SAV growth in North Carolina. In addition, resource
valuation studies indicate that the monetary value of the ecosystem services provided by SAV such as
waste management, food production, and climate regulation are very high, making SAV habitat protection
a priority. The major threats to SAV remain channel dredging and water quality degradation associated
with excess nutrient and sediment accumulation. Since completion of the 2005 CHPP, coastwide imagery
of SAV was obtained in 2007-2008 through a multi-agency effort. Preliminary delineation in Bogue and
Core Sounds noted an increase in patchiness of SAV compared to historical maps. There were anecdotal
reports of an increase in SAV abundance in low salinity areas and high salinity areas south of New River.
The observed increase could be attributed to drought and lack of storms during that period. Although a
quantified estimate of SAV abundance or change over time has not been completed in North Carolina, a
metadata study found a global and national decline in SAV. Accomplishments of the 2005 CHPP that
2010 Coastal Habitat Protection Plan
Executive Summary Page vi
may benefit SAV include adoption of coastal stormwater rules by EMC, a modified SAV definition by
MFC, and revised dock rules by CRC. Continued priority needs include completing delineation of SAV
imagery, and modeling water quality parameters necessary to identify potential SAV habitat for
restoration and establishment of appropriate water quality standards. Emerging issues include developing
comprehensive monitoring programs to determine trends, initiating monitoring of SAV indicators, and
assessing sea level rise effects.
Wetlands are the fish habitat occupying the transition between land and water. By storing and filtering
land runoff, they enhance coastal water quality and play a vital role in providing refuge and food for
juvenile fish. It is estimated that over 95% of the commercial finfish and shellfish fisheries are dependent
on wetlands for some portion of their life cycle. Like SAV, valuation studies indicate wetlands provide
beneficial ecosystem services through water filtration, carbon sequestration, and production of food fish.
Precolonial estimates of wetlands in North Carolina are approximately 7.2 million acres, and current
estimates are approximately 5.1 million acres. No new mapping information was available since the 2005
CHPP. However, there is data suggesting a loss of marsh islands from erosion. Between 2001 and 2008
approximately 1,700 acres of permitted wetland impacts were documented. Conversion for development
and shoreline alterations are the major cause of wetland loss. Wetland losses and gains through
mitigation are difficult to track, but it appears that mitigation and restoration are currently preventing net
loss of wetlands. Improvements in wetland restoration address some important CHPP recommendations.
Continued priority needs include updating wetland and shoreline maps, improving mapping and tracking
system for wetland loss by wetland types, and modifying shoreline stabilization techniques to maintain
shallow nursery habitat and enhance riparian buffers. Emerging needs include developing CRC and
DENR policies regarding sea level rise adaptations and revising land use planning guidelines, as well as
considering alternative types of restoration/mitigation.
Soft bottom habitat is a key foraging habitat for juvenile and adult fish and invertebrates, and aids in
storing and cycling of sediment, nutrients, and toxins between the bottom and water column. Shallow
unvegetated bottom is particularly productive and, by providing refuge from predators, is an important
nursery area. Species dependent on soft bottom include clams, crabs, flounder, and rays, although almost
all fish will forage on microalgae, infauna, or epifauna on the soft bottom. Soft bottom habitat is dynamic
and resilient to change, although it can be degraded by toxins, hypoxia, or dredging. There is minimal
monitoring of sediment quality (i.e., contamination, nutrient enrichment). Since the 2005 CHPP, there
has been a large increase in requests for federally authorized and locally funded beach nourishment
projects. Large scale projects have been conducted or are underway at Bogue Banks, and Brunswick
County beaches, and are in late planning stages for portions of Dare County and most of Topsail Island.
Accomplishments of the 2005 CHPP that may benefit soft bottom include implementation of CRC
sediment criteria rules, modification to CRC dock rules to protect PNAs, DCM development of a Beach
and Inlet Management Plan, and research on the effect of hypoxia on fish productivity. Emerging priority
needs include updating existing bathymetric maps, preventing hardened structures on ocean shorelines,
and implementing regional sand management strategies of the 2009 Ocean Policy Report.
Low to high relief hard bottom in nearshore ocean waters adds to the diversity of North Carolina‘s
waters. The hard bottom areas serve as secondary nursery areas for estuarine dependent reef fish such as
black sea bass and gag. Little new information is available for this habitat. SEAMAP-SA has conducted
some mapping, but it is limited in information on fish use or habitat description or quality. The largest
threat to hard bottom is large scale beach nourishment projects where hard bottom occurs immediately
offshore of the nourished beach or near borrow areas. Continuing priority needs include establishing
baseline data on the extent and quality of ocean hard bottom & fish use, monitoring water quality trends
in bottom waters of the coastal ocean, and monitoring the effect of beach nourishment projects on
nearshore hard bottom.

2010 Coastal Habitat Protection Plan
Executive Summary Page vii
Ecosystem management is an approach to maintaining or restoring the composition, structure, function,
and delivery of ecosystem services that focuses on multiple interdependent species and/or habitats rather
than single species or habitats. The 2010 CHPP, while looking at each habitat individually also examines
the interrelationship among habitats. Almost all threats mentioned in the CHPP affected more than one
habitat and all habitats are affected by more than one threat. The largest threat to coastal fish habitats is
the cumulative impact of multiple threats. Similarly, no single habitat is the most ecologically important.
Multiple habitats are needed to maintain the functions of the entire system. Areas having high quality,
structurally complex and diverse habitats are known to support ecosystem stability and resilience and
should be high priorities for protection and conservation. To accomplish this, the CHPP recommended
identification of Strategic Habitat Areas, which are habitat complexes of exceptional habitat quality or
that are particularly at risk due to imminent threat, rarity, or vulnerability. The MFC approved a process
in 2006, the first assessment (Region 1 - Albemarle Sound area) was completed in 2008, and the second
assessment for Region 2 (Pamlico Sound and the Pamlico and Neuse rivers) began in April 2010.
The 2010 CHPP identifies numerous management needs, some accomplished, others with progress,
without progress, or newly identified. The CHPP staff and CSC reviewed these management needs to
determine if the existing goals and recommendations established in the 2005 CHPP adequately addressed
all the specific management needs. The results suggested some necessary revision of the
goals/recommendation language. New recommendations are in bold, italic font below. The goals and
recommendations listed below will serve as the new guiding framework for CHPP implementation over
the next five years.
GOAL 1. IMPROVE EFFECTIVENESS OF EXISTING RULES AND PROGRAMS PROTECTING
COASTAL FISH HABITATS
1. Continue to enhance enforcement of, and compliance with, Coastal Resources Commission
(CRC), Environmental Management Commission (EMC), Marine Fisheries Commission (MFC),
and Wildlife Resources Commission (WRC) rules and permit conditions.
2. Coordinate and enhance water quality, physical habitat, and fisheries resource monitoring
(including data management) from headwaters to the nearshore ocean.
3. Enhance and expand educational outreach on the value of fish habitat, threats from land-use and
human activities, climate change, and reasons for management measures.
4. Coordinate rulemaking and data collection for enforcement among regulatory commissions and
agencies.
5. Develop and enhance assessment and management tools for addressing cumulative impacts.
6. Enhance control of invasive species with existing programs.
GOAL 2. IDENTIFY, DESIGNATE, AND PROTECT STRATEGIC HABITAT AREAS
1. Support Strategic Habitat Area assessments by:
a. Coordinating, completing, and maintaining baseline habitat mapping (including seagrass,
shell bottom, shoreline, and other bottom types) using the most appropriate technology.
b. Selective monitoring of the status of those habitats, and
c. Assessing fish-habitat linkages and effects of land use and human activities on those
habitats
2. Identify, designate, and protect Strategic Habitat Areas.
GOAL 3. ENHANCE HABITAT AND PROTECT IT FROM PHYSICAL IMPACTS
1. Expand habitat restoration in accordance with ecosystem restoration plans, including:
a. Creation of subtidal oyster reef no-take sanctuaries.
b. Re-establishment of riparian wetlands and stream hydrology.
2010 Coastal Habitat Protection Plan
Executive Summary Page viii
c. Restoration of SAV habitat and shallow soft bottom nurseries.
d. Developing compensatory mitigation process to restore lost fish habitat functions.
2. Sustain healthy barrier island systems by maintaining and enhancing ecologically sound
policies for ocean and inlet shorelines and implement a comprehensive beach and inlet
management plan that provides ecologically based guidelines to protect fish habitat and address
socio-economic concerns.
3. Protect habitat from fishing gear effects through improved enforcement, establishment of
protective buffers around habitats, modified rules, and further restriction of fishing gears, where
necessary.
4. Protect estuarine and public trust shorelines and shallow water habitats by revising shoreline
stabilization rules to include consideration of erosion rates and prefer alternatives to vertical
shoreline stabilization measures that maintain shallow nursery habitat.
5. Protect and enhance habitat for migratory fishes by:
a. Incorporating the water quality and quantity needs of fish in water use planning and rule
making.
b. Eliminating or modifying obstructions to fish movements, such as dams and culverts, to
improve fish passage.
6. Ensure that energy development and infrastructure is designed and sited in a manner that
minimizes negative impacts to fish habitat, avoids new obstructions to fish passage, and where
possible provides positive impacts.
7. Protect important fish habitat functions from damage associated with activities such as
dredging and filling.
8. Develop coordinated policies including management adaptations and guidelines to increase
resiliency of fish habitat to climate change and sea level rise.
GOAL 4. ENHANCE AND PROTECT WATER QUALITY
1. Reduce point source pollution discharge by:
a. Increasing inspections of discharge treatment facilities, collection infrastructure, and
disposal sites.
b. Providing incentives for upgrading all types of discharge treatment systems.
c. Develop standards and treatment facilities that minimize the threat of endocrine
disrupting chemicals on aquatic life.
2. Adopt or modify rules or statutes to prohibit ocean wastewater discharges.
3. Prevent additional shellfish and swimming closures through targeted water quality restoration and
prohibit new or expanded stormwater outfalls to coastal beaches and to coastal shellfishing waters
(EMC surface water classifications SA and SB) except during times of emergency (as defined by
the Division of Water Quality‘s Stormwater Flooding Relief Discharge Policy) when public
safety and health are threatened, and continue to phase-out existing outfalls by implementing
alternative stormwater management strategies.
4. Enhance coordination with, and financial/technical support for, local government actions to better
manage stormwater and wastewater.
5. Improve strategies throughout the river basins to reduce non-point pollution and minimize
cumulative losses of fish habitats through voluntary actions, assistance, and incentives, including:
a. Improved methods to reduce pollution from construction sites, agriculture, and forestry.
b. Increased on-site infiltration of stormwater.
c. Documentation and monitoring of small but cumulative impacts to fish habitats from
approved, un-mitigated activities.
d. Encouraging and providing incentives for low impact development.
e. Increased inspections of onsite wastewater treatment facilities.
f. Increased water re-use and recycling.
2010 Coastal Habitat Protection Plan
Executive Summary Page ix
6. Improve strategies throughout the river basins to reduce non-point pollution and minimize
cumulative losses of fish habitats through rule making, including:
a. Increased use of effective vegetated buffers.
b. Implementing and assessing coastal stormwater rules and modify if justified.
c. Modified water quality standards that are adequate to support SAV habitat.
7. Maintain adequate water quality conducive to the support of present and future aquaculture.
8. Reduce non-point source pollution from large-scale animal operations by the following actions:
a. Support early implementation of environmentally superior alternatives to the current
lagoon and spray field systems as identified under the Smithfield Agreement and
continue the moratorium on new/expanded swine operations until alternative waste
treatment technology is implemented.
b. Seek additional funding to phase-out large-scale animal operations in sensitive areas and
relocate operations from sensitive areas, where necessary.
c. Use improved siting criteria to protect fish habitat.

2010 Coastal Habitat Protection Plan
Executive Summary Page x
2010 Coastal Habitat Protection Plan
Table of Contents Page xi
TABLE OF CONTENTS
Acknowledgements ....................................................................................................................................... ii
Executive Summary ..................................................................................................................................... iii
GOAL 1. IMPROVE EFFECTIVENESS OF EXISTING RULES AND PROGRAMS PROTECTING
COASTAL FISH HABITATS ............................................................................................... vii GOAL 2. IDENTIFY, DESIGNATE, AND PROTECT STRATEGIC HABITAT AREAS .................... vii GOAL 3. ENHANCE HABITAT AND PROTECT IT FROM PHYSICAL IMPACTS ........................ vii GOAL 4. ENHANCE AND PROTECT WATER QUALITY ............................................................... viii
Table of Contents ......................................................................................................................................... xi
List of Tables ............................................................................................................................................. xxi
List of Figures ........................................................................................................................................... xxv
List of Maps ............................................................................................................................................. xxvi
Chapter 1. Introduction ................................................................................................................................. 1
HABITAT AND WATER QUALITY CONCERNS .............................................................................................. 1 1.2. THE FISHERIES REFORM ACT AND COASTAL HABITAT PROTECTION PLANS .................................... 2 1.3. AUTHORITY FOR MANAGEMENT AND PROTECTION OF PUBLIC TRUST RESOURCES ........................... 2 1.4. PURPOSE AND ORGANIZATION OF DOCUMENT ................................................................................... 4 1.5. AREA DESCRIPTION ............................................................................................................................ 7
1.5.1. Land use and human population ................................................................................................. 9 1.5.2. Fisheries and protected species ................................................................................................ 12
1.5.2.1. Fisheries ............................................................................................................................. 13 1.5.2.2. Protected species ................................................................................................................ 15
1.6. STATUS OF FISHERIES ....................................................................................................................... 16 1.7. HABITAT CONCEPTS AND TERMINOLOGY ......................................................................................... 20
Chapter 2. Water Column ........................................................................................................................... 24
2.1. DESCRIPTION AND DISTRIBUTION .................................................................................................... 24 2.1.1. Creeks and rivers ...................................................................................................................... 25 2.1.2. Lakes and ponds ........................................................................................................................ 27 2.1.3. Estuarine systems ...................................................................................................................... 27 2.1.4. Marine systems ......................................................................................................................... 30 2.1.5. Fish assemblages by system ...................................................................................................... 30 2.1.6. Fish habitat requirements ......................................................................................................... 33
2.1.6.1. Flow and water movement ................................................................................................. 33 2.1.6.2. pH ....................................................................................................................................... 33 2.1.6.3. Temperature ....................................................................................................................... 34 2.1.6.4. Dissolved oxygen ............................................................................................................... 35 2.1.6.5. Light and water clarity ....................................................................................................... 36
2.2. ECOLOGICAL ROLE AND FUNCTIONS ................................................................................................ 37 2.2.1. Productivity ............................................................................................................................... 37 2.2.2. Fish utilization .......................................................................................................................... 38
2.2.2.1. Corridor and connectivity .................................................................................................. 39 2.2.2.2. Spawning ............................................................................................................................ 39
Anadromous fish spawning ......................................................................................................... 41 Estuarine spawning ..................................................................................................................... 42 Marine spawning ......................................................................................................................... 44
2010 Coastal Habitat Protection Plan
Table of Contents Page xii
2.2.2.3. Nurseries ............................................................................................................................ 47 Anadromous fish nurseries.......................................................................................................... 48 Low- and high-salinity nurseries ................................................................................................. 49 High-salinity nurseries ................................................................................................................ 52
2.2.2.4. Foraging ............................................................................................................................. 53 2.2.2.5. Refuge ................................................................................................................................ 54
2.3. STATUS AND TRENDS........................................................................................................................ 55 2.3.1. Physical and chemical environment ......................................................................................... 55
2.3.1.1. Causes of impairment ......................................................................................................... 59 2.3.1.2. Sources of impairment ....................................................................................................... 61 2.3.1.3. Assessment needs relative to aquatic life ........................................................................... 62
2.3.2. Fish kills .................................................................................................................................... 63 2.3.3. Fisheries associated with pelagic habitat ................................................................................. 64 2.3.4. Water column restoration and enhancement ............................................................................ 65 2.3.5. Designations ............................................................................................................................. 69
2.3.5.1. Regulatory .......................................................................................................................... 69 2.3.5.2. Non-regulatory ................................................................................................................... 73
2.4. THREATS AND MANAGEMENT NEEDS ............................................................................................... 74 2.4.1. Hydrological modifications ...................................................................................................... 74
2.4.1.1. Flow regulation .................................................................................................................. 74 Dams/impoundments .................................................................................................................. 74 Water withdrawals ...................................................................................................................... 78
2.4.1.2. Road fill and culverts ......................................................................................................... 83 2.4.1.3. Channelization and drainage .............................................................................................. 86 2.4.1.4. Dredging (navigation channels and boat basins) ............................................................... 87 2.4.1.5. Mining ................................................................................................................................ 88 2.4.1.6. Jetties and groins ................................................................................................................ 89 2.4.1.7. Shoreline stabilization ........................................................................................................ 90 2.4.1.8. Fishing gear impacts .......................................................................................................... 90
2.4.2. Water quality degradation – sources ........................................................................................ 90 2.4.2.1. Point sources ...................................................................................................................... 91 2.4.2.2. Marinas and multi-slip docking facilities ........................................................................... 95 2.4.2.3. Land use and non-point sources ....................................................................................... 101
Land use trends ......................................................................................................................... 103 Studies comparing land use and water quality .......................................................................... 106 Non-point source management ................................................................................................. 110
2.4.3. Water quality degradation – causes ....................................................................................... 121 2.4.3.1. Eutrophication and oxygen depletion............................................................................... 121
Sources of nutrient enrichment ................................................................................................. 123 Status and trends in nutrient enrichment ................................................................................... 125
2.4.3.2. Suspended sediment and turbidity ................................................................................... 129 Sources of turbidity and sedimentation ..................................................................................... 130 Status and trends in turbidity/sedimentation ............................................................................. 131
2.4.3.3. Toxic chemicals ............................................................................................................... 132 Toxicity and bioaccumulation ................................................................................................... 133 Endocrine disruptors ................................................................................................................. 135 Pesticides................................................................................................................................... 139 Fossil fuels ................................................................................................................................ 140 Other toxins ............................................................................................................................... 141 Status and trends in toxic contamination .................................................................................. 142
2.4.3.4. Other causes of water quality degradation ....................................................................... 142
2010 Coastal Habitat Protection Plan
Table of Contents Page xiii
Saline discharge ........................................................................................................................ 142 Marine debris ............................................................................................................................ 144
2.4.4. Non-native, invasive, or nuisance species .............................................................................. 144 2.4.5. Sea level rise and climate change ........................................................................................... 145 2.4.6. Management and research needs and accomplishments ........................................................ 147
2.4.6.1. Research needs and progress (2005-2010) ....................................................................... 147 Accomplished research needs ................................................................................................... 147 Research needs with progress ................................................................................................... 147 Research needs without progress .............................................................................................. 147 Emerging research needs .......................................................................................................... 148
2.4.6.2. Management needs and progress (2005-2010) ................................................................ 149 Accomplished management needs ............................................................................................ 149 Management needs with progress ............................................................................................. 150 Management needs without progress ........................................................................................ 151 Emerging management needs ................................................................................................... 153
2.5. SUMMARY OF WATER COLUMN CHAPTER ...................................................................................... 157
Chapter 3. Shell Bottom ............................................................................................................................ 171
3.1. DESCRIPTION AND DISTRIBUTION .................................................................................................. 171 3.1.1. Definition ................................................................................................................................ 171 3.1.2. Description .............................................................................................................................. 171 3.1.3. Habitat requirements .............................................................................................................. 172 3.1.4. Distribution ............................................................................................................................. 172
3.1.4.1. Shellfish habitat and abundance mapping ........................................................................ 173 3.2. ECOLOGICAL ROLE AND FUNCTIONS .............................................................................................. 174
3.2.1. Ecosystem enhancement.......................................................................................................... 174 3.2.1.1. Water quality enhancement .............................................................................................. 174 3.2.1.2. Habitat Enhancement ....................................................................................................... 175
3.2.2. Productivity ............................................................................................................................. 176 3.2.3. Fish utilization ........................................................................................................................ 176 3.2.4. Specific biological functions ................................................................................................... 177
3.2.4.1. Refuge .............................................................................................................................. 177 3.2.4.2. Spawning .......................................................................................................................... 179 3.2.4.3. Nursery ............................................................................................................................. 179 3.2.4.4. Foraging ........................................................................................................................... 179 3.2.4.5. Corridor and Connectivity ............................................................................................... 180
3.3. STATUS AND TRENDS...................................................................................................................... 180 3.3.1. Status of shell bottom habitat .................................................................................................. 180 3.3.2. Status of associated fishery stocks .......................................................................................... 183 3.3.3. Shell bottom enhancement and restoration ............................................................................. 184
3.3.3.1. For fishery enhancement .................................................................................................. 184 3.3.3.2. For ecosystem enhancement ............................................................................................ 186 3.3.3.3. For mitigation ................................................................................................................... 189 3.3.3.4. Planning efforts ................................................................................................................ 189
3.3.4. Designated areas .................................................................................................................... 190 3.4. THREATS AND MANAGEMENT NEEDS ............................................................................................. 190
3.4.1. Physical threats and hydrologic modifications ....................................................................... 191 3.4.1.1. Water-dependent development ........................................................................................ 191 3.4.1.2. Fishing gear impacts ........................................................................................................ 192
Mobile bottom disturbing fishing gear ...................................................................................... 192 Hand harvest ............................................................................................................................. 194
2010 Coastal Habitat Protection Plan
Table of Contents Page xiv
3.4.2. Water quality degradation ...................................................................................................... 195 3.4.2.1. Nutrient and eutrophication ............................................................................................. 195 3.4.2.2. Sedimentation and turbidity ............................................................................................. 197 3.4.2.3. Microbial contamination .................................................................................................. 197 3.4.2.4. Toxic chemicals ............................................................................................................... 198
Endocrine disrupting chemicals ................................................................................................ 200 Fossil fuels ................................................................................................................................ 200
3.4.3. Diseases and microbial stressors ............................................................................................ 201 3.4.4. Non-native, invasive, or nuisance species .............................................................................. 202 3.4.5. Sea level rise and climate change ........................................................................................... 204 3.4.6. Management needs and accomplishments .............................................................................. 206
3.4.6.1. Research needs and progress (2005-2010) ....................................................................... 206 Accomplished research needs ................................................................................................... 206 Research needs with progress ................................................................................................... 206 Research needs with no progress .............................................................................................. 206 Emerging research needs .......................................................................................................... 206
3.4.6.2. Management needs and progress (2005-2010) ................................................................ 207 Accomplished management needs ............................................................................................ 207 Management needs with progress ............................................................................................. 207 Management needs with no progress ........................................................................................ 208 Emerging management needs ................................................................................................... 208
3.5. SHELL BOTTOM SUMMARY ............................................................................................................. 209
Chapter 4. Submerged Aquatic Vegetation ............................................................................................... 222
4.1. DESCRIPTION AND DISTRIBUTION .................................................................................................. 222 4.1.1. Definition ................................................................................................................................ 222 4.1.2. Description .............................................................................................................................. 223 4.1.3. Habitat requirements .............................................................................................................. 224
4.1.3.1. High salinity SAV/sea grasses (18-30ppt) ....................................................................... 227 4.1.3.2. Moderate salinity/brackish SAV (5-18ppt) ...................................................................... 227 4.1.3.3. Freshwater-low salinity SAV (0-5ppt) ............................................................................. 227
4.1.4. Distribution ............................................................................................................................. 228 4.2. ECOLOGICAL ROLE AND FUNCTIONS .............................................................................................. 229
4.2.1. Productivity ............................................................................................................................. 230 4.2.2. Ecosystem enhancement.......................................................................................................... 230 4.2.3. Fish utilization ........................................................................................................................ 231
4.2.3.1. Moderate-high salinity SAV ............................................................................................ 231 4.2.3.2. Freshwater-low salinity SAV ........................................................................................... 233
4.2.4. Specific biological functions ................................................................................................... 234 4.2.4.1. Refuge .............................................................................................................................. 234 4.2.4.2. Spawning .......................................................................................................................... 235 4.2.4.3. Nursery ............................................................................................................................. 235 4.2.4.4. Foraging ........................................................................................................................... 237 4.2.4.5. Corridor and connectivity ................................................................................................ 237
4.3. STATUS AND TRENDS...................................................................................................................... 238 4.3.1. Status of submerged aquatic vegetation habitat ..................................................................... 238 4.3.2. Status of associated fishery stocks .......................................................................................... 241 4.3.3. Submerged aquatic vegetation restoration and enhancement ................................................ 242 4.3.4. Designated areas .................................................................................................................... 245
4.4. THREATS AND MANAGEMENT NEEDS ............................................................................................. 245 4.4.1. Physical threats ....................................................................................................................... 246
2010 Coastal Habitat Protection Plan
Table of Contents Page xv
4.4.1.1. Water-dependent development ........................................................................................ 246 Dredging (navigation channels and boat basins) ...................................................................... 246 Shoreline stabilization ............................................................................................................... 248 Marinas and docks .................................................................................................................... 248 Infrastructure ............................................................................................................................. 250
4.4.1.2. Boating activity ................................................................................................................ 250 4.4.1.3. Fishing gear impacts ........................................................................................................ 251
Scallop dredging ....................................................................................................................... 254 Mechanical clam harvesting...................................................................................................... 254
4.4.2. Water quality degradation ...................................................................................................... 255 4.4.2.1. Nutrients and sediment ..................................................................................................... 255 4.4.2.2. Toxic chemicals ............................................................................................................... 259
Herbicides ................................................................................................................................. 259 Fossil fuels ................................................................................................................................ 259
4.4.3. Non-native, invasive, or nuisance species .............................................................................. 260 4.4.4. Diseases and microbial stressors ............................................................................................ 262 4.4.5. Sea level rise and climate change ........................................................................................... 262 4.4.6. Management needs and accomplishments .............................................................................. 263
4.4.6.1. Research needs and progress (2005-2010) ....................................................................... 264 Accomplished research needs ................................................................................................... 264 Research needs with progress ................................................................................................... 264 Research needs without progress .............................................................................................. 265 Emerging research needs .......................................................................................................... 265
4.4.6.2. Management needs and progress (2005-2010) ................................................................ 266 Accomplished management needs ............................................................................................ 266 Management needs with progress ............................................................................................. 267 Management needs without progress ........................................................................................ 268 Emerging management needs ................................................................................................... 269
4.5. SUMMARY OF SUBMERGED AQUATIC VEGETATION CHAPTER ........................................................ 270
Chapter 5. Wetlands .................................................................................................................................. 273
5.1. DESCRIPTION AND DISTRIBUTION .................................................................................................. 273 5.1.1. Definition ................................................................................................................................ 273 5.1.2. Description .............................................................................................................................. 274 5.1.3. Habitat requirements .............................................................................................................. 275
5.1.3.1. Estuarine wetlands ........................................................................................................... 275 5.1.3.2. Riverine wetlands ............................................................................................................. 276 5.1.3.3. Headwater swamps .......................................................................................................... 276
5.1.4. Distribution ............................................................................................................................. 276 5.1.4.1 Salt/brackish marsh ........................................................................................................... 277 5.1.4.2. Estuarine shrub/scrub ....................................................................................................... 277 5.1.4.3. Estuarine forests ............................................................................................................... 277 5.1.4.4. Freshwater marsh (riparian only) ..................................................................................... 277 5.1.4.5. Riverine forested wetlands (riparian only) ....................................................................... 277 5.1.4.6. Headwater swamps (riparian only) .................................................................................. 278
5.2. ECOLOGICAL ROLE AND FUNCTIONS .............................................................................................. 280 5.2.1. Ecosystem enhancement.......................................................................................................... 280 5.2.2. Productivity ............................................................................................................................. 282 5.2.3. Fish utilization ........................................................................................................................ 283
5.2.3.1. Salt/brackish marsh .......................................................................................................... 283 5.2.3.2. Freshwater marsh ............................................................................................................. 283
2010 Coastal Habitat Protection Plan
Table of Contents Page xvi
5.2.3.3. Bottomland hardwood and riverine swamp forest ........................................................... 285 5.2.3.4. Flat/depressional wetlands ............................................................................................... 285
5.2.4. Specific biological functions ................................................................................................... 285 5.2.4.1. Nursery ............................................................................................................................. 285
Salt/brackish marsh ................................................................................................................... 285 Freshwater marsh ...................................................................................................................... 286 Bottomland hardwood and riverine swamp forest .................................................................... 287
5.2.4.2. Foraging ........................................................................................................................... 287 Salt/brackish marsh ................................................................................................................... 287 Freshwater marsh ...................................................................................................................... 288 Bottomland hardwood and riverine swamp forest .................................................................... 288
5.2.4.3. Refuge .............................................................................................................................. 288 5.2.4.4. Spawning .......................................................................................................................... 288 5.2.4.5. Corridor and connectivity ................................................................................................ 289
5.3. STATUS AND TRENDS...................................................................................................................... 289 5.3.1. History of loss and regulatory action ..................................................................................... 289
5.3.1.1. Historic loss of wetland habitat ........................................................................................ 289 5.3.1.2. Regulatory response to historic losses ............................................................................. 292 5.3.1.3. Recent loss of wetland habitat (1994-present) ................................................................. 294 5.3.1.4. Regulatory response to recent losses................................................................................ 297
5.3.2. Status of associated fishery stocks .......................................................................................... 298 5.3.3. Wetland enhancement and restoration ................................................................................... 299
5.3.3.1. North Carolina Ecosystem Enhancement Program .......................................................... 302 5.3.3.2. Other initiatives ................................................................................................................ 304 5.3.3.3. Evaluating mitigation/restoration efforts ......................................................................... 304
5.3.4. Designated areas .................................................................................................................... 307 5.3.4.1. Regulatory ........................................................................................................................ 307 5.3.4.2. Non-regulatory ................................................................................................................. 308
5.4. THREATS AND MANAGEMENT NEEDS ............................................................................................. 309 5.4.1. Physical threats and hydrologic modifications ....................................................................... 309
5.4.1.1. Water-dependent development ........................................................................................ 310 Dredging (navigation channels and boat basins) ...................................................................... 310 Shoreline stabilization ............................................................................................................... 310 Marinas and docks .................................................................................................................... 318 Infrastructure ............................................................................................................................. 319
5.4.1.2. Upland development ........................................................................................................ 320 5.4.1.3. Mining .............................................................................................................................. 320 5.4.1.4. Channelization and drainage ............................................................................................ 321 5.4.1.5. Obstructions ..................................................................................................................... 322 5.4.1.6. Water withdrawals ........................................................................................................... 322 5.4.1.7. Boating activity ................................................................................................................ 322
5.4.2. Water quality degradation ...................................................................................................... 323 5.4.2.1. Sulfate enrichment ....................................................................................................... 323 5.4.2.2. Fossil fuels ................................................................................................................... 324
5.4.3. Non-native, invasive, or nuisance species .............................................................................. 324 5.4.4. Sea level rise and climate change ........................................................................................... 325 5.4.5. Management needs and accomplishments .............................................................................. 328
5.4.5.1. Research needs and progress (2005-2010) ....................................................................... 328 Research needs with progress ................................................................................................... 328 Research needs with no progress .............................................................................................. 328 Emerging research needs .......................................................................................................... 328
2010 Coastal Habitat Protection Plan
Table of Contents Page xvii
5.4.5.2. Management needs and progress (2005-2010) ................................................................ 329 Accomplished management needs ............................................................................................ 329 Management needs with progress ............................................................................................. 329 Management needs with no progress ........................................................................................ 329 Emerging management needs ................................................................................................... 330
5.5. WETLANDS CHAPTER SUMMARY .................................................................................................... 332
Chapter 6. Soft Bottom ............................................................................................................................. 339
6.1. DESCRIPTION AND DISTRIBUTION .................................................................................................. 339 6.1.1. Definition ................................................................................................................................ 339 6.1.2. Habitat requirements .............................................................................................................. 339 6.1.3. Description and distribution ................................................................................................... 339
6.1.3.1. Freshwater soft bottom..................................................................................................... 341 6.1.3.2. Estuarine soft bottom ....................................................................................................... 341 6.1.3.3. Ocean soft bottom ............................................................................................................ 342
6.2. ECOLOGICAL ROLE AND FUNCTIONS .............................................................................................. 343 6.2.1. Ecosystem enhancement.......................................................................................................... 343 6.2.2. Productivity ............................................................................................................................. 344
6.2.2.1. Freshwater and estuarine .................................................................................................. 344 6.2.2.2. Marine .............................................................................................................................. 345
6.2.3. Benthic community structure .................................................................................................. 345 6.2.3.1. Freshwater ........................................................................................................................ 345 6.2.3.2. Estuarine .......................................................................................................................... 345 6.2.3.3. Marine .............................................................................................................................. 346
6.2.4. Fish utilization ........................................................................................................................ 346 6.2.5. Specific biological functions ................................................................................................... 348
6.2.5.1. Foraging ........................................................................................................................... 348 6.2.5.2. Spawning .......................................................................................................................... 349 6.2.5.3. Nursery ............................................................................................................................. 349 6.2.5.4. Refuge .............................................................................................................................. 351 6.2.5.5. Corridor and connectivity ................................................................................................ 351
6.3. STATUS AND TRENDS...................................................................................................................... 352 6.3.1. Status of soft bottom habitat ................................................................................................... 352 6.3.2. Status of associated fishery stocks .......................................................................................... 352
6.3.2.1. Fishery independent monitoring programs ...................................................................... 352 6.3.3. Designated areas .................................................................................................................... 355
6.4. THREATS AND MANAGEMENT NEEDS ............................................................................................. 356 6.4.1. Physical threats ....................................................................................................................... 356
6.4.1.1. Water-dependent development ........................................................................................ 356 Dredging (navigation channels and boat basins) ...................................................................... 356 Dredge material disposal on subtidal bottom ............................................................................ 357 Marinas and docks .................................................................................................................... 358 Shoreline stabilization ............................................................................................................... 360
6.4.1.2. Infrastructure .................................................................................................................... 376 Oil and gas development ........................................................................................................... 376 Wind Energy ............................................................................................................................. 377
6.4.1.3. Off-road vehicles.............................................................................................................. 377 6.4.2. Mining/salvage ........................................................................................................................ 378
6.4.2.1. Minerals ........................................................................................................................... 378 6.4.2.2. Logs/pilings ...................................................................................................................... 378
6.4.3. Fishing gear impacts............................................................................................................... 378
2010 Coastal Habitat Protection Plan
Table of Contents Page xviii
6.4.3.1. Mobile bottom disturbing gear ......................................................................................... 379 Dredging ................................................................................................................................... 379 Bottom trawling ........................................................................................................................ 379 Status and trends of estuarine and ocean trawling .................................................................... 382 Active Gillnet Techniques ........................................................................................................ 385
6.4.4. Water quality degradation ...................................................................................................... 385 6.4.4.1. Eutrophication and oxygen depletion............................................................................... 386 6.4.4.2. Sedimentation and turbidity ............................................................................................. 388 6.4.4.3. Toxic chemicals ............................................................................................................... 389
Fossil fuels ................................................................................................................................ 390 Heavy metals ............................................................................................................................. 390 PAHs, PCBs, and pesticides ..................................................................................................... 391 Status of sediment contamination ............................................................................................. 392 Resident time ............................................................................................................................ 393
6.4.4.4. Sewage spill ..................................................................................................................... 393 6.4.5. Non-native, invasive, and nuisance species ............................................................................ 393 6.4.6. Climate change and sea level rise .......................................................................................... 394 6.4.7. Management needs and accomplishments .............................................................................. 395
6.4.7.1. Research needs and progress (2005-2010) ....................................................................... 395 Accomplished research needs ................................................................................................... 395 Research needs with progress ................................................................................................... 395 Research needs without progress .............................................................................................. 396 Emerging research needs .......................................................................................................... 396
6.4.7.2. Management needs and progress (2005-2010) ................................................................ 396 Accomplished management needs ............................................................................................ 396 Management needs with progress ............................................................................................. 396 Management needs without progress ........................................................................................ 397 Emerging management needs ................................................................................................... 398
6.5. SUMMARY OF SOFT BOTTOM CHAPTER ......................................................................................... 399
Chapter 7. Hard Bottom ............................................................................................................................ 414
7.1. DESCRIPTION AND DISTRIBUTION .................................................................................................. 414 7.1.1. Definition ................................................................................................................................ 414 7.1.2. Description .............................................................................................................................. 414 7.1.3. Habitat requirements .............................................................................................................. 415 7.1.4. Distribution ............................................................................................................................. 415
7.1.4.1. Hard bottom mapping ...................................................................................................... 415 7.1.4.2. Distribution of man-made hard bottom ............................................................................ 417
7.2. ECOLOGICAL ROLE AND FUNCTIONS .............................................................................................. 417 7.2.1. Ecosystem enhancement.......................................................................................................... 417 7.2.2. Productivity ............................................................................................................................. 417 7.2.3. Benthic community structure .................................................................................................. 418 7.2.4. Fish utilization of natural hard bottom ................................................................................... 419 7.2.5. Fish utilization of man-made structures ................................................................................. 422 7.2.6. Specific biological functions ................................................................................................... 422
7.2.6.1. Refuge and foraging ......................................................................................................... 422 7.2.6.2. Spawning .......................................................................................................................... 423 7.2.6.3. Nursery ............................................................................................................................. 423 7.2.6.4. Corridor and connectivity ................................................................................................ 423
7.3. STATUS AND TRENDS...................................................................................................................... 424 7.3.1. Status of hard bottom habitat .................................................................................................. 424
2010 Coastal Habitat Protection Plan
Table of Contents Page xix
7.3.2. Status of associated fishery stocks .......................................................................................... 424 7.3.3. Hard bottom enhancement ...................................................................................................... 425 7.3.4. Designated areas .................................................................................................................... 426
7.4. THREATS AND MANAGEMENT NEEDS ............................................................................................. 428 7.4.1. Water-dependent development ................................................................................................ 428
7.4.1.1. Dredging (navigation channels and boat basins) ............................................................. 428 7.4.1.2. Shoreline stabilization ...................................................................................................... 428 7.4.1.3. Energy infrastructure ........................................................................................................ 430
7.4.2. Boating activity ....................................................................................................................... 432 7.4.2.1. Anchoring and diving....................................................................................................... 432
7.4.3. Fishing gear impacts............................................................................................................... 432 7.4.3.1. Mobile bottom disturbing gear ......................................................................................... 432 7.4.3.2. Passive capture techniques ............................................................................................... 434 7.4.3.3. Rod and reel ..................................................................................................................... 434
7.4.4. Water quality degradation ...................................................................................................... 435 7.4.5. Non-native, invasive, or nuisance species .............................................................................. 436 7.4.6. Climate change ....................................................................................................................... 437 7.4.7. Management needs and accomplishments .............................................................................. 437
7.4.7.1. Research needs and progress (2005-2010) ....................................................................... 438 Accomplished research needs ................................................................................................... 438 Research needs with progress ................................................................................................... 438 Research needs without progress .............................................................................................. 438 Emerging research needs .......................................................................................................... 438
7.4.7.2. Management needs and progress (2005-2010) ................................................................ 439 Accomplished management needs ............................................................................................ 439 Management needs with progress ............................................................................................. 439 Management needs without progress ........................................................................................ 439 Emerging management needs ................................................................................................... 440
7.5. HARD BOTTOM SUMMARY .............................................................................................................. 441
Chapter 8. Ecosystem Management and Strategic Habitat Areas ............................................................. 446
THREATS AND CUMULATIVE IMPACTS .................................................................................................. 448 STRATEGIC HABITAT AREAS ................................................................................................................ 449 OTHER HABITAT DESIGNATIONS AND PROTECTION PROGRAMS ........................................................... 450
Chapter 9. Management Recommendations ............................................................................................. 454
9.1 INTRODUCTION ................................................................................................................................ 454 9.2. PUBLIC INPUT ................................................................................................................................. 454 9.3. RECOMMENDATIONS ...................................................................................................................... 455
GOAL 1. IMPROVE EFFECTIVENESS OF EXISTING RULES AND PROGRAMS PROTECTING
COASTAL FISH HABITATS ............................................................................................. 456 GOAL 2. IDENTIFY, DESIGNATE, AND PROTECT STRATEGIC HABITAT AREAS .................. 456 GOAL 3. ENHANCE HABITAT AND PROTECT IT FROM PHYSICAL IMPACTS ...................... 456 GOAL 4. ENHANCE AND PROTECT WATER QUALITY .............................................................. 457
9.4. POSSIBLE FUNDING SOURCES ......................................................................................................... 458
Literature Cited ......................................................................................................................................... 464
Appendix A. State, Federal, and Interstate Authorities Affecting Coastal Fish Habitat in North Carolina
........................................................................................................................................................... 590
Appendix B. CHPP Steering Committee and Plan Development Team (2005-2010) .............................. 592
2010 Coastal Habitat Protection Plan
Table of Contents Page xx
CHPP STEERING COMMITTEE ............................................................................................................... 592 Marine Fisheries Commission .......................................................................................................... 592 Environmental Management Commission ........................................................................................ 592 Coastal Resources Commission ........................................................................................................ 592 Wildlife Resources Commission ........................................................................................................ 592
CHPP DEVELOPMENT TEAM................................................................................................................. 593
Appendix C. Part 1 (Acronyms) ............................................................................................................... 594
Appendix C. Part 2 (Definitions) .............................................................................................................. 598
Appendix D. Common and Scientific Names of Selected Fish and Invertebrates Cited in This Document
........................................................................................................................................................... 602
Appendix E. Existing State and Federal Agency Programs That May Affect Water Quality (Source:
Estuarine Shoreline Protection Stakeholders Report 1999) .............................................................. 603
Appendix F. Effects of Environmental Pollutants on Fish Early Life Stages ........................................... 612
Appendix G. Policy Statement for Protection of SAV Habitat ................................................................. 616
The role of SAV as habitat ................................................................................................................ 616 Management guidelines .................................................................................................................... 616
Appendix H. Policies for the Protection and Restoration of Marine and Estuatine Resources and
Environmental Permit Review and Commenting .............................................................................. 618
Issue 618 Background ....................................................................................................................................... 618 Discussion ......................................................................................................................................... 618 Proposed Resource Protection and Environmental Permit Review and Commenting Policies ....... 620
Appendix I: MFC Beach Nourishment Policy .......................................................................................... 622
Policy Context ................................................................................................................................... 622 Marine and Estuarine Resources at Risk from Beach Dredge and Fill Activities ............................ 622 Threats to Marine and Estuarine Resources from Beach Dredge and Fill Activities....................... 624 Commission Policies for Beach Dredge and Fill Projects and Related Large Coastal Engineering
Projects ............................................................................................................................. 625
Appendix J: CHPP Implementation Plan (2009-2011) ............................................................................. 627
2010 Coastal Habitat Protection Plan
List of Tables Page xxi
LIST OF TABLES
Table 1.1. The water area within CHPP management regions .................................................................... 8
Table 1.2. Human population, density, and growth in Coastal Plain counties of North Carolina, 1990–
2010 ..................................................................................................................................................... 11
Table 1.3. Changes in permanent population for barrier island municipalities, 1970-2007 ...................... 12
Table 1.4. Annual Atlantic coast commercial fisheries landings by state, 1997-2007 .............................. 14
Table 1.5. Annual Atlantic coast marine recreational fisheries harvest by state, 1997-2007 .................... 14
Table 1.6. Average annual North Carolina landings for important commercial and recreational fishery
species reported during the first (1997-2002) CHPP cycle and last five years. .................................. 18
Table 1.7. Trends in the stock status of important fishery species and stocks listed in Table 1.6. (1998–
2010). .................................................................................................................................................. 19
Table 2.1. Hydrologic and hydrodynamic characteristics of major estuaries in North Carolina. .............. 29
Table 2.2. Spawning location/strategy (―spawning/nursery guild‖) and vertical orientation of some
prominent coastal fishery species. ....................................................................................................... 32
Table 2.3. Spawning seasons for coastal fish and invertebrate species occurring in North Carolina that
broadcast planktonic or semidemersal eggs. ....................................................................................... 40
Table 2.4. Physical spawning (adult) and egg development requirements for resident freshwater and
anadromous fishes inhabiting coastal North Carolina. ........................................................................ 42
Table 2.5. Water quality requirements for spawning of fish and invertebrates in the estuarine waters of
coastal North Carolina......................................................................................................................... 44
Table 2.6. Water quality requirements for fish spawning in the marine waters of coastal North Carolina.
............................................................................................................................................................. 46
Table 2.7. Peak larval abundance of seven important fish species near Beaufort Inlet. ............................ 47
Table 2.8. Larval and juvenile water quality requirements for anadromous fish species inhabiting coastal
North Carolina. .................................................................................................................................... 48
Table 2.9. Water quality requirements for selected larval and juvenile estuarine fish species inhabiting
low – high estuarine nurseries in coastal North Carolina. ................................................................... 51
Table 2.10. Water quality requirements of selected larval and juvenile coastal estuarine fish species
inhabiting high-salinity nurseries in coastal North Carolina. .............................................................. 52
Table 2.12a. DWQ Use Support status for freshwater streams and shorelines (miles) in North Carolina
coastal draining river basins (2004-2006). .......................................................................................... 58
Table 2.12b. DWQ Use Support status for estuarine creeks and shorelines (miles) in North Carolina
coastal draining river basins (2006). ................................................................................................... 58
Table 2.12c. DWQ Use Support status for estuarine and saltwater bays, inlets, and tidal areas (acres) in
North Carolina coastal draining river basins (2006). .......................................................................... 59
Table 2.13. Causes of DWQ use support impairment from 2006 assessment of freshwater streams and
shorelines (miles). ............................................................................................................................... 60
Table 2.14. Causes of DWQ use support impairment from 2006 assessment of estuarine and saltwater
bays, inlets, and tidal areas (acres). ..................................................................................................... 61
Table 2.16. Stream mitigation in coastal draining river basins (WRP 2000–2004). .................................. 68
2010 Coastal Habitat Protection Plan
List of Tables Page xxii
Table 2.17. Supplemental EMC/DWQ classification of streams in CHPP management regions. ............. 71
Table 2.18. Supplemental EMC/DWQ classification of rivers, lakes, and estuaries in CHPP management
regions. ................................................................................................................................................ 71
Table 2.19. MFC and WRC fish habitat designations in CHPP management regions. ............................. 72
Table 2.20. Coastal streams miles in lands managed for conservation (CGIA 2002 data). ....................... 74
Table 2.21. Number of documented obstructions (i.e., dams, locks, culverts) in coastal plains portion of
CHPP regions based on data from Virginia Game and Inland Fisheries (1983 data), Collier and
Odum (1989), Moser and Terra (1999), Department of Transportation (2003 data), Division of Water
Resources (2003 data), and USACE obstructions inventory (2009 data). ......................................... 75
Table 2.22. Most recent (2008) estimate of statewide water use compiled by the Division of Water
Resources, by type of use, in millions of gallons per day (mgd). ....................................................... 79
Table 2.23. Surface and groundwater volumes requiring user registration inside and outside of Central
Coastal Plain Capacity Use Area (CCPCUA), North Carolina. .......................................................... 80
Table 2.24. Current (2008) surface water withdrawals and relevant capacities derived from data reported
to DENR-Division of Water Resources and Department of Agriculture and Consumer Services
Agricultural Statistics for CHPP subregions. ...................................................................................... 81
Table 2.25. Current (2008) water withdrawals registered for agriculture and aquaculture with the
Department of Agriculture and Consumer Services and not included in Table 2.24. ......................... 82
Table 2.26. NPDES permits in coastal draining river basins of North Carolina (2006 data). ................... 93
Table 2.27. Sewage spills, in 1,000s of gallons, reaching surface waters in Coastal counties from 2002-
2009 ..................................................................................................................................................... 94
Table 2.28. Notices of Violation and civil penalty assessments issued to NPDES permittees from
reporting years 2002–2009 in coastal counties ................................................................................... 95
Table 2.29. Number of public marinas (WRC coastal boating guide 2009) within 500m of high (>15 ppt),
low (<0.5 ppt), and transitional salinity zones in coastal North Carolina. .......................................... 99
Table 2.30. Number of docking facilities along SA, SB, and SC waters with >10 slips (marinas) and 8-10
slips ................................................................................................................................................... 100
Table 2.31. Land cover and CHPP regions and subregions based on 2001 NLCD. ................................ 101
Table 2.32. Percent increase and percent coverage of urban/built-upon + rural transportation land cover
classes within North Carolina's coastal drainages ............................................................................. 105
Table 2.33. Stormwater permits by CAMA county and approximate CHPP region ............................... 106
Table 2.34. Recent coverages of shellfish density by harvest water closure area. ................................... 108
Table 2.35. Stormwater management programs and requirements in North Carolina. ............................ 111
Table 2.36. Acres of shellfish closures in SA waters from 2004 to 2009 ................................................ 113
Table 2.37. Stormwater rules for areas with one half mile of SA waters and within 575 feet of ORWs 114
Table 2.38. Current water quality standards and literature values (micrometers/liter) for measured
toxicity of selected chemicals on selected pelagic species................................................................ 134
Table 3.1. Shell bottom habitat mapped by the North Carolina Division of Marine Fisheries' Shellfish
Habitat and Abundance Mapping Program by CHPP subregions (November 2008). ...................... 174
Table 3.2. Partial listing of finfish and shellfish species observed in collections from shell bottom in
2010 Coastal Habitat Protection Plan
List of Tables Page xxiii
North Carolina, and ecological functions provided by the habitat. ................................................... 178
Table 3.3. Amount of bottom habitat mapped (acres) by the North Carolina Division of Marine Fisheries
Shellfish Habitat and Abundance Mapping Program within areas receiving specific North Carolina
Marine Fisheries Commission designations that restrict fishing activities (as of September 2008). 194
Table 3.4. Comparison of acute and chronic (sublethal) toxicity (g/l) levels for oysters and clams with
North Carolina‘s 2007 saltwater surface water quality standards. .................................................... 199
Table 4.1. Average environmental conditions at locations where submerged aquatic vegetation occurred
in coastal North Carolina, 1988-1991. .............................................................................................. 225
Table 4.2. Light requirements for SAV species found in coastal North Carolina. .................................. 225
Table 4.3. Estimated acreage of mapped SAV habitat within regions of North Carolina. The area
estimates are from a mosaic of mapping efforts spanning a time period from 1981-2008. .............. 229
Table 4.4. Partial list of species documented to use submerged aquatic vegetation habitat. ................... 232
Table 4.5. Fishing gears used in North Carolina identified as potentially damaging to submerged aquatic
vegetation habitat. ............................................................................................................................. 252
Table 4.6. Amount of mapped SAV within areas receiving specific North Carolina Marine Fisheries
Commission designations that restrict fishing activities (as of September 2008). ............................ 253
Table 4.7. Threshold nutrient and sediment concentrations for SAV. ..................................................... 257
Table 4.8. North Carolina Environmental Management Commission classifications and standards (mg/l)
related to SAV presence and condition (May 2007). ........................................................................ 258
Table 5.1. Total acreage of unaltered riparian and non-riparian wetland types by CHPP region. ........... 279
Table 5.2. Partial listing of fish and their use of wetland habitat in coastal North Carolina. .................. 284
Table 5.3. North Carolina wetland acreage estimates. ............................................................................. 290
Table 5.4. Altered coastal and riparian wetland types in CHPP regions. ................................................ 291
Table 5.5. Altered non-riparian wetland types in CHPP regions. ............................................................ 292
Table 5.6. Wetland mitigation types and their associated permitting authorities .................................... 300
Table 5.7. Net regulatory (compensatory mitigation) and non-regulatory (voluntary restoration/creation)
wetland gains in coastal river basins from 1999-2003. ..................................................................... 302
Table 5.8. Gross mitigation assets (planned and constructed) available from EEP in coastal draining river
basins of North Carolina from FY 2004/2005 to 2007/2008 ............................................................ 303
Table 5.9. Estimated wetlands acreage (1950‘s-2001), and 401 permitted impacts in North Carolina.
Note: small or unauthorized wetlands impacts and net losses due to erosion are not included in the
401 permitted impacts. ...................................................................................................................... 304
Table 5.10. The amount and percentage of each hydrogeomorphic wetland class in eastern North
Carolina located within lands managed for conservation ................................................................. 309
Table 5.11. Number of registered recreational boats of different length categories in the 20 coastal
counties of North Carolina, 2008 ...................................................................................................... 323
Table 6.1. Estimated acreage of shallow and deep bottom habitat within CHPP regions of North Carolina
........................................................................................................................................................... 340
Table 6.2. Benthic productivity estimates as measured by chlorophyll a biomass in Virginia (Chesapeake
Bay), North Carolina (Masonboro Sound), and South Carolina (North Inlet Estuary). .................... 344

2010 Coastal Habitat Protection Plan
List of Tables Page xxiv
Table 6.3. Partial list of common or important fish species occurring on soft bottom habitat in riverine,
estuarine, and ocean waters, and ecological functions provided to those species. ............................ 347
Table 6.4. Dominant juvenile fish species groupings found in the Pamlico Sound system by biotic cluster
analysis of juvenile fish data ............................................................................................................. 350
Table 6.4. Reported biological recovery time at mine sites. .................................................................... 365
Table 6.5. Reported biological recovery times at nourished ocean beaches. ........................................... 368
Table 6.6. Ongoing USACE dredge disposal projects on North Carolina ocean beaches ....................... 372
Table 6.7. North Carolina beach communities with federally authorized or requested storm damage
reduction projects by the USACE ..................................................................................................... 374
Table 6.8. North Carolina beach communities with non-federally authorized or requested storm damage
reduction projects (does not include beach disposal from navigational dredging projects). ............. 375
Table 6.9. Soft bottom trawl impact studies on the continental shelf of eastern North America. ........... 382
Table 6.10. Annual number of trips reported for shrimp, crab, and flounder trawls in NC estuarine and
ocean waters <3 miles 1, 1994-2008 ................................................................................................. 384
Table 7.1. Hard bottom and possible hard bottom locations in North Carolina state territorial waters by
coastal bay. ........................................................................................................................................ 416
Table 7.2. Fishes occurring at nearshore hard bottom in North Carolina and South Carolina coastal
waters. ............................................................................................................................................... 420
Table 7.3. Habitat utilization, stock status, and use of important fish species that occupy hard bottom
areas in North Carolina's nearshore (≤ 3 nm from shore) ocean waters. ........................................... 421
Table 8.1. Threat sources, impact severities (both measured and potential), and documentation in the
habitat chapters. ................................................................................................................................ 449
Table 9.1. Recommendations for the long-term enhancement of coastal fisheries associated with coastal
habitats. ............................................................................................................................................. 460
2010 Coastal Habitat Protection Plan
List of Figures Page xxv
LIST OF FIGURES
Figure 2.1. Average and standard deviation of monthly discharge (time period: 1969-1999, n=1,464) and
water temperature (time period: 1953-2001, data points per month=52-123). ................................... 26
Figure 2.2. Average annual discharge in the Roanoke, Tar, Neuse, and Cape Fear rivers during water
years 1983-2008, based on data from the USGS hydrologic monitoring stations. ............................. 27
Figure 2.3. The relative proportion of estuarine salinity zones within CHPP subregions (excluding the
coastal ocean). ..................................................................................................................................... 28
Figure 2.4. Annual fish kill events and mortality copied from DWQ (2008b). ......................................... 64
Figure 2.5. Stream feet impacted, by fiscal year, in coastal draining river basins (WRP 2000-2004). ..... 66
Figure 2.6. Stream feet impacted, by river basin, in North Carolina (WRP 2000-2004). .......................... 67
Figure 2.8. Stormwater programs and where their requirements apply ................................................... 111
Figure 3.1. Commerical oyster landings (in pounds of meat) by gear type from 1930 to 2007. ............. 182
Figure 3.2. Northern and southern area (separated by Newport River) average oyster spatfall per unit
cultch, 1979–2007. ............................................................................................................................ 183
Figure 3.3. North Carolina oyster rehabilitation activities for 1947–2007 .............................................. 185
Figure 3.4. Infection categories and proportion of individuals infected by Perkinsus marinus in North
Carolina 1991-2006. .......................................................................................................................... 202
Figure 5.1. Relative amount and proportion of unaltered riparian wetland types among CHPP subregions.
........................................................................................................................................................... 280
Figure 5.2. Total 401 Permitted Wetland Impacts (acres) during FY 1999/2000-2007/2008 in the seven
coastal draining river basins (excluding the Lumber River basin) by fiscal year. ............................ 294
Figure 5.3. Total 401 permitted wetlands impacts (acres) during FY 1999/2000-2007/2008 by coastal
draining river basin. .......................................................................................................................... 295
Figure 5.4. Sources of wetland impact in eastern North Carolina. .......................................................... 296
Figure 5.5. Linear miles of bulkheading authorized through a Division of Coastal Management general
permit annually, 1984-2008. ............................................................................................................ 315
Box 5.1. Coastal Resources Commission concepts/principles for estuarine shoreline stabilization policy
assessment and development. ............................................................................................................ 317
Figure 5.6. Annual number of CAMA general permits issued by the North Carolina Division of Coastal
Management for piers, 1990-2002. ................................................................................................... 319
Figure 6.1. Southern flounder juvenile abundance indices (geometric mean CPUE) from DMF Estuarine
trawl survey, core stations sampled in May and June, 1990-2008. ................................................... 353
Figure 6.2. Spot and Atlantic croaker juvenile abundance indices (geometric mean CPUE) from DMF
estuarine trawl survey core stations sampled in May and June (1990-2008). ................................... 353
Figure 7.1a. Shrimp trawl fishing effort (number of trips) in North Carolina's nearshore ocean waters (0-3
miles from shore), 1994–2007, by coastal region. ............................................................................ 433
Figure 7.1b. Flounder trawl fishing effort (number of trips) in North Carolina's nearshore ocean waters
(0-3 miles from shore), 1994–2007, by coastal region. .................................................................... 434
2010 Coastal Habitat Protection Plan
List of Maps Page xxvi
LIST OF MAPS
Map 1.1a. Hydrographic features in northern coastal North Carolina. ...................................................... 21
Map 1.1b. Hydrographic features in southern coastal North Carolina. ...................................................... 22
Map 1.2. The CHPP region and subregion boundaries (based on USGS hydrologic units), along with the
fall line separating Coastal Plains and Piedmont physiographic regions. ........................................... 23
Map 2.1. Location of U.S. Geological Survey stream gauge stations in the coastal draining river basins of
North Carolina. .................................................................................................................................. 160
Map 2.2a. Winter and spring salinity zones in eastern North Carolina ................................................... 161
Map 2.2b. Summer and fall salinity zones in eastern North Carolina ..................................................... 162
Map 2.3. Current water quality monitoring stations and 2006 impaired waters in coastal draining river
basins of North Carolina. .................................................................................................................. 163
Map 2.4. Targeted Local Watersheds, Local Watershed Plans and Ecosystem Enhancement Program
(EEP) project inventory relative to fish spawning and nursery areas (MFC/WRC designations). ... 164
Map 2.5a. Documented water control structures in the North Carolina coastal plains (northern regions)
relative to Anadromous Fish Spawning areas (AFSAs). ................................................................... 165
Map 2.5b. Documented water control structures in the North Carolina coastal plains (southern regions)
relative to Anadromous Fish Spawning Areas (AFSAs). ................................................................. 166
Map 2.6. Location of NPDES permits (DWQ 2006 data) relative to fish spawning and nursery areas. . 167
Map 2.7. Ditches, channelization, and some municipal stormwater outfalls (DWQ 2006 data) in
Albemarle Pamlico region of eastern North Carolina. Hydrographic data from 1:100,000 scale
National Hydrologic Dataset (ditching) and Natural Resource Conservation Service (channelization).
........................................................................................................................................................... 168
Map 2.8a. Dredged channels (USACE 2003 data), marinas (WRC and DEH-SS 2009 data), 10-slip docks
(DEH-SS 2009 data) and fish spawning and nursery areas............................................................... 169
Map 2.8b. Dredged channels (USACE 2003 data), marinas (WRC and DEH-SS 2009 data), 10-slip docks
(DEH-SS 2009 data) and fish spawning and nursery areas............................................................... 170
Map 3.1. General distribution of eastern oysters, hard clams, and bay scallops in the Albemarle-Pamlico
estuarine system. ............................................................................................................................... 211
Map 3.2. Areas for which the bottom type has been mapped or is planned for mapping by the DMF‘s
bottom mapping program (August 2009). ......................................................................................... 212
Map 3.3a. Estimated density of living shellfish in completed portions of the bottom mapping area from
Roanoke Island to northern Core Sound (August 2009). .................................................................. 213
Map 3.3b. Estimated density of oysters in completed portions of the bottom mapping area from southern
Core Sound to Surf City (August 2009). ........................................................................................... 214
Map 3.3c. Estimated density of oysters in completed portions of the bottom mapping area from Surf City
to Shallotte River (August 2009). ..................................................................................................... 215
Map 3.4a. Location of cultch planting sites (1998-2007), shellfish management areas and research
sanctuaries (2008), and oyster sanctuaries (2007, 2008) from Roanoke Island to northern Core
Sound. ............................................................................................................................................... 216
Map 3.4b. Location of cultch planting sites (1998-2007), shellfish management areas and research
2010 Coastal Habitat Protection Plan
List of Maps Page xxvii
sanctuaries (2008), and oyster sanctuaries (2007, 2008) from southern Core Sound to Surf City. .. 217
Map 3.4c. Location of cultch planting sites (1998-2007), shellfish management areas and research
sanctuaries (2008), and oyster sanctuaries (2007, 2008) from Surf City to Shallotte River. ............ 218
Map 3.5a. Areas prohibited to dredging and/or trawling from Roanoke Island to northern Core Sound (as
of 2008). ............................................................................................................................................ 219
Map 3.5b. Areas prohibited to dredging and/or trawling from southern Core Sound to Surf City (as of
2008). ................................................................................................................................................ 220
Map 3.5c. Areas prohibited to dredging and/or trawling from Surf City to Shallotte River (as of 2008).
........................................................................................................................................................... 221
Map 4.1. Location of mapped submerged aquatic vegetation (SAV) habitat in coastal North Carolina
(1981-2009). ...................................................................................................................................... 272
Map 5.1a. Location of riparian wetland areas derived from maps produced by DCM (1994) in
northwestern North Carolina. ............................................................................................................ 334
Map 5.1b. Location of riparian wetland areas derived from maps produced by DCM (1994) in
northeastern North Carolina. ............................................................................................................. 335
Map 5.1c. Location of riparian wetland areas derived from maps produced by DCM (1994) in
southcentral North Carolina. ............................................................................................................. 336
Map 5.1d. Location of riparian wetland areas derived from maps produced by DCM (1994) in
southeastern North Carolina. ............................................................................................................. 337
Map 5.2. Location of flat/depressional wetland areas derived from maps produced by DCM (1994). ... 338
Map 6.1a. Location of marine topographic features, northeastern coast of North Carolina. ................... 402
Map 6.1b. Location of marine topographic features, central coast of North Carolina. ............................ 403
Map 2.1c. Location of marine topographic features, southcentral coast of North Carolina. ................... 404
Map 6.1d. Location of marine topographic features, southeast coast of North Carolina. ........................ 405
Map 6.1e. Location of marine topographic features, south coast of North Carolina. .............................. 406
Map 6.2a. Sediment composition in the Albemarle-Pamlico estuarine system. ...................................... 407
Map 6.2b. Sediment composition in the Tar-Pamlico, Neuse, and Core/Bogue estuaries (Wells 1989). 408
Map 6.3a. Location of Storm Damage Reduction projects (active, awaiting funding, or pending study),
dredge disposal sites (approved areas), jetties, groins, and designated CBRA zones, northern coastal
area of North Carolina. ...................................................................................................................... 409
Map 6.3b. Location of Storm Damage Reduction projects (active, awaiting funding, or pending study),
dredge disposal sites (approved areas), jetties, groins, and designated CBRA zones, central coastal
area of North Carolina. ...................................................................................................................... 410
Map 6.3c. Location of Storm Damage Reduction projects (active, awaiting funding, or pending study),
dredge disposal sites (approved areas), jetties, groins, and designated CBRA zones, southern coastal
area of North Carolina. ...................................................................................................................... 411
Map 6.4. Location of phosphate districts (known concentrations of phosphate deposits) on the continental
shelf off North Carolina .................................................................................................................... 412
Map 6.5. Areas where mechanical harvest for clams (clam kicking, hydraulic dredge) and crabs (crab
dredging) is authorized in estuarine waters of North Carolina. ........................................................ 413

2010 Coastal Habitat Protection Plan
List of Maps Page xxviii
Map 7.1a. Location of hard bottom, possible hard bottom, shipwrecks, and artificial reefs in state and
federal waters off North Carolina - northern coast. .......................................................................... 443
Map 7.1b. Location of hard bottom, possible hard bottom, shipwrecks, and artificial reefs in state and
federal waters off North Carolina - central coast. ............................................................................. 444
Map 7.1c. Location of hard bottom, possible hard bottom, shipwrecks, and artificial reefs in state and
federal waters off North Carolina - southern coast. .......................................................................... 445
Map 8.1. Strategic Habitat Area nominations presented and approved by the Marine Fisheries
Commission in January 2009. ........................................................................................................... 452
Map 8.2. Total alteration scores calculated from 18 individual alteration factors coinciding with habitat
targets in the Albemarle Sound region. ............................................................................................. 453

2010 Coastal Habitat Protection Plan
Chapter 1. Introduction Page 1
CHAPTER 1. INTRODUCTION
habitat and water quality concerns
North Carolina has the largest estuarine system of any state along the Atlantic coast. The numerous
estuarine rivers, creeks, large sounds, inlets, and ocean bays create a diverse aquatic system totaling over
2.3 million acres in size. North Carolina is located at the convergence of the mid-Atlantic and south
Atlantic biogeographical provinces, supporting a mix of both northern and southern fish species in North
Carolina‘s waters. Because of this, the extensive amount of estuarine and marine waters, and the
diversity and abundance of habitats occurring there, North Carolina‘s coastal fisheries are among the most
productive in the United States.
However, pressures from development, loss of habitat, and water quality degradation appeared to be
taking a toll on North Carolina‘s estuaries in the late 1980s. Several major fish kills, associated with low
oxygen events and diseases, such as Pfeisteria, occurred. Oysters were dying from diseases (Dermo and
MSX). Sea turtle and marine mammal mortalities related to disease and fishing gear interactions were
increasing. Several commercially and recreationally important fisheries were classified as overfished,
including summer flounder, weakfish, river herring, and striped bass. All of these concerns resulted in
conflicts between recreational and commercial fishermen and raised environmental concerns by the
public.
Because of these concerns, the State of North Carolina, through the Governor and General Assembly,
convened several high level panels during this period to examine coastal environmental and fishery
management issues. Each has made numerous policy recommendations concerning improved
management of fish habitat and water quality.
The Governor's Blue Ribbon Panel on Environmental Indicators published a report and
recommendations in December 1990 (C. Manooch/DMF, pers. com., 2004). This report,
compiled by the Department of Environment, Health, and Natural Resources (now DENR)
provided guidelines for developing a set of indicators to evaluate the status and trends of
environmental quality within North Carolina.
The Albemarle-Pamlico Estuarine Study (1987 – 1994) recommended numerous water quality,
fishery management, and land use reforms in its Comprehensive Conservation and Management
Plan, including retain, restore, and enhance water quality; conserve and protect vital fish and
wildlife habitats; and restore or maintain fisheries (Waite et al. 1994).
The North Carolina Coastal Futures Committee was established to reevaluate coastal issues since
the Coastal Area Management Act (CAMA), which established North Carolina‘s coastal zone
management system under the CRC, was enacted 20 years ago. Recommendations of the report
included restoration and protection of important fisheries habitats and impaired waters, the need
to address nonpoint source pollution, and protection of freshwater wetlands similar to existing
protection of coastal wetlands (North Carolina Coastal Futures Committee 1994).
The Blue Ribbon Advisory Council on Oysters recommended a major increase in planting of
oyster cultch to help restore oyster resources as well as changes in management of oyster culture
practices (Frankenberg 1995).
The Fisheries Moratorium Act, in 1994, established a steering committee to oversee study of
fishery resources.
Up until this point, the majority of the panel recommendations were not implemented. However, most of
the recommendations of the Fisheries Moratorium Act Steering Committee were included in the Fisheries
Reform Act in 1997.

2010 Coastal Habitat Protection Plan
Chapter 1. Introduction Page 2
1.2. The Fisheries Reform Act and Coastal Habitat Protection Plans
On August 14, 1997, Governor James B. Hunt, Jr., signed the Fisheries Reform Act (FRA) into law,
bringing to a close a three-year process of intense meetings, discussions, and debates over the future of
fisheries management in North Carolina. This far-reaching reform package was put together by a
coalition of legislators, commercial and recreational fishermen, scientists, fisheries managers, and
conservationists, in order to ensure healthy fish stocks, the recovery of depleted stocks and the wise use of
North Carolina‘s fisheries resources. The FRA (G.S. 143B-279.8) requires preparation of Fishery
Management Plans by the Division of Marine Fisheries and Coastal Habitat Protection Plans (CHPPs) by
the North Carolina Department of Environment and Natural Resources. The goal of all Fishery
Management Plans is to ensure the long-term viability of the State‘s commercially and recreationally
significant species and fisheries. The Fishery Reform Act mandates that each plan include all pertinent
fishery information as well as habitat and water quality considerations that are consistent with the Coastal
Habitat Protection Plan. This section of the FRA resembles the federal Magnuson-Stevens Fishery
Conservation and Management Act reauthorization of 1996 [also known as the Sustainable Fisheries Act
(SFA)]. The SFA requires the regional fishery management councils and National Marine Fisheries
Service (NMFS) to amend federal fishery management plans to include provisions for the protection of
―Essential Fish Habitat‖ (EFH) from federally funded activities.
The legislative goal of the CHPP is long-term enhancement of coastal fisheries associated with coastal
habitats. The law specified that the CHPP identify threats and recommend management actions to protect
and restore habitats critical to North Carolina‘s coastal fishery resources. The plans must be adopted by
the Coastal Resources (CRC), Environmental Management (EMC), and Marine Fisheries (MFC)
commissions. The intent of this tri-commission effort was to ensure consistent actions among
commissions, as well as their supporting Department of Environment and Natural Resources (DENR)
agencies. The public had become increasingly frustrated with the inability of multiple panels to
successfully implement recommendations. However, the FRA clearly required that recommendations of
the management plans be implemented. The passage of the FRA and the initiation of the CHPP program
demonstrated the public desire and political will to better manage North Carolina‘s coastal fishery
habitats. Because the CHPP uniquely brings together three major regulatory commissions, the public has
an expectation that positive actions would result from this effort.
1.3. Authority for management and protection of public trust resources
The Public Trust Doctrine provides the authority for the state to manage public trust resources. The
doctrine states that ―public trust lands, waters, and living resources in a State are held by the State in trust
for the benefit of all the people, and establishes the right of the public to fully enjoy public trust lands,
waters, and living resources for a wide variety of recognized public uses. The doctrine also sets
limitations on the States, the public, and private owners, as well as establishing the responsibilities of the
States when managing these public trust assets‖ (Coastal States Organization 1997). The Constitution of
North Carolina implements the Public Trust Doctrine in Article XIV, Section 5, which states: ―It shall be
the policy of this State to conserve and protect its lands and waters for the benefit of all its citizenry, and
to this end it shall be a proper function of the State of North Carolina and its political subdivisions to . . .
preserve as a part of the common heritage of this State its forests, wetlands, estuaries, beaches, historical
sites, open lands, and places of beauty.‖
Public trust resources include the waters to the upstream extent of navigation, including navigation by
small recreational boats, such as canoes or kayaks [North Carolina Supreme Court (Gwathmey v. State of
North Carolina, 342 N.C. 287, 464 S. E. 2d. 674, 1995)]; submerged lands beneath the waters up to the
normal high tide line (or normal water level in areas not subject to lunar tides); and the fisheries resources
within those waters (see definition below). Common public trust uses include navigation and commerce,

2010 Coastal Habitat Protection Plan
Chapter 1. Introduction Page 3
fishing, bathing (swimming), and hunting. Under certain circumstances, private entities may own
submerged lands, but public trust rights in the waters over those lands are not affected by such ownership.
The State can restrict exercise of public trust rights in the overall public interest. Such restrictions can be
in the form of laws enacted by the North Carolina General Assembly or rules adopted as part of the North
Carolina Administrative Code (NCAC) by regulatory commissions established by the General Assembly.
A variety of regulatory commissions and administrative agencies established by the General Assembly
have authority for management of North Carolina‘s coastal lands, waters, and fishes under state and
federal laws. State authority generally applies within the boundaries of North Carolina, which extends
from internal waters (creeks, rivers, and lakes) downstream through the coastal sounds, and into the
Atlantic Ocean for three nautical (nm) or 3.45 statute miles from the state‘s Atlantic Ocean shoreline.
Federal jurisdiction applies from that point out to 200 nm (230.16 statute miles) from shore, an area called
the Exclusive Economic Zone (EEZ). Several state and federal agencies conduct major regulatory,
research, and educational programs that affect North Carolina‘s coastal fisheries resources and their
habitats (Appendix A).
While the MFC manages commercial and recreational fishing practices in coastal waters through rules
implemented by the Division of Marine Fisheries (DMF), several other agencies directly and indirectly
affect coastal fisheries and fish habitats. The EMC has wide-ranging authority over activities affecting
water quality statewide. Rules adopted by the EMC govern point and nonpoint discharges, wastewater
management, alteration of non-coastal wetlands, and stormwater management. The EMC is unique
because its rules are implemented by several different DENR agencies, including the Division of Water
Quality (DWQ), Division of Air Quality (DAQ), Division of Water Resources (DWR), and the Division
of Land Resources (DLR). The DLR is also unique because it administers rules adopted by multiple
regulatory commissions, including the EMC, Sedimentation Control Commission, and the Mining
Commission. The CRC enacts rules to manage development and land disturbing activities along estuarine
and ocean shorelines, shoreline stabilization, alteration of submerged bottoms and coastal wetlands, and
marina construction. The Division of Coastal Management (DCM) implements rules adopted by the
CRC. The NC Wildlife Resources Commission (WRC) has a direct role in the management of fisheries
through the designation of primary nursery areas in Inland Waters, including many anadromous fish
spawning areas, and regulation of fishing in those waters. There are a myriad of other state, federal, and
interstate programs affecting coastal fisheries habitat in North Carolina (Appendix A).
1.4. CHPP PROCESS
DMF staff, with assistance from the CHPP Development Team, completed drafting of the first CHPP in
2004. The CHPP team includes scientists and planners from DMF, DCM, DWQ, Division of
Environmental Health (DEH), and WRC. An Intercommission Review Committee (IRC), consisting of
two members from each of three commissions, the Marine Fisheries, Coastal Resources, and
Environmental Management commissions, provided policy oversight, reviewed this plan, and developed
the management recommendations (Street et al. 2005). After the IRC and DENR reviewed the draft plan,
the Marine Fisheries, Coastal Resources, and Environmental Management Commissions separately
approved of the plan and recommendations. Following that, each division and the Department compiled
bi-annual implementation plans to accomplish recommendations within their authority. The IRC was
slightly reorganized to reflect their new charge – to meet quarterly to discuss implementation progress,
cross-cutting issues and facilitate CHPP implementation actions, as well as review future CHPP updates.
Changes included renaming the group to the CHPP Steering Committee (CSC) and asking the Wildlife
Resources Commission to join the CSC in 2009 since many of the implementation actions affect
resources under their jurisdiction (see Appendix B for current CSC membership). In addition, other
DENR division staff, such as Division of Environmental Health, Division of Forestry, Division of Water
2010 Coastal Habitat Protection Plan
Chapter 1. Introduction Page 4
Resources, Division of Land Resources, Division of Soil and Water Conservation, and Ecosystem
Enhancement Program were invited to participate at CSC meetings.
1.4. Purpose and organization of document
The purpose of the CHPP is to assimilate information on the environmental requirements, spatial
distribution, ecological value, overall condition, and threats to coastal fish habitats and ecosystems, so
that management needs can be identified to protect, enhance, and restore associated fisheries. The 2005
CHPP identified four overarching goals for protection of coastal fisheries habitat:
1) Improve effectiveness of existing rules and programs protecting coastal fish habitats
2) Identify, designate, and protect all Strategic Habitat Areas
3) Enhance habitat and protect it from physical impacts
4) Enhance and protect water quality
The updated 2010 CHPP follows the same organizational format as the initial 2005 plan, with updated
information and additional focus on ecosystem integrity and Strategic Habitat Areas. The CHPP is
organized around six basic habitats utilized by coastal fishery species: water column, shell bottom,
submerged aquatic vegetation (SAV), wetlands, soft bottoms, and hard bottoms. Within each of the
following habitat chapters (Chapters 2 - 7), there is detailed information on the habitat‘s description,
distribution, ecological role and functions for finfish and shellfish species (primarily fishery species, but
also forage and protected species), status and trends, threats, and management needs. The term
―management‖ is defined broadly to include regulatory, enforcement, research, monitoring, and
restoration activities affecting coastal fish habitat. Management needs are based on documented
inadequacies or gaps in the current management framework and are highlighted in the habitat chapters
with italics. The threat sections are followed by a listing of habitat-specific management needs from the
2005 and 2010 CHPP, with a brief narrative on progress to date. A summary highlighting the most
pressing management needs is provided at the end of each habitat chapter.
Following the habitat chapters, there is a discussion of ecosystem management and Strategic Habitat
Areas (Chapter 8). The ecosystem management chapter will provide a cross-reference for threat-based
information and a synthesis of information and recommendations regarding ecosystem-level management
issues (i.e., cross-cutting threats, habitat trade-offs). The chapter will also summarize Strategic Habitat
Area assessments and their role in ecosystem management.
The final chapter covers recommendations organized by CHPP goals. This chapter revisits the 2005
CHPP recommendations in light of new information presented in the update and discussions among the
commissioners on the CSC. Each of the Commissions and the Department will use the threats discussion,
management needs, and recommendations to develop and update coordinated coastal habitat
implementation plans as provided in the Act.
1.6. ACCOMPLISHMENTS
After the CHPP was formally adopted in December of 2004, the commissions, their administrative
divisions, and DENR developed and adopted bi-annual implementation plans during the summer of 2005.
The implementation plans detailed more than 100 specific steps the Department, its agencies and their
respective commissions would take during the 2005/06 – 2006/07 fiscal years to implement the CHPP
recommendations. Following that, a second two year implementation plan was developed and adopted by
the CSC for the 2007/08-2008/09. Many of the 07-09 implementation actions were continuations of
ongoing activity. The 2007-2009 implementation plan includes proposed implementation actions and is
available on the DMF website.
2010 Coastal Habitat Protection Plan
Chapter 1. Introduction Page 5
Over the past five years, implementation of the CHPP has been a significant part of the decision making
process of DENR‘s divisions and regulatory commissions. All three commissions and their DENR
agencies actively used the CHPP and its recommendations as guidance in their regulatory and operational
programs. Numerous implementation actions were accomplished or are underway.
The CHPP Steering Committee concluded that the six most significant accomplishments and
advancements of the CHPP in the first five years included:
Interagency coordination/cooperation – CHPP coordinator position established, CHPP Steering
Committee and interagency quarterly meetings
Stormwater runoff management – adoption of EMC Phase 2 and coastal stormwater rules
Habitat mapping – SAV due to APNEP workgroup, shellfish and shellfish closures due to new
positions, SHA process to prioritize habitat areas, shoreline mapping through grant funding
Compliance monitoring – new positions in multiple divisions, cross training marine patrol,
increased permit fees and fines
Oyster reef restoration – new positions and funding for sanctuary development and monitoring,
funding for construction of a shellfish hatchery, and creation of an oyster shell recycling program
Beach nourishment management – development of the Beach and Inlet Management Plan through
grant funding, and adoption of CRC sediment criteria rules
A common thread to all of these accomplishments was support from the Department and the General
Assembly to implement these actions.
In the first fiscal year (2005-2006), most of the implementation measures were setting the stage to
facilitate future actions. A CHPP coordinator position was created, the IRC was reorganized into the
CHPP Steering Committee, and quarterly CHPP permit coordination meetings were established. Three
DWQ, four DCM, three DEH-SS, and three DFR positions were funded by the General Assembly for
compliance monitoring. Additionally, an agreement was established for Marine Patrol to regularly fly
DCM compliance staff and to train officers how to report possible environmental violations. All of these
actions were directed at improving effectiveness of existing rules and programs protecting coastal fish
habitat (Goal 1). Goal 2 called for identification and designation and protection of Strategic Habitat
Areas. Before this could be done, mapping of CHPP habitats was needed. Three positions were
appropriated to DMF to accelerate completion of shell bottom mapping. Elizabeth City State University,
under a NOAA grant, began mapping SAV in Currituck Sound. CHPP staff, along with a SHA Advisory
Committee, began developing the process to identify SHAs. To enhance habitat and protect it from
physical impacts (Goal 3), DMF enhanced three existing oyster sanctuaries with more rock material and
closed additional areas to mechanical shellfish harvesting. DCM began to formulate sediment
compatibility rules, and NC Sea Grant formed a multi-slip docking facility advisory committee to discuss
environmental issues related to multi-slip docking facilities and develop recommendations if needed to
better protect fish habitat. To enhance and protect water quality (Goal 4), DWQ conducted a study,
inspecting engineered stormwater structures, and surveyed stormwater outfalls draining into SA and
ocean waters. In addition, DWQ, after hearing concerns of the CHPP Steering Committee and MFC
Habitat and Water Quality Committee, began discussing the need for coastal stormwater rules.
In the second fiscal year (2006-2007), progress continued on the newly organized coordination meetings,
and the appropriated positions were filled and began working. To further improve effectiveness of
existing rules (Goal 1), CRC increased civil penalties to discourage violations. In addition NERRs hosted
several workshops and outreach events on a variety of habitat and water quality protection topics. The
major accomplishment toward identifying SHAs (Goal 2) was that an interagency SAV mapping
workgroup was formed, with APNEP serving as the lead. An MOU was signed and the group began
planning a coastwide mapping effort of SAV. Progress continued on shell bottom mapping and the SHA
2010 Coastal Habitat Protection Plan
Chapter 1. Introduction Page 6
methodology process was completed and approved. For Goal 3, sediment compatibility rules were
completed and approved, funding for the Beach and Inlet Management Plan was received, and the CRC
Estuarine Shoreline Stabilization scientific work group completed a report including recommendations
regarding the placement and suitability of hardened shoreline structures. DCM received funding to map
the shoreline and structures on it, an important precursor to managing shorelines. The CRC Estuarine
Shoreline Stabilization Subcommittee reviewed the report and considered possible rule changes. Toward
protection and enhancement of water quality (Goal 4), Phase II stormwater rules became effective, and
DWQ drafted coastal stormwater rules went through the public hearing process.
In the third fiscal year (2007-2008), coordination and educational outreach continued for Goal 1 and
several efforts underway previously were substantially completed. Under Goal 2, the Interagency SAV
Mapping Partnership pooled funding to acquire aerial imagery of SAV and the imagery was taken. The
analysis of SHA Region 1 was well underway. In terms of enhancing and protecting habitat (Goal 3), the
benefits of the additional resources for DMF‘s Resource Enhancement Section were beginning to be seen,
with increased mapping of shell bottom, collection of recycled oyster shell, and monitoring and research
of oyster sanctuaries. The MFC and the WRC designated Anadromous Fish Spawning Areas, an
important step in protecting anadromous fish habitat. DMF began spawning and stream obstruction
surveys, critical for prioritizing future habitat restoration. DCM began drafting of the Beach and Inlet
Management Plan and received a Cooperative Institute for Coastal and Estuarine Environmental
Technology (CICEET) multi-agency grant to study shoreline stabilization and marsh sills. The most
visible accomplishment of 2007-2008 was the adoption of coastal stormwater rules which went into effect
in October 2008, after a huge effort was made by the DWQ, EMC, and Department as well as other
supporting state agencies to keep the rules from being overruled due to opposing development interests
(Goal 4). Other accomplishments in protecting and enhancing water quality included the formation of the
Community Conservation Assistance Program with the Soil and Water Conservation Districts. This is the
only program designed to address stormwater retrofitting from existing development. Other efforts
included expansion of the areas that qualify for CREP funding, completion of three additional lagoon
conversion projects, continuation of the swine lagoon buyout program, and additional equipment
purchases by DFR to enhance forestry BMPs.
In 2008-2009, budget shortfalls constrained implementation success. Funding for two DCM positions
(compliance education coordinator and Clean Marina Program) was rescinded, and the CHPP quarterly
interagency meetings were cancelled due to travel restrictions. Similarly, funding approved by the
legislature in the previous year to greatly accelerate oyster reef restoration was partially rescinded. The
gain in funding to the program balanced out losses from DMF‘s budget, with the final result being a small
net gain in resources for oyster restoration. Shell bottom and SAV mapping was slower than expected
due to vacancies and the inability to fill positions. However, progress was still made.
Toward improving effectiveness of existing rules (Goal 1), DMF received approval for two grant funded
positions dedicated to coastal permit review, and MFC approved a revised definition of SAV habitat, to
improve effectiveness in protecting this habitat. Agencies worked together to ensure consistency among
rules with this definition change. DWQ began reviewing coastal CAMA land use plans, sponsored
workshops for local government and developers on the new stormwater rules, and hosted a Water Quality
Monitoring Forum aimed at coordinating monitoring efforts. Regarding Goal 2, analysis for Strategic
Habitat Areas in Region 1 was completed, areas were identified and approved by the MFC, and are being
incorporated into DENR‘s Conservation Planning Tool. DMF completed spawning and obstruction
surveys on the majority of the Chowan River system. Regarding Goal 3, enhancing and protecting
habitat, sanctuary monitoring work continued and DWQ worked with DOT on a SAV and oyster habitat
restoration and mitigation project in Currituck Sound. DWQ also established a compensatory mitigation
database. DMF incorporated results of EEP and university research on compensatory mitigation to
develop a MFC policy on compensatory mitigation which will hopefully encourage compensatory
2010 Coastal Habitat Protection Plan
Chapter 1. Introduction Page 7
mitigation methods that successfully restore coastal watershed functions. DCM made major progress on
drafting the Beach and Inlet Management Plan and delineating the coastal estuarine shoreline. Through
CHPP discussions, plans are underway to assess the success of existing marsh sills as alternatives to
vertical stabilization structures, provide tools to the general public to educate them on the effects of
shoreline stabilization and a range of management options, and to then revisit rules related to estuarine
shoreline stabilization. CRC approved rules to better protect marshes from mowing, and reduce impacts
from docks and piers. In terms of enhancing and protecting water quality (Goal 4), DWQ has begun
reviewing several rules such as ocean stormwater discharges and marinas for adequacy in water quality
protection. DWQ conducted a smart sponge pilot study to examine new ways to clean up stormwater,
constructed four low impact development projects, and is developing a mitigation policy for intermittent
streams. Additional resources were also appropriated to the Soil and Water for the Lagoon Conversion
Program.
In summary, relative to other past planning efforts to protect North Carolina‘s coastal environment, the
CHPP has been largely successful in implementing plan recommendations. The greatest
accomplishments of the CHPP have been non-regulatory. Prior to making large management changes,
positions and funding were needed to assess compliance of existing environmental rules, complete
mapping of fish habitats, and educate the public on environmental issues. Multiple large grants have been
awarded to state agencies and universities to conduct research or projects in support of the CHPP.
Examples include DCM receiving funding for the BIMP, shoreline mapping, and the CICEET project
looking at shoreline stabilization; APNEP coordinating the pooling of resources to map SAV coastwide;
and universities receiving Fishery Resource Grants (FRGs) and Coastal Recreational Fishing License
(CRFL) grants to collect needed habitat information. Much has been done in those areas, but work still
remains. The passing of the coastal stormwater rules marks the largest regulatory change that the CHPP
influenced. It occurred through the hard work of numerous DENR staff, commissioners, and CHPP
supporters such as environmental NGOs. With the exception of the EMC‘s coastal stormwater rules, rule
changes for habitat protection occurred slowly and incrementally. Increased communication among
divisions and commissions may have slowed down rule-making in some ways, but resulted in buy-in
from other agencies and final products that are more consistent among divisions and commissions.
Several large issues that involve regulations such as beach nourishment, estuarine shoreline stabilization,
and protections for anadromous fish habitat are underway.
1.5. Area description
North Carolina‘s coast is framed by a chain of low-lying barrier islands extending from Virginia to Cape
Fear. The barrier islands create large and productive sounds and estuaries behind them. Southwest of the
Cape Fear River, dredging of the Atlantic Intracoastal Waterway (ICW) in the 1930s created an artificial
extension of these barrier islands (Map 1.1a-b). The northern part of the natural barrier islands, the Outer
Banks, separates the Albemarle-Pamlico sounds complex from the coastal ocean. The topography of the
three major capes has a major influence on adjacent ocean circulation.
Weather conditions, especially temperature, precipitation, wind, and storms, exert major influences on the
coastal area and fishery resources of eastern North Carolina. The climate along the North Carolina coast
is strongly influenced by the Atlantic Ocean. North Carolina‘s coastal ocean includes the convergence
between two major oceanic currents: the warm, north-flowing Gulf Stream and the cool, south-flowing
Virginia coastal current (also called the Labrador Current). The Gulf Stream current moves within 10 –
12 mi (16.1 – 19.3 km) of the coast at Cape Hatteras before turning northeast toward Europe, bringing
southern species (such as brown, white, and pink shrimp; king and Spanish mackerel; snappers and
groupers; and calico scallops) to North Carolina‘s ocean and estuarine waters. The Virginian (Labrador)
Current ends at the Gulf Stream, supplying northern oceanic species (such as Atlantic mackerel, Atlantic
herring, and Atlantic cod) to North Carolina.
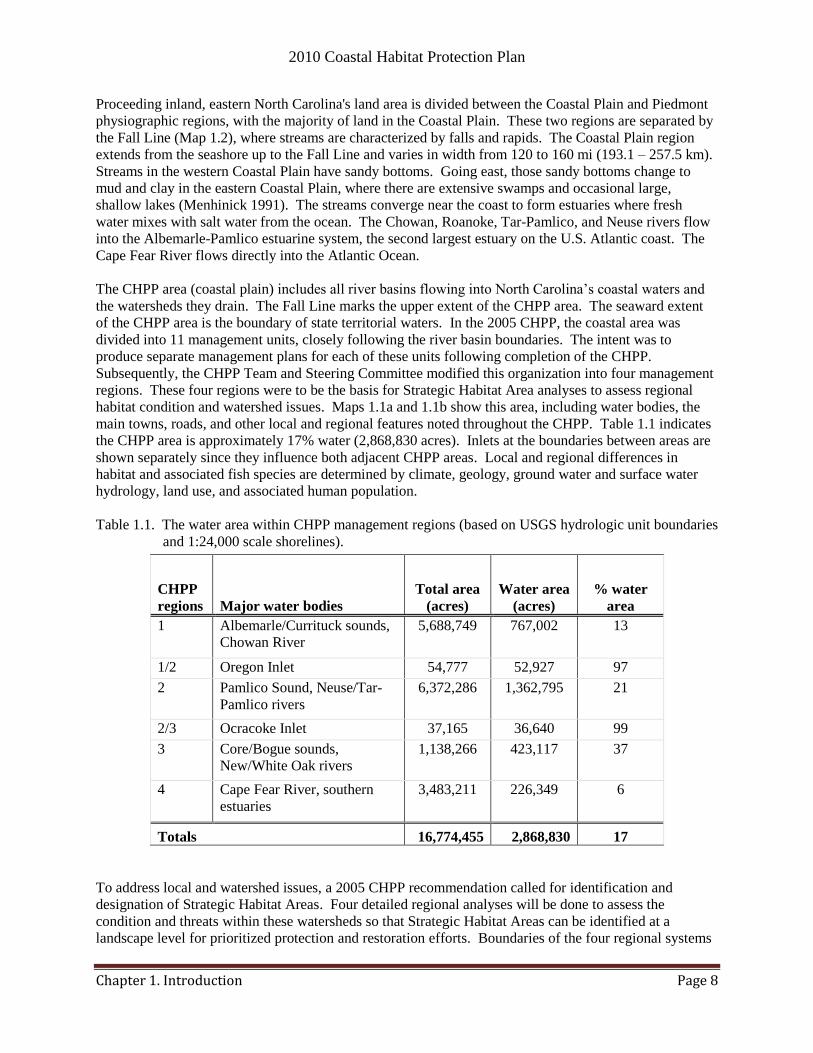
2010 Coastal Habitat Protection Plan
Chapter 1. Introduction Page 8
Proceeding inland, eastern North Carolina's land area is divided between the Coastal Plain and Piedmont
physiographic regions, with the majority of land in the Coastal Plain. These two regions are separated by
the Fall Line (Map 1.2), where streams are characterized by falls and rapids. The Coastal Plain region
extends from the seashore up to the Fall Line and varies in width from 120 to 160 mi (193.1 – 257.5 km).
Streams in the western Coastal Plain have sandy bottoms. Going east, those sandy bottoms change to
mud and clay in the eastern Coastal Plain, where there are extensive swamps and occasional large,
shallow lakes (Menhinick 1991). The streams converge near the coast to form estuaries where fresh
water mixes with salt water from the ocean. The Chowan, Roanoke, Tar-Pamlico, and Neuse rivers flow
into the Albemarle-Pamlico estuarine system, the second largest estuary on the U.S. Atlantic coast. The
Cape Fear River flows directly into the Atlantic Ocean.
The CHPP area (coastal plain) includes all river basins flowing into North Carolina‘s coastal waters and
the watersheds they drain. The Fall Line marks the upper extent of the CHPP area. The seaward extent
of the CHPP area is the boundary of state territorial waters. In the 2005 CHPP, the coastal area was
divided into 11 management units, closely following the river basin boundaries. The intent was to
produce separate management plans for each of these units following completion of the CHPP.
Subsequently, the CHPP Team and Steering Committee modified this organization into four management
regions. These four regions were to be the basis for Strategic Habitat Area analyses to assess regional
habitat condition and watershed issues. Maps 1.1a and 1.1b show this area, including water bodies, the
main towns, roads, and other local and regional features noted throughout the CHPP. Table 1.1 indicates
the CHPP area is approximately 17% water (2,868,830 acres). Inlets at the boundaries between areas are
shown separately since they influence both adjacent CHPP areas. Local and regional differences in
habitat and associated fish species are determined by climate, geology, ground water and surface water
hydrology, land use, and associated human population.
Table 1.1. The water area within CHPP management regions (based on USGS hydrologic unit boundaries
and 1:24,000 scale shorelines).
CHPP
regions Major water bodies
Total area
(acres)
Water area
(acres)
% water
area
1 Albemarle/Currituck sounds,
Chowan River
5,688,749 767,002 13
1/2 Oregon Inlet 54,777 52,927 97
2 Pamlico Sound, Neuse/Tar-
Pamlico rivers
6,372,286 1,362,795 21
2/3 Ocracoke Inlet 37,165 36,640 99
3 Core/Bogue sounds,
New/White Oak rivers
1,138,266 423,117 37
4 Cape Fear River, southern
estuaries
3,483,211 226,349 6
Totals 16,774,455 2,868,830 17
To address local and watershed issues, a 2005 CHPP recommendation called for identification and
designation of Strategic Habitat Areas. Four detailed regional analyses will be done to assess the
condition and threats within these watersheds so that Strategic Habitat Areas can be identified at a
landscape level for prioritized protection and restoration efforts. Boundaries of the four regional systems
2010 Coastal Habitat Protection Plan
Chapter 1. Introduction Page 9
were based primarily on USGS 14-digit hydrologic units comprising hydrologically connected receiving
waters and watersheds. The regions represent a continuum of aquatic habitats extending from coastal
plain rivers through estuarine waters and passing into coastal ocean waters through dynamic inlet
systems. A watershed approach is necessary because many fisheries rely on the interconnectivity of
waters within a watershed, and most pollutants are conveyed into estuarine waters via upstream conduits.
The four regional systems and their boundaries approved by the CHPP Steering Committee are shown on
Map 1.2. The regions are generally referred to as: Northern (Region 1), North-Central (Region 2), South-
Central (Region 3), and Southern (Region 4). Because major inlet flow influences adjacent CHPP
regions, some overlap between regions exist. To take this into account, Oregon and Ocracoke inlets have
been tallied separately. The total hydrologic unit area and water area of the regions is approximated in
Table 1.1.
1.5.1. Land use and human population
Estuarine and coastal areas contain some of the nation‘s most densely populated and rapidly growing
areas (Beach 2002). Population density patterns reflect historical development and population pressures,
location relative to transportation networks and jobs, and the natural resources of the coastal areas (NOS
1990). North Carolina‘s coast has historically consisted of small residential communities and beach
towns, with a tourism and retirement component. Quaint towns like Edenton, Beaufort, and Southport
remain small but are growing. While some island towns have retained their relatively small summer
cottage character (Ocracoke Island, Topsail Beach), others have shifted to large scale homes and multi-
unit housing (Carolina Beach, Atlantic Beach, Hatteras Island). The largest coastal cities include
Wilmington, Jacksonville, and New Bern. Military bases contribute significantly to the economy of the
latter two. Large industries are relatively uncommon, and are primarily located near the port of
Wilmington along the Cape Fear River. Population growth in coastal North Carolina has been driven by
tourism and retirement communities, due to the high quality of its coastal resources. As population
density increases, so does the potential for degradation of the natural environment by human activities
(Cairns and Pratt 1992).
Population, density, and change in population from 1990 to projected 2010 numbers are shown in Table
1.2. In the twenty coastal counties, New Hanover County, followed by Onslow County continue to have
the largest populations and densities in 2010. Brunswick County followed by Craven and Carteret
counties had the next highest populations. Pasquotank County has a modest population but is third in
population density. In both 2000 and 2010 the lowest populations and densities in eastern North Carolina
(about 10 persons/mi P
2) were in Tyrrell and Hyde counties, located on the Albemarle-Pamlico peninsula.
This is about 100 times less dense than in New Hanover and about 20 times less than Onslow and
Pasquotank counties. Although population density is increasing along the coast, many of the interior
coastal plain counties like Cumberland, Pitt, and Johnston counties, had higher densities and similarly
high growth rates (Map 1.4), suggesting that some coastal pollution may be derived from these upstream
sources.
The coastal counties that have undergone the greatest population change in the past ten years are
Brunswick, Camden, Pender, and Currituck counties (Table 1.2). Growth over the past ten years ranged
from 21-34% in those counties and was primarily the result of urban sprawl since all are within
commuting distance of larger municipalities such as Wilmington, Jacksonville, and Norfolk, VA. In the
other coastal counties, population increased up to 18%, with the exception of Hyde, Washington, and
Pamlico, where population declined slightly. For the past twenty years, the greatest population increases
have occurred in the oceanfront counties. However, in the past ten years, the population increase in these
areas slowed. The rate of county population change in the past ten years (2000-2010) was greater than
the preceding ten years (1990-2000) in six counties, but slightly lower in fourteen. With the exception of
Onslow County, which saw a major military base expansion, the other counties with greater population
2010 Coastal Habitat Protection Plan
Chapter 1. Introduction Page 10
increases in the past ten years were located in non-oceanfront counties with relatively low populations on
the north side of Albemarle Sound (Pasquotank, Perquimans, Camden, Hertford, and Bertie). This area
and other western Albemarle-Pamlico counties have been marketed as the ―Inner Banks‖ over the past
five years by the real estate industry.
Municipalities on North Carolina‘s barrier islands have experienced great increases in population along
the coast in the past twenty years (Table 1.3). Population increased by as much as 100-486% in some
beaches from 1990 to 2000. However, as these islands become more densely built-out, growth rates have
slowed some. From 2000 to 2007, 69% was the maximum population increase. Brunswick County
beaches accounted for the majority of the largest population increases, while some of the older established
beach communities such as Wrightsville and Atlantic Beach showed minimal new growth. Overall, the
permanent population of all oceanfront municipalities declined in the last ten years. However, permanent
dwelling units may have converted to seasonal rentals. Influx of tourists on barrier island beaches results
in tremendous seasonal population fluctuations. Seasonal population estimates at beach towns are 3 – 59
times greater than their permanent population. These estimates do not include day trippers. In many of
these municipalities, public facilities, including wastewater treatment systems, roads, and water supply
systems, are being taxed to the limit (Steel 1991).
Since the 2005 CHPP was completed, patterns in coastal development have varied greatly. Prior to about
2002, coastal development appeared to be moderately increasing, primarily on the oceanfront
communities, with some increase in the mainland communities as well. Between 2002 and 2006 a coastal
boom in development escalated along the mainland waterfront as real estate prices rapidly increased.
Termed as the ―new waterfront‖ or the ―Inner Banks‖, developers targeted these areas for extremely large
developments, where one subdivision could almost double a town‘s population. In 2006, a survey by the
News and Observer found that over 34,000 new homes in nearly 100 subdivisions and condominium
projects were planned or under construction along the coast (http://www.newsandobserver.com, 2006).
Pamlico, Chowan, Bertie, Washington, Brunswick, and Down East Carteret counties were among the
coastal areas targeted for new large scale developments. Concerns rose over the potentially rapid change
to rural coastal communities from the loss of farmland, fish houses, and public water access and the effect
on the environment. Fish houses, struggling economically with falling seafood prices and rising fuel
costs could sell their property for greater profits to developers. A study found that approximately one
third of the fish houses open in 2000 had shut down by 2006 (Garrity-Blake and NC Sea Grant 2006). In
2008, sharply falling real estate prices and the recession lead to a major slow down in new development.
Although some of the plans for property purchased by developers during the boom have been put on hold,
land may have been zoned, platted, and/or permitted, allowing for future construction once economic
conditions improve. The increase in population in these rural areas will require additional infrastructure
(roads, schools, water and sewer facilities, electric transmission lines, etc.), which can result in loss or
degradation of important habitats and supporting areas, such as wetlands and riparian forests (see Water
Column and Wetland chapters for more information on changes in land cover).
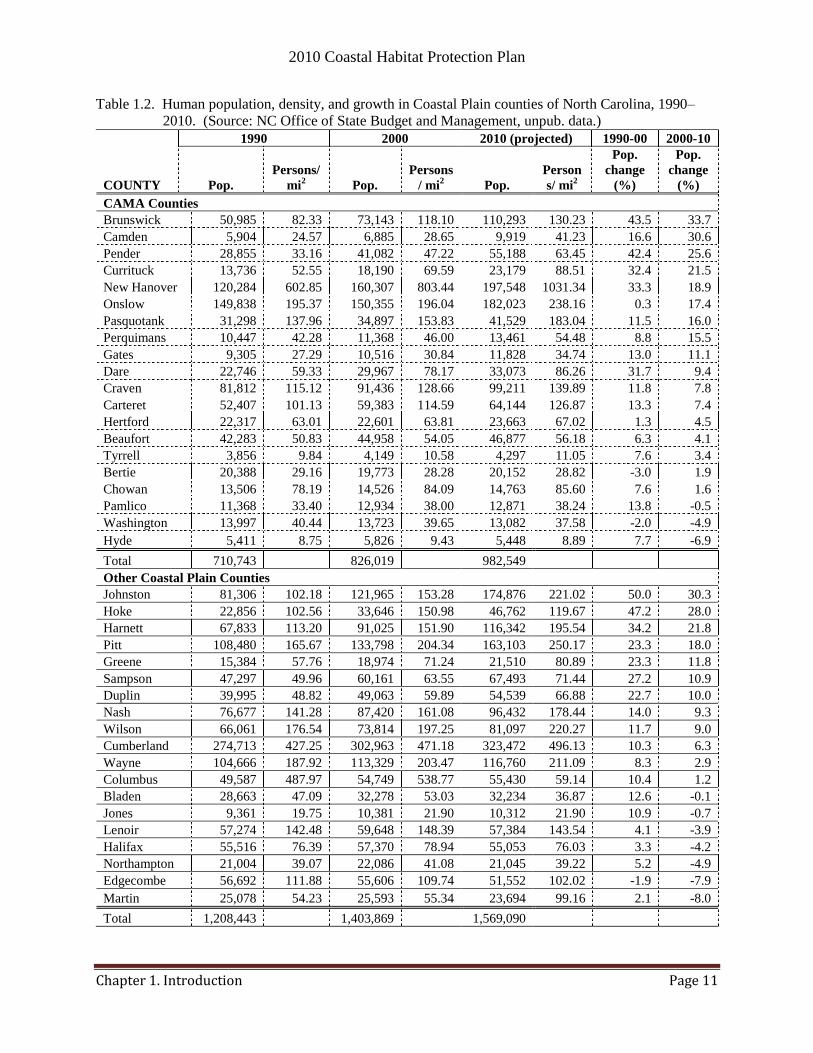
2010 Coastal Habitat Protection Plan
Chapter 1. Introduction Page 11
Table 1.2. Human population, density, and growth in Coastal Plain counties of North Carolina, 1990–
2010. (Source: NC Office of State Budget and Management, unpub. data.)
COUNTY
1990 2000 2010 (projected) 1990-00 2000-10
Pop.
Persons/
mi2 Pop.
Persons
/ mi2 Pop.
Person
s/ mi2
Pop.
change
(%)
Pop.
change
(%)
CAMA Counties
Brunswick 50,985 82.33 73,143 118.10 110,293 130.23 43.5 33.7
Camden 5,904 24.57 6,885 28.65 9,919 41.23 16.6 30.6
Pender 28,855 33.16 41,082 47.22 55,188 63.45 42.4 25.6
Currituck 13,736 52.55 18,190 69.59 23,179 88.51 32.4 21.5
New Hanover 120,284 602.85 160,307 803.44 197,548 1031.34 33.3 18.9
Onslow 149,838 195.37 150,355 196.04 182,023 238.16 0.3 17.4
Pasquotank 31,298 137.96 34,897 153.83 41,529 183.04 11.5 16.0
Perquimans 10,447 42.28 11,368 46.00 13,461 54.48 8.8 15.5
Gates 9,305 27.29 10,516 30.84 11,828 34.74 13.0 11.1
Dare 22,746 59.33 29,967 78.17 33,073 86.26 31.7 9.4
Craven 81,812 115.12 91,436 128.66 99,211 139.89 11.8 7.8
Carteret 52,407 101.13 59,383 114.59 64,144 126.87 13.3 7.4
Hertford 22,317 63.01 22,601 63.81 23,663 67.02 1.3 4.5
Beaufort 42,283 50.83 44,958 54.05 46,877 56.18 6.3 4.1
Tyrrell 3,856 9.84 4,149 10.58 4,297 11.05 7.6 3.4
Bertie 20,388 29.16 19,773 28.28 20,152 28.82 -3.0 1.9
Chowan 13,506 78.19 14,526 84.09 14,763 85.60 7.6 1.6
Pamlico 11,368 33.40 12,934 38.00 12,871 38.24 13.8 -0.5
Washington 13,997 40.44 13,723 39.65 13,082 37.58 -2.0 -4.9
Hyde 5,411 8.75 5,826 9.43 5,448 8.89 7.7 -6.9
Total 710,743 826,019 982,549
Other Coastal Plain Counties
Johnston 81,306 102.18 121,965 153.28 174,876 221.02 50.0 30.3
Hoke 22,856 102.56 33,646 150.98 46,762 119.67 47.2 28.0
Harnett 67,833 113.20 91,025 151.90 116,342 195.54 34.2 21.8
Pitt 108,480 165.67 133,798 204.34 163,103 250.17 23.3 18.0
Greene 15,384 57.76 18,974 71.24 21,510 80.89 23.3 11.8
Sampson 47,297 49.96 60,161 63.55 67,493 71.44 27.2 10.9
Duplin 39,995 48.82 49,063 59.89 54,539 66.88 22.7 10.0
Nash 76,677 141.28 87,420 161.08 96,432 178.44 14.0 9.3
Wilson 66,061 176.54 73,814 197.25 81,097 220.27 11.7 9.0
Cumberland 274,713 427.25 302,963 471.18 323,472 496.13 10.3 6.3
Wayne 104,666 187.92 113,329 203.47 116,760 211.09 8.3 2.9
Columbus 49,587 487.97 54,749 538.77 55,430 59.14 10.4 1.2
Bladen 28,663 47.09 32,278 53.03 32,234 36.87 12.6 -0.1
Jones 9,361 19.75 10,381 21.90 10,312 21.90 10.9 -0.7
Lenoir 57,274 142.48 59,648 148.39 57,384 143.54 4.1 -3.9
Halifax 55,516 76.39 57,370 78.94 55,053 76.03 3.3 -4.2
Northampton 21,004 39.07 22,086 41.08 21,045 39.22 5.2 -4.9
Edgecombe 56,692 111.88 55,606 109.74 51,552 102.02 -1.9 -7.9
Martin 25,078 54.23 25,593 55.34 23,694 99.16 2.1 -8.0
Total 1,208,443 1,403,869 1,569,090
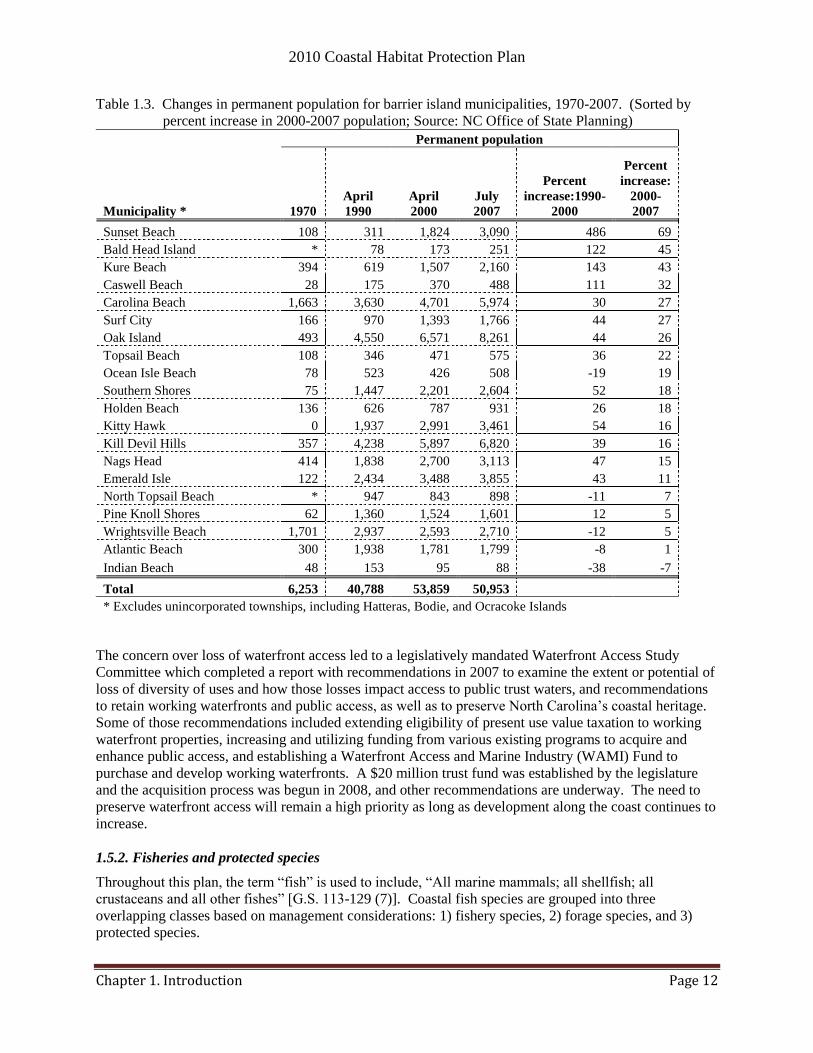
2010 Coastal Habitat Protection Plan
Chapter 1. Introduction Page 12
Table 1.3. Changes in permanent population for barrier island municipalities, 1970-2007. (Sorted by
percent increase in 2000-2007 population; Source: NC Office of State Planning)
Municipality *
Permanent population
1970
April
1990
April
2000
July
2007
Percent
increase:1990-
2000
Percent
increase:
2000-
2007
Sunset Beach 108 311 1,824 3,090 486 69
Bald Head Island * 78 173 251 122 45
Kure Beach 394 619 1,507 2,160 143 43
Caswell Beach 28 175 370 488 111 32
Carolina Beach 1,663 3,630 4,701 5,974 30 27
Surf City 166 970 1,393 1,766 44 27
Oak Island 493 4,550 6,571 8,261 44 26
Topsail Beach 108 346 471 575 36 22
Ocean Isle Beach 78 523 426 508 -19 19
Southern Shores 75 1,447 2,201 2,604 52 18
Holden Beach 136 626 787 931 26 18
Kitty Hawk 0 1,937 2,991 3,461 54 16
Kill Devil Hills 357 4,238 5,897 6,820 39 16
Nags Head 414 1,838 2,700 3,113 47 15
Emerald Isle 122 2,434 3,488 3,855 43 11
North Topsail Beach * 947 843 898 -11 7
Pine Knoll Shores 62 1,360 1,524 1,601 12 5
Wrightsville Beach 1,701 2,937 2,593 2,710 -12 5
Atlantic Beach 300 1,938 1,781 1,799 -8 1
Indian Beach 48 153 95 88 -38 -7
Total 6,253 40,788 53,859 50,953
* Excludes unincorporated townships, including Hatteras, Bodie, and Ocracoke Islands
The concern over loss of waterfront access led to a legislatively mandated Waterfront Access Study
Committee which completed a report with recommendations in 2007 to examine the extent or potential of
loss of diversity of uses and how those losses impact access to public trust waters, and recommendations
to retain working waterfronts and public access, as well as to preserve North Carolina‘s coastal heritage.
Some of those recommendations included extending eligibility of present use value taxation to working
waterfront properties, increasing and utilizing funding from various existing programs to acquire and
enhance public access, and establishing a Waterfront Access and Marine Industry (WAMI) Fund to
purchase and develop working waterfronts. A $20 million trust fund was established by the legislature
and the acquisition process was begun in 2008, and other recommendations are underway. The need to
preserve waterfront access will remain a high priority as long as development along the coast continues to
increase.
1.5.2. Fisheries and protected species
Throughout this plan, the term ―fish‖ is used to include, ―All marine mammals; all shellfish; all
crustaceans and all other fishes‖ [G.S. 113-129 (7)]. Coastal fish species are grouped into three
overlapping classes based on management considerations: 1) fishery species, 2) forage species, and 3)
protected species.

2010 Coastal Habitat Protection Plan
Chapter 1. Introduction Page 13
Fishery species are those finfish, crustaceans, and mollusks that may be harvested in North
Carolina‘s Coastal and Inland Fishing Waters (DMF 2003a) by commercial and recreational
fishermen. Habitats supporting fishery species are the primary focus of the CHPP.
Forage species make up a significant portion of the diet of fishery species (e.g., killifish, grass
shrimp, menhaden, mullet, etc.).
Protected species meet two criteria: 1) listed according to state law [G. S. 113-331] or through the
federal Endangered Species Act by the relevant state or federal agency or protected under the federal
Marine Mammal Protection Act, and 2) require aquatic or wetland habitat within North Carolina‘s
coastal river basins or nearshore ocean waters at some point in their life cycle. Protected species are
important in the CHPP process because they can be indicators of ecological stress (Ricklefs 1993).
In addition, their habitat needs provide support for designating strategic habitat in locations where
the distribution of fishery and protected species overlap, as well as in upstream areas important for
maintaining estuarine water quality.
1.5.2.1. Fisheries
Authority to protect and conserve marine and estuarine resources and public trust resources resides in the
Secretary of DENR (GS 143B-10) who has delegated it to the DMF director. The North Carolina MFC
enacts rules to govern all fishing in coastal waters (GS 143B-279-8). Coastal fisheries are defined as,
―Any and every aspect of cultivating, taking, possessing, transporting, processing, selling, utilizing, and
disposing of fish taken in coastal fishing waters, whatever the manner or purpose of taking…‖ [G.S.113-
129 (2)].
North Carolina is one of the nation‘s leading coastal fishing states. Reported landings by both
commercial and recreational fishermen in North Carolina generally rank among the top Atlantic coast
states every year (Tables 1.4 and 1.5). More than 90% of North Carolina‘s commercial fisheries landings
and over 60% of the recreational harvest (by weight) are comprised of estuarine-dependent species (from
DMF annual commercial and recreational fisheries landings data). These species depend on North
Carolina‘s coastal sounds and rivers to complete their life cycle. North Carolina‘s history of productive
commercial and recreational fisheries is due not only to its large and diverse coastal ecosystem, but also
to flexible and responsive management of coastal fisheries with extensive data collection and public
participation, as well as a strong heritage of commercial and sport fishing throughout eastern North
Carolina.
Coastal North Carolina has historically supported a vigorous commercial fishing industry. In the past five
years, there has been a trend of declining numbers of commercial fishermen. Since 2000, the number of
licensed commercial fishermen has declined by about 10% and the number of dealers by about 13%. In
fiscal year 2008, there were 8711 commercial licenses issued with selling privileges (approximately 8565
commercial fishermen) and 738 licensed fish dealers throughout the coastal area. The annual ex-vessel
value (paid to the fishermen, without any economic multipliers) has declined from about $100 million in
2000 to $82 million in 2008. The total economic impact from the commercial fishing industry in 2008 is
still large however, estimated at $144 million. Dare, Carteret, and Hyde counties had the highest seafood
landings by weight and value in 2008 (DMF 2009a).
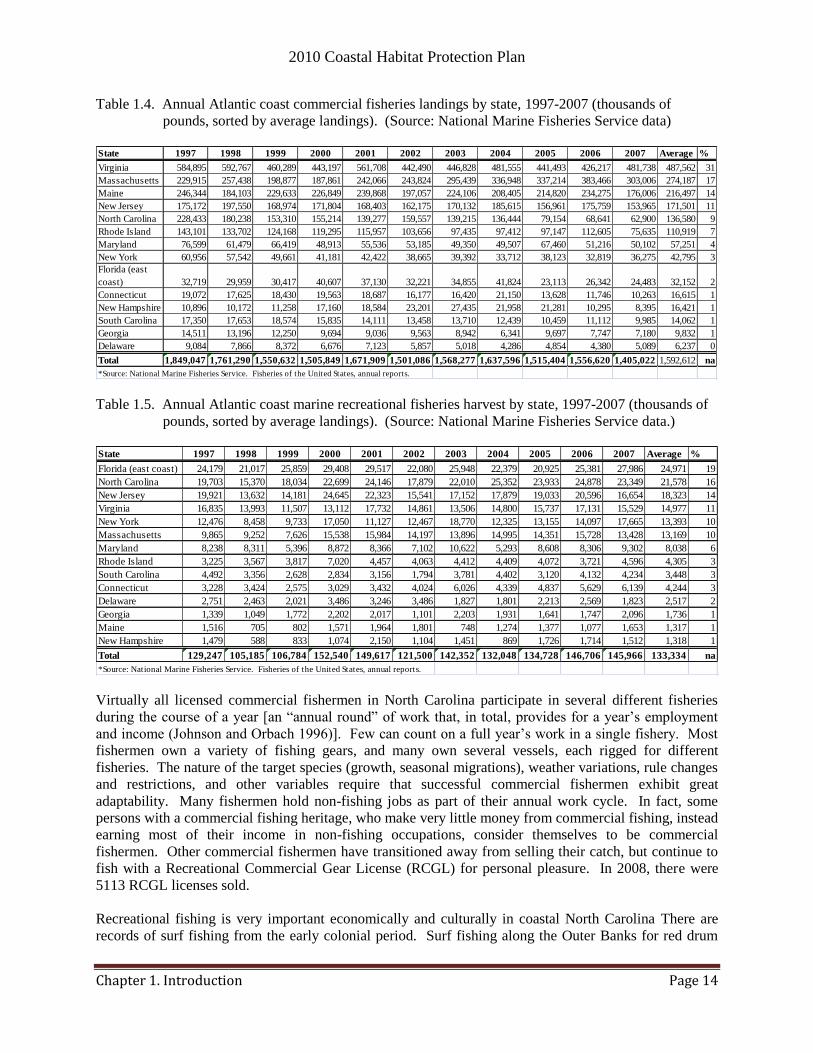
2010 Coastal Habitat Protection Plan
Chapter 1. Introduction Page 14
Table 1.4. Annual Atlantic coast commercial fisheries landings by state, 1997-2007 (thousands of
pounds, sorted by average landings). (Source: National Marine Fisheries Service data)
State 1997 1998 1999 2000 2001 2002 2003 2004 2005 2006 2007 Average %
Virginia 584,895 592,767 460,289 443,197 561,708 442,490 446,828 481,555 441,493 426,217 481,738 487,562 31
Massachusetts 229,915 257,438 198,877 187,861 242,066 243,824 295,439 336,948 337,214 383,466 303,006 274,187 17
Maine 246,344 184,103 229,633 226,849 239,868 197,057 224,106 208,405 214,820 234,275 176,006 216,497 14
New Jersey 175,172 197,550 168,974 171,804 168,403 162,175 170,132 185,615 156,961 175,759 153,965 171,501 11
North Carolina 228,433 180,238 153,310 155,214 139,277 159,557 139,215 136,444 79,154 68,641 62,900 136,580 9
Rhode Island 143,101 133,702 124,168 119,295 115,957 103,656 97,435 97,412 97,147 112,605 75,635 110,919 7
Maryland 76,599 61,479 66,419 48,913 55,536 53,185 49,350 49,507 67,460 51,216 50,102 57,251 4
New York 60,956 57,542 49,661 41,181 42,422 38,665 39,392 33,712 38,123 32,819 36,275 42,795 3
Florida (east
coast) 32,719 29,959 30,417 40,607 37,130 32,221 34,855 41,824 23,113 26,342 24,483 32,152 2
Connecticut 19,072 17,625 18,430 19,563 18,687 16,177 16,420 21,150 13,628 11,746 10,263 16,615 1
New Hampshire 10,896 10,172 11,258 17,160 18,584 23,201 27,435 21,958 21,281 10,295 8,395 16,421 1
South Carolina 17,350 17,653 18,574 15,835 14,111 13,458 13,710 12,439 10,459 11,112 9,985 14,062 1
Georgia 14,511 13,196 12,250 9,694 9,036 9,563 8,942 6,341 9,697 7,747 7,180 9,832 1
Delaware 9,084 7,866 8,372 6,676 7,123 5,857 5,018 4,286 4,854 4,380 5,089 6,237 0
Total 1,849,047 1,761,290 1,550,632 1,505,849 1,671,909 1,501,086 1,568,277 1,637,596 1,515,404 1,556,620 1,405,022 1,592,612 na
*Source: National Marine Fisheries Service. Fisheries of the United States, annual reports.
Table 1.5. Annual Atlantic coast marine recreational fisheries harvest by state, 1997-2007 (thousands of
pounds, sorted by average landings). (Source: National Marine Fisheries Service data.)
State 1997 1998 1999 2000 2001 2002 2003 2004 2005 2006 2007 Average %
Florida (east coast) 24,179 21,017 25,859 29,408 29,517 22,080 25,948 22,379 20,925 25,381 27,986 24,971 19
North Carolina 19,703 15,370 18,034 22,699 24,146 17,879 22,010 25,352 23,933 24,878 23,349 21,578 16
New Jersey 19,921 13,632 14,181 24,645 22,323 15,541 17,152 17,879 19,033 20,596 16,654 18,323 14
Virginia 16,835 13,993 11,507 13,112 17,732 14,861 13,506 14,800 15,737 17,131 15,529 14,977 11
New York 12,476 8,458 9,733 17,050 11,127 12,467 18,770 12,325 13,155 14,097 17,665 13,393 10
Massachusetts 9,865 9,252 7,626 15,538 15,984 14,197 13,896 14,995 14,351 15,728 13,428 13,169 10
Maryland 8,238 8,311 5,396 8,872 8,366 7,102 10,622 5,293 8,608 8,306 9,302 8,038 6
Rhode Island 3,225 3,567 3,817 7,020 4,457 4,063 4,412 4,409 4,072 3,721 4,596 4,305 3
South Carolina 4,492 3,356 2,628 2,834 3,156 1,794 3,781 4,402 3,120 4,132 4,234 3,448 3
Connecticut 3,228 3,424 2,575 3,029 3,432 4,024 6,026 4,339 4,837 5,629 6,139 4,244 3
Delaware 2,751 2,463 2,021 3,486 3,246 3,486 1,827 1,801 2,213 2,569 1,823 2,517 2
Georgia 1,339 1,049 1,772 2,202 2,017 1,101 2,203 1,931 1,641 1,747 2,096 1,736 1
Maine 1,516 705 802 1,571 1,964 1,801 748 1,274 1,377 1,077 1,653 1,317 1
New Hampshire 1,479 588 833 1,074 2,150 1,104 1,451 869 1,726 1,714 1,512 1,318 1
Total 129,247 105,185 106,784 152,540 149,617 121,500 142,352 132,048 134,728 146,706 145,966 133,334 na
*Source: National Marine Fisheries Service. Fisheries of the United States, annual reports.
Virtually all licensed commercial fishermen in North Carolina participate in several different fisheries
during the course of a year [an ―annual round‖ of work that, in total, provides for a year‘s employment
and income (Johnson and Orbach 1996)]. Few can count on a full year‘s work in a single fishery. Most
fishermen own a variety of fishing gears, and many own several vessels, each rigged for different
fisheries. The nature of the target species (growth, seasonal migrations), weather variations, rule changes
and restrictions, and other variables require that successful commercial fishermen exhibit great
adaptability. Many fishermen hold non-fishing jobs as part of their annual work cycle. In fact, some
persons with a commercial fishing heritage, who make very little money from commercial fishing, instead
earning most of their income in non-fishing occupations, consider themselves to be commercial
fishermen. Other commercial fishermen have transitioned away from selling their catch, but continue to
fish with a Recreational Commercial Gear License (RCGL) for personal pleasure. In 2008, there were
5113 RCGL licenses sold.
Recreational fishing is very important economically and culturally in coastal North Carolina There are
records of surf fishing from the early colonial period. Surf fishing along the Outer Banks for red drum

2010 Coastal Habitat Protection Plan
Chapter 1. Introduction Page 15
and bluefish was the subject of articles in sporting magazines as far back as the 1930s (Godwin et al.
1971). While commercial fishing has declined in recent years, recreational fishing has increased as North
Carolina‘s resident and visitor population has grown. Tens of thousands of private recreational boaters
fish the coastal waters, while thousands more fish from the shore, piers, and other structures. In 2007, it
was estimated that about 1.9 million anglers went fishing in coastal North Carolina, with a total of
approximately 6.9 million recreational fishing trips (DMF 2008). This includes trips from land, private
boat, headboats, and both resident and non-resident fisherman. Diaby (1997) estimated that sport fishing
contributed almost $75 million to the Carteret County economy, supporting over 1,800 jobs. In January
2007, GS 113-174 required establishment of a coastal recreational fishing license. This will allow better
estimates of recreational fishing effort. In 2007, approximately 470,000 recreational fishing licenses were
issued, of which approximately one third were for out-of-state visitors. Wake, New Hanover, Onslow,
Carteret, and Brunswick counties accounted for the greatest number of licenses.
1.5.2.2. Protected species
North Carolina state law [G.S. 113-331] protects endangered, threatened, and special concern species of
mammals, birds, reptiles, amphibians, freshwater fishes, freshwater and terrestrial mollusks, and
freshwater and terrestrial crustaceans under the jurisdiction of the North Carolina Wildlife Resources
Commission. The shortnose sturgeon (Acipenser brevirostrum) is listed as endangered at the state and
federal levels. The Atlantic sturgeon (Acipenser oxyrinchus) is listed as special concern at the state level
and as a candidate for listing at the federal level. A MFC rule [15A NCAC 3M .0508] prohibits
possession of any sturgeon in North Carolina's coastal waters. Shortnose sturgeon and Atlantic sturgeon
occur in riverine, estuarine, and marine systems within the CHPP management area.
Beginning in 2004, the NC NHP decided to no longer track marine and estuarine fishes due to insufficient
data, and difficulty of surveying and protecting fish species that occur in salt and brackish waters
(LeGrand et al. 2008). The North Carolina Natural Heritage Program (NHP) had previously tracked five
marine and estuarine fishes considered as significantly rare: spinycheek sleeper (Eleotris pisonis), lyre
goby (Evorthodus lyricus), marked goby (Gobionellus stigmaticus), freckled blenny (Hypsoblennius
ionthas), and opossum pipefish (Microphis brachyurus). All five of these species occur in marine and
estuarine systems of the Cape Fear MU.
Other marine and estuarine species tracked by NHP include Florida manatee (Trichechus manatus),
loggerhead sea turtle (Caretta caretta), green sea turtle (Chelonia mydas), hawksbill sea turtle
(Eretmochelys imbricata), leatherback sea turtle (Dermochelys coriacea), and Kemp‘s ridley sea turtle
(Lepidochelys kempii). There are also numerous birds, reptiles, mollusks, and mammals tracked by NHP
associated with salt marshes and other coastal wetlands [LeGrand et al. 2008 (NHP animals); Buchanan
and Finnegan 2008 (NHP plants)]. Tracked estuarine species include the Carolina diamondback terrapin
(Malaclemys terrapin centrala), Carolina salt marsh snake (Nerodia sipedon williamenglelsi), and the
federally listed piping plover (Charadrius melodus), which inhabit ocean beaches and inlet shorelines.
In addition to species tracked by NHP, there are also species designated for protection under the Marine
Mammal Protection Act (for example, bottlenose dolphin, Tursiops truncatus). Several species of marine
mammals regularly utilize North Carolina‘s nearshore ocean waters as migratory corridors or nursery and
feeding grounds. Northern right whales (Balaena glacialis), one of the world‘s most endangered species,
migrate annually through North Carolina waters, between winter calving grounds along the Georgia coast
and summer feeding areas from Cape Cod to the Bay of Fundy. Similarly, humpback whales (Megaptera
novaeangliae) pass by offshore North Carolina during their annual journey between North Atlantic
feeding grounds and winter calving areas off Hispanola. Bottlenose dolphin are year-round residents of
the coastal ocean waters of North Carolina, and they utilize much of the estuarine system during the
warmer months, going as far upstream as the lower Neuse River. Harbor porpoise (Phocoena phocoena)
2010 Coastal Habitat Protection Plan
Chapter 1. Introduction Page 16
spend a part of each winter off the Outer Banks, as far south as Hatteras Bight, below Diamond Shoals. A
number of other marine mammals occasionally utilize North Carolina‘s coastal waters, including pygmy
sperm whales (Kogia breviceps) and long-finned pilot whales (Globicephala melas).
1.6. Status of fisheries
The current status of fisheries may in part be an indicator of habitat conditions or indicate the fisheries for
which it would be particularly important to minimize habitat degradation due to an already stressed fish
population. The status of North Carolina‘s coastal fishery stocks are evaluated every year by DMF. A
stock is defined as a group of genetically similar fish that behave as a unit. Determining stock status
requires long-term collection and subsequent analysis of data such as length, weight, age, catch, fishing
effort, spawning stock biomass, juvenile abundance indices, fishing mortality, and natural mortality. All
data are not available for all species, and there is no single measure or simple index that, by itself,
describes the status of a given stock. Furthermore, information from a single year does not indicate stock
status. Therefore, the stock status assigned for each coastal fishery stock is based on the available time-
series of data. This information is incorporated into MFC Fishery Management Plans to determine
appropriate management actions and goals for a fishery.
Table 1.6 lists 5-year average landings in pounds of commercially and recreationally important fishery
species during the previous CHPP cycle and in the last five years. Commercially, Atlantic menhaden,
blue crab, Atlantic croaker, shrimp, and flounder have accounted for the most landings during both time
periods. In the past five years, average landings of Atlantic menhaden greatly declined due to the closure
of the single menhaden plant in North Carolina. Blue crab and shrimp landings declined, while Atlantic
croaker slightly increased. Commercial catch of thirteen of the nineteen fishery species listed declined in
the past five years. Recreationally, striped bass, spot, bluefish, snapper-grouper, and spotted seatrout
accounted for the most landings in the past decade. Of the ten species listed with recreational data,
landings of seven fishery species have increased in the past five years, including all of the most abundant.
Summer flounder, Atlantic croaker, and red drum landings decreased slightly.
Stock status terms were modified by DMF in 2007 to better address the assignment of a status to stocks
that have unapproved or no stock assessment, or whose stock assessments are too unreliable to determine
a status. In addition, the term ―Overfished‖ was changed to ―Depleted‖ to address those stocks that may
have other factors besides fishing contributing to low population abundances. Categories now include:
Viable - Viable stocks exhibit stable or increasing trends in average length and weight, catch per unit
effort, spawning stock biomass, juvenile abundance indexes based on historical averages, stable age
structure that includes representatives of the older age classes, and stable or declining trends in
fishing mortality. Stocks deemed recovered by a Division of Marine Fisheries (DMF), Atlantic States
Marine Fisheries Commission (ASMFC), or regional Council fishery management plan (FMP) would
be considered ―viable‖. A stock is considered ―recovered‖ when it has reached the target(s) for
sustainable harvest, spawning stock biomass, spawning potential ratio, fishing mortality, size/age
structure, or any other biological target required in an approved DMF, ASMFC and/or regional
Council FMP. (No Overfishing; Not Overfished)1
Recovering - Recovering stocks are those stocks that show marked and consistent improvement in
the criteria listed for a ―viable‖ stock. A ―recovering‖ species may still be depleted but would be
defined as one that, under a current plan, shows measurable and consistent improvement but has not
yet reached the target(s) of a specific FMP. (No Overfishing; Overfished)*
1 Overfishing/overfished designations result from completed stock assessments.

2010 Coastal Habitat Protection Plan
Chapter 1. Introduction Page 17
Concern - Stocks designated as ―concern‖ are those stocks that exhibit increased effort, declining
landings, truncated age distribution, or are negatively impacted by biotic and/or abiotic factors that
cannot be controlled (example: water quality, habitat loss, disease, life history, predation, etc). Stocks
with or without an approved stock assessment or FMP but are exhibiting declining trends may be
classified as ―concern‖. (Overfishing; Not Overfished)* Stocks whose assessments have unreliable
benchmarks may also be classified as ―concern‖ (Example: Overfishing cannot be determined)
Depleted – Depleted stocks are those stocks where the spawning stock abundance is below a
predetermined threshold or where low stock abundance precludes an active fishery. Factors that can
contribute to ―depleted‖ status include but are not limited to fishing, predation, competition, water
quality, habitat loss, recruitment variability, disease, or a combination of these factors. Determination
is based on approved DMF, ASMFC, and/or regional Council FMPs and/or stock assessments.
Species designated as ―depleted‖ would be priority candidates for FMP development.
Unknown - Stocks for which insufficient data are available to determine trends in effort, landings,
age distribution, recruitment, etc. are classified as ―unknown‖. Many stocks that have been
designated as ―unknown‖ have been picked up in DMF sampling programs that may result in
sufficient data to designate a status in the future.
Of the fishery species listed in Table 1.6, comprising at least 25 fish stocks, eight stocks are Viable
(32%), two are Recovering (8%), eight are Concern (33%), six are Depleted (24%), and one is Unknown
(4%), as of 2008 (Table 1.7). Depleted stocks include black sea bass south of Hatteras, bay scallop, river
herring (Albemarle stock), southern flounder, and striped bass (central/southern stock). Species that have
demonstrated a decline in their stock status since the last CHPP include bay scallop, weakfish, spot,
summer flounder, gag, and black sea bass north of Hatteras. Species with improved stock status include
Atlantic croaker, bluefish, and striped mullet. Others remained the same. For more information on the
status of individual fishery species, see the DMF website at http://www.ncdmf.net/stocks/index.html.

2010 Coastal Habitat Protection Plan
Chapter 1. Introduction Page 18
Table 1.6. Average annual North Carolina landings for important commercial and recreational fishery
species reported during the first (1997-2002) CHPP cycle and last five years. (Sorted
alphabetically; Recreational landings include a+b1 landing type; Source: DMF fisheries
landings data)
Species
Average commercial fisheries
landings
Average recreational fisheries
landings
Lead FMP agency
1997-2002
(lb)
2003-2007
(lb)
5 yr
Change
1997-
2002 (lb)
2003-
2007 (lb)
5 yr
Change
American shad 233,718 268,359 + Unknown Unknown ASMFC
Atlantic croaker 10,692,337 11,782,240 + 276,740 193,490 - ASMFC
Atlantic
menhaden 63,330,289 17,812,110 - Unknown Unknown ASMFC
Bay scallops 39,903 2,855 - Unknown Unknown DMF
Blue crab 47,673,736 29,819,727 - Unknown Unknown DMF
Bluefish 3,240,218 3,038,788 - 838,102 1,141,502 + ASMFC/NMFS
Hard clams 671,716 467,317 - Unknown Unknown DMF
Oysters 234,445 379,268 + Unknown Unknown DMF
Red drum 203,537 137,249 - 255,884 202,314 - ASMFC/DMF
River herring 352,364 149,845 - Unknown Unknown ASMFC / DMF
Shrimp 7,688,851 5,738,901 - Unknown Unknown DMF < 3 mi,
NMFS > 3 mi
Snapper/grouper
/ sea bass 1,788,967 1,792,935 + 409,521 757,759 + NMFS
Southern
flounder 3,523,763 2,178,931 - 134,186 349,569 + DMF
Spot 2,563,527 1,663,773 - 1,028,822 1,404,384 + ASMFC
Spotted seatrout 290,303 225,873 - 419,273 618,003 + ASMFC
Striped bass 555,421 639,960 + 663,626 2,364,036 +
ASMFC - ocean,
DMF/WRC -
internal waters
Striped mullet 2,311,092 1,649,147 - Unknown Unknown DMF
Summer
flounder 2,938,425 3,826,534 + 381,729 209921 - ASMFC/NMFS
Weakfish 2,531,015 498,949 - 116,632 171,598 + ASMFC/NMFS
While much of the concern over declining fish stocks has been attributed to overfishing, habitat loss and
degradation can make a stock more susceptible to overfishing. The effect of habitat loss and degradation
could be indicated by the lack of recovery of certain stocks after fishing pressure is reduced. For
example, river herring stocks have not recovered despite reduced fishing effort and a fishing moratorium.
Although the role of environmental factors in the river herring decline is uncertain, the center of river
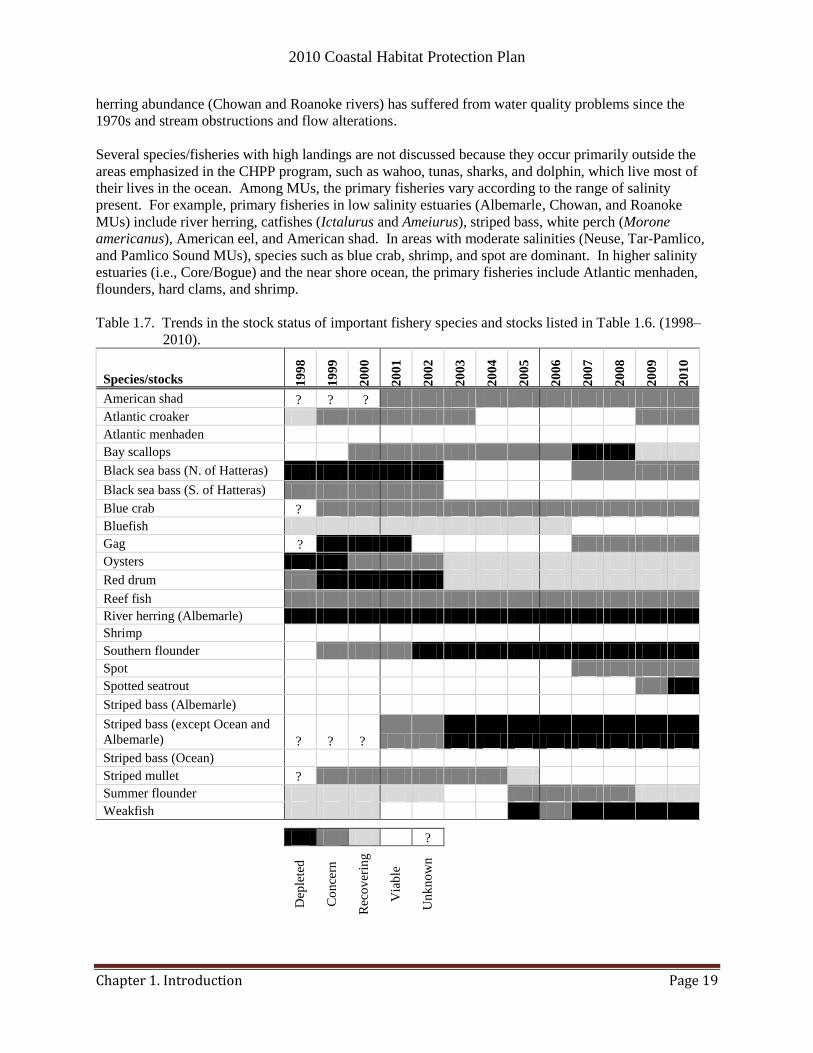
2010 Coastal Habitat Protection Plan
Chapter 1. Introduction Page 19
herring abundance (Chowan and Roanoke rivers) has suffered from water quality problems since the
1970s and stream obstructions and flow alterations.
Several species/fisheries with high landings are not discussed because they occur primarily outside the
areas emphasized in the CHPP program, such as wahoo, tunas, sharks, and dolphin, which live most of
their lives in the ocean. Among MUs, the primary fisheries vary according to the range of salinity
present. For example, primary fisheries in low salinity estuaries (Albemarle, Chowan, and Roanoke
MUs) include river herring, catfishes (Ictalurus and Ameiurus), striped bass, white perch (Morone
americanus), American eel, and American shad. In areas with moderate salinities (Neuse, Tar-Pamlico,
and Pamlico Sound MUs), species such as blue crab, shrimp, and spot are dominant. In higher salinity
estuaries (i.e., Core/Bogue) and the near shore ocean, the primary fisheries include Atlantic menhaden,
flounders, hard clams, and shrimp.
Table 1.7. Trends in the stock status of important fishery species and stocks listed in Table 1.6. (1998–
2010).
Species/stocks 19
98
19
99
20
00
20
01
20
02
20
03
20
04
20
05
20
06
20
07
20
08
20
09
20
10
American shad ? ? ?
Atlantic croaker
Atlantic menhaden
Bay scallops
Black sea bass (N. of Hatteras)
Black sea bass (S. of Hatteras)
Blue crab ?
Bluefish
Gag ?
Oysters
Red drum
Reef fish
River herring (Albemarle)
Shrimp
Southern flounder
Spot
Spotted seatrout
Striped bass (Albemarle)
Striped bass (except Ocean and
Albemarle) ? ? ?
Striped bass (Ocean)
Striped mullet ?
Summer flounder
Weakfish
?
Dep
lete
d
Co
nce
rn
Rec
ov
erin
g
Via
ble
Un
kn
ow
n
2010 Coastal Habitat Protection Plan
Chapter 1. Introduction Page 20
1.7. Habitat concepts and terminology
The following habitat chapters contain numerous technical terms and acronyms that may not be familiar
to the average reader. A complete list of terms and acronyms is found in Appendix C.
Habitat is simply the place where an organism lives (Odum 1959). Fish Habitat (FH) is defined as
freshwater, estuarine, and marine areas that support juvenile and adult populations of economically
important fish species (commercial and recreational), as well as forage species important in the food
chain. Fish habitat also includes land areas that are adjacent to, and periodically flooded by, riverine and
coastal waters. Fish occupy specific areas or sites where the conditions are suitable for growth,
protection, and/or reproduction. A species‘ use of specific areas can depend on various factors, including
life stage, time of day, and tidal stage. Together, these habitat areas form a functional and connected
system that supports the fish from spawning until death. Within North Carolina‘s coastal ecosystem, six
habitat types were distinguished based on similar physical properties, ecological functions, and habitat
requirements for living components: water column, shell bottom, submerged aquatic vegetation (SAV),
wetlands, and hard bottom.
North Carolina‘s coastal fishery resources (the ―fish‖) exist within a system of interdependent habitats
that provide the basis for long-term fish production available for use by people (the ―fisheries‖). Most
fish rely on different habitats throughout their life cycle (Figure 1.1); therefore, maintaining the health of
an entire aquatic system is essential. The integrity of the entire system depends upon the health of areas
and individual habitat types within the system. The areas that contribute most to the integrity of the
system are another category of habitat termed Strategic Habitat Area.
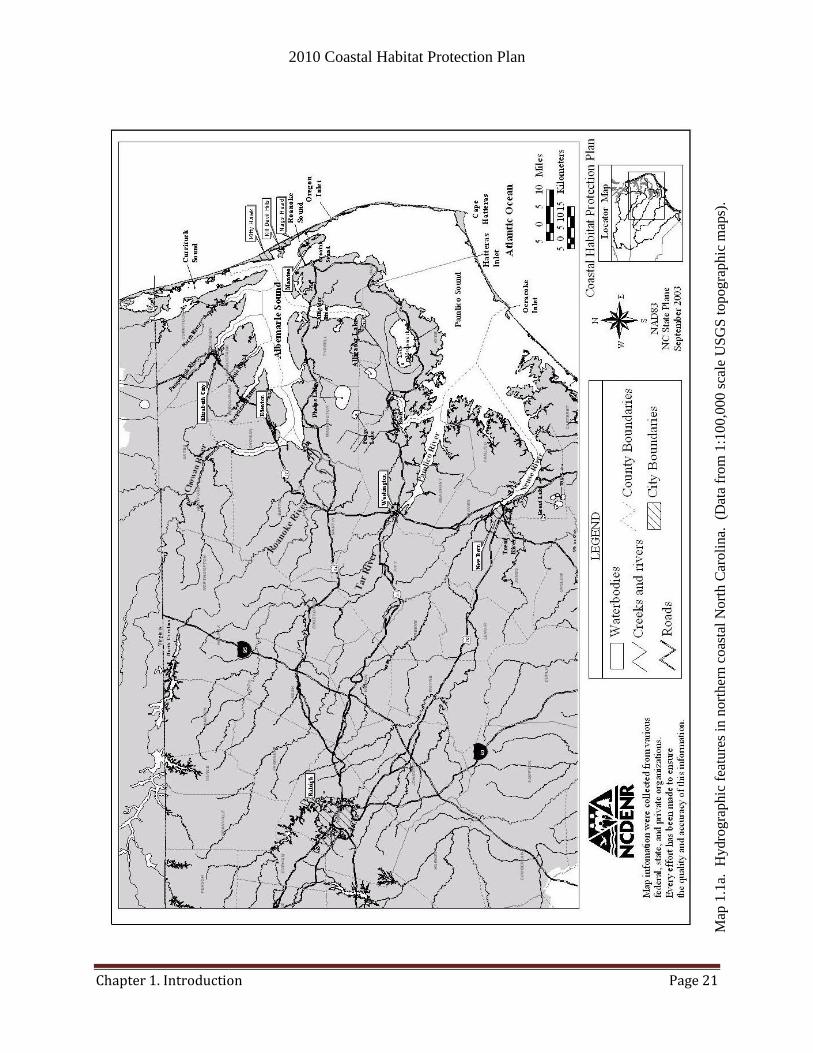
2010 Coastal Habitat Protection Plan
Chapter 1. Introduction Page 21
Map
1.1
a. H
ydro
gra
phic
fea
ture
s in
nort
her
n c
oas
tal
Nort
h C
aroli
na.
(D
ata
from
1:1
00,0
00 s
cale
US
GS
to
pog
rap
hic
map
s).

2010 Coastal Habitat Protection Plan
Chapter 1. Introduction Page 22
Map
1.1
b. H
yd
rog
rap
hic
fea
ture
s in
south
ern c
oas
tal
Nort
h C
aroli
na.
(D
ata
from
1:1
00,0
00 s
cale
US
GS
to
pog
rap
hic
map
s).
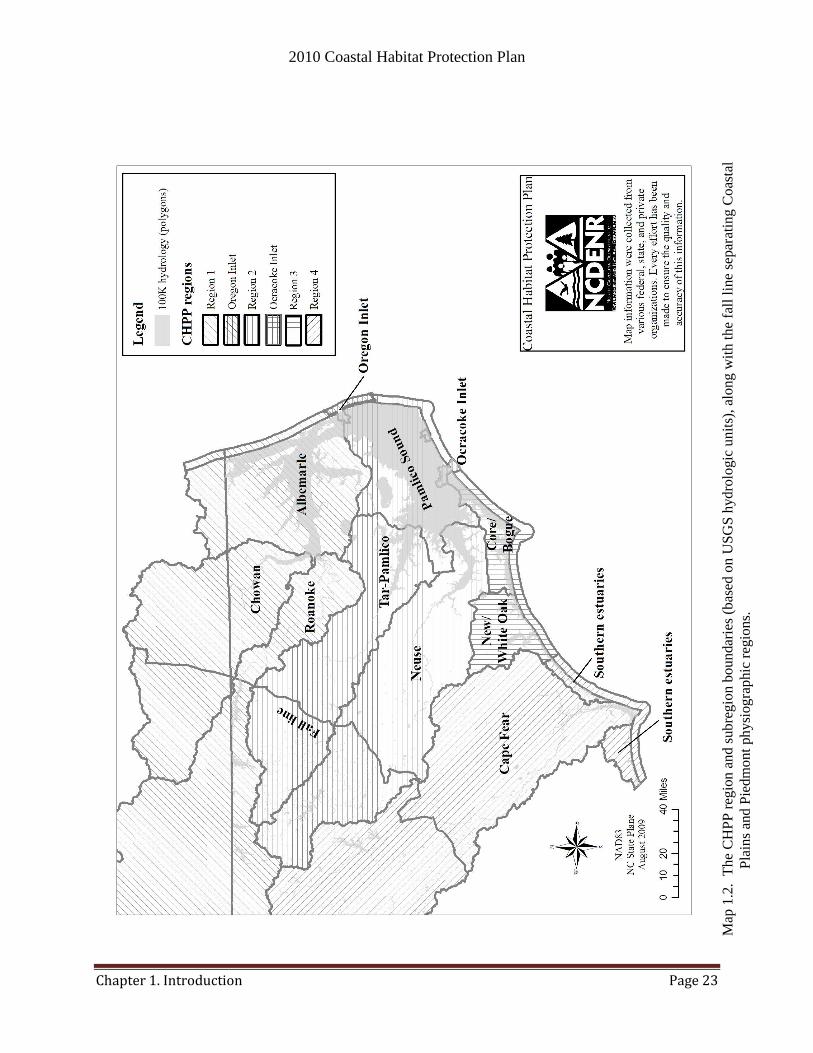
2010 Coastal Habitat Protection Plan
Chapter 1. Introduction Page 23
Map
1.2
. T
he
CH
PP
reg
ion
an
d s
ub
regio
n b
oundar
ies
(bas
ed o
n U
SG
S h
ydro
logic
unit
s),
along w
ith
th
e fa
ll l
ine
separ
atin
g C
oas
tal
Pla
ins
and
Pie
dm
on
t ph
ysi
ogra
phic
reg
ions.
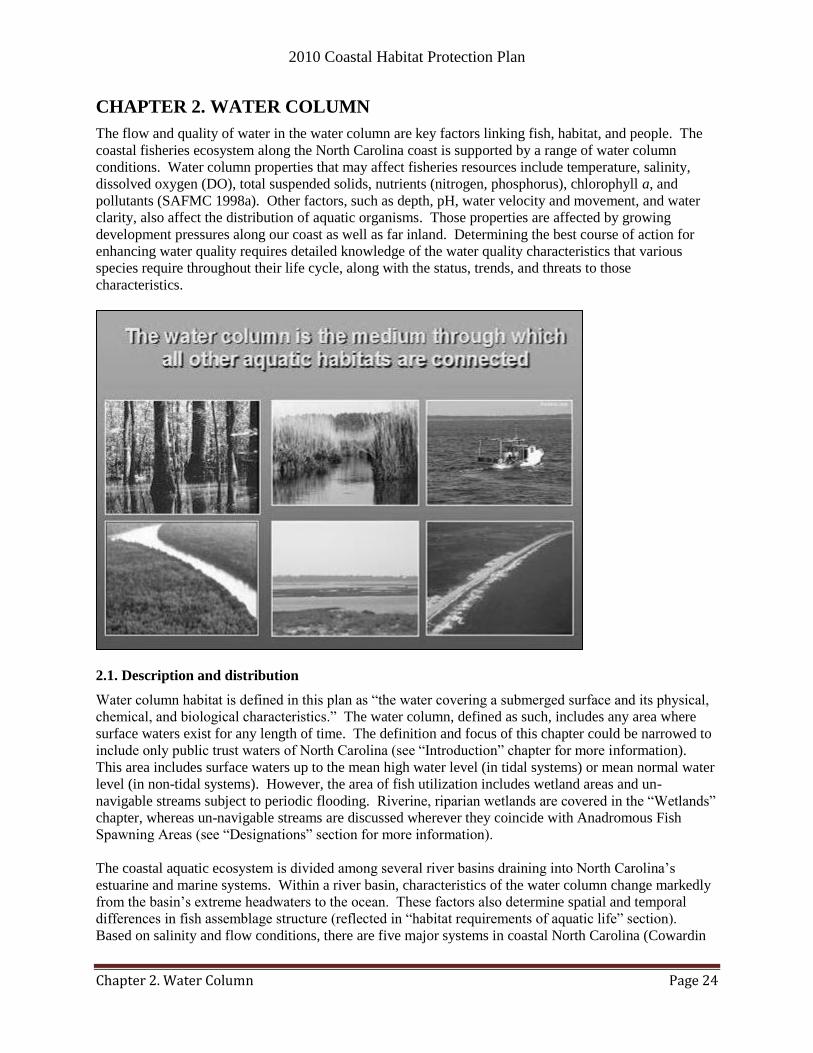
2010 Coastal Habitat Protection Plan
Chapter 2. Water Column Page 24
CHAPTER 2. WATER COLUMN
The flow and quality of water in the water column are key factors linking fish, habitat, and people. The
coastal fisheries ecosystem along the North Carolina coast is supported by a range of water column
conditions. Water column properties that may affect fisheries resources include temperature, salinity,
dissolved oxygen (DO), total suspended solids, nutrients (nitrogen, phosphorus), chlorophyll a, and
pollutants (SAFMC 1998a). Other factors, such as depth, pH, water velocity and movement, and water
clarity, also affect the distribution of aquatic organisms. Those properties are affected by growing
development pressures along our coast as well as far inland. Determining the best course of action for
enhancing water quality requires detailed knowledge of the water quality characteristics that various
species require throughout their life cycle, along with the status, trends, and threats to those
characteristics.
2.1. Description and distribution
Water column habitat is defined in this plan as ―the water covering a submerged surface and its physical,
chemical, and biological characteristics.‖ The water column, defined as such, includes any area where
surface waters exist for any length of time. The definition and focus of this chapter could be narrowed to
include only public trust waters of North Carolina (see ―Introduction‖ chapter for more information).
This area includes surface waters up to the mean high water level (in tidal systems) or mean normal water
level (in non-tidal systems). However, the area of fish utilization includes wetland areas and un-
navigable streams subject to periodic flooding. Riverine, riparian wetlands are covered in the ―Wetlands‖
chapter, whereas un-navigable streams are discussed wherever they coincide with Anadromous Fish
Spawning Areas (see ―Designations‖ section for more information).
The coastal aquatic ecosystem is divided among several river basins draining into North Carolina‘s
estuarine and marine systems. Within a river basin, characteristics of the water column change markedly
from the basin‘s extreme headwaters to the ocean. These factors also determine spatial and temporal
differences in fish assemblage structure (reflected in ―habitat requirements of aquatic life‖ section).
Based on salinity and flow conditions, there are five major systems in coastal North Carolina (Cowardin

2010 Coastal Habitat Protection Plan
Chapter 2. Water Column Page 25
et al. 1979).
1. Creek and rivers (riverine system) – All deepwater habitats contained within a channel; may
have salinities in excess of 0.5 ppt.
2. Lakes and ponds (Lacustrine and palustrine systems, respectively) – isolated water bodies with
salinity below 0.5 ppt and situated in a topographic depression or dammed river channel. Ponds
are generally less than 8 ha in size and water depth is no greater than 2 m (6.6 ft). Lakes are
generally greater than 8 ha (20 acres) in size and deeper than 2 m (6.6 ft).
3. Estuarine system – Mixing area of saltwater and freshwater; tidally- and wind-influenced waters
that are usually semi-enclosed by land but have open, partly obstructed, or sporadic access to the
ocean, with ocean-derived water at least occasionally diluted by freshwater runoff from the land.
The upstream and landward limit is where ocean-derived salts cause the water to have salinity 0.5
ppt during the period of average annual low flow. The seaward limit is an imaginary line closing
the mouth of a river, bay, or sound.
4. Marine system - Open ocean overlying the continental shelf and coastline exposed to waves and
currents of the open ocean shoreward to extreme high water of spring tides; or the seaward limit
of the Estuarine System. Salinities exceed 30 ppt.
2.1.1. Creeks and rivers
The characteristics of river basins depend on climate, geology, topography, and land cover. The coastal
plain has a basin slope of approximately one foot per mile (DWQ 1997a); higher in the southern portion
and lower in the northern portion. The riverine system also changes as one moves from the headwater
tributaries to mainstem channels. Changes include a shift to increasing turbidity, depth (Sheehan and
Rasmussen 1993), phytoplankton abundance, and flooding frequency. There also tends to be a decrease
in particle size of organic matter (Vannote et al. 1980), an increase in the importance of floodplain
wetlands (Junk et al. 1989), and more continuous flow in downstream areas. Sluggish streams in sub-
watersheds with flat topography and extensive riverine wetlands are often acidic with high inputs of
dissolved organic matter (a condition known as ―dystrophy‖). Dystrophy also reduces the availability of
nutrients for phytoplankton and dissolved oxygen for fish (Wetzel 2001). However, dystrophy does not
imply poor water quality as native biological communities are adapted to such conditions in non-
anthropogenically impacted such systems. Dystrophic waters should be classified as “swamp waters” for
the purpose of water quality standards (See ―Designations‖ section for more information)
Rivers and creeks also exhibit seasonal variations in stream flow, suspended particle concentrations, and
water temperature. Average monthly discharge among all coastal river basins peaks in March, declines
throughout the summer and fall, and gradually increases again around November (Figure 2.1). Elevated
discharge is a result of low temperatures and correspondingly low evapotranspiration rather than more
rainfall. This discharge pattern also corresponds with low and high-salinity time periods in downstream
estuaries. Flow variability also follows the general discharge pattern, with the highest variability during
March. Heavy spring flows carry relatively high sediment loads, which, in combination with spring algal
blooms, result in increased turbidity. Water temperatures are generally highest from June to September
(25-27º C) and lowest during December - January (5-9º C) (Figure 2.1). From 1983 to 2008, annual
discharge patterns within river basins appear to rise and fall on a 3-4 year cycle (Figure 2.2; see Map 2.1
for USGS stream gauge stations used).
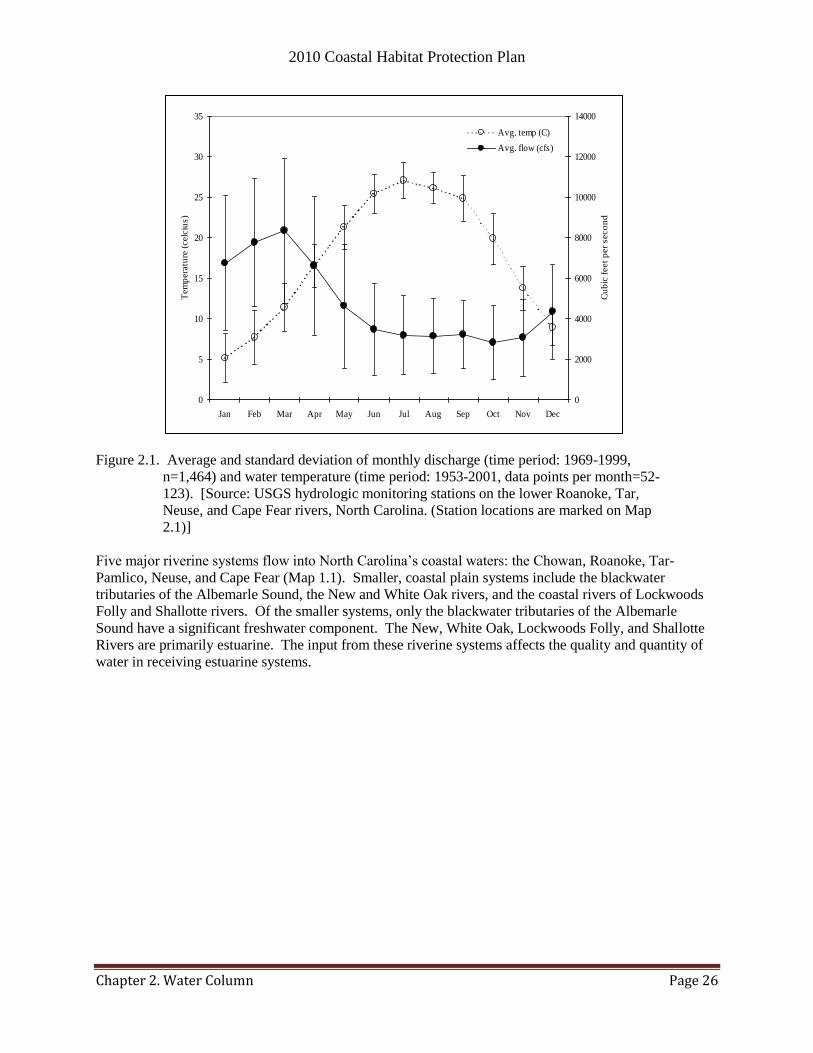
2010 Coastal Habitat Protection Plan
Chapter 2. Water Column Page 26
Figure 2.1. Average and standard deviation of monthly discharge (time period: 1969-1999,
n=1,464) and water temperature (time period: 1953-2001, data points per month=52-
123). [Source: USGS hydrologic monitoring stations on the lower Roanoke, Tar,
Neuse, and Cape Fear rivers, North Carolina. (Station locations are marked on Map
2.1)]
Five major riverine systems flow into North Carolina‘s coastal waters: the Chowan, Roanoke, Tar-
Pamlico, Neuse, and Cape Fear (Map 1.1). Smaller, coastal plain systems include the blackwater
tributaries of the Albemarle Sound, the New and White Oak rivers, and the coastal rivers of Lockwoods
Folly and Shallotte rivers. Of the smaller systems, only the blackwater tributaries of the Albemarle
Sound have a significant freshwater component. The New, White Oak, Lockwoods Folly, and Shallotte
Rivers are primarily estuarine. The input from these riverine systems affects the quality and quantity of
water in receiving estuarine systems.
0
5
10
15
20
25
30
35
Jan Feb Mar Apr May Jun Jul Aug Sep Oct Nov Dec
Tem
pera
ture
(celc
ius)
0
2000
4000
6000
8000
10000
12000
14000
Cu
bic
feet
per
seco
nd
Avg. temp (C)
Avg. flow (cfs)
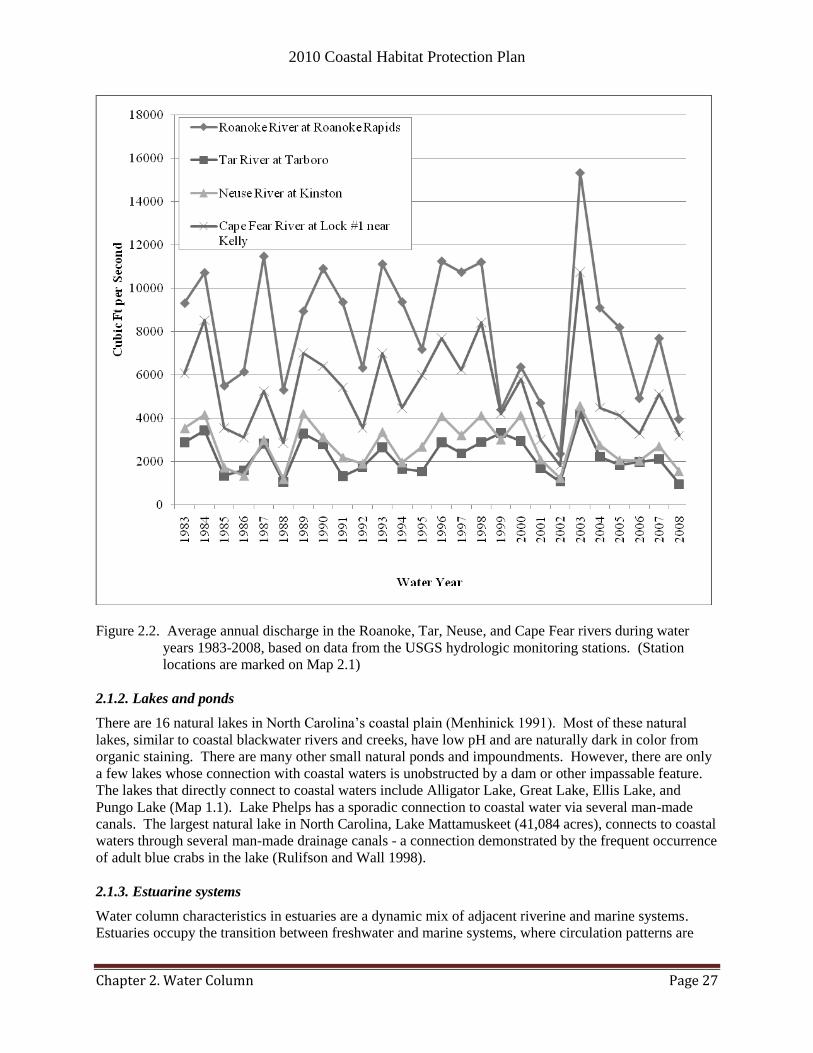
2010 Coastal Habitat Protection Plan
Chapter 2. Water Column Page 27
Figure 2.2. Average annual discharge in the Roanoke, Tar, Neuse, and Cape Fear rivers during water
years 1983-2008, based on data from the USGS hydrologic monitoring stations. (Station
locations are marked on Map 2.1)
2.1.2. Lakes and ponds
There are 16 natural lakes in North Carolina‘s coastal plain (Menhinick 1991). Most of these natural
lakes, similar to coastal blackwater rivers and creeks, have low pH and are naturally dark in color from
organic staining. There are many other small natural ponds and impoundments. However, there are only
a few lakes whose connection with coastal waters is unobstructed by a dam or other impassable feature.
The lakes that directly connect to coastal waters include Alligator Lake, Great Lake, Ellis Lake, and
Pungo Lake (Map 1.1). Lake Phelps has a sporadic connection to coastal water via several man-made
canals. The largest natural lake in North Carolina, Lake Mattamuskeet (41,084 acres), connects to coastal
waters through several man-made drainage canals - a connection demonstrated by the frequent occurrence
of adult blue crabs in the lake (Rulifson and Wall 1998).
2.1.3. Estuarine systems
Water column characteristics in estuaries are a dynamic mix of adjacent riverine and marine systems.
Estuaries occupy the transition between freshwater and marine systems, where circulation patterns are
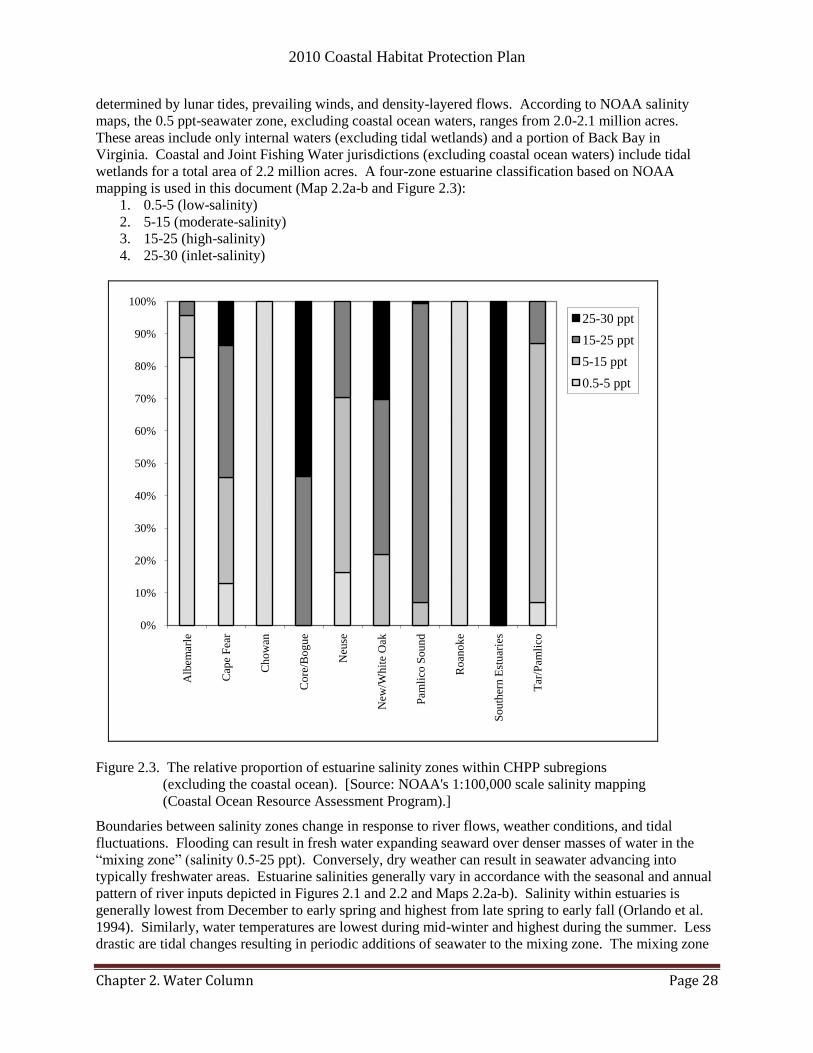
2010 Coastal Habitat Protection Plan
Chapter 2. Water Column Page 28
determined by lunar tides, prevailing winds, and density-layered flows. According to NOAA salinity
maps, the 0.5 ppt-seawater zone, excluding coastal ocean waters, ranges from 2.0-2.1 million acres.
These areas include only internal waters (excluding tidal wetlands) and a portion of Back Bay in
Virginia. Coastal and Joint Fishing Water jurisdictions (excluding coastal ocean waters) include tidal
wetlands for a total area of 2.2 million acres. A four-zone estuarine classification based on NOAA
mapping is used in this document (Map 2.2a-b and Figure 2.3):
1. 0.5-5 (low-salinity)
2. 5-15 (moderate-salinity)
3. 15-25 (high-salinity)
4. 25-30 (inlet-salinity)
0%
10%
20%
30%
40%
50%
60%
70%
80%
90%
100%
Alb
emar
le
Cap
e F
ear
Chow
an
Core
/Bogue
Neu
se
New
/Whit
e O
ak
Pam
lico
Sound
Roan
oke
South
ern E
stuar
ies
Tar
/Pam
lico
25-30 ppt
15-25 ppt
5-15 ppt
0.5-5 ppt
Figure 2.3. The relative proportion of estuarine salinity zones within CHPP subregions
(excluding the coastal ocean). [Source: NOAA's 1:100,000 scale salinity mapping
(Coastal Ocean Resource Assessment Program).]
Boundaries between salinity zones change in response to river flows, weather conditions, and tidal
fluctuations. Flooding can result in fresh water expanding seaward over denser masses of water in the
―mixing zone‖ (salinity 0.5-25 ppt). Conversely, dry weather can result in seawater advancing into
typically freshwater areas. Estuarine salinities generally vary in accordance with the seasonal and annual
pattern of river inputs depicted in Figures 2.1 and 2.2 and Maps 2.2a-b). Salinity within estuaries is
generally lowest from December to early spring and highest from late spring to early fall (Orlando et al.
1994). Similarly, water temperatures are lowest during mid-winter and highest during the summer. Less
drastic are tidal changes resulting in periodic additions of seawater to the mixing zone. The mixing zone
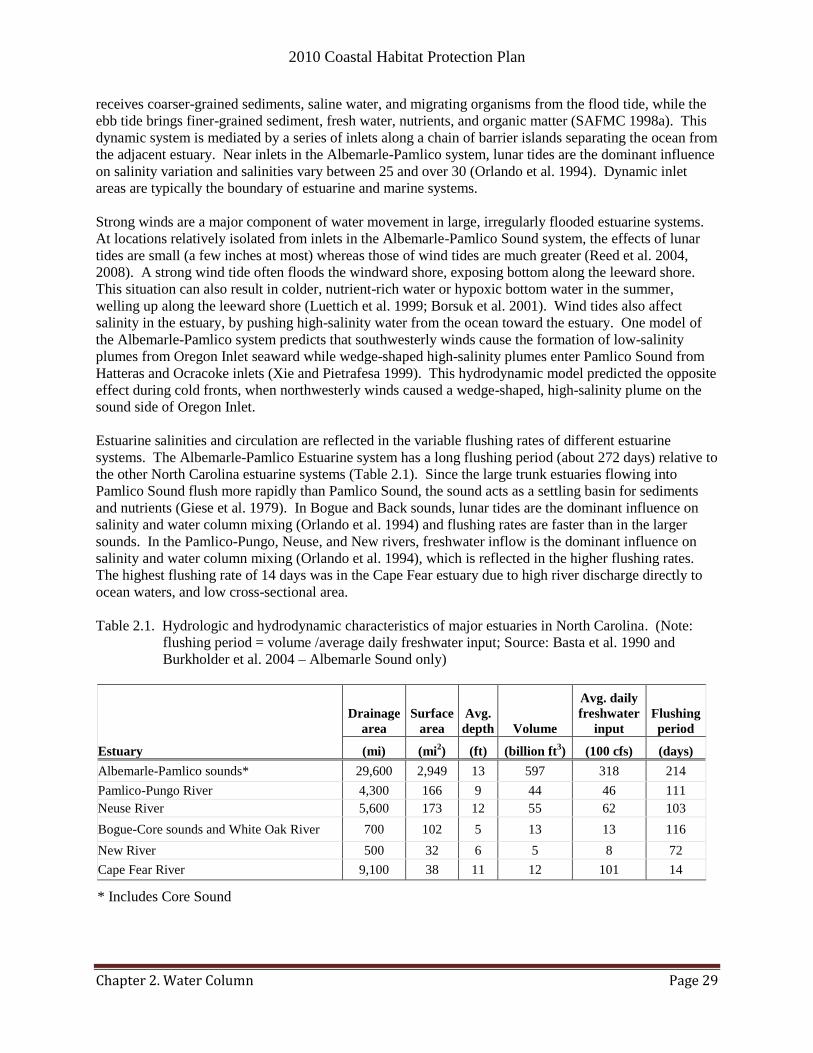
2010 Coastal Habitat Protection Plan
Chapter 2. Water Column Page 29
receives coarser-grained sediments, saline water, and migrating organisms from the flood tide, while the
ebb tide brings finer-grained sediment, fresh water, nutrients, and organic matter (SAFMC 1998a). This
dynamic system is mediated by a series of inlets along a chain of barrier islands separating the ocean from
the adjacent estuary. Near inlets in the Albemarle-Pamlico system, lunar tides are the dominant influence
on salinity variation and salinities vary between 25 and over 30 (Orlando et al. 1994). Dynamic inlet
areas are typically the boundary of estuarine and marine systems.
Strong winds are a major component of water movement in large, irregularly flooded estuarine systems.
At locations relatively isolated from inlets in the Albemarle-Pamlico Sound system, the effects of lunar
tides are small (a few inches at most) whereas those of wind tides are much greater (Reed et al. 2004,
2008). A strong wind tide often floods the windward shore, exposing bottom along the leeward shore.
This situation can also result in colder, nutrient-rich water or hypoxic bottom water in the summer,
welling up along the leeward shore (Luettich et al. 1999; Borsuk et al. 2001). Wind tides also affect
salinity in the estuary, by pushing high-salinity water from the ocean toward the estuary. One model of
the Albemarle-Pamlico system predicts that southwesterly winds cause the formation of low-salinity
plumes from Oregon Inlet seaward while wedge-shaped high-salinity plumes enter Pamlico Sound from
Hatteras and Ocracoke inlets (Xie and Pietrafesa 1999). This hydrodynamic model predicted the opposite
effect during cold fronts, when northwesterly winds caused a wedge-shaped, high-salinity plume on the
sound side of Oregon Inlet.
Estuarine salinities and circulation are reflected in the variable flushing rates of different estuarine
systems. The Albemarle-Pamlico Estuarine system has a long flushing period (about 272 days) relative to
the other North Carolina estuarine systems (Table 2.1). Since the large trunk estuaries flowing into
Pamlico Sound flush more rapidly than Pamlico Sound, the sound acts as a settling basin for sediments
and nutrients (Giese et al. 1979). In Bogue and Back sounds, lunar tides are the dominant influence on
salinity and water column mixing (Orlando et al. 1994) and flushing rates are faster than in the larger
sounds. In the Pamlico-Pungo, Neuse, and New rivers, freshwater inflow is the dominant influence on
salinity and water column mixing (Orlando et al. 1994), which is reflected in the higher flushing rates.
The highest flushing rate of 14 days was in the Cape Fear estuary due to high river discharge directly to
ocean waters, and low cross-sectional area.
Table 2.1. Hydrologic and hydrodynamic characteristics of major estuaries in North Carolina. (Note:
flushing period = volume /average daily freshwater input; Source: Basta et al. 1990 and
Burkholder et al. 2004 – Albemarle Sound only)
Estuary
Drainage
area
Surface
area
Avg.
depth Volume
Avg. daily
freshwater
input
Flushing
period
(mi 2) (mi2) (ft) (billion ft
3) (100 cfs) (days)
Albemarle-Pamlico sounds* 29,600 2,949 13 597 318 214
Pamlico-Pungo River 4,300 166 9 44 46 111
Neuse River 5,600 173 12 55 62 103
Bogue-Core sounds and White Oak River 700 102 5 13 13 116
New River 500 32 6 5 8 72
Cape Fear River 9,100 38 11 12 101 14
* Includes Core Sound

2010 Coastal Habitat Protection Plan
Chapter 2. Water Column Page 30
2.1.4. Marine systems
Marine systems are defined as open ocean waters overlying the continental shelf and its associated high-
energy coastline where salinities exceed 30 (Cowardin et al. 1979). Salinity, temperature, and circulation
patterns in the marine system are affected by freshwater input, proximity to inlets, prevailing winds,
major ocean currents, and shoals. The mix of factors results in generally uniform temperatures and
salinities (from top to bottom) on the inner shelf during fall and winter (Menzel 1993). During summer,
inner shelf waters are often stratified.
The effects of freshwater runoff are also most apparent near inlets and river mouths. Salinities and
temperatures are lowest in coastal marine systems during periods of maximum freshwater runoff in March
(Figure 2.1). The Cape Fear River is a major source of direct river runoff into southern North Carolina‘s
ocean waters. Low-salinity waters also enter the ocean through the multiple inlets along the coast and
from southerly flow of Chesapeake Bay waters along the Outer Banks. The plume of lower-salinity
Chesapeake Bay water is pushed southward by the southerly-flowing coastal frontal zone (CFZ). The
effects of tides and bottom friction are most evident near inlets and along the shoreline. Tidal amplitude
along North Carolina‘s ocean shoreline is greatest in the southern coastal area where the continental shelf
is widest. The average tidal height in North Carolina is approximately 2 ft (0.6 m) near Cape Hatteras
and 4.3 ft (1.3 m) near Cape Fear. A considerable amount of mixing is provided by the turbulence of
twice-daily tides. In contrast, the Neuse and Pamlico estuaries are almost entirely wind-influenced, with
very little effect of tides.
Winds are important in all layers of the marine water column. Wind stress can alter or reverse the
generally southern pattern of flow in the CFZ (Blanton et al. 1999). Winds can also mix and move water
masses inshore. In the mid-Atlantic, waters from Gulf Stream intrusions move across the shelf at a rate of
approximately 2-3 mi/day (3-5 km/day), and parallel to the coast at a rate of approximately 3-9 mi/day (5-
15 km/day) (Hare et al. 1999). Georgian shelf waters flow into the Carolina Capes region during periods
of persistent southwesterly winds, while Virginian coastal waters flow south across Diamond, and
occasionally Lookout, shoals during periods of persistent northerly winds (Pietrafesa 1989). There is also
a strong upwelling along the beaches north of Oregon Inlet during the summer caused by southwest
winds, resulting in surface water temperature changes of 10F (5.5C) in one or two days.
The warm, north-flowing Gulf Stream and cool, south-flowing Virginia Coastal Labrador current meet
near Cape Hatteras, separating mid- and south Atlantic waters. Warm Gulf Stream waters tend to elevate
temperatures and salinities in the water column south of Cape Hatteras, and transport fish larvae from
southern areas into North Carolina nearshore waters (Menzel 1993). The cool, lower salinity Virginia
Current runs along the northern shore of the Outer Banks, and tends to lower temperature and salinity of
the water column (Pietrafesa 1989). These currents also interact with shoals extending roughly
perpendicular from shore near capes and inlets along North Carolina‘s coastal ocean. Oceanic currents
interacting with these shoals create upwellings of nutrient-rich bottom water. In offshore areas, the
interaction of frontal zones and bottom topography can often result in nutrient-rich upwellings.
Upwellings also recycle nutrients locked under a strong halocline. The most probable locations of
upwellings and their associated blooms are around Cape Hatteras.
2.1.5. Fish assemblages by system
Salinity and proximity to inlets are the key factors shaping fish distribution in North Carolina estuaries
(Ross and Epperly 1985; Noble and Monroe 1991; Szedlmayer and Able 1996). Salinity affects fish
distribution according to physicochemical tolerances specific to a species or life stage. Some aquatic
species are capable of tolerating large variations in salinity (e.g., blue crab), while others are capable of
living in only a narrow salinity range (e.g. black sea bass) (see Appendix D for scientific names of
species). Inlet proximity affects the delivery of organisms from offshore spawning areas to their nearest
2010 Coastal Habitat Protection Plan
Chapter 2. Water Column Page 31
intersection with estuarine nursery areas. A partial list of important fishery species in North Carolina
coastal waters is shown in Table 2.2. Species are organized by salinity zone of spawning and nursery
areas to give an indication of where species occur in coastal waters. The demersal/pelagic orientation of
species and life stages is also listed for the table.
In low-salinity areas of coastal North Carolina, the fish community is dominated by freshwater and
anadromous species (Table 2.2). In late winter, river herring (blueback herring and alewife), striped bass,
Atlantic sturgeon, American shad, and other anadromous species migrate from the ocean and lower
estuary to spawn upstream in freshwater areas. After spawning, the adults migrate back to the lower
estuary or oceans, while the juveniles spawned in spring begin their seaward migration in late fall (Sholar
1975, Marshall 1976, Sholar 1977, Fischer et al. 1979, Hawkins 1980). Residents of the low-salinity
zone include estuarine species like bay anchovy but are dominated by freshwater species, such as white
perch, yellow perch, catfishes, sunfishes, and minnows (Keefe and Harriss 1981, Copeland et al. 1983,
Epperly 1984). The low-salinity zone is also occupied by the catadromous American eel. During spring
and summer, juvenile and adult estuarine species spawned in high-salinity estuarine waters (e.g., blue
crab, red drum, weakfish) or the nearshore ocean (e.g., Atlantic menhaden, Atlantic croaker, spot,
southern flounder) also occupy the low-salinity zone (Table 2.2).
Unlike freshwater and low-salinity areas, the moderate- to high-salinity zone has very few and generally
small resident species (i.e., gobies, anchovies, pipefish, grass shrimp, hogchokers) (Epperly and Ross
1986). Eastern oysters, bay scallops, and hard clams are the only fishery species that resides year-round
in moderate- to high-salinity estuaries. During the growing season, these areas are dominated by the
young of estuarine and marine spawning fishery species including Atlantic menhaden, spot, Atlantic
croaker, southern flounder, striped mullet, blue crabs, red drum, and seatrout. Catadromous American
eels migrate through the lower estuary in late summer to fall on their way to spawning in the Sargasso
Sea. Anadromous fish migrate through these areas during their fall to early winter migration to the open
ocean. Higher salinity regions of the estuary are also used by marine species including black sea bass,
bluefish, juvenile gag, gulf flounder, summer flounder, pinfish, sheepshead, kingfish, and Spanish
mackerel (Table 2.2). Other common inhabitants of the nearshore marine zone during the growing season
include bottom fish such as kingfishes, Florida pompano, and dogfish sharks, along with more pelagic
species like silversides, striped mullet, king mackerel, cobia, silversides. During late fall and winter, the
nearshore marine zone is flooded with the post-juveniles of species reared in the estuary (i.e., southern
flounder, Atlantic croaker, spot, shrimp, striped mullet, Atlantic menhaden, red drum, and seatrout)
(Francesconi 1994, Hackney et al. 1996, Ross and Lancaster 1996).
Recent research in the Chesapeake Bay suggests a shifting pattern of dominance among spawning/nursery
guilds in estuaries related to cycles of wet and dry climatic conditions (Wood and Austin 2009). The
abundance of anadromous species (striped bass, river herring) was inversely correlated with abundance of
shelf-spawning estuarine species (spot, Atlantic menhaden) using a long time series of fisheries-
independent data (1968-2004). The data also suggested that recruitment dynamics were driven more by
interannual variability than spawning stock biomass. Among species comprising spawning/nursery area
guilds (i.e., river herring and striped bass), spawning stock biomass, predator-prey interactions, and
differences in habitat availability can still be more significant sources of recruitment variation. The
CHPP focuses primarily on habitat-mediated predator-prey interactions and other ecological functions of
available habitat. Spawning stock/recruitment relationships are thoroughly evaluated for species subject
to Fisheries Management Plans.
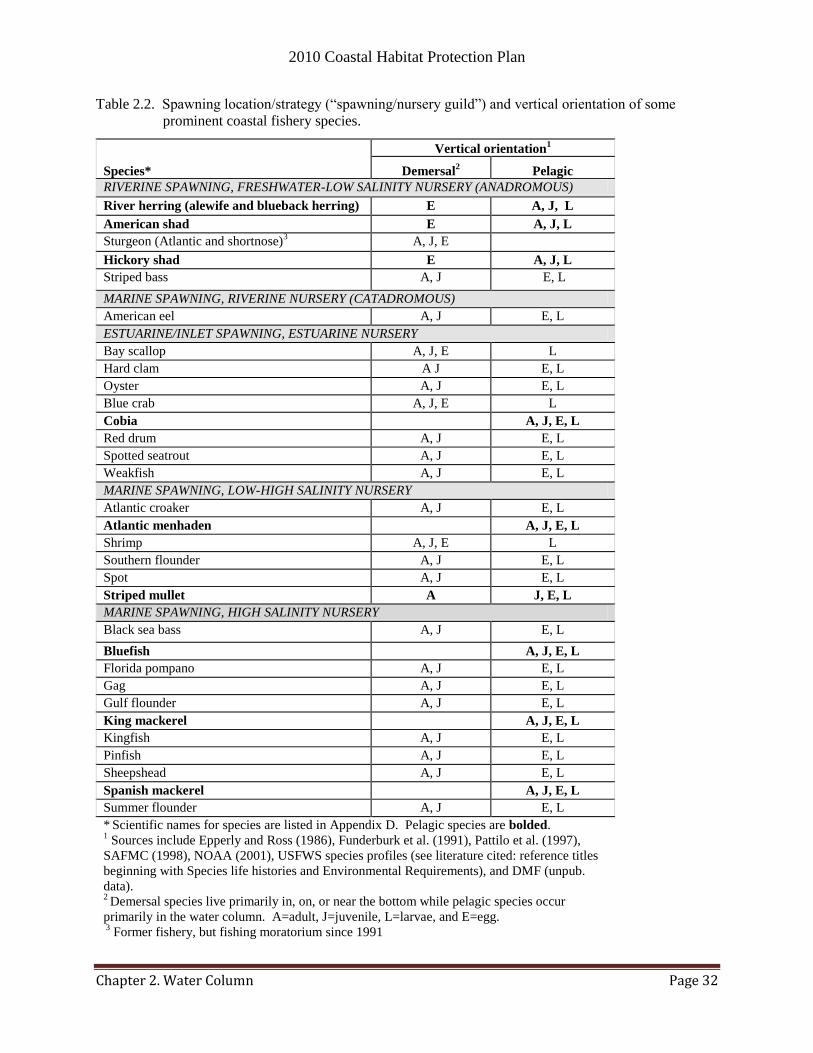
2010 Coastal Habitat Protection Plan
Chapter 2. Water Column Page 32
Table 2.2. Spawning location/strategy (―spawning/nursery guild‖) and vertical orientation of some
prominent coastal fishery species.
Species*
Vertical orientation1
Demersal2
Pelagic
RIVERINE SPAWNING, FRESHWATER-LOW SALINITY NURSERY (ANADROMOUS)
River herring (alewife and blueback herring) E A, J, L
American shad E A, J, L
Sturgeon (Atlantic and shortnose)3 A, J, E
Hickory shad E A, J, L
Striped bass A, J E, L
MARINE SPAWNING, RIVERINE NURSERY (CATADROMOUS)
American eel A, J E, L
ESTUARINE/INLET SPAWNING, ESTUARINE NURSERY
Bay scallop A, J, E L
Hard clam A J E, L
Oyster A, J E, L
Blue crab A, J, E L
Cobia A, J, E, L
Red drum A, J E, L
Spotted seatrout A, J E, L
Weakfish A, J E, L
MARINE SPAWNING, LOW-HIGH SALINITY NURSERY
Atlantic croaker A, J E, L
Atlantic menhaden A, J, E, L
Shrimp A, J, E L
Southern flounder A, J E, L
Spot A, J E, L
Striped mullet A J, E, L
MARINE SPAWNING, HIGH SALINITY NURSERY
Black sea bass A, J E, L
Bluefish A, J, E, L
Florida pompano A, J E, L
Gag A, J E, L
Gulf flounder A, J E, L
King mackerel A, J, E, L
Kingfish A, J E, L
Pinfish A, J E, L
Sheepshead A, J E, L
Spanish mackerel A, J, E, L
Summer flounder A, J E, L
* Scientific names for species are listed in Appendix D. Pelagic species are bolded.
1 Sources include Epperly and Ross (1986), Funderburk et al. (1991), Pattilo et al. (1997),
SAFMC (1998), NOAA (2001), USFWS species profiles (see literature cited: reference titles
beginning with Species life histories and Environmental Requirements), and DMF (unpub.
data). 2 Demersal species live primarily in, on, or near the bottom while pelagic species occur
primarily in the water column. A=adult, J=juvenile, L=larvae, and E=egg. 3 Former fishery, but fishing moratorium since 1991
2010 Coastal Habitat Protection Plan
Chapter 2. Water Column Page 33
2.1.6. Fish habitat requirements
Within salinity zones, a specific combination of physical and chemical water quality parameters within
the known tolerance range of the species is required for the water column to provide suitable habitat for
various fish species. Those parameters include flow and water movement, pH, temperature, dissolved
oxygen, and water clarity.
2.1.6.1. Flow and water movement
Variation in water flow occurs at a broad range of spatial scales in estuarine and marine systems. The
interaction of topographic features (e.g., shoals, bays) and tidal or wind-driven circulation patterns creates
large-scale (km) spatial variation (Xie and Eggleston 1999, Inoue and Wiseman 2000). At much smaller
scales (<1m), topographic changes or the presence of bottom habitat structure (e.g., SAV, oyster reef,
pilings, stumps, logs) can create areas of reduced and increased water velocity (Jokiel 1978, Gambi et al.
1990, Komatsu and Murakami 1994, Lenihan 1998). Temporal variation in flow is caused by regular
tidal flushing or irregular circulation by the wind.
Aquatic organisms rely on flow and water movement to: (1) distribute sediment and affect structures that
serve as habitats (i.e., shell bottom, SAV, soft bottom) for many fish species (DMF 2003b), (2) cue
spawning activity, and (3) transport/distribute eggs, larvae, and juveniles to the appropriate nursery area
for optimum food availability and protection from predators. Larvae and juveniles generally prefer lower
velocities than adults, enabling them to settle out and maintain their positions in the estuary.
Consequently, juvenile, estuarine-dependent fish are highly abundant in shallow, side-channel habitats
where velocities are low (Ross and Epperly 1985; Noble and Monroe 1991). Refer to, ―Ecological role
and function,‖ sections for specific information on spawning and nursery habitat conditions.
As fish larvae grow in mobility, the nursery value of areas depends on complex biological interactions
mediated by water movement and other parameters. Powers and Kittinger (2002) found that blue crab
predation on juvenile hard clams and bay scallops decreased with increasing water velocity, while whelk
predation on bay scallops increased under the same treatment. Dilution of water-borne chemical cues was
likely the reason for reduced blue crab predation (Powers and Kittinger 2002). Tamburri et al. (1996)
found that chemical cues successfully induced larval settlement of oysters regardless of flow conditions.
In another study, Palmer (1988) showed that higher current velocities increased erosion of small animals
from below the sediment surface (meiofauna) into the water column, resulting in increased predation by
spot (a more non-visual feeder). Species that rely primarily on visual cues would not be affected by
dilution of chemical cues. However, all mobile aquatic organisms (including visual predators) also seek
to minimize the energetic cost of movement through the water column while maximizing foraging
efficiency.
2.1.6.2. pH
The pH of the water column is a basic chemical characteristic that affects egg development, reproduction,
and the ability of fish to absorb dissolved oxygen (Wilbur and Pentony 1999). Among freshwater,
estuarine, and marine systems, pH varies naturally, and the organisms of the aquatic community have
adapted to that natural variation. However, most fish require pH >5 (Wilbur and Pentony 1999), within a
possible range of 0 (extremely acidic) – 14 (extremely basic). The pH of seawater is the most stable
among systems and varies between 7.5 and 8.5 (Nybakken 1993). The pH of estuaries depends on the
dynamic mix of seawater and upstream freshwaters. In high-salinity estuaries with little river input (e.g.,
Core and Bogue Sound), pH is near that of seawater. Fresh water has the most variable pH, depending on
organic matter content and buffering capacity of the water. Freshwaters with low buffering capacity and
high organic matter (e.g., swampy creeks) can have very low pH (<5). The pH standard for surface
freshwaters in North Carolina is between 6.0 and 9.0 depending on classification (see ―Designations‖
2010 Coastal Habitat Protection Plan
Chapter 2. Water Column Page 34
section for more information). With dense plant growth, pH and dissolved oxygen may fluctuate
dramatically between day and night. The pH can affect chemical cycling, availability, and ionic balance
of compounds within the water column, some of which may be toxic to aquatic organisms under
appropriate pH conditions, but have no effect otherwise. Globally, ocean acidification impacts shell
formation due to the increased carbon dioxide in the atmosphere. Carbon dioxide readily dissolves in the
water creating carbonic acid, which lowers the pH and alters the saturation point of calcium carbonate and
aragonite; the components used in making shell (See the hard bottom chapter).
The pH of the water is an important requirement for reproduction of estuarine organisms. For example,
the optimum pH for normal egg development and larval growth of oysters occurs between 8.25 and 8.5
(Calabrese and Davis 1966, Calabrese 1972). Oysters also have an optimum pH of 7.8 for spawning and
>6.75 for successful recruitment. Likewise, hard clam eggs and larvae require pH levels of 7.0-8.75 and
7.5-8.5, respectively, for the same functions (Funderburk et al. 1991). Anadromous fish species can
generally tolerate fresh water with lower pH. For example, alewife eggs and larvae require pH between
5.0-8.5 pH and blueback herring eggs and larvae require pH levels between 5.7 and 8.5 (Funderburk et al.
1991). This pattern of pH requirements between systems also illustrates the adaptation of freshwater and
estuarine organisms to their environment. Gerritsen et al. (1996) studied the effects of periodic
acidification in headwater streams harboring spawning river herring. The acidification was attributed to
rain storms in poorly buffered streams. Several coastal streams in the Chesapeake Bay watershed were
monitored for pH and correlated with base-flow conditions, buffering capacity, and precipitation. These
factors explained 74% of the variation in stream pH. The resulting risk assessment for the Chesapeake
Bay predicted greater than 50% of streams would experience harmful pH levels during wet years. A
similar assessment of acidification risk should be conducted in Anadromous Fish Spawning Areas in
North Carolina.
2.1.6.3. Temperature
Temperature patterns in North Carolina coastal waters affect fish distribution and functions. The North
Carolina coast is located at the southern end of the cooler Mid-Atlantic Bight and the northern end of the
warmer South Atlantic Bight, with Cape Hatteras marking the transition between these two major zones.
Predominantly northern fish include summer flounder, weakfish, spiny dogfish, and migratory striped
bass, whereas primarily southern species include snappers, groupers, southern shrimps, and southern
flounder.
In riverine systems, water temperature increases downstream from river headwaters to the estuary. The
gradual increase in temperature is determined naturally by elevation, air temperature, shading, and water
velocity. Temperature in riverine systems is one of the primary cues for anadromous fish spawning. For
example, spawning of striped bass in coastal rivers is triggered by increasing water temperatures in early
spring (Hill et al. 1989, Funderburk et al. 1991). See, ―Ecological role and functions,‖ section for specific
information on the spawning habitat of anadromous fish.
The greatest variation in temperature within North Carolina‘s estuaries occurs from season to season and
is highly influenced by high spring flows in the rivers feeding the estuary (Figure 2.1). Apart from very
high river flows, the temperature of upper estuarine waters is most affected by air temperatures. For
example, average monthly temperatures in the Pamlico River estuary range from 41ºF (5ºC) in January to
81ºF (27ºC) in July and August, but in extreme conditions may range from 32º to 86ºF (0-30ºC)
(Copeland et al. 1984). The seasonal temperature range of the Pamlico River estuary follows the average
monthly temperature of upstream rivers very closely (Figure 2.1). Estuarine water temperature also
responds to the tides (Peterson and Peterson 1979). In winter, water temperatures near ocean inlets rise
abruptly with the incoming tide, whereas, during summer, the incoming tide is cooler (Peterson and

2010 Coastal Habitat Protection Plan
Chapter 2. Water Column Page 35
Peterson 1979). Estuarine, and especially slow-moving or stationary, organisms have adapted to survive
these short-term and seasonal conditions.
In general, all estuarine organisms can tolerate a very wide range of temperatures, if given adequate time
to acclimate (Nybakken 1993). Organisms cannot readily adapt to a rapid increase or decrease in
temperature. Early life stages of many species (e.g., clams, oysters, spot, croaker, flounder, menhaden)
have a much narrower temperature tolerance than adults (Kennedy et al. 1974). If water temperature
becomes too low, or falls too rapidly, there can be a fish kill of sensitive species like seatrout and red
drum. Great variability in annual reported catch is typical for seatrout species and seems related to
climatic conditions of the preceding winter and spring. Low catches follow severe winters; winter cold
shock of juveniles and adults is cited as a primary factor in local and coast-wide declines in spotted
seatrout (http://www.ncdmf.net/stocks/spottedseatrout.htm, January 2010).
Temperature varies least in the marine system (Peterson and Peterson 1979, Nybakken 1993) and marine
species tend to be less tolerant of temperature extremes and rapid changes in temperature. Water
temperature is one of the most important factors in determining use of coastal ocean habitat by warm
temperate and tropical species (SAFMC 1998a). Tropical species occur off the North Carolina coast
where offshore bottom water temperatures range from approximately 52-81ºF (11–27ºC) (SAFMC
1998a). Temperatures less than 54ºF (12ºC) may result in the death of some tropical fish and
invertebrates (Wenner et al. 1984; SAFMC 1998a). Estuarine-dependent species in the nearshore ocean,
such as black sea bass and southern flounder, have a broader temperature tolerance (Reagan and Wingo
1985, Steimle et al. 1999).
2.1.6.4. Dissolved oxygen
All fish and invertebrates require a minimum amount of dissolved oxygen (DO) to survive, and an even
greater amount for growth and reproduction. Oxygen tolerance varies by organism type. Not accounting
for mobility, fish are generally most sensitive to hypoxia (low dissolved oxygen; DO < 2 mg/l), followed
by crustaceans and echinoderms, annelid worms, and mollusks (clams, oysters) (Gray et al. 2002).
However, because highly mobile organisms can avoid areas of low DO, they are least affected by
hypoxia. Although benthic invertebrates are fairly tolerant of low oxygen (Diaz and Rosenburg 1995),
stationary invertebrates are helpless against prolonged anoxia. Therefore, DO is considered a critical
factor affecting the survival of stationary benthic invertebrates and sedentary fishes and the distribution of
mobile species (Seliger et al. 1985, Jordan et al. 1992, Eby et al. 2000, Buzzelli et al. 2002). Fish are also
impacted by the increase in sulfide production associated with low dissolved oxygen in bottom sediments.
This combination of conditions is lethal to many benthic organisms (Tenore 1972), which can have
significant effects on the aquatic food chain (Peterson et al. 2000a, Taylor and Eggleston 2000).
Growth of actively swimming fish is reduced at DO concentrations below about 6 mg/l, metabolism is
reduced at 4.5 mg/l, and most fish cannot tolerate DO less than 2 mg/l (Gray et al. 2002). In tests
comparing the response of selected juvenile estuarine fish (mummichog, juvenile spot, pinfish, Atlantic
croaker, menhaden, white mullet, and brown shrimp) to hypoxia, Atlantic croaker and white mullet were
more sensitive to low DO than spot and pinfish, and mummichog (a resident estuarine species) was the
only species that did not avoid low oxygen (1 mg/l DO) (Wannamaker and Rice 2000). Croaker and
mullet preferred 2-4 mg/l, whereas spot and pinfish showed no preference. Other species and life stages
requiring DO levels greater than 3-4 mg/l include egg and larval striped mullet, larval spotted seatrout,
juvenile river herring, southern flounder, and bluefish (Deubler and Posner 1963, Funderburk et al. 1991;
Pattilo et al. 1997; Blanchet et al. 2001, Taylor and Miller 2001). Species tolerating less than 3 mg/l, but
greater than 1 mg/l DO, include Atlantic menhaden, bay anchovy, spot, oyster, pinfish, silversides, striped
mullet, hogchoker, and larval red drum (Overstreet 1983, Funderburk et al. 1991, Pihl et al. 1991, Pattilo
et al. 1997, Wannamaker and Rice 2000, Taylor and Rand 2003). Species and life stages requiring high
2010 Coastal Habitat Protection Plan
Chapter 2. Water Column Page 36
DO levels (>4 mg/l) include larval alewife, yellow perch and blueback herring, and adult American shad,
striped bass, white perch, and yellow perch (Funderburk et al. 1991). The majority of species requiring
high DO are pelagic species, although some prominent forage species can tolerate hypoxic conditions.
Among invertebrate species, mortality was reported after species were exposed to 0.5-1.0 mg/l oxygen for
five days (90% mortality of blue crabs after exposure for about 3 days), although many species, such as
the mud crab Neopanope sayi, the serpulid polychaete Hydroides dianthus, the polychaete Sabellaria
vulgaris, and the hydroid Obelia bicuspidata survived in hypoxic waters for more than one week (Sagasti
et al. 2001). Taylor and Eggleston (2000) found that low DO concentrations hindered the foraging
abilities of blue crabs, and increased clam vulnerability since they moved higher to the sediment surface
and increased siphon extension in response to low-oxygen conditions. Carpenter and Cargo (1957, in
Funderburk et al. 1991) documented 50% mortality of blue crabs at DO levels <2.0 mg/l. Another study
reported total mortality of crabs after 3 hours in hypoxic conditions (DO < 0.5 mg/l) (De Fur et al. 1990
in Funderburk et al. 1991). The DO requirement of adult hard clams and brown shrimp is reported as >4
mg/l and 3-4 mg/l, respectively (Funderburk et al. 1991; Pattilo et al. 1997). Benthic hypoxia and anoxia
degrade water column habitat by altering the behavior, growth, production, and survival of both benthic
invertebrates and mobile vertebrates (Breitburg 1992).
Low-oxygen conditions can occur naturally in a system from flushing of swamp waters, which
characteristically have low DO, or from stratification of the water column due to wind, temperature, and
salinity conditions. However, low-oxygen conditions during the growing season can also be fueled by
nutrients and oxygen-consuming wastes, which result in excessive oxygen demand in the water column or
sediment (see ―Nutrients‖ section for more information). Algal production and microbial decomposition
are enhanced in warm, nutrient-rich waters. Excessive algal production can deplete the water column of
DO through nighttime plant respiration (DWQ 2000b). Excessive algal production creates labile organic
biomass that dies and is consumed by microbial decomposition, creating a biochemical oxygen demand
(BOD). Chlorophyll a concentrations and BOD have been strongly correlated in a variety of North
Carolina coastal creeks, estuaries, lakes and rivers (Mallin et al. 2006). Warmer water, calm winds, and
reduced freshwater inflow in the summer also reduces mixing and the corresponding aeration of the water
column. The stratified bottom layer of water is prevented from receiving oxygenated surface waters and
rapidly becomes depleted of oxygen. Shallow water estuaries with less frequent flushing often develop
persistent stratification and bottom-water hypoxia that can last for weeks to months (Tenore 1972).
Weather events can have varying impacts to water column habitat. Low-oxygen events frequently occur
as a result of increased runoff and organic loading from heavy rainfall. Alternatively, hurricanes can
flush out large quantities of organic matter that has accumulated in estuarine systems, reducing excessive
nutrients that could otherwise fuel eutrophication over many years (Paerl et al. 2001, Burkholder et al.
2004).
2.1.6.5. Light and water clarity
Water clarity is determined by the concentration of dissolved and suspended organic and inorganic
particles in the water column. Water clarity and the resulting light availability in the water column are
especially important for aquatic plant growth. Some amount of turbidity is natural in a water body, as it is
related to nutrient inputs and productivity. Extreme turbidity is known to reduce light availability for
plant growth, reduce visibility of pelagic food (Bruton 1985), and enhance temperature stratification. As
a general rule, algae species can grow to a depth of 1% of surface light availability (Wetzel 2001).
Submerged aquatic vegetation (SAV) has higher light requirements than microalgae and represents a
more sensitive indicator of impaired light availability (see ―Submerged aquatic vegetation‖ chapter for
more information) where SAV is naturally occurring and non-invasive. For most visual fish predators,
turbidity reduces visual range, which therefore reduces reactive distance (Barrett et al. 1992, Gregory and

2010 Coastal Habitat Protection Plan
Chapter 2. Water Column Page 37
Northcote 1993), volume of water searched, and feeding efficiency (Moore and Moore 1976, Vingard and
O‘Brien 1976, Gardner 1981, Reilly and Bellis 1983, Benfield and Minello 1996, Lindquist and Manning
2001). However, moderate turbidity can be beneficial to small or non-visually feeding fish afforded
protection from visually feeding predators in shallow, food-rich areas (see ―Ecological role and function‖
section on ―Refuge‖ for information). Suspended particles causing turbidity also have physical effects on
aquatic organisms explained in the ―Sediment and turbidity‖ subsection of the ―Water quality degradation
– Causes‖ section.
2.2. Ecological role and functions
The water column is the lifeblood of aquatic ecosystems. It is the medium through which all other
aquatic habitats are connected. As such, the water column provides a basic ecological role and function
for organisms within it. The water column also provides other functions, both by itself and by virtue of
benthic-pelagic coupling. Benthic-pelagic coupling refers to the influence of the water column on the
benthic community and sediments and vice versa (see ―Soft bottom‖ chapter for more information),
through integrated events and processes such as resuspension, settlement, and absorption (Warwick
1993).
2.2.1. Productivity
The potential productivity of fish and invertebrates in an aquatic system is determined by the assimilation
of energy and nutrients by plants and other life at the base of the food chain. Productivity in the water
column is derived from phytoplankton, floating plants, macroalgae, benthic microalgae, and bacterial
decomposition of plants (detritus). The potential productivity of a habitat can indicate its relative value in
supporting fish populations. The foundation of riverine production during elevated flows is detritus from
adjacent wetlands and fine particulate organic matter from upstream areas (Vannote et al. 1980; Junk et
al. 1989). As flows decline through summer, phytoplankton can maintain its position in the water column
and photosynthetic production can support the majority of secondary production. Rivers play a dominant
role in providing nutrients and flushing for downstream estuaries in the Albemarle, Tar-Pamlico, Pamlico,
Neuse, and Cape Fear subregions. These nutrients, in turn, contribute to primary productivity and fish
production. Mallin et al. (1993) demonstrated that primary productivity in the Neuse River estuary was
strongly correlated with river discharge, which in turn was strongly correlated with nitrate and rainfall in
the Neuse headwaters area. Arhonditsis et al. (2007) examined the spatiotemporal phytoplankton
community patterns to assess underlying causal mechanisms in a freshwater–saltwater continuum, the
Neuse River Estuary. Their modeling results indicated hydrologic forcing (mainly the river flow
fluctuations) as a dominant factor in up-estuary processes that loosens the coupling between nutrients and
phytoplankton. The switch from hydrologic forcing upstream to nutrient forcing downstream led to a
phytoplankton accumulation in the mid- and down-estuary segments. This was more evident among
diatoms, chlorophytes and cryptophytes, which exhibit opportunistic behavior (faster nutrient uptake and
growth rates and tolerance to low salinity conditions) that allows them to dominate the phytoplankton
community during high freshwater flows. Model results also showed a stronger association between
phosphorus and total phytoplankton dynamics at the upstream freshwater locations. Both nitrogen and
phosphorus played a significant role in the middle section of the estuary, while the nitrogen–
phytoplankton relationship was stronger in the downstream meso-polyhaline zone. The research also
provided evidence of a prolonged favorable environment for cyanobacteria going down-estuary, resulting
in structural shifts on the phytoplankton assemblage through time.
In the mesohaline Neuse Estuary, Rothenberger et al. (2009a) used a continuous, long-term record of
environmental data and phytoplankton species and assemblage structure to evaluate phytoplankton
responses to changing environmental conditions, and potential environmental predictors of phytoplankton
assemblage patterns. Their models indicated that phytoplankton assemblages were strongly related to
temperature and total nitrogen to total phosphorus ratios. Inter-annual changes in river discharge
2010 Coastal Habitat Protection Plan
Chapter 2. Water Column Page 38
influenced whether the phytoplankton assemblages were dominated by diatoms and photosynthetic
flagellated algae, or by heterotrophic dinoflagellates. Overall, the data from this study suggested an
increasingly important role of ammonium in controlling phytoplankton assemblage structure in the Neuse
Estuary.
Studies of phytoplankton production in several North Carolina and South Carolina estuaries have reported
relatively high productivity, ranging from 67-500 g/C/m2/y (Williams and Murdoch 1966; Thayer 1971;
Sellner and Zingmark 1976; Peterson and Peterson 1979). Mallin et al. (2000a) found that the highest
phytoplankton production is in riverine estuaries where flushing is limited by extensive barrier islands
(e.g., Neuse Estuary), whereas areas that are well flushed or unconstrained (e.g., Cape Fear River) support
a much lower phytoplankton biomass and productivity.
However, phytoplankton productivity is generally considered secondary to detritus-based production in
salt marsh-dominated estuaries (Peterson and Peterson 1979; Dame et al. 2000). A study conducted on a
Georgia salt marsh found a net productivity of 6,850 kcal/m2/year from emergent vegetation and only
1,600 kcal/m2/yr from the various algae (Teal 1962). Compared to broad, open water areas, narrow tidal
creeks and their associated marsh would likely contribute more detritus than phytoplankton. However,
some research suggests that much of the detrital production from emergent vegetation remains in the
marsh and that juvenile fish production is the major export (see ―Wetland‖ chapter for more information).
Phytoplankton production in shallow estuaries can also be secondary to phytobenthic (microscopic plants
that live on the bottom) production. Based on relative rates of primary production and nutrient cycling,
Webster et al. (2002) found that phytobenthos was the dominant primary producer in a shallow estuary
where light was not limiting. Other turbid estuaries also were found to have high primary productivity
from resuspended benthic microalgae (Cloern 1987; Mallin et al. 1992; MacIntyre and Cullen 1996). The
type and net productivity of a given estuary depends on water column conditions that also affect the
relative proportion of wetlands, shallow soft bottom, SAV, shell bottom and deep water in the system.
In nearshore ocean waters, Menzel (1993) reported that primary production rates decreased significantly
from the inner shelf to the outer shelf of the South Atlantic Bight. Cahoon et al. (1990) found that on the
inner shelf in Onslow Bay, 80% of the chlorophyll a was associated with the sediment. Benthic
microalgal biomass (36.4 mg chlorophyll a/m2) always exceeded phytoplankton biomass (8.2 mg
chlorophyll a/m2) (Cahoon and Cooke 1992). Mallin et al. (1992) estimated that microalgal production
can be at least 66% of the total annual primary production in coastal areas, the majority of which is
contributed by benthic microalgae. Hackney et al. (1996) reported that, because of circulation patterns,
inorganic nutrients could be resuspended and retained in sufficient amounts to allow localized
phytoplankton blooms within the surf zone.
Production levels in nearshore waters may increase by a factor of three to ten with warm core intrusions
from the Gulf Stream (Signorini and McClain 2007). Upwellings, associated currents, and winds also
transport floating Sargassum weed (from the Sargasso Sea) into nearshore coastal waters. Because these
intrusions occur irregularly on the inner shelf zone, this nearshore area depends more on nutrients
recycled or resuspended by wind or tidal forces.
2.2.2. Fish utilization
Although all fish technically use the water column, this section focuses primarily on species associated
with open water (pelagic) habitat. Pelagic species are those most commonly found near the surface of the
water column and include alewife, American shad, hickory shad, blueback herring, bay anchovy,
silversides, Atlantic menhaden, striped mullet, bluefish, cobia, king mackerel, and Spanish mackerel. In
addition to these species, eggs and larvae of most fish species depend on the open water for passive
2010 Coastal Habitat Protection Plan
Chapter 2. Water Column Page 39
transport and food. Primarily demersal species/life stages also have water quality requirements
documented in these sections.
Fish use of water column can be assessed using a variety of sampling methods. A recent application of
hydroacoustics could prove useful for assessing pelagic fish abundances in similar areas of the state.
Mitchell et al. (2007) tracked and attempted to identify fish during their anadromous spawning migration
using hydroacoustics, fish wheels and shocking boats. Using acoustic signal strength differences Mitchell
et al. (2007) was able to identify and estimate the number of anadromous fish (e.g. American shad,
gizzard shad, and striped bass) migrating upstream to spawn in the Albemarle Sound and Chowan River.
2.2.2.1. Corridor and connectivity
The corridor function is the most basic function of the water column because the various life stages of fish
species must move through it to reach other habitats supporting other functions. The corridor function is
particularly important for species whose life history spans more than one system (anadromous,
catadromous, and marine spawning/estuarine nursery) (Table 2.2). Meroplankton (organisms that spend
only part of their life cycle in the plankton), in particular, rely on the corridor function of the water
column to transport them from spawning areas (see ―Spawning‖ subsection for more information) to
favorable nursery areas (see ―Nursery‖ subsection for more information). The spatial and temporal
interplay of factors triggering migration and the water column conditions needed for successful migration
determine the degree of corridor function in an area. The primary conduits used by meroplankton and
migrating fish include the ocean inlets and the network of channels draining the coastal region from
riverine headwaters to downstream estuaries. The most variable connections occur in tributaries where
local watershed conditions are isolated from the mixed conditions in the mainstem. These corridors are
implied from the discussion of spawning and nursery areas below.
2.2.2.2. Spawning
During late winter and early spring, increasing light, flow, and temperature in freshwater creeks and rivers
provides spawning habitat for resident freshwater and anadromous fish (Orth and White 1993) (Table
2.3). The reverse is true for marine spawning/estuarine nursery species as declining light, flow, and
temperature in low salinity nurseries triggers spawning in the ocean during late fall and early winter.
Species completing their life cycle in the inlet estuary system (i.e., red drum, seatrout, blue crab, eastern
oyster) generally spawn during summer and fall. Specific conditions for spawning vary according to
species and the mix of triggers for photoperiod, temperature/salinity change, and river discharge. When
conditions are met for spawning, many fish species broadcast planktonic or semi-demersal eggs. Survival
of the planktonic larvae (meroplankton) to free-swimming juveniles is affected by water quality, flow and
circulation patterns in route to nursery areas. High flows serve as a cue for spawning activity of
anadromous fish, whereas low flows correspond to the growth and recruitment period of young fish (Orth
and White 1993). Once the eggs are released into riverine waters, the survival of the developing larvae
depends on reaching favorable nursery habitat conditions (see ―Nursery‖ section for more information).

2010 Coastal Habitat Protection Plan
Chapter 2. Water Column Page 40
Table 2.3. Spawning seasons for coastal fish and invertebrate species occurring in North Carolina
that broadcast planktonic or semidemersal eggs. [Sources: USFWS species profiles
(see literature cited: reference titles beginning with Species Life Histories and
Environmental Requirements), DMF fishery management plans, Funderburk et al.
(1991), Pattilo et al. (1997), Luczkovich et al. (1999), NOAA (2001), and DMF
(2003a)]
Species
Winter Spring Summer Fall
Jan Feb Mar Apr May Jun Jul Aug Sep Oct Nov Dec
ANADROMOUS FISH
Alewife
American shad
Blueback herring
Striped bass
ESTUARINE AND INLET SPAWNING AND NURSERY
Atlantic silversides
Bay anchovy
Bay scallop
Blue crab
Black drum
Cobia
Hard clam
Inland silversides
Oyster
Red drum
Spotted seatrout
Weakfish
MARINE SPAWNING, LOW-HIGH SALINITY NURSERY
Atlantic croaker
Atlantic menhaden
Brown shrimp
Southern flounder
Spot
Striped mullet
White shrimp
MARINE SPAWNING, HIGH SALINITY NURSERY
Black sea bass
Bluefish
Gag
Gulf flounder
King mackerel
Pinfish
Pink shrimp
Sheepshead
Spanish mackerel
Southern kingfish
Summer flounder
Black squares indicate peak spawning. Cross-hatched squares indicate spawning period.
2010 Coastal Habitat Protection Plan
Chapter 2. Water Column Page 41
Anadromous fish spawning
Anadromous fish species such as river herring (alewife and blueback herring), striped bass, and shads
(hickory and American shad) use the riverine water column during spring to broadcast eggs, which
develop as they float downstream. Current velocity, increasing light and temperature are all important
cues for anadromous spawning activity (Klauda et al. 1991; Orth and White 1993) (Table 2.4). Sufficient
rainfall during mid-February to mid-June is needed to provide suitable current velocities for spawning.
The strongest currents are required by striped bass and blueback herring, whereas slower current
velocities are needed for American shad and alewife (Funderburk et al. 1991). Successful spawning of
striped bass coincides with optimal water velocities between 3.3 and 6.6 ft/s (100-200 cm/s), while adult
American shad prefer water velocities between 2 and 3 ft/s (61-91 cm/s) (Fay et al. 1983d; Mackenzie et
al. 1985; Hill et al. 1989). Alewife spawn in lakes, slow-moving oxbows and small streams where the
species co-occurs with blueback herring. Alewives spawn in water that is between 15cm and 3m deep,
while blueback herring prefer deeper waters (Ross 1991). Blueback herring will use lentic (standing)
water or lotic (moving) water as spawning habitat, while alewives will only use lentic (Walsh et al. 2005).
Lake Mattamuskeet is a lentic system that historically supported significant anadromous alewife
spawning runs (Winslow et al. 1983, Epperly 1985). Species also differ in whether they prefer the
mainstem river or small tributary creeks for spawning. Mainstem spawners include American shad and
striped bass (Funderburk et al. 1991). Blueback herring and alewife spawn in tributary creeks. For
hickory shad, there is evidence of spawning in flooded tributaries in North Carolina and Virginia (Pate
1972, Funderburk et al. 1991). Species-specific spawning areas are included, but not differentiate, on
designated Anadromous Fish Spawning Areas (See ―Designations‖ section for more information). In
terms of water quality, adequate DO levels in slow-moving backwaters are critical to spawning river
herring because the eggs require >5 mg/l DO (Funderburk et al. 1991) (see ―Dissolved oxygen‖
subsection of ―Habitat requirements‖ section for more information). During their spawning migration,
anadromous fish actively avoid waters with low DO and extremely high turbidity (Steel 1991).

2010 Coastal Habitat Protection Plan
Chapter 2. Water Column Page 42
Table 2.4. Physical spawning (adult) and egg development requirements for resident freshwater and
anadromous fishes inhabiting coastal North Carolina. [Sources: Funderburk et al. (1991),
Pattilo et al. (1997), SAFMC (1998a), USFWS species profiles (see literature cited:
reference titles beginning with Species Life Histories and Environmental Requirements),
Wannamaker and Rice (2000), NOAA (2001).]
Species
Salinity (ppt) Temperature (C)
Dissolved oxygen
(mg/l)
Flow
(cm/s)
Other
parameters
Adult
Spawn/
Egg Adult
Spawn/
Egg Adult
Spawn/
Egg Spawning Spawn/ Egg
Alewife [S] 0-5 [S] 0-5
[O] 0-2
[S] 11-28
[O] 17-
21
[S] >3.6 [S] >4 [O] slow
current
[S]
Suspended
solids <1000
mg/l
American
shad
[S] 0-
18 [S] 0-18 [S] 10-30
[S] 13.0-
26.0 [S] >5 [S] 30-90
Blueback
herring [S] 0-5
[S] 0-22
[O] 0-2
[S] 14-26
[O] 20-
24
[S] >5 [O] strong
current
[S]
Suspended
solids <1000
mg/l
Striped
bass [S] 0-5
[S] 0.5-
10 [S] 20-22
[S] 12-
24, [O]
~18-22
[S] >5
[S] 30.5-
500, [O]
100-200
Yellow
perch
[S] 0-
13 [S] 0-2 [S] 6-30
[S] >5
[S]
Suspended
solids <1000
mg/l
White
perch
[S] 5-
18 [S] 0-2 [S] 10-30 [S] 12-20 [S] >5
[S]
Suspended
solids <100
mg/l
Sturgeon,
Atlantic
[S] 0 to
>30 [S] 0-5
[S] 0 to
>30 [S] 11-20
Sturgeon,
Shortnose
[S] 0 to
>30 [S] 0-5
[S] 0 to
>30 [S] 5-15
[S] = Suitable, and [O] = Optimum
Estuarine spawning
The estuarine spawning species are mostly resident forage finfish species that spawn in shallow water
during the warmer months (Table 2.3). This group also includes some important shellfish species (e.g.,
oysters, hard clams, bay scallops, blue crabs) and sportfish (e.g., red drums, weakfish, spotted seatrout,
cobia) that spawn in deeper, flowing waters (Luczkovich et al. 1999; Powers and Gaskill 2004). Red
Drum will spawn in high salinity nearshore waters, including inlets and estuaries (such as Pamlico
Sound), in late summer (Murphy and Taylor 1990, Johnson and Funicelli 1991, Nicholson and Jordan
1994). These waters have the necessary conditions for the pelagic red drum eggs and larvae to be
transported to the nursery grounds (Johnson 1978, Ross and Stevens 1992). Red drum larvae require
water to have salinity greater than 25 ppt (Nelson et al. 1991).
2010 Coastal Habitat Protection Plan
Chapter 2. Water Column Page 43
Spawning for blue crabs, oysters, clams, and scallops is triggered primarily by increasing water
temperatures during spring and/or decreasing water temperatures in fall (Fay et al. 1983c, Burrell 1986,
Eversole 1987, DMF 2004a). Winds and currents carry the larvae resulting from spawning to nursery
habitats in the estuary and nearshore ocean. Understanding water movements is therefore essential in
understanding larval transport. Lipcius et al. (2008) discuss how one must understand habitat quality,
larval dispersal, and population dynamics when trying to replenish a stock through a stock replenishment
program. A stocking program fails if it supplies individuals to a habitat, and the individuals do not recruit
to the spawning stock. It is also important to know where the spawning occurs. Blue crabs, for example,
spawn near inlets from April-June and August-September (Table 2.3). Ballance and Eggleston (2008)
studied oyster larvae transport and settlement in Pamlico Sound. The results suggest where to place
source population for supplying recruits to other areas (see ―Shell bottom restoration and enhancement‖
section of Shell Bottom chapter for more information). Successful movement of larvae through the inlets
is also of great importance to North Carolina fisheries, particularly where inlets are limited, such as along
the Outer Banks (see ―Marine spawning‖ section for more information). The environmental requirements
for successful spawning and egg development for estuarine spawners are shown in Table 2.5.
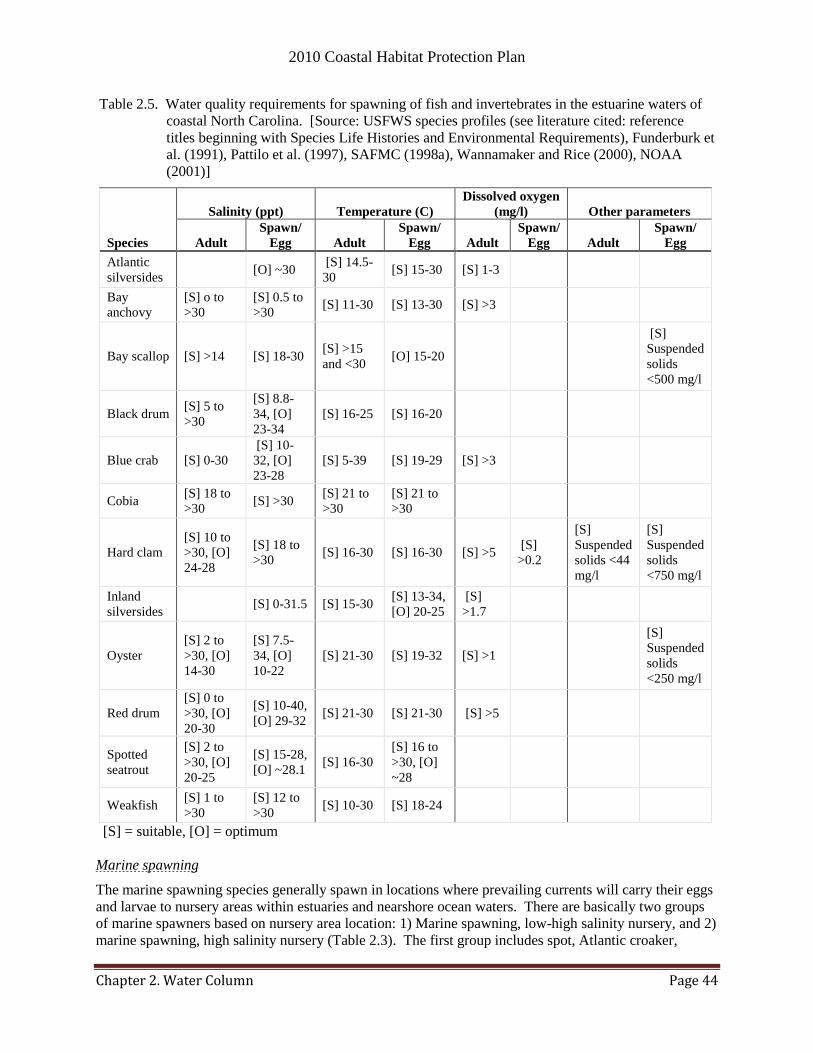
2010 Coastal Habitat Protection Plan
Chapter 2. Water Column Page 44
Table 2.5. Water quality requirements for spawning of fish and invertebrates in the estuarine waters of
coastal North Carolina. [Source: USFWS species profiles (see literature cited: reference
titles beginning with Species Life Histories and Environmental Requirements), Funderburk et
al. (1991), Pattilo et al. (1997), SAFMC (1998a), Wannamaker and Rice (2000), NOAA
(2001)]
Species
Salinity (ppt) Temperature (C)
Dissolved oxygen
(mg/l) Other parameters
Adult
Spawn/
Egg Adult
Spawn/
Egg Adult
Spawn/
Egg Adult
Spawn/
Egg
Atlantic
silversides [O] ~30
[S] 14.5-
30 [S] 15-30 [S] 1-3
Bay
anchovy
[S] o to
>30
[S] 0.5 to
>30 [S] 11-30 [S] 13-30 [S] >3
Bay scallop [S] >14 [S] 18-30 [S] >15
and <30 [O] 15-20
[S]
Suspended
solids
<500 mg/l
Black drum [S] 5 to
>30
[S] 8.8-
34, [O]
23-34
[S] 16-25 [S] 16-20
Blue crab [S] 0-30
[S] 10-
32, [O]
23-28
[S] 5-39 [S] 19-29 [S] >3
Cobia [S] 18 to
>30 [S] >30
[S] 21 to
>30
[S] 21 to
>30
Hard clam
[S] 10 to
>30, [O]
24-28
[S] 18 to
>30 [S] 16-30 [S] 16-30 [S] >5
[S]
>0.2
[S]
Suspended
solids <44
mg/l
[S]
Suspended
solids
<750 mg/l
Inland
silversides [S] 0-31.5 [S] 15-30
[S] 13-34,
[O] 20-25
[S]
>1.7
Oyster
[S] 2 to
>30, [O]
14-30
[S] 7.5-
34, [O]
10-22
[S] 21-30 [S] 19-32 [S] >1
[S]
Suspended
solids
<250 mg/l
Red drum
[S] 0 to
>30, [O]
20-30
[S] 10-40,
[O] 29-32 [S] 21-30 [S] 21-30 [S] >5
Spotted
seatrout
[S] 2 to
>30, [O]
20-25
[S] 15-28,
[O] ~28.1 [S] 16-30
[S] 16 to
>30, [O]
~28
Weakfish [S] 1 to
>30
[S] 12 to
>30 [S] 10-30 [S] 18-24
[S] = suitable, [O] = optimum
Marine spawning
The marine spawning species generally spawn in locations where prevailing currents will carry their eggs
and larvae to nursery areas within estuaries and nearshore ocean waters. There are basically two groups
of marine spawners based on nursery area location: 1) Marine spawning, low-high salinity nursery, and 2)
marine spawning, high salinity nursery (Table 2.3). The first group includes spot, Atlantic croaker,
2010 Coastal Habitat Protection Plan
Chapter 2. Water Column Page 45
southern flounder, Atlantic menhaden, shrimp, and striped mullet spawning offshore from fall to late
winter (Anderson 1958, Epperly and Ross 1986). The specific time of spawning is determined by
coincidence of environmental conditions in the water column (Table 2.6). Their larvae are transported
into the estuaries where they settle in nursery areas of low to high-salinity. The other group of marine
spawners (pinfish, black sea bass, gag, kingfish) reproduces at various times, but their nursery habitat is
limited to higher salinity areas. Evidence suggests that gag grouper will spawn offshore and larvae will
spend some time in high salinity inlets before moving into estuaries (Keener et al. 1988). The DMF
initiated a program in 2009 to study the ingress of gag larvae to estuaries near Masonboro Inlet in CHPP
region 4 (C. Collier/DMF, pers. com., September 2009). The study results are being used to calculate an
annual index of abundance for larval gag grouper, among other things.
The larvae of both spawning/nursery area groups is affected by hydrodynamic conditions within oceanic
inlets. Research projects conducted under the South Atlantic Bight Recruitment Experiment (SABRE)
studied transport of winter-spawned fish larvae into the estuaries. They found larvae concentrated on the
shelf in a narrow ―withdrawal zone‖ upwind of an inlet within the 23-foot (7m) depth contour. When the
ocean currents were appropriate, the larvae passed through the inlets. Even with the best wind and tidal
conditions, only about 10% of the available larvae are successfully drawn into the inlet (Blanton et al.
1999). Larvae passing downwind and outside the narrow withdrawal zone pass seaward of the inlet
shoals and, given the right conditions, will be transported into the next available inlet downstream.
Churchill et al. (1999) noted that transport dynamics in the immediate vicinity of inlets are complex, and
larvae may also remain near an inlet or move in and out repeatedly before actually immigrating.
However, since the along-shore flow component of the coast is four to five times greater than the cross-
shelf component, larvae are highly dependent on being transported along the shore in a narrow zone and
then injected through the inlet (Hare et al. 1999). The larvae of estuarine inlet spawners such as red drum,
seatrout and blue crab are also affected by hydrodynamic conditions propagated through inlets.
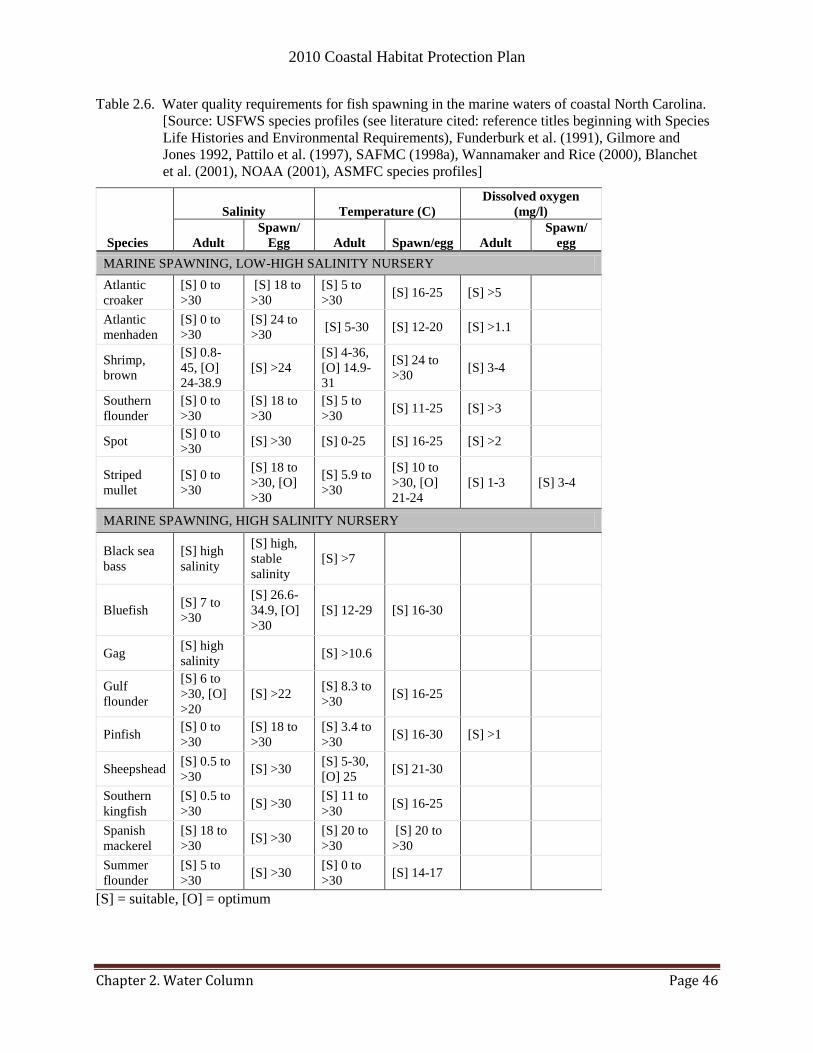
2010 Coastal Habitat Protection Plan
Chapter 2. Water Column Page 46
Table 2.6. Water quality requirements for fish spawning in the marine waters of coastal North Carolina.
[Source: USFWS species profiles (see literature cited: reference titles beginning with Species
Life Histories and Environmental Requirements), Funderburk et al. (1991), Gilmore and
Jones 1992, Pattilo et al. (1997), SAFMC (1998a), Wannamaker and Rice (2000), Blanchet
et al. (2001), NOAA (2001), ASMFC species profiles]
Species
Salinity Temperature (C)
Dissolved oxygen
(mg/l)
Adult
Spawn/
Egg Adult Spawn/egg Adult
Spawn/
egg
MARINE SPAWNING, LOW-HIGH SALINITY NURSERY
Atlantic
croaker
[S] 0 to
>30
[S] 18 to
>30
[S] 5 to
>30 [S] 16-25 [S] >5
Atlantic
menhaden
[S] 0 to
>30
[S] 24 to
>30 [S] 5-30 [S] 12-20 [S] >1.1
Shrimp,
brown
[S] 0.8-
45, [O]
24-38.9
[S] >24
[S] 4-36,
[O] 14.9-
31
[S] 24 to
>30 [S] 3-4
Southern
flounder
[S] 0 to
>30
[S] 18 to
>30
[S] 5 to
>30 [S] 11-25 [S] >3
Spot [S] 0 to
>30 [S] >30 [S] 0-25 [S] 16-25 [S] >2
Striped
mullet
[S] 0 to
>30
[S] 18 to
>30, [O]
>30
[S] 5.9 to
>30
[S] 10 to
>30, [O]
21-24
[S] 1-3 [S] 3-4
MARINE SPAWNING, HIGH SALINITY NURSERY
Black sea
bass
[S] high
salinity
[S] high,
stable
salinity
[S] >7
Bluefish [S] 7 to
>30
[S] 26.6-
34.9, [O]
>30
[S] 12-29 [S] 16-30
Gag [S] high
salinity [S] >10.6
Gulf
flounder
[S] 6 to
>30, [O]
>20
[S] >22 [S] 8.3 to
>30 [S] 16-25
Pinfish [S] 0 to
>30
[S] 18 to
>30
[S] 3.4 to
>30 [S] 16-30 [S] >1
Sheepshead [S] 0.5 to
>30 [S] >30
[S] 5-30,
[O] 25 [S] 21-30
Southern
kingfish
[S] 0.5 to
>30 [S] >30
[S] 11 to
>30 [S] 16-25
Spanish
mackerel
[S] 18 to
>30 [S] >30
[S] 20 to
>30
[S] 20 to
>30
Summer
flounder
[S] 5 to
>30 [S] >30
[S] 0 to
>30 [S] 14-17
[S] = suitable, [O] = optimum
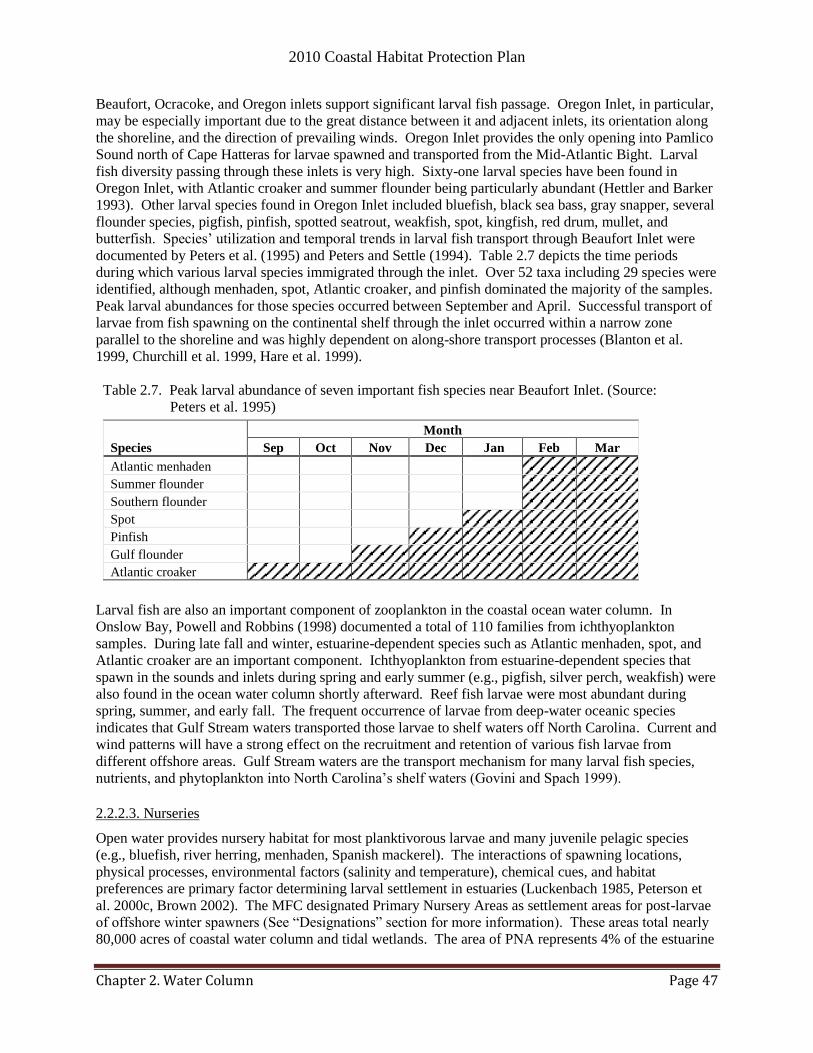
2010 Coastal Habitat Protection Plan
Chapter 2. Water Column Page 47
Beaufort, Ocracoke, and Oregon inlets support significant larval fish passage. Oregon Inlet, in particular,
may be especially important due to the great distance between it and adjacent inlets, its orientation along
the shoreline, and the direction of prevailing winds. Oregon Inlet provides the only opening into Pamlico
Sound north of Cape Hatteras for larvae spawned and transported from the Mid-Atlantic Bight. Larval
fish diversity passing through these inlets is very high. Sixty-one larval species have been found in
Oregon Inlet, with Atlantic croaker and summer flounder being particularly abundant (Hettler and Barker
1993). Other larval species found in Oregon Inlet included bluefish, black sea bass, gray snapper, several
flounder species, pigfish, pinfish, spotted seatrout, weakfish, spot, kingfish, red drum, mullet, and
butterfish. Species‘ utilization and temporal trends in larval fish transport through Beaufort Inlet were
documented by Peters et al. (1995) and Peters and Settle (1994). Table 2.7 depicts the time periods
during which various larval species immigrated through the inlet. Over 52 taxa including 29 species were
identified, although menhaden, spot, Atlantic croaker, and pinfish dominated the majority of the samples.
Peak larval abundances for those species occurred between September and April. Successful transport of
larvae from fish spawning on the continental shelf through the inlet occurred within a narrow zone
parallel to the shoreline and was highly dependent on along-shore transport processes (Blanton et al.
1999, Churchill et al. 1999, Hare et al. 1999).
Table 2.7. Peak larval abundance of seven important fish species near Beaufort Inlet. (Source:
Peters et al. 1995)
Species
Month
Sep Oct Nov Dec Jan Feb Mar
Atlantic menhaden
Summer flounder
Southern flounder
Spot
Pinfish
Gulf flounder
Atlantic croaker
Larval fish are also an important component of zooplankton in the coastal ocean water column. In
Onslow Bay, Powell and Robbins (1998) documented a total of 110 families from ichthyoplankton
samples. During late fall and winter, estuarine-dependent species such as Atlantic menhaden, spot, and
Atlantic croaker are an important component. Ichthyoplankton from estuarine-dependent species that
spawn in the sounds and inlets during spring and early summer (e.g., pigfish, silver perch, weakfish) were
also found in the ocean water column shortly afterward. Reef fish larvae were most abundant during
spring, summer, and early fall. The frequent occurrence of larvae from deep-water oceanic species
indicates that Gulf Stream waters transported those larvae to shelf waters off North Carolina. Current and
wind patterns will have a strong effect on the recruitment and retention of various fish larvae from
different offshore areas. Gulf Stream waters are the transport mechanism for many larval fish species,
nutrients, and phytoplankton into North Carolina‘s shelf waters (Govini and Spach 1999).
2.2.2.3. Nurseries
Open water provides nursery habitat for most planktivorous larvae and many juvenile pelagic species
(e.g., bluefish, river herring, menhaden, Spanish mackerel). The interactions of spawning locations,
physical processes, environmental factors (salinity and temperature), chemical cues, and habitat
preferences are primary factor determining larval settlement in estuaries (Luckenbach 1985, Peterson et
al. 2000c, Brown 2002). The MFC designated Primary Nursery Areas as settlement areas for post-larvae
of offshore winter spawners (See ―Designations‖ section for more information). These areas total nearly
80,000 acres of coastal water column and tidal wetlands. The area of PNA represents 4% of the estuarine
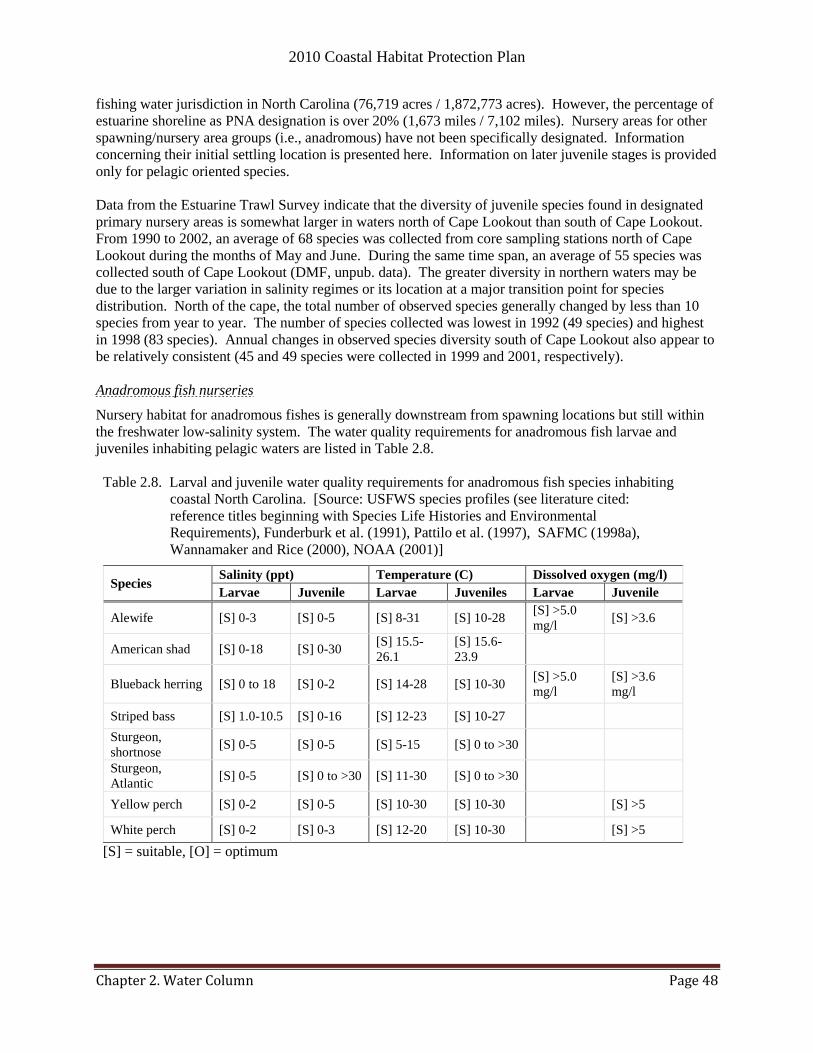
2010 Coastal Habitat Protection Plan
Chapter 2. Water Column Page 48
fishing water jurisdiction in North Carolina (76,719 acres / 1,872,773 acres). However, the percentage of
estuarine shoreline as PNA designation is over 20% (1,673 miles / 7,102 miles). Nursery areas for other
spawning/nursery area groups (i.e., anadromous) have not been specifically designated. Information
concerning their initial settling location is presented here. Information on later juvenile stages is provided
only for pelagic oriented species.
Data from the Estuarine Trawl Survey indicate that the diversity of juvenile species found in designated
primary nursery areas is somewhat larger in waters north of Cape Lookout than south of Cape Lookout.
From 1990 to 2002, an average of 68 species was collected from core sampling stations north of Cape
Lookout during the months of May and June. During the same time span, an average of 55 species was
collected south of Cape Lookout (DMF, unpub. data). The greater diversity in northern waters may be
due to the larger variation in salinity regimes or its location at a major transition point for species
distribution. North of the cape, the total number of observed species generally changed by less than 10
species from year to year. The number of species collected was lowest in 1992 (49 species) and highest
in 1998 (83 species). Annual changes in observed species diversity south of Cape Lookout also appear to
be relatively consistent (45 and 49 species were collected in 1999 and 2001, respectively).
Anadromous fish nurseries
Nursery habitat for anadromous fishes is generally downstream from spawning locations but still within
the freshwater low-salinity system. The water quality requirements for anadromous fish larvae and
juveniles inhabiting pelagic waters are listed in Table 2.8.
Table 2.8. Larval and juvenile water quality requirements for anadromous fish species inhabiting
coastal North Carolina. [Source: USFWS species profiles (see literature cited:
reference titles beginning with Species Life Histories and Environmental
Requirements), Funderburk et al. (1991), Pattilo et al. (1997), SAFMC (1998a),
Wannamaker and Rice (2000), NOAA (2001)]
Species Salinity (ppt) Temperature (C) Dissolved oxygen (mg/l)
Larvae Juvenile Larvae Juveniles Larvae Juvenile
Alewife [S] 0-3 [S] 0-5 [S] 8-31 [S] 10-28 [S] >5.0
mg/l [S] >3.6
American shad [S] 0-18 [S] 0-30 [S] 15.5-
26.1
[S] 15.6-
23.9
Blueback herring [S] 0 to 18 [S] 0-2 [S] 14-28 [S] 10-30 [S] >5.0
mg/l
[S] >3.6
mg/l
Striped bass [S] 1.0-10.5 [S] 0-16 [S] 12-23 [S] 10-27
Sturgeon,
shortnose [S] 0-5 [S] 0-5 [S] 5-15 [S] 0 to >30
Sturgeon,
Atlantic [S] 0-5 [S] 0 to >30 [S] 11-30 [S] 0 to >30
Yellow perch [S] 0-2 [S] 0-5 [S] 10-30 [S] 10-30
[S] >5
White perch [S] 0-2 [S] 0-3 [S] 12-20 [S] 10-30
[S] >5
[S] = suitable, [O] = optimum
2010 Coastal Habitat Protection Plan
Chapter 2. Water Column Page 49
Juvenile alewife and blueback herring in the Potomac River exhibited apparent upstream movement over
the four months before emigration to nursery areas (Fay et al. 1983b). Both species were most abundant
in surface waters through September. Juvenile blueback herring remained in the upper portion of the
water column during their stay in nursery areas. While juvenile alewife were more abundant at a depth
of 15 feet (4.6 m) and on the bottom for the two months prior to emigration (Warinner et al. 1969).
Juvenile alewife were collected in upriver areas of the Tar River (CHPP Region 2) later in their maturity
than blueback herring (Jones and Overton 2009). The results for juvenile blueback herring suggest a
greater benefit from early arrival to higher salinity zones relative to juvenile Alewife. Jones and Overton
(2009) also documented higher catch-per-unit-effort of larval river herring in ―backwater‖ tributaries of
the Tar River than in the mainstem. The peak abundances for both species in the meroplankton occurred
in April and May. Recruitment of larval river herring in tributaries of the Chowan system is also related
to flow conditions (O‘Rear 1983). Walsh et al. (2005) observed an increase in the number of alewife
larvae in 1997, when there was a large amount of wetlands flooded. Juvenile river herring migrate
offshore from freshwater/estuarine nursery areas by November of their first year of life (Burbidge 1974;
Kissil 1974, Richkus 1975, O‘Neill 1980). Heavy rainfall, high water flow, and sharp declines in water
temperature have been found to influence the initiation of migration from nursery areas (Cooper 1961,
Kissil 1974, Richkus 1975).
Larval striped bass move downstream from spawning locations in the upper river during summer and
early fall, where they inhabit shoal waters less than six feet deep (Funderburk et al. 1991). As the larvae
grow into juveniles, they move progressively downstream, where they seem to prefer shallow-water,
nearshore waters (Funderburk et al. 1991). During winter, young striped bass may move even farther
downstream and into deeper, high salinity water (Fay et al. 1983d, Hill et al. 1989). Water flow
conditions are essential for recruitment for all life stages of striped bass (Hassler et al. 1981, Rulifson and
Manooch 1990). In the Roanoke River, juvenile abundance indices (JAI) were highest when water flow
was low to moderate (5,000-11,000 ft3/sec). When flow was above or below this range, JAI were low
(Rulifson and Manooch 1990). Larval striped bass move downstream from spawning locations in the
upper river during summer and early fall, where they inhabit shoal waters less than six feet deep
(Funderburk et al. 1991). As the larvae grow into juveniles, they move progressively downstream, where
they seem to prefer shallow-water, nearshore areas (Funderburk et al. 1991) with a sandy bottom (Hill et
al. 1989). During winter, young striped bass may move even farther downstream and into deeper, high
salinity water (Fay et al. 1983d; Hill et al. 1989). Water flow regimes that minimize impacts to striped
bass and other species were recommended in Manooch and Rulifson (1989).
Juvenile American shad use the same general nursery areas as river herring, but the young shad prefer
deeper pools away from the shoreline and occasionally move into shallow riffles (Funderburk et al. 1991).
During summer, juvenile shad migrate from the bottom during the day to the surface at night (Loesch and
Kriete 1984). Juvenile blueback herring will also make a nightly migration towards the surface. Juvenile
river herring tend to be found higher in the water column than alewives as a way to possible reduce
interspecies competition (Loesch et al. 1982, Loesch 1987). A decrease in temperature during the fall and
slight increases in river flow seem to trigger downstream movement of American shad (Funderburk et al.
1991). Nursery area surveys conducted by DMF noted decreased catch of juvenile shad in October on the
Cape Fear River, Neuse River, and Albemarle Sound (Winslow 1990).
Low- and high-salinity nurseries
For species spawned offshore in winter, the larval (primary) nursery habitat extends from the inlet water
column, across primarily inshore-flowing channels, to the upper reaches of estuaries. Survival to the
juvenile life stage and beyond is then dependent on the estuarine nursery areas providing the biological,
physical, and chemical characteristics needed for growth (Table 2.9). In Pamlico Sound, salinity and
circulation patterns are the key physical conditions affecting the species composition occurring in juvenile
2010 Coastal Habitat Protection Plan
Chapter 2. Water Column Page 50
nursery habitat (Ross and Epperly 1985, Noble and Monroe 1991). Low-salinity nurseries include the
upper Pamlico Estuary, Pungo River, upper Neuse Estuary, the eastern portion of Albemarle Sound
(including Croatan and Roanoke sounds), and the upper Cape Fear estuary. During spring through fall,
pelagic species dominating shallow areas within these systems include juvenile Atlantic menhaden,
striped mullet (Epperly and Ross 1986), silversides, and anchovies (Nelson et al. 1991). However,
different species arrive in nursery areas at different times of the year and remain for variable periods.
Post-larval striped mullet enter low-salinity nurseries primarily in winter (Nelson et al. 1991), whereas
menhaden post-larvae arrive from February to June (Purvis 1976). Juvenile anchovies and silversides are
generally year-long residents (Nelson et al. 1991). By late fall, many of these nonresident estuarine fish
migrate to the ocean or to deeper regions of the estuary to overwinter (Epperly and Ross 1986).
Moderate-salinity areas include the bays and open waters of Pamlico Sound. In addition to juvenile
species present in lower salinity areas, spotted seatrout, weakfish, silver perch, and red drum are also
abundant in these moderate-salinity estuaries (Noble and Monroe 1991). Young weakfish and silver
perch tend to occupy deeper waters of the moderate and high-salinity zones, while young blue crabs and
other demersal species prefer shallow areas (Epperly and Ross 1986). Nursery habitats for North
Carolina juvenile weakfish are reported to be in deeper portions of coastal rivers, bays, sounds and
estuaries (Mercer 1989, DMF unpublished program 195 data). As they grow, juvenile weakfish have
been found to be most abundant in shallow bays or navigational channels that are characterized by
moderate depths, slightly higher salinities, and areas with a sandy bottom (ASMFC 1996). See ―Soft
bottom‖ chapter for more information on nursery habitat for juvenile demersal fish.
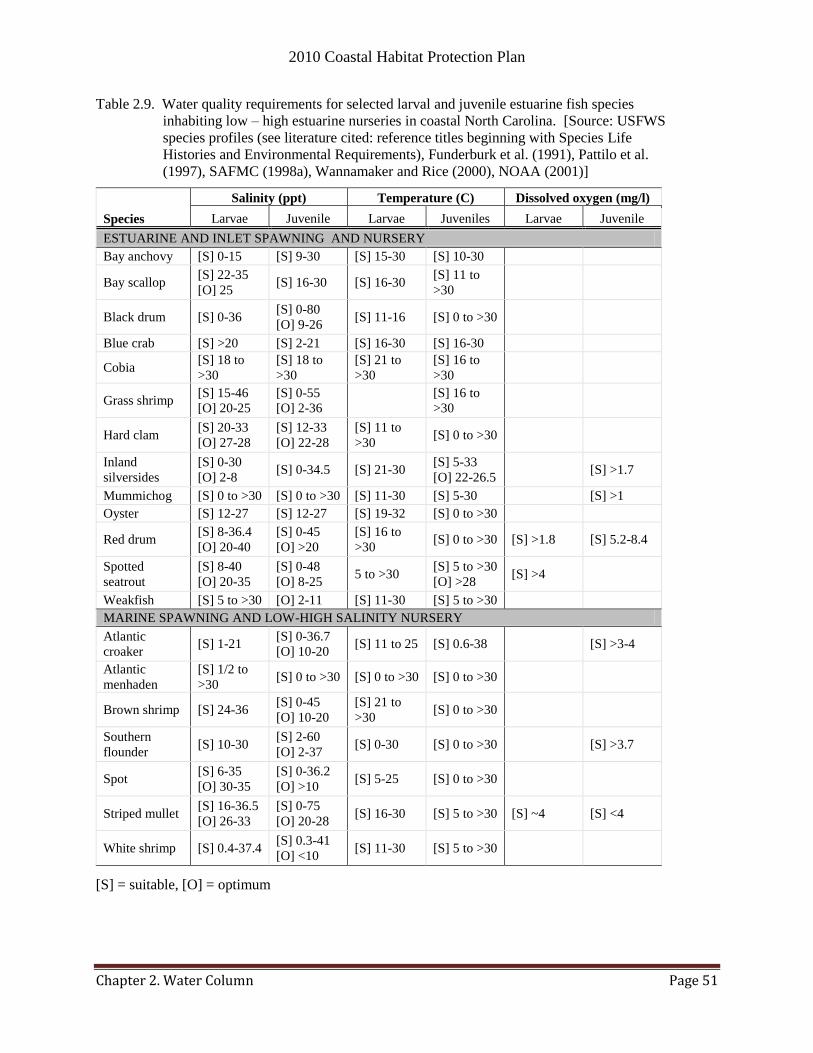
2010 Coastal Habitat Protection Plan
Chapter 2. Water Column Page 51
Table 2.9. Water quality requirements for selected larval and juvenile estuarine fish species
inhabiting low – high estuarine nurseries in coastal North Carolina. [Source: USFWS
species profiles (see literature cited: reference titles beginning with Species Life
Histories and Environmental Requirements), Funderburk et al. (1991), Pattilo et al.
(1997), SAFMC (1998a), Wannamaker and Rice (2000), NOAA (2001)]
Species
Salinity (ppt) Temperature (C) Dissolved oxygen (mg/l)
Larvae Juvenile Larvae Juveniles Larvae Juvenile
ESTUARINE AND INLET SPAWNING AND NURSERY
Bay anchovy [S] 0-15 [S] 9-30 [S] 15-30 [S] 10-30
Bay scallop [S] 22-35
[O] 25 [S] 16-30 [S] 16-30
[S] 11 to
>30
Black drum [S] 0-36 [S] 0-80
[O] 9-26 [S] 11-16 [S] 0 to >30
Blue crab [S] >20 [S] 2-21 [S] 16-30 [S] 16-30
Cobia [S] 18 to
>30
[S] 18 to
>30
[S] 21 to
>30
[S] 16 to
>30
Grass shrimp [S] 15-46
[O] 20-25
[S] 0-55
[O] 2-36
[S] 16 to
>30
Hard clam [S] 20-33
[O] 27-28
[S] 12-33
[O] 22-28
[S] 11 to
>30 [S] 0 to >30
Inland
silversides
[S] 0-30
[O] 2-8 [S] 0-34.5 [S] 21-30
[S] 5-33
[O] 22-26.5 [S] >1.7
Mummichog [S] 0 to >30 [S] 0 to >30 [S] 11-30 [S] 5-30
[S] >1
Oyster [S] 12-27 [S] 12-27 [S] 19-32 [S] 0 to >30
Red drum [S] 8-36.4
[O] 20-40
[S] 0-45
[O] >20
[S] 16 to
>30 [S] 0 to >30 [S] >1.8 [S] 5.2-8.4
Spotted
seatrout
[S] 8-40
[O] 20-35
[S] 0-48
[O] 8-25 5 to >30
[S] 5 to >30
[O] >28 [S] >4
Weakfish [S] 5 to >30 [O] 2-11 [S] 11-30 [S] 5 to >30
MARINE SPAWNING AND LOW-HIGH SALINITY NURSERY
Atlantic
croaker [S] 1-21
[S] 0-36.7
[O] 10-20 [S] 11 to 25 [S] 0.6-38
[S] >3-4
Atlantic
menhaden
[S] 1/2 to
>30 [S] 0 to >30 [S] 0 to >30 [S] 0 to >30
Brown shrimp [S] 24-36 [S] 0-45
[O] 10-20
[S] 21 to
>30 [S] 0 to >30
Southern
flounder [S] 10-30
[S] 2-60
[O] 2-37 [S] 0-30 [S] 0 to >30
[S] >3.7
Spot [S] 6-35
[O] 30-35
[S] 0-36.2
[O] >10 [S] 5-25 [S] 0 to >30
Striped mullet [S] 16-36.5
[O] 26-33
[S] 0-75
[O] 20-28 [S] 16-30 [S] 5 to >30 [S] ~4 [S] <4
White shrimp [S] 0.4-37.4 [S] 0.3-41
[O] <10 [S] 11-30 [S] 5 to >30
[S] = suitable, [O] = optimum [S] = suitable, [O] = optimum
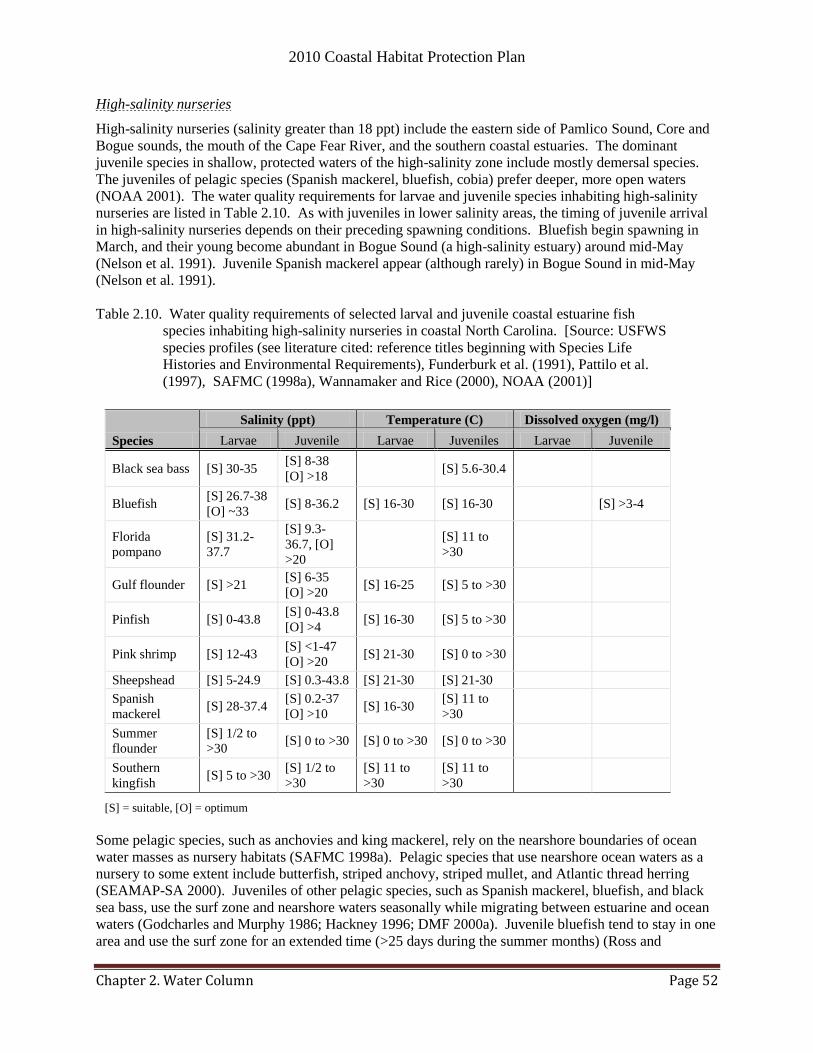
2010 Coastal Habitat Protection Plan
Chapter 2. Water Column Page 52
High-salinity nurseries
High-salinity nurseries (salinity greater than 18 ppt) include the eastern side of Pamlico Sound, Core and
Bogue sounds, the mouth of the Cape Fear River, and the southern coastal estuaries. The dominant
juvenile species in shallow, protected waters of the high-salinity zone include mostly demersal species.
The juveniles of pelagic species (Spanish mackerel, bluefish, cobia) prefer deeper, more open waters
(NOAA 2001). The water quality requirements for larvae and juvenile species inhabiting high-salinity
nurseries are listed in Table 2.10. As with juveniles in lower salinity areas, the timing of juvenile arrival
in high-salinity nurseries depends on their preceding spawning conditions. Bluefish begin spawning in
March, and their young become abundant in Bogue Sound (a high-salinity estuary) around mid-May
(Nelson et al. 1991). Juvenile Spanish mackerel appear (although rarely) in Bogue Sound in mid-May
(Nelson et al. 1991).
Table 2.10. Water quality requirements of selected larval and juvenile coastal estuarine fish
species inhabiting high-salinity nurseries in coastal North Carolina. [Source: USFWS
species profiles (see literature cited: reference titles beginning with Species Life
Histories and Environmental Requirements), Funderburk et al. (1991), Pattilo et al.
(1997), SAFMC (1998a), Wannamaker and Rice (2000), NOAA (2001)]
Species
Salinity (ppt) Temperature (C) Dissolved oxygen (mg/l)
Larvae Juvenile Larvae Juveniles Larvae Juvenile
Black sea bass [S] 30-35 [S] 8-38
[O] >18 [S] 5.6-30.4
Bluefish [S] 26.7-38
[O] ~33 [S] 8-36.2 [S] 16-30 [S] 16-30 [S] >3-4
Florida
pompano
[S] 31.2-
37.7
[S] 9.3-
36.7, [O]
>20
[S] 11 to
>30
Gulf flounder [S] >21 [S] 6-35
[O] >20 [S] 16-25 [S] 5 to >30
Pinfish [S] 0-43.8 [S] 0-43.8
[O] >4 [S] 16-30 [S] 5 to >30
Pink shrimp [S] 12-43 [S] <1-47
[O] >20 [S] 21-30 [S] 0 to >30
Sheepshead [S] 5-24.9 [S] 0.3-43.8 [S] 21-30 [S] 21-30
Spanish
mackerel [S] 28-37.4
[S] 0.2-37
[O] >10 [S] 16-30
[S] 11 to
>30
Summer
flounder
[S] 1/2 to
>30 [S] 0 to >30 [S] 0 to >30 [S] 0 to >30
Southern
kingfish [S] 5 to >30
[S] 1/2 to
>30
[S] 11 to
>30
[S] 11 to
>30
[S] = suitable, [O] = optimum
Some pelagic species, such as anchovies and king mackerel, rely on the nearshore boundaries of ocean
water masses as nursery habitats (SAFMC 1998a). Pelagic species that use nearshore ocean waters as a
nursery to some extent include butterfish, striped anchovy, striped mullet, and Atlantic thread herring
(SEAMAP-SA 2000). Juveniles of other pelagic species, such as Spanish mackerel, bluefish, and black
sea bass, use the surf zone and nearshore waters seasonally while migrating between estuarine and ocean
waters (Godcharles and Murphy 1986; Hackney 1996; DMF 2000a). Juvenile bluefish tend to stay in one
area and use the surf zone for an extended time (>25 days during the summer months) (Ross and
2010 Coastal Habitat Protection Plan
Chapter 2. Water Column Page 53
Lancaster 1996). The major recruitment period for juvenile fish to surf zone nurseries is late spring
through early summer. Refer to the ―Soft bottom‖ chapter for information on high-salinity nursery habitat
for demersal fish. 2.2.2.4. Foraging
The primary food sources abundant in open waters are decayed plant material (detritus), phytoplankton,
and zooplankton (including meroplankton). Most fish consume plankton at some point in their life cycle
(larval stage in particular). Of the over 30 species listed in Table 2.2, nearly all larval stages eat
phytoplankton or zooplankton. Resuspended benthic microalgae are also an important source of food (see
―Soft bottom‖ chapter for more information). The diet of adult, pelagic filter-feeders (i.e., river herring,
shads, Atlantic menhaden, striped mullet) includes zooplankton (the most common component), detritus,
or phytoplankton (the least common). Filter-feeding pelagics may also consume benthic copepods,
mysids, and amphipods as they rise through the water column at night (P. Peterson/UNC-IMS, pers. com.,
2003). Other species are almost strictly piscivorous (i.e., striped bass, Spanish mackerel, king mackerel,
bluefish). Young-of-year (YOY) bluefish feed predominately on fish species that are found throughout
the water column. In 1992 and 1993, Buckel and Conover (1997) found clupeids, moronids, and bay
anchovy (Anchoa mitchilli) in a majority of the YOY stomachs that were sampled. A review of studies in
Buckel et al. (2009) concluded very little overlap in the diet of juvenile bluefish and striped bass despite
similar feeding ability. The non-overlap suggests differences in habitat use within the water column for
juvenile bluefish and striped bass.
In freshwater streams, larval and juvenile American shad and blueback herring tend to feed on different
sizes of zooplankton (Crecco and Blake 1983, Jenkins and Burkhead 1993). In years with a shortage of
certain prey items, there is some overlap in the diets of larval American shad and river herrings as a result
of interspecies competition (Crecco and Blake 1983). Zooplankton abundance for river herring in the
Chowan River and tributaries is being studied as part of a Fisheries Resource Grant (S. Ensign/UNC-IMS,
pers. com., January 2010). Monitoring results from April 2008 through May 2009 showed individuals per
liter ranging from 21-42, which is approximate ten-fold higher than densities reported from the early
1980s (S. Mosley/NCSU, unpub. data). The preliminary data indicate a suitable abundance of
zooplankton forage for river herring in the Chowan River and tributaries. However, the spatial and
temporal coincidence of larval fish and zooplankton abundances remains an issue (B.J. Copeland/MFC,
pers. com., March 2010).
Adult striped bass found in Albemarle Sound, Roanoke River, and Cape Fear River will feed primarily on
clupeids (herrings, Atlantic menhaden, and shad) and engraulids during the summer and fall months
(Trent and Hassler 1968; Manooch 1973; and Patrick and Moser 2001). In the winter and spring months
adult striped bass will have a prey switch and feed predominately on invertebrates (i.e., amphipods and
blue crabs) (Manooch 1973).
Within an estuary, menhaden, anchovy, silversides, striped mullet, and other pelagic species use
suspended organic matter exported from the adjacent marshes, SAV, and oyster reefs without physically
occupying these structured bottom habitats (SAFMC 1998a). The relative contributions of detritus and
phytoplankton between the estuarine and nearshore ocean ecosystem are demonstrated by the foraging
behavior of Atlantic menhaden. Lewis and Peters (1994) found the dominant food sources for menhaden
were detritus in shallow estuarine systems and phytoplankton in coastal waters. Adult striped mullet in
North Carolina are opportunistic ―interface feeders,‖ feeding at the water surface, water bottom, or on the
surface of objects. While feeding at these interfaces striped mullets will consume epiphytic microalgae
and dissolved organic matter (DMF 2006b).
2010 Coastal Habitat Protection Plan
Chapter 2. Water Column Page 54
A large number of fish inhabit the marine water column as adults. Coastal pelagics, highly migratory
species, and anadromous fish species are dependent on the water column for adequate foraging (Manooch
and Hogarth 1983). The boundaries of water masses (coastal fronts) in the nearshore ocean are favorite
foraging areas for mackerel and dolphin (SAFMC 1998a). King and Spanish mackerel feed on baitfish
that congregate seasonally on shoals and natural and artificial reefs. National Marine Fisheries Service
(SAFMC 1998a) has designated the cape shoals of North Carolina as Habitat Areas of Particular Concern
(HAPC) for both mackerels. Anadromous species such as shad, river herring, and striped bass utilize the
cape shoals as a staging area for migration along the coast. Large aggregations of striped bass have been
documented, in the northern, nearshore coastal area of the state during winter months, feeding and resting
prior to initiation of an extensive northward spawning migration (Holland and Yelverton 1973, Laney et
al. 1999). This wintering ground is shared by the Chesapeake, Hudson, and Roanoke/Albemarle striped
bass stocks, and is therefore important to the entire Atlantic coast population (Benton 1992). The water
column off the Outer Banks during winter supports an abundance of anchovies and menhaden, weakfish
and other sciaenids, on which the striped bass feed. Laney et al. (1999) considered the existence of an
area with such abundant food sources to be critical for building energy reserves for successful migration
and reproduction of striped bass. Both striped bass and bluefish use the water column off the Outer
Banks during winter, suggesting possible competition for resources. Buckel et al. (2009) postulated
competitive exclusion as a contributing factor in a decline in bluefish recreational landings during the
1990s and early 2000s (Buckel et al. 2009). However, the results of laboratory experiments suggested no
competitive interactions between adult bluefish and sub-adult striped bass in continental shelf waters.
2.2.2.5. Refuge
The refuge function of water column varies according to the relative area of open water, the depth, the
distribution of water quality, and floating plants in a water body. Large expanses of open water can
provide protection for forage species by reducing their encounter rate with predators. Juvenile fishes use
shallow areas as refuge from larger predators. Spatial variability in dissolved oxygen and turbidity can
provide a refuge function for pelagic forage species. For example, silversides can create such dense
schools that DO concentrations are low enough to repel predators (Fay et al. 1983a). Other areas of low
DO can provide refuge for prey species whose predators are less tolerant of low DO. For example,
copepods and zooplankton have a high tolerance for low DO, which could impact the food web in areas
where the small invertebrates use low DO areas for refuge (Breitburg et al. 1997; Keister et al. 2000).
Turbidity in the water column can also provide refuge for prey species from visual predation (Ritchie
1972, Blader and Blader 1980, Boehlert and Morgan 1985, Bruton 1985, Miller et al. 1985). For
example, bay anchovy may be attracted to more turbid areas for the refuge it provides (Livingston 1975).
Utne-Palm (2002) found that increased turbidity may be more optimal for some species and size groups of
fish.
The value of floating plants has been evaluated in marine systems, where Sargassum floating in the water
column supports a diverse assemblage of marine organisms, including at least 145 species of
invertebrates, 100 species of fish, four species of marine turtles, and numerous marine birds (SAFMC
1998a). Sargassum is concentrated as small patches, large rafts, or weed lines at the convergence of
water masses in the coastal ocean, such as those found along ―tide lines‖ near coastal inlets. The greatest
concentrations of Sargassum patches are found in the Sargasso Sea and on the outer continental shelf of
the South Atlantic, although they can be pushed into nearshore waters by winds and currents. Large
pelagic adult fish such as dolphin and sailfish feed on the small prey hiding in and around Sargassum.
This behavior prompts sport fishermen to target Sargassum patches. Casazza and Ross (2008)
documented a higher diversity of species living in and around floating Sargassum mats relative to
unvegetated open water habitat in the Gulf Stream off North Carolina.
2010 Coastal Habitat Protection Plan
Chapter 2. Water Column Page 55
2.3. Status and trends
Evaluating status and trends in water-column characteristics is a very difficult task. The number of
independent monitoring agents, spatial distribution of monitoring sites, frequency of data collection, and
parameters measures do not easily lend themselves to a comprehensive assessment of water quality. This
section briefly describes current state water quality and fishery monitoring programs that help determine
the status and trends of water column habitat in coastal North Carolina. However, the status and trends of
water column are not described in terms of habitat distribution (unlike other habitats). The condition of
waters is described in terms of physical and chemical conditions (e.g., nutrients, suspended sediment,
toxins), indicators of pollution (e.g., chlorophyll a, fecal coliforms, fish kills), and status of pelagic
fisheries (e.g., bluefish, Atlantic menhaden). Fish species and assemblages exhibit threshold responses to
physical and chemical parameters (see ―Habitat requirements‖ section for more information). Conditions
of the water column that are outside the threshold tolerance or preference of fish are considered impaired,
polluted, or otherwise not supporting fishery species.
In order to evaluate impairment of water quality/quantity for fishery species, one must understand the
basic parameters as they relate to fish. Those parameters include: flow and water movement, pH,
temperature, dissolved oxygen, and water clarity. The parameters also affect each other, causing a suite
of water quality changes. The suites can be grouped into processes connecting the various parameters.
Nutrient concentrations, biochemical oxygen demand, pH, suspended solids, water clarity, and
temperature stratification are all related processes in eutrophication (see ―Eutrophication and oxygen
depletion‖ section for more information). There is also the addition of chemicals that interact with
biological processes (i.e., heavy metals, endocrine disrupting substances), causing unintended
consequences (see ―Toxic chemicals‖ section for more information). Excessive amounts of sediment
from human activities on the land exacerbate the process of eutrophication and toxic contamination (see
―Suspended sediment and turbidity‖ section for more information). Water flow and movement have a
vital role in habitat distribution and connectivity, as well as distributing (dispersing/concentrating) the
drivers of eutrophication and chemical pollution (see ―Hydrologic modifications‖ section for more
information).
2.3.1. Physical and chemical environment
The 2004 National Water Quality Inventory Report to Congress
(http://www.epa.gov/owow/305b/2004report, November 2010) indicated polluted conditions in 44% of
assessed streams, 64% of assessed lakes, and 30% of assessed estuaries, which is higher than the
percentages found in the 2002 report (EPA 2002c). However, only 16%, 39%, and 29% of all streams,
lakes, and estuaries were assessed, respectively. Although water quality monitoring data are abundant for
North Carolina (Appendix E), differences in sampling methodology (i.e., duration, magnitude, parameters
studied) complicate comparisons within and among river basins over time. However, information
obtained from state-wide monitoring programs and research projects allows for some indirect evaluations.
The status of water quality conditions in North Carolina‘s territorial waters, as well as the probable causes
of water quality problems, is determined primarily by DWQ‘s use support assessments. Water quality
data are collected and summarized by river basin on five-year cycles. The information is used to assess
whether waters are supporting their designated use (Use Support). Surface waters are assigned a use
support status based on assessment of DWQ‘s biological sampling (benthic macroinvertebrates and fish);
ambient water quality monitoring; lake monitoring data; United States Geological Survey (USGS) stream
flow/quality stations; NPDES monitoring; Division of Environment and Health –Shellfish Sanitation
(DEH-SS) sampling (fecal coliform concentrations) and other information. Impaired waters do not meet
one or more water quality standards or some other criterion. If data are inconclusive for a determination
of use support, the water body is not rated. Likewise, if no data are available, the use support status is ―no
data.‖
2010 Coastal Habitat Protection Plan
Chapter 2. Water Column Page 56
State-wide monitoring stations in the CHPP area include approximately 212 DWQ ambient stations
(http://h2o.enr.state.nc.us/esb/ams.html, 2009), 76 USGS stream flow/quality stations
(http://wdr.water.usgs.gov/nwisgmap, 2009), 651 NPDES sites (C. McNutt/DWQ, unpub. data, 2006),
1020 DEH-SS growing area stations (B. Pogue/DEH-SS, pers. com., October 2009), 241 DEH-SS
recreational water quality stations (E. Bryan-Millush/DEH-SS, pers. com., October 2009) and 22
Albemarle Pamlico National Estuarine Program (APNEP) Citizen‘s Water Quality Monitoring Stations2
(http://portal.ncdenr.org/web/apnep/cmn, December 2010). Stations monitoring water quality/quantity
directly are concentrated in riverine and upper estuarine waters (Map 2.3). Only shellfish sanitation
surveys and University research programs provide significant coverage of monitoring stations in lower
estuarine and nearshore ocean waters. Water monitoring in offshore waters is conducted by various
federal authorities and organizations (see http://secoora.org/data for more information, December 2010).
Basic water quality monitoring is conducted in conjunction with fish sampling programs of the DMF. In
2009, DMF evaluated their fisheries independent monitoring programs and modified them to collect
additional and consistent habitat data. The parameters measured include depth, water level, temperature,
salinity, dissolved oxygen, sediment size, bottom composition, alteration state, and allowed fishing
activities. Additional data elements collected include secchi depth, shoreline type, shoreline structure,
land use, percent development, and SAV identification and density. Collectively, these programs cover a
large area of coastal waters, though the coverage of any one program is limited. The DMF has also
deployed nine continuous monitoring devices in the Chowan, Roanoke, Perquimans, Scuppernong,
Pasquotank, and Alligator rivers as part of ongoing river herring research (S. Winslow/DMF, pers. com.,
2009). These devices collect data every 2 hours, including water temperature, dissolved oxygen, salinity,
pH, and conductivity.
University research programs include those of the UNC-Chapel Hill‘s Institute of Marine Science, UNC
Coastal Studies Institute, NCSU‘s Center for Applied Aquatic Ecology, UNC-Wilmington‘s Center for
Marine Science, ECU‘s Interdisciplinary Institute for Coastal Science and Policy, and the Duke
University Marine Lab. Research findings from these programs figure prominently in assessing the status
of estuarine and nearshore ocean waters. These programs track water quality conditions, including
nutrients and other factors, and examine the major processes affecting water flows and water quality in
North Carolina‘s estuaries and coastal ocean.
Water quality standards and biotic integrity criteria are used as the, ―measuring stick,‖ in DWQ use-
support assessments (http://h2o.enr.state.nc.us/csu/documents/ncactable290807.pdf, October 2009).
Biotic integrity is determined from species composition and is evaluated in terms of biological diversity,
sensitivity, and tolerance to anthropogenic stressors. The indices were developed and are primarily used
on invertebrate and/or fish assemblages in freshwater streams. Evaluating biotic integrity in large rivers
and estuaries has been problematic. Biotic integrity and water quality are used to evaluate aquatic life
support in these systems. The water quality standards may vary according to the use supported (i.e.,
drinking water, shellfish harvest, primary recreation, aquatic life) and certain regulatory designations (see
―Designations‖ section of this chapter for more information). Some basic standards for aquatic life
support are listed in Table 2.11. Other supported uses and designations carry higher or lower standards.
Because of changes in methodology and in EPA requirements for assessing use support and
improvements in analytical methodologies, current use support ratings cannot be directly compared to
previous assessments, and trends in use support ratings cannot be readily identified. Division of Water
Quality use support assessments give a snapshot of recent water quality conditions and can be used to
determine where further studies or different management strategies are needed (DWQ 2000a). The DWQ
Use Support status of water bodies is referred to throughout this document as a general indicator of the
2 State does not accept volunteer collected data. However, data may be used in litigation against polluters.

2010 Coastal Habitat Protection Plan
Chapter 2. Water Column Page 57
current condition of some North Carolina streams flowing into coastal waters. However, use support
impairment has a specific meaning relative to established water quality standards (Table 2.11) and does
not necessarily reflect support for the coastal fisheries ecosystem. The DWQ‘s 2004 and 2006 use
support assessments (http://h2o.enr.state.nc.us/tmdl/General_303d.htm) are reported here, along with a
map of impaired waters for 2006 (Map 2.3).
Table 2.11. Basic 2009 water quality standards for freshwater and saltwater aquatic life support.
Parameters
Freshwater Aquatic Life Saltwater Aquatic Life
ug/l (unless noted) ug/l (unless noted)
Dissolved Oxygen not less than 5.0 mg/L (N)* not less than 5.0 mg/L (N)
pH 6.0-9.0 (N)* 6.8-8.5 (N)
Salinity
(N)
Solids, settleable (N) (N)
Solids, total suspended (N) 10 mg/L in PNA
Temperature (N) (N)
Turbidity 50/25 NTU (N) 25 NTU (N)
(AL) Action Level Standard - See 2B .0211 for additional information (N) = Narrative
standard See 2B .0211 and for WS: .0212, 0214,.0215, .0216 and.0218
* Standards are lower (pH >4.3) for Swamp Water classification.
The 2004 and 2006 reports indicate the amount (miles or acres) of waters assessed and impaired for use
attainment, by river basin. The 2006 report assessed some uses on 31% of streams, 27% of estuarine
creeks and shorelines, and 89% of estuarine and saltwater bays, inlets, and tidal areas (Table 2.12a-c).
The percentages assessed were somewhat better than the national averages reported in 2004. However,
0% of North Carolina waters were assessed for all uses in 2006. Of the total stream mileage, 11-12% was
impaired for at least one use in 2004 and 2006, respectively. The level of impairment among estuarine
creeks and shorelines was 17%. For estuarine and saltwater bays, inlets, and tidal areas, the level was
5%. Based on the total assessment mileage/area, 32-39% of streams were impaired for at least one use in
2004 and 2006, respectively. A greater percentage of assessed estuarine creeks and shorelines were
impaired (61%). Only 6% of assessed estuarine areas were classified as impaired. The percentage of
assessed streams and estuaries in North Carolina classified as impaired in 2006 was less than the national
averages for 2004. However, the DWQ assessment of estuaries reflected primarily use support for
shellfish harvesting.
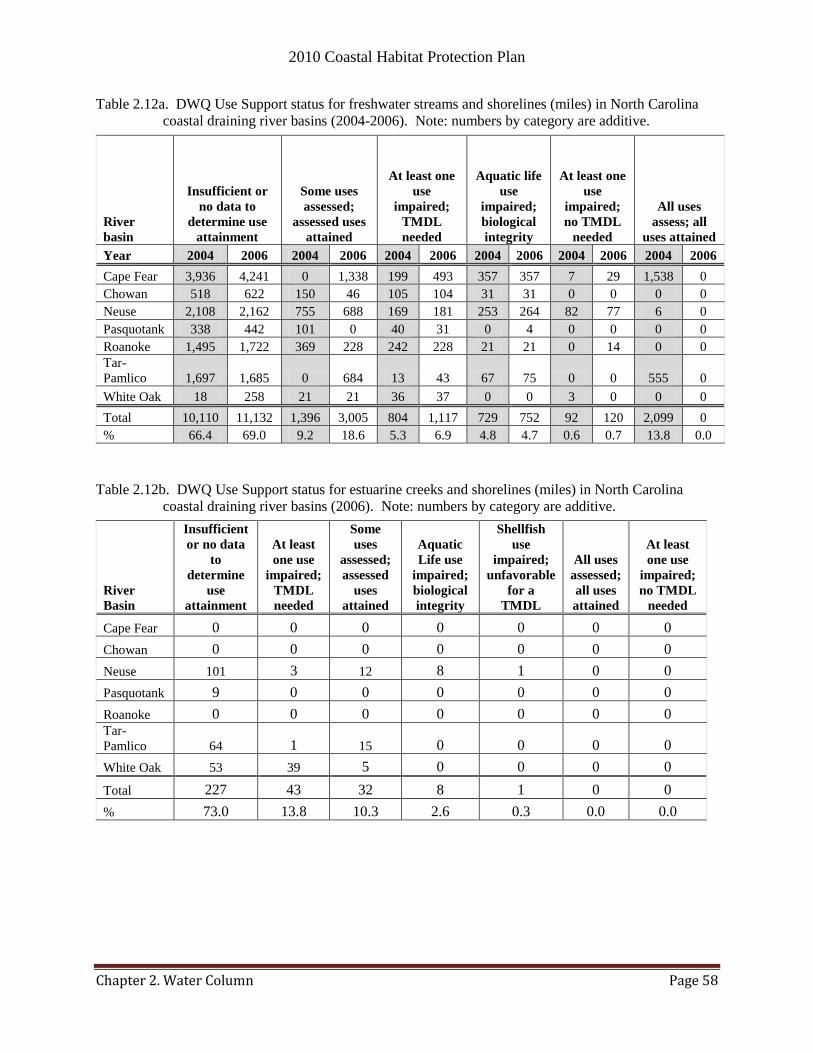
2010 Coastal Habitat Protection Plan
Chapter 2. Water Column Page 58
Table 2.12a. DWQ Use Support status for freshwater streams and shorelines (miles) in North Carolina
coastal draining river basins (2004-2006). Note: numbers by category are additive.
River
basin
Insufficient or
no data to
determine use
attainment
Some uses
assessed;
assessed uses
attained
At least one
use
impaired;
TMDL
needed
Aquatic life
use
impaired;
biological
integrity
At least one
use
impaired;
no TMDL
needed
All uses
assess; all
uses attained
Year 2004 2006 2004 2006 2004 2006 2004 2006 2004 2006 2004 2006
Cape Fear 3,936 4,241 0 1,338 199 493 357 357 7 29 1,538 0
Chowan 518 622 150 46 105 104 31 31 0 0 0 0
Neuse 2,108 2,162 755 688 169 181 253 264 82 77 6 0
Pasquotank 338 442 101 0 40 31 0 4 0 0 0 0
Roanoke 1,495 1,722 369 228 242 228 21 21 0 14 0 0
Tar-
Pamlico 1,697 1,685 0 684 13 43 67 75 0 0 555 0
White Oak 18 258 21 21 36 37 0 0 3 0 0 0
Total 10,110 11,132 1,396 3,005 804 1,117 729 752 92 120 2,099 0
% 66.4 69.0 9.2 18.6 5.3 6.9 4.8 4.7 0.6 0.7 13.8 0.0
Table 2.12b. DWQ Use Support status for estuarine creeks and shorelines (miles) in North Carolina
coastal draining river basins (2006). Note: numbers by category are additive.
River
Basin
Insufficient
or no data
to
determine
use
attainment
At least
one use
impaired;
TMDL
needed
Some
uses
assessed;
assessed
uses
attained
Aquatic
Life use
impaired;
biological
integrity
Shellfish
use
impaired;
unfavorable
for a
TMDL
All uses
assessed;
all uses
attained
At least
one use
impaired;
no TMDL
needed
Cape Fear 0 0 0 0 0 0 0
Chowan 0 0 0 0 0 0 0
Neuse 101 3 12 8 1 0 0
Pasquotank 9 0 0 0 0 0 0
Roanoke 0 0 0 0 0 0 0 Tar-
Pamlico 64 1 15 0 0 0 0
White Oak 53 39 5 0 0 0 0
Total 227 43 32 8 1 0 0
% 73.0 13.8 10.3 2.6 0.3 0.0 0.0
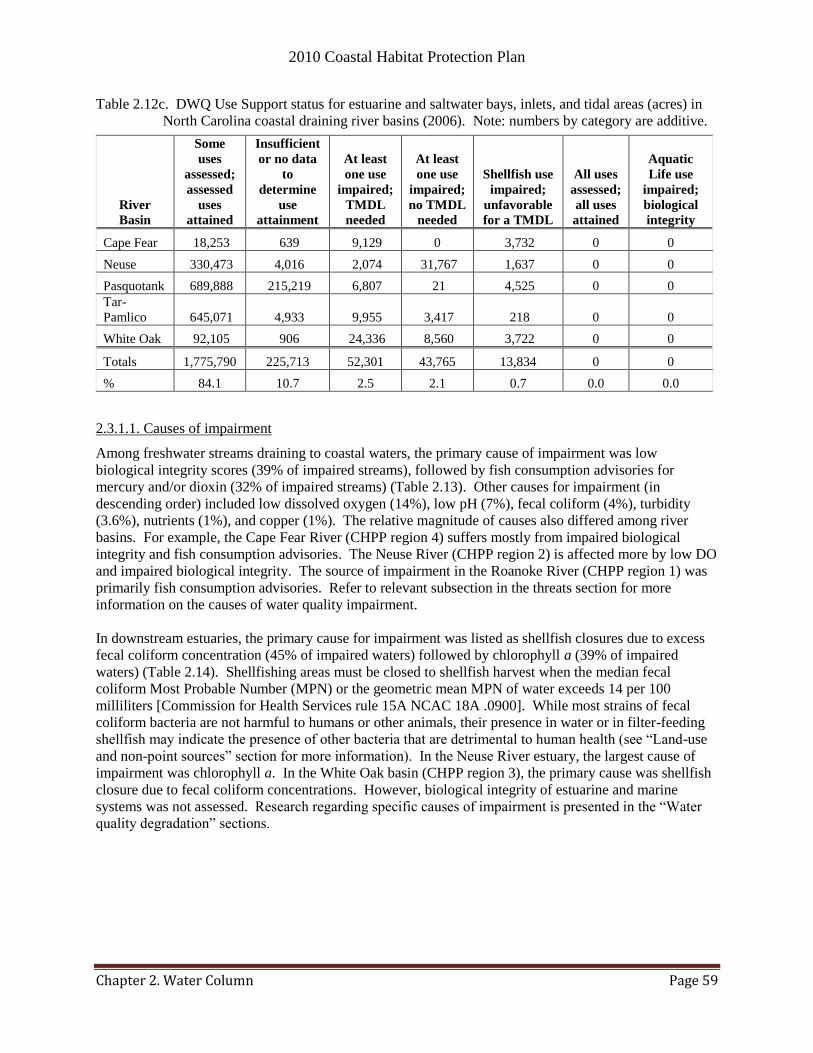
2010 Coastal Habitat Protection Plan
Chapter 2. Water Column Page 59
Table 2.12c. DWQ Use Support status for estuarine and saltwater bays, inlets, and tidal areas (acres) in
North Carolina coastal draining river basins (2006). Note: numbers by category are additive.
River
Basin
Some
uses
assessed;
assessed
uses
attained
Insufficient
or no data
to
determine
use
attainment
At least
one use
impaired;
TMDL
needed
At least
one use
impaired;
no TMDL
needed
Shellfish use
impaired;
unfavorable
for a TMDL
All uses
assessed;
all uses
attained
Aquatic
Life use
impaired;
biological
integrity
Cape Fear 18,253 639 9,129 0 3,732 0 0
Neuse 330,473 4,016 2,074 31,767 1,637 0 0
Pasquotank 689,888 215,219 6,807 21 4,525 0 0
Tar-
Pamlico 645,071 4,933 9,955 3,417 218 0 0
White Oak 92,105 906 24,336 8,560 3,722 0 0
Totals 1,775,790 225,713 52,301 43,765 13,834 0 0
% 84.1 10.7 2.5 2.1 0.7 0.0 0.0
2.3.1.1. Causes of impairment
Among freshwater streams draining to coastal waters, the primary cause of impairment was low
biological integrity scores (39% of impaired streams), followed by fish consumption advisories for
mercury and/or dioxin (32% of impaired streams) (Table 2.13). Other causes for impairment (in
descending order) included low dissolved oxygen (14%), low pH (7%), fecal coliform (4%), turbidity
(3.6%), nutrients (1%), and copper (1%). The relative magnitude of causes also differed among river
basins. For example, the Cape Fear River (CHPP region 4) suffers mostly from impaired biological
integrity and fish consumption advisories. The Neuse River (CHPP region 2) is affected more by low DO
and impaired biological integrity. The source of impairment in the Roanoke River (CHPP region 1) was
primarily fish consumption advisories. Refer to relevant subsection in the threats section for more
information on the causes of water quality impairment.
In downstream estuaries, the primary cause for impairment was listed as shellfish closures due to excess
fecal coliform concentration (45% of impaired waters) followed by chlorophyll a (39% of impaired
waters) (Table 2.14). Shellfishing areas must be closed to shellfish harvest when the median fecal
coliform Most Probable Number (MPN) or the geometric mean MPN of water exceeds 14 per 100
milliliters [Commission for Health Services rule 15A NCAC 18A .0900]. While most strains of fecal
coliform bacteria are not harmful to humans or other animals, their presence in water or in filter-feeding
shellfish may indicate the presence of other bacteria that are detrimental to human health (see ―Land-use
and non-point sources‖ section for more information). In the Neuse River estuary, the largest cause of
impairment was chlorophyll a. In the White Oak basin (CHPP region 3), the primary cause was shellfish
closure due to fecal coliform concentrations. However, biological integrity of estuarine and marine
systems was not assessed. Research regarding specific causes of impairment is presented in the ―Water
quality degradation‖ sections.
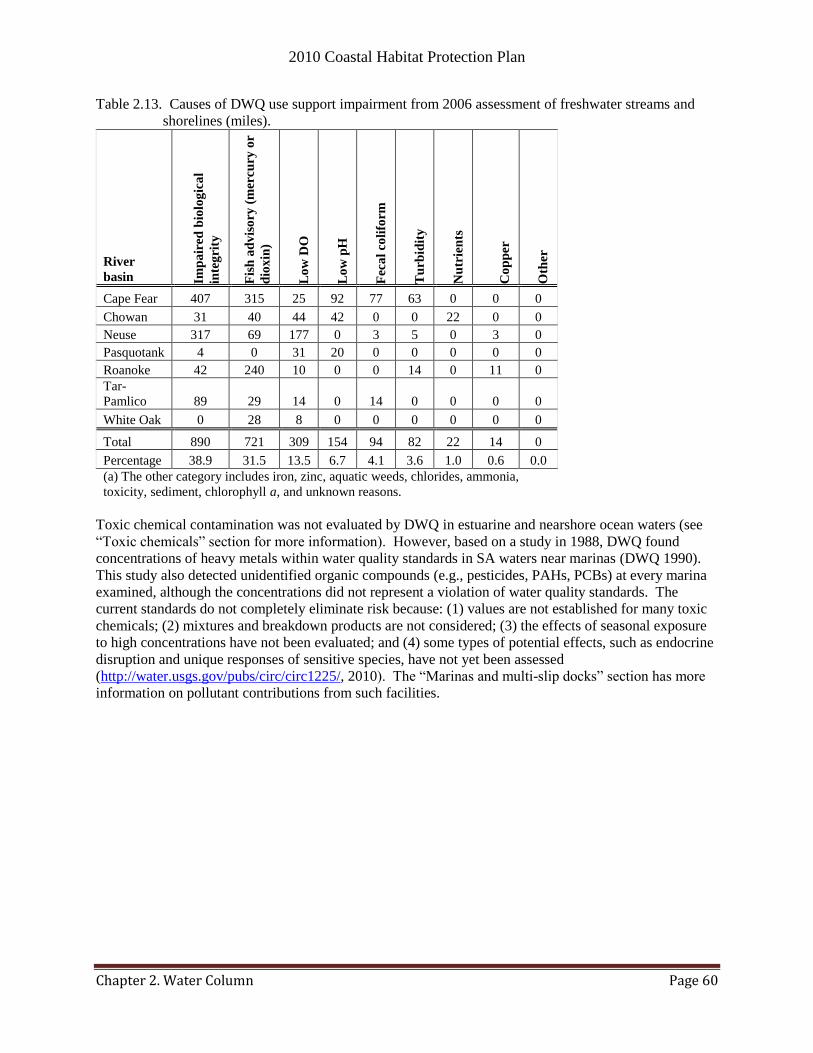
2010 Coastal Habitat Protection Plan
Chapter 2. Water Column Page 60
Table 2.13. Causes of DWQ use support impairment from 2006 assessment of freshwater streams and
shorelines (miles).
River
basin Imp
air
ed b
iolo
gic
al
inte
gri
ty
Fis
h a
dv
iso
ry (
mer
cu
ry o
r
dio
xin
)
Lo
w D
O
Lo
w p
H
Fec
al
co
lifo
rm
Tu
rbid
ity
Nu
trie
nts
Co
pp
er
Oth
er
Cape Fear 407 315 25 92 77 63 0 0 0
Chowan 31 40 44 42 0 0 22 0 0
Neuse 317 69 177 0 3 5 0 3 0
Pasquotank 4 0 31 20 0 0 0 0 0
Roanoke 42 240 10 0 0 14 0 11 0
Tar-
Pamlico 89 29 14 0 14 0 0 0 0
White Oak 0 28 8 0 0 0 0 0 0
Total 890 721 309 154 94 82 22 14 0
Percentage 38.9 31.5 13.5 6.7 4.1 3.6 1.0 0.6 0.0
(a) The other category includes iron, zinc, aquatic weeds, chlorides, ammonia,
toxicity, sediment, chlorophyll a, and unknown reasons.
Toxic chemical contamination was not evaluated by DWQ in estuarine and nearshore ocean waters (see
―Toxic chemicals‖ section for more information). However, based on a study in 1988, DWQ found
concentrations of heavy metals within water quality standards in SA waters near marinas (DWQ 1990).
This study also detected unidentified organic compounds (e.g., pesticides, PAHs, PCBs) at every marina
examined, although the concentrations did not represent a violation of water quality standards. The
current standards do not completely eliminate risk because: (1) values are not established for many toxic
chemicals; (2) mixtures and breakdown products are not considered; (3) the effects of seasonal exposure
to high concentrations have not been evaluated; and (4) some types of potential effects, such as endocrine
disruption and unique responses of sensitive species, have not yet been assessed
(http://water.usgs.gov/pubs/circ/circ1225/, 2010). The ―Marinas and multi-slip docks‖ section has more
information on pollutant contributions from such facilities.

2010 Coastal Habitat Protection Plan
Chapter 2. Water Column Page 61
Table 2.14. Causes of DWQ use support impairment from 2006 assessment of estuarine and saltwater
bays, inlets, and tidal areas (acres).
River
Basin
Shellfish
closure:
Fecal
coliform
Chlorophyll
a
Low
DO
Low
pH
Recreational
posting:
Enterococcus
Fecal
coliform
Cape Fear 6501 0 6,527 6360* 97 0
Lumber 3606 0 0 0 0 0
Neuse 3711 31,767 0 0 0 0
Pasquotank 5089 0 6264 0 21 0
Tar-
Pamlico 7516 6071 0 0 0 3
White Oak 28,058 8560 0 0 0 0
Totals 54,481 46,398 12,791 6,360 118 3
% 45.3 38.6 10.6 5.3 0.1 0.0
* Note: most of the low pH in this region is natural due to the predominantly blackwater
streams and organic leachate, and is not necessarily harmful to native biota.
2.3.1.2. Sources of impairment
The sources of impairment were estimated for freshwater streams in the 2006 assessment report. Among
impaired streams, the majority of sources for a cause were unknown (28% of impaired streams). The
most common and known cause of impairment was agriculture and row crop production (21%) followed
closely by permitted wastewater discharge (20%) (Table 2.15). Stormwater runoff from urban and built-
upon areas was the source attributed to 11% of impaired streams. The relative contribution of sources
also varied among river basins. In the Cape Fear River, permitted wastewater was the primary source of
impairment. Agriculture was the primary source of impairment in the Neuse and Tar-Pamlico Estuaries.
Atmospheric deposition was the primary source in the Roanoke River. Urban runoff was only the
primary source of impairment in the White Oak basin. The largest contributions from urban runoff were
in the Neuse and Tar-Pamlico basins. Refer to relevant subsections of the, ―Threats and management
needs,‖ section for more information on the sources of water quality impairment.
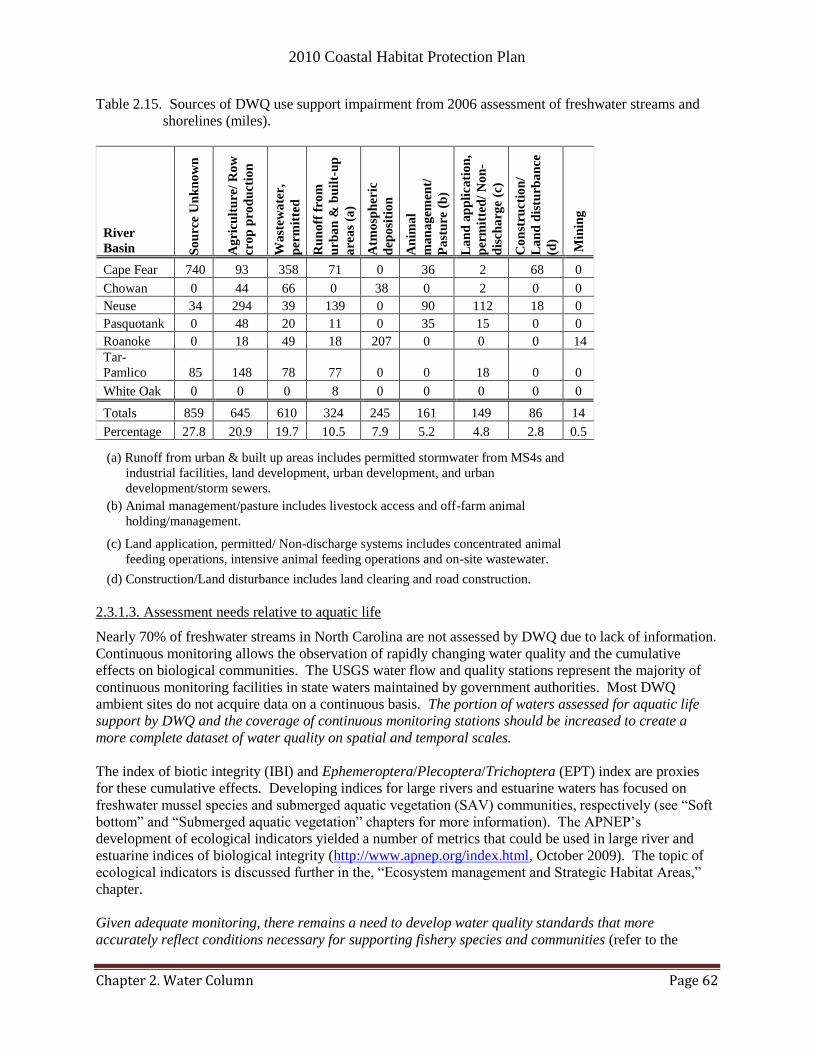
2010 Coastal Habitat Protection Plan
Chapter 2. Water Column Page 62
Table 2.15. Sources of DWQ use support impairment from 2006 assessment of freshwater streams and
shorelines (miles).
River
Basin So
urc
e U
nk
no
wn
Ag
ricu
ltu
re/
Ro
w
cro
p p
rod
uct
ion
Wa
stew
ate
r,
per
mit
ted
Ru
no
ff f
rom
urb
an
& b
uil
t-u
p
are
as
(a)
Atm
osp
her
ic
dep
osi
tio
n
An
ima
l
ma
na
gem
ent/
Pa
stu
re (
b)
La
nd
ap
pli
cati
on
,
per
mit
ted
/ N
on
-
dis
cha
rge
(c)
Co
nst
ruct
ion
/
La
nd
dis
turb
an
ce
(d)
Min
ing
Cape Fear 740 93 358 71 0 36 2 68 0
Chowan 0 44 66 0 38 0 2 0 0
Neuse 34 294 39 139 0 90 112 18 0
Pasquotank 0 48 20 11 0 35 15 0 0
Roanoke 0 18 49 18 207 0 0 0 14
Tar-
Pamlico 85 148 78 77 0 0 18 0 0
White Oak 0 0 0 8 0 0 0 0 0
Totals 859 645 610 324 245 161 149 86 14
Percentage 27.8 20.9 19.7 10.5 7.9 5.2 4.8 2.8 0.5
(a) Runoff from urban & built up areas includes permitted stormwater from MS4s and
industrial facilities, land development, urban development, and urban
development/storm sewers.
(b) Animal management/pasture includes livestock access and off-farm animal
holding/management.
(c) Land application, permitted/ Non-discharge systems includes concentrated animal
feeding operations, intensive animal feeding operations and on-site wastewater.
(d) Construction/Land disturbance includes land clearing and road construction.
2.3.1.3. Assessment needs relative to aquatic life
Nearly 70% of freshwater streams in North Carolina are not assessed by DWQ due to lack of information.
Continuous monitoring allows the observation of rapidly changing water quality and the cumulative
effects on biological communities. The USGS water flow and quality stations represent the majority of
continuous monitoring facilities in state waters maintained by government authorities. Most DWQ
ambient sites do not acquire data on a continuous basis. The portion of waters assessed for aquatic life
support by DWQ and the coverage of continuous monitoring stations should be increased to create a
more complete dataset of water quality on spatial and temporal scales.
The index of biotic integrity (IBI) and Ephemeroptera/Plecoptera/Trichoptera (EPT) index are proxies
for these cumulative effects. Developing indices for large rivers and estuarine waters has focused on
freshwater mussel species and submerged aquatic vegetation (SAV) communities, respectively (see ―Soft
bottom‖ and ―Submerged aquatic vegetation‖ chapters for more information). The APNEP‘s
development of ecological indicators yielded a number of metrics that could be used in large river and
estuarine indices of biological integrity (http://www.apnep.org/index.html, October 2009). The topic of
ecological indicators is discussed further in the, ―Ecosystem management and Strategic Habitat Areas,‖
chapter.
Given adequate monitoring, there remains a need to develop water quality standards that more
accurately reflect conditions necessary for supporting fishery species and communities (refer to the
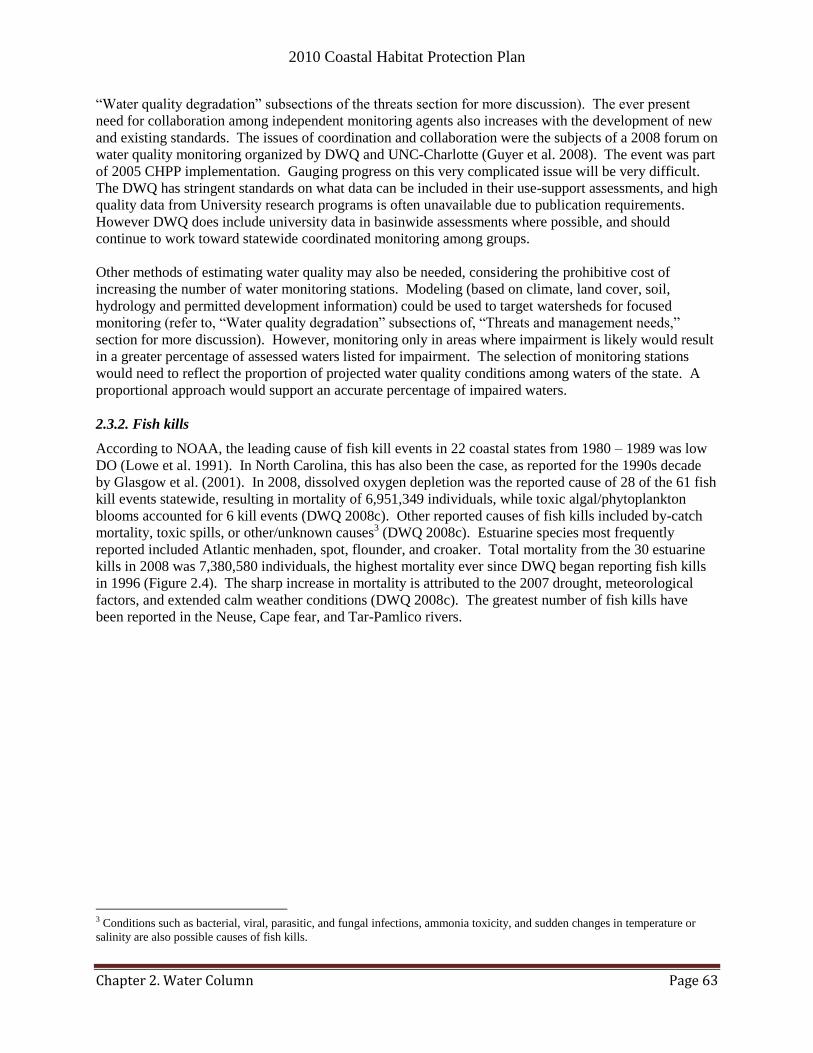
2010 Coastal Habitat Protection Plan
Chapter 2. Water Column Page 63
―Water quality degradation‖ subsections of the threats section for more discussion). The ever present
need for collaboration among independent monitoring agents also increases with the development of new
and existing standards. The issues of coordination and collaboration were the subjects of a 2008 forum on
water quality monitoring organized by DWQ and UNC-Charlotte (Guyer et al. 2008). The event was part
of 2005 CHPP implementation. Gauging progress on this very complicated issue will be very difficult.
The DWQ has stringent standards on what data can be included in their use-support assessments, and high
quality data from University research programs is often unavailable due to publication requirements.
However DWQ does include university data in basinwide assessments where possible, and should
continue to work toward statewide coordinated monitoring among groups.
Other methods of estimating water quality may also be needed, considering the prohibitive cost of
increasing the number of water monitoring stations. Modeling (based on climate, land cover, soil,
hydrology and permitted development information) could be used to target watersheds for focused
monitoring (refer to, ―Water quality degradation‖ subsections of, ―Threats and management needs,‖
section for more discussion). However, monitoring only in areas where impairment is likely would result
in a greater percentage of assessed waters listed for impairment. The selection of monitoring stations
would need to reflect the proportion of projected water quality conditions among waters of the state. A
proportional approach would support an accurate percentage of impaired waters.
2.3.2. Fish kills
According to NOAA, the leading cause of fish kill events in 22 coastal states from 1980 – 1989 was low
DO (Lowe et al. 1991). In North Carolina, this has also been the case, as reported for the 1990s decade
by Glasgow et al. (2001). In 2008, dissolved oxygen depletion was the reported cause of 28 of the 61 fish
kill events statewide, resulting in mortality of 6,951,349 individuals, while toxic algal/phytoplankton
blooms accounted for 6 kill events (DWQ 2008c). Other reported causes of fish kills included by-catch
mortality, toxic spills, or other/unknown causes3 (DWQ 2008c). Estuarine species most frequently
reported included Atlantic menhaden, spot, flounder, and croaker. Total mortality from the 30 estuarine
kills in 2008 was 7,380,580 individuals, the highest mortality ever since DWQ began reporting fish kills
in 1996 (Figure 2.4). The sharp increase in mortality is attributed to the 2007 drought, meteorological
factors, and extended calm weather conditions (DWQ 2008c). The greatest number of fish kills have
been reported in the Neuse, Cape fear, and Tar-Pamlico rivers.
3 Conditions such as bacterial, viral, parasitic, and fungal infections, ammonia toxicity, and sudden changes in temperature or
salinity are also possible causes of fish kills.
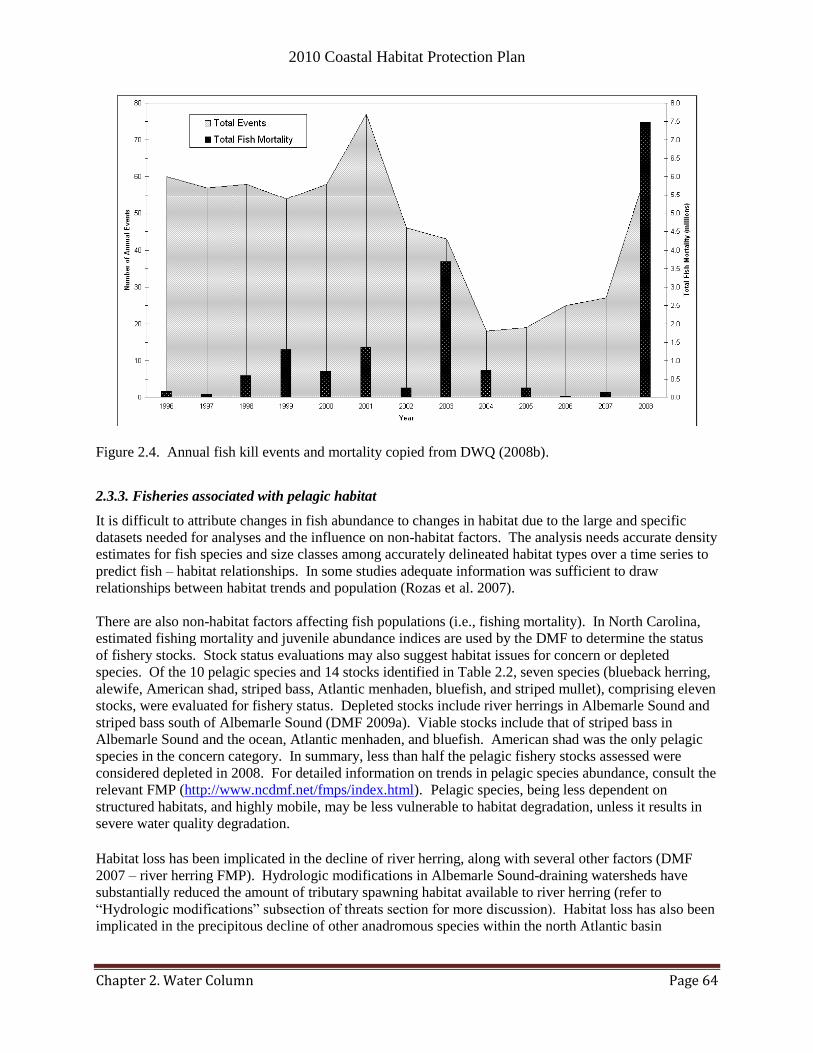
2010 Coastal Habitat Protection Plan
Chapter 2. Water Column Page 64
Figure 2.4. Annual fish kill events and mortality copied from DWQ (2008b).
2.3.3. Fisheries associated with pelagic habitat
It is difficult to attribute changes in fish abundance to changes in habitat due to the large and specific
datasets needed for analyses and the influence on non-habitat factors. The analysis needs accurate density
estimates for fish species and size classes among accurately delineated habitat types over a time series to
predict fish – habitat relationships. In some studies adequate information was sufficient to draw
relationships between habitat trends and population (Rozas et al. 2007).
There are also non-habitat factors affecting fish populations (i.e., fishing mortality). In North Carolina,
estimated fishing mortality and juvenile abundance indices are used by the DMF to determine the status
of fishery stocks. Stock status evaluations may also suggest habitat issues for concern or depleted
species. Of the 10 pelagic species and 14 stocks identified in Table 2.2, seven species (blueback herring,
alewife, American shad, striped bass, Atlantic menhaden, bluefish, and striped mullet), comprising eleven
stocks, were evaluated for fishery status. Depleted stocks include river herrings in Albemarle Sound and
striped bass south of Albemarle Sound (DMF 2009a). Viable stocks include that of striped bass in
Albemarle Sound and the ocean, Atlantic menhaden, and bluefish. American shad was the only pelagic
species in the concern category. In summary, less than half the pelagic fishery stocks assessed were
considered depleted in 2008. For detailed information on trends in pelagic species abundance, consult the
relevant FMP (http://www.ncdmf.net/fmps/index.html). Pelagic species, being less dependent on
structured habitats, and highly mobile, may be less vulnerable to habitat degradation, unless it results in
severe water quality degradation.
Habitat loss has been implicated in the decline of river herring, along with several other factors (DMF
2007 – river herring FMP). Hydrologic modifications in Albemarle Sound-draining watersheds have
substantially reduced the amount of tributary spawning habitat available to river herring (refer to
―Hydrologic modifications‖ subsection of threats section for more discussion). Habitat loss has also been
implicated in the precipitous decline of other anadromous species within the north Atlantic basin

2010 Coastal Habitat Protection Plan
Chapter 2. Water Column Page 65
(Limburg and Waldman 2009). Restoration and protection of river herring spawning and nursery habitat
is a major focus of the water column chapter as a whole.
2.3.4. Water column restoration and enhancement
Restoring water column habitat addresses a history of stream, wetland, and riparian buffer alteration on
the landscape. The restoration of wetlands is discussed in the wetland chapter. Stream and upland buffer
restoration are covered in this section. Restoration efforts may occur as a result of mitigation
requirements or proactive watershed restoration plans. There are mitigation requirements for impacted
streams and buffers (Tar and Neuse rivers only) similar to impacting wetlands. The permitted alteration
of streams and buffers is tracked by the Wetlands/401 Unit of the DWQ. The need for a USACE Section
404 permit authorizing the fill or alteration of wetlands, streams, or buffers triggers the 401 Water Quality
Certification process by the DWQ. However, projects impacting less than 150 linear feet of stream are
not required to notify DWQ and represent an unknown loss of stream segments. The loss of streams
refers to altered hydrologic conditions affecting water quality (i.e., buffer impact, dredge and fill). The
intent of mitigation is to maintain natural hydrologic conditions and associated water quality. Watershed
restoration plans may target streams and shorelines impaired by non-point sources of pollution. Point
source pollution is addressed by National Pollution Discharge Elimination System (NPDES) permit
requirements and Total Maximum Daily Load (TMDL) allocations (see ―Water quality degradation‖
section for more information). Impoundment effects on water quality have only recently been included as
a potential violation of the Clean Water Act (http://act.americanrivers.org/site/DocServer/04-
1527o.pdf?docID=4142, 2006). Managing hydrologic obstructions as an integral part of water column
restoration is discussed in the ―Hydrologic modifications‖ section.
The amount of stream and riparian buffer impacts and corresponding mitigation were reported by the
Wetland Restoration Program (WRP) from 1999-2003. Thereafter, the Ecosystem Enhancement Program
has reported stream and buffer mitigation assets. The 2002-2003 WRP report documented 103.75 acres
of buffer impacts since 1998. There were 102.19 acres in the Neuse River basin and 1.56 in the Tar-
Pamlico River basin. The corresponding mitigation assets included 177.7 acres in the Neuse River basin.
The 2003-2004 EEP report documented an additional 82.41 acres of buffer impacts in the Cape Fear,
Neuse, and Tar-Pamlico river basins. The corresponding mitigation was 139.25 acres, for a net gain of
56.84 acres. The need for mitigating buffer impacts came about with implementation of the Tar-Pamlico
and Neuse River Nutrient Reduction Strategies (see ―Non-point source management‖ section for more
information). After 2004, the EEP reports are presented differently and do not include the amount of
buffer impacts and corresponding impacts. The assets are reported as gross and used assets based on
mitigation needs of the Department of Transportation (DOT) and other permit applicants. The assets are
reported as stream feet and wetland acres.
Reported stream impacts in coastal draining river basins increased gradually from 1999 to 2003, based on
WRP reports (Figure 2.5). Annual permitted impacts increased from 58,342-ft (11 mi) to 90,000-ft (17
miles) over a period of 5 years. The majority of the permitted losses required mitigation. The total length
of impacted streams from 1999-2003 was 385,386-ft (73 miles, or 14 miles/year). The majority of
impacts occurred in the Cape Fear and Neuse river basins (Figure 2.6). Relatively small amounts of
stream impact were permitted in other coastal draining river basins.
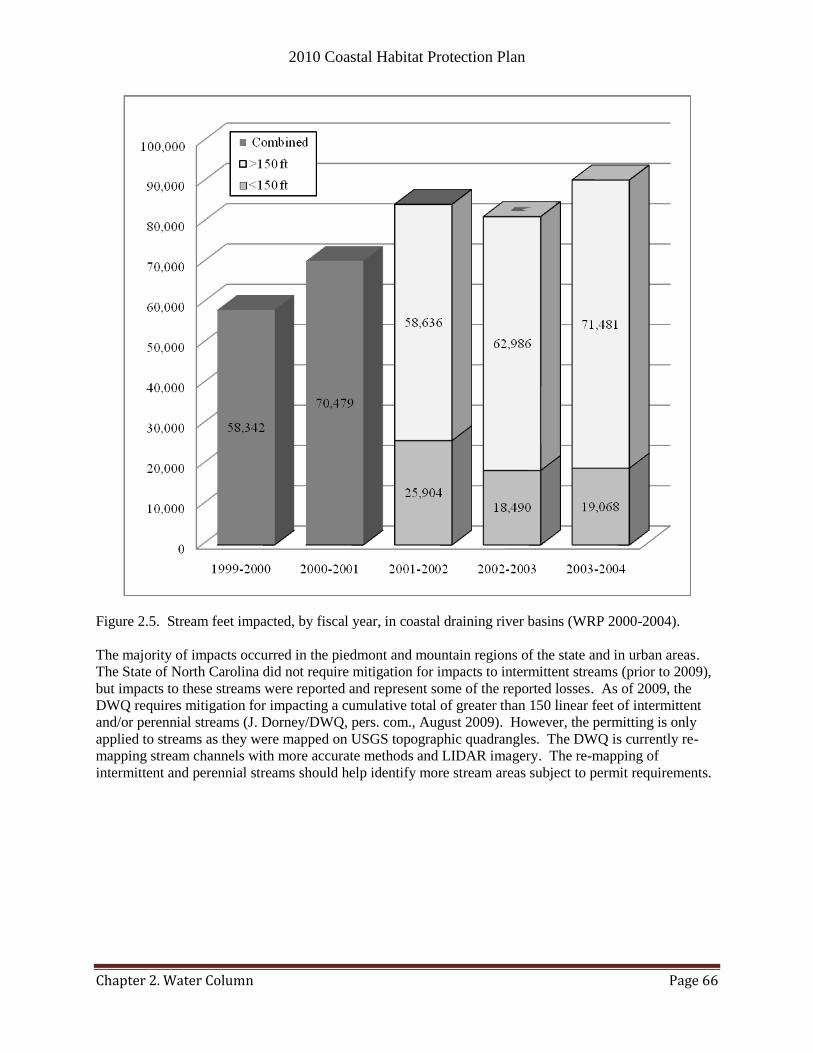
2010 Coastal Habitat Protection Plan
Chapter 2. Water Column Page 66
Figure 2.5. Stream feet impacted, by fiscal year, in coastal draining river basins (WRP 2000-2004).
The majority of impacts occurred in the piedmont and mountain regions of the state and in urban areas.
The State of North Carolina did not require mitigation for impacts to intermittent streams (prior to 2009),
but impacts to these streams were reported and represent some of the reported losses. As of 2009, the
DWQ requires mitigation for impacting a cumulative total of greater than 150 linear feet of intermittent
and/or perennial streams (J. Dorney/DWQ, pers. com., August 2009). However, the permitting is only
applied to streams as they were mapped on USGS topographic quadrangles. The DWQ is currently re-
mapping stream channels with more accurate methods and LIDAR imagery. The re-mapping of
intermittent and perennial streams should help identify more stream areas subject to permit requirements.
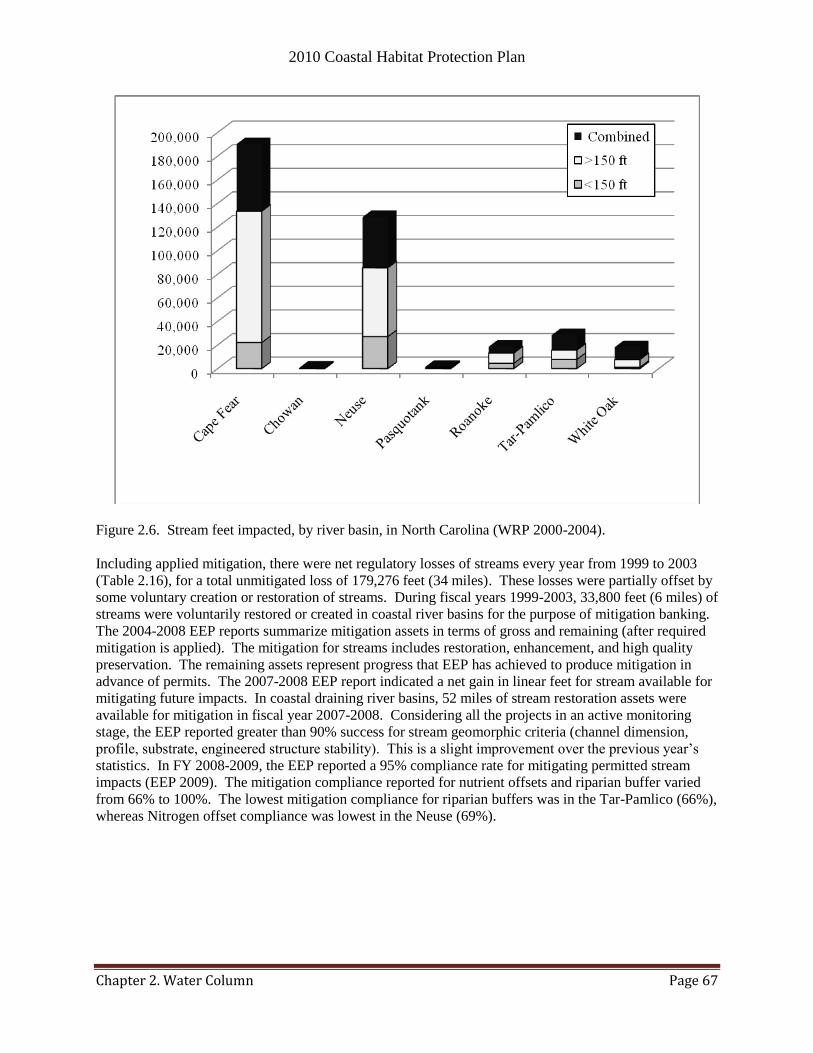
2010 Coastal Habitat Protection Plan
Chapter 2. Water Column Page 67
Figure 2.6. Stream feet impacted, by river basin, in North Carolina (WRP 2000-2004).
Including applied mitigation, there were net regulatory losses of streams every year from 1999 to 2003
(Table 2.16), for a total unmitigated loss of 179,276 feet (34 miles). These losses were partially offset by
some voluntary creation or restoration of streams. During fiscal years 1999-2003, 33,800 feet (6 miles) of
streams were voluntarily restored or created in coastal river basins for the purpose of mitigation banking.
The 2004-2008 EEP reports summarize mitigation assets in terms of gross and remaining (after required
mitigation is applied). The mitigation for streams includes restoration, enhancement, and high quality
preservation. The remaining assets represent progress that EEP has achieved to produce mitigation in
advance of permits. The 2007-2008 EEP report indicated a net gain in linear feet for stream available for
mitigating future impacts. In coastal draining river basins, 52 miles of stream restoration assets were
available for mitigation in fiscal year 2007-2008. Considering all the projects in an active monitoring
stage, the EEP reported greater than 90% success for stream geomorphic criteria (channel dimension,
profile, substrate, engineered structure stability). This is a slight improvement over the previous year‘s
statistics. In FY 2008-2009, the EEP reported a 95% compliance rate for mitigating permitted stream
impacts (EEP 2009). The mitigation compliance reported for nutrient offsets and riparian buffer varied
from 66% to 100%. The lowest mitigation compliance for riparian buffers was in the Tar-Pamlico (66%),
whereas Nitrogen offset compliance was lowest in the Neuse (69%).
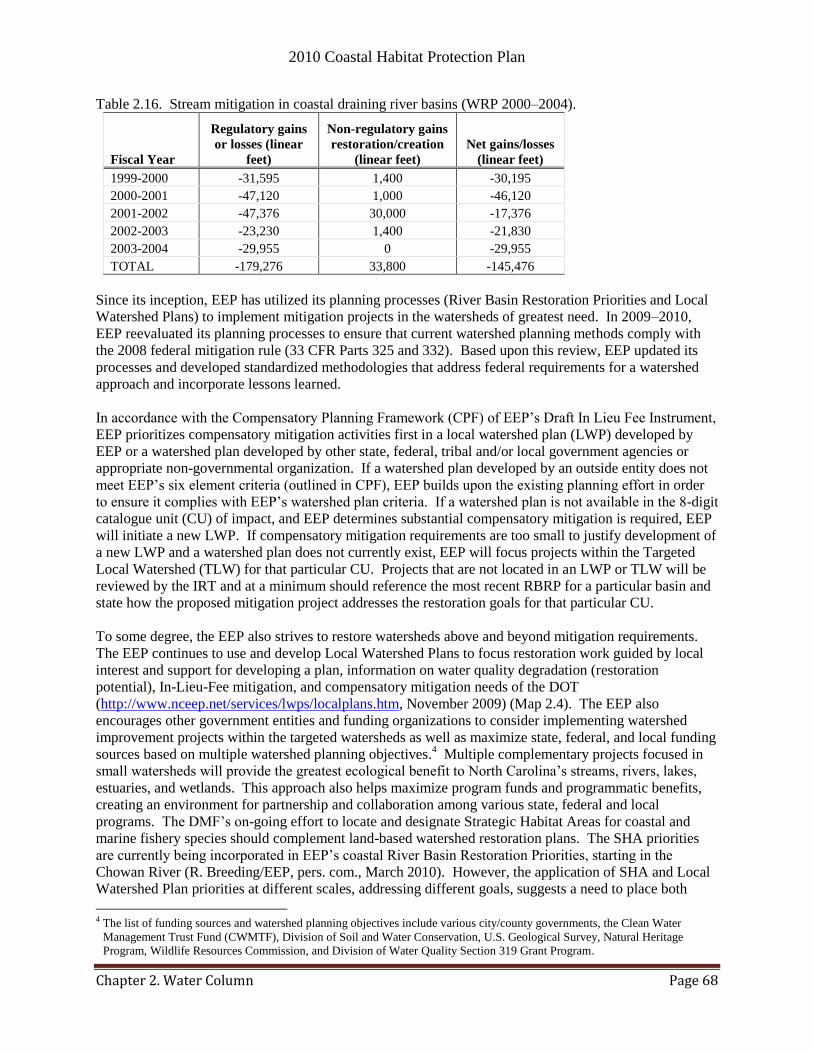
2010 Coastal Habitat Protection Plan
Chapter 2. Water Column Page 68
Table 2.16. Stream mitigation in coastal draining river basins (WRP 2000–2004).
Fiscal Year
Regulatory gains
or losses (linear
feet)
Non-regulatory gains
restoration/creation
(linear feet)
Net gains/losses
(linear feet)
1999-2000 -31,595 1,400 -30,195
2000-2001 -47,120 1,000 -46,120
2001-2002 -47,376 30,000 -17,376
2002-2003 -23,230 1,400 -21,830
2003-2004 -29,955 0 -29,955
TOTAL -179,276 33,800 -145,476
Since its inception, EEP has utilized its planning processes (River Basin Restoration Priorities and Local
Watershed Plans) to implement mitigation projects in the watersheds of greatest need. In 2009–2010,
EEP reevaluated its planning processes to ensure that current watershed planning methods comply with
the 2008 federal mitigation rule (33 CFR Parts 325 and 332). Based upon this review, EEP updated its
processes and developed standardized methodologies that address federal requirements for a watershed
approach and incorporate lessons learned.
In accordance with the Compensatory Planning Framework (CPF) of EEP‘s Draft In Lieu Fee Instrument,
EEP prioritizes compensatory mitigation activities first in a local watershed plan (LWP) developed by
EEP or a watershed plan developed by other state, federal, tribal and/or local government agencies or
appropriate non-governmental organization. If a watershed plan developed by an outside entity does not
meet EEP‘s six element criteria (outlined in CPF), EEP builds upon the existing planning effort in order
to ensure it complies with EEP‘s watershed plan criteria. If a watershed plan is not available in the 8-digit
catalogue unit (CU) of impact, and EEP determines substantial compensatory mitigation is required, EEP
will initiate a new LWP. If compensatory mitigation requirements are too small to justify development of
a new LWP and a watershed plan does not currently exist, EEP will focus projects within the Targeted
Local Watershed (TLW) for that particular CU. Projects that are not located in an LWP or TLW will be
reviewed by the IRT and at a minimum should reference the most recent RBRP for a particular basin and
state how the proposed mitigation project addresses the restoration goals for that particular CU.
To some degree, the EEP also strives to restore watersheds above and beyond mitigation requirements.
The EEP continues to use and develop Local Watershed Plans to focus restoration work guided by local
interest and support for developing a plan, information on water quality degradation (restoration
potential), In-Lieu-Fee mitigation, and compensatory mitigation needs of the DOT
(http://www.nceep.net/services/lwps/localplans.htm, November 2009) (Map 2.4). The EEP also
encourages other government entities and funding organizations to consider implementing watershed
improvement projects within the targeted watersheds as well as maximize state, federal, and local funding
sources based on multiple watershed planning objectives.4 Multiple complementary projects focused in
small watersheds will provide the greatest ecological benefit to North Carolina‘s streams, rivers, lakes,
estuaries, and wetlands. This approach also helps maximize program funds and programmatic benefits,
creating an environment for partnership and collaboration among various state, federal and local
programs. The DMF‘s on-going effort to locate and designate Strategic Habitat Areas for coastal and
marine fishery species should complement land-based watershed restoration plans. The SHA priorities
are currently being incorporated in EEP‘s coastal River Basin Restoration Priorities, starting in the
Chowan River (R. Breeding/EEP, pers. com., March 2010). However, the application of SHA and Local
Watershed Plan priorities at different scales, addressing different goals, suggests a need to place both
4 The list of funding sources and watershed planning objectives include various city/county governments, the Clean Water
Management Trust Fund (CWMTF), Division of Soil and Water Conservation, U.S. Geological Survey, Natural Heritage
Program, Wildlife Resources Commission, and Division of Water Quality Section 319 Grant Program.
2010 Coastal Habitat Protection Plan
Chapter 2. Water Column Page 69
planning efforts under the larger umbrella of DENR strategic planning. The CHPP agencies (DMF,
DCM, DWQ, WRC) and EEP should meet to determine how SHA and LWP methodologies complement
and contribute to complementary goals of the North Carolina Department of Natural Resources.
Sudduth et al. (2007) provides an excellent study of stream restoration practices in the southeastern
United States. The study compared nationwide and state-level databases documenting stream restoration
projects. The states included were Georgia, Kentucky, North Carolina, and South Carolina. North
Carolina figured prominently in the study; having the majority of projects represented (502 of 860). The
study looked at number of projects per 1,000 km of stream, length of projects, cost of projects, goals for
restoration, measures of success, associated monitoring, and site location criteria. The results for the
southeast were compared to nationwide data included in the National River Restoration Science Synthesis
(NRRSS). The number of projects per kilometer of stream was generally less than the national average
(8.3 per 1,000 km), though North Carolina was very close to the national average. North Carolina also
had the second highest percentage being monitored at 36%. The positive differences for North Carolina
were attributed to the Clean Water Management Trust Fund (NCCWMTF), the EEP, and the monitoring
required to earn mitigation credit. However, there were some problems identified for stream restoration
practices in the southeast. One of the most significant problems was the 50% of projects not following a
watershed assessment and the even lower percentage following a watershed management plan. The most
common reason for choosing a site was available land opportunities and not the potential ecological
benefit of restoration. As of February 2010, EEP has instituted 559 projects. These projects include
projects that pre-dated EEP and its current watershed planning processes. Of these projects, 60% are
located in TLWs and 19% are located in local watershed planning areas. This percentage is expected to
grow as EEP implements more projects that developed within EEP‘s current watershed planning and
project implementation processes (Map 2.4). More incentives are needed to generate
conservation/restoration opportunities in areas with the most ecological benefit of restoration.
Other important programs restoring streams and riparian buffers include the Conservation Reserve
Enhancement Program (CREP) and Agriculture Cost-share Program (ACSP) administered by the State
Division of Soil and Water Conservation (DSWC). The CREP was designed to pay farmers who place
marginal land overlapping stream riparian zones into conservation easements. From 1983-2008, the
CREP has restored and protected 32,000 riparian acres and 883 stream miles in coastal draining river
basins of North Carolina (http://www.enr.state.nc.us/dswc/pages/annual%20report.pdf, November 2009)
via temporary or permanent easements. In 2008, a total 1,358 acres were enrolled protecting 37 miles of
stream not including CREP and ACSP (Sudduth et al. (2007). These data could be obtained from
individual county offices and were thus not included in the regional NRRSS database.
2.3.5. Designations
2.3.5.1. Regulatory
Surface waters are provided varying levels of protection through designated EMC water classifications.
The EMC classifies surface waters according to the best use of the water (e.g., water supply, aquatic life
protection, and swimming) and adopts water quality standards intended to protect the designated uses.
Supplemental surface water quality classifications provide additional protection to waters that have
special physical, chemical, biological, or use characteristics. The standard and supplemental
classifications are described below:

2010 Coastal Habitat Protection Plan
Chapter 2. Water Column Page 70
Most streams are classified as C (73%), followed by WS (18%). The greatest total length of streams
occurred in the coastal plains portion large riverine systems. The majority of water bodies in the coastal
plains were classified as SA (61%), followed by SB (16%) and SC (16%). Most of the SA waters were in
the central coast due to Pamlico Sound. The distribution of fresh- and saltwater classifications follows
the approximate boundary of salinity zones (see ―Description and distribution‖ section for more
information).
The most widely distributed supplemental classification for streams was NSW at 49% of total stream
mileage (48% in the coastal plains and 50% in the piedmont) (Table 2.17). In the coastal plains, there
were also a large number of streams classified as swamp water (54%) of coastal plain streams). Nearly
all the ORW streams were located in the coastal plains. The majority of NSW streams were in Neuse and
Tar-Pamlico watersheds. Most of the swamp streams could be found in regions with large riverine
systems.
The largest number of ORW streams was in coastal plain portions of regions 1 and 4. The NSW
classification was also the most common among water bodies in the coastal plain (28%), followed by
ORWs (9%) and Swamp waters (7%) (Table 2.18). Most of the ORW water bodies were in the central
coast due to the large sounds (Core, etc.), whereas the majority of NSW water bodies were in the Neuse
and Pamlico estuaries. The Albemarle Sound system had the majority of Swamp water acreage.
Primary Surface Water Classifications:
C or SC*—Supporting secondary recreation (including swimming on an unorganized or infrequent basis); wildlife; fishing;
fish and other aquatic life propagation and survival; agriculture and any other usage, except for primary recreation or water
supply.
B or SB*—Supporting primary recreation (including swimming on an organized or frequent basis) and all uses specified for
Class C or SC (and not water supply use).
WS—Water supply in natural and undeveloped watersheds (WS-I), predominantly undeveloped watershed (WS-II), low to
moderately developed watersheds (WS-III), and moderately to highly developed watersheds (WS-IV), plus former or
industrial potable water supplies or waters upstream and draining to WS-IV waters (WS-V).
SA*—Commercial shellfishing waters and all Class SC and SB uses.
* = saltwater classification
Supplemental Surface Water Classifications:
ORW (Outstanding Resource Waters)—Unique and special waters that are of exceptional state or national recreational or
ecological significance which require special protection to maintain existing uses. These waters have been identified as
having excellent water quality in conjunction with at least one important resource value.
HQW (High Quality Waters)—Waters rated as excellent by DWQ; Primary Nursery Areas or other functional nursery area;
Native and Special Native Trout Waters and their tributaries; WS-I, WS-II and SA waters and waters for which DWQ has
received reclassification to WS-I or WS-II.
NSW (Nutrient Sensitive Waters)—Waters needing additional nutrient management due to their being subject to excessive
growth of microscopic or macroscopic vegetation.
SW (Swamp Waters)—Waters with low velocities and other characteristics different from adjacent water bodies (generally
low pH, DO, high organic content).
TR (Trout Waters)—Waters protected for natural trout propagation and stocked trout survival.

2010 Coastal Habitat Protection Plan
Chapter 2. Water Column Page 71
Table 2.17. Supplemental EMC/DWQ classification of streams in CHPP management regions.
Phys.
Region
CHPP
region
EMC/DWQ Supplemental Classification (miles)
ORW HQW NSW Sw Tr
Coastal
Plains 1 195 1 1,479 2,182 0
2 20 46 8,361 4,901 0
3 22 29 392 7 0
4 207 202 2 4,386 0
ALL 444 278 10,235 11,476 0
Piedmont 1 2 0 10 0 149
2 0 0 4,597 30 0
4 0 201 2,112 100 0
ALL 2 201 6,719 130 149
TOTAL ALL 445 479 16,953 11,606 149
Table 2.18. Supplemental EMC/DWQ classification of rivers, lakes, and estuaries in CHPP management
regions.
Phys.
region
CHPP
region
EMC/DWQ Supplemental Classifications (acres)
ORW HQW NSW Sw Tr
Coastal
Plains 1 43,717 33 49,158 91,318 0
2 35,276 871 459,579 45,076 0
2/3 3,403 0 5,082 0 0
3 112,954 1,656 61,447 210 0
4 2,181 172 0 11,939 0
Piedmont 1 0 0 6 0 10
2 0 0 23,346 0 0
4 0 910 22,573 300 0
TOTAL ALL 197,531 3,642 621,193 148,843 10
The Marine Fisheries Commission (MFC) designates areas subject to commercial and recreational fishing
regulations. The MFC and the Wildlife Resource Commission (WRC) also designate areas with
ecological functions vital to fish and shellfish production, such as nursery and spawning areas for finfish
and crustaceans. These definitions and classifications of water column habitat and their associated
regulatory jurisdictions provide the authority for management actions. These areas may also be
recognized by the EMC for enhanced water quality standards, or by CRC for more protective coastal
development standards. Primary Nursery Areas, in particular, are considered High Quality Waters for the
purpose of water quality standards, and have dredging restrictions by EMC and CRC (see ―Dredging
(navigation channels and boat basins)‖ section for map references). Designated Inland Primary Nursery
Areas and Anadromous Fish Spawning Areas have not been recognized for specific water quality
standards. In 2008, the MFC and WRC joined in designating Anadromous Fish Spawning Areas (MFC
rule 15A NCAC 03R .0115 and WRC rule 15A NCAC 10C .0603) (see ―Flow regulation‖ section for
map references).
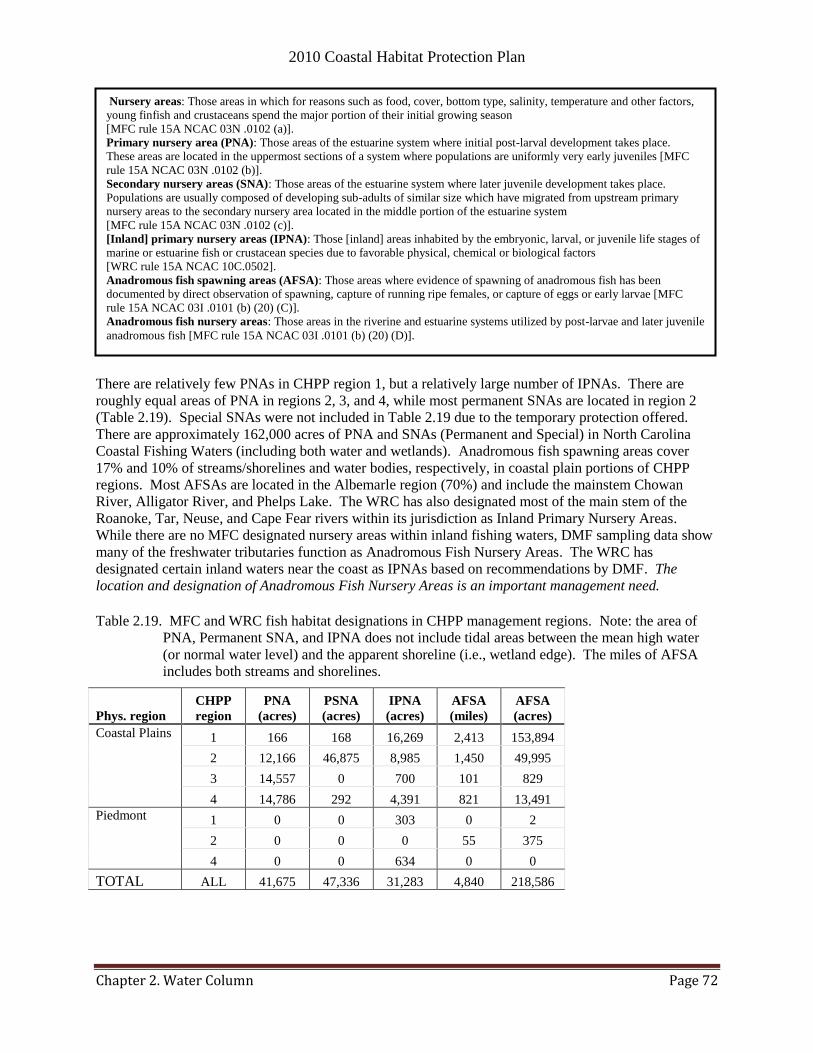
2010 Coastal Habitat Protection Plan
Chapter 2. Water Column Page 72
There are relatively few PNAs in CHPP region 1, but a relatively large number of IPNAs. There are
roughly equal areas of PNA in regions 2, 3, and 4, while most permanent SNAs are located in region 2
(Table 2.19). Special SNAs were not included in Table 2.19 due to the temporary protection offered.
There are approximately 162,000 acres of PNA and SNAs (Permanent and Special) in North Carolina
Coastal Fishing Waters (including both water and wetlands). Anadromous fish spawning areas cover
17% and 10% of streams/shorelines and water bodies, respectively, in coastal plain portions of CHPP
regions. Most AFSAs are located in the Albemarle region (70%) and include the mainstem Chowan
River, Alligator River, and Phelps Lake. The WRC has also designated most of the main stem of the
Roanoke, Tar, Neuse, and Cape Fear rivers within its jurisdiction as Inland Primary Nursery Areas.
While there are no MFC designated nursery areas within inland fishing waters, DMF sampling data show
many of the freshwater tributaries function as Anadromous Fish Nursery Areas. The WRC has
designated certain inland waters near the coast as IPNAs based on recommendations by DMF. The
location and designation of Anadromous Fish Nursery Areas is an important management need.
Table 2.19. MFC and WRC fish habitat designations in CHPP management regions. Note: the area of
PNA, Permanent SNA, and IPNA does not include tidal areas between the mean high water
(or normal water level) and the apparent shoreline (i.e., wetland edge). The miles of AFSA
includes both streams and shorelines.
Phys. region
CHPP
region
PNA
(acres)
PSNA
(acres)
IPNA
(acres)
AFSA
(miles)
AFSA
(acres)
Coastal Plains 1 166 168 16,269 2,413 153,894
2 12,166 46,875 8,985 1,450 49,995
3 14,557 0 700 101 829
4 14,786 292 4,391 821 13,491
Piedmont 1 0 0 303 0 2
2 0 0 0 55 375
4 0 0 634 0 0
TOTAL ALL 41,675 47,336 31,283 4,840 218,586
Nursery areas: Those areas in which for reasons such as food, cover, bottom type, salinity, temperature and other factors,
young finfish and crustaceans spend the major portion of their initial growing season
[MFC rule 15A NCAC 03N .0102 (a)].
Primary nursery area (PNA): Those areas of the estuarine system where initial post-larval development takes place.
These areas are located in the uppermost sections of a system where populations are uniformly very early juveniles [MFC
rule 15A NCAC 03N .0102 (b)].
Secondary nursery areas (SNA): Those areas of the estuarine system where later juvenile development takes place.
Populations are usually composed of developing sub-adults of similar size which have migrated from upstream primary
nursery areas to the secondary nursery area located in the middle portion of the estuarine system
[MFC rule 15A NCAC 03N .0102 (c)].
[Inland] primary nursery areas (IPNA): Those [inland] areas inhabited by the embryonic, larval, or juvenile life stages of
marine or estuarine fish or crustacean species due to favorable physical, chemical or biological factors
[WRC rule 15A NCAC 10C.0502].
Anadromous fish spawning areas (AFSA): Those areas where evidence of spawning of anadromous fish has been
documented by direct observation of spawning, capture of running ripe females, or capture of eggs or early larvae [MFC
rule 15A NCAC 03I .0101 (b) (20) (C)].
Anadromous fish nursery areas: Those areas in the riverine and estuarine systems utilized by post-larvae and later juvenile
anadromous fish [MFC rule 15A NCAC 03I .0101 (b) (20) (D)].
2010 Coastal Habitat Protection Plan
Chapter 2. Water Column Page 73
2.3.5.2. Non-regulatory
Some streams and riparian buffers are protected by virtue of public ownership. Larger water bodies, such
as lakes, may be surrounded by lands managed for conservation. Except for Lake Phelps, which is
designated as a State Park, the natural lakes in North Carolina are largely under federal government
jurisdiction in Croatan National Forest and national wildlife refuges (Pocosin Lakes and Mattamuskeet).
The feeder creeks and canals flowing out of them are partially under state and private ownership.
However, no one can own public trust bottom in navigable waters (except in rare cases of submerged land
claims or King‘s Grants); the government holds the submerged land in public trust (see Introduction
chapter for more information). Small streams can be owned if they are not considered navigable. Some
of these streams are within lands owned by non-profit groups, government agencies, land trusts,
municipalities, and private citizens for the purpose of conservation.
The GIS data layer for lands managed for conservation and open space is based on multiple source layers
(http://www.nconemap.com/nconemap_meta/lmcos_faq.htm, November 2009). Partners in the creation
of this data layer included the Department of Environment and Natural Resources (the Division of Parks
and Recreation, the Wildlife Resources Commission, the Division of Coastal Management, and the
Conservation Tax Credit program), the State Property Office, the Land Trust for North Carolina and its
associated land trusts, the Department of Agriculture and Consumer Services, the Clean Water
Management Trust Fund, the Conservation Fund, the Nature Conservancy, the US Forest Service, the US
Fish and Wildlife Service, the NC GAP Analysis program, and the Triangle J Council of Governments
and its associated local governments. However, not all land that has recreational, historic, scenic and
natural resource value is defined as "open space and preserved farmland" for this project.5 Approximately
9% of streams in coastal draining river basins (in the coastal plains) are protected in lands managed for
conservation (CGIA 2002 data) (Table 2.20). Rates and trends in land conservation and development
could be tracked and compared to predict future landscape characteristics, and water quality impacts,
and determine conservation actions needed. Protection of water quality through land acquisition and
deed obligations is a passive and less controversial approach to management of non-point sources of
water pollution than regulations.
The North Carolina Department of Environment and Natural Resources (NCDENR) recognizes the need
to coordinate statewide conservation efforts and developed the One NC Naturally Conservation Planning
Tool (CPT) to streamline the process of identifying and prioritizing natural areas for conservation. The
need for a tool became evident after the North Carolina General Assembly established the goal of
permanently protecting one million acres of natural lands by the end of 2009. The state managed to
achieve over half of the one million acres in the allotted time
http://www.onencnaturally.org/pages/CPT_Detailed_Report.html, January 2010. The CPT approach is
based on the ―Green Infrastructure‖ principle, which emphasizes the importance of maintaining an
interconnected network of natural areas for maintaining ecosystem stability. The tool can be used to
pinpoint areas that are already protected as well as ―gap‖ areas in ecosystem connectivity. The geospatial
data layers supporting the tool are separated them into six classifications considered equally valuable:
biodiversity/wildlife habitat, open space/conservation, water services, farmland, forestry lands, and
marine/estuarine (see ―Ecosystem management and Strategic Habitat Areas‖ chapter for more
information).
5 The Lands Managed for Conservation and Open Space database does NOT include privately owned green spaces, homeowner
association green spaces, public leases of private land, school yards, university and college campus land, athletic fields, golf
courses, utility-owned land, privately owned forests, prison property, university campuses, research farms or military bases.
Private land that is leased or managed by the state for gameland reserves is not included in the database and does not count
toward the Million Acre goal. These types of property all have value as areas that are free of buildings and parking lots, but they
lack the permanency and purposes required for this project's working definitions.

2010 Coastal Habitat Protection Plan
Chapter 2. Water Column Page 74
Table 2.20. Coastal streams miles in lands managed for conservation (CGIA 2002 data). Note: Column
sorted in order of descending total stream miles.
CHPP
region Fed
era
l
Sta
te
Pri
va
te
Co
nse
rv
ati
on
gro
up
La
nd
Tru
st
Mu
nic
ipa
l
Oth
er p
ub
lic
Lo
cal
Oth
er n
on
-pro
fit
Co
un
ty
TO
TA
L
1 635.3 202.4 61.7 32.5 0 0.6 0 0 0 0 932.6
1/2 0.9 0 0 0 0 0 0 0 0 0 0.9
2 348.9 101.4 3.7 0 8.8 13.5 14.8 0 5.3 0 496.5
2/3 0.8 0 0 0 0 0 0 0 0 0 0.8
3 267.3 14 3.2 7.1 6.3 0.4 0 0.8 0 0.1 299.3
4 56.6 158.5 30.6 9.8 26 3 0 8 0.7 0.2 293.3
ALL 1,309.90 476.4 99.3 49.4 41.1 17.5 14.8 8.8 6 0.3 2,023.40
2.4. Threats and management needs
Human activities can negatively impact fish communities by altering naturally occurring flow and/or
water quality conditions. Hydrological modifications – such as dam and culvert construction; water
withdrawal; channelization; channel modification; stream bank modification; and shoreline erosion – can
obstruct fish passage and/or affect flow and quality of the water column. Pollutant loading from point or
nonpoint sources affects the quality of the water column. Excessive inputs of nutrients, bacteria,
sediment, toxins or biochemical agents (i.e., endocrine disrupting substances), from point or nonpoint
sources alike, can lead to visible signs of habitat degradation, including algal blooms, hypoxia, fish kills,
and/or deformed fish. Threats are organized and discussed in this section by hydrological modifications,
water quality degradation, non-native /nuisance species, and sea level rise/climate change.
2.4.1. Hydrological modifications
2.4.1.1. Flow regulation
Dams and water withdrawals modify the quantity of water in coastal North Carolina waters according to
the water demands of a growing population. Flow regulation is a side-effect of road fill and culverts,
channelization and drainage, and other hydrologic modifications.
Dams/impoundments
Dams have been constructed throughout North Carolina to provide flood control, hydropower generation,
water supply, irrigation, navigation, recreation, fish and wildlife ponds, debris and sediment control, and
fire protection (DLR, unpub. data). The majority of dams in North Carolina occur in the upstream
portions of estuaries, rivers, and streams. In the coastal plain, dams are most abundant in the upper
reaches of the Cape Fear, Neuse, Tar-Pamlico, Roanoke, and Chowan watersheds. These structures
primarily impact anadromous fish and the catadromous American eel spawning migrations (Maps 2.5a-b).
Eggs and larvae are less likely to survive if passage to their historical spawning areas is obstructed by
dams or other alterations (Moser and Terra 1999). In the coastal plains portion of CHPP Region 1,
approximately 18% (2,369 miles) of National Hydrologic Dataset (NHD) streams (13,070 miles) appear

2010 Coastal Habitat Protection Plan
Chapter 2. Water Column Page 75
blocked by an impoundment, based on SHA Assessment results (see ―Ecosystem management and
Strategic Habitat Areas‖ chapter for more information). The Chowan subregion of Region 1 had the
largest percent of dam-obstructed streams at 38%. Table 2.21 tallies the number of dams, locks, and
culverts in CHPP regions and subregions.
Table 2.21. Number of documented obstructions (i.e., dams, locks, culverts) in coastal plains portion of
CHPP regions based on data from Virginia Game and Inland Fisheries (1983 data), Collier
and Odum (1989), Moser and Terra (1999), Department of Transportation (2003 data),
Division of Water Resources (2003 data), and USACE obstructions inventory (2009 data).
Note: Structures duplicated in different datasets were consolidated into one dataset.
CHPP
Region Subregion Dam
/im
po
un
dm
en
t
Bea
ver
dam
*
Lock
*
Sto
rm g
ate
*
Veg
etati
on
*
Cu
lvert
(u
nsp
ecif
ied
)
Pip
e cu
lver
t
Box c
ulv
ert*
*
1
Albemarle 2 0 1 4 2 33 39 3
Chowan 95 1 0 0 0 25 46 5
Roanoke 28 0 0 0 0 29 32 0
TOTAL 125 1 1 4 2 87 117 8
2
Neuse 113 0 0 0 0 119 139 1
Pamlico Sound 1 0 0 0 0 15 9 0
Tar/Pamlico 73 0 0 0 0 95 68 0
TOTAL 187 0 0 0 0 229 216 1
3
Core/Bogue 1 0 0 0 0 0 8 0
New/White Oak 5 0 0 0 0 8 24 0
TOTAL 6 0 0 0 0 8 32 0
4
Cape Fear 191 0 0 0 0 104 176 1
Southern estuaries 3 0 0 0 0 1 6 0
TOTAL 194 0 0 0 0 105 182 1
ALL TOTAL 512 1 1 4 2 429 547 10
* Collier and Odum (1989) only
** Moser and Terra (1999) only
Alteration of natural flow patterns by operation of reservoir dams can also impact conditions needed for
successful spawning of anadromous species. Water releases in the Roanoke River have adversely
affected flow conditions needed for some anadromous fish species and lowered dissolved oxygen levels
(Fay et al. 1983b,d; USFWS, unpub. letter 2001). Among other factors, low oxygen levels were
implicated in the decline of the Albemarle/Roanoke River stock of striped bass as well as in fish kill
events (USFWS 1992). Other regulated rivers in coastal North Carolina include the Chowan, Tar-
Pamlico, Neuse, and Cape Fear systems. All of these rivers historically supported striped bass and other
anadromous fish populations (DMF 2003b).
2010 Coastal Habitat Protection Plan
Chapter 2. Water Column Page 76
Concern for anadromous fish spawning resulted in a cooperative agreement between the USACE,
NCWRC, NCDMF, and the operators of Kerr Reservoir to store and release water between April 1 and
June 15 when stored water is available (>299.5 ft msl) in the reservoir (P. Kornegay/WRC, pers. com.,
December 2008). When Kerr‘s elevation drops below 299.5 ft msl, the USACE will endeavor to store
water and release it during peak spawning periods for anadromous species. Releases from downstream
Roanoke Rapids Reservoir are regulated by Dominion Power Company, who has agreed to not release
peaking flows from April to June 15. Dominion also agreed to re-release the exact ―spawning flows‖
released by the USACE from Kerr Reservoir.
The USACE recently undertook a Neuse River Basin Study for which the WRC recommended the
following flow guidelines for anadromous species. The guidelines were based spring striped bass and
American shad survey work by the WRC. The guidelines have not been put into use (B. Wynn/WRC,
pers. com., December 2008). Currently, the Army Corps‘ Falls Lake project is operated to meet a 184 cfs
minimum flow target at the Clayton gage from November 1 to March 30. The rest of the year, a 254 cfs
minimum target at Clayton is used. Since winter flows usually exceed 184 cfs, for practical purposes the
target can be considered to be 254 cfs. While these targets take into account water quality and fish
spawning, a primary concern is having water levels high enough to cover the many downstream water
users‘ intake pipes.
In the Cape Fear River basin, the USACE operates Jordan Lake to meet a minimum flow target of 550 cfs
at the Lillington gage. This target is sufficient for downriver water users and also generally maintains
flow over the downstream Locks and Dams to the extent fish kills are prevented. Enhanced fish passage
at the Locks and Dams may justify revision of this target, however (B. Wynn/WRC, pers. com.,
December 2008). There is no federal project on the Tar River, so the USACE has no specific mechanism
for regulating flows in this basin. It is widely recognized, however, that the Tar can experience extremely
low flows during drought conditions. The City of Greenville is initiating an instream flow study for the
Tar River to address future water availability from this surface water source. Habitat and water quality
needs will likely be considered in this study. Hopefully, flow targets will be developed from the study
that accommodate the needs of anadromous fish (Bennett Wynn/pers.com., December 2008).
Efforts have been made to restore spawning habitat for anadromous species by removing dams that are no
longer necessary. In 1997, the Quaker Neck Dam on the Neuse River near Goldsboro was removed,
reclaiming 74 miles of historic spawning habitat available upstream to the Milburnie Dam near Raleigh
(Map 2.5b). Similarly, the Rains Mill Dam on the Little River in Johnston County was removed in 1999,
opening an additional 49 miles of spawning grounds for anadromous species. After dam removal, striped
bass spawned farther upstream and juvenile American shad used the entire river downstream of the fall
line as a nursery area (Hightower and Jackson 2000). The 2005 removal of Lowell Mill Dam in Johnston
County, the most downstream dam on the Little River (tributary of the Neuse), provided 130 newly
opened river miles of the Little River and its tributaries. The largest dam removal project ever in North
Carolina, the Carbonton Dam removal in Lee, Moore, and Chatham Counties, took place in December
2005 and opened up 10 miles of the Deep River (Cape Fear subregion, Piedmont physiographic region).
It is estimated that 30% of the dams in the United States are no longer needed and are more costly to
renovate and repair than to remove. Removal has demonstrated almost immediate positive benefits for
migratory species allowing species to migrate further upstream to reclaimed habitat (Hightower and
Jackson 2000, Bowman 2001, Burdick and Hightower 2006). Although dam removal reopens substantial
migratory fish habitat, it also eliminates the created reservoir habitat, disrupts downstream aquatic
communities, releases a substantial amount of sediment and any associated heavy metals, toxic chemicals,
and nutrients, allows opportunities for invasive species on reservoir sediments, and will ultimately impact
other fisheries and their habitats (Stanley and Doyle 2003). Further research is encouraged to monitor
impacts of dam removal on downstream fisheries and habitats. Removing unnecessary dams should be
2010 Coastal Habitat Protection Plan
Chapter 2. Water Column Page 77
undertaken with consideration for both upstream and downstream impacts. A prioritized list of dams for
removal or modification should also be compiled by state and federal resource agencies. The highest
priorities for dam removal are Milburnie Dam on the mainstem Neuse River and the remaining dam on
the Little River near Goldsboro (Atkinson Mill Dam), in the Neuse subregion (M. Wicker/USFWS, pers.
com., March 2010).
Where obstructions cannot be removed, fish passages (i.e. step-pool, roughened channels, and hybrid
fishways) can be constructed that allow fish to maneuver upstream. When designing a fishway, the
species present and the environmental conditions must be taken into account in order to ensure fish
migration can and will occur. In the Chesapeake Bay region, several different types of fish passages are
utilized (http://www.chesapeakebay.net, 2003). The Denil fishway, which is commonly used in
Chesapeake Bay, consists of a series of sloped channels that allow the fish to swim over the dam or
obstruction. Wooden baffles are placed at regular intervals within the channels to slow the velocity of the
water. There are resting pools between each section of the fishway to conserve the energy of the
migrating fish. The necessary slope and length of the fishway are determined by the swimming ability of
the predominant species at the site. A fish lift or fish elevator is generally only used at very large
obstructions. In this design, a flow of water guides the fish into a large hopper, which then raises the fish
over the dam. At the top of the dam, the fish can be released into the river.
In the Cape Fear River, locking procedures were modified and a fishway was installed in 1997 to improve
passage of anadromous fish. Moser et al. (2000) investigated the success of American shad using Lock
#1 and fish passages on the Cape Fear River using acoustic tags from 1996 to 1998. During the time
period of this study Moser et al. (2000) observed a range of 18 to 61% of American shad moving
upstream of the lock. In this study they found more fish migrating upstream utilizing the navigation lock
instead of the fish passage as a result of design flaws in the fish passageway. The U.S. Army Corps of
Engineers (COE) was required to enhance fish passage around the lowermost dam (Lock and Dam # 1)
as mitigation for the deepening of the Wilmington Harbor dredging project and resulting sturgeon
impacts, which finished in 2004. Removal of the dam was discussed but the City of Wilmington was
strongly opposed to that because their water intake is just upstream of the dam. They were concerned that
dam removal would lower water levels and increase salt content, impacting their water supply. The
USACE then considered constructing an artificial bypass to allow a portion of the river flow to travel
around the dam in a meandering channel that approximates a natural stream (USACE 2002), but met
resistance from the adjacent land owner. The current proposal is to construct a rock ramp in front of the
dam. However, the USACE has yet to receive funding for the required mitigation, due to budget
restraints. The USACE received federal stimulus funding to fill the scour hole and build fish passage at
Lock and Dam #1. Completion of a fish passage at Lock and Dam 1 would greatly benefit habitat
conditions for Atlantic and shortnose sturgeon, American shad, striped bass, American eel, blueback
herring, and hickory shad stocks (USACE 2002). Following the construction of a fish passage, natural
resource agencies would like to remove or construct fish passage structures at Lock and Dam #2 and 3.
Restoration efforts through removal or modification of dam structures that impede migration of
anadromous fish should remain a high priority to continue in North Carolina, focusing on the lowermost
structures in rivers or streams, and advancing upstream. In particular, the Cape Fear system (i.e., Lock
and Dam #1) should be a high priority, since striped bass, shortnose sturgeon, and Atlantic sturgeon have
not recovered.6 State and federal agencies should work together to secure grant or other funding for fish
passage restoration.
Efforts should continue to remove or modify the lowermost dams in the Cape Fear, Neuse, Tar-Pamlico,
and Chowan rivers, in order to increase spawning habitat available to anadromous fish species.
Additionally, new dam construction should be avoided whenever possible or designed and sited to
6 Refer to Soft bottom chapter for more information on sturgeon.

2010 Coastal Habitat Protection Plan
Chapter 2. Water Column Page 78
minimize impacts to anadromous fish use and to maintain appropriate flow conditions. Flow alterations
that may significantly change the temporal and spatial features of inflow and circulation that are
required for successful spawning of anadromous fish should be prohibited. A process that fully evaluates
cumulative impacts from water withdrawals and other hydrological modifications should be developed
and implemented. There are several other options concerning flow regulation, listed in the Striped Bass
FMP, which should be implemented (DMF 2003b):
For free flowing rivers, work with water resources authorities in North Carolina and/or Virginia
and South Carolina, as appropriate, to secure commitments for preservation of the unaltered flow
regimes.
For rivers which are presently dammed to such a degree that flow patterns depart significantly
from a free flowing condition, require establishment of appropriate flow regimes for striped bass
and other anadromous fish spawning and nursery areas, and work with the appropriate regulatory
agencies to secure commitments for preservation of such regimes.
Require water allocation for riverine fish habitat as part of the local water supply planning
process and future water allocation processes.
Water withdrawals
Water is withdrawn from surface and ground waters for multiple purposes. Surface water is withdrawn
for industrial uses (such as cooling water for nuclear and fossil fuel power plants), municipal water
supply, crop irrigation, and other uses. Thermoelectric power generation accounts for the greatest amount
of surface water withdrawals (Table 2.22). Excluding thermoelectric use, non-agricultural industrial use
accounted for the largest source of water withdrawal from both public water supply and self-supplied
surface water in 1995 (Street et al. 2005). Public water supply (including residential, commercial, and
industrial uses) is responsible for the second largest amount of water withdrawn at 873 mgd. Public water
supply systems withdraw primarily surface water (698 mgd) and a lesser amount of ground water (174
mgd). Water treatment plants mark the general location of surface water withdrawals for public water
supply (Map 2.6). Documented water use in the state has risen from 9,286 to 10,863 mgd from 1995-
2008 (an increase of 1,577 mgd in 13 years).
Cooling water intake systems (CWISs) for power plants affect aquatic ecosystems by pulling organisms
into water intake systems (entrainment) or trapping them on parts of the intake structure (impingement)
(Greene et al. 2009). Water intake structures transport surface waters to the intake pump where the force
of the water passing through the structure can cause the impingement of organisms. The organisms then
suffocate because the water current prevents opening of their gill covers, or die from starvation,
exhaustion, or de-scaling (ASMFC 2002b). Fish impinged for a short period can survive or experience
delayed mortality from the stress. Protected species, such as shortnose sturgeon, sea turtles, or manatees
have also been trapped against or within intake structures. Usually only small organisms, including early
life stages of fish and invertebrates, can pass through the mesh screens. The early life stages of fish are
particularly vulnerable to damage because their soft tissues offer little protection against thermal or
mechanical stress (EPA 2002b). Once entrained, organisms can be subjected to physical, thermal, and
toxicity stresses. Studies have shown that very large numbers of fish larvae can be entrained through a
power plant and that mortality is high, but varies by species and life stage.
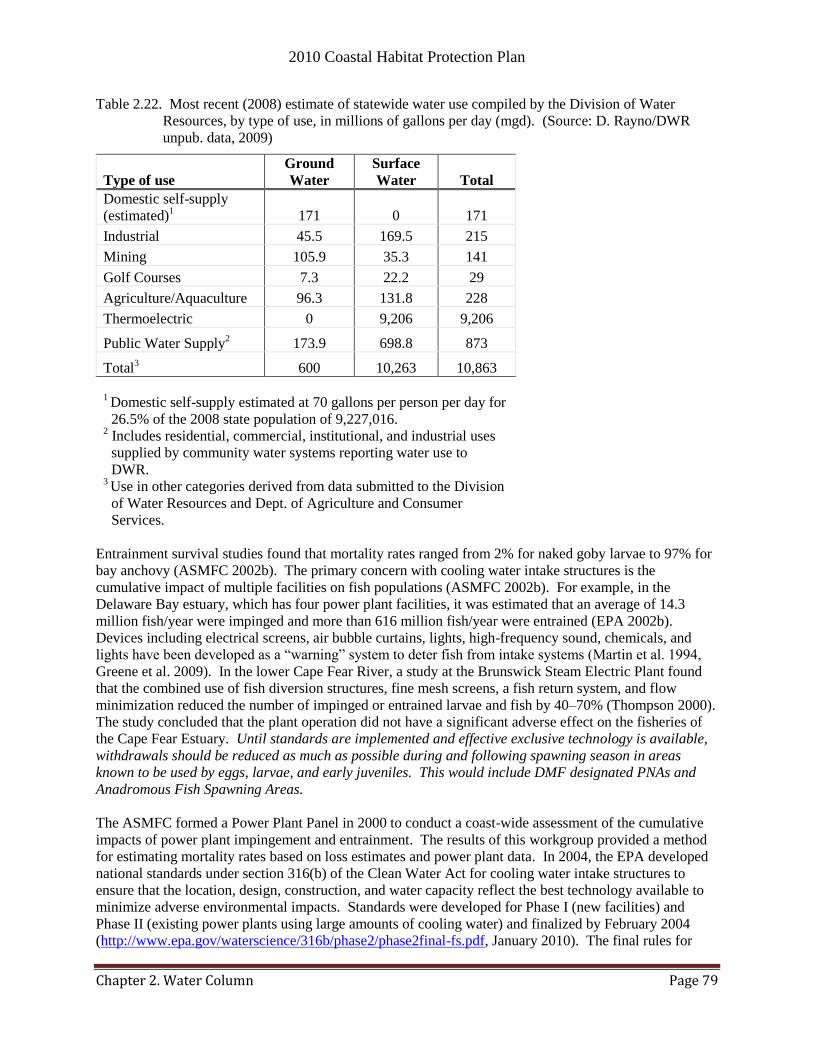
2010 Coastal Habitat Protection Plan
Chapter 2. Water Column Page 79
Table 2.22. Most recent (2008) estimate of statewide water use compiled by the Division of Water
Resources, by type of use, in millions of gallons per day (mgd). (Source: D. Rayno/DWR
unpub. data, 2009)
Type of use
Ground
Water
Surface
Water Total
Domestic self-supply
(estimated)1 171 0 171
Industrial 45.5 169.5 215
Mining 105.9 35.3 141
Golf Courses 7.3 22.2 29
Agriculture/Aquaculture 96.3 131.8 228
Thermoelectric 0 9,206 9,206
Public Water Supply2 173.9 698.8 873
Total3 600 10,263 10,863
1 Domestic self-supply estimated at 70 gallons per person per day for
26.5% of the 2008 state population of 9,227,016. 2 Includes residential, commercial, institutional, and industrial uses
supplied by community water systems reporting water use to
DWR. 3 Use in other categories derived from data submitted to the Division
of Water Resources and Dept. of Agriculture and Consumer
Services.
Entrainment survival studies found that mortality rates ranged from 2% for naked goby larvae to 97% for
bay anchovy (ASMFC 2002b). The primary concern with cooling water intake structures is the
cumulative impact of multiple facilities on fish populations (ASMFC 2002b). For example, in the
Delaware Bay estuary, which has four power plant facilities, it was estimated that an average of 14.3
million fish/year were impinged and more than 616 million fish/year were entrained (EPA 2002b).
Devices including electrical screens, air bubble curtains, lights, high-frequency sound, chemicals, and
lights have been developed as a ―warning‖ system to deter fish from intake systems (Martin et al. 1994,
Greene et al. 2009). In the lower Cape Fear River, a study at the Brunswick Steam Electric Plant found
that the combined use of fish diversion structures, fine mesh screens, a fish return system, and flow
minimization reduced the number of impinged or entrained larvae and fish by 40–70% (Thompson 2000).
The study concluded that the plant operation did not have a significant adverse effect on the fisheries of
the Cape Fear Estuary. Until standards are implemented and effective exclusive technology is available,
withdrawals should be reduced as much as possible during and following spawning season in areas
known to be used by eggs, larvae, and early juveniles. This would include DMF designated PNAs and
Anadromous Fish Spawning Areas.
The ASMFC formed a Power Plant Panel in 2000 to conduct a coast-wide assessment of the cumulative
impacts of power plant impingement and entrainment. The results of this workgroup provided a method
for estimating mortality rates based on loss estimates and power plant data. In 2004, the EPA developed
national standards under section 316(b) of the Clean Water Act for cooling water intake structures to
ensure that the location, design, construction, and water capacity reflect the best technology available to
minimize adverse environmental impacts. Standards were developed for Phase I (new facilities) and
Phase II (existing power plants using large amounts of cooling water) and finalized by February 2004
(http://www.epa.gov/waterscience/316b/phase2/phase2final-fs.pdf, January 2010). The final rules for

2010 Coastal Habitat Protection Plan
Chapter 2. Water Column Page 80
Phase II included impingement requirements to reduce the number of organisms pinned against parts of
the intake structure to be reduced by 80 to 95 percent from uncontrolled levels. Entrainment requirements
called for a 60 to 90% reduction in number of aquatic organisms drawn into the cooling system. The rule
also included several compliance alternatives for large power plants. Phase III standards (existing
facilities that withdraw at least 2MGD) were discussed in 2006, but the EPA decided that due to cost
restraints it would be best to handle each case individually. In 2007 the EPA suspended the Phase II rules
affecting existed CWISs following a ruling by the U.S. Circuit Court of Appeals.
Most surface water withdrawals for power plants or water supply are located in fresh water and associated
with a dam or reservoir. Although increasing numbers of potable water intakes are being located in the
mainstem of coastal plain rivers (e.g., Neuse, Tar), in some large rivers, such as the Cape Fear, there is a
considerable amount of water directly withdrawn from the river for industrial use. The quantity of water
removed can be large enough to significantly affect river flow patterns below the intake. In addition to
altering flow downstream, water intakes placed behind dams can impede efforts to restore fish passage.
The impact of the withdrawal may be offset if treated wastewater or cooling water is discharged back into
the same river system. Most cooling water is returned in close proximity to its source, reducing the effect
on overall water quantity (DWR 2001). During low flow conditions, such as drought, returned
wastewater can comprise a significant portion of the river‘s flow. Interbasin transfers could result in large
permanent flow reductions (DMF 2003b).
The amount of water withdrawn from surface and ground water is tracked through water withdrawal
registrations. The Registration of Water Withdrawals and Transfers law (G.S.143-215.22H) requires
users who withdraw predetermined amounts of ground and surface water in North Carolina to register
annually with the Division of Water Resources (if non-agricultural) or with the NC Department of
Agriculture and Consumer Services (if agricultural) (Table 2.23). Agricultural activities include those
―directly related or incidental to the production of crops, fruits, vegetables, ornamental and flowering
plants, dairy products, livestock, poultry, and other agricultural products‖ (G.S.143-215.22H). Because
persons or entities falling below the required use designations are exempt from registration, data obtained
from Water Withdrawal Registrations represent only part of the total water usage.
Table 2.23. Surface and groundwater volumes requiring user registration inside and outside of
Central Coastal Plain Capacity Use Area (CCPCUA), North Carolina.
User type
Gallons of water per day (gpd)
Inside CCPCUA Outside CCPCUA
Non-agricultural > 10,000 100,000
Agricultural > 10,00 > 1, 00,000
Within the coastal-draining river basins, surface water intakes are permitted in four river basins –Cape
Fear, Roanoke, Tar-Pamlico, and Neuse (Table 2.24). Permitted withdrawals include community water
systems, thermoelectric generation, agricultural operations, golf courses, quarries, and non-electric
generating industrial operations. The maximum permitted volume of surface water withdrawal from
community water systems ranges from 69 to 338 million gallons per day (mgd) among the four river
basins. The largest amounts of community withdrawal are in the Cape Fear and Neuse basins.
Withdrawals for thermoelectric generation are much greater than withdrawals for community water
systems (Table 2.24). The Cape Fear and Roanoke have the largest quantity of withdrawals for
thermoelectric generation. Withdrawals for other uses range from 14 to 122 mgd among river basins.
The total quantity of surface water withdrawals from Table 2.24 sources is over 5,000 mgd in the
specified coastal draining river basins. Additional surface water use from agriculture and aquaculture was
reported by the Department of Agriculture and Consumer Services (Table 2.25). The additional sources
add 59 mgd to the total quantity of surface water withdrawn in the Cape Fear, Roanoke (NC portion),
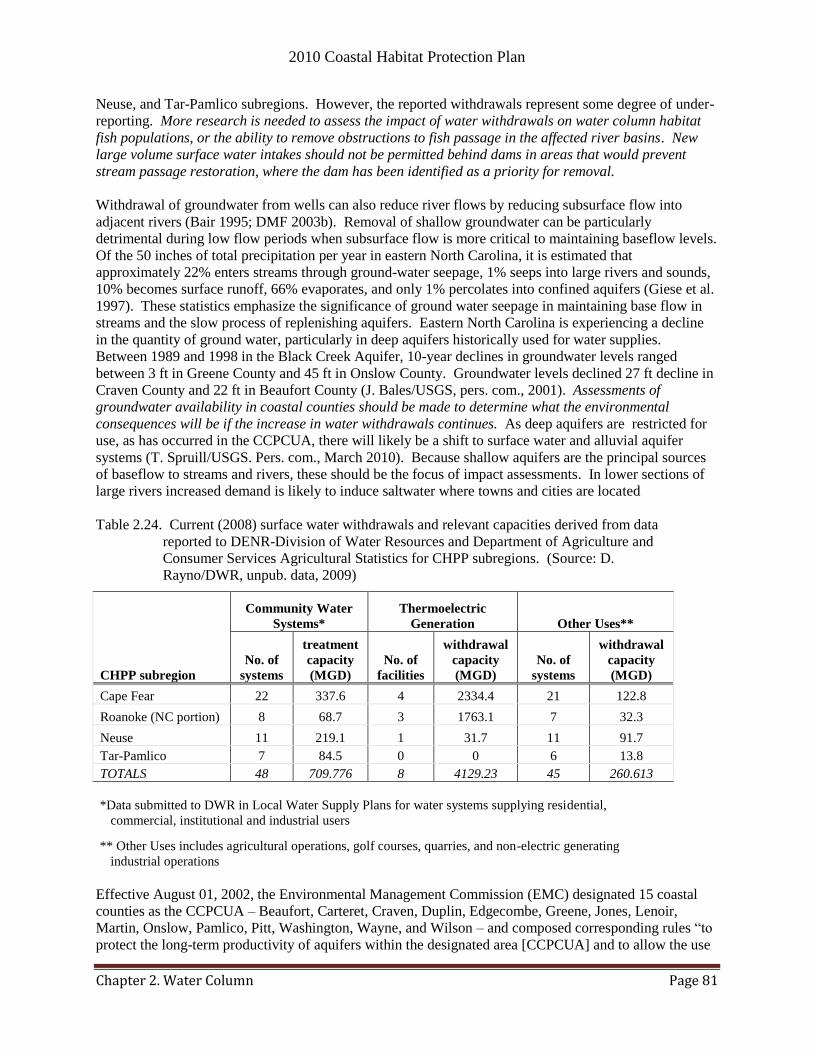
2010 Coastal Habitat Protection Plan
Chapter 2. Water Column Page 81
Neuse, and Tar-Pamlico subregions. However, the reported withdrawals represent some degree of under-
reporting. More research is needed to assess the impact of water withdrawals on water column habitat
fish populations, or the ability to remove obstructions to fish passage in the affected river basins. New
large volume surface water intakes should not be permitted behind dams in areas that would prevent
stream passage restoration, where the dam has been identified as a priority for removal.
Withdrawal of groundwater from wells can also reduce river flows by reducing subsurface flow into
adjacent rivers (Bair 1995; DMF 2003b). Removal of shallow groundwater can be particularly
detrimental during low flow periods when subsurface flow is more critical to maintaining baseflow levels.
Of the 50 inches of total precipitation per year in eastern North Carolina, it is estimated that
approximately 22% enters streams through ground-water seepage, 1% seeps into large rivers and sounds,
10% becomes surface runoff, 66% evaporates, and only 1% percolates into confined aquifers (Giese et al.
1997). These statistics emphasize the significance of ground water seepage in maintaining base flow in
streams and the slow process of replenishing aquifers. Eastern North Carolina is experiencing a decline
in the quantity of ground water, particularly in deep aquifers historically used for water supplies.
Between 1989 and 1998 in the Black Creek Aquifer, 10-year declines in groundwater levels ranged
between 3 ft in Greene County and 45 ft in Onslow County. Groundwater levels declined 27 ft decline in
Craven County and 22 ft in Beaufort County (J. Bales/USGS, pers. com., 2001). Assessments of
groundwater availability in coastal counties should be made to determine what the environmental
consequences will be if the increase in water withdrawals continues. As deep aquifers are restricted for
use, as has occurred in the CCPCUA, there will likely be a shift to surface water and alluvial aquifer
systems (T. Spruill/USGS. Pers. com., March 2010). Because shallow aquifers are the principal sources
of baseflow to streams and rivers, these should be the focus of impact assessments. In lower sections of
large rivers increased demand is likely to induce saltwater where towns and cities are located
Table 2.24. Current (2008) surface water withdrawals and relevant capacities derived from data
reported to DENR-Division of Water Resources and Department of Agriculture and
Consumer Services Agricultural Statistics for CHPP subregions. (Source: D.
Rayno/DWR, unpub. data, 2009)
CHPP subregion
Community Water
Systems*
Thermoelectric
Generation Other Uses**
No. of
systems
treatment
capacity
(MGD)
No. of
facilities
withdrawal
capacity
(MGD)
No. of
systems
withdrawal
capacity
(MGD)
Cape Fear 22 337.6 4 2334.4 21 122.8
Roanoke (NC portion) 8 68.7 3 1763.1 7 32.3
Neuse 11 219.1 1 31.7 11 91.7
Tar-Pamlico 7 84.5 0 0 6 13.8
TOTALS 48 709.776 8 4129.23 45 260.613
*Data submitted to DWR in Local Water Supply Plans for water systems supplying residential,
commercial, institutional and industrial users
** Other Uses includes agricultural operations, golf courses, quarries, and non-electric generating
industrial operations
Effective August 01, 2002, the Environmental Management Commission (EMC) designated 15 coastal
counties as the CCPCUA – Beaufort, Carteret, Craven, Duplin, Edgecombe, Greene, Jones, Lenoir,
Martin, Onslow, Pamlico, Pitt, Washington, Wayne, and Wilson – and composed corresponding rules ―to
protect the long-term productivity of aquifers within the designated area [CCPCUA] and to allow the use
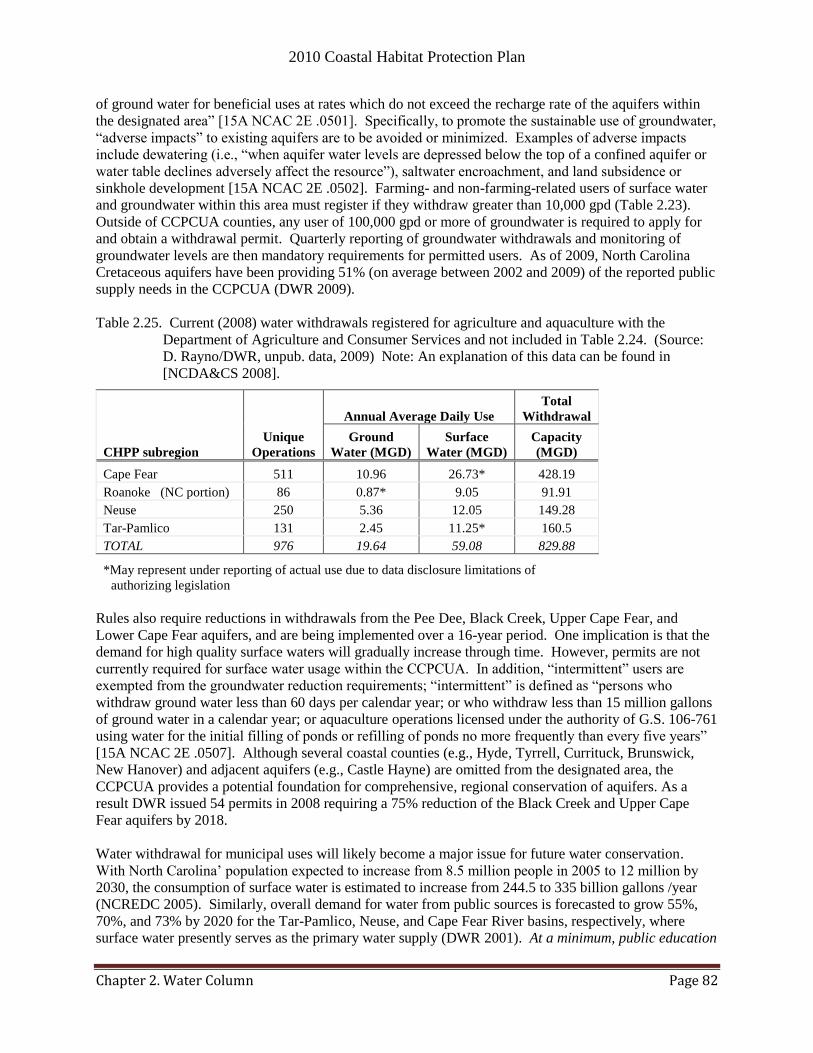
2010 Coastal Habitat Protection Plan
Chapter 2. Water Column Page 82
of ground water for beneficial uses at rates which do not exceed the recharge rate of the aquifers within
the designated area‖ [15A NCAC 2E .0501]. Specifically, to promote the sustainable use of groundwater,
―adverse impacts‖ to existing aquifers are to be avoided or minimized. Examples of adverse impacts
include dewatering (i.e., ―when aquifer water levels are depressed below the top of a confined aquifer or
water table declines adversely affect the resource‖), saltwater encroachment, and land subsidence or
sinkhole development [15A NCAC 2E .0502]. Farming- and non-farming-related users of surface water
and groundwater within this area must register if they withdraw greater than 10,000 gpd (Table 2.23).
Outside of CCPCUA counties, any user of 100,000 gpd or more of groundwater is required to apply for
and obtain a withdrawal permit. Quarterly reporting of groundwater withdrawals and monitoring of
groundwater levels are then mandatory requirements for permitted users. As of 2009, North Carolina
Cretaceous aquifers have been providing 51% (on average between 2002 and 2009) of the reported public
supply needs in the CCPCUA (DWR 2009).
Table 2.25. Current (2008) water withdrawals registered for agriculture and aquaculture with the
Department of Agriculture and Consumer Services and not included in Table 2.24. (Source:
D. Rayno/DWR, unpub. data, 2009) Note: An explanation of this data can be found in
[NCDA&CS 2008].
CHPP subregion
Unique
Operations
Annual Average Daily Use
Total
Withdrawal
Ground
Water (MGD)
Surface
Water (MGD)
Capacity
(MGD)
Cape Fear 511 10.96 26.73* 428.19
Roanoke (NC portion) 86 0.87* 9.05 91.91
Neuse 250 5.36 12.05 149.28
Tar-Pamlico 131 2.45 11.25* 160.5
TOTAL 976 19.64 59.08 829.88
*May represent under reporting of actual use due to data disclosure limitations of
authorizing legislation
Rules also require reductions in withdrawals from the Pee Dee, Black Creek, Upper Cape Fear, and
Lower Cape Fear aquifers, and are being implemented over a 16-year period. One implication is that the
demand for high quality surface waters will gradually increase through time. However, permits are not
currently required for surface water usage within the CCPCUA. In addition, ―intermittent‖ users are
exempted from the groundwater reduction requirements; ―intermittent‖ is defined as ―persons who
withdraw ground water less than 60 days per calendar year; or who withdraw less than 15 million gallons
of ground water in a calendar year; or aquaculture operations licensed under the authority of G.S. 106-761
using water for the initial filling of ponds or refilling of ponds no more frequently than every five years‖
[15A NCAC 2E .0507]. Although several coastal counties (e.g., Hyde, Tyrrell, Currituck, Brunswick,
New Hanover) and adjacent aquifers (e.g., Castle Hayne) are omitted from the designated area, the
CCPCUA provides a potential foundation for comprehensive, regional conservation of aquifers. As a
result DWR issued 54 permits in 2008 requiring a 75% reduction of the Black Creek and Upper Cape
Fear aquifers by 2018.
Water withdrawal for municipal uses will likely become a major issue for future water conservation.
With North Carolina‘ population expected to increase from 8.5 million people in 2005 to 12 million by
2030, the consumption of surface water is estimated to increase from 244.5 to 335 billion gallons /year
(NCREDC 2005). Similarly, overall demand for water from public sources is forecasted to grow 55%,
70%, and 73% by 2020 for the Tar-Pamlico, Neuse, and Cape Fear River basins, respectively, where
surface water presently serves as the primary water supply (DWR 2001). At a minimum, public education
2010 Coastal Habitat Protection Plan
Chapter 2. Water Column Page 83
is needed to encourage greater voluntary re-use and recycling of water within communities.
The current frequency of droughts and forecasted increases with climate change (see ―Climate change‖
section for more information) could also exacerbate water supply issues (NWF 2008). The major
droughts that occurred during 2000-2002 and 2007-2008 are captured on Figure 2.2. The drought of
2007-08 was the worst in North Carolina since recordkeeping began on the subject in 1895. The drought
started Feb. 13, 2007, creeping from the mountains to the coast as a lack of rainfall depleted stream flows
and reservoirs to record low levels. The drought prompted many towns to enact mandatory and voluntary
water conservation restrictions and helped bring about a state law that makes state and local officials
better prepared to respond to future droughts. The cycle of flood and drought years has a significant
impact on the cyclic nature of plant life growing in the water column. For example, the high abundance
of SAV documented in 2007-2008 was encouraged by the relatively clear water and cloud-free days
associated with minimal rainfall conditions (see ―Submerged aquatic vegetation‖ chapter for more
information on SAV status and trends).
An emerging issue since the 2005 CHPP is the effect of dewatering on estuarine waters. Dewatering is
often done in association with mining, to temporarily lower the water table. Large amounts of fresh water
are discharged. Where the water is discharged to SA waters, there is concern regarding the effect of the
dewatering on salinity in adjacent and downstream waters. Excessive decrease or rapid change in salinity
can be detrimental to juvenile fish and shellfish. To properly review mining applications, more
information is needed on the expected effect of the freshwater discharge on the salinity of receiving
waters. Large amounts of dewatering are also required when utilizing a new type of wastewater treatment
system known as rapid infiltration system. In this centralized wastewater treatment system, treated
effluent is discharged into a storage pond. Wells are installed around the pond for dewatering, lowering
water table levels and allowing room for the treated effluent to filter down. Not only will large amounts
of freshwater be discharged to an adjacent stream, there is concern that over time, the groundwater will be
contaminated with the effluent, and then discharged to the stream as freshwater (L. Willis/DWQ, pers.
com. 2010). This new technology is being increasingly used. Research on the potential ecological
impact of this type of wastewater system needs to be assessed further before widespread use.
2.4.1.2. Road fill and culverts
Based on analysis of NC DENR and NC DOT records, it has been estimated that the state loses, on
average, about 500 acres of wetlands per year, mostly from road construction (see ―Status and trends‖
section of the Wetlands chapter for more information). Road construction over rivers, streams, or
wetlands often involves blockage of a portion of the original stream channel and floodplain. Bridges may
cross over the water or culverts may be constructed under the road, depending on the size of stream and
associated wetlands. In the past, bridges were constructed by filling the adjoining wetlands and creating a
narrow channel for water passage. Current wetland protection rules and DOT policies discourage placing
fill in adjoining wetlands, thus requiring bridges to span a longer distance in some areas. Culverts have
been placed on small streams bisecting the road/rail network. Pipe and box culverts vary in dimensions,
but are generally low and narrow passages that reduce light levels in the culverts and constrict water flow
to some degree. Both bridge channels and culverts narrow water passages (due to fill placed at the stream
edge to support the structures), slowing drainage, altering water velocities and causing localized erosion
(Mudre et al. 1985, Clay 1995, Riggs 2000). Any of these factors may prevent fish from entering the
culverts to reach otherwise suitable spawning grounds. Placing the culverts at the wrong elevation or
slope can also prevent passage during certain flow conditions. In 1997, a multi-disciplinary committee
comprised of members from the DMF, WRC, NMFS, USFWS, DEM (Division of Environment
Management), and the DOT developed guidelines for minimizing the impact of bridge and culvert
infrastructure on anadromous species. The guidelines pertain to ―blue line‖ streams in the Coastal Plains,
and include the following stipulations:
Avoidance of instream work during the spring migration period, defined as occurring from
2010 Coastal Habitat Protection Plan
Chapter 2. Water Column Page 84
February 15 to June 15,
Preference for bridges and other channel spanning structures over road fill and culverts,
Requirement that proposed openings allow passage of the average historical spring flows without
adversely altering flow velocity (―adverse‖ not defined), and a
Requirement to place culvert bottoms below the stream bed
Fish migration may also be hampered by reduced light in culverts and under bridges. Moser and Terra
(1999) studied the effect of, ―light in the pipe,‖ on river herring migratory behavior in tributaries of
Albemarle Sound and in the Neuse, Pamlico, and Cape Fear rivers. Results showed that river herring
preferred to migrate through areas with a minimum light level – at least 1.4% of ambient light. Where
lighting was less than 1.4% ambient conditions, avoidance was observed. Light measurements in the
center of the structures were below this threshold in 6 ft diameter corrugated metal pipes and 6 ft by 6 ft
box culverts. Sufficient light was available in 12 ft diameter pipes and bridges more than one meter
above the water surface. Light was marginally adequate in bridges less than one meter above the water
surface. Light penetrated approximately 10 ft inside the 6 ft diameter culverts. Since the average length
of the 6 ft diameter pipes was 54 ft, approximately 30 ft in the center of the pipes was dark. Although
culverts may reduce the number of herring passing upstream of the structures, some fish did successfully
pass through culverts at night and, in some cases, under low light conditions (<1%) during the day.
Because of the observed hydrological impacts and light reduction, the MFC supported replacement of all
temporary stream crossing structures with structures that were ―herring friendly,‖ including bridge piling
structures and properly designed and situated box culverts. In 2001, an interagency team including staff
from DOT, DENR, USACE, and other state and federal agencies began meeting to discuss such changes,
as well as other changes in permit processing improvements and mitigation. From this effort, the team
established the Ecosystem Enhancement Program (see ―Wetland restoration and enhancement‖ section of
the ―Wetland‖ chapter for more information).
According to DOT, there are numerous aging culverts and bridges in need of replacement. Because of
this increase, DOT formed an interagency permit group to discuss streamlining the permit process for
bridge and culvert replacement to reduce permit process time and expense. With culverts being much
cheaper to install than bridges, economics may discourage upgrading culverts to bridges. Funding should
be allocated for replacing filled channels and streams with “fish friendly” culverts or bridges and
upgrading existing culverts to “fish friendly” structures, prioritizing structures that are known to impede
anadromous fish migration to spawning grounds, or have been found to be particularly problematic to
the natural hydrology of a system. Partnering with resource agencies, NGOs, and regional conservation
groups such as Albemarle-Pamlico Conservation and Communities Collaborative (AP3C), Cape Fear
Arch, and Onslow Bight Partners to assist with any associated costs should be considered.
Since 2005, some research and monitoring of culverts and anadromous fish passage has been conducted.
Environmental Defense (ED) is finalizing a report using a GIS-based tool to identify the most valuable
spawning and nursery habitats for river herring in coastal watersheds. The model was tested within the
North Carolina portion of the Chowan River basin. A two-part habitat suitability analysis was conducting
starting with an expert workshop and resulting criteria applied to 1:24,000 scale (USGS) hydrology and
DCM wetland type maps. The area selected covered streams and adjoining floodplain wetlands up to the
point of major fragmentation of riparian wetland habitats. Duke University Marine Lab‘s Geospatial
Analysis Program conducted the second part of suitability analysis with GIS modeling of the following
components:
1. Determination of river herring habitat:
a. Construction of high resolution drainage network based on LIDAR floodplain mapping;
b. Determination of suitable river herring habitat patches using DCM‘s Coastal Region Evaluation
of Wetland Significance dataset. Then confirming suitability with DMF data on river herring
2010 Coastal Habitat Protection Plan
Chapter 2. Water Column Page 85
spawning locations (Street et al. 1975, Johnson et al. 1977, Winslow et al. 1983, Winslow et al.
1985, Winslow and Rawls 1992);
c. Identification of restorable and enhanceable river herring habitat patches using DCM‘s Potential
Restoration and Enhancement Site Mapping;
2. Delineation and description of buffer areas around suitable and restorable river herring habitat
using STATSGO soil database and 1996 statewide land cover data;
3. Identification and incorporation of obstacles to habitat using statewide dams database, bridge and
culvert data from DOT, and other obstructions data from Collier and Odum (1989)
In the summer of 2007, a field assessment was conducted to evaluate a subset of the obstructions. A total
of 62 sites were randomly selected and visited to confirm the physical presence of structures (bridges and
culverts) and to judge the degree to which each structure presented an obstacle to river herring movement.
A total of 14 bridges, 30 pipe culverts and 14 box culverts were visited. Criteria established by Moser
and Terra (1999) were used to determine whether the bridges and culverts posed challenges to herring
movement. The results of the field assessment indicated that none of the 14 bridges assessed as an
obstruction to river herring. All but one of the culverts was less than twelve feet in diameter; therefore
the vast majority of culverts were obstructions. The findings were applied to the GIS model; all culverts
were classified as obstructions and all bridges were not. Applying the model to the Chowan River Basin
assessment area, there were a total of 91 obstructions (dams and culverts) yielding 8,587 acres of suitable
river herring habitat and 1,163 acres of restorable/enhanceable habitat are inaccessible to herring. This
corresponds to an equivalent of 28% of the total 5,920 drainage network stream miles being blocked from
river herring access in the Chowan River study area. The model is intended to help resource managers
select the best opportunities for habitat preservation or restoration projects. The DWQ does not consider
culverts bisecting anadromous spawning areas as a source of impairment and thus EEP does not include
culvert removal as a restoration target for local watershed plans. The DWQ should consider including
culverts obstructing suitable anadromous fish spawning habitat as a source of water column impairment,
and culvert removal as a restoration credit for the EEP and DOT. The EEP could then include such
proactive restoration options in its overall mission to mitigate and restore lost ecosystem functions.
Strategic Habitat Area assessment in CHPP Region 1 (Albemarle Sound and tributaries), a larger area
than the ED study, generated a GIS coverage of possible and documented culverts forming the upstream
limit of unobstructed creeks. Sources of culvert data included the DOT, Collier and Odum (1989), Moser
and Terra (1999), and a GIS analysis intersecting streams (1:100,000 scale National Hydrologic Dataset)
and unbridged roads. Based on this data, there were nearly 9,000 culverts and possible culverts in Region
1 (including Virginia). Ninety eight percent of the culverts were located with GIS analysis and therefore
undocumented. Based on culvert locations, the amount of obstructed lowland streams7 (both natural and
ditched) in Region 1 could be as much as 5,027 miles (63% of all lowland streams in Region 1). The
figures go up only slightly when dam and lock obstructed areas are included. However, it should be noted
that total mileage of streams varies according to the mapping scale. The EDF study represents a very fine
scale representation of the stream network, including many more low order streams. The locations of
culverts and storm gates on AFSAs are shown on Maps 2.5a-b and inventoried in Table 2.21.
In an ongoing effort to locate obstructions and impedances to river herring passage, the DMF also
conducted surveys on the lowest downstream culvert, or primary culvert, in Chowan and Meherrin River
tributaries (beginning in 2007). Such work has resulted in the removal of one culvert blocking river
herring migration at the mouth of Brooks Creeks, a tributary of the Wiccacon River in the Chowan river
basin (K. Rawls/DMF, pers. com., February 2010). Information collected included; culvert type,
material, dimensions, water depth, distance between water level and top/bottom of culvert, water level
and water body width. The results of the EDF study and DMF field surveys should be used to determine
7 The lowest of three elevation categories found in the coastal plains of North Carolina, based on natural breaks.
2010 Coastal Habitat Protection Plan
Chapter 2. Water Column Page 86
priorities for culvert removal. The need for priorities was highlighted when American Rivers came to
DMF for suggestions on where to fund a culvert or dam removal project (L. Batt/American Rivers/pers.
com., February 2010).
2.4.1.3. Channelization and drainage
Channelization is the deepening and straightening of a natural stream. Ditching involves the creation of
new channels for draining adjacent lands. These activities can affect the slope, depth, width, and
roughness of the channel, thus changing the dynamic equilibrium of the stream and associated wetlands.
Channelized streams are deeper, more variable in flow, and less variable in depth than natural streams
(Orth and White 1993). Both channelization and ditching increase channel cross-section and flow
capacity, thus reducing the frequency of overbank flow events that allow wetland filtration and fish access
to the riparian wetlands (DMF 2000b). Consequently, loading and movement of sediment and other
nonpoint source pollutants are often greater in channelized streams than in natural streams (White 1996;
EPA 2001). The banks created by disposal of spoil along the shoreline further prevent fish from entering
the adjacent wetlands (see ―Channelization/ditching‖ section of ―Wetland‖ chapter for more information).
Ditches and canals (large ditches) have been constructed primarily in uplands, previously filled wetlands,
and wetlands (both riparian and non-riparian). Ditching of riparian wetlands is no longer allowed without
a permit and possible mitigation (see ―Status and trends‖ section of ―Wetland‖ chapter for more
information). Ditching is discussed further in the ―Land-use and non-point sources‖ section of this
chapter.
The impacts of channelization primarily affects smaller species and life stages (i.e., larval river herring)
using wetlands and shallow stream margins (O‘Rear 1983); habitats that are reduced or made inaccessible
by channelization. Elevated water velocities in channelized streams can also deter or prevent movement
of adult and juvenile fish. A study in the Tar River, for example, found that high water velocities in
channelized sections of a stream prevented the entrance of adult and juvenile herring into those areas
(Frankensteen 1976, DMF 2000b). Due to their typically short length and relatively lower habitat quality,
channelized streams generally support fewer fishery resources than unaltered, meandering streams.
Several studies have found that the size, number, and species diversity of fish in channelized streams are
reduced and the fisheries associated with them are less productive than those associated with
unchannelized reaches of streams (Tarplee et al. 1971, Hawkins 1980, Schoof 1980).
Channelized streams have also been found to have less suitable spawning habitat and reduced recruitment
success for anadromous species (Sholar 1975). The amount of in-stream vegetation, woody debris, and
streamside vegetation is generally reduced in channelized streams resulting in reduced substrate for
fertilized herring eggs, the protective cover for adult and juvenile fish, and habitat for invertebrates (DMF
2000b). Macroinvertebrate species richness, biomass, and production are higher on snags and debris than
any other habitat in Coastal Plain streams (Smock and Gilinsky 1992). Removal of large woody debris
also contributes to accelerating water velocity. Excessive woody debris can also hamper upstream fish
migration and downstream water conveyance, suggesting a need for threshold criteria. Municipalities
often view ―naturalized channels‖ as a problem that will increase flooding. As channelized streams have
aged, there is increasing interest in clearing them out for flood control. Education to local government is
needed on the negative ecological impacts of de-snagging and proper techniques. De-snagging of woody
debris in AFSAs should be conducted in accordance with, “Stream Obstruction Removal Guidelines,”
published by the American Fisheries Society in 1983. Guidelines for woody debris removal in streams
are also provided at http://www.americanwhitewater.org/content/Wiki/stewardship:woody_debris.
Most streams in eastern North Carolina have been channelized to some extent (NC Sea Grant 1997).
North Carolina has a long history of stream channelization and drainage. However, documentation of
historic drainage activities has not differentiated between channelized streams and artificial drainage

2010 Coastal Habitat Protection Plan
Chapter 2. Water Column Page 87
channels (see ―Land use and non-point sources‖ section for more information on ditching). No new
channelization projects have occurred since the 1970‘s (Chicod Creek, Pitt and Beaufort counties, Tar-
Pamlico subregion). However, maintenance of existing channels in agricultural drainage districts
(DEHNR 1995a) is a recurring issue in permit decisions. There are over 200 miles of channelized
streams in CHPP region 1 (3% of all lowland streams in region), based on Strategic Habitat Area (SHA)
assessment (Map 2.7). Many of these old channels have re-naturalized and are now supporting river
herring migration (S. Winslow/DMF, pers. com., Nov. 2007). So far, the DMF has successfully opposed
the maintenance of re-naturalized channels. Channelization regulations could be modified to discourage
or prevent maintenance of previously un-navigable and re-naturalized channels in Anadromous Fish
Spawning Areas and Primary Nursery Areas.
2.4.1.4. Dredging (navigation channels and boat basins)
Dredging of canals, channels, and boat basins involves land excavation or deepening areas for boating or
drainage. Excavation of coastal wetlands has also been done to control mosquitoes; a practice that is no
longer permitted. The most obvious impacts of dredging are the deepening of shallow water habitats and
the creation of artificial channels.
Deepening of shallow-water habitats can result in a loss of nursery habitat for some estuarine-dependent
species (Rozas 1992). For this reason, CAMA rules restrict new dredging in MFC-designated Primary
Nursery Areas. Dredged channels may also accumulate fine silt and pollutants that can be easily
resuspended by boat wakes, prop wash, strong winds, and/or channel maintenance (DEHNR 1990).
Chemicals, metals, nutrients, and organic matter stored in the sediment can then re-enter the water
column, causing short-term increases in toxicity, turbidity, algal blooms, and biological oxygen demand
(BOD) (Lalancette 1984). Habitat alteration from dredging may have been responsible for major
reductions noted in brown shrimp (-88%), blue crab (-75%), Atlantic croaker (-45%), and spot (-19%)
following dredging for a marina site on Pierces Creek (Neuse River) (Street et al. 2005). However,
turbidity from dredging may also protect small or young fish from visual predators (Livingston 1975;
Bruton 1985; Walsh et al. 1999). Recruitment of invertebrate larvae, growth of filter feeding
invertebrates, and visual foraging for prey by adult fish are also affected by turbidity from dredging
(Reilly and Bellis 1983; Hackney et al. 1996; Peterson et al. 2000a, Lindquist and Manning 2001). Some
organisms may not be adapted to the chronic disturbance near frequently dredged channels, especially in
areas that are poorly flushed. Dredging coarse sediment in areas with strong currents has much less
impact on water column habitat than dredging fine sediment in areas with little or no current. New
dredging in shallow, nearshore areas with fine sediment and low flushing should be discouraged. These
areas are likely to include Anadromous Fish Nursery Areas that have yet to be designated.
Fish species attracted to the topography of dredged canals and basins can be adversely impacted by
altered water quality conditions that occur there. Major canals connecting estuarine areas and coastal
lakes attract fish and sometimes create stressful temperature and oxygen conditions where storm gates
prevent water movement during low flows (W. Laney/USFWS, pers. com., February 2009). The USFWS
and WRC are investigating gate technologies that allow passage of fish even during low flow periods.
Dead-end canals and upland boat basins may also be isolated from riverine flow, causing stagnation
during even normal flows. The CRC currently requires flow studies and facility designs that minimize
stagnation (i.e., basin no deeper than connecting water body). However, some canals augment existing
nursery habitat where they form the headwaters of PNAs and SNAs. A visual GIS evaluation of over
2,400 fish nursery areas (PNA, SNA and IPNAs) suggested that about 40 designated areas were actually
drainage canals (DMF unpub. data, December 2008). Canals classified as fish nursery habitat should
receive the same consideration in permit decisions as naturally occurring designated areas. Equal
protection is justified by a history of unmitigated loss of shallow water habitat to shoreline development.
Upland boat basins in nursery habitat may also attract larvae and juveniles. In CHPP region 1 there are
2010 Coastal Habitat Protection Plan
Chapter 2. Water Column Page 88
nearly 200 miles of canals and boat basins, based on SHA assessment. These 200 miles are in addition to
the nearly 8,000 miles of lowland streams in Region 1.
While dredging has water quality impacts, it has been used in some instances to enhance water quality by
improving circulation. The mouths of many creeks along the Atlantic Intracoastal Waterway have
shoaled in with sediment from suspension and settlement of sediment from dredging and boat wakes. In
1995 and 1996, the mouth of Futch Creek, in New Hanover County, was dredged to increase flushing,
lower bacteria levels, and improve water quality. Fecal coliform levels declined and additional acreage
was opened to shellfish harvesting. The creek has continued to maintain good water quality, in terms of
fecal coliform, since the mouth of the channel was dredged (Mallin et al. 2002a, Mallin et al. 2008).
However, when Bald Head creek was similarly dredged to reduce bacterial contamination, the dredging
was unsuccessful and resulted in no water quality improvements (R. Carpenter/DMF, pers. Com. 2009).
Navigational channels were dredged through most major coastal water bodies in North Carolina by the
USACE in the 1930s to create the North Carolina portion of the Intracoastal Waterway. Dredging for
access to other public facilities is also financed by the NC Division of Water Resources. The DOT
maintains most of the channels associated with the ferry system. And there are dozens of privately
maintained channels serving marinas and private docking facilities. The two major commercial shipping
ports in North Carolina, located in Morehead City and Wilmington, have extensive areas of dredged
channels and basins (38 – 45 ft deep). The locations of dredge channels, marinas, and 10-slip docks are
shown in Map 2.8a-ba-c. The primary dredging activities occurring within North Carolina‘s coastal
waters are maintenance or improvement dredging of existing navigation channels (DEHNR 1995a). The
maintenance frequency for most channels ranges from annually to intervals of 10 years or more.
Dredging in estuarine waters is prohibited from April 1 to October 1 to avoid disturbing the bottom in
nursery areas when juvenile fish are present, except in specific areas where dredging is allowed during the
moratorium period. The USACE maintains the federal waterways within North Carolina by dredging
sediments from the channels with Government-owned sidecast and hopper dredges, industry-owned
hydraulic pipeline dredges, and hopper dredges. The size and type of dredge to be used to perform the
work are dependent on the channel dimensions and material disposal methods. Timing of all work is
dependent upon the area to be maintained, the type of equipment to be used, and the anticipated
environmental effects. Disposal of material is dependent on the type of dredge used to perform the work.
Material dredged by sidecast is deposited on either side of the channel. Hopper dredges place the material
in the nearshore zone (10-18 foot contour), on the beach with direct pumpout capabilities, or in an EPA
designated ocean dredged material disposal site. Material dredged by a hydraulic pipeline dredge may be
placed on the nearby beaches or within a confined upland diked disposal site. Beneficial uses of dredge
spoil include in enhancement and restoration of marsh islands being lost to sea level rise and the
interruption of barrier island over-wash with beach-front development (see ―Wetland‖ and ―Submerged
Aquatic Vegetation‖ chapters for more information).
2.4.1.5. Mining
In coastal North Carolina, there are surface, open pit mines for sand/gravel, crushed stone, and phosphate.
Sand/gravel and crushed stone mines occur generally in upland areas, although some may be located in or
adjacent to wetlands (M. Street/DMF, pers. com., 2004). The open pits created by coastal mines fill with
groundwater that is often pumped into ditches and rivers during excavation (G. Cooper/DWR, pers. com.,
2004). Many mine sites are in the vicinity of rivers and estuaries
(http://www.dlr.enr.state.nc.us/pages/permittedmines.html, November 2009). The discharge can contain
sediment, nutrients, and heavy metals. Although mining was the source implicated in only 0.5% of
impaired streams in coastal draining river basins in the DWQ (2006) Integrated 305(b)/303(d) report, if
2010 Coastal Habitat Protection Plan
Chapter 2. Water Column Page 89
more resources could be applied to required monitoring, checking for compliance, or incorporating
monitoring results in the BIMS, then perhaps the impacts from mining would traceable.
Sand/gravel mines are the most common mine in coastal North Carolina. Data from DLR for 2009
indicate 634 active and inactive mines in the CHPP management area, with 302 located in CAMA
counties. Of the 271 active mines in CAMA counties, there are 262 permits for sand/gravel mining, 8
permits for crushed stone mining, and 1 permit for phosphate mining. The number of mines in CAMA
counties has changed very little since 2000. The phosphate mining permit, which includes 12,140 acres
along and within the Pamlico River in Beaufort County, is now owned by PCS Phosphate, (see ―Mining‖
section of ―Wetland‖ chapter for more information). The phosphate mine is the largest wastewater
discharger among all coastal NC mining operations. In addition to substantial stream and wetland
impacts due to excavation, before 1992, this mine was discharging 50-60 million gallons/day of
phosphate-rich water into Pamlico Sound contributing to eutrophication of the Pamlico River (Steel
1991). Since 1992, PCS Phosphate uses a water recycling process that has reduced discharge of nutrients
by over 90% (USACE/PCS Phosphate DEIS, 2006).
In addition to open pit mining near rivers and ditches, there is also mining of marine soft bottom for beach
nourishment sand (see ―Soft bottom‖ chapter for more information on beach nourishment) and mining
riverine soft bottom near old saw mills for ancient logs. Log salvage operations have been permitted in
the Cape Fear, Roanoke, and Perquimans rivers (Street et al. 2005). The Log Salvage Policy
Development Team was created by DENR in 1999, in response to growing interest by commercial
operations in this industry, to assess the potential impacts of this activity and to establish the most
appropriate permit process (DENR 2000c). The removal of ancient logs removal large woody debris
from the system and may impact water quality of anadromous fish habitat. Log salvaging in areas of
contaminated sediment could allow pollutants to re-enter the water column. However, this resuspension
of sediment is a temporary impact from a relatively minor industry.
2.4.1.6. Jetties and groins
Jetties and groins are both hardened structures positioned perpendicular from shore to control sand
movement. In association with inlets, these structures can potentially interfere with the passage of larvae
and early juveniles from offshore spawning grounds into estuarine nursery areas because successful
transport of larvae through the inlet occurs within a narrow zone parallel to the shoreline and is highly
dependent on along-shore transport processes (Blanton et al. 1999; Churchill et al. 1999; Hare et al.
1999). Obstacles such as jetties adjacent to inlets block the natural passage for larvae into inlets and
reduce recruitment success (Kapolnai et al. 1996; Churchill et al. 1997; Blanton et al. 1999). Offshore
spawning, estuarine-dependent species that could be impacted by jetties include many of North Carolina‘s
most important commercial and recreational fish species such as menhaden, spot, Atlantic croaker,
shrimp, gag, black sea bass, and flounders (see ―Marine spawning‖ subsection of ―Ecological Role and
Function‖ section for more information).
Impacts from jetties and groins may be greatest in coastal areas like the Outer Banks, where there are few
inlets. Miller (1992) and Settle (NMFS, unpub. data), in reviewing the potential impacts of a dual jetty
system at Oregon Inlet, estimated that successful passage of winter-spawned, estuarine-dependent larvae
through Oregon Inlet could be reduced 60-100%. The Environmental Impact Statement (USACE 1999)
for the Oregon Inlet project concluded the jetties should not be constructed because of, among other
concerns, the impact of jetties on larval fish passage. Although there is uncertainty regarding the
magnitude of fisheries impacts, jetties and groins would likely reduce larval recruitment into estuarine
nurseries (Kapolnai et al. 1996; Churchill et al. 1997; Blanton et al. 1999). Research is needed to
determine when and where recruitment to adult fish stocks is limited by larval ingress to estuarine
2010 Coastal Habitat Protection Plan
Chapter 2. Water Column Page 90
nursery habitats. Without conclusive research, changes to North Carolina‟s policy on prohibition of
shoreline hardening structures on the oceanfront should be considered very carefully.
Most of North Carolina‘s inlets do not have jetties. There is a long dual jetty system at Masonboro Inlet,
single groins at Beaufort and Oregon inlets, and a groin field on Bald Head Island (see Map 6.3a-c in the
Soft Bottom chapter). There is also a jetty at Cape Lookout, although it is not immediately adjacent to
Barden‘s Inlet. State law currently prohibits the construction of groins for shoreline protection along
North Carolina‘s ocean beaches. However, pressure from littoral local governments and resulting
legislative action has re-opened the possibility of groins for protecting beach property. Session Law
2009-479 mandated that the CRC conduct a study on the feasibility advisability of the use of terminal
groins, and present a report to the Environmental Review Commission and the General Assembly by
April 1, 2010. The bill directs the CRC to consider the effectiveness of terminal groins constructed in
North Carolina and other states in controlling erosion, scientific data regarding the impact of terminal
groins on the environment and natural wildlife habitats, and information on the economics of terminal
groins. The study will compile information on the effectiveness and impacts of five existing groin
structures at five inlets: Oregon Inlet and Beaufort Inlet in North Carolina, Amelia Island/Nassau Sound,
northeast Florida, and Captiva Island and St John‘s Pass, west coast Florida. The long-term consequences
of hardened structures on larval transport and recruitment should be thoroughly assessed.
Environmental outreach regarding the effect of inlet stabilization on coastal fish habitat is needed to
educate public stakeholders (fishing communities and coastal property owners) on this issue and gain
support for maintaining natural barrier island processes.
2.4.1.7. Shoreline stabilization
Shoreline stabilization using vertical structures, such as seawalls on the ocean shoreline or bulkheads on
the estuarine shoreline, can impact the condition of the nearshore water column by scouring along the toe
and sides of the structure. Other impacts are to adjoining wetlands, SAV, and shallow soft bottom. The
impacts of stabilization along the estuarine and ocean shoreline are primarily discussed in the ―Wetland‖
and ―Soft bottom‖ chapters, respectively.
2.4.1.8. Fishing gear impacts
Fishing gear is not a major threat to the condition of the water column. Mobile bottom disturbing gear
can resuspend sediment and associated contaminants in the sediment, causing temporary turbidity (see
soft bottom chapter for more information). Corbett et al (2004) in examining the effect of trawling on
water quality, found that trawling increased total suspended sediment 1.5 – 3 times above background
concentrations for less than one day, and had minor impacts on nutrient and chlorophyll a concentrations.
Wind forced water circulation played a greater role in mixing the water column and altering nutrient and
sediment characteristics of the water.
Entanglement gear, such as gill nets, do not cause bottom disturbance and are size selective, allowing
smaller species to pass through. However, certain sized gill nets can unintentionally capture larger non-
targeted species. DMF data has found that the large mesh gill net fishery in certain locations and times
was resulting in sea turtle deaths. The gill nets in these cases are impeding the function of the water
column as a corridor for migration of protected species. DMF is actively working to address this
situation and should develop a comprehensive plan to minimize impacts to protected species.
2.4.2. Water quality degradation – sources
Changes in chemistry causing degradation of water quality can originate from defined points such as
industrial or wastewater discharges (point sources) or from land-use patterns contributing pollutants by
2010 Coastal Habitat Protection Plan
Chapter 2. Water Column Page 91
sheet flow or through drainage features (nonpoint sources). The primary pollutants are oxygen-
consuming wastes, nutrients, suspended sediment, and toxins (including chlorine, ammonia, and metals).
A National Pollution Elimination System (NPDES) permit is needed for individually significant point
source discharges, and most NPDES discharges are treated municipal or industrial wastewater. Nonpoint
source pollution is pollution that enters waters through diffuse sources with no defined point of entry.
Nonpoint pollutants are generally carried into waters by rainfall, runoff, groundwater seepage, or
atmospheric deposition. Unlike point sources, nonpoint pollutant loading varies with weather patterns
and land disturbance. The concentration of point source pollutants in streams tends to increase under low
flow or drought conditions.
Tracking sources of pollutants is generally more difficult than measuring pollutants levels in the water.
The difficulty is implied by the unspecified source of pollutants in 28% of streams and 100% of estuaries
in coastal draining river basins of North Carolina. Of the 72% of streams with specified sources of
impairment, 27% were point sources and 73% were non-point sources. The USGS and University
research programs have attempted to allocate nutrient sources in the Albemarle-Pamlico and Cape Fear
systems, where there is extensive water quality monitoring (see ―Nutrients and eutrophication‖ section for
more information). Pollution source/pollutant contribution modeling should be used to support DWQ
assessment of impairment sources. Such modeling should also be used to evaluate impairment where
water quality data is lacking. The attribution of pollution sources is a vital component in developing
Local Watershed Plans and TMDLs, which could be applied to the management of cumulative impacts.
2.4.2.1. Point sources
Discharges that enter surface waters through a pipe, ditch, or other well-defined point of discharge are
broadly referred to as ―point sources.‖ By this definition, point sources include not only industrial and
municipal discharge pipes, but also the myriad of ditches draining coastal watersheds and some marina
basins. The regulatory definition is based on state and federal wastewater and stormwater rules and
includes municipal (city and county) and industrial wastewater treatment plants, small domestic
wastewater treatment systems, and reverse osmosis water treatment plants (see ―Other causes of water
quality degradation‖ for more information). As exemplified by recent studies in the Neuse River basin, in
watersheds with increasing human population such point sources continue to be large contributors to
nutrient loading to estuarine waters (Rothenberger et al. 2009b). Point source dischargers in North
Carolina must apply and obtain a National Pollutant Discharge Elimination System (NPDES) permit, and
comply with applicable Nutrient Management Strategies and stormwater rules (see ―Non-point source
management‖ subsection of ―Land-use and non-point sources‖ section for more information). Discharge
permits are issued under the NPDES program, delegated to the DWQ by the Environmental Protection
Agency (EPA). The NPDES program also has non-discharging and stormwater components, which
address primarily water treatment (see ―Water withdrawal‖ section for more information), groundwater
remediation, and non-point source pollution (see Land use and non-point sources‖ section for more
information). As of 2009, the NPDES general permit for discharging stormwater also includes marinas as
a point source.
Point sources of pollution discharges are managed by NPDES permit conditions, Total Maximum Daily
Load (TMDL) allocations and Notices and Violation (NOV). Permit conditions require discharges to
maintain water quality standards at the outlet pipe. Failing to meet water quality standard could lead to a
NOV. Load limits are also placed on point sources with specific TMDLs allocations. In 2002, the DWQ
set a goal of developing TMDLs for all impaired waters within 10 years of their first placement on the
North Carolina 303(d) list (http://h2o.enr.state.nc.us/tmdl/General_TMDLs.htm, November 2009). The
TMDLs for impaired waters are currently at many different stages on the path to EPA approval. Some
require additional data collection to adequately define the problem in TMDL terms. Some require more
outreach to increase stakeholder involvement. Others need to have a technical strategy budgeted, funded,
2010 Coastal Habitat Protection Plan
Chapter 2. Water Column Page 92
and scheduled. Some are ready for EPA submittal. Having defined pollutant allocations maintaining
water quality conditions is a vital tool for coastal habitat protection. However, the water quality standards
and available monitoring do not necessarily correspond to the needs of sensitive estuarine indicators (i.e.,
submerged aquatic vegetation; see ―Assessment needs relative to aquatic life‖ section and ―Submerged
Aquatic Vegetation‖ chapter for more information). Further comparison of water quality standards and
water quality needs for estuarine aquatic life is provided in the following sections on nutrients, sediment,
and toxic chemicals.
In the CHPP management area, there are 317 and 181 permitted discharges of municipal/domestic and
industrial wastewater, respectively (Table 2.26). Over half the NPDES discharges are in the coastal
plains (Map 2.6). Permitted wastewater accounted for 20% of impaired streams in coastal draining river
basins in 2006 (see ―Status and trends‖ section for more information). The contribution of permitted
wastewater to shellfishing closures was not listed in the 2006 DWQ assessment. The DEH requires
closures around all NPDES wastewater discharges due to the possibility that mechanical failure could
allow inadequately treated sewage to reach shellfish waters. However, the DEH automatically closes
waters to shellfish harvesting in most marina basins due to high potential for shellfish contamination.
Sanitary surveys conducted by DEH (Shellfish Sanitation and Recreational Water Quality Section)
implicated permitted discharges and marina closures as the primary source of microbial contamination in
about 10% of shellfishing areas sampled (G. Gilbert/DEH, pers. com., 2002). Current EMC rules
discourage creation of new direct discharges into shellfish waters [EMC rule 15A NCAC 2B .0224]. In
fact, there has been a trend to remove some direct discharges, such as in the New River, and dispose of
treated effluent on land.
There are also episodic discharges of raw sewage into estuarine waters resulting in elevated biological
oxygen demand and microbial contamination. From 2002-2009, the amount of sewage spilled in coastal
waters ranged from 0.5 million to over 10 million gallons per year (Table 2.27, DWQ unpub. data, 2009).
In wet years, the totals are generally larger due to storm sewer overflows. Counties with over one million
gallons spilled in a year included Pasquotank, Onslow, and New Hanover. The volume of spills is
estimated by the violators and is probably underestimated (K. Glazier/DWQ, pers. com., December
2009). Loading of pollutants into coastal waters from mechanical failures, spills, and inadequate
treatment must be reduced. This will require additional funding to upgrade plants and infrastructure.
Increased inspections of sewage treatment facilities, collection infrastructure, land disposal sites, and
onsite wastewater treatment facilities are needed to identify and prioritize sites needing upgrades. Since
the 2005 CHPP, Wilmington and New Hanover County experienced a series of large spills due to failing
infrastructure and high usage. A 3,000,000 gallon raw sewage spill into Hewletts Creek resulted in strong
hypoxia and large fish kills, algal blooms from nutrient inputs, fecal microbial contamination of the water
and sediments, waterfowl kills (presumably from pathogenic microbes) and lengthy shellfishing and
swimming waters closures (Mallin et al. 2007). The city was issued multiple fines and now has a SOP.
Work is partially completed to upgrade sewer lines. DWQ‘s strict enforcement helped facilitate getting
infrastructure improvements completed. Enforcement of high fines should be consistently used by DWQ
to encourage proactive maintenance of sewage infrastructure and plants. In 2010, HB 1746 established a
Water Infrastructure Information Needs Task Force to develop a statewide survey on water and
wastewater infrastructure needs, and develop a plan to address resources and funding needed for that.
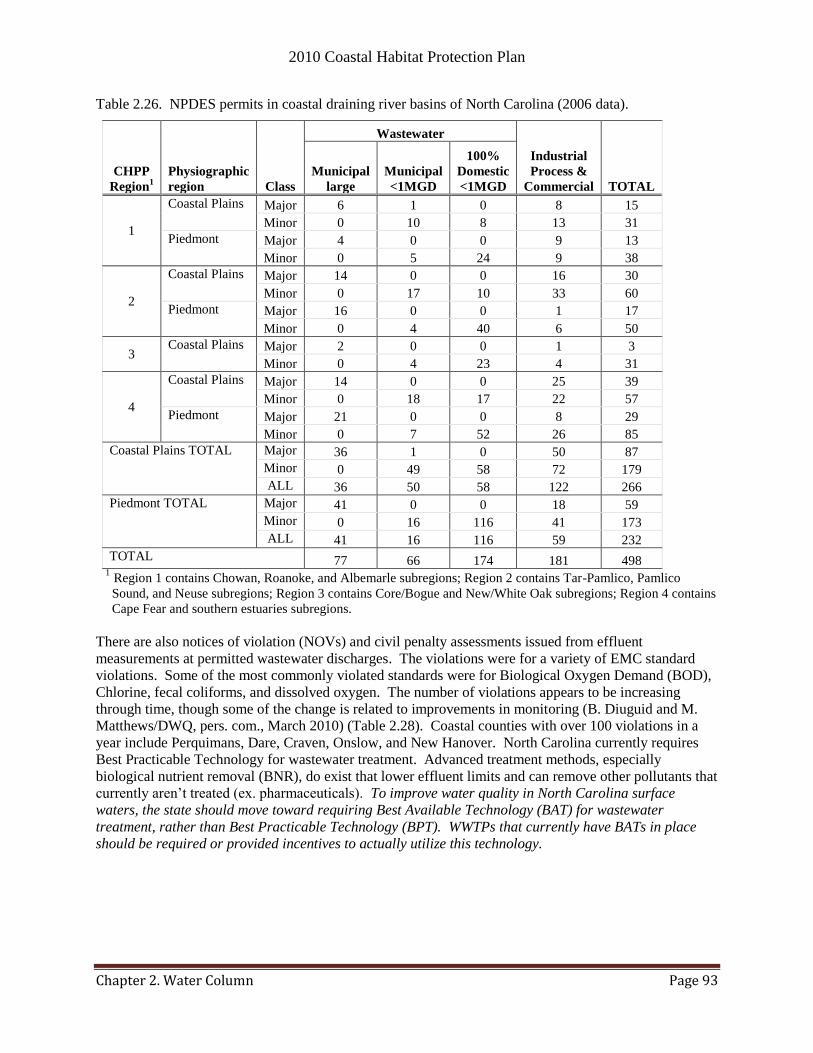
2010 Coastal Habitat Protection Plan
Chapter 2. Water Column Page 93
Table 2.26. NPDES permits in coastal draining river basins of North Carolina (2006 data).
CHPP
Region1
Physiographic
region Class
Wastewater
Industrial
Process &
Commercial TOTAL
Municipal
large
Municipal
<1MGD
100%
Domestic
<1MGD
1
Coastal Plains Major 6 1 0 8 15
Minor 0 10 8 13 31
Piedmont Major 4 0 0 9 13
Minor 0 5 24 9 38
2
Coastal Plains Major 14 0 0 16 30
Minor 0 17 10 33 60
Piedmont Major 16 0 0 1 17
Minor 0 4 40 6 50
3 Coastal Plains Major 2 0 0 1 3
Minor 0 4 23 4 31
4
Coastal Plains Major 14 0 0 25 39
Minor 0 18 17 22 57
Piedmont Major 21 0 0 8 29
Minor 0 7 52 26 85
Coastal Plains TOTAL Major 36 1 0 50 87
Minor 0 49 58 72 179
ALL 36 50 58 122 266
Piedmont TOTAL Major 41 0 0 18 59
Minor 0 16 116 41 173
ALL 41 16 116 59 232
TOTAL 77 66 174 181 498 1 Region 1 contains Chowan, Roanoke, and Albemarle subregions; Region 2 contains Tar-Pamlico, Pamlico
Sound, and Neuse subregions; Region 3 contains Core/Bogue and New/White Oak subregions; Region 4 contains
Cape Fear and southern estuaries subregions.
There are also notices of violation (NOVs) and civil penalty assessments issued from effluent
measurements at permitted wastewater discharges. The violations were for a variety of EMC standard
violations. Some of the most commonly violated standards were for Biological Oxygen Demand (BOD),
Chlorine, fecal coliforms, and dissolved oxygen. The number of violations appears to be increasing
through time, though some of the change is related to improvements in monitoring (B. Diuguid and M.
Matthews/DWQ, pers. com., March 2010) (Table 2.28). Coastal counties with over 100 violations in a
year include Perquimans, Dare, Craven, Onslow, and New Hanover. North Carolina currently requires
Best Practicable Technology for wastewater treatment. Advanced treatment methods, especially
biological nutrient removal (BNR), do exist that lower effluent limits and can remove other pollutants that
currently aren‘t treated (ex. pharmaceuticals). To improve water quality in North Carolina surface
waters, the state should move toward requiring Best Available Technology (BAT) for wastewater
treatment, rather than Best Practicable Technology (BPT). WWTPs that currently have BATs in place
should be required or provided incentives to actually utilize this technology.
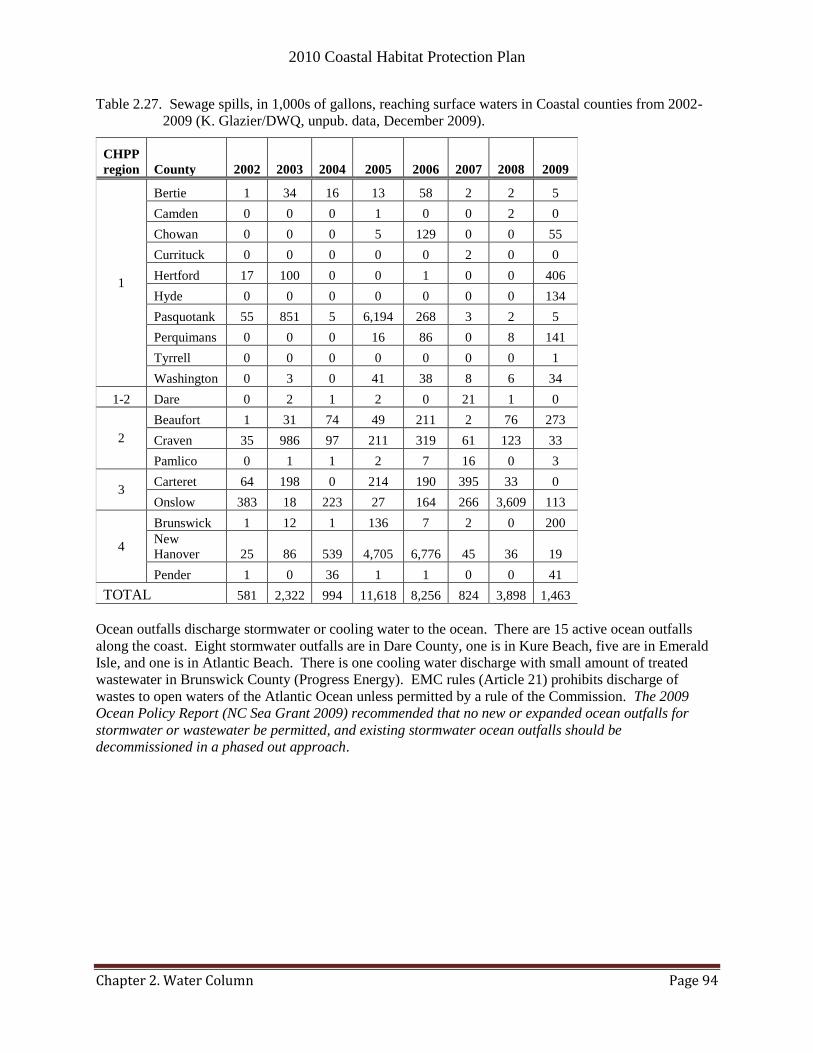
2010 Coastal Habitat Protection Plan
Chapter 2. Water Column Page 94
Table 2.27. Sewage spills, in 1,000s of gallons, reaching surface waters in Coastal counties from 2002-
2009 (K. Glazier/DWQ, unpub. data, December 2009).
CHPP
region County 2002 2003 2004 2005 2006 2007 2008 2009
1
Bertie 1 34 16 13 58 2 2 5
Camden 0 0 0 1 0 0 2 0
Chowan 0 0 0 5 129 0 0 55
Currituck 0 0 0 0 0 2 0 0
Hertford 17 100 0 0 1 0 0 406
Hyde 0 0 0 0 0 0 0 134
Pasquotank 55 851 5 6,194 268 3 2 5
Perquimans 0 0 0 16 86 0 8 141
Tyrrell 0 0 0 0 0 0 0 1
Washington 0 3 0 41 38 8 6 34
1-2 Dare 0 2 1 2 0 21 1 0
2
Beaufort 1 31 74 49 211 2 76 273
Craven 35 986 97 211 319 61 123 33
Pamlico 0 1 1 2 7 16 0 3
3 Carteret 64 198 0 214 190 395 33 0
Onslow 383 18 223 27 164 266 3,609 113
4
Brunswick 1 12 1 136 7 2 0 200
New
Hanover 25 86 539 4,705 6,776 45 36 19
Pender 1 0 36 1 1 0 0 41
TOTAL 581 2,322 994 11,618 8,256 824 3,898 1,463
Ocean outfalls discharge stormwater or cooling water to the ocean. There are 15 active ocean outfalls
along the coast. Eight stormwater outfalls are in Dare County, one is in Kure Beach, five are in Emerald
Isle, and one is in Atlantic Beach. There is one cooling water discharge with small amount of treated
wastewater in Brunswick County (Progress Energy). EMC rules (Article 21) prohibits discharge of
wastes to open waters of the Atlantic Ocean unless permitted by a rule of the Commission. The 2009
Ocean Policy Report (NC Sea Grant 2009) recommended that no new or expanded ocean outfalls for
stormwater or wastewater be permitted, and existing stormwater ocean outfalls should be
decommissioned in a phased out approach.
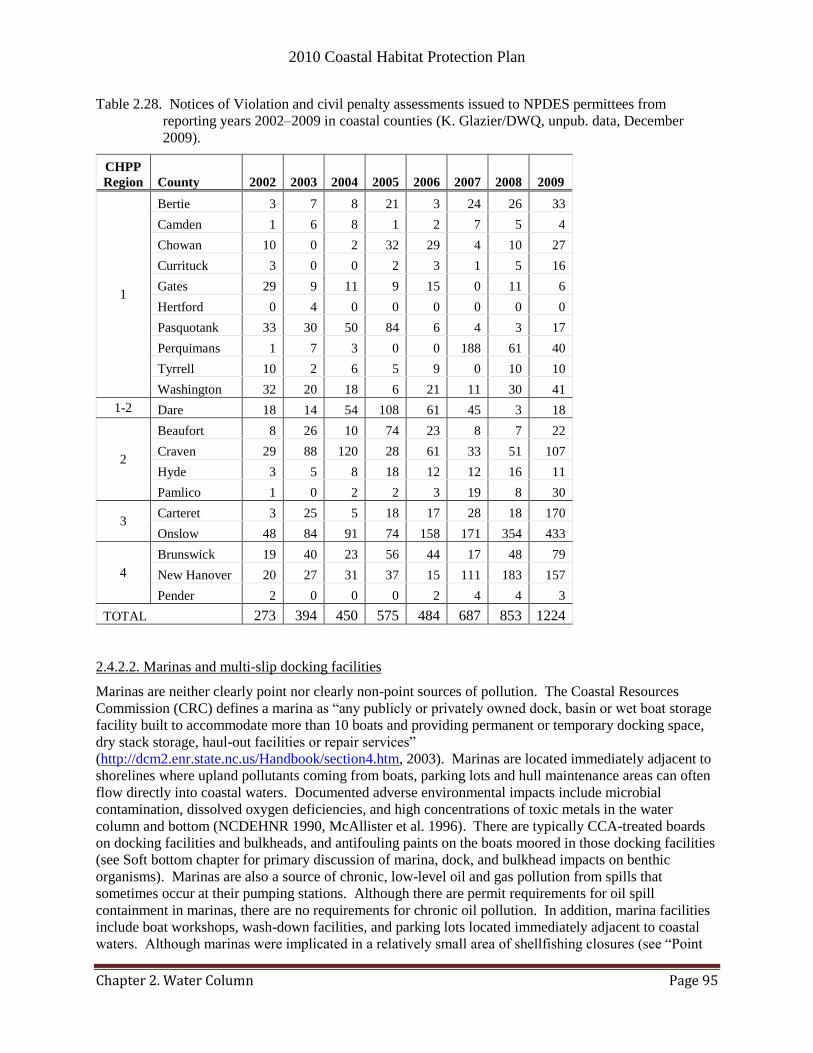
2010 Coastal Habitat Protection Plan
Chapter 2. Water Column Page 95
Table 2.28. Notices of Violation and civil penalty assessments issued to NPDES permittees from
reporting years 2002–2009 in coastal counties (K. Glazier/DWQ, unpub. data, December
2009).
CHPP
Region County 2002 2003 2004 2005 2006 2007 2008 2009
1
Bertie 3 7 8 21 3 24 26 33
Camden 1 6 8 1 2 7 5 4
Chowan 10 0 2 32 29 4 10 27
Currituck 3 0 0 2 3 1 5 16
Gates 29 9 11 9 15 0 11 6
Hertford 0 4 0 0 0 0 0 0
Pasquotank 33 30 50 84 6 4 3 17
Perquimans 1 7 3 0 0 188 61 40
Tyrrell 10 2 6 5 9 0 10 10
Washington 32 20 18 6 21 11 30 41
1-2 Dare 18 14 54 108 61 45 3 18
2
Beaufort 8 26 10 74 23 8 7 22
Craven 29 88 120 28 61 33 51 107
Hyde 3 5 8 18 12 12 16 11
Pamlico 1 0 2 2 3 19 8 30
3 Carteret 3 25 5 18 17 28 18 170
Onslow 48 84 91 74 158 171 354 433
4
Brunswick 19 40 23 56 44 17 48 79
New Hanover 20 27 31 37 15 111 183 157
Pender 2 0 0 0 2 4 4 3
TOTAL 273 394 450 575 484 687 853 1224
2.4.2.2. Marinas and multi-slip docking facilities
Marinas are neither clearly point nor clearly non-point sources of pollution. The Coastal Resources
Commission (CRC) defines a marina as ―any publicly or privately owned dock, basin or wet boat storage
facility built to accommodate more than 10 boats and providing permanent or temporary docking space,
dry stack storage, haul-out facilities or repair services‖
(http://dcm2.enr.state.nc.us/Handbook/section4.htm, 2003). Marinas are located immediately adjacent to
shorelines where upland pollutants coming from boats, parking lots and hull maintenance areas can often
flow directly into coastal waters. Documented adverse environmental impacts include microbial
contamination, dissolved oxygen deficiencies, and high concentrations of toxic metals in the water
column and bottom (NCDEHNR 1990, McAllister et al. 1996). There are typically CCA-treated boards
on docking facilities and bulkheads, and antifouling paints on the boats moored in those docking facilities
(see Soft bottom chapter for primary discussion of marina, dock, and bulkhead impacts on benthic
organisms). Marinas are also a source of chronic, low-level oil and gas pollution from spills that
sometimes occur at their pumping stations. Although there are permit requirements for oil spill
containment in marinas, there are no requirements for chronic oil pollution. In addition, marina facilities
include boat workshops, wash-down facilities, and parking lots located immediately adjacent to coastal
waters. Although marinas were implicated in a relatively small area of shellfishing closures (see ―Point

2010 Coastal Habitat Protection Plan
Chapter 2. Water Column Page 96
sources‖ section for more information), development pressures associated with them can be more
threatening (e.g., increased boating, upland development, and shoreline stabilization). Boats within
marinas or anchored outside of marinas can be sources of fecal microbial contamination (from boat head
discharge) to nearby recreational waters, as has been determined recently for the Town of Wrightsville
Beach (Sobsey et al. 2003; Mallin et al. 2009).
Since the 2005 CHPP, DWQ obtained additional information on toxin inputs associated with marinas.
Marinas, boatyards, and boat manufacturers often provide services such as boat maintenance, wastewater
pumpout, pressure washing, sanding, and painting that can lead to introduction of toxins into adjacent
waters. To assess the types of activities ongoing in marina facilities along the coast and potential water
quality concerns, DWQ conducted a survey of 141 marina facilities in the 20 coastal counties in 2007
(DWQ 2008b). Of 112 marinas and 52 boatyards, 51 were permitted by a NPDES stormwater permit and
29% of the facilities inspected, generated process wastewater from pressure washing or rinsing activities.
Levels of copper, iron, zinc, and aluminum in the wastewater were significantly elevated, and lead,
nickel, chromium, arsenic, and cadmium were elevated to a lesser extent. High metal concentrations were
attributed to sloughing of residual paints from boat hulls during washing, with pressure washing
contributing significantly greater loading of copper, zinc, and aluminum. Boats with ―bottom paint‖
designed to prevent marine life growth on boat hulls, have the highest concentrations of metals in process
wastewater, compared to water from boats without bottom paint. The DWQ report concluded that due to
the extremely high concentrations of metals in the powerwashing process of wastewater, and since the
majority of these operations were located immediately adjacent to coastal surface waters, the
environmental effects of these wastewater streams was a significant concern. The report recommended
that wastewater generated from marinas, boatyards, and manufacturers should be addressed, to prevent
process wastewater from mixing with storm event water by:
1) Elimination of the waste stream
2) The use of other medias (sanding, sand blasting–provided the dry product is captured)
3) Recycle systems
4) Industrial pretreatment and connection to a publicly owned treatment works (POTW)
5) Development of a non-discharge waste system for hand washing operations
6) Development of new service industry designed to collect, treat, perhaps recycle residual
metals, and/or to use these process waters in other industrial production processes.
To address the concerns of the study, DWQ decided to use education and outreach to the marina industry
to provide guidance about how this industry can reduce its impacts to water quality from boat-cleaning
operations. These materials are located at http://h2o.enr.state.nc.us/ws/marinas.htm. The wash water
created from pressure washing and hand washing is defined as a type of wastewater, and therefore must
be handled and treated per the wastewater permitting requirements. Discharging this wastewater to
surface waters without a permit is prohibited and is not allowed in SA waters.
Marinas and boatyards that provide services for boat maintenance, repairing, or building are required to
obtain an NPDES Stormwater General Permit called the NCG190000. This permit was renewed on
October 1, 2009 and contains a few additions and changes that were partially affected by the DWQ study
in 2008. This permit, forms, and the additions and changes to this permit can be found on the Technical
Bulletin provided at http://portal.ncdenr.org/web/wq/ws/su/npdessw#tab-3 (December 2010). They are as
follows:
• Twice per year analytical monitoring of pH, oil & grease, Total Suspended Solids (TSS), copper,
aluminum, lead, and zinc.
• Refinements and clarifications to the SPPP requirements; refer to Part II, Section A.
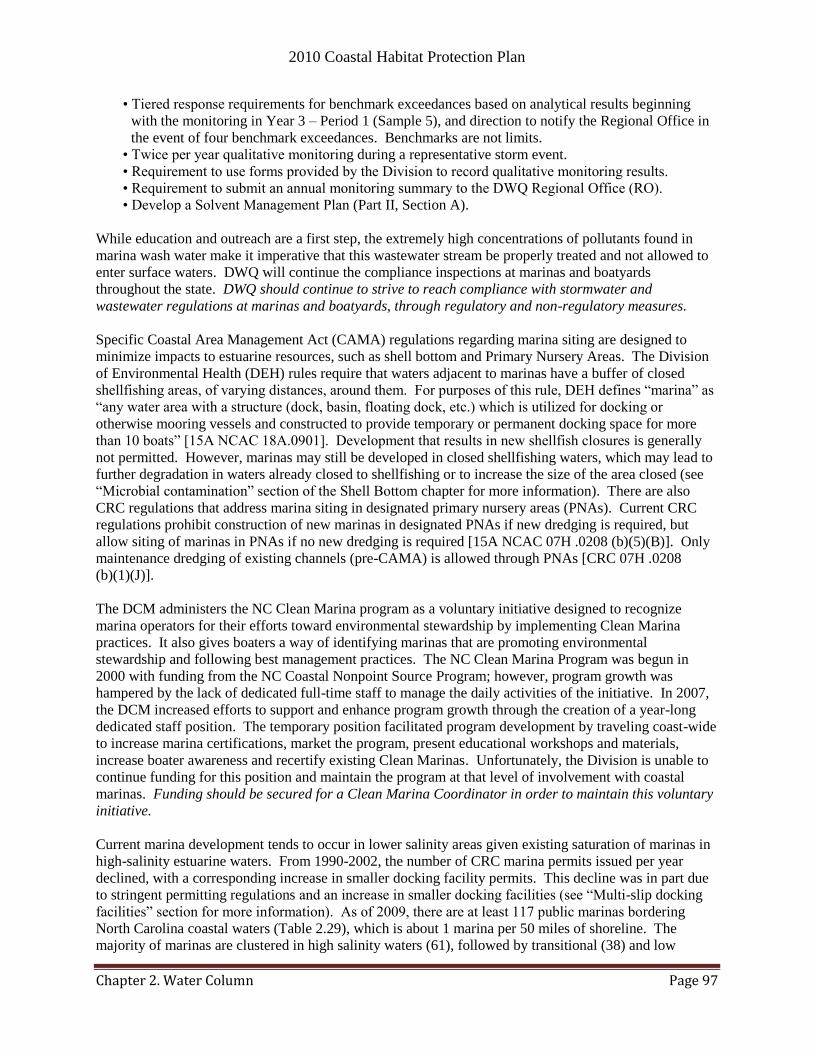
2010 Coastal Habitat Protection Plan
Chapter 2. Water Column Page 97
• Tiered response requirements for benchmark exceedances based on analytical results beginning
with the monitoring in Year 3 – Period 1 (Sample 5), and direction to notify the Regional Office in
the event of four benchmark exceedances. Benchmarks are not limits.
• Twice per year qualitative monitoring during a representative storm event.
• Requirement to use forms provided by the Division to record qualitative monitoring results.
• Requirement to submit an annual monitoring summary to the DWQ Regional Office (RO).
• Develop a Solvent Management Plan (Part II, Section A).
While education and outreach are a first step, the extremely high concentrations of pollutants found in
marina wash water make it imperative that this wastewater stream be properly treated and not allowed to
enter surface waters. DWQ will continue the compliance inspections at marinas and boatyards
throughout the state. DWQ should continue to strive to reach compliance with stormwater and
wastewater regulations at marinas and boatyards, through regulatory and non-regulatory measures.
Specific Coastal Area Management Act (CAMA) regulations regarding marina siting are designed to
minimize impacts to estuarine resources, such as shell bottom and Primary Nursery Areas. The Division
of Environmental Health (DEH) rules require that waters adjacent to marinas have a buffer of closed
shellfishing areas, of varying distances, around them. For purposes of this rule, DEH defines ―marina‖ as
―any water area with a structure (dock, basin, floating dock, etc.) which is utilized for docking or
otherwise mooring vessels and constructed to provide temporary or permanent docking space for more
than 10 boats‖ [15A NCAC 18A.0901]. Development that results in new shellfish closures is generally
not permitted. However, marinas may still be developed in closed shellfishing waters, which may lead to
further degradation in waters already closed to shellfishing or to increase the size of the area closed (see
―Microbial contamination‖ section of the Shell Bottom chapter for more information). There are also
CRC regulations that address marina siting in designated primary nursery areas (PNAs). Current CRC
regulations prohibit construction of new marinas in designated PNAs if new dredging is required, but
allow siting of marinas in PNAs if no new dredging is required [15A NCAC 07H .0208 (b)(5)(B)]. Only
maintenance dredging of existing channels (pre-CAMA) is allowed through PNAs [CRC 07H .0208
(b)(1)(J)].
The DCM administers the NC Clean Marina program as a voluntary initiative designed to recognize
marina operators for their efforts toward environmental stewardship by implementing Clean Marina
practices. It also gives boaters a way of identifying marinas that are promoting environmental
stewardship and following best management practices. The NC Clean Marina Program was begun in
2000 with funding from the NC Coastal Nonpoint Source Program; however, program growth was
hampered by the lack of dedicated full-time staff to manage the daily activities of the initiative. In 2007,
the DCM increased efforts to support and enhance program growth through the creation of a year-long
dedicated staff position. The temporary position facilitated program development by traveling coast-wide
to increase marina certifications, market the program, present educational workshops and materials,
increase boater awareness and recertify existing Clean Marinas. Unfortunately, the Division is unable to
continue funding for this position and maintain the program at that level of involvement with coastal
marinas. Funding should be secured for a Clean Marina Coordinator in order to maintain this voluntary
initiative.
Current marina development tends to occur in lower salinity areas given existing saturation of marinas in
high-salinity estuarine waters. From 1990-2002, the number of CRC marina permits issued per year
declined, with a corresponding increase in smaller docking facility permits. This decline was in part due
to stringent permitting regulations and an increase in smaller docking facilities (see ―Multi-slip docking
facilities‖ section for more information). As of 2009, there are at least 117 public marinas bordering
North Carolina coastal waters (Table 2.29), which is about 1 marina per 50 miles of shoreline. The
majority of marinas are clustered in high salinity waters (61), followed by transitional (38) and low

2010 Coastal Habitat Protection Plan
Chapter 2. Water Column Page 98
salinity (18) (Map 2.8a-b). The greatest numbers of marinas (in descending order) occur in Core/Bogue,
Southern Estuaries, and Neuse subregions. In high and transitional salinity zones, there are currently 30
marinas located within 500 meters of a PNA. Marinas in low-salinity areas are often on smaller water
bodies that may include designated Anadromous Fish Spawning Areas (AFSAs), Inland Primary Nursery
Areas (IPNAs), or undesignated anadromous fish nursery areas (see ―Designations‖ subsection of ―Status
and trends‖ section). There were 18 marinas located within 500 meters of designated AFSAs.
The threat posed to spawning anadromous fish depends on the design of the marina basin. The DWQ
tends to prefer marina boat basins designed with open water basins to enhance flushing, while DCM tends
to prefer marinas designed as upland basins with a dredged connecting channel to minimize impacts to
shoreline vegetation and obstruction of navigational access. Open water basins may encourage use by
young freshwater and anadromous species while also flushing out pollutants. Marina basins created in
upland areas may attract fish larvae and juveniles while accumulating pollutants. Fish kills are often
spotted in off-channel habitats where the morphology of the shoreline creates a virtual trap for pelagic
species such as menhaden (see ―Fish kills‖ subsection of ―Status and trends‖ section for more
information). Studies are needed to compare use of both upland and open water basins by young
anadromous fish. To protect designated AFSAs and IPNAs from marina impacts, dredging for new
marina construction and other marina-related activities should be managed to minimize alteration of
these important functional areas.
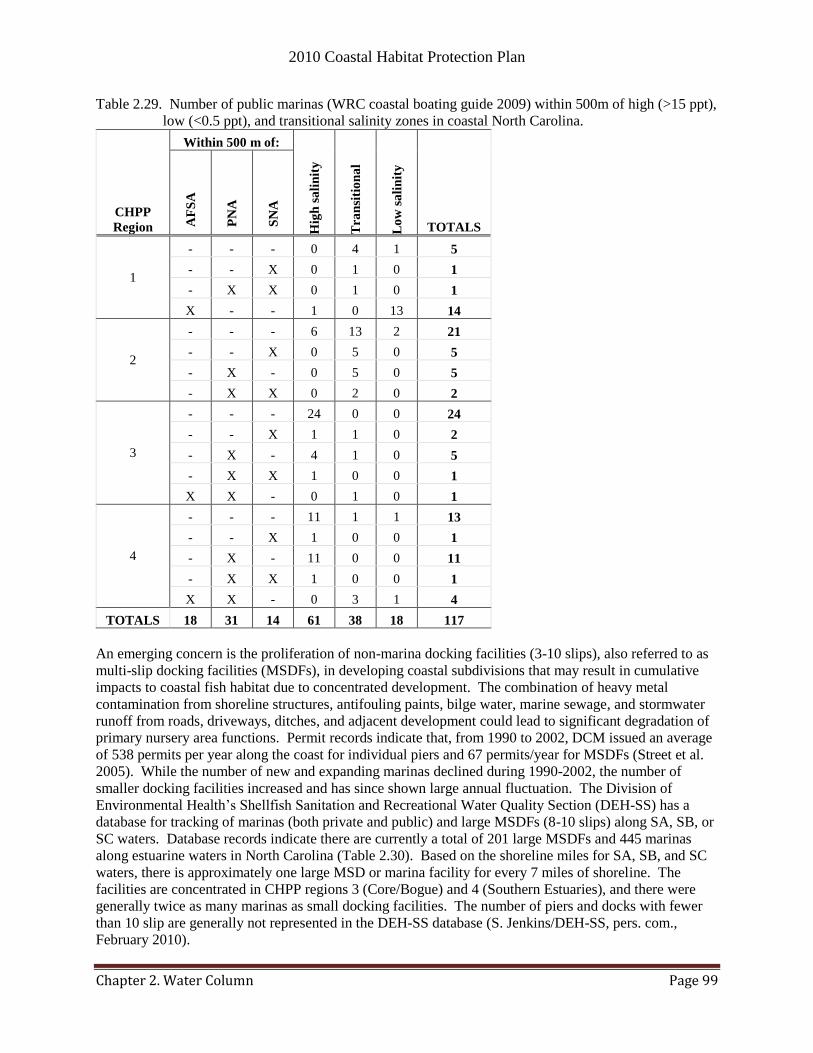
2010 Coastal Habitat Protection Plan
Chapter 2. Water Column Page 99
Table 2.29. Number of public marinas (WRC coastal boating guide 2009) within 500m of high (>15 ppt),
low (<0.5 ppt), and transitional salinity zones in coastal North Carolina.
CHPP
Region
Within 500 m of:
Hig
h s
ali
nit
y
Tra
nsi
tio
na
l
Lo
w s
ali
nit
y
TOTALS AF
SA
PN
A
SN
A
1
- - - 0 4 1 5
- - X 0 1 0 1
- X X 0 1 0 1
X - - 1 0 13 14
2
- - - 6 13 2 21
- - X 0 5 0 5
- X - 0 5 0 5
- X X 0 2 0 2
3
- - - 24 0 0 24
- - X 1 1 0 2
- X - 4 1 0 5
- X X 1 0 0 1
X X - 0 1 0 1
4
- - - 11 1 1 13
- - X 1 0 0 1
- X - 11 0 0 11
- X X 1 0 0 1
X X - 0 3 1 4
TOTALS 18 31 14 61 38 18 117
An emerging concern is the proliferation of non-marina docking facilities (3-10 slips), also referred to as
multi-slip docking facilities (MSDFs), in developing coastal subdivisions that may result in cumulative
impacts to coastal fish habitat due to concentrated development. The combination of heavy metal
contamination from shoreline structures, antifouling paints, bilge water, marine sewage, and stormwater
runoff from roads, driveways, ditches, and adjacent development could lead to significant degradation of
primary nursery area functions. Permit records indicate that, from 1990 to 2002, DCM issued an average
of 538 permits per year along the coast for individual piers and 67 permits/year for MSDFs (Street et al.
2005). While the number of new and expanding marinas declined during 1990-2002, the number of
smaller docking facilities increased and has since shown large annual fluctuation. The Division of
Environmental Health‘s Shellfish Sanitation and Recreational Water Quality Section (DEH-SS) has a
database for tracking of marinas (both private and public) and large MSDFs (8-10 slips) along SA, SB, or
SC waters. Database records indicate there are currently a total of 201 large MSDFs and 445 marinas
along estuarine waters in North Carolina (Table 2.30). Based on the shoreline miles for SA, SB, and SC
waters, there is approximately one large MSD or marina facility for every 7 miles of shoreline. The
facilities are concentrated in CHPP regions 3 (Core/Bogue) and 4 (Southern Estuaries), and there were
generally twice as many marinas as small docking facilities. The number of piers and docks with fewer
than 10 slip are generally not represented in the DEH-SS database (S. Jenkins/DEH-SS, pers. com.,
February 2010).

2010 Coastal Habitat Protection Plan
Chapter 2. Water Column Page 100
Table 2.30. Number of docking facilities along SA, SB, and SC waters with >10 slips (marinas) and 8-10
slips (DEH-SS, unpub. data, December 2009).
CHPP
Region Subregion
Number of slips
TOTALS 8-10 >10
1 Albemarle 18 48 66
2
Neuse 24 54 78
Pamlico Sound 20 35 55
Tar/Pamlico 10 17 27
3 Core/Bogue 51 128 179
New/White Oak 22 41 63
4 Cape Fear 5 10 15
Southern estuaries 51 112 163
TOTALS 201 445 646
Kirby-Smith and White (2006) examined the relationships among estuarine shellfish closures due to fecal
coliform contamination, adjacent shoreline land uses (including non-marina docking facilities,
undeveloped shoreline, old developed shoreline, new developed shoreline, and marinas), and environment
(precipitation events). The 1-year study was conducted in a developing watershed of a small estuary in
central North Carolina. Microbial contamination levels were measured from samples taken bi-weekly
(summer) and monthly (other seasons). Results indicated that old developed shoreline has the highest
bacterial counts followed by newly developed shoreline, marinas, and non-marina docking facilities. The
top three failed to meet NC shellfishing standards, and less than half of the 10-slip marina sites failed to
meet standards. Water level from wide tides was strongly correlated with bacteria levels in the OD,
undeveloped, and non-marina docking facilities. The investigators speculated that inundation of wildlife
habitat and animal feces was the cause. Weekend boat use had no effect on bacterial counts in this
relatively remote area. The researchers stated a need to sample pollutant levels using a strategy to
separate local sources from more remote sources to focus limited restoration/mitigation efforts more
effectively.
As part of 2005-07 CHPP implementations, a workgroup was established to examine the issue of marinas
and multi-slip docking facilities. The Sea Grant Marina Advisory Group completed its report on Multi-
slip docking Facilities (MSDFs) and provided recommendations to the CRC in 2007. The report resulted
in a revised application form for MSDFs (DCM-MP-4) designed to capture information that can be used
to assess the impacts of individual projects. Other recommendations of the study that have been partially
addressed include protecting working waterfronts and public access, and collecting baseline mapping of
sensitive habitats. Recommendations that remain to be addressed include:
Research on cumulative impacts of these small docking facilities and associated development on
pollutant concentrations in the water column,
Review and development of cumulative impact assessment techniques
Once additional information is obtained, development standards for MSDFs, such as limiting in
shallow ecologically sensitive waters, may be considered.
Develop educational materials for property owners, developers, and realtors on ecological
concerns of docking facility construction
The research could be part of a large study predicting receiving water quality from watershed
characteristics (see “Land use and non-point sources” section for more information). The results could
help in defining a rule limiting the ratio of developed public trust bottom to undeveloped shoreline near
shallow nursery habitats.
2010 Coastal Habitat Protection Plan
Chapter 2. Water Column Page 101
2.4.2.3. Land use and non-point sources
Land cover and water quality within a watershed are closely linked. The impact of land-uses on fish
habitat and water quality depends on the location of specific land-uses in the context of watershed
hydrology, which is affected by land surface characteristics (i.e., slope, elevation, soil type) and local
weather conditions (i.e., prevailing winds, precipitation, evapotranspiration). The focus of this section is
primarily the delivery of nutrients, sediment, and toxic chemicals to receiving water (see following
sections on nutrients, sediment, and toxic chemicals for more information on impacts). The 2006
National Land Cover Dataset (NLCD) was not available for use in the 2010 CHPP; consequently this data
has not changed since the 2005 CHPP. Table 2.31 below provides a brief overview of 2001 land-
use/land-cover in CHPP subregions. Developed areas are characterized by a high percentage (30 percent
or greater) of constructed materials. Grassland, forest, and shrubland include upland habitat, whereas
wetlands include periodically saturated areas with more than 20% vegetative cover.
Table 2.31. Land cover and CHPP regions and subregions based on 2001 NLCD.
NLCD land
cover
Region 1 Region 2 Region 3 Region 4
Ch
ow
an
Ro
an
ok
e
Alb
ema
rle
Ta
r-P
am
lico
Neu
se
Pa
mli
co S
ou
nd
Co
re/B
og
ue
New
/Wh
ite
Oa
k
Ca
pe
Fea
r
So
uth
ern
Est
ua
ries
Open water 5.8% 2.6% 32.4% 4.9% 4.2% 73.2% 45.6% 7.9% 1.7% 6.9%
Developed 2.0% 2.4% 0.9% 2.3% 4.7% 0.2% 2.0% 5.5% 4.6% 18.2%
Barren
Land 0.0% 0.2% 0.2% 0.1% 0.2% 0.1% 1.4% 0.6% 0.3% 1.0%
Transitional 0.7% 1.1% 0.1% 1.2% 0.9% 0.0% 0.1% 1.5% 1.1% 0.0%
Upland
Forests 45.9% 61.3% 11.0% 44.3% 41.6% 3.5% 15.3% 45.9% 54.5% 28.0%
Scrubland 0.0% 0.0% 0.0% 0.0% 0.0% 0.0% 0.0% 0.3% 0.0% 4.2%
Grassland/
herbaceous* 0.2% 0.2% 0.1% 0.2% 0.4% 0.0% 0.3% 1.1% 0.3% 10.2%
Planted/
cultivated 28.6% 20.0% 24.3% 29.9% 29.6% 6.5% 12.7% 10.6% 23.0% 8.7%
Wetlands 16.8% 12.2% 31.2% 17.3% 18.3% 16.4% 22.6% 27.0% 14.5% 27.0%
* Mostly "Urban/recreational grasses" subclass
The developed, grassland/herbaceous (urban/recreational grasses), planted/cultivated, and upland forests
(silviculture portion) can be sources of pollution. The most developed CHPP subregions (in descending
order) were the Southern Estuaries (18.2%), New/White Oak (5.5%), Neuse (4.7%), and Cape Fear
(4.6%). Planted or cultivated lands were the most widespread among subregions. The greatest
percentages of planted/cropland area (in descending order) were in the Tar-Pamlico (30%), Neuse (30%),
Chowan (29%), Albemarle (24%), Cape Fear (23%), and Roanoke (20%) subregions. Urban/recreational
grasses (i.e., golf courses) were a significant percentage (10%) of only the Southern Estuaries subregion.
Pollutants from non-point sources are delivered to receiving waters through atmospheric deposition
(including air-borne particles, gases, and precipitation), surface drainage, and groundwater seepage.

2010 Coastal Habitat Protection Plan
Chapter 2. Water Column Page 102
Whereas surface drainage and groundwater seepage can be linked to water quality conditions
downstream, the contribution from atmospheric deposition is more difficult to trace. Sources of
atmospheric pollutants include vehicle exhaust, industrial emissions, and waste from animal operations
(Walker et al. 2000; USGS 2003). Atmospheric deposition was the source implicated in 7.9% of
impaired coastal draining streams in North Carolina (DWQ 2006). The greatest number of streams
impaired from atmospheric deposition occurred in the Roanoke River Basin. A significant portion of
nutrient pollution has also been attributed to atmospheric sources (see ―Nutrients and eutrophication‖
section for more information).
Septic systems that discharge on land near the water can be another source of non-point pollution. Septic
systems can fail during heavy rain events or where they are not properly sited or constructed, the soil is
not suitable, or they are improperly maintained (North Carolina Ocean Resources Task Force 1995).
Degradation of water quality occurs with waste leaching from failing or improperly functioning
drainfields or where septic systems become exposed or located below mean high water due to erosion.
Storm-damaged septic tanks may also cause contamination for a short but concentrated period in localized
areas. Over 200 damaged septic systems were reportedly damaged after Hurricanes Dennis and Floyd (D.
Moffitt/DCM, pers. com., 2002). In the past, the eastern ends of Ocean Isle and Holden Beach have had
to relocate septic tanks and homes on a regular basis following large storm events. Leakage from systems
either with inadequate setbacks from ocean waters due to erosion or not designed to handle heavy use by
renters may cause gradual contamination to nearshore waters. Cahoon et al. (2006) demonstrated that
septic tank leakage in this area has caused elevated fecal coliform and nutrient loading to nearby streams
and tidal creeks. More detailed monitoring is needed to assess the extent oceanfront septic systems are
causing degradation to nearshore coastal waters.
The Shellfish Sanitation & Recreational Water Quality Section within the Division of Environmental
Health documents some failing septic systems along SA, SB, and SC waters as part of their pollution
source surveys for shellfish growing areas. The shoreline surveys are conducted adjacent to estuarine
waters and within certain watersheds in coastal North Carolina. Malfunctioning wastewater systems such
as failing septic systems and gray water discharges as defined in 15A NCAC 18A .1961(a) are identified
and referred to the local Health Department for corrective action. Onsite wastewater issues can be a
significant pollution source in localized areas but remain a small number relative to the number of
inspections made and when compared to other pollution sources. Historically, the percentage of onsite
wastewater issues found during shoreline surveys averages to be 1% to 4% of inspections made (S.
Jenkins/DEH-SS&RWQ, pers. com., August 2010).
To reduce pollutant loading from septic systems, the town of Nags Head implemented a Septic System
Inspection and Tank Pumping Program. This program provides incentives for properly maintaining and
repairing septic systems. The town provides free system inspections and offers a $30 credit for having a
tank pumped as a result of the septic inspection. They also have a low-interest loan program for those
needing to repair or replace their system. The town also maintains a database to track failures, site use,
age of systems, size of tanks, and other information. The program has been very successful and popular
with the community. This program could be used as a model for other coastal communities to follow.
Agricultural sources accounted for 20.9% (row crop production) and 10% (animal management/pastures
and concentrated feeding operations) of stream impairment in 2006 (Table 2.15). Aquaculture was not
specifically listed as a source of impairment. The greatest agriculture impacts were assessed in the Neuse
(496 stream miles), Tar-Pamlico (166 miles), and Cape Fear (131 miles) subregions. These subregions
are also in the top 5 for percentage of agricultural land cover (Table 2.31). The water quality impacts of
silviculture operations are included with land disturbances implicated in <3% of impaired streams in
coastal draining river basins in 2006. Runoff from impervious surfaces was implicated in 10.5% of
impaired streams; mostly in the Neuse (139 miles), Tar/Pamlico (77 miles), and Cape Fear (71 miles)
2010 Coastal Habitat Protection Plan
Chapter 2. Water Column Page 103
river basins. The Southern Estuaries (part of Cape Fear river basin) had the greatest percentage of
developed land-use among CHPP subregions.
Ditches, canals, and vegetated swales (wide, shallow ditches with sloping banks) are watershed features
constructed for surface drainage (Map 2.7). These artificial drainage features can degrade water quality
and alter flow conditions by moving stormwater from uplands more rapidly, causing pulses of stormwater
with lower salinity or high levels of sediment, nutrients, toxic chemicals, or bacteria (Heath 1975; Jones
and Sholar 1981, Maxted et al. 1997; Serafy et al. 1997, White et al. 2000; Cahoon et al. 2006). Pate and
Jones (1981) compared nursery areas that were unaltered and anthropogenically altered by upland
drainage (ditching) and found that brown shrimp, spot, croaker, southern flounder, and blue crab were
more abundant in nursery habitats with no man-made drainage. They attributed this to the unstable
salinity conditions that occurred in areas adjacent to channelized systems following moderate to heavy
rainfall (>1 inch/24 hr). The observed declines in habitat quality were attributed to the changes in flow
characteristics, water quality, and decrease in structural complexity. After several years, however, fishery
landings appeared to return to levels similar to nearby unaffected areas. The recovery could be related to
required wetland and stream restoration in the affected watershed (see ―Status and trends‖ section of the
―Wetland‖ chapter for more information).
On the Pamlico-Albemarle Peninsula, ditch networks through peatlands have replaced intermittent
streams that were historically important to spawning river herring (both in the stream and associated
floodplain and as pathways to natural lakes) (M. Wicker/USFWS, pers. com., February 2010). For
example, the ditching and canal works around Lake Phelps have replaced the seasonal overflow channels
that once existed to concentrate river herring passage into the lake. The USFWS has expressed some
interest in consolidating overflow from the lake into one major canal (i.e., Bee Tree Canal) to promote
fish passage (M. Wicker/USFWS, pers. com., February 2010). Ditching through ―peatlands‖ can also
enhance the release of stored carbon, nitrogen, and mercury (Di Giulio and Ryan 1987;
http://www.ces.ncsu.edu/nreos/forest/feop/AWC2009/proceedings/Ward.html, February 2010).
Restoring hydrology to drained peatlands can prevent these additional pollution sources from entering
coastal waters or the atmosphere. The retention of carbon in restored peatlands bolsters sequestration
efforts aimed at reducing climate change impacts (Henman and Poulter 2008). The TNC‘s climate
change adaption study funding by Duke Power (in cooperation with USFWS) includes the restoration of
peatland hydrology as an integral part of overall site restoration (B. Boutin/TNC, pers. com., 2009). The
project is located on the Pamlico-Albemarle Peninsula.
Water-dependent development, such as dredged navigation channels, boat basins, marinas, docks, and
engineered shoreline stabilization, also contribute to non-point runoff pollution in the water column. The
altered hydrology of dredged channels and boat basins and resulting impact on water quality was
discussed in the, ―Hydrologic modifications,‖ section.
Land use trends
Much of the land around the Albemarle-Pamlico Estuarine System is drained and remains drained to
accommodate existing agriculture and silviculture. It is estimated that over two million acres of land have
been drained and developed for agriculture and silviculture along the North Carolina coast. Within every
square mile of agricultural land in coastal North Carolina, there are estimated to be more than 20 miles of
field ditches, collector canals, and main canals (Heath 1975; Daniel 1978) (Map 2.7). However, North
Carolina agriculture and silviculture lands are currently being replaced with developed land uses
(ENCRPC 2007). Agricultural lands include cropland, pastureland, animal operations, and land-based
aquaculture. According to the US Department of Agriculture‘s 2007 agriculture census, farmland area in
North Carolina has declined from 9.0 to 8.5 million acres during 2002-2009. For animal operations, the
number of swine has remained around 10,000,000 since 1997
2010 Coastal Habitat Protection Plan
Chapter 2. Water Column Page 104
(http://www.nass.usda.gov/Statistics_by_State/North_Carolina/index.asp), the year the moratorium on
new or expansion of swine farms began. For the silviculture industry, ownership has declined by one-
third from 1990 to 2002 (NCDFR 2002).
Ditching and drainage is also associated with development and related infrastructure. Many of the roads
on the Albemarle-Pamlico Peninsula were constructed on top of spoil piles between canals to prevent
flooding. In many urbanized coastal areas, ditches are typically constructed along neighborhood streets,
which drain to nearby coastal waters. These drainage features often connect into headwaters, altering the
natural hydrology of downstream systems.
Unlike agriculture and silviculture, developed land uses have been steadily increasing. Table 2.32 shows
the percent change of urban/built-upon and transportation classifications in 12-digit USGS hydrologic
units (HUs) from 1982 to 1997 (http://www.nc.nrcs.usda.gov/technical/nri/). This was the most recent
NRI data available for comparison. Overall, at least 10 of 26 (38%) USGS hydrologic units in coastal
North Carolina fell below the 10% threshold in 1997, with the highest level of built-upon area (24.8%) in
the Upper Neuse. The Middle Roanoke and Coastal Carolina-Sampit areas experienced the most growth
(131-139%) in built-upon areas. Another coastal hydrologic unit with relatively high growth and percent
built-upon area was Bogue-Core sounds (6-10% impervious and 94-116% growth). Most other coastal
HUs had either low percent built-upon area and moderate growth (Lower Neuse, Pamlico and Albemarle
Sound), very low percent built-upon area and high growth (Pamlico Sound), or high built-upon area and
low growth (New River and portion of southern estuaries). If the rate of increase remains the same as
1982-1997, 17 of 25 HUs (68%) will have exceeded the 10% threshold by 2012.
Rothenberger et al. (2009b) found that in the upper Neuse watershed over the ten-year period, total urban
land cover more than doubled (from 5% to 12%), and high-density urban areas tripled. Suburban sprawl
(low- to medium-density urban as 10-70% impervious surface area) increased by 150%. The major
change in land use for the mid- to lower watershed was in the form of agriculture: croplands decreased
from 23% to 7% of total agriculture, while swine production agriculture increased 285%. These changes
were related to water quality changes in the river and estuary (below).
A means of assessing more recent change in developed land use is through the distribution of stormwater
permits issued from 2001-2009 (Table 2.33), since this permit is required for all developments disturbing
more than one acre of land. The number of stormwater permits issued in CAMA coastal counties has
increased from over 500/year (2001-2004) to around 800/year (2005-2009). The highest ranking counties
in terms of permits per square mile were New Hanover, Onslow, Brunswick, Carteret, and Dare counties.
Comparing the rankings for 2000 population density and 2001-2009 permit density suggests rapidly
growing areas, in terms of built-upon area. The counties ranking lower in 2000 population and higher in
permits included (in descending order) Pamlico, Hyde, Currituck, Dare, and Carteret counties. These
counties represent rapidly growing areas of the Inner and Outer Banks.

2010 Coastal Habitat Protection Plan
Chapter 2. Water Column Page 105
Table 2.32. Percent increase and percent coverage of urban/built-upon + rural transportation land
cover classes within North Carolina's coastal drainages
(http://www.nc.nrcs.usda.gov/technical/nri/).
USGS hydrologic unit
% increase
(1982-1997)
% Urban/built-up and rural transportation1
1997 (measured) 2012 (predicted)
Upper Neuse 91.8 24.8 47.6
Haw 50.21 23.8 35.7
Carolina Coastal-
Sampit 131.58 20.5 47.5
Upper Cape Fear 78.71 15.1 27.0
Deep 47.14 13.2 19.4
Upper Dan 87.04 12.7 23.7
New 33.23 11.9 15.8
Lower Tar 60.82 11.8 19.0
Upper Tar 81.03 10.7 19.3
Roanoke Rapids 77.55 10.3 18.2
Contentnea 51.27 9.5 14.4
Lower Cape Fear 66.5 9.4 15.7
Middle Neuse 43.03 8.9 12.7
Bogue-Core Sounds 89.58 6.8 13.0
Northeast Cape Fear 54.38 6.6 10.2
Middle Roanoke 139.22 6.2 14.7
Lower Dan 92.36 5.8 11.2
Lower Roanoke 41.02 5.8 8.1
Black 62.57 5.6 9.2
Lower Neuse 36.31 5.6 7.6
Pamlico 30.58 5.3 6.9
Meherrin 32.77 4.7 6.3
Albemarle 62.4 4.1 6.6
Chowan 33.33 3.9 5.2
Fishing 28 3.9 5.0
Pamlico Sound 83.72 1.3 2.4
1This land cover classification represents a close approximation of percent impervious
cover, but could somewhat overestimate in some areas. USGS HUs in bold were >10%
urban/built-up and rural transportation in 1997. USGS HUs in italics are predicted to
reach >10% by 2012.
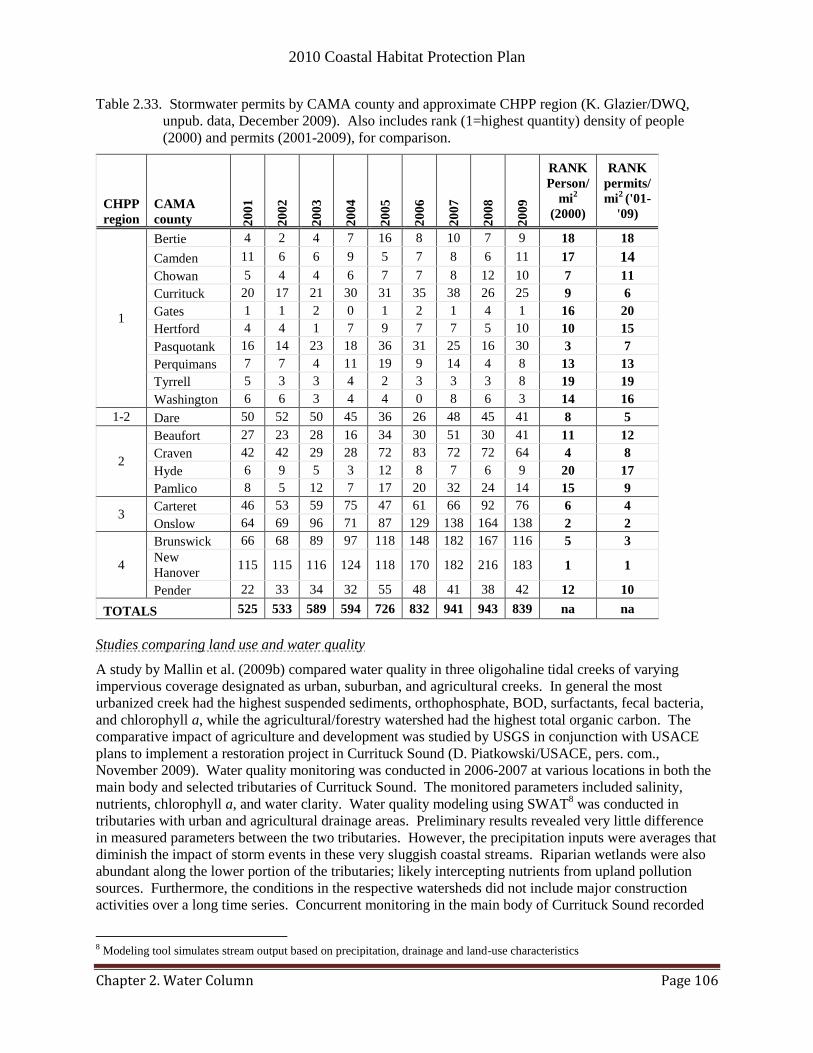
2010 Coastal Habitat Protection Plan
Chapter 2. Water Column Page 106
Table 2.33. Stormwater permits by CAMA county and approximate CHPP region (K. Glazier/DWQ,
unpub. data, December 2009). Also includes rank (1=highest quantity) density of people
(2000) and permits (2001-2009), for comparison.
CHPP
region
CAMA
county 20
01
20
02
20
03
20
04
20
05
20
06
20
07
20
08
20
09
RANK
Person/
mi2
(2000)
RANK
permits/
mi2 ('01-
'09)
1
Bertie 4 2 4 7 16 8 10 7 9 18 18
Camden 11 6 6 9 5 7 8 6 11 17 14
Chowan 5 4 4 6 7 7 8 12 10 7 11
Currituck 20 17 21 30 31 35 38 26 25 9 6
Gates 1 1 2 0 1 2 1 4 1 16 20
Hertford 4 4 1 7 9 7 7 5 10 10 15
Pasquotank 16 14 23 18 36 31 25 16 30 3 7
Perquimans 7 7 4 11 19 9 14 4 8 13 13
Tyrrell 5 3 3 4 2 3 3 3 8 19 19
Washington 6 6 3 4 4 0 8 6 3 14 16
1-2 Dare 50 52 50 45 36 26 48 45 41 8 5
2
Beaufort 27 23 28 16 34 30 51 30 41 11 12
Craven 42 42 29 28 72 83 72 72 64 4 8
Hyde 6 9 5 3 12 8 7 6 9 20 17
Pamlico 8 5 12 7 17 20 32 24 14 15 9
3 Carteret 46 53 59 75 47 61 66 92 76 6 4
Onslow 64 69 96 71 87 129 138 164 138 2 2
4
Brunswick 66 68 89 97 118 148 182 167 116 5 3
New
Hanover 115 115 116 124 118 170 182 216 183 1 1
Pender 22 33 34 32 55 48 41 38 42 12 10
TOTALS 525 533 589 594 726 832 941 943 839 na na
Studies comparing land use and water quality
A study by Mallin et al. (2009b) compared water quality in three oligohaline tidal creeks of varying
impervious coverage designated as urban, suburban, and agricultural creeks. In general the most
urbanized creek had the highest suspended sediments, orthophosphate, BOD, surfactants, fecal bacteria,
and chlorophyll a, while the agricultural/forestry watershed had the highest total organic carbon. The
comparative impact of agriculture and development was studied by USGS in conjunction with USACE
plans to implement a restoration project in Currituck Sound (D. Piatkowski/USACE, pers. com.,
November 2009). Water quality monitoring was conducted in 2006-2007 at various locations in both the
main body and selected tributaries of Currituck Sound. The monitored parameters included salinity,
nutrients, chlorophyll a, and water clarity. Water quality modeling using SWAT8 was conducted in
tributaries with urban and agricultural drainage areas. Preliminary results revealed very little difference
in measured parameters between the two tributaries. However, the precipitation inputs were averages that
diminish the impact of storm events in these very sluggish coastal streams. Riparian wetlands were also
abundant along the lower portion of the tributaries; likely intercepting nutrients from upland pollution
sources. Furthermore, the conditions in the respective watersheds did not include major construction
activities over a long time series. Concurrent monitoring in the main body of Currituck Sound recorded
8 Modeling tool simulates stream output based on precipitation, drainage and land-use characteristics
2010 Coastal Habitat Protection Plan
Chapter 2. Water Column Page 107
lower water clarities than tributaries, suggesting a resuspension problem in this wind-swept, low salinity
and shallow estuary. The nutrient levels measured in Currituck Sound did not indicate over-enrichment
relative to the indicator metric: SAV habitat suitability (see ―Submerged aquatic vegetation‖ chapter for
more information). The USACE workgroup is currently developing defensible criteria for choosing
between restoration site alternatives (D. Piatkowski/USACE, pers. com., November 2009).
By developing a statistical model that integrates a decade of available land use/land cover data and water
quality data, Rothenberger et al. (2009b) found that total phosphorus concentrations were significantly
higher during summer in sub-basins with high densities of wastewater treatment plants (WWTPs) and
confined swine feed operations (CSFOs). Nitrate was significantly higher during the winter season in
sub-basins with high numbers of WWTPs, and organic nitrogen concentrations were higher in sub-basins
with higher agricultural land coverage. Overall, wastewater discharges in the upper watershed and
intensive swine agriculture in the lower watershed were the highest contributors of nitrogen and
phosphorus to the Neuse.
Whereas other studies of agricultural land use and water quality have focused on nutrients (see ―Nutrients
and eutrophication‖ section for more information), studies of development impacts have focused more on
overall habitat degradation. Studies have indicated that substantial degradation of water quality and
aquatic habitat occurs when impervious cover (i.e., roads, roofs, parking lots) within a watershed reaches
10-20% (Schueler 1994; Arnolds and Gibbons 1996; Mallin et al. 2000b; Barnes et al. 2001; Beach
2002). Significant water quality and habitat degradation occurred where impervious surface exceeded
20%. As vegetated areas are replaced, the ability of the land to absorb and filter stormwater runoff is
reduced; flooding, bank erosion, and runoff subsequently increase. More impervious surface also
increases peak runoff in streams and reduces groundwater input for stream base-flow. Line and White
(2007) compared runoff from two similar drainage areas in the Piedmont physiographic region of North
Carolina. The drainage areas were very different in terms of developing land use. Runoff volume,
sediment, and nutrient export were measured in both drainages for 5.6 years. In the developing drainage
area, there was a 68% increase in runoff volume, 0% change in base-flow contribution (as a % of overall
discharge), 95% increase in exported sediment, and 66-88% increase in nutrient export, compared to the
undeveloped drainage. In the undeveloped drainage area, there were 30 meter riparian buffers and no
animal operations confounding the analysis.
Over the past three decades there has been a drop in the value of the clam and oyster harvest in North
Carolina of approximately $10,000,000 annually; much of this drop can be attributed to increased
closures of shellfish beds due to microbial contamination (Mallin 2009). Human population growth and
percentage of impervious surfaces in a watershed is a strong indicator of fecal coliform bacteria and
associated pollutants in surface waters (Maiolo and Tschetter 1981, Mallin et al. 2001b, Mallin et al.
2000b; Mallin 2009). Mallin et al. (1998, 2001b) examined the effects of land-use practices on water
quality in New Hanover County and found a statistically significant relationship between percent
impervious surface cover and fecal coliform concentrations among several tidal creek systems (r2 = 0.95)
(Figure 2.7). Increased human population supplies the human and domestic animal sources for fecal
bacteria, while impervious surface provide the means of conveyance of such microbes into coastal waters.
In a study of 22 tidal creek watersheds in the Charleston, S.C. area Holland et al. (2004) likewise found a
similar statistical relationship. Both the North and South Carolina studies indicated that fecal bacteria
contamination became an important polluting factor once impervious surface coverage reached > 10% of
the watershed (Mallin et al. 2001; Holland et al. 2004). Sanitary surveys conducted by DEH (Shellfish
Sanitation and Recreational Water Quality Section) implicate nonpoint stormwater runoff as the primary
cause of microbial contamination in more than 90% of the shellfishing areas sampled (G. Gilbert/DEH,
pers. com., 2002). There are numerous studies tracking specific sources of microbial contamination in
North Carolina waters (DEM 1994, Mallin et al. 1997, White et al. 2000, Reilly and Kirby-Smith 1999,
Mallin et al. 2001b, Mallin et al. 2002b, Coulliette and Noble 2008, DiDonato et al. 2009). Source

2010 Coastal Habitat Protection Plan
Chapter 2. Water Column Page 108
tracking studies are needed for the development of TMDLs. Fecal coliform concentration tends to be
highest upstream and in shallow creeks and water bodies; decreasing downstream and in larger open
water bodies. The areas prone to high fecal coliforms are also typically areas where shell bottom habitat
is concentrated (Table 2.34; see ―Microbial contamination‖ section of Shell bottom chapter for more
information).
Table 2.34. Recent coverages of shellfish density by harvest water closure area.
Status ≥ 1 shellfish/m^2 <1 shellfish/m^2
Approved 5,419.8 3,002.0
Conditionally approved - closed 774.2 85.09
Conditionally approved – open 3,369.9 1,211.4
CSHA - prohibited 2,268.0 624.9
Figure 2.7. Percent watershed impervious surface coverage versus geometric mean fecal
coliform bacteria counts for six New Hanover County tidal creeks. (Source: modified
from Mallin et al. 2001b)
Elevated levels of fecal coliform bacteria have also been correlated with other water quality parameters
such as nutrients, suspended sediments, turbidity, or toxins (Schueler 1999, Mallin et al. 2000b, 2001b
Mallin et al. 2009b). Chlorophyll a levels, in particular, have been correlated strongly with both bacterial
production (literature review in Apple et al. 2008) and nutrient loading (see ―Status and trends in nutrient
enrichment‖ for more information). Survival of fecal coliform bacteria is enhanced with low temperature,
low salinity, and low light conditions associated with suspended sediment (DEM 1994, Mallin et al.
2010 Coastal Habitat Protection Plan
Chapter 2. Water Column Page 109
2000b, White et al. 2000). The positive relationship between coliform bacteria and nutrients was
attributed to both pollutants being derived from the same sources in some instances. Also, some studies
suggest that nutrient loading can stimulate growth and survival of fecal bacteria indicators (Evison 1988).
The strong statistical relationships between fecal bacteria and suspended sediments and turbidity argue for
measures to control the runoff of suspended sediments into coastal waters (Mallin et al. 2009b); thus, any
steps taken to reduce nonpoint sources of bacteria loading will at the same time reduce loading of other
pollutants into coastal waters and improve water quality and habitat conditions. Efforts to reduce fecal
coliform levels should target pollution sources upstream of significant shell bottom resources in
conditionally approved open (i.e., less degraded) areas (see “Microbial contamination” section of “Shell
bottom” chapter for more information) in order to maximize the probability of successful restoration.
Maintaining riparian buffers is a proven watershed management tool that effectively reduces nonpoint
source runoff into the water column, and positively influences aquatic habitat (Lee et al. 1989, Zirschky et
al. 1989, Groffman et al. 1991, Desbonnet et al. 1994, Gilliam et al. 1994, Lowrance 1997, Mallin and
Wheeler 2000, Schueler 2003). Several studies evaluating the effectiveness of forested riparian buffers
found that where quality riparian habitats were preserved, fish diversity could be maintained with up to
15% impervious cover in the watershed, and aquatic insect diversity could be maintained with as much as
30% impervious cover (Schueler 2003). However, the use of BMPs in some watersheds has not been
demonstrated to reduce the negative impacts of high impervious surfaces (Schueler 2003). This could be
attributed to improper installation or maintenance of stormwater BMPs. Stream riparian zone alterations
associated with development and silviculture operations can also cause considerable hydrological and
water quality changes in receiving waters. Ensign and Mallin (2001) found violations of ambient NC
water quality standards for turbidity, chlorophyll a, fecal coliform bacteria and DO after clear cutting
around a Coastal Plain blackwater stream (Goshen Swamp) compared with a control stream. Despite a
10-m (33-ft) buffer left along the stream bank, these violations occurred over a two-year period following
the clear cut. The buffer was less than the recommended BMP of 50 ft.
The effectiveness of buffers is dependent on the width, slope, soil type, vegetative cover, quantity and
quality of the stormwater runoff, and size of the drainage area (Crowell 1998). Desbonnet et al. (1994)
summarized studies documenting the different benefits of various buffer widths. Scientific literature
suggests that minimum buffers between 26 ft (8m) and 75 ft (23 m) wide are needed to protect water
quality and riparian habitat from logging impacts (Desbonnet et al. 1994, Ensign and Mallin 2001).
Forested riparian buffers are considered to deliver the greatest range of environmental benefits of any
type of stream buffer (Lowrance 1997; CBF 1995b). Unlike most other BMPs, riparian forest buffers
accomplish multiple habitat benefits while also improving water quality. Since forested buffers are
thought to remove some nutrients that grasses cannot, a three-zone riparian buffer concept was proposed
for the Chesapeake Bay region to maximize buffer benefits (Lowrance 1997):
Zone 1 functions as an extension of the water body. Undisturbed woody vegetation remains to
stabilize sediments, reduce flooding, provide woody debris, and remove some pollutants.
Zone 2 consists of a managed forest, where trees remain but can be managed. The primary
function of this zone is removal of pollutants from surface and groundwater, while allowing some
economic benefits.
Zone 3 may contain grass filter strips, level spreaders or other features. This zone is needed to
slow runoff, infiltrate water, and filter sediment and other pollutants.
The predicted increases in impervious surface (Tables 2.32 and 2.33) and population (Table 1.2) suggest a
corresponding increasing in associated water quality problems. However, the land-use data does not
account for the location and effectiveness of riparian buffers and engineered stormwater controls and thus
represents a ―worst case‖ scenario. When averaging impervious cover across vast regions, the relative
amount of impervious surface on smaller watersheds is also not accounted for. Excess impervious cover
in small watersheds could result in localized habitat and water quality degradation and closure of shellfish

2010 Coastal Habitat Protection Plan
Chapter 2. Water Column Page 110
beds. The effect of impervious cover on water quality also depends on proximity to surface waters,
drainage patterns, and soils types. Impervious surfaces having insufficient on-site storage of stormwater
and located in drainage basins near the water have the greatest impact on water quality. A comprehensive
model of pollution sources to predict water quality requires regular mapping/monitoring of pollution
sources (including silviculture, agriculture, and impervious surfaces), riparian zone conditions,
stormwater control measures, climactic events, flushing rates, and measured pollution levels.
Non-point source management
Managing the human activities contributing to non-point source pollution is the intent of various state
stormwater permits, nutrient management strategies, CAMA land use plans, and best management
practices for different land uses. The stormwater programs are charged with controlling stormwater
runoff from new development activities such that water quality standards for DWQ classifications are
maintained (see ―Stormwater program overview‖ and ―Coastal Stormwater Program‖ sections for more
information). Nutrient management strategies are a suite of rules designed to control nutrient enrichment
in sensitive waters (see ―Nutrient Reduction Strategies‖ section for more information). The CAMA land
use plans can assist local communities in developing land-use ordinances. Finally, best management
practices (BMPs) are techniques, measures, or structural controls that are used for a given set of
conditions to manage the quantity and improve the quality of non-point source runoff in the most cost-
effective manner. Best management practices can be applied to any source of pollution (i.e., managed
forestland, croplands, aquaculture, pasturelands, and construction sites).
Stormwater program overview
Stormwater regulations vary across the state according to DWQ water classifications, municipalities, and
counties. Coastal stormwater rules apply to the 20 coastal counties (Figure 2.8). Statewide stormwater
management includes specific rules for NPDES Phase I and II municipalities, Nutrient Sensitive Waters
of the Neuse and Tar-Pamlico, and Outstanding Resource Waters. However, these areas do not cover the
entire state. The only stormwater regulations that apply to the entire state address impervious parking lots
(DWQ 2009b). Other stormwater management in the gap areas is voluntary, though mandatory Erosion
and Sediment Control Plans provide some stormwater protection (see ―Sediment/turbidity‖ section for
more information). Stormwater programs in North Carolina and their requirements are listed in Table
2.35.
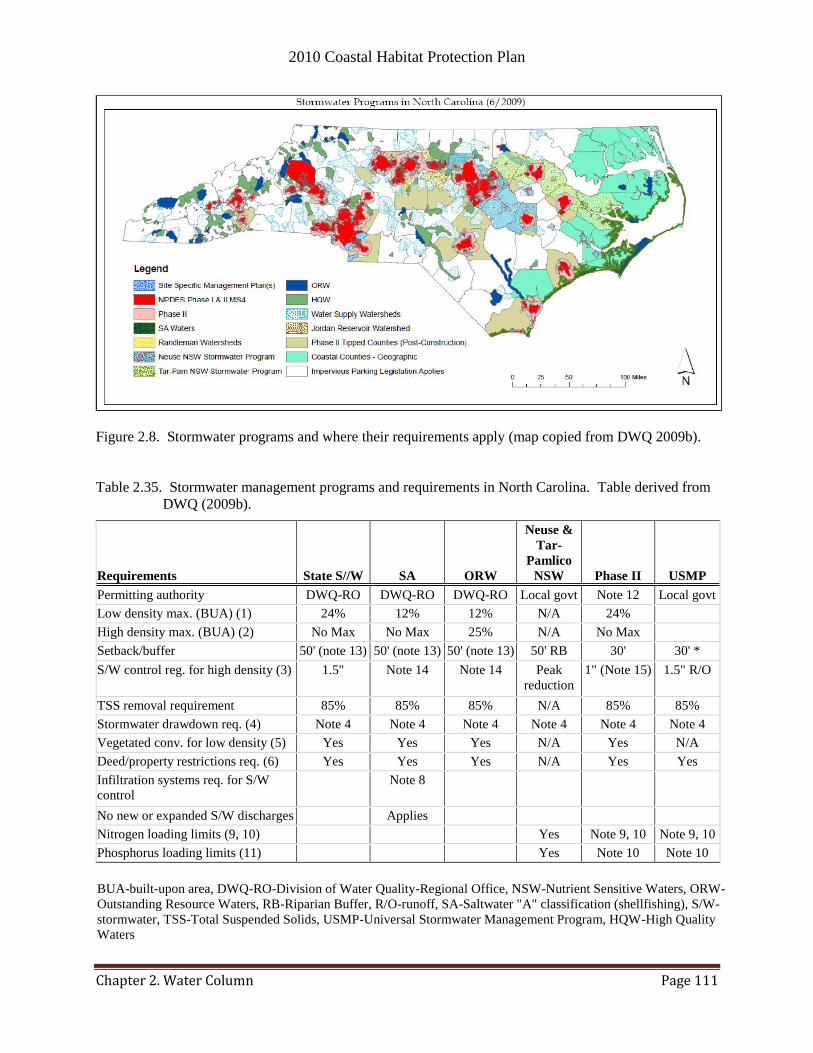
2010 Coastal Habitat Protection Plan
Chapter 2. Water Column Page 111
Figure 2.8. Stormwater programs and where their requirements apply (map copied from DWQ 2009b).
Table 2.35. Stormwater management programs and requirements in North Carolina. Table derived from
DWQ (2009b).
Requirements State S//W SA ORW
Neuse &
Tar-
Pamlico
NSW Phase II USMP
Permitting authority DWQ-RO DWQ-RO DWQ-RO Local govt Note 12 Local govt
Low density max. (BUA) (1) 24% 12% 12% N/A 24%
High density max. (BUA) (2) No Max No Max 25% N/A No Max
Setback/buffer 50' (note 13) 50' (note 13) 50' (note 13) 50' RB 30' 30' *
S/W control reg. for high density (3) 1.5" Note 14 Note 14 Peak
reduction
1" (Note 15) 1.5" R/O
TSS removal requirement 85% 85% 85% N/A 85% 85%
Stormwater drawdown req. (4) Note 4 Note 4 Note 4 Note 4 Note 4 Note 4
Vegetated conv. for low density (5) Yes Yes Yes N/A Yes N/A
Deed/property restrictions req. (6) Yes Yes Yes N/A Yes Yes
Infiltration systems req. for S/W
control
Note 8
No new or expanded S/W discharges Applies
Nitrogen loading limits (9, 10) Yes Note 9, 10 Note 9, 10
Phosphorus loading limits (11) Yes Note 10 Note 10
BUA-built-upon area, DWQ-RO-Division of Water Quality-Regional Office, NSW-Nutrient Sensitive Waters, ORW-
Outstanding Resource Waters, RB-Riparian Buffer, R/O-runoff, SA-Saltwater "A" classification (shellfishing), S/W-
stormwater, TSS-Total Suspended Solids, USMP-Universal Stormwater Management Program, HQW-High Quality
Waters
2010 Coastal Habitat Protection Plan
Chapter 2. Water Column Page 112
(1) Low-density limits are represented in the table in terms of maximum built-upon area percentage. In addition, a two-
dwelling-unit-per-acre limit may be used in lieu of this percentage
(2) High-density limits are represented in maximum built-upon area percentage only. No dwelling-unit-per-acre apply.
(3) Stormwater control requirement: 1.5-inch storm. For SA and ORW water see Note 15. For the Neuse and Tar-
Pamlico stormwater programs (peak reduction), there shall be no increase in peak flow leaving the site from the
predevelopment condition for the 1-year, 4-hour storm.
(4) Drawdown requirement: Runoff volume drawdown time varies between programs but must be a minimum of 24-48
hours (depending on the program), but not more than 120 hours, many differ based on BMP selected.
(5) The low-density option requires the use of vegetated conveyances to the maximum extent practicable and shall not
have a discrete collection system.
(6) Where applicable, deed or property restrictions and protective covenants are required by the locally issued permit and
incorporated by the development to ensure that subsequent development activities maintain the development consistent
with the approved plans. For the 20 coastal counties and Phase II projects, this must be recorded prior to issuance of a
certification of occupancy.
(7) Cluster development is defined in 15A NCAC 02B .0202 (16) as the following: "The grouping of in order to conserve
land resources and provide for innovation in the design of the project including minimizing stormwater runoff impacts.
(8) For 20 Coastal Counties must meet requirements of Section 2 (b)(1)(c) of SL 2008-211
(9) The Neuse stormwater nutrient loading limits specified in 15A NCAC 2B .0235 apply in the applicable affected local
governments within the Neuse river basin.
(10) The Tar-Pamlico stormwater nutrient loading limits specified in 15A NCAC 2B .0258 apply in the applicable
affected local governments within the Tar-Pamlico river basin.
(11) No low/high density designation for USMP; no maximum BUA, except within 575' of SA waters, maximum BUA is
36.
(12) DWQ-RO or location government (see http://h2o.enr.state.nc.us/su/msi_maps.htm)
* Neuse and Tar-Pamlico setbacks are 50' riparian buffers.
(13) 50' vegetated buffer for new development and 30' vegetated buffer for redevelopment
(14) The greater of: 1.5" R/O; or Pre/Post Difference for the 1-year, 24-hour storm
(15) In the 20 Coastal Counties, as local government's Phase II NPDES permits are renewed the post-construction
requirements will be updated to meet those in 2008-211.
Coastal stormwater program
The Coastal Stormwater Program is administered by the DWQ Regional Offices. Any development in the
20 coastal counties that requires a Coastal Area Management Act (CAMA) major permit or a
Sedimentation/Erosion Control Plan must obtain a stormwater management permit. CAMA permits are
required in Areas of Environmental Concern (AECs). Major permits are necessary for activities that
require other state or federal permits, for projects that cover more than 20 acres, or for construction
covering more than 60,000 square feet. Applications for major permits are reviewed by 10 state and four
federal agencies before a decision is made. The CRC designates areas as AECs to protect them from
uncontrolled or incompatible development in 20 coastal counties within CAMA jurisdiction. The
estuarine system, as defined by DCM rules, extends upstream to the dividing line between coastal and
inland fishing waters. The Estuarine System is the Coastal Shoreline category includes estuarine
shorelines and public trust shorelines. Coastal Shorelines include all lands within 75 feet of the normal
high water level of estuarine waters. Along Outstanding Resource Waters, the shoreline jurisdiction
extends 575 feet landward of the normal high water level. Public Trust Shorelines include lands within
30 feet of the normal high water level of public trust waters located inland of the dividing line between
coastal fishing waters and inland fishing waters. Specific stormwater requirements vary according to
adjoining water classification and distance from mean high water.
Rules applicable to CRC jurisdictional shorelines provide some additional water quality protection to
coastal receiving waters compared to waters upstream and landward of CRC jurisdictional areas, unless
2010 Coastal Habitat Protection Plan
Chapter 2. Water Column Page 113
those waters are designated Nutrient Sensitive Waters (NSW), Outstanding Resource Waters (ORW), or
High Quality Waters (HQW). Nutrient management strategies for NSWs (Tar-Pamlico, Neuse, and
Chowan rivers) include mandatory buffers and nutrient reductions from wastewater discharges,
stormwater runoff, and agriculture (see ―Neuse and Tar-Pamlico Nutrient Reduction Strategies‖ for more
information). State-wide stormwater rules of the Environmental Management Commission (EMC) limit
impervious cover adjacent to intermittent and perennial waters depending on their designation as NSW,
ORW, SA, or NPDES Phase II stormwater municipality. However there is no minimum vegetated buffer
required in coastal draining watersheds that are not under the domain of CRC rules or EMC special
designations. Those river basins include portions of the Cape Fear and Roanoke, outside of the 20
CAMA counties.
Prior to October 2008, the coastal stormwater rules for low-density development allowed 25% built-upon
area next to SA waters and ORWs. The inadequacy of that threshold is supported by numerous studies.
The studies were, in turn, supported by the increase in conditional shellfish harvest closures through time
(Street et al. 2005), despite stormwater regulations in place prior to late 2008. Following Street et al.
(2005), the DWQ conducted a study of shellfish closures in five shellfish creeks in New Hanover County.
The study found significant increases in conditionally closed shellfish harvesting waters between 1988
and 2005 (T. Reeder/DWQ, pers. com., 2007; see also Mallin 2009). The implementation of existing
stormwater rules was apparently ineffectiveness at preventing shellfish closures in North Carolina‘s
highest quality waters. Since 2004, there has been nearly 2,000 additional acres of water permanently
closed to shellfish harvesting in North Carolina, occurring mostly in 2006 (Table 2.36).
Table 2.36. Acres of shellfish closures in SA waters from 2004 to 2009 (B. Pogue/DEH-SS, unpub. data
2010). Note: In 2007, the DEH-SS section started calculating acreage figures from GIS
whereas prior acreage figures were hand tallied using a planimeter on NOAA Charts. Please be
aware that the 2007 data will be slightly higher than previous data calculated by hand.
Classification Dec-04 Dec-05 Dec-06 Dec-07 Dec-08 Dec-09
Approved 1,423,046 1,423,046 1,421,833 1,421,551 1,421,489 1,421,450
Conditionally Approved- Open 43,833 43,833 42,831 43,294 43,280 43,531
Conditionally Approved- Closed 12,116 12,116 13,166 12,782 12,782 12,562
CSHA- Prohibited 62,575 62,575 63,740 63,943 64,019 64,027
Additional Acreage Permanently
Closed (Net)1 NA 0 2,215 -182 77 -212
1 Included Conditionally Approved-Closed and CSHA-Prohibited.
To address the demonstrated inadequacy of existing regulations, new stormwater rules were developed
and came into effect in October 2008 (Senate Bill 1967). The changes are highlighted in Table 2.37 for
lands within one half mile of SA water and within 575 feet of ORWs. The most significant change was
the reduction in built-upon area from 25% to 12%, in accordance with study results. The calculation of
impervious surface was also changed to exclude coastal wetland area from the denominator.9 Prior to
2008, all wetland area was excluded from the calculation, making it difficult to build on lots with any
coastal wetland area. The inclusion of wetland area along with the reduction in total built-upon area
allowed, may allow development of more lots but on a smaller area. Building on lots with coastal
wetlands may now require a higher use of engineered stormwater controls.
9 Coastal wetlands comprise only 10-20% of all wetlands in the coastal counties
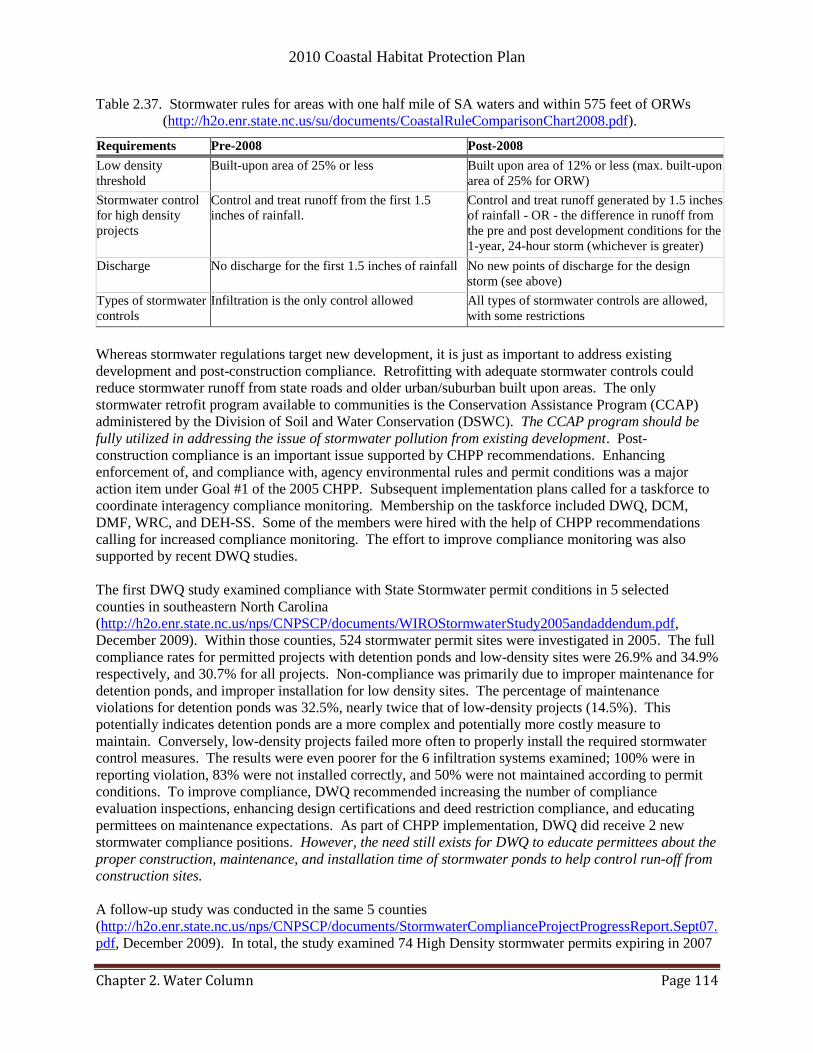
2010 Coastal Habitat Protection Plan
Chapter 2. Water Column Page 114
Table 2.37. Stormwater rules for areas with one half mile of SA waters and within 575 feet of ORWs
(http://h2o.enr.state.nc.us/su/documents/CoastalRuleComparisonChart2008.pdf).
Requirements Pre-2008 Post-2008
Low density
threshold
Built-upon area of 25% or less Built upon area of 12% or less (max. built-upon
area of 25% for ORW)
Stormwater control
for high density
projects
Control and treat runoff from the first 1.5
inches of rainfall.
Control and treat runoff generated by 1.5 inches
of rainfall - OR - the difference in runoff from
the pre and post development conditions for the
1-year, 24-hour storm (whichever is greater)
Discharge No discharge for the first 1.5 inches of rainfall No new points of discharge for the design
storm (see above)
Types of stormwater
controls
Infiltration is the only control allowed All types of stormwater controls are allowed,
with some restrictions
Whereas stormwater regulations target new development, it is just as important to address existing
development and post-construction compliance. Retrofitting with adequate stormwater controls could
reduce stormwater runoff from state roads and older urban/suburban built upon areas. The only
stormwater retrofit program available to communities is the Conservation Assistance Program (CCAP)
administered by the Division of Soil and Water Conservation (DSWC). The CCAP program should be
fully utilized in addressing the issue of stormwater pollution from existing development. Post-
construction compliance is an important issue supported by CHPP recommendations. Enhancing
enforcement of, and compliance with, agency environmental rules and permit conditions was a major
action item under Goal #1 of the 2005 CHPP. Subsequent implementation plans called for a taskforce to
coordinate interagency compliance monitoring. Membership on the taskforce included DWQ, DCM,
DMF, WRC, and DEH-SS. Some of the members were hired with the help of CHPP recommendations
calling for increased compliance monitoring. The effort to improve compliance monitoring was also
supported by recent DWQ studies.
The first DWQ study examined compliance with State Stormwater permit conditions in 5 selected
counties in southeastern North Carolina
(http://h2o.enr.state.nc.us/nps/CNPSCP/documents/WIROStormwaterStudy2005andaddendum.pdf,
December 2009). Within those counties, 524 stormwater permit sites were investigated in 2005. The full
compliance rates for permitted projects with detention ponds and low-density sites were 26.9% and 34.9%
respectively, and 30.7% for all projects. Non-compliance was primarily due to improper maintenance for
detention ponds, and improper installation for low density sites. The percentage of maintenance
violations for detention ponds was 32.5%, nearly twice that of low-density projects (14.5%). This
potentially indicates detention ponds are a more complex and potentially more costly measure to
maintain. Conversely, low-density projects failed more often to properly install the required stormwater
control measures. The results were even poorer for the 6 infiltration systems examined; 100% were in
reporting violation, 83% were not installed correctly, and 50% were not maintained according to permit
conditions. To improve compliance, DWQ recommended increasing the number of compliance
evaluation inspections, enhancing design certifications and deed restriction compliance, and educating
permittees on maintenance expectations. As part of CHPP implementation, DWQ did receive 2 new
stormwater compliance positions. However, the need still exists for DWQ to educate permittees about the
proper construction, maintenance, and installation time of stormwater ponds to help control run-off from
construction sites.
A follow-up study was conducted in the same 5 counties
(http://h2o.enr.state.nc.us/nps/CNPSCP/documents/StormwaterComplianceProjectProgressReport.Sept07.
pdf, December 2009). In total, the study examined 74 High Density stormwater permits expiring in 2007
2010 Coastal Habitat Protection Plan
Chapter 2. Water Column Page 115
and requiring inspections. As of September 2007, 34 of the 74 permitted sites had been inspected. Key
findings were that two stormwater facilities that were approved have not been built, three sites were found
to be compliant and 29 were out of compliance. The primary reason for non-compliance was poor or no
maintenance. Both DWQ studies included recommendations for improving compliance. Those
recommendations were incorporated in the final report from the Compliance Coordination Taskforce
completed in mid-2009 (A. Haines, S. Jenkins/DEH-SS, pers. com., 2009). Recommendations of the
Compliance Coordination report should be a high priority for CHPP implementation. Implementing
measures to enhance permit compliance is also a high priority in the DENR Strategic Plan.
Despite improvements in stormwater regulations and compliance monitoring, the ability of stormwater
controls to reduce impacts associated with increasing impervious surfaces remains difficult to quantify
considering they are generally not installed consistently across an entire local watershed, vary in type and
quality of construction and maintenance, and may not have been designed specifically to protect aquatic
habitat or prevent downstream erosion (Schueler 2003). Several studies evaluating effectiveness of
stormwater ponds in small watersheds were unable to detect major differences in insect diversity between
streams with and without stormwater ponds. Other studies evaluating larger watersheds detected small
positive effects when impervious cover did not exceed 5-20%. These studies concluded that the use of
effective stormwater treatments could allow an increase in maximum impervious cover by as much as
5%, and still maintain aquatic insect diversity (Schueler 2003). The effectiveness of new coastal
stormwater regulations in maintaining water quality and preventing further shellfish closures should be
evaluated by DWQ and DEH-SS. Areas where data is lacking, including water quality in stormwater
ponds and mining effluent, may require new studies to determine what DWQ monitoring requirements
should include.
Nutrient Reduction Strategies
Nutrient reduction strategies include both regulations associated with Nutrient Sensitive Waters and
concentrated animals operations. In 1979, the Chowan River was first to be designated Nutrient Sensitive
Water. Nutrient reduction strategies in the Chowan River basin–which have been in place for over 20
years–have had some success. The following strategies were recommended to reduce point and nonpoint
phosphorus and nitrogen inputs (DWQ 2002b):
Convert point source discharges to land application systems.
Require point source effluent limits of 1 mg/l for phosphorus and 3 mg/l for nitrogen in the North
Carolina portion of the basin.
Target funds from the Agriculture Cost Share Program to implement BMPs for agricultural
nonpoint sources. From 1995 to 2000, over $1,942,634 of Agriculture Cost Share funds were
directed to the Chowan basin.
Since nutrient reduction strategies were implemented, some reductions in nutrient loads have been
achieved and algal blooms have been reduced in frequency and duration. The Chowan River basin met
the goal of a 20% nitrogen reduction. Total phosphorus was reduced by 29% in the same time period,
although the goal was 35% (DWQ 2002b). Current water quality conditions in the Chowan River are
considered good, though a large portion of Swamp Waters makes comprehensive evaluation difficult
(DWQ 2007). Researchers at the UNC-IMS have documented nitrogen concentrations 60% lower than in
the early 1980s (S. Ensign/UNC-IMS, unpub. data, January 2010). Despite the reduced nutrient levels,
measured chlorophyll a and dissolved oxygen concentrations exceeded North Carolina water quality
standards on occasion in the mainstem Chowan River at Shingle Island and Bennetts Creek. Stations in
the upper Wiccacon River and upper Bennetts Creek were in violation 60% and 80% of time,
respectively. The data indicate serious impediments to spawning and juvenile river herring, particularly
in the upper tributaries of the Chowan River.
2010 Coastal Habitat Protection Plan
Chapter 2. Water Column Page 116
In response to the large number of fish kills in the Neuse River in the summer of 1995 and other concerns
over deteriorating water quality, the General Assembly enacted a law into statute that required a 30%
reduction in total nitrogen in the Neuse River basin by 2003. To meet this requirement, five ―Nutrient
Reduction Strategies‖ were developed and made effective as of 1997. Similar rules were implemented for
the Tar-Pamlico river basin in 2000. The rules include:
Riparian buffer protection rule,
Wastewater discharge rule,
Agriculture rule,
Nutrient management rule, and
Stormwater rule.
Agriculture and silviculture are affected by the agriculture rule [15A NCAC 2B .0238] and the nutrient
management rule [15A NCAC 2B .0232]. The agriculture rule gives farmers several options. They may
participate in developing a Local Nitrogen Reduction Strategy where specific plans for each farm are
developed, or implement standard BMPs such as buffers and water control structures. The nutrient
management rule applies to anyone applying fertilizer on 50 or more acres of land, such as cropland, golf
courses, recreational land, nurseries, or residential or commercial lawns. This rule requires training in
nutrient management or development of a nutrient management plan. The wastewater discharge rule
[15A NCAC 2B .0234] and stormwater rule [15A NCAC 2B .0235] target reductions in nutrients from
point and nonpoint urban development, respectively. The wastewater discharge rule allocates a total
maximum discharge limit for the basin and divides that amount among different discharger groups.
Dischargers also have the option to establish a nitrogen trading coalition, a group that collectively meets a
nitrogen limit, determined by the EMC, equal to the combined nitrogen limits of its members
(http://h2o.enr.state.nc.us/nps/pt-sourc.htm, 2003). The stormwater rule applies to certain large and
rapidly growing communities in an effort to reduce urban stormwater runoff. Local governments are
required to develop stormwater plans for new development, educate the public on stormwater issues,
identify and remove illegal discharges, and identify existing development that could be retrofitted.
The Neuse and Tar-Pamlico riparian buffer rules were designed based on the zonation scheme in
Lowrance (1997). Zone 1 must be a 30 ft wide forested area, beginning at mean high water (MHW),
where the first 10 ft remain completely undisturbed, and the other 20 ft may have limited thinning of
trees. Landward of this, Zone 2 must be 20 ft wide and have dense plant cover where no fertilizer use or
development is allowed. The rule applies to all perennial and intermittent streams, lakes, ponds, and
estuaries. All man-made ditches are exempt from this rule [EMC rule 15A NCAC 02B .0233 (6)]. The
EMC considers the buffer rules to be critical to successfully reducing nitrogen (see ―Status and trends‖
and ―Nutrients and eutrophication‖ sections for information on water quality assessments).
The Nutrient Reduction Strategies in the Neuse and Tar-Pamlico have resulted in the targeted 30%
reductions from point source dischargers and agriculture, though the overall goal of a 30% reduction in
receiving waters has not been met (DWQ 2009a; H. Patt/DWQ , pers. com., January 2010). Updates
from the Tar/Pamlico Basin nutrient reduction strategy can be found at the DWQ website
(http://h2o.enr.state.nc.us/nps/documents/LoadSumTabl-Running2008.pdf, January 2010). Each of the
fifteen local governments covered under the Neuse Stormwater Rule have adopted and are implementing
ordinances and programs that in addition to requiring the nutrient export goal be met, carry out public
education activities, and identify and remove illegal discharges (DWQ 2009). The disparity between
source reductions of nutrients and measured concentrations of nutrients in the water column suggests a
―lag-time‖ while excess nutrients stored in sediment are released. This ―lag-time‖ suggests a longer time
frame for realizing water quality improvements resulting from source reductions.
2010 Coastal Habitat Protection Plan
Chapter 2. Water Column Page 117
A statistical analysis of a comprehensive, 10-year data set on the Neuse River estuary demonstrated that
over this period total phosphorus and total nitrogen concentrations significantly decreased, there was no
change in nitrate concentrations, but ammonium concentrations significantly increased by 500%
(Burkholder et al. 2006). Escalating ammonium in the Neuse Estuary is especially problematic because
ammonium is the preferred source of nitrogen by many phytoplankton species, including certain harmful
species whose increased abundance has been related to the increasing ammonium (Rothenberger et al.
2009a). This study also found a significant decrease in dissolved oxygen concentrations. Increased
ammonium from concentrated animal feeding operations was a likely cause of the ammonium increases,
contributing to algal bloom increases. It is notable that during this same period the Cape Fear River
system also experienced a significant increase in ammonium, especially in the CAFO-rich Northeast Cape
Fear and Black Rivers (Burkholder et al. 2006).
The NSW might be expanded to consider nutrient enrichment at larger spatial scales. For example, the
riverine flows of the Cape Fear and Roanoke River discourage algae blooms and low dissolved oxygen,
despite high nutrient loading to receiving waters (i.e., coastal ocean and Albemarle Sound). Dafner et al.
(2007) measured nutrient concentrations in coastal and shelf waters of the Cape Fear River estuary
(CFRE) and found significant removal of inorganic nutrients in wetland-fringed tributaries of the CFRE.
These fringing wetlands are therefore helping to improve coastal ocean water quality.
Managing concentrated animal operations is an important component of overall nutrient management
strategies. The NC legislature has taken a number of steps to reduce water quality impacts from animal
operations [15A NCAC 8F .0100-.0500]:
Since 1997, operators at swine facilities with 250 or more animals are required to be trained.
Beginning in 1996, new and expanding facilities are required to obtain permit.
In 1997, DWQ was directed to inspect all animal waste management facilities annually.
A moratorium on new or expanding swine operations was imposed in 1997 and has been
extended several times. The moratorium was last extended to 2007.
DENR was required to develop and adopt economically feasible odor control standards
In 2007, the General Assembly passed Senate Bill 1465, the NC Swine Farm Environmental
Performance Standards Act
The 2007 Swine Farm Act prohibited new lagoon and sprayfield systems, established a lagoon conversion
cost-share program, and established a swine farm methane capture pilot program. New or expanding
swine operations are required to have specified waste treatment systems that meet stringent health and
environmental standards.
One recent study found that swine operation wastes have lower nutrient concentrations than in the past
(Casteel 2007). Using data from 1999-2006 collected by the NC Department of Agriculture, researchers
found that concentrations of almost all nutrients measured in waste were far lower than the values
obtained by Barker and Zublena (1995) from 1980-1991 (Casteel, 2007). This study updated these
default nutrient values to be used in calculations for NC farm nutrient/waste management plans. The
change was attributed to more efficient feed practices. If lower nutrient concentrations allow greater
sprayfield application, there should be corresponding groundwater monitoring to verify nutrient levels
are not increasing.
A number of programs have provided funds for buyout of swine operations, close inactive lagoons, install
BMPs, preserve or restore riparian buffers, streams, wetlands, and other natural resource concerns. These
programs include:
Clean Water Management Trust Fund (CWMTF)
Division of Soil and Water Conservation

2010 Coastal Habitat Protection Plan
Chapter 2. Water Column Page 118
Environmental Enhancement Grants Program (EEG)
Conservation Reserve Enhancement Program (CREP)
Farmland Protection Program
CAMA Land-Use Plans
A land-use plan is a collection of policies and maps that serves as a community‘s blueprint for growth
(http://dcm2.enr.state.nc.us/planning/about.htm, December 2009). These plans are a fundamental element
of coastal management in North Carolina. The Coastal Area Management Act requires each of the 20
coastal counties to have a local land-use plan in accordance with guidelines established by the Coastal
Resources Commission. Each land-use plan includes local policies that address growth issues such as the
protection of productive resources (i.e., farmland, forest resources, and fisheries), desired types of
economic development, natural resource protection and the reduction of storm hazards. Once a land-use
plan is certified by the CRC, the Division of Coastal Management uses the plan in making CAMA permit
decisions and federal consistency determinations. Proposed projects and activities must be consistent
with the policies of a local land-use plan, or DCM cannot permit a project to go forward. At the local
level, land-use plans provide guidance for both individual projects and a broad range of policy issues,
such as the development of regulatory ordinances and public investment programs.
By 1997, 72 cities and towns had adopted their own plans, although CAMA does not require them to do
so. By 1999, each of the 20 coastal counties, and numerous towns, had updated its plan four times,
improving the quality of the plan with each update
(http://dcm2.enr.state.nc.us/planning/LUP%20Submittal_Approval_website.pdf, December 2009). Land-
use planning provides one of the best opportunities for public involvement in the coastal land-use issues.
Best Management Practices
Silviculture, agriculture, and mining are generally exempt from stormwater permit requirements if there
are assurances of BMP implementation. Silviculture and agriculture are only required to comply with
Nutrient Sensitive Strategies in the Neuse, Tar-Pamlico, and Chowan river basins (see ―Nutrient
Reductions Strategy‖ section for more information). Construction site preparations have BMPs
associated with mandatory Erosion and Sediment Control Plans. A listing and description of non-point
source management programs for silviculture, agriculture, and other land-uses can be found in the DWQ‘s
Citizen‘s Guide to Water Quality (http://h2o.enr.state.nc.us/basinwide/WQ citizen guide on the web.pdf,
December 2009).
Silviculture
In North Carolina, forestry (silviculture) related site-disturbing activities must comply with the
performance standards described in the state water quality regulations (15A NCAC 01I .0100 - .0209)
entitled the Forest Practices Guidelines Related to Water Quality, abbreviated as FPG‘s. The statewide
FPG‘s are incorporated as part of the NC Sedimentation Pollution Control Act, (GS113A-52.1) and cover
the full spectrum of forestry activities, including a section that describes requirements for establishing a
Streamside Management Zone (SMZ) along intermittent streams, perennial streams, and perennial water
bodies; refer to the NC Division of Forest Resources (NCDFR) Web site for citations of the FPG‘s:
http://dfr.nc.gov/publications/Forestry%20Leaflets/WQ01.pdf.
In addition to the statewide FPG‘s, forestry activities also must comply with the 50-foot riparian buffer
protection and maintenance rules described by the nutrient sensitive water strategies within the Catawba
River basin; Neuse River basin; Tar-Pamlico River basin; Jordan Lake watershed; Randleman Lake
watershed; and similar state rules for the Goose Creek watershed. And, there are two General Statutes
related to the prohibition of obstructing streams, ditches, and drainages (GS77-13, GS77-14) which must
2010 Coastal Habitat Protection Plan
Chapter 2. Water Column Page 119
be followed when conducting forestry activities. The NCDFR inspects forestry sites across the state for
compliance with the aforementioned rules and laws. Of the over 3,000 sites inspected each year from
2005-2009, compliance with forestry rules and laws has increased from 95-97% (T. Gerow/DFR, unpub.
data, March 2010). To learn more about FPG‘s refer to this Web site:
http://dfr.nc.gov/water_quality/fpg_bmp_differences.htm.
During 2006, a comprehensive multi-year stakeholder-driven revision of North Carolina‘s forestry Best
Management Practices (BMPs) was completed. The forestry BMP manual outlines recommendations that
may be implemented as a means to promote compliance with the FPG‘s, as well as other water-quality
regulations. The manual goes into detail regarding the inter-relationships between BMPs, soil
conservation, and water quality. The SMZ-width recommendations now include more options based
upon site-specific variables. While the primary objective of establishing a SMZ is for water quality
protection, a well-managed SMZ can provide multiple benefits, including wildlife cover and habitat;
recreation; aesthetic visual screens; and windbreaks. Generally, harvesting is allowed within a SMZ, but
should occur in a low-impact manner that maintains the integrity of the soil and water resources.
In addition, an entire chapter of the forestry BMP manual is dedicated to forested wetlands and provides a
summary of regulations, guidance, and recommended measures to implement when conducting
silvicultural activities in wetlands. Silvicultural activities in wetlands are governed under Section 404 of
the federal Clean Water Act, and there are mandatory federal BMPs for activities related to road
construction and mechanical site prep. These requirements, along with additional wetland-related BMPs
are described in Chapter 6 of the forestry BMP Manual:
http://dfr.nc.gov/publications/WQ0107/BMP_chapter06.pdf.
While the implementation of forestry BMPs is voluntary in North Carolina, the NCDFR conducts
periodic site survey assessments to determine the degree of BMP implementation. A 2005 report
summarizes the results from BMP surveys that were completed from 2000 to 2003 across the state, with
selected highlights noted below:
565 logging sites evaluated
82% statewide average BMP implementation rate
85% coastal area average BMP implementation rate
87% piedmont area average BMP implementation rate
69% mountain area average BMP implementation rate
Practices in need of improvement: stream crossings; skid trails; site rehabilitation.
Copies of the report are available from the NCDFR and from the Web site noted below. As of March
2010, data analysis and report development is underway for the second round of these periodic BMP
surveys. This second round was undertaken between 2006 and 2008, and evaluated more than 200
logging sites. The NCDFR expects to complete and produce this final report by mid-2010 and will post
this report to the ‗Water Quality‘ portion of the Web site:
http://dfr.nc.gov/water_quality/water_quality.htm. Additional periodic BMP surveys are being planned
for the foreseeable future, with the third round of surveys expected to begin in 2010.
Ongoing efforts of education, training, and on-site technical assistance are employed to reach landowners,
loggers, and others who may need to understand FPGs, BMPs and the multitude of water quality
regulations that affect forestry operations in North Carolina. Some examples of accomplishments from
the NC Division of Forest Resources since the previous CHPP include:
Production and distribution of two stream crossing BMP training videos that were used to train
over 1,000 loggers statewide through the ProLogger Program.
Production and distribution of one logging skid trail BMP training video that was used to train
2010 Coastal Habitat Protection Plan
Chapter 2. Water Column Page 120
over 1,000 loggers statewide through the ProLogger Program.
Acquisition and deployment of portable bridges for loggers to protect stream and ditch crossings.
These bridges are staged or available for use across the 20 coastal counties.
Implementation of a comprehensive forest-water quality and nonpoint source educational
program at Clemmons Educational State Forest in Clayton which includes an outdoor water
quality classroom, a river basin observation deck, and two workbook modules.
Establishment of a paired-watershed research study in the upper Neuse River basin to monitor the
effectiveness of riparian buffers and BMPs during forest harvesting.
The NC Division of Forest Resources recognizes that water-resource issues continue to dominate the
areas of concern regarding land use practices, including forestry. The NCDFR also recognizes that a new
set of challenges is facing the forestry community, as land-use development expands into areas that have
traditionally been rural, agriculture and/or forested. Bridging the gap between traditional forest
management practices, and traditional arboricultural urban forestry practices will be needed to address the
transition of forested watersheds from rural, to suburban, to urbanized areas. Strategies for continuing
efforts and exploring new opportunities are outlined below.
Create and implement a Forest Watershed Assistance Program that would provide enhanced
water resource technical assistance to forestland owners in targeted watersheds.
Create and implement an Urban Forest Watershed Management Program that would explore and
implement opportunities to incorporate forestry-related management practices with low-impact
development (LID), green infrastructure, and traditional nonpoint source stormwater control
measures.
Continue periodic BMP implementation surveys and monitoring of BMP effectiveness to
ascertain trends in forest harvest activities, especially with questions concerning the harvesting
of forest biomass, as well as evaluate the BMPs that were revised in 2006.
Create an online GIS-based preharvest planning tool that would allow users to gain access to
volumes of data related to soils, water resources, aerial imagery and other information that
would be worthwhile for planning their harvest.
Pursue opportunities for regulatory reform that would standardize the SMZ and/or riparian
buffer requirements for forestry activities, in an effort to enhance performance on the ground and
streamline the regulatory framework that governs forestry in the state.
Continue to pursue the establishment of a Water Quality Forester position in areas of the state
that do not have such a position. For eastern North Carolina, the gaps in coverage are the
Fayetteville District (middle Cape Fear area), and the Fairfield District (Albemarle-Pamlico
peninsula area). In western North Carolina, the gaps in coverage are the Asheville District and
Sylva District.
Develop BMPs related to water handling and the use of water resources for the purposes of
suppressing and controlling peat-fueled wildfires based upon the lessons learned from the 2008
Evans Road Fire and similar wildfires in recent years.
Develop threshold criteria for determining at what point a non-compliant forestry operation
directly contributes to a degradation or loss of in-stream aquatic habitat that is sufficient to
warrant restoration or remediation of the impacted water resource.
Agriculture
Agricultural non-point source pollution is managed primarily through voluntary participation. The
approach is supported by financial incentives, technical and educational assistance, research, and
regulatory programs. Financial incentives are provided through North Carolina‘s Agriculture Cost Share
Program administered by the Division of Soil and Water Conservation. The Cost Share program was
authorized in 1983 as a pilot program to address nonpoint source problems in the NSWs of Jordan Lake,
Falls Lake, and the Chowan River covering 16 counties. The program has been extended to all 96 Soil

2010 Coastal Habitat Protection Plan
Chapter 2. Water Column Page 121
and Water Conservation Districts that includes all 100 counties. In addition, use of effective BMPs is
enhanced by to availability of funds and technical assistance from multiple programs administered
through the U.S. Department of Agriculture, Natural Resources Conservation Service, NC Department of
Agriculture and Consumer Services, and N.C. Division of Soil and Water Conservation. Increased
monitoring of runoff, both groundwater and surface water, will be needed to evaluate effectiveness of
BMPS or any management procedure implemented.
Construction
Construction site BMPs (i.e., groundcover on slopes) are implemented with Erosion and Sediment
Control Plans (ESCPs) required for projects impacting >1 acre. The DWQ reported to the EMC in 2002
that actions should be taken to strengthen groundcover requirements in the ESCPs and improve
enforcement of the erosion and sedimentation control law and rules. The Sediment Control Act was
amended in 2007 in accordance with some recommendations. The time that developers have to stabilize
graded slopes was reduced from 30 to 21 calendar days. And the maximum civil penalty allowed for
initial violations of the Sedimentation Pollution Control Act increased from $500 to $5000 per day in
violation. For additional information, the ―North Carolina Erosion and Sediment Control Planning and
Design Manual‖ provides a comprehensive description of construction site BMPs
(http://www.dlr.enr.state.nc.us/pages/publications.html).
2.4.3. Water quality degradation – causes
The previous section covered the major sources and management of composite pollution (i.e., point
source discharge, marina ―hot spots,‖ non-point sources) causing impairment based on existing water
quality standards. The following section covers the specific ecological impacts and causes of nutrient
enrichment, turbidity, toxic chemicals, desalinization, and marine debris in North Carolina coastal waters.
The section may also compare existing water quality standard to the levels suggested in the primary
literature.
2.4.3.1. Eutrophication and oxygen depletion
Nutrients are chemical compounds or elements that are needed for growth of living organisms and are
beneficial in appropriate amounts. Nitrogen and phosphorus are the major plant nutrients responsible for
regulating growth of phytoplankton, algae, and other marine plants (DeAngelis et al. 1989). While a
certain level of these nutrients is needed to support aquatic life, an overabundance of nutrients, or
eutrophication, due to human activities often leads to increased primary production resulting in algal
blooms (Nixon 1995). Nixon (1995) defines eutrophication as ‗‗an increase in the rate of supply of
organic matter to an ecosystem‘‘ and points out that that most common form of eutrophication is nutrient
enrichment. Andersen et al. (2006), defines eutrophication as ―the enrichment of water by nutrients,
especially nitrogen and/or phosphorus and organic matter, causing and increased growth of algae and
higher forms of plant life to produce an unacceptable deviation in structure, function, and stability of
organisms present in the water and to the quality of the water concerned, compared to reference
conditions‖. Nixon (2009) re-emphasizes that while nutrient enrichment is the most common cause of
eutrophication, it is not the only one. It is important to separate the process of eutrophication from its
causes and consequences.
Algal blooms are typically composed of phytoplankton (but sometimes include macroalgal species) at
hundreds to thousands of cells per milliliter. When these blooms die off and settle through the water
column, bacterial decomposition of the available organic matter drives respiratory uptake of dissolved
oxygen (DO). In several types of coastal water bodies BOD5 (labile BOD) has been positively correlated
with chlorophyll a biomass (Mallin et al. 2006). The blooms themselves can deplete the water column of
DO through the nighttime respiration of dense algal concentrations. This increase in biological oxygen
demand causes low dissolved oxygen levels (hypoxia or anoxia) in poorly-mixed, stratified water
2010 Coastal Habitat Protection Plan
Chapter 2. Water Column Page 122
columns where oxygen is not being replaced through exposure to the air or resupply through
photosynthesis (Diaz 2001). Increased oxygen demand can also result from the resuspension of un-
decomposed or partially decomposed organic matter that previously settled to the bottom (Gray et al.
2002). Finally, BOD concentrations have been positively correlated with rainfall in a series of tidal
creeks in New Hanover County, and BOD was correlated with suspended solids as well (Mallin et al.
2009a). It is interesting to note that longer-term BOD (BOD20) was more strongly correlated with
suspended sediments than five-day BOD, indicating that particulate matter (refractory material) entrained
in runoff is an important BOD source involved in hypoxia, in addition to the more labile algal blooms.
Algal blooms tend to occur when water flow is slow and where mixing of the water column is reduced
due to salinity and/or temperature gradients. In freshwater areas, blue-green algae are usually associated
with blooms, and they have lower nutritional value to aquatic life than other types of algae. In estuarine
and marine waters, dinoflagellates and other flagellated algae are usually responsible for algal blooms
(Smayda 1989, NC Sea Grant 1997, Mallin et al. 2000a). With nutrient enrichment, there is a shift in the
dominant plant community from slower growing SAV and perennial macroalgae to faster growing
phytoplankton, microphytobenthos, and ephemeral macroalgae (Duarte 1995). The Chowan-Roanoke-
Albemarle system is generally phosphorus-limited for phytoplankton growth, whereas phytoplankton
growth in both the Tar-Pamlico and the Neuse Estuaries is generally limited by the levels of nitrogen-
(Lin et al., 2007), or, in the Neuse, co-limited by both N and P (Rudek et al. 1991).
Elevated levels of phytoplankton in the water column reduce water clarity. Reduced water clarity reduces
successful feeding by some visually orienting fish (Peterson et al. 2000a) (see ―Light and water clarity‖
subsection of ―Status and trends‖ section for more information). Other indirect effects of nutrient
enrichment include changes in the biomass, community structure, growth and reproduction rates of
invertebrates, and change in the organic carbon inputs and biogeochemistry of the sediments (Cloern
2001). Algal blooms are also aesthetically undesirable to the public; the unpleasant odor and degraded
visual appearance of the water‘s surface (green scum) discourages swimming, boating and fishing. Some
dinoflagellate species release toxic chemicals into the water column that harm fish and shellfish by
affecting their nervous systems and paralyzing their respiratory systems (Tyler 1989). The chemicals
released either inhibit ion channels in cell membranes or protein functions. Many fish kills have been
attributed to toxic algal blooms and associated ulcerative mycosis (see ―Status and trends‖ section for
more details).
There are many potentially toxic algal species (Burkholder 1998). Species, though species often
associated with fish kills in the estuarine and marine waters have included dinoflagellates such as Karena
brevis (one major event in 1987), Karlodinium veneficum, Pfiesteria piscicida, and Pfiesteria shumwayae
(Tyler 1989, Burkholder et al. 1995, Burkholder and Glasgow 1997, Glasgow et al. 2001, Hall et al.
2008). Karenia brevis blooms, sometimes referred to as ―red tides‖ because the dinoflagellates can make
the water appear red in color, impact benthic organisms through suffocation and nervous system paralysis
(Tyler 1989). Karlodinium veneficum, found in the Neuse Estuary in 2006, causes fish kills at high cell
concentrations (10,000 cells/ml or more), and is able to out-compete other co-occurring dinoflagellates,
perhaps because of the production of karlotoxins that are known to act as grazing deterrents in addition to
being toxic to fish (Hall et al. 2008). Pfiesteria spp. and Karlodinium veneficum, as well as various other
algae that can harm fish, have been shown to be stimulated by nutrient pollution (Lewitus et al. 1999;
Glibert et al. 2006; Burkholder et al. 2008).
Pfiesteria piscicida and Pfiesteria shumwayae are potentially toxic dinoflagellates that were related to
certain fish kills in North Carolina and Maryland estuaries during the 1990s (Glasgow et al. 2001).
Pfiesteria toxins were recently characterized by Moeller et al. (in 2007), who found that when combined
with metals, the free radicals were found to be highly toxic, but ephemeral in nature and thus, very
difficult to isolate. Moeller et al. (2007) reported that the combination of exposure to sunlight and metals

2010 Coastal Habitat Protection Plan
Chapter 2. Water Column Page 123
is likely to control the presence or absence of the toxins. Low DO has been documented to cause large
fish kills in areas where Pfiesteria was also present (Burkholder and Glasgow 1997, Paerl et al. 1998,
Burkholder et al. 1999).
Fish kills are often accompanied by ulcerative mycosis (a certain type of fish skin lesions), which has
been attributed to Pfiesteria spp. and other toxic algae, various protozoan fish parasites, mycobacteria,
and physical stressors , and various other chemical poisons or toxins (Glasgow et al. 2001; Blazer et al.
1999; Jacobs et al. 2009; Noga et al. 1996, Noga 2000). Pfiesteria piscicida has been found to cause
rapid erosion of fish cells and ulcerations on living fish (Parrow et al. 2005, Burkholder et al. 2005).
Hackney et al. (1998) noted that high numbers of menhaden with lesions were found in estuarine areas
containing high concentrations of toxic substances such as toxic metals, DDT, and PCBs. Recently,
based on samples of skin ulcers of Atlantic menhaden (Brevoortia tyrannus) from populations found in
the Pamlico and Neuse River estuaries, Vandersea et al. (2006) reported that the fungal pathogen
Aphanomyces invadans (water mold) was the primary ethiological agent in ulcerative mycosis. However,
the study results are based on 50 samples taken in very recent years; no samples were used from the
1990s or early 2000s.
Several NC estuarine environments are characterized by slowly moving, poorly flushed waters with high
level of nutrients, which offer ideal conditions for various algae, fungi, and bacteria to thrive. These
organisms promote low dissolved oxygen in the water that can lead to fish kills, and some of these
microbes can also attack fish and shellfish directly (e.g. Springer et al. 2002, Shumway et al. 2006,
Vandersea et al. 2006), compounding the impact of eutrophication on fisheries.
Coastal research and monitoring needs to continue to improve our understanding of all of the processes
of eutrophication and the effects on fish populations.
Sources of nutrient enrichment
The majority of nutrient pollution to the Albemarle-Pamlico system has been linked to agriculture;
including cropland, pastureland, and animal operations (Stone et al. 1995; Gilliam et al. 1996; Burkholder
et al. 1997; Huffman 1999; Paerl and Whitall 1999; Mallin et al. 2000a; Mallin et al. 2001c; Cahoon and
Ensign 2004; Rothenberger et al. 2009b). Research has demonstrated that use of spray fields by
concentrated animal operations chronically and significantly impact surface and groundwater resources
due to surface runoff, subsurface flow, and atmospheric deposition (Stone et al. 1995; Gilliam et al. 1996;
Burkholder et al. 2007a; Costanza et al. 2008a). Other sources include golf courses and atmospheric
deposition from industry.
The presence of concentrated animal operations on river floodplains has been shown to be a danger to fish
survival and habitat suitability (Burkholder et al. 1997, Mallin et al. 2000a,; Mallin et al. 2001c). Animal
wastes are highly concentrated sources of nutrients, organic matter, fecal coliform bacteria, and
pathogenic microbes (Sobsey 1996; Burkholder et al. 1997; Mallin et al. 1997; Mallin et al. 2000a).
Waste from animal operations is commonly discharged into lagoons, where it undergoes some anaerobic
digestion and is then sprayed on fields. Pollutants may be transported into surface waters or groundwater
if the lagoon ruptures, leaks or overflows. Pollutants can also enter groundwater beneath sprayfields and
move laterally down slope toward streams (Mallin et al. 2000a). Between 1995 and 1999, multiple
animal waste lagoon accidents and several hurricanes resulted in breaching, overtopping, and flooding of
animal waste into coastal waters (Burkholder et al. 1997; Mallin et al. 1997; Mallin et al. 2000a). Lagoon
wastes also entered streams via spraying onto fields already saturated from rain (Mallin et al. 2000a;
Mallin et al. 2001c). In 1995, the spilling of concentrated animal wastes into coastal waters in the lower
Cape Fear and coastal New River watersheds resulted in anoxic and hypoxic conditions,; high nitrogen
and phosphorus concentrations,; dense phytoplankton blooms, high fecal coliform bacteria levels, high
2010 Coastal Habitat Protection Plan
Chapter 2. Water Column Page 124
turbidity, and fish kills (Burkholder et al. 1997; Mallin et al. 1997). A growing concern is the release of
pharmaceuticals, antibiotics and other veterinary drugs from CAFOs into the environment (Burkholder et
al. 2007a).
Groundwater can be contaminated through leaking lagoons (lined and unlined) or leaching of waste
applied on sprayfields (Huffman 1999; Mallin 2000). An NCSU study found that 38% of older unlined
lagoons leaked nitrogen into ground water at strong or very strong levels (Huffman 1999. Research has
demonstrated that use of spray fields by concentrated animal operations chronically and significantly
impact surface and groundwater resources due to surface runoff, subsurface flow, and air deposition
(Stone et al. 1995, Gilliam et al. 1996). Increased levels of nutrients in the air and deposition into coastal
waters have been associated with the substantial increase in livestock operations (Paerl and Whitall 1999).
Paerl and Whitall (1999) found that approximately two-thirds of the nitrogen in the swine excretions are
emitted to the air due to the design of lagoon and sprayfield systems. Swine facilities are responsible for
an estimated 20% of North Carolina‘s total atmospheric nitrogen compounds, 53% of which was
contributed by eastern North Carolina alone (Paerl and Whitall 1999). Those compounds react with other
constituents in the air and are deposited on land, vegetation, and water bodies. Empirically-verified
modeling results from Costanza et al. (2008a) indicated a small portion of CAFOs contributes
disproportionately to atmospheric deposition of Nitrogen in the Albemarle-Pamlico Sound. The study
estimated that 14-37% of the state receives 50% of the state‘s atmospheric Nitrogen deposition from
CAFO lagoons. The authors suggested stronger waste management and emission standards for CAFOs
in certain areas of the Coastal Plains.
The discharge from coastal aquaculture facilities are also a source of nutrients. This issue was raised by
the MFC Habitat and Water Quality Committee due to high chlorophyll a concentrations at the discharge
sites. To address this new source of nutrient enrichment, the DWQ developed a Schedule of Compliance
(SOC) calling for the preparation of Farm Management Plans that minimize water quality impacts during
the life of the SOC (DWQ staff, pers. com., October 2008). The Farm Management Plans would be
followed by a Final Solution Plan designed to resolve all water quality impacts on the chlorophyll a
standard. The first five striped bass operations have submitted Farm Management Plans and are preparing
Final Solution Plans that analyze impacts and specify how to treat, reuse, and irrigate discharge water as
much as possible. To be eligible for an NPDES permit, the aquaculture facilities will conduct an 18
month study on water quality impacts/effluent characterization at various ages of operation. Once the
process is complete for first five, other facilities will have to comply. The Division of Soil and Water
Conservation has also convened a workgroup to identify ways they Agriculture Cost Share Program can
assist aquaculture facilities with effective discharge BMPs.
Nutrients are also transported into coastal waters through shoreline erosion processes. A study in the
Chesapeake Bay region found that sediments from eroding high bank shorelines were significant sources
of total particulate nitrogen (N) and phosphorus (P) loading (Ibison et al. 1992). The N and P loading
rates from highly eroding shorelines in the study varied considerably but were higher than that estimated
from typical agricultural runoff. North Carolina‟s shorelines should be evaluated to identify potential hot
spots of nutrient inputs from bank erosion.
Mallin and Wheeler (2000) studied the effect of golf courses in New Hanover and Brunswick counties on
water quality in adjacent water bodies. Although this study found that ammonium and orthophosphate
was tightly bound to the soils, nitrate levels in the streams increased as they flowed through the courses
and in some places caused increases in phytoplankton biomass and algal blooms. The authors concluded
that waters adjacent to golf courses having vegetated buffer zones, wet detention ponds, and wooded
wetland areas had considerably lower nutrient levels than sites without these landscape features and
management tools (Mallin and Wheeler 2000). Another study, in New Hanover County, found that soils
under suburban and golf course grasses were highest in phosphorus, followed by soils in wet detention
2010 Coastal Habitat Protection Plan
Chapter 2. Water Column Page 125
ponds and runoff channels (Mallin et al. 2002a). Soils in undisturbed forests had the least phosphorus
associated with them. Their results indicated that fertilizer use was positively correlated with phosphorus
levels. Unfortunately, Nutrient Reduction Strategies apply to golf course in only the Neuse and Tar-
Pamlico river basins, where the percent cover of urban/recreation grasses is relatively low (see ―Land-use
and non-point sources‖ section for more information). The highest percent cover of urban/recreational
grasses was in the southern estuaries subregion (part of Cape Fear River basin), where only stormwater
rules apply. These studies suggest that sites with high sediment loss and intense fertilizer use, such as
agricultural lands, CAFOs, golf courses, or manicured lawns, have high potential for nutrient
contributions to the water column. Additional education is needed on proper application of fertilizers to
reduce runoff of nutrients into coastal waters, targeting homeowners, golf course owners, and landscape
businesses in non-NSW watersheds (Mallin and Wheeler 2000). BMPs, including vegetated buffers,
detention ponds, and wetland areas, should be required on all new and existing golf courses draining to
coastal waters to help reduce nutrient concentrations.
Nutrients can also enter the water column habitat through atmospheric deposition from industries other
than agriculture and CAFOs. In June 2002, the NC General Assembly took a major step toward reducing
nitrogen and sulfur emissions from power plants by enacting the ―Clean Smokestacks‖ Act. The Air
Quality/Electric Utilities law requires significant emissions reductions from coal-fired power plants in
North Carolina. Under the Act, power plants must reduce their nitrogen oxide emissions 77% by 2009
and sulfur dioxide emissions 73% by 2013. The cuts in both SO2 and NOx emissions will improve
respiratory conditions for North Carolina residents, as well as reduce acid rain and airborne deposition of
nitrogen in coastal waters.
Automobiles contribute to air pollution across North Carolina. Increasing air pollution from automobiles
could be attributed to increasing urban sprawl; as members of a more dispersed human population
typically drive longer distances per day in vehicles, contributing to increased nitrogen emissions. The
relative increase in urban built-upon areas may also be contributing excess nutrients during extreme
weather events. Engelhaupt (2008) compared nitrogen release in urban areas and agriculture lands and
found that urban areas were shown to become a bigger contributor when rainfall patterns were more
variable. Specifically, the study documented a 50% decrease in nitrogen retention during wet years.
Forests and agricultural lands largely kept their nitrogen-retaining ability.
Status and trends in nutrient enrichment
Nutrient enrichment in Albemarle-Pamlico estuarine system and the subsequent effects on phytoplankton
populations and water quality parameters has been observed by many researchers since the 1970s,
Changes in these parameters were linked to anthropogenic nutrient loading events including changes in
agricultural fertilizer use, the phosphate detergent ban, overall improvements to WWTPs, upstream dam
construction as well as to discharge fluctuations caused by hurricanes and droughts (Stanley and Hobbie
1981, Christian et al. 1991, Boyer et al. 1993, Stanley 1993, Stow et al. 2001, Paerl et al. 2004) Since the
phytoplankton blooms seen in North Carolina estuaries resulted from nutrient enrichment, measures of
chlorophyll a, a photosynthetic pigment found in all algae and most cyanobacteria, is a commonly used
indicator of algal biomass, primary production, and eutrophication.
Paerl et al. (2004, 2007) found that depending on seasonal hydrologic cycles and episodic (hurricane)
events, phytoplankton community structure differed substantially. They argue that since phytoplankton
are relatively easy to detect, identify, and quantify, conduct a large share of primary production, and are
sensitive to diverse environmental stressors, they can be valuable indicators of eutrophication (Paerl et al.
2007). Andersen et al. (2006), argues that measuring primary production should be ―mandatory‖ in
monitoring coastal waters for eutrophication. It should be noted, however, that the sampling frequency
and location have a major influence on the data because of the high variation in the system.
2010 Coastal Habitat Protection Plan
Chapter 2. Water Column Page 126
In the lower Cape Fear River, Mallin et al. (2001c) reported high nutrient levels in the river channels, but
algal blooms rarely occurred. This was attributed to high flushing and reduced water clarity from
turbidity and color, which reduced photosynthesis (Mallin et al. 2001c). A study of tidal creeks in New
Hanover County found that chlorophyll a concentrations were greatest at mid to low tide (Mallin et al.
1999a). The reason for higher nutrient levels at lower tides was primarily attributed to the transporting of
nutrients from the adjacent marsh and headwater areas. Headwater areas often have the highest
chlorophyll a concentrations within a tidal creek (Laws et al. 1994; Mallin et al. 1996; Mallin et al.
1999a; Mallin et al. 2004). In continental-draining tidal creeks, phytoplankton growth in the lower
reaches is limited by nitrogen, while in the upper reaches it can be limited by phosphorus at times due to
elevated nitrate inputs, or even by light through self-shading of the algae (Mallin et al. 2004). Other
studies have also found that falling tides transport algae from upstream to downstream sources (Litaker et
al. 1987; 1993).
NAWQA results from the mid-1990s in the Albemarle-Pamlico system found that the Neuse Basin had
the highest nitrogen and phosphorus concentrations due to intensive agriculture and urban runoff while
the lowest concentrations occurred in the forested Chowan Basin (Spruill et al. 1998). Although nitrogen
and phosphorus concentrations in streams had shown a general decline since 1980 in all four basins,
concentrations are still such that continue to cause to algal blooms in the Tar-Pamlico and Neuse river
basins. The decrease in nutrient levels was likely due to improved agricultural practices, the phosphate
detergent ban in 1988, and improved water treatment practices. The authors estimated that a 50%
reduction of nitrogen and phosphorus concentrations in the Neuse River and a 30% reduction in the Tar
River during summer months were needed to reach levels that will reduce the incidence of nuisance algal
blooms and fish kills (Spruill et al. 1998).
A geologic source also contributes to naturally high phosphorus in the Neuse and Tar-Pamlico. Fear et al.
(2007) worked in areas high in organic sediments and reported that submerged groundwater discharge in
the Neuse Estuary represented a small part of watershed nitrogen and phosphorus loading, 0.8% and
1.0%, respectively. Similar measurements reported in Spruill and Bratton (2008) indicated 4% and 5% of
N and P originating from ground water. However, Null et al. (2009) measured ten-fold higher
concentrations of ammonium in nearshore sandy sediments of that estuary than in the overlying water
column, and significant seasonal groundwater input to porewaters. They conclude that groundwater is an
important mechanism forcing nutrients from porewaters to the overlying water column in this shallow
lagoonal estuary.
The National Oceanic and Atmospheric Administration‘s Estuarine Eutrophication Survey assessed the
scale and scope of nutrient enrichment and eutrophication in the North Atlantic, South Atlantic and Gulf
coasts (NOAA 1996). The report summarized status and trends in tidal freshwater, mixing, and seawater
zones of Albemarle-Pamlico sounds, Pamlico-Pungo rivers, Neuse River, Bogue Sound, New River, and
Cape Fear River from 1970 to 1996. Medium or high concentrations (>5 µg/l) of chlorophyll a occurred
in 19 of 21 South Atlantic estuaries, and were most frequent in estuarine mixing zones (66% of the areas
sampled). Nuisance and toxic algae events occurred throughout all salinity zones in the South Atlantic
but were concentrated in North Carolina estuaries (NOAA 1996). The upper Pamlico River and the
Neuse River had increasing chlorophyll a concentrations in the mixing zone, while most others showed
no trend or a decreasing trend, especially in the tidal freshwater and mixing zones. All systems reported
nuisance or toxic algal blooms at least once during the course of the year except Bogue Sound and the
Cape Fear River (NOAA 1996). This survey was a part of the National Estuarine Eutrophication
Assessment (NEAA) Program that was designed to improve monitoring and assessment efforts to develop
models and tools for successful management of eutrophication (Whitall et al. 2007). The NOAA (1996)
survey of these estuaries was updated by Bricker et al. (2007), and North Carolina estuaries were
evaluated similarly as in the earlier assessment. Conditions were predicted to worsen in 65% of the
2010 Coastal Habitat Protection Plan
Chapter 2. Water Column Page 127
assessed estuaries in the future, especially in shallow, poorly flushed estuaries such as the Albemarle-
Pamlico in North Carolina.
For 17 years ongoing, NCSU Center for Applied Aquatic Ecology‘s (CAAE) Neuse River Monitoring
and Research Program has tracked riverine discharge, dissolved oxygen throughout the water column,
phytoplankton assemblages, phytoplankton biomass, fecal coliform bacteria densities, suspended
sediment loads, and nutrient concentrations and loads in the mesohaline Neuse Estuary (e.g. Burkholder
et al. 2004, 2006). Important findings contributed by this effort that are pertinent to fish health and fish
habitat include:
Long-term analysis of land use changes in the Neuse watershed showed that urban/suburban
development and associated runoff and sewage inputs are the most important contributors to
water quality degradation in the upper watershed, whereas industrialized swine agriculture is the
most important contributor to water quality degradation in the middle and lower watershed
(Rothenberger et al. 2009b).
Total nitrogen loading declined over the period from 1994 to 2009, but at the same time,
ammonium has increased. Ammonium is an important form of nitrogen that is preferred by many
phytoplankton species.
Algal biomass (as chlorophyll a) has significantly increased in both the oligohaline and
mesohaline estuary from 1993 to 2009, despite management efforts to control algal biomass by
reducing the total nitrogen load. The significant trend upward in algal biomass appears to be
related to nonpoint source pollution (Burkholder et al. 2006)
Bottom-water dissolved oxygen has significantly decreased in the mesohaline estuary from 1993
to 2009, reflecting a status of chronic eutrophication of this system. This trend indicates, as do
the significant trends upward in chlorophyll a and ammonium, that the Neuse Estuary is
sustaining progressive, increased habitat degradation for fish and other beneficial aquatic life.
Fish kills have not declined in the Neuse Estuary over this period, despite management actions to
reduce total nitrogen loading, our data support DWQ‘s having reported that 2008-2009 marked
record fish kill years. While drought years sometimes have sustained more fish kills, this dataset
showed that fish kills may also be significantly affected by pollutant loadings and the degree of
flushing by major storms (Burkholder et al. 2004).
Co-management of both nitrogen and phosphorus, and major reductions in inputs from nonpoint
as well as point sources, are needed (Glasgow and Burkholder 2000) to reverse water quality
degradation in this estuary
The ongoing (1997 to the present), Neuse River Modeling and Monitoring Project (MODMON) research
has found that riverine discharge, nutrient loading, and circulation (flushing and stratification) are
strongly related and primarily determined by weather patterns. Irregular weather patterns and lack of
long-term data in this dataset complicate trend analysis. Because the Albemarle-Pamlico estuaries are
wind-driven systems and do not directly drain into ocean waters, tidal flushing is limited and weak.
Consequently, nutrients and detrital matter are stored in the sediments, maintaining eutrophic conditions
(Luettich et al. 1999). In addition, because of the shallow depth of the estuary, the bottom sediments store
and release nutrients and carbon that can fuel algal blooms or low-oxygen events, independent of new
sources, making it difficult to evaluate the effectiveness of nutrient reductions and management actions
(Luettich et al. 1999). Some important findings of the research pertinent to fish habitat were:
Nitrogen loading had declined since 1999 and blooms in the upper Neuse River Estuary (NRE)
north of New Bern have declined. This is attributed to upstream wastewater treatment plant
improvements.
The mesohaline portion of the estuary has persistent salinity stratification and regular
phytoplankton blooms due to nutrient enrichment
The increased hurricane frequency since the mid-1990s has resulted in decreased upstream N and

2010 Coastal Habitat Protection Plan
Chapter 2. Water Column Page 128
P concentrations due to increased flushing
Benthic and pelagic respiration is capable of fully depleting the oxygen pool in stratified bottom
water in less than 5 days during summer months. Primary production is largely influenced by the
amount of freshwater flushing of the estuary. Large amounts of discharge move the largest
measures of algal biomass far downstream while droughts result in high algal biomass far
upstream.
Oxygen depletion is positively correlated with the accumulation of organic material in the
sediments from water column production (algal blooms) or external organic matter loading and
appropriate environmental conditions.
Low-oxygen conditions occur more often and for longer duration in deeper portions of the water
column. These conditions caused lethal and sublethal stress of benthic infauna in the deeper
sections of the estuary. The benthos affected included species that are important forage for
demersal fish species, such as spot and croaker (Luettich et al. 2000, Buzzelli et al. 2001, Paerl et
al. 2009)
The Lower Cape Fear River Program (UNC-W) has monitored nutrients and other parameters since 1995.
In 2008, chronic or periodic high nitrate levels were found at a number of stations. There were
considerably more algal blooms than the previous two years, most likely due to low flow throughout 2008
(Mallin et al. 2008). Low flow is also the likely explanation for annual mean turbidity levels being much
lower than the long-term average. Dissolved oxygen levels were similar to the annual average in the river
channel but lower in the blackwater creeks. These ―blackwater‖ systems often have low to moderate
phytoplankton production, but, given a source of human-generated nutrients and an open canopy, shallow
blackwater streams can support dense phytoplankton blooms (Ensign and Mallin 2001, Mallin et al.
2001a). The Lower Cape Fear River Program (UNC-W) uses its data, along with that of DWQ‘s
Basinwide Assessments, to give ratings for each parameter in each sub-basin in the Lower Cape Fear.
This effort provides a detailed description of the changes occurring in each sub-basin and could be used
for planning efforts.
The Cape Fear Program‘s tidal creek monitoring has found that nutrient loading is high enough in several
of the creeks to support small algal blooms periodically. In 2006-2007, the three creeks that have the
most development and impervious surfaces in their drainage area had the worst water quality degradation.
Of the 11 tidal creeks monitored in 2008, five were reported to have good water quality, often attributed
to low development and impervious surfaces (Mallin et al. 2008). The new stormwater rules made
effective in October 2008 should help maintain water quality in the creek with good water quality (see
―Non-point source management‖ subsection of ―Land-use and non-point sources‖ section for more
information). Comprehensive water quality monitoring is needed in other tidal creeks that are highly
important nursery and shellfish areas.
In the Cape Fear River Estuary (CFRE), highest concentrations of all individual N and P compounds
measured in coastal and shelf waters were found in the upper parts of each tributary. There has been a
significant increasing trend, as mentioned earlier, in ammonium concentrations in areas of the Cape Fear
watershed that are rich in CAFOs (Burkholder et al. 2006). The lower parts of estuaries and surface shelf
waters were characterized by oceanic surface values, indicating removal of N and P downstream in all
tributaries. Despite a high level of anthropogenic pressure on the uppermost coastal waters, significant
amounts of the inorganic N and P load are retained within estuarine and nearshore waters without
reaching the shelf (Dafner et al. 2006). Lin et al. (2008) found that light limitation controls phytoplankton
growth in the upper CFRE while nutrient availability limits growth in the lower estuary during low flow
periods, as in the coastal ocean. Their model predicted that in low flows, light limitation decreases and
phytoplankton growth increased, while in high flows residence time was shorter, light availability was
reduced, and less nutrients were consumed. This study, along with others, highlights the importance of
discharge on residence time, light availability, and nutrient uptake by phytoplankton in North Carolina

2010 Coastal Habitat Protection Plan
Chapter 2. Water Column Page 129
estuaries (Christian et al. 1991, Paerl et al. 2009).
A recent analysis of hypoxia, nitrogen loadings, and fisheries landings in 30 estuaries worldwide,
suggests that hypoxia does not typically reduce system-wide fisheries landings below what would be
predicted from nitrogen loadings. There was also no correlation found between N loading and the spatial
extent of hypoxia. Although compensatory mechanisms limit the translation of local-scale effects of
hypoxia to the scale of the whole system, hypoxia should still be considered in fisheries management
strategies (Breitburg et al. 2009).
However, fisheries landings are not the only measure of ecosystem integrity and resilience. Other studies
have indicated a fundamental change in trophic structure and species composition as eutrophication
intensifies (Jackson et al. 2001, Kemp et al. 2005). Jackson et al. (2001) found that the combined effects
of eliminating a particular species/trophic level and adding excessive amounts of nutrients and sediments,
greatly alters relative community composition and allows for extreme eutrophication-related events that
may not have occurred unless both conditions were present. They argue that overfishing, both the
elimination of top predators as well as structural bottom impacts may actually be a precondition to
eutrophication, disease, and microbial outbreaks. They propose that large scale oyster reef restoration in
temperate estuaries to increase water filtration may be required, in addition to nutrient input reduction, for
significant reduction in eutrophication to be achieved (Jackson et al. 2001, Boesch et al. 2001, and
Peterson et al. 2001). In a review of eutrophication in Chesapeake Bay, VA, Kemp et al. (2005) note that
declines in eastern oyster stocks may have exacerbated eutrophication in the estuary. They conclude that
while overall fisheries production may not have been effected, there have been fundamental shifts in
trophic and habitat structures (Kemp et al. 2005).
2.4.3.2. Suspended sediment and turbidity
The dynamic process in which the physical energy of waves, tides, and currents is transferred to stream,
estuarine, and ocean shorelines ultimately results in the erosion, transport, and deposition of sediment in
aquatic systems. Shorelines will respond differently to wave and current energy, depending on the source
and magnitude of energy, topography of land, substrate, and vegetative cover. Shoreline erosion and
sediment transport are ongoing natural processes (Riggs 2001). However, erosion and sediment loading
can be accelerated by human activities. The affects of light availability on aquatic organisms and other
basic water quality parameters (i.e., temperature, pH, dissolved oxygen) were discussed in the preface for
―Status and trends.‖ Here we discuss the physical effects of suspended sediment and turbidity on aquatic
organisms and the synergy of sediment additions with eutrophication and toxic contamination in North
Carolina coastal and estuarine waters.
Excessive suspended sediments can directly impact aquatic animals by clogging gills and pores of
juvenile fish and invertebrates, which can result in mortality or reduced feeding (Ross and Lancaster
1996). Auld and Schubel (1978) demonstrated reducing hatching success and reduced larval fish survival
with increased turbidity for several fisheries species in the Chesapeake Bay. Increases in the amount of
nonfood particles ingested by suspension-feeding shellfish and polychaetes lower the nutrient value of
their diet and their growth rates (Reilly and Bellis 1983, Benfield and Minello 1996, SAFMC 1998a;
Lindquist and Manning 2001). Turbidity has also been found to disrupt spawning migrations and social
hierarchies (Reed et al. 1983) and results in decreased combined fish biomass (Aksnes 2007). Peterson
and Manning (2001) found that high turbidity (~100 NTUs) resulted in 25% reduction in growth by
Donax variabilis and 30-40% reduced feeding rate by Florida pompano in experimental wave tanks.
Suspended sediment absorbs toxic chemicals, heavy metals, phosphorus, and bacteria, providing a
mechanism for pollutants to be transported farther downstream, where they may be ingested by filter
feeding fish and invertebrates (Steel 1991). In a set of North Carolina oligohaline tidal creeks Mallin et
2010 Coastal Habitat Protection Plan
Chapter 2. Water Column Page 130
al. (2009a) found that both TSS and turbidity were strongly correlated with fecal bacteria, phosphate, and
BOD, and that TSS and turbidity were strongly correlated with rainfall events. Results from the
MODMON project have estimated that the amount of nitrogen and organic carbon stored in the upper 2
cm of bottom sediments is ten times more than the amount of total nitrogen content in the entire 3-4 m
water column (Luettich et al. 1999). Once bottom sediments are resuspended, contaminants can be
released back into the water column. As the oxygen of the water near the sediment interface is reduced,
the release of phosphorus, iron, and manganese increases markedly (Wetzel 2001).
Excessive sediment loading from nonpoint sources can gradually fill in creeks and small water bodies
over time, reducing the depth and width of channels. This, in turn, alters currents and can bury benthic
organisms, including entire oyster or mussel beds in the upper estuary (Schueler 1997; P. Peterson, UNC-
IMS, pers. com., 2003). Successful recruitment of invertebrate larvae may also be reduced (Reilly and
Bellis 1983, Hackney et al. 1996, SAFMC 1998a, Peterson et al. 2000b).
Sources of turbidity and sedimentation
Sources of deposited or re-suspended sediment include land-disturbing activities, dredging for navigation
channels and boat basins, mining, beach nourishment, boating activities, and bottom-disturbing fishing
gear. The primary human sources of increased sediment loading include:
Most land disturbing activities such as building and road construction, post-construction
stormwater runoff from urbanized areas, agriculture, timber harvesting, animal operations,
mining, and removal of vegetated buffers (see ―Land-use and non-point sources‖ for information
on status and trends for these activities).
Dredging for navigation channels and boat basins causes re-suspension of bottom sediments and
additions of sediment from disturbed uplands (see ―Dredging (navigation channels and boat
basins)‖ and ―Water-dependent development‖ sections for information on status and trends for
these activities).
Mine dewatering is another source of land-based sediment (see ―Mining‖ subsection of
―Hydrologic modifications‖ section for information on status and trends for mining).
Beach nourishment activities redistribute sediment between ocean shoreline and
estuarine/offshore borrow sites (see ―Beach nourishment‖ section of ―Soft bottom‖ chapter for
more information).
Bottom fishing gear and boating activities primarily re-suspend bottom sediments (see ―Boating
activity‖ section of ―Submerged aquatic vegetation‖ chapter for more information).
Bottom disturbing fishing activities that generate turbidity in the water column include bottom
trawling, clam kicking, and hydraulic clam dredging (see ―Soft bottom‖ chapter for more
information on fishing gear impacts).TT
Municipal and industrial wastewater treatment discharges (point sources) can be a minor source
of sediment (see ―Point sources‖ subsection of ―Water quality degradation – Source‖ section for
information on status and trends).
Of all the sources of sediment loading, sedimentation from agriculture has been cited as one of the largest
contributors to water pollution in the southeastern states (SAFMC 1998a). The EPA concluded that
siltation and nutrients impair more miles of assessed rivers and streams than any other pollutant, affecting
45% and 37% of impaired rivers and streams, respectively. However, since the amount of land in
agriculture is declining, with a corresponding increase in development, the sediment contributions from
these activities could be changing (see ―Land-use and non-point sources‖ for more information).
Stream bank erosion can be accelerated by increased flow and velocity of stormwater runoff (Beach
2002) or from bank destabilization. In naturally forested systems of the southeast, there is very little
surface runoff during and after a rainfall event, since the rainwater flows slowly over vegetated land, and
infiltrates the soil (Beach 2002). Increasing impervious surfaces associated with development result in
2010 Coastal Habitat Protection Plan
Chapter 2. Water Column Page 131
higher volumes and rates of flow into receiving streams. Bank failures are likely to occur when stream
banks are subjected to high flows, when stabilizing vegetation is removed or not present, and at livestock
or vehicle crossings. Sediment inputs will generally be high where erosion rates are high and shorelines
are unstable. Although shoreline stabilization with vertical structures may help retain sediments, erosion
is often intensified adjacent to and in front of stabilized shorelines (Crowell 1998; Pilkey et al. 1998). In
Piedmont NC, Line and White (2007) found that as land cover change progressed from
forested/agriculture to a residential development in a small drainage area, there were increased runoff
volumes (68% higher) and TSS (95%) compared to a similar undisturbed drainage area (see ―Land-use
and non-point sources‖ section for more information). The Line and White study also supports the
likelihood of urban development eventually outpacing agriculture as a source of sediment pollution. The
effectiveness of stormwater regulations, Erosion and Sediment Control Plans, and land-use BMPs will
modify the relative contributions of agriculture and residential development (see ―Nonpoint source
management‖ section for more information).
Corbett et al. (2009) found that sediment accumulation rates in two small tributaries of the Neuse River
Estuary are 0.2-0.5 cm/yr, indicating sediment retention. They explain that estuaries in the southeastern
U.S. are lined with tributaries and marshes that widen as they join the trunk estuary (see ―Soft bottom‖
chapter for information on sedimentation and resuspension in mainstem estuaries). These areas act as
temporary storage of sediment from the watershed and deliver sediment to the estuary only during high
flows and/or storm events. In disturbed watersheds, these tributaries accumulate a large amount of
sediment that can become storage for contaminants, nutrients, and organic matter.
Another important factor in sediment loading from shoreline erosion is the effect of global climate change
on sea level rise and resulting accelerated erosion (IPCC 2007). The accelerated erosion stems from
submerging portions of barrier islands (see ―Soft bottom‖ chapter for more information on ocean
shoreline erosion and sea level rise), increased erosion along previously protected shorelines, and
increasing loss of wetlands trapping sediment and other pollutants (see ―Wetland‖ chapter for more
information on estuarine shoreline change with sea level rise and erosion).
Status and trends in turbidity/sedimentation
Sediment and suspended solids water quality information is available from federal and localized
university monitoring programs. Results of the USGS NAWQA program stated that total suspended
solids had decreased throughout the Albemarle-Pamlico drainage system from 1980 to 1995 (Spruill et al.
1998). Decreases in sediment and solids concentrations were probably a result of:
Construction of new reservoirs, ponds, and beaver ponds in the basin, which trap solids,
Improved agricultural soil management, including use of conservation tillage, and
Improved wastewater management.
In the lower Neuse River Estuary, UNC‘s MODMON data indicated there is generally sufficient light
(lack of turbidity) to support phytoplankton photosynthesis in the upper three meters of the water column
(http://www.marine.unc.edu/neuse/modmon/results/results.htm, 2003). Based on results from UNCW‘s
Cape Fear Program in the lower Cape Fear River, annual mean turbidity in 2008 was much lower than the
long-term average due to low rainfall and discharge (Mallin et al. 2008). As expected, the highest
turbidities, which were only 25 NTUs, were found in the upper estuary and decreased downstream, with
the lowest in the blackwater tributaries. In the tidal creeks monitored by UNC-W, turbidity was generally
not a problem during the time period sampled.
The NCSU CAAE conducted decadal trend analysis of suspended solids loads to the mesohaline Neuse
Estuary and showed a significant trend downward (24% decrease) in suspended solids loads during 1994-
2003 (Burkholder et al. 2006). The resulting increased light availability, together with the striking
increase in ammonium concentrations, likely are both contributing to the significant trend upward in
2010 Coastal Habitat Protection Plan
Chapter 2. Water Column Page 132
chlorophyll a that the estuary has sustained.
Although the two commonly measured water quality parameters are water column turbidity (NTU) and
total suspended solids (TSS), correlations can be misleading due to the light scattering characteristics of
the suspended particles (Newcombe and MacDonald, 1991; Davies-Colley and Smith, 200; Fries et al.
2007). Fries et al. (2007) suggested that, under certain conditions, either of these measures could
represent a proxy for runoff and provide rapid measures of identifying suspensions dominated by various
particles (phytoplankton, runoff particles, or resuspended sediments). This knowledge could then be used
to help identify the source and predict water quality consequences of particle suspensions found.
2.4.3.3. Toxic chemicals
A toxic substance is defined in the North Carolina Administrative Code [15A NCAC 2B. 0202(36)] as
―any substance or combination of substances … which after discharge and upon exposure, ingestion,
inhalation, or assimilation into any organism, either directly from the environment or indirectly by
ingestion through food chains, has the potential to cause death, disease, behavioral abnormalities, cancer,
generic mutations, physiological malfunctions (including malfunctions or suppression in reproduction or
growth) or physical deformities in such organisms or their offspring or other adverse health effects.‖
Many of these chemicals occur naturally (e.g., heavy metals), while others are created almost entirely by
humans (e.g., pesticides). Potentially toxic chemicals found in the water column include:
Heavy metals - Metals that have a density of at least five times that of water. These include
mercury, nickel, lead, arsenic, cadmium, aluminum, iron, platinum and copper. Nonpoint sources
of heavy metal inputs include municipal and agricultural runoff, contaminated groundwater and
sediments, industrial shipping, copper- and organotin-based antifoulants, recreational boating,
and atmospheric deposition (Wilbur and Pentony 1999). Point sources of heavy metals include
industrial discharges, power plants, ocean disposal of dredged material, and marine transportation
(e.g., hull paints containing butyltin compounds to hinder biofouling).
Pesticides - Chemical compounds that are typically composed of chlorinated hydrocarbons and
are used as herbicides, insecticides, and wood preservatives for agriculture, aquaculture, and
urban/suburban development. Examples of pesticides are aldrin, atrazine, chlordane, fenvalerate,
permethrin, toxaphene, and DDT.
Dioxins - By-products of pesticide production, high temperature-combustion processes, and
chemical bleaching of pulp in paper production (DWQ 1997a). Dioxins are also present as trace
impurities in some commercial products.
Petroleum hydrocarbons - Compounds found in fuel-related products such as gas, oil, and grease.
There are over 100 hydrocarbon compounds in gasoline as well as numerous additives. Lubricant
oil also contains elements such as zinc, sulfur, and phosphorus (Jackivicz and Kuzminski 1973).
Hydrocarbons enter surface waters through stormwater runoff, boat use, and fuel spills.
Polycyclic aromatic hydrocarbons (PAHs) - A group of over 100 different chemicals that are
formed during the incomplete burning of coal, oil and gas, garbage, or other organic substances
like tobacco or charbroiled meat. Compounds in the PAH group are found in coal tar, crude oil,
creosote, and roofing tar, but a few are used in medicines or to make dyes, plastics, and pesticides
(http://www.atsdr.cdc.gov/toxfaqs/tf.asp?id=121&tid=25, October 2010).
Biocides- chlorine and other disinfectants used to disinfect waste and pool water, clean clothes,
and wash boats and other surfaces.
Polychlorinated biphenyls (PCBs) - Organic chemicals containing chlorine that have properties
that make them useful for many industrial and commercial applications like electrical, heat
transfer, and hydraulic equipment; in paints, plastics and rubber products; in pigments, dyes and
carbonless copy paper and many other areas. PCBs are used in plasticizers and flame retardants.
Plasticizers and flame retardants - Plasticizers (containing bisphenol A) are used to soften PVC
and used in storage containers and other items. Flame retardants are used in building materials
2010 Coastal Habitat Protection Plan
Chapter 2. Water Column Page 133
such as insulation, electric cable insulation, electronics, motor vehicles, household furnishings,
plastics, and polyurethane foams. These chemicals are being found increasingly in surface waters
(Kuiper et al. 2007; Kimbrough et al. 2008), bioaccumulate in organisms, and disrupt endocrine
processes (http://www.epa.gov/endo/index.htm, December 2010).
Ammonia - Form of nitrogen that comes from concentrated animal operations, cleaning products,
and point source dischargers. Ammonia is also a highly toxic waste product of living organisms
Pharmaceuticals and personal care products - a broad collection of substances referring to any
product consumed by individuals for personal health or cosmetic reasons, such as over -the-
counter drugs like ibuprofen, prescription drugs such as antibiotics, antidepressants and oral
contraceptives, caffeine, nicotine, disinfectants, and fragrances in products like shampoo and
detergent (http://www.epa.gov/endo/index.htm, December 2010).
Many factors affect a given chemical‘s toxicity to marine organisms. Some species or life stages are
more sensitive than others. Eggs, and larvae in particular, are generally more sensitive to toxics than
adult and juvenile life stages because they have more permeable membranes and less developed
detoxifying systems (EPA 1985; Weis and Weis 1989; Funderburk et al. 1991; Gould et al. 1994). For
example, larval striped bass are less tolerant of copper sulfate (CuSOB4B) than juveniles (Kaumeyer and
Setzlter-Hamilton 1982). Individuals of these early life stages often float in the water column, where
toxic chemicals are more available for uptake. Human -introduced chemicals can damage aquatic
organisms directly by causing mortality or indirectly by altering endocrine related growth and
reproductive processes.
Regardless of the life stage affected, some chemicals are inherently more toxic to organisms than others.
For example, some pesticides and metals (i.e., toxaphene, TBT, mercury) cause acute mortality to fish or
shellfish at very low concentrations (approximately 1 part per billion or less), whereas others (i.e.,
chromium, atrazine) can cause toxic effects only at much higher concentrations (>10,000 parts per
billion) (Funderburk et al. 1991). The effect on organisms also varies according to the physical and
chemical properties of the water column in which they live; higher salinity water can neutralize more
dissolved chemicals than fresh water, making these toxics less biologically available for uptake. There
are other physiochemical conditions that can either increase or decrease toxicity of a given chemical. For
example, copper is less toxic in the presence of dissolved organic matter. Cadmium toxicity, on the other
hand, decreases as salinity increases due to binding to chloride.
While some toxins will remain in aqueous form in the water column, others, especially heavy metals are
readily adsorbed on small sediment particles and eventually removed from the water column (Butler
1971; Wolfe and Rice 1972; Vandermeulen and Mossman 1996). Adsorption on sediment particles
allows some toxic chemicals to accumulate and continue contaminating sediments until they degrade into
less harmful substances. Refer to the soft bottom chapter for information on sources and effects of heavy
metal and hydrocarbon impacts to bottom feeding fish. However when these chemicals are re-suspended,
they become biologically available to pelagic species as well and can be incorporated into fish tissue
through absorption or diet. Upon entering the water column, many organic compounds will break down
and not persist indefinitely (Jackivicz and Kuzminski 1973).
Toxicity and bioaccumulation
The acute and chronic toxicity of selected chemicals on a few pelagic species are listed in Table 2.38.
The effects of environmental pollutants on early fish life stages are listed in Appendix F. Based on the
limited number of chemicals for which data are available, the water quality standard is less than the acute
and chronic toxicity level for the selected pelagic species and early fish life stages. However, these data
are mostly from anadromous species and based on laboratory tests to determine acute levels of mortality,
which are difficult to translate into ecosystem-level effects in very complex chemical and biological
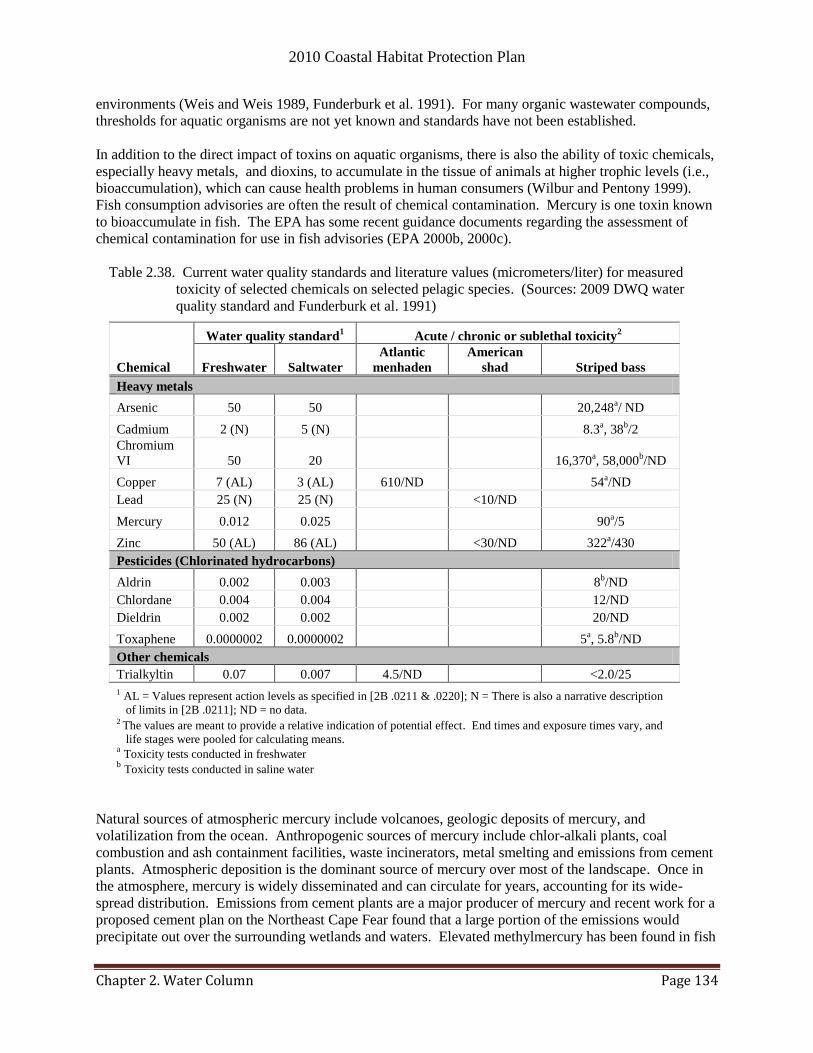
2010 Coastal Habitat Protection Plan
Chapter 2. Water Column Page 134
environments (Weis and Weis 1989, Funderburk et al. 1991). For many organic wastewater compounds,
thresholds for aquatic organisms are not yet known and standards have not been established.
In addition to the direct impact of toxins on aquatic organisms, there is also the ability of toxic chemicals,
especially heavy metals, and dioxins, to accumulate in the tissue of animals at higher trophic levels (i.e.,
bioaccumulation), which can cause health problems in human consumers (Wilbur and Pentony 1999).
Fish consumption advisories are often the result of chemical contamination. Mercury is one toxin known
to bioaccumulate in fish. The EPA has some recent guidance documents regarding the assessment of
chemical contamination for use in fish advisories (EPA 2000b, 2000c).
Table 2.38. Current water quality standards and literature values (micrometers/liter) for measured
toxicity of selected chemicals on selected pelagic species. (Sources: 2009 DWQ water
quality standard and Funderburk et al. 1991)
Chemical
Water quality standard1 Acute / chronic or sublethal toxicity
2
Freshwater Saltwater
Atlantic
menhaden
American
shad Striped bass
Heavy metals
Arsenic 50 50 20,248a/ ND
Cadmium 2 (N) 5 (N) 8.3a, 38
b/2
Chromium
VI 50 20 16,370a, 58,000
b/ND
Copper 7 (AL) 3 (AL) 610/ND 54a/ND
Lead 25 (N) 25 (N) <10/ND
Mercury 0.012 0.025 90a/5
Zinc 50 (AL) 86 (AL) <30/ND 322a/430
Pesticides (Chlorinated hydrocarbons)
Aldrin 0.002 0.003 8b/ND
Chlordane 0.004 0.004 12/ND
Dieldrin 0.002 0.002 20/ND
Toxaphene 0.0000002 0.0000002 5a, 5.8
b/ND
Other chemicals
Trialkyltin 0.07 0.007 4.5/ND <2.0/25
1 AL = Values represent action levels as specified in [2B .0211 & .0220]; N = There is also a narrative description
of limits in [2B .0211]; ND = no data. 2 The values are meant to provide a relative indication of potential effect. End times and exposure times vary, and
life stages were pooled for calculating means. a Toxicity tests conducted in freshwater
b Toxicity tests conducted in saline water
Natural sources of atmospheric mercury include volcanoes, geologic deposits of mercury, and
volatilization from the ocean. Anthropogenic sources of mercury include chlor-alkali plants, coal
combustion and ash containment facilities, waste incinerators, metal smelting and emissions from cement
plants. Atmospheric deposition is the dominant source of mercury over most of the landscape. Once in
the atmosphere, mercury is widely disseminated and can circulate for years, accounting for its wide-
spread distribution. Emissions from cement plants are a major producer of mercury and recent work for a
proposed cement plan on the Northeast Cape Fear found that a large portion of the emissions would
precipitate out over the surrounding wetlands and waters. Elevated methylmercury has been found in fish
2010 Coastal Habitat Protection Plan
Chapter 2. Water Column Page 135
tissue of several species in the lower Cape Fear watershed and several miles are listed as impaired for
mercury by DWQ. One major source of the contamination was a former chlor-alkali manufacturing plant
(HoltraChem facility) used to provide chlorine gas, caustic soda, and bleach to the adjacent International
Paper facility. The lagoons holding process water and the plant were highly contaminated with mercury.
The site is now designated as a Superfund site; removal of the waste has been underway since 2003.
Additional industrial emissions of mercury would be detrimental to fish populations in this area and
should be highly limited.
Another emerging source of toxic contamination was documented recently in reports concerning coal ash
containment facilities in coastal North Carolina and elsewhere (Stant 2010;
http://www.publicintegrity.org/assets/pdf/CoalAsh-Doc1.pdf). The reports document toxic leachate from
these facilities at very high concentrations in the receiving waters. The levels of some deadly pollutants,
such as arsenic, cadmium, lead, selenium, and other toxic metals were as much as 145 times greater than
federal discharge standards. The results from 31 such facilities have strengthened the case for releasing
delayed federal regulations on coal ash containment facilities. Two active facilities in North Carolina
were located in coastal draining river basins; one operated by Progress Energy near the Cape Fear River,
and another located near Swift Creek in the Neuse River Basin. Among other things, the delayed federal
regulations would require flue-gas desulfurization controls (scrubbers). Progress Energy has opted to
close all of its coal-fired power plants that do not have the scrubbers. The company decided that it was
cheaper to close them than to install the necessary retrofits (http://progress-
energy.com/aboutus/news/article.asp?id=22982, March 2010). The company has plans to build cleaner,
natural gas-powered plants to replace some of the lost capacity. Cleaning up coal ash containment
facilities is supported by CHPP goals and objectives to protect water quality.
Once in surface waters, bacteria that process sulfate can take up inorganic mercury, convert it to methyl
mercury through metabolic processes, and be consumed by the next higher level in the food chain.
Eventually, methyl mercury accumulates higher trophic species. Mercury can settle on the bottom and
become buried by sediment or be resuspended into the water column. In a US study, blackwater coastal
plain streams draining forested wetlands in the southeast tended to have the highest concentrations of
mercury in fish tissue (Scudder et al. 2009). Studies have documented that the Cape Fear system has
favorable conditions for conversion to methylmercury and for retention in the system (Schneider 2009).
Fish consumption advisories in North Carolina can be found at
http://www.rabies.ncdhhs.gov/epi/fish/current.html (November 2010). There is a statewide mercury
advisory and site specific advisories for PCBs, dioxin, and other toxins. Site-specific advisories for
dioxin have been given for Albemarle Sound, lower Roanoke River, and Welch Creek in Beaufort,
Martin, and Washington counties, due to a former paper mill plant. There is also fish consumption
―advice‖ for mercury in sharks, swordfish, tilefish, king mackerel, bowfin, largemouth bass, and chain
pickerel caught in waters south and east of Interstate 85. In addition to bioaccumulating, both inorganic
and organic mercury have been reported to be lethal to fish and invertebrates in low concentrations and
cause various physiological, reproductive, and biochemical abnormalities at sublethal concentrations
(Boening 2000). Temperature, pH, salinity, and DO will affect toxicity values.
Endocrine disruptors
Since the 2005 CHPP, more information is available that residuals of many new compounds (emerging
contaminants) used today in products that improve our lifestyle, such as mosquito control chemicals,
antibiotics, cleaning supplies, hand sanitizer, flea control, and lawn pesticides and herbicides, and others,
can enter the environment and have significant environmental and human health effects. These
―emerging contaminants‖ have been identified in wastewater, surface, and groundwater in the United
States and other countries (Shea et al. 2001; Kolpin et al. 2002; Giorgino et al. 2007) and may act as
2010 Coastal Habitat Protection Plan
Chapter 2. Water Column Page 136
endocrine disrupting chemicals.
Endocrine disrupting chemicals (EDCs) are hormonally active chemicals that alter growth, development,
reproductive or metabolic processes, adversely affecting the organism, its progeny, and/or stock viability
(Weis and Weis 1989; Wilbur and Pentony 1999, DeFur and Foersom 2000). EDCs may include some,
but not necessarily all industrial chemicals, pesticides, metals, flame retardants, plasticizers, disinfectants,
prescription medications such as antibiotics and hormones, and some pharmaceuticals and personal care
products. While the public may realize that pesticides and heavy metals from industrial and car emissions
may be dangerous, it is less known that seemingly benign products such as caffeine, ibuprofen,
antibacterial soap, and byproducts from plastic bottles and upholstery materials are entering coastal
waters and may be adversely affecting the growth and reproduction of aquatic organisms. Some
examples of the effects that have been documented as a result of exposure to these contaminants include:
decreases in reproduction, altered sexual development or ―gender bending‖, environmental antibiotic
resistance to one or more antibiotics, and changes in population structure or localized extinction of some
species. These chemicals are human generated and are very persistent in the environment. They may be
active at very low levels (P. McClellan-Green/NCSU, pers. com. 2009). The majority of these chemicals
are not removed with most types of tertiary wastewater treatment and enter waters through effluent
discharges (Giorgino et al. 2007). They can also enter surface waters through urban and agricultural
runoff.
Numerous aquatic and marine species suffer adverse effects following chemical exposure because of their
diverse pathways for exposure, their methods of uptake, and their individual metabolism. The effects
seen in individuals that are higher on the food chain and exposed to higher levels of contaminants are
readily noticeable. However, those organisms inhabiting the lower reaches of the food chain, i.e. the
invertebrates, are often overlooked. The levels of chemicals entering aquatic ecosystems through
hazardous spills have decreased over time and most exposures currently occur through a low level chronic
uptake. In addition, levels of active chemicals that accumulate in the environment are now known to
affect invertebrates at much lower concentrations than previously considered. The types of endocrine
disrupting and newly emerging contaminants encountered by invertebrates, including marine
invertebrates, are similar to those encountered by terrestrial organisms. These include metals, pesticides,
various organic compounds (PAHs, PCBs, steroids, etc.), and pharmaceuticals and personal care products
(Damstra et al. 2002; P. McClellan-Green/NCSU, pers. com., 2009).
The divergent nature of endocrine systems found in invertebrates serves to complicate the analysis of
potential risk following exposure to endocrine active compounds. At least eight different types of
hormones are active in the endocrine systems of eukaryotic organisms. These endocrine systems are
many times inter-related and dependent upon one another for function and signaling capacity. Their end
function can be carried out through direct action or through circulating levels of the various endocrine
compounds. Invertebrates are unique in that their endocrine systems control not only sexual development
and reproduction but also growth, molting, limb regeneration, diapause, metamorphosis, pigmentation,
immune function and the production of pheromones (B. Roer, pers. com., 2009). For the most part, these
aspects of endocrine regulation while they may be susceptible to the effects of environmental
contaminants have not been fully examined and their influence on population structure and population
stability unknown.
The prevalence and effects of endocrine disrupting chemicals in North Carolina is largely unknown. The
U.S. Geological Survey conducts a nationwide monitoring program looking for a large variety of
chemicals in selected sampling stations and has found widespread occurrence of organic wastewater
compounds in rivers and streams. Kolpin et al. (2002), in sampling 30 states for organic wastewater
compounds, reported at least one organic wastewater compound detected in 80 percent of the sampled
streams. Organic wastewater compounds included chemicals widely used by households, industry, and

2010 Coastal Habitat Protection Plan
Chapter 2. Water Column Page 137
agriculture such as sterols, pharmaceuticals, and antibiotics. These wastes may enter surface waters
through agricultural or urban runoff or wastewater effluent. Other studies have found presence of organic
wastewater compounds in wastewater effluent and elevated concentrations downstream of wastewater
effluents in West Virginia (Chambers and Leiker 2006) Georgia (Frick and Zaugg 2003), lower
Mississippi ecosystem (Shae et al. 2001), Colorado (Sprague and Battaglin 2005), and South Dakota
(Sando et al. 2005). In North Carolina, the USGS conducted a limited amount of monitoring for
endocrine disrupting chemicals in freshwater reaches of the Tar, Neuse, and Cape Fear river basins
(Giorgino et al. 2007; M. Giorgino/USGS, pers. com., 2009). Prescription drugs (antibiotics and other
medications), non-prescription drugs, flame retardants, plasticizers, fragrances, pesticides, detergent
metabolites, antimicrobial agents, and other suspected endocrine disruptors were detected. In the areas
sampled in North Carolina, pharmaceuticals, followed by flame retardants and plasticizers were the most
frequently detected wastewater compounds. While some of the sites were downstream of wastewater
discharges, others were in areas receiving runoff from agriculture and urban development as well. North
Carolina‘s estuaries were not targeted in these studies.
Typical municipal wastewater treatment processes are not capable of removing hormones, antibiotics, and
other EDCs, making sewage effluent a major source. The current recommended federal policy for
disposal of unused drugs is to flush medicines down the toilet or mix with cat litter and take to a landfill.
Hospitals also routinely dump expired and unused medications into the wastewater system. The NC
Department of Agriculture and Consumer Services (NCDACS) has been working to add a Prescription
Drug Collection and Disposal Program to their Pesticide Disposal Assistance Program for the citizens of
North Carolina. The concept is that when residents come to a One Day Pesticide Disposal Collection
Event, run by NCDACS, to dispose of unused herbicides or pesticides they could also bring unused over
the counter (OTC) or prescription medications. These could be dropped into a drum of reagent directly
by each individual, so there is no risk of inappropriate re-use of medications. The drum of reagent is
secured for final incineration. There is support for a program like this as an initial option for the disposal
of household pharmaceutical product wastes until take-back programs can be established. However,
because of the current federal policy, approval is needed from the federal Drug Enforcement
Administration (DEA). Other states have managed to institute some type of drug take-back program.
Assistance and support is needed from the Attorney General‟s office to implement a take-back program in
North Carolina.
In 2008, the MFC established an Endocrine Disrupting Chemical workgroup to discuss what was known
regarding the effects of EDCs on coastal fishery species and determine the status of these chemicals in
estuarine waters. The group consisted of university scientists, USGS scientists, and staff from DEH,
DWQ, NCDA, and DMF. They compiled a white paper with recommendations. The workgroup
recommended that to assess potential impact of endocrine disruptors in North Carolina‟s estuaries, a
site-specific, compound- specific monitoring program is needed. The program should include:
1) estuarine monitoring of the concentration and prevalence of priority chemicals of concern with
possible focus on the Neuse River system,
2) specific research on the effects of chemicals on fishery species, particularly blue crab, oysters,
and fish,
3) education and outreach regarding proper disposal of pharmaceuticals, pesticides, and
antibiotics, including what existing waste management and recycling programs are available,
4) expand the NC Pesticide Disposal Assistance Program to include unused and outdated
pharmaceuticals, and
5) a plan for removal of chemicals from wastewater and runoff.
The NC Division of Water Quality could expand its sampling program to include collection of water
samples for analyses, with USGS laboratories conducting the analyses. Critical chemicals should be
selected for analyses, rather than analyzing for everything. Chemicals like fipronil (frontline), bisphenol
2010 Coastal Habitat Protection Plan
Chapter 2. Water Column Page 138
A (certain plastics), alpha and beta estrodiol (hormones), antibiotic degradation products, alachlor and
other high-use pesticides, juvenile hormone analogs (mosquito control), etc. should be prime candidates.
A monitoring task force comprised of USGS, DWQ, DMF, NCDA, Shellfish Sanitation, as well as
representative researchers, could identify a list of most likely problematic chemicals.
Crustaceans
Numerous studies have been done assessing the effect of hormone-like substances, insecticides, and
juvenile hormone insecticides (interrupt the insect life cycle) on crustaceans, including amphipods,
copepods, grass and mysid shrimp, crabs, and lobster. Over the past two decades, scientists began to
observe so-called ―intersex‖ individuals among crustacean (e.g. shrimp, crabs, lobsters) populations (Zou
and Fingerman 1999; Ford et al. 2004; Brian 2005). These individuals were generally males that
exhibited female sexual characteristics. The incidence of intersex males was associated with areas
downstream from urban wastewater outflows. Other observed impacts associated with human hormones
and hormone-like substances include toxicity, increases in female/male sex ratios, molting enzyme
abnormalities, abnormal larval development, and altered egg production and maturation. Analysis of the
wastewater and subsequent controlled experiments indicated that the cause of these developmental
abnormalities was due to both human sex hormones (predominantly estrogen – naturally occurring and
from birth control and hormone replacement sources) and compounds that mimicked the structure of these
sex hormones (including many insecticides and other agricultural chemicals).
Crustaceans, being bound by a rigid exoskeleton, must molt (shed the outer skeleton) in order to grow.
Mating and reproduction, in addition to larval development, are intimately tied to molting and growth.
For example, many crabs and lobsters can only mate when the females have just molted. Many of the
hormones that control molting and reproduction in crustaceans are steroids that bear a structural
resemblance to human reproductive hormones like estrogen. Thus estrogenic and estrogen-like
compounds have the potential to affect molting, growth, mating, reproduction, and development of
crustaceans (B. Roer/UNCW, pers. com. 2009).
The past few decades have also seen the emergence of insecticides that mimic insect juvenile hormones.
Juvenile hormone maintains larval characteristics when insects molt, preventing the development of the
adult, reproductive form. Insects and crustaceans are closely related, and crustaceans employ a hormone
similar in both form and function to insect juvenile hormone. Thus, the juvenile hormone (JH) analog
insecticides have the potential to adversely affect reproduction and development in commercially
important crustacean species (e.g. blue crabs, shrimp, and lobsters) (McKinney 2005, Turberty and
McKinney 2005). In North Carolina, one of the JH analog insecticides (methoprene) is widely used
against mosquitoes and fleas.
Other studies have examined the effects of non-hormonal insecticides used in agriculture (i.e., dieldrin,
heptachlor, lindane, endosulfan) on crustaceans (water fleas, crabs, and lobsters). Similar to hormone
effects, these studies found molting enzyme abnormalities, increase in male/female sex ratios, intersex
males, and toxicity (Ayaki et al. 2005, Waddy et al. 2002).
Molluscs
Decreased reproduction, increased vitellogenesis, and sperm abnormalities have been documented in
oysters, clams, and scallops exposed to human hormones or hormone-like substances (Gagne et al. 2002,
Matozzo and Marin 2008, Wang and Croll 2006, Canesi et al. 2008). Exposure to insecticides via
agricultural runoff also decreased reproduction and filtration, and caused gonad atrophy and abnormal
larval development in oysters, snails, clams and scallops (Wessel et al. 2007, Anguiano-Vega et al. 2007).
Exposure to organics and metals had the same consequences (Curiewx-Belfond 2001, Cju et al. 2003,
Smaoui-Damak et al. 2006, Choy et al. 2007, Wintermyer and Copper 2007). In other studies that looked
2010 Coastal Habitat Protection Plan
Chapter 2. Water Column Page 139
at effects from mixed contaminants associated with marina harbor pollutants and sewage effluent, altered
sex ratios, impaired immune function, delayed growth and development, and decreased reproduction were
observed in mussels (Gagne et al. 2002, Gagne et al. 2007).
Fish
In the past decade, there have been increasing number of studies examining the effects of EDC on fish,
but most have focused on freshwater species. In the Chesapeake Bay, male catfish exhibited arrested or
indeterminate sexual development when their tissue contained significant concentrations of PCBs,
organotins, mercury, DDT, and DDT metabolites (DeFur and Foersom 2000). Other studies have found
altered sex hormone levels associated with PCB and mercury contamination downstream of wastewater
treatment plants (Baldigo et al. 2006). Kuiper et al. (2007) examined the effect of flame retardants on
flounder and found limited endocrine effects. Studies in multiple regions of the United States (Potomac
River, Colorado, lower Mississippi River systems) have found similar effects from human hormones on
fish (mosquitofish, largemouth bass, white suckers, catfish, carp, gar) as invertebrates, including intersex,
gonad deformities, delayed maturation, and asynchronous ovarian development (Shae et al. 2001;
Woodling et al. 2006, Blazer et al. 2007, Fong and Molnar 2008, Hinck et al. 2009, Iwanowicz et al.
2009). Kidd et al. (2007) found that not only did exposure of fish (fathead minnow) to estrogens and
mimics downstream of wastewater outfalls cause feminization of males, the reproductive alterations led to
a near extinction of the population, suggesting that EDC impacts can affect the sustainability of wild fish
populations.
Pesticides
Pesticides and herbicides can be toxic to aquatic organisms or act as endocrine disruptors. In a review of
pesticide toxicity on aquatic microorganisms, DeLorenzo et al. (2001) documented a great deal of
variability in the toxicity of even a single pesticide among microbial species. The authors also stressed
considering the toxicity of pesticide mixtures and interaction with nutrients. Pesticides and herbicides
tend to be greatest where agricultural runoff is present, but are also are attributed to urban runoff from
residential and golf course-related lawn care. More information is available on golf course runoff in the
nutrient section. Pesticides and herbicides may be more concentrated and problematic to fish when heavy
runoff from spring rains coincides with juvenile fish nursery use in shallow waters The concentration of
atrazine and other herbicides in the Albemarle-Pamlico system was highest in late May and early June
and decreased gradually until September; a seasonal pattern of pesticide concentration coinciding with
seasonal patterns of pesticide use (Harned et al. 1995). Many of the chemicals used today are EDCs
(Damstra et al. 2002).
The most commonly applied pesticides in agricultural areas of the North Carolina Coastal Plain include
the herbicides atrazine and metolachlor (McCarthy 2002, McCarthy et al. 2007). These pesticides also
were among the most frequently detected pesticides in streams of the Tar-Pamlico River Basin (Woodside
and Ruhl 2001). For example, atrazine was detected in 38 – 92 percent of samples annually collected in
the Tar-Pamlico basin during 1992 – 2001, and metolachlor was detected in 73 – 100 percent of the
samples each year during the same period (Woodside and Ruhl 2001, McCarthy, 2002). McCarthy et al.
(2007) reported that more than 1,230 kg of active ingredient of atrazine and 902 kg of active ingredient of
metolachlor were applied annually in Beaufort County, North Carolina, which is likely typical of
agricultural counties in eastern North Carolina.
Another potentially increasing threat is the effect of mosquito spraying over shallow water s and
wetlands. The U.S. Environmental Protection Agency, hoping to stem the rapid spread of West Nile
virus, has recently modified pesticide use procedures to allow some spraying of pesticides over water
(contrary to the pesticide label instructions) to kill mosquitoes, without having to get a permit under the
2010 Coastal Habitat Protection Plan
Chapter 2. Water Column Page 140
Clean Water Act (http://cfpub.epa.gov/NPDES/HOME.CFM?PROGRAM_ID=41). However, these
mosquito control agents can be non-selective, and are known to harm or kill larval aquatic invertebrates
and fish (Weis and Weis 1989, Milam et al. 2000), which is the reason they are not labeled for use over
open water. The toxicity of several common mosquito control pesticides on non-target zooplankton and
fish species (minnows and mosquitofish) has been investigated (Milam et al. 2000). Malathion was
identified as the cause of 64% of the pesticide-related fish kills in U.S. coastal areas between 1980 and
1989 (Key et al. 1998). The toxicity of malathion was tested on grass shrimp in moderate-salinity water
(20 ppt) and found to be highest for newly hatched larvae (Key et al. 1998). However, the doses used to
evaluate toxicity (up to 30 g/l) were much higher than were required to kill mosquito larvae in fresh
water (1 g/l). It may be that salinity has a buffering effect on the toxicity of malathion to both fish and
mosquito larvae. Research is needed to identify those pesticides safe for spraying over open waters and,
for those pesticides whose toxicity is impacted by salinity, appropriate application rates for controlling
mosquitoes.
Juvenile hormone analogs (JHA) are a substance used as insecticides to alter molting cycles and disrupt
the normal growth and development of targeted pests. The use of JHA is commonly used for the control
of insects in general mosquitoes, fleas, and fire ants. Of the various products, S-methoprene appears to be
the JHA with the greatest potential to contaminate NC surface water based on registered uses as a
mosquito/midge control product and as an animal feed supplement (B. Bruss/NCDACS, pers. com.,
2009). Subsequent efforts are needed to refine the details of product use to prevent its transport into
surface waters. Education and enforcement to ensure proper application of pesticides according to label
instruction, is needed.
There are also natural pesticides and bacteria that can be used for mosquito control (Buchsbaum 1994).
The bacterium Bacillus thuringiensis israelensis (B.T.I.) is more specific to mosquito larvae and less
toxic than malathion. There is also the Integrated Pest Management approach that allows natural
predators of mosquito larvae (e.g., mosquitofish, killifish) access to breeding areas. However, allowing
fish access to breeding areas could disrupt or eliminate amphibians dependent on the exclusion of fish
predators for their survival.
Crop spraying over agricultural crops is another source of pesticides in the water column. Some fish kills
in coastal rivers have been found to be related to crop spraying. Pesticides can enter the water through
runoff or directly due to drift from aerial applications. The North Carolina Department of Agriculture and
Consumer Services administers and enforces the N.C. Pesticide Law of 1971 and N.C. Pesticide Board-
adopted regulations, including crop spraying practices. The purpose of the N.C. Pesticide Program is to
protect public health and safety and to promote continued environmental quality by minimizing and
managing risks associated with the legal use of pesticides. Policies on drift from aerial applications will
affect the potential for toxin contamination in coastal waters and associated chronic and acute effects on
fish populations.
The N.C. Pesticide Board has rules regarding aerial spraying that prohibit the application of pesticides
under conditions that result in drift and adverse effects to non-target areas. Deposition of pesticides
labeled toxic or harmful to aquatic life is not permitted in or near water bodies. Another aerial rule states
that no pesticide shall be deposited onto any non-target area in such a manner that it is more likely than
not to cause an adverse effect, unless such aquatic life is the intended target of the pesticide. An inspector
will investigate whenever there is an allegation of pesticide drift to non-target sites to determine whether
the pesticide was applied according to the label. Although safeguards are in place, the N.C. Pesticide
Board‟s policies on drift should be assessed and modified if necessary to ensure adequate protection of
aquatic life and water quality.
Fossil fuels
2010 Coastal Habitat Protection Plan
Chapter 2. Water Column Page 141
Although fish that utilize the water column are highly mobile and can migrate from oil affected areas,
fisheries can still be adversely impacted by oil. With oil present in the water column, water quality begins
to degrade, making fauna more susceptible to other stress factors such as disease (Giles et al. 1978). In
tank experiments mullet, Mugil cephalus, had outbreaks of fin rot (vibrio) when exposed to varying
amounts of oil (Giles et al. 1978).
After an oil spill, oil will begin to evaporate and be broken down by varying microbes or by the use of
dispersants. As the oil breaks down PAHs become available in the water column were they are taken up
through fish gills and mouths and eventually excreted in bile (Jung et al. 2009). Chemically dispersed oil
can greatly affect larval development of fishes. McIntosh et al. (2010) showed that the level of toxicity
on larval fish development varied depending on the exposure duration and the amount of time post
fertilization with the youngest being the most sensitive. The presence of oil can prevent fish eggs from
hatching, limiting the growth rate of small fish, and can prevent fish from returning to previously utilized
spawning habitat (Peterson 2001 and Peterson et al. 2003b). After exposing larval herring to crude oil,
Incardona et al. (2009) observed a cardiac arrhythmia in 100% of the exposed larvae. Together, there are
indications that all of these affects have some part in the collapse of the Pacific herring (Clupea pallasi)
(Hulson et al. 2008; Thorne and Thomas 2008).
In pond experiments, compared to control ponds, there was a 44 to 65% reduction in primary production
and a 30 to 50 % reduction in respiration two weeks after crude oil was introduced into ponds (De La
Cruz 1982). After two months there was a 17% and 7% lower level of primary production and
respiration, respectively, when compared to the control ponds (De La Cruz 1982). This is important to
note since primary production reduces the potential for hypoxic and anoxic conditions (as described in
other parts of this chapter).
Tar balls, are partially degraded patches of oil that may drift in currents and wash onto the shoreline or
become entangled in macroalgae drift lines. Tar balls have been observed in various aquatic species
including loggerhead turtles (Witherington 2002), yellowfin tuna [(Thunnus albacares) Manooch and
Mason 1983] and Coryphaena hippurus (Manooch et al. 1984). Manooch et al. (1984) goes as far as
saying that due to the presence of manmade debris in Coryphaena hippurus stomachs they could be
indicator species for offshore water quality.
Most of the information presented above comes from one time spill events that had a finite amount of oil.
Additional impacts to other habitats and their residents are discussed in subsequent chapters. In the case
of continuously flowing oil from a leaking well, it is important that the source of oil is stopped and not
allowed to flow free so recovery can occur. As a result of oil contamination, commercial and/or
recreational fisheries may be closed as a result of PAH uptake. In order to determine if an area can be
reopened baseline samples are needed of pre-impact conditions. In North Carolina, DMF and Shellfish
Sanitation are collecting samples of crustaceans, mollusks, and finfish to have such a baseline in
preparation of a potential oil spill that reaches and impacts North Carolina. NCDENR have been working
with various federal agencies in order to have a response plan in case of such an emergency with the US
Coast Guard and NC Division of Emergency Management being the lead agencies. Due to the high
potential impacts associated with deepwater drilling, there should be a continued ban of oil and gas
drilling in off North Carolina waters.
Other toxins
Polymers are organic compounds such as polyacrylamides (PAM) and the Smart Sponge that have
recently begun to be used as soil erosion control techniques. These substances are synthetic and designed
to increase the soil‘s available pore volume infiltration, increase flocculation of suspended sediments,
increase retention of sediment, oil and gas products, and in some cases, bacteria as well. The chemical

2010 Coastal Habitat Protection Plan
Chapter 2. Water Column Page 142
can be incorporated into fiber check dams, filter bags, or applied directly to a side bank or ditch. These
products can be used as BMPs for disturbed soil areas that discharge to a sediment trap or basin. Since
the chemicals have been found to be toxic to aquatic organisms, improper application or degradation over
time could result in toxic products entering surface waters and impacting the nervous system of aquatic
organisms. DWQ is implementing more stringent turbidity limits on construction site general permits that
go into effect for sites over 20 acres by 2011 and over 10 acres by 2014. Since the use of this new
technology is expected to increase rapidly, there is an urgent need for research to assess the impacts of
polymers on aquatic estuarine life.
Status and trends in toxic contamination
Because contaminants often settle out into sediment in close proximity to their origin, status and trends of
sediment contamination can be an indicator of what has occurred in the water column in the past (see
―Soft bottom‖ chapter for more information).
2.4.3.4. Other causes of water quality degradation
Desalination plants and marine debris are two other threats to the water column.
Saline discharge
Withdrawal of brackish water for desalination and use as a municipal water supply is an activity that has
potential impacts to water quantity or quality (Copeland 1967). In rapidly developing coastal counties
where adequate volumes of shallow fresh groundwater is not available, desalination of saltier
groundwater provides another source of drinking water. Effluent from desalination (membrane filtration)
and water softening (ion exchange) treatment plants discharged into fresh surface water environments
could create isolated pockets of higher salinity water with very low diversity of species, the majority of
which occupy lower tropic levels. The reduction in species diversity and isolation from the surrounding
aquatic community would constitute a loss of habitat. Even under natural circumstances, vertical salinity
stratification in the estuarine water column creates unfavorable low dissolved oxygen (DO) conditions,
which serves to degrade bottom habitat, cause stress or mortality in benthic species, and force mobile
species to move (Stanley and Nixon 1992, Buzzelli et al. 2002). Similar conditions may occur artificially
through a salt water effluent release into fresh water. Currently, DWQ general permits restrict flow in
HQW and PNA to no more than 50% of the 7Q10, but there is no 7Q10 calculated for tidal creeks, which
results in no flow restrictions in these areas. In some waters, unrestricted effluent flow from a
desalination water treatment plant could greatly affect water column salinity, as well as ammonia, pH and
temperature. Even if aquatic organisms were able to adjust to salinity changes, they may also face an
imbalance of ions that would make adjustment even more difficult (Copeland 1967; Florida DEP 1995;
Goodfellow et al. 2000). Florida Department of Environmental Protection (1995) indicated that ionic
imbalance could be toxic to mysid shrimp, which are an important food item in the diet of many
freshwater fish species found in coastal North Carolina (Adams 1976; Whitehead 1985; Robins and Ray
1986; Page and Burr 1991; Bowman et al. 2000). Other potential effects of the hypersaline effluent are
listed in Pantell (1993).
Currently, in coastal North Carolina, there are 16 reverse osmosis desalination facilities and several
proposed facilities. Most of the older desalination plants in the coastal area are low volume and discharge
wastewater into the Atlantic Ocean and sounds where the receiving waters had lower or higher salinity
than the effluent. Several of the existing low volume plants are located in freshwater areas. However,
some of the newer high volume facilities are moving more inland to less saline waters. For example, the
DWQ issued an NPDES permit for a facility in Camden County that discharges 300,000 gallons/day of
saltwater (salinity ~10-15 ppt) into the Pasquotank River, where salinities range from 1-4 (Rulifson et al.
2010 Coastal Habitat Protection Plan
Chapter 2. Water Column Page 143
2006a, Rulifson et al. 2006b). The Camden County facility is also located in an Anadromous Fish
Spawning Area.
Due to concerns with two proposed high volume (1.67 MGD discharge) reverse osmosis (desalinization)
water treatment plants located in Albemarle Sound at the mouth of North (Currituck Mainland) and Little
(Pasquotank) rivers, government agencies requested a one-year, pre-construction and a two-year post-
discharge study of potential effects. During the pre-construction study, water quality, mixing potential,
and aquatic life conditions at the proposed discharge sites and the existing Camden County facility were
evaluated relative to control areas (Rulifson et al. 2006a, Rulifson et al. 2006b). The Camden County
discharge was used as a model to predict potential impacts at the proposed sites. Bi-monthly samples
taken from surface and bottom waters (depth approximately 2 meters) at 13 sites around the discharge
pipe and at proposed sites were analyzed for major elements and nutrients. All major elements of the
whole effluent were quantified instead of relying on TDS or conductivity to indicate water quality.
Ambient conditions were also assessed at each location. Data analyses included contour maps and
profiles of ion concentrations, analysis of mineral saturation, sediment grain-size and organic-content
analysis. The effluent plume was detected in bottom waters as increased concentrations of major
elements (only within 50 meters of the pipe). The plume shifted its position frequently, presumably with
prevailing wind and current conditions. Surface waters were not noticeably affected and showed less
variable chemistry than bottom waters. No samples, including those around the Camden discharge,
showed harmful ratios (15:1) of calcium (Ca) and sodium (Na) to aquatic animals. Of the major-
elemental ratios, only bicarbonate (alkalinity) to chloride (HCO3-: Cl
-) ratio was significantly higher than
ambient ratios and this was only for a few bottom samples nearest the discharge pipe. The ammonium
(NH4+) levels were significantly higher than ambient levels within a few meters of the discharge pipe.
However, no algal blooms were observed due to the highly stained water at the Camden discharge site.
There were also no significant reductions in the abundance of benthic organisms around the discharge
location. The researchers concluded there would be only minor impacts at the proposed discharge sites
along the more saline and higher energy shoreline of Albemarle Sound. Despite NCDMF‘s ongoing
concern, commitments and evaluations planned for the two-year post-discharge studies at the Currituck
Mainland and Pasquotank reverse osmosis discharge sites have been abandoned by the two counties, and
NCDWQ has issued discharge permits without adequate instream monitoring.
Proposals to locate large saline discharges (>0.5 mgd) in low energy/salinity areas should include specific
information to evaluate the impacts (Water Treatment Plant Workgroup report, L. Henry/DMF, pers.
com., 2002):
Location of project and discharge;
Ambient water quality at discharge location;
Proposed designed flow;
Type of treatment process (e.g., reverse osmosis, cation exchange);
Proposed water source;
Dilution modeling;
Chemical cleaning procedures; and
Ratio of potable water to concentrate.
Using the Rulifson et al. (2006a,b) studies and the above site specific information, permit review agencies
can evaluate the singular and cumulative impacts of desalinization facilities on aquatic organisms.
2010 Coastal Habitat Protection Plan
Chapter 2. Water Column Page 144
Marine debris
Trash and other waste that is carried into the water (marine debris) accidentally or intentionally are a
threat to fishery resources due to entanglement and ingestion. Entanglement can strangle or injure
organisms, or impair mobility. Ingestion of plastic resin pellets, plastic bags, and other packaging by
marine life can impede feeding and breathing. A 1997 study found that at least 267 species were affected
by marine debris, including numerous fish, invertebrates, sea turtles, and marine mammals (Laist 1997).
In 1998, the amount of trash dumped at sea was more than twice the weight of the total U.S. fishery catch
(http://www.cmc-ocean.org, December 2000). Plastics comprise about 90% of debris found floating in
the water (http://www.unep.org/regionalseas/marinelitter/, November 2002). Surveys indicate that water
based sources of trash include cruise ship operations, recreational boating, commercial fishing, offshore
oil drilling, and military vessel operations. Land based sources include storm drains, sewer outfalls, and
general littering.
Agency programs and Organizations such as NOAA‘s Marine Debris Program
(http://marinedebris.noaa.gov/welcome.html, November 2010), and The Ocean Conservancy (TOC)
(http://www.oceanconservancy.org/site/PageServer?pagename=program_marinedebris, November 2010)
are actively involved in monitoring and clean-up efforts. The TOCs Marine Debris Index documents the
results of recent cleanup efforts around the world
(http://www.oceanconservancy.org/pdf/2009_Marine_Debris_Index.pdf, November 2010). In addition to
the national programs, North Carolina Big Sweep is a state-wide nonprofit organization whose mission is
a litter–free environment. NC Big Sweep conducts year-round education to prevent litter and coordinates
the North Carolina Big Sweep, the North Carolina component of the International Coastal Cleanup – an
event in which volunteers from all 100 counties in the State and approximately 90 countries worldwide
come together to clean up our land and waterways. The most abundant trash items in U.S. waters were
related to shoreline and recreational activities. Other categories include ocean/waterway activities,
smoking activities, dumping activities, and medical/personal hygiene. The United Nations Environmental
Program‘s Global Initiative on Marine Litter provides an effective framework for conducting regional
activities addressing marine litter around the world, including those of the 12 participating Regional Seas
programs (UNEP 2009). At the state level, education and incentives are needed to encourage removal
and proper disposal of derelict fishing gear and other waste from water-dependent activities.
2.4.4. Non-native, invasive, or nuisance species
There is widespread documentation that some non-native species can out-compete native species, altering
the established ecosystem, habitat, and eventually water quality (Mallin et al. 2001c, Burkholder et al.
2007b). In the water column, these invasive species tend to be transported and introduced by ship‘s
ballast, fishing gear, and through association with another non-native species.
The ―water mold,‖ Aphanomyces invadans, reported to be a major cause of the characteristic, deeply
penetrating lesions that commonly afflict Atlantic menhaden in North Carolina estuaries, is an invasive
species from the western Pacific. This fungal pathogen infects schooling species in low-salinity or fresh
water. It is held responsible for ulcerative fish diseases around the world, including red spot disease
(RSD) in Australia, epizootic ulcerative syndrome (EUS) in Asia, and mycotic granulomatosis (MG) in
Japan. It is suspected that Aphanomyces invadans was introduced to the US via another infected invasive
species, such as the northern snakehead fish (Channa argus) from northern China, because the genetic
make-up of the two strains of water mold have been found to be identical (Blazer et al. 2002).
Foreign organisms in the discharge of ships‘ ballast water at or near ports have resulted in the
introduction and spread of non-native invertebrate animals, algae, bacteria, and dinoflagellates.
Hallegraeff (1998) linked a global increase in the frequency, intensity, and geographic distribution of
paralytic shellfish poisoning (a human illness resulting from consumption of shellfish contaminated with

2010 Coastal Habitat Protection Plan
Chapter 2. Water Column Page 145
certain red tide toxins) with increased translocation of non-native dinoflagellate species via ships‘ ballast
and import/export of shellfish products. In Australia, the sudden appearance of dinoflagellate cysts was
tied to exportation of woodchips (Hallegraeff 1998), an industry currently active in North Carolina.
The Australian spotted jellyfish, Phyllorhiza punctata, was found in Bogue Sound and Sunset Beach, NC
in 2007. This jellyfish has an average diameter of around 50 cm and can consume a large amount of
plankton, eggs, and larvae in the water column. The large size has also resulted in the fouling of fishing
gear in the Gulf of Mexico, where they are thought to have arrived in the US either attached to ships or in
ship ballast.
In 2004, the Coast Guard published regulations establishing a national mandatory ballast water
management (BVM) program and penalties for ships headed to the U.S. that fail to submit a ballast water
management reporting form. These regulations also require vessels to maintain a ballast water
management plan that is specific for that vessel and assigns responsibility to the master or appropriate
official to understand and execute the ballast water management strategy for that vessel. These
regulations also increased the number of vessels subject to these provisions by expanding the reporting
and the recordkeeping requirements on ships, increasing the Coast Guard‘s ability to determine the
patterns of ballast water movement as required by National Invasive Species Act of 1996. This final rule
in 2004 changed the national voluntary BWM program to a mandatory one, requiring all vessels equipped
with ballast water tanks and bound for ports or places of the United States to conduct a mid-ocean ballast
water exchange (BWE), retain their ballast water onboard, or use an alternative environmentally sound
BWM method approved by the Coast Guard (USCG 2009a).
Currently, the U.S. Coast Guard is proposing new regulations that include the treatment of ballast water
and propose a ballast water discharge standard. They found that 60% of US ships do not travel 200
nautical miles from shore, as required in the current rules for BWE, and BWE was not always effective in
removing non-native organisms (USCG 2009b). The proposed regulations include ballast water
discharge standards, composed of concentration limits of various organisms, as a quantifiable measure of
ballast composition that can be used to verify compliance and effectiveness of the treatment systems
(USCG 2009a). DENR should work with the U.S. Coast Guard to encourage support for these proposed
rules.
Some of the most likely methods of treating ballast water include hypochlorite generators, filters and UV
light treatment, and deoxygenation. Other ballast water treatment options include chemical treatment
with chlorine or hydrogen peroxide, electric shocking, ozonation, heat (35 – 45o C), and reballasting.
Ballast water contamination is a worldwide maritime issue that must be addressed on an international
scale, but may also be partially addressed on a regional scale (Burkholder et al. 2007b, and references
therein).
The 2010 Ocean Policy Report, produced by the Ocean Policy Steering Committee, DCM, and Sea Grant,
identified marine aquaculture as an emerging issue in which the primary concern was the introduction on
non-native species into endemic environments due to incidental escapement of farmed fish. The report
recommended that the state conduct a technical assessment of the feasibility of marine aquaculture in
North Carolina‘s coastal ocean waters and if the federal government passes a national offshore
aquaculture act, that North Carolina policies be developed as part of the Coastal Management consistency
process.
2.4.5. Sea level rise and climate change
The Wetland chapter contains the primary discussion of sea level effects along the North Carolina coast.
Other chapters contain information on climate change that is specific to biological features of a habitat
2010 Coastal Habitat Protection Plan
Chapter 2. Water Column Page 146
(i.e., SAV, estuarine shellfish, ocean hard bottom). This chapter covers the changes in distribution of
basic water quality parameters (i.e., temperature, pH, salinity, etc.) and anticipated changes in fish
community distribution. The affects of local climate warming in coastal North Carolina are expected to
be relatively severe, given the state‘s position at the boundary between the North and South Atlantic
Bights. Based on a history of measurement data, there is an anticipated rise in both temperature10
and sea
level11
for the immediate future (Bin et al. 2007; UNC-W report to UNC president 2008; ECU 2008).
Long-term changes in temperature and salinity suggest expansion of some species at the expense of
others. There is also a predicted increase in storm events and other extreme weather (i.e., drought). So
there are several dimensions of change bearing on fish communities in North Carolina estuaries that favor
resilient species with warmer temperature and higher salinity preferences. Analysis and monitoring of
long-term trends in estuarine salinity and temperature is needed to evaluate the impact of sea level rise
and climate change on fishery resources in North Carolina.
Variations in the predicted rate of rise could also have major implications for the current distribution
biological communities. If the rate of sea level rise increases too quickly, coastal wetland accretion may
not keep pace (see ―Wetland‖ chapter for more information). There may also be an increasing frequency
of inlet breaches along the barrier islands. The proliferation of inlets along the Outer Banks could
significantly increase salinities in Pamlico Sound and tributaries. Even without the persistence of new
inlets, there will be increasing flow through existing inlets and elevated water levels. The proportion of
depth zones may also change as coastal wetlands are submerged. All these factors (depth, flow,
temperature, salinity) are very basic in determining both species distribution and other water quality
parameters.12
The loss of barrier islands, reductions in wetlands, and increase in flushing could also
reduce the productivity of the estuarine nursery areas. Increased runoff from predicted increased storms,
loss of wetlands, and septic systems located increasingly close to the shoreline and water table due to sea
level rise could result in more degraded water quality. Acidification of ocean waters could also impact
calcareous plankton (coccolithophores, foraminifera), which would have major implications on the
marine food web, particularly in high latitude areas (Raven et al. 2005).
Nye et al. (2009) evaluated changes in fish species distribution from 1968 to 2007 with concurrent
climate changes. The changes included a rise in temperature and changes in oceanographic oscillations.
The study tested the hypothesis that such changes in the Northeast United States continental shelf
ecosystem have caused a change in the distribution of marine fish. Trends in the annual abundance of 36
fish stocks were related to depth of occurrence, mean temperature, and area occupied. Many stocks
spanning several taxonomic groups, life-history strategies, and fishing pressure exhibited a northern shift
in their center of biomass, most with a simultaneous increase in depth, and a few with corresponding
expansion of their northern range. However, the changes were highly dependent on the location of
stocks. Stocks located in the southern extent of the survey area exhibited much greater northward shifts
in biomass and some occupied increasingly greater depths, relative to northern stocks. The northward
shift in biomass of alewife and American shad are of particular interest to North Carolina inshore
fisheries. Overall, large-scale temperature increases and changes in circulation, represented by the
Atlantic Multidecadal Oscillation, was the most important factor associated with shifts in the mean center
of stock biomass. Restoration goals for anadromous stocks should be adjusted to reflect the shifting
distribution of species with climate change.
10 International Panel on Climate Change scenarios predict a future increase of 1.1◦–6.4◦C during the twenty-first century (IPCC
2007). 11 Sea-levels are rising at a rate of at least 2 mm/yr (IPCC 2007), though local SLR rates vary widely and can be as high as 10
mm/yr (Scavia et al. 2002 in Crain et al. 2009). 12 Apple et al. (2008) analyzed water quality data from various National Estuarine Research Reserves to verify the relationships
among basic water quality parameters. The analysis shows the inverse relationships between temperature and dissolved
oxygen, and salinity/pH and nitrogen.
2010 Coastal Habitat Protection Plan
Chapter 2. Water Column Page 147
2.4.6. Management and research needs and accomplishments
The management needs noted by italics in the 2005 CHPP were addressed to some degree during 2005-
2010. Some needs are considered accomplished, whereas others are considered ongoing with or without
progress. Emerging management needs are new or significantly modified from their 2005 versions and
may or may not be refined and adopted as actions in the 2009-2011 CHPP implementation plans.
Discontinued needs includes those recommendations from Street et al. (2005) that were omitted from the
chapter update for various reasons (i.e., included in another chapter as part of primary discussion, need
discontinued, considered minor, redundant, or too general). The subheadings reflect these distinctions.
2.4.6.1. Research needs and progress (2005-2010)
Accomplished research needs
1. Collaborative research is underway by NCSU and NOAA to determine accurate and cost effective
methods of bacterial source tracking (M. Fulton/NOAA, pers. com., 2003). DENR should support
this research since it is needed for successful restoration of bacteria impaired waters. The latest
bacterial source tracking research is listed in the “Studies comparing land use and water quality”
subsection of Section 2.4.2.3. “Land use and non-point sources”.
2. Moreover, under natural circumstances, vertical stratification in the estuarine water column due to
salinity differences creates conditions favorable to low DO, which serve to degrade bottom habitat,
cause stress or mortality in benthic species, and force mobile species to move (Stanley and Nixon
1992, Buzzelli et al. 2002). Similar conditions may occur artificially through effluent release in fresh
water. However, research is needed to determine if effluent from desalination plants could create the
predicted effect. A research project was conducted on existing and proposed saline discharges in low
salinity systems of the Albemarle Sound (see “Saline discharge” subsection of Section 2.4.3.4. “Other
causes of water quality degradation” for more information).
Research needs with progress
1. There is a need to study development patterns around marinas in high and low salinity waters and the
cumulative impact of docking facilities and associated development on toxic chemical and other
contaminant concentrations in the water column. Partial progress with study results (see Section
2.4.2.2. “Marinas and multi-slip docking facilities” for more information).
2. Coastal research and monitoring needs to continue to improve our understanding all of processes of
eutrophication and the effects on fish populations. Partial progress with latest research (see Section
2.4.3.1. “Eutrophication and oxygen depletion” for more information.
Research needs without progress
1. More research is needed to assess the impact of water withdrawals on water column habitat and fish
populations in the affected river basins. No specific progress; related to monitoring stream flow and
water supplies (see “Water withdrawals” subsection of Section 2.4.1.1. “Flow regulation” for more
information).
2. Studies are needed to compare use of both upland and open water basins by young anadromous fish.
To protect designated AFSAs and IPNAs from marina impacts, dredging for new marina construction
and other marina-related activities should be managed to minimize alteration of these important
functional areas. No specific progress; see Section 2.4.2.2. “Marinas and multi-slip docking facilities”
for context.
2010 Coastal Habitat Protection Plan
Chapter 2. Water Column Page 148
3. Research is needed to identify those pesticides safe for spraying over open waters and, for those
pesticides whose toxicity is impacted by salinity, appropriate application rates for controlling
mosquitoes. No specific progress; see “Pesticides” subsection of Section 2.4.3.3. “Toxic chemicals” for
context.
Emerging research needs
1. A similar assessment of acidification risk should be conducted in Anadromous Fish Spawning Areas
in North Carolina. See Section 2.1.6.2. “pH” for context.
2. Further research is encouraged to assess impacts of dam removal on downstream fisheries and
habitats. See “Dams/impoundments” subsection of Section 2.4.1.1. “Flow regulation” for context.
3. Research on the potential ecological impact of this type of wastewater system (mine discharge) needs
to be assessed further before widespread use. See “Water withdrawals” subsection of Section 2.4.1.1.
“Flow regulation” for context.
4. Research is needed to determine when and where recruitment to adult fish stocks is limited by larval
ingress to estuarine nursery habitats. Without conclusive research, changes to North Carolina‟s
policy on prohibition of shoreline hardening structures on the oceanfront should be considered very
carefully. See Section 2.4.1.6. “Jetties and groins” for context.
5. The long-term consequences of hardened structures on larval transport and recruitment should be
thoroughly assessed. See Section 2.4.1.6. “Jetties and groins” for context.
6. Develop a comprehensive model of pollution sources predicting water quality based on regular
mapping/monitoring of pollution sources (including silviculture, agriculture, and impervious
surfaces), riparian zone conditions, stormwater control measures, climactic events, flushing rates,
and measured pollution levels. See Section 2.4.2. “Water quality degradation – sources” for context.
7. A Sea Grant study assessing impacts of multi-slip docking facilities recommended the following
research:
a. Cumulative impacts of these small docking facilities and associated development on pollutant
concentrations in the water column,
b. Review and development of cumulative impact assessment techniques See Section 2.4.2.2. “Marinas and multi-slip docking facilities” for context.
8. The effectiveness of new coastal stormwater regulations in maintaining water quality and preventing
further shellfish closures should be evaluated by DWQ and DEH-SS. Areas where data is lacking,
including water quality in stormwater ponds and mining effluent, may require new studies to
determine what DWQ monitoring requirements should include. See “Coastal stormwater program”
subsection of Section 2.4.2.3. “Land use and non-point sources” for context.
9. Since the use of this new technology is increasing, more research is needed to assess the impacts of
polymers on aquatic estuarine life. See “Other toxins” subsection of Section 2.4.3.3. “Toxic chemicals”
for context.
10. The EDC workgroup recommended that a site-specific, compound specific monitoring program is
needed to assess potential impact of endocrine disruptors in North Carolina‟s estuaries. The
program should include the following research components:
1) estuarine monitoring of the concentration and prevalence of priority chemicals of concern with
possible focus on the Neuse River system,
2010 Coastal Habitat Protection Plan
Chapter 2. Water Column Page 149
2) specific research on the effects of chemicals on fishery species, particularly blue crab, oysters,
and fish See “Endocrine disruptors” subsection of Section 2.4.3.3. “Toxic chemicals” for context.
11. Analysis and monitoring of long-term trends in estuarine salinity and temperature is needed to
evaluate the impact of sea level rise and climate change on fishery resources in North Carolina. See
Section 2.4.5. “Sea level rise and climate change” for context.
2.4.6.2. Management needs and progress (2005-2010)
Accomplished management needs
1. Formal criteria need to be developed to classify and protect Anadromous Fish Spawning Areas that
will be recognized by DENR agencies. Anadromous Fish Spawning Areas have been designated by the
MFC and WRC (see Section 2.3.5. “Designations” for more information).
2. Efforts to reduce nutrient loading from point and nonpoint sources in the Neuse, Tar-Pamlico, and
Cape Fear river systems, where the largest number of fish kills have occurred, should continue and
be increased as necessary. Nutrient reduction strategies have shown signs of success (see “Nutrient
reduction strategies” subsection of Section 2.4.2.3. “Land use and non-point sources” for more
information).
3. These impervious surface numbers suggest that water quality problems associated with development
and excessive impervious cover will continue to worsen unless improved land-based strategies that
reduce nonpoint source pollution are utilized at a local level. Voluntary strategies could include
providing incentives for low impact development, improved BMPs and other techniques. Rule-
making strategies may also be necessary to adequately retain stormwater on-site. This could be
achieved through site design, construction of engineered storm water controls, or lower maximum
amounts of impervious surfaces on developments choosing the low-density option for stormwater
control. Phase II stormwater rules already recognize the need to limit impervious surfaces.13
The
EMC and CRC should consider 1) modifying rules regarding limits of built-upon area (low-density
option) to be consistent with the scientific literature regarding water quality protection needs, or 2)
modifying stormwater rules to require adequate retention or treatment of stormwater on-site, through
alternative effective techniques. Stormwater rules have been improved to address increasing shellfish
harvest water closures (see “Coastal stormwater program” subsection of Section 2.4.2.3. “Land use and
non-point sources” for context).
4. Requiring professional foresters to be involved with the implementation of logging BMPs, even on
small private forests, would enhance proper use of BMPs. In addition, notifying the Division of
Forest Resources prior to initiating logging operations would facilitate BMP inspections and,
hopefully, improve overall compliance. Educating owners of small non-industrial forests would also
improve BMP implementation and success. Implementation of BMPs has been improved (see “Best
management practices” subsection of Section 2.4.2.3. “Non-point source management” for more
information).
5. The moratorium should remain in effect until alternative waste treatment is implemented that will
reduce pollutant loading to streams and nitrogen release into the air. In addition EMC should phase
out use of waste lagoons or reclassify waste lagoon systems from nonpoint to point source
discharges, and be permitted accordingly, as recommended in DENR‟s Neuse River Nutrient
Sensitive Waters Management Strategy (DWQ 1997b). Management of animal waste has improved
13 Refer to Existing Management Measures for more information on Phase II stormwater permitting.
2010 Coastal Habitat Protection Plan
Chapter 2. Water Column Page 150
(see “Nutrient reduction strategies” subsection of Section 2.4.2.3. “Land use and non-point sources” for
more information).
6. Some environmentally superior alternatives to the current lagoon and spray field systems were
identified in the Smithfield Agreement. The early implementation of these superior alternatives
should be encouraged. Management of animal waste has improved (see “Nutrient reduction strategies”
subsection of Section 2.4.2.3. “Land use and non-point sources” for more information).
7. Consideration should be given to a allocating a greater portion of agricultural conservation funds to
the buyout or relocation of animal operations from sensitive areas, and for the purchase of
conservation easements. (see “Nutrient reduction strategies” subsection of Section 2.4.2.3. “Land use
and non-point sources” for more information).
8. More stringent sediment controls on construction projects are still needed to reduce sedimentation in
coastal waters. Management of sediment from construction sites has improved (see “Best management
practices” subsection of Section 2.4.2.3. “Land use and non-point sources” for more information).
9. More expeditious application of land cover on disturbed sites. Management of sediment from
construction sites has improved (see “Best management practices” subsection of Section 2.4.2.3. “Land
use and non-point sources” for more information).
10. Modification of local or state stormwater rules limiting built upon area for new development adjacent
to all coastal waters to less than approximately 12% (for the low density option) would be a
scientifically based means of preventing additional water quality degradation. Stormwater rules have
been improved to address increasing shellfish harvest water closures (see “Coastal stormwater program”
subsection of Section 2.4.2.3. “Land use and non-point sources” for more information).
11. New or expanded stormwater outfalls to coastal shellfishing waters should be prohibited by the EMC
and existing outfalls should be phased out. Stormwater rules have been improved to address increasing
shellfish harvest water closures (see “Coastal stormwater program” subsection of Section 2.4.2.3. “Land
use and non-point sources” for more information).
12. Until treatment of ballast water is required and implemented, monitoring of port waters for algal
blooms is recommended to minimize risks of introduction elsewhere (Hallegraeff 1998). Management
of ballast water has changed (see “Nutrient reduction strategies” subsection of Section 2.4.2.3. “Land use
and non-point sources” for more information).
13. Thorough evaluation of water quality conditions and effectiveness of the nutrient reduction strategies
should be performed in the Neuse River in 2006 and the Tar-Pamlico River in 2007/2008 and rules
modified as necessary to achieve nutrient reduction goals. Evaluations have been conducted and
results are presented (see “Nutrient reduction strategies” subsection of Section 2.4.2.3. “Land use and
non-point sources” for more information).
Management needs with progress
1. Dystrophic waters should be classified as “swamp water” for the purpose of water quality standards. The DWQ continues to evaluate coastal streams for swamp water classification (see Section 2.1.1.
“Creeks and rivers” for context).
2. There is also a need to increase the coverage of continuous water quality monitoring stations. Some
progress has been made on deployment of continuous water quality monitoring stations by state
authorities (see Section 2.3. “Status and trends” for more information).
2010 Coastal Habitat Protection Plan
Chapter 2. Water Column Page 151
3. Public education is needed to encourage greater voluntary re-use and recycling of water within
communities. The drought of 2007-08 led to restriction in water use and incentives for wise use of water
(see “Water withdrawals” subsection of Section 2.4.1.1. “Flow regulation” for more information).
4. Channelization regulations could be modified to discourage or prevent maintenance of previously un-
navigable and re-naturalized channels in Anadromous Fish Spawning Areas and Primary Nursery
Areas (AFSAs). Though regulations have not been modified, objections to maintenance dredging in re-
naturalized AFSAs have prevented renewed alteration (see Section 2.4.1.3. “Channelization and
drainage” for more information).
5. More detailed monitoring is needed to assess the extent oceanfront septic systems are causing
degradation to nearshore coastal waters. Some progress has been made with DEH-SS shoreline
surveys. See Section 2.4.2.1. “Point sources” for context.
6. Restoration efforts through removal or modification of dam structures that impede migration of
anadromous fish should remain a high priority to continue in North Carolina, focusing on the
lowermost structures in rivers or streams, and advancing upstream. In particular, the Cape Fear
system (i.e., Lock and Dam #1) should be a high priority, since striped bass, shortnose sturgeon, and
Atlantic sturgeon have not recovered.14
Removing unnecessary dams should be undertaken with
consideration for both upstream and downstream impacts. Some dams have been removed after the
reporting in Street et al. (2005) (see “Dams/impoundments” subsection of Section 2.4.1.1. “Flow
regulation” for more information.
7. Assessments of groundwater water supplies in coastal counties should be made to determine what the
environmental consequences will be if the increase in water withdrawals continues. An assessment
has been conducted (see “Water withdrawals” subsection of Section 2.4.1.1. “Flow regulation” for more
information).
8. Through the EEP process, additional focus on restoring stream flow and fish habitat through the
replacement of culverts with bridges should be accelerated. Funding should be allocated for
replacing filled channels and streams with “fish friendly” culverts or bridges and upgrading existing
culverts to “fish friendly” structures, prioritizing structures that are known to impede anadromous
fish migration to spawning grounds, or have been found to be particularly problematic to the natural
hydrology of a system. Partnering with resource agencies, NGOs, and regional conservation groups
such as AP3C, Cape Fear Arch, and Onslow Bight Partners to assist with any associated costs should
be considered. Progress has been made (see Section 2.4.1.2. “Road fill and culverts” for more
information).
9. New dredging in shallow, nearshore areas with fine sediment and low flushing should be
discouraged. CAMA rules restrict new dredging in MFC-designated Primary Nursery Areas. However,
similar yet undesignated areas are not specifically protected (see Section 2.4.1.4. “Dredging (navigation
channels and boat basins)” for more information).
Management needs without progress
1. Additionally, new dam construction should be avoided whenever possible or designed and sited to
minimize impacts to anadromous fish use and to maintain appropriate flow conditions. Flow
alterations that may significantly change the temporal and spatial features of inflow and circulation
that are required for successful spawning of anadromous fish should be prohibited. A process that
fully evaluates cumulative impacts from water withdrawals and other hydrological modifications
14 Refer to Soft bottom chapter for more information on sturgeon.
2010 Coastal Habitat Protection Plan
Chapter 2. Water Column Page 152
should be developed and implemented. No major dams have been constructed on North Carolina
coastal rivers since 2003 (see “Dams/impoundments” subsection of Section 2.4.1.1. “Flow regulation” for
more information).
2. Until standards are implemented and effective exclusive technology is available, withdrawals should
be reduced as much as possible during and following spawning season in areas known to be used by
eggs, larvae, and early juveniles. This would include DMF designated PNAs and anadromous fish
spawning and nursery areas that are currently being mapped by DMF staff. No specific progress (See
“Water withdrawals” subsection of Section 2.4.1.1. “Flow regulation” for context).
3. Environmental outreach regarding the effect of inlet stabilization on coastal fish habitat and
ecosystem processes is needed to educate public stakeholders (fishing communities and coastal
property owners) on this issue and gain support for maintaining natural barrier island processes. No
specific progress (see Section 2.4.1.6. “Jetties and groins” for more information).
4. Increased inspections of sewage treatment facilities, collection infrastructure, land disposal sites, and
onsite wastewater treatment facilities is needed to identify and prioritize sites needing upgrades. No
specific progress (see Section 2.4.2.1. “Point sources” for context).
5. Loading of pollutants into coastal waters from mechanical failures, spills, and inadequate treatment
must be reduced. This will require additional funding to upgrade plants and infrastructure. No
specific progress (see Section 2.4.2.1. “Point sources” for context).
6. To protect designated AFSAs and IPNAs from marina impacts, dredging for new marina construction
and other marina-related activities should be managed to minimize alteration of these important
functional areas. No specific progress (see Section 2.4.2.2. “Marinas and multi-slip docking facilities”
for more information).
7. North Carolina‟s shorelines should be evaluated to identify potential hot spots of nutrient inputs from
eroding shorelines. Additional education is also needed on proper application of fertilizers to reduce
runoff of nutrients into coastal waters, targeting homeowners, golf course owners, and landscape
businesses (Mallin and Wheeler 2000). No specific progress (see Section 2.4.3.1. “Eutrophication and
oxygen depletion” for context).
8. BMPs, including vegetated buffers, detention ponds, and wetland areas, should be required on all
new and existing golf courses draining to coastal waters to help reduce nutrient concentrations. No
specific progress (see Section 2.4.3.1. “Eutrophication and oxygen depletion” for context).
9. Comprehensive water quality monitoring is needed in other tidal creeks that are highly important
nursery and shellfish areas. No specific progress (see Section 2.4.3.1. “Eutrophication and oxygen
depletion” for context).
10. Although safeguards are in place, the N.C. Pesticide Board‟s policies on drift should be assessed and
modified if necessary to ensure adequate protection of aquatic life and water quality. No specific
progress (see “Pesticides” subsection of Section 2.4.3.3. “Toxic chemicals” for more context).
11. Education and incentives are needed to encourage removal and proper disposal of derelict fishing
gear and other debris from water-dependent activities. No specific progress (see “Marine debris”
subsection of Section 2.4.3.4. “Other causes of water quality degradation” for context).
2010 Coastal Habitat Protection Plan
Chapter 2. Water Column Page 153
Emerging management needs
1. Given adequate monitoring, there remains a need to develop water quality standards that more
accurately reflect conditions necessary for supporting fishery species and communities (refer to the
―Water quality degradation‖ subsections of the threats section for more discussion). See Section
2.3.1.3. “Assessment needs relative to aquatic life” for context.
2. The CHPP agencies (DMF, DCM, DWQ, WRC) and EEP should meet to determine how SHA and
LWP methodologies complement and contribute to complementary goals of the North Carolina
Department of Natural Resources. See Section 2.3.4. “Water column restoration and enhancement” for
context.
3. More incentives are needed to generate conservation/restoration opportunities in areas with the most
ecological benefit of restoration. See Section 2.3.5. “Designations” for context.
4. Identify and designate Anadromous Fish Nursery Areas for consideration in permit decisions. See
Section 2.3.5. “Designations” for context.
5. Track the rates and trends in land conservation and development to predict future landscape
characteristics and water quality impacts, and determine conservation actions needed. See Section
2.3.5. “Designations” for context.
6. Compile a prioritized list of dams for removal or modification that would benefit recovery of
anadromous species. The next highest priority for dam removal could be removal of the remaining
dam on the Little River near Goldsboro, in the Neuse subregion (M. Wicker/USFWS, pers. com.,
March 2010). See “Dams/impoundments” subsection of Section 2.4.1.1. “Flow regulation” for context.
7. State and federal agencies work together to secure grant or other funding for fish passage
restoration. See “Dams/impoundments” subsection of Section 2.4.1.1. “Flow regulation” for context.
8. New large volume surface water intakes should not be permitted behind dams in areas that would
prevent stream passage restoration, where the dam has been identified as a priority for removal. See
“Water withdrawals” subsection of Section 2.4.1.1. “Flow regulation” for context.
9. To properly review mining applications, more information is needed on the expected effect of the
freshwater discharge on the salinity of receiving waters. See “Water withdrawals” subsection of
Section 2.4.1.1. “Flow regulation” for context.
10. Consider including culverts obstructing suitable anadromous fish spawning habitat as a source of
water column impairment, and culvert removal as a restoration credit for the EEP and DOT. The
EEP could then include such proactive restoration options in its overall mission to mitigate and
restore lost ecosystem functions. See Section 2.4.1.2. “Road fill and culverts” for context.
11. The results of the EDF study and DMF field surveys should be used to determine priorities for culvert
removal. See Section 2.4.1.2. “Road fill and culverts” for context.
12. Canals classified as fish nursery habitat should receive the same consideration in permit decisions as
naturally occurring designated areas. See Section 2.4.1.3. “Channelization and drainage” for context.
13. De-snagging of woody debris in AFSAs should be conducted in accordance with, “Stream
Obstruction Removal Guidelines,” published by the American Fisheries Society in 1983. Guidelines
for woody debris removal in streams are also provided at
2010 Coastal Habitat Protection Plan
Chapter 2. Water Column Page 154
http://www.americanwhitewater.org/content/Wiki/stewardship:woody_debris. See Section 2.4.1.3.
“Channelization and drainage” for context.
14. Although mining was the source implicated in only 0.5% of impaired streams in coastal draining
river basins in the DWQ (2006) Integrated 305(b)/303(d) report, if more resources could be applied
to required monitoring, checking for compliance, or incorporating monitoring results in the BIMS,
then perhaps the impacts from mining would traceable. See Section 2.4.1.5. “Mining” for context.
15. Environmental outreach regarding the effect of inlet stabilization on coastal fish habitat is needed to
educate public stakeholders (fishing communities and coastal property owners) on this issue and gain
support for maintaining natural barrier island processes. See Section 2.4.1.6. “Jetties and groins” for
context.
16. DMF is actively working to address this situation and should develop a comprehensive plan to
minimize impacts to protected species. See Section 2.4.1.8. “Fishing gear impacts” for context.
17. Pollution source/pollutant contribution modeling could be used to support DWQ assessment of
impairment sources. The attribution of pollution sources is a vital component in developing Local
Watershed Plans and TMDLs - the current management tools for addressing cumulative impacts.
Such modeling could also be used to evaluate impairment where water quality data is lacking. See
Section 2.4.2. “Water quality degradation – sources” for context.
18. Enforcement of high fines should be consistently used by DWQ to encourage proactive maintenance
of sewage infrastructure and plants. See Section 2.4.2.1. “Point sources” for context.
19. To improve water quality in North Carolina surface waters, the state should move toward requiring
Best Available Technology for wastewater treatment, rather than Best Practicable Technology. See
Section 2.4.2.1. “Point sources” for context.
20. WWTPs that currently have BATs in place should be required or provided incentives to actually
utilize this technology. See Section 2.4.2.1. “Point sources” for context.
21. Funding should be secured for a Clean Marina Coordinator in order to maintain this voluntary
initiative. See Section 2.4.2.2. “Marinas and multi-slip docking facilities” for context.
22. The report recommended that wastewater generated from marinas, boatyards, and manufacturers
should be addressed, to prevent process wastewater from mixing with storm event water by:
1) Elimination of the waste stream
2) The use of other medias (sanding, sand blasting–provided the dry product is captured)
3) Recycle systems
4) Industrial pretreatment and connection to a publicly owned treatment works (POTW)
5) Development of a non-discharge waste system for hand washing operations
6) Development of new service industry designed to collect, treat, perhaps recycle residual
metals, and/or to use these process waters in other industrial production processes. See Section 2.4.2.2. “Marinas and multi-slip docking facilities” for context.
23. DWQ should continue to strive to reach compliance with stormwater and wastewater regulations at
marinas and boatyards, through regulatory and nonregulatory measures. See Section 2.4.2.2.
“Marinas and multi-slip docking facilities” for context.
24. A Sea Grant study assessing impacts of multi-slip docking facilities recommended the following:
2010 Coastal Habitat Protection Plan
Chapter 2. Water Column Page 155
a. Once additional information is obtained, development standards for MSDFs, such as limiting
in shallow ecologically sensitive waters, may be considered.
b. Develop educational materials for property owners, developers, and realtors on ecological
concerns of docking facility construction See Section 2.4.2.2. “Marinas and multi-slip docking facilities” for context.
25. Efforts to reduce fecal coliform levels should target pollution sources upstream of significant shell
bottom resources in conditionally approved open (i.e., less degraded) areas (see “Microbial
contamination” section of “Shell bottom” chapter for more information) in order to maximize the
probability of successful restoration. See “Studies comparing land use and water quality” subsection of
Section 2.4.2.3. “Land use and non-point sources” for context.
26. The need still exists for DWQ to educate permittees about the proper construction, maintenance, and
installation time of stormwater ponds to help control run-off from construction sites. See “Coastal
stormwater program” subsection of Section 2.4.2.3. “Land use and non-point sources” for context.
27. The Community Conservation Assistance Program should be fully utilized in addressing the issue of
stormwater pollution from existing development. See “Coastal stormwater program” subsection of
Section 2.4.2.3. “Land use and non-point sources” for context.
28. Recommendations of the Compliance Coordination report should be a high priority for CHPP
implementation. See “Coastal stormwater program” subsection of Section 2.4.2.3. “Land use and non-
point sources” for context.
29. If lower nutrient concentrations allow greater sprayfield application, there should be corresponding
groundwater monitoring to verify nutrient levels are not increasing (T. Spruill/USGS, pers. com.,
March 2010). See “Nutrient reduction strategies” subsection of Section 2.4.2.3. “Land use and non-point
sources” for context.
30. Increased monitoring of runoff, both groundwater and surface water, will be needed to evaluate
effectiveness of BMPS or any management procedure implemented. See “Best Management Practices”
subsection of Section 2.4.2.3. “Land use and non-point sources” for context.
31. Create an online GIS-based preharvest planning tool that would allow users to gain access to
volumes of data related to soils, water resources, aerial imagery and other information that would be
worthwhile for planning their harvest. See “Best Management Practices” subsection of Section 2.4.2.3.
“Land use and non-point sources” for context.
32. Create and implement a Forest Watershed Assistance Program that would provide enhanced water
resource technical assistance to forestland owners in targeted watersheds. See “Best Management
Practices” subsection of Section 2.4.2.3. “Land use and non-point sources” for context.
33. Create and implement an Urban Forest Watershed Management Program that would explore and
implement opportunities to incorporate forestry-related management practices with low-impact
development (LID), green infrastructure, and traditional nonpoint source stormwater control
measures. See “Best Management Practices” subsection of Section 2.4.2.3. “Land use and non-point
sources” for context.
34. Pursue opportunities for regulatory reform that would standardize the SMZ and/or riparian buffer
requirements for forestry activities, in an effort to enhance performance on the ground and
streamline the regulatory framework that governs forestry in the state. See “Best Management
Practices” subsection of Section 2.4.2.3. “Land use and non-point sources” for context.

2010 Coastal Habitat Protection Plan
Chapter 2. Water Column Page 156
35. Continue to pursue the establishment of a Water Quality Forester position in areas of the state that
do not have such a position. For eastern North Carolina, the gaps in coverage are the Fayetteville
District (middle Cape Fear area), and the Fairfield District (Albemarle-Pamlico peninsula area). In
western North Carolina, the gaps in coverage are the Asheville District and Sylva District. See “Best
Management Practices” subsection of Section 2.4.2.3. “Land use and non-point sources” for context.
36. Develop BMPs related to water handling and the use of water resources for the purposes of
suppressing and controlling peat-fueled wildfires based upon the lessons learned from the 2008
Evans Road Fire and similar wildfires in recent years. See “Best Management Practices” subsection of
Section 2.4.2.3. “Land use and non-point sources” for context.
37. Develop threshold criteria for determining at what point a non-compliant forestry operation directly
contributes to a degradation or loss of in-stream aquatic habitat that is sufficient to warrant
restoration or remediation of the impacted water resource. See “Best Management Practices”
subsection of Section 2.4.2.3. “Land use and non-point sources” for context.
38. Continue periodic BMP implementation surveys and monitoring of BMP effectiveness to ascertain
trends in forest harvest activities, especially with questions concerning the harvesting of forest
biomass, as well as evaluate the BMPs that were revised in 2006. See “Best Management Practices”
subsection of Section 2.4.2.3. “Land use and non-point sources” for context.
39. The authors suggested stronger waste management and emission standards for CAFOs in certain
areas of the Coastal Plains. See “Sources of nutrient enrichment” subsection” of Section 2.4.3.1.
“Eutrophication and oxygen depletion” for context.
40. Education and enforcement to ensure proper application of pesticides according to label instruction,
is needed. See “Pesticides” subsection of Section 2.4.3.3. “Toxic chemicals” for context.
41. Assistance and support is needed from the Attorney General‟s office to implement a drug take-back
program in North Carolina. See “Endocrine disruptors” subsection of Section 2.4.3.3. “Toxic
chemicals” for context.
42. The NC Division of Water Quality could expand its sampling program to include collection of water
samples for analyses, with USGS laboratories conducting the analyses. Critical chemicals should be
selected for analyses, rather than analyzing for everything. Chemicals like fipronil (frontline),
bisphenol A (certain plastics), alpha and beta estrodiol (hormones), antibiotic degradation products,
alachlor and other high-use pesticides, juvenile hormone analogs (mosquito control), etc. should be
prime candidates. A monitoring task force comprised of USGS, DWQ, DMF, NCDA, Shellfish
Sanitation, as well as representative researchers, could identify a list of most likely problematic
chemicals. See “Endocrine disruptors” subsection of Section 2.4.3.3. “Toxic chemicals” for context.
43. The EDC workgroup recommended the following management needs:
a. education and outreach regarding proper disposal of pharmaceuticals, pesticides and
antibiotics, including what existing waste management and recycling programs are available,
b. expand the NC Pesticide Disposal Assistance Program to include unused and outdated
pharmaceuticals, and a plan for removal of chemicals from wastewater and runoff. See “Status and trends in toxic contamination” subsection of Section 2.4.3.3. “Toxic chemicals” for
context.
44. Due to the high potential impacts associated with deepwater drilling, there should be a continued ban
of oil and gas drilling in off North Carolina waters. See “Fossil fuels” subsection of Section 2.4.3.3.
“Toxic chemicals” for context.

2010 Coastal Habitat Protection Plan
Chapter 2. Water Column Page 157
45. DENR should work with the U.S. Coast Guard to encourage support for these proposed rules. See
Section 2.4.4. “Non-native, invasive, or nuisance species” for context.
46. Restoration goals for anadromous stocks should be adjusted to reflect the shifting distribution of
species with climate change. See Section 2.4.5. “Sea level rise and climate change” for context.
47. The 2009 Ocean Policy Report (NC Sea Grant 2009) recommended that no new or expanded ocean
outfalls for stormwater or wastewater be permitted, and existing stormwater ocean outfalls should be
decommissioned in a phased out approach. See Section 2.4.2.1. “Point sources” for context.
2.5. Summary of water column chapter
The water column connects and affects all other fish habitats, emphasizing the need for ecosystem
management in aquatic systems. Environmental conditions of the water column, including salinity,
temperature, flow, pH, nutrients, and dissolved oxygen are the primary factors determining the
distribution and abundance of coastal fish species and communities. Seasonal and annual variation in
these factors is affected by both climatic cycles and anthropogenic stressors. Some of the pelagic species
dependent on the water column include blueback herring, alewife, shad, menhaden, striped bass, bluefish,
and Spanish mackerel. New ecological information since the 2005 CHPP includes information on
additional research regarding diet studies of some pelagic species and distribution of anadromous fish
using acoustic methods.
The status and trends of water column are described in terms of physical and chemical conditions (e.g.,
nutrients, suspended sediment, toxins), indicators of pollution (e.g., chlorophyll a, fecal coliforms, fish
kills), and status of pelagic fisheries (e.g., bluefish, Atlantic menhaden). These parameters can change
very quickly through time at any given location due to natural or anthropogenic causes, making
monitoring the status and trends of this habitat very difficult. In addition, changes in monitoring methods
over time make trend analysis challenging. The status and trends in water column condition are evaluated
by both government regulatory programs and University programs. Though quantifying management and
water quality trends is difficult, there was notable information added for the period from 2003-2009.
Since the 2005 CHPP, comprehensive water quality monitoring coverage for estuaries remained low, with
the exception of a few a DMF stations added in the Albemarle Sound region. Monitoring for microbial
contamination of shellfish harvesting waters remained the most abundant measurements of estuarine
water quality but is limited in the parameters monitored. There was little change in the amount of DWQ
assessed stream impairment from 2004 to 2006 (2008 assessment not available), though only about 30%
of streams and shorelines assessed. The percentage assessed is greater for estuaries, primarily due to
monitoring for microbial contamination in shellfish harvesting waters. A major drought from 2007-2008,
the worst recorded since 1895, most likely had an effect on coastal water quality in the past five years.
River discharges were below normal from 2006 to 2008. High abundance of SAV reported in 2007-2008
and minimal change in water quality impairment may be partially due to low runoff conditions during
drought. Salinities were also higher in coastal rivers, bringing estuarine fish further upstream.
Fish status is also used as an indicator of water column condition. Total reported fish kill events did not
rise in the past five years above a 2001 maximum. However, the total mortality of fish reported has
increased from 1996-2008. In terms of stock status, less than half of assessed pelagic fishery stocks in
2009 were considered depleted, which is a modest improvement over the 2003 assessment (Street et al.
2005). The depleted status of river herring continues to provide a target for restoration and enhancement
efforts.
The cumulative effect of human activities that alter naturally occurring flow and/or water quality continue
to influence the water column, which in turn can negatively impact fish communities. Hydrological

2010 Coastal Habitat Protection Plan
Chapter 2. Water Column Page 158
modifications, such as dam and culvert construction, water withdrawal, channelization, channel
modification, stream-bank modification, and shoreline erosion can obstruct fish passage and/or affect
flow and quality of the water column. Since the 2005 CHPP a small amount of progress was made in
removing physical obstructions. Two dams were removed in the Neuse and Cape Fear in 2005 opening a
total of 140,000 additional miles of habitat in the Piedmont physiographic region. There was also some
groundtruthing of culvert obstructions in the Chowan River system. Federal stimulus funding was
approved in 2010 to construct a rock ramp fish passage at Lock and Dam #1 on the Cape Fear River,
which will significantly improve fish access. Permitted stream impacts associated with development
steadily increased from 1999-2004 with a corresponding low percentage of mitigation. However, the
2008-09 EEP report indicated a surplus of restoration projects available for mitigation. However, there
was substantial disparity between the location stream restoration activities and local watershed plans. The
EEP has adapted its planning and implementation processes to address the disparity.
Other human activities from point or nonpoint sources result in excessive inputs of nutrients, bacteria,
sediment, toxins or biochemical agents (i.e., endocrine disrupting substances), which can lead to visible
signs of habitat degradation, including algal blooms, hypoxia, fish kills, and/or deformed fish. Weather
patterns such as storm events and droughts, which may be exacerbated by global warming, can alter water
column conditions in a manner that stresses aquatic organisms. In the past five years, there was an
increase in reported notices of violation (NOVs) for effluent measurements at permitted wastewater
discharges, though improvements in monitoring could be responsible. There was also a substantial
amount of sewage spills occurring, especially during wet years. Pollutant loading from these point
sources must be addressed. The past five years was marked by a development boom along the coast and
especially in the Inner Banks. Based on stormwater permits issued from 2001-2009, the top five counties
for permit density include New Hanover, Onslow, Brunswick, Carteret, and Dare. The lowest 2001
population density and highest post-2001 permit density was in Pamlico county (part of the ―Inner
Banks‖), indicating an area undergoing rapid growth. The rapid growth will likely contribute to increased
nonpoint source runoff. Although the economic recession in 2009 has slowed growth, many previous
undeveloped areas were rezoned and platted to permit development when economic conditions improve.
In 2008, a DWQ marina study found that the wash water created from pressure washing and hand
washing was resulting in extremely high concentrations of metals in the wastewater streams and should
therefore be defined as a wastewater, and handled and treated per the wastewater permitting requirements.
However, difficulties remain in how to handle this waste.
The most significant accomplishment related to the water column was the adoption of the revised 2008
coastal stormwater rules. The rules require decreased built-upon area next to SA waters and ORWs from
25 to 12% to further reduce run-off from new development, and expand the stormwater control methods
that can be used. Other accomplishments included the designation of Anadromous Fish Spawning Areas
by MFC and WRC, establishment of additional staff positions for compliance with EMC rules and
Division of Forestry BMPs, and improvements to sediment management on construction sites. Progress
was made to prevent additional pollution from swine farms. In 2007, the General Assembly passed
Senate Bill 1465, the NC Swine Farm Environmental Performance Standards Act that prohibited new
lagoon and sprayfield systems, established a lagoon conversion cost-share program, and established a
swine farm methane capture pilot program. New or expanding swine operations are required to have
specified waste treatment systems that meet stringent health and environmental standards. However,
there are many existing hog lagoons in flood plains or near coastal waters that need to be relocated or
converted. Since the 2005 CHPP, monitoring indicates the Nutrient Reduction Strategies in the Neuse
and Tar-Pamlico have resulted in the targeted 30% reductions from point source dischargers and
agriculture, though in 2010, the overall goal of a 30% reduction in receiving waters has not been met.
Additionally, there has been a significant increase in ammonium in the water column of the Neuse River
estuary (as well as the Cape Fear River estuary).

2010 Coastal Habitat Protection Plan
Chapter 2. Water Column Page 159
Emerging research needs include assessing the risk of acidification on anadromous fish spawning and
larval development, determining when and where recruitment is limited by larval transport into estuaries,
and the long-term effect of hardened structures on larval transport and recruitment. Development of
cumulative impact assessment techniques is greatly needed, as well as assessment of the effectiveness of
the coastal stormwater rules and the effect of new erosion control materials (polymers). The increasing
evidence of endocrine disrupting chemicals in surface waters nationwide suggests a need to monitor
North Carolina coastal waters for such chemicals and conduct further research on the effects of various
chemicals on fish and invertebrates, as well as research on wastewater treatment methodology to remove
EDCs from sewage effluent. Emerging management needs include prioritizing dams and culverts for
removals or modifications and initiating removal, shift toward requiring Best Available Technology for
wastewater treatment rather than Best Practicable Technology to improve water quality, and reviewing
and modifying as needed water quality standards that accurately reflect conditions necessary to support
fish species and habitats. DWQ should develop a means to enforce prevention of marina washwater from
entering surface waters and continue education on proper construction and maintenance of stormwater
ponds and erosion control structures to control runoff at construction sites. In addition, educational
outreach on proper disposal of pharmaceuticals and pesticides, and development of a drug take-back
program through NC Pesticide Disposal Assistance Program, drug stores, or hospitals is needed to
minimize introduce of EDCs into surface waters. Changes in water temperature, salinity, water levels and
weather patterns associated with climate change and sea level rise will affect water quality, flows, and
fish distribution. The state should take steps to implement adaptive management measures to minimize
expected impacts.
In updating the chapter, many of the very general, minor, or redundant research and management needs
were discontinued. Of the remaining 2005 CHPP research and management needs, progress was made on
more than half of both categories. However, there were 44 new or clarified research (10) and
management (34) needs identified, indicating new challenges for future water quality protection and
restoration efforts. Some priority management needs include:
Removal of unnecessary obstructions to anadromous fish passage,
Use of current land-use, shoreline development, and point source data to model water quality
/quantity impacts,
Improve water monitoring coverage and suite of measurements taken in gap areas identified by
modeling, and
Enhance regulatory tools (i.e., Local Watershed plans, TMDLs) to address cumulative impacts.

2010 Coastal Habitat Protection Plan
Chapter 2. Water Column Page 160
Map
2.1
. L
oca
tio
n o
f U
.S. G
eolo
gic
al S
urv
ey s
trea
m g
auge
stat
ions
in t
he
coas
tal
dra
inin
g r
iver
bas
ins
of
Nort
h C
aro
lin
a.
Note
:
Nu
mb
ered
gau
ges
are
ass
oci
ated
wit
h F
igure
s 2.1
and 2
.2.
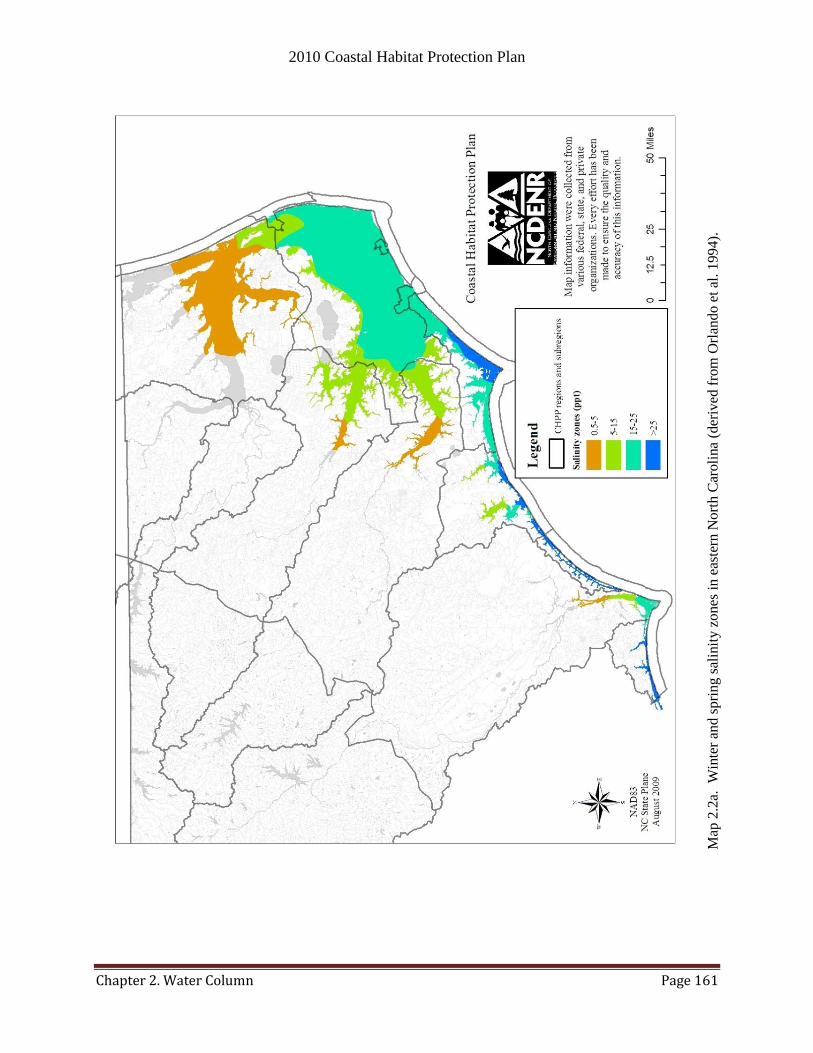
2010 Coastal Habitat Protection Plan
Chapter 2. Water Column Page 161
Map
2.2
a.
Win
ter
and
spri
ng s
alin
ity z
ones
in e
aste
rn N
ort
h C
aroli
na (
der
ived
fro
m O
rlan
do
et
al. 1
99
4).

2010 Coastal Habitat Protection Plan
Chapter 2. Water Column Page 162
Map
2.2
b. S
um
mer
and f
all
sali
nit
y z
ones
in e
aste
rn N
ort
h C
aroli
na (
der
ived
fro
m O
rlan
do
et
al.
19
94).
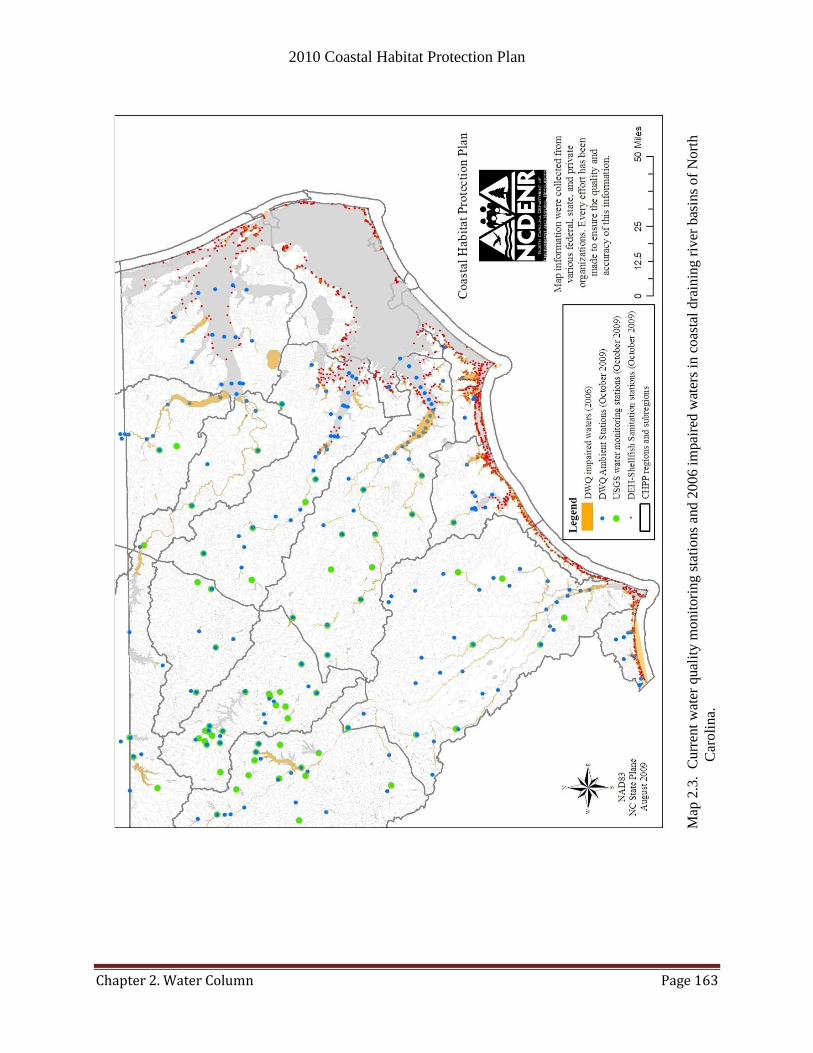
2010 Coastal Habitat Protection Plan
Chapter 2. Water Column Page 163
Map
2.3
. C
urr
ent
wat
er q
ual
ity m
onit
ori
ng s
tati
ons
and 2
006 i
mpai
red w
ater
s in
co
asta
l dra
inin
g r
iver
bas
ins
of
No
rth
Car
oli
na.
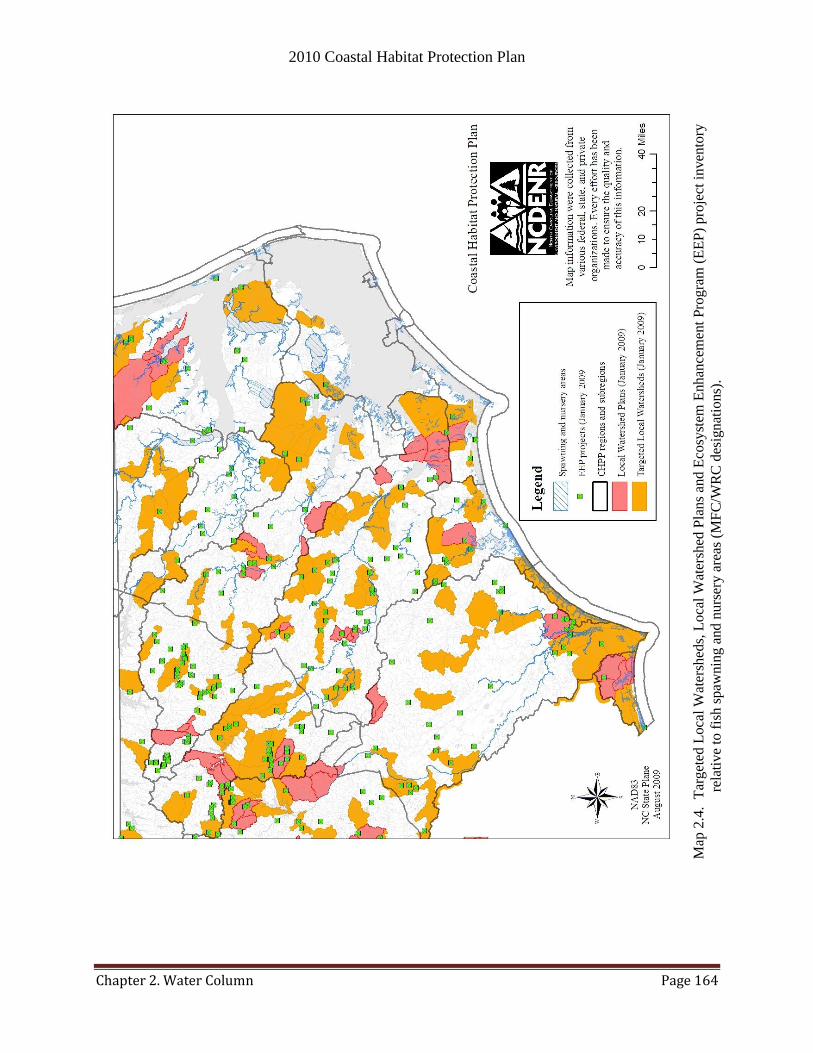
2010 Coastal Habitat Protection Plan
Chapter 2. Water Column Page 164
Map
2.4
. T
arg
eted
Loca
l W
ater
shed
s, L
oca
l W
ater
shed
Pla
ns
and E
cosy
stem
Enhan
cem
ent
Pro
gra
m (
EE
P)
pro
ject
in
ven
tory
rela
tiv
e to
fis
h s
paw
nin
g a
nd n
urs
ery a
reas
(M
FC
/WR
C d
esig
nat
ions)
.
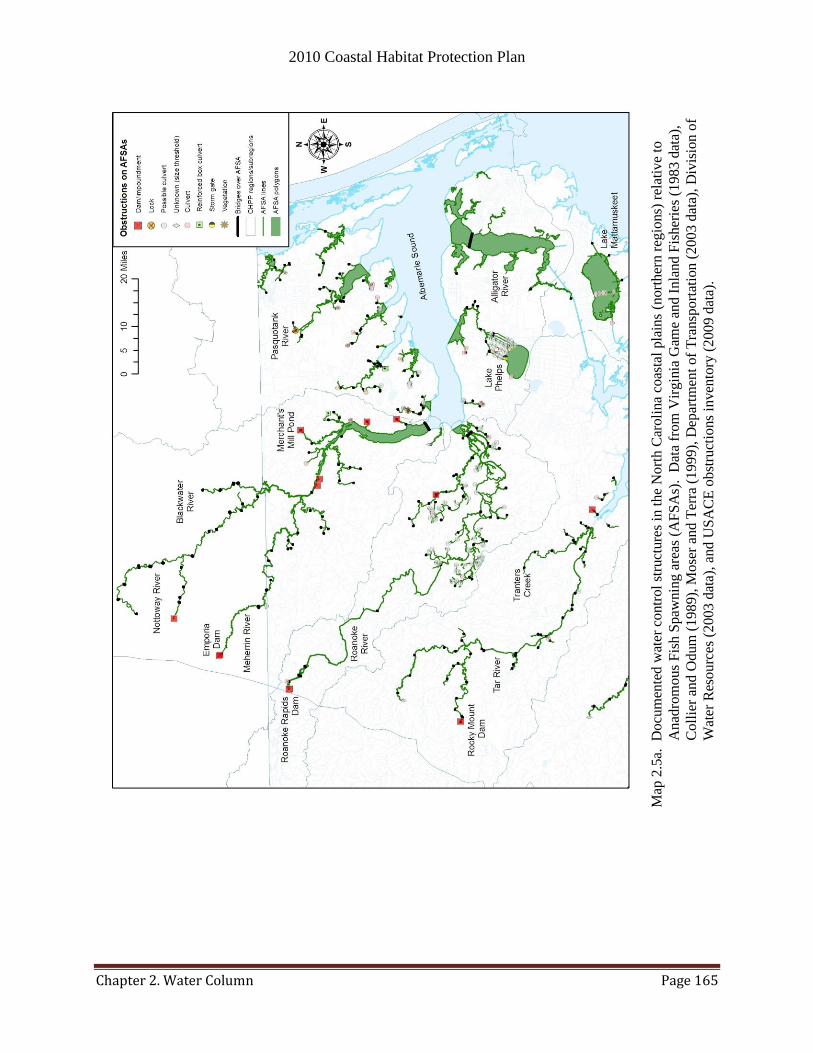
2010 Coastal Habitat Protection Plan
Chapter 2. Water Column Page 165
Map
2.5
a.
Do
cum
ente
d w
ater
contr
ol
stru
cture
s in
the
Nort
h C
aroli
na
coas
tal
pla
ins
(nort
her
n r
egio
ns)
rel
ativ
e to
An
adro
mous
Fis
h S
paw
nin
g a
reas
(A
FS
As)
. D
ata
from
Vir
gin
ia G
ame
and
In
land
Fis
her
ies
(19
83 d
ata)
,
Co
llie
r an
d O
dum
(1989),
Mose
r an
d T
erra
(1999),
Dep
artm
ent
of
Tra
nsp
ort
atio
n (
20
03
dat
a),
Div
isio
n o
f
Wat
er R
esourc
es (
2003 d
ata)
, an
d U
SA
CE
obst
ruct
ions
inven
tory
(2
00
9 d
ata)
.
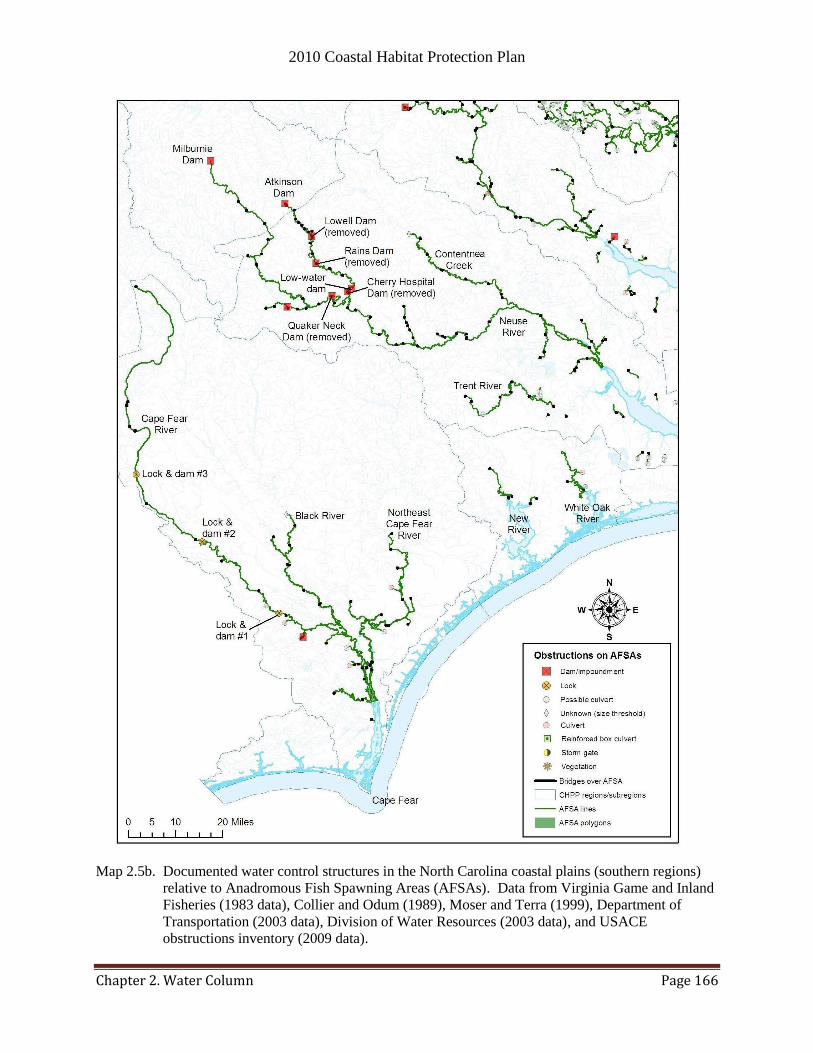
2010 Coastal Habitat Protection Plan
Chapter 2. Water Column Page 166
Map 2.5b. Documented water control structures in the North Carolina coastal plains (southern regions)
relative to Anadromous Fish Spawning Areas (AFSAs). Data from Virginia Game and Inland
Fisheries (1983 data), Collier and Odum (1989), Moser and Terra (1999), Department of
Transportation (2003 data), Division of Water Resources (2003 data), and USACE
obstructions inventory (2009 data).
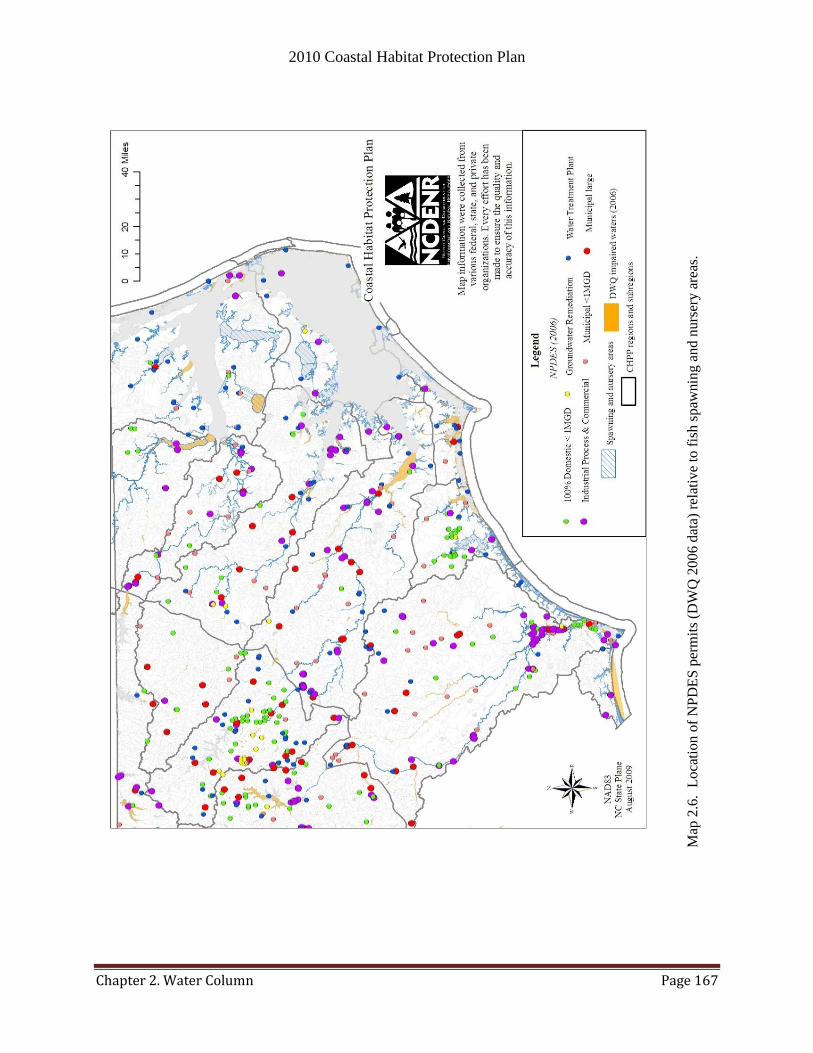
2010 Coastal Habitat Protection Plan
Chapter 2. Water Column Page 167
Map
2.6
. L
oca
tio
n o
f N
PD
ES
per
mit
s (D
WQ
2006 d
ata)
rel
ativ
e to
fis
h s
paw
nin
g a
nd
nurs
ery
are
as.

2010 Coastal Habitat Protection Plan
Chapter 2. Water Column Page 168
Map
2.7
. D
itch
es, ch
annel
izat
ion,
and s
om
e m
unic
ipal
sto
rmw
ater
outf
alls
(D
WQ
20
06
dat
a) i
n A
lbem
arle
Pam
lico
reg
ion
of
east
ern N
ort
h C
aroli
na.
H
ydro
gra
phic
dat
a fr
om
1:1
00,0
00 s
cale
Nat
ion
al H
ydro
logic
Dat
aset
(dit
chin
g)
and
Nat
ura
l R
esourc
e C
onse
rvat
ion S
ervic
e (c
han
nel
izat
ion).
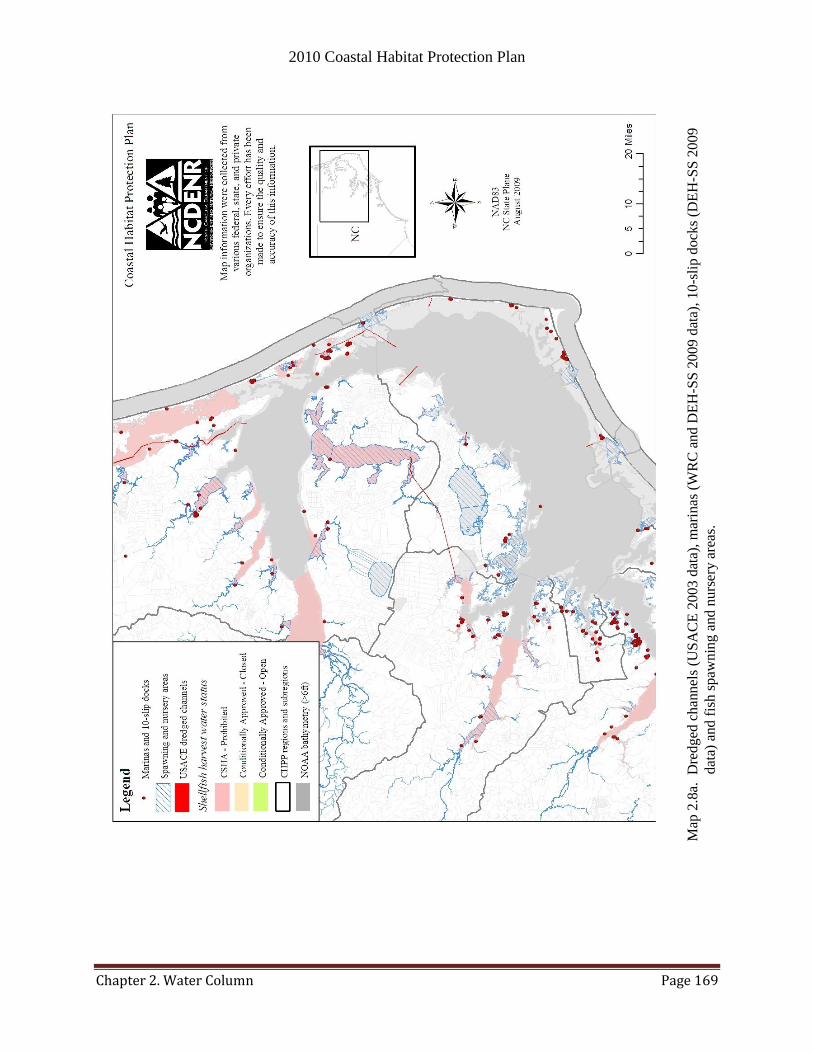
2010 Coastal Habitat Protection Plan
Chapter 2. Water Column Page 169
Map
2.8
a.
Dre
dg
ed c
han
nel
s (U
SA
CE
2003 d
ata)
, m
arin
as (
WR
C a
nd D
EH
-SS
20
09
dat
a), 1
0-s
lip
dock
s (D
EH
-SS
20
09
dat
a) a
nd
fis
h s
paw
nin
g a
nd n
urs
ery a
reas
.
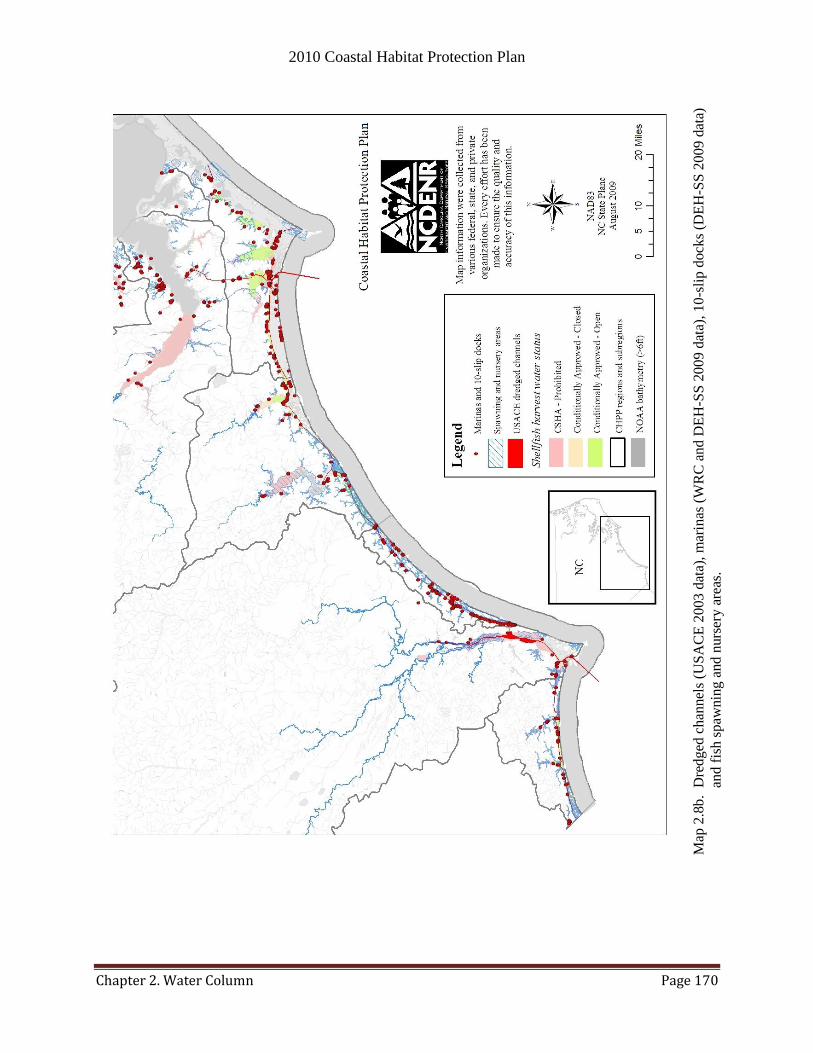
2010 Coastal Habitat Protection Plan
Chapter 2. Water Column Page 170
Map
2.8
b. D
red
ged
ch
annel
s (U
SA
CE
2003 d
ata)
, m
arin
as (
WR
C a
nd D
EH
-SS
20
09
dat
a), 1
0-s
lip
dock
s (D
EH
-SS
20
09
dat
a)
and
fis
h s
paw
nin
g a
nd n
urs
ery a
reas
.
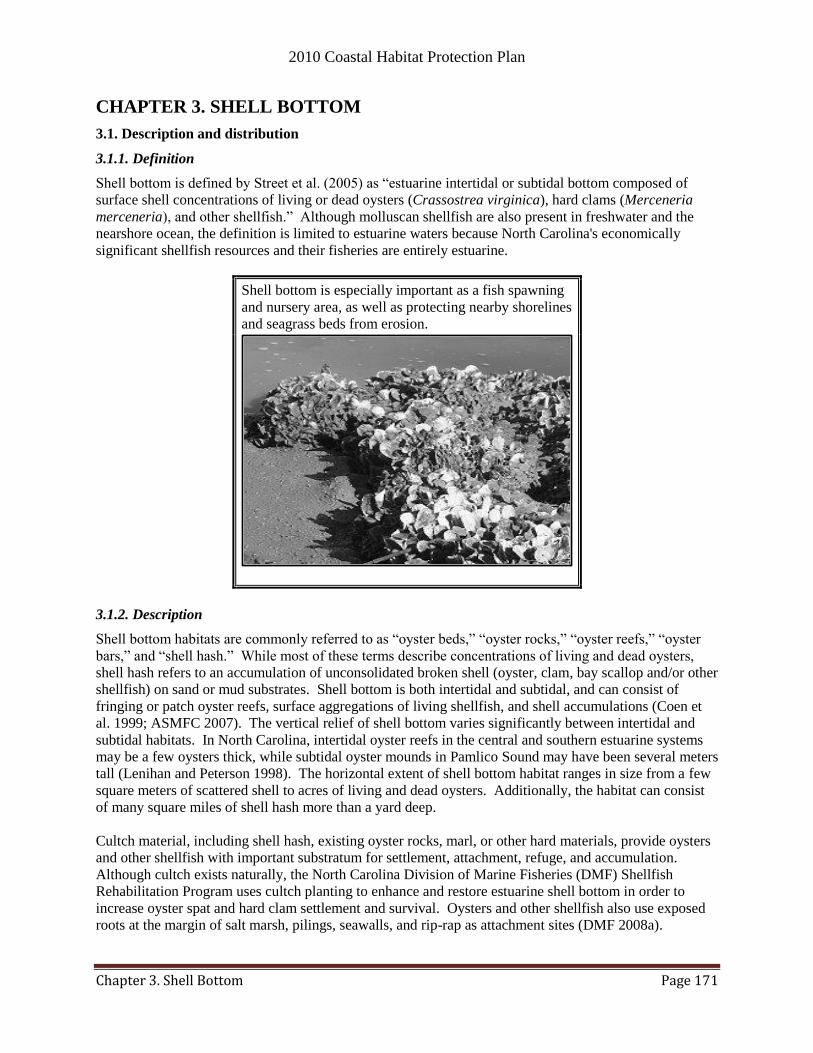
2010 Coastal Habitat Protection Plan
Chapter 3. Shell Bottom Page 171
CHAPTER 3. SHELL BOTTOM
3.1. Description and distribution
3.1.1. Definition
Shell bottom is defined by Street et al. (2005) as ―estuarine intertidal or subtidal bottom composed of
surface shell concentrations of living or dead oysters (Crassostrea virginica), hard clams (Merceneria
merceneria), and other shellfish.‖ Although molluscan shellfish are also present in freshwater and the
nearshore ocean, the definition is limited to estuarine waters because North Carolina's economically
significant shellfish resources and their fisheries are entirely estuarine.
Shell bottom is especially important as a fish spawning
and nursery area, as well as protecting nearby shorelines
and seagrass beds from erosion.
3.1.2. Description
Shell bottom habitats are commonly referred to as ―oyster beds,‖ ―oyster rocks,‖ ―oyster reefs,‖ ―oyster
bars,‖ and ―shell hash.‖ While most of these terms describe concentrations of living and dead oysters,
shell hash refers to an accumulation of unconsolidated broken shell (oyster, clam, bay scallop and/or other
shellfish) on sand or mud substrates. Shell bottom is both intertidal and subtidal, and can consist of
fringing or patch oyster reefs, surface aggregations of living shellfish, and shell accumulations (Coen et
al. 1999; ASMFC 2007). The vertical relief of shell bottom varies significantly between intertidal and
subtidal habitats. In North Carolina, intertidal oyster reefs in the central and southern estuarine systems
may be a few oysters thick, while subtidal oyster mounds in Pamlico Sound may have been several meters
tall (Lenihan and Peterson 1998). The horizontal extent of shell bottom habitat ranges in size from a few
square meters of scattered shell to acres of living and dead oysters. Additionally, the habitat can consist
of many square miles of shell hash more than a yard deep.
Cultch material, including shell hash, existing oyster rocks, marl, or other hard materials, provide oysters
and other shellfish with important substratum for settlement, attachment, refuge, and accumulation.
Although cultch exists naturally, the North Carolina Division of Marine Fisheries (DMF) Shellfish
Rehabilitation Program uses cultch planting to enhance and restore estuarine shell bottom in order to
increase oyster spat and hard clam settlement and survival. Oysters and other shellfish also use exposed
roots at the margin of salt marsh, pilings, seawalls, and rip-rap as attachment sites (DMF 2008a).
2010 Coastal Habitat Protection Plan
Chapter 3. Shell Bottom Page 172
3.1.3. Habitat requirements
Although numerous species of molluscan shellfish contribute surface shell material to the estuarine
environment, oysters in particular dominate shell bottom habitat in North Carolina‘s estuaries. Oyster
beds and rocks are the most critical habitat for oyster populations, as they provide the most abundant and
preferred substrate (oyster shell) for larval settlement (Marshall 1995; Kennedy et al. 1996; DMF 2008a).
While oysters colonize a wide variety of locations within the estuary, their distribution and abundance is
generally limited by ambient physicochemical conditions. Optimal growth conditions for adult oysters
and oyster spat exist at temperatures between 10 and 30C (Burrell 1986), salinities ranging from 14 to
28 ppt (Quast et al. 1988; Shumway 1996) and dissolved oxygen levels above 1-2 mg O2 l-1
(Funderburk
et al. 1991). Oysters can survive for up to 5 days in waters with < 1 mg O2 l-1
(Sparks et al. 1958).
Several studies have found that the combination of low salinities and high temperatures increase oyster
mortality (Loosanoff 1953; Funderburk et al. 1991), while predation rates are highest in near seawater
conditions (Gunter 1955; Bahr and Lanier 1981). The combination of these two factors effectively
concentrates subtidal oysters in moderate salinity areas of North Carolina estuaries. Intertidal oyster
growth and distribution is generally less influenced by predation and more influenced by exposure, tidal
flows and food availability.
Other factors, such as turbidity and circulation patterns can have profound effects on oyster survival and
viability. Oyster eggs have experienced over 50% at suspended sediment concentration >500 mgl-1
, while
oyster larvae are slighter more tolerant with 50% mortality occurring from 100-150 mgl-1
(Davis and
Hidu 1969a; Funderburk et al. 1991). Good water circulation is of critical importance for larval dispersal
and successful spat settlement (Burrell 1986). Adult oysters also require adequate circulation to deliver
food and oxygen and to remove wastes and sediment. For subtidal oyster reefs, the vertical height of the
oyster rock maximizes circulation benefits by physically locating the oysters off the bottom to avoid
anoxic water (Lenihan and Peterson 1998) or sedimentation (Coen et al. 1999).
3.1.4. Distribution
The primary shell-building organism in North Carolina estuaries, the eastern oyster, ranges from the Gulf
of St. Lawrence in Canada through the Gulf of Mexico to the Bay of Campeche, Mexico and to the West
Indies (Bahr and Lanier 1981; Carlton and Mann 1996; Carriker and Gaffney 1996; MacKenzie 1997;
Jenkins et al. 1997). To the degree commercial fishery landings may indicate abundance, the highest
documented oyster abundance along the Atlantic coast is in the Chesapeake Bay (DMF 2001a).
Historically, Maryland‘s landings of 15 million bushels dwarfed North Carolina‘s highest annual oyster
landings of 1.8 million bushels in 1902 (DMF 2001a).
Oysters are found along a majority of the North Carolina coast from extreme southeastern Albemarle
Sound to the estuaries of the southern part of the state along the South Carolina border (DMF 2001a).
Oyster reefs occur at varying distances upstream in North Carolina‘s estuaries, depending upon salinity,
substrate, and flow regimes. In the wind-driven Pamlico Sound system north of Cape Lookout, oyster
reefs consist overwhelmingly of subtidal beds. South of Cape Lookout, subtidal rocks also occur in the
New, Newport, and White Oak rivers (DMF 2001a). Extensive intertidal oyster beds occur in North
Carolina‘s southern estuaries, where the lunar tidal ranges are higher. Substantial shell hash is present in
New River, eastern Bogue Sound, and along the edges of many streams and channels, such as portions of
the Atlantic Intracoastal Waterway (ICW) in the southern coastal area.
In the Albemarle-Pamlico estuary, oysters are concentrated in the lower portion of Pamlico Sound
tributaries, along the western shore of Pamlico Sound, and to a lesser extent behind the Outer Banks.
(Epperly and Ross 1986) (Map 3.1).
2010 Coastal Habitat Protection Plan
Chapter 3. Shell Bottom Page 173
3.1.4.1. Shellfish habitat and abundance mapping
The DMF Shellfish Habitat and Abundance Mapping Program began creating detailed bottom type maps
of the estuarine system in 1988. These maps are being compiled using standardized survey methods from
the South Carolina border north through Core Sound, along the perimeter of Pamlico Sound, Lower
Neuse River, Lower Pamlico River, Pungo River and in Croatan/Roanoke sounds (Map 3.2). The
program delineates all bottom habitats, including shell bottom, with field surveys, and samples the density
of oysters, clams, and bay scallops in these habitats. This program has differentiated 24 different bottom
types based on combinations of depth, bottom firmness, vegetation density, and density of shells (surface
or subsurface). This program defines shell present strata as significant cover (>30% of bottom) of living
or dead shells on the surface or in the substrate. Some of the other habitats mapped by the program
include salt marsh, where the intertidal fringe is habitat for shellfish, submerged aquatic vegetation, and
soft bottom. A stratified random sampling design is used to provide statistically valid shellfish density
estimates by area and habitat.
The CHPP implementation plan of 2005 called for accelerating the mapping of shell bottom. The
Department was able to secure funding in the legislative budget to support four new shellfish mapping
technician positions, as well as a GIS analyst. From January 2003 to November 2008, Resource
Enhancement staff has mapped 270,920 additional acres of bottom, primarily in Pamlico, Carteret,
Brunswick, Onslow, Dare, and Hyde counties (B. Conrad/DMF, pers. com., 2009). The only areas that
have not been mapped are a portion of the waters in Brunswick County, northwest Pamlico Sound
nearshore and tributaries (mainland Hyde County from Spencer Bay to Far Creek), Pamlico Sound areas
around Ocracoke Island, and subtidal oyster beds in Pamlico Sound with depths over twelve feet. With
current staffing, DMF now plans to map all of these areas less than 12ft deep on a five year cycle. (B.
Conrad, DMF, pers. com., 2008). Resource Enhancement also plans to implement mapping of the
Pamlico Sound subtidal oyster beds with depths greater than twelve feet in the future, using acoustic
sonar technology when additional funding and manpower become available.
As of November 2008, 90% (493,563 acres) of the total area intended for mapping (543,169 acres <12
feet deep) has been completed. Military restricted areas, lease areas, and major navigation channels are
excluded from the mapping effort. Of the entire area mapped during Iteration 1, approximately 2.24%
(11,052 acres) of the bottom was classified as shell bottom (Table 3.1 and Maps 3.3a-c). The southern
estuaries have the greatest relative area of shell bottom (16% - mostly intertidal) among the areas mapped
to date. Cape Fear had the greatest relative area of subtidal shell bottom (12%). The largest areas of
subtidal shell bottom was in Core/Bogue Sound (5,586 ac), followed by Southern Estuaries (1,159 ac),
New/White Oak (1,090 ac), and Pamlico Sound (857 ac). The vast majority of intertidal shell bottom was
mapped in the Southern Estuaries (2,782 ac) and Core/Bogue (1,938 ac) subregions. Due to the sampling
method and because not all shell bottom is inhabited by living oysters, these estimates of shell bottom
abundance represent potential habitat where salinities are suitable for larval settlement, and do not take
into account oyster beds in deep water (> 12 ft) outside of bottom mapping areas, such as those known in
Pamlico Sound. Estimated densities of living shellfish on shell bottom are included on Maps 3.3a-c. The
shellfish densities sampled in shell present strata/area combinations were applied to the entire strata
within an area to create the maps of shellfish densities on shell bottom. Estimated densities suggest the
additional ecological functions of living shellfish where shell bottom has been mapped.
As of January 2007, there were 160 shellfish lease areas mapped in coastal North Carolina waters
occupying 880 acres, which comprises less than 1% of the Shellfish Habitat and Abundance Mapping
Program focus area.15
For the entire coast, including locations outside the Shellfish Habitat and
15 However, the contribution of shellfish leases to overall shell bottom is unknown because they contain areas that do not meet
the definition of shell bottom. So the estimates for overall shell bottom coverage are probably underestimated.
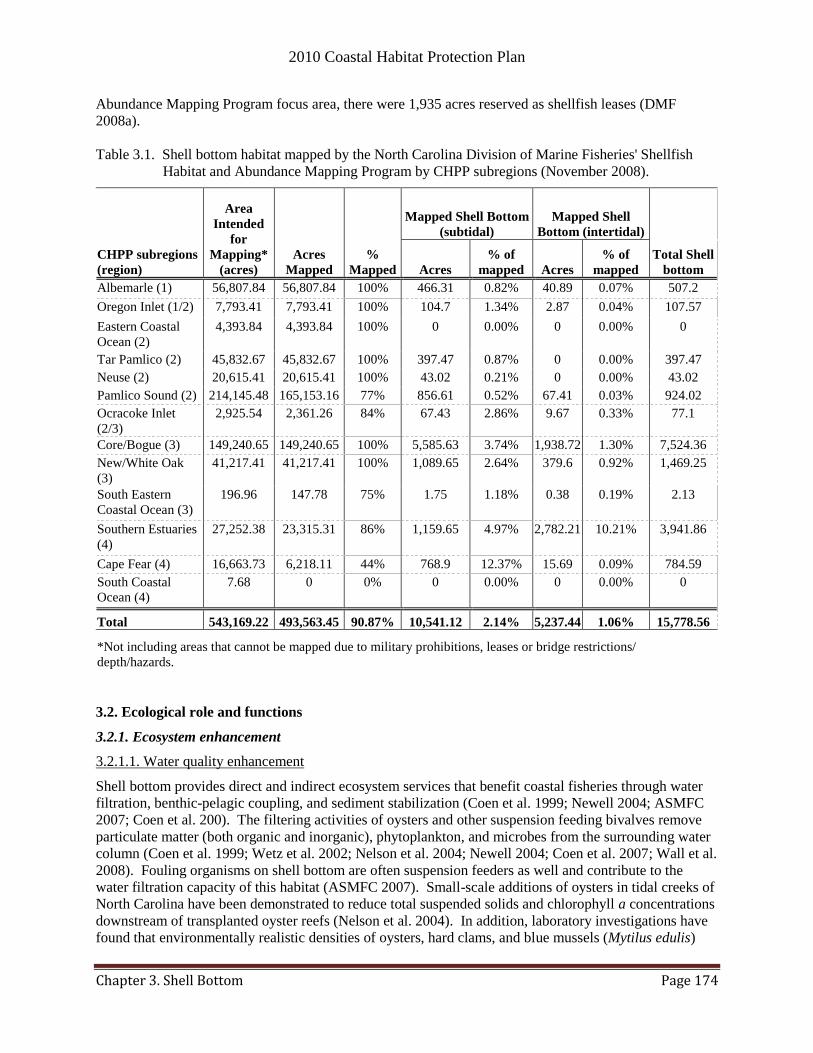
2010 Coastal Habitat Protection Plan
Chapter 3. Shell Bottom Page 174
Abundance Mapping Program focus area, there were 1,935 acres reserved as shellfish leases (DMF
2008a).
Table 3.1. Shell bottom habitat mapped by the North Carolina Division of Marine Fisheries' Shellfish
Habitat and Abundance Mapping Program by CHPP subregions (November 2008).
CHPP subregions
(region)
Area
Intended
for
Mapping*
(acres)
Acres
Mapped
%
Mapped
Mapped Shell Bottom
(subtidal)
Mapped Shell
Bottom (intertidal)
Total Shell
bottom Acres
% of
mapped Acres
% of
mapped
Albemarle (1) 56,807.84 56,807.84 100% 466.31 0.82% 40.89 0.07% 507.2
Oregon Inlet (1/2) 7,793.41 7,793.41 100% 104.7 1.34% 2.87 0.04% 107.57
Eastern Coastal
Ocean (2)
4,393.84 4,393.84 100% 0 0.00% 0 0.00% 0
Tar Pamlico (2) 45,832.67 45,832.67 100% 397.47 0.87% 0 0.00% 397.47
Neuse (2) 20,615.41 20,615.41 100% 43.02 0.21% 0 0.00% 43.02
Pamlico Sound (2) 214,145.48 165,153.16 77% 856.61 0.52% 67.41 0.03% 924.02
Ocracoke Inlet
(2/3)
2,925.54 2,361.26 84% 67.43 2.86% 9.67 0.33% 77.1
Core/Bogue (3) 149,240.65 149,240.65 100% 5,585.63 3.74% 1,938.72 1.30% 7,524.36
New/White Oak
(3)
41,217.41 41,217.41 100% 1,089.65 2.64% 379.6 0.92% 1,469.25
South Eastern
Coastal Ocean (3)
196.96 147.78 75% 1.75 1.18% 0.38 0.19% 2.13
Southern Estuaries
(4)
27,252.38 23,315.31 86% 1,159.65 4.97% 2,782.21 10.21% 3,941.86
Cape Fear (4) 16,663.73 6,218.11 44% 768.9 12.37% 15.69 0.09% 784.59
South Coastal
Ocean (4)
7.68 0 0% 0 0.00% 0 0.00% 0
Total 543,169.22 493,563.45 90.87% 10,541.12 2.14% 5,237.44 1.06% 15,778.56
*Not including areas that cannot be mapped due to military prohibitions, leases or bridge restrictions/
depth/hazards.
3.2. Ecological role and functions
3.2.1. Ecosystem enhancement
3.2.1.1. Water quality enhancement
Shell bottom provides direct and indirect ecosystem services that benefit coastal fisheries through water
filtration, benthic-pelagic coupling, and sediment stabilization (Coen et al. 1999; Newell 2004; ASMFC
2007; Coen et al. 200). The filtering activities of oysters and other suspension feeding bivalves remove
particulate matter (both organic and inorganic), phytoplankton, and microbes from the surrounding water
column (Coen et al. 1999; Wetz et al. 2002; Nelson et al. 2004; Newell 2004; Coen et al. 2007; Wall et al.
2008). Fouling organisms on shell bottom are often suspension feeders as well and contribute to the
water filtration capacity of this habitat (ASMFC 2007). Small-scale additions of oysters in tidal creeks of
North Carolina have been demonstrated to reduce total suspended solids and chlorophyll a concentrations
downstream of transplanted oyster reefs (Nelson et al. 2004). In addition, laboratory investigations have
found that environmentally realistic densities of oysters, hard clams, and blue mussels (Mytilus edulis)
2010 Coastal Habitat Protection Plan
Chapter 3. Shell Bottom Page 175
lower chlorophyll a concentrations and increase light penetration to levels that facilitate the growth of
SAV (Wall et al. 2008).
Modeling efforts of the effects of oyster filtration on water quality in Chesapeake Bay have suggested that
oysters play an important role in determining water clarity, phytoplankton biomass, and dissolved oxygen
(DO) dynamics in that system (Newell and Koch 2004; Cerco and Noel 2007). Cerco and Noel (2007)
found that a tenfold increase in oyster biomass would result in a system-wide reduction of chlorophyll a
concentration by 1 mg m-3
, an increase in deepwater DO by 25 g m-3
, and a 20% increase in summer SAV
biomass. Newell and Koch (2004) came to similar conclusions for the addition of oysters, suggesting that
a modest increase in oyster biomass in Chesapeake Bay would reduce suspended sediment concentrations
by an order of magnitude and increase the depth at which SAV was predicted to grow, but found that the
influence of hard clams on reducing turbidity was much less than oysters due to their lower weight-
specific filtration rate. The results of water quality models such as these and in situ measurements of
filtration capacities has lead numerous authors conclude that oysters exert top-down grazer control of
phytoplankton blooms (Coen et al. 1999; Newell 2004; Newell and Koch 2004; Cerco and Noel 2007;
Coen et al. 2007). However, several investigators have recently questioned the validity of this conclusion
stating that oyster filtration rates have been overestimated due to spatial and temporal mismatches
between oyster and phytoplankton biomass and the lack of filtration access to all but the shallow bay
water (Pomeroy et al. 2006; Fulford et al. 2007). Nevertheless, filtration by oysters has been
demonstrated to improve water quality and clarity in both laboratory and field settings (Coen et al. 1999;
Wetz et al. 2002; Nelson et al. 2004; Newell 2004; Coen et al. 2007; Wall et al. 2008). An economic
analysis is needed that compares the cost-saving of oyster restoration and sanctuary development with
that of wastewater treatment capacity, along with the added fishery production of associated finfish
species and oyster harvest in the remaining open shellfish harvesting waters. The results of one such
analysis are pending (J. Grabowski/GMRI, pers. com., January 2009).
Shell bottom also enhances water quality through coupling benthic and pelagic processes (Newell et al.
2002; Newell 2004; Porter et al. 2004; Newell et al. 2005; ASMFC 2007; Coen et al. 2007; DMF 2008a).
Suspension feeding bivalves consume particles suspended in the water column, while accumulating
biodeposits on the sediment surface (Newell 2004; Porter et al. 2004; Newell et al. 2005). The nitrogen
(N) and phosphorous (P) excreted by the bivalves can become buried in the sediment or may be lost via
bacterially mediated nitrification-denitrification (Newell et al. 2002; Newell 2004; Porter et al. 2004;
Newell et al. 2005). The net ecosystem loss of N and P results in bottom-up nutrient control of
phytoplankton production through alterations in nutrient regeneration processes (Newell 2004; Newell et
al. 2005). However, bivalve biodeposits can be released back into the water column by erosion, sediment
reworking by animals, or resuspension with possible uptake by adjacent SAV and phytoplankton
(Peterson and Peterson 1979; Newell 2004).
3.2.1.2. Habitat Enhancement
The structural relief shell bottom provides plays an important role in the estuarine system. High relief
shell bottom alters currents and water flows, and physically traps and stabilizes large quantities of
suspended solids, reducing turbidity (Dame et al. 1989; Coen et al. 1999; Lenihan 1999; Grabowski et al.
2000). In addition, intertidal shell bottom, specifically oyster reefs, protects shoreline habitats from
waves and currents, which aids in creek bank stabilization and reduction of salt marsh erosion (Bahr and
Lanier 1981; Dame and Patten 1981; Marshall 1995; Breitburg et al. 2000; Henderson and O‘Neil 2003;
Piazza et al. 2005; ASMFC 2007). By decreasing erosive forces, intertidal oyster reefs reduce vegetative
losses and, in some instances, promote marsh accretion (Meyer and Townsend 2000; Piazza et al. 2005;
ASMFC 2007). In North Carolina, Meyer et al. (1997) found that placement of oyster cultch along the
lower intertidal fringe of Spartina marshes resulted in net sediment accretion, while noncultched
shorelines eroded. Additional studies in the Gulf of Mexico and along the Atlantic coast have also
2010 Coastal Habitat Protection Plan
Chapter 3. Shell Bottom Page 176
suggested the value of shell bottom for shoreline protection and erosion control, indicating lower erosion
rates at shorelines protected by intertidal oyster reefs as compared to unprotected locations (Piazza et al.
2005; ASMFC 2007).
3.2.2. Productivity
Primary production on shell bottom is comprised of modest production from macroalgae,
microphytobenthos, and organic biofilms. These organisms provide food for resident secondary
consumers. The low primary productivity on oyster reefs reflects the importance of exogenous sources of
primary production, such as phytoplankton, to this habitat. Meta-analysis of estuarine habitat
productivity ratios indicated secondary production on oyster reefs was an order of magnitude greater than
production in Spartina marshes, soft bottom, SAV, and mangrove forests (Peterson et al. in prep.). The
high secondary productivity of this habitat was attributed to the high biomass of the oysters themselves
and other macroinvertebrates inhabiting oyster reefs. In addition, tertiary production of nektonic
organisms was found to be more than two times higher on oyster reefs than in Spartina marshes, soft
bottom, and SAV, indicating the importance of this habitat for higher order consumers. 6
3.2.3. Fish utilization
Shell bottom has been widely recognized as essential fish habitat (EFH) for oysters and other reef-
forming mollusks (Coen et al. 1999; ASMFC 2007). The functional value of shell bottom for oysters
includes aggregation of spawning stock, chemical cues for successful spat settlement, and refuge from
predators and siltation (Coen et al. 1999). As a reef matures, a complex habitat with greater reef height
and more interstitial spaces for recruiting oysters to settle is created. This has led numerous authors to
describe oysters as ecosystem engineers in recognition of the importance of the biogenic reef structure to
estuarine biodiversity, fishery production, water quality, and hydrodynamic processes (Lenihan and
Peterson 1998; Gutierrez et al. 2003; Dame 2005; Brumbaugh et al. 2006).
In addition to its role as EFH for oysters, shell bottom also provides critical fisheries habitat for
ecologically and economically important finfish, mollusks, and crustaceans. In North Carolina, well over
40 species of fish and decapod crustaceans have been documented using natural and restored oyster reefs
including American eel, Atlantic croaker, Atlantic menhaden, black sea bass, sheepshead, spotted
seatrout, red drum, and southern flounder (Coen et al. 1999; Lenihan et al. 2001; Peterson et al. 2003a;
Grabowski et al. 2005; ASMFC 2007). These documented species include 12 ASMFC-managed species
and 7 SAFMC-managed species, suggesting the importance of this habitat for recreational and
commercial fisheries. However, the most abundant species on oyster reefs are generally small forage
fishes and crustaceans, such as pinfish, gobies, grass shrimp, and mud crabs (Coen et al. 1999; Minello
1999; Posey et al. 1999; Plunket and La Peyre 2005; ASMFC 2007). These small fish and crustaceans
are important prey items in the diet of larger recreationally and commercially important fishes that make
foraging excursions to this habitat, reflecting the aforementioned importance of shell bottom to fisheries
production.
Fish that utilize shell bottom can be classified into three categories: resident, facultative resident, and
transient species (Coen et al. 1999; Lowery and Paynter 2002; ASMFC 2007). Resident species use shell
bottom as their primary habitat and depend on the availability of this habitat for breeding, feeding, and
refuge from predation. Facultative resident species are generally associated with structured habitats
including shell bottom and depend on this habitat for food. Transient species are wide-ranging species
that use shell bottom for both refuge and forage grounds, but do not necessarily depend on this habitat.
While oyster reef residents often dominate in sheer abundance, transients are frequently the most diverse.
Peterson et al. (2003) estimated the amount of fish production that shell bottom provides in addition to
adjacent soft bottom habitats. Using results from numerous studies, they compared the density of fish at
different life stages on oyster reefs and adjacent soft bottom habitats. The results grouped species into

2010 Coastal Habitat Protection Plan
Chapter 3. Shell Bottom Page 177
three categories: recruitment enhanced, growth enhanced, and not enhanced (relative to soft bottom
habitat). Recruitment and growth enhancement are discussed in the nursery and foraging sections,
respectively.
A partial list of finfish and macroinvertebrates documented from collections on shell bottom is provided
in Table 3.2. Those species that use shell bottom as spawning, nursery, forage, or refuge grounds are
identified. Although more than 30 species are listed in Table 3.2, this list is by no means all
encompassing.
3.2.4. Specific biological functions
3.2.4.1. Refuge
The complex three-dimensional structure of shell bottom provides valuable refuge habitat for larval,
juvenile, and adult finfish and macroinvertebrates (Arve 1960; Wells 1961; MacKenzie 1983;
Zimmerman et al. 1989; Meyer et al. 1996; Breitburg 1998; Lenihan et al. 1998; Coen et al. 1999;
Harding and Mann 1999; Grabowski and Powers 2004; Posey et al. 2004; Soniat et al. 2004; Grabowski
and Kimbro 2005; Hughes and Grabowski 2006). Often, oyster reefs provide the only source of structural
refuge habitat in submerged areas of estuaries (Grabowski et al. 2000). Oyster reefs also represent the
dominant structural habitat in the mid-intertidal to shallow subtidal zone of estuarine waters where SAV
is absent (e.g. southern North Carolina to Florida) (Eggleston et al. 1998; Posey et al. 1999). The
interstitial spaces between shells and within the shell matrix of oyster reefs are critical to the survival of
recruiting oysters and other small, slow-moving macrofauna, such as polychaete worms, crabs, hard
clams, and amphipods (Zimmerman et al. 1989; SAFMC 1998a; Bartol and Mann 1999; Coen et al. 1999;
Soniat et al. 2004; Grabowski and Kimbro 2005; Hughes and Grabowski 2006; F et al. 2006). Mud crabs,
a dominant component of the oyster reef macrofaunal assemblage, utilize shell bottom as refuge from
oyster toadfish, blue crabs, and wading birds (Meyer 1994; Grabowski and Kimbro 2005). However,
mud crabs also function as an important intermediate predator, foraging on juvenile hard clams within
oyster reefs (Grabowski and Powers 2004; Posey et al. 2004). Predation pressure by oyster toadfish has
been documented to reduce mud crab foraging on juvenile hard clams, thus increasing the refuge value of
oyster reefs for juvenile hard clams and highlighting the complexity of interactions dictating the
significance of shell bottom as refuge (Grabowski and Kimbro 2005). Previous investigations have also
documented the importance of shell bottom for predation protection of adult and juvenile hard clams,
citing increased survival in shell bottom habitats as compared to open soft bottom (Peterson et al. 1995).
To take advantage of the hard clam-oyster shell refuge relationship, DMF specifically manages some
intertidal oyster cultch planting sites in the southern coastal area for harvesting both oysters and hard
clams. Once oysters are harvested off the planted site, the areas are opened specifically for clam harvest
by hand gears. Fishermen dig under the cultch to take high concentrations of hard clams that recruited
under the oyster shell. Subsequent to the clam harvest, the areas are re-planted with cultch, and the two-
year cycle begins again (Marshall et al. 1999; DMF 2008a).
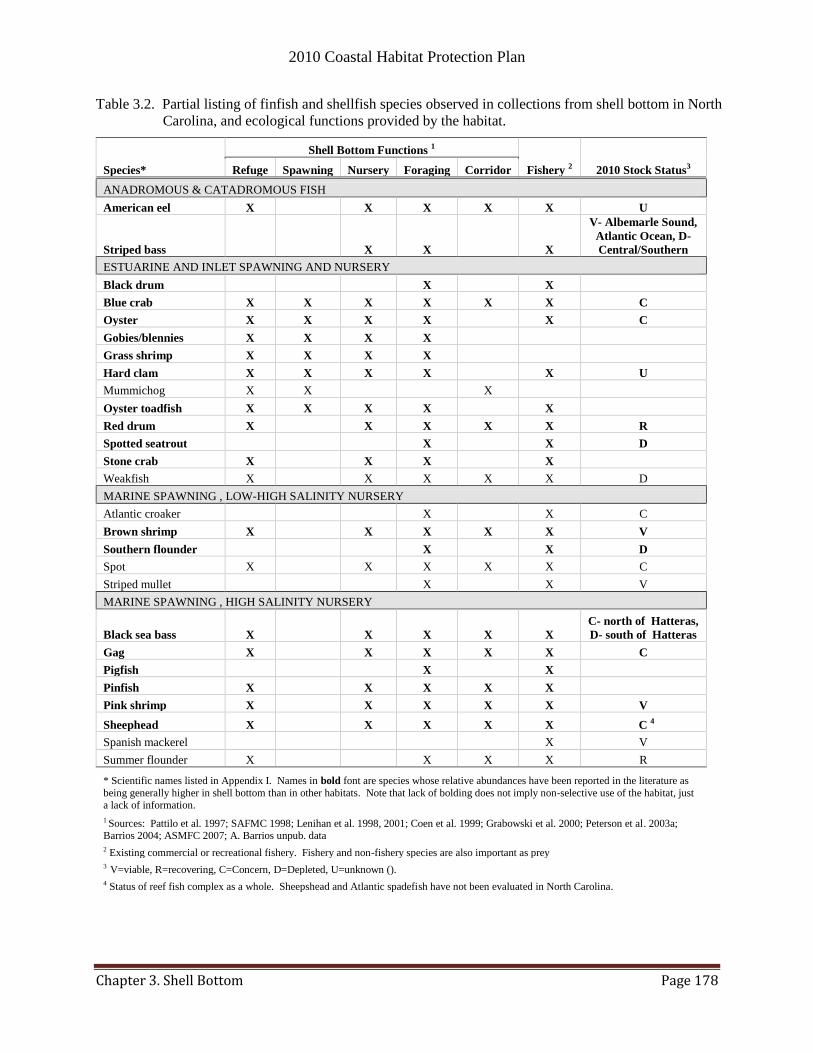
2010 Coastal Habitat Protection Plan
Chapter 3. Shell Bottom Page 178
Table 3.2. Partial listing of finfish and shellfish species observed in collections from shell bottom in North
Carolina, and ecological functions provided by the habitat.
Species*
Shell Bottom Functions 1
Fishery 2 2010 Stock Status3 Refuge Spawning Nursery Foraging Corridor
ANADROMOUS & CATADROMOUS FISH
American eel X X X X X U
Striped bass X X X
V- Albemarle Sound,
Atlantic Ocean, D-
Central/Southern
ESTUARINE AND INLET SPAWNING AND NURSERY
Black drum X X
Blue crab X X X X X X C
Oyster X X X X X C
Gobies/blennies X X X X
Grass shrimp X X X X
Hard clam X X X X X U
Mummichog X X X
Oyster toadfish X X X X X
Red drum X X X X X R
Spotted seatrout X X D
Stone crab X X X X
Weakfish X X X X X D
MARINE SPAWNING , LOW-HIGH SALINITY NURSERY
Atlantic croaker X X C
Brown shrimp X X X X X V
Southern flounder X X D
Spot X X X X X C
Striped mullet X X V
MARINE SPAWNING , HIGH SALINITY NURSERY
Black sea bass X X X X X
C- north of Hatteras,
D- south of Hatteras
Gag X X X X X C
Pigfish X X
Pinfish X X X X X
Pink shrimp X X X X X V
Sheephead X X X X X C 4
Spanish mackerel X V
Summer flounder X X X X R
* Scientific names listed in Appendix I. Names in bold font are species whose relative abundances have been reported in the literature as
being generally higher in shell bottom than in other habitats. Note that lack of bolding does not imply non-selective use of the habitat, just
a lack of information.
1 Sources: Pattilo et al. 1997; SAFMC 1998; Lenihan et al. 1998, 2001; Coen et al. 1999; Grabowski et al. 2000; Peterson et al. 2003a; Barrios 2004; ASMFC 2007; A. Barrios unpub. data
2 Existing commercial or recreational fishery. Fishery and non-fishery species are also important as prey
3 V=viable, R=recovering, C=Concern, D=Depleted, U=unknown ().
4 Status of reef fish complex as a whole. Sheepshead and Atlantic spadefish have not been evaluated in North Carolina.
2010 Coastal Habitat Protection Plan
Chapter 3. Shell Bottom Page 179
3.2.4.2. Spawning
Shell bottom resident species, such as oyster toadfish, gobies, grass shrimp, and hard clams, have been
documented to use oyster reefs for reproduction (Hardy 1978a-b, Johnson 1978; Coen et al. 1999; NOAA
2001; Tolley and Volety 2005). Many of these residents use the interstitial spaces within and between the
shells as nesting sites and attach their eggs to the shell surface (Coen et al. 1999). Recent research has
suggested that estuary-spawning transient species use shell bottom for spawning purposes as well. In the
Neuse River estuary, spawning aggregations of red drum and spotted seatrout were found to frequently
occur over subtidal oyster beds, although a distinct preference for this habitat in comparison to soft
bottom was not found (Barrios 2004; Barrios-Beckwith et al. 2006; A. Barrios unpub. data). More
research is needed on the functional value of oyster reefs as spawning habitat for estuary-spawning
transient species in North Carolina.
3.2.4.3. Nursery
Shell bottom serves as valuable nursery habitat for numerous juvenile finfish and macroinvertebrates
(Daniel 1988; Orterga and Sutherland 1992; Minello 1999; Grabowski et al. 2000; Lehnert and Allen
2002; Grabowski et al. 2005; ASMFC 2007; Shervette and Gelwick 2008). Species considered,
―recruitment-enhanced,‖ by shell bottom (relative to soft bottom) include stone crabs, sheepshead,
blennies/gobies, skilletfish, gray snapper, gag, toadfish, and tautog (Peterson et al. 2003a). Both juvenile
oysters and hard clams settle on shell bottom, taking advantage of the protection this habitat provides
(Wells 1957; MacKenzie 1977; Peterson 1982; Nestlerode et al. 2007; DMF 2008a; DMF 2008b).
Survival of juvenile oysters post-settlement is often higher on oyster shell as compared to other shell
substrates due to the structural complexity oyster shell affords (Nestlerode et al. 2007). Juvenile stone
crabs occur almost exclusively on shell bottom in areas where other sources of hard substrate are rare to
absent (Minello 1999; Lowery and Paynter 2002). Megalopal stone crabs key in on the chemical signals
of the oyster themselves and associated biofilms as a cue for settlement (Krimsky and Epifanio 2008).
The nursery area function of shell bottom for resident finfish was demonstrated by Lehnert and Allen
(2002) who found abundances of juvenile naked goby (Gobiosoma bosc), oyster toadfish (Opsanus tau),
and crested blenny (Hypleurochilus geminatus) to be higher on shell bottom than on adjacent mud and
sand bottom habitats.
Commercially and recreationally important finfish, such as black sea bass, gag, snappers, and sheepshead
also use shell bottom as nurseries (Grabowski et al. 2000; Lenihan et al. 2001; Lehnert and Allen 2002;
Lowery and Paynter 2002; Levin and Hay 2003; Peterson et al. 2003a; Grabowski et al. 2005; SAFMC
2007a). The ASMFC and SAFMC consider shell bottom as important nursery habitat for juveniles of
these species (SAFMC 1998a; Lowery and Paynter 2002; ASMFC 2007; SAFMC 2007a). Grabowski et
al. (2005) found that juvenile gag and grey snapper were some of the most abundant species on intertidal
oyster reefs in Middle Marsh, North Carolina, and that the abundances of these species were higher than
on the adjacent mud flat. Lehnert and Allen (2002) reported that black sea bass and groupers were nearly
500 times more abundant on shell bottom as compared to adjacent soft bottom habitats, leading these
authors to suggest that oyster reefs function as EFH for those species.
3.2.4.4. Foraging
Numerous aquatic organisms use shell bottom as foraging grounds during one or more of their life stages
(Loosanoff 1965; Eggleston 1990; Mann and Harding 1997; Grabowski et al. 2000; Lenihan et al. 2001;
Peterson et al. 2003a; ASMFC 2007; Simonsen 2008). Species considered, ―growth-enhanced,‖ by shell
bottom (relative to soft bottom) include bay anchovy, black sea bass, sheepshead minnow, spottail
pinfish, silversides, white perch, pigfish, and southern flounder (Peterson et al. 2003a). The structure
shell bottom provides concentrates prey organisms and attracts predators. Both mud and blue crabs
forage heavily on oyster reefs, functioning as important predators of oyster spat and juvenile hard clams

2010 Coastal Habitat Protection Plan
Chapter 3. Shell Bottom Page 180
(Menzel and Hopkins 1955; Krantz and Chamberlin 1978; Eggleston 1990; Mann and Harding 1997;
Coen et al. 1999; Grabowski and Powers 2004; Posey et al. 2004; Grabowski and Kimbro 2005). In the
Gulf of Mexico, oysters and other reef associated bivalves were documented to comprise over one third of
the diet of juvenile and adult black drum (Brown et al. 2008). Stomach content analysis of fishes
collected in association with oyster reefs in the Neuse River and Middle Marsh, North Carolina, indicated
preferential foraging on reef-associated fish, crustaceans, and mollusks (Grabowski et al. 2000; Lenihan
et al. 2001). Studies in Louisiana and Chesapeake Bay found that dietary breadth of spotted seatrout,
bluefish, and Atlantic croaker was greater over oyster reefs than adjacent soft bottom (Harding and Mann
2001; Simonsen 2008). Recently, the ASMFC has recognized the importance of shell bottom as foraging
grounds for economically and ecologically important species, noting that 17 of the 22 ASMFC-managed
species use shell bottom for this purpose (ASMFC 2007).
3.2.4.5. Corridor and Connectivity
Shell bottom has been suggested to serve as a corridor to other habitats, such as salt marsh and SAV, for
finfish and macroinvertebrates (Coen et al. 1999; Micheli and Peterson 1999; Grabowski et al. 2000).
Several authors have found that the proximity and connectivity of intertidal oyster reefs to other habitats,
specifically SAV, affect fish and blue crab utilization patterns and the functional value of those reefs
(Micheli and Peterson 1999; Grabowski et al. 2000). Nevertheless, there is a general paucity of
information documenting the corridor function of shell bottom habitat. Further research is needed on the
corridor function of intertidal oyster reefs and the importance of connectivity to SAV and salt marsh for
fisheries production.
3.3. Status and trends
3.3.1. Status of shell bottom habitat
Status and trends of shell bottom can be assessed by examining changes in abundance and distribution
over time. Other indicators could include changes in associated fishery landings, extent of shell bottom in
protective designations, extent of disease, and change in recruitment indices (spatfall).
During the colonial period in the Mid-Atlantic, oyster reefs occurred so extensively that they were
considered to be a hazard to navigation (Newell 1988). Street et al. (2005) and DMF (2001a, 2008a) have
summarized the historical losses of oyster reefs in North Carolina, primarily in the Pamlico Sound region.
Winslow (1889) documented the historical distribution of oyster beds in North Carolina in 1886-1887.
Although the Winslow methods differed from today‘s methods, those early estimates indicated a greater
distribution and abundance of oyster reefs in Croatan, Roanoke, Pamlico, and Core sounds. In this area,
Winslow (1889) estimated roughly 8,328 acres of public and private oyster beds (0.6% of the bottom) and
20,554 acres of potential ―public oyster grounds.‖ Since the DMF Shellfish Habitat and Abundance
Mapping Program has not completed mapping within this region, and methods differed, a comparison
cannot be done. However, in the North River, where Winslow estimated 553 acres of natural and private
oyster beds, DMF estimated 445 acres in the 1990s.
In Pamlico Sound, large changes in the abundance of oyster rocks since the 1880s were documented by
Ballance (2004). Using new technologies to locate some of the subtidal reefs in Pamlico Sound reported
by Winslow (1889), Ballance found that many of the once productive high profile reefs of the 1880s
consisted of low profile, shell rubble, low density reefs, or had been completely buried by sediment.
Ballance (2004) also found that the larger solid reefs tended to have less live oysters, which was attributed
to the ease of locating these reefs by fishermen. The DMF has used the results of that study to guide
oyster restoration activities.
2010 Coastal Habitat Protection Plan
Chapter 3. Shell Bottom Page 181
Studies in riverine systems suggest that viable oyster beds have been displaced downstream roughly 10-
15 miles in the Pungo, Pamlico, and Neuse rivers since the late 1940s (Jones and Sholar 1981; Steel
1991). Re-mapping of the bottom is needed to accurately evaluate changes in distribution and density of
oysters. In the future, change analysis in a subset of areas remapped by DMF, particularly where major
changes are suspected, is needed to assess trends in this habitat. Currently, there are no plans to conduct
change analysis before mapping of the entire bottom area is completed. The Resource Enhancement
Section estimated that increases in staffing through CHPP implementation and changes in methodology
will enable each region of the coast to be remapped on five year cycles (B. Conrad/DMF, pers. com.
2008). New technology should be investigated that will further reduce time of mapping and enhance
mapping products.
Harvest data (fishery-dependent data) has been used as an indicator of overall change in oyster abundance
due to the lack of fishery-independent information. Based on harvest data, North Carolina oyster stocks
were in a state of decline for most of the 20th century (DMF 2001a). High landings around 1890
associated with introduction of the oyster dredge were followed by sharp declines in landings around
1918 due to restrictions in the oyster dredging and size limits. Data on landings by gear type indicate
that, between 1887 and 1960, most oysters were harvested by dredge when compared to all hand methods
(Chestnut 1955; DMF 2001a). Poor harvesting practices are believed to be the primary cause of initial
degradation and loss of shell bottom habitat in the Pamlico Sound area (DMF 2001a; Jackson et al. 2001).
Since 1991, oyster stocks and harvests from Pamlico Sound have collapsed due to high mortalities from
disease and low spawning stock biomass (DMF 2001a). However, harvest of oysters has risen slightly
since 2002 (DMF 2008a) (Figure 3.1). Oyster dredges are still used in some central coastal areas but are
not permitted in the southern portion of the state. Between 1994 and 2002, oyster dredge fishery landings
accounted for only 1% to about 21% of the annual oyster catch. Landings data indicate that, since 1997,
oyster harvest has remained fairly constant at around 50 pounds of oyster meat landed per oyster dredging
trip, while the number of trips, although generally increasing, has fluctuated between 3 and 943. Between
2002 and 2007, oyster dredging trips have generally increased with increasing harvest, while hand harvest
trips have remained fairly constant (DMF 2008a; DMF 2008c). However, we cannot infer that oyster
populations are increasing from harvest data alone.
Oyster populations in the southern portion of the coast have suffered only moderately from disease and,
due to a prohibition on the use of mechanical oyster harvest methods south of Pamlico Sound, these
populations have not been impacted by those methods (DMF, unpub. data). The harvest of oysters in this
area is primarily limited by availability of open areas, since harvest closures have increased over time due
to pollution. However, in open areas, fishing effort via hand harvest is high as intertidal oyster beds
typical of the southern coast are easily accessible. In general, cumulative and secondary effects from
severe disease infestations, coupled with continued decline in suitable habitat, have seriously impacted
oyster stocks.16
16 Fishing gear and disease impacts are given a more thorough discussion in the Section 3.4 (Threats and Management Needs).

2010 Coastal Habitat Protection Plan
Chapter 3. Shell Bottom Page 182
Figure 3.1. Commerical oyster landings (in pounds of meat) by gear type from 1930 to 2007. (Source:
DMF 2008c)
Average oyster spatfall in the Pamlico Sound area for the 1989–1999 period was less than half the value
for the 1979–1988 period (DMF 2008a) (Figure 3.2). However, data since 1999 show an increase in
spatfall (Figure 3.2). Unpublished DMF spatfall data for cultch planting sites over the past 24 years
indicate a decline in maximum spatfall relative to similar surveys reported by Chestnut (1955). Some
researchers suspect that oysters are becoming spawner-limited, while others attribute the decline to stress
and mortality from infectious diseases that affect primarily larger, more fecund (egg-producing) adults
(Choi et al. 1994; Lenihan et al. 1999; DMF 2008a), or to physical damage from dredging (Marshall et al.
1999). Although there has been no reported decline in spatfall in the southern coastal region of North
Carolina (R. Carpenter/DMF, pers. com., 2002), more information is needed to determine trends in
spatfall in this area over time.

2010 Coastal Habitat Protection Plan
Chapter 3. Shell Bottom Page 183
Figure 3.2. Northern and southern area (separated by Newport River) average oyster spatfall per unit
cultch, 1979–2007. (Source: DMF 2008a)
3.3.2. Status of associated fishery stocks
Based on the link between fishery species and shell bottom established in Section 3.2, some inferences
can be made using the status and trends of fishery species that are highly dependent on shell bottom
habitat (bolded species in Table 3.2). However, the utility of inferences is severely limited because the
majority of shell bottom loss is thought to have occurred before detailed fishery harvest statistics were
collected (prior to 1972). The DMF juvenile finfish surveys use seines and bottom trawls, which are
ineffective for sampling in oyster beds. University researchers have conducted some research targeting
fish use of shell bottom (see ―For ecosystem enhancement‖ section below), although there is no
monitoring on a regular basis. Fishery-independent sampling on oyster reefs using appropriate sampling
gear is needed to monitor juvenile and adult fish abundance in shell bottom. Recent fishery harvest
statistics may also provide a benchmark for future analysis, especially trip ticket data collected since
1994.
Of at least twenty five species (including oysters) showing higher relative abundance in shell bottom as
compared to other habitats (bolding in Table 3.2), thirteen species, comprising at least fifteen stocks, were
evaluated for fishery status in 2010
(http://www.ncdmf.net/stocks/2010NCDMF%20StockStatusReport.pdf). Of the thirteen stocks whose
status was known, four were designated Depleted, six were Concern, two were Recovering, and three
were Viable. Specifically, the southern flounder stock, the central-southern stock of striped bass,
weakfish, spotted seatrout and the black sea bass stock south of Cape Hatteras are classified as Depleted;
blue crab, oyster, spotted seatrout, Atlantic croaker, spot, gag, sheepshead, and the black seas bass stock
north of Cape Hatteras are classified as Concern; and red drum and southern flounder are classified as
Recovering. Viable stocks include brown and pink shrimp, striped mullet, and the ocean and Albemarle
Sound stocks of striped bass. The stock status of hard clams, stone crabs, black drum and other shell
bottom-associated fishery species is unknown. Since 2003, there have been more stocks added to the list
of concern and a corresponding reduction in the number of stocks considered viable (Street et al. 2005).
However, a change in stock status does not necessarily suggest any relationship to changing habitat
conditions. The change in stock status only stresses the importance of protecting shell bottom as a habitat
for species of concern.
2010 Coastal Habitat Protection Plan
Chapter 3. Shell Bottom Page 184
Stock status of Concern or Depleted could be attributed to a variety of causes ranging from habitat loss,
disease, and overfishing, to annual variation in environmental conditions. Compounding this uncertainty
is the fact that status of some shell bottom-associated species, such as hard clams and black drum, is
currently unknown. More information on the status of hard clams, black drum, and other fishery and
resident non-fishery species (i.e., oyster toadfish) as indicators of shell bottom conditions is needed. Due
to the limitations of using fisheries-dependent data (landings data) to indicate stock trends, fisheries-
independent data should be collected for these species to develop independent indices. The capacity of
shell bottom habitat to affect water quality and overall community structure would probably be the best
indicator of status and trends in shell bottom habitat. However, before this function could be used as an
indicator, research is needed on the critical amount and quality of living and dead shell bottom in a water
body below which significant changes in biotic community structure occur.
3.3.3. Shell bottom enhancement and restoration
Restoration efforts are a form of oyster management designed to address the precipitous decline in oyster
harvest and associated population size. However, the nature of oyster enhancement and restoration efforts
has changed through the years. The earliest restoration efforts were directed at fishery enhancement,
whereas recent efforts also included no-take sanctuaries and mitigation projects.
3.3.3.1. For fishery enhancement
The Shellfish Rehabilitation Program has contributed to the restoration of depleted oyster grounds
through the planting of cultch material and seed oysters (Chestnut 1955). State-sponsored cultch
plantings begin in 1915. Between 1915 and 1934, a total of 1,856,379 bushels of shells and seed oysters
were planted in North Carolina‘s estuaries. The Shellfish Rehabilitation Program officially began in 1947
and resulted in planting 838,088 bushels of shell and 350,734 bushels of seed oysters over its first 10
years. Since 1970, North Carolina has relied almost exclusively on cultch planting as a means of
enhancing oyster production (Figure 3.3). From 1958 to 1994, 12,475,000 bushels of shell material were
planted, for an annual average of 337,162 bushels (Marshall et al. 1999). Over the entire period of cultch
planting from 1915-1994, about 15 million bushels of oysters were planted in North Carolina waters
(Street et al. 2005). While some cultch plantings target soft bottom to create additional shell bottom
habitat, other plantings are replenishments of older existing plantings, making it impossible to estimate
how much shell bottom has been created over time.

2010 Coastal Habitat Protection Plan
Chapter 3. Shell Bottom Page 185
Figure 3.3. North Carolina oyster rehabilitation activities for 1947–2007 (data stacked to show
cumulative total). The peak in 1988 was due to special state disaster funding during the
red tide of 1987-88. (Sources: Marshall et al. 1999; DMF unpub. data)
The majority of cultch planting sites during 1990-1994 were in Pamlico Sound, lower Neuse River and
lower Pamlico River (Marshall et al. 1999). Most of these sites were ―new‖ plantings on soft bottom
(Marshall et al. 1999). The same general areas were also planted from 1998-2008 (Maps 3.4a-b). Criteria
for site selection include suitable sediment types, currents, protection from storm damage, historical
productivity, salinity patterns, and existing shellfish concentrations. The presence of bottom disturbing
fisheries, such as trawling, mechanical clamming, and long haul seining, is also considered.
Recommended sites for cultch plantings are often narrow bands of mixed sand and mud sediment
between shallow, hard, nearshore sediment and soft offshore sediment. In deep water, large oyster
mounds are constructed to increase recruitment and reduce effects of low oxygen on the bottom. The
planting sites are monitored for oyster recruitment and survival over a period of three years (DMF 2001a).
Using vessels currently in operation, cultch can be planted in water as shallow as two feet (Marshall et al.
1999). Since the early 1980s, the DMF has concentrated primarily on cultch plantings and small-scale,
high quality seed transplanting activities, also referred to as the ―relay program.‖ In the relay program,
oysters are removed from dense oyster populations in prohibited areas (closed to harvest) and relocated to
open harvest areas with depleted resources. The relay program is very small and concentrated in the
south, where there is very little effect on the seed source areas, or seed management areas (C.
Hardy/DMF, pers. com., 2008).
Funding for the acquisition of cultch material was drastically cut in the 1990 budget for DMF. As a
result, cultch plantings had declined to around 200,000 bushels by 2002 (Figure 3.3). And until 2005, the
DMF possessed more planting capacity than available cultch material (Street et al. 2005). Then in 2005
and 2006, legislative actions to support CHPP implementation accelerated the acquisition of cultch
material. Those actions included funding for a dedicated shell recycling coordinator, additional public
2010 Coastal Habitat Protection Plan
Chapter 3. Shell Bottom Page 186
recycling sites and some important legislation. The shell recycling program had started in 2004 using
local coordinators to collect discarded shells from individuals and businesses. The shells were then
transferred to stockpile facilities before being planted in new or expanding cultch planting sites. The
program started out slow with only about 1,000 bushels donated in 2004. The amount of cultch collected
was secondary to the public awareness gained from a shell recycling program. Since 2005, contributions
have increased each year to nearly 30,000 bushels in 2007 (S. Varnum/DMF, pers. com., 2008). The
following statutes also encouraged voluntary shell recycling:
General Statute 105-130.48: A taxpayer who donates oyster shells to the Division of Marine
Fisheries is eligible for a state tax credit of one dollar ($1.00) per bushel of oyster shells donated.
This act will remain in effect until tax year 2011.
General Statute 130A-309.10(f): No person shall knowingly dispose of oyster shells in solid
waste landfills.
General Statute 136-123(b): No landscaping or highway beautification project undertaken by the
Department of Transportation (DOT) or any other unit of government may use oyster shells as a
ground cover. The DOT or any other unit of government that comes into possession of oyster
shells shall make them available to the Department of Environment and Natural Resources,
Division of Marine Fisheries, for use in any oyster bed revitalization programs or any other
program that may use the shells.
The shortfalls in cultch planting material are primarily offset with the purchase of limestone marl for
subtidal reefs. Thus, legislative actions in 2005 have allowed DMF to reach operational capacity (C.
Hardy/DMF, pers. com., 2008). The legislative actions also followed recommendations and proposed
actions in the 2005-2007 CHPP implementation plans. Maps 3.4a-b show the cultch planting sites from
1998 to 2007.
During 2007, over 200,000 bushels of cultch were distributed among nearly 50 sites. However,
management of these sites varies. There are basically three management designations for cultch planting
sites: (1) Research Sanctuary, (2) Seed Management Area, or (3) Shellfish Management Area. The
Research Sanctuary designations are discussed in the following section. Shellfish Management Areas are
designated under proclamation authority of the Fisheries Director [MFC rule 15A NCAC 03K .0103].
These areas include shellfish populations or shellfish enhancement projects that may produce commercial
quantities of shellfish or shellfish suitable for transplanting as seed [MFC rule 15A NCAC 03K .0103a].
Use of trawl nets, long haul seines, and swipe nets is prohibited in Shellfish Management Areas and,
unless open by proclamation, they are closed to all shellfish harvest. Cultch planting sites in the Pamlico
Sound have not been designated as Shellfish Management Areas because of the difficulties in enforcing
the prohibition of shellfish harvesting on these areas (i.e., small numbers of Marine Patrol Officers
patrolling large water bodies (M. Marshall/DMF, pers. com., 2002). South of Pamlico Sound there are
numerous Seed Management Areas and Shellfish Management Areas (Map 3.4a-b).
3.3.3.2. For ecosystem enhancement
The primary purpose of the DMF cultch-planting program since it began has been oyster fishery
enhancement, which primarily provides temporary habitat value. Recent research showing the important
ecological and economic value of oyster reefs (Breitburg 1998; Lenihan et al. 1998; Coen et al. 1999;
Harding and Mann 1999; Grabowski et al. 2000; Lenihan et al. 2001; Peterson et al. 2003a) has prompted
DMF enhancement efforts to broaden their primary focus to include ecosystem enhancement. Grabowski
et al. (2000) found that landscape characteristics seemed to influence fish species' relative abundance (i.e.,
connectivity with SAV and/or salt marsh). Fish abundance was significantly greater on restored oyster
reefs adjacent to SAV than on mud flat and/or salt marsh restored reefs. Restored intertidal oyster reefs
produced significantly more economically valuable oysters ($95.68/10 m2) than estimates of oyster
production on subtidal reefs ($11.61/10 m2). The value of legal oysters present on mud flat reefs
2010 Coastal Habitat Protection Plan
Chapter 3. Shell Bottom Page 187
($129.38/10 m2) exceeded that for oysters on salt marsh ($50.50/10 m
2) or SAV restored reefs ($24.25/10
m2). They estimated that the long-term value of commercial finfish fisheries landings from restored reefs
was greater than the oyster harvest value for both intertidal and subtidal shell bottoms. Peterson et al.
(2003) estimated the amount of fish production that shell bottom provides in addition to adjacent soft
bottom habitats. Using results from numerous studies, they compared the density of fish at different life
stages on oyster reefs and adjacent soft bottom habitats. Analysis of the studies revealed that every 10 m2
of newly constructed oyster reef in the southeast United States is expected to yield a benefit of an
additional 2.6 kg of fish production per year for the lifetime of the reef (Peterson et al. 2003a).
The aforementioned research supported the development of Oyster Sanctuaries and Shellfish
Management Areas for large, mature oysters (Maps 3.4a-b), in addition to cultch planting sites for oyster
fisheries enhancement. Large oysters are known to be more viable than their smaller (younger)
counterparts (DMF 2008a). They are assumed to be disease-resistant and have the potential to establish
these traits in populations beyond sanctuary boundaries. This in turn could have long-term benefits on a
sustainable fishery. Although still open to debate, relaying large surviving oysters to sanctuaries could
promote characteristics needed to suppress the trends in Perkinsus marinus (Dermo) mortality. Another
strategy would be to plant hatchery-reared disease resistant oysters on sanctuaries on the premise that they
will pass their resistance on to wild populations. Currently, there are no state operated hatcheries for
shellfish restoration in North Carolina (DMF 2008a). However, in 2008, per recommendations from the
General Assembly, the DMF was provided $4.3 million to build an oyster research hatchery at the
University of North Carolina at Wilmington. The money was designated for construction cost only.
Additional funding is needed to staff and operate the oyster hatchery facility.
As of 2008, the DMF has established and developed nine Oyster Sanctuaries encompassing 4.6 – 47.7
acres each, totaling 167.9 acres, of which approximately 42.8 acres have substrate for oyster attachment
(Map 3.4a-b). The sanctuaries are located around Pamlico Sound and constructed of multiple, high
profile mounds using mostly Class B Riprap (limestone marl) and the use of shell and seeded shell as part
of the research needs. The Nature Conservancy (TNC), the North Carolina Coastal Federation (NCCF),
the National Marine Fisheries Service (NMFS) Hurricane grant 2001-2006, state appropriations through
DMF, and other mitigation sources provided funding. Current plans for expansion include an additional
sanctuary along northwestern Pamlico Sound funded to NCCF and DMF by Coastal Recreational Fishing
License revenue (S. Slade/DMF, pers. com., 2008). Oyster Sanctuaries are designated and delineated
under North Carolina Marine Fisheries Rule 15A NCAC 03R .0117 and are protected from damaging
harvest practices under rule 15A NCAC 03K .0209.
Some factors considered in the selection of sites for Oyster Sanctuaries include depth, bottom type,
salinity, currents, cover, or cultch necessary for shellfish growth, presence of larvae, and proximity to
SAV, salt marsh, fish nursery areas, or Military Protected Areas. There is currently a NMFS-Sea Grant
Fellowship project (NA08OAR4170764) developing other criteria for placement of sanctuaries based on
larval transport (Eggleston et al. 2008). Oyster Sanctuaries are monitored by DMF staff to:
Establish the effectiveness of the different types of cultch materials,
Determine the recruitment, survival, and growth potential of each sanctuary on an annual basis,
Determine the best water characteristics for long-term oyster growth in Pamlico Sound, and
Characterize habitat utilization by sessile organisms in Pamlico Sound.
Seven of the nine Oyster Sanctuaries were monitored by DMF in 2007-2008. There is also a General
Assembly funded two-year project underway that includes monitoring of fish predation on young oysters
in Oyster Sanctuaries (principal investigator: C. Peterson, UNC-CH). In addition, a CRFL supported
($132,242) project has recently been approved to examine how planting size for oyster seed influences
seeding success on constructed oyster reefs at three sites in the Pamlico Sound (principal investigator: C.

2010 Coastal Habitat Protection Plan
Chapter 3. Shell Bottom Page 188
Peterson, UNC-CH). In an effort to further expand monitoring efforts, the DMF is working to assign
different researchers to different sanctuaries (C. Hardy/DMF, pers. com., 2008).
The placement of sanctuaries by DMF has primarily focused on Pamlico Sound due to the large historic
loss of oyster reefs in this area, as well as the sizeable amount of oysters in areas closed to harvest south
of Pamlico Sound by reason of pollution. However, there are some cultch planting sites in the central and
southern regions sponsored by various non-profit organizations, a University, and one coastal community
(Map 3.4b). These sites are designated as Research Sanctuaries [MFC rule 15A NCAC 03I .0109] or
Shellfish Management Areas [MFC rule 15A NCAC 03K .0103] under proclamation authority of the
Fisheries Director. The North Carolina Coastal Federation (NCCF) has sponsored most of the sites. The
NCCF sites are located in Williston Creek (Research Sanctuary), Everett Bay (Shellfish Management
Area), Hewlett‘s Creek (Shellfish Management Area), New River near Sneads Ferry (Research
Sanctuary), Dicks Bay in Myrtle Grove Sound (Research Sanctuary), and Alligator Bay (Shellfish
Management Area) (Map 3.4a-b). The sites are monitored for three years after planting. The parameters
measured include oyster density and abundance, epifaunal coverage, bed height and rugosity, and selected
water quality measurements. Other sponsors and sites include:
the St. James Plantation (golf course community), which built two large reefs (Research
Sanctuaries) in Brunswick County that now serve as spat monitoring stations;
the University of North Carolina at Wilmington, which has Research Sanctuaries in Spicer
Bay/Kings Creek and Everett Bay; and
Pender Watch and TNC, which have sponsored two sites that will be designated as Shellfish
Management Areas in closed shellfish harvesting waters (S. Taylor/DMF, pers. com., 2008).
To provide better long-term protection for oysters, DMF (2008a) recommended that stakeholders and
legal counsel investigate the feasibility of conservation leasing whereby environmental groups are
allowed to lease coastal submerged lands and utilize portions of the water column for long term habitat
restoration or enhancement projects rather than close these areas to any potentially damaging harvest
practice through short-term proclamation only.
Researchers in Chesapeake Bay have recommended that 10% of the total shell bottom area be managed as
sanctuaries to provide a means to restore this habitat closer to its original distribution and abundance
(DMF 2008a). This equates to about 832 acres in North Carolina based on an estimate of total (mostly
subtidal) shell bottom by Winslow (1889). Given no other caveats, at the current rate of sanctuary
development, it could take over 100 years to reach a goal of 10%. However, other Marine Fisheries
Commission (MFC) rules restricting mechanical bottom disturbing gear also provide varying levels of
protection to other areas of shell bottom (see Threats-mobile disturbing fishing gear section). These areas
serve as partial sanctuaries and should be included in the total area of shell bottom within protective
designations.
Recent increases in funding for the Oyster Sanctuary program could accelerate the creation of sanctuaries
(S. Slade/DMF, pers. com., 2008). However, it should be noted that there is less suitable habitat for
oyster reef restoration than existed in the late 1880s, so the goal of restoring shell bottom to its original
distribution and abundance is in all likelihood unrealistic. The causes of habitat unsuitability include
sedimentation, hypoxic waters, and other water quality degradation (Ballance 2004). Many of the 1880
shell beds re-located by Ballance (2004) were covered in layers of sediment. There have also been
changes in the hydrology and water quality covering oyster rocks that were lost due to poor harvest
practices (refer to section on Water quality degradation). A more current comprehensive estimate of shell
bottom abundance will be available when DMF bottom mapping is complete in late 2009 (B.
Conrad/DMF, pers. com., 2008).
2010 Coastal Habitat Protection Plan
Chapter 3. Shell Bottom Page 189
3.3.3.3. For mitigation
The first focused oyster reef restoration project in North Carolina occurred in 1992-1993 when 13 acres of
oyster producing habitat were created on an existing, degraded reef as mitigation for the loss of 16 acres
of estuarine bottoms and 1.5 acres of wetlands in Roanoke Sound (Marshall et al. 1999). The DMF is
monitoring this site as part of a mitigation agreement with the U.S. Army Corps of Engineers (COE).
Additional projects creating more than 70 acres of shell bottom have been planned with the USACE
(Marshall et al. 1999), but are currently on hold until project details are agreed upon (C. Hardy/DMF,
pers. com., 2008). An improved mitigation policy is needed to identify mitigation needs, increase
mitigation efficiency, and reduce project timelines. The DMF has also performed mitigation projects for
the North Carolina Department of Transportation (DOT) (Marshall et al. 1999). Since 1999, there have
been at least three mitigation projects funded by various entities targeting the Crab Hole Oyster Sanctuary
in northern Pamlico Sound (C. Hardy/DMF, pers. com., 2008). These mitigation projects resulted in an
additional 12.65 acres of shell bottom created. The mitigated impacts included:
Impacts from Highway 64 bridges in Dare County; DOT/Division of Coastal Management
(DCM) provided funding in 2003 for the construction of 17 cultch mounds.
Prop dredging by a crew with DOT (Ferry Division) in Currituck Sound; DOT provided funding
in 2006 for the construction of 55 cultch mounds.
Habitat lost due to Pirate‘s Cove development on Roanoke Island; conservation funds for
mitigation were provided in 2007 for the construction of 26 cultch mounds.
The DCM does not allow mitigation to impact shell bottom for privately funded projects. In other words,
direct impacts to shell bottom habitat are not allowed by DCM rules. Where any depletion or loss of shell
bottom is allowed, agencies should consider requiring mitigation. The EEP is developing an out-of-kind
crediting system that could be employed in mitigating the permitted loss of shell bottom to water-
dependent development.
3.3.3.4. Planning efforts
To coordinate various organizations‘ interests with DMF restoration work, a steering committee was
established by the NCCF to draft an oyster restoration plan for North Carolina. The need for a
comprehensive oyster restoration plans was also noted in Street et al. (2005). Some of the
recommendations from the NCCF plan (NCCF 2007) are reflected in the previous sections, as well as in
the 2007-2009 CHPP implementation plan. The recommendations of interest involve cooperation and
coordination between DMF and other organizations. The continuing development of financial,
jurisdictional, and technical partnerships will undoubtedly help in reaching oyster protection and
restoration goals. There are numerous organizations that play a role in the development and monitoring
of shell bottom enhancement and restoration.
The North Carolina Clean Water Management Trust Fund, NOAA‘s Community-based
Restoration Fund, and Sea Grant FRGs provide funding for projects.
University researchers and knowledgeable citizens provide guidance for site placement, seeding,
and subsequent monitoring.
Non-governmental organization, such as TNC and NCCF, help with all phases of a project
(planning, funding, site development, monitoring, etc.).
The North Carolina Division of Environmental Health (DEH) Shellfish Sanitation and
Recreational Water Quality Program provide shellfish harvest closure information.
The Ecosystem Enhancement Program local watershed plans prioritize shellfish waters affected
by road construction and develop appropriate mitigation credits.
The North Carolina Division of Water Quality (DWQ) basinwide plans help identify waters that
are becoming more or less degraded.
The State of North Carolina and USACE basin studies help evaluate sites for restoration
2010 Coastal Habitat Protection Plan
Chapter 3. Shell Bottom Page 190
potential.
One must also consider the added benefit of oyster restoration for other habitat types. There is a positive
synergy between SAV growth, marsh formation, and shell bottom development (see Ecosystem
enhancement section). So the above restoration efforts apply not only to shell bottom, but also riparian
wetlands, and SAV.
Another aspect of oyster restoration involves watershed restoration and/or enhancement, a necessary
component of any water-based restoration initiative (see ―Water column restoration and enhancement‖
section of Water column chapter for more information). There are numerous planning efforts that
prioritize lands for conservation/restoration, which could open the possibility for oyster restoration
downstream.
The North Carolina Department of Environment and Natural Resources (DENR) Conservation
Planning Tool can help prioritize statewide conservation of both terrestrial and aquatic habitats.
This strategic planning effort was meant to be a ―one stop shop‖ for various conservation plan
priorities based on multiple federal, state, nonprofit, and private programs.
The Coastal Area Management Act (CAMA) land use plans could balance economic
development with oyster restoration activities within their jurisdiction.
The Ecosystem Enhancement Program local watershed plans can prioritize wetland mitigation
sites based on oyster restoration potential downstream.
The Onslow Bight Initiative plans can help prioritize conservation of both terrestrial and aquatic
habitats in that particular region.
Albemarle-Pamlico Conservation and Communities Collaborative (AP3C) developed by
institutions interested in balancing the long-term conservation of natural systems with
opportunities for the well-being of all the region‘s citizens coordinate efforts.
Cape Fear Arch Conservation Collaborative - a partnership of organizations and individuals
interested in protecting this region while balancing the needs of man and nature.
Appropriate DENR staff should continue to participate in collaborative efforts to plan, develop, and
monitor the biological effectiveness of oyster enhancement and restoration activities.
3.3.4. Designated areas
Special designations may provide additional protection for shell bottom above the default level of
protection granted wherever they occur. State designations protecting Shell bottom in public trust waters
fall into basically three categories: (1) water quality protection, (2) physical habitat protection, and (3)
both water quality and physical habitat. Water quality designations include Outstanding Resource
Waters, High Quality Waters, Nutrient Sensitive Waters, and Water Supply Water I & II. These
designations are described in the ―Designations‖ section of the ―Water Column‖ chapter. Physical habitat
protections include trawling and mechanical methods prohibited areas, Crab Spawning Sanctuaries,
Oyster Sanctuaries, Shellfish Management Areas, and Military Prohibited Areas. Both physical and water
quality protections are afforded to open shellfish harvesting waters and Primary Nursery Areas. The
protections are described later in reference to particular threats. The vast majority of mapped Shell
bottom occurs within one or more designations providing some degree of additional protection, based on
GIS analysis comparing SAV maps and regulatory designations (DMF unpub. data, July 2009).
3.4. Threats and management needs
Although shell bottom consists of both living and non-living shell material, annual recruitment of live
shellfish is needed to sustain the supply of shell material and three-dimensional structure of oyster reefs.
2010 Coastal Habitat Protection Plan
Chapter 3. Shell Bottom Page 191
Therefore, any activities that directly remove or destroy live shellfish, or indirectly prevent or slow
growth and survival, are threats to shell bottom habitat. Mollusks that contribute shell material include
oysters, hard clams, bay scallops, as well as many non-fishery species. Since oysters are the dominant
contributor to shell bottom, the threats discussed below focus primarily on oyster reefs.
3.4.1. Physical threats and hydrologic modifications
3.4.1.1. Water-dependent development
Water-dependent development includes any permanent, man-made structures that are designed for access
to the water (Kelty and Bliven 2003). These include marinas, boat ramps, docks, piers, and bulkheads.
Although the construction of water-dependent structures may actually increase substrate for oysters,
negative impacts from such activities generally outweigh the benefits. Projects involving channel
dredging for navigational purposes can remove, damage, or degrade existing shell bottom if permit
reviewers, including DMF, NMFS, and N.C. Wildlife Resource Commission (WRC), do not advise
against damaging project alternatives when making habitat value determinations. Dredging creates
turbidity that can clog oyster gills or cover the oysters completely. Even low levels of siltation affect
growth of oyster beds by reducing larval attachment. Although there are no major new channels being
constructed at this time in North Carolina‘s estuarine waters, maintenance dredging, construction of new
marinas and docking facilities, and new dredging for deep water access continue to be potential problems.
Primary Nursery Areas (PNAs) are currently protected from dredging projects for deep-water access.
However, some areas with extensive shell bottom habitat are not so explicitly protected from dredging.
Oyster beds in closed shellfishing waters, which can provide similar habitat functions to those in open
waters, are particularly vulnerable to loss and degradation from marina–associated impacts, unless
significant adverse impacts to viable shell bottom can be identified by permit reviewers.
Turbidity and siltation over shell bottom can also occur from increased boating activity once a given
marina or dock project is completed. Scouring of the bottom by frequent boat traffic causes resuspension
of fine sediments, which is similar to the effect of dredging on nearby oyster beds. The associated boat
wakes increase wave energies and shoreline erosion, and promote the development of dead margins along
intertidal reefs (Grizzle et al. 2002; Walters et al. 2003; Wall et al. 2005). In a study of recruitment and
survival of oysters in Mosquito Lagoon, Florida, Wall et al. (2005) found that reefs adjacent to areas with
intense boating activity (i.e. those containing dead margins) had higher sediment loads, relative water
motion, and juvenile oyster mortality than pristine reefs. Other studies in this same system have indicated
reef migration away from the ICW, as well as total reef destruction in response to increased boating
activity since the mid twentieth century (Grizzle et al. 2002). Current (2009) Coastal Resources
Commission (CRC) marina siting rules discourage significant degradation of existing shellfish resources
[CRC rule 15A NCAC 07H .0208].
Marinas can also negatively impact shell bottom through increased runoff from associated development
and discharges from boats (see Water quality degradation section). Due to the potential for physical and
water quality impacts, a variety of rules apply to development of new marinas in shellfishing waters. The
DCM is responsible for permitting marinas under the CAMA. The CAMA permitting process requires
coordination with DEH, DMF, DWQ, and other state and federal agencies. If the marina is located in
waters that would be classified as shellfishing waters (SA) by the Environmental Management
Commission (EMC), then a review of the status of the waters is required. If the waters are currently
classified as open to shellfishing, then DWQ would recommend denying the permit to protect the
designated use of those waters. However, the marina does not require a status review if the receiving
waters are closed to shellfishing. This policy may unintentionally promote additional development, rather
than restoration, in areas with degraded water quality, and can result in further degradation of water
quality, as well as physical degradation of shell bottom habitat. Marinas may also be allowed in
freshwater areas upstream of shellfishing waters, which may export toxins, microbes, and other
2010 Coastal Habitat Protection Plan
Chapter 3. Shell Bottom Page 192
contaminants downstream. Another issue is the similar effect of numerous multi-slip docking facilities in
an area. Multi-slip docking facilities do not meet the definition of a marina and may be allowed in open
shellfishing waters, after consultation with the DMF and other agencies, if no significant adverse impact
can be demonstrated by permit reviewers. However, it is very difficult to determine when and where one
additional multi-slip dock will cause a closure. The accumulation of multi-slip docking is therefore
difficult to control based solely on potential to close shellfish waters. The accumulation of multi-slip
facilities has been linked with shellfish harvest area closures (see ―Water quality degradation-sources‖
section of Water column chapter for more information). A threshold contamination level is needed to cap
multi-slip docking facilities in open shellfish harvesting waters.
A variety of work groups have recommended the development of a coastal marina policy that
encompasses all associated regulatory activities conducted within the DENR (NC Coastal Futures
Committee 1994, Waite et al. 1994). As part of 2005-07 CHPP implementations, a workgroup was
established to examine the issue of marinas and multi-slip docking facilities. The Sea Grant Marina
Advisory Group completed its report on Multi-slip docking Facilities (MSDFs) and provided
recommendations to the CRC in 2007. The report resulted in a revised application form for MSDFs
(DCM-MP-4) designed to capture information that can be used to judge the impacts of projects. The
CRC has also proposed changes to dock and piers rules which give property owners greater flexibility in
docking facilities (8 sq. ft./linear ft. shoreline) and provides better protection of shallow water habitat by
including minimum water depth for docks permitted under a general permit (2 ft) and minimum water
depth for floating docking facilities under the general permit if located in a PNA, in SAV, or in shell
bottom (18 in).
Bulkheads and other shoreline stabilization structures can also impact oyster populations. The placement
of bulkheads along eroding shorelines causes scouring of sediment at the base and downdrift of the
structure (Clark 1974; Watts 1987). The loss of fringing wetlands waterward of structures (see
―Wetlands‖ chapter) can also mean the loss of associated oyster beds. However, shoreline structures may
also provide substrate for oyster attachment, depending on the material used. One alternative to
traditional shoreline stabilization in tidal estuarine waters involves the placement of oyster bags just
above mean low water. It is well know that oyster spat prefer settlement on oyster shells compared to
other hard structures. The addition of oyster shell bags may be a preferred alternative to other materials
where engineered structures are considered necessary. The issue of shoreline stabilization is examined
more closely in the ―Wetlands‖ chapter.
3.4.1.2. Fishing gear impacts
Mobile bottom disturbing fishing gear
Mechanical fishing gear includes any gear that is towed or run by engine power, including oyster dredges,
hydraulic clam dredges and clam kicking gear, bottom trawls, and patent tongs. Over-harvesting and
habitat destruction from excessive oyster dredging were the initial causes for the large-scale decline in
oyster resources from approximately the late 1800s to the mid-1900s, particularly in the northern portion
of North Carolina. Although other factors had contributed to the decline in the oyster fishery, dredging
and tonging had the greatest impact on the physical structure of reefs in Chesapeake Bay (Hargis and
Haven 1988; Rothschild et al. 1994). One full season of simulated oyster dredge harvesting effort
reduced the mean height of high profile oyster mounds by 30% (Lenihan and Peterson 1998; DeAlteris et
al. 1999).
Oyster harvesting reduces the vertical relief of subtidal oyster reefs (Marshall 1954) and oyster dredging
results in several additional negative habitat impacts, including scattering and removing shell and oysters
and destabilizing the shell structure (Lenihan and Peterson 1998; Lenihan et al. 1999). These harvesting
effects result in reduced spawning stock biomass, reduced substrate availability for recruitment, reduced

2010 Coastal Habitat Protection Plan
Chapter 3. Shell Bottom Page 193
structural complexity utilized for refuge and foraging by juvenile fish and crustaceans, and decreased
resistance to disease.17
Between the 1970s and 1990s, the negative impact of oyster dredging and other mechanical methods on
shell bottom was recognized, and areas were designated where all mechanical methods for shellfish
harvest were prohibited by rules of the MFC Areas [MFC rules 15A NCAC 03N .0104 and .0105, 03J
.0103, 3J .0104] (Maps 3.5a-b). These methods include towed dredges, hydraulic dredges, patent tongs,
rakes powered by an engine, and clam kicking. In October 2004, additional areas in the Pamlico Sound
system were prohibited to mechanical harvest (DMF 2008a). These additional areas are located primarily
in the upper portion of Pamlico Sound tributaries and small bays. The majority of larger bays along
Pamlico Sound remain open to mechanical harvest methods (Map 3.5a-b).
Although the use of oyster dredges has been limited by the MFC in recent years due to habitat impacts
(DMF 2008a), historically fished subtidal oyster beds have not recovered (Lenihan and Peterson 1998),
and oysters are still listed as a species of concern in the 2008 DMF stock status report (DMF 2008d).
Degraded water quality, partially due to reduced filtration by oysters after stocks were reduced, and
increased disease occurrence from environmental stress are thought to have prevented full recovery
(Lenihan and Micheli 2000; Jackson et al. 2001). The extent of dredge damage to shell bottom depends
on trip duration and frequency, as well as the amount of oyster reef area worked over time (Powell et al.
2001). Some of the damage is mitigated through re-planting with cultch at 3-4 year time intervals (Map
3.4a).
Trawling for shrimp, crabs, and finfish, long haul seining, and dredging for crabs have similar types of
habitat impacts as oyster dredges, but at reduced levels of disturbance (DMF 2001a). The weight and
movement of trawl doors or chain towed across the seafloor can disrupt the structure of the oyster mound,
removing the upper layers of shells or scattering oysters (DMF 2001a). Long haul seines dragged through
shell bottom can also damage oyster mound structures by entangling, uprooting, and scattering shell.
Frankenberg (1995) studied the state of the oyster fishery and concluded that, because of its intensity,
trawling had a significant negative impact on living shell bottom habitat.
There are several different fishing gear restrictions and designations that limit some or all bottom
disturbing gears permanently or seasonally (Table 3.3). On nearly 400,000 acres or 70% of the bottom
mapping area, trawling, oyster dredging, or mechanical shellfish harvesting is prohibited (Table 3.3).
However, only 36% of the bottom mapping area is protected from all of these bottom disturbing gear
year-round. This protected area includes PNAs, Shellfish Management Areas, and locations where No
Trawl Areas or Secondary Nursery Areas (SNAs) overlap with Mechanical Methods Prohibited (Map
3.5a-b, Table 3.3). South of Pamlico Sound, a significant portion of the bottom mapping area is closed to
oyster dredging but not to trawling. However, trawling generally occurs in deeper channels, avoiding the
majority of the oyster beds, which are intertidal. Wherever bottom disturbing gears are allowed in
subtidal oyster habitat, creation, maintenance, and re-establishment of oyster beds may be deterred.
Bottom disturbing gear is problematic where deepwater oyster restoration is occurring or natural
processes favor re-establishment of deepwater oyster beds.
In other areas, such as Special SNAs and Crab Spawning Sanctuaries (47,423 acres, 8% of bottom
mapping area), trawling or dredging is prohibited at certain times of the year. In military designations,
the federal government has the authority to allow or prohibit all or some fishing activities on a case-by-
case basis. Mechanical clam harvesting and crab dredging are severely limited and are only allowed in
specific defined areas, usually on soft bottom habitat. Permanent shellfish harvest closures due to
polluted waters, prevent harvest of shellfish with any gear. Many of these closed waters overlap with
17 See disease section for more information
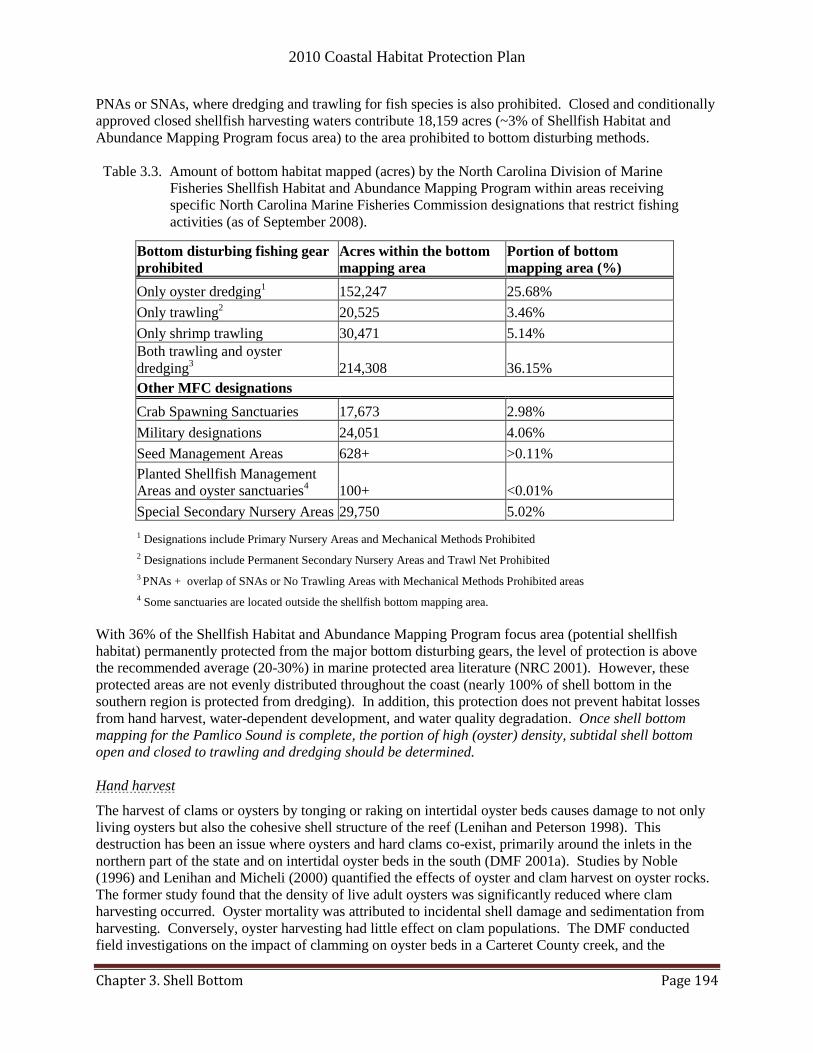
2010 Coastal Habitat Protection Plan
Chapter 3. Shell Bottom Page 194
PNAs or SNAs, where dredging and trawling for fish species is also prohibited. Closed and conditionally
approved closed shellfish harvesting waters contribute 18,159 acres (~3% of Shellfish Habitat and
Abundance Mapping Program focus area) to the area prohibited to bottom disturbing methods.
Table 3.3. Amount of bottom habitat mapped (acres) by the North Carolina Division of Marine
Fisheries Shellfish Habitat and Abundance Mapping Program within areas receiving
specific North Carolina Marine Fisheries Commission designations that restrict fishing
activities (as of September 2008).
Bottom disturbing fishing gear
prohibited
Acres within the bottom
mapping area
Portion of bottom
mapping area (%)
Only oyster dredging1 152,247 25.68%
Only trawling2 20,525 3.46%
Only shrimp trawling 30,471 5.14%
Both trawling and oyster
dredging3 214,308 36.15%
Other MFC designations
Crab Spawning Sanctuaries 17,673 2.98%
Military designations 24,051 4.06%
Seed Management Areas 628+ >0.11%
Planted Shellfish Management
Areas and oyster sanctuaries4 100+ <0.01%
Special Secondary Nursery Areas 29,750 5.02%
1 Designations include Primary Nursery Areas and Mechanical Methods Prohibited
2 Designations include Permanent Secondary Nursery Areas and Trawl Net Prohibited
3 PNAs + overlap of SNAs or No Trawling Areas with Mechanical Methods Prohibited areas
4 Some sanctuaries are located outside the shellfish bottom mapping area.
With 36% of the Shellfish Habitat and Abundance Mapping Program focus area (potential shellfish
habitat) permanently protected from the major bottom disturbing gears, the level of protection is above
the recommended average (20-30%) in marine protected area literature (NRC 2001). However, these
protected areas are not evenly distributed throughout the coast (nearly 100% of shell bottom in the
southern region is protected from dredging). In addition, this protection does not prevent habitat losses
from hand harvest, water-dependent development, and water quality degradation. Once shell bottom
mapping for the Pamlico Sound is complete, the portion of high (oyster) density, subtidal shell bottom
open and closed to trawling and dredging should be determined.
Hand harvest
The harvest of clams or oysters by tonging or raking on intertidal oyster beds causes damage to not only
living oysters but also the cohesive shell structure of the reef (Lenihan and Peterson 1998). This
destruction has been an issue where oysters and hard clams co-exist, primarily around the inlets in the
northern part of the state and on intertidal oyster beds in the south (DMF 2001a). Studies by Noble
(1996) and Lenihan and Micheli (2000) quantified the effects of oyster and clam harvest on oyster rocks.
The former study found that the density of live adult oysters was significantly reduced where clam
harvesting occurred. Oyster mortality was attributed to incidental shell damage and sedimentation from
harvesting. Conversely, oyster harvesting had little effect on clam populations. The DMF conducted
field investigations on the impact of clamming on oyster beds in a Carteret County creek, and the
2010 Coastal Habitat Protection Plan
Chapter 3. Shell Bottom Page 195
effectiveness of designating Shellfish Management Areas, where clamming was prohibited from
December to March, and oystering was limited to hand harvest (Noble 1996). The DMF found that the
structural integrity and oyster abundance on most of the surveyed oyster rocks were good and, in most
cases, had improved following the implementation of the Shellfish Management Area restrictions.
Because restrictions were successful in curbing the destruction and deterioration of oyster rocks, the
Shellfish Management Area designation was extended to other waters to protect shell bottom habitat, with
several locations periodically marked for closure by proclamation of the Fisheries Director (C.
Caroon/DMF, pers. com., 2008).
Noble (1996) concluded that, by preventing the destruction of oyster rocks, optimum substrate for oyster-
spat settlement and critical habitat for other estuarine species would be preserved. Clamming on oyster
beds is primarily a concern for open harvesting areas south of Core Sound (DMF 2008a). Oyster rocks
are protected from mechanical harvest of clams and bull rakes by MFC rules [15A NCAC 03K .0304 and
03K .0102]. The DMF has also designated some areas as Shellfish Management Areas where
enhancement activities are conducted (shell is added and/or oysters are transplanted) and oystering and
clamming are restricted or prohibited, except by proclamation (Map 3.4a-b). However, there are very few
oyster beds posted as Shellfish Management Areas anywhere in the state due to the localized nature of
such destructive harvesting, as well as limited enforcement capabilities. Creation of additional Shellfish
Management Areas in locations of intense hand harvest would reduce habitat damage and enhance
spatfall of oysters and clams.
There are currently over 628 acres of Seed Management Areas south of Bogue Sound that are part of the
DMF Shellfish Habitat and Abundance Mapping Program focus area (Table 3.3). There are also oyster
Seed Management Areas at the south end of Roanoke Island in Cedar Bush Bay, and in Bay River at
Spencer Point. Oyster/Research Sanctuaries and Shellfish Management Areas cover over 200 acres in
coastal waters and over 100 acres in the Shellfish Habitat and Abundance Mapping Program focus area
(Table 3.3). Currently, almost 90% of the bottom mapping area is open to hand harvest methods.
3.4.2. Water quality degradation
Degradation of the water column affects all living habitats features of the coastal aquatic ecosystem.
Whereas the primary discussion of water quality degradation resides in the ―Water Column‖ chapter, the
major water quality issues for shell bottom are summarized in this section.
3.4.2.1. Nutrient and eutrophication
Anthropogenic nutrient loading from expanding urban, agricultural, and industrial development can
indirectly impair shell bottom habitat by stimulating nuisance phytoplankton blooms and causing episodic
oxygen depletion. Recent research indicates that the magnitude of eutrophication in coastal waters has
increased globally over the past century (Paerl et al. 1995; NRC 2000; CENR 2003; Selman et al. 2008).
Increasing eutrophication, in turn, has caused the frequency, duration, and spatial extent of hypoxia (< 2
mg O2 l-1
) and anoxia (0 mg O2 l-1
) to intensify in many estuaries due to increased biological oxygen
demand (Lenihan and Peterson 1998; CENR 2003; Diaz and Rosenberg 2008; Selman et al. 2008).
Prolonged periods of hypoxic conditions can cause mass mortalities of oysters and other shellfish, and
can significantly decrease oyster spatfall (Sparks et al. 1958; Widdows et al. 1989; Baker and Mann 1992;
Lenihan and Peterson 1998). The detrimental effects of oxygen depletion are exacerbated on fishery-
disturbed oyster beds where reduced reef heights increase exposure of oysters and other sessile
invertebrates to bottom water hypoxia/anoxia (Lenihan and Peterson 1998; Kirby and Miller 2005).
Data have shown that eutrophication, as indicated by nutrient levels and high chlorophyll a
concentrations, is a concern in North Carolina coastal waters. According to the most recent draft DWQ
integrated 305(b) and 303(d) report (DWQ 2008a), there are approximately 43,870 acres of coastal waters
impaired by excessive chlorophyll a levels. Additionally, 1441.5 acres of shellfish producing (SA) waters
2010 Coastal Habitat Protection Plan
Chapter 3. Shell Bottom Page 196
are impaired by low dissolved oxygen (< 5 mg O2 l-1
), an indication of excessive nutrients. In an
Environmental Protection Agency (EPA) sponsored four-year study in North Carolina, low dissolved
oxygen and low infaunal communities within SA waters were most frequently reported in Pamlico River
and the lower portion of Neuse River where nutrient loading has been problematic (Hackney et al. 1998).
Eutrophic conditions can also trigger harmful algal blooms (HABs) (CENR 2003; Selman et al. 2008).
Algal toxins associated with HABs affect the nervous system of fish and shellfish, inhibiting respiration
(Tyler 1989). Oysters, clams, and other benthic organisms eventually die of suffocation because of
nervous system paralysis. In laboratory trials, significant mortality of oyster embryos was documented
when exposed to the toxic dinoflagellate Karlodinium veneficum (Stoecker et al. 2008). It was suggested
that survival and maturation of oyster embryos and larvae may be reduced when spawns coincide with
high density K. veneficum blooms during the summer months. Exposure of oysters to laboratory cultures
of Heterosigma akashiwo caused significant long-term sublethal physiological effects, including
hepatopancreas lysosomal destabilization, which can compromise oyster resilience to other environmental
stressors (Keppler et al. 2005). Other shellfish, such as the bay scallop, are also vulnerable to the negative
effects of HABs. Research during an outbreak of the red tide Karenia brevis in North Carolina
documented recruitment failure, as well as widespread adult mortality of bay scallops in Bogue and Back
sounds (Summerson and Peterson 1990).
Multiple sources and activities contribute to excessive nutrient loading of surface waters, including
agricultural fertilizer use, sewage discharge, industrial effluent, filling of wetlands, loss of riparian
buffers, stormwater runoff from developed areas, ditching, channelization, and atmospheric nitrogen
deposition from fossil fuel combustion and animal operations (Cooper and Brush 1991; Paerl et al. 1995;
CENR 2003; Selman et al. 2008). Catastrophic weather events, such as hurricanes, tropical storms, and
nor‘easters, can also greatly increase delivery of nutrients to coastal waters. High volume discharge of
nutrient-laden floodwaters following Hurricanes Fran and Bertha in 1996 and Hurricanes Dennis, Floyd,
and Irene in 1999 resulted in large-scale hypoxia in the Neuse, Tar, Cape Fear, and Lumber Rivers, as
well as in Pamlico Sound (Mallin et al. 1999b; Bales et al. 2000; Paerl et al. 2001). Although hypoxic
conditions often occur naturally following such weather events due to flushing of swamp waters and
heavy precipitation, environmental damage was exacerbated by failure of animal waste lagoons and
municipal and private wastewater-treatment facilities, allowing large quantities of organic waste to enter
coastal waters (Mallin et al. 1999b). Excessive nutrient loading from wastewater-treatment facilities,
animal operations, and other sources must be reduced upstream of shell bottom habitat in order to
minimize hypoxia-induced mortality of shellfish and associated organisms.
Several initiatives have already been taken to reduce nutrient levels in coastal North Carolina. The North
Carolina General Assembly established the Lagoon Conversion Program [SL 2007-0523] in which,
among other things, grants are provided to assist in the conversion of animal waste management systems
that serve swine farms from anaerobic lagoons to innovative animal waste management systems. The
EMC has designated a number of coastal river basins as Nutrient Sensitive Waters, requiring removal of
wastewater discharges and other management actions to reduce nutrient inputs. The EMC has also
mandated a 30% reduction in nitrogen loading in the Neuse and Tar-Pamlico river basins from regulated
sources. Effective October 1, 2008, new Coastal Stormwater Rules [SL 2008-211] require more stringent
stormwater controls for development within 0.5 mi of, and draining to, SA waters. High-density
development projects in these areas must control and treat runoff generated by 1.5 in of rainfall or the
excess runoff (as compared to pre-development conditions) generated by the 1-year, 24 hour storm
(whichever is greater), while low-density development projects must maintain a maximum built upon area
of 12% or less. A 50-ft vegetative setback from mean high water was also mandated for all new
development within the 20 coastal counties to increase the filtration function of these buffers. Nutrient
loading in watersheds draining to shell bottom habitat, however, remains an issue. Reductions in nutrient
loads draining to coastal shellfish waters must be achieved by increasing inspections and improving
2010 Coastal Habitat Protection Plan
Chapter 3. Shell Bottom Page 197
maintenance of sewage treatment facilities, collection infrastructure, and on-site wastewater systems.18
3.4.2.2. Sedimentation and turbidity
Excessive turbidity and sedimentation can have profound effects on oyster health and viability. As
suspended sediment disperses and settles to the bottom, it can bury oyster larvae, adults, or shell,
deterring successful recruitment of larvae due to lack of an exposed hard substrate (Coen et al. 1999).
Excessive sedimentation can clog the gills of shellfish, increase survival time of pathogenic bacteria, or
increase ingestion of non-food particles (SAFMC 1998a). Oyster eggs and larvae are most sensitive to
suspended sediment loading (Davis and Hidu 1969a).
Sediment has been considered the largest cause of water quality degradation in the Albemarle-Pamlico
estuarine area (DEM 1989). In 2008, 12,017 saltwater acres (sounds, ocean) and 11 saltwater miles (tidal
creeks) were impaired due to turbidity (DWQ 2008a). This amount of impairment represents less than
1% of the total saltwater acres and stream miles in North Carolina. However, turbidity is only sparsely
measured in estuarine and marine waters. There remains a need to enhance monitoring of turbidity in
estuarine waters and in the adjacent nearshore ocean.
There are many sources of human-induced turbidity and sediment pollution. Any activity that involves
clearing of vegetation, grading, and ditching of land can potentially increase erosion and sediment loading
in stormwater runoff. These activities include, but are not limited to, construction of residential,
commercial, and transportation structures; forestry harvesting; and agricultural activities. Increased
sedimentation in headwaters from upland development has caused environmental stress and possibly
some mortality to upstream oyster stocks (Ulanowicz and Tuttle 1992; Mallin et al. 1998). There is
anecdotal evidence that sedimentation from upstream development (primarily road construction) has
silted over numerous oyster beds in trunk estuaries such as the Newport River, where Cross Rock (a large
oyster rock) has been buried under 1-2 feet of soft sediment (P. Pate/DMF, pers. com., 2004; C.
Peterson/UNC-CH, pers. com., 2004). There was also a recent FRG project (03-EP-03) that found many
historic oyster bed foundations silted over (Ballance 2004). Use of bottom disturbing fishing gear,
including hydraulic clam dredges, clam trawls (kickers), and shrimp and crab trawls can also increase
turbidity and sedimentation on and adjacent to oyster reefs. Restoration activities should be planned to
restore natural hydrology, dredge excess sediment, reduce the sources of excess sediment, and plant
oysters on historic oyster bed foundations.
Sediment in excessive amounts is also problematic because it transports pathogenic microorganisms and
toxic chemicals in stormwater, and allows the bacteria to persist longer in the water column than such
bacteria would live in clear waters (Schueler 1999; Fries et al. 2008; Jartun et al. 2008). See the microbial
and chemical contamination sections below for more information on pathogenic microbes and toxic
chemicals. The issue of sedimentation in streams is more thoroughly discussed in the ―Water Column‖
chapter.
3.4.2.3. Microbial contamination
Elevated levels of fecal coliform bacteria in shellfish and adjacent waters do not harm oysters or clams.
Such levels indicate contamination of waters, shellfish, and sediments from warm-blooded animal waste.
Because of the sources and pathways of fecal coliform, high bacteria levels are an indication that other
water quality problems may also exist that could impact growth, survival, reproduction, or recruitment of
fisheries resources, and potentially impact human health through harvest and consumption of
contaminated shellfish. Water quality monitoring in several tidal creeks in New Hanover County found a
positive correlation between fecal coliform abundance and turbidity, nitrates, and orthophosphates
18 See the Water Column chapter for more information on water quality degradation affecting shell bottom.
2010 Coastal Habitat Protection Plan
Chapter 3. Shell Bottom Page 198
(Mallin et al. 2000a; 2001b). There was also a correlation between levels of fecal coliform and levels of
other pollutants, such as toxins and sediment. Similar spatial patterns of increased fecal coliform as well
as increased nitrates, chlorophyll a, and, to some extent, turbidity, were observed at upstream locations in
the same study. Highest concentrations at upstream areas were attributed to proximity to development
sources and reduced flushing and dilution compared to higher salinity waters near the ICW (Mallin et al.
1998). The majority of fecal coliform contamination has been attributed to nonpoint stormwater runoff
(DEM 1994; Frankenberg 1995; Schueler 1999; Reilly and Kirby-Smith 1999; DMF 2001a).
The DEH shellfish harvest closure areas provide oysters protection from harvesting in North Carolina.
Based on surveys and bacterial sampling, the DEH may recommend waters as closed to shellfish
harvesting, on either a full-time basis (permanent closure) or rainfall-dependent basis (conditionally
approved). It should be noted that significant portions of closed shellfish waters are located in areas not
suitable for shellfish propagation and maintenance due to low salinity levels or other conditions. There
are also some closed areas that have robust oyster populations (C. Peterson/UNC-CH, pers. com., 2003).
Some closed shellfish harvesting water may therefore have significant habitat value as shell bottom.
Research is currently underway to address the question of oyster condition in closed areas and evaluate
the potential function of closed areas as sanctuaries in the southern region (T. Alphin/UNC-W, pers. com.,
2008). Similar work is needed in closed areas of the central and northern regions. In the mean time,
some non-government organizations have sponsored Research Sanctuaries in closed areas (see ―Shell
bottom enhancement and restoration‖ subsection). Construction of sanctuaries in closed areas could
highlight those robust oyster populations in permit decisions. Identifying oyster beds with robust oyster
populations in closed shellfish harvesting areas will help permit reviewers evaluate marina projects in
shellfish harvesting waters. Protecting oyster beds in closed harvesting area may also be more
acceptable to oyster harvesters who have seen a growing area of closures over the years. The general
location of high quality oyster beds in shellfish growing areas was assessed and summarized in Haines
(2004).
3.4.2.4. Toxic chemicals
Toxic chemicals include any substance or combination of substances that can cause adverse health effects
to oysters and other aquatic organisms. Such chemicals include heavy metals, petroleum hydrocarbons,
polycyclic aromatic hydrocarbons (PAHs), polychlorinated biphenyls (PCBs), dioxins, pesticides,
antifoulants, and pharmaceuticals. Heavy metals and PAHs are of particular concern with regard to
oyster resources due to bioaccumulation and human health concerns (Huanxin et al. 2000; Sanger and
Holland 2002; O‘Conner and Lauenstein 2005). Many of these toxic chemicals enter estuarine waters
through urban stormwater runoff and accumulate in adjacent sediments (Dauer et al. 2000; Williamson
and Morrisey 2000; Hwang and Foster 2006; Jartun et al. 2008). Spills and releases of industrial effluent
and waste can allow toxic chemicals to occur in acutely toxic concentrations.
Oyster embryos and larvae are more sensitive to toxic chemical effects than adults and juveniles, which
are generally more tolerant of contaminants than most estuarine species (Funderburk et al. 1991). The
substances having the greatest chronic (sublethal) effect on oysters include tributyltin, heavy metals,
petroleum hydrocarbons, PCBs, and dioxins (Funderburk et al. 1991; Chu et al. 2003; Wintermyer and
Cooper 2007; Ivanina et al. 2008). Acute and chronic toxicity of certain toxic chemicals to oysters and
hard clams, as well as the current North Carolina saltwater surface water quality standards [EMC rule
15A NCAC 02B .0200], are listed in Table 3.4. Current surface water quality standards are sufficiently
stringent to protect these species. For those toxicants with no listed standard, EMC rule 15A NCAC 02B
.0208 allows for the calculation of criteria to prevent chronic toxicity.
Several studies have documented the effects of toxins associated with placement of docks and marinas on
the estuarine environment (Wendt et al. 1990; Steel 1991; Sanger and Holland 2002; Kelty and Bliven

2010 Coastal Habitat Protection Plan
Chapter 3. Shell Bottom Page 199
2003; Sanger et al. 2004). Contaminants entering estuarine waters from such development, such as heavy
metals and PAHs, can cause acute toxicity (mortality) and sublethal stress on oysters and other estuarine
benthos. Research conducted in South Carolina found that densities of oyster spat were significantly
reduced at marina sites as compared to controls (Wendt et al. 1990). During the summer months,
increased marina activity intensified tissue concentrations of several PAHs in marina-associated oysters.
Copper concentrations in oyster tissue were also considerably higher at the marina than at control sites.
Other data from South Carolina showed that concentrations of copper and zinc in oysters were elevated
above statewide averages around a large shipyard and boat repair complex (SC DHEC 1987).
Table 3.4. Comparison of acute and chronic (sublethal) toxicity (g/l) levels for oysters and clams
with North Carolina‘s 2007 saltwater surface water quality standards.
Contaminant
Eastern oyster
(g/l)1 Hard clam (g/l)
1
N.C. surface
saltwater
standards
Acute Chronic Acute Chronic (ug/L)
Aldrin (insecticide) 15 0.1 - 202.5 0.003
Arsenic (metaloid) 500 - - - 50
Atrazine (herbicide) >30,000 >10,000 - - 2
Cadmium (heavy metal) 2579/39 39 - - 5
Chlordane (insecticide) 8 6 - - 0.004
Chromium VI (heavy metal) 10,300 - - - 20
Copper (heavy metal) 38 50 22 25 3
Dieldrin (insecticide) 67 13 - - 0.0002
Lead (heavy metal) 2450 - 780 - 25
Mercury (heavy metal) 8 12 20 14 0.025
PCB (polychlorinated biphenyl) 10 13.9 - - 0.001
Permethrin (insecticide) >1,000 - - - 2
Toxaphene (insecticide) 23 40 <250 1,120 0.0002
Tributyltin (antifoulant) 1.5 0.7 0.05 0.08 0.007
Zinc (heavy metal) 263 200 190 - 86
1 Geometric means of literature values from Funderburk et al. 1991.
2 No numeric standard in rules at this time (2008), but currently use ―no toxics in toxic
amounts‖ Environmental Management Commission rule 15A NCAC 2B .0208 to control for
substances not listed in the rules.
The extent of contamination from Copper/Chromium/Arsenic (CCA) could be significant, considering the
quantity of treated timber used by the marine construction industry for bulkheads, docks, and marinas
(Weis and Weis 1994). Although the toxicity of treated wood decreases over time, with most leaching
occurring in the first five to six days (Sanger and Holland 2002), dock pilings and bulkheads are
periodically replaced, providing a continual source of newly treated wood in coastal waters. Effective
December 31, 2003, the EPA mandated that no wood treater or manufacturer may treat wood with CCA
for residential uses, with certain exceptions. This CCA prohibition excludes ―wood for marine
construction‖ (i.e., subject to immersion and/or salt or brackish water splash)
(http://www.epa.gov/oppad001/reregistration/cca/ cca_strategy5.pdf , October 2008). Moreover,
alternative wood preservatives such as alkaline copper quaternary (ACQ), copper boron azole (CBA),
ammoniacal copper zinc arsenate (ACZA), and creosote may have similar toxicity to marine organisms.
Spot (Leiostomus xanthurus) exposed to creosote-derived PAH concentrations as low as 320 µg/l
2010 Coastal Habitat Protection Plan
Chapter 3. Shell Bottom Page 200
exhibited fin erosion and skin lesions (Sved et al. 1992). Any new wood preservative product should be
evaluated for impacts to marine organisms, including oysters.19
Furthermore, recycled plastics, concrete,
and natural rock are non-wood alternatives that do not require any chemical preservatives and should be
recommended for use in future water-dependent development projects.
Endocrine disrupting chemicals
There is increasing concern regarding the presence and effects of endocrine disrupting chemicals (EDC)
entering surface waters of freshwater, brackish, and marine environments (Cooper et al. 2008). EDCs are
exogenous substances that alter an organism‘s reproductive physiology and morphology (WHO 2002).
EDCs include natural and synthetic estrogens, dioxins, PCBs, as well as other chemicals. These
chemicals originate mostly from wastewater-treatment plant discharge and industrial effluent, but sources
also include runoff from animal operations and use of sewage sludge as fertilizers (Cooper 2008). EDCs
have been found to have significant negative effects on oyster gametogenesis and reproductive success
(Chu et al. 2003; Wintermyer and Cooper 2007). Exposure of oysters to relatively low concentrations of
PCBs in a laboratory setting resulted in decreased lipid metabolism, altered spawning and diminished
oocyte development (Chu et al. 2003). Similarly, at concentrations as low as 2 ppt, dioxin has been
documented to cause decreased oyster fertilization success and veliger development (Wintermyer and
Cooper 2007). A recent study conducted in Taylor‘s Creek near Beaufort, North Carolina found
increasing proximity to a wastewater-treatment facility associated with declines in oyster fecundity
(Romano 2007; P. McClellan-Green/NCSU, unpub. data).
The extent and magnitude of EDC contamination in North Carolina‘s estuaries is currently unknown.
However, this knowledge is necessary to assess the seriousness of potential adverse impacts on the native
oyster population. U.S. Geological Survey (USGS) monitoring in upper portions of coastal rivers (Neuse
and Cape Fear rivers) indicates that a broad range of endocrine disrupting chemicals were present at low
concentrations (Giorgino et al. 2007). An EDC monitoring program should be established through
cooperative efforts of DMF, DWQ, Shellfish Sanitation, USGS, and the North Carolina Department of
Agriculture and Consumer Services (NCDA&CS) to determine the presence and concentrations of
selected chemicals in North Carolina‟s coastal waters, beginning in the Neuse River estuary.
Additionally, funding from FRGs and other programs is needed to provide support for further research
on oysters and their response to EDCs at critical life stages.
Fossil fuels
Exposure to hydrocarbons can be toxic to or alter proper development of oyster embryos and larvae
(Geffard et al. 2003). Consequently, oyster spat development on shell material covered in petroleum
products has been shown to decline, although barnacles tended to flourish due to the reduced competition
(Smith and Hackney 1989; Roberts et al. 2008). Generally, oysters can recover from spills as long as they
are small scale (i.e., a small leak), but with larger spills during the period of highest settlement recovery
may be hindered by the presence of oil (Hulathduwa and Brown 2006).
Shellfish are known to be good indicators of contaminants due to their ability to accumulate chemicals,
including PAH in their soft tissue (Jackson et al. 1994). Blue mussels, Mytilus edilus, have shown a
slowed growth rate when exposed to oil. This reduced growth rate was due in part to a reduced feeding
rate and food absorption efficiency (Widdows et al. 1987). In laboratory experiments oysters showed a
reduced filtration rate when exposed to PAH (Mu-Chan et al. 2007). Although oil can have negative
impacts on shellfish, laboratory experiments have shown that shellfish have the ability to eliminate levels
of PAH once removed from contaminated water and placed in clean water (Enwere 2009). These results
are consistent with other studies showing shellfish eliminating PAH levels in varying time periods (2-120
19 See Soft bottom chapter for management needs concerning toxic contaminants affecting benthic invertebrates.

2010 Coastal Habitat Protection Plan
Chapter 3. Shell Bottom Page 201
days) depending on the type of oil and the length of exposure (Pruell et al. 1986; Boehm et al. 1998;
McIntosh et al. 2004; and Richardson et al. 2005). It is important to note that monitoring has to be
complete to reduce the chances of PAHs, a known carcinogen, entering the market through commercial
fisheries. With continued monitoring these levels can be assessed to determine if shellfish are safe for
human consumption.
3.4.3. Diseases and microbial stressors
The protozoan pathogens Perkinsus marinus (Dermo) and Haplosporidium nelsoni (MSX) have caused
significant oyster mortality throughout the species‘ geographic range (Andrews 1988; Hargis and Haven
1988; Kennedy 1996; Lenihan et al. 1999). Although MSX can infect all ages of oysters (Andrews 1966;
Barber et al. 1991), Dermo infects a disproportionate amount of larger, more fecund individuals (Mackin
1951; Ray 1954; Andrews and Hewatt 1957). Once infected, oysters suffer reduced growth, poor
condition, and diminished reproductive capacity (Ray and Chandler 1955; Haskin et al. 1966; Ford and
Figueras 1988; Ford and Tripp 1996). Eventually, mortality results as a consequence of tissue lysis and
occlusion of hemolymph vessels.
Infection rates of both pathogens generally increase with water temperature and salinity (Paynter and
Burreson 1991; Ewart and Ford 1993; La Peyre et al. 2006). Salinities below 10 ppt are energetically
stressful to Dermo and are lethal to MSX when persisting for two weeks or more (VIMS 2002; La Peyre
et al. 2006; DMF 2008a). Reduced salinities associated with freshet events have been found to decrease
pathogen prevalence and infection intensities, resulting in low oyster mortality and good growth (La
Peyre et al. 2003; Tarnowski 2005). In contrast, elevated salinities during drought years allow for
infection intensification (Rebach 2005) and range expansions into areas where Dermo and/or MSX had
been rare or absent (Burreson and Ragone Calvo 1996; Tarnowski 2003). In spite of severe to extreme
drought conditions in North Carolina from 2007 to 2008, Dermo infection intensity was low and disease-
related oyster mortality was, on average, negligible (DMF, unpub. data). Nevertheless, Dermo
prevalence, infection intensity, and disease-related oyster mortality may increase significantly if optimum
conditions for parasitic growth and dispersal continue to persist (DMF 2008a).
Although both Dermo and MSX have been documented in North Carolina‘s estuaries, Dermo has been
responsible for the majority of adult oyster mortality in recent years (DMF 2008a). Intense hurricane
activity and the associated heavy rainfall experienced in North Carolina since 1996 has periodically
reduced salinities in Pamlico Sound, and consequently, the occurrence of MSX in that area (DMF 2008a).
Conversely, Dermo prevalence has remained near 100% coastwide during that same time period (Fig.
3.4), although disease-related mortality has been relatively low (DMF 2008a). It is interesting to note that
the recovery of oyster recruitment during 2000-2006 coincided with a very low occurrence of high level
Dermo infections (DMF 2008a), indicating possible pathogen regulation of spawning stock and
recruitment potential. Some research results suggest that North Carolina oysters are developing an
increased resistance to Dermo infections (Brown et al. 2005), but more testing is needed.
Environmental stressors, such as low dissolved oxygen, sediment loading, and anthropogenic pollution,
increase the susceptibility of oysters to parasitism and disease (Barber 1987; Kennedy 1996; Lenihan et
al. 1999). Research on experimental subtidal oyster reefs in the Neuse River estuary (Lenihan et al. 1999)
found that oysters with the highest Dermo prevalence, infection intensity, and mortality were located at
the base of reefs, where currents and food quality were lowest and sedimentation rates highest. Oysters
located at the crest of reefs, however, were much less susceptible to parasitism and Dermo-related
mortality. Maintenance of high-profile oyster rocks is, therefore, critical for subtidal oysters to perform
their ecological functions, as well as provide resources for harvest.
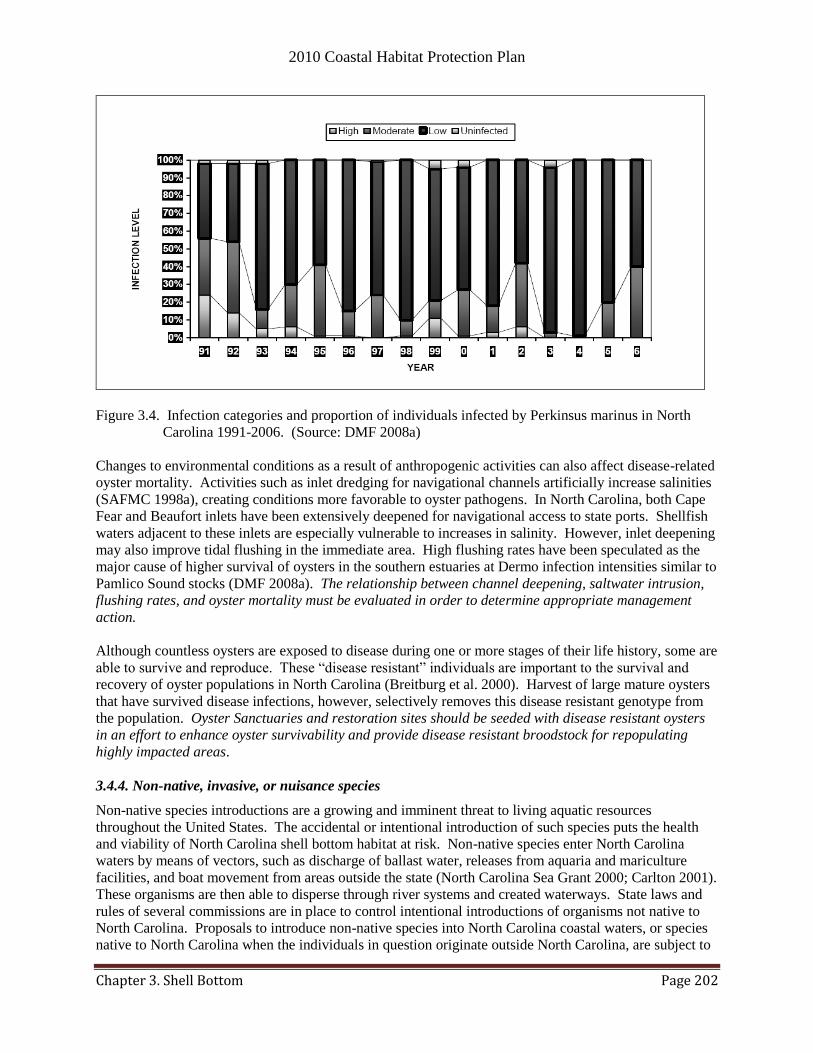
2010 Coastal Habitat Protection Plan
Chapter 3. Shell Bottom Page 202
Figure 3.4. Infection categories and proportion of individuals infected by Perkinsus marinus in North
Carolina 1991-2006. (Source: DMF 2008a)
Changes to environmental conditions as a result of anthropogenic activities can also affect disease-related
oyster mortality. Activities such as inlet dredging for navigational channels artificially increase salinities
(SAFMC 1998a), creating conditions more favorable to oyster pathogens. In North Carolina, both Cape
Fear and Beaufort inlets have been extensively deepened for navigational access to state ports. Shellfish
waters adjacent to these inlets are especially vulnerable to increases in salinity. However, inlet deepening
may also improve tidal flushing in the immediate area. High flushing rates have been speculated as the
major cause of higher survival of oysters in the southern estuaries at Dermo infection intensities similar to
Pamlico Sound stocks (DMF 2008a). The relationship between channel deepening, saltwater intrusion,
flushing rates, and oyster mortality must be evaluated in order to determine appropriate management
action.
Although countless oysters are exposed to disease during one or more stages of their life history, some are
able to survive and reproduce. These ―disease resistant‖ individuals are important to the survival and
recovery of oyster populations in North Carolina (Breitburg et al. 2000). Harvest of large mature oysters
that have survived disease infections, however, selectively removes this disease resistant genotype from
the population. Oyster Sanctuaries and restoration sites should be seeded with disease resistant oysters
in an effort to enhance oyster survivability and provide disease resistant broodstock for repopulating
highly impacted areas.
3.4.4. Non-native, invasive, or nuisance species
Non-native species introductions are a growing and imminent threat to living aquatic resources
throughout the United States. The accidental or intentional introduction of such species puts the health
and viability of North Carolina shell bottom habitat at risk. Non-native species enter North Carolina
waters by means of vectors, such as discharge of ballast water, releases from aquaria and mariculture
facilities, and boat movement from areas outside the state (North Carolina Sea Grant 2000; Carlton 2001).
These organisms are then able to disperse through river systems and created waterways. State laws and
rules of several commissions are in place to control intentional introductions of organisms not native to
North Carolina. Proposals to introduce non-native species into North Carolina coastal waters, or species
native to North Carolina when the individuals in question originate outside North Carolina, are subject to

2010 Coastal Habitat Protection Plan
Chapter 3. Shell Bottom Page 203
MFC rule 15A NCAC 3I .0104. A written application must be submitted to the Fisheries Director with
sufficient information for the Director to ―determine the level of risk to any native marine resource or the
environment.‖
Bioinvasions of zebra mussels (Dreissena polymorpha) have not been reported in North Carolina as of
yet, but they have been found in Virginia and Tennessee, as well as 23 other states (Benson and Raikow
2008). The rapid rate that this non-native has spread in the United States has led researchers to presume
that zebra mussels are likely to invade all southeastern states eventually, with negative impacts to the
native freshwater and low salinity mollusks (Neves et al. 1997). Zebra mussels are notorious for their
biofouling capabilities, frequently clogging water intake pipes and smothering native mussels and large
crustaceans (i.e., crayfish) (Benson and Raikow 2008). It is estimated that 13 species of native freshwater
mussel could be extirpated from North Carolina streams and rivers if zebra mussels were to invade, and
among those, four species could become extinct (North Carolina Sea Grant 2000). Most estuarine shell
bottom (oyster beds) would not be affected, however, since the upper salinity tolerance limit of zebra
mussels is < 10 ppt (North Carolina Sea Grant 2000).
The substantial decline of North Carolina‘s native oyster population has prompted resource managers to
consider the introduction of non-native oysters for fishery restoration and ecosystem enhancement (DMF
2008a). While some oyster introductions have revived or expanded oyster fisheries (e.g. Europe and
Australia) (Shatkin et al. 1997), others have failed or caused problems (Andrews 1980; DMF 2008a). The
deadly oyster disease MSX was introduced with attempts to establish Pacific oyster (Crassostrea gigas)
populations along the Atlantic coast of the United States (Burreson 1997; Richards and Ticco 2002). If
native oyster stocks cannot recover naturally, however, establishment of a non-native oyster population
could provide complex structure for fish habitat, water filtration functions, and preserve a traditional
North Carolina fishery.
Although several candidates for non-native oyster introduction have been considered, the Suminoe oyster
(Crassostrea ariakensis) has proven most promising (USACE 2008; DMF 2008a). Laboratory and field
trials have consistently shown rapid growth and survival of C. ariakensis under a suite of environmental
conditions typical of estuaries in the Middle and South Atlantic Bights (Richards and Ticco 2002; NRC
2003; Bishop and Peterson 2005; Peterson 2005; Bishop and Peterson 2006a; VIMS 2007). Overboard
tests in Newport River, North Carolina found that C. ariakensis was able to provide ecosystem services,
such as enhancement of benthic secondary production and water filtration functions, similar to that of
native oysters without substantial ecological costs (Peterson 2005). C. ariakensis was also documented to
have a significant level of tolerance to the parasite-induced diseases Dermo and MSX during initial
studies in the Chesapeake Bay (Richards and Ticco 2002; USACE 2008; Paynter et al. 2008). However,
recent investigations have shown that C. ariakensis can acquire advanced Dermo infections capable of
causing substantial mortality (Moss et al. 2006; Schott et al. 2008). Additionally, the Suminoe oyster is
highly vulnerable to a novel haplosporidium parasite Bonamia spp. (Audemard et al. 2008a; Audemard et
al. 2008b; Carnegie et al. 2008), as well as predation by blue crabs (Bishop and Peterson 2006b),
Polydora spp. infestations (Bishop and Peterson 2005), and the ichthyotoxic dinoflagellate Karlodinium
veneficum (Brownlee et al. 2006; Brownlee et al. 2008). These susceptibilities potentially limit the
ecological and economic benefits of Suminoe oyster introduction.
Introduction of non-native oysters remains a subject of much debate and uncertainty. A draft
Programmatic Environmental Impact Statement (PEIS) was recently completed by the USACE
concerning the use of non-native oysters for fishery and ecosystem restoration in the Chesapeake Bay
(USACE 2008). Although recommendations have yet to be made, the draft PEIS does highlight three
alternatives to investigate more thoroughly. One option calls for native oyster aquaculture and enhanced
efforts to restore native oyster populations. Another calls for enhanced native restoration efforts and
aquaculture, as well as large-scale aquaculture of sterile triploid Suminoe oysters. A third option contains
2010 Coastal Habitat Protection Plan
Chapter 3. Shell Bottom Page 204
all the recommendations of the second but would also introduce fertile diploid Suminoe oysters with the
intention of creating a self-sustaining wild population. All three options include a temporary moratorium
on the harvest of wild oysters, with a compensation program for watermen. Nevertheless, concerns over
non-native oyster introduction remain, including competition with native oysters, cross-fertilization
(reducing viability of spat and decreasing reproductive success), long-term survival of introduced species,
and introduction of non-native pests with the introduced oysters (USACE 2008; DMF 2008a). Policy
makers are faced with a dilemma of lack of consensus among scientists regarding the impact of non-
native oysters on Atlantic coastal ecosystems and pressure from commercial and economic interests to
revive a once prosperous oyster industry (Richards and Ticco 2002). In November 2008, the MFC
decided to write a letter commenting on the PEIS, expressing concern that an introduction of non-native
oysters into the Chesapeake Bay would likely result in an unwanted introduction in North Carolina
waters. The MFC should continue to support the use of native oysters in Oyster Sanctuaries, cultch
plantings, and other restoration efforts rather than non-native introductions to enhance oyster resources
until appropriate scientific and socioeconomic data are available that strongly support any other actions.
3.4.5. Sea level rise and climate change
Global climate change has potentially profound implications for shell bottom habitat in North Carolina.
Long-term changes in temperature regimes, precipitation/streamflow patterns, and sea level can alter
shellfish distributions, growth, reproduction, and survival (Hofmann and Powell 1998; Dekshenieks et al.
2000; Najjar et al. 2000; Scavia et al. 2002; Wood et al. 2002; Lawrence and Soame 2004; Oviatt 2004;
Harley et al. 2006; Kimmel and Newell 2007). Temperature increases may initially benefit oysters and
other shellfish, allowing for increased filtration and growth rates (Powell et al. 1992; Grizzle et al. 2003),
a longer spawning season, a shorter duration of the planktonic larval phase (Dekshenieks et al. 1993), and
range expansion of lower latitude species (Scavia et al. 2002; Oviatt 2004). However, sustained
deviations from normal temperature patterns amplify the susceptibility of oysters to environmental
stressors (Hofmann et al. 1999; Najjar et al. 2000; McLaughlin and Jordan 2003; Ford and Chintala 2006;
Lannig et al. 2006). Lannig et al. (2006) found that increasing the temperature of cadmium polluted water
resulted in increased mortality and lowered condition of oysters. Temperature elevation has also been
associated with an increased prevalence and infection rate of the oyster parasites MSX and Dermo
(Hofmann et al. 1999; Najjar et al. 2000; McLaughlin and Jordan 2003; Ford and Chintala 2006). High
temperatures inflate proliferation rates of these pathogens, triggering widespread epizootic conditions
(Hofmann et al. 1999; McLaughlin and Jordan 2003; Ford and Chintala 2006). Extensive infections can
result in mass mortality of mature oysters, potentially impacting the viability and distribution of shell
bottom habitat. Higher temperatures may also decouple environmental cues for reproduction and optimal
larval conditions by inducing spawning earlier in the season (Harley et al. 2006), which could result in a
temporal mismatch between larval production and food supply. The likely effect of temperature-induced
early season reproduction on subsequent spatfall should be evaluated.
Although current climate models disagree on whether precipitation in North Carolina will increase or
decrease in the years to come (EPA 1998; Munger and Shore 2005), both scenarios threaten the health
and viability of shell bottom habitat. Changing precipitation patterns influence freshwater inflow,
nutrient delivery, and salinity regimes (Najjar et al. 2000; Scavia et al. 2002). Increased precipitation
would cause an upsurge in freshwater inflow and a subsequent decline in estuarine salinity. At salinities
< 10 ppt, oysters become physiologically stressed, and filtration and respiration rates are reduced
(Loosanoff 1953; Shumway and Koehn 1982; Hofmann and Powell 1998). Prolonged exposure to
salinities <5 ppt can result in mass oyster mortalities, especially when combined with higher temperatures
(Burrell 1986; Hofmann and Powell 1998; Funderburk et al. 2001). Dekshenieks et al. (2000) found that
a simulated increase of freshwater inflow in Galveston Bay, Texas resulted in substantial declines in
oyster larvae production and larval survivorship. An escalation in the frequency and/or duration of
precipitation events, therefore, may be detrimental to the health of oyster reefs, particularly for those
2010 Coastal Habitat Protection Plan
Chapter 3. Shell Bottom Page 205
currently near their lower salinity tolerance limit.
Increased precipitation and freshwater inflow can also cause water column stratification and nutrient
enrichment via runoff (Najjar et al. 2000; Scavia et al. 2002; Wood et al. 2002). These two factors in
concert provide conditions necessary for the development of persistent areas of hypoxia or anoxia.
Although oysters are generally tolerant to low DO conditions, mortality occurs when exposed to sustained
hypoxic/anoxic conditions (Lenihan and Peterson 1998).
Decreased precipitation, on the other hand, would greatly reduce freshwater inflows, increasing estuarine
salinity. Higher salinities would initially be somewhat physiologically beneficial to oysters through an
increase in filtration and growth rates, and reproduction (Castagna and Chanley 1973; Dekshenieks et al.
1993; Dekshenieks et al. 2000). However, salinities above 15 ppt increase the susceptibility of oysters to
pathogens (Paynter and Burreson 1991; Lenihan et al. 1999; Wood et al. 2002; McLaughlin and Jordan
2003) and predators (Gunter 1955; Bahr and Lanier 1981). Nevertheless, Dekshenieks et al. (2000)
reported that mortality associated with increased Dermo infection was offset by the positive effects of
higher salinity under simulated low freshwater inflow conditions, resulting in a 101-200% increase in the
oyster population. It is essential to gain a better understanding of forecasted changes in estuarine
salinities in North Carolina to more accurately predict the effects on shell bottom distribution and health.
A particularly notable effect of climate change is a rise in sea level. Sea level rise is a second order
response, whose rate is dependent on atmospheric temperature and the dynamics of polar ice masses
(IPCC 2007). Current accelerated rates of sea level rise predominantly threaten intertidal oyster reefs,
which may not be able to migrate landward quickly enough to maintain their intertidal position or may be
impeded by land-based development. In a study of sea level rise in southwest Florida, M. Savarese
(unpub. data) found that present-day rates of sea level rise are comparable to those in the late Holocene
prior to 4500 ybp (years before present). Intertidal oyster reefs were found to be short-lived and not very
extensive during that time period. It was suggested that if accelerated sea level rise rates continue,
intertidal oyster reef development may decline. Still, current intertidal reefs may be able to persist
subtidally if submerged by a rise in sea level. Subtidal reefs have, however, been suggested to be subject
to higher rates of predation by boring sponges, oyster drills, and blue crabs (Burrell 1986), potentially
limiting the ability of intertidal reefs to invade the subtidal. The increase of salinity associated with sea
level rise can also allow for range extensions of predators that prefer higher salinities into areas which
were once seldom impacted by predation. Submerging of intertidal reefs may also cause a disconnect in
the corridor function between the reefs and the adjacent tidal marsh, thus reducing habitat quality for
fishes and macroinvertebrates that use intertidal reefs as way stations during flood tides.
An emerging issue associated with climate change is the decline in ocean pH resulting from human
emissions of carbon dioxide (Feely et al. 2004; Orr et al. 2005; Harley et al. 2006; IPCC 2007; Guinotte
and Fabry 2008). This acidification is caused by an increased amount of CO2 dissolved in ocean waters,
which lowers the pH, decreases the availability of carbonate (CO2− 3
) ions, and lowers the saturation state
of the major carbonate minerals (Feely et al. 2004; Orr et al. 2005). Exposure of calcifying organisms,
such as oysters, to seawater less than a pH of 7.5 can considerably reduce their rates of calcification,
diminishing growth rates, hindering larval development and settlement, and even resulting in dissolution
of adult calcareous shells (Gazeau et al. 2007; Kurihara et al. 2007; Kurihara et al. 2008). Such changes
can slow reef development and maturation, as well as increase the susceptibility of mature oysters to
predation. Thus, in an environment with declining pH, the density and distribution of shell bottom is
likely to also decline, leading to greatly reduced habitat complexity and biodiversity loss (Orr et al. 2005).
More research is needed to examine the potential ecological effects of declining ocean pH on shell bottom
in North Carolina under environmentally realistic scenarios.
2010 Coastal Habitat Protection Plan
Chapter 3. Shell Bottom Page 206
3.4.6. Management needs and accomplishments
The management needs noted by italics in the 2005 CHPP were addressed to some degree during 2005-
2010. Some of the needs were refined and adopted as actions in the multi-agency CHPP implementation
plans (IPs). There were also shell bottom-related actions that came directly from the implementation
plans, without a specific call in the 2005 CHPP. However, numerous IP actions affect multiple habitats
(see ―Introduction‖ chapter) and will not be duplicated here. Only shell bottom-focused actions from the
IPs are listed in the ―Needs and progress‖ sections. Emerging management needs are included without a
reference and may or may not be refined and adopted as actions in the 2009-2011 CHPP implementation
plan.
3.4.6.1. Research needs and progress (2005-2010)
Accomplished research needs
1. Research on the impact of dock-associated boating on shell bottom habitat. Some new research is
presented in Section 3.4.1.1. “Water-dependent development”.
Research needs with progress
Research needs with no progress
1. Research on the critical amount and quality of living and dead shell bottom in a water body below
which significant changes in biotic community structure occur. No specific progress. However, there
has been more research on the cumulative effect of oyster filtering capacity on large water bodies (see
Section 3.2.1. “Ecosystem enhancement”).
Emerging research needs
1. An economic analysis is needed that compares the cost saving of oyster restoration and sanctuary
development with that of wastewater treatment capacity, along with the added fishery production of
associated finfish species and oyster harvest in the remaining open shellfish harvesting waters. The
results of one such analysis are pending (J. Grabowski/GMRI, pers. com., January 2009). See Section
3.2.1. “Ecosystem enhancement” for context.
2. More research is needed on the functional value of oyster reefs as spawning habitat for estuary-
spawning transient species in North Carolina. See Section 3.2.4. “Specific biological functions” for
context.
3. Further research is needed on the corridor function of intertidal oyster reefs and the importance of
connectivity to SAV and salt marsh for fisheries production. See 3.2.4. “Specific biological functions”
for context.
4. A threshold contamination level is needed to cap multi-slip docking facilities in open shellfish
harvesting waters. See Section 3.4.1.1. “Water-dependent development” for more context.
5. The effect of temperature-induced early season reproduction on subsequent spatfall should be
evaluated. See Section 3.4.5. “Sea level rise and climate change” for context.
6. Funding from FRGs and other programs is needed to provide support for further research on oysters
and their response to EDCs at critical life stages. See Section 3.4.2.4. “Toxic chemicals” for context.
7. It is essential to gain a better understanding of forecasted changes in estuarine salinities in North
2010 Coastal Habitat Protection Plan
Chapter 3. Shell Bottom Page 207
Carolina to more accurately predict the effects on shell bottom distribution and health. See Section
3.4.5. “Sea level rise and climate change” for context.
8. More research is needed to examine the potential ecological effects of declining ocean pH on shell
bottom in North Carolina under environmentally realistic scenarios. See Section 3.4.5. “Sea level rise
and climate change” for context.
3.4.6.2. Management needs and progress (2005-2010)
Accomplished management needs
1. Creation of additional “no take” subtidal oyster sanctuaries. There has been significant progress in
this area (see Section 3.3.3.2. “For ecosystem enhancement”).
2. More planting and longer protection of sites in Pamlico Sound to offset declining spatfall.
Restoration efforts must use knowledge of larval availability in order to be most effective. There are
now more sanctuaries in Pamlico Sound (see Section 3.3.3. “Shell bottom enhancement and restoration”)
and spatfall has improved (see Section 3.3.1. “Status of shell bottom habitat”).
3. Increasing funding for acquisition of cultch material to more efficiently use the existing planting
capabilities of DMF. There has been significant progress in this area (see Section 3.3.3.1. For fishery
enhancement”).
4. Use DMF pilot project methodology for assessing shoreline hardening for a larger portion of the
coast to spatially delineate and quantify where and how much of the shoreline is hardened. Coast-
wide shoreline mapping, by type and structures, is being conducted by DCM (see Section 3.4.1.1. “Water-
dependent development”).
5. Developing a coastal marina policy that encompasses all associated regulatory activities conducted
within the DENR. There has been some progress in regulating multi-slip docks (see Section 3.4.1.1.
“Water-dependent development”).
6. Construction of oyster sanctuaries in locations of historic abundance and restriction of trawling over
restored shell bottom to restore shell bottom in northern subtidal areas. There are also areas where
trawling is prohibited, but oyster dredging is not. Oyster dredging in these areas should also be
prohibited. Additional Oyster Sanctuaries have been constructed in locations where trawling was
allowed (see Section 3.3.3.2. “For ecosystem enhancement”). There are very few areas where trawling is
prohibited but dredging is not (see “Mobile bottom disturbing fishing gear” subsection of Section 3.4.1.2.
“Fishing gear impacts”).
7. Adoption of criteria to designate additional areas where mechanical harvest methods are prohibited. Additional areas were closed to mechanical harvest methods in Pamlico Sound (see “Mobile bottom
disturbing fishing gear” subsection of Section 3.4.1.2. “Fishing gear impacts”).
Management needs with progress
1. Creation of additional Shellfish Management Areas to reduce habitat damage and enhance spatfall of
oysters and clams in areas where hand-harvesting activity is intense. Additional Research Sanctuaries
have been created south of Cape Lookout (see “Section 3.3.3.2. “For ecosystem enhancement”).
2. Evaluating the value of closed shellfishing waters as oyster sanctuaries. An assessment of shellfish
resources in growing areas (including closed waters) was summarized in Haines (2004). See Section
3.4.2.3. “Microbial contamination” for context.
2010 Coastal Habitat Protection Plan
Chapter 3. Shell Bottom Page 208
3. Maintaining high profile Oyster Sanctuaries and restoration sites and seeding them with disease
resistant oysters in an effort to enhance oyster survivability and provide disease resistant broodstock
for repopulating highly impacted areas. The Oyster Sanctuary program develops and maintains high
profile reefs. The production of disease-resistant oysters may come about with construction and
operation of a state oyster hatchery (see “Emerging management needs” subsection of 3.4.6.2.
“Management needs and progress (2005-2010)”). See Section 3.4.3. “Diseases and microbial stressors”
for context.
Management needs with no progress
1. Re-mapping of the bottom to accurately evaluate changes in distribution and density of oysters. In
the future, change analysis in a subset of areas remapped by DMF, particularly where major changes
are suspected, is needed to assess trends in this habitat. Neither base map nor repeat mapping is
complete. However, the bottom mapping program has made significant progress (see Section 3.1.4.
“Distribution” for context).
2. Fishery-independent sampling on oyster reefs using appropriate sampling gear to monitor juvenile
and adult fish abundance in shell bottom. No specific progress. However, the DMF Resource
Enhancement Section is planning a sampling program to track juvenile fish abundance in and around
oyster sanctuaries (G. Bodnar/DMF, pers. com., February 2009). See Section 3.3.2. “Status of associated
fishery stocks” for context.
3. More information on the status of hard clams, black drum, and other fishery and resident non-fishery
species (i.e., oyster toadfish) as indicators of shell bottom conditions. Due to the limitations of using
fisheries-dependent data (landings data) to indicate stock trends, fisheries-independent data should
be collected for these species to develop independent indices. No specific progress. However, the
aforementioned DMF sampling program will address this management need as well. See Section 3.3.2.
“Status of associated fishery stocks” for context.
4. Developing an overall strategy for shell bottom restoration as the effort expands. There is no overall
strategy for shell bottom restoration. However, there are somewhat coordinated planning efforts
directing oyster restoration activities (see Section 3.3.3.4. “Planning efforts”).
5. Evaluating the relationship between channel deepening, saltwater intrusion, flushing rates, and
oyster mortality in order to determine appropriate management action. No specific progress. See
Section 3.4.3. “Diseases and microbial stressors” for context.
Emerging management needs
1. New technology should be investigated that will further reduce time of mapping and enhance
mapping products. See Section 3.3.1. “Status of shell bottom habitat” for context.
2. Although there has been no reported decline in spatfall in the southern coastal region of North
Carolina (R. Carpenter/DMF, pers. com., 2002), more information is needed to determine trends in
spatfall in this area over time. See Section 3.3.1. “Status of shell bottom habitat” for context.
3. Additional funding is needed to staff and operate the oyster hatchery facility. See Section 3.3.3.2. “For
ecosystem enhancement” for context.
4. An improved mitigation policy for shell bottom is needed to identify mitigation needs, increase
mitigation efficiency, and reduce project timelines. See Section 3.3.3.3. “For mitigation” for context.
5. Where any depletion or loss of shell bottom is allowed, agencies should consider requiring
2010 Coastal Habitat Protection Plan
Chapter 3. Shell Bottom Page 209
mitigation. The EEP is developing an out-of-kind crediting system that could be employed in
mitigating the permitted loss of shell bottom to water-dependent development. See Section 3.3.3.3.
“For mitigation” for context.
6. Appropriate DENR staff should continue to participate in collaborative efforts to plan, develop, and
monitor the biological effectiveness of oyster enhancement and restoration activities. See Section
3.3.3.4. “Planning efforts” for context.
7. Once shell bottom mapping for the Pamlico Sound is complete, the portion of high (oyster) density,
subtidal shell bottom open and closed to trawling and dredging should be determined. See “Mobile
bottom disturbing fishing gear” subsection of Section 3.4.1.2. “Fishing gear impacts” for context.
8. There remains a need to enhance monitoring of turbidity in estuarine waters and in the adjacent
nearshore ocean. See Section 3.4.2.2. “Sedimentation and turbidity” for context.
9. Restoration activities should be planned to restore natural hydrology, dredge excess sediment, reduce
the sources of excess sediment, and plant oysters on historic oyster bed foundations. See Section
3.4.2.2. “Sedimentation and turbidity” for context.
10. Identifying oyster beds in closed shellfish harvesting areas with robust oyster populations will help
permit reviewers evaluate marina projects in shellfish harvesting waters. Protecting oyster beds in
closed harvesting area may also be more acceptable to oyster harvesters who have seen a growing
area of closures over the years. See Section 3.4.2.3. “Microbial contamination” for context.
11. Recycled plastics, concrete, and natural rock are non-wood alternatives that do not require any
chemical preservatives and should be recommended for use in future water-dependent development
projects. See Section 3.4.2.4. “Toxic chemicals” for context.
12. An EDC monitoring program should be established through cooperative efforts of DMF, DWQ,
Shellfish Sanitation, USGS, and the North Carolina Department of Agriculture and Consumer
Services (NCDA&CS) to determine the presence and concentrations of selected chemicals in North
Carolina‟s coastal waters, beginning in the Neuse River estuary. See Section 3.4.2.4. “Toxic
chemicals” for context.
13. The MFC should continue to support the use of native Oyster Sanctuaries, cultch plantings, and other
restoration efforts rather than non-native introductions to enhance oyster resources until appropriate
scientific and socioeconomic data are available that strongly support other actions. See Section 3.4.4.
“Non-native, invasive, or nuisance species” for context.
3.5. Shell bottom summary
Shell bottom habitat is unique because it is the only coastal fish habitat that is also a fishery species
(oysters). The ecological value of shell bottom has only recently been recognized to be as or more
significant than the fishery itself, since it provides numerous habitat and water quality functions that are
vital for fishery and non-fishery species. The buffering presence of oysters also benefits the leeward
establishment of other habitats, such wetlands and SAV.
Shell bottom habitat declined for most of the 20th century. The current distribution of shell bottom has
shrunk to a mere fraction of its historical range, when oyster rocks were so abundant that they were
considered a hazard to navigation. Anecdotal information suggests that oyster beds have been displaced
roughly 10-15 miles (16-24 kilometers) downstream in the Pamlico and Neuse estuaries and completely
covered by sediment in other areas. Furthermore, North Carolina‘s commercial oyster landings have
2010 Coastal Habitat Protection Plan
Chapter 3. Shell Bottom Page 210
declined about 90% from 1889 to 2006. However, oyster harvest and spatfall in northern areas has
improved slightly from 2003-2006 (attributed to reduced mortality from Dermo). Most shell bottom
losses were due to a history of dredging activity on subtidal beds in Pamlico Sound, lower Neuse River,
and lower Pamlico River.
As of November 2008, nearly 400,000 acres or 70% of the DMF Shellfish Habitat and Abundance
Mapping Program focus area is closed to either trawling, dredging, and/or mechanical shellfish
harvesting. However, only 36% of the bottom mapping area is protected from all mobile bottom-
disturbing gear year-round. As of November 2008, the bottom mapping program has covered 493,563
acres (90%) of the area intended for mapping. The DMF Shellfish Habitat and Abundance Mapping
Program focus area does not include the deeper subtidal bottom of the larger sounds, although these areas
are the target of future mapping efforts. The additional positions and resources received from the
legislature for shell bottom mapping in 2005 enabled the DMF bottom mapping program to accelerate and
nearly complete mapping and initiate remapping the entire area on five year cycles. This effort allows not
only monitoring of shell bottom distribution, but also SAV and fringing wetlands in SA waters of the
state.
Whereas mechanical harvesting of oysters has been greatly restricted, recovery of oysters is limited by
degraded water quality, sedimentation on overharvested reef foundations, endocrine disrupting chemicals,
periodic disease mortality, and trawling activity over suitable oyster habitat. Sea-level rise and associated
changes in salinity and ocean pH could have major impacts on living oyster populations. The loss of shell
bottom habitat could be particularly damaging to associated fishery stocks that are classified as Depleted
by DMF, such as southern flounder, black sea bass south of Cape Hatteras, or the central/southern stock
of striped bass. The protection and restoration of living oyster beds is therefore critical to the restoration
of numerous fishery species, as well as proper functioning and protection of surrounding coastal fish
habitats.
Efforts to restore oysters began in 1947 and have continued at various levels since then. Through CHPP
implementation, a significant amount of additional funds were allocated to enhance oyster sanctuary
development and monitoring. Historically, oyster restoration was managed for oyster fishery
enhancement. Current efforts are a mix of fishery enhancement and ecosystem enhancement with
sanctuary development. There are currently nine oyster sanctuaries spread throughout Pamlico Sound,
which the DMF monitors for their viability and ecosystem benefits, and there are plans for establishing
more using Coastal Recreational Fishing License revenue. Further restoration activities may require
restoring natural hydrology, dredging excess sediment, reducing the sources of excess sediment, and
planting oysters on historic oyster bed foundations.
In updating the chapter, many of the very general, minor, or redundant research and management needs
were discontinued. Of the remaining 2005 CHPP research (2) and management needs (15), eight (1
research, 7 management) were considered accomplished and discontinued. There were also three
renewed management needs with progress and five without progress. However, 20 new or clarified
research and management needs were also identified. Major themes of the current management needs
include:
1. Refining programs for determining status and trends in shell bottom resources;
2. Continuing shell bottom restoration efforts guided by planning efforts, spat source-destination
models and suitable habitat locations; and
3. Monitoring the effects of endocrine disruptor compounds on shell bottom resources
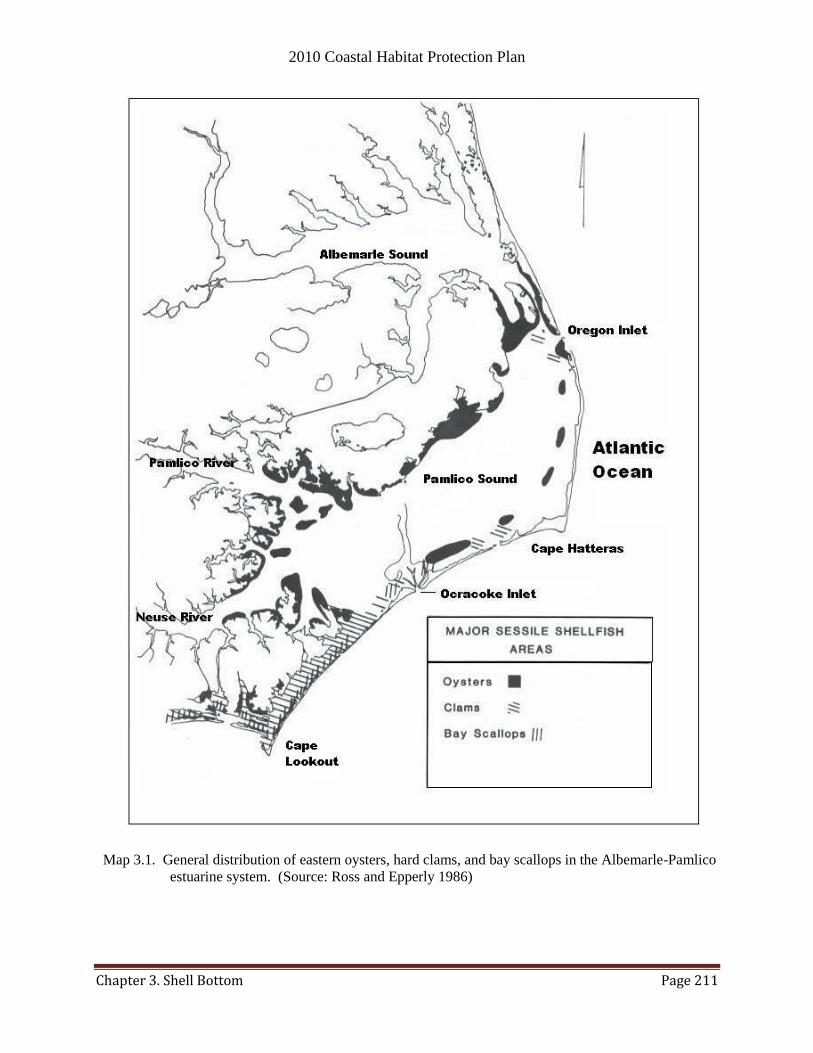
2010 Coastal Habitat Protection Plan
Chapter 3. Shell Bottom Page 211
Map 3.1. General distribution of eastern oysters, hard clams, and bay scallops in the Albemarle-Pamlico
estuarine system. (Source: Ross and Epperly 1986)
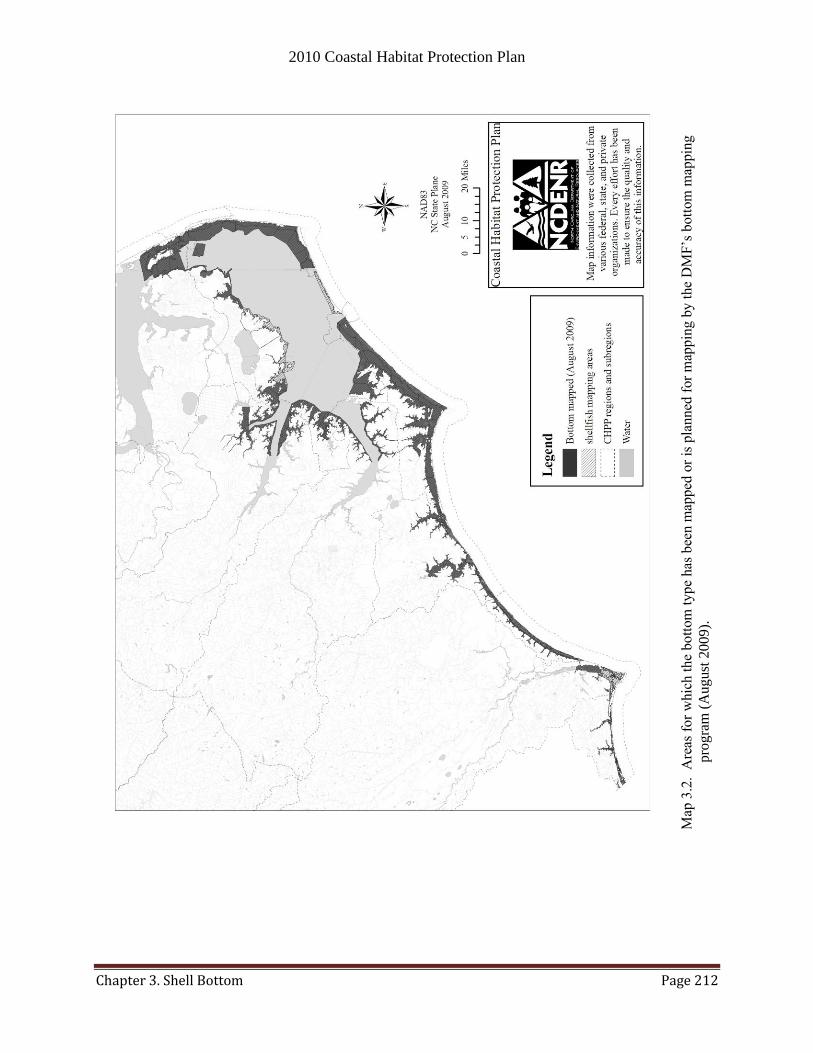
2010 Coastal Habitat Protection Plan
Chapter 3. Shell Bottom Page 212
Map
3.2
. A
reas
fo
r w
hic
h t
he
bott
om
type
has
bee
n m
apped
or
is p
lanned
for
map
pin
g b
y t
he
DM
F‘s
bott
om
map
pin
g
pro
gra
m (
August
2009).
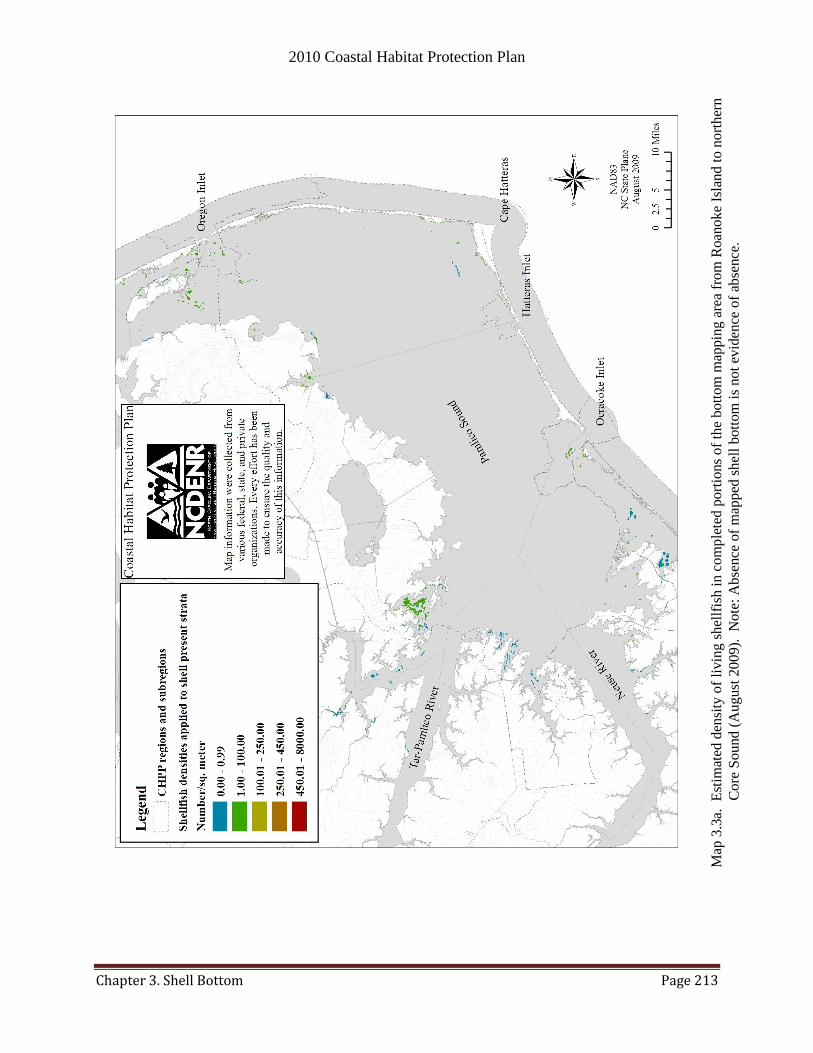
2010 Coastal Habitat Protection Plan
Chapter 3. Shell Bottom Page 213
Map
3.3
a. E
stim
ated
den
sity
of
livin
g s
hel
lfis
h i
n c
om
ple
ted p
ort
ions
of
the
bott
om
map
pin
g a
rea
fro
m R
oan
ok
e Is
lan
d t
o n
ort
her
n
Co
re S
ou
nd
(A
ugust
2009).
N
ote
: A
bse
nce
of
map
ped
shel
l bott
om
is
not
evid
ence
of
abse
nce
.
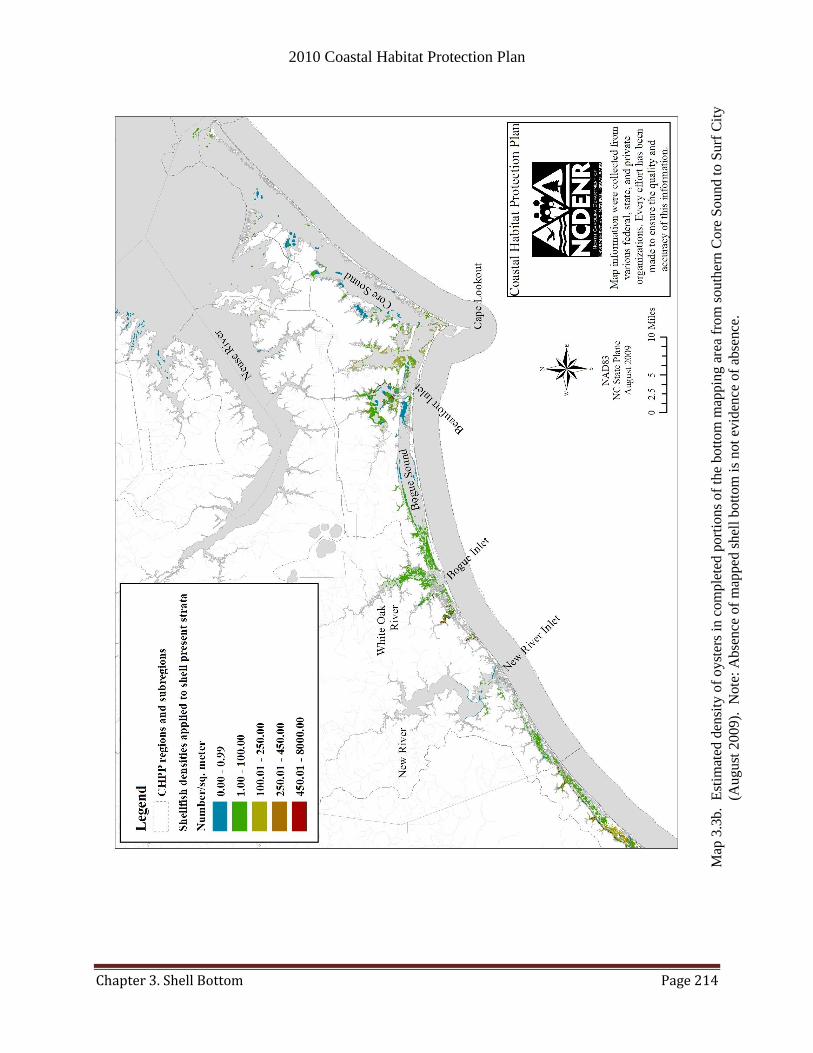
2010 Coastal Habitat Protection Plan
Chapter 3. Shell Bottom Page 214
Map
3.3
b. E
stim
ated
den
sity
of
oyst
ers
in c
om
ple
ted p
ort
ions
of
the
bott
om
map
pin
g a
rea
fro
m s
ou
ther
n C
ore
So
un
d t
o S
urf
Cit
y
(Au
gu
st 2
00
9).
N
ote
: A
bse
nce
of
map
ped
shel
l bott
om
is
not
evid
ence
of
abse
nce
.
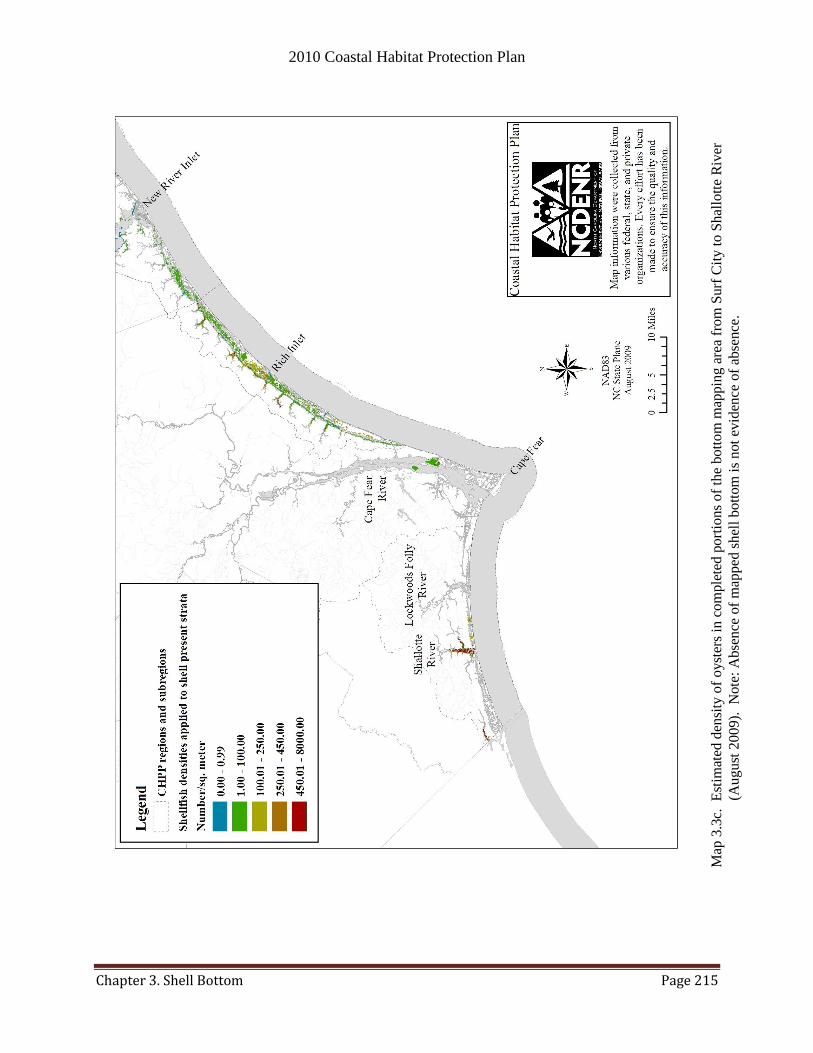
2010 Coastal Habitat Protection Plan
Chapter 3. Shell Bottom Page 215
Map
3.3
c. E
stim
ated
den
sity
of
oyst
ers
in c
om
ple
ted p
ort
ions
of
the
bott
om
map
pin
g a
rea
fro
m S
urf
Cit
y t
o S
hal
lott
e R
iver
(Au
gu
st 2
00
9).
N
ote
: A
bse
nce
of
map
ped
shel
l bott
om
is
not
evid
ence
of
abse
nce
.

2010 Coastal Habitat Protection Plan
Chapter 3. Shell Bottom Page 216
Map
3.4
a.
Lo
cati
on
of
cult
ch p
lanti
ng s
ites
(1998-2
007),
shel
lfis
h m
anag
emen
t ar
eas
and
res
earc
h s
anct
uar
ies
(20
08
), a
nd
oyst
er
san
ctu
arie
s (2
007,
2008)
from
Roan
oke
Isla
nd t
o n
ort
her
n C
ore
Sound.
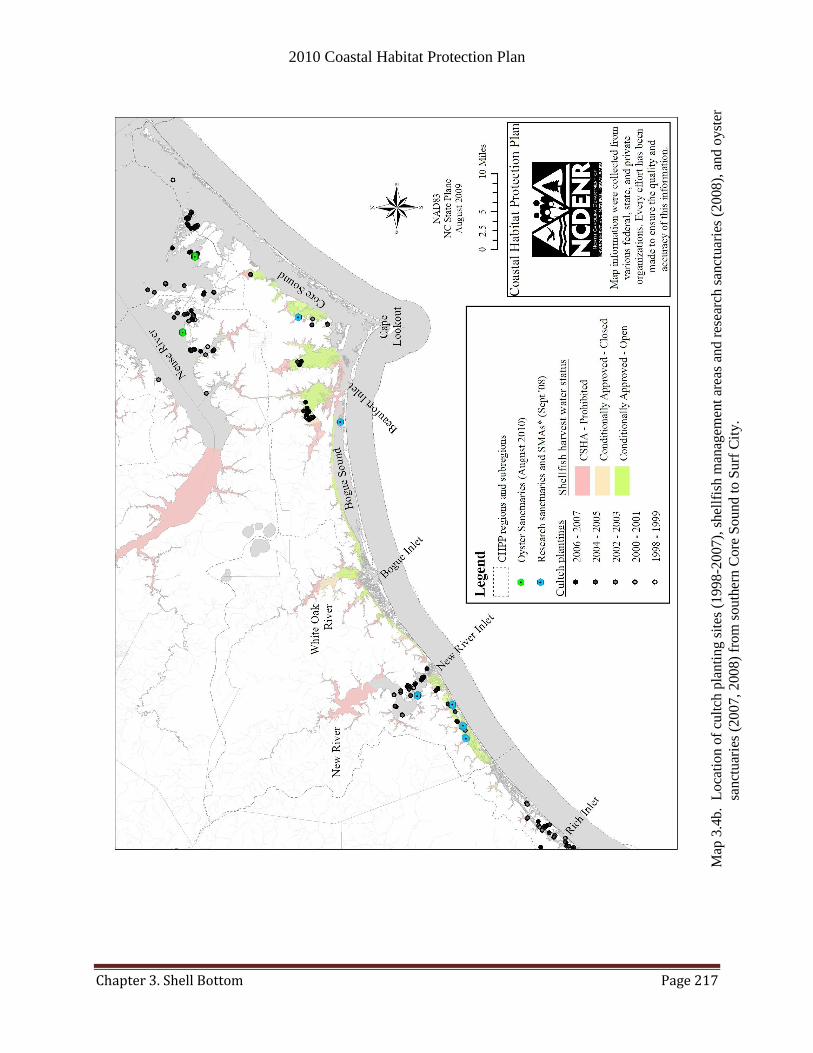
2010 Coastal Habitat Protection Plan
Chapter 3. Shell Bottom Page 217
Map
3.4
b. L
oca
tio
n o
f cu
ltch
pla
nti
ng s
ites
(1998
-2007),
shel
lfis
h m
anag
emen
t ar
eas
and
res
earc
h s
anct
uar
ies
(20
08
), a
nd
oyst
er
san
ctu
arie
s (2
007,
2008)
from
south
ern C
ore
Sound t
o S
urf
Cit
y.
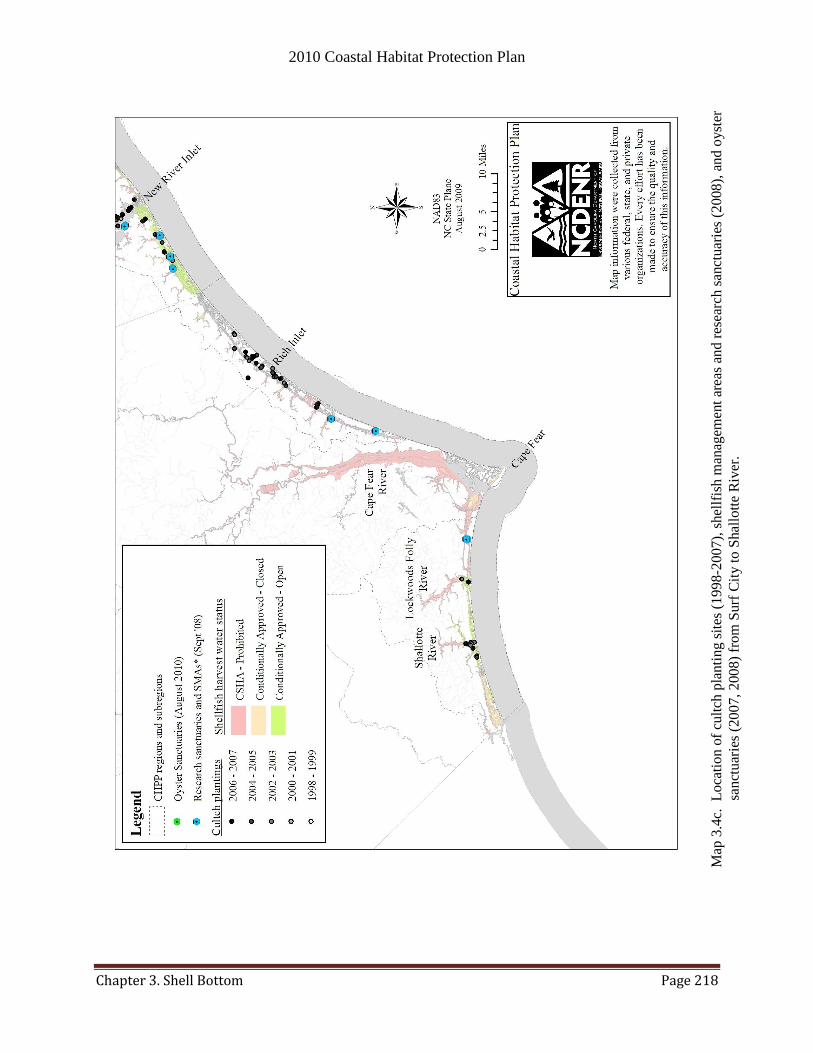
2010 Coastal Habitat Protection Plan
Chapter 3. Shell Bottom Page 218
Map
3.4
c. L
oca
tio
n o
f cu
ltch
pla
nti
ng s
ites
(1998-2
007),
shel
lfis
h m
anag
emen
t ar
eas
and
res
earc
h s
anct
uar
ies
(20
08
), a
nd
oyst
er
san
ctu
arie
s (2
007,
2008)
from
Surf
Cit
y t
o S
hal
lott
e R
iver
.

2010 Coastal Habitat Protection Plan
Chapter 3. Shell Bottom Page 219
Map
3.5
a. A
reas
pro
hib
ited
to d
redgin
g a
nd/o
r tr
awli
ng f
rom
Roan
oke
Isla
nd t
o n
ort
her
n C
ore
So
un
d (
as o
f 2
00
8).
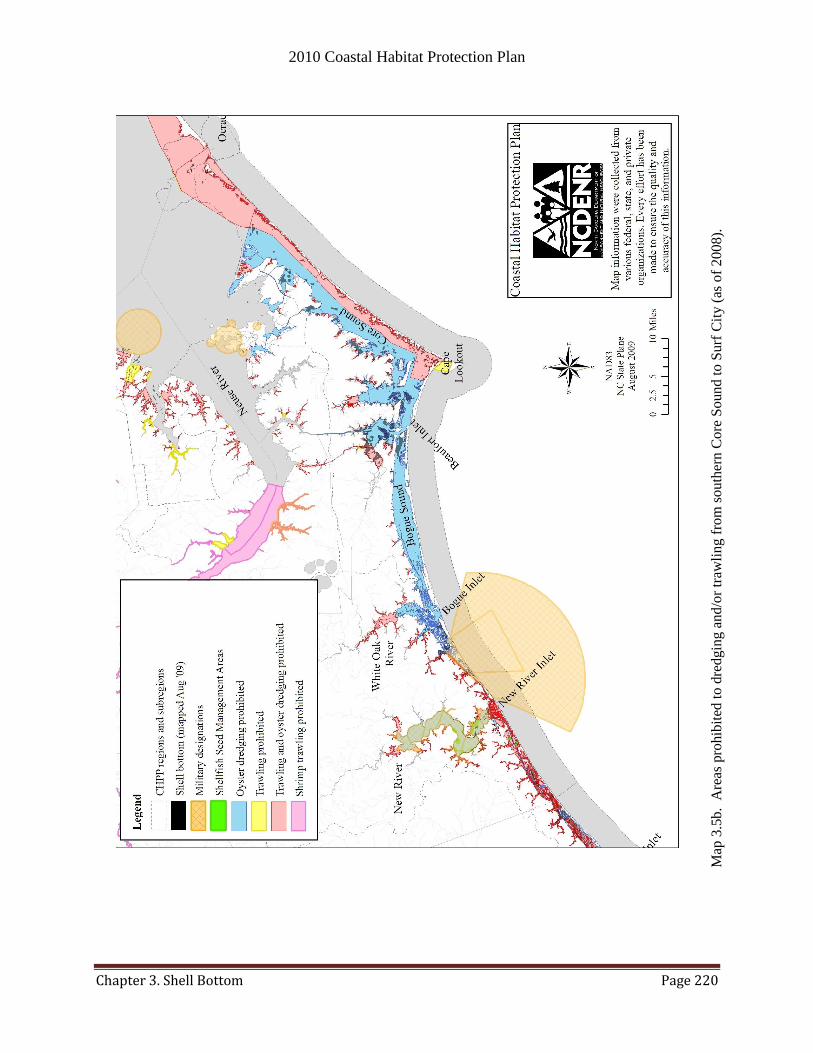
2010 Coastal Habitat Protection Plan
Chapter 3. Shell Bottom Page 220
Map
3.5
b. A
reas
pro
hib
ited
to d
redgin
g a
nd/o
r tr
awli
ng f
rom
south
ern C
ore
Sound t
o S
urf
Cit
y (
as o
f 2
00
8).
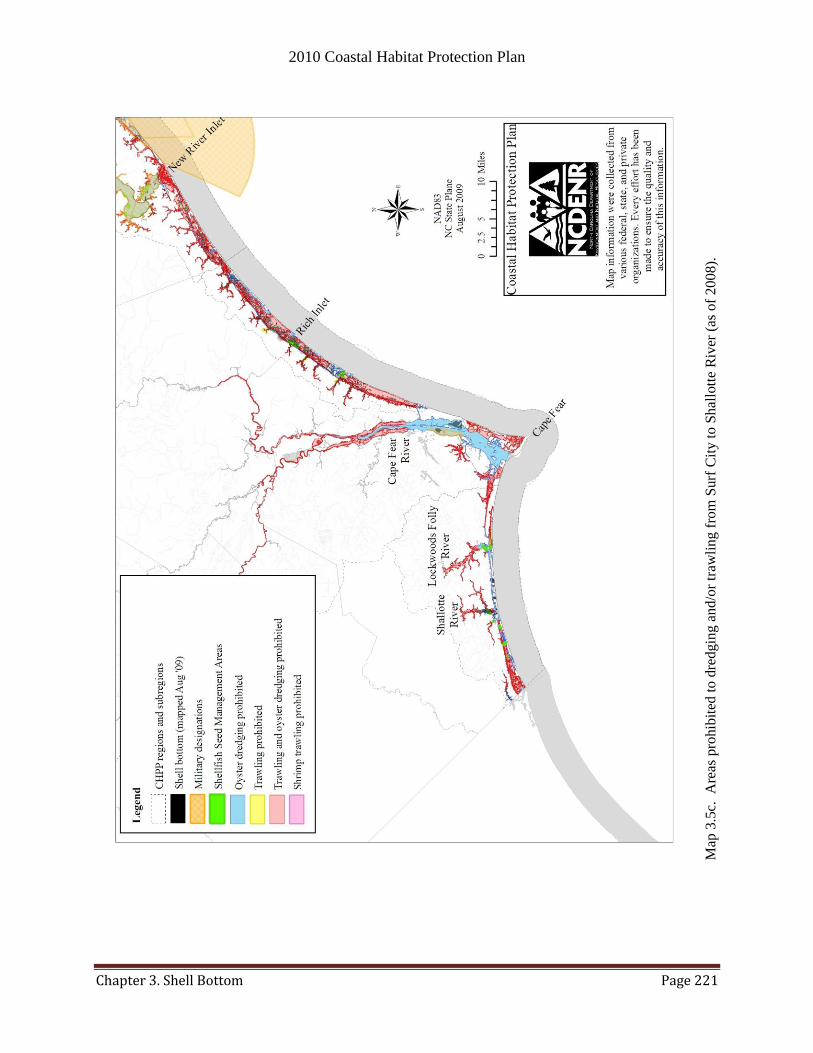
2010 Coastal Habitat Protection Plan
Chapter 3. Shell Bottom Page 221
Map
3.5
c. A
reas
pro
hib
ited
to d
redgin
g a
nd/o
r tr
awli
ng f
rom
Surf
Cit
y t
o S
hal
lott
e R
iver
(as
of
20
08).

2010 Coastal Habitat Protection Plan
Chapter 4. Submerged Aquatic Vegetation Page 222
CHAPTER 4. SUBMERGED AQUATIC VEGETATION
4.1. Description and distribution
4.1.1. Definition
Submerged aquatic vegetation (SAV) is a fish habitat dominated by one or more species of underwater
vascular plants. The North Carolina Marine Fisheries Commission (MFC) define SAV habitat as
submerged lands that:
―(i) are vegetated with one or more species of submerged aquatic vegetation including bushy
pondweed or southern naiad (Najas guadalupensis), coontail (Ceratophyllum demersum),
eelgrass (Zostera marina), horned pondweed (Zannichellia palustris), naiads (Najas spp.),
redhead grass (Potamogeton perfoliatus), sago pondweed (Stuckenia pectinata, formerly
Potamogeton pectinatus), shoalgrass (Halodule wrightii), slender pondweed (Potamogeton
pusillus), water stargrass (Heteranthera dubia), water starwort (Callitriche heterophylla),
waterweeds (Elodea spp.), widgeongrass (Ruppia maritima) and wild celery (Vallisneria
americana). These areas may be identified by the presence of above-ground leaves, below-
ground rhizomes, or reproductive structures associated with one or more SAV species and
include the sediment within these areas; or
(ii) have been vegetated by one or more of the species identified in Sub-item (4)(i)(i) of this Rule
within the past 10 annual growing seasons and that meet the average physical requirements of
water depth (six feet or less), average light availability (secchi depth of one foot or more), and
limited wave exposure that characterize the environment suitable for growth of SAV. The
past presence of SAV may be demonstrated by aerial photography, SAV survey, map, or
other documentation. An extension of the past 10 annual growing seasons criteria may be
considered when average environmental conditions are altered by drought, rainfall, or storm
force winds.‖ [2009 MFC rule 15A NCAC 03I .0101 (4)(i)].
SAV is an underwater forest for
juvenile fish and small invertebrates
and a barometer of water quality.
Submerged aquatic vegetation is included as fish habitat areas under MFC rules [2009 MFC rule 15A
NCAC 03I .0101 (4)]. The MFC definition was modified as above since the 2005 CHPP as part of CHPP
implementation to include low salinity species and address difficulties in identification of SAV habitat.
The definition went into effect in April 2009. The former definition required the presence of leaves,
2010 Coastal Habitat Protection Plan
Chapter 4. Submerged Aquatic Vegetation Page 223
shoots, or rhizomes. However, because the presence of SAV vegetation varies seasonally and inter-
annually, a one-time inspection could result in improper habitat determination. The modified definition
allows SAV habitat to include either areas where SAV vegetation is present during the active growing
season, or there is past documentation or professional knowledge of SAV in the area within the past ten
years. A concern with the new definition arises for SAV habitat that has not been mapped or otherwise
documented within the last 10 years. Although documentation of past occurrence may be limited, it can
be taken into account where available and should improve over time. Regular mapping and monitoring of
SAV habitat is consequently imperative for proper identification of SAV habitat. In areas appearing
suitable for SAV, surveys are required during the active growing season. To ensure consistency in
identifying SAV habitat among agencies (an action in the 2007-09 CHPP Implementation Plan) CRC
rules were modified to reference the MFC definition.
4.1.2. Description
Submerged aquatic vegetation habitat includes marine, estuarine and riverine vascular plants that are
rooted in sediment. Although SAV occurs intertidally in high salinity regions, the plants are generally
submerged and cannot survive if removed from the water for an extended length of time (Hurley 1990).
Leaves and stems have specialized thin-walled cells (aerenchyma) with large intercellular air spaces to
provide buoyancy and support in an aquatic environment. Leaves and stems are generally thin and lack
the waxy cuticle found in terrestrial plants. The lack of a waxy cuticle increases the exchange of water,
nutrients, and gases between the plant and the water (Hurley 1990). The extensive root and rhizome
system anchors the plants, and also absorbs nutrients (Thayer et al. 1984). Because the plants are rooted
in anaerobic sediments, they need to produce a large amount of oxygen to aerate the roots, and therefore
have the highest light requirements of all aquatic plants (including phytoplankton, macroalgae, floating
leaf plants, etc.). Reproduction occurs both sexually and asexually (i.e., vegetatively).
There are three basic types of SAV communities in North Carolina, all of which are important to coastal
fisheries – (1) high salinity or saltwater (18-30 ppt), (2) moderate salinity or brackish (5-18 ppt), and (3)
freshwater - low salinity (0-5 ppt) . High salinity estuarine species that occur in North Carolina include
eelgrass (Z. marina) and shoalgrass (H. wrightii). Eelgrass is a temperate species at the southern limit of
its Atlantic coast range in North Carolina. In contrast, shoalgrass is a tropical species that reaches its
northernmost extent in the state. Widgeon grass (R. maritime) grows best in moderate salinity but has a
wide salinity range and grows from low to high salinity environments. The co-occurrence of these three
SAV species is unique to North Carolina, resulting in high coverage, both spatially and temporally, of
shallow bottoms in North Carolina‘s estuaries (Ferguson and Wood 1994). Freshwater – low salinity
SAV species in North Carolina are diverse and include native wild celery (V. americana), non-native
Eurasian milfoil (Myriophyllum spicatum), bushy pondweed (Najas guadalupensis), redhead grass (P.
perfoliatus), and sago pondweed (P. pectinatus) (Ferguson and Wood 1994). Submerged aquatic
vegetation covers areas that vary in size from small isolated patches of plants less than a meter (<3 ft) in
diameter to continuous meadows covering many acres.
Habitat for SAV supports other types of aquatic plants in addition to submerged grasses. Macroalgae
(benthic, drift, and floating forms) often co-occur with SAV and provide similar ecological services, but
the plant taxa have distinctly different growth forms and contrasting life requirements (SAFMC 1998a).
Macroalgae grow faster than SAV and do not require unconsolidated substrate for anchoring extensive
root systems. Because of this growth pattern, macroalgae do not provide as much sediment stabilization
as submerged rooted vascular plants. Their leaves are also less rigid than those of submerged rooted
vascular plants, thus reducing their function as substrate for attachment and as a source of friction for
sediment deposition. Macroalgal genera include salt/brackish (Ulva, Codium, Gracilaria, Enteromorpha)
and freshwater (Chara and Nitella) species. Macroalgae common to the rivers of the Albemarle Sound
system include the charophytes (Chara spp.). In addition, the macroalgae Ectocarpus and Cladomorpha
2010 Coastal Habitat Protection Plan
Chapter 4. Submerged Aquatic Vegetation Page 224
grow on salt marsh flats (Mallin et al. 2000a) and in association with SAV beds (Thayer et al. 1984).
Epibiota are another important component of SAV habitat. Epibiota are organisms that attach or grow on
the surface of a living plant and may or may not derive nutrition from the plant itself. Micro- and
macroalgae (i.e., seaweed) can grow on the leaves of SAV. Invertebrates attached to the SAV leaves
include protozoans, nematodes, polychaetes, hydroids, bryozoans, sponges, mollusks, barnacles, shrimps
and crabs.
The three-dimensional shape of SAV habitat can be quite variable, ranging from highly mounded, patchy
beds several meters wide, to more contiguous, low-relief beds (Fonseca et al. 1998). Leaf canopies
formed by the SAV range in size from a few inches to more than three feet (0.91 m) tall. The structural
complexity of an SAV bed also varies somewhat because of the growth form of the species present
(SAFMC 1998a). While leaf density tends to be higher in contiguous beds than in patchy SAV habitat,
below-ground root mass is often higher in patchy beds (Fonseca et al. 1998). Despite the difficulty of
defining the boundaries of SAV beds, unvegetated bottom between nearby adjacent patches is included as
a component of patchy SAV habitat since rhizomes and/or seedlings may be present and the beds ―move‖
around with patterns of sediment erosion and deposition (Fonseca et al. 1998).
4.1.3. Habitat requirements
Beds of SAV occur in North Carolina in subtidal, and occasionally intertidal, areas of sheltered estuarine
and riverine waters where there is unconsolidated substrate (loose sediment), adequate light reaching the
bottom, and moderate to negligible current velocities or turbulence (Thayer et al. 1984; Ferguson and
Wood 1994). While this is generally true for all SAV species, individual species vary in their occurrence
along gradients of salinity, depth, and water clarity (Table 4.1). Field sampling of SAV beds in the
Albemarle-Pamlico estuarine system between 1988 and 1991 found that occurrence of SAV was related
to water depth, water clarity as measured by secchi depth, and salinity. In the area sampled, average
depth of SAV occurrence ranged from 2.63–3.94 ft (0.8–1.2 m), depending on the species. The maximum
depth of observed presence, regardless of species, was 7.87 ft (2.4 m) (Ferguson and Wood 1994). Data
indicated that freshwater SAV had a somewhat greater tolerance to turbidity than salt and brackish SAV,
since they were found in areas of similar water depths to high salinity grasses, but secchi depths were
lower (Ferguson and Wood 1994). This conclusion supports other research (Funderburk et al. 1991)
showing that salt/brackish SAV requires slightly greater water clarity (secchi depth >1.0 m, or 3.28 ft)
than freshwater SAV (secchi depth >0.8 m or 2.63 ft).
The primary factors controlling distribution of SAV are water depth, sediment composition,
currents/wave energy, and the penetration of photosynthetically active radiation (PAR) through the water
column (Goldsborough and Kemp 1988; Duarte 1991; Kenworthy and Haunert 1991; Dennison et al.
1993; Stevenson et al. 1993; Gallegos 1994; Moore et al. 1996; Virnstein and Morris 1996; Moore et al.
1997; Koch 2001; French and Moore 2003; Havens 2003; Kemp 2004; Cho and Poirrier 2005; Duarte et
al. 2007; Biber et al. 2008). At a minimum, high salinity SAV leaves require 15-25% of incident light
(Dennison and Alberte 1986; Kenworthy and Haunert 1991; Bulthius 1994; Fonseca et al. 1998). Low
salinity species have generally lower light requirements (9-13%) than high salinity grasses (Funderburk et
al. 1991; Fonseca et al. 1998; EPA 2000a; Kemp et al. 2004). For comparison, phytoplankton in the
water column requires only 1% of light available at the surface (Fonseca et al. 1998). The light
requirements of SAV species can be expressed as percent of surface light, light attenuation coefficient
(Kdm-1
), or secchi depth (m). Table 4.2 summarizes what is known about the growing season and light
requirements of North Carolina SAV species. The amount of light penetrating through the water column
is partitioned into two categories: light required through the water column, and light required at leaf. The
―light required at leaf‖ refers to the amount of water column light that can penetrate epibiota to the leaf
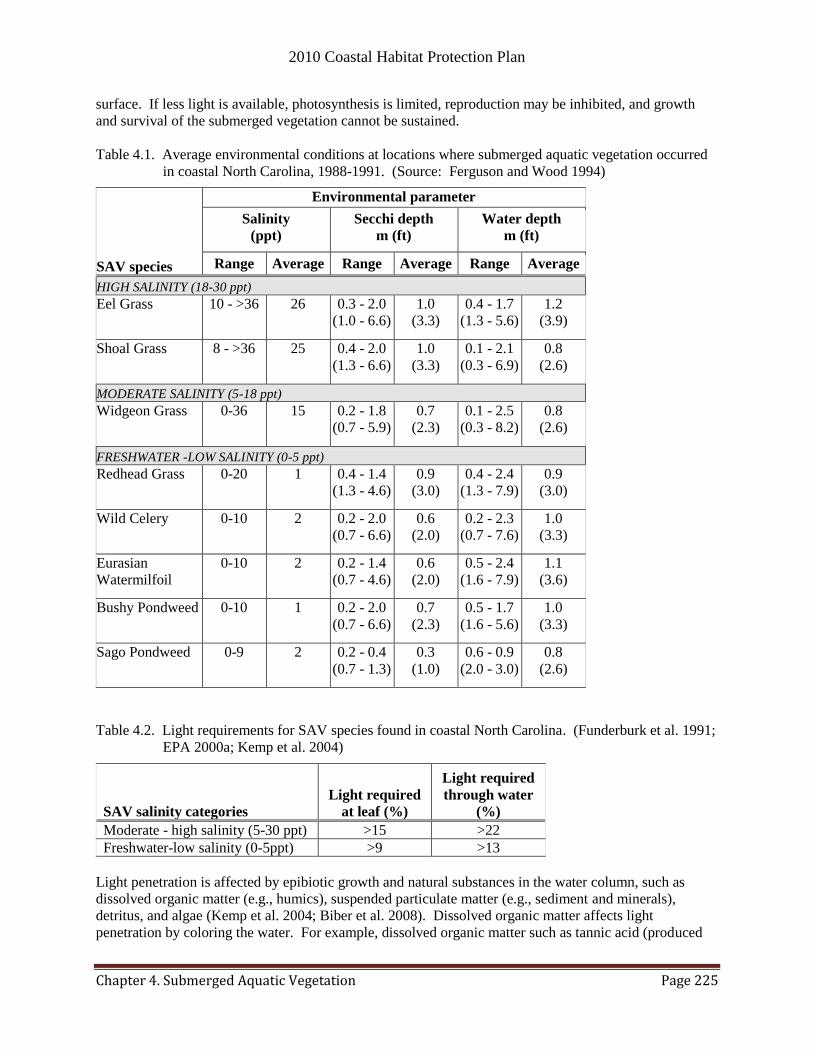
2010 Coastal Habitat Protection Plan
Chapter 4. Submerged Aquatic Vegetation Page 225
surface. If less light is available, photosynthesis is limited, reproduction may be inhibited, and growth
and survival of the submerged vegetation cannot be sustained.
Table 4.1. Average environmental conditions at locations where submerged aquatic vegetation occurred
in coastal North Carolina, 1988-1991. (Source: Ferguson and Wood 1994)
SAV species
Environmental parameter
Salinity
(ppt)
Secchi depth
m (ft)
Water depth
m (ft)
Range Average Range Average Range Average
HIGH SALINITY (18-30 ppt)
Eel Grass 10 - >36 26 0.3 - 2.0
(1.0 - 6.6)
1.0
(3.3)
0.4 - 1.7
(1.3 - 5.6)
1.2
(3.9)
Shoal Grass 8 - >36 25 0.4 - 2.0
(1.3 - 6.6)
1.0
(3.3)
0.1 - 2.1
(0.3 - 6.9)
0.8
(2.6)
MODERATE SALINITY (5-18 ppt)
Widgeon Grass 0-36 15 0.2 - 1.8
(0.7 - 5.9)
0.7
(2.3)
0.1 - 2.5
(0.3 - 8.2)
0.8
(2.6)
FRESHWATER -LOW SALINITY (0-5 ppt)
Redhead Grass 0-20 1 0.4 - 1.4
(1.3 - 4.6)
0.9
(3.0)
0.4 - 2.4
(1.3 - 7.9)
0.9
(3.0)
Wild Celery 0-10 2 0.2 - 2.0
(0.7 - 6.6)
0.6
(2.0)
0.2 - 2.3
(0.7 - 7.6)
1.0
(3.3)
Eurasian
Watermilfoil
0-10 2 0.2 - 1.4
(0.7 - 4.6)
0.6
(2.0)
0.5 - 2.4
(1.6 - 7.9)
1.1
(3.6)
Bushy Pondweed 0-10 1 0.2 - 2.0
(0.7 - 6.6)
0.7
(2.3)
0.5 - 1.7
(1.6 - 5.6)
1.0
(3.3)
Sago Pondweed 0-9 2 0.2 - 0.4
(0.7 - 1.3)
0.3
(1.0)
0.6 - 0.9
(2.0 - 3.0)
0.8
(2.6)
Table 4.2. Light requirements for SAV species found in coastal North Carolina. (Funderburk et al. 1991;
EPA 2000a; Kemp et al. 2004)
SAV salinity categories
Light required
at leaf (%)
Light required
through water
(%)
Moderate - high salinity (5-30 ppt) >15 >22
Freshwater-low salinity (0-5ppt) >9 >13
Light penetration is affected by epibiotic growth and natural substances in the water column, such as
dissolved organic matter (e.g., humics), suspended particulate matter (e.g., sediment and minerals),
detritus, and algae (Kemp et al. 2004; Biber et al. 2008). Dissolved organic matter affects light
penetration by coloring the water. For example, dissolved organic matter such as tannic acid (produced

2010 Coastal Habitat Protection Plan
Chapter 4. Submerged Aquatic Vegetation Page 226
naturally in swamp waters via breakdown of detritus) and lignins (produced naturally as well as
artificially, such as through wood pulp mill processing) strongly absorbs blue light.
Suitable or potential SAV habitat can be determined by modeling habitat requirements. This could be
done by simply selecting shallow bottom with appropriate substrate or could be further refined through
modeling of additional bio-optical parameters and wave exposure. Turbidity, total suspended solids
(TSS), Chlorophyll a, and dissolved organic matter are the optically active constituents (OACs) typically
measured to determine light available in the water column above the substrate (Biber et al. 2008). In the
mid-Atlantic, environmental conditions that allow adequate light penetration for SAV survival are total
suspended solids (TSS) less than 15 mg/l and chlorophyll a less than 15μg/l (Kemp et al. 2004).
However, another study indicated that high salinity SAV requires chlorophyll a < 10 μg/l and turbidity <1
ntu (Gallegos 1994). Bio-optical models predicting light attenuation under various environmental
conditions have been calibrated for the Chesapeake Bay (Gallegos 2001), Indian River Lagoon in Florida
(Gallegos and Kenworthy 1996), and North River in North Carolina (Biber et al. 2008). In North
Carolina, the North River was chosen because it exhibited a broad range of depths and salinities
representing the Albemarle-Pamlico estuarine system. In the North River, the bio-optical model predicted
a deeper depth distribution (1.7 m MSL) for SAV than was observed (0.87 m MSL). The reason SAV
was not found as deep as predicted may be due to confining hydrographic features, currents, epiphytic
growth, substrate composition, or overestimation of colonization depth (Duarte 1991; Kemp et al. 2004;
Bradley and Stolt 2006; Biber et al. 2008).
Kemp et al. (2004) developed a relationship to estimate epiphytic material and its associated light
attenuation. The estimation required input data on light attenuation in the water column, TSS, dissolved
inorganic nitrogen (DIN), and dissolved inorganic phosphorus (DIP). In the Chesapeake Bay, epiphytic
growth contributed 20-60% additional light attenuation in low salinity areas and 10-50% in moderate to
high salinity areas (Kemp et al. 2004). From that, the amount of needed DIN and DIP was determined (~
0.15 mg/l DIN; 0.01-0.02 mg/l DIP) (Sand-Jensen 1977; Funderburk et al. 1991; Kemp et al. 2004).
However, the majority of nitrate used by SAV is derived from the sediment, rather than the water column
(Thayer et al. 1984), suggesting the importance of substrate fertility in SAV distribution. Once light
attenuation at both leaf and water column is determined, a maximum depth of SAV can be estimated. The
actual distribution of potential habitat for SAV also depends on the distribution of substrate compositions,
current velocities, and wave exposure during the growing season.
Contiguous beds of eelgrass or other species of SAV rarely occur in high energy areas or where currents
are strong (>20-40 cm/s) (Thayer et al. 1984; Fonseca et al. 1998). Work conducted in Core Sound by
Fonseca and Bell (1998) found that percent cover of SAV, bed perimeter to area ratio, sediment organic
content, and percent silt/clay declined with increased wave exposure and currents. A simple model to
predict potential SAV habitat in North Carolina would be helpful for identification and protection of this
important habitat where it has not been mapped or otherwise documented recently (within the past 10
years). To make the most accurate prediction of SAV habitat, the bio-optical model (calibrated for North
Carolina) should include adjustments for epiphytic growth, substrate composition, currents and wave
energies at a location. However, the data needs for such an analysis are not satisfied by either current
spatial data on bathymetry or available spatial/temporal data on physicochemical conditions. Refer to the
soft bottom and water column chapters for information on bathymetric data and physicochemical
monitoring stations, respectively.
Below is a brief description of the habitat and plant characteristics of the five submerged grasses common
to North Carolina‘s brackish to freshwater systems and the two submerged grasses common to high
salinity estuarine waters (Hurley 1990; Bergstrom et al. 2006).
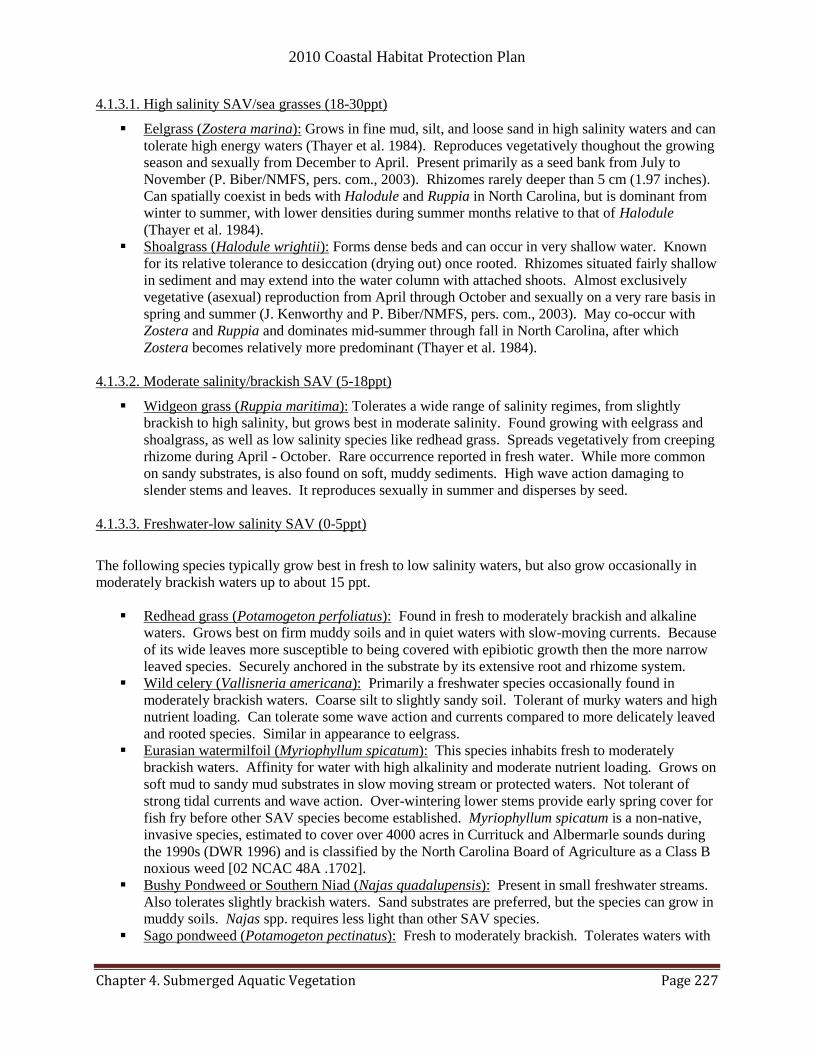
2010 Coastal Habitat Protection Plan
Chapter 4. Submerged Aquatic Vegetation Page 227
4.1.3.1. High salinity SAV/sea grasses (18-30ppt)
UEelgrass (Zostera marina): Grows in fine mud, silt, and loose sand in high salinity waters and can
tolerate high energy waters (Thayer et al. 1984). Reproduces vegetatively thoughout the growing
season and sexually from December to April. Present primarily as a seed bank from July to
November (P. Biber/NMFS, pers. com., 2003). Rhizomes rarely deeper than 5 cm (1.97 inches).
Can spatially coexist in beds with Halodule and Ruppia in North Carolina, but is dominant from
winter to summer, with lower densities during summer months relative to that of Halodule
(Thayer et al. 1984).
UShoalgrass (Halodule wrightii): Forms dense beds and can occur in very shallow water. Known
for its relative tolerance to desiccation (drying out) once rooted. Rhizomes situated fairly shallow
in sediment and may extend into the water column with attached shoots. Almost exclusively
vegetative (asexual) reproduction from April through October and sexually on a very rare basis in
spring and summer (J. Kenworthy and P. Biber/NMFS, pers. com., 2003). May co-occur with
Zostera and Ruppia and dominates mid-summer through fall in North Carolina, after which
Zostera becomes relatively more predominant (Thayer et al. 1984).
4.1.3.2. Moderate salinity/brackish SAV (5-18ppt)
Widgeon grass (Ruppia maritima): Tolerates a wide range of salinity regimes, from slightly
brackish to high salinity, but grows best in moderate salinity. Found growing with eelgrass and
shoalgrass, as well as low salinity species like redhead grass. Spreads vegetatively from creeping
rhizome during April - October. Rare occurrence reported in fresh water. While more common
on sandy substrates, is also found on soft, muddy sediments. High wave action damaging to
slender stems and leaves. It reproduces sexually in summer and disperses by seed.
4.1.3.3. Freshwater-low salinity SAV (0-5ppt)
The following species typically grow best in fresh to low salinity waters, but also grow occasionally in
moderately brackish waters up to about 15 ppt.
Redhead grass (Potamogeton perfoliatus): Found in fresh to moderately brackish and alkaline
waters. Grows best on firm muddy soils and in quiet waters with slow-moving currents. Because
of its wide leaves more susceptible to being covered with epibiotic growth then the more narrow
leaved species. Securely anchored in the substrate by its extensive root and rhizome system.
Wild celery (Vallisneria americana): Primarily a freshwater species occasionally found in
moderately brackish waters. Coarse silt to slightly sandy soil. Tolerant of murky waters and high
nutrient loading. Can tolerate some wave action and currents compared to more delicately leaved
and rooted species. Similar in appearance to eelgrass.
Eurasian watermilfoil (Myriophyllum spicatum): This species inhabits fresh to moderately
brackish waters. Affinity for water with high alkalinity and moderate nutrient loading. Grows on
soft mud to sandy mud substrates in slow moving stream or protected waters. Not tolerant of
strong tidal currents and wave action. Over-wintering lower stems provide early spring cover for
fish fry before other SAV species become established. Myriophyllum spicatum is a non-native,
invasive species, estimated to cover over 4000 acres in Currituck and Albermarle sounds during
the 1990s (DWR 1996) and is classified by the North Carolina Board of Agriculture as a Class B
noxious weed [02 NCAC 48A .1702].
Bushy Pondweed or Southern Niad (Najas quadalupensis): Present in small freshwater streams.
Also tolerates slightly brackish waters. Sand substrates are preferred, but the species can grow in
muddy soils. Najas spp. requires less light than other SAV species.
Sago pondweed (Potamogeton pectinatus): Fresh to moderately brackish. Tolerates waters with

2010 Coastal Habitat Protection Plan
Chapter 4. Submerged Aquatic Vegetation Page 228
high alkalinity. Associated with silt-mud sediments. Long rhizomes and runners provide strong
anchorage to the substrate. Capable of enduring stronger currents and greater wave action than
most other SAV.
4.1.4. Distribution
The dynamic nature of SAV beds has important implications for mapping and monitoring work. The
distribution, abundance, and density of SAV varies seasonally and among years (Thayer et al. 1984;
Dawes et al. 1995; Fonseca et al. 1998; SAFMC 1998a). Therefore, one should consider historical as
well as current SAV occurrence to determine locations of viable seagrass habitat (SAFMC 1998a). In
North Carolina, annual meadows of eelgrass are common in shallow, protected estuarine waters in the
winter and spring when water temperatures are cooler. However, in the summer when water temperatures
are above 25 – 30°C (77 – 86°F), shoalgrass is more abundant, and eelgrass thrives only where water
temperatures are lower (i.e., deeper areas and tidal flats with continuous water flow (SAFMC 1998a).
SAV habitat occurs along the entire east coast of the United States, with the exception of South Carolina
and Georgia, where high freshwater input, high turbidity, and large tidal amplitude (vertical tide range)
inhibit their occurrence. Along the Atlantic coast, North Carolina supports more SAV than any other
state, except for Florida (Funderburk et al. 1991; Sargent et al. 1995). The 2005 CHPP reported that,
based on interpretation and field verification by NOAA of remotely-sensed imagery taken during 1985-
1990, the total area of visible SAV was approximately 134,000 acres (Ferguson and Wood 1994). Other
mapping efforts included Carroway and Priddy (1983) in Core and Bogue Sounds and DWQ (1998) in the
Neuse River system. In addition to mapped SAV, Davis and Brinson (1989) surveyed and described the
distribution of SAV in Currituck Sound and the Western Albemarle-Pamlico Estuarine System.
Since 2005, some additional mapping efforts have added over 20,000 acres of mapped vegetated areas,
suggesting SAV habitat covers over 150,000 acres in coastal North Carolina (Map 4.1). The additional
mapping efforts include the following:
DMF (North Carolina Division of Marine Fisheries) Bottom Mapping Program –
http://www.ncdmf.net/habitat/shellmap.htm, November 2010 *Maps based on interpolated
transect data.
ECSU (Elizabeth City State University) Mapping Program –
http://www.ecsu.edu/academics/mathsciencetechnology/chemgeophys/sav/index.cfm, December
2010 *Maps based on aerial photography.
NCSU (North Carolina State University) – Dr. Eggleston (http://www4.ncsu.edu/~dbeggles/,
November 2010) *Maps based on aerial photography.
DWQ Rapid Response Teams - http://portal.ncdenr.org/web/wq/ess/savmapping, December 2010
*Maps based on interpolated transect data.
An inventory of all SAV mapping and monitoring efforts is provided at
http://www.ncdmf.net/habitat/chpp28.html (June 2009). When considering only mapping data, the area
of SAV habitat in North Carolina covers approximate 20% of the shallow (<6 foot) littoral zone within
the area mapped20
, and approximately 5% of the total water area. Of course, the spatial distribution of
SAV coverage varies within and among regions, corresponding generally to the relative area of shallow
estuarine waters (Table 4.3).
SAV habitat in coastal North Carolina occurs mostly along the estuarine shoreline of the Outer Banks
(Pamlico and Core/Bogue sounds), with sparse cover along much of the mainland shores of the estuarine
system (Ferguson et al. 1989). As the systems become more riverine (i.e., tributaries of Albemarle
20 Based on digitizing contours from the depth points drawn on NOAA nautical charts.
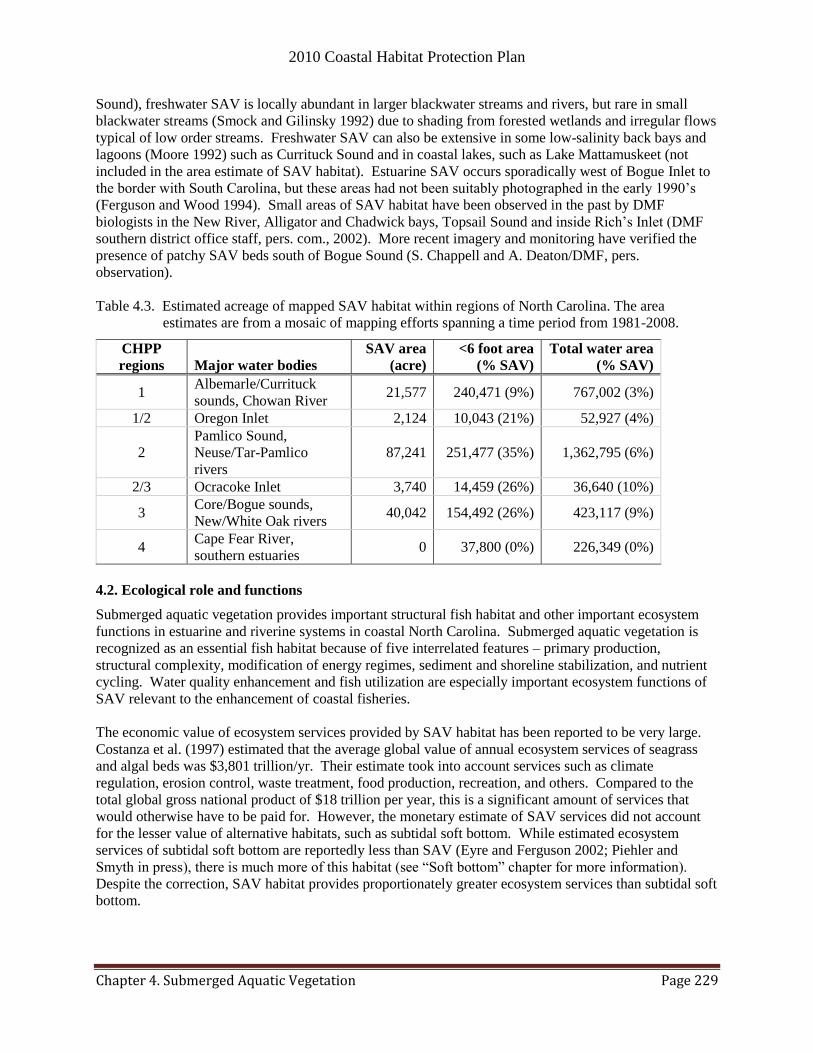
2010 Coastal Habitat Protection Plan
Chapter 4. Submerged Aquatic Vegetation Page 229
Sound), freshwater SAV is locally abundant in larger blackwater streams and rivers, but rare in small
blackwater streams (Smock and Gilinsky 1992) due to shading from forested wetlands and irregular flows
typical of low order streams. Freshwater SAV can also be extensive in some low-salinity back bays and
lagoons (Moore 1992) such as Currituck Sound and in coastal lakes, such as Lake Mattamuskeet (not
included in the area estimate of SAV habitat). Estuarine SAV occurs sporadically west of Bogue Inlet to
the border with South Carolina, but these areas had not been suitably photographed in the early 1990‘s
(Ferguson and Wood 1994). Small areas of SAV habitat have been observed in the past by DMF
biologists in the New River, Alligator and Chadwick bays, Topsail Sound and inside Rich‘s Inlet (DMF
southern district office staff, pers. com., 2002). More recent imagery and monitoring have verified the
presence of patchy SAV beds south of Bogue Sound (S. Chappell and A. Deaton/DMF, pers.
observation).
Table 4.3. Estimated acreage of mapped SAV habitat within regions of North Carolina. The area
estimates are from a mosaic of mapping efforts spanning a time period from 1981-2008.
CHPP
regions Major water bodies
SAV area
(acre)
<6 foot area
(% SAV)
Total water area
(% SAV)
1 Albemarle/Currituck
sounds, Chowan River 21,577 240,471 (9%) 767,002 (3%)
1/2 Oregon Inlet 2,124 10,043 (21%) 52,927 (4%)
2
Pamlico Sound,
Neuse/Tar-Pamlico
rivers
87,241 251,477 (35%) 1,362,795 (6%)
2/3 Ocracoke Inlet 3,740 14,459 (26%) 36,640 (10%)
3 Core/Bogue sounds,
New/White Oak rivers 40,042 154,492 (26%) 423,117 (9%)
4 Cape Fear River,
southern estuaries 0 37,800 (0%) 226,349 (0%)
4.2. Ecological role and functions
Submerged aquatic vegetation provides important structural fish habitat and other important ecosystem
functions in estuarine and riverine systems in coastal North Carolina. Submerged aquatic vegetation is
recognized as an essential fish habitat because of five interrelated features – primary production,
structural complexity, modification of energy regimes, sediment and shoreline stabilization, and nutrient
cycling. Water quality enhancement and fish utilization are especially important ecosystem functions of
SAV relevant to the enhancement of coastal fisheries.
The economic value of ecosystem services provided by SAV habitat has been reported to be very large.
Costanza et al. (1997) estimated that the average global value of annual ecosystem services of seagrass
and algal beds was $3,801 trillion/yr. Their estimate took into account services such as climate
regulation, erosion control, waste treatment, food production, recreation, and others. Compared to the
total global gross national product of $18 trillion per year, this is a significant amount of services that
would otherwise have to be paid for. However, the monetary estimate of SAV services did not account
for the lesser value of alternative habitats, such as subtidal soft bottom. While estimated ecosystem
services of subtidal soft bottom are reportedly less than SAV (Eyre and Ferguson 2002; Piehler and
Smyth in press), there is much more of this habitat (see ―Soft bottom‖ chapter for more information).
Despite the correction, SAV habitat provides proportionately greater ecosystem services than subtidal soft
bottom.

2010 Coastal Habitat Protection Plan
Chapter 4. Submerged Aquatic Vegetation Page 230
4.2.1. Productivity
SAV habitat is dominated by dense stands of vascular plants, their associated epiphyte communities, as
well as benthic micro- and macroalgae. These grasses produce large quantities of organic matter under
optimum conditions. Estimates of daily production for eelgrass beds rank among the most productive of
marine plant habitats (Thayer et al. 1984; Peterson et al. 2007; Hemminga and Duarte 2000; Larkum et al.
2006). The typical biomass of growing eelgrass beds (leaves, roots, and rhizomes) in North Carolina was
reported as 57–391 g (dry weight)/m2 (Thayer et al. 1984; Twilley et al. 1985). The majority of biomass
was contained in the roots (45-285 g m-2
). The productivity of eelgrass beds in North Carolina was
reported as 1.05-1.32 g C m-2
d-1
(Thayer et al. 1984). Based on a compilation of published research
(Peterson et al. 2007), the annual primary production estimates for eelgrass surpassed intertidal Spartina,
intertidal soft bottom, subtidal soft bottom, and shell bottom. The relative productivity of SAV suggests
its importance as a source of secondary production. The components of SAV habitat production include
epiphytes, above-ground biomass, below-ground biomass, epibenthic algae, and water column
phytoplankton.
Contributions of the various components of SAV productivity varies by species, salinity type, and
location throughout the growing season (Stevenson 1988). In general, high salinity grasses have more
annual production than freshwater SAV where they develop greater standing crops and have more
capacity to store biomass in extensive root and rhizome systems. Stevenson (1988) reported high salinity
SAV production at >10 g C m-2
d-1
and low salinity SAV production
at <5 g C m
-2 d
-1. Attached epiphytes
contribute substantially to the total productivity of SAV beds (Koch 2001) and are an important food
source for fish and invertebrates. While early stages of epiphytic growth increase primary productivity of
the habitat, later stages can may impede SAV growth and density due to competition for light, nutrients,
and carbon (Thayer et al. 1984; Koch 2001). Excessive epiphytic and macrophytic growth can result in
loss of SAV (Hauxwell et al. 2000; McGlathery 2001) (see ―Water quality degradation, nutrients‖
section). Dillon (1971) and Penhale (1977) estimated that epiphytes (macroalgae) constitute 10-25% of
the total SAV biomass in a North Carolina estuary, although seasonal variability in macroalgal abundance
corresponds to seasonal fluctuations in eelgrass biomass (Thayer et al. 1975; Penhale 1977). Freshwater
and high salinity grasses also vary in growing season (see ―Habitat description‖ and ―Habitat
requirements‖ sections), suggesting temporal variation in productivity.
Because of their high rates of primary production and particle deposition, SAV beds are important sources
and sinks for nutrients (SAFMC 1998a). Thayer et al. (1984) concluded that SAV beds in high velocity
areas are sources (exporters) of organic matter, while SAV in low current areas are sinks (importers) of
organic matter. Exported matter represents a large portion of total SAV production in high salinity SAV
beds in North Carolina (Thayer et al. 1984). When grasses die and decompose, the detrital material is
broken down by invertebrates, zooplankton and bacteria, and energy is transferred through the estuarine
detrital food web. Decomposed SAV matter and its associated bacteria are actually of greater importance
as a food source for fish than the living SAV leaves (Thayer et al. 1984; Kenworthy and Thayer1984).
4.2.2. Ecosystem enhancement
Because SAV are rooted in the substrate and provide semi-permanent structures in estuaries and coastal
rivers, system enhancement is one of their more important ecological functions. Some of these functions
include (Thayer et al. 1984; SAFMC 1998a):
Accelerated deposition of sediment and organic matter,
Physical binding of sediments beneath the canopy,
Nutrient cycling between the water column and sediments, and
Modification of water flow and reduction in wave turbulence,
2010 Coastal Habitat Protection Plan
Chapter 4. Submerged Aquatic Vegetation Page 231
These functions improve water quality in estuaries by removing suspended solids from the water column,
improving water clarity, and adding dissolved oxygen. The presence of SAV is both a maintainer and
indicator of good water quality (Dennison et al. 1993; Virnstein and Morris 1996; Biber et al. 2008).
Moore (2004) studied the effect of SAV beds on water quality inside compared to outside the bed in
Chesapeake Bay. During spring (April – June), the rapidly growing SAV beds were a sink for nutrients,
suspended solids, and phytoplankton. The beds began to die as the summer progressed, releasing
sediment and nutrients to the surrounding water. The improvements in water quality were not
measureable until SAV biomass exceeded 50-100 g (dry weight) m-2
or 25-50% vegetative cover. The
rapid uptake of nutrients by growing SAV was reflected in a 73% decline in nitrate levels inside the bed
compared to outside. A threshold coverage and density of SAV is needed to ensure bed survival through
high levels of spring turbidity (Moore et al. 1997; Moore 2004). Beds of SAV can also enhance grazing
on phytoplankton by providing a daytime refuge for planktonic filter feeders (Scheffer 1999). Scheffer
(1999) synthesized an extensive literature resource to model the effect of SAV density on planktivore
abundance. The analysis suggested a threshold level of SAV density and grazing pressure where
phytoplankton can be reduced to very low levels.
Aquatic grasses, by absorbing moderate wave energy (Fonseca 1996a), buffer nearshore turbulence and
reducing erosion along adjacent shorelines, improves water clarity, and helps stabilize marsh edge habitat
(Stephan and Bigford 1997). Although oyster reefs are relatively more resilient to turbulence than SAV
beds, both oyster reefs and SAV beds provide, among other ecosystem functions, shoreline protection
(Day et al. 1989; Fonseca 1996a).
4.2.3. Fish utilization
Many fish species occupy SAV at some point in their life cycle (Thayer et al. 1984). However, the
importance of SAV depends on its relative contribution to a particular species' refuge, spawning, nursery,
foraging, and corridor needs. Because of the temporal abundance patterns among SAV species, refuge
and foraging habitat are provided almost year-round for estuarine-dependent species (Steel 1991). In
addition to natural fluctuations in coverage and density, the utilization of SAV by fish and invertebrates
differs spatially and temporally due to species distribution ranges, time of recruitment, and life histories
(Nelson et al. 1991, Heck et al. 2008; Hovel et al. 2002).
The SAFMC considers SAV Essential Fish Habitat (EFH) for red drum; brown, white, and pink shrimp;
and species in the snapper-grouper complex. Species whose relative abundances at some life stage are
generally higher in SAV than in other habitats, or otherwise show some preference for SAV, are referred
to as ―SAV-enhanced.‖ A partial list of SAV-enhanced species and species utilizing SAV habitat in
North Carolina is compiled in Table 4.4.
4.2.3.1. Moderate-high salinity SAV
In brackish and high salinity estuaries, fish and invertebrates use seagrass, to varying extents, as nursery,
refuge, foraging, and spawning locations. Studies in eelgrass beds in the Newport River estuary and
vicinity reported between 39 and 56 fish species during regular monitoring conducted in the 1970s
(Thayer et al. 1975; Adams 1976; Thayer et al. 1984). Results from DMF‘s juvenile fish sampling in
SAV beds in eastern Pamlico and Core sounds found over 150 species of fish and invertebrates from 1984
to 1989, of which 34 fish and six invertebrate species were important commercial species (DMF 1990).
Composition of long haul seine catches sampled by DMF reported at least 49 adult fish species collected
over SAV beds in eastern Pamlico Sound (DMF 1990). In addition to fish, over 70 benthic invertebrate
species have been reported from eelgrass beds along the east coast (Thayer et al. 1984). Spotted seatrout
(Cynoscion nebulosus), are highly dependent on the quantity and quality of seagrass habitat (Vetter 1977),
and bay scallops occur almost exclusively in seagrass beds (Thayer et al. 1984).
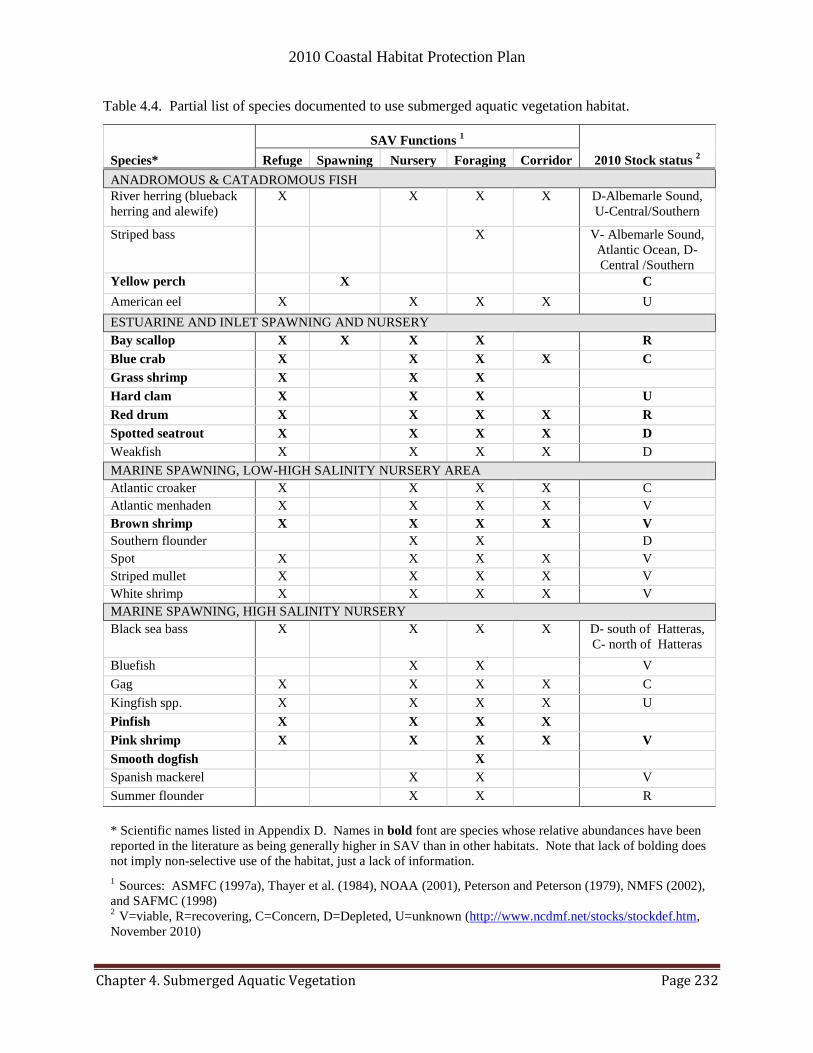
2010 Coastal Habitat Protection Plan
Chapter 4. Submerged Aquatic Vegetation Page 232
Table 4.4. Partial list of species documented to use submerged aquatic vegetation habitat.
Species*
SAV Functions 1
2010 Stock status 2 Refuge Spawning Nursery Foraging Corridor
ANADROMOUS & CATADROMOUS FISH
River herring (blueback
herring and alewife)
X X X X D-Albemarle Sound,
U-Central/Southern
Striped bass X V- Albemarle Sound,
Atlantic Ocean, D-
Central /Southern
Yellow perch X C
American eel X X X X U
ESTUARINE AND INLET SPAWNING AND NURSERY
Bay scallop X X X X R
Blue crab X X X X C
Grass shrimp X X X
Hard clam X X X U
Red drum X X X X R
Spotted seatrout X X X X D
Weakfish X X X X D
MARINE SPAWNING, LOW-HIGH SALINITY NURSERY AREA
Atlantic croaker X X X X C
Atlantic menhaden X X X X V
Brown shrimp X X X X V
Southern flounder X X D
Spot X X X X V
Striped mullet X X X X V
White shrimp X X X X V
MARINE SPAWNING, HIGH SALINITY NURSERY
Black sea bass X X X X D- south of Hatteras,
C- north of Hatteras
Bluefish X X V
Gag X X X X C
Kingfish spp. X X X X U
Pinfish X X X X
Pink shrimp X X X X V
Smooth dogfish X
Spanish mackerel X X V
Summer flounder X X R
* Scientific names listed in Appendix D. Names in bold font are species whose relative abundances have been
reported in the literature as being generally higher in SAV than in other habitats. Note that lack of bolding does
not imply non-selective use of the habitat, just a lack of information.
1 Sources: ASMFC (1997a), Thayer et al. (1984), NOAA (2001), Peterson and Peterson (1979), NMFS (2002),
and SAFMC (1998) 2
V=viable, R=recovering, C=Concern, D=Depleted, U=unknown (http://www.ncdmf.net/stocks/stockdef.htm,
November 2010)

2010 Coastal Habitat Protection Plan
Chapter 4. Submerged Aquatic Vegetation Page 233
Several studies along the coasts of the Atlantic Ocean and the Gulf of Mexico have demonstrated
significantly greater species richness and numerical abundance of organisms in SAV beds compared to
unvegetated bottom (Thayer et al. 1975; Summerson and Peterson 1984; Thayer et al. 1984; Heck et al.
1989; Ross and Stevens 1992; Irlandi 1994; ASMFC 1997a; Wyda et al. 2002; Hirst and Attrill 2008).
Blue crabs and pink shrimp were significantly more abundant in SAV beds than in adjacent shallow non-
vegetated estuarine bottoms in North Carolina, Alabama, and Florida (Williams et al. 1990; Murphey and
Fonseca 1995). Wyda et al. (2002) found significantly higher abundance, biomass, and species richness
of fish at sites with high levels of seagrass habitat (biomass >100 wet g m-2
; density > 100 shoots m-2
)
than sites with low-absent eelgrass (biomass <100 wet g m-2
; density <100 shoots m-2
). The sites with
low-absent SAV biomass and density also had higher proportions of pelagic species than sites with high
SAV biomass and density. In the Newport River estuary (Core/Bogue MU), rough silverside (Membras
martinica) and smooth dogfish (Mustelus canis) were classified as abundant in SAV beds, but were rare
or absent in marsh channel and intertidal flats (Thayer et al. 1984). In Back Sound, N.C., Elis et al.
(1996) found that fish and shrimp were more abundant on artificial SAV beds than on shell bottom.
In Florida Bay, changes in animal abundances were compared between the 1980s and 1990s when
significant changes in SAV coverage also occurred (Matheson et al. 1999). The major change observed
was a decrease in abundance of small fish and invertebrates inhabiting seagrass beds (such as crustaceans
and pipefish) with decreases in seagrass coverage, while larger demersal predatory fish (such as toadfish
and sharks) increased. Similarly, increases in seagrass density were characterized by significant increases
in crustaceans. In another study in Florida Bay, greater reductions in pink shrimp abundance occurred in
seagrass die-off areas relative to adjacent undamaged or recovering areas (Roblee and DiDomenico
1992).
Some studies have shown a linkage between the abundance and species composition of fish and the
quantity and/or quality of seagrass beds. Abundance, biomass, and species richness of fish assemblages
in two spatially distant areas of the Mid-Atlantic Bight (Buzzards Bay and Chesapeake Bay) were
significantly higher at sites with higher levels of habitat complexity (biomass >100 wet g/m2; density
>100 shoots/m2) compared to sites with reduced habitat complexity (Wyda et al. 2002). Abundance,
biomass, and species diversity were also more variable at sites with reduced SAV complexity. Sites with
lower habitat complexity also had a greater proportion of pelagic species than bottom, structure-oriented
species. In North Carolina, comparison of pink shrimp densities in continuous and patchy SAV beds
found significantly greater shrimp densities in continuous beds than in patchy grass beds (Murphey and
Fonseca 1995). Although patchy beds did not support as great a density of shrimp, they still functioned
as important habitat for pink shrimp (Murphey and Fonseca 1995). Hirst and Attrill (2008), in examining
benthic invertebrate composition, found that the size of the SAV patch did not impact the level of
increased invertebrate diversity – presence of SAV alone significantly increased diversity.
Hovel et al. (2002) examined the effect of SAV bed structure (percent cover and total linear edge), local-
scale ecological attributes (shoot density, shoot biomass, percent organic matter), and elements of
physical setting (water depth and wave energy regime) on fish and shellfish densities in Core and Back
Sound, North Carolina. The surveys were conducted in two consecutive years in both spring and fall.
Wave energy regime and SAV shoot biomass had the most influence of species densities. Other factors
explained little of the variation in species densities. Processes operating at larger than local spatial scales
(e.g., larval delivery by currents) were evident between sites with high and low faunal abundance
(western vs. eastern Core Sound). The results support treating all moderate-high salinity SAV within
different regions equally in terms of fish and shellfish use.
4.2.3.2. Freshwater-low salinity SAV
Less information is available on fish use in low-salinity SAV habitat. Fish abundance and size has been
shown to be greater in freshwater and low-salinity systems with submerged aquatic vegetation than in
2010 Coastal Habitat Protection Plan
Chapter 4. Submerged Aquatic Vegetation Page 234
similar systems devoid of SAV (Randall et al. 1996;
http://www.fao.org/DOCREP/006/X7580E/X7580E10.htm, August 2007). In Currituck Sound, Borawa
et al. (1979) observed an increase in fish abundance from approximately 1,000 to more than 15,000 fish
hectare-1
after Myriophylum spicatum became established. However, the size of fish declined drastically.
Another study in the Potomac River (VA) found densities of fish in SAV habitat that were 2-7 times
higher than areas without SAV (Killgore et al. 1989). Floating leaf aquatic vegetation is particularly
important in freshwater systems such as the Roanoke River (Cooper et al. 1994). Common species using
freshwater SAV is shown below and in Table 4.4. Species that utilize freshwater SAV include not only
freshwater species but certain estuarine species and anadromous fish species (Rozas and Odum 1987;
SAFMC 1998a; NOAA 2001). The most commonly occurring include:
Freshwater Estuarine Anadromous
Minnows Juvenile menhaden Striped bass
Juvenile American eel Spot Shad (American and hickory)
Pirate perch Blue crab River herring
Inland silversides Grass shrimp
Yellow perch Bay anchovy
Largemouth bass Striped mullet
Bluegill (bream) Tidewater silverside
White perch
4.2.4. Specific biological functions
4.2.4.1. Refuge
The physical structure of SAV conceals prey from visual detection, restricts the pursuit and capture of
prey by predators and protects small organisms from adverse weather conditions (Savino and Stein 1989;
SAFMC 1998a; Rooker et al. 1998). Light levels are reduced within the canopy as well, further
concealing small prey (SAFMC 1998a). Since beds of SAV can be as tall as one meter (3.28 ft), their leaf
canopies provide a three-dimensional structure containing a large volume of sheltered water. In addition,
cryptic species that have the ability to change color use camouflage to decrease their visibility within the
SAV habitat. The roots and rhizomes of SAV also provide a substrate matrix for meiofauna21
and
macrofauna22
(Kenworthy and Thayer 1984). Hard clams, for example, are significantly more abundant
in SAV beds than in adjacent unvegetated bottom due to differences in food supply, predation, and
sediment stability (Peterson and Peterson 1979; Peterson 1982; Irlandi 1994, 1997).
High densities of seagrass shoots and increased plant surface area inhibit predator efficiency and provide
shelter to prey (Coen et al. 1981 for grass shrimp; Prescott 1990 for bay scallops; Orth 1992 for blue
crabs; Rooker et al.1998 for juvenile red drum). Estuarine-dependent spring-summer spawners (i.e., red
drum, seatrout) utilize SAV habitat in the spring and summer for forage and refuge, residing there prior to
emigrating to the mouths of bays and rivers, inlets, or coastal ocean shelf waters to spawn (SAFMC
1998a; Luczkovich et al. 1999).
The refuge value of SAV also depends on its corresponding value for predators. For example, benthic
macroinvertebrates can be more vulnerable to crab predation in SAV because crabs use SAV for refuge
from avian predators (Skilleter 1994; Micheli and Peterson 1999; Beal 2000). Summerson and Peterson
(1984) hypothesized that nocturnal bottom predators living on sand flats use SAV during the day to avoid
their own predators. Matilla et al. (2008) found that SAV beds of various densities equally increased
survival of shrimp from predators compared to unvegetated bottom. In freshwater systems, excess
21 Very small benthic animal, 0.1 – 0.5 mm in size, about the size of a sand grain, important food source for larval fish 22 Small benthic animal larger than 0.5 mm in size; e.g., mole crabs, amphipods

2010 Coastal Habitat Protection Plan
Chapter 4. Submerged Aquatic Vegetation Page 235
vegetation can actually hamper movement and foraging efficiency of large predatory fish, resulting in a
stunted fish population (Colle and Shireman 1980). Based on investigation of 60 Florida lakes, Hoyer
and Canfield (1993) concluded that total harvestable fish biomass (per unit of adjusted Chlorophyll a) is
maximal when the percent coverage of SAV ranged from 20-40%. However, large opportunistic
predators such as largemouth bass can thrive at <20% SAV coverage, as long as higher nutrient levels are
maintained and sufficient nursery habitat is available (Hoyer and Canfield 1996). Percent coverage of
SAV in North Carolina estuaries is much lower than 20%, and cannot reach >40% given the proportion of
shallow and deep waters (Table 4.3).
Seagrass, particularly eelgrass, may also provide overwintering habitat for some estuarine species. Pink
shrimp have been collected in SAV during winter months in North Carolina sounds (Williams 1964;
Purvis and McCoy 1972). The presence of SAV in the winter is thought to contribute to the pink
shrimp‘s ability to survive, supporting the spring pink shrimp fishery (Murphey and Fonseca 1995),
which comprises a large portion of North Carolina‘s annual shrimp landings. In contrast, in South
Carolina and Georgia, where no SAV is present, pink shrimp comprise an extremely small portion of the
shrimp landings. Similarly, survival of blue crabs in a New Jersey estuary was attributed to the ability of
the species to overwinter in SAV (Wilson et al. 1990).
4.2.4.2. Spawning
It is difficult to discern species whose reproduction is more successful in SAV than in other habitats.
Preference for spawning in SAV could be assumed for species found exclusively in SAV habitat. The
bay scallop is one estuarine species that occurs almost exclusively in high salinity SAV beds (Thayer et
al. 1984). The presence of spawning adults is therefore dependent on high salinity SAV. There are few
other year-round estuarine residents found almost exclusively in moderate-high SAV. However, many
species benefit from the close proximity of spawning and SAV nursery areas (see ―Nursery‖ function
section below). Seasonal patterns of reproduction and development of many temperate fishery species
also coincide with seasonal abundance of seagrass (Stephan and Bigford 1997).
Freshwater fish spawning preferentially on or near SAV include common carp, crappie, yellow perch and
chain pickerel (Balon 1975; Graff and Middleton 2000). The roots and stems of the submerged
vegetation provide substrate for attachment of eggs. As with high salinity SAV, many species benefit
from the close proximity of spawning areas and SAV nursery area (see ―Nursery‖ function section
below). Research is needed to assess the effect of SAV proximity to spawning areas on juvenile
production.
4.2.4.3. Nursery
Submerged aquatic vegetation is considered a nursery habitat for numerous species of fish and
invertebrates along the Atlantic coast (Thayer et al. 1984). The roots and stems of SAV provide ideal
protection and foraging habitat for developing fish and invertebrate larvae (Ambrose and Irlandi 1992;
SAFMC 1998a). Important commercial and recreational species present in SAV as juveniles in the spring
and early summer include gag, black sea bass, snappers, weakfish, spotted seatrout, bluefish, mullet, spot,
Atlantic croaker, red drum, flounders, southern kingfish, hard clam, and herrings (Rooker et al. 1998,
SAFMC 1998a). Estuarine-dependent reef fish (i.e., gag, black sea bass) use seagrass meadows as
juveniles, prior to moving offshore (Ross and Moser 1995). Juvenile sheepshead (<50 mm or <2.17 in)
and juvenile gray snapper also utilize SAV beds (Pattilo et al. 1997). However, juvenile gray snapper are
rare in most interior waters of North Carolina, and they are common only in Pamlico Sound from July to
November (Nelson et al. 1991). In North Carolina, where SAV is present year-round, some larval and
early juvenile finfish, molluscan, and crustacean species are present in SAV habitat much of the year
(SAFMC 1998a). Offshore, winter-spawning species such as spot, croaker, shrimp, and pinfish inhabit
SAV habitat as early juveniles in winter and early spring (Rooker et al. 1998).
2010 Coastal Habitat Protection Plan
Chapter 4. Submerged Aquatic Vegetation Page 236
While some juveniles of a species have been documented occurring in SAV, other species show some
preference for SAV habitat over other habitat types. Minello (1999) summarized information on densities
of juvenile fisheries species (<100 mm TL) in shallow-water estuarine habitats (marsh edge, SAV, and
soft bottom) of Texas and Louisiana, which showed highest densities of pink shrimp and red drum in
SAV habitat. Submerged aquatic vegetation has been recognized as critical nursery habitat for pink
shrimp in North Carolina (Murphey and Fonseca 1995). For juvenile red drum in Galveston Bay, Stunz
et al. (2002) reported measuring increased growth rates in SAV enclosures compared to other habitat
enclosures (shell bottom, wetland edge, and soft bottom). The degree of preference by red drum for SAV
is somewhat uncertain since they also utilize estuaries lacking SAV, such as in the southern portion of
North Carolina and South Carolina. However, red drum eggs, larvae, postlarvae, and juveniles have been
documented in SAV beds in North Carolina which is particularly important as a foraging area for young
(1-2 year old) red drum (Mercer 1984; Reagan 1985; Ross and Stevens 1992). Abundance of juvenile red
drum in SAV beds varies seasonally and spatially, being more common during summer months and in
grass beds that are close to spawning areas (Zieman 1982; DMF, unpub. data). Juvenile red drum were
also more abundant in edge habitat with patchy grass coverage than in homogeneously vegetated sites
(Mercer 1984; Reagan 1985; Ross and Stevens 1992). Data from DMF red drum seine surveys and
tagging studies indicate high abundance of late young of year red drum in shallow high salinity SAV
behind the Outer Banks (DMF 2001c). More rigorous analysis of DMF data, including both juvenile
abundance and concurrent habitat measurements, indicated a higher affinity to seagrass for both age-1 and
age-2 red drum (Bachelor et al. 2009).
Other species showing some preference for SAV habitat include brown shrimp, bay scallop, hard clams,
and blue crabs. Clark et al. (2004) compared the density of juvenile brown shrimp in various habitats
(marsh edge, SAV, and soft bottom) using 16 years of data for Galveston Bay. The results indicated a
preference of marsh and SAV over soft bottom, with SAV selected over marsh where both habitats co-
occurred. Both bay scallops and hard clams attach to seagrass blades temporarily before settling on the
bottom (Thayer et al. 1984; SAFMC 1998a). While hard clams also utilize other substrates, such as
oysters and shell hash, bay scallops almost exclusively utilize seagrass, and are therefore highly
dependent on its existence for successful recruitment23
(Thayer et al. 1984; Stephan and Bigford 1997).
Juvenile blue crabs prefer shallow water areas with structures, including SAV, tidal marsh, shell bottom
and detritus (Etherington and Eggleston 2000). In the Albemarle-Pamlico system, the majority of initial
recruitment of juvenile crabs occurs in SAV beds around inlets behind the Outer Banks, unless there is a
major storm event. In years with large storm events, crabs are dispersed into additional lower salinity
habitats (Etherington and Eggleston 2000). At sites near Ocracoke and Hatteras inlets, the density of
juvenile blue crabs increased significantly with increasing seagrass blade length, but not with biomass or
shoot abundance (Etherington and Eggleston 2000). In the Chesapeake Bay region, juvenile crabs grow
faster, occur more densely, and have higher survival rates in SAV beds (Heck and Orth 1980; Chesapeake
Bay Commission 1997). Hovel (2003) correlated the survival of juvenile blue crabs to SAV landscape
characteristics such as patch size, patch isolation, and proximity to edge in Back Sound, North Carolina.
The results indicated that juvenile blue crab survival was positively correlated with patch area and was
negatively correlated with seagrass shoot biomass.
In coastal riverine systems, such as the Chowan River, finfish, shellfish, and crustaceans utilize SAV as
nursery areas for refuge and protection, particularly minnows, killifish, juvenile striped bass, largemouth
bass, and molting/soft shelled blue crabs (Hurley 1990). Hoyer and Canfield 1996 determined that
although adult largemouth bass can thrive with very little SAV coverage, adequate nursery habitat must
be available for juveniles. Paller (1987) determined that the standing stock of larval fish in freshwater
23 Recruitment = successful settlement, and in some cases metamorphosis, of pelagic larvae into their juvenile habitat. Also
refers to successful movement of juveniles into adult habitat or fishery.
2010 Coastal Habitat Protection Plan
Chapter 4. Submerged Aquatic Vegetation Page 237
SAV beds was 160 times higher than in adjacent open waters, and that larvae would concentrate in the
interior of aquatic beds rather than in the transition zones between habitats. This difference suggests that
large SAV beds provide better refuge for larvae than an equivalent area of patchy SAV. Several studies
in estuarine SAV beds also found that juvenile hard clams, pink shrimp, and blue crabs were more
abundant in large or continuous SAV beds than in small or patchy SAV beds, whereas the opposite was
found for adult pink shrimp and grass shrimp (Murphey and Fonseca 1995; Irlandi 1997; Eggleston et al.
1998). Hirst and Attrill (2008) found that a decrease in patch size (increase in fragmentation) did not
affect the invertebrate biodiversity. These findings suggest that habitat fragmentation could have a
varying effect on recruitment, depending on the species.
4.2.4.4. Foraging
The majority of macrofauna in SAV habitat forage on secondary production from epibiotic communities,
benthic algae, organic detritus, and bacteria rather than direct consumption of SAV (Day 1967; Adams
and Angelovic 1970; Carr and Adams 1973; Meyer 1982; SAFMC 1998a). Only a few fish species are
known to consume submerged grasses directly. These include pinfish (Lagodon rhomboides), spot
(Leiostomus zanthurus), filefish (Monocanthus hispidus), and toadfish (Opsanus tau). However, SAV
comprised only 1 – 12% of their diet (Thayer et al. 1984). In contrast, there are numerous air-breathing
species grazing directly on SAV that include migratory birds (e.g., black brant, Branta bernicla; Canada
goose, Branta canadensis; and widgeon, Anas penelope), green sea turtles, and West Indian manatees
(SAFMC 1998a). Green sea turtles appear to be more abundant in seagrass than in unvegetated areas in
North Carolina, based on data from incidental occurrence in pound nets (SAFMC 1998a). Abundant
green turtles closely crop seagrass, greatly reducing the input of organic matter and nutrients to sediments
near the SAV (Ogden 1980). Dramatic declines in eelgrass abundance have also been documented
following the over-winter foraging activity of Canadian geese (River and Short 2007). Due to the geese
consuming plant meristems, sexual reproduction of the remaining eelgrass was minimal the following
summer. An absence of SAV grazers can result in excessive growth and accumulation of substrate
suitable for proliferation of slime mold, which is largely responsible for SAV wasting disease24
(Jackson
et al. 2001). The balancing of SAV abundance and grazer populations is another example of ecosystem
management.
Large predatory fish, such as Atlantic stingrays, flounders, bluefish, sandbar and other sharks, weakfish,
red drum, spotted seatrout, and blue crabs, are attracted to SAV beds for their concentrations of juvenile
fish and shellfish (Thayer et al. 1984). Though large shellfish predators represent a small proportion of
the fish biomass in SAV habitat, they can be important in structuring seagrass communities and, at times,
can uproot grasses or alter the substrate (e.g., cownose ray; Orth 1975). Overharvesting predators of
shellfish consumers (i.e., large coastal sharks) could therefore lead to increasing damage on their foraging
habitat (Myers et al. 2007).
4.2.4.5. Corridor and connectivity
For some species, such as blue crabs, SAV can function as a safe corridor between habitats, thereby
reducing predation (Micheli and Peterson 1999). In marshes where adjacent SAV was removed, the
abundance of grass shrimp declined 27% compared to areas where SAV was not removed (Rozas and
Odum 1987). Submerged aquatic vegetation adjacent to marshes also provides a refuge at low tide for
organisms associated with marsh edge habitat at high tide (Rozas and Odum 1987). Consequently, the
catch of fish was higher at sites with both marsh and SAV, rather than at marsh-dominated sites. In a
North Carolina estuary where SAV occurred adjacent to intertidal marsh, pinfish showed more
movement, were more abundant, and weighed more than those in areas where SAV was not present
adjacent to the marsh edge. These findings indicate that SAV provided a safe passage and offered
24 See ―Threats‖ section
2010 Coastal Habitat Protection Plan
Chapter 4. Submerged Aquatic Vegetation Page 238
additional food resources (Irlandi and Crawford 1997). Another study in North Carolina found that adult
fish abundances were greater where marsh, seagrass, and oyster reefs co-occurred, rather than areas with
shell bottom alone or shell bottom with marsh (Grabowski et al. 2000). The corridor function of SAV
may also apply to other small predators (i.e., juvenile red drum, seatrout) that are more susceptible to
predation in open water. Research is needed on the relationship between juvenile Sciaenid abundance
and connectivity among nursery habitats and spawning area.
4.3. Status and trends
4.3.1. Status of submerged aquatic vegetation habitat
When SAV beds are subjected to human-induced impacts in addition to natural stressors, large-scale
losses of SAV may occur (Fonseca et al. 1998). Scientific studies indicate a global and national trend of
declining SAV habitat (Orth et al. 2006; Waycott et al. 2009). Orth et al. (2006) summarized status and
trends information on SAV at a global scale and found reports of large-scale SAV losses in the European
Mediterranean, Japan, and Australia. Reports of SAV recovery were very low by comparison. Waycott
et al. (2009) showed sea grasses disappearing at rates similar to coral reefs and tropical rainforests based
on more than 215 studies and 1,800 observations dating back to 1879. The compilation of studies shows
a 29% decline in known SAV extent since 1879. The study also indicated an acceleration of loss since
1940 (7%/yr, up from <0.9%/yr prior). In North America, losses of seagrass beds have been as high as
50% in Tampa Bay, 43% in northern Biscayne Bay, and 30% in the northern portion of Indian River
Lagoon (all in Florida), and as much as 90% in Galveston Bay, Texas, and Chesapeake Bay (Taylor and
Saloman 1968; Kemp et al. 1983; Pulich and White 1991; Smith 1998). In North Carolina, SAV loss has
not been quantified, but anecdotal reports indicate that the extent of SAV may have been reduced by as
much as 50%, primarily on the mainland side of the coastal sounds (North Carolina Sea Grant 1997; J.
Hawkins/DMF, pers. com., 2003; B.J. Copeland/MFC, pers. com., 2003). However, since low salinity
SAV tends to exhibit large fluctuations from year to year, and because no mapping has been conducted to
quantify the reported SAV changes, the extent of loss is uncertain.
Trend data on SAV distribution in North Carolina are either limited to qualitative information for broad
areas or quantitative information for selected areas of the coast. The qualitative information includes:
Elderly fishermen and fishermen‘s journal accounts from the late 1800s describe extensive beds
of SAV in many coves along mainland Pamlico Sound where it was absent in the late 1990‘s
(Mallin et al. 2000a).
Seagrass wasting disease devastated eelgrass populations throughout the North Atlantic,
including North Carolina, between 1930 and 1933, dramatically disrupting estuarine systems.
Healthy eelgrass beds were generally re-established by the 1960s.
In the upstream half of the Pamlico River estuary, tidal freshwater SAV was common until the
mid-1970s (Davis and Brinson 1976; Davis and Brinson 1990). During the mid-1980‘s, SAV in
western Albemarle Sound and Neuse River declined significantly (Davis and Brinson 1990).
During the 1990‘s, Mallin et al. (2000a) reported extensive losses of eelgrass beds along the
intercoastal waterway (Morehead City area) and near the Harker‘s Island mainland. There was
also a major die-off of SAV in the Perquimans River after Hurricane Floyd in 1999 (S.
Chappell/DMF, pers. observation). But there was also a resurgence of SAV during the 1990‘s in
some locations. The resurgence was implied by complaints about abundant SAV around docks in
the Neuse River and fishermen‘s anecdotal accounts in the Pamlico River (Mallin et al. 2000a).
In 2002, DMF biologists noted high abundance of SAV throughout many shallow water areas of
Albemarle Sound and its tributaries, especially in Perquimans River (S. Winslow/DMF, pers.
com., 2002).
In 2007 and 2008, DMF biologists reported extensive SAV growth throughout the estuarine
system (attributed primarily to drought conditions and lack of major storm events).
2010 Coastal Habitat Protection Plan
Chapter 4. Submerged Aquatic Vegetation Page 239
Quantitative information on SAV status and trends comes in basically 3 forms: 1) station monitoring, 2)
transect monitoring, and 3) areal coverage monitoring (i.e., mapping). The earliest data on SAV status
and trends comes come from a history of station and transect monitoring in Currituck Sound (Davis and
Brinson 1983). Studies have documented the status of SAV in Currituck Sound since 1909, including a
major decline around 1918 attributed principally to increased turbidity (Bourn 1932; Davis and Brinson
1983). The locks of the Albemarle and Chesapeake Canal were opened during this period (Davis and
Brinson 1983). This canal connects the Norfolk (Virginia) Harbor at the mouth of the Chesapeake Bay
with Currituck Sound, by way of the North Landing River. From 1914 to 1918 the canal was deepened
and widened, and the North Landing River was dredged extensively. In 1932, operation of the canal
locks was modified, improving the situation, and the SAV began to recover. Submerged vegetation had
fully recovered by 1951, with the highest production of submerged aquatic plants in the Currituck-Back
Bay system since 1918 (Davis and Brinson 1983). During 1954 and 1955, the occurrence of four
hurricanes along the North Carolina coast increased turbidities via sediment suspension and resulted in
widespread destruction of plant beds (Dickson 1958). Submerged vegetation in other hurricane-impacted
areas of North Carolina may have been similarly affected. However, the SAV community recovered
rapidly, as growth was considered good in 1957 (Davis and Brinson 1983). After a severe nor'easter
storm in 1962, saltwater intrusion in the sound raised the average salinity slightly (4.4 ppt) and caused
major reductions in freshwater SAV biomass (Davis and Brinson 1983). Another likely factor
contributing to reductions in northern Currituck Sound was the accumulation of silty, semiliquid dredge
spoil in the North Landing River and the resulting turbidity (Davis and Brinson 1983).
As the native SAV beds recovered after 1962, Eurasian watermilfoil (a non-native species) began to
spread across Currituck Sound from its northern extremities (Davis and Brinson 1983). The spread of the
exotic plant was probably encouraged by improved water clarity caused by dry conditions and higher
salinities after 1962. Before 1962, native sago pondweed and wild celery were the dominant and
subdominant SAV species. By 1973, Eurasian watermilfoil had replaced sago pondweed as the
dominated aquatic plant species, followed by bushy pondweed. After a severe storm in 1978, bushy
pondweed was virtually eliminated, and total macrophyte biomass was 42% less than in 1973. Again, the
reductions in SAV biomass were associated with extreme turbidity and turbulence associated with the
severe weather during the early growing season in 1978. The monitoring transects referenced in Davis
and Brinson (1983) were revisited in recent years by the Marine Environmental Science Program at
Elizabeth City State University (Liz Noble, unpub. data 2006) and USACE (report pending). It is
apparent from the historical record that SAV coverage and biomass are greatly affected by weather
events, site conditions, and human activities that affect turbidity and salinity (see ―Threats and
management needs‖ sections). This relationship is true not only for Currituck Sound, but also for other
coastal water bodies containing SAV. In order to quantify trends in SAV abundance, regular mapping
efforts of all or a subset of the habitat are needed in addition to monitoring data from stations and
transects. Monitoring should focus on SAV in the most vulnerable locations (close to land where water
quality degradation and shoreline development impacts greatest, edge of southern and western
distribution range) and in areas of current or former importance to bay scallops.
Coast-wide aerial photography of SAV combined with on-site sampling is the standard method for
mapping SAV in Chesapeake Bay and elsewhere. The relatively short history of SAV mapping in North
Carolina estuaries started in 1981 with digitizing from aerial photographs of Core and Bogue sounds
(Carroway and Priddy 1983). The largest mapping coverage (Albemarle-Pamlico estuarine system) over
the shortest time period (1983 – 1992) was completed by NOAA and published in Ferguson and Wood
(1994).25
Since then, comparable repeat mapping is available for the Neuse River, Currituck Sound, and
Back Bay (Virginia). The Neuse River was remapped in 1998 by DWQ, and the Currituck Sound and
Back Bay were remapped by ECSU in 2003. However, basic change analysis has only been completed
25 An inventory of SAV mapping and monitoring efforts is provided at (http://www.ncdmf.net/habitat/chpp28.html, June 2009).
2010 Coastal Habitat Protection Plan
Chapter 4. Submerged Aquatic Vegetation Page 240
for the Neuse River (DWQ 1998). The DWQ assessment was conducted using aerial photography and
field verification methods similar to those of Ferguson and Wood (1994). Results showed that SAV was
present at four of five areas that had supported SAV in 1991, indicating there has not been a major decline
in SAV abundance over the seven-year period on the Neuse. More SAV was identified in 1998 than in
1991. However, because of differences in methodology, any change in coverage cannot be determined
with certainty. In 2006, NOAA acquired SAV imagery of Core and Bogue Sound and completed
digitizing in 2009 (D. Field/NOAA, pers. com., August 2009). The multiple years of data for Bogue and
Core Sound (Carroway and Priddy 1983; Ferguson and Wood 1994) suggest the possibility of change
analysis. However, conducting SAV change analysis in different areas should be undertaken with careful
consideration of annual differences in growth-integrated environmental conditions. Undigitized imagery
is also available for the purpose of SAV mapping and change analysis. The earliest such imagery was
funded by DOT in 2004, for the Pea Island Area in northern Pamlico Sound. However, field verification
data is lacking for the area and time period.
Prior to 2007, the mapping and monitoring of SAV was sporadic and piece meal, resulting in the lack of a
comprehensive baseline dataset for SAV distribution. Comprehensive mapping of SAV habitat in coastal
North Carolina was initiated in 2007 by a joint effort of federal and state agency and academic institutions
(http://www.apnep.org/pages/sav.html, June 2009). The SAV Partnership began in summer 2001 when
Region 5 (Virginia) staff of the U.S. Fish and Wildlife Service (FWS) needed matching non-federal funds
to secure an agency grant. The outcome of their initial inquiry was the formation of a SAV Working
Group, whose common goal was to pool resources from organizations with a common interest in
assessing SAV habitat along the North Carolina and southeast Virginia coastal region. The first aerial
surveys in support of this goal were flown during fall 2003 in the northernmost portion of the region. The
Albemarle-Pamlico National Estuarine Program (APNEP) became the lead coordinator in summer 2004.
During this period the Working Group began the process of creating a Memorandum of Understanding to
formalize agency interactions for implementing a combined effort map and monitor SAV habitat.
Beginning in winter 2006, meetings were scheduled on a regular (quarterly) basis and agenda topics
expanded beyond mapping and monitoring to include assessment, restoration, policy, and outreach. The
Memorandum of Understanding was signed by all signatories in fall 2006, thus creating the Partnership.
The APNEP then allocated $160,000 toward contracting out imagery for 2007-08. The FWS, DMF,
DENR, and NOAA contributed an additional $130,000. The NOAA representative took the lead on
imagery specifications and securing the contract. The DMF was responsible for verifying water clarity
conditions, coordinated field survey efforts and conducting the photo-interpretation. A stratified random
sampling design was used to conduct 1,250 field surveys to accompany the 1-m resolution imagery. The
strata consisted of previously vegetated and nonvegetated bottom less than 6 feet deep. The DMF
conducted the majority of field surveys, with the remaining stations covered by ECU, ECSU, DWQ,
DOT, WRC, NERR, FWS, and DCM. Over 90% of the flight lines were covered in 2007, with the
remaining area flown in 2008. Digitizing SAV polygons on the imagery is currently discontinued due to
a staff position vacancy and freeze on hiring. The SAV Partnership is looking into other locations to
house a GIS analysis for digitizing SAV polygons from the imagery (J. Luczkovich/ECU, pers. com.,
May 2009).
While a quantified change analysis is not available, preliminary review of core areas of SAV, such as
behind the Outer Banks in Pamlico Sound and Core Sound do not indicate large change since previous
imagery for those areas in 2004 (D. Field/NOAA, pers. com, 2010). However, there may have been a
shift to increased patchiness of previously dense beds in Bogue Sound. Observations of DENR field staff
have noted SAV presence in previously unvegetated areas in some of the low salinity systems and
southern range of SAV, which may be related to improved water clarity associated with the coastwide
drought in 2007-2008.
2010 Coastal Habitat Protection Plan
Chapter 4. Submerged Aquatic Vegetation Page 241
A comprehensive SAV monitoring program must employ methods covering the range of water quality
conditions where SAV grows in North Carolina. The relatively shallow estuarine waters of North
Carolina vary in optical properties from highly organic stained in the coastal rivers to clear saline behind
the barrier islands. Ferguson and Wood (1994) noted the difficulty in digitizing SAV beds in turbid, low
salinity waters. Aerial reconnaissance conducted during 2005 revisited some field-verified SAV beds in
the upper Neuse River and found most of the beds indistinguishable from the air (S. Chappell/DMF and J.
Green/DWQ, pers. observation). The low visibility in riverine areas from the air presents a challenge to
periodic areal monitoring of SAV coverage in the state. Other comprehensive SAV monitoring methods
are being investigated to address the issue. The APNEP was awarded a North Carolina Coastal
Recreational Fishing License grant from the DMF and WRC for a 2-year project to establish a protocol
for sampling submerged aquatic vegetation in the field. This field sampling will use underwater video
and acoustic equipment to compare methodology and be complementary to the aerial imagery acquired in
2007-2008. The project will attempt to provide a rigorous statistical evaluation of annual changes in SAV
abundance and develop a standardized method of field monitoring SAV in North Carolina. Partnering
organizations for this grant include APNEP, NOAA, NCSU, and ECU. The results of this new SAV
monitoring research should be evaluated for broader application in the estuary as a whole.
There have been several smaller mapping projects involving various techniques. DMF‘s Bottom
Mapping Program and DWQ‘s Rapid Response Program map SAV by delineating bottom type strata
boundaries along transect lines and interpolating. The DMF has been mapping subtidal vegetated strata in
moderate to high salinity waters since 1989. Bottom mapping personnel also comprised a large portion of
the field survey crew working with the 2007-2008 aerial imagery. The DWQ started mapping freshwater
and low salinity SAV in western Pamlico Sound tributaries in 2005. However, there has been no repeat
sampling of areas mapped using transect-based interpolation methods. The DMF also surveys for SAV
presence and density in conjunction with selected fisheries monitoring programs. The NEER is also
monitoring SAV on their reserves as part of 2005 CHPP implementation. Local and regional monitoring
programs should eventually be coordinated with a comprehensive SAV monitoring program.
4.3.2. Status of associated fishery stocks
It is very difficult to attribute changes in fish abundance to changes in habitat due to the difficulty of
achieving the data needs for such an analysis. The analysis needs accurate density estimates for fish
species and size classes among accurately delineated habitat types over a time series to predict fish –
habitat relationships. Assessments have been attempted for penaeid shrimp and red drum. The habitat
relationships of fishery species and life stages were used to estimate population densities of brown shrimp
by Clark et al. (2004), and priorities for habitat protection by Levin and Stunz (2005) in Galveston Bay.
Clark et al. (2004) used the density of juvenile brown shrimp in different habitats to estimate an overall
population size of 1.3 billion in Galveston Bay. Levin and Stunz (2005) estimated that habitat for red
drum larval and juveniles should be given the highest priority for protection. Such analyses have not been
conducted in North Carolina. Research is needed to quantify habitat relationships of fisheries species
and life stages in North Carolina in order to estimate population sizes and determine habitat protection
priorities.
Fish-habitat change analysis is also difficult because of the confounding effect of fishing on fish
populations. In North Carolina, estimated fishing mortality and juvenile abundance indices are used by
the DMF to determine the status of fishery stocks. Stock status evaluations may also suggest habitat
issues for concern or depleted species. Of the species identified in Table 4.4 with a preference for SAV
habitat, 8 stocks were evaluated for fishery status.26
The hard clam was assigned an Unknown status. Of
the remaining 7 stocks with a designated status, one was designated Depleted (spotted seatrout), two were
26 Refinement of the ecological role and function section lead to a reduction in documentation of SAV-enhanced species noted in
the 2005 CHPP (Street et al. 2005).
2010 Coastal Habitat Protection Plan
Chapter 4. Submerged Aquatic Vegetation Page 242
Concern (yellow perch, blue crab), two were Recovering (red drum, bay scallop), and two were Viable
(brown shrimp, pink shrimp) (http://www.ncdmf.net/stocks/2010NCDMF%20StockStatusReport.pdf).
Whereas much of the cause of declining stock status is attributed to overfishing, habitat loss and
degradation can make a stock more susceptible to overfishing. Therefore, protection or enhancement of
SAV habitat can be especially beneficial to SAV-enhanced species classified as Depleted or Concern, by
maximizing recruitment and productivity. More fishery-independent information and habitat change
analysis are needed to evaluate the effect of SAV-coverage on the abundance of fish and invertebrates.
4.3.3. Submerged aquatic vegetation restoration and enhancement
Although protection, rather than mitigation or restoration, is the more environmentally sound and a less
costly management approach for long-term enhancement of SAV habitat, restoration and/or enhancement
is possible in areas of recovering SAV abundance or where human impacts have physically removed the
vegetation (Fonseca et al. 1998, SAFMC 1998a, Treat and Lewis 2006, Orth et al. 2006). Restoration in
the latter case requires only replacing SAV where it had recently existed. Successfully restoring SAV to
areas where it is not currently present depends on conditions at the site throughout the year.
As SAV grows and spreads, it creates a feedback loop of increasing resilience to perturbation and
improving habitat conditions for itself, up to a point (see ―Diseases and microbial stressor‖ section for
more information). This positive feedback suggests a critical mass of SAV, above which, the vegetation
is less susceptible to periodic disturbances (Moore et al. 1997; Moore 2004). Recent research examining
the water treatment capacity of SAV beds (see ―Ecosystem enhancement section‖ for more information)
observed water quality benefits at bed densities of 50% or greater. The actual density, extent and location
of SAV needed to establish resilience and ecological functions depends on the corresponding quality and
quantity of water circulating through the system. To use an analogy, dirtier water needs a larger filter to
prevent clogging. Successful restoration efforts will establish an SAV coverage during optimum
conditions that is sufficient to allow recovery after natural perturbations to the system. In areas of
recovering SAV abundance, restoration and enhancement techniques can be used to accelerate the
recovery of SAV toward some critical density and coverage. Hard clam restoration could be one possible
means of enhancing water quality for SAV growth. SAV has been observed expanding adjacent to some
clam aquaculture leases in Virginia and North Carolina. This suggests that by seeding areas adjacent to
SAV with hard clams, the filter feeders will reduce suspended sediment and nutrients. Research is
needed on the feasibility of hard clam augmentation for the purpose of water quality based restoration of
SAV.
In suitable habitat areas, SAV can recover quickly after a natural disturbance. In more human-altered
areas, SAV may recover very slowly or not at all. Water-based restoration efforts are warranted in areas
where SAV is very slow to recover. A perfect example of slow recovery may be occurring in Back Bay,
Virginia, just north of Currituck Sound. Throughout most of the 20th Century, Back Bay and Currituck
Sound garnered a reputation for excellent hunting and fishing along the East Coast. This began to change
during the 1970s. Annual Mid-winter Waterfowl Surveys coupled with Back Bay NWR aerial waterfowl
surveys revealed a decline in waterfowl populations during the early 1970s (Baker et al. 2006) in the
system. The decline was linked to significant reductions in the distribution and abundance of freshwater
and low salinity SAV throughout the Bay. Unfortunately, systematic water quality monitoring was not in
place in Back Bay; so the cause of the decline could not be correlated with data. However, the decline
corresponded to major landscape changes in the northwestern portion of Back Bay‘s watershed during the
1970s and 1980s, as new housing developments and farming activities increased. A similar decline was
noticed about ten years later in the Knotts Island Bay-Currituck Sound (Baker et al. 2006), immediately
south of Back Bay.
The SAV in Back Bay-Currituck Sound was mapped by ECSU in 2003 and again by the APNEP SAV
partnership in 2007. The 2003 imagery and field verification indicated a very low abundance of SAV in

2010 Coastal Habitat Protection Plan
Chapter 4. Submerged Aquatic Vegetation Page 243
the Back Bay portion of the system (Noble and Hall 2005). A very low abundance of SAV was also
indicated from ECSU transect monitoring of Back Bay during 2006 (Noble and Mohr 2008). However,
the imagery from 2007 and observations during 2008 suggest a substantial increase in SAV abundance
from 2003-2008 (J. Gallegos/USFWS, pers. observation). The increase in SAV is an encouraging sign
for the multiple federal and state agencies interested in restoring the SAV resources of Back Bay (i.e.,
USACE, USFWS, Virginia Game and Inland Fisheries (VDGIF), APNEP). The VDGIF is pursuing a
pilot project to enhance SAV habitat in Back Bay with the use of strategically placed turbidity curtains
(C. Boyce/VDGIF, pers. com., May 2009). The VDGIF is seeking information regarding potential
habitat locations, effective planting techniques, and seed/rhizome dispersal patterns.
Given the range of environmental conditions at a site, modeling potential habitat must indicate both
habitat suitability and probability of occurrence. Restoration efforts could then move out from locations
of highest probability. Probabilities are indicated by the pattern of SAV recovery in a water body. The
reported spread of SAV in Perquimans River after Hurricane Floyd occurred upstream from the lower
reaches of the rivers, near the main body of Albemarle Sound (S. Winslow/DMF, pers. com.). A recovery
pattern was also suggested in the Neuse River from small, sunlit coves and tributaries having a consistent
coverage of SAV (J. Paxon/DWQ, pers. com.). The observed patterns suggest core areas of abundance
from which to launch restoration efforts. Research in Chesapeake Bay observed eelgrass seeds settling
rapidly with the waves and currents to disperse only a few meters from the seed sources (Orth et al.
1994). However, other SAV species may differ in their dispersion range, suggesting a pattern of
succession in species composition during recovery. Research is needed to verify where recovery of SAV
is occurring and if there is a spatial (and species) pattern of that recovery. If there is a pattern, special
monitoring and protection should be afforded to those core areas from which SAV begins its
recolonization. In the mean time, Back Bay/Currituck Sound should serve as a test case for re-
establishing SAV in a recovering/recoverable ecosystem.
Land-based restoration may also be possible in locations of historical SAV abundance where it is
currently absent or severely reduced (even in the best of years). Improving the quality of water
circulating through the system will mitigate the need for extensive water-based restoration of SAV. A
good example of land-based restoration facilitating SAV restoration is occurring in Wilson Bay, New
River. The Wilmington USACE-Jacksonville SAV Restoration project (Section 206) has done a lot of
work restoring water quality, wetland, and oysters in Wilson Bay. And there are plans to establish SAV
in the system (C. Wilson/USACE, pers. com., 2009) where it currently exists upstream and downstream.
The restoration was made possible by removing or diverting polluted effluent entering the bay (Mallin et
al. 2005). A nursery facility on Wilson Bay is producing plants for restoration, with technical assistance
from the Chesapeake Bay Program (Dr. Deborah Shafer and Steve Ailstock). The project employs annual
seed collections from areas of high SAV abundance for growing rooted transplants for restoration (P.
Donovan-Potts, pers. com., June 2009).
The facility on Wilson Bay could also be expanded to supply SAV transplants for other project areas.
Other projects with an SAV restoration component include USACE‘s Festival Park & Wanchese Marsh
Restoration Projects on Roanoke Island, USFWS‘s Monkey Island Restoration in Currituck Sound
(shoreline protection component could include SAV restoration as wave buffers), DWR‘s Silver Lake
Harbor estuarine shoreline restoration project, and the town of Kitty Hawk‘s proposal to protect an
eroding marsh shoreline where SAV is abundant offshore (need to avoid, mitigate and/or monitor SAV
impacts). In 2007, Elizabeth City State University (ECSU) was granted $59,834 to evaluate restoration
opportunities in Currituck Sound and Back Bay (J. Gallegos/USFWS, pers. com., November 2009).
ECSU faculty investigators Elizabeth Brinker and Dr. Maurice Crawford are tasked with: (1) producing
digital polygon maps of potential SAV restoration sites in Currituck Sound and Back Bay; (2) completing
some experimental SAV plantings in Currituck Sound to assess plant survival, vigor, and feasibility of
SAV restoration efforts in Back Bay and Currituck Sound; (3) calibrating the Kemp et al. (2004)
2010 Coastal Habitat Protection Plan
Chapter 4. Submerged Aquatic Vegetation Page 244
algorithm and/or other light attenuation models; (4) producing a GIS data layer of the bathymetry of
Currituck Sound and Back Bay, and (5) hosting a workshop at ECSU to communicate SAV restoration
techniques to State, Federal, and Non-governmental agency staff. ECSU will also produce a final report
on SAV restoration techniques and recommendations for re-establishment of SAV in Currituck Sound
and Back Bay. As of October 2009, ECSU has completed bathymetric transects of Currituck Sound and
Back Bay and has established reference and transplants sites in Coinjock Bay (Currituck Sound).
Transplanting efforts in 2008 met with limited success, whereas 2009 efforts exhibited survival and
growth attributed to retention of transplanted sediment (Brinker and Crawford 2009). Lessons learned
and data accumulated from the Coinjock Bay restoration site will be applied to proposed expanded
restoration efforts. Back Bay is targeted as the high priority for a restoration site. The results from
Brinker and Crawford study could also be used in SAV restoration for mitigation in low salinity areas.
Compensatory mitigation is often required for major shoreline development projects involving direct
removal of SAV. The mitigation is required by the USACE‘s enforcement of Clean Water Act Section
404 or by state regulations enforced by other regulatory agencies (DCM, DWQ). The intent is
replacement of ecological functions such as water quality, habitat, and hydrology. Though in practice,
mitigation is only designed to replace an acreage equal to or greater than that which was lost or impacted
(see ―Wetland enhancement and restoration‖ section of ―Wetlands‖ chapter for more information). So
mitigation activities should represent very little net change is SAV coverage, if the restored habitat is
functionally equivalent to what was lost. Mitigation may also be required by enforcement actions, such as
the recent (2004) case of unpermitted dredging in northern Currituck Sound by DOT.
Mitigation for impacts to SAV is only allowed by CRC rules if the activity associated with the proposed
project will have public benefits that outweigh the short or long range adverse impacts. Otherwise, direct
impacts to SAV are not allowed by DCM policies and CRC rules. Most permitted impacts have involved
transportation (bridge construction) or navigation (channel dredging). Based on data available through
the Internet on SAV restoration and mitigation (http://dcm2.enr.state.nc.us/ims/restsites/srchall.htm, May
2002), there were 12 SAV restoration projects documented in Carteret and two in Onslow counties
between 1978 and 1991. Three projects were done as N.C. Department of Transportation (DOT)
mitigation, while the others were research projects conducted by NOAA. A total of 1.95 acres (0.79 ha)
of bottom was restored to SAV by these projects. The general criteria for determining success was
defined by DCM as, ―those conditions which must be met for a mitigation site to be considered successful
in order to receive a permit to impact those wetlands…[and the criteria] may include any combination of
the following and often include all of the following: vegetation establishment, wildlife use and a
hydrologic regime that is characteristic of the target wetland type‖
(http://dcm2.enr.state.nc.us/Wetlands/defs.htm#habitat%20type, November 2010). Of the 14 sites, 11
were considered ―successful.‖
Since 1991, there have been four more DOT projects involving some level of SAV impacts/mitigation:
Neuse River bridge, Chowan River US 17 bridge, Wright Memorial bridge from Currituck to Dare
county, (D. Huggett/DCM, pers. com., August 2009), and the illegal dredging of a channel off Corolla‘s
Heritage Park (see ―Dredging (navigation channels and boat basins)‖ section for more information). The
impacts were estimated at 1-2 acres for each project, and the mitigation was almost always out-of-kind.
Some mitigation was also required for at least two private projects. The Sandy Point Development near
Edenton impacted around 3-4 acres of SAV habitat, with mitigation occurring adjacent to the site. The
Joseph Thompson Project in Dare County involved moving a navigation channel away from SAV habitat.
Mitigation for this project involved transplanting SAV into the old channel area. The DCM generally
does not permit projects with direct SAV impacts, therefore negating the need for restoration/mitigation
(D. Huggett/DCM, pers. com., August 2009).
2010 Coastal Habitat Protection Plan
Chapter 4. Submerged Aquatic Vegetation Page 245
Techniques and success criteria for SAV restoration have been developed and evaluated by the NOAA‘s
Coastal Ocean Office (Fonseca et al. 1998) and others (Orth et al. 1994; Smart et al. 1998; Boustany
2003; Ailstock and Shafer 2006; Treat and Lewis 2006). However, a detailed description of the various
restoration techniques and specific success criteria will not be discussed here. The APNEP SAV
Partnership is developing an action plan for SAV restoration activities in North Carolina and southeastern
Virginia, with guidance from the Chesapeake Bay experience (Orth et al. 2002). Some important action
items for the plan include developing a central database of SAV restoration projects, a central repository
for mapping/monitoring data, and some means of coordinating research, monitoring, and restoration
activities among multiple agencies and conservation organizations. The plan for SAV restoration should
also be coordinated with other habitat restoration plans and activities.
Any plan for SAV restoration should include target goals for measuring progress toward some end point.
Setting goals based on historical abundance has been suggested (Street et al. 2005). However, setting
goals based on historical abundance may not be justified given an evolving system. Setting restoration
goals based on potential habitat maps and projected water quality improvements would be more
justifiable (see ―Habitat requirements‖ section for more information on modeling potential habitat). An
accurate map of potential habitat could guide restoration work aimed at accelerating SAV recolonization
after a period of low abundance due to unfavorable or extreme conditions. The SAV restoration action
plan should include restoration goals based on potential habitat maps and projected water quality
improvements (see “Water column restoration and enhancement” section of water column chapter for
more information).
4.3.4. Designated areas
Strong regulations are in place to protect SAV, particularly from physical damage. Special designations
may provide additional, indirect protection for native SAV above the regulatory protection granted
wherever they occur. State designations protecting SAV in public trust waters fall into basically three
categories: (1) water quality protection, (2) physical habitat protection, and (3) both water quality and
physical habitat. EMC rules related to water quality designations such as Outstanding Resource Waters,
High Quality Waters, Nutrient Sensitive Waters, and Water Supply Water I & II protect water quality,
which in turn benefits SAV. These designations are described in the ―Designations‖ section of the
―Water Column‖ chapter. MFC designations such as trawling and mechanical methods prohibited areas,
Crab Spawning Sanctuaries, Oyster Sanctuaries, Shellfish Management Areas, and Military Prohibited
Areas provide protection from fishing gear damage. CRC rules (general use standards 7 H .0208) require
activities in public trust waters, such as navigation channel dredging and marina siting, to avoid
significant adverse impacts to SAV habitat, as defined by the MFC. Both physical and water quality
protections are afforded to open shellfish harvesting waters and Primary Nursery Areas. At the federal
level, the South Atlantic Fishery Management Council (SAFMC) classifies SAV as Essential Fish Habitat
for penaeid shrimp, red drum, and snapper/grouper species. The protections are described later in
reference to particular threats. The vast majority of mapped SAV occurs within one or more designations
providing some degree of additional protection, based on GIS analysis comparing SAV maps and
regulatory designations (DMF unpub. data, July 2009).
4.4. Threats and management needs
Natural events, human activities, and global climate change influence the distribution and quality of SAV
habitat. Natural events may include regional shifts in salinity because of drought or excessive rainfall,
animal foraging, storm events, cold temperatures, or disease. Human-related activities can be broken into
two basic categories: physical and water quality. Submerged aquatic vegetation is extremely susceptible
to physical disturbance because of its vulnerable location in shallow nearshore waters. Physical threats
can inflict damage or mortality on SAV directly, as well as by indirectly influencing future survival,
reproduction, or establishment through alteration of habitat conditions (e.g., increased turbidity via
2010 Coastal Habitat Protection Plan
Chapter 4. Submerged Aquatic Vegetation Page 246
sediment resuspension). SAV is also vulnerable to water quality degradation, and in particular to
suspended sediment, due to its relatively high light requirements (see ―Habitat requirements‖ section for
more information). Human impacts to SAV habitat have been documented and summarized by the
Chesapeake Bay Program (CBP 1995), Atlantic States Marine Fisheries Commission (ASMFC 1997a),
South Atlantic Fisheries Management Council (SAFMC 1998a), NOAA (Thayer et al. 1984; Fonseca et
al. 1998), and others (Funderburk et al. 1991; Mallin et al. 2000; Orth et al. 2006). The most recent
synthesis of research describes a global crisis for seagrass ecosystems (Orth et al. 2006; Waycott et al.
2009). Climate change and sea-level rise could cause large-scale losses of SAV habitat due to rising
temperatures, water levels, and a collapse of the barrier island system (see ―Sea-level rise and climate
change‖ section for more information). The situation for North Carolina SAV will be described using
these sources, in addition to permitted impacts documented by regulatory agencies, and personal
observations.
4.4.1. Physical threats
4.4.1.1. Water-dependent development
Dredging (navigation channels and boat basins)
Dredge and fill activities are considered the primary physical threat to SAV (Orth et al. 2006). Dredging
for creation or maintenance of navigational channels and inlets resulted in degradation or elimination of
SAV habitat. The change in bottom depth, bottom sediment characteristics, and water clarity that
accompanies dredged channels prevents or discourages future growth or establishment of SAV
(Stevenson and Confer 1978; Funderburk et al. 1991). In addition, dredged channels tend to refill with
finer sediments (Thayer et al. 1984; Bishof and Kent 1990) that are easily resuspended by currents or boat
wakes. The resulting chronic elevated turbidity and sedimentation can reduce light penetration to levels
that reduce or eliminate productivity of adjacent grass beds and make colonization of unvegetated areas
more difficult (Thayer et al. 1984). Turbidity from dredging of fine sediments, such as mud bottom, is
usually more severe and persistent than dredging of coarse sand bottom.27
SAV habitat can also be
destroyed if dredged material is placed directly on shallow soft bottom where it could grow. However,
placement of dredge spoil is restricted to upland sites except on subtidal bottom where spoil islands are
permitted. The current permit process should prevent spoil islands being placed on SAV habitat.
However, dredge spoil could also be used in deeper water to create SAV habitat. The beneficial use of
dredge material is addressed in the wetlands and soft bottom chapters.
Loss of SAV habitat from dredge and fill activities has been particularly severe in bays with major ports
or metropolitan areas, such as Tampa Bay, Galveston Bay, and Chesapeake Bay (Taylor and Saloman
1968; Duarte et al. 2005). North Carolina‘s ports in Wilmington and Morehead City are small in
comparison. The Wilmington port resides in the turbid, riverine section of the Cape Fear River where
suitable habitat for SAV is lacking. In contrast, considerable SAV loss may have occurred in Morehead
City when the port‘s turning basins and access channels were originally dredged, given that nearby,
similar yet undredged areas within Bogue Sound support SAV. Dredged channels connecting marinas
and small docking facilities (including boat ramps) to major navigation channels are another source of
SAV habitat loss and degradation. Maps 2.13a-c (Water Column chapter) shows the location of ports,
navigational channels (both dredged and undredged), boat ramps, marinas, and multi-slip docking
facilities in coastal North Carolina. Some artificial channels bisect uniformly shallow areas with SAV
beds on both sides, indicating a possibly unmitigated loss of SAV habitat (S. Chappell/DMF, pers.
observation). Restoration goals could be established for historic losses of dredged SAV habitat, by using
the 2007-08 SAV imagery and GIS data for marinas, boat ramps, small boat basins, and navigation
channels to calculate the amount of dredged area. This would provide a conservative starting point for
27 Refer to the ―Habitat Requirements‖ section for the light and sediment conditions needed for SAV colonization
2010 Coastal Habitat Protection Plan
Chapter 4. Submerged Aquatic Vegetation Page 247
SAV restoration compared to other methods for determining restoration goals (i.e., predicted changes in
water quality are uncertain, as is the historic distribution of SAV).
Coastal Management rules and policies require aligning dredge channels to avoid submerged aquatic
vegetation, as defined by the MFC [CRC rule 15A NCAC 7H .0208(b)(1)]. In the past, to satisfy these
criteria, the permit process would work with the applicant to locate the proposed area for dredging
between visible patches of SAV. As part of CHPP implementation the MFC modified the definition of
SAV habitat to take into account growing seasons and inter-annual variability. CRC modified their rules
to refer to the MFC definition. With this modified definition effective in 2009, regulatory and review
agencies, now assess past and current occurrence of documented SAV coverage within the past 10 years
(see ―Definition‖ section for more information) when siting coastal development projects to avoid areas
of SAV habitat. However, some areas of historic SAV occurrence can still be dredged if they are
―essential to maintain a traditional and established use‖ based on meeting four criteria [15A NCAC 07H
.0208]: ―(i) the applicant demonstrates and documents that a water-dependent need exists for the
excavation; (ii) there exists a previously permitted channel that was constructed or maintained under
permits issued by the State or Federal government (if a natural channel was in use, or if a human-made
channel was constructed before permitting was necessary, there shall be clear evidence that the channel
was continuously used for a specific purpose); (iii) excavated material can be removed and placed in a
disposal area in accordance with Part (b)(1)(B) of this rule without impacting adjacent nursery areas and
submerged aquatic vegetation as defined by the MFC; (iv) the original depth and width of a human-made
or natural channel shall not be increased to allow a new or expanded use of the channel.‖
Although the USACE maintains 6,992 acres (2,829.56 ha) of navigation channels in coastal North
Carolina (USACE, unpub. data, 2003), the quantity dredged in a typical year will likely amount to less
than 1,000 acres, the majority of which is restricted to maintenance dredging in deep water ports and
ocean inlets (J. Sutherland/DWR, pers. com., 2004). Some of these channels are adjacent to or bisect
SAV occurrence (Maps 4.3a-b), suggesting the potential for historic and/or indirect impacts. New
dredging projects that could potentially impact SAV continue to be proposed. Some of the major projects
(proposed, permitted, or discussed) with SAV considerations included:
Relocation of ferry landing on north end of Ocracoke Island -
Realignment of existing navigation channel through Bogue Inlet -
Town of Southern Shores (Dare County) -
Sandy Point Development (Chowan County) -
Sunset Village (Dare County) - Mitigation/restoration
Kitty Hawk Landing HOA(Dare county) – currently proposed
Craven Board of Education – boat ramp with SAV
Alternative proposals often require weighing the impact on one habitat versus another (see ―Ecosystem
management and Strategic Habitat Areas‖ chapter for discussion of habitat trade-offs). As the coast
becomes more developed, additional projects involving SAV impacts will likely be proposed. The DMF
and MFC should continue to use existing permit review to prevent or limit as much as possible direct or
indirect impacts to SAV from all dredge and fill projects.
There is also some degree of illegal propeller dredging (i.e., ―kicking‖) where large boats are docked in
very shallow water. One notable case of illegal dredging occurred in 2004 when a DOT work boat kicked
2 feet of sediment to create a 5 foot deep channel through shallow water and SAV in Currituck Sound (S.
Mitchell/DOT, pers. com., 2009). The intent was to deepen an existing channel in order to accommodate
a pedestrian ferry to Currituck‘s Heritage Park in Corolla. Permits for the project had previously been
denied by DCM to protect shallow nursery habitat in the area. The CRC‘s current rules and regulations
adequately addressed the situation and DCM staff handled a complicated enforcement case appropriately,
2010 Coastal Habitat Protection Plan
Chapter 4. Submerged Aquatic Vegetation Page 248
ensuring all impacted SAV habitat was restored (M. Lopazanski/DCM, pers. com., January 2010). The
DOT efforts to restore SAV in the affected area have been successful (S. Mitchell/DOT, pers. com., July
2009).
Shoreline stabilization
The primary discussion of shoreline stabilization occurs in the Wetlands chapter and includes information
on SAV impacts. Hardened vertical structures in moderate-energy environments can potentially degrade
shallow SAV habitat by increasing wave energy, turbidity, and water depth. Scouring, deepened water,
and reduced water clarity due to suspended sediments degrade optimal conditions for SAV growth. One
specific observation was noted by ECU researchers conducting a video and acoustic assessment of SAV
near Sandy Point on Albemarle Sound. A graduate student working with Dr. Joe Luczkovich noticed a
conspicuous contraction and degradation of SAV habitat along hardened portions of the shoreline relative
to natural shoreline. Dr. Luczkovich has considered investigating the observation further. The
relationship between SAV habitat characteristics and associated shoreline types should be investigated
further.
In comparing impacts of vertical versus non-vertical structures, there are habitat trade-offs that can make
one alternative more ecologically beneficial than another. For example, bulkheads placed to prevent
upland erosion typically increase the depth of shallow nearshore soft bottom, resulting in a loss of shallow
soft bottom areas near SAV. In contrast, non-vertical structures, while not causing as much scouring and
deepening, may require placement of rock structure further out onto submerged lands, resulting in loss of
SAV habitat under the subtidal footprint of the sill. However, the gain of marsh habitat and increased
stormwater runoff control landward of the sill may enhance water quality for SAV (see ―Ecosystem
enhancement‖ section of ―Wetland‖ chapter for more information). The issue of habitat trade-offs is
explored further in the ―Ecosystem management and Strategic Habitat Areas‖ chapter.
Marinas and docks
The CRC requires marinas to be sited in non-wetland areas in deep waters that don't require dredging and
shall not disturb SAV as defined by the MFC. The CRC‘s preference is for upland basins, where SAV
may become established. However, upland boat basins (like navigational channels) reduce light
availability at the seafloor because of the increased depth, or change the sediment composition so that
SAV cannot survive or recruit into the area (Stevenson and Confer 1978). Vertical shoreline stabilization
and docking facilities associated with marinas may also impact SAV. Recent rule changes by the CRC
state that, ―Piers and docking facilities located over shellfish beds or submerged aquatic vegetation (as
defined by the Marine Fisheries Commission) may be constructed without prior approval from the
Division of Marine Fisheries or the Wildlife Resources Commission (whichever is applicable) if the
following two conditions are met: (1) Water depth at the docking facility is equal to or greater that two
feet of water at normal low water level or normal water level (whichever is applicable). (2) The pier and
docking facility is located to minimize the area of submerged aquatic vegetation or shellfish beds under
the structure‖ [CRC rule 15A NCAC 07H.1205(h)]. The location of marinas, boat basins, and public boat
access areas relative to SAV is depicted in Maps 2.13a-b of the Water Column chapter.
Shading from docks also results in loss of SAV beneath the dock structures (Loflin 1995; Beal and
Schmit 1998; Shafer 1999; Connell and Murphey 2004). In a study in the Indian River Lagoon, Florida,
light availability was reduced under docks that were 3 ft (0.91 m) and 5 ft (1.52 m) high to 11 and 14% of
ambient light, which is less than the minimum amount needed (15-25%) for growth and survival of
seagrass (Beal and Schmit 1998). Light availability increased with increasing dock elevation, and was
significantly greater under the higher dock (5 ft or 1.52 m). The Florida Department of Environmental
Protection (unpub. data) assessed the impact of dock shading to SAV in Palm Beach County, Florida, and
found that 45% of surveyed docks had SAV around them but no SAV under them. Shading effects

2010 Coastal Habitat Protection Plan
Chapter 4. Submerged Aquatic Vegetation Page 249
extended 1–3 m (3.28 - 9.84 ft) to either side of the docks. Seagrass presence was strongly correlated
with dock height for docks ranging from 0–5.5 ft (1.68 m) above mean high water (MHW). Other studies
in Florida found significantly less SAV under docks than in adjacent unshaded areas (Loflin 1995), and
no sea grasses under docks having light levels less than 14% of surface irradiance (Shafer 1999). These
small individual losses of SAV may seem insignificant, but they can have significant cumulative impacts.
The overall significance of dock shading on SAV should be assessed by comparing concurrent maps of
shoreline structures and SAV habitat.
A study by NCDMF in 2002-2003 (Connell and Murphey 2004) found reduced shoot density and
coverage of SAV under docks compared to pre-construction conditions, indicating shading impacts. To
minimize shading effects to wetland plants, CRC rules require a dock height of at least three feet (0.91 m)
above the wetland substrate, and a pier width of no greater than six feet (1.83 m) [CRC rule 15A NCAC
07H.0208 (6)]. However, there is no requirement for height above the water surface. Burdick and Short
(1999) identified dock height, orientation, and width as the most important factors affecting SAV survival
under a dock Plank spacing was of some but less importance. Their assessment in Massachusetts
recommended that docks be built less than 2 m wide, oriented within 10 degrees of north-south, be at least
3 m above the bottom, and add 0.4 m in dock height for every additional m in width. The impact of dock
structures on SAV habitat in North Carolina could be minimized given sufficient height of dock structures
above the water surface. CRC dock rules were modified in 2009 providing some additional protection for
SAV by requiring applications for docking facilities over SAV in less than 2 ft of water (MLW) to be
reviewed by the state resource agencies. Where SAV habitat is evident, additional permit conditions
regarding dock design should be considered on a case by case basis to maximize light penetration below
docks. Minimum height requirements are not without precedent in the Atlantic region. State regulations
in Maryland, Virginia, Florida and Rhode Island as well as federal regulations have stringent restrictions
on constructing piers over SAV, often requiring the applicant to pier out past the SAV, specifying width
and height standards, and prohibiting or limiting new dredging in SAV habitat (Orth et al. 2002; DMF
unpub. report 2008- tech guidance doc for SAV). In Florida aquatic preserves, guidelines for dock
construction require that access piers be five feet (1.52 m) above MHW with half inch (1.27 cm) deck
spacing to allow more light to reach beneath the structure (Beal 1999).
In addition to direct damage from docks and marinas, indirect damage to MFC-defined SAV habitat can
result from boating activity associated with these structures. Shoals and other shallow bottoms supporting
SAV may become scarred as boating activity to and from the docking areas increases. Boat wakes can
destabilize and erode SAV beds, or resuspend sediment, reducing light penetration. The potential for
boating-related damage increases as additional docks and marinas are constructed along the coast.
As part of 2005-07 CHPP implementation, a workgroup was established to examine the issue of marinas
and multi-slip docking facilities in North Carolina. The Sea Grant Marina Advisory Group completed its
report on Multi-slip docking Facilities (MSDFs) and provided recommendations to the CRC in 2007. The
report resulted in a revised application form for MSDFs (DCM-MP-4) designed to capture information
that can be used to judge the impacts of projects. The CRC has also proposed changes to the rules
regarding the general permit conditions for dock and piers which give property owners flexibility in
docking facilities (8 sq. ft/linear ft shoreline) and provides better protection of shallow water habitat by
requiring minimum water depth for docks permitted under a general permit (2 ft) and minimum water
depth for floating docking facilities under the general permit if located in a PNA, in SAV, or in Shell
bottom (18 in between bottom of floating dock and substrate). Where these conditions aren‘t met, the
applicant may apply for a permit through the major permit process. Pre-existing rules limited dock
lengths to no more than 25% of a water body‘s width (with some exceptions), and not extending into
navigation channels or beyond the length of other piers along the same shoreline.
2010 Coastal Habitat Protection Plan
Chapter 4. Submerged Aquatic Vegetation Page 250
The cumulative impacts from dock structures in rapidly developing coastal areas must also be considered.
The DCM has the authority to deny coastal development permits based on the comments of other DENR
review agencies relative to cumulative impacts. However, the research and modeling tools necessary for
review agencies to determine criteria for denial are lacking. Any research and modeling effort conducted
on dock impacts should address the cumulative impact of shading, turbidity, boater access, and other
impacts on the quality and quantity of SAV beds. Subdivisions choosing community docks over
individual docks could minimize the cumulative impact of dock structures on SAV and other aquatic
habitats (see ―Water-dependent development‖ section of ―Water column‖ chapter for more information).
Infrastructure
Infrastructure is generally defined as a conduit spanning the length between supply and demand locations
(i.e., bridges, power lines, fiber optic cables, pipelines). Infrastructure can be an SAV issue where the
structures overshadow or replace SAV habitat with hard substrate (see ―Ecosystem management and
Strategic Habitat Areas‖ chapter for further discussion of habitat trade-offs) or require dredging to lay
cables or pipes. Infrastructure projects that require SAV impacts should be avoided. Where impacts are
unavoidable, SAV losses should be minimized and adequately compensated through mitigation, using
methods recommended by NMFS for SAV restoration or creation. Such projects should be monitored
over time to determine persistence of restored SAV beds (Street et al. 2005).
In North Carolina, proposed and completed bridge projects can and have resulted in loss and degradation
of SAV habitat. The Highway 17 By-pass Bridge over the Neuse River at New Bern resulted in a loss of
SAV habitat and subsequent mitigation (referenced in ―Submerged aquatic vegetation restoration and
enhancement‖ section). The bridge constructed over Croatan Sound in 2002 managed to avoid all
mapped SAV habitat in the area. The pending replacement of Bonner bridge over Oregon Inlet could
cause direct impacts to the grass beds in the area, as well as indirect impacts from changing current
patterns and scouring. The current status of the Oregon Inlet bridge replacement remains in the plan
development phase (A. Deaton/DMF, pers. com., July 2009). A new bridge was also proposed to cross
the middle of Currituck Sound (Street et al. 2005). The proposed location is just north of the largest
concentration of SAV in Currituck Sound. As of July, 2009, the Mid-Currituck Bridge is still proposed
by the NC Turnpike Authority and will be funded ―privately‖ (S. Winslow/DMF, pers. com., July 2009).
The EIS is being finalized and will be out for review soon.
Infrastructure can also be an SAV issue where development of alternative energy sources is considered
water-dependent (i.e., requires location in public trust waters). The conduit for transferring the energy
produced in the estuary may intersect SAV habitat. There is an increasing interest in the development of
wind farms in Albemarle and Pamlico sounds, as well as off the coast of Cape Hatteras and Cape
Lookout, as these areas have some of the most abundant wind resources in the state
(http://www.ncsc.ncsu.edu/, 2009). Although wind farms are generally considered a source of ―green‖
energy, the construction of towers and infrastructure can impact immediate and adjacent marine or
estuarine habitats (Byrne Ó Cléirigh et al. 2000). While current CRC rules prohibit the placement of
wind turbines in state waters as they are not considered water-dependent structures, the CRC has taken
steps to amend these rules (M. Lopazanski/DCM, pers. com., January 2010). The proposal currently
under consideration would declare wind energy facilities of three MW or larger to be water dependent
structures. Should the State consider locating a wind facility in state or federal waters, proper placement
of energy infrastructure is necessary to minimize potential impacts to SAV habitat and minimize conflicts
with existing activities.
4.4.1.2. Boating activity
Direct physical impacts from propeller scarring, vessel wakes, and mooring scars have been identified
nationally as a major and growing source of SAV loss (Sargent et al. 1995; ASMFC 1997a; Fonseca et al.

2010 Coastal Habitat Protection Plan
Chapter 4. Submerged Aquatic Vegetation Page 251
1998). Propeller scarring of SAV occurs when outboard vessels travel through water that is shallower
than the draft of the boat. The propeller cuts the plants‘ leaves, roots, and stems, as well as creates a
narrow trench through the sediment. The damaged area is referred to as a ―prop scar‖ (Sargent et al.
1995). Large holes may also be excavated where boaters attempt to rapidly power off the shallow bottom
(Kenworthy et al. 2000). Mechanical disturbance to sediments damages the plant‘s rhizomes, which
reduces plant abundance and cover for extensive periods of time, sometimes for many years. Recovery of
SAV can take anywhere from two to 10 years, depending on the SAV species and local conditions, or in
some cases, the habitat may never recover (Zieman 1976; ASMFC 2000). Once started, SAV damage can
increase beyond the initial footprint of the prop scar due to physical scouring by tidal currents, storms, or
biological disturbance such as crab and ray burrowing (Patriquin 1975; Townsend and Fonseca 1998).
Where prop scarring is extensive and SAV beds destabilized, the ecological value of the SAV habitat is
reduced (Fonseca et al. 1998). A study in Florida found that fish abundance was not significantly
different between scarred and unscarred seagrass beds, but that severe scarring leading to complete bed
removal could affect nekton (Bell et al. 2002).
In Florida, boats have severely scarred seagrass beds (Sargent et al. 1995). Prop scarring was identified
as an increasing problem in some areas of Chesapeake Bay as well (Funderburk et al. 1991; Moore et al.
1997). In both locations, increasing occurrence of prop scarring was associated with an increasing human
population, as well as an increasing number of registered vessels (Hurley 1990; Sargent et al. 1995).
Preliminary aerial observations of high salinity grass flats in North Carolina indicate that damage to SAV
from propeller scarring is currently not a significant problem. However, as the human population along
North Carolina‘s coast increases (see ―Introduction‖ chapter on population trends), so will the number of
boats. As the number of boaters in North Carolina continues to increase, the potential for damage to SAV
via prop scarring is likely to increase, as has happened in Florida and Virginia. Clearly marked
navigation channels, boater training, and SAV education materials would help boaters avoid SAV beds.
Educational material targeting boaters include an excerpt in the coastal boating guides describing the
value of SAV habitat for fishery species and the threats posed by careless boating activity
(http://www.ncwildlife.org/fs_index_05_boating.htm, May 2009). Broader educational outreach for
CHPP implementation was undertaken by the NC-NERR and the DMF. There is also an outreach
subcommittee of the SAV partners workgroup chaired by NC-NERR staff. The DCM has a Boater‟s
Guide to Protecting Coastal Resources that briefly mentions boating impacts to SAV
(http://www.nccoastalmanagement.net/Marinas/BoaterGuide2004.pdf). This document could be
enhanced to provide better education to NC‘s recreational boaters.
4.4.1.3. Fishing gear impacts
Several bottom disturbing fishing gears have the potential to destroy or damage SAV. The ASMFC SAV
policy (ASMFC 1997b) urged development of technical guidelines and standards to objectively determine
fishing gear impacts and develop standard mitigation strategies, in cooperation with NMFS and FWS. In
North Carolina, the Fisheries Moratorium Steering Committee‘s Habitat Subcommittee identified specific
habitat impacts from various commercial and recreational fishing gears used in North Carolina waters,
and made recommendations to minimize such impacts (MSC 1996). The Fisheries Moratorium Steering
Committee presented the summary of findings to the Joint Legislative Commission on Seafood and
Aquaculture of the General Assembly. Fishing gear found to be potentially damaging to SAV is listed in
Table 4.5.
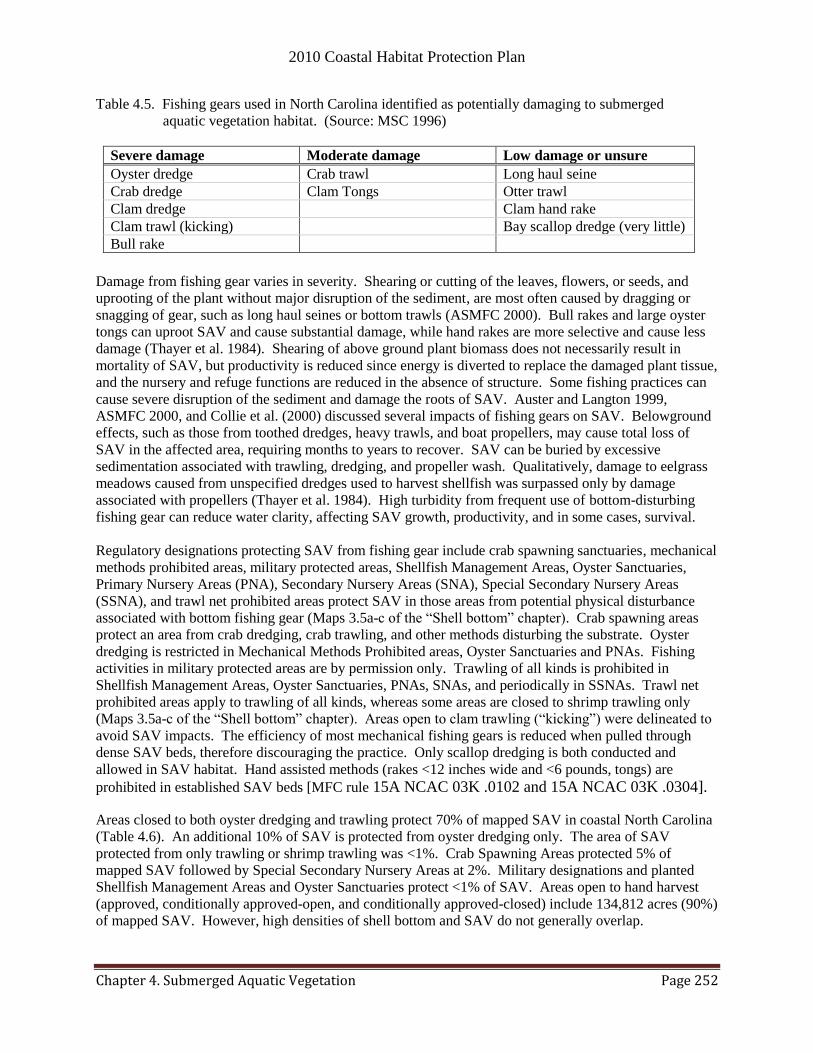
2010 Coastal Habitat Protection Plan
Chapter 4. Submerged Aquatic Vegetation Page 252
Table 4.5. Fishing gears used in North Carolina identified as potentially damaging to submerged
aquatic vegetation habitat. (Source: MSC 1996)
Severe damage Moderate damage Low damage or unsure
Oyster dredge Crab trawl Long haul seine
Crab dredge Clam Tongs Otter trawl
Clam dredge Clam hand rake
Clam trawl (kicking) Bay scallop dredge (very little)
Bull rake
Damage from fishing gear varies in severity. Shearing or cutting of the leaves, flowers, or seeds, and
uprooting of the plant without major disruption of the sediment, are most often caused by dragging or
snagging of gear, such as long haul seines or bottom trawls (ASMFC 2000). Bull rakes and large oyster
tongs can uproot SAV and cause substantial damage, while hand rakes are more selective and cause less
damage (Thayer et al. 1984). Shearing of above ground plant biomass does not necessarily result in
mortality of SAV, but productivity is reduced since energy is diverted to replace the damaged plant tissue,
and the nursery and refuge functions are reduced in the absence of structure. Some fishing practices can
cause severe disruption of the sediment and damage the roots of SAV. Auster and Langton 1999,
ASMFC 2000, and Collie et al. (2000) discussed several impacts of fishing gears on SAV. Belowground
effects, such as those from toothed dredges, heavy trawls, and boat propellers, may cause total loss of
SAV in the affected area, requiring months to years to recover. SAV can be buried by excessive
sedimentation associated with trawling, dredging, and propeller wash. Qualitatively, damage to eelgrass
meadows caused from unspecified dredges used to harvest shellfish was surpassed only by damage
associated with propellers (Thayer et al. 1984). High turbidity from frequent use of bottom-disturbing
fishing gear can reduce water clarity, affecting SAV growth, productivity, and in some cases, survival.
Regulatory designations protecting SAV from fishing gear include crab spawning sanctuaries, mechanical
methods prohibited areas, military protected areas, Shellfish Management Areas, Oyster Sanctuaries,
Primary Nursery Areas (PNA), Secondary Nursery Areas (SNA), Special Secondary Nursery Areas
(SSNA), and trawl net prohibited areas protect SAV in those areas from potential physical disturbance
associated with bottom fishing gear (Maps 3.5a-c of the ―Shell bottom‖ chapter). Crab spawning areas
protect an area from crab dredging, crab trawling, and other methods disturbing the substrate. Oyster
dredging is restricted in Mechanical Methods Prohibited areas, Oyster Sanctuaries and PNAs. Fishing
activities in military protected areas are by permission only. Trawling of all kinds is prohibited in
Shellfish Management Areas, Oyster Sanctuaries, PNAs, SNAs, and periodically in SSNAs. Trawl net
prohibited areas apply to trawling of all kinds, whereas some areas are closed to shrimp trawling only
(Maps 3.5a-c of the ―Shell bottom‖ chapter). Areas open to clam trawling (―kicking‖) were delineated to
avoid SAV impacts. The efficiency of most mechanical fishing gears is reduced when pulled through
dense SAV beds, therefore discouraging the practice. Only scallop dredging is both conducted and
allowed in SAV habitat. Hand assisted methods (rakes <12 inches wide and <6 pounds, tongs) are
prohibited in established SAV beds [MFC rule 15A NCAC 03K .0102 and 15A NCAC 03K .0304].
Areas closed to both oyster dredging and trawling protect 70% of mapped SAV in coastal North Carolina
(Table 4.6). An additional 10% of SAV is protected from oyster dredging only. The area of SAV
protected from only trawling or shrimp trawling was <1%. Crab Spawning Areas protected 5% of
mapped SAV followed by Special Secondary Nursery Areas at 2%. Military designations and planted
Shellfish Management Areas and Oyster Sanctuaries protect <1% of SAV. Areas open to hand harvest
(approved, conditionally approved-open, and conditionally approved-closed) include 134,812 acres (90%)
of mapped SAV. However, high densities of shell bottom and SAV do not generally overlap.
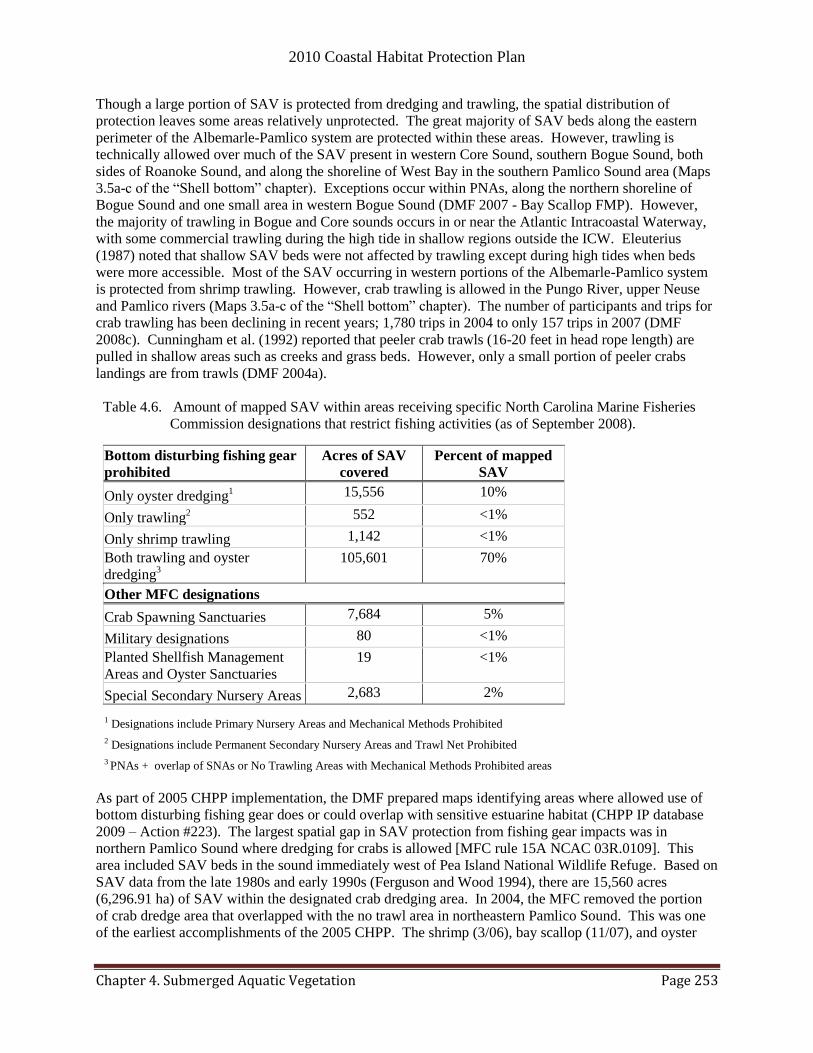
2010 Coastal Habitat Protection Plan
Chapter 4. Submerged Aquatic Vegetation Page 253
Though a large portion of SAV is protected from dredging and trawling, the spatial distribution of
protection leaves some areas relatively unprotected. The great majority of SAV beds along the eastern
perimeter of the Albemarle-Pamlico system are protected within these areas. However, trawling is
technically allowed over much of the SAV present in western Core Sound, southern Bogue Sound, both
sides of Roanoke Sound, and along the shoreline of West Bay in the southern Pamlico Sound area (Maps
3.5a-c of the ―Shell bottom‖ chapter). Exceptions occur within PNAs, along the northern shoreline of
Bogue Sound and one small area in western Bogue Sound (DMF 2007 - Bay Scallop FMP). However,
the majority of trawling in Bogue and Core sounds occurs in or near the Atlantic Intracoastal Waterway,
with some commercial trawling during the high tide in shallow regions outside the ICW. Eleuterius
(1987) noted that shallow SAV beds were not affected by trawling except during high tides when beds
were more accessible. Most of the SAV occurring in western portions of the Albemarle-Pamlico system
is protected from shrimp trawling. However, crab trawling is allowed in the Pungo River, upper Neuse
and Pamlico rivers (Maps 3.5a-c of the ―Shell bottom‖ chapter). The number of participants and trips for
crab trawling has been declining in recent years; 1,780 trips in 2004 to only 157 trips in 2007 (DMF
2008c). Cunningham et al. (1992) reported that peeler crab trawls (16-20 feet in head rope length) are
pulled in shallow areas such as creeks and grass beds. However, only a small portion of peeler crabs
landings are from trawls (DMF 2004a).
Table 4.6. Amount of mapped SAV within areas receiving specific North Carolina Marine Fisheries
Commission designations that restrict fishing activities (as of September 2008).
Bottom disturbing fishing gear
prohibited
Acres of SAV
covered
Percent of mapped
SAV
Only oyster dredging1 15,556 10%
Only trawling2 552 <1%
Only shrimp trawling 1,142 <1%
Both trawling and oyster
dredging3
105,601 70%
Other MFC designations
Crab Spawning Sanctuaries 7,684 5%
Military designations 80 <1%
Planted Shellfish Management
Areas and Oyster Sanctuaries
19 <1%
Special Secondary Nursery Areas 2,683 2%
1 Designations include Primary Nursery Areas and Mechanical Methods Prohibited
2 Designations include Permanent Secondary Nursery Areas and Trawl Net Prohibited
3 PNAs + overlap of SNAs or No Trawling Areas with Mechanical Methods Prohibited areas
As part of 2005 CHPP implementation, the DMF prepared maps identifying areas where allowed use of
bottom disturbing fishing gear does or could overlap with sensitive estuarine habitat (CHPP IP database
2009 – Action #223). The largest spatial gap in SAV protection from fishing gear impacts was in
northern Pamlico Sound where dredging for crabs is allowed [MFC rule 15A NCAC 03R.0109]. This
area included SAV beds in the sound immediately west of Pea Island National Wildlife Refuge. Based on
SAV data from the late 1980s and early 1990s (Ferguson and Wood 1994), there are 15,560 acres
(6,296.91 ha) of SAV within the designated crab dredging area. In 2004, the MFC removed the portion
of crab dredge area that overlapped with the no trawl area in northeastern Pamlico Sound. This was one
of the earliest accomplishments of the 2005 CHPP. The shrimp (3/06), bay scallop (11/07), and oyster
2010 Coastal Habitat Protection Plan
Chapter 4. Submerged Aquatic Vegetation Page 254
FMP (6/08) also identified and resolved some of the conflicts. No trawl areas were expanded along the
banks side of northern Core Sound, and no shrimp trawl areas were established in the Pamlico, Neuse,
and Pungo rivers (DMF 2006a) (Maps 3.5a-c of the ―Shell bottom‖ chapter). The MFC supported
modifying no trawl areas as needed to protected SAV habitat (DMF 2007a) and expanded Mechanical
Methods Prohibited areas in Pamlico Sound (DMF 2008a).
Scallop dredging
Bay scallop dredges, in contrast to oyster and crab dredges, cause less severe damage to SAV because
they are smaller (not over 50 lb (22.68 kg)) and have no teeth. They are intended to glide along the
substrate surface, taking bay scallops lying on the surface within SAV beds. Bay scallops depend on
SAV for initial post-larval setting, so they are strongly associated with SAV beds. An evaluation of
impacts to eelgrass (Zostera marina) from bay scallop dredging in North Carolina found that scallop
dredging over grass beds significantly reduced the biomass, surface area, and shoot density of eelgrass
(Fonseca et al. 1984). The impacts were more severe in soft bottom compared to harder bottom. Full
recovery was estimated to take up to two years. Because bay scallop populations in North Carolina
typically spawn between August and December (Fay et al. 1983c), eelgrass leaves are most needed for
attachment of juveniles (the next season's scallop crop) during the winter, which is also the time of
maximum fishing effort (Fonseca et al. 1984). However, most damage observed by DMF staff has not
been from the dredge, but from propeller scarring while pulling the dredge, particularly when the season
opening coincides with low tide (T. Murphey/DMF, pers. com., 2002). The opening of the scallop
dredging season now corresponds to high tide, and is often limited to hand harvest.
The area fished with bay scallop dredges in the Albemarle-Pamlico region (Cunningham et al. 1992)
encompasses approximately 46,000 acres (18,615.54 ha) of mapped SAV in eastern Pamlico, Core, Back,
and Bogue sounds. Bay scallop landings have been quite variable, ranging from about 201,000 lb
(91,172.07 kg) in 1995 to only 19,000 lb (8,618.26 kg) in 2002. There have been no trips documented for
scallop dredging in North Carolina since 2003 (DMF 2008c) due to a harvest moratorium. Most of the
catch is now taken by hand when the season is opened by proclamation. The projected impact of intense
scallop dredging on juvenile scallops prompted Bishop et al. (2005) to recommend only hand harvesting
methods for bay scallops. The season is opened for a specified area when DMF biologists determine
there is a sufficient population (see DMF 2007a for more information). Annual monitoring of bay scallop
populations not only provides data for fisheries management actions, but also provides information on a
sensitive environmental indicator.
Mechanical clam harvesting
Mechanical clam harvesting methods include clam dredging and clam trawling (kicking). Clam dredging
can cause severe impacts to SAV. There are basically two types of clam dredges: basic and hydraulic.
The impacts of and restrictions on basic clam dredging is similar that of oyster dredging. Hydraulic
dredges direct high-pressure water jets into the bottom to blow surface sediment away and expose clams.
The clams are then captured by the dredge head and brought to the surface on a conveyor belt. Hydraulic
dredges dig trenches in the bottom, create mounds of discarded material, and redistribute bottom material
(Adkins et al. 1983). When hydraulic clam dredging occurs in SAV beds, it digs up all vegetation in a
swath approximately three feet (0.91 m) wide (ASMFC 2000). Hydraulic clam dredging can also
significantly increase local turbidity (ASMFC 2000). Because of the severe impacts on the bottom, the
MFC and DMF restrict use of this gear to open sand and mud bottoms, including areas frequently dredged
as navigation channels, such as sections of the Atlantic Intracoastal Waterway. This gear is not allowed
in SAV or oyster beds and the restrictions are strictly enforced. The reported number of participants,
vessels, and trips for clam dredging include both basic and hydraulic dredging (DMF 2008c). There were
768 clam dredge trips in 1995 and only 344 in 2007. The number of trips declined markedly after 2004.
However mechanical clam harvesting in close proximity to SAV could cause turbidity impacts.

2010 Coastal Habitat Protection Plan
Chapter 4. Submerged Aquatic Vegetation Page 255
Another method of mechanical clamming is clam kicking. Several kicking techniques have been
developed over time (e.g., anchor, bedstead, oyster drag, clam trawl); each technique uses different gear
but all rely on propeller backwash to expose clams buried in the sediment to facilitate their harvest
(Guthrie and Lewis 1982). The most prevalent technique currently employed in North Carolina is the
clam trawl, in which a small, heavily weighted trawl is towed behind a vessel. The vessel‘s propeller
backwash is directed into the bottom and displacing the substrate so that the buried clams are collected in
the trawl (Guthrie and Lewis 1982). Most kicking activities are restricted to depths less than 10 feet (3 m)
(Guthrie and Lewis 1982). Some areas where this method is used (open waters of Core Sound, southeast
Pamlico Sound) contain clams that otherwise might not be harvested because the areas are exposed to the
wind, making it difficult for fishermen to use clam tongs. The methods and gears associated with kicking
can also cause severe damage to SAV. Peterson et al. (1987) found that clam kicking reduced plant
biomass in eelgrass and shoalgrass beds. Loss of SAV biomass and time needed for recovery increased as
intensity of clam kicking increased (Peterson et al. 1987). The probability of historic damage to SAV via
kicking seems likely to be high for three reasons: (1) kicking techniques were first experimented with in
eastern North Carolina during the 1940s, (2) almost 150 kicking vessels operated in 1980 in Carteret
County alone, and (3) kicking vessels tend to operate in shallow waters (Guthrie and Lewis 1982).
Because of the severe disturbance to the bottom, clam kicking is restricted to open sand areas in Core and
Pamlico sounds, Newport, North, New, and White Oak rivers, and southeastern Pamlico Sound. The
fishery is managed intensively, with strong enforcement to prevent clam kicking outside the designated
areas. Much of the designated mechanical clamming areas have SAV in close proximity to them, so
vessels that fish illegally outside the open areas may severely impact SAV. Turbidity generated by clam
kicking may also affect adjacent SAV beds. Annual effort in this fishery has been declining from around
1,000 trips (1996-1999) to 214 trips in 2007 (DMF 2008c).TT High salinity SAV species are more likely to
be impacted by mechanical clamming practices due to the location of the fishery. As a part of CHPP
implementation, the clam kicking area was modified by proclamation to clearly avoid all SAV and oysters
beds and establish a buffer of 50-100 feet between the gear and habitat. If this buffer appears inadequate,
DMF should modify it to an effective and scientifically based distance (CHPP IP database 2009 – Action
#71).
4.4.2. Water quality degradation
Degradation of the water column affects all living habitat features of the coastal aquatic ecosystem.
Submerged aquatic vegetation, in particular, is highly dependent on water quality conditions. Whereas
the primary discussion of water quality degradation resides in the ―Water Column‖ chapter, the major
water quality issues for SAV are summarized in this section.
4.4.2.1. Nutrients and sediment
While physical damage to SAV beds generally occurs in a discrete area and within discrete time periods,
water quality degradation can cause SAV loss over less defined and much larger areas and time periods.
The majority of SAV loss is now attributed to large-scale nutrient enrichment and sedimentation, which
reduces light penetration to the leaf (Twilley et al. 1985; Orth et al. 1986; Goldsborough and Kemp 1988;
Kenworthy and Haunert 1991; Funderburk et al. 1991; Dennison et al. 1993; Stevenson et al. 1993;
Durako 1994; Orth et al. 2006; Steward and Green 2007). Nutrient enrichment and/or increased sediment
loads impact light at leaf for SAV by:
Reducing water clarity with suspended sediment or phytoplankton associated with algal blooms
that absorb light rays prior to reaching SAV blades,
Increasing epiphytic coverage, sedimentation, or covering by drift algae on the SAV blades
(Virnstein and Morris 1996), and
2010 Coastal Habitat Protection Plan
Chapter 4. Submerged Aquatic Vegetation Page 256
Diminishing dissolved oxygen concentrations as photosynthesis from SAV beds decrease,
coupled with increasing concentrations of hydrogen sulfide resulting in toxicity (Dennison et al.
1993; Fonseca et al. 1998).
In addition to epiphytic growth, eutrophication of shallow estuaries can lead to the proliferation of
extensive thick unattached mats of ephemeral macroalgae over and around SAV, often filamentous or
sheet-like bloom forming green and brown algae (Ulva, Cladophora, Chaetomorpha, Gracilaria,
Ectocarpus) (McGlathery 2001). Some of these macroalgal species are also epiphytes (Neckles et al.
1993). Studies have found that macroalgae biomass was directly related to increased nutrient levels
(Neckles et al. 1993; Valiela et al. 1997) and that SAV loss (density and productivity) increased with
increasing macroalgae, particularly the macroalgal canopy height (Hauxwell et al. 2000). Where eelgrass
loss occurred due to macroalgal cover, nitrogen loading rates were 30 kg/ha/yr in the urbanized watershed
compared to 5 kg/ha/yr in the forested watershed. Once heavy macroalgal blooms die off, they
decompose rapidly, increasing nutrient levels in the water column, which stimulates phytoplankton
production and further light reductions. Low grazing pressure has also been shown to lead to increased
epiphytic biomass on SAV, and may have a greater effect than nutrient enrichment (Neckles et al. 1993).
Monitoring of the epiphytic and macrophytic algal community has been used as an indicator of SAV
condition and anthropogenic impacts in some areas (Dunn et al. 2008). Epiphytic and macroalgal cover
should be considered as a monitoring parameter for SAV in North Carolina.
Nutrient concentrations could indicate eutrophic conditions favoring faster-growing epiphytic algae over
SAV. In freshwater lakes, algae begin to dominate SAV at phosphorus concentrations greater than 50
mg/l (McComas 2003). Nutrients also adsorb to sediment particles, which contribute to turbidity and
reduced water clarity. Turbidity is a measure of the reduced transparency of water due to suspended or
dissolved substances, while total suspended solids is a measure of the density of suspended solids in the
water column. Chlorophyll a is a measure of the abundance of algal biomass (e.g. phytoplankton), by
measuring the green pigments contained in plants in the water column. Higher abundances of
Chlorophyll a indicate an increasing dominance of algae and phytoplankton around SAV in the water
column.
Research has shown that elevated nitrogen concentrations not only affect SAV through light reduction
from phytoplankton and epiphyte biomass, but may actually be toxic to eelgrass. In laboratory
experiments, long-term exposure of eelgrass to enriched nitrate concentrations was lethal at enrichment
levels ranging from 3.5 – 35 M water column NOB3B -- Nd
-1 (Burkholder et al. 1992b). In another
experiment with eelgrass, nitrogen enrichment (10 M water column NO B3B -- Nd
-1 for 14 wk) significantly
lowered shoot production compared to control plants without nitrogen enrichment (<2 M water column
NOB3B -- Nd
-1) (Burkholder et al. 1994). In contrast, growth in shoalgrass and widgeon grass was stimulated
by similar nutrient enrichment conditions (Burkholder et al. 1994). Widgeon grass shoot production
actually increased by 300%. These results indicate that of the three species studied, eelgrass would be
most impacted by eutrophication.
Nutrient concentrations (mainly phosphorus and nitrogen) and dissolved or suspended matter (organic or
inorganic) can also affect the distribution and condition of SAV beds (see ―Habitat requirements‖ section
for more information). Even before nutrient and sediment enrichments from human activities, SAV
distribution and abundance expands and contracts naturally with climatic conditions (i.e., storms,
droughts) since these weather patterns alter timing and magnitude of nutrient, sediment and freshwater
inputs. The specific effects of human-caused eutrophication on SAV survival are dependent on the
growth periods and environmental requirements of the dominant species, and the timing and duration of
the water quality problem (Burkholder et al. 1994). Eutrophication effects are generally most severe in
sheltered habitats with reduced tidal flushing where nutrient loadings are concentrated and frequent, and
where temperature fluctuations may be greater (Burkholder et al. 1994). Early season pulses of turbidity

2010 Coastal Habitat Protection Plan
Chapter 4. Submerged Aquatic Vegetation Page 257
can also affect SAV survival along the river continuum where conditions are suitable later in the growing
season (Moore et al. 1997). Therefore, optimal criteria for preventing eutrophication and sedimentation
vary by salinity, species, time of year, and specific location of SAV beds.
Threshold nutrient and sediment concentrations for SAV growth have been provided in the literature
(Funderburk et al. 1991; Fonseca et al. 1998; McComas 2003; Kemp et al. 2004). The threshold values
vary among freshwater, moderate and high salinity SAV, with freshwater-low salinity SAV having
slightly higher tolerance for nutrient concentrations. Table 4.7 provides those threshold values for
dissolved inorganic nitrogen (DIN), dissolved inorganic phosphorus (DIP), total suspended solids (TSS),
and Chlorophyll a (proxy for nutrient concentrations). Table 4.8 provides the North Carolina water
quality classifications and standards that most closely match these parameters. There is no official
standard for light attenuation in North Carolina. However, several water quality standards can be used as
indicators of light conditions, including turbidity, total suspended solids, and chlorophyll a levels (EPA
2000a). Other standards affecting SAV growth include dissolved oxygen and nitrate. However, the
standards are sometimes different among DWQ water body classifications (Table 4.8). The water quality
parameters are measured periodically by DWQ at fixed stations concentrated in riverine systems of the
coast (Street et al. 2005). There are relatively few water quality stations in the estuarine system (see
―Water column‖ chapter for more information). Regulations on wastewater discharge, development
density, buffer requirements, erosion and sediment controls, best management practices, and landfill
restrictions may also affect light conditions in receiving waters with SAV (see ―Water column‖ chapter
for more information). However, the effect of regulations on water clarity can only be measured in terms
of a water quality standard.
Table 4.7. Threshold nutrient and sediment concentrations for SAV. (Funderburk et al. 1991; Fonseca et
al. 1998; EPA 2000a; Kemp et al. 2004)
SAV salinity categories
Growing
season
Total
suspended
solids
(mg/l)
Dissolved
inorganic
Nitrogen
(mg/l)
Dissolved
inorganic
Phosphorus
(mg/l)
Chlorophyll
a (mg/l)
High salinity (18-30 ppt) March-
May,
September-
November
<15 <0.15 <0.01 <15
Moderate salinity (5-18 ppt) April-
October <15 <0.15 <0.01 <15
Freshwater-low salinity (0-
5ppt)
April-
October <15 - <0.02 <15
In comparing current North Carolina water quality standards to SAV habitat requirements, the standard
for chlorophyll a is higher (40 mg/l vs. <15 mg/l). The standard for TSS is also higher, but to a lesser
degree and applies only to discharges (20 mg/l vs. <15 mg/l) (Table 4.8). Given the current standards for
water quality in North Carolina, the system is not being managed to support SAV requirements even with
continuous monitoring of parameters. There are basically two alternatives for supporting SAV habitat via
standards monitoring: (1) lowering existing standards pertaining to light attenuation, or (2) including a
light attenuation standard. A study is needed to evaluate the feasibility of implementing adequate water
quality standards for supporting SAV habitat. The study would include selecting representative locations
for monitoring the standards, when and how often to measure the standard, what constitutes a 303(d)
listing, and additional cost estimates. Another important question affecting feasibility would be where to
apply the enhanced standards (e.g., Outstanding Resource Waters, NSWs, High Quality Water, Strategic
Habitat Areas). Areas not meeting the standard could then be targeted by DWQ for Total Maximum
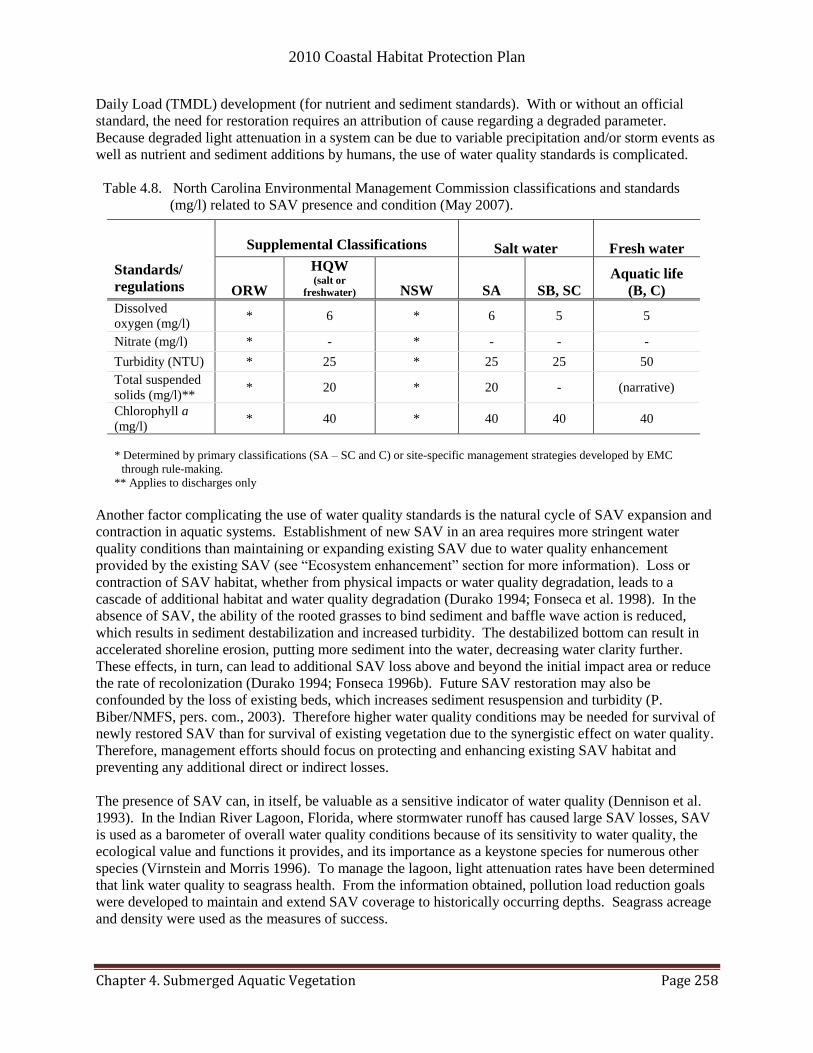
2010 Coastal Habitat Protection Plan
Chapter 4. Submerged Aquatic Vegetation Page 258
Daily Load (TMDL) development (for nutrient and sediment standards). With or without an official
standard, the need for restoration requires an attribution of cause regarding a degraded parameter.
Because degraded light attenuation in a system can be due to variable precipitation and/or storm events as
well as nutrient and sediment additions by humans, the use of water quality standards is complicated.
Table 4.8. North Carolina Environmental Management Commission classifications and standards
(mg/l) related to SAV presence and condition (May 2007).
Standards/
regulations
Supplemental Classifications Salt water Fresh water
ORW
HQW (salt or
freshwater) NSW SA SB, SC
Aquatic life
(B, C)
Dissolved
oxygen (mg/l) * 6 * 6 5 5
Nitrate (mg/l) * - * - - -
Turbidity (NTU) * 25 * 25 25 50
Total suspended
solids (mg/l)** * 20 * 20 - (narrative)
Chlorophyll a
(mg/l) * 40 * 40 40 40
* Determined by primary classifications (SA – SC and C) or site-specific management strategies developed by EMC
through rule-making.
** Applies to discharges only
Another factor complicating the use of water quality standards is the natural cycle of SAV expansion and
contraction in aquatic systems. Establishment of new SAV in an area requires more stringent water
quality conditions than maintaining or expanding existing SAV due to water quality enhancement
provided by the existing SAV (see ―Ecosystem enhancement‖ section for more information). Loss or
contraction of SAV habitat, whether from physical impacts or water quality degradation, leads to a
cascade of additional habitat and water quality degradation (Durako 1994; Fonseca et al. 1998). In the
absence of SAV, the ability of the rooted grasses to bind sediment and baffle wave action is reduced,
which results in sediment destabilization and increased turbidity. The destabilized bottom can result in
accelerated shoreline erosion, putting more sediment into the water, decreasing water clarity further.
These effects, in turn, can lead to additional SAV loss above and beyond the initial impact area or reduce
the rate of recolonization (Durako 1994; Fonseca 1996b). Future SAV restoration may also be
confounded by the loss of existing beds, which increases sediment resuspension and turbidity (P.
Biber/NMFS, pers. com., 2003). Therefore higher water quality conditions may be needed for survival of
newly restored SAV than for survival of existing vegetation due to the synergistic effect on water quality.
Therefore, management efforts should focus on protecting and enhancing existing SAV habitat and
preventing any additional direct or indirect losses.
The presence of SAV can, in itself, be valuable as a sensitive indicator of water quality (Dennison et al.
1993). In the Indian River Lagoon, Florida, where stormwater runoff has caused large SAV losses, SAV
is used as a barometer of overall water quality conditions because of its sensitivity to water quality, the
ecological value and functions it provides, and its importance as a keystone species for numerous other
species (Virnstein and Morris 1996). To manage the lagoon, light attenuation rates have been determined
that link water quality to seagrass health. From the information obtained, pollution load reduction goals
were developed to maintain and extend SAV coverage to historically occurring depths. Seagrass acreage
and density were used as the measures of success.
2010 Coastal Habitat Protection Plan
Chapter 4. Submerged Aquatic Vegetation Page 259
Further research in Indian River lagoon has addressed setting load limits for nutrients and suspended
solids based on seagrass depth-limit targets (Steward and Green 2007). Total Maximum Daily Loads
were calculated based on regressing total nitrogen (TN), total phosphorus (TP), and total suspended solids
(TSS) loading [log (kg ha-1 yr-1)] against seagrass depth limits (percent of depth limit targets).
Calculating TMDLs for SAV in North Carolina would require coordinated multi-year monitoring of: (1)
SAV depth and distribution, and (2) nutrient and sediment loading. However, TMDLs should only be
developed for areas where light attenuation is strongly affected by watershed pollutant loading (i.e.,
NSWs). A multi-year protocol for detecting annual changes in SAV distribution in North Carolina is
being developed jointly by APNEP, NOAA, ECU, and NCSU (see ―Status and trends‖ section for more
information). The primary discussion of nutrient and sediment monitoring is in the ―Water column‖
chapter.
In Chesapeake Bay, cooperative efforts by scientists, managers, and politicians have worked for over two
decades to protect and restore SAV (Orth et al. 2002). Chesapeake Bay Agreements in 1983, 1987, and
2000 as well as other related ongoing efforts have established policies and regulations to protect and
restore SAV through adaptive management. Research and modeling was conducted to determine light
and water quality standards needed to sustain SAV and evaluate point and nonpoint pollutant loading
reductions needed to achieve these conditions. Despite the enormous efforts, success in terms of water
quality improvements and SAV habitat increases has been limited.
Knowing that water quality degradation is the largest contributor to declines in SAV, and that North
Carolina‟s growing coast will likely lead to additional water quality degradation, North Carolina needs
to investigate the best method to protect SAV habitat from water quality degradation.
4.4.2.2. Toxic chemicals
Herbicides
Herbicides are the primary toxic chemical known to have negative impacts to SAV (Funderburk et al.
1991). Herbicides enter riverine and estuarine waters from agricultural runoff and other sources. The
most common agricultural herbicides used in Chesapeake Bay were atrazine, simazine, diquat, paraquat,
and linuron. Research in Chesapeake Bay found that concentrations of the toxins in the water column
were seldom high enough to damage SAV beds. In addition, SAV recovery was rapid following exposure
to low concentrations of herbicides (Funderburk et al. 1991). Some SAV species may even be viable
candidates for monitoring hydrophobic organochlorines (cis- and trans-chlordane, dieldrin, and
polychlorinated biphenyls). Along the tidal Potomac River, Hopple and Foster (1996) found toxic
concentrations in Hydrilla beds similar to surrounding riverine sediment. However, impacts to SAV from
sporadic or localized pulses of higher concentrations are not known, and could potentially cause
problems. While most agricultural herbicides come in contact with SAV indirectly through runoff, there
are other chemicals specifically developed for aquatic weed control in freshwater and brackish systems.
These chemicals are designed to be short-lived and should not persist in the water for long periods of
time. The following section (―Introduced and nuisance species‖) includes more information on toxic
chemicals effects on SAV.
Fossil fuels
Oil spills can have negative impacts on SAV in several ways. SAV can be smothered and die by high
concentrations of oil. In lesser concentrations oil may leave a ―burnt‖ look on SAV blades, but this is a
temporary effect since new leaf production continues once oil concentrations subside (Jacobs 1980). In
lower concentrations of oil SAV can have a reduced photosynthetic rate as a result of oil toxicity. Oil
may also have sublethal effects by accumulating PAH in sea grasses reducing its tolerance to other stress
factors (as described in above sections) potentially leading to death of the SAV (Zieman et al. 1984).
2010 Coastal Habitat Protection Plan
Chapter 4. Submerged Aquatic Vegetation Page 260
Although in most field studies of oil effects on SAV and the associated fauna there is seldom pre-event
data, many studies compare oil affected sites versus non affected sites or observe trends over a period of
time. After the ‗Exxon Valdez‘ spill Jewett et al. (1999) observed lower abundance of amphipods at oil
affected sites than those not affected as well a higher numbers of certain polychaetes species. The
reduced number of amphipods may be caused by the acute toxicity of oil, while the increased number of
polychaetes may be from the increased amount of detritus from the dead/decaying SAV. This shift in the
benthic invertebrates may cause a shift in the food web. These results have been observed in other studies
such after other spills such as the ‗Amico Cadiz‘ (Dauvin 1982). Dispersants may be useful in the
cleanup of oil, but they may be detrimental to SAV. Edwards et al. (2003) showed dispersants encourage
the breakdown of SAV‘s waxy cuticle, allowing greater penetration of oil into SAV blades.
4.4.3. Non-native, invasive, or nuisance species
There is a general perception by some of the public that all SAV is a nuisance. Grass blades may get in
boat propellers, water intakes, or entangle or weigh down fishing gear. Aesthetically, swimmers may
prefer a sand bottom to a grass bottom. Highly invasive non-native species form dense beds in the water,
which can make swimming, fishing, and boating difficult; clog water intake systems for municipalities
and industries; and impede water flow in drainage canals
(http://www.ncwater.org/Education_and_Technical_Assistance/Aquatic_Weed_Control, May 2002).
Moreover, dense beds of Eurasian watermilfoil, a submerged rooted grass, can cause the water column to
become anoxic at night, which can stress fish or cause fish to leave the area (T. West/ECU, pers. com.,
2003). Although these nuisance species do provide some beneficial fish functions, such as refuge and
sediment stabilization, they can also negatively impact SAV habitat by shading or out-competing other
native species, which may have greater value to fish as a food source or refuge area (DWR 1996). Native
species may also be more resilient to long-term patterns in temperature, salinity and energy regime.
The Division of Water Resources, under the Aquatic Weed Control Act of 1991 [General Statute 113A-
220 ff; DENR rules 15A NCAC 02G .0600], manages the North Carolina Aquatic Weed Control Program
(AWCP)28
, under direction from the Aquatic Weed Control Council. This program primarily focuses on
non-native invasive species in freshwater lakes, ponds, and rivers. Some of the annual control activities
occur in fresh and low salinity waters used by anadromous fishes and blue crabs, including the Albemarle
Sound system. The program‘s focus is determined by public notices, which are primary directed at
vegetation problems in impoundments (mostly hydrilla in Lake Gaston) (R. Emens/DWR, pers. com.,
May 2009). Program staff (―the Weed Team‖) work with local governments to provide technical and
financial assistance (50:50 cost share). The Weed Team conducts a site assessment using the DENR list
of noxious aquatic weeds (includes Hydrilla, Elodea, water hyacinth, Eurasian watermilfoil, alligator
weed, purple loostrife, brittle naiad, and Phragmites) to identify projects for assistance. The species most
pertinent for DMF in 2010 included Alternanthera philoxeroides (alligator weed), Myriophyllum
spicatum (Eurasian milfoil), and Phragmites australis. Hydrilla was reported for the first time in the
Chowan River. Aquatic herbicides may be used to kill the nuisance vegetation. Herbicides used include
copper-based compounds (cheap but results in water use restrictions), 2-4-Dichlorophenoxyacetic acid (2-
4-D), and/or SONAR (expensive but can be used with no water use restrictions). The Weed Control
Program also posts signs at boat ramps warning of the danger in spreading noxious weeds to other
systems. Signs could also be posted to educate the public on the value of native aquatic plants.
The most troublesome species in low salinity, estuarine waters is Eurasian watermilfoil. Weed control
activities in coastal waters are primarily focused on this species. Control activities target areas where
native species are not the dominant species based on site assessments (R. Emens/DWR, pers. com., May
2009). The AWCP may consult with DENR resource management agencies in assessing coastal sites
28 http://www.ncwater.org/Education_and_Technical_Assistance/Aquatic_Weed_Control
2010 Coastal Habitat Protection Plan
Chapter 4. Submerged Aquatic Vegetation Page 261
concerning any impacts on native SAV. A recent consultation involved the area of Kitty Hawk Bay
where treatments of dense Eurasian milfoil stands resulted in a significant reduction of milfoil coverage
(R. Emens/DWR, pers. com., August 2009). The Weed Team also observed native species resilience to 2-
4-D treatments of milfoil and would like to test the observation further (R. Emens/DWR., pers.
observation, May 2009). The AWCP, in cooperation with the Town of Kill Devil Hills intends to
continue monitoring the milfoil infestation and conduct spot treatments on an as needed basis. Long-term
management and restoration of SAV habitat should include replacement of Eurasian watermilfoil with
native species throughout the estuary. However, because milfoil is providing habitat for important
fishery species, treatment of milfoil should only be conducted where milfoil occurs as a dense
monoculture and native species are minimally or not present. The AWCP staff agreed to consult with
regional DMF staff prior to chemical applications in public trust waters to ensure that fish habitat impacts
are minimized, and should continue to do so.
To spray submerged or emergent vegetation in public trust waters, one must be licensed for herbicide
spraying and have a special certification for public water spraying (B. Bruss/Dept of Agriculture, pers.
com. 2009). The spraying must be done according to the label and overspray to unintentional areas would
be a violation of the label. Only state agencies or local government are allowed to have the public water
certification. Possible violations are investigated by the Dept. of Agriculture on request. In 2008
property owners in a private subdivision treated a large area of public trust waters independently, without
having proper certification or consulting with DWR or DMF staff. As a result, a large area of native and
non-native SAV species was obliterated. G.S. 113-300.1 states that WRC has authority to regulate,
prohibit or restrict use of poisons or pesticides severely affecting wildlife resources (includes SAV as
resource), as long as the rules do not conflict with the Pesticide Law of 1971 or Structural Pest Control
Act of 1955. Furthermore, an Attorney General review in 1995 found that MFC had authority under
143B-289.3(b) to regulate use of pesticides on SAV. EPA is in the process of requiring a NPDES permit
for any spraying of aquatic pesticides and herbicides over or near public trust waters. NC DWQ is in the
process of developing the permit. However, the exemption thresholds will be fairly high and the permit
will not address the spraying of native vegetation. Legislation is needed to prohibit chemical treatment of
native vegetation in estuarine waters, due to its high value as fish habitat.
Another introduced species affecting SAV is the grass carp, which is often stocked in ponds and
impoundments for nuisance weed control. Grass carp have escaped from stocked ponds and reservoirs
into some river systems in North Carolina. The escaped carp can have a significant impact on native
freshwater SAV in receiving waters. North Carolina requires that only sterile triploid grass carp be used
for stocking because of their potential damage to submerged vegetation. However, a recent study in the
Chesapeake Bay found that although stocking of sterile grass carp has been required for over 20 years,
18% of the non-native grass carp were not sterile (Schultz et al. 2001). Non-native species may also be
introduced through unintentional releases from aquaculture and live bait facilities.
Nuisance species, from the perspective of SAV habitat, may or may not be introduced. Examples include
macroalgae and the ―animal grass‖ (a bryozoan) that sometimes overwhelms SAV in high salinity waters
(T. Murphy/DMF, pers. com., 2007). Excessive macroalgae growth (drift algae or epiphytic), has been
shown to negatively impact productivity of SAV (Kemp et al. 2004). The animal grass infestations
observed in 2007 were identified as the Sauerkraut bryozoan, Zoobotryon verticillatum (B. Burns/DMF,
pers. com., October 2007). The overabundance of animal grass appears to occur in drought years in high
salinity areas. Though Z. verticillatum competes with SAV for space and interferes with certain fisheries
activities, it also filters large quantities of water to provide a function similar to living oyster reefs.
Research is needed to determine the ecological role and effects of animal grass on SAV beds and related
fish communities in North Carolina.
2010 Coastal Habitat Protection Plan
Chapter 4. Submerged Aquatic Vegetation Page 262
4.4.4. Diseases and microbial stressors
Seagrass wasting disease is a natural event that has affected SAV in North Carolina and may occur when
SAV is stressed. Historic population losses of large vertebrate grazers may have, among other
consequences, increased seagrass vulnerability to infection by pathogens (Jackson et al. 2001). It was
suspected, but never proven, that the slime mold protist, Labryinthula, was the cause of the wasting
disease event that devastated eelgrass populations throughout the North Atlantic between 1930 and 1933,
dramatically disrupting estuarine systems (Steel 1991). Higher water temperatures apparently stressed the
sea grasses, making them more susceptible to Labryinthula. Vergeer et al. (1995) later confirmed a
decline in the microbial defenses of seagrass with increasing temperature. The primary factor enhancing
microbial defenses was increasing light intensity, which is related to both water quality and self-shading.
Jackson et al. (2001) suggested that declining grazer abundance has caused, among other things, a self-
shading stressor for dense seagrass beds. Healthy eelgrass beds were generally reestablished by the
1960s. More recently, similar large-scale die-offs of eelgrass from Nova Scotia to Connecticut, and turtle
grass in Florida Bay have been attributed to Labryinthula (Short et al. 1987). Eelgrass infected with
Labryinthula was also found near Beaufort, North Carolina in the 1980s (Short et al. 1987). Submerged
aquatic vegetation is less susceptible to infection by the pathogen in low salinity waters (Short et al.
1987). Potential impacts in North Carolina include reductions in bay scallops and other fisheries
resources, and large reductions in migratory waterfowl populations and loss of ecosystem services.
Although the current infections have not caused catastrophic declines in eelgrass populations such as
those which occurred in the 1930s, the disease is a potential threat to coastal fisheries should large-scale
mortalities occur. Submerged grasses need to be monitored on a periodic basis to assess the status of
wasting disease and its association with human-induced stresses.
Another microbial stressor on SAV could be the gall-like growths on widgeon grass observed in low
salinities areas such as Blounts Bay on the Tar River (C. Wilson/USACE, pers. com., April 2008). The
effects of the gall-like growths on widgeon grass in Blounts Bay are unknown. However, the 2009
disappearance of widgeon grass in Blounts Bay may suggest a causal link (J. Paxon/DWQ, pers. com.,
2009). Research is needed to determine effects of gall infections on SAV beds and related fish
communities in North Carolina.
4.4.5. Sea level rise and climate change
The ―Wetlands‖ chapter contains the primary discussion of sea level rise and its effect on coastal habitats.
Changing temperature and salinity patterns with climate change are discussed primarily in the ―Water
column‖ chapter. Specific issues and effects of sea level rise and climate change on SAV habitat in North
Carolina are discussed in this section. The effects/issues include:
1. The significant impact of increasing CO2 concentrations on growth of CO2-limited seagrass
species (Palacios and Zimmerman 2007);
2. Shifting relative abundance and distribution of eelgrass and shoal grass with increasing
temperature (Micheli et al. 2008).
3. The importance of seagrass genetic diversity in providing resilience to heat waves and other
extreme climate conditions (Ehlers et al. 2008);
4. Loss of marsh and barrier island windbreaks and subsequent loss of sheltered SAV habitat (D.
Piatkowski /USACE, pers. observation, 2009).
5. Deepening of waters adjacent to hardened shoreline (see ―Shoreline stabilization‖ section of
Wetlands chapter) exacerbated by predicted increases in the severity and frequency of large storm
events (IPCC 2007).
Palacios and Zimmerman (2007) compared the growth of eelgrass with various levels of CO2 enrichment.
The results indicated significantly higher reproductive output, below-ground biomass and vegetative
production of new shoots at 33% surface irradiance at leaf. The results suggest an increasing CO2 content
2010 Coastal Habitat Protection Plan
Chapter 4. Submerged Aquatic Vegetation Page 263
in the atmosphere and ocean surface will increase the area-specific productivity of seagrass meadows.
This also suggests the value of seagrass beds in sequestering carbon. However, warming trends pose a
threat to eelgrass growing near its southern limits in North Carolina. There is some evidence of declining
summer densities and biomass of eelgrass in Bogue Sound at sites that were monitored between 1985 and
2004 (Micheli et al. 2008). The study also found that an increase in shoal grass compensated for the
eelgrass decline, but invertebrate diversity and abundance declined. In a study looking at the role of
eelgrass genetic diversity on their resilience to temperature extremes, the results suggested a reduction in
seagrass resilience to climate change with alterations that tend to reduce genetic diversity (Ehlers et al.
2008). Site monitoring of SAV should include species composition and genetic diversity to track the
potential impacts of climate change. North Carolina is uniquely situated to conduct such research.
The reduction in extent of marsh islands described in the wetlands chapter was observed by USACE
managers working in Currituck Sound and associated with loss of SAV (D. Piatkowski /USACE, pers.
observation, 2009). Marsh islands provide shelter from the wind and waves during the growing season
for SAV. The shrinking of marsh islands is caused by sea level rise, erosion, and the interruption of
barrier island over-wash by oceanfront development (see ―Soft bottom‖ chapter for more information).
The relationship between marsh island extent and quality of surrounding SAV beds should be investigated
further.
Seagrass habitat, as one of the most productive systems in the world, is considered an important carbon
dioxide sink relative to other terrestrial and aquatic habitats. Because the plants have a slow turnover
rate, the leaves degrade slowly, and a large part of the carbon production is put into the below-ground
rhizome system, sea grasses have a large capacity for accumulation and storage of carbon. It is estimated
that seagrass habitat is responsible for about 15% of the total carbon storage in the ocean while occupying
a lesser portion of the seafloor (Pidgeon 2009; UNEP 2009). To sustain the carbon sink service provided
by submerged grasses, the habitat must be preserved, with management efforts focused on maintaining
environmental conditions (nutrient and sediment concentrations) needed for SAV growth (Bjork et al.
2008).
4.4.6. Management needs and accomplishments
The global and nationwide trend of declining SAV habitat (Orth et al. 2006; Waycott et al. 2009), coupled
with recognition of its ecological importance, has led several regional and state resource management
agencies to develop protective management policies for SAV habitat, including Atlantic States Marine
Fisheries Commission, South Atlantic Fishery Management Council, Chesapeake Bay Program, and
Rhode Island Coastal Resources Management Program. Virginia and Maryland, through the Chesapeake
Bay program, developed a guidance document for SAV (EPA 1995) and Rhode Island Coastal Resources
Management Program has definitions, findings, policies, and standards regarding activities that can
impact SAV (http://www.edc.uri.edu/Eelgrass/300_18.pdf, November 2010). Both documents address
identification and protection of both existing and historically occurring SAV habitat, recommend SAV
mapping, require surveys of the SAV habitat during appropriate growing seasons, require buffers around
identified grass beds, and restrict certain specific activities from occurring in or over SAV habitat.
Chesapeake Bay implements a tiered approach in SAV habitat protection, based on the documented
bottom information available. In 2003 the MFC adopted a policy statement for protection of SAV
habitat. The document summarizes the habitat value of SAV and provides management guidelines for
protection of SAV, to aid in development of habitat protection and fishery management plans (Appendix
G). The policy includes the following guidelines:
In order to delineate and assess the distribution and health of SAV habitat, SAV beds need to be
mapped and monitored. The saltwater end of coastal waters supports eelgrass, widgeon grass
and shoalgrass, and the freshwater end supports several species of freshwater SAV.
Minimize nutrient and sediment loading to coastal waters that support existing SAV to protect

2010 Coastal Habitat Protection Plan
Chapter 4. Submerged Aquatic Vegetation Page 264
adequate water quality as defined by water-column clarity in standard measurement units.
All SAV needs to be protected from all bottom-disturbing fishing and recreational gear.
Sufficient buffer zones surrounding SAV beds should also be protected from disturbance to
prevent impacts of sediments on growing SAV.
Provide adequate safeguards to prevent direct (or indirect) impacts from development projects
adjacent to or connected to SAV.
Assess cumulative impacts of land use and development changes in the watershed affecting SAV
to identify the potential impact. Require identification of cumulative impacts as a condition of
development of permit applications.
Require compensatory mitigation where impacts are unavoidable. Initiate restoration programs
to recoup and/or enhance lost SAV habitat.
Educate landowners adjacent to SAV, boaters, and other potential interested parties about the
value of SAV as a habitat for many coastal fishes and invertebrates.
Commission actions (MFC, CRC, and EMC) have been fairly consistent with this policy. Substantial
progress has been made on the majority of these guidelines, but there are others that have not yet been
addressed.
The management needs noted by italics in the 2005 CHPP were addressed to some degree during 2005-
2010. Some needs are considered accomplished, whereas others are considered ongoing with or without
progress. Emerging management needs are new or significantly modified from their 2005 versions and
may or may not be refined and adopted as actions in the 2009-2011 CHPP implementation plans.
Discontinued needs includes those recommendations from Street et al. (2005) that were omitted from the
chapter update for various reasons (i.e., included in another chapter as part of primary discussion, need
discontinued, considered minor, redundant, or too general). The subheadings reflect these distinctions.
4.4.6.1. Research needs and progress (2005-2010)
Accomplished research needs
1. Model a wide range of estuaries to determine environmental requirements for SAV over a broader
spatial and temporal scale to determine if changes in EMC water quality standards are needed. The
relationship between water quality and SAV has been examined sufficiently in North Carolina, the
Chesapeake Bay, and Florida (see Section 4.1.3. “Habitat requirements” and Section 4.4.2. “Water
quality degradation” for more information and context).
2. Examine the relationship between juvenile red drum abundance in SAV and marsh edge habitat and
the effect of spatial connectivity on habitat use to support management of this important species. Conclusive research has been conducted (see Section 4.2.4.3. “Nursery” for more information and
context).
Research needs with progress
1. Evaluate whether current sampling locations and methods are sufficient in estuarine waters to
monitor the suitability of water quality conditions for SAV survival and growth. If additional
monitoring is needed, establishment of continuous monitoring stations should be considered. In
either case, priority should be given to those areas already classified NSW (Street et al. 2005). The
DMF Habitat Section assembled an inventory of water quality monitoring stations to help determine if
conditions could be modeled throughout the estuary – part of mapping potential habitat for SAV. The
results show that water quality data are few and far between, especially in estuarine waters (see Section
4.1.3. “Habitat requirements”). Relating land-use characteristics to downstream water quality in a
hydrodynamic model could be the most cost effective means of locating potential SAV habitat – existing
WQ monitoring stations could be used to calibrate the model.
2010 Coastal Habitat Protection Plan
Chapter 4. Submerged Aquatic Vegetation Page 265
2. Determine the relationship between changing SAV coverage and water quality conditions (Street et
al. 2005). There has been some research in North Carolina, Virginia and Florida relating SAV habitat
characteristics to water quality measurements (see Section 4.1.3. “Habitat requirements” and Section
4.2.2. “Ecosystem enhancement”).
3. DENR should work with NMFS to determine what levels of TSS, chlorophyll a and other parameters
are needed to achieve desired water clarity (Street et al. 2005). The latest research is presented in
Section 4.4.2.1. “Nutrients and sediment”.
4. Determine if adequate light is available beneath North Carolina docks, given the CRC‟s current
siting criteria. The criteria should be evaluated to determine if changes would be needed to allow the
minimum amount of light for SAV growth (Street et al. 2005). A study by NCDMF in 2002-2003
(Connell and Murphey 2004) found reduced shoot density and coverage of SAV under docks compared to
pre-construction conditions (see “Marinas and docks” subsection of Section 4.4.1.1. “Water-dependent
development”).
5. Develop criteria to designate SAV beds as a component of Strategic Habitat Areas (Street et al.
2005). The DMF has also developed criteria for designating Strategic Habitat Areas that capture the
vast majority of low and high salinity SAV and assesses potential alteration from fishing gear, among
other factors (see chapter 8. “Ecosystem management and Strategic Habitat Areas” for more
information).
Research needs without progress
1. Verify if a recovery of SAV has occurred and determine if there is a spatial pattern of that recovery.
If there is a pattern, special monitoring and protection should be afforded those core areas from
which SAV begins its recolonization (Street et al. 2005). In the mean time, Back Bay/Currituck Sound
should serve as a test case for re-establishing SAV in a recovering/recoverable ecosystem. No specific
progress. See Section 4.3.3. “Submerged aquatic vegetation restoration and enhancement” for more
information.
2. Assess the cumulative impacts of dock placement (i.e., shading, boating activity, associated
development) on SAV habitat in selected water bodies (Street et al. 2005). No progress, but
anticipated completion of shoreline mapping and structures inventory will help DCM and other permit
review authorities evaluate cumulative impacts (see “Marinas and docks” subsection of Section 4.4.1.1.
“Water-dependent development” for more information).
3. Conduct research to determine the relative fishery value of Eurasian watermilfoil compared to native
vegetation (Street et al. 2005). No specific progress. See Section 4.4.3. “Non-native, invasive, or
nuisance species” for more information.
Emerging research needs
1. A simple model to predict potential SAV habitat in North Carolina would be helpful for identification
and protection of this important habitat where it has not been mapped or otherwise documented
recently (within the past 10 years). See Section 4.1.3. “Habitat requirements” for more information.
2. Research is needed on how much SAV proximity affects juvenile production from spawning areas. See Section 4.2.4.2. “Spawning” for more information.
2010 Coastal Habitat Protection Plan
Chapter 4. Submerged Aquatic Vegetation Page 266
3. Research is needed on the relationship between juvenile Sciaenid abundance and connectivity among
nursery habitats and spawning areas. See Section 4.2.4.5. “Corridor and connectivity” for more
information.
4. Research is needed to determine the habitat preferences of other fisheries species and life stages in
North Carolina in order to estimate population sizes and determine habitat protection priorities. See
Section 4.3.2. “Status of associated fishery stocks” for more information.
5. More fishery-independent information and habitat change analysis are needed to evaluate the effect
of SAV-coverage on the abundance of fish and invertebrates. See Section 4.3.2. “Status of associated
fishery stocks” for more information.
6. The relationship between SAV habitat characteristics and associated shoreline types should be
investigated further. See “Shoreline stabilization” subsection of Section 4.4.1.1. “Water-dependent
development” for more information.
7. Research is needed to estimate the loss of SAV habitat from apparent dredging using the 2007-08
SAV imagery and GIS data for marinas, boat ramps, small boat basins, and navigation channels. The
results of such research could be used to set restoration goals addressing historic losses of SAV
habitat to dredging. See “Dredging (navigation channels and boat basins)” subsection of Section 4.4.1.1.
“Water-dependent development” for more information.
8. The overall significance of dock shading on SAV should be assessed by comparing concurrent maps
of shoreline structures and SAV habitat. See “Marinas and docks” subsection of Section 4.4.1.1.
“Water-dependent development” for more information.
9. The Weed Team observed native species resilience to 2-4-D treatments of milfoil and would like to
test the observation further (Rob Emens/DWR., pers. observation, May 2009). See Section 4.4.3.
“Non-native, invasive, or nuisance species” for more information.
10. Research is needed to determine the ecological role and effects of animal grass on SAV beds and
related fish communities in North Carolina. See Section 4.4.3. “Non-native, invasive, or nuisance
species” for more information.
11. Research is needed to determine effects of gall infections on SAV beds and related fish communities
in North Carolina. See Section 4.4.4. “Diseases and microbial stressors” for more information.
12. The relationship between marsh island extent and quality of surrounding SAV beds should be
investigated further. See Section 4.4.5. “Sea level rise and climate change” for more information.
13. Epiphytic and macroalgal cover should be considered as a monitoring parameter for SAV condition
in North Carolina. See Section 4.4.2.1. “Nutrients and sediment” for more information.
14. Research is needed on the feasibility of hard clam augmentation for the purpose of water quality
based restoration of SAV. See Section 4.3.3. “Submerged aquatic vegetation restoration and
enhancement” for more information.
4.4.6.2. Management needs and progress (2005-2010)
Accomplished management needs
1. Ensure consistency in habitat definitions among agencies and commissions (CHPP IP database 2009
– Action #152). MFC approved revised definition of SAV habitat in 2009. CRC references definition in

2010 Coastal Habitat Protection Plan
Chapter 4. Submerged Aquatic Vegetation Page 267
revised General and Specific Use Standards for Development. See Section 4.1.1. “Definition” for more
information.
2. Evaluate the boundaries of No Trawl Areas and adjusting, if necessary, to adequately protect all high
salinity SAV beds from both direct and indirect impacts, such as turbidity. Additional law
enforcement may be needed to enforce buffers necessary to protect SAV from gear-induced turbidity
(Street et al. 2005). The DMF prepared maps identifying areas where allowed use of bottom disturbing
fishing gear does or could overlap areas with sensitive estuarine habitat. The Shrimp FMP (2007), Bay
scallop FMP (2007) and oyster FMP (2008) identified and resolved gear/habitat conflicts (i.e., crab
dredging in Oregon Inlet overlapping SAV). See Section 4.4.1.3. “Fishing gear impacts” for more
information.
3. Modify clam kicking and hydraulic dredging areas by proclamation to clearly avoid all SAV and
oyster beds and allow a buffer of 50-100 ft between mechanical shellfish gear and SAV and shell
bottom. The size of the buffer may be modified if supported by scientific studies. Done for Core Sound
in 2006. The MFC also closed >30,000 acres in Pamlico Sound tributaries to mechanical shellfish harvest
in 2005. See Section 4.4.1.3. “Fishing gear impacts” for more information.
4. Provide more education on the value of SAV to the health of North Carolina‟s estuaries and fisheries
is needed to modify attitudes toward this habitat and improve individual and community stewardship
of SAV (Street et al. 2005). Broader educational outreach for CHPP implementation was undertaken by
the DCM NERR and the DMF. There is also an outreach subcommittee of the SAV partners workgroup
chaired by NC-NERR staff. See Section 4.4.1.2. “Boating activity” for more information.
5. Conduct educational outreach to increase awareness by the boating public of the ecological value of
SAV and the damaging effects of boat propellers on SAV habitat (Street et al. 2005). Educational
material targeting boaters includes an excerpt in the coastal boating guides describing the value of SAV
habitat for fishery species and the threats posed by careless boating activity
(http://www.ncwildlife.org/fs_index_05_boating.htm and
http://www.nccoastalmanagement.net/Marinas/BoaterGuide2004.pdf, May 2009).
6. Conduct a review of current chlorophyll, TSS, and turbidity standards to determine if they are
appropriate for the protection of SAV in North Carolina waters. A review is provided in Section
4.4.2.1. “Nutrients and sediment”.
7. Ensure that chemical removal of European watermilfoil and other non-native vegetation does not
also eradicate native species in the process (Street et a. 2005). The DWR Weed Team is consulting
with DENR resource management agencies as part of their site assessments. See Section 4.4.3. “Non-
native, invasive, or nuisance species” for more information.
Management needs with progress
1. To quantify trends in SAV abundance, regular mapping efforts of all or a subset of the habitat is
needed in addition to monitoring data from stations and transects (Street et al. 2005). The mapping
was coordinated through the Albemarle-Pamlico National Estuary Program (APNEP), in partnership
with multiple agencies. A multi-agency MOU was signed in 2006; state and federal funds were allocated
for SAV aerial photography in 2007; sampling protocols were developed in 2006-2007, and image
acquisition was completed in 2007-2008. However, the imagery has not been classified due to loss of staff
position. See Section 4.1.4. “Distribution” for more information.
2. Require compensatory mitigation where impacts to SAV are unavoidable. Initiate restoration
programs to recoup and/or enhance lost SAV habitat (Street et al. 2005). DWQ worked with DOT on
a SAV and oyster habitat restoration and mitigation project in the Currituck Sound. Restoration work

2010 Coastal Habitat Protection Plan
Chapter 4. Submerged Aquatic Vegetation Page 268
has been completed and monitoring continues to assess the success of the project. EEP has initiated
internal research to determine the functional value of SAV restoration. EEP will review the DCM
permitting requirements involving impacts to SAV. EEP will incorporate SAV restoration
recommendations into the non-traditional mitigation strategy to be proposed to the PACG in the
following year. See Section 4.3.3. “Submerged aquatic vegetation restoration and enhancement” for
more information.
3. Use existing permit review and issuing authorities to provide more protection of SAV by addressing
both direct and indirect impacts from dredge and fill projects (Street et al. 2005). Change in SAV
definition and dock rules has helped improve protection, but is an ongoing battle with progress difficult
to quantify. See Section 4.3.3. “Dredging (navigation channels and boat basins)” for more information.
4. Infrastructure projects that require SAV impacts should be avoided. Where impacts are unavoidable,
SAV losses should be minimized and adequately compensated through mitigation, using methods
recommended by NMFS for SAV restoration or creation. Such projects should be monitored over
time to determine persistence of restored SAV beds (Street et al. 2005). Ongoing need with the
placement and replacement of bridges in coastal North Carolina. See the “Infrastructure” subsection of
Section 4.4.1.1. “Water-dependent development” for more information.
Management needs without progress
1. Conduct regular monitoring of SAV beds to assess their changing distribution and condition (Street et
al. 2005). The DMF and NERR will initiate SAV monitoring of sentinel sites. Initial concepts have
been discussed at the APNEP SAV Partners meetings. Monitoring activities are dependent on
identification of funding; a multi-agency team of SAV researchers (NOAA, ECU, and NCSU) submitted a
CRFL proposal for testing long term field monitoring of SAV in August 2008, but no SAV monitoring
plan has been established. NC-NERR sites may be included in monitoring sites if the project is selected
for funding. See Section 4.3. “Status and trends” for more information.
2. Conduct additional juvenile fish sampling stations in SAV habitat (Street et al. 2005). No specific
progress. However, the DMF Resource Enhancement Section is planning a sampling program to track
juvenile fish abundance in and around oyster sanctuaries (G. Bodnar/DMF, pers. com., February 2009).
The sampling will be conducted in SAV, shell bottom, and soft bottom habitats.
3. Periodically assess the level of prop scar damage on SAV habitats. In areas where boating activity is
found to cause significant SAV impacts, navigational markers should be installed to clearly delineate
navigational channels to be used or persistent SAV beds to avoid (Street et al. 2005). No specific
progress. See Section 4.4.1.2. “Boating activity” for more information.
4. Focus management efforts on protecting (and enhancing) existing SAV habitat and preventing any
additional direct or indirect losses (Street et al. 2005). Direct losses of habitat areas meeting the
definition of SAV are strongly discouraged by permitting authorities. If losses are unavoidable, publicly
funded projects are required to mitigate for the losses whereas privately funded project may be asked to
include a mitigation plan. Indirect losses due to changes in water quality are more difficult to project. See Section 4.4.2.1. “Nutrients and sediment” for more information.
5. The need and feasibility for a water quality standard for light attenuation should be further
investigated to provide a pro-active target or standard for protection and restoration of SAV (Street
et al. 2005). The need for a water quality standard is demonstrated in Section 4.4.2. “Water quality
degradation”. See Section 4.4.2.1. “Nutrients and sediment” for more information.
6. Knowing that water quality degradation is the largest contributor to declines in SAV, and that North
Carolina‟s growing coast will likely lead to additional water quality degradation, North Carolina
2010 Coastal Habitat Protection Plan
Chapter 4. Submerged Aquatic Vegetation Page 269
needs to investigate the best method to protect SAV habitat from water quality degradation (See
Section 4.4.2.1. “Nutrients and sediment” for more information).
7. Include replacement of Eurasian watermilfoil with native species as an objective in SAV management
and restoration plans. No specific progress. The need is predicated on research demonstrating the
value of milfoil as fish habitat. See Section 4.4.3. “Non-native, invasive, or nuisance species” for more
information.
8. Conduct regular monitoring of submerged grasses for wasting disease and its association with
human-induced stresses (Street et al. 2005). No specific progress. See Section 4.4.4. “Diseases and
microbial stressors” for more information.
Emerging management needs
1. Local and regional monitoring programs should eventually be coordinated with a comprehensive
SAV monitoring program. See Section 4.3. “Status and trends” for more information.
2. The results of this new SAV monitoring research should be evaluated for broader application in the
estuary as a whole. See Section 4.3. “Status and trends” for more information.
3. Monitoring should focus on SAV in the most vulnerable locations (close to land where water quality
degradation and shoreline development impacts greatest, edge of southern and western distribution
range) and in areas of current or former importance to bay scallops. See Section 4.3.1. “Status of
submerged aquatic vegetation habitat” for more information.
4. The APNEP SAV Partnership is developing an action plan for SAV restoration activities in North
Carolina and southeastern Virginia, with guidance from the Chesapeake Bay experience (Orth et al.
2002). The plan for SAV restoration should also be coordinated with other habitat restoration plans
and activities. See Section 4.3.3. “Submerged aquatic vegetation restoration and enhancement” for more
information.
5. The SAV restoration action plan should include restoration goals based on potential habitat maps
and projected water quality improvements. See Section 4.3.3. “Submerged aquatic vegetation
restoration and enhancement” for more information.
6. Where SAV habitat is evident, additional permit conditions regarding dock design should be
considered on a case by case basis to maximize light penetration below docks. See “Marinas and
docks” subsection of Section 4.4.1.1. “Water-dependent development” for more information.
7. Should the State consider locating a wind facility in state or federal waters, proper placement of
energy infrastructure is necessary to minimize potential impacts to SAV habitat and minimize
conflicts with existing activities. See the “Infrastructure” subsection of Section 4.4.1.1. “Water-
dependent development” for more information.
8. Clearly marked navigation channels, boater training/licensing, and SAV education materials would
help boaters avoid SAV beds. See Section 4.4.1.2. “Boating activity” for more information.
9. If this buffer appears inadequate, DMF should modify it to an effective and scientifically based
distance. See Section 4.4.1.3. “Fishing gear impacts” for more information.
10. Site monitoring of SAV should include species composition and genetic diversity to track the potential
impacts of climate change. See Section 4.4.5. “Sea level rise and climate change” for more information.
2010 Coastal Habitat Protection Plan
Chapter 4. Submerged Aquatic Vegetation Page 270
11. The Weed Control Program also posts signs at boat ramps warning of the danger in spreading noxious
weeds to other systems. Signs could also be posted to educate the public on the value of native
aquatic plants. See Section 4.4.3. “Non-native, invasive, or nuisance species” for more information.
12. Legislation is needed to prohibit chemical treatment of native vegetation in estuarine waters, due to
its high value as fish habitat. See Section 4.4.3. “Non-native, invasive, or nuisance species” for more
information.
13. To sustain the carbon sink service provided by submerged grasses, the habitat must be preserved,
with management efforts focused on maintaining environmental conditions (nutrient and sediment
concentrations) needed for SAV growth (Bjork et al. 2008). See Section 4.4.5. “Sea level rise and
climate change” for more information.
4.5. Summary of submerged aquatic vegetation chapter
The ecological importance of SAV habitat is well documented in the literature. Some additional research
since the 2005 CHPP has looked at fish use of SAV of various patchiness or density and found that SAV
presence, regardless of the bed shape or density, supports a greater diversity and abundance of organisms
than unvegetated bottom, although some species favor certain SAV habitat characteristics over others.
Valuation studies indicate that the monetary value of the ecosystem services provided by SAV is very
significant. With North Carolina having the second largest amount of SAV on the east coast, protection
and enhancement of this resource should be a high priority for the state. The major threats to SAV habitat
remain channel dredging and water quality degradation from excessive nutrient and sediment loading. An
emerging issue that could have large consequences on SAV is the effect of sea level rise associated with
global climate change.
The 2010 CHPP provides additional information on habitat requirements and distribution of SAV. The
light requirements of SAV groups (based on salinity) are now well established and documented in this
chapter. Since the 2005 CHPP, coastwide imagery of SAV was obtained in 2007-2008, with delineation
delayed due to staff vacancies (a state/federal cooperative mapping effort). Digitizing SAV polygons on
the imagery is in progress. Additional mapping in western Pamlico Sound, Neuse River, and Tar/Pamlico
River by the DMF and DWQ have increased the total area of mapped SAV to over 150,000 acres. While
a quantified change analysis is not available, there appeared to be an increase of SAV in some of the low
salinity systems and southern range of SAV, which may be related to improved water clarity associated
with the coastwide drought in 2007-2008. Preliminary review of core areas of SAV, such as behind the
Outer Banks in Pamlico Sound and Core Sound do not indicate large change. However, there may have
been a shift to increased patchiness of previously dense beds in Bogue Sound. Mapping SAV using aerial
imagery to assess status and trends is a large and difficult task that must be augmented with monitoring.
Some annual monitoring of SAV presence and species composition is being done, but is not being applied
to a coastwide analysis of annual change in distribution and abundance. A cooperative agency/academic
research project (funded by Coastal Recreational Fishing License dollars) is underway and investigating
methods to employ for SAV change analysis. Less rigorous analysis of change has been conducted for
the Currituck Sound and Back Bay system, where restoration plans are being developed by the USACE in
consultation with other resource management agencies and University researchers. The SAV in these
systems is currently recovering naturally, but could benefit from restoration/enhancement work to build
more resilience during less favorable conditions in the future. With better information available on light
and other habitat requirements of SAV, it may be possible to manage water quality for protection of SAV.
The 2010 CHPP provides information on techniques to identify potential SAV habitat so that these areas
can be targeted for protection and restoration. However, the bathymetric data and existing network of
water quality monitoring stations remain inadequate for coastwide modeling SAV habitat suitability. The
state of North Carolina would have to commit substantial resources to adequately manage SAV habitat
2010 Coastal Habitat Protection Plan
Chapter 4. Submerged Aquatic Vegetation Page 271
through regular monitoring, mapping, and development of SAV specific water quality standards such as
has been done in the Chesapeake Bay and regions of Florida.
Over half of the research and management needs identified in the 2005 CHPP have advanced to some
degree. Nine were accomplished, nine others had significant progress, and eleven had no action. Of the
research needs, the most significant advancement is information regarding the bio-optical habitat
requirements of SAV. Numerous management needs were accomplished while some are ongoing and
require continued effort and funding. The most significant management accomplishment was obtaining
aerial imagery to map all SAV along the coast. However progress to get the SAV imagery delineated has
been delayed due to staffing shortages and budget issues. There are also 13 and 12 emerging or modified
research and management needs, respectively.
Progress since the 2005 CHPP included an updated, regulatory definition of SAV habitat that should
further reduce piecemeal loss and degradation of SAV habitat from water-dependent development. There
are also more areas of SAV habitat closed to bottom disturbing fishing gear, and fishing gear buffer
boundaries were re-evaluated and are being enforced. Direct dredge and fill impacts to existing and
historic SAV are being avoided to a greater extent, due to improved education and commitment of the
permitting agencies, revisions to the MFC definition of SAV habitat and revisions of the CRC dock rules.
So the management of SAV habitat loss to individual, direct impacts has improved, while management of
cumulative impacts continues to be an issue. Steps have been taken to reduce nutrient and sediment
loading from nonpoint sources through implementation of coastal stormwater rules. Though water
quality degradation affects large areas of SAV habitat, monitoring of water quality standards continues to
only marginally reflect support of SAV habitat requirements. There remains a need for improved water
quality standards and monitoring for SAV habitat. Some research in underway looking at various
monitoring methods however. Educational awareness of the value of SAV habitat remains a great need.
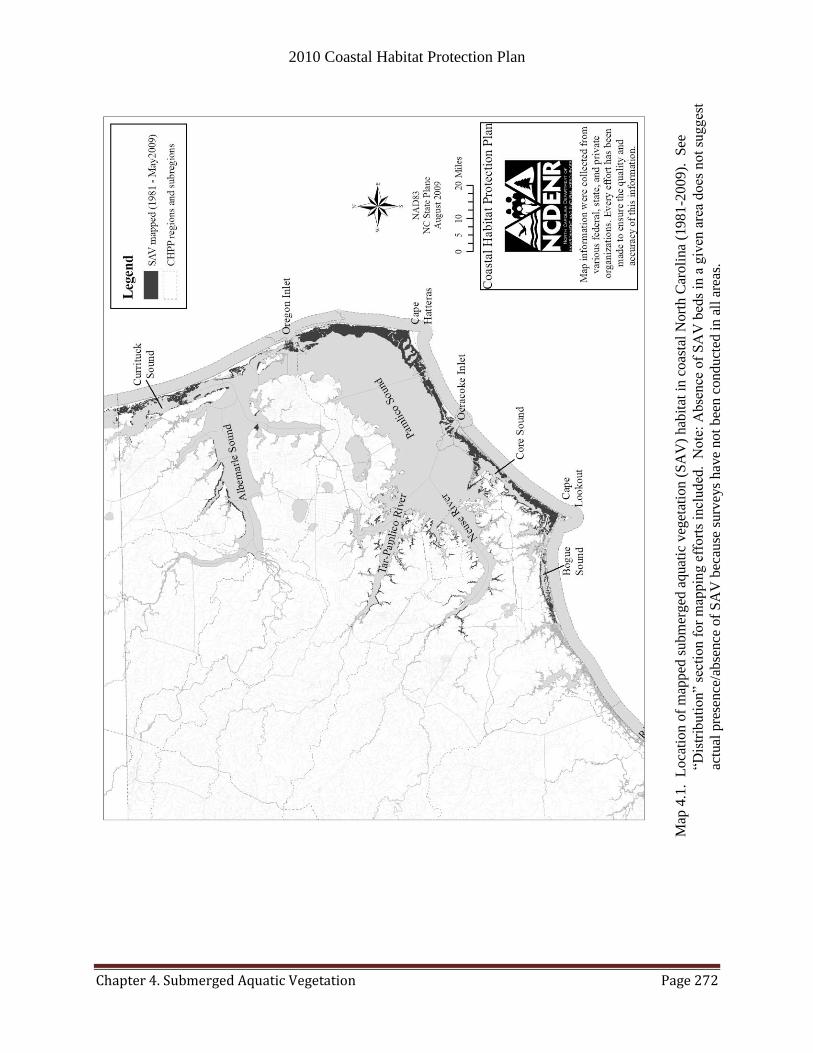
2010 Coastal Habitat Protection Plan
Chapter 4. Submerged Aquatic Vegetation Page 272
Map
4.1
. L
oca
tio
n o
f m
apped
subm
erged
aquat
ic v
eget
atio
n (
SA
V)
hab
itat
in c
oas
tal
Nort
h C
aroli
na
(19
81
-20
09
).
See
―Dis
trib
uti
on‖
sect
ion f
or
map
pin
g e
ffort
s in
cluded
. N
ote
: A
bse
nce
of
SA
V b
eds
in a
giv
en a
rea
do
es n
ot
sug
ges
t
actu
al p
rese
nce
/abse
nce
of
SA
V b
ecau
se s
urv
eys
hav
e not
bee
n c
ond
uct
ed i
n a
ll a
reas
.
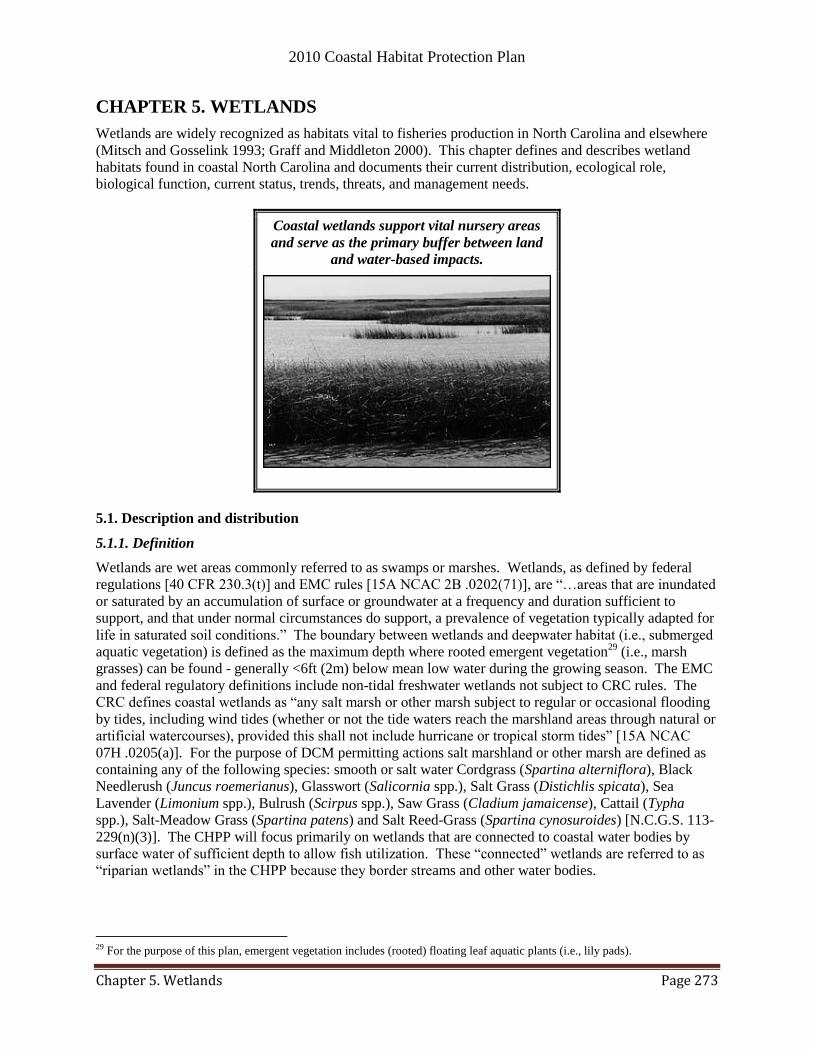
2010 Coastal Habitat Protection Plan
Chapter 5. Wetlands Page 273
CHAPTER 5. WETLANDS
Wetlands are widely recognized as habitats vital to fisheries production in North Carolina and elsewhere
(Mitsch and Gosselink 1993; Graff and Middleton 2000). This chapter defines and describes wetland
habitats found in coastal North Carolina and documents their current distribution, ecological role,
biological function, current status, trends, threats, and management needs.
Coastal wetlands support vital nursery areas
and serve as the primary buffer between land
and water-based impacts.
5.1. Description and distribution
5.1.1. Definition
Wetlands are wet areas commonly referred to as swamps or marshes. Wetlands, as defined by federal
regulations [40 CFR 230.3(t)] and EMC rules [15A NCAC 2B .0202(71)], are ―…areas that are inundated
or saturated by an accumulation of surface or groundwater at a frequency and duration sufficient to
support, and that under normal circumstances do support, a prevalence of vegetation typically adapted for
life in saturated soil conditions.‖ The boundary between wetlands and deepwater habitat (i.e., submerged
aquatic vegetation) is defined as the maximum depth where rooted emergent vegetation29
(i.e., marsh
grasses) can be found - generally <6ft (2m) below mean low water during the growing season. The EMC
and federal regulatory definitions include non-tidal freshwater wetlands not subject to CRC rules. The
CRC defines coastal wetlands as ―any salt marsh or other marsh subject to regular or occasional flooding
by tides, including wind tides (whether or not the tide waters reach the marshland areas through natural or
artificial watercourses), provided this shall not include hurricane or tropical storm tides‖ [15A NCAC
07H .0205(a)]. For the purpose of DCM permitting actions salt marshland or other marsh are defined as
containing any of the following species: smooth or salt water Cordgrass (Spartina alterniflora), Black
Needlerush (Juncus roemerianus), Glasswort (Salicornia spp.), Salt Grass (Distichlis spicata), Sea
Lavender (Limonium spp.), Bulrush (Scirpus spp.), Saw Grass (Cladium jamaicense), Cattail (Typha
spp.), Salt-Meadow Grass (Spartina patens) and Salt Reed-Grass (Spartina cynosuroides) [N.C.G.S. 113-
229(n)(3)]. The CHPP will focus primarily on wetlands that are connected to coastal water bodies by
surface water of sufficient depth to allow fish utilization. These ―connected‖ wetlands are referred to as
―riparian wetlands‖ in the CHPP because they border streams and other water bodies.
29 For the purpose of this plan, emergent vegetation includes (rooted) floating leaf aquatic plants (i.e., lily pads).
2010 Coastal Habitat Protection Plan
Chapter 5. Wetlands Page 274
5.1.2. Description
Riparian wetlands can be differentiated into four broad wetland classes based on their landscape position
within drainage networks (hydrogeomorphology): estuarine, riverine, headwater, and flat/depressional
(Sutter 1999).
Estuarine wetlands are generally found along the margins of estuaries and sounds. Estuarine wetlands
include salt/brackish marsh, estuarine shrub/scrub and estuarine forests.
Salt/brackish marshes, classified as a coastal wetland by DCM, is a herbaceous plant community
subjected to tidal inundation and defined by containing one of the following plant species: smooth
cordgrass, black needlerush, glasswort, salt grass, sea lavender, bulrush, saw grass, cattail, salt-
meadow grass, and salt reed-grass [G.S. 113-229(n)(3)].
Estuarine shrub/scrub is any shrub/scrub dominated community subject to occasional flooding by
tides, including wind tides (whether or not the tide waters reach the marshland areas through natural
or artificial watercourses). Typical species include wax myrtle and eastern red cedar. Examples
include areas along the sound shorelines of barrier islands.
Estuarine forested wetlands are a tree-dominated community subject to occasional flooding by
tides, including wind tides (whether or not the tide waters reach the marshland areas through natural
or artificial watercourses). Examples include pine-dominated communities with rushes in the
understory or fringe swamp communities, such as those that occur along large back barrier estuaries
like Albemarle and Pamlico sounds. Estuarine forested wetlands are common in upper estuarine
sections of coastal rivers.
Riverine wetlands are those in which hydrology is determined or heavily influenced by proximity to a
perennial stream of any size. Overbank flow from the stream exerts considerable influence on the
hydrology of larger streams. Riverine wetlands include freshwater marshes, bottomland hardwood forest,
and riverine swamp forest.
Freshwater marshes are defined as herbaceous areas that are flooded for extended periods during the
growing season (Sutter 1999). Included are marshes within lake systems, managed impoundments,
some Carolina Bays, and other non-tidal marshes (i.e., marshes which do not fall into the salt/brackish
marsh category). Typical communities include species of sedges, millets, rushes and grasses that are
not specified in the coastal wetlands regulations. Also included are giant cane, arrowhead,
pickerelweed, arrow arum, and smartweed. Such marshes occur in the coastal waters of the Trent
River near New Bern and along parts of the Cape Fear and Northeast Cape Fear rivers.
Bottomland hardwood forests and riverine swamp forests are generally forested, or occasionally
shrub/scrub, communities usually occurring in floodplains, that are semi-permanently to seasonally
flooded.30
Bottomland hardwood forests contain mostly oaks (overcup, water, laurel, swamp,
chestnut), sweet gum, green ash, cottonwoods, willows, river birch, and occasionally pines, while
riverine swamp forests contain generally cypress, black gum, water tupelo, green ash and red maple.
These swamps occur throughout the floodplain and shoreline areas of coastal rivers.
Headwater wetlands exist in the uppermost reaches of local watersheds upstream of perennial streams.
Headwater systems may contain channels with intermittent flow, but the primary sources of water input
are precipitation, overland runoff, and groundwater discharge rather than overbank flow from a stream.
Headwater swamps are wooded, riverine systems along small, intermittent or perennial tributary streams.
Headwater swamps include hardwood-dominated communities with soil that is moist most of the year.
Channels receive their water from overland flow and rarely overflow their banks.
30 Cowardin et al. (1979): Semi-permanently flooded = water covers the land surface throughout the growing season in most
years. Seasonally flooded = water covers the land surface for most of the growing season, but is usually absent by the end of
the season in most years.
2010 Coastal Habitat Protection Plan
Chapter 5. Wetlands Page 275
Flat/depressional wetlands are generally not in direct proximity to surface water. While they are
isolated from or hydrologically disconnected from surface water, the hydrology of depressional wetlands
is primarily determined by groundwater discharge, overland runoff, and precipitation. Flat/depressional
wetlands include pocosins, pine flats, depressional swamp forest, hardwood flats, maritime swamp
forests, and some managed pinelands. They are also referred to as non-riparian wetlands.
While fish occupy riverine and estuarine wetlands (Map 5.1a-d) during periods of regular inundation,
headwater and flat/depressional wetlands (Map 5.2) are generally not directly utilized by fish. However,
there are some exceptions, such as the pocosins adjacent to the Alligator and Northeast Cape Fear rivers
have surface drainage to coastal waters (Brinson 1991) and the center of Cedar Island NWR (M.
Brinson/ECU, pers. com., June 2009). The center of the refuge has rainwater killifish, yet it is only
connected during storm tides (1 mile from the shore). Most of the marsh has ‗resident‖ populations of
mummichog that do not exchange with the estuary. However, the primary focus of this chapter is the
riparian wetlands found in estuarine and riverine systems.
5.1.3. Habitat requirements
5.1.3.1. Estuarine wetlands
Salt-brackish marsh occupy wetland areas at salinities from 0.5 to >35 ppt in North Carolina (Wiegert and
Freeman 1990). Salt marsh occurs in salinities >15 ppt (eastern Pamlico Sound, Core/Bogue sounds, etc.)
and brackish marsh occurs from 0.5-15 ppt (Albemarle Sound, western Pamlico sound, etc.) (see ―Water
Column‖ chapter for salinity zone maps). Within these salinity ranges, salt-tolerant marsh plants persist
in low-energy protected areas where the rate of sediment building (accretion) exceeds the rate of sediment
loss (through erosion) or subsidence (Mitsch and Gosselink 1993). Inorganic sediments are deposited by
river currents, tidal creeks and ocean overwash on and adjacent to the marsh platform (Wiegert and
Freeman 1990; Mitsch and Gosselink 1993). Deposition from sediment-laden creek water builds side
banks of higher elevation (low marsh) and coarser particle size than the sediments in the marsh interior
(high marsh). Fringing salt marshes bordering larger water bodies exhibit different patterns of sediment
accretion and particle size (Currin et al. 2008; Morgan et al. 2009).
Erosion and sedimentation are natural processes that can result in changing distributions of marsh
vegetation. The rate of erosion is dependent on shoreline orientation, fetch, water depth, bank height,
sediment bank composition, shoreline vegetation, and presence of offshore vegetation (Riggs 2001). In
general, all of the Albemarle-Pamlico estuarine system, which is a drowned river system, is in a state of
shoreline recession (Riggs and Ames 2003). South of Bogue Sound, estuarine erosion is severe only in
portions of drowned river estuaries such as the Cape Fear, New, and White Oak rivers, and along the ICW
and navigational channels. The remaining narrow or otherwise sheltered estuaries are eroding at very low
rates, allowing the marshes and flats to vertically accrete sediment to keep up with rising sea level. Riggs
(2001) mapped the shoreline types and shoreline areas where erosion was noticeable (see ―Sea level rise
and climate change‖ section for more information on erosion). Channels through marsh platforms form
from micro-differences in sediment elevation and accretion patterns (Pratolongo et al. 2009 in Perillo et
al. 2009).
The zonation of marsh vegetation in tidal systems is largely determined by variations of salinity and
drainage of sediment porewater (Wiegert and Freeman 1990). Porewater salinity in the low marsh bank
tends to remain similar to that of adjacent estuarine waters because of the frequent exchange of water and
better internal drainage (due to coarser sediment) than the more isolated high marsh. Few species can
survive in the low marsh because of high porewater salinity and frequent inundation. In the high marsh,
frequent precipitation (and occasionally groundwater) creates salinities that may be low enough to support
shrubs and other plants intolerant of high salinities (i.e., wax myrtle, groundsel-tree, and marsh elder) in
low marsh. However, very high salinity sediments devoid of vegetation (i.e., salt pans) may develop in
2010 Coastal Habitat Protection Plan
Chapter 5. Wetlands Page 276
mid-marsh areas where shallow, salt ponds evaporate between periods of high water (Pratolongo et al.
2009). Frequency and depth of inundation increase with increasing proximity to inlets, modified
somewhat by prevailing wind patterns. Porewater salinity and inundation frequency in coastal wetlands
areas also vary with seasonal and annual changes in precipitation and relative sea level (see ―Sea level
rise and climate change‖ section for graph of annual changes in sea level).
5.1.3.2. Riverine wetlands
Swamp forests and freshwater marshes occupy riverine wetland areas at salinities less than 0.5 ppt.
Hydrology in riverine systems may be tidal or non-tidal depending on proximity to ocean inlets and
elevation gradient (Perillo et al. 2009). In North Carolina, tidal freshwater wetlands occur in the Cape
Fear, New, and White Oak rivers. Though small in relative area to other wetlands, tidal freshwater
wetlands occupy a unique hydrogeomorphic setting at the upper limit of tidal influence (tidal range 0.1-
0.5 m) where brackish water meets downstream flow from nontidal rivers (Perillo et al. 2009). The
development of tidal freshwater marshes is similar to that of salt/brackish marsh. However, tidal
freshwater marshes have more diverse plant communities than salt/brackish marsh due to increased soil
aeration and lack of salinity stress (Odum et al. 1984; Perillo et al. 2009).
The hydrology of non-tidal freshwater wetlands is more variable than tidal wetlands that receive regular
inundation. Consequently, these communities are adapted to survive in varying water levels. In inland
marshes water levels are determined by the type of water body in which they occur, whereas in isolated
marshes they are controlled more by the balance of precipitation and evapotranspiration than connection
to larger water bodies (Mitsch and Gosselink 1993).
Riverine swamp forests typically develop along low lying margins of rivers and lakes where they receive
seasonal flooding (Wharton et al. 1982). Depth and duration of flooding determine whether an area is
bottomland hardwood forest or swamp forest. Bottomland hardwood and swamp forest wetlands are
generally irregularly to seasonally flooded (Sutter 1999). Riverine swamp forests are semi-permanently
to permanently flooded. Overbank flooding and surface and groundwater discharge are likely sources of
inundation in riverine swamp forests (Wharton et al. 1982). The frequency and magnitude of flooding in
swamp forests depends on the land use characteristics of the watershed, bank height, the degree of stream
channelization, and tidal influence. The source of inundation varies with the type of river or stream.
Wetlands adjacent to large rivers receive overbank flow from flood pulses or tidal flows, whereas water
level in small blackwater tributaries is influenced more by groundwater discharge and local precipitation
(Winner and Simmons 1977; Wharton et al. 1982). When the mainstem channel is low, water level in
blackwater streams is controlled more by local precipitation. The timing and duration of flooding in the
different riverine wetlands will affect the type and regularity of fish use. The seasonal (winter-spring)
inundation of swamps bordering blackwater streams allows temporary use by opportunistic fish at high
mainstem river flows.
5.1.3.3. Headwater swamps
The requirements of headwater swamps are similar to small tributary streams referenced above. The main
difference between riverine forested wetlands and headwater wetlands is their position in the watershed:
headwater wetlands are located along the upper reaches of first order streams. They are critical in
buffering potentially harmful effects of land use that generate high levels of sediment and nitrate loading.
They are the first line of defense for the protection of the waters further downstream.
5.1.4. Distribution
There has been no new coastwide mapping of wetland distribution since the last CHPP. The DCM
mapping effort used GIS technology to map and classify wetlands in the 20 coastal counties using
2010 Coastal Habitat Protection Plan
Chapter 5. Wetlands Page 277
National Wetland Inventory (NWI) maps, Natural Resource Conservation Service digital soils maps,
satellite imagery (1988, 1994), and hydrography maps as source data (Sutter 1999). Analyses showed
there were a total of 1.3 and 2.2 million acres of unaltered riparian and non-riparian wetlands,
respectively, in the CHPP management area. Riparian and non-riparian wetlands therefore covered 8.9%
and 14.5% of the regions for SHA assessment. The classification error for wetlands was approximately
11% (Shull 1999), making the total figure for wetlands acreage in coastal North Carolina between 3.1 and
3.9 million acres. The range of mapped wetland acreage does not include small wetland areas and narrow
fringing wetlands less than 30 meters wide. Some overestimation also occurs where small creeks and
ponds are located within the wetland area.
Riverine wetlands were the most abundant of the three riparian wetland classes (i.e., estuarine, riverine,
and headwater) at 30.70% of all mapped wetlands (Table 5.1). Estuarine wetlands came in a distant
second at 6.55%, and headwater wetlands barely registered at <1%. Riparian wetlands are not distributed
evenly along the coast (Map 5.1a-d). The Cape Fear subregion of CHPP region 4 contained the largest
area of riparian wetlands, followed by the Neuse and Albemarle (Figure 5.1). The greatest proportions of
estuarine wetlands were in Core-Bogue, Southern Estuaries, and Pamlico subregions, whereas the
Roanoke, Cape Fear, and Neuse had the highest proportion of riverine wetlands (Figure 5.1). The
Chowan, Roanoke, and coastal Ocean subregions are the only areas without any mapped estuarine
wetlands. All types of riverine wetlands occurred throughout all subregions except the coastal ocean.
5.1.4.1 Salt/brackish marsh
The total area of unaltered salt/brackish marsh in coastal North Carolina was 199,068 acres in 1994,
which comprised 15% of riparian wetland types (Table 5.1).
The greatest acreage (89,224 acres) of salt/brackish marsh was in CHPP region 2 (Pamlico Sound and
tributaries).
5.1.4.2. Estuarine shrub/scrub
There was a total of 28,291 acres of estuarine shrub/scrub habitat, which comprised 2.1% of riparian
wetland areas.
The greatest acreage (8,279) of estuarine shrub/scrub habitat was in CHPP region 2.
5.1.4.3. Estuarine forests
There was a total of 968 acres of estuarine forest, comprising less than 1% of riparian wetlands.
The greatest acreage of estuarine forested wetlands was in CHPP region 2.
5.1.4.4. Freshwater marsh (riparian only)
Freshwater marsh covered a total area of 16,960 acres and comprised 1.3% of riparian wetlands
(Table 5.1).
The greatest acreage (10,608) of freshwater marsh was in CHPP region 4 (Cape Fear River and
southern estuaries).
5.1.4.5. Riverine forested wetlands (riparian only)
The combined total acreage of bottomland hardwood forest and riverine swamp forest was 1,052,556,
which comprised 79.2% of all riparian wetlands.
The greatest area (407,109 acres) of bottomland hardwood and riverine swamp forest was in CHPP
region 1 (Albemarle Sound and major tributaries).
2010 Coastal Habitat Protection Plan
Chapter 5. Wetlands Page 278
5.1.4.6. Headwater swamps (riparian only)
The total area of headwater swamps was 31,088 acres, which comprised 2.3% of all riparian
wetlands.
The greatest acreage of headwater swamps (14,673 acres) was in CHPP region 2.
Accurate and up-to-date mapping of wetland types is needed for North Carolina. As of March 2009,
there has been no repeat mapping of wetlands in coastal North Carolina since 1994. However, there are
plans to update the NWI maps with LIDAR and multispectral imagery (J. Harrell/DENR, pers. com.,
March 2009). The National Landcover Dataset (NLCD) for 2006 will also be available sometime in
2009. According to the 2001 NLCD, there were 2,867,548 acres of wetlands in coastal draining river
basins of North Carolina (excluding Lumber River), and 5,132,634 acres in the entire state. The error of
the 2001 NLCD is still being determined (http://www.epa.gov/mrlc/accuracy-2001.html, April 2009).
The classification error (by pixel) of the wetland classes on the 1992 NLCD for North Carolina was 32%
(http://landcover.usgs.gov/accuracy/table5.php, April 2009). So the actual amount of wetlands in coastal
draining river basins of North Carolina was between 1,949,933 and 3,785,164 acres in 2001, assuming the
accuracy is equal to that of 1992 classification.
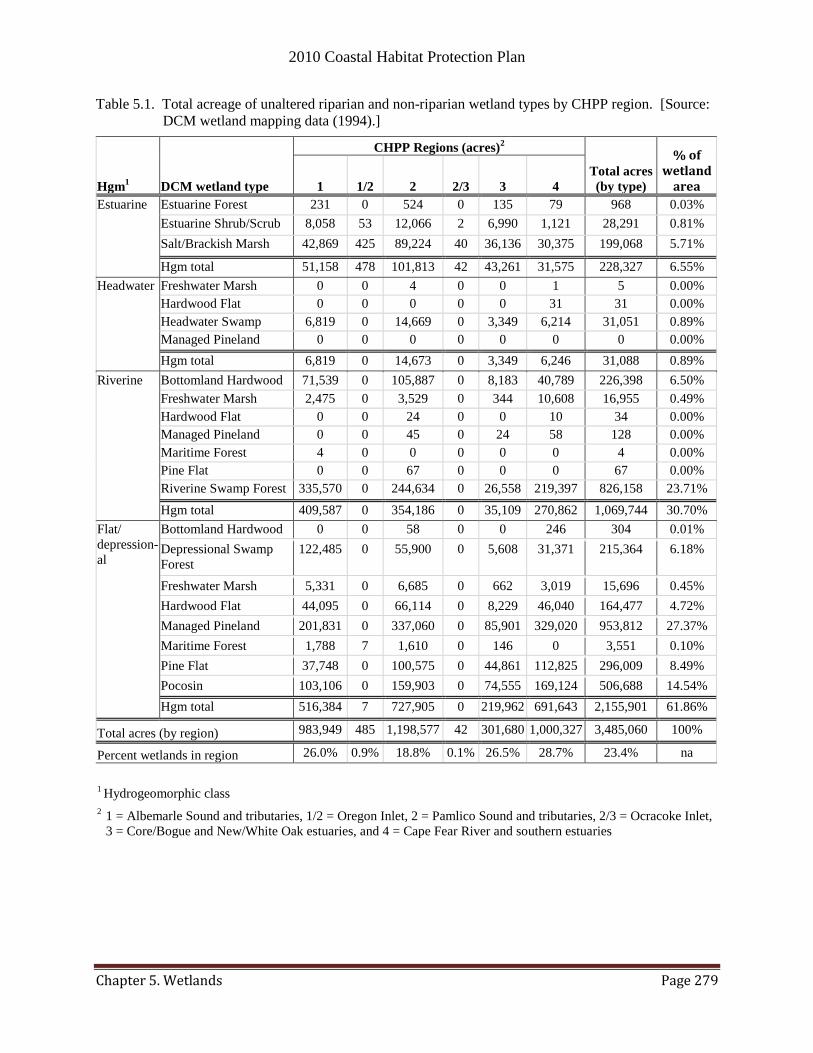
2010 Coastal Habitat Protection Plan
Chapter 5. Wetlands Page 279
Table 5.1. Total acreage of unaltered riparian and non-riparian wetland types by CHPP region. [Source:
DCM wetland mapping data (1994).]
Hgm1 DCM wetland type
CHPP Regions (acres)2
Total acres
(by type)
% of wetland
area 1 1/2 2 2/3 3 4
Estuarine Estuarine Forest 231 0 524 0 135 79 968 0.03%
Estuarine Shrub/Scrub 8,058 53 12,066 2 6,990 1,121 28,291 0.81%
Salt/Brackish Marsh 42,869 425 89,224 40 36,136 30,375 199,068 5.71%
Hgm total 51,158 478 101,813 42 43,261 31,575 228,327 6.55%
Headwater Freshwater Marsh 0 0 4 0 0 1 5 0.00%
Hardwood Flat 0 0 0 0 0 31 31 0.00%
Headwater Swamp 6,819 0 14,669 0 3,349 6,214 31,051 0.89%
Managed Pineland 0 0 0 0 0 0 0 0.00%
Hgm total 6,819 0 14,673 0 3,349 6,246 31,088 0.89%
Riverine Bottomland Hardwood 71,539 0 105,887 0 8,183 40,789 226,398 6.50%
Freshwater Marsh 2,475 0 3,529 0 344 10,608 16,955 0.49%
Hardwood Flat 0 0 24 0 0 10 34 0.00%
Managed Pineland 0 0 45 0 24 58 128 0.00%
Maritime Forest 4 0 0 0 0 0 4 0.00%
Pine Flat 0 0 67 0 0 0 67 0.00%
Riverine Swamp Forest 335,570 0 244,634 0 26,558 219,397 826,158 23.71%
Hgm total 409,587 0 354,186 0 35,109 270,862 1,069,744 30.70%
Flat/
depression-
al
Bottomland Hardwood 0 0 58 0 0 246 304 0.01%
Depressional Swamp
Forest
122,485 0 55,900 0 5,608 31,371 215,364 6.18%
Freshwater Marsh 5,331 0 6,685 0 662 3,019 15,696 0.45%
Hardwood Flat 44,095 0 66,114 0 8,229 46,040 164,477 4.72%
Managed Pineland 201,831 0 337,060 0 85,901 329,020 953,812 27.37%
Maritime Forest 1,788 7 1,610 0 146 0 3,551 0.10%
Pine Flat 37,748 0 100,575 0 44,861 112,825 296,009 8.49%
Pocosin 103,106 0 159,903 0 74,555 169,124 506,688 14.54%
Hgm total 516,384 7 727,905 0 219,962 691,643 2,155,901 61.86%
Total acres (by region) 983,949 485 1,198,577 42 301,680 1,000,327 3,485,060 100%
Percent wetlands in region 26.0% 0.9% 18.8% 0.1% 26.5% 28.7% 23.4% na
1 Hydrogeomorphic class
2 1 = Albemarle Sound and tributaries, 1/2 = Oregon Inlet, 2 = Pamlico Sound and tributaries, 2/3 = Ocracoke Inlet,
3 = Core/Bogue and New/White Oak estuaries, and 4 = Cape Fear River and southern estuaries
U

2010 Coastal Habitat Protection Plan
Chapter 5. Wetlands Page 280
0
50,000
100,000
150,000
200,000
250,000
300,000
Ro
an
ok
e
Ch
ow
an
Alb
em
arl
e
Ore
go
n I
nle
t
NE
co
ast
al o
cean
Tar-
Pam
lico
Neu
se
Pam
lico
So
un
d
Ocra
co
ke
Inle
t
E c
oast
al o
cean
Co
re/B
ogu
e
New
/Wh
ite O
ak
SE
co
ast
al o
cean
Cap
e F
ear
So
uth
ern
est
uari
es
S c
oast
al o
cean
Acres
CHPP subregions
Estuarine Shrub/Scrub
Headwater Swamp
Freshwater Marsh
Salt/Brackish Marsh
Bottomland Hardwood
Riverine Swamp Forest
Figure 5.1. Relative amount and proportion of unaltered riparian wetland types among CHPP subregions.
[Source: DCM wetland mapping data (1994).]
5.2. Ecological role and functions
Wetlands are well known for the ecological services they provide. Wetland services improve the quality
of adjacent habitats with their capacity for water control and filtration. They can also protect upland
habitats from erosion. Wetlands play a vital role in providing abundant food and cover for juvenile and
adult finfish and shellfish. Support and documentation of these important functions are provided in this
section. Since the last CHPP there has been some additional research on the economic value of wetlands
and the critical importance of even a narrow fringe of wetland edge for fish utilization and erosion
control.
5.2.1. Ecosystem enhancement
The flood control and water quality benefits of wetlands have been extensively studied (Mitsch and
Gosselink 1993). By spreading and slowing flood waters, wetlands decrease flooding in adjacent upland
areas and downstream areas. Some wetlands can store flood waters and slowly release it to surface and
groundwater systems during periods of low flow (Mitsch and Gosselink 1993). Bottomland hardwood
forest along the Mississippi River stored floodwater equivalent to about 60 days of river discharge before
European settlement. The storage capacity of these wetlands today has been reduced to about 12 days
(Mitsch and Gosselink 1993). Consequently, flooding has increased along the lower Mississippi River.
2010 Coastal Habitat Protection Plan
Chapter 5. Wetlands Page 281
Reduced extent of coastal wetlands31
has also been linked to increased hurricane damage. Costanza et al.
(2008b) estimated that a loss of 1 acre of coastal wetlands resulted in a $13,360 loss of gross domestic
product. The study also estimated that coastal wetlands in the U.S. could provide as much as $23.2
billion, per year, in storm protection services.
Rooted vegetation stabilizes unconsolidated sediment, buffering erosive forces and improving water
clarity for SAV and benthic microalgae (Mitsch and Gosselink 1993, Riggs 2001). Studies have shown
that even narrow (7-25m), marsh borders reduce incoming wave energy by 60-95% (Knutson et al. 1982;
Morgan et al. 2009). The buffering of sediment-laden water also causes deposition of suspended solids
(inorganic sediment and organic matter) among the vegetation (Mitsch and Gosselink 1993). Leonard
and Croft (2006) quantified the relationship between flow velocity, turbulence, and sediment
deposition/retention in salt/brackish marsh vegetation. The buffering effect of wetland vegetation also
reduces sediment additions from upland areas creating new shallow water habitat (Rogers and Skrabal
2001). Consequently, both wetland and non-wetland shorelines play an important role in maintaining the
function of the estuarine system. Maintaining a natural proportion and relative position of wetland and
non-wetland shorelines will be a vital component of habitat restoration and management.
Under favorable conditions, toxic chemicals and nutrients (especially phosphorus) are also retained in
some wetlands due to adsorption to sediment particles (Wolfe and Rice 1972; Mitsch and Gosselink
1993). Kao et al. (2001) and Kao and Wu (2001) quantified the percent of pesticides and nutrients treated
by a wetland in the North Carolina mountains with a hydraulic retention time of 10.5 days. The wetland
completed removed Atrazine (a pesticide) pollution from the upstream agricultural lands. Once adsorbed
to sediment particles in low-oxygen (anaerobic or reducing) sediment, ammonia and nitrate (organic
waste or fertilizer) is transformed into nitrogen gas (Mitsch and Gosselink 1993). Nitrogen processing in
wetlands may prevent nutrient over-enrichment and resulting oxygen stress in receiving waters. Forested
(streamside) wetlands in agricultural drainages have been shown to remove approximately 80% of the
phosphorus and 90% of the nitrogen from the water (EPA 2006).
Temporary and permanent retention of nutrients, such as phosphorus, are facilitated by particle deposition
and burial as well as formation of organic matter in the sediment by roots and rhizomes (Mitsch and
Gosselink 1993). Mitsch and Gosselink (1993) concluded that nutrients are probably stored in
salt/brackish marshes fringing estuaries with limited water circulation (i.e., back barrier sounds), whereas
wetlands in funnel-shaped (trunk) estuaries export more nutrients. There is also evidence that
salt/brackish marshes act as a source of nutrients during the growing season and a sink in winter and
spring (Woodwell et al. 1979). Over the long term, marshes are effectively sinks where they are not
losing material from erosion (M. Brinson/ECU, pers. com., June 2009). The most active uptake and
retention of nutrients in riverine systems can be found in headwater wetlands (Peterson et al. 2001,
Thompson et al. 1998; Meyer et al. 2007). Retention and controlled release of particles, toxic chemicals,
and nutrients can improve water quality downstream. Therefore, forested wetlands and marshes upstream
influence the potential for erosion, flooding, sedimentation, algal blooms, and fish kills downstream.
Though flat/depressional or non-riparian wetlands are not used by fish, they can have a significant effect
on water quality in public trust waters. Pocosins cover a vast continuous expanse of the coastal North
Carolina landscape and are connected to surface waters through shallow aquifers. These facts suggest
that pocosins are connected to regulated tributary waters of the United States (Richardson 2003). A
survey of USACE personnel in North Carolina indicated that most pocosins are considered hydrologically
connected to regional water supplies where they dominate the landscape (Richardson 2003).
Only recently have studies revealed the importance of freshwater and coastal marshes in storing silicon,
which is critical for benthic diatom production (Hackney et al. 2000; Struyf et al. 2005). Tidal
31 Not necessarily ―Coastal wetlands‖ as defined in CRC rule.

2010 Coastal Habitat Protection Plan
Chapter 5. Wetlands Page 282
marshplants store silica in their tissues until it is liberated by decomposition into surface waters.
Maintaining high concentration of silica is important because it supports a high abundance of diatoms,
which are critical for secondary production of commercial fish and crustaceans (Hackney et al. 2000).
Tidal marshes are also an important source of silicon for diatoms in freshwater systems (Struyf et al.
2005). In tidal freshwater systems of the Schelde Estuary (Belgium), nearly half of silicon recycling was
performed by marsh grasses, based on comparing import and export rates during the spring and summer.
5.2.2. Productivity
Because of the abundant supply of water, nutrients, and sunlight, wetland plant communities can be one
of the most biologically productive ecosystems in the world (Teal 1962; Teal and Teal 1969; Mitsch and
Gosselink 1993; SAFMC 1998a). Some of the high primary production (creation of organic compounds
through photosynthesis) of wetland vegetation is transferred to adjacent aquatic habitats via detritus and
microalgae (Peterson and Howarth 1987; Wiegert and Freeman 1990; Mitsch and Gosselink 1993).
However, wetland plant species vary in their rate of decomposition, with leafy, succulent, low vegetation
decomposing the quickest and woody, high vegetation the slowest (Mitsch and Gosselink 1993).
Inundated wetland plants also exude dissolved organic substances contributing to epiphytic growth on
their stems and leaves (Mitsch and Gosselink 1993) and to the dissolved organic matter content of the
water column.
Salt/brackish marsh growth in the low marsh is limited by self-shading, where other habitat requirements
are met, whereas growth in the high marsh can be affected by a number of factors, including high salinity,
sulfides, scarcity of iron, and lack of nitrogen (Wiegert and Freeman 1990). Discounting phytoplankton
in the water column and algae on the sediment surface, productivity of low marsh (Spartina alterniflora)
in a Georgia tidal creek was 1,539 g carbon/m2/yr while production in the high marsh was somewhat
lower (about 1,350 g carbon/m2/yr) (Wiegert and Freeman 1990). In North Carolina, Stroud (1976)
reported somewhat higher salt/brackish marsh production in low marsh (1660 g carbon/m2/yr), but much
lower production in the high marsh (750 g carbon/m2/yr). In both North Carolina and Georgia, above
ground production was about 20% greater than below-ground production (Mitsch and Gosselink 1993).
Primary production in salt/brackish marshes is converted into fish production through several pathways.
Using sulfur, carbon, and nitrogen isotopes to trace organic matter flow in the salt marsh estuaries of
Sapelo Island, Georgia, Peterson and Howarth (1987) found two major sources of organic matter used in
fish production: Spartina (detritus) and algae. The relative importance of each source is determined by
the feeding mode, size, location, and trophic position of the marsh and estuarine consumers (Peterson and
Howarth 1987). For example, benthic microalgae probably support herbivorous snails, whereas detritus
supports sheepshead minnows, mummichogs, and their prey. Attached algae can be found on the marsh
grass itself, the intertidal mudflats, and the shallow subtidal bottom near the marsh. Pinckney and
Zingmark (1993) compared production rates of benthic microalgae in various bottom types in an estuarine
system (North Inlet, South Carolina). Short Spartina marsh accounted for the greatest amount of
microalgal productivity (44.6%) in the system, followed by intertidal mudflats (22%), tall Spartina marsh
(18%), and shallow subtidal bottom (<1 m mean low water) (13%). Sand flats accounted for only 3% of
the total annual microalgal production (Pinckney and Zingmark 1993).
Productivity in riverine forested wetlands in North Carolina has been reported to be much lower than in
salt/brackish marsh, representing about 523 to 677 g carbon/m2/yr of leaf and twig litter (Brinson 1977;
Mulholland 1979). However, the total production of forested wetlands may be similar to that of
salt/brackish marsh when stem growth and below ground production are taken into account. The export
of detritus from these riverine forested wetlands can be significant (Mitsch and Gosselink 1993).
Mulholland and Kuenzler (1979) found that organic export was higher from river basins containing more
deepwater swamps than other riparian habitats. From a Louisiana swamp forest, Day et al. (1977)
2010 Coastal Habitat Protection Plan
Chapter 5. Wetlands Page 283
measured an export rate of 10.4 g carbon/m2/yr. By contrast, salt/brackish marshes can have an organic
export rate as high as 100 g carbon/m2/yr (Wiegert et al. 1981). However, export rates in swamp forest
can vary greatly with submersion regime and temperature, with higher temperatures (allowing faster
decomposition) and frequent inundation increasing the export rate.
5.2.3. Fish utilization
It is estimated that over 95% of the finfish and shellfish species commercially harvested in the United
States are wetland-dependent (Feierabend and Zelanzy 1987). Wetlands provide numerous ecological
services to coastal fishes (Table 5.2). The use of wetlands by finfish and shellfish is presented first,
followed by documentation of specific functions for selected species.
5.2.3.1. Salt/brackish marsh
Finfish and shellfish using salt/brackish marsh fall into several categories based on location and timing of
use. Year-round residents of the marsh include small forage species such as killifish, mummichogs,
sheepshead minnows, gobies, grass shrimp, bay anchovies, and silversides (SAFMC 1998a). Transient
species include those spawned in deeper waters that use marsh habitat as nursery or foraging areas (i.e.,
red drum, flounder, spot, croaker). Among transient species, some prefer the edge of salt/brackish marsh
(i.e., red drum, flounder) while others are found on unvegetated bottom near the edge (i.e., spot, croaker).
Some species are not found in the marsh, but derive substantial food resources from the marsh plants as
detritus (i.e., menhaden; Lewis and Peters 1994) or from microalgae produced on the marsh surface. Of
fishery species in North Carolina, penaeid shrimp and red drum are considered critically linked to marsh
edge habitat (SAFMC 1998a).
A study in South Carolina looking at the relationship between depth and movement of nekton at different
tide stages found a consistent pattern of resident species entering early in the rising tide followed by
transient species entering during the mid to late tide (Bretsch and Allen 2006). The depth of migrations
among species were also consistent between creeks, days (within months), and years. The only variation
occurred as the summer progressed, with some species (i.e., spot, mullet, pinfish) moving into deeper
water. This pattern of nekton migration is probably similar to that of North Carolina salt marshes.
5.2.3.2. Freshwater marsh
Fishery and forage fish inhabiting tidal and non-tidal freshwater marshes include largemouth bass,
bluegill, warmouth, black crappie, chain pickerel, southern flounder, white perch, mummichog, bay
anchovy, inland silversides, river herrings, striped bass, and sturgeon (Mitsch and Gosselink 1993). The
nature and degree of association with freshwater marsh habitat depend on the species. For example,
striped bass and river herring are not only abundant along marsh edge, but also in open water areas
adjacent to the marsh edge. Bluegill, black crappie, largemouth bass, and warmouth are found almost
exclusively near shoreline structures such as marsh grass. Mosquitofish are an important forage species
and a ―mosquito control agent‖ closely associated with freshwater marsh habitat (Odum et al. 1984).
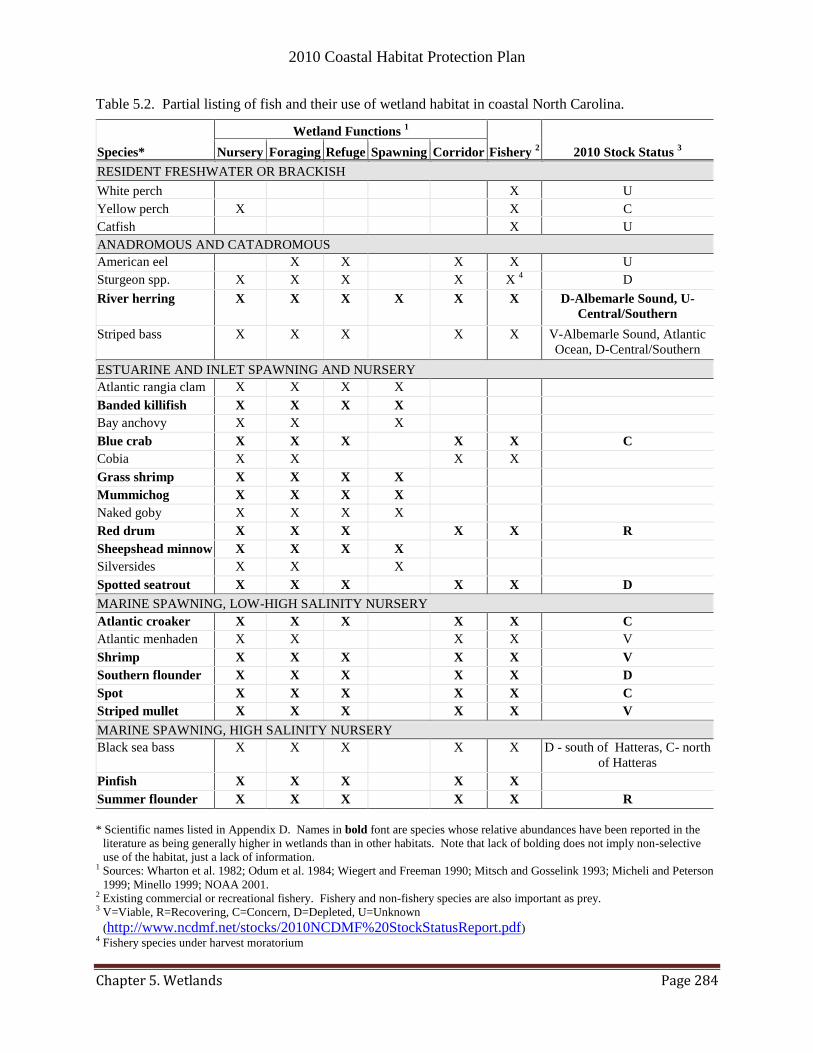
2010 Coastal Habitat Protection Plan
Chapter 5. Wetlands Page 284
Table 5.2. Partial listing of fish and their use of wetland habitat in coastal North Carolina.
Species*
Wetland Functions 1
Fishery 2 2010 Stock Status
3 Nursery Foraging Refuge Spawning Corridor
RESIDENT FRESHWATER OR BRACKISH
White perch X U
Yellow perch X X C
Catfish X U
ANADROMOUS AND CATADROMOUS
American eel X X X X U
Sturgeon spp. X X X X X 4 D
River herring X X X X X X D-Albemarle Sound, U-
Central/Southern
Striped bass X X X X X V-Albemarle Sound, Atlantic
Ocean, D-Central/Southern
ESTUARINE AND INLET SPAWNING AND NURSERY
Atlantic rangia clam X X X X
Banded killifish X X X X
Bay anchovy X X X
Blue crab X X X X X C
Cobia X X X X
Grass shrimp X X X X
Mummichog X X X X
Naked goby X X X X
Red drum X X X X X R
Sheepshead minnow X X X X
Silversides X X X
Spotted seatrout X X X X X D
MARINE SPAWNING, LOW-HIGH SALINITY NURSERY
Atlantic croaker X X X X X C
Atlantic menhaden X X X X V
Shrimp X X X X X V
Southern flounder X X X X X D
Spot X X X X X C
Striped mullet X X X X X V
MARINE SPAWNING, HIGH SALINITY NURSERY
Black sea bass X X X X X D - south of Hatteras, C- north
of Hatteras
Pinfish X X X X X
Summer flounder X X X X X R
* Scientific names listed in Appendix D. Names in bold font are species whose relative abundances have been reported in the
literature as being generally higher in wetlands than in other habitats. Note that lack of bolding does not imply non-selective
use of the habitat, just a lack of information. 1 Sources: Wharton et al. 1982; Odum et al. 1984; Wiegert and Freeman 1990; Mitsch and Gosselink 1993; Micheli and Peterson
1999; Minello 1999; NOAA 2001. 2 Existing commercial or recreational fishery. Fishery and non-fishery species are also important as prey. 3 V=Viable, R=Recovering, C=Concern, D=Depleted, U=Unknown
(http://www.ncdmf.net/stocks/2010NCDMF%20StockStatusReport.pdf) 4 Fishery species under harvest moratorium
2010 Coastal Habitat Protection Plan
Chapter 5. Wetlands Page 285
5.2.3.3. Bottomland hardwood and riverine swamp forest
There is a strong relationship between fishery yields and forested river floodplains (Wharton 1982, Junk
et al. 1989, Mitsch and Gosselink 1993). A study on the Suwannee River floodplain (Florida/Georgia)
found that fish production was much greater in floodplain sloughs than in the main river (Holder et al.
1970). A study conducted on the Savannah River floodplain found that fish use was limited to wetlands
that dried infrequently, were most connected to intermittent water bodies, and had an elevation closest to
the nearest permanent water body (Snodgrass et al. 1996). Similar studies of fish use on river floodplains
in North Carolina has not been conducted (literature search in March, 2009). Fish use of riverine forested
wetlands is generally restricted to periods of seasonal inundation. Some exceptions to this general pattern
occur. The riverine wetlands below Lock and Dam #1 on the Cape Fear River receive regular tidal
inundation (C. Hackney/UNC-W, pers. com., 2003). In North Carolina, seasonal high water in riverine
systems generally occurs from winter to spring. Summer conditions (falling water levels, increasing
temperatures, and low dissolved oxygen) exclude most fish from forested wetlands areas. Only fish
adapted to low oxygen conditions continue to inhabit wetland areas as long as they contain water (i.e.,
bowfin, gar, mudminnows, killifish; Wharton et al. 1982).
A study on fish use of creek floodplains in North Carolina documented several common species using
channels in the floodplain (Walker 1984). Those species included several small sunfish species, redfin
pickerel, bowfin, brown bullheads, redear sunfish, pumpkinseed, bluegill sunfish, green sunfish, and
small forage species (e.g., shiners, darters, killifish, and crayfish). Estuarine-dependent species found on
river floodplains include hickory shad, blueback herring (Wharton et al. 1982), and alewife (SAFMC
1998a). The tidal swamp forests in the Cape Fear estuary are also inhabited by blue crabs and other
transient estuarine species (C. Hackney/UNC-W, pers. com., 2003).
5.2.3.4. Flat/depressional wetlands
Fish use of normally isolated wetlands (i.e., pocosins along the Alligator and Northeast Cape Fear rivers)
depends on many factors. Pocosins that are located directly adjacent to salt/brackish marsh or other
riparian wetlands are potential fish habitat. As sea level continues to rise and low-lying pocosins near
coastal North Carolina waters transform into marshes, they will become more important as primary
nursery areas for estuarine-dependent fish (Brinson 1991).
5.2.4. Specific biological functions
5.2.4.1. Nursery
The large expanses of shallow water and thick vegetation found in riparian wetlands provide abundant
food and cover for larval, juvenile and small organisms (Graff and Middleton 2000). Nursery habitat is
not only provided by the dense structures, but also by the shallow depth and expanse of water itself,
which provides refuge from aquatic fish predators (review in Rozas and Odum 1987). The avoidance of
shallow water by large, deep-bodied aquatic predators is a common behavior, which indirectly protects
smaller fish. McIvor and Odum (1987) found reduced predation by large carnivorous fish in the shallow
water (<3ft or <1m) of freshwater tidal creeks, possibly due to unfavorable water quality, the physical
constraints of shallow water, and/or increased predation from predatory birds (i.e., herons).
Salt/brackish marsh
Along with the shallow soft bottom and shell hash areas they border, salt/brackish marshes along the
North Carolina coast are probably the most recognizable nursery habitat for estuarine-dependent species.
The majority of Primary and Secondary Nursery Areas designated by the MFC are located in soft bottom
areas surrounded by salt/brackish marsh. Marsh wetlands are a vital component of estuarine nursery
habitat, while salinity and transport mechanisms are the key physical factors affecting the species
2010 Coastal Habitat Protection Plan
Chapter 5. Wetlands Page 286
composition in nursery habitats in Pamlico Sound and its tributaries (Ross and Epperly 1985; Noble and
Monroe 1991; Ross 2003).
Many of the juveniles of fishery species found in salt/brackish marsh nurseries were spawned offshore
during winter. The larvae were transported through inlets and into estuarine waters where they settled in
the upper (lower salinity) or lowermost (higher salinity) reaches of estuarine creek systems (Ross 2003).
The peak of juvenile settlement generally occurs in spring through early summer, depending on water
temperature (Ross and Epperly 1985). Settlement in upper reaches is particularly beneficial to spot and
croaker, where growth and survivorship are enhanced compared to lower reaches (Ross 2003).
According to DMF‘s juvenile abundance survey data, the dominant species in high salinity marshes
behind the Outer Banks and Core Sound include pinfish, pink shrimp, black sea bass, gag, pigfish, red
drum, gulf flounder, and summer flounder (Noble and Monroe 1991). However, the primary nursery
habitat in these areas is submerged aquatic vegetation. Juvenile spot, brown shrimp, striped mullet, and
southern flounder are abundant along the western shores of Pamlico and Core sounds and their tributaries
(Epperly and Ross 1986; Noble and Monroe 1991). In the Newport River estuary, juvenile southern
flounder showed a distinct preference for marsh edge habitat over other habitats, but only during fall
(Walsh et al. 1999). The juvenile southern flounder were most abundant in more turbid, upper regions of
the estuary. In higher salinity marshes of the Pamlico Sound, spotted seatrout, weakfish, silver perch, and
red drum are also abundant (Noble and Monroe 1991). A study in Galveston Bay, Texas, found that
juvenile brown shrimp, white shrimp, blue crab, spotted seatrout, and southern flounder were most
abundant along salt marsh edge habitat compared to inner marsh, shell bottom, SAV, and shallow, non-
vegetated bottom (Minello 1999). Resident estuarine species, such as gulf killifish and sheepshead
minnow, were most abundant in high marsh (Rozas and Zimmerman 2000).
During spring through fall, brackish marshes in the Albemarle-Pamlico estuary are dominated by juvenile
Atlantic menhaden, striped mullet (Epperly and Ross 1986), silversides, anchovies (Nelson et al. 1991)
and more demersal species such as Atlantic croaker, brown shrimp, blue crab, red drum, and southern
flounder (Tagatz and Dudley 1961; Noble and Monroe 1991, C. Peterson/UNC-CH, pers. com., 2003).
Fish use of low salinity (brackish) marsh habitat in estuaries of North Carolina was studied by Rozas and
Hackney (1984), who found a combination of freshwater and estuarine species. The most abundant
species were spot, grass shrimp, bay anchovy, and Atlantic menhaden. They also reported three seasonal
peaks in abundance: (1) spring peak with influx of juvenile spot, Atlantic menhaden, Atlantic croaker, and
southern flounder; (2) summer peak of grass shrimp; and (3) fall peak of bay anchovies and grass shrimp.
Habitat types derived from salt/brackish marsh (i.e., peat blocks) can also provide important nursery
habitat for certain species. Peat blocks are generally found along eroding marsh shorelines, where they
serve as firm substrate for the attachment of sessile invertebrates and refuge for juvenile blue crabs in
western Pamlico Sound (D. Eggleston/NCSU, pers. com., 2001). Szedlmayer and Able (1996) found that,
in a New Jersey estuary, juvenile black seabass were more abundant in sponge-peat habitats (associated
with eroding marsh) compared to eelgrass beds, upper estuary, subtidal creeks, marsh channels, and open
bay areas.
Freshwater marsh
Studies documenting the use and significance of freshwater marsh for larval and juvenile fish in North
Carolina are lacking. Freshwater marshes comprise only a very small portion of riparian wetlands in
coastal North Carolina. A study conducted in Virginia found that larvae and juvenile fish represented
79% and 59% of the total number of fish collected at tidal freshwater and salt marsh sites, respectively
(Yozzo and Smith 1997).

2010 Coastal Habitat Protection Plan
Chapter 5. Wetlands Page 287
Bottomland hardwood and riverine swamp forest
Forested wetlands are important nursery areas for anadromous and resident freshwater species (Wharton
et al. 1982; DMF 2000b). Forested wetlands are also important for some transient estuarine species (i.e.,
spot, croaker, southern flounder, blue crab) in the lower Cape Fear River (Mallin et al. 2001c; C.
Hackney, UNC-W/pers. com., 2003). The timing and extent of flooding are critical to fish use of
bottomland hardwood and riverine swamp forest. Larval and juvenile river herring have been collected
near flooded riverine wetlands in North Carolina (DMF 2000b). Studies of larval fish abundance and
diversity on Mississippi River floodplains suggested that nearly 50% of fish species inhabiting the river
used the floodplain as a nursery (Gallagher 1979). Sections of the Missouri River with accessible
floodplains produced 2 to 2.5 times more fish than channelized sections (Groen and Schmulbach 1978).
In general, vegetated shoreline inundation during spring and early summer has been correlated with
increased year-class strength of largemouth bass, sunfish, and yellow perch (Nelson and Walburg 1977;
Strange et al. 1982; Ploskey 1986).
5.2.4.2. Foraging
Salt/brackish marsh
Few aquatic species feed directly on living plant tissue in salt/brackish marsh (i.e., periwinkle), and their
productivity is very low compared to that of detritivores and consumers of microalgae (Wiegert and
Freeman 1990; Steel 1991; SAFMC 1998a). However, biotic interactions with primary consumers can
result in degradation or loss of wetlands. Study results from the southeastern United States suggest that
blue crab predation on plant-eating snails (Littorinid spp.) may prevent the snail from overgrazing the
marsh grass (Silliman and Bertness 2002). A more recent study (Tyrrell et al. 2008) observed greater
snail damage on S. alterniflora in more stressful conditions associated with sea-level rise (i.e., longer
inundation periods, lower elevation, poorer drainage).
Detritus and bacteria production from salt/brackish marsh exhibit some of the highest recorded values per
unit area of any ecosystem in the world (Wiegert and Evans 1967). Slow-moving or sessile species
residing in salt/brackish marsh and contributing to secondary production include fiddler crabs, mud snails,
amphipods, oysters, clams, and ribbed mussels (Wiegert and Freeman 1990). Based on data from
Georgia marshes, biomass of these resident species exceeded 15 g carbon/m2, and consisted of 80-200
fiddler crabs, 400-700 periwinkle snails or mud snails, and 7-8 mussels (Wiegert and Freeman 1990).
The resident estuarine fishes (i.e., killifish, grass shrimp, sheepshead minnow) are an important link
between estuarine production and transient predatory fish populations (Wiegert and Freeman 1990; Kneib
1997). Salt-brackish marsh edge provides important feeding areas for blue crabs, red drum, flounder,
seatrout and other large predators searching the edge of complex structure near deeper water, as illustrated
by greater predation on grass shrimp with increasing depth in shallow-estuarine water (Clark et al. 2003).
The biomass of secondary production going in and out with the tide (fish, shrimp) is less well known than
resident species biomass (Kneib and Wagner 1994). Deegan et al. (2000) concluded that secondary
production derived from salt marsh vegetation occurs in close proximity to the marsh, indicating the
possibly minor flux of salt marsh organic matter to offshore habitats. Salt marsh support of offshore
fisheries is more likely indirect through export of juvenile fish. The exported production of brown and
white shrimp is probably the best known and most significant to coastal fisheries (Turner 1977; Wiegert
and Freeman 1990). The estimated yield of shrimp from North Carolina was 107 lb per acre of intertidal
vegetated bottom (Turner 1977), where intertidal vegetation included ―salt marsh macrophytes, Spartina
spp. [and] Juncus species.‖ However, research suggests that wetlands vary greatly in their role as
exporters or importers of organic matter (Wiegert and Freeman 1990). This variation could be the result
of variable erosion or deposition rates among seasons or wetland areas.
2010 Coastal Habitat Protection Plan
Chapter 5. Wetlands Page 288
Freshwater marsh
Compared to salt/brackish marsh, most living vegetation in freshwater marshes can be more readily
consumed by insects, crayfish, muskrats, waterfowl, and carp (Mitsch and Gosselink 1993; SAFMC
1998a). The export of this production (in the form of particulate detritus) to other systems is less
understood than that of salt marshes (Mitsch and Gosselink 1993), but is probably similarly affected by
the rates of erosion and water exchange between wetlands and open water systems. Because many
freshwater marshes in North Carolina generally occur in slow-moving, backwater areas, export of detritus
is probably less significant than salt marshes.
The detritus that remains in the marsh provides food for meio- and macrobenthic communities consisting
of nematode worms, chironomid fly larvae, mysids, snails, and amphipods (Odum et al. 1984; Mitsch and
Gosselink 1993; SAFMC 1998a). The macrobenthic community, in turn, provides abundant food for
small fish, grass shrimp, crayfish, crabs, and waterfowl. Large fish feeding within the marsh include
chain pickerel, bowfin, and gars (Odum et al. 1984). Many other large, aquatic predators (i.e., largemouth
bass, crappie) feed along the edge of freshwater marshes where there is deep water nearby for refuge
(Odum et al. 1984).
Bottomland hardwood and riverine swamp forest
Although riverine forests contain vast stores of organic matter, much of it is not rapidly converted into
particulate organic matter for secondary production (Mitsch and Gosselink 1993) because woody material
and leaves break down more slowly than succulent vegetation in marshes. In spite of this, riverine
forested wetlands still produce abundant invertebrate food, such as copepods, ostracods, amphipods,
isopods, oligochaetes, flatworms, crayfish, and terrestrial insects (Wharton et al. 1982; Mitsch and
Gosselink 1993). Fish species and life stages adapted for feeding in riverine swamp forests include adult
mosquitofish, gar, bowfin, carp and chain pickerel, along with early life stages of many other species
(Wharton et al. 1982; Mitsch and Gosselink 1993). Other species, such as largemouth bass and catfish,
are opportunistic predators within the flooded forest.
5.2.4.3. Refuge
Many small resident species, such as grass shrimp and killifish, find refuge from predators and adverse
weather conditions on and among the dense leaf canopies found in marshes (Mitsch and Gosselink 1993;
Pattilo et al. 1997; SAFMC 1998a; Rozas and Zimmerman 2000; Graff and Middleton 2000). Clark et al.
(2003) highlighted the importance of a refuge from predation during the daytime and a relaxation of
predation at night. Large, somewhat less mobile organisms also find refuge in the vegetation. For
example, Micheli and Peterson (1999) found that adult blue crabs utilized marsh edge habitat in
preference to unvegetated, open water habitat in a North Carolina estuary, presumably as refuge from
predation.
The structure provided by freshwater marsh vegetation and forested wetland margins provides excellent
refuge for sunfish, crappie, largemouth bass, and other ambush predators, as well as slow-moving benthic
invertebrates (e.g., crayfish). Numerous studies have documented the preference of largemouth bass,
bluegill, and other freshwater ambush predators for vegetated habitat (review in Savino and Stein 1989).
5.2.4.4. Spawning
The stems and leaves of wetland vegetation provide a surface for attachment of eggs. The combination of
egg-laying structures, abundant food and relative scarcity of predators (Power et al. 1995) in seasonally
flooded wetlands makes them an ideal spawning area. Numerous freshwater riverine species use riparian
swamps as a spawning habitat (Wharton et al. 1982). River herring are an important coastal species that
spawn adhesive eggs in flooded swamps, oxbows, and along stream edges (Wharton et al. 1982; DMF

2010 Coastal Habitat Protection Plan
Chapter 5. Wetlands Page 289
2000b). Spawning of river herring in North Carolina occurs during elevated spring flows from March
through May in small tributaries (DMF 2000b). The DMF surveyed river herring spawning activity
(eggs, larvae, spawning adults) through riverine forested wetlands in the early 1970‘s and again in 2008-
2009. The data from the original survey was used to map and officially designated Anadromous Fish
Spawning Areas in 2008 [North Carolina Rules for Coastal Fishing Waters 2009 - 15A NCAC 03I .0101
(4) (b)]. Spawning hickory shad are thought to use flooded swamps and tributaries of the main river (Pate
1972; Funderburk et al. 1991). Pate (1972) collected hickory shad larvae and eggs in flooded swamps
and sloughs off of the mainstem of the Neuse River.
The structural complexity of vegetation and intertidal submersion regime in salt/brackish marsh provides
spawning habitat for forage species such as killifish (including mummichogs), silversides, gobies, and
grass shrimp (Anderson 1985; Pattilo et al. 1997). The number of species spawning in salt marsh habitat
is low compared to the number of estuarine species spawning offshore and in deep channel habitat (see
―Water column‖ chapter). Nevertheless, many of the species spawning in wetlands are also important
food items for transient fishery species.
5.2.4.5. Corridor and connectivity
Within the marsh, elevation and proximity to open water are important influences on the distribution of
fish. Rozas and Odum (1987) found that shallow water and greater distance from deep water typically
meant lower abundance of large predatory fish (Rozas and Odum 1987). Marsh edge is also more utilized
when adjacent to SAV or shell beds where small organisms can take refuge at low tide (Rozas and Odum
1987; Irlandi and Crawford 1997; Micheli and Peterson 1999). Studies comparing fish and shellfish
densities in tidal creeks with and without adjacent SAV beds found that pinfish and grass shrimp numbers
greatly declined in tidal creeks without subtidal SAV (Rozas and Odum 1987; Irlandi and Crawford
1997). The movement of pinfish between the intertidal marsh and subtidal grass beds could provide an
important link in the transfer of secondary production from the marsh to adjacent aquatic habitats, and
vice versa. Subtidal structures (i.e., SAV, large woody debris) near freshwater wetlands may serve a
similar corridor function in wind tidal systems of Pamlico and Albemarle Sound. Wetlands can also
enhance the foraging function of adjacent habitats. Micheli and Peterson (1999) found that marsh edge
provided a corridor function for blue crabs foraging on nearby subtidal oyster reefs. These studies show
the importance of considering optimal locations for habitat restoration/creation projects.
5.3. Status and trends
5.3.1. History of loss and regulatory action
5.3.1.1. Historic loss of wetland habitat
Past studies have estimated that North Carolina had about 7.2 million acres of wetlands prior to European
colonization, of which 95% occurred in the Coastal Plains (DWQ 2000a). Dahl (1990) estimated that by
the mid-1980s, only about 50% of these wetlands remained. The trend in wetland loss for North Carolina
mirrors national trends (Dahl 1990). DWQ also estimated wetland losses but concluded that
approximately 66% of North Carolina‘s original wetland extent remains and 83% of its original salt
marsh, bottomland hardwood, and swamp forests still remain (Table 5.3) (DWQ 2000a). However, the
83% figure is only a rough estimate because the DWQ study did not distinguish between depressional
(non-riparian) and riverine swamp forest. Pocosins have suffered even greater losses (48% remaining
from the 1950s). The figures also do not account for wetland losses after 1993. The acreage of remaining
wetlands in North Carolina will be updated later in this chapter with more recent permit statistics.
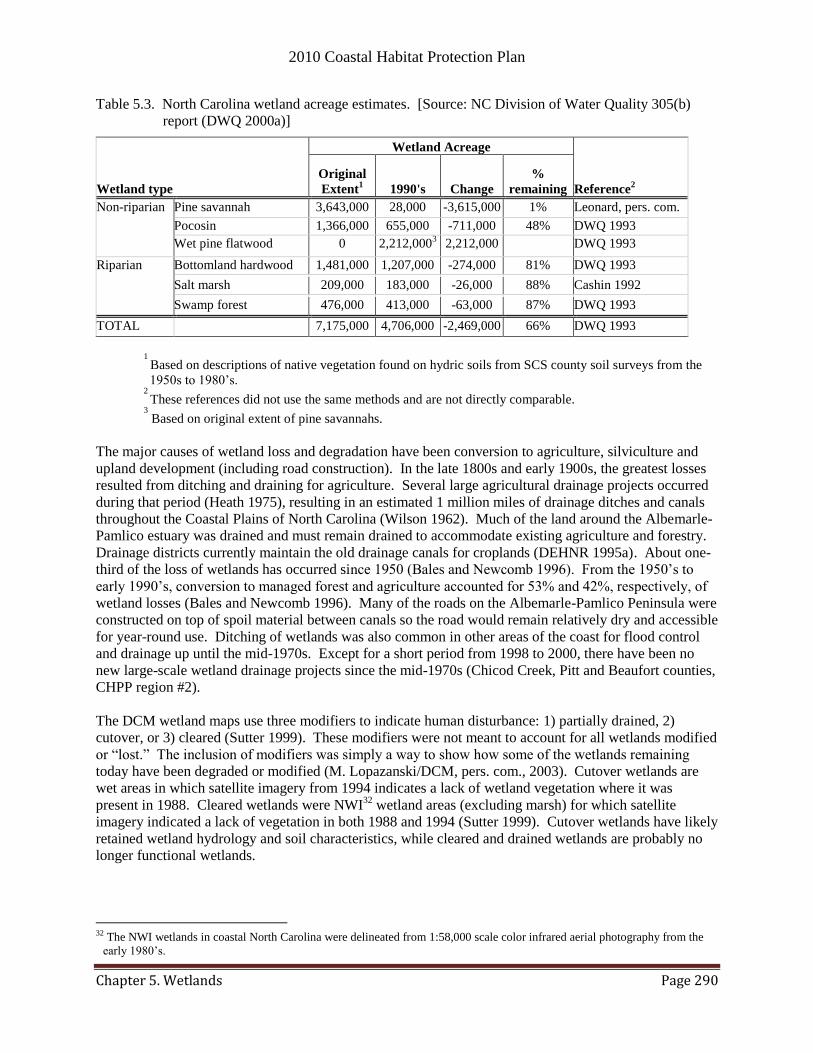
2010 Coastal Habitat Protection Plan
Chapter 5. Wetlands Page 290
Table 5.3. North Carolina wetland acreage estimates. [Source: NC Division of Water Quality 305(b)
report (DWQ 2000a)]
Wetland type
Wetland Acreage
Reference2
Original
Extent1 1990's Change
%
remaining
Non-riparian Pine savannah 3,643,000 28,000 -3,615,000 1% Leonard, pers. com.
Pocosin 1,366,000 655,000 -711,000 48% DWQ 1993
Wet pine flatwood 0 2,212,0003 2,212,000 DWQ 1993
Riparian Bottomland hardwood 1,481,000 1,207,000 -274,000 81% DWQ 1993
Salt marsh 209,000 183,000 -26,000 88% Cashin 1992
Swamp forest 476,000 413,000 -63,000 87% DWQ 1993
TOTAL 7,175,000 4,706,000 -2,469,000 66% DWQ 1993
1
Based on descriptions of native vegetation found on hydric soils from SCS county soil surveys from the
1950s to 1980‘s.
2
These references did not use the same methods and are not directly comparable. 3
Based on original extent of pine savannahs.
The major causes of wetland loss and degradation have been conversion to agriculture, silviculture and
upland development (including road construction). In the late 1800s and early 1900s, the greatest losses
resulted from ditching and draining for agriculture. Several large agricultural drainage projects occurred
during that period (Heath 1975), resulting in an estimated 1 million miles of drainage ditches and canals
throughout the Coastal Plains of North Carolina (Wilson 1962). Much of the land around the Albemarle-
Pamlico estuary was drained and must remain drained to accommodate existing agriculture and forestry.
Drainage districts currently maintain the old drainage canals for croplands (DEHNR 1995a). About one-
third of the loss of wetlands has occurred since 1950 (Bales and Newcomb 1996). From the 1950‘s to
early 1990‘s, conversion to managed forest and agriculture accounted for 53% and 42%, respectively, of
wetland losses (Bales and Newcomb 1996). Many of the roads on the Albemarle-Pamlico Peninsula were
constructed on top of spoil material between canals so the road would remain relatively dry and accessible
for year-round use. Ditching of wetlands was also common in other areas of the coast for flood control
and drainage up until the mid-1970s. Except for a short period from 1998 to 2000, there have been no
new large-scale wetland drainage projects since the mid-1970s (Chicod Creek, Pitt and Beaufort counties,
CHPP region #2).
The DCM wetland maps use three modifiers to indicate human disturbance: 1) partially drained, 2)
cutover, or 3) cleared (Sutter 1999). These modifiers were not meant to account for all wetlands modified
or ―lost.‖ The inclusion of modifiers was simply a way to show how some of the wetlands remaining
today have been degraded or modified (M. Lopazanski/DCM, pers. com., 2003). Cutover wetlands are
wet areas in which satellite imagery from 1994 indicates a lack of wetland vegetation where it was
present in 1988. Cleared wetlands were NWI32
wetland areas (excluding marsh) for which satellite
imagery indicated a lack of vegetation in both 1988 and 1994 (Sutter 1999). Cutover wetlands have likely
retained wetland hydrology and soil characteristics, while cleared and drained wetlands are probably no
longer functional wetlands.
32 The NWI wetlands in coastal North Carolina were delineated from 1:58,000 scale color infrared aerial photography from the
early 1980‘s.
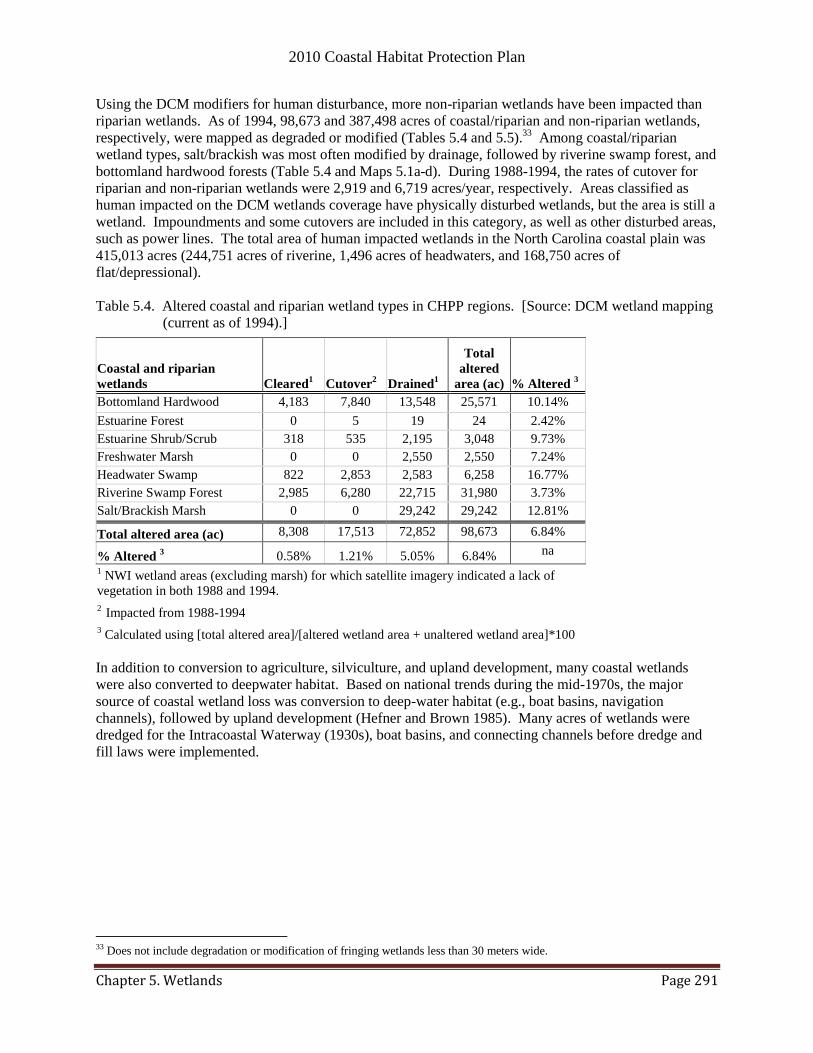
2010 Coastal Habitat Protection Plan
Chapter 5. Wetlands Page 291
Using the DCM modifiers for human disturbance, more non-riparian wetlands have been impacted than
riparian wetlands. As of 1994, 98,673 and 387,498 acres of coastal/riparian and non-riparian wetlands,
respectively, were mapped as degraded or modified (Tables 5.4 and 5.5).33
Among coastal/riparian
wetland types, salt/brackish was most often modified by drainage, followed by riverine swamp forest, and
bottomland hardwood forests (Table 5.4 and Maps 5.1a-d). During 1988-1994, the rates of cutover for
riparian and non-riparian wetlands were 2,919 and 6,719 acres/year, respectively. Areas classified as
human impacted on the DCM wetlands coverage have physically disturbed wetlands, but the area is still a
wetland. Impoundments and some cutovers are included in this category, as well as other disturbed areas,
such as power lines. The total area of human impacted wetlands in the North Carolina coastal plain was
415,013 acres (244,751 acres of riverine, 1,496 acres of headwaters, and 168,750 acres of
flat/depressional).
Table 5.4. Altered coastal and riparian wetland types in CHPP regions. [Source: DCM wetland mapping
(current as of 1994).]
Coastal and riparian
wetlands Cleared1 Cutover
2 Drained
1
Total
altered
area (ac) % Altered 3
Bottomland Hardwood 4,183 7,840 13,548 25,571 10.14%
Estuarine Forest 0 5 19 24 2.42%
Estuarine Shrub/Scrub 318 535 2,195 3,048 9.73%
Freshwater Marsh 0 0 2,550 2,550 7.24%
Headwater Swamp 822 2,853 2,583 6,258 16.77%
Riverine Swamp Forest 2,985 6,280 22,715 31,980 3.73%
Salt/Brackish Marsh 0 0 29,242 29,242 12.81%
Total altered area (ac) 8,308 17,513 72,852 98,673 6.84%
% Altered 3 0.58% 1.21% 5.05% 6.84% na
1 NWI wetland areas (excluding marsh) for which satellite imagery indicated a lack of
vegetation in both 1988 and 1994.
2 Impacted from 1988-1994
3 Calculated using [total altered area]/[altered wetland area + unaltered wetland area]*100
In addition to conversion to agriculture, silviculture, and upland development, many coastal wetlands
were also converted to deepwater habitat. Based on national trends during the mid-1970s, the major
source of coastal wetland loss was conversion to deep-water habitat (e.g., boat basins, navigation
channels), followed by upland development (Hefner and Brown 1985). Many acres of wetlands were
dredged for the Intracoastal Waterway (1930s), boat basins, and connecting channels before dredge and
fill laws were implemented.
33 Does not include degradation or modification of fringing wetlands less than 30 meters wide.
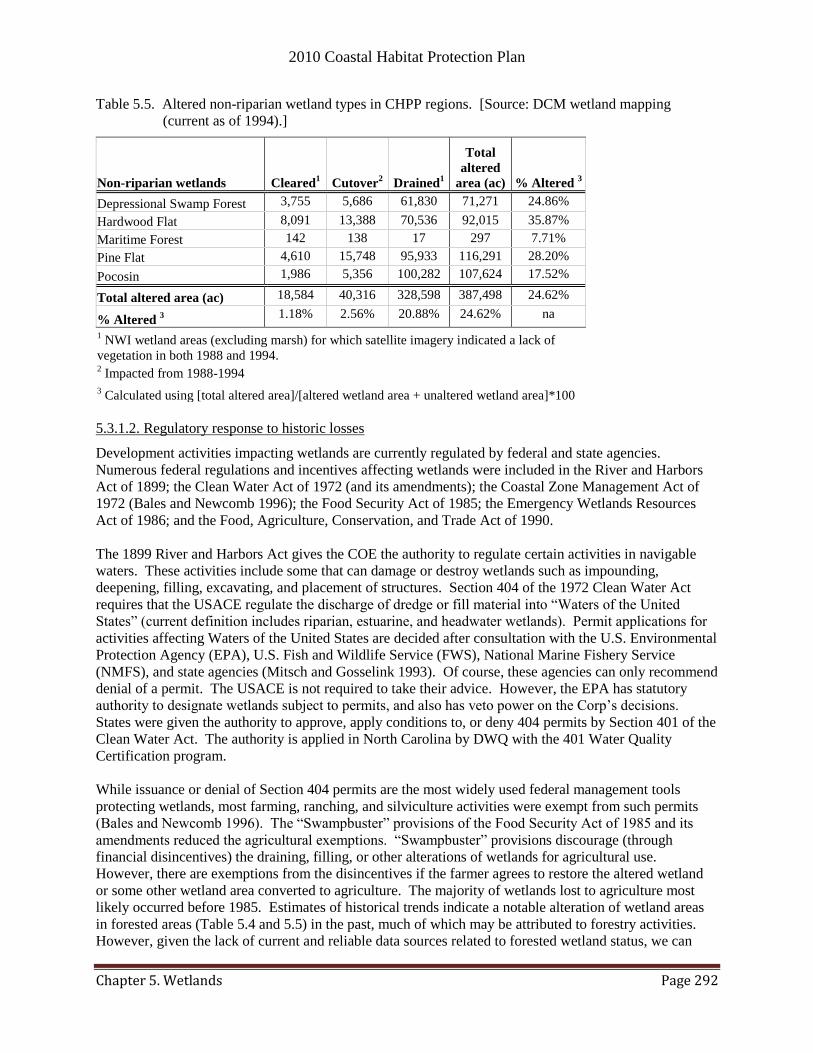
2010 Coastal Habitat Protection Plan
Chapter 5. Wetlands Page 292
Table 5.5. Altered non-riparian wetland types in CHPP regions. [Source: DCM wetland mapping
(current as of 1994).]
Non-riparian wetlands Cleared1 Cutover
2 Drained
1
Total
altered
area (ac) % Altered 3
Depressional Swamp Forest 3,755 5,686 61,830 71,271 24.86%
Hardwood Flat 8,091 13,388 70,536 92,015 35.87%
Maritime Forest 142 138 17 297 7.71%
Pine Flat 4,610 15,748 95,933 116,291 28.20%
Pocosin 1,986 5,356 100,282 107,624 17.52%
Total altered area (ac) 18,584 40,316 328,598 387,498 24.62%
% Altered 3
1.18% 2.56% 20.88% 24.62% na
1 NWI wetland areas (excluding marsh) for which satellite imagery indicated a lack of
vegetation in both 1988 and 1994. 2 Impacted from 1988-1994
3 Calculated using [total altered area]/[altered wetland area + unaltered wetland area]*100
5.3.1.2. Regulatory response to historic losses
Development activities impacting wetlands are currently regulated by federal and state agencies.
Numerous federal regulations and incentives affecting wetlands were included in the River and Harbors
Act of 1899; the Clean Water Act of 1972 (and its amendments); the Coastal Zone Management Act of
1972 (Bales and Newcomb 1996); the Food Security Act of 1985; the Emergency Wetlands Resources
Act of 1986; and the Food, Agriculture, Conservation, and Trade Act of 1990.
The 1899 River and Harbors Act gives the COE the authority to regulate certain activities in navigable
waters. These activities include some that can damage or destroy wetlands such as impounding,
deepening, filling, excavating, and placement of structures. Section 404 of the 1972 Clean Water Act
requires that the USACE regulate the discharge of dredge or fill material into ―Waters of the United
States‖ (current definition includes riparian, estuarine, and headwater wetlands). Permit applications for
activities affecting Waters of the United States are decided after consultation with the U.S. Environmental
Protection Agency (EPA), U.S. Fish and Wildlife Service (FWS), National Marine Fishery Service
(NMFS), and state agencies (Mitsch and Gosselink 1993). Of course, these agencies can only recommend
denial of a permit. The USACE is not required to take their advice. However, the EPA has statutory
authority to designate wetlands subject to permits, and also has veto power on the Corp‘s decisions.
States were given the authority to approve, apply conditions to, or deny 404 permits by Section 401 of the
Clean Water Act. The authority is applied in North Carolina by DWQ with the 401 Water Quality
Certification program.
While issuance or denial of Section 404 permits are the most widely used federal management tools
protecting wetlands, most farming, ranching, and silviculture activities were exempt from such permits
(Bales and Newcomb 1996). The ―Swampbuster‖ provisions of the Food Security Act of 1985 and its
amendments reduced the agricultural exemptions. ―Swampbuster‖ provisions discourage (through
financial disincentives) the draining, filling, or other alterations of wetlands for agricultural use.
However, there are exemptions from the disincentives if the farmer agrees to restore the altered wetland
or some other wetland area converted to agriculture. The majority of wetlands lost to agriculture most
likely occurred before 1985. Estimates of historical trends indicate a notable alteration of wetland areas
in forested areas (Table 5.4 and 5.5) in the past, much of which may be attributed to forestry activities.
However, given the lack of current and reliable data sources related to forested wetland status, we can
2010 Coastal Habitat Protection Plan
Chapter 5. Wetlands Page 293
only speculate about the current level of silviculture alteration of wetland areas. Nonetheless, it is widely
recognized than in order to maintain the exemptions under Section 404, a land-use activity must not result
in the immediate or gradual conversion of a wetland to a non-wetland.
There are also section 404 and 401 general permits issued for projects causing minimal individual and
cumulative environmental impacts. These permits are important because the activities they cover may not
require wetland restoration. The most frequently used, but no longer issued, 404 general permit is
Nationwide Permit 26, which applied to wetland fills less than 10 acres in size. This permit had the
following general conditions: (1) the wetland must be located adjacent to a stream and above headwaters,
or (2) the wetland must be isolated (equivalent to flat/depressional hydrogeomorphic class). Nationwide
Permit 26 probably contributed primarily to loss of flat/depressional wetlands noted earlier in the Status
and Trends section. A sample list of other activities covered under federal general permits includes:
Fish and wildlife harvesting,
Survey activities,
Minor road crossings,
Modifications of existing marinas,
Maintenance dredging of existing basins,
Boat ramps with no discharge to wetlands, and
Cleanup of hazardous and toxic waste.
Stream and wetland restoration
The Emergency Wetlands Resources Act of 1986 required states to address wetland protection in their
Comprehensive Outdoor Recreation Plans in order to qualify for federal funding. Other wetland
protection incentives were provided by the Coastal Zone Management Act, which required coastal states
to adopt coastal zone management programs in order to be eligible for federal funding and technical
assistance. As a result, the Coastal Resources Commission (CRC) was established in North Carolina
under the NC Coastal Area Management Act (CAMA) of 1974. The Division of Coastal Management
(DCM) was later established as the operational arm of the CRC. Rules promulgated by the CRC apply to
North Carolina‘s 20 coastal counties. Prior to the NC CAMA, dredging and filling of coastal waters was
regulated under the NC Dredge and Fill Law.
The CRC rules state that activities directly impacting wetlands shall not have significant adverse impacts.
The CRC prohibits disposal of fill in coastal wetlands and dredging activities in all but the narrowest
fringing wetlands [CRC rule 15A NCAC 07H .0208 (b) (1) (A-C)]. Furthermore, CRC rules require that
bulkheads be constructed landward of coastal wetland areas. However, CRC and EMC rules allow
bulkhead backfilling of small, freshwater wetlands landward of coastal wetlands following the size
threshold criteria for permitting wetland impacts.34
This will result in a cumulative loss of freshwater
wetlands and will impede the ability of the estuarine marsh to migrate landward with sea level rise.
Encouraged by the progress of wetland regulations, ―No Net Loss‖ policies were developed by the federal
government in the late 1980s (Wiebe and Heimlich 1995). But despite their achievements, wetland
regulations are still considered by some of the public as ―taking‖ of property that should be discontinued
or compensated for financially. The central problem of wetland protection remains how to protect
wetlands for public benefit when the majority of converted or remaining wetlands are privately owned.
These factors have lead to increasing reliance on land acquisition and direct incentives for protecting
remaining wetlands. Increasing public awareness of wetlands benefits (i.e., reducing flood levels,
34 Projects impacting less than 1/3 acre of wetland within 50 feet of the high water line are exempt from 401 water quality
certifications, as well as projects impacting less than 1 acre within 150 feet of the high water line [EMC rule 15A NCAC 02H
.0506 (c)(2)]. There is no minimum area criterion for mitigation when dealing with designated unique wetlands [EMC rule 15A
NCAC 02H .0506(e)].

2010 Coastal Habitat Protection Plan
Chapter 5. Wetlands Page 294
velocities, and damage) encourages greater acceptance of wetland regulations, as well as voluntary
actions.
5.3.1.3. Recent loss of wetland habitat (1994-present)
Within coastal draining river basins, 401-permitted wetland impacts over a period of eight fiscal years
(FY 1999/2000-2007/2008) indicate a potential conversion of 1,613 wetland acres to non-wetlands
(Figure 5.2). Approximately 25% of these wetland impacts did not require mitigation. Among coastal
draining river basins, the Cape Fear had the most impacts, followed by the Neuse and Pasquotank (Figure
5.3). However, it should be noted that section 401 water quality certifications (from DWQ) precede
section 404 permits (from the U.S. Army Corps of Engineers or COE) that may never be issued. In
addition, some permitted impacts never occur. There were an additional 11,580 acres of pocosin wetland
(flat/depressional) lost after repeal of the federal Tulloch Rule (see ―Regulatory response to recent losses‖
section). However, most of this acreage had its hydrology restored through an intensive state and federal
enforcement effort (see ―Wetland enhancement and restoration‖ section). There is also an unquantified
amount of wetland acres lost each year to the indirect effects of bulkheads (see ―Shoreline Stabilization‖
section) as well as unauthorized and/or small projects not requiring notification of DWQ.35
Thus, the
amount of impacted wetland acres may be underestimated. The DWQ is working to resolve the issue of
tracking unauthorized and cumulative, small impacts (EEP 2004).
Figure 5.2. Total 401 Permitted Wetland Impacts (acres) during FY 1999/2000-2007/2008 in the seven
coastal draining river basins (excluding the Lumber River basin) by fiscal year. Note: These
data are for permanent wetland loss and do not include impacts from CAMA, Corps of
Engineers Nationwide Permits 12, 27 and 33, and Corps of Engineers Regional General
Permit 030 since these impacts are temporary, impacts to water (e.g., drainage), or impacts for
wetland creation, restoration, or enhancement.
35
Impacts to wetlands less than 1/3 acres (east of I-95) or 1/10 acre (west of I-95) and not designated as unique wetlands, or
adjacent to ORW, SA, WS-I, WS-II, or contiguous with a state or national Wild and Scenic River
(http://h2o.enr.state.nc.us/ncwetlands/rd_wetlands_certifications.htm, February 2009).
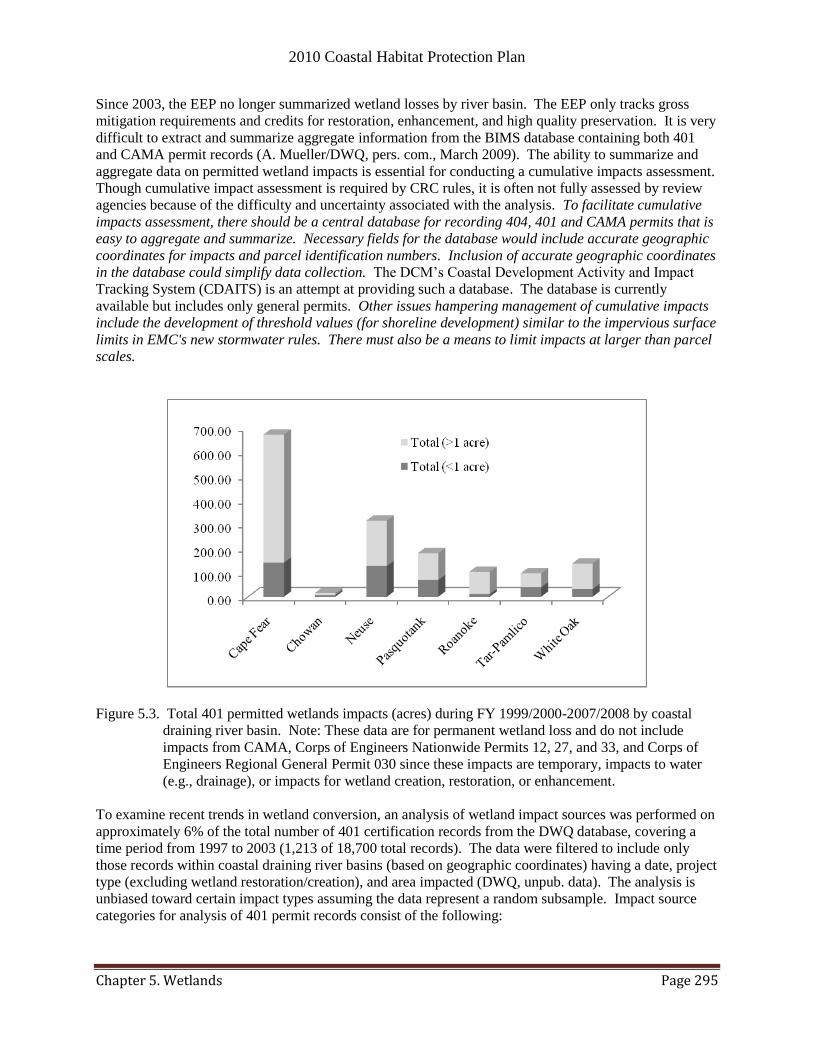
2010 Coastal Habitat Protection Plan
Chapter 5. Wetlands Page 295
Since 2003, the EEP no longer summarized wetland losses by river basin. The EEP only tracks gross
mitigation requirements and credits for restoration, enhancement, and high quality preservation. It is very
difficult to extract and summarize aggregate information from the BIMS database containing both 401
and CAMA permit records (A. Mueller/DWQ, pers. com., March 2009). The ability to summarize and
aggregate data on permitted wetland impacts is essential for conducting a cumulative impacts assessment.
Though cumulative impact assessment is required by CRC rules, it is often not fully assessed by review
agencies because of the difficulty and uncertainty associated with the analysis. To facilitate cumulative
impacts assessment, there should be a central database for recording 404, 401 and CAMA permits that is
easy to aggregate and summarize. Necessary fields for the database would include accurate geographic
coordinates for impacts and parcel identification numbers. Inclusion of accurate geographic coordinates
in the database could simplify data collection. The DCM‘s Coastal Development Activity and Impact
Tracking System (CDAITS) is an attempt at providing such a database. The database is currently
available but includes only general permits. Other issues hampering management of cumulative impacts
include the development of threshold values (for shoreline development) similar to the impervious surface
limits in EMC's new stormwater rules. There must also be a means to limit impacts at larger than parcel
scales.
Figure 5.3. Total 401 permitted wetlands impacts (acres) during FY 1999/2000-2007/2008 by coastal
draining river basin. Note: These data are for permanent wetland loss and do not include
impacts from CAMA, Corps of Engineers Nationwide Permits 12, 27, and 33, and Corps of
Engineers Regional General Permit 030 since these impacts are temporary, impacts to water
(e.g., drainage), or impacts for wetland creation, restoration, or enhancement.
To examine recent trends in wetland conversion, an analysis of wetland impact sources was performed on
approximately 6% of the total number of 401 certification records from the DWQ database, covering a
time period from 1997 to 2003 (1,213 of 18,700 total records). The data were filtered to include only
those records within coastal draining river basins (based on geographic coordinates) having a date, project
type (excluding wetland restoration/creation), and area impacted (DWQ, unpub. data). The analysis is
unbiased toward certain impact types assuming the data represent a random subsample. Impact source
categories for analysis of 401 permit records consist of the following:
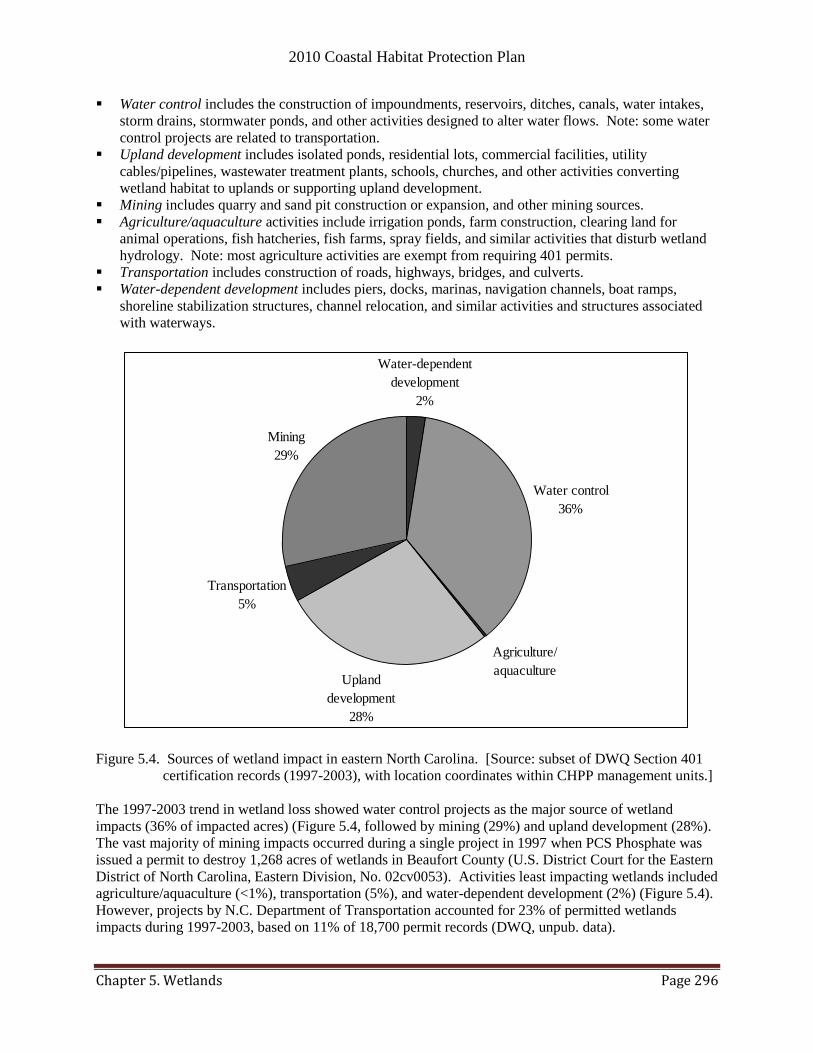
2010 Coastal Habitat Protection Plan
Chapter 5. Wetlands Page 296
Water control includes the construction of impoundments, reservoirs, ditches, canals, water intakes,
storm drains, stormwater ponds, and other activities designed to alter water flows. Note: some water
control projects are related to transportation.
Upland development includes isolated ponds, residential lots, commercial facilities, utility
cables/pipelines, wastewater treatment plants, schools, churches, and other activities converting
wetland habitat to uplands or supporting upland development.
Mining includes quarry and sand pit construction or expansion, and other mining sources.
Agriculture/aquaculture activities include irrigation ponds, farm construction, clearing land for
animal operations, fish hatcheries, fish farms, spray fields, and similar activities that disturb wetland
hydrology. Note: most agriculture activities are exempt from requiring 401 permits.
Transportation includes construction of roads, highways, bridges, and culverts.
Water-dependent development includes piers, docks, marinas, navigation channels, boat ramps,
shoreline stabilization structures, channel relocation, and similar activities and structures associated
with waterways.
Figure 5.4. Sources of wetland impact in eastern North Carolina. [Source: subset of DWQ Section 401
certification records (1997-2003), with location coordinates within CHPP management units.]
The 1997-2003 trend in wetland loss showed water control projects as the major source of wetland
impacts (36% of impacted acres) (Figure 5.4, followed by mining (29%) and upland development (28%).
The vast majority of mining impacts occurred during a single project in 1997 when PCS Phosphate was
issued a permit to destroy 1,268 acres of wetlands in Beaufort County (U.S. District Court for the Eastern
District of North Carolina, Eastern Division, No. 02cv0053). Activities least impacting wetlands included
agriculture/aquaculture (<1%), transportation (5%), and water-dependent development (2%) (Figure 5.4).
However, projects by N.C. Department of Transportation accounted for 23% of permitted wetlands
impacts during 1997-2003, based on 11% of 18,700 permit records (DWQ, unpub. data).
Water-dependent
development
2%
Water control
36%
Upland
development
28%
Transportation
5%
Mining
29%
Agriculture/
aquaculture
0%
2010 Coastal Habitat Protection Plan
Chapter 5. Wetlands Page 297
In addition to conversion caused directly by humans, wetlands are also being lost to erosion resulting
from sea level rise and shoreline hardening (Riggs 2001). Based on a recent study of 21 field sites and
then extrapolated to the entire length of estuarine shoreline in northeastern North Carolina, annual
wetland losses are approximately 802 acres/year, most of which are mainland brackish marsh habitat
(Riggs and Ames 2003). However, wetland areas are not lost where wetland accretion keeps pace with
sea level rise (see ―Sea level rise and climate change‖ section for more information).
5.3.1.4. Regulatory response to recent losses
Between 1993 and 1998, the Tulloch rule gave the USACE authority to regulate ditching and draining of
wetlands by preventing the removal of material that could fall back into the wetland. At that time,
ditching required a federal 404 permit with a DWQ 401 certification, to ensure that water quality
standards were not violated. When the federal court overturned the Tulloch rule in June 1998, the
USACE lost authority to issue permits for wetland ditching unless spoil was actually placed on adjacent
wetlands. As a result, thousands of acres of wetlands were drained, primarily in Brunswick, New
Hanover, and Pender counties (J. Steenhuis/DWQ, pers. com., 2002). Approximately 9,500 acres of
wetlands were impacted in Brunswick County alone (DWQ 1999), and a total of approximately 11,580
acres of wetlands were impacted in the Coastal Plain. These losses are in addition to 401 Water Quality
certification records. In Brunswick, New Hanover, Pender, and Onslow counties, 24% of the ditching
was reported as forestry-related, 6% as agriculture-related, and 70% was done for development or other
purposes (J. Steenhuis/DWQ, pers. com., 2002).
In 1999, the State of North Carolina determined that wetlands ditching and draining activities fall under
its authority, constituting an illegal activity if proper approval is not obtained. The EMC then adopted a
wetland draining policy to ensure that required wetland conditions are maintained
(http://portal.ncdenr.org/web/wq/swp/ws/401/policies, Decemeber 2010). In addition, inspections were
made of previously ditched wetlands to determine if the ditching was conducted in a manner that violated
wetland standards. Where violations occurred, property owners were required to restore the natural
hydrology through the filling of the ditches. Approximately 50% of the ditched wetlands have been
restored, 22% are likely not to be restored, and the status of the remainder is undetermined (J.
Steenhuis/DWQ, pers. com., 2002). Many of the remaining ditches, although not appearing to be
violating water quality standards, continue to transport stormwater into coastal waters. The DWQ created
two stormwater compliance positions in 2007 that were filled in 2008, to inspect for compliance with
water quality standards, including wetland draining. The positions are located in Washington and
Wilmington, respectively.
In 1995, the USACE and EPA issued a joint guidance memo
http://www.epa.gov/owow/wetlands/guidance/silv2.html that specifies how mechanical site preparation
forestry activities must be conducted in order to maintain the silvicultural exemption under Section 404 of
the Clean Water Act. This joint guidance memo describes six ‗mandatory‘ best management practices
(BMPs) for conducting mechanical site preparation for the establishment of pine plantations. However,
this guidance memo also describes nine wetland types in which a permit is required to conduct such site
preparation activities; these wetland types are listed below:
1. Permanently flooded, intermittently exposed, and semi-permanently flooded wetlands
2. Riverine Bottomland Hardwood wetlands
3. White Cedar swamps
4. Carolina Bay wetlands
5. Non-riverine Forest Wetlands
6. Low Pocosin wetlands
7. Wet Marl forests
8. Tidal freshwater marshes
2010 Coastal Habitat Protection Plan
Chapter 5. Wetlands Page 298
9. Maritime grasslands, shrub swamps and swamp forests
It could be implied that after 1995, any silvicultural site preparation activity for the establishment of pine
plantations in the above nine types of wetlands should not have taken place without applicable permits.
The following case demonstrates how the silvicultural (forestry) exemption can be abused by a landowner
and/or company who ultimately does not have an interest in maintaining sustainable forestry operations.
In a court case related to the drainage activities during 1998-2000, a development company claimed the
forestry exemption when it ditched and drained over 200 acres of flat/depressional wetland in Onslow
county (N.C. Shellfish Growers Association and NCCF vs. Holly Ridge Associates; U.S. District Court
for the Eastern District of North Carolina, Eastern Division, No. 02cv0053). The judge said the ditches
and the site itself were all ―point sources‖ of stormwater and sediment pollution, and therefore required
discharge permits under the Act – even if the activities were for forestry purposes. However, minor
drainage- as described for silvicultural purposes in the Code of Federal Regulations 33CFR323.4 – is
categorized, treated, and regulated as a nonpoint source contributor of pollution. In a related state case,
an administrative judge ruled there was no credible evidence that the ditching and drainage were for the
purpose of forestry. Holly Ridge Associates was found in violation of the Clean Water Act for not
obtaining a CAMA permit, a 401 Water Quality Certification, and an NPDES discharge permit. Any
ditching activity resulting in excess pollutant discharge to North Carolina's rivers and sounds should
require an NPDES permit. The EMC‟s constraints on discharges in SA waters could then be extended to
small drainage projects, in addition to traditional point source discharges (i.e., wastewater treatment
plants).
In order for forest roads in wetlands to maintain the silvicultural exemption under Section 404, there are
fifteen required practices that must be implemented, as described in Code of Federal Regulations 33 CFR
Part 323.4 - ―Discharges not requiring permits‖,
http://www.saw.usace.army.mil/wetlands/authority.html#Code%20of%20Federal%20Regulations
(November 2010).
In addition to these federal rules, in 2004 the Wilmington District of the USACE issued an information
document that contains specific recommendations related to the construction of forest roads in wetlands
of North Carolina regarding compliance under Section 404
(http://www.saw.usace.army.mil/WETLANDS/Policies/Forest%20Road%20Guidance-final-11-9-
2004.pdf). Finally, in 2006 the NC Division of Forest Resources completed a multi-year effort to
coordinate and publish a revised North Carolina Forestry Best Management Practices (BMP) Manual
(http://www.dfr.state.nc.us/water_quality/bmp_manual.htm). This comprehensive manual was developed
through a multi-disciplinary technical advisory group and incorporates extensive information and
recommendations for conducting forestry activities in wetlands, including citations of the applicable
federal and state laws that effect forestry activities (refer to ―Best management practices‖ subsection of
Section 2.4.2.3. for more information on forestry management).
5.3.2. Status of associated fishery stocks
It is very difficult to attribute changes in fish abundance to changes in habitat for several reasons. A
major difficulty arises in achieving the data needs for such an analysis. The analysis needs accurate
density estimates for fish species and size classes among accurately delineated habitat types over a time
series to predict fish – habitat relationships. A study in Galveston Bay was able to predict a substantial
decline in shrimp and blue crab populations following a decline in salt marsh edge relative to open water
(Rozas et al. 2007). Such an analysis has not been conducted in North Carolina.
There are also non-habitat factors affecting fish populations (i.e., fishing mortality). In North Carolina,
estimated fishing mortality and juvenile abundance indices are used by the DMF to determine the status
of fishery stocks. Stock status evaluations may also suggest habitat issues for concern or depleted
2010 Coastal Habitat Protection Plan
Chapter 5. Wetlands Page 299
species. Of the fishery stocks with higher relative abundance in wetlands (Table 5.2), six are Depleted,
five are Concern, two are Recovering, and five are Viable
(http://www.ncdmf.net/stocks/2010NCDMF%20StockStatusReport.pdf). There are an approximately
equal number of Viable and Concern stocks showing some preference for wetland habitat. The wetland-
enhanced36
stocks listed as Depleted were river herring (alewife and blueback herring in Albemarle
Sound), sturgeon sp., CSMA striped bass, southern flounder, spotted seatrout and black seabass (South of
Hatteras). Wetland-enhanced species of Concern included yellow perch, blue crab, Atlantic croaker, spot,
and black seabass (North of Hatteras) T The two Recovering species are red drum and summer flounder.
The Viable species were striped bass (ASMA and Atlantic Ocean migratory stocks), Atlantic menhaden,
shrimp and striped mullet. While most of the concern over declining fish stocks has focused on
overfishing, habitat loss and degradation can also prevent recovery or make a stock more susceptible to
overfishing. Therefore, protection or enhancement of wetland habitat can be especially beneficial to
wetland-enhanced species classified as Depleted or Concern, by maximizing recruitment and
productivity. More fishery-independent information and habitat change analysis are needed to determine
the effect of wetland-coverage on the abundance of fish and invertebrates.
5.3.3. Wetland enhancement and restoration
The loss of wetlands and need for alternative pollution control methods prompted restoration/creation
efforts beginning in the late 1980s and early 1990s (Mitsch and Gosselink 1993). The Clean Water Act
(CWA) of 1972 and subsequent agreements (MOAs) between the EPA and USACE develop requirements
to compensate for wetlands lost to authorized dredge and/or fill activities. Permit applicants are required
to avoid, minimize, or compensate for lost wetlands and their associated water quality functions. The
USACE may issue permits to dredge or fill wetlands considered ―Waters of the United States.‖ As
currently defined, Waters of the United States do not include isolated wetlands (i.e., flat/depressional). In
response, the Environmental Management Commission has adopted rules governing the impact to isolated
wetlands. DWQ administers these rules. Permitting impacts to salt/brackish marsh is handled through
CAMA major permits, which include 404 and state 401 permit conditions. However, each permit
authority has a slightly different jurisdiction in terms of wetland type and mitigation requirements (Table
5.6).
The 1990 MOA between the USACE and EPA (http://www.wetlands.com/fed/moafe90.htm, February
2009) states a preference for in-kind, on-site mitigation where permit conditions require compensation.
To date, avoidance and minimization have received far less policy attention than mitigation by the
USACE (Hough and Robertson 2009). A new USACE/EPA rule finalized in April 2008 specifies the
following order of preference: (1) mitigation bank credits, (2) in-lieu fee credits, (3) permitee responsible
under a watershed approach, (4) permittee responsible in-kind and on-site, and (5) permitee responsible
off-site and/or out of kind
(http://www.epa.gov/owow/wetlands/pdf/wetlands_mitigation_final_rule_4_10_08.pdf, June 2009). The
USACE (Section 404) and DWQ (Section 401) use the mitigation types in Table 5.6 for determining in-
kind. Where on-site mitigation cannot be achieved, off-site mitigation is allowed within the same 8-digit
USGS hydrologic unit (HU) and preferred within the same 14-digit HU. Mitigation may include
restoration, enhancement, creation, or preservation of wetlands.
Restoration is the re-establishment or rehabilitation of wetlands or stream hydrology and wetlands
vegetation into an area where wetland conditions (or stable stream bank and stream channel
conditions) have been lost or degraded (http://www.nceep.net/resources/glossary.pdf, February
2009). Re-establishment and rehabilitation are specifically differentiated in a 2002 regulatory
guidance letter (http://www.fws.gov/habitatconservation/RGL2-02.pdf, June 2009).
Enhancement refers to actions taken to increase or enhance wetland functions through the
36 Wetland-enhanced species are those showing some documented preference for wetland habitat.

2010 Coastal Habitat Protection Plan
Chapter 5. Wetlands Page 300
manipulation of either vegetation or hydrology, but not both; an example would be the filling in
of ditches in a previously drained wetland area.
Creation is the establishment of wetlands or stream hydrology and wetlands vegetation into an
area where wetland conditions (or stable stream bank and stream channel conditions) were not
lost.
Preservation is the long-term protection of an area with high habitat and/or water quality
protection value (e.g., wetland, riparian buffer), generally effected through the purchase or
donation of a conservation easement by/to a government agency or non-profit group (e.g., land
trust); such areas are generally left in their natural state, with minimal human disturbance or land-
management activities.
The types of wetland mitigation count differently toward replacing lost wetland functions. The guidelines
for awarding credit for mitigation types are (USACE 2008):
1 acre of restoration is equal to 1 restoration equivalent
2 acres of enhancement is equal to 1 restoration equivalent
3 acres of creation is equal to 1 restoration equivalent
5 acres of preservation is equal to 1 restoration equivalent
Enhancement, creation, or preservation can only be employed after planning at least one acre of
restoration.
Table 5.6. Wetland mitigation types and their associated permitting authorities (USACE 2008).
Mitigation type DCM wetland types
Minimum area threshold for mitigation (acres)
CAMA 401 404
CAMA coastal
wetland
Estuarine -
Salt/brackish marsh 1 0 0.1
Riverine Riverine - swamp
forest, freshwater
marsh
na 1 0.1
Riparian Riverine - bottomland
hardwood forest,
headwater wetland
na 1 0.1
Non-riparian
wetter variety
Flat/depressional -
swamp forest,
pocosins, estuarine
forested or shrub-
scrub
na 1 na
Non-riparian,
drier variety
Flat/depressional -
pine flat, hardwood
flat
na 1 na
In North Carolina, state-sponsored restoration began in 1996 with the establishment of the Wetland
Restoration Program (NCWRP), which was later expanded to form the Ecosystem Enhancement Program
(EEP) in 2003. The purpose of both programs was/is to restore, enhance, preserve, and create wetlands,
streams, and riparian buffers throughout North Carolina. The WRP/EEP restoration activities were
primarily undertaken as mitigation for past, present, or future (anticipated) losses of wetland acreage.
However, a 2002 study in North Carolina found that mitigation sites restored by the N.C. Department of
Transportation (DOT) relied too much on hydrologic criteria, leading to reduced survivorship of planted
seedlings in some excavated areas with non-wetland soil (Rheinhardt and Brinson 2002). They also
found that reference sites were rarely utilized in measuring the success of restoration. Thus, Rheinhardt
2010 Coastal Habitat Protection Plan
Chapter 5. Wetlands Page 301
and Brinson (2002) encouraged long-term monitoring of restoration projects using success criteria based
on hydrology, soil, and vegetation characteristics at established reference sites. The EEP follows a more
rigorous process for monitoring mitigation success than the WRP (refer to section on the ―North Carolina
Ecosystem Enhancement Program‖ below).
The early years of the WRP were devoted to the development of local watershed plans (LWPs). The
DWQ basin-wide assessment reports were used to identify targeted local watersheds for development of
local watershed plans (LWP). The development of LWPs was described in a Department of Environment
and Natural Resource (DENR) Memorandum of Understanding (MOU) with the Department of
Transportation (DOT). The MOU allowed DENR, through the WRP, to help the DOT mitigate
environmental impacts associated with highway construction projects. The watershed restoration plans
were developed to identify the coincidence of restoration needs and opportunities on the scale of 14-digit
hydrologic units. The local watershed approach was considered the preferred alternative to distributing
restoration projects randomly throughout a river basin. By concentrating several projects within a small
watershed, water quality improvement can more readily be achieved.
Through the local watershed planning process, WRP/EEP conducts watershed characterization and field
assessment tasks to identify critical stressors in local watersheds. The WRP/EEP planners and their
consultants coordinate with local resource professionals, local governments, and local citizens to identify
optimal watershed projects and management strategies to address the major functional stressors identified.
The LWPs prioritize restoration/enhancement projects, preservation sites, and best management practices
(BMP) that will provide water quality and hydrologic improvement, habitat protection and other
environmental benefits to the local watershed. The restoration strategies included in LWPs are not
limited to the scope of WRP/EEP‘s mission (i.e., wetland restoration and mitigation). The strategies
include stormwater management projects, water supply protection strategies, land use planning guidelines
and best management practices for reducing sediment pollution and soil erosion. The development of
Local Watershed Plans is essential for the restoration of degraded watersheds because restoration projects
alone may not improve water quality to use-support standards. The WRP/EEP works closely with local
governments, nonprofit groups and organizations to develop and implement the plans. The LWP
recommendations are implemented at the local level through a consensus-building and stakeholder-driven
process. The WRP/EEP is committed to funding restoration projects identified in the LWPs through
payments made to the Wetlands Trust Fund to satisfy compensatory mitigation requirements.
The WRP/EEP is required by statute to report on both compensatory and non-compensatory (i.e., non-
regulatory) restoration work accomplished in North Carolina annually. The total compensatory
mitigation in North Carolina coastal river basins during fiscal years 1999-2003 was approximately 957.36
acres (WRP 2001, 2002, 2003, EEP 2004) (Table 5.7). There was also a large amount of voluntary
creation or restoration of wetlands. During fiscal years 1999-2003, 3,740 acres of wetlands were
voluntarily restored or created in coastal river basins for the purpose of mitigation banking.
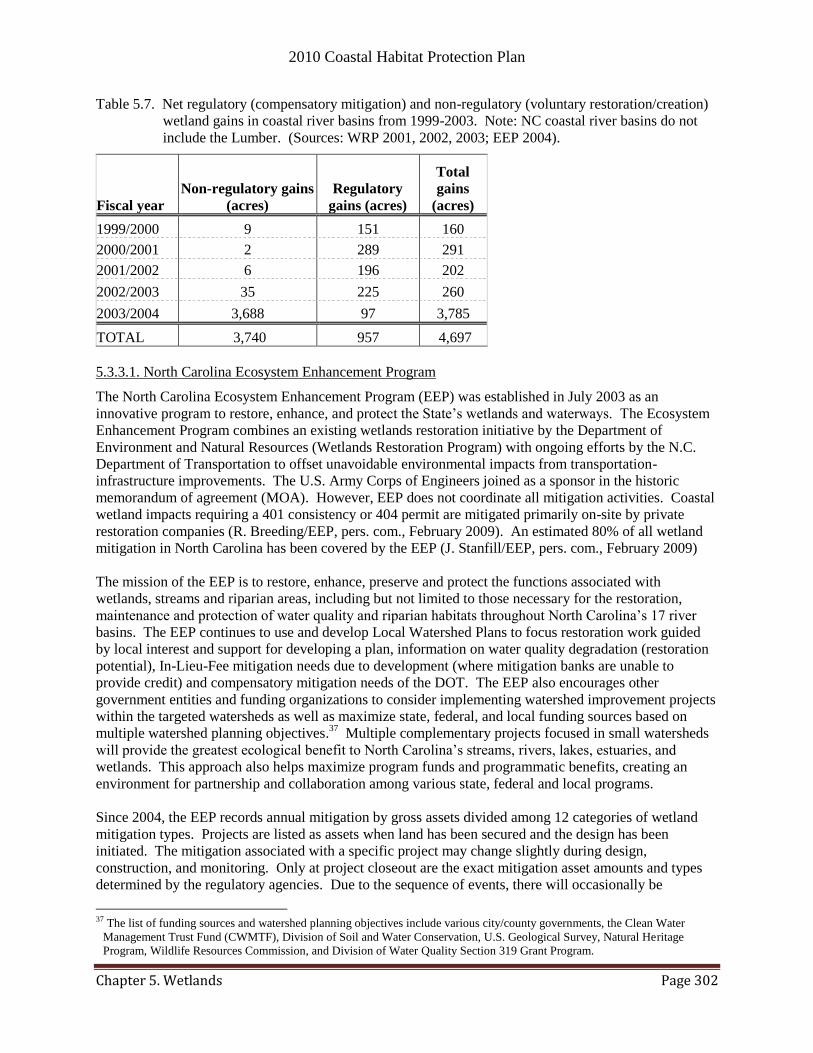
2010 Coastal Habitat Protection Plan
Chapter 5. Wetlands Page 302
Table 5.7. Net regulatory (compensatory mitigation) and non-regulatory (voluntary restoration/creation)
wetland gains in coastal river basins from 1999-2003. Note: NC coastal river basins do not
include the Lumber. (Sources: WRP 2001, 2002, 2003; EEP 2004).
Fiscal year
Non-regulatory gains
(acres)
Regulatory
gains (acres)
Total
gains
(acres)
1999/2000 9 151 160
2000/2001 2 289 291
2001/2002 6 196 202
2002/2003 35 225 260
2003/2004 3,688 97 3,785
TOTAL 3,740 957 4,697
5.3.3.1. North Carolina Ecosystem Enhancement Program
The North Carolina Ecosystem Enhancement Program (EEP) was established in July 2003 as an
innovative program to restore, enhance, and protect the State‘s wetlands and waterways. The Ecosystem
Enhancement Program combines an existing wetlands restoration initiative by the Department of
Environment and Natural Resources (Wetlands Restoration Program) with ongoing efforts by the N.C.
Department of Transportation to offset unavoidable environmental impacts from transportation-
infrastructure improvements. The U.S. Army Corps of Engineers joined as a sponsor in the historic
memorandum of agreement (MOA). However, EEP does not coordinate all mitigation activities. Coastal
wetland impacts requiring a 401 consistency or 404 permit are mitigated primarily on-site by private
restoration companies (R. Breeding/EEP, pers. com., February 2009). An estimated 80% of all wetland
mitigation in North Carolina has been covered by the EEP (J. Stanfill/EEP, pers. com., February 2009)
The mission of the EEP is to restore, enhance, preserve and protect the functions associated with
wetlands, streams and riparian areas, including but not limited to those necessary for the restoration,
maintenance and protection of water quality and riparian habitats throughout North Carolina‘s 17 river
basins. The EEP continues to use and develop Local Watershed Plans to focus restoration work guided
by local interest and support for developing a plan, information on water quality degradation (restoration
potential), In-Lieu-Fee mitigation needs due to development (where mitigation banks are unable to
provide credit) and compensatory mitigation needs of the DOT. The EEP also encourages other
government entities and funding organizations to consider implementing watershed improvement projects
within the targeted watersheds as well as maximize state, federal, and local funding sources based on
multiple watershed planning objectives.37
Multiple complementary projects focused in small watersheds
will provide the greatest ecological benefit to North Carolina‘s streams, rivers, lakes, estuaries, and
wetlands. This approach also helps maximize program funds and programmatic benefits, creating an
environment for partnership and collaboration among various state, federal and local programs.
Since 2004, the EEP records annual mitigation by gross assets divided among 12 categories of wetland
mitigation types. Projects are listed as assets when land has been secured and the design has been
initiated. The mitigation associated with a specific project may change slightly during design,
construction, and monitoring. Only at project closeout are the exact mitigation asset amounts and types
determined by the regulatory agencies. Due to the sequence of events, there will occasionally be
37 The list of funding sources and watershed planning objectives include various city/county governments, the Clean Water
Management Trust Fund (CWMTF), Division of Soil and Water Conservation, U.S. Geological Survey, Natural Heritage
Program, Wildlife Resources Commission, and Division of Water Quality Section 319 Grant Program.

2010 Coastal Habitat Protection Plan
Chapter 5. Wetlands Page 303
reductions in a particular mitigation type. For example if a project was dropped, the design was adjusted,
the construction varied from the design, the monitoring showed that the project was producing more or
less than expected, or it was determined that another mitigation type was needed, the end mitigation
results would be different than originally planned (J. Stanfill/EEP, pers. com., February 2009). The total
mitigation assets in coastal drainage river basins in FY 2004/2005 were 12,741 acres (Table 5.8). When
restoration equivalents are calculated38
, the total mitigation assets were 8,311 acres in FY 2004/2005. By
2007/2008, the adjusted mitigation assets were over 10,000 acres, for a regulatory gain of nearly 2,000
acres. However, only 70% of those mitigation assets have been constructed. Additional mitigation assets
available from private mitigation banks cover an estimated 20% of total assets not accounted for by the
EEP (http://www.saw.usace.army.mil/wetlands/Mitigation/mitbanks.html, July 2009).
Table 5.8. Gross mitigation assets (planned and constructed) available from EEP in coastal draining river
basins of North Carolina from FY 2004/2005 to 2007/2008 (EEP 2005, 2006, 2007, 2008).
Note: The Lumber is not included in NC coastal river basins. The ‗Total – adjusted‘ is
calculated using the equation: [Preservation/5] + [Creation/3] + [Enhancement/2] +
[Restoration/1].
Mitigation type
Gross mitigation asset (acres)
2004/2005 2005/2006 2006/2007 2007/2008
Coastal marsh
Preservation 186 205 205 371
Enhancement 80 80 86 86
Creation 40 40 31 20
Restoration 52 52 24 14
Non-riparian
Preservation 1,388 4,879 5,547 5,347
Enhancement 2,234 1,145 2,220 2,319
Creation 157 157 13 15
Restoration 4,298 4,670 4541 4,621
Riparian
Preservation 2,159 2,808 3,650 3,810
Enhancement 259 496 495 489
Creation 38 80 87 78
Restoration 1,850 2,366 2,213 2,041
Total - unadjusted 12,741 16,978 19,113 19,211
Total – adjusted 8,311 9,620 11,757 10,066
On a statewide level, EEP reports success for advance mitigation (EEP 2008, 2009). In other words, the
amount of mitigation assets exceeds the amount of required mitigation. As of FY 2008-2009, the
program reports a mitigation compliance rate of 96% for wetland impacts. However, much of the current
advance mitigation is focused in particular HUs, whereas the mitigation needs are spread more evenly
across the state. Thus, while some HUs have already achieved advanced mitigation, others will require
additional mitigation credits over the coming years.
Not counting mitigation assets, the total wetland area in North Carolina has declined from 7,175,000 acres
(1950‘s ) to 5,132,634 acres (2001), for a total loss of over 2 million acres (30% of 1950‘s wetland area).
Table 5.9 summarizes what has been documented regarding wetlands losses in North Carolina.
38 Calculated using the equation: [Preservation/5]+[Creation/3]+[Enhancement/2]+[Restoration/1]
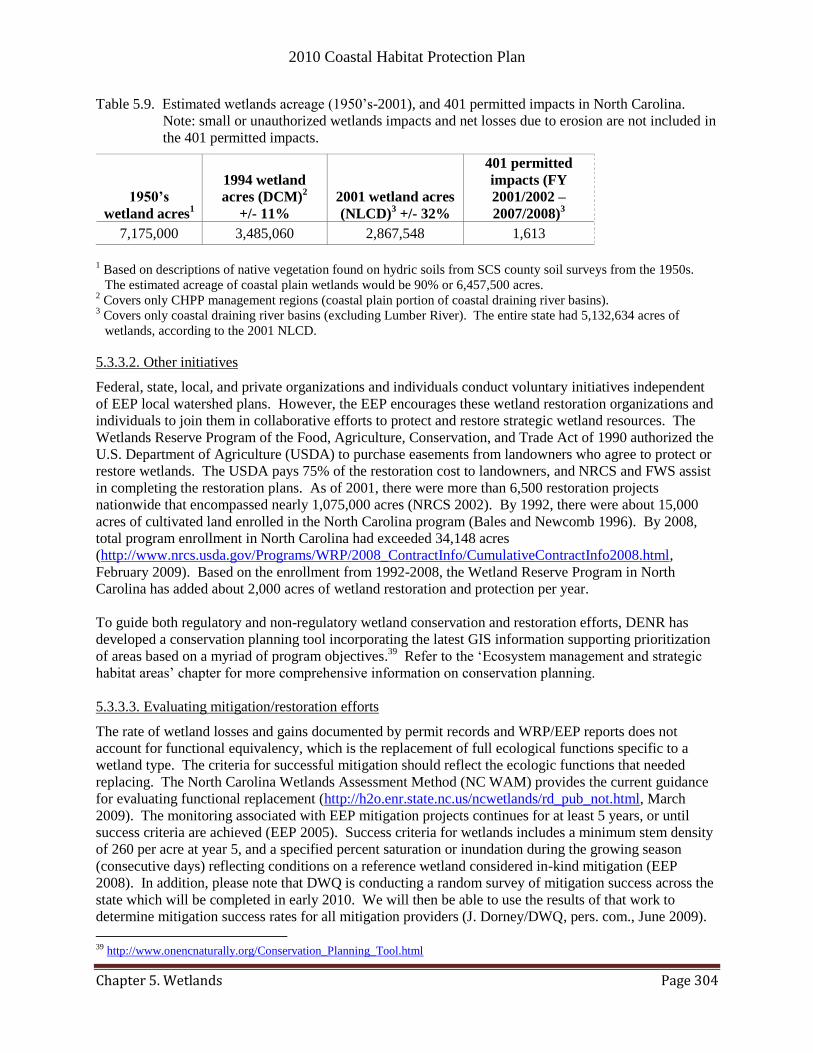
2010 Coastal Habitat Protection Plan
Chapter 5. Wetlands Page 304
Table 5.9. Estimated wetlands acreage (1950‘s-2001), and 401 permitted impacts in North Carolina.
Note: small or unauthorized wetlands impacts and net losses due to erosion are not included in
the 401 permitted impacts.
1950’s
wetland acres1
1994 wetland
acres (DCM)2
+/- 11%
2001 wetland acres
(NLCD)3 +/- 32%
401 permitted
impacts (FY
2001/2002 –
2007/2008)3
7,175,000 3,485,060 2,867,548 1,613
1 Based on descriptions of native vegetation found on hydric soils from SCS county soil surveys from the 1950s.
The estimated acreage of coastal plain wetlands would be 90% or 6,457,500 acres. 2 Covers only CHPP management regions (coastal plain portion of coastal draining river basins).
3 Covers only coastal draining river basins (excluding Lumber River). The entire state had 5,132,634 acres of
wetlands, according to the 2001 NLCD.
5.3.3.2. Other initiatives
Federal, state, local, and private organizations and individuals conduct voluntary initiatives independent
of EEP local watershed plans. However, the EEP encourages these wetland restoration organizations and
individuals to join them in collaborative efforts to protect and restore strategic wetland resources. The
Wetlands Reserve Program of the Food, Agriculture, Conservation, and Trade Act of 1990 authorized the
U.S. Department of Agriculture (USDA) to purchase easements from landowners who agree to protect or
restore wetlands. The USDA pays 75% of the restoration cost to landowners, and NRCS and FWS assist
in completing the restoration plans. As of 2001, there were more than 6,500 restoration projects
nationwide that encompassed nearly 1,075,000 acres (NRCS 2002). By 1992, there were about 15,000
acres of cultivated land enrolled in the North Carolina program (Bales and Newcomb 1996). By 2008,
total program enrollment in North Carolina had exceeded 34,148 acres
(http://www.nrcs.usda.gov/Programs/WRP/2008_ContractInfo/CumulativeContractInfo2008.html,
February 2009). Based on the enrollment from 1992-2008, the Wetland Reserve Program in North
Carolina has added about 2,000 acres of wetland restoration and protection per year.
To guide both regulatory and non-regulatory wetland conservation and restoration efforts, DENR has
developed a conservation planning tool incorporating the latest GIS information supporting prioritization
of areas based on a myriad of program objectives.39
Refer to the ‗Ecosystem management and strategic
habitat areas‘ chapter for more comprehensive information on conservation planning.
5.3.3.3. Evaluating mitigation/restoration efforts
The rate of wetland losses and gains documented by permit records and WRP/EEP reports does not
account for functional equivalency, which is the replacement of full ecological functions specific to a
wetland type. The criteria for successful mitigation should reflect the ecologic functions that needed
replacing. The North Carolina Wetlands Assessment Method (NC WAM) provides the current guidance
for evaluating functional replacement (http://h2o.enr.state.nc.us/ncwetlands/rd_pub_not.html, March
2009). The monitoring associated with EEP mitigation projects continues for at least 5 years, or until
success criteria are achieved (EEP 2005). Success criteria for wetlands includes a minimum stem density
of 260 per acre at year 5, and a specified percent saturation or inundation during the growing season
(consecutive days) reflecting conditions on a reference wetland considered in-kind mitigation (EEP
2008). In addition, please note that DWQ is conducting a random survey of mitigation success across the
state which will be completed in early 2010. We will then be able to use the results of that work to
determine mitigation success rates for all mitigation providers (J. Dorney/DWQ, pers. com., June 2009).
39 http://www.onencnaturally.org/Conservation_Planning_Tool.html
2010 Coastal Habitat Protection Plan
Chapter 5. Wetlands Page 305
In FY 2007-08, the EEP had 238 projects in some phase of monitoring, closeout, or long-term
management. Most projects were in monitoring phases of years 1 through 5. These projects totaled
13,401 acres of wetland restoration, enhancement, and preservation (EEP 2008). Considering all the
projects in active monitoring, the collective success rate was 90% for achieving vegetative and hydrologic
criteria. However, the development of restoration success criteria for different types of wetlands
continues. In late 2008, the DWQ completed a three year, in-depth study of headwater wetlands to supply
specific success criteria for headwater wetland restoration (Baker et al. 2009).
Currently, wetland losses and gains are tracked, by in-kind mitigation types (Table 5.8), on an acre-for-
acre basis. The specific wetland type lost is not always mitigated by the same wetland type. There is
only incidental consideration for maintaining the natural diversity of wetland types on the landscape.
Rheinhardt and Brinson (2002) recommended the tracking of restoration efforts by river basin and
hydrogeomorphic class so that restoration can maintain a balanced distribution of classes on the
landscape. The EEP currently reports mitigation assets using a subset of hydrogeomorphic classes (Table
5.8); riverine and headwater wetlands are lumped into the riparian class. Headwater wetlands restoration
should be tracked separately from other riparian wetlands because of their vulnerability and relative
importance in denitrification (see „Ecosystem enhancement‟ subsection of the „Ecological role and
function‟ section). This point is important and should be discussed among involved agencies (i.e., EEP,
NCDOT, USACE).
U For many coastal watersheds, in-kind mitigation opportunities (i.e. salt marsh restoration) are limited. To
address this issue, the EEP contracted with East Carolina University to develop a rapid assessment
process for coastal watersheds and compensatory mitigation that is consistent with the goals of the
Coastal Habitat Protection Plan. The 2007-09 CHPP implementation plan called for developing an
innovative system for out-of-kind mitigation credit that includes aquatic habitat restoration. Currently,
the mitigation of lost wetlands with restored wetlands is relatively clear and direct. Mitigating lost
wetlands with SAV restoration, for example, is not considered ―in-kind‖ even if similar functions are
supported. If the function is simply water quality improvement, the out-of-kind mitigation may be
justified by the regulatory goal of improving water quality (per the Clean Water Act). One drawback of
this interpretation occurs where the re-establishment of aquatic habitat is dependent on watershed
improvements. In this case, mitigating lost wetlands upstream with SAV downstream would be
unsuccessful without improving water quality. In other words, restoring watersheds is required before
restoring the lost aquatic habitat associated with water quality degradation.
The results of the ECU study are available at
http://www.nceep.net/services/lwps/pull_down/by_basin/WhiteOak_RB.html. The report describes an
approach to determining out-of-kind mitigation credit based on indicators of:
Hydrologic regime functions such as riparian condition, extent of ditching, wetland conversion,
land-use effects on runoff, and watershed impervious surface.
Materials flux/pollution functions such as land-use effects on nutrient loading, point sources of
pollution, and concentrated sources of pollution
Aquatic habitat functions such as near-shore pollution, shellfish water closures, eutrophication,
toxic chemicals, impediments to anadromous fish migration, impediments to circulation, and
maintained channels, trawl areas, and SAV scars.
This assessment approach helps locate the biggest problems in a watershed, thus revealing qualitative
criteria for mitigation success anywhere in the watershed. Unfortunately, difficulty arises in assigning
mitigation success criteria for improvements in a qualitative indicator score. The Strategic Habitat Areas
(SHAs) approach involves similar indicators of function, but attempts to find the highest quality habitat
for marine and coastal fishery species across a much larger area (see ‗Ecosystem management and

2010 Coastal Habitat Protection Plan
Chapter 5. Wetlands Page 306
Strategic Habitat Areas‘ chapter for more information). The DMF‘s on-going effort to locate and
designate SHAs for coastal and marine fishery species should complement land-based watershed
restoration plans. The SHA priorities are currently being incorporated in EEP‘s coastal River Basin
Restoration Priorities, starting in the Chowan River. However, the application of SHA and Local
Watershed Plan priorities at different scales, addressing different goals, suggests a need to place both
planning efforts under the larger umbrella of DENR strategic planning. The CHPP agencies (DMF,
DCM, DWQ, WRC) and EEP should meet to determine how SHA and LWP methodologies complement
and contribute to complementary goals of the North Carolina Department of Natural Resources.
In 2009, the MFC approved a compensatory mitigation policy that endorses the concept developed by the
ECU study. This change is being incorporated into the MFC‘s existing 1999 ―Policies for Protection and
Restoration of Marine and Estuarine Resources and Environmental Permit Review and Commenting‖
(Appendix H). Based on our evolving understanding of the needs of compensatory mitigation to protect
and enhance the quality of coastal waters and watersheds, the focus and goals of compensatory mitigation
should shift from the current no net loss goal to one that allows an array of options to be applied. The
policy recommends:
1) Establishing goals for coastal wetlands based on desired outcomes - protection/restoration of
shellfishing waters, PNAs, SAV beds, etc.;
2) Identifying watersheds/areas where these goals can be realistically achieved. The Strategic Habitat
Area assessments can be used to identify such locations
3) Utilizing the Rapid Watershed Assessment Procedure (or other assessment methods) to assess
watershed condition and identify problems/solutions;
4) Evaluating and authorizing compensatory mitigation projects based on their ability to contribute to
goals established for coastal watersheds. Projects that provide functional replacement, e.g.,
increased water retention/storage through the use of BMPs, may be approved if documentation is
provided that the projects are the most effective mechanism to achieve the goals established for a
watershed;
5) Implementing monitoring to support data acquisition necessary to support the SHA process and the
effectiveness of projects that have been implemented;
6) Seek funding from all available sources (compensatory mitigation, CWMTF, 319, etc.) to fully
implement protection/restoration strategies in coastal watersheds.
Esty (2007) examined the practice of mitigation in detail at the national level. Basically two types of
mitigation were described: (1) individual mitigation with constructed wetlands, and (2) mitigation
banking in which developers purchase credits from companies (mitigation banks) that have restored or
created wetlands deemed acceptable as mitigation. Esty (2007) then quoted a 2001 study by the National
Research Council estimating the country was losing 60,000 acres of wetlands annually, despite mitigation
efforts. He goes on to say most mitigation sites are subject to no more than 5 years of oversight.
Numerous studies have documented replication of natural wetlands functions that require greater than 5
years to realize (Burchell et al. 2007; Bruland et al. 2006; Bruland and Richardson 2005a; Bruland and
Richardson 2005b; Zheng et al. 2004; Craft et al. 2003; Craft and Sacco 2003; Desmond et al. 2002; Craft
et al. 2002). Wetland vegetation and hydrology usually develop within 5 years, whereas soil properties
take much longer. The major concern implied by Esty was a lack of adequate criteria for success and the
resulting accountability. Given a limited time to monitor for success, criteria should focus on identifying
trajectories of functional development that include wetland soil development. In other words, are the
functions developing to fully replace that of lost wetlands within a reasonable timeframe? Recent
literature summarizing the state of coastal wetland research and restoration should help in identifying
trajectories of functional development (Perillo et al. 2009).
2010 Coastal Habitat Protection Plan
Chapter 5. Wetlands Page 307
5.3.4. Designated areas
5.3.4.1. Regulatory
Several state regulatory designations provide some level of protection for wetlands:
Coastal Shoreline Areas of Environmental Concern (CRC rule)
Estuarine Water Area of Environmental Concern (CRC rule)
Outstanding Resource Waters (EMC rule)
Buffer rules for Nutrient Sensitive Waters (EMC rule)
Water Supply Waters I & II (EMC rule)
Unique Wetlands (EMC rule)
Approved Shellfishing Waters (MFC rule)
Primary Nursery Areas (MFC/WRC rule)
Wild and Scenic Rivers (state government designation administered by the Division of Parks and
Recreation administration)
The CRC-designated Estuarine Shoreline Area of Environmental Concern (AECs) extends landward 75
feet from the high water mark along estuarine shorelines, upstream to the line separating Coastal and
Inland Fishing Waters (Figure 2.6 in Chapter 2). The Estuarine Shoreline AEC increases to 575 feet
along shorelines of EMC-designated Outstanding Resource Waters (ORWs). The Public Trust Shoreline
AEC is adjacent to public trust waters and runs inland from the line separating Coastal and Inland Fishing
Waters, and extends landward 30 feet from the high water mark. Coastal Shoreline AEC includes the
Public Trust Shoreline AEC and the Estuarine Waters AEC. These areas, along with adjacent public trust
water, contain the vast majority of salt/brackish marsh in the state. Only water-dependent activities are
allowed in this area, and they require a Coastal Area Management Act (CAMA) permit. . Development
projects any coastal marsh will require a CAMA permit, USACE permit and DWQ 401 consistency most
of the time unless the project meets certain exemptions as defined by the USACE. Projects affecting >1
acre of 404 wetlands (including coastal wetlands) require mitigation by DWQ. The USACE can require
mitigation, preservation, restrictive covenances, or some combination of these for any wetland impact due
to no net loss policies. Dredging of wetlands is at times permitted through the major permit process.
Narrow, fringing wetlands less than 1 acre (per lot) are particularly vulnerable to loss without
compensation. The importance and vulnerability of fringing coastal marsh merits decreasing the
minimum area and/or length requirement for mitigation. Protecting or restoring fringing marsh is
especially important where adjacent slopes allow landward migration with sea level rise (see “Sea level
rise and climate change” section for more information).
Outstanding Resource Waters (ORWs) and their 575 foot buffer from mean high water encompass
approximately 6% of the riparian wetland habitat in coastal North Carolina, the majority of which is
salt/brackish marsh and riverine swamp forest. These ORW areas also cover 2% of non-riparian
wetlands. There is no size threshold for permitting wetland impacts adjacent to ORWs, Water Supply
Waters I & II, or Unique Wetlands. In or near these designations, any development project impacting
wetlands must acquire a permit of some kind, and a permit requirement means documentation. See the
Water Column chapter for a description of Water Supply Waters I & II. Unique Wetlands (UWL) are a
supplemental classification for wetlands of exceptional state or national ecological significance. These
wetlands may include wetlands that have been documented to the satisfaction of the EMC as habitat
essential for the conservation of state or federally listed threatened or endangered species. However,
Unique Wetlands will likely not be designated on private lands without the approval of the landowner.
According to the DWQ Wetlands Unit, approximately 66% of known potential UWL acres are managed
by three state and federal agencies (Ed Schwartzman/DWQ, unpub. data). The remaining 34% are
managed by a variety of public and private entities (i.e., municipal governments, land trust, and private
owners).
2010 Coastal Habitat Protection Plan
Chapter 5. Wetlands Page 308
Waters designated as Primary Nursery Areas (PNAs) by the MFC or WRC (in CAMA counties) are given
additional consideration of impacts by DCM prior to issuing development permits. Only maintenance
dredging is allowed, and only within existing basins and channels. The CRC has also implemented a
minimum depth requirement, effective July 2009, for boat docks in Primary Nursery Areas, SAV, shell
bottom, and soft bottom habitat that may inhibit some dock construction and associated boating impacts
on wetlands landward of these areas (see ‗Water-dependent development‘ section for more information).
Approved Shellfish Harvesting Waters are designated by MFC based at the recommendations of DEH-
SS. Approved Shellfish Harvesting Waters protect wetlands by prohibiting new marina construction that
could result in loss of harvestable waters [CRC rule 15A NCAC 07H .0208 (b)(5)(E)] and, incidentally,
fringing wetlands.
Wild and Scenic Rivers is a state and federal government designation intended to protect certain free
flowing rivers or segments with outstanding natural, scenic, educational, recreational, geologic, fish and
wildlife, historic, scientific or other cultural values. There are three river classifications: Natural, Scenic,
and Recreational river areas. This classification is administered by the NC Division of Parks and
Recreation. There is no size threshold for requiring permits adjacent to state or federal Wild and Scenic
Rivers. Therefore, all wetland impacts along Wildlife and Scenic Rivers should be documented.
5.3.4.2. Non-regulatory
In addition to regulatory designations, wetlands also receive protection by virtue of ownership and
management. Protected lands are owned and managed by federal, state, county, and municipal
governments, as well as conservation organizations, other nonprofit organizations and land trust
properties. These protected lands cover 322,493 ac of riparian wetlands and 747,295 ac of non-riparian
wetlands, representing approximately 20 and 27% of all riparian and non-riparian wetlands, respectively,
in coastal North Carolina (Table 5.10).T Based on the amount of 1994 wetlands within conservation lands,
76% of riparian and non-riparian wetlands are not protected by land ownership, although this amount
does not account for regulatory restrictions and area designations on lands not managed for conservation.
It also does not include lands with restoration cost-share agreements in the Wetland Reserve Program.
Within areas protected by conservation ownership and management, some wetland types are more
represented than others. Of the unaltered hydrogeomorphic wetland categories, estuarine and
flat/depressional were most represented in conservation lands (46.51 and 27.90%, respectively; see Table
5.10). Unaltered headwater wetlands have the lowest percent within conservation lands (8.33%),
followed by riverine wetlands (16.83%). Most headwater wetlands do not contain CAMA coastal
wetlands or are outside of estuarine shoreline AECs, and thus are not protected by CRC use standards.
Projects impacting wetlands outside of CAMA counties or without coastal wetland species may often
require only a general permit and no mitigation, or they may be exempt from a permit due to small size.
Although there are no accurate records on the type of wetlands impacted by 401 Water Quality
Certifications, headwater wetlands are believed to be one of the most heavily impacted wetland types (J.
Dorney/DWQ, pers. com., 2003). Headwater wetlands are separated from flat/depressional or non-
riparian wetlands by their intersection with 1st order watersheds indicated on USGS 7.5 minute
quadrangles. The DWQ is currently re-mapping headwater stream watersheds with more accurate
methods and LIDAR imagery. The re-mapping of headwater streams should be used to identify
headwater wetlands as a new category for tracking impacts and restoration work.
Restoration/enhancement opportunities may exist for altered wetlands located within conservation lands
(Table 5.10). The most opportunities for wetland restoration/enhancement occur where wetlands were
cleared or drained. Of the cleared estuarine (349 ac), headwater (874 ac), and riverine (7,586 ac)
wetlands, there is approximately 54, 10, and 2% within conservation lands, respectively. Ten percent of
the cleared flat/depressional wetlands are located within conservation lands. Of the drained estuarine
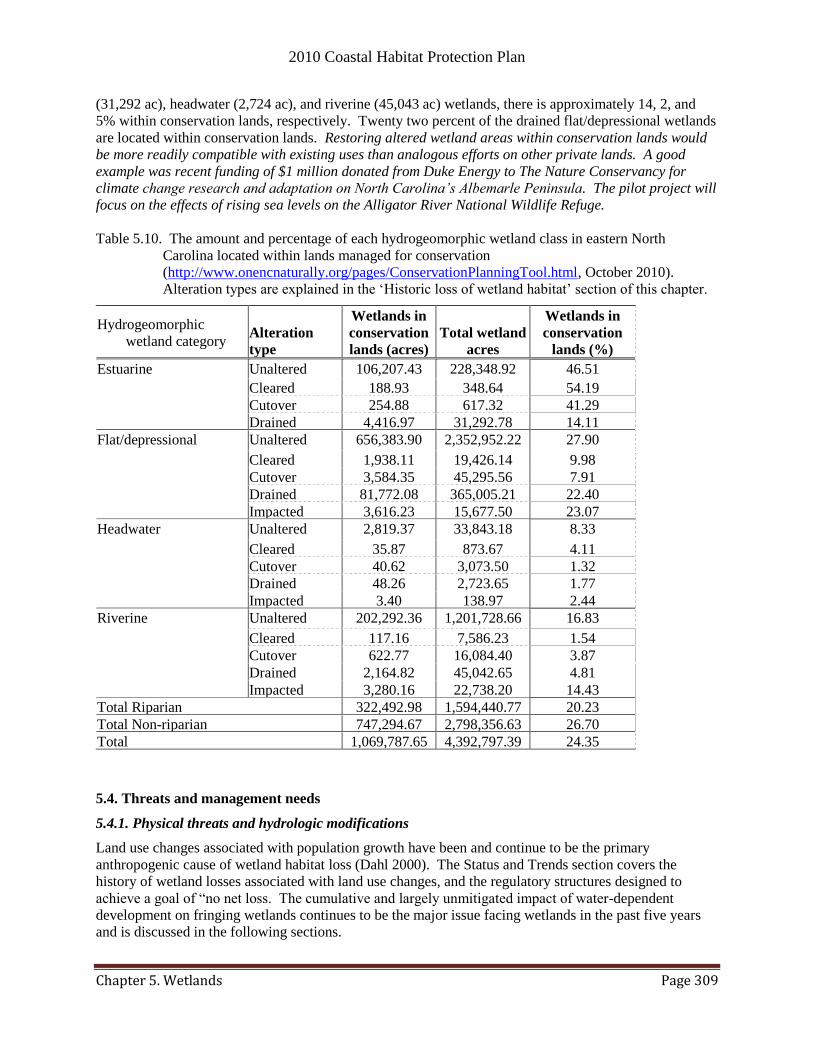
2010 Coastal Habitat Protection Plan
Chapter 5. Wetlands Page 309
(31,292 ac), headwater (2,724 ac), and riverine (45,043 ac) wetlands, there is approximately 14, 2, and
5% within conservation lands, respectively. Twenty two percent of the drained flat/depressional wetlands
are located within conservation lands. Restoring altered wetland areas within conservation lands would
be more readily compatible with existing uses than analogous efforts on other private lands. A good
example was recent funding of $1 million donated from Duke Energy to The Nature Conservancy for
climate change research and adaptation on North Carolina‟s Albemarle Peninsula. The pilot project will
focus on the effects of rising sea levels on the Alligator River National Wildlife Refuge.
Table 5.10. The amount and percentage of each hydrogeomorphic wetland class in eastern North
Carolina located within lands managed for conservation
(http://www.onencnaturally.org/pages/ConservationPlanningTool.html, October 2010).
Alteration types are explained in the ‗Historic loss of wetland habitat‘ section of this chapter.
Hydrogeomorphic
wetland category Alteration
type
Wetlands in
conservation
lands (acres)
Total wetland
acres
Wetlands in
conservation
lands (%)
Estuarine Unaltered 106,207.43 228,348.92 46.51
Cleared 188.93 348.64 54.19
Cutover 254.88 617.32 41.29
Drained 4,416.97 31,292.78 14.11
Flat/depressional Unaltered 656,383.90 2,352,952.22 27.90
Cleared 1,938.11 19,426.14 9.98
Cutover 3,584.35 45,295.56 7.91
Drained 81,772.08 365,005.21 22.40
Impacted 3,616.23 15,677.50 23.07
Headwater Unaltered 2,819.37 33,843.18 8.33
Cleared 35.87 873.67 4.11
Cutover 40.62 3,073.50 1.32
Drained 48.26 2,723.65 1.77
Impacted 3.40 138.97 2.44
Riverine Unaltered 202,292.36 1,201,728.66 16.83
Cleared 117.16 7,586.23 1.54
Cutover 622.77 16,084.40 3.87
Drained 2,164.82 45,042.65 4.81
Impacted 3,280.16 22,738.20 14.43
Total Riparian 322,492.98 1,594,440.77 20.23
Total Non-riparian 747,294.67 2,798,356.63 26.70
Total 1,069,787.65 4,392,797.39 24.35
5.4. Threats and management needs
5.4.1. Physical threats and hydrologic modifications
Land use changes associated with population growth have been and continue to be the primary
anthropogenic cause of wetland habitat loss (Dahl 2000). The Status and Trends section covers the
history of wetland losses associated with land use changes, and the regulatory structures designed to
achieve a goal of ―no net loss. The cumulative and largely unmitigated impact of water-dependent
development on fringing wetlands continues to be the major issue facing wetlands in the past five years
and is discussed in the following sections.
2010 Coastal Habitat Protection Plan
Chapter 5. Wetlands Page 310
Other physical threats to wetlands and their use by fish include construction of marinas and docks,
associated boating activity, infrastructure development, stormwater conveyance, mining for minerals,
obstructions to fish passage and water withdrawals.
5.4.1.1. Water-dependent development
Dredging (navigation channels and boat basins)
Dredging for navigational channels or boat basins can result in an unmitigated direct loss of wetlands, as
well as indirect impacts from dredging of adjacent shallow soft bottom, limiting the amount of shallow
water habitat available for future wetland colonization. The CRC rules require confining all dredging
material to an upland area landward of regularly or irregularly flooded marsh [15A NCAC 07H .0208].
The spoil from dredging could also be used to create shallow water habitat. At a number of sites, the
USACE has established wetlands as part of their management of dredge spoil islands; the spoil islands in
Pamlico Sound (west of Oregon Inlet) and Cape Fear River are good examples. In recent years,
cooperative interagency projects have resulted in some beneficial uses of dredge materials, such as
creation of marsh and water bird nest sites.
Where barrier islands have been developed, back barrier marshes are more likely to be sediment starved,
since actions are usually taken to prevent or undo overwash of ocean sand to the estuarine shoreline
through actions such as beach bulldozing, inlet closing, dune construction, and beach nourishment. Croft
et al. (2006) studied the effect of placing dredged material on sediment-starved back barrier marshes in
southeastern North Carolina. The study questioned whether sediment additions could offset submergence
without negatively affecting wetland functions. A clean sediment layer up to 10cm thick was added to
both deteriorating and non-deteriorating marshes. The sediment additions increased the stem densities of
marsh grass in deteriorating marshes, but the effect was only temporary. The deteriorating sites gradually
returned to pre-fill conditions due to bioturbation and sedimentation. The addition of sediment on non-
deteriorating marshes had little effect on the wetland functions measured. Another study (La Peyre et al.
2009) tested whether a thin layer of dredge material would increase elevation and create favorable soil
conditions for marsh enhancement. The vegetative response to sediment addition was minimal on
wetland areas. However, the addition of sediment into the interior ponds resulted in increased vegetation
cover and productivity. The enhancement or creation of marsh islands should accompany the net loss of
marsh islands to deterioration with sea level rise (see “Sea level rise and climate change” section).
The dredging and deepening of inlets can also increase salt water intrusion, causing a change in wetland
species composition along the boundary between salt/brackish marshes and riverine swamp forests.
Beaufort and Cape Fear River inlets have been dredged to a depth of more than 50 ft for port access. The
deepening of the Lower Cape Fear River caused a large conversion of tidal/riverine swamp forests to
salt/brackish marsh (Hackney et al. 2007).
Shoreline stabilization
Shoreline stabilization is modification of the natural shoreline using hardened structures or organic
materials to prevent or reduce erosion. The purpose is to stabilize and protect shorefront lands, including
natural features, as well as man-made structures. As shoreline development increases, rising sea level
will threaten more waterfront property, likely increasing the number of landowners with an interest to
protect their shorefront from erosion. North Carolina‘s policies and rules for estuarine shoreline
stabilization allow landowners to protect their property from erosion, while attempting to minimize the
impacts of erosion control structures on natural resources. Traditional shoreline stabilization methods in
estuarine and riverine areas of North Carolina consist of hard stabilization, mainly bulkhead construction
near the high water line. This section will discuss the impacts of estuarine and riverine bulkheading on
riparian wetlands, an alternative ―living shoreline‖ approach, the extent of shoreline stabilization that has
2010 Coastal Habitat Protection Plan
Chapter 5. Wetlands Page 311
already occurred in North Carolina, and management needs to reduce or minimize impacts. Stabilization
methods, including construction of seawalls and jetties, beach bulldozing, and beach nourishment, are
discussed further in the Soft Bottom chapters (Chapters 6).
Vertical stabilization techniques can have fairly severe impacts on coastal habitats, including accelerated
erosion, loss of shallow intertidal bottom, loss of fringing marshes, and increased scouring and turbidity
in nearshore waters (Walton and Sensabaugh 1979; Pilkey and Wright 1989; Pilkey et al. 1998; Rogers
and Skrabal 2001; Bozek and Burdick 2005; DCM 2006; NRC 2007; Bilkovic and Roggero 2008).
Current CRC rules attempt to prevent or limit environmental impacts of vertical stabilization on wetlands
by specifying that bulkheads be constructed landward of significant marshland or marsh grass fringes
[CRC rule 15A NCAC 07H .0208 (b)(7)(B)]. Furthermore, the general permit for bulkheads and riprap
[CRC rule NCAC 07H .1105] requires their placement landward of all wetland vegetation at the
approximate high water mark. During construction, use of heavy equipment and backfilling above the
high water line, the location where bulkhead construction is allowed by CRC [CRC rule 15A NCAC 07H
.0208 (b)(7)(A)], may destroy wetlands and transitional vegetation. However, marine contractors often
use BMPs such as matting across wetlands to minimize impacts (T. Tyndall/DCM, pers. com., September
2009). Rather than allowing native vegetation to recolonize, property owners generally replant the
required 30 ft buffer along the estuarine shoreline AEC [CRC rule 15A NCAC 07H .0209 (d)(10)] with
landscape scrubs and lawn grasses. These plants are not as effective at reducing and treating stormwater
laden with nutrients and toxins as natural vegetation, and are less apt at deterring erosion (Watts 1987;
CBF 2007; NRC 2007). Use of native vegetation in the 30 ft buffer along the estuarine shoreline AEC
would minimize stormwater runoff and erosion landward of shoreline stabilization structures, and would
be consistent with the Neuse and Tar-Pamlico River Basin Nutrient Sensitive Waters management
strategies [EMC rules 15A NCAC 02B .0233 and 15A NCAC 02B .0259].
Once bulkhead construction is complete, changes in hydrography and geomorphology often follow with
resultant negative effects on shallow nursery habitats. Scouring action at the toe of bulkheads erodes the
shoreline, undercuts the living root mass of marsh grasses, and deepens the adjacent water, thus reducing
or eliminating vegetated and unvegetated intertidal, and/or shallow subtidal habitat (Riggs 2001; Bozek
and Burdick 2005; Berman et al. 2007). Garbisch et al. (1973) showed that marsh vegetation waterward
of bulkheads experienced 63% mortality post-construction due to stress from increased turbulence and
scour. The change in hydrography and deepened water at the base of bulkheads prevent wetland
vegetation from reestablishing once lost (Knutson 1977; Berman et al. 2007). As sea level rises,
bulkheads also obstruct shoreward migration of fringing wetlands, resulting in the eventual drowning and
loss of wetland vegetation, particularly in the upper transition zone (Boorman 1992; Titus 1998; Bozek
and Burdick 2005; NRC 2007). Construction of bulkheads also reduces shallow water habitat along
mainstem shorelines by preventing transport of sediment from adjacent shorelines to their adjoining
intertidal and shallow subtidal zones (Riggs 2001; NRC 2007). The transport of sediment from upstream
sources primarily contributes to delta formation in the upper portion of estuarine systems. Wherever
possible, sections of estuarine, non-vegetated shoreline with very little hard stabilization should remain
unaltered to provide “new” sediment for shallow water habitats (Riggs 2001).
Degradation and loss of wetlands from shoreline stabilization affects many fishery species linked to this
habitat (see ―Ecological role and function‖ section), including penaeid shrimp, red drum, spotted seatrout,
gag grouper, snapper, Spanish mackerel, striped bass, and river herring (SAFMC 1998a; SAFMC 2008a).
Bulkhead-induced loss of wetlands and shallow intertidal habitat reduces aquatic food resources for
anadromous, estuary-dependent, and surf fishes, as well as shore birds (Byrne 1995; Peterson et al. 2000c;
Toft et al. 2004; Seitz et al. 2006; Bilkovic et al. 2006; Toft et al. 2007; Partyka and Peterson 2008).
Deepening of waters adjacent to the bulkhead structure allows large piscivorous fish access to previously
shallow nursery areas, enhancing their feeding efficiency on small and/or juvenile fishes looking for
shallow water (Rozas 1987). Bulkheads also degrade spawning and nursery habitat for many species,
including river herring and striped bass, which utilize the vegetated marsh edge (O‘Rear 1983; SAFMC
2010 Coastal Habitat Protection Plan
Chapter 5. Wetlands Page 312
1998a; DMF 2004-striped bass FMP; DMF 2007b). Vertical structures may remove narrow marsh
fringes, thereby making areas adjacent to bulkheads less suitable as nurseries, even where SAV or oysters
are present offshore.
Numerous studies have documented lower relative abundance and diversity of fishes and invertebrates
adjacent to bulkheaded shorelines compared to unaltered marsh, beach, or forested wetland habitats:
Bilkovic and Roggero (2008): In James River, Virginia, fish community integrity was reduced
along bulkheaded shorelines with both low and high upland development as compared to natural
and riprap shorelines with low upland development. Species diversity was also lower along
bulkheaded shorelines with many tidal marsh species absent from this habitat.
Partyka and Peterson (2008): In the Pascagoula River estuary, Mississippi, epifaunal-nekton and
infaunal species richness and density were always greater at natural shore types than hardened
ones.
Bilkovic et al. (2006): In the Chesapeake Bay, a benthic index of biological integrity and an
abundance biomass comparison of the macrobenthic community was reduced significantly when
the amount of developed shoreline exceeded 10%.
Seitz et al. (2006): In the lower Chesapeake Bay, bivalve abundance and diversity were higher in
subtidal habitats adjacent to natural marsh than those adjacent to bulkheaded shorelines. Fish and
blue crab density and diversity also tended to be highest adjacent to natural marsh shorelines than
in bulkhead habitats.
Peterson et al. (2000c): On the Gulf coast, the most abundant fauna along unaltered marsh and
beach shorelines, including penaeid shrimp, blue crab, naked goby, grass shrimp, drums, Gulf
menhaden, and bay anchovy, were least abundant along bulkhead or rubble shorelines. In
addition, diversity was lowest adjacent to bulkheads.
Mock (1966), Ellifrit et al. (1972), Gilmore and Trent (1974), and Byrne (1995): These studies
conducted in other states along Atlantic, Gulf, and Pacific coasts found significantly lower littoral
fish and/or benthic invertebrate abundances along bulkheaded sites relative to natural shoreline.
Waters and Thomas (2001) examined fish utilization adjacent to bulkheads and other hardened
shorelines (i.e. rock revetments) in northeastern North Carolina waters, focusing mainly on
spawning success and juvenile recruitment of anadromous fish species. The study found lower
numbers and diversity of fish along bulkheaded shorelines than along forested wetland and riprap
shorelines, with particularly low numbers of juvenile anadromous fish. The difference in juvenile
abundance was attributed to both the greater complexity of riprap and natural shorelines, and their
location near shallower water. These results suggest a reduction in nursery function along
bulkheaded shorelines for juvenile anadromous fishes in North Carolina.
Bulkhead construction is also problematic for aquatic species that move between water and land during
their life cycle. These vertical structures are a physical barrier to animals such as the eastern mud turtle,
yellow-bellied turtle, diamondback terrapin (North Carolina special concern species), and American
alligator (Federally threatened) that live and feed in the estuarine and riverine waters, but nest above the
high tide line (Ernst and Barbour 1972; Rosenburg 1994; Brennessel 2007; USFWS 2008).
Although the effect of a single bulkhead on the adjacent habitat complex may be comparatively small, the
cumulative impact of multiple bulkheads can result in significant habitat degradation with associated
ecosystem effects (NRC 2007). McDougal et al. (1987) found that nearshore wave impact increases in
relation to the horizontal length of the bulkhead structure. This higher wave energy renders the
waterward and surrounding areas unsuitable for wetland vegetation. Therefore, multiple, contiguous
bulkheads have a greater impact on the adjacent natural shoreline than that of spatially distinct structures.
The cumulative impact of multiple bulkheads can also cause serious problems for wetland-dependent
fishes. A study should be conducted to quantify the cumulative impact of shoreline hardening on wetland

2010 Coastal Habitat Protection Plan
Chapter 5. Wetlands Page 313
vegetation and habitat-mediated predator-prey interactions in North Carolina estuarine waters. The
results of such a study could then be developed into a model to predict a threshold value for the allowable
extent of shoreline hardening in a particular water body, after which, changes in community composition
and ecosystem services are likely to occur.
Because of the documented ecological problems associated with vertical hardening of estuarine
shorelines, the 2005 CHPP recommended that public trust and estuarine shoreline stabilization rules be
revised, using the best available information, considering estuarine erosions rates, and development and
promotion of incentives for alternatives to vertical shoreline stabilization measures. This has been a topic
of several CHPP Steering Committee meetings over the past five years. Several alternatives to traditional
vertical stabilization have been developed that use a natural ―living shorelines‖ approach to reduce the
habitat and ecosystem impacts of shoreline erosion control (Broome et al. 1992; Rogers and Skrabal
2001; Berman et al. 2007; CBF 2007; NRC 2007). These alternative methods fall into one of three
categories: (1) nonstructural, (2) structural, and (3) hybrid.
A softer, non-vertical approach can be implemented in low-energy environments and uses natural
vegetation (wetland and terrestrial), biodegradable organic materials such as natural fiber logs (bio-logs),
and/or SAV to protect the shoreline from erosion (Broome et al. 1992; Rogers 1994; Rogers and Skrabal
2001; Berman et al. 2007; CBF 2007). This approach creates the least erosion along adjacent shorelines,
but offers the least protection of property in higher energy environments. In high-energy environments, a
structural approach is typically used whereby a series of detached offshore breakwaters seeded with
oysters dissipate wave energy, thus protecting the natural beach shoreline and/or marsh plantings (Rogers
and Skrabal 2001; Berman et al. 2007; CBF 2007). Riprap and wetland toe riprap revetments are other
non-vertical structural techniques that can be used in moderate to high energy environments and provide
some habitat benefit while stabilizing the shoreline. Where appropriate, these ―living shorelines‖ provide
similar erosion control capabilities to other hard stabilization techniques, while preserving, creating, or
maintaining valuable wetland and shallow intertidal habitat for aquatic flora and fauna (Piazza et al. 2005;
DCM 2006; Currin et al. 2008). Hybrid stabilization (marsh sill) is more appropriate in low to moderate-
energy environments and involves the use of segmented sills, jetties, or groins to anchor nonstructural
materials in place (Broome et al. 1992; Rogers and Skrabal 2001; Berman et al. 2007; CBF 2007).
Nursery functions of a living shoreline are supported where diffuse access to landward marshes and
marsh ponds is designed in the construction. Focused access through solitary passages in the sill may
concentrate predatory fish, thus diminishing the nursery function of the sill-protected marshes. Habitat-
mediated predator-prey interaction along both living shorelines and bulkheads should be studied.
In North Carolina, Currin et al. (2008) found no significant difference in the mean number of fish, crabs,
or shrimp between stone sill-protected and natural marshes. In addition, the study found that sediment
accretion rates in marshes protected by a stone sill were 1.5- to 2-fold greater than in controls. Because of
these findings, the authors cautioned that use of a ―living shoreline‖ could result in replacing soft bottom
with artificial hard substrate and could potentially increase the elevation of the marsh, thus altering the
overall ecosystem services provided. Another conflict exists where the extended subtidal footprint of a
sill covers shallow unvegetated habitat and SAV growing just below the normal high water line. The loss
of SAV beds to the rock sill would constitute a direct impact on the habitat. However, living shorelines
should also improve water quality passing through them, thus enhancing growth of SAV in receiving
waters. The sill-protected marsh could also provide ecosystem services similar to a marsh protected by
fringing oyster beds. Living shorelines often require habitat trade-offs, but can result in long-term habitat
benefits. There is a need for 1) the regulatory and resource management agencies to consider and
acknowledge through the permit review process the long-term benefits of alternative non-vertical
stabilization methods, 2) an assessment of the ecological impacts of sills compared to vertical structures,
and 3) incentives to use non-vertical structures where appropriate. It is equally important to educate the
public on the pluses and minuses of living shorelines, and their availability as an erosion control
2010 Coastal Habitat Protection Plan
Chapter 5. Wetlands Page 314
alternative. And finally, there is a need to determine a way to modify CRC and EMC shoreline
stabilization regulations in a manner that is logistically manageable and effectively results in permitting
of the least environmentally damaging shoreline stabilization structures wherever possible.
Between 1984 and 2000, DCM issued permits to bulkhead approximately 457 miles of shoreline, which is
about 5% of the estimated 9,000 miles of estuarine shoreline40
(S. Geis and B. Bendell/DCM, pers. com.,
June 2009). However, there can be local concentration of stabilization that is much higher than 5% (DMF
unpub. data, Corbett et al. 2008). During this 17- year time period, the amount of bulkheading permitted
annually along the coast has ranged from eight to 91 miles. These numbers must be considered with
caution since there may be data entry errors and the CAMA permits include repairs, replacements, or
projects that may not have been done or completed. In addition there have been changes regarding the
process for permitting bulkheads over the years41
, which could change the number of projects requiring a
permit. Approximately 206 (45%) of these miles were processed under a major permit, with the other
55% processed as GPs. Numbers appear to increase sharply from 1997 to 2000, probably due to the large
number of repairs following a series of damaging hurricanes (during 1996 – 1999) and to the strong
economy of the mid-1990s. The highest number of bulkhead permits issued annually occurred in 1999.
The total amount of bulkheading per county has ranged from less than one mile in Gates County to 109
miles in Beaufort County and 79 miles in Dare County. Beaufort, Dare, Carteret, and Currituck counties
have the greatest total lengths of permitted bulkheads. In these counties, the percent bulkheading along
major water bodies ranged from roughly 8% to 32%. However, the percentages were based a lower
mileage of estuarine shoreline used in the 2005 CHPP (estimated 3,900 miles of estuarine shoreline).
To receive a general permit for a bulkhead, the structure must be located landward of all wetlands and if
waterward of NWL or NHW line, there must be an erosion problem evident on the site. From 2001 to
2008, 143 miles of bulkhead were authorized under GP permits, averaging 18 mi/year (Figure 5.5). In
comparison, from 1984 to 2000, the amount of bulkhead authorized under GP permits average 15 mi/yr.
The rate of bulkhead mileage permitted by GP has varied over time. In the past five years (2004-2008), a
total of 98 miles of bulkhead was permitted in coastal counties. In the previous five year period (1999-
2003) 86 miles were permitted, and five years prior to that (1994-1998), 68 miles were permitted. These
numbers, as previously stated, include both new bulkheads and repairs of existing bulkheads. A mapping
effort by DCM is currently underway to spatially delineate the entire estuarine shoreline of North
Carolina, in which the location and extent of estuarine shoreline modified with engineered structures (i.e.
bulkheads, riprap revetments, etc.) will be identified (Geis and Bendell 2008). With this information, the
level of impact to coastal habitats and associated aquatic flora and fauna can be better assessed.
40 Number of miles highly dependent on scale of delineations and the boundaries placed to separate marine, estuarine, and
riverine systems. 41 Rule 7K .0203 changed in 2002 (Ed Brooks/DCM/ pers. com., 2003). Prior to that, bulkheads above MHW and not affecting
wetlands were exempt and not in the database. After that, they were handled by field reps, mostly as GPs.
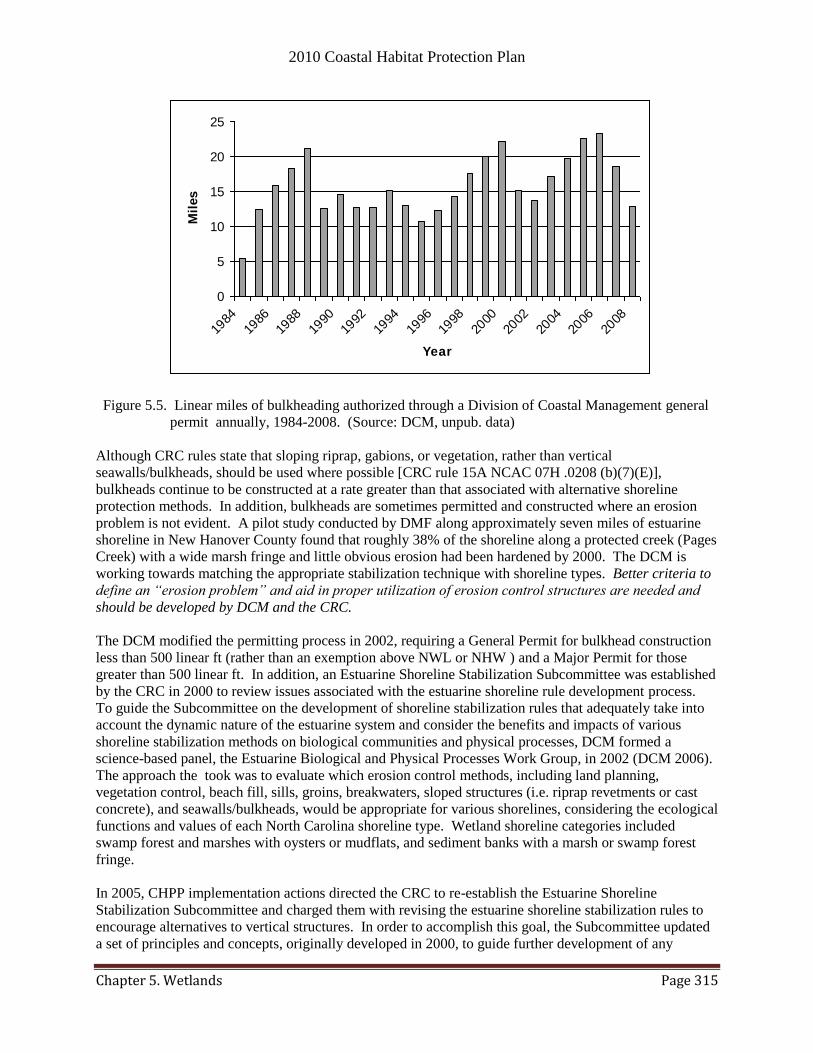
2010 Coastal Habitat Protection Plan
Chapter 5. Wetlands Page 315
0
5
10
15
20
25
1984
1986
1988
1990
1992
1994
1996
1998
2000
2002
2004
2006
2008
Year
Mil
es
Figure 5.5. Linear miles of bulkheading authorized through a Division of Coastal Management general
permit annually, 1984-2008. (Source: DCM, unpub. data)
Although CRC rules state that sloping riprap, gabions, or vegetation, rather than vertical
seawalls/bulkheads, should be used where possible [CRC rule 15A NCAC 07H .0208 (b)(7)(E)],
bulkheads continue to be constructed at a rate greater than that associated with alternative shoreline
protection methods. In addition, bulkheads are sometimes permitted and constructed where an erosion
problem is not evident. A pilot study conducted by DMF along approximately seven miles of estuarine
shoreline in New Hanover County found that roughly 38% of the shoreline along a protected creek (Pages
Creek) with a wide marsh fringe and little obvious erosion had been hardened by 2000. The DCM is
working towards matching the appropriate stabilization technique with shoreline types. Better criteria to
define an “erosion problem” and aid in proper utilization of erosion control structures are needed and
should be developed by DCM and the CRC.
The DCM modified the permitting process in 2002, requiring a General Permit for bulkhead construction
less than 500 linear ft (rather than an exemption above NWL or NHW ) and a Major Permit for those
greater than 500 linear ft. In addition, an Estuarine Shoreline Stabilization Subcommittee was established
by the CRC in 2000 to review issues associated with the estuarine shoreline rule development process.
To guide the Subcommittee on the development of shoreline stabilization rules that adequately take into
account the dynamic nature of the estuarine system and consider the benefits and impacts of various
shoreline stabilization methods on biological communities and physical processes, DCM formed a
science-based panel, the Estuarine Biological and Physical Processes Work Group, in 2002 (DCM 2006).
The approach the took was to evaluate which erosion control methods, including land planning,
vegetation control, beach fill, sills, groins, breakwaters, sloped structures (i.e. riprap revetments or cast
concrete), and seawalls/bulkheads, would be appropriate for various shorelines, considering the ecological
functions and values of each North Carolina shoreline type. Wetland shoreline categories included
swamp forest and marshes with oysters or mudflats, and sediment banks with a marsh or swamp forest
fringe.
In 2005, CHPP implementation actions directed the CRC to re-establish the Estuarine Shoreline
Stabilization Subcommittee and charged them with revising the estuarine shoreline stabilization rules to
encourage alternatives to vertical structures. In order to accomplish this goal, the Subcommittee updated
a set of principles and concepts, originally developed in 2000, to guide further development of any
2010 Coastal Habitat Protection Plan
Chapter 5. Wetlands Page 316
shoreline stabilization rule changes (Figure 5.8). The Work Group completed their report in August 2006
(DCM 2006) and presented their findings to the Subcommittee. Advantages and disadvantages of each
effective erosion control method on various shoreline types were discussed and the preferred methods that
minimize impacts to the hydrological, biogeochemical, and ecological functions of each specific shoreline
type were ranked. For example, adjacent to a high bluff with a sand fringe, a bulkhead structure may be
preferred over a rip-rap rock structure. However, along a low-lying upland with a marsh fringe, a wood
or rock structure on the waterward edge of the marsh would be preferred over a wood or rock structure on
the upland edge of the marsh. For all estuarine shoreline types, the number one recommendation was
adequate land planning (i.e. leave the land in its natural state) (DCM 2006). The Subcommittee also
drafted several changes to the estuarine shoreline stabilization rules to promote responsible use of
shoreline stabilization structures. The CRC adopted these rule changes for groins, sheet pile sills, and
riprap revetments for wetland protection effective February 2009 [CRC rule 15A NCAC 07H .1100] (B.
Bendell/DCM, pers. com., effective July 2009). The changes include increasing the permit fee to $400.00
for the construction of any bulkhead, and positioning bulkheads at approximate NHW. An attempt was
made to require placement of bulkheads more landward of NHW, but the DWQ brought up a potential
conflict with their buffer rules.
Although sill-marsh ―living shorelines‖ were encouraged through CRC permit requirements and fees,
such techniques are rarely selected by property owners. The general permit for marsh sills has more
conditions than the corresponding general permit for bulkheads and may require engineered plans. There
are also relatively few examples of marsh sills to show land owners and marine contractors with an
interest in shoreline stabilization. There are a total of 27 marsh sill projects permitted, and most of those
permitted are in Carteret County (S. Geis and B. Bendell/DCM, pers. com., June 2009). In 2009, the
DCM developed a decision making tool (web based and paper brochure) to assist property owners in
making appropriate shoreline stabilization decisions based upon their shoreline and adjacent water
characteristics (B. Bendell/DCM, pers. com., June 2009). It leads property owners through a series of
questions to determine which stabilization technique may be the most appropriate for their shoreline.
However, the CRC does not mandate use of any particular technique. There remains a need to inform
managers and the public about the hydrological, biogeochemical, ecological, and aesthetic benefits of
alternative stabilization methods. Accurately assessing the pros and cons of various structures requires
information on depth/elevation profiles, current habitat distributions (including sediment types), tidal
ranges, and wave exposures along the shoreline exhibiting erosion. Ideally, the most beneficial structure
in terms of both resilience to erosion and ecological function will be permitted. If depletion or loss of
shallow/intertidal habitats is allowed, agencies should consider requiring mitigation. The EEP is
developing an out-of-kind crediting system that could be employed in mitigating the permitted loss of
shallow/intertidal habitats to shoreline stabilization construction and associated impacts.
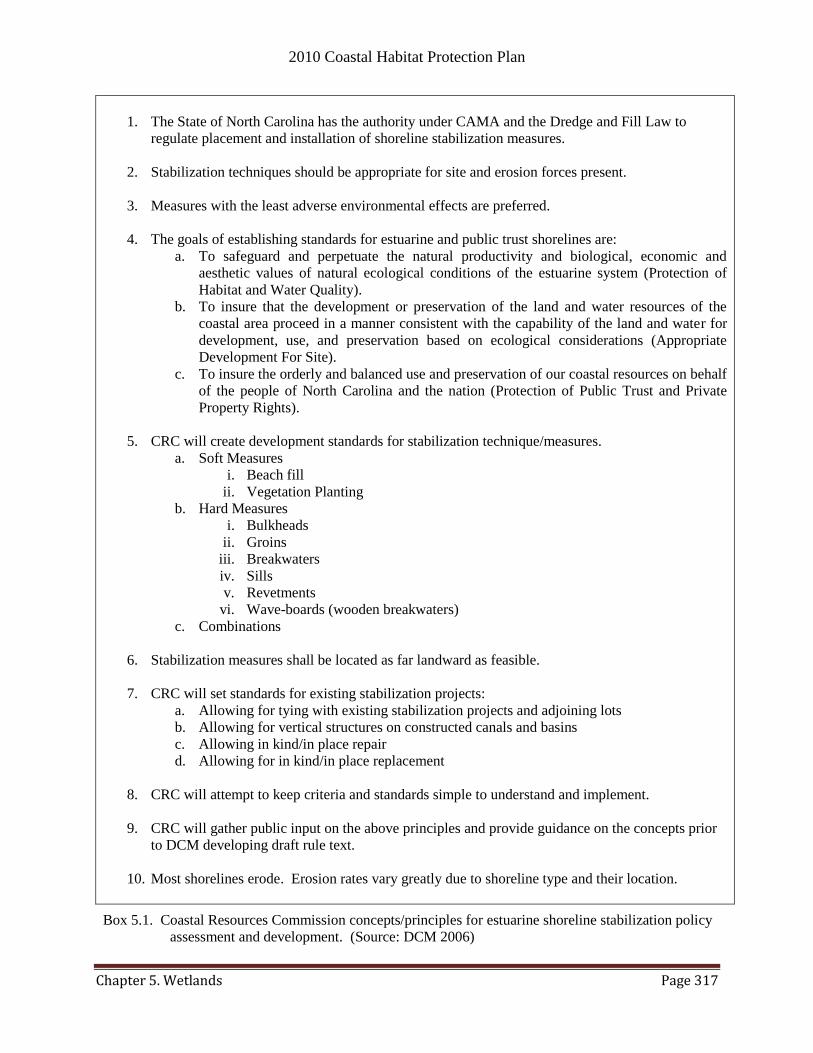
2010 Coastal Habitat Protection Plan
Chapter 5. Wetlands Page 317
1. The State of North Carolina has the authority under CAMA and the Dredge and Fill Law to
regulate placement and installation of shoreline stabilization measures.
2. Stabilization techniques should be appropriate for site and erosion forces present.
3. Measures with the least adverse environmental effects are preferred.
4. The goals of establishing standards for estuarine and public trust shorelines are:
a. To safeguard and perpetuate the natural productivity and biological, economic and
aesthetic values of natural ecological conditions of the estuarine system (Protection of
Habitat and Water Quality).
b. To insure that the development or preservation of the land and water resources of the
coastal area proceed in a manner consistent with the capability of the land and water for
development, use, and preservation based on ecological considerations (Appropriate
Development For Site).
c. To insure the orderly and balanced use and preservation of our coastal resources on behalf
of the people of North Carolina and the nation (Protection of Public Trust and Private
Property Rights).
5. CRC will create development standards for stabilization technique/measures.
a. Soft Measures
i. Beach fill
ii. Vegetation Planting
b. Hard Measures
i. Bulkheads
ii. Groins
iii. Breakwaters
iv. Sills
v. Revetments
vi. Wave-boards (wooden breakwaters)
c. Combinations
6. Stabilization measures shall be located as far landward as feasible.
7. CRC will set standards for existing stabilization projects:
a. Allowing for tying with existing stabilization projects and adjoining lots
b. Allowing for vertical structures on constructed canals and basins
c. Allowing in kind/in place repair
d. Allowing for in kind/in place replacement
8. CRC will attempt to keep criteria and standards simple to understand and implement.
9. CRC will gather public input on the above principles and provide guidance on the concepts prior
to DCM developing draft rule text.
10. Most shorelines erode. Erosion rates vary greatly due to shoreline type and their location.
Box 5.1. Coastal Resources Commission concepts/principles for estuarine shoreline stabilization policy
assessment and development. (Source: DCM 2006)
2010 Coastal Habitat Protection Plan
Chapter 5. Wetlands Page 318
A review of the permits approved for marsh sill, or living shoreline, projects in North Carolina since 2000
was completed by DCM staff in July 2009. There were 19 projects established by major permit and 9
projects under the new general permit. The major permit projects were an average length of 370 feet,
while the general permit projects averaged 114 feet, and the average height of all projects was 0.5 feet
above MHW (B. Bendell/DCM, pers. com., 2009). Overall, the amount of shallow bottom converted to
marsh habitat was approximately equal to the amount of shallow bottom covered by rock sill. The state
will be conducting an on-site evaluation of marsh shill projects in fall 2009 to further evaluate their
erosion control effectiveness and impacts on adjacent habitats and property. Also in 2009, the NC DSWC
- Community Conservation Assistance Program (CCAP) added Marsh Sills as one of their BMPs. This
BMP will reimburse up to 75% with a $5000 cap to allow for an incentive to property owners to install
Marsh Sills. It includes both rock (.2700) and sheetpile (.2100) sills and can be permitted through either
the Major or General Permit process. There are specific guidelines, but generally speaking if the structure
is permitable through DCM‘s program it qualifies for CCAP funding.
Marinas and docks
Direct impacts to wetlands through marina construction are minimized with CRC rules encouraging
marina construction in upland basins [15A NCAC 7H .0208(b)(5)]. Some wetland impacts still occur
where CRC rules allow dredging an access channel through narrow, fringing wetlands. Marinas, docks,
and piers can impact wetlands indirectly by shading and associated boat traffic. Shading results in the
loss of plant growth and vigor beneath the dock structures. A study in South Carolina compared stem
densities of Spartina under docks with stem densities five meters away from docks (Sanger and Holland
2002). The results of the study indicated an average reduction in stem density of 71% under the docks.
The study concluded that although shading of Spartina by docks reduces stem density, the total impact on
wetland habitat was minor. It was estimated that by the year 2010, only 0.02 to 0.24% of the total salt
marsh area in South Carolina would be affected by dock shading. However, local effects in areas with
many docks could be significant. In Georgia two studies similarly found a reduction of approximately
50% in vegetation stem density under docks, resulting in 21-37% reduction in biomass and carbon
production per meter square, and estimated that change to cause a 0.5-0.9 g dw nekton/m2 reduction in
total annual primary nekton production (Alexander and Robinson 2004; 2006). Because of the increasing
proliferation of docks in Georgia, the study concluded that the cumulative effect from dock shading on
critical fish nursery areas should be further assessed. The percent of North Carolina salt marshes covered
by piers is difficult to determine due to technical difficulties in querying the permit database. Data on
pier permits issued from 1990 to 2002 showed an increase from about 250 to about 800 (DCM, unpub.
data; Figure 5.6). However, the portion of these pier permits issued for re-construction (versus new
construction) was unspecified, making it impossible to know exactly how many docks currently exist.
DCM is in the process of spatially identifying all docking structures during their process of delineating
the estuarine shoreline (Geis and Bendell 2008). Division records indicate that about 1,400 permits are
issued annually for docks and piers. Of this total, approximately 150 permits are for floating structures in
PNA, SAV, or shellfish areas, approximately half of which (75) are in water that is less than two feet
deep, representing ~8% of permits in sensitive areas (M. Lopazanski/DCM, pers. com., April 2009).
To minimize shading effects in North Carolina, CRC rules require a dock height of three feet above
wetland substrate, and a pier width of no greater than six feet over coastal wetlands. The impact of dock
and pier shading on wetland vegetation on a coast-wide basis may be minor at present, but the impact will
increase over time with a greater number of piers. A variety of work groups have recommended the
development of a coastal dock and marina policy that encompasses all associated regulatory activities
conducted within DENR (NC Coastal Futures Committee 1994, Waite et al. 1994). As part of 2005-07
CHPP implementation, a workgroup was established to examine the issue of marinas and multi-slip
docking facilities. The Sea Grant Marina Advisory Group completed its report on Multi-Slip Docking
Facilities (MSDFs) and provided recommendations to the CRC in 2007. The report resulted in a revised
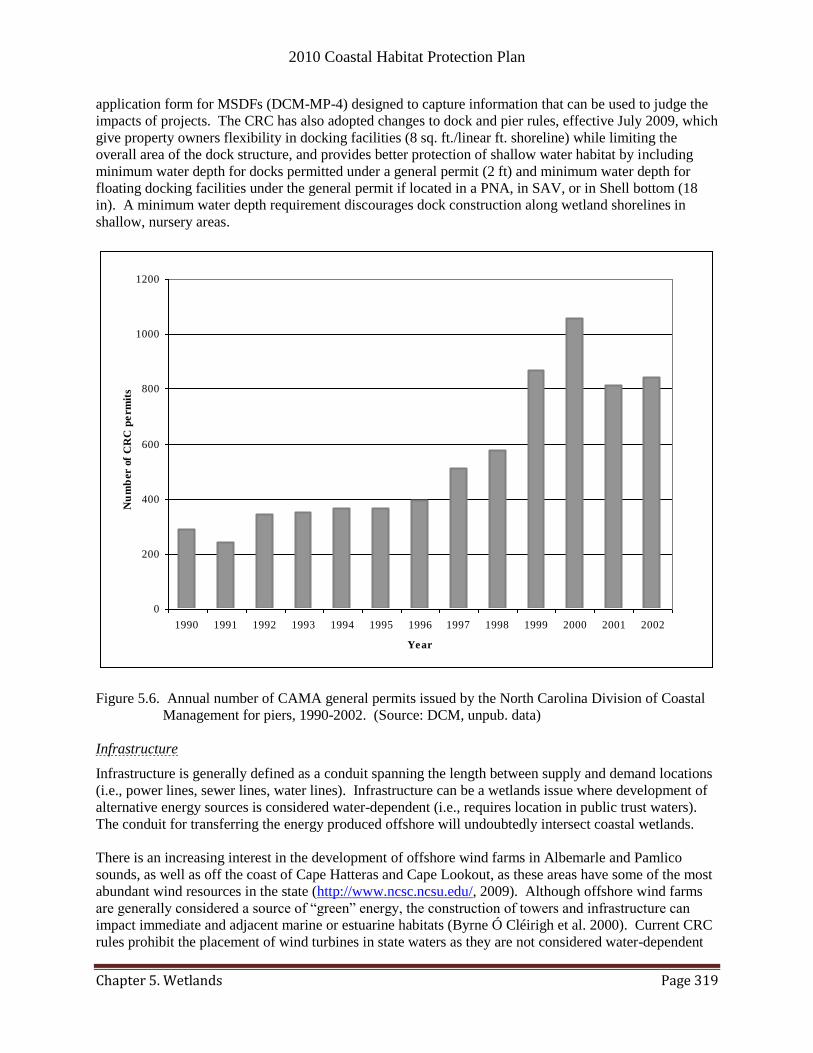
2010 Coastal Habitat Protection Plan
Chapter 5. Wetlands Page 319
application form for MSDFs (DCM-MP-4) designed to capture information that can be used to judge the
impacts of projects. The CRC has also adopted changes to dock and pier rules, effective July 2009, which
give property owners flexibility in docking facilities (8 sq. ft./linear ft. shoreline) while limiting the
overall area of the dock structure, and provides better protection of shallow water habitat by including
minimum water depth for docks permitted under a general permit (2 ft) and minimum water depth for
floating docking facilities under the general permit if located in a PNA, in SAV, or in Shell bottom (18
in). A minimum water depth requirement discourages dock construction along wetland shorelines in
shallow, nursery areas.
0
200
400
600
800
1000
1200
1990 1991 1992 1993 1994 1995 1996 1997 1998 1999 2000 2001 2002
Year
Nu
mb
er o
f C
RC
pe
rm
its
Figure 5.6. Annual number of CAMA general permits issued by the North Carolina Division of Coastal
Management for piers, 1990-2002. (Source: DCM, unpub. data)
Infrastructure
Infrastructure is generally defined as a conduit spanning the length between supply and demand locations
(i.e., power lines, sewer lines, water lines). Infrastructure can be a wetlands issue where development of
alternative energy sources is considered water-dependent (i.e., requires location in public trust waters).
The conduit for transferring the energy produced offshore will undoubtedly intersect coastal wetlands.
There is an increasing interest in the development of offshore wind farms in Albemarle and Pamlico
sounds, as well as off the coast of Cape Hatteras and Cape Lookout, as these areas have some of the most
abundant wind resources in the state (http://www.ncsc.ncsu.edu/, 2009). Although offshore wind farms
are generally considered a source of ―green‖ energy, the construction of towers and infrastructure can
impact immediate and adjacent marine or estuarine habitats (Byrne Ó Cléirigh et al. 2000). Current CRC
rules prohibit the placement of wind turbines in state waters as they are not considered water-dependent

2010 Coastal Habitat Protection Plan
Chapter 5. Wetlands Page 320
structures [15A NCAC 07H. 0208]. Should the State consider locating a wind facility in state or federal
waters, proper placement of energy infrastructure is necessary to minimize potential impacts to wetland
habitat and minimize conflicts with existing activities.
5.4.1.2. Upland development
The increase of impervious surface in coastal North Carolina causes loss and degradation of both riparian
and non-riparian wetlands. Nearly 30% of wetland impacts from 1997-2003 were related directly to
upland developments and associated impervious surfaces (Figure 5.4). Impervious surfaces affect
wetlands indirectly by preventing infiltration into the soil and shallow groundwater tables, thus reducing
discharge to certain groundwater-dependent wetlands. The increased peak flow in urbanized watersheds
(Schueler 1994) can result in greater bank erosion and channel incision in riparian wetlands located near
impervious surfaces and their associated drainage networks.42
Stormwater control may include the
creation of infiltration systems that function like non-riparian wetlands. However, wet infiltration
systems should not be confused with wetlands used to mitigate for the loss of natural wetlands under
permitting provisions (http://h2o.enr.state.nc.us/su/PDF_Files/SW_Documents/BMP_Manual.PDF,
March 2009).
The coastal stormwater rules made effective October 1, 2008 (Senate Bill 1967) also enhanced protection
of CAMA coastal wetlands. For the 20 coastal counties, the vegetative setback requirement from mean
high water was increased from 30 to 50 feet for both new development and re-development. This will
protect wetlands 50 feet landward of the mean high water line. This area includes the high marsh as well
as some non-coastal wetlands. The CAMA coastal wetlands are also not included in the calculation of
impervious surfaces limits. The exclusion of coastal wetlands from the equation will likely inhibit
development on small lots with a large proportion of coastal wetlands area. But the exclusion does not
necessarily protect narrow fringing wetlands.
Marsh mowing, a practice conducted by some property owners, can be detrimental to the ecological
integrity of the wetland if conducted repeatedly with the intention of altering the wetland substrate.
Property owners mow the marsh for various reasons, including enhancing the view to the water or to give
the appearance to prospective property buyers of being uplands. Repeated mowing can elevate the marsh
over time, converting it to uplands through the continued deposition of cuttings. In 2009, the CRC
adopted rule changes to restrict how and when marsh can be mowed to maintain the viability of the
vegetation. While this is an improvement, a mowed marsh will not be as effective for fish use, erosion
control, or filtration of runoff.
5.4.1.3. Mining
In coastal North Carolina, there are surface, open pit mines for sand/gravel, crushed stone, and phosphate.
Sand/gravel and crushed stone mines occur generally in upland areas, although some may be located in or
adjacent to wetlands (M. Street/DMF, pers. com., 2004). Sand/gravel mines are the most common mine
in coastal North Carolina (http://www.dlr.enr.state.nc.us/pages/permittedmines.html, December 2010). In
CAMA counties during 2001, there were 249 permits for sand/gravel mining, seven permits for crushed
stone mining, and two permits for phosphate mining. The two phosphate mining permits, totaling 15,952
acres, were for PCS Phosphate in Beaufort County. In the past, whole creeks adjacent to South Creek and
Pamlico River estuary were lost to PCS Phosphate‘s mining activities. The mining company is currently
trying to expand its operation into more wetland areas in the vicinity. The Certification issued by DWQ
would allow the company to mine an additional 11,000 acres over 35 years. The mining will affect 4.8
miles of streams and 3,900 acres of wetlands, representing the largest destruction of wetlands ever
permitted in North Carolina. The mitigation effort could also be the largest ever conducted in North
42 Refer to Chapter 2 (Water Column) for more information on impervious surfaces.
2010 Coastal Habitat Protection Plan
Chapter 5. Wetlands Page 321
Carolina. The USACE issued a permit allowing reduced wetland impacts in June 2009 after consulting
EPA and PCS Phosphate. Mitigation, generally at a 2:1 ratio, is being provided by the company under
oversight of the Corp of Engineers and Division of Water Quality and is required for the lost streams and
wetlands.
5.4.1.4. Channelization and drainage
Channelization is the deepening and straightening of a natural stream. Ditching involves the creation of
new channels for draining adjacent lands. These activities can affect the slope, depth, width and
roughness of the channel, thus changing the dynamic equilibrium of the stream and associated wetlands.
Channelized streams are deeper, more variable in flow, and less variable in depth than natural streams
(Orth and White 1993). These differences affect primarily smaller species and life stages using wetlands
and shallow stream margins, habitats that are reduced or made inaccessible by channelization (see
―Channelization and drainage‖ section of ―Water column‖ chapter for more information). Channelization
increases channel cross-section and flow capacity, thus reducing the frequency of overbank flow events
that allow fish access to the wetlands. The remaining wetlands exist with an altered hydrology, relying
more on overland flow from upland areas and groundwater discharge, and/or overbank flow from
unchannelized stream segments nearby. These changes greatly reduce the natural beneficial functions of
wetlands to filter pollutants and regulate water flow between uplands and coastal waters. Consequently,
loading and movement of sediment and other nonpoint source pollutants are often greater in channelized
streams than in natural streams, which can have negative effects on water quality and fish habitat
downstream (White 1996; EPA 2001).
Although new channelization for flood control and drainage has greatly decreased, the existing alterations
continue to alter flow and salinity patterns until natural stream morphology is restored. No new
channelization projects have occurred since the 1970‘s. However, maintenance of existing channels is a
recurring issue in permit decisions. Many of the old channels in CHPP Region 1 have re-naturalized and
are now supporting river herring migration (S. Winslow/DMF, pers. com., Nov. 2007). So far, the DMF
has successfully opposed the maintenance of re-naturalized channels. Channelization regulations could
be modified to discourage or prevent maintenance of previously un-navigable and re-naturalized
channels in Anadromous Fish Spawning Areas and Primary Nursery Areas.
Far more wetland acres have been affected by ditching than by channelization. The DCM‘s wetland
mapping from 1994 documented over 72,000 acres of drained riparian wetlands and 328,000 acres of
drained non-riparian wetlands in coastal North Carolina. The DCM wetland maps show drainage
impacting 5% and 21% of riparian and non-riparian wetlands, respectively (Tables 5.4 and 5.5). Since
1995, large areas of riparian wetlands could not be legally drained without a permit and mitigation
requirements. The determination of drainage impacts has also improved since 1995. Skaggs et al. (2005)
modeled the affect of drainage ditch depth and spacing on wetland hydrology in order to set criteria for
both impacts and restoration.
Evans et al. (2007) summarized seven drainage restoration projects implemented in North Carolina from
1995 to 2006. The results showed nitrogen reductions in the receiving water of 20-70% with in-stream
and constructed stormwater wetlands. Reconnecting the river and floodplain reduced peak flows and
reduced flooding in unchannelized sections downstream. There was also a comparative cost assessment
for the projects relative to traditional drainage practices. The restoration and alternative drainage projects
were more expensive and resulted in 2-3 times more land being taken out of production. However, the
benefits were improved water quality, lower peak flows, and enhanced habitat for wildlife. The monetary
value of improved water quality, flood control, and wildlife habitat was not figured into the comparison.
2010 Coastal Habitat Protection Plan
Chapter 5. Wetlands Page 322
5.4.1.5. Obstructions
Obstructions, such as dams and culverts, affect wetlands both upstream and downstream. Upstream
wetlands may become inaccessible to anadromous fish and downstream wetlands may receive less surface
water from upstream sources during relatively dry periods. The Roanoke River in CHPP Region 1 has
been regulated by a series of dams since the 1950‘s. The upstream dams are causing extended flooding
during the growing season of riverine forested wetlands downstream – an area identified by The Nature
Conservancy, the U.S. Fish and Wildlife Service, and the State of North Carolina as a critical natural
resource for conservation (Pearsall et al. 2005). A coalition of public agencies and private organizations
is cooperating with dam managers to establish an adaptive management program that will enable riverine
forested wetlands in the lower Roanoke to regenerate and continue supporting associated biota (i.e., river
herring) (Pearsall et al. 2005). Of all the connected wetlands43
in CHPP region 1 (including both North
Carolina and Virginia), approximately 6% (72,132 acres) were obstructed by impoundments
(http://www.ncdmf.net/habitat/miscdownloads/SHA_region1_report_11_20_08.pdf, March 2009). The
amount of downstream wetland area affected by impoundments is more difficult to determine. The data
on impoundment locations was acquired from the N.C. Division of Water Resources, U.S. Army Corp of
Engineers, Collier and Odum (1989), and the NWI modifier ―impounded‖ modifier.
Culverts, if improperly designed, primarily obstruct fish passage to upstream tributaries and riparian
wetlands and can alter the hydrology of upstream wetlands. The location of culverts in Region 1 was
based on culverts and bridge data from N.C. Department of Transportation, Collier and Odum (1989),
Moser and Terra (1999) and the intersection of streams and roads without a bridge or documented culvert.
The topic of culverts is discussed in more detail in the ‗Water Column‘ chapter.
5.4.1.6. Water withdrawals
Ground or surface water withdrawals can lower water tables, thus drying out wetland areas. Considering
that most riverine wetland communities are controlled by their response to flooding (Townsend 2001b),
the impact of water withdrawals may only be temporary (until the next flood). Water withdrawal impacts
receive more attention in the ‗Water Column‘ chapter.
5.4.1.7. Boating activity
The most detrimental effect of boating on wetlands is probably loss of vegetation from wave action. The
actual impact of boat wakes on wetlands has not been quantified (SAFMC 1998a; Riggs 2001). Erosion
from boat traffic along the Intracoastal Waterway (ICW) and elsewhere is readily observable and is likely
responsible for substantial loss of fringing wetland habitat (Riggs 2001). Cowart and Currin (unpub.
data) documented relatively severe erosion rates along the ICW in the New River Estuary (see ―Sea level
rise and climate change‖ section for more information). As the human population of coastal North
Carolina increases, so will the impact of boater-induced wave turbulence between boating access points
(i.e., ramps, docks, marinas) and major navigation channels. According to WRC records, there were
approximately 108,100 vessels registered in the coastal counties in 2008 (see Table 5.11). Counties with
the greatest number of boats are in the tidally driven southern counties of New Hanover, Carteret,
Brunswick, and Onslow counties. Craven, Beaufort, Dare and Pender counties also have a considerable
number of registered vessels. Boats less than 16 feet comprise over one third of all vessels, and boats 19
to 23.9 feet were the second most common boat size, accounting for 24% of all vessels. Currently, the
issue of human safety is the only issue driving the WRC‘s authority to establish no-wake zones (habitat
protection is not a consideration). No-wake zones should be considered where they protect wetlands and
other habitats along quiet shorelines with significant, nearshore boat activity.
43 Includes riparian wetlands and adjoining non-riparian wetlands

2010 Coastal Habitat Protection Plan
Chapter 5. Wetlands Page 323
Table 5.11. Number of registered recreational boats of different length categories in the 20 coastal
counties of North Carolina, 2008 (WRC, unpub. data).
< 16 Ft 16 - 16.9 Ft 17 - 17.9 Ft 18 - 18.9 Ft 19 - 23.9 Ft 24 - 30 Ft > 30 Ft Total
New Hanover 5,784 1,965 2,090 1,588 4,606 1,613 347 17,993
Carteret 3,797 1,308 1,423 1,280 4,799 1,511 362 14,480
Brunswick 4,971 1,532 1,099 1,006 2,414 873 155 12,050
Onslow 3,972 1,212 1,254 958 2,176 586 109 10,267
Craven 3,472 866 932 806 2,383 714 190 9,363
Beaufort 2,926 829 717 766 1,853 647 164 7,902
Dare 2,075 592 502 566 1,951 736 116 6,538
Pender 2,851 944 682 484 1,163 325 65 6,513
Currituck 1,677 508 473 499 945 263 22 4,387
Pamlico 1,314 313 301 282 823 430 117 3,580
Pasquotank 1,047 262 264 235 614 188 19 2,629
Perquimans 898 177 165 170 469 174 23 2,076
Chowan 738 190 208 198 489 113 26 1,962
Bertie 743 280 251 166 330 52 9 1,831
Hertford 599 208 173 163 291 58 6 1,498
Washington 531 184 143 142 250 73 9 1,332
Camden 547 129 117 120 282 100 16 1,311
Gates 521 144 129 105 180 26 2 1,107
Hyde 253 97 70 81 176 53 17 747
Tyrrell 197 88 57 53 101 25 12 533
TOTAL 38,913 11,828 11,050 9,668 26,295 8,560 1,786 108,099
Number of boats per boat length interval (feet)
County
5.4.2. Water quality degradation
Of all the CHPP habitats, wetlands are the most resilient to water quality degradation, due to their
position both in and above the water column. Wetlands are also known for their water treatment
capabilities (see ‗Ecosystem enhancement‘ section). However, the effect of excess nutrients on fish use
of wetlands could be problematic. Algal blooms in and around emergent vegetation can cause very low
dissolved oxygen levels at night, resulting in fish kills (see Chapter 2).
5.4.2.1. Sulfate enrichment
Another potential issue regarding the water quality of wetlands (especially freshwater marsh) is sulfate
(SO4-2
), a water-soluble, abundant form of sulfur that commonly occurs in nature (e.g., soil and minerals).
Elevated sulfate concentrations can enter surface waters and eventually reach wetlands from a number of
man-made sources, including: runoff from mining and agriculture, industrial waste discharge and
atmospheric deposition (Lamers et al. 2001; EPA 2002a; Lamers et al. 2002). Sulfates are used in a
variety of industries, including, but not limited to, mining, processing (e.g., wood pulp, metal finishing,
leather), sewage treatment, and manufacturing (e.g., chemical, dye, glass, textile, soap, insecticide,
fungicide) (Greenwood and Earnshaw 1984). Approximately 30% of sulfate in groundwater may be from
the atmosphere, while the remaining 70% is from organic processes (EPA 2002a). In contrast, Moore
(1991) reported that greater than 45% of sulfates detected in rivers originated from human activities.
Dissolved or free sulfide (HS-) can be highly toxic to rooted plants in freshwater wetlands where there is
an insufficient amount of iron (Fe). Typically, sulfate-reducing bacteria convert sulfate to hydrogen
sulfide (H2S), pyrite (FeS2), or iron sulfide (FeS). Sulfate over-enrichment may cause HS- to accumulate
in sediments, and the subsequent toxicity leads to rooted plant communities composed of a few highly
sulfur-tolerant species. Lamers et al. (2002) demonstrated that FeSx oxidation during desiccation, FeSx
oxidation due to nitrate pollution, and atmospheric sulfur (S) pollution threatened the water quality of
freshwater wetlands via eutrophication and HS- accumulation. The degree of HS
- accumulation did not

2010 Coastal Habitat Protection Plan
Chapter 5. Wetlands Page 324
vary among wetland soil types with different humus profiles (Lamers et al. 2001). The susceptibility of
freshwater wetlands to sulfate pollution should be evaluated in coastal North Carolina (literature search,
March 2009). Results should provide the measure of iron concentrations in wetland sediment necessary
to evaluate susceptibility.
5.4.2.2. Fossil fuels
Wetland plants can be smothered by oil that reaches the shoreline. As these plants are covered with oil
they will die which may eventually lead to increased shoreline erosion rates due to the decreased root
density (Peacock 2007; Culbertson et al. 2008). In these low energy anaerobic areas, oil can persist for
long periods of time. In Wild Harbor, Massachusetts residual oil and the effects of the Florida barge spill
were still evident 40 years after the spill occurred (Teal et al. 1978; Sanders et al. 1980; Teal et al. 1992;
Reddy et al. 2002; Frysinger et al. 2003; Peacock et al. 2005; Slater et al. 2005; Culberson et al. 2007a,
b). Elevated levels of crude oil have been shown to not only decrease plant stem density but also reduce
photosynthesis rates and shoot height (Lin and Mendelssohn 2008). With these negative impacts caused
by oil, the marshes may not be able to migrate with the rising sea level or export nutrients to the coastal
aquatic systems which provide for the entire food chain (Culbertson 2008). This is important to note
since many of NC‘s Primary Nursery Areas are bordered by extensive wetlands.
Chemical dispersants can be used to reduce the impacts of oil on wetlands, but they may have negative
effects on the fauna in the area (i.e. slowed growth rate and reduced respiration). Page et al. (2002)
experimentally observed no differences between wetlands affected by oil and chemical dispersed oil, but
chemically dispersed oil was washed away easier than non-treated. As with all habitats that are affected
by oil it is important to note that the extent of the impacts will vary depending on the type of oil.
In estuarine waters, tidal marsh is the highest priority for protection, followed by intertidal oyster beds.
Because of their structural complexity, they support a diversity of small organisms that can be adversely
impacted by petroleum products and would be extremely difficult to clean up if necessary. Those
marshes designated by MFC as Primary and Secondary Nursery Areas represent a subset of particularly
productive areas of marsh and/or oyster beds that would be of greatest importance for protection. In order
to restore coastal wetlands several reports propose varying methods to aid in recovery. These methods
include planting new plants, adding fertilizers or tilling/mixing the sediments (Lin and Mendelssohn
1998; Lin and Mendelssohn 2008). Most of the information presented above comes from one time spill
that had a finite amount of oil. In the case of continuously flowing oil from a damaged well, it is
important that the source of oil is stopped and not allowed to flow free so recovery can occur. There
should be a continued ban of oil drilling off North Carolina waters.
5.4.3. Non-native, invasive, or nuisance species
A major non-native species issue concerning wetlands is the spread of Phragmites species (common reed)
into salt/brackish marsh areas (Weinstein and Balletto 1999). Since the early 1900s, Phragmites australis
has been replacing other salt/brackish marsh vegetation along the Atlantic coast at a rate of about 1% to
6% of the marsh surface per year (Weinstein and Balletto 1999). Phragmites forms dense, monotypic
stands of vegetation that could alter fish use of the marsh. Research in the northeast and mid-Atlantic
found that there was not a clear observed effect on shrimp, mummichogs, and large fish when the non-
native vegetation initially invaded a native Spartina alterniflora marsh (Fell et al. 1998; Able and Hagan
2000; Meyer et al. 2001), but as the vegetation becomes more established, the substrate becomes elevated,
flattened, with fewer depressions for holding water (Rooth and Stevenson 2000; Able et al. 2003). Higher
elevations and dense vegetation associated with Phragmites marshes have also been linked to lower
benthic microalgal biomass in New Jersey marshes, which in turn altered the structure of the food web
supporting mummichogs (Currin et al. 2003). Another study in Chesapeake Bay (Posey et al. 2003)
compared benthic communities associated with P. australis and S. alterniflora microhabitats (high marsh,

2010 Coastal Habitat Protection Plan
Chapter 5. Wetlands Page 325
low marsh, rivulets, and hummocks). In the system and scale studied, the differences in plant species did
not strongly affect benthic infaunal communities. Weis and Weis (2003) observed similar results for
nekton use, but reduced larval mummichog abundance in P. australis compared with S. alterniflora.
They also observed somewhat denser growth of epifauna on S. alterniflora compared to P. australis.
Rooth and Stevenson (2000) working in a salt marsh on the Maryland Eastern Shore of Chesapeake Bay
found significantly greater rates of mineral and organic sediment deposition in a P. australis marsh than
in a Spartina spp. marsh. They concluded that the rapid litter accumulation and the below-ground
accumulation from root biomass were responsible for rapid and substantial increase in substrate elevation
over short time periods. The elevation increase appears to modify the habitat to be less accessible to
estuarine species over relatively short time periods. More research is needed on the long-term impact of
Phragmites invasions on estuarine fish use.
5.4.4. Sea level rise and climate change
Rising sea level is a major threat to coastal and riparian wetlands in North Carolina. Analyses of data
from tide gauge stations in Hampton, Virginia, and Charleston, South Carolina, from 1921 to 2000 (Riggs
2001), show sea level rising along the Atlantic coast by about 3.35 mm per year (1.1 ft per 100 years).
Gauge data specific to North Carolina are available only for 20 years, but suggest a slightly greater rate of
approximately 4.57 mm per year (1.5 ft per 100 years). The Coastal Hazard Advisory Committee of the
CRC was tasked by the CRC with providing input on DCM‘s sea-level rise initiative in late 2009. The
Committee completed a report providing the most current sea-level rise projections for North Carolina.
The report considered a one meter (39 inch rise) rise in 100 years to be most likely because it only
requires the linear relationship between temperature and sea level noted in the 20th century to remain valid
for the 21st century (Rahmstorf, 2007). The anticipated one meter includes the projected impact of
melting glaciers on sea-levels in North Carolina. The Intergovernmental Panel on Climate Change Fourth
Assessment Report (IPCC 2007) estimated that global average sea levels will rise from 0.18 to 0.59 m
(0.59 – 1.92 feet) by the year 2100 (Fitzgerald et al. 2008). The report did not include the potential for
additional sea level rise caused by melting glaciers in Greenland and Antarctica.
Rising sea levels will inundate large areas of the Pam-Albemarle peninsula, causing a positive feedback
of carbon emissions from the drowning peat lands (Henman and Poulter 2008). Salt-intrusion into
freshwater peats could also accelerate collapse of peat lands following a shift in decomposition from
methanogenesis to sulfate reduction, as SO4-2
becomes more abundant (Hackney and Yelverton 1990).
Rising sea levels not only cover low-lying areas, but also redistribute sediment as barrier islands attempt
to migrate landward in order to conserve mass through offshore and onshore sediment transport. The
number and size of inlets will likely increase through time with sea level rise, causing potentially major
changes in salinity distribution (Riggs and Ames 2003). Coastal marshes may keep pace with sea levels
rise according to their rate of accretion, which is largely determined by depth of mean high water
inundation, vegetation density, atmospheric CO2 and total suspended solids in flood water (Langley et al.
2009). Marsh areas are lost if their accretion rate falls behind sea level rise. As the proportion of marsh
declines relative to open water, tidal exchange increases such that sand deposition in tidal deltas and
erosion of adjacent barrier islands are elevated (Fitzgerald et al. 2008).
Not accounting for marsh migration/accretion, the combination of sea level rise and storm events causes
erosion of wetlands at a rate of approximately 802 acres/year in North Carolina (Riggs 2001). However,
the rate of erosion varies according to shoreline orientation, fetch, water depth, bank height, sediment
composition of bank, shoreline vegetation, presence of offshore vegetation, and boat wakes. Riggs (2001)
mapped the shoreline types and shoreline areas where erosion was noticeable, and areas that had been
significantly bulkheaded. In general, all of the Albemarle-Pamlico estuarine system is in a state of
shoreline recession. South of Bogue Sound, erosion is severe only in portions of drowned river estuaries
such as the Cape Fear, New, and White Oak rivers, and along the ICW and navigational channels. The
remaining narrow, shallow estuaries are generally not eroding, as the marshes and flats vertically accrete
2010 Coastal Habitat Protection Plan
Chapter 5. Wetlands Page 326
sediment to keep up with rising sea level. Shoreline erosion rates have been estimated for portions of the
coast by various studies including Stirewalt and Ingram (1974), USDA Soil Conservation Service (1975),
Hartness and Pearson (1977), Riggs et al. (1978), and Hardaway (1980) and their results are summarized
and compared in Riggs (2001). These studies are helpful in indicating where major erosion problems are
occurring.
Wang and Allen (2008) detected shoreline change on the Pamlico-Albemarle peninsula using satellite
radar data from 1994 to 2006. The results indicated no significant losses on the north and south
shorelines, and a significant landward migration of shoreline along the eastern portion of the peninsula.
The rate of shoreline recession along the eastern shore peaked at 11 meters per year. In the Neuse River
estuary, Corbett et al. (2008) measured an average erosion rate of approximately 1 foot per year over a 40
year time period. Every shoreline type (i.e., marsh, beach, bluff) was eroding to some degree in the
estuary. In some locations, erosion rates were greater than 10 feet per year. A very small amount of
shoreline accretion occurred in upper tributary reaches of the Neuse estuary. The accretion in upper
tributaries suggests their importance in maintaining wetlands coverage with sea level rise. Corbett et al.
(2008) also mapped structures for shoreline stabilization (i.e., bulkheads, riprap, sills, and groins) and
found they covered 30% of the estuarine shoreline. The structures were located along the open estuarine
shoreline of the river and not in the tributaries. As sea level rises, the impacts of more vertical structures
on shallow nursery areas and narrow fringing wetlands will be exacerbated.
Shoreline erosion rates have also been estimated in the New River Estuary (NRE) using aerial
photography (Cowart and Currin, unpub. data; RTI International. 2009). Using 2004 and 1956 aerial
photography, shoreline-change rates within the NRE ranged from -2.33 m/yr to 1.06 m/yr with a mean
rate of -0.28m/yr. When the tributaries and main trunk of the NRE are compared, the tributaries exhibit a
lower mean erosion rate (-0.15 m/yr) with a much smaller range (-1.13 m/yr to 0.69 m/yr) compared to
the trunk of the estuary, which had a mean shoreline-change rate of -0.38 m/yr and ranged from -2.33
m/yr to 1.06 m/yr. The shoreline-change rates and width of the Intracoastal Waterway (ICW) were
analyzed from Brown's Inlet south to the NRE using 1938, 1956, 1989, and 2004 aerial photography.
Over the time series analyzed, the ICW width increased from a mean of 65.2 m in 1938 to 151.8 m in
2004. The shoreline-change rates along the ICW within the same area over the same time series ranged
from -1.67 m/yr to 0.18 m/yr with a mean of -0.66 m/yr. The relatively severe erosion along the ICW was
presumable from boat wakes and bank slumping (C. Currin/NOAA, pers. com., June 2009).
While the Albemarle-Pamlico Estuarine System is highly vulnerable to erosion due to the coast‘s low
elevation, geomorphology, and erosion rates (Riggs 2001), shoreline erosion has also been documented in
the southern portion of North Carolina. A study in the Topsail Sound area of Pender County, documented
an 18.7% loss of marsh acreage and concurrent increase in open water, over a 49 year period (NC Sea
Grant, unpub. data, 2009). Concern over erosion has led many waterfront property owners to try to stop
the loss of their property through shoreline stabilization, primarily bulkheading. Buyers and owners of
coastal property should be aware of sea level rise and the potential for loss of wetlands and property.
Coast-wide estuarine erosion rates are needed for the CRC and EMC to determine adequate development
guidelines and rules along the coast (DCM 2002). Priorities for coastal wetland protection and land
acquisition should also acknowledge sea level rise, and protect gently sloping areas upland of coastal
wetlands to allow for landward migration of coastal wetlands with sea level rise. CRC and DENR
policies need to be developed regarding sea level rise adaptations and revise CRC land use planning
guidelines.
The U.S. Environmental Protection Agency (EPA), in collaboration with the U.S. Geological Survey
(USGS) and the National Oceanic and Atmospheric Administration (NOAA), collaborated on a 784 page
report that discusses the impacts of sea-level rise on the physical characteristics of the coast, on coastal
communities, and the habitats that depend on them. The report, Coastal Sensitivity to Sea-level Rise: A

2010 Coastal Habitat Protection Plan
Chapter 5. Wetlands Page 327
Focus on the Mid-Atlantic Region examines multiple opportunities for governments and coastal
communities to plan for and adapt to rising sea levels, and is available online at
http://www.climatescience.gov/Library/sap/sap4-1/final-report. The report listed six key findings:
1. In the short time frame of a few decades, negative consequences of climate change may be
avoided or minimized by enhanced efforts in managing traditional stressors of estuarine
ecosystems through existing best management practices (BMPs).
2. Many management adaptations to climate change can be achieved at modest expense by strategic
shifts in existing practices.
3. The appropriate time scale for both planning and implementing new management adaptations
requires considering and balancing multiple factors.
4. To minimize negative consequences of climate change beyond a few decades, planning for some
future management adaptations and implementing other present management adaptations is
necessary now.
5. Even with sufficient long-term planning and enhancing short-term resilience by instituting BMPs,
dramatic long-term losses in ecosystem services are inevitable and will require tradeoffs among
services to protect and preserve.
6. Establishing baselines and monitoring ecosystem state and key processes related to climate
change and other environmental stressors is an essential part of any adaptive approach to
management.
The EPA also created a ―Climate Ready Estuaries‖ program that works with the National Estuary
Programs and other coastal managers to: 1) assess climate change vulnerabilities, 2) develop and
implement adaptation strategies, 3) engage and educate stakeholders, and 4) share the lessons learned
with other coastal managers (http://www.epa.gov/cre, April 2009).
There are numerous projects currently investigating the impacts of climate change on coastal ecosystems.
Corbett et al. (2008) was part of a larger, NOAA-funded project involving various universities
and locations in North Carolina
(http://www.cop.noaa.gov/stressors/climatechange/current/slr/slr_new_intro.aspx, December
2010).
As part of its Living Coasts Program, The Cooperative Institute for Coastal and Estuarine
Environmental Technology (CICEET) awarded $715,178 to North Carolina NERR and NOAA‘s
Center for Coastal Fisheries and Habitat Research to evaluate the costs and benefits of different
approaches to erosion prevention along the North Carolina coast
(http://ciceet.unh.edu/news/releases/shoreline/index.html, April 2009). The project is focused on
understanding the environmental and economic tradeoffs of alternative erosion control measures
with climate change and sea level rise. The work is a collaboration among representatives of
local, state, and federal agencies, coastal property owners, academic institutions, and nonprofits.
The state of North Carolina has received $5 million for a statewide risk assessment and mitigation
strategy demonstrating the potential impacts of climate change-induced sea level rise
(http://www.fema.gov/news/newsrelease.fema?id=47583, April 2009). The N.C. Division of
Emergency Management is managing the study.
The Department of Defense Strategic Environmental Research and Development Program
(SERDP) has funded a multi-disciplinary research project with the goal of developing an
ecosystem management plan for Marine Corps Base Camp Lejeune, which is located along the
New River Estuary. As part of this research effort, investigators from NOAA‘s Center for
Coastal Fisheries and Habitat Research and the University of South Carolina will be examining
the response of coastal wetlands to sea level rise, and investigating developing a model to predict
the role of wind waves and boat wakes on estuarine shoreline erosion
(http://dcerp.rti.org/Portals/0/DCERP_Executive_Summary_FINAL.pdf). The results of these
2010 Coastal Habitat Protection Plan
Chapter 5. Wetlands Page 328
projects will provide valuable information for devising management strategies to face climate
change.
5.4.5. Management needs and accomplishments
The management needs noted by italics in the 2005 CHPP were, or will be, addressed to some degree
during 2005-2010. Some of the needs were refined and adopted as actions in the multi-agency CHPP
implementation plans (IPs). There were also wetland-related actions that came directly from the
implementation plans, without a specific call in the 2005 CHPP. However, the majority of IP actions
affect either water column (see ―Water column‖ chapter) or multiple bottom habitats (see ―Ecosystem
management and strategic habitat areas‖ chapter) and will not be duplicated here. Only wetland-focused
actions from the IPs are listed in the ―Needs and progress‖ sections. Emerging management needs are
included without a reference and may or may not be refined and adopted as actions in the 2009-2011
CHPP implementation plans.
5.4.5.1. Research needs and progress (2005-2010)
Research needs with progress
1. Research site-specific erosion and accretion rates and their relationship to sea level rise and storm
events (Street et al. 2005). Recent studies have determined site-specific erosion rates in some parts of
coastal North Carolina (see Section 5.4.4. “Sea level rise and climate change”).
Research needs with no progress
1. Examine the effectiveness of ORW-related rules for protected wetlands (changing if necessary) (Street
et al. 2005). No specific progress. However, the new stormwater rules provide some protection for
wetlands by decreasing the % impervious surface allowed and excluding coastal wetland acreage from the
calculation of impervious surface (see Section 5.4.1.2. “Upland development”).
2. Examine the cumulative impact of unmitigated wetland losses on overall wetland area in a watershed
(Street et al. 2005). No specific progress. However, sea level rise and coastal erosion studies suggest a
substantial unmitigated loss of wetlands (see Section 5.4.4. “Sea level rise and climate change” and the
“Shoreline stabilization” subsection of Section 5.4.1.1. “Water-dependent development”).
3. Develop better criteria for defining an “erosion” problem in order to prevent unnecessary structures
(Street et al. 2005). No specific progress (see the “Shoreline stabilization” subsection of Section 5.4.1.1.
“Water-dependent development”).
4. Evaluate the susceptibility of freshwater wetlands to sulfate pollution (Street et al. 2005). No specific
progress (see Section 5.4.2. “Water quality degradation”).
Emerging research needs
1. More fishery-independent information and habitat change analysis are needed to determine the effect
of wetland-coverage on the abundance of fish and invertebrates. See Section 5.3.2. “Status of
associated fishery stocks” for context.
2. Given a limited time to monitor for restoration success, criteria should focus on identifying
trajectories of functional development that include wetland soil development. In other words, are the
functions developing to fully replace that of lost wetlands within a reasonable timeframe. See Section
5.3.3.3. “Evaluating mitigation/restoration efforts”.
3. A study should be conducted to quantify the cumulative impact of shoreline hardening on wetland
2010 Coastal Habitat Protection Plan
Chapter 5. Wetlands Page 329
vegetation and habitat-mediated predator-prey interactions in North Carolina estuarine waters. The
results of such a study could then be developed into a model to predict a threshold value for the
allowable extent of shoreline hardening in a particular water body, after which, changes in
community composition and ecosystem services are likely to occur. See the “Shoreline stabilization”
subsection of Section 5.4.1.1. “Water-dependent development”.
4. More research is needed on the long-term impact of Phragmites invasions on estuarine fish use. See
Section 5.4.3. “Non-native, invasive, or nuisance species”.
5.4.5.2. Management needs and progress (2005-2010)
Accomplished management needs
1. Include land acquisition as an option for wetlands mitigation (Street et al. 2005). The EEP considers
preservation a mitigation option (see Section 5.3.3. “Wetland enhancement and restoration”).
2. Establish success criteria for restoration projects that do not rely too much on hydrologic criteria
(Street et al. 2005). The EEP has improved their monitoring of restoration projects (see Section 5.3.3.3.
“Evaluating mitigation/restoration efforts”.
3. Conduct additional monitoring of drained wetlands for compliance with water quality standards
(Street et al. 2005). More DWQ staff were hired to check compliance with stormwater permit
conditions (see Section 5.3.1.4. “Regulatory response to recent losses”).
4. Include mitigation planning for upland development, and other approaches to habitat enhancement,
restoration, and preservation (Street et al. 2005). EEP covers mitigation needs of upland development
via “in lieu fee” program (see Section 5.3.3. “Wetland enhancement and restoration”). Alternative
mitigation strategies designed to improve water quality have also been explored (see Section 5.3.3.3.
“Evaluating mitigation/restoration efforts”).
5. Track restoration efforts by river basin and hydrogeomorphic class (Street et al. 2005). The EEP
currently tracks restoration efforts by river basins and 3 hydrogeomorphic categories (coastal, riparian,
and non-riparian). Headwater wetland mitigation is a type of riparian wetland is not specifically tracked
(see Section 5.3.3.3. “Evaluating mitigation/restoration efforts”).
Management needs with progress
1. Give higher priority for headwater wetlands in preservation/restoration efforts (Street et al. 2005). The coastal headwater stream mitigation guidance has been modified and finalized by the Corps of
Engineers and DWQ and is now being implemented across the outer coastal plain. In addition, including
headwater wetlands as an “in-kind” mitigation type will put this hydrogeomorphic class in the
accounting system (see Section 5.3.3.3. “Evaluating mitigation/restoration efforts”).
2. Conduct an assessment of where and how much of the estuarine shoreline is hardened (Street et al.
2005). The DCM is currently delineating shoreline types for the entire estuarine system of North
Carolina (see the “Shoreline stabilization” subsection of Section 5.4.1.1. “Water-dependent
development”).
Management needs with no progress
1. These studies show the importance of considering optimal locations for habitat restoration/creation
projects. See Section 5.4.2.5. “Corridor and connectivity” for context.
2. Implement comprehensive planning for wetland preservation and restoration that includes
2010 Coastal Habitat Protection Plan
Chapter 5. Wetlands Page 330
dechannelization of streams, restoration of wetland hydrology, use of alternative drainage
techniques, on-site BMPs, and outreach to private owners of wetland resources (Street et al. 2005). No specific progress. However, there are projects conducting comprehensive and proactive watershed
restoration on lands managed for conservation (see Section 5.3.4.2. “Non-regulatory”).
3. Amend “No Wake” zone authority to include consideration for erosion along normally low-energy
shorelines (Street et al. 2005). No specific progress (see Section 5.4.1.7. “Boating activity”).
4. Increase public awareness of boat wakes on wetland shoreline (Street et al. 2005). No specific
progress (see Section 5.4.1.7. “Boating activity”).
5. Maintain a natural proportion and relative position of wetland and non-wetland shorelines.
Wherever possible, sections of estuarine, non-vegetated shoreline with very little hard stabilization
should remain unaltered to provide “new” sediment for shallow water habitats (Street et al. 2005). No specific progress (see the “Shoreline stabilization” subsection of Section 5.4.1.1. “Water-dependent
development”).
6. Require an NPDES permit for ditching activities resulting in excess pollutant discharge to coastal
North Carolina waters (Street et al. 2005). No specific progress (see Section 5.3.1.4. “Regulatory
response to recent losses”).
7. Inform buyers and owners of coastal property about sea level rise and resulting loss of wetlands and
property (Street et al. 2005). No specific progress. However, recent publications, workshops, meetings,
and television programs provide an ample source of information on the impacts of sea level rise (see
Section 5.4.4. “Sea level rise and climate change”).
8. Acknowledge sea level rise in prioritizing coastal wetland protection and land acquisition efforts
(Street et al. 2005). No specific action at the agency level. However, there are agency studies underway
to help determine priorities (see Section 5.4.4. “Sea level rise and climate change”).
Emerging management needs
1. Accurate and up-to-date mapping of DCM wetland types is needed for North Carolina. Refer to
Section 5.1.4. “Distribution” for a discussion of the current mapping available and potential
improvements.
2. Headwater wetlands restoration should be tracked separately from other riparian wetlands because
of their vulnerability and relative importance in denitrification. See Section 5.2.1. “Ecosystem
enhancement” for context.
3. To facilitate cumulative impacts assessment, there should be a central database for recording 404,
401 permits similar to the CDAITS database being developed for CAMA permits. Necessary fields
for the database would include accurate geographic coordinates for impacts and parcel identification
numbers. See Section 5.3.1.3. “Recent loss of wetland habitat (1994-present)” for context.
4. Other issues hampering management of cumulative impacts include the development of threshold
values (for shoreline development) similar to the impervious surface limits in EMC's new stormwater
rules. There must also be a means to limit impacts at larger than parcel scales. See Section 5.3.1.3.
“Recent loss of wetland habitat (1994-present)” for context.
5. Location of Strategic Habitat Areas should also be coordinated with local watershed planning to
facilitate the linkage between watershed improvement efforts and management of sensitive aquatic
2010 Coastal Habitat Protection Plan
Chapter 5. Wetlands Page 331
habitats (i.e., SAV, oysters) downstream. See Section 5.3.3.3. “Evaluating mitigation/restoration
efforts” for context.
6. The re-mapping of headwater streams should be used to identify headwater wetlands as a new
category for tracking impacts and restoration work. See Section 5.3.4.2. “Non-regulatory” for context.
7. Restoring altered wetland areas within conservation lands would be more readily compatible with
existing uses than analogous efforts on other private lands. See Section 5.3.4.2. “Non-regulatory” for
context.
8. Use of native vegetation in the 30-foot buffer along the estuarine shoreline AEC would minimize
stormwater runoff and erosion landward of shoreline stabilization structures, and would be
consistent with the Neuse and Tar-Pamlico River Basin Nutrient Sensitive Waters management
strategies [EMC rules 15A NCAC 02B .0233 and 15A NCAC 02B .0259]. See the “Shoreline
stabilization” subsection of Section 5.4.1.1. “Water-dependent development” for context.
9. There is a need for 1) the regulatory and resource management agencies to consider and
acknowledge through the permit review process the long-term benefits of alternative non-vertical
stabilization methods, 2) an assessment of the ecological impacts of vertical structures, and 3)
incentives to use non-vertical structures where appropriate. In 2009, the NC Division of Soil and
Water Conservation - Community Conservation Assistance Program (CCAP) added Marsh Sills as one
of their supported BMPs (see the “Shoreline stabilization” subsection of Section 5.4.1.1. “Water-
dependent development”).
10. It is equally important to educate the public on the benefits and advantages of alternatives to vertical
stabilization. See the “Shoreline stabilization” subsection of Section 5.4.1.1. “Water-dependent
development” for context.
11. There is a need to determine a way to modify CRC and EMC shoreline stabilization regulations in a
manner that is logistically manageable and effectively results in permitting of the least
environmentally damaging shoreline stabilization structures wherever possible. The CHPP Steering
Committee is in the discussion phase of dealing with this issue but no significant improvement has
occurred yet. DCM has produced a brochure/website key to assist property owners in matching the
appropriate shoreline stabilization technique to their shoreline type (see the “Shoreline stabilization”
subsection of Section 5.4.1.1. “Water-dependent development”).
12. If depletion or loss of shallow/intertidal habitats is allowed, agencies should consider requiring
mitigation. The EEP is developing an out-of-kind crediting system that could be employed in
mitigating the permitted loss of shallow/intertidal habitats to bulkhead construction and associated
impacts. See the “Shoreline stabilization” subsection of Section 5.4.1.1. “Water-dependent development”
for context.
13. There is also a need to inform managers and the public on the hydrological, biogeochemical,
ecological, and aesthetic benefits of alternative stabilization methods. See the “Shoreline
stabilization” subsection of Section 5.4.1.1. “Water-dependent development” for context.
14. Should the State consider locating a wind facility in state or federal waters, proper placement of
energy infrastructure is necessary to minimize potential impacts to wetland habitat and minimize
conflicts with existing activities. See the “Infrastructure” subsection of Section 5.4.1.1. “Water-
dependent development” for context.
15. Modify EMC regulations to discourage or prevent maintenance of previously un-navigable and re-
2010 Coastal Habitat Protection Plan
Chapter 5. Wetlands Page 332
naturalized channels in Anadromous Fish Spawning Areas and Primary Nursery Areas. See Section
5.4.1.4. “Channelization and drainage” for context.
16. There should be a continued ban of oil drilling off North Carolina waters. See Section 5.4.2.2. “Fossil
fuels” for context.
17. The importance and vulnerability of fringing coastal marsh merits decreasing the minimum area
and/or length requirement for mitigation. Protecting or restoring fringing marsh is especially
important where adjacent slopes allow landward migration with sea level rise. See Section 5.4.4. “Sea
level rise and climate change” for context.
18. The enhancement or creation of marsh islands should accompany the net loss of marsh islands due to
deterioration with sea level rise. See Section 5.4.4. “Sea level rise and climate change” for context.
19. Develop CRC and DENR policies regarding sea level rise adaptations and revise CRC land use
planning guidelines. See Section 5.4.4. “Sea level rise and climate change” for context.
5.5. Wetlands chapter summary
Wetland services improve the quality of adjacent upland and open-water habitats with their capacity for
water storage, filtration, and protection from erosion. Wetlands also play a vital role in providing
abundant food and cover for juvenile and adult finfish and shellfish. It is estimated that over 95% of the
finfish and shellfish species commercially harvested in the United States are wetland-dependent. The
large expanses of shallow water and thick vegetation characterizing wetlands provide nursery habitat for
numerous fishery species, and ecosystem enhancement value for the entire system. The value of wetland
has even been extended to waste treatment and storm protection services for humans.
The 2001 National Land Cover Dataset indicates that approximately 3 million acres in coastal draining
river basins of North Carolina (excluding the Lumber River) and 5.1 million acres in the entire state. Pre-
colonial estimates of wetland area for the entire state are approximately 7.2 million acres. Between 2001
and 2008, there were nearly 1,700 acres of permitted wetland impacts in coastal draining river basins.
More accurate mapping of wetland types has not been conducted since the 1994, suggesting the need to
revisit mapping of wetland types.
Land use and shoreline changes associated with population growth have been and continue to be the
primary anthropogenic cause of wetland habitat loss. The indirect, cumulative and largely unmitigated
impact of water-dependent development nearshore habitats continues to be a major issue facing riparian
wetlands. The presence of bulkheads along the estuarine shoreline exacerbates the degradation and loss
of fringe wetlands and other shallow water habitats. Recent research provides site-specific evidence of
the widespread erosion and shoreline stabilization in the Neuse River estuary. Other parts of the North
Carolina coast are experiencing similar widespread erosion and conversion of wetlands to open water. As
normal water levels rise, wetlands will need space to migrate inland or they will be converted to another
habitat. Additional threats to wetlands and their use by fish include construction of marinas and docks,
associated boating activity, infrastructure development, stormwater conveyance, mining for minerals,
obstructions to fish passage and water withdrawals.
The EEP currently has more mitigation assets (restoration, enhancement, creation, and preservation) than
the permitted losses recorded (not counting advance mitigation) and reports a success rate of 90% for EEP
mitigation projects. Although it appears that ―No Net Loss‖ of wetlands is being achieved by the wetland
permitting programs in North Carolina, the restored wetlands may not be of equivalent function or

2010 Coastal Habitat Protection Plan
Chapter 5. Wetlands Page 333
location to prevent localized impacts. There are also losses of wetlands that are not captured by
regulatory programs and therefore not mitigated for. These losses are from net erosion with sea-level rise
and storm events, unauthorized impacts, and impacts too small to require a permit or mitigation. Loss of
wetland function also occurs from non-native species invasions, such as Phragmites spp., resulting in
reduced biodiversity and potential impacts on fish nursery functions. Mitigating for a history of wetland
alterations may be possible with opportunities such as wetland restoration on conservation lands, re-
building marsh islands, and constructing living shorelines.
Some progress has been made in almost half of the management needs identified in the 2005 CHPP.
Many of the management needs are ongoing and require continued effort and funding. There have been
incremental improvements in the rules governing shoreline development and how it contributes to the
unmitigated loss of wetlands. There are numerous research, planning, and restoration efforts designed to
address the unmitigated loss of wetlands with the interruption of natural shoreline migration processes
during this period of rising sea level. Wetland restoration project through EEP are designed, located,
tracked and monitored with more detail. Both regulatory changes and coordinated mitigation and
restoration opportunities are needed to foster a trajectory of sustainable human development that
recognizes the role of wetlands in sustainability.
In updating the chapter, many of the very general, minor, or redundant research and management needs
were discontinued. Of the remaining 2005 CHPP research and management needs (20), five management
needs were considered accomplished and discontinued. Of the renewed needs, one research need had
progress while the other five did not. There were also two renewed management needs with progress and
eight without progress. However, 22 new or clarified research and management needs were also
identified. Some of the highest priority management needs for wetlands include:
1. A mapping and tracking system for wetland loss by wetland types;
2. Incentives for using alternative shoreline stabilization techniques compatible with riparian buffer
requirements;
3. Further development of success criteria for wetland restoration and consideration of alternative
types of restoration/mitigation
4. Developing coastal management policies and guidelines regarding sea level rise.
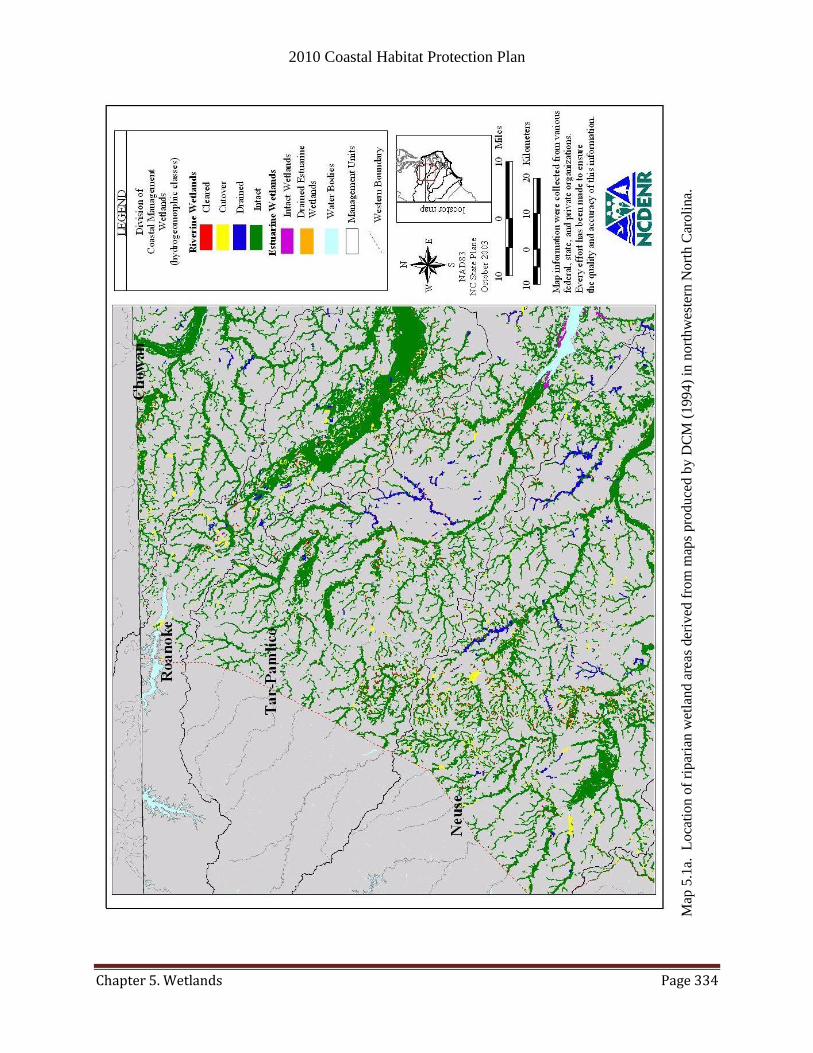
2010 Coastal Habitat Protection Plan
Chapter 5. Wetlands Page 334
Map
5.1
a. L
oca
tio
n o
f ri
par
ian w
etla
nd a
reas
der
ived
fro
m m
aps
pro
duce
d b
y D
CM
(1994)
in n
ort
hw
este
rn N
ort
h C
aroli
na.

2010 Coastal Habitat Protection Plan
Chapter 5. Wetlands Page 335
Map
5.1
b. L
oca
tio
n o
f ri
par
ian w
etla
nd a
reas
der
ived
fro
m m
aps
pro
duce
d b
y D
CM
(1994)
in n
ort
hea
ster
n N
ort
h C
aroli
na.
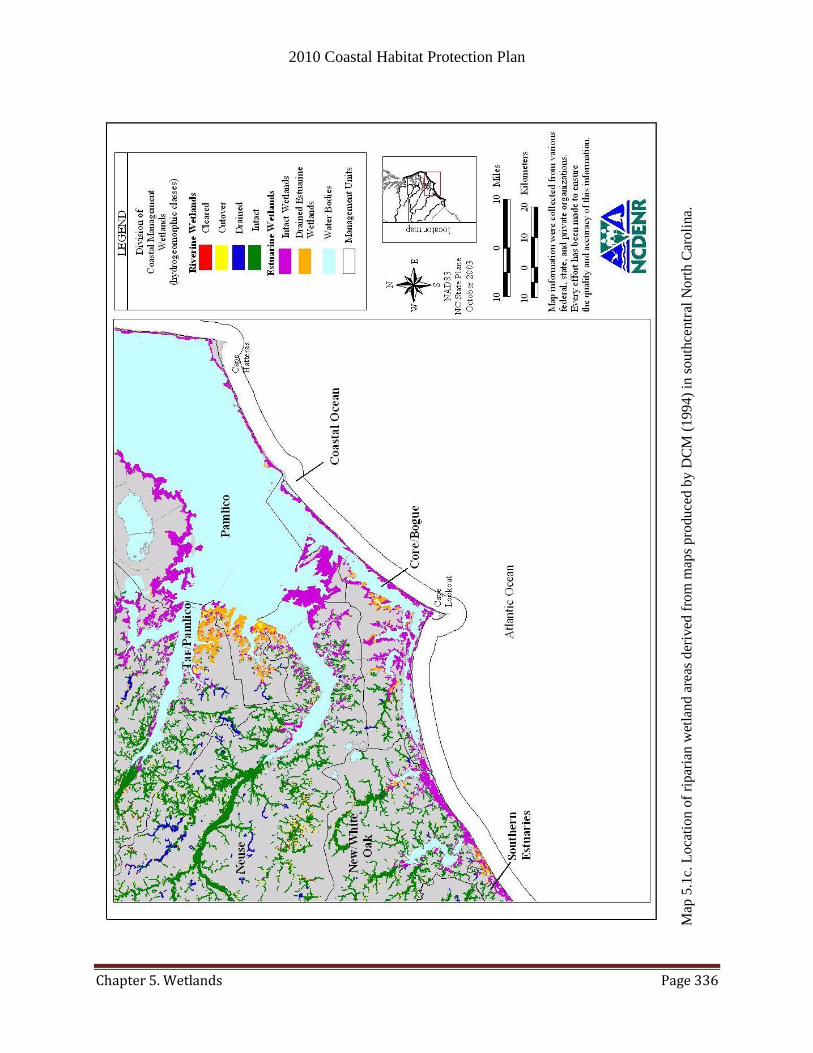
2010 Coastal Habitat Protection Plan
Chapter 5. Wetlands Page 336
Map
5.1
c. L
oca
tio
n o
f ri
par
ian
wet
land a
reas
der
ived
fro
m m
aps
pro
duce
d b
y D
CM
(1994)
in s
ou
thce
ntr
al N
ort
h C
aroli
na.
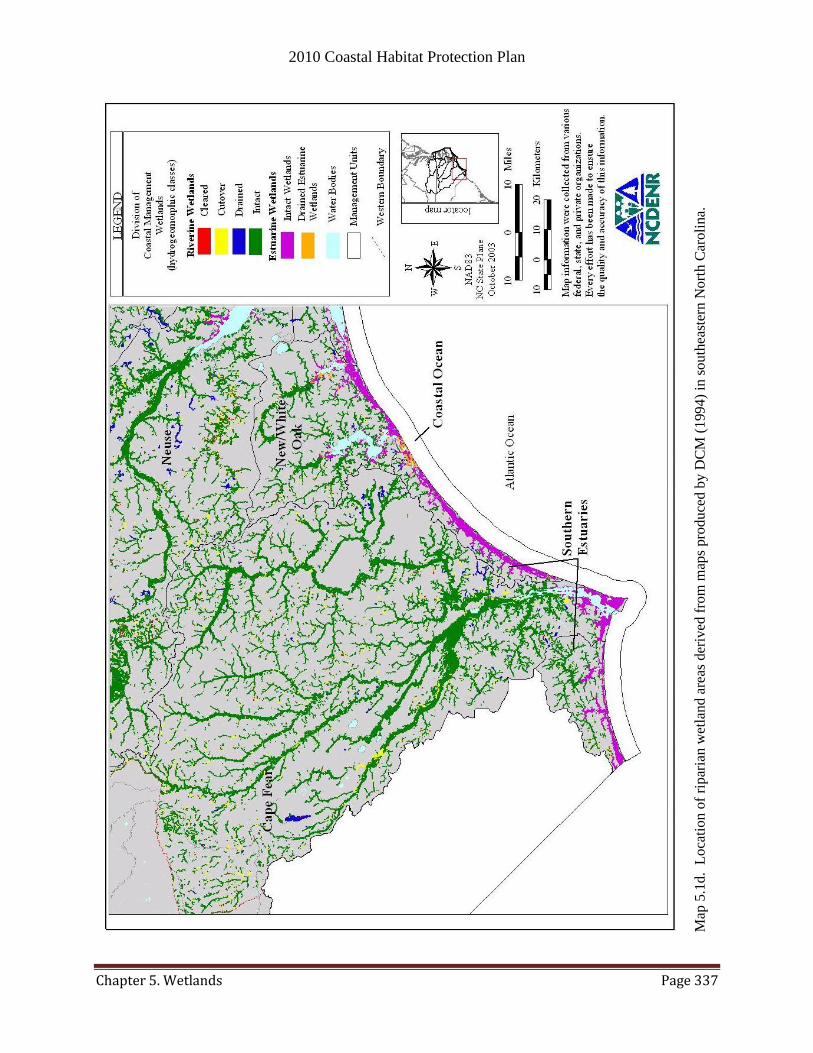
2010 Coastal Habitat Protection Plan
Chapter 5. Wetlands Page 337
Map
5.1
d. L
oca
tio
n o
f ri
par
ian w
etla
nd a
reas
der
ived
fro
m m
aps
pro
duce
d b
y D
CM
(1994)
in s
ou
thea
ster
n N
ort
h C
aroli
na.
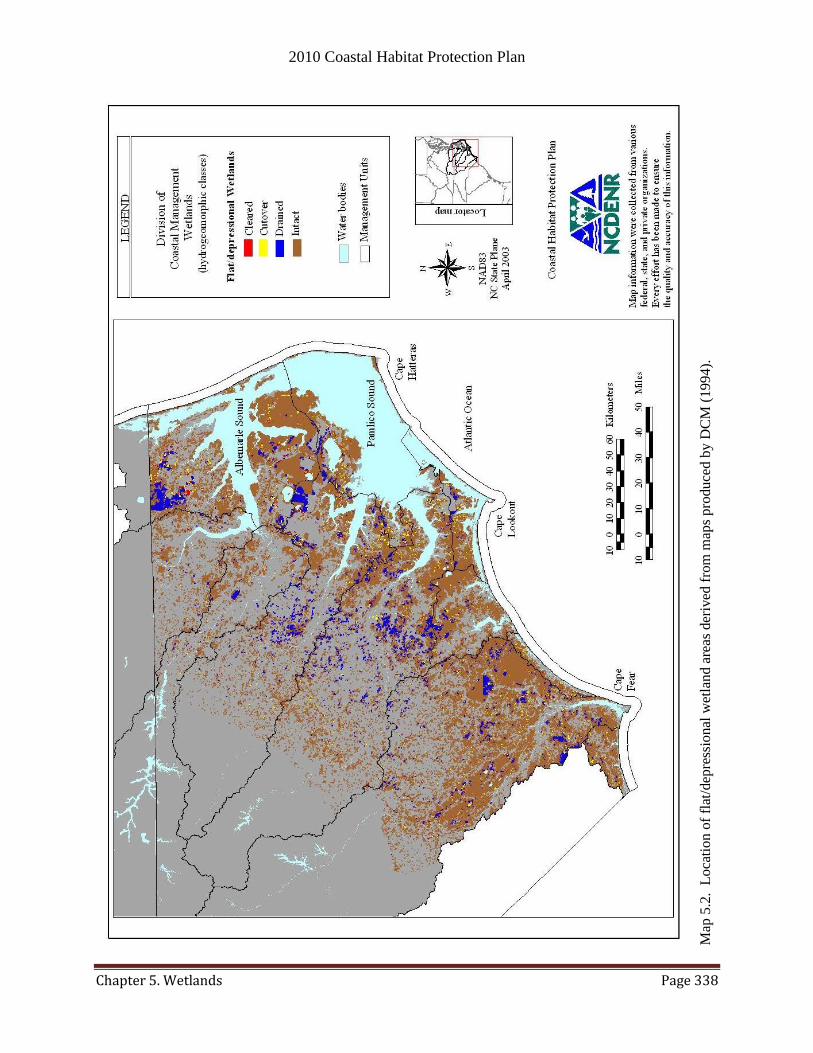
2010 Coastal Habitat Protection Plan
Chapter 5. Wetlands Page 338
Map
5.2
. L
oca
tio
n o
f fl
at/d
epre
ssio
nal
wet
land a
reas
der
ived
fro
m m
aps
pro
duce
d b
y D
CM
(1994).

2010 Coastal Habitat Protection Plan
Chapter 6. Soft Bottom Page 339
CHAPTER 6. SOFT BOTTOM
6.1. Description and distribution
6.1.1. Definition
Soft bottom habitat is defined by Street et al. (2005) as ―unconsolidated, unvegetated sediment that occurs
in freshwater, estuarine, and marine systems.‖ This definition includes both deeper subtidal bottom as
well as shallow intertidal flats.
6.1.2. Habitat requirements
The only requirement for the presence and persistence of soft bottom is sediment supply. Environmental
characteristics, such as sediment grain size and distribution, salinity, dissolved oxygen, and flow
conditions, will affect the condition of the soft bottom habitat and the type of organisms that use it.
However, the habitat itself will persist regardless of its condition unless it becomes sediment starved or is
colonized by organisms, such as oysters or SAV, which can transform soft bottom into another habitat.
6.1.3. Description and distribution
The characteristic common to all soft bottom is the mobility of unconsolidated, uncemented sediment
(Peterson and Peterson 1979). Soft bottom habitat in North Carolina‘s coastal waters can be characterized
by geomorphology, sediment type, water depth, hydrography, and/or salinity regime, and can be
categorized into the following:
Freshwater
unvegetated shoreline
river, creek, and lake bottom
Estuarine
intertidal flats and unvegetated shoreline
subtidal bottom in rivers, creeks, and sounds
Marine
intertidal beach
subtidal bottom
Soft bottom covers approximately 1.9 million acres, or 85% of the total bottom area, in North Carolina‘s
coastal waters, excluding the coastal ocean. An estimate for its area in North Carolina‘s marine waters is
Soft bottom is an important source of
sand, acts as a storage reservoir for
nutrients, and provides abundant
foraging areas for demersal fish
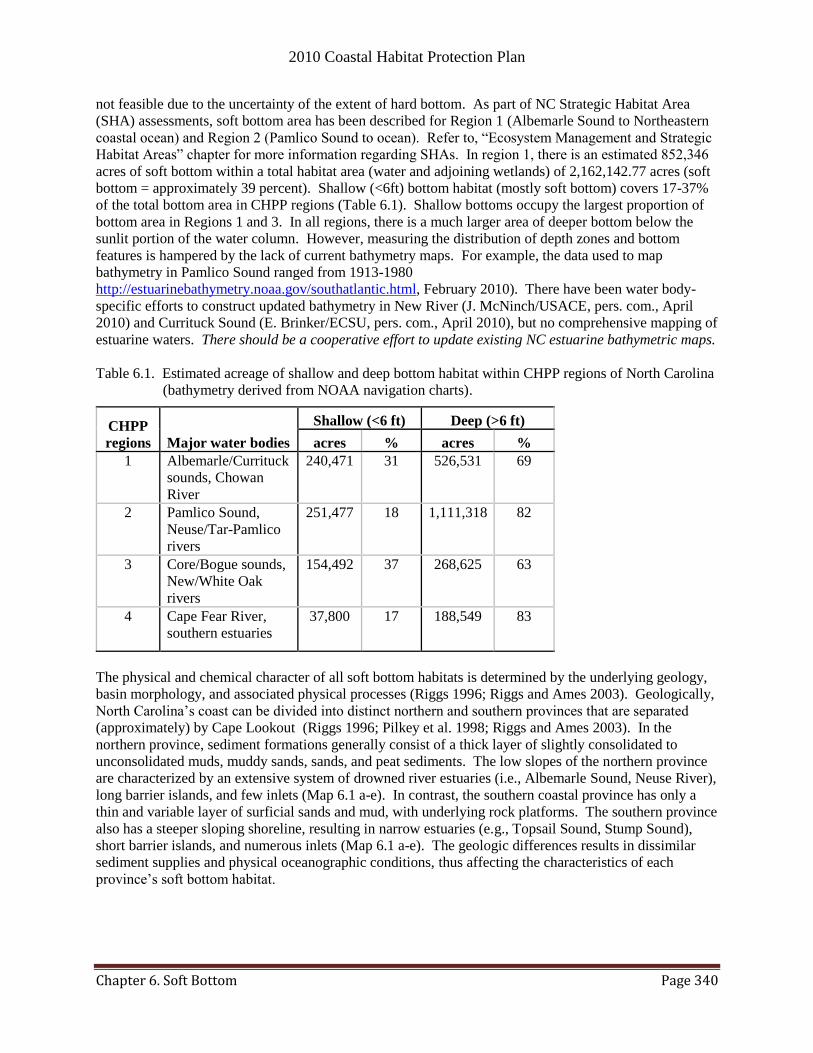
2010 Coastal Habitat Protection Plan
Chapter 6. Soft Bottom Page 340
not feasible due to the uncertainty of the extent of hard bottom. As part of NC Strategic Habitat Area
(SHA) assessments, soft bottom area has been described for Region 1 (Albemarle Sound to Northeastern
coastal ocean) and Region 2 (Pamlico Sound to ocean). Refer to, ―Ecosystem Management and Strategic
Habitat Areas‖ chapter for more information regarding SHAs. In region 1, there is an estimated 852,346
acres of soft bottom within a total habitat area (water and adjoining wetlands) of 2,162,142.77 acres (soft
bottom = approximately 39 percent). Shallow (<6ft) bottom habitat (mostly soft bottom) covers 17-37%
of the total bottom area in CHPP regions (Table 6.1). Shallow bottoms occupy the largest proportion of
bottom area in Regions 1 and 3. In all regions, there is a much larger area of deeper bottom below the
sunlit portion of the water column. However, measuring the distribution of depth zones and bottom
features is hampered by the lack of current bathymetry maps. For example, the data used to map
bathymetry in Pamlico Sound ranged from 1913-1980
http://estuarinebathymetry.noaa.gov/southatlantic.html, February 2010). There have been water body-
specific efforts to construct updated bathymetry in New River (J. McNinch/USACE, pers. com., April
2010) and Currituck Sound (E. Brinker/ECSU, pers. com., April 2010), but no comprehensive mapping of
estuarine waters. There should be a cooperative effort to update existing NC estuarine bathymetric maps.
Table 6.1. Estimated acreage of shallow and deep bottom habitat within CHPP regions of North Carolina
(bathymetry derived from NOAA navigation charts).
CHPP
regions Major water bodies
Shallow (<6 ft) Deep (>6 ft)
acres % acres %
1 Albemarle/Currituck
sounds, Chowan
River
240,471 31 526,531 69
2 Pamlico Sound,
Neuse/Tar-Pamlico
rivers
251,477 18 1,111,318 82
3 Core/Bogue sounds,
New/White Oak
rivers
154,492 37 268,625 63
4 Cape Fear River,
southern estuaries
37,800 17 188,549 83
The physical and chemical character of all soft bottom habitats is determined by the underlying geology,
basin morphology, and associated physical processes (Riggs 1996; Riggs and Ames 2003). Geologically,
North Carolina‘s coast can be divided into distinct northern and southern provinces that are separated
(approximately) by Cape Lookout (Riggs 1996; Pilkey et al. 1998; Riggs and Ames 2003). In the
northern province, sediment formations generally consist of a thick layer of slightly consolidated to
unconsolidated muds, muddy sands, sands, and peat sediments. The low slopes of the northern province
are characterized by an extensive system of drowned river estuaries (i.e., Albemarle Sound, Neuse River),
long barrier islands, and few inlets (Map 6.1 a-e). In contrast, the southern coastal province has only a
thin and variable layer of surficial sands and mud, with underlying rock platforms. The southern province
also has a steeper sloping shoreline, resulting in narrow estuaries (e.g., Topsail Sound, Stump Sound),
short barrier islands, and numerous inlets (Map 6.1 a-e). The geologic differences results in dissimilar
sediment supplies and physical oceanographic conditions, thus affecting the characteristics of each
province‘s soft bottom habitat.

2010 Coastal Habitat Protection Plan
Chapter 6. Soft Bottom Page 341
6.1.3.1. Freshwater soft bottom
Properties of freshwater soft bottom not only depend on the origin of sediment inputs, but also on the
prevailing elevation gradient, flow conditions, riparian cover, local geology, and water column
characteristics. Upstream sources of sediment inputs into riverine systems include erosion of sediment
bank shorelines, flushing of swamp forests and other wetlands, and transport of suspended sediment from
flood waters (Riggs 1996; Riggs and Ames 2003). Bottom composition generally ranges from more
consolidated material (bedrock, boulders) upstream to less consolidated material (gravel, sand)
downstream. Because freshwater rivers and creeks are eroding through older sediment banks, there tends
to be a deep main channel dominated by medium-grained to coarse-grained sand with varying amounts of
organic detritus. Shallow flats may exist on one or both sides of the channel, consisting of a layer of fine
sandy mud on top of older sediments (Riggs 1996). Where the channel bed is relatively deep or wide,
pools form and water velocity slows, allowing finer particles (sand, silt) to settle. Where the channel bed
is relatively narrow or shallow, riffles and runs occur and water velocity increases, leaving only the
heaviest particles (boulder, cobble) on the bottom.
In freshwater lakes, like Lake Mattamuskeet, the shallow bottom around the shoreline is often
unvegetated due to shoreline erosion, high wind exposure, or low water clarity (from turbidity or organic
staining). In sheltered areas, however, shallow bottom may become covered by submerged aquatic
vegetation, assuming appropriate water clarity conditions exist (see ―Submerged aquatic vegetation‖
chapter for more information).
6.1.3.2. Estuarine soft bottom
Sediment composition in estuaries and sounds varies greatly with geomorphology and estuarine position.
The basin-scale formation of most estuaries in the northern geologic province of North Carolina is similar
to a flat-bottomed dish with a narrow and shallow perimeter lip or platform, providing ample space for
sediment deposition (Pilkey et al. 1998; Riggs and Ames 2003). Soft bottoms in this region, including the
Albemarle-Pamlico Estuarine System, consist of three general sediment types: sand, organic rich mud
(ORM), and peat (Wells 1989; Riggs 1996). Coarse sands, derived from erosion of sediment bank
shorelines and transport from barrier island overwash or through inlets, are concentrated on the shallow
perimeter platforms, shoals, and at inlet mouths (Wells 1989; Riggs 1996; Pilkey et al. 1998) (Map 6.2a-
b). Organic rich mud, the most pervasive sediment that comprises approximately 70% of the sediment in
North Carolina‘s estuarine system, generally fills the deeper central basins and downstream channels of
sounds and rivers (Wells 1989; Riggs 1996; Pilkey et al. 1998; Riggs and Ames 2003) (Map 6.2a-b).
Since fine sediments are easily suspended and transported away from high energy waters, the width and
thickness of ORM increase as the estuary widens and deepens in the downstream direction (Riggs 1996;
Riggs and Ames 2003). Peats, sediments with more than 50% organic matter, form either in the swamp
forests of riverine floodplains or in coastal marshes (Riggs and Ames 2003).
Soft bottoms in the estuarine systems of the southern geologic province are dominated by sloped mudflats
on the perimeter and interior of small estuaries (i.e., White Oak River, Pages Creek) (Pilkey et al. 1998).
Coarse sands are concentrated in the lower portion of these estuaries and are transported into the systems
via inlets and barrier island overwash. Small blackwater streams carry relatively low sediment loads into
the upper portion of the southern estuaries where ORM dominates, but the water does contain large
quantities of dissolved organic matter that give it a brown tea color (Riggs and Ames 2003). In contrast,
the Cape Fear River, the only major trunk estuary in North Carolina that discharges directly into the
Atlantic Ocean, transports large sediment loads from erosion of clay Piedmont soils to the lower portion
of the river basin (Riggs and Ames 2003).
Unvegetated estuarine shorelines occur where wave energy prevents colonization by plants and there is a
gently sloping area for sediment to build upon (Riggs 2001). These sediment bank shorelines are

2010 Coastal Habitat Protection Plan
Chapter 6. Soft Bottom Page 342
generally eroding and sandy, providing a source of sand to adjacent waters. In contrast, marsh or swamp
forest shorelines are eroding to a lesser degree and have a high organic content, thus providing fine
organic sediments to adjacent waters. Several shoreline erosion studies have been conducted along North
Carolina‘s coast and were compiled and summarized in Riggs (2001). Due to wave energy, sediments
can have long-shore or cross-shore transport. Sediments undergoing long-shore transport move parallel to
the shoreline where sediments can be deposited on adjacent beaches. Cross-shore transport will move
sediments onshore or offshore creating an equilibrium beach profile.
Estuarine intertidal flats are unvegetated bottoms that occur along shorelines or unconnected, emergent
sediment banks between the high and low tide lines. Intertidal flats are most extensive where tidal range
is greatest, such as near inlets and along the southern portion of the coast. Because the influence of lunar
tides is minimal in the large sounds (e.g., Pamlico, Albemarle, and Currituck), true intertidal flats are not
extensive, except for areas immediately adjacent to an inlet (Peterson and Peterson 1979). Sediment
composition on intertidal flats tends to shift from coarser, sandy sediment on the landward fringe, to finer,
muddier sediments on the waterward fringe (Peterson and Peterson 1979).
Tidal deltas form as sediments shift with tides and waves on the ebb and flood sides of the inlets
separating North Carolina‘s barrier islands. Sediments in the vicinity of inlets are typically composed of
coarse sands and shell fragments (Peterson and Peterson 1979). Intense wave and current energy cause
the flats to continually change, erode, and reform. Inlets are classified as stable, migrating, or ebb-tidal
delta breaching (Fitzgerald et al. 1978). The process of channel realignment and abandonment provides a
mechanism for large sandbar complexes to move onto the adjacent barrier islands, supporting productive
intertidal beach communities (Cleary and Marden 1999).
There are currently 21 inlets in North Carolina that connect estuarine waters to the ocean (Map 6.3 a-c).
Eleven of these inlets originated as a result of storm breaches and remain spatially unstable, including
Oregon and Mason inlets (Cleary and Marden 1999; Mallinson et al. 2008). Ophelia Inlet breached
southwest of Drum Inlet during Hurricane Ophelia in 2005, and has since been expanding, nearly merging
with Drum Inlet (Mallinson et al. 2008). There are nine larger inlet systems, including Ocracoke, Bogue,
and the Cape Fear River inlets, which occupy ancient river channels. Several others have been artificially
created (e.g. Carolina Beach Inlet) or artificially relocated (e.g. Tubbs Inlet).
6.1.3.3. Ocean soft bottom
North Carolina‘s marine soft bottom is part of the Atlantic continental shelf, which slopes gradually away
from oceanfront beaches before dropping off steeply at the 160–250 ft isobath, where the continental
slope begins (Map 6.1 a-e). The intertidal zone of oceanfront beaches is the area periodically exposed
and submerged by waves and tides. In this high energy area, waves continually rework and sort sediment
by grain size, with larger sediments deposited first and finer-grained sediment carried farther landward.
Sediments are generally much coarser, more highly sorted, and contain less organic matter than that found
on protected estuarine intertidal flats (Donoghue 1999).
Seaward of the intertidal beach in the shallow subtidal area of breaking waves lies the surf zone. Within
this zone, longshore sandbars frequently develop and shift seasonally in response to wave action. Ripple
scour depressions, ranging from 130–330 ft in width and up to 3 ft in depth, occur along the southern
portion of the coast and are perpendicularly oriented to the beach (Thieler et al. 1995; Reed and Wells
2000). These features are located adjacent to areas experiencing chronic beach erosion, and may be
indicative of rapid offshore transport of sand during storms (Thieler et al. 1995).
Extending from the surf zone to the point where the slope matches that of the continental shelf is the
generally concave, upward surface called the shoreface (Thieler et al. 1995). The base of the shoreface

2010 Coastal Habitat Protection Plan
Chapter 6. Soft Bottom Page 343
off North Carolina occurs at approximately 33–40 ft water depth and represents the area of active beach
sand movement. Six classes of shoreface systems were recognized by Riggs et al. (1995) based on
differences in the underlying geology. The nature of these shorefaces affects the composition of the
surface and underlying substrate and partially explains the patterns of localized erosion or deposition.
The continental shelf off North Carolina is relatively narrow, approximately 16 mi off Cape Hatteras, 32
mi off Cape Lookout, and about 49 mi off Cape Fear. North of Cape Hatteras, the shelf is relatively
steep, the coastline tends to be linear, and the bottom consists of a regional depositional basin known as
the Albemarle Embayment. Several prominent shoals, including Wimble, Kinnekeet, and Platt shoals,
occur in this region, as well as a series of ridges and swales that are spaced about 1,300–2,000 ft apart
(Inman and Dolan 1989; Rice et al. 1998). Shoals closest to shore, such as Wimble and Kinnekeet shoals,
tend to be oriented at a 20–30 angle from the coastline, while those farther offshore run more parallel to
the coast (MMS 1993). In contrast to that found to the north, the continental shelf south of Cape Hatteras
is less steep and the coastline consists of a series of arcs, dominated by three major capes (Hatteras,
Lookout, and Fear) and three associated bays (Raleigh, Onslow, and Long) (Map 6.1 a-e). Large shoals
also occur in this region and extend across the shelf from each cape (Diamond, Lookout, and Frying Pan
shoals) for more than 11 mi. Water depth on the shoals ranges from 2–18 ft, while adjacent waters are
20–40 ft deep. This region is generally sediment starved due to low direct river input and minimal
sediment exchange between adjacent shelf embayments (Riggs et al. 1998).
6.2. Ecological role and functions
6.2.1. Ecosystem enhancement
Soft bottom plays an important role as a storage reservoir of chemicals and microbes in coastal
ecosystems. Intense biogeochemical processing and recycling allow for deposition and resuspension of
natural and human-induced nutrients and toxic substances (Fear et al. 2005; Smith and Benner 2005;
Sutula et al. 2006). These materials may pass through an estuary (Matoura and Woodward 1983),
become trapped in the organic rich oligohaline zone (Sigels et al. 1982; Imberger 1983), or migrate within
the estuary over seasonal cycles (Uncles et al. 1988). The fate of the materials depends upon freshwater
discharges, density stratification, and formation of salt wedges (Matson and Brinson 1985; Matson and
Brinson 1990; Paerl et al. 1998). Density stratification hampers mixing and oxygen exchange of
sediments with overlying oxygenated waters, often leading to benthic hypoxia (Malone et al. 1988;
Buzzelli et al. 2002; Lin et al. 2006).
In slow-moving, expansive estuaries, such as the Albemarle-Pamlico Estuarine System, nutrients and
organic matter from watershed runoff and phytoplankton production are stored in the soft bottoms.
Depending upon freshwater discharge and density stratification, these materials are recycled within the
sediments via microbial activities and resuspended into the overlying waters (Fear et al. 2005). In organic
enriched oligohaline zones (e.g., Pamlico and Neuse River estuaries), weather-induced recycling results in
higher microbial activity and associated oxygen depletion (Buzzelli et al. 2002; MacPherson et al. 2007).
Colonization of soft bottom by benthic microalgae reduces the extent to which sediment is resuspended at
low water flow velocities, stabilizing the bottom and reducing turbidity in the water column (Holland et
al. 1974; Underwood and Paterson 1993; Yallop et al. 1994; Miller et al. 1996). However, microalgae
cannot stabilize sediments under intense or prolonged disturbance conditions, such as during large storm
events or in the surf zone (Miller 1989). Because of the absence of large, extensive structure, soft bottom
provides relatively less stabilization benefits than other estuarine habitats.
Intertidal shorelines, flats, tidal deltas, and sand bars along the ocean shoreline buffer and modify wave
energy, reducing shoreline erosion. Flood-tidal deltas are an important source of sand, which allows
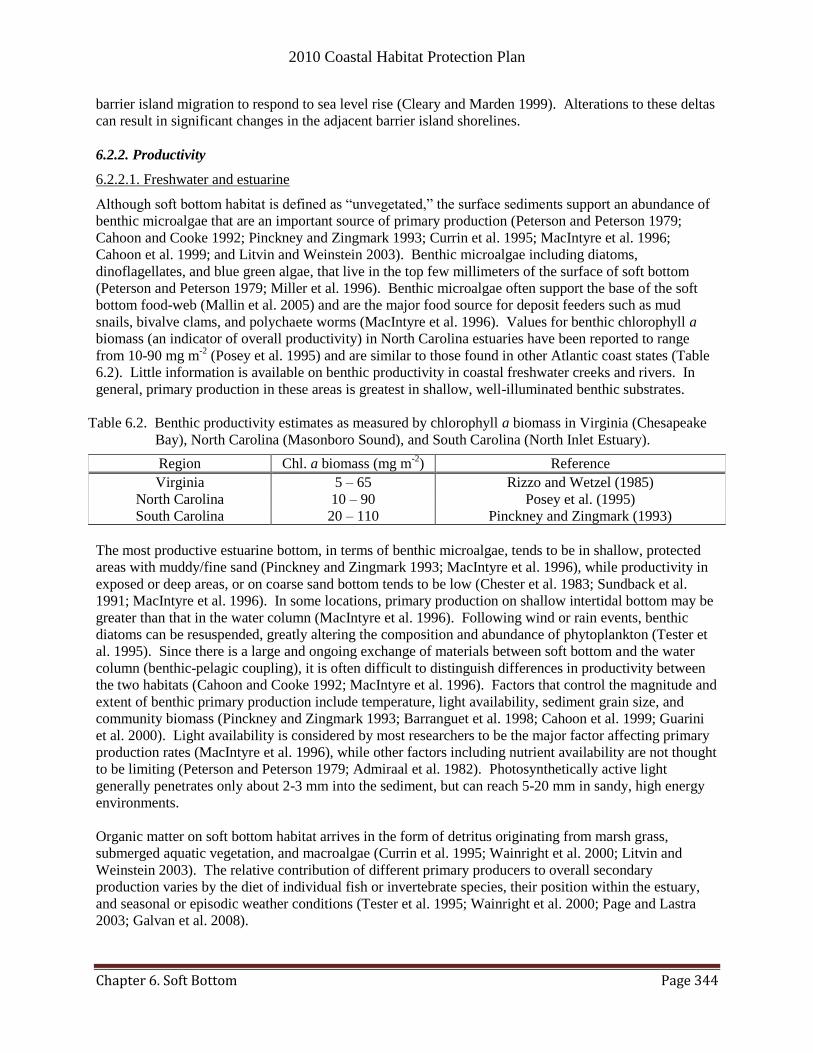
2010 Coastal Habitat Protection Plan
Chapter 6. Soft Bottom Page 344
barrier island migration to respond to sea level rise (Cleary and Marden 1999). Alterations to these deltas
can result in significant changes in the adjacent barrier island shorelines.
6.2.2. Productivity
6.2.2.1. Freshwater and estuarine
Although soft bottom habitat is defined as ―unvegetated,‖ the surface sediments support an abundance of
benthic microalgae that are an important source of primary production (Peterson and Peterson 1979;
Cahoon and Cooke 1992; Pinckney and Zingmark 1993; Currin et al. 1995; MacIntyre et al. 1996;
Cahoon et al. 1999; and Litvin and Weinstein 2003). Benthic microalgae including diatoms,
dinoflagellates, and blue green algae, that live in the top few millimeters of the surface of soft bottom
(Peterson and Peterson 1979; Miller et al. 1996). Benthic microalgae often support the base of the soft
bottom food-web (Mallin et al. 2005) and are the major food source for deposit feeders such as mud
snails, bivalve clams, and polychaete worms (MacIntyre et al. 1996). Values for benthic chlorophyll a
biomass (an indicator of overall productivity) in North Carolina estuaries have been reported to range
from 10-90 mg m-2
(Posey et al. 1995) and are similar to those found in other Atlantic coast states (Table
6.2). Little information is available on benthic productivity in coastal freshwater creeks and rivers. In
general, primary production in these areas is greatest in shallow, well-illuminated benthic substrates.
Table 6.2. Benthic productivity estimates as measured by chlorophyll a biomass in Virginia (Chesapeake
Bay), North Carolina (Masonboro Sound), and South Carolina (North Inlet Estuary).
Region Chl. a biomass (mg m-2
) Reference
Virginia 5 – 65 Rizzo and Wetzel (1985)
North Carolina 10 – 90 Posey et al. (1995)
South Carolina 20 – 110 Pinckney and Zingmark (1993)
The most productive estuarine bottom, in terms of benthic microalgae, tends to be in shallow, protected
areas with muddy/fine sand (Pinckney and Zingmark 1993; MacIntyre et al. 1996), while productivity in
exposed or deep areas, or on coarse sand bottom tends to be low (Chester et al. 1983; Sundback et al.
1991; MacIntyre et al. 1996). In some locations, primary production on shallow intertidal bottom may be
greater than that in the water column (MacIntyre et al. 1996). Following wind or rain events, benthic
diatoms can be resuspended, greatly altering the composition and abundance of phytoplankton (Tester et
al. 1995). Since there is a large and ongoing exchange of materials between soft bottom and the water
column (benthic-pelagic coupling), it is often difficult to distinguish differences in productivity between
the two habitats (Cahoon and Cooke 1992; MacIntyre et al. 1996). Factors that control the magnitude and
extent of benthic primary production include temperature, light availability, sediment grain size, and
community biomass (Pinckney and Zingmark 1993; Barranguet et al. 1998; Cahoon et al. 1999; Guarini
et al. 2000). Light availability is considered by most researchers to be the major factor affecting primary
production rates (MacIntyre et al. 1996), while other factors including nutrient availability are not thought
to be limiting (Peterson and Peterson 1979; Admiraal et al. 1982). Photosynthetically active light
generally penetrates only about 2-3 mm into the sediment, but can reach 5-20 mm in sandy, high energy
environments.
Organic matter on soft bottom habitat arrives in the form of detritus originating from marsh grass,
submerged aquatic vegetation, and macroalgae (Currin et al. 1995; Wainright et al. 2000; Litvin and
Weinstein 2003). The relative contribution of different primary producers to overall secondary
production varies by the diet of individual fish or invertebrate species, their position within the estuary,
and seasonal or episodic weather conditions (Tester et al. 1995; Wainright et al. 2000; Page and Lastra
2003; Galvan et al. 2008).
2010 Coastal Habitat Protection Plan
Chapter 6. Soft Bottom Page 345
6.2.2.2. Marine
Benthic microalgae are also an important source of primary production on marine soft bottom. Viable
chlorophyll a occurs in sediments across the continental shelf of North Carolina (Cahoon et al. 1990).
Studies in Onslow Bay have found that roughly 80% of chlorophyll a was associated with
microphytobenthos and its biomass (36.4 mg m-2
) generally exceeded that of phytoplankton (8.2 mg m-2
)
(Cahoon and Cooke 1992). Recently, McGee et al. (2008) discovered obligate benthic diatoms living on
the upper continental slope offshore from North Carolina, in waters as deep as 191 m. This discovery
increases the estimated total benthic primary production in that area of the continental margin by about
14%.
In the surf zone, wave action is generally too great to allow for the development of productive benthic
microalgae communities. However, this wave action continually re-suspends inorganic nutrients in
sufficient amounts to create localized phytoplankton blooms composed primarily of diatoms (McLachlan
et al. 1981; Hackney et al. 1996). This self-sustaining nutrient input and associated phytoplankton
production supports intertidal filter feeders and, consequently, high concentrations of fish migrating
through the shallow waters of the surf zone.
6.2.3. Benthic community structure
6.2.3.1. Freshwater
The freshwater benthic community varies greatly from extreme headwaters to mainstem rivers and may
be more similar to that found in inland lake bottoms than in estuaries. In headwater streams, the benthic
community consists largely of organisms that break down and collect detritus associated with the dense
tree canopy cover. As the canopy opens up downstream, algae grazers and detritivores increase in
abundance (Vannote et al. 1980). Freshwater benthic sampling conducted by DWQ in all of North
Carolina‘s river basins provides more detailed information on the abundance and diversity of benthic
species present in the freshwater portion of North Carolina‘s coastal rivers. Common coastal freshwater
invertebrates include mayfly and caddisfly larvae, leeches, chironomids, beetles, dragonfly larvae, and
crayfish. Hyland et al. (2004) found that oligochaetes, insect larvae, gammaridean amphipods, and larval
Coelotanypus spp. dominate the tidal freshwaters of the Chowan River.
Mussels are also an important component of the coastal freshwater invertebrate community on soft
bottom (Hyland et al. 2004), with over 60 species of freshwater mussels in North Carolina. However, the
distribution and diversity of native freshwater mussels have been in a state of decline as of late. The
freshwater Asiatic clam (Corbicula fluminea), introduced about 50 years ago, has become a prominent
component of many coastal rivers (Lauritsen and Moxley 1983; Hyland et al. 2004), resulting in alteration
of the benthic substrate and competition with native mollusks (Devick 1991).
6.2.3.2. Estuarine
Estuarine soft bottom supports a high diversity of benthic invertebrates, with over 400 species
documented in North Carolina waters (Hackney et al. 1996; Hyland et al. 2004). Most benthic
invertebrates inhabiting soft bottom live in the sediment (infauna), as opposed to the sediment surface
(epifauna), because of the high mobility of this habitat (Peterson and Peterson 1979). On intertidal flats,
the sediment provides a buffer from drastic fluctuations in salinity, water temperature, and air temperature
(in addition to air and wind exposure) during each tidal cycle, allowing infauna to flourish under these
normally stressful conditions (Peterson and Peterson 1979). Infauna can be separated into three distinct
size classes: microfauna, meiofauna, and macrofauna. Microfauna are comprised of very small
protozoans (< 0.06 mm) and include foraminifera and ciliates. Meiofauna, such as nematodes and
copepods, are about 0.06 – 0.50 mm in size (the size of a sand grain) and generally live within the
interstitial spaces of sands or within the top centimeter of muds. Both microfauna and meiofauna are
2010 Coastal Habitat Protection Plan
Chapter 6. Soft Bottom Page 346
important grazers on estuarine microphytobenthos and bacteria. Macrofauna (> 0.5 mm) contribute the
most to infaunal biomass and include organisms such as amphipods, polychaetes, mollusks, echinoderms,
and crustaceans (Peterson and Peterson 1979).
Benthic infauna may also be classified by feeding mode, specifically as deposit feeders or suspension
feeders (Peterson and Peterson 1979; Miller et al. 1996). Deposit feeders include mud snails, polychaete
worms, and certain bivalve clams and crustaceans that ingest sediment and detrital particles, and
assimilate the associated bacteria, fungi, and microalgae. Suspension feeders capture particles suspended
in the water column and include bivalves such as the hard clam (Mercenaria mercenaria) and razor clam
(Tagelus plebeius), and some polychaete worms (Miller et al. 1996). A large proportion of suspension
feeders‘ diet may consist of resuspended benthic microalgae, particularly when chlorophyll a
concentrations in the water column are low (Miller et al. 1996; Page and Lastra 2003).
Benthic epifauna consist of larger, mobile invertebrates that live on the surface of soft bottom. Fiddler
crabs (Uca spp.), amphipods, and insects congregate on intertidal flats, foraging for microalgae and
detritus. On submerged flats and shallow bottom, the blue crab (Callinectes sapidus) functions as an
important predator and scavenger. Other mobile epifauna include horseshoe crabs (Limulus polyphemus),
whelks (Busycon spp.), tulip snails (Fasciolaria spp.), moon snails (Polinices duplicatus), penaeid
shrimp, hermit crabs (Pagurus spp., Petrochirus spp., and Clibanarius vittatus), sand dollars (Mellita
quinquiesperforata), and spider crabs (Libinia spp.).
6.2.3.3. Marine
Benthic invertebrate species composition and diversity varies greatly from oceanfront beaches to subtidal
marine soft bottom. A diverse assemblage of meiofauna (0.06 – 0.5 mm) occurs in the intertidal zone of
the lower beach (Levinton 1982; Hackney et al. 1996), while a relatively low diversity of macrofauna (>
0.5 mm) ( 20 – 50 species) exists (Hackney et al. 1996). The dominant macrofauna in North Carolina‘s
oceanfront intertidal beaches are mole crabs (Emerita talpoida), coquina clams (Donax variablis, D.
parvula), several species of haustoriid amphipods, and the spionid polychaete Scolelepis squamata
(Hackney et al. 1996; Donoghue 1999; Lindquist and Manning 2001; Peterson et al. 2006).
Because North Carolina is located at a transition between two major physiographic and zoogeographic
zones, the marine subtidal bottom supports a high diversity of invertebrates. Offshore sand bottom
communities along the North Carolina coast have been reported to contain over 600 species of benthic
invertebrates (Posey and Alphin 2002), with over 100 polychaete taxa (Lindquist et al. 1994; Posey and
Ambrose 1994). Posey and Alphin (2002) found that polychaetes dominated the benthic invertebrate
assemblage on soft bottom offshore from Kure Beach, although bivalves, crabs, and amphipods were also
highly represented. On ebb tide deltas, spionid and oweniid polychaetes, haustoriid and phoxocephalid
amphipods, venus clams, tellin clams, and lucina clams are the dominant infauna (Bishop et al. 2006),
while decapod crustaceans and echinoderms (sand dollars) are abundant epifauna. Given that periodic
storms can affect benthic communities along the Atlantic coast to a depth of about 115 ft (35 m), the soft
bottom community tends to be dominated by opportunistic taxa that are adapted to recover relatively
quickly from disturbance (Posey and Alphin 2001; Posey and Alphin 2002).
6.2.4. Fish utilization
Like the water column, soft bottom is used to some extent by almost all native coastal fishes in North
Carolina. Estuary-dependent migratory species, including spot, Atlantic croaker, and penaeid shrimp are
common components of the estuarine soft bottom during summer and fall (Weinstein 1979; Epperly
1984; Ross and Epperly 1985; Noble and Monroe 1991; Ross 2003). Spot and Atlantic croaker also
frequent shallow (< 10 m) nearshore soft bottom, where they dominate the benthic fish assemblage
(Wenner and Sedberry 1989). Certain species, such as flatfish, skates, and rays, are best adapted to,

2010 Coastal Habitat Protection Plan
Chapter 6. Soft Bottom Page 347
characteristic of, or dependent on shallow unvegetated bottom (Peterson and Peterson 1979; Burke et al.
1991; Walsh et al. 1999; Schwartz 2003). Habitat utilization patterns by fishes on soft bottom are
primarily related to season and ontogenetic stage (Walsh et al. 1999; Ross 2003). Table 6.3 summarizes
important fishery and nonfishery species that are dependent on subtidal bottom for some portion of their
life history and the ecological function of the soft bottom habitat.
Table 6.3. Partial list of common or important fish species occurring on soft bottom habitat in riverine,
estuarine, and ocean waters, and ecological functions provided to those species.
Species*
Soft bottom functions 1 2010
Stock
status 2 Spawning Nursery Foraging Refuge Corridor
ANADROMOUS SPAWNING
Atlantic sturgeon X X X X D
Shortnose sturgeon X X X X E
ESTUARINE AND INLET SPAWNING AND NURSERY
Hard clam X X X X U
Hermit crab spp. X X X
Horseshoe crab X X X
Mud crab spp. X X X
Mummichog X X X
Red drum X X X R
Sheepshead minnow X X X
Whelks X X X
MARINE SPAWNING, LOW-HIGH SALINITY NURSERY
Atlantic croaker X X C
Hogchoker X X X X X
Penaeid shrimp X X X X V
Southern flounder X X X X D
Spot X X C
Striped mullet X X V
MARINE SPAWNING, HIGH SALINITY NURSERY
Atlantic stingray X X X X X
Coastal sharks3 X X X C
Cownose ray X X X X X
Florida pompano X X
Gulf flounder X X X X
Gulf kingfish X X U
Smooth dogfish X X X
Spiny dogfish X X V
Striped anchovy X X
Summer flounder X X X X X R
* Scientific names listed in Appendix D. Names in bold font are species whose relative abundances have been
reported in the literature as being generally higher in soft bottom than in other habitats. Note that lack of
bolding does not imply non-selective use of the habitat, just a lack of information.
1 Sources: Hildebrand and Schroeder (1972); Lippson and Moran (1974); Peterson and Peterson (1979); Wang
and Kernehan (1979); Manooch (1984); Thorpe et al. (2003)
2 V = Viable, R = Recovering, C = Concern, D = Depleted, U = Unknown (DMF 2009a), E= federally and state
listed as endangered (http://www.ncdmf.net/stocks/2010NCDMF%20StockStatusReport.pdf) 3 Incl. Atlantic sharpnose, blacknose, blacktip, bonnethead, dusky, sandbar, scalloped hammerhead, and spinner
sharks

2010 Coastal Habitat Protection Plan
Chapter 6. Soft Bottom Page 348
6.2.5. Specific biological functions
6.2.5.1. Foraging
One of the most important functions of soft bottom habitat is as a foraging area. In freshwater reaches,
high concentrations of organic matter and the associated secondary production (i.e. benthic invertebrates)
support a diverse array of freshwater fishes. Several species of coastal freshwater fishes, including
yellow perch (Perca flavescens), bluegill (Lepomis macrochirus), and channel catfish (Ictalurus
punctatus), rely heavily on benthic food resources, such as mayfly nymphs, chironomids, corixids, and
tendipedid larvae, for maintaining elevated growth rates (Bailey and Harrison 1948; Flemer and Woolcott
1966; Lott et al. 1996; Schaeffer et al. 2000). In North Carolina, largemouth bass (Micropterus
salmoides) and white catfish (Ameiurus catus) have been reported to forage on both benthic-associated
crustaceans and fishes in oligohaline, intertidal rivulets of the upper Cape Fear River Estuary (Rozas and
Hackney 1984).
Reliance on benthic productivity for food is not unique to freshwater areas. Members of several trophic
levels, including primary, secondary, and tertiary consumers, benefit directly or indirectly from detrital
and benthic microalgal production, as well as the numerically abundant and diverse invertebrate fauna
associated with estuarine soft bottom (Peterson and Peterson 1979). On shallow intertidal flats,
planktonic and benthic feeding herbivorous fish, such as anchovies, killifish, and menhaden, consume
phyto- and zooplankton in the water column, as well as resuspended benthic algae, microfauna, and
meiofauna (Peterson and Peterson 1979). While numerous fish species use detritus as an alternate food
source when preferred items are not available, striped and white mullet feed preferentially on detritus
collected on estuarine soft bottom.
Most fish that forage on estuarine soft bottom are predators of benthic invertebrates. These fish include
juvenile and adult rays, skates, flatfish, drums, pigfish, sea robins, lizardfish, gobies, and sturgeons
(Peterson and Peterson 1979; Bain 1997). Larger piscivorous fishes typically move onto estuarine flats
during high water to feed on schools of baitfish. These predators include sharks (sandbar, dusky, smooth
dogfish, spiny dogfish, Atlantic sharpnose, and scalloped hammerhead), drum (weakfish and spotted
seatrout), striped bass, and estuary-dependent reef fish (black sea bass, gag grouper, sand perch) (Peterson
and Peterson 1979; Thorpe et al. 2003). Flatfish, rays, and skates are particularly adapted to forage on
shallow intertidal flats due to their compressed body forms (Peterson and Peterson 1979). Small flatfish,
(i.e. bay whiff, fringed flounder, hogchoker, and tonguefish), feed mostly on copepods, amphipods,
mysids, polychaetes, mollusks, and small fish. Summer and Southern flounder, larger flatfish primarily
consume fish, such as silversides and anchovies, as well as shrimp and crabs, small mollusks, annelids,
and amphipods (Peterson and Peterson 1979; Burke 1995). These larger flatfish will ambush their prey
by blending into the bottom sediments or by slowly stalking prey items (Sharf et al. 2006). Various rays
excavate large pits while searching for mollusks, annelids, crustaceans, and benthic fish prey (Cross and
Curran 2004). In the Chowan Creek Channel, SC Cross and Curran (2004) observed an average of 17.8%
of the intertidal surface was disturbed by pit formation not including excavation piles. Due to the
increasing numbers of rays in NC, the impact of ray foraging pits in NC waters should be examined.
Ocean soft bottom, particularly in the surf zone, and along shoals and inlets, serves as an important
feeding ground for numerous fishes that forage on benthic invertebrates (Peterson and Peterson 1979).
These predators generally have high economic value as recreational and commercial fisheries, and include
Florida pompano, red drum, kingfish, spot, Atlantic croaker, weakfish, Spanish mackerel, and striped
bass. Many of these species congregate in and around distinct topographic features of the subtidal
bottom, such as the cape shoals, channel bottoms, sandbars, sloughs, and ebb tide deltas during various
times of the year, presumably to enhance successful prey acquisition or reproduction. The natural
processes that create these features need to be maintained. Additional public outreach is needed to
emphasize the importance of natural barrier island and estuarine processes.
2010 Coastal Habitat Protection Plan
Chapter 6. Soft Bottom Page 349
Hard bottom fishes are also supported by the food resources present in and on soft bottom. Demersal
zooplankton and infauna from sand substrate have been found to be an important component of many
species‘ diets and an important link to reef fish production (Cahoon and Cooke 1992; Thomas and
Cahoon 1993; Lindquist et al. 1994). Reef species documented foraging over sand bottom away from the
reef include tomtate (Haemulon aurolineatum), whitebone porgy (Calamus leucosteus), cubbyu (Equetus
umbrosus), black sea bass (Centropristis striata), and scup (Stenotomus chrysops) (Lindquist et al. 1994).
6.2.5.2. Spawning
Many demersal fish spawn over soft bottom habitat in North Carolina‘s coastal waters (Table 6.2). In
freshwater, largemouth bass (Micropterus salmoides) and bluegill (Lepomis macrochirus) spawn on
shallow flats where they lay eggs in bowl-shaped nests. Longnose gar occasionally spawn in the
depressions made by these fishes, exploiting the brood care afforded by nest-defending species.
Anadromous fishes, such as Atlantic and shortnose sturgeon (Acipenser oxyrinchus oxyrinchus and A.
brevirostrum, respectively), will spawn in the upper freshwater portions of coastal rivers (Moser and Ross
1995).
In estuarine reaches, resident fish and invertebrates, as well as seasonal migratory fish spawn over soft
bottom, particularly in summer. Resident flatfish, including hogchokers and tonguefish, use subtidal
estuarine soft bottom as spawning grounds (Hildebrand and Schroeder 1972; Manooch 1984). Estuarine
invertebrates, like hard clams, whelks, and hermit crabs use the intertidal flats that they inhabit as their
primary spawning habitat. Migratory estuarine spawners, including several species of drum,
predominately spawn over soft bottom during the summer months. Spotted seatrout spawn on the east
and west sides of Pamlico Sound during a similar time period, with peak activity observed around Rose
Bay, Jones Bay, Fisherman‘s Bay, and Bay River (Luczkovich et al. 1999a; Luczkovich et al. 2008). Red
drum were also documented spawning in the mouth of the Bay River on the west side of Pamlico Sound,
and in estuarine channels near Ocracoke Inlet (Luczkovich et al. 1999a; Luczkovich et al. 2008). The
evidence for blue crabs spawning in inlet areas was enough to warrant their protection as Crab Spawning
Sanctuaries (DMF 2004 – blue crab FMP).
Several species of estuary-dependent fishes use ocean soft bottom as critical spawning habitat during
winter, primarily seaward of state waters. Eggs and larvae of these species are carried by currents
through nearshore state waters and inlets to estuarine nursery areas. Important spawning aggregations of
summer flounder occur during winter on Wimble, Platt, and Kinnekeet shoals off the Outer Banks
(MAFMC 1998). Locations of summer flounder spawning aggregations are linked to environmental
conditions, such as water temperature and wind direction, and are generally concentrated north of Cape
Hatteras.
Nearshore ocean waters in North Carolina also serve as important pupping grounds for several species of
sharks. North of Cape Hatteras, pupping of spiny dogfish over subtidal bottom has been documented in
winter months (ASMFC 2002a). Subtidal bottom in the southern portion of North Carolina state waters
serves as pupping grounds for the Atlantic sharpnose shark (Rhizoprionodon terraenovae), bonnethead
shark (Sphyrna tiburo), blacknose shark (Carcharhinus acronotus), spinner shark (C. brevipinna), dusky
shark (C. obscurus), and, to a lesser extent, blacktip shark (C. limbatus), sandbar shark (C. plumbeus),
and scalloped hammerhead shark (S. lewini). Most neonate (newborn) sharks from this area are found in
June and July (Beresoff and Thorpe 1997; Thorpe et al. 2003).
6.2.5.3. Nursery
Shallow soft bottom, usually adjacent to wetlands, is utilized as a nursery for many species of juvenile
fish (Table 6.2). This habitat provides an abundance of food and is relatively inaccessible to larger
predators. Shallow unvegetated flats have been documented as being a particularly important nursery

2010 Coastal Habitat Protection Plan
Chapter 6. Soft Bottom Page 350
habitat for summer and southern flounder, spot, Atlantic croaker, and penaeid shrimp (Weinstein 1979;
Burke et al. 1991; Walsh et al. 1999; Ross 2003). Ongoing DMF juvenile fish monitoring has found that
shallow unvegetated bottom supports an abundance of juvenile fish, composed of relatively few species
that have similar life histories and feeding patterns (Ross and Epperly 1985).
The dominant fishes using shallow estuarine soft bottom as nursery areas are estuary-dependent species,
which primarily spawn offshore in winter. For many species, the uppermost reaches of shallow creek
systems correspond to the site of larval settlement, i.e. the primary nursery areas (Weinstein 1979; Ross
and Epperly 1985). However, in tributaries far removed from ocean inlets, such as Neuse, Pamlico, Bay
and Pungo rivers, larval settlement tends to occur in lower reaches of the system. Abundance of juvenile
species in estuarine nursery areas generally peaks between April and July and is correlated with water
temperatures (Ross and Epperly 1985). As they grow, fish move to deeper waters and areas farther down-
estuary.
In the early 1980s, fishery independent data from shallow creeks and bays in Pamlico Sound documented
78 fish and invertebrate species over a two-year period (Ross and Epperly 1985). Eight species, including
spot, bay anchovy, Atlantic croaker, Atlantic menhaden, silver perch, blue crab, brown shrimp, and
southern flounder, comprised more than 97% of the total nekton abundance. Data from DMF‘s ongoing
juvenile fish monitoring program, which began in 1971, show that the same eight species continue to
dominate North Carolina‘s nekton assemblage, with pinfish and white shrimp also among the most
abundant species collected. The consistency of catch characteristics during 1990-2008 is an indication
that these areas continue to function as healthy nurseries. Temporal and spatial expansion of juvenile fish
sampling would provide additional information on trends in juvenile fish utilization of soft bottom and
other habitats, especially summer and fall spawning species, which are generally not present at existing
sampling stations during May and June.
Historical analyses of DMF‘s juvenile fish data in the Pamlico Sound system have found significant
geographical differences in the fish assemblages (Ross and Epperly 1985; Noble and Monroe 1991).
Noble and Monroe (1991) identified four distinct groupings of juvenile fish (Table 6.4), with salinity
functioning as the primary abiotic variable structuring species composition. Fish assemblages in Pamlico
Sound also have been found to be affected by Bluff Shoal, which runs across the sound from around
Ocracoke Inlet north to Bluff Point. Bluff Shoal effectively splits Pamlico Sound into separate basins of
differing depth and sediment composition, causing distinct fish assemblages to occur north and south of
the shoal (Ross and Epperly 1985).
Table 6.4. Dominant juvenile fish species groupings found in the Pamlico Sound system by biotic cluster
analysis of juvenile fish data (Noble and Monroe 1991).
Group Location Dominant fish species Primary Habitat
1
Pamlico, Pungo, Neuse
rivers, eastern Albemarle
Sound
Atlantic croaker, brown
shrimp, blue crab, southern
flounder
Shallow unvegetated
sediment
2 Western bays of Pamlico
Sound
Species above + weakfish,
spotted seatrout, silver perch
Shallow unvegetated
sediment
3 Behind the Outer and Core
banks
Pinfish, pink shrimp, black sea
bass, gag, pigfish, red drum
SAV beds
4 Western shore and
tributaries of Core Sound
Summer and southern
flounder, brown shrimp
Shallow unvegetated
sediment
2010 Coastal Habitat Protection Plan
Chapter 6. Soft Bottom Page 351
Soft bottom in freshwater areas and the nearshore ocean also function as valuable nursery habitat for
numerous fish species. Benthic anadromous fish, such as Atlantic and shortnose sturgeon, use freshwater
soft bottom as a primary nursery during spring and summer. In the nearshore ocean, subtidal soft bottom
is used extensively as a nursery area for coastal sharks, such as spinner (C. brevipinna), blacknose (C.
acronotus), and dusky (C. obscurus) sharks (Beresoff and Thorpe 1997; Thorpe et al. 2003). Ocean soft
bottom, particularly the surf zone, is also a nursery area for Florida pompano, and southern and gulf
kingfish (Hackney et al. 1996). Juvenile Atlantic sturgeon and spiny dogfish, both demersal feeders, have
been documented over nearshore subtidal bottom between Oregon Inlet and Kitty Hawk during winter
months (Cooperative Striped Bass Tagging Program, unpub. data). In New Jersey, Able et al. (2009),
observed recently hatched juvenile fish in the surf zone during the spring and summer months.
6.2.5.4. Refuge
Shallow soft bottom, such as intertidal flats, can provide refuge to small and juvenile fish and
invertebrates through exclusion of large fish predators (Peterson and Peterson 1979; Ross and Epperly
1985). Consequently, juvenile fish benefit from settling in the shallowest portions of the estuary first.
Many fish and invertebrates, including hard clams, flatfish, skates, rays, and other small cryptic fish, like
gobies, avoid predation by burrowing partially or completely into the sediment, thus camouflaging
themselves from predators (Peterson and Peterson 1979; Luettich et al. 1999). Deep water soft bottom
habitat may be a treacherous environment for small fish and invertebrates, particularly for those that
cannot burrow. These areas are generally the most accessible to large piscivorous fishes and because of
this, many fish venture out on the open bottom only at night (Summerson and Peterson 1984).
6.2.5.5. Corridor and connectivity
Numerous migrating juvenile and subadult demersal fishes use soft bottom as corridors for movement
from freshwater and estuarine nursery habitats to the coastal ocean. As fishes grow, they slowly move
from up-estuary primary nurseries down estuary to secondary nurseries and eventually out into the coastal
ocean. Because large fish are less likely to be consumed as prey, they can travel relatively safely over the
less turbid sand flats and channels of the middle and lower estuary (Walsh et al. 1999). However,
juvenile summer flounder were found in higher density in muddy bottoms that were adjacent to wetlands,
than areas in sandy bottoms (Walsh et al. 1999). In fact, substrate type is the most important factor
influencing juvenile summer flounder habitat (Burke 1991 and Burke et al. 1991). Anadromous fish,
including sturgeon and striped bass, also require a corridor of soft bottom to reach upstream spawning
areas.
While connectivity among structured habitat patches, such as SAV, wetlands, and shell bottom, facilitates
movement of mobile predators, a few meters of unvegetated bottom can act as a barrier to movement
(Micheli and Peterson 1999). Such barriers can be beneficial to small invertebrates by potentially
obstructing predator dispersal and reducing predation risk. In Back Sound, North Carolina, Micheli and
Peterson (1999) documented higher densities and survival rates of small crabs, gastropods, and infaunal
bivalves on isolated oyster reefs (at least 10-15 m of unvegetated bottom between habitats) than on oyster
beds adjacent to salt marsh or SAV. Blue crab predation on infaunal bivalves was greater along vegetated
edges of salt marshes and SAV than on unvegetated intertidal flats (Micheli and Peterson 1999).
Although structural habitat separations by unvegetated soft bottom may benefit the viability of infaunal
populations, fish and crustacean productivity may be enhanced by connectivity of structured estuarine
habitats (Micheli and Peterson 1999).
2010 Coastal Habitat Protection Plan
Chapter 6. Soft Bottom Page 352
6.3. Status and trends
6.3.1. Status of soft bottom habitat
Since standardized or comprehensive baseline mapping of soft bottom habitat has not been completed,
and because sediments shift and move over time, it is currently not possible to quantify how the extent
and condition of the habitat has changed through time. The loss of more structured habitat, such as SAV,
wetlands, and shell bottom, has undoubtedly led to gains in soft bottom habitat, but the low quality of
areas gained may not be considered beneficial to the ecosystem as a whole.
6.3.2. Status of associated fishery stocks
6.3.2.1. Fishery independent monitoring programs
The DMF began a juvenile fish monitoring program (Estuarine Trawl Survey) in 1971. This long-term
database provides fishery independent (data gathered independent of the fishery) information on species
composition and abundance to identify primary and secondary nursery areas, shallow soft bottom habitat
usually surrounded by wetlands. Although the data is not discussed here, the Pamlico Sound Survey is
another long-term monitoring program used to calculate juvenile abundance indices (JAI) in Pamlico
Sound and the lower portion of the Pamlico and Neuse estuaries. JAI, the annual geometric mean
(weighted by strata) of the number of individuals per tow for young of the year fish and invertebrates, are
calculated from these sampling programs for important fish and invertebrate species. The JAI is
considered an accurate indicator of recruitment and year-class strength for many recreational and
commercially important species (DMF 2003c). The information is used to determine stock status of
fishery species by various fishery management agencies. JAI are also used as a criterion to qualify an
area as a designated Primary or Secondary Nursery Area. Designated areas are monitored regularly to
provide long-term information on status and trends in recruitment of the dominant estuarine dependent
species. Trends in JAI may indicate change in the habitat conditions (DMF 2003c). However, consistent
and comparable JAI data are only available since 1990 and, prior to this time, considerable habitat losses
and changes occurred. Habitat information has been collected by NCDMF for the Estuarine Trawl survey
since the beginning, while this information has only been collected for Pamlico Sound Trawl Survey
since 2009. Currently a Sea Grant project is being completed by East Carolina University researchers
examining the impacts of land use change on several species of fish and invertebrates using NCDMF
Estuarine Trawl Survey data (J. Luczkovich/ECU, pers. com., 2009).
Several species are closely linked to soft bottom habitat and juvenile abundance indices from the
Estuarine Trawl Survey for recreationally and commercially important species (i.e. southern flounder ,
spot, and Atlantic croaker) are shown in Figure 6.1 and 6.2. Southern flounder JAIs have varied between
1 and 8.1 with peak JAIs in 1996 and 2003, whereas there were large declines in 1997, 1998, 2002 and
2004 through 2006 (Figure 6.1). Atlantic croaker and spot are benthic feeding fish that could be affected
by changes in soft bottom habitat, such as reductions in benthic food sources due to toxicity or anoxic
conditions in sediments. The JAI for Atlantic croaker from the Estuarine Trawl Survey has fluctuated
between 8.6 and 97.1 while spot have fluctuated between 50 and 350 (Figure 6.2). An Atlantic croaker
ASMFC FMP was completed in 1987 and is in the process of being updated in 2009. The stock
assessment determined that Atlantic croaker is a recruitment-driven stock, where biomass and landings
fluctuate in response to large year classes. Research priorities for Atlantic croaker include determining
the impacts of any dredging activity (i.e. for beach re-nourishment) on all life history stages of croaker
(ASMFC 2009).
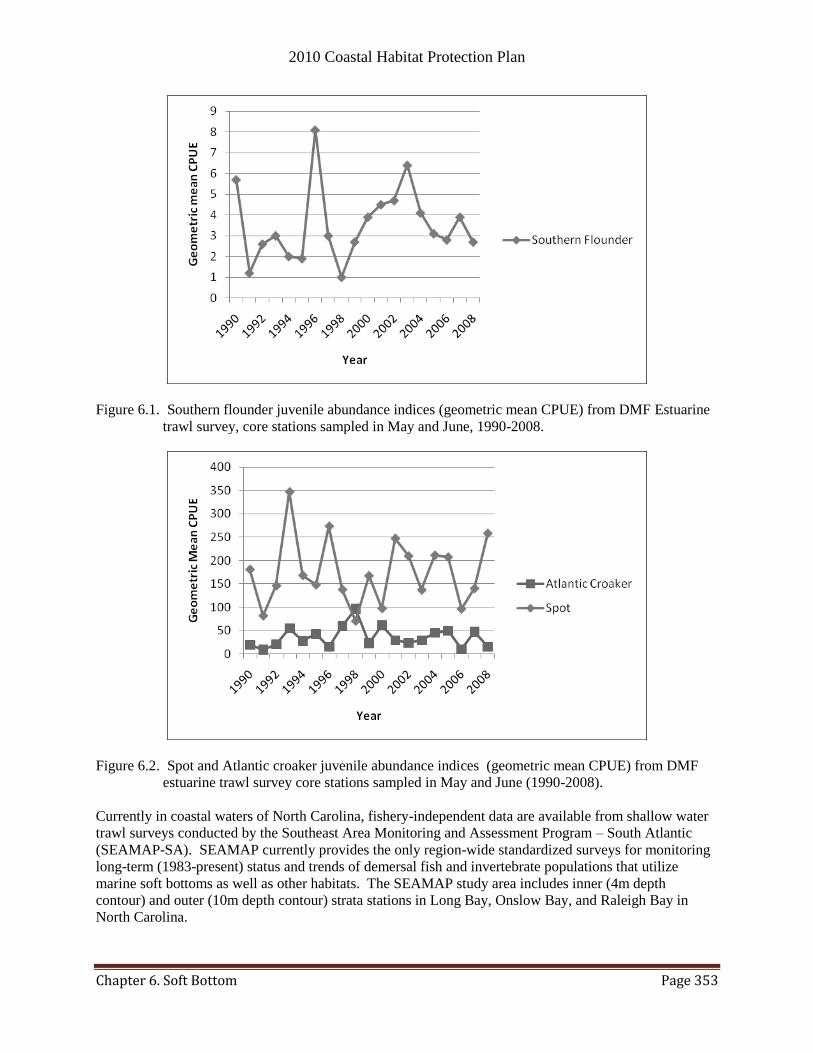
2010 Coastal Habitat Protection Plan
Chapter 6. Soft Bottom Page 353
Figure 6.1. Southern flounder juvenile abundance indices (geometric mean CPUE) from DMF Estuarine
trawl survey, core stations sampled in May and June, 1990-2008.
Figure 6.2. Spot and Atlantic croaker juvenile abundance indices (geometric mean CPUE) from DMF
estuarine trawl survey core stations sampled in May and June (1990-2008).
Currently in coastal waters of North Carolina, fishery-independent data are available from shallow water
trawl surveys conducted by the Southeast Area Monitoring and Assessment Program – South Atlantic
(SEAMAP-SA). SEAMAP currently provides the only region-wide standardized surveys for monitoring
long-term (1983-present) status and trends of demersal fish and invertebrate populations that utilize
marine soft bottoms as well as other habitats. The SEAMAP study area includes inner (4m depth
contour) and outer (10m depth contour) strata stations in Long Bay, Onslow Bay, and Raleigh Bay in
North Carolina.
2010 Coastal Habitat Protection Plan
Chapter 6. Soft Bottom Page 354
The status of benthic macroinvertebrate populations is another measure of soft bottom conditions. Hard
clams, although also present in shell bottom and SAV habitats, require soft bottom habitat for burrowing.
Because clams remain fairly stationary and are filter feeders, they may be vulnerable to habitat
degradation, such as sediment contamination or sedimentation. The status of the hard clam stock is
currently unknown due to lack of adequate data (DMF 2009a). However, using trip ticket data, DMF
(2001b) concluded that hand harvest of clams appeared to be stable, but that clam abundance, in areas
where mechanical clam harvest occurred, appeared to decline from 1994 to 1999. MFC recommended
that mechanical harvest limits in Core Sound be further restricted. From 1978 to 2001 Mercenaria
mercenaria recruitment in central North Carolina decreased 65-72% while fishing pressure for hard clams
has continued to increase (Peterson 2002). Reducing the area available to mechanical clam harvesting is
another means of protecting clam stocks, particularly in location within close proximity of SAV habitat.
In 2010 the stock status of twelve of 18 soft bottom associated fishery species (bolded species in Table
6.2) were evaluated by NCDMF (http://www.ncdmf.net/stocks/2010NCDMF%20StockStatusReport.pdf).
Of these twelve species, two (17%) were of unknown status. Of the ten stocks whose status is known,
two (20%) were classified as Viable, two (20%) were Recovering, four (40%) were of Concern, and two
(20%) were Overfished (Table 6.2,). Viable species included penaeid shrimp and striped mullet; red
drum and summer flounder were Recovering. Depleted species included Atlantic and shortnose sturgeons
and southern flounder. The species listed as Concerned include blue crab, Atlantic croaker, spot, and
coastal sharks.
Atlantic sturgeon has historically supported a valuable commercial fishery; however, landings declined
dramatically by the early 1900s. Shortnose sturgeon is currently a federally listed endangered species and
Atlantic sturgeon is considered threatened in North Carolina (Ross et al. 1988). In 2009, the Atlantic
sturgeon has been petitioned to be classified as a federally endangered species. A decision on this petition
should be reached in 2010. Despite a fishing moratorium in North Carolina since 1991 both sturgeon
species have not shown signs of recovery, indicating that habitat and water quality issues are also
affecting recovery. Potential habitat issues could include reduction of benthic food sources in fresh water
due to eutrophication or toxin contamination, or degradation of spawning and nursery habitat from
channel obstructions, channelization, and sedimentation. The Cape Fear River and Albemarle Sound are
the only estuaries in NC that presently show evidence of spawning for the Atlantic sturgeon. The
Interstate Fishery Management Plan for Atlantic sturgeon has listed dredging as a major concern
(ASMFC 1998) to essential habitat for sturgeon.
Coastal shark species, such as sand bar sharks, Atlantic blacktips, Atlantic sharpnose, hammerheads, and
duskys, are slow growing and mature late, making them more vulnerable to overfishing. Federal and state
harvest restrictions have been in place since 1993, but there has not been evidence of recovery.
Degradation of nearshore marine bottom from beach nourishment or nonpoint runoff could potentially
impact pupping and nursery areas.
The Depleted status of southern flounder is due in part to overfishing but may also be related to habitat
issues in the low salinity estuaries. Dredging (navigational and fishery) and inlet stabilization are listed as
threats to Southern flounder habitat in the NCDMF 2005 FMP. Severe hypoxic events and anoxia can
directly affect populations of southern flounder through mortality from suffocation and indirectly from
reduced growth rates, loss of preferred prey (mortality of benthic community), changes in activity
patterns, or disease. The Division is updating the southern flounder Fishery Management Plan in 2009.
Striped mullet are of concern primarily due to an increase in associated fishing effort. The Division
developed a Fishery Management Plan for striped mullet in 2005. As a result of the 2005 FMP, one
objective is to ―Restore, improve, and protect critical habitats that affect growth, survival, and
2010 Coastal Habitat Protection Plan
Chapter 6. Soft Bottom Page 355
reproduction of the North Carolina striped mullet stock” (DMF 2005-Striped mullet FMP). Atlantic
croaker is listed as Concern because JAIs and estuarine landings have remained low.
6.3.3. Designated areas
There have been some federal actions taken to designate and protect certain portions of soft bottom
habitat in coastal ocean waters. The SAFMC designated all coastal inlets as Habitat Areas of Particular
Concern (HAPC) for blue crab, estuarine-dependent snapper-grouper species, penaeid shrimp, and red
drum. The sandy shoals of Cape Hatteras, Cape Lookout, and Cape Fear are designated as HAPC for all
coastal migratory pelagics, including king mackerel, Spanish mackerel, dolphin, and cobia. In May 2000,
Presidential Executive Order 13158, Marine Protected Areas, was implemented. The order mandated
strengthening of the management, protection, and conservation of existing marine protected areas and
establishing or expanding additional marine protected areas. Marine protected areas (MPA) were defined
as ―any area of the marine environment that has been reserved by Federal, State, territorial, tribal, or local
laws or regulations to provide lasting protection for part or all of the natural and cultural resources
therein‖ (Federal Register 2000). Among the many agencies cited in the order, the Environmental
Protection Agency (EPA), relying on existing Clean Water Act authorities, is required to identify and
prioritize natural and cultural resources for additional protection, propose science-based protocols for
monitoring and evaluating marine protected areas, and propose science-based regulations to ensure
appropriate protection of habitat and water quality standards. These actions may provide additional
protection for North Carolina‘s marine soft bottom habitat, as well as hard bottom and other ocean
habitats. In 2004, DCM compiled an inventory of existing marine managed areas prior to assessing the
need and feasibility of establishing new MPAs in North Carolina. In 2004, there were 84 state sites, 13
de facto sites, and 7 federal sites in the Marine Managed Area (MMA) inventory that were located within
North Carolina; with a proposal to include three more federal sites (Trappe 2004). Additionally, there are
approximately 160 mi of federally or state owned barrier islands along the 320 mi of ocean shoreline.
This includes all or portions of eight (of 23) barrier islands or peninsulas. Intertidal beaches adjacent to
these areas are protected from most development associated threats.
Although soft bottom as a habitat type is not specifically designated or protected by any of North
Carolina‘s regulatory commissions, it is an important component of MFC designated Primary Nursery
Areas (PNAs), Anadromous Fish Spawning Areas, Anadromous Nursery Areas, and crab spawning
sanctuaries (See ―Designation‖ section of Water Column chapter for more information). Most of the
North Carolina PNAs have soft muddy bottoms that are surrounded by marshes and wetlands
(http://www.ncfisheries.net/habitat/pna.htm, 2009).
In July 2001, the USFWS designated 1,798 miles of intertidal and supratidal (dry) beaches and dunes to
the mean low water (MLW) in eight states as Critical Habitat for the wintering population of piping
plover (Charadrius melodus). Critical Habitat is defined in the Endangered Species Act as a specific
geographic area that is essential for the conservation of a threatened or endangered species and that may
require special management and protection (http://www.fws.gov/endangered/, December 2010). This
may include suitable habitat that is not currently occupied by the species but is needed for its recovery,
thereby providing more habitat protection. Federal agencies are required to consult with the USFWS to
ensure that any federal actions do not adversely modify Critical Habitat functions, including areas not
currently occupied by a designated species. This action, by providing protection to wintering habitat, also
protects intertidal benthos, which will benefit foraging habitat for piping plover as well as benthic feeding
surf fish. There are 18 designated areas in North Carolina, primarily inlet systems and adjacent shoals
and spits. Refer to website (http://plover.fws.gov, 2009) for maps of the designated areas.
2010 Coastal Habitat Protection Plan
Chapter 6. Soft Bottom Page 356
6.4. Threats and management needs
Although the soft bottom habitat is always changing, there are several threats to the overall habitat
stability. These threats may be direct impacts to the soft bottom or they may affect water quality thereby
altering the soft bottom community. As people continue to live in coastal North Carolina, there will be
continued channel dredging, dock construction, shoreline stabilization, and commercial fishing. These
methods may all potentially be detrimental to the soft bottom habitat. Water quality will also continue to
be affected by increased nutrient input and heavy metal contamination.
6.4.1. Physical threats
6.4.1.1. Water-dependent development
Dredging (navigation channels and boat basins)
Existing dredged navigational channels and basins are necessary to sustain current boating and fishing
activities and provide access to state ports for transport of commerce. However, dredging activities do
affect physical and biological features of soft bottom communities. New dredging for navigational
channels or marina construction can alter topographic and hydrologic features that attract fish for feeding,
refuge, or spawning, and modify sediment grain characteristics (SAFMC 1998a). Dredging removes all
benthic infauna from the affected areas immediately, reducing food availability temporarily to bottom
feeding fish and invertebrates, including southern and gulf kingfish, Florida pompano, spot, Atlantic
croaker, flounder, and shrimp (Hackney et al. 1996; Peterson et al. 2000a). Whether the magnitude of
prey reduction limits fish growth, reproduction or survival depends on the species‘ diet preference,
foraging range, mobility, abundance of prey elsewhere, and extent and location of other benthic
disturbing activities. Inlet dredging in winter can kill or displace female blue crabs that are burrowing in
the inlet sediments. Disturbance associated with inlet dredging can also deter or alter summer spawning
activity of red drum, weakfish, spotted seatrout, silver perch, and blue crab (Luczkovich et al. 1999a;
DMF 2000c). Spawning activity around the inlets occurs from May through October, depending on the
species (Table 2.3 in Water Column chapter). Because spawning activity occurs at night, daytime
dredging may have less of an effect. However, there are also possible indirect effects associated with
dredging, such as reductions in benthic prey availability and alterations of the acoustic environment (J.
Luczkovich/ECU, pers. com., 2009). While new dredging is prohibited in designated Primary Nursery
Areas, and seasonally restricted in Anadromous Fish Spawning Areas, similar restrictions do not exist for
undesignated anadromous fish nursery areas, which require shallow bottom habitat. Some anadromous
species also require shallow bottom for spawning. Permitting agencies should avoid or minimize
dredging projects in Anadromous Fish Spawning Areas and important associated anadromous fish
nursery areas.
Impacts in the water column associated with dredging induced turbidity were discussed in the water
column chapter of the plan. Turbidity, however, also affects benthic invertebrates in the soft bottom. For
example, mole crabs were killed by excess turbidity generated during a beach nourishment project in
Atlantic Beach (Reilly and Bellis 1983). Growth of coquina clams was significantly reduced when
exposed to elevated turbidity (Lindquist and Manning 2001). The invertebrates and fish associated with
inlet subtidal bottoms, tidal deltas, meandering channels, and shallow shoals have adapted to that specific
environment and to its natural disturbance regimes. In order to reduce the effects of sedimentation on
benthic invertebrates the USACE dredging procedures include dredging during outgoing tides. More
research is needed to assess direct and indirect dredging impacts on blue crabs and inlet spawning
species.
Map 2.8 a-b depicts the location of the major navigational channels in North Carolina‘s coastal waters.
Soft bottom habitat in the southern portion of the coast has been highly modified by navigational
dredging and associated spoil islands. Immediate effects to soft bottom from original dredging have

2010 Coastal Habitat Protection Plan
Chapter 6. Soft Bottom Page 357
recovered. The current system of navigational channels is necessary to maintain boating and fishing
activities, and in some cases, may be beneficial by enhancing flushing. Many of the dredged channels
were originally chosen because they were naturally deeper. While fish have adapted to these channels,
creation of additional navigational channels and basins may require dredging in shallow, undesignated
nursery habitats. Converting shallow bottom into deeper basins and channels is likely to reduce primary
and secondary productivity of the bottom (Wendt et al. 1990). As of November 2009, the USACE had
completed 5 navigational dredging maintenance projects in NC, while 17 projects were ongoing or
scheduled to start in the 2009 fiscal year. Commenting and permitting agencies should continue to use
their existing authorities to a) minimize new dredging of shallow soft bottom habitat, b) prevent direct
impacts from dredge and fill projects, and c) limit as much as possible indirect impacts to shallow soft
bottom or other habitats.
Dredge material disposal on subtidal bottom
Deposition of dredge material from navigational channel maintenance on estuarine or coastal dredge
disposal sites, ebb tidal deltas, or other areas of subtidal bottom results in increased turbidity, temporary
reduction and slow recovery of the abundance and diversity of benthic invertebrates (SAFMC 1998a). In
estuarine waters, dredge material islands, also referred to as spoil islands, were often created adjacent to
the dredged navigational channels. Subsequent maintenance dredging deposits new material onto these
islands. The majority of the dredge material islands were produced when the ICW was first created in the
1930s. The creation of permanent dredge islands a) reduced the amount of available underwater habitat
(including soft bottom), b) changed the natural hydrology of the surrounding water bodies, and c) had a
relatively more profound effect on the smaller water bodies of the southern coast. However, the islands
can provide beneficial nesting bird habitat and fringing wetland habitat along the perimeter (Parnell et al.
1986).
In ocean waters, dredge disposal occurs in both offshore, designated disposal sites and in nearshore
waters and ebb tide deltas. Offshore sites are in federal waters in depths greater than 30 ft, whereas
nearshore areas are in state waters in depths less than 30 ft deep. Sidecast dredging only occurs within
shallow inlet systems in North Carolina with course grained sediment in order to minimize turbidity
impacts and keep littoral sediment within the system. No open water sidecast dredging occurs in
estuarine areas with fine grained sediments and subsequent high turbidity concerns. Hopper dredges also
take dredged material from navigational channels and dispose of the sediment within designated dredged
material disposal sites. All littoral material dredged with a hopper is disposed within designated
nearshore disposal areas to keep the material within the littoral system in accordance with state
requirements. Sediment deposited in nearshore waters and on ebb tide deltas is incorporated into the
beach profile and is discussed further in the beach nourishment section. The rate of bottom recovery will
depend on the volume discharged, characteristics and similarity of the dredge material, hydrography of
the disposal area, time of year, and the resulting turbidity (Windom 1976; SAFMC 1998a). According to
Bolam and Rees (2003) the recovery time for macrobenthos varied (greater than 1 year), but was related
to how stable the environment is, the more stable prior to deposition, the longer the recovery time. All
other offshore disposal is in accordance with EPA requirements for designated Offshore Dredged
Material Disposal Sites (ODMDS). Currently there are three designated EPA approved ocean dredge
material disposal sites off North Carolina, one off Beaufort Inlet and two off Cape Fear River Inlet (Maps
6.3a-c). All three are located just seaward of the state territorial seas
(http://www.epa.gov/region4/water/oceans/sites.html#wilmington, 2010). A significant amount of
sediment testing, including bioassays, is conducted on dredged material before being placed in designated
ODMDS sites; therefore, contaminated sediments are not authorized for ocean disposal. Disposed dredge
material that contains elevated levels of toxic contaminants may have adverse impacts on the benthic
community through bioaccumulation (Winger et al. 2000).

2010 Coastal Habitat Protection Plan
Chapter 6. Soft Bottom Page 358
Marinas and docks
Soft bottom habitat may be affected by marina and dock facilities through alteration of the shoreline
configuration, circulation patterns, and, subsequently, changes in bottom sediment characteristics (Wendt
et al. 1990). Because benthic microalgae, an important component of primary production in soft bottom
habitat, are light dependent, bottom sediments in dredged marinas will have reduced light availability due
to the deeper water depth and shading from docking structures. There are few studies that examine the
effect of marinas and boating activity on benthic productivity. A study estimating macroalgal and
microalgal productivity before and after construction of a marina in Long Island Sound found that
microalgal production on soft bottom would decline by 48% post construction and macroalgal production
would decline by 17%, due to changes in depth, light, and hard structures (Iannuzzi et al. 1996).
However, the authors concluded that some of this loss would be offset by additional microalgal
production on hard structures in the marina.
Operation of a marina can also affect productivity of the soft bottom community due to introduction of
heavy metals, hydrocarbons, and bacteria (Chmura and Ross 1978; Marcus and Stokes 1985; Voudrias
and Smith 1986). In a South Carolina estuary, distinct differences were found in the benthic community
at a marina compared to the control site (Wendt et al. 1990). The marina appeared to favor the
occurrence of infaunal burrowers over infaunal tube dwellers. Overall, there was greater abundance of
deposit feeders at the marina. The authors concluded that the presence of docks and pilings may have
resulted in greater habitat complexity and therefore greater diversity of sessile and motile epifauna.
However, the study did find a lower abundance of several pollution sensitive species at the marina,
indicating some environmental degradation, which could affect the food chain. Faunal differences were
attributed to the finer grained sediments occurring in the marina and proximity to hard structures.
While the higher concentration of organic matter contributed to a greater abundance of certain deposit
feeders, certain species were excluded from the marina. While the additional colonization of non-mobile
epifauna on dock structures within the marina may provide additional biotic diversity and a food source
for some fish, high densities of fouling organisms (tunicates, barnacles, bryozoans) in marinas can reduce
dissolved oxygen levels due to high respiration rates (Wendt et al. 1990). Toxic substances in fouling
organisms bioaccumulate and can become concentrated in successively higher levels of the aquatic food
chain (Nixon et al. 1973; Marcus and Stokes 1985). Both PAHs (polycyclic aromatic hydrocarbons) and
heavy metals were found to be significantly higher in bottom sediments in the marina compared to the
control site. Heavy metals and hydrocarbons are toxic to many soft bottom dwelling invertebrates and
benthic feeding fish (Weis and Weis 1989). The effect of toxins from marinas or other sources is
discussed in more detail in the toxins section. Stringent efforts are needed to prevent toxic contamination
of sediments from marinas to reduce impacts to soft bottom productivity. Toxic sources at marinas
should also be addressed.
In another study in South Carolina, differences in the benthic community in areas with no, low, and high
densities of docks were examined. Similar to the other South Carolina study (Wendt et al. 1990), some
pollution sensitive species of polychaetes were more abundant at control sites than at high dock sites
(Sanger and Holland 2002). Areas in the high dock category usually had the lowest values of benthic
abundance. Three species (S. benedicti, T. acutus, P. cornuta), in addition to the total number of
organisms, had a significant correlation to docks, with the abundance of organisms decreasing as the
number of docks increased (Sanger and Holland 2002). Total fish and crustacean abundance, including
bay anchovy, silver perch, spot, and brown shrimp, were highest in the no dock category, but were not
significantly correlated with dock number (Sanger and Holland 2002). This study also found that shading
from docks decreased stem density of Spartina alterniflora by 70%, which was comparable to studies in
Virginia and other areas of the United States. This reduction can lower the overall productivity in the
vicinity of marinas and multi-docking facilities. Overall productivity in a marina can also be reduced by
2010 Coastal Habitat Protection Plan
Chapter 6. Soft Bottom Page 359
effects on associated wetland and shell bottom communities. Refer to these sections for more information
related to marina and dock impacts.
The presence of docks can alter the young-of-year fish population present. In the Hudson River, New
York and New Jersey, Able et al. (1998) examined the impacts docks had on the YOY fish population
present under docks. Although most YOY fish tend to utilize complex habitats for refuge from predators,
several studies found fewer fish that feed using sight under piers than in adjacent areas (Able et al 1998
and Duffy-Anderson et al. 2003). This difference may be due to light not penetrating under the pier.
YOY winter flounder (Psuedopleuronectes americanus), (a species similar to southern flounder) had
faster growth rates and consumed more prey in caged areas at pier edges than those under piers (Duffy-
Anderson and Able 1999).
Several studies indicate that marinas and concentrations of individual docks have potential to alter soft
bottom habitat, particularly shallow water habitat, in ways that can reduce productivity of the system as a
whole. Marina siting issues were discussed in the water column chapter, and the location of marinas in
North Carolina was shown in Map 2.8 a-b. The majority of docking facility permits are for individual
piers. The number of individual pier permits issued annually by the CRC, with the exception of 2001, has
continually increased in the coastal counties through 2000 (Figure 2.9). Since then, the number of
permits issued annually has dropped below 1999 levels to around 800 per year. The DCM estimates that
approximately 10% of these piers do not have boats associated with them and are used solely for fishing,
swimming, view, etc. The large increase in permit numbers from 1999 to 2000 is at least partially due to
large numbers of repair or replacement requests following hurricane damage. Based on DEH-SS
shoreline surveys in SA, SB, and SC waters, there is approximately one multi-slip docking facility44
for
every 7 miles of shoreline in coastal North Carolina (see ―Marinas and multi-slip docking facilities‖
section of Water Column chapter for more information). If properly designed and located, individual
piers do not pose a large threat to soft bottom habitat. However, when docks are permitted in very
shallow areas, moored boats or floating docks may actually sit on the bottom for a large portion of a tidal
cycle (up to 12 hr) or cause considerable turbidity or prop dredging when attempting to motor to deeper
navigable waters (SAFMC 2009). Either situation can significantly reduce primary or secondary
productivity (F. Rohde/DMF, pers. com., 2009). Recent rule changes by the CRC, allow for piers and
docking facility to be constructed if the following two conditions are met: (1) Water depth at the docking
facility is equal to or greater that two feet of water at normal low water level or normal water level
(whichever is applicable). (2) The pier and docking facility is located to minimize the area of submerged
aquatic vegetation or shellfish beds under the structure‖ [CRC rule 15A NCAC 07H.1205(h)]. The
general permit requirements also include a minimum water depth of 18 inches when a floating dock is
proposed over PNA, shellfish, or SAV. Dock siting criteria should include a minimum water depth over
all habitats to prevent boats or floating docks from sitting directly on shallow soft bottom.
Multi-slip docking facilities (10 slips or less according to the CRC definition) may be a greater threat to
soft bottom habitat due to the number of these facilities and their concentration in shallower areas than
typical marinas. However, by concentrating boat use, overall impacts may be less than what would be
needed to serve the same number of boats with individual piers at individual residences. Also, because
boat use is concentrated, other areas of the shoreline, including wetland and shell bottom habitats, may
not be impacted by docking related activities. There are currently more marinas than multi-slip docking
facilities along estuarine shorelines (see ―Marinas and multi-slip docking facilities‖ section of Water
Column chapter for more information). As waterfront property becomes increasingly developed, requests
for new piers, docks, and marinas in shallower and less suitable locations will likely increase (see
―Marinas and multi-slip docking facilities‖ section of Water Column chapter for more information).
44 Includes both marinas and multi-slip docking facilities

2010 Coastal Habitat Protection Plan
Chapter 6. Soft Bottom Page 360
Research is needed on the cumulative impact of docks and marinas on soft bottom and other fish habitats
in North Carolina.
Shoreline stabilization
Different shoreline stabilization strategies are effective under different environmental conditions, with
varying effects on soft bottom and other habitats. Strategies range from soft techniques such as marsh
planting to engineered hard stabilization techniques. Estuarine and ocean shoreline stabilization are
discussed separately below.
Estuarine and riverine shoreline stabilization
In North Carolina, estuarine and riverine shoreline stabilization has traditionally utilized hard structures
such as bulkheads, rock revetments or riprap, sills, breakwaters, groins, or combinations thereof.
Bulkheads are the most commonly used structure. Although excessive sediment loading is considered a
water quality issue, erosion of sediments is a natural process that provides sand for maintenance of
beaches, wetlands, and shallow water habitat. When this sand supply is cut off by a hard structure under
rising sea level conditions, the long-term results are a net loss of beach and intertidal shoreline and the
deepening of shallow water habitat, which impacts the function of intertidal shoreline and shallow water
habitat as nursery, feeding, and spawning grounds to fish species in North Carolina. Multiple studies
have shown that the diversity and abundance of invertebrates and juvenile fish is lower adjacent to
bulkheaded areas than natural shorelines (Mock 1966; Ellifrit et al. 1972; Gilmore and Trent 1974;
O‘Rear 1983; Byrne 1995; Peterson et al. 2000c; Waters and Thomas 2001; Seitz et al. 2006; Bilkovic
and Roggero 2008; Partyka and Peterson 2008). Deepening of waters adjacent to the bulkhead structure
allows large piscivorous fish access to previously shallow nursery areas, enhancing their feeding
efficiency on small and/or juvenile fishes looking for shallow water (Rozas 1987). Non-vertical
structures, such as marsh sills, offer an alternative to bulkheads that may have less long-term impact on
shallow soft bottom habitat, as well as wetlands and submerged aquatic vegetation. However the larger
footprint of a marsh sill can result in some habitat tradeoff from soft bottom to wetlands and rock and/or
oysters. In the 2003 legislative session, House Bill 1028 was approved, which allows the CRC to
establish a general permit for construction of offshore parallel rock sills for estuarine shoreline protection.
Despite this incentive, only 12 general permits and 22 major permits have been issued for marsh sill
construction. Refer to the wetlands chapter for additional information on the impact of shoreline
stabilization to that habitat, efforts agencies have taken to revise shoreline stabilization rules to minimize
impacts from shoreline hardening, and remaining management needs that should be implemented.
An additional concern of wooden bulkheads is the toxicity of preserved wood to certain aquatic
organisms. Chemically treated wood is also used for dock and marina construction. Estuarine and
riverine bottom may be contaminated by wooden bulkheads treated with copper, chromium, and arsenic
(CCA). These elements are leached from CCA-treated wood, gradually accumulate in adjacent
sediments, and have the capacity to harm marine benthos (i.e. oysters, amphipods, polychaetes, fiddler
crabs, mud snails, fish embryos, and sea urchin) (Weis and Weis 1994 and Weis et al. 1998). CCA-
treated wood preservative has been shown to leach copper, chromium VI, and arsenic into adjacent
sediments and to impact marine benthos (Weis and Weis 1994; Weis et al. 1998). Among CCA
chemicals, copper appears to have the most toxic effect on marine organisms and also consistently
appears to leach the greatest amount (Weis and Weis 1994). The toxicity of these metals to aquatic
organisms is well recorded and all three are listed as priority pollutants by the EPA (Hingston et al. 2001).
Studies have documented significantly elevated concentrations of metals and reduced abundance and
diversity of the benthic community extending approximately 30 ft (10 m) from bulkheads treated with
CCA, decreasing with distance from the structure (Weis and Weis 1994; Weis et al. 1998). Benthic
organisms that were lethally or sublethally impacted included macroalgae, amphipods, polychaetes,
2010 Coastal Habitat Protection Plan
Chapter 6. Soft Bottom Page 361
oysters, fiddler crabs, sea urchins, mud snails, and fish embryos. Sediment contamination has been
documented to be higher in a residential bulkheaded canal than adjacent to bulkheaded open water (Weis
and Weis 1995). Concentrations decreased more rapidly with distance from bulkhead in the open water
system. Weis et al. (1995) found that oysters living on CCA-treated wood in a residential canal had 15
times more copper ( 200 g/g wet weight), two to three times more arsenic, and significantly more
degeneration of digestive gland diverticula than compared to that of reference oysters. Copper is known
to cause this pathology. Although bioaccumulation has been observed in shellfish and other invertebrates
grazing on CCA contaminated algae or bivalves, similar biomagnification in fish has not been
documented for these elements (Weis and Weis 1999). The extent of sediment contamination from CCA
could be significant considering the magnitude of preserved timber used in the marine environment for
bulkheads and docks (Weis and Weis 1994) (refer to wetlands chapter on DCM shoreline study to assess
extent of shoreline alterations). Toxicity of wood decreases with time but CCA can continue leaching for
many years. In addition, bulkheads and docks need to be replaced periodically, providing a continual
source of newly treated wood in coastal waters. In 2003, the EPA required new labeling on all CCA
products specifying use restrictions. The lumber industry voluntarily agreed to eliminate use of CCA for
residential use, although CCA is still being used in certain marine and industrial applications. Local
home stores or lumberyards now sell lumber treated with less toxic alternatives such as amine copper quat
(ACQ), copper azone (CA). Alternative wood preservatives containing copper or other chemicals may
have similar toxicity to marine organisms. Rock sills and revetments are non-wood shoreline stabilization
alternatives that do not require any chemical preservatives. Due to the toxic sediment contamination
associated with pressure treated wood, revised shoreline stabilization rules should require or encourage
use of non-wood materials or wood that is not toxic to benthic organisms. Any new wood preservative
products should be evaluated for toxicity to marine benthic organisms and juvenile fish.
Oceanfront shoreline hardening
Shoreline hardening, or hard stabilization, involves construction of hard immovable engineered structures,
such as seawalls, rock revetments, jetties, and groins. Seawalls and rock revetments run parallel to the
beach. Seawalls are vertical structures, constructed parallel to the ocean shoreline, and are primarily
designed to prevent erosion and other damage due to wave action. Revetments are shoreline structures
constructed parallel to the shoreline and generally sloped in such a way as to mimic the natural slope of
the shoreline profile and dissipate wave energy as the wave is directed up the slope. Breakwaters are
structures constructed waterward of, and usually parallel to, the shoreline. They attempt to break
incoming waves before they reach the shoreline, or a facility (e.g., marina) being protected. Jetties and
groins are manmade structures constructed perpendicular to the beach, with jetties usually being much
longer, and are located adjacent to inlets with the purpose of maintaining navigation in the inlet by
preventing sand from entering it. In contrast, terminal groins are structures built at the end of a littoral
cell to trap and conserve sand along the end of the barrier island, stabilize inlet migration, and widen a
portion of the updrift beach. Terminal groins are designed so that when the area behind the groin fills in
with sand, additional sand will go around the structure and enter the inlet system.
It is well accepted that hard stabilization techniques along high energy ocean shorelines will accelerate
erosion in some location along the shore as a result of the longshore sediment transport being altered
(Defeo et al. 2009). The hydromodifications resulting from coastal armoring modifies sediment grain
size, increases turbidity in the surf zone, narrows and steepens beaches, and results in reduced intertidal
habitat and diversity and abundance of macroinvertebrates (Walton and Sensabaugh 1979; NRC 1995;
Dolan et al. 2004: 2006; Pilkey et al. 1998; Peterson et al. 2000a; Miles et al. 2001; Dugan et al. 2008;
Walker et al. 2008; Riggs and Ames 2009). A study looking at the effect of a short groin (95m) on the
benthic community found that the groin created a depositional condition on one side of the structure and
erosion on the other, and macroinvertebrate diversity and abundance was significantly reduced within 30
m of the structure, as sand particle size and steepness increased (Walker et al. 2008). The change in

2010 Coastal Habitat Protection Plan
Chapter 6. Soft Bottom Page 362
benthic community was attributed to the change in geomorphology of the beach. Hard structures along a
sandy beach can also result in establishment of invasive epibenthic organisms (Chapman and Bulleri
2003). A secondary impact of hardened structures is that the areal loss of beach resulting from hardening
of shorelines is often managed by implementing nourishment projects, possibly having additional damage
to subtidal bottom (Riggs et al. 2009). Anchoring inlets also prevents shoal formation and diminishes ebb
tidal deltas, which are important foraging grounds for many fish species. Recognizing that hardened
structures are damaging to recreational beaches and the intertidal zone, four states have prohibited
shoreline armoring: Maine, Rhode Island, South Carolina, and North Carolina (effective in North
Carolina since 1985).
Perhaps the greatest impact of terminal groins and jetties results in the long-term effect on barrier islands
and the effect that will have on marine and estuarine ecosystems. By stabilizing the inlet, inlet migration
and overwash processes are interrupted, causing a cascade of other effects (Riggs and Ames 2009). In the
case of Oregon Inlet, the terminal groin anchored the bridge to Pea Island and stopped the migration of
the inlet on the south side. But the continuing migration of the north end of Bodie Island led to an
increased need for inlet dredging. The combination of reduced longshore transport of sediment due to the
groin and the post-storm dune construction to open and protect the highway prevented overwash
processes that allow Pea Island to maintain its elevation over time. With overwash processes disrupted,
the beach profile has steepened, and the island has flattened and narrowed, increasing vulnerability to
storm damage (Dolan et al. 2006; Riggs and Ames 2009; Riggs et al. 2009). At Oregon Inlet and Pea
Island, the accelerated need for beach replenishment is further aggravated by the need to maintain Hwy
12 on the narrowing beach. From 1983 to 2009 approximately 12.7 million cubic yards of sand have
been added to the shoreline within three miles of the terminal groin (Riggs and Ames 2009). Dolan
(2006) documented that the large volumes of sand replenishment in this area, required to maintain the
channel, protect the road, and maintain a beach have resulted in a significant reduction in grain size and
reduction in mole crab abundance. Mole crabs are considered an important indicator of beach conditions
due to their importance in the food web as prey for shorebirds and surf fish. In addition to causing
erosion on downdrift beaches, altering barrier island migration processes, and accelerating the need for
beach nourishment projects, jetties obstruct larval fish passage through adjacent inlets (Blanton et al.
1999). Disruption of larval transport is discussed in detail in the water column threats section.
In contrast, where natural coastal barrier island processes, such as overwash and the opening, closing, and
shifting of inlets have occurred without manipulation, the islands have grown in width and elevation and
migrated. Core Banks and Drum Inlet are an example of one of a barrier island with inlets that opened
and closed throughout time (Mallinson et al. 2008). Drum Inlet initially opened in 1899, but closed and
reopened multiple times during storm events. It is possible that several other areas that have historically
had inlets will again in the future (i.e. Buxton Inlet, New Inlet, and Isabel Inlet) (Mallinson et al. 2008).
When inlets open, the new sediment deposition of a flood tide delta aids barrier island migration and
widening. Where new inlets form, Mallison et al.(2008) recommended that allowing the inlets to remain
open even if temporarily until a substantial flood tide delta forms, would allow for long-term maintenance
and stability of the barrier island. Ferries could be used on a temporary basis to allow critical
transportation to continue.
Only a relatively small amount of North Carolina‘s ocean shoreline is hardened compared to other states,
having roughly 6% of the developed shoreline hardened (Pilkey et al. 1998). In contrast, South Carolina,
Florida (Atlantic coast), and New Jersey have 27%, 45%, and 50% of their respective shorelines covered
with some form of hard stabilization. Existing seawalls and revetments in North Carolina were
constructed prior to CAMA (e.g., Atlantic Beach) or were for the purpose of protecting historic structures
(e.g., Ft. Fisher). Existing jetties in North Carolina occur at Masonboro and Barden‘s inlets, terminal
groins occur at Oregon and Beaufort inlets, and small groin fields were constructed at Bald Head Island
and Hatteras Island.
2010 Coastal Habitat Protection Plan
Chapter 6. Soft Bottom Page 363
Use of sandbags is a temporary method of erosion control that is permitted for protection to imminently
threatened structures (shoreline less than 20 feet from structure) while their owners seek more permanent
solutions, such as beach nourishment or relocation of the structure. While filled with sand, these bags are
stacked and act like a seawall, although they can be removed more easily. Sandbag walls may remain in
place for up to two years if the protected structure is 5,000 square feet or less, or for up to five years if the
structure is larger than 5,000 square feet. Sandbags also may remain in place for up to five years –
regardless of the protected structure‘s size – if the community in which it is located is taking part in a
beach nourishment project. Sandbags may remain in place indefinitely if they have become covered with
sand and stable natural vegetation. However, if a storm exposes them, they must be removed if their time
period has expired. However, there has been difficulty in enforcing removal of temporary sandbags. As
of July 2008, there were a total of 381 total sandbag structures on record, 150 of which were still installed
with an expired removal date (K. Richardson/DCM, pers. com. 2009). In 2008, the CRC instructed all
property owners with exposed sandbags that had exceeded their time limit to remove the bags. However,
Session Law 2009-479 intervened on this action by implemented a moratorium on the removal of
sandbags.
In the 2003 legislative session, House Bill 1028 was approved, putting into law the CRC prohibition on
construction of permanent erosion control structures on ocean shorelines. However, there has been
lobbying efforts by special interests to weaken this law by allowing the use of terminal groins. In 2009,
Session Law 2009-479 mandated that the CRC 1) shall not order the removal of sandbags if actively
pursuing a beach nourishment or inlet relocation project; and 2) shall conduct a study on the feasibility
and advisability of use of terminal groins as an erosion control device at the end of a littoral cell or inlet,
and present a report to the Environmental Review Commission and the General Assembly by April 1,
2010.
CRC and DCM contracted the study out to Moffitt and Nichols. The goals of the study were to:
Characterize physical and environmental impacts of terminal groin structures,
Determine engineering techniques used to construct terminal groins including those which may
help minimize impacts on adjacent shorelines,
Determine economic impacts of shifting inlets as well as potential construction/maintenance costs
of terminal groin structures, and
Determine whether the construction of terminal groins is both feasible and advisable in North
Carolina, and if so, what are the types of locations where such structures function as designed
with minimal impacts.
These questions were to be answered by assessing five existing terminal groins which had available data
and were located in a similar environment as North Carolina‘s beach community. The study sites
included Oregon Inlet and Beaufort Inlet in NC, Amelia Island/Nassau Sound in northeast Florida, and
Captiva Island and St John‘s Pass, on the west coast of Florida. The study documented that constructing
terminal groins resulted in the need for periodic nourishment behind the structures, where it had
previously been futile due to dynamic inlet processes (Moffatt and Nichol 2010). Without nourishment,
erosional impacts to adjacent beach areas would occur. This means that construction of terminal groins
create a condition of long-term mandatory maintenance, increasing the expensive of beach management.
The study found that the groins did reduce erosion rates immediately adjacent to the structure, but there
was evidence of increased erosion about two miles downdrift, and on the opposite side of the inlet.
However, effects were inconclusive because of simultaneous inlet dredging and sand disposal. The CRC
terminal groin subcommittee concluded that use of terminal groins may be feasible but not advisable due
to environmental consequences, expense, and large uncertainty of long-term impacts. However, the CRC
voted to state that the study was inconclusive and therefore could not recommend for or against their use.
Because there is strong evidence available on the potential ecological impacts of hardened structures ,

2010 Coastal Habitat Protection Plan
Chapter 6. Soft Bottom Page 364
large uncertainty on the environmental impacts of terminal groins specifically, and no clear economic
benefit from inlet stabilization, North Carolina should not reverse its position or policies on ocean
shoreline hardening. The long-term consequences of hardened structures on larval transport and
recruitment should also be thoroughly assessed prior to approval of such structures (refer to water column
chapter for details). Overall, the scientific evidence does not support changing North Carolina‘s policy on
prohibition of shoreline hardening structures on the oceanfront.
Soft stabilization on oceanfront shorelines
Soft stabilization techniques available for oceanfront erosion control include beach bulldozing and beach
nourishment. Beach bulldozing, also referred to as beach scraping, is a method of short-term erosion
protection that has been used in North Carolina for approximately 40 years. Beach bulldozing is the
process of mechanically redistributing beach sand from the lower portion of the intertidal beach to the
upper portion of the dry beach to create or enhance the primary dune. In contrast to beach nourishment,
new sediment is not added and the existing beach is not widened. Because beach bulldozing only utilizes
sand on-site, the impacts of this soft technique are less, relative to those from beach nourishment (Pilkey
et al. 1998). The largest biological impact of beach bulldozing appears to be reduction in ghost crab
populations on the dry beach (Peterson et al. 2000b). Peterson et al. (2000b) found that beach bulldozing
at Bogue Banks reduced the width of the intertidal beach, shifted sediment composition, and immediately
reduced abundance of benthic organisms. Because of the relatively quick recovery on intertidal and
shallow subtidal benthic communities and the relatively small area that occurs in subtidal waters, fish
impacts from bulldozing should be less than other beach management activities. However, beach
scraping has not been shown to provide any erosion control benefit, and has actually increased wind
erosion of sand where created dunes were left unvegetated (Kerhin and Halka 1981; Tye 1983; McNinch
and Wells 1992; Peterson et al. 2000b). The CRC modified specific conditions for beach bulldozing in
2000 which should help minimize biological impacts if properly enforced, including time windows for
work to be completed, maximum depth of scraping, and replanting of dunes. There is also a federal
bulldozing moratorium in NC from May 1 to November 15 to protect sea turtles.
Beach nourishment is the introduction of new sand to dry and intertidal beach and adjacent shallow
waters from upland areas, navigational channels, inlet systems, or submerged mine sites to restore or
enlarge a beach. There are generally two categories of USACE projects that result in sand being put on
beaches: disposal projects and Coastal storm damage reduction projects. Disposal projects are placement
of dredged material from maintenance dredging of navigation channels. Specifically, they do not include
an engineered and constructed profile designed for protection purposes. Rather, the intent is to take
dredged material from navigation dredging and place it on the recipient site. Disposal projects are
generally smaller in magnitude than storm damage reduction projects, and can be expected to have a
smaller impact on fish habitat. The sand source for disposal projects is inlet dredging. Sand bypassing is
a type of disposal project where sand is moved around physical barriers, such as a jetty or deep port, that
interrupt the natural littoral drift along the shoreline. Storm damage reduction projects have used sand
from dredged channels, offshore borrow areas, ebb tide delta shoals, or inlet relocation. Erosion rates
near inlets tend to be large and variable due to the natural migration processes of barrier islands. Because
of that and the associated risk near inlets, CRC has designated Inlet Hazard Areas along barrier islands.
Greater setbacks are required in these areas. Beach nourishment is generally not recommended
immediately adjacent to the inlet because of the dynamic nature of the area and the expected low retention
time of sand.
Soft stabilization offers an alternative to hard stabilization that has less severe habitat impacts to soft
bottom and some positive effects. For example, wider beaches from properly constructed beach
nourishment projects can enhance sea turtle nesting habitat and protect oceanfront development that is
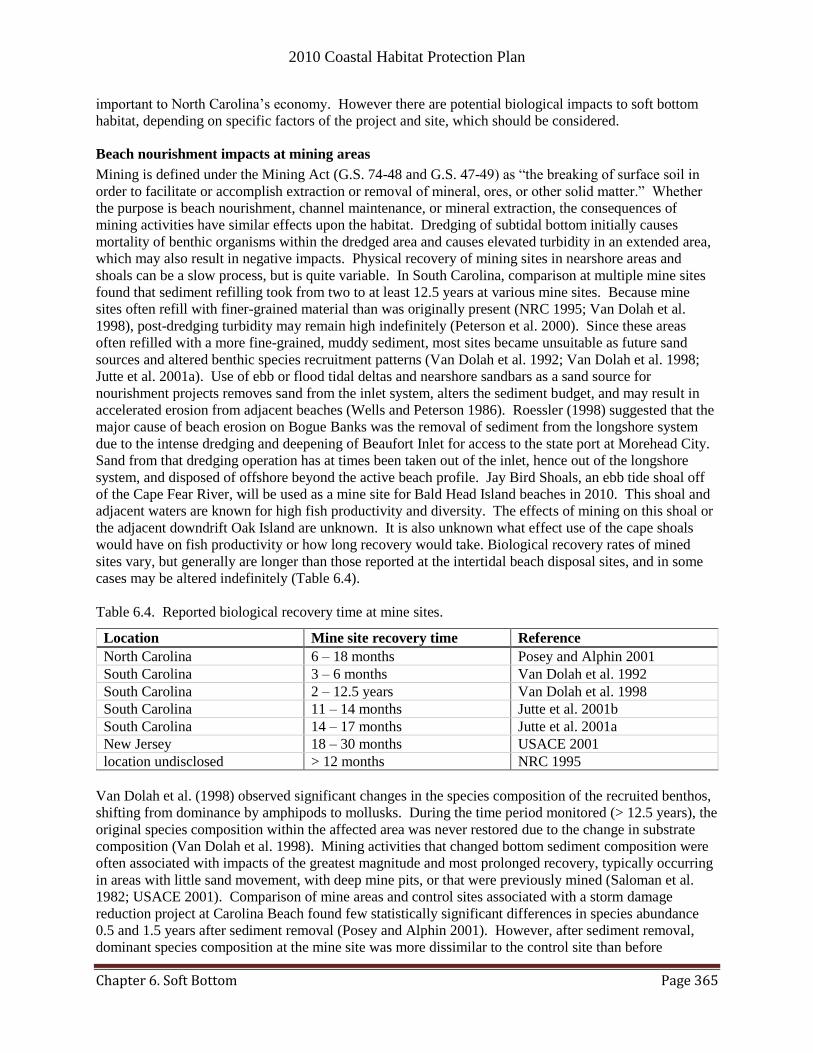
2010 Coastal Habitat Protection Plan
Chapter 6. Soft Bottom Page 365
important to North Carolina‘s economy. However there are potential biological impacts to soft bottom
habitat, depending on specific factors of the project and site, which should be considered.
Beach nourishment impacts at mining areas
Mining is defined under the Mining Act (G.S. 74-48 and G.S. 47-49) as ―the breaking of surface soil in
order to facilitate or accomplish extraction or removal of mineral, ores, or other solid matter.‖ Whether
the purpose is beach nourishment, channel maintenance, or mineral extraction, the consequences of
mining activities have similar effects upon the habitat. Dredging of subtidal bottom initially causes
mortality of benthic organisms within the dredged area and causes elevated turbidity in an extended area,
which may also result in negative impacts. Physical recovery of mining sites in nearshore areas and
shoals can be a slow process, but is quite variable. In South Carolina, comparison at multiple mine sites
found that sediment refilling took from two to at least 12.5 years at various mine sites. Because mine
sites often refill with finer-grained material than was originally present (NRC 1995; Van Dolah et al.
1998), post-dredging turbidity may remain high indefinitely (Peterson et al. 2000). Since these areas
often refilled with a more fine-grained, muddy sediment, most sites became unsuitable as future sand
sources and altered benthic species recruitment patterns (Van Dolah et al. 1992; Van Dolah et al. 1998;
Jutte et al. 2001a). Use of ebb or flood tidal deltas and nearshore sandbars as a sand source for
nourishment projects removes sand from the inlet system, alters the sediment budget, and may result in
accelerated erosion from adjacent beaches (Wells and Peterson 1986). Roessler (1998) suggested that the
major cause of beach erosion on Bogue Banks was the removal of sediment from the longshore system
due to the intense dredging and deepening of Beaufort Inlet for access to the state port at Morehead City.
Sand from that dredging operation has at times been taken out of the inlet, hence out of the longshore
system, and disposed of offshore beyond the active beach profile. Jay Bird Shoals, an ebb tide shoal off
of the Cape Fear River, will be used as a mine site for Bald Head Island beaches in 2010. This shoal and
adjacent waters are known for high fish productivity and diversity. The effects of mining on this shoal or
the adjacent downdrift Oak Island are unknown. It is also unknown what effect use of the cape shoals
would have on fish productivity or how long recovery would take. Biological recovery rates of mined
sites vary, but generally are longer than those reported at the intertidal beach disposal sites, and in some
cases may be altered indefinitely (Table 6.4).
Table 6.4. Reported biological recovery time at mine sites.
Location Mine site recovery time Reference
North Carolina 6 – 18 months Posey and Alphin 2001
South Carolina 3 – 6 months Van Dolah et al. 1992
South Carolina 2 – 12.5 years Van Dolah et al. 1998
South Carolina 11 – 14 months Jutte et al. 2001b
South Carolina 14 – 17 months Jutte et al. 2001a
New Jersey 18 – 30 months USACE 2001
location undisclosed > 12 months NRC 1995
Van Dolah et al. (1998) observed significant changes in the species composition of the recruited benthos,
shifting from dominance by amphipods to mollusks. During the time period monitored (> 12.5 years), the
original species composition within the affected area was never restored due to the change in substrate
composition (Van Dolah et al. 1998). Mining activities that changed bottom sediment composition were
often associated with impacts of the greatest magnitude and most prolonged recovery, typically occurring
in areas with little sand movement, with deep mine pits, or that were previously mined (Saloman et al.
1982; USACE 2001). Comparison of mine areas and control sites associated with a storm damage
reduction project at Carolina Beach found few statistically significant differences in species abundance
0.5 and 1.5 years after sediment removal (Posey and Alphin 2001). However, after sediment removal,
dominant species composition at the mine site was more dissimilar to the control site than before
2010 Coastal Habitat Protection Plan
Chapter 6. Soft Bottom Page 366
sediment removal. The authors concluded that year to year variability in the benthic community, in
addition to multiple hurricanes during the monitoring period, made effects from the project difficult to
determine, suggesting that the effect of beach nourishment is minimal compared to the natural variability
of the system (Posey and Alphin 2001; Posey and Alphin 2002). Observed recovery at this site was more
rapid than expected, due in part to the configuration of the mine areas. The mine area was long (3 mi),
relatively wide (0.5 mi), and, most importantly, not excessively deep (5-10 ft deep) (M. Posey/UNC-W,
pers. com., 2003). At mine sites monitored off New Jersey, infaunal assemblages (diversity) recovered
within one year after disturbance, while biomass and taxonomic richness took 1.5 to 2.5 years to fully
recover (USACE 2001). Because material was removed from a topographically diverse bottom, a deep
pit was not created, leading the authors to conclude that time to recovery was reduced. In addition, strong
water currents and dynamic sand movement in the project area facilitated more rapid infilling. Another
potential concern of sand mining is impacts to nearby hard bottom from physical damage or elevated
turbidity during the mining. Along many of the beaches in Onslow and Long Bays, low to high profile
hard bottom is scattered along the coast, making mining without impacting hard bottom difficult.
Repeated use of a mine site for beach nourishment is generally not possible refilling of the borrow area
with finer sediment or insufficient sand in the borrow areas prior to the next renourishment interval (3 – 8
year cycles). Because of the slow recovery and change in sediment composition, Van Dolah et al. (1998)
stated that nearshore mine areas must be viewed as a non-renewable resource and as the region‘s most
impacted by beach nourishment projects (R. Van Dolah/SC DNR; pers. com., 2002). The benthic
community appeared to recover more quickly where hopper dredges were used rather than pipeline
dredges (Jutte et al. 2001a). Hopper dredges tend to have long shallow dredge cuts and unimpacted
ridges between cuts which facilitate recruitment into dredged areas while pipeline dredges have deep cuts.
Locating mine sites at specific soft bottom locations known to support seasonal aggregations of demersal
fish, such as the critical overwintering area off the Outer Banks for juvenile Atlantic sturgeon, spiny
dogfish, and striped bass, could negatively impact those species. Mine sites established on ebb and flood
tide deltas may recover relatively faster due to nearby longshore sediment transport. However, these
deltas serve as important feeding sites to a number of commercially and recreationally important species,
including red drum, striped bass, spot, Atlantic croaker, weakfish, blue crabs, and shrimp, and serve as
spawning sites for red drum, weakfish, spotted sea trout, and blue crab. Removal of a major component
of their diet could negatively impact these species (Peterson et al. 1999). Factors that appeared to
maximize biological recovery rates include:
Shallow excavation of mine areas,
Use of topographic highs, and
Location in areas of high sand movement.
Since the 2005 CHPP, there has been increased interest from barrier island municipalities in use of the
cape shoals as a sediment source for beach nourishment projects. Boss and Hoffman (2000) collected
detailed information on the sand resources for North Carolina‘s Outer Banks, including specific data
about Diamond Shoals. Diamond Shoals extend approximately 11 nautical miles (nm) (20 km) and are
about 5.5 nm (11 km) wide. The estimated total volume of sand on the shoal was at least 1.66 billion cu
yd, with approximately 256 million cu yd within state waters (Boss and Hoffman 2000). As such, cape
shoals are major sand resources for coastal processes. Detailed mapping of the bottom has been done in
other areas of the coast to varying extent with different techniques. Research on Cape Lookout Shoal
found that the cape associated shoals act as a barrier to longshore transport, diverting southerly flow of
water and sediment seaward in a tidal-driven headland flow, resulting in net sediment transport and
deposition onto the shoal. The shoals are maintained by this sediment transport and serve as a long-term
sink for littoral sediment and limits exchange between adjacent littoral cells and shelf regions (McNinch
and Wells 1999; McNinch and Luettich 2000).
2010 Coastal Habitat Protection Plan
Chapter 6. Soft Bottom Page 367
Due to the increased interest in long-term storm damage reduction projects, there are also several projects
requesting use of borrow areas in nearshore subtidal bottom for large storm reduction projects. This
includes the Bogue Banks, Nags Head, Topsail Beaches, and Brunswick Beaches projects that are at
various stages of the permit process. When mine areas are necessary for beach nourishment projects,
guidelines should strongly encourage siting protocol that maximize biological recovery rates, do not
degrade critical fish foraging areas, do not impact hard bottom, and minimize impacts to longshore
transport processes. Many steps are already taken to minimize environmental impacts. State or National
Environmental Policy Act (SEPA or NEPA) documents, likely including Environmental Impact
Statements (EIS) or Environmental Assessments (EA), must be completed and reviewed prior to these
projects being permitted. A memorandum of agreement between DCM and USACE provides for a
coordinated permit review process between state and federal agencies (Federal Consistency Program). A
federal project cannot begin unless DCM finds that it is consistent with state policies. Other agencies are
given an opportunity to comment on projects as well. The MFC adopted a beach nourishment policy in
2000 to guide the permitting process to more fully consider fish habitat impacts (Appendix I). Existing
CRC rules (15A NCAC 07H .0208(b)(12)(A)(iv)) require a 500 m buffer between dredging and high
relief hard bottom. High relief is defined as relief greater than or equal to 0.5 m per 5 m of horizontal
distance. Research has shown that there is a halo area around hard bottom which reef fish use as a
foraging area to derive a significant portion of their diet. The halo distance was estimated to extend about
500 m from exposed hard bottom of any relief (Lindquist et al. 1994). Because of this, the 2009 Ocean
Policy report (NC Sea Grant 2009) recommended that CRC rule language be modified to require a 500 m
dredging buffer around all hard bottom areas, including those of low relief that are periodically buried
with thin ephemeral sand layers.
Beach nourishment impacts at intertidal beach and adjacent subtidal bottom
Biological impacts of sediment disposal to the intertidal beach community have been studied by Reilly
and Bellis (1983), Van Dolah et al. (1992), Hackney et al. (1996), Donoghue (1999), Jutte et al. (1999),
Peterson et al. (2000b), and others. Studies of dredge disposal and storm damage reduction projects
demonstrated an almost complete initial reduction in the number of benthic invertebrates in the intertidal
zone, as well as in the subtidal zone and dry beach, immediately following the disturbance. The effect on
smaller meio- and microfauna is unknown. The rate of reported biological recovery on nourished
intertidal beaches has varied from about one month to one year, but in some cases longer (Table 6.5).
Factors likely affecting the recovery time of the intertidal beach community include:
compatibility of deposited material with native sand (sediment grain size)
seasonal timing of nourishment
time period between renourishment events on an individual site volume, depth, and length of
sand
alteration of the beach geomorphology
location placed on the beach
longshore transport conditions (higher transport results in more rapid recruitment
In the studies referenced above and others, biological impacts persisted longer when supplemented sand
was either coarser (Rakocinski et al. 1993; McLachlan 1996; Rakocinski et al. 1996; Peterson et al.
2000a) or finer (Gorzelany and Nelson 1987; NRC 1995) than the existing sand. Increased grain size of
the beach can result in significant reduction in species richness and abundance by 1) limiting body size, 2)
limiting burrowing performance and other functions in some species, and 3) changing the beach condition
to a higher energy swash zone (McLachlan 1996). A decrease in grain size impacts the benthos by 1)
smothering organisms, 2) clogging gills from sediment plumes, and 3) decreasing the interstitial space
between sediment grains available to small burrowing invertebrates (Rakocinski et al. 1996).
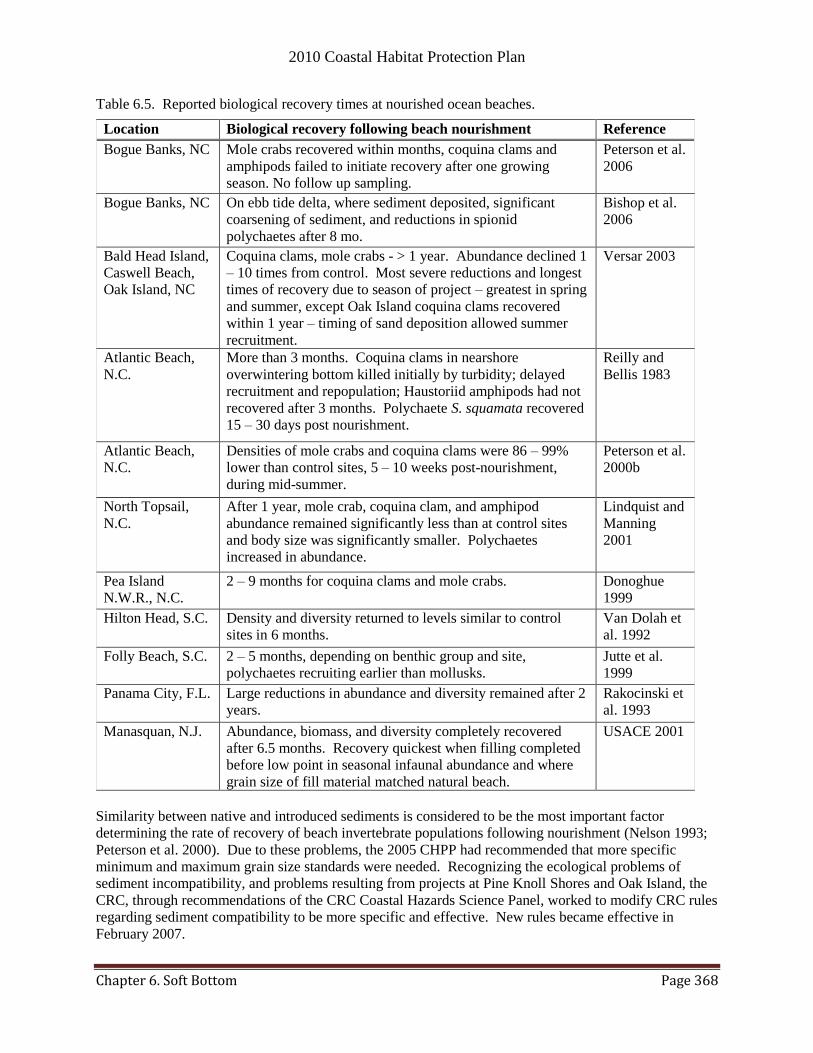
2010 Coastal Habitat Protection Plan
Chapter 6. Soft Bottom Page 368
Table 6.5. Reported biological recovery times at nourished ocean beaches.
Location Biological recovery following beach nourishment Reference
Bogue Banks, NC Mole crabs recovered within months, coquina clams and
amphipods failed to initiate recovery after one growing
season. No follow up sampling.
Peterson et al.
2006
Bogue Banks, NC On ebb tide delta, where sediment deposited, significant
coarsening of sediment, and reductions in spionid
polychaetes after 8 mo.
Bishop et al.
2006
Bald Head Island,
Caswell Beach,
Oak Island, NC
Coquina clams, mole crabs - > 1 year. Abundance declined 1
– 10 times from control. Most severe reductions and longest
times of recovery due to season of project – greatest in spring
and summer, except Oak Island coquina clams recovered
within 1 year – timing of sand deposition allowed summer
recruitment.
Versar 2003
Atlantic Beach,
N.C.
More than 3 months. Coquina clams in nearshore
overwintering bottom killed initially by turbidity; delayed
recruitment and repopulation; Haustoriid amphipods had not
recovered after 3 months. Polychaete S. squamata recovered
15 – 30 days post nourishment.
Reilly and
Bellis 1983
Atlantic Beach,
N.C.
Densities of mole crabs and coquina clams were 86 – 99%
lower than control sites, 5 – 10 weeks post-nourishment,
during mid-summer.
Peterson et al.
2000b
North Topsail,
N.C.
After 1 year, mole crab, coquina clam, and amphipod
abundance remained significantly less than at control sites
and body size was significantly smaller. Polychaetes
increased in abundance.
Lindquist and
Manning
2001
Pea Island
N.W.R., N.C.
2 – 9 months for coquina clams and mole crabs. Donoghue
1999
Hilton Head, S.C. Density and diversity returned to levels similar to control
sites in 6 months.
Van Dolah et
al. 1992
Folly Beach, S.C. 2 – 5 months, depending on benthic group and site,
polychaetes recruiting earlier than mollusks.
Jutte et al.
1999
Panama City, F.L. Large reductions in abundance and diversity remained after 2
years.
Rakocinski et
al. 1993
Manasquan, N.J. Abundance, biomass, and diversity completely recovered
after 6.5 months. Recovery quickest when filling completed
before low point in seasonal infaunal abundance and where
grain size of fill material matched natural beach.
USACE 2001
Similarity between native and introduced sediments is considered to be the most important factor
determining the rate of recovery of beach invertebrate populations following nourishment (Nelson 1993;
Peterson et al. 2000). Due to these problems, the 2005 CHPP had recommended that more specific
minimum and maximum grain size standards were needed. Recognizing the ecological problems of
sediment incompatibility, and problems resulting from projects at Pine Knoll Shores and Oak Island, the
CRC, through recommendations of the CRC Coastal Hazards Science Panel, worked to modify CRC rules
regarding sediment compatibility to be more specific and effective. New rules became effective in
February 2007.

2010 Coastal Habitat Protection Plan
Chapter 6. Soft Bottom Page 369
The season and time period between renourishment events are also important factors that affect the rate of
recovery of the beach community (Dolan et al. 1992; Donoghue 1999; Versar 2003). At the Brunswick
Beaches project, conducted as part of the Cape Fear harbor deepening project, sand was placed
sequentially from east to west: Baldhead Island in spring 2001, Caswell Beach in summer 2001, Oak
Island in fall 2001, and Holden Beach in winter 2002. Impacts were observed immediately to the
intertidal beach community at all beaches, but the severity of invertebrate reductions and time to recovery
was the greatest at beaches nourished in the spring and summer (Versar 2003). The time period between
renourishment events is also an important factor for successful recovery. Lindquist and Manning (2001)
found that at a beach where dredge material was placed between April and June, and redeposited the
following year (April – June), the abundance of the mole crabs, coquina clams, and amphipods was
significantly lower than that of the control beach after one year. Also, mole crabs and coquina clams
were significantly smaller in size than at control sites, indicating that repeated disturbance from beach
disposal (once a year) prevented full recovery of the populations. Peterson et al. (2000b) also argued that
recovery could be accelerated if projects were timed to occur before spring recruitment of benthos.
Dredge material from inlet dredging is often placed in nearshore water (< 30 ft deep) within the beach
profile to enhance sand supply on the beach. Such sand placement in nearshore waters can delay the
duration and reduce the magnitude of the benthos reduction on the beach, but cause additional impacts to
subtidal bottom (Donoghue 1999). Monitoring of a nearshore disposal project that occurred on an ebb
tide delta near Beaufort Inlet in March – April found that after eight months (December), infaunal
invertebrates were only 50% as dense as that of the original benthic community, but mobile epifauna had
fully recovered (Peterson et al. 1999). In the following two months (December – February), density
estimates doubled, as new recruits rapidly entered the area (Peterson et al. 1999). Projects timed to occur
in the winter, prior to peak infauna larval recruitment in the summer and fall, will speed up the recovery
of intertidal benthic organisms within the impacted area (Donoghue 1999).
In summary, several conditions appear to minimize biological impacts of nourishment projects to the
intertidal beach community. These include, but are not limited to:
Use of sand similar in grain size and composition to original beach sands (specific minimum and
maximum standard needed).
Restrict beach nourishment to winter months to minimize mortality of infauna and enhance
recovery rates of intertidal benthic organisms, an important prey source for many surf fish
(Donoghue 1999).
Limit time interval between projects to allow full recovery of benthic communities (1-2 years,
depending on timing of project and compatibility of sediment).
Limit linear length of nourishment projects to provide undisturbed area as a source of
invertebrate colonists for the altered beach, and a food source for fish.
The extent of biological impacts from beach nourishment activities is determined not only by these
individual conditions, such as grain size, time of project, and frequency of reapplication, but also by
combinations of factors. Because of the potential impact of beach nourishment and dredge disposal on
soft bottom communities, there is a need for a coast-wide Beach Management Plan that carefully reviews
cumulative impacts of activities and provides ecologically based guidelines, including sediment
compatibility standards and limits on time of year, linear length, and interval between nourishment to
enhance recovery of the benthic community. The CRC‟s beach nourishment rules should be evaluated
and modified in a comprehensive manner as needed to minimize overall impacts from this activity.
Comprehensive monitoring to assess the impact of each project should be required of the applicant to
determine if and how nourishment practices should be modified. Additional research is also needed to
more clearly quantify the cumulative impact of nearshore dredge disposal on fish populations.

2010 Coastal Habitat Protection Plan
Chapter 6. Soft Bottom Page 370
Beach nourishment impacts on fish
Fish may be impacted by beach nourishment due to reduction in food availability, alteration of preferred
topographic features, disturbance prior to or during spawning, or reduced visibility. Fish and invertebrate
species that spend considerable time in the surf zone and feed on benthic invertebrates, such as Florida
pompano, gulf kingfish, Atlantic croaker, spot, and shrimp, would be most vulnerable to beach
nourishment activities. Some studies have found insignificant impact to fish populations (Van Dolah et
al. 1994; USACE 2001) or a temporary increase (Saloman 1974). This may be 1) due to release of
nutrients and infauna during dredging, 2) because resident fish are wide-foraging, or 3) because migratory
fish spend only a portion of their life cycle at the mine site or target beach (Greene 2002). Other
researchers suggest that fish are dependent on the amount of available habitat and that any loss represents
a decrease in production (Peterson et al. 2001). Although USACE (2001) did not observe a significant
change in the surf zone fish population, they stated that due to the inter-annual variability of surf zone
fishes, a change would only be observed if a catastrophe occurred. Unfortunately, very little monitoring
has been done at the level needed to adequately assess and detect the impacts of nourishment projects on
fish distribution, feeding, growth, or survival. Although, there has been few studies examining the direct
effects of beach nourishment on pelagic fish, several studies have examined the impacts on pelagic fish
prey items (i.e. polychaetes, copepods, and mollusks). Peterson (2000) concluded that nourishment
projects should be ceased in April or May (warm season) to reduce the effects of nourishment on Domax
and Emerita populations. For further discussion on nourishment impacts on invertebrates, refer to the
beach nourishment impacts on the intertidal beach section.
A New Jersey study examined surf zone fish distribution, abundance, and diet in response to ongoing
nourishment projects (USACE 2001). In the immediate vicinity, abundance of bluefish, a visual feeder,
decreased and northern kingfish, a benthic feeder, appeared to increase. However, no long-term trends
were detected in distribution or abundance. Stomach content analyses of kingfish and silversides did not
suggest differences in prey availability between control and project sites. This study concluded that
―because inter-annual variation of surf zone fish community dynamics is considerable, it is unlikely that
anything other than catastrophic environmental impacts on surf zone fish populations would be evident
(USACE 2001).‖
In North Carolina, the effects of a Brunswick County beach nourishment project on surf fish, benthic
invertebrates, and water quality, were evaluated from March 2001 to May 2002 (USACE 2003; Versar
2003). Sand from the lower Cape Fear River dredging project was placed on Bald Head Island, Caswell
Beach, Oak Island, and Holden Beach. Seining and trawling before and after the project found no
significant differences in fish abundance or diversity among disturbed, undisturbed, and reference sites
during any season. This was attributed to the high mobility and schooling behavior of the dominant fish
species (anchovies and drum family), resulting in clustered and variable distribution. Although
statistically not significant, gulf kingfish were less abundant at the disturbed sites than the undisturbed
sites. The decline was thought to be at least partially due to the reduced availability of benthic
invertebrates preferred by gulf kingfish (USACE 2003). The intertidal benthic community was the most
directly impacted by the beach nourishment project. Analysis of the effects of this project was limited by
problems with the statistical design (USACE 2003; Versar 2003). Sample size was often insufficient to
calculate confidence limits, partly due to uneven sampling among treatments (disturbed, undisturbed,
reference). Research is currently being conducted by UNC-Wilmington investigating the effects of beach
nourishment on the nursery function of the surf zone by comparing fish and invertebrate assemblages,
density and nutritional condition of juvenile Florida pompano and gulf kingfish. Initial findings indicate
that fish composition and diet differed significantly at nourished beaches compared to unnourished
beaches, potentially affecting diet and growth (Lipton et al. 2010; Perillo and Lankford 2010). Adequate
monitoring of the effects of beach nourishment on the soft bottom community and associated surf fish
populations is increasingly important as the number of beach nourishment projects increase and should
2010 Coastal Habitat Protection Plan
Chapter 6. Soft Bottom Page 371
be required for all large-scale or long-term nourishment projects.
Status of beach disposal from navigational dredge disposal projects
The USACE is charged to maintain North Carolina‘s navigable inlets and ocean channels through
dredging as necessary. Navigational dredging in inlets by the USACE is allowed at any time of the year
and is not subject to any mandatory dredging moratoria unless sea turtle take quotas are exceeded.
Industry-owned hopper dredges working in the Wilmington and Morehead City port areas and Oregon
Inlet are requested to refrain from using hopper dredges in the December to March time period to ovoid
the taking of sea turtles. These take can jeopardize the future of that and future dredging projects (J.
Richter/USACE, pers. com., 2009).
Maintenance of the seven federal inlet channels is performed by a sidecast dredge or a small hopper
dredge. Maintenance of the federal channels at Morehead City, Wilmington Harbor, and Oregon Inlet is
conducted by hydraulic pipeline dredge or hopper dredge. Timing of all work is dependent upon the area
to be maintained, the type of equipment to be used, and the anticipated environmental effects. Performing
work with a hopper dredge requires consideration of possible impacts on endangered and threatened sea
turtles. The USACE has no anticipated impacts from the dredging aspect of hydraulic dredge jobs, but
beach disposal is conditioned to avoid/minimize impacts to all flora and fauna, specifically turtles, piping
plovers and seabeach amaranth (J. Richter 2009).
Material from navigation dredging projects is put on or adjacent to ocean beaches in close proximity to
the dredged site, or in an EPA designated ocean dredge material disposal site. Beaches receiving sand
from dredged inlets and adjacent waterways are indicated in Table 6.6 and Map 6.3 a-c. Sand from these
projects usually only covers a relatively short linear length of the beach (< one mile), generally close to
the inlet where the sand originated. The amount of sand deposited and the frequency of dredging vary
between sites and with each dredging event (Table 6.6). There are 51 miles of beach designated and
approved for dredge disposal, but only about 16 miles of beach receive dredge material (J.
Richter/USACE, pers. com., 2009). Areas receiving dredge disposal include several locations on Hatteras
Island, south end of both ends of Bogue Banks, Onslow Beach, several locations on Topsail Island,
Wrightsville Beach, Masonboro Island, north end of Carolina Beach, Caswell Beach, Oak Island, east end
of Ocean Isle Beach, east end of Holden beach and both ends of Bald Head Island. In addition, privately
owned Figure 8 Island has received nourishment projects periodically.
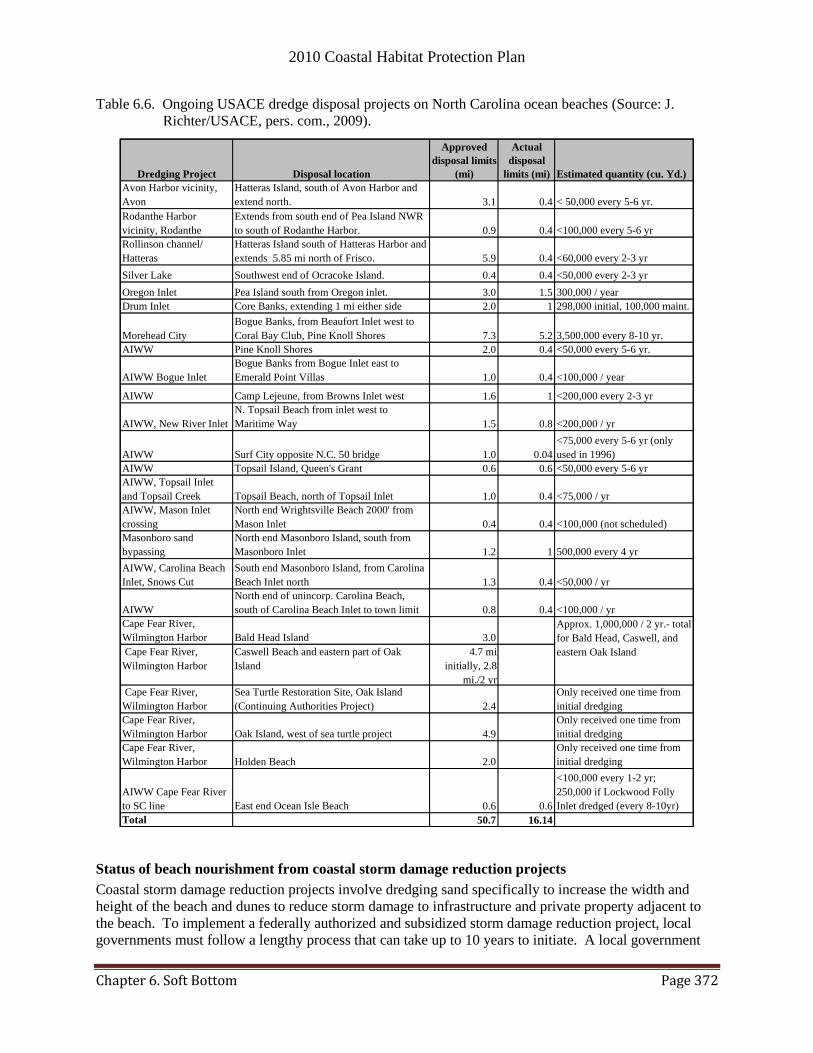
2010 Coastal Habitat Protection Plan
Chapter 6. Soft Bottom Page 372
Table 6.6. Ongoing USACE dredge disposal projects on North Carolina ocean beaches (Source: J.
Richter/USACE, pers. com., 2009).
Status of beach nourishment from coastal storm damage reduction projects
Coastal storm damage reduction projects involve dredging sand specifically to increase the width and
height of the beach and dunes to reduce storm damage to infrastructure and private property adjacent to
the beach. To implement a federally authorized and subsidized storm damage reduction project, local
governments must follow a lengthy process that can take up to 10 years to initiate. A local government
Dredging Project Disposal location
Approved
disposal limits
(mi)
Actual
disposal
limits (mi) Estimated quantity (cu. Yd.)
Avon Harbor vicinity,
Avon
Hatteras Island, south of Avon Harbor and
extend north. 3.1 0.4 < 50,000 every 5-6 yr.
Rodanthe Harbor
vicinity, Rodanthe
Extends from south end of Pea Island NWR
to south of Rodanthe Harbor. 0.9 0.4 <100,000 every 5-6 yr
Rollinson channel/
Hatteras
Hatteras Island south of Hatteras Harbor and
extends 5.85 mi north of Frisco. 5.9 0.4 <60,000 every 2-3 yr
Silver Lake Southwest end of Ocracoke Island. 0.4 0.4 <50,000 every 2-3 yr
Oregon Inlet Pea Island south from Oregon inlet. 3.0 1.5 300,000 / year
Drum Inlet Core Banks, extending 1 mi either side 2.0 1 298,000 initial, 100,000 maint.
Morehead City
Bogue Banks, from Beaufort Inlet west to
Coral Bay Club, Pine Knoll Shores 7.3 5.2 3,500,000 every 8-10 yr.
AIWW Pine Knoll Shores 2.0 0.4 <50,000 every 5-6 yr.
AIWW Bogue Inlet
Bogue Banks from Bogue Inlet east to
Emerald Point Villas 1.0 0.4 <100,000 / year
AIWW Camp Lejeune, from Browns Inlet west 1.6 1 <200,000 every 2-3 yr
AIWW, New River Inlet
N. Topsail Beach from inlet west to
Maritime Way 1.5 0.8 <200,000 / yr
AIWW Surf City opposite N.C. 50 bridge 1.0 0.04
<75,000 every 5-6 yr (only
used in 1996)
AIWW Topsail Island, Queen's Grant 0.6 0.6 <50,000 every 5-6 yr
AIWW, Topsail Inlet
and Topsail Creek Topsail Beach, north of Topsail Inlet 1.0 0.4 <75,000 / yr
AIWW, Mason Inlet
crossing
North end Wrightsville Beach 2000' from
Mason Inlet 0.4 0.4 <100,000 (not scheduled)
Masonboro sand
bypassing
North end Masonboro Island, south from
Masonboro Inlet 1.2 1 500,000 every 4 yr
AIWW, Carolina Beach
Inlet, Snows Cut
South end Masonboro Island, from Carolina
Beach Inlet north 1.3 0.4 <50,000 / yr
AIWW
North end of unincorp. Carolina Beach,
south of Carolina Beach Inlet to town limit 0.8 0.4 <100,000 / yr
Cape Fear River,
Wilmington Harbor Bald Head Island 3.0
Cape Fear River,
Wilmington Harbor
Caswell Beach and eastern part of Oak
Island
4.7 mi
initially, 2.8
mi./2 yr
Cape Fear River,
Wilmington Harbor
Sea Turtle Restoration Site, Oak Island
(Continuing Authorities Project) 2.4
Only received one time from
initial dredging
Cape Fear River,
Wilmington Harbor Oak Island, west of sea turtle project 4.9
Only received one time from
initial dredging
Cape Fear River,
Wilmington Harbor Holden Beach 2.0
Only received one time from
initial dredging
AIWW Cape Fear River
to SC line East end Ocean Isle Beach 0.6 0.6
<100,000 every 1-2 yr;
250,000 if Lockwood Folly
Inlet dredged (every 8-10yr)
Total 50.7 16.14
Approx. 1,000,000 / 2 yr.- total
for Bald Head, Caswell, and
eastern Oak Island
2010 Coastal Habitat Protection Plan
Chapter 6. Soft Bottom Page 373
must first identify an erosion problem and request a study by the USACE to determine if and how a
project could be conducted. While designing these projects avoiding and minimizing environmental
impacts is a primary consideration. DMF and other agencies are given an opportunity to comment to
DCM and the USACE on the potential impacts of a project to fisheries, fish habitat, and other
environmental concerns. The MFC adopted a beach nourishment policy in 2000 to guide the permitting
process to more fully consider fish habitat impacts (Appendix I).
The frequency and magnitude of beach nourishment on developed beaches have increased over time.
From the 1960s to 2000, only nine miles of beach (3% of the ocean shoreline) had ongoing storm damage
reduction projects - Wrightsville Beach, Carolina Beach, and Kure Beach (Table 6.7; Map 6.3 a-c).
These projects were initially authorized and begun in the 1960s, although the first nourishment project in
Wrightsville Beach occurred in 1939 (USACE 1992). With the exception of Currituck County where
there have been no nourishment projects, Onslow County has had the least beach renourishment, with
only one small project in the 1990s. Currently there are 14.2 mi of beach along North Carolina‘s coast
that have authorized and funded storm damage reduction projects ongoing. Additionally beach
renourishment projects are under development for Bogue Banks, Oak Island/ Caswell/ Holden, Bodie
Island, and Topsail Island (Table 6.7). All of Hatteras and Ocracoke islands are also under consideration
because of the DOT NC 12 study, but it is likely that only a small part of these islands would actually be
nourished (J. Sutherland/WRC, pers. com., 2004). Beach renourishment of federally authorized storm
reduction projects generally occurs on three or four year intervals. Potentially 155 mi or 48% of North
Carolina‘s beaches could be renourished regularly if resources existed, and these beaches could be
potentially impacted by such activities. This does not include approximately 16 mi of beaches with
periodic disposal from channel, inlet, and port dredging. There are approximately 160 mi of federally or
state owned barrier islands along the 320 mi of ocean shoreline where storm damage reduction projects
would be unlikely. Along with the federally funded USACE coastal storm reduction projects, there are
several beaches that have or in the process of privately funding beach nourishment projects (including but
not limited to Nags Head, Surf City, North Topsail Beach, Bogue Banks, Figure 8 Island, and Bald Head
Island) (Table 6.8). These privately funded projects must undergo an USACE permit review, and are
considered one time projects.
Preliminary examination of commercial gill net landings data for demersal feeding surf fish in counties
with differing levels of beach nourishment activity indicates some relationship may exist between beach
nourishment events and low landings (DMF, unpub. data). However, more information and analysis are
needed to determine if beach nourishment events negatively impact surf fish abundance, CPUE, or
landings. Given the increasing numbers of existing and requested nourishment projects over time, the
cumulative impacts of activities on the intertidal and subtidal communities are also expected to increase.
Increasing use of beach nourishment may have a cumulative impact on fish productivity of nearshore
waters through impacts on the benthic community and alteration of natural barrier island processes.
Due to the increasing interest by municipalities in beach nourishment of some kind, it was evident that a
plan was needed to provide guidelines on how to manage a limiting resource in an effective and
environmentally sensitive manner. DWR and DCM agreed to collaboratively develop a Beach and Inlet
Management Plan (BIMP) in part, to address the CHPP recommendation to prepare a BIMP that
addresses ecologically based guidelines, socio-economic concerns and fish habitat. In addition, in 2000,
House Bill 1840 required DENR to develop a multiyear beach management and restoration strategy, and
in 2005 the GA commissioned a study of the cost and management issues related to maintaining NC‘s
shallow draft navigation channels. The purpose of the BIMP was to compile data, define regional sand
management regions, and develop management strategies to assist with the decisions and review process
associated with beach nourishment activities. The plan will also assist DWR in developing funding
priorities for beach nourishment projects, and be an educational tool for legislators.
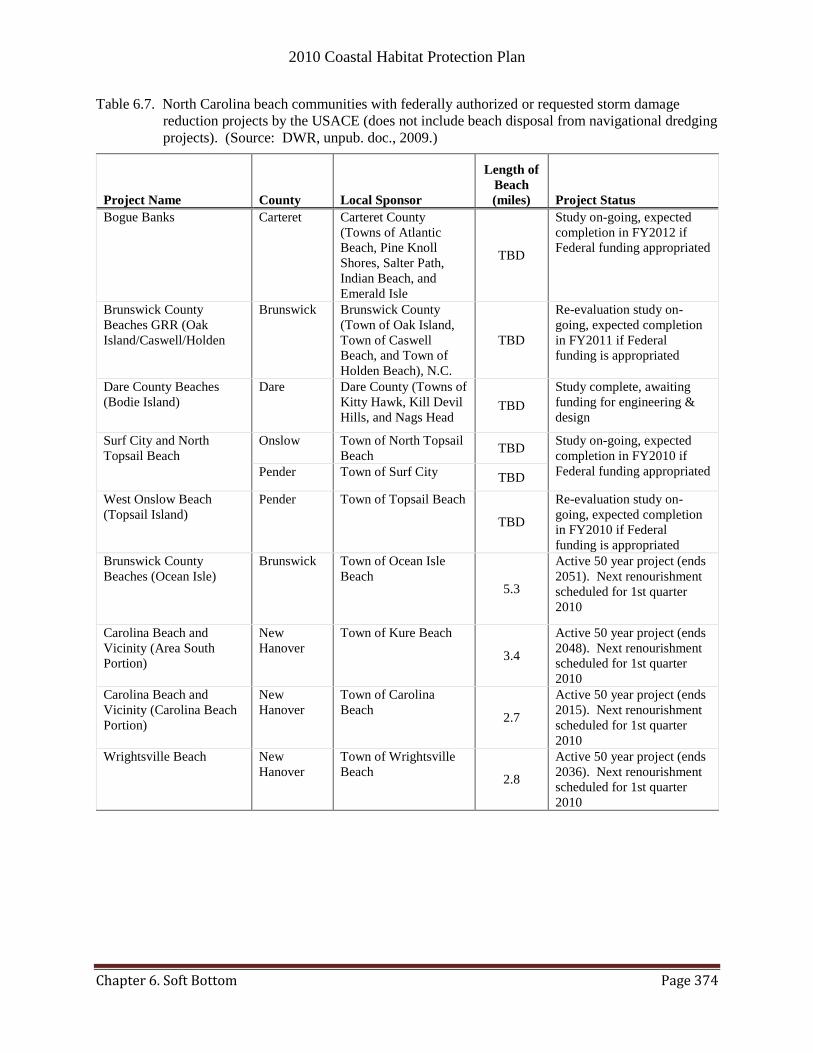
2010 Coastal Habitat Protection Plan
Chapter 6. Soft Bottom Page 374
Table 6.7. North Carolina beach communities with federally authorized or requested storm damage
reduction projects by the USACE (does not include beach disposal from navigational dredging
projects). (Source: DWR, unpub. doc., 2009.)
Project Name County Local Sponsor
Length of
Beach
(miles) Project Status
Bogue Banks Carteret Carteret County
(Towns of Atlantic
Beach, Pine Knoll
Shores, Salter Path,
Indian Beach, and
Emerald Isle
TBD
Study on-going, expected
completion in FY2012 if
Federal funding appropriated
Brunswick County
Beaches GRR (Oak
Island/Caswell/Holden
Brunswick Brunswick County
(Town of Oak Island,
Town of Caswell
Beach, and Town of
Holden Beach), N.C.
TBD
Re-evaluation study on-
going, expected completion
in FY2011 if Federal
funding is appropriated
Dare County Beaches
(Bodie Island)
Dare Dare County (Towns of
Kitty Hawk, Kill Devil
Hills, and Nags Head TBD
Study complete, awaiting
funding for engineering &
design
Surf City and North
Topsail Beach
Onslow Town of North Topsail
Beach TBD
Study on-going, expected
completion in FY2010 if
Federal funding appropriated Pender Town of Surf City TBD
West Onslow Beach
(Topsail Island)
Pender Town of Topsail Beach
TBD
Re-evaluation study on-
going, expected completion
in FY2010 if Federal
funding is appropriated
Brunswick County
Beaches (Ocean Isle)
Brunswick Town of Ocean Isle
Beach 5.3
Active 50 year project (ends
2051). Next renourishment
scheduled for 1st quarter
2010
Carolina Beach and
Vicinity (Area South
Portion)
New
Hanover
Town of Kure Beach
3.4
Active 50 year project (ends
2048). Next renourishment
scheduled for 1st quarter
2010
Carolina Beach and
Vicinity (Carolina Beach
Portion)
New
Hanover
Town of Carolina
Beach 2.7
Active 50 year project (ends
2015). Next renourishment
scheduled for 1st quarter
2010
Wrightsville Beach New
Hanover
Town of Wrightsville
Beach 2.8
Active 50 year project (ends
2036). Next renourishment
scheduled for 1st quarter
2010

2010 Coastal Habitat Protection Plan
Chapter 6. Soft Bottom Page 375
Table 6.8. North Carolina beach communities with non-federally authorized or requested storm
damage reduction projects (does not include beach disposal from navigational
dredging projects). (Source: D. Piatkowski/USACE, pers. com.., 2010.)
Project Name County Local Sponsor
Length of
Beach 2
Town of Nags Head - Beach Nourishment Project Dare Offshore Borrow Areas 10
Emerald Isle FEMA Project Carteret USACE ODMDS –
Morehead City Port
Shipping Channel 4
Bogue Banks FEMA Project Carteret USACE ODMDS –
Morehead City Port
Shipping Channel 13
Bogue Banks Restoration Project – Phase I – Pine
Knoll Shores and Indian Beach Joint Restoration
Carteret Offshore Borrow Areas
7
Bogue Banks Restoration Project – Phase II –
Eastern Emerald Isle
Carteret Offshore Borrow Areas 6
Bogue Banks Restoration Project – Phase III–
Bogue Inlet Channel Realignment Project
Carteret Offshore Borrow Areas
5
North Topsail Dune Restoration (Town of North
Topsail Beach)
Onslow/
Pender
Upland borrow source
near Town of Wallace,
NC
NA
North Topsail Beach Shoreline Protection Project Pender New River Inlet
Realignment and
Offshore Borrow Area 11
*Topsail Beach - Beach Nourishment Project Pender New Topsail Inlet Ebb
Shoal and Offshore
Borrow areas 6
*Figure Eight Island New
Hanover
Banks Channel and
Nixon Channel 3
*Rich Inlet Management Project Pender Relocation of Rich Inlet NA
With approximately 50 % of North Carolina‘s ocean shoreline in state or federal ownership, the
remaining 50% are developed. Of those, 80 mi of shoreline in the recent past have been managed, and
potentially 80 mi more may be managed in the future. The state funding required to maintain potentially
160 mi of beach would be huge. With that in mind, the BIMP may recommend establishment of a
dedicated fund, and a regional commission to coordinate and facilitate projects. As of February 2010, the
BIMP was drafted but not finalized.
In 2008 an Ocean Policy Steering Committee was formed to reexamine ocean resource issues and update
existing policies on ocean uses. In April 2009 DCM published an ocean policy report (NC Sea Grant
2009) which identified five emerging resource policy issue areas and provides recommendations for

2010 Coastal Habitat Protection Plan
Chapter 6. Soft Bottom Page 376
changes to state policy that ensures North Carolina will be responsive with adaptive rule language as the
ocean climate continues to experience technological, social, and economic change. Sand resource
management was identified as an emerging issue. The report recommended:
Identification of regional available sand sources
Development of a state-level comprehensive plan to protect beaches and inlets
Comprehensive management of inlet tidal delta sand sources
Preventing loss to the barrier island system of sand in inlet channels
Amendment to rules regarding dredging around hard bottom areas
Incorporation of a sea level rise component to CAMA land use plans
All of the sand management recommendations of the Ocean Policy Report should be implemented. The
first four items should be addressed in the BIMP.
6.4.1.2. Infrastructure
Oil and gas development
As described in the water column and hard bottom section, oil and natural gas drilling can be a major
threat to the ocean environment. Specifically, oil drilling can affect the soft bottom community by
altering both the inter- and sub-tidal soft bottom habitat. Sub-tidal habitat can be directly influenced by
moving or removing soft sediments during the drill process. This removal process can potentially create
disturbances similar to those caused by soft bottom dredging impacts. As a result of offshore drilling
there is a possibility of increased levels of pollutants and changes in the bottom composition (sediment
characteristics and water movement) that can alter the nearby benthic community (Olsgard and Gray,
1995; Kennicutt et al., 1996; Barros et al., 2001). Studies have found diversity lowest adjacent to oil/gas
platforms, with increasing diversity the further you traveled from the platforms (Kingston 1992; Daan and
Mulder 1996; and Peterson et al. 1996). Although these results have been observed, other studies believe
these changes are influenced by differences in depth, sediment characteristics, distance from shore,
interannual variability, or the presence of previously unavailable hard substrate (Hernández et al. 2005
and Terlizzi et al. 2008). A common theme throughout this research is that in order to determine the
effects of drilling on soft bottom benthos, information regarding pre-drilling, during, and post drilling
conditions, as well as the use of control sites. In 2009 the General Assembly formed a Legislative
Research commission Advisory Subcommittee on Offshore Energy Exploration to examine the impacts of
offshore energy in North Carolina. For further discussion refer to the ―Infrastructure‖ section of the Hard
Bottom chapter.
The potential for an oil spill can be detrimental to the entire ecosystem. Not only can ocean habitats be
impacted by released oil, estuarine habitats can also be affected if the spill occurs in or is transported
through the inlets to estuarine waters. In North Carolina, as a result of wind and water movement, the
first habitat point of contact for oil floating on the water‘s surface in the ocean environment is the
intertidal beaches and flats. Although most of North Carolina‘s coastal beaches are high energy areas, oil
spills can cause closures of beaches and fishing activities. In the areas where there is low flow, oil can
persist for decades (Peterson 2001 and Peterson et al. 2003b). The presence of oil in soft bottom
sediments can prevent fish eggs from hatching, limiting the growth rate of small fish, and prevents fish
from returning to previously utilized spawning habitat (Peterson 2001 and Peterson et al. 2003b). It is
important to note, that these impacts can be caused by other sources such as shipping vessels running
aground and leaking oil or gas.
2010 Coastal Habitat Protection Plan
Chapter 6. Soft Bottom Page 377
Wind Energy
Wind farms are discussed in further detail in the hard bottom section, while this section focuses on the
potential impacts on soft bottom and the associated fauna. Duke Energy Progress is proposing to
construct a wind turbine field in either Pamlico Sound or off of the coast of North Carolina and run
underground power lines from the turbines to land. In areas where there is soft bottom, pilings may be
driven deep into the bottom sediments (approximately 30 to 35 meters). This practice can act similarly to
that of driving pilings into the substrate (i.e. oil/gas platforms, docks, or bridges) or like a platform itself
(modifying sediment composition or water movement). Cables will then be run from the structures to a
facility were the electricity will be distributed. Putting pilings and cables in soft bottom habitat will
immediately crush or kill benthic invertebrates and remove soft bottom habitat that was previously
available. In order to minimize these impacts cables should be below the surface using directional boring
methods. Although hard bottom habitat will be created, the benthic community will change from infaunal
bivalves and annelid worms to epifaunal bivalves and algae, altering the food web (see ―Ecosystem
management and Strategic Habitat Areas‖ for discussion of habitat trade-offs). The practice of driving
pilings into the soft bottom can also have a negative effect on sound producing fish, mammals, and turtles
causing them to leave the immediate area while pilings are being installed. In preliminary work,
Wahlberg and Westerberg (2005) estimated that fish were only affected by the sound produced by wind
mills up to 4 m away when winds were above 13m s-1
. Wahlberg and Westerberg (2005) go on to state
that these wind turbines are masking communication sounds (i.e. mating and warning) and orientation
signals. Underground energy cables are known to give off an electrical charge that can alter fishes‘
migration patterns. Studies have shown different species (including the American eel, Anguilla rostrata)
to be effected by these electrical charges (Rommel and McCleave 1973 and Öham et al. 2007).
While current CRC rules prohibit the placement of wind turbines in state waters as they are not
considered water-dependent structures, the CRC has taken steps to amend these rules (M.
Lopazanski/DCM, pers. com., January 2010). The proposal currently under consideration would declare
wind energy facilities of three MW or larger to be water dependent structures. Should the State consider
locating a wind facility in state or federal waters, proper placement of energy infrastructure is necessary
to minimize potential impacts to SAV habitat and minimize conflicts with existing activities.
The 2009 Ocean Policy Steering Committee made several recommendations regarding ocean based
alternative energy, primarily regarding review and modification of legal structure as needed to support
alternative energy development. Other alternative energy industries that could develop in the future
include wave energy, current energy, and tidal energy.
6.4.1.3. Off-road vehicles
The use of off-road vehicles (ORV) has been allowed in designated beach areas of North Carolina. These
ORV have been shown to increase the loss of sediment from intertidal shoreline and negatively affect
intertidal fauna (Schlacher and Thompson 2008). Fauna can be affected directly by being crushed by
ORVs, or indirectly by altering the sediment composition and behavior (Schlacher and Thompson 2008).
On the Cape Hatteras National Seashore Hobbs et al. (2008) observed a decrease in the number of ghost
crabs (Ocypode quadrata) in areas that had been previously closed to ORV. This is important to note
since ghost crabs have been described to be indicator species of anthropogenic influences on coastal
shorelines (Steiner and Leatherman 1981; Neves and Bemvenuti 2006; and Hobbs et al. 2008). In
Australia, low volumes of ORVs (5 passes through an area) were found to crush large numbers of surf
clams (Donax deltoi) (Schlacher et al. 2008). As the number of trips increased more surf clams were
crushed (Schlacher et al. 2008). On Fire Island, NY, ORVs were estimated to deliver large amounts of
sand to the swash zone contributing to the overall erosion rate (Anders and Leatherman 1987). It is
unclear of whether or not the sand is lost from the long shore sediment transport. In North Carolina, the
National Park Service regulates where ORVs are permitted to drive on beach. Current regulations include

2010 Coastal Habitat Protection Plan
Chapter 6. Soft Bottom Page 378
restrictions to keep ORVs above the wrack line (which protect intertidal fauna) and out of important
nesting areas for birds and other fauna. The National Park Service should continue to restrict ORV beach
access to areas that will not negatively influence soft bottom fauna.
6.4.2. Mining/salvage
6.4.2.1. Minerals
Mining or mineral extraction is another dredging activity that has potential habitat impacts. Phosphate
deposits, of sufficient quality and quantity to be potentially exploitable, have been identified within the
Pungo River geological formation in Onslow Bay (Map 6.4). The formation occurs beneath the Pamlico
River, extends beneath ocean soft bottom from Bogue Banks southwest to Frying Pan Shoals, is
approximately 150 km long and 40 km wide, and covers approximately 6,000 km2 (Powers et al. 1990).
The largest deposit occurs at Frying Pan Shoals, seaward of state jurisdiction, and is potentially available
to dredge mining. Other phosphate deposits, referred to as the Northeast Onslow Bay phosphate district,
occur immediately off Bogue Banks within and seaward of state jurisdiction. Because of its proximity to
shore and a deep-water port, the economic potential of mining these deposits is high. In addition, other
minerals occur in offshore sediments (as phosphate mining byproducts) including trace elements,
radioactive substances like uranium and phosphogypsum, heavy minerals such as titanium, zirconium,
aluminosilicates, and valuable metals such as gold and silver (Riggs and Manheim 1988). Currently no
mining is ongoing in North Carolina waters, although the potential for such activities exists.
6.4.2.2. Logs/pilings
Log salvage is another form of dredging that causes disturbance of soft bottom and water column habitat.
However, the magnitude of disturbance is much less than that created by dredging of a permanent channel
or basin. Refer to the water column chapter for more information on this activity.
6.4.3. Fishing gear impacts
The extent of habitat damage from fishing gear varies greatly with the gear type, habitat complexity, and
amount of gear contact. While MFC rules are designed to minimize commercial fishing gear impacts to
fisheries habitat, these restrictions primarily focus on restricting the use of highly destructive bottom
disturbing gear from most structural habitats such as oyster or SAV beds. Soft bottom habitat, because of
its low structure and dynamic nature, has historically been considered the most appropriate location to use
bottom disturbing gear. There are some fishery rules that restrict bottom disturbing gears in soft bottom
habitat, since DMF research found that their use disturbed shallow soft bottom functions (i.e., nursery
characteristics). These include prohibition of trawls, dredges, and long haul seines in PNAs [15A NCAC
3N .0104] and prohibition of trawls or mechanical shellfish gear in crab spawning sanctuaries [15A
NCAC 3L .0205] in the five northern-most inlets of North Carolina during the blue crab spawning season
(March-August) (Map 3.5a-c in the Shell Bottom chapter).
Fishing related impacts to fish habitat have been reviewed and compiled in federal fishery management
plans for managed species and have been summarized in fishery management plans by SAFMC and
MAFMC, as well as by MSC (1996), Auster and Langton (1999), DMF (1999), and Collie et al. (2000).
A legislative report to the Moratorium Steering Committee (MSC 1996) compiled a list of the gears used
in North Carolina waters and their probable impacts. The gears with the greatest potential for damage to
soft bottom or other habitats include dredges and trawls. The impacts of these gears and where they are
used are discussed below.
2010 Coastal Habitat Protection Plan
Chapter 6. Soft Bottom Page 379
6.4.3.1. Mobile bottom disturbing gear
Dredging
Even with a low fishing effort, dredges are considered to be the most habitat destructive fishing gear
(DeAlteris et al. 1999; Collie et al. 2000). Oyster dredging is conducted over shell bottom and was
discussed in detail in the shell bottom chapter. Crab dredging is allowed in one area of primarily soft
bottom in northern Pamlico Sound (approximately 100,653 acres) (Map 6.5), and is opened by
proclamation from January 1 to March 1 [15A NCAC 3L .0203]. Crab dredges are similar to oyster
dredges, although the dredge teeth are sometimes longer on the crab dredge. Because of the gears‘ teeth,
crab and oyster dredges can dig deep into the sediment and cause extensive sediment disturbance.
Mechanical methods, as well as trawls and pots, for the taking of crabs are prohibited in designated Crab
Spawning Sanctuaries from March through August. In recent years, fishing effort has been very low,
with fewer than 10 crab dredge trips reported per year. Because less habitat damaging methods are
available for harvesting crabs, MFC should consider if prohibition of crab dredging is advisable.
There are two types of scallop dredges used in North Carolina. Bay scallop dredges are used in SAV
beds. Refer to the SAV chapter for more information on this gear. Sea scallop dredges are used
occasionally in the coastal ocean off Cape Lookout. Studies have found that scallop dredges cause
extensive damage to hard bottom and significantly reduce habitat complexity on soft bottom and shell
hash bottom (Auster et al. 1996; Currie and Parry 1996). Habitat complexity is reduced through
flattening of mounds, filling of depressions, dispersing shell hash, and removing small biotic cover such
as hydrozoans and sponges (Auster et al. 1996; Løkkeborg 2005). Due to a decline in bay scallops, a
moratorium was in place from 2005 through 2008. Sea scallop dredging is a sporadic fishery, primarily
occurring in deep coastal waters (federal) north of North Carolina. Since 1994, commercial landings of
sea scallop meats have been very low, ranging from 13,815lb in 1999 to 512,624lb in 2001 ( DMF,
unpub. data). Because of the location of the fishery and the low level of effort, no additional restrictions
appear to be needed.
Hydraulic clam dredging and clam kicking were described in detail in the SAV chapter. Mechanical
clamming, including kicking and dredging, accounts for approximately 21% of the annual hard clam
landings (DMF, unpub. data). The dredging and kicking activity creates trenches and mounds of
discarded material in soft bottom habitat, redistributing and resuspending sediment (Adkins et al. 1983).
Water jets from the hydraulic dredge can penetrate 18 inches into bottom sediments, and uproot any
living structure present (Godcharles 1971). Dredge tracks can remain present from a few days to more
than one year and recolonization by vegetation can take months to begin. Recruitment of clams and other
benthic invertebrates does not appear to be affected by hydraulic dredging (Godcharles 1971). Because of
the severe impacts to habitats, both hydraulic clam dredging and clam kicking are restricted to open sand
and mud bottoms, including areas frequently dredged as navigational channels. However, a study in
North Carolina found no significant effect of this fishing activity on recruitment of hard clams or
abundance of other benthic invertebrates in unvegetated sandy bottom (Peterson et al. 1987). The
locations where mechanical clam harvest is allowed are shown in Map 6.5. There are approximately
39,517 acres that are potentially available to mechanical clam harvest in portions of Core, Bogue, and
Pamlico sounds, Newport, North, White Oak, and New rivers, and a portion of the ICW in Topsail Sound.
The majority of mechanical harvest areas are located in Core Sound (29,951 acres). These fisheries may
be opened by proclamation between Dec 1 and March 31. At this time, no changes are necessary to
protect soft habitat because of the low frequency of the activity and dynamic nature of the habitat.
Bottom trawling
Bottom trawling is used more extensively than dredges on soft bottom habitat in both estuarine and
coastal ocean waters. Bottom trawling in estuarine waters is used primarily to catch shrimp, although
2010 Coastal Habitat Protection Plan
Chapter 6. Soft Bottom Page 380
some crab trawling is also conducted. Flounder trawling is restricted to ocean waters. Bottom trawls are
conical nets that are towed behind a fishing vessel, held open by water pressure against a pair of ―otter
boards‖ or ―doors‖ that are attached to the front of the net. Three components of a bottom trawl can dig
into the sediment: the doors, the weighted line at the opening of the net, and the tickler chains (which are
sometimes added in front of the net to improve the harvest).
Impacts of shrimp and crab trawling in estuarine waters were reviewed and compiled by DMF (1999), at
the request of the MFC and were reported to the General Assembly‘s Joint Legislative Commission on
Seafood and Aquaculture. This report found that trawling can impact fish habitat by altering the physical
structure or biological components of soft bottom. Pulling trawl nets across soft bottom reduces habitat
complexity by (Auster and Langton 1999):
directly removing or damaging epifauna
removing benthic invertebrates which produce structure like burrows and pits
smoothing sediment features of the seafloor, such as sediment ridges and contours
Trawl doors were shown to bring a high number of infaunal bivalves to the sediment surface (Gilkenson
et al. 1998) and Sanchez et al. (2000) observed more annelids in a muddy bottom after trawling had
occurred in the Mediterranean Sea. This is important to note since in Kaiser and Spencer (1996) observed
a large number of benthic organisms that are damaged by trawls in the diets of demersal fish scavengers
after a trawl has been pulled through an area. Studies in areas that are consistently trawled have shown
otter trawls to have a negative effect on the nematode (a food source for fishery species) community by
reducing abundance, production, and genus richness in areas that are not susceptible to environmental
stresses (i.e. wind events) (Hinz et al. 2008). Gear contact can uproot and remove invertebrates attached
to the seafloor, such as sponges and worm tubes and can expose them to predators.
The change and reduction in the structural complexity of the seafloor and increase in turbidity from
frequent trawling can reduce feeding success of filter feeding invertebrates due to gill clogging, or
increase predation due to increased exposure and reduced cover. A reduction in filter feeders on the
subtidal bottom may also result in reduced water clearing capacity in the water column (Auster and
Langton 1999). The increased turbidity reduces light penetration and consequently reduces primary
productivity of benthic microflora on the seafloor as well as phytoplankton in the water column (Auster
and Langton 1999). Decreased primary productivity will affect demersal zooplankton that, in turn,
supports higher trophic layers. The sediment composition of the bottom may also change with frequent
trawling. Due to the close relationship between sediment size and benthic community structure, this
sediment shift will alter the benthic community (Thrush and Dayton 2002). Reduced diversity and
abundance of some benthic taxa are commonly observed in areas experiencing intense fishing activities
(Auster and Langton 1999; Thrush et al. 2006). A shift in dominant species and a reduction in
community stability may also occur. Long-lived species, which take more time to recover from fishing
disturbance, may be temporarily or indefinitely replaced by short-lived species. However, given the
frequency, magnitude, and location of trawling, it is unknown whether these events are having a
significant negative impact on soft bottom habitat in North Carolina‘s estuarine system.
Trawling can also affect primary productivity through the connection of bottom and water column
processes (DMF 1999). Increased chemical exchange between bottom sediments and the water column
(benthic-pelagic coupling) can have positive and negative effects on estuarine systems. Nutrients released
into the water column can greatly increase nitrogen and phosphorus levels, stimulating phytoplankton
growth, as well as enhancing secondary productivity of herbivorous zooplankton and larger prey (DMF
1999). The increased plant growth can reduce light penetration to the bottom and extent to effects of
trawling in an area beyond the episodic increases in turbidity. Eventually, the remains of plankton and
other organisms will settle, adding to the food available to benthic deposit feeders. However, if large
amounts of organic matter are resuspended, the subsequent increase in plankton can reduce water oxygen
levels, causing hypoxia and anoxia (West et al. 1994; Paerl et al. 1998). By resuspending sediments,

2010 Coastal Habitat Protection Plan
Chapter 6. Soft Bottom Page 381
trawling can make inorganic and organic pollutants (e.g., heavy metals and pesticides, respectively)
available in the water column (Kinnish 1992; DMF 1999). Such toxins can negatively affect productivity
and may also accumulate in organisms through food chain interactions.
While some consider trawling to be physically disruptive to the bottom and potentially harmful to the
benthic community due to gear damage, sedimentation, predation exposure, and reduction in benthic
primary production (Auster and Langton 1998), others feel that trawling may mimic natural disturbances
and stimulate benthic production, enhancing fish production. In a literature review of the effects of
trawling in estuarine waters, DMF (1999) noted that multiple studies demonstrated the presence and
absence of long-term effects of trawling in estuarine waters. No or minimal long-term impacts were
reported in MacKenzie (1982), Van Dolah et al. (1991), and Currie and Parry (1996). Of these studies,
Van Dolah et al. (1991) was located closest to North Carolina, in a South Carolina estuary. After five
months of trawling, Van Dolah et al. (1991) found no significant change in abundance, diversity, or
composition of soft bottom habitat. On the contrary, several studies have found trawling to have long-
term habitat impacts (Bradstock and Gordon 1983, Brown 1989, Collie et al. 1997, Engel and Kvitek
1998). Benthic community recovery time greatly depends on the effort and intensity of trawls in a given
area (Watling and Norse 1998, Auster and Langton, 1999). The recovery time tends to vary depending on
the amount of natural disturbances in the area (weather or macrofaunal). In the Gulf of Maine, the
recovery time after trawling over a mud bottom was 3 months, possibly due to the presence of burrowing
megafauna that naturally disturb the bottom (Simpson and Watling 2006).
Cahoon et al. (2002) studied changes in benthic microalgae, demersal zooplankton, and benthic
macroalgae (important food sources for recreationally and commercially important species) in the
Pamlico River estuary in 1999-2000. Demersal zooplankton includes small crustaceans, nematodes, and
other animals that are important grazers of benthic microalgae and prey for larger fish and invertebrates.
Experimental trawling was conducted to document natural seasonal changes in the benthic community,
examine changes before and after experimental trawling, and compare regularly trawled and untrawled
areas. No significant differences were recorded in benthic algal biomass prior to and after experimental
trawling. In comparing commercially trawled and untrawled areas, benthic microalgae were more
abundant in the untrawled sites. This could be because benthic algae in trawled areas are resuspended
into the water column. Nematodes, an important food source for shrimp, were the most abundant
demersal organism found. The authors concluded that, because the soft bottom community in shallow
systems is frequently subjected to disturbance (such as exposure to waves and currents), trawling was not
detrimental (Cahoon et al. 2002). However, since the experimental treatment consisted of one trawling
pass, observed changes do not accurately reflect those consistent with chronic trawling. A key issue in
determining if trawling is having a negative impact to soft bottom communities is the frequency and
intensity of disturbance. Further analysis is needed to spatially quantify where, how often, and when
trawling occurs in specific areas of soft bottom habitat. It is also important to quantify the episodic and
chronic effects of trawling on nursery functions in different estuarine settings.
The impact of trawling and associated bottom changes on fish populations also depends in part on each
species‘ habitat dependence (Auster and Langton 1998). Where a life stage of a demersal species is
highly dependent (obligate) on the structural components of a habitat where trawling occurs, particularly
for recruitment, there is a greater potential for that species to be impacted by trawling (Auster and
Langton 1998). However, if individuals can move to and survive in alternative habitats, impacts may be
less severe (i.e., adult flounder foraging over ocean bottom can occupy other habitats) (DMF 1999).
Primary nursery areas and inlets are described as ―recruitment bottlenecks‖ for estuarine dependent
species in DMF (1999). Since larval flounder, shrimp, and Atlantic croaker must pass through inlets and
recruit to shallow PNAs, trawling impacts to larval fish in inlets and PNAs could be greater than trawling
in ocean or deep estuarine waters. Protection of these “recruitment bottlenecks” from trawling or other
impacts is therefore very important for estuarine dependent fish and invertebrates.
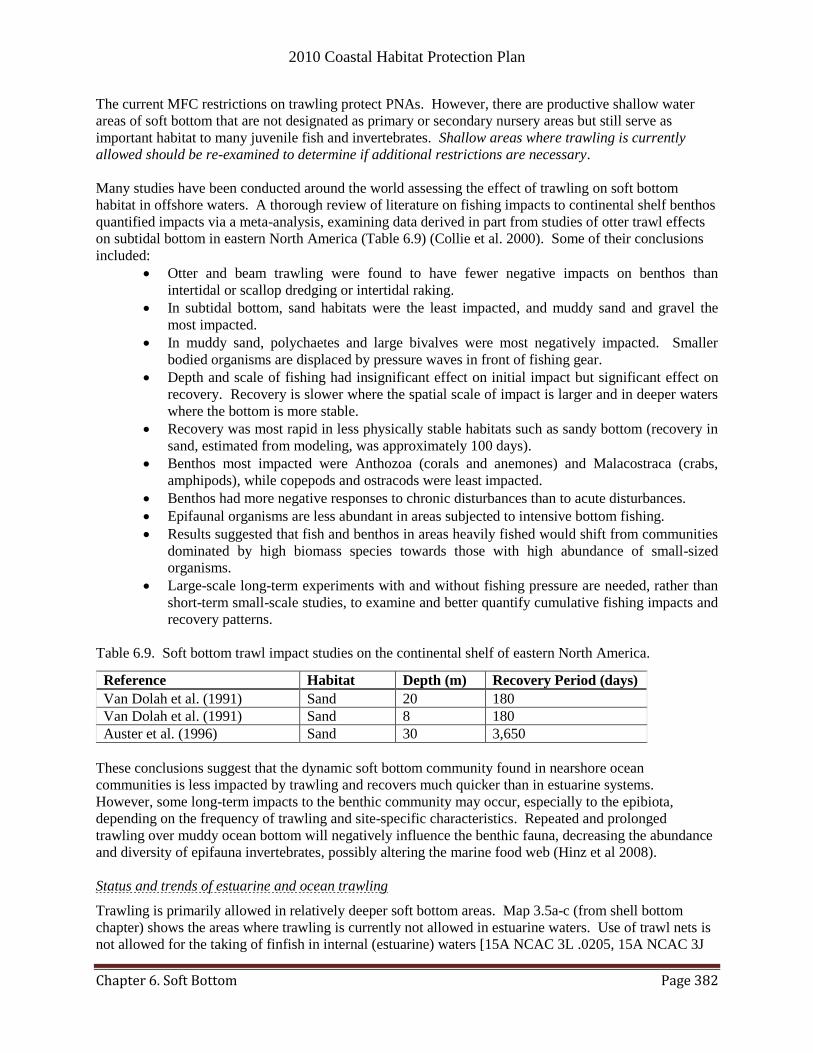
2010 Coastal Habitat Protection Plan
Chapter 6. Soft Bottom Page 382
The current MFC restrictions on trawling protect PNAs. However, there are productive shallow water
areas of soft bottom that are not designated as primary or secondary nursery areas but still serve as
important habitat to many juvenile fish and invertebrates. Shallow areas where trawling is currently
allowed should be re-examined to determine if additional restrictions are necessary.
Many studies have been conducted around the world assessing the effect of trawling on soft bottom
habitat in offshore waters. A thorough review of literature on fishing impacts to continental shelf benthos
quantified impacts via a meta-analysis, examining data derived in part from studies of otter trawl effects
on subtidal bottom in eastern North America (Table 6.9) (Collie et al. 2000). Some of their conclusions
included:
Otter and beam trawling were found to have fewer negative impacts on benthos than
intertidal or scallop dredging or intertidal raking.
In subtidal bottom, sand habitats were the least impacted, and muddy sand and gravel the
most impacted.
In muddy sand, polychaetes and large bivalves were most negatively impacted. Smaller
bodied organisms are displaced by pressure waves in front of fishing gear.
Depth and scale of fishing had insignificant effect on initial impact but significant effect on
recovery. Recovery is slower where the spatial scale of impact is larger and in deeper waters
where the bottom is more stable.
Recovery was most rapid in less physically stable habitats such as sandy bottom (recovery in
sand, estimated from modeling, was approximately 100 days).
Benthos most impacted were Anthozoa (corals and anemones) and Malacostraca (crabs,
amphipods), while copepods and ostracods were least impacted.
Benthos had more negative responses to chronic disturbances than to acute disturbances.
Epifaunal organisms are less abundant in areas subjected to intensive bottom fishing.
Results suggested that fish and benthos in areas heavily fished would shift from communities
dominated by high biomass species towards those with high abundance of small-sized
organisms.
Large-scale long-term experiments with and without fishing pressure are needed, rather than
short-term small-scale studies, to examine and better quantify cumulative fishing impacts and
recovery patterns.
Table 6.9. Soft bottom trawl impact studies on the continental shelf of eastern North America.
Reference Habitat Depth (m) Recovery Period (days)
Van Dolah et al. (1991) Sand 20 180
Van Dolah et al. (1991) Sand 8 180
Auster et al. (1996) Sand 30 3,650
These conclusions suggest that the dynamic soft bottom community found in nearshore ocean
communities is less impacted by trawling and recovers much quicker than in estuarine systems.
However, some long-term impacts to the benthic community may occur, especially to the epibiota,
depending on the frequency of trawling and site-specific characteristics. Repeated and prolonged
trawling over muddy ocean bottom will negatively influence the benthic fauna, decreasing the abundance
and diversity of epifauna invertebrates, possibly altering the marine food web (Hinz et al 2008).
Status and trends of estuarine and ocean trawling
Trawling is primarily allowed in relatively deeper soft bottom areas. Map 3.5a-c (from shell bottom
chapter) shows the areas where trawling is currently not allowed in estuarine waters. Use of trawl nets is
not allowed for the taking of finfish in internal (estuarine) waters [15A NCAC 3L .0205, 15A NCAC 3J

2010 Coastal Habitat Protection Plan
Chapter 6. Soft Bottom Page 383
.0104(a&b)]. Shrimp trawling is allowed, except in primary or secondary nursery areas [15A NCAC 3N
.0105], or in No Trawl Areas [15A NCAC 3R .0106] (Map 3.5a-c in the Shell Bottom chapter). In North
Carolina, bottom trawling in ocean waters is prohibited over hard bottom but is allowed over most soft
bottom communities. Trawling is prohibited in military prohibited areas [15A NCAC 3I .0110 and 3R
.0102], a designated sea turtle sanctuary seaward of Onslow Beach from June 1 to August 31 [15A NCAC
3I .0107 and 3R .0101], within 0.5mi of the beach from Virginia to Oregon Inlet [15A NCAC 3J .0202],
and in designated crab spawning sanctuaries from March 1 to August 1 [15A NCAC 3L .0205]. The
purpose of these regulations is to protect functional habitat areas and reduce bycatch or user conflicts.
Annual effort with various commercial trawling gears in North Carolina water bodies is shown in Table
6.6 (DMF, unpub. data). Commercial shrimp trawling accounts for the majority of all trawl trips (92% in
2002). About 75-80% of shrimp trawl trips occur in estuarine waters, with the remainder in ocean waters,
primarily within state territorial seas (<3 mi offshore) off the central and southern coast of North
Carolina. Total annual estuarine shrimp trawling effort has ranged from 2,944 in 2005 to 15,791 in 1995.
The total number of estuarine shrimp trawl trips has not exceeded 10,000 trips since 2002. Prior to 2002,
the numbers of estuarine shrimp trawl trips declined to below 10,000 during two years: 1998 and 2001.
Total annual shrimp trawling effort has fluctuated with shrimp abundance but appears to have gradually
declined since 1994. However, the lower commercial fishing effort observed from 1999 – 2002, when
compared to earlier years, is thought to be mostly due to a change in licensing procedure (R.
Carpenter/DMF, pers. com., 2004). In 1999, a recreational commercial gear license became available to
fishermen. Under this license, shrimp may be caught recreationally using a trawl, but cannot be sold.
Some fishermen, with previously held commercial licenses, switched from standard commercial gear
licenses (SCGL) to recreational commercial gear licenses (RCGL). Effort from RCGL licenses are not
included in the data shown in Table 6.10. In 2002, approximately 5,000 trips for shrimp were reported
(DMF, unpub. data).
Regionally, the shrimp trawling effort has generally been greatest in Core and Bogue sounds and the
associated estuaries (3,400-6,783 trips/year) (Table 6.10). Estuarine rivers and sounds represent 60 to 99
% of NC shrimp trawls. Pamlico Sound and associated rivers and estuaries account for the second largest
number of trawl trips per year, ranging from 2,900-5,500 trips/year. However in 2000, 2002, 2006, 2007,
and 2008, the Pamlico region accounted for more trips than the Core/Bogue waters. Decreased effort in
Core/Bogue sounds is not attributed to changes in shrimp management or habitat condition. In ocean
waters, shrimp trawling is highly concentrated in the southern portion of the state (Onslow through
Brunswick counties), primarily in the summer (approximately 2,300-3,400 trips/year). In contrast, the
annual effort has ranged from 137 to 457 trips per year in the central district (Carteret County) and from 2
to 34 trips per year in the northern district (Virginia state line through Hyde County). Commercial shrimp
trawl effort has remained relatively stable over time in the southern district of the state.
Over 99% of crab trawling occurs in estuarine waters, while all directed flounder trawling (specially
targeting flounder) occurs in ocean waters (i.e., no directed trawling for finfish is allowed in internal
waters). The majority of crab trawling occurs in Pamlico Sound and adjacent estuarine rivers, followed
by Core/Bogue sounds and estuaries. The number of crab trawl trips has decreased dramatically since
2004 as crab trawlers have switched to other fisheries such as scallop trawling in Virginia (S.
McKenna/NCDMF, pers. com., 2009). Flounder trawling effort occurs primarily in the northern district
of North Carolina‘s coastal waters. Effort in the northern district has varied from 7 trips in 1997 to 134
trips in 1999 (Table 6.10). Overall, current bottom trawling effort in estuarine waters for all fishery
species is greatest in Pamlico Sound and associated estuaries.
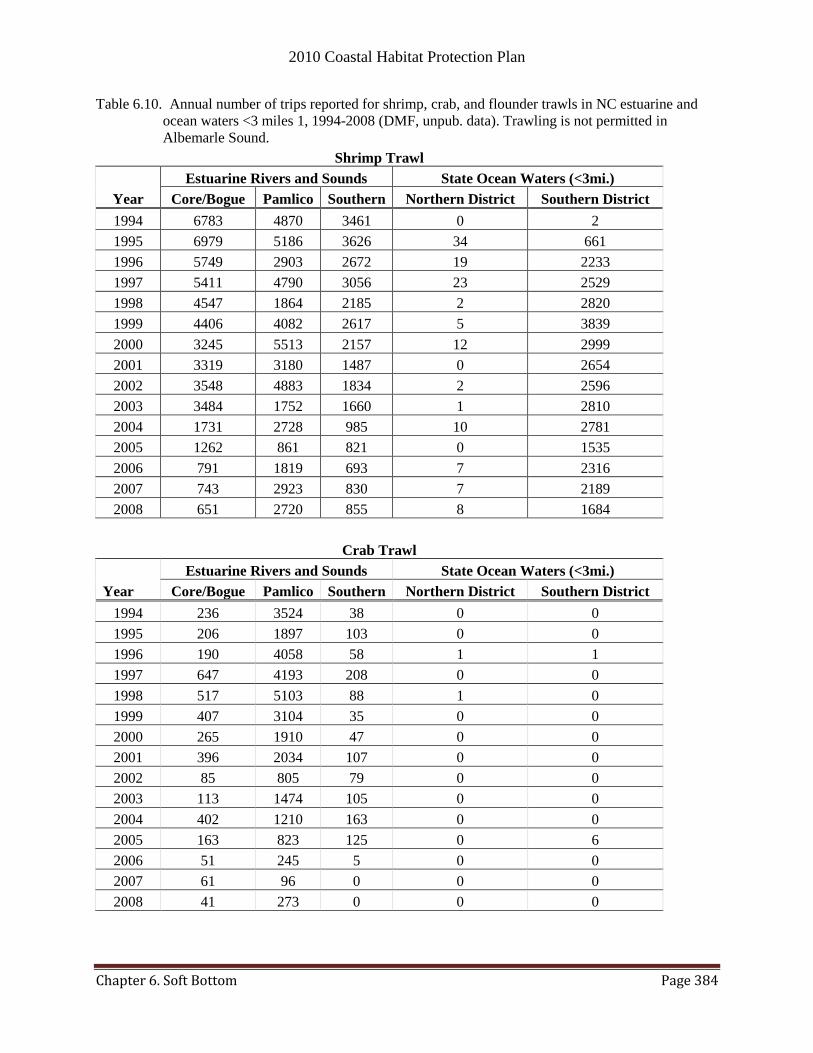
2010 Coastal Habitat Protection Plan
Chapter 6. Soft Bottom Page 384
Table 6.10. Annual number of trips reported for shrimp, crab, and flounder trawls in NC estuarine and
ocean waters <3 miles 1, 1994-2008 (DMF, unpub. data). Trawling is not permitted in
Albemarle Sound.
Shrimp Trawl
Year
Estuarine Rivers and Sounds State Ocean Waters (<3mi.)
Core/Bogue Pamlico Southern Northern District Southern District
1994 6783 4870 3461 0 2
1995 6979 5186 3626 34 661
1996 5749 2903 2672 19 2233
1997 5411 4790 3056 23 2529
1998 4547 1864 2185 2 2820
1999 4406 4082 2617 5 3839
2000 3245 5513 2157 12 2999
2001 3319 3180 1487 0 2654
2002 3548 4883 1834 2 2596
2003 3484 1752 1660 1 2810
2004 1731 2728 985 10 2781
2005 1262 861 821 0 1535
2006 791 1819 693 7 2316
2007 743 2923 830 7 2189
2008 651 2720 855 8 1684
Crab Trawl
Year
Estuarine Rivers and Sounds State Ocean Waters (<3mi.)
Core/Bogue Pamlico Southern Northern District Southern District
1994 236 3524 38 0 0
1995 206 1897 103 0 0
1996 190 4058 58 1 1
1997 647 4193 208 0 0
1998 517 5103 88 1 0
1999 407 3104 35 0 0
2000 265 1910 47 0 0
2001 396 2034 107 0 0
2002 85 805 79 0 0
2003 113 1474 105 0 0
2004 402 1210 163 0 0
2005 163 823 125 0 6
2006 51 245 5 0 0
2007 61 96 0 0 0
2008 41 273 0 0 0
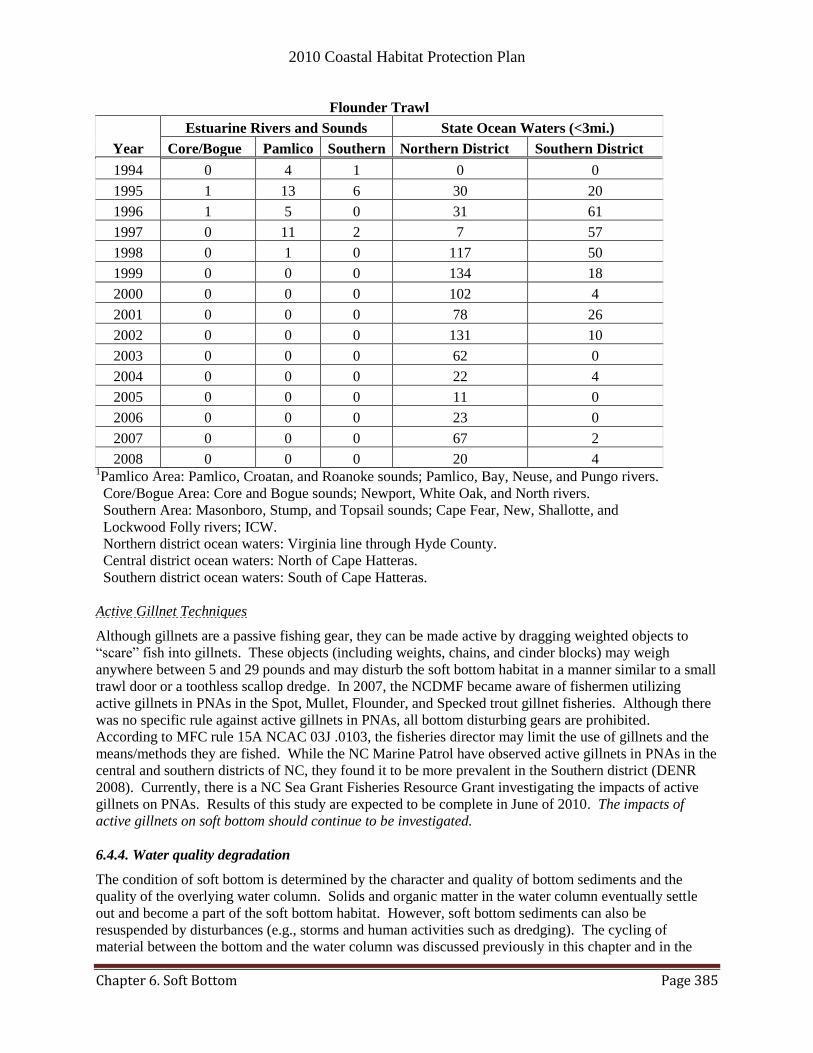
2010 Coastal Habitat Protection Plan
Chapter 6. Soft Bottom Page 385
Flounder Trawl
Year
Estuarine Rivers and Sounds State Ocean Waters (<3mi.)
Core/Bogue Pamlico Southern Northern District Southern District
1994 0 4 1 0 0
1995 1 13 6 30 20
1996 1 5 0 31 61
1997 0 11 2 7 57
1998 0 1 0 117 50
1999 0 0 0 134 18
2000 0 0 0 102 4
2001 0 0 0 78 26
2002 0 0 0 131 10
2003 0 0 0 62 0
2004 0 0 0 22 4
2005 0 0 0 11 0
2006 0 0 0 23 0
2007 0 0 0 67 2
2008 0 0 0 20 4 1Pamlico Area: Pamlico, Croatan, and Roanoke sounds; Pamlico, Bay, Neuse, and Pungo rivers.
Core/Bogue Area: Core and Bogue sounds; Newport, White Oak, and North rivers.
Southern Area: Masonboro, Stump, and Topsail sounds; Cape Fear, New, Shallotte, and
Lockwood Folly rivers; ICW.
Northern district ocean waters: Virginia line through Hyde County.
Central district ocean waters: North of Cape Hatteras.
Southern district ocean waters: South of Cape Hatteras.
Active Gillnet Techniques
Although gillnets are a passive fishing gear, they can be made active by dragging weighted objects to
―scare‖ fish into gillnets. These objects (including weights, chains, and cinder blocks) may weigh
anywhere between 5 and 29 pounds and may disturb the soft bottom habitat in a manner similar to a small
trawl door or a toothless scallop dredge. In 2007, the NCDMF became aware of fishermen utilizing
active gillnets in PNAs in the Spot, Mullet, Flounder, and Specked trout gillnet fisheries. Although there
was no specific rule against active gillnets in PNAs, all bottom disturbing gears are prohibited.
According to MFC rule 15A NCAC 03J .0103, the fisheries director may limit the use of gillnets and the
means/methods they are fished. While the NC Marine Patrol have observed active gillnets in PNAs in the
central and southern districts of NC, they found it to be more prevalent in the Southern district (DENR
2008). Currently, there is a NC Sea Grant Fisheries Resource Grant investigating the impacts of active
gillnets on PNAs. Results of this study are expected to be complete in June of 2010. The impacts of
active gillnets on soft bottom should continue to be investigated.
6.4.4. Water quality degradation
The condition of soft bottom is determined by the character and quality of bottom sediments and the
quality of the overlying water column. Solids and organic matter in the water column eventually settle
out and become a part of the soft bottom habitat. However, soft bottom sediments can also be
resuspended by disturbances (e.g., storms and human activities such as dredging). The cycling of
material between the bottom and the water column was discussed previously in this chapter and in the
2010 Coastal Habitat Protection Plan
Chapter 6. Soft Bottom Page 386
water column chapter. In general, bottom sediments tend to act more as a sink than a source with regards
to benthic-pelagic coupling. Aquatic organisms can accumulate pollutants from the sediment or the water
column. Because water quality inevitably affects soft bottom (i.e., anoxia in the water column leads to
increased production of hydrogen sulfide (H B2BS), a gas that is toxic to aquatic life, in bottom sediments),
many of the same threats to the water column are threats to soft bottom. The primary pollutants of
concern to soft bottom are discussed below.
6.4.4.1. Eutrophication and oxygen depletion
The primary discussion of eutrophication resides in the ―Water quality degradation – causes‖ section of
the Water Column chapter. The enrichment of bottom sediment is discussed in this section.
While a certain level of these nutrients is needed to support aquatic life, an overabundance of nutrients, or
eutrophication, due to human activities often leads to increased primary production resulting in algal
blooms and hypoxic bottom water (Nixon 1995). The effects of nutrient enrichment on soft bottom
habitat are also complicated by additional stressors, such as toxins or hydrological modifications, and by
benthic-pelagic coupling (Riedel et al. 2003). High concentrations of organic material in bottom
sediments serve as continual sources of additional nutrients to the water column, which can fuel algal
blooms. Soft bottoms in North Carolina‘s estuaries tend to store nutrients for several reasons (Peterson
and Peterson 1979). Small clay sized sediment particles that are abundant in ORM adsorb nutrients
readily. In addition, suspension feeding invertebrates remove nutrients and particles from the water
column which later are transformed and deposited on the bottom as feces (a process known as
biodeposition). The ebb and flood of tides increases the residence time of particles in estuarine waters,
further retaining nutrients in the system (Peterson and Peterson 1979). Extensive monitoring in the Neuse
River revealed that large quantities of nutrients were stored in the sediment. Refer to the ―water column
chapter‖ for detailed discussion of the sources and status of nutrient enrichment in the water column.
In the shallow Neuse River estuary, high but variable rates of exchange of nutrients between the water
column and soft bottom were noted, with soft bottom efficiently storing and providing nutrients that can
fuel algal blooms and cause hypoxia (Luettich et al. 1999). When nutrient loading reductions occur, a
decline in nutrient levels may not be observed in a water body until the nutrient supply in the sediment is
depleted (Luettich et al. 1999), making management strategies difficult to evaluate in the short term (see
―Non-point source management‖ section of Water Column chapter for related information). In an effort
to reduce the amount of run-off from farming and animal feed operations, the EMC approved a rule [15A
NCAC 02T .1310-.1311] in 2008 designed to increase monitoring of the Nitrogen, Ammonia, fecal coli
form, and chlorine. Long-term monitoring is required, in combination with management actions that
reduce discharge concentrations, to determine effectiveness and future management needs.
Adequate supply of dissolved oxygen is critical to survival of sessile benthic invertebrates and fish living
on or in soft bottom habitat. In freshwater systems, low oxygen levels resulting from eutrophication has
been suggested as an important source of mortality in mussels (Neves et al. 1997). In mesohaline
estuaries, low oxygen events occur when the water column becomes stratified for a long period,
particularly during summer in areas of deeper water (Tenore 1972). If stratification persists, hypoxic
events in the water column can cause changes in the physical and chemical conditions at the sediment-
water interface, lead to stress or mortality of benthic organisms, and reduce species richness (Tenore
1972). In the benthic community, polychaetes tend to be most tolerant to low oxygen, followed by
bivalves and then crustaceans (Diaz and Rosenberg 1995). Severe oxygen depletion in the sediment also
results in release of toxic levels of sulfide into bottom waters (Luettich et al. 1999).
Mass mortality of benthic infauna due to anoxia and toxic sulfide levels has been documented in the
deeper portions of the Neuse River estuary, in association with stratification of the water column in the
summer (Lenihan and Peterson 1998; Luettich et al. 1999). During these events, oxygen depletion caused
2010 Coastal Habitat Protection Plan
Chapter 6. Soft Bottom Page 387
mass mortality of infauna such as clams and worms. Epifauna like oysters and mud crabs and some
benthic fish, like blennies, also died when adequate tall refuge (oyster reefs) with oxygenated water was
not available (Lenihan and Peterson 1998). More mobile benthos, such as blue crabs, left their burrows
when oxygen was not available and moved to shallower or higher areas. In 1997 during a large hypoxic
event in the Neuse River estuary, the abundance and biomass of Macoma balthica and M. mitchelli, the
dominant benthic invertebrates and critical food sources for demersal fishes such as spot and croaker,
declined by 90 - 100% over a 100 km2 area (Buzelli et al. 2002). The areas of high benthic mortality
coincided with the area estimated to have been the most severely oxygen depleted. Powers et al. (2005)
linked the decrease of Macoma balthica to a diet switch in Atlantic croaker. As a result of less M.
balthica, croaker tended to consume more polychaetes and plants, providing evidence of a change in the
food web.
Low oxygen in bottom sediments can also affect the primary productivity of soft bottom and predation on
the benthic community. Benthic microalgae are limited to oxygenated sediments (MacIntyre et al. 1996).
During a severe anoxic event, mortality of benthic microalgae can occur, due to anaerobic sediments and
the higher turbidity that often accompanies the stratification of the water column (M. Posey, UNC-W,
pers. com., 2003). Predation on members of the benthic community by species such as flounder, spot,
blue crab, and croaker generally increases in the short-term since burrowing organisms tend to move into
the shallowest sediment layers to avoid sulfide release and lack of oxygen in deeper sediments (Luettich
et al. 1999). However, the overall reduction in prey could decrease long-term fish production (P.
Peterson/UNC-CH, pers. com., 2004). Results from statistical modeling, utilizing field data from the
Neuse River, indicated that benthic invertebrate mortality, resulting from intensified hypoxia events,
reduced total biomass of demersal predatory fish and crabs during the summer by 51% in 1997 and 17%
in 1998 (Baird et al. 2004). The decrease in available energy (fewer benthic invertebrates) greatly
reduced the ecosystem‘s ability to transfer energy to higher trophic levels at the time of year most needed
by juvenile fish (Baird et al. 2004). Seitz et al. (2003) observed blue crabs (Callinectes sapidus) and
Baltic clams (Macoma balthica) in cages in the Chesapeake Bay under normal and hypoxic conditions.
Under hypoxic conditions Seitz et al. (2003) showed that crabs had reduced feeding efficiency and trophic
transfer from the clams.
When the benthic community is depleted by a low oxygen event, the pattern of recolonization of the soft
bottom will affect higher trophic levels differently over time (Luettich et al. 1999). Opportunistic, fast-
growing species of polychaetes and copepods will begin to recolonize the bottom first. Juvenile clams
and larger polychaetes will recruit afterwards. The various successional stages may affect benthic feeders
to differing extents. For example, early successional communities composed of very small, shallow-
burrowing opportunists (capitellid worms) and meiofauna may favor small species, such as penaeid
shrimp and larval and juvenile croaker and red drum, but not provide food for large adult fish species.
Partially recovered benthic communities consisting of polychaetes and small juvenile clams could benefit
demersal species like spot, croaker, and blue crab. A fully recovered community with deep burrowing
polychaetes and large clams might benefit adult spot but not benefit shrimp (Luettich et al. 1999).
While hypoxia and anoxia can occur naturally, they can also be attributed, in part, to anthropogenic
changes in the system, including excess nutrient and organic loading from waste discharges, nonpoint
runoff, streambank erosion, and sedimentation (Schueler 1997). In the Neuse River system, MODMON
studies found that the sediment oxygen demand is much greater than the biological oxygen demand in the
water column. Oxygen depletion in the water column was positively correlated with accumulation of
organic material in the sediments (Luettich et al. 1999). Site-specific information on sediment condition
is generally lacking in other areas of North Carolina. Several studies have indicated that the frequency,
duration, and spatial extent of low oxygen events have increased over the years due to increasing
eutrophication of coastal waters from human and animal waste discharges, greater fertilizer use, loss of
wetlands, and increased atmospheric nitrogen deposition (Cooper and Brush 1991; Dyer and Orth 1994;

2010 Coastal Habitat Protection Plan
Chapter 6. Soft Bottom Page 388
Paerl et al. 1995; Buzelli et al. 2002). Research is ongoing at NCSU looking at the effect of hypoxic
events in the Neuse River on fish displacement, foraging, growth, and survival (B.J. Copeland/MFC, pers.
com. April 2010). The research results suggest that the energy utilized by fish to avoid hypoxia and find
adequate food impacts fish growth and productivity. More information is needed to understand the
consequences on the estuarine food web and to what extent anoxia is impacting the soft bottom
community. Refer to Water Column chapter for more information on eutrophication and oxygen
depletion.
6.4.4.2. Sedimentation and turbidity
While resuspended benthic microalgae can be beneficial to the invertebrate community as an additional
food source, excessive suspended sediment and associated algae have been found to reduce growth rates
and survival of macrofauna, such as hard clams (Bock and Miller 1995). These species are also most
susceptible to sediment deposition, turbidity, erosion, or changes in sediment structure associated with
sand mining activities, compared to other more mobile polychaetes (Hackney et al. 1996).
Organisms in soft bottom habitat are adapted to shifting and changing sediments. Shoreline erosion and
stormwater runoff transport sediment into coastal waters, which helps maintain shallow water habitat.
However, when sedimentation is excessive, there can be negative impacts including (Schueler 1997):
Physical smothering of benthic invertebrates
Reduced survival of fish eggs
Destruction of fish spawning areas in freshwater streams
Elimination of sensitive species such as anadromous fish or darters
Increase in sediment oxygen demand and depletion of oxygen
Decline in freshwater mussels
Reduced channel capacity, and subsequent acceleration of downstream bank erosion and flooding
The primary areas that are adversely affected by sedimentation are freshwater systems and upstream
estuarine systems. The effects of sedimentation can be very gradual. Excessive deposition of sediments
in a stream over time causes the depth and velocity to decrease and the width to increase. Consequently,
the number and depth of riffle pools, and the temperature gradients within them, decrease. These riffle
pools are important habitat for some fish species, such as minnows and darters (AFS 2003). The
deposition of silt and fine sediment in gravel-bottom rivers and streams fills the interstices of the gravel,
and can decrease dissolved oxygen content if the organic content is high. Most North Carolina coastal
rivers and streams do not consist of gravel substrate, however.
Excess sedimentation can reduce or eliminate aquatic insect larvae from stream bottoms (AFS 2003).
These larvae are the basic fish food source in freshwater streams, and impacts to them can affect the
productivity of associated fish species (AFS 2003). High levels of suspended sediment in an estuarine or
marine habitat can greatly reduce successful settlement of larval clams and oysters, and can smother other
benthic invertebrates (AFS 2003). In some areas, historic oyster bars have been completely covered with
fine sediment and mud (Rodriguez et al. 2006). Refer to the water column chapter for information on
habitat degradation from sedimentation and options for addressing sedimentation.
Excessive sedimentation has been cited as the major cause of freshwater mussel decline in the United
States since the late 1800s (Neves et al. 1997; Box and Mossa 1999). Poor land use practices, including
construction and road building activities, agriculture, forestry, dams, reservoirs, and channelization are
among the causes cited for sedimentation (Neves et al. 1997; Box and Mossa 1999). Because freshwater
mussels are dependent on specific host fish to complete their reproductive cycle, changes in resident fish
populations, due to dams, channelization, or other habitat alterations, jeopardize survival of mussels
(Neves et al. 1997). The decline in mussel populations in North Carolina is considered severe (Neves et
2010 Coastal Habitat Protection Plan
Chapter 6. Soft Bottom Page 389
al. 1997). Over 50% of approximately 60 native freshwater mussels are designated as Endangered,
Threatened, or of Special Concern within the state and approximately 22 of these occur within coastal
draining river basins (Neves et al. 1997; http://www.ncwildlife.org, April 2009). The Tar River spiny
mussel (Elliptio steinstansana) and dwarf wedgemussel (Alasmidonta heterodon) are federally and state
endangered species that occur in the upper Tar and Neuse rivers, respectively (http://www.ncwildlife.org,
April 2009). Since these species are highly sensitive to water quality and habitat degradation, freshwater
mussels are often considered an excellent early biological indicator of freshwater stream condition.
6.4.4.3. Toxic chemicals
The primary discussion of toxic chemicals resides in the Water Column chapter. This section focuses on
the storage and release of chemicals stored in soft bottom habitat.
While toxins can fluctuate between the sediment and water column, concentrations of toxic chemicals
tend to accumulate in sediments to several orders of greater magnitude than overlying waters (Kwon and
Lee 2001). Multiple studies have examined the toxic chemical contamination in North Carolina‘s
estuaries. One study of bottom sediments throughout coastal North Carolina waters found PAHs, nickel,
arsenic, DDT, chromium, PCBs, and mercury to be the most abundant chemicals between 1994 and 1997
(in order of descending concentration) (Hackney et al. 1998). The study also found concentrations of
other heavy metals such as antimony, copper, lead, cadmium, silver, and zinc. According to the survey,
sediment in 13.4% of estuarine sites sampled was nearly devoid of life during harsh summer conditions.
The bioavailability and transport of a chemical depend on the form of the chemical incorporated into the
sediments, the feeding habits and condition of aquatic organisms, and the physical and chemical
conditions of the environment. Toxins can also be active in surface waters, when dry sediment is
hydrated from rainfall or runoff, toxic chemicals in the soils become oxidized, and heavy metals are
released and transported downstream by heavy rains or water movements. Toxic chemicals that tend to
accumulate in bottom sediments include:
heavy metals
polycyclic aromatic hydrocarbons (PAHs)
petroleum hydrocarbons
pesticides
polychlorinated biphenyls (PCBs)
ammonia
Large spills of toxic chemicals, such as pesticides or petroleum products, can result in fish kill events. In
North Carolina, spills of pesticide, chlorinated water, and sewage waste were responsible for 8% of fish
kill events in 2001 (DWQ 2001b).45
Contaminated sediments affect benthic feeding fish and invertebrates
in several ways. Some toxins can inhibit or alter reproduction and development of marine and aquatic
organisms, or cause mortality in some situations (Weis and Weis 1989; Gould et al. 1994). Lethal and
sublethal levels of toxicity are known for some benthic aquatic species. Mollusks are known to be very
sensitive to petroleum products, pesticides, and TBT, with relatively low levels of exposure affecting
reproduction, tissue development, growth, and survival (Funderburk et al. 1991) (refer to shell bottom
chapter for toxicity levels). Because macrobenthic invertebrate diversity significantly declines with
increasing sediment contamination (Weis et al. 1998; Brown et al. 2000; Dauer et al. 2000), food
resources for benthic feeders may be limited in areas having significant contamination. See Appendix F
for more information on toxicity thresholds for early life stages of fish. However, most information
comes from acute toxicity tests conducted in laboratory settings on standard test species. Data are lacking
on chronic or sublethal toxicity levels for many important fishery species and interactions of contaminants
in the field. Following oil spills, sub-lethal levels of contamination can delay population recovery due to
45 Other suspected causes reported: unknown (46%), dissolved oxygen (34%), blooms (4%), other (9%), and bycatch (1%).

2010 Coastal Habitat Protection Plan
Chapter 6. Soft Bottom Page 390
indirect effects, and may lead to increased fish mortality where predation risk is size-dependent (Peterson
et al. 2003b). More information is needed on the in situ effects of various contaminant levels, in
combination with other contaminants and existing environmental stressors, on survival, growth, and
reproduction of many important fish species in North Carolina.
While some aquatic organisms experience mortality from exposure to toxins, chemicals may
bioaccumulate to toxic levels within surviving organisms and pass through the food chain. Multiple
studies have shown clear connections between concentrations of toxins in sediments and those in benthic
feeding fish and invertebrates (Kirby et al. 2001; Marburger et al. 2002). Heavy metal contamination of
sediments has been documented to result in elevated trace metal concentrations in striped mullet, shrimp,
oysters, and flounder (Kirby et al. 2001; Livingstone 2001). Largemouth bass and catfish, stocked in a
restored and flooded freshwater wetland, had high concentrations of organochlorine (chlordane, DDT,
dieldrin) corresponding to contaminant levels in the sediment (Marburger et al. 2002). Toxic
contaminants are also considered one of the most serious threats to native freshwater mussels, which are
the most imperiled fauna in North America (Keller 1996). In high concentrations copper and ammonia,
by-products of water treatment outfalls, can be fatal to freshwater bivalves (Ward et al. 2007). For further
discussion on toxicity in fishes, refer to ―Toxic chemical section‖ of the Water Column chapter.
Fossil fuels
Anthropogenic sources of hydrocarbons include burning of fossil fuels, the marine industry (boat
maintenance/activity), urban/suburban sprawl, dock and marina development and operation, automotive
transportation, and industrial emissions (Wilbur and Pentony 1999). Potential sources of heavy metals
from these activities include anti-fouling paint, zinc plates on boats, fuel, runoff from parking lots or other
road surfaces, and wood preservatives leached from dock structures (EPA 1985; Marcus and Stokes 1985;
Sanger and Holland 2002).
Hydrocarbons are derived from fuel emissions, runoff from roads, spills from boats and fuel facilities.
Runoff from impervious surfaces such as roads and parking lots appears to be one of the major sources of
heavy metals and hydrocarbons in estuaries and nearshore ocean waters. It was estimated that in the
United States, 11 million gallons of oil enters surface waters through runoff every eight months,
equivalent to the Exxon Valdez-size oil spill (PEW Ocean Commission report;
http://www.pewtrusts.org/our_work_report_detail.aspx?id=30009&category=130). The major source of
this oil appears to be from cumulative oil drips on roadways and dumping of waste crankcase oil (Latimer
et al. 1990). In Maryland, a study of suburban watersheds with little industrial activity found that metals
from lawns, roads, and automobiles accumulated in sediments at levels toxic to aquatic life in streams
(Hartwell et al. 2000). In the Charleston, S.C. area, Lerberg and Holland (2000) found a strong
correlation between increasing impervious surface coverage in tidal creek watersheds and the cumulative
level of contaminants in tidal creek sediments.
Heavy metals
Anthropogenic sources of metals include industrial ore processing, chemical production, agriculture, the
marine industry (boat maintenance/activity), urban/suburban sprawl, dock and marina development and
operation, dredge spoil disposal, automotive transportation, atmospheric deposition, and industrial
emissions (Wilbur and Pentony 1999). Of the heavy metals, arsenic, copper, cadmium, chromium, nickel,
lead, zinc, tin, and mercury are among the greatest concerns. A study in the lower San Francisco Bay
found that half of the cadmium and zinc in the bay came from tire wear (Beach 2002). Lead originated
primarily from diesel-fueled vehicles and half the copper in the bay was derived from brake pad wear.
An additional 25% of the copper came from atmospheric emissions. Also, several studies have shown that
mercury and other metals are released from peat soils subjected to intensive drainage (Evans et al. 1984;
Gregory et al. 1984). Nunes et al (2008) showed that in areas with a high concentration of heavy metals
2010 Coastal Habitat Protection Plan
Chapter 6. Soft Bottom Page 391
studies surface deposit feeders and herbivores decreased in abundance, while subsurface deposit feeders
have increased in areas of high concentration of heavy metals (Nunes et al. 2008). Because low
concentrations of heavy metals in the water column can be easily incorporated into organic rich mud
(ORM), chemicals can accumulate in the sediment to toxic levels and be resuspended into the water
column (Riggs et al. 1991, Steel 1991).
Fine-grained sediments are common in sheltered creeks and small trunk estuaries, or in the deeper regions
of larger estuaries. The highest contamination levels were found in low-salinity areas with limited
flushing and high river discharge (e.g., upper estuaries) (Riggs et al. 1989, Riggs et al. 1991, Hackney et
al. 1998). Some heavy metals and pesticides can cause hormone alterations that affect reproduction
(Wilbur and Pentony 1999). Heavy metals in these areas are of particular concern because they cover the
majority of designated anadromous and low-salinity nursery areas, where young fish gravitate in spring
and summer. Determining the distribution and concentration of heavy metals and other toxins in bottom
sediments throughout the coast is needed to comprehensively assess potential threat to the water column.
Heavy metal concentrations have been measured in Durham Creek, Porter Creek, South Creek, Pamlico
River, Jacks Creek, Huddles Cut, and Tooley Creek by PCS as part of their permit compliance. Arsenic,
cadmium, molybdenum, selenium, and zinc were all found to be higher in concentration than continental
crust concentrations (CZR 1999). The presence of these heavy metals has been directly linked to shell
disease in blue crabs (Callinectes sapidus) found in the Pamlico River (Weinstein et al. 1992).
Steps have been made to reduce heavy metal input into the aquatic system. Mercury and arsenic are no
longer used in antifouling paints due to their toxicity (Bellinger and Benham 1978). Tributyltin (TBT),
another toxic metal compound used in antifouling paints, was restricted on non-military vessels by the
Organotin Antifouling Paint Control Act of 1988 (Milliken and Lee 1990). The use of TBT-containing
paints for coating the hulls of military vessels has been either officially discontinued or is currently in the
process of being phased out.46
PAHs, PCBs, and pesticides
Polycyclic aromatic hydrocarbons (PAHs) are a group of over 100 different chemicals that are formed
during the incomplete burning of coal, oil and gas, garbage, or other organic substances like tobacco or
charbroiled meat. Compounds in the PAH group are found in coal tar, crude oil, creosote, and roofing tar,
but a few are used in medicines or to make dyes, plastics, and pesticides. Polychlorinated biphenyls
(PCBs) are organic chemicals containing chlorine that have properties that make them useful for many
industrial and commercial applications like electrical, heat transfer, and hydraulic equipment; in paints,
plastics and rubber products; in pigments, dyes and carbonless copy paper and many other areas. PCBs
are used in plasticizers and flame retardants.
Certain PAHs have been shown to cause mutations or cancer in fish (White and Triplett 2002).
Documented effects of PAHs to flatfish include DNA damage, liver lesions, and impacts on growth and
reproduction (Johnson et al. 2002). Several pesticides also have been detected in sediments of the
Albemarle-Pamlico estuary (Hyland et al 2000). The concentration of many herbicides was greatest in
spring and summer, during and immediately following application periods. The seasonal pattern of
concentration was less evident for the insecticides prometon, diazinon, and chlorpyrifos (Woodside and
46 Currently, most Navy, MSC [Military Sealift Command], USCG [United States Coast Guard], and Army ships have steel hulls
with copper-based antifouling paints. Paints containing tributyltin (TBT) are still found on some aluminum-hulled small craft
because some copper-based paints are incompatible with aluminum hulls. Currently, TBT-based antifouling paints are found on
approximately 10-20% of small boats and craft with aluminum hulls. The numbers of vessels from the respective Armed
Forces branches estimated to have TBT coatings are: Navy-56, USCG-50, MSC-0, Air Force-50, Army-11 (U.S. Navy and EPA
1999). It is unknown how many of these vessels have operated or presently operate in North Carolina waters, or if the policy
regarding TBT use has changed since the date of the reference‘s publication.
2010 Coastal Habitat Protection Plan
Chapter 6. Soft Bottom Page 392
Ruhl 2001). As a result of offshore transport and atmospheric deposition, pesticides, PAH, and PCBs
have been found 32km off of the coast of Georgia in the Grey‘s Reef Marine Sanctuary (Hyland et al.
2006). Refer to the water column chapter for more detailed information on the sources of toxic
chemicals.
Status of sediment contamination
The extent of sediment contamination in North Carolina coastal waters is not well known. Sediment
sampling is not conducted by the DWQ since there are no sediment standards in the state. Although the
NCDWQ does not sample sediments for heavy metals in NC coastal waters, they require that dredging
applicants sample for heavy metals under certain circumstances (i.e. historically commercial ports). The
NCDWQ requires heavy metal sampling so that if dredging does occur in an area with contaminated
sediments proper dredging and disposal methods can be utilized. A complete list of DWQ pollutant
standards can be found in the DWQ surface water and wetlands standard ―redbook‖, but the pollutants
that are sampled include but are not limited to Mercury, Selenium, and Cadmium
(http://portal.ncdenr.org/c/document_library/get_file?folderId=285750&name=DLFE-8513.pdf, August
2010).
Studies examining sediment contamination at sites in North Carolina soft bottom have found various
levels of contamination. The EPA Environmental Monitoring and Assessment Program surveyed 165
sites within North Carolina‘s sounds and rivers during 1994-1997 to evaluate condition of bottom
sediments (Hackney et al. 1998). The sediment in 13.4% of estuarine sites sampled was nearly devoid of
life during harsh summer conditions, according to the survey. Highest contamination levels occurred in
low salinity areas with low flushing and high river discharge. Benthic communities were dominated by
tolerant opportunistic species and low species richness. Laboratory bioassays showed that sediments
from many sites were toxic to biological organisms. Hyland et al. (2000) sampled 174 station from 1994-
1997, from these stations Hyland estimated less than 10 percent of North Carolina estuaries are
contaminated by toxins. However, because of the low sample size, frequency of sampling, and the
confounding effects of hypoxia in areas sampled, results from this study may not accurately assess the
condition of North Carolina sediments (C. Currin/NOAA, pers. com., 2003). Concentrations of heavy
metals in the Neuse and Pamlico estuaries have been assessed (Riggs et al. 1989; Riggs et al. 1991). In
the Neuse River, surface sediments were found to contain elevated levels of several heavy metals,
including zinc, copper, lead, and arsenic. Furthermore, 17 areas between New Bern and the mouth of the
river were identified as ―contaminated areas of concern‖. The contaminated sites were primarily
attributed to permitted municipal and industrial treatment plant discharges. Marinas were also found to
contribute substantial amounts of copper and variable amounts of zinc and lead. In the Pamlico River,
heavy metal enrichment was generally less severe than in the Neuse River. In the Pamlico and Neuse
rivers, individual waste treatment plants, marinas, industrial plating facilities, and military facilities were
identified as probable sources of heavy metal enrichment (Steel 1991).
Nonpoint sources were more difficult to evaluate. In the Pamlico River, heavy metal contamination was
less severe, although arsenic, cobalt, and titanium exceeded the levels found in the Neuse River. These
studies suggest that sediment contamination in some estuarine areas, especially those where both organic
rich mud and waste water discharges are present, may be significant and could affect fish populations and
the base of their food chain. Corbett et al. (2009) investigated the presence of heavy metals in Slocum
Creek, Hancock Creek, and the adjacent Neuse River Estuary, finding higher concentrations of the heavy
metals in the portions of the creeks with low sedimentation rates. Additionally, Corbett et al (2009)
observed little to no macrofauna in sediment cores where the heavy metal concentrations were high.
Heavy metal and toxin concentrations have been monitored yearly by NOAA‘s mussel watch monitoring
program since 1986 (Kimbrough et al. 2008). In NC, there are 10 sites (Roanoke Sound, Pamlico Sound,
Cape Fear River, and Beaufort Inlet areas) that the heavy metal levels found in the eastern oyster
2010 Coastal Habitat Protection Plan
Chapter 6. Soft Bottom Page 393
Crassostrea virginica are monitored (Lauenstein et al. 2002). For more information regarding toxins see
water column and oyster sections. To better determine if contaminated sediment is a significant threat to
coastal fish habitat, the distribution and concentration of heavy metals and other toxic contaminants in
freshwater and estuarine sediments need to be adequately assessed and areas of greatest concern need to
be identified. Continued minimization of point and nonpoint sources of toxic contaminants is vital for
protecting not only soft bottom but also the other fisheries habitat.
Resident time
Chemical contamination may reside in soft bottom sediments for any period of time. The residence time
depends on the specific chemical. The portion of oil that reaches the bottom may persist for several years
(Olsen et al. 1982). Lead compounds from gasoline additives have a tendency to sink to the bottom
(Chmura and Ross 1978). The degradation (half-life) of pesticides such as malathion, parathion,
endosulfan, fenvalerate, chlorpyrifos-methyl, methanidathion, and diazinon in seawater ranges from 2.2-
17 days (Walker 1977; Cotham and Bidleman 1989; Lacorte et al. 1995). However, the toxicity and
longevity of degradation products must also be considered in evaluating water quality. Toxic chemical
pollution has been affected by severe weather striking the North Carolina coast. For example, after
flooding accompanying Hurricane Floyd in 1999, pesticide concentrations in upper Pamlico River estuary
declined by a factor of ten, while concentrations in the lower estuaries had increased slightly (D.
Shae/NCSU, pers. com., 2002). One year following Floyd, however, the overall concentration of current-
use pesticides was comparable to pre-hurricane levels (D. Shae/NCSU, pers. com., 2002). Toxins can
accumulate and persist over time, chemicals that have been banned since 1977 (e.g. DDT, Diedrin, and
TBT) continue to be found in sediments (Hackney et al. 1998; Marburger et al. 2002).
6.4.4.4. Sewage spill
Sewage spills and overflows can cause an influence in nutrient and fecal coliform bacteria concentrations
in the water column and soft bottom habitats. These higher than normal concentrations can contribute to
anoxic conditions (refer to eutrophication section) that can cause fish kills to bottom feeding fish and soft
bottom invertebrates. Both the nutrients and bacteria can settle out of the water column into the
sediments and remain for several weeks where they will be subject to resuspension (Mallin et al. 2007).
These elevated levels of fecal coliform can create shellfish closure areas as mandated by the Shellfish
Sanitation and Recreational water quality section of NCDENR, due to the potential human health issues.
For further discussion refer to the Shell bottom and Water Column Chapter.
6.4.5. Non-native, invasive, and nuisance species
The presence of non-native species poses a threat to soft bottom habitat by out-competing native species
for food and habitat. An introduced species that has an influence on soft bottom habitats found in coastal
North Carolina is red algae (Gracilaria vermiculophylla).
The red algae Gracilaria vermiculophylla, originally described from East Asia, is believed to occur in
NC‘s southeastern estuaries (Freshwater et al. 2006). It was observed fouling nets and water intakes and
growing on mudflats in Masonboro Sound in 2000. If confirmed it will be the seventh red algae reported
in NC. It is associated with human-related mechanisms of dispersal, likely in fouled fishing gear or boats
(Freshwater et al. 2006). It has also been reported as abundant along saltmarsh borders and mudflats in
Virginia (Thomsen et al. 2009). It is expected that the primary mode of dispersal is through oyster
transplants because it is not generally found in ships ballast and is abundant on Virginia oyster reefs
(Thomsen et al. 2007).
2010 Coastal Habitat Protection Plan
Chapter 6. Soft Bottom Page 394
6.4.6. Climate change and sea level rise
Anticipated climate change is expected to affect soft bottom environmental conditions, thus altering the
biological community. These changes include a rise in sea surface temperatures, intensification of
tropical storms, larger and more extreme waves and storm surges, and altered nutrient run-off (IPCC
2007).
The expected changes from climate change will facilitate an increase erosion rate of the intertidal soft
bottom. Using diatoms to model former sea levels, Horton et al. (2006) observed a rise of 0.7m over
approximately the past 150 years. As sea level rises (SLR) erosion will continue to occur at intertidal
shorelines. Research has stated that if all conditions remain the same as sea level rises, the intertidal
beach will move landward and upland (Brunn Rule) (Zhang et al. 2004). Using data from the mid
nineteenth century to 2004, Zhang et al. (2004) observed approximately 24% of the NC coast that is not
influenced by coastal engineering projects or inlets to be eroding by at a rate of 0.32 m/y. Development
has increased in coastal communities not allowing the intertidal zones to move landward. In an attempt to
reduce the effects of this landward movement, developers have been utilizing varying shoreline
stabilization methods. In NC, the coastal hazards science panel has been issued the task of presenting the
NC CRC with scientific data and recommendations regarding the hazards of SLR on the coastal
community. The science panel has estimated a sea level rise of approximately 1meter by 2100.
Currently, the international best practice is using setbacks, not allowing development landward from the
first line of stable, natural vegetation (Defeo et al. 2009). In NC, the CRC determines setbacks for single
family homes by multiplying the average annual erosion rate by 30, or the set back must be at least 60ft.
Schlacher et al. (2008) summarized the 2006 Sandy Beach Ecology Symposium (Vigo Spain) workshops,
describing the loss of habitat and associated biota as the most severe and immediate effect of climate
change. As a result, Schlacher (2004) states that there is a need to expand the understanding of how
climate change will influence sandy beaches. These research needs include:
long-term studies on communities and populations that quantify ecological responses to changes
in beach morphology and variability
key ecological traits of individual species (i.e. dispersal abilities, reproductive strategies, thermal
tolerance, etc.)
ability of species to adapt or acclimatize
metapopulation studies
realized and predicted geographic range shifts of biota
habitat requirements of iconic and threatened species (birds, turtles, fish)
identification of indicator species and their efficacy in monitoring the effects of climate change
on sandy beaches
linkages across ecosystems – ecotonal coupling (e.g. dunes, estuaries, reefs)
ecological consequences of alternative societal responses to erosion and shoreline retreat (e.g. do
nothing, retreat ⁄ setback, nourish, armor)
scale-dependency and cumulative effects of societal responses to beach erosion
effects of management interventions to sea-level rise and beach erosion on critical linkages of
sandy beaches with adjacent systems (dunes, nearshore, estuaries)
efficacy of mitigation, rehabilitation and restoration measures
impacts on economically important fisheries species on beaches
Increasing water temperatures and sea level rise are thought to influence aquatic community structure.
Although the biological changes that might occur from sea level rise are difficult to predict, researchers
expect the settlement of non-native species to increase, shift in prey availability, and changes to the
nutrient flux originating from upland areas to occur (Stachowicz 2002, Diederich 2005, Büttger et al.
2010 Coastal Habitat Protection Plan
Chapter 6. Soft Bottom Page 395
2008). As sea level rises, certain species of mollusks found in the intertidal zone may become
unavailable to certain bird species. As this shift occurs the mollusks will become more readily available
to predatory fish in subtidal zones (Reise and van Beusekom 2008). Many experts expect tropic and sub-
tropic species (Smith et al. 2000) to move north to the sub-arctic as a result of this warming trend. In
southeastern NC, researchers have observed an increase in the number of benthic invertebrates (e.g.
Caribbean crabs, bivalves, snails, and polychaetes) from waters further south (UNCW 2008). This trend
has already been observed in geologic records from the Pleistocene Epoch (Palumbi and Kessing 1991,
Dayton et al. 1994, King et al. 1995).
Currently, researchers are working on five independent projects that have been examining the impacts of
sea level rise in NC as part of North Carolina Sea Level Rise project. Refer to the Wetlands chapter for a
comprehensive list of sea-level rise and climate change projects/initiatives occurring in North Carolina.
Of these projects, researchers at UNC-CH are modeling estuarine habitat (including intertidal and subtidal
soft bottom) response to sea level rise
(http://www.cop.noaa.gov/stressors/climatechange/current/slr/abstracts.aspx, December 2010). This
project is scheduled to be completed by FY2010. Research needs to continue to investigate the impacts
of climate change on the soft bottom habitat and the associated fauna. This should include effects on
productivity.
As the climate changes, more severe and frequent storms are predicted to occur. Sediment erosion and
run-off is expected to increase with the climate changes. After hurricane activity occurs in the Neuse
River Estuary (NRE), phytoplankton dynamics are altered through nutrient. These high levels of nutrients
can create soft bottom hypoxic conditions (Paerl et al. 2006). Hurricanes may alter the benthic
community, by changing the community structure as a result of salinity changes and hypoxic conditions
(Mallin and Corbett 2006). The increase hurricane events can cause inlets to open and close, affecting
NC‘s estuaries (refer to Water Column chapter for more information).
6.4.7. Management needs and accomplishments
Some of the management needs from the 2005 CHPP were refined and adopted as actions in the multi-
agency CHPP implementation plans (IPs). The status of 2005 research and management needs is listed
below, along with new emerging needs. Emerging needs includes new issues and previously existing
actions that were extensively reworded in the 2010 draft, and therefore considered ―new‖. Research and
management needs are classified as accomplished, with progress, without progress, emerging, or
discontinued because they were found to be redundant or too general or minor.
6.4.7.1. Research needs and progress (2005-2010)
Accomplished research needs
None
Research needs with progress
1. Further analysis is needed to spatially quantify where, how often, and when trawling occurs in
specific areas of soft bottom habitat. It is also important to quantify the episodic and chronic effects
of trawling on nursery functions in different estuarine settings. Some new research presented in the
“Bottom trawling” subsection of section 6.4.3.1. “Mobile bottom disturbing gear”.
2. More information is needed to understand the consequences on the estuarine food web and to what
extent anoxia is impacting the soft bottom community. Some research has been done by NCSU, Jim
Rice on effect of hypoxia on fish displacement and growth. See “Eutrophication and oxygen depletion”
section for context.

2010 Coastal Habitat Protection Plan
Chapter 6. Soft Bottom Page 396
Research needs without progress
1. Research that quantifies the cumulative impact of dock and marina policies on soft bottom and other
fish habitats. Research conducted regarding the cumulative impact of microbial contamination from
multiple docks in an area (see the “Marinas and docks” subsection of section 6.4.1.1. “Water-dependent
development” for context). See section 2.4.2.2. “Marinas and multi-slip docking facilities” in the “Water
column” chapter for more information.
Emerging research needs
The following needs are quoted or paraphrased from the text.
1. There should be a cooperative effort to update existing NC estuarine bathymetric maps. See Section
6.1.3. “Description and distribution” for more information.
2. The long-term consequences of hardened structures on larval transport and recruitment should also
be thoroughly assessed prior to approval of such structures (groins or jetties). See the “Oceanfront
shoreline hardening” subsection of section 6.4.1.1. “Water-dependent development” for context.
3. The impacts of active gillnets on soft bottom should continue to be investigated. NC Sea Grant has
funded a Fisheries Resource Grant to investigate the impacts of active gillnets on PNAs, report pending
(see section 6.4.3.1. “Mobile bottom disturbing gear” for context).
4. Research needs to be conducted to investigate the impacts of climate change on the soft bottom
habitat and fauna. This should include effect on productivity. NC researchers are investigating the
impacts of sea level rise as part of the North Carolina Sea Level Rise Project. The DCM coastal hazards
science panel has been discussing the issues of sea level rise on NC coastal areas. Refer to section 6.4.6.
“Climate change and sea level rise” for context.
5. Due to the increasing numbers of rays in NC, the impact of ray foraging pits in NC waters should be
examined. See section 6.2.5.1. “Foraging”.
6.4.7.2. Management needs and progress (2005-2010)
Accomplished management needs
1. Designating the specific locations of anadromous fish spawning and nursery areas by the MFC and
ensuring they are adequately protected. Anadromous Fish Spawning Areas have been designated by
the MFC and WRC (see section 2.3.5. “Designations” in the “Water column” chapter for more
information).
2. More specific minimum and maximum grain size standards for beach nourishment that minimize
biological impacts. CRC has implemented effective sediment criteria rules (see the “Beach nourishment
impacts on intertidal beach and adjacent subtidal bottom” subsection in section 6.4.1.1. “Water-
dependent development” for more information).
Management needs with progress
1. Reducing the area available to mechanical clam harvesting is another means to protect clam stocks
and provide additional habitat protection. Ongoing DMF effort to adjust boundaries with expansion of
SAV (see section 6.3.2. “Status of associated fishery stocks” for more context.
2. Commenting and permitting agencies should continue using their existing authorities to a) minimize
new dredging of shallow soft bottom habitat, b) prevent direct impacts from dredge and fill projects,
and c) limit as much as possible indirect impacts to shallow soft bottom or other habitats. Ongoing

2010 Coastal Habitat Protection Plan
Chapter 6. Soft Bottom Page 397
(see the “Dredging (navigation channels and boat basins)” subsection in section 6.4.1.1. “Water-
dependent development” for more information).
3. Completing a coast-wide beach management plan that carefully reviews cumulative impacts of
activities and provides ecologically based guidelines, including sediment compatibility standards, to
minimize cumulative impacts. The CRC‟s beach nourishment rules should be evaluated and modified
in a comprehensive manner as needed to minimize overall impacts from this activity. Conditions
should include sediment compatibility, restricting time of nourishment, interval between nourishment
events, and linear length of projects to enhance recovery of the benthic community. The coastwide
Beach and Inlet Management Plan has been drafted and pending review and finalization (see “Status of
beach nourishment from coastal storm damage reduction projects” section for more information).
4. Encourage sand mining guidelines for beach nourishment that maximize biological recovery rates
and do not degrade fish habitat functions. Increased need due to storm damage projects using offshore
borrow areas. See the “Beach nourishment impacts at mining areas” subsection in section 6.4.1.1. Water-
dependent development” for context. May be addressed in BIMP.
5. Re-examining shallow areas where trawling is currently allowed to determine if additional
restrictions are necessary. Some areas were re-examined for the 2004 shrimp FMP
http://www.ncdmf.net/download/shrimpfmp2004finial.pdf. See section 6.4.3.1. “Mobile bottom
disturbing gear” for context.
6. Additional public outreach to emphasize the importance of natural barrier island and estuarine
processes. ECU has produced several publications on barrier island migration and shoreline
stabilization of estuarine and ocean shorelines. See section 6.2.5.1. “Foraging” for context.
7. Including minimum water depth criteria for siting docks in shallow nursery habitats. Minimum water
depth included for structured habitat and PNAs (see the “Marinas and docks” subsection of section
6.4.1.1. “Water-dependent development” for context).
Management needs without progress
1. Expanding temporal and spatial sampling of juvenile fish to provide additional information on trends
in juvenile fish utilization of soft bottom and other habitats, especially summer and fall spawning
species, which are generally not present at existing sampling stations during May and June. See
section 6.2.5.3. “Nursery” for context.
2. More research to assess direct and indirect dredging impacts on blue crabs and other inlet spawning
species. See the “Dredging (navigation channels and boat basins)” subsection in section 6.4.1.1. “Water-
dependent development” for context.
3. Developing a state policy on dredge material management, that a) minimizes impacts to coastal fish
habitat, including soft bottom habitat, and b) is consistent with federal existing guidelines. See the
“Dredge material disposal on subtidal bottom” subsection in section 6.4.1.1. “Water-dependent
development for context.
4. Due to the toxic sediment contamination associated with pressure treated wood, revised shoreline
stabilization rules should require or encourage use of non-wood materials or wood that is not toxic to
benthic organisms. Any new wood preservative products should be evaluated for toxicity to marine
benthic organisms and juvenile fish. See the “Estuarine and riverine shoreline stabilization” subsection
in section 6.4.1.1. “Water-dependent development” for context.
5. Adequate monitoring of the effects of beach nourishment projects on the soft bottom community and

2010 Coastal Habitat Protection Plan
Chapter 6. Soft Bottom Page 398
associated surf fish populations. The monitoring should assess the direct and cumulative impact of
beach nourishment activities on fish, their habitat, and biological recovery rates. See the “Beach
nourishment impacts at intertidal beach and adjacent subtidal bottom” subsection in section 6.4.1.1.
“Water-dependent development” for context.
6. Because less habitat damaging methods are available for harvesting crabs, MFC should consider if
prohibition of crab dredging is advisable. See section 6.4.3.1. “Mobile bottom disturbing gear” for
context.
7. Protection of “recruitment bottlenecks” from trawling or other impacts is very important for
estuarine dependent fish and invertebrates. See the “Bottom trawling” subsection of section 6.4.3.1.
“Mobile bottom disturbing gear” for context.
8. More information on the in situ effects of various contaminant levels, in combination with other
contaminants and existing environmental stressors, on survival, growth, and reproduction of many
important fish species in North Carolina. See section 6.4.4.3. “Toxic chemicals” for context.
9. To better determine if contaminated sediment is a significant threat to coastal fish habitat, the
distribution and concentration of heavy metals and other toxic contaminants in freshwater and
estuarine sediments need to be adequately assessed and areas of greatest concern need to be
identified. Continued minimization of point and nonpoint sources of toxic contaminants is vital for
protecting not only soft bottom but also the other fisheries habitat. See section 6.4.4.3. “Toxic
chemicals” for context.
Emerging management needs
1. Where new inlets form, recommend allowing inlets to remain open even if temporarily until a
substantial flood tide delta forms. This will allow for long-term maintenance and stability of the
barrier island. See the “Oceanfront shoreline hardening” subsection of section 6.4.3.1. “Mobile bottom
disturbing gear” for context.
2. The natural processes that create these features (shoals, sand bars, sloughs, and tidal deltas that surf
fish utilize) need to be maintained. See section 6.2.5.1. “Foraging” for context.
3. Because there is strong evidence available on the potential ecological impacts of hardened
structures, large uncertainty on the environmental impacts of terminal groins specifically, and no
clear economic benefit from inlet stabilization, North Carolina should not reverse its position or
policies on ocean shoreline hardening. Overall, the scientific evidence does not support changing
North Carolina‟s policy on prohibition of shoreline hardening structures on the oceanfront. See the
“Oceanfront shoreline hardening” subsection of section 6.4.3.1. “Mobile bottom disturbing gear” for
context.
4. In an effort to reduce the amount of run-off from farming and animal feed operations, the EMC
approved a rule [15A NCAC 02T .1310-.1311] in 2008 designed to increase monitoring of the
Nitrogen, Ammonia, fecal coli form, and chlorine. Long-term monitoring is required, in combination
with management actions that reduce discharge concentrations, to determine effectiveness and future
management needs. See “Eutrophication and oxygen depletion” section for context.
5. Efforts should be taken by state agencies to assist with creating Ecosystem Sensitivity Index (ESI)
maps of NC. NCDMF is currently cooperating with NOAA to create maps showing the presence of
fauna collected by NCDMF sampling surveys (see section 6.4.4.1. “Toxic chemicals” for context).
2010 Coastal Habitat Protection Plan
Chapter 6. Soft Bottom Page 399
6. The National Park Service should continue to restrict ORV beach access to areas that will not
negatively influence soft bottom fauna. See section 6.4.1.3. “Off-road vehicles” for context.
7. Should the State consider locating a wind facility in state or federal waters, proper placement of
energy infrastructure is necessary to minimize potential impacts to SAV habitat and minimize
conflicts with existing activities. See the “Wind energy” subsection of section 6.4.1.2. “Infrastructure”
for context.
8. Permitting agencies should avoid or minimize dredging projects in Anadromous Fish Spawning
Areas and undesignated but important associated anadromous fish nursery areas. See the “Dredging
(navigation channels and boat basins)” subsection of section 6.4.1.1. “Water-dependent development” for
context.
9. Dock siting criteria should include a minimum water depth over all habitats to prevent boats or
floating docks from sitting directly on shallow soft bottom. See the “Marinas and docks” subsection of
section 6.4.1.1. “Water-dependent development” for context.
10. All of the sand management recommendations of the Ocean Policy Report should be implemented.
The first four items should be addressed in the BIMP. See the “Shoreline stabilization” subsection of
section 6.4.1.1. “Water-dependent development” for context.
11. Because of this, the 2009 Ocean Policy report (NC Sea Grant 2009) recommended that CRC rule
language be modified to require a 500 m dredging buffer around all hard bottom areas, including
those of low relief that are periodically buried with thin ephemeral sand layers. See the “Shoreline
stabilization” subsection of section 6.4.1.1. “Water-dependent development” for context.
6.5. Summary of Soft Bottom chapter
There are a variety of soft bottom habitat types, ranging from intertidal ocean beaches, to sound bottoms
and mud flats. Soft bottom is an important source of primary (benthic microalgae) and secondary
(infauna and epifauna) productivity, and therefore the primary foraging habitat for many species. Soft
bottom also plays an important role in the ecosystem by storing and releasing nutrients and chemicals into
the water column. Shallow soft bottom serves as important nursery areas for many species, especially
spot, croaker, flounder, penaeid shrimp, and blue crabs. Shallow riverine waters function as spawning
areas for some anadromous fish species and inlet channels are often spawning areas for species like blue
crab, speckled sea trout and red drum. Other species highly associated with soft bottom include shortnose
sturgeon in riverine waters, hard clams, and coastal sharks, kingfish, and Florida pompano in marine
waters. It is estimated that roughly 17-37% of soft bottom is less than six feet deep, although bathymetric
maps need updating.
Inadequate data are available to clearly indicate the current condition of soft bottom habitat. Fortunately
this habitat is relatively resistant to a changing environment. This is the most abundant submerged
coastal fish habitat, and estuarine acreage of soft bottom has undoubtedly increased over time as shell
bottom, SAV, and wetland habitats have declined. With the increased effort to map SAV, hard, and shell
bottom habitats in North Carolina, a better understanding of the extent of soft bottom habitat is available.
This increased effort to map North Carolina habitats has included updating both Nursery and Anadromous
Fish Spawning Areas designations. Species that are highly dependent on soft bottom with depleted stock
status in 2009 include Atlantic sturgeon and southern flounder. Those with concern stock status are
croaker, spot, and coastal sharks. Shortnose sturgeon is not classified since they are federally listed as
endangered and there is a fishing moratorium on the species.
In estuarine and fresh waters, a significant threat to shallow soft bottom habitat is channel dredging, as the
2010 Coastal Habitat Protection Plan
Chapter 6. Soft Bottom Page 400
need for boat access continues to grow. Toxin contamination of bottom sediments, particularly where
sediments are fine and flushing is low, can have a negative impact on the benthic community and entire
food chain in fresh and estuarine waters particularly. Although many toxic chemicals and metals that are
harmful to aquatic fauna have been banned from being used in the aquatic environment, they have
remained in soft bottom sediments. In order to fully understand the extent of this issue, chemical analyses
need to be performed on North Carolina estuarine and marine sediments to determine the heavy metal and
toxin distribution and their effect on aquatic organisms. Potential oil and gas development and
infrastructure in North Carolina waters could introduce another source of toxin contamination. There
needs to be a complete understanding of the impacts on the soft bottom habitat and the associated
organisms, as well as other habitats. Eutrophication can also be problematic by exasperating hypoxia and
mortality of the benthic community.
On the oceanfront, shoreline stabilization is a large and growing threat. Since the last CHPP, there have
been increased requests by beach communities along the coast for large-scale storm damage reduction
projects and inlet relocation projects, including Dare and Brunswick counties, Bogue Banks and Topsail
Island. These projects are requesting use of offshore borrow areas for a sand source. There has also been
a shift to more communities requesting privately funded nourishment projects, due to unavailability of
federal funds in a short time frame. Private projects have been done or are in planning stages for
approximately 65 mi of beach. There has also been increased interest in using ebb tidal deltas and the
cape shoals as a sand source for nourishment projects. An emerging issue for this habitat since the 2005
CHPP is the consideration by the legislature to reverse the State‘s long standing policy against ocean
shoreline hardening due to severe erosion on portions of some developed islands and private interests to
protect the affected homes and infrastructure.
As a result of the 2005 CHPP, approximately one third (11) of the 35 research and management needs
(excluding new emerging items) have had some progress in being addressed. Three management needs
were accomplished, but six management needs and two research needs are ongoing and require continued
effort and funding. There were 10 management and research needs that were not addressed, and 14 were
discontinued due to duplication, vagueness, or lack of supporting information. Since the 2005 CHPP, 14
additional emerging research and management needs were identified. These needs include understanding
the long-term effects of climate change, sea level rise, and construction of wind energy facilities. Climate
change and sea level rise are directly linked to the soft bottom habitat threat of shoreline stabilization.
With the threat of sea level rise, there will continue to be a desire to utilize varying methods to stabilize
the shoreline. As these structures continue to be built we must fully understand both the positive and
negative effects they have on the ecosystem as a whole.
Accomplishments related to soft bottom include designation of anadromous fish spawning areas by the
MFC and WRC, new CRC rules regarding sediment criteria for beach nourishment and additional
conditions on siting of docking facilities over designated Primary Nursery Areas. Other progress
underway includes additional MFC restrictions on bottom disturbing gear over shallow soft bottom,
preparation of a draft Beach and Inlet Management Plan, research on the effect of hypoxia on fish
productivity, and some additional public outreach on the importance of natural barrier island and
estuarine processes by ECU. Initial progress has been made regarding improvements to estuarine
shoreline stabilization rules, primarily through development of outreach products, discussions of the issue
with scientists and managers, research on effects of various shoreline stabilization structures on habitat
and associated fauna. Even though several needs have been addressed since 2005, there is more to be
done.
Emerging needs for this habitat include preventing hardened structures along ocean shorelines and inlets,
modifying post-storm practices to allow newly formed inlets to temporarily remain open to form flood
tide deltas, restricting dredging or implementing other needed management actions to protect designated
2010 Coastal Habitat Protection Plan
Chapter 6. Soft Bottom Page 401
Anadromous Fish Spawning Areas, and implementing the sand management strategies of the 2009 Ocean
Policy Report, including rule changes regarding dredging near hard bottom. In order to continue to
preserve the soft bottom habitat and associated fauna there needs to be a continued effort to address the
research and management needs outlined in this document. Informed decisions can be made as we
expand on the available information regarding the soft bottom habitat and its response to its threats.

2010 Coastal Habitat Protection Plan
Chapter 6. Soft Bottom Page 402
Map 6.1a. Location of marine topographic features, northeastern coast of North Carolina.
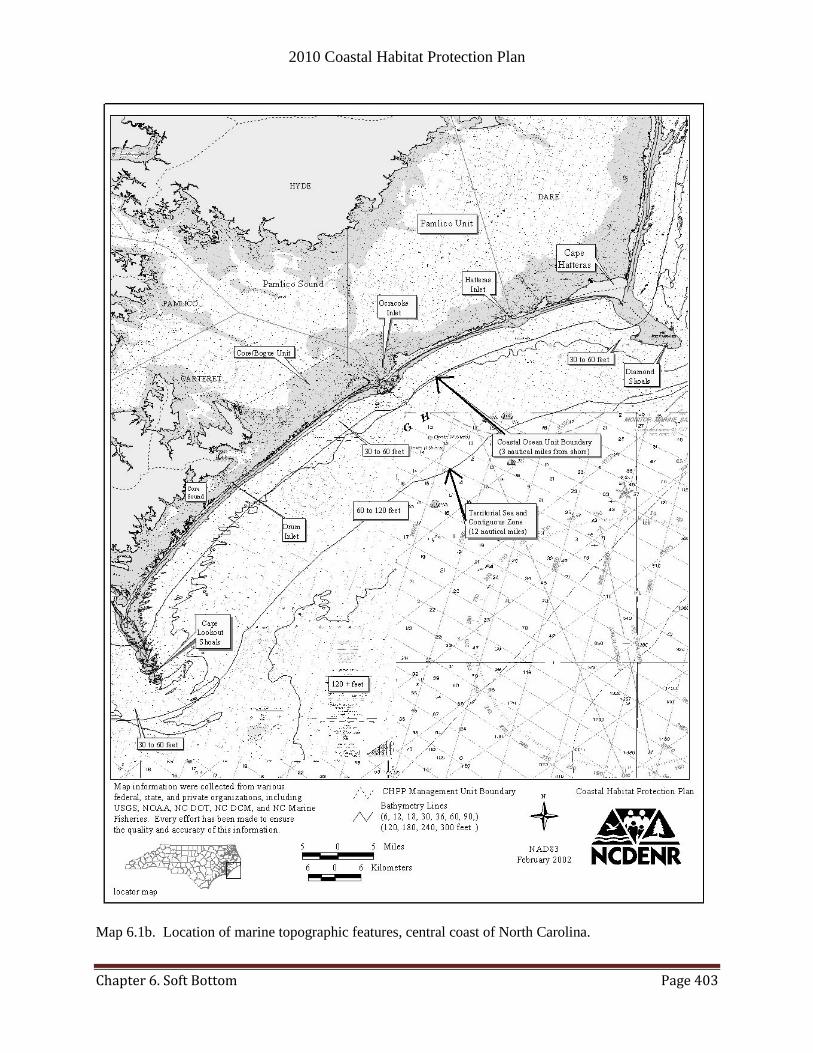
2010 Coastal Habitat Protection Plan
Chapter 6. Soft Bottom Page 403
Map 6.1b. Location of marine topographic features, central coast of North Carolina.
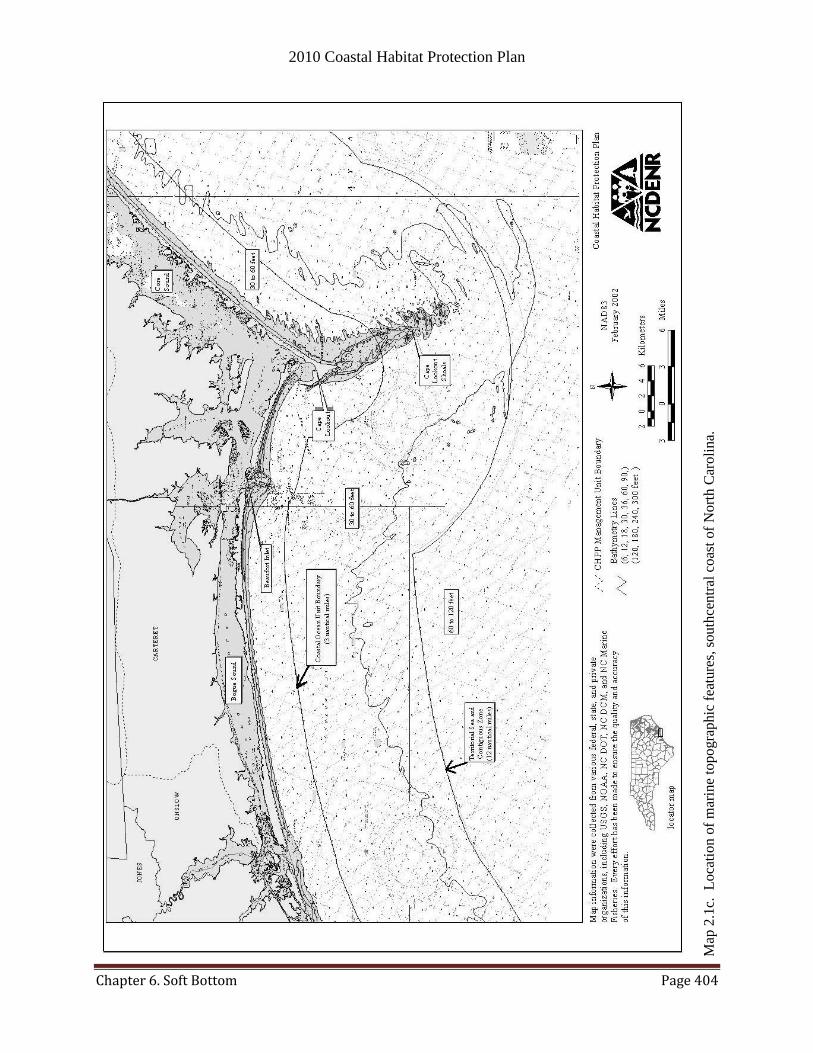
2010 Coastal Habitat Protection Plan
Chapter 6. Soft Bottom Page 404
Map
2.1
c.
Lo
cati
on
of
mar
ine
top
ogra
phic
fea
ture
s, s
outh
centr
al c
oas
t of
Nort
h C
aroli
na.
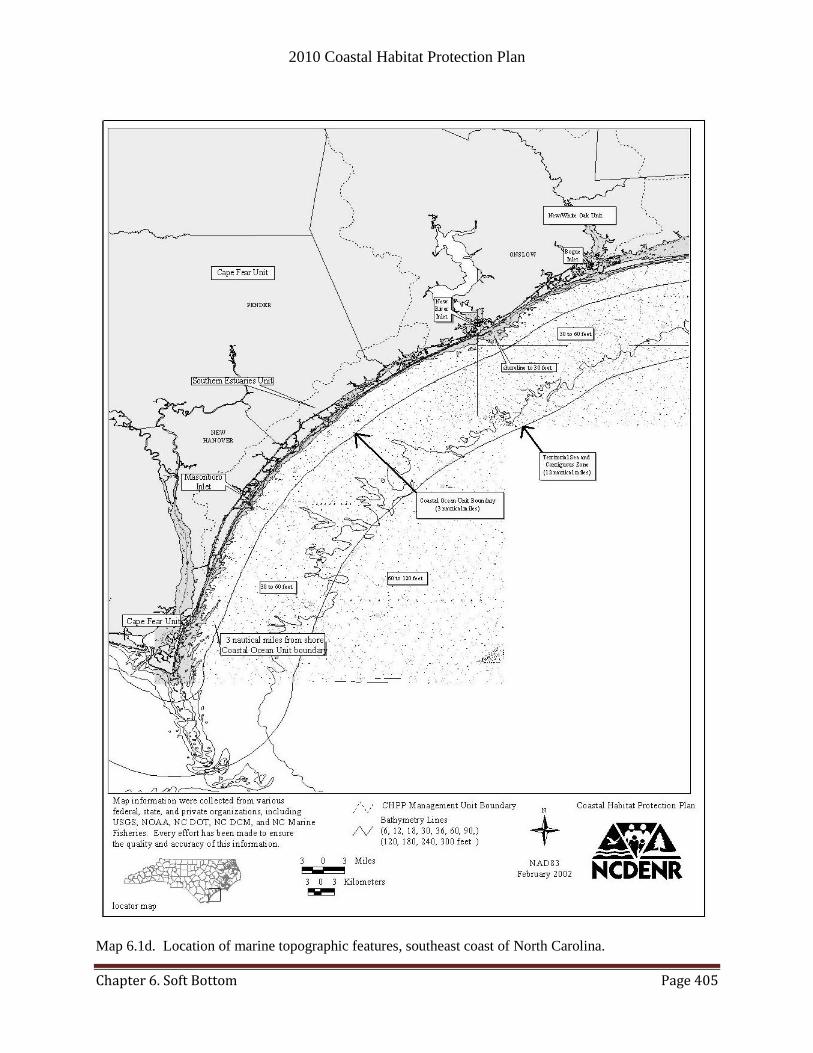
2010 Coastal Habitat Protection Plan
Chapter 6. Soft Bottom Page 405
Map 6.1d. Location of marine topographic features, southeast coast of North Carolina.

2010 Coastal Habitat Protection Plan
Chapter 6. Soft Bottom Page 406
Map
6.1
e.
Lo
cati
on
of
mar
ine
top
ogra
phic
fea
ture
s, s
outh
coas
t of
Nort
h C
aroli
na.

2010 Coastal Habitat Protection Plan
Chapter 6. Soft Bottom Page 407
Map 6.2a. Sediment composition in the Albemarle-Pamlico estuarine system. Inset A = Tar-Pamlico,
Inset B = Neuse, Inset C= Bogue (Wells 1989). Numbers = % sand, M= mud, SC=silty clay,
VFS= very fine sand, MS= medium sand).
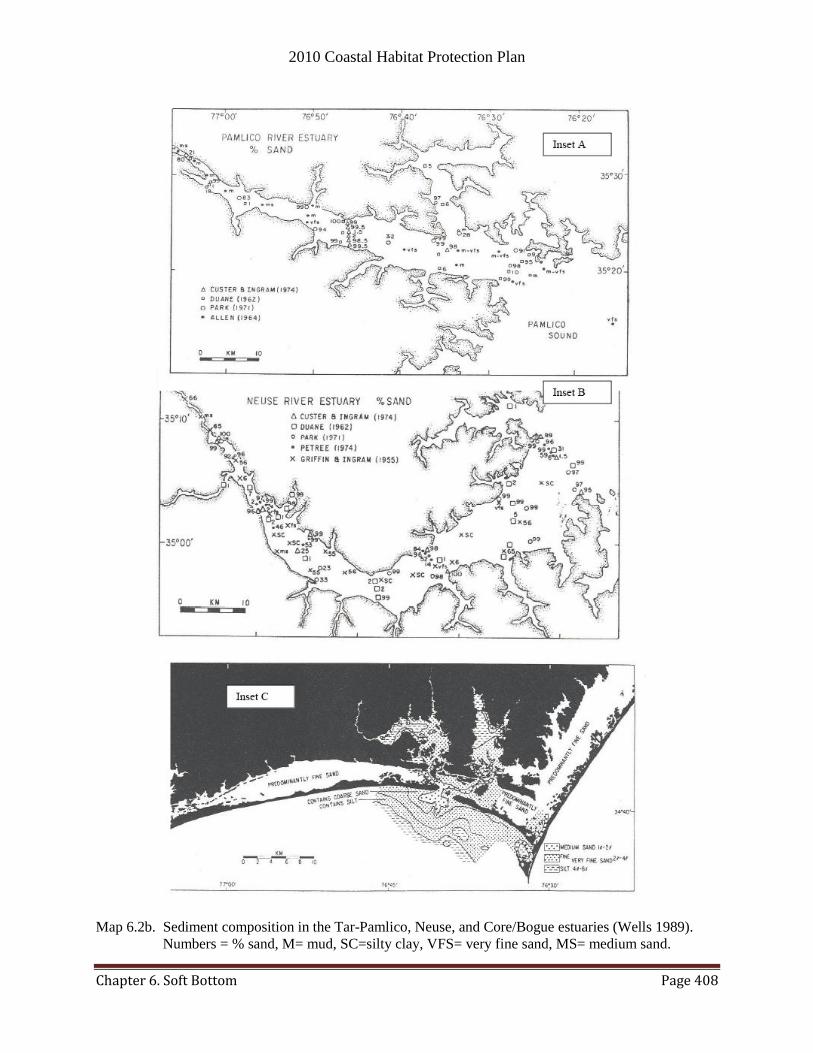
2010 Coastal Habitat Protection Plan
Chapter 6. Soft Bottom Page 408
Map 6.2b. Sediment composition in the Tar-Pamlico, Neuse, and Core/Bogue estuaries (Wells 1989).
Numbers = % sand, M= mud, SC=silty clay, VFS= very fine sand, MS= medium sand.
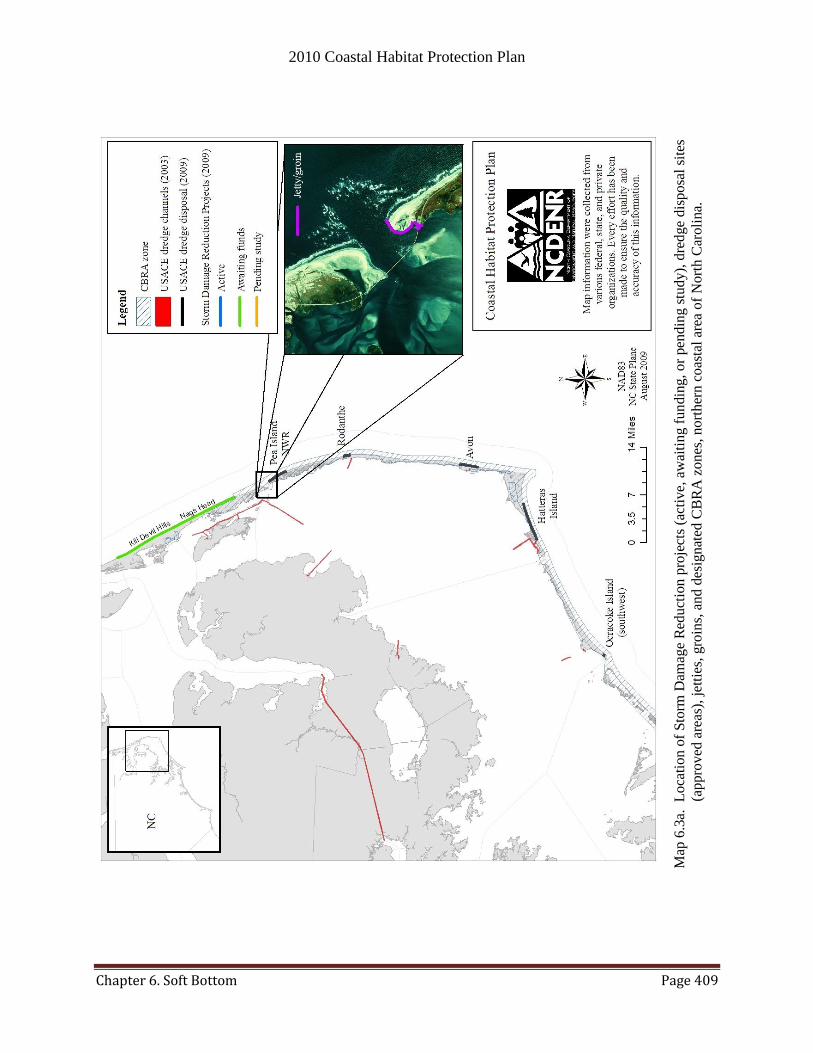
2010 Coastal Habitat Protection Plan
Chapter 6. Soft Bottom Page 409
Map
6.3
a.
Lo
cati
on
of
Sto
rm D
amag
e R
educt
ion p
roje
cts
(act
ive,
aw
aiti
ng f
un
din
g, o
r pen
din
g s
tud
y),
dre
dge
dis
po
sal
site
s
(ap
pro
ved
are
as),
jet
ties
, gro
ins,
and d
esig
nat
ed C
BR
A z
ones
, nort
her
n c
oas
tal
area
of
Nort
h C
aroli
na.

2010 Coastal Habitat Protection Plan
Chapter 6. Soft Bottom Page 410
Map
6.3
b.
Lo
cati
on
of
Sto
rm D
amag
e R
educt
ion p
roje
cts
(act
ive,
aw
aiti
ng f
undin
g,
or
pen
din
g s
tud
y),
dre
dge
dis
po
sal
site
s
(ap
pro
ved
are
as),
jet
ties
, gro
ins,
and d
esig
nat
ed C
BR
A z
ones
, ce
ntr
al c
oas
tal
area
of
No
rth
Car
oli
na.
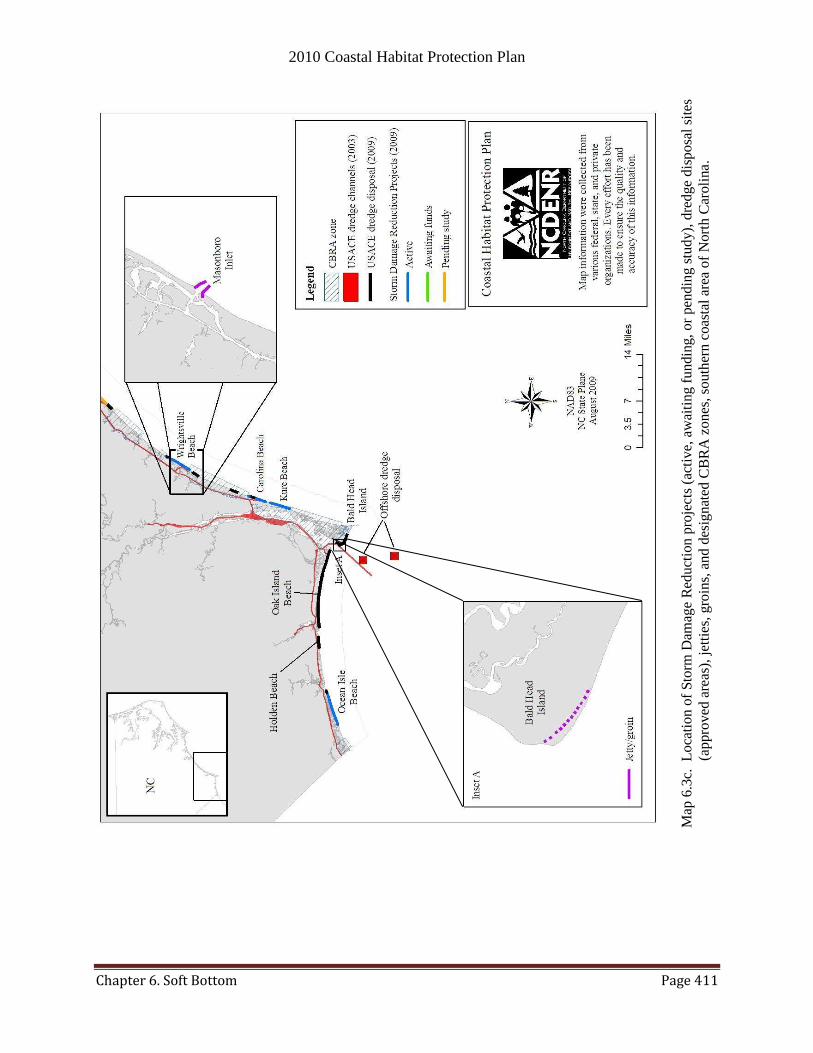
2010 Coastal Habitat Protection Plan
Chapter 6. Soft Bottom Page 411
Map
6.3
c.
Lo
cati
on o
f S
torm
Dam
age
Red
uct
ion p
roje
cts
(act
ive,
aw
aiti
ng f
un
din
g,
or
pen
din
g s
tud
y),
dre
dge
dis
po
sal
site
s
(ap
pro
ved
are
as),
jet
ties
, gro
ins,
and d
esig
nat
ed C
BR
A z
ones
, so
uth
ern
coas
tal
area
of
Nort
h C
aroli
na.
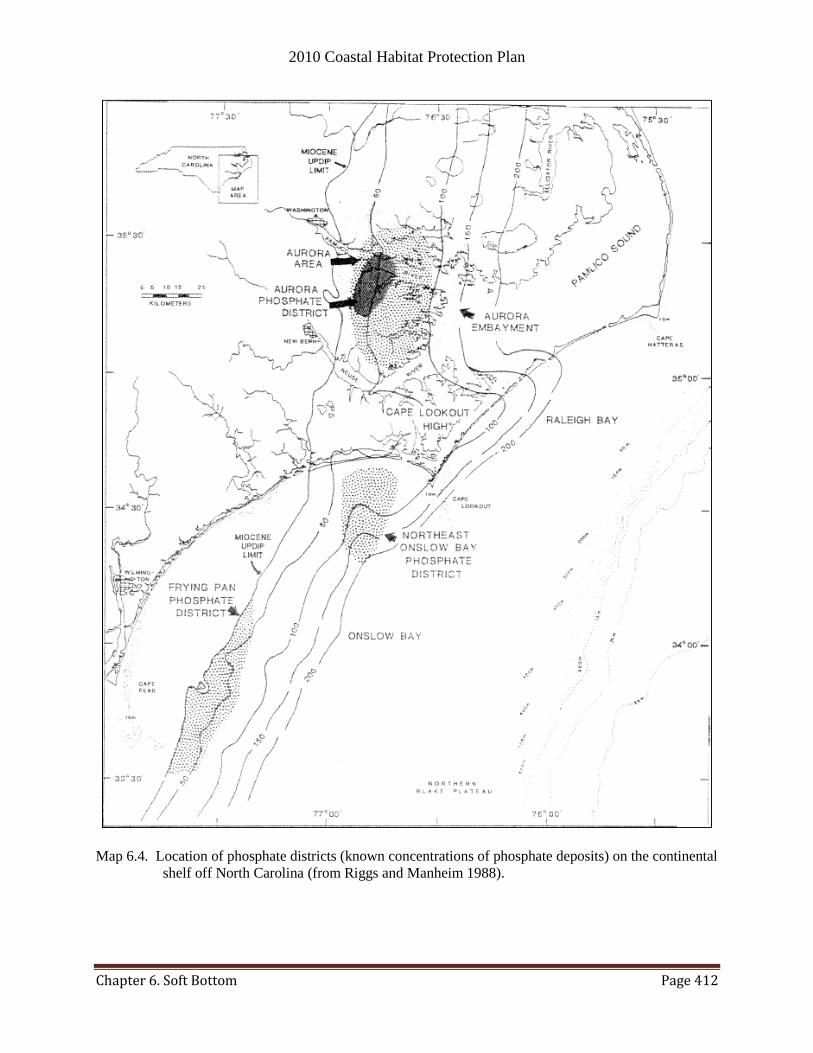
2010 Coastal Habitat Protection Plan
Chapter 6. Soft Bottom Page 412
Map 6.4. Location of phosphate districts (known concentrations of phosphate deposits) on the continental
shelf off North Carolina (from Riggs and Manheim 1988).

2010 Coastal Habitat Protection Plan
Chapter 6. Soft Bottom Page 413
Map
6.5
. A
reas
wh
ere
mec
han
ical
har
ves
t fo
r cl
ams
(cla
m k
ickin
g,
hydra
uli
c dre
dg
e) a
nd
cra
bs
(cra
b d
red
gin
g)
is a
uth
ori
zed
in
estu
arin
e w
ater
s of
Nort
h C
aroli
na.
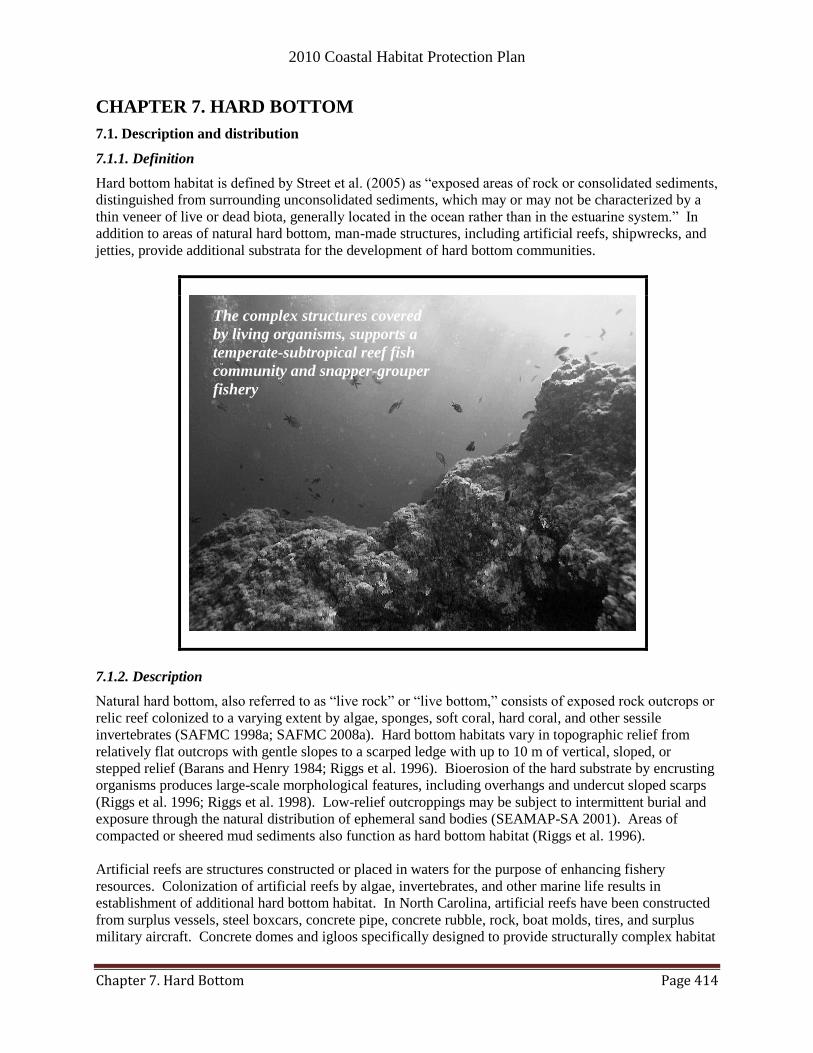
2010 Coastal Habitat Protection Plan
Chapter 7. Hard Bottom Page 414
CHAPTER 7. HARD BOTTOM
7.1. Description and distribution
7.1.1. Definition
Hard bottom habitat is defined by Street et al. (2005) as ―exposed areas of rock or consolidated sediments,
distinguished from surrounding unconsolidated sediments, which may or may not be characterized by a
thin veneer of live or dead biota, generally located in the ocean rather than in the estuarine system.‖ In
addition to areas of natural hard bottom, man-made structures, including artificial reefs, shipwrecks, and
jetties, provide additional substrata for the development of hard bottom communities.
7.1.2. Description
Natural hard bottom, also referred to as ―live rock‖ or ―live bottom,‖ consists of exposed rock outcrops or
relic reef colonized to a varying extent by algae, sponges, soft coral, hard coral, and other sessile
invertebrates (SAFMC 1998a; SAFMC 2008a). Hard bottom habitats vary in topographic relief from
relatively flat outcrops with gentle slopes to a scarped ledge with up to 10 m of vertical, sloped, or
stepped relief (Barans and Henry 1984; Riggs et al. 1996). Bioerosion of the hard substrate by encrusting
organisms produces large-scale morphological features, including overhangs and undercut sloped scarps
(Riggs et al. 1996; Riggs et al. 1998). Low-relief outcroppings may be subject to intermittent burial and
exposure through the natural distribution of ephemeral sand bodies (SEAMAP-SA 2001). Areas of
compacted or sheered mud sediments also function as hard bottom habitat (Riggs et al. 1996).
Artificial reefs are structures constructed or placed in waters for the purpose of enhancing fishery
resources. Colonization of artificial reefs by algae, invertebrates, and other marine life results in
establishment of additional hard bottom habitat. In North Carolina, artificial reefs have been constructed
from surplus vessels, steel boxcars, concrete pipe, concrete rubble, rock, boat molds, tires, and surplus
military aircraft. Concrete domes and igloos specifically designed to provide structurally complex habitat
mperate-subtropical reef fish community and snapper-
grouper fishery
…also called live rock because of the abundance of live plants
and invertebrates that attach to the rock surface, supporting
The complex structures covered
by living organisms, supports a
temperate-subtropical reef fish
community and snapper-grouper
fishery

2010 Coastal Habitat Protection Plan
Chapter 7. Hard Bottom Page 415
(i.e. Reef Balls ™) have also been used for artificial reef construction. The DMF Artificial Reef Program
is responsible for deployment and maintenance of artificial reef sites in state and federal waters, following
the guidelines of the DMF Artificial Reef Master Plan (DMF 1988). Shipwrecks off the North Carolina
coast also provide added structure available as hard bottom habitat. Documented wrecks include World
War II German U-boats, gunboats, tankers, freighters, barges, sailing ships, and wooden and iron-hulled
steamers.
Jetties and groins are man-made rubble (e.g. large boulder) structures built perpendicular to the shoreline
and designed to retard the littoral transport of sediments. Jetties are usually constructed at inlets for the
primary purpose of stabilizing navigational channels. Because jetties emerge above the water line, they
support both intertidal and subtidal hard bottom communities. Groins are similar but shorter than jetties,
and their primary purpose is to trap sand, not maintain the channel. The degree of colonization of these
hard structures by attached invertebrates and algae depends primarily on location, flow characteristics,
and water quality conditions. Bridge and pier pilings, as well as other concrete structures in high salinity
estuarine waters, also provide suitable substrate for hard bottom communities.
7.1.3. Habitat requirements
The primary requirement for the formation and stability of hard bottom habitat is exposed areas of hard
substrate. Species composition and abundance of algae, invertebrates, and reef fishes at hard bottom
habitats in the ocean off North Carolina vary with temperature and depth. Bottom water temperatures at
these habitats range from approximately 11º to 27º C. Temperatures less than 12°C may result in the
death of tropical species of invertebrates and fishes. Changes in water masses, seasonal fluctuations in
water temperature, and light penetration physically stress the hard bottom community in North Carolina
(Kirby-Smith 1989), limiting the abundance and diversity of hard coral and reef fish.
7.1.4. Distribution
Hard bottom occurs in both warm-temperate and subtropical areas of the South Atlantic Bight, although it
is less extensive in the northern end of its range (North Carolina). This habitat extends from the shoreline
and nearshore (within the state‘s three-nautical mile jurisdictional limit) to beyond the continental shelf
edge (>200 m deep), generally occurring in clusters in specific areas (SEAMAP-SA 2001). Parker et al.
(1983) estimated that hard bottom accounts for approximately 14% (504,095 acres) of the substratum
between 27 and 101 m water depth from Cape Hatteras to Cape Fear, and 30% (1,829,321 acres) between
Cape Fear and Cape Canaveral.
7.1.4.1. Hard bottom mapping
Several efforts have been undertaken to map hard bottom resources in coastal waters of the southeastern
United States. In 1985, the Southeast Area Monitoring and Assessment Program—South Atlantic
(SEAMAP-SA) began an initiative to identify the location and extent of hard bottom and coral reef
habitats throughout the South Atlantic Bight to water depths of 200 m. Data used to identify hard bottom
was based upon the presence of indicator species in traps or trawls, side scan sonar records, and video and
diver observations. The amount of hard bottom habitat documented by this program was most likely an
underestimate due to the ephemeral nature of low-relief hard bottoms and the difficulty of distinguishing
bottom type using seismic data (SEAMAP-SA 2001).
Locations of natural hard bottom and artificial reef sites documented by SEAMAP-SA (2001) in both
state and federal waters are shown in Map 7.1, along with some of the known shipwrecks. The majority
of natural hard bottom outcrops identified are located in federal waters (> three nautical miles (nm) from
shore) of Onslow and Long bays. Concentrations of hard bottoms in Long Bay occur between the Cape
Fear River mouth and Shallotte Inlet. In Onslow Bay, hard bottom is most concentrated from Bogue Inlet

2010 Coastal Habitat Protection Plan
Chapter 7. Hard Bottom Page 416
east to Cape Lookout Shoals, from Brown‘s Inlet south to New Topsail Inlet, and from Masonboro Inlet
to Frying Pan Shoals. Hard bottom in Raleigh Bay is most concentrated east of Cape Lookout Shoals and
south of Diamond Shoals. Within state territorial waters, the SEAMAP-SA (2001) database identified 48
natural hard bottom sites and 75 possible hard bottom sites using point and line data, with the majority of
sites occurring in Onslow Bay (Table 7.1).47
Table 7.1. Hard bottom and possible hard bottom locations in North Carolina state territorial
waters by coastal bay. [Source: Point and line data identified by SEAMAP-SA
(2001). Results from Moser and Taylor (1995) in parentheses.]
Bottom Type
Long
Bay
Onslow
Bay
Raleigh
Bay
North of
Hatteras Total
Hard bottom (point) 2 (19) 14 (58) 1 (4) 2 (3) 19 (86)
Hard bottom (line) 3 (6) 25 (39) 1 (2) 0 (2) 29 (49)
Possible hard bottom (point) 1 8 3 4 16
Possible hard bottom (line) 5 37 12 5 59
Total 11 (25) 84 (97) 17 (6) 11 (5) 123 (135)
Recently, SEAMAP-SA expanded their efforts to synthesize existing data on bottom habitat distributions
for water depths between 200 and 2000 m within the U.S. Exclusive Economic Zone (EEZ) of the South
Atlantic Bight (SEAMAP-SA 2004; Udouj 2007). Similar to that done for shallower waters, data used to
identify deepwater hard bottom included visual observations, presence of invertebrate indicator species in
trawls, traps or dredges, and geological records (SEAMAP-SA 2004). The SEAMAP-SA Deepwater
Bottom Mapping Project identified 34 natural hard bottom sites in the waters off North Carolina, many of
which are concentrated in Onslow Bay (Udouj 2007). These sites include the proposed Cape Lookout
and Cape Fear Deepwater Coral Habitat Areas of Particular Concern (CHAPC) (Ross 2006; Partyka et al.
2007; SAFMC 2008b).
In addition to the large-scale SEAMAP-SA mapping efforts, Moser and Taylor (1995) compiled
information on the distribution of hard bottom in the nearshore ocean waters of North Carolina using
surveys of local researchers, dive professionals, and fishermen. A total of 198 hard bottom positions were
identified with several sites not included in the SEAMAP-SA (2001) database (Map 7.1, Table 7.1). Over
92% of the identified nearshore hard bottom is south of Cape Lookout, predominantly in the southern half
of Onslow Bay and in northern Long Bay. Concentrations of nearshore hard bottoms occur seaward of
inlets, including Bogue, New River, New Topsail, Masonboro, Carolina Beach, Lockwood's Folly and
Shallotte inlets. Twenty of the identified nearshore hard bottom sites were reported as high-profile relief,
defined by Moser and Taylor (1995) as vertical relief greater than two meters, with several sites,
specifically those off Carolina Beach and New River, extensive in both area and topographic relief.
Outcroppings of moderate-to-high relief occur in shallow waters near the shoals of Cape Fear and Cape
Lookout. Vast areas of low-relief hard bottom, intermittently covered with a thin layer of sand, occur
extensively from 1) mid-Onslow Beach to south of New River Inlet and 2) Yaupon Beach west to Tubbs
Inlet (Moser and Taylor 1995). At Fort Fisher, a unique intertidal and subtidal coquina rock outcrop
extends from the beach into the surf zone.
Several localized mapping efforts have provided detailed information with regards to the extent of hard
bottom habitats in specific areas of the North Carolina coast (Crowson 1980; Lombardero et al. 2008).
These mapping efforts have primarily focused on nearshore resources in the vicinity of Surf City and New
River Inlet. Extensive low to high-relief hard bottom outcrops have been identified in these areas.
47 Line data represents information from trawls. The lengths of the trawl lines vary, and some lines may actually represent
several transects of one area. Similarly, some hard bottom lines may overlap with hard bottom points.
2010 Coastal Habitat Protection Plan
Chapter 7. Hard Bottom Page 417
Crowson (1980) found that much of the nearshore low-relief hard bottom in the proximity of New River
Inlet was partially covered by a thin layer of sand. In boring for compatible sand sources for Brunswick
County beach nourishment, the US Army Corps of Engineers (USACE) has identified several areas of
low-relief hard bottom seaward of Oak Island, Holden Beach, and Ocean Isle (USACE, unpub. data).
7.1.4.2. Distribution of man-made hard bottom
There are 47 DMF-managed artificial reefs of varying construction in North Carolina, of which 29 are
located in federal ocean waters, 11 in state ocean waters (Map 7.1), and seven in estuarine waters.48
The
DMF Artificial Reef Program generally adds material to the 40 existing ocean sites, rather than creating
new reefs, although new reefs are created on occasion. In addition to the DMF-managed artificial reefs,
the USACE constructed an artificial reef off the Cape Fear River using rock dredged during deepening of
the shipping channel. The North Carolina Department of Cultural Resources, Underwater Archaeology
Branch, estimates there are over 1,000 sunken vessels off the North Carolina coast dating back to the
earliest period of European exploration
(http://www.archaeology.ncdcr.gov/ncarch/underwater/underwater.htm, 2008). The majority of
shipwrecks are in federal waters, with concentrations around the three cape shoals. Gentile (1992) listed
46 documented wrecks in waters south of Hatteras Inlet, with most located northeast and west of the
mouth of the Cape Fear River (Map 7.1). There are also two jetty systems and three groin systems along
the North Carolina ocean shoreline. A single jetty is situated on the west side of Cape Lookout, while
Masonboro Inlet has jetties on both sides–one attached to Wrightsville Beach, and the other attached to
Masonboro Island. The groins are located on the south side of Oregon Inlet, off the former site of the
Cape Hatteras Lighthouse, and on the west side of Beaufort Inlet. Numerous small groins and jetty
systems are in estuarine waters as well, but these features have not been mapped.
7.2. Ecological role and functions
7.2.1. Ecosystem enhancement
Hard bottoms, through bioerosion, contribute significant volumes of new sand to sediment-starved
sections of the North Carolina continental margin, such as Onslow and Long bays (Riggs et al. 1996;
Riggs et al. 1998). Three primary groups of bioeroders, including rock boring bivalves, burrowing
shrimp, and macroalgae, physically and/or chemically degrade hard bottom of different hardnesses and
slopes (Riggs et al. 1998). Larvae of rock boring bivalves erode mostly muddy sandstones by chemically
(i.e. secretion of acid) or mechanically (i.e. abrasion from their hard shell) burrowing through sections of
rock. Over time, multiple tunnels weaken the rock until chunks break off, leaving a fresh surface for
more bivalve larvae to settle on and bore into. Macroalgae erode rock (primarily Pleistocene limestone)
when storms and strong water currents dislodge their holdfasts from the rock surface, removing small
pieces of rock along with the plant itself. Rates of sediment production from bioerosion vary with respect
to substrate type, ranging from 5.5 kg/m2/yr on vertical and sloped Miocene mudstone to 0.03 kg/m
2/yr on
flat, highly lithified Plio-Pleistocene limestone (Riggs et al. 1998). These processes also enhance the
structural complexity of the hard bottom outcrops, which promotes diversity of fish habitat within the reef
(Riggs et al. 1996; Riggs et al. 1998).
7.2.2. Productivity
Exposed hard substrate provides stable attachment surfaces for colonization by sessile marine
invertebrates and algae. The vertical relief and irregularity of hard bottom structure affords greater
habitat complexity, allowing more species to coexist (Wenner et al. 1984; Fraser and Sedberry 2008).
Areas of exposed hard bottom may be quite small and isolated, and have been considered oases of
productivity surrounded by less productive unconsolidated ocean bottom (SAFMC 1998a; SAFMC
48 The Shell Bottom chapter (3.0) covers estuarine reefs located in salinities suitable for oysters.

2010 Coastal Habitat Protection Plan
Chapter 7. Hard Bottom Page 418
2008a). Species diversity and extent of colonization on temperate hard bottom vary with topography,
environmental conditions, and distance from shore. Much of the research on hard bottom communities in
North Carolina has been focused on locations beyond the three-mile state boundary (MacIntyre and
Pilkey 1969; Schneider 1976; Peckol and Searles 1984; Kirby-Smith 1989).
Macroalgae are the dominant colonizing organisms on North Carolina hard bottoms, ranging from 10% to
70% of the biotic cover (Peckol and Searles 1984). Roughly 150 species of encrusting macroalgae have
been identified, with the greatest diversity occurring in Onslow Bay (Schneider 1976). Perennial and
crustose brown and red algae, including Sargassum filipendula, Dictyopteris membranacea, Lobophora
variegata, Lithophyllum subtenellum, Zonaria tournefortii, and Gracilaria mammillaris are dominant
algal forms (Schneider 1976; Peckol and Searles 1984; Renaud et al. 1997; Mallin et al. 2000a; DMF
2001d). The shallow inshore flora consists largely of temperate species, while offshore areas support
more tropical flora (Searles 1984). The greatest abundance of macroalgae occurs at offshore habitats due
to the high proportion of suitable substrate, greater relief on the shelf break, and mild water temperatures.
Of the offshore species, 66% are at their northern limit of distribution in Onslow Bay, and 2% are at their
known southern distributional limit (Schneider 1976).
7.2.3. Benthic community structure
Attached, sessile invertebrates account for 10% or less of the biotic cover on hard bottom in North
Carolina (Peckol and Searles 1984). Peckol and Searles (1984) reported that the soft corals Titandeum
frauenfeldii and Telesto fructiculosa, and the hard coral Oculina arbuscula were the most abundant non-
mobile invertebrates, while sea urchins (Arbacia punctulata and Lytechinus variegatus) were the most
common mobile invertebrates. In a study of hard bottom communities at nearshore and offshore reefs,
Kirby-Smith (1989) found that benthic community structure varied with season, depth, and distance from
the shelf edge. Inner shelf sites, in approximately 16–27 m water depths, had somewhat lower diversity
than mid- or outer shelf sites. Regardless of location, mollusks, polychaetes, and amphipods were
dominant in the number of species observed.
Wenner et al. (1984) reported that sponges, bryozoans, corals, and anemones49
dominated the large
macroinvertebrate community in terms of numbers and species diversity during all seasons at hard bottom
sites in South Carolina and Georgia. Sponges comprised 59–78% of the total invertebrate biomass on the
inner shelf, although tunicates, anthozoans, and mollusks also contributed substantially. Species which
typified inner shelf sites included the sponges Homaxinella waltonsmithi, Spheciospongia vesparium,
Cliona caribbaea, and Halichondria bowerbanki; the echinoderms Lytechinus variegatus, Arbacia
punctuata, Encope michelini, and Ocnus pygmaeus; the bryozoan Membranipora tenuis; and the decapod
crustacean Synalpheus minus. Polychaetes were the most diverse and abundant group of small
invertebrates, followed by mollusks, and amphipods.50
Species composition of hard bottom communities in the nearshore waters of North Carolina is less
tropical in nature compared to that farther offshore or to the south due to cooler water temperatures and
greater temperature fluctuations (Kirby-Smith 1989; Fraser and Sedberry 2008). Furthermore,
macroalgae outcompetes the hard coral Oculina arbuscula at nearshore reefs in Onslow Bay, limiting its
growth and recruitment, as well as restricting its distribution to deeper, poorly lit habitats via competitive
exclusion (Miller and Hay 1996). Because of these conditions, hard bottom in state territorial waters is
colonized to a lesser extent by hard and soft corals than offshore or more southern areas. Offshore hard
bottom, however, appears to offer suitable habitat for two species of tropical reef building corals:
Solenastrea hyades and Siderastrea siderea. These species grow on flat rock outcrops in Onslow Bay at
49 sponges (89 Porifera taxa); bryozoans (91 Bryozoa taxa); and corals and anemones (70 Cnidaria taxa) 50 polychaetes (285 species, 72% of total individuals); mollusks (251 species, 4.3% of total individuals); and amphipods (100
species, 13% of total individuals)

2010 Coastal Habitat Protection Plan
Chapter 7. Hard Bottom Page 419
depths of 20 to 40 m approximately 32 km offshore (MacIntyre and Pilkey 1969; MacIntyre 2003). Other
species of coral reported in North and South Carolina include the hard corals Oculina arbuscula, Oculina
varicosa, Astrangia danae, Phyllangia americana, Balanophyllia floridana, and the soft corals
Leptogorgia virgulata, Telesto spp., Lophogorgia spp., Titanideum frauenfeldii, and Muricea pendula
(Wenner et al. 1984; Hay and Sutherland 1988).
Unique and productive hard bottom communities are also found on the slope off North Carolina (> 250 m
water depth) (Ross 2006; Partyka et al. 2007; Ross and Nizinski 2007). Because these habitats seem to be
at their northern limit of distribution in Onslow Bay, they may be distinct in biotic resources as well as
habitat expression. The hard coral Lophelia pertusa is the dominant macroinvertebrate, although the
colonial corals Madrepora oculata and Enallopsammia profunda as well as a variety of solitary corals,
sponges, and anemones are also abundant. Overall, species diversity of these deep water habitats
increases south of Cape Fear (Partyka et al. 2007; Ross and Nizinski 2007). The Galatheid crab
Eumunida picta, brisingid basket star Novodinia antillensis, and the brittle star Ophiacantha bidentata
typify the mobile invertebrate community in the deep water reefs off North Carolina (Ross 2006).
7.2.4. Fish utilization of natural hard bottom
Fish comprise a significant proportion of the faunal biomass on hard bottom and are an important
component of the overall trophic structure (Jaap 1984; Thomas and Cahoon 1993; Steimle and Zetlin
2000). Habitat utilization patterns by hard bottom fishes are primarily determined by water temperature
and topography (Wenner et al. 1984; SAFMC 1998a; SAFMC 2008a). Temperatures less than 12º C may
result in the death of some tropical species, while hard bottoms with relatively high relief support a
greater abundance and diversity of fishes because of their structural complexity and more permanent
nature (Huntsman and Manooch 1978). Studies that have examined fish assemblages on hard bottom
habitats in North Carolina include Huntsman and Manooch (1978), Miller and Richards (1980), Grimes et
al. (1989), Clavijo et al. (1989), Lindquist et al. (1989), Potts and Hulbert (1994), Parker and Dixon
(1998), Quattrini et al. (2004), Quattrini and Ross (2006), Ross and Quattrini (2007), and Shertzer and
Williams (2008). All of these studies, however, were conducted seaward of state territorial waters,
including those at sites on the inner shelf. Research specific to nearshore hard bottom (i.e. within state
territorial waters) is needed to better understand the dependence of fishes on this habitat.
Natural hard bottoms off the North Carolina coast support large populations of tropical, subtropical, and
warm-temperate reef fish, as well as numerous coastal pelagic species. Along the coasts of North and
South Carolina, well over 150 species of reef fish have been documented on inshore, offshore, and shelf-
edge hard bottoms, with species richness and diversity increasing with distance from shore (Huntsman
and Manooch 1978; Grimes et al. 1989; Clavijo et al. 1989; Lindquist et al. 1989; Parker and Dixon 1998,
Quattrini et al. 2004; Quattrini and Ross 2006; Ross and Quattrini 2007). Documented species include
wrasses, damselfish, snappers, grunts, porgies, and sea basses. Generally, inshore hard bottoms support a
higher proportion of temperate fishes, such as black sea bass (Centropristis striata), spottail pinfish
(Diplodus holbrookii), and estuary-dependent migratory species (Huntsman and Manooch 1978; Grimes
et al. 1989). A list of species reported at nearshore hard bottom in North and South Carolina is provided
in Table 7.2.

2010 Coastal Habitat Protection Plan
Chapter 7. Hard Bottom Page 420
Table 7.2. Fishes occurring at nearshore hard bottom in North Carolina and South Carolina
coastal waters. (Sources: Grimes et al. 1989; Powell and Robins 1998; DMF, unpub.
data)
Family Scientific name Common name
Carcharhinidae Carcharhinus falciformis Silky shark
Muraenidae Gymnothorax nigromarginatus Blackedge moray
Ophichthidae Ophichthus ocellatus Palespotted eel
Engraulidae Anchoa spp. Anchovies
Synodontidae Synodus foetens Inshore lizardfish
Trachinocephalus myops Snakefish
Batrachoididae Opsanus pardus Leopard toadfish
Antennariidae Antennarius ocellatus Ocellated frogfish
Gadidae Urophycis earllii Carolina hake
Ophidiidae Ophidion marginatum Striped cusk-eel
Syngnathidae Hippocampus erectus Lined seahorse
Syngnathus spp. Pipefishes
Serranidae Centropristis ocyurus Bank sea bass
Centropristis striata Black sea bass
Dermatolepis inermis Marbled grouper
Diplectrum formosum Sand perch
Epinephelus adscensionis Rock hind
Epinephelus drummondhayi Speckled hind
Epinephelus morio Red grouper
Cephalopholis fulva Coney
Epinephelus guttatus Red hind
Mycteroperca microlepis Gag
Mycteroperca phenax Scamp
Mycteroperca venenosa Yellowfin grouper
Cephalopholis cruentata Graysby
Serranus subligarius Belted sandfish
Priacanthidae Pristigenys alta Short bigeye
Heteropriacanthus cruentatus Glasseye snapper
Apogonidae Apogon pseudomaculatus Twospot cardinalfish
Pomatomidae Pomatomus saltatrix Bluefish
Carangidae Alectis crinitus African pompano
Caranx ruber Bar jack
Decapterus punctatus Round scad
Lutjanidae Lutjanus analis Mutton snapper
Lutjanus campechanus Red snapper
Lutjanus griseus Gray snapper
Haemulidae Haemulon aurolineatum Tomtate
Haemulon plumieri White grunt
Orthopristis chrysoptera Pigfish
Sparidae Diplodus holbrookii Spottail pinfish
Archosargus probatocephalus Sheepshead
Calamus leucosteus Whitebone porgy
Stenotomus chrysops Scup
Sciaenidae Equetus umbrosus Cubbyu
Cynoscion regalis Weakfish
Labridae Halichoeres bivittatus Slippery dick
Tautoga onitis Tautog
Ephippidae Chaetodipterus faber Atlantic spadefish
Blenniidae Parablennius sp. Blennies
Gobiidae Ioglossus calliurus Blue goby
Paralichthyidae Paralichthys dentatus Summer flounder
Paralichthys lethostigma Southern flounder
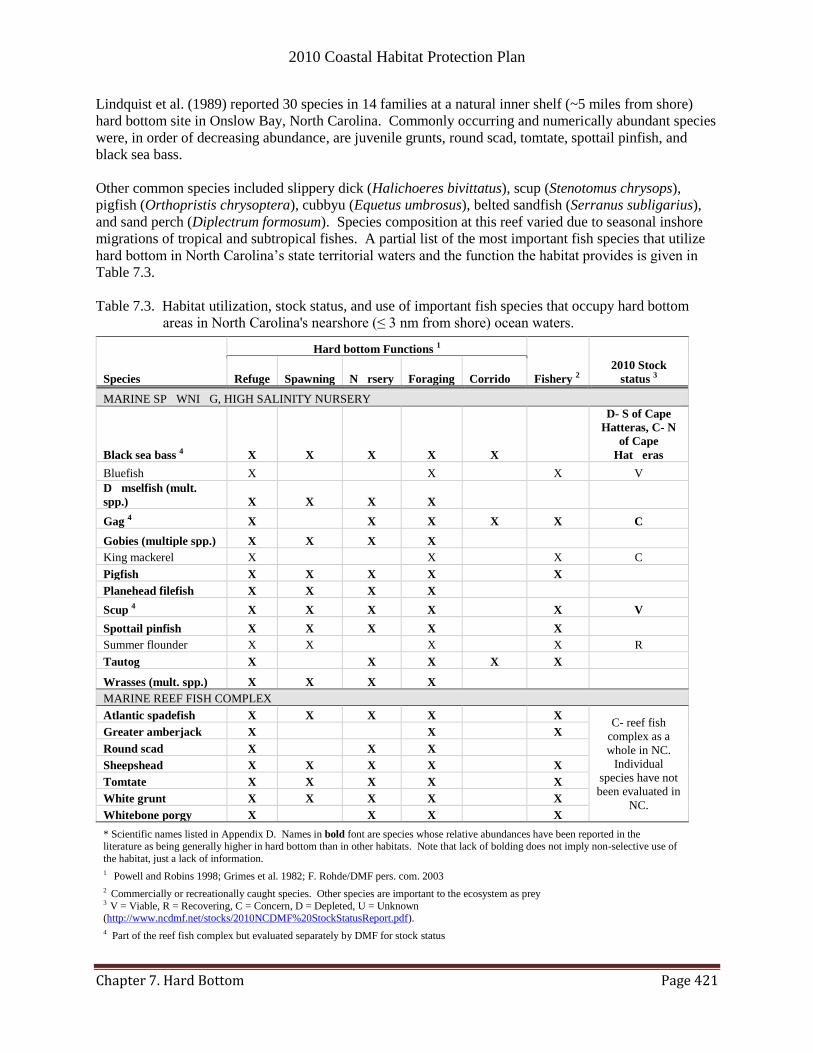
2010 Coastal Habitat Protection Plan
Chapter 7. Hard Bottom Page 421
Lindquist et al. (1989) reported 30 species in 14 families at a natural inner shelf (~5 miles from shore)
hard bottom site in Onslow Bay, North Carolina. Commonly occurring and numerically abundant species
were, in order of decreasing abundance, are juvenile grunts, round scad, tomtate, spottail pinfish, and
black sea bass.
Other common species included slippery dick (Halichoeres bivittatus), scup (Stenotomus chrysops),
pigfish (Orthopristis chrysoptera), cubbyu (Equetus umbrosus), belted sandfish (Serranus subligarius),
and sand perch (Diplectrum formosum). Species composition at this reef varied due to seasonal inshore
migrations of tropical and subtropical fishes. A partial list of the most important fish species that utilize
hard bottom in North Carolina‘s state territorial waters and the function the habitat provides is given in
Table 7.3.
Table 7.3. Habitat utilization, stock status, and use of important fish species that occupy hard bottom
areas in North Carolina's nearshore (≤ 3 nm from shore) ocean waters.
Species
Hard bottom Functions 1
Fishery 2
2010 Stock
status 3 Refuge Spawning N rsery Foraging Corrido
MARINE SP WNI G, HIGH SALINITY NURSERY
Black sea bass 4 X X X X X
D- S of Cape
Hatteras, C- N
of Cape
Hat eras
Bluefish X X X V
D mselfish (mult.
spp.) X X X X
Gag 4 X X X X X C
Gobies (multiple spp.) X X X X
King mackerel X X X C
Pigfish X X X X X
Planehead filefish X X X X
Scup 4 X X X X X V
Spottail pinfish X X X X X
Summer flounder X X X X R
Tautog X X X X X
Wrasses (mult. spp.) X X X X
MARINE REEF FISH COMPLEX
Atlantic spadefish X X X X X C- reef fish
complex as a
whole in NC.
Individual
species have not
been evaluated in
NC.
Greater amberjack X X X
Round scad X X X
Sheepshead X X X X X
Tomtate X X X X X
White grunt X X X X X
Whitebone porgy X X X X
* Scientific names listed in Appendix D. Names in bold font are species whose relative abundances have been reported in the literature as being generally higher in hard bottom than in other habitats. Note that lack of bolding does not imply non-selective use of
the habitat, just a lack of information.
1 Powell and Robins 1998; Grimes et al. 1982; F. Rohde/DMF pers. com. 2003
2 Commercially or recreationally caught species. Other species are important to the ecosystem as prey 3 V = Viable, R = Recovering, C = Concern, D = Depleted, U = Unknown (http://www.ncdmf.net/stocks/2010NCDMF%20StockStatusReport.pdf).
4 Part of the reef fish complex but evaluated separately by DMF for stock status

2010 Coastal Habitat Protection Plan
Chapter 7. Hard Bottom Page 422
7.2.5. Fish utilization of man-made structures
When occurring in similar environmental conditions, the composition and density of fish at artificial reefs
tend to be similar to those at natural hard bottoms (Huntsman and Manooch 1978; Miller and Richards
1980; Ambrose and Swarbrick 1989; Lindquist et al. 1989; Bohnsack et al. 1994; Potts and Hulbert
1994). Species composition, relative abundance, and catch-per-unit-effort (CPUE) at artificial reef sites
in North Carolina are documented periodically by DMF (DMF 1998; DMF 2002). An evaluation of the
effectiveness of different artificial reef materials found species assemblages to be similar on reefs
constructed with concrete pipes or domes. However, the evaluation also found that CPUE was 71 – 85%
greater on natural reefs than nearby artificial reefs (DMF 1998). A more recent assessment conducted
between 2001 and 2005 found that CPUE by number and weight of recreationally important demersal
target species, including grouper (Epinephelus and Mycteroperca), black sea bass, snapper (Lutjanus
spp.), vermilion snapper (Rhombloplites aurorubens), gray triggerfish (Balistes capriscus), porgies
(Calamus and Pagrus), and flounder (Paralichthys spp.), were similar, if not higher at artificial reef sites
compared to adjacent natural reefs (DMF, unpub. data), possibly reflecting the naturalization of artificial
substrata over time. Several studies have reported that multiple artificial patch reefs surrounded by sand
habitat support greater fish abundance and diversity than one large area of equal material, suggesting the
importance of habitat variety to overall ecosystem quality (Bohnsack et al. 1994; Auster and Langton
1999; Jordan et al. 2005).
Jetties provide some of the same habitat functions for fishery resources as natural hard bottoms and
artificial reefs. The fish community found at jetties in North Carolina is a subset of that found on offshore
hard bottoms and estuarine oyster reefs (Lindquist et al. 1985; Hay and Sutherland 1988). Most fishes are
absent from inshore jetty habitats in the winter, gradually returning as waters warm in spring. Hay and
Sutherland (1988) grouped fishes documented on jetties in North and South Carolina into five general
categories based on their mobility, association with structure, and seasonality of jetty occupancy:
Small cryptic resident fishes, such as blennies and gobies;
Numerically dominant fishes that migrate offshore in winter, such as pinfish, spottail pinfish,
black sea bass, and pigfish;
Predatory pelagic fishes, such as bluefish, Spanish mackerel, and king mackerel;
Fishes attracted to jetties during their seasonal migrations, such as smooth dogfish (Mustelus
canis); and
Tropical fishes that occur as strays during summer, such as butterflyfishes and surgeonfishes.
Although jetties provide suitable habitat for some structure-oriented fish, the species that utilize them do
not require jetties for survival since they are attracted from existing natural hard bottom and estuarine
oyster reefs.
7.2.6. Specific biological functions
7.2.6.1. Refuge and foraging
The complex three-dimensional structure of hard bottom provides protective cover for numerous
organisms (Huntsman and Manooch 1978; Potts and Hulbert 1994; Mallin et al. 2000a; Quattrini and
Ross 2006; Fraser and Sedberry 2008; Kendall et al. 2008). Hard bottom habitats are often the only
source of structural refugia in open shelf waters. The abundance of fish on hard bottom is related to the
amount and type of structure of the reef habitat (Huntsman and Manooch 1978; Potts and Hulbert 1994;
Kendall et al. 2008). Rocky faces with more complexity consistently support a greater abundance and
diversity of resident reef fish than less complex habitats.
The structure provided by hard bottom also concentrates prey resources and attracts predators. In general,
most reef fish are carnivores (Jaap 1984; Sedberry and Cuellar 1993; Lindquist et al. 1994; Goldman and
2010 Coastal Habitat Protection Plan
Chapter 7. Hard Bottom Page 423
Sedberry 2006). Benthic invertebrates are therefore very important as energy assimilators and food
sources for reef fish (Jaap 1984). Lindquist et al. (1994) found that black sea bass, scup, and cubbyu
forage extensively on both reef and adjacent soft bottom invertebrates at a nearshore hard bottom site off
the North Carolina coast. Posey and Ambrose (1994) documented significant reductions in soft bottom
macroinvertebrate densities within 10 m of an inner shelf reef due to the foraging activity of several reef
fishes. These finding suggest that, in addition to reef-associated invertebrates, sand substrata organisms
around reefs function as valuable prey for reef fishes.
The abundance of prey and extent of structural refugia afforded by hard bottom in turn supports high fish
productivity. Nearshore hard bottom can support over thirty times as many individuals per transect as
adjacent sand habitats (Lindeman 1997). Accordingly, natural reefs sustain greater fish stocks (270 to
5,279 kg/ha) compared to non-reef open shelf bottom (6.3 to 46.3 kg/ha) (Huntsman 1979).
7.2.6.2. Spawning
Hard bottom also functions as crucial spawning areas for numerous species of fish and invertebrates.
Most reef fish spawn in aggregations in the water column above the reef surface (Jaap 1984). The timing
of egg release is often triggered by nightfall or tide stage, probably to reduce the risk of predation. While
offshore and shelf-edge reefs have been documented as important spawning habitat for species of the
snapper-grouper complex (Wyanski et al. 2000; White and Palmer 2004; Burton et al. 2005; Burgos et al.
2007), nearshore hard bottom provides valuable spawning sites for smaller and more temperate reef
species. Species known to spawn on nearshore hard bottom include black sea bass and sand perch
(Powell and Robins 1998). Sheepshead (Archosargus probatocephalus), Atlantic spadefish
(Chaetodipterus faber), seaweed blenny (Parablennius marmoreus), inshore lizardfish (Synodus foetens),
and several species of damselfish, wrasses, and gobies (Ioglossus calliurus and others) are also thought to
spawn on nearshore hard bottom (F. Rohde/DMF, pers. com., 2001). More research is needed
concerning spawning activity on, and recruitment to, nearshore hard bottom to understand the
importance of this habitat and document trends in fish utilization.
7.2.6.3. Nursery
Nearshore and inner shelf hard bottom serves as important settlement and nursery habitat for the larvae
and early juveniles of many reef fishes. In a study of the abundance and distribution of ichthyoplankton
adjacent to hard bottom in open shelf waters (< 55 m water depth) in Onslow Bay, Powell and Robbins
(1998) collected the larvae of 22 reef-associated families. Planehead filefish (Monacanthus hispidus), the
blenny Parablennius marmoreus, the goby Ioglossus calliurus, black sea bass, sand perch, and several
species of grunts, snappers, and wrasses were commonly collected. These taxa are thought to spawn in
somewhat deeper waters of Onslow Bay and recruit locally to nearshore hard bottom (Powell and Robins
1998). Although the mechanisms of recruitment to hard bottom habitats are generally unclear, it is
apparent that successful recruitment depends on water circulation patterns transporting larvae to suitable
habitat (Jaap 1984).
7.2.6.4. Corridor and connectivity
Nearshore hard bottom also serves as a migratory corridor for the late juveniles of estuary-dependent reef
fishes (Lindeman and Snyder 1999; Baron et al. 2004). In North Carolina, these species include black sea
bass, gag, red grouper, sheepshead, Atlantic spadefish, bank sea bass, and gray snapper, which use
estuarine habitats as early juveniles and move to offshore hard bottom with growth. Red snapper and
mutton snapper juveniles have also been documented in North Carolina‘s estuaries to a lesser extent
(DMF, unpub. data). Juveniles migrating offshore benefit from the structural refugia and high abundance
of prey organisms provided by nearshore hard bottoms. Several studies on the southeast coast of Florida
have reported that early life stages represent over 80% of the individuals at nearshore hard bottom sites
2010 Coastal Habitat Protection Plan
Chapter 7. Hard Bottom Page 424
(Lindeman and Snyder 1999; Baron et al. 2004). These assemblages were primarily dominated by
juvenile grunts, wrasses, and damselfish. In North Carolina, the patchy distribution and limited extent of
nearshore hard bottom suggest that habitat availability may limit survival of early stages of reef fish,
giving available hard bottom habitat particularly high value (P. Parker/NMFS, pers. com., 2002).
7.3. Status and trends
7.3.1. Status of hard bottom habitat
The condition of shallow hard bottom in North Carolina state territorial waters is of particular importance
to the health and stability of estuary-dependent snapper-grouper species that utilize this habitat as ―way
stations‖ or protective stopping points as they emigrate offshore. Because of the high market value,
number of recreational participants, and associated businesses, the offshore snapper-grouper complex
supports productive commercial and recreational fisheries. Between 2005 and 2007, the North Carolina
commercial snapper-grouper fishery harvested an average of 1,148,152 lbs of fish at an annual market
value of over $3.1 million (DMF 2008c). During those same years, recreational fisherman (including
private boats, charter boats and head boats) harvested an average of 687,216 lbs of fish in the snapper-
grouper complex.
Nearshore hard bottoms are generally considered to be in good condition overall (SAFMC 1998b).
Although adequate information exists on the distribution of hard bottom off the North Carolina coast
(Moser and Taylor 1995; SEAMAP-SA 2001; Udouj 2007), little information is available to evaluate the
status and trends of hard bottom habitat in state territorial waters. Anecdotal information from fishermen
and local residents in coastal North Carolina suggests that many known nearshore hard bottom sites in the
mid-twentieth century are now completely covered by sand, and that the abundance of fish in these areas
is much reduced. An extensive and regular survey of nearshore hard bottom distribution and quality is
needed to better evaluate status and trends of both habitat and biological communities.
7.3.2. Status of associated fishery stocks
Commercially or recreationally harvested reef fish are managed collectively as the reef fish complex or
Snapper-Grouper management unit, which includes 73 species of snappers, sea basses and groupers,
porgies, tilefishes, grunts, triggerfishes, wrasses, spadefish, wreckfish, and jacks. Management authority
is shared by NMFS, SAFMC, and DMF/MFC. Of these species, only some are found on hard bottoms in
North Carolina state territorial waters. Information is available on the status of many reef fishes through
state, interstate, and federal stock assessments. Fishery-dependent data on reef fish are collected by the
DMF Offshore Live Bottom Fishery Program (DMF biological database program 438/448). Fishery-
independent data on reef fish abundance and community structure are also available for a portion of North
Carolina from the Marine Resources Monitoring, Assessment, and Prediction Program (MARMAP), a
cooperative fisheries project of the Marine Resources Research Institute (MRRI) of the South Carolina
Department of Natural Resources (SCDNR). This program has conducted standardized groundfish
(bottom fish) surveys from Cape Lookout, North Carolina south to Ft. Pierce, Florida since 1972 using a
variety of fishing gears. Sampling occurs on mid-shelf and shelf-edge reef habitats in water depths of 16
m to more than 92 m. Although sampling is focused seaward of state waters, this program provides
valuable information for stock assessments of reef fishes, including species that utilize nearshore hard
bottom in North Carolina.
Most major South Atlantic reef fish stocks are considered fully utilized or over-utilized (NMFS 2008).
Of 73 managed species in the South Atlantic Snapper-Grouper management unit, three species were
classified as ―Overfished‖ in 2007 by the NMFS, four were ―Not Overfished‖, and 66 were ―Unknown‖
2010 Coastal Habitat Protection Plan
Chapter 7. Hard Bottom Page 425
(NMFS 2008).51
Overfished species included snowy grouper, black sea bass, and red porgy. In addition,
10 species were reported to be subject to Overfishing, 13 were not subject to Overfishing, and the status
of 50 species was Unknown (NMFS 2008). More data are needed for evaluating the stock status of
species in the reef fish complex off North Carolina.
In North Carolina, the reef fish complex as a whole was classified as Concern by DMF in 2009 (DMF
2009a). The reef fish complex includes numerous species, of which at least ten are common in North
Carolina state territorial waters. For stock status of individual reef fishes, DMF defers to SAFMC
Southeast Data, Assessment, and Review (SEDAR) stock assessments. Of the species listed in Table 7.3
that are highly associated with nearshore hard bottom in North Carolina, five stocks have been evaluated
by DMF. One stock was reported as ―Depleted‖ (black sea bass south of Cape Hatteras) in 2010 and
three were reported as Concern (black sea bass north of Cape Hatteras, gag, and reef fish complex)
(http://www.ncdmf.net/stocks/2010NCDMF%20StockStatusReport.pdf). Scup were considered Viable in
2010.
Although most exploited reef fish species are caught primarily in federal waters, several, such as gag and
black sea bass, are highly dependent on nearshore hard bottom as primary and secondary nursery areas,
and for providing migratory corridors as individuals move offshore with age. The apparent vulnerability
of reef fishes to overfishing is attributed to their long lives, slow growth, large size, delayed sexual
maturity, ease of capture, and preference for patchy hard bottom habitats. Nearshore hard bottoms
(within state territorial waters) should be considered for nomination as Strategic Habitat Areas because
of their importance as secondary nursery habitats and migratory corridors for black sea bass, gag, and
other reef fish species, as well as valuable foraging habitat for flounder, mackerel, and weakfish.
The status and health of reef fish stocks in North Carolina may be particularly subject to changes in the
quantity or quality of habitat. Although some research in Florida has indicated that habitat is not limiting
and reef fish populations are controlled primarily by recruitment success (Bohnsack 1996; Grossman et
al. 1997), these studies may not be applicable to North Carolina where hard bottom is much less
extensive. In North Carolina, there appears to be a direct relationship between the amount of hard bottom
and the number of reef fish. Of the three Carolina Bays, Onslow Bay has more hard bottom than Long
Bay or Raleigh Bay, and also has the greatest amount of reef fish (P. Parker/NMFS, pers. com., 2002).
This relationship implies that increased habitat quantity would result in larger populations of reef fish.
7.3.3. Hard bottom enhancement
Artificial reefs may enhance fish production by providing additional foraging, spawning, and refuge
habitat, increasing an area‘s carrying capacity (Bohnsack 1989; Grossman et al. 1997; Lindberg 1997;
Brickhill et al. 2005). They are most effective at bolstering production where reef habitat is limiting,
when a large stock reservoir exists, and when fishing effort is low (Bohnsack 1996; Grossman et al. 1997;
Powers et al. 2003). Powers et al. (2003) estimated that annual fish productivity was 32% greater at
artificial reefs protected from fishing as compared to those subject to fishing pressure. This suggests that
artificial refugia would be beneficial for enhancement of fish productivity and ecosystem value. An
artificial refugia site is an artificial reef that is designated as a no-take area to provide an unfished habitat
to aid in stock recovery, conduct research, and test effectiveness of enforcement. Construction of
artificial refugia (no-take artificial reefs) or designation of existing artificial reefs as refugia (no-take,
Marine Protected Areas) should be considered to enhance fisheries productivity.
High numerical abundance of fish, however, may not necessarily be associated with increased production.
There is some concern among fishery scientists that artificial reefs only concentrate available biomass
51 Overfished is defined as a stock size below an established biomass threshold and Unknown is defined as a stock for which no
recent assessment was conducted or insufficient information about the stock exists to make a determination (NMFS 2008).
2010 Coastal Habitat Protection Plan
Chapter 7. Hard Bottom Page 426
rather than increase regional productivity. This attraction-production debate is yet to be resolved
(Bohnsack 1989; Bohnsack et al. 1994; Pickering and Whitmarsh 1996; Carr and Hixon 1997; Grossman
et al. 1997; Lindberg 1997; Rilov and Benayahu 2000). Additional research is needed to determine if,
and to what extent, artificial reefs in North Carolina simply concentrate available fish or effectively
increase fish biomass.
Artificial reefs must be properly designed, sited, and managed to successfully increase production of
benthic organisms and fish populations (DMF 1988; Gregg 1995; Brickhill et al. 2005; Strelcheck et al.
2005). Small, complex structures that mimic natural hard bottom may be better for recruitment and
enhance juvenile survival, while larger structures may be better for attracting large predators and enhance
fishing opportunities (Bohnsack et al. 1994; Jordan et al. 2005; Lindberg et al. 2006). One ongoing
problem that the DMF has experienced with artificial reefs is the failure of some designs, such as those
composed of tires, to remain assembled and in position. More recent artificial reefs constructed of
concrete pipes and domes appear to be sufficiently stable and durable when deployed (DMF 1995; Gregg
1995). The DMF Artificial Reef Master Plan provides siting guidelines and construction standards for
artificial reefs in North Carolina (DMF 1988). Some of the recommendations that pertain to habitat
enhancement include:
North Carolina‘s artificial reef program should NOT use materials that:
Are toxic to the environment.
Are not stable and may move off-site.
Are not durable and will have a short lifespan in the ocean.
Materials used should provide the degree of habitat complexity and profile appropriate for the
targeted reef species.
Artificial reefs should be designed to increase surface area and interstitial space by addition of rock,
concrete, or other suitable materials to barges and stripped vessels that lack structural complexity.
Trolling alleys, reef clusters, and reef sanctuaries should be incorporated into reef complex designs.
Artificial reefs should NOT be sited where:
Natural hard bottom exists.
The seafloor would not support proposed reef structures.
High-energy environments exist.
Traditional commercial fishing activities occur.
They would be a navigation or liability hazard.
Enhancement of existing artificial reef sites should be a higher priority than construction of new
artificial reef sites.
If artificial reefs are used to replace natural reef habitat that has been damaged or destroyed, they
should be designed and constructed to provide proven biologically productive habitat (DMF 1988).
In 2009, the DMF Artificial Reef Program shifted its focus toward development of estuarine artificial
reefs. The Artificial Reef Program, in association with the Oyster Sanctuary Program52
, will develop
nursery habitat evaluation and enhancement projects for estuary-dependent reef fishes, including gag and
black sea bass. Addition and enhancement of estuarine artificial reefs may increase fish production on
nearshore and offshore hard bottoms by providing additional estuarine nursery habitats, potentially
increasing the number of recruits.
7.3.4. Designated areas
Natural hard bottom is protected through both state and federal designations. The N.C. Natural Heritage
Program inventories, catalogues, and supports conservation of the rarest and most outstanding elements of
natural diversity in the state. The program designates rare or significant plants, animals, or natural
52 See Shell Bottom chapter (2.0) for more information on the Oyster Sanctuary Program.
2010 Coastal Habitat Protection Plan
Chapter 7. Hard Bottom Page 427
communities that merit special consideration when making land use and conservation decisions. Four
hard bottom sites within state territorial waters (Map 2.3) have been designated by this program as
Significant Natural Heritage Areas (SNHA) (Natural Heritage Program, unpub. data). These include rock
outcrops off Bogue Banks (two acres), New River Inlet (1300 acres), South Topsail Island (38 acres), and
Masonboro Island (50 acres). In addition, the intertidal Fort Fisher Coquina Rock outcrops (47 acres)
were also designated as SNHA. These and other nearshore hard bottoms should be considered for
nomination as Strategic Habitat Areas because of their natural significance and vulnerability to impacts
from on-shore land development activities.
Certain natural hard bottoms have been designated as federal Essential Fish Habitat-Habitat Areas of
Particular Concern (EFH-HAPC) based on four criteria: 1) importance of ecological functions; 2)
sensitivity to human degradation; 3) probability and extent of effects from development; and 4) rarity of
the habitat. In North Carolina, all of the nearshore hard bottom, The Point, Ten Fathom Ledge (Onslow
Bay), Big Rock (Onslow Bay), and the entire shelf break have been given this designation for the
snapper-grouper complex (SAFMC 1998a; SAFMC 2008b). In addition, the SAFMC has proposed the
establishment of deepwater Coral Habitat Areas of Particular Concern (CHAPCs) to protect what is
currently thought to be the largest contiguous distribution (>23,000 square miles) of deepwater coral
ecosystems in the world (SAFMC 2008b). The proposed CHAPCs include two locations in Onslow Bay,
North Carolina: the Cape Lookout Lophelia Bank (122 square miles) and the Cape Fear Lophelia Bank
(52 square miles). The Cape Lookout Lophelia Bank encompasses two large Lophelia coral mounds,
with the main mound rising 80 meters (262 ft.). More than 54 species of deepwater reef fishes have
been documented along this bank. The Cape Fear Lophelia Bank also includes mounds rising nearly 80
meters (262 ft.) and exhibits some of the most vertically rugged habitat of any deep water reef in North
Carolina. Over 12 fish species have been documented along this bank, including many larger deepwater
reef fishes. In addition, the Cape Fear Lophelia Bank is the only location in North Carolina where
wreckfish have been observed (Ross 2006; SAFMC 2008b).
In 2000, federal Executive Order 13158 directed federal agencies to strengthen the management,
protection, and conservation of existing Marine Protected Areas (MPAs), and establish new or expanded
MPAs through the creation of a scientifically-based comprehensive national system of MPAs representing
diverse marine ecosystems (65 FR 34909). In response to this directive and because of concern for major
stocks of the snapper-grouper complex that are undergoing overfishing and/or overfished, and failure of
those stocks to adequately recover despite extensive changes in fishing regulations, the SAFMC
established several Marine Protected Areas (MPAs) in the South Atlantic Bight through Amendment 14
to the South Atlantic Snapper Grouper Fishery Management Plan (SAFMC 2007). The NMFS issued a
final rule to implement Amendment 14 effective February 2009 (74 FR 1621-1631), officially creating
eight Type II MPAs in which fishing for or possession of South Atlantic snapper-grouper species are
prohibited, but other types of fishing, such as trolling, are allowed. Use of MPAs has proven effective in
habitat protection and fishery enhancement, particularly for species with restricted geographical
movements typical of most reef fishes (Bohnsack 1993). A study of 89 marine reserves world-wide
showed that fish and other marine life quickly recovered when protected by establishment of marine
reserves (Halpern 2003), and organisms within the protected areas repopulated adjacent waters (AAAS
2001; Roberts et al. 2001). The primary purpose for MPA designation by the SAFMC is to protect a
portion of the population and habitat of long-lived, slow growing, deepwater snapper-grouper species
from directed fishing pressure to achieve a more natural sex ratio and age and size structure within the
proposed MPAs, while minimizing adverse social and economic effects (SAFMC 2007). In North
Carolina, the Snowy Grouper Wreck MPA (150 square miles) was established in federal waters of
Onslow Bay, east of Cape Fear. This location was once the site of a known spawning aggregation of
snowy grouper, and supports numerous speckled hind, gag, red porgy, red grouper, graysby, and hogfish,
as well as tuna, dolphinfish, wahoo, and marlin.
2010 Coastal Habitat Protection Plan
Chapter 7. Hard Bottom Page 428
Although the MFC has the authority to establish no-take areas within state jurisdictional waters, there has
been little discussion concerning establishment of nearshore hard bottom reserves through state
management. The Fisheries Director may prohibit or restrict taking of fish and use of any equipment in
and around any artificial reef or research sanctuary subject to some conditions [MFC Rule 15A NCAC 3I
.0109]. Many areas within state waters, such as primary nursery areas, are already protected from certain
fishing activities through MFC rules. Nearshore hard bottom nominated as Strategic Habitat Areas
should be considered for designation as MPAs, either through state or federal avenues, to provide some
protection from fishing gear impacts and enhance fish production.
Man-made structures functioning as hard bottom have also been given varying levels of designation and
protection. In 1975, the wreck of the USS Monitor, a Civil War ironclad located in federal waters off
Cape Hatteras, was designated as the first national marine sanctuary. Within North Carolina state
territorial waters, the USS Huron, a popular wreck located 250 yards off the beach in Dare County, was
designated by the state as a historic shipwreck preserve (Map 7.1). Furthermore, all artificial reefs, along
with all natural hard bottoms have been designated by the NMFS as Essential Fish Habitat (EFH).
7.4. Threats and management needs
7.4.1. Water-dependent development
7.4.1.1. Dredging (navigation channels and boat basins)
Dredging near or on hard bottom is potentially the most damaging physical human activity to this habitat
(SAFMC 1998b). Navigational dredging is associated with the creation of, or modification to, shipping
channels. Dredge gear impacts hard bottom directly by dislodging corals or colonized rock (live rock), as
well as injuring live tissue, which may lead to infection or mortality (SAFMC 1998b). The disposal of
dredged sediments on Ocean Dredged Material Disposal Sites (ODMDS) may, through sediment
dispersal from the ODMDS, bury adjacent hard bottom habitat, resulting in long-term loss of sessile biota
and associated finfishes (Crowe et al. 2006). Even if hard bottom is not buried, increased sedimentation
stresses corals and other sessile invertebrates, and may result in decreased productivity or death if the
organisms cannot purge the sediments deposited on them (SAFMC 1998b; Crowe et al. 2006). Silt
generated by dredging may remain in the area for long periods and continue to impact hard bottom when
resuspended during storms.
Dredging of large navigation channels through oceanic bottoms in North Carolina is limited to the
entrance channels leading to the state ports in Wilmington and Morehead City via Cape Fear and Beaufort
inlets, respectively. Although hard bottom is found in the general vicinity of both port entrance channels,
it is particularly abundant in the ocean adjacent to the Port of Wilmington. In 2002, the Wilmington
channel was rerouted as part of a project to deepen the river channel and port, and create a new ODMDS.
The proposed route was, however, altered to avoid dredging through hard bottom (F. Rohde/DMF, pers.
com., 2002). Dredging and stabilization of other inlets, such as New River, Masonboro and Shallotte
inlets, can also potentially impact hard bottom through direct removal of hard bottom resources, as well as
increased turbidity and sedimentation in the vicinity of dredge sites.
7.4.1.2. Shoreline stabilization
Due to the economic and recreational value of beaches, several different erosion control measures have
been used to protect coastal property and structures from continued erosional loss of protective shorelines
and dunes (ASMFC 2002a). The most common method of combating ocean shoreline retreat is beach
nourishment, in which sediments from a dredge site (e.g. nearshore ocean or inlet) or land-based source
are placed on the shoreface in order to build the beach profile and extend it seaward (ASMFC 2002a;
Peterson and Bishop 2005). However, these dredge-and-fill projects can have deleterious effects on
nearshore hard bottom if sited inappropriately (Blair et al. 1990). Similar to that for navigational
2010 Coastal Habitat Protection Plan
Chapter 7. Hard Bottom Page 429
dredging, dredging of ocean borrow areas can directly impact hard bottom via mechanical removal of
hard corals, soft corals, sponges, algae, and other benthic organisms. In addition, these organisms may be
fractured (e.g. hard corals), injured (e.g. soft corals and sponges), or silted over, reducing the health and
productivity of hard bottom resources. Current CRC rules prevent dredging activities within a 500 m
buffer of significant biological communities, such as high relief hard bottom areas [CRC Rule 15A
NCAC 07H .0208(b)(12)(A)(iv)]. Under this rule, ―high relief‖ is defined as relief greater than or equal
to one-half meter per five meters of horizontal distance. However, research by Lindquist et al. (1994)
suggests that reef fishes derive a significant portion of their nutritional requirements within a 500 m
―halo‖ of any exposed hard bottom. Because of this finding, the Ocean Policy Steering Committee
(OPSC), a group established by DCM to examine North Carolina‘s emerging ocean policy issues, has
recommended in their draft report that a 500 m dredging buffer should be established around all hard
bottom areas, including those periodically buried with thin, ephemeral sand layers (DCM 2009). In the
past few years beach nourishment planning efforts have attempted to mine closer than this distance due to
the difficulty of finding an area of sand not within the hard bottom buffer. Using the recommendations
from the OPSC, the CRC should modify existing rules pertaining to mining of submerged lands to require
a 500 m dredging buffer around any exposed hard bottom, thus minimizing potential impacts to fish
habitat functions. Furthermore, these buffers should be enforced.
The subsequent addition of sand to the shoreface can also negatively affect nearshore hard bottom
through direct burial and sediment redistribution. At a beach nourishment project site in Florida,
Lindeman and Snyder (1999) observed dramatic decreases in fish species and numerical abundance of
individuals following the burial of nearshore hard bottom. The number of species detected 12 months
prior to and 15 months after burial decreased by nearly one order of magnitude, from 54 to eight species
(Lindeman and Snyder 1999). The average number of individual fish recorded per transect also declined
from 38 pre-burial to less than one post-burial (Lindeman and Snyder 1999). At several other beach
nourishment projects in Florida, added sand was documented to redistribute offshore from the beach via
cross-shelf currents, covering hard bottom habitat (Marsh and Turbeville 1981; Continental Shelf
Associates 2002). Studies off Wrightsville Beach and Atlantic Beach, North Carolina documented
movement of sands from the nourished beaches across the shoreface (Thieler et al. 1995; Thieler et al.
1998; Reed and Wells 2000), with hard bottom becoming buried by nourishment sands in the vicinity of
Wrightsville Beach (R. Thieler/USGS, pers. com., 2001). Commercial fishermen in the Wrightsville
Beach area, where nourishment has been conducted regularly since the 1960s, reported that nearshore
hard bottoms that were once productive fishing areas are now covered in sand and are no longer fished
due to poor yield (W. Cleary/UNC-W, pers. com., 2001). Ojeda et al. (2001) found little to moderate
change in percent of seafloor with exposed hard bottom or rocky substrate within two years of a
nourishment project off Myrtle Beach, South Carolina. Available data from the study indicated that the
nearshore loss of hard bottom seaward of the project was due to localized introduction of new sand from
beach fill, but was only somewhat greater than the natural variability occurring from shifting sands (Ojeda
et al. 2001).
In North Carolina, the frequency and magnitude of beach nourishment activities (including dredged
material from navigational channels placed on beaches) have increased over time.53
The cumulative
length of shoreline affected by ocean beach management projects is approximately 176 miles or about
55% of the North Carolina ocean coastline (ASMFC 2002a). The majority of nourishment projects
(existing, authorized, and requested) are located south of Cape Lookout where hard bottom is most
abundant, especially in the nearshore. The transport of sand from nourished beaches over time should be
monitored. Future research should attempt to determine if the probability or extent of burial are affected
by sand volume, type, or grain size, by the time-of-year of project initiation, and/or by the distance
between nourished beach and hard bottom.
53 Refer to the Soft Bottom chapter threats section for status, trends, and location of beach nourishment activity.
2010 Coastal Habitat Protection Plan
Chapter 7. Hard Bottom Page 430
7.4.1.3. Energy infrastructure
A newly developing threat to hard bottom comes from the opportunity for oil and natural gas exploration
on the outer continental shelf (OCS). During 2008, a federal moratorium on offshore drilling for oil and
natural gas, which covered much of the OCS in the Atlantic and Pacific oceans, was lifted. This opened
the majority of federal waters, including those off the coast of North Carolina, to future oil and natural gas
exploration, development, and production. Such activities can have detrimental effects to hard bottom
habitat. The direct impact of oil and natural gas development on hard bottom is physical in nature, in
which organisms and hard substrate are damaged or dislodged from the platform anchor site, or
smothered by sediments from the disposal of drilling muds (Lissner et al. 1991; Boehm et al. 2001). The
disturbance from drilling reduces, at least temporarily, natural habitat complexity, and species richness
and diversity. Site-specific recovery from such disturbances may take years to decades and is dependent
on the vertical relief of the hard substrate and growth characteristics of the local organisms (Lissner et al.
1991). In addition to physical impacts, disposal of drilling muds, as well as produced formation water
(oily water produced after separation from oil) can cause acute or chronic toxic effects to hard bottom
organisms and reef fishes (Lissner et al. 1991; Hyland et al. 1994; Holdway 2002). Exposure to toxins
associated with drilling activities have been found to cause adult mortality, tissue loss, and reduced
relative viability of corals, and altered liver enzyme activities in reef fish living in close proximity to oil
producing platforms (Holdway 2002). Drilling on or in the vicinity of hard bottom resources on the OCS
of North Carolina should be prohibited to minimize potential impacts to ecologically productive hard
bottoms and there dependent biological communities.
The last active offshore oil and natural gas leases in the federal waters off North Carolina were
relinquished in November 2000 (http://www.gomr.mms.gov/homepg/offshore/atlocs/atocsfax.html,
2008). Several companies, including Amerada Hess, Chevron, Conoco, Marathon, Mobil, Occidental
Petroleum Corporation (OXY), and Shell held interests, singly or jointly, in the Manteo Exploration Unit,
a submerged area comprised of 21 lease blocks located approximately 44.8 statute miles northeast of
Cape Hatteras (Vigil 1998). The current federal Minerals Management Service (MMS) 5-year Lease
Program, which consists of the schedule for lease sales, as well as the size and location of blocks offered,
took effect July 2007 and runs through June 2012. The Program includes a special interest sale scheduled
for 2011 of about 2.9 million acres in the Mid-Atlantic Planning Area, 50 miles offshore the coast of
Virginia and approximately 25 miles north of the North Carolina-Virginia border. Under the authority of
the Outer Continental Shelf Lands Act, CAMA consistency process, and CRC administrative rule on
coastal energy policies (15A NCAC 7M .0400), North Carolina submitted comments on the proposed
Program in which concerns were raised regarding the effects on fisheries, fisheries habitat, tourism, and
continued dependency on fossil fuels, and that by virtue of proximity, North Carolina would be subject to
direct adverse impacts of such a sale, with no commensurate benefit. The MMS, at the request of the
federal government, developed a new draft 5-year Lease Program in January 2009 that could replace or
supersede the remaining portion of the current Program if implemented. North Carolina should continue
to be engaged in the MMS 5-year Lease Program and any proposed OCS energy development project.
In addition to oil and natural gas exploration, there is an increasing interest in the development of offshore
wind farms off the coast of Cape Hatteras and Cape Lookout, as well as in Albemarle and Pamlico
sounds, as these areas have some of the most abundant wind resources in the state
(http://www.ncsc.ncsu.edu/, 2009). Although offshore wind farms are generally considered a source of
―green‖ energy, the construction of foundations for turbine towers can impact immediate and adjacent
marine habitats (Byrne Ó Cléirigh et al. 2000). Changes to the natural seabed structure can alter the
composition and biomass of macroalgae, sessile invertebrates, and fish (Byrne Ó Cléirigh et al. 2000;
Wilhelmsson and Malm 2008). A study in the Baltic Sea found that the presence of turbine foundations
affected the assemblage of invertebrates and algae colonizing adjacent natural hard bottom areas,
resulting in an increased abundance of blue mussels and decreased abundance of algae (Wilhelmsson and

2010 Coastal Habitat Protection Plan
Chapter 7. Hard Bottom Page 431
Malm 2008). These structures may also pose a conflict for commercial fishing activities, as well as beach
nourishment borrow areas. CRC is in the process of modifying their rules to include wind turbines as
water-dependent structures [15A NCAC 07H. 0208]. Should the State consider siting a wind facility in
state or federal waters, proper placement of turbine foundations is necessary to minimize potential
impacts to hard bottom habitat and minimize conflicts with existing activities.
In 2009 the North Carolina General Assembly formed a Legislative Research commission Advisory
Subcommittee on Offshore Energy Exploration. The Advisory Subcommittee is studying:
1) The implications of leasing federal waters off North Carolina's coast in the Atlantic Outer
Continental Shelf to energy companies for oil and natural gas exploration.
2) Relevant federal law and the legal authority of the State of North Carolina with regard to
offshore drilling.
3) The potential impacts on the nation's energy supply, including documenting the best unbiased
estimates available for what oil and natural gas might exist.
4) The potential financial impact of proposed exploration on the State of North Carolina,
including effects on the economy, tourism, the commercial fishing industry, the impacts of a
more industrial coastline, and ensuring a share of State profits.
5) The environmental impacts of exploration on North Carolina's coastline, including possibilities
of spills, effects on water quality, air quality, marine life, and contributions to global climate
change.
6) The environmental impacts of the infrastructure that would be associated with
exploration and drilling for oil and natural gas.
The committee is working on developing final recommendations to the state, which will likely include the
need to work with MMS to achieve the best overall outcome for the state of North Carolina and the need
for additional information.
Associated with offshore energy development, as well as the expansion of high-speed transoceanic
telecommunications, comes the need for installation or maintenance of cables and pipelines placed across
oceans and waterways. Cables and pipelines are generally laid directly on the seafloor, and routed into a
dredged or bored trench, conduit, or access hole where they come onshore (landing site). Once the access
hole or conduit is in place and buried, maintenance or placement of new cables or pipelines involves
dredging these holes back open. Current CRC rules prohibit structures, such as cables and pipelines, from
coming onshore on oceanfront beaches [15A NCAC 07H. 0300].
Environmental concerns to hard bottom associated with laying cables or pipelines identified by Nero
(2001) and Blue Atlantic Transmission System (2003) include:
Cable ―sweeping‖ and crushing of hard bottom communities during installation or repairs.
Escape of pressurized fluid mud used to lubricate the drill hole for directional drilling (drilling a
tunnel under the seafloor) may cause turbidity plumes and subsequent burial or smothering of
sensitive hard bottom resources.
Restriction or alteration of macrofaunal movement due to physical barriers, noise, vibrations, or
magnetic fields.
North Carolina should coordinate with federal agencies, other states, and private companies with
offshore infrastructure interests to manage the placement of cables and pipelines in North Carolina
offshore waters in a manner that minimizes impact to hard bottom and minimizes conflicts with
recreational and commercial fishing.

2010 Coastal Habitat Protection Plan
Chapter 7. Hard Bottom Page 432
7.4.2. Boating activity
7.4.2.1. Anchoring and diving
Boating related activities, such as anchoring or diving on hard bottom, can also damage this habitat.
Anchors and chains from recreational or commercial boats can damage corals and other benthic
organisms, creating lesions and leading to infection (SAFMC 1998b). Divers can kick or overturn corals
and live rock, which results in habitat damage. Recreational spearfishing with power heads also can
damage corals where diving activity is concentrated (SAFMC 1998b). In North Carolina, however,
damage from recreational diving is probably minimal due to the relatively low numbers of divers in the
nearshore areas.
Diver harvest of live rock for the aquarium trade was found to cause extensive destruction and loss of
hard bottom, with additional damage occurring when chemicals were used (SAFMC 1998b). Several
state and federal regulations provide protection for hard bottom habitat from such destructive harvest
techniques. Since 1995, North Carolina has prohibited directed harvest of all coral or any live rock in
state waters [MFC rule 15A NCAC 3I .0116]. In addition, any live rock or coral incidentally harvested
with any gear must be returned immediately to the waters where it was taken. Similar NMFS regulations
exist for federal waters, which prohibit the collection of live rock, stony corals and black corals, fire coral
and hydrocorals, and two species of seafans (SAFMC 1982; SAFMC 1994). However, NMFS may issue
permits to take prohibited coral for scientific, research, and educational purposes, and for use of allowable
chemicals and harvest of octocorals.
7.4.3. Fishing gear impacts
7.4.3.1. Mobile bottom disturbing gear
Bottom trawls, dredges, and other mobile gears can cause rapid and extensive physical damage to living
and non-living components of hard bottom (SAFMC 1998b; Auster and Langton 1999; Freese 2001;
NRC 2002; Reed et al. 2007; Wells et al. 2008). Dragged fishing gear directly removes or damages
attached benthic organisms, such as sponges, corals, and macroalgae, often leading to mortality. These
gear types also displace outcrop structures from the seafloor. Damage from mobile gear is especially
extensive where the bottom is uneven and there is a concentration of epiflora and/or epifauna. The
removal of structure and attached biota decreases species richness and diversity, and reduces habitat
complexity (Watling and Norse 1998; Auster and Langton 1999; NRC 2002). In addition, indirect
damages to hard bottom habitat occur through altered trophic linkages and nutrient cycles, as well as an
increased vulnerability of injured organisms to subsequent diseases and predation (Auster and Langton
1999; NRC 2002). Trawling, in particular, also results in an immediate reduction of mobile benthic
invertebrates (e.g., crabs and polychaete worms) on and adjacent to hard bottom, reducing food resources
available to other reef organisms.54
Although most trawls and dredges are generally not towed over hard bottom, one type of trawl was
designed specifically for use in this habitat. Roller-rigged trawls are equipped with large rubber discs to
roll over hard bottom without becoming entangled. Several studies have noted significant damage to
sponges, hard corals, and soft corals at hard bottom locations where roller-rigged trawls had been used
(Tilmant 1979; Van Dolah et al. 1987). While many sponges and corals can recover, at least partially,
within one year following trawling, it may require several years for some species to completely regenerate
to their initial, pre-disturbance sizes due to slow growth rates (Van Dolah et al. 1987). To address the
potential for extensive hard bottom degradation, roller-rigged trawls have been prohibited by federal
regulations for the harvest of snapper-grouper south of Cape Hatteras since 1989 (SAFMC 1998b).
54 Refer to Appendix O for a list of the fishing gears used in North Carolina waters and their probable habitat impacts.
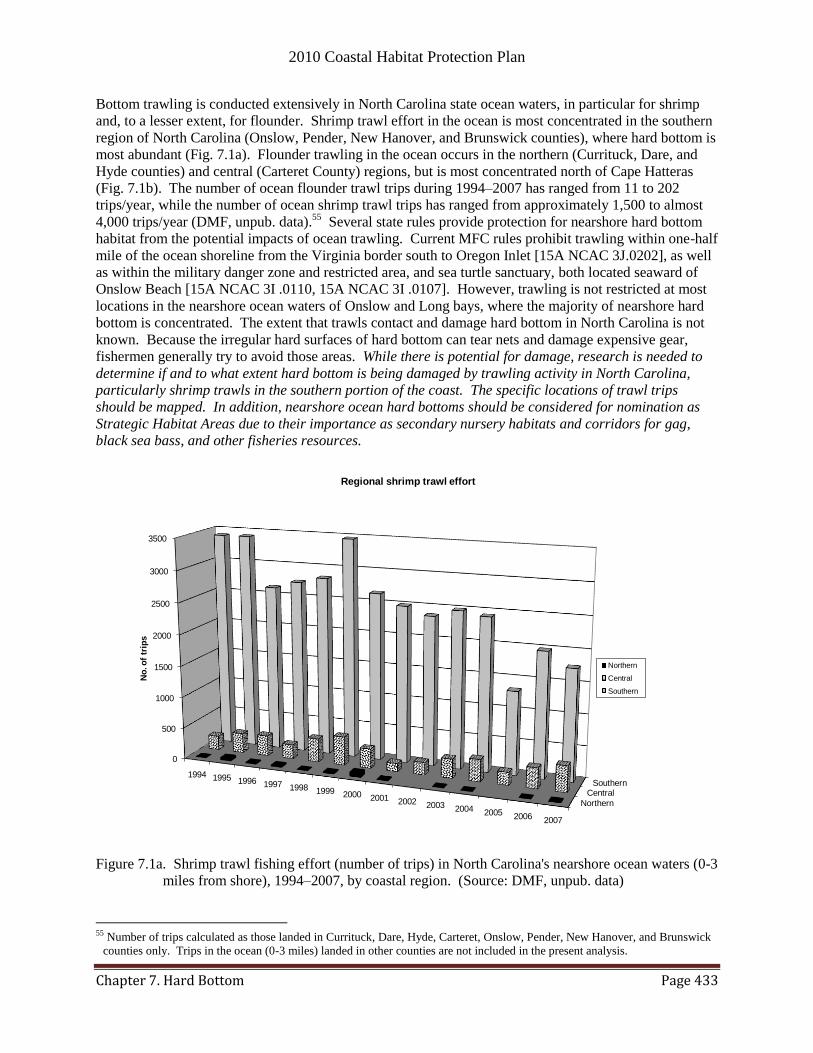
2010 Coastal Habitat Protection Plan
Chapter 7. Hard Bottom Page 433
Bottom trawling is conducted extensively in North Carolina state ocean waters, in particular for shrimp
and, to a lesser extent, for flounder. Shrimp trawl effort in the ocean is most concentrated in the southern
region of North Carolina (Onslow, Pender, New Hanover, and Brunswick counties), where hard bottom is
most abundant (Fig. 7.1a). Flounder trawling in the ocean occurs in the northern (Currituck, Dare, and
Hyde counties) and central (Carteret County) regions, but is most concentrated north of Cape Hatteras
(Fig. 7.1b). The number of ocean flounder trawl trips during 1994–2007 has ranged from 11 to 202
trips/year, while the number of ocean shrimp trawl trips has ranged from approximately 1,500 to almost
4,000 trips/year (DMF, unpub. data).55
Several state rules provide protection for nearshore hard bottom
habitat from the potential impacts of ocean trawling. Current MFC rules prohibit trawling within one-half
mile of the ocean shoreline from the Virginia border south to Oregon Inlet [15A NCAC 3J.0202], as well
as within the military danger zone and restricted area, and sea turtle sanctuary, both located seaward of
Onslow Beach [15A NCAC 3I .0110, 15A NCAC 3I .0107]. However, trawling is not restricted at most
locations in the nearshore ocean waters of Onslow and Long bays, where the majority of nearshore hard
bottom is concentrated. The extent that trawls contact and damage hard bottom in North Carolina is not
known. Because the irregular hard surfaces of hard bottom can tear nets and damage expensive gear,
fishermen generally try to avoid those areas. While there is potential for damage, research is needed to
determine if and to what extent hard bottom is being damaged by trawling activity in North Carolina,
particularly shrimp trawls in the southern portion of the coast. The specific locations of trawl trips
should be mapped. In addition, nearshore ocean hard bottoms should be considered for nomination as
Strategic Habitat Areas due to their importance as secondary nursery habitats and corridors for gag,
black sea bass, and other fisheries resources.
Northern
CentralSouthern
0
500
1000
1500
2000
2500
3000
3500
1994 1995 1996 1997 1998 1999 2000 2001 2002 2003 2004 2005 2006 2007
No
. o
f tr
ips
Regional shrimp trawl effort
Northern
Central
Southern
Figure 7.1a. Shrimp trawl fishing effort (number of trips) in North Carolina's nearshore ocean waters (0-3
miles from shore), 1994–2007, by coastal region. (Source: DMF, unpub. data)
55 Number of trips calculated as those landed in Currituck, Dare, Hyde, Carteret, Onslow, Pender, New Hanover, and Brunswick
counties only. Trips in the ocean (0-3 miles) landed in other counties are not included in the present analysis.

2010 Coastal Habitat Protection Plan
Chapter 7. Hard Bottom Page 434
Central
Northern
0
20
40
60
80
100
120
1994 1995 1996 1997 1998 1999 2000 2001 2002 2003 2004 2005 2006 2007
No
. o
f tr
ips
Regional flounder trawl effort
Central
Northern
Figure 7.1b. Flounder trawl fishing effort (number of trips) in North Carolina's nearshore ocean waters
(0-3 miles from shore), 1994–2007, by coastal region. (Source: DMF, unpub. data)
7.4.3.2. Passive capture techniques
Bottom longlines and fish traps can also physically damage the structure of hard bottom, as well as injure
or kill the associated sessile biota (SAFMC 1998b). However, these passive fishing gears are of minimal
concern because they are not used extensively or at all in North Carolina state waters. Use of bottom
longlines was prohibited by federal regulations in depths of less than 50 fathoms (300 ft) throughout the
South Atlantic area as part of Amendment 4 of the Snapper Grouper Fishery Management Plan in 1991 to
reduce fishing mortality and habitat damage. Fish traps were also prohibited in all federal waters through
Amendment 4, with the exception of smaller black sea bass pots, which are allowed if equipped with
escape vents and biodegradable panels to release undersize fish and eliminate waste from lost pots (―ghost
fishing‖). In North Carolina state territorial waters, fish traps cannot be used to target snapper-grouper
[15A NCAC 3M .0506(s)(1)], but are allowed for black sea bass. Nevertheless, black sea bass pots are
more commonly used in federal waters and may have a greater impact to hard bottom in those areas.
7.4.3.3. Rod and reel
Although direct impacts of rod and reel gear on hard bottom habitat are considered low, recreational
fishing was identified at a NMFS conference as a major concern because of the large number of
participants in the fishery (Hamilton 2000). Reef fishes are targeted by many recreational fishermen and
their habitat may receive concentrated use, leading to unknown cumulative impacts. Lost fishing gear
(e.g., line, wire leaders, hooks, sinkers) and discarded rubbish (especially plastics) can entangle or be
ingested by marine life (Sheavly 2007), as well as cause tissue abrasions and partial colony mortality of
sessile invertebrates (Chiappone et al. 2005). Roughly 18% of marine debris identified in U.S. waters is
comprised of ocean-based items, including clumps of fishing line, and floats and buoys (Sheavly 2007).
Bauer et al. (2008) found that at Gray‘s Reef National Marine Sanctuary, the presence and abundance of

2010 Coastal Habitat Protection Plan
Chapter 7. Hard Bottom Page 435
marine debris, particularly hook and line fishing gear, was directly related to observed recreational
boating and fishing activity. In the Florida Keys National Marine Sanctuary, hook and line fishing gear
represented 87% of the marine debris removed from about 6.2 acres of hard bottom habitat, although less
than 0.2% of the available milleporid hydrocorals, stony corals, and gorgonians were adversely affected
(Chiappone et al. 2004; Chiappone et al. 2005). In addition to the potential physical effects of discarded
fishing gear, chemical contamination from lost lead sinkers is also a concern. Monitoring of hard bottom
is needed to assess the level of impact from rod and reel fishing. Educating anglers on the impacts of lost
fishing gear and discarded litter to hard bottom and associated species would be helpful in reducing
those impacts.
7.4.4. Water quality degradation
Since snapper-grouper species are most sensitive to toxins and other pollutants during early life stages
(SAFMC 1998b), it is essential to maintain good water quality at critical nursery habitats, including
nearshore hard bottoms. The effect of degraded water quality on a given species depends primarily on its
life history (Schaaf et al. 1987; Schaaf et al. 1993), as well as feeding behavior and diet at all life stages.
With the exception of oil and gas development,56
the primary threats to water quality at hard bottom sites
are ocean dumping and coastal pollution from discharge of sewage, stormwater runoff, herbicides, and
pesticides (SAFMC 1998b).
Offshore dumping of dredged material occurs at designated sites in federal waters and must be conducted
pursuant to the Water Resources Development Act Amendments of 1992 to the Marine Protection,
Research, and Sanctuaries Act of 1972 for the management and monitoring of ocean disposal activities.
This law requires that ocean dredged material disposal will not unreasonably degrade the marine
environment. In North Carolina, three ODMDS exist: one seaward of the Port of Morehead City and two
seaward of the Port of Wilmington (COE and EPA 1996; COE and EPA 1997; COE and EPA 2002).
While no hard bottoms have been identified in the vicinity of the Morehead City ODMDS (COE and EPA
1997), extensive hard bottom resources have been found within one nautical mile of both Wilmington
ODMDS (COE and EPA 1996; COE and EPA 2002), suggesting the potential for water quality impacts
on natural hard bottoms neighboring these sites. However, prior to disposal, any fine-grained sediments
that are dredged are chemically and biologically tested to ensure the environmental integrity of an
ODMDS. The COE should continue environmental monitoring during use of the two Wilmington
ODMDS to determine their effect on adjacent hard bottom habitat and report monitoring results.
Point discharges of wastewater and sewage can also negatively impact the health and stability of hard
bottom. Several studies of hard bottom communities in the Mediterranean found that species richness,
abundance, and diversity of corals and echinoderms declined with increasing proximity to sources of
pollution (Hong 1983; Hermelin et al. 1981). Terlizzi et al. (2002) reported that a sewage outfall on the
southern Apulian coast of Italy negatively influenced the natural distribution pattern of filamentous green
algae. At the same location, reef fish assemblages differed between the sewage-impacted site and
adjacent controls, with more planktivorous and detritivorous fishes at the sewage outfall (Guidetti et al.
2003). Current North Carolina state (EMC) policies prevent wastewater discharge into the Atlantic
Ocean, with one exception: the discharge off Oak Island of heated flow-through, non-contact cooling
water from the Brunswick Steam Electric Plant. Because nearshore hard bottoms are so vulnerable to
damage from changes in water quality, this “non-discharge” policy should be maintained.
Hard bottom can be degraded not only by point discharges, but also by outflowing pollutants from
estuarine and river waters. The effect of these non-point outflows on hard bottom off the coast of North
Carolina is largely unknown since little monitoring has been conducted. In 1999, UNC-W began the
56 Refer to the Energy Development section for more information on the effects of oil and gas development.
2010 Coastal Habitat Protection Plan
Chapter 7. Hard Bottom Page 436
Coastal Ocean Monitoring Program (COMP), currently known as the Coastal Ocean Research and
Monitoring Program (CORMP), which focused on ocean processes in the coastal ocean off southeastern
North Carolina. Among other things, this project investigated the chemical and biological effects of the
Cape Fear River‘s plume on the nearshore ocean, as well as responses of the plume to major storm events.
Results following Hurricane Floyd found that approximately 200 mi2 of coastal ocean waters were
affected by elevated turbidity and nutrient levels for approximately one month (Cahoon et al. 2001). In
comparing water quality of nearshore ocean waters in Long Bay, which is heavily influenced by the Cape
Fear River‘s plume, to Onslow Bay, where riverine influence is minimal, Dafner et al. (2007) found
dissolved organic nitrogen and phosphorous concentrations 2–3 times higher and chlorophyll a
concentrations 5–10 times higher in Long Bay than in Onslow Bay. Nearshore hard bottom is highly
concentrated in Long Bay (Map 7.1c), suggesting that declines in estuarine water quality are most likely
to impact hard bottom in that area. Monitoring of hard bottom should be initiated and coordinated with
UNC-W or other ocean water quality monitoring programs to determine the effects of estuarine water
quality, particularly nutrient and sediment loading, on hard bottom.
Hard bottom in close proximity to shore is more vulnerable to pollutants than offshore hard bottom.
Stormwater runoff and discharge of nutrient-rich estuarine waters can increase nutrient levels, potentially
resulting in nuisance algal blooms. Problem levels of nutrients have generally not been found in North
Carolina‘s coastal ocean waters, although, water quality sampling in these areas is extremely limited.57
Residues of the organochlorine pesticides DDT, PCB, dieldrin, and endrin have been found in gag, red
and black grouper, and red snapper (Stout 1980), indicating that toxins from stormwater runoff are a
potential threat to the hard bottom community. Additional water and tissue sampling at hard bottom sites
are needed to determine if the benthos of the hard bottom community or the surrounding waters exhibit
levels that exceed designated levels of concern.
7.4.5. Non-native, invasive, or nuisance species
A relatively new threat to hard bottom ecosystem health and biodiversity is the successful invasion of
Indo-Pacific lionfish (Pterois volitans/miles complex) in the South Atlantic Bight (Whitfield et al. 2002;
Meister et al. 2005; Hamner et al. 2007; Whitfield et al. 2007). Lionfish were first documented in marine
waters off North Carolina in 2000; by 2001, lionfish could be found at eight hard bottom locations
(Whitfield et al. 2002). Documented sightings and collections indicate that lionfish distribution may be
continuous from Cape Hatteras to the North Carolina-South Carolina Border (Meister et al. 2005;
Whitfield et al. 2007), with abundances comparable to many native grouper species (Whitfield et al.
2007). Such a successful invasion is likely to impact natural hard bottom communities through direct
predation, competition, and overcrowding (Whitfield et al. 2007). On natural and artificial reef patches in
the Bahamas, Albins and Hixon (2008) found predation by a single lionfish at each patch reef reduced net
recruitment of native fishes by a mean of 28.1 fish per reef over five weeks, representing an average
reduction in net recruitment of 79%. This finding suggests that an increasing lionfish population on
North Carolina hard bottoms has the potential to decrease the abundance of juvenile reef dwelling species,
as well as increase the competition with native piscivores for this important food resource. Although
there are few documented natural predators of the lionfish, several individuals have been found in the
stomachs of native groupers in the Bahamas (Maljkovic and Van Leeuwen 2008). However, such large
piscivores are systematically targeted by commercial and recreational fisheries which remove a
significant portion of the population, and thus are not likely to substantially reduce the effects of lionfish
on Atlantic hard bottom communities. Staff at the NOAA Center for Coastal Fisheries and Habitat
Research have been conducting studies on lionfish to better understand lionfish distribution, density, life
history, temperature tolerances, and genetics. NOAA also encourages reporting of all lionfish captured
by rod and reel, as well as sightings by SCUBA divers. The information gained will be used to
57 Refer to the Water Column (2.0) chapter for more information on water quality.
2010 Coastal Habitat Protection Plan
Chapter 7. Hard Bottom Page 437
determine, and possibly mitigate, potential ecosystem and fisheries impacts due to the presence of
lionfish. Further information on Indo-Pacific lionfish biology and competitive/predatory interactions
with native fish species is needed. Although complete eradication of lionfish in the marine waters off the
North Carolina coast is unlikely, focused lionfish control efforts in strategic locations are needed to
reduce the likelihood of potentially detrimental ecological effects.
7.4.6. Climate change
Rapid increases in atmospheric carbon dioxide (CO2) concentrations over the past century have led to
global climatic changes (Harley et al. 2006; IPCC 2007). Because of this atmospheric increase, global air
and ocean temperatures have risen by 0.4–0.8°C (IPCC 2007). This warming trend is expected to
accelerate in the current century (IPCC 2007), with implications for hard bottom health and community
structure. A study of hard bottom ledges off the North Carolina coast over a 15 year period reported an
increased prevalence of tropical reef fishes and a decreased abundance of temperate species (Parker and
Dixon 1998). The authors speculated that the observed shift in reef fish community structure was most
likely in association with warmer winter bottom water temperatures allowing for range extensions of
tropical species. An additional study on North Carolina outer shelf hard bottoms documented four
tropical reef fishes new to continental United States waters and range extensions for ten tropical species
(Quattrini et al. 2004), potentially indicating that species composition of reef fishes has become more
tropical in nature. Such changes in reef fish community structure can have profound impacts on hard
bottom by altering the trophic structure, thus changing habitat quality and productivity.
Perhaps the most insidious but poorly understood implication of atmospheric CO2 loading on hard bottom
habitat is that of ocean acidification (Harley et al. 2006; Kleypas et al. 2006; IPCC 2007). Ocean
acidification is caused by an increased amount of CO2 dissolved in ocean waters, which lowers the pH,
decreases the availability of carbonate (CO3− 2
) ions, and lowers the saturation state of the major carbonate
minerals (Feely et al. 2004; Orr et al. 2005). This process can have severe consequences for marine
calcifying organisms that inhabit hard bottom in North Carolina, such as hard corals, gorgonians,
coralline algae, mollusks, sponges, echinoderms, and calcitic plankton, such as such as foraminifera and
coccolithophorids (Feely et al. 2004; Orr et al. 2005; Kleypas et al. 2006; Hoegh-Guldberg et al. 2007).
Decreased carbonate ion concentrations considerably reduce the calcification rates of marine invertebrates
and algae that build carbonate structures, diminishing growth rates, and increasing susceptibility to
predation (Feely et al. 2004; Kleypas et al. 2006; Roberts et al. 2006; Hoegh-Guldberg et al. 2007). In
addition, calcifying organisms may be unable to maintain exoskeletal structures in waters that are
undersaturated with respect to carbonates, ultimately resulting in dissolution of their calcium carbonate
skeletons (Orr et al. 2005). Thus, facing a rapidly acidifying ocean, the density and diversity of hard
corals, gorgonians, coralline algae, mollusks, sponges, and other calcifying organisms on hard bottoms
are likely to decline, leading to greatly reduced habitat complexity and biodiversity loss, including losses
of reef-associated fish and invertebrates (Orr et al. 2005; Hoegh-Guldberg et al. 2007). More research is
needed to examine the potential ecological effects of ocean acidification on nearshore hard bottom in
North Carolina.
7.4.7. Management needs and accomplishments
The management needs noted by italics in the 2005 CHPP were addressed to some degree during 2005-
2010. Some of the needs were refined and adopted as actions in the multi-agency CHPP implementation
plans (IPs). There were also hard bottom-related actions that came directly from the implementation
plans, without a specific call in the 2005 CHPP. However, the majority of IP actions affect either water
column (see ―Water column‖ chapter) or multiple bottom habitats (see ―Ecosystem management and
strategic habitat areas‖ chapter) and will not be duplicated here. Only hard bottom-focused actions from
the IPs are listed in the ―Needs and progress‖ sections. Emerging management needs are included
2010 Coastal Habitat Protection Plan
Chapter 7. Hard Bottom Page 438
without a reference and may or may not be refined and adopted as actions in 2009-2011 CHPP
implementation plans.
7.4.7.1. Research needs and progress (2005-2010)
Accomplished research needs
1. Investigate fish use of nearshore hard bottom (Street et al. 2005). There is additional research
available from other states. See Section 7.2. “Ecological role and functions” for more information.
2. Investigate spawning on, and recruitment to, nearshore hard bottom to understand the importance of
this habitat and document trends in fish utilization (Street et al. 2005). There is additional research on
offshore spawning activity. See Section 7.2.6. “Specific biological functions” for more information.
Research needs with progress
Research needs without progress
1. Conduct further research to determine if and to what extent artificial reefs in North Carolina simply
concentrate available fish or effectively increase fish biomass (Street et al. 2005). No specific
progress. See Section 7.2.5. “Fish utilization of man-made structures” for more information.
2. Conduct research to determine if and to what extent hard bottom is being damaged by trawling
activity in North Carolina, particularly shrimp trawls in the southern portion of the coast. The
specific locations of trawl trips should be mapped. To assess potential effects of trawling,
experimental trawls of predetermined duration, magnitude, and frequency should be conducted in a
previously untrawled hard bottom location (Street et al. 2005). No specific progress. See Section
7.4.3.1. “Mobile bottom disturbing gear” for more information.
3. Coordinate with UNC-W or other ocean water quality monitoring programs to determine the effects
of estuarine water quality, particularly nutrient and sediment loading, on hard bottom (Street et al.
2005). No specific progress. See Section 7.4.4. “Water quality degradation” for more information.
4. Conduct additional water and tissue sampling at hard bottom sites to determine if the benthos of the
hard bottom community or the surrounding waters exhibit levels that exceed designated levels of
concern (Street et al. 2005). No specific progress. See Section 7.4.4. “Water quality degradation” for
more information.
Emerging research needs
1. Further information on Indo-Pacific lionfish biology and competitive/predatory interactions with
native fish species is needed. Although complete eradication of lionfish in the marine waters off the
North Carolina coast is unlikely, focused lionfish control efforts in strategic locations are needed to
reduce the likelihood of potentially detrimental ecological effects. See Section 7.4.5. “Non-native,
invasive, or nuisance species” for more information.
2. More research is needed to examine the potential ecological effects of ocean acidification on
nearshore hard bottom in North Carolina. See Section 7.4.6. “Climate change” for more information.
2010 Coastal Habitat Protection Plan
Chapter 7. Hard Bottom Page 439
7.4.7.2. Management needs and progress (2005-2010)
Accomplished management needs
Management needs with progress
1. Monitor the transport of sand from nourished beaches over time. Future research should attempt to
determine if the probability or extent of burial are affected by sand volume, type, or grain size, by the
time-of-year of project initiation, or by the distance between nourished beach and hard bottom. See
Section 7.4.1.2. “Shoreline stabilization” for context. A DENR Beach Management Plan should be
developed and implemented which includes specific guidelines to minimize impacts to hard bottom
from nourishment projects (Street et al. 2005). See Section 6.4.1.1. “Water-dependent development” in
the “Soft bottom” chapter for information on North Carolina’s Beach and Inlet Management Plan.
2. Require adequate monitoring prior to creation and during use of the Ocean Dredged Material
Disposal Site (ODMDS) off Cape Fear River to determine its effect on nearshore hard bottom habitat
(Street et al. 2005). Prior to disposal, any fine-grained sediments that are dredged are chemically and
biologically tested to ensure the environmental integrity of an ODMDS. The USACE should continue
environmental monitoring during use of the two Wilmington ODMDS to determine their effect on
adjacent hard bottom habitat (Street et al. 2005). See Section 7.4.4. “Water quality degradation” for
more information.
3. Designate hard bottom within State Natural Heritage Areas as Strategic Habitat Areas for
consideration of additional protection under the recent federal Executive Order 13158, which calls
for strengthening and expansion of Marine Protected Areas in the United States or through
additional state actions specifically designed to protect those sites (Street et al. 2005). The SAFMC
identified several Marine Protected Areas (MPAs) in offshore federal waters through Amendment 14 to
the South Atlantic Snapper Grouper Fishery Management Plan. The NMFS issued a final rule to
implement Amendment 14 officially creating eight Type II MPAs in which fishing for or possession of
snapper-grouper species are prohibited, but other types of fishing, such as trolling, are allowed. No
specific progress with regard to state action. However, the MFC has the authority to establish no-take
areas over nearshore hard bottom in North Carolina state waters. See Section 7.3.4. “Designated areas”
for more information.
Management needs without progress
1. Construct artificial refugia (no-take artificial reefs) or designate existing artificial reefs as refugia
(no-take, Marine Protected Areas) to enhance fisheries productivity (Street et al. 2005). No specific
progress. See Section 7.3.3. “Hard bottom enhancement” for more information.
2. Construct numerous small complex sites surrounded by open areas to mimic natural nearshore hard
bottoms and maximize habitat utilization at a shallow, nearshore site near Cape Lookout (Street et al.
2005). No specific progress. See Section 7.3.4. “Designated areas” for more information.
3. Designate nearshore ocean hard bottoms as Strategic Habitat Areas due to their importance as
secondary nursery habitat and corridors for gag, black sea bass, and other fisheries resources (Street
et al. 2005). Strategic Habitat Area assessments have not progressed to regions with significant hard
bottom resources. See Section 7.3.4. “Designated areas” for more information.
4. Monitor hard bottom to assess the level of impact from hook and line fishing. Educating anglers on
the impacts of anchor damage, lost fishing gear, and discarded litter to hard bottom habitat and
associated species would be helpful in reducing those impacts (Street et al. 2005). No specific

2010 Coastal Habitat Protection Plan
Chapter 7. Hard Bottom Page 440
progress. However, there are some monitoring results from other states on the prevalence of marine
debris in marine protected areas. See Section 7.4.3.3. “Rod and reel” for more information.
5. Develop and implement a state policy to prohibit oil and gas drilling in North Carolina‘s coastal
waters to ensure protection of hard bottom and water column habitats (Street et al. 2005). During
2008, a federal moratorium on offshore drilling for oil and natural gas, which covered much of the OCS
in the Atlantic and Pacific oceans, was lifted. This opened the majority of federal waters, including those
off the coast of North Carolina, to future oil and natural gas exploration, development, and production. There are emerging management needs related to lifting moratorium.
6. Ensure state cooperation with ASMFC, other states, and the communications companies to manage
the placement of fiber optic cables in North Carolina offshore waters in a manner that minimizes
impact to hard bottom and minimizes conflicts with existing activities (Street et al. 2005). No specific
progress. Current CRC rules prohibit structures, such as cables and pipelines, from coming onshore on
oceanfront beaches. See Section 7.4.1.3. “Energy infrastructure” for more information.
7. Maintain the state policy on waste water disposal in nearshore ocean waters to protect hard bottom
vulnerable to damage from physical and water quality changes (Street et al. 2005). No changes.
However, there is additional research on the impact of waste water disposal on nearshore hard bottom.
See Section 7.4.4. “Water quality degradation” for more information.
8. Consider designating nearshore hard bottoms in Strategic Habitat Areas as MPAs, either through
state or federal avenues, to provide some protection from fishing gear impacts and enhance fisheries
production (Street et al. 2005). Strategic Habitat Area assessments have not progress to regions with
significant nearshore hard bottom resources. See Section 7.3.4. “Designated areas” for more
information.
Emerging management needs
1. An extensive and regular survey of nearshore hard bottom distribution and quality is needed to better
evaluate status and trends. See Section 7.3.1. “Status of hard bottom habitat” for context.
2. More data is needed for evaluating the stock status of species in the reef fish complex off North
Carolina. See Section 7.3.2. “Status of associated fishery stocks” for context.
3. Using the recommendations from the Ocean Policy Steering Committee, the CRC should modify
existing rules pertaining to mining of submerged lands to require a 500 m dredging buffer around
any exposed hard bottom, thus minimizing potential impacts to fish habitat functions. Furthermore,
these buffers should be complied with. See Section 7.4.1.2. “Shoreline stabilization” for context.
4. Drilling on or in the vicinity of hard bottom resources on the Outer Continental Shelf (OCS) of North
Carolina should be prohibited to minimize potential impacts to ecologically productive hard bottoms. See Section 7.4.1.3. “Energy infrastructure” for context.
5. North Carolina should continue to be engaged in the Minerals Management Service 5-year Lease
Program and any proposed OCS energy development project. See Section 7.4.1.3. “Energy
infrastructure” for context.
6. Should the State consider siting a wind facility in state or federal waters, proper placement of turbine
foundations is necessary to minimize potential impacts to hard bottom habitat and minimize conflicts
with existing activities. See Section 7.4.1.3. “Energy infrastructure” for more information.

2010 Coastal Habitat Protection Plan
Chapter 7. Hard Bottom Page 441
7.5. Hard bottom summary
Hard bottom is valuable to fish because it provides oases of structural complexity for foraging and refuge
in marine waters. The presence of ocean hard bottom off North Carolina, along with appropriate water
temperatures, allows for the existence of a temperate-to-subtropical reef fish community and a snapper-
grouper fishery. Many fishery and non-fishery species spawn on nearshore hard bottoms, including black
sea bass, Atlantic spadefish, sheepshead, tomtate, white grunt, pinfish, pigfish, damselfish, blennies, sand
perch, and inshore lizardfish. Nearshore hard bottoms also serve as nursery areas for these species and
provide important secondary nursery habitat for estuary-dependent fish, such as gag and black sea bass, as
they move between the estuary and offshore reef areas. Because of their importance as spawning,
nursery, and foraging habitat, all of the nearshore hard bottoms off North Carolina have been federally
designated as Habitat Areas of Particular Concern for the snapper-grouper complex.
While the distribution of hard bottom off the North Carolina coast was mapped in the 1990s, little is
known about the biological condition of specific hard bottom sites or how hard bottom distribution or
quality has changed over time. However, increases in beach nourishment activities, which require an
environmental assessment, have resulted in new information on localized hard bottom distribution and
condition. Although not natural, wrecks and state-maintained artificial reefs add to the total amount of
hard structure available to marine organisms and may reduce fishing pressure on natural reefs.
Because of the lack of baseline information, the primary management need for this habitat is continued
research and monitoring specific to nearshore hard bottom to determine its functional importance. In
addition, extensive and regular surveys of nearshore hard bottom distribution and quality are needed to
determine status and trends. It is also essential to provide continual and expanding protection of existing
hard bottom habitats to protect these areas from further degradation or destruction.
Several threats continue to pose an issue for nearshore hard bottom in North Carolina, including channel
dredging, beach nourishment, bottom-disturbing fishing gear, and water quality degradation. Channel
dredging can directly remove hard bottom habitat or increase turbidity to problematic levels. Sand
transported from nourished beaches can cover up hard bottom structure. Bottom-disturbing fishing gear,
such as bottom trawls and dredges, can uproot coral and damage the structure of hard bottom. Excess
nutrients, sediments, or toxins can impact growth or survival of the invertebrates living on hard bottom
structure. Water quality degradation to hard bottom originates from nonpoint sources, such as boating
activity and estuarine or riverine discharges. The quality of waters discharging into marine areas may
have a large overall effect on hard bottom, and can be addressed through the management needs discussed
in the other estuarine habitat sections.
In addition to the above, several new and recently recognized threats jeopardize the health of hard bottom
off North Carolina and have emerging management and research recommendations associated with them.
These include offshore energy development, invasive species, and climate change. Offshore drilling for
oil and natural gas can damage or dislodge corals, sponges, and algae at the platform anchor site, while
disposal of drilling muds, as well as produced formation water (oily water produced after separation from
oil), can cause acute or chronic toxic effects to hard bottom organisms and reef fishes. The invasion of
the Indo-Pacific lionfish in marine waters off North Carolina will likely impact natural hard bottom
communities through direct predation, competition, and overcrowding. Perhaps the largest threat to hard
bottom health and stability comes from climate change. As global temperatures rise, tropical organisms
may invade North Carolina hard bottoms with greater frequency, altering the natural trophic structure.
Increasing atmospheric CO2 concentrations decrease carbonate ion concentrations considerably, thus
reducing the calcification rates of hard bottom invertebrates and algae that build carbonate structures and
increasing their susceptibility to predation.
2010 Coastal Habitat Protection Plan
Chapter 7. Hard Bottom Page 442
As a result of the 2005 CHPP, three of the 17 research and management needs have had some progress in
being addressed. The three needs that have had some progress are all management recommendations.
Two needs from the 2005 CHPP have been addressed or discontinued. Since the 2005 CHPP, there have
been 10 emerging research and management recommendations added that include understanding climate
change, invasive species, status of hard bottom-enhanced fishery species, and energy infrastructure. Of
the three needs with progress, two are related to dredging and nourishment, while the third relates to
designating strategic habitat areas.
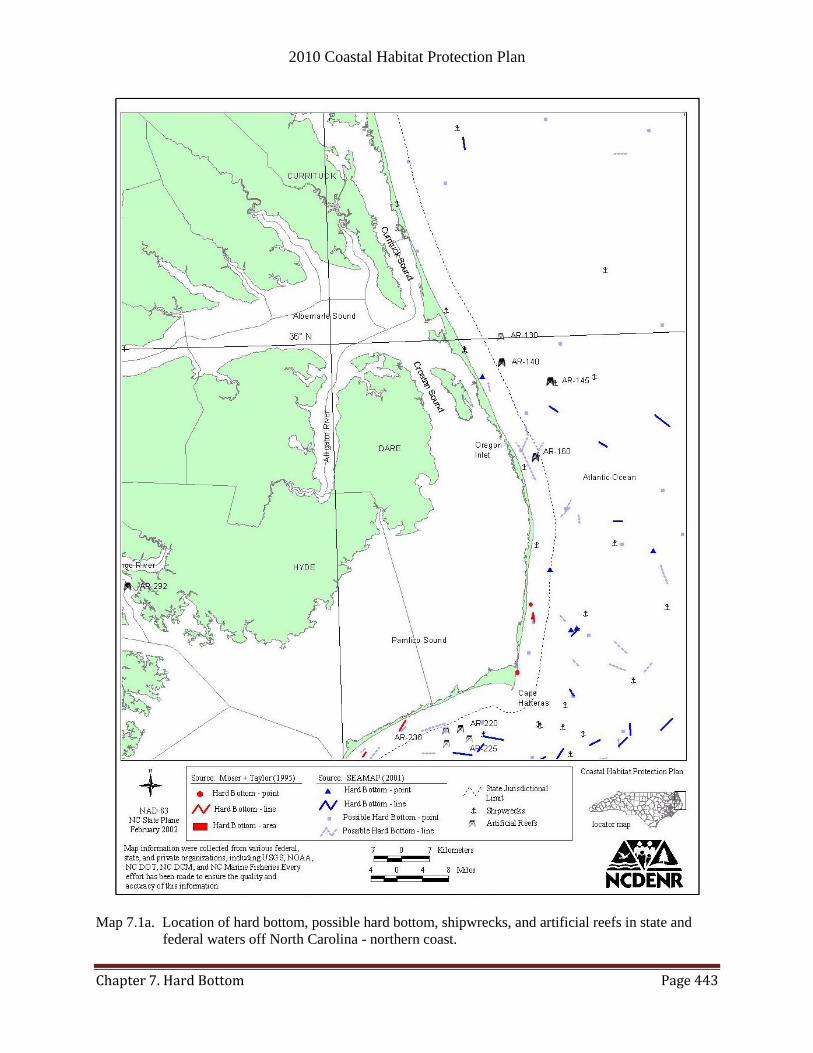
2010 Coastal Habitat Protection Plan
Chapter 7. Hard Bottom Page 443
Map 7.1a. Location of hard bottom, possible hard bottom, shipwrecks, and artificial reefs in state and
federal waters off North Carolina - northern coast.

2010 Coastal Habitat Protection Plan
Chapter 7. Hard Bottom Page 444
Map 7.1b. Location of hard bottom, possible hard bottom, shipwrecks, and artificial reefs in state and
federal waters off North Carolina - central coast.
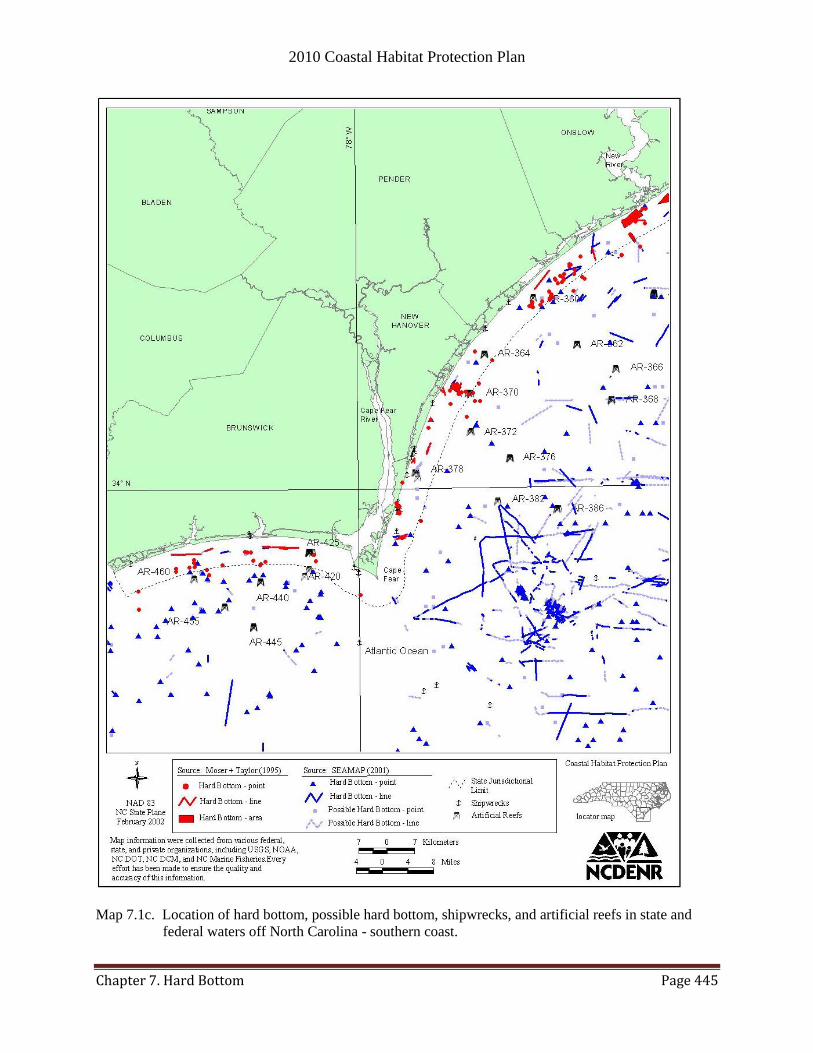
2010 Coastal Habitat Protection Plan
Chapter 7. Hard Bottom Page 445
Map 7.1c. Location of hard bottom, possible hard bottom, shipwrecks, and artificial reefs in state and
federal waters off North Carolina - southern coast.

2010 Coastal Habitat Protection Plan
Chapter 8. Ecosystem Management and Strategic Habitat Areas Page 446
CHAPTER 8. ECOSYSTEM MANAGEMENT AND STRATEGIC
HABITAT AREAS
Ecosystem management is defined as an approach to maintaining or restoring the composition, structure,
function, and delivery of services of natural and modified ecosystems that integrates ecological and
socioeconomic perspectives within a geographic framework, for the goal of achieving sustainability.
Ecosystem management, as a concept, is a broadening of the narrow focus of single species, single
habitat, or single threat management to consider multiple species and habitats that are interdependent. An
ecosystem approach is necessary given the interrelationships among species, habitats, and threats. Thus,
any management activity that considers multiple species, habitats, and/or threats could be considered
ecosystem management. North Carolina‘s coastal fishery resources (the ―fish‖) exist within a system of
interdependent habitats that provide the basis for long-term fish production available for use by people
(the ―fisheries‖). Most fish rely on different habitats throughout their life cycle (Figure 8.1); therefore,
maintaining the health of an entire aquatic system is essential. The integrity of the entire system depends
upon the health of areas and individual habitat types within the system.
In recent years, there has been increasing awareness of the need to manage aquatic resources on an
ecosystem scale (Beck et al. 2000; NRC 2001; SAFMC 2009). To address habitat biodiversity within the
South Atlantic, the SAFMC is adopting an ecosystem approach to fisheries management with the
development of a Fishery Ecosystem Plan (FEP) and Comprehensive Ecosystem-Based Amendment (CE-
BA) that will amend all the Council's Fishery Management Plans. Other regional initiatives, such as the
Southeast Aquatic Resource Partnership (SARP) developed a habitat plan (SARP 2008) that provides
regional watershed conservation and restoration targets. Ecoregional assessments have been conducted in
over half of the ecoregions of the United States to develop conservation priorities (Beck et al. 2000) for
regional funding sources. The North Carolina Department of Environment and Natural Resources has
developed a conservation planning tool (CPT) to provide guidance for both aquatic and terrestrial
conservation efforts in the state (see ―Designations‖ section of Water Column chapter for more
information on the CPT).
One of the most challenging aspects of ecosystem management is the setting of management priorities,
objectives, and measures of success. Success criteria could take the form of indicator metrics and
threshold values. The APNEP is currently developing indicator metrics for the Albemarle-Pamlico region
(D. Carpenter/APNEP, pers. com., 2009). However, there is also a need to set threshold values that
reflect a fundamental, destabilizing shift in ecosystem function. The finding of fundamental indicators
with threshold values is an essential goal of ecosystem management research (Grossman et al. 2006).
Without indicator metrics and threshold values, the management of ecosystems has relied upon
maintenance of ecosystem characteristics (i.e., no net loss of wetlands). Because climate change may
alter ecosystem characteristics, a shift in maintenance goals based on predicted changes may need to be
considered (see ―Sea level rise and climate change‖ sections of habitat chapters). Research suggests that
even minute changes in temperature, salinity, and other basic parameters can have major impacts on
biological community structure (Apple et al. 2008; Baird 2009).
One fundamental metric of ecosystem assessment is biodiversity and the richness of genetic information it
represents (literature review in Airoldi et al. 2008). By fostering enhanced species diversity, structurally
complex habitats add resilience and efficiency to ecosystems in the face of changing conditions. Less
complex habitats favor generalist, colonizing species forming relatively disorganized systems with more
biomass in microbial pathways (Baird 2009). Hypoxia in the Neuse River, for example, can shift biomass
away from the benthic invertebrates (fish food) and more into the phytoplankton and microbial
decomposers. Increasing abundances of toxic algae and pathogenic microbes have also been associated
with nutrient enrichment and hypoxia (Jackson et al. 2001). Carbon-building, structurally complex
habitats in shallow water (i.e., SAV, shell bottom, marsh) also provide greater denitrification services
compared to deeper, less structured habitats (Piehler and Smyth in press), suggesting their importance as

2010 Coastal Habitat Protection Plan
Chapter 8. Ecosystem Management and Strategic Habitat Areas Page 447
waste treatment facilities. The value of services, in terms of nutrient trading rates, ranged from $1000-
2000/acre/year over subtidal bottom.
Figure 8.1. Life cycle of the southern flounder.
1 - Adults spawn in nearshore ocean waters during late winter months.
2 - Larvae drift inshore on currents, eventually passing through inlets and to the estuary beyond.
3 - Small juveniles settle out of the water column in upper, low-salinity estuaries containing
marsh wetlands and shallow soft bottom habitat.
4 - As flounder grow, they begin to occupy deeper channels and the lower portion of the estuary.
Juvenile flounder also move throughout the estuary, foraging on crabs and small fish living in
oyster reefs and along the marsh edge. Once the juvenile flounder recruit to the adult population,
the cycle is continued.
There is abundant evidence that structurally complex habitats (i.e., SAV, shell bottom, hard bottom,
wetlands) are becoming more rare across the globe, with a corresponding increase in less structured
habitats (i.e., soft bottom) (Airoldi et al. 2008). The changes have been linked to coastal development,
overfishing, and eutrophication described in the CHPP habitat chapters. With persistent overfishing and
loss of structural habitats, an ecosystem can change its stabilizing processes to reach an alternative stable
state (Beisner et al. 2003; Briske et al. 2008). Once an Alternative Stable State (AltSS) is reached,
restoration to a former state can be more difficult. However, an AltSS is only one of many possible
behaviors based on a review of AltSS literature (Schroder et al. 2005). Whereas vulnerability or
2010 Coastal Habitat Protection Plan
Chapter 8. Ecosystem Management and Strategic Habitat Areas Page 448
proximity to AltSS is lacking in evidence, maintaining bio-diversity and structurally complex habitat is
undoubtedly a stabilizing influence. Human activities that degrade biodiversity and structurally complex
habitats are therefore destabilizing ecosystems.
Threats and cumulative impacts
The previous habitat chapters cover the effects of individual human activities as threats to a single habitat.
However, threats often affect multiple habitats, with a corresponding impact on bio-diversity and
ecosystem function. Threats affecting a single habitat have indirect impacts on other habitats depending
on their proximity and ecosystem enhancement services (see ―Ecosystem enhancement‖ sections of
habitat chapters). For example, reductions in wetland area and filter-feeding shellfish could degrade
water quality conditions needed for SAV growth. There are also multiple threats affecting habitat areas
that are not necessarily confined to individual property boundaries. A good example is the indirect
relationship between degraded water quality along an individual shorefront property and the cumulative
contribution of pollution sources upstream of the property (see ―Water quality degradation - sources‖
section of the Water Column chapter for more information). The management of cumulative impacts is
an area lacking in state regulatory authority and practices due to the lack of an effective assessment
methodology and management tools. The state‘s best attempts at managing cumulative impacts have
been the coastal impervious surface limits, development of Local Watershed Plans (EEP) and Total
Maximum Daily Loads (DWQ), and acquisition of lands managed for conservation. Though required in
the permit process, assessment of cumulative impacts as the basis for determining significant adverse
impacts is rarely put forward due to the limitations of existing data, lack of threshold values, and
anticipated legal challenges. However, a precedent has been set with the application of impervious
surface limits to individual lots, though no limits have been placed on a hydrologic unit basis.
A review of top threats to coastal marine ecosystems across the globe listed habitat loss, overexploitation,
eutrophication and hypoxia, pollution, invasive species, altered salinities, altered sedimentation, climate
change, ocean acidification, and disease (Crain et al. 2009). The threats were not habitat-specific, unlike
the CHPP, which discusses threats in each habitat chapter (for continuity). In the 2005 CHPP, a threats
table was produced to evaluate the relative threat of various anthropogenic activities to fish habitats in
North Carolina. From that table, it was evident that most threats affected more than one habitat and all
habitats were affected by multiple threats. The original table has been modified to provide a cross-
reference for locating all the information on each threat discussed among the habitat chapters (Table 8.1).
The primary discussion of individual threats can be found in the habitat chapter they most affect. The
table also includes the relative severity of a threat to each habitat. Some alteration sources and/or impacts
clearly threaten the entire ecosystem. The most ―cross-cutting‖ threats include climate change/sea level
rise, water quality degradation from nutrients and toxins, dredging for navigation, water-dependent
development, and non-native/invasive/introduced species. The synergy of these threats may also
exacerbate or mitigate the individual impacts discussed in the habitat chapters. This is particularly true
for sea-level rise and climate change.
The impacts of sea level rise are most apparent along the estuarine and ocean shoreline, where
management decisions regarding water-dependent development can profoundly impact nearshore habitats
(both landward and waterward of shoreline). For this and other reasons, climate change and associated
sea level rise are now recognized as a priority issue for DENR strategic planning. The DENR climate
change initiative includes comprehensive strategies across programs that effectively identify and address
potential impacts to the environment and natural resources that DENR is charged with protecting (J.
Nicholson/DENR, pers. com., February 2010). In the effort to proactively prepare for sea level rise,
DENR has established a working group with representatives from OCCA, DCM, APNEP, DWQ, DMF,
and Natural Heritage Trust Fund. This group will work with external agencies such as NOAA and Sea
Grant, to develop coordinated policies, land use planning guidelines and other recommendations that will
increase the resiliency of estuarine and coastal lands to changing climate and associated impacts.
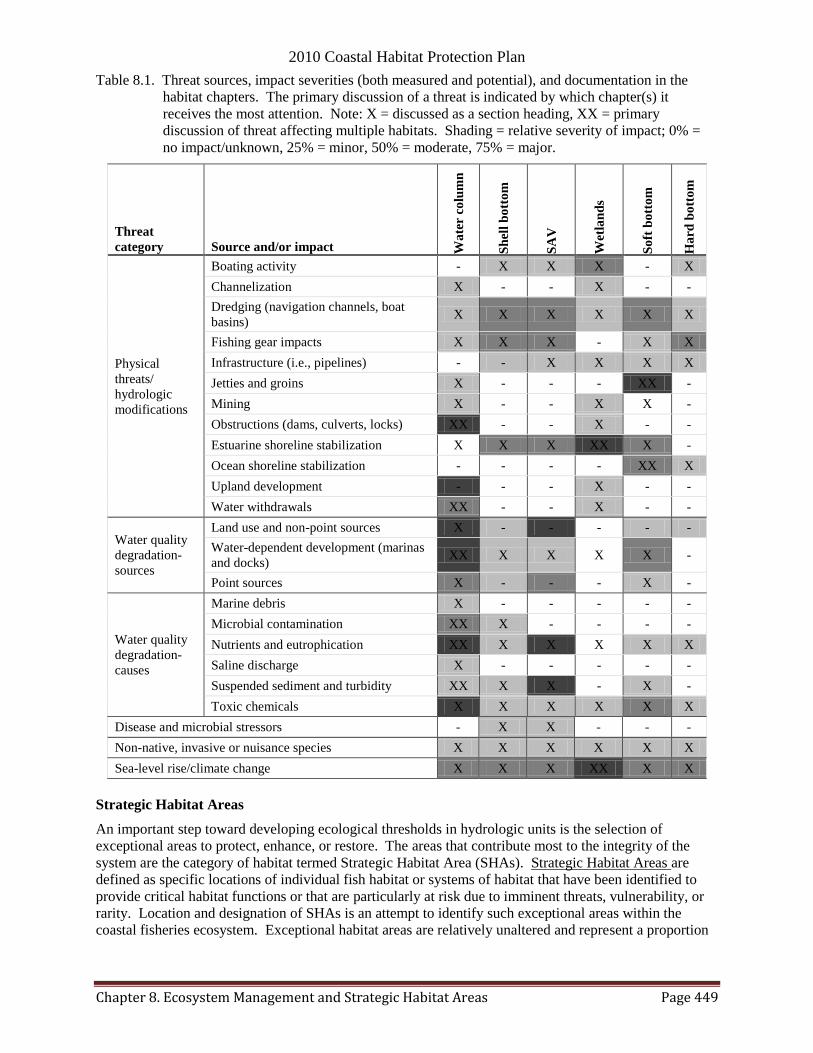
2010 Coastal Habitat Protection Plan
Chapter 8. Ecosystem Management and Strategic Habitat Areas Page 449
Table 8.1. Threat sources, impact severities (both measured and potential), and documentation in the
habitat chapters. The primary discussion of a threat is indicated by which chapter(s) it
receives the most attention. Note: X = discussed as a section heading, XX = primary
discussion of threat affecting multiple habitats. Shading = relative severity of impact; 0% =
no impact/unknown, 25% = minor, 50% = moderate, 75% = major.
Threat
category Source and/or impact Wa
ter c
olu
mn
Sh
ell
bo
tto
m
SA
V
Wet
lan
ds
So
ft b
ott
om
Ha
rd b
ott
om
Physical
threats/
hydrologic
modifications
Boating activity - X X X - X
Channelization X - - X - -
Dredging (navigation channels, boat
basins) X X X X X X
Fishing gear impacts X X X - X X
Infrastructure (i.e., pipelines) - - X X X X
Jetties and groins X - - - XX -
Mining X - - X X -
Obstructions (dams, culverts, locks) XX - - X - -
Estuarine shoreline stabilization X X X XX X -
Ocean shoreline stabilization - - - - XX X
Upland development - - - X - -
Water withdrawals XX - - X - -
Water quality
degradation-
sources
Land use and non-point sources X - - - - -
Water-dependent development (marinas
and docks) XX X X X X -
Point sources X - - - X -
Water quality
degradation-
causes
Marine debris X - - - - -
Microbial contamination XX X - - - -
Nutrients and eutrophication XX X X X X X
Saline discharge X - - - - -
Suspended sediment and turbidity XX X X - X -
Toxic chemicals X X X X X X
Disease and microbial stressors - X X - - -
Non-native, invasive or nuisance species X X X X X X
Sea-level rise/climate change X X X XX X X
Strategic Habitat Areas
An important step toward developing ecological thresholds in hydrologic units is the selection of
exceptional areas to protect, enhance, or restore. The areas that contribute most to the integrity of the
system are the category of habitat termed Strategic Habitat Area (SHAs). Strategic Habitat Areas are
defined as specific locations of individual fish habitat or systems of habitat that have been identified to
provide critical habitat functions or that are particularly at risk due to imminent threats, vulnerability, or
rarity. Location and designation of SHAs is an attempt to identify such exceptional areas within the
coastal fisheries ecosystem. Exceptional habitat areas are relatively unaltered and represent a proportion

2010 Coastal Habitat Protection Plan
Chapter 8. Ecosystem Management and Strategic Habitat Areas Page 450
of habitat types to maintain.58
The amount to maintain is adjusted up or down from 30%, based on
relative ecological importance, rarity, vulnerability, sensitivity to alteration, and/or historic losses.
The process for locating and designating SHAs can be downloaded from the DMF website
(http://www.ncdmf.net/habitat/miscdownloads/FINAL_MFC_SHAreport12-6-06.pdf). Using this
process and several refinements, the first of four regional assessments was completed and presented to the
Marine Fisheries Commission in January 2009. Through the analysis, maps of habitats and relative
alteration levels are produced, and a network of exceptional areas are selected as SHAs (Maps 8.1 and
8.2). The designation of SHAs was postponed until field verification could be conducted. In the
meantime, Region 1 SHAs (Albemarle Sound and tributaries) and supporting data are used in
conservation planning (at the DENR level) and as information for the CHPP update. There are also Sea
Grant research fellowships supporting SHA assessments. The first project was conducted for Region 1
comparing DMF sampling data and proximity to altered habitats. The results indicated some correlations
between juvenile fish data and cumulative alteration within a 0.5 kilometer radius, with low fish
abundance where alteration levels were greater (DMF 2009b). Current research and assessment work is
focused on SHA region 2 (Tar-Pamlico, Neuse, and Pamlico Sound subregions). The SHA assessment for
Region 2 should be complete by late 2010; Regions 3 and 4 should be completed by late 2011 (Map 1.2 of
the Introduction chapter). Additional research is needed to verify the relative impact and distribution of
cumulative alterations affecting the selection of areas.
The input data and results of SHA assessment should help permit reviewers in assessing cumulative
impacts and deciding habitat trade-offs acceptable for development projects. One could estimate how
much more altered an area would get with the addition of proposed structures. The habitat trade-off issue
is exemplified by the criteria required for constructing marsh-sills instead of vertical bulkheads. In this
case, the exchange of soft bottom with shell bottom and wetlands could be justified by comparing
representation levels in the region. The question to ask is whether the loss of soft bottom habitats would
result in those habitats not meeting their representation levels in the SHA network. The addition of
habitats with higher representation levels (i.e., shell bottom and wetlands) and less over-representation
could be applied to restoration goals for those habitats in the area. A basic need of SHA assessment
continues to be the development of accurate and contemporary distribution maps for habitats (see
“Distribution” sections of habitat chapters for specific recommendations) and threats (see “Threats and
management needs” sections of habitat chapters for specific recommendations).
The EEP, along with permitting agency input, is currently developing criteria for out-of-kind restoration
credits based on projected improvements in downstream water quality.59
This is fundamentally an
ecosystem approach to maintaining water quality and associated bottom habitats with permitted impacts.
The SHA approach could provide some input regarding the maintenance of habitat diversity in a
restoration crediting system (see ―Wetland enhancement and restoration‖ section of Wetlands chapter for
more information).
Other habitat designations and protection programs
While Region 1 SHAs have been identified and approved under the CHPP, they have not been placed in
agency rule due to the need to develop site specific management plans for each SHA that will determine if
regulatory actions or restrictions are needed. There are however, several different existing designations
used in North Carolina that identify, delineate, and designate functionally important habitat areas. At the
federal level, the Magnuson-Stevens Fishery Conservation and Management Act Reauthorization of 1996
[the Sustainable Fisheries Act (SFA)] requires the National Marine Fisheries Service (NMFS) to amend
58 In the SHA region 1 (Albemarle Sound and tributaries), there were 42 habitat types and 18 alteration factors. 59 The EEP contracted with East Carolina University to develop a rapid assessment process for coastal watersheds and
compensatory mitigation that is consistent with the goals of the Coastal Habitat Protection Plan. The 2007-09 CHPP
implementation plan called for developing an innovative system for out-of-kind mitigation credit that includes aquatic habitat
restoration. http://www.nceep.net/services/lwps/pull_down/by_basin/WhiteOak_RB.html

2010 Coastal Habitat Protection Plan
Chapter 8. Ecosystem Management and Strategic Habitat Areas Page 451
federal Fishery Management Plans (FMPs) to include provisions for protection of ―Essential Fish
Habitat‖ (EFH), defined as ―those waters and substrate necessary to fish for spawning, breeding, feeding,
or growth to maturity.‖ In North Carolina, salt marshes, oyster reefs, and seagrass beds are designated
EFH for red drum and penaeid shrimp, species managed cooperatively by state and federal authorities.
Similar to CHPP Strategic Habitat Areas, federal ―Habitat Areas of Particular Concern‖ (HAPCs) are
designated for areas of EFH that are particularly important for managed species or species complexes
(SAFMC 1998a). North Carolina Primary Nursery Areas, first designated by the MFC in 1977, are
similar in concept to HAPCs. However, the NMFS has designated very few HAPCs (none in North
Carolina), while the MFC/DMF and WRC have designated tens of thousands of acres as nursery areas in
North Carolina (see below). The state designations are well accepted by the various state and federal
regulatory and permitting agencies, as well as by the public.
The MFC and WRC have designated nursery areas since 1977 and 1990, respectively, based on field
sampling. Approximately 162,000 acres of Coastal Fishing Waters are currently designated by the MFC
as Primary, Secondary, and Special Secondary Nursery Areas. About 10,000 acres of Inland Fishing
Waters in the coastal area are designated as Inland Primary Nursery Areas, as well as the following areas
of the four main rivers draining to North Carolina‘s coast:
Roanoke River, U.S. 258 bridge to Roanoke Rapids Dam (35.5 stream miles, 57.1 km)
Tar-Pamlico River, railroad bridge at Washington to Rocky Mount Mill Dam (90.2 stream miles,
145.2 km)
Neuse River, Pitchkettle Creek to Milburnie Dam (160.6 stream miles, 258.4 km)
Cape Fear River, Lock and Dam #1 to Buckhorn Dam (126.7 stream miles, 203.9 km).
There are specific protections for designated nursery areas included in the rules of all three commissions.
For example, an MFC rule [15A NCAC 3N .0104] prohibits use of trawls, dredges, long haul and swipe
seines, and mechanical shellfishing gears in Primary Nursery Areas (PNAs). Once an area has been
designated as a PNA by the MFC, the area also comes under protection of existing CRC rules [15A
NCAC 07H .0208] and EMC rules [EMC rule 15A NCAC 02B .0301(c)] that protect physical and water
quality parameters of PNAs as a class.
The existing rule definitions for various fish habitats were revised by the Marine Fisheries Commission in
April 2009 [MFC Rule 15A NCAC 03I .0101(4)]. The word ―critical‖ was omitted since all fish habitats,
under the ecosystem concept, are critical to a properly functioning system as a whole. The DMF also
delineated in rule anadromous fish spawning areas based on sampling conducted from the early 1970s to
the present. Although neither CRC nor EMC rules offer any specific protection for anadromous fish
spawning areas, regulatory protections exist for other fish habitats, such as submerged aquatic vegetation
and shellfish producing areas. Beds of submerged aquatic vegetation are protected from the direct
impacts of dredging and trawling (in some locations [MFC rule 15A NCAC 3J .0104]), and open shellfish
harvesting areas are protected from new marina pollution and wastewater discharges [CRC rule 15A
NCAC 07H. 0208(5) (E)]. (More information regarding protection of fish habitat types is provided in
Chapters 2 – 7). Designation and protection of Strategic Habitat Areas was meant to improve on the
piecemeal protection of individual habitats and functional areas.
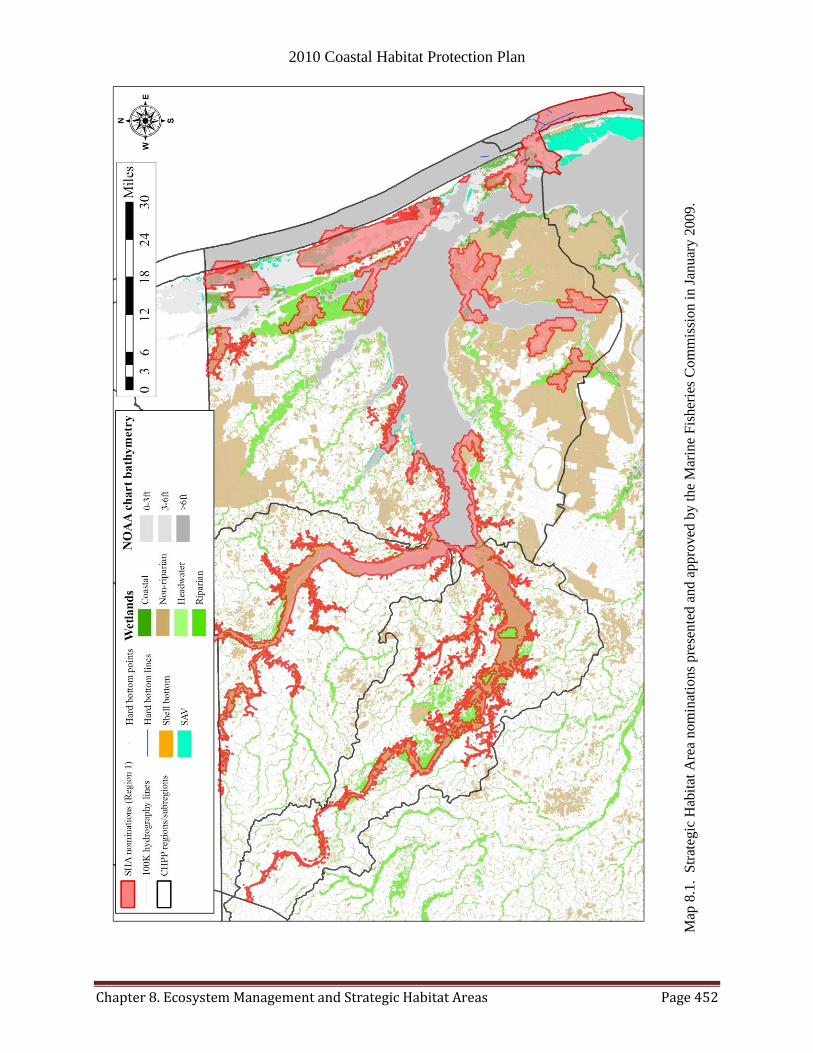
2010 Coastal Habitat Protection Plan
Chapter 8. Ecosystem Management and Strategic Habitat Areas Page 452
Map
8.1
. S
trat
egic
Hab
itat
Are
a n
om
inat
ions
pre
sen
ted a
nd a
ppro
ved
by t
he
Mar
ine
Fis
her
ies
Co
mm
issi
on
in J
anu
ary
200
9.

2010 Coastal Habitat Protection Plan
Chapter 8. Ecosystem Management and Strategic Habitat Areas Page 453
Map
8.2
. T
ota
l al
tera
tio
n s
core
s ca
lcula
ted f
rom
18 i
ndiv
idual
alt
erat
ion f
acto
rs c
oin
cidin
g w
ith h
abit
at t
arg
ets
in t
he
Alb
emar
le S
ou
nd
reg
ion
.
2010 Coastal Habitat Protection Plan
Chapter 9. Management Recommendations Page 454
CHAPTER 9. MANAGEMENT RECOMMENDATIONS
9.1 Introduction
The discussions of the six major habitat types and habitat systems in the preceding chapters demonstrate
the importance of coastal fish habitats, threats to those habitats, and the need to take actions to achieve the
stated goal of the Coastal Habitat Protection Plan as provided by the North Carolina General Assembly:
―long-term enhancement of coastal fisheries associated with each coastal habitat.‖ This chapter provides
management recommendations based on scientific studies cited in chapters 2 – 8, deliberations of the
Environmental Management, Coastal Resources, Marine Fisheries and Wildlife Resources commissions,
and citizen input (verbal comments received in person or by telephone; written comments received in
person or via mail and e-mail) from three public meetings held during the summer of 2010, as well as
additional comments obtained during the CHPP process. The commission representation formed the
CHPP Steering Committee or CSC (Appendix B).
9.2. Public input
In 2003 and 2004, the public cited coastal development as the issue most needing immediate attention,
followed by enforcement of existing statutes, rules, and permit conditions, and then environmental
education and research. Threats associated with development included polluted stormwater runoff,
wastewater discharges, and wetland filling. Meeting attendees agreed that existing laws and rules might
be sufficient for habitat protection, but that they are not adequately enforced largely due to insufficient
staffing and resources. Educating the public about the importance of coastal habitats and the threats they
face was repeatedly mentioned as being critical for successful habitat protection and enhancement.
The public meetings in 2010 focused on what was done to address the recommendations in the 2005
CHPP and getting input on emerging and continuing priority issues of the 2010 CHPP. Three meetings
were held in Morehead City (June 8), Wilmington (June 4), and Manteo (June 17). Two letters were also
received during the comment period, which closed on July 30, 2010. Groups represented at the public
meetings or through comments included Pender Watch, North Carolina Coastal Federation, and Business
Alliance for a Sound Economy (BASE). When asked what they considered the highest priority
recommendations, answers included continuing to enforce existing rules, address cumulative impacts,
prevent pollution, endocrine disruptors, no offshore drilling, increase adaptation to sea level rise, greater
encouragement and interagency cooperation to implement Low Impact Development (LID) techniques to
meet stormwater rule goals, since they are considered the best available technology standard for reducing
polluted stormwater runoff. Another comment noted the need for more specific recommendations to
address failing septic systems since that is a factor in stormwater runoff, as well as funding for
enforcement of existing rules.
There is currently an ongoing DENR Interagency Inspection Task Force, lead by Shellfish Sanitation
Office, to examine the issue of compliance and inspections to reduce nonpoint pollution from failing
septic systems and other sources. Recommendations 4.5d and 4.6b address LID, but more coordination
and outreach efforts are needed to increase use. This could be addressed through establishment of a CSC
workgroup rather than modification of the existing recommendations. Substantive public comments and
CSC consensus regarding possible modifications to recommendations included:
Rec # 3.2 – specifically state to maintain the state law banning hardened structures on ocean shorelines,
rather than leaving the language vague as currently worded. This would be consistent with the literature
findings in the CHPP. The recommendation was not changed due to a CSC member objection.
CSC response (Commissioner Bob Emory): ―The committee is aware that the CRC study on
terminal groins was inconclusive and our recommendation to the General Assembly was similarly
inconclusive. As a matter of fact, at the CRC‘s next meeting there will be a discussion regarding

2010 Coastal Habitat Protection Plan
Chapter 9. Management Recommendations Page 455
just exactly what our recommendation meant. There is significant disagreement among some
Commissioners. My support for retaining a hardened structure ban aside, a definitive statement
in the CHPP report would meet resistance from CRC members; I honestly don‘t know how many
at this point.‖
Rec # 3.4 – strengthen the wording to simplify and promote use of marsh sills and other alternatives by
stating these structures should be preferred rather than just considered. This is supported in the CHPP
literature and would be consistent with the conclusions of the Estuarine Biological and Physical Processes
Work Group report. The MFC‘s Habitat and Water Quality Advisory Committee revised wording was
accepted by the CSC:
Protect estuarine and public trust shorelines and shallow water habitats by revising shoreline
stabilization rules that include consideration of erosion rates and prefer alternatives to vertical shoreline
stabilization measures that maintain shallow nursery areas.
Rec. # 3.6 – reword to clearly state that offshore drilling is incompatible with NC‘s coastal policy because
of potential habitat effects. Due to the Deepwater Horizon oil spill, additional research on the effect of oil
spills is estuarine waters was done and incorporated into the CHPP text. The literature has documented
negative effects to the water column, estuarine wetlands, shellfish, and SAV, as well as ocean hard
bottom, and soft bottom. The recommendation was not changed due to a CSC member objection.
CSC response (Commissioner Anna Beckwith): ―I would be cautious about the oil drilling.
While I personally oppose drilling for oil off our coast and would personally love to see <a
recommendation change>, I would be concerned that it would be considered an emotional
reaction to the current situation.‖ (Commissioner Bob Emory) ―I prefer to leave the energy
development language as it is, without making a statement about banning offshore oil
exploration. We should be informed by upcoming investigation in the Gulf.‖
9.3. Recommendations
The 2010 CHPP update identifies numerous management needs as either accomplished, progressing,
without progress, or emerging/clarified, as shown in the ―Management needs and accomplishments‖
sections of chapters 2 – 7. Major accomplishments and progress on 2005 CHPP goals and
recommendations was presented in the Introduction chapter. There were also numerous discontinued
items because they were found to be redundant, too vague, or insignificant. The management needs
information was summarized for the CSC in March 2010. The CHPP staff reviewed the 2010
management needs to determine if the existing goals and recommendations established in the 2005 CHPP
adequately addressed all the specific management needs. The results suggested some necessary revision
of the goals/recommendation language. The CSC reviewed the changes during their subsequent meeting
in April. The revised goals and recommendations are listed below and in Table 9.1, in no particular order
of priority. New recommendations and additions are in bold, italic font below.
Making further progress on the goals and recommendations will require the continuing development of
CHPP Implementation Plans (IPs). The IPs are developed on a 2-year schedule and include action items
for all the participating commissions and their supporting agencies. Prior IPs have included numerous
items that address the 2005 goals and recommendations but were not specifically included as management
needs in the habitat chapters. The management needs italicized in the habitat chapters are therefore
included as a guide for developing implementation actions that combine the influences of opportunity,
importance to fish habitat, and socio-economic realities. Some action items in the 2009-2011 CHPP
Implementation Plan are listed and described in Appendix J. Contact the DMF Habitat Section (1-252-
808-8066) for the most up-to-date Implementation Plans.
2010 Coastal Habitat Protection Plan
Chapter 9. Management Recommendations Page 456
GOAL 1. IMPROVE EFFECTIVENESS OF EXISTING RULES AND PROGRAMS PROTECTING
COASTAL FISH HABITATS
During the 2005 public meetings, the most common request was to enforce existing rules before
implementing new rules. With additional coordination, enforcement, and education, many of the existing
rules and programs regarding habitat protection could be much more effective. Despite progress made on
this goal during 2005-2010, the following actions are still needed for existing management strategies to be
effective:
1. Continue to enhance enforcement of, and compliance with, Coastal Resources Commission
(CRC), Environmental Management Commission (EMC), Marine Fisheries Commission (MFC),
and Wildlife Resources Commission (WRC) rules and permit conditions.
2. Coordinate and enhance water quality, physical habitat, and fisheries resource monitoring
(including data management) from headwaters to the nearshore ocean.
3. Enhance and expand educational outreach on the value of fish habitat, threats from land-use and
human activities, climate change, and reasons for management measures.
4. Coordinate rulemaking and data collection for enforcement among regulatory commissions and
agencies.
5. Develop and enhance assessment and management tools for addressing cumulative impacts.
6. Enhance control of invasive species with existing programs.
GOAL 2. IDENTIFY, DESIGNATE, AND PROTECT STRATEGIC HABITAT AREAS
To identify and protect Strategic Habitat Areas in a science based manner, mapping and monitoring of all
fish habitat is necessary to assess distribution and condition. Research is also needed on the effect of
anthropogenic activities on fish habitat, as well as ecological linkages between fish and habitat. With
mapping, monitoring, and ecological and threats assessments available, SHAs can be accurately
identified. Strategic Habitat Area assessments and subsequent nominations are not yet completed. The
need for more up-to-date data on habitat distribution and quality, along with current alterations to the
habitat, is a major theme of the CHPP update. The following regulatory and non-regulatory management
actions continue to be recommendations:
1. Support Strategic Habitat Area assessments by:
a. Coordinating, completing, and maintaining baseline habitat mapping (including seagrass,
shell bottom, shoreline, and other bottom types) using the most appropriate technology.
b. Selective monitoring of the status of those habitats, and
c. Assessing fish-habitat linkages and effects of land use and human activities on those
habitats
2. Identify, designate, and protect Strategic Habitat Areas.
GOAL 3. ENHANCE HABITAT AND PROTECT IT FROM PHYSICAL IMPACTS
Large historical losses of wetlands, oysters, and SAV have occurred in North Carolina in the past from
various causes. Habitats continue to be degraded or lost at a smaller but cumulatively significant scale
from certain development, water dependent and fishing activities. Direct and indirect impacts may occur
due to unauthorized impacts, impacts too small to require a permit, indirect and unmitigated impacts of
permitted activities, and unsuccessful mitigation. The following regulatory and non-regulatory measures
continue to be recommendations:
1. Expand habitat restoration in accordance with ecosystem restoration plans, including:
a. Creation of subtidal oyster reef no-take sanctuaries.
b. Re-establishment of riparian wetlands and stream hydrology.
c. Restoration of SAV habitat and shallow soft bottom nurseries.
d. Developing compensatory mitigation process to restore lost fish habitat functions.
2010 Coastal Habitat Protection Plan
Chapter 9. Management Recommendations Page 457
2. Sustain healthy barrier island systems by maintaining and enhancing ecologically sound
policies for ocean and inlet shorelines and implement a comprehensive beach and inlet
management plan that provides ecologically based guidelines to protect fish habitat and address
socio-economic concerns.
3. Protect habitat from fishing gear effects through improved enforcement, establishment of
protective buffers around habitats, modified rules, and further restriction of fishing gears, where
necessary.
4. Protect estuarine and public trust shorelines and shallow water habitats by revising shoreline
stabilization rules to include consideration of erosion rates and prefer alternatives to vertical
shoreline stabilization measures that maintain shallow nursery habitat.
5. Protect and enhance habitat for migratory fishes by:
a. Incorporating the water quality and quantity needs of fish in water use planning and rule
making.
b. Eliminating or modifying obstructions to fish movements, such as dams and culverts, to
improve fish passage.
6. Ensure that energy development and infrastructure is designed and sited in a manner that
minimizes negative impacts to fish habitat, avoids new obstructions to fish passage, and where
possible provides positive impacts.
7. Protect important fish habitat functions from damage associated with activities such as
dredging and filling.
8. Develop coordinated policies including management adaptations and guidelines to increase
resiliency of fish habitat to climate change and sea level rise.
GOAL 4. ENHANCE AND PROTECT WATER QUALITY
Because all fish habitats are connected and influenced by the water column, maintaining and restoring
water quality is the basic component of habitat protection and enhancement. Water quality stressors
include toxins, excess nutrients and sediment, and bacteria. Sources of these stressors include nonpoint
runoff from land-based activities, point source discharges, and spills and failures of wastewater treatment.
Alterations to water flow through intakes, discharges, impoundments, and obstructions can also degrade
habitat functions. Despite numerous improvements in the management of water-born pollutants, there
continue to be areas for improvement, as well as emerging issues. Additional recommendations are
related to the emerging threat of endocrine disrupting chemicals. The following regulatory and non-
regulatory management measures are still necessary to address a diversity of point and non-point
pollution sources:
Point sources
1. Reduce point source pollution discharge by:
a. Increasing inspections of discharge treatment facilities, collection infrastructure, and
disposal sites.
b. Providing incentives for upgrading all types of discharge treatment systems.
c. Develop standards and treatment facilities that minimize the threat of endocrine
disrupting chemicals on aquatic life. 2. Adopt or modify rules or statutes to prohibit ocean wastewater discharges.
3. Prevent additional shellfish and swimming closures through targeted water quality restoration and
prohibit new or expanded stormwater outfalls to coastal beaches and to coastal shellfishing waters
(EMC surface water classifications SA and SB) except during times of emergency (as defined by
the Division of Water Quality‘s Stormwater Flooding Relief Discharge Policy) when public
safety and health are threatened, and continue to phase-out existing outfalls by implementing
alternative stormwater management strategies.
Non-point sources
4. Enhance coordination with, and financial/technical support for, local government actions to better
2010 Coastal Habitat Protection Plan
Chapter 9. Management Recommendations Page 458
manage stormwater and wastewater.
5. Improve strategies throughout the river basins to reduce non-point pollution and minimize
cumulative losses of fish habitats through voluntary actions, assistance, and incentives, including:
a. Improved methods to reduce pollution from construction sites, agriculture, and forestry.
b. Increased on-site infiltration of stormwater.
c. Documentation and monitoring of small but cumulative impacts to fish habitats from
approved, un-mitigated activities.
d. Encouraging and providing incentives for low impact development.
e. Increased inspections of onsite wastewater treatment facilities.
f. Increased water re-use and recycling.
6. Improve strategies throughout the river basins to reduce non-point pollution and minimize
cumulative losses of fish habitats through rule making, including:
a. Increased use of effective vegetated buffers,
b. Implementing and assessing coastal stormwater rules and modify if justified.
c. Modified water quality standards that are adequate to support SAV habitat.
7. Maintain adequate water quality conducive to the support of present and future aquaculture. 8. Reduce non-point source pollution from large-scale animal operations by the following actions:
a. Support early implementation of environmentally superior alternatives to the current
lagoon and spray field systems as identified under the Smithfield Agreement and
continue the moratorium on new/expanded swine operations until alternative waste
treatment technology is implemented.
b. Seek additional funding to phase-out large-scale animal operations in sensitive areas and
relocate operations from sensitive areas, where necessary.
c. Use improved siting criteria to protect fish habitat.
9.4. Possible funding sources
Implementation of the above recommendations will involve new program activities and revised priorities
for existing programs within DENR and other agencies. Significant new funding is essential to expand
and improve enforcement and compliance monitoring to fully implement existing laws and rules.
Coordinating and expanding DENR biological, physical, and water quality monitoring and data
management within the eight coastal river basins will provide local and state environmental managers and
regulatory commissions, as well as the development, agriculture, and forestry communities, with data and
analyses necessary to make informed decisions, and to evaluate the effects of those decisions.
Implementation of coordinated interagency management requires a significant infusion of personnel,
equipment, and operations monies. These funds must be considered as an investment in greatly enhanced
environmental productivity that will benefit all citizens and provide important dividends over the long-
term. Possible funding sources listed below are suggestions only. No specific proposals have been
developed, although the Coastal Recreational Fishing License, which became effective January 1, 2007,
includes a provision to fund habitat restoration activities.
Request expansion funds from the North Carolina General Assembly.
Apply for grant funding collected through sale and renewal of a Coastal Recreational Fishing License
for applicable research on fish habitat.
Utilize existing environmental education and outreach programs.
Incorporate CHPP recommendations into North Carolina Clean Water Management Trust Fund
priorities.
Work with the DENR Ecosystem Enhancement Program to implement coastal habitat restoration
projects.
Develop partnerships to restore and protect coastal fish habitats through private and federal programs,
such as the FishAmerica Foundation, Restore America‘s Estuaries, NOAA Restoration Center, and
the U.S. Fish and Wildlife Service.
2010 Coastal Habitat Protection Plan
Chapter 9. Management Recommendations Page 459
Seek direct federal funding through the U.S. Congress, similar to funding provided for the
Chesapeake Bay program.
Seek regional funds available through participation in National Fish Habitat Initiative partnerships
and alliances.
Apply for grant funding through other environmental and habitat restoration grants.
Establish severance fees for commercial extraction of non-renewable, natural resources from coastal
lands and waters and utilize such funds to enhance, protect, restore, and manage coastal fisheries
resource habitats.
Establish a Coastal Fish Habitat Protection Fund supported by impact fees on development in the
vicinity of coastal fish habitat.

2010 COASTAL HABITAT PROTECTION PLAN
Chapter 9. Management Recommendations Page 460
Table 9.1. Recommendations for the long-term enhancement of coastal fisheries associated with coastal habitats. Note: * signifies new
recommendation. R
efer
ence
No
.
Recommended actions to protect, enhance, restore, and manage coastal fish habitats
Responsible commission
or agency
[Lead group(s) in bold]
Rule-
making?
GOAL 1. IMPROVE EFFECTIVENESS OF EXISTING RULES AND PROGRAMS PROTECTING COASTAL FISH HABITATS
1.1
Continue to enhance enforcement of, and compliance with, Coastal Resources Commission (CRC),
Environmental Management Commission (EMC), Marine Fisheries Commission (MFC), and Wildlife
Resource Commission (WRC) rules and permit conditions.
CRC/DCM, EMC/DWQ,
MFC/DMF, CHS, SCC,
WRC, DFR, DLR, S&WCC
1.2 Coordinate and enhance water quality, physical habitat, and fisheries resource monitoring (including data
management) from headwaters to the nearshore ocean.
DENR, DMF, DWQ, DCM,
WRC
1.3 Enhance and expand educational outreach on the value of fish habitat, threats from land-use and human
activities, climate change and reasons for management measures. DENR, WRC
1.4 Coordinate rulemaking and data collection for enforcement among regulatory commissions and agencies. EMC, CRC, MFC, DENR,
WRC, SWCC, DFR
1.5* Develop and enhance assessment methodology and management tools for addressing cumulative impacts.
CRC/DCM, EMC/DWQ,
MFC/DMF, CHS, SCC,
WRC, DFR, DLR, S&WCC,
APNEP, DENR
1.6* Enhance control of invasive species with existing programs. DENR, WRC
GOAL 2. IDENTIFY, DESIGNATE, AND PROTECT STRATEGIC HABITAT AREAS
2.1
Support Strategic Habitat Area assessments by:
a) coordinating, completing, and maintaining baseline habitat mapping (including seagrass, shell
bottom, shoreline, and other bottom types) using the most appropriate technology
b) selective monitoring of the status of those habitats
c) assessing fish-habitat linkages and effects of land use and human activities on those habitats.
DMF, DCM, DWQ, DENR,
WRC
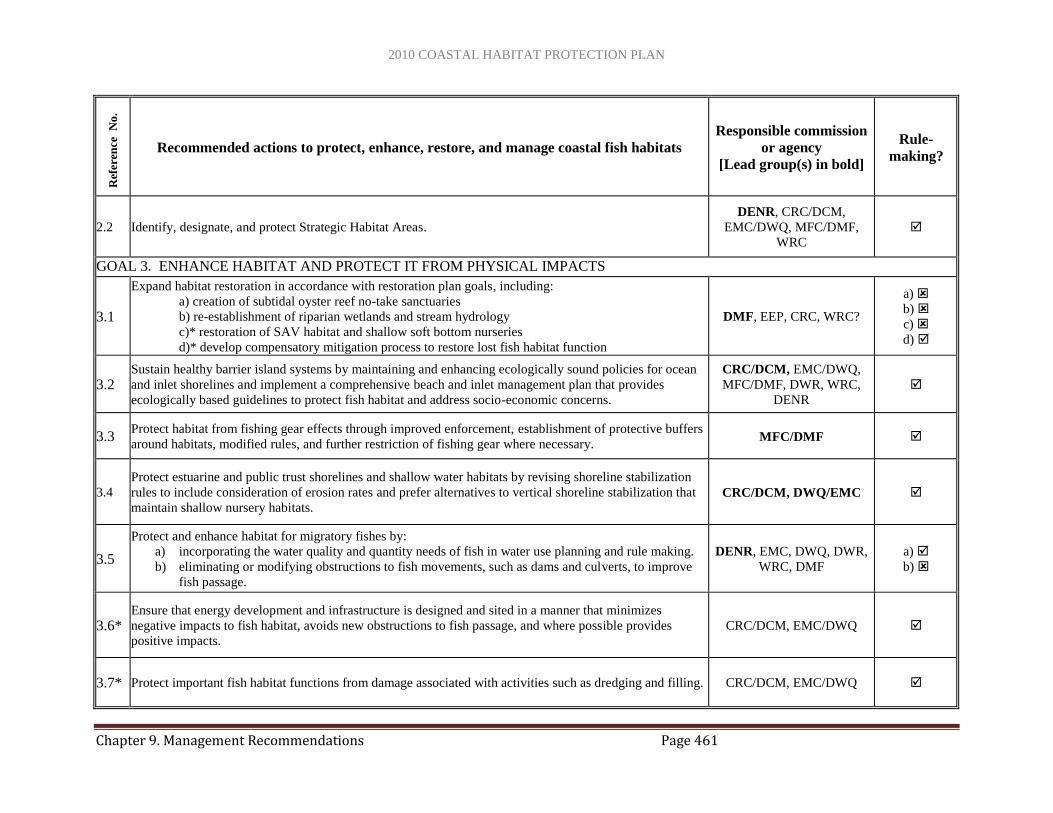
2010 COASTAL HABITAT PROTECTION PLAN
Chapter 9. Management Recommendations Page 461
Ref
eren
ce
No
.
Recommended actions to protect, enhance, restore, and manage coastal fish habitats
Responsible commission
or agency
[Lead group(s) in bold]
Rule-
making?
2.2 Identify, designate, and protect Strategic Habitat Areas.
DENR, CRC/DCM,
EMC/DWQ, MFC/DMF,
WRC
GOAL 3. ENHANCE HABITAT AND PROTECT IT FROM PHYSICAL IMPACTS
3.1
Expand habitat restoration in accordance with restoration plan goals, including:
a) creation of subtidal oyster reef no-take sanctuaries
b) re-establishment of riparian wetlands and stream hydrology
c)* restoration of SAV habitat and shallow soft bottom nurseries
d)* develop compensatory mitigation process to restore lost fish habitat function
DMF, EEP, CRC, WRC?
a)
b)
c)
d)
3.2 Sustain healthy barrier island systems by maintaining and enhancing ecologically sound policies for ocean
and inlet shorelines and implement a comprehensive beach and inlet management plan that provides
ecologically based guidelines to protect fish habitat and address socio-economic concerns.
CRC/DCM, EMC/DWQ,
MFC/DMF, DWR, WRC,
DENR
3.3 Protect habitat from fishing gear effects through improved enforcement, establishment of protective buffers
around habitats, modified rules, and further restriction of fishing gear where necessary. MFC/DMF
3.4
Protect estuarine and public trust shorelines and shallow water habitats by revising shoreline stabilization
rules to include consideration of erosion rates and prefer alternatives to vertical shoreline stabilization that
maintain shallow nursery habitats. CRC/DCM, DWQ/EMC
3.5
Protect and enhance habitat for migratory fishes by:
a) incorporating the water quality and quantity needs of fish in water use planning and rule making.
b) eliminating or modifying obstructions to fish movements, such as dams and culverts, to improve
fish passage.
DENR, EMC, DWQ, DWR,
WRC, DMF
a)
b)
3.6* Ensure that energy development and infrastructure is designed and sited in a manner that minimizes
negative impacts to fish habitat, avoids new obstructions to fish passage, and where possible provides
positive impacts.
CRC/DCM, EMC/DWQ
3.7* Protect important fish habitat functions from damage associated with activities such as dredging and filling. CRC/DCM, EMC/DWQ

2010 COASTAL HABITAT PROTECTION PLAN
Chapter 9. Management Recommendations Page 462
Ref
eren
ce
No
.
Recommended actions to protect, enhance, restore, and manage coastal fish habitats
Responsible commission
or agency
[Lead group(s) in bold]
Rule-
making?
3.8* Develop coordinated policies including management adaptations and guidelines to increase resiliency of
fish habitat to climate change and sea level rise. DENR, WRC
GOAL 4. ENHANCE AND PROTECT WATER QUALITY
4.1
Reduce point source pollution discharges by
a) increasing inspections of wastewater treatment facilities, collection infrastructure, and disposal sites,
b) providing incentives for upgrading all types of discharge treatment systems, and
c)* developing standards and treatment methods that minimize the threat of endocrine disrupting
chemicals on aquatic life.
EMC/ DWQ, CPH/DEH
a)
b)
c)
4.2 Adopt or modify rules or statutes to prohibit ocean wastewater discharges. EMC
4.3
Prevent additional shellfish closures and swimming advisories through targeted water quality restoration
and prohibit new or expanded stormwater outfalls to coastal beaches and to coastal shellfishing waters
(EMC surface water classifications SA and SB) except during times of emergency (as defined by the
Division of Water Quality‘s Stormwater Flooding Relief Discharge Policy) when public safety and health
are threatened, and continue to phase-out existing outfalls by implementing alternative stormwater
management strategies.
EMC/ DWQ, CPH/DEH,
CRC/ DCM
4.4 Enhance coordination with, and financial/technical support for, local government actions to better manage
stormwater and wastewater. DENR, DWQ, DCM, DEH
4.5
Improve strategies throughout the river basins to reduce non-point pollution and minimize cumulative
losses of fish habitat through voluntary actions, assistance, and incentives, including
a) improved methods to reduce pollution from construction sites, agriculture, and forestry,
b) increased on-site infiltration of stormwater,
c) documentation and monitoring of small but cumulative impacts to fish habitats from approved, un-
mitigated activities,
d) encouraging and providing incentives for low-impact development,
e) increased inspections of onsite wastewater treatment facilities, and
f) increased water re-use and recycling.
DENR, EMC, CRC, DWQ,
DCM, SCC, DLR, S&WCC,
DS&WC, Dept. of Agriculture
& Consumer Services, DFR
a)
b)
c)
d)
e)
f)
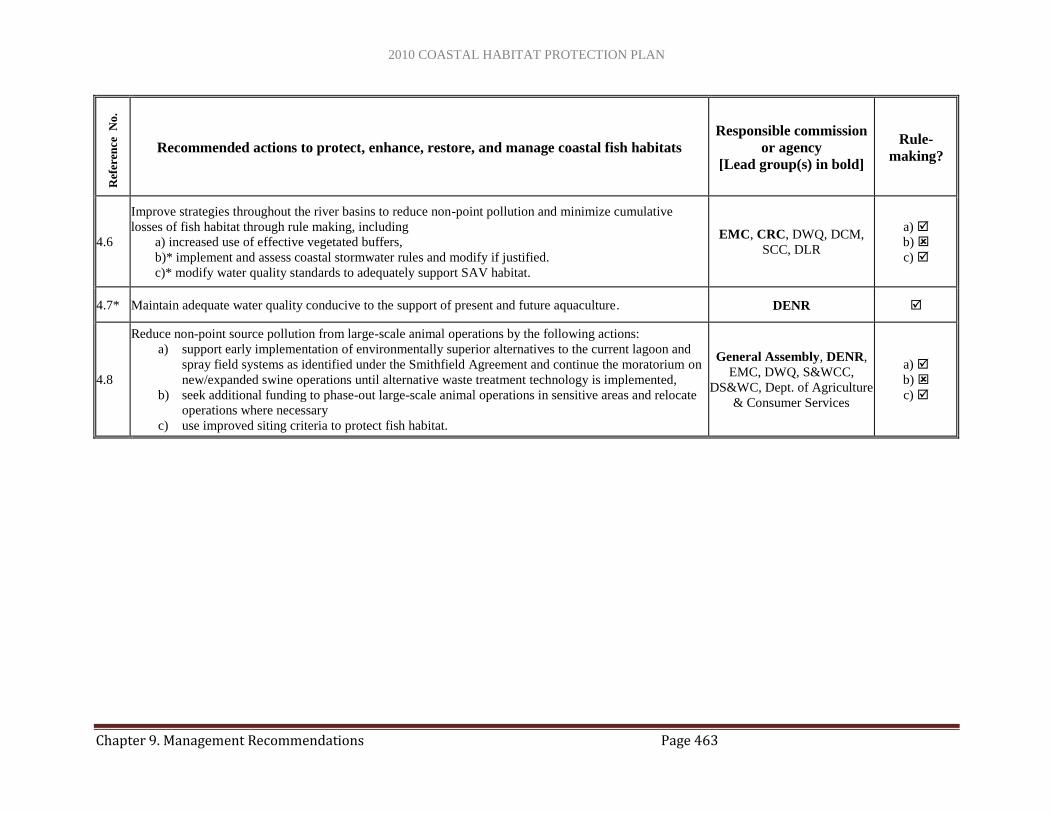
2010 COASTAL HABITAT PROTECTION PLAN
Chapter 9. Management Recommendations Page 463
Ref
eren
ce
No
.
Recommended actions to protect, enhance, restore, and manage coastal fish habitats
Responsible commission
or agency
[Lead group(s) in bold]
Rule-
making?
4.6
Improve strategies throughout the river basins to reduce non-point pollution and minimize cumulative
losses of fish habitat through rule making, including
a) increased use of effective vegetated buffers,
b)* implement and assess coastal stormwater rules and modify if justified.
c)* modify water quality standards to adequately support SAV habitat.
EMC, CRC, DWQ, DCM,
SCC, DLR
a)
b)
c)
4.7* Maintain adequate water quality conducive to the support of present and future aquaculture. DENR
4.8
Reduce non-point source pollution from large-scale animal operations by the following actions:
a) support early implementation of environmentally superior alternatives to the current lagoon and
spray field systems as identified under the Smithfield Agreement and continue the moratorium on
new/expanded swine operations until alternative waste treatment technology is implemented,
b) seek additional funding to phase-out large-scale animal operations in sensitive areas and relocate
operations where necessary
c) use improved siting criteria to protect fish habitat.
General Assembly, DENR,
EMC, DWQ, S&WCC,
DS&WC, Dept. of Agriculture
& Consumer Services
a)
b)
c)
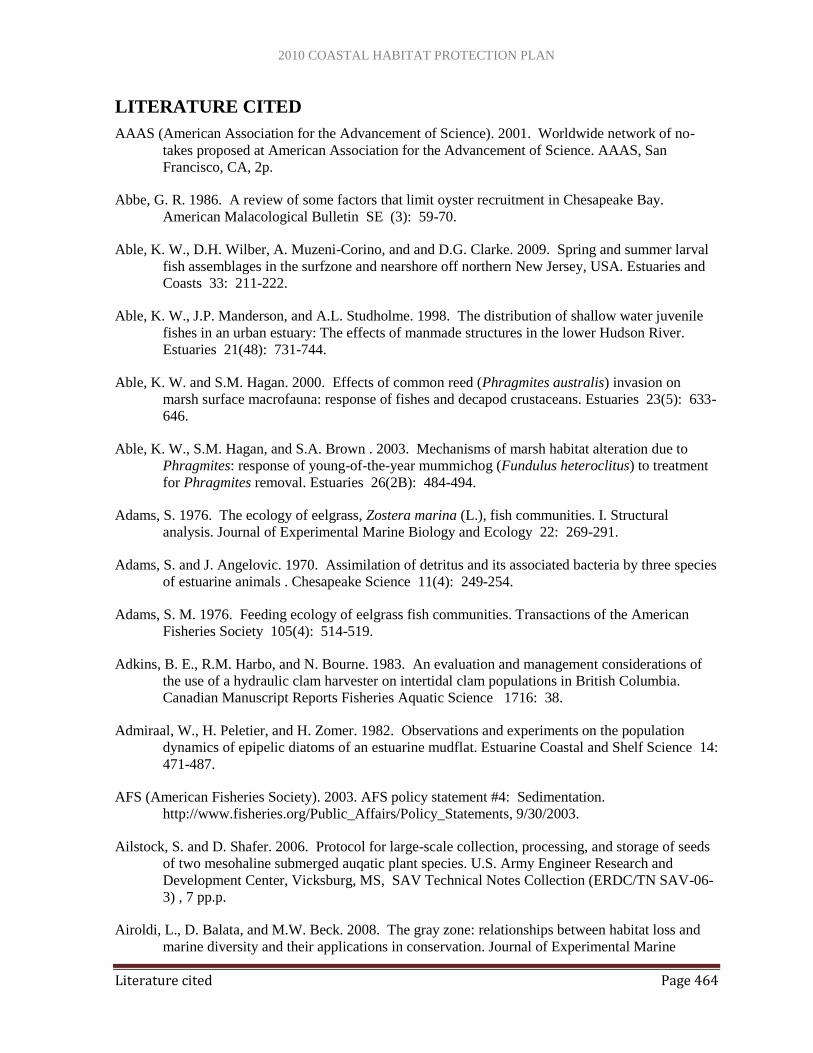
2010 COASTAL HABITAT PROTECTION PLAN
Literature cited Page 464
LITERATURE CITED
AAAS (American Association for the Advancement of Science). 2001. Worldwide network of no-
takes proposed at American Association for the Advancement of Science. AAAS, San
Francisco, CA, 2p.
Abbe, G. R. 1986. A review of some factors that limit oyster recruitment in Chesapeake Bay.
American Malacological Bulletin SE (3): 59-70.
Able, K. W., D.H. Wilber, A. Muzeni-Corino, and and D.G. Clarke. 2009. Spring and summer larval
fish assemblages in the surfzone and nearshore off northern New Jersey, USA. Estuaries and
Coasts 33: 211-222.
Able, K. W., J.P. Manderson, and A.L. Studholme. 1998. The distribution of shallow water juvenile
fishes in an urban estuary: The effects of manmade structures in the lower Hudson River.
Estuaries 21(48): 731-744.
Able, K. W. and S.M. Hagan. 2000. Effects of common reed (Phragmites australis) invasion on
marsh surface macrofauna: response of fishes and decapod crustaceans. Estuaries 23(5): 633-
646.
Able, K. W., S.M. Hagan, and S.A. Brown . 2003. Mechanisms of marsh habitat alteration due to
Phragmites: response of young-of-the-year mummichog (Fundulus heteroclitus) to treatment
for Phragmites removal. Estuaries 26(2B): 484-494.
Adams, S. 1976. The ecology of eelgrass, Zostera marina (L.), fish communities. I. Structural
analysis. Journal of Experimental Marine Biology and Ecology 22: 269-291.
Adams, S. and J. Angelovic. 1970. Assimilation of detritus and its associated bacteria by three species
of estuarine animals . Chesapeake Science 11(4): 249-254.
Adams, S. M. 1976. Feeding ecology of eelgrass fish communities. Transactions of the American
Fisheries Society 105(4): 514-519.
Adkins, B. E., R.M. Harbo, and N. Bourne. 1983. An evaluation and management considerations of
the use of a hydraulic clam harvester on intertidal clam populations in British Columbia.
Canadian Manuscript Reports Fisheries Aquatic Science 1716: 38.
Admiraal, W., H. Peletier, and H. Zomer. 1982. Observations and experiments on the population
dynamics of epipelic diatoms of an estuarine mudflat. Estuarine Coastal and Shelf Science 14:
471-487.
AFS (American Fisheries Society). 2003. AFS policy statement #4: Sedimentation.
http://www.fisheries.org/Public_Affairs/Policy_Statements, 9/30/2003.
Ailstock, S. and D. Shafer. 2006. Protocol for large-scale collection, processing, and storage of seeds
of two mesohaline submerged auqatic plant species. U.S. Army Engineer Research and
Development Center, Vicksburg, MS, SAV Technical Notes Collection (ERDC/TN SAV-06-
3) , 7 pp.p.
Airoldi, L., D. Balata, and M.W. Beck. 2008. The gray zone: relationships between habitat loss and
marine diversity and their applications in conservation. Journal of Experimental Marine
2010 COASTAL HABITAT PROTECTION PLAN
Literature cited Page 465
Biology and Ecology 366: 8-15.
Aksnes, D. L. 2007. Evidence for visual constraints in large marine fish stocks. Limnology and
Oceanography 52(1): 198-203.
Albins, M. A. and M.A. Hixon. 2008. Invasive Indo-Pacific lionfish Pterois volitans reduce
recruitment of Atlantic coral reef fishes. Marine Ecology Progress Series 367: 233-238.
Alexander, C. R. and M.H. Robinson. 2004. GIS and field-based analysis of the impacts of
recreational docks on the salt marshes of Georgia. Skidaway Institute of Oceanography and
Applied Coastal Research Laboratory, Georgia Southern University, Savannah, GA, 40 pp.p.
Alexander, C. R. and M.H. Robinson. 2006. Assessing the impacts of floating docks on bottom
character and benthic productivity in coastal Georgia. Skidaway Institute of Oceanography
and Applied Coastal Research Laboratory, Georgia Southern University, Savannah, GA, 54
pp.p.
Allen, K. O. and J.W. Hardy. 1980. Impacts of navigational dredging on fish and wildlife: a literature
review. National Technical Information Service, Report FWS/OBS - 80/07 , 88 p.
Ambrose, R. and S. Swarbrick. 1989. Comparison of fish assemblages on artificial and natural reefs
off the coast of southern California. Bulletin of Marine Science 44(2): 718-733.
Ambrose, W. G. Jr. and E.A. Irlandi. 1992. Height of attachment on seagrass leads to trade-off
between growth and survival in the bay scallop Argopecten irradians. Marine Ecology
Progress Series 90(1): 45-51.
Amoroso, J. L. 1999. Natural Heritage Program list of the rare plants of North Carolina. North
Carolina Natural Heritage Program.
Anders, F. J. and S.P. Leatherman. 1987. Distrubance of beach sediment by off-road vehicles.
Environmental Geology and Water Sciences 9(3): 183-189.
Andersen, J. H., L. Schluter, and G. Aertebjerg. 2006. Coastal eutrophication: recent developments
on definitions and implications for monitoring strategies. Journal of Plankton Research 28(7):
621-628.
Anderson, A. L., K. O'Brien, and M. Hartwell. 2007. Comparisons of mosquito populations before
and after construction of a wetland for water quality improvement in Pitt County, North
Carolina, and data-reliant vectorborne disease management. Journal of Environmental Health
69(8): 26-33.
Anderson, G. 1985. Species profiles: life histories and environmental requirements of coastal fishes
and invertebrates (Gulf of Mexico)--grass shrimp. U.S. Fish and Wildlife Service, Biological
Report USFWS/BR-82(11.35) , 377p.
Anderson, W. W. 1958. Larval development, growth, and spawning of striped mullet (Mugil
cephalus) along the South Atlantic coast of the United States. Fishery Bulletin 144: 501-519 .
Andrews, J. D. 1966. Oyster mortality studies in Virginia. V. Epizootiology of MSX, a protistan
pathogen of oysters. Ecology 47 (1): 19-31.
2010 COASTAL HABITAT PROTECTION PLAN
Literature cited Page 466
Andrews, J. D. 1980. A review of introductions of exotic oysters and biological planning for new
importations. Marine Fisheries Review 42: 1-11.
Andrews, J. D. 1988. Epizootiology of the disease caused by the oyster pathogen, Perkinsus marinus,
and its effects on the oyster industry. American Fishery Society Special Publication 18: 47-
63.
Andrews, J. D. and W.F. Hewatt. 1957. Oyster mortality studies in Virginia II. The fungus disease
caused by Dermocystidium marinum in oysters in Chesapeake Bay. Bay Ecology Monographs
27: 1-26.
Anguiano-Vega, G., R. Liera-Herrere, E. Rojas, and C. Vazquez-Boucard. 2007. Subchronic
organismal toxicity, cytotoxicity, genotoxicity, and feeding response of Pacific oyster
(Crassostrea gigas, Thunberg 1795) to lindane(y-HCH) exposure under experimental
conditions. Environmental Toxicology and Chemistry 26: 2192-2197.
Apple, J. K., E.M. Smith, and T.J. Boyd. 2008. Temperature, salinity, nutrients, and the covariation of
bacterial production and chlorophyll a in estuarine ecosystems . Journal of Coastal Research
55: 59-75.
Arhonditis, G. B., C.A. Stow, H.W. Paerl, L.M. Valdes-Weaver, L.J. Steinberg, and K.H. Reckhow.
2007. Delineation of the role of nutrient dynamics and hydrologic forcing on phytoplankton
patterns along a freshwater-marine continuum. Ecological Monitoring 208: 230-246.
Arnolds, C. L. and C.J. Gibbons. 1996. Impervious surface coverage - the emergence of a key
environmental indicator. Journal of the American Planning Association 62: 243-258.
Arve, J. 1960. Preliminary report on attracting fish by oyster shell plantings in Chincoteaque Bay,
Maryland. Chesapeake Science 1(1): 58-65.
ASMFC (Atlantic States Marine Fisheries Commission). Fiber optic cables: Issues for marine habitat
and fisheries.
ASMFC (Atlantic States Marine Fisheries Commission). 1996. Amendment #3 to the interstate
fisheries management plan for weakfish. Atlantic States Marine Fisheries Commission,
Washington, DC, 66p.
ASMFC (Atlantic States Marine Fisheries Commission). 1997a. Atlantic coastal submerged aquatic
vegetation: a review of its ecological role, anthropogenic impacts, state regulation, and value
to Atlantic coastal fisheries. unpub. rep., ASMFC Habitat Management Series #1 , 78p.
ASMFC (Atlantic States Marine Fisheries Commission). 1997b. Submerged aquatic vegetation
policy. Unpub. rep., ASFMC Habitat Management Series #3 , 9 p.
ASMFC (Atlantic States Marine Fisheries Commission). 2000. Evaluating fishing gear impacts to
submerged aquatic vegetation and determining mitigation strategies. ASFMC Habitat
Management Series 5 , 38p.
ASMFC (Atlantic States Marine Fisheries Commission). 2001. Amendment 1 to the interstate fishery
management plan for Atlantic menhaden. Washington, DC, 131 p.
2010 COASTAL HABITAT PROTECTION PLAN
Literature cited Page 467
ASMFC (Atlantic States Marine Fisheries Commission). 2002a. Beach nourishment: a review of the
biological and physical impacts. ASMFC, Washington DC, ASMFC Habitat Management
Series #7 , 174p.
ASMFC (Atlantic States Marine Fisheries Commission). 2002b. How are cooling water intake
structures at power plants impacting fish? Habitat Hotline Atlantic 9(1): 8.
ASMFC (Atlantic States Marine Fisheries Commission). 2007. The importance of habitat created by
molluscan shellfish to managed species along the Atlantic coast of the United States. Habitat
Management Series 8 , 108p.
ASMFC (Atlantic States Marine Fisheries Council). 1998. Amendment 1 to the Interstate Fishery
ManagementPlan for Atlantic Sturgeon . Washington DC, 59p.
Audemard, C., R.B. Carnegie, M.J. Bishop, C.H. Peterson, and E.M. Burreson. 2008a. Interacting
effects of temperature and salinity on Bonamia sp. parasitism in the asian oyster Crassostrea
ariakensis. Journal of Invertebrate Pathology 98(3): 344-350.
Audemard, C., R.B. Carnegie, N.A. Stokes, M.J. Bishop, C.H. Peterson, and E.M. Burreson. 2008b.
Effects of salinity on Bonamia sp. survival in the asian oyster Crassostrea ariakensis. Journal
of Shellfish Research 27(3): 535-540.
Auld, A. H. and J. R. Schubel. 1978. Effects of suspended sediment on fish eggs and larvae: A
laboratory assessment. Estuarine and Coastal Marine Science 6(2): 153-164.
Auster, P. J., R.J. Malatesta, R.W. Langton, L. Watling, P.C. Valentine, C.L.S. Donaldson, E.W.
Langton, A.N. Shepard, and I.G. Babb. 1996. The impacts of mobile fishing gear on seafloor
habitats in the Gulf of Maine (Northwest Atlantic): implications for conservation of fish
populations. Reviews in Fisheries Science 4: 185-202.
Auster, P. J. and R.W. Langton. 1999. The effects of fishing on fish habitat. p. 150-187 in L. Benaka
(ed.). Fish habitat: essential fish habitat and rehabilitation. American Fisheries Society,
Bethesda, MD , Symposium 22 , 459 p.
Ayaki, T., Y. Kawauchino, C. Nishimura, H.Ishibashi, and K.Arizono. 2005. Sexual Disruption in the
Freshwater Crab (Geothelphusa dehaani). Integrative and Comparative Biology 45(1): 39-42.
Ayvasian, S. G., L.A. Deegan, and J.T. Finn. 1992. Comparison of habitat use by estuarine fish
assemblages in the Acadian and Virginian zoogeographic provinces. Estuaries 15(3): 368-
383.
Bachelor, N. M., L.M. Paramore, J.A. Buckel, and J.E. Hightower. 2009. Abiotic and biotic factors
influence the habitat use of an estuarine fish. Marine Ecology Progress Series 377: 263-277 .
Bahr, L. N. and W.P. Lanier . 1981. The ecology of intertidal oyster reefs of the South Atlantic coast:
a community profile. U.S. Fish and Wildlife Service Biological Reports, FWS/OBS-81/15 ,
105p.
Bailey, R. M. and H.M. Harrison Jr. 1948. Food habits of the southern channel catfish (Ictalurus
lacustris punctatus) in Des Moines River, Iowa. Transactions of the American Fisheries
Society 75(1): 110-138.
2010 COASTAL HABITAT PROTECTION PLAN
Literature cited Page 468
Bain, M. B. 1997. Atlantic and shortnose sturgeon of the Hudson River: a common and divergent life
history attributes. Environmental Biology of Fishes 48(1-4): 347-358.
Bair, E. S. 1995. Hydrogeology. p. 285-310 in A.D. Ward and W.J. Elliot (eds). Environmental
Hydrology. CRC Press, Inc., Boca Raton, FL, 462 p.
Baird, D. 2009. An assessment of the functional variability of selected coastal ecosystems in the
context of local environmental changes. ICES - Journal of Marine Science 66: 1520-1527.
Baird, D., R.R. Christian, C.H. Peterson, and G.A. Johnson. 2004. Application of mass-balance food
web modeling to assess impacts of hypoxia on trophic transfers to vertebrate consumers and
ecosystem functions in a eutrophied estuary. Ecological Applications In press.
Baker, S. M. and R. Mann. 1992. Effects of hypoxia and anoxia on larval settlement, juvenile growth,
and juvenile survival of the oyster Crassostrea virginica. Biological Bulletin 182(2): 265-
269.
Baker, V., R. Savage, C. Reddy, and M. Turner. 2009. Development of a Wetland Monitoring
Program for Headwater Wetlands in North Carolina. North Carolina Division of Water
Quality, Raleigh, NC, Final Report of EPA Grant CD 974260-01 , 388 p.
Baldigo, B. P., R.J. Sloan, S.B. Smith, N.D. Denslo, V.S. Blazer, and T.S. Gross. 2006.
Polychlorinated biphenyls, mercury, and potential endocrine disruption in fish from the
Hudson River, New York. Aquatic Sciences 68: 206-228.
Baldwin, A. H. and I.A. Mendelssohn. 1998. Effects of salinity and water level on coastal marshes: an
experimental test of disturbance as a catalyst for vegetation change. Aquatic Botany 61(4):
255-268.
Bales, J. D., C.J. Oblinger, and A.H. Sallenger. 2000. Two months of flooding in eastern North
Carolina, September-October 1999. U.S. Geological Survey, Raleigh, NC, 47p.
Bales, J. D. and D.J. Newcomb. 1996. North Carolina wetland resources. p. 297-302 in R.M. Hirsch
(dir). National Water Summary on Wetland Resources. U.S. Geological Survey, Atlanta, GA,
USGS Water-Supply Paper 2425 .
Ballance, E. S. 2004. Using Winslow‘s 1886 NC oyster bed survey and GIS to guide future
restoration projects. North Carolina Sea Grant, Fisheries Resource Grant Final Report #03-
EP-03 , 22p.
Ballance, E. S. and D.B. Eggleston. 2008. Oyster dispersal and metapopulation dynamics in Pamlico
Sound: Part II, settlement, survival and spawning potential. DMF FRG 06-EP-03, 33p.
Balon, E. K. 1975. Reproductive guilds of fishes: a proposal and definition. Journal of Fisheries
Research Board of Canada 32(6): 821-864.
Barans, C. A. and V.J. Henry Jr. 1984. A description of the shelf edge groundfish habitat along the
southeastern United States. Northeast Gulf Science 7: 77-96.
Barber, B. J. 1987. Influence of stress on disease susceptibility. p. 82-85 in Fisher, W. S. and
Figueras (eds.), A. J. Marine Bivalve Pathology. Maryland Sea Grant, College Park, MD.
2010 COASTAL HABITAT PROTECTION PLAN
Literature cited Page 469
Barber, R. D., S.A. Kanaley, and S.E. Ford. 1991. Evidence for regular sporulation by
Haplosporidium nelsoni (MSX) (Ascetospora: Haplosporidiidae) in spat of the American
oyster, Crassostrea virginica. Journal of Eukaryotic Microbiology 38(4): 305-306.
Barker, J. C. and J.P. Zublena. 1995. Livestock manure nutrient assessment in North Carolina.
Proceedings of the 7th International Symposium on Agricultural and Food Processing Wastes,
Chicago 18-20 June 1995 : 98-106.
Barnes, K. B., J.M. Morgan III, and M.C. Roberge. 2001. Impervious surfaces and the quality of
natural and built environments. Department of Geography and Environmental Planning,
Towson University, Baltimore, Md, 28p.
Baron, R. M., L.K.B. Jordan, and R.E. Spieler. 2004. Characterization of the marine fish assemblage
associated with the nearshore hardbottom of Broward County, Florida, USA. Estuarine
Coastal and Shelf Science 60(3): 431-443.
Barranguet, C., J. Kromkamp, and J. Peene. 1998. Factors controlling primary production and
photosynthetic characteristics of intertidal microphytobenthos. Marine Ecology Progress
Series 173: 117-126.
Barrett, J. C., G.D. Grossman, and J. Rosenfield. 1992. Turbidity-induced changes in reactive distance
of rainbow trout. Transactions of the American Fisheries Society 121: 437-443.
Barrios, A. T. 2004. Use of passive acoustic monitoring to resolve spatial and temporal patterns of
spawning activity for red drum, Sciaenops ocellatus, in the Neuse River Estuary, North
Carolina. North Carolina State University, Raleigh, NC, 97 p.
Barrios-Beckwith, A., G. Beckwith, and P. Rand. 2006. Identification of critical spawning habitat
and male courtship vocalization characteristics of red drum, Sciaenops ocellatus, in the lower
Neuse River Estuary of North Carolina. North Carolina Division of Marine Fisheries,
Morehead City, NC, 05-EP-05 , 39p.
Barros F., A. J. Underwood, and M. Lindegarth. 2001. The influence of rocky reefs on structure of
benthic macrofauna in nearby soft-sediments. Estuarine, Coastal and Shelf Science 52: 191-
199.
Bart, D. and J.M. Hartman. 2002. Environmental constraints of early establishment of Phragmites
australis in salt marshes. Estuaries 22(2): 201-213.
Bartol, I. K. and R. Mann. 1999. Small scale patterns of recruitment on a constructed intertidal reef:
the role of spatial refugia. p. 159-170 in M. Luckenbach, R. Mann and J. Wesson eds. Oyster
reef habitat restoration: a synopsis and synthesis of approaches. Virginia Institute of Marine
Science Press, Gloucester Point, VA.
Basta, D. J., M.A. Warren, T.R. Goodspeed, C.M. Blackwell, T.J. Culliton, J.J. McDonough III , M.J.
Katz, D.G. Remer, J.P. Tolson, C.J. Klein, S.P. Orando Jr., and D.M. Lott. 1990. Estuaries of
the United States, vital statistics of a national resource base. National Ocean Service, NOAA,
U.S. Department of Commerce, Rockville, MD, A Special NOAA 20th Anniversary Report ,
79p.
Bauer, L. J., M.S. Kendall, and C.F.G. Jeffery. 2008. Incidence of marine debris and its relationship

2010 COASTAL HABITAT PROTECTION PLAN
Literature cited Page 470
with benthic features in Gray's Reef National Marine Sanctuary, Southeast USA. Marine
Pollution Bulletin 56: 402-413.
Beach, D. 2002. Coastal sprawl : the effects of urban design on aquatic ecosystems in the United
States. Pew Oceans Commission, Arlington, VA, 32p.
Beal, B. F. 2000. The importance of temporal and spatial replication of field experiments: effects of
seagrass cover on the growth and survival of cultured juveniles of the soft-shell clam, Mya
arenaria, and hard clam, Mercenaria mercenaria. Shellfish Research 19(1).
Beal, J. L. 1999. The effects of dock height and alternative construction measures on light irradiance
(PAR) and seagrass (Halodule wrightii and Syringdium filiforme) cover. Florida Department
of Environmental Protection, Divisions of Marine Resources, unpub. rep. 10p.
Beal, J. L. and B.S. Schmit. 1998. The effects of dock height and alternative construction measures on
light irradiance (PAR) and seagrass (Halodule wrightii and Syringdium filiforme) cover.
Florida Center for Environmental Studies, Ft. Lauderdale, Fl, Abstracts from the Workshop on
subtropical and tripical seagrass management ecology: responses to environmental stress , 2p.
Beck, M. W., K.L. Heck Jr., K.W. Able, D.L. Childers, D.B. Eggleston, B.M. Gillanders, B. Halpern,
C.G. Hays, K. Hoshino, T.J. Minello, R.J. Orth, P.F. Sheridan, and M.P. Weinstein. 2001.
The identification, conservation, and management of estuarine and marine nurseries for fish
and invertebrates. Bioscience 51(8): 633-641.
Beck, M. W., M. Odaya, J. Bachant, B. Keller, R. Martin, C. Porter, and G. Ramseur. 2000.
Identification of priority sites for conservation in the northern Gulf of Mexico: an ecoregional
plan. The Nature Conservancy, Arlington, VA.
Beisner, B. E., D.T. Haydon, and K. Cuddington. 2003. Alternative stable states in ecology. Frontiers
in Ecology and the Environment 1(7): 376-382.
Bell, S. S., M.O. Hall, S. Soffian, and K. Madley. 2002. Assessing the impact of boat propeller scars
on fish and shrimp utilizing seagrass beds. Ecological Application 12(1): 206-217.
Bellinger, E. G. and B.R. Benham. 1978. The levels of metals in dock-yard sediments with particular
reference to the contributions from ship-bottom paints. Environmental Pollution 15: 71-81.
Benfield, M. C. and T. J. Minello. 1996. Relative effects of turbidity and light intensity on reactive
distance and feeding of an estuarine fish. Environmental Biology of Fishes 46: 211-216.
Benson, A. J. and D. Raikow. 2008. Dreissena polymorpha. USGS Nonindigenous Aquatic Species
Database, Gainsville, FL, <http://nas.er.usgs.gov/queries/FactSheet.asp?speciesID=5> .
Benton, J. C. 1992. Estimates of total mortality, migration, and length-age composition of Atlantic
striped bass, offshore mixed stocks from 1988 to 1992. USFWS, Unpub. rep. 15p.
Beresoff, D. and T. Thorpe. 1997. Gill net selectivity for coastal shark species. NC Sea Grant, FRG
97FEG-10 , 1p.
Bergstrom, P. W., R.F. Murphy, M.D. Naylor, R.C. Davis, and J.T. Reel. 2006. Underwater Grasses
in Chesapeake Bay and Mid-Atlantic Coastal Waters, Guide to Identifyinf Submerged Aquatic

2010 COASTAL HABITAT PROTECTION PLAN
Literature cited Page 471
Vegetation. Maryland Sea Grant College, 76p.
Berman, M., H. Berquist, J. Herman, and K. Nunez. 2007. The Stability of Living Shorelines - An
Evaluation. Center for Coastal Resources Management, Virginia Institute of Marine Science,
Glouster Point, VA, Final report to NOAA/NOAA Chesapeake Bay Program Office , 36p.
Biber, P. D., C.L. Gallegos, and W.J. Kenworthy. 2008. Calibration of a bio-optical model in the
North River, North Carolina (Albemarle-Pamlico Sound): a tool to evaluate water quality
impacts on seagrass. Estuaries and Coasts: J CERF 31: 177-191.
Bichy, J. and C. Taylor. 2002. Striped mullet life history: An assessment of hydroacoustic sampling
feasibility, survival, and reproduction. Final report to North Carolina Sea Grant. Fishery
resource grant 99-FEG-04 .
Bigelow, G. W. 1977. Primary productivity of benthic microalgae in the Newport River estuary. M.S.,
NCSU, Raleigh, NC, 44 p.
Bilkovic, D. M. and M.M. Roggero. 2008. Effects of coastal development on nearshore estuarine
nekton communities. Marine Ecology Progress Series 358: 27-39.
Bilkovic, D. M., M. Roggero, C.H. Hershner, and K.H. Havens. 2006. Influence of land use on
macrobenthic communities in nearshore estuarine habitats. Estuaries and Coasts 29(6B):
1185-1195.
Bin, O., C. Dumas, B. Poulter, and J. Whitehead. 2007. Measuring the impacts of climate change on
North Carolina coastal resources. East Carolina University, Greenville, NC, 101p.
Bishof, D. and S. Kent. 1990. Preliminary report - the effects of propeller-dredging on benthic
macrofauna in shallow seagrass beds in the Florida Keys. Fl Department of Environmental
Regulation, Unpub. rep. 10p.
Bishop, M. J. and C.H. Peterson. 2005. Constraints to Crassostrea ariakensis aquaculture: season and
method of culture strongly influence success of grow-out. Journal of Shellfish Research
24(4): 995-1006.
Bishop, M. J. and C.H. Peterson. 2006a. Direct effects of physical stress can be counteracted by the
indirect: invertebrate growth on a tidal elevation gradient. Oecologia 147(3): 426-433.
Bishop, M. J. and C.H. Peterson. 2006b. When r-selection may not predict introduced-species
proliferation: predation of a nonnative oyster. Ecological Applications 16(2): 718-730.
Bishop, M. J., C.H. Peterson, H.C. Summerson, and D. Gaskill. 2005. Effects of harvesting methods
on sustainability of a bay scallop fishery: dredging uproots seagrass and displaces recruit.
Fishery bulletin 103(4): 712.
Bishop, M. J., C.H. Peterson, H.C. Summerson, H.S. Lenihan, and J.H. Grabowski. 2006. Deposition
and long-shore transport of dredge spoils to nourish beaches: Impacts on benthic infauna of
an ebb-tidal delta. Journal of Coastal Research 22(3): 530-546.
Bishop, M. J., S.P. Powers, H.J. Porter, and C.H. Peterson. 2006. Benthic biological effects of
seasonal hypoxia in a eutrophic estuary predate rapid coastal development. Estuarine Coastal
2010 COASTAL HABITAT PROTECTION PLAN
Literature cited Page 472
and Shelf Science 70(3): 415-422.
Blader, S. J. M. and T.G. Blader. 1980. Factors affecting the distribution of juvenile estuarine and
inshore fish. Journal of Fish Biology 17: 143-162.
Blair, S. M., B.S. Flynn, and S. Markley. 1990. Characteristics and assessment of dredge related
mechanical impact to hard-bottom reef areas off northern Dade County, Florida. p. 5-20 in
Jaap (ed.), W. C. Diving for science. American Academy of Underwater Sciences, Costa
Mesa, CA, Proceedings of the American Academy of Underwater Sciences Tenth Annual
Scientific Diving Symposium, Oct 4-7 St. Petersburg, Fl .
Blanchet, H., M.V. Hoose, L. McEachron, B. Muller, J. Warren, J. Gill, T. Waldrop, J. Waller, C.
Adams, R.B. Ditton, D. Shively, and S. VanderKooy. 2001. The spotted seatrout fishery of
the Gulf of Mexico, United States: A regional management plan. Gulf State Marine Fisheries
Commission, Ocean Springs, MI, NOAA Publication Number 87 .
Blanchet, R. H., J.A. Shepard, and M.J. Bourgeois. 1997. Report on the status of spotted seatrout; part
I. profile, stock assessment and biological condition of spotted seatrout. Louisiana Department
of Wildlife and Fisheries, Marine Fisheries Division, Baton Rouge, LA.
Blanton, J. O., F.E. Werner, A. Kapolnai, B.O. Blanton, D. Knott, and E.L. Wenner. 1999. Wind-
generated transport of fictitious passive larvae into shallow tidal estuaries. Fisheries
Oceanography 8(2): 210-223.
Blazer, V. S., J.H. Lilley, W.B. Schill, Y. Kiryu, C.L. Densmore, V. Panyawachira, and S. Chinabut.
2002. Aphanomyces invadans in Atlantic Menhaden along the East Coast of the United
States. Journal of Aquatic Animal Health 14: 1-10.
Blazer, V. S., L.R. Iwanowicz, D.D. Iwanowicz, D.R. Smith, JA. Yound, and J.D. Hedrick. 2007.
Intersex (testicular oocytes) in smallmouth bass from the Potomac River and selected nearby
drainages. Journal of Aquatic Animal Health 19: 242-253.
Blazer, V. S., W.K. Vogelbein, C.L. Densmore, E.B. May, J.H. Lilley, and D.E. Zwerner. 1999.
Aphanomyces as a cause of ulcerative skin lesions of menhaden from Chesapeake Bay
tributaries. Journal of Aquatic Animal Health 11: 340-349.
Blue Atlantic Transmission System. 2003. Proceedings of a workshop on the potential effects of the
construction and operation of subsea pipelines on lobster movement and behavior. Unpub.
doc., Rhode Island, 152p.
Bock, M. J. and D.C. Miller. 1995. Storm effects on particulate food resources on an intertidal
sandflat. Journal of Experimental Marine Biology and Ecology 187: 81-101.
Boehlert, G. W. and J.B. Morgan. 1985. Turbidity enhances feeding abilities of larval pacific herring,
Clupea harengus pallasi. Hydrobiologia 123: 161-170.
Boehm, P., D. D. Turton, A. A. Raval, D. Caudle, D. French, N. Rabalais, R. Spies, and J. Johnson.
2001. Deepwater Program: Literature Review, Environmental Risks of Chemical Products
Used in Gulf of MexicoDeepwater Oil and Gas Operations, Volume I: Technical Report. U.S.
Department of the Interior, Minerals Management Service, Gulf of Mexico OCS Region, New
Orleans, LA, OCS Study MMS 2001-011 , 326p.
2010 COASTAL HABITAT PROTECTION PLAN
Literature cited Page 473
Boehm, P. D., S.D. Page, W.A. Burns, A.E. Bence, and P.J. Mankiewicz. 1998. Resolving the origin
of the petrogenic hydrocarbon background in Prince William Sound, Alaska. Environmental
Science and Technology 35: 471-479.
Boening, D. W. 2000. Ecological effects, transport, and fate of mercury: a general review.
Chemosphere 40: 1335-1351.
Boesch, D., E. Burreson, W. Dennison, E. Houde, M. Kemp, V. Kennedy, R. Newell, K. Paynter, R.
Orth, and R. Ulanowicz. 2001. Factors in the decline of coastal ecosystems. Science
293(August 31): 1589-1591.
Boesch, D. F., R.B. Brinsfield, and R.E. Magnien. 2001. Chesapeake Bay eutrophication. Journal of
Environmental Quality 30: 303-320.
Bohnsack, J. A. 1989. Are high densities of fishes at artificial reefs the result of habitat limitation or
behaviorial preference? Bulletin of Marine Science 44(2): 631-645.
Bohnsack, J. A. 1993. Marine reserves: they enhance fisheries, reduce conflicts, and protect
resources. Oceanus 36(3): 63-71.
Bohnsack, J. A. 1996. Maintenance and recovery of reef fishery productivity. p. 284-313 in N.V.
Polunin and C.M. Roberts (eds.). Reef fisheries. Chapman and Hall, London.
Bohnsack, J. A., D.E. Harper, D.B. McClellan, and M. Hulsbeck. 1994. Effects of reef size on
colonization and assemblage structure of fishes at artificial reefs off Southeastern Florida,
USA. Bulletin of Marine Science 55(2-3): 796-823.
Boorman, L. A. 1992. The environmental consequence of climate change on British salt marsh
vegetation. Wetlands Ecology and Management 2(1/2): 11-21.
Borawa, J. C., J.H. Kerby, T. Huish, and A.W. Mullis. 1979. Currituck Sound fish populations before
and after infestation by Eurasian water-milfoil. Procs. Ann. Conf. SE Assoc. Fish and Wildlife
Agencies 32: 520-528.
Borsuk, M. E., C.A. Stow, R.A. Leuttich, H.W. Paerl, and J.L. Pickney. 2001. Modelling oxygen
dynamics in an intermittently stratified estuary: estimation of process rates using field data.
Estuarine Coastal and Shelf Science 52: 33-49.
Boss, S. K. and C.W. Hoffman. 2000. Sand resources of the North Carolina Outer Banks. University
of Arkansas and North Carolina Geological Survey, Final Report prepared for the Outer
Banks Task Force and the North Carolina Dept of Transportation . 43p.
Bourn, W. S. 1932. Ecological and physiological studies on certain aquatic angiosperms.
Contributions Boyce Thompson Institute 4 : 425-496.
Boustany, R. G. 2003. A pre-vegetated mat technique for the restoration of submerged aquatic
vegetation. Ecological Restoration 21(2): 87-94.
Bowman, R. E., C.E. Stillwell, W.L. Michaels, and M.D. Grosslein. 2000 . Food of Northwest
Atlantic fishes and tow common species of squid. National Marine Fisheries Service, NOAA,
NMFS-NE-155 , 19p.

2010 COASTAL HABITAT PROTECTION PLAN
Literature cited Page 474
Bowman, S. W. 2001. American Shad and Striped Bass Spawning migration and Habitat Selection in
the Neuse River, North Carolina . Thesis, North Carolina State University, Raleigh, N.C.
Box, J. B. and J. Mossa. 1999. Sediment, land use, and freshwater mussels: prospects and problems.
Journal North American Benthological Society 18(1): 99-117.
Boyer, J. N., R.R. Christian, and D.W. Stanley. 1993. Patterns of phytoplankton in primary
production in the Neuse River Estuary, North Carolina, USA. Marine Ecology Progress Series
97: 287-297.
Boyer, J. N., R.R. Christian, and D.W. Stanley. 1993. Patterns of phytoplankton primary productivity
in the Neuse River Estuary, NC, USA. Marine Ecology Progress Series 97: 287-297.
Bozek, C. M. and D.M. Burdick. 2005. Impacts of seawalls on saltmarsh plant communities in the
Great Bay Estuary, New Hampshire USA. Wetlands Ecology and Management 13: 553-568.
Bradley, M. P. and M.H. Stolt. 2006. Landscape-level seagrass-sediment relations in a coastal lagoon.
Aquatic Botany 84: 121-128.
Bradstock, M. and D. Gordon. 1983. Coral-like bryozoan growths in Tasman Bay, and their
protection to conserve commercial fish stocks. New Zealand Journal Marine and Freshwater
Research 17: 159-163.
Breitburg, D.L., M.A. Palmer, and T. Loher. 1995. Larval distributions and the spatial patterns of
settlement of an oyster reef fish: responses to flow and structure. Marine Ecology Progress
Series 125: 45-60.
Breitburg, D. L. 1992. Episodic hypoxia in Chesapeake Bay: interacting effects of recruitment
behavior, and physical disturbance. Ecological Monographs 62(4): 525-546.
Breitburg, D. L. 1998. Are three dimensional structure and healthy oyster populations the key to an
ecologically interesting and important fish community. in M.W. Luckenbach, R. Mann and J.
A. Wesson eds. Oyster reef habitat restoration. A synopsis and synthesis of approaches.
Virginia Institute of Marine Science Press.
Breitburg, D. L., D.W. Hondorp, L.A. Davias, and R.J. Diaz. 2009. Hypoxia, nitrogen, and fisheries:
integrating effects across local and global landscapes. Annual Review of Marine Science (1):
329-349.
Breitburg, D. L., L.D. Coen, M.W. Luckenbach, R. Mann, M. Posey, and J.A. Wesson. 2000 . Oyster
reef restoration: convergence of harvest and conservation strategies. Journal of Shellfish
Research 19(1): 371-377.
Breitburg, D. L., N. Steinberg, S. DuBeau, C. Cooksey, and E.D. Houde. 1994. Effects of low
dissolved oxygen on predation on estuarine fish larvae. Marine Ecology Progress Series
104(3): 235-246.
Breitburg, D. L., T. Loher, C.A. Pacey, and A. Gerstein. 1997. Varying effects of low dissolved
oxygen on trophic interactions in an estuarine food web. Ecological Monographs 67(4): 489-
507.

2010 COASTAL HABITAT PROTECTION PLAN
Literature cited Page 475
Brennessel, B. 2007. The Northern Diamondback Terrapin Habitat, Management and Conservation.
Northeast Diamondback Terrapin Working Group, Norton, MA.
Bretsch, K. and D. M. Allen. 2006. Tidal migrations of nekton in salt marsh intertidal creeks.
Estuaries and coasts 29(3): 474-486.
Brian, J. V. 2005. Inter-population variability in the reproductive morphology of the shore crab
(Carcinus maenas): evidence of endocrine disruption in a marine crustacean? Marine Pollution
Bulletin 50: 410-416.
Bricker, S. B., B. Longstaff, W. Dennison, A. Jones, K. Boicourt, C. Wicks, and J. Woerner . 2007.
Effects of Nutrient Enrichment in the Nation‘s Estuaries: A Decade of Change. NOAA
Coastal Ocean Program Decision Analysis Series No. 26. National Centers for Coastal Ocean
Service, Silver Spring, MD, 328p.
Brickhill, M. J., S. Y. Lee, and R. M. Connolly. 2005. Fishes associated with artificial reefs:
attributing changes to attraction or production using novel approaches. Journal of Fish
Biology Supplement B: 53-71.
Brinker, E. L. and M. Crawford. 2009. SAV restoration research in Coinjock Bay. Elizabeth City
State University, Elizabeth City, NC, October , 14p.
Brinson, M. M. 1977. Decomposition and nutrient exchange in litter in an alluvial swamp forest.
Ecology 58: 601-609.
Brinson, M. M. 1991. Landscape properties of pocosins and associated wetlands. Wetlands 11: 441-
465.
Brinson, M. M. and G.J. Davis. 1976. Primary productivity and mineral cycling in aquatic
macrophyte communities of the Chowan River, North Carolina. UNC-WRRI , Raleigh, NC,
Report No. 120 , 137p.
Brinson, M. M. and K.K. Moorhead. 1989. Sea level rise and fringe wetlands in North Carolina:
recommendations from a workshop on management and research. Journal of the Elisha
Mitchell Scientific Society 105(4): 149-157.
Briske, D. D., B.T. Bestelmeyer, T.K. Stringham, and P.L. Shave. 2008. Recommendations for
develoment of resilience-based state-and-transition models. Rangeland Ecology and
Management 61(July): 359-367.
Brooks, K. M. 1996. Evaluating the environmental risks associated with the use of chromated copper
arsenate-treated wood products in aquatic environments. Estuaries 19(2a): 296-305.
Broome, S. W., S.M. Rogers Jr., and Ernest D. Seneca. 1992? Shoreline erosion control using marsh
vegetation and low-cost structures. NOAA, 20p.
Brown, B. L., A.J. Butt, S.W. Shelton, D. Meritt, and K.T. Paynter. 2005. Resistance of Dermo in
eastern oysters, Crassostrea virginica (Gmelin), of North Carolina but not Chesapeake Bay
heritage. Aquaculture Research 36(14): 1391-1399.
Brown, C. A. 2002. The transport of fish larvae to estuarine nursery areas: a modeling study.
2010 COASTAL HABITAT PROTECTION PLAN
Literature cited Page 476
Dissertation Abstracts International Part B: Science and Engineering 62(7): 3099.
Brown, K. M., G.J. George, G.W. Peterson, B.A. Thompson, and J.H. Cowan Jr. 2008. Oyster
predation by black drum varies spatially and seasonally. Estuaries and Coasts 31(3): 597-
604.
Brown, R. A. 1989. Bottom trawling on Strangford Lough: problems and policies. Proceedings
reprints, distress signals, signals from the environment in policy and decision making, May
31-June 2, 1989 Rotterdam, Netherlands. Unpub. rep., 11p.
Brown, S. S., G.R. Gaston, C.F. Rakocinski, and R.W. Heard. 2000. Effects of sediment contaminants
and environmental gradients on macrobenthic community trophic structure in Gulf of Mexico
estuaries. Estuaries 23(3): 411-424.
Brownlee, E. F., A.R. Place, H. Nonogaki, J.E. Adolf, S.G. Sellner, and K.G. Sellner. 2006.
Crassostrea ariakensis and C. virginica responses to ichthyotoxic Karlodinium veneficum.
Journal of Shellfish Research 25(2): 714.
Brownlee, E. F., S. G. Sellner, K. G. Sellner, H. Nonogaki, J. E. Adolf, T. R. Bachvaroff, and A. R.
Place. 2008. Responses of Crassostrea virginica (Gmelin) and C. ariakensis (Fujita) to
bloom-forming phytoplankton including ichthyotoxic Karlodinium veneficum (Ballantine).
Journal of Shellfish Research 27(3): 581-591.
Bruland, G. L. and C.J. Richardson. 2005a. Hydrologic, edaphic, and vegetative responses to
microtopographic reestablishment in a restored wetland. Restoration Ecology 13(3): 515-523.
Bruland, G. L. and C.J. Richardson. 2005b. Spatial variability of soil properties in created, restored,
and paired natural wetlands. Soil Science Society of American Journals 69(1): 273.
Bruland, G. L., C.J. Richardson, and S.C. Whalen. 2006. Spatial variability of denitrification potential
and related soil properties in created, restored, and paired natural wetlands. Wetlands 26(4):
1042-1056.
Brumbaugh, R. D., M.W. Beck, L.D. Coen, L. Craig, and P. Hicks. 2006. A practitioners' guide to the
design and monitoring of shellfish restoration projects: an ecosystem approach. The Nature
Conservancy, Arlington, VA, 28p.
Bruton, M. N. 1985. The effect of suspensoids on fish. Hydrobiologia 125: 221-241.
Brylinsky, M., J. Gibson, and D. Gordon. 1994. Impacts of flounder trawls on the intertidal habitat
and community of the Minas Basin, Bay of Fundi. Canadian Journal of Fisheries and Aquatic
Science 51: 650-661.
Buchanan, M. and J.T. Finnegan. 2008. 2008 Natural Heritage Program list of the rare plant species
of North Carolina. NC Natural Heritage Program, Raleigh, NC.
Buchsbaum, R. 1994. Management of coastal marshes. p. 331 in D.M. Kent (ed). Applied Wetlands
Science and Technology. CRC Press, Boca Raton, FL.
Buckel, J. A. and D.O. Conover. 1997. Movements, feeding periods, and daily ration of piscivorous
young-of-the-year bluefish, Pomatomus saltatrix, in the Hudson River estuary. Fishery
2010 COASTAL HABITAT PROTECTION PLAN
Literature cited Page 477
bulletin 95(4): 665-679.
Buckel, J. A., J.P. Pessutti, J.E. Rosendale, and J.S. Link. 2009. Interactions between bluefish and
striped bass: behavior of bluefish under size- and number-impaired conditions and overlap in
resource use. Journal of Experimental Marine Biology and Ecology 368: 129-137.
Bulger, A. J., M.E. Monaco, D.M. Nelson, and M.G. McCormick-Ray. 1993. Biologically-based
estuarine salinity zones derived from a multivariate analysis. Estuaries 16(2): 311-322.
Bulthius, D. A. 1994. Light environment/implications for management. p. 23-27 in S. Wyllie-
Echeverria, A. M. Olson and M. J. Hershman eds. Seagrass Science and Policy in the Pacific
Northwest: Proceedings of a seminar Series. U.S. Environmental Protection Agency, (SMA).
EPA 910/r-94-004 , 63 p.
Burbidge, R. G. 1974. Distribution, growth, selective feeding and energy transformations of young-
of-the-year blueback herring in the James River, Virginia. Transactions of the American
Fisheries Society 103 : 297-311.
Burchell, B. R., R.W. Skaggs, C.R. Lee, S. Broome, G.M. Chescheir, and J. Osborne . 2007. Substrate
organic matter to improve nitrate removal in surface-flow constructed wetlands. Journal of
Environmental Quality 36(1): 194-207.
Burdick, D. M. and F.T. Short. 1999. The effects of boat docks on eelgrass beds in coastal waters of
Massachusetts. Environmental Management 23: 231-240.
Burdick, S. M. and J.E. Hightower. 2006. Distribution of Spawning Activity by Anadromous Fishes
in an Atlantic Slope Drainage after Removal of a Low-Head Dam. Transactions of the
American Fisheries Society 135: 1290-1300.
Burgos, J. M., G. R. Sedberry, D. M. Wyanski, and P. J. Harris. 2007. Life history of the red grouper
(Epinephelus morio) off the coasts of North Carolina and South Carolina. Bulletin of Marine
Science 21: 45-65.
Burke, J. S. 1991. Influence of abiotic factors and feeding on habitat selection of summer and southern
flounder during colonization of nurery grounds. North Carolina State University, Raleigh, NC,
97 p.
Burke, J. S. 1995. Role of feeding and prey distribution of summer and southern flounder in selection
of estuarine nursery habitats. Journal of Fish Biology 47(3): 355-366.
Burke, J. S., J.M. Miller, and D.E. Hoss. 1991. Immigration and settlement pattern of Paralichthys
dentatus and P. lethostigma in an estuarine nursery ground, North Carolina, USA. Netherlands
Journal Sea Research 27: 393-405.
Burkholder, J., D. Eggleston, H. Glasgow, C. Brownie, R. Reed, G. Melia, C. Kinder, G. Janowitz, R.
Corbett, M. Posey, T. Alphin, D. Toms, N. Deamer, and J. Springer . 2004. Comparative
impacts of two major hurricane seasons on the Neuse River and western Pamlico Sound.
Proceedings of the National Academy of Sciences (USA) 101: 9291-9296.
Burkholder, J. M. 1998. Implications of harmful microalgae and heterotrophic dinoflagellates in
management of sustainable marine fisheries. Ecological Applications 8(1 Supplement): 37-

2010 COASTAL HABITAT PROTECTION PLAN
Literature cited Page 478
62.
Burkholder, J. M., A.S. Gordon, P.D. Moeller, J.M. Law, K.J. Coyne, A.J. Lewitus, J.S. Ramsdell,
H.G. Marshall, N.J. Deamer, S.C. Cary, J.W. Kempton, S.L. Morton, and P.A. Rublee. 2005.
Demonstration of toxicity to fish and to mammalian cells by Pfiesteria species: Comparison of
assay methods and multiple strains. Proceedings of the National Academy of Sciences 102:
3471-3476.
Burkholder, J. M., B. Libra, P. Weyer, S. Heathcote, D. Kolpin, P.S. Thorne, and M. Wichman .
2007a. Impacts of waste from concentrated animal feeding operations on water quality.
Environmental Health Perspectives 115: 308-312.
Burkholder, J. M., D.A. Dickey, C. Kinder, R.E. Reed, M.A. Mallin, G. Melia, M.R. McIver, L.B.
Cahoon, C. Brownie, N. Deamer, J. Springer, H. Glasgow, D. Toms, and J. Smith . 2006.
Comprehensive trend analysis of nutrients and related variables in a large eutrophic estuary: A
decadal study of anthropogenic and climatic influences. Limnology and Oceanography 51:
463-487.
Burkholder, J. M., E.J. Noga, C.W. Glasgow Jr., and S.A. Smith. 1992a. New "phantom"
dinoflagellate is the causative agent of estuarine fish kills. Nature 358: 407-410.
Burkholder, J. M., G.M. Hallegraeff, G. Melia, A. Cohen, H.A. Bowers, D.W. Oldach, M.W. Parrow,
M.J. Sullivan, P.V. Zimba, E.H. Allen, and M.A. Mallin . 2007b. Phytoplankton and bacterial
assemblages in ballast water of U.S. military ships as a function of port of origin, voyage time
and ocean exchange practices. Harmful Algae 6: 486-518.
Burkholder, J. M. and H.B. Glasgow Jr. 1997. Pfiesteria piscicada and other Pfiesteria-like
dinoflagellates: behavior, impacts, and environmental controls. Limnology and oceanography
42: 1052-1075.
Burkholder, J. M., H.B. Glasgow Jr., and C.W. Hobbs. 1995. Distribution and environmental
conditions for fish kills linked to a toxic ambush predator dinoflagellate. Marine Ecology
Progress Series 124: 43-61.
Burkholder, J. M., H.B. Glasgow Jr., and J.E. Cooke. 1994. Comparative effects of water-column
nitrate enrichment on eelgrass Zostera marina, shoalgrass Halodule wrightii, and
widgeongrass Ruppia maritima. Marine Ecology Progress Series 105: 121-138.
Burkholder, J. M., K.M. Mason, and H.B. Glasgow Jr. 1992b. Water-column nitrate enrichment
promotes decline of eelgrass Zostera marina : Evidence from seasonal mesocosm
experiments. Marine Ecology Progress Series 81(2): 163-178.
Burkholder, J. M., M.A. Mallin, and Jr. H.B. Glasgow. 1999. Fish kills, bottom-water hypoxia, and
the toxic Pfiesteria complex in the Neuse River and Estuary. Marine Ecology Progress Series
179: 301-310.
Burkholder, J. M., M.A. Mallin, H.B. Glasgow Jr. , L.M. Larsen, M.R. McIver, G.C. Shank, N.
Deamer-Melia, D.S. Briley, J. Springer, B.W. Touchette, and E.K. Hannon. 1997. Impacts to
a coastal river and estuary from rupture of a swine waste holding lagoon. Journal of
Environmental Quality 26: 1451-1466.
2010 COASTAL HABITAT PROTECTION PLAN
Literature cited Page 479
Burkholder, J. M., P.M. Glibert, and H.M. Skelton . 2008. Mixotrophy, a major mode of nutrition for
harmful algal species in eutrophic waters. Harmful Algae 8: 77-93.
Burrell, V. G. 1986. Species profiles: life histories and environmental requirements of coastal fishes
and invertebrates (South Atlantic) -- American oyster. US Fish and Wildlife Service,
Biological Report 82(11.57) , 17p.
Burrell, V. G. Jr. 1977. Mortalities of oysters and hard clams associated with heavy runoff in the
Santee River system, South Carolina in the spring of 1975. Proceedings of the National
Shellfisheries Association 67: 35-43.
Burreson, E. M. 1997. Molecular evidence for an exotic pathogen: Pacific origin of Haplosporidium
nelsoni (MSX), a pathogen of Atlantic oysters. p. 62 in Pascoe (ed.), M. 10th International
Congress of Protozoology. University of Sydney, Sydney, Australia.
Burreson, E. M. and L. M. Ragone Calvo. 1996. Epizootiology of Perkinsus marinus disease in
Chesapeake Bay, with emphasis on data since 1985. Journal of Shellfish Research 15: 17-34.
Burton, M. L., K. J. Brennan, R. C. Munoz, and R. O. Parker. 2005. Preliminary evidence of
increased spawning aggregations of mutton snapper (Lutjanus analis) at Riley's Hump two
years after establishment of the Tortugas South Ecological Reserve. Fishery Bulletin 103(2):
404-410.
Butler, P. A. 1971. Influence of pesticides on marina ecosystems. Proceedings of the Royal Society of
London 177(1048): 321-329.
Buzzelli, C. P., Jr. R.A. Luettich, H.W. Paerl, J. Fear, J. Fleming, L. Twomey, E. Cleseri, M.J.
Alperin, and C.S. Martens. 2001. Neuse River Estuary modeling and monitoring project
phase 2: monitoring of hydrography and water quality, circulation, phytoplankton physiology,
and sediment-water coupling. Water Resources Research Institute.
Buzzelli, C. P., R.A. Luettich Jr., S.P. Powers, C.H. Peterson, J.E. McNinch, J.L. Pinckney, and H.W.
Paerl. 2002. Estimating the spatial extent of bottom water hypoxia and habitat degradation in
a shallow estuary. Marine ecology progress series 230: 103-112.
Byrne, D. M. 1995. The effect of bulkheads on estuarine fauna: a comparison of littoral fish and
macroinvertebrate assemblages at bulkheaded and non-bulkheaded shorelines in a Barnegat
Bay Lagoon. Second Annual Marine Estuarine Shallow Water Science and Management
Conference : 53-56.
Byrne O Cleirigh Ltd - Ecological Consultancy Services Ltd (EcoServe) - School of Ocean and and
Earth Sciences - University of Southampton. 2000. Assessment of Impact of Offshore Wind
Energy Structures on the Marine Environment. The Marine Institute, 42p.
Büttger, H., H. Asmus, R. Asmus, C. Buschbaum, S. Dittmann, and G. Nehls. 2008. Community
dynamics of intertidal soft-bottom mussel beds over two decades. Netherlands Journal of Sea
Research 27: 23-26.
Cahoon, L. B. and S. H. Ensign. 2004. Spatial and temporal variability in excessive soil phosphorus
levels in eastern North Carolina. Nutrient Cycling in Agroecosystems 69: 111-125.
2010 COASTAL HABITAT PROTECTION PLAN
Literature cited Page 480
Cahoon, L. B., F.M. Bingham, M.A. Mallin, S.A. Kissling, and J.E. Nearhoof. 2000. Effects of
Hurricane Floyd flooding on coastal ocean water quality. p. 1 in: Abstracts from North
Carolina Water Resources Research Conference: The Year of the Hurricanes. WRRI.
Cahoon, L. B., J.C. Hales, E.S. Carey, S. Loucaides, K.R. Rowland, and J.E. Nearhoof. 2006.
Shellfish closures in southwest Brunswick County, North Carolina: Septic tanks vs. storm-
water runoff as fecal coliform sources. Journal of Coastal Research 22: 319-327.
Cahoon, L. B. and J.E. Cooke. 1992. Benthic microalgal production in Onslow Bay, North Carolina,
USA. Marine Ecology Progress Series 84: 185-196.
Cahoon, L. B., J.E. Nearhoof, and C.L. Tilton. 1999. Sediment grain size effect on benthic microalgal
biomass in shallow aquatic ecosystems. Estuaries 22(3B): 735-741.
Cahoon, L. B., M.A. Mallin, F.M. Bingham, S.A. Kissling, and J.E. Nearhoof. 2001. Monitoring the
Coastal Ocean: Responses to Hurricane Floyd. p. 247-253 in Maiolo, J. R., J.C. Whitehead,
M. McGee, L. King, J. Johnson, and H. Stone (eds.). Facing Our Future: Hurricane Floyd and
Recovery in the Coastal Plain. Coastal Carolina Press, Wilmington, NC.
Cahoon, L. B., M.H. Posey, T.D. Alphin, D. Wells, S. Kissling, W. H. Daniels, and J. Hales. 2002.
Shrimp and crab trawling impacts on estuarine soft-bottom organisms. UNC-Wilmington,
Wilmington, NC, 17p.
Cahoon, L., D.G. Lindquist, and I.E. Clavijo. 1990. "Live bottoms" in the continental shelf
ecosystem: A misconception?. Diving for science. Proceedings of the American Academy of
Underwater Sciences Tenth Annual Scientific Diving Symposium, Oct 4-7 St. Petersburg, Fl :
39-47.
Cairns, J. Jr. and J.R. Pratt. 1992. Restoring ecosystem health and integrity during a human
population increase to ten billion. Journal of aquatic ecosystem health. 1: 59-68.
Calabrese, A. 1972. How some pollutants affect embryos and larvae of the American oyster and the
hard shell clam. Marine Fisheries Review 34: 66-77.
Calabrese, A. and H.C. Davis. 1966. The pH tolerance of embryos and larvae of Mercenaria
mercenaria and Crassostrea virginica. Biology Bulletin 131: 427-436.
Canesi, L., C. Borghi, C. Ciacci, R. Fabbri, L.C. Lorusso, L. Vergani, A. Marcomini, and G. Poiana.
2008. Short-term effects of environmentally relevant concentrations of EDC mixtures on
Mytilus galloprovincialis digestive gland. Aquatic Toxicology 87: 272-279.
Carlton, J. T. 2001. Introduced Species in U.S. Coastal Waters: Environmental Impacts and
Management Priorities. Pew Oceans Commission, Arlington, VA, 28p.
Carlton, J. T. and R. Mann. 1996. Transfers and world wide distributions. p. 691-706 in Kennedy, V.
S., R. I. E. Newell, and A.F. Eble (eds.) . The Eastern Oyster Crassostrea virginica. Maryland
Sea Grant College, University of Maryland, College Park, Maryland.
Carnegie, R. B., N.A. Stokes, C. Audemard, M. J. Bishop, A. E. Wilbur, T. D. Alphin, M. H. Posey,
C. H. Peterson, and E. M. Burreson. 2008. Strong seasonality of Bonamia sp. infection and
induced Crassostrea ariakensis mortality in Bogue and Masonboro Sounds, North Carolina,
2010 COASTAL HABITAT PROTECTION PLAN
Literature cited Page 481
USA. Journal of Invertebrate Pathology 98(3): 335-343.
Carr, M. H. and M. A. Hixon. 1997. Artificial reefs: the importance of comparisons with natural reefs.
Fisheries 22(4): 28-33.
Carr, W. and C. Adams. 1973. Food habits of juvenile marine fishes occupying seagrass beds in the
estuarine zone near Crystal River, Florida. Transactions of the American Fisheries Society
102(3): 511-540.
Carraway, R. J. and L.J. Priddy. 1983. Mapping of submerged grass beds in Core and Bogue Sounds,
Carteret County, North Carolina, by conventional aerial photography. CEIP Report No. 20 ,
88p.
Carriker, M. R. and P.M. Gaffney. 1996. A catalogue of selected species of living oysters (Ostreacea)
of the world. p. 1-18 in Kennedy, V. S., R. I. E. Newell, and A. F. Eble (eds.). The Eastern
Oyster Crassostrea virginica. Maryland Sea Grant College, University of Maryland, College
Park, Maryland.
Casazza, T. L. and S.W. Ross. 2008. Fishes associated with pelagic Sargassum and open water
lacking Sargassum in the Gulf Stream off North Carolina. Fisheries Bulletin 106: 348-363.
Cashin, G. E., J.R. Dorney, and C. J. Richardson. 1992. Wetland alteration trends on the North
Carolina coastal plain. Wetlands 12(2): 63-71.
Castagna, M. and P. Chanley. 1973. Salinity tolerance of some marine bivalves from inshore and
estuarine environments in Virginia waters on the western Mid-Atlantic coast. Malacologia 12:
47-96.
Casteel, S. N., B. Cleveland, D. Osmond, and C. Hudak-Wise. 2007. North Carolina trends in animal
waste concentrations. ASA-CSSA-SSSA International Conference .
CBF (Chesapeake Bay Foundation). 2007. Living shorelines for the Chesapeake Bay watershed.
Annapolis, MD, 10p.
CBP (Chesapeake Bay Program). 1995a. Guidance for protecting submerged aquatic vegetation in
Chesapeake Bay from physical disruption. US Environmental Protection Agency, Annapolis,
Md, EPA 903-R-95-013 , 15p.
CBP (Chesapeake Bay Program). 1995b. Riparian Forest Buffer Panel Interim Report. Chesapeake
Bay Program, Annapolis, MD, 14p.
CBP (Chesapeake Bay Program). 2000. Chesapeake Bay Agreement 2000. Chesapeake Bay Program,
www.chesapeakebay.net/agreement.htm , 19p.
Cech, J. J. Jr. and D.E. Wohlschlag . 1982. Seasonal patterns of respiration, gill ventilation, and
hematological characteristics in the striped mullet, Mugil cephalus. Bulletin of Marine
Science 32: 130-138.
CENR (Committee on Environment and Natural Resources). 2003. An Assessment of Coastal
Hypoxia and Eutrophication in U.S. Waters. National Science and Technology Council
Committee on Environment and Natural Resources, Washington, D.C., 76p.
2010 COASTAL HABITAT PROTECTION PLAN
Literature cited Page 482
Cerco, C. F. and M.R. Noel. 2007. Can oyster restoration reverse cultural eutrophication in
Chesapeake Bay? Estuaries and Coasts 30(2): 331-343.
Chambers, D. B. and T.J. Leiker. 2006. A reconnaissance for emerging contaminants in the South
Branch Potomac River, Cacapon River, and Williams River basins, West Virginia, April-
October 2004. US Geological Services, USGS Open file report 2006-1393 .
Chanley, P. E. 1958. Survival of some juvenile bivalves in water of low salinity. Proceedings of the
National Shellfish Association 48(52-65).
Chapman, M. G. and F. Bulleri. 2003. Intertidal seawalls - new features of landscape in intertidal
environments. Landscape and Urban Planning 62: 159-172.
Chesapeake Bay Commission. 1997. Chesapeake Bay blue crab fishery management plan.
Chesapeake Bay Program Office, US EPA, Annapolis, MD, 102p.
Chesapeake Research Consortium. 1999. Chesapeake Bay oyster restoration - Consensus of a meeting
of scientific experts . VIMS, Wachapreague, Va, Executive Summary , 7p.
Chester, A. J., R.L. Ferguson, and G.W. Thayer. 1983. Environmental gradients and benthic
macroinvertebrate distributions in a shallow North Carolina estuary. Bulletin of Marine
Science 33(2): 285-295.
Chestnut, A. F. 1955. The distribution of oyster drills in North Carolina. Proceedings of the National
Shellfishing Association 46: 134-139.
Chiappone, M., H. Dienes, D. W. Swanson, and S. L. Miller. 2005. Impacts of lost fishing gear on
coral reef sessile invertebrats in the Florida Keys National Marine Sanctuary. Biological
Conservation 121(2): 221-230.
Chiappone, M., D. W. Swanson, S. L. Miller, and H. Dienes. 2004. Spatial distribution of lost fishing
gear on fished and protected offshore reefs in the Florida Keys National Marine Sanctuary.
Caribbean Journal of Science 40(3): 312-326.
Chmura, G. L. and N.W. Ross. 1978. Environmental impacts of marinas and their boats. Rhode Island
Sea Grant, Narragansett, RI, P675; RIU-T-78-005 .
Cho, H. J. and M.A. Poirrier. 2005. Vegetation habitat based on studies in Lake Pontchartrain,
Louisiana. Restoration Ecology 13(4): 623-629.
Choi, K.-S., E.N. Powell, D.H. Lewis, and S.M. Ray. 1994. Instantaneous reproductive effort in
female American oysters, Crassostrea virginica, measured by a new immuno- precipitation
assay. Biological Bulletin 186: 41-61.
Choy, E. J., Q. Jo, J. Moon, C. Kang, and J. Kang. 2007. Time-course uptake and elimination of
benzo(a)pyrened and its damage to reproductive outputs of Pacific oyster, Crassostrea gigas.
Marine Biology 151: 157-165.
Christian, R. R., J.N. Boyer, and D.W. Stanley . 1991. Multiyear distribution patterns of nutrients
within the Neuse River Estuary, North Carolina. Marine Ecology Progress Series 71: 259-
274.

2010 COASTAL HABITAT PROTECTION PLAN
Literature cited Page 483
Chu, F. E., P. Soudant, and R.C. Hale. 2003. Relationship between PCB accumulation and
reorductive output in conditioned oysters Crassostrea virginica fed a contaminated algal diet.
Aquatic Toxicology 65(3): 293-307.
Chu, F. L. E., P. Soudant, and R.C. Hale. 2003. Relationship between PCB accumulation and
reproductive output in conditioned oysters Crassostrea virginica fed a contaminated algal diet.
Aquatic Toxicology 65(3): 293-307.
Churchill, J. H., F.E. Werner, R. Luettich, and J.O. Blanton. 1997. Flood tide circulation near
Beaufort Inlet, NC: implications for larval recruitment. Estuaries 22(in press).
Churchill, J. H., R.B. Forward, R.A. Luettich, J.J. Hench, W.F. Hettler, L.B. Crowder, and J.O.
Blanton. 1999. Circulation and larval fish transport within a tidally dominated estuary.
Fisheries Oceanography. 8 (Suppl. 2): 173-189.
Clark, J. 1974. Coastal ecosystems, ecological considerations for management of the coastal zone.
The Conservation Foundation, Washington D.C.
Clark, K. L., G.M. Ruiz, and A.H. Hines. 2003. Diel variation in predator abundance, predation risk
and prey distribution in shallow-water estuarine habitats. Journal of Experimental Marine
Biology and Ecology 287(1): 37-55.
Clark, R. D., J.D. Christensen, M.E. Monaco, P.A. Caldwell, G.A. Matthews, and T.J. Minello. 2004.
A habitat-use model to determine essential fish habitat for juvenile brown shrimp
(Farfantepenaeus aztecus) in Galveston Bay, Texas. Fisheries Bulletin 102: 264-277.
Clavijo, I. E., D.G. Lindquist, S.K. Bolden, and S.W. Burk. 1989. Diver inventory of a midshelf reef
fish community in Onslow Bay, N.C.: preliminary results for 1988 and 1989. p. 59-66 in
Lang, M. A. and Jaap (eds.), W. C. Diving for Science...1989. American Academy for
Underwater Sciences, Costa Mesa, California.
Clay, C. H. 1995. Design of fishways and other fish facilities. Lewis Publishers, Boca Raton, Florida,
248p.
Cleary, W. J. and T. P. Marden. 1999. A pictorial atlas of North Carolina inlets. NC Sea Grant,
Raleigh, NC, UNC-SG-99-04 , 51 p.
Cloern, J. E. 1987. Turbidity as a control on phytoplankton biomass and productivity in estuaries.
Continental Shelf Research 7(11-12): 1367-1381.
Cloern, J. E. 2001. Our evolving conceptual model of the coastal eutrophication problem. Marine
Ecology Progress Series 210: 223-253.
CMC (Center for Marine Conservation). 12/2000. Marine debris kills and injures. http://www.cmc-
ocean.org/mdio.
Coastal States Organization. 1997. Putting the public trust doctrine to work - the application of the
public trust doctrine to the management of lands, waters, and living resources of the coastal
states. 2nd Edition. Coastal States Organization, Inc., Washington, DC, 439p.
Coen L., K. Heck, and L. Abele. 1981. Experiments on competition and predation among shrimps of
2010 COASTAL HABITAT PROTECTION PLAN
Literature cited Page 484
seagrass meadows. Ecology 62 (6): 1484-1493.
Coen, L. D. and M.W. Luckenbach. 1998. Developing success criteria and goals for evaluating
shellfish habitat restoration: ecological function or resource exploitation? Goal Setting and
Success Criteria for Habitat Restoration Conference, January 13-15 : abstract only.
Coen, L. D., R.D. Brumbaugh, D. Bushek, R. Grizzle, M.W. Luckenbach, M.H. Posey, S.P. Powers,
and S.G. Tolley. 2007. Ecosystem services related to oyster restoration. Marine Ecology
Progress Series 341: 303-307.
Coen, L. E., M.W. Luckenbach, and D.L. Breitburg. 1999. The role of oyster reefs as essential fish
habitat: a review of current knowledge and some new perspectives. p. 438-454 in L.R.
Benaka (ed.). Fish habitat: Essential fish habitat and rehabilitation. American Fisheries
Society, Bethesda, MD, Symposium 22 , 459 p.
Colle, D. E. and J.V. Shireman. 1980. Coefficients of condition for largemouth bass, bluegill, and
redear sunfish in hydrilla-infested lakes. Transactions of the American Fishery Society 109:
521-531.
Collie, J. S., G.A. Escanero, and P.C. Valentine. 1997. Effects of bottom fishing on the benthic
megafauna of Georges Bank. Marine Ecology Progress Series 155: 159-182.
Collie, J. S., S.J. Hall, M.J. Kaiser, and I.R. Poiners. 2000. A quantitative analysis of fishing impacts
on shelf-sea benthos. Journal of Animal Ecology 69: 785-798.
Collier, R. S. and M.C. Odom. 1989. Obstructions to anadromous fish migration. US Fish and
Wildlife Service , Raleigh, NC, Project No. 88-12 , 29p.
Connell, B. and T. Murphey. 2004. A preliminary evaluation on the effects of dock shading on
density and coverage of shoal grass (Halodule wrightii) in Bogue Sound, North Carolina.
North Carolina Division of Marine Fisheries, Morehead City, NC, 12p.
Continental Shelf Associates, I. 2002. Second post-nourishment monitoring survey of nearshore hard
bottom habitats south of Fort Pierce Inlet Fort Pierce, Florida. unpub. report, 29p.
Cooper, E. R., T.C. Siewicki, and K. Phillips. 2008. Preliminary risk assessment database and risk
ranking of pharmaceuticals in the environment. Science of the Total Environment 398: 26-
33.
Cooper, J. E., S.F. Wood, and R.A. Rulifson. 1994. Extent of water lily (Nuphar lutea) beds and their
use by larval fishes in the Roanoke River, North Carolina. Journal of the Elisha Mitchell
Scientific Society 110(2): 84-96.
Cooper, R. A. 1961. Early life history and spawning migration of the alewife, Alosa pseudoharengus.
M.S. Thesis, University of Rhode Island, 58 p.
Cooper, S. R. and G.S. Brush. 1991. A 2500 year history of anoxia and eutrophication in the
Chesapeake Bay. Science 254: 992-1001.
Copeland, B. J. 1967. Environmental characteristics of hypersaline lagoons. Contributions in Marine
Science 4: 207-218.
2010 COASTAL HABITAT PROTECTION PLAN
Literature cited Page 485
Copeland, B. J., K.R. Tenore, and D.B. Horton. 1974. Oligohaline regime. p. 315-357 in H.T. Odum,
B. J. Copeland and E. A. McMahan eds. Coastal Ecological Systems of the United States.
Conservation Foundation, Washington, DC, II .
Copeland, B. J., R. Hodson, and S.R. Riggs. 1984. The ecology of the Pamlico River, North Carolina:
an estuarine profile. U.S. Fish and Wildlife Service Biological Reports FWS/OBS-82/06 ,
83p.
Copeland, B. J., R. Hodson, S.R. Riggs, and J.E. Easley Jr. 1983. The ecology of Albemarle Sound,
North Carolina: an estuarine profile. U.S. Fish and Wildlife Service, Biological Services
Program, FWS/OBS-83/01 , 68p.
Corbett, D. R., J.P. Walsh, and K. Marciniak. 2009. Temporal and spatial variability of trace metals in
sediments of two adjacent tributaries of the Neuse River Estuary, North Carolina, USA.
Marine Pollution Bulletin 58(11): 1739-1759.
Corbett, D. R., J.P Walsh, L. Cowart, S.R. Riggs, D.V. Ames, and S.J. Culver. 2008. Shoreline
change within the Albemarle-Pamlico estuarine system, North Carolina. East Carolina
University, Greenville, NC, 10p.
Corbett, D. R., T. West, L. Clough, and H. Daniels. 2004. Potential impacts of bottom trawling on
water column productivity and sediment transport processes. NC SeaGrant, Raleigh, NC, NC
SeaGrant Project No. 01-EP-04 , 57p.
Costanza J.K., S.E. Marcinko, A.E. Goewert, and C.E. Mitchell. 2008a. Potential geographic
distribution of atmospheric nitrogen deposition from intensive livestock production in North
Carolina, USA. Science of the Total Environment 398: 76-86.
Costanza, R., O. Perez-Maqueo, M.L. Martinez, P. Sutton, S.J. Anderson, and K. Mulder. 2008b. The
value of coastal wetlands for hurricane protection. Ambio 37(4): 241-248.
Costanza, R., R d'Arge, R. deGroot, S. Farber, M. Grasso, B. Hannon, K. Limburg, S. Naeem, R. V.
O'Neill, J. Paruelo, R.G. Raskin, P. Sutton, and M. van den Belt. 1997. The value of the
world's ecosystem services and natural capital. Nature 387: 253-260.
Cotham, W. E. and T.F. Bidleman. 1989. Degradation of malathion, endosulfan, and fenvalerate in
seawater and seawater/sediment microcosms. Journal of Agriculture and Food Chemistry 37:
824-828.
Coulliette, A. D. and R.T. Noble. 2008. Impacts of rainfall on the water quality of the Newport River
Estuary (Eastern North Carolina, USA). Journal of Water and Health 6(4): 473-482.
Cowardin, L. M., V. Carter, F. C. Golet, and E. T. LaRoe. 1979. Classification of wetlands and
deepwater habitats of the United States. U.S. Department of Interior Fish and Wildlife Service,
Washington, D.C., FWS/OBS-79/31 .
Craft, C. and J. Sacco. 2003. Long-term succession of benthic infauna communities on constructed
Spartina alterniflora marshes. Marine Ecology-Progress Series 257: 45-58.
Craft, C., P. Megonigal, S. Broome, J. Stevenson, R. Freese, J. Cornell, L. Zheng, and J. Sacco. 2003.
The pace of ecosystem development of constructed Spartina alterniflora marshes. Ecological

2010 COASTAL HABITAT PROTECTION PLAN
Literature cited Page 486
Applications 13(5): 1417-1432.
Craft, C., S. Broome, and C. Campbell. 2002. Fifteen years of vegetation and soil development after
brackish-water marsh creation. Restoration Ecology 10(2): 248-258.
Crain, A. D., A.B. Bolten, and K.A. Bjorndal. 1995. Effects of beach nourishment on sea turtles:
review and research initiatives. Restoration Ecology. 3(2): 99-104.
Crain, C. M., B.S. Halpern, M.W. Beck, and C.V. Kappel. 2009. Understanding and managing human
threats to the coastal marine environment. The Year in Ecology and Conservation Biology:
New York Academy of Science 1162: 39-62.
Crawford, R. E., N.E. Stolpe, and M.J. Moore. 1998. The environmental impacts of boating;
Proceedings of a workshop held at Woods Hole Oceanographic Institute, Woods Hole MA
USA. WHOI-98-03 , 188p.
Crecco, V. A. and M.M. Blake. 1983. Feeding ecology of coexisting larvae of American shad and
blueback herring in the Connecticut River. Transactions of the American Fisheries Society
112: 498-507.
Croft, A. L., L.A. Leonard, T.D. Alphin, L.B. Cahoon, and M.H. Posey. 2006. The effects of thin
layer sand renourishment on tidal marsh processes: Masonboro Island, North Carolina.
Estuaries and Coasts 29(5): 737-750.
Cross, F. A., D.S. Peters, and W.E. Schaaf. 1985. Implications of waste disposal in coastal waters on
fish populations. Aquatic Toxicology and Hazard Assessment: Seventh Symposium,
American Society for Testing and Materials, Philadelphia, PA : 383-399.
Cross, R. E. and M.C. Curran. 2004. Recovery of meiofauna in intertidal feeding pits created by rays.
Southeastern Naturalist 3(2): 219-230.
Crowe, S. E., P.C. Jutte, R.F. Van Dolah, P.T. Gayes, R.F. Viso, and S. E. Noakes. 2006. An
Environmental Monitoring Study of Hard Bottom Reef Areas Near the Charleston Ocean
Dredged Material Disposal Site . U.S. Army Corps of Engineers, Charleston, SC, 123p.
Crowell, B. 1998. Estuarine shoreline initiative: memorandum to the Coastal Resources Commission
. DCM, Raleigh, NC, 16p.
Crowell, T. E. 1966. Lake Phelps. In Coastal Lakes II--1965 Surveys. NC Wildlife Resource
Commission, Statewide Fish-Management, p.
Crowson, R. A. 1980. Nearshore rock exposures and their relationship to modern shelf sedimentation
Onslow Bay, North Carolina. M.S. Thesis, East Carolina University, Greenville, NC, 128 p.
Culbertson, J. B., I. Valiela, M. Pickart, E.E. Peacock, and C.M. Reddy. 2008. Long-term
consequences of residual petroleum on salt marsh grass. Journal of Applied Ecology 45:
1284-1292.
Cunningham, P. A., R.J. Curry, R.W. Pratt, S.J. Stichter, K. West, P. P. L. Mercer, S. Sherman, B.
Burns, and S. Winslow. 1992. Watershed planning in the Albemarle-Pamlico Estuarine
System, Report No. 5 - fishing practices mapping . Report No. 92-05 , 227p.
2010 COASTAL HABITAT PROTECTION PLAN
Literature cited Page 487
Curieux-Belfond, O. L., S. Moslemi, M. Mathieu, and G.E. Seralini. 2001. Androgen metabolism in
oyster Crassostrea gigas: evidence for 17B-HSD activities and characterization of an
aromatase-like activity inhibited by pharmacological compounds and a marine pollutant.
Journal of Steroid Biochemistry and Molecular Biology 78: 359-366.
Currie, D. R. and G.D. Parry. 1996. Effects of scallop dredging on a soft sediment community: a
large-scale experimental study. Marine Ecological Progress Series. 134: 131-150.
Currin, C. A., P.C. Delano, and L.M. Valdes-Weaver. 2008. Utilization of a citizen monitoring
protocol to assess the structure and function of natural and stabilized fringing salt marshes in
North Carolina. Wetlands Ecology and Management 16: 97-118.
Currin, C. A., S.C. Wainright, K.W. Able, M.P. Weinstein, and C.M. Fuller. 2003. Determination of
food web support and trophic position of the mummichog, Fundulus heteroclitus, in New
Jersey smooth cordgrass (Spartina alterniflora), common reed (Phragmites australis), and
restored salt marshes. ESTUARIES 26(2B): 495-510.
Currin, C. A., S.Y. Newell, and H.W. Paerl. 1995. The role of standing dead Spartina alterniflora and
benthic microalgae in salt marsh food webs: considerations based on multiple stable isotope
analysis. Marine Ecology Progress Series 121: 99-116.
CZR Incorporated. 1999. Final Report for the cadmium and other metals study on and adjacent to
PCS phosphate reclamation areas )R-1, R-2, R-3, and the Charles Tract. Wilmington, NC.
Dafner, E. V., M.A. Mallin, J.J. Souza, H.A. Wells, and D.C. Parsons. 2007. Nitrogen and phosphorus
species in the coastal and shelf waters of southeastern North Carolina, Mid-Atlantic US coast.
Marine Chemistry 103(3-4): 289-303.
Dahl, T. E. 1990. Wetlands - losses in the United States, 1780's to 1980's. U.S. Fish and Wildlife
Service, Washington, D.C., Report to Congress , 13p.
Dahl, T. E. 2000. Status and trends of wetlands in the conterminous United States 1986 to 1997. U.S.
Fish and Wildlife Service, Washington, D.C.
Dame, R. 2005. Oyster reefs as complex ecological systems. p. 331-343 in R. Dame and S. Olenin
(eds.). The comparative roles of suspension-feeders in ecosystems. Springer, The Netherlands.
Dame, R., M. ALber, D. Allen, A. Chalmers, R. Gardner, G. Gilman, B. Kjerfve, A. Lewitus, M.
Mallin, C. Montague, J. Pinckney, and N. Smith. 2000. Estuaries of the South Atlantic coast
of North America: their geographic signatures. Estuaries 23: 793-819.
Dame, R. F. 1976. Energy flow in an intertidal oyster population. Estuarine and Coastal Marine
Science 4(4): 43-53.
Dame, R. F. and B.C. Patten. 1981. Analysis of energy flows in an intertidal oyster reef. Marine
Ecology Progress Series 5: 115-124.
Dame, R. F., J.D. Spurrier, and T.G. Wolaver . 1989. Carbon, nitrogen, and phosphorus processing by
an oyster reef. Marine Ecology Progress Series 54: 249-256.
Dame, R. F. and N. Dankers. 1988. Uptake and release of materials by a Wadden Sea mussel bed.
2010 COASTAL HABITAT PROTECTION PLAN
Literature cited Page 488
Journal of Experimental Marine Biology and Ecology 118: 207-216.
Dame, R. F., R.G. Zingmark, and E. Haskins. 1984. Oyster reefs as processors of estuarine material.
Journal of Experimental Marine Biology and Ecology 83: 239-247.
Damstra, T. 2003. Endocrine disruptors: the need for a refocused vision. Toxicological Sciences 74:
231-232.
Daniel III, C. C. 1978. Land use, land cover, and drainage on the Albemarle-Pamlico Peninsula,
eastern North Carolina, 1974. USGS, Washington, DC, Rep. No. 78-134 .
Daniel III, L. B. 1988. Aspects of the biology og juvenile red drum, Sciaenops ocellatus and spotted
seatrout, Cynoscion nebulosus (Pisces: Sciaenidae) in South Carolina. M.S. Thesis, College of
Charleston, Charleston, SC, 58 p.
Daniel III, L. B. 1995. Spawning and ecology of early life stages of black drum, Pogonias cromis, in
lower Chesapeake Bay. ., The College of Willliam and Mary in Virginia, .
Dann, R. and M. Mulder. 1996. On the short-term and long-term impact of drilling activities in the
Dutch sector of the North Sea. ICES Journal of Marine Science 23: 1036-1044.
Dauer, D. M., J.A. Ranasinghe, and S.B. Weisberg. 2000. Relationships between benthic community
condition, water quality, sediment quality, nutrient loads, and land use patterns in Chesapeake
Bay. Estuaries 23(1): 80-96.
Dauvin, J. C. 1982. Impact of Amoco Cadiz oil spill on the muddy fine sand Abra alba and Melina
palmate community from the Bay of Morlaix. Estuary Coast Shelf Science 14: 517-531.
Davies-Colley, R. J. and D.G. Smith. 2001. Turbidity, suspended sediment, and water clarity: a
review. Journal of the American Water Resources Association 37(5): 1085-1101.
Davis, G. J. and M.M. Brinson. 1976. Submersed macrophytes of the Pamlico River estuary. Water
Resources Institute of North Carolina, Raleigh, NC, Report No. 112 , 202p.
Davis, G. J. and M.M. Brinson. 1983. Trends in submerged macrophyte communities of the Currituck
Sound: 1909-1979. Journal of Aquatic Plant Management 21: 83-87.
Davis, G. J. and M.M. Brinson. 1989. Submerged aquatic vegetation of the Currituck Sound and the
western Albemarle-Pamlico estuarine study. NC Department of Environment, Health, and
Natural Resources, Raleigh, NC, Report .
Davis, G. J. and M.M. Brinson. 1990. A survey of submersed aquatic vegetation of the Currituck
Sound and the Western Albemarle-Pamlico estuarine system. DNRCD, Albermarle-Pamlico
Estuarine Study Project No. 89-10 , 135p.
Davis, H. C. 1958. Survival and growth of clam and oyster larvae at different salinities. Biology
Bulletin 114: 296-307.
Davis, H. C. and A. Calabrese. 1964. Combined effects of temperature and salinity on development of
eggs and growth of larvae of Mercenaria mercenaria and Crassostrea virginica. Fisheries
Bulletin 63: 643-655.

2010 COASTAL HABITAT PROTECTION PLAN
Literature cited Page 489
Davis, H. C. and H. Hidu. 1969a. Effects of turbidity-producing substances in sea water on egg and
larvae of three genera of bivalve mollusks. Veliger 11: 316-323.
Davis, H. C. and H. Hidu. 1969b. Effects of pesticides on embryonic development of clams and
oysters and on survival and growth of the larvae. Fisheries Bulletin 67: 393-398.
Dawes, C. J., D. Hanisak, and W.J. Kenworthy . 1995. Seagrass biodiversity in the Indian River
Lagoon. Bulletin of Marine Science 57: 59-66.
Day, J. 1967. The biology of Knysna Estuary, South Africa. p. 397-407 in G. H. Lauff (ed.).
Estuaries.
Day, J., C. Hall, W. Kemp, and A. Yanez-Arancibia (eds). 1989. Estuarine ecology. John Wiley &
Sons, Inc. New York, NY, 558p.
Day, J. W. Jr., T.J. Butler, and W.G. Conner. 1977. Productivity and nutrient export studies in a
cypress swamp and lake system in Louisiana. p. 255-269 in M. Wiley (ed.). Estuarine
Processes. Academic Press, New York, NY, II .
Dayton, P. K., B.J. Mordida, and F. Bacon. 1994. Polar marine communities. American Zoologist 34:
90-99.
DCM (North Carolina Division of Coastal Management). 2002. Estuarine biological and physical
processes work group: Draft recommendations for appropriate shoreline management options
in the North Carolina estuarine system. Unpub. rep., Raleigh, NC, 35 p.
DCM (North Carolina Division of Coastal Management). 2006. The North Carolina Estuarine
Biological and Physical Processes Work Group‘s Recommendations for Appropriate
Shoreline Stabilization Methods for the Different North Carolina Estuarine Shoreline Types
North Carolina Division of Coastal Management . Raleigh, NC, 49p.
DCM (North Carolina Division of Coastal Management). 2009. Developing a Management Strategy
for North Carolina‘s Coastal Ocean: report of the Ocean Policy Steering Committee. North
Carolina Department of Environment and Natural Resources, Raleigh, NC, 116p.
De Jong, V. N. and J. E. E. Van Beusekom. 1995. Wind- and tide- induced resuspension of sediment
and microphytobenthos from tidal flats in the Ems estuary. Limnology and Oceanography 40:
766-778.
De La Cruz, A. A. 1982. Effects of oil on phytoplankton metabolism in natural and experimental
estuarine ponds. Marine Environmental Research 7: 257-263.
DeAlteris, J., L. Skrobe, and C. Lipsky. 1999. The significance of seabed disturbance by mobile
fishing gear relative to natural processes: A case study in Narragansett Bay, Rhode Island.
American Fisheries Symposium 22: 14.
DeAlteris, J. T. 1988. The geometric development of Wreck Shoal, a subtidal oyster reef of the James
River, Virginia. Estuaries 11(4): 240-249.
DeAngelis, D. L., P.J. Mulholland, A.V. Palumbo, A.D. Steinman, M.A. Huston, and J.W. Elwood.
1989. Nutrient dynamics and food-web stability. Annual Review of Ecology and Systematics

2010 COASTAL HABITAT PROTECTION PLAN
Literature cited Page 490
20: 71-95.
Deaton, A., S. Chappell, and K. West. 2006. Process for identification of Strategic Habitat Areas in
coastal North Carolina. North Carolina Division of Marine Fisheries, Morehead City, NC,
54p.
DeBrosse, G. A. and K.S. Allen. 1996. The suitability of land-based evaluations of Crassostrea gigas
(Thunberg, 1793) as an indicator of performance in the field. Journal of Shellfish Research
15: 291-295.
Deegan, L. A., J.E. Hughes, and R.A. Rountree. 2000. Salt marsh ecosystem support of marine
transient species. p. 333-365 in Weinstein, M. P. and D.A. Kreeger. Concepts and
controversies in tidal marsh ecology. Kluwer Academic Publishers, The Netherlands, 875 p.
Defeo, O., A. McLachlan, D.S. Schoeman, T.A. Schlacher, J. Dugan, A. Jones, M. Lastra, and F.
Scapini. 2009. Threats to sandy beach ecosystems: a review. Estuarine, Coastal and Shelf
Science 81: 1-12.
Defeo, P. K., D.S. Schoeman, J. D. T.A. Schlacher, A. Jones, M. Lastra, and F. Scapini. 2009. Threats
to sand beach ecosystem: A review. Estuarine, Coastal and Shelf Science 89(1-2): 1-12.
DeFur, P. L. and L. Foersom. 2000. Toxic chemicals: can what we don't know harm us?
Environmental Research Section A 82: 113-133.
DEHNR (NC Dept. of Environment Health and Natural Resources). 1990. North Carolina coastal
marinas: water quality assessment. DEHNR, Raleigh, NC, 90-01 , 69p.
DEHNR (NC Dept. of Environment Health and Natural Resources). 1991. Coastal marinas: field
survey of contaminants and literature review. Raleigh, NC, 1991, 91-03 , 28p.
DEHNR (NC Dept. of Environment Health and Natural Resources). 1995a. North Carolina coastal
nonpoint pollution control program. Volume VI: hydromodification. DEHNR, Raleigh, NC,
p.
DEHNR (NC Dept. of Environment Health and Natural Resources). 1995b. North Carolina coastal
nonpoint pollution control program. Volume IV: Urban and developing areas. DEHNR,
Raleigh, NC, p.
Dekshenieks, M. M., E.E. Hofmann, and E.N. Powell. 1993. Environmental effects on the growth and
development of eastern oyster, Crassostrea virginica (Gmelin, 1791), larvae: a modeling study.
Journal of Shellfish Research 12(2): 241-254.
Dekshenieks, M. M., E.E. Hofmann, J.M. Klinck, and E.N. Powell. 2000. Quantifying the effects of
environmental change on an oyster population: a modeling study. Estuaries 23(5): 593-610.
DeLorenzo, M. E., G.I. Scott, and P.E. Ross. 2001. Toxicity of pesticides to aquatic microorganisms:
a review. Environmental Toxicology and Chemistry 20: 84-98.
DEM (NC Division of Environmental Management). 1989. North Carolina nonpoint source
assessment report. NC Natural Resources and Community Development, Raleigh, NC, Report
No. 89-02 .

2010 COASTAL HABITAT PROTECTION PLAN
Literature cited Page 491
DEM (NC Division of Environmental Management). 1994. An examination of fecal coliform bacteria
levels in the South River, Carteret County, NC. NC DEHNR, DEM, Raleigh, NC, 71p.
Dennis, W. A. 1988. New River shore protection. in W.L. Lyke and T.J. Hoban (eds.). Symposium
on Coastal Water Resources. Wilmington, NC.
Dennison, W. C., R.J. Orth, K.A. Moore, J.C. Stevenson, V. Carter, S. Kollar, P.W. Bergstrom, and R.
Batiuk. 1993. Assessing water quality with submerged aquatic vegetation. Bioscience 43:
86-94.
Dennison, W. C. and R.S. Alberte. 1986. Photoadaptation and growth of Zostera marina L. (eelgrass)
along a depth gradient. Journal of Experimental Marine Biology and Ecology 98: 265-282.
DENR (NC Department of Environment and Natural Resources). 1997. Neuse River Basinwide
Water Quality Management Plan. North Carolina Division of Water Quality - Water Quality
Section, Raleigh, NC.
DENR (NC Department of Environment and Natural Resources). 2000a. Coastal Habitat Protection
Plans - summary of scientific workshop. DENR, DMF, Morehead City, NC, unpub. rep. 26p.
DENR (NC Department of Environment and Natural Resources). 2000b. Beach and mountain
restoration plan. N.C. Department of Environment and Natural Resources, 19p.
DENR (NC Department of Environment and Natural Resources). 2000c. Log Salvage Policy
Development Team. Log Salvage Final Report . DENR, Raleigh, NC.
DENR (NC Department of Environment and Natural Resources). 2001. Framework for the
conversion of anaerobic swine waste lagoons and sprayfields. Unpub. doc., 7p.
DENR (North Carolina Department of Environmental and Natural Resources). 2008. Gill net
operation disturbance in Primary Nursery Areas, Issue Paper. North Carolina Division of
Marine Fisheries, Morehead City, NC.
Desbonnet, A., P. Pogue, D. Reis, J. Boyd, J. Willis, and M. Imperial. 1994. Vegetated buffers in the
coastal zone - a summary review and bibliography. University of Rhode Island Graduate
School of Oceanography, Narragansett, RI, Coastal Resources Center Technical Report No.
2064 , 72p.
Desmond, J. S., D.H. Deutschman, and J.B. Zedler. 2002. Spatial and temporal variation in estuarine
fish and invertebrate assemblages: analysis of an 11-year data set. Estuaries 25(4A): 552-
569.
DeSylva, D. P. 1975. Nektonic food webs in estuaries. p. 420-477 in Cronin, L. E. Estuarine
Research, Volume 1. Academic Press Inc., New York, NY, 738 p.
Deubler, E. F. Jr. and G.S. Posner. 1963. Response of postlarval flounders to water of low oxygen
concentration. Copeia : 312-317.
Devick, W. S. 1991. Patterns of introductions of aquatic organisms to Hawaiian freshwater habitats.
American Malacological Bulletin. New directions in research, management and conservation
of Hawaiian freshwater stream ecosystem. Proceedings of Freshwater Stream Biology and
2010 COASTAL HABITAT PROTECTION PLAN
Literature cited Page 492
Fisheries Management Symposium Special Edition No. 2: 7-39.
DeVries, D. A. 1981. Description and catch composition of North Carolina's long haul seine fishery.
Southeastern Association of Fish and Wildlife Agency 34: 234-247.
Di Giulio, R. T. and E.A. Ryan. 1987. Mercury in soils, sediments, and clams from a North Carolina
peatland. Water, Air, and Soil Pollution 33: 205-219.
Diaby, S. 1997. Economic analysis of North Carolina's coastal fishing industry; a preliminary
assessment for Carteret County. N.C. Department of Environment and Natural Resources,
Division of Marine Fisheries, 27p.
Diaby, S. 1999. An economic profile of the commercial fishing industry in coastal North Carolina.
N.C. DENR, DMF, Unpub. rep. 46 p.
Diaz, R. J. 2001. Overview of hypoxia around the world. Journal of Environmental Quality 30(2):
275-281.
Diaz, R. J. and R. Rosenberg. 1995. Marine benthic hypoxia: a review of its ecological effects and the
behavioral response of benthic macrofauna. Oceanography and Marine Biology Annual
Review 33: 245-303.
Diaz, R. J. and R. Rosenberg. 2008. Spreading dead zones and consequences for marine ecosystems.
Science 321(5891): 926-929.
Dickson, A. W. 1958. Some ecological observations in Currituck Sound. North Carolina Wildlife
Resources Commission, Raleigh, NC, Mimeo. Report , 11p.
DiDonato, G. T., J.R. Stewart, D.M. Sanger, B.J. Robinson, B.C. Thompson, and R. F. V. D. A.F.
Holland. 2009. Effects of changing land use on the microbial water quality of tidal creeks.
Marine Pollution Bulletin 58: 97-106.
Diederich, S., G. Nehls, J.E.E. van Beusekom, and K. Reise. 2005. Introduced Pacific oysters
(Crassostrea gigas) in the northern Wadden Sea: invasion accelerated by warm summers?
Helgoland Marine Research 59: 97-106.
Dillon, C. R. 1971. A comparative study of the primary productivity of estuarine phytoplankton and
macrobenthic plants. Ph.D. Dissertation, University of North Carolina - Chapel Hill, Chapel
Hill, NC, 112 p.
DMF (North Carolina Division of Marine Fisheries). 1988. North Carolina artificial reef master plan.
DMF, Morehead City, NC, 57 p.
DMF (North Carolina Division of Marine Fisheries). 1990. Justification for submerged aquatic
vegetation critical habitat designation. DMF, Unpub. rep. 15p.
DMF (North Carolina Division of Marine Fisheries). 1993. Description of North Carolina's coastal
fishery resources, 1972-1991. NC Department of Environment, Health and Natural Resources,
Division of Marine Fisheries, Morehead City, NC, Report #277 , 213p.
DMF (North Carolina Division of Marine Fisheries). 1995. North Carolina artificial reef guide. DMF,

2010 COASTAL HABITAT PROTECTION PLAN
Literature cited Page 493
Morehead City, NC, 75 p.
DMF (North Carolina Division of Marine Fisheries). 1998. North Carolina artificial reef monitoring
and evaluation. DMF, Morehead City, NC, Annual Performance Report, Grant F-41-7 , 15p.
DMF (North Carolina Division of Marine Fisheries). 1999. Shrimp and crab trawling in North
Carolina's estuarine waters. DENR, Morehead City, NC, Report to NC Marine Fisheries
Commission , 121p.
DMF (North Carolina Division of Marine Fisheries). 2000a. Red drum fishery management plan.
DMF, Morehead City, NC, 106p.
DMF (North Carolina Division of Marine Fisheries). 2000b. Fish sampling for the presence or
absence of disease. Interim report #2: March 1999 - January 2000. DMF, Morehead City,
NC, 46 p.
DMF (North Carolina Division of Marine Fisheries). 2000b. North Carolina Fishery Management
Plan for Albemarle Sound area river herring. NC Division of Marine Fisheries, Morehead
City, NC, . 126p.
DMF (North Carolina Division of Marine Fisheries). 2000c. Blue crab fishery management plan. NC
DENR, DMF, Morehead City, NC, 171p.
DMF (North Carolina Division of Marine Fisheries). 2001. Draft 5 North Carolina hard clam fishery
management plan. North Carolina Division of Marine Fisheries, Morehead City, NC.
DMF (North Carolina Division of Marine Fisheries). 2001a. North Carolina oyster fishery
management plan. N.C. Department of Environment and Natural Resources, Division of
Marine Fisheries, 225 p.
DMF (North Carolina Division of Marine Fisheries). 2001b. North Carolina hard clam fishery
management plan. N.C. Department of Environment and Natural Resources, Division of
Marine Fisheries, 164 p.
DMF (North Carolina Division of Marine Fisheries). 2001c. Assessment of North Carolina
commercial finfisheries, 1997-2000. North Carolina Division of Marine Fisheries, Morehead
City, NC.
DMF (North Carolina Division of Marine Fisheries). 2001d. Application for renewal of incidental
take permit number 1008 under the Endangered Species Act of 1973. DMF, Morehead City,
NC.
DMF (North Carolina Division of Marine Fisheries). 2002. North Carolina artificial reef monitoring
and evaluation. DMF, Morehead City, Annual Performance Report Grant F-41-11 , 15p.
DMF (North Carolina Division of Marine Fisheries). 2003a. North Carolina Stock Status Report,
2002. DMF, Morehead City, NC.
DMF (North Carolina Division of Marine Fisheries). 2003b. Draft NC striped bass development team
issue paper . DMF and NC WRC, Morehead City, NC, Water flow issues , 32 p.

2010 COASTAL HABITAT PROTECTION PLAN
Literature cited Page 494
DMF (North Carolina Division of Marine Fisheries). 2003c. Survey of population parameters of
marine recreational fishes in North Carolina, annual progress report, Grant F-42, Jan-Dec
2002 . DMF, Morehead City, NC, 49p.
DMF (North Carolina Division of Marine Fisheries). 2004. Blue crab fishery management plan. NC
DENR, DMF, Morehead City, NC, 230p.
DMF (North Carolina Division of Marine Fisheries). 2004a. North Carolina blue crab fishery
management plan. NC Division of Marine Fisheries, Morehead City, NC, 671p.
DMF (North Carolina Division of Marine Fisheries). 2004b. North Carolina estuarine striped bass
fishery management plan for the Albemarle Sound area and Central/Southern area. N.C.
Department of Environment and Natural Resources, Division of Marine Fisheries , Morehead
City, N.C., 374p.
DMF (North Carolina Division of Marine Fisheries). 2005. North Carolina striped mullet fishery
management plan . N.C. Department of Environment and Natural Resources, Division of
Marine Fisheries , Morehead City, N.C.
DMF (North Carolina Division of Marine Fisheries). 2006a. North Carolina shrimp fishery
management plan. NC Division of Marine Fisheries, Morehead City, NC, 390p.
DMF (North Carolina Division of Marine Fisheries). 2006b. North Carolina striped mullet fishery
management plan. NC Division of Marine Fisheries, Morehead City, NC, 207p.
DMF (North Carolina Division of Marine Fisheries). 2007. Stock status of important coastal fisheries
in North Carolina, 2007. DMF, Morehead City, NC.
DMF (North Carolina Division of Marine Fisheries). 2007a. North Carolina bay scallop fishery
management plan. NC Division of Marine Fisheries, Morehead City, NC, 198p.
DMF (North Carolina Division of Marine Fisheries). 2007b. North Carolina Fishery Management
Plan for Albemarle Sound area river herring. NC Division of Marine Fisheries, Morehead
City, NC, .
DMF (North Carolina Division of Marine Fisheries). 2007c. North Carolina river herring fishery
management plan amendment I. N.C. Department of Environment and Natural Resources,
Division of Marine Fisheries , Morehead City, N.C., 311p.
DMF (North Carolina Division of Marine Fisheries). 2008a. North Carolina oyster fishery
management plan amendment II. NC Division of Marine Fisheries, Morehead City, NC, 282p.
DMF (North Carolina Division of Marine Fisheries). 2008b. North Carolina hard clam fishery
management plan. NC Division of Marine Fisheries, Morehead City, NC, 314p.
DMF (North Carolina Division of Marine Fisheries). 2008c. North Carolina License and Statistics
Section Summary Statistics of License and Permit Program, Commercial Trip Ticket Program,
Marine Recreational Fishery Statistics Survey, Recreational Commercial Gear Survey, Striped
Bass Creel Survey in the Central and Southern Management Area. DMF, Morehead City, NC,
430p.
2010 COASTAL HABITAT PROTECTION PLAN
Literature cited Page 495
DMF (North Carolina Division of Marine Fisheries). 2009a. Stock status of important coastal
fisheries in North Carolina, 2009. DMF, Morehead City, NC.
DMF (North Carolina Division of Marine Fisheries). 2009b. Strategic Habitat Area Nominations for
Region #1: Albemarle Sound to northeastern coastal ocean of North Carolina. North Carolina
Division of Marine Fisheries, Morehead City, NC, 92p.
Dolan, R., C. Donoghue, and D. Stewart. 2006. Long-term impacts of tidal inlet bypasing on the
swash zone filter feeder Emerita talpoida, Oregon Inlet and Pea Island, North Carolina. Shore
and Beach 74(1): 23-27.
Dolan R., S. Dofflemeyer, C. Donoghue, and J. Jones-Smith. 2004. Analysis of changes in the beach
sediment and beach-face organisms associated with sand bypassing from the Oregon Inlet and
Pea Island, North Carolina, 1990-2002. Coastal Research Associates Report, 71pp.
Dolan, R. E., J. Fucella, and C. Donoghue. Monitoring and analysis of beach renourishment placed on
Pea Island, NC, Alligator River National Wildlife Refuge 1991-1992. USFWS, Alligator
River National Wildlife Refuge, Manteo, NC.
Doney, S. C., V.J. Fabry, R.A. Feely, and J.A. Kleypas. 2009. Ocean acidification: the other CO2
problem. Annual Review of Marine Science 1: 169-192.
Donnelly, J. P. and M.D. Bertness. 2001. Rapid shoreward encroachment of salt marsh cordgrass in
response to accelerated sea-level rise. Proceeding of the National Academy of Science
98(25): 14,218-14,223.
Donoghue, C. R. 1999. The influence of swash processes on Donax variabilis and Emerita talpoida.
PhD Dissertation, University of Virginia, Charlottesville, Va, 197 p.
Dorsey, E. M. and J. Pederson. 1992. Effects of fishing gear on the sea floor of New England.
Conservation Law Foundation, Boston, MA, 160p.
Duarte, C. M. 1991. Seagrass depth limits. Aquatic Botany 40: 363-377.
Duarte, C. M. 1995. Submerged aquatic vegetation in relation to different nutrient regimes. Ophelia
41: 87-112.
Duarte, C. M., J. Borum, T.T. Short, and D.I. Walker. 2005. Seagrass Ecosystems: Their global status
and prospects. in Polunin NVC (ed). Aquatic ecosystems: trends and global prospects.
Cambridge Univ. Press.
Duffy-Anderson, J. T., J.P. Manderson, and D.W. Able. 2003. A characterization of juvenile fish
assemblages around man-made sturctures in the New York-New Jersy Harbor Estuary, U.S.A.
Bulletin of Marine Science 72(3): 877-889.
Duffy-Anderson, J. T. and K.W. Able. 1999. Effects of municipal piers on the growth of juvenile
fishes in the Hudson River Estuary: A study across a pier edge. Marine Biology 133(3): 409-
418.
Dugan, J. E., D.M. Hubbard, I. Rodil, D.L. Revell, and S. Schroeter. 2008. Ecological effects of
coastal armoring on sandy beaches. Marine Ecology 29: 160-170.

2010 COASTAL HABITAT PROTECTION PLAN
Literature cited Page 496
Dunn, A. E., D.R. Dobberfuhl, and D.A. Casamatta. 2008. A survey of algal epiphytes from
Vallisneria americana Michx. (Hydrcharitaceae) in the Lower St. John's River, Florida.
Southeastern Naturalist 7(2): 229-244.
Durako, M. J. 1994. Seagrass die-off in Florida Bay (USA): changes in shoot demographic
characteristics and population dynamics in Thalassia testudinum. Marine Ecology Progress
Series 110: 59-66.
DWQ (North Carolina Division of Water Quality). 1990. North Carolina coastal marinas: water
quality assessment. DEHNR, Division of Water Quality, Raleigh, NC, 90-01 , 69p.
DWQ (North Carolina Division of Water Quality). 1993. Indicators of freshwater wetland function
and value for protection and management. N.C. Department of Environment, Health, and
Natural Resources, Water Quality section, 50p.
DWQ (North Carolina Division of Water Quality). 1997. Chowan River Basinwide Water Quality
Management Plan. North Carolina Division of Water Quality - Water Quality Section,
Raleigh, NC.
DWQ (North Carolina Division of Water Quality). 1997b. Neuse River Basinwide Water Quality
Management Plan. North Carolina Division of Water Quality - Water Quality Section,
Raleigh, NC.
DWQ (North Carolina Division of Water Quality). 1998. Neuse River estuary SAV ground-truthing
study. DWQ, Unpub. Rep. 11p.
DWQ (North Carolina Division of Water Quality). 1999. Lumber River Basinwide Water Quality
Plan. N.C. Department of Environment and Natural Resources, Raleigh, NC,
http://h20.enr.state.nc.us/nep/tarpamlico_river_basin.htmp.
DWQ (North Carolina Division of Water Quality). 1999a. Tar-Pamlico River Basinwide Water
Quality Plan. N.C. Department of Environment and Natural Resources, Raleigh, NC.
DWQ (North Carolina Division of Water Quality). 2000a. Water quality progress in North Carolina in
1998-1999, 305(b) report. DENR, Division of Water Quality, Raleigh, NC, 34p.
DWQ (North Carolina Division of Water Quality). 2000b. A citizen's guide to water quality
management in North Carolina. DENR, Div. Water Quality, Planning Branch, Raleigh, NC,
156p.
DWQ (North Carolina Division of Water Quality). 2000c. Cape Fear River Basinwide Water Quality
Plan. N.C. Department of Environment and Natural Resources, Raleigh, NC.
DWQ (North Carolina Division of Water Quality). 2000d. North Carolina 303(d) Report . N.C.
Department of Environment and Natural Resources, Division of Water Quality, Raleigh, NC,
14 p.
DWQ (North Carolina Division of Water Quality). 2001a. White Oak River Basinwide Water Quality
Plan. N.C. Department of Environment and Natural Resources, Raleigh, NC,
http://h20.enr.state.nc.us/nepp.
2010 COASTAL HABITAT PROTECTION PLAN
Literature cited Page 497
DWQ (North Carolina Division of Water Quality). 2001b. Annual report of fish kill events. DENR,
Raleigh, NC, 10p.
DWQ (North Carolina Division of Water Quality). 2001c. Roanoke River Basinwide Water Quality
Plan. N.C. Department of Environment and Natural Resources, Raleigh, NC,
http://h20.enr.state.nc.us/nepp.
DWQ (North Carolina Division of Water Quality). 2001e. Tar-Pamlico River Basinwide Water
Quality Plan. N.C. Department of Environment and Natural Resources, Raleigh, NC,
http://h20.enr.state.nc.us/nep/tarpamlico_river_basin.htmp.
DWQ (North Carolina Division of Water Quality). 2002a. Neuse River Basinwide Water Quality
Plan. N.C. Department of Environment and Natural Resources, Raleigh, NC,
http://h20.enr.state.nc.us/nepp.
DWQ (North Carolina Division of Water Quality). 2002b. Chowan River Basinwide Water Quality
Plan. N.C. Department of Environment and Natural Resources, Raleigh, NC,
http://h20.enr.state.nc.us/nepp.
DWQ (North Carolina Division of Water Quality). 2002c. Pasquotank River Basinwide Water
Quality Plan. N.C. Department of Environment and Natural Resources, Raleigh, NC,
http://h20.enr.state.nc.us/nepp.
DWQ (North Carolina Division of Water Quality). 2006. North CarolinaWater Quality Assessment
and Impaired Waters List (2006 Integrated 305(b) and 303(d) Report). North Carolina Divion
of Water Quality, Raleigh, NC, 94p.
DWQ (North Carolina Division of Water Quality). 2007. Chowan River Basinwide Water Quality
Management Plan. North Carolina Division of Water Quality - Water Quality Section,
Raleigh, NC.
DWQ (North Carolina Division of Water Quality). 2008a. Draft North Carolina Water Quality
Assessment and Impaired Waters List (2008 Integrated 305(b) and 303(d) Report). N.C.
Department of Environment and Natural Resources, Division of Water Quality, Raleigh, NC.
DWQ (North Carolina Division of Water Quality). 2008b. Marinas, boatyards, and boat
manufacturers: an account of services, activities, stormwater, and process wastewater in the
twenty coastal counties in North Carolina. NC DWQ, Raleigh, NC, 35p.
DWQ (North Carolina Division of Water Quality). 2008c. Annual report of fish kill events. North
Carolina Division of Water Quality, Raleigh, NC, 26p.
DWQ (North Carolina Division of Water Quality). 2009a. Neuse River Basinwide Water Quality
Plan. North Carolina Division of Water Quality, Raleigh, NC.
DWQ (North Carolina Division of Water Quality). 2009b. North Carolina Stormwater Best
Management Practices manual. North Carolina Division of Water Quality, Raleigh, NC, 102p.
DWR (North Carolina Division of Water Resources). 1996. Economic and environmental impacts of
N.C. aquatic weed infestations. North Carolina Department of Environment, Health and
Natural Resources.
2010 COASTAL HABITAT PROTECTION PLAN
Literature cited Page 498
DWR (North Carolina Division of Water Resources). 2001. North Carolina state water supply plan.
DENR, Raleigh, NC.
DWR (North Carolina Division of Water Resources). 5/2002. Swamped by aquatic weed problems?
www.ncwater.org/education&technicalassistance/aquaticweedcontrol.
DWR (North Carolina Division of Water Resources). 2009. Central Coastal Plain Capacity Use Area
Status Report. N.C. Department of Environment and Natural Resources, Raleigh, N.C.,
August .
Dyer, K. R. and R.J. Orth. 1994. Changes in fluxes in estuaries: implications from science to
management. Olsen and Olsen, Fredenburg, Denmark.
Eby, L., L. Crowder, and C. McClellan. 2000. Neuse River estuary modeling and monitoring project
Stage 1: effects of water quality on distribution and composition of the fish community.
Water Resources Research Institute, Raleigh, NC, Report N. 325-C , 2p.
Eckman, J. E., D.O. Duggins, and A.T. Sewell . 1989. Ecology of understory kelp environments: 1.
Effects of kelp on flow and particle transport near the bottom. Journal of Experimental Marine
Biology and Ecology 129: 173-187.
ECU (East Carolina University) faculty. 2008. Global warming and coastal North Carolina: A
Response in Two Parts from East Carolina University to Senator Marc Basnight‘s Request
Concerning Global Warming. 32p.
Edwards, K. R., J.E. Lepo, and M.A. Lewis. 2003. Toxicity comparison of biosurfactants and
synthetic surfactants used in oil spill remediation to two estuarine species. Marine Pollution
Bulletin 46: 1309-1316.
EEP (Ecosystem Enhancement Program). 2004. Ecosystem Enhancement Program, 2003-2004
Annual Report. N.C. Department of Environment and Natural Resources, Wetlands
Restoration Program, Raleigh, NC, . 31p.
EEP (Ecosystem Enhancement Program). 2005. Ecosystem Enhancement Program, 2004-2005
Annual Report. N.C. Department of Environment and Natural Resources, Wetlands
Restoration Program, Raleigh, NC, . 48p.
EEP (Ecosystem Enhancement Program). 2006. Ecosystem Enhancement Program, 2005-2006
Annual Report. N.C. Department of Environment and Natural Resources, Wetlands
Restoration Program, Raleigh, NC, . 62p.
EEP (Ecosystem Enhancement Program). 2007. Ecosystem Enhancement Program, 2006-2007
Annual Report. N.C. Department of Environment and Natural Resources, Wetlands
Restoration Program, Raleigh, NC, . 94p.
EEP (Ecosystem Enhancement Program). 2008. Ecosystem Enhancement Program, 2007-2008
Annual Report. N.C. Department of Environment and Natural Resources, Wetlands
Restoration Program, Raleigh, NC, . 141p.
EEP (Ecosystem Enhancement Program). 2009. Ecosystem Enhancement Program, 2008-2009
Annual Report. N.C. Department of Environment and Natural Resources, Wetlands
2010 COASTAL HABITAT PROTECTION PLAN
Literature cited Page 499
Restoration Program, Raleigh, NC, .
Eggleston, D., R. Loycano, and B. Puckett. 2008. Designing marine reserve networks for oyster
restoration: a metapopulation and graph-theoretic approach. North Carolina State University,
Center for Marine Science and Technology, Morehead City, NC, progress report , 28 pp.p.
Eggleston, D. B. 1990. Foraging behavior of the blue crab, Callinectes sapidus, on juvenile oysters,
Crassostrea virginica: effects of prey density and size. Bulletin of Marine Science 46(1): 62-
82.
Eggleston, D. B., L.L. Etherington, and W.E. Elis. 1998. Organism response to habitat patchiness:
species and habitat-dependent recruitment of decapod crustaceans. Journal of Experimental
Marine Biology and Ecology 223(1): 111-132.
Ehlers, A., B. Worm, and T.B.H. Reusch. 2008. Importance of genetic diversity in eelgrass Zostera
marina for its resilience to global warming. Marine ecology progress series 355: 1-7.
Eldridge, P. J. and G.M. Meaburn. 1992. Potential impact of PCB's on bluefish, Pomatomus saltatrix,
management. Marine Fisheries Review 54(4): 19-24.
Eleuterius, L. 1987. Seagrass ecology along the coasts of Alabama, Louisiana, and Mississippi. p. 11-
24 in M.J. Durako, R. C. Phillips and R. R. Lewis III eds. Proceedings of the symposium on
subtropical–tropical seagrasses in the Southeastern United States. Florida Marine Resources
Publication, St Petersburg, FL, 42 .
Elis, W. E., D.B. Eggleston, L.L. Etherington, C.P. Dahlgren, and M.H. Posey. 1996. Patch size and
substrate effects on macrofaunal recruitment. p. 94 in: Abstracts from Twenty-fourth Annual
Benthic Ecology Meeting.
Ellifrit, N. J., M.S. Uoshinaka, and D.W. Coon. 1972. Some observations of clam distribution at four
sites on the Hook Canal, Washington. Proceedings of the National Shellfish Association 63:
7.
Ellis, W. 1995. The intertidal distribution of the daggerblade grass shrimp: effects of vegetation
assessed using bottomless liftnet samples. Twenty-third Benthic Ecology Meeting .
ENCRPC (Environment North Carolina Research and Policy Center). 2007. Losing our natural
heritage: development and open space loss in North Carolina. Environment North Carolina
Research and Policy Center, Raleigh, NC, April , 28p.
Engel, J. and R. Kvitek. 1998. Effects of otter trawling on a benthic community in Monterey Bay
National Marine Sanctuary. Conservation Biology 12(6): 1204-1214.
Engelhaupt, E. 2007. In a changing climate, cities worsen water quality. Environmental Science and
Technology August: 5836.
Ensign, S. E. and M.A. Mallin. 2001. Stream water quality following timber harvest in a Coastal Plain
swamp forest. Water Research 35: 3381-3390.
Enwere, R. 2009. Environmental risk management of contamination of marine biota by hydrocarbons
specifically those arising following an oil spill. Dissertation, Robert Gordon Universit,
2010 COASTAL HABITAT PROTECTION PLAN
Literature cited Page 500
Aberden, 283 p.
EPA (Environmental Protection Agency). 2006. Riparian buffer width, vegetative cover, and nitrogen
removal effectiveness: a review of current science and regulations. U.S. Environmental
Protection Agency, Office of Research and Development, National Risk Management
Research Laboratory, Ada, OK, EPA/600/R-05/118 , 40p.
EPA (U.S. Environmental Protection Agency). 1985. Coastal marinas assessment handbook. EPA,
Atlanta, GA, 904/6-85-132 .
EPA (U.S. Environmental Protection Agency). 1992. National water quality inventory: 1990 report to
Congress. U.S. Environmental Protection Agency, Washington, DC, EPA-503-9-92-006 .
EPA (U.S. Environmental Protection Agency). 1995. National water quality inventory: 1994 report
to Congress. EPA, Washington, DC, 841-R-95-005 , 123p.
EPA (U.S. Environmental Protection Agency). 1998. Climate Change and North Carolina. EPA,
Washington, D.C., EPA 236-F-98-007q , 4p.
EPA (U.S. Environmental Protection Agency). 2000a. Chesapeake Bay submerged aquatic
vegetation water quality and habitat based requirements and restoration targets: a second
technical synthesis, Executive Summary. US EPA, Annapolis, Md, 19p.
EPA (U.S. Environmental Protection Agency). 2000b. Guidance for Assessing Chemical
Contaminant Data for Use in Fish Advisories, Vol. 1: Fish Sampling and Analysis. United
States Environmental Protection Agency, Office of Water, Washington, D.C., EPA-823-B-00-
007 .
EPA (U.S. Environmental Protection Agency). 2000c. Guidance for Assessing Chemical
Contaminant Data for Use in Fish Advisories, Vol. 2: Risk Assessment and Fish Consumption
Limits. United States Environmental Protection Agency, Office of Water, Washington, D.C.,
EPA-823-B-00-008 .
EPA (U.S. Environmental Protection Agency). 2001. Hydromodification chapter factsheet.
http://www.epa.gov/OWOW/NPS/MMGI/hydro.html, 12/2001.
EPA (U.S. Environmental Protection Agency). 2002a. Drinking water advisory: consumer
acceptability advice and health effects analysis on sulfate. U.S. Environmental Protection
Agency, Washington, D.C., EPA 822-R-02-033, Contract Number 68-C-01-002, Work
Assignment Number: B-02 .
EPA (U.S. Environmental Protection Agency). 2002b. National Pollutant Discharge Elimination
System - proposed regulations to establish requirements for cooling water intake structures at
Phase II existing facilities. Federal Register. April 9: 17,121-17,225.
EPA (U.S. Environmental Protection Agency). 2002c. National water quality inventory: 2000 report
to Congress. U.S. Environmental Protection Agency, Washington, DC.
Epperly, S. P. 1984. Fishes of the Pamlico-Albemarle peninsula, N.C., area utilization and potential
impacts. North Carolina Division of Marine Fisheries, Morehead City, NC, Special Scientific
Report 42 , 129p.

2010 COASTAL HABITAT PROTECTION PLAN
Literature cited Page 501
Epperly, S. P. 1985. Nekton of the Pamlico-Albemarle peninsula: area utilization. Estuaries 8(2B):
8a.
Epperly, S. P. and S. W. Ross. 1986. Characterization of the North Carolina Pamlico-Albemarle
estuarine complex. National Marine Fisheries Service - Southeast Fisheries Center, Beaufort,
NC, NMFS-SEFC-175 , 55p.
Ernst, C. H. and R.W. Barbour. 1972. Turtles of the United States. University of Kentucky,
Lexington, KY.
Esty, A. 2007. Banking on mitigation. American Scientist 95(2): 122-123.
Etherington, L. L. and D.B. Eggleston. 2000. Large-scale blue crab recruitment: linking postlarval
transport, post-settlement planktonic dispersal, and multiple nursery habitats. Marine Ecology
Progress Series 204: 179-198.
Evans, D. R., R. DiGuilio, and E. Ryan. 1984. Mercury in peat and its drainage waters in eastern
North Carolina. Rep. No. 218. WRRI , Raleigh, NC, 66.p.
Evans, R. O., K.L. Bass, M.R. Burchelt, R.D. Hinson, R. Johnson, and M. Doxey. 2007. Management
alternatives to enhance water quality and ecological functions of channelized streams and
drainage canals. Journal of Soil and Water Conservation 62(4): 308-320.
Eversole, A. G. 1987. Species profile: life histories and environmental requirements of coastal fishes
and invertebrates (South Atlantic)--hard clam. US Fish and Wildlife Service, Biological
Report 82(11.75) , 33p.
Evison, L. M. 1988. Comparative studies on the survival of indicator organisms and pathogens in
fresh and sea water. Water Science and Technology 20: 309-315.
Ewart, J. W. and S.E. Ford. 1993. History and Impact of MSX and Dermo Diseases on Oyster Stocks
In the Northeast Region. Northeastern Regional Aquaculture Center, North Dartmouth, MA,
NRAC Fact Sheet No. 200 , 8p.
Eyre, B. and A. J. Ferguson. 2002. Comparison of carbon production and decomposition, benthic
nutrient fluxes and denitrification in seagrass, phytoplankton, benthic microalgae- and
macroalgae-dominated warm-temperate Australian lagoons. Marine Ecology Progress Series
229: 43-59.
Fairbanks, L. O. 1963. Biodemographic studies of the clam, Rangia cuneata, Gray. Tulane Study.
Zoology 10: 3-47.
Fay, C. W., R.J. Neves, and G.B. Pardue. 1983a. Species profiles: life histories and environmental
requirements of coastal fishes and invertebrates (Mid-Atlantic) -- Atlantic silversides. US Fish
and Wildlife Service, Division of Biological Services, FWS/OBS-82/11.10 , 15p.
Fay, C. W., R.J. Neves, and G.B. Pardue. 1983b. Species profiles: life histories and environmental
requirements of coastal fishes and invertebrates (Mid-Atlantic) -- alewife/blueback herring.
US Fish and Wildlife Service, Division of Biological Services, FWS/OBS-82/11.9 , 15p.
Fay, C. W., R.J. Neves, and G.B. Pardue. 1983c. Species profiles: life histories and environmental
2010 COASTAL HABITAT PROTECTION PLAN
Literature cited Page 502
requirements of coastal fishes and invertebrates (Mid-Atlantic) -- bay scallop. US Fish and
Wildlife Service, Division of Biological Services, FWS/OBS-82/11.12 , 17p.
Fay, C. W., R.J. Neves, and G.B. Pardue. 1983d. Species profiles: life histories and environmental
requirements of coastal fishes and invertebrates (Mid-Atlantic) -- striped bass. US Fish and
Wildlife Service, Biological Report FWS/OBS-82/11.8 , 36p.
Fear, J. M., H.W. Paerl, and J.S. Braddy. 2007. Importance of submarine groundwater discharge as a
source of nutrients for the Neuse River Estuary, North Carolina. Estuaries and Coasts 30(6):
1027-1033.
Fear, J. M., S.P. Thompson, T.E. Gallo, and H.W. Paerl. 2005. Denitrification Rates Measured Along
a Salinity Gradient in the Eutrophic Neuse River Estuary, North Carolina, USA. Estuaries
28(4): 608-619.
Federal Register. 2000. Executive Order 13158, Marine Protected Areas. Presidential Documents
65(105): 34909-34911.
Feely, R. A., C.L. Sabine, K. Lee, W. Berelson, J. Kleypas, V.J. Fabry, and F.J. Millero. 2004. Impact
of anthropogenic CO2 on the CaCO3 system in the oceans. Science 305(5682): 362-366.
Feierabend, S. J. and J.M. Zelazny. 1987. Status report on our nation's wetlands. National Wildlife
Federation, Washington, D.C., 50p.
Fell, P. E., S.P. Weissbach, D.A. Jones, M.A. Fallon, J.A. Zeppieri, E.K. Faison, K.A. Lennon, K.J.
Newberry, and L.K. Reddington. 1998. Does invasion of oligohaline tidal marshes by reed
grass, Phragmites australis (Cav.) Trin. ex Steud., affect the availability of prey resources for
the mummichog, Fundulus heteroclitus L.? Journal of Experimental Marine Biology and
Ecology 222(1-2): 59-77.
Fell, P. E., S.P. Weissbach, D.A. Jones, M.A. Fallon, J.A. Zeppieri, E.K. Faison, K.A. Lennon, K.J.
Newberry, and L.K. Reddington. 1998. Does invasion of oligohaline tidal marshes by reed
grass, Phragmites australis (Cav.) , affect the availability of prey resources for the
mummichog, Fundulus heteroclitus . Journal of Experimental Marine Biology and Ecology
222(1-2): 59-77.
Ferguson, R. L., J.A. Rivera, and L.L. Wood. 1989. Submerged aquatic vegetation in the Albemarle-
Pamlico estuarine system. Cooperative agreement between the US EPA, through the State of
North Carolina, Albermarle-Pamlico Estuarine Study and the National Marine Fisheries
Service Project No. 88-10: 65.
Ferguson, R. L. and L.L. Wood. 1990. Mapping submerged aquatic vegetation in North Carolina with
conventional aerial photography. A Report by the National Ocean Pollution Policy Board's
Habitat Loss and Modification Working Group. 125-132.
Ferguson, R. L. and L.L. Wood. 1994. Rooted vascular aquatic beds in the Albemarle-Pamlico
estuarine system. NMFS, NOAA, Beaufort, NC, Project No. 94-02 , 103 p.
Fields, S. 2003. The environmental risks of pleasure boating. Environmental Health Perspectives
111(4): A216-A223.

2010 COASTAL HABITAT PROTECTION PLAN
Literature cited Page 503
Fischer, C. A., G.W. Judy, J.H. Hawkins, S.E. Winslow, H.B. Johnson, and B.F. Holland Jr. 1979.
North Carolina anadromous fisheries management program. North Carolina Department of
Natural Resources and Community Development, Progress Report AFCS-16-1 , p.
Fitzgerald, D. M., D.K. Hubbard, and D. Nummendal. 1978. Shoreline changes associated with tidal
inlets along the South Carolina coast. Coastal Zone '78, Sixth Symposium of the Waterway,
Port, Coastal and Ocean Div. 1973-1984.
Fitzgerald, D. M., M.S. Fenster, B.A. Argow, and I.V. Buynevich. 2008. Coastal impacts due to sea-
level rise. Annual Review of Earth and Planetary Sciences 36: 601-647.
Flemer, D. A. and W. S. Woolcott. 1966. Food habits and distribution of teh fishes of Tuckahoe
Creek, Virginia, with special emphasis on the bluegill, Lepomis m. macrochirus Rafinesque.
Chesapeake Science 7(2): 75-89.
Florida DEP (Department of Environmental Protection). 1995. Protocols for determining major
seawater ion toxicity in membrane-treatment technology water-treatment concentrate. Florida
Department of Environmental Protection, Bureau of Laboratories, Tallahassee, Fl.
Fong, P. P. and N. Molnar. 2008. Norfluoxetine induces spawning and parturition in estuarine and
freshwater bivalves. Bulletin of Environmental Contamination & Toxicology 81: 535-538.
Fonseca, M. S. 1996a. The role of seagrasses in nearshore sedimentary processes: a review. p. 261-286
in C. Roman and K. Nordstrom (eds). Estuarine Shores: Hydrological, Geomorphological and
Ecological Interactions. Blackwell, Boston, MA.
Fonseca, M. S. 1996b. Scale dependence in the study of seagrass systems: a review. p. 95-104 in J.
Kuo, R. C. Phillips D. L. Walker and H. Kirkman eds. Seagrass Biology: Proceedings of an
International Workshop. Rottnest Island, Western Australia.
Fonseca, M. S., G.W. Thayer, A.J. Chester, and C. Foltz. 1984. Impact of scallop harvesting on
eelgrass (Zostera marina) meadows: implications for management. North American Fisheries
Management 4: 286-293.
Fonseca, M. S., J.C. Zieman, G.W. Thayer, and and J.S. Fisher. 1982. The role of current velocity in
structuring eelgrass (Zostera marina L.) meadows. Estuarine, Coastal and Shelf Science 17:
367-380.
Fonseca, M. S., J.C. Ziemman, G.W. Thayer, and J.S. Fisher. 1983. The role of current velocity in
structuring eelgrass (Zostera marina L.) meadows. Estuarine Coastal and Shelf Science 17:
367-380.
Fonseca, M. S., W. J. Kenworthy, and G. W. Thayer. 1998. Guidelines for the conservation and
restoration of seagrasses in the United States and adjacent waters. NOAA Coastal Ocean
Office, Silver Springs, Md., NOAA Coastal Ocean Program Decision Analysis Series No. 12 ,
222p.
Fonseca, M. S. and S.S. Bell. 1998. Influence of physical setting on seagrass landscape near Beaufort,
North Carolina, USA. Marine Ecology Progress Series 171: 109-121.
Ford, A. T., T.F. Fernandes, S.A. Rider, P.A. Read, C.D. Robinson, and I.M. Davies. 2004. Endocrine
2010 COASTAL HABITAT PROTECTION PLAN
Literature cited Page 504
disruption in a marine amphipod? Field observations of intersexuality and de-masculinisation.
Marine Environmental Research 58: 169-173.
Ford, S. E. and A. J. Figueras. 1988. Effects of sublethal infection by the parasite Haplosporidium
nelsoni (MSX) on gametogenesis, spawning, and sex ratios of oysters in Delaware Bay, USA.
Diseases of Aquatic Organisms 4(2): 121-133.
Ford, S. E. and M.M. Chintala. 2006. Northward expansion of a marine parasite: testing the role of
temperature adaptation. Journal of Experimental Marine Biology and Ecology 339(2): 226-
235.
Ford, S. E. and M.R. Tripp. 1996. Diseases and defense mechanisms. p. 581-660 in Kennedy, V. S.,
Newell, R. I. E., and Eble (eds.), A. F. The eastern oyster Crassostrea virginica. Maryland Sea
Grant, College Park, MD.
France, R. and J. Holmquist. 1990. d13C
variability of macroalgae: effects of water motion via baffling
by seagrasses and mangroves. Marine Ecology Progress Series 149: 305-308.
Francesconi, J. J. 1994. Effect of stop nets on pier and beach angler catch rates and general fish
movement along Bogue Banks, NC. N.C. Department of Environment and Natural Resources,
Division of Marine Fisheries, Morehead City, NC, 17p.
Frankenberg, D. 1995. Report of the North Carolina Blue Ribbon Advisory Council on Oysters . NC
DEHNR, Raleigh, NC.
Frankensteen, E. D. 1976 . Genus Alosa in a channelized and unchannelized creek of the Tar River
Basin, North Carolina. M.S. thesis, ECU, Greenville, NC, 123 p.
Fraser, S. B. and G.R. Sedberry. 2008. Reef morphology and invertebrate distribution at continental
shelf edge reefs in the South Atlantic Bight. Southeastern Naturalist 7(2): 191-206.
Freese, J. L. 2001. Trawl-induced damage to sponges observed from a research submersible. Marine
Fisheries Review 63(3): 7-13.
French, G. T. and K.A. Moore. 2003. Interactive effects of light and salinity stress on the growth,
reproduction, and photosynthetic capabilities of Vallisneria americana (Wild Celery).
Estuaries 26(5): 1255-1268.
Freshwater, D. W., F. Montgomery, J.K. Greene, R.M. Hamner, M. Williams, and P.E. Whitfield.
2006. Distribution and identification of an invasive Gracilaria species that is hampering
commercial fishing operations in southeastern North Carolina, USA. Biological Invasions 8:
631-637.
Frick, E. A. and S.D. Zaugg. 2003. Organic wastewater contaminants inthe upper Chattahoochee River
basin, Georgia, 1999-2002. in Hatcher, K. J. ed. Proceedings of the 2003 Georgia Water
Resources Conference, April 23-24, 2003. Institute of Ecology, University of Georgia, Athens.
Fries, J. S., G.W. Characklis, and R.T. Noble. 2008. Sediment-water exchange of Vibrio sp. and fecal
indicator bacteria: implications for persistence and transport in the Neuse River Estuary, North
Carolina, USA. Water Research 42(4-5): 941-950.
2010 COASTAL HABITAT PROTECTION PLAN
Literature cited Page 505
Fries, J. S., R.T. Noble, H.W. Paerl, and G.W. Characklis. 2007. Particle suspensions and their
regions of effect in the Neuse River Estuary: implications for water quality monitoring.
Estuaries and Coasts 30(2): 359-364.
Frysinger, G. S., R.B. Gaines, L. Xu, and C.M. Reddy. 2003. Resolving the unresolved complex
mixture in petroleum-contaminated sediments. Environmental Science and Technology 37.
Fulford, R. S., D.L. Breitburg, R.I.E. Newell, W.M. Kemp, and M. Luckenbach. 2007. Effects of
oyster population restoration stratagies on phytoplankton biomass in Chesapeake Bay: a
flexible modeling approach. Marine Ecology Progress Series 336: 43-61.
Funderburk, S. L., J.A. Mihursky, S.J. Jordan, and D. Riley. 1991. Habitat requirements for
Chesapeake Bay living resources. Habitat Objectives Workgroup, Living Resources
Subcommittee and Chesapeake Research Consortium with assistance from Maryland
Department of Natural Resources, Solomons, MD.
Gagne, F., C.Blaise, J. Pellerin, and C. Andre. 2007. Neuroendocrine disruption in Mya arenaria
clams during gametogenesis at sites under pollution stress. Marine Environmental Research
64: 87-107.
Gagne, F., C.Blaise, J. Pellerin, and S. Gauthier-Clerc . 2002. Alteration of the biochemcial properties
of female gonads and vitellins in the clam Mya arenaria at contaminated sites in the Saguenay
Fjord. Marine Environmental Research 53: 295-310.
Gallagher, R. P. 1979. Local distribution of ichthyoplankton in the lower Mississippi River, Louisiana.
Ph.D. Dissertation, Louisiana State University, Baton Rouge, LA, 52 p.
Gallegos, C. L. 1994. Refining habitat requirements of submerged aquatic vegetation: role of optical
models. Estuaries 17(18): 187-199.
Gallegos, C. L. 2001. Calculating optical water quality targets to restore and protect submerged
aquatic vegetation: overcoming problems in partitioning the diffuse attenuation coefficient for
photosynthetically active radiation. Estuaries 24(3): 381-397.
Gallegos, C. L. and W.J. Kenworthy. 1996. Seagrass depth-limits in the Indian River Lagoon
(Florida, USA): application of an optical water quality model. Estuarine and Coastal Shelf
Science 42: 267-288.
Galvan, K., J.W. Fleeger, and B. Fry. 2008. Stable Isotope Addition Reveals Dietary Importance of
Phytoplankton and Microphytobenthos to Saltmarsh Infauna. Marine Ecology Progress Series
359: 37-49.
Gambi, M., A. Nowell, and P.A. Jumars. 1990. Flume observations on flow dynamics in Zostera
marina (eelgrass) beds. Marine Ecology Progress Series 61: 159-169.
Garbisch, E. W., P.B. Woller, W.J. Bostian, and R.J. McCallum. 1973. Biotic techniques for shore
stabilization. p. 405-407 in L.E. Cronin (ed.). Estuarine Research. Academic Press Inc., New
York, NY, II .
Gardner, M. B. 1981. Effects of turbidity on feeding rates and selectivity in bluegills. Transactions of
the American Fisheries Society 110: 446-450.

2010 COASTAL HABITAT PROTECTION PLAN
Literature cited Page 506
Gazeau, F., C. Quiblier, J.M. Jansen, J.P Gattuso, J.J. Middelburg, and C.H.R. Heip. 2007. Impact of
elevated CO2 on shellfish calcification. Geophysical Research Letters 34(7).
Geffard O., A. Geffard, E. Hisc, and H. Budzinskia . 2003. Assessment of the bioavailability and toxicity of sediment-associated polycyclic aromatic hydrocarbons and heavy metals applied to Crassostrea gigas embryos and larvae. Marine Pollution Bulletin 46(April): 481-490.
Geis, S. and B. Bendell. 2008. Charting the estuarine environment: methodology spatially delineating
a contiguous, estuarine shoreline of North Carolina. North Carolina Division of Coastal
Management, Raleigh, NC, July , 31p.
Gentile, G. 1992. Ultimate wreck diving guide. Gary Gentile Productions, Philadelphia, PA, 152p.
Gerritsen, J., J.M. Dietz, and Jr. H.T. Wilson. 1996. Episodic acidification of coastal plain streams:
an estimation of risk to fish. Ecological Applications 6(2): 438-448.
Giese, G. L., H.B. Wilder, and G.G. Parker Jr. 1979. Hydrology of major estuaries and sounds of
North Carolina. US Geological Survey , Water Resource Investigations 79-46 , 175p.
Giese, G. L., J.L. Eimers, and R.W. Coble. 1997. Simulation of ground-water flow in the Coastal
Plain aquifer system of North Carolina. U.S. Geological Survey, U.S. Geological Survey
Professional Paper 1404-M , 142p.
Gilbert, C. R. 1986. Species profiles: life histories and environmental requirements of coastal fishes
and invertebrates (South Florida)--southern, gulf, and summer flounders. U.S. Fish Wildl.
Serv. / U.S. Army Corps of Engineers, Biol. Rep. 82(11.54) / TR EL-82-4 , 27p.
Giles, R. C., L.R. Brown, and C.D. Minchew. 1978. Bacteriological aspects of fin erosion in mullet
exposed to crude oil. Journal of Fish Biology 13: 113-117.
Gilkenson, K., M. Paulin, S. Hurley, and P. Schwinghamer. 1998. Impacts of trawl door scouring on
infaunal bivalvs: results of a physical trawl door model: dense sand interaction. Journal of
Experimental Marine Biology and Ecology 224: 291-312.
Gilliam, J. W., D.L. Osmond, and R.O. Evans. 1994. Riparian wetlands and water quality. Journal of
Environmental Quality 23: 896-900.
Gilliam, J. W., R.L. Huffman, R.B. Daniels, E.E. Buffington, A.E. Morey, and S.R. Leclerc. 1996.
Contamination of surficial aquifers with nitrogen applied to agricultural land. UNC Water
Resources Research Institute, Raleigh, NC, Rep. 306.
Gilmore, G. and Trent X. 1974. Abundance of benthic macroinvertebrates in natural and altered
estuarine areas. NMFS, NOAA Technical Report NMFS SSRF - 677 .
Gilmore, R. G. 1995. Environmental and biogeographic factors influencing ichthyofaunal diversity:
Indian River Lagoon. Bulletin of Marine Science 57: 153-170.
Giorgino, M. J., R.B. Rasmussen, and C.A. Pfeifle. 2007. Occurrence of organic wastewater
compounds in selected surface-water supplies, triangle area of North Carolina, 2002-2005. US
Geological Survey, Raleigh, NC, Scientific Investigations Report 2007-5054 .
2010 COASTAL HABITAT PROTECTION PLAN
Literature cited Page 507
Giorgino, M. J., R.B. Rasmussen, and C.M. Pfeifle. 2007. Occurrence of organic wastewater
compounds in selected surface-water supplies, Triangle Area of North Carolina, 2002-2005.
U.S. Geological Survey, Reston, VA, USGS Scientific Report 2007-5054 , 28p.
Glasgow, H. B. Jr. and J.M. Burkholder. 2000. Water quality trends and management implications
from a five-year study of a eutrophic estuary. Ecological Applications 10(4): 1024-1046.
Glasgow, H. B. Jr., J.M. Burkholder, M.A. Mallin , N.J. Deamer-Melia, and R.R. Reed. 2001. Field
ecology of toxic Pfiesteria complex species and a conservative analysis of their role in
estuarine fish kills. Environmental Health Perspectives 109: 715-730.
Glibert, P. M., J.M. Burkholder, M.W. Parrow, A.J. Lewitus, and D.E. Gustafson . 2006. Direct
uptake of nitrogen by Pfiesteria piscicida and Pfiesteria shumwayae, and nitrogen nutritional
preferences. Harmful Algae 5: 380-394 .
Godcharles, M. F. 1971. A study of the effects of a commercial hydraulic clam dredge on benthic
communities in estuarine areas. Florida Department of Natural Resources, St. Petersburg, FL,
51p.
Godcharles, M. F. and M.D. Murphy. 1986. Species profiles: life histories and environmental
requirements of coastal fishes and invertebrates (South Florida) -- king mackerel and Spanish
mackerel. U.S. Fish Wildlife Service / U.S. Army Corps of Engineers, Biol. Rep. 82(11.58) /
TR EL-82-4 , 18p.
Godwin, W. F., M.W. Street, and T.R. Rickman. 1971. Problems, priorities, and research needs of
North Carolina's marine fisheries. NC Department of Conservation and Development,
Division of Commercial and Sports Fisheries, Raleigh, NC, 41p.
Goldman, S. F. and G.R. Sedberry. 2006. Feeding habits of several deep water reef fish on the
continental slope off the southeastern United States: preliminary analysis. Eos Trans. AGU
87(36): Ocean Sci. Meet. Suppl., Abstract OS23A-04.
Goldsborough, W. J. and W.M. Kemp. 1988. Light responses of submersed macrophytes: implication
for survival in turbid waters. Ecology 69: 1775-1786.
Goodfellow, W. L., L.W. Ausley, D.T. Burton, D.L. Denton, P.B. Dorn, D.R. Grothe, M.A. Heber,
T.J. Norberg-King, and J.H. Rodgers Jr. 2000. Major ion toxicity in effluents: a review with
permitting recommendations. Environmental Toxicology and Chemistry 19(1): 175-182.
Gorzelany, J. F. and W.G. Nelson. 1987. The effects of beach replenishment of the benthos of a
subtropical Florida beach. Marine Environmental Research 21: 75-94.
Gould, E., P.E. Clark, and F.P. Thurberg. 1994. Pollutant effects on demersal fishes. p. 30-40 in R.W.
Langton, J. B. Pearce and J. A. Gibson eds. Selected living resources, habitat conditions, and
human perturbations of the Gulf of Maine. National Oceanographic and atmospheric
Administration, Woods Hole, Mass, NMFS-NE-106 .
Govoni, J. J. and H.L. Spach. 1999. Exchange and flux of larval fishes across the western Gulf Stream
front south of Cape Hatteras, USA, in winter. Fisheries Oceanography. 8(2): 77-92.
Grabowski, J. H., A.R. Hughes, D.L. Kimbro, and M.A. Dolan. 2005. How habitat setting influences
2010 COASTAL HABITAT PROTECTION PLAN
Literature cited Page 508
restored oyster reef communities. Ecology 86(7): 1926-1935.
Grabowski, J. H. and D.L. Kimbro. 2005. Predator-avoidance behavior extends trophic cascades to
refuge habitats. Ecology 86(5): 1312-1319.
Grabowski, J. H., D. Pettipas, M.A. Dolan, A.R. Hughes, and D.L. Kimbro. 2000. The economic and
biological value of restored oyster reef habitat to the nursery function of the estuary. NC Sea
Grant, Morehead City, NC, FRG # 97-EP-6 , 29p.
Grabowski, J. H. and S.P. Powers. 2004. Habitat complexity mitigates trophic transfer on oyster reefs.
Marine Ecology Progress Series 277: 291-295.
Graff, L. and J. Middleton. 2000. Wetlands and fish: catch the link. NOAA, National Marine
Fisheries Service, Office of Habitat Conservation, Silver Springs, Maryland, 48p.
Graff, L. and J. Middleton. 2003. Wetlands and fish: catch the link. NOAA, National Marine
Fisheries Service, Silver Springs, MD , 48p.
Gratten, L. M., D. Oldach, T.M. Perl, M.H. Lowitt, D.L. Matuszak, C. Dickson, C. Parrott, R.C.
Shoemaker, M.P. Wasserman, J.R. Hebel, P. Charache, and J.G. Morris Jr. 1999. Problems in
learning and memory occur in persons with environmental exposure to waterways containing
toxin-producing Pfiesteria or Pfiesteria-like dinoflagellates. Lancet 352: 532-539.
Gray, J. S., R. S. Wu, and Y.Y. Or. 2002. Effects of hypoxia and organic enrichment on the coastal
marine environment. Marine Ecology Progress Series 238: 249-279.
Grecay, P. A. and T.E. Targett. 1996. Effects of turbidity, light level and prey concentration on
feeding of juvenile weakfish Cynoscion regalis. Marine Ecology Progress Series 131: 11-16.
Greene, K. 2002. ASMFC Habitat Management Series #7 Beach nourishment: a review of the
biological and physical impacts. ASMFC, Washington DC, 174p.
Greene, K. E., J.L. Zimmerman, R.W. Laney, and J.C. Thomas-Blate. 2009 . Atlantic Coast
Diadromous Fish Habitat: A Review of Utilization, Threats, Recommendations For
Conservation, and Research Needs. Atlantic States Marine Fisheries Commission,
Washington, D.C., Habitat Management Series No. 9 .
Greenwood, N. and A. Earnshaw. 1984. Chemistry of the Elements. Pergamon Press, Oxford,
England.
Gregg, K. L. 1995. Comparisons of Three Manufactured Artificial Reef Units in Onslow Bay, North
Carolina. North American Journal of Fisheries Management 15: 316-324.
Gregory, J., R. Skaggs, R. Broadhead, R. Culbreath, J. Bailey, and T. Foutz. 1984. Hydrology and
water quality impacts of peat mining in North Carolina. Report 214. Water Resources
Research Institute, Raleigh, NC, 215 p.
Gregory, R. S. and T.G. Northcote. 1993. Surface, planktonic, and benthic foraging by juvenile
chinook salmon (Oncorhynchus tshawytscha) in turbid laboratory conditions. Canadian
Journal of Fisheries and Aquatic Science 50: 233-240.
2010 COASTAL HABITAT PROTECTION PLAN
Literature cited Page 509
Grimes, B. H., M.T. Huish, J.H. Kerby, and D. Moran. 1989. Species profiles: life histories and
environmental requirements of coastal fishes and invertebrates (Mid-Atlantic)--summer and
winter flounder. USFWS, Biological Rep. 82(11.112) , 13p.
Grimes, C. B., C.S. Manooch III, and G.R. Huntsman. 1982. Reef and rock outcropping fishes of the
outer continental shelf of North Carolina and South Carolina, and ecological notes on the red
porgy and vermilion snapper. Bulletin of Marine Science. 32(1): 277-289.
Grizzle, R. E., E.E. Hofmann, J.M. Klinck, E.N. Powell, J.N. Kraeuter, V.M. Bricelj, and S.C.
Buckner. 2003. A simulation model of the growth of hard clams (Mercenaria mercenaria),
IV. Effects of climate change. Journal of Shellfish Research 22(1): 333.
Grizzle, R. E., J.R. Adams, and L.J. Walters. 2002. Historical changes in intertidal oyster
(Crassostrea virginica) reefs in a Florida lagoon potentially related to boating activities.
Journal of Shellfish Research 21(2): 749-756.
Groen , C. L. and J.C. Schmulbach. 1978. The sport fishery of the unchannelized and channelized
middle Missouri River. Transaction of the American Fishery Society 107: 412-418.
Groffman, P. M., A.J. Gold, T.P. Husband, R.C. Simmons, and W.R. Eddleman. 1991. An
investigation into multiple uses of vegetated buffer strips. Providence, RI, NBP-91-63 .
Grossman, G. D., G.P. Jones, and W.J. Seaman Jr. 1997. Do artificial reefs increase regional fish
production? A review of existing data. Fisheries 22(4): 17-23.
Grossman, P. M., J.S. Baron, T. Blett, A.J. Gold, I. Goodman, L.H. Gunderson, B.M. Levinson, M.A.
Palmer, H.W. Paerl, G.D. Peterson, N.L. Poff, D.W. Rejeski, J.F. Reynolds, M.G. Turner, and
K.C. Weathers. 2006. Ecoogical thresholds: the key to successful environmental management
or an important concept with no practical application? Ecosystems 9: 1-13.
Guarini, J.-M., G.F. Blanchard, P. Gros, D. Gouleau, and C. Bacher. 2000. Dynamic model of the
short-term variability of microphytobenthic biomass on temperate intertidal mudflats. Marine
Ecology Progress Series 195: 291-303.
Guidetti, P., A. A. Terlizzi, S. Fraschetti, and F. Boero. 2003. Changes in Mediterranean rocky-reef
fish assemblages exposed to sewage pollution. Marine Ecology Progress Series 253: 269-
278.
Guinotte, J. M. and V.J. Fabry. 2008. Ocean Acidification and Its Potential Effects on Marine
Ecosystems. p. 320-342 in Annals of the New York Academy of Sciences. Year in Ecology
and Conservation Biology 2008. New York Academy of Sciences, New York, NY, 1134 ,
Abstract p.
Gunter, G. 1955. Mortality of oysters and abundance of certain associates as related to salinity.
Ecology 36: 601-605.
Guthrie, J. F. and C. W. Lewis. 1982. The clam-kicking fishery of North Carolina. Marine Fisheries
Review 44(1): 16-21.
Guthrie J.F., R.L. Kroger, H.R. Gordy, and C. W. Lewis. 1973. The long-haul fishery of North
Carolina. Marine Fisheries Review 35(12): 27-33.

2010 COASTAL HABITAT PROTECTION PLAN
Literature cited Page 510
Gutierrez, J. L., C.G. Jones, D.L. Strayer, and O.O. Iribarne. 2003. Mollusks as ecosystem engineers:
the role of shell production in aquatic habitats. Oikos 101(1): 79-90.
Guyer, R., S. Watson, G. Menezes, D. Siepart, and T. Smith. 2008. North Carolina Comprehensive
Water Quality Monitoring Forum. University of North Carolina-Charlotte, Charlotte, NC, 8p.
Hackney, C. T., G.B. Avery, L.A. Leonard, M. Posey, and T. Alphin. 2007. Chapter 8 - Biological,
chemical, and physical characteristics of tidal freshwater swamp forests of the lower Cape
Fear River/estuary, North Carolina. p. 183-222 in W.H. Conner, T. W. Doyle and K. W
Krauss. Ecology of tidal freshwater forested wetlands of the Southeastern United States.
Springer, 505 p.
Hackney, C. T. and G.F. Yelverton. 1990. Effects of human activities and sea level rise on wetland
ecosystems in the Cape Fear River estuary, North Carolina, USA. p. 55-61 in D.F. Whigham
(ed.). Wetlands Ecology and Management: Case Studies. Kluwer Academic Publishers,
Netherlands.
Hackney, C. T., J. Grimley, M. Posey, T. Alphin, and J. Hyland. 1998. Sediment contamination in
North Carolina's estuaries. Center for Marine Science Research, UNC-W, Wilmington, NC,
Publication #198 , 59p.
Hackney, C. T., L.B. Cahoon, C. Preziosi, and A. Norris. 2000. Silicon is the link between tidal
marshes and estuarine fisheries: a new paradigm. p. 543-552 in Weinstein, M. P. and D. A.
Kreeger eds. Concepts and controversies in tidal marsh ecology. Kluwer Academic Publishers,
The Netherlands, 875 p.
Hackney, C. T., M.H. Posey, S.W. Ross, and A.R. Norris. 1996. A review and synthesis of data on
surf zone fishes and invertebrates in the South Atlantic Bight and the potential impacts from
beach renourishment. Prepared for Wilmington District, US Army Corps of Engineers. UNC-
Wilmington, Wilmington, NC, 111 p.
Hackney, C. T., W.D. Burbanck, and O.P. Hackney. 1976. Biological and physical dynamics of a
Georgia tidal creek. Chesapeake Science 17: 271-280.
Hackney, C. T. and W.J. Cleary. 1987. Saltmarsh loss in southeastern North Carolina lagoons:
importance of sea level rise and inlet dredging. Journal of Coastal Research 3(1): 93-97.
Haines, A. C. 2004. Oyster restoration and management in coastal North Carolina. M.S. Thesis, Duke
University, Nicholas School of Environment and Earth Sciences, Beaufort, NC, 75 p.
Haines, E. B. 1979. Interactions between Georgia salt marshes and coastal waters: a changing
paradigm. p. 35-46 in R.J. Livingston (ed.). Ecological Processes in Coastal and Marine
Systems. Plenum, NY.
Hall, N. S., R.W. Litaker, E. Fensin, J.E. Adolf, H.A. Bowers, A.R. Place, and H.W. Paerl. 2008.
Environmental factors contributing to the development and demise of a toxic dinoflagellate
(Karlodinium veneficum) bloom in a shallow, eutrophic, lagoonal estuary. Estuaries and
Coasts 31: 402-418.
Hallegraef, G. M. 1998. Transport of toxic dinoflagellates via ships' ballast water: bioeconomic risk
assessment and efficacy of possible ballast water management strategies. Marine Ecology
2010 COASTAL HABITAT PROTECTION PLAN
Literature cited Page 511
Progress Series 168: 297-308.
Halpern, B. 2003. The impact of marine reserves: do reserves work and does reserve size matter?
Ecological Applications 13(1): S117-S137.
Hamilton, A. N. 2000. Gear impacts on Essential Fish Habitat in the southeastern region. NMFS,
Pascagoula, Ms, Unpub. rep. 41p.
Hamner, R. M., D.W. Freshwater, and P.E. Whitfield. 2007. Mitochondrial cytochrome b analysis
reveals two invasive lionfish species with strong founder effects in the western Atlantic.
Journal of Fish Biology 71(sb): 214-222.
Hardaway, C. S. 1980. Shoreline erosion and its relationship to the geology of the Pamlico River
estuary. M.S. Thesis, East Carolina University, Greenville, NC, 116 p.
Hardaway, C. S., G.R. Thomas, J.B. Glover, J.B. Smithson, M.R. Berman, and A.K. Kenne. 1992.
Bank erosion study. Applied Marine Science and Ocwan Engineering Spec. Rep. # 319: 1-
73.
Harding, J. H. and R. Mann. 2001. Diet and habitat use by bluefish, Pomatomus salatrix, in a
Chesapeake Bay estuary. Environmental Biology of Fishes 60: 401-409.
Harding, J. M. and R. Mann. 1999. Fish species in relation to restored oyster reefs, Piankatank River,
Virginia. Bulletin of Marine Science 65(1): 289-300.
Harding, J. M. and R. Mann. 2001. Oyster reefs as fish habitat: opportunistic use of restored reefs by
teansient fishes. Journal of Shellfish Research 20(3): 951-959.
Hardy, J. D. Jr. 1978a. Development of the fishes of the Mid-Atlantic Bight, an atlas of egg, larval,
and juvenile stages, Vol. II. Anguillidae through Sygnathidae. US Fish and Wildlife Service,
FWS/OBS-78/12 .
Hardy, J. D. Jr. 1978b. Development of the fishes of the Mid-Atlantic Bight, an atlas of egg, larval,
and juvenile stages, Vol. III. Aphredoderidae through Rachycentridae. US Fish and Wildlife
Service, FWS/OBS-78/12 .
Hare, J. O., J.A. Quinlan, F.E. Werner, B.O. Blanton, J.J. Govini, R.B. Forward, L.R. Settle, and D.E.
Hoss. 1999. Larval transport during winter in the SABRE study area: results of a coupled
vertical larval behavior-three-dimensional circulation model. Fisheries Oceanography. 8(2):
57-76.
Hargis, W. J. Jr. and D.S. Haven. 1988. Rehabilitation of the troubled oyster industry of the lower
Chesapeake Bay. Journal of Shellfish Research. 7(2): 271-279.
Hargis, W. J. Jr. and D.S. Haven. 1999. Chesapeake Bay oyster reefs, their importance, destruction
and guidelines for restoring them. p. 329-358 in M.W. Luckenbach, R. Mann and J. A.
Wesson eds. Oyster reef habitat restoration: a synopsis of approaches. Virginia Institute of
Marine Science Press, 1999.
Harley, C. D. G., A.R. Hughes, K.M. Hultgren, B.G. Miner, C.J.B. Sorte, C.S. Thornber, L.F.
Rodriguez, L. Tomanek, and S.L. Williams. 2006. The impacts of climate change in coastal
2010 COASTAL HABITAT PROTECTION PLAN
Literature cited Page 512
marine systems. Ecology Letters 9(2): 228-241.
Harned, D. A., G. McMahon, T.B. Spruill, and M.D. Woodside. 1995. Water-quality assessment of
the Albemarle-Pamlico drainage basin, North Carolina and Virginia - characterization of
suspended sediment, nutrients, and pesticides. United States Geological Survey, Open-File
Report 95-191 , 131p.
Hartness, T. S. and D.R. Pearson. 1977. Estuarine shoreline inventory for Pender, New Hanover, and
Brunswick Counties, North Carolina: NC Coastal Resources Commission Report. Unpub.
Rep. 47p.
Hartwell, S. I., R.W. Alden, D.A. Wright, S. Ailstock, and R. Kerhin. 2000. Correlation of measures
of ambient toxicity and fish community diversity in a Chesapeake Bay tributary, Maryland,
USA: a biological, chemical, and geological assessment. Environmental Toxicology and
Chemistry 19: 1753-1763.
Hartwell, S. I. ed. 1998. Biological Habitat Quality Indicators for Essential Fish Habitat. NOAA
Technical Memorandum NMFS-F/SPO-32 .
Haskin, H. H., L.A. Stauber, and G. Mackin. 1966. Minchinia nelsoni n. sp. (Haplosporida,
Haplosporidiidae): causative agent of the Delaware Bay oyster epizootic. Science 153: 1414-
1416.
Hassler, W. W., N.L. Hill, and J.T. Brown. 1981. The status and abundance of striped bass, Morone
saxatilis, in the Roanoke River and Albemarle Sound, North Carolina, 1956-1980. NC
Division of Marine Fisheries, Morehead City, NC, Special Scientific Report No. 38 , 156p.
Hassler, W. W. and R.P. Rainville. 1975. Techniques for hatching and rearing cobia, Rachycentron
canadum, in the Chesapeake Bay area, with observations of juvenile specimens. University of
North Carolina Sea Grant College Program, Raleigh, NC, Publication UNC-SG-75-30 , 26p.
Hauxwell, J., J. Cebrian, C. Furlong, and I. Valiela. 2000. Macroalgal canopies contribute to eelgrass
(Zostera marina) decline in temperate estuarine ecosystems. Ecology 82: 1007-1022.
Haven, D. and R. Morales-Alamo. 1970. Filtration of particles from suspension by American oyster,
Crassostrea virginica. Biological Bulletin 139: 248-264.
Havens, K. E. 2003. Submerged aquatic vegetation correlations with depth and light attenuating
materials in a shallow subtropical lake. Hydrobiologia 493: 173-186.
Hawkins, J. H. 1980. Investigations of anadromous fishes of the Neuse River, North Carolina. DMF,
Morehead City, NC, Special Science Report No. 34 , 111p.
Hay, M. E. and J.P. Sutherland. 1988. The ecology of rubble structures of the South Atlantic Bight: a
community profile. USFWS, Biological Rep. 85(7.20) , 67 p.
Heath, R. C. 1975. Hydrology of the Albemarle-Pamlico region, North Carolina: a preliminary report
on the impact of agricultural developments. US Geological Survey Water Resources
Investigations 80(44): 1-85.
Heck, K. L., K.W. Able, M.P. Fahay, and C.T. Roman. 1989. Fishes and decapod crustaceans of Cape
2010 COASTAL HABITAT PROTECTION PLAN
Literature cited Page 513
Cod eelgrass meadows: species composition, seasonal abundance patterns and comparison
with unvegetated substrates. Estuaries 12(2): 59-65.
Heck, K. L., T.J Carruthers, C.M. Duarte, A. R. Hughes, G. Kendrick, R.J. Orth, and S.W. Williams.
2008. Trophic transfers from seagrass meadows subsidize diverse marine and terrestrial
consumers. Ecosystems 11: 1198-1210.
Heck, K. L. Jr. and R. J. Orth. 1980. Structural components of eelgrass (Zostera marina) meadows in
the lower Chesapeake Bay - decapod crustacea. Estuaries 4: 289-295.
Hefner, J. M. and J.D. Brown. 1985. Wetland trends in the southeastern United States. Wetlands 4:
1-11.
Heinz Center. 2000. Evaluation of erosional hazards . Final Report for Federal Emergency
Management Agency, Contract # EMW-97-CO-0375 , 205 p.
Heinz Center . 2002. The State of the Nation's Ecosystems: Measuring the Land, Waters, and Living
Resources of the United States. Cambridge University Press, New York, NY, 276p.
Hemminga, M. A. and C.M. Duarte. 2000. Seagrass ecology. Cambridge Univ Press, NY.
Henderson, J. and J. O'Neal. 2003. Economic values associated with construction of oyster reefs by
the Corps of Engineers. U.S. Army Engineer Research and Development Center, Vicksburg,
MS, EMRRP Technical Notes Collection (ERDC TN-EMRRP-ER-01) , 10p.
Henman, J. and B. Poulter. 2008. Inundation of freshwater peatlands by sea level rise: uncertainty and
potential carbon cycle feedbacks. Journal of Geophysical Research-Biogeosciences 113(G1).
Henson, M. 1995. Forest practice guidelines and best management practices - implementation and
effectiveness survey on timber operations in North Carolina. NC DEHNR, Raleigh, NC,
Unpub. rep. 19p.
Hermelin, J. G., C. Bouchon, and J.S. Hong. 1981. Pollution impact on the distribution of echinoderm
populations of hard bottoms in Provence (North Western Mediterranean Sea). Tethys 10(1):
13-36.
Hernández Arana H.A., R.M. Warwick, M.J. Attrill, A.A. rowden, and G. Gold-Bouchot. 2005.
Assessing the impact of oil-related activites on benthic macrofauna assemblages of the
Campeche Shelf, southern Gulf of Mexico. Marine Ecology Progress Series 28: 89-107.
Hester, J. M. Jr. and B.J. Copeland . 1975. Nekton population dynamics in the Albemarle Sound and
Neuse River estuaries. University of North Carolina Sea Grant, UNC-SG-75-02 , 129p.
Hetler, W. F. Jr. 1998. Abundance and size of dominant winter-immigrating fish larvae at two inlets
into Pamlico Sound, NC. Brimleyana 25: 144-155.
Hettler, W. F. and A.J. Chester. 1982. The relationship of winter temperature and spring landings of
pink shrimp, Penaeus duorarum, in North Carolina. Fishery Bulletin 80(4): 761-768.
Hettler, W. F. J. and D.L. Barker. 1993. Distribution and abundance of larval fish at two North
Carolina inlets. Estuarine, Coastal, and Shelf Sciences 37: 161-179.
2010 COASTAL HABITAT PROTECTION PLAN
Literature cited Page 514
Hightower, J. E. and J.R. Jackson. 2000. Distribution and natural mortality of stocked striped bass in
Lake Gaston, North Carolina. North Carolina Wildlife Resources Commission , Research
Reports Study Number 5 .
Hildebrand, S. F. and L.E. Cable. 1934. Reproduction and development of whiting or kingfishes,
drums, spot, croaker, and weakfishes or seatrouts, family Sciaenidae, of the Atlantic coast of
the United States. Bulletin of the U.S. Bureau of Fisheries 48: 41-117.
Hildebrand, S. F. and W.C. Schroeder. 1972. Fishes of the Chesapeake Bay. Smithsonian Institution
Press, Washington, DC, 388p.
Hill, J., J.W. Evans, and M.J. Van Den Avyle. 1989. Species profiles: life histories and environmental
requirements of coastal fishes and invertebrates (South Atlantic )--striped bass. Fish Wildl.
Serv. / U.S. Army Corps of Engineers, Biol. Rep. 82(11.118) / TR EL-82-4 , 35p.
Hinck, J. E., V.S. Blazer, C.J. Schmitt, D.M. Papoulias, and D.E. Tillitt. 2009. Widespread occurrence
of intersex in black basses (Micropterus spp. from US rivers, 1995- 2004. Aquatic
Toxicology 95(1): 60-70.
Hingston, J. A., C.D. Collins, R.J. Murphy, and J.N. Lester. 2001. Leaching of chromated copper
arsenate wood preservatives: a review. Environmental Pollution 111: 53-66.
Hingston, J. A., R.J. Murphy, and J.N. Lester. 2006. Monitoring losses of copper based wood
preservatives in the Thames Estuary. Environmental Pollution 143(2): 367-375.
Hinz, H., J.G. Hiddink, J. Forde, and M.J. Kaiser. 2008. Large-scale response of nematode
communities to chronic otter-trawl disturbance. Canadian Journal of Fisheries and Aquatic
Sciences 65: 723-732.
Hirst, J. A. and M.J. Attrill. 2008. Small is beautiful: an inverted view of habitat fragmentation in
seagrass beds. Estuarine, Coastal, and Shelf Science 78: 811-818.
Hobbs, C. H., C.B. Landry, and J.E. Perry. 2008. Assessing anthropogenic and natural impacts on
ghost crabs (Ocypode quadrata) at Cape Hatteras National Seashore, North Carolina. Journal
of Coastal Research 24(6): 1450-1458.
Hoegh-Guldberg, O., P.J. Mumby, A.J. Hooten, R.S. Steneck, P. Greenfield, E. Gomez, C.D. Harvell,
P.F. Sale, A.J. Edwards, K. Caldeira, N. Knowlton, C.M. Eakin, R. Iglesias-Prieto, N.
Muthiga, R.H. Bradbury, A. Dubi, and M.E. Hatziolos. 2007. Coral reefs under rapid climate
change and ocean acidification. Science 318(5857): 1737-1742.
Hofmann, E. E., J.M. Klinck, S.E. Ford, and E.N. Powell. 1999. Disease dynamics: modeling the
effect of climate change on oyster disease. Journal of Shellfish Research 18(1): 329.
Hofmann, E. E. and T.M. Powell. 1998. Environmental variability effects on marine fisheries: four
case histories. Ecological Applications 8(1): S23-S32.
Holder, D. R., L. McSwain, W.D. Hill Jr., W. King, and C. Sweet. 1970. Population studies of
streams. Game and Fish Commission, Department of Natural Resources, Atlanta, GA, Annual
Progress Report F-21-2, Study XVI .
2010 COASTAL HABITAT PROTECTION PLAN
Literature cited Page 515
Holdway, D. A. 2002. The acute and chronic effects of wastes associated with offshore oil and gas
production on temperate and tropical marine ecological processes. Marine Pollution Bulletin
44(3): 185-203.
Holland, A., R. Zingmark, and J. Dean. 1974. Quantitative evidence concerning the stabilization of
sediments by marine benthic diatoms. Marine Biology 27: 191-196.
Holland, A. F., D.M. Sanger, C.P. Gawle, S.B. Lerberg, M.S. Santiago, G.H.M. Riekerk, L.E.
Zimmerman, and G.I. Scott. 2004. Linkages between tidal creek ecosystems and the
landscape and demographic attributes of their watersheds. Journal of Experimental Marine
Biology and Ecology 298: 151-178.
Holland, B. F. J. and G.F. Yelverton. 1973. Distribution and biological studies of anadromous fishes
offshore North Carolina . NC Department of Natural and Economic Resources, Division of
Commercial and Sport Fisheries, Morehead City, NC, Special Sci. Rep. No. 24, AFS-5-3 ,
132p.
Holmes, P. E., M.L. Tarves, R. Tomio, and W. Jansen. 1985. Fish and fish habitat impact study of
seven British Columbia coastal marinas, 1984. Canadian Manuscript of Fisheries and Aquatic
Sciences 1809: 106 p.
Hong, J.-S. 1983. Impact of the pollution on the benthic community. Environmental impact of the
pollution on the benthic coralligenous community in the Gulf of Fos, northwestern
Mediterranean. Bulletin of the Korean Fisheries Society 16(3): 273-290.
Hopple, J. A. and G.D. Foster. 1996. Hydrophobic organochlorine compounds sequestered in
submerged aquatic macrophytes (Hydrilla verticillata (L.F.) Royle) from the tidal Potomac
River (USA). Environmental Pollution 94(1): 39-46.
Horton, B. P., R. Corbett, S.J. Culver, R.J. Edwards, and C. Hillier. 2006. Modern saltmarsh diatom
distributions of the Outer Banks, North Carolina, and the development of a transfer function
for high resolution reconstructions of sea level. Estuarine. Coastal and Shelf Science 69(3-4):
381-394.
Hough, P. and M. Robertson. 2009. Mitigation under section 404 of the Clean Water Act: where it
comes from, what it means. Wetlands Ecology and Management (17): 15-33.
Hovel, K. A. 2003. Habitat fragmentation in marine landscapes: relative effects of habitat cover and
configuration on juvenile crab survival in California and North Carolina seagrass beds.
Biological Conservation 110: 401-412.
Hovel, K. A., M.S. Fonseca, D.L. Myer, W.J. Kenworthy, and P.E.Whitfield. 2002. Effect of seagrass
landscape structure, structural complexity and hydrodynamic regime on macrofaunal densities
in North Carolina seagrass beds. Marine Ecology Progress Series 243: 11-24.
Hoyer, M. V. and D.E. Canfield. 1993. Aquatic macrophytes and their relation to fish populations of
Florida lakes. Abstracts, Thirty-third Annual Meeting, The Aquatic Plant Management
Society, Inc. South Carolina Aquatic Plant Management Society, Inc., Charleston, South
Carolina.
Hoyer, M. V. and D.E. Canfield Jr. 1996. Lake size, aquatic macrophytes, and largemouth bass
2010 COASTAL HABITAT PROTECTION PLAN
Literature cited Page 516
abundance in Florida Lakes: A reply. Journal of Aquatic Plant Management 34: 48-50.
Huanxin, W., Z. Lejun, and B.J. Presley. 2000. Bioaccumulation of heavy metals in oyster
(Crassostrea virginica) tissue and shell. Environmental Geology 39(11): 1216-1226.
Huffman, R. L. 1999. Evaluating the impacts of older swine lagoons on shallow groundwater. p. 92-98
In: Proceedings of the 1999 amimal waste management symposium, January 27-28, 1999,
Embassy Suites Hotel and Conference Center. Cary, NC.
Hughes, A. R. and J.H. Grabowski. 2006. Habitat context influences predator interference interactions
and the strength of resource partitioning. Oecologia 149: 256-264.
Hughes, J. E., L.A. Deegan, M.J. Weaver, and J.E. Costa. 2002. Regional application of an index of
estuarine biotic integrity based on fish communities. Estuaries 25(2): 250-263.
Hulathduwa, Y. D. and K.M. Brown. 2006. Relative importance of hydrocarbon pollutants, salinity
and tidal height in colonization of oyster reefs. Marine Environmental Research 62: 301-314.
Hulson, P.-J. F., S.E. Miller, T.J. Quinn II, G.D. Marty, S.D. Moffitt, and F. Funk . 2008. Data
conflicts in fishery models: incorporating hydroacoustic data into the Prince William Sound
Pacific herring assessment model. ICES Journal of Marine Science 65: 2543.
Hunt, J. H., R.J. Carroll, V. Chinchilli, and D. Frankenberg. 1980. Relationship Between
Environmental Factors and Brown Shrimp Production in Pamlico Sound, North Carolina. NC
Department of Natural Resources and Community Development, Division of Marine Fisheries
, Morehead City, NC, Special Scientific Report #33 , 29p.
Huntsman, G. R. 1979. The biological bases of reef fishery production. Proceedings of the Gulf and
Caribbean Fisheries Institute, Miami Beach, Fl : 167-174.
Huntsman, G. R. and C.S. Manooch III. 1978. Coastal Pelagic and Reef Fishes in the South Atlantic
Bight. Marine Recreational Fisheries : 97-106.
Hurley, L. M. 1990. Field Guide to the Submerged Aquatic Vegetation of Chesapeake Bay. USFWS,
Chesapeake Bay Estuary Program, Annapolis, Md, 48p.
Hwang, H. and G.D. Foster. 2006. Characterization of polycyclic aromatic hydrocarbons in urban
stormwater runoff flowing into the tidal Anacostia River, Washington, D.C., USA.
Environmental Pollution 140(3): 416-426.
Hyland, J., C. Cooksey, W.L. Balthis, M. Fulton, D. Bearden, G. McFall, and M. Kendall. 2006. The
soft-bottom macrobenthos of Gray's Reef National Marine Sanctuary and nearby shelf waters
off the coast of Georgia, USA. Journal of Experimental Marine Biology and Ecology 330:
307-326.
Hyland, J., D. Hardin, M. Steinhauer, D. Coats, R. Green, and J. Neff. 1994. Environmental impact of
offshore oil development on the outer continental shelf and slope off Point Arguello,
California. Marine Environmental Research. London 37(2): 195-229.
Hyland, J. L., W.L. Balthis, C.T. Hackney, and M.Posey. 2000. Sediment quality of North Carolina
Estuaries: An integrative assessment of sediment contamination, toxicity, and condition of
2010 COASTAL HABITAT PROTECTION PLAN
Literature cited Page 517
benthic fauna. Journal of Aquatic Ecosystem Stress and Recovery 8(1): 107-124.
Hyland, J. L., W.L. Balthis, M. Posey, and C.T. Hackney. 2004. The soft-bottom macrobenthos of
North Carolina estuaries. Estuaries 27(3): 501-514.
Iannuzzi, T. J., M.P. Weinstein, K.G. Sellner, and J.C. Barrett. 1996. Habitat disturbance and marina
development: An assessment of ecological effects. I. Changes in primary production due to
dredging and marina construction. Estuaries 19(2A): 257-271.
Ibison, N. A., J.C. Baumer, C.L. Hill, N.H. Burger, and J.E. Frye. 1992. Eroding bank nutrient
verification study for the Lower Chesapeake Bay. Department of Conservation and
Recreation, Division of Soil and Water Conservation, Shoreline Programs Bureau, Gloucester
Point, Va, 79 p.
Ibison, N. A., J.C. Buaumer, C.L. Hil, N.H. Burger, and J.E. Frye. 1992. Eroding Bank Nutrient
Verification Study for the Lower Chesapeake Bay. Department of Conservation and
Recreation. Division if Soil and Water Conservation.
Shoreline Programs Bureau. Gloucester Point, Virginia., Gloucester Point, Virginia.
Imberger, R. 1983. The influence of water motion on the distribution and transport of materials in a
salt marsh estuary. Limnology and Oceanography 28: 201-214.
Incardona, J. P., M.G. Carls, H.L. Day, C.A. Sloan, J.L. Bolton, K. C. T, and N.L. Scholz. 2009.
ardiac arrhythmia is the primary response of embryonic Pacific herring (Clupea pallasi)
exposed to crude oil during weathering. Environmental Science and Technology C: 201-207.
Inman, D. and R. Dolan. 1989. The Outer Banks of North Carolina: budget of sediment and inlet
dynamics along a migrating barrier system. Journal of Coastal Research 5(2): 192-237.
Inoue, M. and W.J. Wiseman. 2000. Transport, mixing and stirring processes in a Louisiana estuary: a
model study. Estuarine and Coastal Shelf Science 50: 449-466.
IPCC (Intergovernmental Panel on Climate Change). 2007. Climate Change 2007: Synthesis Report.
73p.
IPPC (Intergovernmental Panel on Climate Change). 1990. Climate change: the Intergovernmental
Panel on Climate Change scientific assessment: J.T. Houghton, G.J. Jenkins, and J.J.
Epharuams, eds. Press Syndicate, University of Cambridge, New York, NY, 365p.
Irlandi, E. A. 1994. Large- and small-scale effects of habitat structure on rates of predation: How
percent coverage of seagrass affects rates of predation and siphon nipping on an infaunal
bivalve. Oecologia 98(2): 176-183 .
Irlandi, E. A. 1997. Seagrass patch size and survivorship of an infaunal bivalve. Oikos 78(3): 511-
518.
Irlandi, E. A. and M.K. Crawford. 1997. Habitat linkages: the effect of intertidal saltmarshes and
adjacent subtidal habitats on abundance, movement, and growth of an estuarine fish.
Oecologia 110(2): 222-230.
Ivanina, A. V., E. Habinck, and I.M. Sokolova. 2008. Differential sensitivity to cadmium of key
2010 COASTAL HABITAT PROTECTION PLAN
Literature cited Page 518
mitochondrial enzymes in the eastern oyster, Crassostrea virginica Gmelin (Bivalvia:
Ostreidae). Comparative Biochemistry and Physiology C-Toxicology & Pharmacology
148(1): 72-79.
Iwanowicz, L. R., V.S. Blazer, C.P. Guy, A.E. Pinkney, J.E. Mullican, and D.A. Alvarez. 2009.
Reproductive health of bass in the Potomac, USA draiage: part 1. Exploring the effects of
proximity to wastewater treatment plant discharge. Environmental Toxicology and Chemistry
28(5): 1072-1083.
Jaap, W. C. 1984. The ecology of the South Florida coral reefs: a community profile. US Fish and
Wildlife Service, FWS/OBS 82/08 , 138p.
Jackivicz, T. P. Jr. and L.N. Kuzminski. 1973. A review of outboard motors effects on the aquatic
environment. Journal of the Water Pollution Control Federation 48(8): 1759-1770.
Jackson, J. B. C., M. Kirby, W.H. Berger, K.A. Bjorndal, L.W. Botsford, B.J. Bourque, R.H.
Bradbury, R. Cooke, J. Erlandson, J.A. Estes, T.P. Hughes, S. Kidwell, C.B. Lange, H.S.
Lenihan, J.M. Pandolfi, C.H. Peterson, R.S. Steneck, M.J. Tegner, and R.R. Warner. 2001.
Historical overfishing and the recent collapse of coastal ecosystems. Science 293: 629-638.
Jackson, T. J., T.L. Wade, T.J. McDonald, D.L. Wilkinson, and J.M. Brooks. 1994. Polynuclear
aromatic hydrocarbon contaminants in oysters from the Gulf of Mexico (1986-1990).
Environmental Pollution 83: 291-298.
Jacobs, J. M., M.R. Rhodes, A. Baya, R. Reimschuessel, H. Townsend, and R.M. Harrell. 2009.
Influence of nutritional state on the progression of and severity, of mycobacteriosis in striped
bass Morone saxatilis. Diseases of Aquatic Organisms 87: 183-197.
Jacobs, R. P. W. M. 1980 . Effects of the ‗Amoco Cadiz‘ oil spill on the seagrass community at
Roscoff with special reference to the benthic infauna. Marine Ecology Progress Series 2:
207-212.
Jacot, A. P. 1920. Age, growth and scale characters of the mullets, Mugil cephalus and M. curema.
Transactions of the American Microscop. Society 39: 199-229.
Jartun, M., R.T. Ottesen, E. Steinnes, and T. Volden. 2008. Runoff of particle bound pollutants from
urban impervious surfaces studied by analysis of sediments from stormwater traps. Science of
the Total Environment 396(2-3): 147-163.
Jenkins, J. B., A. Morrison, and C.L. MacKenzie Jr. 1997. The molluscan fisheries of the Canadian
Maritimes. p. 15-44 in MacKenzie Jr., C. L., Burrell Jr., V. G., Rosenfield, A., and Hobart
(eds.), W. L. The History, Present Condition, and Future of the Molluscan Fisheries of North
and Central America and Europe, Vol. 1. Atlantic and Gulf Coasts. U.S. Department of
Commerce, NOAA, NMFS, Silver Spring, MD, NOAA Tech. Rept. NMFS 127 .
Jenkins, R. E. and N.M. Burkhead. 1993. Freshwater fishes of Virginia. American Fisheries Society,
Bethesda, Maryland, 1079p.
Jennings, C. A. 1985. Species requirements of coastal fishes profiles: life histories and environmental
and invertebrates (Gulf of Mexico) -- sheepshead. U.S. Fish Wildl. Serv. / U.S. Army Corps of
Engineers, Biol. Rep. 82(11.29) / TR EL-82-4 , 10p.
2010 COASTAL HABITAT PROTECTION PLAN
Literature cited Page 519
Jewett, S. C., T.A. Dean, R.O. Smith, and A. Blanchard. 1999. ‗Exxon Valdez‘ oil spill: impacts and
recovery in the soft-bottom benthic community in and adjacent to eelgrass beds. Marine
Ecology Progress Series 185: 1999.
Johnson, D. R. and N.A. Funicelli. 1991. Spawning of the red drum in Mosquito Lagoon, east-central
Florida. Estuaries 14(1): 74-79.
Johnson, G. D. 1978. Development of fishes of the Mid-Atlantic Bight, an atlas of egg, larval, and
juvenile stages, Vol. IV. Carangidae through Ephippidae. US Fish and Wildlife Service
Biological Service Program, FWS/OBS-72/12 .
Johnson, H. B., B. F. Jr. Holland, and S. G. Keefe. 1977. Anadromous Fisheries Research Program,
Northern Coastal Area. p. in North Carolina Division of Marine Fisheries. NC Division of
Marine Fisheries Complete Report. NC Division of Marine Fisheries, AFCS-11 , p.
Johnson, J. C. and M.K. Orbach. 1996. Effort management in North Carolina fisheries: a total systems
approach. NC Sea Grant College Program and Institute for Coastal and Marine Resources,
UNC-SG-96-08, Technical Report 96-07 , 155p.
Johnson, L. L., T.K. Collier, and J.E. Stein. 2002. An analysis in support of sediment quality
thresholds for polycyclic aromatic hydrocarbons (PAHs) to protect estuarine fish . Aquatic
Conservation: Marine and Freshwater Ecosystems 12(5): 517-538.
Jokiel, P. L. 1978. Effects of water motion on coral reefs. Journal of Experimental Marine Biology
and Ecology 35: 87-97.
Jone, N. A. and A.S. Overton. 2009. Habitat specific and cohort specific growth and mortality of
larval river herring in the Tar-Pamlico River, North Carolina. East Carolina University,
Greenville, NC, slide presentation , 21p.
Jones, N. A. 2009. Habitat-specific and cohort-specific growth and mortality of larval river harring in
the Tar-Pamlico River, North Carolina. Overton, A.S., ECU Department of Biology,
Greenville
Jones, R. A. and T.M. Sholar. 1981. The effects of freshwater discharge on estuarine nursery areas of
Pamlico Sound. NC Division of Marine Fisheries, Morehead City, NC, Project CEIP 79-11 ,
60p.
Jordan, L. K. B., D.S. Gilliam, and R.E. Spieler. 2005. Reef fish assemblage structure affected by
small-scale spacing and size variations of artificial patch reefs. Journal of Experimental
Marine Biology and Ecology 326(2): 170-186.
Jordan, S., C. Stenger, R. B. M. Olson, and K. Mountford. 1992. Chesapeake Bay dissolved oxygen
goal for restoration of living resources. United States Environmental Protection Agency,
Annapolis, MD.
Joseph, E. B., J.J. Norcross, and W.H. Massmann. 1964. Spawning of the cobia, Rachycentron
canadum, in the Chesapeake Bay area, with observations of juvenile specimens. Chesapeake
Science. 5(1): 67-71.
Jung, J. H., U.H. Yim, G.M. Han, and W.J. Shim. 2009. Biochemical changes in rockfish, Sebastes
2010 COASTAL HABITAT PROTECTION PLAN
Literature cited Page 520
schlegeli, exposed to dispersed crude oil. Comparative Biochemistry and Physiology Part
C(150): 218-223.
Junk, W. J., P.B. Bayley, and R.E. Sparks. 1989. The floodplain pulse concept in river-floodplain
systems. p. 110-127 in D.P. Dodge (ed.). Proceedings of the International Large River
Symposium . Canadian Special Publications Aquatic Sciences 106 .
Jutte, P. C., L.E. Zimmerman, R.F. Van Dolah, G.Y. Ojeda, and P.T. Gayes. 2001b. Final report. An
environmental monitoring study of the Myrtle Beach renourishment project: physical and
biological assessment of offshore sand borrow sites. Phase III - Surfside Borrow Area. SC
DNR and Coastal Carolina University, Charleston, SC, 80p.
Jutte, P. C., R.F. Van Dolah, G.Y. Ojeda, and P.T. Gayes. 2001a. Final report. An environmental
monitoring study of the Myrtle Beach renourishment project: physical and biological
assessment of offshore sand borrow sites. Phase II - Cane South Borrow Area. SC DNR and
Coastal Carolina University, Charleston, SC, 70p.
Jutte, P. C., R.F.Van Dolah, and M.V.Levison . 1999. An environmental monitoring study of the
Myrtle Beach renourishing project: intertidal benthic community assessment. Phase II- Myrtle
Beach. Final Report, prepared by Marine Resources Division; submitted to US Army Corps of
Engineers. SC Department of Natural Resources, Charleston, SC, 34p.
Kaiser, M. J. and B.E. Spencer. 1996. Behavioural responses of scavengers to beam trawl disturbance.
p. 116-123 in S.P.R. Greenstreet and M. L. Tasker (eds.). Aquatic predators and their prey.
Fishing News Book, Oxford.
Kao, C. M., J.Y. Wang, and M.J. Wu. 2001. Evaluation of atrazine removal processes in a wetland.
Water Science and Technology 44(11-12): 539-544.
Kao, C. M. and M.J. Wu. 2001. Control of non-point source pollution by a natural wetland. Water
Science and Technology 43(5): 169-174.
Kapolnai, A., R.E. Werner, and J.O. Blanton. 1996. Circulation, mixing, and exchange processes in
the vicinity of tidal inlets. Journal of Geophysical Research 101(14): 253-268.
Kauffman-Axelrod, J. L. and S.J. Steinberg. 2010. Development and application of an automated GIS
based evaluation to prioritize wetland restoration opportunities. Wetlands 30: 437-448.
Kaumeyer, K. R. and E.M. Setzlter-Hamilton. 1982. Effects of pollutants and water quality on
selected estuarine fish and invertebrates: a review of the literature. US Environmental
Protection Agency, Chesapeake Bay Program, Annapolis, MD, UMCEED Ref. no. 82-13-
CBL , 171p.
Kay, X. 1991. Invasive aquatic and wetland plants field guide. UNC Sea Grant , Raleigh, NC, UNC-
SG-01-15 , 42p.
Keefe, S. B. and R.C. Harriss Jr. 1981. Preliminary assessment of non-anadromous fishes of the
Albemarle Sound. NC Division of Marine Fisheries, Morehead City, NC, Project 2-324-R ,
46p.
Keener, P., G.D. Johnson, B.W. Stender, E.B. Brothers, and H.R. Beatty. 1988. Ingress of postlarval
2010 COASTAL HABITAT PROTECTION PLAN
Literature cited Page 521
gag, Mycteroperca microlepis (pisces, serranidae), through a South Carolina barrier island
inlet. Bulletin of marine science 42(3): 376-396.
Keister, J. E., E.D. Houde, and D.L. Breitburg. 2000. Effects of bottom-layer hypoxia on abundances
and depth distributions of organisms in Patuxent River, Chesapeake Bay. Marine Ecology
Progress Series 205: 43-59.
Keller, A. E. 1996. Contaminant impacts on native freshwater mussels - lethal and sublethal responses
relative to water quality criteria. Journal of Shellfish Research 15(2): 484-485.
Kelty, R. and S. Bliven. 2003. Environmental and aesthetic impacts of small docks and piers. NOAA
Coastal Ocean Program, Silver Springs, MD, Workshop report: developing a science-based
decision support tool for small dock management, phase 1: status of the science , 62p.
Kemp, W. M., R. Batiuk, R. Bartleson, P. Bergstrom, V. Carter, C.L. Gallegos, W. hunley, L. Karrh,
E.W. Koch, J.M. Landwehr, K.A. Moore, L. Murray, M. Naylor, N.B. Rybicki, J.C.
Stevenson, and D.J. Wilcox . 2004. Habitat requirements for submerged aquatic vegetation in
Chesapeake Bay: water quality, light regime, and physical-chemical factors. Estuaries 27(3):
363-377.
Kemp, W. M., W.R. Boynton, J.E. Adolf, D.F. Boesch, W.C. Boicourt, G. Brush, J.C. Cornwell, T.R.
Fisher, P.M. Glibert, J.D. Hagy, LW. Harding, E.D. Houde, D.G. Kimmel, W.D. Miller, R.I.E.
Newell, M.R. Roman, E.M. Smith, and J.C. Stevenson. 2005. Eutrophication of Chesapeake
Bay: historical trends and ecological interactions. Marine Ecology Progress Series 303: 1-29.
Kemp, W. M., W.R. Boynton, R.R. Twilley, and J.C. Means. 1983. The decline of submerged
vascular plants in upper Chesapeake Bay: Summary of results concerning possible causes.
Marine Technology Society Journal 17: 78-89.
Kendall, M. S., L.J. Bauer, and C.F.G. Jeffrey. 2008. Influence of benthic features and fishing
pressure on size and distribution of three exploited reef fishes from the southeastern United
States. Transactions of the American Fisheries Society 137(4): 1134-1146.
Kennedy, V. S. 1991. Eastern oyster Crassostrea virginica. p. 3-1--3-20 in Funderburk et al. (eds.).
Habitat Requirements of Chesapeake Bay Living Resources (2nd edition). Chesapeake Bay
Research Consortium, Inc., Solomans, MD.
Kennedy, V. S. 1996. The ecological role of eastern oyster, Crassostrea virginica, with remarks on
disease. Journal of Shellfish Research 15: 177-183.
Kennedy, V. S. 1996. The ecological role of the eastern oyster, Crassostrea virginica, with remarks
on disease. Journal of Shellfish Research 15: 177-183.
Kennedy, V. S., R.I.E. Newell, and A.F. Ebele. 1996. The Eastern Oyster, Crassostrea virginica.
Maryland Sea Grant College, College Park, MD.
Kennedy, V. S., W.H. Roosenburg, M. Castagna, and J.A. Mihursky. 1974. Mercenaria mercenaria
(Mollusca: Bivalvia): temperature-time relationship for survival of embryos and larvae.
Fisheries Bulletin 72(4): 1160-1166.
Kennicutt, M. C., R.H. Green, P. Montagna, and P.F. Roscigno. 1996. Gulf of Mexico offshore
2010 COASTAL HABITAT PROTECTION PLAN
Literature cited Page 522
operations monitoring experiment (GOOMEX), phase I: sublethal responses to contaminant
exposure-introduction and overview. Canadian Journal of Fisheries and Aquatic Sciences 53:
2540-2553.
Kennish, M. J. 1976. Monitoring thermal discharge: a natural method. Underwater Naturalist 9(4):
8-11.
Kenworthy, W. J. and D.E. Haunert. 1991. The light requirements of seagrasses: proceedings of a
workshop to examine the capability of water quality criteria, standards and monitoring
progress to protect seagrasses. National Oceanic and Atmospheric Administration, Beaufort,
NC, Tech. Memo. NMFS-SEFC-287 , 181p.
Kenworthy, W. J. and G.W. Thayer. 1984. Production and decomposition of the roots and rhizomes
of seagrasses, Zostera marina and Thalassia testudinum, in temperate and subtropical marine
ecosystems. Bulletin of Marine Science 5: 365-379.
Kenworthy, W. J., M.S. Fonseca, P.E. Whitfield, K. Hammerstrom, and A.C. Schwarzschild. 2000. A
comparison of two methods for enhancing the recovery of seagrasses into propeller scars:
Mechanical injection of a nutrient and growth hormone solution vs. defecation by roosting
seabirds. Center for Coastal Fisheries and Habitat Research, NOAA, Beaufort, NC, Final
report , 40 p.
Keppler, C. J., J. Hoguet, K. Smith, A.H. Ringwood, and A.J. Lewitus. 2005. Sublethal effects of the
toxic alga Heterosigma akashiwo on the southeastern oyster (Crassostrea virginica). Harmful
Algae 4(2): 275-285.
Kerhin, R. T. and J. Halka. 1981. Beach changes associated with bulldozing of the lower foreshore.
Maryland Geological Survey, Open File Report 7: 28 pp.
Key, P. B., M.H. Fulton, G.I. Scott, S.L. Layman, and E.F. Wirth. 1998. Lethal and sublethal effects
of malathion on three life stages of the grass shrimp, Palaemonetes pugio. Aquatic Toxicology
40: 311-322.
Kidd, K. A., P.J. Blanchfield, K.H. Mills, V.P. Palace, R.E.Evans, J.M. Lazochak, and R.W. Flick.
2007. Collapse of a fish population after exposure to a synthetic estrogen. PNAS 104(21):
8897-8901.
Killgore, K. J., R.P. Morgan II, and N.B. Rybicki. 1989. Distribution and abundance of fishes
associated with submerged aquatic plants in the Potomac River. N. Amer. J. Fish.
Management 9: 101-111.
Kimbrough, K. L., W.E. Johnson, G.G. Lauenstein, J.D. Christensen, and D.A. Apeti. 2008. An
assessment of two decades of contaminant monitoring in the nation's coastal zone. NOAA,
Silver Spring, MD, NOS NCCOS 47 , 105p.
Kimmel, D. G. and R.I.E. Newell. 2007. The influence of climate variation on eastern oyster
(Crassostrea virginica) juvenile abundance in Chesapeake Bay. Limnology and
Oceanography 52(3): 959-965.
King, G. M., C. Giray, and I. Kornfield. 1995. Biogeographical, biochemical and genetic
differentatiation among North American saccoglossids (Hemichordata; Enteropneusta;
2010 COASTAL HABITAT PROTECTION PLAN
Literature cited Page 523
Harrimaniidae). Marine Biology 123: 369-377.
Kingston, P. F. 1992. Impact of offshore oil production installations on the benthos of the North Sea.
ICES Journal of Marine Science 49(1): 45-53.
Kinnish, M. 1992. Ecology of estuaries: anthropogenic effects. CRC Press, Boca Raton, Fl, 357-398p.
Kirby, J., W. Maher, and F. Krikowa. 2001. Selenium, cadmium, copper, and zinc concentrations in
sediments and mullet (Mugil cephalus) from the southern basin of Lake Macquarie, NSW
Australia. Archives of environmental contamination and toxicology 40(2): 246-256.
Kirby, M. X. and H.M. Miller. 2005. Response of a benthic suspension feeder (Crassostrea virginica
Gmelin) to three centuries of anthropogenic eutrophication in Chesapeake Bay. Estuarine,
Coastal and Shelf Science 62(4): 679-689.
Kirby-Smith, W. W. 1989. The community of small macroinvertebrates associated with rock outcrops
on the continental shelf of North Carolina. NOAA-National Undersea Research Program
Report. 89(2): 279-304.
Kirby-Smith, W. W. and N.M. White. 2006. Bacterial contamination associated with estuarine
shoreline development. Journal of Applied Microbiology 100: 648-657.
Kissil, G. W. 1974. Spawning of the anadromous alewife in Bride Lake, Connecticut. Transactions of
the American Fisheries Society 103: 312-317.
Klauda, R. J., S.A. Fischer Jr., L.W. Hall, and J.A. Sullivan. 1991. Alewife and blueback herring:
Alosa pseudoharengus and Alosa aestivalis. Habitat Requirements for Chesapeake Bay Living
Resources, 10-1 - 10-29p.
Kleypas, J. A., R.A. Feely, V.J. Fabry, C. Langdon, C.L. Sabine, and L.L. Robbins. 2006. Impacts of
Ocean Acidification on Coral Reefs and Other Marine Calcifiers: A Guide for Future
Research. report of a workshop held 18–20 April 2005, St. Petersburg, FL, sponsored by
NSF, NOAA, and the U.S. Geological Survey , 88p.
Kneib, R. T. 1997. The role of tidal marshes in the ecology of estuarine nekton. p. 163-220 in R.T.
Kneib (ed.). Oceanography and Marine biology: an Annual Review. UCL Press, London, 35 .
Kneib, R. T. and S.L. Wagner. 1994. Nekton use of vegetated marsh habitats at different stages of
tidal inundation. Marine Ecology Progress Series 106: 227-238.
Knutson, P. L. 1977. Planting guidelines for marsh development and bank stabilization. US Army
Corps of Engineering Research Center, Fort Belvoir, Va.
Knutson, P. L. W. N. S. and M.R. Inskeep. 1982. Wave damping in Spartina alterniflora marshes.
Wetlands 2: 85-105.
Koch, E. W. 2001. Beyond light: Physical, geological, and geochemical parameters as possible
submersed aquatic vegetation habitat requirements. Estuaries 24(1): 1-17.
Kolpin, D. W., E.T. Furlong, M.T. Meyer, E.M. Thurman, S.D. Zaugg, L.B.Barber, and H. T. Buxton.
2002. Pharmaceuticals, hormones, and other organic wastewater contaminants in US streams,
2010 COASTAL HABITAT PROTECTION PLAN
Literature cited Page 524
1999-2000: a national reconnaissance. Environmental Science and Technology 36: 1202-
1211.
Komatsu, T. and S.I. Murakami. 1994. Influence of a Sargassum forest on the spatial distribution of
water flow. Fisheries Oceanography 3: 256-266.
Krantz, G. E. and J.F. Chamberlin. 1978. Blue crab predation of cultchless oyster spat. Proceedings of
the National Shellfisheries Association 68: 38-41.
Krimsky, L. S. and C.E. Epifanio. 2008. Multiple cues from multiple habitats: effect on
metamorphosis of the Florida stone crab Menippe mercenaria. Journal of Experimental Marine
Biology and Ecology 358(2): 178-184.
Kuiper, R. V., R.F. Canton, P.E. G. Leonards, B.M. Jenssen, M. Dubbeldam, P.W. Wester, M. van den
Berg, J.G. Vos, and A.D. Vethaak. 2007. Long-term exposure of European flounder
(Platichthys flesus) to the flame-retardants tetrabromobisphenol A (TBBPA) and
bexabromocyclododecane (HBCD). Eoctoxicology and Environmental Safety 67: 349-360.
Kurihara, H. 2008. Effects of CO2-driven ocean acidification on the early developmental stages of
invertebrates. Marine Ecology Progress Series 373: 275-284.
Kurihara, H., S. Kato, and A. Ishimatsu. 2007. Effects of increased seawater PCO2 on early
development of the oyster Crassostrea gigas. Aquatic Biology 1(1): 91-98.
Kwon, Y. and C. Lee. 2001. Ecological risk assessment of sediment in wastewater discharging area
by means of metal speciation. Microchemical Journal 70: 255-264.
La Peyre, M., S. Casas, and J. La Peyre. 2006. Salinity effects on viability, metabolic activity and
proliferation of three Perkinsus Species. Diseases of Aquatic Organisms 71(1): 59-74 .
La Peyre, M. K., A.D. Nickens, A.K. Volety, G.S. Tolley, and J.F. La Peyre. 2003. Environmental
significance of freshets in reducing Perkinsus marinus infection in eastern oysters Crassostrea
virginica: potential management applications. Marine Ecology Progress Series 248: 165-176.
La Peyre, M. K., B. Gossman, and B.P. Piazza. 2009. Short- and Long-Term Response of
Deteriorating Brackish Marshes and Open-Water Ponds to Sediment Enhancement by Thin-
Layer Dredge Disposal. Estuaries and Coasts 32(2): 390-402 .
Lacorte, S., S.B. Lartiges, P. Garrigues, and D. Barcelo. 1995. Degradation of organophosphorus
pesticides and their transformation products in estuarine waters. Environmental Science and
Technology 29(2): 431-438.
Laist, D. W. 1997. Impacts of marine debris: entanglement of marine life in marine debris, including a
comprehensive list of species with entanglement and ingestion records. in J.M. Coe and D.B.
Rogers (eds.). Marine debris: Sources, impacts and solutions. Springer-Verlag, 1997.
Lalancette, L.-M. 1984. The effects of dredging on sediments, plankton, and fish in the Vauvert Area
of Lake St. Jean, Quebec. Archive fur Hydrobiologie 99(4): 463-477.
Lamers, L. P. M., G.E.T. Dolle, S.T.G. Van Den Berg, S.P.J. Van Delft, and J.G.M. Roelofs. 2001.
Differential responses of freshwater wetland soils to sulphate pollution. Biogeochemistry 55:

2010 COASTAL HABITAT PROTECTION PLAN
Literature cited Page 525
87-102.
Lamers, L. P. M., S.-J. Falla, E.M. Samborska, I A.R. van Dulken, G. van Hengstum, and J.G.M.
Roelofs. 2002. Factors controlling the extent of eutrophication and toxicity in sulfate-polluted
freshwater wetlands. Limnology and Oceanography 47(2): 585-593.
Laney, R. W. 1997. The relationship of submerged aquatic vegetation (SAV) ecological value to
species managed by the Atlantic States Marine Fisheries Commission (ASMFC): summary for
the ASMFC SAV subcommittee. in C.D. Stephan and T.E. Bigford (eds.). Atlantic coastal
submerged aquatic vegetation: a review of its ecological role, anthropogenic impacts, state
regulation, and value to Atlantic coastal fisheries. Atlantic States Marine Fisheries
Commission, Habitat Management Series #1 , 78 p.
Laney, R. W., D.J. Newcomb, and C.S. Manooch III. 1999. Impact assessment of proposed Corps of
Engineers dredging associated with the Dare County beaches project upon fisheries resources.
Appendix B. Draft Report. Northern Dare County Storm Damage Reduction Project, Dare
County, North Carolina. Draft USFWS Coordination Report. 83 pp.
Langley, J. A., K.L. McKee, D.R. Cahoon, J.A. Cherry, and J.P. Megonigal. 2009. Elevated CO2
stimulates marsh elevation gain, counteracting sea-level rise. Proceedings of the National
Academy of Science 106(15): 6182-6186.
Lannig, G., J.F. Flores, and I.M. Sokolova. 2006. Temperature-dependent stress response in oysters,
Crassostrea virginica: pollution reduces temperature tolerance in oysters. Aquatic Toxicology
79(3): 278-287.
Larkum, A. W., C.W. Duarte, and R. Orth. 2006. Seagrass conservation biology: an interdisciplinary
science for protection of the seagrass biome. Springer, Netherlands.
Lassuy, D. R. 1983. Species profiles: life histories and environmental requirements (Gulf of Mexico)
-- spotted seatrout. U.S. Fish and Wildlife Service, Division of Biological Services,
FWS/OBS-82/11.4. 14p.
Latimer, J. S., E.J. Hoffman, G. Hoffman, J.L. Fasching, and J.G. Quinn. 1990. Sources of petroleum
hydrocarbons in urban runoff. Water, Air, & Soil Pollution 52: 1-21.
Lauenstein, G. G., A.Y. Cantillo, and T.P. O'Connor. 2002. The status and trends of trace elements
and organic contaminants n oysters, Crassostrea virginica, in the waters of the Carolinas,
USA. The Science of the Total Environment 285: 79-87.
Lauritsen, D. and S. Moxley. 1983. Freshwater Asian clam Corbicula fluminea as a factor affecting
nutrient cycling in the Chowan River, NC. Water Resources Research Institute of North
Carolina , Raleigh, NC, Report No. 192 , 60p.
Lawrence, A. J. and J.M. Soame. 2004. The effects of climate change on the reproduction of coastal
invertebrates. Ibis 146: 29-39.
Laws, E. A., J. Hiraoka, M. Mura, B. Punu, T. Rust, S. Vink, and C. Yamamura. 1994. Impact of land
runoff on water quality in a Hawaiian estuary. Marine Environmental Research 38: 225-241.
Lee, D. L., T.A. Dillaha, and J.H. Sherrard. 1989. Modeling phosphorus in grass buffer strips. Journal

2010 COASTAL HABITAT PROTECTION PLAN
Literature cited Page 526
of Environmental Engineering 115: 409-427.
Legislative Research Commission. 2001. Coastal beach movement, beach renourishment, and storm
mitigation. Report to the 2001 session of the 2001 General Assembly of North Carolina. State
of North Carolina, Unpub. rep. 29 p.
LeGrand, H. E., S.E. McRae, S.P. Hall, and J. Finnegan . 2008. 2008 Natural Heritage Program list of
the rare animals of North Carolina. North Carolina Natural Heritage Program, Raleigh, NC,
119 pp.p.
LeGrand, H. E. and S.P. Hall. 1999. Natural Heritage Program List of the Rare Animals of North
Carolina. North Carolina Natural Heritage Program, Raleigh, NC.
Lehnert, R. L. and D.M. Allen. 2002. Nekton use of subtidal oyster shell habitat in a southeastern
U.S. estuary. Estuaries 25(5): 1015-1024.
Leight, A. K. and R.F. Van Dolah. 1999. Acute toxicity of the insecticides endosulfan, chlorpyrifos,
and malathion to the epibenthic estuarine amphipod Gammarus palustris (Bousfield).
Environmental Toxicology and Chemistry 18(5): 958-964.
Lenihan, H. S. 1998. Physical-biological coupling on oyster reefs: how habitat structures individual
performance. Ecological Monographs 79: 251-275.
Lenihan, H. S. 1999. Physical-biological coupling on oyster reefs: how habitat structure influences
individual performance. Ecological Monographs 69(3): 251-275.
Lenihan, H. S. and C.H. Peterson. 1998. How habitat degradation through fishery disturbance
enhances impacts of hypoxia on oyster reefs. Ecological Applications 8(1): 128-140.
Lenihan, H. S., C.H. Peterson, J.E. Byers, J.H. Grabowski, and G.W. Thayer. 2001. Cascading of
habitat degradation: oyster reefs invaded by refugee fishes escaping stress. Ecological
Applications 11(3): 764-782.
Lenihan, H. S. and F. Micheli. 2000. Biological effects of shellfish harvesting on oyster reefs:
resolving a fishery conflict by ecological experimentation. Fishery Bulletin 98: 86-95.
Lenihan, H. S., F. Micheli, S.W. Shelton, and C.H. Peterson. 1999. The influence of multiple
environmental stressors on susceptibility to parasites: an experimental determination with
oysters. Limnology and Oceanography 44: 910-924.
Lenihan, H. S. and G.W. Thayer. 1999. Ecological effects of fishery disturbance to oyster reef habitat
in eastern North America. Journal of Shellfish Research 18(2): 719.
Lenihan, H. S., J.H. Grabowski, and G.W. Thayer. 1998. Recruitment to and utilization of oyster reef
habitat by commercially valuable crabs and fishes: an experiment with economic analysis.
National Marine Fisheries Service, Beaufort, NC, National Research Council Final Report
Number 1-97 .
Leonard, L. A. and A.L. Croft. 2006. The effect of standing biomass on flow velocity and turbulence
in Spartina alterniflora canopies. Estuarine Coastal and Shelf Science 69(3-4): 325-336.
2010 COASTAL HABITAT PROTECTION PLAN
Literature cited Page 527
Lerberg, S. B. and A.F. Holland. 2000. Responses of tidal creek macrobenthic communities to the
effects of watershed development. Estuaries 23: 838-853.
Levin, P. S. and G.W. Stunz. 2005. Habitat triage for exploited fishes: can we identify essential
"Essential Fish Habitat?". Estuarine, Coastal and Shelf Science 64: 70-78.
Levin, P. S. and M.E. Hay. 2003. Selection of estuarine habitats by juvenile gags in experimental
mesocosms. Transactions of the American Fisheries Society 132(1): 76-83.
Levinton, J. S. 1982. Marine ecology. Prentice Hall, Englewood Cliffs, NJ, 526p.
Lewis, V. P. and D.S. Peters. 1994. Diet of juvenile and adult Atlantic menhaden in estuarine and
coastal habitats. Transactions of the American Fisheries Society 123: 803-810.
Lewitus, A. J., B.M. Willis, K.C. Hayes, J.M. Burkholder, H.B. Glasgow, P.M. Glibert, and M.K.
Burke . 1999. Mixotrophy and nitrogen uptake by Pfiesteria piscicida (Dinophyceae). Journal
of Phycology 35: 1430-1437.
Limburg, K. E. and J.R. Waldman. 2009. Dramatic declines in north Atlantic diadromous fishes.
BioScience 59(11): 955-965.
Lin, J., L. Xie, L.J. Pietrafesa, H. Xu, W. Woods, M.A. Mallin, and M.J. Durako. 2008. Water quality
responses to simulated flow and nutrient reductions in the Cape Fear River estuary and
adjacent coastal region, North Carolina. Ecological Modeling 212: 200-217.
Lin, J., L. Xie, L.J. Pietrafesa, J.S. Ramus, and H.W. Paerl. 2007. Water quality gradients across
Albemarle-Pamlico estuarine system: seasonal variations and model applications. Journal of
Coastal Research 23(1): 213-229.
Lin, J., L. Xie, L.J. Pietrafesa, J. Shen, M.A. Mallin, and M.J. Durako. 2006. Dissolved oxygen
stratification in two micro-tidal partially-mixed estuaries. Estuarine Coastal and Shelf Science
70(3): 423-437.
Lin, Q. and I.A. Mendelssohn. 1998. The combined effects of phytoremediation and biostimulation in
enhancing habitat restoration and oil degradation of petroleum contaminated wetlands.
Ecological Engineering 10: 263274.
Lin, Q. and I.A. Mendelssohn. 2008. Evaluation of tolerance limits for restoration and
phytoremediation with Spartina alterniflora in crude oil-contaminated coastal salt marshes.
International Oil Spill Conference, Savanah, GA .
Lindberg, W. J. 1997. Can science resolve the attraction-production issue? Fisheries 22(4): 10-13.
Lindberg, W. J., T.K. Frazer, K.M. Portier, F. Vose, J. Loftin, D.J. Muries, D.M. Mason, B. Nagy ,
and M.K. Hart. 2006. Density-depenndent habitat selection and performance by a large
mobile reef fish. Ecological Applications 16(2): 731-746.
Lindeman, K. C. 1997. Development of grunts and snappers of Southeast Florida: Cross-shelf
distributions and effects of beach management alternatives. Ph.D. Dissertation, Univ. of
Miami, Miami, Fl, 419 p.
2010 COASTAL HABITAT PROTECTION PLAN
Literature cited Page 528
Lindeman, K. C. and D.B. Snyder. 1999. Nearshore hardbottom fishes of southeast Florida and effects
of habitat burial caused by dredging. Fisheries Bulletin 97: 508-525.
Lindquist, D. G., I. E. Clavijo, L. B. Cahoon, S. K. Bolden, and S. W. Burk. 1989. Quantitative diver
visual surveys of innershelf natural and artificial reefs in Onslow Bay, N.C.: preliminary
results for 1988 and 1989. p. 219-227 in Lang, M. A. and W. C. Jaap (eds.). Diving for
Science...1989. American Academy for Underwater Sciences, Costa Mesa, California.
Lindquist, D. G., L.B. Cahoon, I.E. Clavijo, M.H. Posey, S.K. Bolden, L.A. Pike, S.W. Burk, and
P.A.Cardullo. 1994. Reef fish stomach contents and prey abundance on reef and sand
substrata associated with adjacent artificial and natural reefs in Onslow Bay, North Carolina.
Bulletin of Marine Science 55(2-3): 308-318.
Lindquist, D. G., M.V. Ogburn, W.B. Stanley, H.L. Troutman, and S.M. Pereira. 1985. Fish
utilization patterns on rubble-mound jetties in North Carolina. Bulletin of Marine Science 37:
244-251.
Lindquist, N. and L. Manning. 2001. Impacts of beach nourishment and beach scraping on critical
habitat and productivity of surf fishes. NC Division of Marine Fisheries, Fisheries Resource
Grant 98-EP-05: 41 .
Line, D. E. and N.M. White. 2007. Effects of Development on Runoff and Pollutant Export. Water
Environment Research 79(2): 185-190.
Lipcius, R. N., D.B. Eggleston, S.J. Schreiber, R.D. Seitz, J. Shien, M. Sisson, W.T. Stockhausen, and
H.V. Wang. 2008. Importance of metapopulation connectivity to restocking and restoration of
marine species. Reviews in Fisheries Sciences 16(1-3): 101-110.
Lippson, A. J. and R. Moran. 1974. Manual for identification of early development stages of fishes of
the Potomac River estuary. Martin Marietta Corp., PPSP-MP-13 , 282p.
Lipton, I., L. Perillo, R. Dixon, P. Pellerite, and T.E. Lankford. Fish nursery function of ocean surf-
zone habitat: response to a human disturbance gradient. UNC Wilmington
Lissner, A. L., G.L. Taghon, D.R. Diener, S.C. Schroeter, and J.D. Dixon. 1991. Recolonization of
deep-water hard-substrate communities: potential impacts from oil and gas development.
Ecological Applications 1(3): 258-267.
Litaker, W., C.S. Duke, B.E. Kenney, and J. Ramus. 1987. Short-term environmental variability and
phytoplankton abundance in a shallow tidal estuary. I. Winter and summer. Marine Biology
96(1): 115-121.
Litaker, W., C.S. Duke, B.E. Kenney, and J. Ramus. 1993. Short term environmental variability and
phytoplankton abundance in a shallow tidal estuary. II. Spring and fall. Marine Ecology
Progress Series 94(2): 141-154.
Litvin, S. Y. and M.P. Weinstein. 2003. Life history strategies of estuarine nekton: the role of marsh
macrophytes, benthic microalgae, and phytoplankton in the trophic spectrum. Estuaries
26(2B): 552-562.
Livingston, R. J. 1975. Impact of Kraft pulp-mill effluent on estuarine and coastal fishes in Apalachee
2010 COASTAL HABITAT PROTECTION PLAN
Literature cited Page 529
Bay, Florida, U.S.A. Marine Biology 32(1): 19-48.
Livingstone, D. R. 2001. Contaminant-stimulated reactive oxygen species production and oxidative
damage in aquatic organisms. Marine Pollution Bulletin 42(8): 656-666.
Lockwood, J. C. 1990. Seagrass as a consideration in the site selection and construction of marinas.
Environmental Management for Marinas Conferece, September 5-7. Technical Reprint
Series( .).
Loesch, J. G. 1987. Overview of the life history aspects of anadromous alewife and blueback herring
in freshwater habitats. American Fisheries Society Symposium 1: 89-103.
Loesch, J. G. and W.H. Kriete Jr. 1984. Anadromous fisheries research program, 1980-83. Virginia
Institute of Marine Science, Gloucester Point, VA.
Loesch, J. G., Jr. W.H. Kriete, and E.J. Foell. 1982a. Effects of light intensity on the catchability of
juvenile anadramous Alosa species. Trans. Amer. Fish. Soc. 111: 41-44.
Loflin, R. K. 1995. The effects of docks on seagrass beds in the Charlotte Harbor estuary. Florida
Scientist 58(2): 198-205.
Løkkeborg, S. 2005. Impacts of trawling and scallop dredging on benthic habitats and communities.
FAO, Rome, FAO Fisheries Technical Paper No. 472 , 58p.
Lombardero, N., C.T. Smit, J.T. McCullough, L.S. Floyd, J. Craft, A. Hannes, and K. Wilson. 2008.
Surf City/North Topsail Beach, N.C. shoreline protection project, hardbottom resource
confirmation and characterization study. ANAMAR Environmental Consulting, Inc. and
Coastal Planning and Engineering, Inc., 44p.
Long, E. R., D.D. McDonold, S.L. Smith, and F.D. Calder. 1995. Incidence of adverse biological
effects within ranges of chemical concentrations in marine and estuarine sediments.
Environmental Management 19: 81-97.
Loosanoff, V. L. 1953. Behavior of oysters in water of low salinity. Proceedings of the National
Shellfish Association 1952: 135-151.
Loosanoff, V. L. 1965. The American or Eastern oyster. U.S. Fish and Wildlife Service, Circular 205
.
Lott, J. P., D.W. Willis, and D.O. Lucchesi. 1996. Relationship of Food Habits to Yellow Perch
Growth and Population Structure in South Dakota Lakes. Journal of Freshwater Ecology
11(1): 27-37.
Lough, R. G. 1975. A reevaluation of the combined effects of temperature and salinity on survival
and growth of bivalve larvae using surface techniques. Fisheries Bulletin 73: 86-94.
Lowe, A. J., D.R.G. Farrow, A.S. Pait, S.J. Arenstam, and E.F. Lavan. 1991. Fish kills in coastal
waters. National Oceanic and Atmospheric Administration, Rockville, MD, 190-1989p.
Lowery, J. and K.T. Paynter. 2002. The importance of molluscan shell substrate. National Marine
Fisheries Service, Unpub. rep. 17p.

2010 COASTAL HABITAT PROTECTION PLAN
Literature cited Page 530
Lowrance, R. R. 1997. Water quality functions of riparian forest buffer systems in the Chesapeake
Bay watershed. Environmental Management 21(5): 687-712.
Lucas, L. V., J.R. Koseff, J.E. Cloern, S.G. Monismith, and J.K. Thompson. 1999. Processes
governing phytoplankton blooms in estuaries. I: The local production-loss balance. Marine
Ecology Progress Series 187: 1-15.
Luce, C. 1995. Forest and wetlands. p. 253-283 in A.D. Ward and W.J. Elliot (eds.). Environmental
Hydrology. CRC Press, Boca Raton, FL.
Luckenbach, M. W. 1985. Biotic and hydrodynamic processes affecting the recruitment of a marine
infaunal invertebrate. Dissertation Abstracts Int. Pt. B.- Science and Engineering 46(6): 119.
Luczkovich, J. J., H.J. Daniel III, and M.W. Sprague . 1999. Characterization of critical spawning
habitats of weakfish, spotted seatrout and red drum in Pamlico Sounds using hydrophone
surveys. East Carolina University, Institute for Coastal and Marine Resources, Greenville, NC,
Final Report and Annual Performance Report , 127p.
Luczkovich, J. J., M.W. Sprague, S.E. Johnson, and R.C. Pullinger. 1999b. Delimiting spawning areas
of weakfish Cynoscion regalis (Family Scianenidae) in Pamlico Sound, North Carolina using
passive hydroacoustics surveys. Bioacoustics, The International Journal of Animal Sound and
its Recording 10: 143-160.
Luczkovich, J. J., R.C. Pullinger, S.E. Johnson, and M.W. Sprague . 2008. Identifying sciaenid
critical spawning habitats by the use of passive acoustics. Transactions of the American
Fisheries Society 137: 576-605.
Luettich, R. A., J.E. McNinch, J.L. Pinckney, M.J. Alperin, C.S. Martens, H.W. Paerl, C.H. Peterson,
and J.T. Wells. 1999. Neuse River estuary modeling and monitoring project, final report:
Monitoring phase. Water Resources Research Institute, Raleigh, NC, 190p.
Luettich, R. A., J.E. McNinch, J.L. Pinckney, M.J. Alperin, C.S. Martens, H.W. Paerl, C.H. Peterson,
and J.T. Wells. 2000. Neuse River estuary modeling and monitoring project, final report:
Monitoring phase. Water Resources Research Institute, Raleigh, NC, 190p.
Løkkenborg, S. 2005. Impacts of trawling and scallop dredging on benthic habitats and communities.
FAO, Rome, Italy, FAO Fisheries Technical Paper No. 472 , 58p.
M.R. Burchell, R. W. Skaggs, C. R. Lee, S. Broome, G. M. Chescheir, and J. Osborne. 2007.
Substrate organic matter to improve nitrate removal in surface-flow constructed wetlands.
JOURNAL OF ENVIRONMENTAL QUALITY 36(1): 194.
MacIntyre, H. L. and J.J. Cullen. 1996. Primary production by suspended and benthic microalgae in a
turbid estuary: Time-scales of variability in San Antonio Bay, Texas. Marine Ecology
Progress Series 145: 245-268.
MacIntyre, H. L., R.J. Geider, and D.C. Miller. 1996. Microphytobenthos: the ecological role of the
"secret garden" of unvegetated, shallow-water marine habitats. I. Distribution, abundance, and
primary production . Estuaries 19(2A): 186-201.
MacIntyre, I. G. 2003. A classic marginal coral environment: tropical coral patches off North

2010 COASTAL HABITAT PROTECTION PLAN
Literature cited Page 531
Carolina, USA. Coral Reefs 22: 474.
MacIntyre, I. G. and O.H. Pilkey. 1969. Tropical reef corals: tolerance of low temperatures on the
North Carolina continental shelf. Science 166: 374-375.
MacKenzie, C., L.S. Weiss-Glanz, and J.R. Moring. 1985. Species profiles: life histories and
environmental requirements of coastal fishes and invertebrates. US Fish and Wildlife Service,
Biological Report 82(11) .
MacKenzie, C. L. Jr. 1977. Development of an aquacultural program for rehabilitation of damaged
oyster reefs in Mississippi. Marine Fisheries Review 39: 1-3.
MacKenzie, C. L. Jr. 1982. Compatibility of invertebrate populations and commercial fishing for
ocean quahog. North American Journal of Fishery Management 2: 270-275.
Mackenzie, C. L. Jr. 1983. To increase oyster production in the northeastern United States. Marine
Fisheries Review 45: 1-22.
MacKenzie Jr., C. L. 1997. The U.S molluscan fisheries from Massachusetts Bay through Raritan Bay
to Delaware Bay. p. 87-117 in MacKenzie Jr., C. L., Burrell Jr., V. G., Rosenfield, A., and
Hobart (eds.), W. L. The History, Present Condition, and Future of the Molluscan Fisheries of
North and Central America and Europe, Vol. 1. Atlantic and Gulf Coasts. U.S. Department of
Commerce, NOAA, NMFS, Silver Spring, MD, NOAA Tech. Rept. NMFS 127 .
Mackin, J. G. 1951. Incidence of infection of oysters by Dermocystidium marinum in the Barataria
Bay area of Louisiana. Proceedings of the National Shellfish Association 1951: 22-35 .
Macpherson, T. A., L.B. Cahoon, and M.A. Mallin. 2007. Water column oxygen demand and
sediment oxygen flux: patterns of oxygen depletion in tidal creeks. Hydrobiologia 586: 235-
248.
MAFMC (Mid-Atlantic Fishery Management Council). 1998. Amendment 12 to the summer
flounder, scup, and black sea bass fishery management plan. Mid-Atlantic Fishery
Management Council and the Atlantic States Marine Fisheries Commission, in cooperation
with the National Marine Fisheries Service, the New England Fishery Management Council,
and the South Atlantic Fishery Management Council, 398p.
Maiolo, J. R. and P. Tschetter. 1981. Relating population growth to shellfish bed closures: a case
study from North Carolina. Coastal Zone Management Journal 9(1): 1-18.
Maljkovic, A. and T.E. Van Leeuwen. 2008. Predation on the invasive red lionfish, Pterois volitans
(Pisces: Scorpaenidae), by native groupers in the Bahamas. Coral Reefs 27: 501.
Mallin, M. A. 2000. Impacts of industrial animal production on rivers and estuaries. American
Scientist 88: 2-13.
Mallin, M. A. 2009. Chapter 4: Effect of human land development on water quality. p. 64-94 in S.
Ahuja (ed.). Handbook of Water Quality and Purity. Elsevier.
Mallin, M. A. and C.C. Corbett. 2006. How hurricane atttributes determine the extent of
environmental effects: Multiple hurricanes and different coastal systems. Estuaries and Coasts

2010 COASTAL HABITAT PROTECTION PLAN
Literature cited Page 532
29(6a): 1046-1061.
Mallin, M. A., D.C. Parsons, V.L. Johnson, M.R. McIver, and H.A. CoVan. 2004. Nutrient limitation
and algal blooms in urbanizing tidal creeks. Journal of Experimental Marine Biology and
Ecology 298: 211-231.
Mallin, M. A., H.W. Paerl, J. Rudek, and P.W. Bates. 1993. Regulation of estuarine primary
production by rainfall and river flow. Marine Ecology-Progress Series 93: 199-203.
Mallin, M. A., J.M. Bukholder, and M.J. Sullivan. 1992. Contributions of benthic microalgae to
coastal fishery yield. Transactions of the American Fisheries Society 121: 691-695.
Mallin, M. A., J.M. Burkholder, L.B. Cahoon, and M.H. Posey. 2000a. North and South Carolina
coasts. Marine Pollution Bulletin 41(1-6): 56-75.
Mallin, M. A., J.M. Burkholder, M.R. McIver, G.C. Shank, H.B. Glasgow, B.W. Touchette, and J.
Springer. 1997. Comparative effects of poultry and swine waste lagoon spills on the quality
of receiving streamwaters. Journal of Environmental Quality 26: 1622-1631.
Mallin, M. A., K.E. Williams, E.C. Esham, and R.P. Lowe. 2000b. Effect of human development on
bacteriological water quality in coastal watersheds. Ecological Applications 10(4): 1047-
1056.
Mallin, M. A., L.B. Cahoon, B.R. Toothman, D.C. Parson, M.R. McIver' M.L. Ortwine, and R.N.
Harrington. 2007. Impacts of a raw sewage spill on water and sediment quality in an
urbanized estuary. Marine Pollution Bulletin 54: 81-88.
Mallin, M. A., L.B. Cahoon, D.C. Parsons, and S.H. Ensign. 2001a. Effect of nitrogen and
phosphorus loading on plankton in coastal plain blackwater rivers. Journal of Freshwater
Ecology 16(3): 455-466.
Mallin, M. A., L.B. Cahoon, J.J. Manock, J.F. Merritt, M.H. Posey, R.K. Sizemore, W.D. Webster,
and T.D. Alphin. 1998. A four year environmental analysis of New Hanover County tidal
creeks 1993-1997. Center for Marine Science Research, Wilmington, NC, 98-01 , 115p.
Mallin, M. A., L.B. Cahoon, J.J. Manock, J.F. Merritt, M.H. Posey, T.D. Alphin, R.K. Sizemore, and
K. Williams. 1996. Water quality in New Hanover County tidal creeks, 1995-1996.
University of North Carolina Wilmington, Wilmington, NC.
Mallin, M. A., L.B. Cahoon, M.H. Posey, L.A. Leonard, D.C. Parsons, V.L. Johnson, E.J. Wambach,
T.D. Alphin, K.A. Nelson, and J.F. Merritt. 2002a. Environmental quality of Wilmington and
New Hanover County watersheds, 2000-2001. Center for Marine Science, UNC-W,
Wilmington, 102p.
Mallin, M. A., M.H. Posey, G.C. Shank, M.R. McIver, S.H. Ensign, and T.D. Alphin. 1999b.
Hurricane effects on water quality and benthos in the Cape Fear watershed: natural and
anthropogenic impacts. Ecological Applications 9(1): 350-362.
Mallin, M. A., M.H. Posey, M.R. McIver, D.C. Parsons, S.H. Ensign, and T.D. Alphin. 2002b.
Impacts and recovery from multiple hurricanes in a Piedmont-Coastal Plain river system.
Bioscience 52: 999-1010.
2010 COASTAL HABITAT PROTECTION PLAN
Literature cited Page 533
Mallin, M. A., M.H. Posey, T.E. Lankford, M.R. McIver, S.H. Ensign, T.D. Alphin, M.S. Williams,
M.L. Moser, and J.F. Merritt. 2001c. Environmental assessment of the lower Cape Fear River
system, 2000-2001. Center for Marine Science Research, UNC-W, Wilmington, NC, CMS
Report No. 01-01 , 139p.
Mallin, M. A., M.I. Haltom, and B. Song. 2009. Assessing Fecal Bacteria Sources in the Wrightsville
Beach, N.C. Area: Final Report. Center for Marine Science, University of North Carolina at
Wilmington, Wilmington, N.C., CMS Report 09-04 .
Mallin, M. A., M.R. mcIver, H.A. Wells, D.C. Parsons, and V.L. Johnson. 2005. Reversal of
eutrophication following treatment upgrades in the New River estuary, North Carolina.
Estuaries 28(5): 750-760.
Mallin, M. A., M.R. McIver, M.I.H. Spivey, M.E. Tavares, T. D. Alphin, and M.H. Posey. 2008.
Environmental quality of Wilmington and New Hanover County watersheds 2006-2007.
CMS Report 08-01 , 201p.
Mallin, M. A., S.H. Ensign, M.R. McIvor, G.C. Shank, and P.K. Fowler. 2001b. Demographic,
landscape, and meteorological factors controlling the microbial pollution of coastal water.
Hydrobiologia 460(185-193): MHC CHPP planner reports/journal articles file #2.
Mallin, M. A. and T.L. Wheeler. 2000. Nutrient and fecal coliform discharge from coastal North
Carolina golf courses. Journal of Environmental Quality 29: 979-986.
Mallin, M. A., V.L. Johnson, and S.H. Ensign. 2009. Comparative impacts of stormwater runoff on
water quality of an urban, a suburban, and a rural stream. Environmental Monitoring and
Assessment 159: 475-491.
Mallin, M. A., V.L. Johnson, S.H. Ensign, and T.A. MacPherson . 2006. Factors contributing to
hypoxia in rivers, lakes and streams. Limnology and Oceanography 51: 690-701.
Mallin, M., E. Esham, K. Williams, and J. Nearhoof. 1999a. Tidal stage variability of fecal coliform
and chlorophyll a concentrations in coastal creeks. Marine Pollution Bulletin 38( 5): 414-
422.
Mallinson, D. J., S.J. Culver, S.R. Riggs, J.P. Walsh, D. Ames, and C.W. Smith. 2008. Past, present
and future inlets of the Outer Banks Barrier Island, North Carolina. Department of Geolgical
Sciences, Thomas Harriot College of Arts and Sciences and Institue for Coastal Science and
Policy, East Carolina University, Greenville, NC, 22p.
Mallison, D. J., S.J. Culver, S.R. Riggs, J.P. Walsh, D. Ames, and C.W. Smith. 2008. Past, present
and future inlets of the Outer Banks barrier islands, North Carolina. ECU, Greenville, NC,
22p.
Malone, T. C., L.H. Crocker, S.E. Pike, and B.W. Wendler. 1988. Influences of river flow on the
dynamics of phytoplankton production in a partially stratified estuary. Marine Ecology
Progress Series 48: 235-249.
Mann, R. 2000. Restoring the oyster reef communities in the Chesapeake Bay: a commentary. Journal
of Shellfish Research 19(1): 335-339.
2010 COASTAL HABITAT PROTECTION PLAN
Literature cited Page 534
Mann, R. and J. Harding. 1997. Trophic studies on constructed "restored" oyster reefs. Annual
research report to the U.S. Environmental Protection Agency Chesapeake Bay Program.
Living Resources Committee, Virginia Institute of Marine Science, Gloucester Point, VA.
Manooch, C. S. and D.L. Mason. 1983. Comparative food studies of yellowfin in tuna, Thunnus
albacores, and blackfin tuna, Thunnus atlanticus, (Pisces: Scobridae) from the southeastern
and Gulf Coast of the United States. Acta Ichthyologica et Piscatoria 8: 25-46.
Manooch, C. S., D.L. Mason, and R.S. Nelson. 1984. Food and gastrointestinal parasites of dolphin
Coryphaena hippurus collected along the southeastern and gulf coasts of the United States.
Bulletin of the Japanese Society of Scientific Fisheries 50: 1511-1525.
Manooch, C. S. I. and R.A. Rulifson. 1989. Roanoke River water flow committee report: A
recommended water flow regime for the Roanoke River, North Carolina, to benefit
anadromous striped bass and other below-dam resources and users. NMFS, Beaufort, NC,
NOAA Tech. Mem. NMFS-SEFC-216 .
Manooch III, C. S. 1984. Fisherman's guide - fishes of the southeastern United States. North Carolina
State Museum of Natural History, Raleigh, NC, 362p.
Manooch III, C. S. and W.T. Hoggarth. 1983. Stomach contents and giant trematodes of the wahoo
(Acanthocybium solanderi) , collected along the South Atlantic and Gulf coasts of the United
States. Bulletin of Marine Science 33: 227-238.
Marburger, J. E., W.E. Johnson, T.S. Gross, D.R. Douglas, and J. Di. 2002. Residual organochlorine
pesticides in soils and fish from wetland restoration areas in central Florida. Wetlands 22(4):
705-711.
Marcus, J. M. and T.P. Stokes. 1985. Polynuclear aromatic hydrocarbons in oyster tissue around three
coastal marinas. Bulletin of Environmental Contamination and Toxicology 35: 835-844.
Marsh, G. 1973. The Zostera epifaunal community in the York River, Virginia. Chesapeake Science
14(2): 87-97.
Marsh, G. A. and D.B. Turbeville. 1981. The environmental impact of beach nourishment: Two
studies in southeastern Florida. Shore and Beach July: 40-44.
Marshall, L. P. 1976. A biological and fisheries profile of spotted seatrout, Cynoscion nebulosus. NC
Division of Marine Fisheries, Morehead City, NC, Completion report for project AFCS-10 ,
90p.
Marshall, M. D. 1995. North Carolina oyster restoration and fishery management plan. North
Carolina Division of Marine Fisheries and the North Carolina Blue Ribbon Advisory Council
on Oysters, Morehead City, NC, 116p.
Marshall, M. D., J.E. French, and S.W. Shelton. 1999. A history of oyster reef restoration in North
Carolina. p. 107-116 in Luckenbach M.W., R. Mann, and J.A. Wesson (ed.). Oyster Reef
Restoration: A Synopsis and Synthesis of Approaches. Virginia Institute of Marine Science
Press, Gloucester Point, VA.
Marshall, N. 1954. Changes in the physiography of oyster bars in the James River, Virginia.
2010 COASTAL HABITAT PROTECTION PLAN
Literature cited Page 535
Proceedings of the National Shellfisheries Association 44: 113-122.
Marshall, N. 1970. Food transfer through the lower trophic levels of the benthic environment. p. 52-66
in J.H. Steele (ed.). Marine food chains. University of California, Berkeley.
Martin, P., N. Taft, and C. Sullivan. 1994. Reducing Entrainment of Juvenile American Shad Using a
Strobe Light Diversion System. p. 57-63 in Cooper, J. E., R. T. Eades, R. J. Klauda, and J.G.
Loesch (editors). Anadromous Alosa Symposium. Tidewater Chapter, American Fisheries
Society, Bethesda, Maryland.
Matheson, R. E. Jr., D.K. Camp, S.M. Sogard, and K.A. Bjorgo. 1999. Changes in seagrass-associated
fish and crustacean communities on Florida Bay mud banks: the effects of recent ecosystem
changes? Estuaries 22(2B): 534-551.
Matilla, J., K.L. Heck Jr., M. Erika, M. Emily, G. Camilla, S. Williams, and D. Byron. 2008.
Increased habitat structure does not always provide increased refuge from predation. Marine
Ecology Progress Series 361(June 9): 15-20.
Matoura, R. F. C. and E.M.C. Woodward. 1983. Conservative behavior of riverine dissolved organic
carbon in the Severn estuary: chemical and geochemical implications. Geochimica
Cosmochimica Acta 47: 1293-1309.
Matozzo, V. and M.G. Marin. 2005. Can 4-nonylphenol induce vitellogenin-like proteins in the clam
Tapes philippinarum? Environmental Research 97: 43-49.
Matson, E. A. and M.M. Brinson. 1985. Sulfate enrichments in estuarine waters of North Carolina.
Estuaries 8: 279-289.
Matson, E. A. and M.M. Brinson. 1990. Stable carbon isotopes and the C:N ratio in the estuaries of
the Pamlico and Neuse rivers, North Carolina. Limnology and Oceanography 35: 1290-
1300.
Maxted, J. R., S. B. Weisberg, J. C. Chaillou, R. A. Eskin, and F. W. Kutz. 1997. The ecological
condition of dead-end canals of the Delaware and Maryland coastal bays. Estuaries 20: 319-
327.
Mcallister, T. L., M.F. Overton, and E.D. Brill. 1996. Cumulative Impact of Marinas on Estuarine
Water Quality. Environmental Management 20(3): 385-396.
McAllister, T. L., M.F. Overton, and Jr. E.D. Brill. 1996. Cumulative impact of marinas on estuarine
water quality. Environmental Management. 20(3): 385-396.
McComas, S. 2003. Lake and pond management guidebook. CRC Press, Boca Raton, FL, 304 pp.p.
McDougal, W. G., M.A. Sturtevant, and P.D. Komar. 1987. Laboratory and field investigations of the
impact of shoreline stabilization structures on adjacent properties. in Krause, N. C. ed.
Coastal Sediments '87. American Society of Civil Engineering , New York, NY.
Mcgee, D., R.A. Laws, and L.B. Cahoon. 2008. Live benthic diatoms from the upper continental
slope: extending the limits of marine primary production. Marine Ecology Progress Series
356: 103-112.

2010 COASTAL HABITAT PROTECTION PLAN
Literature cited Page 536
McGlathery, J. K. 2001. Macroagal blooms contribute to the decline of seagrass in nutrient-enriched
coastal waters. Journal of Phycology (37): 453-456.
McIntosh, A. D., C.F. Moffat, G. Packer, and L. Webster. 2004. Polycyclic aromatic hydrocarbon
(PAH) concentration and composition determined in farmed blue mussels (Mytilus edulis) in a
sea loch pre- and post-closure of an aluminium smelter. J. Environ. Monit. 6: 209-218.
McIntosh, S., T. King, D. Wu, and P.V. Hodson. 2010. Toxicity of dispersed weathered crude oil to
early life stages of Atlantic herring (Clupea harengus). Environmental Toxicology and
Chemistry 29(5): 1160-1167.
McIvor, C. C. and W.E. Odum. 1987. Marsh fish community structure: roles of geomorphology and
salinity. Ph.D. dissertation, University of Virginia, Charlottesville, VA, 132 p.
McKenney, C. L. Jr. 2005 . The influence of insect juvenile hormone agonists on metamorphosis and
reproduction in estuarine crustaceans. Integrative and Comparative Biology 45(1): 97-105.
McLachlan, A., T. Erasmus, A.H. Dye, T. Wooldridge, G. Van der Horst, G. Rossouw, T.A. Lasiak,
and L. McGwynne. 1981. Sand beach energetics: an ecosystem approach towards a high
energy interface. Estuarine, Coastal, and Shelf Science 13: 11-25.
McLachlan, A. 1996. Physical factors in benthic ecology: effects of changing sand particle size on
beach fauna. Marine Ecology Progress Series 131: 205-217.
McLaughlin, S. M. and S.J. Jordan. 2003. A potential ecoforecast for protozoal infections of the
eastern oyster (Crassostrea virginica) in the upper Chesapeake Bay. p. 73-79 in Vallette-
Silver, N. J. and Scavia (eds.), D. Ecological Forecasting: New Tools for Coastal and
Ecosystem Management. NOAA, Silver Spring, MD, NOAA Technical Memeorandum NOS
NCCOS 1 .
McNinch, J. E. and J.T. Wells. 1992. Effectiveness of beach scraping as a method of erosion control.
Shore and Beach 1: 13-20.
McNinch, J. E. and R.A. Luettich Jr. 2000. Physical porcesses around a cuspate foreland: implications
to the evolution and long-term maintenance of a cape-associated shoal. Continental Shelf
Research 20: 2367-2389.
McNinch, J. E. and R.A. Luettich Jr. 2000. Physical processes around a cuspate foreland: implications
to the evolution and long-term maintenance of a cape-associated shoal. Continental Shelf
Research 20: 2367-2389.
Meister, H. S., D.M. Wyanski, J.K. Loefer, S.W. Ross, A.M. Quattrini, and K.J. Sulak. 2005. Further
evidence for the invasion and establishment of Pterois volitans (Teleostei: Scorpaenidae)
along the Atlantic coast of the United States. Southeastern Naturalist 4(2): 193-206.
Menhinick, E. F. 1991. The freshwater fishes of North Carolina. The Delmar Company, Charlotte,
NC, 227p.
Menzel, D. W. 1993. Ocean processes: U.S. Southeast continental shelf. Office of Scientific and
Technical Information, U.S. Department of Energy.
2010 COASTAL HABITAT PROTECTION PLAN
Literature cited Page 537
Menzel, R. W. and S.H. Hopkins. 1955. Crabs as predators of oysters in Louisiana. Proceedings of the
National Shellfisheries Association 45: 177-184.
Mercer, L. P. 1984. A biological and fisheries profile of red drum, Sciaenops ocellatus. North
Carolina Division of Marine Fisheries, Morehead City, NC, Special Scientific Report 41 .
Mercer, L. P. 1989a. Species profiles: life histories and environmental requirements of coastal fishes
and invertebrates (Mid-Atlantic)--weakfish. U.S. Fish and Wildlife Service, 82(11.109) , 17p.
Mercer, L. P. 1989b. Species profiles: life histories and environmental requirements of coastal fishes
and invertebrates (South Atlantic)--black sea bass. U.S. Fish Wildl. Serv. / U.S. Army Corps
of Engineers, Biol. Rep. 82(11.99) / TR EL-82-4 , 16p.
Meyer, C. E. 1982. Zooplankton communities in Chesapeake Bay seagrass systems. M.A. Thesis,
College of William and Mary, Williamsburg, VA, 96 p.
Meyer, D. L. 1994. Habitat partitioning between the Xanthid crabs Panopeus herbstii and
Eurypanopeus depressus on intertidal oyster reefs (Crassostrea virginica) in southeastern
North Carolina. Estuaries 17(3): 6674-679.
Meyer, D. L. and E.C. Townsend. 2000. Faunal utilization of created intertidal eastern oyster
(Crassostrea virginica) reefs in the southeastern United States. Estuaries 23(1): 34-45.
Meyer, D. L. and E.C. Townsend. 2000. Faunal utilization of created intertidal eastern oyster reefs in
the southeastern United States. Estuaries 23(1): 34-45.
Meyer, D. L., E.C. Townsend, and G.W. Thayer. 1997. Stabilization and erosion control value of
oyster cultch for intertidal marsh. Restoration Ecology 5(1): 93-99.
Meyer, D. L., E.C. Townsend, and P.L. Murphey. 1996. Final report for the project evaluation of
restored wetlands and enhancement methods for existing restorations. National Oceanic and
Atmospheric Administration, Office of Habitat Conservation Restoration Center, Silver
Springs, MD.
Meyer, D. L., J. M. Johnson, and J. W. Gill. 2001. Comparison of nekton use of Phragmites australis
and Spartina alterniflora marshes in the Chesapeake Bay, USA. Marine Ecology-Progress
Series 209(209): 71-84.
Meyer, J. L., L.A. Kaplan, D. Newbold, D.L. Strayer, C.J. Woltemade, J.B. Zedler, R. Beilfuss, Q.
Carpenter, R. Semlitsch, M.C. Watzin, and P. Zedler. 2007. Where rivers are born: the
scientific imperative for defending small streams and wetlands. American Rivers, Sierra Club,
and Turner Foundation,
http://amr.convio.net/site/DocServer/WhereRiversAreBorn1.pdf?docID=182, 23 pp.p.
Micheli, F., M.J. Bishop, C.H. Peterson, and J. Rivera. 2008. Alteration of seagrass species
composition and function over two decades. Ecological Monographs 78(2): 225-244.
Micheli, F. M. and C. H. Peterson. 1999. Estuarine vegetated habitats as corridors for predator
movement. Conservation Biology 13(4): 869-881.
Milam, C. D., J.L. Farris, and J.D. Wilhide. 2000. Evaluating mosquito control pesticides for effect on
2010 COASTAL HABITAT PROTECTION PLAN
Literature cited Page 538
target and nontarget organisms. Archives of Environmental Contamination and Toxicology.
39(.): 324-328.
Miles, J. R., P.E. Russell, and D.A. Huntley. 2001. Field measurements of sediment dynamics in front
of a seawall. Journal of Coastal Research 17: 195-206.
Miller, D. C. 1989. Abrasion effects on microbes in sandy sediments. Marine Ecology Progress Series
55: 73-82.
Miller, D. C., R.J. Geider, and H.L. MacIntyre. 1996. Microphytobenthos: the ecological role of the
"secret garden" of unvegetated, shallow-water marine habitats. II. Role in sediment stability
and shallow-water food webs. Estuaries 19(2A): 202-212.
Miller, G. C. and W.J. Richards. 1980. Reef fish habitat, faunal assemblages, and factors determining
distributions in the South Atlantic Bight. Proceedings of the U.N.F. and Caribbean Fisheries
Institute, Miami Beach, Fl 32: 114-130.
Miller, J. M. 1992. Larval fish migration at Oregon Inlet, North Carolina. Supplemental Reports to the
Department of the Interior Consultant's Report. US Dept. of the Interior. USFWS 8: 27.
Miller, J. M., L.B. Crowder, and M.L. Moser. 1985. Migration and utilization of estuarine nurseries by
juvenile fishes: an evolutionary perspective. p. 338-352 in M.A. Rankin (ed.). Migration:
mechanisms and adaptive significance. Contributions to Marine Science (Supplement). 27 .
Miller, M. W. and M.E. Hay. 1996. Coral-seaweed-grazer-nutrient interactions on temperate reefs.
Ecological Monographs 66(3): 323-344.
Milliken, A. S. and V. Lee. 1990. Pollution impacts from recreational boating. NOAA Office of Sea
Grant, 25p.
Minello, T. J., K.W. Able, M.P. Weinstein, and C.G. Hays. 2003. Salt marshes as nurseries for
nekton: testing hypotheses on density, growth and survival through meta-analysis. Marine
Ecology Progress Series 246: 39-59.
Minello, T. J. 1999. Nekton densities in shallow estuarine habitats of Texas and Louisiana and the
identification of Essential Fish Habitat. p. 43-75 in Benaka, L. R. ed. Fish Habitat: Essential
Fish Habitat and Rehabilitation. American Fisheries Society, Bethesda, Maryland, 459 p.
Mitchell, W., T. Pratt, and C. Taylor. 2007. Feasibility of using mobile hydroacoustic surveys for
estimating spawning stock size of blueback herring in western Albemarle Sound, North
Carolina. North Carolina Sea Grant, Morehead City, NC.
Mitsch, W. J. and J.G. Gosselink. 1993. Wetlands - 2nd edition. John Wiley & Sons, Inc., U.S.A., .
722p.
Mitsch, W. J. and J.G. Gosselink. 1993. Wetlands, Second Edition. Van Nostrand Reinhold, New
York, NY, Second Edition , 772p.
MMS (Minerals Management Service). 1993. Sand and gravel maps of the Atlantic continental shelf
with explanatory text. US Department of the Interior , No. 37 , 35 p.
2010 COASTAL HABITAT PROTECTION PLAN
Literature cited Page 539
Mock, C. R. 1966. Natural and altered estuarine habitats of penaeid shrimp. Proceedings Gulf
Caribbean Fish Institute 19th Annual Session : 86-98.
Moeller, P. D. R., K.R. Beauchesne, K.M. Huncik, W.C. Davis, S.J. Christophoer, P. Riggs-Gelasco,
and A.K. Gelasco. 2007. Metal complexes and free radical toxins produced by Pfiesteria
piscicida. Environmental Science and Technology 41(4): 1166-1172.
Moffat and Nichol, I. 2010. Terminal groin study. for NC Coastal Resources Commission, Raleigh.
Moore, J. W. 1991. Inorganic contaminants of surface water, research and monitoring priorities.
Springer-Verlag, New York, NY, Springer series on environmental management. 334p.
Moore, J. W. and J.A. Moore. 1976. The basis of food selection in flounders, Platichthys flesus (L.) in
Severn estuary. Journal of Fish Biology 9: 139-156.
Moore, K. A. 2004. Influence of seagrasses on water quality in shallow regions fo the lower
Chesapeake Bay. Journal of Coastal Research 45: 162-178.
Moore, K. A., H.A. Neckles, and R.J. Orth. 1996. Zostera marina (eelgrass) growth and survival
along a gradient of nutrients and turbidity in the lower Chesapeake Bay. Marine Ecology
Progress Series. 142(.): 247-259.
Moore, K. A., R.L. Wetzel, and R.J. Orth. 1997. Seasonal pulses of turbidity and their relations to
eelgrass (Zostera marina L.) survival in an estuary. Journal of Experimental Marine Biology
and Ecology. 215(.): 115-134.
Moore, R. H. 1992. Low-salinity backbays and lagoons. p. 541-614 in C.T. Hackney, S. M. Adams
and W. H. Martin eds. Biodiversity of the southeastern United States: aquatic communities.
John Wiley and Sons, Inc., NY, 779 p.
Moorhead, K. K. and M.M. Brinson. 1995. Response of wetlands to rising sea level in the lower
coastal plain of North Carolina. Ecological Applications. 5(1): 261-271.
Morgan, P. A., D.M. Burdick, and F.T. Short. 2009. The functions and values of fringing salt marshes
in northern New England, USA. Estuaries and Coasts 32: 483-495.
Morton, T. 1. 1989. Species profiles: life histories and environmental requirements of coastal fishes
and invertebrates (Mid-Atlantic)--bay anchovy. U. S. Fish Wildl. Serv. Biol. Rep., 82t11.97 ,
13p.
Moser, M. L., A.M. Darazsdi, and J. R. Hall. 2000. Improving passage efficiency of adult American
shad at low-elevation dams with navigation locks. North American Journal of Fisheries
Management 20: 376-385.
Moser, M. L. and M.E. Terra. 1999. Low light as a possible impediment to river herring migration.
Center for Marine Science Research, University of North Carolina at Wilmington,
Wilmington, NC, 137p.
Moser, M. L. and S. W. Ross. 1995. Habitat use and movements of shortnose and Atlantic sturgeons
in the lower Cape Fear River, North Carolina. Transactions of the American Fisheries Society
124(2): 225-234.
2010 COASTAL HABITAT PROTECTION PLAN
Literature cited Page 540
Moser, M. L. and B. L. Taylor. 1995. Hard bottom habitat in North Carolina state waters: a survey of
available data. Final report to NC Division of Coastal Management. Unpub. doc., 20p.
Moss, J. A., E.M. Burreson, and K.S. Reece. 2006. Advanced Perkinsus marinus Infections in
Crassostrea ariakensis maintained under laboratory conditions. Journal of Shellfish Research
25(1): 65-72.
MSC (Moratorium Steering Committee). 1996. Final report of the Moratorium Steering Committee to
the Joint Legislative Commission on Seafood and Aquaculture of the North Carolina General
Assembly. N.C. Sea Grant College Program, Raleigh, NC, NC-SG-96-11 , 155p.
Mu-Chan, K., C. Sang-Man, and J. Woo-Geon. 2007. Short-term physiological response of the Pacific
oyster, Crassostrea gigas, on exposure to varying levels of polycyclic aromatic hydrocarbon.
Aquaculture Research 38(15): 1612-1681.
Mudre, J. M., J.J. Ney, and R.J. Neves. 1985. An analysis of the impediments to spawning migrations
of anadromous fish in Virginia rivers. Final report. Virginia Highway Research Council, V.A.
Department of Highways and Transportation, Charlottesville, Va.
Mulholland, P. J. 1979. Organic carbon in a swamp-stream ecosystem and export by streams in eastern
North Carolina. Ph.D. Dissertation, University of North Carolina, Chapel Hill, NC
Mulholland, P. J. and E.J. Kuenzler. 1979. Organic carbon export from upland and forested wetland
watersheds. Limnology and Oceanography 24: 960-966.
Munger, A. and M. Shore. 2005. Understanding Global Warming for North Carolina: Sound Science
For Making Informed Decisions. Environmental Defense, Raleigh, NC, 24p.
Murphey, P. L. and M. S. Fonseca. 1995. Role of high and low energy seagrass beds as nursery areas
for Penaeus duorarum in North Carolina. Marine Ecology Progress Series 121: 91-98.
Murphy, M. D. and R.G. Taylor. 1990. Reproduction, growth, and mortality of red drum Sciaenops
ocellatus in Florida waters. Fishery Bulletin 88: 531-542.
Myers, R. A., J.K. Baum, T.D. Shepherd, S.P. Powers, and C.H. Peterson. 2007. Cascading effects of
the loss of Apex predatory sharks from a coastal ocean. Science 315(March): 1846-1850.
Najjar, R. G., H.A. Walker, P.J. Anderson, E.J. Barron, R.J. Bord, J.R. Gibson, V.S. Kennedy, C.G.
Knight, J.P. Megonigal, R.E. O'connor, C.D. Polsky, N.P. Psuty, B.A. Richards, L.G.
Sorenson, E.M. Steele, and R.S. Swanson. 2000. The potential impacts of climate change on
the Mid-Atlantic coastal region. Climate Research 14(3): 219-233.
NC Sea Grant. 1997. Coastal water quality. NC State University, Raleigh, NC, UNC-SG-97-04 , 72
p.
NC Sea Grant. 1999. Fishery Resource Grant Program (Aquaculture & Mariculture, Fisheries
Equipment & Gear, Seafood Technology, Environmental Pilot Studies). North Carolina Sea
Grant, Raleigh, NC.
NC Sea Grant. 2000. Aquatic nuisance species report: An update on Sea Grant research and outreach
projects. Sea Grant, Raleigh, NC, 4p.
2010 COASTAL HABITAT PROTECTION PLAN
Literature cited Page 541
NC Sea Grant. 2009. Developing a management strategy for North Carolina's coastal ocean. UNC-
SG-09-02 , 101p.
NCCF (North Carolina Coastal Federation). 2007. Oyster Restoration and Protection Plan for North
Carolina. North Carolina Coastal Federation, 8p.
NCDA&CS (North Carolina Department of Agriculture and Consumer Services). 2008. North
Carolina agricultural water use. North Carolina Department of Agriculture and Consumer
Services, Raleigh, NC, 8p.
NCREDC (North Carolina Rural Economic Development Center). 2005. Water 2030 Initiative.
Conclusions and Recommendations.
Neckles, H. A., R.L. Wetzel, and R.J. Orth. 1993. Relative effects of nutrient enrichment and grazing
on epipyte-macrophyte (Zostera marina L.) dynamics. Oecologia (93): 285-295.
Nelson, D. M., M.E. Monaco, E.A. Irlandi, L.R. Settle, and L. Coston-Clements. 1991. Distribution
and abundance of fishes and invertebrates in southeast estuaries. NOAA/NOS Strategic
Environmental Assessment Division, Silver Spring, MD, 167p.
Nelson, K. A., L.A. Leonard, M.H. Posey, T.D. Alphin, and M.A. Mallin. 2004. Journal of
Experimental Marine Biology and Ecology. Using transplanted oyster (Crassostrea virginica)
beds to improve water quality in small tidal creeks: a pilot study 298(2): 347-368.
Nelson, R. W. and C.H. Walburg. 1977. Population dynamics of yellow perch (Perca flavescens),
sauger (Stizostedion canadense) and walleye (S. vitreum vitreum) in four main stem Missouri
River reservoirs. Journal of the Fisheries Research Board of Canada 34: 1748-1763.
Nelson, T. C. 1938. The feeding mechanism of the oyster. I. On the pallium and branchial chambers
of Ostrea virginica, O. edulis, and O. angulata, with comparisons with other species of the
genus. Journal of Morphology 63: 1-61.
Nelson, T. C. 1960. The feeding mechanism of the oyster. II. On the gills and palps of Ostrea
virginica, O. edulis, and O. angulata, with comparisons with other species of the genus.
Journal of Morphology 107: 163-203.
Nero, L. 2001. Fiber optic cables: issues for marine habitat and fisheries. Habitat Hotline Atlantic
8(1): 1-2.
Nestlerode, J. A., M.W. Luckenbach, and F.X. O'Beirn. 2007. Settlement and survival of the oyster
Crassostrea virginica on created oyster reef habitats in Chesapeake Bay. Restoration Ecology
15(2): 273-283.
Neves, F. M. and C.E. Bemvenuti. 2006. The ghost crab Ocypode quadrata (Fabruicus, 1787) as
potential indicator of antropic impact along the Rio Grande do Sul coast, Brazil. Biological
Conservation 133: 431-435.
Neves, R. J., A.E. Bogan, J.D. Williams, S.A. Ahlstedt, and P.W. Hartfield. 1997. Status of aquatic
mollusks in the southeastern United States: a downward spiral of diversity. p. 43-85 in G.W.
Benz, D. E. Collins eds. Aquatic fauna in peril: the southeastern perspective. Southeast
Aquatic Research Institute, Decatur, GA, Special Publication 1 , 554 p.

2010 COASTAL HABITAT PROTECTION PLAN
Literature cited Page 542
Newcombe, C. P. and D.D. MacDonald. 1991. Effects of suspended sediments on aquatic ecosystems.
North American Journal of Fisheries Management 11: 72-82.
Newell, R. I. E. 1988. Ecological changes in the Chesapeake Bay: are they the result of overharvesting
the Amercian oyster? p. 536-546 in M.P. Lynch and E.C. Krome (eds.). Understanding the
estuary: advances in Chesapeake Bay research. Chesapeake Bay Research Consortium,
Baltimore, MD, Publication 129 .
Newell, R. I. E. 2004. Ecosystem influence of natural and cultivated populations of suspension-
feeding bivalve molluscs: a review. Journal of Shellfish Research 23(1): 51-61.
Newell, R. I. E. and E.W. Koch. 2004. Modelling seagrass density and distribution in response to
changes in turbidity stemming from bivalve filtration and seagrass sediment stabilization.
Estuaries 27(5): 793-806.
Newell, R. I. E., J.C. Cornwell, and M.S. Owens. 2002. Influence of simulated bivalve biodeposition
and microphytobenthos on sediment nitrogen dynamics: a laboratory study. Limnology and
Oceanography 47(5): 1367-1379.
Newell, R. I. E., T.R. Fisher, R.R. Holyoke, and J.C. Cornwell. 2005. Influence of eastern oysters on
nitrgen and phosphorus regeneration in Chesapeake Bay, USA. p. 93-120 in R. Dame and S.
Olenin (eds.). The comparative roles of suspension feeders in ecosystems. Springer, The
Netherlands, 47 .
Nicholson, N. and S.R. Jordan. 1994. Biotelemetry study of red drum in Georgia. Georgia Department
of Natural Resources, Brunswick, GA, 64p.
Nixon, S. W. 1995. Coastal marine eutrophication: a definition, social causes, and future concerns.
Ophelia 41: 199-219.
Nixon, S. W. 2009. Eutrophication and the macroscope. Hydrobiologia 629: 5-19.
Nixon, S. W., C.A. Oviatt, and S.L. Northby. 1973. Ecology of small boat marinas. University of
Rhode Island, Kingston, RI, Mar. Tech. Rep. Ser. No. 5 , 20p.
NMFS (National Marine Fisheries Service). 1998. Biological opinion on hopper dredges in channels
and borrow areas along the southeast US Atlantic coast. NMFS, Letter to the USACOE , 9p.
NMFS (National Marine Fisheries Service). 1999. Our Living Oceans. Report on the status of US
living marine resources,1999. U.S. Dept. Commerce, Silver Springs, Md, NOAA Tech.
Memo. NMFS-F/SPO-41 .
NMFS (National Marine Fisheries Service). 2002. Annual Report to Congress on the Status of U.S.
Fisheries - 2001. NOAA, Silver Spring, MD, 142p.
NMFS (National Marine Fisheries Service). 2003. Annual Report to Congress on the Status of U.S.
Fisheries - 2002 . NOAA, Silver Spring, MD, 156p.
NMFS (National Marine Fisheries Service). 2008. Annual Report to Congress on the Status of U.S.
Fisheries - 2007. NOAA, Silver Spring, MD, 23p.
2010 COASTAL HABITAT PROTECTION PLAN
Literature cited Page 543
NOAA. 1991. United States coast pilot #4: Cape Henry to Key West. National Ocean Service ,
Riverdale, MD, 300p.
NOAA (National Oceanic and Atmospheric Administration). 1996. NOAA's estuarine eutrophication
survey. Volume 1: South Atlantic Region. Office of Ocean Resources Conservation
Assessment, Silver Spring, Md, 50p.
NOAA (National Oceanic and Atmospheric Administration). 2001. Unpublished data - ELMR
distribution and abundance and life history tables for estuarine fish and invertebrate species.
NOAA/NOS Biogeography Program, Silver Springs, MD.
NOAA (National Oceanographic and Atmospheric Administration). 2001. Seagrasses: an overview
for coastal managers. NOAA, Charleston, SC, 19p.
Noble, E. 1996. Report to the oyster, clam, and scallop committee on Ward Creek field investigation
by resource enhancement staff . DENR, DMF, Unpub. rep. 8p.
Noble, E. B. and K.A. Mohr. 2008. Currituck Sound Restoration Project, submerged aquatic
vegetation transect field surveys, Currituck Sound NC and Back Bay VA, Summer 2006.
Elizabeth City State University, Elizabeth City, NC , 21 pp.p.
Noble, E. B. and K.M. Hall. 2005. Submerged aquatic vegetation cooperative habitat mapping
project: a partnership to map submerged aquatic vegetation in the estuarine and coastal
riverine systems of North Carolina and Southeastern Virginia. Elizabeth City State University,
Elizabeth City, NC, February , 15 pp.p.
Noble, E. B. and R.J. Monroe. 1991. Classification of Pamlico Sound Nursery Areas:
Recommendations for Critical Habitat Criteria. North Carolina Department of Environment,
Health, and Natural Resources, Morehead City, NC, A/P Project No. 89-09 , 70 p.
Noga, E. J. 2000. Skin ulcers in fish: Pfiesteria and other Etiologies. Toxicologic pathology 28(6):
807-823.
Noga, E. J., L. Khoo, J.B. Stevens, Z. Fan, and J.M. Burkholder . 1996. Novel toxic dinoflagellate
causes epidemic disease in estuarine fish. Marine Pollution Bulletin 32: 219-224 .
Noga, E. J., M.J. Dykstra, and J.F. Levine. 1989. Fish diseases of the Albemarle-Pamlico estuary.
University of North Carolina Water Resources Research Institute, Report No. 238 .
North Carolina Coastal Futures Committee. 1994. Charting a Course for Our Coast. North Carolina
Coastal Futures Committee, 101p.
North Carolina Estuarine Shoreline Protection Stakeholders. 1999. Protecting North Carolina's coastal
resources, A framework for maintaining and improving water quality. Unpub. rep.
North Carolina Ocean Resources Task Force. 1995. Management and stewardship of North Carolina's
coastal ocean: Recommendations of the NC Ocean Resources Task Force. DCM, Unpub. rep.
25p.
NOS (National Ocean Service). 1990. Estuaries of the United States, vital statistics of a national
resource base. NOAA, U.S. Department of Commerce, Rockville, Maryland, A Special
2010 COASTAL HABITAT PROTECTION PLAN
Literature cited Page 544
NOAA 20th Anniversary Report .
NRC (National Research Council). 1995. Beach nourishment and protection. National Academy
Press, Washington, D.C., 334p.
NRC (National Research Council). 2000. Clean coastal waters: Understanding and reducing the
effects of nutrient pollution. Committee on the causes and management of eutrophication,
ocean studies board, Water Science and Technology Board. National Academy Press,
Washington, DC.
NRC (National Research Council). 2001. Marine Protected Areas: tools for sustaining ocean
ecosystems. National Academy Press, Washington, DC.
NRC (National Research Council). 2002. Effects of trawling and dredging on seafloor habitat.
National Academy Press, Washington, D.C., 125p.
NRC (National Research Council). 2002. Riparian areas: functions and strategies for management.
National Academy Press, Washington, D.C., 436p.
NRC (National Research Council). 2003. Non-native oysters in the Chesapeake Bay. The National
Academic Press, Washington, DC.
NRC (National Research Council). 2007. Mitigating shore erosion on sheltered coasts. National
Academy Press, Washington, DC.
NRCS (Natural Resources Conservation Service). 2002. Restoring America's Wetlands, Wetland
Reserve Program. U.S. Department of Agriculture, Natural Resources Conservation Service, .,
. 8p.
NRCS (Natural Resources Conservation Service). 2003. Restoring America's wetlands, Wetland
Reserve Program. U.S. Department of Agriculture, Natural Resources Conservation Service,
8p.
Null, K., J. Burkholder, D. DeMaster, R. Corbett, C. Thomas, and R. Reed. 2009. Ammonium fluxes
from channel deposits in the Neuse River Estuary, North Carolina, USA: Implications for
ammonium increase in estuarine waters. In: Proceedings of the 2009 Winter Meeting of the
American Society of Limnology and Oceanography, Nice, France (abstract; Ph.D. thesis
available in April 2010) .
Nunes, M., J.P. Coelho, P.G. Cardos, M.E. Pereira, A.C. Duarte, and M.A. Pardal. 2008. The
macrobenthic community along a mercury contamination in a temperate estuarine system.
Science of the Total Environment 405: 186-194.
NWF (National Wildlife Federation). 2008. More variable and uncertain water supply: global
warming's wake-up call for the southeastern United States. National Wildlife Federation, 8p.
Nybakken, J. W. 1993. Marine Biology, an Ecological Approach. Harper Collins College Publishers,
New York, NY, Third edition , 462p.
Nye, J. A., J.S. Link, J.A. Hare, and W.J. Overholtz. 2009. Changing spatial distribution of fish stocks
in relation to climate and population size on the northeast United States continental shelf.
2010 COASTAL HABITAT PROTECTION PLAN
Literature cited Page 545
Marine Ecology Progress Series 393: 111-129.
O'Connor, T. P. and G .G. Lauenstein. 2005. Status and trends of copper concentrations in mussels
and oysters in the USA. Marine Chemistry 97(1-2): 49-59.
O'Neill, J. T. 1980. Aspects of the life histories of anadromous alewife and the blueback herring,
Margaree River and Lake Ainsle, Nova Scotia, 1978-1979. M.S. Thesis, Acadia University,
Wolfville, Nova Scotia, Canada, 306 p.
O'Rear, C. W. 1983. A study of river herring spawning and water quality in Chowan River. NC
Department of Natural Resources and Community Development, DMF, Raleigh, NC,
Complete Report, Project AFC-17 , 31p.
Odum, E. P. 1959. Fundamentals of ecology. 2nd Edition. W. B. Saunders Co., Philadelphia, Pa,
546p.
Odum, W. E., T.J. Smith, J.K. Hoover, and C.C. McIvor. 1984. The ecology of tidal freshwater
marshes of the United States east coast: a community profile. US Fish and Wildlife Service,
Washington, DC, FWS/OBS-83/17 , 177p.
Odum, W. E., T.J. Smith III, J.K. Hoover, C.C. McIvor, and E.C. Pendleton. 1984. The ecology of
tidal freshwater marshes of the United States East Coast: a community profile. U.S. Fish and
Wildlife Service, Washington, D.C., FWS/OBS-83/17 , 177p.
Officer, C. B., T.J. Smayda, and R. Mann. 1982. Benthic filter feeding: a natural eutrophication
control. Marine Ecology Progress Series 9: 203-210.
Ogden J.C. 1980. Faunal relationships in Caribbean seagrass beds. p. 173–198 in Phillips R.C.,
McRoy C. P. eds. Handbook of seagrass biology. Garland Publishing, New York.
Öham, M. C., P.Sigray, and H. Westerberg. 2007. Offshore windmills and the effects of
electromagnetic fields on fish. Ambio 36(8): 630-633.
Ojeda, G. Y., P.T.Gayes, A.L. Sapp, P.C. Jutte, and R.F. Van Dolah. 2001. Habitat mapping and sea
bottom change detection on the shoreface and inner shelf adjacent to the Grand Strand beach
nourishment project. Coastal Carolina University and SC DNR, Charleston, SC, 48p.
Oliver, J. D., M.J. Van Den Avyle, and E.L. Bozeman Jr. 1989. Species profiles: life histories and
environmental requirements of coastal fishes and invertebrates (South Atlantic)--bluefish. US
Fish and Wildlife Service, Biological Report 82(11.96) , 13p.
Olsen, S., M.E.Q. Pilson, and J.N. Gearing. 1982. Ecological consequences of low sustained
concentrations of petroleum hydrocarbons in temperate estuaries. Graduate School of
Oceanography, University of Rhode Island, Narragansett, RI.
Olsgard, F. and J. Gray. 1995. A comprehensive analysis of the effects of offshore oil and gas
expoloration and production on the benthic communities of the Norwegian continental shelf.
Marine Ecology Progress Series 122: 277-306.
Onuf, C. P. 1994. Seagrasses, dredging and light in Laguna Madre, Texas, U.S.A. Estuarine, Coastal
and Shelf Science 39: 75-91.
2010 COASTAL HABITAT PROTECTION PLAN
Literature cited Page 546
Orlando, S. P. Jr., C. J. K. P.H. Wendt, M.E. Pattillo, K.C. Dennis, and G.H. Ward . 1994. Salinity
characteristics of South Atlantic estuaries. National Oceanic and Atmospheric
Administration, Office of Ocean Conservation and Assessment, Silver Springs, MD, 117p.
Orr, J. C., V.J. Fabry, O. Aumont, L. Bopp, S.C. Doney, R.A. Feely, A. Gnanadesikan, N. Gruber, A.
Ishida, F. Joos, R.M. Key, K. Lindsay, E. Maier-Reimer, R. Matear, P. Monfray, A. Mouchet,
R.G. Najjar, G.K. Plattner, K.B. Rodgers, C.L. Sabine, J.L. Sarmiento, R. D. S. R. Schlitzer,
I.J. Totterdell, M.F. Weirig, Y. Yamanaka, and A. Yool. 2005. Anthropogenic ocean
acidification over the twenty-first century and its impact on calcifying organisms. Nature
437(7059): 681-686.
Ortega, S. and J.P. Sutherland. 1992. Recruitment and growth of the eastern oyster, Crassostrea
virginica, in North Carolina. Estuaries 15(2): 158-170.
Ortega, S., J.P. Sutherland, and C.H. Peterson. 1990. Environmental determination of oyster success
in the Pamlico Sound. Albemarle-Pamlico Study, North Carolina Department of Environment,
Health, and Natural Resources and United States Environmental Protection Agency, Report
90-08 , 29p.
Orth, D. J. and R.J. White. 1993. Stream habitat management . p. 205-228 in C.C. Kohler and W.A.
Hubert (eds.). Inland Fisheries Management in North America. American Fisheries Society,
Bethesda, MD, 594 p.
Orth, R. J. 1975. Destruction of eelgrass, Zostera marina, by the cownose ray, Rhinoptera bonasus, in
the Chesapeake Bay. Chesapeake Science 16(3): 205-208.
Orth, R. J. 1992. A perspective on plant-animal interactions in seagrasses: physical and biological
determinants influencing plant and animal abundance. p. 147-164 in D. M. John, S. J.
Hawkins and J. H. Price eds. Plant-Animal Interactions in the Marine Benthos. Clarendon
Press, Oxford, Systematic Special Volume No. 46 , 570 p.
Orth, R. J., J. Simons, J. Capelli, V. Carter, L. Hindman, S. Hodges, K. Moore, and N. Rybicki. 1986.
Distribution of submerged aquatic vegetation in the Chesapeake Bay and tributaries - 1985.
US EPA, Washington, DC, Final report .
Orth, R. J., M. Luckenbach, and K.A. Moore. 1994. Seed dispersal in a marine macrophyte:
implications for colonization and restoration. Ecology 75(7): 1927-1939.
Orth, R. J., R.A. Batiuk, P.W. Bergstrom, and K.A. Moore. 2002. A perspective on two decades of
policies and regulations influencing the protection and restoration of submerged aquatic
vegetation in Chesapeake Bay, USA. Bulletin of Marine Science 71(3): 1391-1403.
Orth, R. J., T.J.B. Carruthers, W.C. Dennison, C.M. Duarte, J.W. Fourqurean, K.L. Heck Jr., A.R.
Hughes, G.A. Kendrick, J.D. Kenworthy, S. Olyarnik, F.T. Short, M. Waycott, and S.L.
Williams. 2006. A global crisis for seagrass ecosystems. Bioscience 56(12): 987-997.
Osenberg, C., C. St. Mary, J. Wilson, and W. Lindberg. 2002. A quantitative framework to evaluate
the attraction-production controversy. ICES Journal of Marine Science 59: 1-8.
Overstreet, R. M. 1983. Aspects of the biology of the red drum, Sciaenops ocellatus. Gulf Research
Report Supplement 1: 45-68.
2010 COASTAL HABITAT PROTECTION PLAN
Literature cited Page 547
Oviatt, C. A. 2004. The changing ecology of temperate coastal waters during a warming trend.
Estuaries 27(6): 895-904.
Owens, L. B., W.M. Edwards, and R.W. Van Keuren. 1996. Sediment losses from a pastured
watershed before and after fencing. Journal of Soil and Water Conservation 51: 90-94.
Paerl, H. W. 1982. Environmental factors promoting and regulating N2 fixing blue-green algal blooms
in the Chowan River. N. C. University of North Carolina, Water Resources Research Institute,
Raleigh, NC, Report No. 176 , 65p.
Paerl, H. W. and D.R. Whitall. 1999. Anthropogenically derived atmospheric nitrogen deposition,
marine eutrophication and harmful algal bloom expansion: Is there a link? Ambio 28(4): 307-
311.
Paerl, H. W., J.D. Bales, L.W. Ausley, C.P. Buzzelli, L.B. Crowder, L.A. Eby, J.M. Fear, M. Go, B.L.
Peierls, T.L. Richardson, and J.S. Ramus. 2001. Ecosystem impacts of three sequential
hurricanes (Dennis, Floyd, and Irene) on the United States' largest lagoonal estuary, Pamlico
Sound, NC. Proceedings of the National Academy of Sciences, USA 98(10): 5655-5660.
Paerl, H. W., J. Pinckney, J. Fear, and B. Peierls. 1998. Ecosystem response to internal watershed
organic matter loading: Consequences for hypoxia in the eutrophying Neuse River Estuary,
North Carolina. Marine Ecological Progress Series 166: 17-25.
Paerl, H. W., L.M. Valdes, A.R. Joyner, B.L. Peierls, M.F. Piehler, S.R. Riggs, R.R. Christian, L.A.
Eby, L.B. Crowder, J.S. Ramus, E.J. Clesceri, C.P. Buzzelli, and R.A. Luettich Jr. 2006.
Ecological response to hurricane events in the Pamlico Sounds system, North Carolina, and
implications for assessment and management in a regime of increased frequence. Estuaries
and Coasts 29(6a): 1033-1045.
Paerl, H. W., L.M. Valdes, A.R. Joyner, and M.F. Piehler. 2004. Solving problems resulting from
solutions: evolution of a dual nutrient management strategy for the eutrophying Neuse River
estuary, North Carolina. Environmental Science and Technology 38: 3068-3073.
Paerl, H. W., L.M. Valdes-Weaver, A.R. Joyner, and V. Winklemann. 2007 . Phytoplankton
indicators of ecological change in the eutrophying Pamlico Sound system, North Carolina.
Ecological Applications 17(5): S88-S101.
Paerl, H. W., M.M. Mallin, C.A. Donahue, M. Go, and B.L. Peierls. 1995. Nitrogen loading sources
and eutrophication of the Neuse River, North Carolina: direct and indirect roles of
atmospheric deposition. UNC - Chapel Hill, Water Resources Research Institute, Chapel Hill,
NC, Publication 291 .
Page, C. A., J.S. Bonner, T.J. McDonald, and R.L. Autenrieth. 2002. Behavior of a chemically
dispersed oil in a wetland environment. Water Research 36: 3821-3833.
Page, H. M. and M. Lastra. 2003. Diet of intertidal bivalves in the Ria de Arosa (NW Spain):
evidence from stable C and N isotope analysis. Marine Biology 143: 519-532.
Page, L. M. and B.M. Burr. 1991. A field guide to freshwater fishes of North America north of
Mexico. Houghton Mifflin Company, Boston, USA, 432p.
2010 COASTAL HABITAT PROTECTION PLAN
Literature cited Page 548
Palacios, S. L. and R.C. Zimmerman. 2007. Response of eelgrass Zostera marina to CO2 enrichment:
possible impacts of cimate change and potential for remediation of coastal habitats. Marine
Ecology Progress Series 344: 1-13.
Paller, M. H. 1987. Distribution of larval fish between macrophyte beds and open channels in a
southeastern floodplain swamp. Journal of Freshwater Ecology 4(2): 191-200.
Palmer, M. A. 1988. Epibenthic predators and marine meiofauna: separating predation, disturbance,
and hydrodynamic effects. Ecology 69: 1251-1259.
Palumbi, S. R. and B.D. Kessing. 1991. Population biology of the trans-Arctic exchange: MtDNA
sequence similarity between Pacific and Atlantic sea urchins. Evolution 45: 1790-1805.
Pantell, S. E. 1993. Potential environmental impacts/Coastal Act issues. In: Seawater Desalination in
California. California Coastal Commission, San Francisco, Ca.
Parker Jr., R. O. and R.L. Dixon. 1998. Changes in a North Carolina reef fish community after 15
years of intense fishing - global warming implications. Transactions of the American Fisheries
Society 127: 908-920.
Parker, R. O., D.R. Colby, and T.D. Willis. 1983. Estimated amount of reef habitat on a portion of the
US South Atlantic and Gulf of Mexico continental shelf. Bulletin of Marine Science 33(4):
935-940.
Parker, R. O. and R.L. Dixon. 1998. Changes in a North Carolina reef fish community after 15 years
of intense fishing- global warming implications. Transactions of the American Fisheries
Society. 127: 908-920.
Parrow, M. W., J.M. Burkholder, N.J. Deamer, and J.S. Ramsdell. 2005. Contaminant-free cultivation
of Pfiesteria shumwayae (Dinophyceae) on a fish cell line. Aquatic Microbial Ecology 39:
97-105.
Partyka, M. L. and M.S. Peterson. 2008. Habitat quality and salt-marsh species assemblages along an
anthropogenic estuarine landscape. Journal of Coastal Research 24(6): 1570-1581.
Partyka, M. L., S. W. S.W. Ross, A.M. Quattrini, G.R. Sedberry, T.W. Birdsong, J. Potter, and S.
Gottfried. 2007. Southeastern United States Deep-Sea Corals (SEADESC) Initiative: A
Collaborative Effort to Characterize Areas of Habitat-Forming Deep-Sea Corals. NOAA,
Silver Spring, MD, NOAA Tech. Mem. OAR OER 1 , 176p.
Pate, P. P. Jr. 1972. Life History Aspects of the Hickory Shad, Alosa mediocris (Mitchill), in the
Neuse River, North Carolina. M.S. Thesis, North Carolina State University, Raleigh, NC, 67
p.
Pate, P. P. Jr. and R. Jones. 1981. Effects of upland drainage on estuarine nursery areas of Pamlico
Sound, North Carolina. UNC Sea Grant , Raleigh, NC, Pub. No. UNC-SG-WP-10 , 24p.
Patrick, W. S. and M.L. Moser. 2001. Potential competition between hybrid striped bass (Morone
saxatilis x M. americana) and striped bass (M. saxatilis) in the Cape Fear River Estuary, North
Carolina. Estuaries 24(3): 425-429.

2010 COASTAL HABITAT PROTECTION PLAN
Literature cited Page 549
Patriquin, D. G. 1975. Migration of blowouts in seagrass beds at Barbados and Carriacou West Indies
and its ecological and geological applications. Aquatic Botany 1: 163-189.
Pattilo, M. E., T.E. Czapla, D.M. Nelson, and M.E. Monaco. 1997. Distribution and abundance of
fishes and invertebrates in Gulf of Mexico estuaries. Volume II: Species life history
summaries. NOAA/NOS Strategic Environmental Assessment Division, Silver Springs, MD,
ELMR Rep. No. 11. 377p.
Paynter, K. T. and E.M. Burreson. 1991. Effects of Perkinsus marinus infection in the eastern oyster,
Crassostrea virginica: 2. Disease development and impact on growth rate at different
salinities. Journal of Shellfish Research 10: 425-431.
Paynter, K. T., J.D. Goodwin, M.E. Chen, N.J. Ward, M.W. Sherman, D.W. Meritt, and S.K. Allen.
2008. Crassostrea ariakensis in Chesapeake Bay: growth, disease and mortality in shallow
subtidal environments. Journal of Shellfish Research 27(3): 509-515.
PCS (Potash Corporation of Saskatchewan Phosphate Division). 2006. Draft environmental impact
statement for the PCS Phosphate Mine continuation, Aurora , NC.
Peacock, E. E. 2007. Long-term petroleum hydrocarbon contamination of New England salt marshes:
Persistence, degradation, and sediment erosion. MA Thesis, Boston University, Boston MA
Peacock, E. E., R.K. Nelson, A.R. Solow, J.D. Warren, J.L. Baker, and C.M. Reddy. 2005. The West
Falmouth oil spill: ~100 kg oil found to persist decades later. Environmental Forensics 6:
273281.
Pearsall, S., B. McCrodden, and P. A. Townsend. In review. Adaptive Management of Flows in the
Lower Roanoke River, North Carolina. Rivers .
Pearsall, S. H., B.J. McCrodden, and P.A. Townsend. 2005. Adaptive management of flows in the
lower Roanoke River, North Carolina, USA. Environmental Management 35(4): 353-367.
Peckol, P. and R.B. Searles. 1984. Temporal and spatial patterns of growth and survival of
invertebrates and algal populations of a North Carolina continental shelf community.
Estuarine, Coastal and Shelf Science 18: 133-143.
Penhale, P. 1977. Macrophyte-epiphyte biomass and productivity in an eelgrass (Zostera marina L.)
community. Journal of Experimental Marine Biology and Ecology 26: 211-224.
Perillo, G. M. E., E. Wolanski, D.R. Cahoon, and M. M. Brinson. 2009. Coastal Wetlands. Elsevier,
941p.
Perillo, L. and T.E. Lankford. Long-term effects of beach nourishment on the diets of juvenile
Trachinotus carolinus (Florida pompano) and Menticirrhus littoralis (Gulf kingfish)., UNC
Wilmington
Peters, D. S. and L.R. Settle. 1994. Larval fish abundance in vicinity of Beaufort Inlet prior to berm
construction. NMFS data summary report of project funded by the US Army Corps of
Engineers. NMFS, Beaufort, NC, 38 p.
Peters, D. S., L.R. Settle, and J.D. Fuss. 1995. Larval fish abundance in the vicinity of Beaufort Inlet
2010 COASTAL HABITAT PROTECTION PLAN
Literature cited Page 550
prior to berm construction. NMFS, Beaufort, NC, NMFS Progress Report , 20 p.
Peters, K. M. and Jr. R.H. McMichael. 1990. Early life history of the black drum Pogonias cromis
(Pisces: Sciaenidae) in Tampa Bay, Florida. Northeast Gulf Science 11: 39-58.
Peterson, B. J. and R.W. Howarth. 1987. Sulfur, carbon, and nitrogen isotopes used to trace organic
matter flow in the salt-marsh estuaries of Sapelo Island, Georgia. Limnology and
Oceanography 32(6): 1195-1213.
Peterson, C. H. 1982. Clam predation by whelks (Busycon spp.): experimental tests on the importance
of prey size, prey density, and seagrass cover. Marine Biology 66(159-170).
Peterson, C. H. 2001. A synthesis of direct and indirector chronic delayed effects of the Exxon
Valdex oil spill. Advances in Marine Biology 29: 1-103.
Peterson, C. H. 2002. Recruitment overfishing in a vivalve mollusc fishery: Hard clams (Mercenaria
mercenaria) in North Carolina. Canadian Journal of Fisheries and Aquatic Sciences 59(1):
96-104.
Peterson, C. H. 2005. Developing the capacity for fisheries use of the non-native oyster, Crassostrea
ariakensis. NC Department of Environment and Natural Resources, Division of Marine
Fisheries, Morehead City, NC, Final Report to NC Department of Environment and Natural
Resources, Division of Marine Fisheries , 29p.
Peterson, C. H., D.H.M. Hickerson, and G.G. Johnson. 2000b. Short-term consequences of
nourishment and bulldozing on the dominant large invertebrates of a sandy beach. Journal of
Coastal Research 16(2): 368-378.
Peterson, C. H., H.C. Summerson, E.Thompson, H.S. Lenihan, J. Grabowski, L. Manning, F. Micheli,
and G. Johnson. 2000a. Synthesis of linkages between benthic and fish communities as a key
to protecting essential fish habitat . Bulletin of Marine Science 66(3): 759-774.
Peterson, C. H., H.C. Summerson, H.S. Lenihan, J. Grabowski, S.P. Powers, and G.W. Sarfit Jr. 1999.
Beaufort Inlet benthic resources survey . UNC-CH, Morehead City, NC, Final Report to the
US Army Corps of Engineers. 18p.
Peterson, C. H., H.C. Summerson, and J. Huber. 1995. Replenishment of hard clam stocks using
hatchery seed: combined importance of bottom type, seed size, planting season, and density.
Journal of Shellfish Research 14(2): 93-300.
Peterson, C. H., H.C. Summerson, and S.R. Fegley. 1983. Relative efficiency of two clam rakes and
their contrasting effects on seagrass biomass. Fisheries Bulletin 81(2): 429-434.
Peterson, C. H., H.C. Summerson, and S.R. Fegley. 1987. Ecological consequences of mechanical
harvesting of clams. Fisheries Bulletin 85(2): 281-298.
Peterson, C. H., J.H. Grabowski, and S.P. Powers. 2003a. Quantitative enhancement of fish
production by oyster reef habitat: restoration valuation. Marine Ecology Progress Series 264:
249-264.
Peterson, C. H. and L. Manning. 2001. How beach nourishment affects the habitat value of intertidal

2010 COASTAL HABITAT PROTECTION PLAN
Literature cited Page 551
beach prey for surf fish and shorebirds and why uncertainty still exists. Proceedings of the
Coastal Ecosystems and Federal activities Technical Training Symp.
Peterson, C. H., I. M.C. Kennicutt, R.H. Green, P. Montagna, E.N. Powell, and P. Rosigno. 1996.
Ecolgical consequences of environmental perturbations associated with offshore hydrocabon
production: a perspective from study of long-term exposures in the Gulf of Mexico. Canadian
Journal of Fisheris and Aquatic Sciences 53: 2637-2654.
Peterson, C. H. and M.J. Bishop. 2005. Assessing the environmental impacts of beach nourishment.
BioScience 55(10): 887-896.
Peterson, C. H., M.J. Bishop, G.A. Johnson, L.M. D'Anna, and L.M. Manning. 2006. Expoliting
beach filling as an unaffordable experiment: Benthic intertidal impacts propagating upwards
to shorebirds. Journal of Experimental Marine Biology and Ecology 338: 205-221.
Peterson, C. H., M. Wong, M.F. Piehler, J.H. Grabowski, R.R. Twilley, and M.S. Fonseca. 2007.
Estuarine habitat productivity ratios at multiple trophic levels. UNC Institute of Marine
Science, Morehead City, NC, manuscript .
Peterson, C. H., M. Wong, M.F. Piehler, J.H. Grabowski, R.R. Twilley, and M.S. Fonseca. in prep.
Estuarine habitat productivity ratios at multiple trophic levels.
Peterson, C. H. and N.M. Peterson. 1979. The ecology of intertidal flats of North Carolina: A
community profile. U.S. Fish and Wildlife Service, OBS-79/39 , 73 p.
Peterson, C. H., S.D. Rice, J.W. Short, D. Esler, and J.L. Bodkin. 2003b. Long-term ecosystem
response to the Exxon Valdez oil spill. Science 302(5653): 2082-2086.
Peterson, C. H., W. Laney, and T. Rice. 2001. Biological impacts of beach nourishment. In:
Workshop on the Science of Beach Renourishment, May 7-8, 2001. Pine Knoll Shores, NC.
Peterson, M. S., B.H. Comyns, J.R. Hendon, P.J. Bond, and G.A. Duff. 2000c. Habitat use by early
life-stages of fishes and crustaceans along a changing estuarine landscape: difference between
natural and altered shoreline sites. Wetland, Ecology, and Management 8(2-3): 209-219.
Phillips, J. D. 1982. Salinity in Pamlico Sound, North Carolina: a space-time approach. East Carolina
University, Greenville, NC , 68p.
Phillips, W. and B. Garrity-Blake. 2000. Draft proceedings from the public forum on cleaning up
coastal waters for oystering and clamming. NC Marine Fisheries Commission and DENR,
Morehead City, NC, 32 p.
Piazza, B. P., P.D. Banks, and M.K. La Peyre. 2005. The potential for created oyster shell reefs as a
sustainable shoreline protection strategy in Louisiana. Restoration Ecology 13(3): 499-506.
Pickering, H. and D. Whitmarsh. 1996. Artificial reefs and fisheries exploitation: a review of the
'attraction versus production' debate, the influence of design, and its significance for policy.
University of Portsmouth, United Kingdom, Centre for the Economics and Management of
Aquatic Resources (CEMARE) Research Paper 107 , 27p.
Pidgeon, E. 2009. Carbon sequestration by coastal marine habitats: important missing sinks. p. 47 in

2010 COASTAL HABITAT PROTECTION PLAN
Literature cited Page 552
La.. oley, D. d A. & Grimsditch G. eds. The managment of natural coastal carbon sinks.
IUCN, Gland, Switzerland, 53 p.
Piehler M.F. and A.R. Smyth. 2010. Differences in habitat-specific estuarine denitrification affect
both ecosystem function and services. In press .
Pietrafesa, L. J. 1989. The Gulf Stream and wind events on the Carolina Capes shelf. NOAA-
National Undersea Research Program Report 2: 89-128.
Pietrafesa, L. J., G.S. Janowitz, J.M. Miller, E.B. Noble, S.W. Ross, and S.P. Epperly. 1986. Abiotic
factors influencing the spatial and temporal variability of juvenile fish in Pamlico Sound,
North Carolina. p. 341-453 in D.A. Wolfe (ed.). Estuarine variability. Academic Press, New
York, NY.
Pietrafesa, P. J. and G.S. Janowitz. 1988. Physical oceanographic processes affecting larval transport
around and through North Carolina inlets. American Fishery Society Symposium 3: 34-50.
Pihl, L. S., P. Baden, and R.J. Diaz. 1991. Effects of periodic hypoxia on distribution of demersal fish
and crustaceans. Marine Biology 108: 349-360.
Pilkey, O. H. and H.L. Wright. 1989. Seawalls versus beaches. p. 41-67 in Krauss, N. C. and Pilkey,
O. H. eds. The effects of seawalls on beaches. SI (4) .
Pilkey, O. H., W.J. Neal, S.R. Riggs, C.A. Webb, D.M. Bush, D.F. Pilkey, J. Bullock, and B.A.
Cowan. 1998. The North Carolina shore and its barrier islands: restless ribbons of sand. Duke
University Press, Durham and London, 318p.
Pinckney, J. and R.G. Zingmark. 1993. Modelling the annual production of intertidal benthic
microalgae in estuarine ecosystems. Journal of Phycology 29(4): 396-407.
Ploskey, G. R. 1986. Effects of water-level changes on reservoir ecosystems with implications for
fisheries management . p. 86-97 in Hall and Van Den Avyle (eds.). Reservoir fisheries
management: strategies for the 80's. American Fisheries Society, Bethesda, Maryland.
Plunket, J. and M.K. La Peyre. 2005. Oyster beds as fish and macroinvertebrate habitat in Barataria
Bay, Louisiana. Bulletin of Marine Science 77(1): 155-164.
Poe, A., S. Thompson, M. Piehler, and H. Paerl. 2002. Effectiveness of a constructed wetland at
removing nitrogen from agricultural runoff in the Neuse River estuary watershed. Water
Resources Research Institute, UNC - Chapel Hill, Chapel Hill, NC, Setting the agenda for
Water Resources Research, Abstracts of presentations and posters at the Annual North
Carolina Water Resources Research Conference .
Pomeroy, L. R., C.F. D'Elia, and L.C. Schaffner. 2006. Limits to top-down control of phytoplankton
by oysters in Chesapeake Bay. Marine Ecology Progress Series 325: 301-309.
Porter, E. T., J.C. Cornwell, and L.P. Sanford. 2004. Effect of oysters Crassostrea virginica and
bottom shear velocity on benthic-pelagic coupling and estuarine water quality. Marine
Ecology Progress Series 271: 61-75.
Posey, M. and T. Alphin. 2002. Resilience and stability in an offshore benthic community: Responses

2010 COASTAL HABITAT PROTECTION PLAN
Literature cited Page 553
to sediment borrow activities and hurricane disturbance. Journal of Coastal Research 18(4):
685-697.
Posey, M. H., C. Powell, L. Cahoon, and D. Lindquist. 1995. Top down vs. bottom up control of
benthic community composition on an intertidal tideflat. Journal of Experimental Marine
Biology and Ecology 185(1): 19-31.
Posey, M. H. and T.D. Alphin. 2001. Monitoring of benthic faunal responses to sediment removal
associated with the Carolina Beach and vicinity - area south project. UNC-Wilmington,
Wilmington, NC, Final Report to the US Army Corps of Engineers , 18 p.
Posey, M. H. and T.D. Alphin. 2002. Resilience and stability in an offshore benthic community:
responses to sediment borrow activities and hurricane disturbance. Journal of Coastal
Research 18(4): 685-697.
Posey, M. H., T.D. Alphin, C.M. Powell, and E. Townsend. 1999. Use of oyster reefs as habitat for
epibenthic fish and decapods. p. 229-238 in M.W. Luckenbach, R. Mann and J. A. Wesson
eds. Oyster Reef Habitat Restoration: A Synopsis and Synthesis of Approaches. Virginia
Institute of Marine Science Press, Gloucester Point, VA.
Posey, M. H., T.D. Alphin, D.L. Meyer, and J.M. Johnson. 2003. Benthic communities of common
reed Phragmites australis and marsh cordgrass Spartina alterniflora marshes in Chesapeake
Bay. Marine Ecology-Progress Series 261: 51-61.
Posey, M. H., T.D. Alphin, H.D. Harwell, and T. Molesky. 2004. Effects of reef complexity on
habitat function for intertidal oysters. Journal of Shellfish Research 23(1): 307-308.
Posey, M. H. and W.G. Ambrose Jr. 1994. Effects of proximity to an offshore hard-bottom reef on
infaunal abundances. Marine Biology 118: 745-753.
Potts, T. A. and A.W. Hulbert. 1994. Structural influences of artificial and natural habitats on fish
aggregations in Onlsow Bay, North Carolina. Bulletin of Marine Science 55(2-3): 609-622.
Poulter, B., R.L. Feldman, M.M. Brinson, B.P. Horton, M.K. Orbach, S.H. Pearsall, E. Reyes, S.R.
Riggs, and J.C. Whitehead. 2009. Sea-level rise research and dialogue in North Carolina:
Creating windows for policy change. Ocean & Coastal Management 52: 147-153.
Powell, A. B. and R.E. Robbins. 1998. Ichthyoplankton adjacent to live-bottom habitats in Onslow
Bay, North Carolina. NOAA , Seattle, Washington, Tech. Rep. NMFS 133 , 32p.
Powell, A. B. and R.J. Schwartz. 1977. Distribution of paralichthid flounders (Bothidae:
Paralichthys) in North Carolina estuaries. Chesapeake Science 18: 334-339.
Powell, E. N., E.E. Hofmann, J.M. Klinck, and S.M. Ray. 1992. Modeling oyster populations. I. a
commentary on filtration rate. Is faster always better? Journal of Shellfish Research 11: 387-
398.
Powell, E. N., J.N. Kraeuter, and K.A. Ashton-Alcox. 2006. How long does oyster shell last on an
oyster reef? Estuarine, Coastal and Shelf Science 69(3-4): 531-542.
Powell, E. N., K.A. Ashton-Alcox, S.E. Banta, and A.J. Bonner . 2001. Impact of repeated dredging

2010 COASTAL HABITAT PROTECTION PLAN
Literature cited Page 554
on a Delaware Bay oyster reef. Journal of Shellfish Research 20(3): 961-975.
Power, M. E., A. Sun, G.Parker, W.E. Dietrich, and J.T. Wootton. 1995. Hydraulic food-chain model.
Bioscience 45(3): 159-167.
Powers, E. R., R.A. Crowson, S.R. Riggs, S.W. Snyder, S.W. Snyder, and A.C. Hine. 1990. Chemical
characteristics and reevaluation of the phosphate resource potential in Onslow Bay, North
Carolina Continental Shelf. Marine Mining 9: 1-41.
Powers, M. J. and D. Gaskill. 2004. Recruitment, growth, and habitat utilization of red drum
Sciaenops ocellatus, in North Carolina estuaries. North Carolina Sea Grant Extension
Program, FRG project #00-EP-04 , 40p.
Powers, S. P., C.H. Peterson, R.R. Christian, E. Sullivan, M.J. Powers, M.J. Bishop, and C.P. Buzzelli.
2005. Effects of eutrophication on bottom habitat and prey resources of demersal fishes.
Marine Ecology Progress Series 302: 233-243.
Powers, S. P., J.H. Grabowski, C.H. Peterson, and W.J. Lindberg. 2003. Estimating enhancement of
fish production by offshore artificial reefs: uncertainty exhibited by divergent scenarios.
Marine Ecology Progress Series 264: 265-277.
Powers, S. P. and J.N. Kittinger. 2002. Hydrodynamic mediation of predator-prey interactions:
differential patterns of prey susceptibility and predator success explained by variation in water
flow. Journal of Experimental Marine Biology and Ecology 273: 171-187.
Powles, H. and B.W. Stender. 1978. Taxonomic data on the early life history stages of Sciaenidae of
the South Atlantic Bight of the United States. South Carolina Marine Resources Center
Technical Report No. 31 , 64p.
Pratolongo, P. D., J.R. Kirby, A. Plater, and M.M. Brinson. 2009. Temperate coastal wetlands:
morphology, sediment processes, and plant communities. in Perillo, G. M. E., E. Wolanski,
D. R. Cahoon, and M. M. Brinson (eds.). Coastal Wetlands. Elsevier, 941 p.
Prentice, J. A. 1989. Low-temperature tolerance of southern flounder in Texas. Transactions of the
Amercan Fisheries Society 118: 30-35.
Prescott, R. C. 1990. Sources of predatory mortality in the bay scallop Argopecten irradians
(Lamarck): interactions with seagrass and epibiotic coverage. Journal of Experimental Marine
Biology and Ecology. 144(1): 63-83.
Preyer, L. R. 1994. Charting a course for our coast - A report to the governor. North Carolina Coastal
Futures Committee, Raleigh, NC, 106 p.
Pruell, R. J., J.L. Lake, W.R. Davis, and J.G. Quinn. 1986. Uptake and depuration of organic
contaminants by blue mussels (Mytilus edulis) exposed to environmentally contaminated
sediment. Marine Biology 91: 497-507.
Pulich, W. M. Jr. and W.A. White. 1991. Decline of submerged vegetation in the Galveston Bay
system: Chronology and relationships to physical processes. Journal of Coastal Research 7:
1125-1138.
2010 COASTAL HABITAT PROTECTION PLAN
Literature cited Page 555
Purvis, C. 1976. Nursery area survey of northern Pamlico Sound and tributaries. NC Division of
Marine Fisheries, Morehead City, NC, Completion report for Project 2-239-R .
Purvis, C. E. and E.G. McCoy . 1972. Overwintering pink shrimp Penaeus duorarum in Core and
Pamlico Sounds. NC Dept Natural Economic Resources , NC, Spec Sci Rep 22 .
Quast, W. D., M.A. Johns, D.E. Pitts Jr., G.C. Matlock, and J.E. Clark. 1988. Texas oyster fishery
management plan. Texas Parks and Wildlife Department, Coastal Fisheries Branch, Austin,
Texas, Fishery Management Plan Series Number 1 , 178p.
Quattrini, A. M. and S.W. Ross. 2006. Fishes associated with North Carolina shelf-edge hardbottoms
and initial assessment of a proposed Marine Protected Area. Bulletin of Marine Science
79(1): 137-163.
Quattrini, A. M., S.W. Ross, K.J. Sulak, A.M. Necaise, T.L. Casazza, and G.D. Dennis. 2004. Marine
fishes new to continental United States waters, North Carolibna, and the Gulf of Mexico.
Southeastern Naturalist 3(1): 155-172.
Rahmstorf, S. 2007. A semi-empirical approach to projecting future sea-level rise. Science 315: 368-
370.
Rakocinski, C., S.E. LeCroy, J.A. McLelland, and R.W. Heard. 1993. Responses by
macroinvertebrate communities to beach renourishment at Perdido Key, Florida: benthic
recovery. US Dept. of the Interior, National Park Service.
Rakocinski, C. F., R.W. Heard, S.E. LeCroy, J.A. McLelland, and T. Simons. 1996. Responses by
macrobenthic assemblages to extensive beach restoration at Perdido Key, Florida, USA.
Journal of Coastal Research 12(1): 326-353.
Randall, R. G., C.K. Minns, V.W. Cairns, and J.E. Moore. 1996. The relationships between an index
of fish production and submerged macrophytes and other habitat features at three littoral areas
in the Great Lakes. Can. J. Aquat. Sci. 53(Supplement 1): 35-44.
Raven, J., K. Caldeira, H. Elderfield, O. Hoegh-Guldberg, P. Liss, U. Riebesell, J. Shepherd, C.
Turley, and A. Watson. 2005. Ocean acidification due to increasing atmospheric carbon
dioxide. The Royal Society, London, UK, 68p.
Ray, S. M. 1954. Biological studies of Dermocystidium marinum , a fungus parasite of oysters. Rice
Institute Pamplet Special Issue November.
Ray, S. M. and A.C. Chandler. 1955. Parasitological reviews: Dermocystidium marinum, a parasite of
oysters. Experimental Parasitology 4: 172-200.
Reagan, R. E. Jr. 1985. Species Profiles: life histories and environmental requirments of coastal fishes
and invertebrates (Gulf of Mexico) - red drum. US Fish and Wildlife Service, Washington,
DC, Biological Report 82 (11.36) , 16p.
Reagan, R. E. Jr. and W.M. Wingo. 1985. Species profiles: life histories and environmental
requirements of coastal fishes and invertebrates (Gulf of Mexico)--southern flounder. US Fish
and Wildlife Service, 82 (11.30) , 9p.
2010 COASTAL HABITAT PROTECTION PLAN
Literature cited Page 556
Rebach, S. 2005. North Carolina Under Dock Oyster Culture Program. North Carolina Sea Grant,
Raleigh, NC, 21p.
Reddy, C. M., T.I. Eglinton, A. Hounshell, H.K. White, L. Xu, R.B. Gaines, and Frysinger. 2002. The
West Falmouth oil spill: the persistence of petroleum hydrocarbons in marsh sediments.
Environmental Science and Technology 36: 47544760.
Reed, A. J. and J.T. Wells. 2000. Sediment distribution patterns offshore of a renourished beach:
Atlantic Beach and Fort Macon, North Carolina. Journal of Coastal Research. 16(1): 88-98.
Reed, J. K., C.C. Koenig, and A.N. Shepard. 2007. Impacts of bottom trawling on a deep-water
Oculina coral ecosystem off Florida. Bulletin of Marine Science 81(3): 481-496.
Reed, J. P., J.M. Miller, D.F. Pence, and B. Schaich. 1983. The effects of low level turbidity on fish
and their habitat. Department of Zoology, North Carolina State University, Raleigh, NC,
Report No. 190 .
Reed, R. E., D.A. Dickey, J.M. Burkholder, C.A. Kinder, and C. Brownie. 2008. Water level
variations in the Neuse and Pamlico Estuaries, North Carolina, due to local and non-local
forcing. Estuarine and Coastal Shelf Science 76: 431-446.
Reilly, F. J. Jr. and B.J. Bellis. 1983. The ecological impact of beach nourishment with dredged
materials on the intertidal zone at Bogue Banks, North Carolina. U.S. Army Corps of
Engineers, Coastal Engineering Research Center, Fort Belvoir, VA.
Reilly, J. D. and W.W. Kirby-Smith. 1999. Development of the technical basis and a management
strategy for reopening a closed shellfishing area. Water Resources Research Institute,
University of North Carolina , Chapel Hill, NC, UNC-WRRI-99-321 , 46 p.
Reise, K. and J.E.E. van Beusekom. 2008. Interactive effects of global and regional change on a
coastal ecosystem. Helgoland Marine Research 62(1-2): 85-91.
Reish, D. J. 1963. Further studies on the benthic fauna in a recently constructed boat harbor in
southern California. Southern California Academy of Sciences 62: 23-32.
Renaud, P. E., S.R. Riggs, W.G. Ambrose Jr., K. Schmid, and S.W. Snyder. 1997. Biological-
geological interactions: storm effects on macroalgal communities mediated by sediment
characteristics and distribution. Continental Shelf Research 17(1): 37-56.
Rheinhardt, R. D. and M.M. Brinson. 2002. An evaluation of North Carolina Department of
Transportation wetland mitigation sites: selected case studies. U.S. Department of
Transportation, Research and Special Programs Administration, Washington, DC, Report No.
FHWA/NC/2002-009 , 99p.
Rice, S. D., R.E. Thomas, G. Carls, R.A. Heintz, A.C. Wertheimer, M.L. Murphy, J.W. Short, and A.
Moles. 2001. Impacts to pink salmon following the Exxon Valdez oil spill: persistence,
toxicity, sensitivity, and controversy. Reviews in Fisheries Science 9(3): 165-211.
Rice, T. M., R.L. Beavers, and S.W. Snyder. 1998. Preliminary geologic framework of the inner
continental shelf offshore Duck, North Carolina. Journal of Coastal Research 26: 219-225.

2010 COASTAL HABITAT PROTECTION PLAN
Literature cited Page 557
Richards, W. R. and P.C. Ticco. 2002. The Suminoe oyster, Crassostrea ariakensis. Virginia Sea
Grant/University of Virginia - Charlottesville, Charlottesville, VA, VSG-02-23 , 6p.
Richardson, B. J., E.S. Tse, S.B. De Luca-Abbott , M. Martin, and P.K. Lam. 2005. Uptake and
depuration of PAHs and chlorinated pesticides by semi-permeable membrane devices
(SPMDs) and green-lipped mussels (Perna viridis). Marine Pollution Bulletin 51: 975-993.
Richardson, C. J. 2003. Pocosins: Hydrologically isolated or integrated wetlands on the landscape?
Wetlands 23(3): 563-576.
Richardson, C. J., S. Qian, C.B. Craft, and R.G. Qualls. 1997. Predictive models for phosphorus
retention in wetlands. Wetlands Ecology and Management 4(3): 159-175.
Richkus, W. A. 1975. Migratory behavior and growth of juvenile anadromous alewives in a Rhode
Island drainage. Transactions of the American Fisheries Society 104: 483-493.
Ricklefs, R. E. 1993. The economy of nature. W.H. Freeman and Company, New York, NY, 3rd
edition .
Riedel, G.F., J.G. Sanders, and D.L. Breitburg. 2003. Seasonal variability in response of estuarine
phytoplankton communities to stress: linkages between toxic trace elements and nutrient
enrichment. Estuaries 26(2A): 323-338.
Riggs, S. R. 1996. Sediment evolution and habitat function of organic-rich muds within the
Albemarle estuarine system, North Carolina. Estuaries 19(2A): 169-185.
Riggs, S. R. 2000. Were human impacts upon the riverine systems of coastal North Carolina
significant factors in the flood of September 1999? Abstracts from the Annual North Carolina
Water Resources research Conference: The Year of the Hurricanes : 22.
Riggs, S. R. 2001. Shoreline Erosion in North Carolina estuaries. North Carolina Sea Grant, Raleigh,
NC, UNC-SG-01-11 , 68p.
Riggs, S. R. and D.V. Ames. 2003. Drowning the North Carolina coast: sea level rise and estuarine
dynamics. North Carolina Sea Grant, Raleigh, NC, 152p.
Riggs, S. R., D.V. Ames, S.J. Culver, D.J. Mallinson, D.R. Corbett, and J.P. Walsh. 2009. Eye of a
human hurricane: Pea Island, Oregon Inlet, and Bodie Island, northern Outer Banks, North
Carolina. p. 43-72 in J.T. Kelley, O. H. Plkey and J. A. G. Cooper eds. America's Most
Vulnerable Coastal Communities: Geological Society of America special Paper 460.
Riggs, S. R., E.R. Powers, J. T. Bray, P.M. Stout, C. Hamilton, D. Ames, R. Moore, J. Watson , S.
Lucas, and M. Williamson. 1989. Heavy metal pollutants in organic rich muds of the Pamlico
River estuarine system: their concentration, distribution, and effects upon benthic
environments and water quality: Albemarle-Pamlico Estuarine Study. Project No. 89-06. US
EPA and NC DNRCD, Raleigh, NC, 108p.
Riggs, S. R. and F.T. Manheim. 1988. Mineral resources of the US Atlantic continental margin. p.
501-520 in Sheridan, R. E. and J.A. Grow (eds.). The Geology of North America, Vol. I-2,
The Atlantic Continental Margin: US. Geological Society of America.
2010 COASTAL HABITAT PROTECTION PLAN
Literature cited Page 558
Riggs, S. R., J.T. Bray, E.R. Powers, C. Hamilton, D. Ames, D. Yeates, K. Owens, S. Lucas, J.
Watson, and M. Williamson. 1991. Heavy metal pollutants in organic-rich muds of the Neuse
River Estuary: their concentration and distribution. Albemarle-Pamlico Estuarine Study
Report. Project no. 90-07. DENR, Raleigh, 168p.
Riggs, S. R., M.P. O'Connor, and V.J. Bellis. 1978. Estuarine shoreline types and erosion in the
Albemarle Sound system. UNC Sea Grant College, Raleigh, NC, Five part poster series .
Riggs, S. R., S.W. Snyder, A.C. Hine, and D.L. Mearns. 1996. Hardbottom morphology and
relationship to the geologic framework: Mid-Atlantic continental shelf. Journal of
Sedimentary Research 66(4): 830-846.
Riggs, S. R., W.G. Ambrose, J.W. Cook, S.W. Snyder, and S.W. Snyder. 1998. Sediment production
on sediment-starved continental margins: the interrelationship between hardbottoms,
sedimentological and benthic community processes, and storm dynamics. Journal of
Sedimentary Research 68(1): 155-168.
Riggs, S. R., W.G. Ambrose Jr., J.W. Cook, S.W. Snyder, and S. Snyder. 1998. Sediment production
on sediment-starved continental margins: the inter-relationships between hardbottoms,
sedimentological and benthic community processes, and storm dynamics. Journal of
Sedimentary Research. 68(1): 155-168.
Riggs, S. R., W.J. Cleary, and S.W. Snyder. 1995. Influence of inherited geologic framework on
barrier shoreface morphology and dynamics. Marine Geology 126: 213-234.
Rilov, G. and Y. Benayahu. 2000. Fish assemblage on natural versus artificial reefs: the rehabilitation
perspective. Marine Biology 136: 931-942.
Ritchie, J. C. 1972. Sediment, fish, and fish habitat. Journal of Soil Water Conservation 27: 124-125.
Rivers, D. O. and F.T. Short. 2007. Effect of grazing by Canada geese Branta canadensis on an
intertidal eelgrass Zostera marina meadow. Marine Ecology Progress Series 333: 271-279.
Rizzo, W. M. and R.L. Wetzel. 1985. Studies on the scales of temporal variability in the oxygen
metabolism of a shoal sediment in a temperate estuary. Estuaries 8(2B): 70a.
Rizzo, W. M. and R.R. Christian. 1996. Significance of subtidal sediments to heterotrophically-
mediated oxygen and nutrient dynamics in a temperate estuary. Estuaries 19(2B): 475-487.
Robblee, M. B., T.R. Barber, P.R. Carlson Jr., M.J. Durako, J.W. Fourqurean, L.K. Muehlstein, D.
Porter, L.A. Yarbo, R.T. Zieman, and J.C. Zieman. 1991. Mass mortality of the tropical
seagrass Thalassia testudinum in Florida Bay (USA). Marine Ecology Progress Series 71:
297-299.
Roberts, C. M., J.A. Bohnsack, F. Gell, J.P. Hawkins, and R. Goodridge. 2001. Effects of marine
reserves on adjacent fisheries. Science 294: 1920-1923.
Roberts, D. A., E.L. Johnston, and A.G.B. Poore. 2008. Contamination of marine biogenic habitats
and effects upon associated epifauna. Marine Pollution Bulletin 56: 1057-1065.
Roberts, J. M., A.J. Wheeler, and A. Freiwald. 2006. Reefs of the deep: the biology and geology of

2010 COASTAL HABITAT PROTECTION PLAN
Literature cited Page 559
cold-water coral ecosystems. Science 312(5773): 543-547.
Robins, C. R. and G.C. Ray . 1986. A field guide to Atlantic coast fisheries of North America.
Houghton Mifflin Company, Boston, USA, 354p.
Roblee, M. B. and W.J. DiDomenico. 1992. Seagrass die-off in Florida Bay, Everglades National
Park. Park Science 11: 21-23.
Rodriquez, K., N. Grindlay, L. Abrams, T. Alphin, and S. Artabane. 2006. Implications of high-
resolution geophysical techniques in oyster habitat identification: Cape Fear River, North
Carolina. Journal of Shellfish Research 25(2): 769.
Roessler, T. S. 1998. Effects of offshore geology and the Morehead City Harbor Project on eastern
Bogue Banks, NC. M.S. Thesis, University of North Carolina, Chapel Hill, NC
Rogers Jr., S. M. 1994. Marsh grass protection with low-cost breakwaters: shoreline erosion control
demonstration. North Carolina State University, Raleigh, NC, 61p.
Rogers, S. and T. Skrabal. 2002. Managing erosion on estuarine shorelines. North Carolina Division
of Coastal Management and North Carolina Sea Grant, ., UNC-SG-01-12 , 32p.
Romano, J. A. 2007. Acute toxicity and sub-lethal effects of non-point source pollutants on
invertebrates. Ph.D. Dissertation, Duke University, Durham, NC
Rommel, S. A. and D. McCleave. 1973. Sensitivity of American eels (Anguilla rostrata) and Atlantic
salmon (Salmo salar) to weak electric and magnetic fields. Journal of Fisheries Research
Board of Canada 30: 657-663.
Rooker, J. R., G.J. Holt, and S.A. Holt. 1998. Vulnerability of newly settled red drum (Sciaenops
ocellatus) to predatory fish: is early-life survival enhanced by seagrass meadows? Marine
Biology 131(1): 145-151.
Rooth, J. E. and J.C. Stevenson. 2000. Sediment deposition patterns in Phragmites australis
communities: implications for coastal areas threatened by rising sea-level. Wetlands Ecology
and Management 8: 173-183.
Rose, C., W. Sharp, W. Kenworthy, J. Hunt, W. Lyons, E. Prager, J. Valentine, M. Hall, P. Whitfield,
and J. Fourqurean. 1999. Overgrazing of a large seagrass bed by the sea urchin Lytechinus
variegatus in Outer Florida Bay. Marine Ecology Progress Series 190: 211-222.
Rosenburg, W. M. 1994. Nesting habitat requirements of the diamondback terrapin: a geographic
comparison. The Wetland Journal 6(2): 8-11.
Ross, J. L. and T.M. Stevens. 1992. Life history and population dynamics of red drum (Sciaenops
ocellatus) in North Carolina waters. NC Division of Marine Fisheries, Morehead City, NC,
Marine Fisheries Research Completion Report Project F-29 , 130p.
Ross, J. L., T.M. Stevens, and D.S. Vaughan. 1995. Age, growth, mortality, and reproductive biology
of red drum in North Carolina waters. Transactions of the Amercan Fisheries Society 124:
37-54.
2010 COASTAL HABITAT PROTECTION PLAN
Literature cited Page 560
Ross, M. R. 1991. Recreational Fisheries of Coastal New England. University of Massachusetts Press,
Amherst, MA, 279p.
Ross, S. W. 2003. The relative value of different estuarine nursery areas in North Carolina for
transient juvenile marine fishes. Fishery Bulletin 101: 384-404.
Ross, S. W. 2006. Review of distribution, habitats, and associated fauna of deep water coral reefs on
the southeastern United States continental slope (North Carolina to Cape Canaveral, FL).
South Atlantic Fishery Management Council, Charleston, SC, 36p.
Ross, S. W. and A.M. Quattrini. 2007. The fish fauna associated with deep coral banks off the
southeastern United States. Deep-sea Research 54: 975-1007.
Ross, S. W., F.C. Rohde, and D.G. Lindquist. 1988. Endangered, threatened, and rare fauna of North
Carolina: a re-evaluation of marine fisheries. Occasional Papers of the NC Biological Survey
1988-7(20).
Ross, S. W. and J.E. Lancaster. 1996. Movements of juvenile fishes using surf zone nursery habitats
and the relationship of movements to beach nourishment along a North Carolina beach: pilot
project. North Carolina National Estuarine Research Reserve, Wilmington, NC, Final report
submitted to NOAA Office of Coastal Resource Management and the US Army Corps of
Engineers , 31 p.
Ross, S. W. and J.E. Lancaster. 2002. Movements and site fidelity of two juvenile fish species using
surf zone nursery habitats along the southeastern North Carolina coast. Environmental
Biology of Fishes 63: 161-172.
Ross, S. W. and M.L. Moser. 1995. Life history of juvenile gag, Mycteroperca microlepis, in North
Carolina estuaries. Bulletin of Marine Science 56(1): 222-237.
Ross, S. W. and M.S. Nizinski. 2007. State of deep coral ecosystems in the U.S. southeast region:
Cape Hatteras to southeastern Florida. p. 233-270 in Lumsden, S. E., Hourigan, T. F.,
Bruckner, A. W., and Dorr (eds.), G. The State of Deep Coral Ecosystems of the United
States. NOAA, Silver Spring, Maryland, NOAA Technical Memorandum CRCP-3 .
Ross, S. W., R.K. Carpenter, T.M. Scholar, M.D. Marshall, D.L. Taylor, and K.H. West. 1983. A plan
for management of North Carolina's estuarine fisheries. North Carolina Division of Marine
Fisheries, Morehead City, NC, Final Semi-annual report for North Carolina's Coastal
Assistance Program (Grant No. 04-8-MO1-331, Amendment No. 1) , 101p.
Ross, S. W. and S.P. Epperly. 1985. Chapter 10: Utilization of shallow estuarine nursery areas by
fishes in Pamlico Sound and adjacent tributaries, North Carolina. p. 207-232 in A. Yanez-
Aranciba (ed.). Fish Community Ecology in Estuaries and Coastal Lagoons: Towards and
Ecosystem Integration. DR (R) UNAM Press, Mexico, 654 p.
Rothenberger M., J.M. Burkholder, and C. Brownie . 2009b. Long-term effects of changing land use
practices on surface water quality in a major lagoonal estuary. Environmental Management
44: 505-523.
Rothenberger M., J.M. Burkholder, and T. Wentworth . 2009a. Multivariate analysis of phytoplankton
and environmental factors in a eutrophic estuary. Limnology and Oceanography 54: 2107-

2010 COASTAL HABITAT PROTECTION PLAN
Literature cited Page 561
2127.
Rothschild, B. J., J.S. Ault, P. Goulletquer, and M. Heral. 1994. Decline of the Chesapeake Bay
oyster population: A century of habitat destruction and overfishing. Marine Ecology
Progressive Series 111: 29-39.
Rowe, G. T. 2001. Seasonal hypoxia inthe bottom water off the Mississippi River delta. Journal of
Environmental Qualitiy 30: 281-290.
Rozas, L. P. 1987. Submerged plant beds and tidal freshwater marshes: nekton community structure
and interactions. Ph.D. dissertation, University of Virginia, Charlottesville, VA, 144 p.
Rozas, L. P. 1992. Comparison of nekton habitats associated with pipeline canals and natural
channels in Louisiana salt marshes. Wetlands 12(2): 136-146.
Rozas, L. P. and C.T. Hackney. 1984. Use of oligohaline marshes by fishes and macrofaunal
crustaceans in North Carolina. Estuaries. 7(.): 213-224.
Rozas, L. P. and R.J. Zimmerman. 2000. Small-scale patterns of nekton use among marsh and
adjacent shallow nonvegetated areas of the Galveston bay estuary, Texas (USA). Marine
Ecology Progress Series. 193(.): 217-239.
Rozas, L. P., T.J. Minello, R.J. Zimmerman, and P. Caldwell. 2007. Nekton populations, long-term
wetland loss, and the effect of recent habitat restoration in Galveston Bay, Texas, USA.
Marine Ecology Progress Series 344: 119-130.
Rozas, L. P. and W.E. Odum. 1987. The role of submerged aquatic vegetation in influencing the
abundance of nekton on contiguous tidal freshwater marshes. Journal of Experimental Marine
biology and Ecology 114(2-3): 289-300.
Rubin, C., M.A. McGeehin, A.K. Holmes, L. Backer, G. Burreson, M.C. Earley, D. Griffith, R.
Levine, W. Litaker, J. Mei, L. Naeher, L. Needham, E. Noga, M. Poli, and H.S. Rogers. 2001.
Emerging areas of research reported during the CDC national conference on Pfiesteria: from
biology to public health. Environmental Health Perspectives 109(5): 633-637.
Rulifson, R. A. 1981. Substrate preference of juvenile penaeid shrimps in estuarine habitats. Cont.
Marine Science 24: 35-52.
Rulifson, R. A. 1994. Status of anadromous Alosa stocks along the east coast of North America . p.
134-158 Anadromous Alosa Symposium. American Fisheries Society, Bethesda, MD.
Rulifson, R. A. and B.L. Wall. 1998. Fish passage through water control structures at Mattamuskeet
National Wildlife Refuge, North Carolina, using flap gates and fish slots. East Carolina
University, Institute of Coastal and Marine Resources, Greenville, NC, 7p.
Rulifson, R. A. and C.S. Manooch III. 1990. Recruitment of juvenile striped bass in the Roanoke
River, North Carolina, as related to reservoir discharge. North American Journal of Fisheries
Management 10: 397-407.
Rulifson, R. A., D.W. Stanley, and J.E. Cooper. 1986. Food and feeding of young striped bass in
Roanoke River and Western Albemarle Sound, North Carolina, 1984-1985. DENR, Raleigh,

2010 COASTAL HABITAT PROTECTION PLAN
Literature cited Page 562
NC, ICMR Tech. Rep. 86-02 , 129p.
Rulifson, R. A., M.T. Huish, and R.W. Thosen. 1982. Anadromous fish in the southeastern United
States and recommendations for development of a management plan. USFWS, Fisheries
Resource Program, Atlanta, Ga.
Rulifson, R. A., T.L. Woods, and K.E. Kleber . 2006a. Ecological Assessment of the Pasquotank
County Reverse Osmosis Water Treatment Plant Discharge Site, Albemarle Sound, North
Carolina: Final Report, November 2006. in Hobbs, Upchurch & Associates P. A. Support of
Environmental Assessment Report for Pasquotank County. East Carolina University,
Greenville, NC, ICMR Contribution Number 06-03 , 128 p.
Rulifson, R. A., T.L. Woods, and K.E. Kleber . 2006b. Ecological Assessment of the Currituck County
Reverse Osmosis Water Treatment Plant Discharge Site, Albemarle Sound, North Carolina:
Final Report, November 2006. in Hobbs, Upchurch & Associates P. A. Support of
Environmental Assessment Report for Pasquotank County. East Carolina University,
Greenville, NC, ICMR Contribution Number 06-03 , 128 p.
Sadzinski, R., M. Naylor, D. Weinrich, J.H. Uphoff, H. Speir, and D. Goshorn. 1996. Effects of haul
seining on submerged aquatic vegetation in upper Chesapeake Bay. Maryland Department of
Natural Resources, Annapolis, Maryland.
SAFMC (South Atlantic Fishery Management Council). 1982. Fishery management plan final
environmental impact statement for corals and coral reefs. SAFMC, Charleston, SC, 389p.
SAFMC (South Atlantic Fishery Management Council). 1988. Final Amendment 1 and environmental
assessment and regulatory impact review to the fishery management plan for the snapper
grouper fishery of the South Atlantic region. SAFMC, Charleston, SC, 45p.
SAFMC (South Atlantic Fishery Management Council). 1994. Amendment 2 to the fishery
management plan for coral and coral reefs of the Gulf of Mexico and South Atlantic .
SAFMC, Charleston, SC, 140p.
SAFMC (South Atlantic Fishery Management Council). 1998a. Final habitat plan for the South
Atlantic region: Essential Fish Habitat requirements for fishery management plans of the
South Atlantic Fishery Management Council. SAFMC, Charleston, SC.
SAFMC (South Atlantic Fishery Management Council). 1998b. Final Amendment 9 to the fishery
management plan for the snapper grouper fishery of the South Atlantic region. SAFMC,
Charleston, SC, 246 p.
SAFMC (South Atlantic Fishery Management Council). 2001. Magnuson-Stevens Act/NEPA scoping
document: using marine protected areas in the South Atlantic. South Atlantic Fishery
Management Council.
SAFMC (South Atlantic Fishery Management Council). 2002. Briefing material for SAFMC
December 2002 meeting. South Atlantic Fishery Management Council, Unpub. doc. 3p.
SAFMC (South Atlantic Fishery Management Council). 2007a. Final Amendment 15A to the fishery
management plan for the snapper grouper fishery of the South Atlantic region. SAFMC,
Charleston, SC, 389p.
2010 COASTAL HABITAT PROTECTION PLAN
Literature cited Page 563
SAFMC (South Atlantic Fishery Management Council). 2007b. Final Amendment 14 to the fishery
management plan for the snapper grouper fishery of the South Atlantic region. SAFMC,
Charleston, SC, 389p.
SAFMC (South Atlantic Fishery Management Council). 2008a. Fishery Ecosystem Plan of the South
Atlantic region. Volume II: South Atlantic habitats and species, public hearing draft. SAFMC,
Charleston, SC, 705p.
SAFMC (South Atlantic Fishery Management Council). 2008b. Comprehensive Ecosystem Based
Amendment for the South Atlantic region. SAFMC, Charleston, SC.
SAFMC (South Atlantic Fishery Management Council). 2009. Fishery Ecosystem Plan of the South
Atlantic region. Volume II: South Atlantic habitats and species. SAFMC, Charleston, SC,
705p.
Sagasti, A. S., L.C. Schaffner, and J.E. Duffy. 2001. Effects of periodic hypoxia on mortality,
feeding and predation in an estuarine epifaunal community. Journal of Experimental Marine
Biology and Ecology 258: 257-283.
Saloman, C. H. 1974. Physical, chemical, and biological characteristics of nearshore zone of Sand
Key, Florida, prior to beach restoration. Vols I and II. National Marine Fisheries Service,
Gulf Coast Fisheries Center, Panama City, Fl.
Saloman, C. H., S. Naughton, and J. Taylor. 1982. Benthic community response to dredging borrow
pits, Panama City Beach, Florida. US Army Corps of Engineers, Coastal Engineering
Research Center, Fort Belvoir, Va, Misc. Rep. No. 82-3 .
Sanchez, P., M. Demestre, M. Ramirez, and M.J. Kaiser. 2000. The impact of otter trawling on mud
communities in the Northwestern Mediterranean. ICES Journal of Marine Science 57: 1352-
1358.
Sand-jensen, K. 1977. Effects of epiphytes on eelgrass photosynthesis. Aquatic Botany 3: 55-63.
Sanders, H. L., J.F. Grassle, G.R. Hampson, L.S. Morse, S. Garner-Price, and C.C. Jones. 1980.
Anatomy of an oil spill: long-term effects from the grounding of the barge Florida off West
Falmouth. Massachusetts. Journal of Marine Research 38: 265380.
Sandifer, P. A., J.V. Miglarese, D.R. Calder, J.J. Manzi, and L.A. Barclay (eds.). 1980. Ecological
characterization of the sea island coastal region of South Carolina and Georgia, Vol. III.
biological features of the characterization area. US Fish and Wildlife Service Biological
Services Program, Washington, DC, FWS/OBS - 79/42 , 620p.
Sando, S. K., E.T. Furlong, J.L. Gray, M.T. Meyer, and R.C. Bartholomay. 2005. Occurence of
organic waterwater compounds in wastewater effluent and the Big Sioux Rive inthe upper Big
Sioux River basin, South Dakota: U.S. Geological Survey Scientific Investigations Report.
USGS, 2005-5249 , 108p.
Sanger, D. M. and A.F. Holland. 2002. Evaluation of the impacts of dock structures on South
Carolina estuarine environments. SC Department of Natural Resources, Marine Resources
Research Institute, Charleston, SC, Tech. Rep. No. 99 , 82p.
2010 COASTAL HABITAT PROTECTION PLAN
Literature cited Page 564
Sanger, D. M., A. F. Holland, and D.L. Hernandez. 2004. Evaluation of the impacts of dock structures
and land use on tidal creek ecosystems in South Carolina estuarine environments.
Environmental Management 33(3): 385-400.
Sargent, F. J., T.J. Leary, D.W. Crewz, and C.R. Kruer. 1995. Scarring of Florida's seagrasses:
Assessment and management options. Florida Department of Environmental Protection, St.
Petersburg, Fl, FMRI Technical Report TR-1 , 46p.
SARP (Southeast Aquatic Resource Partnership). 2008. Southeast Aquatic Habitat Plan. Southeast
Aquatic Resources Partnership, 55p.
Saucier, M. H. and D.M. Baltz. 1993. Spawning site selection by spotted seatrout, Cynoscion
nebulosus, and black drum, Pogonias cromis, in Louisiana. Environmental Biology of Fishes
36: 257-272.
Saunders, D. A., R.J. Hobbs, and C.R. Margules. 1991. Biological consequences of ecosystem
fragmentation: a review. Conservation Biology 5(1): 18-32.
Savino, J. F. and R.A. Stein. 1989. Behavior of fish predators and their prey: habitat choice between
open water and dense vegetation. Environmental Biology of Fishes 24(4): 287-293.
SC DHEC (South Carolina Department of Health and Environmental Control. 1987. Heavy metals
and extractable organic chemicals from the Coastal Toxics Monitoring Network 1984 - 1986.
SC DHEC, Tech. Rep. No. 007-87 .
Scavia, D., J.C. Field, D.F. Boesch, R.W. Buddemeier, V. Burkett, D.R. Cayan, M. Fogarty, M.A.
Harwell, C. M. R.W. Howarth, D.J. Reed, T.C. Royer, A.H. Sallenger, and J.G. Titus. 2002.
Climate change impacts on US coastal and marine ecosystems. Estuaries 25(2): 149-164.
SCC (Sedimentation Control Commission). 1999. NC Sedimentation Control Commission inspects
wetlands ditching in Wilmington region. Sediments, Newsletter of the NC Sedimentation
Control Commission 6(2): 1-3.
SCC (Sedimentation Control Commission). 2003. Water quality and land quality report on efforts to
address turbidity. Sediments, Newsletter of the NC Sedimentation Control Commission
10(3): 1-3.
Schaaf, W. E., D.S. Peters, D.S. Vaughan, L. Costonclements, and C.W. Krouse. 1987. Fish
population responses to chronic and acute pollution: the influence of life history strategies.
Estuaries 10(3): 267-275.
Schaaf, W. E., D.S. Peters, L. Costonclements, D.S. Vaughan, and C.W. Krouse. 1993. A simulation
model of how life history strategies mediate pollution effects on fish populations. Estuaries
16(4): 697-702.
Scheffer, M. 1999. The effect of aquatic vegetation on turbidity; how important are the filter feeders.
Hydrobiologia 408-409: 307-316.
Schlacher, T. A., D.S. Schoeman, J. Dugan, M. Lastra, A. Jones, F. Scapini, and A. McLachlan. 2008.
Sandy beach ecosystems: key features, sampling issues, management challenges and climate
change impacts. Marine Ecology 29(Supl. 1): 70-90.

2010 COASTAL HABITAT PROTECTION PLAN
Literature cited Page 565
Schlacher, T. A. and L.M.C Thompson. 2008. Physical impacts caused by off-road vehicles to sandy
beachs: spatial quantification of car tracks on an Australian barrier island. Journal of Coastal
Research 24(2b): 234-242.
Schlacher, T. A., L.M.C. Thompson, and S.J. Walker. 2008. Mortalities caused by off-road vehicles
(ORVs) to a key member of sandy beach assemblages, the surf clam Donax deltoids.
Hydrobiologia 610: 345-350.
Schneider, C. W. 1976. Spatial and temporal distributions of benthic marine algae on the continental
shelf of the Carolinas. Bulletin of Marine Science 26(2): 133-151.
Schneider, S. Z. 2009. Mecury source and cycling processes in the Cafe Fear River Estuary, North
Carolina. UNC-CH, Chapel Hill, NC
Schoof, R. 1980. Environmental impact of channel modification. Water Resources Bulletin 16(4):
697-701.
Schott, E. J., J, .A. Fernandez-Robledo, M.R. Alavi, and G.R. Vasta. 2008. Susceptibility of
Crassostrea ariakensis (Fujita 1913) to Bonamia and Perkinsus spp. infections: potential for
disease transmission between oyster species. Journal of Shellfish Research 27(3): 541-549.
Schroder, A., L. Persson, and A.M. De Roos. 2005. Direct experimental evidence of alternative stable
states: a review. OIKOS 110: 3-19.
Schueler, T. R. 1994. The importance of imperviousness. Watershed Protection Techniques 1(3):
100-111.
Schueler, T. R. 1997. Impact of suspended and deposited sediment. Watershed Protection Techniques
2(3): 443-444.
Schueler, T. R. 1999. Microbes and urban watersheds- implications for watershed managers.
Watershed Protection Techniques 3(1): 549-620.
Schueler, T. R. 2003. Impacts of impervious cover on aquatic systems. Center for Watershed
Protection, Ellicott, Md, Monograph No. 1 , 140p.
Schultz, S. L. W., E.L. Steinkoenig, and B.L. Brown. 2001. Ploidy of feral grass carp in the
Chesapeake Bay watershed. North American Journal of Fisheries Management in press.
Schwartz, F. J. 2003. Sharks, skates, and rays of the Carolinas. University of North Carolina, Chapel
Hill, NC, 161p.
Scudder, B. C., L.C. Chasar, D.A. Wentz, N.J. Bauch, M.E. Brigham, P.W. Moran, and D.P.
Krabbenhoft. 2009. Mercury in fish, bed sediment, and water from streams acress the United
States, 1998-2005. US Geological Survey, Reston, Va, USGS Scientific Investigations Report
2009-5109 , 74p.
SEAMAP-SA (Southeast Area Monitoring and Assessment Program). 2000. SEAMAP-south Atlantic
10-year trawl report, results of trawling efforts in the coastal habitat of the South Atlantic
Bight, FY 1990-1999. 143p.

2010 COASTAL HABITAT PROTECTION PLAN
Literature cited Page 566
SEAMAP-SA (Southeast Area Monitoring and Assessment Program). 2001. South Atlantic Bight
hard bottom mapping. SEAMAP South Atlantic Bottom Mapping Workgroup, Charleston,
South Carolina, 166p.
SEAMAP-SA (Southeast Area Monitoring and Assessment Program). 2004. SEAMAP Deep water
(200 - 2,000 meters) Bottom Mapping Protocols to Capture and transform data into
standardized database. SEAMAP South Atlantic Bottom Mapping Workgroup, Charleston,
South Carolina, 22p.
Searles, R. B. 1984. Seaweed biogeography of the mid-Atlantic coast of the United States.
Helgolander Meeresuntersuchungen 38: 259-271.
Sedberry, G. R. and N. N. Cuellar. 1993. Planktonic and benthic feeding by the reef-associated
vermilion snapper, Rhomboplites aurorubens (Teleostei, Lutjanidae). Fishery Bulletin 91(4):
699-709.
Seitz, R. D., L.S. Marshall Jr., A.H. Hines, and K.L. Clark. 2003. Effects of hypoxia on predator-prey
dynamics of the blue crab Callinectes sapidus and the Baltic clam Macoma balthica in
Chesapeake Bay. Marine Ecology Progress Series 257: 179-188.
Seitz, R. D., R.N. Lipcius, N.H. Olmstead, M.S. Seebo, and D.M. Lambert. 2006. Influence of
shallow-water habitats and shoreline development on abundance, biomass, and diversity of
benthic prey and predators in Chesapeake Bay. Marine Ecology Progress Series 326: 11-27.
Seliger, H. H., J.A. Boggs, and W.H. Biggley . 1985. Catastrophic anoxia in the Chesapeake Bay in
1984. Science 228: 70-73.
Sellner, K. G. and R.G. Zingmark. 1976. Interpretations of the 14
C method of measuring the total
annual production of phytoplankton in a South Carolina estuary. Botanica Marina 19: 119-
125.
Selman, M., S. Greenhalgh, R. Diaz, and Z. Sugg. 2008. Eutrophication and hypoxia in coastal areas:
global assessment of the state of knowledge. WRI Policy Note Water Quality: Eutrophication
and Hypoxia(1): 1-6.
Serafy, J. E., K.C. Lindeman, T.E. Hopkins, and J.S. Ault. 1997. Effects of freshwater canal discharge
on fish assemblages in a subtropical bay: field and laboratory observation. Marine Ecology
Progress Series 160: 161-172.
Shafer, D. J. 1999. The effects of dock shading on the seagrass Halodule wrightii in Perdido Bay,
Alabama. Estuaries 22(4): 936-943.
Shatkin, G., S.E. Shumway, and R. Hawes. 1997. Considerations regarding the possible introduction
of the Pacific oyster (Crassostrea gigas) to the Gulf of Maine: a review of global experience.
Journal of Shellfish Research 16(2): 463-477.
Shea, D., A. McCarthy, and W.G. Cope. 2003. Pesticide use and exposure in the Albemarle-Pamlico
estuarine system of North Carolina and associated effects on blue crab survival in soft crab
shedding operations. NC Sea Grant, Raleigh, NC, NC Sea Grant Fisheries Resource Grant
Project No. 99-EP-16 , 162p.
2010 COASTAL HABITAT PROTECTION PLAN
Literature cited Page 567
Shea, D., C.S. Hofelt, D.R. Luellen, A. Huysman, P.R. Lazaro, R. Zarzecki, and J.R. Kelly. 2001.
Chemical contamination at National Wildlife Refuges in the lower Mississippi River
ecosystem. Report by NC State University to the US Fish and Wildlife Service, Atlanta, Ga,
40p.
Sheavly, S. B. 2007. National Marine Debris Monitoring Program: Final Program Report, Data
Analysis and Summary. Prepared for U.S. Environmental Protection Agency by Ocean
Conservancy, Grant Number X83053401-02, 76p.
Sheehan, R. J. and J.L. Rasmussen. 1993. Large Rivers. p. 445-468 in C.C. Kohler and W.A. Hubert
(eds.). Inland Fisheries Management in North America. American Fisheries Society, Bethesda,
MD.
Shertzer, K. W. and E.H. Williams. 2008. Fish assemblages and indicator species: reef fishes off the
southeastern United States. Fishery Bulletin 106(3): 257-269.
Shervette, V. R. and F. Gelwick. 2008. Seasonal and spatial variations in fish and macroinverterate
communities of oyster and adjacent haitats in a Mississippi estuary. Estuaries and Coasts
31(3): 584-596.
Sholar, T. M. 1975. Anadromous fisheries survey of the New and White Oak River systems. NC
DMF, Morehead City, NC, Compl. Rep. Proj. AFC-9 , 49p.
Sholar, T. M. 1977. Anadromous Fisheries Research Program, Cape Fear River System, Phase I.
North Carolina Division of Marine Fisheries, Rep #AFCS-12 , p.
Short, F. T., L.K. Muehlstein, and D. Porter . 1987. Eelgrass wasting disease: cause and recurrence of
a marine epidemic. Biological Bulletin 173: 557-562.
Shull III, L. N. 1999. An accuracy assessment of GIS wetland mapping in the coastal counties of
North Carolina. North Carolina Department of Environment and Natural Resources, Division
of Coastal Management, ., 41p.
Shumway, S. E. 1996. Natural environmental factors. p. 467-513 in Kennedy, V. S., Newell, R. I. E.,
and Eble (eds.), A. F. The Eastern Oyster Crassostrea virginica. Maryland Sea Grant College,
University of Maryland, College Park, Maryland.
Shumway S.E., J.M. Burkholder, and J. Springer . 2006. Effects of the estuarine dinoflagellate
Pfiesteria shumwayae (Dinophyceae) on survival and grazing activity of several shellfish
species. Harmful Algae 5: 442-458.
Shumway, S. E. and R.K. Koehn. 1982. Oxygen consumption in the American oyster Crassostrea
virginica. Marine Ecology Progress Series 9: 59-68.
Sigels, A. C., T.C. Hoering, and G.R. Helz. 1982. Composition of estuarine colloidal material:
organic components. Geochimica Cosmochimica Acta 46: 1619-1626.
Signorini, S. R. and C. R. McClain. 2007. Large-scale forcing impact on biomass variability in the
South Atlantic Bight. Geophysical Research Letters 34: 6.
Silliman, B. R. and M.D. Bertness. 2002. A trophic cascade regulates salt marsh primary production.

2010 COASTAL HABITAT PROTECTION PLAN
Literature cited Page 568
Proceedings of the National Academy of Science 99(16): 10500-10505.
Simonsen, K. A. 2008. The effect of an inshore artificial reef on the community structure and feeding
ecology of estuarine fishes in Barataria Bay, Louisiana. Louisiana State University, Baton
Rouge, LA, 100 p.
Simpson, A. W. and L. Watling. 2006. An investigation of the cumulative impacts of shrimp trawling
on community structure. ICES Journal of Marine Science 63(9): 1616-1630.
Sincock, J. L. 1966. Back Bay-Currituck Sound data report. Patuxent Wildlife Research Center,
Laurel, MD, 1600p.
Skaggs, R. W., G.M. Chescheir, and B.D. Phillips. 2005. Methods to determine lateral effect of a
drainage ditch on wetland hydrology. Transaction of the ASAE 48(2): 577-584.
Skilleter, G. A. 1994. Refuges from predation and the persistence of estuarine clam populations.
Marine Ecology Progress Series 109(1): 29-42.
Slater, G. F., H.K. White, T.I. Eglinton, and C.M. Reddy. 2005. Determination of microbial carbon
sources in petroleum contaminated sediments using molecular 14C analysis. Environmental
Science & Technology 39: 25522558.
Smaoui-Damak W., T. Rebai, B. Berthet, and A. Hamza-Chaffai. 2006. Does cadmium pollution
affect reproduction in the clam Ruditapes decussates? A one-year case study. Comparative
Biochemistry and Physiology 143C: 252-261.
Smart, R. M., G.O. Dick, and R.D. Doyle. 1998. Techniques for establishing native aquatic plants.
Journal of Aquatic Plant Management 36: 44-49.
Smayda, T. J. 1989. Primary production and the global epidemic of phytoplankton blooms in the sea:
A linkage? In: Novel Phytoplankton Blooms, by E.M. Cosper, V.M. Bricelj and E.J. Carpenter
(eds.). Springer-Verlag, New York, Coastal and Estuarine Studies No. 35 , 449-484p.
Smith, C. M. and C.T. Hackney. 1989. The effects of hydrocarbons on the setting of the American
oyster, Crassostrea virginica, in intertidal habitats in southeastern North Carolina. Estuaries
12: 42-48.
Smith, J. W. 1995. Life history of cobia, Rachycentron canadum, (Osteichthyes: Rachycentridae), in
North Carolina waters. Brimleyana 23: 1-23.
Smith, J. W. and C.A. Wenner. 1985. Biology of the southern kingfish in the South Atlantic Bight.
Transactions of the American Fisheries Society 114: 356-366.
Smith, K. 1998. A summary of limited vessel entry zones for managed seagrass protection in Florida.
Florida Department of Environmental Protection, St. Petersburg, Fl, 30p.
Smith, S. V., W.J. Kimmerer, E.A. Laws, R.E. Brock, and T.W. Walsh. 1981. Kanehoe Bay sewage
diversion experiment: perspectives on ecosystem responses to nutritional perturbation. Pacific
Science 35: 278-396.
Smock, L. A. and E. Gilinsky. 1992. Coastal plain blackwater streams. p. 271-313 in C.T. Hackney,
2010 COASTAL HABITAT PROTECTION PLAN
Literature cited Page 569
S. M. Adams and W. H. Martin eds. Biodiversity of the southeastern United States: aquatic
communities. John Wiley and Sons, Inc., NY, 779 p.
Snodgrass, J. W., A.L. Bryan Jr., R.F. Lide, and G.M. Smith. 1996. Factors affecting the occurrence
and structure of fish assemblages in isolated wetlands of the upper coastal plain, U.S.A.
Canadian Journal of Fisheries and Aquatic Sciences. 53: 443-454.
Sobsey, M. D. 1996. Pathogens and their indicators in North Carolina surface waters. p. 6-10 in
NCSU (ed.). Solutions: Proceedings of a Technical Conference on Water Quality. 19-21
March 1996. NCSU, Raleigh.
Sobsey, M. D., R. Perdue, M. Overton, and J. Fisher. 2003. Factors influencing faecal contamination
in coastal marinas. Water Science and Technology 47: 199-204.
Soniat, T. M., C.M. Finelli, and J.T. Ruiz. 2004. Vertical structure and predator refuge mediate oyster
reef development and community dynamics. Journal of Experimental Marine Biology and
Ecology 310(2): 163-182.
Sparks, A. K., J.L. Boswell, and J.G. Mackin . 1958. Studies on the comparative utilization of oxygen
by living and dead oysters . Proceedings of the National Shellfisheries Association 48: 92-
102.
Sprague, L. A. and W.A. Battaglin. 2005. Wastewater chemicals in Colorado's streams and ground
water: U.S. Geological Survey Fact Sheet . 2004-3127 , 4p.
Spruill, T. B., D.A. Harned, P.M. Ruhl, J.L. Eimers, G. McMahon, K.E. Smith, D.R. Galeone, and
M.D. Woodside. 1998. Water quality in the Albemarle-Pamlico Drainage Basin, North
Carolina and Virginia, 1992-1995. U.S. Geological Survey Circular 1157 .
Spruill, T. B. and J.F. Bratton. 2008. Estimation of groundwater and nutrient fluxes to the Neuse
River estuary, North Carolina. Estuaries and Coasts 31: 501-520.
Stachowicz, J. J., J.R. Terwin, R.B. Whitlatch, and R.W. Osman. 2002. Linking climate change and
biological invasions: ocean warming facilitates nonindigenous species invasions. Proceedings
of the National Academy of Science 99: 15497-15500.
Stanley, D. and S. Nixon. 1992. Stratification and bottom-water hypoxia in the Pamlico River
Estuary. Estuaries 15(2): 270-281.
Stanley, D. W. 1992. Historical Trends in Land Use, Nutrient Production, Water Quality and
Fisheries in the Albemarle-Pamlico System. Institute for Coastal and Marine Resources, East
Carolina University, North Carolina Sea Grant College Publication, Greenville, North
Carolina, 215p.
Stanley, E. H. and M.W. Doyle. 2003. The ecological effects of dam removal. Frontiers in Ecology
and the Environment 1(1): 15-22.
Stanley, J. G. and M.A. Sellers. 1986. Species profiles: life histories and environmental requirements
of coastal fishes and invertebrates (Gulf of Mexico)--American oyster. US Fish and Wildlife
Service, Biological Report 82(11.64) , 25p.
2010 COASTAL HABITAT PROTECTION PLAN
Literature cited Page 570
Stanley, J. G. and R. Dewitt. 1983. Species profiles: life histories and environmental requirements of
coastal fishes and invertebrates (North Atlantic) -- hard clam. US Fish and Wildlife Service,
FWS/OBS-82/11.18 , 19p.
Stant, J. 2010. Out of Control: Mounting Damages From Coal Ash Waste Sites . Environmental
Integrity and Earthjustice, 113p.
Steel, J. 1991. Albemarle-Pamlico Estuarine System, technical analysis of status and trends. DENR,
Raleigh, NC, APES Report No. 90-01 .
Steimle, F. W., C.A. Zetlin, P.L. Berrien, and S. Chang. 1999. Black sea bass, Centropristis striata,
life history and habitat characteristics. NOAA, Northeast Fisheries Science Center, Woods
Hole, Mass, NMFS-NE-143 , 42p.
Steimle, F. W. and C. Zetlin. 2000. Reef habitats in the Middle Atlantic Bight: abundance,
distribution, associated biological communities, and fishery resource use. Marine Fisheries
Review 62(2): 24-42.
Stein, G. 1984. Port's expensive seagrass program fails to take root. The Miami Herald, June 10,1984
.
Steiner, A. J. and S.P. Leatherman. 1981. Recreational impacts on the distribution of ghost crabs,
Ocypode quadrata fab. Biological Conservation 20: 11-122.
Stephan, C. D. and D.G. Lindquist. 1989. A comparative analysis of the fish assemblages associated
with old and new shipwrecks and fish aggregating devices in Onslow Bay, North Carolina.
Bulletin of Marine Science 44(2): 698-717.
Stephan, C. D. and T.E. Bigford. 1997. Atlantic coastal submerged aquatic vegetation: a review of its
ecological role, anthropogenic impacts, state regulations, and value to Atlantic coastal fish
stocks. Atlantic States Marine Fisheries Commission, 77p.
Stevenson, J. C. 1988. Comparative ecology of submersed grass beds in freshwater, estuarine, and
marine environments. Limnology and Oceangraphy 33(4, part 2): 867-893.
Stevenson, J. C., L.W. Staver, and K.W. Staver. 1993. Water quality associated with survival of
submerged aquatic vegetation along an estuarine gradient. Estuaries 16(346-361).
Stevenson, J. C. and N.M. Confer. 1978. Summary of available information on Chesapeake Bay
submerged vegetation. US Fish and Wildlife Service, Office of Biological Services,
FWS/OBS-78/66 , 335p.
Steward, J. S. and W.C. Green. 2007. Setting load limits for nutrients and suspended solids based
upon seagrass depth-limit targets. Estuaries and Coasts 30(4): 657-670.
Stirewalt, G. L. and R.L. Ingram . 1974. Aerial photographic study of shoreline erosion and
deposition, Pamlico Sound, North Carolina. UNC Sea Grant College, Raleigh, NC, UNC-SG-
74-09 , 66p.
Stoecker, D., J. Adolf, A. Place, P. Gilbert, and D. Meritt. 2008. Effects of the dinoflagellates
Karlodinium veneficum and Prorocentrum minimum on the early life history stages of the
2010 COASTAL HABITAT PROTECTION PLAN
Literature cited Page 571
eastern oyster (Crassostrea virginica). Marine Biology 154(1): 81-90.
Stone, K. C., P.G. Hunt, S.W. Coffey, and T.A. Matheny. 1995. Water quality status of a USDA
water quality demonstration project in the eastern Coastal Plain. Journal of Soil and Water
Conservation 40: 567-571.
Stout, V. F. 1980. Organochlorine residues in fishes from the northwest Atlantic Ocean and Gulf of
Mexico. Fishery Bulletin 78(1): 51-58.
Strange, R. J., W.B. Kittrell, and T.D. Broadbent. 1982. Effects of seeding reservoir fluctuation zones
on young-of-the-year black bass and associated species. North American Journal of Fisheries
Management 2: 307-315.
Street, M. W., A.S. Deaton, W.S. Chappell, and P.D. Mooreside. 2005. North Carolina Coastal
Habitat Protection Plan. North Carolina Department of Environment and Natural Resources,
Division of Marine Fisheries, Morehead City, NC, 656p.
Street, M. W., P.P. Pate, B.F. Holland Jr., and A.B. Powell. 1975. Anadromous Fisheries Research
Program, Northern Coastal Region. NC Division of Marine Fisheries, AFCS-8 , 262p.
Strelcheck, A. J., J.H. Cowan, and A. Shah. 2005. Influence of reef location on artificial-reef fish
assemblages in the northcentral Gulf of Mexico. Bulletin of Marine Science 77(3): 425-
440(16).
Stroud, L. M. 1976. Net primary production of belowground material and carbohydrate patterns in two
weight forms of Spartina alterniflora in two North Carolina marshes. Ph.D. dissertation,
North Carolina State University, Raleigh, NC
Struck, S. D., C.B. Craft, and S.W. Broome. 2004. Effects of bridge shading on estuarine marsh
benthic invertebrate community structure and function. ENVIRONMENTAL
MANAGEMENT 34(1): 99-111.
Struyf, E., S. Van Damme, B. Gribsholt, and P. Meire. 2005. freshwater marshes as dissolved silica
recyclers in an estuarine environment (Schelde estuary, Belgium). Hydrobiologia 540: 69-77.
Stunz, G. W., T.J. Minello, and P.S. Levin. 2002. A comparison of early juvenile red drum densities
among various habitat types in Galveston Bay, Texas. Estuaries 25(1): 76-85.
Sudduth, E. B., J.L. Meyer, and E.S. Bernhardt. 2007. Stream restoration practces in the southeastern
United States. Restoration Ecology 15(3): 573-583.
Summerson, H. C. and C.H. Peterson. 1984. Role of predation in organizing benthic communities of a
temperate-zone seagrass bed. Marine Ecology Progress Series 15: 63-77.
Summerson, H. C. and C.H. Peterson. 1990. Recruitment failure of the bay scallop, Argopecten
irradians-concentricus, during the 1st red tide, Ptychodiscus brevis, outbreak recorded in
North Carolina. Estuaries 13(3): 322-331.
Summerson, H. C. and C.H. Peterson. 1990. Recruitment Failure of the bay scallop, Argopecten
irradians concentricus, During the First Red Tide, Ptychodiscus brevis, Outbreak Recorded in
North Carolina. Estuaries 13( 3): 322-331.
2010 COASTAL HABITAT PROTECTION PLAN
Literature cited Page 572
Sundback, L. V., W. Enoksson, W. Graneli, and K. Pettersson. 1991. Influence of sublittoral
microphytobenthos on the oxygen and nutrient flux between sediment and water: A laboratory
continuous-flow study. Marine Ecology Progress Series 74: 263-279.
Sutter, L. 1999. DCM wetland mapping in coastal North Carolina. Division of Coastal Management,
Raleigh, NC, 33p.
Sutula, M., K. Kramer, J. Cable, H. Collis, W. Berelson, and J. Mendez. 2006. Sediments as an
internal source of nutrients to upper Newport Bay, California. Southern California Coastal
Water Research Project No. 482, Technical Report , 167p.
Sved, D. W., P.A. Vanveld, and M.H. Roberts. 1992. Hepatic erod activity in spot, Leiostomus
xanthurus, exposed to creosote-contaminated sediments. Marine Environmental Research
34(1-4): 189-193.
Szedlmayer, S. T. and K.W. Able. 1996. Patterns of seasonal availability and habitat use by fishes and
decapod crustaceans in a southern New Jersey estuary. Estuaries 19(3): 697-709.
Tagatz, M. E. and D.L. Dudley. 1961. Seasonal occurrence of marine fishes in four shore habitats
near Beaufort, NC, 1957-1960. U.S. Fish and Wildlife Service, Special Scientific Report No.
390 .
Tamburri, M. N., C.M. Finelli, D.S. Wethey, and R.K. Zimmer-Faust. 1996. Chemical induction of
larval settlement behavior in flow. Biological Bulletin 191(3): 367-373.
Tarnowski, M. 2003. Maryland oyster population status report: 2002 Fall survey. Maryland
Department of Natural Resources, Annapolis, MD, 32p.
Tarnowski, M. 2005. Maryland oyster population status report: 2003 and 2004 Fall survey. Maryland
Department of Natural Resources, Annapolis, MD, 33p.
Tarplee, W. H. Jr., D.E. Louder, and A.J. Weber . 1971. Evaluation of the effects of channelization on
fish populations in North Carolina's coastal plain streams. North Carolina Wildlife Resources
Commission, Raleigh, NC.
Taylor, D. L. and D.B. Eggleston. 2000. Effects of hypoxia on an estuarine predator-prey interaction:
foraging behavior and mutual interference in the blue crab Callinectes sapidus and the
infaunal clam prey Mya arenaria. Marine Ecology Progress Series 196: 221-237.
Taylor, J. C. and J.M. Miller. 2001. Physiological performance of juvenile southern flounder,
Paralichthys lethostigma (Jordan and Gilbert 1984), in chronic and episodic hypoxia. Journal
of Experimental Marine Biology and Ecology 258(2): 195-214.
Taylor, J. C. and P.S. Rand. 2003. Spatial overlap and distribution of anchovies (Anchoa spp.) and
copepods in a shallow stratified estuary. Aquatic Living Resources 16(3): 191-196.
Taylor, J. E. 1999. Making salmon: An environmental history of the Northwest fisheries crisis.
University of Washington Press, Seattle, WA.
Taylor, J. L. and C.H. Saloman. 1968. Some effects of hydraulic dredging and coastal development in
Boca Ciega Bay, Florida. Fisheries Bulletin 67: 213-241.

2010 COASTAL HABITAT PROTECTION PLAN
Literature cited Page 573
Teal, J. 1962. Energy flow in salt marsh macrophyte production: a review. Ecology 43: 614-624.
Teal, J. and M. Teal. 1969. Life and death of the salt marsh. Audubon/Ballentine Books, New York,
NY, 274p.
Teal, J. M., J.W. Farrington, K.A. Burns, J.J. Stegeman, B.W. Tripp, B. Woodin, and C. Phinney.
1992. The West Falmouth oil spill after 20 years: fate of fuel oil compounds and effects on
animal. Marine Pollution Bulletin 24: 607614.
Teal, J. M., K. Burns, and J. Farrington. 1978. Analyses of aromatic hydrocarbons in intertidal
sediments resulting from two oil spills of no. 2 fuel oil in Buzzards Bay. Massachusetts
Journal of the Fisheries Research Board of Canada 35: 510520.
Tenore, K. R. 1972. Macrobenthos of the Pamlico River estuary, North Carolina. Ecological
Monographs 42: 51-69.
Terlizzi, A., S. Fraschetti, P. Guidetti, and F. Boero. 2002. The effects of sewage discharge on
shallow hard substrate sessile assemblages. Marine Pollution Bulletin 44(6): 544-550.
Tester, P. A., M.E. Geesey, C. Guo, H.W. Paerl, and D.F. Millie. 1995. Evaluating phytoplankton
dynamics in the Newport River estuary (North Carolina, USA) by HPLC-derived pigment
profiles. Marine Ecology Progress Series 124: 237-245.
Tester, P. A. and P.K. Fowler . 1990. Brevetoxin contamination of Mercenaria mercenaria and
Crassostrea virginica: a management issue. p. 499-503 in E. Graneli et al. (eds). Toxic
Marine Phytoplankton. Elsevier Science Publishing Co., Inc..
Thayer, G. W. 1971. Phytoplankton production and distribution of nutrients in a shallow unstratified
estuarine system near Beaufort, NC. Chesapeake Science 12: 240-253.
Thayer, G. W., M.S. Fonseca, and W.J. Kenworthy. 1985. Wetland mitigation and restoration in the
Southeast United States and two lessons from seagrass mitigation. p. 95-117 in: The
Estuarine Management Practice Symposium, November 12-13, 1985. Baton Rouge, LA.
Thayer, G. W., S.M. Adams, and M.W. La Croix. 1975. Structural and functional aspects of a recently
established Zostera marina community. p. 518-540 in L.E. Cronin (ed.). Estuarine Research.
Academic Press, New York, NY, .
Thayer, G. W., W.J. Kenworthy, and M.S. Fonseca. 1984. The ecology of eelgrass meadows of the
Atlantic coast: a community profile. U.S. Fish and Wildlife Service, FWS/OBS-84/02 , 147p.
Thieler, E. R., A.L. Brill, W.J. Cleary, C.H. Hobbs III, and R.A. Gammisch. 1995. Geology of the
Wrightsville Beach, North Carolina shoreface: implications for the concept of shoreface
profile of equilibrium. Marine Geology 126: 271-287.
Thieler, E. R., W.C. Schwab, M.A. Allison, J.F. Denny, and W.W. Danforth. 1998. Sidescan-sonar
imagery of the shoreface and inner continental shelf, Wrightsville Beach, North Carolina .
USGS Open-file Report 98-596 , 16p.
Thomas, C. J. and L.B. Cahoon. 1993. Stable isotope analyses differentiate between different trophic
pathways supporting rocky reef fishes . Marine Ecology Progress Series 95: 19-24.
2010 COASTAL HABITAT PROTECTION PLAN
Literature cited Page 574
Thompson, S. P., H.S. Paerl, and M.C. Go. 1998. Denitrification dynamics of an estuarine headwater
creek recieving agricultural runoff. University of North Carolina-Chapel Hill, Institute of
Marine Science, Chapel Hill, NC, 1p.
Thompson, T. 2000. Intake modifications to reduce entrainment and impingement at Carolina Power
and Light Company's Brunswick Steam Electric Plant, Southport, North Carolina.
Environmental Science and Policy 3(1): 417-424.
Thomsen, M. S., P. Staehr, C.D. Nyberg, S. Schwaerter, D. Krause-Jensen, and B.R. Silliman. 2007.
Gracilaria vermiculophyll (Ohmi) Papenfuss, 1967 (Rhodophyta, Gracilariaeae) in northern
Europe, with emphasis on Danish conditions, and what to expect in the future. Aquatic
Invasions 2(2): 83-94.
Thorne, R. E. and G.L. Thomas. 2008. Herring and the ―Exxon Valdez‖ oil spill: an investigation into
historical data conflicts. ICES Journal of Marine Science 65: 44-50.
Thorpe, T., C.F. Jensen, and M.L. Moser. 2003. Relative abundance and reproductive characteristics
of sharks in southeastern North Carolina coastal waters. Bulletin of Marine Science (in press).
Thrush, S. F., J.S. Gray, J.E. Hewitt, and K.I. Ugland. 2006. Predicting the effects of habitat
homogenization on marine biodiversity. Ecological Applications 16(5): 1636-1642.
Thrush, S. F. and P.K. Dayton. 2002. Disturbance to marine benthic habitats by trawling and
dredging: implications for marine biodiversity. Annual Review of Ecology and Systematics
33: 449-743.
Tilmant, J. T. 1979. Observations on the impacts of shrimp roller frame trawls operated over hard
bottom communities, Biscayne Bay, Florida. National Park Service, Miami, Fl, Report Series
No. P-553 , 23p.
Titus, J. G. 1998. Rising seas, coastal erosion, and the takings clause: How to save wetlands and
beaches without hurting property owners. Maryland Law Review 57: 1279-1399.
Titus, J. G. and C. Richman. 2001. Maps of lands vulnerable to sea level rise: modeled elevations
along the US Atlantic and Gulf coasts. CLIMATE RESEARCH 18(3): 205-228.
Toft, J., C. Simenstad, J. Cordell, and L. Stamatiou. 2004. Fish distribution, abundance, and behavior
at nearshore habitats along City of Seattle marine shorelines, with an emphasis on juvenile
salmonids. University of Washington, Seattle, WA, SAFS-UW-0401 , 51p.
Toft, J. D., J.R. Cordell, C.A. Simenstad, and L.A. Stamatiou. 2007. Fish distribution, abundance, and
behavior along city shoreline types in Puget Sound. North American Journal of Fisheries
Management 27(2): 465-480.
Tolley, S. G. and A.K. Volety. 2005. The role of oysters in habitat use of oyster reefs by resident
fishes and decapod crustaceans. Journal of Shellfish Research 24(4): 1007-1012.
Townsend, E. and M. S. Fonseca. 1998. Bioturbation as a potential mechanism influencing spatial
heterogeneity of North Carolina seagrass beds. Marine Ecology Progressive Series 169: 123-
132.
2010 COASTAL HABITAT PROTECTION PLAN
Literature cited Page 575
Townsend, P. A. 2001b. Relationships between vegetation patterns and hydroperiod on the Roanoke
River floodplain, North Carolina. Plant Ecology 156(1): 43-58.
Townsend, P. A. 2002b. Estimating forest structure in wetlands using multitemporal SAR. REMOTE
SENSING OF ENVIRONMENT 79(2-3): 288-304.
Townsend, P. A. and S.J. Walsh. 2001. Remote sensing of forested wetlands: application of
multitemporal and multispectral satellite imagery to determine plant community composition
and structure in southeastern USA. PLANT ECOLOGY 157(2): 129.
Townsend, P. 2001a. Mapping seasonal flooding in forested wetlands using multi-temporal radarsat
SAR. PHOTOGRAMMETRIC ENGINEERING AND REMOTE SENSING 67(7): 857-864.
Townsend, P. 2002a. Relationships between forest structure and the detection of flood inundation in
forested wetlands using C-band SAR. INTERNATIONAL JOURNAL OF REMOTE
SENSING 23(3): 443-460.
Trappe, C. 2004. Marine protected areas in North Carolina. Master's Thesis, Duke University,
Beaufort, NC
Treat, S. F. and R.R. Lewis. 2006. Seagrass restoration: success, failure, and the costs of both. Lewis
Environmental Services, Inc., Valrico, FL, June , 175 pp.p.
Trent, L. and W.W. Hassler. 1968. Gill net selection, migration, size and age composition, sex ratio,
harvest efficiency, and management of striped bass in the Roanoke River, North Carolina.
Chesapeake Science 9(4): 217-232.
Tripp, M. R. 1974. Effects of organophosphate pesticides on adult oysters (Crassostrea virginica). p.
225-236 in Vernberg, F. J. and W.B. Vernberg. Pollution and physiology of marine
organisms. University of South Carolina, Columbia, SC.
Turberty, S. R. and C.L.Jr. McKenney . 2005. Ecdysteroid responses of estuarine crustaceans exposed
through complete larval development to juvenile hormone agonist insecticides. Integratvie and
Comparitive Biology 45(1): 106-117.
Turner, R. E. 1977. Intertidal vegetation and commercial yields of Penaeid shrimp. Transactions of
the American Fisheries Society 106(5): 411-416.
Turner, S. J., J.E. Hewitt, M.R. Wilkinson, D.J. Morrisey, S.F. Thrush, V.J. Cummings, and G.
Funnell. 1999. Seagrass patches and landscapes: the influence of wind-wave dynamics and
hierarchical arrangements of spatial structure on macrofaunal seagrass communities. Estuaries
22(4): 1016-1032.
Twilley, R. R., W.M. Kemp, K.W. Staver, J.C. Stevenson, and W.R. Boynton. 1985. Nutrient
enrichment of estuarine submersed vascular plant communities. 1. Algal growth and effects
on production of plants and associated communities. Marine Ecology Progress Series 23:
179-191.
Tye, R. 1983. Impact of Hurricane David and mechanical dune restoration on Folly Beach, SC. Shore
and Beach 51: 3-9.

2010 COASTAL HABITAT PROTECTION PLAN
Literature cited Page 576
Tyler, M. 1989. Potential for long-term persistence of the red tide dinoflagellate Ptychodiscus brevis
in North Carolina coastal waters. Final Report prepared to N.C. Department of Natural
Resources and Community Development, Albemarle-Pamlico Estuarine Study 88-09: 14 .
Tyrrell, M., M. Dionne, and J. Edgerly. 2008. Physical factors mediate effects of grazing by a non-
indigenous snail species on saltmarsh cordgrass (Spartina alterniflora) in New England
marshes. ICES Journal of Marine Science 65(5): 746-752.
Tyrus, H. M. 1974. Movements and spawning of anadromous alewives, Alosa pseudoharengus
(Wilson) at Lake Mattamuskeet, North Carolina. Transactions of the American Fisheries
Society 103(2): 392-396.
Udouj, T. 2007. Final Report Deepwater Habitat Mapping Project Phase III: Partnership with the
FWC Florida Fish and Wildlife Research Institute in the Recovery, Interpretation, Integration
and Distribution of Bottom Habitat Information for the South Atlantic Bight (200 – 2,000 m).
SAFMC, Charleston, South Carolina, 16p.
Ulanowicz, R. E. and J.J. Tuttle. 1992. The trophic consequences of oyster stock rehabilitation in the
Chesapeake Bay. Estuaries 15(3): 298-306.
Uncles, R. J., J.A. Stephens, and T.Y. Woodrow. 1988. Seasonal cycling of estuarine sediment and
contaminant transport. Estuaries 11: 108-116.
UNCW (University of North Carolina at Wilmington). 2008. The potential impacts of climate change
on coastal North Carolina. A report by the faculty of the University of North Carolina
Wilmington. University of North Carolina at Wilmington, Wilmington, NC, 124p.
Underwood, G. J. C. and D. Paterson. 1993. Seasonal changes in diatom biomass, sediment stability
and biogenic stabilization in the Severn Estuary. Journal of the Marine Biological Association
of the United Kingdom. Plymouth 73: 881-887.
UNEP (United Nations Environment Programme). 2010. Blue carbon - the role of healthy oceans in
binding carbon. www.unep.org.
UNEP (United Nations Environmental Program). 2009. Marine litter: a global challenge. United
Nations Environmental Program, Nairobi, 232p.
UNESCO. 1994. Marine debris: solid waste management action plan for the wider Caribbean. Paris,
IOC Technical Series 41 .
US Navy and EPA. 1999. Technical Development Document for Phase I Uniform National Discharge
Standards for Vessels of the Armed Forces Naval Sea Systems Command. U.S. Department of
the Navy and U.S. Environmental Protection Agency, Arlington, VA.
USACE (United States Army Corp of Engineers). 2008. Revised framework for mitigation review in
NC. United States Army Corp of Engineers, Wilmington, NC, 6p.
USACE (US Army Corps of Engineers). 1979. General consistency determination: sidecast
maintenance dredging for Bogue Inlet, New River Inlet, Topsail Inlet, Barden Inlet, Oregon
Inlet, Lockwoods Folly Inlet, and Ocracoke Inlet, North Carolina . Letter to NC Division of
Coastal Management .

2010 COASTAL HABITAT PROTECTION PLAN
Literature cited Page 577
USACE (US Army Corps of Engineers). 1992. Draft environmental impact statement: beach erosion
control and hurricane wave protection, Carolina Beach and vicinity area, south project New
Hanover County, NC . U.S. Army Corps of Engineers, Wilmington District, Wilmington, NC,
54p.
USACE (US Army Corps of Engineers). 1999. Environmental Impact Statement: Manteo
(Shallowbag) Bay North Carolina, draft supplement #3 . U.S. Army Corps of Engineers,
Wilmington District, 232p.
USACE (US Army Corps of Engineers). 2001. The New York District's biological monitoring
program for the Atlantic coast of New Jersey, Asbury Park to Manasquan section beach
erosion control project. USACOE, Vicksburg, MS, Final report , 103p.
USACE (US Army Corps of Engineers). 2002. Environmental assessment, fish bypass at Lock and
Dam #1. US Army Corps of Engineers, Wilmington District, Wilmington, NC, 28p.
USACE (US Army Corps of Engineers). 2003. Effects of dredged material beach disposal on surf
zone and nearshore fish and benthic resources on Bald Head Island, Caswell Beach, Oak
Island, and Holden Beach, North Carolina: Interim study findings. Versar, Inc., Columbia,
Md.
USACE (US Army Corps of Engineers). 2008. Draft Programmatic Environmental Impact Statement
for Oyster Restoration in Chesapeake Bay Including the Use of Native and/or Nonnative
Oyster. U.S. Army Corps of Engineers, Norflok District, Norfolk, VA, 20p.
USACE (US Army Corps of Engineers) and EPA (US Environmental Protection Agency). 1996. Site
management and monitoring plan for the Wilmington ocean dredged material disposal site.
U.S. Army Corps of Engineers, Wilmington District, Wilmington, NC, 30p.
USACE (US Army Corps of Engineers) and EPA (US Environmental Protection Agency). 1997. Site
management and monitoring plan for the Morehead City ocean dredged material disposal site.
U.S. Army Corps of Engineers, Wilmington District, Wilmington, NC, 29p.
USACE (US Army Corps of Engineers) and EPA (US Environmental Protection Agency). 2002. Site
management and monitoring plan for the New Wilmington ocean dredged material disposal
site. U.S. Army Corps of Engineers, Wilmington District, Wilmington, NC, 13p.
USCG (United States Coast Guard). 2009. Standards for living organisms in ships ballast water
discharged in U.S. waters. United States Coast Guard, Federal Register 74 (166) , 42p.
USCG (United States Coast Guard). 12/2009b. USCG Ballast water discharge standard - Overview of
notice of proposed rulemaking.
http://www.uscg.mil/hq/cg5/cg522/cg5224/docsNPRM%20Public%20Meeting%202009%20F
INAL-CA-NY.pdf.
USDA (US Department of Agriculture Natural Resources Conservation Service) . 1997. Water
quality and agriculture - status, conditions, and trends. Washington, DC, Working paper #16 ,
125p.
USDA (US Department of Agriculture Natural Resources Conservation Service). 2002. USDA
releases $323 million for conservation programs.

2010 COASTAL HABITAT PROTECTION PLAN
Literature cited Page 578
http://www.nrcs.usda.gov/programs/farmbill, 9/30/2002.
USDA (US Department of Agriculture Soil Conservation Service). 1975. Shoreline erosion inventory,
North Carolina. US Department of Agriculture, Raleigh, NC, 29p.
USFWS (U.S. Fish and Wildlife Service). 1992. Albemarle Sound and Roanoke River Basin. US
Dept Interior, Washington, DC, p.
USFWS (US Fish and Wildlife Service). 2008. American Alligator Alligator mississippiensis. US
Fish and Wildlife Service, Arlington, VA.
USGS (US Geological Survey). 2001. Federal standards for delineation of hydrologic boundaries.
49p.
USGS (US Geological Survey). 2003. National Water Quality Assessment - Nutrients in surface
waters. http://nc.water.usgs.gov/albe/findings.html, 2/14/2003.
Utne-Palm, A. C. 2002. Visual feeding of fish in a turbid environment: Physical and behavioural
aspects. Marine and Freshwater Behavioral Physiology 135: 111-128.
Valiela, I., J. Costa, K. Foreman, J.M. Teal, B.L. Howes, and D. Aubrey. 1990. Transport of ground-
borne nutrients from watersheds and their effects on coastal waters. Biogeochemistry 10:
177-197.
Valiela, I., J. H. J. McClelland, P.J. Behr, D. Hersh, and K. Foreman. 1997. Macroagal blooms in
shallow estuaries: Controls and ecophysiological and ecosystem consequences. Limnology
and Oceanography 45(5): 110-1118.
Van Dolah, R. F., B.J. Digre, P.T. Gayes, P. Donovan-Ealy, and M.W. Dowd. 1998. An evaluation of
physical recovery rates in sand borrow sites used for beach nourishment projects in South
Carolina. Final Report prepared for the South Carolina Task Force on Offshore Resources and
Minerals Management Service. SC Department of Natural Resources, Charleston, SC, 77 p.
Van Dolah, R. F., P. H. Wendt, and M. V. Levisen. 1991. A study of the effects of shrimp trawling on
benthic communities in two South Carolina sounds. Fisheries Research 12: 139-156.
Van Dolah, R. F., P.H. Wendt, and N. Nicholson. 1987. Effects of a research trawl on a hard-bottom
assemblage of sponges and corals. Fisheries Research 5: 39-54.
Van Dolah, R. F., P.H. Wendt, R.M. Martore, M.V. Levison, and W.A. Roumillat. 1992. A physical
and biological monitoring study of the Hilton Head beach nourishment project. Final Report
prepared for the Town of Hilton Head Island and South Carolina Coastal Council. SC DNR,
Charleston, SC, 159p.
Van Dolah, R. F., R.M. Martore, A.E. Lynch, M.V. Levison, P.H. Wendt, D.J. Whitaker, and W.D.
Anderson. 1994. Environmental evaluation of the Folly Beach nourishment project. SC
Department of Natural Resources, Charleston, SC, Final Report prepared by US Army Corps
of Engineers and Marine Resources Division of the South Carolina Dept of Natural Resources.
100p.
Vandermeulen, J. H. and D. Mossman. 1996. Sources of variability in seasonal hepatic microsomal
2010 COASTAL HABITAT PROTECTION PLAN
Literature cited Page 579
oxygenase activity in winter flounder (Pleuronectes americanus) from a coal tar contaminated
estuary. Canadian Journal of Fisheries and Aquatic Sciences 53: 1741-1753.
Vandersea, M. W., R.W. Litaker, B. Yonnish, E. Sosa, J.H. Landsberg, C. Pullinger, P. Moon-Butzin,
J. Green, J.A. Morris, H. Kator, E.J. Noga, and P.A. Tester. 2006. Molecular assays for
detecting Aphanomyces invadans in ulcerative mycotic fish lesions. Applied and
Environmental Microbiology 72(2): 1551-1557.
Vannote, R. L., G.W. Minshall, K.W. Cummins, J.R. Sedell, and C.E. Cushing. 1980. The river
continuum concept. Canadian Journal of Fisheries and Aquatic Sciences 37: 130-137.
Vergeer, L. H. T., T.L. Aarts, and J.D. de Groot. 1995. The 'wasting disease' and the effect of abiotic
factors (light intensity, temperature, salinity) and infection with Labyrinthula zosterae on the
phenolic content of Zostera marina shoots. Aquatic Botany 52: 35-44.
Versar Inc. 2003. Year 2 recovery from impacts of beach nourishment on surf zone and nearshore
fish and benthic resources on Bald Head Island, Caswell Beach, Oak Island, and Holden
Beach, North Carolina. Final Study Findings. Columbia, Maryland, 126 p.
Vetter, R. D. 1977. Respiratory metabolism of and niche separation between, two co-occurring
congeneric species, Cynoscion nebulosus and Cynoscion arenarius, in a South Texas estuary.
M.S. Thesis, University of Texas, Austin, TX, 114 p.
Vigil, D. 1998. North Carolina / Minerals Management Service technical workshop on Manteo unit
exploration: February 4-5, 1998. U.S. Department of Interior, Minerals Management Service,
New Orleans, 168p.
Vigil, D. L. 1998. North Carolina/Minerals Management Service Technical Workshop on Manteo
Unit Exploration: February 4-5, 1998. U.S . Dept. of the Interior, Minerals Management
Service, Gulf of Mexico OCS Region, New Orleans, LA, OCS Study MMS 98-0024 , 168p.
VIMS (Virginia Institute of Marine Science). 2002. Oyster Diseases of the Chesapeake Bay: Dermo
and MSX Fact Sheet. 4p.
VIMS (Virginia Institute of Marine Sciences). 2007. Status of research on the Asian oyster. NOAA
Chesapeake Bay Office, Annapolis, MD, NOAA Ariakensis Team 1/17/07 Update , 2p.
Vingard, G. L. and W.J. O'Brien. 1976. Effects of light and turbidity on the reactive distance of
bluegill (Lepomis macrochirus). Journal of the Fisheries Research Board of Canada 33(2845-
2849).
Virnstein, R. W. and L.J. Morris. 1996. Seagrass preservation and restoration: a diagnostic plan for
the Indian River Lagoon . St. Johns River Water Management District, Palatka, Fl, Tech.
Mem. #14 , 43p.
Virnstein, R. W., P.S. Mikkelsen, K.D. Cairns, and M.A. Capone. 1983. Seagrass beds versus sand
bottoms: the trophic importance of their associated benthic invertebrates. Florida Scientist 46:
363-381.
Vogelbein, W. K., V.J. Lovko, J.D. Shields, K.S. Reece, P.L.Mason, L.W. Haas, and C.C. Walker.
2002. Pfiesteria shumwayae kills fish by micropredation not exotoxin secretion. Nature
2010 COASTAL HABITAT PROTECTION PLAN
Literature cited Page 580
418(6901): 967-970.
Voudrias, E. A. and C.L. Smith. 1986. Hydrocarbon pollution from marinas in estuarine sediments.
Estuarine Coastal Shelf Sciences 22: 271-284.
Waddy, S. L., L.E. Burridge, M.N. Hamilton, S.M. Mercer, D.E. Aiken, and K. Haya. 2002.
Emamectin benzoate induces molting in American lobster, Homarus americanus. Canadian
Journal of Fisheries and Aquatic Sciences 59(7): 1096-1099.
Wahlberg, M. and H. Westerberg. 2005. Hearing in fish and their reactions to sounds from offshore
wind farms. Marine Ecology Progress Series 288: 295-309.
Wainright, S., M.P.Weinstein, K.W. Able, and C.A. Currin. 2000. Relative importance of benthic
microalgae, phytoplankton and the detritus of smooth cordgrass Spartina alterniflora and the
common reed Phragmites australis to brackish-marsh food webs. Marine Ecology Progress
Series 200: 77-91.
Waite, R., J. Giordano, M. Scully, K. Rowles, J. Steel, M. Rumley, T. Stroud, G. Stefanski, A.
Coburn, L. Everett, L. Webb-Margeson , J. Chazal, L. Peck, and N. Petrovich. 1994.
Comprehensive Conservation and Management Plan (Technical Document), Albemarle-
Pamlico Estuarine Study. U.S. Environmental Protection Agency, Washington, DC, .
Walker, J. T., V.P. Aneja, and D.A. Dickey. 2000. Atmospheric transport and wet deposition of
ammonium in North Carolina. Atmospheric Environment 34: 3407-3418.
Walker, M. D. 1984. Fish utilization of an inundated swamp-stream floodplain. M.S. Thesis , East
Carolina University, Greenville, NC, 72 p.
Walker, S. J., T.A. Schlacher, and L.M.C. Thompson. 2008. Habitat modification in a dynamic
environment: The influence of a small articial groyne on macrofaunal assemblages of a sandy
beach. Estuarine, Coastal, Shelf Science 79: 24-34.
Walker, W. W. 1977. Pesticides and their residues in the Mississippi coastal zone. Journal of the
Mississippi Academy of Science 21: 148-154.
Wall, C. C., B.J. Peterson, and C.J. Gobler. 2008. Facilitation of seagrass Zostera marina productivity
by suspension-feeding bivalves. Marine Ecology Progress Series 357: 165-174.
Wall, L. M., L.J. Walters, R.E. Grizzle, and P.E. Sacks. 2005. Recreational boating activity and its
impacts on the recruitment and survival of the oyster Crassostrea virginica on intertidal reefs
in Mosquito Lagoon, Florida. Journal of Shellfish Research 24(4): 965-973.
Walsh, H. J., D.S. Peters, and D.P. Cyrus. 1999. Habitat utilization by small flatfishes in a North
Carolina estuary. Estuaries 22(3B): 803-813.
Walsh, H. J., L.R. Settle, and D.S. Peters. 2005. Early life history of blueback herring and alewife in
the lower Roanoke River, North Carolina. Transactions of the American Fisheries Society
134: 910-926.
Walters, L., P. Sacks, L. Wall, J. Grevert, D. LeJeune, S. Fischer, and A. Simpson. 2003. Declining
intertidal oyster reefs in Florida: direct and indirect impacts of boat wakes. Journal of Shellfish
2010 COASTAL HABITAT PROTECTION PLAN
Literature cited Page 581
Research 22(1): 359-360.
Walton, T. L. and W.M. Sensabaugh. 1979. Seawall design on the open coast. Florida Sea Grant
Report 29: 24 p.
Wang, C. and R.P. Croll. 2006. Effects of sex steroids on spawning in the sea scallop, Placopecten
magellanicus. Aquaculture 256: 423-432.
Wang, J. C. S. and R.J. Kernehan. 1979. Fishes of the Delaware estuaries. Ecological Analysts, Inc.,
Towson, Md, 410p.
Wang, Y. and T.R. Allen. 2008. Estuarine shoreline change detection using Japanese ALOS PALSAR
HH and JERS-1 L-HH SAR data in the Albemarle-Pamlico sounds, North Carolina, USA.
International Journal of Remote Sensing 29(15): 4429-4442.
Wannamaker, C. M. and J.A. Rice . 2000. Effects of hypoxia on movements and behavior of selected
estuarine organisms from the southeastern United States. Journal of Experimental Marine
Biology and Ecology 249: 145-163.
Ward, S., T. Augspurger, F.J. Dwyer, C. Kane, and C.G. Ingersoll. 2007. Risk assessment of water
quality in three North Carolina, USA, streams supporting federally endangered freshwater
mussels (Unionidae). Environmental Toxicology and Chemistry 26(10): 2075-2085.
Warinner, J. E., J.P. Miller, and J. Davis. 1969. Distribution of juvenile river herring in the Potomac
River. Proceedings of the Annual Conference of the Southeast Association of Game and Fish
Commissions 23: 384-388.
Warwick, R. 1993. Environmental impact studies in marine communities: pragmatical considerations.
Australian Journal of Ecology 18: 63-80.
Waters, C. T. and C.D. Thomas. 2001. Shoreline hardening effects on associated fish assemblages in
five North Carolina coastal rivers. North Carolina Wildlife Resources Commission, Raleigh,
NC, 20p.
Watling, L. and E. Norse. 1998. Disturbance of the seabed by mobile fishing gear: a comparison to
forest clearcutting. Conservation Biology 12(6): 1180-1197.
Watts, J. G. 1987. Physical and biological impacts of bulkheads on North Carolina's estuarine
shoreline. Duke University, Durham, NC, Report to North Carolina Division of Coastal
Management , 39 p.
Waycott, M., C.M. Duarte, T.J.B. Carruthers, R.J. Orth, W.C. Dennison, S. Olyarnik, A. Calladine,
J.W. Fourqurean, K.L. Heck Jr., A.R. Hughes, G.A. Kendrick, W.Judson Kenworthy, F.T.
Short, and S.L. Williams. 2009. Accelerating loss of seagrasses across the globe threatens
coastal ecosystems. Proceedings of the National Academy of Science 106(30): 12377-12381.
Webb, E. 1997. Causes of vegetation dieback and subsequent wetland loss in two Louisiana coastal
marshes. Dissertation Abstract International Part B: Science and Engineering 58(6): 2828.
Webster, I. T., P.W. Ford, and B. Hodgson. 2002. Microphytobenthos contribution to nutrient-
phytoplankton dynamics in a shallow coastal lagoon. Estuaries 25(4A): 540-551.
2010 COASTAL HABITAT PROTECTION PLAN
Literature cited Page 582
Weinstein, J. E., T.L. West, and J.T. Bray. 1992. Shell disease and metal content of blue crabs,
Callinectes sapidus, from the Albemarle-Pamlico Estuarine System, North Carolina. Archives
of Environmental Contamination and Toxicology 23: 355-362.
Weinstein, M. P. 1979. Shallow marsh habitats as primary nurseries for fishes and shellfish, Cape
Fear River, NC. Fisheries Bulletin 2: 339-357 .
Weinstein, M. P. and J.H. Balletto. 1999. Does the common reed, Phragmites autralis, affect
Essential Fish Habitat? Estuaries Annual Marine and Estuarine Shallow Water Science and
Management Conference: The Interrelationship among habitats and their management(No.
3B): 793-802.
Weis, J. S. and P. Weis. 1989. Effects of environmental pollutants on early fish development. Aquatic
Sciences 1(1): 45-55.
Weis, J. S. and P. Weis. 1994. Effects of contaminants from chromated copper arsenate-treated
lumber on benthos. Archives of Environmental Contamination and Toxicology 26: 103-109.
Weis, J. S. and P. Weis. 1995. Effects of bulkheads made of pressure-treated wood and other
materials on shallow water benthos in estuaries. Second Annual Marine and Estuarine Shallow
Water Science and Management Conference : 14 .
Weis, J. S. and P. Weis. 2003. Is the invasion of the common reed, Phragmites australis, into tidal
marshes of the eastern US an ecological disaster? Marine Pollution Bulletin 46(7): 816-820.
Weis, J. S., P. Weis, J. Couch, C. Daniels, and T. Chen. 1995. Pathological and genotoxicological
observations in oysters (Crassostrea virginica) living on chromated copper arsenate (CCA) -
treated wood. Marine Environmental Research 39: 275-278.
Weis, J. S., P. Weis, and T. Proctor . 1998. The extent of benthic impacts of CCA-treated wood
structures in Atlantic coast estuaries. Archives of Environmental Contamination and
Toxicology 34(4): 313-322.
Weis, P. and J.S. Weis. 1999. Accumulation of metals in consumers associated with chromated
copper arsenate-treated wood panels. Marine Environmental Research 48: 73-81.
Weis, P., J.S. Weis, A. Greenberg, and J.T. Nosker. 1992. Toxicity of construction materials in the
marine environment: a comparison of chromated copper arsenate-treated wood and recycled
plastic. Archives of Environmental Contamination and Toxicology 22: 99-106.
Weis, P., J.S. Weis, and J. Couch. 1993. Histopathology and bioaccumulation in oysters Crassostrea
virginica living on wood preserved with chromated copper arsenate. Diseases of Aquatic
Organisms 17(1): 41-46.
Weis, P., J.S. Weis, J. Couchl C. Daniels, and T. Chen. 1995. Pathological and genotoxicological
observations in oysters (Crassostrea virginica) living on chromated copper arsenate (CCA)-
treated wood. Marine Environmental Research 39(1-4): 275-278.
Wells, H. W. 1957. Abundance of the hard clam Mercenaria mercenaria in relation to environmental
factors. Ecology 38: 123-128.
2010 COASTAL HABITAT PROTECTION PLAN
Literature cited Page 583
Wells, H. W. 1961. The fauna of oyster beds, with special reference to the salinity factor. Ecological
Monographs 31: 239-266.
Wells, J. T. 1989. A scoping study of the distribution, composition, and dynamics of water-column
and bottom sediments: Albemarle-Pamlico estuarine system. Institute of Marine Sciences,
UNC-Chapel Hill, Morehead City, NC, 89-05 , 39p.
Wells, J. T. and C.H. Peterson. 1986. Restless ribbons of sand: Atlantic and Gulf coastal barriers .
USFWS, National Wetlands Research Center. 24 p.
Wells, R. J. D., J.H. Cowan Jr., and W.F. Patterson III. 2008. Habitat use and the effect of shrimp
trawling on fish and invertebrate communities over the northern Gulf of Mexico continental
shelf. ICES Journal of Marine Science 65(9): 1610-1619.
Wendt, P. H., R.F. Van Dolah, M.Y. Bobo, and J.J. Manzi. 1990. Effects of marina proximity on
certain aspects of the biology of oysters and other benthic macrofauna in a South Carolina
estuary. South Carolina Wildlife and Marine Resources Department, Charleston, SC, South
Carolina Marine Resources Center Tech. Rep. No. 74 , 49p.
Wendt, P. H., R.F. Vandolah, M.Y. Bobo, T.D. Mathews, and M.V. Levisen. 1996. Wood
preservative leachates from docks in an estuarine environment. Archives of Environmental
Contamination and Toxicology 31(1): 24-37.
Wenner, C. A. and G.R. Sedberry. 1989. Species composition, distribution,and relative abundance of
fishesin the coastal habitat off the southeastern United States. NOAA/NMFS, Silver Spring,
MD, NOAA Technical Report NMFS 79 , 47p.
Wenner, E. H., R. Beatty, and L. Coen. 1996. A method of quantitatively sampling nekton on
intertidal oyster reefs. Journal of Shellfish Research 15(3): 769-775.
Wenner, E. L., D.M. Knott, R.F. Van Dolah, and V.G. Burrell. 1983. Invertebrate communities
associated with hard bottom habitats in the South Atlantic Bight. Estuarine Coastal Shelf
Science 17: 143-158.
Wenner, E. L., P.Hinde, D.M. Knott, and R.F. Van Dolah. 1984. A temporal and spatial study of
invertebrate communities associated with hard-bottom habitats in the South Atlantic Bight.
NOAA, Technical Report NMFS 18. 104 p.
Wente, S. P. 2000. Proximity-based measure of land use impacts to aquatic ecosystems.
Environmental Toxicology and Chemistry 19(4).
Wessel, S. Rousseau, X. Caisey, R. Quiniou, and R. Akcha. 2007. Investigating the relationshop
between embryotoxic and genotoxic effects of benzo(a)pyrene, 17a-ethinylestradiol and
endosulfan on Crassostrea gigas embryos. Aquatic Toxicology 85: 133-142.
West, T. L., W.G. Ambrose Jr., and G.A. Skilleter. 1994. A review of the effects of fish harvesting
practices on the benthos and bycatch: implication and recommendations for North Carolina.
Albemarle-Pamlico Estuarine Study. US Environmental Protection Agency and NC DEHNR,
Raleigh, NC, 94-06 , 93p.
Wetz, M. S., A.J. Lewitus, E.T. Koepfler, and K.C. Hayes. 2002. Impact of the Eastern oyster

2010 COASTAL HABITAT PROTECTION PLAN
Literature cited Page 584
Crassostrea virginica on microbial community structure in a salt marsh estuary. Aquatic
Microbial Ecology 28: 87-97.
Wetzel, R. G. 1983. Limnology. Saunders College Publishing, USA, 2nd edition , 767p.
Wetzel, R. G. 2001. Limnology: Lake and River Ecosystems. Academic Press, San Diego, CA, 3rd
Edition .
Wharton, C. H., W.M. Kitchens, E.C. Pendleton, and T.W. Sipe. 1982. The ecology of bottomland
hardwood swamps of the southeast: a community profile. U.S. Fish and Wildlife Service,
Biological Services Program, Washington, D.C., . 133p.
Whitall, D., S. Bricker, J. Ferreira, A. M. Nobre, T. Simas, and M. Silva. 2007. Assessment of
eutrophication in estuaries: pressure-state-response and nitrogen source. Environmental
Management 40(4): 678-690.
White, D. B. and S.M. Palmer. 2004. Age, growth, and reproduction of the red snapper, Lutjanus
campechanus, from the Atlantic waters of the southeastern US. Bulletin of Marine Science
75(3): 335-360.
White, J. C. and T. Triplett. 2002. Polycyclic Aromatic Hydrocarbons (PAHs) in the sediments and
fish of the Mill River, New Haven, Connecticut. Bulletin of Environmental Contamination
and Toxicology 68(1): 104-110.
White, K. 1996. Restoration of channelized streams to enhance fish habitat.
http://www.ies.wisc.edu/research/ies900/kimchannelization.htm, Dec. 2003.
White, N. M., D.E. Line, J.D. Potts, W. Kirby-Smith, B. Doll, and W.F. Hunt. 2000. Jumping Run
Creek shellfish restoration project. Journal of Shellfish Research 19(1): 473-476.
Whitehead, P. J. P. 1985. FAO Species catalogue. Clupeoid fishes of the world. An annotated and
illustrated catalogue of the herrings, sardines, pilchards, sprats, shads, anchovies and wolf-
herrings. Part 1 Chirocentridae, Clupeidae and Pristigasteridae. 7 , 303p.
Whitfield, P. E., J.A. Hare, A.W. David, S.L. Harter, R.C. Munoz, and C.M. Addison. 2007.
Abundance estimates of the Indo-Pacific lionfish Pterois volitans/miles complex in the
western North Atlantic. Biological Invasions 9(1): 53-64.
Whitfield, P. E., T. Gardner, S.P. Vives, M.R. Gilligan, W.R. Courtenay, G.C. Ray, and J.A. Hare.
2002. Biological invasion of the Indo-Pacific lionfish Pterois volitans along the Atlantic
Coast of North America. Marine Ecology Progress Series 235: 289-297.
WHO (World Health Organization). 2002. Global assessment of the state-of-the-science of endocrine
disruptors. International Programme On Chemical Safety.
Widdows, J., P. Donkin, and S.V. Evans. 1987. Physiological responses of Mytilus edulis during
chronic oil exposure and recovery. Marine Environmental Research 23: 15-32.
Widdows, J., R.I.E. Newell, and R. Mann. 1989. Effects of hypoxia and anoxia on survival, energy
metabolism, and feeding of oyster larvae (Crassostrea virginica, Gmelin). Biological Bulletin
177(1): 154-166.
2010 COASTAL HABITAT PROTECTION PLAN
Literature cited Page 585
Wiebe, K. and R. Heimlich. 1995. Evolution of federal wetland policy. Choices 10(1): 8-14.
Wiegert, R. G. and F.C. Evans. 1967. Investigations of secondary production in grasslands. p. 499-518
in Petrusewicz, K. Secondary productivity in terrestrial ecosystems. Polish Academy of
Science, Krakow, Poland.
Wiegert, R. G. and B. J. Freeman. 1990. Tidal salt marshes of the southeast Atlantic coast: a
community profile. U.S. Fish and Wildlife Service Biological Reports 85(7.29): 71.
Wiegert, R. G., L.R. Pomeroy, and W.J. Wiebe. 1981. Ecology of salt marshes: an introduction. p. 2-
19 in Pomeroy, L. R. and R. G. Wiegert. Ecology of a salt marsh. Springer-Verlag New
York, Inc., New York, USA.
Wilber, D. H. and D.G. Clarke. 2001. Biological effects of suspended sediments: A review of
suspended sediment impacts on fish and shellfish with relation to dredging activities in
estuaries. North American Journal of Fisheries Management 21(4): 855-875.
Wilber, D. H., D.G. Clarke, and M.H. Burlas. 2006. Suspended sediment concentrrations associated
with a beach nourishment project on the northern coast of New Jersey. Journal of Coastal
Research 25(5): 1035-1042.
Wilbur, A. R. and M.W. Pentony. 1999. Human-induced nonfishing threats to essential fish habitat in
the New England region. p. 299-321 in L.R. Benaka (ed.). Fish Habitat: Essential Fish
Habitat and Rehabilitation. American Fishery Society , Silver Springs, MD, Symposium 22 ,
459 p.
Wilhelmsson, D. and T. Malm. 2008. Fouling assemblages on offshore wind power plants and
adjacent substrata. Estuarine, Coastal and Shelf Science 79(3): 459-466.
Williams, A. B. 1964. A postlarval shrimp survey in North Carolina. NC Dept Development, Spec
Sci Rep 3 .
Williams, A. H., L.D. Coen, and M.S. Stoelting. 1990. Seasonal abundance, distribution, and habitat
selection of juvenile Callinectes sapidus (Rathbun) in the northern Gulf of Mexico. Journal of
Experimental Marine Biology and Ecology 137: 165-183.
Williams, R. B. and M.B. Murdoch. 1966. Phytoplankton production and chlorophyll concentration in
the Beaufort channel, North Carolina. Limnology and Oceanography 11: 73-82.
Williams, R. D. and A.D. Nicks. 1988. Using CREAMS to simulate filter strip effectiveness in
erosion control. Journal of Soil and Water Conservation 43: 108-112.
Williamson, R. B. and D.J. Morrisey. 2000. Stormwater contamination of urban estuaries. 1.
Predicting the build-up of heavy metals in sediments. Estuaries 23(1): 56-66.
Wilson, D. P. 1968. The settlement behavior of the larvae of Sabellaria alveolata. Journal of Marine
Biological Association, United Kingdom 48: 387-435.
Wilson, K. A. 1962. North Carolina wetlands--Their distribution and management. North Carolina
Wildlife Resources Commission, Raleigh, NC, Project W-6-R , 169p.

2010 COASTAL HABITAT PROTECTION PLAN
Literature cited Page 586
Wilson, K. A., K.W. Able, and K.L. Heck Jr. 1990. Habitat use by juvenile blue crabs: a comparison
among habitats in southern New Jersey. Bulletin of Marine Science 46: 105-114.
Windom, H. L. 1976. Environmental aspects of dredging in the coastal zone. CRC Critical Review
Environmental Control 7: 91-109.
Winger, P. V., P.J. Lasier, D.H. White, and J.T. Seginak. 2000. Effects of contaminants in drege
material from the lower Savannah River. Archives of Environmental Contamination and
Toxicology 38(1): 128-136.
Winner, M. D. and C.E. Simmons. 1977. Hydrology of the Creeping Swamp watershed, North
Carolina with reference to potential effects of stream channelization. U.S. Geological Survey,
Water Resources Investigation 77-26 , 54p.
Winslow, F. 1889. Sounds and estuaries of North Carolina with reference to oyster culture, US Coast
and Geodetic Survey. Bull. No. 10 , 137p.
Winslow, S. E. 1989. North Carolina alosid fisheries management program. NC Department of
Natural Resources and Community Development, Division of Marine Fisheries, Completion
report for project AFC-27 , 102 pp. + appendicesp.
Winslow, S. E. 1990. Status of the American shad, Alosa sapidissima (Wilson), in North Carolina.
NC Division of Marine Fisheries, Morehead City, NC, Special Scientific Report No. 52 , 77
pp. p.
Winslow, S. E. and K.B.Rawls. 1992. North Carolina Alosid Management Program. Compl. Rep.
Proj. AFC-36, Seg. 1-3. North Carolina Dept. Environ, Health, Nat. Resour, Div Mar. Fish .
77.
Winslow, S. E., N.S. Sanderlin, G.W. Judy, J.H. Hawkins, B.F. Holland Jr., C.A. Fischer, and R.A.
Rulifson. 1983. North Carolina anadromous fisheries management program. North Carolina
Department of Natural Resources and Community Development, Division of Marine
Fisheries, Completion report for project AFCS-16 , 402p.
Winslow, S. E., S.C.Mozley, and R.A.Rulifson. 1985. North Carolina Anadromous Fisheries
Management Program. Compl. Rep. Proj. AFCS-22, North Carolina Dept. and Community
Develop, Div. Mar. Fish. . 207.
Wintermeyer, M. L. and K.R.Cooper. 2007. The development of an aquatic bivalve model:
Evaluating the toxic effects on gametogenesis following 2,3,7,8-tetrachlorodibenzo-p-dioxin
(2,3,7,8-TCDD) exposure in the eastern oyster (Crassostrea virginica). Aquatic Toxicology
81(1): 10-26.
Wintermyer, M. L. and K.R. Cooper. 2007. The development of an aquatic bivalve model: evaluating
the toxic effects on gametogenesis following 2,3,7,8-tetrachlorodibenzo-p-dioxin ( 2,3,7,8
TCDD) exposure in the eastern oyster (Crassostrea virginica). Aquatic Toxicology 81(1):
10-26.
Wisby, J. P. and M.J. Lopazanski. 1995. 1994 North Carolina marine sewage pumpout and dump
station survey. NC Div. of Coastal Management, DENR, Unpub. Rep.
2010 COASTAL HABITAT PROTECTION PLAN
Literature cited Page 587
Witherington, B. E. 2002 . Ecology of neonate loggerhead turtles inhabitating lines of downwelling
near a Gulf Stream front. Marine Biology 140: 843-853.
Wolfe, D. A. and T.R. Rice. 1972. Cycling of elements in estuaries. Fisheries Bulletin 70: 959-972.
Wood, R. J., D.F. Boesch, and V. S. V.S. Kennedy. 2002. Future consequences of climate change for
the Chesapeake Bay ecosystem and its fisheries. p. 171-184 in Rose (ed.), G. A. Fisheries in
a Changing Climate . American Fisheries Society, Bethesda, Maryland, Symposium 32 .
Wood, R. J. and H.M. Austin. 2009. Synchronous multidecadal fish recruitment patterns in
Chesapeake Bay, USA. Canadian Journal of Fisheries and Aquatic Science 66: 496-508.
Woodling, J. D., E.M. Lopez, T.A. Maldonado, D.O. Norris, and A.M. Vajda. 2006. Intersex and
other reproductive disruption of fish in wastewater effluent dominated Colorado streams.
Comparative Biochemistry and Physiology Part C: Toxicology & Pharmacology 144(1): 10-
15.
Woodside, M. D. and K.E. Ruhl. 2001. Pesticides in streams in the Tar-Pamlico drainage basin, North
Carolina, 1992-94. US Geological Survey.
Woodwell, G. M., C.A.S. Hall, D.E. Whitney, and R.A. Houghton. 1979. The Flax Pond ecosystem
study: exchanges of inorganic nitrogen between an estuarine marsh and Long Island Sound.
Ecology 60: 695-702.
WRC (North Carolina Wildlife Resources Commission). 1966. Coastal Lakes II -- 1965 surveys.
North Carolina Wildlife Resources Commission, Raleigh, NC, Annual progress report on
Federal Aid in Fish Restoration Project F-14-R-6 , 17p.
Wright, D. A., V.S. Kennedy, W.H. Roosenburg, M. Castagna, and J.A. Mihursky. 1983. The
temperature tolerance of embryos and larvae of five bivalve species under simulated power
plant entrainment conditions: a synthesis. Marine Biology 77: 271-278.
WRP (Wetland Restoration Program). 2000. NC Wetlands Restoration Program, 2000 Annual Report.
N.C. Department of Environment and Natural Resources, Wetlands Restoration Program,
Raleigh, NC, .
WRP (Wetland Restoration Program). 2001. NC Wetlands Restoration Program, 2000-2001 Annual
Report. N.C. Department of Environment and Natural Resources, Wetlands Restoration
Program, Raleigh, NC, .
WRP (Wetland Restoration Program). 2001. NC Wetlands Restoration Program, 2001 Annual Report.
N.C. Department of Environment and Natural Resources, Wetlands Restoration Program,
Raleigh, NC, .
WRP (Wetland Restoration Program). 2002. NC Wetlands Restoration Program, 2001-2002 Annual
Report. N.C. Department of Environment and Natural Resources, Wetlands Restoration
Program, Raleigh, NC, . 111p.
WRP (Wetland Restoration Program). 2002. NC Wetlands Restoration Program, 2002 Annual Report.
N.C. Department of Environment and Natural Resources, Wetlands Restoration Program,
Raleigh, NC, .

2010 COASTAL HABITAT PROTECTION PLAN
Literature cited Page 588
WRP (Wetland Restoration Program). 2003. NC Wetlands Restoration Program, 2002-2003 Annual
Report. N.C. Department of Environment and Natural Resources, Wetlands Restoration
Program, Raleigh, NC, . 84p.
Wyanski, D. M., D.B. White, and C.A. Barans. 2000. Growth, population age structure, and aspects
of the reproductive biology of snowy grouper, Epinephelus niveatus, off North Carolina and
South Carolina. Fishery Bulletin 98(1): 199-218.
Wyda, J. C., L.A. Deegan, J.E. Hughes, and M.J. Weaver. 2002. The response of fishes to submerged
aquatic vegetation complexity in two ecoregions of the Mid-Atlantic Bight: Buzzards Bay and
Chesapeake Bay. Estuaries 25(1): 86-100.
Xie, L. and D.B. Eggleston. 1999. Computer simulations of wind-induced estuarine circulation
patterns and estuary-shelf exchange processes: the potential role of wind forcing on larval
transport. Estuarine, Coastal, and Shelf Science 49(2): 221-234.
Xie, L. and L.J. Pietrafesa. 1999. Systemwide modeling of wind and density driven circulation in
Croatan-Albemarle-Pamlico estuary system part I: model configuration and testing. Journal of
Coastal Research 15(4): 1163-1177.
Yallop, M. L., B. de Winder, D.M. Paterson, and L.J. Stal . 1994. Comparative structure, primary
production and biogenic stabilization of cohesive and non-cohesive marine sediments
inhabited by microphytobenthos. Estuarine Coastal Shelf Science 39: 565-582.
Yozzo, D. J. and D.E. Smith. 1997. Composition and abundance of resident marsh-surface nekton:
comparison between tidal freshwater and salt marshes in Virginia, USA. Hydrobiologia
362(1-3): 9-19.
Zhang, K., B.C. Douglas, and S.P. Leatherman. 2004. Global Warming and Coastal Erosion. Climatic
Change 64: 41-58.
Zheng, L., R.J. Stevenson, and C. Craft. 2004. Changes in benthic algal attributes during salt marsh
restoration. Wetlands 24(2): 309-323.
Zieman, J. C. 1976. The ecological effects of physical damage from motor boats on turtle grass beds
in southern Florida. Aquatic Botany 2: 127-139.
Zieman, J. C. 1982. The ecology of seagrasses of south Florida: a community profile. US Fish and
Wildlife Service, Washington, DC, FWS/OBS-82/25 , 123p.
Zieman, J. C., R. Orth, R.C. Phillips, G. Thayer, and A. Thorhaug. 1984. The effects of oil on seagrass
ecosystems. p. 37-64 in Cairns, J. and Buikema A. L. Eds. Resoration of Habitats Impacted
by Oil Spills. Butterworth, Boston.
Zimmerman, R. T., T. Minello, and M. Gastiglione. 1989. Oyster reef as habitat for estuarine
macrofauna. National Oceanic and Atmospheric Administration, Springfield, VA, NOAA
Technical Memorandum NMFS-SEFC-249 .
Zirschky, J. D., D. Crawford, L. Norton, and D. Deemer. 1989. Metals removal in overland flow.
Journal of the Water Pollution Control Federation 16: 470-475.

2010 COASTAL HABITAT PROTECTION PLAN
Literature cited Page 589
Zou, E. and M. Fingerman. 1999. Effects of exposure to diethyl phthalate, 4-(tert)-octyophenol, and
2,4,5-trichlorobiphenyl on activity of chitobiase in the epidermis and hepatopancreas of the
fiddler crab, Uca pugilator. Comparative Biochemistry and Physiology Part C(122): 115-
120.
2010 COASTAL HABITAT PROTECTION PLAN
Appendices Page 590
APPENDIX A. STATE, FEDERAL, AND INTERSTATE AUTHORITIES
AFFECTING COASTAL FISH HABITAT IN NORTH CAROLINA
Public Trust Doctrine - Implemented as part of North Carolina‘s constitution; applied in management
of North Carolina‘s coastal lands, surface waters, and the resources in those waters. The doctrine states
that ―public trust lands, waters, and living resources in a State are held by the State in trust for the
benefit of all the people, and establishes the right of the public to fully enjoy public trust lands, waters,
and living resources for a wide variety of recognized public uses. The doctrine also sets limitations on
the States, the public, and private owners, as well as establishing the responsibilities of the States
when managing these public trust assets‖ (Coastal States Organization 1997).
North Carolina General Assembly - Enacts statutes affecting all of North Carolina. State laws and
rules implementing those laws cannot overrule federal laws. However, state actions can be more
restrictive than federal rules for environmental protection.
North Carolina Fisheries Reform Act of 1997 (FRA) - Includes a provision [G.S. 143B-279.8] for
preparation of Coastal Habitat Protection Plans (CHPPs) by the N.C. Department of Environment and
Natural Resources (DENR), with adoption and implementation by three regulatory commissions and
their administrative agencies.
Magnuson-Stevens Fisheries Conservation and Management Act of 1976 - The basic law giving the
federal government fisheries management authority in the ocean. The reauthorization law (in 1996) is
known as the Sustainable Fisheries Act (SFA), which established the basis for federal designation of
Essential Fish Habitat (EFH).
National Marine Fisheries Service (NMFS) - The agency in the National Oceanic and Atmospheric
Administration (NOAA) charged with principal responsibilities for management of the Nation‘s
fisheries and fish habitat in the oceans beyond individual states‘ jurisdictions. Federal fishery
management plans must include provisions for the protection of Essential Fish Habitat (EFH) from
negative impacts from federally funded activities.
Coastal Resources Commission (CRC) - One of three North Carolina regulatory commissions that
must adopt CHPPs and implement their recommendations. The CRC enacts rules to manage
development and land disturbing activities along estuarine and ocean shorelines, shoreline
stabilization, alteration of submerged bottoms and coastal wetlands, and marina construction. The
Division of Coastal Management (DCM), an agency of the N.C. Department of Environment and
Natural Resources, implements CRC rules.
Environmental Management Commission (EMC) - One of North Carolina regulatory commissions
that must adopt CHPPs and implement their recommendations. The EMC has wide-ranging authority
over activities affecting water quality statewide. Rules adopted by the EMC govern point and nonpoint
discharges, wastewater management, alteration of non-coastal wetlands, and stormwater management.
Several different DENR agencies implement EMC rules, including the divisions of Water Quality
(DWQ), Air Quality (DAQ), Water Resources (DWR), and Land Resources (DLR) of the N.C.
Department of Environment and Natural Resources.
Marine Fisheries Commission (MFC) - One of three North Carolina regulatory commissions that must
adopt CHPPs and implement their recommendations. The MFC manages commercial and recreational
fishing practices in coastal waters through rules implemented by the Division of Marine Fisheries
(DMF), an agency of the N.C. Department of Environment and Natural Resources.
2010 COASTAL HABITAT PROTECTION PLAN
Appendices Page 591
Intercommission Review Committee (IRC) - A committee of two members from each of the three
regulatory commissions (EMC, CRC, MFC), who reviewed the CHPP and developed the management
recommendations.
Division of Marine Fisheries (DMF) - DENR agency that implements MFC rules affecting
commercial and recreational fishing practices in coastal waters, including rules governing effects of
fishing practices on fish habitats. The DMF also conducts extensive monitoring and research programs
concerning fish stocks, landings statistics, licensing, and enforcement, and prepares and implements
state fishery management plans.
Division of Water Quality (DWQ) - One of the DENR agencies that implements rules of the
Environmental Management Commission to govern point and nonpoint discharges into surface waters,
wastewater management, alteration of non-coastal wetlands, and stormwater management. The DWQ
conducts an extensive statewide water quality monitoring program, manages permit programs for
wetlands impacts and wastewater discharges, and prepares and implements basinwide management
plans.
Division of Air Quality (DAQ) - One of the DENR agencies that implements rules of the
Environmental Management Commission to govern discharges of particulates and gases into the
atmosphere. The DAQ operates a statewide network to monitor air quality.
Division of Water Resources (DWR) - One of the DENR agencies that implements rules of
Environmental Management Commission pertaining to use of water resources and water supply. The
DWR manages state grant programs for water resource development projects, such as navigation and
ocean beach nourishment.
Division of Land Resources (DLR) - The DLR administers rules adopted by Sedimentation Control
Commission to control sediment transport from land development, as well as rules of the N.C. Mining
Commission. The DLR administers the State‘s dam safety program, and also includes the N.C.
Geological Survey and the N.C. Geodetic Survey.
Division of Coastal Management (DCM) - DENR agency that implements rules adopted by the CRC
to manage development and land disturbing activities along estuarine and ocean shorelines, shoreline
stabilization, alteration of submerged bottoms and coastal wetlands, and marina construction through
permit programs. The DCM also sponsors and conducts research and analysis concerning coastal
erosion and wetlands mapping.
Wildlife Resources Commission (WRC) - The state agency charged with management of inland
fisheries, hunting, and management of wildlife, including birds and protected species. The WRC has
authority over most anadromous fish spawning areas in coastal rivers and creeks. The WRC conducts
fisheries research on a statewide basis.
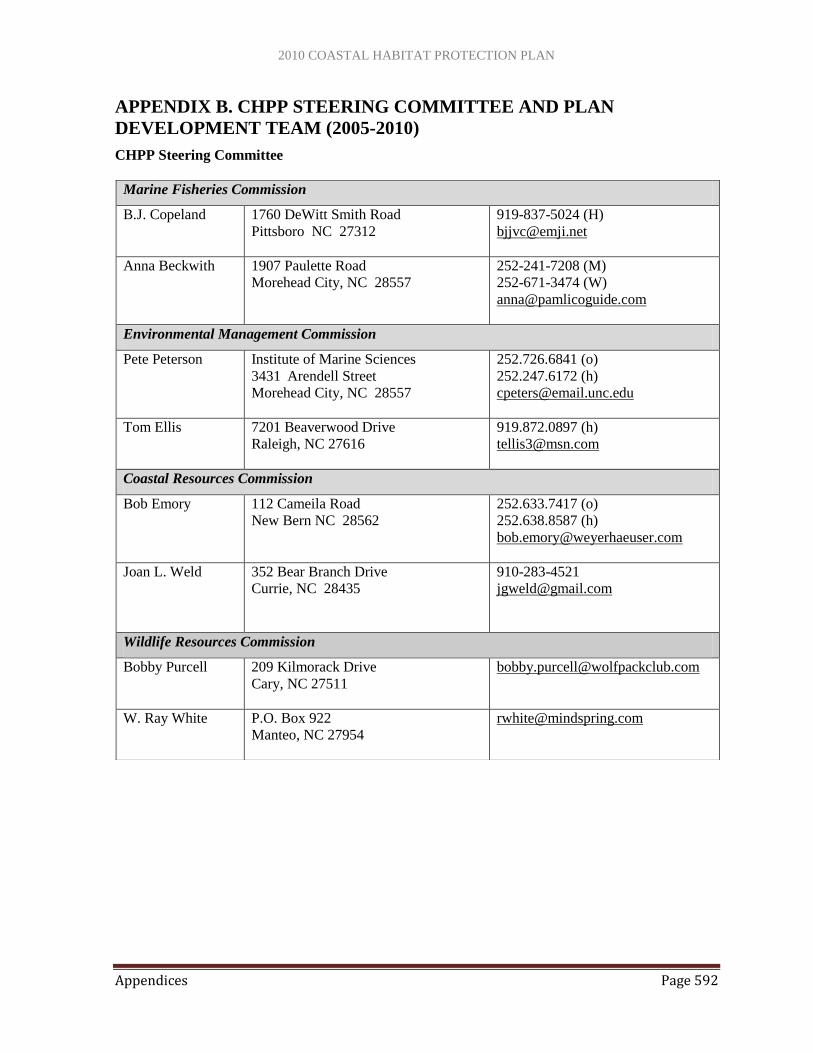
2010 COASTAL HABITAT PROTECTION PLAN
Appendices Page 592
APPENDIX B. CHPP STEERING COMMITTEE AND PLAN
DEVELOPMENT TEAM (2005-2010)
CHPP Steering Committee
Marine Fisheries Commission
B.J. Copeland 1760 DeWitt Smith Road
Pittsboro NC 27312
919-837-5024 (H)
Anna Beckwith 1907 Paulette Road
Morehead City, NC 28557
252-241-7208 (M)
252-671-3474 (W)
Environmental Management Commission
Pete Peterson Institute of Marine Sciences
3431 Arendell Street
Morehead City, NC 28557
252.726.6841 (o)
252.247.6172 (h)
Tom Ellis 7201 Beaverwood Drive
Raleigh, NC 27616
919.872.0897 (h)
Coastal Resources Commission
Bob Emory 112 Cameila Road
New Bern NC 28562
252.633.7417 (o)
252.638.8587 (h)
Joan L. Weld
352 Bear Branch Drive
Currie, NC 28435
910-283-4521
Wildlife Resources Commission
Bobby Purcell 209 Kilmorack Drive
Cary, NC 27511
W. Ray White P.O. Box 922
Manteo, NC 27954
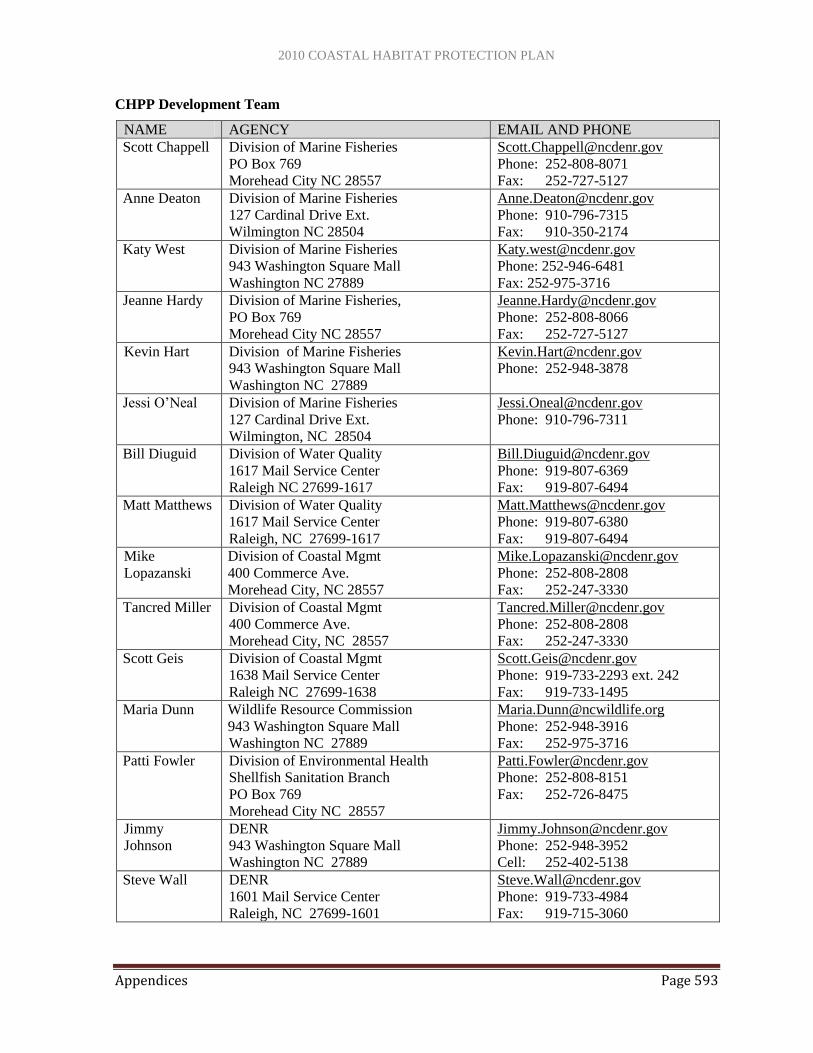
2010 COASTAL HABITAT PROTECTION PLAN
Appendices Page 593
CHPP Development Team
NAME AGENCY EMAIL AND PHONE
Scott Chappell Division of Marine Fisheries
PO Box 769
Morehead City NC 28557
Phone: 252-808-8071
Fax: 252-727-5127
Anne Deaton Division of Marine Fisheries
127 Cardinal Drive Ext.
Wilmington NC 28504
Phone: 910-796-7315
Fax: 910-350-2174
Katy West Division of Marine Fisheries
943 Washington Square Mall
Washington NC 27889
Phone: 252-946-6481
Fax: 252-975-3716
Jeanne Hardy Division of Marine Fisheries,
PO Box 769
Morehead City NC 28557
Phone: 252-808-8066
Fax: 252-727-5127
Kevin Hart Division of Marine Fisheries
943 Washington Square Mall
Washington NC 27889
Phone: 252-948-3878
Jessi O‘Neal Division of Marine Fisheries
127 Cardinal Drive Ext.
Wilmington, NC 28504
Phone: 910-796-7311
Bill Diuguid Division of Water Quality
1617 Mail Service Center
Raleigh NC 27699-1617
Phone: 919-807-6369
Fax: 919-807-6494
Matt Matthews Division of Water Quality
1617 Mail Service Center
Raleigh, NC 27699-1617
Phone: 919-807-6380
Fax: 919-807-6494
Mike
Lopazanski
Division of Coastal Mgmt
400 Commerce Ave.
Morehead City, NC 28557
Phone: 252-808-2808
Fax: 252-247-3330
Tancred Miller Division of Coastal Mgmt
400 Commerce Ave.
Morehead City, NC 28557
Phone: 252-808-2808
Fax: 252-247-3330
Scott Geis Division of Coastal Mgmt
1638 Mail Service Center
Raleigh NC 27699-1638
Phone: 919-733-2293 ext. 242
Fax: 919-733-1495
Maria Dunn Wildlife Resource Commission
943 Washington Square Mall
Washington NC 27889
Phone: 252-948-3916
Fax: 252-975-3716
Patti Fowler
Division of Environmental Health
Shellfish Sanitation Branch
PO Box 769
Morehead City NC 28557
Phone: 252-808-8151
Fax: 252-726-8475
Jimmy
Johnson
DENR
943 Washington Square Mall
Washington NC 27889
Phone: 252-948-3952
Cell: 252-402-5138
Steve Wall DENR
1601 Mail Service Center
Raleigh, NC 27699-1601
Phone: 919-733-4984
Fax: 919-715-3060
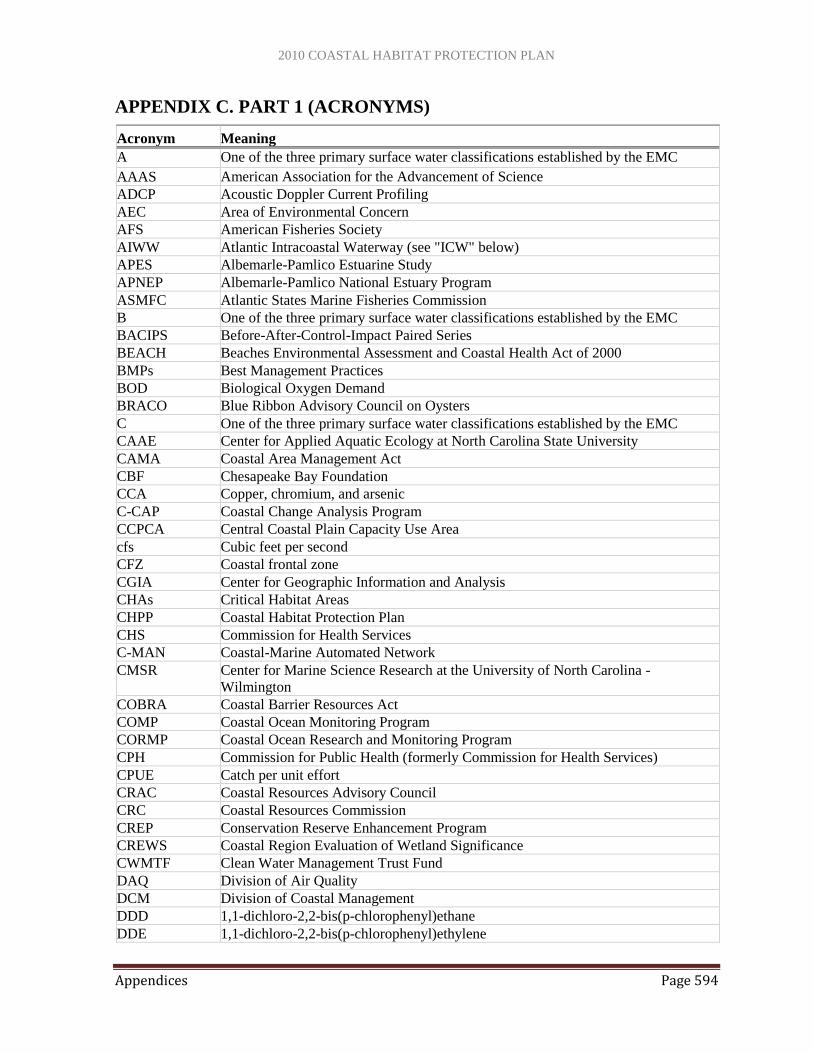
2010 COASTAL HABITAT PROTECTION PLAN
Appendices Page 594
APPENDIX C. PART 1 (ACRONYMS)
Acronym Meaning
A One of the three primary surface water classifications established by the EMC
AAAS American Association for the Advancement of Science
ADCP Acoustic Doppler Current Profiling
AEC Area of Environmental Concern
AFS American Fisheries Society
AIWW Atlantic Intracoastal Waterway (see "ICW" below)
APES Albemarle-Pamlico Estuarine Study
APNEP Albemarle-Pamlico National Estuary Program
ASMFC Atlantic States Marine Fisheries Commission
B One of the three primary surface water classifications established by the EMC
BACIPS Before-After-Control-Impact Paired Series
BEACH Beaches Environmental Assessment and Coastal Health Act of 2000
BMPs Best Management Practices
BOD Biological Oxygen Demand
BRACO Blue Ribbon Advisory Council on Oysters
C One of the three primary surface water classifications established by the EMC
CAAE Center for Applied Aquatic Ecology at North Carolina State University
CAMA Coastal Area Management Act
CBF Chesapeake Bay Foundation
CCA Copper, chromium, and arsenic
C-CAP Coastal Change Analysis Program
CCPCA Central Coastal Plain Capacity Use Area
cfs Cubic feet per second
CFZ Coastal frontal zone
CGIA Center for Geographic Information and Analysis
CHAs Critical Habitat Areas
CHPP Coastal Habitat Protection Plan
CHS Commission for Health Services
C-MAN Coastal-Marine Automated Network
CMSR Center for Marine Science Research at the University of North Carolina -
Wilmington
COBRA Coastal Barrier Resources Act
COMP Coastal Ocean Monitoring Program
CORMP Coastal Ocean Research and Monitoring Program
CPH Commission for Public Health (formerly Commission for Health Services)
CPUE Catch per unit effort
CRAC Coastal Resources Advisory Council
CRC Coastal Resources Commission
CREP Conservation Reserve Enhancement Program
CREWS Coastal Region Evaluation of Wetland Significance
CWMTF Clean Water Management Trust Fund
DAQ Division of Air Quality
DCM Division of Coastal Management
DDD 1,1-dichloro-2,2-bis(p-chlorophenyl)ethane
DDE 1,1-dichloro-2,2-bis(p-chlorophenyl)ethylene
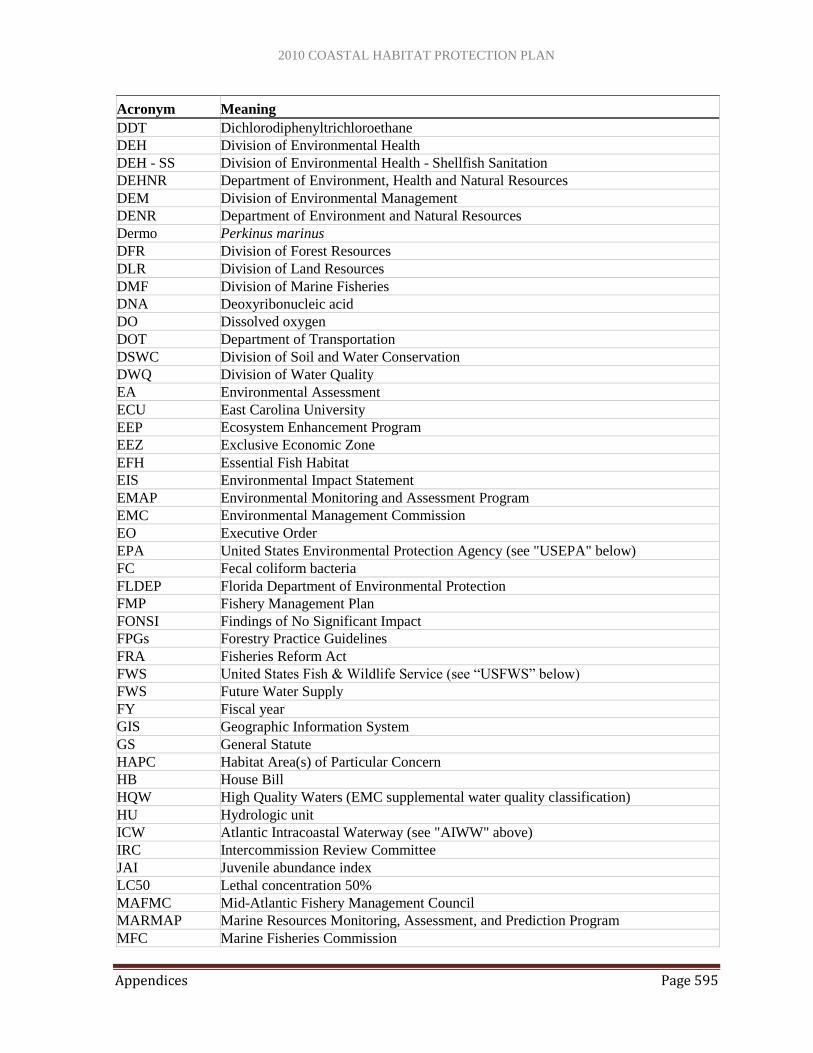
2010 COASTAL HABITAT PROTECTION PLAN
Appendices Page 595
Acronym Meaning
DDT Dichlorodiphenyltrichloroethane
DEH Division of Environmental Health
DEH - SS Division of Environmental Health - Shellfish Sanitation
DEHNR Department of Environment, Health and Natural Resources
DEM Division of Environmental Management
DENR Department of Environment and Natural Resources
Dermo Perkinus marinus
DFR Division of Forest Resources
DLR Division of Land Resources
DMF Division of Marine Fisheries
DNA Deoxyribonucleic acid
DO Dissolved oxygen
DOT Department of Transportation
DSWC Division of Soil and Water Conservation
DWQ Division of Water Quality
EA Environmental Assessment
ECU East Carolina University
EEP Ecosystem Enhancement Program
EEZ Exclusive Economic Zone
EFH Essential Fish Habitat
EIS Environmental Impact Statement
EMAP Environmental Monitoring and Assessment Program
EMC Environmental Management Commission
EO Executive Order
EPA United States Environmental Protection Agency (see "USEPA" below)
FC Fecal coliform bacteria
FLDEP Florida Department of Environmental Protection
FMP Fishery Management Plan
FONSI Findings of No Significant Impact
FPGs Forestry Practice Guidelines
FRA Fisheries Reform Act
FWS United States Fish & Wildlife Service (see ―USFWS‖ below)
FWS Future Water Supply
FY Fiscal year
GIS Geographic Information System
GS General Statute
HAPC Habitat Area(s) of Particular Concern
HB House Bill
HQW High Quality Waters (EMC supplemental water quality classification)
HU Hydrologic unit
ICW Atlantic Intracoastal Waterway (see "AIWW" above)
IRC Intercommission Review Committee
JAI Juvenile abundance index
LC50 Lethal concentration 50%
MAFMC Mid-Atlantic Fishery Management Council
MARMAP Marine Resources Monitoring, Assessment, and Prediction Program
MFC Marine Fisheries Commission
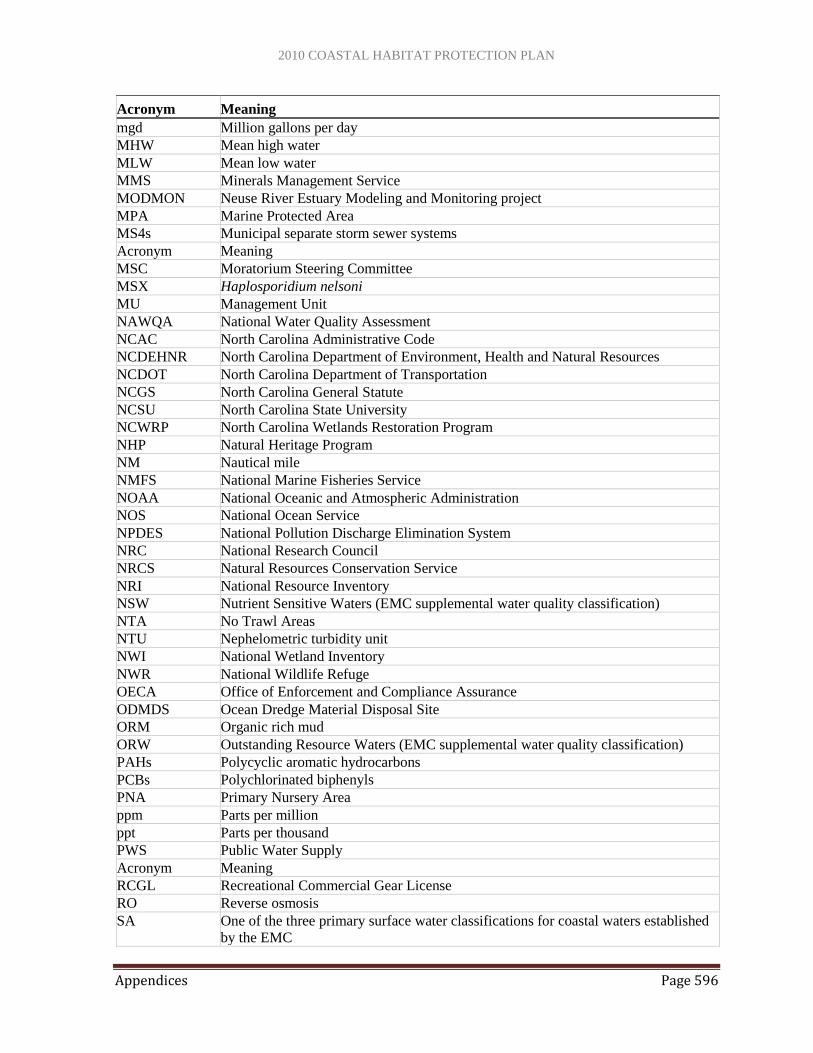
2010 COASTAL HABITAT PROTECTION PLAN
Appendices Page 596
Acronym Meaning
mgd Million gallons per day
MHW Mean high water
MLW Mean low water
MMS Minerals Management Service
MODMON Neuse River Estuary Modeling and Monitoring project
MPA Marine Protected Area
MS4s Municipal separate storm sewer systems
Acronym Meaning
MSC Moratorium Steering Committee
MSX Haplosporidium nelsoni
MU Management Unit
NAWQA National Water Quality Assessment
NCAC North Carolina Administrative Code
NCDEHNR North Carolina Department of Environment, Health and Natural Resources
NCDOT North Carolina Department of Transportation
NCGS North Carolina General Statute
NCSU North Carolina State University
NCWRP North Carolina Wetlands Restoration Program
NHP Natural Heritage Program
NM Nautical mile
NMFS National Marine Fisheries Service
NOAA National Oceanic and Atmospheric Administration
NOS National Ocean Service
NPDES National Pollution Discharge Elimination System
NRC National Research Council
NRCS Natural Resources Conservation Service
NRI National Resource Inventory
NSW Nutrient Sensitive Waters (EMC supplemental water quality classification)
NTA No Trawl Areas
NTU Nephelometric turbidity unit
NWI National Wetland Inventory
NWR National Wildlife Refuge
OECA Office of Enforcement and Compliance Assurance
ODMDS Ocean Dredge Material Disposal Site
ORM Organic rich mud
ORW Outstanding Resource Waters (EMC supplemental water quality classification)
PAHs Polycyclic aromatic hydrocarbons
PCBs Polychlorinated biphenyls
PNA Primary Nursery Area
ppm Parts per million
ppt Parts per thousand
PWS Public Water Supply
Acronym Meaning
RCGL Recreational Commercial Gear License
RO Reverse osmosis
SA One of the three primary surface water classifications for coastal waters established
by the EMC

2010 COASTAL HABITAT PROTECTION PLAN
Appendices Page 597
Acronym Meaning
SAB South Atlantic Bight
SABRE South Atlantic Bight Recruitment Experiment
SAFMC South Atlantic Fishery Management Council
SAV Submerged aquatic vegetation
SB One of the three primary surface water classifications for coastal waters established
by the EMC
SB Senate Bill
SBFMP Striped Bass Fishery Management Plan
SC One of the three primary surface water classifications for coastal waters established
by the EMC
SCC Sedimentation Control Commission
SCGL Standard Commercial Gear License
SCDHEC South Carolina Department of Health and Environmental Control
SCMRD South Carolina Marine Resources Division
SEAMAP Southeast Area Monitoring and Assessment Program
SEAMAP-SA Southeast Area Monitoring and Assessment Program - South Atlantic
SECC Sedimentation and Erosion Control Commission
SEPA State Environmental Policy Act
SFA Sustainable Fisheries Act
SHA Strategic Habitat Area
SL Session Law
SMZ Federal Artificial Reef Special Management Zone
SMZ Streamside Management Zone
SNA Secondary Nursery Area
SNHA Significant Natural Heritage Area
SOC Schedule of Compliance
SOD Sediment Oxygen Demand
SSMAs Shellfish/Seed Management Areas
SSR Stock Status Report
STORET Storage and Retrieval System
SW Swamp waters (EMC supplemental water quality classification)
TBT Tributyltin
TL Total length
Acronym Meaning
TMDL Total Maximum Daily Load
TR Trout waters (EMC supplemental water quality classification)
TRC Total residual chlorine
TSS Total suspended solids
UM Ulcerative mycosis
UNC University of North Carolina
UNC-IMS University of North Carolina - Institute of Marine Science
UNC-W University of North Carolina - Wilmington
USACE United States Army Corps of Engineers (see "ACOE" and "COE" above)
USC United States Code
USCG United States Coast Guard
USDA United States Department of Agriculture
USEPA United States Environmental Protection Agency (see "EPA" above)

2010 COASTAL HABITAT PROTECTION PLAN
Appendices Page 598
Acronym Meaning
USFWS United States Fish & Wildlife Service
USGS United States Geological Survey
UV Ultraviolet light
VIMS Virginia Institute of Marine Science
WRC Wildlife Resources Commission
WRP Wetland Restoration Program
WS Water Supply (EMC supplemental water quality classification)
APPENDIX C. PART 2 (DEFINITIONS)
Term Description
Accretion/
accrete
Natural process by which marshes build in elevation with rising water level.
Adsorption Chemical attachment to a particle.
Aerenchyma Specialized thin-walled cells with large air spaces between them to provide
buoyancy and support in an aquatic environment.
Anadromous Fish species that migrate from the ocean to fresh water streams, lakes, and wetlands
to spawn.
Anaerobic/
reducing Condition of the water column without oxygen.
Anoxia Absence of oxygen.
Anthropogenic Human-like or caused by humans.
Baseflow Sustained low flow of a stream which is often due to groundwater inflow to the
stream channel.
Benthic Associated with the bottom under a water body.
Benthic-pelagic
coupling
The influence of the benthic community and sediments on the water column, and, in
turn, the influence of the water column on the benthic community and sediments,
through integrated events and processes such as resuspension, nutrient cycling,
settlement, and absorption .
Biomass Weight of living material, usually expressed as a dry weight, in all or part of an
organism, population, or community. Commonly presented as weight per unit area,
a biomass density.
Biotic
interactions The physical interactions among organisms (i.e., predation, spawning, competition).
Buffer A vegetated transitional zone between upland areas and aquatic habitats, which
functions as a filter of surface water runoff.
Catadromous Fish species that migrate from fresh waters through to spawning areas in the ocean.
Catch per unit
effort
Amount of fish (numbers or weight) caught by a standard amount of fishing, such as
pounds per trip.
Compensatory
mitigation
The restoration, creation, enhancement, or, in exceptional cases, preservation of
wetlands and/or other aquatic resources for the purpose of compensating for
unavoidable impacts from human activities.
Demersal Fish species that live primarily on or near the bottom.
Denitrification Biochemical reduction, primarily by microorganisms, of nitrogen from nitrate (NO3-)
eventually to molecular nitrogen (N2).
Desiccation Removal of water from organic material.
Detritivores An organism that feeds on freshly dead or partially decomposed organic matter.
Detritus Fragments of plant material occurring in the water during the process of
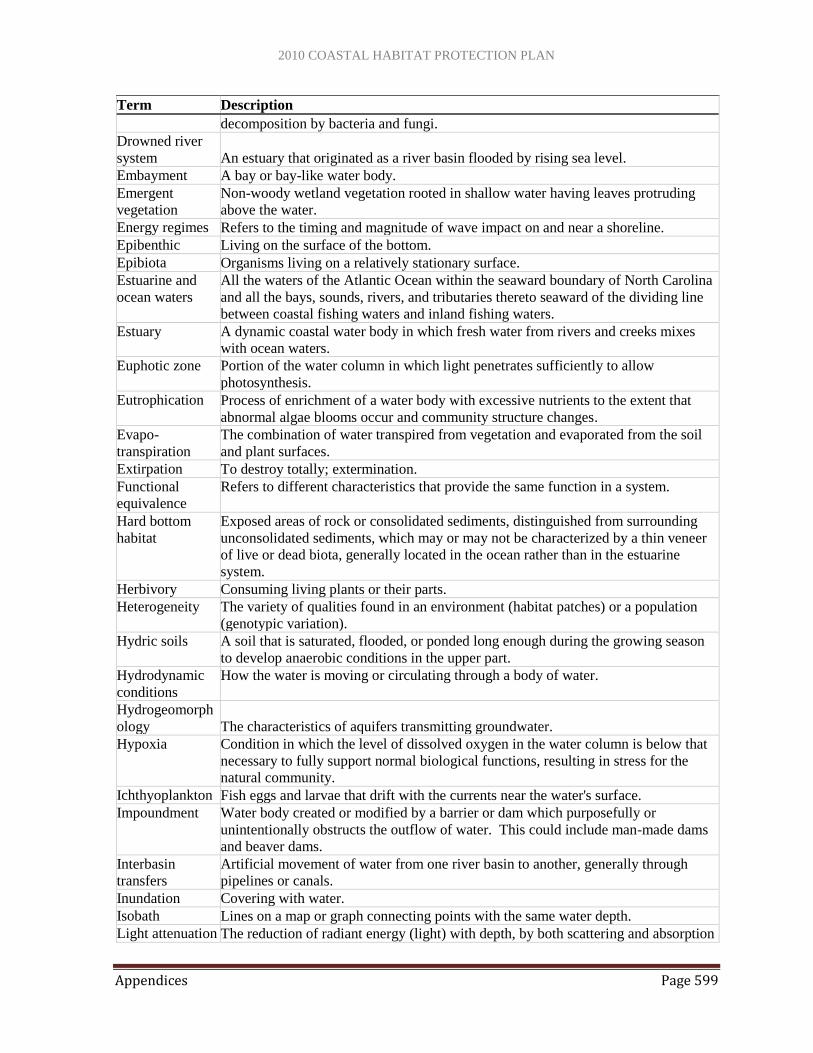
2010 COASTAL HABITAT PROTECTION PLAN
Appendices Page 599
Term Description
decomposition by bacteria and fungi.
Drowned river
system An estuary that originated as a river basin flooded by rising sea level.
Embayment A bay or bay-like water body.
Emergent
vegetation
Non-woody wetland vegetation rooted in shallow water having leaves protruding
above the water.
Energy regimes Refers to the timing and magnitude of wave impact on and near a shoreline.
Epibenthic Living on the surface of the bottom.
Epibiota Organisms living on a relatively stationary surface.
Estuarine and
ocean waters
All the waters of the Atlantic Ocean within the seaward boundary of North Carolina
and all the bays, sounds, rivers, and tributaries thereto seaward of the dividing line
between coastal fishing waters and inland fishing waters.
Estuary A dynamic coastal water body in which fresh water from rivers and creeks mixes
with ocean waters.
Euphotic zone Portion of the water column in which light penetrates sufficiently to allow
photosynthesis.
Eutrophication Process of enrichment of a water body with excessive nutrients to the extent that
abnormal algae blooms occur and community structure changes.
Evapo-
transpiration
The combination of water transpired from vegetation and evaporated from the soil
and plant surfaces.
Extirpation To destroy totally; extermination.
Functional
equivalence
Refers to different characteristics that provide the same function in a system.
Hard bottom
habitat
Exposed areas of rock or consolidated sediments, distinguished from surrounding
unconsolidated sediments, which may or may not be characterized by a thin veneer
of live or dead biota, generally located in the ocean rather than in the estuarine
system.
Herbivory Consuming living plants or their parts.
Heterogeneity The variety of qualities found in an environment (habitat patches) or a population
(genotypic variation).
Hydric soils A soil that is saturated, flooded, or ponded long enough during the growing season
to develop anaerobic conditions in the upper part.
Hydrodynamic
conditions
How the water is moving or circulating through a body of water.
Hydrogeomorph
ology The characteristics of aquifers transmitting groundwater.
Hypoxia Condition in which the level of dissolved oxygen in the water column is below that
necessary to fully support normal biological functions, resulting in stress for the
natural community.
Ichthyoplankton Fish eggs and larvae that drift with the currents near the water's surface.
Impoundment Water body created or modified by a barrier or dam which purposefully or
unintentionally obstructs the outflow of water. This could include man-made dams
and beaver dams.
Interbasin
transfers
Artificial movement of water from one river basin to another, generally through
pipelines or canals.
Inundation Covering with water.
Isobath Lines on a map or graph connecting points with the same water depth.
Light attenuation The reduction of radiant energy (light) with depth, by both scattering and absorption
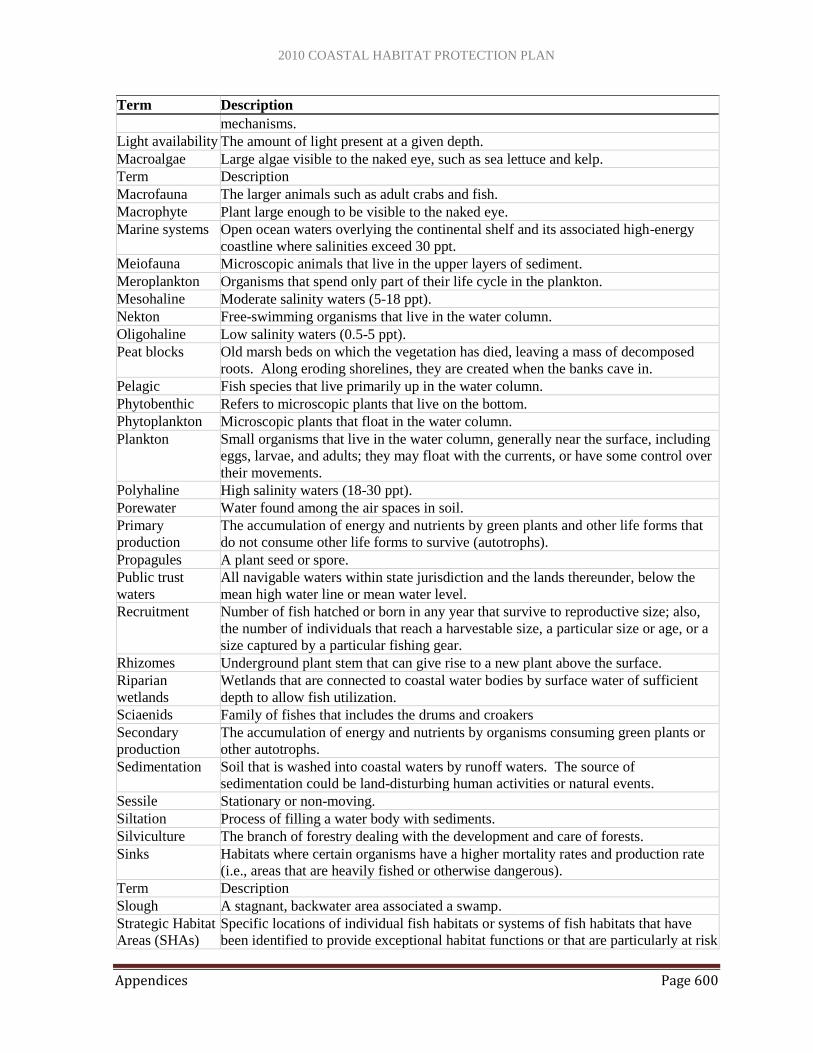
2010 COASTAL HABITAT PROTECTION PLAN
Appendices Page 600
Term Description
mechanisms.
Light availability The amount of light present at a given depth.
Macroalgae Large algae visible to the naked eye, such as sea lettuce and kelp.
Term Description
Macrofauna The larger animals such as adult crabs and fish.
Macrophyte Plant large enough to be visible to the naked eye.
Marine systems Open ocean waters overlying the continental shelf and its associated high-energy
coastline where salinities exceed 30 ppt.
Meiofauna Microscopic animals that live in the upper layers of sediment.
Meroplankton Organisms that spend only part of their life cycle in the plankton.
Mesohaline Moderate salinity waters (5-18 ppt).
Nekton Free-swimming organisms that live in the water column.
Oligohaline Low salinity waters (0.5-5 ppt).
Peat blocks Old marsh beds on which the vegetation has died, leaving a mass of decomposed
roots. Along eroding shorelines, they are created when the banks cave in.
Pelagic Fish species that live primarily up in the water column.
Phytobenthic Refers to microscopic plants that live on the bottom.
Phytoplankton Microscopic plants that float in the water column.
Plankton Small organisms that live in the water column, generally near the surface, including
eggs, larvae, and adults; they may float with the currents, or have some control over
their movements.
Polyhaline High salinity waters (18-30 ppt).
Porewater Water found among the air spaces in soil.
Primary
production
The accumulation of energy and nutrients by green plants and other life forms that
do not consume other life forms to survive (autotrophs).
Propagules A plant seed or spore.
Public trust
waters
All navigable waters within state jurisdiction and the lands thereunder, below the
mean high water line or mean water level.
Recruitment Number of fish hatched or born in any year that survive to reproductive size; also,
the number of individuals that reach a harvestable size, a particular size or age, or a
size captured by a particular fishing gear.
Rhizomes Underground plant stem that can give rise to a new plant above the surface.
Riparian
wetlands
Wetlands that are connected to coastal water bodies by surface water of sufficient
depth to allow fish utilization.
Sciaenids Family of fishes that includes the drums and croakers
Secondary
production
The accumulation of energy and nutrients by organisms consuming green plants or
other autotrophs.
Sedimentation Soil that is washed into coastal waters by runoff waters. The source of
sedimentation could be land-disturbing human activities or natural events.
Sessile Stationary or non-moving.
Siltation Process of filling a water body with sediments.
Silviculture The branch of forestry dealing with the development and care of forests.
Sinks Habitats where certain organisms have a higher mortality rates and production rate
(i.e., areas that are heavily fished or otherwise dangerous).
Term Description
Slough A stagnant, backwater area associated a swamp.
Strategic Habitat
Areas (SHAs)
Specific locations of individual fish habitats or systems of fish habitats that have
been identified to provide exceptional habitat functions or that are particularly at risk
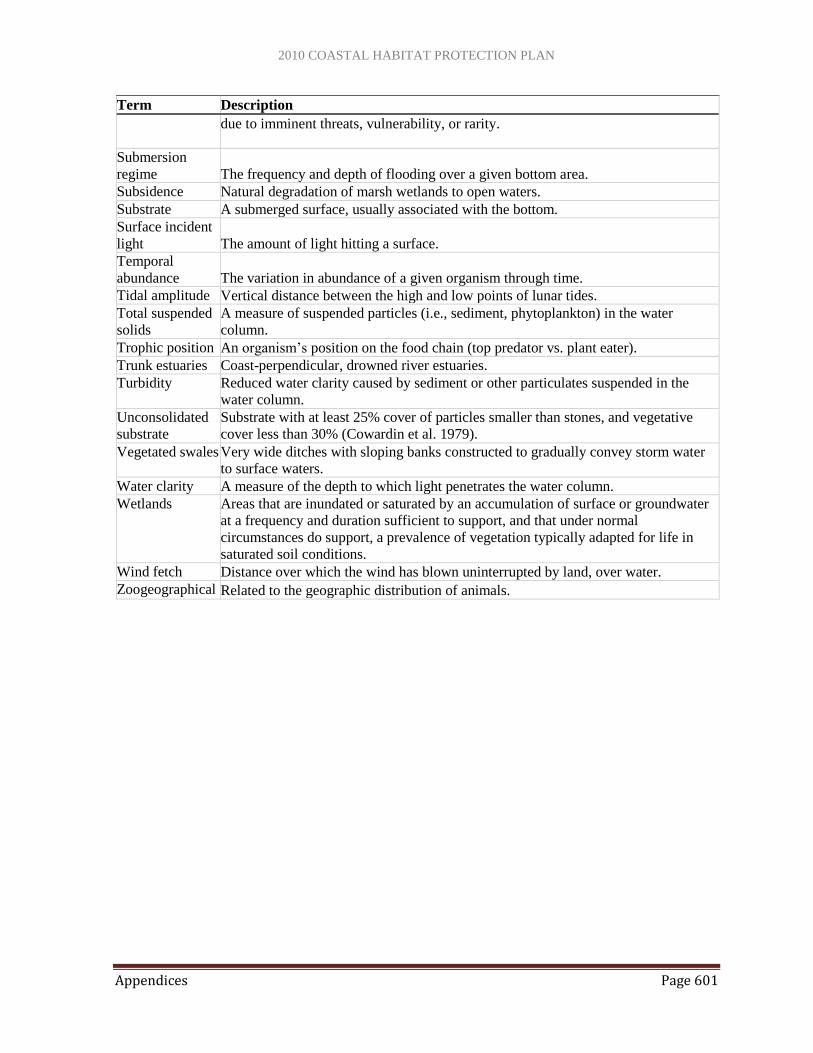
2010 COASTAL HABITAT PROTECTION PLAN
Appendices Page 601
Term Description
due to imminent threats, vulnerability, or rarity.
Submersion
regime The frequency and depth of flooding over a given bottom area.
Subsidence Natural degradation of marsh wetlands to open waters.
Substrate A submerged surface, usually associated with the bottom.
Surface incident
light The amount of light hitting a surface.
Temporal
abundance The variation in abundance of a given organism through time.
Tidal amplitude Vertical distance between the high and low points of lunar tides.
Total suspended
solids
A measure of suspended particles (i.e., sediment, phytoplankton) in the water
column.
Trophic position An organism‘s position on the food chain (top predator vs. plant eater).
Trunk estuaries Coast-perpendicular, drowned river estuaries.
Turbidity Reduced water clarity caused by sediment or other particulates suspended in the
water column.
Unconsolidated
substrate
Substrate with at least 25% cover of particles smaller than stones, and vegetative
cover less than 30% (Cowardin et al. 1979).
Vegetated swales Very wide ditches with sloping banks constructed to gradually convey storm water
to surface waters.
Water clarity A measure of the depth to which light penetrates the water column.
Wetlands Areas that are inundated or saturated by an accumulation of surface or groundwater
at a frequency and duration sufficient to support, and that under normal
circumstances do support, a prevalence of vegetation typically adapted for life in
saturated soil conditions.
Wind fetch Distance over which the wind has blown uninterrupted by land, over water.
Zoogeographical Related to the geographic distribution of animals.
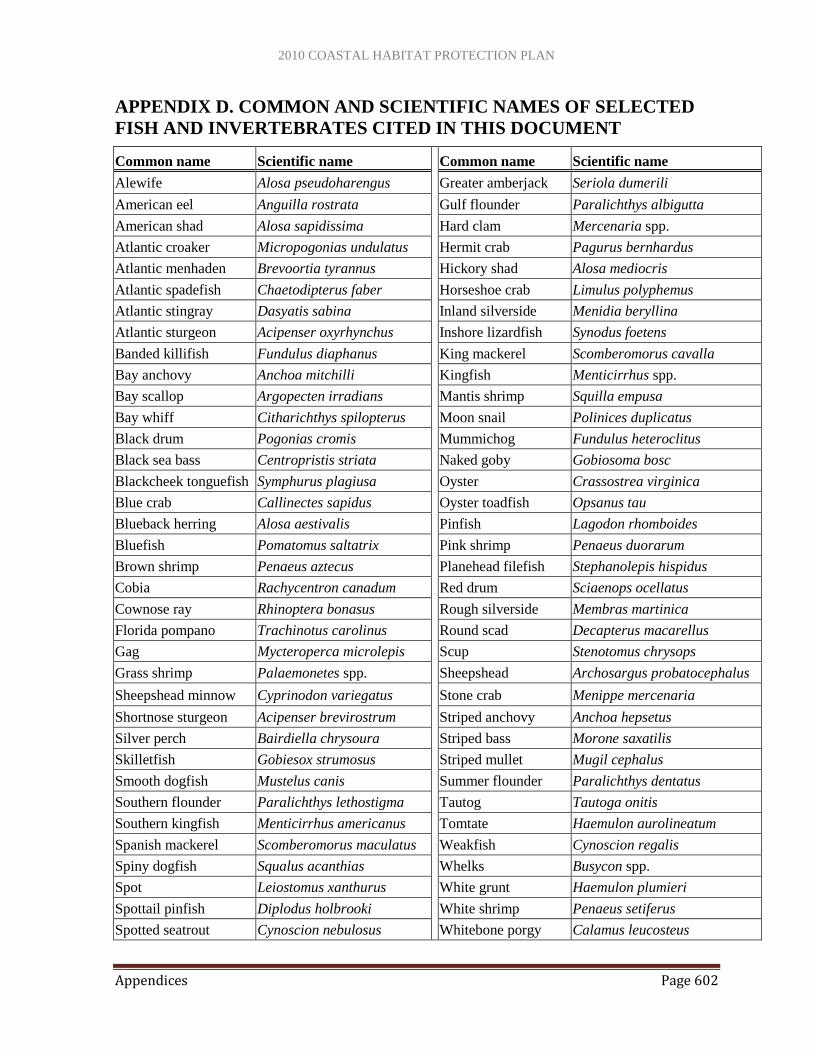
2010 COASTAL HABITAT PROTECTION PLAN
Appendices Page 602
APPENDIX D. COMMON AND SCIENTIFIC NAMES OF SELECTED
FISH AND INVERTEBRATES CITED IN THIS DOCUMENT
Common name Scientific name
Common name Scientific name
Alewife Alosa pseudoharengus Greater amberjack Seriola dumerili
American eel Anguilla rostrata Gulf flounder Paralichthys albigutta
American shad Alosa sapidissima Hard clam Mercenaria spp.
Atlantic croaker Micropogonias undulatus Hermit crab Pagurus bernhardus
Atlantic menhaden Brevoortia tyrannus Hickory shad Alosa mediocris
Atlantic spadefish Chaetodipterus faber Horseshoe crab Limulus polyphemus
Atlantic stingray Dasyatis sabina Inland silverside Menidia beryllina
Atlantic sturgeon Acipenser oxyrhynchus Inshore lizardfish Synodus foetens
Banded killifish Fundulus diaphanus King mackerel Scomberomorus cavalla
Bay anchovy Anchoa mitchilli Kingfish Menticirrhus spp.
Bay scallop Argopecten irradians Mantis shrimp Squilla empusa
Bay whiff Citharichthys spilopterus Moon snail Polinices duplicatus
Black drum Pogonias cromis Mummichog Fundulus heteroclitus
Black sea bass Centropristis striata Naked goby Gobiosoma bosc
Blackcheek tonguefish Symphurus plagiusa Oyster Crassostrea virginica
Blue crab Callinectes sapidus Oyster toadfish Opsanus tau
Blueback herring Alosa aestivalis Pinfish Lagodon rhomboides
Bluefish Pomatomus saltatrix Pink shrimp Penaeus duorarum
Brown shrimp Penaeus aztecus Planehead filefish Stephanolepis hispidus
Cobia Rachycentron canadum Red drum Sciaenops ocellatus
Cownose ray Rhinoptera bonasus Rough silverside Membras martinica
Florida pompano Trachinotus carolinus Round scad Decapterus macarellus
Gag Mycteroperca microlepis Scup Stenotomus chrysops
Grass shrimp Palaemonetes spp. Sheepshead Archosargus probatocephalus
Sheepshead minnow Cyprinodon variegatus Stone crab Menippe mercenaria
Shortnose sturgeon Acipenser brevirostrum Striped anchovy Anchoa hepsetus
Silver perch Bairdiella chrysoura Striped bass Morone saxatilis
Skilletfish Gobiesox strumosus Striped mullet Mugil cephalus
Smooth dogfish Mustelus canis Summer flounder Paralichthys dentatus
Southern flounder Paralichthys lethostigma Tautog Tautoga onitis
Southern kingfish Menticirrhus americanus Tomtate Haemulon aurolineatum
Spanish mackerel Scomberomorus maculatus Weakfish Cynoscion regalis
Spiny dogfish Squalus acanthias Whelks Busycon spp.
Spot Leiostomus xanthurus White grunt Haemulon plumieri
Spottail pinfish Diplodus holbrooki White shrimp Penaeus setiferus
Spotted seatrout Cynoscion nebulosus Whitebone porgy Calamus leucosteus
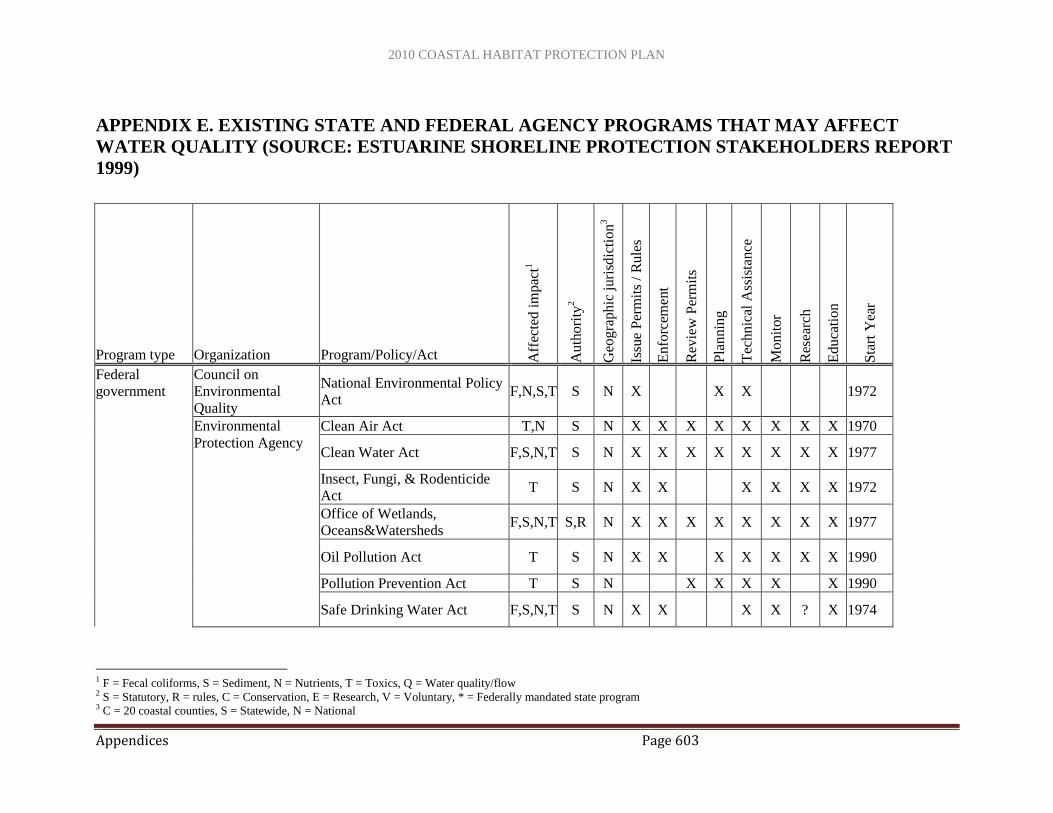
2010 COASTAL HABITAT PROTECTION PLAN
Appendices Page 603
APPENDIX E. EXISTING STATE AND FEDERAL AGENCY PROGRAMS THAT MAY AFFECT
WATER QUALITY (SOURCE: ESTUARINE SHORELINE PROTECTION STAKEHOLDERS REPORT
1999)
Program type Organization Program/Policy/Act Aff
ecte
d i
mpac
t1
Auth
ori
ty2
Geo
gra
phic
juri
sdic
tion
3
Issu
e P
erm
its
/ R
ule
s
Enfo
rcem
ent
Rev
iew
Per
mit
s
Pla
nnin
g
Tec
hnic
al A
ssis
tance
Monit
or
Res
earc
h
Educa
tion
Sta
rt Y
ear
Federal
government
Council on
Environmental
Quality
National Environmental Policy
Act F,N,S,T S N X X X 1972
Environmental
Protection Agency
Clean Air Act T,N S N X X X X X X X X 1970
Clean Water Act F,S,N,T S N X X X X X X X X 1977
Insect, Fungi, & Rodenticide
Act T S N X X X X X X 1972
Office of Wetlands,
Oceans&Watersheds F,S,N,T S,R N X X X X X X X X 1977
Oil Pollution Act T S N X X X X X X X 1990
Pollution Prevention Act T S N X X X X X 1990
Safe Drinking Water Act F,S,N,T S N X X X X ? X 1974
1 F = Fecal coliforms, S = Sediment, N = Nutrients, T = Toxics, Q = Water quality/flow 2 S = Statutory, R = rules, C = Conservation, E = Research, V = Voluntary, * = Federally mandated state program 3 C = 20 coastal counties, S = Statewide, N = National

2010 COASTAL HABITAT PROTECTION PLAN
Appendices Page 604
Program type Organization Program/Policy/Act Aff
ecte
d i
mpac
t1
Auth
ori
ty2
Geo
gra
phic
juri
sdic
tion
3
Issu
e P
erm
its
/ R
ule
s
Enfo
rcem
ent
Rev
iew
Per
mit
s
Pla
nnin
g
Tec
hnic
al A
ssis
tance
Monit
or
Res
earc
h
Educa
tion
Sta
rt Y
ear
Nat. Oceanic &
Atmospheric Adm. Coastal Non-point Source Prog. F,N,S,T S N X X X 1990
National Marine Fisheries
Service F,N,S,T S,E N X X X X
Federal
government
US Army Corps of
Engineers N/A F,N,S,T S N X X X 1899
US Coast Guard N/A F,N,S,T S N X
US Dept. of
Agriculture
Conservation Reserve Enhance.
P. N,F,S,T V,C C X X 1999
Conservation Reserve Program N,F,S,T V,C S X X
Environ. Quality Incentives P. N,F,S,T V,C S X X 1996
Farmland Protection Program N,F,S,T V,C S X X
Flood Risk Reduction Program N,F,S,T V,C S X X
Wetlands Reserve Program N,F,S,T V,C S X X
Wildlife Habitat Incentives P. N,F,S,T V,C S X X
US Fish & Wildlife
Service Endangered Species Act S,N,T S N X X X X X X X X 1973
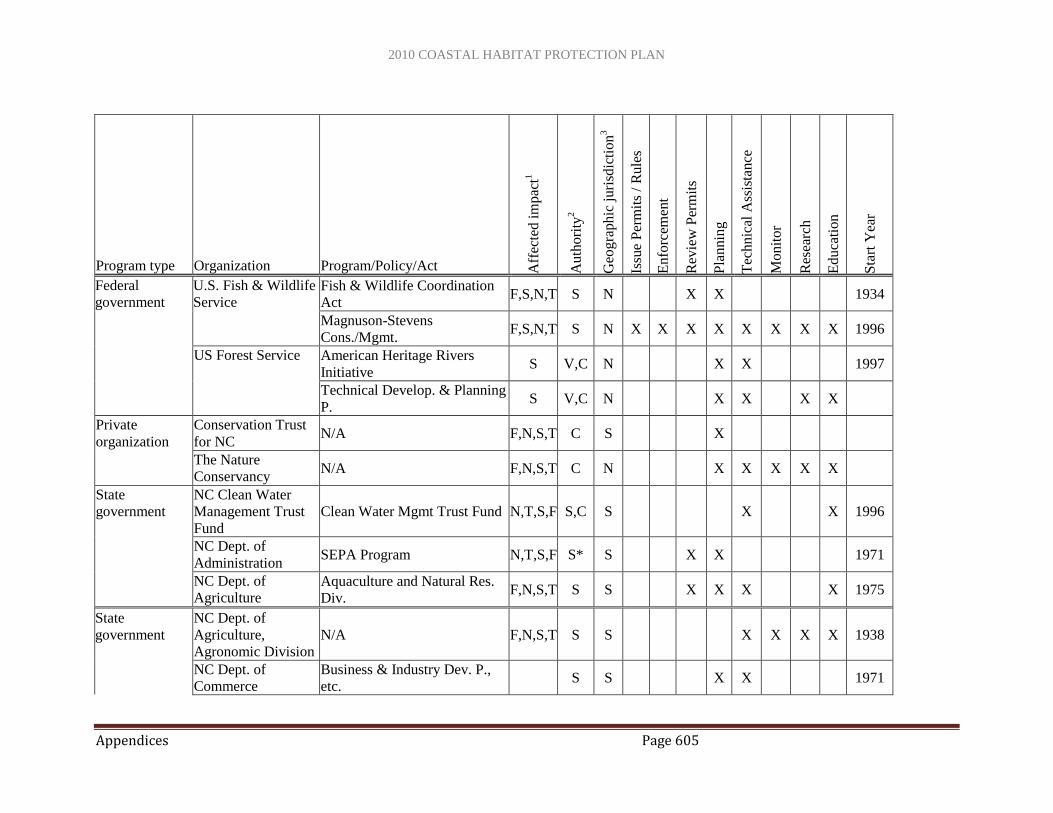
2010 COASTAL HABITAT PROTECTION PLAN
Appendices Page 605
Program type Organization Program/Policy/Act Aff
ecte
d i
mpac
t1
Auth
ori
ty2
Geo
gra
phic
juri
sdic
tion
3
Issu
e P
erm
its
/ R
ule
s
Enfo
rcem
ent
Rev
iew
Per
mit
s
Pla
nnin
g
Tec
hnic
al A
ssis
tance
Monit
or
Res
earc
h
Educa
tion
Sta
rt Y
ear
Federal
government
U.S. Fish & Wildlife
Service Fish & Wildlife Coordination
Act F,S,N,T S N X X 1934
Magnuson-Stevens
Cons./Mgmt. F,S,N,T S N X X X X X X X X 1996
US Forest Service American Heritage Rivers
Initiative S V,C N X X 1997
Technical Develop. & Planning
P. S V,C N X X X X
Private
organization
Conservation Trust
for NC N/A F,N,S,T C S X
The Nature
Conservancy N/A F,N,S,T C N X X X X X
State
government
NC Clean Water
Management Trust
Fund
Clean Water Mgmt Trust Fund N,T,S,F S,C S X X 1996
NC Dept. of
Administration SEPA Program N,T,S,F S* S X X 1971
NC Dept. of
Agriculture Aquaculture and Natural Res.
Div. F,N,S,T S S X X X X 1975
State
government
NC Dept. of
Agriculture,
Agronomic Division
N/A F,N,S,T S S X X X X 1938
NC Dept. of
Commerce
Business & Industry Dev. P.,
etc. S S X X 1971
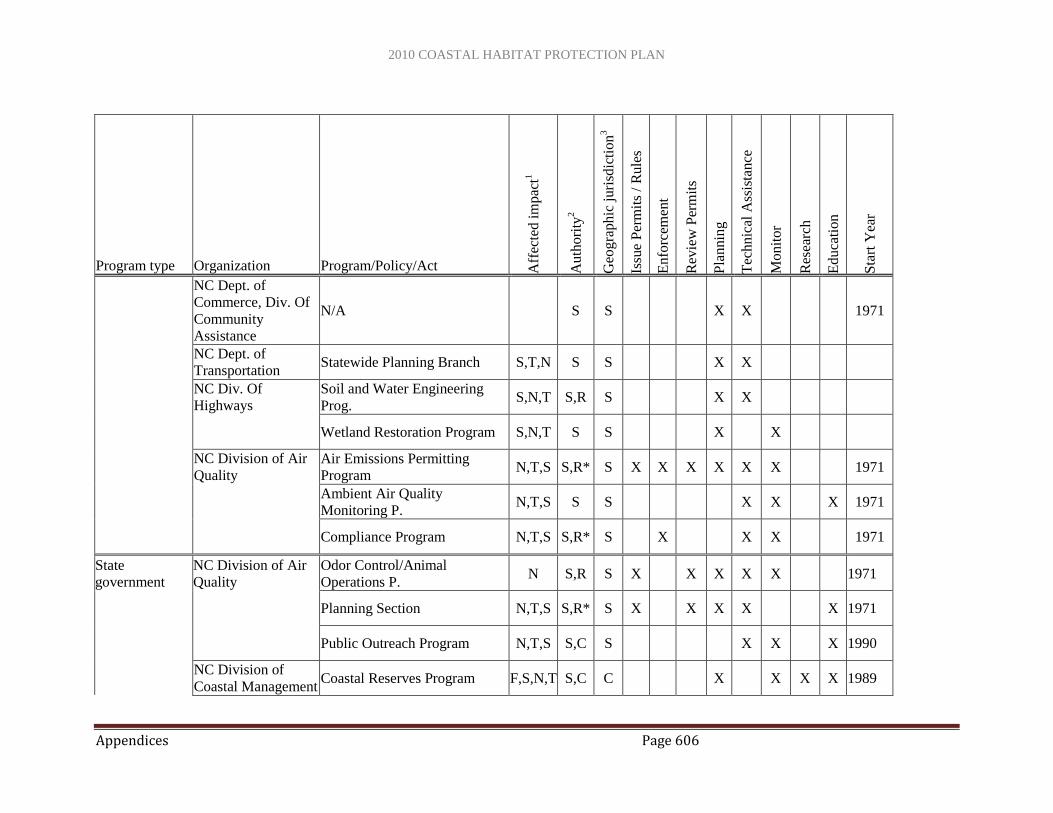
2010 COASTAL HABITAT PROTECTION PLAN
Appendices Page 606
Program type Organization Program/Policy/Act Aff
ecte
d i
mpac
t1
Auth
ori
ty2
Geo
gra
phic
juri
sdic
tion
3
Issu
e P
erm
its
/ R
ule
s
Enfo
rcem
ent
Rev
iew
Per
mit
s
Pla
nnin
g
Tec
hnic
al A
ssis
tance
Monit
or
Res
earc
h
Educa
tion
Sta
rt Y
ear
NC Dept. of
Commerce, Div. Of
Community
Assistance
N/A S S X X 1971
NC Dept. of
Transportation Statewide Planning Branch S,T,N S S X X
NC Div. Of
Highways
Soil and Water Engineering
Prog. S,N,T S,R S X X
Wetland Restoration Program S,N,T S S X X
NC Division of Air
Quality
Air Emissions Permitting
Program N,T,S S,R* S X X X X X X 1971
Ambient Air Quality
Monitoring P. N,T,S S S X X X 1971
Compliance Program N,T,S S,R* S X X X 1971
State
government
NC Division of Air
Quality
Odor Control/Animal
Operations P. N S,R S X X X X X 1971
Planning Section N,T,S S,R* S X X X X X 1971
Public Outreach Program N,T,S S,C S X X X 1990
NC Division of
Coastal Management Coastal Reserves Program F,S,N,T S,C C X X X X 1989

2010 COASTAL HABITAT PROTECTION PLAN
Appendices Page 607
Program type Organization Program/Policy/Act Aff
ecte
d i
mpac
t1
Auth
ori
ty2
Geo
gra
phic
juri
sdic
tion
3
Issu
e P
erm
its
/ R
ule
s
Enfo
rcem
ent
Rev
iew
Per
mit
s
Pla
nnin
g
Tec
hnic
al A
ssis
tance
Monit
or
Res
earc
h
Educa
tion
Sta
rt Y
ear
Development Permitting (AEC)
P. F,S,N,T R C X X X X 1974
Dredge & Fill Permitting
Program S,N,T R S X X X X 1970
Federal Consistency Program F,S,N,T R C X X X 1974
Land-use Planning Program F,S,N,T S C X X X 1974
Marine Sewage Pumpout
Program F,T,N S C X X X 1994
Ocean Res. Mgmt./OCS
Program F,S,N,T S* C X X X 1993
Wetland Mapping Program S,C C X X 1992
State
government
NC Division of
Environmental
Health
On-site Wastewater Program F,N S,R S X X X X 1977
NC Division of
Environmental
Health
Public Health Pest Mgmt.
Program S R S X X X X X X 1957
Public Water Supply Program Q R S X X X X X X X
Shellfish Sanitation Program F S,R C X X X X X X X 1930s
NC Division of
Forestry Resources Forest Practices Guidelines S,N R S X X X 1990
Forestry BMPs S,N V S X X X
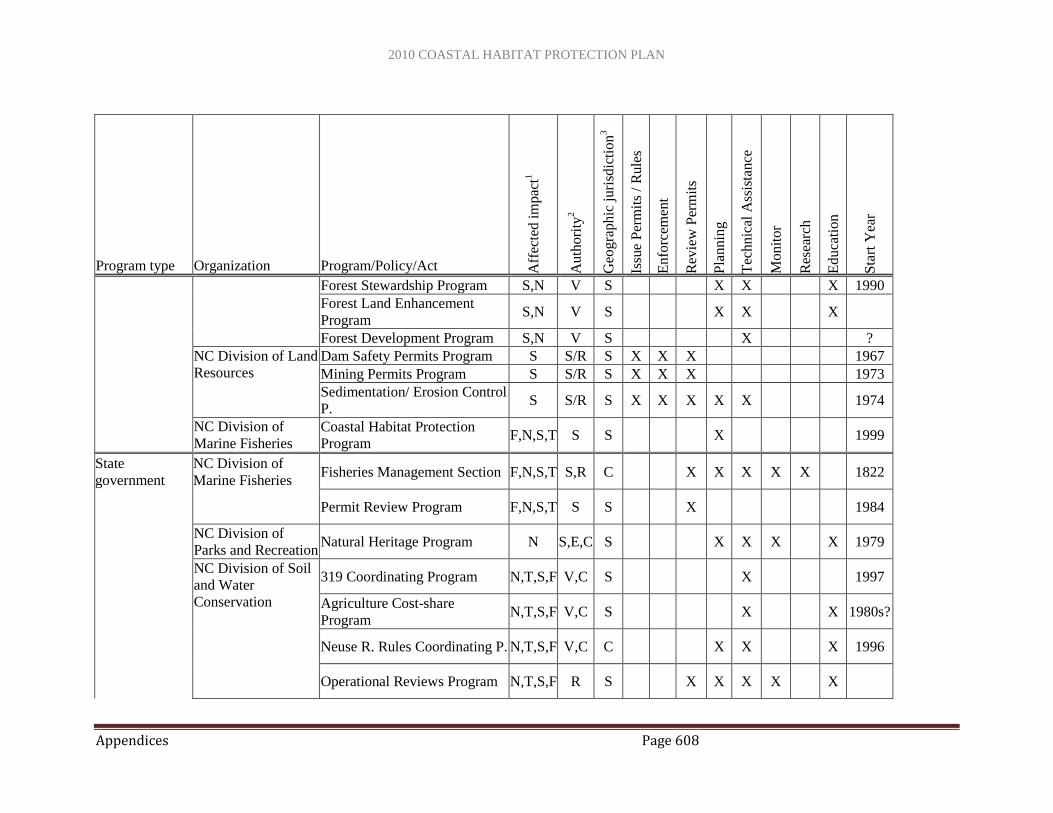
2010 COASTAL HABITAT PROTECTION PLAN
Appendices Page 608
Program type Organization Program/Policy/Act Aff
ecte
d i
mpac
t1
Auth
ori
ty2
Geo
gra
phic
juri
sdic
tion
3
Issu
e P
erm
its
/ R
ule
s
Enfo
rcem
ent
Rev
iew
Per
mit
s
Pla
nnin
g
Tec
hnic
al A
ssis
tance
Monit
or
Res
earc
h
Educa
tion
Sta
rt Y
ear
Forest Stewardship Program S,N V S X X X 1990
Forest Land Enhancement
Program S,N V S X X X
Forest Development Program S,N V S X ?
NC Division of Land
Resources
Dam Safety Permits Program S S/R S X X X 1967
Mining Permits Program S S/R S X X X 1973
Sedimentation/ Erosion Control
P. S S/R S X X X X X 1974
NC Division of
Marine Fisheries
Coastal Habitat Protection
Program F,N,S,T S S X 1999
State
government
NC Division of
Marine Fisheries Fisheries Management Section F,N,S,T S,R C X X X X X 1822
Permit Review Program F,N,S,T S S X 1984
NC Division of
Parks and Recreation Natural Heritage Program N S,E,C S X X X X 1979
NC Division of Soil
and Water
Conservation
319 Coordinating Program N,T,S,F V,C S X 1997
Agriculture Cost-share
Program N,T,S,F V,C S X X 1980s?
Neuse R. Rules Coordinating P. N,T,S,F V,C C X X X 1996
Operational Reviews Program N,T,S,F R S X X X X X

2010 COASTAL HABITAT PROTECTION PLAN
Appendices Page 609
Program type Organization Program/Policy/Act Aff
ecte
d i
mpac
t1
Auth
ori
ty2
Geo
gra
phic
juri
sdic
tion
3
Issu
e P
erm
its
/ R
ule
s
Enfo
rcem
ent
Rev
iew
Per
mit
s
Pla
nnin
g
Tec
hnic
al A
ssis
tance
Monit
or
Res
earc
h
Educa
tion
Sta
rt Y
ear
Pamlico R. Rules Coordinating
P. N,T,S,F V,C C X X X 1996
Soil survey Program S S S X X X X 1938
NC Division of
Waste Management Hazardous Waste Program T SF/R S X X X 1980
Solid Waste Management
Program T S/R S X X X X 1989
Superfund Program T SF S X X 1980
State
government
NC Division of
Waste Management
Underground Storage Tank
Prog. T S/R S X X X 1983
NC Division of
Water Quality 303(d) TMDL Program F,N,S,T R* S X X X X 1997
404/401 Wetlands Program F,N,S,T R* S X X X X 1973
Albemarle-Pamlico Program F,N,S,T S,R* C X X 1987
Basinwide Mgmt. Plans
Program F,N,S,T S* S X X X 1993
Construction Grants & Loan P. F,N S* S X X
NC 319 Program F,N,S,T S* S X X 1990
Neuse R. Rapid Response Prog. F,N,S,T S,E C X X ?
Non-discharge Program -
Sewage F,N R S X X X X X
rev.
1997
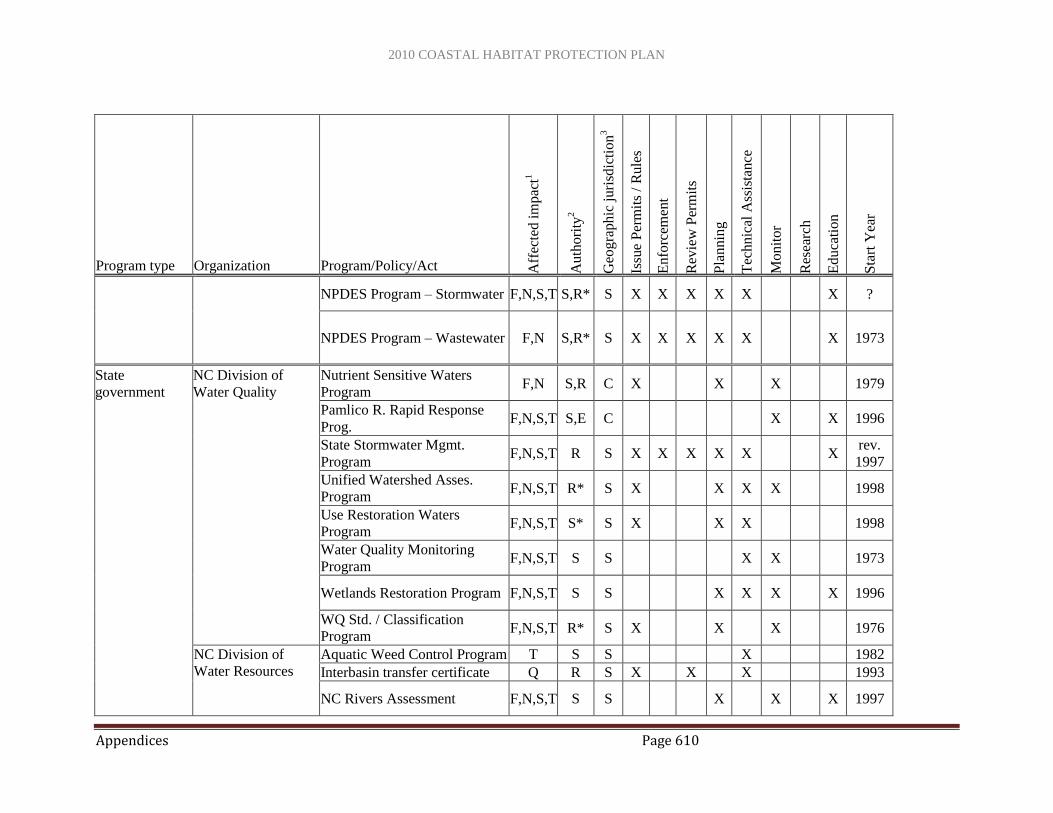
2010 COASTAL HABITAT PROTECTION PLAN
Appendices Page 610
Program type Organization Program/Policy/Act Aff
ecte
d i
mpac
t1
Auth
ori
ty2
Geo
gra
phic
juri
sdic
tion
3
Issu
e P
erm
its
/ R
ule
s
Enfo
rcem
ent
Rev
iew
Per
mit
s
Pla
nnin
g
Tec
hnic
al A
ssis
tance
Monit
or
Res
earc
h
Educa
tion
Sta
rt Y
ear
NPDES Program – Stormwater F,N,S,T S,R* S X X X X X X ?
NPDES Program – Wastewater F,N S,R* S X X X X X X 1973
State
government
NC Division of
Water Quality
Nutrient Sensitive Waters
Program F,N S,R C X X X 1979
Pamlico R. Rapid Response
Prog. F,N,S,T S,E C X X 1996
State Stormwater Mgmt.
Program F,N,S,T R S X X X X X X
rev.
1997
Unified Watershed Asses.
Program F,N,S,T R* S X X X X 1998
Use Restoration Waters
Program F,N,S,T S* S X X X 1998
Water Quality Monitoring
Program F,N,S,T S S X X 1973
Wetlands Restoration Program F,N,S,T S S X X X X 1996
WQ Std. / Classification
Program F,N,S,T R* S X X X 1976
NC Division of
Water Resources
Aquatic Weed Control Program T S S X 1982
Interbasin transfer certificate Q R S X X X 1993
NC Rivers Assessment F,N,S,T S S X X X 1997
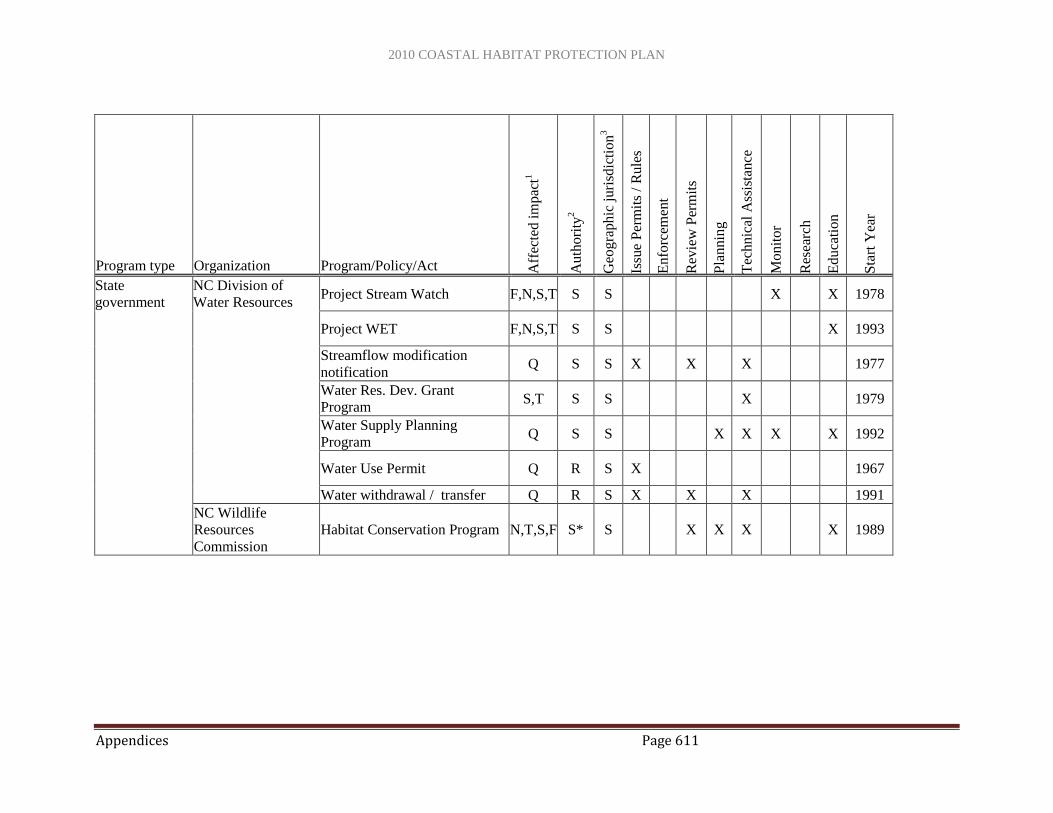
2010 COASTAL HABITAT PROTECTION PLAN
Appendices Page 611
Program type Organization Program/Policy/Act Aff
ecte
d i
mpac
t1
Auth
ori
ty2
Geo
gra
phic
juri
sdic
tion
3
Issu
e P
erm
its
/ R
ule
s
Enfo
rcem
ent
Rev
iew
Per
mit
s
Pla
nnin
g
Tec
hnic
al A
ssis
tance
Monit
or
Res
earc
h
Educa
tion
Sta
rt Y
ear
State
government
NC Division of
Water Resources Project Stream Watch F,N,S,T S S X X 1978
Project WET F,N,S,T S S X 1993
Streamflow modification
notification Q S S X X X 1977
Water Res. Dev. Grant
Program S,T S S X 1979
Water Supply Planning
Program Q S S X X X X 1992
Water Use Permit Q R S X 1967
Water withdrawal / transfer Q R S X X X 1991
NC Wildlife
Resources
Commission
Habitat Conservation Program N,T,S,F S* S X X X X 1989
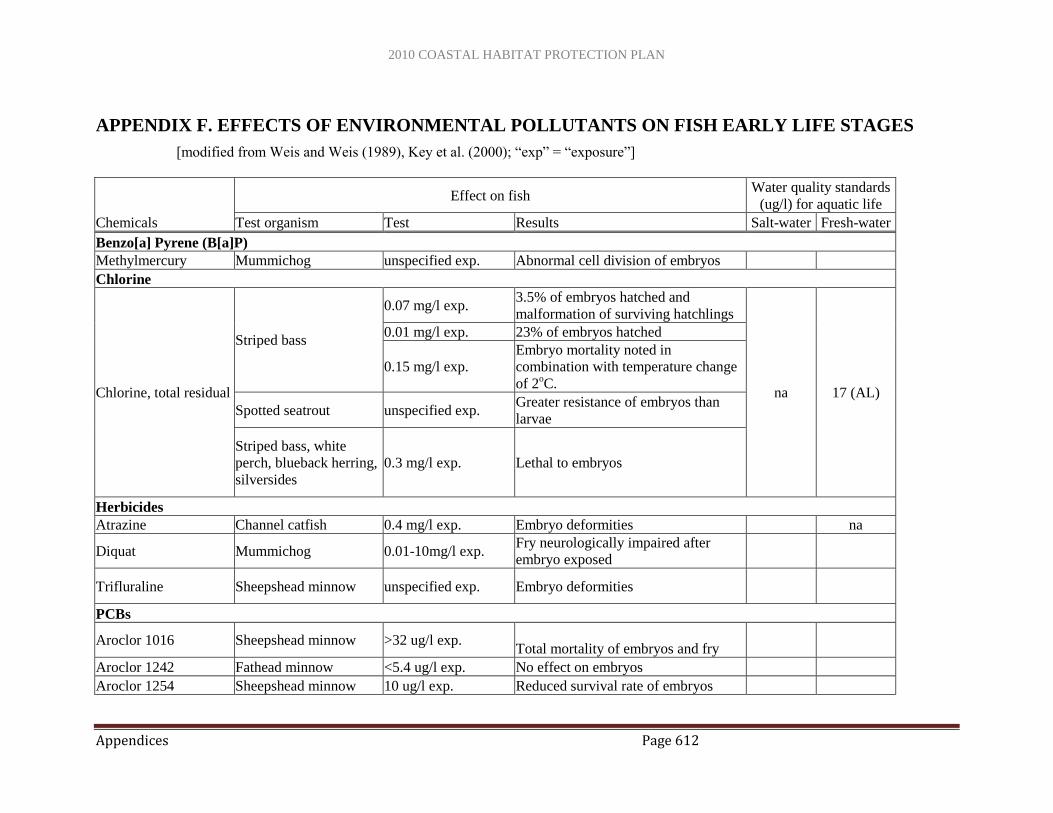
2010 COASTAL HABITAT PROTECTION PLAN
Appendices Page 612
APPENDIX F. EFFECTS OF ENVIRONMENTAL POLLUTANTS ON FISH EARLY LIFE STAGES
[modified from Weis and Weis (1989), Key et al. (2000); ―exp‖ = ―exposure‖]
Chemicals
Effect on fish Water quality standards
(ug/l) for aquatic life
Test organism Test Results Salt-water Fresh-water
Benzo[a] Pyrene (B[a]P)
Methylmercury Mummichog unspecified exp. Abnormal cell division of embryos
Chlorine
Chlorine, total residual
Striped bass
0.07 mg/l exp. 3.5% of embryos hatched and
malformation of surviving hatchlings
na 17 (AL)
0.01 mg/l exp. 23% of embryos hatched
0.15 mg/l exp.
Embryo mortality noted in
combination with temperature change
of 2oC.
Spotted seatrout unspecified exp. Greater resistance of embryos than
larvae
Striped bass, white
perch, blueback herring,
silversides
0.3 mg/l exp. Lethal to embryos
Herbicides
Atrazine Channel catfish 0.4 mg/l exp. Embryo deformities na
Diquat Mummichog 0.01-10mg/l exp. Fry neurologically impaired after
embryo exposed
Trifluraline Sheepshead minnow unspecified exp. Embryo deformities
PCBs
Aroclor 1016 Sheepshead minnow >32 ug/l exp. Total mortality of embryos and fry
Aroclor 1242 Fathead minnow <5.4 ug/l exp. No effect on embryos
Aroclor 1254 Sheepshead minnow 10 ug/l exp. Reduced survival rate of embryos

2010 COASTAL HABITAT PROTECTION PLAN
Appendices Page 613
Chemicals
Effect on fish Water quality standards
(ug/l) for aquatic life
Test organism Test Results Salt-water Fresh-water
Aroclor 1254 Sheepshead minnow
>0.1 ug/l exp. Reduced fry survival
0.14 ug/l exp. Adult exposure and reduced survival
of embryos and fry
Pesticides
Aldicarb (Temik) Fathead minnow <320 ug/l exp. No effect
Fathead minnow 156 ug/l exp. 100% larvae mortality in 30-day test
Carbaryl (Sevin)
Silversides 10 ug/l exp. Embryo malformations
Killifish 10 ug/l exp.
Arrested embryo development,
embryos transferred to clear water
after continuous exp. had
abnormalities
DDT
Killifish 1mg/l exp. Hatchlings with tail deformities
0.001 0.001 0.1 ug/l exp. Slowed development of embryos
Silversides 25 ug/l exp. Embryo malformations
Yellow perch unspecified exp. No fin ray asymmetry
Dieldrin Winter flounder >1.74 ng/g eggs Eggs not fertilized
0.0002 0.002 39 ug/l exp. 50% mortality
Endrin Sheepshead minnow 0.31 ug/l Embryo stunting, some mortality, and
lower fertility of adults 0.002 0.002
Fenoprop (Kuron) Bluegill >10 ug/l exp. 100% mortality of hatchlings
Fenvalerate Sheepshead minnow 3.9 ug/l exp. Reduced hatchling survival
Fathead minnow 0.43 ug/l exp. Unspecified negative effect on larvae
Fonofos Fathead minnow <80 ug/l exp. No effect
33 ug/l exp. 100% larvae mortality in 30-day test
Kelthane (Dicophol) Fathead minnow 125 ug/l exp.
Delayed and reduced hatching,
survivors deformed and died
39 ug/l exp. 50% mortality

2010 COASTAL HABITAT PROTECTION PLAN
Appendices Page 614
Chemicals
Effect on fish Water quality standards
(ug/l) for aquatic life
Test organism Test Results Salt-water Fresh-water
Kepone Sheepshead minnow 1.9 ug/l exp. 16% arrested development of embryos
Fathead minnow 0.31ug/l exp. Reducing hatching success
Lindane Caranx unspecified exp. Premature hatching and fry
deformities 0.004 0.01
Malathion Silversides 10 ug/l exp. Embryo malformations
Methoxychlor Winter flounder >1.74 ng/g eggs Eggs not fertilized
0.03 0.03 39 ug/l exp. 50% mortality
Mirex Fathead minnow 2,3,7 ug/l exp. Increased viability of hatchlings
0.001 0.001 13,34 ug/l exp. No effect
Parathion Mummichog 10 ug/l exp.
Arrested embryonic development,
50% of embryos exposed for 3 days
and returned to clean water had
malformations
0.178 0.013
Permethrin Sheepshead minnow 22 ug/l exp. Reduced hatchling survival
2.2 ug/l exp. Reduced hatchling size
Permethrin biomist Gambusia 25,114 mg/l 48 h LC50
Permethrin-Permanone Gambusia 0.0027 mg/l 48 h LC50
Pyrethroids Sheepshead minnow 0.06 ug/l exp. Reduced fish weight
Temephos Gambusia 0.014-0.039 mg/l 48 h LC50
Petroleum hydrocarbon
Toluene Fathead minnow 30-45 mg/l exp. Embryonic malformations na 11
Water soluable fraction
of No. 2 fuel oil Mummichog unspecified exp.
Malformation of larvae and decreased
time to hatching of embryos, increased
toxicity noted at suboptimal water
conditions

2010 COASTAL HABITAT PROTECTION PLAN
Appendices Page 615
Chemicals
Effect on fish Water quality standards
(ug/l) for aquatic life
Test organism Test Results Salt-water Fresh-water
Water soluable fraction
of No. 2 fuel oil
Mummichogs,
sheepshead minnow
12 ppm 100% mortality of hatchlings
6 ppm 50% mortality of hatchlings
1,4 ppm Stimulated hatching
Wood preservative
Pentachlorophenol Fathead minnow 128 ug/l exp. Reduced larval survival
>73 ug/l exp. Reduced growth of larvae
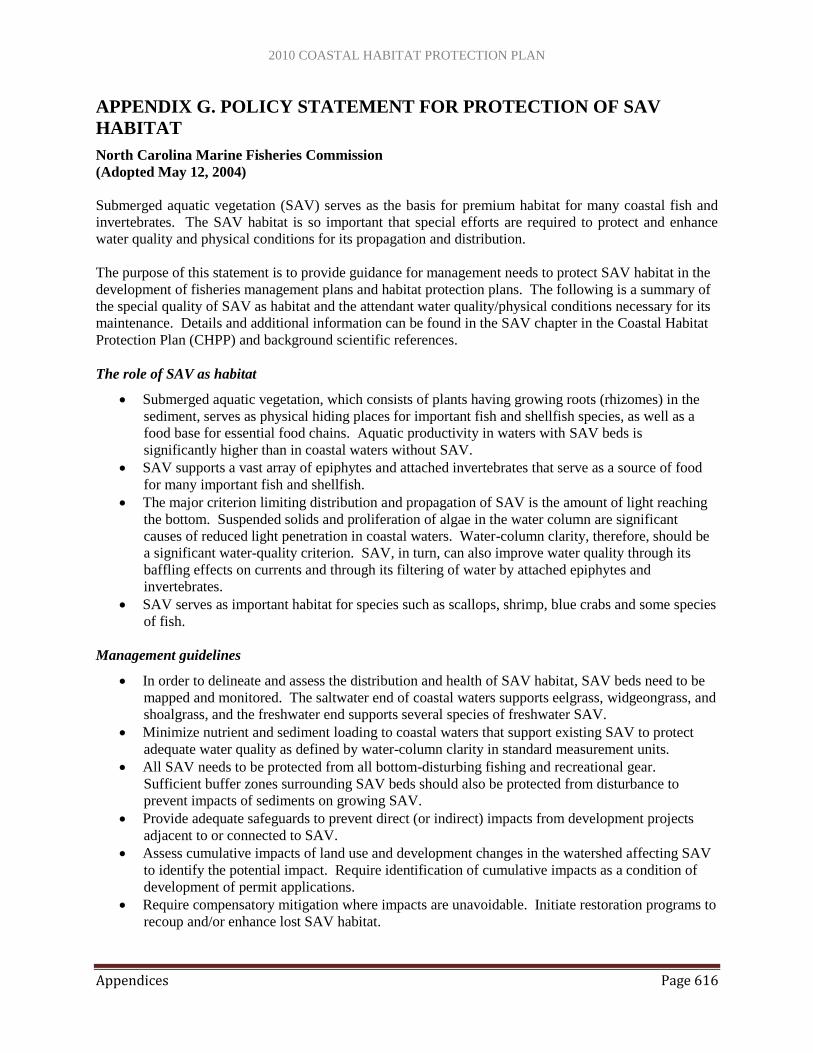
2010 COASTAL HABITAT PROTECTION PLAN
Appendices Page 616
APPENDIX G. POLICY STATEMENT FOR PROTECTION OF SAV
HABITAT
North Carolina Marine Fisheries Commission
(Adopted May 12, 2004)
Submerged aquatic vegetation (SAV) serves as the basis for premium habitat for many coastal fish and
invertebrates. The SAV habitat is so important that special efforts are required to protect and enhance
water quality and physical conditions for its propagation and distribution.
The purpose of this statement is to provide guidance for management needs to protect SAV habitat in the
development of fisheries management plans and habitat protection plans. The following is a summary of
the special quality of SAV as habitat and the attendant water quality/physical conditions necessary for its
maintenance. Details and additional information can be found in the SAV chapter in the Coastal Habitat
Protection Plan (CHPP) and background scientific references.
The role of SAV as habitat
Submerged aquatic vegetation, which consists of plants having growing roots (rhizomes) in the
sediment, serves as physical hiding places for important fish and shellfish species, as well as a
food base for essential food chains. Aquatic productivity in waters with SAV beds is
significantly higher than in coastal waters without SAV.
SAV supports a vast array of epiphytes and attached invertebrates that serve as a source of food
for many important fish and shellfish.
The major criterion limiting distribution and propagation of SAV is the amount of light reaching
the bottom. Suspended solids and proliferation of algae in the water column are significant
causes of reduced light penetration in coastal waters. Water-column clarity, therefore, should be
a significant water-quality criterion. SAV, in turn, can also improve water quality through its
baffling effects on currents and through its filtering of water by attached epiphytes and
invertebrates.
SAV serves as important habitat for species such as scallops, shrimp, blue crabs and some species
of fish.
Management guidelines
In order to delineate and assess the distribution and health of SAV habitat, SAV beds need to be
mapped and monitored. The saltwater end of coastal waters supports eelgrass, widgeongrass, and
shoalgrass, and the freshwater end supports several species of freshwater SAV.
Minimize nutrient and sediment loading to coastal waters that support existing SAV to protect
adequate water quality as defined by water-column clarity in standard measurement units.
All SAV needs to be protected from all bottom-disturbing fishing and recreational gear.
Sufficient buffer zones surrounding SAV beds should also be protected from disturbance to
prevent impacts of sediments on growing SAV.
Provide adequate safeguards to prevent direct (or indirect) impacts from development projects
adjacent to or connected to SAV.
Assess cumulative impacts of land use and development changes in the watershed affecting SAV
to identify the potential impact. Require identification of cumulative impacts as a condition of
development of permit applications.
Require compensatory mitigation where impacts are unavoidable. Initiate restoration programs to
recoup and/or enhance lost SAV habitat.
2010 COASTAL HABITAT PROTECTION PLAN
Appendices Page 617
Educate landowners adjacent to SAV, boaters, and other potential interested parties about the
value of SAV as a habitat for many coastal fishes and invertebrates.

2010 COASTAL HABITAT PROTECTION PLAN
Appendices Page 618
APPENDIX H. POLICIES FOR THE PROTECTION AND RESTORATION
OF MARINE AND ESTUATINE RESOURCES AND ENVIRONMENTAL
PERMIT REVIEW AND COMMENTING
North Carolina Marine Fisheries Commission
(Adopted September 24, 2009)
Issue
This document establishes the policies of the NC Marine Fisheries Commission (Commission) regarding
overall protection and restoration of the state‘s marine and estuarine resources, and for environmental
permit review for proposed projects with the potential to adversely impact those resources.
Background
The ―marine and estuarine resources‖ of North Carolina are defined broadly as ―[a]11 fish, except inland
game fish, found in the Atlantic Ocean and in coastal fishing waters; all fisheries based upon such fish; all
uncultivated or undomesticated plant and animal life, other than wildlife resources, inhabiting or
dependent upon coastal fishing waters; and the entire ecology supporting such fish, fisheries, and plant
and animal life.‖ N.C.G.S. 113-129(11). The Commission is charged with the duty to ―(m)anage,
restore, develop, cultivate, conserve, protect, and regulate the marine and estuarine resources within its
jurisdiction.‖ N.C.G.S. 143B-289.51(b)(1).
Two powers of the Commission constitute its primary authorities to effectuate that charge, and thereby to
protect and restore North Carolina marine and estuarine resources. First, the Commission is specifically
empowered ―[t]o comment on and otherwise participate in the determination of permit applications
received by state agencies that may have an effect on the marine and estuarine resources of the state.‖
N.C.G.S. 143b-289.52(2)(9). Second, the Commission has to power and duty to participate in the
development, approval, and implementation of Coastal Habitat Protection Plans (CHPPs) for all ―critical
fisheries habitats.‖ N.C.G.S. 143B-279.8; 143B-289.52(a)(11). The goal of such CHPPs is ―the net long-
term enhancement of coastal fisheries associated with each coastal habitat identified.‖ N.C.G.S. 142B-
279.8. The Commission by unanimous vote has delegated its permit commenting authority to its Habitat
and Water Quality Standing Advisory Committee (Committee) for the sake of efficiency and
effectiveness. Likewise, the Commission has designated the Committee as its participating body in the
development of CHPPs, which will then be approved and implemented by the full Commission.
However, since the formal preparation of will not begin until at least 1 July 1999, it will be some time
before final CHPPs can be developed and implemented in order to help protect against the impacts of
coastal development and other human activities that adversely affect North Carolina‘s marine and
estuarine resources. Consequently, the Commission‘s environmental permit review authority currently
constitutes the primary vehicle by which the Commission can effectuate its duty to protect and enhance
the state‘s marine and estuarine resources.
Discussion
There are two equally serious challenges to the Commission‘s successfully maintaining and enhancing
North Carolina‘s marine and estuarine resources: (1) the lack of necessary information on the current
nature and status of many of those resources; and (2) the lack of obvious mechanisms to account for and
ameliorate the ever accumulating changes that impair the functioning of critical fisheries habitats and
otherwise adversely affect fisheries stocks. The Commission cannot hope to comply with its statutory
duties to protect and enhance marine and estuarine resources without the abilities to identify and monitor
2010 COASTAL HABITAT PROTECTION PLAN
Appendices Page 619
changes in those resources, to compensate for losses to critical fisheries habitats, and to enhance the
overall functioning of the altered coastal ecosystem.
Cumulative adverse resource impacts from both large and small scale human activities constitute the
principal impediment to the Commission‘s ability to achieve its statutory mandate of conserving,
protecting, and restoring North Carolina‘s marine and estuarine resources. Many of the activities that
contribute to coastal resource destruction or impairment require no environmental permits. As a
consequence, their impacts are not accounted for, to the long-term detriment of marine and estuarine
resources. Even for permitted activities, the adverse impacts on marine and estuarine resources may be
individually minor, causing them to fall below the thresholds that require compensatory mitigation under
existing state policy.
However, where specific projects requiring environmental permits pose a threat to resources under the
Commission‘s jurisdiction, it is reasonable to expect the permittee to contribute to resolving both the
informational and resource protection dilemmas faced by the Commission to ensure that unacceptable
impacts to marine and estuarine resources do not occur. A direct precedent to such action by a state
agency is found in the N.C. Division of Water Quality‘s current requirement that NPDES permittees
conduct upstream and downstream monitoring as a condition of their permits, to ensure that state water
quality standards are not violated. In addition, that agency has worked with dischargers in certain river
basins to establish industry - funded, integrated monitoring networks to track water quality trends in those
waters.
Specific action by the Commission is required if it is to meet its charge of protecting and restoring the
state‘s marine and estuarine resources. To the greatest extent possible, activities that potentially threaten
those resources must be prevented from contributing to overall resource degradation. Instead, adequate
measures must be implemented to ensure a long-term, net improvement in the quantity and quality of
fisheries stocks and critical fisheries habitats under the Commission‘s jurisdiction. To achieve that end,
two goals must be attained:
adequate compensatory and resource enhancement measures must be incorporated into existing
environmental permitting processes
resource restoration and enhancement programs must be developed to offset losses from activities
not requiring permits
No net loss policies for permitted activities, while having many benefits, have at times limited the ability
of state agencies to implement compensatory mitigation in a manner that effectively offsets losses to the
impacted watershed. By requiring in-kind mitigation, primarily for wetland impacts, mitigation, in some
instances, targets wetlands in a different landscape position or watershed, which serves different
ecological functions, and consequently does not replace the ecological services lost by the permitted
activity in the affected watershed. In addition, mitigation is not required for permitted aquatic resource
impacts associated with private water dependent activities, such as loss of submerged aquatic vegetation
habitat from channel dredging or degradation of a primary nursery area from shoreline hardening.
The Marine Fisheries Commission authorized DMF staff to begin to incorporate mitigation policy into
bylaws at their Business Meeting in Atlantic Beach, NC, on December 2-3, 2004. MFC endorsed the
concept of holding workshops to address technical and policy issues related compensatory mitigation.
These workshops have now been completed, and provided guidance for a study conducted by East
Carolina University, Environmental Defense Fund, and NC Ecosystem Enhancement Program. From this
work utilizing two expert panels – one on wetland science and the other on wetland policy, two
documents have been completed to provide guidance on alternatives to traditional mitigation. The first
report, A Science-based Framework for Compensatory Mitigation of Coastal Habitat in North Carolina
(ECU 2006) presented a scientific framework for an alternative approach to compensatory mitigation to
2010 COASTAL HABITAT PROTECTION PLAN
Appendices Page 620
better assure functional replacement. The framework involves evaluating watershed condition,
encouraging the use of varied complementary techniques for functional recovery, and designing
restoration projects in response to system-wide watershed scale challenges. The goal was to integrate
compensatory mitigation requirements into watershed protection strategies that are consistent with the
goals and objectives of the CHPP. In the second phase of the project, in a report entitled, An Approach to
Coordinate Compensatory Mitigation Requirements to Meet Goals of the Coastal Habitat Protection Plan
(ECU and Environmental Defense, 2006), the group developed an alternative assessment procedure for
North Carolina‘s watersheds. The results of the study were presented during a day-long meeting (October
15, 2008) to a group represented by state and federal regulatory agencies and academic researchers, most
of who were involved in the original workshops. The next phase of the project involves demonstrating
application of the approach in two subwatersheds of the White Oak River basin.
A summary of the first two phases of this project were presented to the MFC on November 6, 2008. The
MFC endorsed developing a compensatory mitigation process as part of the policy statement. On January
16, 2009 the Habitat and Water Quality Committee unanimously voted to recommend the following
policy for consideration by the MFC. This compensatory mitigation policy would be implemented as a
final component of the existing Resource Protection and Environmental Permit Review and Commenting
Policies.
The first two policies below were established in 1999 primarily to achieve the first goal of incorporating
adequate compensatory and resource enhancement measures into existing environmental permitting
processes. The third policy was established in 2009 to provide more direction in how to accomplish that,
given our evolving understanding of ecosystem functions, threats, and techniques for successful
mitigation and restoration. Progress on the second goal (developing restoration/enhancement programs to
offset losses not directly associated with permitted activities) has primarily occurred in North Carolina
through enhancement of DMF‘s oyster sanctuary program, Clean Water Management Trust Fund
projects, and numerous wetland and oyster restoration projects conducted by non-profit environmental
organizations.
Proposed Resource Protection and Environmental Permit Review and Commenting Policies
It shall be the policy of the North Carolina Marine Fisheries Commission that the overall goal of its
marine and estuarine resource protection and restoration programs is the long-term enhancement of the
extent, functioning and understanding of those resources.
Toward that end, in implementing the Commission‘s permit commenting authority pursuant to N.C.G.S.
143B-289.52(a)(9), the Habitat and Water Quality Standing Advisory Committee shall, to the fullest
extent possible, ensure that state or federal permits for human activities that potentially threaten North
Carolina marine and estuarine resources:
1) are conditioned on (a) the permittee‘s avoidance of adverse impacts to marine and estuarine resources
to the maximum extent practicable; (b) the permittee‘s minimization of adverse impacts to those resources
where avoidance is impracticable; and (c) the permittee‘s provision of compensatory mitigation for all
reasonably foreseeable impacts to marine and estuarine resources in the form of both informational
mitigation (the gathering of base-line resource data and/or prospective resource monitoring) and resource
mitigation (in kind, local replacement, restoration or enhancement of impacted fish stocks or habitats);and
2) result, at a minimum, in no net loss to coastal fisheries stocks, nor functional loss to marine and
estuarine habitats and ecosystems; and
3) incorporate the following array of options when planning compensatory mitigation to allow focus on
2010 COASTAL HABITAT PROTECTION PLAN
Appendices Page 621
restoration of equivalent ecosystem functions within a watershed, based on our evolving understanding of
the needs of compensatory mitigation to protect and enhance coastal water quality and watersheds:
i. Establish goals for coastal watersheds by the MFC based on desired outcomes -
protection/restoration of shellfishing waters, PNAs, SAV beds, etc.;
ii. Identify watersheds/areas where these goals can be realistically achieved. The Strategic Habitat
Areas approach that emerged from CHPP can be used to identify locations where
protection/restoration is most likely to be successful;
iii. Utilize the Rapid Watershed Assessment Procedure (or other assessment methods) to assess
watershed condition and identify problems/solutions;
iv. Evaluate and authorize compensatory mitigation projects based on their ability to contribute to
goals established for coastal watersheds. Projects that provide functional replacement, e.g.,
increased water retention/storage through the use of BMPs, may be approved if documentation is
provided that the projects are the most effective mechanism to achieve the goals established for a
watershed;
v. Implement monitoring to support data acquisition necessary to support the SHA process and the
effectiveness of projects that have been implemented;
vi. Solicit funding from all available sources (compensatory mitigation, CWMTF, 319, etc.) to fully
implement protection/restoration strategies in coastal watersheds.
2010 COASTAL HABITAT PROTECTION PLAN
Appendices Page 622
APPENDIX I: MFC BEACH NOURISHMENT POLICY
North Carolina Marine Fisheries Commission
(Adopted November 16, 2000)
Policy Context
This document establishes the policies of the North Carolina Marine Fisheries Commission (Commission)
regarding protection and restoration of the state‘s marine and estuarine resources associated with beach
dredge and fill activities, and related large-scale coastal engineering projects. The policies are designed
to be consistent with the overall habitat protection policies of the Commission, adopted April 13, 1999, as
amended February 17-18, 2000, as follows:
It shall be the policy of the North Carolina Marine Fisheries Commission that the overall goal of its
marine and estuarine resource protection and restoration programs is the long-term enhancement of the
extent, functioning and understanding of those resources.
Toward that end, in implementing the Commission‘s permit commenting authority pursuant to N.C.G.S.
§143B-289.52(a)(9), the Chairs of the Habitat and Water Quality Standing Advisory Committee, in
consultation with the Commission Chair, shall, to the fullest extent possible, ensure that state or federal
permits for human activities that potentially threaten North Carolina marine and estuarine resources:
(1) are conditioned on (a) the permittee‘s avoidance of adverse impacts to marine and estuarine resources
to the maximum extent practicable; (b) the permittee‘s minimization of adverse impacts to those resources
where avoidance is impracticable; and (c) the permittee‘s provision of compensatory mitigation for all
reasonably foreseeable impacts to marine and estuarine resources in the form of both informational
mitigation (the gathering of base-line resource data and/or prospective resource monitoring) and resource
mitigation (in kind, local replacement, restoration or enhancement of impacted fish stocks or habitats);
and
(2) result, at a minimum, in no net loss to coastal fisheries stocks, nor functional loss to marine and
estuarine habitats and ecosystems.
The findings presented below assess the marine and estuarine resources of North Carolina which are
potentially threatened by activities related to the large-scale movement of sand in the coastal ocean and
adjacent habitats, and the processes whereby those resources are placed at risk. The policies established
in this document are designed to avoid, minimize, and offset damage caused by these activities, in
accordance with the laws of the state and the general habitat policies of this Commission.
Marine and Estuarine Resources at Risk from Beach Dredge and Fill Activities
The Commission finds:
1. In general, the array of large-scale and long-term beach alteration projects currently being
considered for North Carolina together constitute a real and significant threat to the marine and
estuarine resources of the United States and North Carolina.
2. The cumulative effects of these projects have not been adequately assessed, including impacts on
public trust marine and estuarine resources, use of public trust beaches, public access, state and
federally protected species, state critical habitats, and federal essential fish habitats.
2010 COASTAL HABITAT PROTECTION PLAN
Appendices Page 623
3. Individual beach dredge-and-fill projects and related large-scale coastal engineering activities
rarely provide adequate assessment or consideration of potential damage to fishery resources
under state and federal management. Historically, emphasis has been placed on the logistics of
sand procurement and movement, and economics, with environmental considerations dominated
by compliance with limitations imparted by the Endangered Species Act for sea turtles, piping
plovers and other listed organisms.
4. Opportunities to avoid and minimize impacts of beach dredge-and-fill activities on fishery
resources, and offsets for unavoidable impacts have rarely been proposed or implemented.
5. Large-scale beach dredge and fill activities have the potential to cause impacts in four types of
habitats:
a. waters and benthic habitats near the dredging sites;
b. waters between dredging and filling sites;
c. waters and benthic habitats near the fill sites; and
d. waters and benthic habitats potentially affected as sediments move subsequent to
deposition in fill areas.
6. Certain nearshore habitats are particularly important to the long-term viability of North Carolina‘s
commercial and recreational fisheries and potentially threatened by large-scale, long-term or
frequent disturbance of sediments:
a. inlets;
b. the swash and surf zones and beach-associated bars; and
c. underwater soft-sediment topographic features, both onshore and offshore
d. underwater hard-substrate topographic features.
7. Large sections of North Carolina waters potentially affected by these projects, both individually
and collectively, have been identified as Essential Fish Habitats (EFH) by the South Atlantic
Fishery Management Council (SAFMC) and the Mid-Atlantic Fishery Management Council
(MAFMC). Affected species under federal management include:
a. summer flounder (various nearshore waters, including the surf zone and inlets; certain
offshore waters);
b. bluefish (various nearshore waters, including the surf zone and inlets);
c. red drum (ocean high-salinity surf zones and unconsolidated bottoms to a depth of 50
meters);
d. several snapper and grouper species (live hard bottom from shore to 600 feet, and – for
estuarine-dependent species [e.g., gag grouper and gray snapper] – unconsolidated
bottoms and live hard bottoms to the 100 foot contour);
e. spiny dogfish (various coastal waters from the surf zone to 200 miles);
f. black sea bass (various nearshore waters, including unconsolidated bottom and live hard
bottom to 100 feet, and hard bottoms to 600 feet);
g. penaeid shrimps (offshore habitats used for spawning and growth to maturity, and waters
connecting to inshore nursery areas, including the surf zone and inlets);
h. coastal migratory pelagics (sandy shoals of capes and bars, barrier island and ocean-side
waters from the surf zone to the shelf break inshore of the Gulf Stream; all coastal inlets);
i. corals of various types (hard substrates and muddy, silty bottoms from the subtidal to the
shelf break);
2010 COASTAL HABITAT PROTECTION PLAN
Appendices Page 624
j. calico scallops (unconsolidated bottoms northeast and southwest of Cape Lookout in 62-
102 feet);
k. sargassum (wherever it occurs out to 200 miles);
l. many large and small coastal sharks, managed by the Secretary of the Department of
Commerce (inlets and nearshore waters, including pupping and nursery grounds).
8. Beach dredge and fill projects also potentially threaten important fish habitats for anadromous
species under federal, interstate and state management (in particular, inlets and offshore
overwintering grounds), as well as essential overwintering grounds and other critical habitats for
weakfish and other species managed by the Atlantic States Marine Fisheries Commission and the
State of North Carolina. The SAFMC identified for anadromous and catadromous species those
habitats that have been EFH if there had been a council plan (inlets and nearshore waters).
9. Many of the habitats potentially affected by these projects have been identified as Habitat Areas
of Particular Concern by the SAFMC. The specific fishery management plan is provided in
parentheses:
a. all nearshore hard bottom areas (SAFMC, snapper-grouper);
b. all coastal inlets (SAFMC, penaeid shrimps, red drum, and snapper-grouper);
c. near-shore spawning sites (SAFMC, penaeid shrimps, and red drum)
d. well-known seafloor features, including the Point, Ten Fathom Ledge and Big Rock
(SAFMC, snapper-grouper, coastal migratory pelagics, and corals);
e. pelagic and benthic sargassum (SAFMC, snapper-grouper);
f. sandy shoals of Cape Lookout, Cape Fear, and Cape Hatteras (SAFMC, coastal migratory
pelagics) and;
g. Bogue Sound and New River Estuary (SAFMC, coastal migratory pelagics).
10. Habitats likely to be affected by beach dredge and fill projects include many being recognized in
North Carolina Fishery Management Plans as important for state-managed species. Many of
these habitats are in the process of being recognized as Critical Habitat Areas by the Commission,
in either FMPs or in Coastal Habitat Protection Plans. Examples include:
a. inlets (Blue Crab FMP, Red Drum FMP, River Herring FMP);
b. oceanic nearshore waters (Blue Crab FMP, Red Drum FMP); and
c. many others as FMPs and CHPPs are adopted over the coming years.
11. Recent work by scientists in east Florida has documented exceptionally important habitat values
for nearshore, hard-bottom habitats often buried by beach dredging projects, including use by
over 500 species of fishes and invertebrates, and juveniles of many reef fishes. Equivalent
scientific work is just beginning off North Carolina, but life histories suggest that similar habitat
use patterns will be found.
Threats to Marine and Estuarine Resources from Beach Dredge and Fill Activities
The Commission finds that beach dredge-and-fill activities and related large-scale coastal engineering
projects (including inlet alteration projects) threaten the marine and estuarine resources of North Carolina
through the following mechanisms:
1. Direct mortality and displacement of organisms at and near sediment dredging sites;
2. Alteration of seafloor topography and associated current and waves patterns and magnitudes at
dredging areas;
2010 COASTAL HABITAT PROTECTION PLAN
Appendices Page 625
3. Alteration of seafloor sediment size-frequency distributions at dredging sites, with secondary
effects on benthos at those sites;
4. Elevated turbidity and deposition of fine sediments down-current from dredging sites;
5. Direct mortality and displacement of organisms at initial sediment fill sites;
6. Elevated turbidity in and near initial fill sites, especially in the surf zone, and deposition of fine
sediment down-current from initial fill sites;
7. Alteration of near-shore topography and current and waves patterns and magnitudes associated
with fill;
8. Movement of deposited sediment away from initial fill sites, especially onto hard bottoms;
9. Alteration of large-scale sediment budgets, sediment movement patterns and feeding and other
ecological relationships, including the potential for cascading disturbance effects;
10. Alteration of large-scale movement patterns of water, with secondary effects on water quality and
biota;
11. Alteration of movement patterns and successful inlet passage for larvae, post-larvae, juveniles
and adults of marine and estuarine organisms;
12. Alteration of long-term shoreline migration patterns (inducing further ecological cascades with
consequences that are difficult to predict); and
13. Exacerbation of transport and/or biological uptake of toxicants and other pollutants released at
either dredge or fill sites.
Commission Policies for Beach Dredge and Fill Projects and Related Large Coastal Engineering
Projects
The Commission establishes the following general policies related to large-scale beach dredge-and-fill
and related projects, to clarify and augment the general policies already adopted on April 13, 1999:
1. Projects should fulfill the Commission‘s general habitat policy by avoiding, minimizing and
offsetting damage to the marine and estuarine resources of North Carolina;
2. Projects should provide detailed analyses of possible impacts to each type of Essential Fish
Habitat (EFH), with careful and detailed analyses of possible impacts to Habitat Areas of
Particular Concern (HAPC) and Critical Habitat Areas (CHA), including short and long term, and
population and ecosystem scale effects;
3. Projects should provide a full range of alternatives, along with assessments of the relative impacts
of each on each type of EFH, HAPC and CHA;
4. Projects should avoid impacts on EFH, HAPCs and CHAs that are shown to be avoidable through
the alternatives analysis, and minimize impacts that are not;
5. Projects should include assessments of potential unavoidable damage to marine resources, using
conservative assumptions;
6. Projects should be conditioned on the avoidance of avoidable impacts, and should include
compensatory mitigation for all reasonably predictable impacts to the marine and estuarine
resources of North Carolina, taking into account uncertainty about these effects. Mitigation
should be local, up-front and in-kind wherever possible;
7. Projects should include baseline and project-related monitoring adequate to document pre-project
conditions and impacts of the projects on the marine and estuarine resources of North Carolina;
2010 COASTAL HABITAT PROTECTION PLAN
Appendices Page 626
8. All assessments should be based upon the best available science, and be appropriately
conservative so as to be prudent and precautionary; and
9. All assessments should take into account the cumulative impacts associated with other beach
dredge-and-fill projects in North Carolina and adjacent states, and other large-scale coastal
engineering projects that are ecologically related.
2010 COASTAL HABITAT PROTECTION PLAN
Appendices Page 627
APPENDIX J: CHPP IMPLEMENTATION PLAN (2009-2011)
The listing below was drawn from the CHPP 2008-2009 Annual Report approved by the Joint Legislative
Commission on Seafood and Aquaculture in September 2009. The full implementation plans can be
queried from a database housed on the Division of Marine Fisheries, Habitat Protection server.
Implementation Plans also contain specific actions from previous plans that are ―carried forward‖ due to a
partially complete or incomplete status. These actions may also be considered ―on-going‖ until the CHPP
Steering Committee decides to discontinue them.
September 2009 – August 2010 Planned Action and Needs
Delineate SHAs in Region 3 (Approximately White Oak River Basin). (DMF/MFC, WRC,
EEP/DENR).
Conduct SHA evaluation and designation process for Region 2 (Pamlico Sound and
tributaries).(DMF, WRC)
Continue to review ―Inner Banks‖ development issues and address environmental
issues.(CRC/DCM, DWQ/EMC)
Begin to address the challenges associated with Sea Level Rise and climate change more broadly
in a context consistent with the reports of the Legislative Committee on Climate Change to
NC.(DENR)
Continue to increase public awareness on the value of and threats to coastal fish habitats and the
role of the CHPP process to protect and enhance these resources.(DMF, DCM, EEP/DENR)
Continue to study the feasibility and benefits of dam and barrier removal in general and for
mitigation.(DMF/DCM, EEP/DWR/DENR, WRC)
Examine the feasibility and preferred siting of wind turbines in North Carolina without
significantly impacting fish habitat.(DENR)
Pursue funding for the Community Conservation Assistance Program (CCAP) in the Division of
Soil and Water Conservation.(DSWC/DENR)
Seek dedicated funding to staff DCM‘s Clean Marina Program and effectively implement Best
Management Practices as a non-regulatory way to improve water quality in and around marinas
and docks.(DCM, DENR)
Continue development and refinement of shoreline stabilization rules that preserve ecosystem
function and consider rising sea levels and a changing land/water interface.(DCM/CRC,
EEP/DENR)
Take steps to encourage more restoration of degraded waters and work towards removal from the
Federal 303-d listing.(APNEP, DWQ)
Continue to identify problems regarding infrastructure for Waste Water Treatment Plants and
system maintenance. Work with the local governments to develop and implement plans to
correct deficiencies.(DWQ)
Continue to develop a non-traditional mitigation strategy with the White Oak basin as a pilot
project. The consultants developing the Local Watershed Plan (East Carolina University and
Environmental Defense Fund) are working through EEP‘s Non-Traditional Mitigation Steering
Committee and two ad hoc advisory committees to seek consensus goals and a viable mitigation
strategy.(EEP/DENR)
Work with the Division of Water Resources to minimize conflicts between Aquatic Weed Control
practices and protection of SAV habitat.(DMF/MFC, WRC)
Consider development of a conservation lease for the purpose of oyster and other habitat
restoration.(DMF/MFC)
Seek funding to initiate research on impacts of endocrine-disrupting chemicals to blue crabs and
oysters.(DENR)

2010 COASTAL HABITAT PROTECTION PLAN
Appendices Page 628
Work with the Department of Agriculture and Consumer Services to develop and implement a
drug disposal program for pharmaceuticals.(DMF/MFC)
Complete photo-interpretation of SAV imagery of coast.(DMF, APNEP)
Continue to study the feasibility and benefits of developing an SAV Restoration Program.(DMF,
APNEP, EEP/DENR)
Seek dedicated funding for the state SAV mapping program.(DMF, APNEP)
Complete river herring spawning surveys in Albemarle system and prioritize obstruction
removals.(DMF)
Continue expanding the oyster sanctuary program, seeding sanctuaries with live oysters, and
construct a shellfish hatchery.(DMF)
Continue to work toward more funding for the Community Conservation Assistance Program.
(DSWC)
Workshops currently planned for next year include topics such as water reuse (i.e. rain water
harvesting, gray water use), stormwater workshops for realtors, an invasive red fox symposium, a
microbial pollution workshop, and a grant writing workshop depending upon budget
constraints.(DCM/NERR)
In the coming year, APNEP will work with the NC Division of Water Quality to implement
several projects: 1) to host Coastal Stormwater and Riparian Buffer Rules Workshop for
Development Professionals. 2) Develop information for display and distribution about Riparian
Buffers and 401 Water Quality Certifications. Information will focus on the riparian buffer rules
in the Neuse and Tar-Pamlico River Basins and the 401 Water Quality Certification Program,
which is in effect throughout the entire state. 3) A project will provide information to focus on
students in K-12 understanding the biodiversity the lakes, streams and estuaries.(APNEP, DWQ)
APNEP will continue to build upon the data inventory survey conducted in 2006 in partnership
with the Virginia Institute for Marine Sciences. Data referenced in the survey for the Virginia
portion of the Pasquotank and Chowan Rivers. Data will include monitoring data on water
quality and living resources as well as land use, population trends and other potential ecosystem
stressors. Analyses will be conducted for indications of change over the period of record. The
goal is to develop a preliminary State of the River Basin report for the Pasquotank and Chowan
Rivers. The approach will be holistic in that changes in monitored variables will be tracked
throughout river basins and river systems. These stations are monitored by the Virginia
Department of Environmental Quality. These data can be further analyzed to look for trends in
seasons as well as trends in other monitored parameters. An attempt will be made to trace
changes in water quality and living resources back to changes in the basin.(APNEP)
DEH – SS will continue meeting with the Shoreline Survey Task Force finalizing proposed
inspection program and put the plan in the form of a report for presentation to CHPP Steering
Committee.(DEH-SS/DENR)