Assessing public perception of flood risk and flood control measure in urban areas
Upload
khangminh22Category
view
0download
0
NATIONAL ENGINEERING IIAI~IBOOK
SECTION 4
HYDROLOGY
CHAPTER 17. FMOD ROUTING
Victor Mockus Hydraulic Engineer
Revisions by
Wendell Styner
1972
Revised and reprinted, 1972
NM Notice 4-102, AUgUSt 1972


NATIONAL ENGINEERING HANDBOOK
SECTION 4
HYDROLOGY
CHAPTER 17 . FLOOD ROUTING
Contents
Introduction . . . . . . . . . . . . . . . . . . . . . . . . . . 17-1 SCS electronic computer program . . . . . . . . . . . . . . . 17-2 . . . . . . . . . . . . . . . . . . . . . . . . . References 17-2 hmmary of chapter contents . . . . . . . . . . . . . . . . . 17-3
. . . . Elevation-storage and Elevation-discharge relationships 17-3 Elevation-storage relationships for reservoirs . . . . . . . . 17-3 . . . . . . Elevation-discharge relationships for reservoirs 17-7 Storage-discharge relationships for reservoirs . . . . . . . 17-7 Elevation. stage. storage. discharge relationships
for streams . . . . . . . . . . . . . . . . . . . . . . . 17-7 L
Reservoir Routing Methods . . . . . . . . . . . . . . . . . . . The continuity equation . . . . . . . . . . . . . . . . . . . Methods and examples . . . . . . . . . . . . . . . . . . . . . . . . . . . . . . . Mass curve method: numerical version
. . . . . . . . . . . . . . . . . . . . . Example 17-1 Example 17-2 . . . . . . . . . . . . . . . . . . . . .
Mass curve method: direct version . . . . . . . . . . . . Mass curve method: graphical version . . . . . . . . . . .
Example 17-3 . . . . . . . . . . . . . . . . . . . . . Storage indication method . . . . . . . . . . . . . . . .
Example 17-4 . . . . . . . . . . . . . . . . . . . . . Example 17-5 . . . . . . . . . . . . . . . . . . . . .
Storage indication method as used in the SCS . . . . . . . . . . . . . . electronic computer program Culp' s method . . . . . . . . . . . . . . . . . . . . . .
Example 17-6 . . . . . . . . . . . . . . . . . . . . . . . . . . . . . . . . . Short cuts for reservoir routings
Channel Routing Methods . . . . . . . . . . . . . . . . . . . . . Theory of the convex method . . . . . . . . . . . . . . . . . Discussion . . . . . . . . . . . . . . . . . . . . . . . . . . . . . . . . . . . Some useful realtionships and procedures
Determination ofK . . . . . . . . . . . . . . . . . . . . . Determination of C . . . . . . . . . . . . . . . . . . . . Determination of At . . . . . . . . . . . . . . . . . . . . . . . . . L Procedure for routing through any reach length
Variability of routing parameters. selection of velocity V . NM Notice 4.102. August 1972

CONTENTS cont'd .
Examples: Convex routing methods . . . . . . . . . . . . . . . 17-53 Example 17-7 . . . . . . . . . . . . . . . . . . . . . . 17-54 Example 17-8 . . . . . . . . . . . . . . . . . . . . . . 17-56 Example 17-9 . . . . . . . . . . . . . . . . . . . . . . 17-57' Example17-10 . . . . . . . . . . . . . . . . . . . . . 17-59 Example 17-11 . . . . . . . . . . . . . . . . . . . . . 17-61 . . . . . . . . Effects of transmission losses on routed flows 17-66
. . . . . . . . . . . . Routing through a system of channels 17-66
Unit-hydrograph Routing Methods . . . . . . . . . . . . 17-82 Basic equations a * . . . . . . . . . . . . . . . . . . . . . 17-82 . . . . . Effects of storm duration and time of concentration 17-83 Elimination of Tp . . . . . . . . . . . . . . . . . . . . . . 17-84 Working equations f o r special cases . . . . . . . . . . . . . 17-85 Examples . . . . . . . . . . . . . . . . . . . . . . 17-86
Use of equation 17-40 . . . . . . . . . . . . . . . . 17-86 Example 17-12 . . . . . . . . . . . . . . . . . . . . . 17-86
Use of equation 17-43 . . . . . . . . . . . . . . . . . 17-86 Example 17-13 . . . . . . . . . . . . . . . . . . . . . 17-86
Use of equation 17-43 on large watersheds . . . . . . . . . 17-86 Use of equations 17.48. 17.50. and 17-52 . . . . . . . . . 17-89
Example 17-14 . . . . . . . . . . . . . . . . . . . . . 17-89 Example 17-15 . . . . . . . . . . . . . . . . . . . . . 17-89 Example 17-16 . . . . . . . . . . . . . . . . . . . . . 17-90 Example 17-17 . . . . . . . . . . . . . . . . . . . . . 17-90
Discussion . . . . . . . . . . . . . . . . . . . . . . . . . . 17-91
Figures 17-1 Elevation. storage. discharge relationship
f o r a r e s e r v o i r . . e m . . . . . d . . . . . . . . . . 17-2 Storage. Discharge re la t ionship and plot ted mass
inflow curve for a reservoir . . . . . . . . . . . . . 17-3 Mass inflow. storage. and mass outflow curves
f o r Example 17-2 . . . . . . . . . . . . . . . . . . . 17-4 Graphical version of Mass Curve method of
reservoir routing f o r Example 17-3 . . . . . . . . . . 17-5 Graphical version f o r Example 17-2. 'Step 4 . . . . . . . 17-6 Working curve for Storage-Indication method of . . . . . . . . . . reservoir routing f o r Example 17-4 17-7 Inflow and outflow hydrograph f o r Example 17-4 . . . . . 17-8 Principal spillway hydrograph and outflow
hydrograph f o r Example 17-5 . . . . . . . . . . . . . . 17-9 Working curves for Storage-Indication method
of reservoir routing for Example 17-5 . . . . . . . . . 17-10 Culp's method of reservoir routing for Example 17-6 . . 17-11 Typical shortcut method of reservoir flood routing . . 17-12 Relationships for Convex method of channel routing . . . 17-13 Convex routing coefficient versus velocity . . . . . . .
NM Notice 4.102. August 1972

CONTENTS cont'd.
Figures 17-14 ES-1025 rev.
S h e e t l o f 2 . . . . . . . . . . . . . . . . . . . . . . S e e t 2 0 f 2 . . . . . . . . . . . . . . . . . . . . . .
17-15 Inflow and routed outflow hydrograph for Example 17-7 . . '. . . . . . . . . . . . . . . .
17-16 Inflow and routed outflow hydrograph f o r Example 17-8 . . . . . . . . . . . . . . . . . . . .
17-17 Outflow and routed inflow hydrograph f o r Example 17-9 . . . . . . . . . . . . . . . . . . . .
17-18 Mass inflow, mass outflow and r a t e hydrograph for Example 17-10 . . . . . . . . . . . . . . . . .
17-19 Inflow hydrograph and routed outflow hydrographs for Example 17-11, Method 1 and 2 . . .
17-20 !&pica1 schematic diagram for routing through a system of channels . . . . . . . . . . . . . . . .
17-21 Q/Q versus A for a typ ica l physiographic area . . . Tables
L 17-1 Equations for conversion of uni ts . . . . . . . 17-2 Elevation-storage re la t ionship for a
reservoir . . . . . . . . . . . . . . . . . . 17-3 Elevation-discharge relationship for a
2-stage principal spillway . . . . . . . . . . 17-4 Working table for a storage-discharge
relationship . . . . . . . . . . . . . . . . . 17-5 Operations table for the mass-curve
method of routing for Example 17-1 . . . . . . 17-6 Operations table f o r determining storage
a f t e r 10 days of drawdown f o r Example 17-2 . . 17-7 Working tab le for t he graphical version of
the mass-curve method for Example 17-3 . . . . 17-8 Working table for preparation of the working
curve for Example 17-4 . . . . . . . . . . . . 17-9 Operations table f o r the S-I method f o r
Example 17-4 . . . . . . . . . . . . . . . . . 17-10 Procedure for routing by the storage-indication
method for Example 17-4. . . . . . . . . . . . 17-11 Working table for preparation of the working
curves for Example 17-5. . . . . . . . . . . . 17-12 Operations table for Example 17-5 . . . . . . . 17-13 Working table for Culp method, step 1 3 of
Example 17-6 . . . . . . . . . . . . . . . . . 17-14 Basic operations i n the Convex routing method .
L 17-15 Operations table for Example 17-8 . . . . . . . 17-16 Operations table for Example 17-9 . . . . . . . 17-17 Operations table f o r Example 17-10. . . . . . . 17-18 Operations table for Example 17-11 Method 1 . .
NM Notice 4-102, August 1972

CONTENTS cont 'd .
Tables . . . . . . . 17-19 Operation t a b l e f o r Example 17-11 Method 2 17-67 17-20 Por t ion of a t y p i c a l operat ions t a b l e f o r . . . . . . . . . . . rou t ing through a s tream sys tem. 17-71 17-21 Data and working t a b l e f o r use of Equation . . . . . . . . . . . . . . 17-43 on a l a r g e watershed 17-88 17-22 Area and s to rage d a t a f o r Example 17-17 . . . . . . . . . 17-92
NEH Notice 4-102, August 1972

NATIONAL ENGINEERING HANDBOOK
SECTION 4
HYDROLOGY
Introduction
In the Americari Society of Civil Engineers' manual, "Nomenclature for Hydraulics," flood routing i s variously defined as follows:
routing (hydraulics) .-- (1) The derivation of an outflow hydro- graph of a stream from known values of upstream inflow. The procedure u t i l i z e s wave velocity and the storage equa- t ion ; sometimes both. (2 ) Computing the flood a t a down- stream point from the flood inflow a t an upstream point, and taking channel storage i n t o account.
routing. flood.-- The process of determining progressively the timing and shape of a flood wave a t successive points along a r iver .
routing, streamflow.--The procedure used t o derive a downstream hydrograph from an upstream hydrograph, or t r ibu ta ry hydro- graphs, and from considerations of l oca l inflow by solving the storage equation.
Routing i s a lso done with mass curves of runoff o r with merely peak r a t e s or peak stages of runoff, as well as hydrographs. The routing need not be only downstream because the process can be reversed for upstream routing, which is often done t o determine upstream hydro- graphs from hydrographs gaged downstream. Nor i s routing confined t o streams and r ivers ; it i s regularly used i n obtaining inflow or out- flow hydrographs, mass curves, or peak r a t e s i n reservoirs, farm ponds, tanks, swamps, and lakes. And low flows are routed, as well as floods. The term "flood routing" covers all of these practices.
The purpose of flood routing i n most engineering work is t o learn what stages or r a t e s of flow occur, without actual ly measuring them, a t specif ic locations i n streams o r s t ructures during passages of floods. The stages or r a t e s a r e used i n evaluating or designing a water- control s t ructure o r project . Differences i n stages or ra tes from routings made with and without t he s t ructure or project i n place show i t s e f fec t s on the flood flows. In evaluations, the differences are t ransla ted in to monetary terms t o show benefits on an easi ly compa- rable basis; i n design, the differences a r e used d i rec t ly i n developing or modifying the s t ruc ture or project character is t ics .
L
NM Notice 4-102, AugUSt 1972

The routing process i s based on one of the following approaches:
1. Solution of simultaneous p a r t i a l d i f f e r en t i a l equations of motion and continuity. Simplified versions of the equations are generally used i n electronic computer routings; even the simplifi- cations are too laborious for manual routings. 2. Solution of the continuity equation alone. A simplified form of t h e equation i s t h e basis for many routing methods. 3. Use of inflow-outflow hydrograph relationships. 4. Use of u n i t hydrograph theory. 5. Use of empirical relationships between inflow and outflow pesk stages or r a t e s . Mostly used for large r ivers . 6. Use of hydraulic models.
Methods based on the second, t h i rd , and fourth approaches a r e presented i n t h i s chapter. The routing operations i n the methods can be made . numerically by means of an electronic computer, desk calculator, s l i de ru l e , nomograph, network char t , or by mental calculations; or graphically by means of an analog machine, special char t , or by successive geometri- c a l drawings. Methods spec i f ica l ly intended for electronic computers o r analog machines are nei ther presented nor discussed.
A l l methods presented i n t h i s chapter are accurate enough for p rac t ica l work i f they are applied as they are meant t o be and i f aata needed f o r t h e i r proper application are used. Advantages and disadvantages of par- t i cu l a r methods a r e mentioned and s i tuat ions t ha t lead t o greater or l e s se r accuracy of a method are pointed out, but there is no presenta- t i o n of t e s t s for accuracy or of comparisons between routed and gaged hydrographs . SCS e lec t ror ic computer program The electronic computer program now being used in SCS watershed evalua- t ions contains two methods of flood routing. The Storqe-Indication method is used f o r routing through reservoirs and the Convex method fo r routing through stream channels. Manual versions of both methods a r e described i n t h i s chapter.
References Each of t he following references contains general material on flood routing and descriptions of two or more methods. References whose main subject i s not flood routing but which contain a useful example of routing are c i t e d i n t he chapter as necessary.
1. Thomas, H. A . , 1937, The hydraulics of flood movements i n r ivers : Pittsburg, Carnegie In s t . Tech., Eng. B u l l . Out of p r in t but it can be found i n most l i b r a r i e s having collections of engineering l i t e r a tu re .
2. Gilcrest , B. R., 1950, Flood routing: Engineering Hydraulics (H. Rouse, ed. ), New York, John Wiley and Sons, Chapter 10, pp. 635-710.
NEH Notice 6-102, August 1972

3. US. Department of the Army, Corps of &gineers, 1960, Routing of floods t h r o u ~ h r ive r channels: Eng. Manual EM 1110-2-1408.
4. Carter, R.W., and R. G. Godfrey, 1960, Storage and flood routing: U.S. Geol. Survey Water-Supply Paper 1543-B.
5. Yevdjevich, Vujica M . , 1964, Bibliography and discussion of flood-routing methods and unsteady flow i n channels: U.S. Geol. Survey Water-Supply Paper 1690. Prepared i n cooperation with the So i l Conservation Service.
6. Lawler, Edward A. , 1964, Flood routing: Handbook of Applied Hydrology (v.T. Chow, ed. ) , New York, McGraw-Hill Book Co. , sec- t i on 25-11, pp. 34-59.
Summary of chapter contents The remainder of t h i s chapter i s divided i n t o four par t s : elevation- - - storage and elevation-discharge relationships, reservoir routing methods, channel routing methods, and unit-hydrograph routing methods. In t h e first par t , some relationships used i n reservoir or channel routing are discussed and exhibits of typical r e su l t s are given; i n the second, the continuity equation is discussed and methods of using it i n reservoir routings are shown i n examples of typ ica l applications; i n t he t h i r d , the theory of the Convex method i s presented and examples of typ ica l applications i n channel routings are given; and i n the fourth, the un i t hydrograph theory i s discussed and methods of applying it i n systems analysis are shown i n examples using systems of floodwater-retarding strictures .
Elevation-Storaae and Elevation-Discharge Relationships
In the examples of routing through reservoirs and stream channels it w i l l be necessary t o use elevation-storage or elevation-discharge curves (or both) i n making a routing or as a preliminary t o routing. Preparation of such curves is not emphasized i n t he examples because t h e i r construction i s described i n other SCS publications. The relationships are b r i e f ly discussed here as preliminary material; exhibi ts of tables and curves used i n routings are given here and i n some of the examples. Conversion equations used i n preparing the t ab l e s and curves s r e given i n Table 17-1.
Elevation storage relationships for reservoirs Table 17-2 is a working t ab l e t h a t shows data and computed r e su l t s f o r an elevation-storage relationship t o be used i n some of the examples given l a t e r . Columus 1 and 7 or 1 and 8 give the re la t ionship i n dif ferent un i t s of storage.
The relationship i s developed from a contour map (or equivalent) of t he reservoir area and the tab le i s a record of t he computations t ha t were made. Once the map i s available, t he work goes as follows: (1) s e l ec t contours close enough t o define the topography with reasonable accuracy and tabulate the contour elevations i n column 1; (2) determine the
NEH ~ o i i c e 4-102, August 1972

reservoir surface area a t each elevation; for t h i s t ab l e the areas were determined i n square fee t as shown i n column 2 and converted t o acres as shown i n column 3; (3) compute average surface areas as shown i n column 4; ( 4 ) tabulate the increments of depth i n column 5; ( 5 ) compute the increments of storage f o r column 6 by multiplying an average area i n column 4 by i t s appropriate depth increment i n column 5; ( 6 ) accmu- l a t e the storage increments of column 6 t o get accumulated storage i n column 7 for each elevation of column 1; (7 ) convert storages of col- umn 7 t o storages i n another uni t , i f required, and show them i n the next column. The relationship of data i n columns 1 and 8 is p lo t ted i n figure 17.1 as an elevation-storage curve.
NM Notice 4-102, August 1972

Table 17-1. Equations for conversions of units
Conversion - ---
Equation No.
where A = drainage area in square miles A, = cross section end-area in square
feet. for discharge x
AF = kcre-feet
L = reach length in feet
= discharge in acre-feet per day
q& = discharge in acre-feet per hour
qcfs = discharge in cfs
qid = discharge in inches per day
qih = discharge in inches per hour
Sx = reach storage in cfs-hours for a given discharge x
SA = reach storage in acre-feet for a given discharge x
N&X Notice 4-102, August 1972

17-6
Table 17-2. Elevation-storage relationship for a reservoir.
Ele- Surface Surf ace Average A A Storage Storage vat ion area area surface depth storage
area (feet) (q.ft.1 (acres) (acres) (feet) (AF) (AF) (inches )

Elevation-dischar~e relationships for reservoirs The elevation-discharge relationship for a reservoir i s made using ele- vations of the reservoir and discharges of the spillways t o be used i n a routing. A typ ica l relationship for a 2-stage principal spillway i s given by columns 1 and 6 of Table 17-3 for discharges i n c fs , and i n col- umns 1 and 7 for discharges i n in./day. The procedure for developing t h e relationship w i l l not be given here because suff ic ient char ts , equa- t ions , and examples for pr incipal spillways are given i n NM-5 and i n ES-150 through 153, and for emergency spillways i n ES-98 and ES-124. Table 17-3 i l l u s t r a t e s a useful way of keeping the work i n order: by tabulat ing the data for different types of flow i n separate columns, and by keeping the two stages separate, the t o t a l discharges a r e more ea s i ly summed. Note t h a t the t o t a l s i n cfs are not merely sums of a l l cfs i n a row; the operation of the spillway must be understood when se- l ec t ing the discharges t o be included i n the sum. To combine the princi- p a l spillway flow with emergency spillway flow a column for the emergency spillway discharges i s added between columns 5 and 6 , and t o t a l s i n column 6 must include those discharges where appropriate. Column 7 gives discharges converted from those i n column 6; it is shown because t h i s t ab l e i s used i n examples given l a t e r and t h a t par t icu la r un i t of flow i s required (see Figure 17-1).
Storage-discharge relationships for reservoirs If rhe elevation-storage and elevation-discharge relationships a r e To be used f o r many routings it i s more convenient t o use them as a storage- discharge relationship. The relationships are combined by p lo t t ing a graph of storage and elevation, another of discharge and elevation, and, while referr ing t o the f i r s t two graphs, making a t h i rd by p lo t t ing storage f o r a selected elevation against discharge for t ha t elevation; f o r a typ ica l curve see Figure 17-2. The storage-discharge curve can a l so be modified for ease of operations with a par t icular routing method; f o r a typ ica l modification see Figure 17-6 and s tep 4 of Example 17-4.
Elevation, stage, storage, discharge relationships for streams It i s common pract ice t o divide a stream channel i n t o reaches (see Chap- t e r 6 ) and to develop storage o r discharge relationships for individual reaches ra ther than the stream as a whole. A stream elevation- or stage- discharge curve i s for a par t icular cross section. I f a reach has several cross sections within it they are a l l used i n developing the working tools f o r routing. Some routing methods require the use of separate discharge curves for the head and foot of a reach; such methods are not presented i n t h i s chapter.
Elevation- or stage-discharge curves f o r cross sections o r reaches are prepared as shown i n Chapter 14. They w i l l not be discussed here.
Elevation- or stage-storage curves for a reach can be prepared using the procedure for. reservoirs but ordinarily a modified approach i s used and t he storage-discharge curve prepared d i rec t ly . Table 17-4 i s a working t ab l e f o r developing such a curve. The work is based on the assumption t h a t steady flow occurs i n the reach a t all stages of flow.' The reach used i n Table 17-4 has four cross sections so t h a t a weighting method
NEH Notice 4-102, August 1972

Table 17-3 Elevation-discharge relationship for a 2-stage pr incipal spillway.
Elevation F i r s t stage: Second stage: Weir Orifice Weir Pipe Total Total
( f ee t ) ( c f s ) ( c f s ) ( c f s ) ( c f s ) ( c f s ) (in./day)
XEH Notice 4-102, August 1972

i s needed; with only one or two sections the weighting i s eliminated but t he reach storage i s l e s s well defined. Development of t he storage-discharge curve goes as follows: (1) select a se r ies of dis- charges from zero t o a discharge greater than any t o be routed and tabulate them i n column 1; (2) enter the stage-discharge curve for each cross section with a discharge from column 1 and find the stage; (3) enter the stage-end-area curve for t ha t section with the stage from s tep 2 and find the area a t t ha t st&ge, tabulating areas for a l l sections as shown i n columns 2 , 3, 4 , and 5; ( 4 ) determine the dis- tances between cross sections and compute the weights as follows:
From To cross cross Distance Weight
section section ( f e e t )
with t he weight for sub-reach 1-2 being 1000/10000 = 0.10, and so on; (5) compute weighted end areas for columns 6, 7, and 8; for example, a t a discharge of 3,500 cfs cross section 1 has an end area of 2,500 square feet and section 2 has 640 square f e e t , and the weighted end area i s 0.10(2500 + 640)/2 = 157 square f ee t ; ( 6 ) sum the weighted areas of columns 6 , 7, and 8 for each discharge, tabulating the sums i n column 9 ; (7 ) compute storages i n column 10 by use of Equation 17-8 or 17-9, whichever i s required; for example, a t a discharge of 3,500 c f s the storage i n cfs-hrs i s s3500 = 10000(1189)/3600 = 3300 cfs-hrs, by a slide-rule computation. The storage-discharge curve i s plot ted using data from columns 1 and 10. Data of those columns can be used i n preparing the working curve for routing. How t h i s i s done depends on the routing method t o be used. For t he Storage-Indication method the working curve i s prepared as shown i n Example 17-4.
NM Notice 4-102, August 1972

Table 17-4 Working tab le for a storage-discharge re la t ionship
Out- Cross sect ion end-areas Wei~hted end-areas Avg . Stor- flow
1 2 3 4 1-2 2-3 3-4 end- age areas
( c f s ) (sq.ft) ( sq . f t ) ( s q . f t ) ( s q . f t ) ( sq . f t ) ( sq . f t ) ( sq . f t ) ( s q . f t ) (cfs-hrs)

Reservoir Routing Methods
Reservoirs have the character is t ic t ha t t he i r storage i s closely re- l a ted t o t h e i r outflow ra t e . I n reservoir routing methods the storage- discharge r e l a t i on i s used for repeatedly solving the continuity equation, each solution b e i ~ g a s tep i n delineating the outflow hydrograph. A reservoir method i s suited for channel routings i f the channel has the reservoir character is t ic . Suitable channels are those w i t h swamps or other f l a t areas i n the routing reach and with a constrict ion or similar control a t the foot of the reach. There i s an exception t o t h i s : a reservoir method i s also sui table for routing through any stream reach i f the inflow hydrograph r i s e s and f a l l s so slowly tha t nearly steady flow occurs and makes storage i n the reach closely re la ted t o t he out- flow ra t e . Examples i n t h i s pa r t show the use of reservoir methods f o r both reservoirs and stream channels.
'I'ne Continuity Equation
The continuity equation used i n reservoir routing methods i s concerned with conservation of mass: For a given time in te rva l , t he volume of inflow minus the volume of outflow equals the change i n volume of storage. The equation i s often writ ten i n the simple form:
- ~t (7 - O ) = AS (EQ. 17-10)
where A t = a time interval
- I = average r a t e of inflow during the time in te rva l - 0 = average r a t e of outflow during the time in te rva l
AS = change i n volume of storage during the time in te rva l
In most applications of the continuity equation the flow and storage variables are expanded as follows:
so t ha t Equation 17-10 becomes:
where A t = t2 - tl = time interval ; tl ts the time a t the beginning of t he interval and t2 the tlme a t the end of t he in te rva l
Il = inflow r a t e a t t l
I 2 = inflow ra t e a t t2
01 = outflow ra t e a t tl
NEH Notice 4-102, August 1972

02 = outflow ra t e a t t 2
S1 = storage volume a t tl
S2 = storage volume a t t2
When routing with Equation 17-10 the usual objective i s t o f ind 5, with Equation 17-11 f ind 02; t h i s means tha t the equations must be rearranged i n some more convenient working form. It i s also necessary t o use the relationship of outflow t o storage i n m+king a solution. Most reservoir routing methods now in use d i f f e r only i n t h e i r arrangement of t he routing equation and i n t h e i r form of t he storage-outflow relationship.
It i s necessary t o use consistent uni ts with any routing equation. Some commonly used s e t s of uni ts are:
Time Rates Volumes Inflow Outflow Inflow Outflow Storage
Hours c f s cfs cfs-hrs cfs-hrs cf s-hrs days cfs c fs cfs-days cfs-days cfs-days days AF'/day M / d w AF AF' AF hours i n . /hr in. /hr inches inches inches days in . /day in . /day inches inches inches
Methods and Examples Two methods of reservoir routing based on the continuity equation are presented i n t h i s section, a mass-curve method and the Storage-Indication method. The mass-curve nethod i s given because it i s one of t he most ve r sa t i l e of a l l reservoir methods. It can be applied numerically or graphically; examples of both versions are given. The Storage-Indication method is given because it i s the method used a t the present time i n the SCS electronic computer program for watershed evaluations and because it i s a widely used method for both reservoir and channel routings. Ex- amples of reservoir and channel routing are given.
Mass-Curve Method: Numerical Version - According t o item 52 i n reference 5 , a mass-curve method of routing through reservoirs was already i n use i n 1883. Many other mass-curve methods have since been developed. The method described here i s similar t o a method given i n King's "Handbook of Hydraulics," 3rd edit ion, 1939, pages 522-527; another resembling it i s given i n "Design of Small Dams," U. S. Bureau of Reclamation, 1960, pages 250-252.
The method requires the use of elevation-storage and elevation-discharge relationships e i t he r separately or i n combination. The input is the mass (or accumulated) inflow; the output is the mass outflow, outflow hydrograph, and reservoir storage. The routing operation i s a trial-and- e r ro r process when performed numerically, but it i s simple and eas i ly done. Each operation i s a solution of Equation 17-10 rewri t ten i n t he form:
NM Notice 4-102, August 1972

M I 2 - (MO1 + 'i;; a t ) = S2
where MI2 = mass inflow a t time 2
M01 = mass outflow a t time 1
- 0 = average discharge during the routing in te rva l
A t = routing interval = time 2 minus time 1
S2 = storage a t time 2
The routing in te rva l can be e i t he r variable or constant. Usually it i s more convenient t o use a variable in te rva l , making it small f o r a large change i n mass inflow and large for a s m a l l change. The PSMC of Chapter 21 are tabulated i n intervals especially sui ted f o r t h i s method of rou- t ing .
The following example shows the application of t he method i n determining minimum required storage for a floodwater-retarding s t ructure by use of a PSMC from Chapter 21.
Example 17-1.--Determine the minimum required storage, by SCS c r i t e r i a , fo r a floodwater-retarding s t ructure having the drainage area use i n Example 21-2 of Chapter 21. Use the data and r e su l t s of t h a t example for t h i s s t ructure . Work with volumes i n inches and r a t e s i n inches per day; round off a l l r e su l t s t o the nearest 0.01 inch.
1. Develop an elevation-discharge curve for the s t ructure . A curve f o r the principal spillway discharges i s needed f o r t h i s routing. Columns 1 and 7 of Table 17-3 w i l l be used f o r t h i s structure. The elevation-discharge curve is plot ted i n Figure 17-1.
2. Develop an elevation-storage curve for t he s t ructure . Columns 1 and 8 of Table 17-2 w i l l be used f o r t h i s structure. The elevation-storage curve is p lo t ted i n Figure 17-1.
(Note: The curves of steps 1 and 2 can be combined in to a storage- discharge curve as shown by the in se t of Figure 17-2. This curve i s a time-saver i f more than one routing i s made.)
3. Develop and plot the curve of mass inflow (PSMC). The PSMC developed i n Example 21-2, and given by columns 1 and 7 of Table 21-7, w i l i be used fir t h i s example. he- p lo t ted mass inflow i s shown i n Figure 17-2. The p lo t t i ng i s used as a guide i n the routing and l a t e r used t o show the r e su l t s but it i s not essent ia l t o the method.
4. Prepare an operations t ab l e for t he routing. Suitable headings and arrangement f o r an operations t ab l e are shown i n Table 17-5.
NM Notice 4-102, August 1972

5. Determine the reservoir storage for the s t a r t of the routing. If the routing i s t o begin with some storage already occupied then e i ther the amount i n storage i s entered i n the f i r s t l i n e or column 5 of the operations table (as done i n Example 17-2) or t h e elevation- storage curve i s modified t o give a zero storage for the f i r s t l ine . I n t h i s example t h e sediment or dead storage, which i s not t o be used i n t he routing, occupies the reservoir t o elevation 580.2 fee t as shown i n Figure 17-1. Storage a t t ha t elevation i s 1.00 inches and because t h i s i s a whole scale un i t t he storage curve f o r routing i s easi ly obtained by sh i f t ing the point of or igin as shown in Figure 17-1. Ordinarily, if the Sediment o r dead storage i s some fract ional quantity it i s b e t t e r t o re-plot the curve t o show zero storage a t the elevation where the routing begins.
6. Determine the spillway discharge a t the start of the routing. If the spillway is flowing a t the s t a r t of t he routing the discharge r a t e i s entered i n t h e f i r s t l i n e of column 7 of able 17-5 (see Example 17-2). For t h i s example t h e s t a r t i ng r a t e i s zero.
7. Do the routinq. The trial-and-error procedure goes as follows:
a. Select a time and tabulate it i n column 1, Table 17-5. For This example t h e times used w i l l be those given for t he PSMC i n Table 21-7, except fo r occasional omissions unimportant f o r t h i s routing.
b. - Compute A t and enter t he r e su l t i n column 2.
c. Tabulate i n column 3 the mass inflow f o r the t i m e i n column - 1. The en t r ies f o r t h i s example come from'column 7 of Table 21-7.
d. Assume a m a s s outflow amount and en te r , it i n column 4. - e. Compute the reservoir storage, which i s the inflow of - column 3 minus the outflow of column 4, and enter it i n col- umn 5.
f . Determine the instantaneous discharge r a t e of t he spillway. - Using the elevation-storage curve of Figure 17-1, f ind the ele- vation f o r t he storage of column 5 ; with t h a t elevation enter the elevation-discharge curve and f ind the discharge, tabulating it i n column 6. I f a storage-discharge curve i s being used, simply enter t he curve with t he storage and f ind the corres- ponding discharge.
g. Compute the average discharge for A t . The average i s always the arithmetic mean of the r a t e determined i n s tep f and the r a t e f o r the previous time. For the time 0.5 days the r a t e i n column 6 i s 0.03 in. /day; f o r t he previous time the r a t e i s zero; t h e average r a t e i s (0 + 0.03)/2 = 0.015, which
NEH notice 4-102, August 1972

Table 17-5. Operations table for the mass-curve method of routing for Example 17-1.
Spillway Time Acc. Assumed Res. discharne Outflow Acc .
Acc . At inflow acc. volume Inst. Am. for At outflow - out flow
(days) (days) (in.) (in.) (in.) (in./dsy)(in./day)(in.) (in.)
(1)
0 .5 1.0 2.0
3.0
3.5
4.0
4.4
4.8 5.0 5.1
5.2
5.3
5.4
5.6
6.0
6.5
7.0 8.0 etc.
- etc. etc. etc. etc. etc. etc. etc. etc.
Mass outflow is plotted using entries in column 4 or column 9. The out- flow hydrograph is plotted using column 6, which gives instantaneous rates at the accumulated times shown in column 1.
NEH Notice 4-102, A~gUst 1972

is rounded t o 0.02 in./day. For t he time 1.0 days the average is (0.03 + 0.08)/2 = 0.055, which i s rounded t o 0.06 in./day; and so on.
h. Compute the outflow for A t . Multiply the A t of column 2 by the average r a t e of column 7 and get the increment of out- flow for column 8.
i. Add the outflow increment of column 8 t o t he t o t a l of column - 9 for t he previous time and tabulate t he sum i n column 9.
.j-. Compare the mass outflow of column 9 with t he assumed mass outflow of column 4. I f the two en t r i e s agree within the spe- c i f ied degree of accuracy (0.01 inch, i n t h i s routing) then t h i s routing operation i s complete and a new one is begun with s tep 5. If the two en t r ies do not agree well enough then assume another mass outflow f o r column 4 and repeat s teps 2 through ;L.
8. Determine t h e minimum required s to rwe . Examine the en t r ies i n column 5 and f ind the largest entry, which i s 2.82 inches a t 5.3 days. This i s the minimum required storage.
The routing gives t he reservoir storages i n column 5, outflow hydrograph i n column 6, and mass outflow i n column 9, f o r the times of column 1. Unless the r e su l t s a r e t o be used i n a report or exhibit , t he routing is usually carr ied only f a r enough past t he time of maximum storage t o ensure t h a t no larger storage w i l l occur. The mass inflow and outflow for t h i s example are plot ted i n Figure 17-2, with outflow shown only t o 8.0 days. If the mass outflow p lo t t ing i s made during the routing t h e trend of the curve indicates the best assumption for the next s tep i n column 4.
The next example shows how the routing proceeds when it must s t a r t with the reservoir containing l i v e storage and the spillway discharging.
Example 17-2.--For t he same reservoir used i n Example 17-1, determine the elevation and amount of storage remaining i n t he reservoir a f te r 10 days of drawdown from the minimum leve l allowed by SCS c r i t e r i a . The base flow used i n developing the PSMC (see Example 21-2) i s assumed t o continue a t the same r a t e throughout the routing. Round a l l work t o the nearest 0.01 inch.
1. Determine the storage volume i n the reservoir and the spillway discharge for t he s t a r t of the routing. SCS c r i t e r i a sermit the drawdown routina t o start with storage at the maximum eievation attained i n the routing of the PSH or PSMC used i n determining the minimum required storage, even though the s t ructure may be designed t o contain more than the minimum storage. For t h i s example the s ta r t ing storage of 2.82 inches i s found i n column 5, and the associated discharge of 1.69 in./day i n column 6, of Table 17-5 i n the l i n e for 5.3 days.
REH Notice 4-102, August 1972

2. Prepare an operations tab le for the routing. Ordinarily the suitable headings and arrangement are those of Table 17-5, but- i f base flow, snowmeit, or upstream releases must be included (base flow i n t h i s routing) then one or more addit ional columns are needed. Table 17-6 shows headings and arrangement su i t - able for t h i s example.
3. Do the routing. The procedure of s tep 7, Example 17-1, i s s l i gh t ly modified for t h i s routing. The f i r s t l i n e of data i n the operations tab le must con- t a i n the i n i t i a l reservoir volume i n column 4 and the i n i t i a 1 , s p i l l - way discharge i n column 7. Accumulated base flow i s added t o t he i n i t i a l value of column 4 t o give the "accumulat;d inflow" of t h a t column. In a l l other respects the routing procedure i s t ha t of s tep 7, Example 17-1.
4. Determine the s t o r w e remaining a f t e r 10 days of drawdown. The entry i n column 6 a t day 10 shows t h a t the remaining storage i s 0.20 inches, which i s a t elevation 581.1 f ee t .
The routing for t h i s example has been carried t o 1 4 days t o show tha t when the inflow r a t e i s steady, as it i s i n t h i s case (0.045 in . /day) , then the outflow r a t e eventually also becomes steady a t the same r a t e . The la rger the steady r a t e of inflow the sooner the outflow becomes steady. Note t ha t if the routing had been done with an accuracy t o t h e nearest 0.001 inch, the outflow r a t e would be 0.045 i n . / d q , the base flow ra te .
The mass inflow, storage, and mass outflow curves for t h i s example are shown i n Figure 17-3. Note tha t the work i s accurate t o the nearest 0.01 inch, therefore the curves must follow the plot ted points within t h a t l i m i t . Slight i r r egu la r i t i e s i n the smooth curves are due t o slope changes i n the storage-discharge curve.
Mass-Curve Method: Direct Version.- It is easy enough t o eliminate the trial-and-error process of the mass-curve method but the resul t ing "direct version" is much more laborious than the trial-and-error version. To get a d i rec t version the working equation is obtained from Equation 17-12 as follows.
The average discharge 5 i n Equation 17-12 la (01 + 02)/2 so tha t the equation can be writ ten:
Because O2 as well as S2 i s unknown it i s necessary t o make combinations of S and 0 t o get di rect solutions i n the routing operation. A t any time, mass outflow i s equal t o mass inflow minus storage, or:
NM Notice 4-102, August 1972

Table 17-6 Operations table fo r determining storage after 1 0 days of drawdown for Ekample 17-2.
As- Spillvray Out- Time Acc. Acc. sumed Res. discharge flow Acc.
k c . A t base in- acc. vol- Inst. Avg. for out- flow* flow outflow me A t flow
(days) (days) ( in . ) ( i n . ) ( i n . ) ( in;) ( in./dqr) ( i n . /dw) ( in . ) ( in . )
14.0 1.0 e tc . e tc .
(3)
0 .01 .02 -03
,04 .07 .o9 ;ll
.14
.16
.18
.20 ; 22 .27 .32 -36
-40 .45 .50 .54 .58
.63 e tc .
( 4 )
2.82 2.83 2.84 2.85
2.86 2.89 2.91 2.93
2.96
2.98
3.00 3.02 3.04 3.09 3.14 3.18
3.22 3.27 3.32 3.36 3.40
3.45 etc .
1.50 1.80 2.03 2.01 2.23 2.19 3.30 2.32 2.42 2.52 2-59 2.73 2.85 2.94 2.93 3.00 3.07 3.13 3.19 3.25 3.24 3.29 etc .
1.39 L . l l .go .92 .73 .77 .68 .66 .58 .5O .45 .36 .29 .24 .25 .22 .20 -19 -17 . l5 .16 .16 etc .
1.69 1.66 1.35
.87
.98
.66
.60
.53
.37
.38
.27
.29
.24
.23
.20 -17 .I5 .12 .O9 07
.08 -07 .07 -06 .05 .04 05 05
e tc .
1.67 1.50 1.n 1.16
.82
.63
.56
.45
.46
.32
.34
.26
.26 -22 .18 .16 .14 .10 .08 .08 .08 .07 .06 .06 .04 .05 .O5 etc .
0.33 .3O .22 .23 .33 .32 .28 .22 .23 .16 -17 . I3 .I3 .11 .09. .08 .14 .10 .08 .08 .08 .07 .06 .06 .04 -05 .O5 etc.
0 .33 .63 .85 .86
1.19 1.51 1.79 2.01 2.02 2.18 2.19 2.32 2.32 2.43 2.52 2.60 2.74 2.84 2.92 2.92 3.00 3.07 3.13 3.19 3.23 3.24 3.29 etc.
* A t a r a t e of 0.045 inches per day.
NELI Notice 4-102, August 1972

Substituting MI1 - S1 for MOl in Equation 17-13 and rearranging gives: At
M I 2 - MI1 + (sl - - At 2 ol) = S2 " - 02
2 (Eq. 17-15)
which is the working equation for the direct version. Working curves of 01 and (Sl - (At 01)/2) and of 02 and (S2 + (At 02)/2) are needed for routing . Other arrangements of working equations can also be obtained from Equa- tion 17-12. Equation 17-15 is the mass-curve version of the Storage- Indication method, which is described later in this part. Routing by use of Equation 17-15 takes about twice as much work as routing by the Storage-Indication method.
Examples of direct versions of the mass-curve method are n.ot given in this chapter because the trial-and-error version is more efficient in every respect.
Mass-Curve Method: Graphical Version.- The graphical version of the mass-curve method is in a sense a direct version because there is no trial-and-error involved. The graphical version is usually faster than the trial-and-error version if the routing job is simple. For complex jobs the trial-and-error version is more efficient and its results more easily reviewed. For any routing it gives mass outflow, storage, and the outflow hydrograph; the graphical version gives only the mass outflow and storage. The following example shows the use of the graphical ver- sion with the data and problem of Example 17-1.
Example 17-3.--Use the graphical version of the mass-curve method to determine the minimum required storage for the structure used in Example 17-1. Use the data of that example.
1. Develop an elevation-discharge curve for the structure. The curve used in Example 17-1 will be used here.
2. Develop an elevation-storwe curve for the structure. The curve used in Example 17-1 will be used here.
3. Prepare a working table for the routing. Using the curves of steps 1 and 2, select enough discharges on the discharge curve to define the curve accurately and tabulate them in column 2, Table 17-7. Tabulate the associated elevations in column 1 and storages at those elevations in column 4. Compute average dis- charges from column 2 for column 3. The designations in column 5 show which line is associated with each pair of storages shown on Figure 17-4. Thus, line A applies when the storage is between 0 and 0.18 inches; line B when it is between 0.18 and 0.40 inches; and so on.
4. Plot the mass inflow. The PSMC used in Example 17-1 is used here. It is plotted in Figure
IiEH Botice 4-102, August 1972

5. Do the routing. The work is done on 17-7 i s used during
the graph of mass inflow, Figure 17-4. Table the work. The procedure goes as follows:
a. Draw l i n e A with i t s or igin a t the beginning of mass inflow - and with i t s slope equal t o the associated average discharge (column 3 of Table 17-7), which is 0.025 in./day. This i s the f i r s t portion of the mass outflow curve.
(Note: Every par t of t he l i n e of mass outflow must f a l l on or below the mass inflow curve. If some par t i s above the inflow, determine the slope and storage l i m i t s fo r a l i n e with a f l a t t e r slope and use it instead.)
b. Determine the time a t which the difference between mass - inflow and l i n e A i s equal t o t he la rger of the storage l imi t s for l i n e A, i n t h i s case 0.18 inches, which occurs a t 0.65 days. This i s t h e point of or igin for l i n e B.
c. Draw l i n e B with i ts or igin a t t he point found i n s tep 2 - and with a slope of 0.09 in./day.
d. Determine the time a t which the difference between mass in- - flow and l i n e B i s equal t o t he la rger of the storage limits for l i n e B, i n t h i s case 0.40 inches, which occui-s a t 1.50 days. This i s t he point of o r ig in for l i n e C.
e . Repeat t he procedure of s teps 5 and d with l i nes C, I), E, - e t c . , u n t i l the storage being used i s s o large it exceeds the possible difference between mass inflow and mass outflow. For t h i s example t h i s occurs with l i n e H. The pa ra l l e l l i n e above it shows t h a t t h e associated storage of 3.44 inches f a l l s above the mass inflow l i n e . When t h i s s tep is reached the required storage is obtained by taking the maximum difference between l i n e H and the mass inflow curve. The difference occurs a t t he point on the mass inflow curve where a l i n e p a r a l l e l t o l i n e H i s tangent t o t he inflow curve. For t h i s example it i s 2.80 inches a t 5.33 days. This s tep completes t he routing.
The graphical method can a l so be used f o r routings s t a r t i ng with some storage occupied and with t he spillway discharging. For the problem used i n Example 17-2 the graphical method s t a r t s with l i n e H and continues with l i nes G, F, E, D , C, B, and A i n t ha t order. The r e su l t s are shown i n Figure 17-5. The storage a f t e r 10 days of drawdown i s 0.18 inches, which i s nearly t he same as found i n Example 17-2. Differences between r e su l t s of the two methods are due mainly t o the use of s m a l l - scale graphs for working curves; l a rge r scales increase the accuracy. Note t ha t l i n e A i'n Figure 17-5 i s f l a t t e r %ban the l i n e of accumulated base flow. This indicates t ha t the flow becomes steady a t or near 10 days and tha t the dashed l i n e (pa ra l l e l t o mass inflow) i s the actual outflow.
NEB Notice 4-102, August 1972

Table 17-7 Working t a b l e fo r the graphical version of t he mass-curve method f o r Example 17-3.
Spillway discharge Designation Elevation Storage I n s t . Avg . on Fig . 17-4
( feet ) ( in . /day) ( in. /day) (inches )
(1) ( 2 ) ( 3 ) ( 4 ) ( 5 )
580.2 0 0 0.025 l i n e A
581.0 .05 .18 .09 l i n e B
582.0 .13 .40 .23 l i n e C
583.5 .33 .80 .42 l i n e D
584.6 52 1.09 .61 l i n e E
587.0 70 1 .86 .95 l i n e F
587.8 1.20 2.16 1.42 l i n e G
588.4 1.64 2.38 1.69 l i n e H
591.0 1.74 3.44 1.77 l i n e I
592.5 1.80 4.15
NEH Notice 4-102, Amst 1972

Storage-Indication Method.- Reservoir routing methods t h a t are a lso used f o r stream routings are generally discharge, not mass, methods because it i s usually only the discharge hydrograph tha t i s wanted. The Storage- Indication method, which has been widely used for channel and reservoir routings, has discharge r a t e s as input and output. The method was given i n the 1955 edit ion of NEH-4, Supplement A. Example 17-4, below i s the same example used i n t h a t publication except for minor changes.
The Storage-Indication method uses Equation 17-11 %n the form:
where 7 = (I1 + 12)/2. The values of are e i ther taken from midpoints of routing intervals of plotted inflow hydrographs or computed from in- flows tabulated a t regular intervals . A working curve of 02 plot ted against (s2/At) + (02/2) i s necessary for solving the equation.
In channel routing the Storage-Indication method has the defect t h a t outflow begins a t the same time inflow begins so t h a t presumably the in- flow a t t he head of the reach passes instantaneously through the reach regardless of i t s length. This defect i s not serious i f t he r a t i o Tt /Tp is about 1/2 or l e s s , where Tp is the inflow hydrograph time t o peak and T t i s a t r ave l time defined as:
where T t = reach t r a v e l time i n hours; the time it takes a selected steady-flow discharge t o pass through the reach
L = reach length i n feet
A = average end-area for discharge q i n square f e e t
q = selected steady-flow discharge i s cfs
V = q/A = average velocity of discharge q i n fps
In determining T t the discharge q i s usually the bank-full discharge under steady flow conditions (see Chapter 15 ) .
Another defect of the Storage-Indication method, f o r both channel and reservoir routing, i s t h a t there i s no ru l e for select ing the proper s i ze of routing interval . T r i a l routings show tha t negative outflows w i l l occur during recession periods of outflow whenever A t is greater than 2 S2/02 (or whenever 02/2 i s greater than S2/At). This a l so means tha t r i s ing portion's of hydrographs are being dis tor ted. I n pract ice , t o avoid these poss ib i l i t i e s , the working curve can be p lo t ted as shown i n Figure 17-6; i f any pa r t of the working curve falls above the l i n e of equal values then the e n t i r e curve should be discarded and a new one made using a smaller value of A t . For channel routing the poss ib i l i t y of negative outflows i s usually excluded by taking A t l e s s than Tt.
Notice 4-102, A u g u s t 1972

The following example shows the use of the Storage-Indication method i n channel routing. The example i s the one used i n t he 1955 edi t ion of NEE-4, Supplement A, with some minor changes.
Example 17-4.--Use the Storage-Tndication method of reservoir routing t o route the inflow hydrograph of Figure 17-7 through the stream reach of Table 17-4.
1. Prepare the storage-discharge re la t ionship f o r the reach. This i s done i n Table 17-4 and the t ex t accompanying it.
2. Determine the reach t r ave l time. This i s done using Equation 17-17. Table 17-4 and the accompanying t ex t supply the following data: L = 10,000 f ee t and f o r a bank- full discharge of 800 cfs as q the end-area A = 234 square fee t . Then by Equation 17-17, T t = 10000(23~)/3600(800) = 0.813 hours.
3. Select the routing interval . The routing interval for t h i s example w i l l be 0.5 hours, which i s l e s s than the t r ave l time of step 2 and which i s a convenient s i ze for the given inflow hydrograph. (See the discussion i n the t ex t accompanying Equation 17-30 for further information on the selec- t ion of reach routing in te rva ls . )
4. Prepare the working curve. Use the storage-discharge relationship of s tep 1, which is given i n columns 1 and-10 of able 17-4. 'Fnese two coiumk are reproduced as columns 1 and 3 of Table 17-8, the working t ab l e ; columns 2, 4 , and 5 of the tab le are self-explanatory. The working curve i s plot ted using columns 1 and 5. The finished curve i s shown i n Figure 17-6.
5. Prepare the operations table . Suitable headings and arrangement for an operations t ab l e are shown i n Table 17-9.
6. Enter times and inflows i n the operations tab le . Accumulated time i n steps of the routing in t e rva l is shown i n - column 1 of Table 17-9.- I values read From midintervals on the inflow hydrograph of Figure 17-7 are shown i n column 2.
7. Do the routing. The procedure i s shown i n Table 17-10. The routing r e su l t s are shown i n columns 3 and 4 of Table 17-9. The outflow hydrograph given i n column 4 i s plot ted i n Figure 17-7.
In routing through channels it i s generally necessary t o add loca l inflow t o the routed outflow. The method of doing t h i s i s described l a t e r i n the par t on channel routing methods.
NEEf Notice 4-102, August 1972

The Storage-Indication procedure for reservoir routing i s ident ical with tha t for channel routing except t ha t there i s no need t o determine a t rave l time. The following example shows the reservoir procedure. The problem and data of Example'l7-1 are used i n order t o al low a comparison of procedures and resu l t s .
&le 17-5.--Use the Storage-Indication method t o determine the minimum required storage for the s t ructure used i n Example 17-1. Use the data of t h a t example where applicable. Make the routing with discharges i n cfs.
1. Develop an elevation-discharge curve f o r the structure. The curve used i n Example 17-1 w i l l be used here. That curve i s f o r discharges i n in . /hr . Ordinarily when cfs are t o be used the curve i s developed i n t h a t uni t . The conversion t o cfs w i l l be made i n s tep 5.
2. Develop an elevation-storage curve for the structure. The curve used i n Example 17-1 w i l l be used here. That curve i s - for storage i n inches. The conversion t o cfs-days w i l l be made i n s tep 5 .
3. Develop and p lo t the inflow hydrograph. Because of the type of problem the inflow hydrograph must be a Prin- c ipa l -Sj?illway Hydrograph (PSH) taken from Chapter-21. The PSH corresponding t o the PSMC of Example 17-1 is given i n columns 1 md 4 of Table 21-7. The PSH i s plot ted i n Figure 17-8.
4. Select t he rout in^ interval . Examination of the PSH i n F imre 17-8 shows t h a t two routing inter- va l s w i l l be needed, one of 6.5 days for small changes i n r&es and one of 0.1 days f o r large changes.
5. Prepare the working curves.. Data and computations for t h e working curves are shown i n Table 17-11. Two curves a r e needed because two routing intervals w i l l be used. The elevations of column 1 and discharges of column 2 are taken from the curve of s t ep 1 with the discharges being converted from in./hr. to cfs i n the process. The discharges are selected so t h a t they adequately define the elevation-dischaxge relationship. Column 3 of Table 17-11 gives the corresponding storages from the curve of s tep 2 , converted from inches t o cfs-hrs during the tabula- t ion . The remaining columns contain self-explanatory computations. Columns 2 and 6 give the f i r s t working curve and columns 2 and 8 the second; they are p lo t ted i n Figure 17-9. Note tha t " l ines of equal values" i f drawn would be well above t h e working curves, therefore the routing in te rva ls a r e adequately small. Also note t h a t the second curve i s shown only for t he higher discharges i n order t o use a la rger scale; ordinar i ly the en t i r e curve i s plotted.
NM Notice 4-102, AugUSt 1972

Table 17-8 Working t a b l e f o r preparation of t h e working curve f o r Example 17-4.
NM Notice 4-102, August 1972

Table 17-9 Operations table for the S-I method for Example 17-4.
Time
0 .5 1.0 1.5 2.0 2.5 3.0 3.5 4.0 4.5 5.0 5.5 6.0 6.5 7.0 7.5 8.0 etc.
(2)
0 625" 1875 3125 4375 4615 3865 3125 2375 1635 900 265 O*" 0 0 0 0
etc.
(3)
0 625 2215 4310 6805 8540 8795 8210 7135 5720 4180 2635 1425 795 420 260 178 etc.
(4)
0 285 1030 1880 2880 3610 3710 3450 3050 2440 1810 1210 630 375 160 82 53
etc.
* 625 cfs is the average discharge for the time from 0 to 0.5 hours, 1875 cfs the average discharge from 0.5 to 1.0 hours, and so on.
** Inflow ceases at 5.33 hours.
NEH Notice 4-102, August 1972

Table 17-10 Procedure for routing by the Storage-Indication method for Example 17-4.
Remarks
e tc . e tc . e tc .
0 Given
Given
o - o + 625 = 625
285 From Figure 17-6
Given
625 - 285 + 1875 = 2215
1030 From Figure 17-6
Given
2215 - 1030 + 3125 = 4310
1880 From Figure 17-6
Given
4310 - 1880 + 4375 = 6805
2880 From Figure 17-6
etc. e tc .
NEH Notice 4-102, August 1972

6. Prepare the operations table . Suitable headings and arrangement are shown i n Table 17-12. Note - tha t there i s a column f o r ins tg taneous r a t e s of inflow. These ra tes w i l l be used for get t ing I values because it i s d i f f i c u l t t o select I values accurately enough from some portions of the plot ted hydrograph.
7. Tabulate times and r a t e s of inflow and compute 7 values. Accumulated times are shown i n column 1 of Table 17-12 a t in tervals of A t = 0.5 days for the i n i t i a l slow-rising portion of the PSH, a t A t = 0.1 days f o r the fas t - r is ing and -fa l l ing portion, and again a t A t = 0.5 days for the slow recession. Instantaneous r a t e s of inflow for those times are taken from the PSH of Figure 17-8 (or from column 4 of Table 21-7 i f they are for the selected times) and shown i n column 2. The I values of column 3 are arithmetic averages of en t r ies i n column 2.
8. Do the routin@;. The procedure i s the same as t ha t given i n Table 17-10 except when a change i s made from one working curve t o another. The changes are made as follows. A t time 4.5 days the routing in te rva l changes, therefore, the working curve must be changed. The outflow r a t e a t tha t time i s 116 cfs. Entering the second working curve with t h i s r a t e gives 2,640 cfs as the value of (s2/At) + (0212) i n column 4 for t he same time. Once t h i s value i s entered the routing continues with use of t he second working curve. A t time 6.0 days the routing in te rva l chknges back t o the first one and therefore the first working curve must again be used. The outflow r a t e a t t ha t time i s 357 cfs . Entering the f i r s t working curve with t h i s r a t e gives 1,270 cfs as t h e value of (s2/At) + (02/2) i n column 4 for t h a t time. After entering t h i s value the routing continues with use of the first working curve.
9. Determine the maximum storage at ta ined i n t he routing. The maximum storage at ta ined i n a reservoir during the routing of a single-peaked hydrograph occurs a t the time when outflow equals inflow. The p lo t t ing i n Figure 17-8 shows tha t t h i s occurs a t 5.33 days. For t h i s time, Table 17-12 shows t h a t 02 = 364 cfs and (s2/At) + (02/2) = 6,480 c f s . solving f o r S2 gives S2 = A t 6480 - (0 12). With A t = 00. days and 02 = 364 c f s , S2 = 0.1 6480 - (3&/2) = 629.8 cfs-days , the maximum storage. To convert t o AF use Equation 17-2, which gives 629.8/0.504 = 1,247 AF as the maxi- mum storage i n AT. To convert AF t o inches use Equation 17-3 and the given drainage area of 8.0 square miles (see Example 17-11, which give l247/53.3(8.0) = 2.93 inches as t he maximum storage i n inches. (Tote: The storage can also be found by use of a storage- discharge curve o r elevation-discharge and elevation-storage curves but with the Storage-Indication method it i s generally best t o use the above method. )
A comparison of peak r a t e s of outflow shows t h a t the mass-curve method of Example 17-1 gave a peak r a t e of 1.69 in./dsy, which converts t o 363
NEH Notice 4-102, August 1972

Table 17-11 Working t ab l e for preparation of the working curves f o r Example 17-5.
For A t = 0.5 days For A t = 0.1 days Eleva- Dis-
Storage O2 t ion charge - S2 - S2 "2 s2 S2 o2 (S2) + - - -
A t A t 2 + -
(02) A t A t 2
( f e e t ) ( c f s ) (cfs-days) ( c f s ) ( c f s ) ( c f s ) (c fs ) ( c f s )
NM Notice 4-102, August 1972

Table 17-12 Operations tab le for Example 17-5.
Gut- f OH
etc. e tc . e tc . e tc . e t c .
* From f i r s t working curve. ""From second working curve.
NEH Notice 4-102, August 1972

cfs, and the Storage-Indication method gave 364 cfs, which i s excellent agreement. But a comparison of maximum storage i n inches shows tha t t he mass-curve method of Example 17-1 gave 2.82 inches, t he graphical mass- curve method of Example 17-3 gave 2.80 inches, and the Storage-Indication method gave 2.93 inches. The discrepancy is f o r the most part due t o use of small-scale graphs for the working curves. Larger graphs would reduce the discrepancy.
St orage-Indication Method as Used i n the SCS Electronic Computer Program. - SCS electronic computer program for watershed evaluations uses t h e Storage-Indication method only for reservoir routings. The chief differ- ence between the manual procedure of Example 17-5 and the electronic- computer procedure i s that i n the l a t t e r no working curves are used. In- stead, the working equation i s solved during a process i n which interpo- la t ions a r e made i n the elevation-discharge and elevation-storage data stored i n the computer. The process i s repeated during the routing jus t as the working curve i s repeatedly used i n manual routing. The machine routing has a numerical accuracy greater than tha t of t he manual routing, but the machine cannot improve the accuracy of the input data. Details of the machine routing process are given i n pages A-61 through A-66 of the report t i t l e d "Computer Program f o r Project Formulation - Hydrology," by C-E-I-R, Inc. Arlington, Va., January 1964, which w a s prepared for SCS. Copies of t h i s report are available from the Washington, D. C. off ice of SCS.
Culp's Method.- Some routing methods are developed f o r solving special problems, for which they have a high efficiency. One such method i s described next.
In the design of an emergency spillway of a dam it is SCS pract ice t o base the design on the resu l t s from a routing of an Bnergency Spillway Hydrograph. Because all of the spillway dimensions cannot be known i n advance, it i s necessary t o route the hydrograph through three or four dif ferent spillways w i t h assumed dimensions before t he spillway w i t h the proper dimensions can be found. M. M. Culp's routing method elimi- nates much of t h a t work by giving the routed peak discharge without t he use of spillway dimensions. The following example shows an application of the method t o the structure used i n previous examples. The example i s lengthy because many de ta i l s are given; a f t e r the method is understood it w i l l be seen t o be f a s t and easy t o apply.
Example 17-6.--Find the routed peak discharge t o be used i n design of an emergency spillway for the s t ructure of Example 17-1. The required difference i n elevation between the c res t of the spillway and the reser- voir water surface, H , i s 4.0 f ee t during the peak discharge. Water- shed and s t ructure dafa are given i n examples 17-1 and 17-2.
1. Prepare the elevation-discharge curve for t he pr incipal sp i l l - = This curve was prepared for Example 17-1 with t he discharges i n inches per hour. It w i l l be used here as shown i n Figure 17-10(a) with discharges i n cfs.
NEII Notice 4-102, August 1972

2. Prepare the elevation-storage curve for t he s t ructure . This curve was prepared f o r Example 17-1. Only the portion above the sediment storage w i l l be used here; it is shown i n figure 17-10(a).
3. Determine t h e elevation of the emergency spillway c res t . According t o SCS c r i t e r i a , t he elevation of the emergency spillway - - cres t can be a t or above the maximum water-surface elevation attained i n the reservoir during the routing of the Principal Spillway Hydrograph (PSH) o r i t s mass curve (PSMC) . The water- surface elevation found i n Example 17-1 w i l l be used here as t he c res t elevation. This elevation i s 589.5 fee t with floodwater storage of 2.82 inches.
4. Determine the water-surface elevation of the floodwater remain- ing i n the reservoir after LO days of drawdown from storage a t the water-surface elevation attained i n routing the PSH o r PSMC. This s tep i s required by SCS c r i t e r i a . The determination i s made i n Fxample 17-2 and those r e su l t s w i l l be used here. The water- surface elevation a f t e r 10 days of drawdown i s 581.1 fee t with floodwater storage a t 0.20 inches.
5. Prepare the Emergency Spillway Hydrograph (ESH) and i t s mass curve (ESMC). The ESH f o r t h i s example was prepared using the method of Example 21-5 and the following data: drainage area = 8.0 square miles, time of concentration = 2.0 hours, runoff curve number = 75, design storm r a i n f a l l = 9.1 inches, storm duration = 6.0 hours, r u n o f f = 6.04 inches, hydrograph family = 2, To = 5.05 hours, i n i t i a l Tp = 1 .4 hours, To/Tp = 3.61, selected To/Tp = 4, revised Tp = 1.26 hours, qp = 3,073 c f s , and Q(q ) = 18,560 c f s . The ESMC was prepared using Table 21-17 and the folEowing data: hydrograph family = 2, To/Tp = 4, Tp = 1.26 hours, and Q = 6.04 inches. The hydrograph i s shown i n Flgure 17-10(b) and the mass curve i n Figure 17-10(c).
(Note: The above s teps are taken, i n much the same way, regardless of which manual method of routing i s used f o r t h i s kind of problem. The following steps apply t o the Culp method. )
6. Determine the time a t which the emergency spillway begins t o flow during passage of the ESH or ESMC. For t h i s example the time was found by routing the ESMC of s tep 5 by the method of Example 17-1, using the curves of Figure 17-10(a) as working c w e s . The routing w a s s ta r ted with 0.20 inches of floodwater i n t he reservoir (SCS c r i t e r i a require t h e ESH or ESMC routing t o s t a r t a t the elevation for the floodwater remaining a f t e r the 10-day drawdown period; see step 4) . The emergency s p i l l - way began t o flow a t 2.9 hours, a t which time the mass outflow was 0.06 inches. The time and outflow are indicated by point c l on Figure 17-10(c )
iWH Notice 4-102, August 1972

7 . Determine the average discharge of t he pr incipal s p i l l w q during, passage of the ESH or ESMC through the emergency spillway. The principal spillway average discharge i s for t he period during which the reservoir storage r i s e s from the elevation of t he emer- gency spillway crest t o the crest elevation plus 2. the ele- vation-discharge curve of Figure 17-10(a) t o f ind he discharges a t the two elevations. These discharges are 361 and 392 c f s res- pectively; t h e i r average i s 376 cfs .
8. Locate a reference point i n t he ESH for use i n l a t e r steps. The reference point, shown as point b l i n Figure 17-10(b), i s located a t the time determined i n s tep 6 and a t the average dis- charge determined i n s tep 7. A second point, not actual ly necessary i n the work, i s shown as b2 on the recession s ide. A s t ra igh t l i n e connecting points b l and b2 represents the pr incipal spillway out- flow r a t e during the period used i n step 7.
9. Compute the slope of the pr incipal spillway mass outflow l i n e for use on the mass inflow graph. Tne mass outflow t o be used i s for the period considered i n step 7. Ful l pipe flow occurs and the mass outflow i s adequately represented by a s t ra igh t l i ne . The slope of the l i n e for t h i s example must be i n inches per hour because the mass inflow scales are f o r inches and hours. To get the slope, convert the average discharge of s tep 7 by use of Equation 17-5, which gives 376/645(8.0) = 0.073 inches per hour.
10. Plot a reference l i n e and a working l i n e of pr incipal spillway mass outflow on the graph for mass inflow. The l i nes are for the period considered i n step 7 but for working convenience they are extended beyond the limits of the period. To plot the reference l i n e , f i r s t locate point c2 on the mass inflow curve of Figure 17-10(c) a t the time determined i n s tep 6, then through c2 draw a s t ra igh t l i n e having the slope determined i n s tep 9; t h i s gives l i n e A as shown. To p lo t t he working l i ne , f i r s t determine the storage associated with EIp, which is 1.84 inches as shown i n Figure 17-10(a), then draw l i n e B p a r a l l e l t o l i n e A and 1.84 inches of runoff above it as shown i n Figure 17-10(c).
11. Find the period within which the emergency spillway peak dis- charge w i l l occur. Point c3 is a t t he intersect ion of the mass inflow curve and l i n e B i n Figure 17-10(c). Locate point b3 on the ESH of Figure 17-10(b) a t the time found for c3. Points b3 and b2 are the end points f o r the period within which the emergency spillway peak discharge w i l l occur.
2 . Select several working discharges between points b3 and b2. Four selected working discharges are indicated by points b4, b5, b6, and b7 i n Figure-17-10(b); t he discharges a r e 4,750, 3,500, 2,200, and 920 cfs respectively. These discharges represent the peak discharges of outflow hydrographs.
NEH Notice 4-102, August 1972

( ~ o t e : After some experience with t h i s method, it may be found easier t o select only two working discharges i n t h i s s tep, t o work through steps 13 t o 15, and i f t he r e su l t s are unsatisfactory t o re turn t o s tep 12 again by select ing a t h i r d working discharge, working through steps 13 through 15 for t ha t discharge, and so on.1
13. Compute a volume-to-peak for each working discharge of step 12. In the Culp method the r i s ing s ide of the outflow hydrograph for a trapezoidal spillway i s taken as being nearly parabolic so tha t the volume from the beginning of r i s e t o t he peak r a t e , or the volume-to-peak, i s :
where Qe i s the volume i n cfs-hrs, qe i s the working discharge of s tep 12 i n cfs, qps i s the pr incipal spillway r a t e of s tep 7 i n cfs , and Te i s the time i n hours from point b l t o the peak time. The volume Qe must be converted t o a unit usable with the mass inflow curve, i n t h i s case, inches. The summary of work f o r t h i s s tep i s given i n Table 17-13. I n t he columns for points b4 through b7, the items i n l i n e 1 are from s t ep 12; items i n l i n e 2 a r e from step 7; items i n l i n e 3 are obtained by subtracting qps from qe; items .in l i n e 4 are obtained by inspection of Figure 17-10(b); items i n l i n e 5 are products of (qe - qps) x Te; items i n l i n e 6 are products of ( ~ e j 0 . 6 2 ) x 0.62; items i n l i n e 7 a r e Qe's of l i n e 6 divided by the drainage area of 8.0 square miles; items of l i n e 8 are Qe' s of l i n e 7 divided by 645. Each Qe of l i n e 8 applies only at t he time indicated by i ts point on the ESH.
14. Plot a curve of mass inflow minus mass outflow. This i s a working curve, not the complete curve of inflow minus outflow. Subtract each Qe of l i n e 8, Table 17-13, from the inflow amount a t the iden t ica l time on the mass inflow curve of Figure 17-10(c) and plot t he r e su l t as shown for points c4, c5, c6, and c7. Connect the points with a curve, l i n e C.
15. Determine the time and r a t e f o r the emergency spillway peak discharge. The intersect ion of l i ne s B and C , a t point c8 i n Figure 17-10(c), gives t he time a t which the emergency spillway peak discharge occurs The t o t a l discharge r a t e a t t h a t time i s 3,050 cfs as shown by the corresponding point b8 on the ESE of Figure 17-10(b). The emer- gency spillway discharge r a t e i s 3050 - 376 = 2,674 c f s , which occurs when the reservoir water surface i s a t the given elevation of 593.5 f e e t (c res t elevation plus Hp). This s tep completes the routing. Design of the emergency spillway now follows with use of ES-98, ES-124, and spillway c r i t e r i a .
I f Kp is not known i n advance, the Culp method can be used with assumed values of Hp t o get associated discharges from which the su i tab le combi- nation of Hp and discharge can be selected. For ear th spillways % can be closely approximated from permissible ve loc i t ies and the appropriate
IiEH Notice 4-102, August 1972

17-35
Table 17-13 Working table for Culp method s tep 13 of Example 17-6.
Line It em Unit Point :
b4 b5 b6 b7
qe cfs ¶€'s cfs
qe - q ~ s C ~ S Te hrs
Qel0.62 cfs-hrs Qe cfs-hrs Qe csm-hrs Qe in.
NJB Notice 4-102, August 1972

length and chosen prof i le of the i n l e t channel. A close approximation of the emergency spillway discharge r a t e can be obtained i n t h i s way fo r an ELp ~ a l u e near the middle of the desired range t o get a " C curve" ( l i n e C on Flgure 17-10(c)). The average discharge i n t he conventional drop i n l e t under f u l l pipe flow conditions varies only s l i gh t ly as H?, varies re la t ive ly great ly , thus the discharge through the emergency splllway can be closely approximated from such an average C curve. If refine- ment i s jus t i f ied , then t r i a l adjustments on the slope of l i n e B w i l l give the required accuracy. The correction process converges rapidly. For preliminary layouts or comparative cost studies such refinement i s seldom jus t i f ied .
Short-Cuts for Reservoir Rout in~s . - Various equations and charts have been developed f o r quickly estimating the required storage i n a reser- voir or t h e required capacity of a spillway, such estimates being used i n preliminary studies of s t ructures or projects. The equations and charts are usually based on the r e su l t s of routings so t h a t using the equation or chart i s i n effect a form of routing.
A typ ica l short-cut i s the graph, Figure 17-11. The curve through the c i rc led points i s based on information i n table 2 on page 39 of "Low D a m s , " a design manual prepared by the Subcommittee on Small Water Storage Projects, National Resources Committee, Washington, D. C . , 1938 ( the manual i s out of p r in t and no longer available for ~ u r c h a s e ) . Relationships of t h i s kind are developed from routings made through a par t icu la r type of spillway and they apply only t o t h a t type. The form of standard inflow hydrograph used for routing also a f fec t s the relation- ship and the same form must be applicable when the short-cut i s used. With such a re la t ionship i f any three of the four variables are known the fourth can be estimated. Usually e i ther t he reservoir storage or the reservoir discharge r a t e i s the unknown.
The t r iangular point on Figure 17-11 i s for the routing made i n Example 17-6. For t ha t example the outflow/inflow r a t i o i s 3050/10200 = 0.30 and the storage/inflow-volume r a t i o i s 2.82/(2.62 + 1.84) = 0.63. Note t ha t the emergency spillway "surcharge" storage is included when com- puting the volume r a t i o . Thi: cross points, fo r "miscellaneous routings", are for routings of several kinds ofhydrographs through emergency s p i l l - ways of the SCS type. The "Low Dams" curve appears t o be an enveloping curve for the points. As such it can be used f o r making conservative estimates. Thus, i f t he inflow volume is 8.15 inches of runoff and the t o t a l available storage i s 5.7 inches then the storage r a t i o i s 0.7; a t t ha t r a t i o the discharge r a t i o i s 0.4, which means tha t t he peak outflow r a t e w i l l be not more than 0.4 of the peak inflow. Such estimates are often useful i n preliminary work.
NM Notice 4-102, August 1972

I I DISCHARGE, INCHES PER DAY, I-w Z(3 OF PRINCIPAL SPILLWAY WITH TWO-STAGE INLET w a
- -zg g k
1 2 3 4 5 6 7
TOTAL STORAGE- INCHES
0 I 2 3 4 5 6
STORAGE USED IN ROUTING- INCHES

Figure 17-2. Storage, discharge relationship and plotted mass inflow e w e for a reservoir.
NEB Notice 4-102, August 1972

PLUS ACCUMULATED BASE
TIME, DAYS
Figure 17-3. Mass inflow, storage, and mass outflow curves for Example 17-2.
NM Notice 4-102, August 1972


I MASS INFLOW OR :ONTENTS PLUS I
dFTER 10 DAYS DRAM
I -INE OF ACTUAL FL( :LINE IS PARALLEL ' KCUMULATED BASE
OY LOW)
2 4 6 8 10
TIME, DAYS
Figure 17-5. Graphical version for Example 17-2, Step 4.
NEH Notice 4-102, August 1972

Figure 17-6. Working curve for Storage-Indication method of reservoir routing for Example 17-4.
NEH Notice 4-102, August 1972

TIME, HOURS
Figure 17-7. Inflow and outflow hydrograph f o r Example 17-4.
NEH Notice 4-102, August 1972

Figure 17-8. Principal spillway hydrograph and outflow hydrograph for Example 17-5.
mEII Notice 4-102, August 1972

, FOR At = 0.1 DAYS (SECOND WORKING CURVE)
I
0 FOR At = 0.5 DAYS 0 1000 2 0 0 0 3000 FOR At = 0. l DAYS 2 0 0 0 3000 4000 5 0 0 0 6000 7000 8000 9000
Figure 17-9. Working curves for Storage-Indication method of reservoir routing for I C
Example 17-5. vl

Figure 17-10. Culp's method of reservoir routing for Example 17-6.
NM Notice 4-102, August 1972

OUTFLOW PEAK RATE INFLOW PEAK RATE
Figure 17-11. Typical shortcut method of reservoir flood routing.
NEH Notice 4-102, August 1972

Channel Routina Methods
The Convex method of routing through stream channels i s presented i n t h i s pa r t . The method i s derived from inflow-outflow hydrograph re la - tionships and, because of t h i s , t he method has some features not pos- sessed by channel routing methods derived from consideration of the continuity equation. The Storage-Indication method of channel routing, presented i n Example 17-4, w i l l not be discussed here, but discussions of procedures for adding loca l inflows, deducting transmission losses, and routing through stream systems also apply t o t ha t method.
Theory of the Convex Method The Convex method i s based on t h e following principle: When a natural flood flow passes t h r o u b a na tura l stream channel having negligible loca l inflows or transmission losses , there i s a reach length L and a time in te rva l A t such t h a t 02 i s not more than the la rger nor less than the smaller of the two flows 11 and O1. A t i s considered as both the t r a v e l time of t he flood wave through t h e reach measured a t t he beginning of the r i s ing portion of the hydrograph a t both ends of the reach; and the required routing time in te rva l .
The principle requires t h a t :
If I1 2 01, then I1 2 O2 2 O1 (Eq. 17-19)
If 11 5 01, then I1 5 02 5 01 (Eq. 17-20)
In general, inequality Equation 17-19 applies t o r i s ing portions of hy- drographs and Equation 17-20 t o f a l l i ng portions. Note tha t 12 does not enter in to the principle; t h i s makes the Convex method a forecasting method (see under "Discussion" ) . The routing principle can be extended t o include loca l inflows and transmission losses but t h i s unnecessarily complicates the working equa- t ion . It i s common pract ice t o add l o c a l inflows t o t he routed outflow hydrographs t o get the t o t a l outflows, and t h i s pract ice w i l l be fol- lowed here. There may be s i tua t ions , however, i n which the loca l inflow i s added t o the inflow hydrograph and then routed. Small transmission losses are generally deducted a f t e r the routing, large ones during the routing; f o r a discussion of transmission losses see t he heading "Effects
I of transmission losses on routed flows."
The routing or working equation is formed a f t e r examination of typ ica l inflow and outflow hydrographs such as those i n Figure 17-12. Typical flood wave combinations of 11, O1 and O2 a r e shown on the r i s ing and f a l l i ng sides of the hydrographs. The routing pr inciple s t a t e s t h a t for a properly selected reach length L, hence A t , O2 K i l l f a l l some- where on or between I1 and O1 i n magnitude but not above or below them. This i s evident on Figure 17-12 despite t h e displacement of 02 i n time;
l it i s the magnitudes t h a t are of concern here.
R& Notice 4-102, August 1972

L The next step i s t o recognize t h a t 11, 01 and O2.are members of a Convex s e t i / . For such a s e t , i f points A and B are i n the s e t then a l l points on a s t ra igh t l i n e connecting A and B are a lso i n the se t . Because the concern i s with magnitudes and not with time it i s not necessary for O2 t o be physically on the l i n e between 11 and 01. The routing equation can now be wri t ten based on the theory of convex sets . For the s i tuat ion just described, and using proportions as shown on the i n s e t o f Figure L7-12, the routing o r working equation is:
where C i s a parameter with the range:
zero < C 5 one ( E ~ . 17-22)
Given Equation 17-22, Equation 17-21 meets t he requirements of Equations 17-19 and 17-20 and therefore of the routing principle.
The routing method based on Equation 17-21 i s cal led the Convex method t o c a l l a t tent ion t o the equation's background.
It follows from Equation 17-21that :
In the inset of Figure 17-12 the relationships between 11, 01, and O2 make similar t r i angles , so t ha t :
I where K is considered the reach t r a v e l time for a selected steady flow discharge of a water pa r t i c l e through the given reach. From Equation 17-24 it follows tha t :
I
Combining Equations 17-23 and 17-25 gives:
'/ Enough of the theory of convex s e t s for the purposes of t h i s chap- t e r i s given i n pages 41-42 of "An Introduction t o Linear Program- ming," by A. Charnes, W. W. Cooper, and A. Henderson; John Wiley and Sons, Inc., New York, 1953.
NEH Notice 4-102, August 1972

I from which comes the equation tha t defines A t , the wave t r ave l time and also the required routing interval : I i/
Discussion This much of t he theom i s enouah for makina a workable routina method. - - - The emphasis i n t h i s chapter i s on working examples, not on theory, therefore t he addit ional r e su l t s from the theory are summarized i n the next section without giving derivations or proofs. Further work can be done on some aspects qf the Convex routing method but even i n i t s present s t a t e the method i s highly useful for most types of problems of routing flood flows through stream channels.
The theory as given so f a r can be used f o r exploratory routings by assuming magnitudes f o r any two of the variables i n Equation 17-27 com- puting the t h i r d , and using Equation 17-21 with various inflow hydro- graphs. Such routings show t h e features of the Convex method. I n Figure 17-12, f o r example, note tha t outflow begins a t one routing inter- val , A t , a f t e r inflow begins, which i s t o be expected for a stream reach because it takes water waves time t o t r ave l through the reach. It i s chiefly t h i s character is t ic t h a t distinguishes the Convex method from channel methods based on the continuity equation. In Convex routing the peab r a t e of the outflow hydrograph does not f a l l on the recession limb of the inflow hydrograph, as i n reservoir methods. But, as i n all routing methods, t he maximum storage i n the reach i s at tained when outflow equals inflow ( a t point A i n Figure 17-12). The maximum storage i s represented by the area under the inflow hydrograph t o t he l e f t of point A minus the area of the outflow hydrograph t o the l e f t of point A. Also note t h a t inflow I 2 does not appear i n the working equation though it does appear i n equations f o r other channel methods. This feature makes the Convex method a forecasting method. For example, i f the rou- t i n g in te rva l i s one day, today's inflow and outflow are known and loca l inflow i s k n 0 ~ or negligible, then tomorrow's outflow can be predicted accurately without knowing tomorrow's inflow. The predictive feature is more important for large r i ve r s than for small streams because the routing in te rva l for reaches of such streams is usually short.
Some UsefU Relationships and Procedures Of t h e equations so far given, only Equations 17-21 and 17-27 are needed i n prac t ica l applications of the Convex method. The f i r s t i s the working equation and the second an auxi l iary equation used once before a routing begins. Several other relationships and procedures a l so-usefu l i n appli- cations follow . Determination of K. - K i s t he reach t r ave l time for a selected steady- flow discharge and can be computed using Equation 17-7 subst i tut ing K for Tt. Example 17-8 shows a preferred method fok select ing the dis- charge. The K used i n the Muskingum routing method (refs. 2 and 3) may also be used as the K f o r the Convex method.
NM Notice 4-102, August 1972

L I Determination of C. - From Equations 17-17 and 17-26 the parameter o r I routing coefficient C can be derived as the r a t i o of two veloci t ies :
t h a t i s , C = V/U, where V i s the steady-flow water velocity re la ted t o i t he reach t r ave l time for steady flow discharge, K, and U i s considered I t h e wave velocity re la ted t o the t rave l time of the wave through the i reach, A t . For prac t ica l purposes C may be estimated from an empirical
re la t ionship between C and V shown i n Figure 17-13. The dashed l i n e i n ! t he Figure i s represented by the equation:
I n some applications it i s more convenient t o use Equation 17-28 than Figure 17-13. The "x" used i n the Muskingum routing method (refs . 2 and 3) may also be used t o approximate C. The approximation i s :
I n the Muskingum procedure the x i s sometimes determined only t o the nearest tenth; if t h i s i s done then C is approximated t o the nearest two tenths and accurate routing r e su l t s should not be expected.
Determination of A t . - I f C and K are known, from Equation 17-27, there is only one permissible routing interval. This permissible i n t en r s l may be an inconvenient magnitude because it i s e i ther an unwieldy frac-
'U , t i o n of an hour or does not fit the given hydrograph. In select ing a , sui table routing in te rva l keep i n mind tha t too large an interval w i l l
not accurately define the inflow hydrograph and tha t too s m a l l an inter- v a l w i l l needlessly increase the effor t required for the routing. A
) generally sui table r u l e of thumb t o follow is tha t the selected routing time interval , A t * , should be no greater than 115 of the time from the beginning of r i s e t o the time of the peak discharge of the inflow hydro- graph, or:
T A t * j p 5
' where Tp is the time t o peak (Chapter 16). I f the hydrograph has more I than one peak the in te rva l should be selected using the 3 , t he / shortes t of the r i s e periods of the bpor t an t peaks. It is important
t h a t an end-point of a time in te rva l f a l l a t or near the inflow peak / time and any other large change i n ra te .
Procedure f o r routing through any reach length.- The re la t ionship of K, C, and A t is val id f o r one and only one routing reach length for a given time in te rva l and inflow hydrograph. I f A t i s t o be changed t o At*
I (desired routing time in te rva l ) it follows from Equation 17-27 tha t e i t he r / (1) C or K must be changed (Method 1) or , (2) routing through a s e r i e s / of subreaches, L*, (Equation 17-32) must be made u n t i l t he sum of t he / t r a v e l time of the A t ' s fo r each subreach, L*, equal the desired t r a v e l
L : time, At* , f o r the t o t a l reach, L (Method 2). Selection of e i t he r method
NER Notice 4-102, August 1972

depends on the manner of computation and the consistency of the answers desired. Method 1 may be used when rough approximations of the routing e f fec t are desired and manual computation i s used. Method 2 is used when consistency of the routing i s important or a computer i s used. Con- sistency, as used here, re fe rs t o the changes i n t he outflou hydrograph (Tp and q ) caused by varying At*. If there i s l i t t l e change i n t he hydrograp8 when A t * i s changed the routing is considered consistent.
In Method 1, the reach length i s fixed, hence, K i s f ixed (Equation
I 17-17) and C must be modified by the empirical re la t ionship:
where C* i s the modified routing coefficient required f o r use with A t W , C i s the coefficient determined from Figure 17-13 or computed by Equa- t ion 17-28, At* i s the desired routing in t e rva l , and A t i s the routing interval determined from Equation 17-27. After select ing At* the coeffi- cient C* i s found by using e i ther Equation 17-31 o r Figure 17-14 (ES- 1025 rev.)
Method 2 assumes t h a t C and the desired routing in t e rva l A t * are f ixed and the routing i s made for a reach length L*. From Equation 17-27, the
' desired t r ave l time i s : I
i From Equation 17-17 the proper routing reach length t o match C and A t *
, i s then:
I f L* i s l e s s than the given reach length, L , t h e inflow hydrograph i s repet i t ively routed u n t i l t he difference between the sum of t he L*'s and L becomes l e s s than the next L*. The l a s t routing i n t h e reach is a f ract ional routing using C* computed by Equation 17-31. The A t used i n Equation 17-31 i s the time in te rva l for routing through the f rac t iona l length increment of L, L**. (see Example 17-11 Method 2).
If L* i s greater than the given reach length, L, the , inf low hydrograph is routed once using Method 1. Example 17-11 i l l u s t r a t e s the use of Methods 1 and 2.
Variabil i ty of routing parameters; selection of velocity, V. As shown by preceding relationships, the magnitudes of the routing para- meters C and K (and therefore of At) depend on the magnitude of t he velocity V. For steady flow i n natural streams this velocity var ies with stage but the var ia t ion is not the same for a l l seasons of a year or for a l l reaches of a stream, nor does the veloci ty consistently in- crease or decrease with stage. For unsteady flow, veloci ty varies not only w i t h stage but a lso with the r a t e of change of the stream flow.
NM notice 4-102, A w t 1972

L These facts would appear t o require a change i n routing parameters for each operational s tep i n a routing. But exploratory routings with the Convex method show tha t constant parameters must be used t o conserve mass, that i s , t o make t o t a l outflow equal t o t a l infiow. The necessity for the use of constant parameters i s a charac te r i s t ic of coefficient routing equations, including not only Equation 17-21 but a l so with the Muskingum routing equation ( re fs . 2 and 3) and the Storage-Indication equations. Therefore all of the examples i n t h i s par t show a use of con- s tan t parameters. I n practice the parameters need not be constant for a l l steps of a routing but the more often they are changed the more l ike ly tha t the t o t a l outflow w i l l not equal t o t a l inflow.
The average, dominant, and peak veloci t ies of one inflow hydrograph w i l l nearly always differ from the corresponding veloci t ies of another hydro- graph. Even though a single value of V i s used t o get the constant val- ues of C , K , and A t for a routing, t h i s V w i l l nearly always be different for different inflow hydrographs t o a reach. Each inflow hydrograph w i l l need i t s own routing parameters determined from i t s own selected velocity. There are various methods of select ing the velocity.
One method, useful when a computer i s used, computes the velocity as the average of veloci t ies f o r all given discharges of the inflow hydrograph 2 50 percent of the peak discharge.
A manual method with the same objective as the machine method w i l l be L used i n t h i s chapter t o make manual routings comparable t o machine rou-
t ings . In t h i s method the dominant velocity of t he inflow hydrograph i s used t o determine the parameters t o be used i n the routing. I f t he inflow hydrograph has a single peak the velocity i s for a discharge equal t o 314 of the peak inflow ra t e . If the inflow hydrograph has two or more peaks the velocity is f o r the discharge with the la rges t value of Tq, where:
The use of Equation 17-34 i s i l l u s t r a t ed i n Example 17-8. Some additional remarks concerning the selected velocity are given i n the paragraph pre- ceding Example 17-7.
Examples.- The Convex method i s generally used for routing hydrographs through stream reaches. It can also be used, without any change i n pro- cedure for routing mass curves through reaches. Examples of both uses w i l l be given. The method can be used for routing through reservoirs but for t h i s it i s not as eff ic ient as the mass-curve method of Example 17-1; therefore no examples of reservoir routing are given i n t h i s par t . Exam- ples are given showing various aspects of Convex routing.
Example 17-7 - Basic routine using assumed parameters.
Example 17-8 - Routing with parameters determined from reach data and with loca l inflow added a t bottom of .reach.
NEH Notice 4-102, August 1972

Example 17-9 - "Reverse Routing" or determining the inflow hydrograph for a given outflow hydrograph.
Example 17-10 - Routing of Mass Curve and method of gett ing the outflow hydrograph.
Example 17-11 - Routing any hydrograph through any reach. Method 1 and Method 2 are. compared.
For the following examples it is assumed tha t stage-discharge and stage-end-area curves are available for t he routing reach. These curves are used for determining the velocity, V, a f t e r the dominant discharge of the inflow hydrograph i s obtained. I n preliminary work such curves may not be avai lable , i n which case the velocity can be estimated during a f i e l d t r i p t o t he stream area, o r a sui table velocity assumed, and the routing made as a ten ta t ive study; such routings need ver i f icat ion by routings based on reach da ta before making firm decisions about a project .
In the f i r s t example'the values of C and A t are assumed; therefore the reach length and K do not d i rec t ly enter i n to the work:
Example 17-7.--Route the t r iangular inflow hydrograph of Figure 17-15 by the Convex computational method. Use assumed values of C = 0.4 and A t = 0.3 hours. There i s no l o c a l inflow in to the reach.
1. Prepare the operations t ab l e . Suitable headings and &rangement a r e shown for t he f i r s t three col- umns i n Table 17-14. The "remarks" column i s used here t o e m l a i n d the s teps; it i s not needed i n routine work.
2. Tabulate the inflow r a t e s a t accumulated times, using in te rva ls of A t . - The accumulated times a t in tervals of A t = 0.3 hours are shown i n column 1 of Table 17-14. The inflow ra tes a t these times are taken from the inflow hydrograph of Figure 17-15 and shown i n column 2.
3. Prepare t he working equation. Since C = 0.4 then (1 - C ) = 0.6 and the working eauation is - - o2 = ( 1 - C ) 01 t C 11 = 0.6 o1 + 0.4 11. When inflow ceases the working equation i s 02 = 0.6 01.
4. Do the routing. Follow the s teps shown i n the remarks column of Table 17-14.
The computational work i n s tep 4 can usually be done on most desk- - calculators by using a system of making the two multiplications and the addition i n one machine operation.
The outflow hydrograph of Table 17-14 i s plot ted on Figure 17-15. The circled points a r e the outflow discharges obtained i n the routing. D i s - charges between the points are found by connecting the points with a smooth curve. Sometimes the routing points do not define the peak region
3 NEH Notice 4-102, A u g u s t 1972

17-55
L. Table 17-14 Basic operations in the Convex routing method.
Time Inflow, I Outflow, 0 (hrs) (cfs) (cfs
Remarks
Given.
Oe = 0.6(0) + 0.4(0) = zero
O2 = 0.6(0) + 0.4(800) = 320
0, = 0.6(320) + 0.4(1600) = 832
O2 = 0.6(832) + 0.4(2400) = 1459
0, = 0.6(1459) + 0.4(3200) = 2155
02 = 0.6(2155) + 0.4(4000) = 2893
02 = 0.6(2893) + 0.4(3520) = 3144
02 = 0.6(3144) + 0.4(3040) = 3102
0, = 0.6(3102) + 0.4(2560) = 2885
02 = 0.6(2885) + 0.4(2080) = 2563
O2 = 0.6(2563) + 0.4(1600) = 2178
02 = 0.6(2178) + 0.4(1120) = 1755
0, = 0.6(1755) + 0.4(640) = 1309
0, = 0.6(1309) + 0.4(160) = 849
02= 0.6(849) = 509 I1= zero.
0, = 0.6(509) = 305 PI tt 11
0, = 0.6(305) = 183 I I TI 11
0, = 0.6(183) = 110 " " "
etc . etc. etc. etc.
1/ Outflow starts at At = 0.3 hrs. - 2/ Inflow ceases at 4.0 hrs. -
NEH Notice 4-102, August 1972

well enough; t h i s usually happens when the routing in te rva l i s large. In such cases the peak i s estimated by use of a smooth curve o r t he routing i s repeated using smaller intervals [see Example 17-11 f o r use of At*).
The recession curve or t a i l of t h e outflow hydrograph continues t o infin- i t y , the discharges gett ing smaller with every s tep but'never becoming zero. This i s a character is t ic of most routing methods. In pract ice the recession curve is e i ther a rb i t r a r i l y brought t o zero a t some con- venient low discharge or the routing is stopped a t some low discharge as shown i n Figure 17-15.
The next example i s typical of the routine used i n pract ice . Routing parameters are obtained from reach data and loca l inflow i s added i n the conventional manner. Local inflow i s the (usually) small flow from the contributing area between the head and foot of a reach. Local inflow and the inflow into the head of the reach together make up the t o t a l flow from the drainage area above the foot of the reach. The loca l inflow i s generally given as a hydrograph made with reference t o the foot of the routing reach. When it i s added t o the routed outflow the sum i s the total. outflow hydrograph.
Example 17-8.--The inflow hydrograph i n Figure 17-16 i s t o be routed tbrough a reach having a low-flow channel length of 14,900 f ee t and a valley length of 12,400 feet . Stage-discharge and stage-end-area curves for the reach are available (not i l l u s t r a t e d ) . A hydrograph of l o c a l inflow i s given i n Figure 17-16. Obtain the t o t a l outflow hydrograph for the reach.
1. Determine t h e discharge t o be used f o r get t ing the veloci ty V. The inflow hydrograph has two peaks and it i s not readily appar- ent which peak i s the dominant-one, therefore the ru le expressed by Equation 17-34 w i l l be used. The 3/4-discharge for t he f i r s t peak i s 3,750 c f s w i t h a duration of 2.63 hours; for the second, 2,680 cfs with a duration of 5.35 hours, Then Tq = 3750(2.63) = 9,850 cfs-hrs f o r the f i r s t peak and Tq = 2680(5.35) = 14,320 cfs- hrs for the second, therefore the second discharge w i l l be used.
2. Determine the velocity, V. Enter the stage-discharge curve for the reach with the selected 3/4- discharge from s tep 1 a& f ind the stage for t ha t flow. Then enter the stage-end-area curve with t ha t stage and get the end- area i n square fee t . The velocity i s the discharge divided by the end area. For t h i s example V w i l l be taken as 3.0 fps.
3. Determine K. The reach has two lengths, one for t he low-flow channel, t he other for the valley. From an examination of the stage-discharge curve and the inflow hydrograph it i s evident t h a t most of the f l o w w i l l exceed the capacity of the low-flow channel, therefore use t he valley length. This i s given as 12,400 fee t . By Equation 17-17, using T t = K, t he value of K = 12400/3600(3.0) = 1.15 hours by a slide-rule computation.
ii
NEH Notice 4-102, August 1972

4. Determine C. Enter Figure 17-13 with V = 3.0 fps and find C = 0.65.
5. Compute A t . Using resu l t s from steps 3 and 4 , and by Equation 17-27, A t = 0.65 (1.15) = 0.745 hours. Round t o 0.75 hours.
6. Prepare an operations table for t he routing. Suitable headings and arrangement are shown i n Table 17-15.
7. Tabulate accumulated time a t in tervals of A t and the discharges for inflow and loca l inflow a t those times. The times are given i n column 1 of Table 17-15, inflows i n column 2, and loca l inflows i n column 4. Inflows and loca l inflows are taken from the given hydrographs, which are shown i n Figure 17-16.
8. Prepare the working equation. From step 4, C = 0.65 so tha t (1 - C ) = 0.35. The working equation i s O2 = 0.35 O1 + 0.65 I1.
9. Do the routing. Follow the routine used i n Table 17-14 t o aet the outflows for col- - umn 3 of Table 17-15.
10. Get the t o t a l outflow hydrograph. Add the Local inflows of column 4, Table 17-15, t o the routed out- flows of column 3 t o get the t o t a l outflows for Column 5. This s tep completes the example. The t o t a l outflow hydrograph i s shown i n Figure 17-16.
Note i n Figure 17-16 tha t the routed outflow peaks are not much small- e r than the inflow peaks. The f i r s t routed outflow peak i s 93.0 per- cent of i t s respective inflow peak, and the second 97.7 percent of i t s inflow peak. The reach has re la t ive ly small storage when compared with the inflow volumes; the f i r s t inflow peak has l e s s volume associated with it than the second and it is reduced more than the second.
The next example i l l u s t r a t e s a routine sometimes needed t o get the up- stream hydrograph when the downstream one is given. The uorking equa- t ion for t h i s routine i s a rearranged form of Equation 17-21:
Example 17-9.--Obtain the inflow hydrograph of a reach from the t o t a l outflow hydrograph by use of reverse routing. The t o t a l outflow hydro- graph and loca l inflow a re given i n Table 17-16.
1. Determine the routing coefficient C and the routing; in te rva l A t . - Follow the procedure of steps 1 through 5 of Example 17-8. For t h i s example C = 0.44 and A t = 0.5 hrs .
NEH Notice 4-102, August 1972

Table 17-15 Operations table for Example 17-8.
Local Tot a1 Time Inflow Out flow Inflow Outflow
(hrs. ) ( c f s ) (cfs (c fs ) (c fs )
21.00 21.75 27.50 23.25 24.00 24.75 25.50 26.25 27.00 27.75 28.50 29.25 30.00 e tc .
(2 )
0 380
1400 3000 4450 5000 4600 3750 2800 2100 1600 1280 1150 1210 1480 1880 2360 2880 3250 3500 3580 3480 3240 2930 2600 2280 i.980 1730 1480 1280 1130
980 850 720 620 530 450 400 350 310 270
e t c . e tc .
230 190 150 120 100 90 80 70 60 50 Lo 30 20
e tc .
2105 1808 1548 1344 1165 1015
872 750 642 546 47 4 383 345
etc.
Outflow s t a r t s a t A t = 0.75 hrs.
NEH Notice 4-102, August 1972

2. Prepare the operations t ab l e for t he routing. Suitable headings and arrangements are shown i n Table 17-16.
3. Tabulate accumulated time a t in tervals of A" and the dis- charges for t o t a l outflow and loca l inflow a t those times. The times are given i n column 1 of Table 27-16, t o t a l outflows i n column 2, and loca l inflows i n column 3 . The t o t a l outflow (but not the loca l inflow) i s shown i n Figure 17-17.
4. Determine the outflows t o be routed uustream. A value i n column 2, Table 17-16, minus the corresponding value i n column 3 gives the outflow for column 4, which contains the outflows t o be routed upstream.
5. Prepare the working equation. C is given i n s tep 1 as 0.44. By Equation 17-35, 11 = 2.27 O2 - 1.27 O1.
6. Do the routing. The routine is s l i gh t ly dif ferent from tha t i n Table 17-14. Using values from Table 17-16, the sequence is: for outflow time 0.5 hrs , Il = 2.27(0) - 1.27(0) = 0, which is recorded for inflow time zero; a t outflow time 1.0 hrs , 11 = 2.27(163) - 1.27(0) = 370, recorded for inflow time 0.5 hrs ; fo r outflow 1.5, I1 = 2.27(478) - 1.27(163) = 878, recorded for inflow time 1.0 hrs ; and so on. The work is easi ly done by accumulative posi t ive and negative multiplication on a desk calculator. The inflow hydrograph t o time 7,5 hours i s plotted on Figure 17-17.
It w i l l sometimes happen i n reverse routing tha t the working equation gives negative values for t h e inflow. This occurs when the t o t a l outflow hydrograph o r the l o c a l inflow i s i n error .
The next example shows the downstream routing of a mass curve of inflow. The routine i s the same as t h a t for Example 17-7. The outflow hydro- graph can be obtained from t h e mass outflow curve by a ser ies of simple calculations; these outflows must be plotted a t midpoints of time incre- ments, not a t end points.
Example 17-10.--Route the mass curve of inflow of Figure 17-18 by the Convex method. There i s no loca l inflow.
1. Determine the routing coefficient C and the routing interval A t . - Follow the procedure of steps 1 through 5 of Example 17-8. For t h i s example C = 0.40 and A t = 0.3 hrs .
2. Prepare t he operations t ab l e for t he routing. Suitable headings and arrangement are shown i n Table 17-17.
NM Nbtice 4-102, August 1972

Table 17-16 Operations t a b l e f o r Example L7-9
- pp - - - -- --
Outflou Time Tot a 1 Local t o be Inflow
Outflow Inflow routed ( h r s ) (c f s ) ( c f s ) ( c f s ) ( c f s )
( 1 )
0 .5
1 .0 155 2.0 2.5 3.0 3.5 4.0 4.5 5.0 5.5 6.0 6.5 7.0 7.5 8.0 e t c .
0 120 310 680
1250 1850 2490 3030 3440 3700 3900 3940 3840 3500 3000 2485 1960 e t c .
31 e t c .
O 1 / 0-
163 478 932
1525 2165 2708 3122 3420 3631 3714 3637 3344 2915 2424 1929 e t c .
0 370 878
1508 2278 2978 3398 3648 3793 3899 3819 3539 2972 2370 1800 1300 etc.
1/ Outflow starts at A t = 0.5 hours. -
NEH Notice 4-102, A u g u s t 1972

3. Tabulate accumulated time a t in tervals of A t and the mass inflows a t those times. The times are given i n column 1 of Table 17-17 and mass inflows i n column 2.
4. Prepare the working, equation. C i s given i n step 1 as 0.40. By Equation 17-21, O2 = 0.6 O1 + 0.4
5. Do the routing. Tne routine i s exactly the same as t ha t i n Table 17-14. For exam- ple , a t inflow time 2.7 h r s , O2 i s computed using inflow and out- flow for the previous time or O2 = 0.6(3707) + 0.4(5952) = 4605 cfs- hrs .
(Note: I f only the mass outflow is needed the work stops with s tep 5. I f t he outflow hydrograph i s a lso needed, the following steps are a lso taken. )
6. Compute increments of outflow. These are the differences shown i n column 4, Table 17-17.
7. Compute average ra tes of outflow. Dividing the increment of outflow of column 4 , Table 17-17, by the increment of time ( i n t h i s case, 0.3 h r s ) gives the average r a t e of outflow for the time increment. For example, between 1.8 and 2.1 hours i n Table 17-17, the time increment i s 0.3 hrs and the outflow increment i s 906 cfs-hrs; then the average r a t e i s 9061 0.3 = 3,020 cfs. The average ra tes must be plot ted as midpoints between the two accumulated times involved; for t h i s case, 3020 cfs i s p lo t ted a t a time of (1.8 + 2.1112 = 1.95 hours.
The mass inflow, mass outflow, and r a t e hydrograph are p lo t ted in Figure 17-18.
The next example shows how t o route any hydrograph through any reach length. Methods 1 and 2 are compared. I Example 17-11.--Route the inflow hydrograph of Figure 17-19 through a reach 30,000 fee t long. Assume no loca l inflow.
I 1. Determine desired routing time in te rva l , A t x . Following the rule expressed i n Equation 17-30, At* w i l l be 0.4 hrs.
I 2. Determine routing coeff ic ient , C, and routing in te rva l A t . If a stage-discharge-velocity table for a typical section in the reach i s used, the average velocity V i s determined using the method from page 17-54, and C is computed using Equation 17-28. I f a ra t ing table is not used the C or V must be assumed; i n t h i s case, l e t C = 0.72. Rearranging Eq. 17-28 gives V = 1 . 7 ~ / ( 1 - C ) =
NEH Notice 4-102, August 1972

Table 17-17 Operations tab le for Example 17-10.
Incre- Time Mass Mass ment of Outflow
Inflow Outflow Outflow Rate (hrs. 1 (cfs-hrs) (cfs-hrs) (cfs-hrs) ( c f s )
5.2 7992 7817 70
5.5 7992 7887 e tc .
- .
233
e t c . e tc . e tc . e tc .
1/ Outflow starts a t A t = 0.3 hours -
iTBl Notice 4-102, August 1972

(1.7) ( .72)/0.28 = 4.37 fps. Combining Equations 17-17 and 17-27, A t CL
= - or A t = - = ( . 7 2 ) ( 3 0 0 0 0 ) 1 ( 3 6 0 0 ) ( 4 . 3 7 ) = K = 3600V C 3600V
1.37 hrs . Use 1 .4 h rs . A t i s also the wave t r ave l time through the en t i re reach.
3. Determine C* Using Equation 17-31 with A t = 1 .4 h r s , At* = 0.4 hrs , and C = 0.72
0.4+0.5(1.4) 1 1.1
C* = 1 - (1-.72) ( 1. j ( 1 . 4 ) = 1-(.28) (3.T) = 1-(.28) 0.524 =
4. Prepare an operations t ab l e f o r t he routing. Suitable headings and arrangement a r e shown i n Table 17-18.
5. Tabulate accumulated time intervals of At* and the inflow discharges f o r those times. The times a r e given in column 1 Table 17-18, the inflows taken from Figure 17-19 i n column 2.
6. Prepare t he working equation. From step 3 , C* = 0.49. Using Equation 17-21 O? = ( 1 - C*) O1 + C X I l o r O2 = 0.51 O1 + 0.49 I1. Solutions of t h r s equation can eas i ly be made by accumulative multiplication or a desk calculator.
7. Do the routing. Follow the routine o f . Table 17-14. The outflows a re shown i n col- umn 3 of Table 17-18.
8. Determine the times f o r t he outflow. Outflow begins a t t he end of t he f i r s t A t (not A t * ) in terval .
J i th A t = 1 . 4 h r s , show t h i s time i n column 4 of Table 17-18 i n t he ?ow where outflow begins. Get succeeding times by adding A t * in te r - rals, 0.4 hours i n t h i s case, as shown i n column 4. I n plot t ing o r ~therwise displaying the inflow and outflow hydrographs they are put in t h e i r proper time order, using columns 1 and 4 , as shown i n figure L7-19.
1. Determine desired routing time in te rva l , At* . Same as Method 1, At* = 0.4 hr.
2. Determine routin4 coefficient C. The routing coefficient YC" f o r each subreach is computed from the outflow hydrograph of the preceding subreach as done i n Step 2, Method 1. A constant C may be used f o r t he e n t i r e reach but the resul tant hydrograph w i l l vary from one produced by recornputin@ C f o r each subreach. For simplicity i n t h i s example, a constant C = 0.72 i s assumed. V = 4.37 fps.
NM Notice 4-102, August 1972

Table 17-18 Operations t a b l e f o r Example 17-11 Method 1.
Time Time Inflow Inflow Outflow Outflow
(hrs) ( c f s ) ( c f s ) ( h r s )
( 1 )
0 .4 . 8
1 . 2 1 . 6 2.0 2.4 2.8 3.2 3.6 4.0 4.4 4.8 5.2 5.6 6.0 6.4 6.8 7.2 7.6 8.0 8.4 8.8 9.2 9.6
10.0 e tc .
( 2 )
0 260 980
2100 3120 3500 3220 2630 1960 1470 1120
840 630 455 345 265 180 130 100 75 60 45 35 20 1 0
0 e t c .
(3)
0 1/ 0-
127 545
1307 2195 2834 3023 2830 2404 1946 1541 1198
920 692 522 396 290 212 157 117
89 67 5 1 36 23 12
6 3 2 1
etc .
( 4 )
1 .4 1.8 2.2 2.6 3.0 3.4 3.8 4.2 4.6 5.0 5.4 5 .8 6.2 6.6 7.0 7.4 7.8 8.2 8.6 9.0 9.4 9.8
10.2 10.6 11.0 11.4 11.8 12.2 12 .6 13.0
e t c .
1/ Outflow starts at A t = 1 . 4 hours -
NEH Notice 4-102, August 1972

3. Determine length of subreach L*. This i s the length of reach required t o s a t i s fy the re la t ionship of Equation 17-26 with C = 0.72 and A t * = 0.4 hrs. Combining Equa- t ions 17-26 and 17-17 ( l e t K = T ~ ) we have L* = (a t ) (v) ( ~ ~ o o ) / c = (0.4)(4.37)(3600)/0.72 = 8740 f t ;
4. Compare the t o t a l of subreach lengths, CL* with the given reach length, L. For ELX<L 80 t o s teo 5 - - - For EL*>L go t o s tep 7
I n t h i s example CL*n=l = 8740
= 17480
CL*,=~ = 26220
XL*,,4 = 34960
Therefore, t he f i r s t three rout .ings a r e ma the l a s t routing by going t o s tep 7.
t o s tep 5 and
5. Prepare working equation and do the routing. Using Equation 17-21 and the routing coefficient computed i n s tep 2, O2 = (1 - C)O1 + C I 1 = 0.28 O1 + 0.7211. The outflows for each subreach are shown i n Table 17-19.
6. Go . t o s tep 2.
7. Determine the length of the reinaining subreach t o be routed. Subtract the EL* of the 3 completed routings, i .e , , 26220 f t from the t o t a l reach length t o get the remaining reach length t o be routed L** = 30000 - 26220 = 3780 ft.
8. Determine the A t time in te rva l f o r the remaining subreach. The time in te rva l used here i s the same as the wave t r ave l time through the remaining subreach. Combining Equations 17-17 and 17-27 as i n s tep 2 Method 1 At** = - CL** = (0.72)(3780)/(3600)(4.37) = 0.173 hrs. 3 6 0 0 ~
9. Determine the modified routing coefficient C*. Usinn Eouation 17-31 with At** = 0.173. A t * = 0.4 and C = 0.72,
10. Prepare working equation. Following Method 1 O2 = (1-C*)O1 + C*Il = (1 - .91) O1 + 0.9111 = .09 O1 + 0.91 11.
NEH Notice 4-102, August 1972
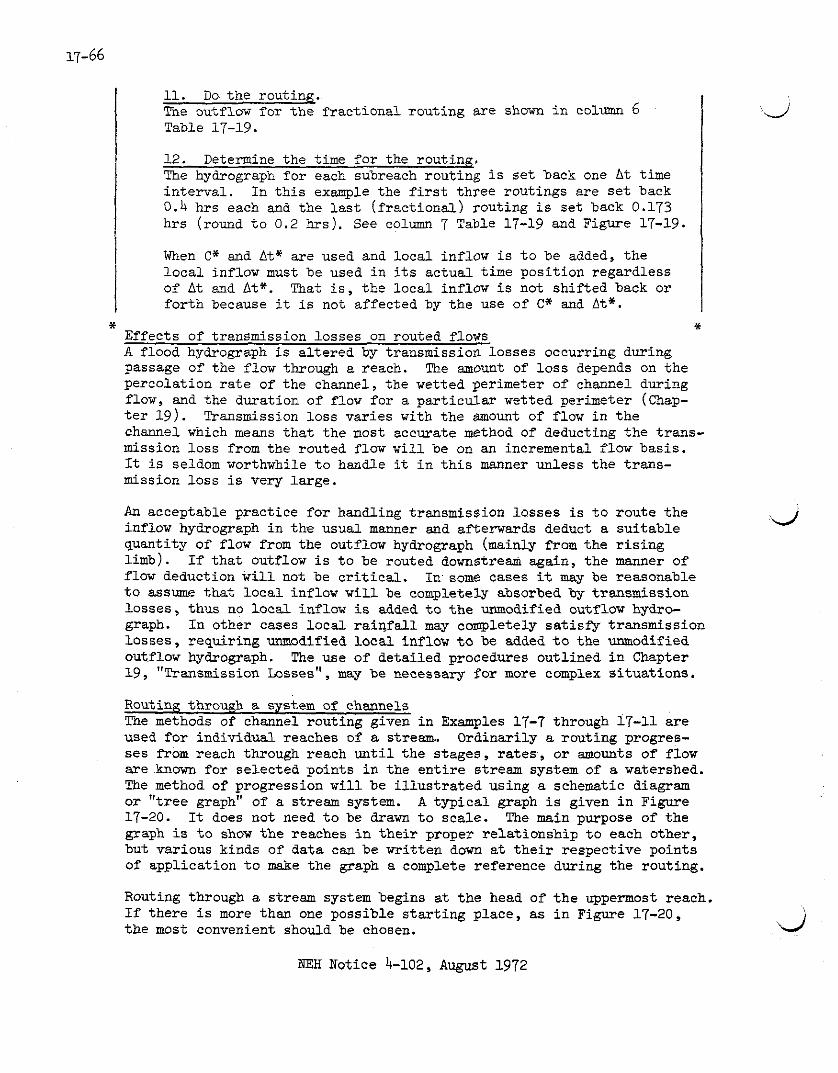
11. Do the routinq. The outflow for t he f ract ional routing are shown i n column 6 Table 17-19.
12. Determine the time for the routing. The hydrograph for each subreach routing i s s e t back one A t time in te rva l . In t h i s example the f i r s t three routings are s e t back 0.4 hrs each and the l a s t ( f ract ional) routing i s se t back 0.173 hrs (round t o 0.2 hrs) . See column 7 Table 17-19 and Figure 17-19.
When C* and At* are used and loca l inflow i s t o be added, the l oca l inflow must be used i n i t s actual time posit ion regardless of A t and At*. That i s , the loca l inflow i s not shifted back o r for th because it i s not affected by the use of C* and A t * .
* * Effects of transmission losses on routed flows A flood hydrograph i s a l tered by transmission losses occurring during passage of the flow through a reach. The amount of l o s s depends on the percolation r a t e of the channel, the wetted perimeter of channel during flow, and the duration of flow for a par t icular wetted perimeter (Chap- t e r 19) . Transmission loss varies with the mount of flow i n the channel which means tha t the most accurate method of deducting the trans- mission loss from the routed flow w i l l be on an incremental flow basis. It is seldom worthwhile t o handle it i n t h i s manner unless t he trans- mission loss i s very large.
An acceptable practice f o r handling transmission losses i s t o route t he inflow hydrograph i n the usual manner and afterwards deduct a su i tab le quantity of flow from the outflow hydrograph (mainly from the r i s i n g limb). If tha t outflow i s t o be routed downstream again, the manner of flow deduction w i l l not be c r i t i c a l , I n some cases it may be reasonable t o assume tha t l oca l inflow w i l l be completely absorbed by transmission losses, thus no loca l inflow i s added t o t he unmodified outflow hydro- graph. I n other cases loca l r a i q f a l l may completely s a t i s fy transmission losses , requiring unmodified loca l inflow t o be added t o the unmodified outflow hydrograph. The use of detailed procedures outlined i n Chapter 19 , "Transmission Losses", may be necessary for more complex Situations.
Routing thro* a system of channels The methods of channel routing given i n Examples 17-7 throuah 17-11 a re - used for individual reaches 02 a, stream. 0 r k n a r i l y a routing progres- ses from reach through reach u n t i l the stages, r a t e s , o r amounts of flow are known for selected points i n the en t i r e stream system of a watershed. The method of progression w i l l be i l l u s t r a t e d using a schematic diagram o r " t ree grapht' of a stream system. A typ ica l graph i s given i n Figure 17-20. It does not need t o be drawn t o scale. The main purpose of the graph i s t o show the reaches i n t h e i r proper re la t ionship t o each other, but various kinds of data can be writ ten down a t t h e i r respective points of application t o make the graph a complete reference during the routing.
Routing through a stream system begins a t t he head of t h e uppermost reach. I f there i s more than one possible s t a r t i ng place, as i n Figure 17-20, t he most convenient should be chosen.
NEH Notice 4-102, A u g u s t 1972

Table 17-19 Operation t a b l e f o r Example 17-11 Method 2
Time Outflow Outflow Outflow Outflow Outflow Inflow Inflow C~*=8740 ZL*=17480 ~ ~ * = 2 6 2 2 0 CL*=30000 Time
l h r s ) ( c f s ) ( c f s ) ( c f s ) ( c f s ) ( c f s ) (hrs )
(1)
0 .4 .8
1.2 1.6 2.0 2.4 2.8 3.2 3.6 4.0 4.4 4.8 5.2 5.6 6.0 6.4 6.8 7.2 7.6 8.0 8.4 8.8 9.2 9.6
10.0 e t c .
( 2 )
0 260 980
2100 3120 3500 3220 2630 1960 1470 1120
840 630 455 345 265 180 130 100
75 60 45 35 20 10
0 e t c .
( 3 )
11 0- 187 758
1724 2729 32e4 3238 2800 2195 1673 1275
962 723 530 397 302 214 154 115
86 67 51 40 25 14
4 1 0
e t c .
( 4 )
0 135 584
1405 2358 3025 3178 2906 2394 1875 1442 1096
827 613 457 345 251 181 133
99 76 58 45 31 19 8 3 1 0
e t c .
(5 )
0 97
447 1137 2016 2743 3056 2948 2549 2064 1617 1242
944 706 527 396 292 212 155 115
87 66 51 36 24 1 3
6 2 1 0
e t c .
( 6 )
21 0- 88
415 1072 1931 2670 3021 2955 2586 2111 1661 1280
974 730 545 409 303 220 161 119
90 68 53 38 25 1 4
7 2 1 0
e t c .
1/ Outflow from subreach 1, 2, & 3 starts A t * = 0.4 hours a f t e r inf low - starts i n t o each subreach.
2/ Outflow from subreach 4 starts A t = 0.2 hours (rounded from 0.17 - hours) a f t e r inflow starts i n t o subreach 4.
NEE Notice 4-102, August 1972

m e f i r s t major s tep i n routing through a stream system i s t o develop the routing parameters, C and A t , for each reach. Many times it i s necessary t o use At* t o make the routing in t e rva l uniform through the stream system; these parameters should be obtained before the routing begins. The method of developing the parameters C, K , and A t i s given i n steps 1 through 5 of Example 17-8. The method of determining C* and At* i s given i n steps 1 through 3 of Example 17-11.
The second major step i s the development of the inflow hydrographs a t heads of uppermost reaches and of loca l inflow hydrographs for a l l reaches. The methods of Chapter 16 are used.
The th i rd major s tep i s the routing. For routing any par t icu la r flood on the stream system pictured i n Figure 17-23 a sui table sequence i s as follows :
1. Route the inflow hydrograph a t ( a ) through reach (a,b) . 2 . Add loca l inflow of reach (a ,b) t o the routed outflow t o get
the t o t a l outflow hydrograph, which becomes the inflow hydrograph for reach (b ,c ) . It should be noted here t h a t l oca l inflow f o r a reach i s usually added a t the foot of t he reach. These may be circumstances, however, i n which the loca l inflow should be added a t t h e beginning of the reach. The proper sequence for adding loca l inflow can be determined only by evaluating each reach.
3. Route the t o t a l outflow from reach (a,b) through reach (b ,c) .
4. Add loca l inflow of reach (b ,c ) t o the routed outflow t o get the t o t a l outflow hydrograph f o r tha t t r ibutary.
5. Route the inflow hydrograph a t (d ) through reach (d,c)
6. Add loca l inflow of reach (d ,c) t o t he routed outflow t o get the t o t a l outflow hydrograph a t point ( c ) .
7. Add t h e t o t a l outflow hydrographs from. reaches (b ,c) and (d,c) , steps 4 and 6, t o get the t o t a l outflow hydrograph a t point ( c ) .
8. Route t he t o t a l hydrograph a t point ( c ) through reach ( c , f ) .
9 . Add loca l inflow of reach ( c , f ) t o the routed outflow t o get the t o t a l outflow hydrograph a t point (f) .
10. Route the inflow hydrograph a t point ( e ) through reach ( e , f ) .
11. Add loca l inflow of reach ( e , f ) t o the routed outflow t o get the t o t a l outflow hydrograph for tha t t r ibu ta ry .
12. Route the inflow hydrograph a t point ( g ) through reach ( g , f ) .
13. Add loca l inflow of reach ( g , f ) t o the routed outflow t o get t he t o t a l outflow for t h a t t r ibu ta ry a t point ( f ) .
NM Notice 4-102, August 1972

14. Add the t o t a l outflow hydrographs from reaches (c , f ) , ( e , f ) ,
and ( g , f ) , steps 9, 11, and 1 3 t o get the t o t a l outflow hydrograph a t point ( f ) .
15 . Route -the t o t a l hydrograph a t point ( f ) through reach ( f ,h).
16. Add loca l inflow of reach (f ,h) t o the routed outflow t o get the t o t a l outflow hydrograph for reach ( f , h ) .
17 . Route the t o t a l hydrograph a t point (h) through reach ( h , i ) .
18. Add loca l .inflow of reach ( h , i ) t o the routed outflow t o get the t o t a l outflow hydrograph f o r reach ( h , i ) .
19. Route the inflow hydrograph a t point ( j ) through reach ( 3 ,k) . 20. Add loca l inflow of reach ( j ,k) t o the routed outflow t o get
the t o t a l outflow hydrograph for reach ( j ,LC).
21. Route t he hydrograph a t point (k) through reach ( k , i )
22. Add loca l inflow of reach ( k , i ) t o the routed outflow t o get the t o t a l outflow hydrograph f o r t h i s t r ibu ta ry .
23. ~ d d the t o t a l outflow hydrographs from reaches ( h , i ) and ( k , i ) , steps 18 snd 22, t o get the t o t a l outflow hydrograph for point ( i) .
24. Route the hydrograph a t point ( i ) through reach ( i ,I).
25. Add loca l inflow of reach (i,l?) t o the routed outflow t o get the t o t a l outflow hydrograph a t point (l?). This completes t he routing for a par t icular flood on t h i s stream system.
When manual computations are used, an operations t ab l e with times, inflow hydrographs and loca l inflows tabulated i n t h e i r proper sequence i s use- fu l . Blank columns a re l e f t for the routed outflows and t o t a l outflows, which are tabulated as routing progresses. Above the appropriate columns the required data and routing parameters are tabulated so t h a t the tab le becomes a complete reference for t he routing. A sample operations tab le for routing by Method 2 i s shown as Table 17-20. After the inflow hydro- graph and loca l inflows are tabulated the sequence of the work i s as follows :
Tabulate the reach numbers i n the order i n which the routing w i l l progress; per fom the routings as shown i n Example 17-11 and continue i n t h i s manner through the stream system. Note the routed outflow a t 1.17 hrs which i s rounded t o 1.0 hrs . Theoretically, the outflow hydro- graph should be interpolated on a multiple of A t t o properly position the hydrograph i n re la t ion t o time. The l i nea r interpolation equation i s :
At* - A t 9. I. = 9 i + ( ~ i ~ + ~ - qi) x A t *
NEX Notice 4-102, August 1972

where: qi and qi+i are consecutive discharges, A t * i s the desired time in te rva l and A t 1s the required time in te rva l of the p a r t i a l routing. When using Method 2, A t i s always l e s s than At* .
If the interpolation s tep is omitted and the s ta r t ing times rounded as i n Table 17-20 it i s recognized an error i s introduced, the magnitude of which depends on the re la t ive values of A t and A t * .
NEH Notice 4-102, August 1972

Table 17-20. Portion of a t y p i c a l operations t a b l e f o r rout ing through a stream system.
REACH 16 15 1 4 L ( f t ) 19300. 4000. 37000.
V(fps) 2.9 4.8 3.2 .63 .63 .74 .65 .65
Atx(hrs)l.OO 1.00 1.00 1.00 1.00 L X ( f t ) 1 6 5 4 1 . 2759. 4000. 17486. 17486. 2028.
A t ( h r s ) .17 .12
C* .986 1.00 .998
Time Inflow Outflow Outflow Local Tota l Outflow Local Tota l Outflow Outflow Outflow Lacal Total
031
97 498
1371 2560 3887 5007 5588
5525 4963 4173 3365 2640
2037 e t c .
0 97
498
1371 2560 3887 5007 5588
5525 4963 4173 3365 2640
2034 e t c .
1 5 450 735 739 5 744 e t c . e t c . e t c . e t c . e t c . e t c .
794 35 e t c . e t c .
779 1279 e t c . e t c .
80 2117 e t c . etc.
Outflow begins a t 1.00 h r s . , rounded from 1.17 hrs . ' 1 Outflow begins a t 0.00 h r s . , rounded from 0.17 h r s .
Outflow begins a t 2.00 hrs . , rounded from 2.12 h r s .

NEH Notice 4-10?, August 1972

Figure 17-13. Convex routing coefficient versus velocity.
NM Notice 4-102, August 1972

r
I P
I
- R
Equat~on by W. A. Styner Nomoqraph by Glenn 0. Commons
D l m O l i - m1Y)m DATE 6 . 71
Figure 17-14. ES-1025 rev. sheet 1 of 2.
~f A t * >KO or A t > 6.0 then d iv ida both by 2 to t i c Eaampl. : Ata= 3.0 ond At= 8.2. Use Ata:l.s a n d A f = + . t .
Th. A t and At* must ba in identical units of time (minutes or hours or days. etc.)
SYMBOLS
K - raach t r a w l tima C - rou!inq co.fiici.nt
A t - complied routing intonol A t ' - desired routinq iekrval
/ ' C* - required mu l l n~ car t t i c i~n l
/ EXAMPLE
/ Giwn C = 0.8, Kz3.0, and A1':l.o
I. Compute A t = CK= 0.8(3.0) = 2.4 2. U n A t ond A t o f o r mova I. 3. U n C in mova 2 ond rood : 0.628
At EFERENCE U. 8. mARl%ENT OP ADRlCUL'IVILE STANDARD D M . NO.
NEX Notice 4-102, August 1972

at*+ At HYDROLOGY: NOMOGRAPH FOR SOLUTION OF c*=I-(I-C) 1.5At
tEFERENCE I U. S. DEP- OF AOBICULTURE I STANDARD DWG. NO.
Equation by W.A. Stynar SOIL CONSERVATION SERVICE Nomograph by Glenn G. Commons
R I G M W M O DnmnON . RmROIDCY aa*llCn
gure 17-14. ES-1025 rev. sheet 2 of 2.
NEH Notice 4-102, August 1972

2 3 4
TIME, HOURS
Figure 17-15. Inflow and routed outflow hydrograph f o r Example 17-7
X!i Nctice 4-102, August 1972

0 5 10 15 20 25 30 7 -4
TIME, HOURS -4

3 51
w 0 ct P. 0 m C I
N "
C 10
ct
I-' \O -4 N
4 0 0 0
TOTAL OUTFLOW --\
ROUTED INFLOW
(TOTAL OUTFLOW MINUS LOCAL
0 I 2 3 4 5 6 7 8 TIME, HOURS

I 2 3 4 5 TIME, HOURS
Figure 17-18. Mass inflow, mass outflow and r a t e hydrograph f o r Eiample 17-10.
NM Notice 4-102, August 1972

4
TIME, HOURS

Figure 17-20. Typical Schematic diagram for routing through a system of channels.
NEH Notice 4-102, August 1972

Unit-Hydrograph Routing Methods
Principles of the un i t hydrograph theory are given i n Chapter 16. They apply t o single-peaked hydrographs originating from uniform runoff on the contributing area b u t t h e y can be extended t o apply t o more complex runoff conditions. Despite the l imita t ions of the theory it has features t ha t can be used i n determining peak r a t e s i n stream reaches not only when the watershed is i n a "present" unreservoired condition but a l so when it i s controlled by many reservoirs. It i s the ease w i t h which complex systems of control s t ructures are evaluated t h a t has made the unit-hydrograph type of routing a popular method f o r many years. If suitable data are used the r e su l t s are usually as good as those obtained by more detailed methods of routing.
In t h i s par t of the chapter the basic equations for unit-hydrograph routing w i l l be given and discussed ana some of t h e i r uses explained by means of examples. The unit-hydrograph method of routing gives only the peak ra tes of runoff. The peak-producing hydrograph, i f it i s needed, must be obtained i n some other way.
Basic Equations A l l of the unit-hydrograph working equations are derived from the re la- tionship for the peak r a t e of a uni t hydrograph:
where qp = peak r a t e i n cfs
K = a constant (not the routing parameter used i n the Convex method)
A = drainage area contributing runoff; i n square miles
Q = average depth of runoff, i n inches, from the contributing area
Tp = time t o peak, i n hours
By l e t t i n g q K, A, Q, and T stand for a watershed i n one condition P' and using prmed symbols q;, %, A ' , & I , and T' for the same watershed i n a condition being studied, then by use of &tion 17-37 it i s evi- dent that :
A' Q' Tp (Eq. 17-38)
which i s a typical working equation of the uni t hydrograph method. It can be used, for example, i n determining the peak r a t e s a f t e r establishment of land use and treatment measures on a watershed. In such work the pre- sent peaks, areas, runoff amounts, and peak times are known and it is only a matter of f inding the change i n runoff by use of Chapter 10 methods. The areas and peak times are assumed t o remain constant.
d
NM Notice 4-102, August 1972

i When a floodwater retarding s t ructure , or other structure controll ing a par t of the watershed, i s being used i n the "future" condition then the value of A' is reduced. And i f there are releases from the s t ructure then they must also be taken in to account. For a project having struc- tures controlling a t o t a l of A* square miles and having an average release r a t e of q* csm, the peak r a t e equation becomes:
When using Equation 17-39 t o f ind the reduced peak r a t e t he major assump- t i on i s tha t the structures are about uniformly dis t r ibuted over the watershed. Another assumption i s tha t all s t ructures contribute t o q*, but t h i s i s sometimes too conservative an assumption (see the section t i t l e d "Use of Equation 17-43 on large watersheds").
When A' = A and T ' = T , which i s the usual case when evaluating land P use and treatment effects, Equation 17-38 becomes:
which i s one of the basic expressions of the unit hydrograph theory. I f the same simplification applies when evaluating s t ructures then Equation 17-39 becomes:
Equation 17-41 can be fur ther simplified by using:
(Eq. 17-42)
where r i s the f ract ion of drainage area under control or t he percent of control divided by 100. Using Equation 17-42 i n Equation 17-41 gives:
Effects of storm duration and time of concentration When the e f fec t s of a change i n e i ther the storm duration o r the time of concentration must be taken in to account, one way t o do it i s t o use the following re la t ion from Chapter 16:
where Tp = time t o peak, i n hours
a = a constant
D = storm duration, i n hours, during which runoff is generated; it i s usua l ly- less than the t o t a l storm dura- t ion .
NFX Notice 4-102, August 1972

b = a constant
T, = time of concentration, i n hours
As shown i n Chapter 16, t he constants a and b can be taken as 0.5 and 0.6 respectively, for most problems, i n which case Equation 17-44 becomes :
Using Equation 17-45 i n equations 17-37. 17-38, and 17-39 produces work- ing equations i n which e i t h e r the storm duration or the time of concen- t r a t i on can be changed and the effect of t he change determined. Such equations are not often used because the main comparison i s usually between present and future conditions i n which only runoff amount and drainage area w i l l change. In special problems where storm duration must be taken i n t o account there are other approaches t ha t are more applicable (see the section t i t l e d "Use of Equation 17-43 on large watersheds").
Elimination of Tp
In many physiographic areas there i s a consistent re la t ion between Tp and A because there i s a typical storm condition or pattern. The re la- t ionship i s usually expressed as:
where c i s a constant mult ipl ier and d i s a constant exponent. Sub- i/
s t i t u t i n g C A ~ fo r Tp i n Equation 17-37 gives:
q p = k A (1 - d) (Eq. 17-47)
where k = K/c. Letting (1 - d) = h, Equation 17-47 becomes:
qp = k Ah Q (Eq. 17-48)
which i s the working equation i n practice. The parameters k and h are obtained from da ta for a large storm over the watershed or region being studied. Values of q a t several locations are obtained e i the r from
P streamflow s ta t ions or by means of slope-area measurements (Chapter 14): values of Q associated with each qp are obtained fromthe s t a t i on data or by use of r a i n f a l l and watershed data and methods of chapter 10; and drainage areas a t each locat ion are determined. A p lo t t ing of q /Q against A i s made on log paper and a l i n e of best f i t i s drawn t % rough the plott ing. The mult ipl ier k is the intercept of the l i n e where A = 1 square mile and t h e exponent h is t h e slope of the l ine . See t h e section t i t l e d "Use .of Equations 17-48, 17-50, and 17-52" for an application of t h i s procedure.
After h i s known, t he equivalent of Equation 17-38 i s :
NEH Notice 4-102, August 1972

The k ' s cancel out i n making t h i s change.
In t he "Concordant Flow" method of peak determination, Equation 17-48 i s modified t o take i n t o account the effects of control structures and t h e i r release r a t e s , with the working equation being:
which i s the same as Equation 17-43 i n form but where qp i s now determined from Equation 17-48.
Equations 17-39, 17-41, 17-43, 17-50, and 17-51 should be used only when the storm runoff volume does not exceed the storage capacity of the struc- tu re with the smallest capacity. If the runoff does exceed tha t capacity these equations must be modified further. Equation 17-50, for example, becomes:
C where Qs i s the average storage capacity of the structures. It i s shown i n Example 17-20 how Equation 17-51 and similar equations can be used even when the capacity varies from structure t o structure.
Working equations for special cases Additional equations can be developed from those given i f a special pro- blem ar i ses i n watershed evaluation. For an example, suppose tha t Equa- t i on 17-43 i s t o be used for determining the effects of a proposed system of floodwater retarding s t ructures i n a watershed, and tha t the evaluation reaches a r e so long that the percent of area reservoired varies s ignif i - cantly from the head t o the foot of the reach. To modify Equation 17-43 f o r t h i s case, l e t A* be the area reservoired, A the t o t a l area, and r = A*/A for the head of the reach; and l e t B* be the t o t a l area reservoired (including A*), B the t o t a l area (including A ) , and r" = BY/B f o r the foot of the reach. For evaluations t o be made a t the foot of the reach, Equation 17-43 then becomes:
After f i r s t computing ( 2 - r - r1 ' ) /2 = C ' and (A* + B*)/2 = C" fo r the reach, t he working equation becomes:
q;, = 9p C' + q* C" (Eq. 17-54)
NEH Notice 4-102, August 1972

where C' and C" are the computed coefficients. Each evaluation reach requires i t s own se t of coefficients.
Examples The problems i n the following examples range from the very simple t o the complex, the l a t t e r being given t o show tha t unit-hydrograph methods have wide application. For some complex problems, however., it w i l l generally be more e f f ic ien t t o use the SCS electronic-computer evaluation program.
Use of Equation 17-40. - This basic expression of the uni t hydrograph theory has many uses. The major l imita t ion i n i t s use i s t ha t Q and Q' must be about uniformly dis t r ibuted over the watershed being studied. The following i s a typ ica l but simple problem.
&le 17-12.--A watershed has a peak discharge of 46,300 c f s from a storm tha t produced 2.54 inches of runoff. What would the peak r a t e have been f o r a runoff of 1.68 inches?
1. Apply Equation 17-40. For t h i s problem q = 46,300 c fs , Q = 2.54 inches, and Q' = 1.68 P inches. By Equation 17-40 q; = 46300(1.68/2.54) = 30,604 cfs , rihich i s roun'ded t o 30,600 cfs .
Use of Equation 17-43 - The major l imita t ions i n the use of t h i s equation are tha t both the runoffs and the s t ructures must be about uniformly dis- t r ibu ted over the watershed and tha t the stream t r a v e l times f o r the 1,
d future" condition must be about the same as for the "present." The
following is a typical but simple problem.
Example 17-13.--A watershed of 183 square miles has a flood peak of 37,800 cfs . I f 42 square miles of t h i s watershed were controlled by floodwater retarding structures having a n average release r a t e of 15 csm, what would the reduced peak be?
1. Computer. By Equation 17-42 r = 42/183 = 0.230 because A* = 42 and A = 183 square miles.
2. Apply Equation 17-43. For t h i s problem, q, = 37,800 c fs , r = 0.230 from s tep 1, q* = 15 - . - csm, and A* = 42 s&re miles. ~y Equation 17-43 q' = 37800(1 - 0.230) + 15(42) = 29,736 c fs , which i s rounded t o 25,700 c fs . This is the reduced peak.
Use of Equation 17-43 on large watersheds.- I f Equation 17-43 is used fo r evaluating the effects of s t ructures i n a larne watershed or r i ve r basin - t he releases from structures far upstream may not add t o the peak r a t e s i n the lower reaches of t he main stem. And i f re leases from cer ta in up- stream structures do not a f fec t peaks f a r downstream then those s t ructures a l so are not reducing the peak r a t e s , therefore t h e i r drainage areas should not be used i n the equation. L/
NM Notice 4-102, August 1972

L I n problems of t h i s kind the approach t o be taken is r e l a t i ve ly simple though there are supplementary computations t o be made before the equa- t ion is used. The key s tep i n the approach i s finding the Tp f o r an evaluation flood and using only those areas and s t ructures close enough t o the sub-basin out le t t o affect the peak r a t e of t h a t flood. How t h i s i s done w i l l be i l l u s t r a t ed using the data and computations of Table 17-21. The data are for a sub-basin of 620 square miles, with a time of concentration of 48 hours. Storm durations for the floods t o be evalu- ated w i l l vary from 1 t o over 72 hours, which means t h a t the sub-basin Tp w i l l a lso vary considerably.
Table 17-21 i s developed as follows:
Column 1 l i s t s the t r ave l times on the sub-basin main stem from the out le t point t o selected points upstream, which are mainly junctions with major t r ibu ta r ies . The f i r s t entry i s for the ou t le t point .
Column 2 gives the t o t a l drainage area above each selected point.
Column 3 gives the increments of area.
Column 4 gives the accumulated areas, going upstream. These are the contributing areas when the flood's Tp is within the l imi t s shown i n column 1. For example, when Tp i s between 3.5 and 9.1 hours, the con- t r ibut ing drainage area i s 74 square miles. Tp must be a t l e a s t 48 hours
L before the en t i re watershed contributes t o t he peak r a t e .
Column 5 shows the t o t a l areas controlled by s t ructures .
Column 6 gives the increments of controlled area.
Column 7 gives the accumulated controlled areas, going upstream.
Column 8 gives values of r, which are computed using en t r i e s of columns 7 and 4.
Column 9 gives values of (1 - r ) , which are computed using en t r i e s of column 8.
Column 10 gives the t o t d l average re lease r a t e i n cfs f o r the con- t r o l l ed areas of column 7. For t h i s t ab le the average release r a t e q* i s 7 csm. Therefore the q*(A*) entry for a par t icu la r row is the column 7 area of that row multiplied by the average r a t e i n csm.
Only columns 1, 9, and 10 are used i n the remaining work. To determine the e f fec t of the structures the qp and T of the evaluation flood must be known, t he proper en t r ies taken from tge tab le , and Equation 17-43 applied. For example, i f qp = 87,000 cfs and Tp = 24 hours for a par t i - cular flood, f i r s t enter column 1 with Tp = 24 hours and find the row t o be used, in t h i s case it i s between Tt values of 21.1 and 28.0 hours; next select ( 1 - r ) = 0.459 from column 9 of t h a t row and q*(AW) = 1,491
Ll cfs from column 10; f i na l ly , use Equation 17-43 which gives q i = 87000 (0.459) + 1491 = 41,424 c fs , which i s rounded t o 41,400 cfs.
NM Notice 4-102, August 1972

Table 17-21 D a t a and working table f o r use of Equation 17-43 on a large watershed
T t A A A AU A* A A* 4: r (1 - r ) q * ( ~ * p ' (hrs ) ( s q . m i . ) (sq.mi.) (sq.mi.) ( s q . m i . ) (sq.mi.) ( s q . m i . ) (cfs)
(1) ( 2 ) ( 3 ) ( 4 ) ( 5 ) ( 6 ) ( 7 ) (8 ) ( 9 ) ( l o )
o 620 359 8 8 0 0 0 1.000 0
2.0 612 359 6 14 3 3 .214 .786 21
3.5 606 356 60 74 24 27 .365 .635 189
9.1 546 332 90 164 43 70 .426 .574 490
15.3 456 289 80 244 56 126 517 .483 882
21 .1 376 233 150
394 146 87 213 .541 .459 1491
28.0 226 101 495 '77 290 .586 .414 2030
31.0 125 69 98 593 48 338 5'70 .430 2366
42.0 27 21 27 620 2 1 359 .580 .420 2513
'48.0 0 o --
1/ Using an average rate of q* = 7 c s m . -

'..- If any other point i n the sub-basin i s a l s o t o be used f o r evaluation of s t ruc tu re e f f e c t s then a separa te t a b l e i s needed f o r t h a t point .
Use of Equations 17-48, 17-50, and 17-52.- When streamflow da ta or slope- a rea measurements and Q est imates a re avai lable f o r a watershed and i t s v i c i n i t y , t h e information can be used t o construct a graph of qp/Q and A as shown i n Figure 17-21. This i s the graphical form of Equation 17-48. If a l i n e with an in tercept of 484 cfs / in . and slope of 0.4 can be reason- ably wel l f i t t e d t o t h e data , as i n t h i s case, it means t h a t t h e hydro- graph shapes of these watersheds c lose ly resemble the shape of t h e u n i t hydrograph of Figure 16-1 ( s e e Chapter 16) . Usually t h e slope w i l l be 0.4 f o r other shapes of hydrographs ( t h e reason f o r t h i s i s discussed i n Chapter 1 5 ) but t h e in te rcep t w i l l vary. kor the l i n e of Figure 17-21, Equation 17-48 can be wri t ten:
The following examples show some t y p i c a l uses of the graph o r i t s equa- t i o n .
Example 17-14.--For a watershed i n the region t o which Figure 17-21 appl ies , A = 234 square miles and Q = 3.15 inches f o r a storm event. What i s q 7
P'
1. Find qp/Q f o r the given A.
Enter t h e graph with A = 234 square miles and a t t h e l i n e of re la- t i o n f i n d qp/Q = 4,290 c f s / i n .
2. Compute q,.
Multiplying %/Q by Q g ives qp, the re fo re , qp = 3.15(4290) = 13,500 cfs by a s l ide-rule computation.
If p a r t of a watershed is control led by floodwater r e ta rd ing s t r u c t u r e s t h e graph can be used together with equation 17-50, as follows:
Example 17-15.--A watershed of 234 square miles has a system of flood- water r e ta rd ing s t r u c t u r e s on it control l ing a t o t a l of 103 square miles. Each s t r u c t u r e has a storage capacity of 4.5 inches before discharge begins through t h e emergency spillway. Each s t r u c t u r e has an average re lease r a t e of 15 csm. When t h e storm runoff Q i s 4 . 1 inches what is t h e pea& r a t e with ( a ) s t ruc tu res not i n place, and (b) s t ruc- t u r e i n place?
1. Determine t h e f lood peak f o r t h e watershed with s t ruc tu res not i n place. Use the method of Example 17-14. Enter Figure 17-21 with A = 234 square miles and f ind qp/Q = 4,290 c f s / in . Multiplying t h a t r e s u l t by Q = 4.1 inches gives qp = 4.1(4290) = i7,600 c f s by a s l ide - r u l e computation. This discharge i s (k A Q ) i n Equation 17-50.
NEH Notice 4-102, Augus t 1972

2. Determine (1 - r ) . From Equation 17-42 r = A*/A = 1031234 = 0.440. Then ( 1 - r ) = 1 - 0.440 = 0.560.
3. Determine the flood peak for the watershed with s t ructures i n place. Use Equation 17-50 with the r e su l t s of steps 1 and 2 and the given data for controlled area and release ra te : q$ = 17600(0.560) + 15(103) =. 11,410 cfs , using a sl ide-rule for the multiplications. Round the discharge t o 11,400 c fs .
If the storm runoff exceeds the storage capacit ies of the s t ructures but the capacities are the same for a l l s t ructures then Equation 17-52 can be applied as shown i n t he following example.
Example.17-16.--For the same watershed and s t ructures used i n Example 17-18 find the peak ra tes without and with s t ructures i n place when the storm runoff i s 6.21 inches.
1. Determine the flood peak f o r the watershed with s t ructures not i n place. Use the method of Example 17-14. h t e r Figure 17-21 with A = 234 square miles and f ind q p / ~ = 4,290 cfs / in . This i s (k ~ h ) i n Equa- t ion 17-52. Multiplying tha t r e su l t by Q = 6.21 inches gives q = 6.21 (4290) = 26,700 cfs by a sl ide-rule computation. This i s ?he peak r a t e without s t ructures i n place.
2. Determine r. From Equation 17-42 r = AY/A = 1031234 = 0.440
3. Determine the flood peak f o r the watershed with s t ructures i n place. Use Equation 17-52 with (k A ~ ) = 4,290 cfs / in . from s t ep 1; Q = 6.21 inches, as given; r = 0.440, from step 2; and Qs = 4.5 inches, q* = 15 csrn, and A* = 103 square miles as given i n Example 17-17. Then q$ = 4290(6.21 - O.bkO(4.5)) + 15(103) = 18160 + 1540 = 19,700 cfs.
Note that the effect of the release r a t e on reducing the storm runoff amount i s not taken in to account i n t h i s example. This means tha t the peak of 19,700 cfs i s s l i gh t ly too large and t h a t t h i s approach gives a conservatively high answer.
I f the storage capacit ies of the s t ructures vary then Equation 17-52 i s used with ( Q - r Qs) computed by a more detai led method, as shown i n the following example.
Example 17-17.--A watershed of 311 square miles has a system of flood- water retarding s t ructures controll ing a t o t a l of 187 square miles and having average release r a t e s of 8 csm. Storage capacit ies of the struc- t u re s are shown i n column 3 of Table 17-22; these are t he capacit ies before emergency spillway discharge begins. When the storm runoff i s
NEH Notice 4-102, August 1972

L uniformly 7.5 inches over the watershed, what i s the peak r a t e of flow with ( a ) no structures i n place and (b ) s t ructures i n place?
1. Determine the flood peak for the watershed with s t ructures not i n place. Use the method of Example 17-14. Enter Figure 17-21 with A = 311 square miles and find qp/4 = 4,800 cfs / in . This . i s (k A ~ ) i n Equa- t ion 17-52. Multiplying tha t resu l t by Q = 7.5 inches gives qp = 36,000 cfs by a slide-rule computation. This i s the peak r a t e with- out s t ructures i n place.
2. Compute the equivalent of (r QS) i n Equation 17-52. The factor (r Qs) can also be expressed as :
where Ax i s the drainage area i n square miles of the x-th s t ructure and Qsx i s the reservoir capacity i n inches fo r t h a t structure. In Table 17-22 each drainage area of column 2 i s multiplied by the res- pective storage of column 3 t o get the entry for column 4. But note tha t when the storage exceeds the storm runoff it is the storm runoff amount, i n t h i s case 7.5 inches, which i s used t o get the entry for column 4. Equation 17-56 i s solved f o r ( r Qs) by dividing the sum of column 4 by the t o t a l watershed area:
( r Qs) = 967.26
311 = 3.11 inches
(Note: Column 4 is not needed if the calculations a r e made by accumulative multiplication on a desk-calculator. )
3. Determine the flood peak for the watershed with s t ructures i n place. Use Equation 17-52 with (k A ~ ) = 4,800 cfs / in . from step 1; Q = 7.5 inches, as given; (r QS) = 3.11 inches as computed i n s tep 2; and q* = 8 csm and A* = 187 square miles, as given. This gives: q i = 4800(7.5 - 3.11) + 8(187) = 21100 + 1495 = 22,595 c f s , which is rounded t o 22,600 cfs . This i s the peak r a t e with s t ructures i n place.
DISCUSSION. These examples are a sample of the many ways i n which the unit-hydrograph methoa of routing can be used. Accuracy of the method depends on what has been ignored, such as variable re lease r a t e , surcharge storage, and so on. In general, the method gives conservative results-- t ha t i s , the e f fec t s of s t ructures , for example, are usually underesti- mated so t h a t the peak r a t e i s s l i gh t ly too high.
The examples also show tha t as the problem contains more de t a i l s t he pro- cedure gets more complex. It i s easi ly possible t o make t h i s "short-cut" method so complicated it becomes d i f f i c u l t t o get t he solution. For t h i s
L reason, and for reasons of accuracy, it is b e t t e r t o use t he SCS eleetronic- computer program for complex routing problems.
NHI Notice 4-102, August 1972

Table 17-22 Area and storage data for Example 17-17
Floodwater Gontribut ing retarding drainage Storage Ax X Qsx s t ructure area
(sq. mi.) ( i n . ) (sq. mi. x in . )
* This is (drainage area) x (storm runoff of 7.5 inches) because the storage greater than the runoff i s ineffec- t i ve and should not be used i n the computation.
NEB ~o t ' i c e 4-102, August 1972


Copyright © 2022 FDOKUMEN