
Flood Risk Evaluation and Flood Control Solutions Phase 1
308
FLOOD RISK EVALUATION AND FLOOD CONTROL SOLUTIONS PHASE 1- FINAL REPORT MAY 2009 McElhanney Consulting Services Ltd. Environmental Dynamics Inc. M. Miles and Associates Ltd.
-
Upload
khangminh22 -
Category
Documents
-
view
3 -
download
0
Transcript of Flood Risk Evaluation and Flood Control Solutions Phase 1

FLOOD RISK EVALUATION AND FLOOD CONTROL SOLUTIONS
PHASE 1- FINAL REPORT
MAY 2009
McElhanney Consulting Services Ltd. Environmental Dynamics Inc. M. Miles and Associates Ltd.

Prepared for:
City of Prince George 1100 Patricia Boulevard,
Prince George, B.C. V2L 3V9
Prepared by: Northwest Hydraulic Consultants Ltd.
30 Gostick Place North Vancouver, BC
V7M 3G3
and McElhanney Consulting Services Ltd.
Environmental Dynamics Inc. M. Miles and Associates Ltd.
May 2009 3-4920
CITY OF PRINCE GEORGE FLOOD RISK EVALUATION AND FLOOD CONTROL SOLUTIONS
PHASE 1- FINAL REPORT

nhc
Flood Risk Evaluation and Flood Control Solutions – Phase 1 Final Report i
DISCLAIMER This document has been prepared by Northwest Hydraulic Consultants Ltd. (NHC), McElhanney Consulting Services Ltd. (MCSL), Environmental Dynamics Inc. (EDI) and M. Miles and Associates Ltd. (MMA) in accordance with generally accepted engineering and geoscience practices and is intended for the exclusive use and benefit of the client for whom it was prepared and for the particular purpose for which it was prepared. No other warranty, expressed or implied, is made.
Northwest Hydraulic Consultants Ltd. and its officers, directors, employees, agents and sub-consultants (McElhanney Consulting Services Ltd., Environmental Dynamics Inc. and M. Miles and Associates Ltd.) assume no responsibility for the reliance upon this document or any of its contents by any party other than the client for whom the document was prepared. The contents of this document are not to be relied upon or used, in whole or in part, by or for the benefit of others without specific written authorization from Northwest Hydraulic Consultants Ltd. and our client.
Report prepared by:
Original signed by: Original signed by:
Bruce Walsh, P.Eng. Bill Cheung, P.Eng. NHC – Principal MCSL – Assistant Branch Manager
Original signed by: Original signed by:
Dave Andres, P.Eng. Mike Miles, P.Geo. NHC – Principal MMA - Principal
Original signed by: Original signed by:
Monica Mannerström, P.Eng. Rob Van Schubert, R.P.Bio. NHC - Senior Engineer EDI – Vice-President

nhc
Flood Risk Evaluation and Flood Control Solutions – Phase 1 Final Report ii
ACKNOWLEDGEMENTS AND CREDITS This project is conducted under the guidance of Dave Dyer, P.Eng., Chief Engineer - City of Prince George, who throughout the project has provided information, direction and advice. Bob Radloff, P.Eng., Director Development Services and Dan Milburn, MCIP, Manager of Long Range Planning, both of City of Prince George, reviewed the report and provided valuable comments.
Background information and comments were received from Lyle Larsen, BC Ministry of Environment Water Stewardship Division. Input was also received from several environmental agencies and the assistance of Byron Nutton of Fisheries and Oceans Canada is gratefully acknowledged. Lynne Campo, Water Survey of Canada made available published hydrometric data and archived material. Input was also obtained from stakeholders in Prince George through open meetings organized by Steve Litke, Program Manager – Fraser Basin Council and Joan Chess, Manager, Upper Fraser Region of Fraser Basin Council. The Lheidli T’enneh First Nation assisted with field work and environmental investigations.
The development of flood control options and corresponding cost estimates were carried out chiefly by McElhanney Consulting Services Ltd. (MCSL), under the direction of Bill Cheung, P.Eng. Geomorphologic and sedimentology investigations were completed by Mike Miles, P.Geo. of M. Miles Associates Ltd. (MMA) and environmental investigations were undertaken by Environmental Dynamics Inc. (EDI), led by Rob Van Schubert, R.P.Bio. The project team was managed by Bruce Walsh, P.Eng. of Northwest Hydraulic Consultants Ltd. (NHC). Ice analyses were performed by David Andres, P.Eng. and NHC also undertook the hydrologic and hydraulic investigations, with modelling and graphics output completed by Guilherme de Lima, Ph.D. Project engineering was by Monica Mannerström, P.Eng. who compiled the report, with Charles Neill, P.Eng. and David McLean, P.Eng. providing an internal review. Kevin Brown Communications Ltd., although not directly involved in Phase 1 of the project, is also part of the team and will assist with the launch of this report and public consultations in Phase 2.

nhc
Flood Risk Evaluation and Flood Control Solutions – Phase 1 Final Report iii
EXECUTIVE SUMMARY Objectives and Background The City of Prince George experienced severe ice-related flooding during the winter of 2007-08, when inundation of lands along the lower Nechako River caused extensive damage. This ice event had an estimated return period of about 90 years, meaning that such a high flood level can be expected to occur on average about once every 90 years. Just a few months before, in the spring of 2007, high water levels in the Fraser River had caused localized flooding of low-lying areas along the Fraser and in the area of the Nechako-Fraser confluence. This spring event had an estimated return period of about 20 years.
Prompted by these two events, the City of Prince George initiated the current study and retained a consulting team lead by Northwest Hydraulic Consultants Ltd. to evaluate flood risks and develop flood control solutions. The work is divided into two parts, with the first part focusing on evaluating flood risks and identifying flood control options (as described in this report), and the second part involving public consultations, and selection and development of preferred flood-control solutions.
In the Fraser River, flooding normally occurs in the spring, caused by melting of large snow-packs combined with sudden rises in temperature and/or heavy rains. In the Nechako River, on the other hand, the most critical condition is ice-related flooding that occurs during fall freeze-up. When November-December flows in the Nechako exceed a certain threshold and there is a prolonged period of cold weather, ice-related flooding may occur. Since 1957 the Nechako flow at Prince George has been partly regulated by Rio Tinto Alcan's Kenney Dam, almost 300 km upstream. The current mode of operating the reservoir tends to reduce winter flows during freeze-up and to delay the summer peak until after the Fraser River has peaked, thereby reducing the risks of both open-water and ice-related flooding.
Numerous fish species are found in the Nechako and Fraser Rivers, including different types of salmon and white sturgeon, an endangered species. Proposed flood control projects within and along the rivers must be approved by provincial and federal regulatory agencies before any work can proceed.
Project Approaches The first step was to collect all relevant background information that could be used to assess flood risks and understand flood threats - such as past reports, historic air-photos, river flows and meteorological records. The river channel and floodplain were surveyed using the latest technology. Local residents provided general observations regarding channel changes. Environmental data such as information on fish habitat was also assembled.
To determine how a river has changed over time it is useful to look at consecutive historic air-photographs. The earliest air-photos of the Prince George area date from 1928. Later photos show how in the confluence area, floodplain zones were gradually subjected to urban development, backchannels were filled in, and vegetation extended on gravel bars (likely in response to the regulation of Nechako flows). However, a comparison of river cross-sections from 1979 and 2008 shows surprisingly little change in the main river channel itself. The hydraulic capacity of the channel remains much the same, and recent high floods do not seem to reflect significant changes to the flow regime or the river channel morphology. Effects on

nhc
Flood Risk Evaluation and Flood Control Solutions – Phase 1 Final Report iv
river flows of climate change and pine beetle infestations are presently undetectable, but could become significant in the future.
The BC Ministry of Environment (MOE) design standard for flood control works is the estimated 200-year flood level, plus a freeboard allowance (vertical separation between design flood level and top-of-dike) of 0.6 m to account for factors such as waves and uncertainty in the flood level estimate. This design level is called the Flood Construction Level (FCL) and is shown on the existing Prince George floodplain maps developed in 1997. The 200-year Nechako and Fraser water surface profiles were simulated and form the basis for designing flood control protection and updating the floodplain maps. Assuming a freeboard allowance of 0.6 m, the updated Nechako River FCL is on average 1.1 m higher than the 1997 levels and the Fraser River FCL is 0.3 m higher. These increases are the result of revised design flows and updated ice jam assessment techniques rather than changes to the river channels. A review of the 0.6 m freeboard allowance is recommended considering potential future changes to the design flows caused by pine beetle infestations, climate change and possible altered reservoir operating regimes.
Identified areas at risk of flooding within the City include seven locations along the Nechako and another seven along the Fraser. The areas near the confluence are vulnerable to both ice-related flooding from the Nechako and backwater flooding from the Fraser, and are considered to have the highest priority for receiving protection. Potential flood control options include:
1) River solutions such as gravel bar scalping, dredging and flood relief side-channels. 2) Building dikes or raising roads with provision for internal drainage and seepage
prevention. 3) Land use changes. 4) Local flood-proofing. 5) Providing no permanent protection and continuing to rely on emergency protection.
Options were evaluated in terms of their technical performance, environmental impacts and overall costs (both direct and indirect). All options were assigned a general ranking to show which appear best suited for each area, then a filtering process was applied. All options remaining after filtering will go forward to public consultations.
Discussion of Flood Control Options
Gravel extractions can be effective for lowering flood levels in some rivers. After careful investigation it was concluded that this would not be the case at Prince George. Some gravel build-up has occurred in the confluence area and to some extent affects open-water profiles when Fraser water levels are low, it does not however affect the ice-related or backwater-generated design flood conditions. With respect to ice-related flooding, removing gravel would increase flow areas, which would reduce velocities and encourage more ice to accumulate. Similarly, the Fraser backwater condition from open-water floods would not be alleviated. Removals of up to 2 million cubic metres were modelled but did not provide a benefit. The effects of gravel removals are summarized in Appendix H of the report. The analyses took into account observed and surveyed channel changes, potential sediment supply sources, flow variations as a result of reservoir regulation and floodplain changes.

nhc
Flood Risk Evaluation and Flood Control Solutions – Phase 1 Final Report v
Enlarging existing side-channels or introducing new side-channels can reduce ice-related flood levels in the main channel downstream of the side-channel entrances, as long as the entrances and side-channels remain ice-free. The Cottonwood Island side-channel provided flood relief in the winter of 2007-08 and enlarging it to carry more flow would be beneficial.
Dikes alongside rivers are expensive because they have to be rock-protected against erosion and the protection must be maintained over time. They also tend to damage riparian habitat and to a limited extent raise flood levels. Dikes set back from the river are often preferable. During flooding, groundwater levels rise - any dike or road-raising project must consider groundwater seepage and provide internal drainage. Environmental permits are required for building dikes.
Land use decisions in the past have resulted in urban development within some highly flood-prone areas of Prince George. Land use changes, whereby properties are purchased and developments are removed, may be the best option for some locations. This was done in the Island Cache area after the large flood in 1972. The option is maintenance-free and offers opportunities to provide environmental compensation for developments elsewhere.
Local flood-proofing such as raising buildings, driveways, well-casings and septic fields may be practical for single-family developments.
Conclusions and Recommendations Flood control options for each risk area were ranked based on costs, environmental impacts and other factors. The highest ranking options, for the risk areas listed in order of priority, are summarized in the attached Conclusions and Recommendations table, as well as shown on the Summary Map.
The complete suite of options for Prince George would have a total cost of about $35.4 M. The cost estimates provided in this report are order of magnitude estimates and will be refined following public consultations. Improvements to the Cottonwood Island side-channel are also recommended and the feasibility of a Nechako north shore flood relief side-channel should be assessed in detail.
It is recommended that the project proceed to public consultations, and selection and development of the preferred flood control solutions. The present floodplain maps are outdated and need to be revised.

nhc
Flood Risk Evaluation and Flood Control Solutions – Phase 1 Final Report vi
CONCLUSIONS AND RECOMMENDATIONS
CONCLUSIONS (C) RECOMMENDATIONS (R) Flood Risk Evaluation
C1. The dominant 200-year flood threat at Prince George for the Nechako River from the City boundary to about 1,250 m downstream of Cameron Street Bridge (to cross-section N6) is ice-related flooding. Downstream of this section and throughout the Fraser River study reach, the Fraser freshet is the dominant 200-year flood threat.
R1. To provide an effective response during flooding, it is recommended that the City of Prince George develop a flood response plan which should, among other elements, include:
a. A real-time forecasting procedure for Fraser River freshet floods using flows predicted by MOE’s River Forecast Centre and the hydraulic model developed for this project.
b. A tool to monitor antecedent conditions conducive to ice jamming, when flows are greater than 200 m3/s in combination with prolonged cold periods of temperatures less than -5oC. A continuous recording gauge should be introduced at John Hart or Cameron Street Bridge to provide accurate flow and water level information.
C2. Historic air-photograph comparisons of Nechako River from 1928 to present indicate:
a. the floodplain has been extensively developed; b. many side-channels have filled in; and, c. the extent (size) of vegetated islands has increased.
The floodplain and river channel configurations will continue to evolve in the future. The design profiles developed reflect present channel conditions and may be subject to change.
R2. During future large flow events, high watermarks should be recorded and checked against the current numerical models for both freshet and ice-related floods on the Nechako River and freshet events on the Fraser River.

nhc
Flood Risk Evaluation and Flood Control Solutions – Phase 1 Final Report vii
C3. Recent high ice-related and freshet flooding is not a result of river channel changes. A comparison of Nechako and Fraser River cross-sections from 1979/1995 and 2008 indicate:
a. There is little change in terms of thalweg (lowest point) elevations, average bed elevations or cross-sectional areas. There is no evidence of significant aggradation or degradation, although the channel sections have changed shape as a result of gravel bar shifting.
b. In the Nechako River, there is no apparent channel change upstream of the Foothills Bridge, some random increases and decreases in bed levels between the Foothills and John Hart Bridges and a general lowering of the bed downstream of Cameron Street Bridge. The most downstream cross-section (N1) shows some deposition.
c. In the Fraser River, the thalweg at the CN Rail Bridge has in-filled, whereas the channel between the CN Rail Bridge and the Yellowhead Bridge has lowered. At the confluence (cross-sections F26 and F27), the average bed level has increased.
R3. In order to assess future channel changes more precisely, it is recommended that the river bed at the confluence be monitored. The 2008 grid bathymetric survey can be used as the baseline condition. Gravel storage and shifting of bars has taken place both before and after the construction of Kenney Dam. It should be recognized that this is a natural consequence of the flatter gradient within the lower Nechako River. Build-up of material may occur over a series of low/medium flow years with intermittent material removal during high flow years or ice-floods.
C4. Current operation of the Nechako Reservoir reduces the risk of flooding at Prince George. The present operating regime tends to lower winter flows during freeze-up which reduces the potential for ice-related flooding. In the spring, the reservoir delays the Nechako freshet peak by up to a month or until well after the Fraser River has peaked. Generally, the magnitude of the Nechako peak flow has been reduced by the operation of the reservoir.
R4. MOE in cooperation with Rio Tinto Alcan should be encouraged to predict the likely reservoir operations during a 200-year flood, so that the reducing effect on the design flow at Prince George can be estimated. Similarly, the extent to which flow releases can be reduced during freeze-up should be explored. If changes are introduced to the reservoir operation, the Nechako freshet and ice design flows need to be reviewed.

nhc
Flood Risk Evaluation and Flood Control Solutions – Phase 1 Final Report viii
C5. The return periods of recent events are: a. Ice related (Nechako River)
i. 2007-08 - estimated return period of 90 years. (In some instances, WSC reported flows at the different gauges along Nechako River appear not to add up in the downstream direction with reported tributary flows.)
b. Freshet: (Fraser River) i. 2002 - estimated return period of 14 years;
ii. 2007 - estimated return period of 19 years; iii. 2008 - estimated return period of 16 years.
R5. a) WSC should be requested to investigate apparent discrepancies in reported flows along the Nechako River, particularly for winter periods. b) The conversion to geodetic elevations at the Shelley gauge needs to be verified.
C6. Based on analysis of historic floods and available WSC flow records, the estimated 200-year design flows are:
a. 1,450 m3/s for the Nechako River at Prince George (6% increase from the previous design flow used for the 1997 floodplain mapping).
b. 5,660 m3/s for the Fraser River at Shelley (2% increase from previous design flow).
c. 6,360 m3/s for Fraser River below Nechako River (3% increase from previous design flow).
R6. a) The analysis of hydraulic conditions on the Nechako and Fraser Rivers indicates a significant deviation from the previous design flood profiles. It is recommended that Prince George work with the Ministry of Environment to adopt the revised water surface design flood profiles.
b) Considering the limited clearance of the CNR Bridge, CNR should be informed regarding the revised higher 200-year flood profile for the Fraser River.
C7. The floodplain mapping developed in 1997 is no longer valid. The primary reasons are:
a. The previous study did not include ice modelling on the Nechako River.
b. The updated design flows are higher, being based on longer record periods.
c. On average, the Nechako River ice-related flood profile is 1.1 m higher than previously adopted. The revised Fraser River flood profile is on average 0.3 m higher. The rise in the profiles will expand the floodplain areas correspondingly.
R7. It is recommended that Prince George update the 1997 Floodplain Mapping based on the revised 200-year water surface profiles plus a freeboard allowance.

nhc
Flood Risk Evaluation and Flood Control Solutions – Phase 1 Final Report ix
C8. Climate change and Mountain Pine Beetle infestation adds greater uncertainty to both winter and freshet flows. However, the recent above average freshet peaks and ice related flooding is unlikely the result of consistent change in the river basin or changing meteorological conditions. If a flow increase of 20% (assumed probable maximum) were to occur it would result in a corresponding average water level increase of 1.0 m for the Fraser River 200-year flood and 0.6 m for the Nechako River 200-year freshet flood.
R8. a) In consultation with MOE’s Inspector of Dikes’ office, an appropriate freeboard allowance for determining Flood Construction Levels at Prince George should be determined. A freeboard of 0.6 m, as generally assumed in this report, should be considered a minimum. In view of the increased uncertainty of climate change and Mountain Pine Beetle impacts, consideration should be given to increasing the Ministry of Environment standard freeboard allowance of 0.6 metres to 1.0 metres. b) More detailed hydrologic analysis and modelling would be required to examine how climate change and Mountain Pine Beetle infestation might change the flow regime in the Nechako and Fraser Rivers at Prince George. Results from current investigations of both factors by MOE’s River Forecast Centre should be reviewed when available, and the need for additional work assessed.
Flood Control Solutions
C9. Modelling various sizes and shapes of sediment removals (both bar scalping and dredging) for ice and open water conditions indicated that during 200-year flood conditions, the water surface profile does not change as a result of the removals. Sediment removals in the Nechako River would likely increase the amount of ice accumulation during ice-related flood events. The confluence ice levels and freshet backwater levels are set by the Fraser River hydraulic conditions below the confluence. Increasing the flow capacity of this steep, confined river reach through channel improvements is not practical.
R9. Sediment removal from the Nechako River or the Fraser River confluence is not considered a viable flood control solution for Prince George. Under present conditions, it is recommended that Prince George does not further pursue sediment removal from the main channels as a flood mitigation measure.
C10. Restoring and increasing the conveyance of Nechako River side-channels would reduce ice-related flood levels in the main channel downstream of the side-channel
R10. It is recommended that Prince George consider increasing the conveyance capacity of the Cottonwood Island side-channel by sediment excavation and debris removal. An

nhc
Flood Risk Evaluation and Flood Control Solutions – Phase 1 Final Report x
entrances, as long as the entrances and channels remain ice-free. This applies to the existing Cottonwood Island side-channel and if land-use prescriptions allow, extension and recovery of the in-filled channel along the north bank.
inlet structure at the channel entrance would be required. If allowed by land-use change, reclamation of the side-channel previously in-filled by development along the north bank should also be considered.
C11. Seven areas at risk of flooding were identified along the Nechako River and another seven along the Fraser River. The south and north banks of the Nechako River at the confluence are at greatest risk, since they are susceptible to flooding from both Fraser freshets and Nechako ice jams. Highest ranking solutions for the risk areas in order of priority are (order of magnitude cost estimates are shown in parenthesis):
a. Area AN - South Bank of Nechako River at Confluence - Build dike on river side of River Road, providing internal drainage and reducing groundwater seepage. Introduce land-use change north of River Road. ($15.5 M)
b. Area CN - North Bank of Nechako River near Confluence – Introduce land-use/zoning changes south of PG Pulpmill Road. On north side of road land-use change or local flood-proofing can be considered. ($9.3 M)
c. Area DN - North Bank of Nechako River West of John Hart Bridge - Raise Preston Road. Introduce land-use/zoning changes or local flood-proofing on river side of road. In the river side area, subdrains/ emergency protection may reduce flooding of buildings/basements.($1.2 M raising of road only)
d. Area BN - North Bank of Nechako River East of John Hart Bridge - No permanent protection, provide temporary protection as needed. Residents should be
R11. a) It is recommended that the City of Prince George consider the solutions listed under Conclusion 11 and advance with the City’s public consultation strategy. All options remaining after the medium filtering process (see Section 6.6) should be put forward for public consultation, with emphasis on the options that ranked the highest. b) Dike designs need to include internal drainage provisions and groundwater seepage prevention. c) Of all flood control solutions considered, land-use change involves the least maintenance and should be considered first where feasible. d) For evaluating environmental impacts of flood control solutions, it should be determined whether the Lower Nechako River is a sturgeon spawning area.

nhc
Flood Risk Evaluation and Flood Control Solutions – Phase 1 Final Report xi
encouraged to include subdrains to reduce the potential for groundwater effects. Introduce land-use/zoning changes.
e. Area BF – South Fort George – Introduce land-use/ zoning changes as necessary. Optionally local flood-proofing can be considered in some locations. ($1.4 M)
f. Area EN – Morning Place – Introduce land-use/ zoning changes as necessary. Optionally, local flood-proofing can be considered in some locations. ($1.4 M)
g. Area DF – Lansdowne South End – Introduce land-use/zoning changes as necessary. Optionally local flood-proofing can be considered in some locations. ($0.8 M)
h. Area FN – South Bank of Nechako River at Foot Hills Bridge - Land-use/zoning changes as necessary.
i. Area GN – South Bank of Nechako River between John Hart and Foothills Bridges - Land-use/zoning changes as necessary.
j. Area AF – West bank at Yellowhead Highway - land-use/zoning changes as necessary.
k. Area CF – Hudson’s Bay Slough west of Queensway – Review adequacy of existing protection.
l. Area EF – West Bank at Island – Undeveloped, introduce land-use/zoning changes as necessary.
m. Area FF – Northwood Pulp mill Road - Land-use/ zoning changes as necessary. Raise Landooz Road for access. ($5.8 M)
n. Area GF – Across River from Shelley - Land-use/ zoning changes.

Land-use change orlocal flood-proofing
Land-use changeNo permanent protection,temporary protection as needed / optional subdrains
Raise Preston Roadand build short dike
Land-use change orlocal flood-proofing / optional subdrains
Land-use change
Dike along River Road (with seepageprevention and drainage)
Land-use change orlocal flood-proofing
Land-use change orlocal flood-proofing
Build north shoreflood relief side-channel
Enlarge Cottonwood Isl.flood relief side-channel
Existing dike andpump station
AN
CNBN
BF
DN
DF
514000.000000
514000.000000
516000.000000
516000.000000
518000.000000
518000.000000
5970
000.
0000
00
5970
000.
0000
00
5972
000.
0000
00
5972
000.
0000
00
5974
000.
0000
00
5974
000.
0000
00
5976
000.
0000
00
5976
000.
0000
00
Land-use change orLocal flood-proofingLand-use change orLocal flood-proofing
ENEN
®
City of Prince GeorgeFraser River and Nechako River
Jan / 2009
Flood Control SolutionsUTM Zone 10 (NAD 83) - Units: MetresNotes: Satellite Images from Gogle Earth
FLOOD RISK AREAS - Highest Phase 1 Ranking
Area AN - South Bank of Nechako River at ConfluenceArea CN - North Bank of Nechako River near ConfluenceArea DN - North Bank of Nechako River West of John Hart BridgeArea BN - North Bank of Nechako River East of John Hart BridgeArea BF - Fraser River at South Fort GeorgeArea EN - North Bank of Nechako River at Morning PlaceArea DF - Fraser River at Lansdowne South End
Legend1997 Floodplain (to be updated)
0 0.5 1 1.5 20.25Kilometres
(with Highest Phase 1 Ranking)
Morning Place
Note:A total of 14 risk areas were identified.Please refer to Phase 1 Report for lower priority areas.

nhc
Flood Risk Evaluation and Flood Control Solutions – Phase 1 Final Report xii
TABLE OF CONTENTS 1 INTRODUCTION................................................................................................. 1
1.1 Background................................................................................................... 1 1.1.1 Project Initiation .................................................................................................1 1.1.2 Previous Floodplain Mapping ............................................................................2
1.2 Terms of Reference ...................................................................................... 2 1.2.1 Phase 1 – Flood Risk Evaluation.......................................................................2 1.2.2 Phase 2 – Flood Control Solutions ....................................................................4
2 BIOPHYSICAL DESCRIPTION ........................................................................ 5
2.1 Study Area .................................................................................................... 5
2.2 River Morphology.......................................................................................... 5 2.2.1 Nechako River ...................................................................................................5 2.2.2 Fraser River.......................................................................................................5
2.3 Nechako Reservoir ....................................................................................... 6 2.3.1 Flood Reduction ................................................................................................6 2.3.2 Effects of Reservoir on Flow Regime and Morphology .....................................7
2.4 Channel Changes ......................................................................................... 7 2.4.1 Nechako River ...................................................................................................8 2.4.2 Fraser River.......................................................................................................9 2.4.3 Present and Future Channel Conditions .........................................................10
2.5 Environmental Setting................................................................................. 11 2.5.1 General Description.........................................................................................11 2.5.2 Salmonid Habitat .............................................................................................12 2.5.3 White Sturgeon................................................................................................13
3 OPEN WATER FLOOD HYDROLOGY AND HYDRAULICS ........................... 15
3.1 Historic Floods and Hydrometric Records................................................... 15
3.2 Fraser River Freshet Design Flows Upstream of Nechako River................ 16
3.3 Nechako River Freshet Design Flows......................................................... 17
3.4 Fraser River Freshet Design Flows Downstream of Nechako River ........... 19
3.5 Potential Future Impact of Climate and Basin Change ............................... 21

nhc
Flood Risk Evaluation and Flood Control Solutions – Phase 1 Final Report xiii
3.5.1 Climate Change...............................................................................................21 3.5.2 Mountain Pine Beetle ......................................................................................22 3.5.3 Change Predictions Applied to Flooding at Prince George .............................23
3.6 Hydraulic Analysis ...................................................................................... 23 3.6.1 Model Development.........................................................................................23 3.6.2 Model Calibration and Validation.....................................................................24 3.6.3 Design Freshet Flood Profiles .........................................................................25 3.6.4 Flood Profile Sensitivity Analysis.....................................................................26 3.6.5 Design Frequency and Freeboard Assessment ..............................................27
4 ICE-RELATED WATER LEVELS ..................................................................... 29
4.1 Basic Hydraulic Concepts ........................................................................... 29
4.2 Generalized Freeze-up Processes ............................................................. 30
4.3 Ice-Related Flooding Assessment .............................................................. 31 4.3.1 Fraser River.....................................................................................................31 4.3.2 Nechako River .................................................................................................32 4.3.3 Frequency Analysis of Peak Freeze-up Water Level ......................................34
4.4 Effect of Climate and Basin Change ........................................................... 34
4.5 Effect of Gravel Removals .......................................................................... 35
5 FLOOD RISK EVALUATION............................................................................ 36
5.1 Flood Threat Analysis ................................................................................. 36 5.1.1 Flood Levels at Prince George ........................................................................36 5.1.2 Floods in Fraser River .....................................................................................36 5.1.3 Floods in Nechako River.................................................................................37 5.1.4 Ice-Related versus Open-Water Flood Levels.................................................37
5.2 Identification of Risk Areas ......................................................................... 38
5.3 Asset Inventory ........................................................................................... 39 5.3.1 General Description of Assets .........................................................................39 5.3.2 Overview of Flood Risks to Assets ..................................................................40 5.3.3 Nechako River Risk Areas...............................................................................40 5.3.4 Fraser River Risk Areas ..................................................................................42
5.4 Assessment of Flood Threats ..................................................................... 43
nhc
Flood Risk Evaluation and Flood Control Solutions – Phase 1 Final Report xiv
6 FLOOD CONTROL OPTIONS.......................................................................... 45 6.1 Identification of Flood Control Options........................................................ 45
6.2 Hydraulic Effectiveness of Flood Control Options....................................... 46 6.2.1 No Permanent Protection ................................................................................46 6.2.2 Land Acquisition / Land Use Change ..............................................................47 6.2.3 Internal Drainage .............................................................................................47 6.2.4 Individually Raise / Flood-proof Essential Developments................................47 6.2.5 Reactivating / Modifying Side-Channels For Flood Relief ...............................47 6.2.6 Diking - Setback Diking, Raising Existing Roads, Riverbank Diking ...............48 6.2.7 Instream Sediment Removal ...........................................................................49 6.2.8 Upstream Flow Control....................................................................................50
6.3 Environmental Considerations .................................................................... 51 6.3.1 No Permanent Protection ................................................................................51 6.3.2 Land Acquisition / Land Use Change ..............................................................51 6.3.3 Internal Drainage .............................................................................................52 6.3.4 Individually Raise / Floodproof Essential Development...................................52 6.3.5 Reactivating / Modifying Channels for Flood Relief .........................................52 6.3.6 Diking - Setback Diking, Raising Existing Roads, Riverbank Diking ...............52 6.3.7 Instream Sediment Removal ...........................................................................53
6.4 Initial Review of Flood Control Options....................................................... 54
6.5 Description of Selected Flood Control Options ........................................... 55 6.5.1 Nechako River .................................................................................................55 6.5.2 Fraser River.....................................................................................................61
6.6 Assessment of Flood Control Options (Medium Filtering)........................... 63 6.6.1 Financial Costs ................................................................................................63 6.6.2 Environmental Impacts ....................................................................................63
6.7 Ranking of Flood Control Options............................................................... 64
7 PHASE 2 WORK PROGRAM........................................................................... 68
7.1 Completion of Phase 1................................................................................ 68
7.2 Public and Related Consultations ............................................................... 68
7.3 Tentative Flood Control Solutions............................................................... 68

nhc
Flood Risk Evaluation and Flood Control Solutions – Phase 1 Final Report xv
7.4 Final Reporting ........................................................................................... 69
7.5 Floodplain Maps ......................................................................................... 70
8 CONCLUSIONS AND RECOMMENDATIONS................................................. 71
9 REFERENCES................................................................................................. 77
10 GLOSSARY ..................................................................................................... 83
10.1 Abbreviations .............................................................................................. 83
10.2 Technical Terms ......................................................................................... 83
LIST OF TABLES Table 2.1 Nechako River Thalweg Elevation Changes Table 2.2 Nechako River Average Bed Elevation Changes Table 2.3 Nechako River Flow Area Changes Table 2.4 Fraser River Thalweg Elevation Changes Table 2.5 Fraser River Average Bed Elevation Changes Table 2.6 Fraser River Flow Area Changes Table 2.7 General Migration and Spawning Timing Windows for Sport Fish or Fish of
Special Concern Documented within the Study Area Table 3.1 Historic Freshet Flooding at Prince George Table 3.2 Water Survey Canada Key Gauges Table 3.3 Nechako Calibration/Validation Table 3.4 Fraser Calibration/Validation Table 3.5 Nechako Freshet Design Water Surface Profiles Table 3.6 Fraser Freshet Design Water Surface Profiles Table 3.7 Nechako 200-Year Open Water Surface Profile – Sensitivity to Roughness
and Flow Variation Table 3.8 Fraser 200-Year Water Surface Profile – Sensitivity to Roughness and Flow
Variation Table 4.1 Freeze-Up Data, Fraser River at Prince George Table 4.2 Summary of High Ice-Related Water Levels on the Nechako River at Prince
George Table 4.3 Summary of oC-Days of Freezing Table 4.4 Summary of Ice-Related Water Levels for a Range of Return Periods Table 5.1 Nechako Freshet Design Water Surface and Ice Profiles with FCL’s Table 5.2 Fraser Freshet Design Water Surface Profiles with FCL’s Table 6.1 Environmental Considerations and Anticipated Applicable Legislation by
Flood Control Option Table 6.2 Flood Control Solutions – Nechako River Table 6.3 Flood Control Solutions – Fraser River Table 6.4 Flood Control Solutions – Cost Analyses

nhc
Flood Risk Evaluation and Flood Control Solutions – Phase 1 Final Report xvi
LIST OF FIGURES Figure 2.1 Location Map Figure 2.2 Comparison of Nechako River Cross-Sections, N1-N5 Figure 2.3 Comparison of Nechako River Cross-Sections, N6-N33 Figure 2.4 Nechako River Bed Changes Figure 2.5 Aggradation / Degradation Comparison Figure 2.6 September 2, 1928 Air Photos of Prince George Figure 2.7 1946 Air Photo Mosaic Showing 1948 Flood Limits Figure 2.8 2006 Air Photo Mosaic Showing 1948 Flood Limits Figure 2.9 Historical Changes in Channel Conditions, Nechako River Upstream of the
Fraser River Confluence 1946-2006 Figure 2.10 Comparison of Fraser River Cross-Sections Figure 2.11 Fraser River Bed Changes Figure 2.12 Historical Changes in Channel Conditions, Fraser River in the Vicinity of the
Nechako Confluence (1946-2008) Figure 3.1 Fraser River at Shelley, Annual Peak Flows 1950-2007 Figure 3.2 Nechako River at Isle Pierre, Annual Peak Flows 1950-2007 Figure 3.3 Fraser River at South Fort George, Annual Peak Water Levels 1947-2007 Figure 3.4 Nechako/Fraser River Timing of Freshet Peak Figure 3.5 Fraser River at Shelley, Monthly Flows Figure 3.6 Nechako River at Isle Pierre, Monthly Flows Figure 3.7 Fraser River at South Fort George, Monthly Water Levels Figure 3.8 Nechako and Fraser Rivers, Extent of LiDAR Survey Figure 3.9 Nechako River 200-Year Open Water Surface Profiles Figure 3.10 Nechako River Open Water 20-Year and 200-Year Flood Profiles Figure 3.11 Fraser River 200-Year Open Water Surface Profiles Figure 3.12 Fraser River 200-Year and 20-Year Water Surface Profiles Figure 3.13 Nechako River 200-Year Open Water Surface Profiles - Sensitivity to
Roughness Variation Figure 3.14 Fraser River 200-Year Open Water Surface Profiles – Sensitivity to
Roughness Variation Figure 3.15 Nechako River 200-Year Open Water Surface Profiles - Sensitivity to Flow
Variation Figure 3.16 Fraser River 200-Year Open Water Surface Profiles – Sensitivity to Flow
Variation Figure 4.1 Schematic of Ice Cover Formation, Profile Figure 4.2 Schematic of Ice Cover Formation, Cross-Sections Figure 4.3 South Fort George Freeze-Up Date Figure 4.4 Fraser River Freeze-Up Conditions Figure 4.5 Freeze-Up Degree-Day Frequency Curve Figure 4.6 South Fort George Open Water and Ice-Related Rating Curves Figure 4.7 Nechako River Conditions for Ice-Related Flooding Figure 4.8 Nechako River Reported Ice-Related Water Levels

nhc
Flood Risk Evaluation and Flood Control Solutions – Phase 1 Final Report xvii
Figure 4.9 2007 Recorded Ice-Related Water Levels, Nechako River Figure 4.10 Cameron Street Bridge Rating Curves Figure 4.11 Ice Cover Advancement, 1996 and 2007 Figure 4.12 Degree-Days of Freezing Frequency Curve Figure 4.13 Nechako Post-Freeze-Up Flow Probability Figure 4.14 Historical Freeze-Up Elevation Frequency Curve Figure 5.1 Nechako River Open Water and Ice-Related Flood Profiles Figure 5.2 Nechako River Extent of Open Water and Ice-Related Flood Conditions Figure 6.1 Nechako River Gravel Removal Figure 6.2 Nechako River Gravel Deposition Figure 6.3 Flood Control Solutions – Nechako Area AN Figure 6.4 Flood Control Solutions – Nechako Areas BN and DN Figure 6.5 Flood Control Solutions – Nechako Area CN Figure 6.6 Flood Control Solutions – Nechako Area EN Figure 6.7 Flood Control Solutions – Fraser Area BF Figure 6.8 Flood Control Solutions – Fraser Area DF
LIST OF MAPS Map 1 Fraser River above Nechako River Cross-Section Locations Map 2 Nechako River Cross-Section Locations Map 3 Fraser River below Nechako River Cross-Section Locations Map 4 Flood Risk Areas - Fraser River Upstream of Nechako Confluence Map 5 Flood Risk Areas - Nechako River Map 6 Flood Risk Areas - Fraser River Downstream of Nechako Confluence
LIST OF APPENDICES Appendix A Terms of Reference Appendix B Fluvial Geomorphology Appendix C Environmental Setting Appendix D Flood Frequency Analyses Appendix E Detailed Ice Analyses Appendix F Initial Flood Control Solutions – Progress Report 1 Appendix G Groundwater Report by Thurber Engineering Ltd. Appendix H Discussion of Gravel Removals at Nechako-Fraser Confluence

nhc
Flood Risk Evaluation and Flood Control Solutions – Phase 1 Final Report 1
1 INTRODUCTION
1.1 BACKGROUND
1.1.1 PROJECT INITIATION
Some parts of City of Prince George were flooded during the 2007 spring freshet and others during the ice jam in the winter of 2007-08. The freshet flooding affected lands at the confluence of the Fraser and Nechako Rivers, along the Fraser River at Landooz Road, and the Farrell Crescent and Regents Crescent areas. The Nechako River ice jam flooded residential properties in the areas of PG Pulpmill Road, Pozer Road, Preston Road and Morning Place. Flooded industrial areas included North Nechako Road, Ongman Road, McAlhoney Road, River Road, Foley Crescent and Kelliher Road. One of the City’s water supply wells was threatened, but not affected because of flood-proofing improvements made around 1999.
Some freshet flooding of the Fraser River floodplain occurs about every five years. The last major flood (return period greater than 50 years) occurred in 1972, after which the residents of the Island Cache area at the confluence were relocated and the residences removed.
Severe ice jam flooding on the Nechako River has been recorded 12 times since the early 1900’s (Klohn-Crippen 1997). The 2007-08 ice-related flood levels appear to have exceeded any observed over at least the past 50 years. On two occasions during the event (December 31, 2007 and January 5, 2008) ice levels breached temporary berms and sand-gabion dikes that had been constructed to the 200-year flood level. During the event Northwest Hydraulic Consultants Ltd. (NHC) provided on-going advice, McElhanney Consulting Services Ltd. (MCSL) were involved with designing and implementing emergency flood protection, and Environmental Dynamics Inc.(EDI) provided environmental monitoring.
These recent events initiated the need to review the risk of both freshet and ice-related flooding, especially at the Nechako/Fraser confluence where several industries, the CN railway yard and inter-modal facility, and much of the downtown area are at risk of flooding. Severe freshet and ice-jam conditions give cause not only high surface-water levels but also high groundwater levels and consequent local flooding in various parts of the floodplain.
As in 2007, flooding in Prince George in any year can result from either high freshet flows or ice jamming. Typically, spring freshets cause more severe flooding in the Fraser River, whereas ice jamming is more critical for the Nechako River and typically causes flooding during freeze-up. In most years, the Nechako ice cover at Prince George forms as frazil floes1 that accumulate against the ice cover on the Fraser River. The probability of high ice-related water levels along the Nechako is related to the combined probability of cold temperatures and high Nechako flows during the freeze-up period. The City of Prince George is proceeding with a flood risk evaluation and flood control solutions project to consider the long term options to reduce the risk of flooding and to protect floodplain lands within the City.
1 Technical terms are defined in Section 10 – Glossary of Technical Terms.

nhc
Flood Risk Evaluation and Flood Control Solutions – Phase 1 Final Report 2
1.1.2 PREVIOUS FLOODPLAIN MAPPING
BC Ministry of Environment (MOE) prepared floodplain maps for Prince George in 1983. The maps were updated by Klohn Crippen in 1997 in the form of 12 map sheets and a design brief. The updated mapping followed MOE standard procedures and was reviewed and adopted by MOE.
The 1997 maps were based on hydraulic modelling using river cross-sections surveyed in 1979 and 1995. There was no overlap of 1979 and 1995 cross-sections, and potential channel changes over the intervening years could not be identified. The 1997 hydraulic model was calibrated to high water marks from 1972 and 1990.
Ice-jam modelling was not included in the 1997 study, although it was recognized that ice jamming on the Nechako River could cause higher flood levels than freshet conditions. A contingency for ice conditions was provided by increasing the standard freeboard allowance from 0.6 m to 1.8 m in the reach upstream of Cross-Section 7 (which is roughly 750 m below Cameron Street Bridge). This freeboard increase was based primarily on water levels observed during the 1996 jam. Downstream of Cross-Section 7 (Map 1), where freshet conditions were determined to generate more severe conditions, the standard freeboard of 0.6 m was adopted.
In view of the 2007 ice jam flooding, recent relatively high freshet flows, and possible channel changes within the confluence area, City of Prince George decided it was necessary to review and update the 1997 floodplain maps.
1.2 TERMS OF REFERENCE
The present study is divided into two phases. Phase 1 consists of a comprehensive flood risk evaluation as described in this report. Phase 2, the development of conceptual flood control solutions, will commence after release of this Phase 1 report and is scheduled to be completed in the next six months. Terms of reference for both phases are summarized below.
1.2.1 PHASE 1 – FLOOD RISK EVALUATION
The City of Prince George, prepared the complete Terms of Reference for the project as included in Appendix A. The scope of work for the Phase 1 component includes:
• Risk Analysis • Feasibility Assessment • Preparation of Summary Report

nhc
Flood Risk Evaluation and Flood Control Solutions – Phase 1 Final Report 3
Risk Analysis The risk analysis was summarized in Progress Report 1 issued in June, 2008. For completeness, key findings from the progress report are incorporated in the present report.
The risk analysis was broken into five stages:
• Threat Analysis - use available information to determine how often specified events occur and the magnitude of the consequences.
• Consequence Analysis – review infrastructure, residential, commercial and industrial assets potentially at threat within the floodplain.
• Flood Relief Options – categorize floodplain areas prone to flooding and identify flood relief options for these areas, together with conceptual-level costs for the purpose of comparative analysis and priority setting.
• Priority Setting – use a decision-matrix, benefit-cost analysis or other suitable method to prioritize the flood relief options, considering public safety, environmental impact, land values, economic impact, life-cycle cost of mitigation measures, etc; prepare priority assessment.
• Coarse Filtering – summarize results of the above analysis in a report, with the objective of eliminating flood relief options not recommended in view of the risk analysis or further investigation of mitigation measures during the feasibility assessment; present options for further analysis in the feasibility assessment.
Feasibility Assessment The Terms of Reference (see Appendix A for details) specified that following the risk analysis, a feasibility assessment should be conducted for the recommended flood relief options, encompassing:
• Data Collection and Review • Hydrological Analysis • Soils and Geotechnical Investigation • River Hydraulics, Freshet and Ice-Related Flooding Analysis • Environmental Impacts • Floodplain (Internal) Drainage Considerations • Property Acquisition • Medium Filtering
As part of the feasibility assessment, the City of Prince George retained Thurber Engineering Ltd. to carry out soils and geotechnical investigations. Results of this work were presented under separate cover (Thurber Engineering 2008) and are mentioned in Section 6.2.3. The findings from the other components of the feasibility assessment are summarized in this report and will be presented to City of Prince George staff and to the Mayor and Council.

nhc
Flood Risk Evaluation and Flood Control Solutions – Phase 1 Final Report 4
1.2.2 PHASE 2 – FLOOD CONTROL SOLUTIONS
Phase 2 encompasses participation in public consultations and a selection of flood control solutions:
Public Consultations Public meetings are planned for shortly after the release of the Phase 1 report. Input from these meetings will be used to select viable flood control solutions.
Selected Flood Control Solutions
Summarize the results of the public consultation process and revise previously recommended solutions for flood control and risk reduction. Specific tasks include:
• Flood Control Infrastructure – based on the flood risk evaluation and public consultations, identify and evaluate the proposed infrastructure measures complete with cost estimates (Class D) and timelines for property acquisition, regulatory approvals, design and construction.
• Land Use – identify land use changes that are considered necessary on the basis of the risk analysis and the feasibility assessment, providing timelines and implementation strategies.
• River Solutions – as required, review with regulatory agencies any in-river solutions (such as gravel extraction and flood relief side-channels) that satisfy the risk analysis and feasibility assessment; identify processes required to obtain approvals, with cost estimates and timelines.
• Floodplain Mapping (outside present budget) – based on the river hydraulics and ice-related flooding analyses and in conjunction with the BC Ministry of Environment, prepare revised floodplain mapping for the City of Prince George; mapping to be prepared in accordance with the Fraser Basin Council Floodplain Mapping Guidelines and Specifications, March 2004, in digital format compatible with the City’s GIS Mapping system. A design brief supporting the analysis is to accompany the mapping.

nhc
Flood Risk Evaluation and Flood Control Solutions – Phase 1 Final Report 5
2 BIOPHYSICAL DESCRIPTION
2.1 STUDY AREA
The City of Prince George, with a population of roughly 80,000, is situated at the confluence of the Fraser and Nechako Rivers. The Lheidli T’enneh (People of the Confluence) First Nation has inhabited the Prince George area for millennia. European settlement began when the North West Company established a fur trading post at Fort George in 1807 but it was not until 1909 that the town sites at South and Central Fort George were settled and in 1915 the City of Prince George was founded. The study area is shown in Figure 2.1 and encompasses the area within the Prince George city boundaries.
The Fraser River drainage area at Shelley, just upstream of Prince George, is 32,400 km2. The considerably larger Nechako River basin of 47,100 km2 is partly regulated by Kenney Dam and a portion of the runoff is diverted to the Kemano power-plant. The Nechako River freshet mean annual peak flow is only about one quarter of the Fraser peak flow.
2.2 RIVER MORPHOLOGY
2.2.1 NECHAKO RIVER
The lower Nechako River can generally be characterized as having a riffle-pool morphology. Most of the mainstem channels are characterized by coarse substrates complicated by backeddies, riffles and shallow pools. The lower Nechako River has two large island complexes, Cottonwood Island and Fish Trap Island, and one permanent tributary, McMillan Creek. McMillan Creek enters the Nechako approximately 3 km upstream from the mouth, near the Cameron Street Bridge. There are also three off-channel sloughs: at Fish Trap Island, near Howie’s Marine boat launch, and near the upstream end of the study area.
The reach-average channel slope is 0.8 m/km. The bank-full width of the channel is typically 150 to 200 m, but is wider and divided into multiple channels in the confluence area. Velocities range from 1.8 to 2.0 m/s at low flow and up to 3.6 m/s at flood flows.
2.2.2 FRASER RIVER
The Fraser River upstream of the Nechako confluence has an irregularly meandering pattern, with a few large islands and some point bars. The channel has historically been laterally unstable and shows evidence of large meander scrolls. Downstream of the confluence the channel has a more sinuous and incised form, without islands and only limited side bars. This reach appears to have been quite stable over time. The confluence area is very wide, perhaps three times the expected regime width, and contains large gravel bars.
The river has an average slope of roughly 0.25 m/km upstream and 0.47 m/km downstream of the confluence. The channel width averages about 400 m upstream of the confluence, increasing to 800-900 m at the confluence and then reducing to about 300 m downstream.

nhc
Flood Risk Evaluation and Flood Control Solutions – Phase 1 Final Report 6
Flow velocities range from 1.5 to 2.0 m/s upstream and 2.5 to 3.5 m/s downstream during design flood conditions.
Within the City Limits, the morphology of the Fraser River can be characterized as large channel glide. Large-scale biophysical assessments of the Fraser River have typically delineated a reach break at the confluence of the Nechako River, where there is a distinct increase in discharge (Nowotny and Hickey 1993). The banks and nearshore areas of the upstream reach are dominated by fine substrates, whereas those of the downstream reach consist primarily of embedded cobbles and coarse gravel. Fraser River tributaries within the City Limits include Rancheree Creek entering Fraser Vista (Goose) Slough, Foreman Creek, Bittner Creek, Parkridge Creek, Haggith Creek, Brodman Creek, two unnamed creeks and Hudson’s Bay Slough.
2.3 NECHAKO RESERVOIR
2.3.1 FLOOD REDUCTION
Kenney Dam was built in 1952, and since 1957 the Nechako Reservoir behind the dam has been fully regulated. Rio Tinto Alcan is in charge of reservoir operation and diverts a portion of flow to Kemano for power generation. The reservoir amalgamates and redirects several watersheds. The rivers and lakes of Ootsa, Intata, Whitesail, Chelaslie, Tetachuk, Tahtsa and Natalkuz were linked to form a reservoir area of over 900 km2. Flow releases to the Nechako River are controlled at the Skins Lake spillway. Kenney Dam is located about 295 km above the Nechako/Fraser confluence and controls only about one-third of the Nechako drainage area, but this portion has the highest unit run-off. The Nautley River, draining Francois Lake and Fraser Lake, enters the Nechako River upstream of Vanderhoof. The Stuart River, draining Stuart Lake, flows into the Nechako between Vanderhoof and Isle Pierre (Insert, Figure 2.1).
The operating procedure of the Nechako Reservoir has changed over time. Initially, powerhouse flows were lower than at present because of a lower installed generating capacity. In the early 1980’s monthly minimum flows and cooling flows were imposed to reduce summer water temperatures in the Nechako River. Future inflows to the Nechako reservoir may not be significantly different from those in the past, but outflows at Skins Lake, which reflect past operating conditions, could change further in the future.
Rio Tinto Alcan is not legally bound to operate the reservoir for flood reduction purposes. However, the present operating guidelines, in contrast to those of the early 1960’s that resulted in relatively high winter releases, tend to reduce winter flows in order to avoid ice-jam flooding in Prince George. Also, during critical years, the reservoir has been operated for freshet flood relief, reducing and delaying the Nechako peak flow and thereby reducing flood flows as far downstream as Vancouver (NHC 2008a).

nhc
Flood Risk Evaluation and Flood Control Solutions – Phase 1 Final Report 7
2.3.2 EFFECTS OF RESERVOIR ON FLOW REGIME AND MORPHOLOGY
In general, reservoir regulation reduces flood peaks and reduces or eliminates sediment supply from upstream of a dam. The Nechako Reservoir diverts flow to Kemano, also affecting mean and minimum discharges released to the Nechako River. Reid Crowther & Partners and NHC (1987) evaluated changes to the flow regime and geomorphology introduced by Kenney Dam in the reach between Cheslatta Falls and Vanderhoof. As expected, the changes were found to be more pronounced near the dam, reducing in the downstream direction as more unregulated flow enters the system. The average annual flood at Vanderhoof was estimated to be about 50% of the pre-regulation average. As the return period of the annual flood increases, the reduction becomes less - based on data for 1957-79, the 100-year flood was estimated to be 90% of the pre-regulation value. The duration of a given flood flow was also found to be reduced, and the time of the peak was delayed from June to July.
The relationship between regulation and downstream channel morphology is not well understood and the rate of response, as well as the time required for adjustment to a new equilibrium, is unclear. In some reaches of the Nechako River, accumulation of sediment occurred long before construction of the dam. Regulation appears to have induced a change in the rate of sediment accumulation, but without knowing previous natural rates it is difficult to estimate changes induced by regulation. Reid Crowther & Partners and NHC (1987) reported a reduction of channel width (mainly through vegetation encroachment), a reduction in the total length of active backchannels, and some accumulation of sand and fine gravels in the Cheslatta Falls-Vanderhoof reach. The report recommended future sediment sampling and monitoring of cross-sections and vegetation extent.
NHC (2003) extended the geomorphic assessment to the Vanderhoof-Isle Pierre reach as part of a White Sturgeon habitat evaluation. The average annual flow at Isle Pierre was estimated to be 63% of the pre-regulation flow. The study did not detect evidence of large scale geomorphic change downstream of Stuart River as far as Isle Pierre. The effects of the reservoir on gravel accumulation, fish habitat and other environmental factors at Prince George are difficult to determine. As will be discussed in Section 2.5, the river still provides high salmonid habitat ratings, and white sturgeon is still found in the river although the population is declining.
2.4 CHANNEL CHANGES
Channel changes in the Nechako and Fraser River channels within the City limits were reviewed in order to examine how the local geomorphology, flow capacity and ice processes may have changed over time and what future characteristics can be predicted. Repeat channel surveys were compared, historic air-photography reviewed, specific gauge analyses conducted and sediment sources identified. Separate reports (MMA 2008a and MMA 2008b) detail the air-photography review and the sediment source investigations.

nhc
Flood Risk Evaluation and Flood Control Solutions – Phase 1 Final Report 8
River cross-sections established for previous floodplain mapping studies were re-surveyed to provide current information on channel bathymetry, as described in Section 3.6.1. Locations of the surveyed sections are indicated on Maps 1 to 3.
All these investigations are described or summarized below.
2.4.1 NECHAKO RIVER
Cross-Section Comparison The 2008 Nechako River cross-sections are compared with the 1979 and 1995 cross-sections in Figures 2.2 and 2.3. Changes in the long profile (as indicated by the channel thalweg and average bed elevation) are illustrated in Figure 2.4 a and b. These data are also listed in Tables 2.1 and 2.2, respectively. The percentage change in channel area below the predicted elevation of the 20-year flood has also been calculated (Table 2.3 and Figure 2.4 c).
The above analyses indicate that channel morphometry has not changed significantly upstream of approximately HEC-RAS Station 8,000 m (or Cross-Section N21). In the section of channel between Stations 8,000 m and 2,000 m (Cross-Section N21 to N4) the thalweg elevation has lowered by up to 1.5 m since 1979 (or 1995, depending on the Section) and the average river bed elevation has lowered by a maximum of 0.74 m at Station 2938 m (Cross-Section N6). These changes have resulted in a 15% increase in channel cross-sectional area.
In the area downstream of Station 2000 m (Cross-Section N4), the thalweg elevation has risen at two sections (N1 and N3), the average bed elevation has lowered slightly (N3) or remained about the same (N1 and N2), and the channel cross-section area has increased by up to 6% (N3), remained the same (N2), or decreased by 6% (indicating aggradation) at N1.
The results are also shown in plan view in Figure 2.5. The figure assumes that the aggradation (bed rise) or degradation (bed lowering) reported at a section extends halfway to the next upstream and downstream sections. The results for the thalweg elevation, average bed elevation and flow area do not always agree, since the changes are typically quite small. However, there is some indication of aggradation at Cross-Section N1 and general degradation from N2 to N11.
A specific gauge analysis at Isle Pierre, 61 km upstream of the confluence (as described in Appendix B) did not show significant trends in the relationship of water level to discharge and indicates that the channel at the gauge site is probably stable.
Air-Photography Interpretation The earliest available air photography of Prince George was flown in 1928 (Figure 2.6). This imagery illustrates the sizeable distributary channels which formerly existed along the lower Nechako River near the Fraser River confluence. These secondary channels provided flood conveyance capacity, particularly when the main channel was frozen over, and also potential fish habitat. Subsequent urban development has substantially reduced the number

nhc
Flood Risk Evaluation and Flood Control Solutions – Phase 1 Final Report 9
and size of these features. Figures 2.7 and 2.8 compare the 1948 flood limits2 with river conditions in 1946 and 2006, further illustrating the loss of both floodplain areas and secondary channels. The lost flood storage and conveyance capacity cannot be readily restored without reversing land use decisions made over the last 50 years.
A separate report (MMA 2008a) compiles a series of historical airphotos for the Nechako River between the Foothills Bridge and the Fraser River confluence, spanning the period between 1946 and 2008. This analysis documents the development of vegetation on previously barren gravel bars, and some loss of secondary channels flowing around instream bars or islands due to sediment deposition or vegetation growth.
The largest change in channel characteristics along the lower 10 km of the Nechako River has occurred near the Fraser confluence (Figure 2.9). These photographs illustrate post-1946 land use encroachments into the floodplain, vegetation development on former gravel bars, the loss of small secondary channels and the recent formation of a mid-channel gravel bar in the vicinity of River Km 294 (below Kenney Dam). This area, illustrated on Plate B.1 in Appendix B, is located between Sections N2 and N3 and is poorly defined by the available cross-sectional data. Gravel storage and shifting of bars has taken place both before and after the construction of Kenney Dam and is a natural consequence of the flatter gradient within the lower Nechako River. Build-up of material may occur over a series of low/medium flow years with intermittent material removal during high flow years or ice-floods.
Sediment Sources and Bed Material Transport A separate report (MMA 2008b) describes sediment sources to the Nechako River in the 35 km length of channel between the Chilako River confluence and Prince George. Key components of this work are included in Appendix B. The analyses indicate that there are significant sediment source areas in lower Nechako River which cannot be readily stabilized. These sites erode during periods of high flow and the resulting sediment load (as well as that derived from farther upstream) is gradually conveyed downstream.
Calculations were undertaken to estimate the bed material transport capacity of the Nechako River for a range of discharges, as summarized in Appendix B. Actual loads are supply dependent and were not assessed. The calculated potential transport capacity is highly dependent on the assumed material size. Large fluctuations occur in the calculated annual loads, implying that unusual floods such as the 2007 freshet considerably exceeded threshold conditions and resulted in a substantial capacity to transport bed material.
2.4.2 FRASER RIVER
Cross-Section Comparison Fraser River cross sections used in the analysis are illustrated on Maps 1 and 3 and are compared in Figure 2.10. Changes in thalweg elevation, average bed elevation, and cross-
2 From Klohn-Crippen, 1997.

nhc
Flood Risk Evaluation and Flood Control Solutions – Phase 1 Final Report 10
sectional area below the predicted 20-year flood elevation were computed. The data are compiled in Tables 2.4 to 2.6 and the results are illustrated in Figure 2.11.
The area of most interest to this study is located between the Nechako confluence and the Yellowhead Bridge (Sections F27 to F20.3). The surveys indicate that the channel thalweg at the Grand Trunk Pacific Railway Bridge (Plate B.8 – Appendix B) infilled locally by 0.9 to 2.3 m (at cross-sections F23 and F25, about 30 m apart). Other areas showed random rises and falls in the thalweg. Changes in the average bed elevation ranged from a drop of 0.8 m between the Yellowhead and Grand Trunk bridges (Cross-Section F22) to a rise of 0.3 m adjacent to the Nechako confluence. Changes in channel cross-section area range from a decrease of 4% at the railway bridge (indicating aggradation) to an increase of 3% (indicating degradation) between the two bridges. The results are shown in plan view in Figure 2.5. Again, there are inconsistencies between the three sets of comparisons because the changes are relatively small.
A specific gauge analysis for the Water Survey Canada gauge at Shelley, 23 km upstream of the confluence (Appendix B) showed no indications of a time trend, implying that there has been no significant scour or fill in the Fraser River in that vicinity over the period of record.
Air Photography Interpretation As previously noted, substantial land use and channel changes have occurred since 1946 along the Fraser River in the vicinity of the Nechako River confluence. As illustrated in Figure 2.12, the right (north) abutment of the Yellowhead Bridge extends into the river channel. Land development has also infilled secondary channels and floodplain areas upstream of the bridge.
Comparison of photos from 1946 and 2003 indicates the development of a series of gravel bars at the Grand Trunk Pacific Railway Bridge. These features are not evident on the 2008 airphotos, which were flown during a period of higher river discharge.
Sediment Sources A separate report (MMA 2008b) describes sediment sources to the Fraser River in the 35 km length between the Salmon River confluence and Prince George. As summarized in Appendix B, the two largest sources are the Salmon River, conveying bedload, and a rapidly eroding fluvial terrace 30 km upstream of Prince George. The potential for material from these sources to be deposited at the Nechako River confluence cannot be quantified without detailed sediment transport modelling.
2.4.3 PRESENT AND FUTURE CHANNEL CONDITIONS
Early air-photographs from before construction of Kenney Dam show an active fan at the confluence with Fraser River, with shifting gravel bars and side-channels. According to public perception, significant sediment accumulation has occurred in this area in recent years.

nhc
Flood Risk Evaluation and Flood Control Solutions – Phase 1 Final Report 11
The cross-section comparison suggests some build-up on Nechako River immediately upstream of Fraser River (Cross-Section N1) and some accumulation on Fraser River at the confluence (Sections F26 and F27) over the past thirty years, whereas Nechako and Fraser River cross-sections elsewhere show no change or a general lowering of the bed. Since only two sets of surveys are available, intervening changes are unknown and the observed changes could be the result of recent high flows in the Nechako River. The Fraser River downstream of the confluence is relatively steep and has a high bedload transport capacity, so that the confluence area may undergo change after the next large Fraser freshet. The airphoto analysis provides a useful qualitative overview but cannot provide quantitative results.
Future channel conditions in the lower Nechako River will be affected by land use, climate change, sediment availability, vegetation evolution and the operating regime of Kenney Dam, which may be altered if changes are made to the reservoir.
Salvage logging and increased risk of fire as a result of Mountain Pine Beetle infestation may also affect future channel evolution. A worst case scenario could involve substantially increased sediment loadings and increased flood flows (Hélie et al. 2005; Uunila et al. 2006; BC Forest Practices Board 2007; and Redding et al. 2007). In this scenario, accelerated sediment deposition could occur in the lower Nechako River at Prince George.
A large flood or fire could cause an abrupt change in sediment regime. However, it is more likely that the Mountain Pine Beetle effects will be incremental and be subject to multi-year lag times. Potential channel changes could therefore be detected at an early stage through appropriate monitoring. It is recommended that a program be developed to monitor changes in channel morphometry, water level and discharge in the Prince George area.
2.5 ENVIRONMENTAL SETTING
2.5.1 GENERAL DESCRIPTION
A detailed description of the environmental setting is provided in Appendix C. The following sections outline some key issues. The study area lies within the Sub-boreal Spruce biogeoclimatic zone, which covers much of the central interior of British Columbia (MOF 1991). This zone is characterized by seasonal extremes of temperature with warm short summers and cold snowy winters. Annual precipitation ranges from 440 to 900 mm. Vegetation is dominated by coniferous forests with hybrid Engelmann white spruce and subalpine fir as climax species. Seral species include lodgepole pine, trembling aspen, paper birch and Douglas fir. Floodplains of major rivers, as in the study area, often have forests of black cottonwood with a smaller component of spruce (MOF 1991).
Numerous fish species within the study area include salmonids (sockeye salmon, Chinook salmon, coho salmon, pink salmon, rainbow trout, and mountain whitefish), burbot, non-sport fish (chiselmouth, prickly sculpin, slimy sculpin, largescale sucker, longnose sucker, white sucker, bridgelip sucker, pacific lamprey, redside shiner, northern pikeminnow, peamouth chub, brassy minnow, longnose dace and leopard dace) and two species of concern

nhc
Flood Risk Evaluation and Flood Control Solutions – Phase 1 Final Report 12
(white sturgeon, bull trout3) identified by the British Columbia Conservation Data Center4. The Conservation Data Centre (CDC) is a part of the Environmental Stewardship Division of the Ministry of Environment which collects, maintains and distributes information on species5 and ecological communities at risk in B.C. Within the study area the white sturgeon6 has been red-listed and the bull trout is blue-listed. The provincial Red list includes species extirpated, endangered or threatened7, while the Blue list includes species and communities especially sensitive to human activities or natural events. Table 2.7 provides an overview of the important life stages of salmonid species as well as species of special concern documented within the study area. Spawning and incubation timing windows are provided, although not all listed species are known to spawn or incubate within the study area. More detailed life history information for these species is included in the following subsections.
2.5.2 SALMONID HABITAT
Nearshore Habitats The Nechako River is an important salmon river. It has been estimated that the Nechako watershed provides approximately 23% of the total Fraser River sockeye salmon production (CSTC 2008). The value of the commercial salmon catch associated with the Nechako River watershed may be as much as $70 million annually (Rankin 1993 in CSTC 2008).
The Nechako River at the Fraser confluence contains active and inactive side-channels. Active side-channels are typically permanently or seasonally wetted and contain an abundance of nearshore vegetation, large woody debris and undercut banks which provide good quality summer rearing for most juvenile salmonids. Off-channel habitats also provide refuge areas for outmigrating salmon fry and foraging habitats for resident fish species. Inactive side-channels typically do not contain water except perhaps during extreme flood events. Historic airphoto analysis of the lower river suggests that many of the inactive side-channels have been progressively revegetating with terrestrial species since the onset of river regulation in the 1950s (MMA 2008a).
A comprehensive inventory and rating of salmonid habitats of the Nechako and Fraser Rivers within Prince George city limits was completed by Fisheries and Oceans Canada in 1992 (Nowotny and Hickey 1993). Streambank sections were delineated according to a general
3 Bull trout are also salmonids. White sturgeon and burbot may be considered sport fish although they are not
salmonids and as endangered species white sturgeon may not be harmed, killed or taken within the Omineca Region (BC 2008).
4 This list of fish species likely present at the confluence was prepared by merging the fish species list for each of the Nechako and Fraser Rivers (FFSBC 2005) and removing species distributed in other areas of these large rivers (i.e. the lower sections of the Fraser River) according to distributions in McPhail 2007.
5 Vertebrate, vascular plant species and ecological communities at risk have been identified in B.C. A list of invertebrates, mosses and lichens at risk is being created.
6 The following three white sturgeon populations in the Omineca Region are red-listed: Nechako River population, Upper Fraser River population and Middle Fraser River population.
7 Not all Red-listed species will become formally designated as extirpated, endangered or threatened under the Wildlife Act. The Red list serves to identify species at risk that should at minimum be considered candidates for one of these legal designations.

nhc
Flood Risk Evaluation and Flood Control Solutions – Phase 1 Final Report 13
consistency of habitat variables (e.g. substrate type; water depth; habitat type; bank composition and stability; instream, bank and upland vegetation; and upland status). Based on the collective quality of habitat variables, each section was assessed for rearing, spawning and over-wintering habitat value and rated into a category of high, medium or low.
Significant changes to river morphology and fish habitat may have occurred since 1992. A field data collection program was initiated in 2008 to verify and update this information and document current baseline conditions. The methodology of Nowotny and Hickey (1993) was used as the basis for the 2008 field activities and to update the habitat mapping information.
Results of the 2008 salmonid habitat inventory within the study area are presented in tabular form and illustrated on three 1:10,000 scale maps displaying the location and ratings of streambank sections (Appendix C.1). The 1992 assessment delineated 81 streambank sections along the Nechako River, 42 of which were rated as high quality habitat. In 2008, twenty additional sections were identified, which suggests either slight differences in methodology or an increase in habitat diversity. A total of 53 streambank sections were rated as high quality habitat in 2008. Only minor habitat changes had occurred along the Fraser River portion of this study.
Mid-channel Habitats In order to gain an understanding of mesohabitat characteristics on the lower Nechako River, a Level 1 Fish Habitat Assessment (FHAP) was conducted in the fall of 2008 from the Fraser confluence to Wilson Park, approximately 8 km upstream. The FHAP procedures can be used to help predict the effects of certain instream work activities on aquatic resources.
Results of the FHAP show that even under summer base flow conditions, the lower river is predominantly composed of continuous riffle (areas of turbulent fast-flowing water) or glide (areas of fast flowing, non-turbulent water) habitat units. These characteristics are typical of watercourses with relatively flat bottoms in cross-section (Johnston and Slaney 1996). There is a distinct lack of pool habitats, which are generally important for supporting fish over the winter months (Appendix C.1).
2.5.3 WHITE STURGEON
Current Status The white sturgeon was ranked as an endangered species by the Committee on the Status of Endangered Wildlife in Canada (in November 2003) and both sturgeon populations that may be found within the Nechako-Fraser confluence are red-listed by the BC Conservation Data Centre. Both of these populations8 were also added to Schedule 1 of the Species at Risk Act (SARA) in 2006.
8 Four populations of white sturgeon, the Upper Fraser, Nechako, Columbia and Kootenay, were added to
Schedule 1 of SARA in 2006.

nhc
Flood Risk Evaluation and Flood Control Solutions – Phase 1 Final Report 14
In 2001, the upper Fraser River population of white sturgeon was estimated at 815 fish (Yarmish and Toth 2002), of which 185 were estimated as mature (DFO 2007). RL&L (2000) also suggested that this population consists mostly of juveniles and subadults. The growth rate of this population is slow, like that of the Nechako River population (RL&L 2000).
The Nechako River sturgeon population in 1999 was estimated at 571 fish and displayed an age structure similar to those in other regulated rivers (RL&L 2000). RL&L (2000) found that the population was dominated by older fish and displayed poor juvenile recruitment. 305 mature white sturgeon are thought to exist in this population, with little or no juvenile recruitment since 1967 (DFO 2007). The population is declining and at risk of extirpation due to decades of recruitment failure. Model projections suggest that recovery efforts are required to restore recruitment and a self-sustaining population (DFO 2007; RL&L 2000).
Recovery efforts have been headed by the Nechako White Sturgeon Recovery Initiative. This organization is concerned with discovering the reason(s) for sturgeon recruitment failure in the Nechako watershed and establishes habitat protection and restoration and other management works. The short-term goal of the Initiative is to create a conservation fish culture program to sustain the population while the long-term goal of re-establishing a self-sustaining population is being realized (Nechako White Sturgeon Recovery Initiative 2008). Since 2006, over 8000 juvenile white sturgeon have been released (BC 2008).
Critical Habitat Potentially critical habitats for white sturgeon include important areas in which adults feed and “stage” prior to migration to spawning grounds, spawning sites, and rearing locations for larvae and juveniles (DFO 2007). A study by RL&L (2000) suggested the following areas presented suitable habitat that may be used as spawning sites for the Nechako River population: Isle Pierre, Whitemud, Hulatt rapids, Nautley River and the lower Stuart River. Both spawning and overwintering sites have been located near Vanderhoof. Threats to sturgeon habitat include instream activities such as gravel removal, development of riparian and/or foreshore areas, river regulation, upstream use of land and water, and effluent discharges (DFO 2007).
Although white sturgeon research on the Nechako and Fraser Rivers has been conducted over a number of years, no known study has specifically examined habitat at the confluence. As there is a potential for critical habitat within this area, EDI in conjunction with Lheidli T’enneh First Nation (LTN) and Upper Fraser Fisheries Conservation Alliance (UFFCA), began field inspections in the confluence area that may aid in determining whether this area should be considered as critical sturgeon habitat. As an investigation of this nature requires extensive study, the results of the 2008 field investigations (Appendix C.2) give only a preliminary picture of the situation.

Table 2.1 – Nechako River Thalweg Elevation Changes
Thalweg Change ‐ Nechako River XS Dist. (m) El. MOE (m) El. NHC (m) Diff. (m)
XS N1 452 560.62 561.67 1.05 XS N2 889 561.49 561.36 ‐0.13 XS N3 1337 561.91 562.54 0.63 XS N4 1957 562.35 561.87 ‐0.48 XS N5 2518 562.26 562.18 ‐0.08 XS N6 2938 564.60 563.10 ‐1.50 XS N7 3423 565.27 564.56 ‐0.71 XS N8 3792 565.76 565.24 ‐0.52 XS N11 4201 564.87 564.19 ‐0.68 XS N12 4745 565.78 565.29 ‐0.49 XS N15 5118 565.04 565.36 0.32 XS N16 5541 565.03 564.91 ‐0.12 XS N17 5932 566.21 566.46 0.25 XS N18* 6402 566.99 567.14 0.15 XS N19* 6913 567.79 567.93 0.14 XS N20* 7456 568.27 568.24 ‐0.03 XS N21* 8098 568.60 568.66 0.06 XS N27* 11148 569.61 569.48 ‐0.13 XS N30* 12896 571.65 571.67 0.02 XS N33* 15135 573.86 573.53 ‐0.33 NOTES: 1 ‐ MOE Cross sections are from 1979 survey or if indicated by (*) from 1995 survey.

Table 2.2 ‐ Nechako River Average Bed Elevation Changes
Average Bed Level Change ‐ Nechako River
XS Dist. (m) El. MOE (m) El. NHC (m) Diff. (m) XS N1 452 563.03 562.97 ‐0.07 XS N2 889 563.68 563.65 ‐0.03 XS N3 1337 563.98 563.78 ‐0.20 XS N4 1957 563.87 563.93 0.06 XS N5 2518 564.45 564.29 ‐0.16 XS N6 2938 565.44 564.70 ‐0.74 XS N7 3423 565.87 565.52 ‐0.36 XS N8 3792 566.46 565.94 ‐0.53 XS N11 4201 566.87 566.44 ‐0.44 XS N12 4745 567.77 567.77 0.00 XS N15 5118 567.59 567.57 ‐0.02 XS N16 5541 567.50 567.20 ‐0.30 XS N17 5932 568.34 568.20 ‐0.14 XS N18* 6402 568.06 568.37 0.31 XS N19* 6913 569.18 569.23 0.05 XS N20* 7456 570.64 570.59 ‐0.05 XS N21* 8098 569.73 569.58 ‐0.16 XS N27* 11148 571.16 570.90 ‐0.26 XS N30* 12896 572.86 573.35 0.49 XS N33* 15135 574.85 574.77 ‐0.07 NOTES: 1 ‐ MOE Cross sections are from 1979 survey or if indicated by (*) from 1995 survey.

Table 2.3 ‐ Nechako River Flow Area Changes
Area Change ‐ Nechako River
XS Dist. (m) A. MOE (m2) A. NHC (m2) Diff. (%) XS N1 452 4706 4440 -5.7 XS N2 889 3451 3511 1.8 XS N3 1337 3017 3212 6.5 XS N4 1957 912 1016 11.3 XS N5 2518 712 736 3.5 XS N6 2938 661 760 15.1 XS N7 3423 576 620 7.8 XS N8 3792 511 579 13.3 XS N11 4201 536 600 11.9 XS N12 4745 553 545 -1.4 XS N15 5118 576 556 -3.4 XS N16 5541 466 461 -1.0 XS N17 5932 529 516 -2.3 XS N18* 6402 539 544 0.9 XS N19* 6913 529 501 -5.3 XS N20* 7456 485 475 -2.2 XS N21* 8098 456 445 -2.5 XS N27* 11148 394 393 -0.4 XS N30* 12896 355 349 -1.9 XS N33* 15135 330 334 1.5 NOTES: 1 ‐ MOE Cross sections are from 1979 survey or if indicated by (*) from 1995 survey. 2 ‐ Area calculation based on 20‐year flood cross‐sectional area

Table 2.4 – Fraser River Thalweg Elevation Changes
Thalweg Change ‐ Fraser River XS Dist. (m) El. MOE (m) El. NHC (m) Diff. (m)
XS F10 7716 554.97 555.21 0.24 XS F15 10156 556.01 556.29 0.28 XS F18 10786 557.76 557.72 ‐0.04 XS F19 11701 557.48 557.61 0.13 XS F20 12639 557.53 557.61 0.08 XS F21* 13059 558.17 558.13 ‐0.04 XS F22 13430 559.64 559.61 ‐0.03 XS F23 13680 555.19 556.07 0.88 XS F25 13714 553.89 556.22 2.33 XS F26 13868 557.60 557.23 ‐0.37 XS F27 14446 558.73 558.98 0.25 XS F31 15668 556.76 555.47 ‐1.29 XS F33 17276 560.24 560.19 ‐0.05 NOTES: 1 ‐ MOE Cross sections are from 1979 survey or if indicated by (*) from 1995 survey.
Table 2.5 – Fraser River Average Bed Elevation Changes
Average Bed Level Change ‐ Fraser River
XS Dist. (m) El. MOE (m) El. NHC (m) Diff. (m) XS F10 7716 557.77 557.47 ‐0.31 XS F15 10156 559.63 559.71 0.08 XS F18 10786 559.62 559.31 ‐0.31 XS F19 11701 561.14 560.64 ‐0.51 XS F20 12639 559.26 558.87 ‐0.39 XS F21* 13059 560.68 560.78 0.11 XS F22 13430 562.97 562.16 ‐0.81 XS F23 13680 561.88 561.95 0.08 XS F25 13714 562.28 562.15 ‐0.13 XS F26 13868 562.18 562.45 0.28 XS F27 14446 561.01 561.27 0.26 XS F31 15668 560.39 560.14 ‐0.25 XS F33 17276 561.83 562.05 0.22 NOTES: 1 ‐ MOE Cross sections are from 1979 survey or if indicated by (*) from 1995 survey.

Table 2.6 – Fraser River Flow Area Changes
Area Change ‐ Fraser River
XS Dist. (m) A. MOE (m2) A. NHC (m2) Diff. (%) XS F10 7716 2667 2673 0.2 XS F15 10156 1881 1876 ‐0.3 XS F18 10786 1727 1734 0.4 XS F19 11701 2109 2101 ‐0.4 XS F20 12639 2036 2018 ‐0.9 XS F21* 13059 3176 3129 ‐1.5 XS F22 13430 4799 4957 3.3 XS F23 13680 5377 5165 ‐3.9 XS F25 13714 5078 4907 ‐3.4 XS F26 13868 4437 4451 0.3 XS F27 14446 2578 2608 1.2 XS F31 15668 1879 1920 2.2 XS F33 17276 2289 2238 ‐2.2 NOTES: 1 ‐ MOE Cross sections are from 1979 survey or if indicated by (*) from 1995 survey. 2 ‐ Area calculation based on 20‐year flood cross‐sectional area

Table 2.7 General migration and spawning timing windows for sport fish or fish of special concern documented within the study area (from McPhail 2007 and Scott and Crossman 1973).
Species Spawning period Adult migration
period Incubation
period
Juvenile outmigration
period
Rainbow trout Late April - June April -May May – Mid July n/aBull trout September - November August - September September to June n/aMountain whitefish October - November September - October November to June n/aChinook salmon July - November July - September August to May Spring - early fall.Sockeye salmon August - November June to late August November to spring SpringPink salmon August - October Late July and August November to spring Late February –
late May Coho salmon September – December September – October December to spring February – June
White Sturgeon After peak spring discharge (likely June to July)
n/a July n/a

")
")
")
")
FRASER RIVER AT SHELLEY
NECHAKO RIVER AT ISLE PIERRE
FRASER RIVER AT PRINCE GEORGE
FRASER RIVER AT SOUTH FORT GEORGE
490000
490000
500000
500000
510000
510000
520000
520000
530000
530000
5970
000
5970
000
5980
000
5980
000
5990
000
5990
000
Figure 2.1
GD
L, Y
:\349
20 P
G F
PM
\GIS
\349
20_M
SN
_Loc
atio
nMap
1.m
xd
CITY OF PRINCE GEORGE
Location Map
Northwest Hydraulic Consultants project no. 3-4920 January 2009
coord. syst.: UTM Zone 10 horz. datum: NAD 83 horz. units: metres
®2 0 2 4 61 KilometresScale - 1:135,000
Legend
") Hydrometric Station
City Boundary
City of Prince George
Landsat 7 sattelite image by Geobase.ca
Overview Map
¬

FIGURE 2.2

FIGURE 2.3

(a)
560.0
562.0
564.0
566.0
568.0
570.0
572.0
574.0
576.0
0 2000 4000 6000 8000 10000 12000 14000 16000
Elevation (m
, GSC)
Distance from Mouth (XS F26, m)
Cross Section Comparison ‐Nechako Profile (Thalweg)
NHC MOE
XS N5
XSN4
XSN3
XSN2
XSN1
XSN16
XSN17
XSN18
XSN19
XSN20
XSN21
XSN27
XSN30
XSN33
XS N6
XSN15
XSN12
XSN11
XS N8
XSN7
561.0
563.0
565.0
567.0
569.0
571.0
573.0
575.0
577.0
0 2000 4000 6000 8000 10000 12000 14000 16000
Elevation (m
, GSC)
Distance from Mouth (XS F26, m)
Cross Section Comparison ‐Nechako Profile (Average Bed Level)
NHC MOE
XS N5
XSN4
XSN3
XSN2
XSN1
XSN16
XSN17
XSN18
XSN19
XSN20
XSN21
XSN27
XSN30
XSN33
XS N6
XSN15
XSN12
XSN11
XS N8
XSN7
‐20
‐15
‐10
‐5
0
5
10
15
20
0.00 2000.00 4000.00 6000.00 8000.00 10000.00 12000.00 14000.00 16000.00
Area Change
(%)
Distance from Mouth (XS F26, m)
Cross Section Comparison ‐Nechako Profile (Area)
XS Area Comparison (MOE/NHC)
XS N5
XSN4
XSN3
XSN2
XSN1
XSN16
XSN17
XSN18
XSN19
XSN20
XSN21
XSN27
XSN30
XSN33
XS N6
XSN15
XSN12
XSN11
XS N8
XSN7
Increased Area(Degradation)
Decreased Area(Aggradation)
Nechako River Bed Changes
January 2009 Figure 2.4
City of Prince George
(b)
(c)

Aggradation / Degradation
Comparison
January 2009 Figure 2.5
City of Prince George
Thalweg Comparison
Average Bed Level Comparison
Cross Section Area Comparison

Figure 2.6: September 2, 1928 air photos of Prince George.
M. MILES AND ASSOCIATES LTD.

FIGURE 2.7 PROJECT # 322
Km # 292 to 294
REV:
A
M. MILES AND ASSOCIATES LTD. 645 ISLAND ROAD, VICTORIA, BC, V8S 2T7
Phone: 250-595-0653 Fax: 250-595-7367 email: [email protected]
APPROXIMATE SCALE: 1:7,500
DATE: May 7, 2008
DRAWN: S. Allegretto
DESIGNED: S. Allegretto
CHECKED: M. Miles
APPROVED:
REFERENCED DRAWING DESCRIPTION REFERENCED DRAWING NO.
Issued for discussion May 7, 2008 A
NECHAKO RIVER AIR PHOTOGRAPH MOSAIC
BC280 #95 August 18, 1946
CLIENT: CITY OF PRINCE GEORGE
1100 PATRICIA BOULEVARD PRINCE GEORGE, BC
V2L 3V9
1946 AIR PHOTO MOSAIC SHOWING 1948 FLOOD LIMITS
75 37.5 0 75 150 225 300 Metres
MAP SCALE 1:7,500 1 mm = 7.5 m
292 292
293 293
294 294
Kilometers downstream Kilometers downstream of Kenney Dam of Kenney Dam
1948 flooding 1948 flooding

FIGURE 2.8 PROJECT # 322
Km # 292 to 294
REV:
A
M. MILES AND ASSOCIATES LTD. 645 ISLAND ROAD, VICTORIA, BC, V8S 2T7
Phone: 250-595-0653 Fax: 250-595-7367 email: [email protected]
APPROXIMATE SCALE: 1:7,500
DATE: May 12, 2008
DRAWN: S. Allegretto
DESIGNED: S. Allegretto
CHECKED: M. Miles
APPROVED:
REFERENCED DRAWING DESCRIPTION REFERENCED DRAWING NO.
Issued for discussion May 12, 2008 A
NECHAKO RIVER AIR PHOTOGRAPH MOSAIC
Orthophoto
May 3, 2006
CLIENT: CITY OF PRINCE GEORGE
1100 PATRICIA BOULEVARD PRINCE GEORGE, BC
V2L 3V9
2006 AIR PHOTO MOSAIC SHOWING 1948 FLOOD LIMITS
Nechako River at Isle Pierre 202 m3/s Fraser River at Shelley 948 m3/s
75 37.5 0 75 150 225 300 Metres
MAP SCALE 1:7,500 1 mm = 7.5 m
292 292
293 293
294 294
Kilometers downstream Kilometers downstream of Kenney Dam of Kenney Dam
1948 flooding 1948 flooding

1946
2006
Nechako River at Isle Pierre na Fraser River at Shelley na
Nechako River at Isle Pierre 202 m3/s Fraser River at Shelley 948 m3/s South Fort George 5.46 m3/s
Figure 2.9: Historical changes in channel conditions, Nechako River upstream of the Fraser River confluence (1946 to 2006).
M. MILES AND ASSOCIATES LTD.
Nechako RiverNechako River
Fraser RiverFraser River
Nechako RiverNechako River
Fraser RiverFraser RiverRecentRecentSedimentSediment

FIGURE 2.10

(a)
553.0
554.0
555.0
556.0
557.0
558.0
559.0
560.0
561.0
562.0
6500 8500 10500 12500 14500 16500
Elevation (m
, GSC)
Distance from XS F1 (m)
Cross Section Comparison ‐ Fraser Profile (Thalweg)
NHC MOE
XSF10
XSF15
XSF22
XSF21
XSF20
XSF19
XSF18
XSF23
XSF27
XSF31
XSF33
XSF26
557.0
558.0
559.0
560.0
561.0
562.0
563.0
564.0
565.0
566.0
6500 8500 10500 12500 14500 16500
Elevation (m
, GSC)
Distance from XS F1 (m)
Cross Section Comparison ‐ Fraser Profile (Average Bed Level)
NHC MOE
XSF10
XSF15
XSF22
XSF21
XSF20
XSF19
XSF18
XSF23
XSF27
XSF31
XSF33
XSF26
‐10
‐8
‐6
‐4
‐2
0
2
4
6
8
10
6500 8500 10500 12500 14500 16500
Area Change
(%)
Distance from XS F1 (m)
Cross Section Comparison ‐ Fraser Profile (Area)
XS Area Comparison (MOE/NHC)
XSF10
XSF15
XSF22
XSF21
XSF20
XSF19
XSF18
XSF23
XSF27
XSF31
XSF33
XSF26
IncreasedArea(Degradation)
Decreased Area(Aggradation)
Fraser River Bed Changes
January 2009 Figure 2.11
City of Prince George
(b)
(c)

Fraser RiverFraser River
Nechako River at Isle Pierre na Fraser River at Shelley na South Fort George na
Nechako River at Isle Pierre 235 m3/s Fraser River at Shelley 752 m3/s South Fort George 5.02 m
Nechako River at Isle Pierre 539 m3/s Fraser River at Shelley 1,850 m3/s South Fort George 7.0m
M. MILES AND ASSOCIATES LTD.
Figure 2.12: Historical changes in channel conditions, Fraser River in the vicinity of the Nechako confluence (1946-2008).
19461946
20032003
20082008

nhc
Flood Risk Evaluation and Flood Control Solutions – Phase 1 Final Report 15
3 OPEN WATER FLOOD HYDROLOGY AND HYDRAULICS
For the design of flood control works, the BC Ministry of Environment minimum design standard is the 200-year flood. Higher standards have been stipulated in some cases - for example, the design flow for the Fraser River downstream of Hope is the flood of 1894, estimated to have a return period in the order of 500 years.
An in-depth review of Nechako and Fraser River flows was carried out and flood frequency analyses were conducted as described below, to determine the appropriate freshet design flows for the Fraser River above the Nechako River confluence, for the Nechako River at Prince George, and for the Fraser River below the confluence. Flow contributions from minor tributaries that enter within the City were neglected. The flood frequency results were used for calculating 200-year water surface profiles along the rivers.
3.1 HISTORIC FLOODS AND HYDROMETRIC RECORDS
For reliable flood frequency analysis, it is generally important to trace historical flood records as far back as possible, so that any unusually large floods that may have preceded systematic records can be included in the analysis. For the Prince George area, however, only limited historical information is available. D. Septer (2007) described flooding in Northern British Columbia based on eyewitness accounts and newspaper reports covering the period 1820 to 2006. Klohn Crippen (1997) provided some information on Fraser and Nechako River flooding. Water Survey Canada (WSC) provided unpublished flow and water level records from their archives. For the frequency analyses described herein, published flow records were extended as far as possible based on available historical information and correlation with other gauges.
Major freshet floods in the Fraser River are summarized in Table 3.1. All water levels were converted to GSC datum at South Fort George. The flood of 1894, according to recent analysis by NHC (2008a), was the largest flood at Hope in at least the last 160 years. According to WSC information from 1962, the 1894 flood level at the Fraser-Nechako confluence was estimated to be El. 569.5 m GSC - the same as the 200-year water level computed by Klohn-Crippen (1997).
Published flow records were obtained for the WSC stations listed in Table 3.2. Gauge locations are shown in Figure 2.1 and annual peak flow histograms for Station 08KB001, Fraser River at Shelley and Station 08JC002, Nechako River at Isle Pierre are shown in Figures 3.1 and 3.2. An annual peak water level histogram for Station 08KE018, Fraser River at South Fort George is shown in Figure 3.3. The South Fort George record was extended for the period 1947-1967 based on water level records for Station 08KE001, Fraser River at Prince George, located 2.5 km upstream. For the year 1968, daily water level records are available for both stations; based on linear regression the following expression relating water levels was developed:
WLSouth Fort George = 0.98 x WLPrince George + 9.77 (r2=0.99)

nhc
Flood Risk Evaluation and Flood Control Solutions – Phase 1 Final Report 16
Other relevant Nechako River flow gauges are Station 08JA013, Skins Lake Spillway, Nechako Reservoir and Station 08JC001, Nechako River at Vanderhoof. Nechako tributary flow records are available for Station 08JB003, Nautley River near Fort Fraser and Station 08JE001, Stuart River near Fort St. James. The records at Skins Lake Spillway are provided by Rio Tinto Alcan based on reservoir levels and gate settings, whereas the other records are regular WSC stations. When the Nechako stations are reporting accurately, flows at different points along the river and from the various tributaries add up to the flow reported at the most downstream station of Isle Pierre. In general, the freshet flows add up fairly well but winter flows are more problematic. Freeze-up conditions may suddenly increase water levels and if ice-free rating tables are applied to estimate ice-covered flows, large errors may occur. For example, in December of 2007, the flow at the upstream Vanderhoof station was reported to be higher than at downstream Isle Pierre although the Stuart River enters between the two stations and had flows exceeding 130 m3/s. It is recommended that WSC more closely monitor these gauges.
Figure 3.4 shows the average dates of peak events on the Fraser and Nechako Rivers:
• On average, the Fraser River at Shelley has peaked around June 10. Over the past sixty years there appears to be no trend towards earlier or later peaks.
• The annual maximum daily water level at Prince George is mainly a function of Fraser River flows. Water levels at South Fort George, downstream of the confluence, typically peak about one day later than at Shelley.
• In general, peaks in the Nechako River at Isle Pierre occur later than in the Fraser. Over the period of record, reservoir operations have delayed the date of the Nechako peak by up to a month.
Monthly flows for Fraser River at Shelley and Nechako River at Isle Pierre are plotted in Figures 3.5 and 3.6, and monthly water levels at South Fort George are shown in Figure 3.7. The figures also show maximum and minimum values for the period of record, to illustrate the range that can be expected in a given month of the year.
As part of the hydrologic investigations the Klohn Crippen (1997) design flows were reviewed, as well as three memoranda by Nichols (1981a), Nichols (1981b) and Wyman (1981).
3.2 FRASER RIVER FRESHET DESIGN FLOWS UPSTREAM OF NECHAKO RIVER
WSC Station 08KB001, Fraser River at Shelley, is located near the upstream end of the Fraser River study reach. The available 59-year record from 1950 to 2008 is near continuous. In addition to the flood of 1894, very large floods are known to have occurred in 1936 and 1948 and attempts were made to include this information. The 1894 flood at Hope was estimated to have a magnitude of 17,000 m3/s (NHC, 2008a). There are no flow estimates for the upper Fraser basin for 1894, but an unpublished graph from 1962 in the WSC archives suggests a water level of El. 569.3 m GSC at the South Fort George gauge site. The 1894

nhc
Flood Risk Evaluation and Flood Control Solutions – Phase 1 Final Report 17
Nechako flow is not known, hence the flow at Shelley cannot be estimated based on the water level alone. The Shelley drainage area is only 32,400 km2 compared to 217,000 km2 at Hope and correlation between the two gauges is fairly poor, as might be expected, but suggests an 1894 flow at Shelley in the order of 6,000 m3/s. The 1936 and 1948 floods at Shelley were estimated through correlation with the flow record for Station 08MD013, Fraser River at Big Bar Creek, with a drainage area of 146,000 km2, in operation from 1935 to 1972. A linear regression between the annual maximum flows for Shelley and Big Bar Creek for the joint period of record from 1950 to 1972 yielded the following equation:
QShelley = 0.46 x QBig Bar + 845 (r2=0.8)
Observed and extended maximum annual daily flows for Fraser River at Shelley are listed in Appendix D. Since instantaneous maxima at Shelley are only about 1% higher than daily maxima, frequency analyses were limited to daily values. (According to BC Ministry of Environment standards, a minimum freeboard allowance of 0.6 m is to be applied to water surface profiles based on daily maxima and 0.3 m to those based on instantaneous maxima. Since the difference between instantaneous and daily peak flows is small in this case, the 0.6 m freeboard governs.)
Frequency analysis used the software “HydroFreq” developed at the University of Alberta (Appendix D). The program computes General Extreme Value, Log Normal III, Log Pearson III and Pearson III distributions. Results for all distributions are presented in Appendix D. For the design profile the Log Pearson III distribution was selected – as also used by the US Geological Survey and Federal Emergency Management Agency (FEMA).
For Fraser River at Shelley, the following design flood estimates based on the period 1935-2007, with 1894 as a historical outlier, are recommended:
Return Period (Years) Fraser River above Nechako - Flow (m3/s)
20 4,470 50 4,940 100 5,300 200 5,660
The updated 20-year flow is the same as used by Klohn-Crippen (1997). The new 200-year flood estimate of 5,660 m3/s is slightly (2%) higher than the previous value of 5,560 m3/s.
3.3 NECHAKO RIVER FRESHET DESIGN FLOWS
Typically, the Nechako and Fraser River freshet peak flows do not coincide, so that adding the Nechako and Fraser 200-year floods would yield a flood value with a return period well above 200 years. Instead, the Nechako River design water surface profile was based on the following two scenarios:
• The Nechako River 200-year flood and coincident Fraser River flow. • The Fraser River 200-year flood and coincident Nechako River flow.

nhc
Flood Risk Evaluation and Flood Control Solutions – Phase 1 Final Report 18
The two profiles were then overlaid and the higher used to develop the design freshet profile for the river. The first condition is expected to yield higher water levels in the upper and middle study reaches while the second condition, described in Section 3.4, likely governs near the confluence. The coincident Fraser River flow was determined by estimating the 200-year Fraser flow for the period June 20 to July 20, or during the time interval when the Nechako annual peak occurs. The coincident Nechako flow was estimated as the difference between Fraser flows below and above the confluence as described in Section 3.4.
The 1950-2008 flow record for Nechako River at Isle Pierre (nearest WSC Station) is statistically non-homogenous, because the reservoir operating regime has changed over time. As part of a recent flood assessment study for Vanderhoof, NHC (2008b) produced a simulated Nechako River flow record for 1957-2006 at Vanderhoof that supposes present reservoir operations to have existed over the period. This simulated homogenous record indicated a somewhat reduced risk of high ice-related flows compared to the actual historical record. Nechako freshet flows, on the other hand, could actually be increased by regulation but be further delayed. Those simulations are under review by Rio Tinto Alcan and the Province of British Columbia, but have not yet been accepted, therefore the results were used for sensitivity analyses only. An enquiry to MOE drew the following response from Mr. G. Davidson, Director (personal communication):
“While there is ongoing discussion with Rio Tinto Alcan (RTA) to improve inflow forecasting and flood routing operations there are currently no plans to dramatically alter flood operations on the Nechako. Alcan continues to operate their facilities within the current water license.
What may lead to a change in operations would be a change in the works. The Province and RTA are currently considering options related to the installation of a water release facility at the Kenney Dam9. Installation of such a facility would change water release operations and would likely affect flood flows. However, it is still too soon to predict what type of a facility may be constructed.
In addition, RTA continues to look at opportunities to enhance aluminum production at their Kitimat facility. Some options related to this may include changes to hydraulic works associated with the Kemano hydroelectric facility. Changes such as dredging of Tahtsa Narrows or increased penstock capacity could improve the ability to manage large reservoir inflows. However, again it is too early to say if or when these projects may go ahead.
The bottom line is that there is currently no plan to dramatically alter the RTA works, the water licenses, or the flood routing operations. There may be some opportunity to make minor improvements to flood forecasting and flood release operations. So for the purposes of (the Prince George) analysis, I would assume releases similar to previous years.”
Consequently, to estimate the Nechako River 200-year flood, the flow record for Isle Pierre was routed using an area ratio adjustment to Prince George and a frequency analysis carried 9 Plans for this facility were suspended in October 2008 but other developments may be considered in the
future.

nhc
Flood Risk Evaluation and Flood Control Solutions – Phase 1 Final Report 19
out for the period 1957 to 2007. The Log Pearson Type III distribution yields the following results:
Return Period Nechako River at Prince George (Years) Flows (m3/s)
20 1,050 50 1,200 100 1,320 200 1,450
The new Nechako 200-year flow of 1,450 m3/s, used to model the water surface profile, is 6% higher than the previous estimate of 1,365 m3/s by Klohn Crippen (1997). If the above-described simulated Nechako flow record (NHC 2008b) were used, the 200-year estimate would be considerably higher at 1,870 m3/s. However, since ice-related flooding is known to produce the highest flood levels on the Nechako, the freshet design flow was not further refined. Also, since maximum instantaneous peaks at Isle Pierre average only 0.5% higher than daily flows, the latter were used in the frequency analysis.
In the hydraulic modelling of water surface profiles, the Nechako downstream starting level is set by the coincident Fraser River water level at the confluence. To determine an appropriate Fraser River flow to coincide with the Nechako 200-year flood, Fraser River flows at Shelley from June 20th to July 20th each year, corresponding to the Nechako peak period, were analyzed. Since Fraser River flows are generally considerably higher than Nechako flows, water levels at the confluence are largely dependent on Fraser flows. Based on the Log Pearson Type III distribution the following values were adopted as coincident with the Nechako return period floods:
Corresponding (June 20th to July 20th ) NechakoReturn Period (Years) Fraser River at Prince George - Flow (m3/s)
20 3,710 50 3,940 100 4,070 200 4,190 In other words, to model the Nechako River 200-year flood, starting levels at the confluence were computed using a Fraser River inflow of 4,190 m3/s and outflow of 5,640 m3/s, equal to the sum of 4,190 m3/s (Fraser) and 1,450 m3/s (Nechako).
3.4 FRASER RIVER FRESHET DESIGN FLOWS DOWNSTREAM OF NECHAKO RIVER
To generate Fraser River flood estimates downstream of the confluence, the daily flows for Fraser River at Shelley were combined with the daily flows for Nechako River at Prince George (recorded at Isle Pierre and routed to Prince George) for the period 1957 to 2006. Based on the Log Pearson Type III distribution the following estimates were obtained:

nhc
Flood Risk Evaluation and Flood Control Solutions – Phase 1 Final Report 20
Return Period Fraser River below Confluence (Years) Flow (m3/s)
20 5,130 50 5,630 100 6,000 200 6,360
These estimates are based on the 1957-2007 period only to account for regulation, whereas the design flows estimated for Shelley (Section 3.2) covered the period from 1935 to 2007. To approximate a longer flow record below the confluence, a separate frequency analysis was conducted on Shelley flows for 1957 to 2007. The ratio between the 1935-2007 and 1957-2007 results was then computed and applied to the design flows below the confluence as tabulated below (all flows are in m3/s):
Return Period
Shelley (1935-2007)
Shelley (1957-2007)
Ratio: Shelley (1935-2007)/ (1957-2007)
Fraser below Confluence (1957-2007)
Fraser below Confluence (1935-2007)
20 4,470 4,430 1.009 5,130 5,180 50 4,940 4,900 1.007 5,630 5,670 100 5,300 5,260 1.006 6,000 6,040 200 5,660 5,630 1.005 6,360 6,390
The Nechako River flows coincident with the Fraser River design floods were estimated by simply subtracting the Shelley flows from the flows below the confluence giving the following values:
Fraser River Return Period (years) Nechako River Flow (m3/s)
20 710 50 730 100 730 200 730
To compute the Fraser River 200-year design flood profile, a flow of 5,660 m3/s was used above the confluence, a flow of 6,390 m3/s below the confluence, and a Nechako flow of 730 m3/s equal to the difference between the two. Compared to the previous modelling (Klohn Crippen 1997) that used Fraser River flows of 5,560 m3/s and 6,200 m3/s, the revised flows are 2% and 3% higher.

nhc
Flood Risk Evaluation and Flood Control Solutions – Phase 1 Final Report 21
3.5 POTENTIAL FUTURE IMPACT OF CLIMATE AND BASIN CHANGE
3.5.1 CLIMATE CHANGE
There is a strong consensus within the scientific community that anthropogenic climate change has contributed to warming observed in the latter part of the 20th century (IPCC 2007a, 2007b). It is expected that the global annual mean temperature will rise more than 3oC over the next century. Predictions about changes in precipitation are much less certain.
A review of future climate impacts in British Columbia (Rodenhuis et al 2007) has recently been undertaken by the Pacific Climate Impacts Consortium (PCIC). The report was prepared to provide a comprehensive survey of the current knowledge of climate variability and change in British Columbia, and provides estimates of future climate conditions predicted for the 2050’s. For the Fraser Plateau region, the temperature and precipitation are expected to increase as follows10:
Temperature Anomaly11 (oC) Precipitation Anomaly (mm)
Winter Summer Annual Winter Summer Annual
2.4 1.8 1.9 9 3 7
These numbers agree with a recent study by PCIC (2008) for the Prince George region, which indicates that annual mean temperatures for 2041-2070 will increase by 2oC to 3oC, summer temperatures by 2oC to 3oC, and winter temperatures by 3oC to 4oC. The increases for precipitation are less certain, mainly because of natural variability (see Section 4.1 Rodenhuis et al 2007).
Warmer winter temperatures mean that more precipitation falls as rain rather than snow, resulting in increased winter runoff and decreased snowpack accumulation. The spring snow water equivalent (SWE) is projected to decrease across the greater part of the area by 5% to 20% (Rodenhuis et al 2007, PCIC 2008). Reductions in spring floods are expected because of reduction in the snowpack and warmer temperatures causing an earlier spring melt (Rodenhuis et al 2007).
Morrison et al (2002) modelled future flows on the Fraser River using projected temperatures and precipitations for 2070-2099. These results predict a modest 5% (150 m3/s) increase in flow volume but a decrease in the mean annual peak flow at Hope of about 18% (1,600 m3/s). The peaks occurred on average about 24 days earlier, although some peaks (13%) occurred later in the year as a result of summer or fall rain. Less snow will accumulate at lower elevations. Sushama et al (2006) also project a decrease in SWE, higher runoff during late fall and early winter, and earlier and smaller spring peaks.
10 taken from Rodenhuis et al (2007), Table 4.1.1b. 11 Anomaly refers to the projected change in future climate expressed as a difference from the model baseline
which is the 1961-1990 baseline.

nhc
Flood Risk Evaluation and Flood Control Solutions – Phase 1 Final Report 22
3.5.2 MOUNTAIN PINE BEETLE
The Mountain Pine Beetle (MPB) infestation is changing the landscape over much of British Columbia, affecting an estimated 13.5 million hectares of provincial crown forest (MOF 2008). Attributed at least in part to forest management practices and to climate change, the extent of the epidemic has extensive environmental, economic and social impacts. Hydrological changes and aquatic habitat effects have been studied in particular and are of interest to the study area.
Forecasting specific streamflow changes due to beetle infestation within watersheds is difficult as these changes originate at the forest stand level, where characteristics of each forest stand such as terrain, elevation and amount of infestation, dictate changes to their contribution of downstream streamflows (EDI 2008, Uunila et al 2006). On the basis of academic studies, however, generalized changes can be expected. As trees in a MPB-infested forest die, transpiration rates and interception of precipitation are reduced. Increases in forest soil water result and may contribute to poor surface water drainage and elevated water tables. In the Vanderhoof and Lakes Forest Districts, conversion of dry firm “summer” ground to wetter, less firm “winter” ground within dead-pine leading stands has been documented, making use of traditional heavy logging equipment difficult or impossible (Rex and Dubé 2006). Also near Vanderhoof, on the Nechako Plateau, it was found that a low ablation rate and increased ground snow accumulation in a dead stand of MPB-killed trees (compared to a live stand) resulted in a lengthened period of snowpack disappearance (Boon 1997). A modelling study in the Baker Creek watershed near Quesnel (drainage area 1,570 km2) predicted a 30% increase in annual water yield and 60% increase in annual peak streamflows under the assumption that 75% of the mature pine were attacked by MPB in this watershed, which has been affected by past harvesting practices (BC FPB 2007). These increases in soil water, streamflow and water yield are expected to last several decades and could lead to decreased slope stability, increased flooding, and changes in water quality and aquatic habitat.
The effect of MPB on much larger systems such as the Fraser River Basin is more complex. Specific hydrologic modelling studies have not yet been undertaken (Alila 2007). Forest hydrology literature is dominated by stand-level knowledge and small paired watershed studies, often less than a few square kilometers in size. Applying this knowledge on its own to much larger watersheds affected by MPB is not reasonable (Alila 2007). The Ministry of Environment is currently investigating the effect of pine-beetle devastation on run-off to the Fraser River basin, and a VIC-model is being assembled (personal communication with Mr. Allan Chapman, MOE River Forecast Centre). This model will be used for evaluating the effects of tree-cover reduction on Fraser River peak flows, but no results are yet available.

nhc
Flood Risk Evaluation and Flood Control Solutions – Phase 1 Final Report 23
3.5.3 CHANGE PREDICTIONS APPLIED TO FLOODING AT PRINCE GEORGE
Studies reviewed suggest that climate change will reduce spring peak flows at Prince George, while the effects of MPB will likely increase them. The interaction between the two processes is complex and no hydrologic modelling is available to allow an assessment of the combined effect on flows at Prince George. Hydraulic modelling of flood flows typically includes a sensitivity analysis to determine how the flood profile responds to variations in the assumed flow. Flow increases of 10% and 20% are typically used, and will be applied to the flows at Prince George until other information is available.
The studies suggest that winter flows will increase, but it is not possible to say by how much. This would be most important on the Nechako River, where the increase might result in more frequent flow conditions conducive to ice jamming (see Section 4.4). On the other hand, increased winter temperatures might reduce the tendency for frazil ice development (a key component for ice jamming - see Section 4.4), which may reduce the frequency of ice jamming.
3.6 HYDRAULIC ANALYSIS
Hydraulic modelling was undertaken to simulate open water (freshet) flood profiles corresponding to the estimated Nechako and Fraser River design flows, using HEC-RAS, a one-dimensional hydrodynamic software developed by the US Army Corps of Engineers. Required inputs are channel and floodplain geometry, Manning’s roughness coefficients, bridge details and boundary conditions consisting of reach inflows and downstream starting water levels. The developed model was calibrated and validated to observed water levels and then used to simulate design profiles. Its sensitivity to variations in roughness, flows and starting conditions was also assessed. The Nechako River 200-year open water flood profile was compared to the 200-year ice-related profile and the higher of the two taken as the design condition.
3.6.1 MODEL DEVELOPMENT
From May 27 to 30, 2008, NHC with assistance from EDI surveyed 23 cross-sections on the Nechako River and 8 on the Fraser River, using a sonar depth sounder linked to a real-time kinetic (RTK) GPS. Water levels at the time of the survey were recorded at each section for model calibration purposes. Terrestrial benchmarks were surveyed using the RTK system twice daily for quality assurance. The cross-sections, at approximately the same locations as the 1979 and 1995 sections used in the Klohn Crippen (1997) study, are shown on Maps 1 to 3. The 2008 cross-sections were concentrated along the lower and middle Nechako River reaches and in the confluence area of the Fraser, where the most significant channel changes were expected. However, a comparison of the old and new surveys showed little change. Repeat surveys were not conducted for the upper end of the Nechako reach nor the upper and

nhc
Flood Risk Evaluation and Flood Control Solutions – Phase 1 Final Report 24
lower reaches of the Fraser River. In the immediate confluence area, the bathymetric survey was expanded to a grid survey to allow for future monitoring and optional two-dimensional hydraulic modelling.
To obtain up-to-date floodplain topography for the Lower Nechako and Fraser confluence areas, MCSL conducted a LiDAR (Light Detecting and Ranging) survey on June 30, 2008. The survey covered an area of approximately 19.3 km2 as shown in Figure 3.8, with a two-point/m2 density, corresponding to an accuracy of +20-25 cm or better. For floodplain areas outside the LiDAR area, topography was obtained from the old floodplain mapping based on 1993 air photography.
The bathymetric, topographic and LiDAR data were combined in GIS and the cross-sectional spacing along the thalweg extracted. Within the study area, there are three bridge crossings on the Nechako River and five on the Fraser River. Bridge information, available from the previous mapping study (Klohn Crippen 1997), was included in the model.
3.6.2 MODEL CALIBRATION AND VALIDATION
During the 2008 freshet, the Fraser River at Shelley peaked on May 22 with an estimated discharge of 4,310 m3/s based on WSC’s real time data (final approved flows not being available as of yet). During the bathymetric surveys from May 27 to 30, the real-time discharge dropped to an average of 3,300 m3/s. As suggested by a WSC flow measurement obtained during the freshet and listed on the real-time data website, the rating curve presently in use may be too high by about 8% and a revision to the curve may be required. Since a calibration flow higher than the actual discharge would result in non-conservative roughness coefficients, a corresponding 8% adjustment was made to the real time flows, giving a calibration flow of 3,027 m3/s.
During the calibration period, the Nechako River flow at Isle Pierre averaged 540 m3/s. Again, a WSC flow measurement taken during the freshet suggested that the real-time data may be too high, in this case by about 3%. On the other hand, local inflows between Isle Pierre and Prince George were estimated to increase the flow by 2%. A calibration flow of 536 m3/s was assumed.
HEC-RAS allows modelling of river junctions by two methods, based on either the conservation of energy or conservation of momentum. Based on the available calibration data, the energy method was found to be more representative. However, the flow pattern at the confluence is strongly two-dimensional, so that for more accurate results, two-dimensional modelling using a software like River2D is recommended.
In the calibration process, Manning roughness coefficients (n) were adjusted to provide the best fit of modelled to observed water levels. As the 2008 survey of high-water marks did not cover the entire study area, marks from 1990 were used to extend the calibration. Considering the only minor changes in the cross-sectional geometry over time, this was considered reasonable.
For the Nechako River, a roughness coefficient of 0.031 was adopted for the reach from Cross-Section N1 to N27, and 0.032 upstream of N27. Adopted Fraser River coefficients

nhc
Flood Risk Evaluation and Flood Control Solutions – Phase 1 Final Report 25
ranged from 0.027 to 0.030. Adopted overbank coefficients ranged from 0.05 for open fields to 0.10 for densely vegetated areas.
For an independent validation, high-water marks from 1972 were used. Generally, good agreement was found between observed and computed values. Calibration flows, adopted roughness values and deviations of modelled from observed water levels are summarized in Table 3.3 for Nechako River and Table 3.4 for Fraser River. Average absolute errors range from 0.06 m (2008 - Nechako River) to 0.18 m (1972 – Fraser River). Suspect observed data were not used in the error calculations. During large floods, significant super-elevation of flow occurs in sharp river bends, resulting in substantial water level differences between the banks. Because water levels at the WSC Shelley gauge were difficult to match using realistic roughness values, it is recommended that the gauge benchmark be confirmed.
For all simulated profiles, the starting condition was assumed to be normal flow at the downstream end of the Fraser River study reach. The sensitivity of the model to this boundary condition as well as to variations in roughness and flows was examined as part of the sensitivity assessments described in Section 3.6.4.
3.6.3 DESIGN FRESHET FLOOD PROFILES
Nechako River Using the calibrated model, water surface profiles for the design flow were simulated and compared with the Klohn Crippen (1997) results. Since the future Nechako operating regime, particularly during very high flows, is not clearly defined, the 200-year flood based on past recorded flows (1,450 m3/s) was adopted as the design flow. The corresponding profile is shown in Figure 3.9. Also shown is the backwater profile for the 200-year Fraser River flood of 5,660 m3/s and the coincident Nechako design flow of 730 m3/s. The latter condition results in higher water levels over a distance of 3.8 km upstream of the confluence, to roughly Cross-Sections N8. The final 200-year freshet profile is represented by the combination of the two profiles, using whichever is higher at each section.
Figure 3.10 shows the 20-year and 200-year water surface profiles and the thalweg. The 20-year profile is included because it is typically incorporated on floodplain maps along with the 200-year design condition. Water levels are listed in Table 3.5.
Fraser River The Fraser River 200-year water surface profile is shown in Figure 3.11. It is consistently higher than the Klohn Crippen (1997) profile as a result of historical and recent floods being included in the frequency analysis.
Figure 3.12 compares the 20- and 200-year Fraser River water surface profiles and also shows the thalweg profile. Corresponding water levels are listed in Table 3.6. Flood Construction Levels are discussed in Section 5.1.

nhc
Flood Risk Evaluation and Flood Control Solutions – Phase 1 Final Report 26
The CNR trestle bridge at the confluence has a sloping low chord, with a clearance above the 200-year water surface profile of only 0.2 m on the left bank and 1.4 m on the right bank. Large quantities of debris are transported by the Fraser River and a substantial log jam could occur at the upstream side of the bridge during the 200-year flood. The river section is quite wide and a log jam may not significantly alter the upstream water surface profile but could damage the bridge. CNR should be informed about the updated flood profile.
Section 2.4 compared the old and new river cross-sections in terms of thalweg elevations, average bed elevations and flow areas. As part of the hydraulic analyses a fourth comparison was carried out by importing the cross-sections surveyed in 1979 into the 2008 HEC-RAS model. This allowed direct comparison of the simulated 200-year flood profiles for both sets of cross-sections, without influence from other model parameters. The two profiles were within a few centimetres of each other, further confirming that the conveyance of Fraser and Nechako Rivers has not significantly changed at the confluence over the past 30 years.
3.6.4 FLOOD PROFILE SENSITIVITY ANALYSIS
The sensitivity of the Nechako and Fraser River design flood profiles (base-case) to variations in roughness, flow and starting levels was evaluated. This involved adjusting each variable and then determining the resulting deviation from the base profile.
The roughness values for the Nechako River were increased by 10% over the entire reach. This caused 200-year freshet flood levels to rise on average 0.29 m above the base profile. A similar roughness increase raised Fraser River water levels on average by 0.44 m. Sensitivity test results are plotted in Figures 3.13 and 3.14 and listed in Tables 3.7 and 3.8.
Sensitivity to discharge variations was evaluated by increasing both Nechako and Fraser River design flows by 10% and by 20% (Section 3.5.3). Results are shown in Figures 3.15 and 3.16. Corresponding average water level rises were 0.32 m and 0.61 m in the Nechako and 0.51 m and 1.00 m in Fraser. The Nechako profile corresponding to a 200-year flood based on simulated reservoir outflows for a tentative present-day operating regime (Section 3.3 and NHC 2008b) is also shown.
For the base-case, the Fraser River 200-year starting level at Cross-Section F1 is 563.15 m, based on normal flow assumptions. This level was raised by 0.5 m and 1 m and corresponding flood profiles were computed. The 0.5 m increase raised the profile over a distance of roughly 10 km. The 1.0 m rise raised the profile over about 17 km, to above the Nechako confluence.
These sensitivity assessments suggest that the computed design flood profile is fairly sensitive to relatively minor variations in roughness, flow, and starting levels. The model was calibrated to Nechako flows in the 540 to 800 m3/s range, and to Fraser River flows in the ranges of 3,300 to 4,800 m3/s upstream of the Nechako and 3,560 to 5,200 m3/s downstream. These flows are considerably lower than the design discharges. Since roughness may vary somewhat with discharge, it is recommended that high water marks be observed in future large floods, in order to validate the model and update the design profiles if required.

nhc
Flood Risk Evaluation and Flood Control Solutions – Phase 1 Final Report 27
3.6.5 DESIGN FREQUENCY AND FREEBOARD ASSESSMENT
In British Columbia, the 200-year flood (0.5% risk of exceedance) is commonly adopted for the design of dikes and for assessing flood hazards. On the Lower Fraser River, the 1894 flood of record (return period of about 500 years) has been used by the joint federal/provincial Fraser River Flood Control Program and the BC Ministry of Environment. Other agencies including Indian and Northern Affairs Canada use the 200-year flood level.
Looking at these BC design flood standards in a global context, it is now commonly held that the level of flood protection should depend on the importance of the area being protected and the potential for loss of life and damage. Where there is a great threat to life if flood control facilities fail, much rarer design floods are often specified. For example, in China along some sections of the Yellow River, the design return period ranges from 500 to 2,000 years (annual exceedance probability 0.2% to 0.05%). In the Netherlands, where much of the country is below sea level, very high standards of protection are used. In Central Holland, coastal dikes are designed against a 10,000-year storm surge, and river dikes against a 1,250-year flood. Poland uses the 1,000-year flood for critical river levees.
The tops of river dikes are normally required to be set at a freeboard above the design flood level to prevent overtopping caused by:
• Waves (wind and ice consolidation generated) • Wind setup • Tidal surges • Hydraulic jumps and standing waves in the channel • Super-elevation of the water surface in bends • Unforeseen raising of water levels due to sedimentation or an increase in channel
roughness due to bedforms or vegetation • Effects of floating debris or ice • Settlement of the dikes or underlying floodplain • Other uncertainties in the hydrology and hydraulics
Freeboard in British Columbia is typically specified to be 0.6 m. This value is within the range commonly specified elsewhere for “typical” conditions where the risk of deaths or unacceptable damage is low. However, the specified amount of freeboard for a particular diking project may depend on several factors including:
• Height of the dikes • Type of construction material used to build the dikes • Top width of the dikes • Flow velocity and degree of curvature of the channel • Value of the land protected • Potential loss of life if the dikes were to fail

nhc
Flood Risk Evaluation and Flood Control Solutions – Phase 1 Final Report 28
A review of freeboard requirements in other countries (McArthur 1991) provides the following examples:
Germany: The lowest allowable value is 0.8 m. It can be as high as 1.5 m for populated areas. A variety of sophisticated methods are used for computing the design discharge, water surface elevation and freeboard.
Hungary: A fixed value of 1.0 m or 1.5 m is used, depending on wave conditions and potential for erosion of the dikes.
Japan: The freeboard increases with the magnitude of the design discharge. For small streams (flow less than 200 m3/s) the minimum freeboard is 0.6 m. For large rivers (flow greater than 10,000 m3/s), a freeboard of 2.0 m is used.
Netherlands: Freeboard is computed using a detailed analysis related to the specific characteristics of the dikes and local hydraulic conditions. The minimum freeboard provided is always greater than or equal to 0.5 m. For sea dikes, the minimum freeboard is computed using the 2% significant wave run-up condition applied during the design high water event (10,000-year return period). Besides freeboard, an allowance for sea-level rise is added to the design height of the dikes to cover the design period (50 years).
There appears to be insufficient information at present with respect to risks to determine the appropriate freeboard for the Nechako and Fraser Rivers. The commonly accepted B.C. value of 0.6 m appears to be at the lower end of the range used for highly developed urban areas in other jurisdictions.
The sensitivity analysis indicated that the base-case simulated flood profile for the Fraser/ Nechako Rivers are sensitive to changes in channel roughness and discharge, and that corresponding rises in the profile could use up a significant portion of a 0.6 m freeboard. A larger freeboard may be warranted, particularly if the combined effect of climate change and Mountain Pine-Beetle infestation increases peak flows.

Table 3.1 Historic Freshet Flooding at Prince George
Year Gauge Height Gauge Height PG WL (m) SFG WL (m) General Comparison (4) Description of Damage (4)
(Old Datum) (New Datum) GSC (1) GSC (2)
1875 - - - - 9.9 m above Low Water at Quesnel or higher than ever known before (since 1860?).
Several buildings flooded. Year was likely 1876 rather than 1875, based on record at Mission.
1894 - 11.5 569.5 569.3 (3) Estimated water level from WSC file (1962).(Design flood - Fraser River downstream of Hope).
Severe flooding throughout BC.
1911 25 ? ft - 568.6 ? 567.9? (3) - City flooded.1920 - - - - Water at "danger point". -1936 21.8 ft ?
1867.5 ft approx
- 569.2 568.5 (3) Within 5 ft of of CNR Bridge decking. Highest observed since 1911.
Vanderhoof flooded. Vanderhoof -Prince George HWY flooded. Water up to 1st Street and Fraser Avenue (south side of RR tracks).
1939 19.7 ft - 566.94 566.3 (3) - East End Flats flooded.First Avenue flooded in one location. Sloughs filled to capacity.
1948 26.36 ft1866.7 ft
- 568.98 568.3 (3) - Refer to inundation boundaries.
1954 24.92 ft - 568.53 567.8 (3) - -1964 - - 568.33 567.6 (3) - 400 residents evacuated from the Cache.1967 - 9.96 568.22 567.74 - North Nechako threatened. Cache flooded.
Dike improvements made.1972 - 10.44 - 568.22 - Cottonwood Isl and SFG flooded.1990 - 9.90 - 567.68 - Foreman Flats, Cottonwood Island,
Paddlewheel Park flooded. Farrell, Hazelton, Inlander Streets - people left homes. Landsdowne & Pulpmill Rd basements flooded. Lawsuit.
1997 - 9.88 - 567.66 - Increased water table - 2nd & 3rd Avenue businesses affected. Damage at $1M. Shelley and Foreman Flats partly evacuated. Nechako flooding - bank erosion at Miworth and Prince George, Island Drive and Bergman Rd. GeoNorth recommended riprap at Aspen Lane. Relocate homes along Island Park Drive.
2002 - 9.73 - 567.51 - -2007 - 9.83 - 567.61 - -2008 - 9.70 - 567.48 - -
Notes: 1. PG = WSC gauge Fraser River at Prince George2. SFG = WSC gauge Fraser River at South Fort George3. Estimated based on water level at Prince George gauge4. Septer (2007)

Table 3.2: Water Survey Canada Key Gauges
Station No Station Name Drainage Area (km2)
Period of Record
Number of Years
Type of Record
08JC002 Nechako River at Isle Pierre 42,500 1950-2008 59 Flow 08KB001 Fraser River at Shelley 32,400 1950-2008 59 Flow 08KE001 Fraser River at Prince George 79,500 1947-1968 22 Water Level only 08KE018 Fraser River at South Fort George 79,900 1968-2008 41 Water Level only 08MD013 Fraser River at Big Bar Creek 146,000 1935-1972 38 Flow 08JA013 Skins Lake Spillway, Nechako Reservoir --- 1956-2008 53 Flow 08JC001 Nechako River at Vanderhoof 25,100 1948-2008 61 Flow 08JB003 Nautley River near Fort Fraser 6,030 1950-2008 59 Flow 08JE001 Stuart River near Fort St. James 14,600 1929-2008 80 Flow

Table 3.3 - Nechako Calibration/Validation
Nechako River Calibration Summary
XS Name Channel n ‐ value
Calibration 2008 Calibration 1990 Calibration 1972
W.L. Sim.
W.L. Obs.
Sim. ‐ Obs
W.L. Sim.
W.L. Obs.
Sim. ‐ Obs
W.L. Sim.
W.L. Obs.
Sim. ‐ Obs
XS N34 0.032 578.05 ‐‐ ‐‐ 577.59 ‐‐ ‐‐ 578.82 ‐‐ ‐‐
XS N33 0.032 577.67 577.75 ‐0.08 577.21 ‐‐ ‐‐ 578.43 ‐‐ ‐‐
XS N32 0.032 576.84 ‐‐ ‐‐ 576.46 ‐‐ ‐‐ 577.47 ‐‐ ‐‐
XS N31 0.032 576.10 ‐‐ ‐‐ 575.69 ‐‐ ‐‐ 576.79 ‐‐ ‐‐
XS N30 0.032 575.37 575.43 ‐0.06 574.88 ‐‐ ‐‐ 576.16 ‐‐ ‐‐
XS N29 0.032 574.96 ‐‐ ‐‐ 574.48 ‐‐ ‐‐ 575.76 ‐‐ ‐‐
XS N28 0.032 574.40 ‐‐ ‐‐ 573.92 ‐‐ ‐‐ 575.19 ‐‐ ‐‐
XS N27 0.031 573.93 573.87 0.06 573.47 ‐‐ ‐‐ 574.69 ‐‐ ‐‐
XS N26 0.031 573.60 573.55 0.05 573.16 ‐‐ ‐‐ 574.33 ‐‐ ‐‐
XS N25 0.031 573.24 573.27 ‐0.03 572.82 ‐‐ ‐‐ 573.94 ‐‐ ‐‐
XS N24 0.031 572.85 ‐‐ ‐‐ 572.44 ‐‐ ‐‐ 573.55 ‐‐ ‐‐
XS N23 0.031 572.54 ‐‐ ‐‐ 572.13 ‐‐ ‐‐ 573.23 ‐‐ ‐‐
XS N22B 0.031 572.24 ‐‐ ‐‐ 571.85 ‐‐ ‐‐ 572.89 ‐‐ ‐‐
XS N22A 0.031 572.20 572.34 ‐0.14 571.82 ‐‐ ‐‐ 572.84 ‐‐ ‐‐
XS N21 0.031 571.97 571.58 0.39 571.61 ‐‐ ‐‐ 572.60 ‐‐ ‐‐
XS N20 0.031 571.51 571.59 ‐0.08 571.19 ‐‐ ‐‐ 572.10 ‐‐ ‐‐
XS N19 0.031 570.99 571.01 ‐0.02 570.67 ‐‐ ‐‐ 571.62 ‐‐ ‐‐
XS N18 0.031 570.49 570.42 0.07 570.18 ‐‐ ‐‐ 571.19 ‐‐ ‐‐
XS N17 0.031 570.05 569.92 0.13 569.81 ‐‐ ‐‐ 570.83 ‐‐ ‐‐
XS N16 0.031 569.71 569.71 0.00 569.56 ‐‐ ‐‐ 570.50 ‐‐ ‐‐
XS N15 0.031 569.32 569.31 0.01 569.33 569.28 0.05 570.21 570.19 0.02
XS N14 0.031 569.29 ‐‐ ‐‐ 569.31 569.27 0.04 570.20 570.18 0.02
XS N12 0.031 568.96 568.90 0.06 569.17 569.18 ‐0.01 570.01 570.06 ‐0.05
XS N11 0.031 568.49 568.34 0.15 569.02 569.02 0.00 569.78 569.80 ‐0.02
XS N9 0.031 568.39 ‐‐ ‐‐ 569.00 569.00 0.00 569.74 569.78 ‐0.04
XS N8 0.031 567.99 568.02 ‐0.03 568.93 568.79 0.14 569.61 569.50 0.11
XS N7 0.031 567.69 567.69 0.00 568.90 568.62 0.28 569.53 569.38 0.15
XS N6 0.031 567.53 567.49 0.04 568.87 568.25 0.62 569.48 569.34 0.14
XS N5 0.031 567.33 567.35 ‐0.02 568.84 568.56 0.28 569.36 569.30 0.06
XS N4 0.031 567.24 567.28 ‐0.04 568.83 568.88 ‐0.05 569.34 569.29 0.05
XS N3 0.031 567.22 567.25 ‐0.03 568.83 568.64 0.19 569.35 569.28 0.07
XS N2 0.031 567.21 567.24 ‐0.03 568.82 568.72 0.10 569.34 569.29 0.05
XS N1 0.031 567.21 567.29 ‐0.08 568.82 568.76 0.06 569.34 ‐‐ ‐‐
Error +‐ 0.06 +‐ 0.14 +‐ 0.07 NOTES: 1. ‐ For the 1972 and 1990 Floods the observed values were calculated based on linear interpolation of available water marks. 2. ‐ For the 1972 observed water marks in Nechako River the distance from the starting point was adjusted by ‐459.4 m 3. ‐ Suspect observed data shown in Italics and not included in average error calculation. 4. - All water levels and elevations are in metres (GSC).

Table 3.4 - Fraser Calibration/Validation
Fraser River Calibration Summary
XS Name Channeln ‐ value
Calibration 2008 Calibration 1990 Calibration 1972
W.L. Sim.
W.L. Obs.
Sim. ‐ Obs
W.L. Sim.
W.L. Obs.
Sim. ‐ Obs
W.L. Sim.
W.L. Obs.
Sim. ‐ Obs
XS F61 0.027 573.96 ‐‐ ‐‐ 575.76 ‐‐ ‐‐ 575.94 ‐‐ ‐‐
XS F60 0.027 573.66 573.20 0.46 575.47 574.86 0.61 575.66 575.07 0.59
XS F59 0.027 573.44 ‐‐ ‐‐ 575.24 574.86 0.38 575.43 ‐‐ ‐‐
XS F58 0.027 573.30 ‐‐ ‐‐ 575.14 574.79 0.35 575.33 ‐‐ ‐‐
XS F57 0.027 573.06 ‐‐ ‐‐ 574.83 574.59 0.24 575.03 ‐‐ ‐‐
XS F56 0.027 572.91 ‐‐ ‐‐ 574.73 574.42 0.31 574.93 ‐‐ ‐‐
XS F55 0.027 572.65 ‐‐ ‐‐ 574.40 574.19 0.21 574.60 ‐‐ ‐‐
XS F54 0.028 572.25 ‐‐ ‐‐ 574.15 573.99 0.16 574.36 ‐‐ ‐‐
XS F53 0.028 571.63 ‐‐ ‐‐ 573.67 573.80 ‐0.13 573.90 ‐‐ ‐‐
XS F52B 0.028 571.42 ‐‐ ‐‐ 573.44 573.59 ‐0.15 573.68 ‐‐ ‐‐
XS F52 0.028 571.41 ‐‐ ‐‐ 573.42 573.58 ‐0.16 573.66 ‐‐ ‐‐
XS F51 0.028 571.37 ‐‐ ‐‐ 573.37 573.31 0.06 573.61 ‐‐ ‐‐
XS F50 0.028 571.13 ‐‐ ‐‐ 573.12 573.09 0.03 573.36 ‐‐ ‐‐
XS F49 0.028 571.14 ‐‐ ‐‐ 573.16 573.04 0.12 573.41 ‐‐ ‐‐
XS F48 0.028 570.71 ‐‐ ‐‐ 572.41 572.91 ‐0.50 572.63 ‐‐ ‐‐
XS F47 0.028 570.63 ‐‐ ‐‐ 572.40 572.53 ‐0.13 572.63 ‐‐ ‐‐
XS F46 0.028 570.35 ‐‐ ‐‐ 572.11 572.11 0.00 572.36 ‐‐ ‐‐
XS F45 0.027 570.10 ‐‐ ‐‐ 571.88 571.66 0.22 572.14 ‐‐ ‐‐
XS F44 0.027 569.93 ‐‐ ‐‐ 571.71 571.33 0.38 571.97 ‐‐ ‐‐
XS F43 0.027 569.79 ‐‐ ‐‐ 571.56 571.14 0.42 571.83 ‐‐ ‐‐
XS F42 0.027 569.56 ‐‐ ‐‐ 571.32 571.18 0.14 571.61 ‐‐ ‐‐
XS F41 0.027 569.33 ‐‐ ‐‐ 571.06 571.32 ‐0.26 571.36 ‐‐ ‐‐
XS F40 0.029 569.09 ‐‐ ‐‐ 570.95 570.90 0.05 571.27 ‐‐ ‐‐
XS F39 0.029 568.88 ‐‐ ‐‐ 570.77 570.70 0.07 571.13 ‐‐ ‐‐
XS F38 0.029 568.75 ‐‐ ‐‐ 570.65 570.64 0.01 571.01 ‐‐ ‐‐
XS F37 0.029 568.65 ‐‐ ‐‐ 570.57 570.54 0.03 570.94 ‐‐ ‐‐
XS F36 0.030 568.45 ‐‐ ‐‐ 570.27 570.44 ‐0.17 570.64 ‐‐ ‐‐
XS F35 0.030 568.28 ‐‐ ‐‐ 570.11 570.25 ‐0.14 570.49 ‐‐ ‐‐
XS F34 0.030 568.17 ‐‐ ‐‐ 569.97 570.13 ‐0.16 570.36 ‐‐ ‐‐
XS F33 0.029 567.93 567.86 0.07 569.71 569.61 0.10 570.13 ‐‐ ‐‐
XS F32 0.029 567.57 567.60 ‐0.03 569.20 569.06 0.14 569.65 569.42 0.23
XS F31 0.029 567.40 567.39 0.01 568.95 568.84 0.11 569.43 569.32 0.11
XS F30 0.029 567.43 567.30 0.13 569.02 568.83 0.19 569.49 569.32 0.17
XS F29 0.029 567.40 ‐‐ ‐‐ 568.96 568.83 0.13 569.44 569.32 0.12
XS F28 0.029 567.36 567.43 ‐0.07 568.92 568.78 0.14 569.40 569.26 0.14
XS F27 0.030 567.18 567.22 ‐0.04 568.75 568.72 0.03 569.26 569.19 0.07
XS F26 0.030 567.11 ‐‐ ‐‐ 568.72 568.55 0.17 569.24 569.18 0.06
XS F25 0.030 567.10 ‐‐ ‐‐ 568.72 568.50 0.22 569.24 569.17 0.07
XS F23 0.030 567.09 ‐‐ ‐‐ 568.71 568.49 0.22 569.23 569.16 0.07
XS F22 0.030 567.07 ‐‐ ‐‐ 568.69 568.40 0.29 569.20 569.02 0.18
XS F21 0.029 566.96 ‐‐ ‐‐ 568.55 568.27 0.28 569.06 568.62 0.44
XS F21A 0.029 566.92 ‐‐ ‐‐ 568.51 568.25 0.26 569.01 568.56 0.45
XS F20 0.028 566.71 ‐‐ ‐‐ 568.22 568.11 0.11 568.69 568.40 0.29
XS F19 0.028 566.41 ‐‐ ‐‐ 567.92 567.67 0.25 568.40 568.00 0.40
XS F18 0.028 565.93 565.52 0.41 567.38 567.14 0.24 567.83 567.64 0.19
XS F16 0.028 565.66 ‐‐ ‐‐ 567.10 566.97 0.13 567.56 567.49 0.07
XS F15 0.028 565.66 ‐‐ ‐‐ 567.10 566.97 0.13 567.56 567.48 0.08
XS F14 0.028 565.45 ‐‐ ‐‐ 566.89 566.84 0.05 567.35 567.41 ‐0.06
XS F13 0.028 565.22 ‐‐ ‐‐ 566.67 566.67 0.00 567.13 567.36 ‐0.23
XS F12 0.028 565.14 ‐‐ ‐‐ 566.63 566.53 0.10 567.11 567.28 ‐0.17
XS F11 0.030 564.96 563.00 1.96 566.49 566.45 0.04 566.98 567.25 ‐0.27
XS F10 0.030 564.79 ‐‐ ‐‐ 566.30 566.22 0.08 566.78 566.85 ‐0.07
XS F9 0.030 564.51 ‐‐ ‐‐ 565.96 565.97 ‐0.01 566.42 ‐‐ ‐‐
XS F8 0.030 563.92 ‐‐ ‐‐ 565.28 565.42 ‐0.14 565.72 ‐‐ ‐‐
XS F7 0.030 563.54 ‐‐ ‐‐ 564.86 565.02 ‐0.16 565.29 ‐‐ ‐‐
XS F6 0.030 562.94 ‐‐ ‐‐ 564.28 564.40 ‐0.12 564.72 ‐‐ ‐‐
XS F5 0.030 562.44 ‐‐ ‐‐ 563.80 563.80 0.00 564.26 ‐‐ ‐‐
XS F4 0.029 561.84 ‐‐ ‐‐ 563.24 562.99 0.25 563.71 ‐‐ ‐‐
XS F3 0.029 561.34 ‐‐ ‐‐ 562.55 562.21 0.34 562.98 ‐‐ ‐‐
XS F2 0.029 561.14 ‐‐ ‐‐ 562.31 ‐‐ ‐‐ 562.73 ‐‐ ‐‐
XS F1 0.029 560.87 ‐‐ ‐‐ 562.01 ‐‐ ‐‐ 562.44 ‐‐ ‐‐
Error +‐ 0.06 +‐ 0.15 +‐ 0.18 NOTES: 1. ‐ For the 1972 and 1990 Floods the observed values were calculated based on linear interpolation of available water marks. 2. ‐ Suspect observed data shown in Italics and not included in average error calculation. 3. - All water levels and elevations are in metres (GSC).

Table 3.5 – Nechako Freshet Design Water Surface Profiles
XS Name Distance
(m) Channeln ‐ value
Freshet Design Profile (m GSC)
20‐yr 200‐yr
XS N34 15573 0.032 579.47 580.38
XS N33 15135 0.032 579.05 579.92
XS N32 14045 0.032 578.00 578.76
XS N31 13385 0.032 577.39 578.27
XS N30 12896 0.032 576.79 577.68
XS N29 12489 0.032 576.38 577.25
XS N28 11814 0.032 575.82 576.69
XS N27 11148 0.031 575.30 576.13
XS N26 10627 0.031 574.92 575.72
XS N25 10060 0.031 574.50 575.27
XS N24 9495 0.031 574.11 574.88
XS N23 9025 0.031 573.76 574.52
XS N22B 8555 0.031 573.40 574.12
XS N22A 8496 0.031 573.34 574.04
XS N21 8098 0.031 573.08 573.77
XS N20 7456 0.031 572.53 573.16
XS N19 6913 0.031 572.07 572.80
XS N18 6402 0.031 571.62 572.34
XS N17 5932 0.031 571.21 571.95
XS N16 5541 0.031 570.77 571.45
XS N15 5118 0.031 570.39 571.10
XS N14 5087 0.031 570.36 571.06
XS N12 4745 0.031 570.07 570.81
XS N11 4201 0.031 569.63 570.40
XS N9 4175 0.031 569.54 570.32
XS N8 3792 0.031 569.23 570.03
XS N7 3423 0.031 569.03 569.98
XS N6 2938 0.031 568.97 569.95
XS N5 2518 0.031 568.85 569.88
XS N4 1957 0.031 568.82 569.88
XS N3 1337 0.031 568.82 569.88
XS N2 889 0.031 568.81 569.88
XS N1 452 0.031 568.81 569.88

Table 3.6 – Fraser Freshet Design Water Surface Profiles
XS Name Distance
(m) Channeln ‐ value
Freshet Design Profile (m GSC)
20‐yr 200‐yr
XS F61 39338 0.027 575.45 576.56
XS F60 38312 0.027 575.17 576.29
XS F59 37532 0.027 574.94 576.05
XS F58 36837 0.027 574.83 575.97
XS F57 35961 0.027 574.54 575.65
XS F56 35186 0.027 574.43 575.57
XS F55 34290 0.027 574.11 575.22
XS F54 33364 0.028 573.84 575.03
XS F53 32073 0.028 573.35 574.59
XS F52B 31433 0.028 573.13 574.35
XS F52 31419 0.028 573.11 574.34
XS F51 30981 0.028 573.07 574.28
XS F50 30378 0.028 572.82 574.03
XS F49 29697 0.028 572.85 574.08
XS F48 29099 0.028 572.16 573.19
XS F47 28429 0.028 572.14 573.22
XS F46 27700 0.028 571.86 572.94
XS F45 26813 0.027 571.64 572.73
XS F44 26090 0.027 571.47 572.56
XS F43 25674 0.027 571.33 572.42
XS F42 24521 0.027 571.11 572.20
XS F41 23856 0.027 570.86 571.93
XS F40 22730 0.029 570.74 571.89
XS F39 21595 0.029 570.56 571.75
XS F38 20958 0.029 570.45 571.64
XS F37 20290 0.029 570.38 571.57
XS F36 19666 0.030 570.11 571.24
XS F35 18831 0.030 569.95 571.10
XS F34 18281 0.030 569.83 570.95
XS F33 17276 0.029 569.59 570.71
XS F32 16322 0.029 569.14 570.18
XS F31 15668 0.029 568.93 569.93
XS F30 15650 0.029 568.98 570.01
XS F29 15632 0.029 568.93 569.95
XS F28 15421 0.029 568.90 569.92
XS F27 14446 0.030 568.75 569.78
XS F26 13868 0.030 568.71 569.77
XS F25 13714 0.030 568.71 569.77
XS F23 13680 0.030 568.70 569.76
XS F22 13430 0.030 568.68 569.74
XS F21 13059 0.029 568.54 569.59
XS F21A 13004 0.029 568.50 569.53
XS F20 12639 0.028 568.21 569.19
XS F19 11701 0.028 567.91 568.90
XS F18 10786 0.028 567.37 568.32
XS F16 10176 0.028 567.10 568.05
XS F15 10156 0.028 567.10 568.04
XS F14 9680 0.028 566.90 567.84
XS F13 9093 0.028 566.68 567.63
XS F12 8686 0.028 566.64 567.62
XS F11 8417 0.030 566.50 567.51
XS F10 7716 0.030 566.31 567.31
XS F9 7010 0.030 565.97 566.93
XS F8 5804 0.030 565.31 566.23
XS F7 5004 0.030 564.90 565.81
XS F6 4144 0.030 564.34 565.27
XS F5 3317 0.030 563.89 564.85
XS F4 2203 0.029 563.36 564.35
XS F3 1422 0.029 562.73 563.62
XS F2 735 0.029 562.51 563.40
XS F1 0 0.029 562.25 563.15

Table 3.7 – Nechako 200‐Year Open Water Surface Profile – Sensitivity to Roughness and Flow Variation.
XS Name W S Elev. (m GSC) (Q = 1450 m3/s)
n+10% (W.L. Diff.)
Q+10% (W.L. Diff.)
Q+20% (W.L. Diff.)
1870 m3/s (1) (W. L. Diff.)
XS N34 580.38 0.27 0.30 0.59 0.84
XS N33 579.92 0.27 0.28 0.55 0.79
XS N32 578.76 0.27 0.26 0.51 0.73
XS N31 578.27 0.27 0.30 0.58 0.83
XS N30 577.68 0.29 0.30 0.57 0.82
XS N29 577.25 0.29 0.28 0.55 0.78
XS N28 576.69 0.28 0.28 0.54 0.77
XS N27 576.13 0.28 0.27 0.52 0.74
XS N26 575.72 0.27 0.27 0.51 0.72
XS N25 575.27 0.26 0.26 0.48 0.69
XS N24 574.88 0.25 0.26 0.48 0.68
XS N23 574.52 0.24 0.25 0.44 0.63
XS N22B 574.12 0.23 0.24 0.40 0.58
XS N22A 574.04 0.23 0.23 0.38 0.56
XS N21 573.77 0.22 0.24 0.37 0.54
XS N20 573.16 0.23 0.23 0.46 0.62
XS N19 572.80 0.22 0.25 0.50 0.66
XS N18 572.34 0.23 0.25 0.50 0.65
XS N17 571.95 0.24 0.27 0.53 0.66
XS N16 571.45 0.26 0.26 0.51 0.58
XS N15 571.10 0.26 0.28 0.55 0.59
XS N14 571.06 0.27 0.29 0.56 0.59
XS N12 570.81 0.28 0.32 0.60 0.60
XS N11 570.40 0.30 0.35 0.66 0.57
XS N9 570.32 0.31 0.35 0.67 0.56
XS N8 570.04 0.34 0.39 0.72 0.54
XS N7 569.84 0.35 0.41 0.76 0.52
XS N6 569.69 0.36 0.44 0.80 0.51
XS N5 569.32 0.39 0.44 0.90 0.35
XS N4 569.23 0.40 0.49 0.97 0.36
XS N3 569.25 0.38 0.48 0.95 0.37
XS N2 569.23 0.39 0.49 0.96 0.37
XS N1 569.23 0.39 0.49 0.96 0.36
Average ‐‐‐ 0.29 0.32 0.61 0.61
Notes: (1) 200‐yr flow based on simulated Nechako Reservoir Operation. (2) All water levels are in metres (GSC).

Table 3.8 – Fraser 200‐Year Open Water Surface Profile – Sensitivity to Roughness and Flow Variation
XS Name W S Elev. (m GSC) (Q = 5660 / 6390 m3/s)
n+10% (W.L. Diff.)
Q+10% (W.L. Diff.)
Q+20% (W.L. Diff.)
XS F61 576.56 0.44 0.51 1.01
XS F60 576.29 0.43 0.51 1.01
XS F59 576.05 0.42 0.51 1.01
XS F58 575.97 0.42 0.52 1.03
XS F57 575.65 0.42 0.51 1.01
XS F56 575.57 0.41 0.52 1.03
XS F55 575.22 0.42 0.51 1.01
XS F54 575.03 0.40 0.54 1.08
XS F53 574.59 0.40 0.56 1.11
XS F52B 574.35 0.41 0.56 1.10
XS F52 574.34 0.41 0.55 1.09
XS F51 574.28 0.41 0.56 1.10
XS F50 574.03 0.42 0.56 1.10
XS F49 574.08 0.41 0.57 1.12
XS F48 573.19 0.46 0.47 0.93
XS F47 573.22 0.44 0.50 0.99
XS F46 572.94 0.46 0.50 0.99
XS F45 572.73 0.44 0.50 0.99
XS F44 572.56 0.44 0.51 1.00
XS F43 572.42 0.45 0.51 1.01
XS F42 572.2 0.44 0.51 1.01
XS F41 571.93 0.45 0.51 1.01
XS F40 571.89 0.43 0.54 1.06
XS F39 571.75 0.44 0.55 1.09
XS F38 571.64 0.45 0.56 1.10
XS F37 571.57 0.45 0.56 1.11
XS F36 571.24 0.46 0.54 1.06
XS F35 571.1 0.45 0.54 1.07
XS F34 570.95 0.45 0.54 1.06
XS F33 570.71 0.45 0.54 1.06
XS F32 570.18 0.47 0.51 1.01
XS F31 569.93 0.45 0.50 0.98
XS F30 570.01 0.44 0.50 1.00
XS F29 569.95 0.45 0.50 0.99
XS F28 569.92 0.44 0.50 1.00
XS F27 569.78 0.43 0.52 1.03
XS F26 569.77 0.42 0.53 1.04
XS F25 569.77 0.42 0.53 1.04
XS F23 569.76 0.42 0.53 1.04
XS F22 569.74 0.42 0.52 1.04
XS F21 569.59 0.43 0.51 1.02
XS F21A 569.53 0.44 0.52 1.02
XS F20 569.19 0.45 0.48 0.95
XS F19 568.9 0.45 0.49 0.97
XS F18 568.32 0.46 0.47 0.93
XS F16 568.05 0.45 0.46 0.93
XS F15 568.04 0.45 0.47 0.93
XS F14 567.84 0.45 0.47 0.94
XS F13 567.63 0.44 0.47 0.94
XS F12 567.62 0.43 0.49 0.97
XS F11 567.51 0.44 0.50 1.00
XS F10 567.31 0.43 0.49 0.97
XS F9 566.93 0.45 0.48 0.94
XS F8 566.23 0.45 0.46 0.90
XS F7 565.81 0.44 0.45 0.88
XS F6 565.27 0.46 0.47 0.92
XS F5 564.85 0.46 0.48 0.94
XS F4 564.35 0.46 0.49 0.97
XS F3 563.62 0.48 0.44 0.86
XS F2 563.4 0.45 0.44 0.86
XS F1 563.15 0.45 0.45 0.88
Average ‐‐‐ 0.44 0.51 1.00
Note: (1) All water levels are in metres (GSC).

0
500
1000
1500
2000
2500
3000
3500
4000
4500
5000
1950
1952
1954
1956
1958
1960
1962
1964
1966
1968
1970
1972
1974
1976
1978
1980
1982
1984
1986
1988
1990
1992
1994
1996
1998
2000
2002
2004
2006
Max
imum
Dai
ly F
low
(m3 /s
)
Year
Fraser River at Shelley Annual Peak Flows 1950 ‐ 2007
January 2009 Figure 3.1
City of Prince George

0
100
200
300
400
500
600
700
800
900
1000
1100
1200
1950
1952
1954
1956
1958
1960
1962
1964
1966
1968
1970
1972
1974
1976
1978
1980
1982
1984
1986
1988
1990
1992
1994
1996
1998
2000
2002
2004
2006
Max
imum
Dai
ly Fl
ow (m
3 /s)
Year
Nechako River at Isle Pierre Annual Peak Flows 1950 ‐ 2007
January 2009 Figure 3.2
City of Prince George

6
6.5
7
7.5
8
8.5
9
9.5
10
10.5
11
1947
1950
1952
1955
1957
1959
1961
1963
1965
1968
1970
1972
1974
1976
1978
1980
1982
1984
1986
1988
1990
1992
1994
1996
1998
2000
2002
2004
2006
Max
imum
Dai
ly G
auge
Hei
ght (
m)
YearNotes: 1. 1947-1967 water levels based on adjusted record for WSC gauge at Prince George.2. Datum 0 = 557.784 m GSC3. SFG - South Fort George
Fraser River at SFG Annual Peak WL’s 1947 ‐ 2007
January 2009 Figure 3.3
City of Prince George

22-Apr
12-May
1-Jun
21-Jun
11-Jul
31-Jul
20-Aug
9-Sep
1940 1950 1960 1970 1980 1990 2000 2010
Year
Dat
e of
Ann
ual P
eak
Flow
/Wat
er L
evel
Fraser River at South Fort GeorgeNechako River at Isle PierreFraser River at Shelley
Nechako / Fraser River Timing of Freshet Peak
January 2009 Figure 3.4
City of Prince George

0
500
1000
1500
2000
2500
3000
3500
4000
4500
5000
Jan Feb Mar Apr May Jun Jul Aug Sep Oct Nov Dec
Mon
thly
Flo
w (m
3 /s)
MonthAverage
Maximum
Minimum
Fraser River at Shelley Monthly Flows
January 2009 Figure 3.5
City of Prince George

0
100
200
300
400
500
600
700
800
900
1000
1100
1200
Jan Feb Mar Apr May Jun Jul Aug Sep Oct Nov Dec
Flow
(m3 /s
)
MonthAverage
Maximum
Minimum
Nechako River at Isle Pierre Monthly Flows
January 2009 Figure 3.6
City of Prince George

0
1
2
3
4
5
6
7
8
9
10
11
Jan Feb Mar Apr May Jun Jul Aug Sep Oct Nov Dec
Mon
thly
Gau
ge H
eigh
t (m
)
MonthAverage
Maximum
MinimumDatum 0 = El. 557.784 m GSC at South Fort George
Fraser River at SFG Monthly Water Levels
January 2009 Figure 3.7
City of Prince George

City of Prince G
eorge
Nechako R
iver
Fraser River
Extent of LiDA
R Survey
5120
00.0
0000
0
5120
00.0
0000
0
5140
00.0
0000
0
5140
00.0
0000
0
5160
00.0
0000
0
5160
00.0
0000
0
5180
00.0
0000
0
5180
00.0
0000
0
5200
00.0
0000
0
5200
00.0
0000
0
5220
00.0
0000
0
5220
00.0
0000
0
5973000.000000
5973000.000000
5976000.000000
5976000.000000
0 500 1,000 1,500 2,000250Metres
®
Legend - LiDAR Survey
Extent of LiDAR Survey
1:30,000
GD
L \\1
0.0.
3.10
\pro
ject
s\34
920
PG
FPM
\GIS
_XS
Scale:Coord. System: UTM Zone 10Datum: NAD 83Units: MetresNotes: Satellite image from Google Earth
City of Prince George
Nechako and Fraser Rivers
January 2009 Figure 3.8
Extent of LiDAR Survey

569.0
570.0
571.0
572.0
573.0
574.0
575.0
576.0
577.0
578.0
579.0
580.0
581.0
0 2000 4000 6000 8000 10000 12000 14000 16000
Eleva
tion (m, G
SC)
Distance from Mouth (XS F26, m)Q = 1,450 cms (recorded flows)
Q = 730 cms (Fraser 200‐yr backwater)
Klohn Crippen (1997)
XS N5
XSN4
XSN3
XSN2
XSN1
XSN17
XSN24
XSN23
XSN21
XSN22
A
XSN16
XSN18
XSN19
XSN20
XS N6
XSN14
XSN12
XSN9
XS N8
XSN7
XSN26
XSN34
XSN33
XSN28
XSN27
XSN25
XSN32
XSN31
XSN30
XSN29
Foothills Boulevard Bridge
(L.C. 577.03 m )
John
Hart Bridge
(Highw
ay 97
(L.C. 578.13 m )
Cameron
Street Bridge
(L.C. 574
m )
Nechako River
200‐Yr Open Water Surface Profiles
January 2009 Figure 3.9
City of Prince George

Nechako River Open Water
20‐yr and 200‐yr Flood Profiles
January 2009 Figure 3.10
City of Prince George
561.0
562.0
563.0
564.0
565.0
566.0
567.0
568.0
569.0
570.0
571.0
572.0
573.0
574.0
575.0
576.0
577.0
578.0
579.0
580.0
581.0
582.0
583.0
0 2000 4000 6000 8000 10000 12000 14000 16000
Eleva
tion (m, G
SC)
Distance from Mouth (XS F26, m)Open Water 200‐yr Profile
Open Water 20‐yr Profile
Thalweg
XS N5
XSN4
XSN3
XSN2
XSN1
XSN17
XSN24
XSN23
XSN21
XSN22
A
XSN16
XSN18
XSN19
XSN20
XS N6
XSN14
XSN12
XSN9
XS N8
XSN7
XSN26
XSN34
XSN33
XSN28
XSN27
XSN25
XSN32
XSN31
XSN30
XSN29
Foothills Boulevard Bridge
(L.C. 577.03 m )
John
Hart Bridge
(Highw
ay 97
(L.C. 578.13 m )
Cameron
Street Bridge
(L.C. 574
m )
Boat Launch
Morning
Place

561.0
562.0
563.0
564.0
565.0
566.0
567.0
568.0
569.0
570.0
571.0
572.0
573.0
574.0
575.0
576.0
577.0
578.0
579.0
0 5000 10000 15000 20000 25000 30000 35000 40000
Eleva
tion (m, G
SC)
Distance from XS F1 (m)Qu/s = 5,660 cms and Qd/s = 6,390 cms (Fraser design condition)
Klohn Crippen (1997)
Qu/s = 4,190 cms and Qd/s = 5,640 cms (Nechako design condition)
XS F6
XSF5
XSF4
XSF3
XSF2
XSF19
XSF41
XSF40
XSF36
XSF39
XSF18
XSF27
XSF33
XSF34
XS F7
XSF14
XSF11
XSF10
XS F9
XSF8
XSF45
XSF61
XSF59
XSF49
XSF47
XSF43
XSF57
XSF55
XSF54
XSF51
C.N.R. Trestle Bridge
(L.C. 570.01 m )
Highw
ay 16 Bridge
(L.C. 574.22 m )
Simon
Fraser Bridge
‐Highw
ay 97
(L.C. 571.5 m
)
XSF22
XSF32
XSF20
B.C. Railway
Trestle / Pulp Mill
(L.C. 577.5 m
)
Northwood Road
Bridge
(L.C. 577.1 m
)
Fraser River
200‐Yr Open Water Surface Profiles
January 2009 Figure 3.11
City of Prince George

550551552553554555556557558559560561562563564565566567568569570571572573574575576577578
0.00 5000.00 10000.00 15000.00 20000.00 25000.00 30000.00 35000.00 40000.00
Eleva
tion (m, G
SC)
Distance from XS F1 (m)FCL (NHC 2008)Old FCL (KC 1997)Open Water 200‐yr ProfileOpen Water 20‐yr ProfileThalweg
XS F6
XSF5
XSF4
XSF3
XSF2
XSF19
XSF41
XSF40
XSF36
XSF39
XSF18
XSF27
XSF33
XSF34
XS F7
XSF14
XSF11
XSF10
XS F9
XSF8
XSF45
XSF61
XSF59
XSF49
XSF47
XSF43
XSF57
XSF55
XSF54
XSF51
C.N.R. Trestle Bridge
(L.C. 570.01 m )
Highw
ay 16 Bridge
(L.C. 574.22 m )
Simon
Fraser Bridge
‐Highw
ay 97
(L.C. 571.5 m
)
XSF22
XSF32
XSF20
B.C. Railway
Trestle / Pulp Mill
(L.C. 577.5 m
)
Northwood Road
Bridge
(L.C. 577.1 m
)
WSC
South Fort George
WSC
Shelley
Fraser River
200‐Yr and 20‐Yr Water Surface Profiles
January 2009 Figure 3.12
City of Prince George

569.0
570.0
571.0
572.0
573.0
574.0
575.0
576.0
577.0
578.0
579.0
580.0
581.0
0 2000 4000 6000 8000 10000 12000 14000 16000
Eleva
tion (m, G
SC)
Distance from Mouth (XS F26, m)Q = 1,450 cms
n+10%
XS N5
XSN4
XSN3
XSN2
XSN1
XSN17
XSN24
XSN23
XSN21
XSN22
A
XSN16
XSN18
XSN19
XSN20
XS N6
XSN14
XSN12
XSN9
XS N8
XSN7
XSN26
XSN34
XSN33
XSN28
XSN27
XSN25
XSN32
XSN31
XSN30
XSN29
Foothills Boulevard Bridge
(L.C. 577.03 m )
John
Hart Bridge
(Highw
ay 97
(L.C. 578.13 m )
Cameron
Street Bridge
(L.C. 574
m )
Nechako River 200‐Yr Open Water Surface Profiles
Sensitivity to Roughness Variation
January 2009 Figure 3.13
City of Prince George

561
562
563
564
565
566
567
568
569
570
571
572
573
574
575
576
577
578
579
0 5000 10000 15000 20000 25000 30000 35000 40000
Eleva
tion (m, G
SC)
Distance from XS F1 (m)
Qu/s = 5,660 cms and Qd/s = 6,390 cms
n+10%
XS F6
XSF5
XSF4
XSF3
XSF2
XSF19
XSF41
XSF40
XSF36
XSF39
XSF18
XSF27
XSF33
XSF34
XS F7
XSF14
XSF11
XSF10
XS F9
XSF8
XSF45
XSF61
XSF59
XSF49
XSF47
XSF43
XSF57
XSF55
XSF54
XSF51
C.N.R. Trestle Bridge
(L.C. 570.01 m )
Highw
ay 16 Bridge
(L.C. 574.22 m )
Simon
Fraser Bridge
‐Highw
ay 97
(L.C. 571.5 m
)
XSF22
XSF32
XSF20
B.C. Railway
Trestle / Pulp Mill
(L.C. 577.5 m
)
Northwood Road
Bridge
(L.C. 577.1 m
)
Fraser River 200‐Yr Open Water Surface Profiles
Sensitivity to Roughness Variation
January 2009 Figure 3.14
City of Prince George

569.0
570.0
571.0
572.0
573.0
574.0
575.0
576.0
577.0
578.0
579.0
580.0
581.0
0 2000 4000 6000 8000 10000 12000 14000 16000
Eleva
tion (m, G
SC)
Distance from Mouth (XS F26, m)Q = 1,450 cmsQ+10% (= 1,595 cms)Q+20% (=1,740 cms)Q = 1,870 cms (simulated flows)
XS N5
XSN4
XSN3
XSN2
XSN1
XSN17
XSN24
XSN23
XSN21
XSN22
A
XSN16
XSN18
XSN19
XSN20
XS N6
XSN14
XSN12
XSN9
XS N8
XSN7
XSN26
XSN34
XSN33
XSN28
XSN27
XSN25
XSN32
XSN31
XSN30
XSN29
Foothills Boulevard Bridge
(L.C. 577.03 m )
John
Hart Bridge
(Highw
ay 97
(L.C. 578.13 m )
Cameron
Street Bridge
(L.C. 574
m )
Nechako River 200‐Yr Open Water Surface Profiles
Sensitivity to Flow Variation
January 2009 Figure 3.15
City of Prince George

561
562
563
564
565
566
567
568
569
570
571
572
573
574
575
576
577
578
579
0 5000 10000 15000 20000 25000 30000 35000 40000
Eleva
tion (m, G
SC)
Distance from XS F1 (m)Qu/s = 5,660 cms and Qd/s = 6,390 cms
Q+10% (Qu/s = 6,226 cms and Qd/s = 7,029 cms)
Q+20% (Qu/s = 6,792 cms and Qd/s = 7,668 cms)
XS F6
XSF5
XSF4
XSF3
XSF2
XSF19
XSF41
XSF40
XSF36
XSF39
XSF18
XSF27
XSF33
XSF34
XS F7
XSF14
XSF11
XSF10
XS F9
XSF8
XSF45
XSF61
XSF59
XSF49
XSF47
XSF43
XSF57
XSF55
XSF54
XSF51
C.N.R. Trestle Bridge
(L.C. 570.01 m )
Highw
ay 16 Bridge
(L.C. 574.22 m )
Simon
Fraser Bridge
‐Highw
ay 97
(L.C. 571.5 m
)
XSF22
XSF32
XSF20
B.C. Railway
Trestle / Pulp Mill
(L.C. 577.5 m
)
Northwood Road
Bridge
(L.C. 577.1 m
)
Fraser River 200‐Yr Open Water Surface Profiles
Sensitivity to Flow Variation
January 2009 Figure 3.16
City of Prince George

nhc
Flood Risk Evaluation and Flood Control Solutions – Phase 1 Final Report 29
4 ICE-RELATED WATER LEVELS Prince George is situated at the confluence of two large rivers which both experience freeze-up jams in the early winter and break-up jams in the spring.
On the Fraser River, the records indicate that break-up jams result in higher water levels, however given the high banks of the river, ice-related flooding does not appear to be a concern.
On the Nechako River, the most serious ice-related flooding appears to occur at freeze-up, which is the focus of discussion in this section. The ice-related water levels are later compared with ice-free freshet flood profiles in Section 5; the higher of the two profiles governs the adopted design flood profile.
The HEC-RAS software used for modelling ice-free water surface profiles has a routine for simulating ice-related flood levels. However, ice levels in the Nechako River are not only a function of discharge but also dependent on other factors such as temperature, ice supply and conditions at the confluence and instead the probability-based approach described in this section was adopted. A more technical discussion of some ice-related topics can be found in Appendix E.
4.1 BASIC HYDRAULIC CONCEPTS
The formation of an ice cover is complex and some basic hydraulic concepts are required to understand the processes. The first useful concept is continuity, which means that under steady-state conditions the flow remains the same at different points along a river if no local inflows are present. For instance, the flow at Morning Place must be roughly the same as the flow near the confluence. If the cross-sectional flow area increases from one point to another, there must be a corresponding decrease in the velocity to maintain continuity. A decrease in the flow area would result in an increase in the velocity. For a river, a change in area is reflected by a change in the depth of flow.
The second concept is that the velocity is affected by the condition of the bed, banks and, during the winter, by the ice cover. For a given discharge, the velocity will decrease as the “roughness” increases, or increase if the “roughness” decreases. A channel with a boulder bed will normally be rougher than a channel with a gravel bed. A river with bars and multiple channels will be rougher than a single channel of uniform shape. A channel covered with ice will be rougher than the same channel not covered with ice. In all these cases, for a given flow in the river, the rougher channel will have a lower velocity, and according to continuity, a greater depth.
The third concept is that slush ice can move along the bottom of the ice cover if the velocity is high enough. The moving slush is referred to in this report as “cover load”. If the velocity is not high enough the slush will accumulate, which will reduce the flow area. As the flow area reduces, continuity requires the velocity to increase until it is high enough to begin moving the slush.

nhc
Flood Risk Evaluation and Flood Control Solutions – Phase 1 Final Report 30
Key references that track developments in ice hydraulics include Pariset and Hausser (1961), Pariset, Hausser and Gagnon (1966), Beltaos (1983), and Shen et al. (1984, 1990, 1993). A practical summary of techniques for analysis of river ice problems is a compendium edited by Ashton (1986).
4.2 GENERALIZED FREEZE-UP PROCESSES
Ice production and ice cover formation by the accumulation of floating ice pans are common processes on northern rivers. Figures 4.1 and 4.2 show the freeze-up process from a schematic perspective, with accompanying photographs to illustrate the appearance of the river during freeze-up.
In general, the initial ice cover on a river forms by the combination of shore ice growth and the accumulation of frazil "pans". Small frazil crystals form throughout the flow when the water temperature cools to 0 oC, then coalesce into slush accumulations that float to the surface to form "pans". Evidence indicates that the “pans” appear at Prince George when the air temperature is less than -5 oC.
At Prince George, frazil ice that is generated on the Nechako River floats downstream and is carried away by the Fraser River while the Fraser River is open. Lodgement of the Nechako ice pans only begins when an ice cover forms on the Fraser River at the confluence. As the ice covers form and more ice pans accumulate against the Fraser River ice cover, the water level rises quickly due to the increased roughness, which floats the accumulating ice higher above the bed.
Once lodgement has occurred, the ice cover begins to advance upstream. Two types of ice cover can form - “juxtaposed” and “consolidated” - depending on the flow in the river and the air temperature.
If the channel velocity is low enough, a “juxtaposed” cover forms by the accumulation of a single layer of frazil pans. The ice cover advances upstream at a rate determined by the velocity and concentration of the arriving frazil ice pans. The pans can freeze if the air temperature is sufficiently low, which strengthens the ice cover. Slush beneath the ice pans is moved downstream as “cover load”.
The “juxtaposed” ice cover can suddenly collapse to form a “consolidated” ice cover if the downstream-acting forces exceed the strength of the “juxtaposed” cover. If this occurs, the broken pieces of ice will shove together to form a thicker cover, sometimes releasing a wave of ice and water, known as a “jave”. The thickness of the “consolidated” ice cover will depend on the strength of the ice and the flow - higher flows will produce a thicker “consolidated” cover. Secondary consolidations often occur when river flow and air temperature conditions fluctuate significantly.
As an ice cover forms, the water level will rise due to the additional “roughness” caused by the ice cover, and the ice rises with it. Eventually the ice accumulation or jam will reach equilibrium where the downstream-acting hydraulic forces are balanced by the upstream-acting resistance of the ice accumulation involving both external and internal forces.

nhc
Flood Risk Evaluation and Flood Control Solutions – Phase 1 Final Report 31
4.3 ICE-RELATED FLOODING ASSESSMENT
The assessment of ice-related flooding requires the collection and analysis of historical data on ice jams and accumulations, air temperatures and river flows. Data and observations show that the initial ice cover on the Nechako River forms by lodgement of floating ice against a pre-existing ice cover on the Fraser River. Thus, the timing of freeze-up on the Nechako River depends on the timing of freeze-up on the Fraser.
The following sections discuss the conditions on the Fraser River that lead to ice lodgement followed by accumulation and upstream advance on the Nechako River. This analysis is then used to estimate the probability of flood-producing ice jams occurring in the future.
4.3.1 FRASER RIVER
Historic Water Levels The historical water level record at the WSC gauge, Fraser River at South Fort George, was used to determine the freeze-up date. Figure 4.3 shows some typical historical water level records, where the sudden rise in the water level indicates the date of freeze-up. After freeze-up, water levels can change due to destabilization of the ice cover by mechanical processes, changes in flow, or in the case of Prince George, by industry warm water effluent melting the ice cover.
Table 4.1 summarizes the freeze-up dates and the corresponding hydro-meteorological characteristics for those years when the freeze-up date could be confidently determined. These hydro-meteorological parameters include the accumulated degree-days of freezing12 at freeze-up, the approximate flow at South Fort George, the post-freeze-up climate characteristics at Prince George, and the freeze-up water level at the confluence of the Nechako and Fraser Rivers.
Timing of Freeze-up Figure 4.4 shows the relationship between the Fraser River discharge and the degree-days of freezing that produced freeze-up on the Fraser River. Further analysis of this data provides Figure 4.5 which shows the frequency curve of the degree-days required to produce freeze-up. There would only be about a 10 percent chance of freeze-up after 100°C-days of freezing, 50 percent chance after 200oC-days, and a 90 percent chance of freeze-up after 400 °C-days.
Ice-Related Water Levels Approximate open water and ice-related rating curves at the confluence are shown in Figure 4.6. The peak freeze-up levels are also shown in Figure 4.6, relative to the open water rating curve. It is evident that the water level increases of between 0.4 and 3.3 m at freeze-up can occur due to the effects of the ice cover. The upper range of the data reflects
12 The sum of the average daily degrees below freezing for a specified time period

nhc
Flood Risk Evaluation and Flood Control Solutions – Phase 1 Final Report 32
an ice cover thickness that would be representative of an equilibrium ice jam. A more in-depth discussion of the figure is provided in Appendix E.1.
4.3.2 NECHAKO RIVER
Historic Water Levels Campbell (1990) provides a summary of historical freeze-up water levels experienced in Prince George since the 1920's. Most of the peak freeze-up levels have been observed at the City Gauge located at Cameron Street Bridge which provides a historical index of ice jam events. Table 4.2 summarizes the water levels associated with freeze-up. It is evident from these records that Prince George has been affected by high freeze-up related water levels during its entire history.
Prior to 1940, the water levels (adjusted to reflect conditions at the City Gauge near the Cameron Street Bridge) approached or exceeded El. 572.0 m GSC five times. There likely were other high freeze-up water events, but these would not have been recorded because they probably did not overtop the railway grade and cause enough disruption for the residents to take note. That is, the elevation of the railway tracks is probably the significant “perception level” in existence before the City Gauge became operational. Since 1956, after the installation of the City Gauge, most of the significant events would have been documented (hence the denser record) until the gauge was removed in 1976. The freeze-up levels approached or exceeded El. 570.0 m GSC on four occasions during the period 1956-1976. The maximum water elevation recorded was El. 570.7 m GSC in 1959-60.
Only two events appear to have caused concern in the post-1976 record – 1996 and 2007. Both of these events produced water levels at Cameron Street Bridge close to and in excess of El. 570.0 m GSC. Both of these events were documented with some rigour and therefore provide a basis to quantify the characteristics of the ice accumulations and the subsequent freeze-up levels within the City. The 1996 event appears to be the seventh highest on record and the 2007 event the sixth highest and the highest since records of any sort have been kept. Since regulation in the early 1950’s, it appears that these two events have been the two largest. Thus, from a simple extrapolation, the 2007 freeze-up is at least a 50-year event and the 1996 is at least a 25-year event.
Figure 4.7 provides a histogram of Nechako flows during freeze-up and coinciding air temperatures over a 10-day period. Highlighted years correspond to events when flood levels exceeded El. 569.0 m GSC at Cameron Street Bridge, an approximate threshold level for initiation of flooding. The figure shows that typically a discharge of at least 200 m3/s in combination with average air-temperatures colder than -5oC, is required to initiate ice-related flooding. These conditions were prevalent in the early1960’s and early 1970’s but did not occur from the mid-1970’s to mid-1990’s.
Figure 4.8 shows the maximum ice-related water level along the Nechako River between the Fraser River and Morning Place for the 1996 and 2007 events. Figure 4.9 summarizes the measured water levels at five locations during the 2007 event. It is clear that the formation of the ice cover caused water levels to increase by 1.0 to 3.9 m due to the influence of the ice cover. At the Fraser River and Cottonwood Island locations the water level increases were

nhc
Flood Risk Evaluation and Flood Control Solutions – Phase 1 Final Report 33
limited by the ability for the water to escape via the various back channels of the Nechako River.
Ice-Related Water Levels Figure 4.10 shows both the open water and the equilibrium ice jam rating curve at the Cameron Street Bridge, along with the available peak freeze-up levels and their corresponding estimated discharges. The equilibrium ice jam rating curve provides the upper envelope to these data as would be expected since the equilibrium ice jam condition always represents the maximum possible water level that could occur for a given discharge under ice conditions.
The 3.8 m and 3.9 m increase in water levels at the Cameron Street Bridge and the Boat Launch (Figure 4.9) represent reasonably well the equilibrium ice jam levels associated with a single channel of uniform slope and more or less uniform shape conveying the entire flow of the Nechako River.
Effects of Ice Supply Ice supply plays an important role in determining the peak freeze-up water levels, and two important characteristics can be deduced from the 1996 and 2007 ice jam data. These are (1) the amount of cooling required to produce sufficient ice to allow the ice cover to start its upstream advance and (2) the rate of ice cover advance. These are relatively important because they define the probability of upstream locations being affected by ice in any given year.
After allowing for two days of ice production to account for the ice already in the Nechako River, about 70 °C-days of freezing is required to produce enough ice to accumulate on the Fraser River between South Fort George and the confluence to allow the ice cover to begin its upstream advance (Figure 4.11). Furthermore, after accounting for rapid temporary advances of the juxtaposed ice cover (before its eventual consolidation), the ice cover appears to advance upstream at a rate of about 0.13 km/°C-day. So, for every 10 °C-days of freezing, the ice cover advances upstream by about 1.3 km for the range of flows in excess of about 200 m3/s, that might result in ice-related flooding. (For a note on ice volumes refer to Appendix E.2).
On the basis of the above calculations, Table 4.3 shows the severity of cold weather required to produce enough ice for the cover to advance upstream to a given point. Experience suggests that once freeze-up has occurred on the Fraser River, there is only a limited period when ice production on the Nechako River can contribute to formation of an ice cover at Prince George. A period of 20 days has been adopted on the assumption that shore growth upstream of Prince George will cut off the upstream ice supply after that time. If an equilibrium accumulation cover has not formed within 20 days, any ice cover that does form is likely to be from lateral growth of shore ice, with relatively low water levels.

nhc
Flood Risk Evaluation and Flood Control Solutions – Phase 1 Final Report 34
Figure 4.12 shows the results of the frequency analysis on which is based the annual probability of achieving the required degree-days of freezing (within the 20 day period) to form an equilibrium ice cover at the locations listed in Table 4.3.
4.3.3 FREQUENCY ANALYSIS OF PEAK FREEZE-UP WATER LEVEL
The probability of experiencing a given freeze-up level at any location each year is a function of:
• the probability of experiencing a given flow at freeze-up Figure 4.13;
• the probability of experiencing the required amount of cold weather to allow an ice cover to form at that location (Table 4.3); and,
• the probability of a stable equilibrium ice cover forming at that location.
The calculated frequency curves are shown in Figure 4.14 and the ice related water levels for various return periods (including 0.6 m freeboard) are summarized in Table 4.4. The 200-year ice-related design flood level (including 0.6 m freeboard allowance) at Cameron Street Bridge is El. 572.3 m. During the winter of 2007-08, the maximum reported water level at Cameron Street Bridge was El. 571.3 m GSC, or about 1 m below the revised design level. The 2007-08 event is estimated to have had a return period of 90 years.
A more detailed explanation of the frequency analysis procedure can be found in Appendix E.3.
4.4 EFFECT OF CLIMATE AND BASIN CHANGE
As mentioned earlier, the severity of freeze-up is determined mostly by the combined effects of ambient air temperatures and river flows. In response to changing climate, changes can be expected in both air temperatures and precipitation. Winter air temperature would tend to rise, on the average reducing the amount of ice produced during freeze-up. However, since severe ice events usually occur with a relatively cold air mass over Prince George, a rise of say 2°C from an ambient value of -20 to -25°C would not significantly reduce the likelihood of a high freeze-up level if river flows were high. Likewise, precipitation changes arising from climate change are considered unlikely to have a significant impact on river flows during freeze-up.
With respect to Mountain Pine Beetle infestation, it seems likely that its hydrological effects may be substantially larger than those of climate change, but they are expected to last no more than a few decades. Nevertheless, the amount of water in surface storage may increase, producing higher lake and shallower groundwater levels and possibly leading to higher flows before and during the freeze-up period. This might mean that the 200 m3/s freeze-up flow criterion at Prince George would be exceeded more often, the flows at freeze-up would be systematically greater, and the freeze-up levels would be systematically higher.

nhc
Flood Risk Evaluation and Flood Control Solutions – Phase 1 Final Report 35
The freeze-up rating curve of Figure 4.10 indicates that for every 50 m3/s increase in freeze-up flow, the water level increases by about 0.3 m. Thus, at the 200-year freeze-up level the standard 0.6 m freeboard could accommodate a flow increase due to the changing basin conditions of about 100 m3/s, which appears to be adequate. However, if there is any concern about the validity of these estimates, the freeboard could be increased to 1.0 m.
4.5 EFFECT OF GRAVEL REMOVALS
Gravel removal, in the form of bar-scalping or dredging, has been mentioned as one option for reducing the potential for ice-related flooding. However, some reasons why dredging will not help are explained below (a more theoretical discussion is included in Appendix E.4.):
• The ice cover on the Fraser River begins by forming downstream of Prince George and eventually progresses upstream to the confluence. Typically, the Fraser first freezes over at a location roughly 30 km downstream of the Nechako, at the Fort George Canyon (Personal Communication with Mr. Lyle Larsen, MOE). The eventual elevation of the ice cover at the confluence is controlled by hydraulic conditions in the Fraser River many kilometres downstream. Dredging the Fraser River near the confluence will not change the ice cover elevation, and Nechako frazil will continue to lodge at elevations indicated by the historical record.
• If the ice cover elevation at the confluence is unchanged, dredging the Nechako River will effectively increase the cross-sectional area of the channel. This would reduce the velocity (according to continuity), making it more likely for ice pans to lodge at the Fraser, advancing the date for forming a stable ice cover, and contributing to a more rapid upstream advance. The elevation of the ice cover would not be lowered by the dredging.
• Dredging the Nechako at the confluence will not change the flow-dependent ice thickness that develops upstream of the Boat Launch. The ice-related rating curve (Figure 4.6) and frequency curves (Figure 4.14) would remain unchanged by dredging.
• If the velocity is low enough, incoming frazil slush accumulates under the ice, gradually reducing the flow area until the velocity is high enough to transport the slush. Dredging effectively increases the flow area and is likely to aggravate slush accumulation, which could also aggravate ice jam conditions. The geometric shape of the dredged channel does not affect the outcome.
• Since initial lodgement of ice does not occur on the gravel bars at the confluence, dredging in this area will not alter the lodgement process.
• Sediment deposition has occurred between the confluence and the CNR Bridge (Section 2.4.2). Dredging this material will not change the ice cover level at the confluence, which is governed by Fraser River conditions downstream of Prince George.
A summary discussion of gravel removals is provided in Appendix H.
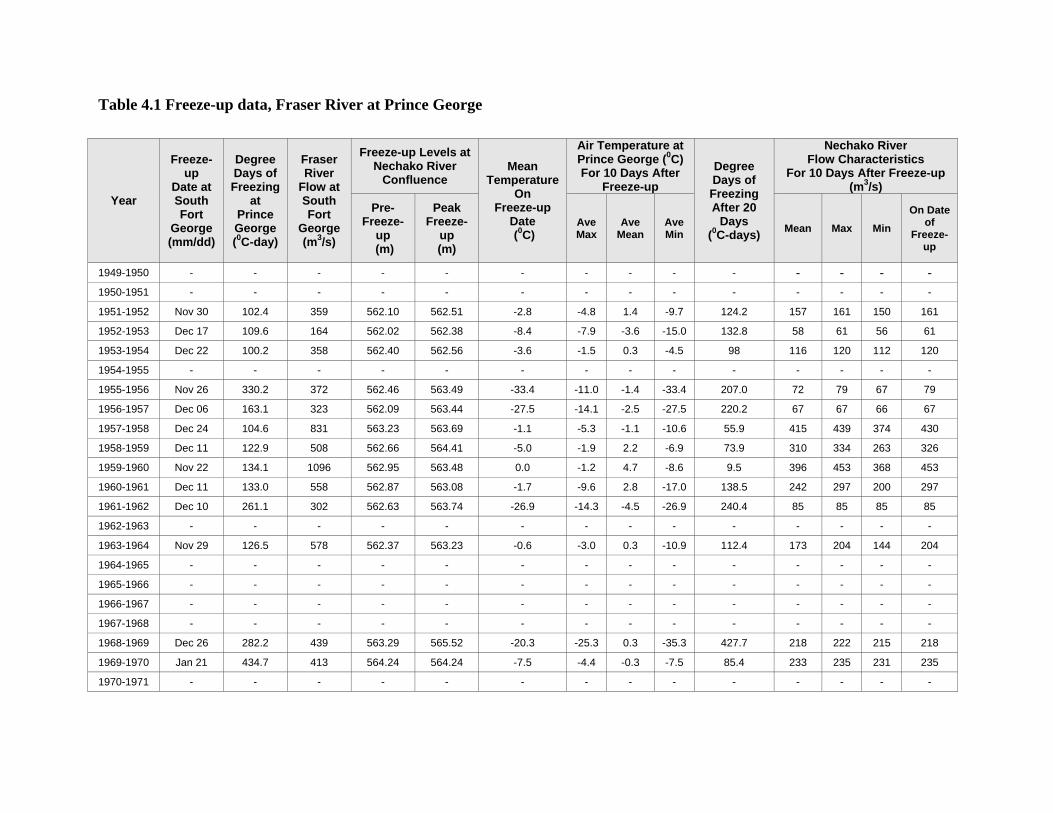
Year
Freeze- up
Date at South Fort
George (mm/dd)
Degree Days of Freezing
at Prince George (0C-day)
Fraser River
Flow at South Fort
George (m3/s)
Freeze-up Levels at Nechako River
Confluence Mean
Temperature On
Freeze-up Date (0C)
Air Temperature at Prince George (0C) For 10 Days After
Freeze-up
Degree Days of Freezing After 20
Days (0C-days)
Nechako RiverFlow Characteristics
For 10 Days After Freeze-up (m3/s)
Pre-Freeze-
up (m)
Peak Freeze-
up (m)
Ave Max
Ave Mean
Ave Min Mean Max Min
On Date of
Freeze-up
1949-1950 - - - - - - - - - - - - - - 1950-1951 - - - - - - - - - - - - - -
1951-1952 Nov 30 102.4 359 562.10 562.51 -2.8 -4.8 1.4 -9.7 124.2 157 161 150 161
1952-1953 Dec 17 109.6 164 562.02 562.38 -8.4 -7.9 -3.6 -15.0 132.8 58 61 56 61
1953-1954 Dec 22 100.2 358 562.40 562.56 -3.6 -1.5 0.3 -4.5 98 116 120 112 120
1954-1955 - - - - - - - - - - - - - -
1955-1956 Nov 26 330.2 372 562.46 563.49 -33.4 -11.0 -1.4 -33.4 207.0 72 79 67 79
1956-1957 Dec 06 163.1 323 562.09 563.44 -27.5 -14.1 -2.5 -27.5 220.2 67 67 66 67
1957-1958 Dec 24 104.6 831 563.23 563.69 -1.1 -5.3 -1.1 -10.6 55.9 415 439 374 430
1958-1959 Dec 11 122.9 508 562.66 564.41 -5.0 -1.9 2.2 -6.9 73.9 310 334 263 326
1959-1960 Nov 22 134.1 1096 562.95 563.48 0.0 -1.2 4.7 -8.6 9.5 396 453 368 453
1960-1961 Dec 11 133.0 558 562.87 563.08 -1.7 -9.6 2.8 -17.0 138.5 242 297 200 297
1961-1962 Dec 10 261.1 302 562.63 563.74 -26.9 -14.3 -4.5 -26.9 240.4 85 85 85 85
1962-1963 - - - - - - - - - - - - - -
1963-1964 Nov 29 126.5 578 562.37 563.23 -0.6 -3.0 0.3 -10.9 112.4 173 204 144 204
1964-1965 - - - - - - - - - - - - - -
1965-1966 - - - - - - - - - - - - - -
1966-1967 - - - - - - - - - - - - - -
1967-1968 - - - - - - - - - - - - - -
1968-1969 Dec 26 282.2 439 563.29 565.52 -20.3 -25.3 0.3 -35.3 427.7 218 222 215 218
1969-1970 Jan 21 434.7 413 564.24 564.24 -7.5 -4.4 -0.3 -7.5 85.4 233 235 231 235
1970-1971 - - - - - - - - - - - - - -
Table 4.1 Freeze-up data, Fraser River at Prince George

Year
Freeze- up
Date at South Fort
George (mm/dd)
Degree Days of Freezing
at Prince George (0C-day)
Fraser River
Flow at South Fort
George (m3/s)
Freeze-up Levels at Nechako River
Confluence Mean
Temperature On
Freeze-up Date (0C)
Air Temperature at Prince George (0C) For 10 Days After
Freeze-up
Degree Days of Freezing After 20
Days (0C-days)
Nechako RiverFlow Characteristics
For 10 Days After Freeze-up (m3/s)
Pre-Freeze-
up (m)
Peak Freeze-
up (m)
Ave Max
Ave Mean
Ave Min Mean Max Min
On Date of
Freeze-up
1971-1972 Dec 17 226.3 478 562.63 564.53 -10.9 -20.4 -5.0 -33.4 344.4 193 195 191 195
1972-1973 Dec 07 175.9 351 562.63 564.70 -24.7 -16.1 -2.0 -24.7 240.2 157 175 139 139
1973-1974 Dec 08 299.8 459 562.77 562.96 -5.3 -4.1 -0.6 -10.6 72.4 125 126 124 124
1974-1975 Dec 06 103.9 443 562.96 563.19 -4.5 -2.6 2.2 -8.6 53.7 187 197 173 197
1975-1976 Dec 19 304.7 390 563.26 564.97 -4.2 -2.0 2.5 -9.5 97.0 172 177 170 177
1976-1977 Dec 22 91.0 584 563.50 564.02 -1.4 -4.9 -0.3 -8.6 151.5 290 294 286 294
1977-1978 Nov 26 142.3 275 562.25 564.89 -4.1 -7.7 2.7 -26.5 255.9 139 142 137 142
1978-1979 Dec 31 517.9 295 562.70 564.13 -38.1 -29.2 -19.9 -38.1 545.1 113 113 113 113
1979-1980 Jan 11 462.8 185 562.44 563.51 -23.9 -12.2 -0.5 -23.9 177.3 57 59 55 59
1980-1981 Dec 07 160.4 426 562.02 563.94 -17.3 -1.3 7.8 -17.3 184.0 126 164 105 107
1981-1982 Jan 03 366.5 254 562.40 563.84 -24.3 -18.5 -5.1 -31.9 345.9 79 81 79 80
1982-1983 Nov 27 175.4 369 562.42 564.13 -0.2 -3.4 0.2 -13.3 106.2 120 122 117 122
1983-1984 Dec 23 397.5 284 562.68 563.78 -25.1 -18.0 1.8 -28.8 241.4 95 95 95 95
1984-1985 Dec 23 474.5 293 562.64 564.04 -20.5 -25.3 -11.7 -39.0 342.2 108 113 104 113
1985-1986 Nov 21 215.8 333 562.68 564.02 -21.9 -26.8 -20.0 -31.8 402.4 90 94 88 94
1986-1987 Nov 18 148.8 305 562.56 563.13 -12.1 -2.6 3.5 -12.7 88.7 116 123 104 112
1987-1988 Jan 06 267.4 259 562.47 563.49 -25.1 -12.1 -0.7 -25.1 187.0 101 101 100 101
1988-1989 Jan 08 355.1 285 562.57 563.91 -18.2 -7.2 0.1 -18.2 161.3 105 107 102 107
1989-1990 Dec 29 126.0 739 562.14 564.87 0.0 -0.6 2.1 -5.8 30.8 107 112 103 112
1990-1991 Dec 22 186.9 316 562.62 564.15 -19.8 -17.1 -4.5 -33.4 505.1 74 76 72 73
1991-1992 Nov 15 81.6 563 563.27 563.82 2.9 1.1 3.6 -2.3 1.2 126 128 122 125
1992-1993 Dec 28 324.9 278 562.68 564.68 -24.5 -25.1 -20.1 -30.0 432.5 111 123 106 123
1993-1994 Dec 04 109.6 413 562.46 563.00 -3.1 -3.3 3.5 -11.0 47.7 119 123 116 123
Table 4.1 Freeze-up data, Fraser River at Prince George (cont.)

Year
Freeze- up
Date at South Fort
George (mm/dd)
Degree Days of Freezing
at Prince George (0C-day)
Fraser River
Flow at South Fort
George (m3/s)
Freeze-up Levels at Nechako River
Confluence Mean
Temperature On
Freeze-up Date (0C)
Air Temperature at Prince George (0C) For 10 Days After
Freeze-up
Degree Days of Freezing After 20
Days (0C-days)
Nechako RiverFlow Characteristics
For 10 Days After Freeze-up (m3/s)
Pre-Freeze-
up (m)
Peak Freeze-
up (m)
Ave Max
Ave Mean
Ave Min Mean Max Min
On Date of
Freeze-up
1994-1995 Dec 10 214.9 298 562.56 563.74 -5.7 -3.6 5.5 -9.5 50.1 109 113 105 110
1995-1996 Dec 11 296.0 339 562.71 564.03 -16.6 -6.4 -1.0 -16.6 179.4 113 124 85 85
1996-1997 Nov 23 186.6 486 563.16 565.14 -23.2 -8.5 0.5 -23.2 165.9 194 202 188 196
1997-1998 Jan 11 357.6 363 562.74 564.51 -29.0 -13.3 -3.4 -29.0 170.7 179 189 163 163
1998-1999 Dec 30 246.3 297 562.26 564.13 -6.0 -6.0 1.2 -15.1 100.5 98 102 94 94
1999-2000 Jan 19 296.0 299 562.60 563.89 -21.2 -14.2 -3.9 -21.5 228.8 98 99 96 96
2000-2001 Dec 15 185.8 376 562.22 563.77 -23.7 -11.3 -4.0 -23.7 172.5 153 161 148 161
2001-2002 Jan 02 338.0 376 562.69 563.93 -0.1 1.1 6.0 -3.6 48.2 120 122 118 121
2002-2003 Jan 05 103.6 359 562.49 562.93 3.6 -4.7 7.4 -12.7 112.4 121 124 118 124
2003-2004 Jan 05 397.8 247 562.62 563.94 -30.9 -8.8 4.8 -30.9 137.1 115 120 110 110
2004-2005 Dec 23 115.3 632 563.46 563.81 -2.2 -10.3 0.9 -22.8 271.1 134 140 127 140
2005-2006 Dec 13 147.5 610 562.83 563.35 -5.6 -8.0 1.7 -13.2 79.1 191 205 183 205
2006-2007 Dec 05 241.0 298 562.94 563.40 -3.5 0.6 3.0 -3.5 29.8 87 88 85 88
2007-2008 Dec 09 265.1 - 562.13 564.63 -17.7 -2.8 -5.9 -9.0 152.1 279 282 274 274
Table 4.1 Freeze-up data, Fraser River at Prince George (cont.)

Table 4.2 Summary of high ice-related water levels on the Nechako River at Prince George (after Campbell, 1990, with additions)
Date
Maximum Water
Elevation (m)
Approximate Discharge (m3/s) (3)
Comments
Dec, 1917 >571.7 (1) - Level measured at CN Station, 2200 m downstream of Cameron Street Bridge
Early 1920's >571.7 (1) - Level measured at CN Station, 2200 m downstream of Cameron Street Bridge
Late 1920's 572.1 - Cameron Street Bridge
Dec, 1933 >572.3 (1) - Level measured at CN Station, 2200 m downstream of Cameron Street Bridge
Jan, 1937 >572.3 (1) - Level measured at CN Station, 2200 m downstream of Cameron Street Bridge
Mar, 1957 >569.4 311 Cameron Street Bridge (likely breakup)
Mar 7, 1960 570.7 212 Cameron Street Bridge (unknown type)
Feb 5, 1961 569.6 142 Cameron Street Bridge (unknown type)
Jan 22, 1963 569.4 143 Cameron Street Bridge (likely freeze-up)
Dec 15, 1964 568.9 171 Cameron Street Bridge (freeze-up)
Jan 3, 1968 568.9 140 Cameron Street Bridge (freeze-up)
Dec 27, 1968 568.8 219 Cameron Street Bridge (freeze-up)
Jan 26, 1970 >570.4 233 Cameron Street Bridge (likely freeze-up)
Dec 10, 1970 569.6 143 Cameron Street Bridge (freeze-up)
Dec 22, 1971 569.1 193 Cameron Street Bridge (freeze-up)
Apr 3, 1972 567.5 205 Cameron Street Bridge (likely breakup)
Dec 18, 1972 570.0 182 Cameron Street Bridge (freeze-up)
Jan 22, 1974 569.0 107 Cameron Street Bridge (likely freeze-up)
Jan 15, 1975 569.0 139 Cameron Street Bridge (likely freeze-up)
Jan 12, 1976 569.8 162 Cameron Street Bridge (likely freeze-up)
Nov 28, 1996 570.9 220 (2) Cameron Street Bridge (freeze-up)
Jan 01, 2008 571.3 250 (2) Cameron Street Bridge (freeze-up)
Notes: 1. The measured water level was adjusted to reflect the stage at Cameron Street Bridge. 2. Estimated from preliminary flows provided by Water Survey of Canada. 3. Average Discharge (m3/s)

Table 4.3 Summary of 0C-days of freezing within twenty days of the start of freeze-up that is required to form an equilibrium ice cover at locations along the Nechako River within Prince George
Location Distance Upstream
of Fraser River (km)
Degree-days of Freezing Required to Form Ice Cover
(0C-days)
Annual Probability of Experiencing Required
0C-days of Freezing (%)
Water Intake 1.4 81 78
Boat Launch 1.7 83 77
Winton Global 2.7 91 73
Cameron Street Bridge 3.7 98 71
John Hart Bridge 4.6 105 68
Water Intake 5.5 112 65
Foothills Bridge 8.0 130 58
Rosia/Riverview Road 9.0 140 54
Morning Place 13.5 170 42
Upstream City Limits 14.0 180 38

Table 4.4 Summary of ice-related water levels for a range of return periods
Location Ice‐Related Water Level (m) for Return Period (yrs) (1) 1997 Floodplain Map Change
from 1997 20 50 100 200 200‐yr FCL (Klohn Crippen)
Boat Launch 568.5 569 569.3 569.7 570.4(2) ‐‐‐
Cameron Street Bridge 571 571.5 572 572.3 571.7 +0.6
John Hart Bridge 572.1 572.6 573.3 573.7 572.6 +1.1
Foothills Bridge 575.7 576.2 576.6 577 575.5 +1.5
Morning Place 579.1 580.1 581.3 581.5 580.5 +1.0 Notes: 1. Includes 0.6 m freeboard allowance.
2. Freshet flooding governs in this part of the river.

Schematic of Ice Cover Formation Profile
January 2009 Figure 4.1
City of Prince George
4.2
4.2
4.2
4.2
4.2
4.2
4.2
4.2

Schematic of Ice Cover Formation
Cross Sections
January 2009 Figure 4.2
City of Prince George
4.1 4.1
4.1
4.1

560.0
561.0
562.0
563.0
564.0
565.0
566.0
1-Nov 8-Nov 16-Nov 23-Nov 1-Dec 9-Dec 16-Dec 24-Dec 1-Jan 8-Jan 16-Jan 23-Jan 31-Jan
Wat
er l
evel
at
Sou
th F
ort
Geo
rge
(m, G
SC
)
Date
1972-73, Dec 7
1974-75, Dec 6
1981-82, Jan 3
1990-91, Dec 22
1992-93, Dec 28
1996-97, Nov 23
Note: Vertical bars indicate the adopted freeze-up dates
South Fort George Freeze‐Up Date
January 2009 Figure 4.3
City of Prince George

0.0
100.0
200.0
300.0
400.0
500.0
600.0
0 100 200 300 400 500 600 700 800 900 1000
Deg
ree-
days
of f
reez
ing
to fo
rm ic
e co
ver
(0C
-day
s)
Discharge at freeze-up (m3/s)
Fraser River Freeze‐Up Conditions
January 2009 Figure 4.4
City of Prince George

0
100
200
300
400
500
600
700
800
Deg
ree-
days
of f
reez
ing
for
free
ze-u
p at
P
rinc
e G
eorg
e (0
C-d
ays)
Annual exceedence probability (%)
Observed
Log normal distribution
50 20 10 5 2 1 0.5809095989999.5
Mean = 230 0C-daysStandard deviation = 116 0C-days
Freeze‐Up Degree‐Day Frequency Curve
January 2009 Figure 4.5
City of Prince George

558.0
559.0
560.0
561.0
562.0
563.0
564.0
565.0
566.0
567.0
0 100 200 300 400 500 600 700 800 900 1000
Wat
er l
evel
at
Nec
hako
Riv
er c
onflu
ence
(m
, GS
C)
Discharge (m3/s)
Measured open water levelSimulated open water rating curveSimulated ice jam rating curveMeasured peak freeze-up levelsSimulated solid ice rating curve, h = 0.40 m
nij = 0.050
S = 0.00040
nb = 0.038
nis = 0.020
South Fort George Open Water and Ice‐Related Rating Curves
January 2009 Figure 4.6
City of Prince George

Nechako River – Conditions for Ice‐Related Flooding
January 2009 Figure 4.7
City of Prince George DischargeYears when freeze-up level exceeds 569.0 m at Cameron Street BridgeAir temperature
Note: Refer to Table 4.1
-60
-50
-40
-30
-20
-10
0
10
0
100
200
300
400
500
600
700
1951
1952
1953
1954
1955
1956
1957
1958
1959
1960
1961
1962
1963
1964
1965
1966
1967
1968
1969
1970
1971
1972
1973
1974
1975
1976
1977
1978
1979
1980
1981
1982
1983
1984
1985
1986
1987
1988
1989
1990
1991
1992
1993
1994
1995
1996
1997
1998
1999
2000
2001
2002
2003
2004
2005
2006
2007
Ave
rage
air
tem
pera
rtur
e du
ring
fre
eze-
up p
erio
d (0 C
)
Dis
char
ge a
t fre
eze-
up (m
3 /s)
Year (at the beginning of winter)

560.0
565.0
570.0
575.0
580.0
585.0
590.0
274.0 276.0 278.0 280.0 282.0 284.0 286.0 288.0 290.0 292.0 294.0 296.0
Ele
vatio
n (m
, GS
C)
Distance downstream of Kinney Dam (km)
ThalwegTop of bank1996 Peak ice-related water levelPre-freeze-up water level, 20072007 Peak ice-related water level
Cameron Street
Morning Place
Foothills Bridge
Pozer Road
Boat Launch
Fraser River
John Hart Bridge
Nechako River Reported Ice‐Related Water Levels
November 2008 Figure 4.8
City of Prince George

562.0
563.0
564.0
565.0
566.0
567.0
568.0
569.0
570.0
571.0
572.0
573.0
24-Nov 1-Dec 8-Dec 15-Dec 22-Dec 29-Dec 5-Jan
Ele
vatio
n (m
, GS
C)
Date, 2006-07
Fraser River
Cottonwood Island
Boat Launch
Cameron Street Bridge
Pozer Road - Delhaven
2007 Recorded Ice‐Related Water Levels, Nechako River
January 2009 Figure 4.9
City of Prince George

565.0
566.0
567.0
568.0
569.0
570.0
571.0
572.0
0 100 200 300 400 500
Wat
er E
leva
tion,
(m, G
SC
)
Discharge (m3/s)
Measured open water, Nov 30, 2007
Simulated open water rating curve, nb = 0.018
Historical peak freeze-up water level
Simulated juxtaposed ice cover, nij = 0.030
Simulated equilibrium ice jam rating curve, nij = 0.040
1960
1970
19962007
Cameron Street Bridge Rating Curves
January 2009 Figure 4.10
City of Prince George

0.0
5.0
10.0
15.0
20.0
0 50 100 150 200 250
Loca
tion
of h
ead
of ic
e co
ver u
pstr
eam
of F
rase
r Riv
er (k
m)
Degree-days of freezing after freeze-up on the Fraser River at South Fort George (0C -days)
1996
2007
0.13 km/degree-day of accumulated freezing
Winton GlobalCameron Street John Hart Bridge
Foothills Bridge
Morning Place
Ice Cover Advancement, 1996 and 2007
January 2009 Figure 4.11
City of Prince George

DD = -250 P + 275R2 = 0.9941
0
20
40
60
80
100
120
140
160
180
200
220
240
260
0 0.1 0.2 0.3 0.4 0.5 0.6 0.7 0.8 0.9 1
Deg
ree-
days
of f
reez
ing
in t
wen
ty d
ay p
erio
d af
ter i
ce c
over
fo
rms
at S
outh
For
t G
eorg
e, D
D (0 C
-day
s)
Probability of degree day value being exceeded, P
Degree Days of Freezing Frequency Curve
January 2009 Figure 4.12
City of Prince George

0
100
200
300
400
500
600
Ave
rage
Nec
hako
Riv
er f
low
for
10 d
ay p
erio
d af
ter
free
ze-u
p (m
3 /s)
Annual exceedence probability (%)
Observed
Log normal distribution
Monte Carlo simulation
50 20 10 5 2 1 0.5809095989999.5
Mean = 150 m3/sStandard deviation = 80 m3/s
Nechako Post‐Freeze‐Up Flow Probability
January 2009 Figure 4.13
City of Prince George

564.0
566.0
568.0
570.0
572.0
574.0
576.0
578.0
580.0
582.0
Free
ze-u
p el
evat
ion
(m, G
SC
)
Annual exceedence probability (%)
Historical data at Cameron Steet Bridge, approximate curveMonte Carlo, Boat LaunchMonte Carlo, Cameron Street BridgeMonte Carlo, Hart BridgeMonte Carlo, Foothills BridgeMonte Carlo, Morning Place
50 20 10 5 2 1 0.5809095989999.5
Historical Freeze‐Up Elevation Frequency Curve
January 2009 Figure 4.14
City of Prince George

nhc
Flood Risk Evaluation and Flood Control Solutions – Phase 1 Final Report 36
5 FLOOD RISK EVALUATION Two distinct flood hazards have been identified at City of Prince George, due to either high freshet flows or ice jamming. Typically, the freshet causes the more severe flooding in the Fraser River whereas ice jamming, particularly during freeze-up, is the more critical condition for the Nechako River. Section 3 estimated the 200-year freshet flows for both the Fraser and Nechako Rivers and simulated the corresponding open water flood profiles. Ice processes and ice-related flood levels were outlined in Section 4. The present section compares the results of the two flood analyses and determines which condition produces the more severe flooding within the City boundaries.
A general risk analysis was completed in the first stage of the project and was summarized in Progress Report 1, issued in June of 2008. Based on the technical investigations completed to date, this work can now be expanded on.
5.1 FLOOD THREAT ANALYSIS
5.1.1 FLOOD LEVELS AT PRINCE GEORGE Section 3.1 described historic freshet floods on the Fraser and Nechako Rivers. Maps 4, 5 and 6 show the extent of flooding reported during the floods of 1948 and 1972. Recorded and estimated water levels at South Fort George(SFG) for these and other relevant floods are:
Year Water Level, SFG (m) GSC Height above 2007 Water Level (m)
1894 569.3 (estimate, accuracy unknown) 1.7
1948 568.3 0.7
1972 568.1 0.5
2007 567.6 -
In general, it is not possible to assign return periods to flood levels since the river cross-section at South Fort George may have changed over time. With present channel conditions, the simulated 200-year flood level at this location is about El. 568.6 m GSC or over 1 m higher than the flood level reached in 2007.
5.1.2 FLOODS IN FRASER RIVER
Freshet flows, generated by snowmelt in combination with sudden high temperatures and/or heavy precipitation during the spring time, consistently produce the annual peak flow for both the Fraser and Nechako Rivers.
The flow record for Fraser River at Shelley, 23 km upstream of the Nechako confluence, covers the period from 1950 to 2008. The six highest recorded floods for this period are:
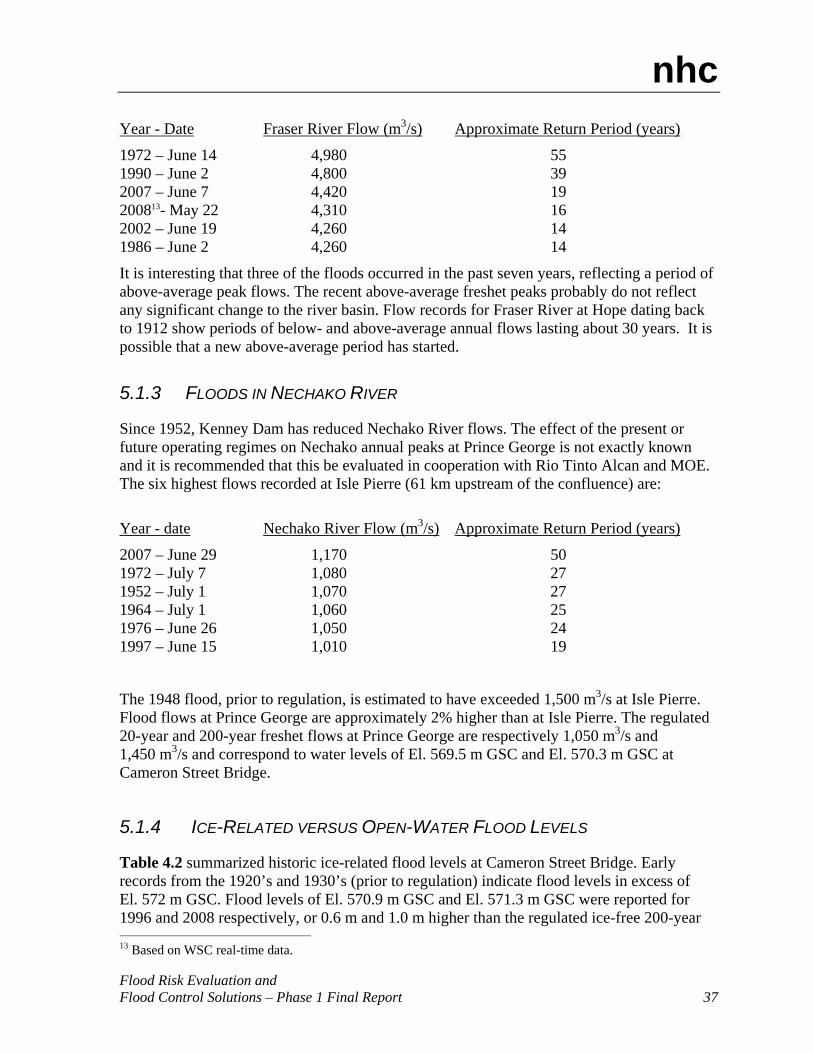
nhc
Flood Risk Evaluation and Flood Control Solutions – Phase 1 Final Report 37
Year - Date Fraser River Flow (m3/s) Approximate Return Period (years)
1972 – June 14 4,980 55 1990 – June 2 4,800 39 2007 – June 7 4,420 19 200813- May 22 4,310 16 2002 – June 19 4,260 14 1986 – June 2 4,260 14
It is interesting that three of the floods occurred in the past seven years, reflecting a period of above-average peak flows. The recent above-average freshet peaks probably do not reflect any significant change to the river basin. Flow records for Fraser River at Hope dating back to 1912 show periods of below- and above-average annual flows lasting about 30 years. It is possible that a new above-average period has started.
5.1.3 FLOODS IN NECHAKO RIVER
Since 1952, Kenney Dam has reduced Nechako River flows. The effect of the present or future operating regimes on Nechako annual peaks at Prince George is not exactly known and it is recommended that this be evaluated in cooperation with Rio Tinto Alcan and MOE. The six highest flows recorded at Isle Pierre (61 km upstream of the confluence) are:
Year - date Nechako River Flow (m3/s) Approximate Return Period (years)
2007 – June 29 1,170 50 1972 – July 7 1,080 27 1952 – July 1 1,070 27 1964 – July 1 1,060 25 1976 – June 26 1,050 24 1997 – June 15 1,010 19
The 1948 flood, prior to regulation, is estimated to have exceeded 1,500 m3/s at Isle Pierre. Flood flows at Prince George are approximately 2% higher than at Isle Pierre. The regulated 20-year and 200-year freshet flows at Prince George are respectively 1,050 m3/s and 1,450 m3/s and correspond to water levels of El. 569.5 m GSC and El. 570.3 m GSC at Cameron Street Bridge.
5.1.4 ICE-RELATED VERSUS OPEN-WATER FLOOD LEVELS
Table 4.2 summarized historic ice-related flood levels at Cameron Street Bridge. Early records from the 1920’s and 1930’s (prior to regulation) indicate flood levels in excess of El. 572 m GSC. Flood levels of El. 570.9 m GSC and El. 571.3 m GSC were reported for 1996 and 2008 respectively, or 0.6 m and 1.0 m higher than the regulated ice-free 200-year 13 Based on WSC real-time data.

nhc
Flood Risk Evaluation and Flood Control Solutions – Phase 1 Final Report 38
level at the bridge. Based on the ice analysis, the 2008 ice-related event at Cameron Street Bridge had a return period in the order of 90 years.
Figure 5.1 compares the Nechako open water freshet profile with the ice-related profile. Except downstream of Cross-Section N6, the ice-related 200-year profile is higher. This profile, corresponding to equilibrium ice-conditions, is recommended for the design of flood control works. Ice-related water levels for the 20-, 50-, and 100-year ice events are also shown along with the 20-year open water profile. As discussed in Section 3.6.5, a minimum freeboard allowance of 0.6 m should be added to the water surface profile to give the Flood Construction Level (FCL) at any point along the river.
The new design profile is considerably higher than the previous one (Table 5.1 and Figure 5.1). In some locations, the 2007 and 2008 ice-related flood levels overtopped the previous FCL’s. Revised design water surface profiles and FCL’s are listed in Table 5.1. Figure 5.2 shows where ice-related flood conditions or Fraser backwater conditions govern. The figure also indicates the following range of FCL increases compared to the previous mapping:
Rise in FCL (m) Reach defined by Cross-sections 0.00 – 0.50 N1 – N6 0.50 – 1.00 N6 – N12 1.00 – 1.50 N12 – N20, N30 – N34 1.50 – 1.75 N20 – N30
As part of Phase 2 of this project, the floodplain mapping for Prince George will be updated accordingly.
On the Fraser River, the open-water (freshet) flood levels are considerably higher than the ice-related levels. A detailed comparison was not carried out. FCL’s are based on freshet levels as listed in Table 5.2 and shown in Figure 3.12.
5.2 IDENTIFICATION OF RISK AREAS
In Progress Report 1, developed land areas within the 1997 floodplain boundaries were identified as areas at risk, potentially requiring flood control solutions. The areas are shown on Maps 4 to 6. Also indicated on the maps are the 1997 floodplain boundaries, the outline of areas flooded during the freshets of 1948 and 1972, and the flooding caused by the 2007-2008 ice jams. In the confluence area, the 1948 flood limits generally match the floodplain boundaries derived in 1997. The areas flooded during the winter 2007-08 are typically within the 1997 designated floodplain, except near Morning Place. Maps 4 to 6 also indicate areas where high groundwater levels caused flooding during the 2007-2008 ice jams.
Because the revised FCL’s are higher than the specified 1997 levels, the dimensions of the risk areas will increase somewhat, depending on the topography of each area. Correspondingly, asset values may be higher than formerly estimated.
Map 5 identifies seven flood risk areas along the Nechako River, as follows:

nhc
Flood Risk Evaluation and Flood Control Solutions – Phase 1 Final Report 39
• Area AN – South Bank of Nechako River at Confluence • Area BN – North Bank of Nechako River east of John Hart Bridge • Area CN – North Bank of Nechako River near Confluence • Area DN – North Bank of Nechako River west of John Hart Bridge • Area EN – North Bank of Nechako River at Morning Place • Area FN – South Bank of Nechako River at Foot Hills Bridge • Area GN – South Bank of Nechako River between John Hart and Foothills Bridges
Maps 4 and 6 identify another seven flood risk areas along the Fraser River, as follows:
• Area AF – West bank at Yellowhead Highway • Area BF – South Fort George • Area CF – Hudson’s Bay Slough west of Queensway • Area DF – Lansdowne south end • Area EF – West Bank at Island • Area FF – Northwood Pulpmill Road • Area GF – Across River from Shelley
In accordance with the project Terms of Reference, flood-prone areas outside the City of Prince George municipal boundaries, such as Foreman Flats and Shelley, are not included.
5.3 ASSET INVENTORY
5.3.1 GENERAL DESCRIPTION OF ASSETS
Assets include residential, commercial, industrial and non-profit properties located within the Nechako and Fraser River floodplains, as well as publicly owned infrastructure and private utilities located in road allowances and lanes. For the private properties, assessed values of land and improvements are used. Where appropriate, a more detailed breakdown of specific properties is provided depending on the mitigation option being contemplated.
Public-owned infrastructure includes roadways, bridges, community wells, trails, parks, water-mains, sanitary sewers and storm sewers including outfalls. Private utilities include hydro, telephone, natural gas and cable services generally located within road allowances. These assets tend to be linear in nature with a roadway generally having parallel installations of water and sewer mains, storm sewers, gas lines and hydro/telephone/cable lines. This infrastructure can, however, include specific components such as pump houses, vaults or regulating stations that are outside the typical linear installations.
Portions of the utility infrastructure provide local service to adjoining private properties. For mitigation options involving land use changes, this infrastructure can be decommissioned by removing surface features such as pavement or pole lines and by plugging or removing underground lines.

nhc
Flood Risk Evaluation and Flood Control Solutions – Phase 1 Final Report 40
Other infrastructure services off-site areas or specific site conditions. This category includes some storm sewers, and major structures such as water-well pumping stations. Relocation of such facilities may not be practical or desirable.
5.3.2 OVERVIEW OF FLOOD RISKS TO ASSETS
A flood event poses direct risks to assets from inundation by floodwater or rising groundwater, and from erosion or structural damage by flowing water or moving ice. Activities associated with the flood response, such as emergency diking, may also affect assets. Road surfaces, appurtenances such as pad-mounted transformers and structures may be immediately at risk. Inundation generally has greater effects on private properties than on linear assets, due to damage to buildings, contents and equipment. Other considerations are:
• Storm and sanitary sewers may become surcharged, causing backups in buildings. Inundation may cause sediment and debris to deposit in piping, vaults and ducts, incurring costs for later cleaning and removal.
• Underground pressure mains such as natural gas lines, water-mains or sewage force-mains are unlikely to be affected by inundation unless the underlying soil is de-stabilized. Buried cables and vaults are also generally treated to resist inundation, but access to them may be affected. (As protection of public water utilities received priority during the 2007-2008 ice jam event, it can be expected that efforts to protect them would be made in future similar events.)
• Flowing water or moving ice may damage structures and surface appurtenances, and in extreme cases also threaten buried facilities if new flood channels are cut. Ice jams may also threaten overhead lines by striking the poles.
• Emergency works during a flood may damage surface features such as pole lines, landscaping, trees and fences through encroachment of temporary dikes. Heavy mobile equipment and temporary dikes may also damage shallow buried ducts and piping. Temporary dikes may also limit access to businesses, residences and utilities.
In addition to immediate effects to assets within flooded areas, floods also have consequential impacts due to temporary loss of use of residences and businesses, including wage losses to employees.
5.3.3 NECHAKO RIVER RISK AREAS
Urban and other developments within the risk areas were reviewed. Site visits were made to most areas, and a helicopter reconnaissance was conducted on October 8, 2008. Descriptions of the various areas on Map 5 follow.

nhc
Flood Risk Evaluation and Flood Control Solutions – Phase 1 Final Report 41
Area AN (South Bank of Nechako River at Confluence) This complex area includes a portion of downtown Prince George, commercial areas along 1st Avenue, the CN Rail yards, forestry-related industries along River Road, some residences and sparsely developed areas such as log storage yards, Cottonwood Island Park and the Railway Museum. As indicated on Map 5, ice-jam flooding in 2007/2008 affected businesses and residences in various places, particularly along River Road. Groundwater flooding associated with the ice jam affected properties along the west end of 1st Avenue.
The major effects on public infrastructure during the 2007/2008 ice-jam event were restricted use of River Road due to temporary dike construction, and damage to facilities at Cottonwood Island Park. Power and telephone lines are mainly overhead and were unaffected except for tilting of a few poles. Because access along River Road is considered important, the roadway has since been raised to permit vehicle access during floods. Considering the significant increases to the Nechako 200-year design levels as a result of the ice analysis contained in Section 4, top-of-road elevations should be reviewed.
The freshet floods in 1948 and 1972 appear to have affected mainly the eastern portion of the area, with little effect on properties affected in the winter of 2007/2008. The limits of the 1948 flood included densely developed downtown areas.
Area BN (North Bank of Nechako River East of John Hart Bridge) This area contains a mixture of commercial and light industrial uses and was directly affected by emergency works in response to the ice-jam flooding in 2007/2008. It does not appear to have been affected by the freshet flood events of 1948 and 1972. Except for some property on the west side beside Highway 97, most of the area has been developed.
Area CN (North Bank of Nechako River near Confluence) This area contains a major water intake and well facility for Canfor and is the corridor for Prince George Pulpmill Road, but otherwise consists predominantly of low-density residential development. The west end experienced ice-jam and groundwater flooding in 2007/2008, and the whole area appears vulnerable to freshet flooding as in 1948 and 1972. Erosion of the north river bank is becoming more of a threat to properties and residences.
Prince George Pulpmill Road is a major asset in this area, being the sole road access to major industrial sites to the east, including two pulp mills, a refinery, chemical plants, industrial contractors, etc. Pulpmill Road was also used as a staging area during the 2007/2008 ice-jam event for evacuating residents and deploying equipment. Presently, the road surface is above the revised Flood Construction Level.
Area DN (North Bank of Nechako River West of John Hart Bridge) Major facilities are the Pacific Western Brewing Company and a school. The floodplain contains several residential properties and a portion of North Nechako Road as well as a

nhc
Flood Risk Evaluation and Flood Control Solutions – Phase 1 Final Report 42
ramp access to Highway 97. Flooding from the 2007/2008 ice-jam event threatened residences in the Del Haven multifamily complex.
Area EN (North Bank of Nechako River at Morning Place) This area is residential. Direct impacts from the 2007/2008 ice jam were related to the installation and removal of temporary gabion works alongside residential properties.
Area FN (South Bank of Nechako River at Foothills Bridge) This area is mostly undeveloped land, known as Fishtrap Island. However it contains a major water well and pump station that supplies the City. Some ice-jam related flooding took place at the Foothills bridge in 2007/2008 , but the pump station site did not appear to be affected.
Area GN (South Bank of Nechako River between John Hart and Foothills Bridges) This area, accessible through Wilson Park, is similar to Fishtrap Island in that it is predominantly undeveloped but contains a major water well and pump station. Some ice-jam flooding appears to have taken place near the pump station in 2007/2008.
5.3.4 FRASER RIVER RISK AREAS
Area AF (West Bank at Yellowhead Bridge) This relatively small area has some basic landscaping but is otherwise undeveloped. Existing infrastructure is limited to a storm outfall, a sanitary sewer force-main and a gravity sewer. The area appears to be outside the influence of ice-jam flooding on the Nechako River, but is vulnerable to freshet flooding from the Fraser River.
Area BF (South Fort George) This area is part of the Hudson’s Bay Slough system and is bounded by Queensway Road and the Fraser River. The area has some residential development on Farrell Street and a recreational baseball diamond but is otherwise undeveloped. It serves as a discharge location for two storm sewer trunk lines, and contains a sewage lift station.
Area CF (Hudson’s Bay Slough West of Queensway) This area follows the Hudson’s Bay Slough creek system and includes part of Winnipeg Street up to a topographical divide from Area AN. More recent residential areas between Queensway and Upland Street would have been inundated in the 1948 and 1972 floods. The

nhc
Flood Risk Evaluation and Flood Control Solutions – Phase 1 Final Report 43
area includes part of Highway 16 near Strathcona Avenue, and the upper reach of the Slough may affect a BC Hydro substation at Winnipeg Street.
Area DF (Lansdowne South End) This area is mostly undeveloped but includes part of the City’s sewage treatment plant. A 900 mm diameter outfall pipe traverses the area to discharge treated effluent into the Fraser River. It is not known to what extent this area was affected by freshet flooding in 1948 and 1972.
Area EF (West Bank at Island) This area consists of agricultural land with a barn at its northeast corner.
Area FF (Northwood Pulp Road) This area surrounds the Northwood Pulpmill complex, which lies on high ground above 200-year levels. It contains parts of the Northwood Pulp Road, several private paved and gravel roads, a private bridge crossing, log storage areas and some treatment lagoons for the plant site. Landooz Road passing through the area is the sole access for several low-density residential properties in the northeast corner of the city, as well as the North Shelley community outside the City Limits.
Area GF (Across River from Shelley) Land in this area is either undeveloped or agricultural. A natural gas transmission main traverses the area to a crossing structure over the Fraser River. Area GF can be considered to extend beyond the City Limits into Fort George Indian Reserve No. 2 and to the North Shelley community.
5.4 ASSESSMENT OF FLOOD THREATS
Map 5 demonstrates that threats to assets are not evenly distributed. Areas near the confluence are affected by both ice-related flooding and freshet flooding, while others are affected by only one type of event. Freshet and ice flood events are not completely independent. Following the severe freshet flooding in June 2007, particularly within the Nechako basin, the watershed was probably more saturated than in normal years, tending to produce above-average runoff in the subsequent fall and winter. Fully lowering the Nechako Reservoir to typical fall levels may have been difficult in view of the prolonged high flow releases necessary in the summer and fall, and early November flows were well above normal.
Fraser freshet flooding is the critical condition along the Fraser River and along the Nechako River as far upstream as Cross-Section N6. The revised FCL’s are on average 0.3 m higher

nhc
Flood Risk Evaluation and Flood Control Solutions – Phase 1 Final Report 44
than those specified in 1997, due to slight increases in the 200-year design flows. Consequently the flood boundaries shift farther from the river, increasing the size of the identified risk areas. Upstream of Nechako Cross-Section N6, the recommended FCL’s have risen substantially (average 1.1 m), resulting in potentially much larger floodplain areas where the land is relatively flat.
The Fraser freshet flood magnitude is a function of the accumulated spring snowpack, and to a lesser degree temperatures and precipitation during snowmelt. Freeze-up conditions leading to ice-jam floods are a function of temperatures and Nechako River flows, as described in Section 4.
Based on the flood threats and asset inventories described above, the identified risk areas can be listed tentatively in descending order of priority as follows:
1. Area AN - South Bank of Nechako River at Confluence. At risk during freshet and freeze-up. Includes downtown core south of the railway, the railway, and industrial lands to the north.
2 Area CN - North Bank of Nechako River near Confluence. At risk during freshet and at freeze-up. Relatively sparsely populated.
3. Area DN - North Bank of Nechako River west of John Hart Bridge. Primary risk is ice-related. Low-lying, densely developed, includes multi-family housing.
4. Area BN - North Bank of Nechako River east of John Hart Bridge. The primary threat is ice-related flooding. The area is low-lying and densely developed with mainly commercial and light industrial uses.
5. Area BF – South Fort George. The primary threat is freshet flooding and flooding commences at relatively low return period floods of 15 to 20 years. The area is low-lying and contains residential development.
6. Area EN – Morning Place. The primary threat is ice-related flooding. The area is relatively low-lying and contains residential development.
7. Area DF – Lansdowne South End. The area is at risk of freshet flooding and contains some residential development.
The following areas which presently exhibit only limited development may not need flood protection measures. In some cases future development should be discouraged by appropriate zoning.
• Area FN – South Bank at Foothills Bridge. • Area GN – South Bank between John Hart and Foothills Bridges. • Area AF – West bank at Yellowhead Highway • Area EF – West Bank at Island • Area FF – Northwood Pulpmill Road • Area GF – Across River from Shelley
Area CF – Hudson’s Bay Slough west of Queensway, is a densely developed low-lying area protected by the Queensway road embankment which acts as a standard dike. An adjacent pump-station provides for internal drainage. Considering the revised FCL’s, the adequacy of this protection will be verified in Phase 2.

Table 5.1 – Nechako Freshet Design Water Surface and Ice Profiles with FCL’s
XS Name Distance
(m) Channel n ‐ value
Freshet Design Profile Ice‐Related NHC FCL's Old FCL's Increase (m) 20‐yr 200‐yr Design Profile (200‐yr) Freshet or Ice
Klohn Crippen
XS N34 15573 0.032 579.47 580.38 582.03 582.63 581.60 1.03
XS N33 15135 0.032 579.05 579.92 581.68 582.28 581.20 1.08
XS N32 14045 0.032 578.00 578.76 580.81 581.41 580.10 1.31
XS N31 13385 0.032 577.39 578.27 580.29 580.89 579.40 1.49
XS N30 12896 0.032 576.79 577.68 579.90 580.50 578.90 1.60
XS N29 12489 0.032 576.38 577.25 579.57 580.17 578.50 1.67
XS N28 11814 0.032 575.82 576.69 579.04 579.64 577.90 1.74
XS N27 11148 0.031 575.30 576.13 578.51 579.11 577.40 1.71
XS N26 10627 0.031 574.92 575.72 578.09 578.69 577.00 1.69
XS N25 10060 0.031 574.50 575.27 577.64 578.24 576.60 1.64
XS N24 9495 0.031 574.11 574.88 577.19 577.79 576.30 1.49
XS N23 9025 0.031 573.76 574.52 576.82 577.42 575.90 1.52
XS N22B 8555 0.031 573.40 574.12 576.45 577.05 575.49 1.56
XS N22A 8496 0.031 573.34 574.04 576.40 577.00 575.44 1.56
XS N21 8098 0.031 573.08 573.77 576.01 576.61 575.10 1.51
XS N20 7456 0.031 572.53 573.16 575.39 575.99 574.50 1.49
XS N19 6913 0.031 572.07 572.80 574.87 575.47 574.10 1.37
XS N18 6402 0.031 571.62 572.34 574.37 574.97 573.70 1.27
XS N17 5932 0.031 571.21 571.95 573.92 574.52 573.30 1.22
XS N16 5541 0.031 570.77 571.45 573.54 574.14 572.90 1.24
XS N15 5118 0.031 570.39 571.10 573.13 573.73 572.60 1.13
XS N14 5087 0.031 570.36 571.06 573.10 573.70 572.60 1.10
XS N12 4745 0.031 570.07 570.81 572.58 573.18 572.30 0.88
XS N11 4201 0.031 569.63 570.40 571.74 572.34 571.70 0.64
XS N9 4175 0.031 569.54 570.32 571.70 572.30 571.60 0.70
XS N8 3792 0.031 569.23 570.03 571.18 571.78 571.10 0.68
XS N7 3423 0.031 569.03 569.98 570.69 571.29 570.70 0.59
XS N6 2938 0.031 568.97 569.95 570.03 570.63 570.40 0.23
XS N5 2518 0.031 568.85 569.88 569.46 570.48 570.30 0.18
XS N4 1957 0.031 568.82 569.88 ‐‐‐ 570.48 570.20 0.28
XS N3 1337 0.031 568.82 569.88 ‐‐‐ 570.48 570.20 0.28
XS N2 889 0.031 568.81 569.88 ‐‐‐ 570.48 570.20 0.28
XS N1 452 0.031 568.81 569.88 ‐‐‐ 570.48 570.20 0.28
Average ‐‐‐ ‐‐‐ ‐‐‐ ‐‐‐ ‐‐‐ ‐‐‐ ‐‐‐ 1.10
Notes: (1) Governing flood levels are shown in bold. FCL’s include 0.6 m freeboard. (2) All water levels and elevations are in metres (GSC).

Table 5.2 – Fraser Freshet Design Water Surface Profiles and FCL’s
XS Name Distance
(m) Channeln ‐ value
Freshet Design Flow NHC FCL's Old FCL's Increase (m)
20‐yr 200‐yr Freshet Klohn Crippen
XS F61 39338 0.027 575.45 576.56 577.16 576.80 0.36
XS F60 38312 0.027 575.17 576.29 576.89 576.40 0.49
XS F59 37532 0.027 574.94 576.05 576.65 576.10 0.55
XS F58 36837 0.027 574.83 575.97 576.57 576.00 0.57
XS F57 35961 0.027 574.54 575.65 576.25 575.50 0.75
XS F56 35186 0.027 574.43 575.57 576.17 575.40 0.77
XS F55 34290 0.027 574.11 575.22 575.82 575.20 0.62
XS F54 33364 0.028 573.84 575.03 575.63 575.00 0.63
XS F53 32073 0.028 573.35 574.59 575.19 574.80 0.39
XS F52B 31433 0.028 573.13 574.35 574.95 574.60 0.35
XS F52 31419 0.028 573.11 574.34 574.94 574.60 0.34
XS F51 30981 0.028 573.07 574.28 574.88 574.60 0.28
XS F50 30378 0.028 572.82 574.03 574.63 574.40 0.23
XS F49 29697 0.028 572.85 574.08 574.68 574.40 0.28
XS F48 29099 0.028 572.16 573.19 573.79 573.70 0.09
XS F47 28429 0.028 572.14 573.22 573.82 573.70 0.12
XS F46 27700 0.028 571.86 572.94 573.54 573.40 0.14
XS F45 26813 0.027 571.64 572.73 573.33 573.20 0.13
XS F44 26090 0.027 571.47 572.56 573.16 573.00 0.16
XS F43 25674 0.027 571.33 572.42 573.02 572.90 0.12
XS F42 24521 0.027 571.11 572.20 572.80 572.60 0.20
XS F41 23856 0.027 570.86 571.93 572.53 572.20 0.33
XS F40 22730 0.029 570.74 571.89 572.49 572.10 0.39
XS F39 21595 0.029 570.56 571.75 572.35 572.00 0.35
XS F38 20958 0.029 570.45 571.64 572.24 571.90 0.34
XS F37 20290 0.029 570.38 571.57 572.17 571.80 0.37
XS F36 19666 0.030 570.11 571.24 571.84 571.50 0.34
XS F35 18831 0.030 569.95 571.10 571.70 571.40 0.30
XS F34 18281 0.030 569.83 570.95 571.55 571.30 0.25
XS F33 17276 0.029 569.59 570.71 571.31 571.00 0.31
XS F32 16322 0.029 569.14 570.18 570.78 570.50 0.28
XS F31 15668 0.029 568.93 569.93 570.53 570.30 0.23
XS F30 15650 0.029 568.98 570.01 570.61 570.30 0.31
XS F29 15632 0.029 568.93 569.95 570.55 570.30 0.25
XS F28 15421 0.029 568.90 569.92 570.52 570.20 0.32
XS F27 14446 0.030 568.75 569.78 570.38 570.10 0.28
XS F26 13868 0.030 568.71 569.77 570.37 570.10 0.27
XS F25 13714 0.030 568.71 569.77 570.37 570.10 0.27
XS F23 13680 0.030 568.70 569.76 570.36 570.10 0.26
XS F22 13430 0.030 568.68 569.74 570.34 570.10 0.24
XS F21 13059 0.029 568.54 569.59 570.19 569.90 0.29
XS F21A 13004 0.029 568.50 569.53 570.13 569.86 0.27
XS F20 12639 0.028 568.21 569.19 569.79 569.60 0.19
XS F19 11701 0.028 567.91 568.90 569.50 569.30 0.20
XS F18 10786 0.028 567.37 568.32 568.92 568.70 0.22
XS F16 10176 0.028 567.10 568.05 568.65 568.40 0.25
XS F15 10156 0.028 567.10 568.04 568.64 568.40 0.24
XS F14 9680 0.028 566.90 567.84 568.44 568.10 0.34
XS F13 9093 0.028 566.68 567.63 568.23 567.90 0.33
XS F12 8686 0.028 566.64 567.62 568.22 567.90 0.32
XS F11 8417 0.030 566.50 567.51 568.11 567.70 0.41
XS F10 7716 0.030 566.31 567.31 567.91 567.50 0.41
XS F9 7010 0.030 565.97 566.93 567.53 567.20 0.33
XS F8 5804 0.030 565.31 566.23 566.83 566.50 0.33
XS F7 5004 0.030 564.90 565.81 566.41 566.10 0.31
XS F6 4144 0.030 564.34 565.27 565.87 565.60 0.27
XS F5 3317 0.030 563.89 564.85 565.45 565.10 0.35
XS F4 2203 0.029 563.36 564.35 564.95 564.60 0.35
XS F3 1422 0.029 562.73 563.62 564.22 563.90 0.32
XS F2 735 0.029 562.51 563.40 564.00 563.50 0.50
XS F1 0 0.029 562.25 563.15 563.75 563.30 0.45
Average ‐‐‐ ‐‐‐ ‐‐‐ ‐‐‐ ‐‐‐ ‐‐‐ 0.33
Notes: (1) Freshet levels are consistently higher than ice levels (FCL’s include 0.6 m freeboard). (2) All water levels and elevations are in metres (GSC).

561.0
562.0
563.0
564.0
565.0
566.0
567.0
568.0
569.0
570.0
571.0
572.0
573.0
574.0
575.0
576.0
577.0
578.0
579.0
580.0
581.0
582.0
583.0
0 2000 4000 6000 8000 10000 12000 14000 16000
Eleva
tion (m, G
SC)
Distance from Mouth (XS F26, m)FCL (NHC 2008) FCL (KC 1997)Open Water 200‐yr Profile Open Water 20‐yr Profile200‐yr Ice Level 50‐yr Ice Level100‐yr Ice Level 20‐yr Ice LevelThalweg
XS N5
XSN4
XSN3
XSN2
XSN1
XSN17
XSN24
XSN23
XSN21
XSN22
A
XSN16
XSN18
XSN19
XSN20
XS N6
XSN14
XSN12
XSN9
XS N8
XSN7
XSN26
XSN34
XSN33
XSN28
XSN27
XSN25
XSN32
XSN31
XSN30
XSN29
Foothills Boulevard Bridge
(L.C. 577.03 m )
John
Hart Bridge
(Highw
ay 97
(L.C. 578.13 m )
Cameron
Street Bridge
(L.C. 574
m )
Boat Launch
Morning
Place
Nechako River
Open Water and Ice‐Related Flood Profiles
January 2009 Figure 5.1
City of Prince George Note: Flood Construction Level (FCL) = 200‐yr ice‐related or freshet
design level, whichever is higher, plus a freeboard allowance of 0.6 m.

City of Prince G
eorge
Nechako R
iver
Fraser River
XS
N34
XS
N33
XS
N32X
S N
31
XS
N30
XS
N29
XS
N28
XS
N27
XS
N26
XS
N25
XS
N24
XS
N23
XS
N22BX
S N
22X
S N
22A
XS
N21
XS
N20
XS
N19
XS
N18
XS
N17
XS
N16
XS
N15
XS
N14
XS
N13X
S N
12
XS
N11
XS
N10
XS
N9
XS
N8
XS
N7
XS
N6
XS
N5
XS
N4
XS
N3
XS
N2
XS
N1
FCL Increase: 1.0 - 1.5 m
FCL Increase: 1.5 - 1.75 m
FCL Increase: 1.0 - 1.5 m
FCL Increase: 0.5 - 1.0 m
FCL Increase: 0 - 0.5 m
Ice-related Flooding Producesthe H
ighest Flood Levels
Fraser River B
ackwater produces
the Highest Flood Levels
1997 Floodplain Boundary
5080
00.0
0000
0
5080
00.0
0000
0
5100
00.0
0000
0
5100
00.0
0000
0
5120
00.0
0000
0
5120
00.0
0000
0
5140
00.0
0000
0
5140
00.0
0000
0
5160
00.0
0000
0
5160
00.0
0000
0
5180
00.0
0000
0
5180
00.0
0000
0
5975000.000000
5975000.000000
5980000.000000
5980000.000000
0 500 1,000 1,500 2,000250Metres
®
Legend - Year of SurveyXS (1995 & 2008)
XS (1979 & 2008)XS (2008)XS (1995)XS (1979)
1:35,000
GD
L \\1
0.0.
3.10
\pro
ject
s\34
920
PG
FPM
\GIS
_XS
Scale:
Coord. System: UTM Zone 10Datum: NAD 83Units: MetresNotes: Satellite image from Google Earth
City of Prince GeorgeNechako River
January 2009 Figure 5.2
Extent of Open Water and Ice-RelatedFlood Conditions

nhc
Flood Risk Evaluation and Flood Control Solutions – Phase 1 Final Report 45
6 FLOOD CONTROL OPTIONS
6.1 IDENTIFICATION OF FLOOD CONTROL OPTIONS
Using Maps 4 to 6, potential preliminary flood relief options were developed for each risk area as listed in Progress Report 1 (NHC et. al. 2008c) and in the summary table included in Appendix F of this report. The options encompass both structural and non-structural solutions and are grouped by Risk Area as discussed in Section 5 above. Nechako River flood control options with potential benefits to several areas are listed as a separate group. The options fall into the following broad categories:
• No permanent protection • Land acquisition / land use change • Internal drainage • Individually raising / floodproofing of essential developments • Re-activation / modification of natural secondary channels as flood relief channels • Diking (including riverside, setback, and raised roads or platforms for temporary
protection) • In-channel sediment removal • Upstream flow control
Ice jam prevention strategies are also included in Appendix F. The temporary works installed by the City and some property owners during the 2007-2008 ice jam were reviewed and their effectiveness briefly evaluated. Prior to the ice jam, design work was in progress to upgrade and raise River Road. This work, along with a report on Prince George diking options (Doughty-Davies and Morley 1974) was reviewed.
The initial flood control solutions were reviewed (as described in Progress Report 1) in terms of general hydraulic, infrastructure, environmental and geomorphic considerations. The options were initially assessed using a decision-matrix approach on the basis of this pre-feasibility screening. At the time, technical investigations had not been completed and none of the options were eliminated from further investigation. Each option was assessed for its suitability as a flood control solution by rating the following eight factors:
• Flood risk following implementation of the option • Construction difficulty and long-term maintenance requirements • Access problems during floods • Internal drainage problems • Environmental impacts • Risk of causing river instabilities • Direct costs • Social costs (such as loss of productivity, inconvenience and disruption)
Each factor was rated on a scale from 1 (low) to 3 (high), based on the apparent relevance of that factor to the flood control solutions. Environmental impact ratings were based on the

nhc
Flood Risk Evaluation and Flood Control Solutions – Phase 1 Final Report 46
assumption that the amount of environmental permitting required for each control option is roughly correlated with the severity of environmental impact.
The individual factors are not all equally important for a particular flood control solution. To compensate, weights were assigned to the individual factors. The ‘risk after implementing’, ‘environmental impact’, ‘direct cost’ and ‘social cost’ factors were most heavily weighted at a value of 3. ‘Construction/maintenance’ and ‘river instability risk’ were weighted at 2. ‘Access problems’ and ‘drainage problems’ were weighted at 1.
After multiplying the relevance index by the weighting, the various options for a particular area were ranked according to the weighted ratings to provide a preliminary comparison of options. In general, set-back dikes and land use changes rank higher than river dikes. Ring dikes protecting only small compartments of the floodplain typically received a low ranking. Providing no permanent protection and relying only on emergency protection also ranked low. It was noted that options involving direct work in or beside the rivers would trigger federal and provincial reviews and likely result in requirements for environmental compensation.
6.2 HYDRAULIC EFFECTIVENESS OF FLOOD CONTROL OPTIONS
Following the risk analysis (Section 5), the identified flood control options were evaluated from a technical and hydraulic engineering perspective, as described below. This evaluation is based in part on HEC-RAS one-dimensional numerical modelling of channel hydraulics.
6.2.1 NO PERMANENT PROTECTION
The floodplain within City of Prince George is largely developed and some areas have experienced frequent flooding, every five to ten years. Flooding of low-lying areas is expected to continue. Whereas the ice-related flooding during the winter of 2007-08 had an approximate return period of about 90 years, severe freshet flooding has not been experienced since the flood of 1972, estimated to have a return period of just over 50 years (at Shelley).
Neither freshet nor ice-related flooding has a “flashy” behaviour. Normally some warning of flood risk is available. For freshet floods this takes the form of an exceptionally large spring snow-pack and high atmospheric temperature or heavy rainfall forecasts. For ice-related freeze-up flooding it takes the form of high fall to early winter flow releases at Skins Lake spillway (Kenney Dam), combined with heavy run-off from the unregulated portion of the basin plus a prolonged cold snap. Nevertheless, severe flooding generally entails some risk of loss of life and potential legal consequences for not providing protection to known risk areas.
With no permanent protection in place, the City is repeatedly on call to provide emergency response when needed. Besides, it is probably infeasible to provide temporary flood protection able to withstand a 200-year Fraser River freshet flood or ice-related Nechako River flood.

nhc
Flood Risk Evaluation and Flood Control Solutions – Phase 1 Final Report 47
During high freshets, the HEC-RAS hydraulic model could be run in real-time forecasting mode using flows predicted by the MOE River Forecast Centre, to provide advance warning of anticipated flood levels at risk areas without protection. A similar ice-related flood forecast tool could be developed, taking into account Nechako Reservoir levels, Fraser and Nechako River flows and long-range weather forecasts.
6.2.2 LAND ACQUISITION / LAND USE CHANGE
Land use change provides permanent flood protection without a need for on-going maintenance. Land use change was introduced in the Island Cache area by Cottonwood Island following the flood of 1972, when low-cost housing prone to flooding was removed. From a hydraulic perspective, land use change provides more space for the river, increasing floodplain storage and potentially reducing requirements for bank protection.
6.2.3 INTERNAL DRAINAGE
Particularly in the confluence area, the soil is highly porous and seepage flows can cause localized flooding in low-lying areas away from the river, as shown on Map 5. Groundwater studies were conducted by GeoNorth (2006 and 2008) and a more detailed evaluation of drainage along River Road was conducted by Thurber Engineering (2008). Thurber's summary report is provided in Appendix G.
Infilled former back-channels identified in the air-photography review (Section 2.4.1) can provide seepage routes for groundwater. If diking is proposed as a flood control solution, seepage will need to be assessed and these channels may need to be blocked.
Wherever dikes are proposed, internal drainage will need to be included in the plan, incorporating flood-boxes, pump-stations or temporary pumping.
6.2.4 INDIVIDUALLY RAISE / FLOOD-PROOF ESSENTIAL DEVELOPMENTS
Individually raising or flood-proofing essential development has little impact on river hydraulics. Access issues may arise where roads leading to the flood-proofed development have not been raised above the FCL.
6.2.5 REACTIVATING / MODIFYING SIDE-CHANNELS FOR FLOOD RELIEF
As previously shown, Nechako River flood levels are determined either by backwater from Fraser River freshet flood levels or by local ice-related flooding. Flood relief side-channels, in the form of re-opened former secondary channels or newly excavated channels, would not

nhc
Flood Risk Evaluation and Flood Control Solutions – Phase 1 Final Report 48
help during the freshet backwater condition and would be beneficial only for the ice-related condition. During high open-water Nechako flows, with low Fraser levels and no backwater, flood relief channels would provide some additional capacity, but they would not affect the 200-year flood levels used to determine FCL’s.
The increase in flow capacity of the Cottonwood side-channel that would result from gravel removal at its outlet was assessed using a local HEC-RAS model based on six surveyed cross-sections. On the basis of the bridge failures that occurred during the ice jam of 2007/2008, peak flows through the side-channel were estimated to be in the order of 60 m3/s. Different gravel removal scenarios were evaluated. It appeared that by scalping the bar at the channel outlet to winter low-water level, and by widening the constricted bridge opening just upstream of the bar, the flow capacity of the side-channel could be increased by roughly 5 to 10%. Additional excavation in the channel could further increase its flow capacity.
During freeze-up, as long as the main channel remains ice-free at a side-channel entrance, flow can enter the side-channel, thereby tending to reduce flood levels in the main channel downstream of the entrance. Figure 4.10 showed a simulated equilibrium ice-jam rating curve at Cameron Street Bridge. Assuming that one or more side-channels could carry a combined discharge of say 100 m3/s, reducing the main channel discharge for example from 250 m3/s to 150 m3/s, the maximum theoretical water-level reduction would be about 0.7 m downstream of the side-channel entrances. Such a reduction could reduce the return period of the flood level from 200 to around 50 years, but have limited benefit upstream of the entrances. Since the Cottonwood side-channel entrance is within the Nechako River reach where Fraser River backwater determines design flood levels, increasing the capacity of the side-channel would not reduce the flood construction levels.
A side-channel reduces ice-related water levels only while the main channel at the side-channel entrance and the side-channel itself are ice free and affect mainly the river reach downstream of the entrance. To maximize their benefit, channel entrances should be located as far upstream as possible. An inlet control structure, blocking ice from entering the side-channel but allowing through-flow is required.
6.2.6 DIKING - SETBACK DIKING, RAISING EXISTING ROADS, RIVERBANK DIKING
The construction of dikes falls under the jurisdiction of MOE’s Inspector of Dikes Office, and approval must be sought under the Dike Maintenance Act. In general, dikes must be constructed to at least the 200-year maximum daily flood level plus a freeboard allowance of 0.6 m, or the 200-year maximum instantaneous flood level plus a freeboard allowance of 0.3 m, whichever is higher. An Operation and Maintenance Manual must be developed and signed and adopted by the Local Dike Authority.
The sensitivity of the Nechako River open-water 200-year flood profile (upstream of backwater effects from the Fraser River) to different dike options along the river was evaluated in the HEC-RAS model. Water levels were found to be fairly insensitive to the degree of flow confinement by dikes on the floodplain as follows:

nhc
Flood Risk Evaluation and Flood Control Solutions – Phase 1 Final Report 49
• Riverbank dikes on both the north and south banks below Cross-Section N11, as outlined in Section 6.4.1, would raise the open-water design profile by approximately 0.11 m.
• A north or south dike alone would raise water levels by 0.05 m.
• On the other hand, if both the River and Prince George Pulpmill roadways were completely removed, the existing profile would be lowered by up to 0.13 m.
It is more difficult to assess the impact of riverbank dikes on ice-related flood levels. Based on experience from other rivers, similar variations as for the open water conditions are expected.
For some areas, as described below in Sections 6.4.1 and 6.4.2, dikes with crest elevations below the MOE 200-year standard are suggested as an option. Such dikes would be unlikely to obtain approval under the Dike Maintenance Act. They should be viewed simply as platforms for constructing temporary emergency protection. The public would need to be informed about the purpose of these dikes, to avoid generating a false sense of security.
6.2.7 INSTREAM SEDIMENT REMOVAL
There is a public perception that large amounts of gravel have accumulated in the lower reaches of the Nechako River and at the confluence. This perception is supported to some extent by the review of historic air-photographs (see Section 2.4.1), but is not consistently confirmed by comparison of historical and recent cross-section surveys. The 2008 grid survey at the confluence will provide a basis for future comparison, if monitoring is undertaken as recommended.
To evaluate the effects of gravel removal in the main channels of the Nechako and Fraser Rivers under open water conditions, assumed dredging scenarios were introduced in the model for a range of flows. Figure 6.1 shows simulated profiles for a 450,000 m3 removal extending downstream from Cross-Sections N4 to N1 (1200 m x 80 m x 4.7 m average thickness). Since the 200-year and 20-year flood profiles are set by downstream Fraser River water levels, dredging produces essentially no change. However, under 2-year flood conditions with typical corresponding Fraser levels, there is a maximum drop of about 1 m at N4 tailing out to virtually zero at N1. For very low flows (say 50 m3/s in the Nechako and 100 m3/s in the Fraser) the water level drops as much as 1.8 m and 0.74 m at Cross-Sections N3 and N1, respectively. So that whereas dredging can lower water surface profiles for low and medium flows, there is apparently no benefit for the Nechako River 20-year and 200-year flood profiles.
The effects of a 70,000 m3 deposition downstream of Cross-Section N6 were similarly assessed. Over a length of 2,000 m, a 45 m width of channel was infilled by up to 1 m as shown in Figure 6.2. Again, low and medium flow profiles were affected somewhat, but there was essentially no difference in the 20-year and 200-year profiles.
Comparison of surveyed cross-sections suggested that material has built up at the CNR Bridge on the Fraser River. The impact of removing 180,000 m3 of this material was

nhc
Flood Risk Evaluation and Flood Control Solutions – Phase 1 Final Report 50
investigated in the model and was found to lower the 200-year flood profile by less than a few centimetres. From the air-photography review, the CNR Bridge appeared to act as somewhat of a constriction. However, the channel in this location is quite wide and complete removal of the bridge in the model only marginally lowered the 200-year flood profile.
A significantly larger gravel extraction was also modelled, simulating a 5-year removal program of 400,000 m3/year from the confluence area between Nechako Cross-Section N4 and Fraser Cross-Section F25. The main channel depth was increased by 5 m over a width of 250 m and length of 2,100 m. The result was that the Nechako 200-year flood profile was locally lowered by a small amount at Cross-Sections N6 and N7, but was otherwise unchanged. Where water levels are backwater controlled, dredging clearly does not help. Downstream of the confluence, the Fraser River flows in a steep, confined channel; and reducing water levels in this reach, which sets water levels at the confluence, is not practical.
Scalping of material from bars is generally less effective in lowering water levels than channel dredging and was not separately modelled.
Gravel deposits in the Fraser River are not believed to aggravate ice-related flood levels in the Nechako or Fraser Rivers. Removing gravel in the Nechako would not reduce ice-related flood levels as discussed in Section 4.5. Removals of any configuration would increase the flow area, reduce velocities and encourage ice-cover formation. A summary discussion of gravel removals is provided in Appendix H.
In general, flow regulation by a reservoir reduces flood peaks and the sediment transport capacity of a river. The morphologic effects of Kenney Dam flow regulation on the Nechako River are most apparent near the reservoir and reduce downstream as more unregulated flows enter the river. Over time, regulated systems find a new equilibrium in response to an altered flow regime. It is not clear to what extent the reservoir has attributed to the material depositions implied by the air-photo analysis. However, they appear not to have exacerbated the 20 or 200-year ice-related or freshet flooding, although profiles corresponding to relatively low open water flows may have changed.
6.2.8 UPSTREAM FLOW CONTROL
The regulation effect of Nechako reservoir on downstream flood flows diminishes with increasing flood magnitude, and its effect on a 200-year flood is not clearly known. However, since ice-related flooding is the governing flood condition on the Nechako at Prince George, the reservoir's ability to reduce freeze-up flows is more critical. During November and December, the flow originating from upstream of Kenney Dam is proportionally smaller than from below the dam, because the upper watershed is at higher elevations and precipitation is more often snow than rain. Consequently, in the freeze-up period a larger percentage of the Prince George flow originates from the unregulated basin below the dam.
The present operating regime is designed to reduce flows during the freeze-up, and a further reduction would likely be possible only if more flow were diverted to Kemano through an

nhc
Flood Risk Evaluation and Flood Control Solutions – Phase 1 Final Report 51
expansion of the generating facility. The City cannot pursue this option on its own. Increased diversions, if physically possible, could have significant environmental impacts and would probably trigger complex provincial and federal reviews requiring multi-year studies and extensive negotiations and agreements. For these reasons, upstream flow control has not been included as a short-term flood control option. However, it is recommended that MOE in cooperation with Rio Tinto Alcan explore the extent to which flow releases can be reduced during freeze-up.
6.3 ENVIRONMENTAL CONSIDERATIONS
Potential environmental impacts associated with the flood control options listed in Table 6.1 are reviewed and summarized below. The discussion is general, and the extent to which various environmental effects apply will depend on specific designs and construction scenarios. Permitting required for each control option is based on the assumption that the degree of permitting is roughly correlated with the degree of impact. Potential effects of construction were not evaluated as they are highly dependent on construction methodology and generally can be mitigated.
6.3.1 NO PERMANENT PROTECTION
No environmental regulatory approvals are required, since existing floodplain and habitat diversity is maintained. Consequently, this option was assigned a coarse-filtering result of “Low environmental impact”. However, it is likely to imply temporary or emergency flood control works when flooding occurs, which may bring up a range of environmental considerations specific to the particular response.
6.3.2 LAND ACQUISITION / LAND USE CHANGE
Acquisition of land at risk of flooding and its conversion to less susceptible uses (e.g. park, green-space or other land use that excludes residential or commercial development) is the most preferred option from an environmental perspective. Flooding would be allowed to occur freely in these areas, thereby restoring as much functional floodplain as possible. No regulatory approvals are known to be required for this option, therefore, the coarse-filtering result for this option was ranked as “Low environmental impact”. However, extensive clean-up in terms of demolishing and removing structures, oil tanks and other potential environmental hazards could be required.
Benefits from implementing the land use change option in some areas might be used to offset unavoidable habitat damage from less environmentally friendly options in other areas. It should be a component of any long-term flood control strategy for the City.

nhc
Flood Risk Evaluation and Flood Control Solutions – Phase 1 Final Report 52
6.3.3 INTERNAL DRAINAGE
Potential environmental effects of drainage projects are difficult to predict without specific designs, but new or upgraded stormwater outfalls may result in minor habitat alterations. Consequently, a coarse-filtering result of “Low environmental impact” was assigned. Some inter-action with regulatory agencies would be required after design parameters are developed, and a Water Act notification would be required. Consultation with Fisheries and Oceans Canada (DFO) would be advisable to determine if the design may constitute a HADD, although this result seems unlikely.
6.3.4 INDIVIDUALLY RAISE / FLOODPROOF ESSENTIAL DEVELOPMENT
If individually raising/floodproofing existing essential development involves no increase in development footprint into the riparian area, it is not expected to present more detrimental effects than the current state. A “Low environmental impact” ranking was assigned to this option.
6.3.5 REACTIVATING / MODIFYING CHANNELS FOR FLOOD RELIEF
Modifying existing secondary channels such as the Cottonwood Island side-channel, and reactivating historical back channels within areas AN and CN, has been proposed in order to increase flood relief capacity during ice-jam events. This could cause significant environmental disturbance and would likely require substantial provincial and/or federal regulatory reviews, resulting in a “High environmental impact” rating. Potential effects could include damage to fish habitat, or increased erosion and scour.
Some adverse effects could probably be offset by incorporating habitat enhancement features into the designs. For example, summer dissolved oxygen levels in the Cottonwood Island side-channel are currently below minimum thresholds for the maintenance of salmonid life stages, due to lack of surface water inflow in low water periods. Developing the side-channel for flood relief could allow the introduction of small, highly oxygenated Nechako River flows through the summer.
Stream diversion projects are subject to Water Act approval, and may also trigger requirement for approvals under the BC Environmental Assessment Act (BCEAA), the Fisheries Act or the Canadian Environmental Assessment Act (CEAA).
6.3.6 DIKING - SETBACK DIKING, RAISING EXISTING ROADS, RIVERBANK DIKING
Riverbank dikes isolate the floodplain from the active channel and can cause a number of biophysical effects. For example, Kukulka and Jay (2003) estimated that diking had reduced important shallow-water salmonid habitat in the lower Columbia River by 52%. Riverbank

nhc
Flood Risk Evaluation and Flood Control Solutions – Phase 1 Final Report 53
dikes also result in losses of riparian vegetation, which is often important for controlling erosion, conserving soil and maintaining habitat complexity. While some of these effects can be mitigated by following best practices for vegetation management (BC MELP and DFO 1999), permanent alterations to shoreline habitats are likely unavoidable.
Provincial and federal environmental regulatory approvals would be required, resulting in a “High environmental impact” rating. The extensive shoreline modification for a riverbank dike would almost certainly cause a HADD (Harmful Alteration, Disruption or Destruction) under the federal Fisheries Act. Issuance of a Section 35 Authorization for the HADD would trigger federal review under CEAA. Under Part 5 of the Reviewable Projects Regulation, dikes to protect an area of 10 sq.km or more are also reviewable under the BCEAA. Potential effects on wildlife and migratory bird habitats would likely necessitate more comprehensive habitat assessments under Species at Risk Act (SARA), Migratory Birds Convention Act and the Wildlife Act.
Lower dikes that provide less than 200-year protection may have smaller footprints, but they offer little environmental benefit over full-height designs since the same types of habitat impact would still occur. Therefore this type of dike requires similar regulatory approvals and has been given a “High environmental impact” rating.
There is an advantage to raising existing roads or building dikes along roads since the construction can take place within an existing right-of-way. In most cases setback dikes are preferable to riverbank dikes because some functional floodplain area is retained adjacent to the channel. If standard riparian setback allowances specified by MOE are observed, setback dikes should comply with most environmental legislation. They have been given a “Medium environmental impact” rating.
6.3.7 INSTREAM SEDIMENT REMOVAL
Instream sediment removal may be accomplished by bar scalping or dredging. The following discussion pertains to the Nechako/Fraser confluence area. Although bar scalping is usually done in the dry, it may still have an impact on aquatic habitat (Packer et al. 2005), for example by creating wider cross-sections with less sediment transport capacity. Scalping can also reduce rearing habitat for juvenile salmonids (Wiegand 1991 in Brown et al. 1998).
Dredging differs from bar scalping in that it is done within the wetted cross-section. Environmental effects are similar to those described for scalping, but with the added risk of immediate impacts on water quality and fish habitat. These may be mitigated by temporary isolation during construction, but are unlikely to be fully avoidable.
Both scalping and dredging would probably require Fisheries Act authorizations and a CEAA screening review. BCEAA review would also be triggered if two or more hectares of foreshore or submerged land are to be dredged. Comprehensive studies would be required to ensure that dredging would have no impact on SARA-listed white sturgeon and their habitat. A rating of “High environmental impact” has been assigned.

nhc
Flood Risk Evaluation and Flood Control Solutions – Phase 1 Final Report 54
6.4 INITIAL REVIEW OF FLOOD CONTROL OPTIONS
In the light of the technical and initial environmental assessments described in Sections 6.2 and 6.3, the initially selected flood control options were reviewed. Options considered unlikely to perform satisfactorily, unjustifiably expensive or environmentally unacceptable were eliminated as indicated in Tables 6.2 and 6.3 under the heading “Comments for Phase 1 Costing and Medium Filtering”.
Maintaining the status quo by providing no permanent protection is not necessarily a practical option. Costs were developed for this option, however, to provide a baseline for comparison with other options. Drainage improvements are not an option in themselves but must be included with most of the diking options. In general, ring-diking or dikes that protect small localized areas, is not practical from an available space and local drainage perspective; local flood-proofing by raising buildings is preferable. Low dikes provide a temporary platform for emergency works but do not protect against the design flood. Practicable options for each area are considered to be as follows:
Nechako River • Area AN – South Bank of Nechako River at Confluence
- River dike - Dike on river side of River Road - Build set-back dike along railway - Land use change • Area BN – North Bank of Nechako River east of John Hart Bridge
- Dike next to river (full height) - Platform for temporary protection along river - Raise McAloney and Ongman Roads - Land use change • Area CN – North Bank of Nechako River near Confluence
- River dike - Ring dike at development - Land use change/flood-proofing • Area DN – North Bank of Nechako River west of John Hart Bridge
- Dike next to river (full height) - Platform for temporary protection along river - Raise Preston Road - Land use change • Area EN – North Bank of Nechako River at Morning Place
- Dike next to river (full height) - Platform for temporary protection along river - Individual flood-proofing - Land use change

nhc
Flood Risk Evaluation and Flood Control Solutions – Phase 1 Final Report 55
• General - Enlarge Cottonwood Island side-channel
- Excavate and straighten historic back-channel (South of river) - Channel through Area CN
Fraser River • Area AF – West bank of Fraser River at Yellowhead Highway
- Dike next to river (full height) - Platform for temporary protection along river - Individual flood-proofing - Land use change • Area BF – Fraser River at South Fort George
- Dike next to river (full height) - Platform for temporary protection along river - Land use change • Area DF – Fraser River at Lansdowne south end
- Dike next to river (full height) - Platform for temporary protection along river - Individual flood-proofing - Land use change • Area FF – Fraser River at Northwood Pulpmill Road
- Raise Landooz Road for access
6.5 DESCRIPTION OF SELECTED FLOOD CONTROL OPTIONS
The possible options identified in Section 6.4 are further described below. Approximate costs are summarized in Table 6.4.
6.5.1 NECHAKO RIVER
Area AN (South Bank of Nechako River at Confluence) Mitigation options (Figure 6.3) include three permanent dike arrangements. In all three cases groundwater issues also need to be addressed.
The first arrangement involves a dike adjacent to the Nechako River and along a back channel at Cottonwood Island. This option is similar to the Heritage Trail Dike concept developed by Associated Engineering in their August 2007 report titled “East of Queensway and River Road Floodproofing Concept Study”. This report proposed the use of imported fill to construct a dike 4 m wide on top with 3:1 side slopes where site conditions permitted.

nhc
Flood Risk Evaluation and Flood Control Solutions – Phase 1 Final Report 56
A significant departure from the Associated Engineering concept is the assumption that the City will acquire properties between River Road and the Nechako River and remove structures that conflict with the dike location, thereby eliminating the previous need for retaining walls to reduce the dike footprint. The dike encroaches onto the river bank, which will need riprap slope protection and environmental mitigation and compensation. As the dike will impede surface drainage, flood boxes and pumping stations will be needed. Associated Engineering's cost estimate has been revised to include pump stations and an allowance for seepage cut-off, yielding an estimated cost of $17.0 M.
The second option involves a dike adjacent to River Road, between the road and the riverbank. River Road was raised during the 2007-08 ice-related flooding and widened afterwards. The as-yet unpaved road is not as high as the revised 200-year ice-related profile plus freeboard, so that further raising could be considered. However, access issues may arise. A design for a 2 m deep sub-drain along the road, including pumping, has been developed (Appendix G).
It is assumed that the City will acquire the properties between River Road and the Nechako River and remove any structures that conflict with the dike location. The dike will be set back from the river but could still have some impact on the riverbank. Riprap slope protection, and environmental permitting, mitigation and compensation will be necessary.
At the Railway Museum the dike will deflect around the Cottonwood Island parking lot and museum site, to accommodate the existing railway spur that crosses River Road to access the museum. The cost estimate assumes that the dike top will be grassed and not paved, and does not include trail construction or improvements to River Road. As with Dike Option 1, floodboxes and pump stations will be needed to deal with surface drainage south of River Road. The estimated cost for the dike is $15.5 M.
The third option involves a setback dike located alongside the CN Rail tracks. For the cost estimate, it is assumed that the dike crosses River Road by the Railway Museum and for the eastern portion of River Road, runs parallel to the road. The dike will need to be constructed with breaches for existing railway spur lines to the Railway Museum and a log storage yard. Realigning the dike to go around the spur lines does not appear to be feasible because it would interfere with the operation of the log storage yard and a breach would still be present where the spur line crosses River Road.
The estimated cost of this setback dike is $8.5 M. This dike offers no protection to properties located between the river and the dike. Individual ring dikes are possible to provide additional flood protection but the aggregate costs of these individual dikes are likely to raise the overall cost such that they are comparable to those of constructing a riverbank dike or a dike along River Road.
Alternatively, the capital cost of land use change over the entire area was estimated at $23.2 M.

nhc
Flood Risk Evaluation and Flood Control Solutions – Phase 1 Final Report 57
Area BN (North Bank of Nechako River East of John Hart Bridge) The primary dike mitigation options for this area are a dike constructed along the riverbank and the raising of existing road beds to act as a dike as shown on Figure 6.4.
The riverbank dike concept is similar to that proposed for the Heritage Trail Dike and will include lock block retaining walls where existing structures limit the available area along the riverbank. Riprap rock protection would be installed as required. The western portion of the dike ties into the embankment for the John Hart Bridge and passes through undeveloped industrial land. This portion of the dike can likely be set back from the bank to avoid undesirable environmental impacts.
The remainder of the dike lies in constricted areas and lock block retaining walls are necessary to reduce the dike footprint. Riprap rock protection and environmental permitting, mitigation and compensation are likely required. Flood boxes and a pumping station will be needed because the dike will block surface drainage. The order of magnitude cost estimate for the riverbank dike is $3.5 M.
A variant of the riverbank dike concept is a low profile dike following the same alignment. This platform for temporary protection will have a top surface below the 200-year flood level and act as a base for gabions or other temporary flood protection works when needed. There are potential savings in construction cost through the reduction of imported fill material and the shorter height of retaining walls but there is unlikely to be any significant reduction in riverbank protection or environmental mitigation requirements. The estimated cost for the low profile riverbank dike is $2.7 M.
The third dike concept for Area BN is the raising of McAloney Road and Ongman Road to act as a dike. An earth dike will connect to the raised portion of McAloney Road and extend to the embankment for Highway 97 to the west. This alternative avoids many of the environmental and riverbank protection issues associated with the riverbank dike but will be disruptive to businesses along McAloney and Ongman Roads and will offer no flood protection to those properties on the south side of the roadway.
Elevating the roadway will require adjusting grades along Richard Road, Tomlin Road and the north leg of Ongman Road to match the higher road elevation. Affected portions of these existing roads could extend 100 m or more from the intersections. Driveways and accesses to existing businesses would be similarly affected and some existing parking lots and truck loading bays fronting onto McAloney and Ongman Roads would be rendered unusable. The roadways also have existing water and sewer mains, hydro poles and gas lines. The cost estimate includes an allowance for adjustments to existing surface appurtenances but does not account for any major upgrading work that may be desirable before the road is raised.
The estimated cost for locating diking along the existing roads is $3.9 M.
Alternatively, the capital cost of land use change over the entire area was estimated at $8.8 M.

nhc
Flood Risk Evaluation and Flood Control Solutions – Phase 1 Final Report 58
Area CN (North Bank of Nechako River near Confluence) Area CN contains broadly spaced residential development as well as Canfor’s water intake and well facility. Much of the residential development is clustered in the western portion of the area around Wolczuk Road and Cutbank Road. The Prince George Pulpmill Road already meets dike height requirements and is assumed to be geotechnically sound but groundwater intrusion resulted in flooding on the north side of the road during the 2007/2008 ice jam event. Properties on the south side of the road were affected directly by the ice jam flooding.
Figure 6.5 shows a dike along the riverbank as a possible mitigation option for this area at an estimated cost of $10.1 M. This dike is costly, triggers concerns about environmental and flood conveyance impacts and benefits a relatively small number of existing residences. The Canfor facility is located at the waterline of the Nechako River and thus the dike would have to bypass the buildings.
An alternative concept is to construct a local ring dike around a cluster of existing residences on the south side of PG Pulpmill Road. The proposed ring dike would begin approximately 0.3 km west of Cutbank Road, run east along the riverbank and tie back to PG Pulpmill Road approximately 0.1 km east of Wolczuk Road. Lock block retaining walls and riprap slope protection would be necessary. Bank erosion along the north bank is becoming more of a problem and maintaining the dike would be expensive, significantly exceeding the initially estimated cost of $3.4 M. Land use changes are preferable and the ring dike option was not explored further. (Reference to aerial photos on the City’s website indicates that there are three properties on the south side of PG Pulpmill Road that would have buildings that would lie outside of the area protected by this dike configuration.)
Alternatively, the capital cost of land use change over the entire area was estimated at $9.3 M.
Area DN (North Bank of Nechako River West of John Hart Bridge) Figure 6.4 shows two primary mitigation options for this area.
One option is a dike constructed along the riverbank and tying into the embankment for the John Hart Bridge. The riverbank dike encroaches onto the river bank and riprap rock protection as well as environmental mitigation and compensation will be necessary. The dike also passes through constricted areas by the Del Haven multifamily development, Howie’s Marine and the Pacific Western Brewery. Lock block retaining walls will be necessary to reduce the dike footprint. Some portions of the dike pass through undeveloped land and it might be possible to set back part of the dike to reduce impact on the riverbank. The dike would block river views and probably be unsightly and undesirable to some residents.
The riverbank dike provides protection to virtually all of Area DN including a portion of North Nechako Road and ramps connecting to Highway 97. The dike will be a barrier to surface drainage and flood boxes and a pumping station will be needed. The dike will also affect an existing dock area serving Howie’s Marine and a new dock and access will likely be needed. The order of magnitude cost estimate for the riverbank dike is $3.3 M.

nhc
Flood Risk Evaluation and Flood Control Solutions – Phase 1 Final Report 59
Alternatively, the riverbank dike could be a low profile dike, or platform for emergency works, following the same alignment but having a top surface below the 200-year flood level. In the event of a major flood, the dike would act as a base for temporary flood protection works such as gabions. There are potential savings in construction cost through the reduction in retaining wall height and the amount of imported fill material but there will be little or no change in riverbank protection or environmental permitting and mitigation requirements. The estimated cost for the low profile riverbank dike is $2.6 M. The dike in itself would not provide adequate protection or meet MOE standards.
Another dike concept for Area DN is the raising of Preston Road to act as a dike along with a section of earth dike set back from the river. The earth dike could continue from the end of Preston Road east to the embankment for Highway 97 or deflect north to tie to North Nechako Road. Tying the dike into the highway embankment has the advantage of providing flood protection to North Nechako Road. This alternative has little or no impact on the existing riverbank but the higher roadway will make access to adjoining residences and parking areas less convenient. This alternative offers no flood protection to those properties, such as Del Haven, located on the south side of Preston Road. The estimated cost for raising Preston Road and extending a dike to the highway embankment is $1.2 M.
Alternatively, the capital cost of land use change over the entire area was estimated at $6.7 M.
Area EN (North Bank of Nechako River at Morning Place) This area is residential property predominantly along the road Morning Place.
Diking options appear to be limited to a dike constructed along the riverbank as shown on Figure 6.6. There is little opportunity for setting back the dike and riprap rock protection will be necessary for the full length. The dike covers a relatively small area and though flood boxes will likely be necessary, pump stations might not be required. The estimated cost of the riverbank dike is $2.1 M.
To reduce costs, a low profile dike could be constructed following the same alignment but having a top surface below the 200-year flood level. In the event of a major flood, the dike would act as a base for temporary flood protection works such as gabions. The estimated cost for the low profile riverbank dike is $1.6 M. Some properties have existing accesses to the river for boat launches that might be more feasible to accommodate with a low profile dike.
Approximately eight residential lots lie in Area EN and individual flood proofing for existing structures is a possible alternative. For comparison, flood proofing would need to incur costs in the order of $200,000 for each lot to yield an overall cost similar to that of the low profile dike.
Alternatively, the capital cost of land use change over the entire area was estimated at $1.4 M.

nhc
Flood Risk Evaluation and Flood Control Solutions – Phase 1 Final Report 60
Area FN (South Bank of Nechako River at Foothills Bridge) The impact of the raised FCL’s on the pumping station and a well in the area needs to be assessed and further development restricted through zoning.
Area GN (South Bank of Nechako River between John Hart and Foothills Bridges) The impact of the raised FCL’s on the pumping station and a well in the area needs to be assessed and further development restricted through zoning.
General Lower Nechako River Area General flood mitigation options for the Nechako River near the confluence with the Fraser River are described in Table 6.2 and Figure 6.3 and involve reactivating or improving former side-channels along the river.
On the south side of the river, flood relief options include enlarging an existing back channel in Cottonwood Island Park and opening up a historic back channel through existing industrial development.
The Cottonwood Island channel experienced high flows during the 2007/2008 ice jam event that resulted in the destruction of several pedestrian bridges and causeways that had been part of a trail system in the park. Reinstating these crossings will form part of the works for enlarging the channel. For the purpose of the cost estimate, it is assumed that the channel will be deepened by approximately 2 m and that it will follow its existing alignment. The cost estimate includes allowances for a control structure and environmental mitigation and compensation. The estimated cost for enlarging the Cottonwood Island Channel is $3.0 M.
A historic back channel meanders through Area AN that has been filled and developed as industrial land, the CN Rail yard and log storage yards. As shown on Figure 6.1, the channel’s historic location crosses River Road at four locations. The cost estimate assumes that portions of the channel are realigned to eliminate two of the River Road crossings and reduce impacts on the existing industrial development. One portion will be realigned to follow a direct route from the area of Foley Crescent east to where the channel crosses River Road by the Railway Museum. The realigned channel passes through areas now used for log storage and eliminates a meander that otherwise would have affected several building structures. Excavation of the channel could also uncover significant environmental hazards such as deleterious material that was used as fuel.
On the east side of River Road the channel is realigned to go around the Railway Museum grounds and run parallel to River Road until it intercepts its historical location approximately 200 m from the confluence with the Fraser River. The channel traverses private property, making property acquisition necessary and some environmental mitigation may be necessary where the channel joins the Fraser River. The estimated cost of opening up the historic back channel is $9.0 M and does not include any clean up cost for deleterious material.

nhc
Flood Risk Evaluation and Flood Control Solutions – Phase 1 Final Report 61
A historic channel is also present on the north side of the Nechako River in Area CN. The channel passes through several residential properties with crossings at Cutbank Road and Wolczuk Road. Upgrading this channel will require land use change in the affected locations. The estimated cost of upgrading the north shore flood relief channel is $7.6 M.
6.5.2 FRASER RIVER
Area AF (West Bank at Yellowhead Bridge) This area is predominantly lawn area with a recreation trail beside the abutment of the Yellowhead Bridge but also takes in portions of several residential properties along the riverbank.
Diking options appear to be limited to a dike constructed along the riverbank. There is little opportunity for setting back the dike and riprap slope protection will be necessary for the full length. Lock block retaining walls can be used to minimize encroachment onto private property. The dike covers a relatively small area and though flood boxes will likely be necessary, pump stations might not be required. The estimated cost of the riverbank dike is $1.5 M.
Alternatively, a low profile dike could be constructed following the same alignment but having a top surface below the 200-year flood level. In the event of a major flood, the dike would act as a base for temporary flood protection works such as gabions. The estimated cost for the low profile riverbank dike is $0.8 M. Limitations of this type of diking was discussed in Section 6.2.6.
Though several residential lots impinge on Area AF, only three structures appear to be at risk during flood events. Individual flood proofing for these existing structures and some sanitary sewer manholes is a possible alternative. For comparison, flood proofing would need to incur costs in the order of $200,000 for each building to yield an overall cost similar to that of the low profile dike.
Alternatively, the capital cost of land use change over the entire area was estimated at $2.5 M.
Area BF (South Fort George) This area is a portion of South Fort George straddling the Hudson’s Bay Slough east of Queensway (Figure 6.7). It is low-lying and partly flooded quite frequently.
A possible mitigation option is to construct a dike to protect existing residences on Farrell Street and Regents Crescent. The dike would follow the riverbank for most of its length and then deflect west to tie into Regents Crescent. The area between Farrell Street and the riverbank is constricted by existing residences and out-buildings and lock block walls will be necessary to minimize the dike footprint. Even with the retaining wall, there will be conflicts with structures and it will likely be necessary to remove three existing buildings to accommodate the dike.

nhc
Flood Risk Evaluation and Flood Control Solutions – Phase 1 Final Report 62
The limited area available will not allow the dike to be set back and riprap slope protection will be necessary along the riverbank. A flood box and pump station will likely be necessary to deal with drainage behind the dike. The estimated cost of the dike around Farrell Street is $2.9 M.
To reduce costs, the dike could be constructed with a lower top elevation but following the same alignment. In the event of a major flood, the dike would act as a base for temporary flood protection works such as gabions. The estimated cost for a low profile dike is $1.5 M. Considering how frequently this area gets flooded, this may not be a good option and land use change or individual floodproofing could be preferable.
Alternatively, the capital cost of land use change over the entire area was estimated at $1.4 M.
Area CF (Hudson’s Bay Slough West of Queensway) Queensway acts as a dike, protecting this area, and a pump-station accommodates internal drainage flows. The top-of-road elevation should be compared to the revised FCL’s and the pumping capacity verified.
Area DF (Lansdowne South End) Area DF is predominantly undeveloped but does have several residential properties at the ends of Lansdowne Road and Wiens Road as shown in Figure 6.8.
An earth dike could be extended to protect these residences. The dike would follow the riverbank and, with the exception of one lot at the end of Wiens Road, would fall outside of the property limits. The dike would be a barrier to future extension of Lansdowne Road and further development should be prevented through zoning. The estimated cost of the dike is $1.6 M.
Alternatively, the dike could be constructed with a lower top elevation and would act as a base for temporary flood protection works in the event of an emergency. The estimated cost for a low profile dike is $0.7 M. There appear to be four residences that would be at risk in the event of a flood. Individual flood proofing would need to incur costs of approximately $150,000 per structure to yield an overall cost comparable to that of the low profile dike.
Alternatively, the capital cost of land use change over the entire area was estimated at $0.8 M.
Area EF (West Bank at Island) Development should be restricted through zoning.

nhc
Flood Risk Evaluation and Flood Control Solutions – Phase 1 Final Report 63
Area FF (Northwood Pulp Road) Area FF has a mixture of undeveloped land, agricultural areas, log storage and isolated buildings. Northwood Bridge crosses the Fraser in this area. The Canfor pulp mill complex is surrounded by Area FF but appears to mainly be on high ground not within the 1997 floodplain limit. The Northwood Pulp Road and the CN rail tracks accessing the pulp mill traverse Area FF but appear to be largely constructed above potential flood levels.
Landooz Road traverses the length of Area FF and is the sole road access for a residential area at the northeast City Limit. Landooz Road is vulnerable to inundation in the event of a flood and vehicle access to the areas noted could be blocked. Landooz Road could be raised for access purposes at an estimated cost of $5.8M.
Area GF (Across River from Shelley) Further development should be restricted through zoning.
6.6 ASSESSMENT OF FLOOD CONTROL OPTIONS (MEDIUM FILTERING)
The purpose of the medium filtering process was to eliminate flood relief options not deemed practical following the feasibility assessment and recommend options for further evaluation in Phase 2 of the project.
6.6.1 FINANCIAL COSTS
The costs developed for the potential options are summarized in Table 6.4 along with asset values of the development within each risk area.
Life cycle costs are included in the table and were evaluated over a 50-year period based on:
• Assessed property values; • Capital, operation and maintenance costs of the flood control works; and, • Predicted flood damage costs such as municipal infrastructure damage, utility
infrastructure damage, lost wages, business cost, emergency response cost, residential property damage and flood recovery costs.
Computed cost comparison ratios are shown in Table 6.4. For a given risk area and flood control option, this is the ratio between the cost of a “No Protection” alternative and the cost of the option. Ratios greater than 1.00 means that there is a benefit to adopting the given flood control option – the greater the ratio the greater the benefit.
6.6.2 ENVIRONMENTAL IMPACTS
It is difficult to make quantitative estimates of environmental costs until actual designs are developed and alternative construction techniques are explored. Rather, environmental costs

nhc
Flood Risk Evaluation and Flood Control Solutions – Phase 1 Final Report 64
are qualified in Table 6.4 as low (L), medium (M) or high (H). A low rating means that there is no applicable legislation associated with the option. A medium rating means that the option would generally involve consultation with DFO and potential review under the BC Environmental Assessment Act. A high rating means that the option will require authorization under the federal Fisheries Act, the Canadian Environmental Assessment Act, the BC Environmental Assessment Act and the BC Water Act. Other considerations that affect the overall ranking are also included in Table 6.4. General environmental considerations and anticipated legislation by flood control option were summarized in Table 6.1. Applicable federal and provincial legislation is described in more detail in Appendix C.
6.7 RANKING OF FLOOD CONTROL OPTIONS
Cost comparison ratios as referred to in Section 6.6.1 are used as the primary factor for ranking the flood control options for each risk area, as shown in Table 6.4. Options ranked “n/a” indicate that the option is not recommended, although cost comparison ratios are shown for those cases.
Section 5.4 provided a tentative indication of where flood threats are most severe and asset values high. Using this information, the following options appear most attractive for the risk areas ranked in descending order of priority. (The list may be modified in Phase 2 after discussions with the City of Prince George, government agencies and other stakeholders.)
1. Area AN - South Bank of Nechako River at Confluence - Build dike on river side of River Road, providing internal drainage and reducing groundwater seepage.
2. Area CN - North Bank of Nechako River near Confluence - Introduce land use change south of PG Pulpmill Road. On north side of road land use change or local flood-proofing can be considered.
3. Area DN - North Bank of Nechako River West of John Hart Bridge - Raise Preston Road. Consider land use change or local flood-proofing on river side of road.
4. Area BN - North Bank of Nechako River East of John Hart Bridge - No permanent protection. Provide temporary protection as needed.
5. Area BF – South Fort George - Introduce land use change as necessary. Optionally local flood-proofing can be considered in some locations.
6. Area EN – Morning Place - Introduce land use change as necessary. Optionally local flood-proofing can be considered in some locations.
7. Area DF – Lansdowne South End - Introduce land use change as necessary. Optionally local flood-proofing can be considered in some locations.
Improvements to the Cottonwood Island side-channel are recommended, and the feasibility of a north side-channel should be investigated in more detail.

nhc
Flood Risk Evaluation and Flood Control Solutions – Phase 1 Final Report 65
The following areas do not urgently require flood control solutions, but should be appropriately zoned to prevent or discourage further development:
• Area FN – South Bank at Foothills Bridge. • Area GN – South Bank between John Hart and Foothills Bridges. • Area AF – West bank at Yellowhead Highway • Area EF – West Bank at Island • Area FF – Northwood Pulpmill Road • Area GF – Across River from Shelley
Area CF – Hudson’s Bay Slough west of Queensway has flood protection in place.
Cost ratios, capital costs and environmental impact ratings (Low, Medium and High) for all options are summarized on the next two pages.

nhc
Flood Risk Evaluation and Flood Control Solutions – Phase 1 Final Report 66
Nechako River – Summary of Options
Risk Area/Option Priority Cost
Ratio Capital Cost $M
Env. Cost Ranking
Area AN – South Bank of Nechako River at Confluence
1
No protection 1.00 L 5 River dike 1.54 17.0 H 4 Dike on river side of River Road 1.64 15.5 M 1 Build set-back dike along railway 1.58 8.5 L 3 Land use change 1.60 23.2 L 2 Area BN – North Bank of Nechako River east of John Hart Bridge
4
No protection 1.00 L 1 Dike next to river (full height) 0.98 3.5 H n/a Platform for temp protection 0.88 2.7 H 2 Raise McAlonEy and Ongman Roads 0.77 3.9 M 3 Land use change 0.52 8.8 L 4 Area CN – North Bank of Nechako River near Confluence
2
No protection 1.00 L 2 River dike 0.73 10.1 H n/a Ring dike - 3.4 H n/a Land use change 0.88 9.3 L 1 Area DN – North Bank of Nechako River west of John Hart Bridge
3
No protection 1.00 L 2 Dike next to river (full height) 1.12 3.3 H n/a Platform for temporary protection 0.95 2.6 H 3 Raise Preston Road 1.13 1.2 M 1 Land use change 0.76 6.7 L 4 Area EN – North Bank of Nechako River at Morning Place
6
No protection 1.00 L 2 Dike next to river (full height) 1.06 2.1 H n/a Platform for temporary protection 0.93 1.6 H 3 Land use change 2.05 1.4 L 1 General Enlarge Cottonwood Isl. sidechanel 3.0 H 1 Excavate historic back-channel 9.0 H 3 Channel through Area CN 7.6 H 2

nhc
Flood Risk Evaluation and Flood Control Solutions – Phase 1 Final Report 67
Fraser River – Summary of Options
Risk Area/Option Priority Cost Ratio
Capital Cost $M
Env.
Cost Ranking
Area AF – West bank at Yellowhead Highway
No protection 1.00 L 1 Dike next to river (full height) 0.79 1.5 H 3 Platform for temporary protection 0.96 0.8 H 2 Land use change 0.58 2.5 L 4 Area BF – South Fort George 5 No protection 1.00 L 2 Dike next to river (full height) 1.03 2.9 H 4 Platform for temporary protection 1.07 1.5 H 3 Land use change 2.46 1.4 L 1 Area DF – Lansdowne south end 7 No protection 1.00 L 2 Dike next to river (full height) 0.76 1.6 H 4 Platform for temporary protection 1.03 0.7 H 3 Land use change 1.68 0.8 L 1 Area FF – Northwood Pulpmill Road
No protection - L - Raise Landooz Road for access - 5.8 M -

Table 6.1 ‐ Environmental considerations and anticipated applicable legislation, by flood control option.
Option Coarse-Filtering Result*
Brief Environmental Considerations
Anticipated Applicable Legislation
Additional Comments
Land acquisition/Land use change
1 Restores functional
floodplain areas None
Acquired lands could be reclaimed to increase natural riparian areas (which would have numerous benefits).
May be considered as compensation for HADD of
another control option.
No permanent protection, provide temporary works as
required
1
No new environmental impacts expected in absence
of permanent protection. The functionality of the
floodplain area for the river system is also maintained in the absence of dikes which
constrict floodwaters. Potential environmental considerations associated
with temporary works depends on design of those
works.
None
Negative environmental effects may also be realized in
the haste of installing temporary flood control
works.
Modify 1st Avenue storm drains
1
Not expected to present significantly different negative
environmental effects than the current state.
Water Act notification, consultation with DFO
Not likely to be used as a flood control option on its
own.
Individually raise/floodproof
essential development 1 1
Not expected to present significantly different negative
environmental effects than the current state.
None
Potential small interference with natural floodplain processes. Negative
environmental effects may also be realized in the haste
of installing temporary flood control works.
Raising existing roads 2 Potential for minor riparian
area encroachment. consultation with DFO,
potential for BCEAA review
Potential small interference with natural floodplain
processes.
Setback diking 2 Potential for minor riparian
area encroachment. consultation with DFO,
potential for BCEAA review
Potential small interference with natural floodplain
processes.
Reactivating/modifying channels as floodways
3
Potential alteration or destruction of instream and
riparian fish habitat. Potential streambank erosion and streambed scour. Federal
review will be triggered.
Fisheries Act authorization, BC Environmental Assessment Act
review, Canadian Environmental Assessment Act review, Water
Act approval
Partial restoration of historic floodplain processes.
Potential increased fish habitat values in Cottonwood
Island side channel.
Riverbank diking 3
Riparian habitat encroachment. HADD.
Potential streambank erosion and streambed scour. Federal
review will be triggered.
Fisheries Act authorization, CEAA review, BCEAA
review, Water Act approval, SARA, Migratory Birds
Convention Act, Wildlife Act
Interference with natural floodplain processes.
Largescale environmental permitting required.
Bar scalping 3 Disturbance of river bed.
HADD. Federal review will be triggered.
Fisheries Act authorization, CEAA review, Water Act
approval, SARA, Wildlife Act
Potential severe environmental effects. Interferes with natural floodplain processes.
Largescale environmental permitting required.
Dredging 3 Disturbance of river bed.
HADD. Federal review will be triggered.
Fisheries Act authorization, CEAA review, Water Act
approval, SARA, Wildlife Act
Potential severe environmental effects. Interferes with natural floodplain processes.
Largescale environmental permitting required.
* 1 = Low, 2 = Medium, 3 = High risk.
1 Note that upon re-evaluation the ranking of this option has been changed from “Medium” to “Low” from the original coarse-filter decision matrix based on the assumption that there will be no increase in development footprint into the riparian area.

Table 6.2: Flood Control Solutions - Nechako River
Comments for Phase 1 Costing and Medium FilteringFlood Control Options Mitigation Sub-Options Alternate Designs Hydraulic Considerations Infrastructure Considerations Environmental Considerations Geomorphology Considerations General Evaluation
Area AN (Southbank at confluence)No permanent protection, provide temporary works as required
On-going flood risk. Emergency response on call. No new environmental impacts expected in absence of permanent protection. Potential environmental considerations associated with temporary works depends on design of those works. For example, release of deleterious substances is possible with use of amphibex and warm water release.
The effects of ongoing sediment deposition must be considered.
Not acceptable in the long term. 9 -Operate as usual; respond to flooding as it occurs.-Develop costs to provide comparison to other options. -Hot oil plant remains a significant environmental threat.
Diking Construct dike next to river and along Cottonwood Island back channel
Need erosion protection, install lockblock/sheetpile walls where insufficient space, provide seepage cut-off, seal old channel entrances, pump&treat internal flows.
Access limited for construction and maintenance.
Riparian habitat encroachment. Potential streambank erosion and streambed scour. Federal review will be triggered.
Reduced flood conveyance area. Sub-surface flow will continue to cause flooding hazard.
Significant environmental, river encroachment and access issues. Feasible but still need to deal with groundwater problems.
8 -Significant environmental, river encroachment and access issues, make this option undesirable.-Develop costs to provide comparison with other options.
Construct set-back dike along a raised River Road. (City considers raising River Road common to all the options and construction to raise the road proceeded in July 2008.)
Do nothing for development outside road
Some erosion protection, install lockblock/sheetpile walls where insufficient space, provide seepage cut-off, seal old channel entrances, pump&treat internal flows.
Continued flood risk outside road. Potential minor riparian habitat encroachment.
Maintains exising flood conveyance area.
Feasible but still need to deal with groundwater problems.
6 -Owners of development outside dike to consider construction and maintenance of local ring dikes; if temporary dikes constructed during events some encroachment issues would ensue.-Hot oil plant remains a significant environmental threat.-Not recommended; land-use change outside of dike provides best alternative.
Extend dike locally to protect development outside dike
Need erosion protection, install lockblock/sheetpile walls where insufficient space, provide seepage cut-off, seal old channel entrances, pump&treat internal flows.
Access limited for construction and maintenance.
Potential riparian habitat encroachment. Federal review potentially triggered.
Reduces flood conveyance area. Sub-surface flow is still an issue.
Feasible but still need to deal with groundwater problems.
4 -Hydraulically similar to riverside dike; required height of local dikes makes construction impractical; no conveyance advantage if local dikes used to protect development on riverside of dike.-Long-term risk to performance of main dike.-Hot oil plant remains a significant environmental threat.-Not recommended; land-use change outside of dike provides best alternative.
Land-use change outside dike Some erosion protection, install lockblock/sheetpile walls where insufficient space, provide seepage cut-off, seal old channel entrances, pump&treat internal flows.
Business issues. Potential minor riparian habitat encroachment.
Maintains or increases conveyance area
Feasible but still need to deal with groundwater problems. Significant economic/business issues.
1 -Possible option.-Develop costs for comparison with other options.
Raise development outside dike Need erosion protection, install lockblock/sheetpile walls where insufficient space, provide seepage cut-off, seal old channel entrances, pump&treat internal flows.
Business access issues. Potential minor riparian habitat encroachment.
Modest reduction in conveyance area Feasible but still need to deal with groundwater problems.
5 -City floodplain bylaw requires all new development to be floodproofed and built to the flood construction level. Owners of existing development to consider improvements to floodproof and raise their developments. Required height of raised structures may be impractical. Raised development would introduce encroachment issues during a flood event, and affect performance of main dike.-Hot oil plant remains a significant environmental threat.-Not recommended; land-use change outside of dike provides best alternative.
Build setback dike along railway. Individually ring dike some development outside dike
Provide seepage cut-off, seal old channel entrances, pump&treat any internal flows.
Business access issues. Potential minor riparian habitat encroachment.
Maintains conveyance area Good from river engineering perspective but expensive.
7 -Owners of existing developments to consider construction and maintenance of local ring dikes; if ring dikes not constructed there would effectively be no change from current conditions for most of the development within the floodplain; required height of local dikes require large footprint and is not practical; local ring dikes may result in long-term risk to performance of main dike; ring dikes could introduce encroachment issues.-Develop costs for dike, but do not include ring dikes.
Land-use change outside dike Provide seepage cut-off, seal old channel entrances, pump&treat any internal flows.
Potential minor riparian habitat encroachment.
Restores former conveyance area Good from river engineering, environmental and geomorphological perspective but expensive.
2 -Costs similar to land-use change over entire floodplain.
Land-use change over entire floodplain Unlikely to include railroad and downtown area.
Restores functional floodplain areas Restores former conveyance area Unlikely to include downtown area. 3 -Develop cost for comparison with other options.-Use this cost to assess option of setback dike along railway with land-use change outside of dike.
Improve internal drainage. Approx 2 m deep subdrain and groundwater pumping.
Groundwater governed by river levels, not effective without diking.
Large pump capacity required Potential for existing groundwater contamination in industrial areas. Testing and treatment may need to be considered.
It could be difficult to significantly lower ground water levels
Expensive. Expected to be difficult to reduce groundwater levels during flood. Would be undertaken as part of a diking option.
n/a -Not practical as a stand alone solution but would be completed in conjunction with diking.
Ditch and pump. Groundwater governed by river levels, not effective without diking.
Complex ditch network. Difficult to fit in with in with existing infrastructure.
Potential for ditch water contamination in industrial areas. Testing and treatment may need to be considered.
Large deep ditches might improve drainage.
Expensive. Expected to be difficult to reduce groundwater levels during flood. Would be undertaken as part of a diking option.
n/a -Included in cost estimates for diking options shown above.
Area BN (Northbank east of John Hart Bridge)No permanent protection, provide temporary works as required
No new environmental impacts expected in absence of permanent protection. Potential environmental considerations associated with temporary works depends on design of those works. For example, release of deleterious substances is possible with use of amphibex and warm water release.
Status quo - check rates of local sediment accumulation
Not acceptable in the long term. 2 -Operate as usual; respond to flooding as it occurs.-Develop costs to provide comparison to other options.
Land-use change over entire floodplain nil No significant change but reduces future flood protection requirements
Expensive. 1 -Possible option.-Develop costs for comparison with other options.
Diking Construct dike next to river Need erosion protection, install lockblock/sheetpile walls where insufficient space, provide seepage cut-off, pump internal flows.
Access issues. Property concerns, no right of way currently exists for diking.
Riparian habitat encroachment. Potential streambank erosion and streambed scour. Federal review potentially triggered.
No significant change - but reduces flood storage area
Environmental and access issues. 7 -Significant environmental, river encroachment and access issues, make this option undesirable. Temporary dike is still in place.-Develop costs to provide comparison with other options.
Raise McAloney and Ongman Roads Land-used change outside road Install lockblock/sheetpile walls where insufficient space,provide seepage cut-off, pump internal flows.
Access issues Potential minor riparian habitat encroachment.
No significant change - but reduces flood storage area
Feasible but expensive. 2 -Possible option.-Develop costs for comparison with other options.
Do nothing for development outside road
Install lockblock/sheetpile walls where insufficient space,provide seepage cut-off, pump internal flows.
Access issues Potential minor riparian habitat encroachment.
Maintains flood storage area Feasible 6 -Possible option.-Develop costs for comparison with other options.
Construct low dike providing base for temporary high water protection
Same sub-options as for full height dike
Temporarily raise dike as needed using gabions or lock blocks.
Emergency response on call. Riparian habitat encroachment. Potential streambank erosion and streambed scour. Federal review potentially triggered.
No significant change - but reduces flood storage area
Feasible 4 -Possible option.-Develop costs for comparison with other options.
Individually raise/flood proof any essential development/basements
Potential minor riparian habitat encroachment.
Feasible but expensive. 5 -City floodplain bylaw requires all new development to be floodproofed and built to the flood construction level. Owners of existing development to consider improvements to floodproof and raise their developments. Required height of raised structures may be impractical.-Not recommended.
June 2008 Progress ReportPrevious Matrix Ranking Index

Table 6.2: Flood Control Solutions - Nechako River
Comments for Phase 1 Costing and Medium FilteringFlood Control Options Mitigation Sub-Options Alternate Designs Hydraulic Considerations Infrastructure Considerations Environmental Considerations Geomorphology Considerations General Evaluation
June 2008 Progress ReportPrevious Matrix Ranking Index
Area CN (Northbank near confluence)No permanent protection, provide temporary works as required
PG Pulpmill Road shown as dike on provincial dike mapping.
No new environmental impacts expected in absence of permanent protection. Potential environmental considerations associated with temporary works depends on design of those works. For example, release of deleterious substances is possible with use of amphibex and warm water release.
On-going sediment deposition would increase flood hazard
Not acceptable in the long term. Groundwater remains a concern.
7 -Operate as usual; respond to flooding as it occurs.-Develop costs to provide comparison to other options.
Land-use change over entire floodplain Restores functional floodplain areas Some conveyance increase. Good from river engineering, environmental and geomorphological perspective but expensive. (May provide restoration of historical side channel.)
1 -Possible option.-Develop costs for comparison with other options.
Diking Construct dike next to river Need erosion protection, install lockblock/sheetpile walls where insufficient space, provide seepage cut-off, pump internal flows.
Maintenance issues Riparian habitat encroachment. Potential streambank erosion and streambed scour. Federal review potentially triggered.
Decrease flood conveyance/storage area
Not advisable. Groundwater remains a concern.
9 -Significant environmental, river encroachment and access issues; benefits a relatively small number of existing residences.-Not recommended but develop costs to provide comparison with other options.
Raise PG Pulpmill Road if necessary and install seepage prevention to ensure dike meets standards or build new standard dike along road
Do nothing for development outside road
Install flapgates on culverts and prevent seepage, raise as necessary.
Access issues If a new dike is built along road: Riparian habitat encroachment. Potential streambank erosion and streambed scour. Federal review potentially triggered
Road is away from river, little geomorphological impact
Groundwater problems north of road. 5 -PG Pulpmill Road is above the required flood level.
Build local dikes to protect development outside road
Install flapgates on culverts and prevent seepage. Install lockblock/sheetpile walls where insufficient space, provide seepage cut-off, pump internal flows.
Access issues Potential riparian habitat encroachment. Federal review potentially triggered.
Minor reduction in flood conveyance or storage area
Groundwater problems north of road. May not be practical.
4 -PG Pulpmill Road is above the required flood level.-Construct dike to protect some residences to the south of the road. - High erosion risk, not recommended.
Land-use change outside road Install flapgates on culverts and prevent seepage, raise as necessary.
Access issues Potential minor riparian habitat encroachment (associated with raising the road).
Minor increase in flood conveyance or storage area
Feasible but groundwater problems north of road.
2 -Possible option.-Develop costs for comparison with other options.
Raise/flood proof development outside road
Install flapgates on culverts and prevent seepage, raise as necessary.
Access issues Potential minor riparian habitat encroachment.
Road is away from river, little geomorphological impact
Feasible but groundwater problems north of road.
3 -City floodplain bylaw requires all new development to be floodproofed and built to the flood construction level. Owners of existing development to consider improvements to floodproof and raise their developments. Required height of raised structures may be impractical.-Not recommended; land-use change provides best alternative.
Individually ring dike some development, land-use change for remaining properties
Install flapgates on culverts and prevent seepage. Install lockblock/sheetpile walls where insufficient space, provide seepage cut-off, pump internal flows.
Access issues Potential riparian habitat encroachment (i.e. if ring dikes are next to river). Federal review potentially triggered.
Minor reduction in flood conveyance or storage area
Feasible but groundwater problems north of road.
5 -City floodplain bylaw requires all new development to be floodproofed and built to the flood construction level. Owners of existing development to consider improvements to floodproof and raise their developments. Required height of raised structures may be impractical.-Not recommended; land-use change provides best alternative.
Individually raise/flood proof any essential development, land-use change for remaining properties
Most impact if north side of dike bought out
Potential minor riparian habitat encroachment.
Reduces need for future flood protection in hazardous location
Feasible but expensive. 7 -City floodplain bylaw requires all new development to be floodproofed and built to the flood construction level. Owners of existing development to consider improvements to floodproof and raise their developments. Required height of raised structures may be impractical.-Not recommended; land-use change provides best alternative.
Groundwater control pumping (North of road) Groundwater governed by river levels, not effective without diking. Cut-off walls/seepage control required in addition to diking.
Large pump capacity required Potential for existing groundwater contamination in industrial areas. Testing and treatment may need to be considered.
May be difficult to significantly reduce groundwater levels
Expensive. Expected to be difficult to reduce groundwater levels during flood. Would be undertaken as part of a diking option.
n/a -Further geotechnical investigations required.
Area DN (Northbank west of John Hart Bridge)No permanent protection, provide temporary works as required
Emergency response on call. No new environmental impacts expected in absence of permanent protection. Potential environmental considerations associated with temporary works depends on design of those works. For example, release of deleterious substances is possible with use of amphibex and warm water release.
Status quo Not acceptable in the long term. 2 -Operate as usual; respond to flooding as it occurs.-Develop costs to provide comparison to other options.
Land-use change over entire floodplain Restores functional floodplain areas Reduces need for future flood protection in hazardous location
Good from river engineering perspective but expensive and politically difficult.
1 -Possible option.-Develop costs for comparison with other options.
Diking Construct dike next to river Need erosion protection, install lockblock/sheetpile walls where insufficient space, provide seepage cut-off, pump internal flows.
Riparian habitat encroachment. Potential streambank erosion and streambed scour. Federal review potentially triggered.
Decrease flood conveyance/storage area
May not be practical 7 -Significant environmental, river encroachment and access issues, make this option undesirable.-Develop costs to provide comparison with other options.
Raise Preston Road Land-use change outside road Install lockblock/sheetpile walls where insufficient space,provide seepage cut-off, pump internal flows.
Potential minor riparian habitat encroachment.
Could possibly affect left bank side channel/island
Feasible but groundwater problems north of road.
2 -Possible option.-Develop costs for comparison with other options.
Flood proof development outside road Install lockblock/sheetpile walls where insufficient space,provide seepage cut-off, pump internal flows.
Potential minor riparian habitat encroachment.
Minor reduction in flood storage area Feasible but groundwater problems north of road.
6 -City floodplain bylaw requires all new development to be floodproofed and built to the flood construction level. Owners of existing development to consider improvements to floodproof and raise their developments.Required height of raised structures may be impractical; not recommended.
Low dike providing base for temporary high water protection
Same sub-options as for full height dike
Temporarily raise dike as needed using gabions or lock blocks.
Emergency response on call. Riparian habitat encroachment. Potential streambank erosion and streambed scour. Federal review potentially triggered.
No significant change - but reduces flood storage area
Feasible 4 -Possible option.-Develop costs for comparison with other options.
Individually raise/flood proof any essential development/basements, land-use change forremaining properties
Potential minor riparian habitat encroachment.
Minimises loss in flood storage area. Reduces need for future flood protection in hazardous location
Feasible. 5 -City floodplain bylaw requires all new development to be floodproofed and built to the flood construction level. Owners of existing development to consider improvements to floodproof and raise their developments. Required height of raised structures may be impractical.-Not recommended.

Table 6.2: Flood Control Solutions - Nechako River
Comments for Phase 1 Costing and Medium FilteringFlood Control Options Mitigation Sub-Options Alternate Designs Hydraulic Considerations Infrastructure Considerations Environmental Considerations Geomorphology Considerations General Evaluation
June 2008 Progress ReportPrevious Matrix Ranking Index
Area EN (Morning Place)No permanent protection, provide temporary works as required
Emergency response on call. No new environmental impacts expected in absence of permanent protection. Potential environmental considerations associated with temporary works depends on design of those works. For example, release of deleterious substances is possible with use of amphibex and warm water release.
Status quo Not acceptable in the long term. 4 -Operate as usual; respond to flooding as it occurs.-Develop costs to provide comparison to other options.
Diking Construct dike next to river Need erosion protection, install lockblock/sheetpile walls where insufficient space, provide seepage cut-off, pump internal flows.
Maintenance issues Riparian habitat encroachment. Potential streambank erosion and streambed scour. Federal review potentially triggered.
Could destabilize downstream left bank terrace
Not advisable 5 -Significant environmental, river encroachment and access issues; benefits a relatively small number of existing residences.-Not recommended but develop costs to provide comparison with other options.
Construct low dike providing base for temporary high water protection
Temporarily raise dike as needed using gabions or lock blocks.
Emergency response on call. Riparian habitat encroachment. Potential streambank erosion and streambed scour. Federal review potentially triggered.
No significant change - but reduces flood storage area
Feasible 3 -Possible option.-Develop costs for comparison with other options.
Individually raise/flood proof any essential development
Potential minor riparian habitat encroachment.
Minor reduction in flood storage area Feasible 2 City floodplain bylaw requires all new development to be floodproofed and built to the flood construction level. Owners of existing development to consider improvements to floodproof and raise their developments. Required height of raised structures may be impractical.
Land-use change over entire floodplain Restores functional floodplain areas Little benefit, but reduces need for future flood protection in hazardous location.
Feasible 1 -Possible option.-Develop costs for comparison with other options.
Area FN (Southbank at Foot Hills Bridge)
Prevent future development and flood proof existing development if necessary
No hydraulic impact Limited existing development. Potential minor riparian habitat encroachment.
Investigate sidechannel to see if any infilling can be removed.
Feasible 1 -Ensure appropriate zoning.
Area GN (Southbank U/S of John Hart Bridge)Prevent future development and flood proof existing development if necessary
No hydraulic impact. Limited existing development. Potential minor riparian habitat encroachment.
Reduces need for future flood protection in hazardous location.
Feasible 1 -Ensure appropriate zoning.
General Lower Nechako AreaFloodways Enlarge Cottonwood Island back-channel May need erosion protection and series of bridges. Potential ice jam relief. Ongoing
maintenance.Stream morphology change to entire back channel. Riparian habitat encroachment. Potential streambank erosion and streambed scour. Federal review will be triggered.
Would partially restore historic conveyance area
Feasible but not a solution by itself. -Possible option to provide ice jam relief; cost developed as part of Emergency Management BC funding request.-Has no siginificant effect on open water (freshet) design flood profile.
Open up/straighten historic channel between River Road and Railroad.
May need erosion protection and series of bridges. Potential ice jam relief. Ongoing maintenance. Only possible with landuse changes
Stream morphology change. Riparian habitat encroachment. Potential streambank erosion and streambed scour. Federal review will be triggered.
Would partially restore historic conveyance area
Feasible but not a solution by itself. -Straightens sections of the historic back channel to reduce number of crossings of River Road.-Possibility to use as relief channel during ice jam events.-Has no siginificant effect on open water (freshet) design flood profile.
Channel through Area CN, south of PG Pulpmill Road
Stream morphology change. Riparian habitat encroachment. Potential streambank erosion and streambed scour. Federal review will be triggered.
Possible maintenance dredging. Feasible but not a solution by itself. -Possible option to provide ice jam relief; would require land-use change south of PG PulpmillRoad. -Has no siginificant effect on open water (freshet) design flood profile.
Improve drainage Modify 1st Avenue storm drains Design specific - to be assessed individually.
Feasible but not a solution by itself. -Further geotechnical investigations required.
Enlarge main river channel by dredging Bar scalping Monitoring and maintenance required. Disturbance of river bed, likely HADD. Federal review will be triggered.
Maintenance excavation could be needed due to ongoing sediment deposition. Ice jam initiation and freshet flooding may still occur on Fraser River
Feasible but not a solution by itself. -Bar scalping downstream of the Cottonwood island backchannel included in Emergency Management BC funding request. Bar-scalping in main channel is not recommended.
Bar scalping and instream excavation Monitoring and maintenance required. Disturbance of river bed, likely HADD. Federal review will be triggered.
Maintenance excavation could be needed due to ongoing sediment deposition. Ice jam initiation and freshet flooding may still occur on Fraser River
Feasible but not a solution by itself. -No benefit to reduce either open water (freshet) or ice jam flooding conditions. Not recommended.
Flow regulation Enlarge storage behind Kenney Dam Detailed and complex provincial and federal reviews required. Multi-year environmental studies likely required forpermitting.
Larger riparian/shoreline impacts Expensive. Not a solution by itself. -Requires negotiation with Rio Tinto - Alcan; not within project timeframe.-Operation already providing benefits for reducing winter flows and delaying freshet.
Build new storage Detailed and complex provincial and federal reviews required. Multi-year environmental studies likely required forpermitting.
Larger riparian/shoreline impacts Expensive. Not a solution by itself. -Requires negotiation with Rio Tinto - Alcan; not within project timeframe.
Revise operating procedure Detailed and complex provincial and federal reviews required. Multi-year environmental studies likely required forpermitting.
Complex issue including effects on water temperature, sediment transport, bank stability.
Feasible. -Requires extensive negotiation with Rio Tinto - Alcan; not within project timeframe.-Operation already providing benefits for reducing winter flows and delaying freshet.

Table 6.3: Flood Control Solutions - Fraser River
Comments for Phase 1 Costing and Medium FilteringMitigation Options Hydraulic Considerations Infrastructure Considerations Environmental Considerations Geomorphology Considerations General Evaluation
Area AF (Yellowhead Bridge)No permanent protection, provide temporary works as required
Emergency response on call No new environmental impacts expected in absence of permanent protection. Potential environmental considerations associated with temporary works depends on design of those works.
3 -Operate as usual; respond to flooding as it occurs.-Develop costs to provide comparison to other options.
Diking next to river Need erosion protection, install lockblock/sheetpile walls where insufficient space, provide seepage cut-off, pump internal flows.
D/S tie-in may be difficult Riparian habitat encroachment. Potential streambank erosion and streambed scour. Federal review potentially triggered.
Area next to bridge abutment, no measurable impact. Minor loss in flood storage area.
Feasible 4 -Feasible option; develop costs for comparison.
Low dike next to river Low dike providing base for temporary high water protection
Emergency response on call Riparian habitat encroachment. Potential streambank erosion and streambed scour. Federal review potentially triggered.
5 -Feasible option; develop costs for comparison.
Land-use changes Restores functional floodplain areas Feasible 1 -Feasible option; develop costs for comparison.Raise/flood proof any development Potential minor riparian habitat
encroachment. Feasible 2 -City floodplain bylaw requires all new development to be floodproofed and built to the flood
construction level. Owners of existing development to consider improvements to floodproof and raise their developments. Required height of raised structures may be impractical.Compare low dike option with resulting per resident cost.
Area BF (South Fort George)No permanent protection, provide temporary works as required
Emergency response on call No new environmental impacts expected in absence of permanent protection. Potential environmental considerations associated with temporary works depends on design of those works.
Not acceptable in the long term. 3 -Operate as usual; respond to flooding as it occurs.-Develop costs to provide comparison to other options.
Diking-next to river/slough Need erosion protection, install lockblock/sheetpile walls where insufficient space, provide seepage cut-off, pump internal flows.
Riparian habitat encroachment. Potential streambank erosion and streambed scour. Federal review potentially triggered.
Drains or pumps may be needed to prevent water being trapped behind dyke. Reduces flood storage area and cuts off a possible flood drainage channel.
May not be feasible 4 -Develop costs for comparison.
Individually raise/flood proof any essential development, buy out rest
Emergency response on call Potential minor riparian habitat encroachment. Could reactivate sizeable flood relief
channel
Feasible 2 -City floodplain bylaw requires all new development to be floodproofed and built to the flood construction level. Owners of existing development to consider improvements to floodproof and raise their developments. Required height of raised structures may be impractical. Compare low dike option with resulting per resident cost.
Land-use changes Restores functional floodplain areas Could reactivate sizeable flood relief channel
Flooding occurs frequently, this may be best option.
1 -Feasible option; develop costs for comparison.
Area CF (Hudson Bay Slough West of Queensway)Queensway acts as dike. Flap-gated culverts and pumping station installed. Verify that protection is adequate at revised 200-year flood level and upgrade if needed.
Emergency response on call No new environmental impacts. Area already protected by road dike. Determine if additional pumping capacity is required.
1 -Road/dike sufficiently high; may need additional pumping; expect relatively minimal costs.
Land-use changes Most likely not required. -Most likely not required.Provide seepage cut-off. Most likely not required. -To be considered if existing pump capacity is inadequate and additional pumping is difficult
to provide.Individually raise/flood proof any essential development/basements
Potential minor riparian habitat encroachment.
May not be required. -City floodplain bylaw requires all new development to be floodproofed and built to the flood construction level. Owners of existing development to consider improvements to floodproof and raise their developments. Required height of raised structures may be impractical.
Area DF (Lansdowne south end)No permanent protection, provide temporary works as required
Emergency response on call No new environmental impacts expected in absence of permanent protection. Potential environmental considerations associated with temporary works depends on design of those works.
Not acceptable in the long term. 3 -Operate as usual; respond to flooding as it occurs; prevent future development with appropriate zoning.-Develop costs to provide comparison to other options.
Land-use changes Restores functional floodplain areas Feasible 1 -Feasible option; develop costs for comparison.Provide diking for part of area. Riparian habitat encroachment.
Potential streambank erosion and streambed scour. Federal review potentially triggered.
No significant reduction in flood conveyance capacity
Feasible but expensive 4 - Limited space for dike construction.
Individually raise/flood proof any essential development
Potential minor riparian habitat encroachment. Impacts will be determined by the number of
sites
Feasible 2 -City floodplain bylaw requires all new development to be floodproofed and built to the flood construction level. Owners of existing development to consider improvements to floodproof and raise their developments. Required height of raised structures may be impractical. Compare low dike option with resulting per resident cost.
Area EF (Westbank at island)No permanent protection, provide temporary works as required
Emergency response on call No new environmental impacts expected in absence of permanent protection. Potential environmental considerations associated with temporary works depends on design of those works.
Feasible solution considering limited development.
3 -Operate as usual; respond to flooding as it occurs.-Prevent further development with appropriate zoning.
Land-use changes Restores functional floodplain areas Feasible 2 -Not required.Diking May need erosion protection, provide seepage cut-off,
pump internal flows.Riparian habitat encroachment. Potential streambank erosion and streambed scour. Federal review potentially triggered.
No significant reduction in flood conveyance capacity
May not be economically justifiable. 4 -Not required.
Individually raise/flood proof any essential development/basements or move/isolate and land-use changes
Potential minor riparian habitat encroachment. Impacts will be determined by the number of
sites
Feasible 1 -Not required.
Area FF (Northwood Pulpmill Road)No permanent protection, provide temporary works as required
Emergency response on call No new environmental impacts expected in absence of permanent protection. Potential environmental considerations associated with temporary works depends on design of those works.
Feasible solution considering limited development.
4 -Access issue; raise Landooz Road; develop costs.
Ring Diking set-back from river Provide seepage cut-off, pump internal flows. Potential minor riparian habitat encroachment.
Feasible but expensive 3
Individually raise/flood proof any essential development
Potential minor riparian habitat encroachment.
Impacts will be determined by the number of sites
Feasible 2
At any vulnerable development in floodplain, alter land-use
Restores functional floodplain areas Maintains flood conveyance storage area Feasible 1
Area GF (Across River from Shelley)Prevent future development. Flood proof existing development as necessary
Potential minor riparian habitat encroachment.
An appropriate plan Feasible 1 -No associated costs
June 2008 Progress ReportPrevious Matrix Ranking Index

Table 6.4 Flood Control Solutions - Cost Analyses
Flood Risk Area: AN - South Bank of Nechako River at Confluence INVENTORYSub-areas North of River Road River Road to railway Railway and area to the south
of it General asset description A few residential/industrial
propertiesNumerous industrial properties Commercial and residential,
downtown coreAsset inventory by sub-area: - Infrastructure & public assets 9,590,000$ 31,214,000$ - Property value 4,706,000$ 33,923,000$ 69,350,000$ Total assets/sub-area 4,706,000$ 43,513,000$ 100,564,000$ OPTIONSFlood control option No protection River dike Build dike on river side of
River Road.Build set-back dike along
railwayLand-use change
Flood control sub-option 1. No permanent protection, provide temporary works as required
2. Build dike next to river and along Cottonwood Island back channel. (Raise River Rd.)
5. Introduce land-use changes outside dike. (Raise River Rd).
7. Individually ring dike some development outside the dike (ring dikes not included). Raise River Rd.
9. Change land-use in entire area
Area protected None Entire Area River Road to Railway Area South of Railway NoneCOSTINGExpected damage ($) over 50 yr period with option installed 4,160,000$ 822,000$ 822,000$ 1,643,000$ 822,000$ Capital cost of option($) N/A 17,014,000$ 15,518,000$ 8,534,000$ 23,228,000$ Annual Operation/maintenance cost ($) N/A 49,000$ 47,500$ 35,500$ N/ASocial cost ($) 21,964,000$ 4,393,000$ 4,393,000$ 8,785,000$ 4,393,000$ Total 50 yr life cycle cost ($) $40,260,000 26,145,000$ 24,616,000$ 25,420,000$ 25,174,000$ MEDIUM FILTERINGCost Comparison ratio 1.00 1.54 1.64 1.58 1.60Environmental costs (L,M,H) L H M L LNon-monetary considerations Env. cost dependent on timing
and nature of emergency response
RANKING 5 4 1 3 2
Flood Risk Area: BN - North Bank of Nechako River East of John Hart BridgeINVENTORYGeneral asset description Numerous industrial properties
Asset inventory by sub-area:
- Infrastructure & public assets 2,076,000$ - Property value 7,980,000$ Total assets/sub-area 10,056,000$ OPTIONSFlood control option No protection Raise McAlony and Ongman
RoadsLand-use change
Flood control sub-option 1. No permanent protection, provide temporary works as required
2. Build dike next to Nechako River
3. Build low dike next to Nechako River
4. Do nothing for development outside dike
5. Change land-use in entire area
Area protected None Entire area None North of road Entire areaCOSTINGExpected damage ($) over 50 yr period with option installed 153,000$ 31,000$ 77,000$ 61,200$ 31,000$ Capital cost of option($) N/A 3,520,000$ 2,696,000$ 3,913,000$ 8,778,000$ Annual Operation/maintenance cost ($) N/A 14,500$ 14,500$ 13,500$ N/ASocial cost ($) 2,550,000$ 510,000$ 1,275,000$ 1,020,000$ N/ATotal 50 yr life cycle cost ($) $4,700,000 4,780,000$ 5,362,000$ 6,090,000$ 9,016,000$ MEDIUM FILTERINGCost Comparison ratio 1.00 0.98 0.88 0.77 0.52Environmental costs (L,M,H) L H H M LNon-monetary considerations Env. cost dependent on timing
and nature of emergency response
RANKING 1 N/A 2 3 4
Flood Risk Area: CN - North Bank of Nechako River near Confluence INVENTORYGeneral asset description A few residential/industrial
propertiesAsset inventory by sub-area: - Infrastructure & public assets
1,370,000$ - Property value 18,649,000$ Total assets/sub-area 20,019,000$ OPTIONSFlood control option No protection River Dike Land-use changeFlood control sub-option 1. No permanent protection,
provide temporary works as required
2. Build dike next to Nechako River
5. Change land-use in entire area
Area protected None Entire area Entire areaCOSTINGExpected damage ($) over 50 yr period with option installed 8,798,000$ 1,760,000$ 1,760,000$ Capital cost of option($) N/A 10,122,000$ 9,333,000$ Annual Operation/maintenance cost ($) N/A 23,000$ N/ASocial cost ($) 1,693,000$ 339,000$ N/ATotal 50 yr life cycle cost ($) $9,251,000 12,749,000$ 10,518,000$ MEDIUM FILTERINGCost Comparison ratio 1.00 0.73 0.88Environmental costs (L,M,H) L H LNon-monetary considerations Env. cost dependent on timing
and nature of emergency response
RANKING 2 N/A 1
Flood Risk Area: DN - North Bank of Nechako River West of John Hart BridgeINVENTORYGeneral asset description A few residential/industrial
propertiesAsset inventory by sub-area: - Infrastructure & public assets
1,068,000$ - Property value 6,128,000$ Total assets/sub-area 7,196,000$ OPTIONSFlood control option No protection Raise Preston Road Land-use changeFlood control sub-option 1. No permanent protection,
provide temporary works as required
2. Build dike next to Nechako River
3. Build low dike next to Nechako River
4. Do nothing for development outside dike
5. Change land-use in entire area
Area protected None Entire area None North of road Entire areaCOSTINGExpected damage ($) over 50 yr period with option installed 5,886,000$ 1,177,000$ 2,943,000$ 3,531,000$ 1,177,000$ Capital cost of option($) N/A 3,308,000$ 2,587,000$ 1,208,000$ 6,741,000$ Annual Operation/maintenance cost ($) N/A 14,000$ 14,000$ 12,500$ N/ASocial cost ($) 2,617,000$ 524,000$ 1,307,000$ 1,570,000$ N/ATotal 50 yr life cycle cost ($) $5,233,000 4,663,000$ 5,512,000$ 4,623,000$ 6,923,000$ MEDIUM FILTERINGCost Comparison ratio 1.00 1.12 0.95 1.13 0.76Environmental costs (L,M,H) L H H M LNon-monetary considerations Env. cost dependent on timing
and nature of emergency response
Residents might consider dike unsightly.
RANKING 2 N/A 3 1 4
River dike
River dike

Table 6.4 Flood Control Solutions - Cost Analyses
Flood Risk Area: EN - Morning PlaceINVENTORYGeneral asset description Residential propertiesAsset inventory by sub-area:
- Infrastructure & public assets - Property value 1,243,000$ Total assets/sub-area 1,243,000$ OPTIONSFlood control option No protection Land-use changeFlood control sub-option 1. No permanent protection,
provide temporary works as required
2. Build dike next to Nechako River
3. Build low dike next to Nechako River
5. Change land-use in entire area
Area protected None Entire area None Entire areaCOSTINGExpected damage ($) over 50 yr period with option installed 4,150,000$ 830,000$ 2,075,000$ 830,000$ Capital cost of option($) N/A 2,139,000$ 1,600,000$ 1,367,000$ Annual Operation/maintenance cost ($) N/A 2,500$ 2,500$ N/ASocial cost ($) 480,000$ 96,000$ 240,000$ N/ATotal 50 yr life cycle cost ($) $2,939,000 2,782,000$ 3,161,000$ 1,431,000$ MEDIUM FILTERINGCost Comparison ratio 1.00 1.06 0.93 2.05Environmental costs (L,M,H) L H H LNon-monetary considerations Env. cost dependent on timing
and nature of emergency response
Residents might consider dike unsightly.
RANKING 2 N/A 3 1
Flood Risk Area: General Lower Nechako AreaINVENTORYSub-areas North of River Road River Road to railway Railway and area to the south
of it General asset description A few residential/industrial
properties Numerous industrial propertiesCommercial and residential, downtown core
Asset inventory by sub-area: - Infrastructure & public assets 9,590,000$ 31,214,000$ - Property value 4,706,000$ 33,923,000$ 69,350,000$ Total assets/sub-area 4,706,000$ 43,513,000$ 100,564,000$ OPTIONSFlood control optionFlood control sub-option 1. Enlarge Cottonwood Island
side channel2. Excavate and straigten historic backchannel
3. Channel through Area CN
Area protected Entire area Entire area Entire areaCOSTINGExpected damage ($) over 50 yr period with option installed Capital cost of option($) 2,961,000$ 9,040,000$ 7,600,000$ Annual Operation/maintenance cost ($)Social cost ($)Total 50 yr life cycle cost ($)MEDIUM FILTERINGCost Comparison ratioEnvironmental costs (L,M,H) L L LNon-monetary considerations Opportunity to enhance existing
fish habitatOpportunity to restore side channel habitats Creation of new fish habitat
RANKING 1 3 2
Flood Risk Area: AF - West Bank at Yellowhead Bridge INVENTORY
General asset description Park area bordered by residential
Asset inventory by sub-area: - Infrastructure & public assets 113,000$ - Property value 2,236,000$ Total assets/sub-area 2,349,000$ OPTIONSFlood control option No protection Land-use changeFlood control sub-option 1. No permanent protection,
provide temporary works as required
2. Build dike next to Fraser River 3. Build low dike next to Fraser River
5. Change land-use in entire area
Area protected None Entire area None Entire areaCOSTINGExpected damage ($) over 50 yr period 433,000$ 87,000$ 217,000$ 3,600$ Capital cost of option($) N/A 1,524,000$ 760,000$ 2,460,000$ Annual Operation/maintenance cost ($) N/A 1,500$ 1,500$ N/ASocial cost ($) 48,000$ 10,000$ 24,000$ N/ATotal 50 yr life cycle cost ($) $1,450,000 1,847,000$ 1,518,000$ 2,488,000$ MEDIUM FILTERINGCost Comparison ratio 1.00 0.79 0.96 0.58Environmental costs (L,M,H) L H H LNon-monetary considerations Env. cost dependent on timing
and nature of emergency response
Residents might consider dike unsightly.
Residents might consider dike unsightly.
RANKING 1 3 2 4
Flood Risk Area: BF - South Fort GeorgeINVENTORYGeneral asset description Some residentialAsset inventory by sub-area: - Infrastructure & public assets 1,378,000$ - Property value 3,550,000$ Total assets/sub-area 4,928,000$ OPTIONSFlood control option No protection River dike Land-use changeFlood control sub-option 1. No permanent protection,
provide temporary works as required
2. Build dike next to Fraser River around Farrell Street and Regent Crescent
3. Build low dike next to Fraser River
5. Change land-use in entire area
Area protected None Developed area None Entire areaCOSTINGExpected damage ($) over 50 yr period 8,169,000$ 1,634,000$ 4,085,000$ 29,000$ Capital cost of option($) N/A 2,854,000$ 1,502,000$ 1,430,000$ Annual Operation/maintenance cost ($) N/A 13,000$ 13,000$ N/ASocial cost ($) 928,000$ 186,000$ 464,000$ N/ATotal 50 yr life cycle cost ($) $4,075,000 3,955,000$ 3,825,000$ 1,655,000$ MEDIUM FILTERINGCost Comparison ratio 1.00 1.03 1.07 2.46Environmental costs (L,M,H) L H H LNon-monetary considerations Env. cost dependent on timing
and nature of emergency response
RANKING 2 4 3 1
River dike
Floodways
River dike

Table 6.4 Flood Control Solutions - Cost Analyses
Flood Risk Area: DF - Lansdowne South EndINVENTORYGeneral asset description Some residentialAsset inventory by sub-area: - Infrastructure & public assets 427,000$ - Property value 760,000$ Total assets/sub-area 1,187,000$ OPTIONSFlood control option No protection Land-use changeFlood control sub-option 1. No permanent protection,
provide temporary works as required
2. Build dike next to Fraser River 3. Build low dike next to Fraser River
5. Change land-use in entire area
Area protected None Developed area None Entire areaCOSTINGExpected damage ($) over 50 yr period with option installed 1,761,000$ 352,000$ 880,000$ 4,000$ Capital cost of option($) N/A 1,592,000$ 651,000$ 836,000$ Annual Operation/maintenance cost ($) N/A 1,500$ 1,500$ N/ASocial cost ($) 202,000$ 41,000$ 101,000$ N/ATotal 50 yr life cycle cost ($) $1,450,000 1,915,000$ 1,409,000$ 864,000$ MEDIUM FILTERINGCost Comparison ratio 1.00 0.76 1.03 1.68Environmental costs (L,M,H) L H H LNon-monetary considerations Env. cost dependent on timing
and nature of emergency response
RANKING 2 4 3 1
Flood Risk Area: FF - Northwood Pulp RoadINVENTORYGeneral asset description Industrial and residentialAsset inventory by sub-area: - Infrastructure & public assets 3,741,000$ - Property valueTotal assets/sub-area 3,741,000$ OPTIONSFlood control option No protection DikeFlood control sub-option 1. No permanent protection,
provide temporary works as required
2. Raise Landooz Road for access only
Area protected None Developed areaCOSTINGExpected damage ($) over 50 yr period with option installed Capital cost of option($) 5,851,000$ Annual Operation/maintenance cost ($)Social cost ($)Total 50 yr life cycle cost ($)MEDIUM FILTERINGCost Comparison ratioEnvironmental costs (L,M,H) L MNon-monetary considerations Env. cost dependent on timing
and nature of emergency response
RANKING --- ---
River dike

557.0
558.0
559.0
560.0
561.0
562.0
563.0
564.0
565.0
566.0
567.0
568.0
569.0
570.0
571.0
572.0
573.0
574.0
575.0
576.0
0 500 1000 1500 2000 2500 3000 3500 4000
Elevation (m
, GSC)
Distance from Mouth (XS F26, m)200 yr200 yr (Dredged)20 yr20 yr (Dredged)2 yr2 yr (Dredged)Low Flows ALow Flows A (Dredged)Low Flows BLow Flows B (Dredged)ThalwegThalweg (Dredged)
XS N5
XSN4
XSN3
XSN2
XSN1
XS N6
XSN9
XS N8
XSN7
Cameron
Street Bridge
(L.C. 574
m )
Assumed dredged area:Length: 1200 m (XS N1, 2 & 3)Width: 80 m (main channel)Depth: 4‐5 mVolume: 450,000 m3
Nechako River Gravel Removal
January 2009 Figure 6.1
City of Prince George

557.0
558.0
559.0
560.0
561.0
562.0
563.0
564.0
565.0
566.0
567.0
568.0
569.0
570.0
571.0
572.0
573.0
574.0
575.0
576.0
0 500 1000 1500 2000 2500 3000 3500 4000
Elevation (m
, GSC)
Distance from Mouth (XS F26, m)200 yr200 yr (Filled)20 yr20 yr (Filled)2 yr2 yr (Filled)Low Flows ALow Flows A (Filled)Low Flows BLow Flows B (Filled)ThalwegThalweg (Filled)
XS N5
XSN4
XSN3
XSN2
XSN1
XS N6
XSN9
XS N8
XSN7
Cameron
Street Bridge
(L.C. 574
m )
Assumed Filled area:Length: 2000 m (XS N1, 2, 4 & 5)Width: 45 m (main channel)Depth: 1 mVolume: 70,000 m3
Nechako River Gravel Deposition
January 2009 Figure 6.2
City of Prince George

Inlet ControlStructure
Flood Box
Flood Box
Flood Box
Railway Museum
Foley Crescent
River Road
Cutbank Road
Wolczuk Road Northshore floodway
Bar Scalping
Open up historic back
channel
Enlarge Cottonwood Isl.back channel
Modify storm drains along 1st Avenue
Set-back dike along railroad
Dike next to river and Cottonwood
Island back channel
Raise River Road
AN
CNBN
CF
AF
6.3
GD
L, Y
:\349
20 P
G F
PM\G
IS\3
4920
_CM
_Clo
seU
pAre
asA
tRis
k1_A
n_N
ov20
08.m
xd
CITY OF PRINCE GEORGE
project no. 3-4920 Jan.-2009
coord. syst.: UTM Zone 10 horz. datum: NAD 83 horz. units: metres
®100 0 100 200 300 40050 MetresScale - 1:10,000
Flood Control SolutionsNechako Area AN
Notes:- 2006 orthophotos supplied by McElhanney Consulting Services Ltd.- 23 Sep 2000 Landsat 7 satellite image supplied by GeoBase.ca.- For additional flood control options refer to Table 8.1.
Figure
Legend
Areas at RiskNorthwest Hydraulic Consultants

North Nechako Road
Raise McAloney and Ongman Roads
Raise Preston Road
Dike next to river
Dike next to river
BN
DN
GN
AN
CN
Figure
GD
L, Y
:\349
20 P
G F
PM\G
IS\3
4920
_CM
_Clo
seU
pAre
asA
tRis
k1_B
n&D
n_N
ov20
08.m
xd
CITY OF PRINCE GEORGE
Northwest Hydraulic Consultants project no. 3-4920 Jan.-2009
coord. syst.: UTM Zone 10 horz. datum: NAD 83 horz. units: metres
®100 0 100 20050 MetresScale - 1:5,000
Legend
Areas at Risk
Flood Control SolutionsNechako Areas BN and DN
Notes:- 2006 orthophotos supplied by McElhanney Consulting Services Ltd.- 23 Sep 2000 Landsat 7 satellite image supplied by GeoBase.ca.- For additional flood control options refer to Table 8.1.
6.4

Local Dike
Cutbank Road Wolczuk Road
Prince George Pulpmill Road meets standard dike requirements
Dike next to river
AN
CNBN
6.5
GD
L, Y
:\349
20 P
G F
PM\G
IS\3
4920
_CM
_Clo
seU
pAre
asA
tRis
k1_C
n_N
ov20
08.m
xd
CITY OF PRINCE GEORGE
Northwest Hydraulic Consultants project no. 3-4920 Jan.-2009
coord. syst.: UTM Zone 10 horz. datum: NAD 83 horz. units: metres
®100 0 100 200 300 40050 MetresScale - 1:10,000
Legend
Areas at Risk
Flood Control SolutionsNechako Area CN
Notes:- 2006 orthophotos supplied by McElhanney Consulting Services Ltd.- 23 Sep 2000 Landsat 7 satellite image supplied by GeoBase.ca.- For additional flood control options refer to Table 8.1.
Figure

Dikes next to river (tied to high ground)
EN
EN
Figure
GD
L, Y
:\349
20 P
G F
PM\G
IS\3
4920
_CM
_Clo
seU
pAre
asA
tRis
k1_E
n_N
ov20
08.m
xd
CITY OF PRINCE GEORGE
Northwest Hydraulic Consultants project no. 3-4920 Jan.-2009
coord. syst.: UTM Zone 10 horz. datum: NAD 83 horz. units: metres
®100 0 100 20050 MetresScale - 1:5,000
Legend
Areas at Risk
Flood Control SolutionsNechako Area EN
Notes:- 2006 orthophotos supplied by McElhanney Consulting Services Ltd.- 23 Sep 2000 Landsat 7 satellite image supplied by GeoBase.ca.- For additional flood control options refer to Table 8.1.
6.6

BF
6.7
GD
L, Y
:\349
20 P
G F
PM\G
IS\3
4920
_CM
_Clo
seU
pAre
asA
tRis
k1_B
f_N
ov20
08.m
xd
CITY OF PRINCE GEORGE
project no. 3-4920 Jan.-2009
coord. syst.: UTM Zone 10 horz. datum: NAD 83 horz. units: metres
®10 0 10 20 30 40 50 605 MetresScale - 1:1,500
Flood Control SolutionsFraser Area BF
Notes:- 2006 orthophotos supplied by McElhanney Consulting Services Ltd.- 23 Sep 2000 Landsat 7 satellite image supplied by GeoBase.ca.- For additional flood control options refer to Table 8.1.
Figure
Legend
Areas at Risk
Dike
Northwest Hydraulic Consultants
Rege
nts
Cres
Farr
el S
tree
t
Que
ens
Way
Hudson's Bay Slough

DF
6.8
GD
L, Y
:\349
20 P
G F
PM\G
IS\3
4920
_CM
_Clo
seU
pAre
asA
tRis
k1_D
f_N
ov20
08.m
xd
CITY OF PRINCE GEORGE
project no. 3-4920 Jan.-2009
coord. syst.: UTM Zone 10 horz. datum: NAD 83 horz. units: metres
®10 0 10 20 30 40 50 605 MetresScale - 1:1,100
Flood Control SolutionsFraser Area DF
Notes:- 2006 orthophotos supplied by McElhanney Consulting Services Ltd.- 23 Sep 2000 Landsat 7 satellite image supplied by GeoBase.ca.- For additional flood control options refer to Table 8.1.
Figure
Legend
Areas at RiskNorthwest Hydraulic Consultants
Dik
eLans
dow
ne R
d
Wiens Rd

nhc
Flood Risk Evaluation and Flood Control Solutions – Phase 1 Final Report 68
7 PHASE 2 WORK PROGRAM
7.1 COMPLETION OF PHASE 1
Phase 1 as described in this report evaluated flood risks and proposed flood control solutions. The flood control solutions were put through a medium filtering process to eliminate non-advantageous options. The remaining options were ranked to indicate which options appeared most appropriate. All options retained after the filtering (Section 6.7) will go forward to Phase 2 to seek input from the City and the public.
Release of the Phase 1 report will be facilitated by Kevin Brown Communications Ltd. It will initially be presented to City of Prince George Council, followed by a media meeting. The report will also be available on the City website and presented to the community at large.
Displays, pamphlets, digital slides for webpage use, and other educational materials will be prepared for the use of the City and Council.
A proposed work program for Phase 2 is outlined below.
7.2 PUBLIC AND RELATED CONSULTATIONS
The Fraser Basin Council will conduct public and related consultations following completion of Phase 1. Additional material will be prepared as necessary to present the flood risk evaluation and recommended flood control options. The public consultation process will also involve NHC, MCSL, EDI, MMA and KB. The purpose is to provide information on the project and obtain feed-back.
The meetings will likely be held over two days and will be divided into:
• Meeting with staff of regulatory agencies.
• Public open house with posted maps, graphs, and handouts.
• Technical presentations by NHC, MCSL, EDI, and MMA with assistance from KB.
• Question and answer session.
• Meetings with specific groups.
7.3 TENTATIVE FLOOD CONTROL SOLUTIONS
Results from the public consultation process will be summarized. The preferred flood control options from Phase 1 will be reviewed and revised as appropriate, based on input received from the public and related consultations. Subsequent work will focus on refining the options that are selected and developing their implementation plans. Subject to confirmation of the tentative flood control options, anticipated tasks include the following:

nhc
Flood Risk Evaluation and Flood Control Solutions – Phase 1 Final Report 69
Flood Control Infrastructure Complete elementary concept designs and approximate cost estimates for a dike on the river side of River Road in Area AN (South bank of Nechako River at Confluence), and for the raising of Preston Road in Area DN (North Bank of Nechako River). Timelines will be prepared for property acquisition, regulatory approvals, design and construction, taking into account results from the public consultations.
Land Use Land use changes considered necessary on the basis of risk analysis and feasibility assessment were proposed for:
Area AN - South Bank of Nechako River at Confluence (land area north of River Road)
Area CN - North Bank of Nechako River near Confluence (including optional local flood proofing)
Area EN – North Bank of Nechako River Morning Place (including optional local flood-proofing)
Area BF – Fraser River at South Fort George (including optional local flood-proofing)
Area DF – Fraser River at Lansdowne South End (including optional local flood-proofing)
Further work on land-use changes is not anticipated in Phase 2. River Options Extraction of gravel from the river channels was assessed as ineffective for lowering design flood profiles (Appendix H). However, side-channel diversions or relief floodways are considered to be potentially beneficial. The removal of gravel from a bar at the exit of the Cottonwood Island side-channel has already received environmental approval. Elementary concept designs for further side-channel improvements at Cottonwood Island and along the Nechako north bank will be prepared. Processes necessary to obtain further approvals will be outlined, and associated costs and timelines will be estimated.
No Permanent Protection For areas Area BN (North Bank of Nechako River East of John Hart Bridge) and Area AF (West bank of Fraser River at Yellowhead Highway) no provision of permanent protection was identified as the least-cost solution.
7.4 FINAL REPORTING
Final Reporting A Phase 2 report will be prepared that provides selected flood control options, conceptual designs, cost estimates, needed approvals and timelines for implementation.

nhc
Flood Risk Evaluation and Flood Control Solutions – Phase 1 Final Report 70
7.5 FLOODPLAIN MAPS
Mapping Revised floodplain mapping will be prepared for City of Prince George, in conjunction with BC Ministry of Environment and in accordance with the Fraser Basin Council's Floodplain Mapping Guidelines and Specifications of March 2004. (This task will be done outside the present Phase 2 budget.)

nhc
Flood Risk Evaluation and Flood Control Solutions – Phase 1 Final Report 71
8. CONCLUSIONS AND RECOMMENDATIONS
CONCLUSIONS (C) RECOMMENDATIONS (R) Flood Risk Evaluation
C1. The dominant 200-year flood threat at Prince George for the Nechako River from the City boundary to about 1,250 m downstream of Cameron Street Bridge (to cross-section N6) is ice-related flooding. Downstream of this section and throughout the Fraser River study reach, the Fraser freshet is the dominant 200-year flood threat.
R1. To provide an effective response during flooding, it is recommended that the City of Prince George develop a flood response plan which should, among other elements, include:
a. A real-time forecasting procedure for Fraser River freshet floods using flows predicted by MOE’s River Forecast Centre and the hydraulic model developed for this project.
b. A tool to monitor antecedent conditions conducive to ice jamming, when flows are greater than 200 m3/s in combination with prolonged cold periods of temperatures less than -5oC. A continuous recording gauge should be introduced at John Hart or Cameron Street Bridge to provide accurate flow and water level information.
C2. Historic air-photograph comparisons of Nechako River from 1928 to present indicate:
a. the floodplain has been extensively developed; b. many side-channels have filled in; and, c. the extent (size) of vegetated islands has increased.
The floodplain and river channel configurations will continue to evolve in the future. The design profiles developed reflect present channel conditions and may be subject to change.
R2. During future large flow events, high watermarks should be recorded and checked against the current numerical models for both freshet and ice-related floods on the Nechako River and freshet events on the Fraser River.

nhc
Flood Risk Evaluation and Flood Control Solutions – Phase 1 Final Report 72
C3. Recent high ice-related and freshet flooding is not a result of river channel changes. A comparison of Nechako and Fraser River cross-sections from 1979/1995 and 2008 indicate:
a. There is little change in terms of thalweg (lowest point) elevations, average bed elevations or cross-sectional areas. There is no evidence of significant aggradation or degradation, although the channel sections have changed shape as a result of gravel bar shifting.
b. In the Nechako River, there is no apparent channel change upstream of the Foothills Bridge, some random increases and decreases in bed levels between the Foothills and John Hart Bridges and a general lowering of the bed downstream of Cameron Street Bridge. The most downstream cross-section (N1) shows some deposition.
c. In the Fraser River, the thalweg at the CN Rail Bridge has in-filled, whereas the channel between the CN Rail Bridge and the Yellowhead Bridge has lowered. At the confluence (cross-sections F26 and F27), the average bed level has increased.
R3. In order to assess future channel changes more precisely, it is recommended that the river bed at the confluence be monitored. The 2008 grid bathymetric survey can be used as the baseline condition. Gravel storage and shifting of bars has taken place both before and after the construction of Kenney Dam. It should be recognized that this is a natural consequence of the flatter gradient within the lower Nechako River. Build-up of material may occur over a series of low/medium flow years with intermittent material removal during high flow years or ice-floods.
C4. Current operation of the Nechako Reservoir reduces the risk of flooding at Prince George. The present operating regime tends to lower winter flows during freeze-up which reduces the potential for ice-related flooding. In the spring, the reservoir delays the Nechako freshet peak by up to a month or until well after the Fraser River has peaked. Generally, the magnitude of the Nechako peak flow has been reduced by the operation of the reservoir.
R4. MOE in cooperation with Rio Tinto Alcan should be encouraged to predict the likely reservoir operations during a 200-year flood, so that the reducing effect on the design flow at Prince George can be estimated. Similarly, the extent to which flow releases can be reduced during freeze-up should be explored. If changes are introduced to the reservoir operation, the Nechako freshet and ice design flows need to be reviewed.

nhc
Flood Risk Evaluation and Flood Control Solutions – Phase 1 Final Report 73
C5. The return periods of recent events are: a. Ice related (Nechako River)
i. 2007-08 - estimated return period of 90 years. (In some instances, WSC reported flows at the different gauges along Nechako River appear not to add up in the downstream direction with reported tributary flows.)
b. Freshet: (Fraser River) i. 2002 - estimated return period of 14 years;
ii. 2007 - estimated return period of 19 years; iii. 2008 - estimated return period of 16 years.
R5. a) WSC should be requested to investigate apparent discrepancies in reported flows along the Nechako River, particularly for winter periods. b) The conversion to geodetic elevations at the Shelley gauge needs to be verified.
C6. Based on analysis of historic floods and available WSC flow records, the estimated 200-year design flows are:
a. 1,450 m3/s for the Nechako River at Prince George (6% increase from the previous design flow used for the 1997 floodplain mapping).
b. 5,660 m3/s for the Fraser River at Shelley (2% increase from previous design flow).
c. 6,360 m3/s for Fraser River below Nechako River (3% increase from previous design flow).
R6. a) The analysis of hydraulic conditions on the Nechako and Fraser Rivers indicates a significant deviation from the previous design flood profiles. It is recommended that Prince George work with the Ministry of Environment to adopt the revised water surface design flood profiles. b) Considering the limited clearance of the CNR Bridge, CNR should be informed regarding the revised higher 200-year flood profile for the Fraser River.
C7. The floodplain mapping developed in 1997 is no longer valid. The primary reasons are:
a. The previous study did not include ice modelling on the Nechako River.
b. The updated design flows are higher, being based on longer record periods.
c. On average, the Nechako River ice-related flood profile is 1.1 m higher than previously adopted. The revised Fraser River flood profile is on average 0.3 m higher. The rise in the profiles will expand the floodplain areas correspondingly.
R7. It is recommended that Prince George update the 1997 Floodplain Mapping based on the revised 200-year water surface profiles plus a freeboard allowance.

nhc
Flood Risk Evaluation and Flood Control Solutions – Phase 1 Final Report 74
C8. Climate change and Mountain Pine Beetle infestation adds greater uncertainty to both winter and freshet flows. However, the recent above average freshet peaks and ice related flooding is unlikely the result of consistent change in the river basin or changing meteorological conditions. If a flow increase of 20% (assumed probable maximum) were to occur it would result in a corresponding average water level increase of 1.0 m for the Fraser River 200-year flood and 0.6 m for the Nechako River 200-year freshet flood.
R8. a) In consultation with MOE’s Inspector of Dikes’ office, an appropriate freeboard allowance for determining Flood Construction Levels at Prince George should be determined. A freeboard of 0.6 m, as generally assumed in this report, should be considered a minimum. In view of the increased uncertainty of climate change and Mountain Pine Beetle impacts, consideration should be given to increasing the Ministry of Environment standard freeboard allowance of 0.6 metres to 1.0 metres. b) More detailed hydrologic analysis and modelling would be required to examine how climate change and Mountain Pine Beetle infestation might change the flow regime in the Nechako and Fraser Rivers at Prince George. Results from current investigations of both factors by MOE’s River Forecast Centre should be reviewed when available, and the need for additional work assessed.
Flood Control Solutions
C9. Modelling various sizes and shapes of sediment removals (both bar scalping and dredging) for ice and open water conditions indicated that during 200-year flood conditions, the water surface profile does not change as a result of the removals. Sediment removals in the Nechako River would likely increase the amount of ice accumulation during ice-related flood events. The confluence ice levels and freshet backwater levels are set by the Fraser River hydraulic conditions below the confluence. Increasing the flow capacity of this steep, confined river reach through channel improvements is not practical.
R9. Sediment removal from the Nechako River or the Fraser River confluence is not considered a viable flood control solution for Prince George. Under present conditions, it is recommended that Prince George does not further pursue sediment removal from the main channels as a flood mitigation measure.
C10. Restoring and increasing the conveyance of Nechako River side-channels would reduce ice-related flood levels in the main channel downstream of the side-channel
R10. It is recommended that Prince George consider increasing the conveyance capacity of the Cottonwood Island side-channel by sediment excavation and debris removal. An

nhc
Flood Risk Evaluation and Flood Control Solutions – Phase 1 Final Report 75
entrances, as long as the entrances and channels remain ice-free. This applies to the existing Cottonwood Island side-channel and if land-use prescriptions allow, extension and recovery of the in-filled channel along the north bank.
inlet structure at the channel entrance would be required. If allowed by land-use change, reclamation of the side-channel previously in-filled by development along the north bank should also be considered.
C11. Seven areas at risk of flooding were identified along the Nechako River and another seven along the Fraser River. The south and north banks of the Nechako River at the confluence are at greatest risk, since they are susceptible to flooding from both Fraser freshets and Nechako ice jams. Highest ranking solutions for the risk areas in order of priority are (order of magnitude cost estimates are shown in parenthesis):
a. Area AN - South Bank of Nechako River at Confluence - Build dike on river side of River Road, providing internal drainage and reducing groundwater seepage. Introduce land-use change north of River Road. ($15.5 M)
b. Area CN - North Bank of Nechako River near Confluence – Introduce land-use/zoning changes south of PG Pulpmill Road. On north side of road land-use change or local flood-proofing can be considered. ($9.3 M)
c. Area DN - North Bank of Nechako River West of John Hart Bridge - Raise Preston Road. Introduce land-use/zoning changes or local flood-proofing on river side of road. In the river side area, subdrains/ emergency protection may reduce flooding of buildings/basements.($1.2 M raising of road only)
d. Area BN - North Bank of Nechako River East of John Hart Bridge - No permanent protection, provide temporary protection as needed. Residents should be
R11. a) It is recommended that the City of Prince George consider the solutions listed under Conclusion 11 and advance with the City’s public consultation strategy. All options remaining after the medium filtering process (see Section 6.6) should be put forward for public consultation, with emphasis on the options that ranked the highest. b) Dike designs need to include internal drainage provisions and groundwater seepage prevention. c) Of all flood control solutions considered, land-use change involves the least maintenance and should be considered first where feasible. d) For evaluating environmental impacts of flood control solutions, it should be determined whether the Lower Nechako River is a sturgeon spawning area.

nhc
Flood Risk Evaluation and Flood Control Solutions – Phase 1 Final Report 76
encouraged to include subdrains to reduce the potential for groundwater effects. Introduce land-use/zoning changes.
e. Area BF – South Fort George – Introduce land-use/ zoning changes as necessary. Optionally local flood-proofing can be considered in some locations. ($1.4 M)
f. Area EN – Morning Place – Introduce land-use/ zoning changes as necessary. Optionally, local flood-proofing can be considered in some locations. ($1.4 M)
g. Area DF – Lansdowne South End – Introduce land-use/zoning changes as necessary. Optionally local flood-proofing can be considered in some locations. ($0.8 M)
h. Area FN – South Bank of Nechako River at Foot Hills Bridge - Land-use/zoning changes as necessary.
i. Area GN – South Bank of Nechako River between John Hart and Foothills Bridges - Land-use/zoning changes as necessary.
j. Area AF – West bank at Yellowhead Highway - land-use/zoning changes as necessary.
k. Area CF – Hudson’s Bay Slough west of Queensway – Review adequacy of existing protection.
l. Area EF – West Bank at Island – Undeveloped, introduce land-use/zoning changes as necessary.
m. Area FF – Northwood Pulp mill Road - Land-use/ zoning changes as necessary. Raise Landooz Road for access. ($5.8 M)
n. Area GF – Across River from Shelley - Land-use/ zoning changes.

nhc
Flood Risk Evaluation and Flood Control Solutions – Phase 1 Final Report 77
9 REFERENCES Alila, Y., 2007. Mountain Pine Beetle Epidemic and Flood Risk in the Fraser River Basin. www.forestry.ubc.ca/Portals/55/docs/MPBFLOOD-RISK-ALILA.pdf (accessed December 2008).
Andres, D.D. 1995. Frazil Generation and Ice Floe Formation on a Regulated River. Proceedings of the 8th Workshop on the Hydraulics of Ice Covered Rivers: Winter Environments of Regulated Rivers. Committee on River Ice Processes and the Environment, Hydrology Section, Canadian Geophysical Union, Kamloops, British Columbia, Pp. 57-76.
Ashton, G.D. (editor). 1986. River and lake ice engineering. Water Resources Publications, Littleton Colorado, USA.
BC Forest Practices Board. 2007 . The effect of Mountain Pine Beetle Attack and Salvage Harvesting on Streamflows. Special Investigation FPB/SIR/16. 27 p.
Beltaos, S. 1983. River ice jams: theory, case studies and applications. Journal of Hydraulic Engineering, ASCE., Vol. 109, No. 10, pp. 1338-1359.
Bird, S., Hogan, D. and Geertsema, M. 2001. Chilako River Channel Conditions 1953-1999 – A Retrospective Study Based on Airphoto Analysis and Ground Observations. Unpublished report prepared for the British Columbia Conservation Foundation.
Brown, A.V., Lyttle, M.M. and K.B. Brown. 1998. Impacts of gravel mining on gravel bed streams. Transactions of the American Fisheries Society. 127: 979-994.
Bunte, Kristin and Steven R. Abt. 2001. Sampling Surface and Subsurface Particle-Size Distributions in Wadable Gravel- and Cobble-Bed Streams for Analyses in Sediment Transport, Hydraulics, and Streambed Monitoring. Gen. Tech. Rep. RMRS-GTR-74. Fort Collins, CO: U.S. Department of Agriculture, Forest Service, Rocky Mountain Research Station. 429 p.
Campbell, P. 1990. Nechako River Flooding and Erosion, Appendix A of Nechako River Water Management Plan. British Columbia Ministry of Environment, Lands, and Parks. Prince George.
Carrier Sekani Tribal Council (CSTC). 2008. Fisheries (online). Available http://www.cstc.bc.ca/cstc/20/fisheries [accessed November 2008].
Centre for Applied Conservation Research. 2007. Species accounts for freshwater fish in Central British Columbia (online). Available http://www.forestbiodiversityinbc.ca/uploadedfiles/fish-species%20accounts.pdf [accessed November 2008].
Conservation Data Centre (CDC). 2007. BC Species and Ecosystems Explorer. B.C. Ministry of Environment. Victoria, BC. Available: http://srmapps.gov.bc.ca/apps/eswp/ [accessed November 2008].
Doughty-Davies, J. and Morley J.H. 1974. Fraser River Agreement Studies, Task 2, Prince George Diking Costs.

nhc
Flood Risk Evaluation and Flood Control Solutions – Phase 1 Final Report 78
Environment Canada (EC), Canadian Wildlife Service. 2004. Species at Risk Web Mapping Application http://www.sis.ec.gc.ca/ec_species/ec_species_e.phtml [Accessed November 2008].
Fisheries and Oceans Canada (DFO). 2007. Recovery potential assessment for white sturgeon. DFO Can. Sci. Advis. Sec. Sci. Advis. Rep. 2007/014.
Fraser Basin Council (FBC). 2004. Fraser River basin (online). Available http://www.fraserbasin.bc.ca/fraser_basin/index.html [Accessed November 2008].
Freshwater Fisheries Society of British Columbia (FFSBC). 2005. FISHWizard (online). Available http://www.fishwizard.com/ [Accessed November 2008].
GeoNorth Engineering Ltd. 2008. Groundwater Elevation Monitoring Program, 1st Avenue and River Road Area Prince George, BC.
GeoNorth Engineering Ltd. 2006. Groundwater Elevation Monitoring Study, 1st Avenue and River Road Area Prince George, BC.
Golder & Associates. 2003. Application for Environmental Assessment Certificate and Draft Comprehensive Study Report: City of Prince George Hart Water Supply Improvements Fishtrap Island Collector Well Project, Prince George, BC.
Hélie, J.F., D.L. Pelers, K.R. Tattrie and J.J. Gibson. 2005. Review and synthesis of potential hydrologic impacts of Mountain Pine Beetle and related harvesting activities in BC. Mountain Pine Beetle Initiative. Working Paper 2005-23. Pacific Forestry Centre, Canadian Forest Service, Natural Resources Canada. 26 p.
Integrated Land Management Bureau (ILMB). 2008. iMapBC (online database and mapping). Available http://webmaps.gov.bc.ca/imfx/imf.jsp?site=imapbc [Accessed November 2008].
IPCC, 2007a. Summary for Policymakers. Climate Change 2007: Impacts, Adaptations and Vulnerability. Contribution of Working Group II to the Fourth Assessment Report on the Intergovernmental Panel on Climate Change. Cambridge University Press, Cambridge, United Kingdom, 22pp.
IPCC, 2007b. Summary for Policymakers. Climate Change 2007: The Physical Science Basis. Contribution of Working Group I to the Fourth Assessment Report on the Intergovernmental Panel on Climate Change. Cambridge University Press, Cambridge, United Kingdom, and New York, NY, USA 18pp.
Klohn-Crippen. 1997. Floodplain Mapping Fraser and Nechako Rivers at Prince George. Report prepared for BC Ministry of Environment.
Kukulka, T., and D. A. Jay. 2003. Impacts of Columbia River discharge on salmonid habitat: 2. Changes in shallow-water habitat, J. Geophys. Res., 108(C9), 3294.
McAdam, S.O., Walters, C.J., and C. Nistor. 2005. Linkages between White Sturgeon (Acipenser transmontanus) Recruitment and Altered Substrates in the Nechako River, Canada. Trans. Am. Fish. Soc. 134: 1448 – 1456.

nhc
Flood Risk Evaluation and Flood Control Solutions – Phase 1 Final Report 79
McArthur, R. 1991. Review of International Practice for Levee Freeboard Requirements. Consulting Report to US Army Corps of Engineers, Sacramento, California.
McPhail, J.D. 2007. The Freshwater Fishes of British Columbia.
Ministry of Environment, Lands and Parks (MELP) & Environment Canada (EC). 2000. Water Quality Trends in Selected British Columbia Waterbodies.
Ministry of Environment, Lands and Parks and Department of Fisheries and Oceans Canada. 1999. Environmental guidelines for vegetation management on flood protection works to protect public safety and the environment.
Ministry of Forests (MOF). 1991. Ecosystems of British Columbia.
Ministry of Forests and Range (MOFR) 2007. Biogeoclimatic Ecosystem Classification (BEC) web (online). Available http://www.for.gov.bc.ca/hre/becweb/index.html [accessed November 2008].
M. Miles and Associates Ltd. (MMA). 2008a. Nechako River at Prince George Flood Hazard Study: Compilation and Interpretation of Historical Air Photos. Unpublished report prepared for The City of Prince George. 6 p. plus appendices.
M. Miles and Associates Ltd. (MMA). 2008b. Nechako River at Prince George Flood Hazard Study: Identification of Local Sediment Sources. Unpublished report prepared for The City of Prince George.
Ministry of Water, Land and Air Protection (MWLAP). 2004. Long-billed curlew, Numenius americanus in Accounts and Measures for Managing Identified Wildlife – Accounts V. 2004. B.C. Ministry of Water, Land and Air Protection, Victoria, B.C. Available: http://www.env.gov.bc.ca/wld/frpa/iwms/accounts.html [Accessed November 2008].
Morrison, J., Quick, M.C., Foreman, M.G.G., 2002. Climate change in the Fraser River watershed: flow and temperature projections. Journal of Hydrology, 263: 230-244.
National Marine Fisheries Service (NMFS). 2005. National Marine Fisheries Service: National Gravel Extraction Guidance. Available online http://spo.nwr.noaa.gov/tm/tm70.pdf [Accessed October 2008].
Nechako White Sturgeon Recovery Initiative. 2008. Nechako White Sturgeon Recovery Initiative (website). Available http://www.nechakowhitesturgeon.org/sturgeon/index.php [Accessed November 2008].
Nichols, R.W. 1981a. Fraser-Nechako Flood Profile at Prince George. BC Ministry of Environment.
Nichols, R.W. 1981b. Fraser-Nechako Flood Profile at Prince George. BC Ministry of Environment.
Northwest Hydraulic Consultants. 2003. Nechako River Geomorphic Assessment. Phase 1: Historical Analysis of Lower Nechako River. Final Report. Report prepared for BC Ministry of Water, Land and Air Protection.

nhc
Flood Risk Evaluation and Flood Control Solutions – Phase 1 Final Report 80
Northwest Hydraulic Consultants. 2008 a. Comprehensive Review of Fraser River at Hope. Flood Hydrology and Flows – Scoping Study. Final Report prepared for BC Ministry of Environment.
Northwest Hydraulic Consultants. 2008 b. Vanderhoof Flood Mitigation Study. Skins Lake Ouflow Normalization and Effects on Peak flows at Vanderhoof. Draft Report prepared for City of Vanderhoof.
Northwest Hydraulic Consultants et al. 2008 c. Flood Risk Evaluation and Flood Control Solutions Risk Analysis – Progress Report 1.
Northwest Hydraulic Consultants. 2006. Final Report, Lower Fraser River Hydraulic Model. Report prepared for Fraser Basin Council.
Nowotny, C. and D.G. Hickey. 1993. Inventory and Rating of Salmonid Habitats Along the Fraser and Nechako Rivers Within the City Limits of Prince George, B.C. I. Technical Report. Prepared for the Fraser River Environmentally Sustainable Task Force, Department of Fisheries an Oceans. Prepared by ECL Envirowest Consultants Limited, New Westminister, B.C. 39 pp + appendices.
Nutton, B. 2008. Personal communications May 2008 Department of Fisheries and Oceans Section Head Biologist.
Packer, D.B., K. Griffin, and K.E. McGlynn. 2005. National Marine Fisheries Service National Gravel Extraction Guidance. U.S. Dep. Commerce, NOAA Tech. Memo. NMFS-F/SPO-70, 27p.
Parker, G. 1990. Surface-based bedload transport relation for gravel rivers. Journal of Hydraulic Research, 28 (4): 417-436.
Pariset, E. and R. Hausser. 1961. Formation and evolution of ice covers in rivers. Transactions of the Engineering Institute of Canada, Vol. 5, No. 1, pp. 40-49.
Pariset, E., R. Hausser, and A. Gagnon. 1966. Formation of ice covers and ice jams in rivers. Journal of the Hydraulics Division, ASCE., Vol. 92, No. HY6, pp. 1-24.
PCIC, 2008. Draft Report: Changes in Past Hydro-climatology and Projected Future Changes – for the City of Prince George. Pacific Climate Impacts Consortium, University of Northern British Columbia, 47pp.
Perrin, C.J., Rempel, L.L. and M.L. Rosenau. 2003. White Sturgeon Spawning Habitat in an Unregulated River: Fraser River, Canada. Transactions of the American Fisheries Society. 132:154-165 (1).
Province of British Columbia (BC). 2008. Freshwater Fishing Regulations Synopsis: 2008-2009 (online). Available http://www.env.gov.bc.ca/fw/fish/regulations/ [Accessed November 2008].
Read Crowther & Patrners Ltd. and Northwest Hydraulic Consultants. 1987. A Study of Some Aspects of the Geomorphology of the Nechako River. Report prepared for Fisheries and Oceans Canada.

nhc
Flood Risk Evaluation and Flood Control Solutions – Phase 1 Final Report 81
Redding, T., R. Winker, R. Pike, D. Davis and K. Schroder [edit.]. 2007. Mountain Pine Beetle and Watershed Hydrology Workshop: Preliminary results of Research from BC, Alberta and Colorado. July 10, 2007. Sponsored by Forrex, CWRA and the BC Ministries of Environment and Forests. 60 p.
RL&L Environmental Services Ltd. 2000. Fraser River White Sturgeon Monitoring Program – Comprehensive Report (1995 to 1999). Final report prepared for BC Fisheries. RL&L Report No. 815F: 92 p + app.
Rodenhuis, D.R., Bennett, K.E., Werner, A.T., Murdock, T.Q., Bronaugh, D., 2007. Hydro-climatology and Future Climate Impacts in British Columbia. Pacific Climate Impacts Consortium, University of Victoria BC, 132pp.
Sedimentation and River Hydraulics Group. 2007. User’s Natural for SRH-1D. Sedimentation and River Hydraulics – One Dimension, Version 2.0.5. Technical Service Center, Bureau of Reclamation, U.S. Department of the Interior.
Septer, D. 2007. Flooding and Landslide Events Northern British Columbia 1820-2006. BC Ministry of Environment.
Shen, H.T. and L.A. Chiang, 1984. Simulation of growth and decay of river ice cover. Journal of Hydraulic Engineering, ASCE., Vol. 110, No. 7, pp. 958-971.
Shen, H.T., H. Shen, and S.M. Tsai. 1990. Dynamic transport of river ice. Journal of Hydraulic Research, IAHR, Vol. 28, No. 6, pp. 659-671.
Shen, H.T., D.S. Wang, and A.M.W. Lal. 1993. A river ice simulation model - RICEN. Model formulation and program guide. Report No. 93-7, Department of Civil and Environmental Engineering, Clarkson University, Potsdam, NY, USA.
Slaney, P. A. 1986. An Assessment of the Rainbow Trout (Salmo gairdneri) Population in the Upper Nechako River and the Effects of a Sportsfishery Closure. Fisheries Management Report No. 89.
Sushama, L., Laprise, R., Caya, D., Frigon, A., and Slivitzky, M., 2006. Canadian RCM projected climate-change signal and its sensitivity to model errors. International Journal of Climatology, 26: 2141-2159.
Swain, L.G. 2007. Water Quality Assessment of the Nechako River at Prince George (1985-2004). Prepared for BC Ministry of Environment and Environment Canada.
Thurber Engineering Ltd. 2008. River Road Subdrain and Pump Chamber System. Report prepared for City of Prince George.
Uunila, L., B. Guy and R. Pike. 2006. Hydrologic effects of Mountain Pine Beetle in the Interior Pine Forests of BC: Key Questions and Current Knowledge. Streamline Watershed Management Bulleting, Vol. 9, No: 2., pp. 1-6.
Wind, E. and L.A. Dupuis. 2002. COSEWIC status report on the western toad Bufo boreas in Canada, in COSEWIC assessment and status report on the western toad Bufo boreas in Canada. Committee on the Status of Endangered Wildlife in Canada. Ottawa. 1-31 pp.

nhc
Flood Risk Evaluation and Flood Control Solutions – Phase 1 Final Report 82
Wyman, R.R. 1981. Fraser-Nechako 200-Year Discharge estimates. BC Ministry of Environment.
Yarmish, J.A. and B.M. Toth. 2002. 2001/2002 Assessment of upper Fraser River white sturgeon. Report produced by Lheidli T’enneh First Nation for Upper Fraser/Nechako Fisheries Council and Fisheries Renewal BC. 37p.
Yuzyk, T.R. 1986. Bed Material Sampling in Gravel-Bed Streams. Sediment Survey Section, Water Survey of Canada, Inland Waters Directorate, Environment Canada. IWD-HQ-WRB-SS-86-8. 63 p.

nhc
Flood Risk Evaluation and Flood Control Solutions – Phase 1 Final Report 83
10 GLOSSARY
10.1 ABBREVIATIONS
AOX Absorbable organo-halides BCEAA British Columbia Environmental Assessment Act BGC Biogeoclimatic CDC Conservation Data Centre CEAA Canadian Environmental Assessment Act COSEWIC Committee on the Status of Endangered Wildlife in Canada DFO Department of Fisheries and Oceans EDI Environmental Dynamics Inc FCL Flood Construction Level FEMA Federal Emergency Management Agency FHAP Fish Habitat Assessment GIS Geographic Information System GPS Global Positioning System HADD Harmful alteration, disruption, or destruction KBC Kevin Brown Communications LTN Lheidli T’enneh First Nation MMA M Miles and Associates Ltd MCSL McElhanney Consulting Services Ltd MBCA Migratory Birds Convention Act MOE Ministry of Environment NHC Northwest Hydraulic Consultants Ltd PCIP Pacific Climate Impacts Consortium PG City of Prince George RTA Rio Tinto Alcan RTK Real-time kinetic GPS SARA Species at Risk Act SBS Sub-boreal spruce UFFCA Upper Fraser Fisheries Conservation Alliance VIC Variable Infiltration Capacity Macroscale Hydrologic Model (developed at
University of Washington to compute run-off) WMA Wildlife Management Area WSC Water Survey of Canada 10.2 TECHNICAL TERMS
200-year flood A flood that, on average, occurs once in 200 years. Active channel The portion of a river channel that actively conveys flow.

nhc
Flood Risk Evaluation and Flood Control Solutions – Phase 1 Final Report 84
Adfluvial Fish that live in lakes and migrate into rivers or streams to spawn. Aerial radio-telemetry survey The monitoring of radio transmitter-tagged fish from an airplane. Aggradation The geologic process by which stream beds, floodplains, and the bottoms of other water bodies are raised in elevation by the deposition of material eroded and transported from other areas. It is the opposite of degradation. Aggregate mining Extraction of sand, gravel and stone material, generally used as an engineered soil base for stability or in the form of concrete or asphalt products. Alluvial Pertains to alluvium deposited by a stream or flowing water. Anadromous Fish that spend all or part of their adult life in salt water and return to freshwater streams and rivers to spawn. Backeddy A circular current of water, diverging from and initially flowing contrary to the main current. It is usually formed at a point at which the flow passes some obstruction or on the inside of river bends. Backwater Raised water levels produced by obstructing or constricting a channel. Bar scalping Excavation from the tops of gravel bars during the dry season. Bed Load Material moving on or near the stream bed by rolling, sliding, and sometimes making brief excursions into the flow a few grain diameters above the bed, i.e. jumping. The term “saltation” is sometimes used in place of “jumping”. Bed load is bed material that moves in continuous contact with the bed; contrast with “suspended load”. Bed Material The sediment mixture of which the river bed is composed. In alluvial streams, bed material particles are likely to be moved at any moment or during some future flow condition. Bed material transport index Calculated values used to investigate changes in the sedimentation process in a river.

nhc
Flood Risk Evaluation and Flood Control Solutions – Phase 1 Final Report 85
Bed Forms Irregularities found on the bottom (bed) of a stream that are related to flow characteristics. They are given names such as “dunes”, “ripples”, and “antidunes”. They are related to the transport of sediment and interact with the flow because they change the roughness of the stream bed. Bed roughness A numerical factor which expresses the frictional effect that the river bed exerts on the flow. Boundary Conditions Definition or statement of conditions or phenomena at the boundaries. Water levels, flows, concentrations, etc., that are specified at the boundaries of the area being modelled. A specified tailwater elevation and incoming upstream discharge are typical boundary conditions. Braided Channel A stream that is characterized by random interconnected channels divided by islands or bars. Bars which divide the stream into separate channels at low flows are often submerged at high flow. Calibration Adjustment of a model’s parameters such as roughness or dispersion coefficients so that it reproduces observed prototype data to acceptable accuracy. Channel A natural or artificial waterway which periodically or continuously contains moving water. Channel bathymetry The depth of a river bed, generally collected by a sonar depth sounder. The data may be presented as a map with depth contour lines along the river bed. Channel incision A section of the channel where the streambed degrades until the critical bank height is exceeded and the bank fails, increasing channel width and sediment load. Channel instability Lateral or vertical shifts in a river channel. Channel morphometry The measurement of channels. Confluence The point where a tributary joins the mainstem of a river.

nhc
Flood Risk Evaluation and Flood Control Solutions – Phase 1 Final Report 86
Consolidated cover A previously juxtaposed ice cover that has collapsed and shoved in to a dense, thicker form. Conveyance A measure of the flow carrying capacity of a channel section. Flow is directly proportional to conveyance for steady flow. From Manning’s equation, the proportionality factor is the square root of the energy slope. Cooling flows Flows released to lower the temperature of the water in a river. Cover load Ice slush transported under an ice cover. Critical habitat The geographic area occupied by listed or endangered species. Cross Section Depicts the shape of the channel in which a stream flows. Measured by surveying the stream bed elevation across the stream on a line perpendicular to the flow. Necessary data for the computation of hydraulic and sediment transport information. Cross-sectional Area The cross-sectional area is the area of a cross section perpendicular to the direction of flow beneath the water surface. D50 value D50 is a particle diameter at which 50% of the particles have diameters which are smaller than the D50 value. Degradation The geologic process by which stream beds, floodplains, and the bottoms of other water bodies are lowered in elevation by the removal of material from the boundary. It is the opposite of aggradation. Degree-days of freezing A measure of how cold it has been and how long it has been cold; it is usually calculated as a sum of average daily degrees below freezing for a specified time period. Delta A deposit of sediment formed where moving water (as from a stream at its mouth) is slowed by a body of standing water. Depth of Flow The depth of flow is the vertical distance from the bed of a stream to the water surface.

nhc
Flood Risk Evaluation and Flood Control Solutions – Phase 1 Final Report 87
Deposition The mechanical or chemical processes through which sediments accumulate in a (temporary) resting place. The raising of the stream bed by settlement of moving sediment that may be due to local changes in the flow, or during a single flood event. Design Flood A flood, which may occur in any given year, of such magnitude as to equal a flood having a particular recurrence interval (for example 200 years), based on a frequency analysis of unregulated historic flood records or by regional analysis where there is inadequate streamflow data available. The flood of record may also be used for the design flood if equal to or greater than the 200-year flood. Design Flood Level The observed or calculated elevation for the Design Flood and is used in the calculation of the Flood Construction Level. Digital Elevation Models (DEMs) DEMs model the elevation of the land (z-values) at regularly spaced intervals in x and y directions (easting and northings). DEMs are usually displayed as uniformly spaced grids. Because of the uniform point spacing, DEMs can “jump over” breaklines without identifying ditches, stream centerlines, steep banks, and other similar features. However, DEMs are simple data models, easy to store, and suitable for automated hydrologic analyses and modeling where breakline information is unimportant. Dike An embankment, wall, fill or piling constructed to prevent the flooding of land: A “private dike” means a dike built on private property without public funds to protect only the property of the person owning the private dike. Diking Authority A Diking Authority is defined as:
• the commissioners of a district to which part 2 of the Drainage, Ditch and Dike Act applies,
• a person owning or controlling a dike other than a private dike, • a public authority designated by the minister as having any responsibility for
maintenance of a dike other than a private dike, • a regional district, a municipality, or an improvement district.
Discharge The discharge, usually abbreviated as “Q”, is the volume of a fluid or solid passing a cross section of a stream per unit time.

nhc
Flood Risk Evaluation and Flood Control Solutions – Phase 1 Final Report 88
Disturbance regime Various modes of widespread ecosystem disturbance, e.g., flood, fire, disease or wind, or a combination thereof. Drainage basin A drainage basin is an extent of land where water from rain or snow melt drains downhill into a body of water, such as a river, lake, reservoir, estuary, wetland, sea or ocean. The drainage basin acts like a funnel, collecting all the water within the area covered by the basin and channelling it into a waterway. The drainage basin includes both the streams and rivers that convey the water as well as the land surfaces from which water drains into those channels, and is separated topographically from adjacent basins by a geographical barrier such as a ridge, hill or mountain, which is known as a water divide. Dredging Dredging is an excavation activity or operation usually carried out at least partly underwater, in shallow seas or fresh water areas with the purpose of gathering up bottom sediments and disposing of them at a different location. Dunes Bed forms with triangular profile that advance downstream due to net deposition of particles on the steep downstream slope. Dunes move downstream at velocities that are small relative to the streamflow velocity. Dynamic Model A mathematical model of flow in an open channel that solves the complete unsteady flow equations (St. Venant equations for one-dimensional problems). Earth dike An earth dike is a berm or ridge of compacted soil located in a manner to channel water to a desired location. They are used to control erosion, sedimentation, or prevent flooding. Equilibrium ice cover A stable, consolidated ice-cover. Erosion The wearing away of the land surface by detachment and movement of soil and rock fragments through the action of moving water and other geological agents. Fixed Bed Model Model in which the bed and side materials are non-erodible; deposition does not occur either. Flood Construction Level (FCL) The FCL is the design flood level plus an allowance for freeboard. It is used to establish the elevation of habitable areas of buildings and the minimum crest level of a Standard Dike.

nhc
Flood Risk Evaluation and Flood Control Solutions – Phase 1 Final Report 89
Where the Design Flood Level cannot be determined or where there are overriding factors, an assessed height above the natural boundary of the water-body or above the natural ground elevation may be used. Flood profile A graph of computed flood elevations at floodplain cross-sections. Floodbox They are installed in dikes to control the flow of upland water through creeks or sloughs into estuaries or rivers. Doors or lids are attached to the discharge ends of the culverts to control water flow, commonly referred to as tide gates or flap gates. Tide gates close during incoming (flood) tides to prevent tidal waters from moving upland. They open during outgoing (ebb) tides to allow upland water to flow through the culvert and into the receiving body of water. Floodplain A lowland area, whether diked, flood proofed, or not which, by reasons of land elevation, is susceptible to flooding from an adjoining watercourse, ocean, lake or other body of water and for administration purposes is taken to be that area submerged by the Design Flood plus freeboard. Floodway The stream channel and adjacent areas that carry flood flows. Flow capacity A description of how much fluid is being moved and how much work is being performed, usually measured in m3 per second in river applications. Flow resistance Any factor within a channel that impedes the flow of fluid, such as surface roughness or sudden bends, contractions, or expansions. Fluvial deposit A sedimentary deposit of material transported by or suspended in a river. Fluvial terrace The portion of a river valley lying adjacent to the modern floodplain. Sediments of these landforms were deposited in the recent past (Quaternary) and are now undergoing dissection and destruction. They are not subject to flooding, except under the most extreme conditions. They are typically composed of non-to slightly-lithified sand and gravel. Frazil A collection of loose, randomly oriented needle-shaped ice crystals in water.

nhc
Flood Risk Evaluation and Flood Control Solutions – Phase 1 Final Report 90
Frazil Floe Frazil that has clustered to form ice pans or small sheets of ice. Freeboard A vertical distance added to the Designated Flood Level. Used to establish the Flood Construction Level. Freeze-up The formation of ice on open water. Frequency The number of repetitions of a random process in a certain time period. Frequency curve A graphical representation of a continuous frequency distribution. Freshet A flood resulting from spring thaw. Froude number A dimensionless number significant in classifying and analyzing open channel flow phenomena, based on velocity. Gabion A galvanized wire basket with a removable top. The basket, filled with selected stones, is used to stabilize banks to control erosion in streams and to prevent stream gravel from shifting. Gauge Height Also known as stage, gauge height is the height of the water in the stream above a reference point. Gauge height refers to the elevation of the water surface in the specific pool at a stream gauging station, not along the entire stream. Gauge height does not refer to the depth of the stream. Gauging Station A selected cross section of a stream channel where one or more variables are measured continuously or periodically to record discharge and other parameters. Geodetic elevation Survey datum set by Geologic Survey of Canada Glacio-fluvial terrace See fluvial terrace. Material originating from glacier.

nhc
Flood Risk Evaluation and Flood Control Solutions – Phase 1 Final Report 91
Grid Network of points covering the space or time-space domain of a numerical model or river bed. The points may be regularly or irregularly spaced. Glide A slow-moving, relatively shallow type of river run. Calm water flowing smoothly and gently, with moderately low velocities and little or no surface turbulence. Groundwater Water located beneath the ground surface in soil pore spaces. GSC datum See geodetic elevation. Headwater The source of a river or stream, i.e. the place from which the water in the river or stream originates. HEC-RAS An acronym for the U.S. Army Corps of Engineers Hydrologic Engineering Centers River Analysis System. HEC-RAS is a one-dimensional backwater software for modelling steady flow, unsteady flow, sediment transport and water temperature. Hydraulic Depth The hydraulic depth is the ratio of cross-sectional area to top width at any given elevation. Hydraulic Modeling A small-scale physical or numerical representation of a flow situation. Hydraulic Shear The transport of a fluid at different velocities at different positions within the flow. Hydrograph A graph showing, for a given point on a stream or channel, the discharge, water surface elevation, stage, velocity, available power, or other property of water with respect to time. Ice cover The accumulation of ice blanketing water surfaces. Ice floes Frozen masses that float on the water surface. Ice jamming Occurs when water builds up behind a blockage of ice.

nhc
Flood Risk Evaluation and Flood Control Solutions – Phase 1 Final Report 92
Initial Conditions The values of water levels, velocities, concentrations, etc., that are specified everywhere in the grid or mesh at the beginning of a model run. For iterative solutions, the initial conditions represent the first estimate of the variables the model is trying to compute. Internal friction The force resisting motion between the elements making up a material while it undergoes deformation. Interstitial space Space between (ice) crystals. Juxtaposed cover The accumulation of a single layer of frazil pans. Lacustrine Relating to a lake. Large woody debris Wood material (>10 cm dia. And >2 m long) that mainly enters stream channels from stream bank undercutting, windthrow, and slope failures. They provide habitat for Pacific Northwest salmon. LiDAR An acronym for Light Detection and Ranging, LiDAR is a collection of georeferenced digital earth surface data. Local flow velocity A vector field which is used to mathematically describe the motion of a fluid in a localized area. Lock block retaining walls A concrete modular block system that allows for quick and safe erection of a gravity retaining wall. Lodgement An accumulation or collection deposited in a place or remaining at rest. Log Pearson Type III distribution A statistical distribution of annual maximum discharges which help calculate flood occurrence for a given river or stream. Low profile dike A non-standard dike forming a platform for temporary emergency flood protection.

nhc
Flood Risk Evaluation and Flood Control Solutions – Phase 1 Final Report 93
Manning’s roughness coefficient, n n is a coefficient of boundary roughness and accounts for energy loss due to the friction between the bed and the water. In fluvial hydraulics (movable boundary hydraulics), the Manning’s n value usually includes the effects of other losses, such as grain roughness of the movable bed, form roughness of the movable bed, bank irregularities, vegetation, bend losses, and junction losses. Contraction and expansion losses are not included in Manning’s n, and are typically accounted for separately. Maximum daily flow The maximum flow that occurs over the course of a single day. Maximum instantaneous flow The momentary maximum flow that occurs during a day. Mean annual discharge The discharge averaged over an entire year. Meandering Stream An alluvial stream characterized in planform by a series of pronounced alternating bends. The shape and existence of the bends in a meandering stream are a result of alluvial processes and not determined by the nature of the terrain (geology) through which the stream flows. Monthly minimum flow The smallest average flow reported for a particular month. Natal stream Location of the birth of a fish or other aquatic animal. Numerical Model A numerical model is the representation of a mathematical model as a sequence of instructions (program) for a computer. Given appropriate data, the execution of this sequence yields an approximate solution to the set of equations that comprise the mathematical model. Off-channel habitat Created by long-term processes of alluvial deposition, channel migration, and changes in stream bed elevation, they may be used by salmonid species such as chum or coho. Off-channel habitats include overflow, groundwater, and wall-based channels. Outmigration Fish moving from one body of water to another.

nhc
Flood Risk Evaluation and Flood Control Solutions – Phase 1 Final Report 94
Overbank In a river reach, the area between the bank of the main channel and the limits of the floodplain. Overbank coefficient A factor that accounts for energy loss due to the friction between the overbank bed and the water. Overwintering To pass through or wait out the winter season, or to pass through that period of the year when “winter” conditions (cold or sub-zero temperatures, ice, snow, limited food supplies) occur. Point bar An alluvial deposit adjoining a stream bank, usually on the inside of a bend. Pool A portion of a stream with reduced current velocity, often with water deeper than the surrounding areas, and which is frequently used by fish for resting or cover. Porosity A measure of the void spaces in a material, and is measured as a fraction, between 0–1, or as a percentage between 0–100%. Well sorted (grains of approximately all one size) materials have higher porosity than similarly sized poorly sorted materials (where smaller particles fill the gaps between larger particles). Pro-rated flow An estimated flow in a given river, calculated using a ratio by knowing the drainage area of the first river, and the flow and drainage area of a second river. Rating curve A chart that shows the relationship between the river flow and the stream stage. Increasing stream stage corresponds to an increasing stream discharge or flow. Reach A length of a stream or river. Rearing habitat Aquatic habitat used by juvenile fish that provides suitable depths, velocities and cover - overhead vegetation, woody debris, substrate or hydraulic cover - as well as food sources - drift, instream or drop - that provide fish growth. Regulated flow River flows controlled by releases at dams or other water-control structures.

nhc
Flood Risk Evaluation and Flood Control Solutions – Phase 1 Final Report 95
Reservoir inflow Generally comprised of tributary flow, watershed runoff, and precipitation. Return period An estimate of the time interval between events like a flood or river discharge of a certain intensity or size. It is a statistical measurement denoting the average recurrence interval over an extended period of time. Riffle A shallow rapids where the water flows swiftly over completely or partially submerged obstructions to produce surface agitation, but standing waves are absent. Ring dike A localized dike built around structures or land to protect it from flooding. Riparian vegetation The land adjacent to the normal high waterline in a stream or lake whose soils and vegetation are influenced by the presence of the ponded or channelized water. Riprap Stones placed as erosion protection. River2D A two dimensional depth-averaged finite element hydrodynamic model, customized for fish habitat evaluation studies. Riverbank dike Dikes built directly adjacent to rivers to protect against flooding that may occur from high tides, storm surge or flood flows. Roughness The roughness of the bed and banks of a stream or river. The greater the roughness, the greater the frictional resistance to flows; and hence, the greater the water surface elevation for any given discharge. Roughness coefficient Numerical measure of the frictional resistance to flow in a channel (see Manning’s n). Run An area of swiftly flowing water, without surface agitation or waves, which approximates uniform flow and in which the slope of the water surface is roughly parallel to the overall gradient of the stream reach.

nhc
Flood Risk Evaluation and Flood Control Solutions – Phase 1 Final Report 96
Run-off The water flow which occurs when soil is infiltrated to full capacity and excess water, from rain, snowmelt, or other sources flows over the land. Schematization Representation of a continuum by discrete elements, e.g., dividing a real river into reaches with constant parameters. Scour The enlargement of a cross section by the removal of boundary material through the action of the fluid in motion. Secondary channel See Side-channel. Secondary consolidation Consolidation is a process by which a juxtaposed ice-cover is compressed into a thicker layer of ice. Secondary consolidation takes place after primary consolidation, and is caused by increased forces on the ice cover, sudden changes in the discharge or dramatic temperature fluctuations. Sediment (1) Particles derived from rocks or biological materials that have been transported by a fluid. (2) Solid material suspended in or settled from water. A collective term meaning an accumulation of soil, rock, and mineral particles transported or deposited by flowing water. Sediment loading The deposition of sediment load from one area of a channel to another. Sediment load is made up of organic and inorganic matter that is suspended in and carried by moving water, and coarse materials such as gravel, stones, and boulders that move along the bottom of the channel. Sedimentation Refers to the gravitational settling of suspended particles that are heavier than water. Setback dike Dikes that are constructed at a distance from the river channel in order to allow the river to occupy a portion of its floodplain. Setlines A long heavy fishing line to which several hooks are attached in series.

nhc
Flood Risk Evaluation and Flood Control Solutions – Phase 1 Final Report 97
Shields number A value used to denote conditions under which bed sediments are stable but on the verge of being moved. Shore ice Ice that forms along the river banks. Side-channel A lateral channel with an axis of flow roughly parallel to the main stem, which is fed by water from the main stem; a braid of a river with flow appreciably lower than the main channel. Slope armouring The protection of river banks or dike slopes. Smolting A seaward migrating juvenile salmonid, which is silvery in color, has become thinner in body form and is physiologically prepared for the transition from fresh-to saltwater. Spawning The production and depositing of large quantities of eggs in water, by marine animals such as amphibians and fish. Specific gauge plot At a specific location along a river, a graph showing the water level for a particular flow over time. Used to determine if the river channel at the specific location is aggrading or degrading. Stage Height of water surface above a specified elevation. Stage-Discharge (Rating) Curve Defines a relationship between discharge and water surface elevation at a given location. Streambed scour Lowering of streambed or undermining of foundations by erosive action of flowing water. Substrate The river bed material below the surface armouring. Suspended sediment Solid particles transported in a fluid media or found in deposit after transportation by flowing water, wind, glacier and gravitational action.
nhc
Flood Risk Evaluation and Flood Control Solutions – Phase 1 Final Report 98
Terrace A geological term for a flat platform of land created alongside of a river or sea, where, at some time in the past, the river has cut itself a deeper channel. The former floodplain of the river is therefore at a higher point and is known as a terrace. Rivers can create a sequence of terraces over millennia as they erode away more material. Thalweg The line following the lowest part of a valley, whether under water or not. Usually the line following the deepest part, generally close to the middle of a river channel. Thermal ice Ice formed in situ by freezing of the water or the water/frazil mixture. Thermal load Locally heated water preventing or delaying the formation of ice. Threshold velocity The minimum velocity at which wind or water begins to move particles of soil, sand, or other material at a given place under specified conditions. Training Works Any wall, dike or protective structure used to prevent a stream from leaving its channel at a given location. This includes any debris flow training structures including basins, trash racks, or other works. Transport capacity The capacity of a river to transport sediment. Triangulated Irregular Networks (TIN) A TIN is a set of adjacent, non-overlapping triangles, computed from irregularly spaced points with x/y coordinates and z-values. The TIN data structure is based on irregularly spaced point, line, and polygon data interpreted as mass points and breaklines. Tributary A stream or river which flows into a mainstem (or parent) river. Turbidity The cloudiness or haziness of a fluid caused by individual particles (suspended solids), that are generally invisible to the naked eye, similar to smoke in air. The measurement of turbidity is a key test of water quality. Unsteady-State Model Model in which the variables being investigated are time dependent.

nhc
Flood Risk Evaluation and Flood Control Solutions – Phase 1 Final Report 99
Verification Check of the behaviour of a calibrated model against a set of prototype conditions that was not used for calibration. Water surface slope Fall per unit length along the water surface centerline of the channel. Watershed An area of land (the catchment or drainage basin), bounded by a topographic height of land, that delivers water along a stream channel to a common outlet. Wetted perimeter The length of the line of intersection of the channel wetted surface with a cross-sectional plane normal to the direction of flow.

XS F61
XS F60
XS F59
XS F58XS F57
XS F56XS F55
XS F54
XS F53
XS F52.5
XS F51
XS F50
XS F49
XS F48
XS F47
XS F46XS F45
XS F44
XS F43
XS F42
XS F41 XS F40
XS F39
XS F38
XS F37
XS F36XS F35
XS F34
XS F33
XS F32XS F31
XS F30
XS F29
XS F28
XS F27
City of Prince George
Nechako River
Fraser River
XS F52
518000.000000
518000.000000
520000.000000
520000.000000
522000.000000
522000.000000
524000.000000
524000.000000
526000.000000
526000.000000
5976
000.0
0000
0
5976
000.0
0000
0
5980
000.0
0000
0
5980
000.0
0000
0
5984
000.0
0000
0
5984
000.0
0000
0
0 500 1,000 1,500 2,000250Metres
®
Legend - Year of Survey
XS (1979 & 2008)
XS (1995)
XS (1979)
1:35,000
GD
L \\1
0.0.
3.10
\pro
ject
s\34
920
PG F
PM
\GIS
_XS
Scale: City of Prince George
Fraser River above Nechako RiverCoord. System: UTM Zone 10Datum: NAD 83Units: MetresNotes: Satellite image from Google Earth
January 2009 Map 1
Cross-Section Locations

City of P
rince George N
echako River
Fraser River
XS N34
XS N33
XS N32
XS N31
XS N30
XS N29
XS N28
XS N27
XS N26
XS N25
XS N24
XS N23
XS N22BXS N
22XS N
22A
XS N21
XS N20
XS N19
XS N18
XS N17
XS N16
XS N15
XS N14
XS N13XS N
12
XS N11
XS N10
XS N9
XS N8
XS N7
XS N6
XS N5
XS N4
XS N3
XS N2
XS N1
XS C1
XS C2
XS C3
XS C4
XS C5
XS C6
5080
00.0
0000
0
5080
00.0
0000
0
5100
00.0
0000
0
5100
00.0
0000
0
5120
00.0
0000
0
5120
00.0
0000
0
5140
00.0
0000
0
5140
00.0
0000
0
5160
00.0
0000
0
5160
00.0
0000
0
5180
00.0
0000
0
5180
00.0
0000
0
5975000.000000
5975000.000000
5980000.000000
5980000.000000
0 500 1,000 1,500 2,000250Metres
®
Legend - Year of Survey
XS (1995 & 2008)XS (1979 & 2008)XS (2008)
XS (1995)XS (1979)XS_C (2008)
1:35,000
GD
L \\1
0.0.
3.10
\pro
ject
s\34
920
PG
FP
M\G
IS_X
S
Scale:Coord. System: UTM Zone 10Datum: NAD 83Units: MetresNotes: Satellite image from Google Earth
City of Prince George
Nechako River
January 2009 Map 2
Cross-Section Locations

XS F26
City of Prince George
Nechako River
Fraser River
XS F25
XS F24
XS F23
XS F22
XS F20
XS F19
XS F18
XS F17
XS F16
XS F15
XS F14
XS F13
XS F12
XS F11
XS F10
XS F9
XS F8
XS F6
XS F5
XS F3
XS F2
XS F1
XS F21
XS F7
XS F4
XS F21A
514000.000000
514000.000000
516000.000000
516000.000000
518000.000000
518000.000000
520000.000000
520000.000000
5964
000.0
0000
0
5964
000.0
0000
0
5968
000.0
0000
0
5968
000.0
0000
0
5972
000.0
0000
0
5972
000.0
0000
0
0 500 1,000 1,500 2,000250Metres
®
Legend - Year of Survey
XS (1995 & 2008)XS (1979 & 2008)XS (2008)
XS (1995)XS (1979)
1:35,000
GD
L \\1
0.0.
3.10
\pro
ject
s\34
920
PG F
PM
\GIS
_XS
\Fra
ser_
B.m
xd
Scale:
Coord. System: UTM Zone 10Datum: NAD 83Units: MetresNotes: Satellite image from Google Earth
City of Prince George
Fraser River below Nechako River
January 2009 Map 3
Cross-Section Locations

" )
" )
FF
GF
EF
FRASER RIVER AT SHELLEY
FRASER RIVER AT PRINCE GEORGE
MS
N, Y
:\349
20 P
G F
PM
\GIS
\349
20_M
SN
_Haz
ardM
itiga
tion1
_Pan
el1.
mxd
CITY OF PRINCE GEORGE
Flood Risk AreasFraser River above Nechako,
Map 4
northwest hydraulic consultants project no. 3-4920 Jan-2009
Scale -
coord. syst.: UTM Zone 10 horz. datum: NAD 83 horz. units: metres
500 0 500250Metres
1:15,000
Legend
") Hydrometric Station
Flooded Area 1972
Flooded Area 1948
Areas at Risk
1997_Floodplain
Municipal Boundary
®
Map Panel 4
Notes:- 2006 orthophotos supplied by McElhanney Consultings Services Ltd.- 23 Sep 2000 Landsat 7 satellite image supplied by GeoBase.ca.
Map Panel Index
45
6
®

")
")AN
CF
CN
FN
BN
BF
GN DN
EN AF
EN
FRASER RIVER AT PRINCE GEORGE
FRASER RIVER AT SOUTH FORT GEORGE
MS
N, Y
:\349
20 P
G F
PM
\GIS
\349
20_M
SN
_Haz
ardM
itiga
tion1
_Pan
els2
and3
.mxd
CITY OF PRINCE GEORGE
Flood Risk AreasNechako River and Fraser Riverbelow Nechako, Maps 5 and 6
northwest hydraulic consultants project no. 3-4920 Jan-2009
Scale -
coord. syst.: UTM Zone 10 horz. datum: NAD 83 horz. units: metres
500 0 500250Metres
1:15,000
Legend
") Hydrometric Station
Ice Jam Flooding 2007/2008
Groundwater Flooding 2007/2008
Flooded Area 1972
Flooded Area 1948
Areas at Risk
1997 Floodplain
Municipal Boundary
" )
DF
CF
FRASER RIVER AT SOUTH FORT GEORGE
®
®Map Panel 5
Map Panel 6
Notes:- 2006 orthophotos supplied by McElhanney Consultings Services Ltd.- 23 Sep 2000 Landsat 7 satellite image supplied by GeoBase.ca.
Map Panel Index
45
6
®

APPENDIX A TERMS OF REFERENCE

Terms of Reference for Flood Risk Evaluation and Flood Control Solutions Nechako and Fraser Rivers February 2008

City of Prince George Page 2 Flood Risk Evaluation and Flood Control Solutions – Terms of Reference
1. Introduction Flooding of lands within the City of Prince George has occurred during the 2007 spring freshet and now during the winter ice jam beginning December 10, 2007. The freshet flooding affected lands at the confluence of the Fraser and Nechako Rivers and along the Fraser River at Landooz Road and the Farrell Crescent and Regents Crescent area. The Nechako River ice jam has flooded residential properties in the PG Pulpmill Road, Pozer Road, Preston Road and Morning Place areas. Flooded industrial areas include North Nechako Road, Ongman Road, McAlhoney Road, River Road, Foley Crescent and Kelliher Road. One of the City’s water supply wells was threatened, but not affected because of floodproofing improvements made ten years ago. Freshet flooding of the Fraser River threatens or occurs in the floodplain areas about every five years or so. The last major flood (greater than 20-year flood) occurred in the early 1970’s after which the residents of the Island Cache area at the confluence were relocated and the residences removed. Ice jam flooding on the Nechako River has been recorded 12 times since the early 1900’s [Floodplain Mapping Fraser and Nechako Rivers at Prince George, Design Brief, Province of British Columbia, Ministry of Environment, Lands and Parks, Klohn-Crippen, May, 1997]. The current ice jam flooding event beginning December 10, 2007 in the City of Prince George appears to have surpassed the flooding experienced with passed events of the last 50 years. According to the 1997 Klohn-Crippen report, the Nechako discharge rate of 246 cubic metres per second recorded January 12, 2008 at the Foothills Bridge was only surpassed once during an ice jam event in March of 1957, when the discharge was recorded at 311 cubic metres per second. The sustained flow of the Nechako over the 2007-2008 winter appears to be caused by an extended discharge of flow from the Nechako Basin lakes and the reservoir that received runoff caused by snow levels of up to 200 percent during the winter of 2006-2007. On two occasions during the current event, December 31, 2007 and January 5, 2008, ice jam compressions breached the temporary berms and sand gabion dykes that had been constructed to the 200-year flood level. The January 5th compression exceeded a level of up to 0.3 metres over the 200-year ice jam flood level. These events have initiated the need to review the risk to the City of Prince George to both freshet and ice jam flood events, especially at the Nechako River and Fraser River confluence where several industries, the CN railway yard and inter-modal facility, and much of the downtown are at risk to flooding. The City of Prince George, with the assistance of Emergency Management BC, is proceeding with a flood risk evaluation and flood control solutions study to consider the long term options to reduce the risk of flooding and to protect floodplain lands within the City. The services of a qualified engineering firm are required to perform the flood risk evaluation and to develop solutions for flood control.

City of Prince George Page 3 Flood Risk Evaluation and Flood Control Solutions – Terms of Reference 2. Background Since construction of the Kenney Dam in the early 1950’s, Nechako River flooding due to the effects of ice appears to occur mostly at freeze-up. During freeze-up, an ice cover forms on the Nechako River at Prince George in most years due to the accumulation of frazil floes against the ice cover on the Fraser River. The frazil is generated along the river upstream of Prince George in response to sub-zero air temperatures, with the frazil forming into ice floes as it moves downstream. The ultimate timing of when the ice cover begins to form on the Nechako River depends on when the ice cover forms on the Fraser River – it is unlikely that a cover will form on the Nechako River unless lodgement is initiated against ice on the Fraser River. The severity of the ice jam (peak water levels, thickness of the ice accumulation, and the length of the ice accumulation) is a function of both the flow on the Nechako River and the severity of the winter. The flow varies from year to year, depending on Alcan releases at Skins Lake Spillway, outflows from Fraser and Stuart Lakes, and local inflows from tributaries such as the Chilako River. The winter severity also is quite variable, and in years with prolonged periods of cold weather, sufficient ice can be generated to produce thick accumulations of ice that may extend several kilometres upstream of the Fraser River along the Nechako River. Ultimately, the likelihood of experiencing high ice-related water levels along the Nechako is related to the combined risk of experiencing cold temperatures and high flows during freeze-up. This can happen quite frequently – for example water levels at freeze-up have approached or exceeded the 20-year open water level twice in the last ten years. In both cases, flood damages occurred due to both surface water flooding and high groundwater levels in the floodplain adjacent to the river. The ice jam flooding event of 2007-2008 and spring freshet Fraser River flooding has raised questions with regard to the cause of the events, the solutions deployed to deal with the event, the adequacy of the City’s floodplain mapping and the regulatory processes for development of lands with the floodplain.
3. Phase 1 - Flood Risk Evaluation
3.1 Risk Analysis The City of Prince George with the assistance of Emergency Management BC has prepared the following outline for the flood risk analysis. The analysis is broken into five stages: threat analysis, consequence analysis, flood relief options, priority setting and coarse filtering.
• Threat Analysis - A systematic use of available information to determine how often specified events occur and the magnitude of the consequences. For example, how often will the flood occur and how big will the flooding be? The analysis will require the preparation of:
o a review of the historical documentation of past flood events, including, river discharge prior to and during flood events, climate information and weather patterns leading up to and during flood events, and river levels during flood events;
Phase 1 Report Reference Section 5 Section 5.1 Section 3 Section 4

City of Prince George Page 4 Flood Risk Evaluation and Flood Control Solutions – Terms of Reference
o a map to demonstrate the impact of the past flood events; o a review of the development of the existing flood plain mapping and its
reliability in predicting flood level frequency; o recommendations for the review during the feasibility assessment.
• Consequence Analysis – A review of infrastructure, residential, commercial and industrial assets within the flood plain. Tasks for this analysis include:
o prepare an infrastructure inventory with replacement values of public-owned assets within the floodplain including roads, bridges, community wells, trails, parks, water and sanitary sewer pipelines, storm sewer outfalls, etc.;
o prepare an inventory with replacement values of private-owned utility assets such as BC Hydro, Telus, Terasen, Shaw Cable and others;
o prepare an inventory with assessed values of properties within the flood plain, including on-site assets;
o assess and rank public-owned and private-owned assets on the basis of vulnerability to flooding, i.e. functionality and accessibility during a flood event, criticality of asset, flood damage costs, etc.
o assess and rank properties based on vulnerability to flood damage, for example, floor elevation, setback from riverbank, extent of onsite flood-proofing, etc.
• Flood Relief Options – Categorize floodplain areas prone to flooding as
identified during the 2007-2008 flooding event. Identify flood relief options for these areas with concept level costs for the purpose of comparative analysis and priority setting. Consider options that may include, but not limited to, land use change, permanent dyking (with or without groundwater cut-offs or sub-drains), side channel floodways, gravel extraction (dredging), and upstream diversion or regulation. Review impact of existing temporary works and works installed by property owners during the current ice-jam.
• Priority Setting – Use a decision-matrix, benefit-cost analysis or other suitable
method to prioritize the flood relief options. Priority analysis to consider public safety, environmental impact, land values, economic impact, life-cycle cost of mitigation measures, etc. Prepare priority assessment.
• Coarse Filtering – Summarize results of the above analysis in a report with the
objectives of eliminating flood relief options not recommended as a result of the risk analysis and in further investigating mitigation measures during the feasibility assessment. Present the options that will be further analyzed in the feasibility assessment.
3.2 Feasibility Assessment Following the risk analysis, complete a feasibility assessment for the recommended flood relief options considered for the freshet and ice-jam flood events on the Nechako and Fraser Rivers.
Maps 4-6 Section 1.1.2 and 3.6.3 Progr. Report 1 Section 5.3 Section 6 Progr. Report 1 Appendix F Section 6.1

City of Prince George Page 5 Flood Risk Evaluation and Flood Control Solutions – Terms of Reference
1. Data Collection and Review – Obtain information not already compiled for the risk analysis. Data sources may include field investigations and obtaining topographic information from City GIS database. Collect data available from provincial and federal agencies. Review data for completeness and determine what further data collection is required and how it will be obtained.
2. Hydrological Analysis – Using standard industry techniques and models to
perform the hydrologic and flood frequency analyses for the Fraser River and Nechako River systems (see Appendix A). Consider the broad impacts of climate change using any available regional climate change models. Conduct a sensitivity analysis to present probability of flood level changes.
3. Soils and Geotechnical Investigation – Review available data from the City’s ongoing River Confluence Groundwater Monitoring Program and from recent soils/geotechnical studies available from the City of Prince George. Conduct preliminary field investigations as necessary for the recommended flood relief options identified in the Risk Analysis. Determine availability of borrow material (suitable dike fill, riprap, impervious material, etc.).
4. River Hydraulics, Freshet and Ice-Related Flooding Analysis – Refer to
Appendix A for a description of the methodology for determining freeze-up characteristics, forecasting ice-related water levels and local river hydraulic characteristics. Consider allowance for ice jam wave events (javes) with respect to elevation of flood protection works and assess if design of works should allow for overtopping during such javes. Conduct bathymetric surveys at the confluence, bridge structures and at selected salient locations as necessary. Assess the recommended flood relief options with respect to their impact on river migration, existing bridges, the river banks, riparian area and riverfront properties upstream, downstream and lateral to the proposed works.
5. Environmental Impacts – Conduct preliminary environmental impact
assessments for land-base or in-river flood relief options. Identify the processes necessary to obtain approvals complete with cost estimates and time lines – e.g. fisheries window for works within the river or riparian zone. Include concepts and preliminary costs for landscaping that is compatible with riparian and riverbank areas.
6. Floodplain (Internal) Drainage Considerations – Assess the requirement for
drainage and groundwater diversion works in areas to be protected by flood protection works (i.e. dikes). Diversion works may include subdrains, pumpstations, floodboxes, ditches, relief wells, cut-offs, etc. Prepare preliminary cost estimates for such works.
7. Property Acquisition – Identify lands to be purchased or rights-of-way to be
obtained for construction of flood protection works. Prepare cost estimates based on assessed values and consultation with City’s Real Estate Services Division.
Sections 3,4,5 Section 3 Appendix G Section 3 Section 6.3 Section 6.6.2 Appendix G Section 6.4

City of Prince George Page 6 Flood Risk Evaluation and Flood Control Solutions – Terms of Reference
8. Medium Filtering – Present the results of the above analysis in a report document with the objectives of eliminating flood relief options not feasible as a result of the feasibility assessment. Recommend flood control solutions that mitigate flooding and that will be further assessed and estimated for cost in Phase 2 - Flood Control Solutions.
3.3 Report
Present Phase 1 findings and report to City of Prince George Staff and to Mayor and Council.
4. Phase 2 - Flood Control Solutions
4.1. Public Consultation
1. Allow for three separate trips to Prince George to participate in public meetings with stakeholders and property owners impacted by the recommendations of the Flood Risk Evaluation. Prepare displays, pamphlets, digital slides for webpage and other education materials for the City’s use in presenting the results of the Flood Risk Evaluation and the recommended flood control solutions.
4.2. Select Flood Control Solutions Summarize the results of the public consultation process and revise recommended solutions to control and provide protection from flooding or to reduce the risk of flooding for flood plain areas on the Fraser and Nechako Rivers.
• Flood Control Infrastructure – Based on the flood risk evaluation and public consultation process, identify and evaluate the proposed infrastructure measures complete with cost estimates (Class D) and timelines for property acquisition, regulatory approvals, design and construction.
• Land Use – Identify land use changes that are considered necessary from the
risk analysis and the feasibility assessment. Provide timelines and implementation strategies.
• River Solutions – In-river solutions such as gravel extraction and side channel
diversion/relief floodways that satisfy the risk analysis and feasibility assessment may require further review with regulatory agencies. Identify the processes necessary to obtain the necessary approvals complete with cost estimates and timelines.
• Revise Flood Plain Mapping – Based on forecasts presented in the river
hydraulics and ice-related flooding analysis and in conjunction with the BC Ministry of Environment, recommend and prepare revised flood plain mapping for
Section 6.7 To be completed

City of Prince George Page 7 Flood Risk Evaluation and Flood Control Solutions – Terms of Reference
the City of Prince George. Floodplain mapping is to be prepared in accordance with the Fraser Basin Council Floodplain Mapping Guidelines and Specifications, March 2004. The floodplain mapping must be provided in digital format compatible with the City’s GIS mapping system. A design brief providing support for the analysis must accompany the mapping.
5. Available References • Floodplain Mapping Fraser and Nechako Rivers at Prince George, Design
Brief, Province of British Columbia, Ministry of Environment, Lands and Parks, Klohn-Crippen, May, 1997
• Floodplain Mapping Guidelines and Specifications, Fraser Basin Council March 2004.
• Guidelines for Management of Flood Protection Works in BC
• Dike Design and Construction Guide
• Riprap Design and Construction Guide • City of Prince George Flood Plain Regulation Bylaw No. 7855, 2007
6. Schedule Complete Phase 1 within six months of notice to proceed and signing an agreement with the City of Prince George. Following acceptance of the Phase 1 Flood Risk Evaluation, proceed with Phase 2 Flood Control Solutions and complete within six months. Submit a work plan schedule including milestone dates, submission dates, review periods, review meetings, and field work.

City of Prince George Page 8 Flood Risk Evaluation and Flood Control Solutions – Terms of Reference
• Appendix A- Hydrologic, Hydraulic and Ice-Related Flooding Analyses
1. HYDROLOGIC AND HYDRAULIC ANALYSES
• Complete a hydrologic analysis of the Fraser River and Nechako River
systems to estimate the magnitude of the 200-year flood that could inundate the floodplain areas along the Fraser and Nechako Rivers within in the City of Prince George.
• Complete a hydraulic analysis to determine the water surface profile of the 200-year flood for the Fraser and Nechako Rivers.
• Perform analyses in accordance with the Fraser Basin Council, Floodplain Mapping Guidelines and Specifications, March 2004.
2. ICE-RELATED FLOODING ANALYSIS To deal with these ice concerns in a more systematic manner, the following is required: (1) develop a procedure to forecast the timing and severity of freeze-up, (2) develop an understanding of the risks of experiencing high ice-related water levels along the Nechako River, and (3) develop ways to mitigate the effects of high ice-related water levels through improvements to the infrastructure or by strengthening land use bylaws. It is proposed that the work be carried out in two phases: Phase 1 would address the ice-related process identified in items (1) and (2) above, and would ultimately provide the design parameters for Phase 2. Phase 2 would address item (3) above and it would be mainly related to identifying and evaluating a range of flood mitigation measures. The scope of work specified herein addresses only Phase 1. The scope of work for Phase 2 will be defined after the completion of Phase 1. PHASE 1: FORECASTING METHODOLOGIES AND RISK ASSESSMENT The effort here would focus on (1) establishing an understanding of the hydrologic and climate regime, (2) summarizing the historical freeze-up characteristics within the context of conventional ice hydraulics, (3) assessing the local hydraulic characteristics of the Nechako River/Fraser River and their contributions to lodgement and freeze-up levels, (4) assessing the effects of the changing climate, and (5) providing design guidelines for mitigation measures. The following is a list of the potential tasks that would be required to complete the assessment. Hydrologic/Climate Regime
• Characterize the annual flow regime of the Nechako River since regulation, identifying peak flows, recession rates, and flow contributions from the various sub-basins. Put the flows into the context of annual precipitation patterns. Examine any existing flow forecasting methods and determine their applicability to forecast flows in November and December.

City of Prince George Page 9 Flood Risk Evaluation and Flood Control Solutions – Terms of Reference
• Determine the accuracy of the daily winter flow estimates at Isle Pierre. Examine best practices for determining ice-affected flows and evaluate their efficacy. Assemble any available bathymetric data from the vicinity of the hydrometric gauge.
• Assess the water temperatures of outflows from Fraser and Stuart Lakes during the late fall and early winter. If data is unavailable, determine options to collect the appropriate air and water temperatures.
• Summarize the winter climate regime at Prince George within the context of freeze-up on the Fraser River at Old Fort George, the observed development of ice covers on the Nechako River. Temperature frequency-duration curves would be a convenient way to characterize the risks of experiencing severe temperature patterns during the freeze-up period.
Historical Freeze-up Characteristics
• Summarize the freeze-up dates and stage increases of the Fraser River at Old Fort George within the context of the background flows and ambient air temperatures. Provide frequency curves of the expected freeze-up date and any empirical relationships between the onset of freeze-up and water level increases and the ambient background conditions.
• Assess the historical flows on the Nechako River during freeze-up on the Fraser River and provide an indication of the risk of experiencing a given flow condition.
• Discuss the salient ice processes that contribute to freeze-up. • Assess the historical freeze-up water level record on the Nechako River at Prince
George, summarize the freeze-up levels and ambient flows, and put them into the context of conventional ice jam rating curves.
• Provide an assessment of the thickness of the ice accumulation, the volume of ice required to produce an ice cover of a given length, and the meteorological conditions required to generate that volume of ice.
• Develop procedures to forecast ice-related water levels and to estimate the climate conditions required to produce freeze-up ice accumulations of various lengths at various flows. Use this as a basis to assess the risk of a attaining a given ice-related water level at various locations along the Nechako River within the City of Prince George.
Local Hydraulic Characteristics – Nechako River at Prince George
• Summarize the historical channel bathymetry of the Lower Nechako River. • Assess changes to the hydraulic regime of the Lower Nechako River over the
last couple of decades. If required, undertake new bathymetric surveys at selected salient locations.
• Note that there is concern about the potential for ice conditions being exacerbated by aggradation at the mouth of the Nechako River and on the Fraser River. Assess the extent of this aggradation and determine if it has any effect on ice lodgement/transport within the context of backwater conditions on the Fraser River.
• Provide a quantitative assessment of the effects of changing bathymetry on the hydraulic characteristics of the river (slope, width, depth, velocity) for flow

City of Prince George Page 10 Flood Risk Evaluation and Flood Control Solutions – Terms of Reference
conditions during freeze-up, and define the effects of these changes on the thickness of the ice accumulation and freeze-up levels.
Effects of Climate Change on Freeze-up Severity and Design Philosophy
• Chose the appropriate climate change scenarios that best apply to the interior region of British Columbia and identify changes in the precipitation and air temperatures that are expected to occur between now and 2080.
• Summarize the expected impacts that climate change may have on the severity of freeze-up, specifically related to the expected ice-related water level for the design event.
Mitigation Measures/Design Criteria
• Identify and evaluate a range of mitigation measures that could be applied to limit the severity of the ice accumulation or to limit the effects of the water level increases due to the ice accumulation.
• Recommend design criteria that would be used to design mitigation measures such as diking and/or flood proofing within the context of current British Columbia guidelines.

APPENDIX B FLUVIAL GEOMORPHOLOGY

B.1 NECHAKO RIVER
B.1.1 SPECIFIC GAUGE ANALYSES The Water Survey of Canada regularly measures the discharge at their stream gauging stations. This information is used to prepare a ‘stage–discharge rating table’ or ‘curve’ which specifies the relationship between water level and stream flow. This relationship is periodically revised if changes in channel dimensions or river bed elevation occur as a result of sediment accumulation, sediment evacuation, bank erosion or other factors.
A ‘specific gauge plot’ is a method of detecting trends in the series of stage–discharge relationships. In this technique the water level elevation associated with a range of flows is determined and the results are plotted as a time series based on the period of record over which each stage–discharge relationship was employed. The resulting graphs show how changing channel characteristics have affected water levels over time. In general, these water level variations result from changes in river bed elevation or channel cross-sectional area and can sometimes provide information on changes in sediment supply.
The WSC has operated a stream gauging station on Nechako River at Isle Pierre, since 1950. This site is located 61 km upstream of Prince George and 26 km upstream of the Chilako River confluence. As discussed in MMA (2008b), the Isle Pierre gauging station is upstream of numerous sediment sources which periodically contribute material to lower Nechako River.
A specific gauge plot for Nechako River at Isle Pierre is shown as Figure B.1. This graph covers the period between 1950 and 2007. The analysis evaluates stream discharges which are representative of extreme low (100 m³/s), the mean annual discharge (275 m³/s) and larger flows of up to 1,200 m³/s (see MMA 2008b for representative hydrographs).
Figure B.1 does not show any unequivocal trend in water level elevation:
• The lowest flow of 100 m³/s generally decreases in elevation over the period of record;
• Flows of 200 and 300 m³/s maintain a more or less constant elevation; and,
• Peak flows of 600 to 1,200 m³/s decrease in elevation between 1959 and 1979, marginally increase in elevation in the middle period of the record and then marginally decrease.
The small magnitude of the changes and inconsistencies between low and high flow values suggests that there are not significant trends in sediment supply or channel geometry data.
B.1.2 SEDIMENT SOURCES A separate report has been prepared which describes sediment sources to Nechako River in the 35 km long section of channel located between the Chilako River confluence and Prince George (MMA., 2008b). The locations of the 15 identified sites are indicated on Figure B.2. A summary of site characteristics is presented on Table B.1. Identified

sources include Chilako River, eroding glacio-fluvial terraces and more modern fluvial deposits.
The above analyses indicate that there are significant sediment source areas in lower Nechako River which cannot be readily stabilized. These sites will erode during periods of high flow and the resulting sediment load (as well as that derived from more upstream sections of Nechako River) will be conveyed downstream towards the Fraser River confluence.
B.1.3 BED MATERIAL TRANSPORT As discussed in Section 2.4.1, analyses of historical air photographs suggest that some gravel deposition has occurred in Nechako River at the confluence and this is supported by the cross-section comparison at Section N1. The area is illustrated on Plate B.1. Calculations were undertaken to determine how changes in discharge may have affected annual bed material transport capacity on lower Nechako River. Plate B.1 shows a gravel bar (located between surveyed sections) which appears to have enlarged over time. The bed material transport equation proposed by Parker 1990 has been used for this analysis.
The capacity calculations used the average channel geometry in the ‘transport’ area which extends between cross-sections N4 and N19. Within this area an average water surface slope of 0.08% (0.0008 m/m) and an average channel width of 179 m have been adopted.
The analyses were undertaken based on simulated daily discharges for Nechako River at Prince George during the period between 1980 and 2007. This time series includes the maximum estimated daily flow of 1,227 m³/s (in 1997) and the maximum annual discharge (476 m³/s) when Nechako reservoir levels were lowered in the spring of 2007 to avoid over-topping Kenney Dam as a result of an unusually deep winter snow pack.
The surface bed material size was measured at the 9 locations on lower Necahko River indicated on Figure B.3 using the tape grid method described in Yuzyk (1986) and Bunte and Abt (2001). The bed material data are summarized on Table B.2.
The bed material transport capacity was calculated for two grain size values. These are based on:
1. The comparatively small and more mobile gravel deposits at Km 288.5 (distance below Kenney Dam). The D50 or average value is 10 mm. This site is illustrated on Plate B.2; and,
2. An average of the bed material size observed at Km 289, downstream of John Hart Bridge, Km 291.5, Km 292 and Km 293. The average or D50 value is 32 mm. These sites are illustrated on Plates B.3 to B.7.
The results of the transport calculations are summarized on Tables B.3 and B.4. These calculations predict transport capacity not actual loads as mobile bed material is likely to be supply limited in lower Nechako River. The results are probably best employed as an index to illustrate the inter-annual variability in bed material transport. With these cautions, the analyses indicate that the average annual bed material transport capacity for the finer bed material size is approximately 240,000 m³/yr. The predicted average annual transport capacity for the coarser bed material is approximately 2,000 m³/yr. Actual

rates, in years where flows are high enough to erode material from the upstream channel banks, is likely to be somewhere between these values.
The annual variability in this bed material transport index is significant. For example, the high flow conditions in 2007 1 result in annual transport capacities which are 720% and 2,420% of average for the fine and coarse textured bed material sizes, respectively. These unusual flows exceeded threshold conditions and resulted in a substantial capacity to convey the observed bed material.
B.2 FRASER RIVER
B.2.1 SPECIFIC GAUGE ANALYSIS The WSC has operated a stream gauging station on Fraser River at Shelley since 1950. This site is located 23 river km upstream of Prince George (see air photo mosaic in MMA, 2008b, Appendix 3) and 12 km downstream of the Salmon River confluence.
The specific gauge plot for this site is shown on Figure B.4. The evaluated discharges range from a low of 250 m³/s, a mean annual discharge of 800 m³/s and higher flows of up to 5,000 m³/s. Representative hydrographs are again shown in MMA, 2008b.
The specific gauge plot does not show any well defined trends in water level elevation. All discharges show a modest decrease in elevation in the late-1950’s and a poorly-defined trend of small decreases in elevation continues for flows of ≤2,000 m³/s. The main conclusion of this analysis is that Fraser River in the vicinity of Shelley has not experienced any significant sediment accumulation over the period of record.
B.2.2 SEDIMENT SOURCES A separate report has been prepared which describes sediment sources to Fraser River in the 35 km long section of channel located between the Salmon River confluence and Prince George. The locations of the six identified sites are indicated on Figure B.5. A summary of site characteristics is presented on Table B.5. The two largest sediment sources are Salmon River which is conveying significant quantities of bedload and a rapidly eroding fluvial terrace located 30 km upstream of Prince George.
Ground inspection and an analysis of historical air photos indicate that 3.6 x 10⁶ m3 of sand and gravel have been eroded from the fluvial terrace site over the period between 1946 and 2003. This corresponds to an average annual sediment loading of 64,000 m3/yr. Actual rates of sediment production are likely to be episodic. Other sediment source areas include more slowly eroding sections of fluvial or lacustrine materials.
The above analyses indicate that there are sizeable sediment source areas upstream of Prince George which cannot be stabilized. A portion of the eroded materials, along with sediment supplied from upstream reaches of Fraser River, will be carried downstream and are available for deposition in areas such as the Nechako River confluence (Plate B.8).
1 See hydrograph in MMA, 2008b

1 S = Small M = Moderate L = Large U = Unknown
TABLE B.1: SEDIMENT SOURCE SUMMARY, NECHAKO RIVER DOWNSTREAM OF CHILAKO RIVER
MO
SAIC
#
RIV
ER K
M
RIV
ER K
MU
/S O
F PG
RIV
ER B
AN
K
LOCATION TERRAIN UNIT SEDIMENT SOURCE
LEN
GTH
(m)
VOLUME OFSEDIMENT
PRODUCTION1RATE OF
BANKRECESSION
EXISTING BANKPROTECTION
POTENTIALBANK
PROTECTION
EFFE
CTI
VEN
ESS
COST
ANTICIPATEDBANK PROTECTION
PERMITTINGDIFFICULTY
FIN
ES
GR
AV
EL
CO
BB
LES
A1-2 259.3 35.2 Right Chilako River Flood plain & terrace River bank & terrace erosion n/a L M U Locallysignificant
None except possible atrailway bridge
Variable n/a Large Easy (bioengineering) tohard (rip-rap)
A1-4 263.9 30.6 Right Fluvial terrace Bank erosion $150 S S S Slow None Low Variable Large Moderately difficult
A1-4 265.2 29.3 Left Glacio-fluvial terrace Progressive bank erosion &sloughing
600 M M S Moderate None Low Variable Large Difficult
A1-4 266.0 28.5 Right Site investigationrequired
Slope instability $150 S S S Very slow Road and riparianvegetation
To bedetermined
Probablygood
Unknown Easy
A1-5 267.4 27.1 Right Miworth Glacio-fluvial terrace Progressive bank erosion &sloughing
1,100 L M S Moderate None Low Variable Very large Difficult
A1-7 271.5 23.0 Left Fluvial terrace orflood plain
Progressive bank erosion 1,600 S S S Low None Good Good Low Easy
A1-8 273.5 21.0 Right Island Park Drive Glacio-fluvial terrace Progressive bank erosion &sloughing
900 M M S Moderate Some Low Variable Large Difficult
A1-10 278.0 16.5 Right Glacio-fluvial terrace Progressive bank erosion &sloughing
450 S S S Low None Moderate Probablygood
Low Easy
A1-10 279.0 15.5 Right Takla Forest Road Glacio-fluvial terrace Progressive bank erosion &sloughing
800 M M S Moderate Unprotected gravel road Moderate Variable Large Difficult
A1-11 281.0 13.5 Left N. Nechako Road Glacio-fluvial terrace Progressive erosion &sloughing
400 S S S Low None Good Good Low Easy
A1-11 281.8 12.7 Left Toombs Road Glacio-fluvial terrace Progressive bank erosion &sloughing
250 S S S Low None Moderate Good Moderate Difficult
A1-11 282.1 12.4 Right Opposite OtwayRoad
Glacio-fluvial terrace? Progressive erosion &sloughing
200 S S S Low None To bedetermined
Good Moderate Moderate
A1-14 287.2 7.3 Left DownstreamFoothills Bridge
Glavio-fluvial terrace Progressive bank erosion &sloughing
600 S S S Low None Moderate Variable Large Difficult
A1-14 288.5 6.0 Left Hanbury Road Glacio-fluvial terrace Progressive bank erosion &sloughing
700 S S S Low None Good Probablygood
Low Easy
A1-15 291.4 3.1 Left Prince GeorgePulpmill Road
Glacio-fluvial (andlacustrine?) terrace
Mass wasting 700 S S S Very low Paved road constructed atbase of terrace between1963 and 1968
None required Good Zero n/a

TABLE B.2: BED MATERIAL SIZE DISTRIBUTION, NECHAKO RIVER AT PRINCE GEORGE
SAMPLELOCATION(River Km)
% OF MATERIAL FINER THAN B-AXIS WIDTH (in mm) OF:
2 3 4 6 8 11 16 23 32 45 64 91 128 181 256 362
288 0 0 0 0 1 4.5 16 42 71 88 98 100 100 100 100 100
288.5 1 7 9 29 38 66 81 93 99 100 100 100 100 100 100 100
289 0 0 0 0 0 5 18 39 60 70 83 98 100 100 100 100
D/S John HartBridge 0 0 1 4 4 11 29 40 64 76 90 99 100 100 100 100
291.5 4 4 4 4 4 4 5 9 18 33 52 74 84 99 100 100
292 39 39 39 40 41 44 48 54 68 81 95 99 100 100 100 100
293 1 1 1 1 1 4 9 29 25 78 96 99 100 100 100 100
294A 49 50 51 59 61 69 79 86 94 99 100 100 100 100 100 100
294B 100 100 100 100 100 100 100 100 100 100 100 100 100 100 100 100
Average288 to 294B 21.6 22.3 22.8 26.3 27.8 34.2 42.8 54.7 66.6 80.6 90.4 96.6 98.2 99.9 100 100
Average289, J. Hart,
291.5, 292 & 2938.8 8.8 9.0 9.8 10 13.6 21.8 34.2 47 67.6 83.2 93.8 96.8 99.8 100 100

TABLE B.3: ESTIMATED ANNUAL BED MATERIAL TRANSPORT FOR ACOMPARATIVELY FINE BED MATERIAL (D50 = 10 mm)
YEAR
MAXIMUMDAILY
DISCHARGE(m³/s)
AVERAGEANNUAL
DISCHARGE(m³/s)
ANNUAL BED MATERIALTRANSPORT CAPACITY % OF
LONG TERMAVERAGE(kg/min) (kg) (tonnes) (m³)
1980 422 172 125.25 66,009,283 66009 44006 29
1981 605 247 527.61 277,309,241 277309 184873 123
1982 615 250 621.61 326,719,530 326720 217813 145
1983 636 216 341.14 179,305,286 179305 119537 80
1984 604 238 433.36 228,395,946 228396 152264 101
1985 501 204 273.16 143,572,213 143572 95715 64
1986 632 218 392.07 206,072,307 206072 137382 91
1987 524 225 368.15 193,497,590 193498 128998 86
1988 626 254 632.22 333,206,019 333206 222137 148
1989 496 193 246.66 129,644,916 129645 86430 58
1990 626 257 562.85 295,832,173 295832 197221 131
1991 569 226 516.57 271,511,505 271512 181008 120
1992 575 279 584.46 308,031,954 308032 205355 137
1993 705 256 578.76 304,196,676 304197 202798 135
1994 605 260 615.13 323,310,909 323311 215541 143
1995* 450 232 366.73 192,751,133 192751 128501 86
1996 743 341 1,101.43 580,496,086 580496 386997 258
1997 1,227 441 2,776.35 1,459,247,458 1459247 972832 647
1998 500 219 297.60 156,420,873 156421 104281 69
1999 699 286 816.66 429,235,497 429235 286157 190
2000 563 241 383.16 201,942,333 201942 134628 90
2001 602 247 420.42 220,970,807 220971 147314 98
2002 913 341 1,360.32 714,984,192 714984 476656 317
2003 582 237 362.34 190,446,850 190447 126965 84
2004 530 236 303.50 159,955,428 159955 106637 71
2005* 594 296 604.69 317,824,118 317824 211883 141
2006 518 203 245.50 129,034,800 129035 86023 57
2007 1,185 476 3,087.66 1,622,875,147 1622875 1081917 720
AVERAGE 637 260 676.62 355,814,295 355,814 237,210
Notes: The conversion between bed material transport in tonnes and m³ has assumed a density of 1.5 tonnes/m³.
All calculations are based on the bed material transport formula proposed by Parker (1990).
* denotes a partial data record

TABLE B.4: ESTIMATED ANNUAL BED MATERIAL TRANSPORT FOR ACOMPARATIVELY COARSE BED MATERIAL, (D50 = 32 mm)
YEAR
MAXIMUMDAILY
DISCHARGE(m³/s)
AVERAGEANNUAL
DISCHARGE(m³/s)
ANNUAL BED MATERIALTRANSPORT CAPACITY % OF
LONG TERMAVERAGE(kg/min) (kg) (tonnes) (m³)
1980 422 172 0.04 19,046 19 13 1
1981 605 247 1.10 577,708 578 385 44
1982 615 250 1.40 733,450 733 489 56
1983 636 216 0.72 376,479 376 251 29
1984 604 238 0.67 354,753 355 237 27
1985 501 204 0.18 96,702 97 64 7
1986 632 218 0.72 379,994 380 253 29
1987 524 225 0.32 170,587 171 114 13
1988 626 254 1.88 988,879 989 659 76
1989 496 193 0.11 58,789 59 39 5
1990 626 257 1.15 605,057 605 403 46
1991 569 226 0.37 195,665 196 130 15
1992 575 279 0.81 428,616 429 286 33
1993 705 256 1.53 802,102 802 535 62
1994 605 260 0.96 505,409 505 337 39
1995* 450 232 0.11 60,128 60 40 5
1996 743 341 4.85 2,554,326 2554 1703 196
1997 1,227 441 57.20 30,062,796 30063 20042 2309
1998 500 219 0.16 81,558 82 54 6
1999 699 286 2.88 1,511,611 1512 1008 116
2000 563 241 0.46 242,897 243 162 19
2001 602 247 0.74 389,320 389 260 30
2002 913 341 11.24 5,905,936 5906 3937 454
2003 582 237 0.40 210,325 210 140 16
2004 530 236 0.20 105,244 105 70 8
2005* 594 296 1.33 700,797 701 467 54
2006 518 203 0.14 73,584 74 49 6
2007 1,185 476 59.99 31,529,320 31529 21020 2422
AVERAGE 637 260 5.42 2,847,181 2,847 1,898
Notes: The conversion between bed material transport in tonnes and m³ has assumed a density of 1.5 tonnes/m³.
All calculations are based on the bed material transport formula proposed by Parker (1990).
* denotes a partial data record

1 S = Small M = Moderate L = Large U = Unknown
TABLE B.5: SEDIMENT SOURCE SUMMARY, FRASER RIVER DOWNSTREAM OF SALMON RIVERM
OSA
IC #
RIV
ER K
M
RIV
ER B
AN
K
LOCATION TERRAIN UNIT SEDIMENT SOURCE
LEN
GTH
(m)
VOLUME OFSEDIMENT
PRODUCTION1RATE OF
BANKRECESSION
EXISTING BANKPROTECTION
POTENTIALBANK
PROTECTION
EFFE
CTI
VEN
ESS
COST
ANTICIPATEDBANK PROTECTION
PERMITTINGDIFFICULTY
FIN
ES
GR
AV
EL
CO
BB
LES
A3-1 35.2 Right Salmon River Fluvial valley flat andfan
Bank Erosion 740 L L L Moderate tolarge
None High Variable Moderate Moderate
A3-1 30.0 Right BC Rail MP 478.1 Fluvial terrace Progressive bank erosion &sloughing
1,300 L L M High None Low Moderate Very large Very difficult
A3-3 19.2 Right P.G Sawmill Fluvial terrace &lacustrine
Progressive bank erosion 1,800 S S S Low Rip-rap and spurs Unknown Unknown Unknown Unknown
A3-4 10.0 Right Toombs Road Fluvial terrace Gully formation 70 M S S Moderate Railway grade and bridge atbase of gully
Good Good Moderate Easy
A3-4 9.0 Left Denicola Crescent Fluvial terrace Progressive bank erosion 850 S S S Low None ? Good Moderate Low tomoderate
Easy to moderate
A3-4 7.2 Right Hofferkamp Road Fluvial terrace Progressive bank erosion 800 S S S Low Partially protected with rip-rap
Good Good Moderate Moderate

1
1.5
2
2.5
3
3.5
4
4.5
5
5.5
6
1950 1960 1970 1980 1990 2000 2010
Gau
ge H
eigh
t (m
)
Time (Year)
Nechako River at Isle Pierre (08JC002)
Flow = 100 m3/s Flow = 200 m3/s Flow = 300 m3/sFlow = 600 m3/s Flow = 900 m3/s Flow = 1200 m3/s
Figure B.1: Specific gauge plot, Nechako River at Isle Pierre (1950 to 2007).

Figure B.2: Location of principal sediment sources to the Nechako River (2003, 2005 & 2006 Google Earth images).
M. MILES AND ASSOCIATES LTD.
259.3 259.3
263.9 263.9
265.2 265.2
267.4 267.4
266.0 266.0
271.5 271.5
273.5 273.5
277.8 277.8
279.0 279.0
281.0 281.0
281.8 281.8
282.1 282.1
287.2 287.2
288.5 288.5 291.4 291.4
Chilako River Chilako River
Miworth Miworth
Takla Forest Road Takla Forest Road

Figure B.3: Location of bed material sampling sites on lower Nechako River.
M. MILES AND ASSOCIATES LTD.

1.00
2.00
3.00
4.00
5.00
6.00
7.00
8.00
9.00
1950 1960 1970 1980 1990 2000 2010
Gau
ge H
eigh
t (m
)
TIme (Year)
Fraser River at Shelley (08KB001)
Flow = 250 m3/s Flow = 500 m3/s Flow = 1000 m3/s Flow = 2000 m3/sFlow = 3000 m3/s Flow = 4000 m3/s Flow = 5000 m3/s
Figure B.4: Specific gauge plot, Fraser River at Shelley (1950 to 2007).

Figure B.5: Location of principal sediment sources to the Fraser River (2006 & 2004 Google Earth images).
35.2 35.2
Nechako River Nechako River
Prince George Prince George
Salmon River Salmon River
Fraser River Fraser River
Cariboo Highway Cariboo Highway
30.0 30.0 19.2 19.2
10.0 10.0
7.2 7.2
9.0 9.0

Plate :
October 18, 2006 MM Camcorder DSC 08269
Plate B.1: Looking downstream showing the gravel bar located between Sections 3 & 4 which has enlarged over the period since 1977.
Fraser River
Nechako River
Post 1977 Bar

Plate B.2: Bed material sample site at river Km 288.5
Looking upstream P1010377
Looking downstream P1010378

Looking upstream P1010380
Looking downstream P1010381
Plate B.3: Bed material sample site at river Km 289

Looking upstream P1010382
Looking downstream P1010383
Plate B.4: Bed material sample site located downstream of John Hart Bridge.

Looking upstream P1010384
Looking downstream P1010385
Plate B.5: Bed material sample site at river Km 291.5

Looking upstream P1010386
Looking downstream P1010387
Plate B.6: Bed material sample site at river Km 292.

Looking upstream P1010388
Looking downstream P1010389
Plate B.7: Bed material sample site at river Km 293

Plate B.8: Looking downstream to the Grand Trunk Railway Bridge showing the extent of gravel bars at low water.
October 18, 2006 MM Camcorder DSC08276
Fraser River

APPENDIX C ENVIRONMENTAL SETTING

APPENDIX C - ENVIRONMENTAL SETTING Information is presented at an overview level, to a sufficient level of detail so that the feasibility of conceptual flood control solutions can be evaluated and ranked according to their relative environmental merit. The scope of the assessment has been limited primarily to aquatic and riparian-based ecosystem components that are situated within and adjacent to the river floodplains. Environmental information has been collected from previously published reports, online databases and interviews with government agency representatives. Biophysical site descriptions were verified or updated by conducting several reconnaissance-level field investigations during the summer of 2008.
C.1 BIOPHYSICAL CONDITIONS
C.1.1 NECHAKO RIVER
The Nechako River has been a partially regulated river since 1952, when its upper sections were impounded by the construction of the Kenney Dam for hydroelectric power generation; 39 km of the river was eliminated by this manipulation (Slaney 1986). The downstream flows are therefore headwater regulated for electric power demands, but the hydrograph is also affected by rainfall and snowpack, Fraser River flood control measures and summer cooling flow releases to maintain suitable conditions for sockeye salmon migration and spawning (Fisheries and Oceans 1984 in Slaney 1986). As a result of the artificial manipulations of the hydrograph, peak flow in the lower Nechako does not typically occur until July.
The lower Nechako River can be generally characterized as riffle-pool morphology. Most of the mainstem channel banks are characterized by large substrates with enhanced complexity provided by backeddies, riffles and shallow pools. The lower Nechako River has two large island complexes, Cottonwood Island and Fish Trap Island and one permanent tributary, McMillan Creek (Nowotny and Hickey 1993). McMillan Creek is a highly productive fish-bearing system that is situated approximately 3 km upstream from the mouth of the Nechako (and enters the river near the Cameron Street bridge). There are also three off-channel sloughs along the Nechako River including Fish Trap Island Slough, another near Howie’s Marine boat launch basin and the last is unnamed and near the upstream end of the study area.
At the confluence of the rivers, the Nechako contains a number of active and inactive side-channels. Active side-channels are typically permanently or seasonally wetted and contain an abundance of nearshore vegetation, large woody debris and undercut banks which provide good quality summer rearing capabilities for most juvenile salmonids. Off-channel habitats also provide refuge areas for outmigrating salmon fry and foraging habitats for resident fish species. Inactive side channels typically do not contain water (except perhaps during extreme flood events) and provide limited fish habitat. Historic air photo analysis of the lower river seems to suggest many of the inactive side channels have been progressively revegetating with terrestrial species since the onset of river regulation in the 1950s (MMA 2008a).

The Nechako River, the largest tributary to the Fraser River, is an important salmon river. It has been estimated that the Nechako watershed provides approximately 23% of the total Fraser River sockeye salmon production (CSTC 2008). The value of the commercial salmon catch associated with the Nechako River watershed may be as much as $70 million annually (Rankin 1993 in CSTC 2008).
C.1.2 FRASER RIVER
The Fraser River is an unregulated river and is one of the world’s most productive salmon river systems (FBC 2004). Within city limits, the morphology of the Fraser River can be characterized as large channel glide. Large-scale biophysical assessments of the Fraser River have typically delineated a reach break at the confluence of the Nechako River, where there is a distinct change in discharge (Nowotny and Hickey 1993). The lower reach, below the Nechako River confluence, exhibits a subtle increase in gradient accompanied by a straighter channel pattern with less lateral migration and fewer off-channel habitats. The nearshore substrates of the lower reach consist primarily of embedded cobble and large gravel substrates. The banks and nearshore areas of the upper reach, above the confluence of the Nechako River, are dominated by fine substrates. The Fraser River has a number of tributaries within City Limits including: Rancheree Creek, a creek that enters Fraser Vista (Goose) Slough, Foreman Creek, Bittner Creek, Parkridge Creek, Haggith Creek, Brodman Creek, two unnamed creeks and Hudson’s Bay Slough. Mainstem river margins, the lower reaches of tributary streams and off-channel areas in both reaches provide high quality summer rearing habitat for outmigrating salmon fry and resident fish species.
C.2 WATER QUALITY
Water from the Nechako and Fraser Rivers is used for irrigation, livestock watering, and primary and secondary-contact recreation. Both rivers also support terrestrial wildlife species and sustain aquatic life. Nechako River water is used as a source of drinking water in some communities, although the municipal water supply for the City of Prince George is wholly serviced by groundwater wells.
Regular water quality monitoring was conducted on the Nechako River at the Cameron Street Bridge over a twenty-year period from 1985 to 2004 (Swain 2007). Results of this sampling program included:
• Total metal concentrations for aluminum, cadmium, chromium, cobalt, copper, lead, manganese, iron, silver and zinc periodically exceeded drinking water and aquatic life guidelines. Elevated levels of these metals were often associated with high turbidity, suggesting that these parameters were in particulate form and were not bioavailable.
• Summer water temperatures consistently exceeded the maximum guideline to protect migrating salmonids.

• Peak turbidity values appeared to increase over the last eight years of the reporting period, although no reasons for this trend were presented. (Bird et al, 2001, suggested that for the Chilako River, the loss of vegetation has affected the stream channel stability and by inference sediment loadings.)
Regular water quality monitoring was conducted on the Fraser River at Stone Creek over a 10-year period from 1990 to 2000 (MELP & EC, 2000). The main influences on water quality in the Fraser River downstream from Prince George include the effluents from three pulp mills, treated sewage discharges and non-point source runoff from forestry, agriculture and urban areas. No definitive water quality concerns were identified during this program, although occasional fecal coliform sampling suggested that fecal contamination may be a concern at this site. An improving trend was observed in the concentrations of adsorbable organo-halides (AOX), a general measure of chlorinated organics that are associated with pulp mill effluents.
C.3 FISHERIES
Numerous fish species are found within the study area including salmonids (sockeye salmon, Chinook salmon, coho salmon, pink salmon, rainbow trout, and mountain whitefish), burbot, non-sport fish (chiselmouth, prickly sculpin, slimy sculpin, largescale sucker, longnose sucker, white sucker, bridgelip sucker, pacific lamprey, redside shiner, northern pikeminnow, peamouth chub, brassy minnow, longnose dace and leopard dace) and two species of concern (white sturgeon, bull trout.1) identified by the British Columbia Conservation Data Center2. The Conservation Data Centre (CDC) is a part of the Environmental Stewardship Division of the Ministry of Environment which collects, maintains and distributes information on species3 and ecological communities at risk in B.C. Within the study area the white sturgeon4 has been red-listed and the bull trout is blue-listed. The provincial Red list includes those species that are extirpated, endangered or threatened in B.C.5, while the Blue list includes species and communities of special concern due to characteristics that make them sensitive to human activities or natural events. Table 2.7 (main report) provides an overview of the important life stages of salmonid species as well as species of special concern documented within the study area. Spawning and incubation timing windows have been provided even though not all species on the list have been documented to spawn or incubate within the study area
1 Bull trout are also salmonids. White sturgeon and burbot may be considered sport fish although they are
not salmonids and as endangered species white sturgeon may not be harmed, killed or taken within the Omineca Region (BC 2008).
2 This list of fish species likely present at the confluence was prepared by merging the fish species list for each of the Nechako and Fraser Rivers (FFSBC 2005) and removing species distributed in other areas of these large rivers (i.e. the lower sections of the Fraser River) according to distributions in McPhail 2007.
3 Vertebrate, vascular plant species and ecological communities at risk have been identified in B.C. A list of invertebrates, mosses and lichens at risk is being created.
4 The following three white sturgeon populations in the Omineca Region are red-listed: Nechako River population, Upper Fraser River population and Middle Fraser River population.
5 Not all Red-listed species will become formally designated as extirpated, endangered or threatened under the Wildlife Act. The Red list serves to identify species at risk that should at minimum be considered candidates for one of these legal designations.

boundaries. More detailed life history information for these species is included in the following subsections.
C.3.1 SALMONIDS
Rainbow Trout Rainbow trout is a native species widely distributed across British Columbia; however, its native range is unclear due to extensive and widespread introductions. This cool-water species can be found in a number of habitats; it can be broadly categorized into groups based on its five habitat types: anadromous, lacustrine, large river, stream and headwater. Anadromous rainbow trout are known as steelhead.
During the summer, trout inhabiting streams and rivers, are found in riffles, runs, glides and pools. Adults occupy deeper and faster waters than juveniles. In smaller streams, good quality habitat usually has a sufficient amount of overhanging cover, primarily in the form of riparian vegetation and large woody debris. Overwintering habitat in small streams consists of large pools that span the entire width of the channel. Preferred water temperatures are between 7 and 18°C.
Generally, the migration of rainbow trout to spawning streams occurs from late April to May and is triggered by rising water levels and temperature. Spawning habitat usually has a depth of 0.15 to 2.5 m and water velocities between 0.3 to 0.9 m/s. Typically, larger-bodied populations of rainbow trout spawn in deeper, faster-flowing water. Spawning occurs from late April to July (McPhail 2007).
Within the study area, high-quality rainbow trout habitat is known to occur in tributary streams such as McMillan Creek and Parkridge Creek. The distribution and life history of rainbow trout in the primary channels of the Fraser River and lower Nechako is not well understood. Preferred spawning and summer rearing habitat conditions are limited in these systems, suggesting that significant utilization of the mainstems by rainbow trout is unlikely.
Bull trout The life history patterns of bull trout include adfluvial, fluvial and resident stream populations, which require rearing in cold headwaters streams for a portion of their juvenile life stage. The cold water temperature niche of bull trout limits the availability of spawning and rearing habitat and renders them sensitive to habitat alteration.
Fluvial populations of bull trout use the study area as a migration corridor to access spawning or forage areas in the upper Fraser and Nechako watersheds. Spawning occurs in the fall with migration to spawning areas beginning in August (McPhail, 2007). However, bull trout typically prefer cold water habitats during the early portions of their life cycle. As a result, the study area provides only marginal capacity for spawning and juvenile rearing.

Mountain Whitefish Mountain whitefish are widely distributed along both slopes of the Rocky Mountains and are exclusive to western North America. In British Columbia mountain whitefish are primarily an interior species with riverine (life cycle completed entirely within flowing water), lacustrian (life cycle competed entirely within a lake), and adfluvial (life cycle involved migrations between lakes and rivers) populations and are absent from coastal islands. It is believed that fluvial populations undertake several migrations annually to fulfill life requirements (i.e., migration to seasonal feeding areas, spawning areas, and overwintering habitats; McPhail 2007).
Spawning by fluvial populations is usually conducted in flowing water in the fall or early winter (in October or November for most BC populations when temperatures drop below 10 ºC; McPhail 2007). Populations within large river systems (such as the Fraser and Nechako Rivers) likely migrate into smaller streams to spawn. Spawning is conducted at dusk or at night, which has limited the observation of spawning activities. It appears that there is no site preparation prior to the scattering of eggs over the substrate (McPhail 2007). Eggs become lodged within the interstitial spaces in the substrate where they incubate over the winter. Fry emerge in the spring or early summer and drift downstream before moving into shallow, low velocity areas along the river margins where they remain until early fall when the fry move into faster and deeper water (McPhail and Troffe 1998). This tendency to move into faster and deeper water continues as body size increases (McPhail and Troffe 1998).
Spawning has not been observed in the Prince George area, but it is inferred that spawning does occur in the lower Nechako and the mainstem Fraser based on the capture of ripe males with well developed spawning turbicles and the distribution of newly-emerged fry in the area (McPhail and Troffe 1998).
Anadromous Salmonid Life History Most anadromous6 salmonids returning to the Nechako River will likely migrate into the Stuart-Takla drainage basin or Nadina-Francois Lake drainage basin to spawn. Adult Chinook salmon migrating to these areas begin to arrive in the study area as early as June, while the late sockeye run can terminate as late as mid-November.
Salmon fry incubate through the winter months and emerge from the spawning beds in the spring. They outmigrate downstream, spending portions of their first and sometimes second year of life in lakes or along river margins. Side channels and other off-channel habitats are particularly productive areas that can often support high densities of salmon fry. The outmigration of salmon fry to the Fraser River estuary takes place from spring to early fall, depending on the species and natal stream.
6 Anadromous = moving from the marine environment to freshwater to spawn

Chinook salmon Chinook salmon tend to spawn in larger streams with faster water and more coarse substrates than the other species of Pacific salmon. However, Chinook may also spawn in smaller streams and sidechannels. As they tend to produce larger eggs, they require spawning sites with a subgravel flow of oxygen-rich water. Depth and water velocities of spawning sites range widely, but average 35 cm and 0.5 m/s respectively. In the Fraser River system, there are two peak runs of adult Chinook migrating to spawning grounds, one occurring in July, the second in September/October (McPhail 2007).
Although the study area does not appear to support spawning habitat for Chinook salmon (Nowotny and Hickey 1993), it is an important migration corridor and is used extensively for summer rearing by outmigrating young-of-the-year (Fraser et al. 1982 in Nowotny and Hickey 1993). Upper Fraser and Nechako stocks of Chinook salmon are stream-type, meaning they rear for one or sometimes two years in freshwater prior to smolting (Tutty and Yole 1978; Hickey and Lister MS 1981 in Nowotny and Hickey 1993). Outmigration studies on the Nechako River indicate that over 80% of young-of-the-year Chinook salmon leave the upper watershed during their first summer. Although population dynamics of juvenile Chinook in the lower Nechako River are not well understood, high summer water temperatures create sub-optimal rearing conditions, which may encourage these fish to move further downstream into the Fraser River.
Pink salmon Pink salmon typically spawn at age 2 between September and October within their natal stream. Fish that spawn in the Fraser River or in its upper tributaries (e.g. the Nechako River) enter the river from the ocean 2 weeks earlier than other pinks. Eggs incubate within the gravel over the winter months, hatching into alevins within 1.5 to 3 months after being deposited. Fry emerge from the gravel 3 to 5 months after hatching and migrate downstream as soon as they are able (ranging from late February to late May). Pink salmon mature after two growing seasons in the ocean and then return to freshwater to spawn (McPhail 2007).
Of all the pacific salmon, pink salmon spend the least amount of time in freshwater as the fry migrate downstream to the ocean quickly after emerging and usually die within 2 months of returning to freshwater as adults. Therefore freshwater habitat is essentially limited to migration corridors and sites where spawning and egg incubation occurs. Pinks prefer spawning sites with clean gravel and subgravel flow, usually within shallow riffles 20 – 100 cm deep and water velocities between 0.3 and 1 m/s (McPhail 2007). Small numbers of pink salmon (relative to average Chinook or sockeye escapements) spawn at selected sites in the lower Nechako River, upstream of Cottonwood Island (Nutton pers. comm. 2008, ILMB 2008). Pinks in the upper Fraser system spawn only in odd-numbered years.

Sockeye salmon Sockeye salmon return to their natal streams to spawn by four years of age. The majority of the Nechako sockeye salmon migrate into the Stuart-Takla drainage basin or Nadina-Francois Lake drainage basin to spawn. Adult sockeye migrating to these areas begin to arrive in the study area as early as June and terminate in late August.
Following emergence in the spring, sockeye fry typically rear within large lake environments for one year before outmigrating directly to the ocean as smolts the following spring.
Coho salmon Most coho salmon spawn at 3 years old while some precocious jacks spawn at 2 years. Spawning usually occurs in areas with subgravel flow, water velocities between 0.3 and 0.91 m/s and substrate diameters of 3.9 to 13.7 cm. Water temperature during spawning is usually between 1 and 8 °C. Early spawning runs enter freshwater from September to October and spawn from late October to December. Later spawning runs enter in December or January and spawn quickly after (McPhail 2007).
Rearing habitats of fry typically include sidechannels, backwatered areas, and protected areas along shore margins. Movement into pools occurs as they get larger. Like Chinook, most young rear for one year (sometimes two years) in freshwater prior to smolting. Juveniles are occasionally captured in the Nechako River upstream of Vanderhoof, while reports of coho within the Fraser River upstream of the Nechako confluence are not well documented. Overwintering in freshwater usually occurs under cover features such as undercut banks, woody debris and cobbles (McPhail 2007).
Coho are found in all coastal drainages of BC, including the Fraser River up to Prince George and the Nechako River. Coho found above Hell’s Gate within the Fraser, Nechako and Thompson Rivers comprise the genetically distinct Interior Fraser River population. This population, which includes the Upper Fraser subpopulation, was listed as Endangered by COSEWIC in 2002 (Centre for Applied Conservation Research 2007).
Nearshore Habitats In 1992, a comprehensive inventory and rating of salmonid habitats of the Nechako and Fraser Rivers within Prince George city limits was completed by Fisheries and Oceans Canada (Nowotny and Hickey 1993). Streambank sections were delineated according to a general consistency of habitat variables (e.g. substrate type; water depth; habitat type; bank composition and stability; instream, bank and upland vegetation; and upland status). Based on the collective quality of habitat variables, each section was assessed for rearing, spawning and over-wintering habitat value and rated into a category of high, medium or low.
Since this work was completed over 15 years ago, significant changes to river morphology and fish habitat may have occurred over this time period. A field data

collection program was initiated in 2008 to verify and update this information to document current baseline conditions. The methodology of Nowotny and Hickey (1993) was used as the basis for the 2008 field activities and to update the habitat mapping information.
Results of the 2008 salmonid habitat inventory within the study area are presented in tabular form and illustrated on three 1:10,000 scale maps displaying the location and ratings of streambank sections (Appendix C.1). The 1992 assessment delineated 81 streambank sections along the Nechako River, 42 of which were rated as high quality habitat. In 2008, twenty additional sections were identified, which suggests either slight differences in methodology or an increase in habitat diversity. A total of 53 streambank sections were rated as high quality habitat in 2008. Only minor habitat changes occurred along the Fraser River portion of this study.
Mid-channel Habitats In order to gain an understanding of mesohabitat characteristics on the lower Nechako River, a Level 1 Fish Habitat Assessment (FHAP) was conducted in the fall of 2008 from its confluence with the Fraser River to Wilson Park; approximately 8 km upstream. The FHAP procedures provide an accurate and repeatable methodology that can be used to help predict the effects of certain instream work activities on aquatic resources.
Results of the FHAP show that even under summer base flow conditions, the lower river is predominantly composed of continuous riffle (areas of turbulent fast-flowing water) or glide (areas of fast flowing, non-turbulent water) habitat units. These characteristics are typical of watercourses with relatively flat bottoms in cross-section (Johnston and Slaney 1996). There is a distinct lack of primary (main channel) or secondary (side channel) pool habitats, which are generally important features for supporting fish over the winter months (Appendix C.1).
C.3.2 WHITE STURGEON
Life History The white sturgeon is the largest freshwater fish species within British Columbia, growing up to 6 meters in length, weighing up to 650 kg and able to survive to over 100 years in age (DFO 2007). Within the Fraser River drainage, white sturgeon are found from the Fraser River estuary to at least Rearguard Falls (upstream of Prince George, BC) and within the Nechako River from its confluence with the Fraser River to upstream of Vanderhoof (McPhail 2007). There are six genetically distinct populations of white sturgeon in BC (upper Fraser, middle Fraser, lower Fraser, Nechako, Columbia and Kootenay). White sturgeon may also be found in large lakes associated with these river systems (e.g. Fraser Lake and Stuart Lake within the Nechako River drainage). At the confluence of the Fraser and Nechako Rivers, both upper Fraser white sturgeon and Nechako white sturgeon populations may be present.

White sturgeon occupy river mainstems, large tributaries, reservoirs and the large lakes associated with the large river system in which they are found. The specific types of habitat they use is not well known, but like other characteristics of white sturgeon, information is increasing since being added to Schedule 1 of the federal Species at Risk Act (SARA) and the B.C. provincial Red list. Within the upper Fraser River, white sturgeon juveniles are typically found within the lower reaches of large tributary streams or in the mainstem near tributary mouths. In the lower Fraser, juveniles have most often been found in warm water that is usually turbid, low-velocity and with a depth of greater than 5 m. Bed material in these areas is usually composed of sand and silt. Overwintering usually occurs in deep pools in the primary channel and movements during this time period may be very limited (often less than 200 m) (McPhail 2007).
Maturity is reached at different ages for males and females; males become mature in their early teens to early 20s and females in their mid- to late-twenties (lower Fraser population). Once becoming mature, young females may spawn about every four years, while older females may only spawn every 9 – 11 years. In BC, white sturgeon usually spawn after the peak spring discharge for the system they occupy when water temperatures are rising (McPhail 2007). It usually occurs in fast and turbulent water over coarse substrate (DFO 2007).
A study by Perrin and colleagues (2003) on white sturgeon spawning habitat in the lower Fraser River found that five of six identified spawning sites were within non-turbulent side channels of a braided section of river. The remaining spawning site was within the main channel of a confined section of river (without side channels). The average water depth at locations where eggs and larvae were captured was 2.9 m and water velocities averaged 1.8 m/s (eggs) and 1.0 m/s (larvae). However, spawning habitat is variable, for example within impounded sections of the Columbia River most identified spawning sites were within the trailraces of dams (Parsley and Kappenman 2000 in McPhail 2007).
The Nechako River white sturgeon population has experienced recruitment failure, which has resulted in the population exhibiting a modal age group much higher (36 – 39 years) than the usual 10 – 15 years. Due to this failure, there is little information on the juvenile population and their habitat. It has been proposed that the recruitment failure may be due to a major sediment release in early 1960s that has filled the interstitial spaces within gravel substrate at a spawning site near Vanderhoof (which interferes with larvae requirement of gravel for shelter) (McAdam et al. 2005).
Current Status of White Sturgeon – Nechako and Upper Fraser Populations The white sturgeon was ranked as an endangered species by the Committee on the Status of Endangered Wildlife in Canada (in November 2003) and both sturgeon populations that may be found within the confluence of the Nechako River and Fraser River have been red-listed by the BC Conservation Data Centre. Both of these populations7 were also added to Schedule 1 of the Species at Risk Act (SARA) in 2006. These designations 7 Four populations of white sturgeon, the Upper Fraser, Nechako, Columbia and Kootenay, were added to
Schedule 1 of SARA in 2006.

reflect the imperiled population status of the Nechako River and Upper Fraser River populations.
In 2001, the upper Fraser River population of white sturgeon was estimated at 815 fish (Yarmish and Toth 2002). The number of mature fish in this population has been estimated at 185 (DFO 2007). RL&L (2000) has also suggested that this population consists mostly of juveniles and subadults. The growth rate of this population is slow, like that of the Nechako River population (RL&L 2000).
The Nechako River population in 1999 was estimated at 571 fish and displayed a structure similar to sturgeon populations in other regulated rivers (RL&L 2000). RL&L (2000) found that the population was dominated by older fish and it displayed poor juvenile recruitment. 305 mature white sturgeon are currently thought to exist in this population (DFO 2007). Little or no juvenile recruitment is believed to have occurred since 1967 (DFO 2007). The population is declining and at risk of extirpation due to decades of recruitment failure. Model projections suggest that recovery efforts are required to restore recruitment and a self-sustaining population (DFO 2007; RL&L 2000).
Recovery efforts have been headed by the Nechako White Sturgeon Recovery Initiative. This organization is concerned with discovering the reason(s) for sturgeon recruitment failure in the Nechako watershed and establishes habitat protection and restoration and other management works. The short-term goal of the Initiative is to create a conservation fish culture program to sustain the population while the long-term goal of re-establishing a self-sustaining population is realized (Nechako White Sturgeon Recovery Initiative 2008). Since 2006, over 8000 juvenile white sturgeon have been released (BC 2008).
Critical Habitat Potentially critical habitats for white sturgeon include important areas in which adults feed and “stage” prior to migration to spawning grounds, spawning sites, and rearing locations for larvae and juveniles (DFO 2007). A study by RL&L (2000) suggested the following areas presented suitable habitat that may be used as spawning sites for the Nechako River population: Isle Pierre, Whitemud, Hulatt rapids, Nautley River and the lower Stuart River. Both spawning and overwintering sites have been located near Vanderhoof. Threats to sturgeon habitat include instream activities such as gravel removal, development of riparian and/or foreshore areas, river regulation, upstream use of land and water and effluent discharges (DFO 2007).
Although a number of years of white sturgeon research on the Nechako and Fraser Rivers have been completed, no known study has specifically examined white sturgeon habitat at the confluence of the Nechako and Fraser Rivers. As there is a potential for the presence of critical habitat within this area, EDI in conjunction with Lheidli T’enneh First Nation (LTN) and Upper Fraser Fisheries Conservation Alliance (UFFCA), began field inspections in the confluence area that may aid in determining whether this area should be considered as critical habitat for sturgeon. As a determination of this nature requires extensive study, the results of the 2008 field investigations are preliminary only and

should serve to begin understanding of the species’ behavior and habitat utilization within the study area.
2008 Sturgeon Sampling 2008 field investigations of white sturgeon habitat in the vicinity of the confluence included aerial radio-telemetry surveys and sturgeon sampling using setlines (Table C.1).
Sturgeon Sampling by Setlines White sturgeon sampling at the confluence of the Nechako and Fraser Rivers was conducted on a number of occasions in summer 2008 to help add to the understanding of the species’ behavior and habitat utilization within the study area. As overwintering is known to occur in other areas of the rivers, potential use of the study area for rearing and spawning is of particular interest. Sampling for sturgeon was conducted using setlines with baited hooks, set overnight and retrieved the next day. Five sessions of sampling were conducted over the summer; three of which resulted in the capture of sturgeon. A total of twelve white sturgeon were captured with a total effort of 6497 hook hours. All captured sturgeon were measured and examined for tagging information, sex and general health. Coded wire tags were implanted in all fish for future identification and radio tags were implanted in selected adult or sub-adult fish.
Radio-telemetry Surveys In response to concerns that white sturgeon may be in the vicinity of the 2007/08 ice jam and proposed temporary flood relief works (i.e. warm water release), EDI in conjunction with the Lheidli T’enneh First Nation and UFFCA conducted aerial radio-telemetry surveys of the upper Fraser River and lower Nechako River in January and May of 2008. Efforts were made to locate twelve white sturgeon caught (and radio-tagged) in the upper Fraser River between river kilometers 829 (near the Wright Creek confluence) and 950 (Grand Canyon at Longworth) in Fall 2007 by the LTN. In January, five of the twelve sturgeon were located; the individual located farthest downstream was at river kilometer 898 (near the McGregor River confluence) which is approximately 100 km upstream of the Nechako River confluence. On the May 8, 2008 aerial survey, seven white sturgeon were located; the individual located furthest downstream was approximately 15 km upstream of the Nechako River confluence (river km 810).
Appendix C.2 provides location information for each of the twelve radio-tagged white sturgeon at the time of tagging and on the dates of aerial surveys. White sturgeon that could not be located on aerial survey dates are listed as “not located.” While the location of these fish was not known, it is possible that they were in areas too deep to detect the tag signal (e.g. the Grand Canyon at Longworth has depths exceeding 13 meters) or had moved into areas not incorporated into the survey (e.g. wintering areas near Vanderhoof).

C.4 RIPARIAN VEGETATION
Despite the amount of urban development that has taken place over the last 100 years in the Prince George area, there are still large expanses of intact riparian vegetation, particularly along the upper Nechako and the east bank of the Fraser River. Dominant forest cover within the riparian and nearby upland within the study area tends to follow a pattern based on the steepness of the river banks. In areas where banks are moderately steep or steeper, the dominant forest canopy cover is usually coniferous including species such as spruce, Douglas fir and/or lodgepole pine. For example, on the Fraser River, downstream of the Simon Fraser Bridge, the dominant riparian area tree species are spruce and fir. In more flat areas, where banks do not slope much higher than river levels, dominant forest canopy cover is usually deciduous, including species such as black cottonwood, trembling aspen and/or paper birch, or mixed with a combination of coniferous and deciduous species. These species assemblages are common along the Nechako River and the upper reach of the Fraser River. Common shrub species in these areas include wild rose, hardhack, black twinberry, red-osier dogwood, willow and alder (Nowotny and Hickey 1993). Within the Prince George forest district, there are 25 listed plant species (Appendix C.3). There are five listed plant communities within the SBSmh and seven listed plant communities within the SBSdw3, Prince George Forest District (CDC 2007) (Appendices C.3 andC.4).
C.5 WILDLIFE
Numerous wildlife species can be found near the confluence of the Nechako and Fraser Rivers. In 2003, Golder and Associates conducted a wildlife habitat assessment on Fishtrap Island. Wildlife observations or signs were found of the following species: deer species, red squirrel, beaver, river otter, bald eagle, American widgeon, mallard, belted kingfisher, woodpecker species, American crow and black-capped chickadee. Numerous other large mammals (e.g. moose and bear), small mammals (e.g. rodents, coyotes, muskrat, foxes), birds, amphibians and reptiles are known to be present in the study area.
The Prince George Naturalist Club has identified a variety of bird species at Cottonwood Island Park, Macmillan Creek Regional Park and Wilkins Park. All three of these parks are located along the Nechako River within the City limits. Passerines are abundant throughout all three locations.
C.5.1 SPECIES AT RISK
A search of the Conservation Data Centre (CDC)’s BC Species and Ecosystem Explorer revealed 20 provincially listed wildlife species that may occur within or near the study area. White sturgeon was the only red-listed species, while the following are blue-listed vertebrate species: Great Blue Heron (herodias subspecies), Short-eared Owl, American Bittern, Broad-winged Hawk, Bobolink, Sandhill Crane, Wolverine (luscus subspecies), Fisher, Northern Myotis, Long-billed Curlew, Caribou (northern mountain population),

Bull Trout, Sharp-tailed Grouse (columbianus subspecies) and Grizzly Bear. Blue-listed invertebrates included Rocky Mountain Capshell, Mead’s Sulphur, Pygmy Fossaria, Jutta Arctic (chermocki subspecies) and Forcipate Emerald (Appendix C.5).
SARA Schedule 1 species that may be within the project area (as revealed by a map search of the Species at Risk public registry) include the Long-billed Curlew, Western Toad and White Sturgeon8 (EC 2004). The Long-billed Curlew and Western Toad are classified as Species of Special Concern on Schedule 1 which indicates that they have characteristics that may make them sensitive to human activities or natural events but are less at risk than species classified as Threatened or Endangered. These species and their habitat are protected under SARA.
Long-billed curlew (from MWLAP 2004) The long-billed curlew is a large sandpiper, with long legs and a long decurved bill whose numbers and size of breeding range have decreased in the last century. Non-breeding birds are found throughout the south-central interior north to the Nechako Lowland while breeding occurs in the southern interior. The known extent of the northern portion of the breeding range in British Columbia includes the area from Lillooet north to Chubb Lake near Quesnel. A small population has been documented to breed near McBride.
Long-billed curlews breed in grasslands with open, low-lying vegetation which allow co-operative anti-predator mobbing behaviours. During the pre-laying and incubation periods of breeding, vegetation less than 10 cm tall is preferred, which increases up to a preference of 30 cm during the brood rearing period. Clutches are usually started between mid-April and mid-May and the young birds fledge between the end of June and mid-July. Threats to the habitat of curlews include urbanization, conversion of native grasslands to agricultural uses and intrusion by noxious weeds and forest encroachment.
Western toad (from Wind and Dupuis 2002) Western toads are a widespread and abundant amphibian in Canada that have dry, bumpy skin, that can be highly variable in coloring but is usually mottled on the dorsal surface with a lighter-colored dorsal stripe. In British Columbia, they are found from the Rockies to the Pacific Coast. Its status in Canada as a species of Special Concern is due to its known vulnerability to a number of threats (e.g. urban and agricultural development, predation, climatic conditions, desiccation, UV radiation, disease) and the demonstrated potential for rapid population decline or extirpation as seen in the United States.
Western toads may breed in natural or artificial habitats including ponds, the edges of streams or lakes, ditches and road ruts. In BC, western toads may begin to breed when average minimum and maximum daily temperatures are above 0 oC and 10 oC respectively. Tadpoles usually hatch within 12 days and full metamorphosis generally takes three months from egg laying. Non-breeding habitats include wetlands, forests,
8 Previously discussed in Section 7.4.2.

clearcuts, avalanche slopes and subalpine meadows. Toads may prefer areas with shrub cover as protection from predation and desiccation.
C.6 ENVIRONMENTAL LEGISLATION
C.6.1 FEDERAL LEGISLATION
The principal relevant items are reviewed below.
The federal Fisheries Act deals with three matters:
• management and control of recreational, commercial and First Nations fisheries;
• conservation and protection of fish and fish habitat; and,
• prevention of pollution.
Section 34(1) of the Act defines fish habitat as "spawning grounds and nursery, rearing, food supply and migration areas on which fish depend directly or indirectly to carry out their life processes." Section 35, the key habitat protection provision, prohibits “harmful alteration, disruption or destruction (HADD)” of fish habitat without an authorization from the Minister or through regulations under the Act.
The Canadian Environmental Assessment Act (CEAA) requires federal officials to consider the environmental effects of certain types of project before making any decisions or exercising any powers in relations to a proposed project. Generally speaking, the Act applies when a proposed project requires action or decision by a federal agency, such as:
• granting money or other financial assistance
• exercising a regulatory function such as issuing a license or authorization.
The Species at Risk Act (SARA) was created to protect indigenous animal and vegetation species by providing for recovery of species at risk and by ensuring that other species are not endangered or threatened.
The Migratory Birds Convention Act (MBCA) and its complementary Migratory Birds Regulation regulates activities potentially harmful to migratory birds, nests or eggs. Regulatory requirements are placed on hunting and other activities related to airports, agriculture, etc. (Some migratory birds originally excluded from protection are now covered under provincial or territorial legislation.)
C.6.1 PROVINCIAL LEGISLATION
The principal relevant items are reviewed below.
The BC Water Act regulates the use of water from streams, lakes and rivers. Section 9, “Changes In and About a Stream,” requires that such activities be approved in writing by the comptroller, a regional water manager or an engineer. Typically, complex works require an approval from the Ministry of Environment, Water Stewardship Division.

Simpler projects that will not significantly affect the environment or other water users, do not require diversion of water, and can be completed within a short time frame, do not require an approval but must be notified to the Water Stewardship Division.
The BC Wildlife Act applies to nearly all forms of wildlife and their habitats. It authorizes the Minister to designate Wildlife Management Areas (WMA's) and allows the designation of endangered and threatened species (Section 6). The Act prohibits the alteration, damage or destruction of wildlife or their habitat within WMAs (Section 7). Land within a Wildlife Management Area (WMA) can be designated as a Critical Wildlife Area or Wildlife Sanctuary.
The British Columbia Environmental Assessment Act (BCEAA) establishes a process for reviewing potential environmental, social and economic impacts of proposed major projects. Projects subject to the EA process are indicated in the Reviewable Projects Regulation or designated by the Minister of Environment; in order to proceed, such projects must successfully complete the process and receive an EA certificate.

Table C.1 ‐ Setline information for white sturgeon sampling conducted in Nechako and Fraser Rivers, 2008.
Location Date # of hooks per set
Hours/Set Total Effort (hook hrs)
# of White Sturgeon Captured
Fork Lengths (cm)
Comments
Confluence of Nechako River with Fraser River
June 11-12/08 16, 15, 16, 16, 12, 16
16, 16.25, 16.1, 18.25, 18, 17.8
1550.2 6 89.5, 94, 137, 99.5, 142, 62.5
Sampling took place in area of confluence with four lines being set in Nechako River water and two lines set in Fraser River water.
Confluence of Nechako River with Fraser River
June 12-13/08 16, 16, 16, 16 18.5, 18.2, 17.7, 17.25
1146.4 1 ~60 White sturgeon escaped prior to measurement. Sampling took place in area of confluence with all lines being set in Nechako River water.
Confluence of Nechako River with Fraser River
July 29-30/08 16, 13, 16, 16 19.6, 19.1, 21.1, 19.3
1208.3 0 N/A Sampling took place in area of confluence with all lines being set in Nechako River water.
Fraser River, rkm 829.9 – 831.7, near Willow River confluence
Aug 6-7/08 16, 16, 8, 16 22, 22, 22, 22 1232 5 77, 75, 95, 78, 184
All sampling took place in Fraser River.
near Confluence of Nechako River with Fraser River
Sept 29-30/08 16, 16, 16, 16 21.25, 21.25, 21.25, 21.25
1360 0 N/A Due to low water levels at the confluence of the Nechako River, sampling took place at the Cottonwood Park boat launch to the Canfor pumphouse on the Nechako River

APPENDIX C.1
2008 Nearshore Salmonid Habitat Inventory Results Legend
Substrate Bank Stability Vegetation Abundance
O - Organics U - Unstable nil
F - Fines M - Moderately stable S - Sparse (0-25%)
GS - Small Gravel S - Stable I - Infrequent (25-50%)
GL - Large Gravel C - Common (50-75%)
Co - Cobble A - Abundant (75-100%)
Bo - Boulder mm - Man
made
Results
Nechako River Sites
1993 Original Rating
2008 Salmonid Habitat Value Rating
Upper Bank Substrates
Bank Stability
Submergent Species
Emergent Species
Lower Riparian Species
Upper Riparian Species
Upland Species
N1 Low High F(GS) S S NIL I S C N2 High Med GS(F) M NIL I C C S N3 High Med F(GS) M NIL NIL C A A N4 High Med F(GS) M C S A A A N5 High High F(GS) S S A A A A N6 Med Med F(GS) U NIL NIL S S C N7A Med F(GS) M S I C A A N7B High F S C C A A A N7C
Med
High F M NIL S A A A N8 High High F M NIL S A A A N9A Med F(GS) U NIL NIL I A A N9B
High High F(GS) M S S A A A
N10A High F(GL) S NIL S A A A N10B
High Med GS(Co) M NIL NIL C A A
N11 High High F(GS) S S S A A A

Nechako River Sites
1993 Original Rating
2008 Salmonid Habitat Value Rating
Upper Bank Substrates
Bank Stability
Submergent Species
Emergent Species
Lower Riparian Species
Upper Riparian Species
Upland Species
N12A High F(GS) S S I I C C N12B Med F(GS) S NIL C C C C N12C
High
Low F(GS,mm) S NIL A I I A N13 Med Med F(GS) M NIL NIL A A A N14A Low F(Co,GS) U NIL NIL S C C N14B
Med High F(Gs) U NIL NIL S S I
N15A High F S NIL S A A NIL N15B High F S NIL S A A NIL N15C High F S NIL C A A NIL N15D
High
Med F S NIL C A A NIL N16 High High F M NIL S A A NIL N17A High GS(F) M NIL I S A A N17B
Low High GS(F) M I S S A A
N18 Med Med F S S I A A A N19 Low Low GS(F) U NIL S S S C N20 High Med F S S S A A A N21 High Med F S NIL C A A A N22 Low Low mm S NIL NIL S NIL NIL N23 Med Med GL(GS,Co,F) U NIL S S S I N24A High High Co(F) M S C C I I N25 Med Med GL(Co) U NIL NIL NIL A A N26 Med GS(F) S NIL A A A A N26A
High High F(GS) S I C C C C
N27 Med High mm(GL,GS,F) S NIL NIL NIL NIL I N28 High High F(Co,Bo) S I I I C A N29 High High mm(Co,GS) M NIL NIL NIL NIL C N30 High Med GL(F) U NIL S NIL S A N31 High Med F U NIL C S S C N32 High High GS(F,GL) M C C A A A N33 Med Med mm(F) S NIL NIL C NIL NIL N34A Med GL(GS) S I S A A A N34B
High High GS(F) S S I A NIL NIL
N35 Med Med F U NIL I S C A N36 High High F(GS) S NIL A C S NIL N37 High Med F(mm) S S C C C S N38 Med Med F(GS) S A C C NIL NIL N39 High High F(GS) S S C S S S

Nechako River Sites
1993 Original Rating
2008 Salmonid Habitat Value Rating
Upper Bank Substrates
Bank Stability
Submergent Species
Emergent Species
Lower Riparian Species
Upper Riparian Species
Upland Species
N40 Low High GL(GS,F) M NIL NIL S S NIL N41 Med Med F(GS) M S S S S NIL N42 High Med F(GS) S C C A A NIL N43 High High F(GS) S S A A A A N44 Med Med F S NIL S C C NIL N45 High High F(GS) S A A A C NIL N46 Low Low F(GS) M A C C S NIL N47 Med Med F(GS) S S C C C C N48 Med Med F(GS) M S C C C NIL N49 High High F S C A A A NIL N50 Med Med F(GS) M S S I I S N51 High Low Co(GL,F) U NIL I NIL I A N52 High High F S C A C C NIL N53 Low Low GL(GS) M NIL S S I C N54 Med Med F M C C C C A N55 High High F(GS) S C A A A A N56 High High GL(GS) S S I S S A N57 Low F M S I C C A N57A
Low High F(GS) S A A C A NIL
N58 Low Low F(GS) S NIL S C C A N59 High High F(GS) S C A A A A N60 Low Low F M NIL S C I A N61 Low Low mm(GL,F) S NIL NIL I I NIL N62 Med High F(GS) M NIL S A A NIL N63 Low High F(GL) M/S A A C C C N64 Low Low F(GS) S A A A A A N65 High High F(GL) S I I A A A N66 Low Low F(GS) M S I I I S N67 Med Low Co(GL) M NIL S S NIL NIL N68 Med High F(mm,GS) S NIL S NIL NIL NIL N69 Low Low F M I I C C S N70 Med Med F M S I C I A N71 High High F S C A A A A N72 High High F(GS) S I A A A A N73 Med Med F S I C A A C N74 Med Med Co(GL,F) S C C C C C N75 Med Med F(GS) M S C I I C

Nechako River Sites
1993 Original Rating
2008 Salmonid Habitat Value Rating
Upper Bank Substrates
Bank Stability
Submergent Species
Emergent Species
Lower Riparian Species
Upper Riparian Species
Upland Species
N76 High High F(GS) S I A A A A N77 High High F(GS) M I C A A A N78 High High F S I I C C S N79 High High F S C S NIL NIL NIL N80 High High F S I C C C A N81 High High F (Co,GL) S S C C C NIL N82 n/a High F S NIL S S NIL NIL N83 n/a Med F M NIL NIL C C NIL N84 n/a Med F M NIL A C NIL NIL N85 n/a High F S NIL C C A NIL N86 n/a Med F(GS) S NIL I C A NIL N87 n/a Med F(GS) S NIL S S I C
Fraser River Sites
1993 Original Rating
2008 Salmonid Habitat Value Rating
Upper Bank
Substrates
Bank Stability
Submergent Species
Emergent Species
Lower Riparian Species
Upper Riparian Species
Upland Species
F17 Med Med F M S C A A A F18 Low Low F M S C A A A F19 Low Med F U S S S C A F20 High Med F S S A A A A F21 Med Med F M I S C C NIL F22 Med Med F S I C C A A F23 Med Med F(GS) M S I C A I F24 Low Low F S S I C C I F25 Med Med F M S S C C NIL F26 Low Med F U NIL S C C NIL F27 Med Med F M S I C C I F28 High High F(GS) S C C C C C F29 Med Low F M NIL NIL NIL NIL S F31 Low Low F(GS) S S C A A A F32 Med Med mm(GS,F) M NIL S S I NIL F33 High High F(GS) S NIL S A A NIL F34 Low Med F(GS) M NIL NIL I C C F35 Med High mm S NIL NIL S S NIL

Fraser River Sites
1993 Original Rating
2008 Salmonid Habitat Value Rating
Upper Bank
Substrates
Bank Stability
Submergent Species
Emergent Species
Lower Riparian Species
Upper Riparian Species
Upland Species
F36 High High mm(F) S I S I C I F37 High High mm(GL) S S I S I NIL F38 Med Med F S NIL S C C C F39 High Med F M S C C C I F40 Med Med F S S S S C NIL F41 Low Med F U NIL NIL I A A F44 Low Low F(GL,GS) M NIL NIL NIL C I

F75
F65
F28
N49
N59
F76
F29
N55
F44
N65
F27
N72
N35
N33
N60
N44
F30
N40
N43
F43
N4
N51
N71
N3
N45
N57A
N21
N52
F31
N24A
F24
N12B
N42
F34
N2
F33
N1
N18 N6
N13
F64
N36
N50
N58
N11
N19
N5
N16
N17A
F39
N8
N54
F36
N26
F41
N63
N25
N30
N57
N9A
N9B
N83
N7A
N84
N32
N82
N17B
F37
N37
F38
N47
N38N34A
N12C
N87
F73
N66
N28
N34B N24N15C
N12A
N48
F40
N69
N7B
N85
N29
N86
N23
F42
F59
N14A
N15A
N56
N64
N53
N41
N27
N7C
N39
N22
F32
N62
N20
N68
F35
F74
N67
N46
N18
N65
F31
An
Cn
Cf
Fn
Bf
Bn
Dn
Gn
Af
10B
N15BN15D
N31
N10A
N14B
N61
N70
N26A
F45
N65
511031.246469
511031.246469
512031.246469
512031.246469
513031.246469
513031.246469
514031.246469
514031.246469
515031.246469
515031.246469
516031.246469
516031.246469
517031.246469
517031.246469
518031.246469
518031.246469
519031.246469
519031.246469
5971
986.7
5032
1
5972
986.7
5032
1
5972
986.7
5032
1
5973
986.7
5032
1
5973
986.7
5032
1
5974
986.7
5032
1
5974
986.7
5032
1
5975
986.7
5032
1
5975
986.7
5032
1
5976
986.7
5032
1
5976
986.7
5032
1
5977
986.7
5032
1
5977
986.7
5032
1
5978
986.7
5032
1
5978
986.7
5032
1
µ1:10,000
2008 NEARSHORE SALMONID HABITAT INVENTORY
Salmonid Habitat Value Rating
Sites not assessed
High
Medium
Low
Site Photos
Flood Control Solution Areas
! stormwater outfall
City Boundary
0 400 800 1,200Meters
Prepared by: Prepared for:
Northwest Hydraulic Consultants
1 centimeter = 100 meters
Prince George
Prince George Flood Risk Evaluation and Flood Control Solutions Study
Study Area
Mapsheet 1 of 2Nechako River
Date: November 2008
Designed by: Jess Anaka

N72
N77 N75
N49
N59
N76
N55
N65
N60
N44
N43
N51
N71
N45
N57A
N52
N42
N50
N58
N81
N79
N54
N80
N40
N63
N57
N47
N66
N48
N69
N74
N56
N78
N64
N53
N62
N68
N67
N46
N65
Fn
Dn
Gn
Bn
En
En
N61
N70
N65
506080.757518
506080.757518
507080.757518
507080.757518
508080.757518
508080.757518
509080.757518
509080.757518
510080.757518
510080.757518
511080.757518
511080.757518
512080.757518
512080.757518
513080.757518
513080.757518
514080.757518
514080.757518
5974
898.8
0264
5
5975
898.8
0264
5
5975
898.8
0264
5
5976
898.8
0264
5
5976
898.8
0264
5
5977
898.8
0264
5
5977
898.8
0264
5
5978
898.8
0264
5
5978
898.8
0264
5
5979
898.8
0264
5
5979
898.8
0264
5
5980
898.8
0264
5
5980
898.8
0264
5
5981
898.8
0264
5
5981
898.8
0264
5
µ1:10,000
2008 NEARSHORE SALMONID HABITAT INVENTORY
Salmonid Habitat Value Rating
Sites not assessed
High
Medium
Low
Site Photos
Flood Control Solution Areas
! stormwater outfall
City Boundary
0 400 800 1,200Meters
Prepared by: Prepared for:
Northwest Hydraulic Consultants
1 centimeter = 100 meters
Prince George
Prince George Flood Risk Evaluation and Flood Control Solutions Study
Study Area
Mapsheet 2 of 2Nechako River
Date: November 2008
Designed by: Jess Anaka

F20
F24
F22
F16
F28
N49
F27
F23
F29
F21
N35
N33
N44
F44
F30
N40
N43
N4
F17
N3
N45
N21
N52
F31
F43
N55
N24A
N12B
N42
F34
N51
N2
F33
N1
N18 N6
N13N36
N50
N11
N19
F25
N5
N16
N17A
F39
N8
N54
F36
N26
F41
N25
N30
N9A
N9B
N83
N7A
F10
N84
N57A
F18
N32
N82
N17B
F37
N37
F38
N47
N38N34A
N12C
N87N28
N34B
F19
N24N15C
N12A
N48
F40
N58
N7B
N85
F26
N29
N86
N23
F42
N14A
N15A
N53
N41
N27
N7C
F15
N39
N22
F32
N20
F35
N46
F31
N18
An
Cn
Cf
Df
Bf
Bn
Dn
Gn
Af
10B
N15B
N56
N15DN31
F14
N10A
N14B
F59
N26A
510945.016511
510945.016511
511945.016511
511945.016511
512945.016511
512945.016511
513945.016511
513945.016511
514945.016511
514945.016511
515945.016511
515945.016511
516945.016511
516945.016511
517945.016511
517945.016511
518945.016511
518945.016511
5969
039.8
0350
1
5970
039.8
0350
1
5970
039.8
0350
1
5971
039.8
0350
1
5971
039.8
0350
1
5972
039.8
0350
1
5972
039.8
0350
1
5973
039.8
0350
1
5973
039.8
0350
1
5974
039.8
0350
1
5974
039.8
0350
1
5975
039.8
0350
1
5975
039.8
0350
1
5976
039.8
0350
1
5976
039.8
0350
1
µ1:10,000
2008 NEARSHORE SALMONID HABITAT INVENTORY
Salmonid Habitat Value Rating
Sites not assessed
High
Medium
Low
Site Photos
Flood Control Solution Areas
! stormwater outfall
City Boundary
0 400 800 1,200Meters
Prepared by: Prepared for:
Northwest Hydraulic Consultants
1 centimeter = 100 meters
Prince George
Prince George Flood Risk Evaluation and Flood Control Solutions Study
Study Area
Mapsheet 1 of 1Fraser River
Date: November 2008
Designed by: Jess Anaka

Existing Fisheries Compensation Structures
Glide
Glide
Glide
Riffle
Riffle
Glide
Glide
Glide Glide
Riffle
Glide
An
CnBn
Dn
Gn
Gravel BarRiffleGravel Bar
Riffle
Gravel Bar
Riffle
Riffle
Riffle
Gravel BarGravel Bar
1:10,000
µ Prepared by:
Prince George Flood Risk Evaluation and Flood Control Solutions Study
Nechako River Mapsheet 1 of 2Legend
Flood Control Solution Areas
Pink salmon spawning grounds (2001)
Glide
Riffle
Gravel Bar
Pool
Nechako River Meso-Habitat Classification

Glide
Glide
Glide
Glide
Glide
Gravel Bar
Riffle
Gravel Bar
Glide
Glide
Riffle
Riffle
Riffle
Glide
Glide
Glide
Riffle
Glide
An
Cn
Bn
Cf
Af
Gravel Bar
Gravel BarRiffle
Gravel BarGlide
Riffle
Riffle Riffle
Pool
Gravel Bar
Gravel Bar
Gravel Bar
Pool Gravel Bar
1:10,000
µ Prepared by:
Prince George Flood Risk Evaluation and Flood Control Solutions Study
Nechako River Mapsheet 2 of 2Legend
Flood Control Solution Areas
Pink salmon spawning grounds (2001)
Glide
Riffle
Gravel Bar
Pool
Nechako River Meso-Habitat Classification

RESULTS OF THE 2008 HABITAT MAPPING
The 2008 habitat assessments ranked each stream section based on three habitat indicators: spawning, overwintering and rearing. Once assessed the data was compiled into a habitat scoring matrix, designed to provide a more precise assessment of the overall habitat ratings.
The habitat ranking (i.e. Low=1, Med=2 and High=3) for a particular site was evaluated based on the ecological importance of known salmonid life history requirements. A score of “1” was assigned where the shoreline habitat retained low productivity or was lacking in habitat features. A score of “2” was assigned where the presence of habitat was observed to have moderately productive habitat features. A score of “3” was assigned where an abundance of suitable habitat criteria was observed (i.e. spawning gravels, rearing habitat and/or overwintering) resulting in highly productive habitat.
Overall, if a site scored “3” in one of the habitat criteria, the entire site was rated as high. If a given site scored a combination of medium and low scores or medium scores for every habitat criteria, it was rated as medium quality habitat. Conversely, if a site received a low (1) score in every habitat criteria, the entire site was given a low rating.

Nechako River Sites
1993 Original Rating
2008 Salmonid Habitat Value Rating Sp
awni
ng
Rear
ing
Ove
rwin
terin
g
N1 Low High 1 3 3 N2 High Med 2 2 1 N3 High Med 2 2 1 N4 High Med 1 2 2 N5 High High 1 3 1 N6 Med Med 1 2 2
N7A Med 1 1 2 N7B High 2 3 3 N7C
Med High 2 3 1
N8 High High 1 3 3 N9A Med 1 2 2 N9B
High High 1 3 3
N10A High 3 2 1 N10B
High Med 1 2 2
N11 High High 3 3 2 N12A High 3 3 1 N12B Med 1 2 1 N12C
High Low 1 1 1
N13 Med Med 1 2 2 N14A Low 1 1 1 N14B
Med High 3 3 3
N15A High 1 3 1 N15B High 2 3 1 N15C High 3 1 1 N15D
High
Med 2 2 1 N16 High High 1 3 3
N17A High 3 1 1 N17B
Low High 3 2 1
N18 Med Med 1 2 2 N19 Low Low 1 1 1 N20 High Med 1 2 1 N21 High Med 1 2 1 N22 Low Low 1 1 1 N23 Med Med 2 2 1
N24A High High 2 3 2

Nechako River Sites
1993 Original Rating
2008 Salmonid Habitat Value Rating Sp
awni
ng
Rear
ing
Ove
rwin
terin
g
N25 Med Med 2 1 2 N26 Med 1 2 1
N26A High
High 2 3 1 N27 Med High 1 3 1 N28 High High 1 3 1 N29 High High 1 3 2 N30 High Med 1 2 1 N31 High Med 2 2 1 N32 High High 2 3 1 N33 Med Med 1 2 1
N34A Med 1 2 1 N34B
High High 2 3 1
N35 Med Med 1 2 1 N36 High High 2 3 1 N37 High Med 1 2 1 N38 Med Med 1 2 1 N39 High High 1 3 2 N40 Low High 1 3 1 N41 Med Med 1 1 1 N42 High Med 1 2 1 N43 High High 1 3 1 N44 Med Med 1 2 1 N45 High High 2 3 2 N46 Low Low 1 1 1 N47 Med Med 1 2 1 N48 Med Med 1 2 1 N49 High High 1 3 2 N50 Med Med 1 2 1 N51 High Low 1 1 1 N52 High High 3 3 2 N53 Low Low 1 1 1 N54 Med Med 1 2 1 N55 High High 3 2 1 N56 High High 3 2 1 N57 Low 1 1 1
N57A Low
High 1 3 1

Nechako River Sites
1993 Original Rating
2008 Salmonid Habitat Value Rating Sp
awni
ng
Rear
ing
Ove
rwin
terin
g
N58 Low Low 1 1 1 N59 High High 2 3 1 N60 Low Low 1 1 1 N61 Low Low 1 1 1 N62 Med High 2 3 2 N63 Low High 1 3 2 N64 Low Low 1 1 1 N65 High High 1 3 1 N66 Low Low 1 1 1 N67 Med Low 1 1 1 N68 Med High 1 3 1 N69 Low Low 1 1 1 N70 Med Med 1 2 1 N71 High High 1 3 3 N72 High High 1 3 1 N73 Med Med 1 2 1 N74 Med Med 2 2 1 N75 Med Med 1 2 1 N76 High High 2 3 1 N77 High High 1 3 1 N78 High High 1 3 1 N79 High High 1 3 1 N80 High High 1 3 1 N81 High High 1 3 1 N82 n/a High 2 3 1 N83 n/a Med 1 2 1 N84 n/a Med 2 2 2 N85 n/a High 3 3 1 N86 n/a Med 2 2 2 N87 n/a Med 1 2 1

Fraser River Sites
1993 Original Rating
2008 Salmonid Habitat Value Rating Sp
awni
ng
Rear
ing
Ove
rwin
terin
g
F17 Med Med 2 2 2 F18 Low Low 1 1 1 F19 Low Med 1 2 2 F20 High Med 1 2 1 F21 Med Med 1 2 2 F22 Med Med 1 2 1 F23 Med Med 1 2 1 F24 Low Low 1 1 1 F25 Med Med 1 2 1 F26 Low Med 1 2 1 F27 Med Med 1 2 1 F28 High High 1 3 3 F29 Med Low 1 1 1 F31 Low Low 1 1 1 F32 Med Med 1 2 1 F33 High High 1 3 2 F34 Low Med 2 2 1 F35 Med High 1 2 3 F36 High High 1 3 1 F37 High High 1 3 2 F38 Med Med 1 2 1 F39 High Med 1 2 1 F40 Med Med 2 2 1 F41 Low Med 1 2 1 F44 Low Low 1 1 1

APPENDIX C.1 Table 1. Location of 12 white sturgeon radio-tagged in Fall 2007 during radio-telemetry flights in January and May 2008.
Tag Data Location
(May 8, 2008) Location (January 12,
2008) Fall 2007 location at time of radio tag application
Frequency Code rkm Easting Northing rkm Easting Northing rkm Easting NorthingComments
148.400 50 ~949.2 587559 5979319 948.3 587280 5979410 950.6 588892 5978228 Fall 2007: middle of Grand Canyon, Jan 2008: lower portion of Grand Canyon. 148.400 51 ~928 580344 5986313 ~925 581082 5987742 949 587222 5979507 Fall 2007: middle of Grand Canyon, Jan 2008: between the Bowron River and Grand Canyon. 148.380 55 Not located ~900 562980 6003637 880.5 551563 6006314 Fall 2007: along North Fraser Road, Jan 2008: McGregor River/Fraser River confluence.
148.420 54 ~896.3 563566 6003379 ~900 562980 6003637 829.95 530421 5992330 Fall 2007: just downstream of the Willow River confluence with the Fraser River, Jan 2008: McGregor River/Fraser River confluence.
148.420 53 ~890.7 558529 6005645 ~898 560064 6005012 880.6 551563 6006314 Fall 2007: along North Fraser Road, Jan 2008: ~2 km downstream of the McGregor confluence with the Fraser River.
148.420 51 ~950.2 588245 5978910 Not located 949.8 588477 5978821 Originally tagged in Nechako River rkm 110 in 1995, Jan 2008: Not located, but recapture from the Nechako River project so fish may have moved back to known wintering sites near Vanderhoof.
148.420 50 Not located Not located 948.3 587248 5979562 Fall 2007: Grand Canyon rkm 948 Jan 2008: Not located, may have still been in the canyon.
148.420 52 Not located Not located ~949 587235 5979523
Originally tagged at rkm 0.1 (Nechako/Fraser confluence) in 1996, Captured again by LTN in 1999 at rkm 826.6 on the Fraser River, Fall 2007 Grand Canyon, Jan 2008: Not located may have still been in the canyon. Alternatively, it may have moved to wintering sites up the Nechako.
148.400 52 ~810 522801 5980592 Not located 831.3 531508 5992938 Fall 2007: at rkm 831.3, Jan 2008: Not located.
148.400 54 Not located Not located 883.6 553994 6006890 Originally tagged at rkm 110 in 1997, Jan 2008: Not located, but recapture from the Nechako River project so fish may have moved back to known wintering sites near Vanderhoof.
148.400 53 ~896.3 563566 6003379 Not located 884.1 554197 6007462 Fall 2007: rkm 884.1 along North Fraser road, Jan 2008: Not located.
148.380 53 Not located Not located 882.3 552441 6006243 Originally tagged downstream of the Grand Canyon at rkm945.8 in 1999, Fall 2007: at rkm 882.3, Jan 2008: Not located, probable that it moved back into canyon area.

Appendix C.2Scientific Name English Name COSEWIC COSEWIC Comments BC Status Identified Wildlife Prov Wildlife Act SARAAcorus americanus American sweet-flag BlueAnemone virginiana var. cylindroidea riverbank anemone RedApocynum x floribundum western dogbane BlueArnica chamissonis ssp. incana meadow arnica BlueCarex rostrata swollen beaked sedge BlueCarex scoparia pointed broom sedge BlueCarex sprengelii Sprengel's sedge RedCarex tenera tender sedge BlueCarex tonsa var. tonsa bald sedge BlueDraba fladnizensis Austrian draba BlueDryopteris cristata crested wood fern BlueGalium labradoricum northern bog bedstraw BlueJuncus arcticus ssp. alaskanus arctic rush BlueJuncus stygius bog rush BlueMalaxis brachypoda white adder's-mouth orchid BlueMalaxis paludosa bog adder's-mouth orchid BlueMegalodonta beckii var. beckii water marigold BlueNymphaea tetragona pygmy waterlily BlueOxytropis campestris var. davisii Davis' locoweed BluePedicularis parviflora ssp. parviflora small-flowered lousewort BluePinus albicaulis whitebark pine BluePyrola elliptica white wintergreen BlueSenecio plattensis plains butterweed BlueSparganium fluctuans water bur-reed BlueTorreyochloa pallida Fernald's false manna Red

Appendix C.3
Scientific Name English Name BC Status Identified WildlifePicea engelmannii x glauca - Betula papyrifera / Oplopanax horridus
hybrid white spruce - paper birch / devil's club Blue
Picea engelmannii x glauca / Matteuccia struthiopteris hybrid white spruce / ostrich fern Red Y (Jun 2006)Pseudotsuga menziesii / Acer glabrum / Hylocomium splendens Douglas-fir / Douglas maple / step moss RedPseudotsuga menziesii - Picea engelmannii x glauca / Rubus parviflorus
Douglas-fir - hybrid white spruce / thimbleberry Blue
Pseudotsuga menziesii - Pinus contorta / Cladonia spp. Douglas-fir - lodgepole pine / clad lichens Blue

Appendix C.4
Scientific Name English Name BC Status Identified WildlifeEquisetum fluviatile - Carex utriculata swamp horsetail - beaked sedge BluePicea engelmannii x glauca / Spiraea douglasii - Rosa acicularis hybrid white spruce / hardhack - prickly rose BluePinus contorta - Picea mariana / Pleurozium schreberi
lodgepole pine - black spruce / red-stemmed feathermoss Blue
Poa secunda ssp. secunda - Elymus trachycaulus Sandberg's bluegrass - slender wheatgrass RedPseudotsuga menziesii - Pinus contorta / Cladonia spp. Douglas-fir - lodgepole pine / clad lichens BlueSalix drummondiana / Calamagrostis canadensis Drummond's willow / bluejoint reedgrass BlueScheuchzeria palustris / Sphagnum spp. scheuchzeria / peat-mosses Blue

Appendix C.5
Scientific Name English Name COSEWIC COSEWIC Comments BC Status Identified Wildlife Prov Wildlife Act SARA
Acipenser transmontanus pop. 3 White Sturgeon (Nechako River population) E (Nov 2003) Red 1
Acipenser transmontanus pop. 5White Sturgeon (Upper Fraser River population) E (Nov 2003) Red 1
Acipenser transmontanus pop. 6White Sturgeon (Middle Fraser River Population) E (Nov 2003) Red 3
Acroloxus coloradensis Rocky Mountain Capshell NAR (Nov 2001) BlueArdea herodias herodias Great Blue heron, herodias subspecies Blue Y (Jun 2006)Asio flammeus Short-eared Owl SC (Mar 2008) Blue Y (May 2004) 3Botaurus lentiginosus American Bittern BlueButeo platypterus Broad-winged Hawk BlueColias meadii Mead's Sulphur BlueDolichonyx oryzivorus Bobolink BlueFossaria parva Pygmy Fossaria BlueGrus canadensis Sandhill Crane NAR (May 1979) G. Canadensis tabida assessed Blue Y (Jun 2006)Gulo gulo luscus Wolverine, luscus subspecies SC (May 2003) Western Population Only Blue Y (May 2004)Martes pennanti Fisher Blue Y (Jun 2006)Myotis septentrionalis Northern Myotis BlueNumenius americanus Long-billed Curlew SC (Nov 2002) Blue Y (May 2004) 1Oeneis jutta chermocki Jutta Arctic, chermocki subspecies Blue
Rangifer tarandus pop. 15 Caribou (northern mountain population) T/SC (May 2002)
Provincial and COSEWIC borders differ therefore there are two listings for this ecotype. The southern portion of the ecotype falls within the northern part of the COSEWIC area that includes the threatened population of southern mountain caribou. Blue Y (May 2004) 1
Salvelinus confluentus Bull Trout Blue Y (Jun 2006)Somatochlora forcipata Forcipate Emerald Blue
Tympanuchus phasianellus columbianusSharp-tailed Grouse, columbianus subspecies Blue Y (Jun 2006)
Ursus arctos Grizzly Bear SC (May 2002) Blue Y (May 2004)

APPENDIX D FLOOD FREQUENCY ANALYSES

APPENDIX D Fraser River at Shelley
Year Max Flow
(m3/s) 1935 3114.83 1936 3934.34 1937 2930.67 1938 2553.14 1939 3441.72 1940 2903.05 1941 2318.34 1942 2801.76 1943 2981.32 1944 2525.52 1945 2981.32 1946 3400.28 1947 3257.56 1948 4611.13 1949 3206.91 1950 3710.00 1951 3000.00 1952 3060.00 1953 2730.00 1954 2970.00 1955 3680.00 1956 3340.00 1957 3400.00 1958 3200.00 1959 3060.00 1960 3230.00 1961 3230.00 1962 3230.00 1963 2920.00 1964 4080.00 1965 3170.00 1966 3260.00 1967 4080.00 1968 3200.00 1969 2430.00 1970 3940.00 1971 3260.00 1972 4980.00 1973 3310.00 1974 3480.00 1975 2490.00 1976 3260.00 1977 2940.00 1978 2210.00 1979 4080.00 1980 2340.00 1981 3050.00 1982 3270.00 1983 2200.00 1984 2690.00 1985 3650.00 1986 4260.00 1987 2860.00 1988 3270.00 1989 2590.00 1990 4800.00 1991 2890.00 1992 2570.00 1993 2690.00 1994 2660.00 1995 2270.00 1996 2640.00 1997 4120.00 1998 2190.00 1999 3800.00 2000 3270.00 2001 3280.00 2002 4260.00 2003 2440.00 2004 2760.00 2005 3030.00 2006 2780.00 2007 4420.00 2008 4310.00
Extend Shelley record based on Big Bar for 1935-1949 1894 estim=5970 cms
as historic max for 162 years
Flows Log of Flows Hist Wt. Flows
Mean 3242.96 8.06 3223.17 St. Dev 708.98 0.21 669.3 Skew 1.18 0.5 0.97
RP GEV LN3 LP3 P3 2 3123.61 3114.41 3119.9 3117.9 5 3721.34 3724.05 3715.2 3730.22 10 4105.94 4124.59 4100.82 4116.5 20 4466.74 4506.55 4466.78 4472.72 25 4579.55 4627.52 4582.52 4583.25 50 4922.22 5000.45 4939.29 4915.71
100 5255.21 5372.39 5295.56 5236.95 200 5580.06 5746.21 5654.62 5549.49 500 5998.29 6246.51 6137.39 5951.82
Fit Method Moments Max. Like Moments Moments Location 2925.89 7.45 7.01 3223.17
Scale 542.46 0.36 0.04 669.3 Shape 0.03 1389.12 27.67 0.97

Fraser River at Shelley (Period: Jun/20 – Jul/20)
Year Max. Flow
(m3/s) 1957 1900.00 1958 1630.00 1959 2890.00 1960 3230.00 1961 1910.00 1962 3230.00 1963 2730.00 1964 3990.00 1965 2490.00 1966 3000.00 1967 3790.00 1968 3200.00 1969 1590.00 1970 2610.00 1971 2310.00 1972 2890.00 1973 3310.00 1974 3480.00 1975 2490.00 1976 3260.00 1977 2620.00 1978 1660.00 1979 2920.00 1980 2340.00 1981 1620.00 1982 3170.00 1983 2150.00 1984 2690.00 1985 2160.00 1986 2610.00 1987 2090.00 1988 2160.00 1989 1750.00 1990 3110.00 1991 2530.00 1992 1930.00 1993 1670.00 1994 2660.00 1995 1500.00 1996 2610.00 1997 3240.00 1998 1180.00 1999 3800.00 2000 3270.00 2001 3240.00 2002 3930.00 2003 1770.00 2004 1810.00 2005 2020.00 2006 1350.00
FREQUENCY ANALYSIS
57-06 (06/20-07/20)
Flows Log of Flows
Hist Wt. Flows
Mean 2549.80 7.80 St. Dev 726.86 0.30 Skew 0.57 -0.40
RP GEV LN3 LP3 P3 2.00 2521.71 2523.25 2563.23 2481.36 5.00 3194.02 3153.42 3185.20 3131.87 10.00 3552.90 3499.25 3484.15 3513.01 20.00 3844.22 3793.45 3710.35 3850.22 25.00 3927.12 3880.65 3772.22 3952.52 50.00 4157.08 4134.16 3938.56 4254.50
100.00 4351.77 4367.10 4073.84 4539.06 200.00 4517.36 4584.45 4185.33 4810.02 500.00 4699.42 4853.31 4304.49 5151.37
Fit Method L
Moments Max. Like Max. Like Moments
Location 2264.60 9.18 8.46 2549.80 Scale 731.10 0.07 -0.15 726.86 Shape 0.23 -7198.57 4.48 0.57

Year Max. Flow (m3/s) 1957.00 723.23 1958.00 902.32 1959.00 757.27 1960.00 994.82 1961.00 711.47 1962.00 721.11 1963.00 727.16 1964.00 1104.91 1965.00 702.27 1966.00 731.91 1967.00 929.29 1968.00 869.97 1969.00 557.68 1970.00 424.26 1971.00 598.38 1972.00 1101.93 1973.00 544.42 1974.00 956.60 1975.00 401.45 1976.00 1099.07 1977.00 617.55 1978.00 328.00 1979.00 565.21 1980.00 398.65 1981.00 599.95 1982.00 602.79 1983.00 617.01 1984.00 603.40 1985.00 533.00 1986.00 599.41 1987.00 526.85 1988.00 584.02 1989.00 460.58 1990.00 606.99 1991.00 529.90 1992.00 610.75 1993.00 680.81 1994.00 578.51 1995.00 509.00 1996.00 733.73 1997.00 1050.78 1998.00 484.00 1999.00 623.20 2000.00 520.94 2001.00 544.23 2002.00 729.21 2003.00 560.90 2004.00 514.97 2005.00 631.00 2006.00 494.75 2007.00 1194.39
Flows Log of Flows
Hist Wt. Flows
Mean 670.47 6.47 St. Dev 202.29 0.29 Skew 0.98 0.31
RP GEV LN3 LP3 P3 2.00 625.63 635.27 634.36 638.33 5.00 806.77 816.22 812.18 823.46 10.00 937.81 936.52 931.98 940.48 20.00 1072.52 1052.12 1048.71 1048.50 25.00 1117.20 1088.89 1086.20 1082.04 50.00 1261.04 1202.70 1203.45 1182.95
100.00 1413.57 1316.82 1322.90 1280.53 200.00 1575.87 1432.10 1445.56 1375.50 500.00 1806.94 1587.19 1613.85 1497.83
Fit Method
L Moments
Max. Like
Max. Like Moments
Location 571.08 6.18 4.59 670.47 Scale 146.29 0.38 0.04 202.29 Shape -0.09 152.98 43.92 0.98
Nechako River at Prince George (Recorded Values at Isle Pierre + Corrections for Prince George)

Year Max Flow
(m3/s) 1957 815 1958 970 1959 1084 1960 984 1961 743 1962 862 1963 551 1964 1143 1965 643 1966 874 1967 967 1968 1058 1969 831 1970 534 1971 959 1972 1342 1973 589 1974 892 1975 724 1976 1228 1977 795 1978 470 1979 596 1980 422 1981 605 1982 615 1983 636 1984 604 1985 501 1986 632 1987 524 1988 626 1989 496 1990 626 1991 569 1992 575 1993 705 1994 605 1995 541 1996 743 1997 1227 1998 500 1999 699 2000 563 2001 602 2002 913 2003 582 2004 530 2005 754 2006 518
DA's Modified Flows:
(at Prince George)
Flows Log of Flows
Hist Wt. Flows
Mean 731.34 6.55 St. Dev 223.32 0.28 Skew 1 0.54
RP GEV LN3 LP3 P3 2 676.62 673.22 672.92 695.19 5 877.42 879.59 874.3 899.7 10 1027.73 1036.21 1029.22 1029.42 20 1186.47 1200.09 1194.87 1149.4 25 1240.03 1254.83 1251.17 1186.69 50 1415.45 1431.96 1436.94 1298.99 100 1606.3 1620.8 1641.53 1407.69 200 1814.62 1822.45 1867.89 1513.61 500 2120.15 2110.26 2205.77 1650.15
Fit Method L
Moments Max. Like Max. Like Moments
Location 617.81 5.77 5.91 731.34 Scale 156.64 0.59 0.13 223.32 Shape -0.13 353.57 5 1
Nechako River at Prince George (Simulated Flows)

Year Max. Flow
(m3/s) 1957.00 3987.20 1958.00 3763.00 1959.00 3642.08 1960.00 3993.70 1961.00 3774.74 1962.00 3801.65 1963.00 3638.14 1964.00 5069.27 1965.00 3866.94 1966.00 3853.82 1967.00 5009.29 1968.00 3972.57 1969.00 2841.34 1970.00 4335.48 1971.00 3708.34 1972.00 5799.71 1973.00 3792.61 1974.00 4059.00 1975.00 2878.33 1976.00 4329.37 1977.00 3424.70 1978.00 2520.18 1979.00 4586.43 1980.00 2560.02 1981.00 3468.07 1982.00 3745.77 1983.00 2479.96 1984.00 3127.84 1985.00 3963.55 1986.00 4584.45 1987.00 3263.65 1988.00 3599.04 1989.00 2933.92 1990.00 5199.05 1991.00 3297.93 1992.00 3030.02 1993.00 3034.15 1994.00 3129.08 1995.00 2658.46 1996.00 3283.60 1997.00 5110.26 1998.00 2552.08 1999.00 4360.16 2000.00 3687.47 2001.00 3798.10 2002.00 4986.57 2003.00 2773.24 2004.00 3117.46 2005.00 3621.00 2006.00 3065.74
Flows Log of Flows
Hist Wt. Flows
Mean 3701.57 8.20 St. Dev 777.66 0.21 Skew 0.58 0.10
RP GEV LN3 LP3 P3 2.00 3605.57 3597.79 3602.83 3626.90 5.00 4339.38 4308.12 4298.83 4323.48 10.00 4786.94 4752.06 4731.13 4732.49 20.00 5189.67 5162.13 5129.79 5094.82 25.00 5312.25 5289.61 5253.71 5204.82 50.00 5674.91 5676.24 5629.67 5529.71
100.00 6013.63 6053.09 5996.61 5836.09 200.00 6331.27 6424.07 6358.53 6128.03 500.00 6722.01 6909.73 6833.73 6496.07
Fit Method
L Moments
Max. Like
Max. Like Moments
Location 3352.39 7.89 5.83 3701.57 Scale 701.84 0.28 0.02 777.66 Shape 0.09 922.83 133.33 0.58
Fraser River Downstream Nechako River(Flows at Prince George + Flows at Shelley)

APPENDIX E DETAILED ICE ANALYSES

The freeze-up processes in the Fraser and Nechako Rivers are complex and this Appendix provides more technical detail on some aspects of the analysis, omitted from the main text. Some of the tables and figures of the main report are referenced.
E.1 – FRASER RIVER ICE-RELATED WATER LEVELS
Approximate open water and ice-related rating curves at the confluence were shown in Figure 4.6. The curves were determined from water level data at the South Fort George gauge and adjusted by 0.75 m to reflect the difference in water levels between the South Fort George gauge and the discontinued Prince George gauge located near the confluence at the CN railway bridge.
The peak freeze-up levels are also shown in Figure 4.6, relative to the open water rating curve. The water level increases by between 0.4 and 3.3 m at freeze-up due to the effects of the ice cover. The lower range of the increase is associated with either a thermal ice cover (due to shore ice growth) or a juxtaposed ice cover composed of an ice thickness that would be equivalent to the thermal thickness of the frazil floes. The solid-ice rating curve reflects an adopted ice thickness of 0.40 m and a Manning ice roughness coefficient (ni) of 0.020. The upper range of the data reflects an ice cover thickness that would be representative of an equilibrium ice jam. The ice jam rating curve that defines the upper bounds of the freeze-up data was simulated using a Manning ice roughness coefficient (ni) of 0.050 and a coefficient of internal friction of the ice accumulation of 1.0. The value chosen for the coefficient of internal friction is typical of what has been used on other rivers to analyze freeze-up ice accumulations and breakup jams.
The freeze-up level on the Fraser River at the confluence varies from about El. 563 to 565 m GSC. From consideration of the channel cross section on the Nechako River at the confluence (Figure E.1) the velocity on the Nechako River would vary from 0.5 to 1.2 m/s for flows between 100 and 250 m3/s at the minimum freeze-up level and from 0.07 to 0.20 m/s for the corresponding flows at the maximum freeze-up level. The approach flow Froude number would vary between 0.05 and 0.11 at the low freeze-up level and it would vary from 0.03 to 0.08 at the high freeze-up levels for Nechako River flows of 100 and 250 m3/s respectively.
E.2 – NECHAKO RIVER ICE VOLUMES
On the basis of observed shear wall thicknesses (Figure 4.2) and equilibrium ice-jam thickness calculations, the thickness of a typical ice accumulation is estimated to be about 2 m. Assuming a frazil ice porosity of 0.5 and a river width of 120 m, the estimated volume of ice trapped in the upstream-advancing accumulation is then 130 m x 120 m x 2 m x 0.5, or roughly 16,000 m3 per degree-day of freezing. So, for an air temperature of minus 10 0C, the ice discharge contributing to ice accumulation would be 160,000 m3/day or about 1.9 m3/s. Adding 0.6 m3/s to account for the frazil ice transported beneath the cover, the total rate of ice generation is estimated as 2.5 m3/s within the upstream ice generation zone.

E.3 – NECHAKO RIVER ICE FREQUENCY ANALYSIS
The following procedure was used to derive frequency curves of freeze-up water levels at various locations along the Nechako River.
1. A record length of 58 years (1950-51 to 2007-08) representing regulated conditions was adopted. Those ice-related water levels in Table 4.2 that could be ascribed to freeze-up represent the 13 highest freeze-up events in that period. 2. An empirical frequency curve of historical peak freeze-up levels at Cameron Street Bridge (Figure 4.14) was derived by assigning the highest event since regulation in 1950-51 a return period of 58 years, the second-highest a return period of 29 years, and the lowest a return period of about 5 years.
3. A simulated frequency curve of annual peak freeze-up levels at Cameron St Bridge was based on Monte Carlo analysis of a 1000-year time period that combined the annual probability of experiencing a given discharge (Figure 4.13) with (1) the annual probability of experiencing 100 0C-days of freezing after lodgement at South Fort George (70% from Table 4.2) and (2) the annual probability of experiencing a fully developed equilibrium freeze-up accumulation. For years when an equilibrium ice accumulation would have developed at Cameron St Bridge, the peak freeze-up water level was calculated from the ice jam rating curve in Figure 4.10, using the discharge for that year as determined from a Monte Carlo simulation. For the other years, the freeze-up water level was calculated from the solid-ice rating curve shown in Figure 4.10. Finally, a frequency plot of the 1000-year series of freeze-up levels that resulted from the analysis was obtained.
4. The probability of experiencing an equilibrium ice accumulation at Cameron St Bridge was determined by trial and error until the simulated frequency curve more or less matched the empirical frequency curve based on historical data. A value of 25% produced the most reasonable fit (Figure 4.14). The Monte Carlo computation of the 1000-year series of freeze-up discharges was based on a lognormal distribution of known flows averaged over a 10-day period after freeze-up – those had a mean of 150 m3/s and a standard deviation of 80 m3/s. Both the 70% probability of experiencing the required amount of ice production and the 25% probability of developing an ice cover thickness equivalent to a fully-developed equilibrium accumulation were defined by Bernoulli distributions.
5. Frequency curves for other locations along the Nechako River were calculated using the same annual probability of an equilibrium freeze-up accumulation as for Cameron St Bridge, but substituting the annual probability for that particular location of experiencing sufficient degree-days of freezing to ensure an ice accumulation, as shown in Table 4.3.
6. Given the more or less uniform channel characteristics within the study area, the shape of the rating curves for both an equilibrium ice accumulation and a solid ice cover should be similar, but with the actual levels offset vertically according to the slope of the river. On this basis, peak water levels at other locations were offset vertically from the level at Cameron St Bridge according to differences measured in 1996 (Figure 4.8), as follows:

• Winton Global - 2.9 m
• John Hart Bridge 1.1 m
• Foothills Bridge 4.9 m
• Morning Place 8.4 m
The simulated frequency curves are shown in Figure 4.14. Ice-related water levels for various return periods, including 0.6 m of freeboard, are summarized in Table 4.4. For Cameron St Bridge, the 100-year ice-related flood level is 571.4 m, or 572.0 m including freeboard. The reported maximum level at Cameron St Bridge during the winter of 2007-08 was 571.3 m, or only 0.1 m lower than the simulated 100-year level. This event is estimated to have had a return period of approximately 90 years.
E.4 – GRAVEL REMOVALS AND ICE LODGEMENT PROCESS
The propensity for juxtapostion decreases with increasing Froude numbers (increasing velocity) and the transport of frazil slush increases with increasing velocity. In other words, higher velocities result in a delay in the formation of an ice cover.
Any gravel removal in the Nechako River channel would increase the flow area, lower velocities, reduce the Froude number and enhance the juxtapostion processes, allowing a stable ice cover to form sooner, ultimately contributing to a more rapid advance of the ice cover upstream. For example, at a Nechako River flow of 100 m3/s and a low Fraser River freeze-up level, removing gravel from the channel by an average of one metre would reduce the Froude number from 0.05 to 0.01. At a Nechako River flow of 250 m3/s, the gravel removal would reduce the Froude number from 0.11 to 0.03. For the high Fraser River freeze-up level, the Froude number reduction would be from 0.03 to 0.01 and from 0.08 to 0.03 for Nechako River flows of 100 and 250 m3/s respectively. With juxtapostion a near certainty at Froude numbers below 0.08, it is clear that removing gravel would assist the formation of an ice cover and not reduce the likelihood or delay the formation of an ice cover at the confluence.
As slush arrives at the confluence, it will be transported into the Fraser River if the local velocity is large enough. If not, it will accumulate underneath the ice cover at the confluence until the local velocity is increased sufficiently (by the overall reduction in the flow area) to transport the incoming slush. Applying a critical Shields Number of 0.040 for the threshold of ice transport just upstream of the Nechako/Fraser confluence, the threshold velocity below which there would be no cover load transport is about 0.3 m/s. For velocities less than this, the frazil would keep accumulating, reducing the flow area and gradually increasing velocities until they reached the threshold value of 0.3 m/s. The frazil would then be transported into the Fraser and no additional deposition would occur.
At Fraser River freeze-up levels less than about El. 563.5 m GSC (Figure E.1), the velocity at the confluence would be greater than 0.3 m/s for any flow that would likely be evident at freeze-up on the Nechako River. Thus, the entire incoming cover load would be swept out into the Fraser River. At freeze-up levels between El. 563.5 and El. 565.0 m

GSC, between 0.1 and 1.7 m of frazil deposition (the thickness of the deposition increasing with increasing water levels and decreasing with increasing Nechako River flows) would occur until the critical velocity of 0.3 m was reached.
If the main channel in the vicinity of Cottonwood Island (or even in the Fraser River downstream of the Nechako River) was to be dredged, the local velocity would be reduced. This would make it easier for the ice cover to form, thereby most likely promoting a more rapid advance of the ice cover within the section of the river that is dredged. Once the ice cover advanced upstream of the dredged area, the rate of advance would return to that which is currently being experienced. The under-ice velocities in the dredged section would be less than upstream and the cover load arriving from upstream would deposit in the dredged area. Since the water level is controlled by backwater conditions on the Fraser River, the frazil slush would continue to deposit until the thickness of the deposit increased to the point where the under-ice velocity would be large enough to re-establish the required transport rate to transport the incoming cover load without additional deposition.

Fraser River Freeze‐Up Levels
January 2009 Figure E.1
City of Prince George
561
562
563
564
565
566
567
568
569
570
571
2000 2100 2200 2300 2400 2500 2600 2700 2800
Elev
atio
n (m
) GSC
Distance (m) from LB
Nechako Cross-Section N1
200 Year Water Level
Water Level Range at Freeze-Up
Cross-Section viewed downstream.

APPENDIX F INITIAL FLOOD CONTROL SOLUTIONS
- PROGRESS REPORT 1

Table E.1: Flood Control Solutions - Nechako River
Mitigation Options Mitigation Sub-Options Alternate Designs Hydraulic Considerations Infrastructure Considerations Environmental Considerations Geomorphology Considerations General Evaluation3 2 1 1 3 2 3 3
Area AN (Southbank at confluence)No permanent protection, provide temporary works as required
On-going flood risk. Emergency response on call. No new environmental impacts expected in absence of permanent protection. Potential environmental considerations associated with temporary works depends on design of those works. For example, release of deleterious substances is possible with use of amphibex and warm water release.
The effects of ongoing sediment deposition must be considered.
Not acceptable in the long term.
3 3 3 2 1 3 1 3 9 6 3 2 3 6 3 9 41 9
Diking Next to river and along Cottonwood Island back channel
Need erosion protection, install lockblock/sheetpile walls where insufficient space, provide seepage cut-off, seal old channel entrances, pump&treat internal flows.
Access limited for construction and maintenance.
Riparian habitat encroachment. Potential streambank erosion and streambed scour. Federal review will be triggered.
Reduced flood conveyance area. Sub-surface flow will continue to cause flooding hazard.
Significant environmental, river encroachment and access issues. 2 3 1 2 3 3 2 1 6 6 1 2 9 6 6 3 39 8
Permanently raise River Road Do nothing for development outside road
Some erosion protection, install lockblock/sheetpile walls where insufficient space, provide seepage cut-off, seal old channel entrances, pump&treat internal flows.
Continued flood risk outside road. Potential minor riparian habitat encroachment.
Maintains exising flood conveyance area.
Feasible but still need to deal with groundwater problems. 2 3 1 2 2 2 2 2 6 6 1 2 6 4 6 6 37 6
Extend dike locally to protect development outside dike
Need erosion protection, install lockblock/sheetpile walls where insufficient space, provide seepage cut-off, seal old channel entrances, pump&treat internal flows.
Access limited for construction and maintenance.
Potential riparian habitat encroachment. Federal review potentially triggered.
Reduces flood conveyance area. Sub-surface flow is still an issue.
Feasible but still need to deal with groundwater problems. 1 2 1 2 3 2 2 1 3 4 1 2 9 4 6 3 32 4
Land-use change outside dike Some erosion protection, install lockblock/sheetpile walls where insufficient space, provide seepage cut-off, seal old channel entrances, pump&treat internal flows.
Business access issues. Potential minor riparian habitat encroachment.
Maintains or increases conveyance area
Feasible but still need to deal with groundwater problems. 1 1 1 2 2 1 2 2 3 2 1 2 6 2 6 6 28 1
Raise development outside dike Need erosion protection, install lockblock/sheetpile walls where insufficient space, provide seepage cut-off, seal old channel entrances, pump&treat internal flows.
Business access issues. Potential minor riparian habitat encroachment.
Modest reduction in conveyance area Feasible but still need to deal with groundwater problems. 2 2 2 2 2 2 2 1 6 4 2 2 6 4 6 3 33 5
Build setback dike along railway. Individually ring dike some development outside dike
Provide seepage cut-off, seal old channel entrances, pump&treat any internal flows.
Business access issues. Potential minor riparian habitat encroachment.
Maintains conveyance area Good from river engineering perspective but expensive. 2 1 3 2 2 2 2 3 6 2 3 2 6 4 6 9 38 7
Land-use change outside dike Provide seepage cut-off, seal old channel entrances, pump&treat any internal flows.
Potential minor riparian habitat encroachment.
Restores former conveyance area Good from river engineering, environmental and geomorphological perspective but expensive.
1 1 1 1 2 1 3 2 3 2 1 1 6 2 9 6 30 2
Land-use change over entire floodplain Unlikely to include railroad and downtown area.
Restores functional floodplain areas Restores former conveyance area Unlikely to include downtown area. 1 1 1 1 1 1 3 3 3 2 2 1 3 2 9 9 31 3
Improve internal drainage. Deep groundwater pumping Groundwater governed by river levels, not effective without diking.
Large pump capacity required Potential for existing groundwater contamination in industrial areas. Testing and treatment may need to be considered.
It could be difficult to significantly lower ground water levels
Expensive. Expected to be difficult to reduce groundwater levels during flood. Would be undertaken as part of a diking option.
2 1 3 1 2 1 3 2 6 2 3 1 6 2 9 6 35 n/a
Ditch and pump. Groundwater governed by river levels, not effective without diking.
Complex ditch network. Difficult to fit in with in with existing infrastructure.
Potential for ditch water contamination in industrial areas. Testing and treatment may need to be considered.
Large deep ditches might improve drainage.
Expensive. Expected to be difficult to reduce groundwater levels during flood. Would be undertaken as part of a diking option.
2 1 2 1 2 1 3 2 6 2 2 1 6 2 9 6 34 n/a
Area BN (Northbank east of JH Brdg)No permanent protection, provide temporary works as required
No new environmental impacts expected in absence of permanent protection. Potential environmental considerations associated with temporary works depends on design of those works. For example, release of deleterious substances is possible with use of amphibex and warm water release.
Status quo - check rates of local sediment accumulation
Not acceptable in the long term.
3 3 2 2 1 1 1 2 9 6 2 2 3 2 3 6 33 2
Land-use change over entire floodplain nil No significant change but reduces future flood protection requirements
Unlikely. 1 1 1 1 1 1 3 3 3 2 1 1 3 2 9 9 30 1
Diking Next to river Need erosion protection, install lockblock/sheetpile walls where insufficient space, provide seepage cut-off, pump internal flows.
Access issues Riparian habitat encroachment. Potential streambank erosion and streambed scour. Federal review potentially triggered.
No significant change - but reduces flood storage area
Environmental and access issues.
2 3 1 3 3 2 3 1 6 6 1 3 9 4 9 3 41 7
Raise Mcaloney and Ongman Roads Land-used change outside road Install lockblock/sheetpile walls where insufficient space, provide seepage cut-off, pump internal flows.
Access issues Potential minor riparian habitat encroachment.
No significant change - but reduces flood storage area
Feasible but expensive. 1 2 1 2 2 1 3 2 3 4 1 2 6 2 9 6 33 2
Do nothing for development outside road
Install lockblock/sheetpile walls where insufficient space, provide seepage cut-off, pump internal flows.
Access issues Potential minor riparian habitat encroachment.
Maintains flood storage area Feasible 2 3 2 2 2 2 2 2 6 6 2 2 6 4 6 6 38 6
Low dike providing base for temporary high water protection
Same sub-options as for full height dike
Temporarily raise dike as needed using gabions or lock blocks.
Emergency response on call. Riparian habitat encroachment. Potential streambank erosion and streambed scour. Federal review potentially triggered.
No significant change - but reduces flood storage area
Feasible
2 2 1 3 3 2 2 1 6 4 1 3 9 4 6 3 36 4
Individually raise/flood proof any essential development/basements
Potential minor riparian habitat encroachment.
Feasible but expensive. 2 2 3 2 2 2 2 2 6 4 3 2 6 4 6 6 37 5
Ris
k af
ter I
mpl
emen
ting
Con
str./
Mai
nten
ance
Acce
ss P
robl
ems
Dra
inag
e Pr
oble
ms
Are
a R
anki
ng
Envi
ronm
enta
l Im
pact
Riv
er In
stab
ility
Ris
k
EVALUATION CRITERIA1 = low, 3 = high
WEIGHTING FACTOR1 = less important3 = more important
Ris
k af
ter I
mpl
emen
ting
Con
str./
Mai
nten
ance
Dire
ct C
ost
Soci
al C
ost
Dra
inag
e Pr
oble
ms
Envi
ronm
enta
l Im
pact
Riv
er In
stab
ility
Ris
k
Dire
ct C
ost
Soci
al C
ost
Tota
l Wei
ght F
acto
r
Acce
ss P
robl
ems

Table E.1: Flood Control Solutions - Nechako River
Mitigation Options Mitigation Sub-Options Alternate Designs Hydraulic Considerations Infrastructure Considerations Environmental Considerations Geomorphology Considerations General Evaluation3 2 1 1 3 2 3 3
Dire
ct C
ost
Soci
al C
ost
Dra
inag
e Pr
oble
ms
Envi
ronm
enta
l Im
pact
Riv
er In
stab
ility
Ris
k
Dire
ct C
ost
Soci
al C
ost
Tota
l Wei
ght F
acto
r
Acce
ss P
robl
ems
Are
a R
anki
ng
Envi
ronm
enta
l Im
pact
Riv
er In
stab
ility
Ris
k
EVALUATION CRITERIA1 = low, 3 = high
WEIGHTING FACTOR1 = less important3 = more important
Ris
k af
ter I
mpl
emen
ting
Con
str./
Mai
nten
ance
Ris
k af
ter I
mpl
emen
ting
Con
str./
Mai
nten
ance
Acce
ss P
robl
ems
Dra
inag
e Pr
oble
ms
Area CN (Northbank near confluence)No permanent protection, provide temporary works as required
PG Pulpmill Road shown as dike on provincial dike mapping.
No new environmental impacts expected in absence of permanent protection. Potential environmental considerations associated with temporary works depends on design of those works. For example, release of deleterious substances is possible with use of amphibex and warm water release.
On-going sediment deposition would increase flood hazard
Not acceptable in the llong term.
3 3 3 3 1 2 1 3 9 6 3 3 3 4 3 9 40 7
Land-use change over entire floodplain Restores functional floodplain areas Some conveyance increase. Good from river engineering, environmental and geomorphological perspective but expensive.
1 1 1 1 1 1 3 2 3 2 1 1 3 2 9 6 27 1
Diking Next to river Need erosion protection, install lockblock/sheetpile walls where insufficient space, provide seepage cut-off, pump internal flows.
Maintenance issues Riparian habitat encroachment. Potential streambank erosion and streambed scour. Federal review potentially triggered.
Decrease flood conveyance/storage area
Not advisable.
3 3 2 2 3 3 3 2 9 6 2 2 9 6 9 6 49 9
Raise PG Pulpmill Road if necessary and install seepage prevention to ensure dike meets standards or build new standard dike along road
Do nothing for development outside road
Install flapgates on culverts and prevent seepage, raise as necessary.
Access issues If a new dike is built along road: Riparian habitat encroachment. Potential streambank erosion and streambed scour. Federal review potentially triggered
Road is away from river, little geomorphological impact
Groundwater problems north of road.
2 2 2 2 3 2 2 2 6 4 2 2 9 4 6 6 39 5
Build local dikes to protect development outside road
Install flapgates on culverts and prevent seepage. Install lockblock/sheetpile walls where insufficient space, provide seepage cut-off, pump internal flows.
Access issues Potential riparian habitat encroachment. Federal review potentially triggered.
Minor reduction in flood conveyance or storage area
Groundwater problems north of road. May not be practical. 1 3 2 2 3 2 3 1 3 6 2 2 9 4 9 3 38 4
Land-use change outside road Install flapgates on culverts and prevent seepage, raise as necessary.
Access issues Potential minor riparian habitat encroachment (associated with raising the road).
Minor increase in flood conveyance or storage area
Feasible but groundwater problems north of road. 1 2 1 2 2 1 3 2 3 4 1 2 6 2 9 6 33 2
Raise/flood proof development outside road
Install flapgates on culverts and prevent seepage, raise as necessary.
Access issues Potential minor riparian habitat encroachment.
Road is away from river, little geomorphological impact
Feasible but groundwater problems north of road. 1 2 2 2 2 2 3 2 3 4 2 2 6 4 9 6 36 3
Individually ring dike some development, land-use change for remaining properties
Install flapgates on culverts and prevent seepage. Install lockblock/sheetpile walls where insufficient space, provide seepage cut-off, pump internal flows.
Access issues Potential riparian habitat encroachment (i.e. if ring dikes are next to river). Federal review potentially triggered.
Minor reduction in flood conveyance or storage area
Feasible but groundwater problems north of road. 1 2 2 2 3 2 3 2 3 4 2 2 9 4 9 6 39 5
Individually raise/flood proof any essential development, land-use change for remaining properties
Most impact if north side of dike bought out
Potential minor riparian habitat encroachment.
Reduces need for future flood protection in hazardous location
Feasible but expensive.2 2 3 2 2 2 3 2 6 4 3 2 6 4 9 6 40 7
Groundwater control pumping (North of road) Groundwater governed by river levels, not effective without diking.
Large pump capacity required Potential for existing groundwater contamination in industrial areas. Testing and treatment may need to be considered.
May be difficult to significantly reduce groundwater levels
Expensive. Expected to be difficult to reduce groundwater levels during flood. Would be undertaken as part of a diking option.
3 1 3 1 2 1 3 1 9 2 3 1 6 2 9 3 35 n/a
Area DN (Northbank west of JH Brdg)No permanent protection, provide temporary works as required
Emergency response on call. No new environmental impacts expected in absence of permanent protection. Potential environmental considerations associated with temporary works depends on design of those works. For example, release of deleterious substances is possible with use of amphibex and warm water release.
Status quo Not acceptable in the long term.
3 3 2 2 1 1 1 2 9 6 2 2 3 2 3 6 33 2
Land-use change over entire floodplain Restores functional floodplain areas Reduces need for future flood protection in hazardous location
Good from river engineering perspective but expensive and politically difficult.
1 1 1 1 1 1 3 3 3 2 1 1 3 2 9 9 30 1
Diking Next to river Need erosion protection, install lockblock/sheetpile walls where insufficient space, provide seepage cut-off, pump internal flows.
Riparian habitat encroachment. Potential streambank erosion and streambed scour. Federal review potentially triggered.
Decrease flood conveyance/storage area
May not be practical
2 3 1 2 3 3 3 1 6 6 1 2 9 6 9 3 42 7
Raise Preston Road Land-use change outside road Install lockblock/sheetpile walls where insufficient space, provide seepage cut-off, pump internal flows.
Potential minor riparian habitat encroachment.
Could possibly affect left bank side channel/island
Feasible but groundwater problems north of road. 1 2 1 2 2 1 3 2 3 4 1 2 6 2 9 6 33 2
Flood proof development outside road Potential minor riparian habitat encroachment.
Minor reduction in flood storage area Feasible but groundwater problems north of road. 2 3 2 2 2 2 2 2 6 6 2 2 6 4 6 6 38 6
Low dike providing base for temporary high water protection
Same sub-options as for full height dike
Temporarily raise dike as needed using gabions or lock blocks.
Emergency response on call. Riparian habitat encroachment. Potential streambank erosion and streambed scour. Federal review potentially triggered.
No significant change - but reduces flood storage area
Feasible
2 2 1 2 3 2 2 1 6 4 1 2 9 4 6 3 35 4
Individually raise/flood proof any essential development/basements, land-use change for remaining properties
Potential minor riparian habitat encroachment.
Minimises loss in flood storage area. Reduces need for future flood protection in hazardous location
Feasible.2 2 3 2 2 2 2 2 6 4 3 2 6 4 6 6 37 5

Table E.1: Flood Control Solutions - Nechako River
Mitigation Options Mitigation Sub-Options Alternate Designs Hydraulic Considerations Infrastructure Considerations Environmental Considerations Geomorphology Considerations General Evaluation3 2 1 1 3 2 3 3
Area EN (Morning Place)No permanent protection, provide temporary works as required
Emergency response on call. No new environmental impacts expected in absence of permanent protection. Potential environmental considerations associated with temporary works depends on design of those works. For example, release of deleterious substances is possible with use of amphibex and warm water release.
Status quo Not acceptable in the long term.
3 3 2 3 1 2 1 3 9 6 2 3 3 4 3 9 39 4
Diking Next to river Need erosion protection, install lockblock/sheetpile walls where insufficient space, provide seepage cut-off, pump internal flows.
Maintenance issues Riparian habitat encroachment. Potential streambank erosion and streambed scour. Federal review potentially triggered.
Could destabilize downstream left bank terrace
Not advisable
3 3 2 2 3 2 3 2 9 6 2 2 9 4 9 6 47 5
Low dike providing base for temporary high water protection
Temporarily raise dike as needed using gabions or lock blocks.
Emergency response on call. Riparian habitat encroachment. Potential streambank erosion and streambed scour. Federal review potentially triggered.
No significant change - but reduces flood storage area
Feasible
2 3 2 2 3 2 2 1 6 6 2 2 9 4 6 3 38 3
Individually raise/flood proof any essential development
Potential minor riparian habitat encroachment.
Minor reduction in flood storage area Feasible 2 2 2 1 2 2 2 1 6 4 2 1 6 4 6 3 32 2
Land-use change over entire floodplain Restores functional floodplain areas Little benefit, but reduces need for future flood protection in hazardous location.
Feasible1 1 1 1 1 1 3 3 3 2 1 1 3 2 9 9 30 1
Area FN (Southbank at Foot Hills Br)Prevent future development and flood proof existing development if necessary
No hydraulic impact Limited existing development. Potential minor riparian habitat encroachment.
Investigate sidechannel to see if any infilling can be removed.
Feasible 1 1 2 1 2 1 1 1 3 2 2 1 6 2 3 3 22 1
Area GN (Southbank U/S of JH Br)Prevent future development and flood proof existing development if necessary
No hydraulic impact. Limited existing development. Potential minor riparian habitat encroachment.
Reduces need for future flood protection in hazardous location. Can a flood channel be created here?
Feasible
1 1 2 1 2 1 1 1 3 2 2 1 6 2 3 3 22 1
General Lower Nechako AreaFloodways Enlarge Cottonwood Island back channel May need erosion protection and series of bridges. Potential ice jam relief. Ongoing
maintenance. Only possible with landuse changes
Stream morphology change to entire back channel. Riparian habitat encroachment. Potential streambank erosion and streambed scour. Federal review will be triggered.
Would partially restore historic conveyance area
Feasible but not a solution by itself. Effects on Areas A&C to be evaluated in model. 3 3 2 2 3 3 2 2 9 6 2 2 9 6 6 6 46
Open up/straighten historic channel along RR
May need erosion protection and series of bridges. Potential ice jam relief. Ongoing maintenance. Only possible with landuse changes
Stream morphology change. Riparian habitat encroachment. Potential streambank erosion and streambed scour. Federal review will be triggered.
Would partially restore historic conveyance area
Feasible but not a solution by itself. Effects on Areas A&C to be evaluated in model. 3 3 3 2 3 3 3 3 9 6 3 2 9 6 9 9 53
Channel through Area CN, south of road Stream morphology change. Riparian habitat encroachment. Potential streambank erosion and streambed scour. Federal review will be triggered.
Can this be made self-scouring or would maintenance dredging be needed?
Feasible but not a solution by itself.
3 3 2 2 3 3 2 2 9 6 2 2 9 6 6 6 46
Improve drainage Modify 1st Avenue storm drains nil Feasible but not a solution by itself. Effects on Areas A&C to be evaluated in model.
3 3 2 2 1 1 2 1 9 6 2 2 3 2 6 3 33
Enlarge main river channel by dredging Bar scalping Monitoring and maintenance required. Disturbance of river bed, likely HADD. Federal review will be triggered.
Maintenance excavation could be needed due to ongoing sediment deposition. Ice jam initiation may still occur on Fraser River
Feasible but not a solution by itself. Effects on Areas A&C to be evaluated in model. 3 3 2 3 3 3 2 2 9 6 2 3 9 6 6 6 47
Bar scalping and instream excavation Monitoring and maintenance required. Disturbance of river bed, likely HADD. Federal review will be triggered.
Maintenance excavation could be needed due to ongoing sediment deposition. Ice jam initiation may still occur on Fraser River
Feasible but not a solution by itself. Effects on Areas A&C to be evaluated in model. 3 3 2 3 2 3 2 2 9 6 2 3 6 6 6 6 44
Flow regulation Enlarge storage behind Kenney Dam Detailed and complex provincial and federal reviews required. Multi-year environmental studies likely required for permitting.
Larger riparian/shoreline impacts Expensive. Not a solution by itself.
3 3 3 3 3 3 3 1 9 6 3 3 9 6 9 3 48
Build new storage Detailed and complex provincial and federal reviews required. Multi-year environmental studies likely required for permitting.
Larger riparian/shoreline impacts Expensive. Not a solution by itself.
3 3 3 3 3 3 3 1 9 6 3 3 9 6 9 3 48
Revise operating procedure Detailed and complex provincial and federal reviews required. Multi-year environmental studies likely required for permitting.
Complex issue including effects on water temperature, sediment transport, bank stability. Might be tied into proposed water release facility at Kenney Dam.
Feasible.
3 3 3 3 3 3 2 1 9 6 3 3 9 6 6 3 45
Dire
ct C
ost
Soci
al C
ost
Dra
inag
e Pr
oble
ms
Envi
ronm
enta
l Im
pact
Riv
er In
stab
ility
Ris
k
Dire
ct C
ost
Soci
al C
ost
Tota
l Wei
ght F
acto
r
Acce
ss P
robl
ems
Acce
ss P
robl
ems
Dra
inag
e Pr
oble
ms
Note! Direct comparison of Lower Nechako general options is not valid.
Are
a R
anki
ng
Envi
ronm
enta
l Im
pact
Riv
er In
stab
ility
Ris
k
EVALUATION CRITERIA1 = low, 3 = high
WEIGHTING FACTOR1 = less important3 = more important
Ris
k af
ter I
mpl
emen
ting
Con
str./
Mai
nten
ance
Ris
k af
ter I
mpl
emen
ting
Con
str./
Mai
nten
ance

Table E.2: Flood Control Solutions - Fraser River
Mitigation Options Hydraulic Considerations Infrastructure Considerations Environmental Considerations Geomorphology Considerations General Evaluation3 2 1 1 3 2 3 3
Area AF (Yellowhead Br)No permanent protection, provide temporary works as required
Emergency response on call
No new environmental impacts expected in absence of permanent protection. Potential environmental considerations associated with temporary works depends on design of those works. For example, release of deleterious substances is possible with use of amphibex and warm water release.
3 3 3 2 1 1 1 3 9 6 3 2 3 2 3 9 37 3
Diking next to river Need erosion protection, install lockblock/sheetpile walls where insufficient space, provide seepage cut-off, pump internal flows.
D/S tie-in may be difficult
Riparian habitat encroachment. Potential streambank erosion and streambed scour. Federal review potentially triggered.
Area next to bridge abutment, no measurable impact. Minor loss in flood storage area.
Feasible
2 3 1 2 3 1 2 2 6 6 1 2 9 2 6 6 38 4
Low dike next to river Low dike providing base for temporary high water protection
Emergency response on call Riparian habitat encroachment. Potential streambank erosion and streambed scour. Federal review potentially triggered.
3 3 2 2 3 1 2 1 9 6 2 2 9 2 6 3 39 5
Land-use changes Restores functional floodplain areas Feasible 1 1 1 1 1 1 3 2 3 2 1 1 3 2 9 6 27 1Raise/flood proof any development Potential minor riparian habitat
encroachment. Feasible 1 2 2 2 2 1 2 2 3 4 2 2 6 2 6 6 31 2
Area BF (South Fort George)No permanent protection, provide temporary works as required
Emergency response on call No new environmental impacts expected in absence of permanent protection. Potential environmental considerations associated with temporary works depends on design of those works. For example, release of deleterious substances is possible with use of amphibex and warm water release.
Not acceptable in the long term.
3 3 3 3 1 2 1 3 9 6 3 3 3 4 3 9 40 3
Diking-next to river/slough Need erosion protection, install lockblock/sheetpile walls where insufficient space, provide seepage cut-off, pump internal flows.
Riparian habitat encroachment. Potential streambank erosion and streambed scour. Federal review potentially triggered.
Drains or pumps may be needed to prevent water being trapped behind dyke. Reduces flood storage area and cuts off a possible flood drainage channel.
May not be feasible
2 3 2 3 3 2 3 2 6 6 2 3 9 4 9 6 45 4
Individually raise/flood proof any essential development, buy out rest
Emergency response on call Potential minor riparian habitat encroachment.
Could reactivate sizeable flood relief channel
Feasible 2 2 2 3 2 1 3 2 6 4 2 3 6 2 9 6 38 2
Land-use changes Restores functional floodplain areas Could reactivate sizeable flood relief channel
Flooding occurs frequently, this may be best option. 1 1 1 1 1 1 3 3 3 2 1 1 3 2 9 9 30 1
Area CF (SFG west of Queensway)No permanent protection, provide temporary works as required
Emergency response on call No new environmental impacts expected in absence of permanent protection. Potential environmental considerations associated with temporary works depends on design of those works. For example, release of deleterious substances is possible with use of amphibex and warm water release.
Area protected by road/dike. Determine if any additional protection is required.
3 3 2 3 1 1 1 2 9 6 2 3 3 2 3 6 34 3
Land-use changes Restores functional floodplain areas Unlikely. 1 1 1 1 1 1 3 2 3 2 1 1 3 2 9 6 27 1Upgrade to standard dike, provide seepage cut-off and internal pumping
Riparian habitat encroachment. Potential streambank erosion and streambed scour. Federal review potentially triggered.
Drains or pumps may be needed to prevent water being trapped behind dyke. Reduces flood storage area and cuts off a possible flood drainage channel.
May not be required.
2 3 1 3 3 1 2 1 6 6 1 3 9 2 6 3 36 4
Individually raise/flood proof any essential development/basements
Potential minor riparian habitat encroachment.
Impacts will be determined by the number of sites
May not be required. 1 1 3 2 2 1 2 1 3 2 3 2 6 2 6 3 27 1
Tota
l Wei
ght F
acto
r
Are
a R
anki
ng
Soc
ial C
ost
Ris
k af
ter I
mpl
emen
ting
Con
str./
Mai
nten
ance
Acc
ess
Pro
blem
s
EVALUATION CRITERIA1 = low, 3 =high
WEIGHTING FACTOR1 = less important3 = more important
Ris
k af
ter I
mpl
emen
ting
Con
str./
Mai
nten
ance
Dire
ct C
ost
Soc
ial C
ost
Acc
ess
Pro
blem
s
Dra
inag
e P
robl
ems
Env
ironm
enta
l Im
pact
Riv
er In
stab
ility
Ris
k
Dra
inag
e P
robl
ems
Env
ironm
enta
l Im
pact
Riv
er In
stab
ility
Ris
k
Dire
ct C
ost

Table E.2: Flood Control Solutions - Fraser River
Mitigation Options Hydraulic Considerations Infrastructure Considerations Environmental Considerations Geomorphology Considerations General Evaluation3 2 1 1 3 2 3 3
Area DF (Lansdowne south end)No permanent protection, provide temporary works as required
Emergency response on call No new environmental impacts expected in absence of permanent protection. Potential environmental considerations associated with temporary works depends on design of those works. For example, release of deleterious substances is possible with use of amphibex and warm water release.
Not acceptable in the long term.
3 3 3 3 1 1 1 2 9 6 3 3 3 2 3 6 35 3
Land-use changes Restores functional floodplain areas Feasible 1 1 1 1 1 1 3 3 3 2 1 1 3 2 9 9 30 1Provide diking for part of area. Riparian habitat encroachment.
Potential streambank erosion and streambed scour. Federal review potentially triggered.
Reduces flood conveyance capacity
Feasible but expensive
2 2 2 2 3 1 3 2 6 4 2 2 9 2 9 6 40 4
Individually raise/flood proof any essential development
Potential minor riparian habitat encroachment.
Impacts will be determined by the number of sites
Feasible 1 2 2 3 2 1 2 2 3 4 2 3 6 2 6 6 32 2
Area EF (Westbank at island)No permanent protection, provide temporary works as required
Emergency response on call No new environmental impacts expected in absence of permanent protection. Potential environmental considerations associated with temporary works depends on design of those works. For example, release of deleterious substances is possible with use of amphibex and warm water release.
Feasible solution considering limited development.
3 3 3 3 1 1 1 2 9 6 3 3 3 2 3 6 35 3
Land-use changes Restores functional floodplain areas Feasible 1 1 1 1 1 1 3 2 3 2 1 1 3 2 9 6 27 2Diking May need erosion protection, provide seepage cut-off,
pump internal flows.Riparian habitat encroachment. Potential streambank erosion and streambed scour. Federal review potentially triggered.
Minor reduction in flood conveyance capacity
May not be economically justifiable.
1 3 2 2 3 1 3 1 3 6 2 2 9 2 9 3 36 4
Individually raise/flood proof any essential development/basements or move/isolate and land-use changes
Potential minor riparian habitat encroachment. Impacts will be determined by the
number of sites
Feasible 1 1 2 1 2 1 2 1 3 2 2 1 6 2 6 3 25 1
Area FF (Northwood Pulpmill Rd)No permanent protection, provide temporary works as required
Emergency response on call No new environmental impacts expected in absence of permanent protection. Potential environmental considerations associated with temporary works depends on design of those works. For example, release of deleterious substances is possible with use of amphibex and warm water release.
Reduction in flood conveyance capacity
Feasible solution considering limited development.
3 3 3 2 1 2 1 2 9 6 3 2 3 4 3 6 36 4
Ring Diking set-back from river Provide seepage cut-off, pump internal flows. Potential minor riparian habitat encroachment.
Feasible but expensive 1 2 2 2 2 1 3 1 3 4 2 2 6 2 9 3 31 3
Individually raise/flood proof any essential development
Potential minor riparian habitat encroachment.
Impacts will be determined by the number of sites
Feasible 1 2 3 2 2 1 2 1 3 4 3 2 6 2 6 3 29 2
At any vulnerable development in floodplain, alter land-use
Restores functional floodplain areas Maintains flood conveyance storage area
Feasible 1 1 1 1 1 1 3 2 3 2 1 1 3 2 9 6 27 1
Area GF (Across from Shelley)Prevent future development. Flood proof existing development as necessary
Potential minor riparian habitat encroachment.
An appropriate plan Feasible 1 1 1 1 2 1 1 1 3 2 1 1 6 2 3 3 21 1
Tota
l Wei
ght F
acto
r
Are
a R
anki
ng
Soc
ial C
ost
Ris
k af
ter I
mpl
emen
ting
Con
str./
Mai
nten
ance
Acc
ess
Pro
blem
s
EVALUATION CRITERIA1 = low, 3 =high
WEIGHTING FACTOR1 = less important3 = more important
Ris
k af
ter I
mpl
emen
ting
Con
str./
Mai
nten
ance
Dire
ct C
ost
Soc
ial C
ost
Acc
ess
Pro
blem
s
Dra
inag
e P
robl
ems
Env
ironm
enta
l Im
pact
Riv
er In
stab
ility
Ris
k
Dra
inag
e P
robl
ems
Env
ironm
enta
l Im
pact
Riv
er In
stab
ility
Ris
k
Dire
ct C
ost

Table E.3: Ice Jam Flood Control for Nechako River
Flood Control Method Purpose Comments Additional Investigationsto Follow
Diking Prevents direct flooding from high water caused by ice jams.
Due to filled in back-channels and porous soil conditions in the floodplain, dikes will not provide complete protection unless seepage is prevented and/or groundwater is pumped from developed areas.
Yes
Flow Control Allows reduction of flows during critical freeze-up conditions.
Existing storage reservoir at Kenney Dam cannot be operated effectively to reduce flows on an as-needed basis. The length of time between action at Skins Lake and flow reductions are Prince George is too long within the context of how much in advance ice conditions can be forecasted for there to be an effective release management system. There are limitations to how much flow can be reduced within the context of natural flows in the system, and the minimal effects that the reduction would have on ice-related water levels.
-
Ice Control Dam The structure would cause the ice cover to form upstream of the City, preventing the formation of a thick ice cover at and upstream of the confluence with the Fraser River.
A very expensive solution with serious environmental and infrastructure concerns.
-
Ice Booms Similar to the control dam but usually applied in slow velocity rivers.
Not practical in the relatively fast flowing Nechako. -
Channel Modification Ice jams typically form at shallow river sections, gravel bars and surface obstructions. Channel modifications are undertaken to reduce the degree of flow obstruction.
The method may have negative impact on instream and riparian habitat. May not be effective for the Nechako River because the ice levels at the confluence with the Fraser River are determined by the ice levels on the Fraser River, regardless of the Nechako bed levels.
Yes
Side-channel enlargement or introduction of new back-channels
Allows flow passage outside main channel.
Reclamation and expansion of riparian habitat. Limited flood reduction since relief channels are expected to fill with frazil.
Yes
Blasting Breaks ice cover into floes which can be transported downstream.
Absolutely ineffective during the formation of ice jams during freeze-up, high environmental impact and dangerous. Can only be used once a solid ice cover has formed and then in only localized situations - not on the scale of the Nechako River.
-
Mechanical Removal Ice is cut, sawn or split into more transportable pieces to open up an ice-free portion of channel.
This was done last winter using an amphibex (excavator on pontoons). Success of method depends on temperature, flow conditions, and an ice-free area downstream to store the dislodged ice. Not practical for long jams or strong river currents. Can only be used after a jam has formed and peak water levels have been attained. My be used to limit the duration of high water levels, but takes a long time to produce significant results without cooperation of the hydrometeorological conditions.
Yes
Hot Water Supply Supply hot water to melt ice. Method applied last winter. Produced localized melting only. Environmental concerns if unsuitable or polluted water is discharged. Only effective once an ice cover has formed and high water levels have developed. May be useful for reducing the duration of high water, but takes a long time to produce significant results. May operate more successfully if installed ahead of jamming.
-

APPENDIX G GROUNDWATER REPORT BY THURBER ENGINEERING LTD.

YEARS
THURBER ENGINEERING LTD.
E file: a_ds_mem_river road subdrain Page 1 of 4
M E M O R A N D U M To: Dave Dyer Date: September 26, 2008 City of Prince George From: Dave Smith File: 14-224-0
RIVER ROAD SUBDRAIN AND PUMP CHAMBER SYSTEM As requested, we have reviewed the reference documents you provided to assess the feasibility of the proposed subdrain and pump system along River Road to prevent flooding of the area to the south due to high groundwater levels. Our assessment is presented below. 1. REFERENCE INFORMATION
The reference information we have utilized in preparing this assessment is as follows, listed in chronological order of preparation:
1 - February 21, 2006 report by AMEC Earth & Environmental entitled City of Prince George – Groundwater Elevation Study
2 - November 17, 2006 report by GeoNorth Engineering Ltd. (GeoNorth) entitled Groundwater Elevation Monitoring Study – 1stAvenue and River Road Area, Prince George, BC
3 - Figure 4-1946 prepared by M Miles & Associates Ltd. (MMA), at
1:7500 scale and dated May 7, 2008, comprising a mosaic of the study area prepared from 1946 airphotos
4 - May 15, 2008 report by GeoNorth entitled Groundwater Elevation
Monitoring Program – 1st Avenue and River Road Area, Prince George, BC
5 - Airphotos of the study area marked up by McElhanney Consulting
Services (McElhanney) for nhc to show areas affected by flooding due to high groundwater levels and flooding directly from the Nechako River
6 - June 2008 report by northwest hydraulic consultants (nhc) entitled
Flood risk Elevation and Flood Control Solutions – Risk Analysis – Progress Report 1

YEARS
THURBER ENGINEERING LTD.
Client: City of Prince George Date: September 26, 2008 File No. 14-224-0 E file: a_ds_mem_river road subdrain Page 2 of 4
7 - Figure 4 – 2008 prepared by MMA at 1:7500 scale and dated September 10, 2008, comprising a recent, coloured airphoto mosaic of the study area
8 - Report prepared for Prince George City Council entitled River Road
Subdrain and Pump Chamber System dated September 23, 2008 Hereinafter, the documents are referred to by the number
2. SOIL CONDITIONS IN STUDY AREA Document 1 includes the logs of 15 test holes drilled in the study area for installation of monitoring wells. The holes varied in depth from 4.1 m to 9.1 m but most were 7.6 m deep. Sand or sand and gravel was the predominant soil unit encountered with a thin (1 to 2 m thick) clay layer in several holes and a thick silt layer in one hole (MW 05-06). No gradation results are presented in the report but the logs generally indicate a trace of silt, which we interpret to be less than 10% silt. Test hole locations are shown on Attachment 1 taken from Document 4.
3. GROUNDWATER MONITORING RESULTS Groundwater levels in the 15 monitoring wells were recorded daily between January 2007 and February 2008 using data loggers which were downloaded by GeoNorth for digital elevation modelling of the groundwater surface. Groundwater profiles in Document 4 indicate a downward gradient to the north, thus groundwater flow towards the River for most of the year. When the River level rises, mounding of the groundwater surface occurs adjacent to the River, causing groundwater levels to rise throughout the area of influence. Attachment 1, taken from Document 4 shows groundwater levels on January 7, 2008 after the second peak high water level in the Nechako River resulting from the ice jam. Attachment 1 information is reproduced in Table 1 in terms of the depth of the groundwater surface over the study area divided into 4 zones. Allowing for slight inaccuracy in the data logger recordings (to explain groundwater levels above the ground surface), it is evident, that at high River flows and levels, the groundwater surface rises and flooding occurs in the area defined by MWs 05-1, 05-2, 05-7, 05-8, 05-9 and 05-10. These wells are highlighted on Attachment 1. This conclusion is in

YEARS
THURBER ENGINEERING LTD.
Client: City of Prince George Date: September 26, 2008 File No. 14-224-0 E file: a_ds_mem_river road subdrain Page 3 of 4
general agreement with McElhanney’s observations except that McElhanney interpreted flooding north of the railway tracks to result from surface flow directly from the Nechako River. To assess the influence of a historic backwater channel of the River, now backfilled, the channel shown on Document 3 has been added to Attachment 1. It appears that the channel has little if any influence on high groundwater levels. It is not clear from the data reviewed how quickly groundwater levels respond to a rising River level and how far back mounding of the groundwater occurs. However, it is evident from the groundwater profiles shown for Cross-section B-B’ in Document 4 that the gradient reverses for over 500 m from the River, resulting in the high groundwater levels recorded in the monitoring wells. In comparison, groundwater levels recorded in the monitoring wells on May 23, 2007 before high River levels occur are shown for the same 4 zones in Table 2. This table indicates that except for MWs 4th Scotia and 05-2, the groundwater surface drops to between 2 and 3 m below the ground surface and poses no risk of flooding in the study area.
4. PROPOSED SUBDRAIN AND PUMP CHAMBER SYSTEM The conceptual scheme shown in Document 8 will undoubtedly assist in lowering the groundwater table at high River level in the vicinity of the subdrain but its influence to the south will be limited by the clean granular soils which underlie the study area. We do not expect that it can possibly affect the groundwater levels south of the railway tracks, to 600 m south of River Road. Installation of the subdrain to below the groundwater levels recorded in MWs 05-7, 05-8 and 05-10 at low River levels (as shown on Table 2) will assist in lowering the groundwater level until the River level starts to rise. Further analysis of River levels and water levels in these monitoring wells will be required to establish how long this effect will occur. To effectively maintain a low groundwater surface as the River level requires the control exerted by the River and the mounding which occurs to be eliminated. The cut-off shown schematically in Document 8 will achieve this but we expect that the cut-off will need to be of significant depth, possibly of the order of 10 m or more and, therefore, installed below the water table. Determination of the cut-off depth will require

YEARS
THURBER ENGINEERING LTD.
Client: City of Prince George Date: September 26, 2008 File No. 14-224-0 E file: a_ds_mem_river road subdrain Page 4 of 4
further analysis and a knowledge of the hydraulic conductivity (permeability) of the subsoils. With regard to the extent of the subdrain system, Table 1 results indicate that the east end of the study area, beyond MW 05-07, does not experience groundwater levels above 3 to 5 m from the ground surface even at peak River levels. Therefore, it seems likely that the subdrain system could be terminated between MWs 05-7 and 05-6. This limit is shown on Attachment 2 prepared from Document 8.
5. CONCLUSION The discussion presented above is summarized as follows:
− The proposed subdrain scheme is feasible and will have a beneficial effect on groundwater levels, albeit a limited effect that will not extend the entire 600 m width of the 2007 – 2008 problem area
− The efficacy of the system will be enhanced by extending the cut-off, possibly, to 10 m depth or more
− The system need not extend for the entire length of River Road
− Further site investigation and analysis are required for detailed
design of the system We trust this is sufficient for your present needs. DS/cw
c.c. northwest hydraulic consultants Attn.: Ms. Monica Mannerstrom, P.Eng.

YEARS
THURBER ENGINEERING LTD.
Table 1
JANUARY 7, 2008 GROUNDWATER LEVELS (FROM DOCUMENT 4) Location Monitoring Well Depth to Groundwater Surface (m) Adjacent to 05-10 0.29 above ground surface Nechako River 05-8 0.27 above ground surface 05-7 0.58 Near River 05-6 2.68 Road, 05-5 4.91 away from River 3 – River Road 3.90 05-1 0.32 Near Rail 05-2 0.29 Tracks 05-9 0.20 above ground surface Via Rail 2.83 05-3 2.40 NR Motors 2.54 South CKPG 2.62 Of Rail 4th Scotia 1.17 Tracks 05-4 3.30 Note: Groundwater levels of concern are highlighted in yellow.

YEARS
THURBER ENGINEERING LTD.
Table 2
MAY 23, 2007 GROUNDWATER LEVELS (FROM DOCUMENT 4) Location Monitoring Well Depth to Groundwater Surface (m) Adjacent to 05-10 2.38 Nechako River 05-8 2.57 05-7 2.13 Near River 05-6 3.62 Road 05-5 3.76 away from River 3 – River Road 2.68 05-1 2.31 Near Rail 05-2 1.80 Tracks 05-9 2.18 Via Rail 3.90 05-3 N/A NR Motors 3.05 South CKPG 3.32 Of Rail 4th Scotia 1.56 Tracks 05-4 2.99

SWE;-&+6%+8 APPRWEO:
DATE: 2008/05/15 CITY OF PRINCE GEORGE GROUNDWATER ELEVATION MONITORING PROGRAM GEONORTH
DWN BI: LU 1 S T AVENUE AND RIVER ROAD AREA MAP REF: - PRINCE GEORGE, B.C. ENGINEERING LTD. 1301 Kallihs Rood, DWG NO. REV. PRWEC~ NO: ICE JAM 2 0 0 7 - 2 0 0 8 Princa barge. B.C. VLL 558
2284-2008-01-07 - K-2284 GROUNDWATER SURFACE CONTOURS, JANUARY 7, 2008 ('") 56"4304 Fm (25D) 584-9x3


APPENDIX H DISCUSSION OF GRAVEL REMOVALS AT
NECHAKO-FRASER CONFLUENCE

1. INTRODUCTION
Flood control solutions for City of Prince George were developed as outlined in the main report. The report concluded that gravel removals from the confluence area would not reduce design flood levels. This is opposite to the preference held by some stakeholders and this appendix was prepared to clarify the technical basis for the findings by NHC.
2. BACKGROUND
Flooding in Prince George is caused by either high freshet (snowmelt) flows in the Fraser River or ice-related flooding in the Nechako River. According to public perception, gravel has accumulated in the lower Nechako River and some landowners fear that the accumulations may aggravate flood levels. Evidence from historic air photographs supports that some material accumulation has taken place at the confluence. However, the photographs were taken at various flow conditions and it is not possible to quantitatively estimate accumulation volumes.
A comparison of river cross-sections surveyed in 1979 and 2008 indicates substantial lateral shifting of gravel bars but only very minor net build-up within the confluence area and bed lowering in some other areas. The 1979 cross-sections were surveyed about 400 m to 500 m apart and any depositions between the sections would not have been picked up by the surveys. When the hydraulic models with 1979 and 2008 cross-sections were compared (for the same flows, section spacing and channel roughness), the computed 200-year water surface profiles were nearly identical. This suggests that the channel changes from the past 30 years have had little impact on the freshet design profiles.
3. EFFECTS OF DREDGING ON FRESHET FLOOD
PROFILES
During the freshet, the Nechako flood levels are controlled by conditions in the Fraser River. The Fraser River below the confluence essentially acts as a bathtub drain and the water levels at the confluence are determined by the capacity of the channel for many kilometres below the confluence. This river reach is relatively straight and steep, containing no major gravel bars, and increasing its flow capacity by removing gravel is not practical.
Dredging or bar scalping within the confluence area would not increase the flow drainage capacity of the downstream Fraser channel. Even if a very large volume of material were to be removed, creating a deep lake at the confluence, it would not reduce flood levels in the Nechako River. This was tested in the 2008 hydraulic model, where a volume of 2,000,000 m3 was removed, without any significant change to the flood profile. The actual configuration of the excavation does not affect the results.
However, during low flows when the Fraser River does not produce backwater conditions, the Nechako profile is affected by dredging, dropping locally in response to any significant removal.

4. ICE FORMATION IN NECHAKO RIVER
The formation of an ice cover is complex and to understand the process the following basic hydraulic concepts are helpful:
• In any river, the flow rate is the product of the channel cross-sectional area and the flow velocity. If the flow area at a cross-section increases, there must be a corresponding decrease in the velocity. Correspondingly, a decrease in the flow area results in a velocity increase.
• The flow velocity is affected by the roughness of the bed/banks and of the ice cover in the winter. Ice increases the roughness, reducing flow velocities and requiring a much larger flow area (increased depth) to pass a particular flow than during ice-free conditions. This is why there is an increase in the water level when an ice cover forms.
• Icy slush can move along the bottom of the ice cover if the velocity is high enough. The moving slush is known as “cover load”. If the velocity is not high enough, the slush will accumulate which will reduce the flow area. As the flow area reduces, the velocity will increase until the velocity becomes high enough to begin moving the slush.
Figures 4.1 and 4.2 (Main Report) schematically illustrate the freeze-up process in the Nechako River. At Prince George, frazil ice that is generated in the Nechako River floats downstream and is carried away by the Fraser River while the Fraser River is open. Lodgement of the ice pans on the Nechako River only begins when an ice cover on the Fraser River forms at the confluence. As the ice cover forms and more ice pans accumulate against the Fraser River ice cover, the water level in the Nechako increases due to the increased roughness, which floats the accumulating ice higher above the bed.
Figure 5.3 (Main Report) shows that ice-related flooding typically occurs when Nechako River flows during the freeze-up period exceed 200 m3/s and the ten-day average air-temperature is colder than -5oC. The figure suggests that if gravel were removed from the lower Nechako in the 1960’s and early 1970’s, it did not prevent ice-related flooding. On the other hand, the reason ice-related flooding did not occur from the mid 1970’s to mid 1990’s was because the flow/climate conditions were non-conducive to ice-flooding, regardless if gravel removals took place. 5. EFFECTS OF DREDGING ON THE ICE FLOOD
PROFILE
While dredging has been suggested as a method to reduce ice-related flooding, the following are key reasons why dredging will not help:
• The ice cover on the Fraser River begins by forming downstream of Prince George and eventually progresses upstream to the confluence. The eventual elevation of the ice cover at the confluence is a function of conditions in the Fraser River many kilometers downstream and the river flow. Dredging the Fraser River near the confluence will not change the ice cover elevation and

Nechako frazil will continue to lodge at elevations suggested by the historical record.
• If the ice cover elevation at the confluence is unchanged, dredging the Nechako River will effectively increase the size of the channel. This would reduce the velocity making it more likely for ice pans to lodge at the Fraser. This would in turn make it more likely for a stable ice cover to form sooner and ultimately contribute to a more rapid upstream advance of the ice cover. The elevation of the ice cover would not be lowered by the dredging.
• While dredging the Nechako at the confluence will make it more likely for a stable ice cover to form, it will not change the fundamental flow-related ice thickness and water elevations that would develop further upstream past the boat launch where ice-related flooding governs the design levels.
• Incoming frazil slush can be transported under the ice cover, provided the velocity is large enough. If not, the slush will accumulate under the ice, slowly reducing the flow area until the velocity increases sufficiently to begin transporting the slush. Dredging effectively increases the flow area and will cause slush to accumulate. The shape of the dredged channel does not affect the outcome.
• If first lodgement were to occur on the gravel bars at the confluence, dredging the area could improve the transport of ice into the Fraser. However, this situation has not been observed, nor would the dredging change ice cover conditions in the Fraser River. The Fraser River conditions would still govern the lodgement process.
• Some sediment deposition has occurred between the confluence and the CNR bridge, just downstream. Dredging this material will not change the ice cover level at the confluence since these conditions are governed by river conditions downstream of Prince George.
6. CONCLUSIONS
Considering that gravel removals from the Nechako-Fraser confluence would not reduce freshet or ice-related flood levels we cannot recommend them as a flood control solution at this time. We recommend performing repeat grid surveys in the confluence area to compare against the survey completed in 2008 and more accurately determine the deposition volumes in the confluence to see if future maintenance gravel removals may be warranted.
Numerous fish species are found in the Nechako and Fraser Rivers, including different types of salmon and white sturgeon, an endangered species. If proposed in the future, gravel removals must be approved by provincial and federal regulatory agencies before they can proceed.