Appendix 20.1 - Flood Risk Assessment - National ...
97
Norfolk Boreas Offshore Wind Farm Appendix 20.1 Flood Risk Assessment Environmental Statement Volume 3 Applicant: Norfolk Boreas Limited Document Reference: 6.3.20.1 RHDHV Reference: PB5640-006-2001 Pursuant to APFP Regulation: 5(2)(a) Date: June 2019 Revision: Version 1 Author: Royal HaskoningDHV Photo: Ormonde Offshore Wind Farm
-
Upload
khangminh22 -
Category
Documents
-
view
5 -
download
0
Transcript of Appendix 20.1 - Flood Risk Assessment - National ...
Norfolk Boreas Offshore Wind Farm
Appendix 20.1 Flood Risk Assessment Environmental Statement Volume 3
Applicant: Norfolk Boreas Limited Document Reference: 6.3.20.1 RHDHV Reference: PB5640-006-2001 Pursuant to APFP Regulation: 5(2)(a) Date: June 2019 Revision: Version 1 Author: Royal HaskoningDHV
Photo: Ormonde Offshore Wind Farm

Environmental Statement Norfolk Boreas Offshore Wind Farm 6.3.20.1 June 2019 Page i
Date Issue
No.
Remarks / Reason for Issue Author Checked Approved
28/02/19 01D First draft for Norfolk Boreas Limited review PS HW/AH CD/JL
20/03/19 01F Final for DCO submission PS HW/CD AmH/JL
Environmental Statement Norfolk Boreas Offshore Wind Farm 6.3.20.1 June 2019 Page ii
Table of Contents
1 Introduction ........................................................................................................... 1
2 Baseline Environment ............................................................................................. 3
3 Policy, Guidance and Consultation .......................................................................... 5
4 Definition of Flood Hazard ...................................................................................... 9
5 Climate Change .................................................................................................... 32
6 Surface Water Drainage ........................................................................................ 33
7 Flood Risk Management Measures ........................................................................ 37
8 Conclusions .......................................................................................................... 40
9 References ........................................................................................................... 42
10 Annex 1 Figures .................................................................................................... 44
Environmental Statement Norfolk Boreas Offshore Wind Farm 6.3.20.1 June 2019 Page iii
Tables
Table 3.1 Summary of Flood Zone Definitions 5
Table 4.1 Temporary watercourse crossings in surface water catchments (Scenario 1) 13
Table 4.2 The number of mobilisation areas and watercourses crossed by the onshore cable
route (Scenario 2) 13
Table 4.3 Environment Agency Product 4 data summary (Bure catchment) 16
Table 4.4 Environment Agency Product 4 data summary (Wensum catchment) 20
Table 5.1 Flood risk vulnerability and flood zone ‘compatibility’ 31
Table 6.1 Peak river flow allowances for Anglian river basin district (uses 1961 to 1990
baseline) 32
Figures (Annex 1)
Figure 20.1.1 Environment Agency Product 4 data location points
Figure 20.1.2 Environment Agency Flood Zones Map
Figure 20.1.3 Surface Water Flood Risk
Figure 20.1.4 Crossing locations
Environmental Statement Norfolk Boreas Offshore Wind Farm 6.3.20.1 June 2019 Page iv
Glossary of Acronyms
AEP Annual Exceedance Probability
AStGWF Areas Susceptible to Groundwater Flooding
BGS British Geological Survey
CDA Critical Drainage Areas
CFMP Catchment Flood Management Plan
CoCP Code of Construction Practice
DECC Department of Energy and Climate Change
FRA Flood Risk Assessment
HDD Horizontal Directional Drill
IDB Internal Drainage Board
LFRMS Local Flood Risk Management Strategy
LiDAR Light Detection and Ranging
LLFA Lead Local Flood Authority
mAOD Metres Above Ordnance Datum
NPPF National Planning Policy Framework
NPS National Policy Statement
PEIR Preliminary Environmental Impact Report
PFRA Preliminary Flood Risk Assessment
PPG Planning Policy Guidance
SAC Special Area of Conservation
SFRA Strategic Flood Risk Assessment
SMP Shoreline Management Plan
SPZ Source Protection Zones
SSSI Site of Special Scientific Interest
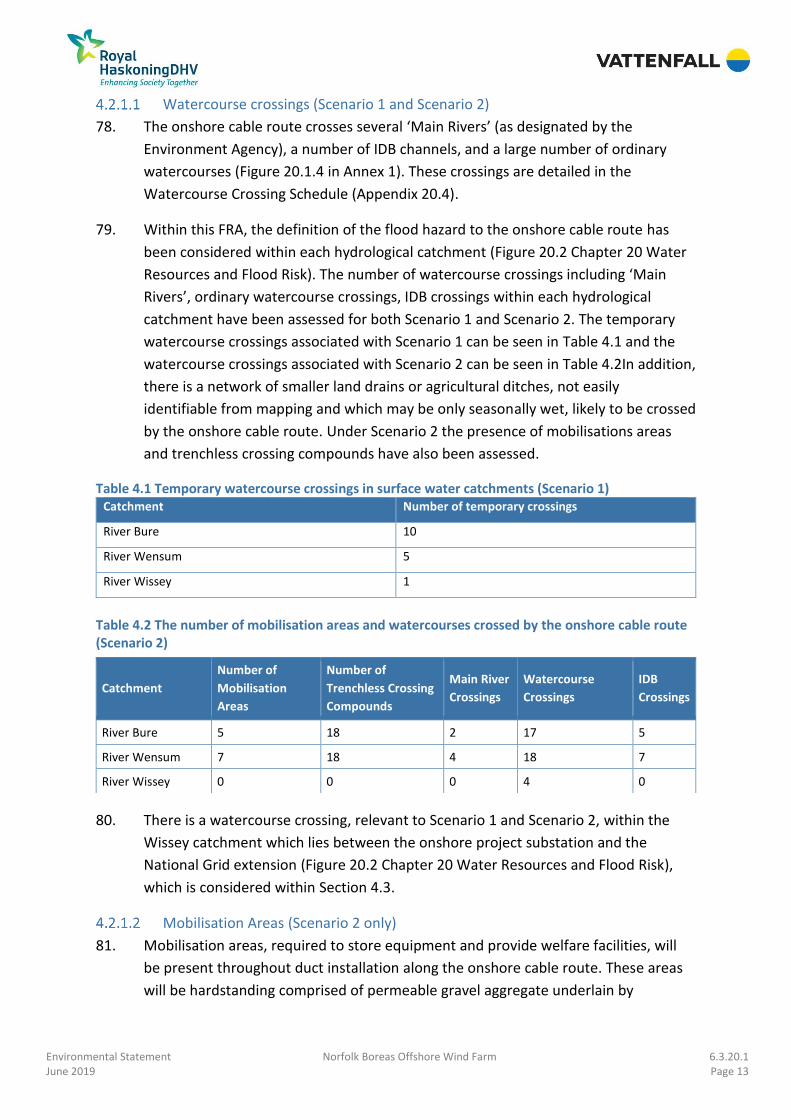
SuDS Sustainable Drainage Systems
Glossary of Terminology
Cable pulling Installation of cables within pre-installed ducts from jointing pits located along
the onshore cable route.
Ducts A duct is a length of underground piping, which is used to house electrical and
communication cables.
Jointing pit
Underground structures constructed at regular intervals along the onshore
cable route to join sections of cable and facilitate installation of the cables
into the buried ducts
Landfall Where the offshore cables come ashore at Happisburgh South.
Mobilisation area
Areas approx. 100 x 100m used as access points to the running track for duct
installation. Required to store equipment and provide welfare facilities.
Located adjacent to the onshore cable route, accessible from local highways
network suitable for the delivery of heavy and oversized materials
and equipment.
National Grid substation
extension The permanent footprint of the National Grid substation extension.
Environmental Statement Norfolk Boreas Offshore Wind Farm 6.3.20.1 June 2019 Page v
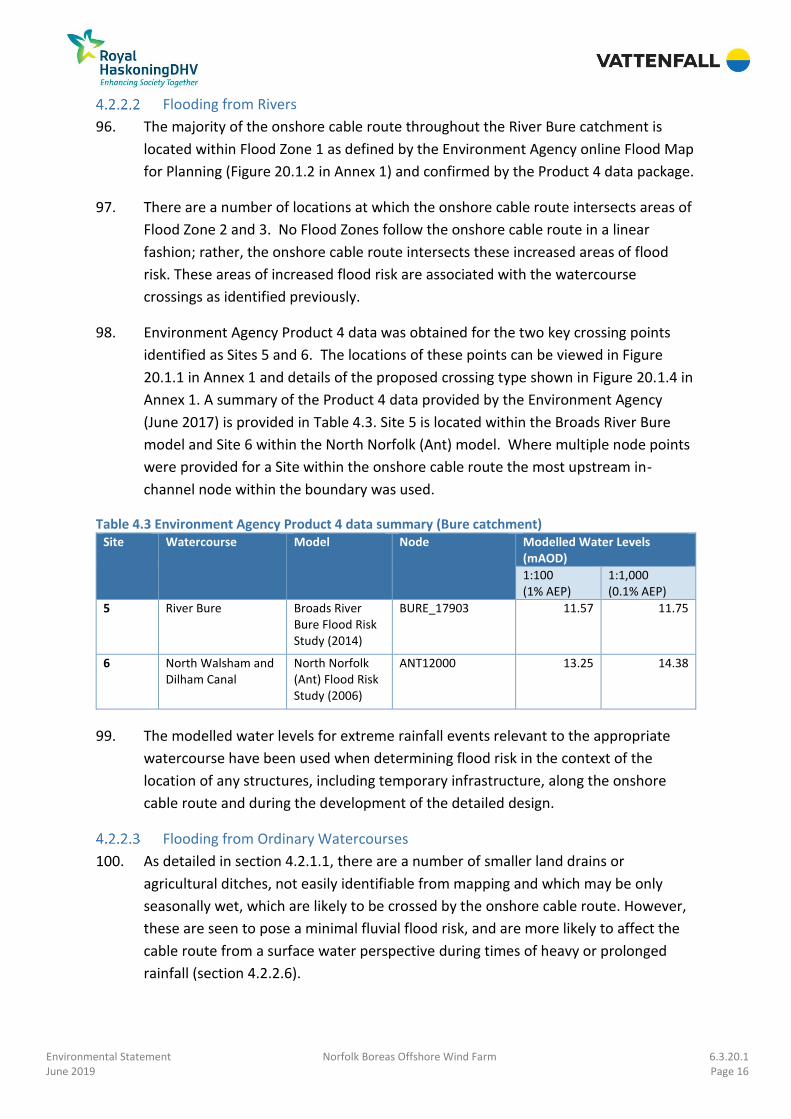
Necton National Grid
substation The grid connection location for Norfolk Boreas and Norfolk Vanguard.
Onshore 400kV cable
route
Buried high-voltage cables linking the onshore project substation to the
Necton National Grid substation.
Onshore cable route
The up to 35m working width within a 45m wide corridor which will contain
the buried export cables as well as the temporary running track, topsoil
storage and excavated material during construction.
Onshore cables The cables which take power and communications from landfall to the
onshore project substation.
Onshore project area
The area of the onshore infrastructure (landfall, onshore cable route,
accesses, trenchless crossing zones and mobilisation areas; onshore project
substation and extension to the Necton National Grid substation and
overhead line modifications).
Onshore project
substation
A compound containing electrical equipment to enable connection to the
National Grid. The substation will convert the exported power from HVDC to
HVAC, to 400kV (grid voltage). This also contains equipment to help maintain
stable grid voltage.
Running track The track along the onshore cable route which the construction traffic would
use to access workfronts.
The project Norfolk Boreas Wind Farm including the onshore and offshore infrastructure.
Transition pit Underground structures that house the joints between the offshore export
cables and the onshore cables.
Workfront A length of onshore cable route within which duct installation works will
occur, approximately 150m.
Environmental Statement Norfolk Boreas Offshore Wind Farm 6.3.20.1 June 2019 Page 1
1 Introduction
1.1 Background
1. This Flood Risk Assessment (FRA) has been prepared to accompany the Norfolk
Boreas Environmental Statement (ES) and is included as Appendix 20.1.
2. The overall aim of this FRA is to provide sufficient justification to regulators and
other stakeholders that the Norfolk Boreas Offshore Wind Farm project (herein the
‘project’) is appropriate and in line with planning and national policy requirements
regarding flood risk.
3. The purpose of this FRA is:
• To provide information required to support the ES in terms of flooding,
supported by the application of the Sequential and, where appropriate, the
Exception Test;
• To establish whether the project is likely to be affected by current or future
flooding from any source and whether it will increase flood risk elsewhere;
• To inform potential mitigation options; and
• To provide recommendations on potential measures required to reduce flood
risk, if applicable.
4. As described in Chapter 5 Project Description, Norfolk Boreas is the sister project to
Norfolk Vanguard. Vattenfall Wind Power Limited (the parent company of Norfolk
Boreas Limited) is developing the two projects in tandem and is planning to co-locate
the export infrastructure for both projects in order to minimise overall impacts.
However, there is a possibility that Norfolk Vanguard would not be constructed. In
order for Norfolk Boreas to stand up as an independent project, this scenario must
be provided for within the Norfolk Boreas DCO.
5. The FRA has therefore been undertaken using the following two alternative
scenarios:
• Scenario 1 – Norfolk Vanguard proceeds to construction and installs ducts and
other shared enabling works for Norfolk Boreas.
• Scenario 2 – Norfolk Vanguard does not proceed to construction and Norfolk
Boreas proceeds alone. Norfolk Boreas undertakes all works required as an
independent project
6. For further details on the two scenarios please refer to Chapter 5 Project
Description.
Environmental Statement Norfolk Boreas Offshore Wind Farm 6.3.20.1 June 2019 Page 2
1.2 Approach and Method
7. This FRA has been prepared in accordance with EN-1 Overarching National Policy
Statement (NPS) for Energy, National Planning Policy Framework (NPPF), Planning
Practice Guidance (PPG) for Flood Risk and Coastal Change (Department of Energy
and Climate Change, 2014), and the Environment Agency’s Climate Change
Allowance guidance (Environment Agency, 2016).
8. The Climate Change Allowance guidance sets out the Environment Agency’s
recommended climate change allowances for development when considering flood
risk and coastal change for planning purposes. The principal aim of these policies and
guidance documents is to avoid inappropriate development in areas at risk of
flooding and, wherever possible, to direct development away from areas at highest
flood risk.
9. The Environment Agency Product 4 and 8 data packages1 were requested to support
the FRA for the sister project, Norfolk Vanguard. Product 4 data was provided at key
locations related to strategic watercourse crossings and the landfall in June 2017.
Data locations can be seen in Figure 20.1.1 in Annex 1. Further Product 4 data
related to the onshore project substation and the National Grid substation extension
was provided by the Environment Agency in April 2018. No Product 8 data has been
provided, and it is confirmed through consultation with the Environment Agency
that no breach analysis has been undertaken within, or in proximity to, the onshore
project area. This information has not been updated since it was received for
Norfolk Vanguard, and has therefore been used to support this FRA for Norfolk
Boreas2.
10. Due to the size and nature of the onshore project area, and the varying flood risk,
the potential sources of flood risk are considered within the following key sections of
this document:
• Section 4.1 – Landfall;
• Section 4.2 – Onshore cable route including access routes and mobilisation
areas;
• Section 4.3 – Onshore project substation; and
• Section 4.4 – National Grid substation extension and overhead line
modifications.
1 Product 4: Detailed Flood Risk Assessment Map, including flood zones, defences and storage areas, areas benefiting from defences, statutory main river designations, historic flood event outlines and more detailed information from our computer river models. Product 8: Flood Defence Breach Hazard Map including, maximum flood depth, maximum flood velocity, maximum flood hazard. 2 The data supplied by the Environment Agency for Norfolk Vanguard covers the entire assessment area for Norfolk Boreas and is therefore the most up to date and complete source of data for Norfolk Boreas at the time of this FRA.
Environmental Statement Norfolk Boreas Offshore Wind Farm 6.3.20.1 June 2019 Page 3
11. This FRA is structured to first give a high-level overview of the existing flood risk
within the project area. It then highlights all relevant polices and guidance for FRAs,
before evaluating the risk of flooding to each of the four elements as set out in the
above paragraph.
12. The analysis of flood risk dictates the discussions within sections 5 to 8, which
explores how the identified risks will be mitigated both during temporary
construction works, and throughout the full design life of the project for both
scenarios.
2 Baseline Environment
2.1 Existing surface water drainage system
13. The onshore project area will largely be located on rural, agricultural land where
there are limited existing formal surface water drainage systems; however, there are
a large number of agricultural land drains and ordinary watercourses, especially
along the onshore cable route (see Chapter 21 Land Use and Agriculture for more
information).
14. More formal surface water drainage systems may be present in locations where the
onshore project area passes in proximity to settlements or highways. These are
explored in more detail in section 48 (Definition of Flood Hazard).
15. The existing Necton National Grid substation has a formalised surface water
drainage system; however, this will be incorporated into the National Grid
substation extension as part of the drainage design and appropriate surface water
attenuation and mitigation measures incorporated.
2.2 Geology and hydrogeology
16. The British Geological Survey (BGS) solid and superficial geology maps identify the
bedrock underlying the onshore project area as Chalk to the west and Neogene and
Quaternary Rocks to the east, overlain by superficial deposits of till (diamicton),
glacial sand and gravel, clay, silt and sand alluvium, and Crag Group (sand and gravel)
throughout.
17. Regionally, the principal groundwater body underlying the majority of the onshore
project area is the Broadland Rivers Chalk and Crag. The chalk bedrock is designated
as a Principal Aquifer. These are layers of rock that have high intergranular and/or
fracture permeability meaning they usually provide a high level of water storage. A
number of Source Protection Zones (SPZs) are identified within the onshore project
area, with both inner and outer zones of the SPZ areas extending across the eastern
section of the onshore cable route. The superficial deposits within the area are
Environmental Statement Norfolk Boreas Offshore Wind Farm 6.3.20.1 June 2019 Page 4
predominantly classified as secondary aquifers, deemed to be formed of permeable
layers capable of supporting local water supplies.
18. There are small sections of the onshore project area close to the coast, north of
North Walsham underlain by the North Norfolk Chalk groundwater body; and to the
far west of the onshore project area that are underlain by the North Norfolk Chalk
and North West Norfolk Chalk groundwater bodies.
2.3 Surface hydrology
19. The onshore project area is located within three surface water hydrological
catchments (Figure 20.2 Chapter 20 Water Resources and Flood Risk):
The River Bure and several of its tributaries would be crossed by the onshore
cable route. The river rises near Briston, from where it flows in an easterly
direction until it reaches Aylsham. From here, it continues to flow to the
south east until it enters the sea at Great Yarmouth. The downstream
reaches of the river include a wide range of wetland features, including
Hoveton Great Broad and Marshes, Woodbastwick Fens and Marshes, Bure
Marshes and the Norfolk Broads. The two most significant tributaries of the
Bure are the King’s Beck which rises in Roughton and joins the River Bure in
Buxton, and the North Walsham and Dilham Canal (formerly the River Ant),
which rises in Antingham and joins the Bure at Horning.
The River Wensum and several of its tributaries would be crossed by the
onshore cable route. The river rises near Whissonsett, from where it flows
north towards Fakenham before continuing in a broadly south easterly
direction towards Norwich. The River Wensum is designated as a Special
Area of Conservation (SAC) and Site of Special Scientific Interest (SSSI).
Significant tributaries of the River Wensum include Wendling Beck and the
Blackwater Drain, rising west and east of the Wensum respectively.
The River Wissey, the headwaters of which are close to the grid connection at
the Necton National Grid substation and the onshore project substation. The
Wissey rises to the east of Bradenham and drains in a westerly direction
towards Necton before eventually joining the River Great Ouse at Denver
Sluice, near Downham Market.
20. All three of the above surface water hydrological catchments will be considered
during the assessment of both Scenario 1 and Scenario 2.
Environmental Statement Norfolk Boreas Offshore Wind Farm 6.3.20.1 June 2019 Page 5
3 Policy, Guidance and Consultation
3.1 National Planning Policy Framework (NPPF)
21. The NPPF PPG (Planning Practice Guidance) for Flood Risk and Coastal Change
(Department of Energy and Climate Change (DECC), 2014) and Climate Change
Allowance Guidance (Environment Agency, 2016) provide direction on how flood risk
should be considered at all stages of the planning and development process. The
planning system should ensure that new development is safe and not exposed
unnecessarily to the risks associated with flooding. This FRA sets out the planning
and wider context within which the project needs to be considered along with the
flood risk to the onshore project area under each scenario.
3.2 Probability of Flooding – Flood Zones
22. Table 3.1 outlines the definitions of each flood zone and associated probability,
taken from Table 1 of the NPPF PPG (DECC, 2014). The NPPF through the application
of the Sequential Test aims to steer development towards areas at lowest risk of
flooding (Flood Zone 1) and away from medium and high flood risk areas (Flood
Zones 2 and 3).
Table 3.1 Summary of Flood Zone Definitions
Flood zone Probability of flooding Return periods
1 Low Land having a less than 1 in 1,000 annual probability of river
or sea flooding.
2 Medium Land having between a 1 in 100 and 1 in 1,000 annual
probability of river flooding; or
Land having between a 1 in 200 and 1 in 1,000 annual
probability of sea flooding.
3a High Land having a 1 in 100 or greater annual probability of river
flooding; or
Land having a 1 in 200 or greater annual probability of sea
flooding.
3b High – Functional Floodplain This zone comprises land where water has to flow or be
stored in times of flood.
Local planning authorities should identify in their SFRAs areas
of functional floodplain and its boundaries accordingly, in
agreement with the Environment Agency.
23. Flood Zones are informed by the extent of the modelling undertaken by the
Environment Agency. This includes all designated Main Rivers. Some of the larger
ordinary watercourses can also be included in the modelling and therefore are
included within the extent of the Flood Zone datasets.
Environmental Statement Norfolk Boreas Offshore Wind Farm 6.3.20.1 June 2019 Page 6
24. Any watercourse that is not classified as a Main River is referred to as an ordinary
watercourse. This covers any streams, drains, ditches and passages through which
water flows that do not form the network of main rivers.
25. This means that small agricultural drainage ditches, often only seasonally wet, are
also categorised as ordinary watercourses. Whilst acknowledged in terms of flood
risk, their potential impacts are discussed within the surface water flooding sections
throughout this document.
3.3 Local Authorities
26. The onshore project area is located within the authority area of Norfolk County
Council. Three District Councils cover the development area:
Breckland Council;
Broadland District Council; and
North Norfolk District Council.
27. Norfolk County Council is the Lead Local Flood Authority (LLFA) covering the onshore
project area. Under the Flood and Water Management Act (2010) LLFAs are
responsible for managing flooding from surface water, groundwater and ordinary
watercourses. Among other responsibilities they are required to deliver a strategy
for local flood risk management in their areas, to investigate flooding and to
maintain a register of flood risk assets.
3.4 Preliminary Flood Risk Assessment
28. The most recent Preliminary Flood Risk Assessment (PFRA) for the county was
produced by Norfolk County Council in July 2011 (Norfolk County Council, 2011).
29. The PFRA provides a high level overview of the potential risk of flooding from local
sources and identifies areas at flood risk which may require more detailed studies.
The PFRA is used to inform the Local Flood Risk Management Strategy.
3.5 Strategic Flood Risk Assessment
30. Level 1 Strategic Flood Risk Assessments (SFRA) were produced for North Norfolk
District Council (North Norfolk District Council, 2017) and Broadland District Council
(Greater Norwich Partnership, 2017) in consortium with other Norfolk Local Planning
Authorities in 2017.
31. An updated SFRA was produced in 2017 for Breckland Council (Breckland Council,
2017) entitled Breckland District Council Level 1 Strategic Flood Risk Assessment
Update.

Environmental Statement Norfolk Boreas Offshore Wind Farm 6.3.20.1 June 2019 Page 7
32. The SFRAs are high level strategic documents carried out by local planning
authorities to assess the risk to an area from flooding, at present and into the future,
taking into consideration the impacts of climate change and to assess the impact
that land use changes and development will have on flood risk. The SFRA informs
the Local Plan for development.
3.6 Local Flood Risk Management Strategy (LFRMS)
33. Norfolk County Council produced the Norfolk Local Flood Risk Management Strategy
(LFRMS) in 2015 (Norfolk County Council, 2015), which outlines the aims and
objectives of the Council as the LLFA and provides policies based on these aims.
34. Critical Drainage Areas (CDAs) are defined in the Town and Country Planning
(General Development Procedure) (Amendment) (No. 2) (England) Order 2006, as
‘an area within Flood Zone 1 which has critical drainage problems’. Consideration of
CDAs is necessary to inform key flood risk priorities. The LFRMS did not identify any
locations within the onshore project area that are designated as CDAs.
3.7 Catchment Flood Management Plan (CFMP)
35. Catchment Flood Management Plans (CFMPs) consider all types of inland flooding
including from rivers, groundwater, surface water and tidal flooding. Flooding
directly from the sea (coastal flooding) is covered in Shoreline Management Plans
(SMPs), which are addressed later in this FRA. CFMPs consider the likely impacts of
climate change, the effects of how we manage the land and how areas can be
developed sustainably.
36. The onshore project area is covered by three CFMPs:
North Norfolk CFMP (Environment Agency, 2009a);
Broadland Rivers CFMP (Environment Agency, 2009b); and
Great Ouse CFMP (Environment Agency, 2011).
37. The Broadland Rivers CFMP covers the majority of the onshore project area. The
CFMP identifies that the main sources of flood risk in the area are river flooding from
the River Bure, tidal flooding, tide locking, failure of pumping stations and breaching
of embankments. The North Norfolk CFMP and Great Ouse CFMP do not identify
any of the onshore project area to be at significant risk of flooding from any sources.
3.8 Shoreline Management Plan (SMP)
38. Shoreline Management Plans (SMPs) are non-statutory plans for coastal defence
management planning. They aim to identify the best ways to manage flood and
erosion risk and develop an ‘intent of management’ for the shoreline.

Environmental Statement Norfolk Boreas Offshore Wind Farm 6.3.20.1 June 2019 Page 8
39. The onshore project area is covered within SMP6; Kelling Hard to Lowestoft (Aecom,
2012). Specifically, Happisburgh is located within Policy Unit 6.12: Ostend to Eccles.
40. A review of the SMP found that the landfall is to the south of the most active length
of coastline from East of Cromer extending to Happisburgh. The erosion in this
section is necessary to allow beaches to build and help avoid accelerated erosion of
the shoreline both within the section and further along the coast. As such, Policy
Unit 6.12 outlines a plan of managed coastal retreat. Indicative erosion zones
provided within the SMP show this will not affect the landfall compound.
41. Appendix 4.5 of Chapter 4 Site Selection and Assessment of Alternatives provides a
study on coastal erosion in the area and this has informed the site selection and
design of the landfall works.
3.9 Flood Risk Stakeholders and Consultation
3.9.1 Key flood risk stakeholders
42. The onshore project area crosses multiple channels that are managed by the Norfolk
Rivers Internal Drainage Board (IDB).
43. The Environment Agency is also considered a key flood risk stakeholder in this
project, due to their management of the Main Rivers that the onshore project area
will cross.
44. Other stakeholders and consultees include Norfolk County Council and other IDBs
within the Water Management Alliance as well as key communities.
45. Any works, either temporary or permanent, which will change the flow of water
along a watercourse or require the erection of a culvert, bridge or modification to
the channel require consent from the relevant authorities. Upon identification of all
Main Rivers and ordinary watercourses to be crossed, application consents shall be
made to the appropriate authority, including the Environment Agency, Norfolk
County Council and the IDB.
3.9.2 Consultation
46. Statutory consultees were consulted in relation to the project with key responses
received from stakeholders such as, but not limited to, the Environment Agency,
Norfolk County Council and Norfolk Rivers IDB.
47. Comments relevant to flood risk centred around the following themes:
Local sources of flooding not accounted for by the Environment Agency Flood
Map for Planning including but not limited to water table level, poorly
draining soils, local topography;
Environmental Statement Norfolk Boreas Offshore Wind Farm 6.3.20.1 June 2019 Page 9
Historical flooding of Necton, Ivy Todd and West End;
Removal and / or alteration of existing land drains; and
Increased surface water runoff from the onshore project substation.
48. This FRA aims to consider all the stakeholder comments in terms of the impact of the
project on potential flood risk and drainage issues. Consultation responses and how
they have been addressed are provided in Chapter 20 Water Resources and Flood
Risk, Chapter 7 Technical Consultation and the Consultation Report (document
reference 5.1).
4 Definition of Flood Hazard
49. This chapter explores the risk of flooding to each of the four key project elements
(landfall, onshore cable route, onshore project substation and National Grid
substation extension), as outlined in section 1.2. Where flood risk is identified,
appropriate mitigation methods are discussed within section 8.
4.1 Landfall
4.1.1 Overview of Proposed Activities
50. The landfall is situated to the south of Happisburgh and is comprised of a stretch of
coastline approximately 1.5km from Beach Road in the north to Cart Gap Road in the
south. The landfall (the area where the location for the drilling compound would be
located) extends inland between 0.2 and 0.7km. The landfall site consists of
agricultural land.
51. Both Scenario 1 and Scenario 2 will require construction works to be carried out at
the landfall. Therefore, all assessments of the flood risk to the landfall, presented in
the subsequent sections, are considered to apply equally to both Scenario 1 and
Scenario 2.
4.1.2 Historic Flooding
52. The Product 4 data package provided by the Environment Agency in June 2017
shows the landfall (marked as Site 7 on Figure 20.1.1 in Annex 1) to have been
unaffected by historical tidal or fluvial flood events.
4.1.3 Flooding from Rivers
53. The landfall is located within Flood Zone 1, as defined by the Environment Agency
online Flood Map for Planning (Environment Agency, undated) (Figure 20.1.2 in
Annex 1) and confirmed by the Product 4 data package obtained in June 2017.
54. The placement of the landfall within Flood Zone 1 ensures that a sequential, risk
based approach has been applied in determining this location. The sequential
Environmental Statement Norfolk Boreas Offshore Wind Farm 6.3.20.1 June 2019 Page 10
approach, which in decision-making requires the application of the Sequential Test,
aims to locate any development within the lowest flood risk areas possible which
helps ensure that development can be safely and sustainably delivered.
55. The North Norfolk SFRA (North Norfolk District Council, 2017) focussed on fluvial
flood risk in existing urban areas only. No analysis of potential flood risk from rivers
was included for the landfall. Therefore, the landfall is at low risk of flooding from
fluvial sources.
4.1.4 Flooding from Ordinary Watercourses
56. A review of the Ordnance Survey mapping identifies that the landfall does not
intersect and is not located within the vicinity of any ordinary watercourses.
57. The landfall is located outside of the Norfolk Rivers IDB catchment boundary.
However, it is noted that small ditches may drain into the adjacent Broads IDB
catchment, which begins approximately 750m to the south of the landfall (Figure
20.4 Chapter 20 Water Resources and Flood Risk).
58. Given the absence of ordinary watercourses at the landfall site, there is a low risk of
flooding from ordinary watercourses.
4.1.5 Flooding from the Sea
59. The landfall is located within Flood Zone 1, as defined by the Environment Agency
online Flood Map for Planning (Environment Agency, undated) (Figure 20.1.2 in
Annex 1) and confirmed by the Product 4 data package obtained in June 2017.
60. The Environment Agency Product 4 data package also identified the presence of the
Happisburgh to Winterton Concrete Sea Wall, immediately to the south of the
landfall, which has a crest level of 7.5mAOD and provides a 1 in 1,000 year standard
of protection. However, these formal defences do not extend northward within the
landfall.
61. A review of Light Detection and Ranging (LiDAR) data within the landfall identified
the typical ground elevation along the top of beach line as varying between
approximately 6mAOD at the minimum elevation, and over 12mAOD at the highest
elevation.
62. The North Norfolk SFRA (North Norfolk District Council, 2017) contains limited
information on the risk of tidal flooding. No analysis of potential flood risk from tidal
sources was included for the landfall.
63. Still water levels have been provided for a number of offshore nodes from the
Extreme Sea Levels Flood Risk Study (2008), the most relevant of which shows
maximum water levels of 3.81mAOD during the 1 in 200 year (0.5% AEP) event and
Environmental Statement Norfolk Boreas Offshore Wind Farm 6.3.20.1 June 2019 Page 11
4.22mAOD during the extreme 1 in 1,000 year (0.1% AEP) event. Based on the
ground elevations along the top of beach line within and adjacent to the landfall and
the maximum still water levels during an extreme event, the site is afforded
considerable protection on account of the natural ground elevations. This does not
account for wave action during an extreme event.
64. As discussed in section 3.8, the landfall compound falls outside of the indicative
erosion zones. Therefore, it is likely that predicted coastal erosion will not affect the
landfall in terms of increased flood risk. As such, the landfall is considered to be at
low risk of flooding from tidal sources.
4.1.6 Flooding from Groundwater
65. The landfall is located over bedrock designated as a Principal Aquifer, typically
providing a high level of water storage. Further information is provided in section
2.2.
66. The North Norfolk SFRA (North Norfolk District Council, 2017) contains limited
information on the risk of flooding from groundwater sources. Isolated low-lying
valley areas may be subject to local groundwater flooding; however, details of such
areas are unknown. As the landfall includes below ground works there is a risk that
groundwater flooding could affect the project, primarily during construction;
however, the effect the landfall shall have on groundwater flows once operational is
likely to be minimal due to the relatively shallow depth of the construction. As such,
the landfall is at low risk of flooding from groundwater flooding.
4.1.7 Flooding from Surface Water
67. The Environment Agency’s Long Term Flood Risk Information map (Environment
Agency, undated) (Figure 20.1.3 in Annex 1) shows the landfall to be located in an
area predominantly at very low risk of surface water flooding, i.e. primarily outside
the extent of the 1 in 1,000 year surface water flooding event.
68. There are small areas of low to medium flood risk from surface water along the
western boundary of the landfall. A review of the aerial imagery indicates that the
low to medium flood risk areas appear to be associated with existing agricultural
land drains or ditches. As such, the landfall is at low risk of flooding from surface
water.
4.1.8 Flooding from Sewers
69. The North Norfolk SFRA (North Norfolk District Council, 2017) did not report any
flooding from sewers within the landfall. The landfall is located within existing
agricultural land and it is likely that there is no foul sewer network within proximity
of this location. As such, there is a low risk of flooding from sewer sources.
Environmental Statement Norfolk Boreas Offshore Wind Farm 6.3.20.1 June 2019 Page 12
4.1.9 Flooding from Reservoirs
70. The Environment Agency’s Long Term Flood Risk Information map (Environment
Agency, undated) shows the landfall is located outside the maximum extent of
flooding from reservoirs. As such, there is a low risk of flooding from reservoirs.
4.1.10 Flooding from Canals and Other Artificial Sources
71. A review of the Norfolk Rivers and Broads IDB area maps indicates there are no IDB
pumping stations in proximity to the landfall, relating to surface water drainage. As
such, there is currently no risk of flooding from failure of a pumping station.
72. The landfall is located away from canals and other artificial sources. As such, there is
no risk of flooding from these sources.
4.1.11 Summary of Flooding Sources
73. The landfall is located within Flood Zone 1, at low flood risk from fluvial or tidal
sources. The landfall compound is sufficiently inland that the managed coastline
retreat proposed for this area as outlined by the SMP6; Kelling Hard to Lowestoft
(Aecom, 2012), will not affect the landfall in terms of flood risk from the sea.
74. There has been no history of flooding identified as part of this FRA for the immediate
landfall; however, this does not mean that flooding has not occurred in the past.
75. The overall risk of flooding from all sources to the landfall is deemed to be low.
4.2 Onshore Cable Route and Associated Project Infrastructure
4.2.1 Overview of Proposed Activities
76. Under Scenario 1, the onshore cables ducts and associated works will have been
installed by Norfolk Vanguard. As such construction activities in the River Bure and
River Wensum catchments will be limited to installation of cables in the pre-installed
ducts, the construction of joint pits (each with an area of 90m2) and the
reinstatement of limited areas of running track. Although construction activities for
Scenario 1 will be relatively limited and temporary in nature (i.e. for the duration of
the cable pulling activities only) in comparison with those required for Scenario 2,
there is still the potential for them to be affected by flooding.
77. On this basis, the assessment of flood risk relating to the onshore cable route and
associated project infrastructure has been considered for both Scenario 1 and
Scenario 2.
Environmental Statement Norfolk Boreas Offshore Wind Farm 6.3.20.1 June 2019 Page 13
Watercourse crossings (Scenario 1 and Scenario 2)
78. The onshore cable route crosses several ‘Main Rivers’ (as designated by the
Environment Agency), a number of IDB channels, and a large number of ordinary
watercourses (Figure 20.1.4 in Annex 1). These crossings are detailed in the
Watercourse Crossing Schedule (Appendix 20.4).
79. Within this FRA, the definition of the flood hazard to the onshore cable route has
been considered within each hydrological catchment (Figure 20.2 Chapter 20 Water
Resources and Flood Risk). The number of watercourse crossings including ‘Main
Rivers’, ordinary watercourse crossings, IDB crossings within each hydrological
catchment have been assessed for both Scenario 1 and Scenario 2. The temporary
watercourse crossings associated with Scenario 1 can be seen in Table 4.1 and the
watercourse crossings associated with Scenario 2 can be seen in Table 4.2In addition,
there is a network of smaller land drains or agricultural ditches, not easily
identifiable from mapping and which may be only seasonally wet, likely to be crossed
by the onshore cable route. Under Scenario 2 the presence of mobilisations areas
and trenchless crossing compounds have also been assessed.
Table 4.1 Temporary watercourse crossings in surface water catchments (Scenario 1) Catchment Number of temporary crossings
River Bure 10
River Wensum 5
River Wissey 1
Table 4.2 The number of mobilisation areas and watercourses crossed by the onshore cable route (Scenario 2)
80. There is a watercourse crossing, relevant to Scenario 1 and Scenario 2, within the
Wissey catchment which lies between the onshore project substation and the
National Grid extension (Figure 20.2 Chapter 20 Water Resources and Flood Risk),
which is considered within Section 4.3.
Mobilisation Areas (Scenario 2 only)
81. Mobilisation areas, required to store equipment and provide welfare facilities, will
be present throughout duct installation along the onshore cable route. These areas
will be hardstanding comprised of permeable gravel aggregate underlain by
Catchment
Number of
Mobilisation
Areas
Number of Trenchless Crossing
Compounds
Main River
Crossings
Watercourse
Crossings
IDB
Crossings
River Bure 5 18 2 17 5
River Wensum 7 18 4 18 7
River Wissey 0 0 0 4 0

Environmental Statement Norfolk Boreas Offshore Wind Farm 6.3.20.1 June 2019 Page 14
geotextile or other suitable material to allow safe movement of vehicles and
maintain required drainage.
82. Mobilisation areas will remain in place for the duration of the onshore duct
installation activities, proposed as two years. Following installation of the ducts, the
mobilisation areas will be removed and the land reinstated.
83. The mobilisation areas are primarily located within Flood Zone 1 (Figure 20.1.2 in
Annex 1). Those located within proximity to Flood Zone 3 are associated with river
crossings and are over 150m away from the Flood Zone 3 extent.
84. Environment Agency Product 4 data obtained in June 2017 and April 2018 confirms
that the mobilisation areas in proximity to Flood Zone 3 are associated with river
crossings. The Environment Agency has confirmed that there is no indication of
historical flood events affecting the locations of the mobilisation areas.
Trenchless Crossing Compounds (Scenario 2 only)
85. Trenchless crossing compounds will be present for shorter durations than the
mobilisation areas i.e. they are anticipated to be in place for weeks as opposed to
months (see section 20.7.2 in Chapter 20 Water Resources and Flood Risk for
details), as the onshore cable route is installed (via trenchless techniques e.g. HDD)
under key watercourses and infrastructure. These compounds will be hardstanding
comprised of permeable gravel aggregate underlain by geotextile or other suitable
material to allow safe movement of vehicles and maintain required drainage.
86. Where possible, the compounds are located within Flood Zone 1. However, two are
located within Flood Zone 2 and four within Flood Zone 3, due to the associated river
crossings (Figure 20.1.2 in Annex 1). Two compounds are also at risk from surface
water flood risk, due to proximity to the River Wensum.
87. The compounds are identified as being at medium / high risk of flooding due to
proximity to the watercourses.
Access Routes (Scenario 1 and 2)
88. Access routes shall be used during the cable pulling phase of the project, as well as
during operation to provide vehicular access. Access routes will either be aggregate
running tracks or temporary track such as bog mats. The routes are split into the
following two categories:
• Construction access routes: These will be temporary access routes used during
cable pulling and removed following completion of the construction phase; and
• Operational access routes: These are rights of access over existing field access
routes to allow continued vehicular access for required maintenance.
Environmental Statement Norfolk Boreas Offshore Wind Farm 6.3.20.1 June 2019 Page 15
89. Under Scenario 2 a number of access routes will need to cross existing watercourses,
with environmental permits and consents likely to be required for each crossing
point. The methodology to be used for any temporary construction at crossing
points over existing ditches and watercourses shall be agreed with the Environment
Agency and relevant Local Authority and IDB as part of the Environmental Permitting
(Amendment) Regulations 2018 process or as an Ordinary Watercourse Consent
application.
90. The access route adjoining Swanton Road, Dereham may be at increased risk of
surface water flooding. As discussed in section 4.2.3.7, the Breckland District Council
SFRA (Breckland Council, 2017) identified that Swanton Road has previously been
subject to surface water flooding. This risk will need to be considered during
construction and mitigation measures will be included within the Code of
Construction Practice (CoCP).
91. Access routes located within or near to Flood Zones 2 or 3 are at greatest risk of
fluvial flooding. The locations of these routes are associated with river crossings and
design of the access routes will replicate, wherever possible, the existing ground
levels to limit the impact of flood risk into the future.
92. Additionally, there are three locations with increased flood risk where the
permanent access routes are proposed to connect the wider road network to the
onshore project substation related to the existing surface water flood extent (Figures
20.1.3b and 20.1.3c in in Annex 1).
4.2.2 River Bure Catchment (Scenario 1 and Scenario 2)
93. Within the River Bure catchment, the onshore cable route intersects two key
crossing points; the River Bure and the North Walsham and Dilham Canal. There are
a number of other watercourses including Mermaid Stream, King’s Beck and East
Ruston Stream that are crossed. In addition, there are a number of minor
watercourses, land drains and ditches that are not named (Figure 20.4 Chapter 20
Water Resources and Flood Risk).
94. There are five IDB channels within the Bure catchment that are crossed. These
include: BG1301 Hundred Stream, AG1216, Boundary Farm Spur (19a) and Low Level
Drain - Colby to Suffield Hall (18). The other IDB channels are not named and
therefore have not been listed individually.
Historic Flooding
95. The Product 4 data package provided by the Environment Agency (June 2017) shows
that the onshore cable route does not intersect any locations within the Bure
Catchment affected by a historic flood event.
Environmental Statement Norfolk Boreas Offshore Wind Farm 6.3.20.1 June 2019 Page 16
Flooding from Rivers
96. The majority of the onshore cable route throughout the River Bure catchment is
located within Flood Zone 1 as defined by the Environment Agency online Flood Map
for Planning (Figure 20.1.2 in Annex 1) and confirmed by the Product 4 data package.
97. There are a number of locations at which the onshore cable route intersects areas of
Flood Zone 2 and 3. No Flood Zones follow the onshore cable route in a linear
fashion; rather, the onshore cable route intersects these increased areas of flood
risk. These areas of increased flood risk are associated with the watercourse
crossings as identified previously.
98. Environment Agency Product 4 data was obtained for the two key crossing points
identified as Sites 5 and 6. The locations of these points can be viewed in Figure
20.1.1 in Annex 1 and details of the proposed crossing type shown in Figure 20.1.4 in
Annex 1. A summary of the Product 4 data provided by the Environment Agency
(June 2017) is provided in Table 4.3. Site 5 is located within the Broads River Bure
model and Site 6 within the North Norfolk (Ant) model. Where multiple node points
were provided for a Site within the onshore cable route the most upstream in-
channel node within the boundary was used.
Table 4.3 Environment Agency Product 4 data summary (Bure catchment) Site Watercourse Model Node Modelled Water Levels
(mAOD)
1:100 (1% AEP)
1:1,000 (0.1% AEP)
5 River Bure Broads River Bure Flood Risk Study (2014)
BURE_17903 11.57 11.75
6 North Walsham and Dilham Canal
North Norfolk (Ant) Flood Risk Study (2006)
ANT12000 13.25 14.38
99. The modelled water levels for extreme rainfall events relevant to the appropriate
watercourse have been used when determining flood risk in the context of the
location of any structures, including temporary infrastructure, along the onshore
cable route and during the development of the detailed design.
Flooding from Ordinary Watercourses
100. As detailed in section 4.2.1.1, there are a number of smaller land drains or
agricultural ditches, not easily identifiable from mapping and which may be only
seasonally wet, which are likely to be crossed by the onshore cable route. However,
these are seen to pose a minimal fluvial flood risk, and are more likely to affect the
cable route from a surface water perspective during times of heavy or prolonged
rainfall (section 4.2.2.6).
Environmental Statement Norfolk Boreas Offshore Wind Farm 6.3.20.1 June 2019 Page 17
Flooding from the Sea
101. The majority of the onshore cable route is located away from the coast and as such
the risk associated with tidal flooding is limited to the landfall and the extent of the
onshore cable route that connects with it.
102. The Broadland Rivers CFMP (Environment Agency, 2009b) indicates that the areas
along the onshore cable route are most at risk from fluvial flooding. As such, there is
a low risk of flooding from tidal sources.
Flooding from Groundwater
103. The River Bure catchment is located over bedrock designated as a Principal Aquifer,
usually providing a high level of water storage. Further information can be found in
section 2.2.
104. Knowledge of the risk of flooding from groundwater in the Bure catchment is limited.
The North Norfolk SFRA (North Norfolk District Council, 2017) contains limited
information on the risk of flooding from groundwater sources.
105. The effect the onshore cable route shall have on groundwater flows both during
construction and once operational is likely to be minimal should the cable duct be
located at relatively shallow depths, in a minimally sized waterproof duct. Embedded
mitigation measures related to the construction phase of the cable excavation, as set
out in Chapter 19 Ground Conditions and Contamination, have been incorporated in
the design to limit the impact of the onshore cable route on groundwater
disturbance and to limit the impact on the hydraulic connectivity between
groundwater and surface water. This would be applicable to the construction of the
temporary joint pits in Scenario 1 and the wider construction activities in Scenario 2.
Flooding from Surface Water
106. The Environment Agency’s Long Term Flood Risk Information map (Environment
Agency, undated) (Figure 20.1.3 in Annex 1) indicates that surface water flooding
within proximity of the onshore cable route in the Bure catchment is largely
contained within watercourses and ditches. There are small areas at risk of flooding
from surface water within topographically low-lying areas of the route.
107. The Norfolk LFRMS (Norfolk County Council, 2015) indicates that North Walsham and
Aylsham are within the top 20 settlements most likely to be affected by surface
water flooding. North Walsham and Aylsham at their nearest extents are
approximately 0.2 and 1km respectively, south of the onshore cable route. There is
no further information regarding the precise locations of the risk of surface flooding.
108. The North Norfolk SFRA (North Norfolk District Council, 2017) includes details of a
small flood in 2013 at Whimpwell Street, caused due to low capacity systems being
overwhelmed and exceeded in heavy rainfall. The precise location of the flooding
Environmental Statement Norfolk Boreas Offshore Wind Farm 6.3.20.1 June 2019 Page 18
has not been identified, however the onshore cable route crosses Whimpwell Street
approximately 0.5km from landfall.
109. Where trenchless techniques (e.g. Horizontal Directional Drill (HDD)) are proposed
and the onshore cables will pass beneath watercourses in low-lying areas, the risk of
flooding from surface water is low.
110. Existing small ordinary watercourses, such as localised agricultural / land drains
running alongside and / or crossing through the onshore cable route have the
potential to cause flooding to the onshore cable route, as well as there being a
potential off-site impact as a result of the proposed works. A pre-construction
Surface Water and Drainage plan will be developed, agreed with regulators and
implemented to minimise water within the cable trench and other working areas and
ensure ongoing drainage of surrounding land.
Flooding from Sewers
111. The majority of the onshore cable route in the Bure catchment is contained in rural,
agricultural land and as such the risk of flooding from sewers is likely to be low in
these areas.
112. The risk of flooding from sewer sources increases in areas where the onshore cable
route passes through small urban areas such as Silvergate, and where it passes in
proximity to larger urban areas such as Aylsham and North Walsham and / or as it
crosses highway infrastructure.
Flooding from Reservoirs
113. The onshore cable route crosses a number of small areas shown to be within the
maximum extent of flooding from reservoir sources. These extents are limited to
locations within proximity of existing watercourses such as Blackwater Beck and the
River Bure and other IDB managed drains. The flood risk from reservoirs whilst
significant in consequence should it occur is unlikely due to the extensive legislation
that governs the maintenance and operation of these structures.
Flooding from Canals and Other Artificial Sources
114. The onshore cable route crosses the North Walsham and Dilham Canal (Site 6 in the
Environment Agency Product 4 data package), however the canal is designated as an
Environment Agency Main River and forms part of the River Ant watercourse
network. As a result, the risk of flooding from the canal is deemed to be fluvial in
nature and has been described in section 4.2.2.2 above.
115. A review of the Norfolk Rivers IDB area maps indicates no pumping stations in
proximity to the onshore cable route. As such, there is currently no risk of flooding
from failure of a pumping station. Therefore, it is assumed there is no risk of flooding
from these sources.
Environmental Statement Norfolk Boreas Offshore Wind Farm 6.3.20.1 June 2019 Page 19
Summary of Flooding Sources
116. Based on the information presented above the onshore cable route, as part of
Scenario 2 only, located within the Bure catchment is at low risk of flooding from all
potential sources.
117. The majority of the onshore cable route within the Bure catchment is located within
Flood Zone 1. Areas located within Flood Zones 2 and 3 are associated with
watercourse crossings or topographically low-lying areas.
118. There is an increased risk of surface water flooding and flooding from sewers, as the
onshore cable route passes in proximity to larger settlements in particular North
Walsham and Aylsham.
119. In addition, there is a risk of surface water flooding affecting the onshore cable route
in the vicinity of existing smaller ordinary watercourses such as agricultural land
drains. A pre-construction Surface Water and Drainage Plan (SWDP) will be
developed, agreed with regulators and implemented to minimise water within the
cable trench and other working areas and ensure ongoing drainage of surrounding
land. Design measures, including multiple interceptor ditches, will be implemented
to limit the potential risk to the onshore cable route as a result of surface water
flooding.
4.2.3 River Wensum Catchment (Scenario 1 and Scenario 2)
120. Within the River Wensum catchment, the onshore cable route crosses three Main
Rivers at key crossing points; Wendling Beck, the River Wensum and Blackwater
Drain. There are several other watercourses, land drains and agricultural ditches that
are not named, but are crossed by the onshore cable route.
121. The onshore cable route also crosses seven IDB channels including MN 16 –
Reepham, MN 25 – Bylaugh Meadows, MN 12 – Swanton Morley and MN26 –
Pennyspot Farm. The other IDB channels are not named and therefore have not
been listed individually.
Historic Flooding
122. The Environment Agency Product 4 data (June 2017) shows one record of historical
flooding close to where the onshore cable route intersects the River Wensum;
however, the mapped historic flood extent is outside the boundary of the onshore
cable route. This was a fluvial event which occurred in 1993 along the River
Wensum, to the north west of Elsing. Further details of this flood event have not
been provided by the Environment Agency.
Environmental Statement Norfolk Boreas Offshore Wind Farm 6.3.20.1 June 2019 Page 20
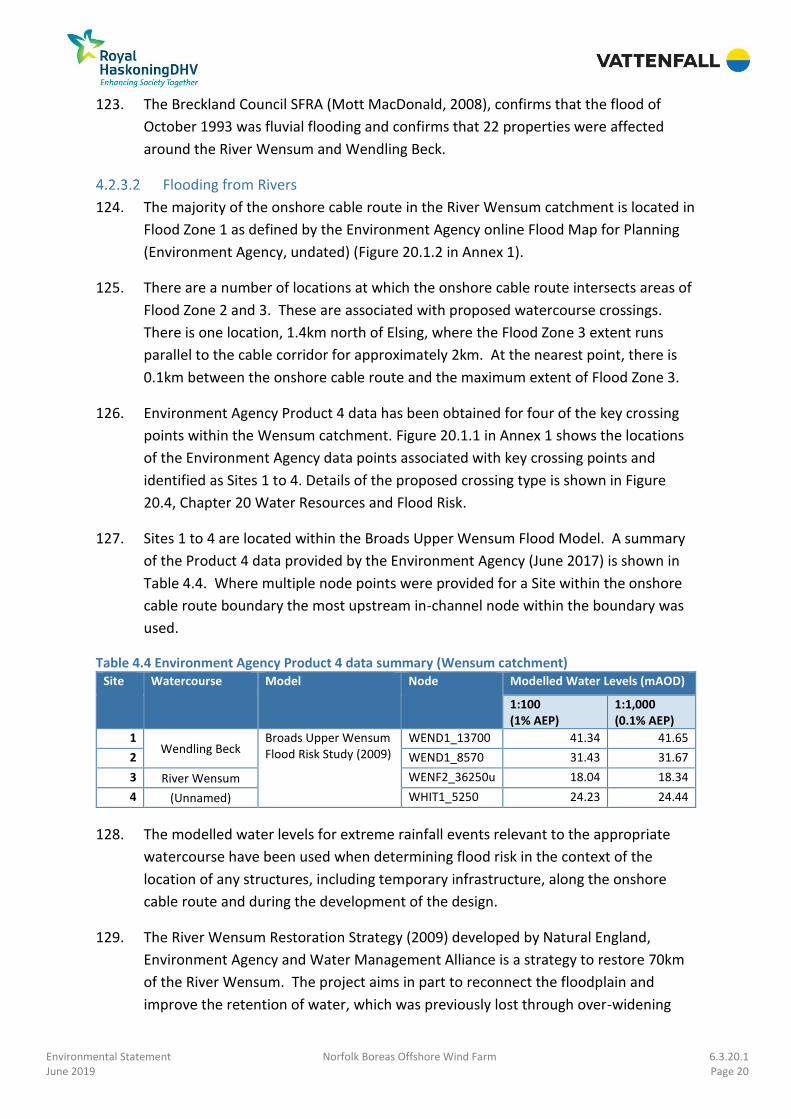
123. The Breckland Council SFRA (Mott MacDonald, 2008), confirms that the flood of
October 1993 was fluvial flooding and confirms that 22 properties were affected
around the River Wensum and Wendling Beck.
Flooding from Rivers
124. The majority of the onshore cable route in the River Wensum catchment is located in
Flood Zone 1 as defined by the Environment Agency online Flood Map for Planning
(Environment Agency, undated) (Figure 20.1.2 in Annex 1).
125. There are a number of locations at which the onshore cable route intersects areas of
Flood Zone 2 and 3. These are associated with proposed watercourse crossings.
There is one location, 1.4km north of Elsing, where the Flood Zone 3 extent runs
parallel to the cable corridor for approximately 2km. At the nearest point, there is
0.1km between the onshore cable route and the maximum extent of Flood Zone 3.
126. Environment Agency Product 4 data has been obtained for four of the key crossing
points within the Wensum catchment. Figure 20.1.1 in Annex 1 shows the locations
of the Environment Agency data points associated with key crossing points and
identified as Sites 1 to 4. Details of the proposed crossing type is shown in Figure
20.4, Chapter 20 Water Resources and Flood Risk.
127. Sites 1 to 4 are located within the Broads Upper Wensum Flood Model. A summary
of the Product 4 data provided by the Environment Agency (June 2017) is shown in
Table 4.4. Where multiple node points were provided for a Site within the onshore
cable route boundary the most upstream in-channel node within the boundary was
used.
Table 4.4 Environment Agency Product 4 data summary (Wensum catchment) Site Watercourse Model Node Modelled Water Levels (mAOD)
1:100 (1% AEP)
1:1,000 (0.1% AEP)
1 Wendling Beck
Broads Upper Wensum Flood Risk Study (2009)
WEND1_13700 41.34 41.65
2 WEND1_8570 31.43 31.67
3 River Wensum WENF2_36250u 18.04 18.34
4 (Unnamed) WHIT1_5250 24.23 24.44
128. The modelled water levels for extreme rainfall events relevant to the appropriate
watercourse have been used when determining flood risk in the context of the
location of any structures, including temporary infrastructure, along the onshore
cable route and during the development of the design.
129. The River Wensum Restoration Strategy (2009) developed by Natural England,
Environment Agency and Water Management Alliance is a strategy to restore 70km
of the River Wensum. The project aims in part to reconnect the floodplain and
improve the retention of water, which was previously lost through over-widening

Environmental Statement Norfolk Boreas Offshore Wind Farm 6.3.20.1 June 2019 Page 21
and straightening. It is believed that the rehabilitation of the Upper Wensum could
potentially reduce flood risk in the urban areas downstream in the long term,
including Lyng which is in proximity to the onshore cable route.
Flooding from Ordinary Watercourses
130. As detailed in section 4.2.1.1, there are a number of smaller land drains or
agricultural ditches, not easily identifiable from mapping and which may be only
seasonally wet, which are likely to be crossed by the onshore cable route. However,
these are seen to pose a minimal fluvial flood risk, and are more likely to affect the
cable route from a surface water perspective during times of heavy or prolonged
rainfall (section 4.2.3.6).
Flooding from the Sea
131. The onshore cable route, passing through the River Wensum catchment is inland and
located a minimum of 20km from the coast. As such there is anticipated to be no
risk of coastal or tidal flooding to the onshore cable route through this length.
Flooding from Groundwater
132. The River Wensum catchment is located over bedrock designated as a Principal
Aquifer, usually providing a high level of water storage. Further information can be
found in section 2.3.
133. The Breckland District Council SFRA (Breckland Council, 2017) acknowledges that
there is limited understanding of the risk of groundwater flooding in the district,
however there have been some occurrences of flooding associated with high
groundwater levels following significant rainfall in 2012.
134. The SFRA (Breckland Council, 2017) provides the Environment Agency Areas
Susceptible to Groundwater Flooding (AStGWF) dataset, in the form of a local map.
The map indicates that the onshore cable route is located within land shown to have
an increased susceptibility to groundwater flooding, with a number of small 1km2
areas showing a >=75% susceptibility to groundwater flooding.
135. The effect the onshore cable route shall have on groundwater flows both during
construction and once operational is likely to be minimal, should the cable duct be
located at relatively shallow depths, in a minimally sized waterproof duct.
Embedded mitigation measures related to the construction phase of the onshore
cable route, as set out in Chapter 19 Ground Conditions and Contamination, have
been incorporated in the design to limit the impact of the onshore cable route on
groundwater disturbance and to limit the impact on the hydraulic connectivity
between groundwater and surface water. This would be applicable to the
construction of the jointing pits in Scenario 1 and the wider construction activities in
Scenario 2.
Environmental Statement Norfolk Boreas Offshore Wind Farm 6.3.20.1 June 2019 Page 22
Flooding from Surface Water
136. Flooding from surface water along the onshore cable route (Figure 20.1.3 in Annex
1), as depicted by the Environment Agency’s Long Term Flood Risk Information map
(Environment Agency, undated) is largely contained within watercourses and
ditches, with small areas shown to be at risk of flooding from this source within
topographically low-lying areas of the route.
137. The Breckland District Council SFRA (Breckland Council, 2017) outlines two surface
water flood events that occurred in proximity to the onshore cable route. These
were at Swanton Road, Dereham and Toftwood, Dereham. There are no exact
locations identified, therefore precise distances from the onshore cable route cannot
be determined. As an estimation, Toftwood, Dereham is located approximately 3km
to the south-east of the onshore cable route.
138. The onshore cable route passes under Swanton Road, Dereham and runs adjacent to
it for approximately 0.75km. The exact location of the previous flood has not been
identified, however information provided by Norfolk County Council (2013) would
suggest that the flood is likely to have occurred at the southern end of the road and
therefore away from the crossing point. At the furthest distance, Swanton Road is
approximately 1.5km from the onshore cable route.
139. Dereham is listed as one of the top five settlements likely to be affected by surface
water flooding in the Norfolk LFRMS (Norfolk County Council, 2015). Exact locations
at increased risk of surface water flooding are not identified, however the onshore
cable route is situated approximately 1.3km away from the most northern extent of
Dereham.
140. The surface water flood risk mapping from the Environment Agency (Figure 20.1.3 in
Annex 1) shows surface water flood risk is largely contained within watercourses and
ditches, and there has only been one recorded flood in a location that the onshore
cable route interacts with, the risk of flooding from surface water is deemed to be
low. Where trenchless techniques (e.g. HDD) are proposed and the onshore cables
will pass beneath watercourses in low-lying areas, the risk of flooding from surface
water is low. This is also the case where the onshore cable route crosses Swanton
Road, Dereham.
141. In addition, there are a large number of small ordinary watercourses, such as
agricultural land drains that may be only seasonally wet and there is a risk of surface
water flooding from these and / or the flow routes into them being affected by the
onshore cable route. A pre-construction SWDP will be developed as part of the Code
of Construction Practice (DCO Requirement 20(2)(i)) and agreed with regulators and
implemented to minimise water within the cable trench and other working areas and
ensure ongoing drainage of surrounding land.

Environmental Statement Norfolk Boreas Offshore Wind Farm 6.3.20.1 June 2019 Page 23
Flooding from Sewers
142. The onshore cable route within the Wensum catchment is located mainly within
agricultural land and as such the risk of flooding from sewers is likely to be low in
these areas.
143. The risk of flooding from sewer sources is likely to increase in areas where the
onshore cable route passes through small urban areas such as Reepham and
Swanton Morley and where it passes in proximity to larger urban areas such as
Dereham.
144. The Breckland District Council SFRA (Breckland Council, 2017) identifies that
Dereham is a ‘hotspot’ for sewer flooding, having occurred at several roads within
approximately 3.5km of the onshore cable route, including Swanton Road. The
information provided in the SFRA suggests that sewer flooding occurs almost
exclusively within the town centre of Dereham and not in proximity to the proposed
onshore cable route where it crosses Swanton Road. As such, the risk of flooding
from sewers is still deemed to be low.
Flooding from Reservoirs
145. The onshore cable route within the River Wensum catchment does not intersect any
areas shown to be within the maximum extent of flooding from reservoirs and
therefore there is likely to be no risk of flooding from this source.
Flooding from Canals and Other Artificial Sources
146. A review of the Norfolk Rivers and Broads IDB area maps, as well as Ordnance Survey
mapping, identifies the onshore cable route is not located near to any canals or
other artificial sources within the River Wensum catchment. As such there is a low
risk of flooding from these sources.
Summary of Flooding Sources
147. Based on the information presented above it is deemed that the onshore cable route
located within the Wensum catchment is at low risk of flooding from all potential
sources.
148. Within the Wensum catchment, the majority of the onshore cable route is situated
within Flood Zone 1. Locations where the onshore cable route passes through Flood
Zones 2 and 3 are areas associated with proposed watercourse crossings.
149. Surface water flood risk extents are largely located within proximity to watercourses
and drains (Figure 20.1.3 in Annex 1). However, small areas of increased surface
water flood risk are also located within isolated low-lying areas.
150. In addition, there is a risk of surface water flooding affecting the onshore cable route
in the vicinity of existing smaller ordinary watercourses such as agricultural land
Environmental Statement Norfolk Boreas Offshore Wind Farm 6.3.20.1 June 2019 Page 24
drains. A pre-construction SWDP will be developed, agreed with regulators and
implemented to minimise water within the cable trench and other working areas and
ensure ongoing drainage of surrounding land. Design measures, including multiple
interceptor ditches, will be implemented to limit the potential risk to the onshore
cable route as a result of surface water flooding.
Given the information presented above, it is believed that the key risk of flooding to
the onshore cable route within the River Wensum catchment is from fluvial and
surface water sources.
4.3 Onshore Project Substation
4.3.1 Overview of Proposed Activities
151. The onshore project substation will consist of a High Voltage Direct Current (HDVC)
substation and ancillary infrastructure. The location of the substation under
Scenario 1 is located within the footprint illustrated in Figure 5.5 (Chapter 5 Project
Description). Under Scenario 2 the onshore project substation is located within the
footprint illustrated in Figure 5.6 (Chapter 5, Project Description) and will include
other ancillary infrastructure such as the permanent access route. The site is located
approximately 5km to the south-west of the first strategic crossing point (Site 1).
152. Both Scenario 1 and Scenario 2 involve the construction of the onshore project
substation. Therefore, all assessment below is relevant to both scenarios.
4.3.2 Historic Flooding
153. The Product 4 data package received in April 2018, does not indicate any historic
flooding in proximity to the onshore project substation.
154. The Breckland District Council SFRA (Breckland Council, 2017) does not outline any
historic floods in proximity to the onshore project substation.
4.3.3 Flooding from Rivers
155. The Environment Agency Product 4 data obtained in April 2018 (Figure 20.1.1 in
Annex 1) indicates that the onshore project substation is in Flood Zone 1 (Figure
20.1.2 in Annex 1). The site is located approximately 2km to the north of the Main
River. The upstream location of the onshore project substation and the elevated
topography of the area would suggest it is unlikely to be affected by flooding from
rivers. The risk of fluvial flooding to the onshore project substation is therefore
deemed to be low.
Environmental Statement Norfolk Boreas Offshore Wind Farm 6.3.20.1 June 2019 Page 25
4.3.4 Flooding from Ordinary Watercourses
156. A number of ordinary watercourses are identified within the onshore project
substation and associated infrastructure boundary (Figure 20.4, Chapter 20 Water
Resources and Flood Risk). Three small drainage ditches are identified within the
onshore project substation boundary; with a more prominent watercourse
intersecting the onshore 400kV cable route that connects the onshore project
substation to the National Grid substation extension.
157. Review of aerial imagery and topographic data shows the small watercourses drain
the agricultural land surrounding the onshore project substation. As such, they are
discussed regarding risk of flooding from surface water (see section 4.3.7).
158. The Environment Agency Long Term Flood Risk Information map (Environment
Agency, undated) indicates that there is an area of medium to high flood risk from
rivers which the onshore 400kV cable route intersects. This is confirmed by
anecdotal information indicating past records of flooding associated with this
watercourse.
159. The risk of fluvial flooding from ordinary watercourses to the onshore project
substation is low. However, the risk to the cable route between the onshore project
substation and the National Grid substation extension is classified as medium / high,
due to known historic records of flooding in the vicinity.
4.3.5 Flooding from the Sea
160. The onshore project substation is located approximately 60km inland and therefore
there is no risk of flooding from the sea.
4.3.6 Flooding from Groundwater
161. The Breckland District Council SFRA (Breckland Council, 2017) provides details from
the Environment Agency’s Areas Susceptible to Groundwater Flooding map. This
map indicated that the onshore project substation would be located on land with up
to 50% susceptibility to groundwater flooding.
162. The Norfolk LFRMS (Norfolk County Council, 2015) identifies that following
significant rainfall in 2012, there have been some instances of flooding associated
with high groundwater levels. However, there is limited understanding of the risk of
groundwater flooding in Breckland, and limited information on historical flood
events as a result of groundwater. As the onshore project substation includes below
ground works there is a risk that groundwater flooding could affect the
development, primarily during construction. However, mitigation measures will be
incorporated into the design and the onshore project substation is therefore at low
risk of groundwater flooding.
Environmental Statement Norfolk Boreas Offshore Wind Farm 6.3.20.1 June 2019 Page 26
4.3.7 Flooding from Surface Water
163. The Environment Agency Long Term Flood Risk Information map (Environment
Agency, undated) (Figure 20.1.3 in Annex 1) shows an area of low flood risk along the
northern perimeter of the site. This is likely to be due to localised agricultural and
land drainage issues, as highlighted by local knowledge.
164. Although the onshore project substation is located within Flood Zone 1 the onshore
400kV cable route which runs between the onshore project substation and the
National Grid substation extension, intersects an area of medium to high flood risk
from surface water (Figure 20.1.3 and Figure 20.1.4 in Annex 1). Review of aerial
imagery indicates that the area of increased flood risk is associated with the existing
watercourse. Design mitigation measures to address this flood risk are discussed in
section 6.
4.3.8 Flooding from Sewers
165. The onshore project substation is to be located on existing agricultural land, and
therefore there is a low risk of flooding from sewers.
4.3.9 Flooding from Reservoirs
166. The Environment Agency’s Long Term Flood Risk Information map (Environment
Agency, undated) indicates that the onshore project substation is located outside of
the maximum extent of flooding from reservoirs. Therefore, there is no risk of
flooding from this source.
4.3.10 Flooding from Canals and Other Artificial Sources
167. There are no canals or other artificial sources of flooding located near to the onshore
project area, as such there is no risk of flooding from these sources.
4.3.11 Summary of Flooding Sources
168. The onshore project substation is identified by the Environment Agency to be
located within Flood Zone 1. Considering the information presented above, the risk
of flooding from the majority of sources is deemed to be low.
169. Flooding from surface water poses the greatest risk to and from the site, however
this risk will be addressed through the adoption of appropriate management
techniques, as discussed in section 5.
Environmental Statement Norfolk Boreas Offshore Wind Farm 6.3.20.1 June 2019 Page 27
4.4 National Grid Substation Extension and Overhead Line Modifications
4.4.1 Overview of Proposed Activities
170. Under both Scenario 1 and Scenario 2, the existing Necton National Grid substation
will require an extension to accommodate the Norfolk Boreas connection points.
Under Scenario 1, extension works to Necton National Grid substation would be in
an easterly direction (as a result of the extension works which would have been
completed by Norfolk Vanguard) and under Scenario 2 would be in a westerly
direction (see Chapter 5 Project Description or Figure 20.1.3 in Annex 1 for further
details). Therefore, the assessment below is applicable to both scenarios for the
extension of the existing Necton National Grid substation.
171. Under Scenario 1, modifications to the existing overhead line structures adjacent to
the substation would have been completed by Norfolk Vanguard to accommodate
both projects and no further works would be required. There would therefore be no
change in flood risk under Scenario 1.
172. Under Scenario 2, modifications to the existing overhead lines would be carried out
in parallel to the National Grid substation extension. Overhead line modifications
under Scenario 2 are therefore considered in the assessment presented in the
sections below.
4.4.2 Historic Flooding
173. The Environment Agency Product 4 data obtained in April 2018 does not indicate any
historic flood events in proximity to the National Grid substation extension.
174. The Breckland District Council SFRA (Breckland Council, 2017) does not outline any
historic flood events that have occurred within proximity of the National Grid
substation extension and overhead line modifications.
4.4.3 Flooding from Rivers
175. The Environment Agency Product 4 data obtained in April 2018 indicates that the
National Grid substation extension and overhead line modifications are in Flood
Zone 1. The site is located approximately 2km to the north of the Main River. The
upstream location of the National Grid substation extension and the elevated
topography of the area would suggest it is unlikely to be affected by flooding from
rivers.
176. The extension of the Necton National Grid substation under Scenario 1, and the
substation extension and overhead line modifications under Scenario 2, are located
within Flood Zone 1 as defined by the Environment Agency online Flood Map for
Planning (Environment Agency, undated).
Environmental Statement Norfolk Boreas Offshore Wind Farm 6.3.20.1 June 2019 Page 28
177. The Breckland District Council SFRA (Breckland Council, 2017) identifies that Chantry
Lane, Necton has flooded many times because of Necton Brook. At Chantry Lane,
situated approximately 1.1km from the proposed substation extension, Necton
Brook runs through a culvert which is described as undersized. Necton Brook is a
hydrologically separate watercourse to that which passes between the onshore
project substation and the National Grid substation extension.
178. The risk of fluvial flooding to the National Grid substation extension and overhead
line modifications is therefore deemed to be low.
4.4.4 Flooding from Ordinary Watercourses
179. The National Grid substation extension and overhead line modifications appear to
include three ordinary watercourses within their boundary.
180. Review of aerial imagery and topographic data show that two of these watercourses
are small drainage ditches, serving either agricultural land, or part of the existing
Necton National Grid substation. As such, they are discussed in terms of the risk of
flooding from surface water runoff (see section 4.4.7).
181. To the north east of the overhead lines temporary works area (required under
Scenario 2 only) (Figure 20.4c, Chapter 20 Water Resources and Flood Risk), a
watercourse runs through a section of the site. This watercourse is known to have
flooded in the past, and is therefore more significant than most of the smaller
drainage ditches in the area. However, this area is limited to temporary works during
the construction phase. Appropriate management techniques as discussed in section
6 should be adopted to reduce this risk during construction.
182. The risk of fluvial flooding from ordinary watercourses to the National Grid
substation extension and overhead line modifications is therefore deemed to be low.
4.4.5 Flooding from the Sea
183. The National Grid substation extension and overhead line modifications are
approximately 60km inland and therefore there is no risk of flooding from the sea.
4.4.6 Flooding from Groundwater
184. The Breckland District Council SFRA (Breckland Council, 2017) provides details from
the Environment Agency’s Areas Susceptible to Groundwater Flooding map. This
map indicated that the National Grid substation extension and overhead line
modifications would be located on land with up to 50% susceptibility to groundwater
flooding.
185. The Norfolk LFRMS (Norfolk County Council, 2015) identifies that following
significant rainfall in 2012, there have been some instances of flooding associated
Environmental Statement Norfolk Boreas Offshore Wind Farm 6.3.20.1 June 2019 Page 29
with high groundwater levels. However, there is limited understanding of the risk of
groundwater flooding in the Breckland District, and limited information on historic
flood events as a result of groundwater.
4.4.7 Flooding from Surface Water
186. The Environment Agency Long Term Flood Risk Information map (Environment
Agency, undated) shows an area of medium to high flood risk along the northern
perimeter of the site (Figure 20.1.3 in Annex 1). Upon review of aerial imagery of the
site, this is confirmed as being linked to the existing land drains and watercourses in
the area.
187. The Breckland District Council SFRA (Breckland Council, 2017) highlights that surface
water flooding occurred in 2004 on the A47 to the north of Necton, as reported by
the Highways Agency. The precise location of this flood event is not identified,
however the A47 is situated less than 0.2km from the National Grid substation
extension and overhead line modifications and so flood risk from surface water is
deemed to be moderate.
4.4.8 Flooding from Sewers
188. The National Grid substation extension and overhead line modifications will be
located on agricultural land and therefore there is a low risk of flooding from sewers.
4.4.9 Flooding from Reservoirs
189. The Environment Agency’s Long Term Flood Risk Information map (Environment
Agency, undated) indicates that the National Grid substation extension and
overhead line modifications are located outside of the maximum extent of flooding
from reservoirs. Therefore, there is likely to be no risk of flooding from this source.
4.4.10 Flooding from Canals and Artificial Sources
190. The National Grid substation extension and overhead line modifications are not
located near to any canals or other artificial sources and therefore there is no risk of
flooding from these sources.
4.4.11 Summary of Flooding Sources
191. The National Grid substation extension and overhead line modifications are located
within Flood Zone 1. The risk of flooding from all other potential sources is deemed
to be low. Considering the information presented above, under both Scenario 1 and
Scenario 2, the greatest potential source of flooding to the National Grid substation
extension is from surface water (Figure 20.1.3 in Annex 1). Appropriate
management techniques as discussed in section 5 should reduce this risk. Flood Risk
Vulnerability

Environmental Statement Norfolk Boreas Offshore Wind Farm 6.3.20.1 June 2019 Page 30
192. As this section relates to permanent onshore infrastructure such as the cable
ducting, onshore project substation and National Grid substation extension, this is
applicable to both Scenario 1 and Scenario 2.
4.5 Background to Sequential and Exception Test
193. The aim of the NPPF PPG Sequential Test is to ensure that a sequential approach is
adopted to steer new development to areas with the lowest probability of flooding,
i.e. Flood Zone 1. Where there are no reasonably available sites in Flood Zone 1, the
local authority can consider reasonably available sites in Flood Zone 2. Only where
there are no reasonably available sites for development in Flood Zone 1 or 2, should
the suitability of sites in Flood Zone 3 be considered.
194. Following application of the Sequential Test, if it is not possible for the project to be
located in zones with a lower probability of flooding, consistent with wider
sustainability objectives, the Exception Test can be applied if appropriate.
195. For the Exception Test to be passed, the following two elements must be passed for
development to be allocated or permitted:
It must be demonstrated that the project provides wider sustainability
benefits to the community that outweigh flood risk, informed by an SFRA
where one has been prepared;
A site-specific FRA must demonstrate that the project will be safe for its
lifetime taking account of the vulnerability of its users, without increasing
flood risk elsewhere, and where possible will reduce flood risk overall.
196. Within each flood zone, surface water and other sources of flooding also need to be
considered when applying the sequential approach to the location of the project.
4.6 Vulnerability Classification
197. Under the NPPF PPG Flood Risk and Coastal Change, the project is considered as
‘Essential Infrastructure’, which is defined as:
Essential transport infrastructure (including mass evacuation routes), which
must cross the area at risk;
Essential utility infrastructure which must be located in a flood risk area for
operational reasons, including electricity generating power stations and grid
and primary substations; and water treatment works that need to remain
operational in times of flood; and
Wind turbines.
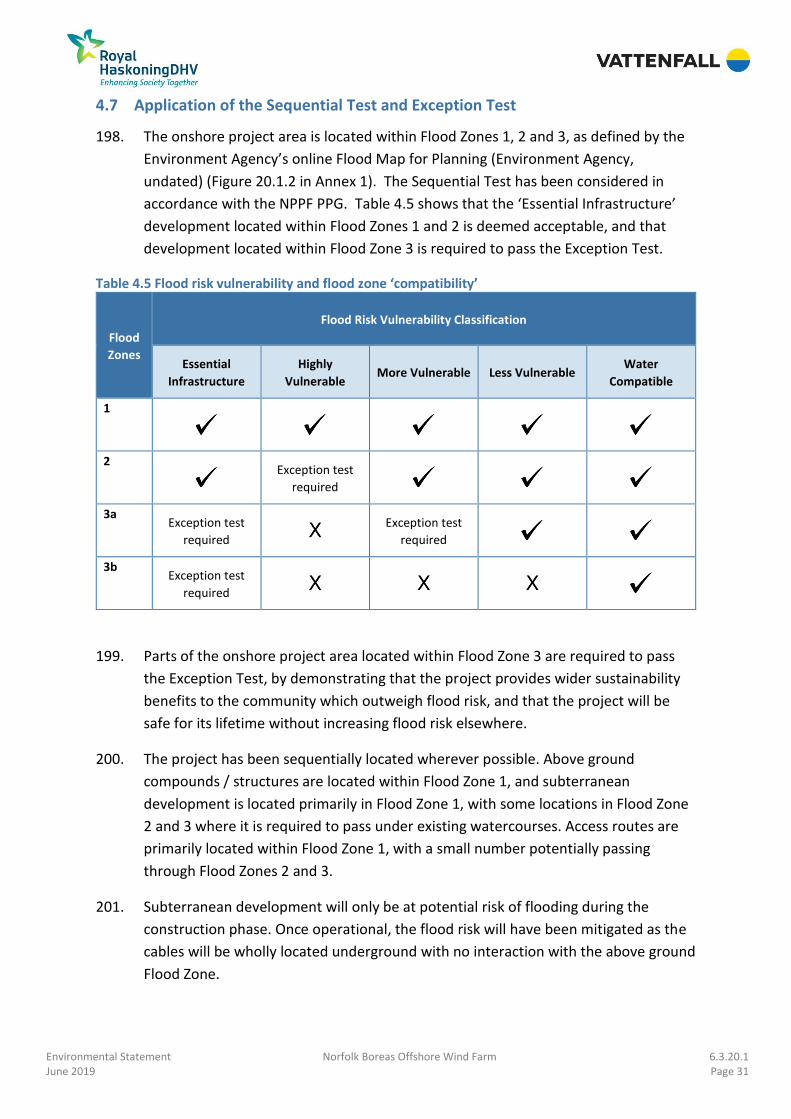
Environmental Statement Norfolk Boreas Offshore Wind Farm 6.3.20.1 June 2019 Page 31
4.7 Application of the Sequential Test and Exception Test
198. The onshore project area is located within Flood Zones 1, 2 and 3, as defined by the
Environment Agency’s online Flood Map for Planning (Environment Agency,
undated) (Figure 20.1.2 in Annex 1). The Sequential Test has been considered in
accordance with the NPPF PPG. Table 4.5 shows that the ‘Essential Infrastructure’
development located within Flood Zones 1 and 2 is deemed acceptable, and that
development located within Flood Zone 3 is required to pass the Exception Test.
Table 4.5 Flood risk vulnerability and flood zone ‘compatibility’
Flood
Zones
Flood Risk Vulnerability Classification
Essential
Infrastructure
Highly
Vulnerable More Vulnerable Less Vulnerable
Water
Compatible
1
2
Exception test
required
3a Exception test
required
Exception test
required
3b Exception test
required
199. Parts of the onshore project area located within Flood Zone 3 are required to pass
the Exception Test, by demonstrating that the project provides wider sustainability
benefits to the community which outweigh flood risk, and that the project will be
safe for its lifetime without increasing flood risk elsewhere.
200. The project has been sequentially located wherever possible. Above ground
compounds / structures are located within Flood Zone 1, and subterranean
development is located primarily in Flood Zone 1, with some locations in Flood Zone
2 and 3 where it is required to pass under existing watercourses. Access routes are
primarily located within Flood Zone 1, with a small number potentially passing
through Flood Zones 2 and 3.
201. Subterranean development will only be at potential risk of flooding during the
construction phase. Once operational, the flood risk will have been mitigated as the
cables will be wholly located underground with no interaction with the above ground
Flood Zone.
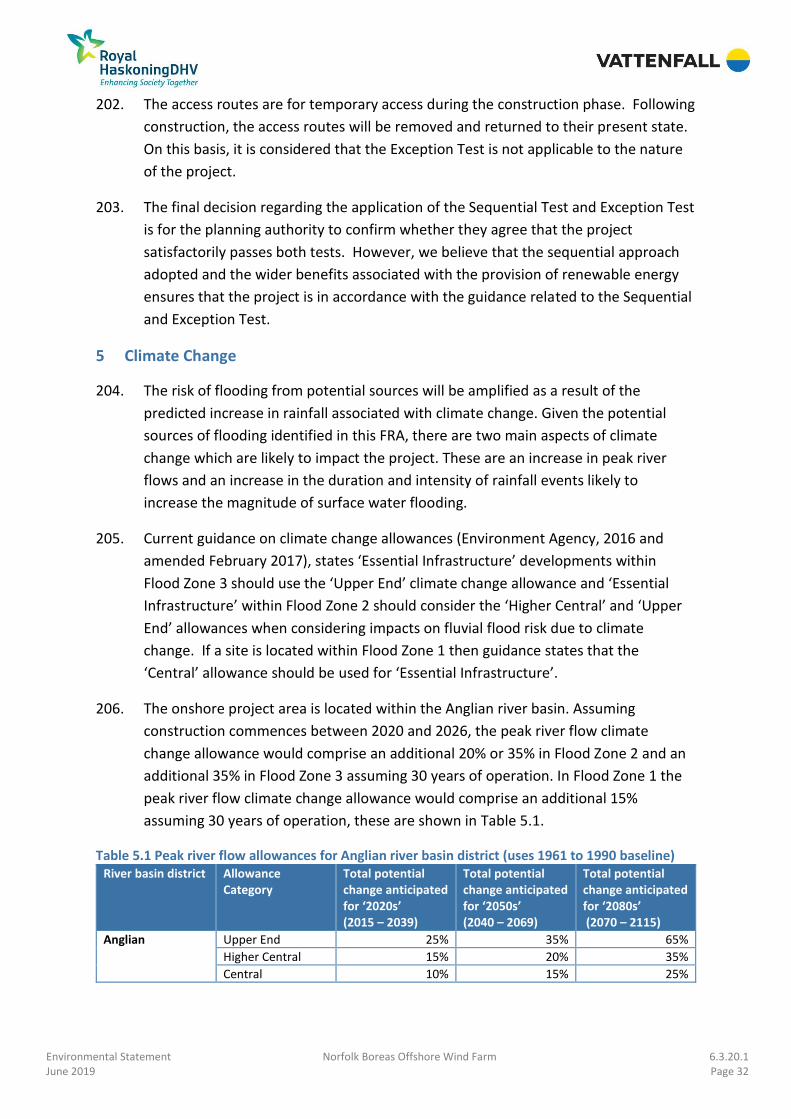
Environmental Statement Norfolk Boreas Offshore Wind Farm 6.3.20.1 June 2019 Page 32
202. The access routes are for temporary access during the construction phase. Following
construction, the access routes will be removed and returned to their present state.
On this basis, it is considered that the Exception Test is not applicable to the nature
of the project.
203. The final decision regarding the application of the Sequential Test and Exception Test
is for the planning authority to confirm whether they agree that the project
satisfactorily passes both tests. However, we believe that the sequential approach
adopted and the wider benefits associated with the provision of renewable energy
ensures that the project is in accordance with the guidance related to the Sequential
and Exception Test.
5 Climate Change
204. The risk of flooding from potential sources will be amplified as a result of the
predicted increase in rainfall associated with climate change. Given the potential
sources of flooding identified in this FRA, there are two main aspects of climate
change which are likely to impact the project. These are an increase in peak river
flows and an increase in the duration and intensity of rainfall events likely to
increase the magnitude of surface water flooding.
205. Current guidance on climate change allowances (Environment Agency, 2016 and
amended February 2017), states ‘Essential Infrastructure’ developments within
Flood Zone 3 should use the ‘Upper End’ climate change allowance and ‘Essential
Infrastructure’ within Flood Zone 2 should consider the ‘Higher Central’ and ‘Upper
End’ allowances when considering impacts on fluvial flood risk due to climate
change. If a site is located within Flood Zone 1 then guidance states that the
‘Central’ allowance should be used for ‘Essential Infrastructure’.
206. The onshore project area is located within the Anglian river basin. Assuming
construction commences between 2020 and 2026, the peak river flow climate
change allowance would comprise an additional 20% or 35% in Flood Zone 2 and an
additional 35% in Flood Zone 3 assuming 30 years of operation. In Flood Zone 1 the
peak river flow climate change allowance would comprise an additional 15%
assuming 30 years of operation, these are shown in Table 5.1.
Table 5.1 Peak river flow allowances for Anglian river basin district (uses 1961 to 1990 baseline) River basin district Allowance
Category Total potential change anticipated for ‘2020s’ (2015 – 2039)
Total potential change anticipated for ‘2050s’ (2040 – 2069)
Total potential change anticipated for ‘2080s’ (2070 – 2115)
Anglian Upper End 25% 35% 65%
Higher Central 15% 20% 35%
Central 10% 15% 25%
Environmental Statement Norfolk Boreas Offshore Wind Farm 6.3.20.1 June 2019 Page 33
207. The above climate change allowance related to peak river flow and fluvial flooding is
only likely to be relevant to the National Grid substation extension and the onshore
project substation as all other elements of the project will be below ground once
constructed. As the National Grid substation extension and the project substation
are located within Flood Zone 1 it is recommended that a climate change allowance
equivalent to a 15% increase in peak river flows be considered.
208. When considering surface water flood risk, the guidance also predicts an increase in
peak rainfall intensity of up to 20% assuming 30 years of operation with construction
commencing between 2020 and 2026. Design of surface water management
measures and the drainage system for above ground structures will include the
above allowance as a minimum, to take into account the potential increase in
surface water flood risk resulting from climate change.
6 Surface Water Drainage
6.1 Pre-Construction Work
209. Prior to commencement of the construction works, a number of surveys and studies
will be undertaken to inform the development of the final design including ecological
surveys, geotechnical investigations and drainage assessments.
210. Surface water drainage requirements for the onshore project substation will be
detailed in an Operational Drainage Plan (ODP) (DCO Requirement 32), an outline
ODP (document reference 8.22) has been produced and submitted as part of the
DCO application. The drainage strategy will be designed to meet the requirements of
the NPPF, NPS EN-1,NPS EN-5 and the CIRA SuDs Manual C753 (CIRA, 2015) with
runoff limited where feasible, through the use of infiltration techniques which can be
accommodated within the area of the development.
211. The drainage strategy will be developed according to the principles of the SuDS
discharge hierarchy. Generally, the aim will be to discharge surface water runoff as
high up the following hierarchy of drainage options as reasonably practicable:
i) into the ground (infiltration);
ii) to a surface water body;
iii) to a surface water sewer, highway drain or another drainage system; or
iv) to a combined sewer.
212. It is proposed that surface water drainage will be discharged via infiltration or to an
adjacent surface water body (including an attenuation pond at the onshore project
substation) and therefore there will be no requirement to connect to the surface
water sewer network.
Environmental Statement Norfolk Boreas Offshore Wind Farm 6.3.20.1 June 2019 Page 34
213. The ODP will assess the current and proposed runoff rates, volume of storage
required and the proposed approach for discharge of water from the site. It will also
contain maintenance and management plans detailing who will be responsible for
the ongoing maintenance of the surface water drainage features for the lifetime of
the development. This will be applicable to proposed works under both Scenario 1
and Scenario 2.Temporary Works.
214. A pre-construction SWDP as part of the CoCP will be developed, agreed with
regulators and implemented to minimise water within the working areas, ensure
ongoing drainage of surrounding land and that there is no increase in surface water
flood risk.
215. Aspects of the temporary works relating to the construction of the onshore cable
route are primarily applicable to Scenario 2 where Norfolk Vanguard does not
proceed and all construction works are undertaken by Norfolk Boreas. However,
under Scenario 1, temporary construction access will be required both to pull the
cable through the pre-installed ducts as well as to provide access for maintenance
work. Therefore, both maintenance and cable pulling activities are applicable in both
scenarios.
216. A local specialised drainage contractor will undertake surveys, locate drains, create
drawings pre- and post-construction, and ensure appropriate reinstatement. The
pre-construction SWDP will include provisions to minimise flood risk within the
working area and ensure ongoing drainage of surrounding land.
6.1.1 Scenario 1 and Scenario 2
217. Access routes comprise existing tracks which will be protected using either stone
running tracks or bog mats, whichever is appropriate. As such it is anticipated that
there will be no change to drainage from these elements.
218. The onshore cable route is required to cross a number of watercourses (Figure
20.1.4 in Annex 1) and a variety of construction methods have been proposed, linked
to the significance / sensitivity of the watercourse.
219. Trenchless crossings are to be used at key watercourse crossing locations as detailed
in sections 20.7.1 and 20.7.4.1 of Chapter 20 Water Resources and Flood Risk. In
these locations, there will be no impact on flood risk as all proposed elements are
below ground.
220. At other crossing locations, it is proposed that open cut techniques are utilised to
cross the watercourse. In these locations, it will be necessary to ensure that flow
along the watercourse is maintained and there is no increase in flood risk as a result
of the temporary works. The methodology to be used for any temporary

Environmental Statement Norfolk Boreas Offshore Wind Farm 6.3.20.1 June 2019 Page 35
construction at crossing points over existing ditches and watercourses shall be
agreed with the Environment Agency and relevant Local Authority as part of the
Environmental Permitting (Amendment) Regulations 2018 process or as an Ordinary
Watercourse Consent application.
221. During construction works there are a large number of smaller agricultural land
drains and watercourses, along the onshore cable route, that may be only seasonally
wet. There is a risk of surface water flooding from these and / or the flow routes into
them being affected by the onshore cable route. Embedded mitigation measures to
intercept and collect flow will be implemented along the onshore cable route to
ensure there is no increase in flood risk to off-site receptors. This will typically
include the temporary installation of interceptor drainage ditches parallel to the
trenches and soil storage areas to provide interception of surface water runoff and
the use of pumps to remove water from the trenches during duct installation.
222. The sectionalised duct installation method (excavate, lay and reinstate
approximately 150m/week) is designed to minimise water ingress to the trenches.
Any pumps, flumes or channels will be designed to have sufficient capacity to convey
the required range of flows at each location. Depending upon the precise location,
water from the channels will be infiltrated or discharged into the drainage network.
6.1.2 Scenario 2 only
223. Temporary mobilisation areas are likely to be hardstanding comprising permeable
gravel underlain by geotextile or other suitable material to allow safe storage and
movement of vehicles within the area and maintain the current drainage regime.
224. Trenchless crossings are to be a minimum of 2m below the bed of the channel and
are proposed for all Main River crossings.
6.2 Post-Construction
6.2.1 Scenario 1 and Scenario 2
225. Following construction of the onshore cable route there will be no permanent above
ground elements, other than the link boxes (worst case dimensions will be 1.5m x
1.5m) which will have a negligible impact on flood risk. Additionally, it is proposed
that drainage will be reinstated to match the existing baseline condition. As such
there would be no impact on surface water drainage. Temporary works and all
access route surfacing, with the exception of the permanent access for the onshore
project substation, shall be removed and would have no operational use.
226. The backfilling of material, within both construction drainage channels and along the
onshore cable route itself will prevent a conduit from forming and ensure there are
Environmental Statement Norfolk Boreas Offshore Wind Farm 6.3.20.1 June 2019 Page 36
no changes to the local flow rates due to permeability changes. This will be dictated
by the Surface Water and Drainage Strategy as part of the CoCP.
227. Existing land drains along the onshore cable route and at the onshore project
substation will be reinstated following construction, for more details on this see
Chapter 21 Land Use and Agriculture. A local specialised drainage contractor will
undertake surveys, locate drains, create drawings pre-and post-construction, and
ensure appropriate reinstatement. The pre-construction SWDP will include
provisions to minimise water within the working area and ensure ongoing drainage
of surrounding land.
228. The surface water drainage requirements for the National Grid substation extension
and onshore project substation will be dictated by the final Surface Water Drainage
Strategy and will be designed to meet the requirements of the NPPF, NPS EN-1 and
NPS EN-5. Changes in surface water runoff as a result of the increase in
impermeable area from the onshore project substation and National Grid substation
extension will be attenuated and discharged at a controlled rate, as outlined below,
in consultation with the LLFA and Environment Agency.
229. The controlled runoff rate will be equivalent to the greenfield runoff rate. The
resultant storage / attenuation volume provided will be sufficient to ensure that
during the 1 in 100 year event plus an allowance for climate change there will be no
increase in runoff from the site. Depending on the lifetime of the development
(approximately 30 years) this will include an allowance for an increase of up to 20%
to allow for future climate change. Within the outline drainage design a more
conservative allowance of 40% for climate change has been included and therefore
additional storage volume is likely to be available.
230. High level studies and outline calculations have identified the required volume for
the attenuation pond at the onshore project substation to provide sufficient
attenuation prior to discharge at greenfield runoff rates into the closest watercourse
or sewer connection. The full specification for the attenuation pond and Surface
Water Drainage Strategy will be addressed as part of detailed design.
231. Allowance for increased attenuation of surface water drainage (an extension to the
existing pond or a new pond in proximity to the existing pond) at the Necton
National Grid Substation will also be included to accommodate additional
impermeable ground associated with the National Grid substation extension.
232. Additionally, due to the potential presence of a large number of land / agricultural
drains in the vicinity of the onshore project substation, there will be a need to
intercept any water flowing through these and collecting prior to a controlled
Environmental Statement Norfolk Boreas Offshore Wind Farm 6.3.20.1 June 2019 Page 37
discharge to limit the potential displacement or redirection of water, such that there
is no increase in flood risk to off-site receptors.
233. Furthermore, planting has been incorporated into the design for the onshore project
substation to aid in attenuating surface water runoff.
7 Flood Risk Management Measures
234. There is always a potential for there to be a residual flood risk to people and
property due to the failure of systems and defences. Residual risk will remain after
flood management or mitigation measures have been installed. Therefore, the FRA
has considered residual flood risk and measures to manage residual flood risk where
appropriate.
7.1 Design Mitigation
7.1.1 Scenario 2 only
235. The onshore project area is primarily located within Flood Zone 1, at low risk of
flooding from fluvial or tidal sources, and as such the sequential approach has been
used in the location of the above ground structures.
236. The onshore cable would be buried a minimum of 1.5m beneath the bed of any
watercourse along the route (and a minimum of 2m below any trenchless crossing).
Therefore, any flood risk to this element of the project would comprise a residual
risk of groundwater flooding to the underground cable. Cable ducts shall be designed
to be resilient to groundwater ingress to ensure this potential flood risk is mitigated.
237. During construction, the cable route will be bounded by drainage channels (one on
each side) to intercept drainage from within the working corridor. Additional
drainage channels will be installed to intercept water from the cable trench.
238. Where water enters the trenches during installation, this would be pumped via
settling tanks or ponds to remove sediment, before being discharged at a controlled
rate into local ditches or drains via temporary interceptor drains. Depending upon
the precise location, water from the channels will be infiltrated or discharged into
the drainage network.
7.1.2 Scenario 1 and Scenario 2
239. Access routes are primarily to be located where there is an existing track or access
route. The adoption of this additional design measure aims to limit the potential for
an increase in the risk associated with surface water flooding through the use of
permeable surfaces and existing routes.
Environmental Statement Norfolk Boreas Offshore Wind Farm 6.3.20.1 June 2019 Page 38
240. Flood risk from surface water to the onshore project substation and off-site as a
result of the proposed project will be addressed through the development of a
detailed drainage design. Existing land drains will need to be sympathetically
reinstated to deliver improvements to in-channel habitats where appropriate, with
at least the same capacity as the pre-construction channel to prevent impacts on
flood risk.
7.2 Flood Resilient and Resistant Design
7.2.1 Scenario 2 only
241. Where small watercourses, shallower than 1.5m, are to be crossed during duct
installation, temporary damming and diverting of the watercourse is proposed. To
ensure flood risk is not increased during this phase of work the capacity of the water
pipe, or pumping system shall need to be suitable to maintain the original flow
volumes and velocity of each watercourse. Post construction, channels would be
reinstated to pre-construction depths, as far as possible, to ensure flood risk is not
increased elsewhere following development.
242. Where open cut trenching methods are not suitable due to the crossing width,
trenchless crossing techniques (e.g. HDD) are proposed. During boring it is
important that potential flood risks are taken into consideration, with plant and
materials either raised above modelled flood levels or protected with flood barriers
or similar construction.
7.3 Flood Warning and Evacuation Plan
7.3.1 Scenario 1 and Scenario 2
243. A flood warning and evacuation plan is a list of steps to be taken in case of a flood,
although it can also include steps such as taking out the relevant insurance or using
recommended flood mitigation products.
244. Specific flood warning and evacuation plans should be produced, and an operational
flood plan completed for both the onshore project substation and the onshore cable
route, specifically related to construction works at watercourse crossing locations
where personnel or materials may be located, albeit temporarily, within Flood Zones
2 and 3 (Figure 20.1.4 in Annex 1).
245. All personnel using the access routes should be made aware of those access routes
which are located within Flood Zones 2 and 3 and any flood warnings issued for
those areas should result in the relevant access routes being cleared of all project
personnel and, where possible, all project plant / materials.

Environmental Statement Norfolk Boreas Offshore Wind Farm 6.3.20.1 June 2019 Page 39
246. A site specific flood warning and evacuation plan should include practical steps for
protecting the project, be easy to communicate and consider delegated
responsibility, or whether personnel are likely to require additional support during a
flood event.
247. The Environment Agency has produced a ‘Personal Flood Plan’ template
(Environment Agency, 2009c), as well as guidance for ‘Preparing Businesses for
Flooding’ (Environment Agency, 2015). These provide check lists and supporting
guidance for preparing for a flood event. Whilst the project is not of the same scale
as those considered within these documents, it is anticipated that the project will
require a comprehensive Flood Warning and Evacuation Plan including elements of
this guidance which should form the foundation of any flood plan considerations.
The following aspects need to be considered:
• A list of important contacts, including Floodline, utilities companies and
insurance providers;
• A description or map showing locations of service shut-off points;
• Basic strategies for protecting property, including moving assets to safety where
possible, turning off / isolating services and moving to safety; and
• Safe access and egress routes.
248. During construction, contractors and management should liaise with the LLFA and
the Environment Agency so they are aware of when heavy rainfall is due, and to
issue a flood warning when necessary to allow work to stop, especially in areas in
close proximity to key watercourses. Additional precautions should be put in place
and the site cleared of all personnel in this instance.
7.4 Access and Egress
7.4.1 Scenario 1 and Scenario 2
249. Both the onshore project substation and the National Grid substation extension have
been located within Flood Zone 1 and as such any personnel accessing these
compounds shall be at low risk of flooding from rivers or the sea.
250. The proposed operational access routes to the north of Little London Rd and from
A1067 at Sparham appear to cross Flood Zones 2 and 3; however, the access routes
are for a temporary and transient use and therefore users would not be anticipated
to use these during times of potential flooding. All other access routes are located in
Flood Zone 1.
251. A small number of access routes cross areas with a surface water flood risk.
252. The surrounding area primarily comprises Flood Zone 1 and therefore access can be
maintained to the wider area for the efficient access and egress of personnel.
Environmental Statement Norfolk Boreas Offshore Wind Farm 6.3.20.1 June 2019 Page 40
8 Conclusions
253. Under Scenario 1 Norfolk Vanguard will have installed the cable ducts and associated
works on behalf of Norfolk Boreas. Therefore, the consideration of potential flood
risk under Scenario 1 for Norfolk Boreas is limited to the landfall, temporary joint pits
for cable pulling along the cable route, onshore project substation and extension to
the National Grid substation.
254. Under Scenario 2 Norfolk Boreas would undertake all the works required for the
standalone project. Therefore, the assessment of potential flood risk is associated
with proposed works at the landfall, duct installation and cable pulling along the
onshore cable route, the onshore project substation as well as the National Grid
substation extension and overhead line modifications.
8.1.1 Scenario 1 and Scenario 2
255. The landfall is located within Flood Zone 1, at low risk of flooding from fluvial or tidal
sources. The landfall compound is also located sufficiently inland such that
indicative erosion zones provided within the SMP (related to potential future risk)
show this will not affect the landfall compound and therefore there is a low risk of
flooding from the sea.
256. The onshore project substation is located within Flood Zone 1, at low risk of flooding
from fluvial sources. The onshore project substation is located within areas of very
low and low surface water flood risk (Figure 20.1.3 in Annex 1). An area of high
surface water flood risk, which appears to be linked to the existing agricultural and
land drain network is located to the north of the onshore project substation (Figure
20.1.3 in Annex 1).
257. A pre-construction SWDP as part of the CoCP will be developed, agreed with
regulators and implemented to minimise water within the working areas, ensure
ongoing drainage of surrounding land and that there is no increase in surface water
flood risk. This will assess the current and proposed runoff rates, volume of storage
required and the proposed approach for discharge of water from the site. The
controlled runoff rate will be equivalent to the greenfield runoff rate. The resultant
storage / attenuation volume provided will be sufficient to ensure that during the 1
in 100 year event plus an allowance for climate change there will be no increase in
runoff from the site.
258. Under Scenario 1, construction-stage activities will be limited to pulling of cables
through pre-installed ducts, the construction of joint pits (each with an area of 90m2)
and the reinstatement of limited areas of running track. Although construction
activities for Scenario 1 will be relatively limited and temporary in nature i.e. for the
duration of the cable pulling activities only, compared with those required for
Environmental Statement Norfolk Boreas Offshore Wind Farm 6.3.20.1 June 2019 Page 41
Scenario 2, there is still the potential for them to be affected by flooding. On this
basis, the assessment of flood risk relating to the onshore cable route and associated
project infrastructure has been considered for both Scenario 1 and Scenario 2.
8.1.2 Scenario 2 only
259. The onshore cable route duct installation will pass primarily through Flood Zone 1,
with some locations in Flood Zone 2 and 3. Whilst undertaking watercourse
crossings the construction areas may be at risk of flooding, as well as posing a
potential risk of increased flooding elsewhere. Therefore, the design related to
temporary crossing has been developed to limit this risk. Once operational there will
be no flood risk posed to the onshore cable route from fluvial, tidal, surface or sewer
flooding. A residual risk of flooding from groundwater shall be mitigated through the
use of suitable waterproofing of the cable duct.
260. Mobilisation areas for use during construction are located within Flood Zone 1, with
good transport links away from areas of increased fluvial or tidal flood risk.
261. Mitigation of the existing flood risk at key crossing points during the construction
phase of the project will be managed. Any construction work located within Flood
Zone 2 or 3, or within proximity to a watercourse will undertake suitable risk
assessments, including the formation of site specific evacuation routes into areas of
low flood risk and the location of plant above modelled flood levels. Any temporary
plant which can be removed from a site at flood risk during construction, should
there be a heavy rainfall event forecast, will be relocated to Flood Zone 1 and
outside of an area with a potential surface water flood risk (Figure 20.1.3 in Annex
1).
262. During the construction works any temporary damming and re-routing of
watercourses along the onshore cable route will be designed such that the original
flow volumes and rates are maintained to ensure flood risk is not increased.
263. Post-construction, watercourses will be reinstated to pre-construction depths
wherever possible to ensure flood risk is not affected.
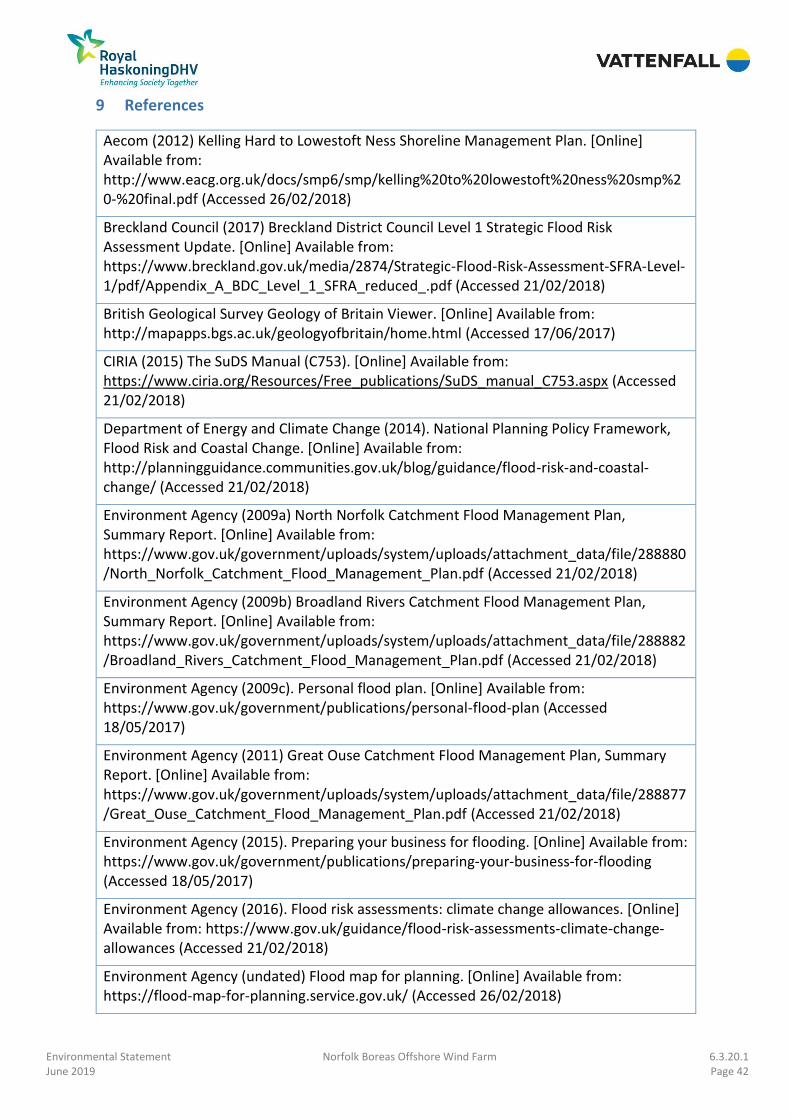
Environmental Statement Norfolk Boreas Offshore Wind Farm 6.3.20.1 June 2019 Page 42
9 References
Aecom (2012) Kelling Hard to Lowestoft Ness Shoreline Management Plan. [Online] Available from: http://www.eacg.org.uk/docs/smp6/smp/kelling%20to%20lowestoft%20ness%20smp%20-%20final.pdf (Accessed 26/02/2018)
Breckland Council (2017) Breckland District Council Level 1 Strategic Flood Risk Assessment Update. [Online] Available from: https://www.breckland.gov.uk/media/2874/Strategic-Flood-Risk-Assessment-SFRA-Level-1/pdf/Appendix_A_BDC_Level_1_SFRA_reduced_.pdf (Accessed 21/02/2018)
British Geological Survey Geology of Britain Viewer. [Online] Available from: http://mapapps.bgs.ac.uk/geologyofbritain/home.html (Accessed 17/06/2017)
CIRIA (2015) The SuDS Manual (C753). [Online] Available from: https://www.ciria.org/Resources/Free_publications/SuDS_manual_C753.aspx (Accessed 21/02/2018)
Department of Energy and Climate Change (2014). National Planning Policy Framework, Flood Risk and Coastal Change. [Online] Available from: http://planningguidance.communities.gov.uk/blog/guidance/flood-risk-and-coastal-change/ (Accessed 21/02/2018)
Environment Agency (2009a) North Norfolk Catchment Flood Management Plan, Summary Report. [Online] Available from: https://www.gov.uk/government/uploads/system/uploads/attachment_data/file/288880/North_Norfolk_Catchment_Flood_Management_Plan.pdf (Accessed 21/02/2018)
Environment Agency (2009b) Broadland Rivers Catchment Flood Management Plan, Summary Report. [Online] Available from: https://www.gov.uk/government/uploads/system/uploads/attachment_data/file/288882/Broadland_Rivers_Catchment_Flood_Management_Plan.pdf (Accessed 21/02/2018)
Environment Agency (2009c). Personal flood plan. [Online] Available from: https://www.gov.uk/government/publications/personal-flood-plan (Accessed 18/05/2017)
Environment Agency (2011) Great Ouse Catchment Flood Management Plan, Summary Report. [Online] Available from: https://www.gov.uk/government/uploads/system/uploads/attachment_data/file/288877/Great_Ouse_Catchment_Flood_Management_Plan.pdf (Accessed 21/02/2018)
Environment Agency (2015). Preparing your business for flooding. [Online] Available from: https://www.gov.uk/government/publications/preparing-your-business-for-flooding (Accessed 18/05/2017)
Environment Agency (2016). Flood risk assessments: climate change allowances. [Online] Available from: https://www.gov.uk/guidance/flood-risk-assessments-climate-change-allowances (Accessed 21/02/2018)
Environment Agency (undated) Flood map for planning. [Online] Available from: https://flood-map-for-planning.service.gov.uk/ (Accessed 26/02/2018)
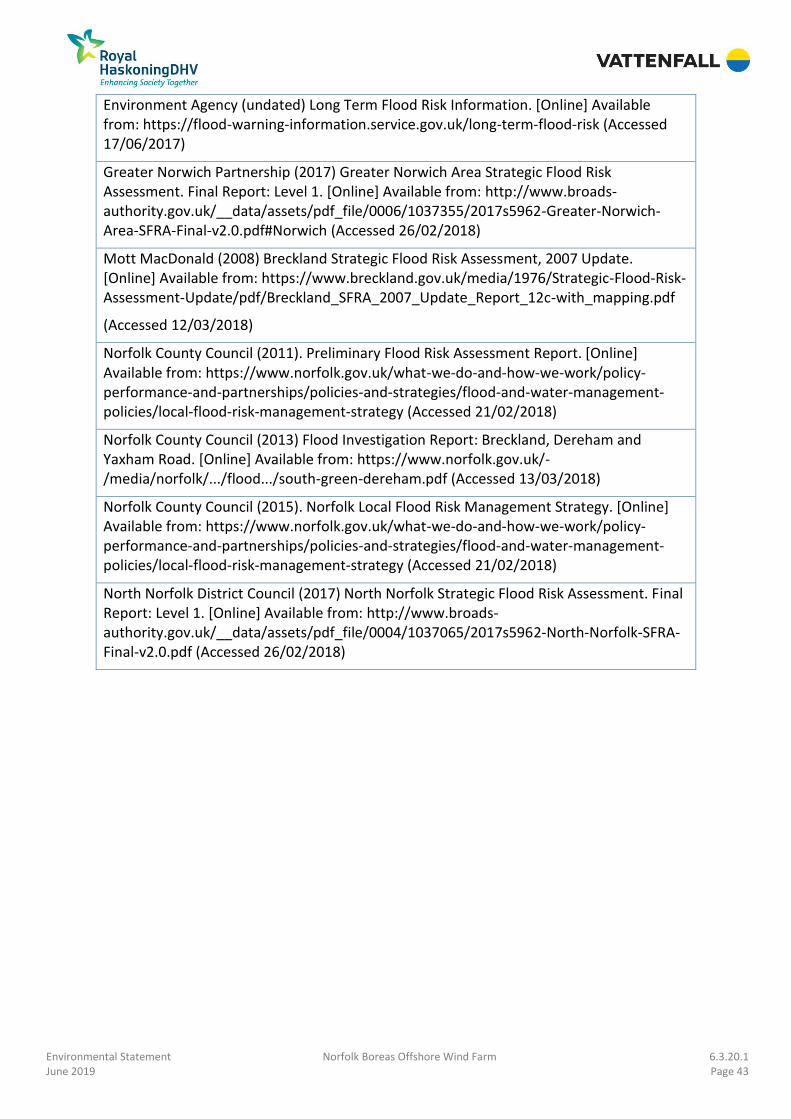
Environmental Statement Norfolk Boreas Offshore Wind Farm 6.3.20.1 June 2019 Page 43
Environment Agency (undated) Long Term Flood Risk Information. [Online] Available from: https://flood-warning-information.service.gov.uk/long-term-flood-risk (Accessed 17/06/2017)
Greater Norwich Partnership (2017) Greater Norwich Area Strategic Flood Risk Assessment. Final Report: Level 1. [Online] Available from: http://www.broads-authority.gov.uk/__data/assets/pdf_file/0006/1037355/2017s5962-Greater-Norwich-Area-SFRA-Final-v2.0.pdf#Norwich (Accessed 26/02/2018)
Mott MacDonald (2008) Breckland Strategic Flood Risk Assessment, 2007 Update. [Online] Available from: https://www.breckland.gov.uk/media/1976/Strategic-Flood-Risk-Assessment-Update/pdf/Breckland_SFRA_2007_Update_Report_12c-with_mapping.pdf
(Accessed 12/03/2018)
Norfolk County Council (2011). Preliminary Flood Risk Assessment Report. [Online] Available from: https://www.norfolk.gov.uk/what-we-do-and-how-we-work/policy-performance-and-partnerships/policies-and-strategies/flood-and-water-management-policies/local-flood-risk-management-strategy (Accessed 21/02/2018)
Norfolk County Council (2013) Flood Investigation Report: Breckland, Dereham and Yaxham Road. [Online] Available from: https://www.norfolk.gov.uk/-/media/norfolk/.../flood.../south-green-dereham.pdf (Accessed 13/03/2018)
Norfolk County Council (2015). Norfolk Local Flood Risk Management Strategy. [Online] Available from: https://www.norfolk.gov.uk/what-we-do-and-how-we-work/policy-performance-and-partnerships/policies-and-strategies/flood-and-water-management-policies/local-flood-risk-management-strategy (Accessed 21/02/2018)
North Norfolk District Council (2017) North Norfolk Strategic Flood Risk Assessment. Final Report: Level 1. [Online] Available from: http://www.broads-authority.gov.uk/__data/assets/pdf_file/0004/1037065/2017s5962-North-Norfolk-SFRA-Final-v2.0.pdf (Accessed 26/02/2018)

Environmental Statement Norfolk Boreas Offshore Wind Farm 6.3.20.1 June 2019 Page 44
10 Annex 1 Figures
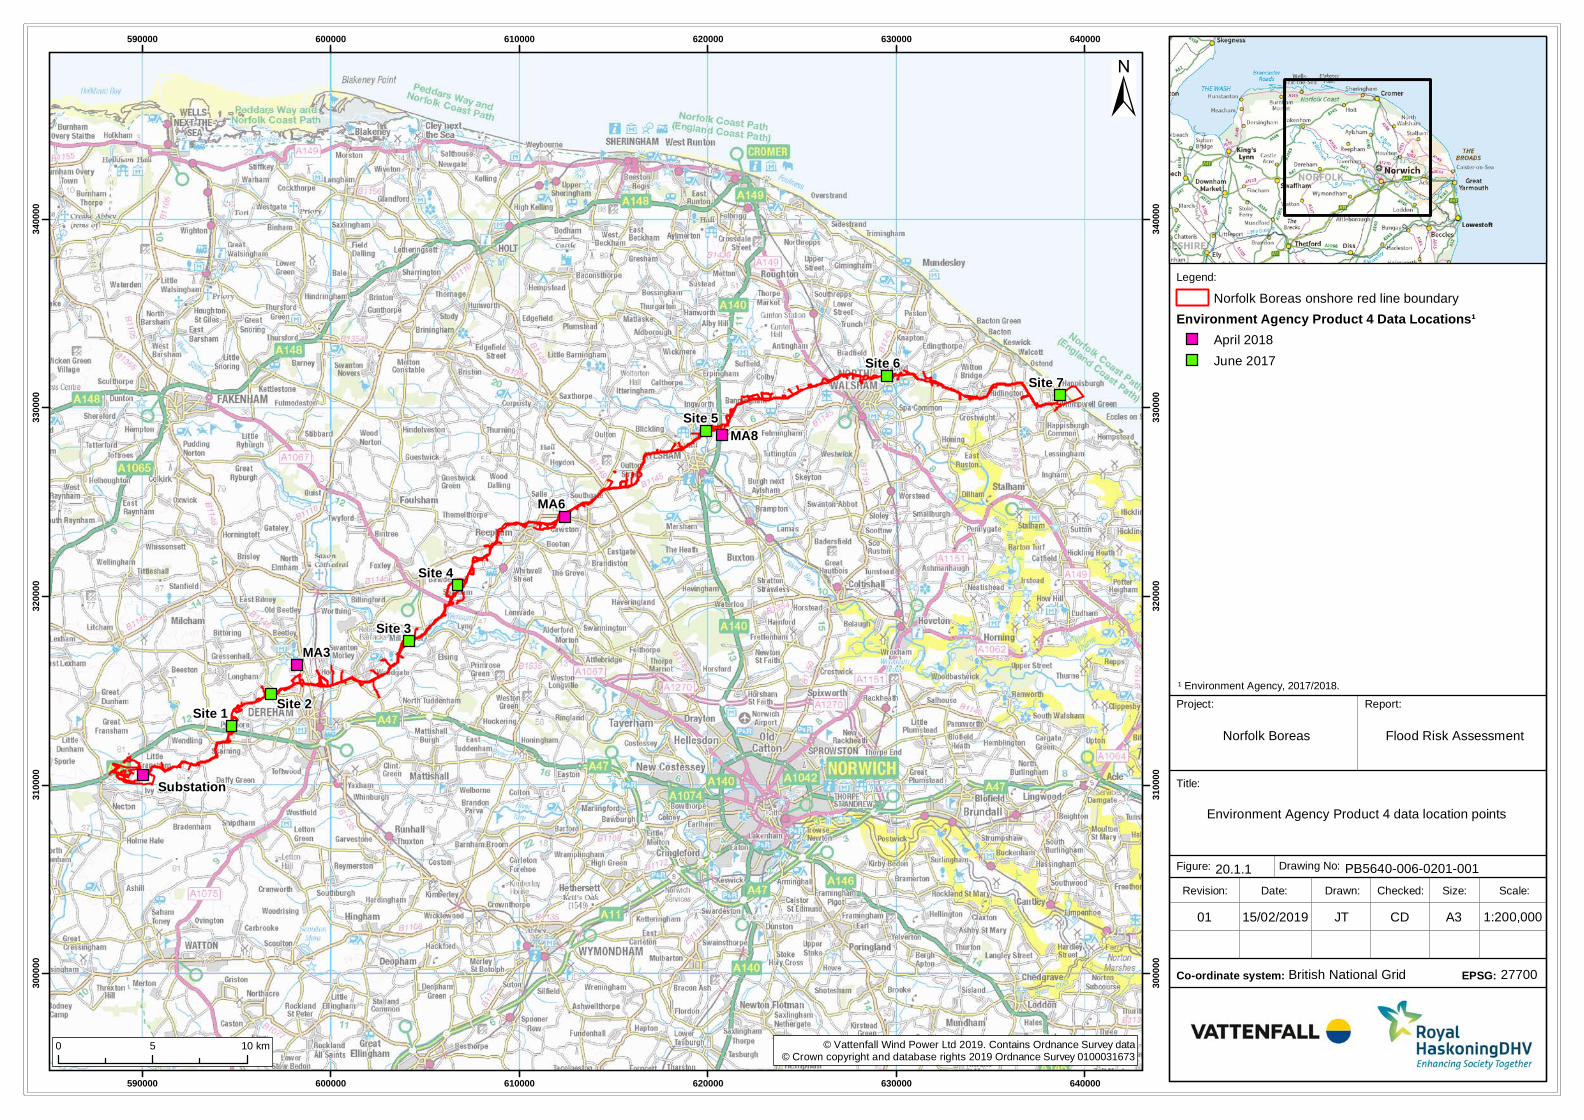
Legend:
Title:
Report:
Norfolk Boreas
Drawn: Scale:Checked:Date:Revision:
Drawing No:
Size:
British National Grid
Figure:
Co-ordinate system:
MA3
MA6
MA8
Site 7Site 6
Site 5
Site 4
Site 3
Site 2Site 1
Substation
590000
590000
600000
600000
610000
610000
620000
620000
630000
630000
640000
640000
3000
00
3000
00
3100
00
3100
00
3200
00
3200
00
3300
00
3300
00
3400
00
3400
00
© Vattenfall Wind Power Ltd 2019. Contains Ordnance Survey data© Crown copyright and database rights 2019 Ordnance Survey 0100031673
±
1:200,00015/02/201901 JT CD A3
0 5 10 km
Environment Agency Product 4 data location points
20.1.1 PB5640-006-0201-001
27700EPSG:
Project:
Flood Risk Assessment
Norfolk Boreas onshore red line boundary
Environment Agency Product 4 Data Locations¹April 2018
June 2017
¹ Environment Agency, 2017/2018.
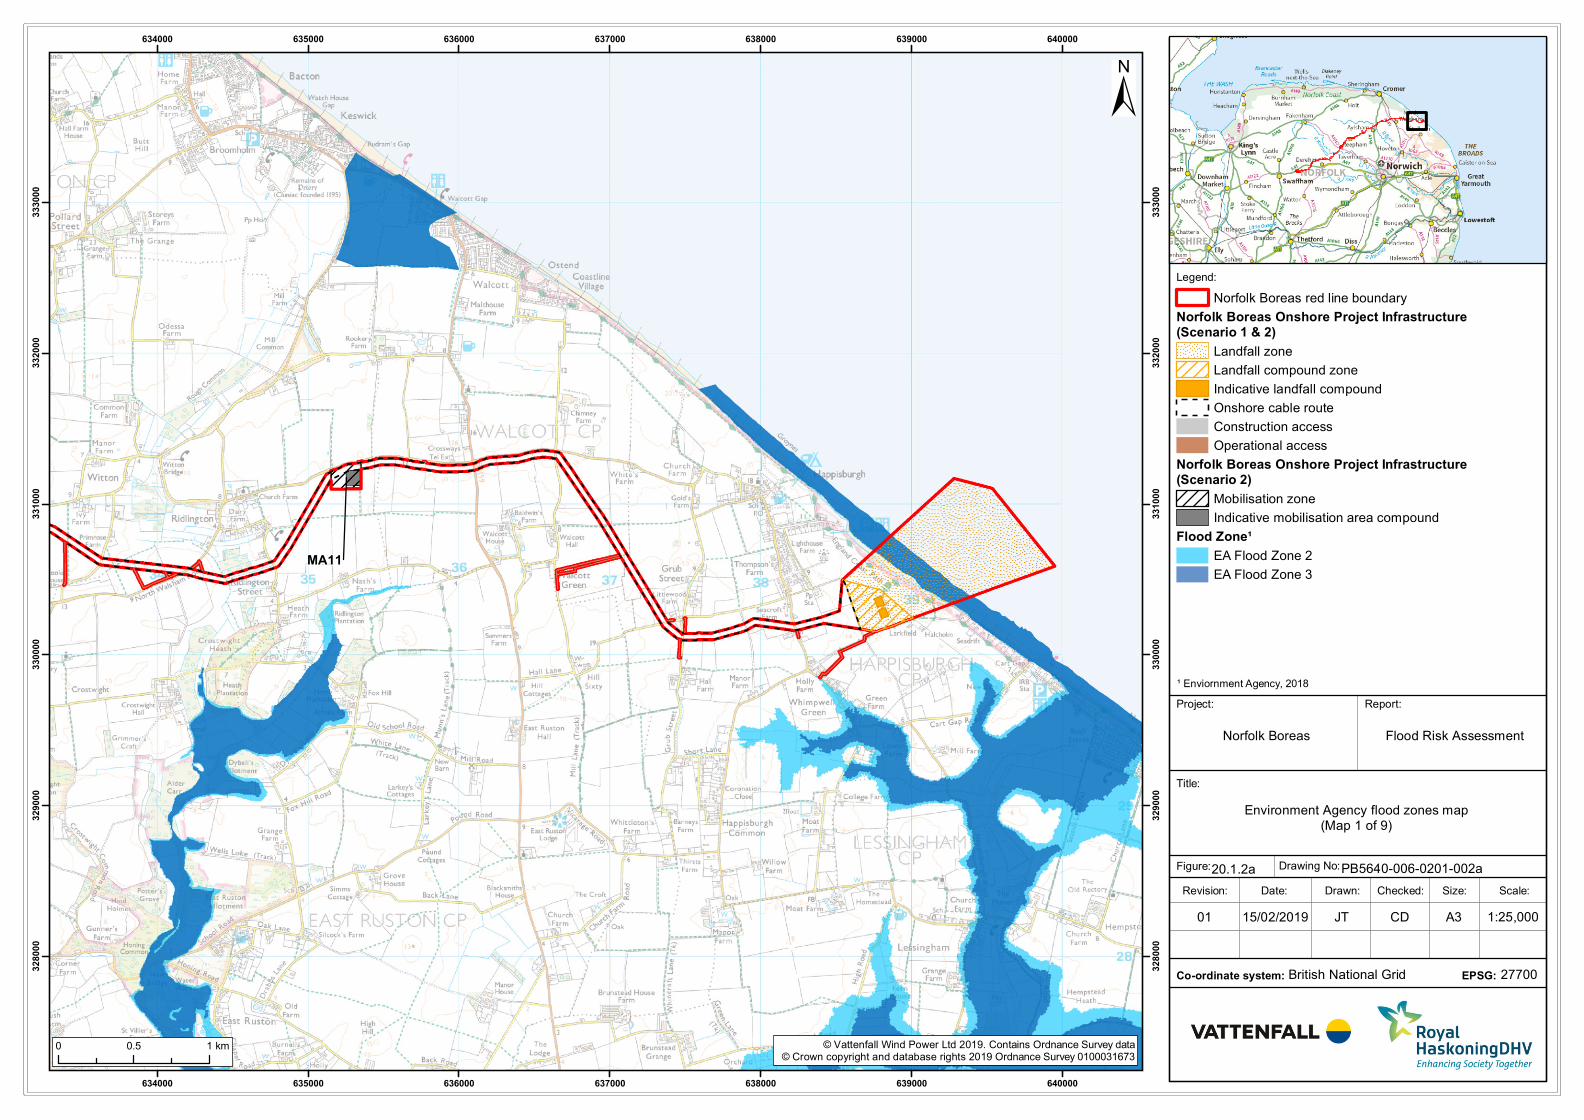
Legend:
Title:
Report:
Norfolk Boreas
Drawn: Scale:Checked:Date:Revision:
Drawing No:
Size:
British National Grid
Figure:
Co-ordinate system:
MA11
634000
634000
635000
635000
636000
636000
637000
637000
638000
638000
639000
639000
640000
640000
328000
328000
329000
329000
330000
330000
331000
331000
332000
332000
333000
333000
© Vattenfall Wind Power Ltd 2019. Contains Ordnance Survey data© Crown copyright and database rights 2019 Ordnance Survey 0100031673
±
1:25,00015/02/201901 JT CD A3
0 0.5 1 km
Environment Agency flood zones map(Map 1 of 9)
20.1.2a PB5640-006-0201-002a
27700EPSG:
Project:
Flood Risk Assessment
Norfolk Boreas red line boundary
Norfolk Boreas Onshore Project Infrastructure(Scenario 1 & 2)
Landfall zone
Landfall compound zone
Indicative landfall compound
Onshore cable route
Construction access
Operational access
Norfolk Boreas Onshore Project Infrastructure(Scenario 2)
Mobilisation zone
Indicative mobilisation area compound
Flood Zone¹
EA Flood Zone 2
EA Flood Zone 3
¹ Enviornment Agency, 2018
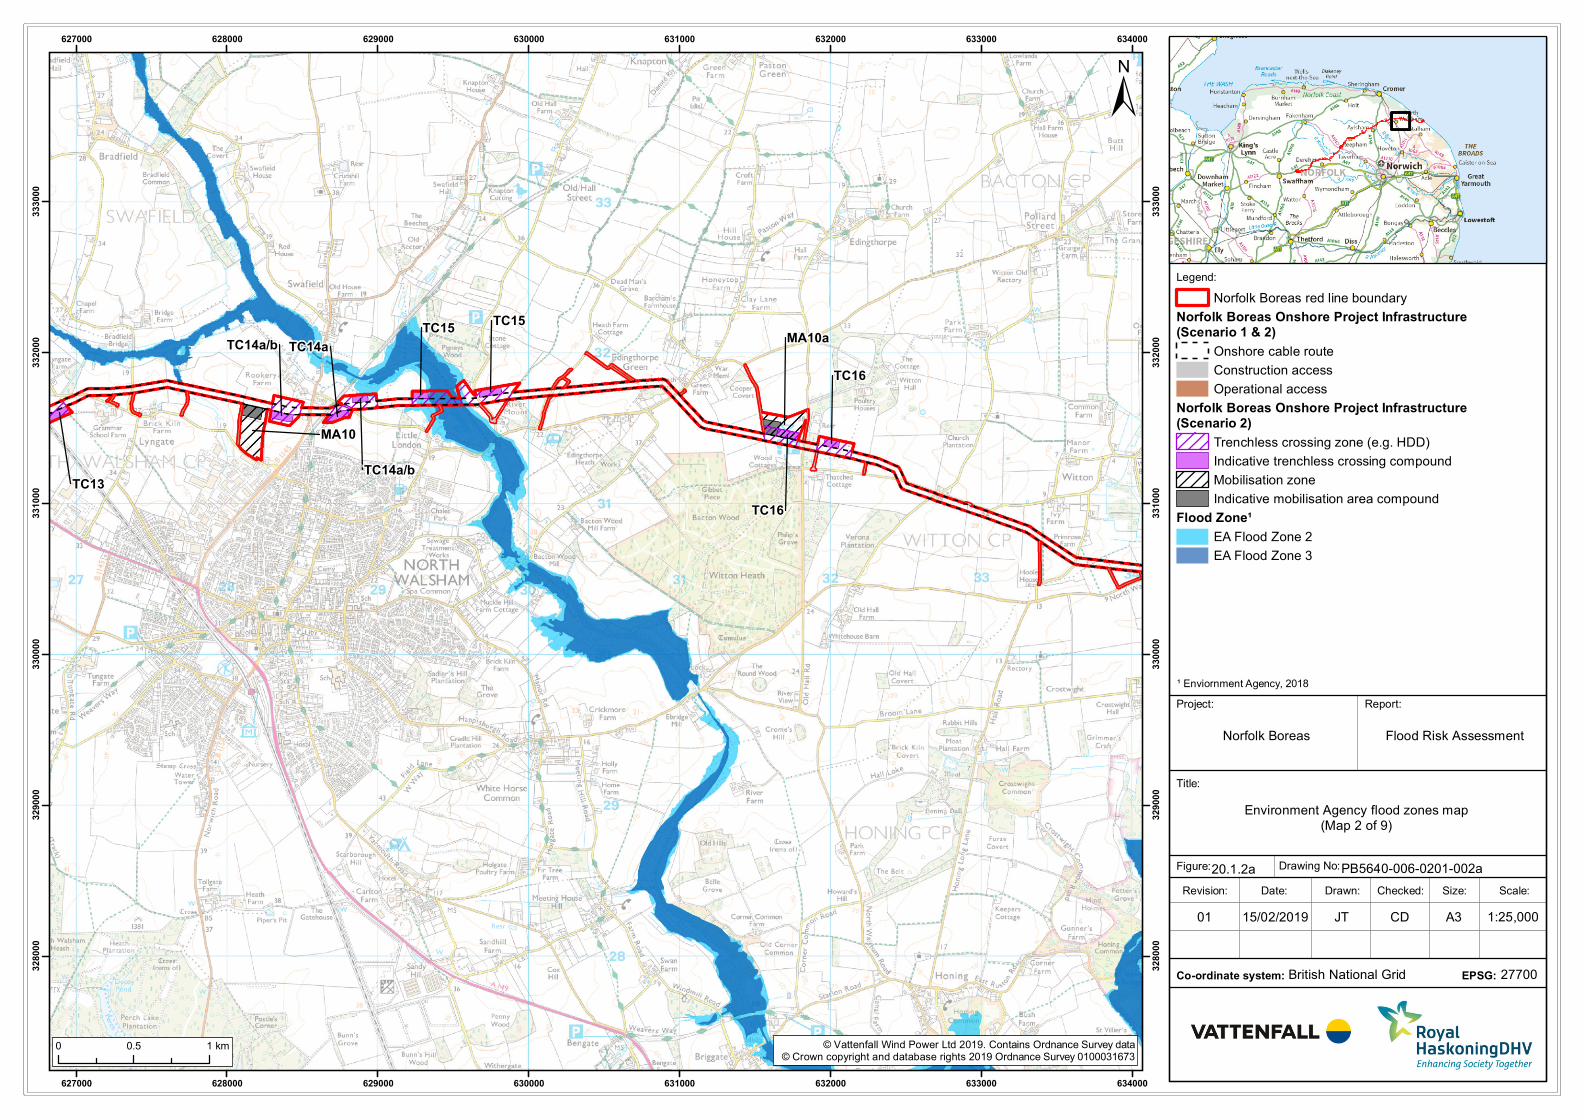
Legend:
Title:
Report:
Norfolk Boreas
Drawn: Scale:Checked:Date:Revision:
Drawing No:
Size:
British National Grid
Figure:
Co-ordinate system:
TC16
TC15
TC13
TC16
TC15
TC14a/b
TC14a/b TC14a
MA10
MA10a
627000
627000
628000
628000
629000
629000
630000
630000
631000
631000
632000
632000
633000
633000
634000
634000
328000
328000
329000
329000
330000
330000
331000
331000
332000
332000
333000
333000
© Vattenfall Wind Power Ltd 2019. Contains Ordnance Survey data© Crown copyright and database rights 2019 Ordnance Survey 0100031673
±
1:25,00015/02/201901 JT CD A3
0 0.5 1 km
Environment Agency flood zones map(Map 2 of 9)
20.1.2a PB5640-006-0201-002a
27700EPSG:
Project:
Flood Risk Assessment
Norfolk Boreas red line boundary
Norfolk Boreas Onshore Project Infrastructure(Scenario 1 & 2)
Onshore cable route
Construction access
Operational access
Norfolk Boreas Onshore Project Infrastructure(Scenario 2)
Trenchless crossing zone (e.g. HDD)
Indicative trenchless crossing compound
Mobilisation zone
Indicative mobilisation area compound
Flood Zone¹
EA Flood Zone 2
EA Flood Zone 3
¹ Enviornment Agency, 2018
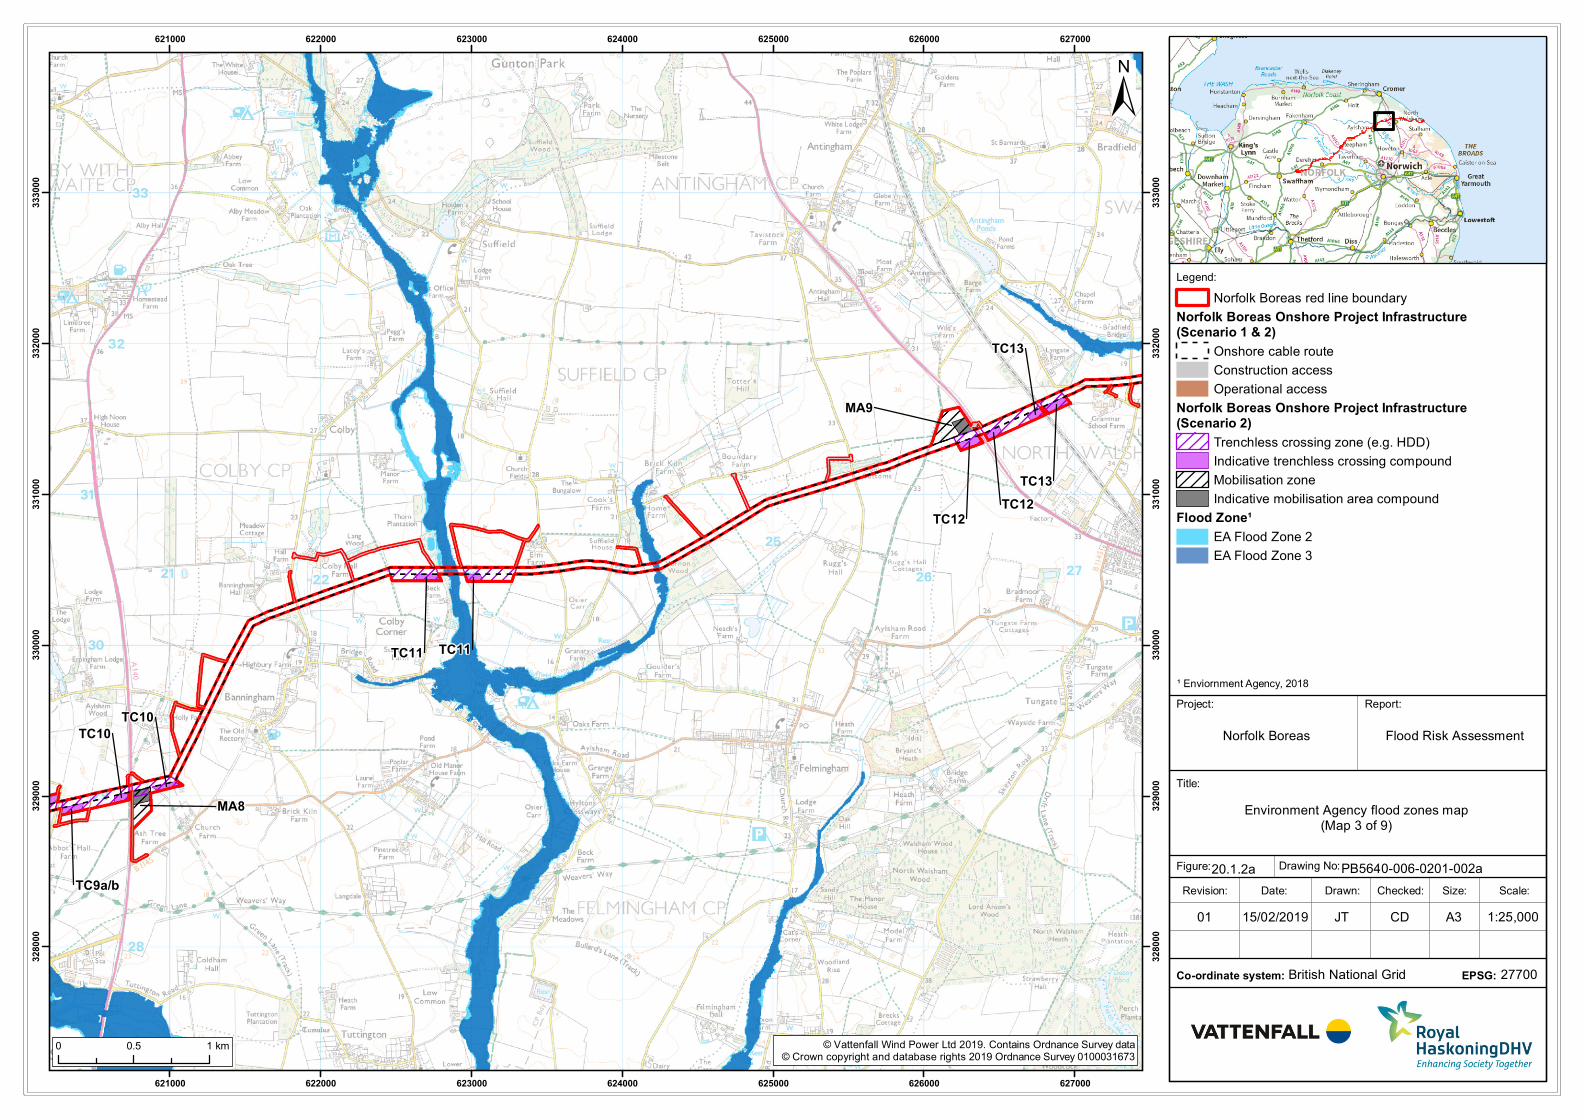
Legend:
Title:
Report:
Norfolk Boreas
Drawn: Scale:Checked:Date:Revision:
Drawing No:
Size:
British National Grid
Figure:
Co-ordinate system:
TC13
TC10
TC10
TC9a/b
TC12
TC13
TC12
TC11TC11
MA8
MA9
621000
621000
622000
622000
623000
623000
624000
624000
625000
625000
626000
626000
627000
627000
328000
328000
329000
329000
330000
330000
331000
331000
332000
332000
333000
333000
© Vattenfall Wind Power Ltd 2019. Contains Ordnance Survey data© Crown copyright and database rights 2019 Ordnance Survey 0100031673
±
1:25,00015/02/201901 JT CD A3
0 0.5 1 km
Environment Agency flood zones map(Map 3 of 9)
20.1.2a PB5640-006-0201-002a
27700EPSG:
Project:
Flood Risk Assessment
Norfolk Boreas red line boundary
Norfolk Boreas Onshore Project Infrastructure(Scenario 1 & 2)
Onshore cable route
Construction access
Operational access
Norfolk Boreas Onshore Project Infrastructure(Scenario 2)
Trenchless crossing zone (e.g. HDD)
Indicative trenchless crossing compound
Mobilisation zone
Indicative mobilisation area compound
Flood Zone¹
EA Flood Zone 2
EA Flood Zone 3
¹ Enviornment Agency, 2018
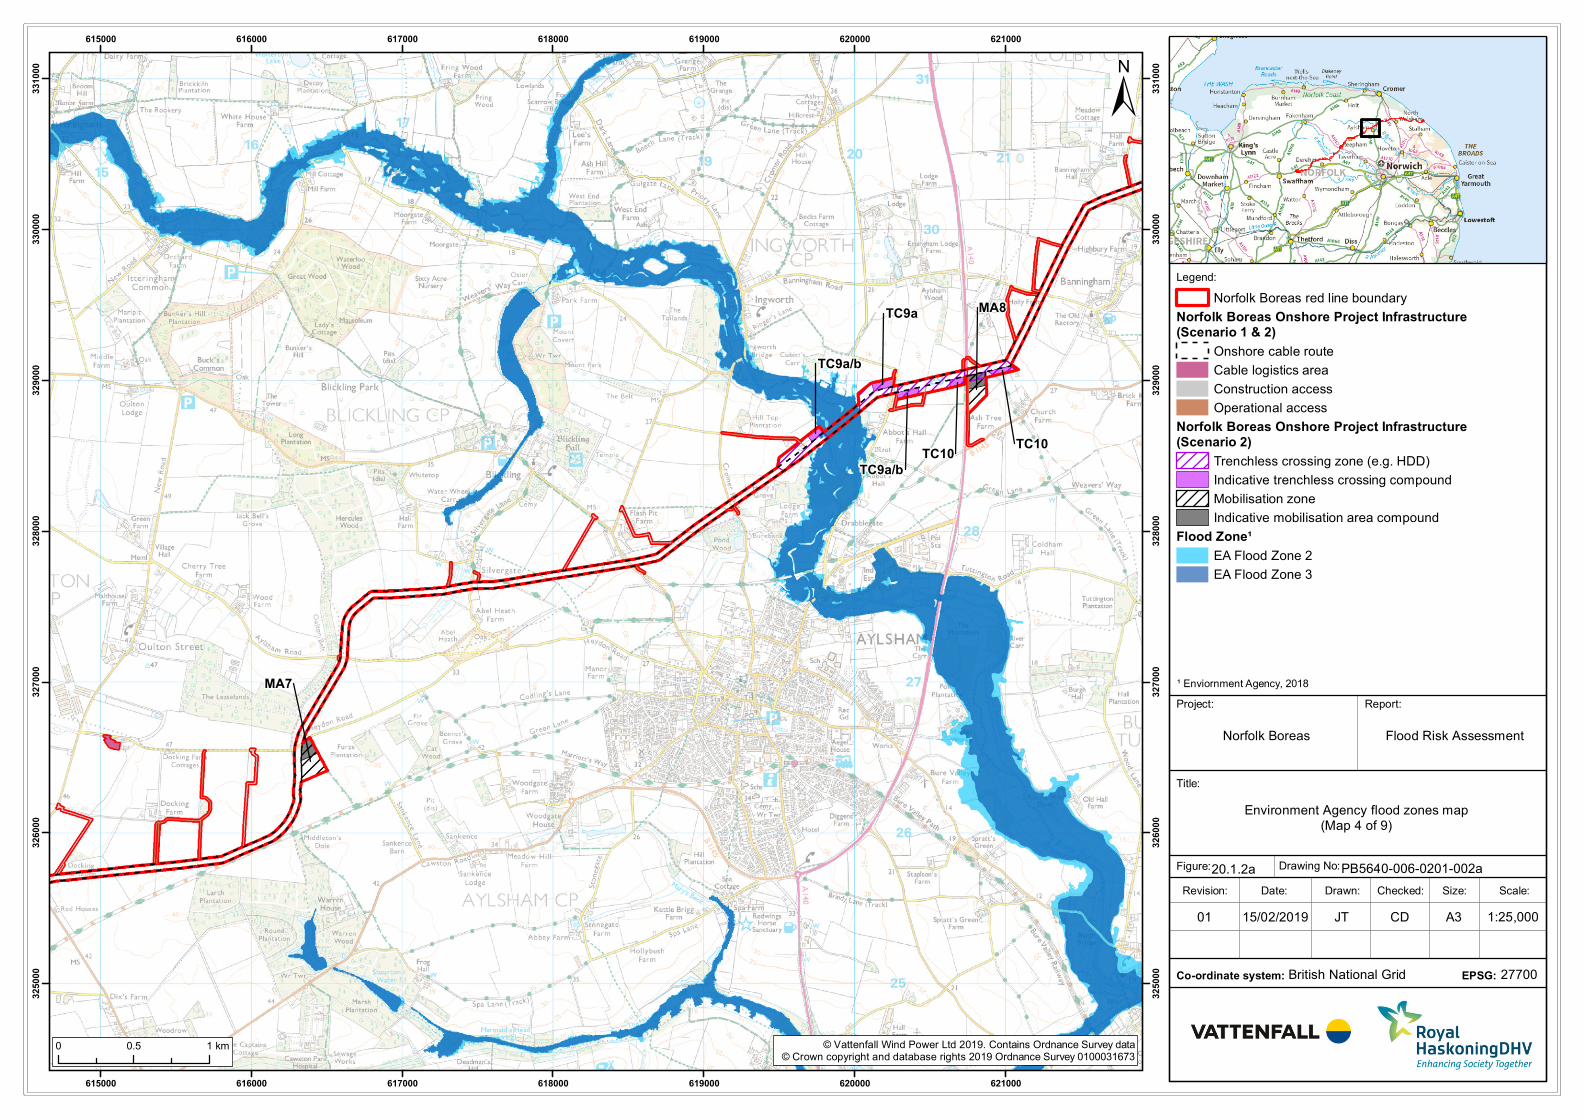
Legend:
Title:
Report:
Norfolk Boreas
Drawn: Scale:Checked:Date:Revision:
Drawing No:
Size:
British National Grid
Figure:
Co-ordinate system:
TC10TC10
TC9a/b
TC9a/b
TC9a MA8
MA7
615000
615000
616000
616000
617000
617000
618000
618000
619000
619000
620000
620000
621000
621000
325000
325000
326000
326000
327000
327000
328000
328000
329000
329000
330000
330000
331000
331000
© Vattenfall Wind Power Ltd 2019. Contains Ordnance Survey data© Crown copyright and database rights 2019 Ordnance Survey 0100031673
±
1:25,00015/02/201901 JT CD A3
0 0.5 1 km
Environment Agency flood zones map(Map 4 of 9)
20.1.2a PB5640-006-0201-002a
27700EPSG:
Project:
Flood Risk Assessment
Norfolk Boreas red line boundary
Norfolk Boreas Onshore Project Infrastructure(Scenario 1 & 2)
Onshore cable route
Cable logistics area
Construction access
Operational access
Norfolk Boreas Onshore Project Infrastructure(Scenario 2)
Trenchless crossing zone (e.g. HDD)
Indicative trenchless crossing compound
Mobilisation zone
Indicative mobilisation area compound
Flood Zone¹
EA Flood Zone 2
EA Flood Zone 3
¹ Enviornment Agency, 2018
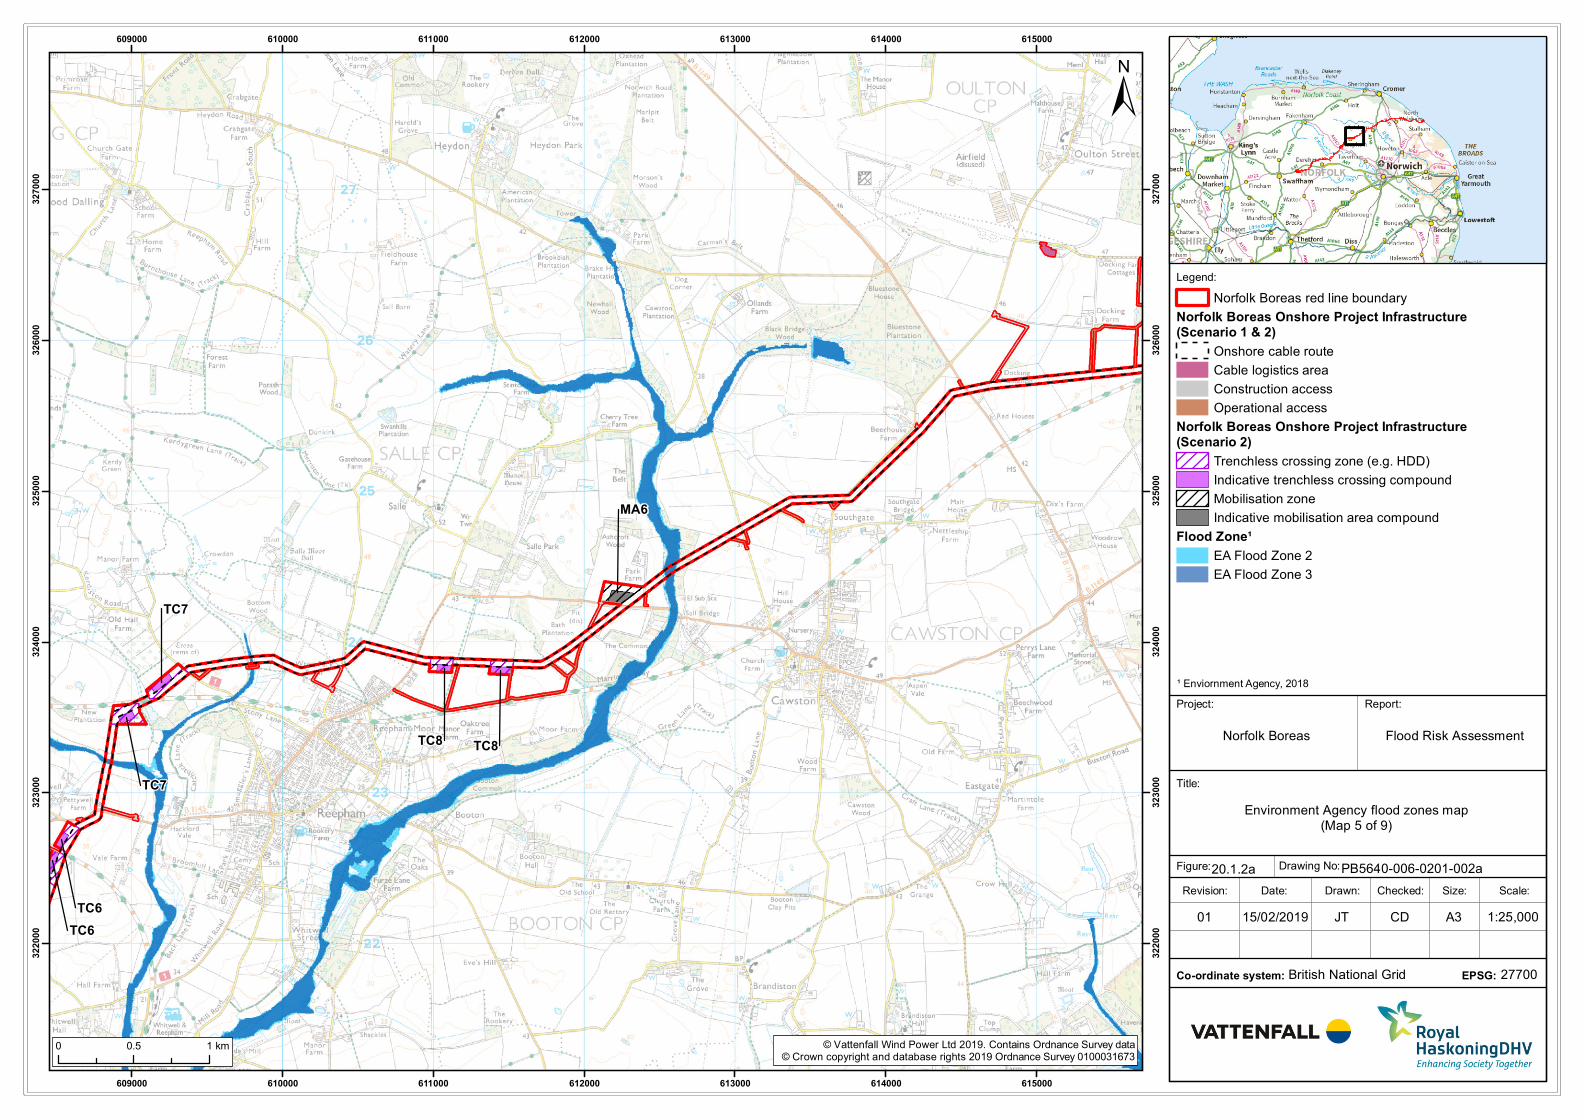
Legend:
Title:
Report:
Norfolk Boreas
Drawn: Scale:Checked:Date:Revision:
Drawing No:
Size:
British National Grid
Figure:
Co-ordinate system:
TC8TC8
TC6
TC6
TC7
TC7
MA6
609000
609000
610000
610000
611000
611000
612000
612000
613000
613000
614000
614000
615000
615000
322000
322000
323000
323000
324000
324000
325000
325000
326000
326000
327000
327000
© Vattenfall Wind Power Ltd 2019. Contains Ordnance Survey data© Crown copyright and database rights 2019 Ordnance Survey 0100031673
±
1:25,00015/02/201901 JT CD A3
0 0.5 1 km
Environment Agency flood zones map(Map 5 of 9)
20.1.2a PB5640-006-0201-002a
27700EPSG:
Project:
Flood Risk Assessment
Norfolk Boreas red line boundary
Norfolk Boreas Onshore Project Infrastructure(Scenario 1 & 2)
Onshore cable route
Cable logistics area
Construction access
Operational access
Norfolk Boreas Onshore Project Infrastructure(Scenario 2)
Trenchless crossing zone (e.g. HDD)
Indicative trenchless crossing compound
Mobilisation zone
Indicative mobilisation area compound
Flood Zone¹
EA Flood Zone 2
EA Flood Zone 3
¹ Enviornment Agency, 2018
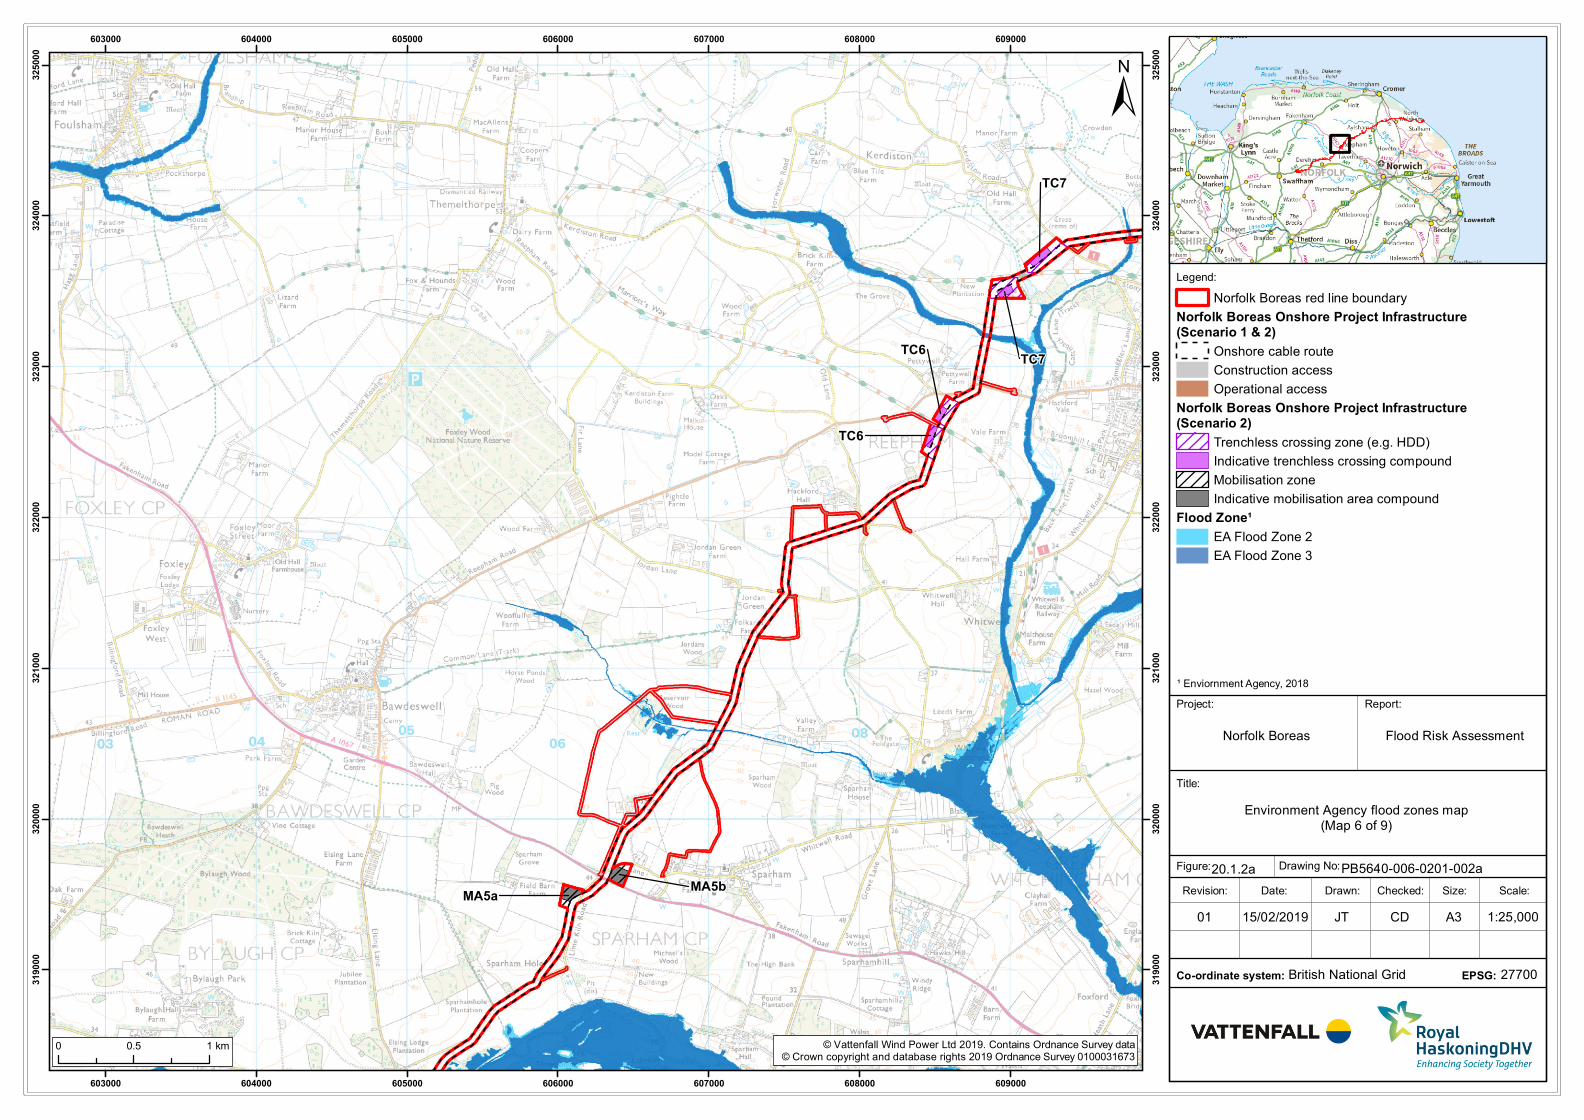
Legend:
Title:
Report:
Norfolk Boreas
Drawn: Scale:Checked:Date:Revision:
Drawing No:
Size:
British National Grid
Figure:
Co-ordinate system:
TC6
TC6
TC7
TC7
MA5bMA5a
603000
603000
604000
604000
605000
605000
606000
606000
607000
607000
608000
608000
609000
609000
319000
319000
320000
320000
321000
321000
322000
322000
323000
323000
324000
324000
325000
325000
© Vattenfall Wind Power Ltd 2019. Contains Ordnance Survey data© Crown copyright and database rights 2019 Ordnance Survey 0100031673
±
1:25,00015/02/201901 JT CD A3
0 0.5 1 km
Environment Agency flood zones map(Map 6 of 9)
20.1.2a PB5640-006-0201-002a
27700EPSG:
Project:
Flood Risk Assessment
Norfolk Boreas red line boundary
Norfolk Boreas Onshore Project Infrastructure(Scenario 1 & 2)
Onshore cable route
Construction access
Operational access
Norfolk Boreas Onshore Project Infrastructure(Scenario 2)
Trenchless crossing zone (e.g. HDD)
Indicative trenchless crossing compound
Mobilisation zone
Indicative mobilisation area compound
Flood Zone¹
EA Flood Zone 2
EA Flood Zone 3
¹ Enviornment Agency, 2018
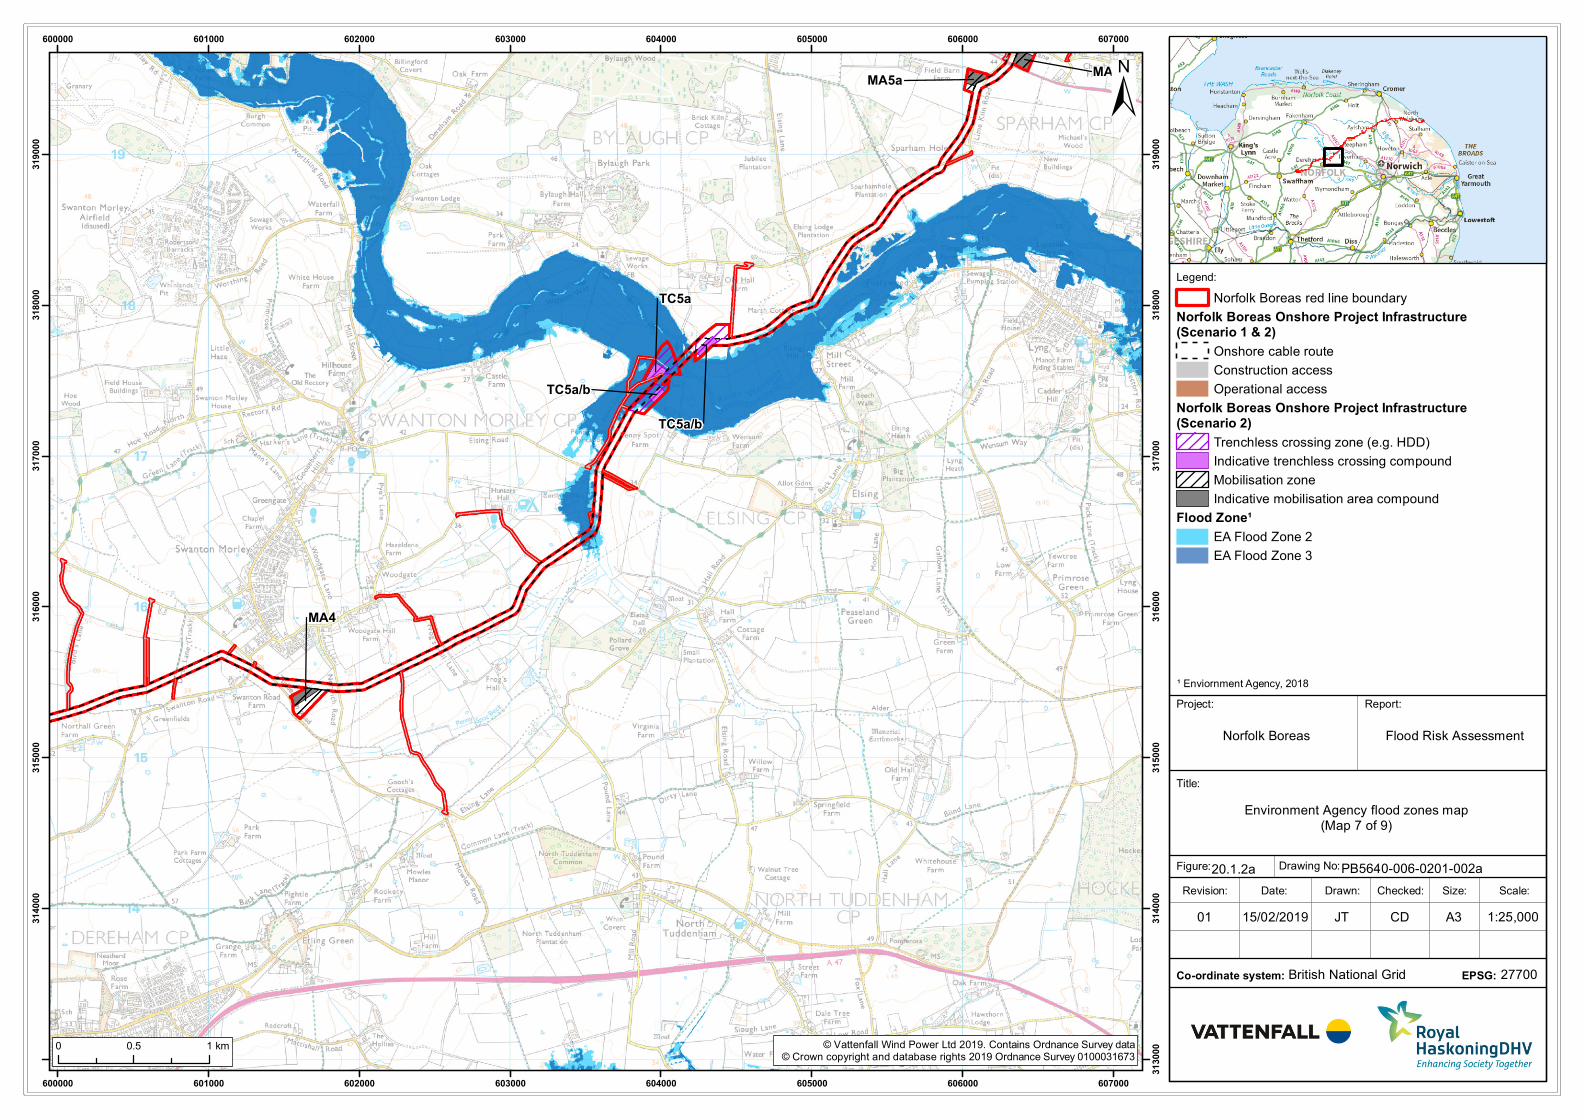
Legend:
Title:
Report:
Norfolk Boreas
Drawn: Scale:Checked:Date:Revision:
Drawing No:
Size:
British National Grid
Figure:
Co-ordinate system:
TC5a/b
TC5a/b
TC5a
MA4
MA5bMA5a
600000
600000
601000
601000
602000
602000
603000
603000
604000
604000
605000
605000
606000
606000
607000
607000
313000
314000
314000
315000
315000
316000
316000
317000
317000
318000
318000
319000
319000
© Vattenfall Wind Power Ltd 2019. Contains Ordnance Survey data© Crown copyright and database rights 2019 Ordnance Survey 0100031673
±
1:25,00015/02/201901 JT CD A3
0 0.5 1 km
Environment Agency flood zones map(Map 7 of 9)
20.1.2a PB5640-006-0201-002a
27700EPSG:
Project:
Flood Risk Assessment
Norfolk Boreas red line boundary
Norfolk Boreas Onshore Project Infrastructure(Scenario 1 & 2)
Onshore cable route
Construction access
Operational access
Norfolk Boreas Onshore Project Infrastructure(Scenario 2)
Trenchless crossing zone (e.g. HDD)
Indicative trenchless crossing compound
Mobilisation zone
Indicative mobilisation area compound
Flood Zone¹
EA Flood Zone 2
EA Flood Zone 3
¹ Enviornment Agency, 2018
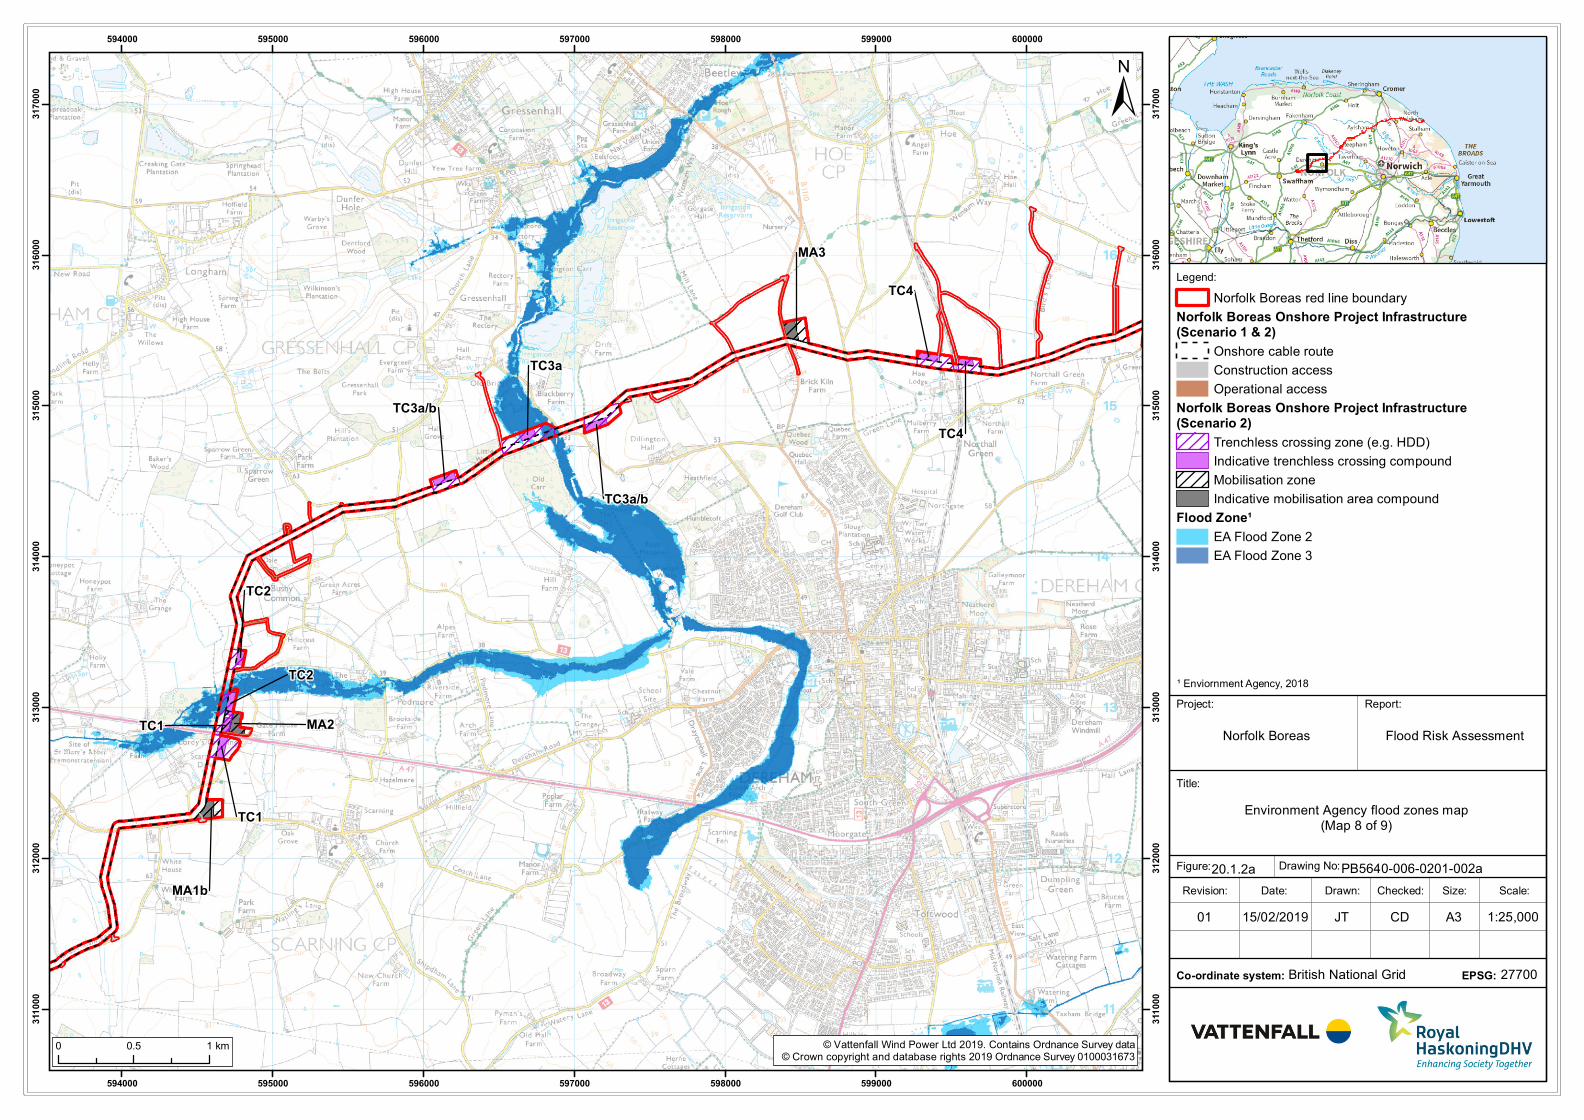
Legend:
Title:
Report:
Norfolk Boreas
Drawn: Scale:Checked:Date:Revision:
Drawing No:
Size:
British National Grid
Figure:
Co-ordinate system:
TC4
TC4
TC3a/b
TC3a
TC3a/b
TC1
TC1
TC2
TC2
MA1b
MA2
MA3
594000
594000
595000
595000
596000
596000
597000
597000
598000
598000
599000
599000
600000
600000
311
000
311
000
312000
312000
313000
313000
314000
314000
315000
315000
316000
316000
317000
317000
© Vattenfall Wind Power Ltd 2019. Contains Ordnance Survey data© Crown copyright and database rights 2019 Ordnance Survey 0100031673
±
1:25,00015/02/201901 JT CD A3
0 0.5 1 km
Environment Agency flood zones map(Map 8 of 9)
20.1.2a PB5640-006-0201-002a
27700EPSG:
Project:
Flood Risk Assessment
Norfolk Boreas red line boundary
Norfolk Boreas Onshore Project Infrastructure(Scenario 1 & 2)
Onshore cable route
Construction access
Operational access
Norfolk Boreas Onshore Project Infrastructure(Scenario 2)
Trenchless crossing zone (e.g. HDD)
Indicative trenchless crossing compound
Mobilisation zone
Indicative mobilisation area compound
Flood Zone¹
EA Flood Zone 2
EA Flood Zone 3
¹ Enviornment Agency, 2018
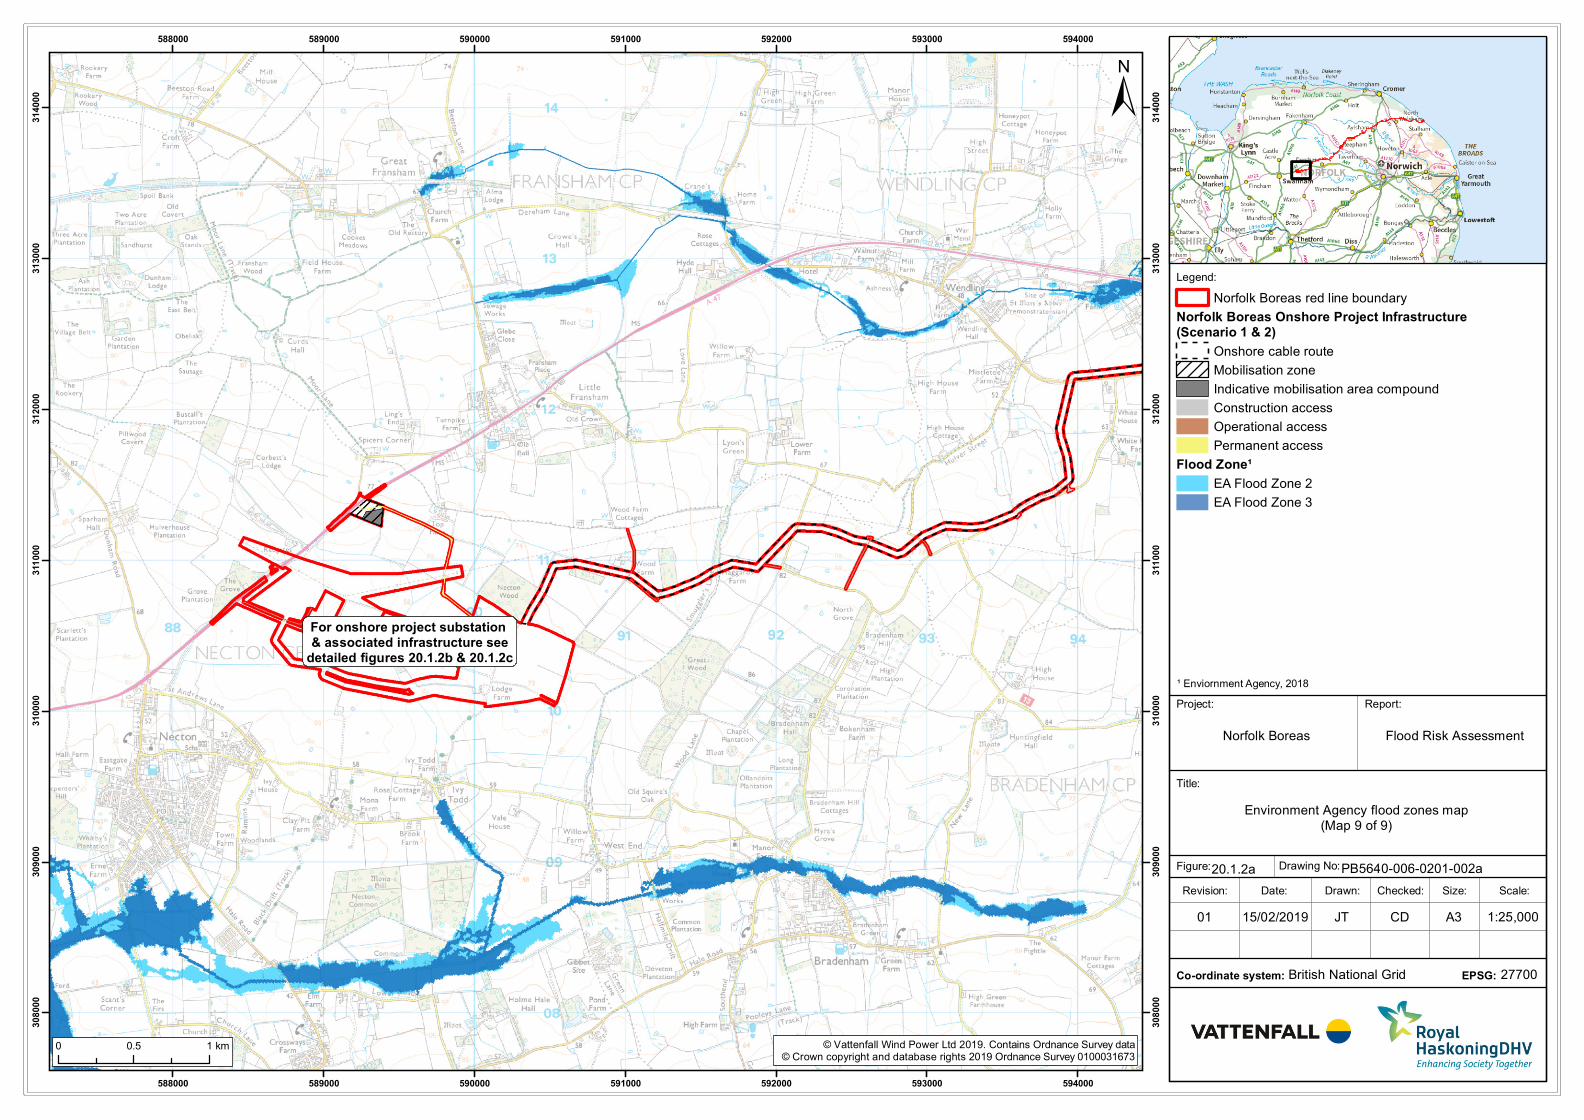
Legend:
Title:
Report:
Norfolk Boreas
Drawn: Scale:Checked:Date:Revision:
Drawing No:
Size:
British National Grid
Figure:
Co-ordinate system:
For onshore project substation & associated infrastructure see
detailed figures 20.1.2b & 20.1.2c
588000
588000
589000
589000
590000
590000
591000
591000
592000
592000
593000
593000
594000
594000
308000
308000
309000
309000
310000
310000
311
000
311
000
312000
312000
313000
313000
314000
314000
© Vattenfall Wind Power Ltd 2019. Contains Ordnance Survey data© Crown copyright and database rights 2019 Ordnance Survey 0100031673
±
1:25,00015/02/201901 JT CD A3
0 0.5 1 km
Environment Agency flood zones map(Map 9 of 9)
20.1.2a PB5640-006-0201-002a
27700EPSG:
Project:
Flood Risk Assessment
Norfolk Boreas red line boundary
Norfolk Boreas Onshore Project Infrastructure(Scenario 1 & 2)
Onshore cable route
Mobilisation zone
Indicative mobilisation area compound
Construction access
Operational access
Permanent access
Flood Zone¹
EA Flood Zone 2
EA Flood Zone 3
¹ Enviornment Agency, 2018
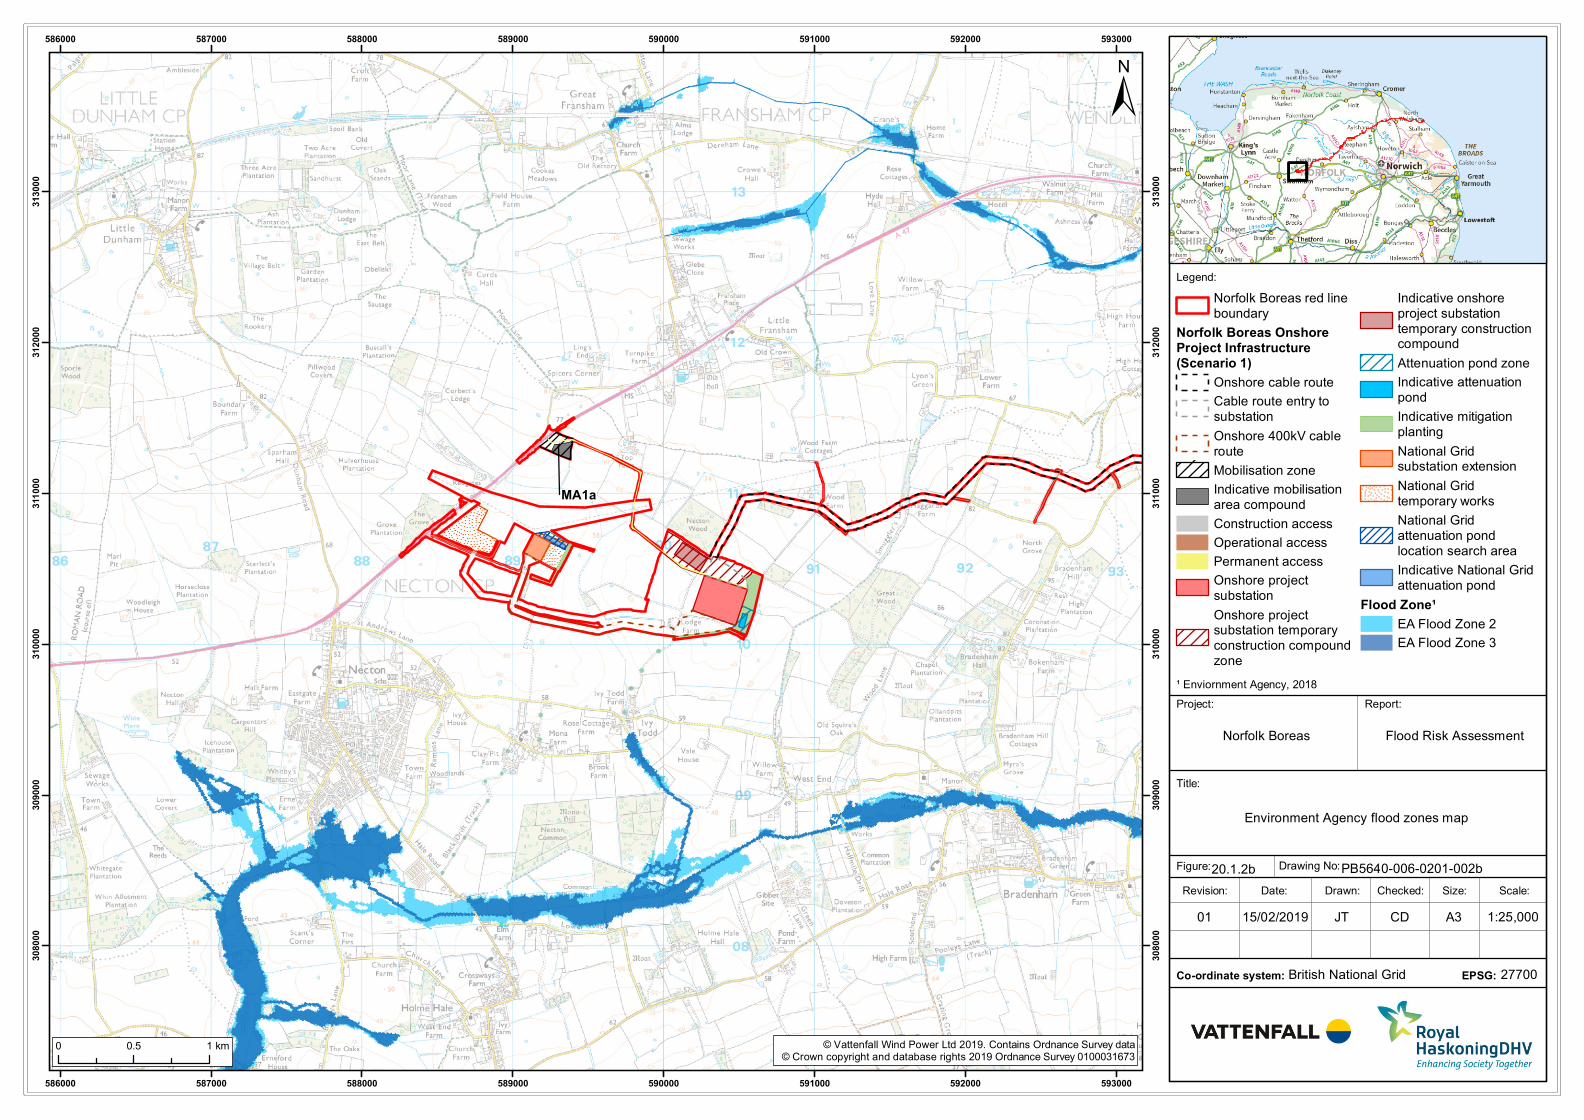
Legend:
Title:
Report:
Norfolk Boreas
Drawn: Scale:Checked:Date:Revision:
Drawing No:
Size:
British National Grid
Figure:
Co-ordinate system:
MA1a
586000
586000
587000
587000
588000
588000
589000
589000
590000
590000
591000
591000
592000
592000
593000
593000
308000
308000
309000
309000
310000
310000
311
000
311
000
312000
312000
313000
313000
© Vattenfall Wind Power Ltd 2019. Contains Ordnance Survey data© Crown copyright and database rights 2019 Ordnance Survey 0100031673
±
1:25,00015/02/201901 JT CD A3
0 0.5 1 km
Environment Agency flood zones map
20.1.2b PB5640-006-0201-002b
27700EPSG:
Project:
¹ Enviornment Agency, 2018
Flood Risk Assessment
Norfolk Boreas red lineboundary
Norfolk Boreas OnshoreProject Infrastructure(Scenario 1)
Onshore cable route
Cable route entry tosubstation
Onshore 400kV cableroute
Mobilisation zone
Indicative mobilisationarea compound
Construction access
Operational access
Permanent access
Onshore projectsubstation
Onshore projectsubstation temporaryconstruction compoundzone
Indicative onshoreproject substationtemporary constructioncompound
Attenuation pond zone
Indicative attenuationpond
Indicative mitigationplanting
National Gridsubstation extension
National Gridtemporary works
National Gridattenuation pondlocation search area
Indicative National Gridattenuation pond
Flood Zone¹
EA Flood Zone 2
EA Flood Zone 3

Legend:
Title:
Report:
Norfolk Boreas
Drawn: Scale:Checked:Date:Revision:
Drawing No:
Size:
British National Grid
Figure:
Co-ordinate system:
MA1a
586000
586000
587000
587000
588000
588000
589000
589000
590000
590000
591000
591000
592000
592000
593000
593000
308000
308000
309000
309000
310000
310000
311
000
311
000
312000
312000
313000
313000
© Vattenfall Wind Power Ltd 2019. Contains Ordnance Survey data© Crown copyright and database rights 2019 Ordnance Survey 0100031673
±
1:25,00015/02/201901 JT CD A3
0 0.5 1 km
Environment Agency flood zones map
20.1.2c PB5640-006-0201-002c
27700EPSG:
Project:
¹ Enviornment Agency, 2018
Flood Risk Assessment
Norfolk Boreas red line
boundary
Norfolk Boreas OnshoreProject Infrastructure(Scenario 2)
Onshore cable route
Cable route entry tosubstation
Onshore 400kV cable
route
Mobilisation zone
Indicative mobilisationarea compound
Highways temporaryworks area
Construction access
Operational access
Permanent access
Onshore projectsubstation
Onshore projectsubstation temporaryconstruction compound
zone
Indicative onshore project
substation temporaryconstruction compound
Attenuation pond zone
Indicative attenuationpond
Indicative mitigationplanting
National Grid substation
extension
National Grid new /replacement OHL towersearch area
National Grid temporary
works
Overhead line temporaryworks
National Grid attenuationpond
Flood Zone¹
EA Flood Zone 2
EA Flood Zone 3

Legend:
Title:
Report:
Norfolk Boreas
Drawn: Scale:Checked:Date:Revision:
Drawing No:
Size:
British National Grid
Figure:
Co-ordinate system:
638000
638000
638500
638500
639000
639000
639500
639500
640000
640000
640500
640500
329000
329000
329500
329500
330000
330000
330500
330500
331000
331000
331500
331500
© Vattenfall Wind Power Ltd 2019. Contains Ordnance Survey data© Crown copyright and database rights 2019 Ordnance Survey 0100031673
±
1:10,00015/02/201901 JT CD A3
0 200 400 m
Surface Water Flood Risk(Map 1 of 22)
20.1.3a PB5640-006-0201-003a
27700EPSG:
Project:
¹ Enviornment Agency, 2018
Flood Risk Assessment
Norfolk Boreas red line boundary
Norfolk Boreas Onshore Project Infrastructure(Scenario 1 & 2)
Landfall zone
Landfall compound zone
Indicative landfall compound
Onshore cable route
Operational access
Surface Water Flooding Extent¹
1 in 30
1 in 100
1 in 1000
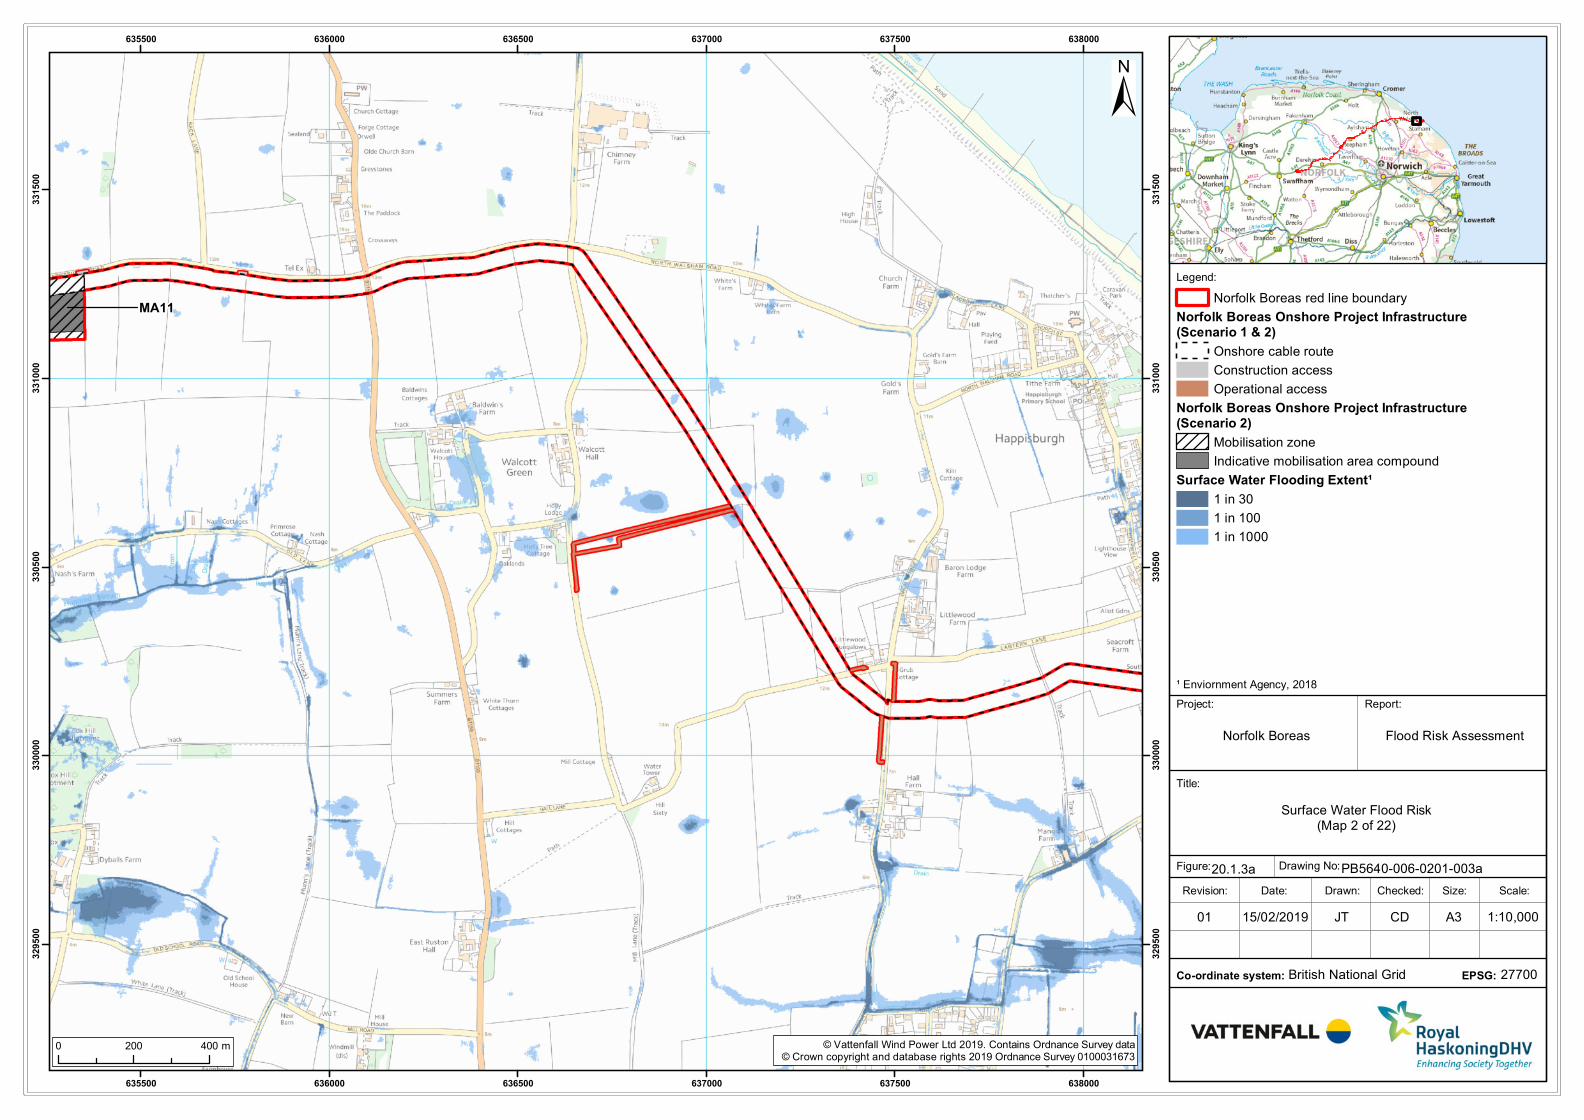
Legend:
Title:
Report:
Norfolk Boreas
Drawn: Scale:Checked:Date:Revision:
Drawing No:
Size:
British National Grid
Figure:
Co-ordinate system:
MA11
635500
635500
636000
636000
636500
636500
637000
637000
637500
637500
638000
638000
329500
329500
330000
330000
330500
330500
331000
331000
331500
331500
© Vattenfall Wind Power Ltd 2019. Contains Ordnance Survey data© Crown copyright and database rights 2019 Ordnance Survey 0100031673
±
1:10,00015/02/201901 JT CD A3
0 200 400 m
Surface Water Flood Risk(Map 2 of 22)
20.1.3a PB5640-006-0201-003a
27700EPSG:
Project:
¹ Enviornment Agency, 2018
Flood Risk Assessment
Norfolk Boreas red line boundary
Norfolk Boreas Onshore Project Infrastructure(Scenario 1 & 2)
Onshore cable route
Construction access
Operational access
Norfolk Boreas Onshore Project Infrastructure(Scenario 2)
Mobilisation zone
Indicative mobilisation area compound
Surface Water Flooding Extent¹
1 in 30
1 in 100
1 in 1000
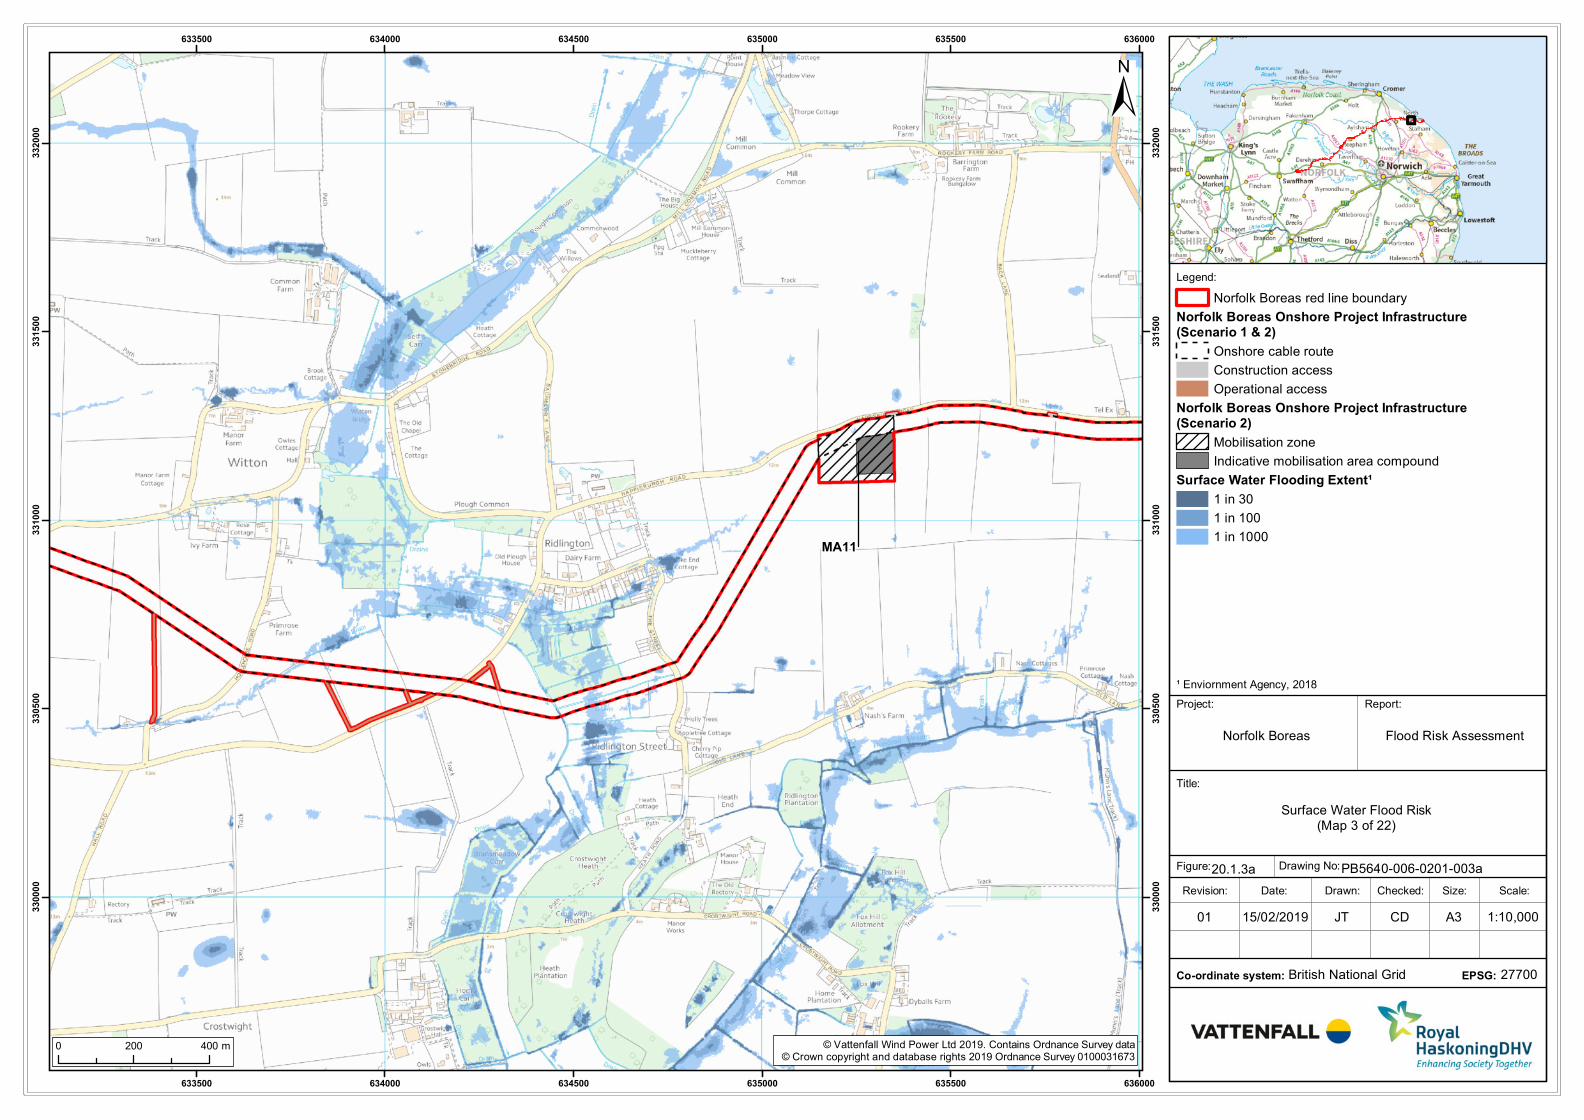
Legend:
Title:
Report:
Norfolk Boreas
Drawn: Scale:Checked:Date:Revision:
Drawing No:
Size:
British National Grid
Figure:
Co-ordinate system:
MA11
633500
633500
634000
634000
634500
634500
635000
635000
635500
635500
636000
636000
330000
330000
330500
330500
331000
331000
331500
331500
332000
332000
© Vattenfall Wind Power Ltd 2019. Contains Ordnance Survey data© Crown copyright and database rights 2019 Ordnance Survey 0100031673
±
1:10,00015/02/201901 JT CD A3
0 200 400 m
Surface Water Flood Risk(Map 3 of 22)
20.1.3a PB5640-006-0201-003a
27700EPSG:
Project:
¹ Enviornment Agency, 2018
Flood Risk Assessment
Norfolk Boreas red line boundary
Norfolk Boreas Onshore Project Infrastructure(Scenario 1 & 2)
Onshore cable route
Construction access
Operational access
Norfolk Boreas Onshore Project Infrastructure(Scenario 2)
Mobilisation zone
Indicative mobilisation area compound
Surface Water Flooding Extent¹
1 in 30
1 in 100
1 in 1000
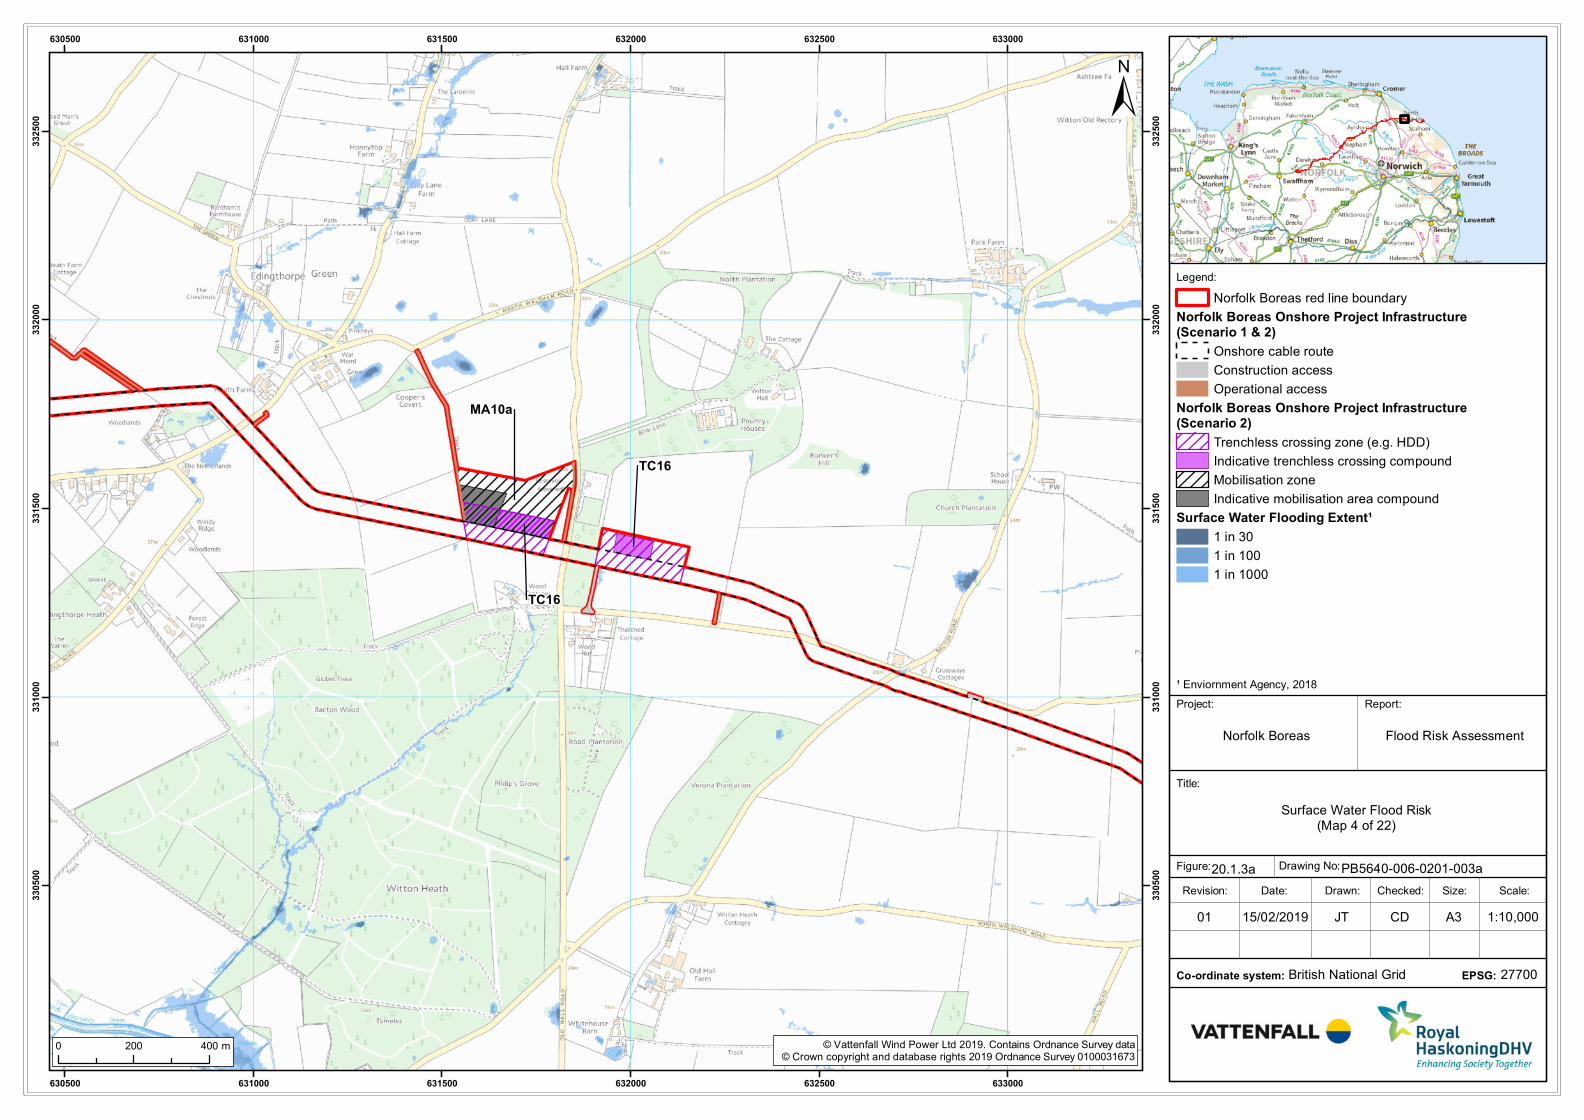
Legend:
Title:
Report:
Norfolk Boreas
Drawn: Scale:Checked:Date:Revision:
Drawing No:
Size:
British National Grid
Figure:
Co-ordinate system:
TC16
TC16
MA10a
630500
630500
631000
631000
631500
631500
632000
632000
632500
632500
633000
633000
330500
330500
331000
331000
331500
331500
332000
332000
332500
332500
© Vattenfall Wind Power Ltd 2019. Contains Ordnance Survey data© Crown copyright and database rights 2019 Ordnance Survey 0100031673
±
1:10,00015/02/201901 JT CD A3
0 200 400 m
Surface Water Flood Risk(Map 4 of 22)
20.1.3a PB5640-006-0201-003a
27700EPSG:
Project:
¹ Enviornment Agency, 2018
Flood Risk Assessment
Norfolk Boreas red line boundary
Norfolk Boreas Onshore Project Infrastructure(Scenario 1 & 2)
Onshore cable route
Construction access
Operational access
Norfolk Boreas Onshore Project Infrastructure(Scenario 2)
Trenchless crossing zone (e.g. HDD)
Indicative trenchless crossing compound
Mobilisation zone
Indicative mobilisation area compound
Surface Water Flooding Extent¹
1 in 30
1 in 100
1 in 1000
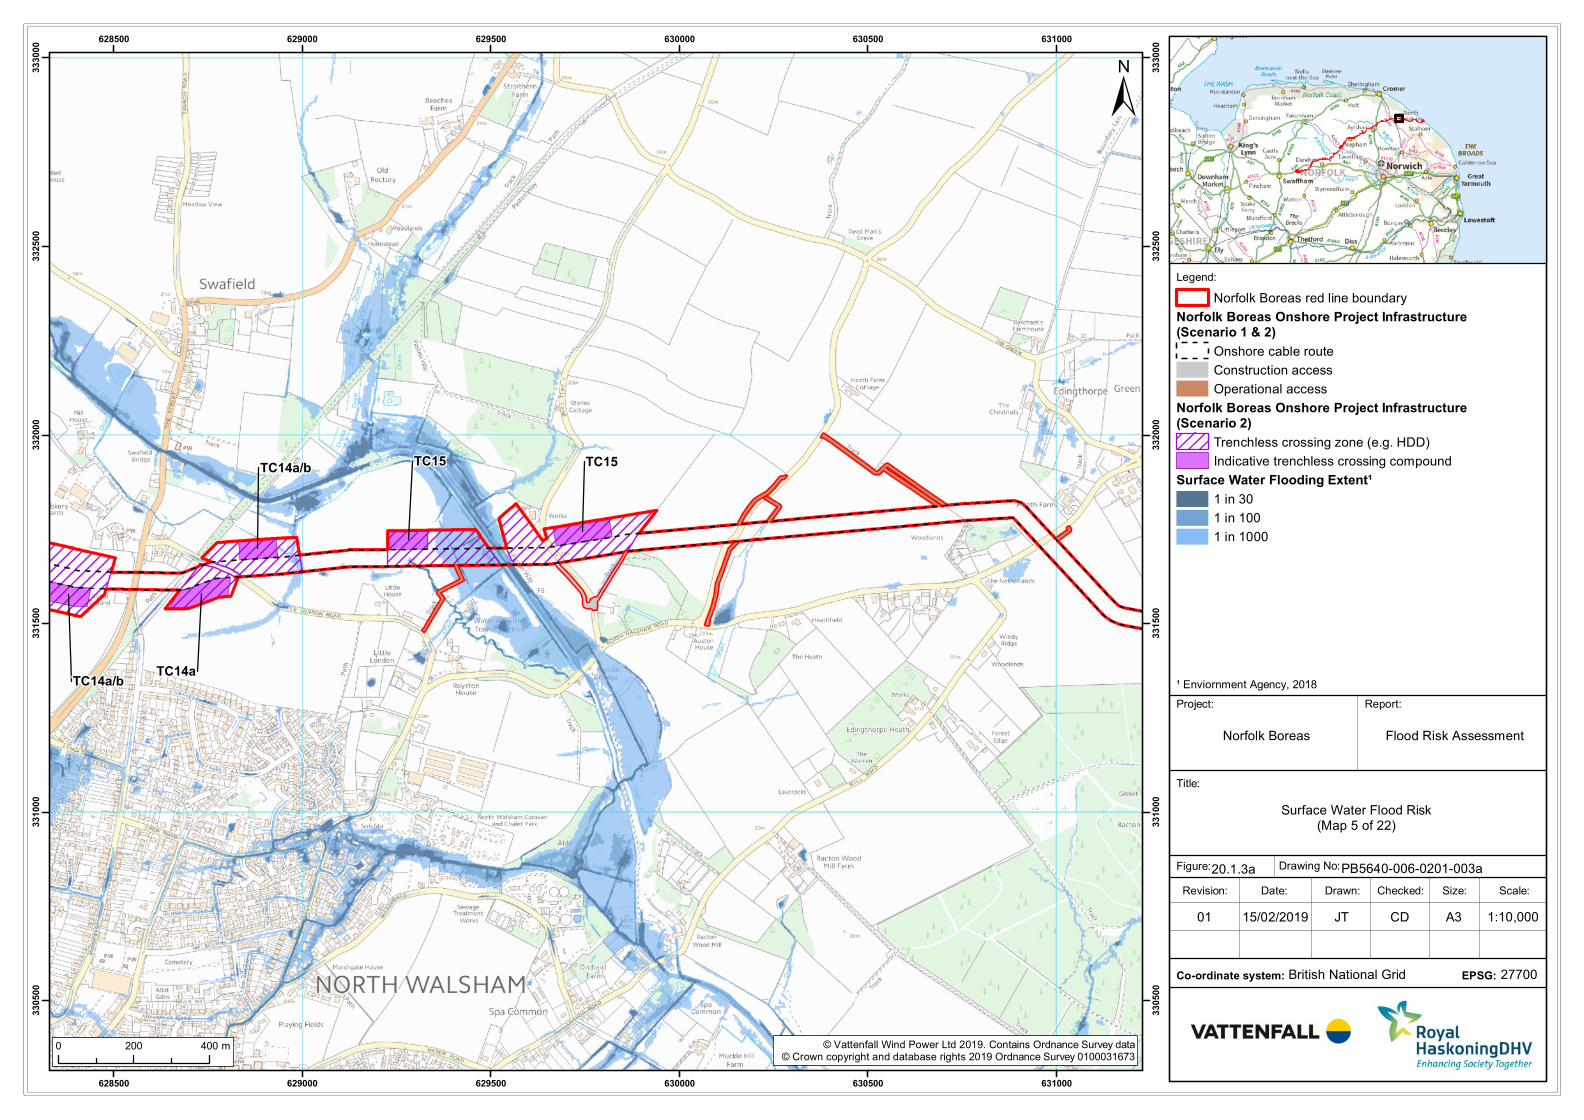
Legend:
Title:
Report:
Norfolk Boreas
Drawn: Scale:Checked:Date:Revision:
Drawing No:
Size:
British National Grid
Figure:
Co-ordinate system:
TC15 TC15TC14a/b
TC14a/bTC14a
628500
628500
629000
629000
629500
629500
630000
630000
630500
630500
631000
631000
330500
330500
331000
331000
331500
331500
332000
332000
332500
332500
333000
333000
© Vattenfall Wind Power Ltd 2019. Contains Ordnance Survey data© Crown copyright and database rights 2019 Ordnance Survey 0100031673
±
1:10,00015/02/201901 JT CD A3
0 200 400 m
Surface Water Flood Risk(Map 5 of 22)
20.1.3a PB5640-006-0201-003a
27700EPSG:
Project:
¹ Enviornment Agency, 2018
Flood Risk Assessment
Norfolk Boreas red line boundary
Norfolk Boreas Onshore Project Infrastructure(Scenario 1 & 2)
Onshore cable route
Construction access
Operational access
Norfolk Boreas Onshore Project Infrastructure(Scenario 2)
Trenchless crossing zone (e.g. HDD)
Indicative trenchless crossing compound
Surface Water Flooding Extent¹
1 in 30
1 in 100
1 in 1000

Legend:
Title:
Report:
Norfolk Boreas
Drawn: Scale:Checked:Date:Revision:
Drawing No:
Size:
British National Grid
Figure:
Co-ordinate system:
TC13
TC14a/b
TC12
TC13
TC12
MA10
MA9
626000
626000
626500
626500
627000
627000
627500
627500
628000
628000
330500
330500
331000
331000
331500
331500
332000
332000
332500
332500
333000
333000
© Vattenfall Wind Power Ltd 2019. Contains Ordnance Survey data© Crown copyright and database rights 2019 Ordnance Survey 0100031673
±
1:10,00015/02/201901 JT CD A3
0 200 400 m
Surface Water Flood Risk(Map 6 of 22)
20.1.3a PB5640-006-0201-003a
27700EPSG:
Project:
¹ Enviornment Agency, 2018
Flood Risk Assessment
Norfolk Boreas red line boundary
Norfolk Boreas Onshore Project Infrastructure(Scenario 1 & 2)
Onshore cable route
Construction access
Operational access
Norfolk Boreas Onshore Project Infrastructure(Scenario 2)
Trenchless crossing zone (e.g. HDD)
Indicative trenchless crossing compound
Mobilisation zone
Indicative mobilisation area compound
Surface Water Flooding Extent¹
1 in 30
1 in 100
1 in 1000
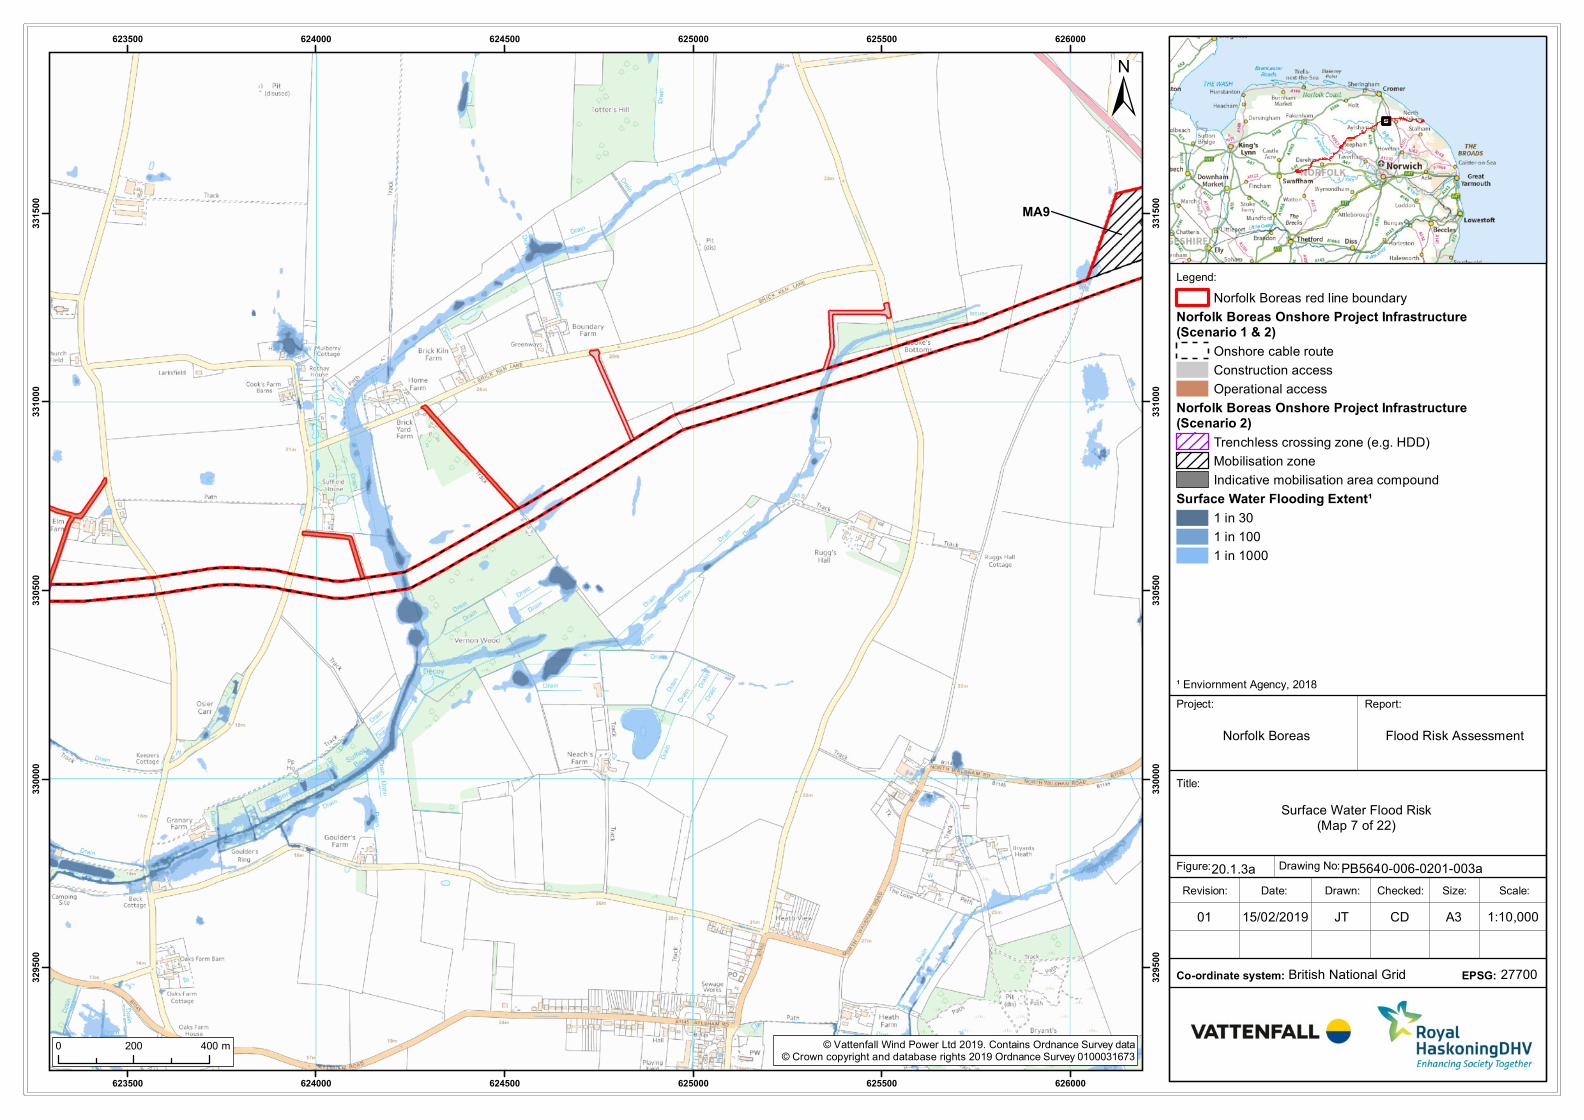
Legend:
Title:
Report:
Norfolk Boreas
Drawn: Scale:Checked:Date:Revision:
Drawing No:
Size:
British National Grid
Figure:
Co-ordinate system:
MA9
623500
623500
624000
624000
624500
624500
625000
625000
625500
625500
626000
626000
329500
329500
330000
330000
330500
330500
331000
331000
331500
331500
© Vattenfall Wind Power Ltd 2019. Contains Ordnance Survey data© Crown copyright and database rights 2019 Ordnance Survey 0100031673
±
1:10,00015/02/201901 JT CD A3
0 200 400 m
Surface Water Flood Risk(Map 7 of 22)
20.1.3a PB5640-006-0201-003a
27700EPSG:
Project:
¹ Enviornment Agency, 2018
Flood Risk Assessment
Norfolk Boreas red line boundary
Norfolk Boreas Onshore Project Infrastructure(Scenario 1 & 2)
Onshore cable route
Construction access
Operational access
Norfolk Boreas Onshore Project Infrastructure(Scenario 2)
Trenchless crossing zone (e.g. HDD)
Mobilisation zone
Indicative mobilisation area compound
Surface Water Flooding Extent¹
1 in 30
1 in 100
1 in 1000
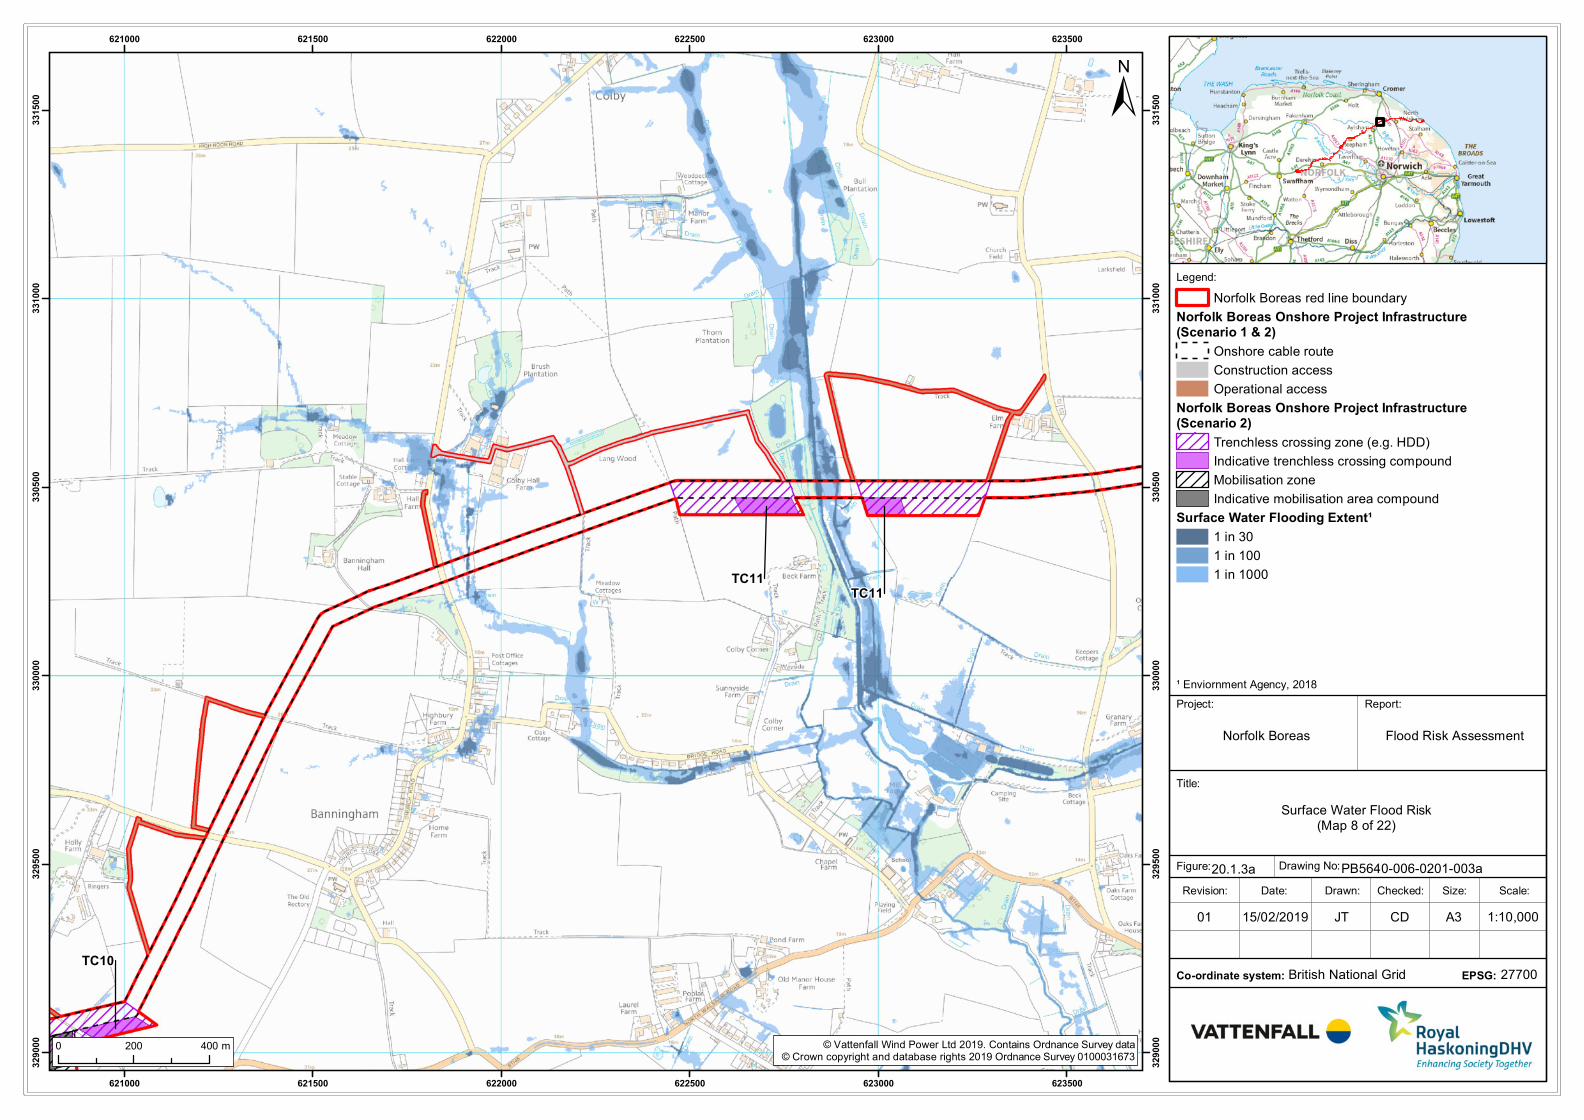
Legend:
Title:
Report:
Norfolk Boreas
Drawn: Scale:Checked:Date:Revision:
Drawing No:
Size:
British National Grid
Figure:
Co-ordinate system:
TC10
TC11TC11
MA8
621000
621000
621500
621500
622000
622000
622500
622500
623000
623000
623500
623500
329000
329000
329500
329500
330000
330000
330500
330500
331000
331000
331500
331500
© Vattenfall Wind Power Ltd 2019. Contains Ordnance Survey data© Crown copyright and database rights 2019 Ordnance Survey 0100031673
±
1:10,00015/02/201901 JT CD A3
0 200 400 m
Surface Water Flood Risk(Map 8 of 22)
20.1.3a PB5640-006-0201-003a
27700EPSG:
Project:
¹ Enviornment Agency, 2018
Flood Risk Assessment
Norfolk Boreas red line boundary
Norfolk Boreas Onshore Project Infrastructure(Scenario 1 & 2)
Onshore cable route
Construction access
Operational access
Norfolk Boreas Onshore Project Infrastructure(Scenario 2)
Trenchless crossing zone (e.g. HDD)
Indicative trenchless crossing compound
Mobilisation zone
Indicative mobilisation area compound
Surface Water Flooding Extent¹
1 in 30
1 in 100
1 in 1000
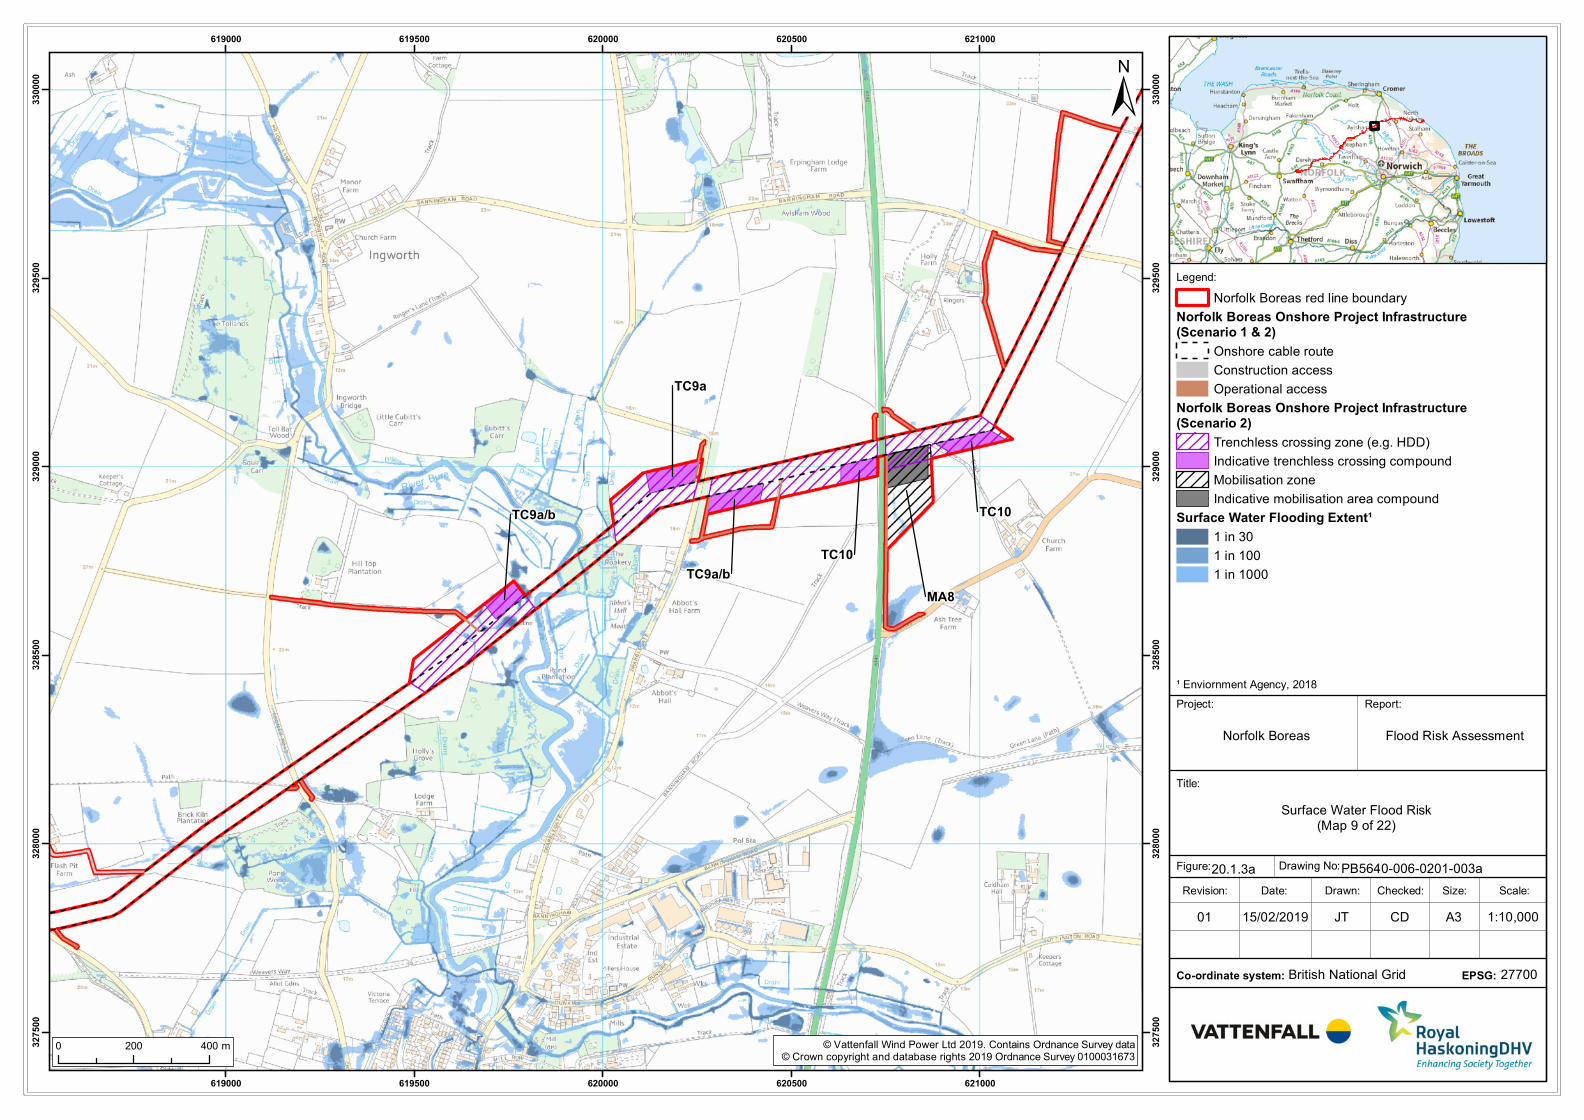
Legend:
Title:
Report:
Norfolk Boreas
Drawn: Scale:Checked:Date:Revision:
Drawing No:
Size:
British National Grid
Figure:
Co-ordinate system:
TC10
TC10
TC9a/b
TC9a/b
TC9a
MA8
619000
619000
619500
619500
620000
620000
620500
620500
621000
621000
327500
327500
328000
328000
328500
328500
329000
329000
329500
329500
330000
330000
© Vattenfall Wind Power Ltd 2019. Contains Ordnance Survey data© Crown copyright and database rights 2019 Ordnance Survey 0100031673
±
1:10,00015/02/201901 JT CD A3
0 200 400 m
Surface Water Flood Risk(Map 9 of 22)
20.1.3a PB5640-006-0201-003a
27700EPSG:
Project:
¹ Enviornment Agency, 2018
Flood Risk Assessment
Norfolk Boreas red line boundary
Norfolk Boreas Onshore Project Infrastructure(Scenario 1 & 2)
Onshore cable route
Construction access
Operational access
Norfolk Boreas Onshore Project Infrastructure(Scenario 2)
Trenchless crossing zone (e.g. HDD)
Indicative trenchless crossing compound
Mobilisation zone
Indicative mobilisation area compound
Surface Water Flooding Extent¹
1 in 30
1 in 100
1 in 1000
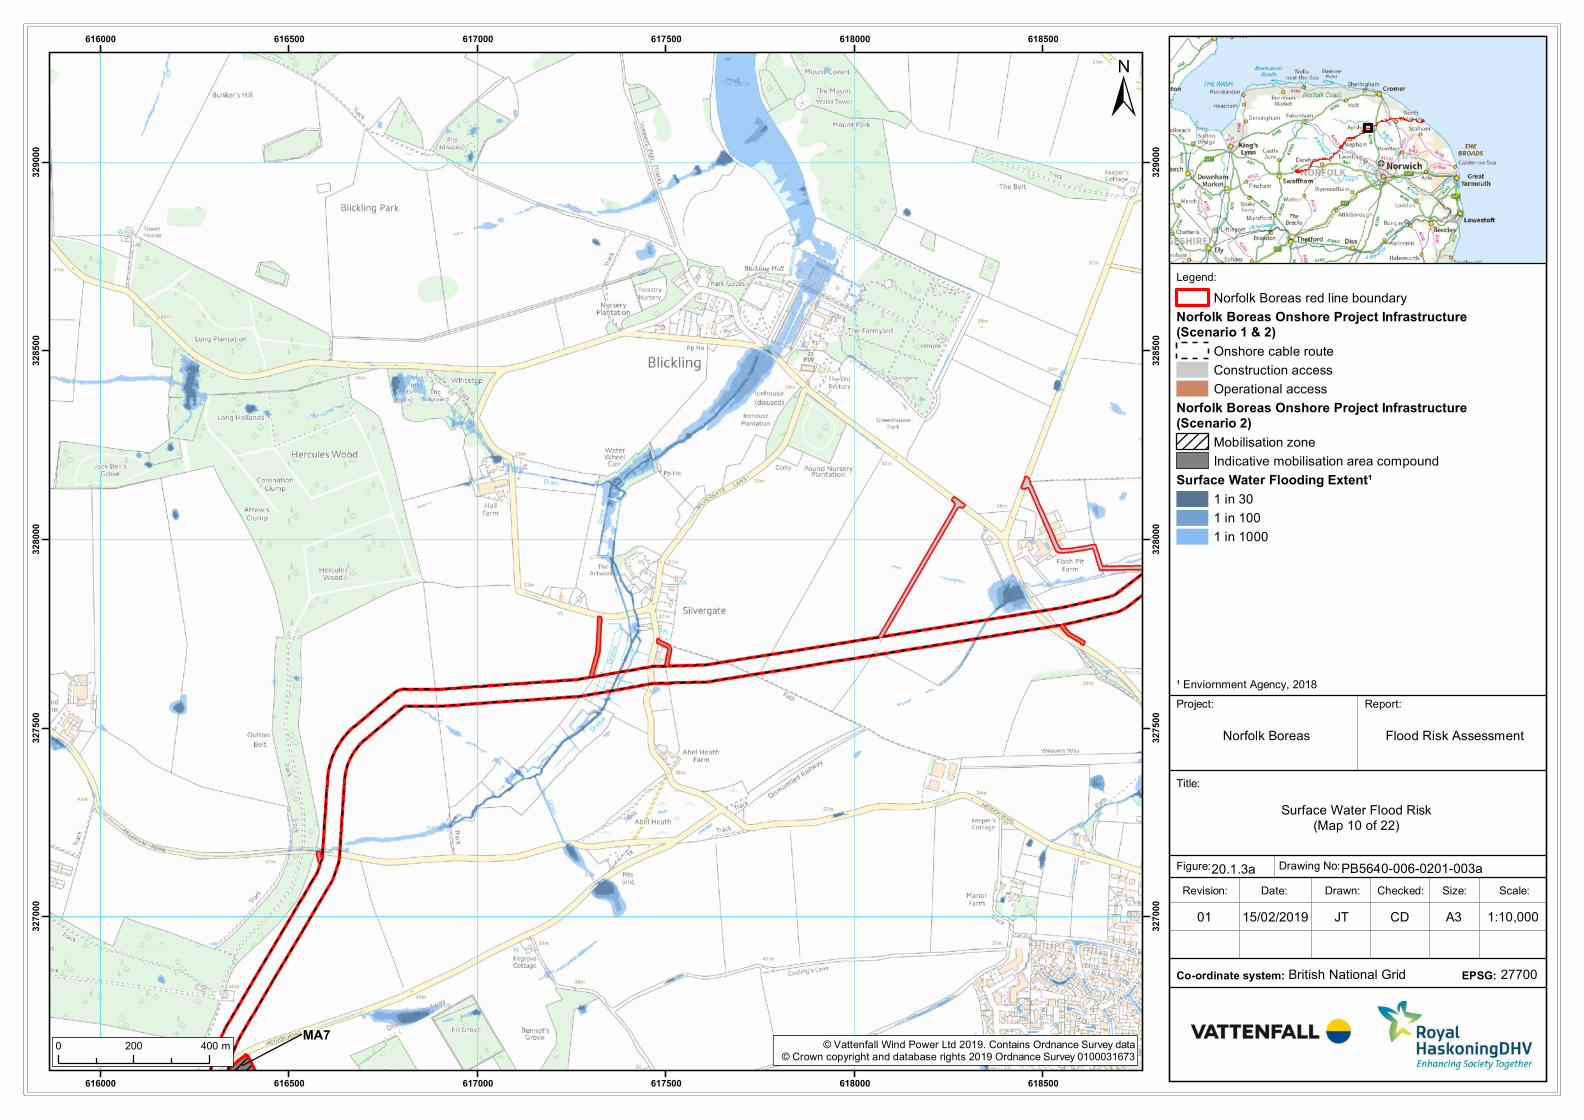
Legend:
Title:
Report:
Norfolk Boreas
Drawn: Scale:Checked:Date:Revision:
Drawing No:
Size:
British National Grid
Figure:
Co-ordinate system:
MA7
616000
616000
616500
616500
617000
617000
617500
617500
618000
618000
618500
618500
327000
327000
327500
327500
328000
328000
328500
328500
329000
329000
© Vattenfall Wind Power Ltd 2019. Contains Ordnance Survey data© Crown copyright and database rights 2019 Ordnance Survey 0100031673
±
1:10,00015/02/201901 JT CD A3
0 200 400 m
Surface Water Flood Risk(Map 10 of 22)
20.1.3a PB5640-006-0201-003a
27700EPSG:
Project:
¹ Enviornment Agency, 2018
Flood Risk Assessment
Norfolk Boreas red line boundary
Norfolk Boreas Onshore Project Infrastructure(Scenario 1 & 2)
Onshore cable route
Construction access
Operational access
Norfolk Boreas Onshore Project Infrastructure(Scenario 2)
Mobilisation zone
Indicative mobilisation area compound
Surface Water Flooding Extent¹
1 in 30
1 in 100
1 in 1000
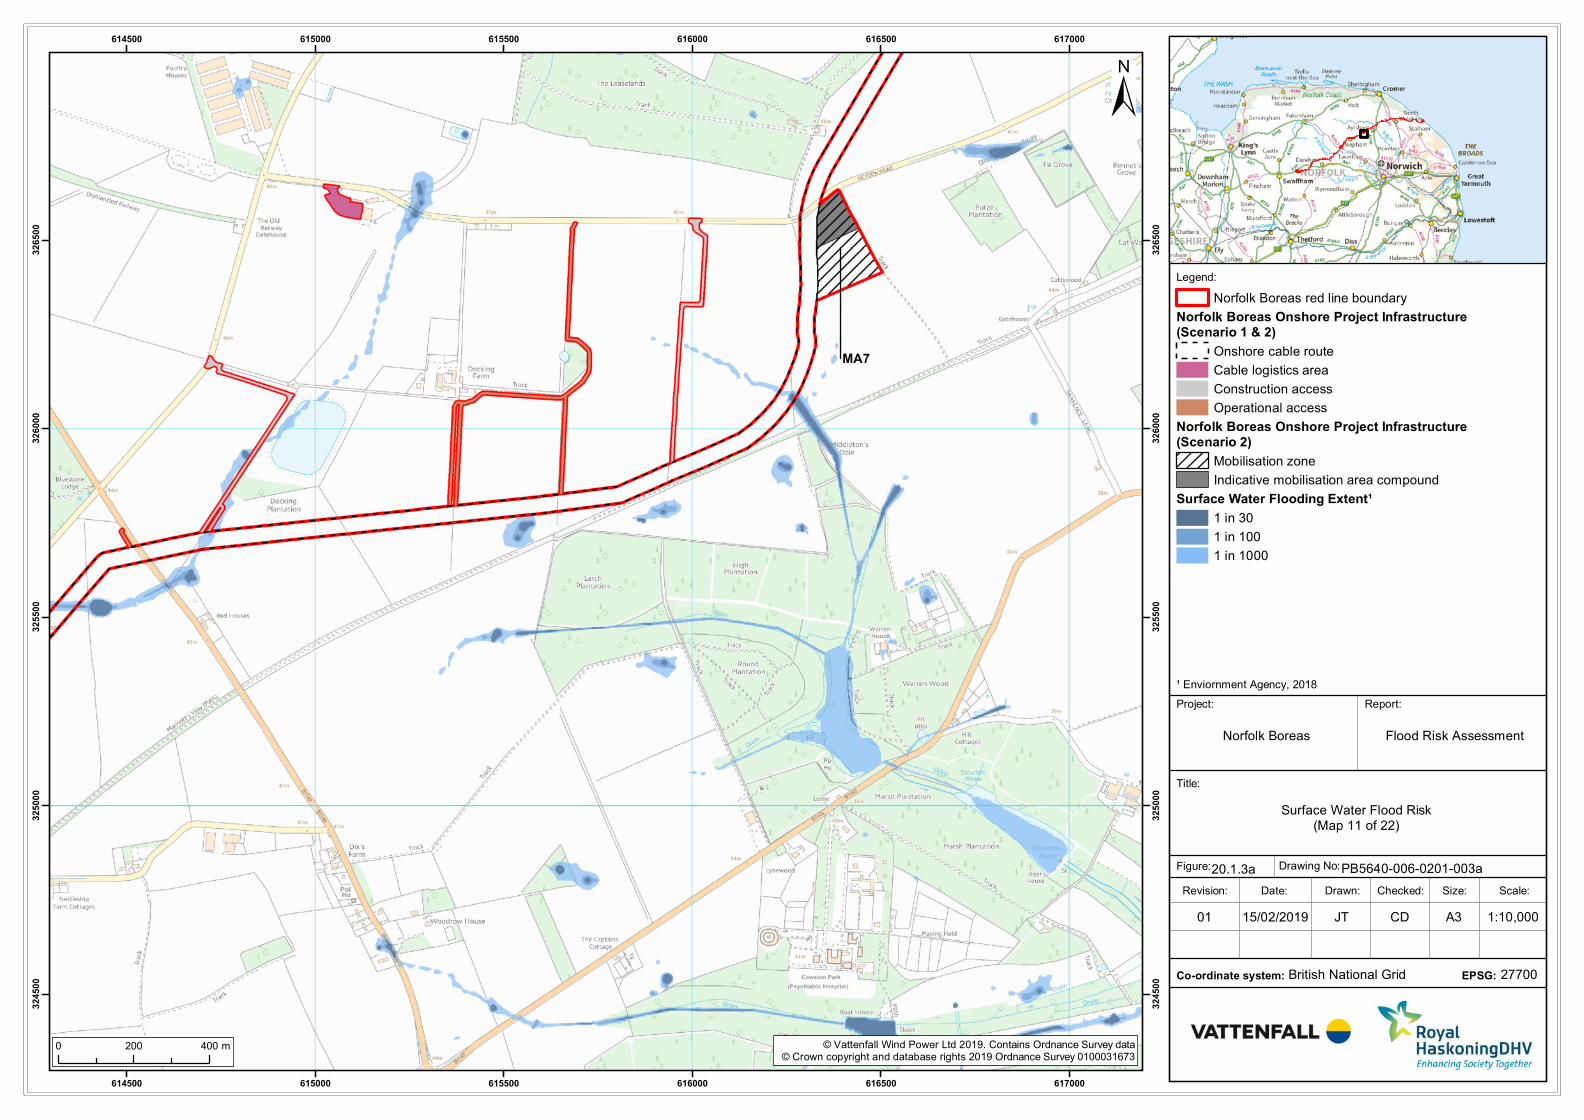
Legend:
Title:
Report:
Norfolk Boreas
Drawn: Scale:Checked:Date:Revision:
Drawing No:
Size:
British National Grid
Figure:
Co-ordinate system:
MA7
614500
614500
615000
615000
615500
615500
616000
616000
616500
616500
617000
617000
324500
324500
325000
325000
325500
325500
326000
326000
326500
326500
© Vattenfall Wind Power Ltd 2019. Contains Ordnance Survey data© Crown copyright and database rights 2019 Ordnance Survey 0100031673
±
1:10,00015/02/201901 JT CD A3
0 200 400 m
Surface Water Flood Risk(Map 11 of 22)
20.1.3a PB5640-006-0201-003a
27700EPSG:
Project:
¹ Enviornment Agency, 2018
Flood Risk Assessment
Norfolk Boreas red line boundary
Norfolk Boreas Onshore Project Infrastructure(Scenario 1 & 2)
Onshore cable route
Cable logistics area
Construction access
Operational access
Norfolk Boreas Onshore Project Infrastructure(Scenario 2)
Mobilisation zone
Indicative mobilisation area compound
Surface Water Flooding Extent¹
1 in 30
1 in 100
1 in 1000
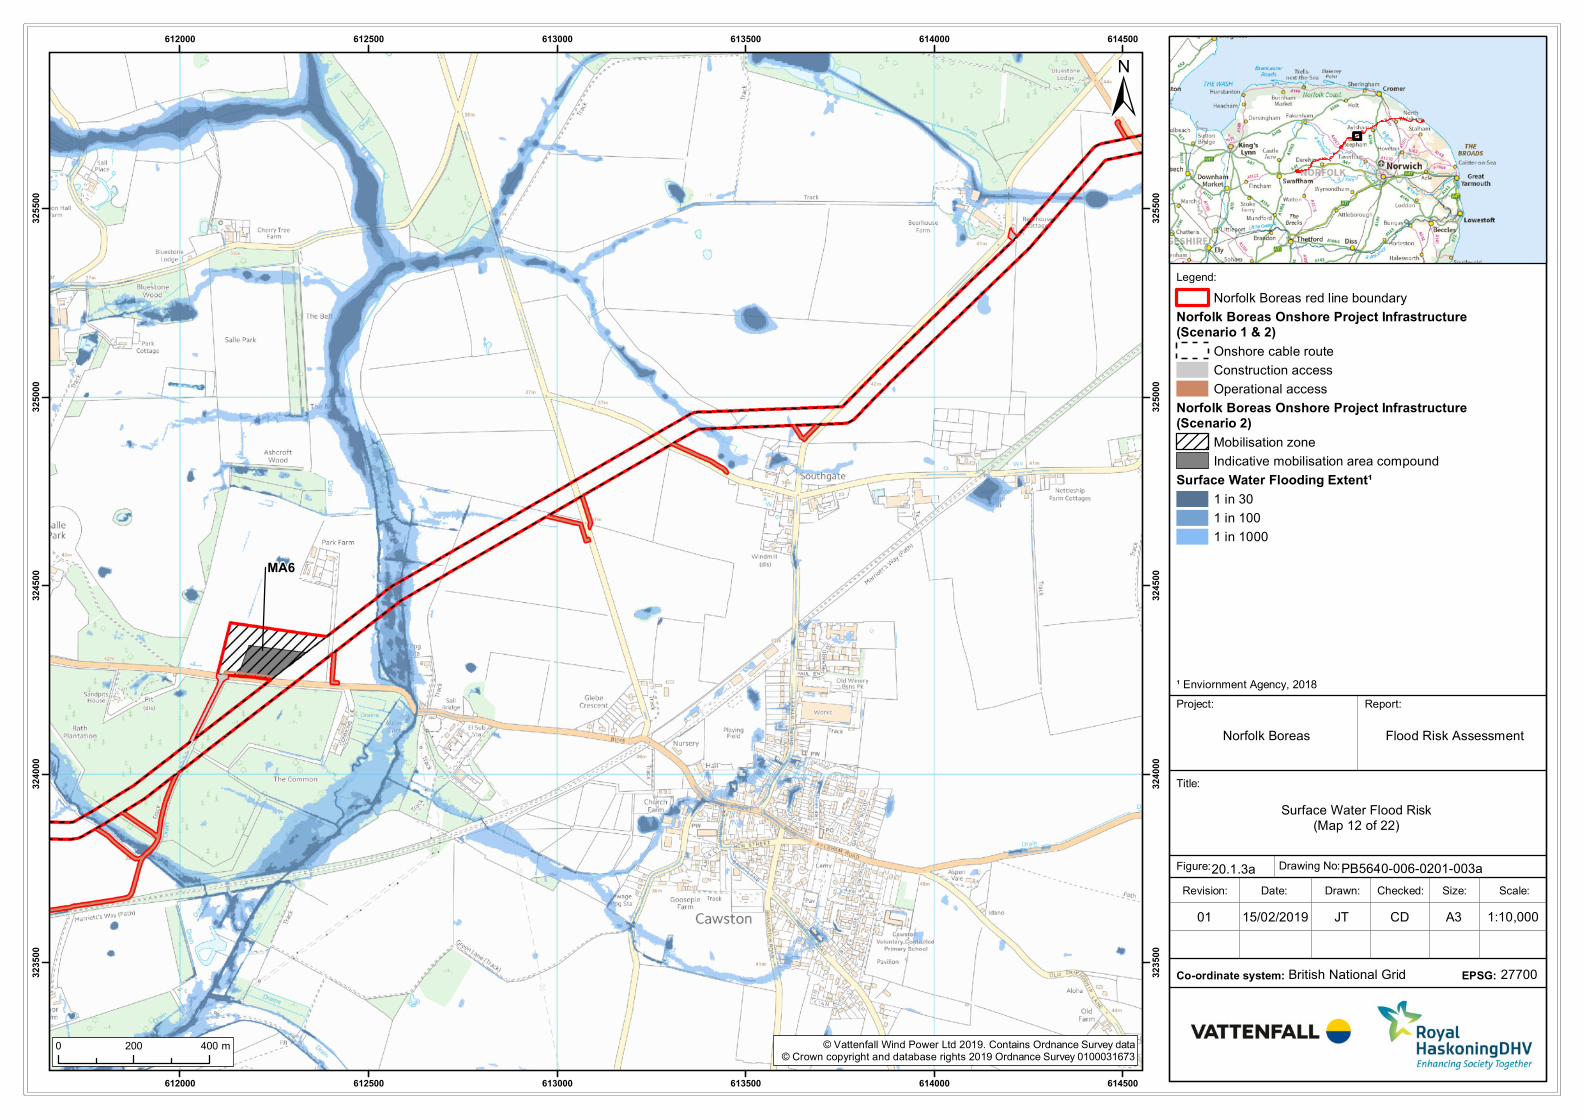
Legend:
Title:
Report:
Norfolk Boreas
Drawn: Scale:Checked:Date:Revision:
Drawing No:
Size:
British National Grid
Figure:
Co-ordinate system:
MA6
612000
612000
612500
612500
613000
613000
613500
613500
614000
614000
614500
614500
323500
323500
324000
324000
324500
324500
325000
325000
325500
325500
© Vattenfall Wind Power Ltd 2019. Contains Ordnance Survey data© Crown copyright and database rights 2019 Ordnance Survey 0100031673
±
1:10,00015/02/201901 JT CD A3
0 200 400 m
Surface Water Flood Risk(Map 12 of 22)
20.1.3a PB5640-006-0201-003a
27700EPSG:
Project:
¹ Enviornment Agency, 2018
Flood Risk Assessment
Norfolk Boreas red line boundary
Norfolk Boreas Onshore Project Infrastructure(Scenario 1 & 2)
Onshore cable route
Construction access
Operational access
Norfolk Boreas Onshore Project Infrastructure(Scenario 2)
Mobilisation zone
Indicative mobilisation area compound
Surface Water Flooding Extent¹
1 in 30
1 in 100
1 in 1000
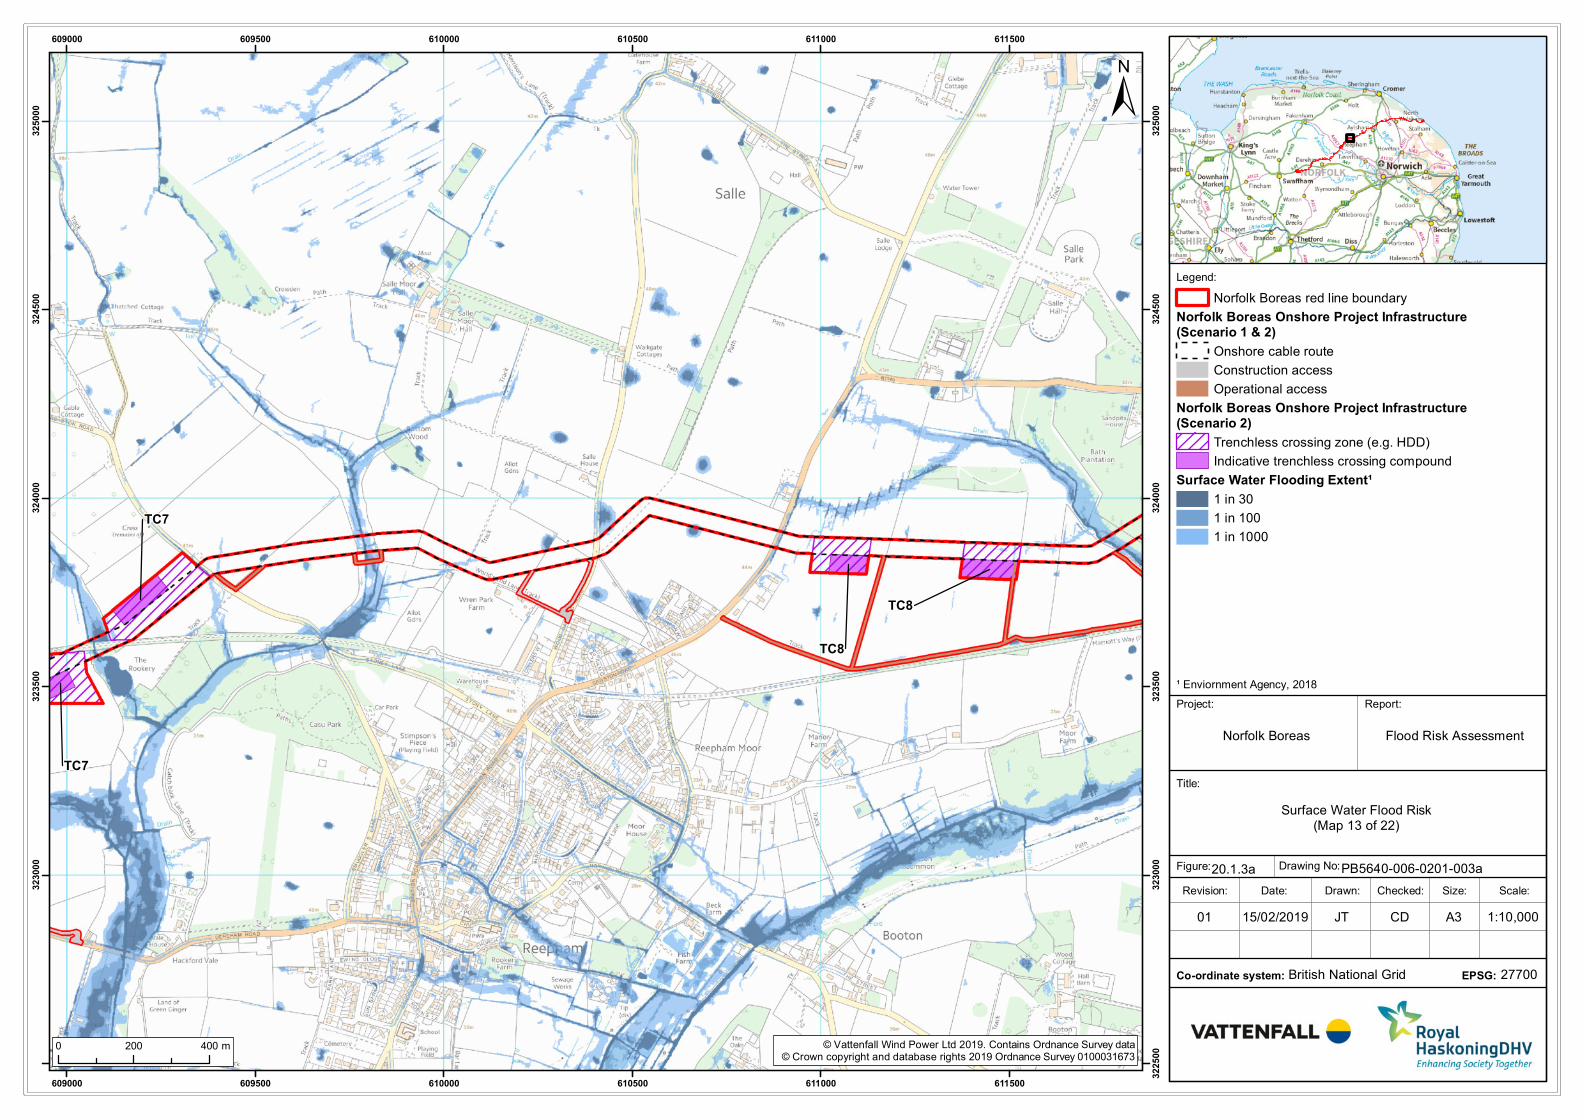
Legend:
Title:
Report:
Norfolk Boreas
Drawn: Scale:Checked:Date:Revision:
Drawing No:
Size:
British National Grid
Figure:
Co-ordinate system:
TC8
TC8
TC7
TC7
609000
609000
609500
609500
610000
610000
610500
610500
611000
611000
611500
611500
322500
323000
323000
323500
323500
324000
324000
324500
324500
325000
325000
© Vattenfall Wind Power Ltd 2019. Contains Ordnance Survey data© Crown copyright and database rights 2019 Ordnance Survey 0100031673
±
1:10,00015/02/201901 JT CD A3
0 200 400 m
Surface Water Flood Risk(Map 13 of 22)
20.1.3a PB5640-006-0201-003a
27700EPSG:
Project:
¹ Enviornment Agency, 2018
Flood Risk Assessment
Norfolk Boreas red line boundary
Norfolk Boreas Onshore Project Infrastructure(Scenario 1 & 2)
Onshore cable route
Construction access
Operational access
Norfolk Boreas Onshore Project Infrastructure(Scenario 2)
Trenchless crossing zone (e.g. HDD)
Indicative trenchless crossing compound
Surface Water Flooding Extent¹
1 in 30
1 in 100
1 in 1000
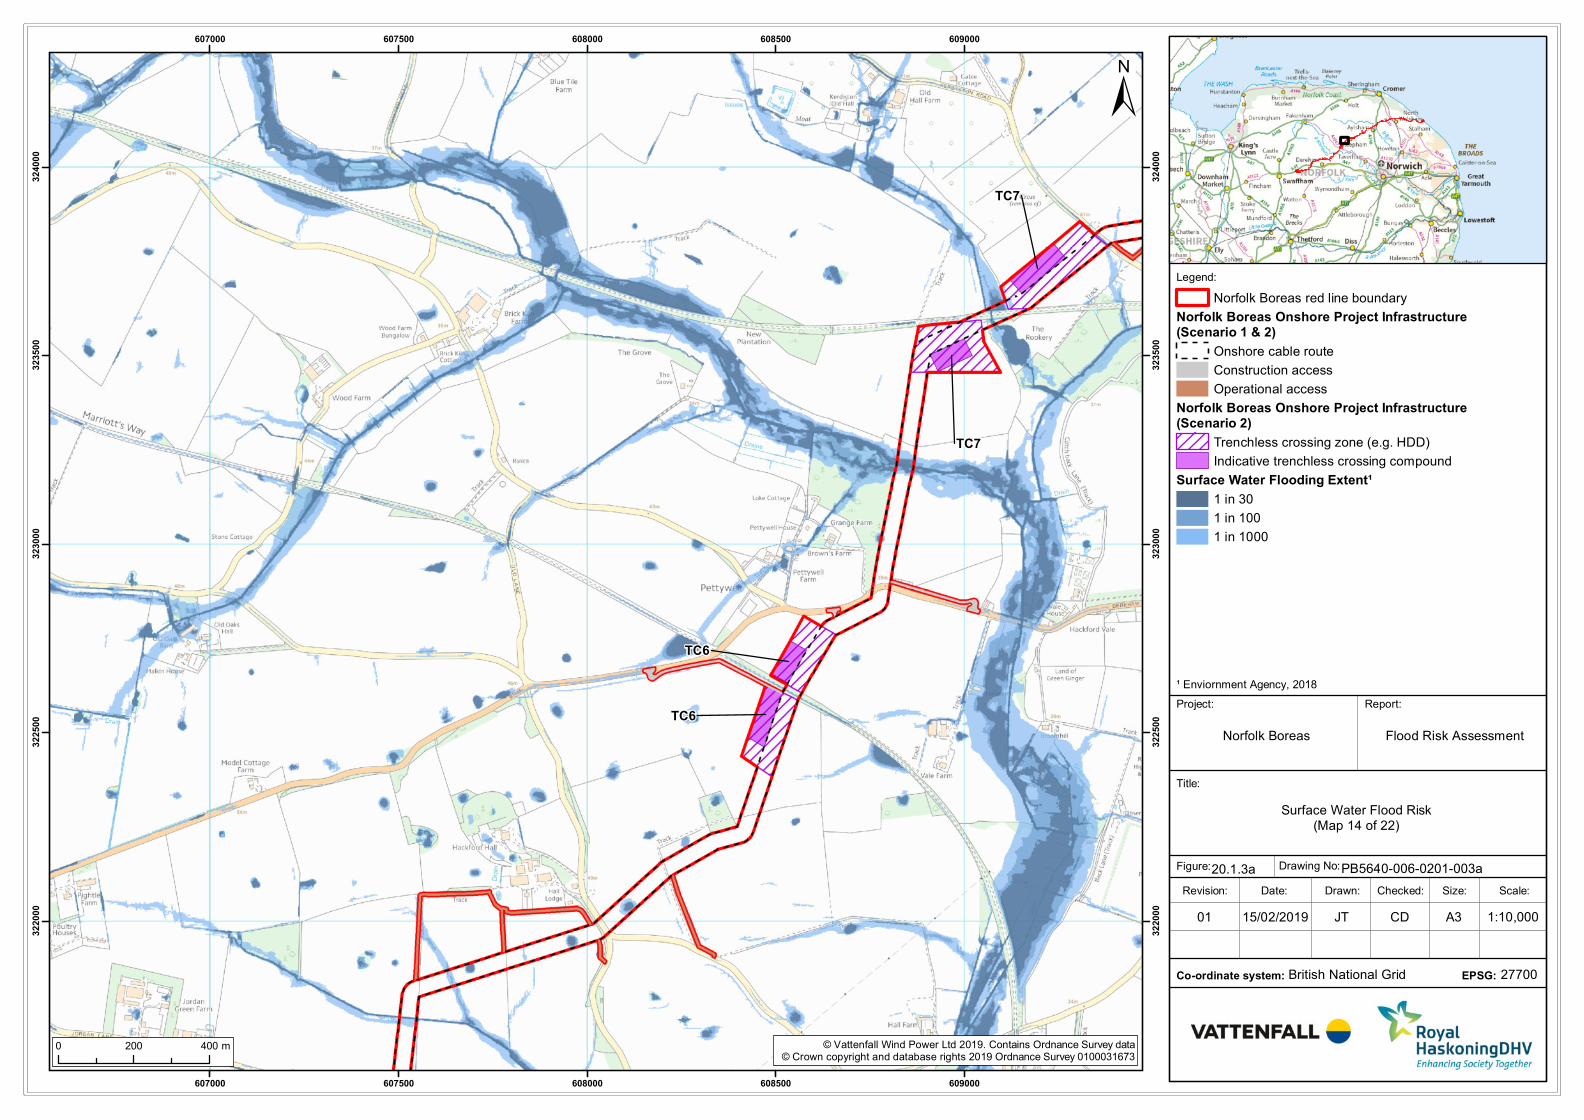
Legend:
Title:
Report:
Norfolk Boreas
Drawn: Scale:Checked:Date:Revision:
Drawing No:
Size:
British National Grid
Figure:
Co-ordinate system:
TC6
TC6
TC7
TC7
607000
607000
607500
607500
608000
608000
608500
608500
609000
609000
322000
322000
322500
322500
323000
323000
323500
323500
324000
324000
© Vattenfall Wind Power Ltd 2019. Contains Ordnance Survey data© Crown copyright and database rights 2019 Ordnance Survey 0100031673
±
1:10,00015/02/201901 JT CD A3
0 200 400 m
Surface Water Flood Risk(Map 14 of 22)
20.1.3a PB5640-006-0201-003a
27700EPSG:
Project:
¹ Enviornment Agency, 2018
Flood Risk Assessment
Norfolk Boreas red line boundary
Norfolk Boreas Onshore Project Infrastructure(Scenario 1 & 2)
Onshore cable route
Construction access
Operational access
Norfolk Boreas Onshore Project Infrastructure(Scenario 2)
Trenchless crossing zone (e.g. HDD)
Indicative trenchless crossing compound
Surface Water Flooding Extent¹
1 in 30
1 in 100
1 in 1000
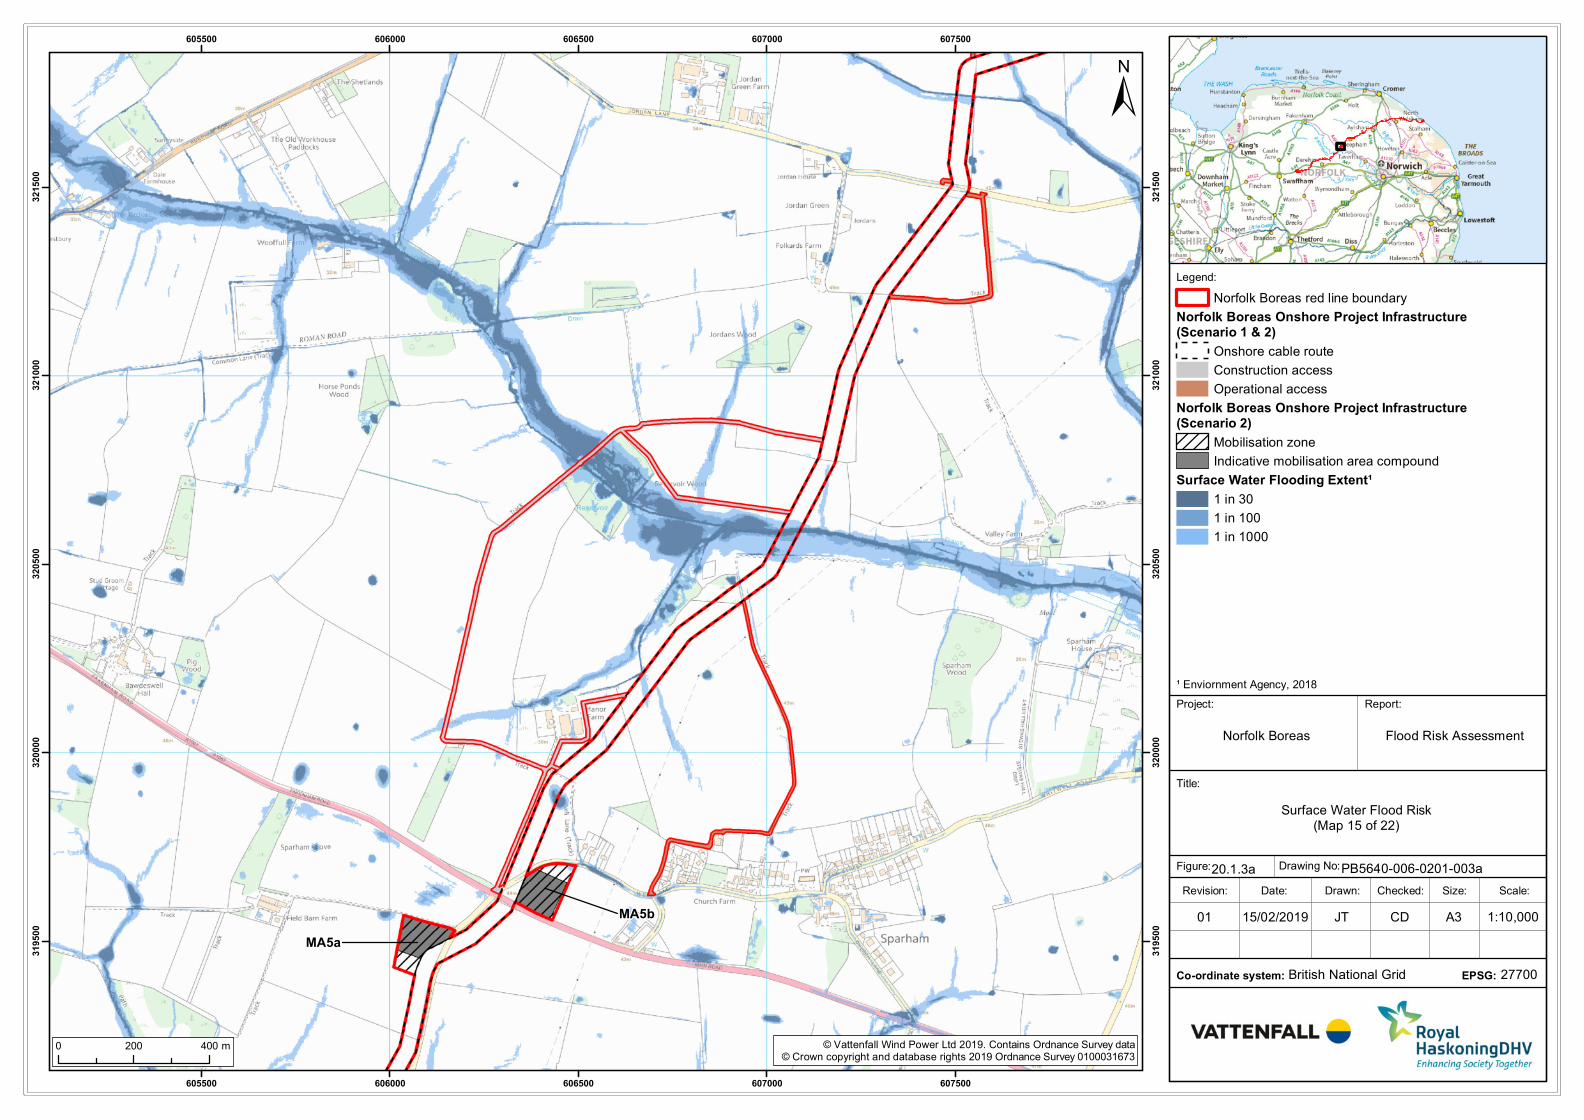
Legend:
Title:
Report:
Norfolk Boreas
Drawn: Scale:Checked:Date:Revision:
Drawing No:
Size:
British National Grid
Figure:
Co-ordinate system:
MA5b
MA5a
605500
605500
606000
606000
606500
606500
607000
607000
607500
607500
319500
319500
320000
320000
320500
320500
321000
321000
321500
321500
© Vattenfall Wind Power Ltd 2019. Contains Ordnance Survey data© Crown copyright and database rights 2019 Ordnance Survey 0100031673
±
1:10,00015/02/201901 JT CD A3
0 200 400 m
Surface Water Flood Risk(Map 15 of 22)
20.1.3a PB5640-006-0201-003a
27700EPSG:
Project:
¹ Enviornment Agency, 2018
Flood Risk Assessment
Norfolk Boreas red line boundary
Norfolk Boreas Onshore Project Infrastructure(Scenario 1 & 2)
Onshore cable route
Construction access
Operational access
Norfolk Boreas Onshore Project Infrastructure(Scenario 2)
Mobilisation zone
Indicative mobilisation area compound
Surface Water Flooding Extent¹
1 in 30
1 in 100
1 in 1000
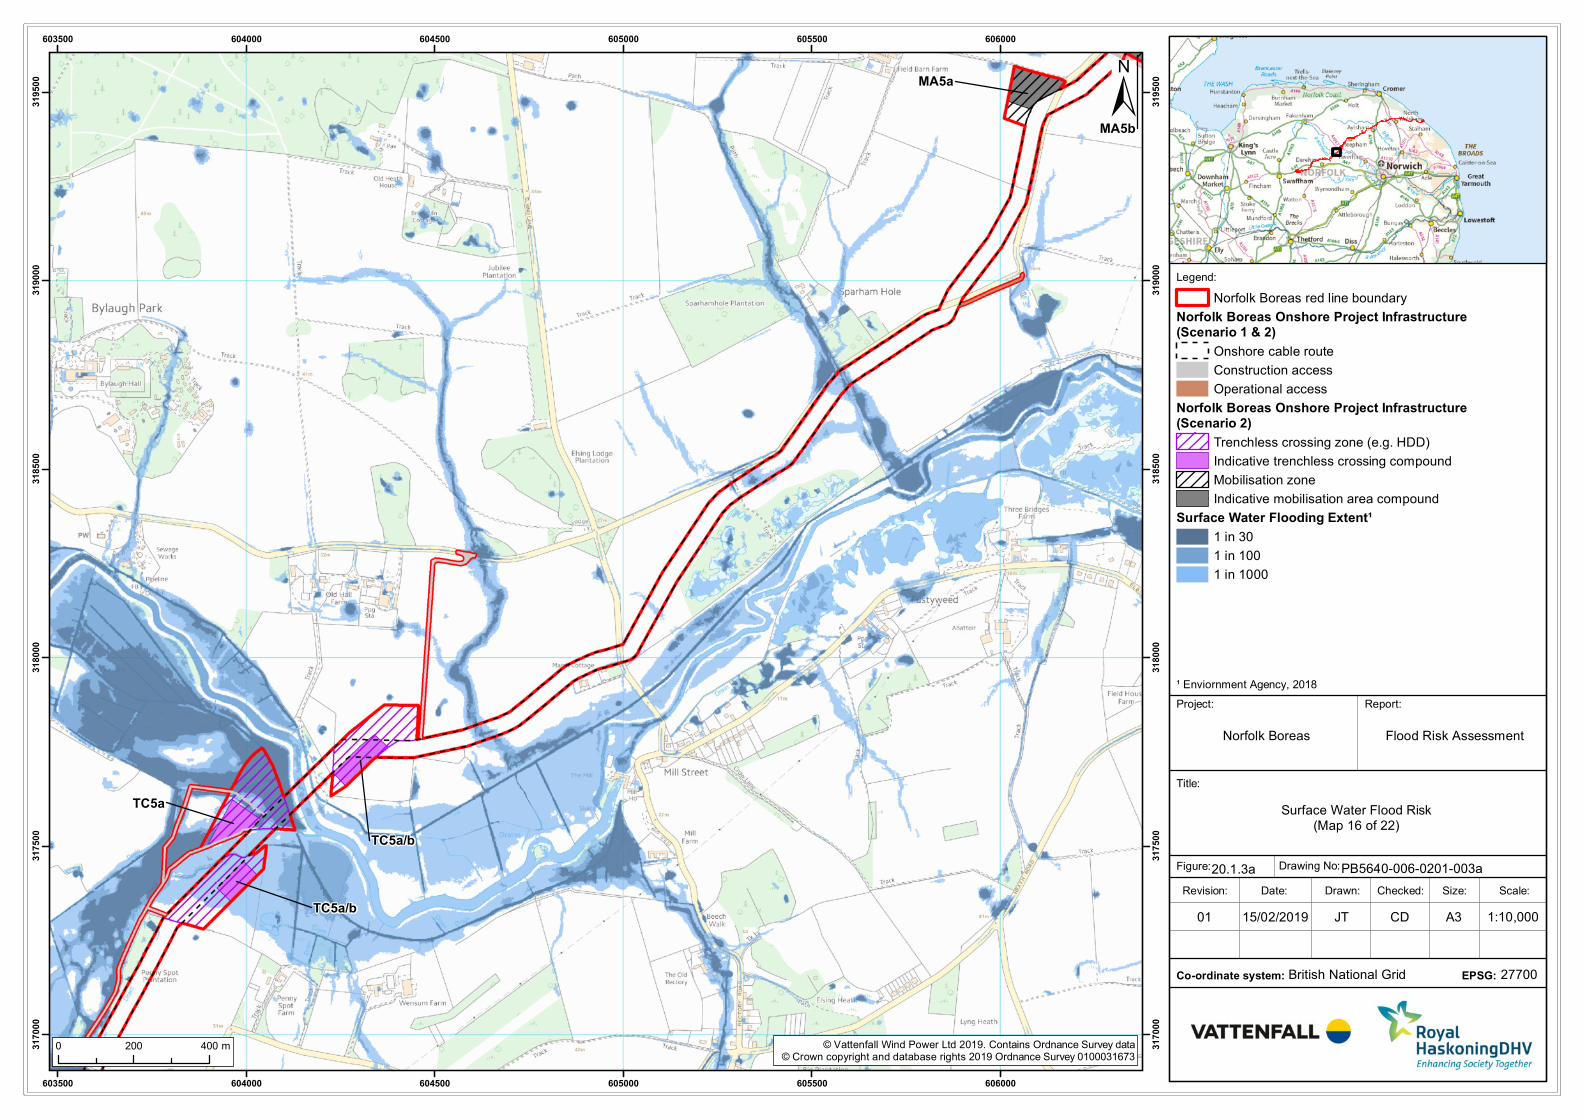
Legend:
Title:
Report:
Norfolk Boreas
Drawn: Scale:Checked:Date:Revision:
Drawing No:
Size:
British National Grid
Figure:
Co-ordinate system:
TC5a/b
TC5a/b
TC5a
MA5b
MA5a
603500
603500
604000
604000
604500
604500
605000
605000
605500
605500
606000
606000
317000
317000
317500
317500
318000
318000
318500
318500
319000
319000
319500
319500
© Vattenfall Wind Power Ltd 2019. Contains Ordnance Survey data© Crown copyright and database rights 2019 Ordnance Survey 0100031673
±
1:10,00015/02/201901 JT CD A3
0 200 400 m
Surface Water Flood Risk(Map 16 of 22)
20.1.3a PB5640-006-0201-003a
27700EPSG:
Project:
¹ Enviornment Agency, 2018
Flood Risk Assessment
Norfolk Boreas red line boundary
Norfolk Boreas Onshore Project Infrastructure(Scenario 1 & 2)
Onshore cable route
Construction access
Operational access
Norfolk Boreas Onshore Project Infrastructure(Scenario 2)
Trenchless crossing zone (e.g. HDD)
Indicative trenchless crossing compound
Mobilisation zone
Indicative mobilisation area compound
Surface Water Flooding Extent¹
1 in 30
1 in 100
1 in 1000

Legend:
Title:
Report:
Norfolk Boreas
Drawn: Scale:Checked:Date:Revision:
Drawing No:
Size:
British National Grid
Figure:
Co-ordinate system:
MA4
601500
601500
602000
602000
602500
602500
603000
603000
603500
603500
604000
604000
314500
314500
315000
315000
315500
315500
316000
316000
316500
316500
317000
317000
© Vattenfall Wind Power Ltd 2019. Contains Ordnance Survey data© Crown copyright and database rights 2019 Ordnance Survey 0100031673
±
1:10,00015/02/201901 JT CD A3
0 200 400 m
Surface Water Flood Risk(Map 17 of 22)
20.1.3a PB5640-006-0201-003a
27700EPSG:
Project:
¹ Enviornment Agency, 2018
Flood Risk Assessment
Norfolk Boreas red line boundary
Norfolk Boreas Onshore Project Infrastructure(Scenario 1 & 2)
Onshore cable route
Construction access
Operational access
Norfolk Boreas Onshore Project Infrastructure(Scenario 2)
Mobilisation zone
Indicative mobilisation area compound
Surface Water Flooding Extent¹
1 in 30
1 in 100
1 in 1000

Legend:
Title:
Report:
Norfolk Boreas
Drawn: Scale:Checked:Date:Revision:
Drawing No:
Size:
British National Grid
Figure:
Co-ordinate system:
TC4TC4
MA4
599000
599000
599500
599500
600000
600000
600500
600500
601000
601000
601500
601500
314500
314500
315000
315000
315500
315500
316000
316000
316500
316500
© Vattenfall Wind Power Ltd 2019. Contains Ordnance Survey data© Crown copyright and database rights 2019 Ordnance Survey 0100031673
±
1:10,00015/02/201901 JT CD A3
0 200 400 m
Surface Water Flood Risk(Map 18 of 22)
20.1.3a PB5640-006-0201-003a
27700EPSG:
Project:
¹ Enviornment Agency, 2018
Flood Risk Assessment
Norfolk Boreas red line boundary
Norfolk Boreas Onshore Project Infrastructure(Scenario 1 & 2)
Onshore cable route
Construction access
Operational access
Norfolk Boreas Onshore Project Infrastructure(Scenario 2)
Trenchless crossing zone (e.g. HDD)
Indicative trenchless crossing compound
Mobilisation zone
Indicative mobilisation area compound
Surface Water Flooding Extent¹
1 in 30
1 in 100
1 in 1000
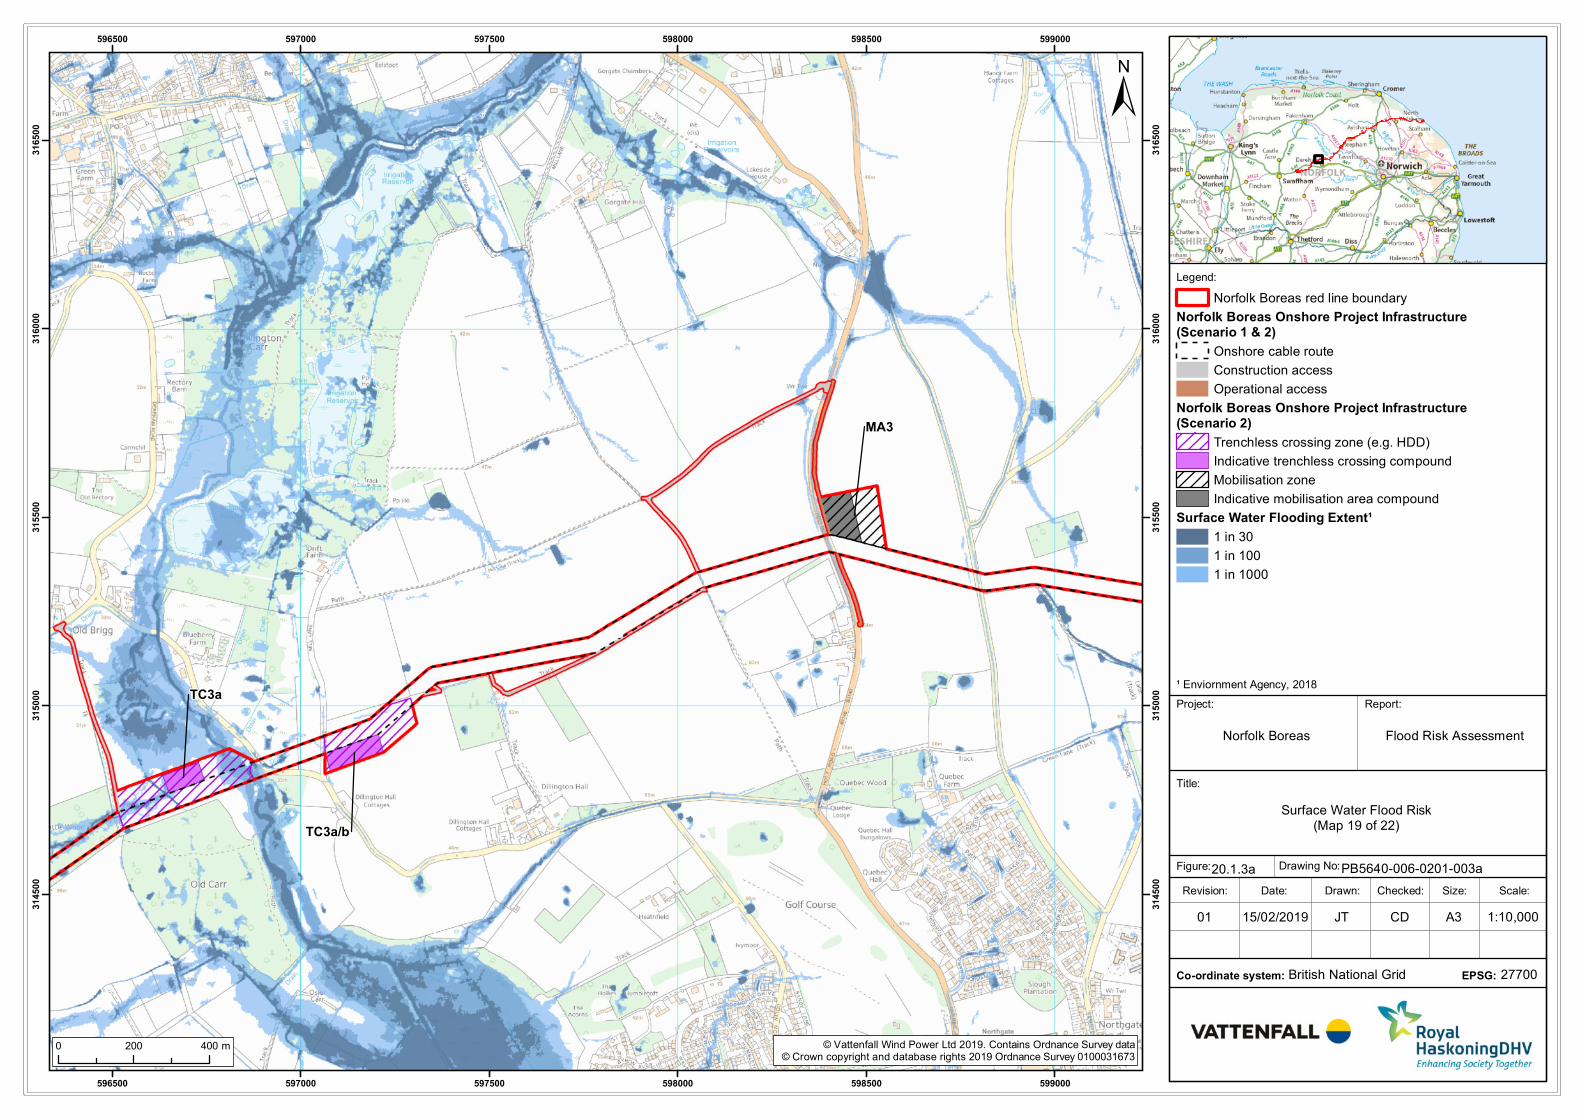
Legend:
Title:
Report:
Norfolk Boreas
Drawn: Scale:Checked:Date:Revision:
Drawing No:
Size:
British National Grid
Figure:
Co-ordinate system:
TC3a/b
TC3a
MA3
596500
596500
597000
597000
597500
597500
598000
598000
598500
598500
599000
599000
314500
314500
315000
315000
315500
315500
316000
316000
316500
316500
© Vattenfall Wind Power Ltd 2019. Contains Ordnance Survey data© Crown copyright and database rights 2019 Ordnance Survey 0100031673
±
1:10,00015/02/201901 JT CD A3
0 200 400 m
Surface Water Flood Risk(Map 19 of 22)
20.1.3a PB5640-006-0201-003a
27700EPSG:
Project:
¹ Enviornment Agency, 2018
Flood Risk Assessment
Norfolk Boreas red line boundary
Norfolk Boreas Onshore Project Infrastructure(Scenario 1 & 2)
Onshore cable route
Construction access
Operational access
Norfolk Boreas Onshore Project Infrastructure(Scenario 2)
Trenchless crossing zone (e.g. HDD)
Indicative trenchless crossing compound
Mobilisation zone
Indicative mobilisation area compound
Surface Water Flooding Extent¹
1 in 30
1 in 100
1 in 1000
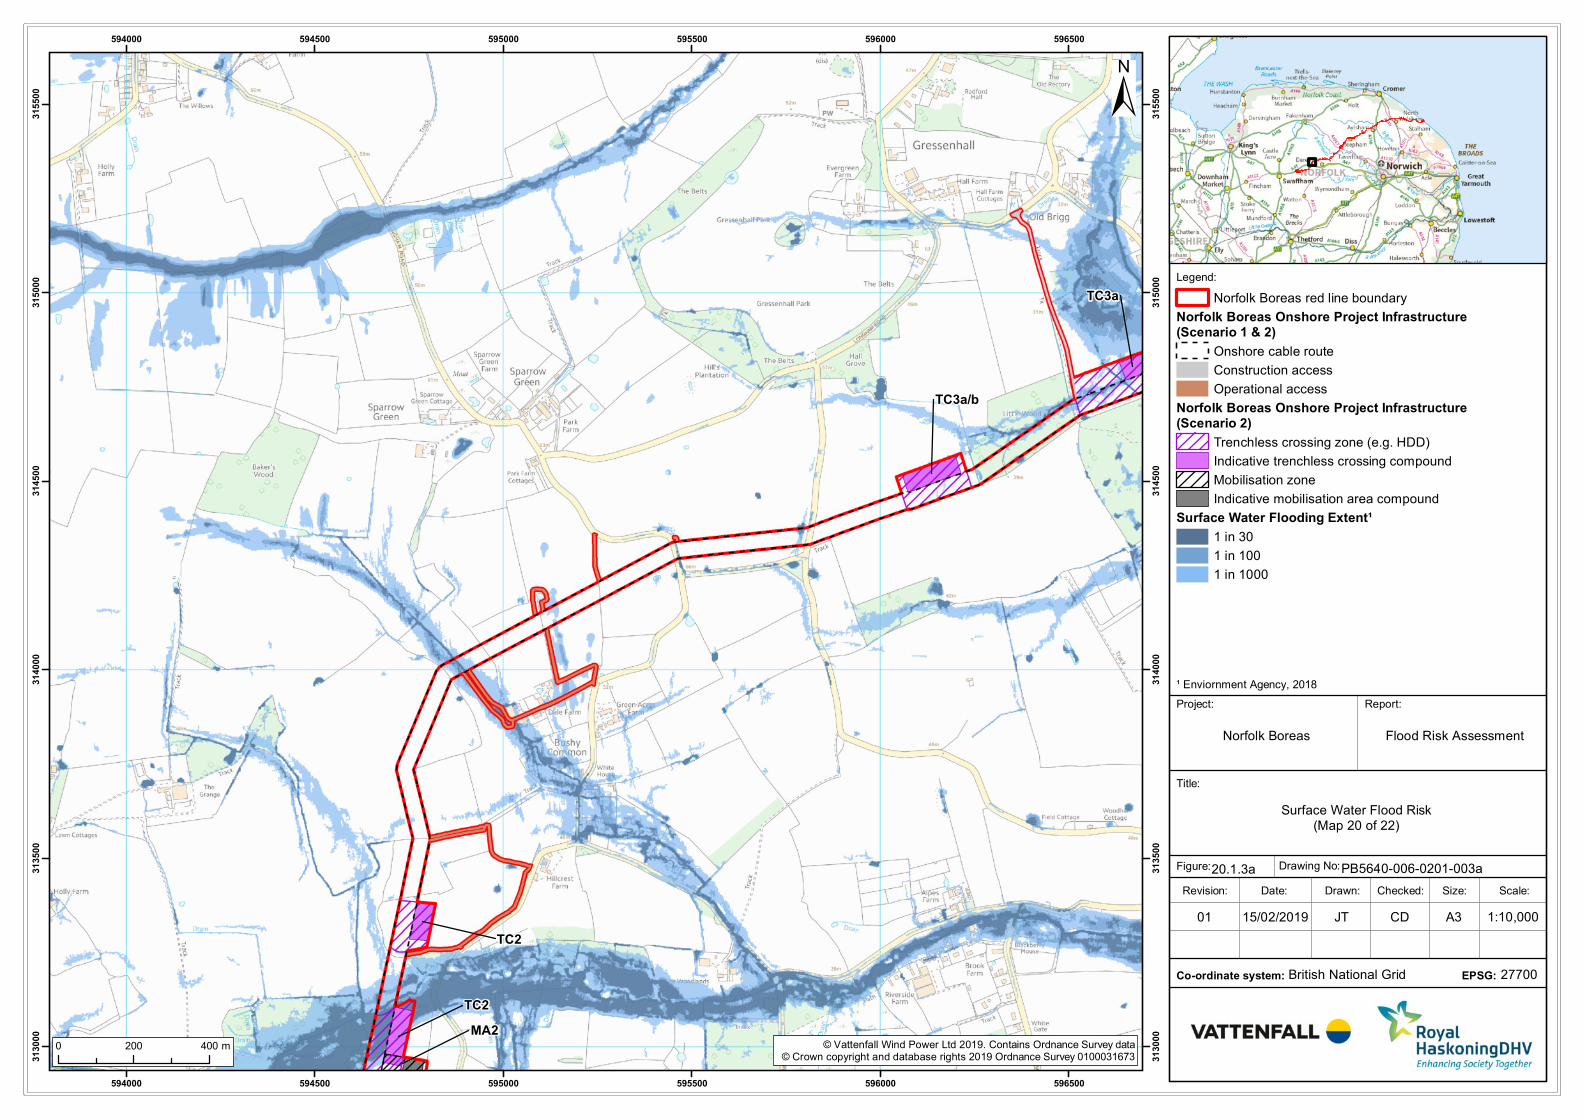
Legend:
Title:
Report:
Norfolk Boreas
Drawn: Scale:Checked:Date:Revision:
Drawing No:
Size:
British National Grid
Figure:
Co-ordinate system:
TC3a
TC3a/b
TC2
TC2
MA2
594000
594000
594500
594500
595000
595000
595500
595500
596000
596000
596500
596500
313000
313000
313500
313500
314000
314000
314500
314500
315000
315000
315500
315500
© Vattenfall Wind Power Ltd 2019. Contains Ordnance Survey data© Crown copyright and database rights 2019 Ordnance Survey 0100031673
±
1:10,00015/02/201901 JT CD A3
0 200 400 m
Surface Water Flood Risk(Map 20 of 22)
20.1.3a PB5640-006-0201-003a
27700EPSG:
Project:
¹ Enviornment Agency, 2018
Flood Risk Assessment
Norfolk Boreas red line boundary
Norfolk Boreas Onshore Project Infrastructure(Scenario 1 & 2)
Onshore cable route
Construction access
Operational access
Norfolk Boreas Onshore Project Infrastructure(Scenario 2)
Trenchless crossing zone (e.g. HDD)
Indicative trenchless crossing compound
Mobilisation zone
Indicative mobilisation area compound
Surface Water Flooding Extent¹
1 in 30
1 in 100
1 in 1000
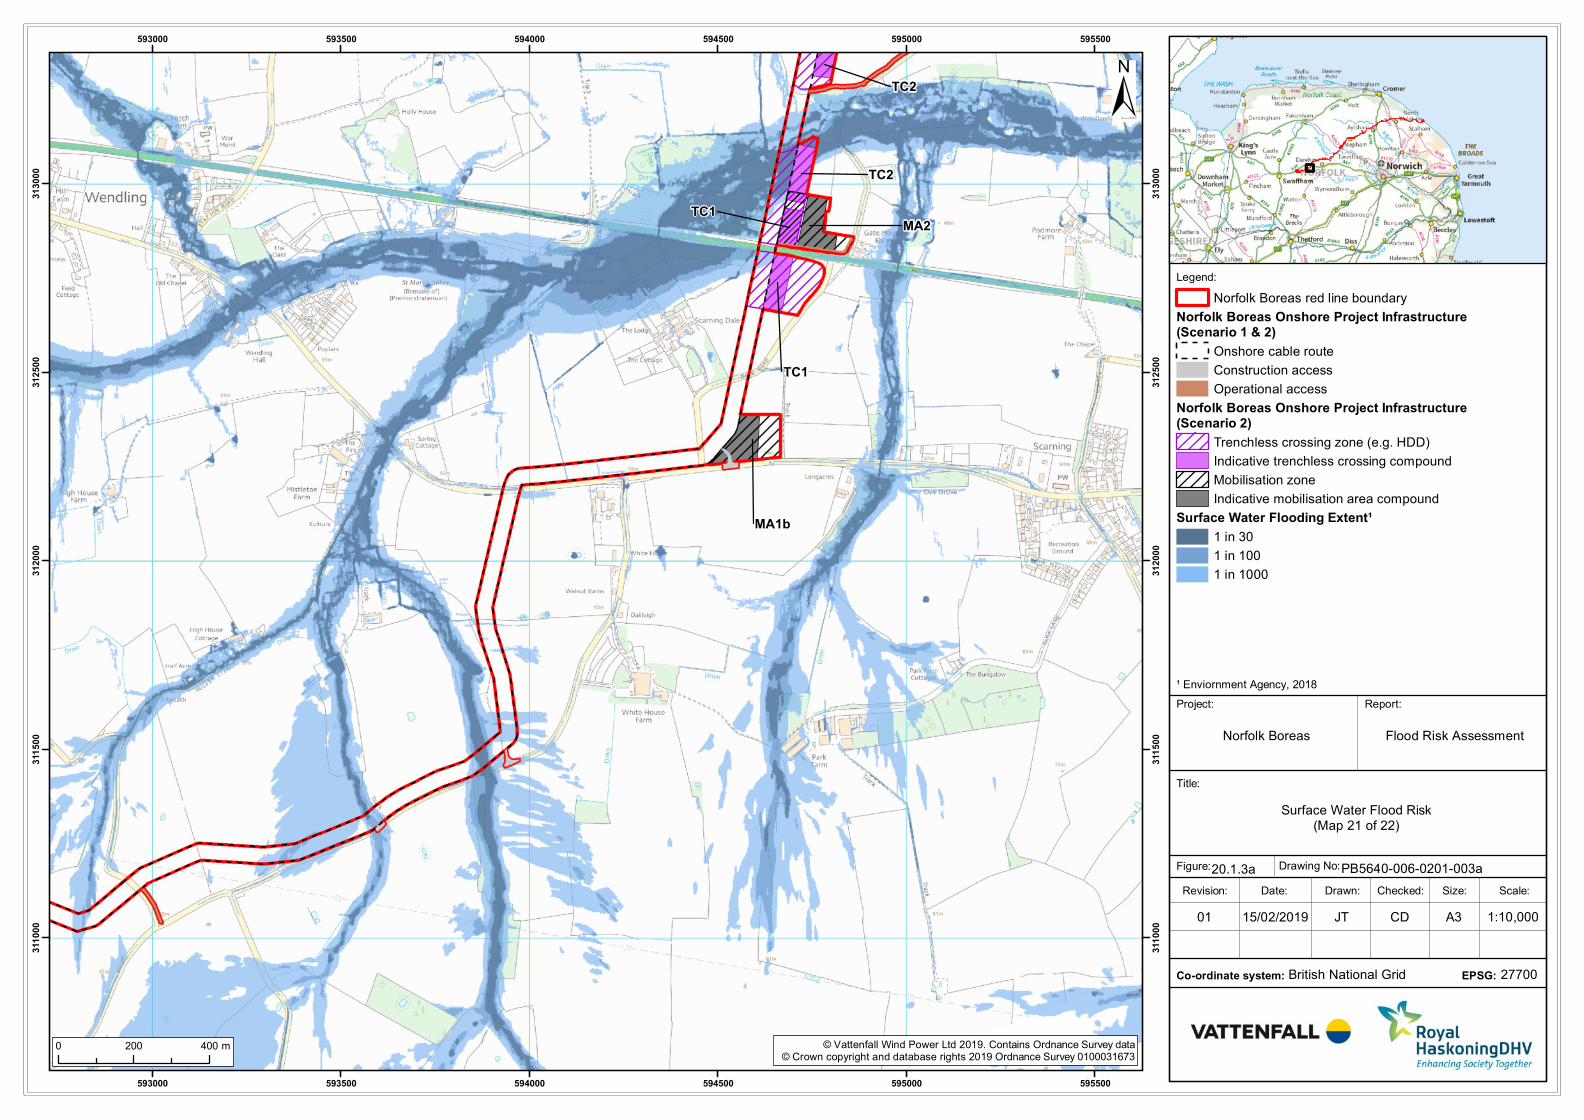
Legend:
Title:
Report:
Norfolk Boreas
Drawn: Scale:Checked:Date:Revision:
Drawing No:
Size:
British National Grid
Figure:
Co-ordinate system:
TC1
TC1
TC2
TC2
MA1b
MA2
593000
593000
593500
593500
594000
594000
594500
594500
595000
595000
595500
595500
311
000
311
000
311
500
311
500
312000
312000
312500
312500
313000
313000
© Vattenfall Wind Power Ltd 2019. Contains Ordnance Survey data© Crown copyright and database rights 2019 Ordnance Survey 0100031673
±
1:10,00015/02/201901 JT CD A3
0 200 400 m
Surface Water Flood Risk(Map 21 of 22)
20.1.3a PB5640-006-0201-003a
27700EPSG:
Project:
¹ Enviornment Agency, 2018
Flood Risk Assessment
Norfolk Boreas red line boundary
Norfolk Boreas Onshore Project Infrastructure(Scenario 1 & 2)
Onshore cable route
Construction access
Operational access
Norfolk Boreas Onshore Project Infrastructure(Scenario 2)
Trenchless crossing zone (e.g. HDD)
Indicative trenchless crossing compound
Mobilisation zone
Indicative mobilisation area compound
Surface Water Flooding Extent¹
1 in 30
1 in 100
1 in 1000
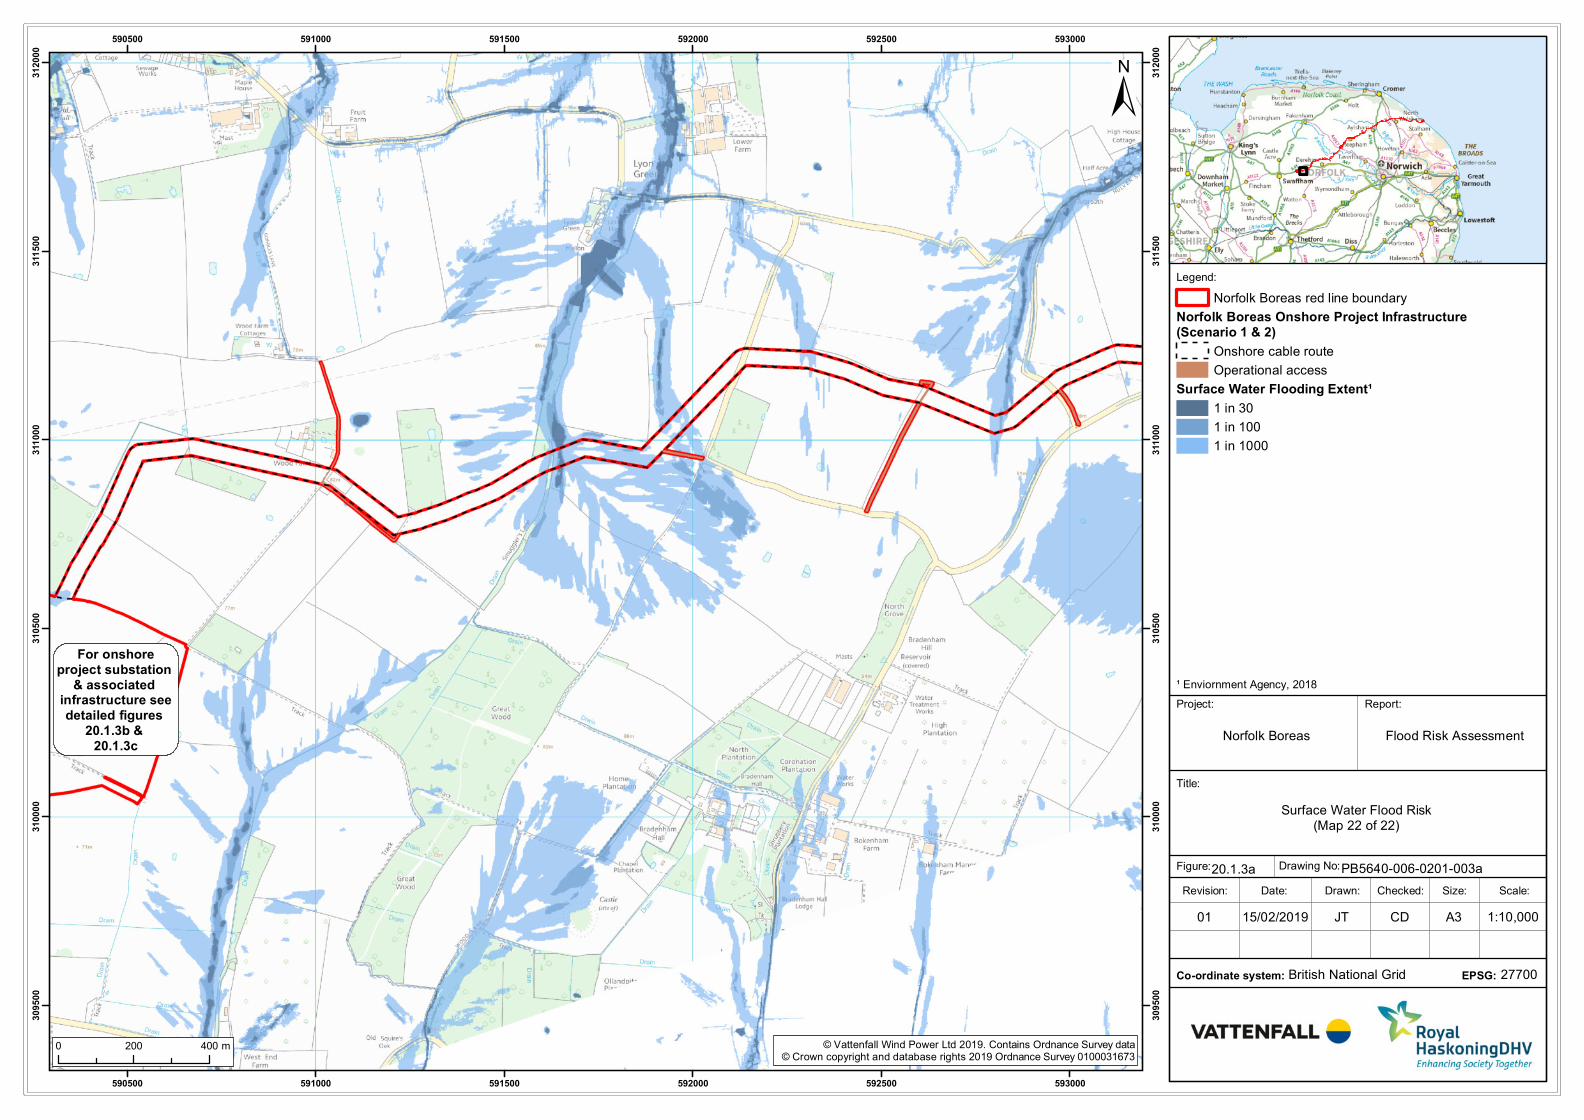
Legend:
Title:
Report:
Norfolk Boreas
Drawn: Scale:Checked:Date:Revision:
Drawing No:
Size:
British National Grid
Figure:
Co-ordinate system:
For onshoreproject substation
& associated infrastructure seedetailed figures
20.1.3b & 20.1.3c
590500
590500
591000
591000
591500
591500
592000
592000
592500
592500
593000
593000
309500
309500
310000
310000
310500
310500
311
000
311
000
311
500
311
500
312000
312000
© Vattenfall Wind Power Ltd 2019. Contains Ordnance Survey data© Crown copyright and database rights 2019 Ordnance Survey 0100031673
±
1:10,00015/02/201901 JT CD A3
0 200 400 m
Surface Water Flood Risk(Map 22 of 22)
20.1.3a PB5640-006-0201-003a
27700EPSG:
Project:
¹ Enviornment Agency, 2018
Flood Risk Assessment
Norfolk Boreas red line boundary
Norfolk Boreas Onshore Project Infrastructure(Scenario 1 & 2)
Onshore cable route
Operational access
Surface Water Flooding Extent¹
1 in 30
1 in 100
1 in 1000

Legend:
Title:
Report:
Norfolk Boreas
Drawn: Scale:Checked:Date:Revision:
Drawing No:
Size:
British National Grid
Figure:
Co-ordinate system:
MA1a
588000
588000
588500
588500
589000
589000
589500
589500
590000
590000
590500
590500
309500
309500
310000
310000
310500
310500
311
000
311
000
311
500
311
500
312000
312000
© Vattenfall Wind Power Ltd 2019. Contains Ordnance Survey data© Crown copyright and database rights 2019 Ordnance Survey 0100031673
±
1:10,00015/02/201901 JT CD A3
0 200 400 m
Surface Water Flood Risk
20.1.3b PB5640-006-0201-003b
27700EPSG:
Project:
Flood Risk Assessment
Norfolk Boreas red lineboundary
Norfolk Boreas OnshoreProject Infrastructure(Scenario 1)
Onshore cable route
Cable route entry tosubstation
Onshore 400kV cableroute
Mobilisation zone
Indicative mobilisationarea compound
Construction access
Operational access
Permanent access
Onshore projectsubstation
Onshore projectsubstation temporaryconstruction compoundzone
Indicative onshoreproject substationtemporary constructioncompound
Attenuation pond zone
Indicative attenuationpond
Indicative mitigationplanting
National Grid substationextension
National Grid temporaryworks
National Grid attenuationpond location searcharea
Indicative National Gridattenuation pond
Surface WaterFlooding Extent¹
1 in 30
1 in 100
1 in 1000¹ Enviornment Agency, 2018
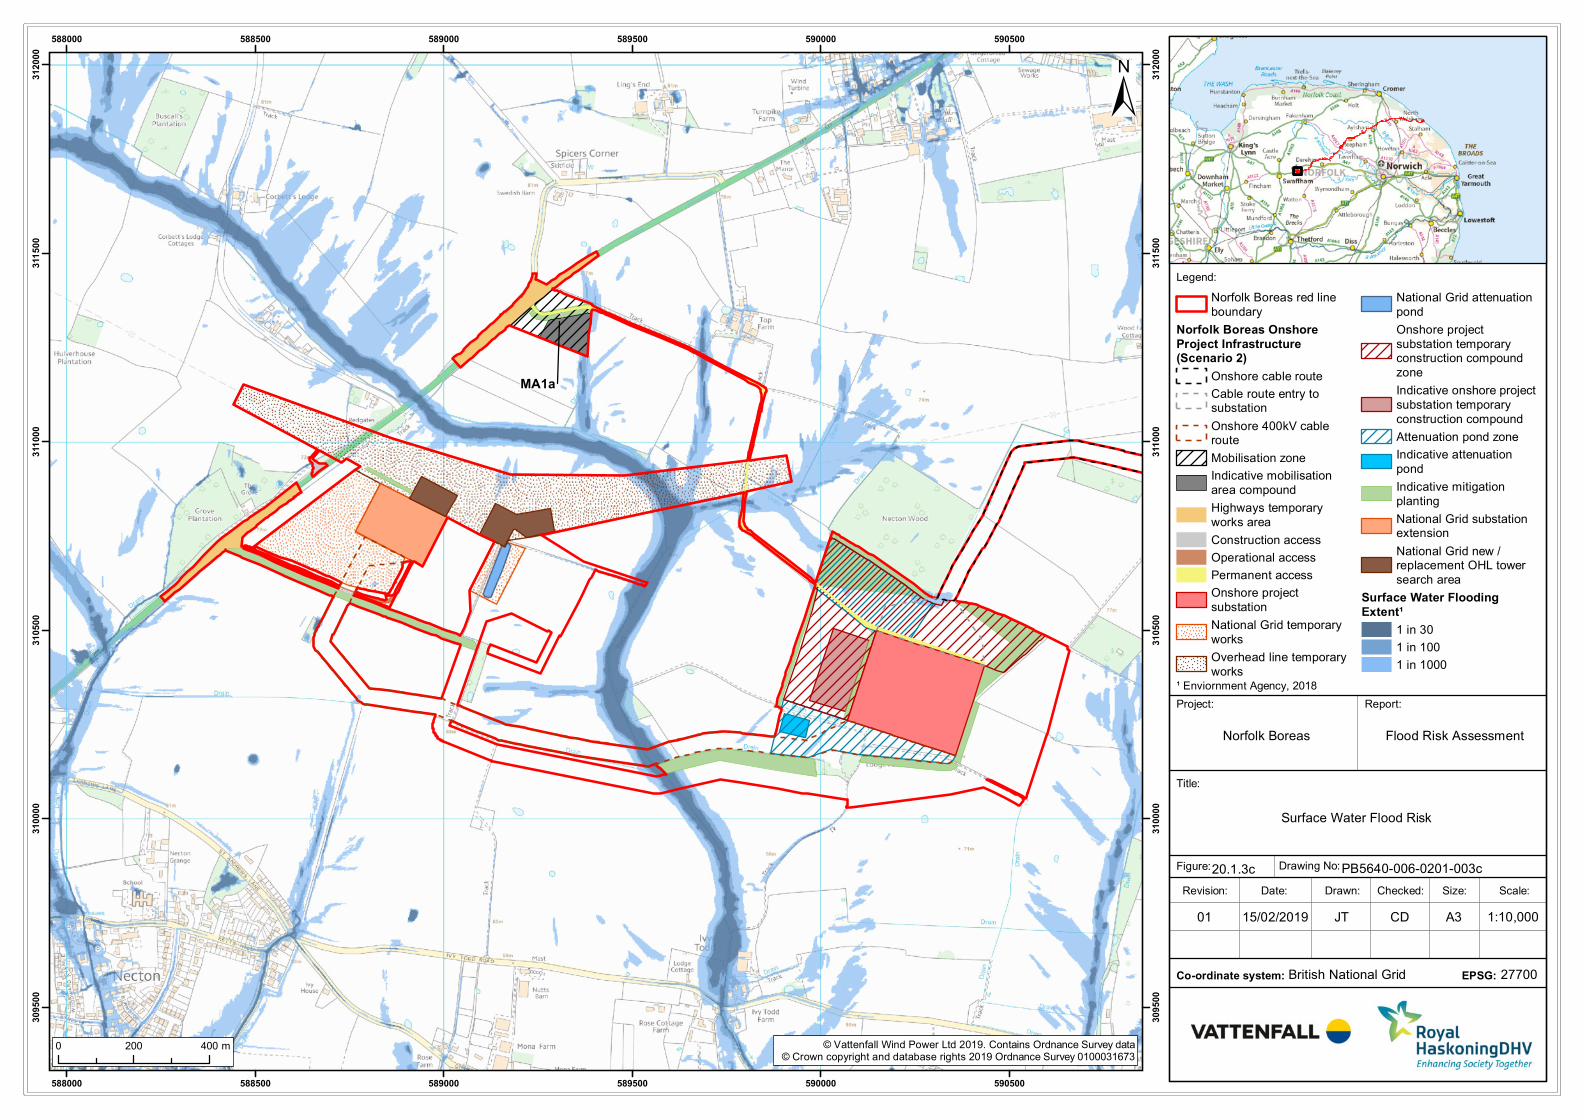
Legend:
Title:
Report:
Norfolk Boreas
Drawn: Scale:Checked:Date:Revision:
Drawing No:
Size:
British National Grid
Figure:
Co-ordinate system:
MA1a
588000
588000
588500
588500
589000
589000
589500
589500
590000
590000
590500
590500
309500
309500
310000
310000
310500
310500
311
000
311
000
311
500
311
500
312000
312000
© Vattenfall Wind Power Ltd 2019. Contains Ordnance Survey data© Crown copyright and database rights 2019 Ordnance Survey 0100031673
±
1:10,00015/02/201901 JT CD A3
0 200 400 m
Surface Water Flood Risk
20.1.3c PB5640-006-0201-003c
27700EPSG:
Project:
¹ Enviornment Agency, 2018
Flood Risk Assessment
Norfolk Boreas red line
boundary
Norfolk Boreas Onshore
Project Infrastructure(Scenario 2)
Onshore cable route
Cable route entry tosubstation
Onshore 400kV cableroute
Mobilisation zone
Indicative mobilisation
area compound
Highways temporary
works area
Construction access
Operational access
Permanent access
Onshore project
substation
National Grid temporary
works
Overhead line temporary
works
National Grid attenuation
pond
Onshore project
substation temporaryconstruction compound
zone
Indicative onshore project
substation temporary
construction compound
Attenuation pond zone
Indicative attenuation
pond
Indicative mitigation
planting
National Grid substationextension
National Grid new /replacement OHL tower
search area
Surface Water Flooding
Extent¹
1 in 30
1 in 100
1 in 1000
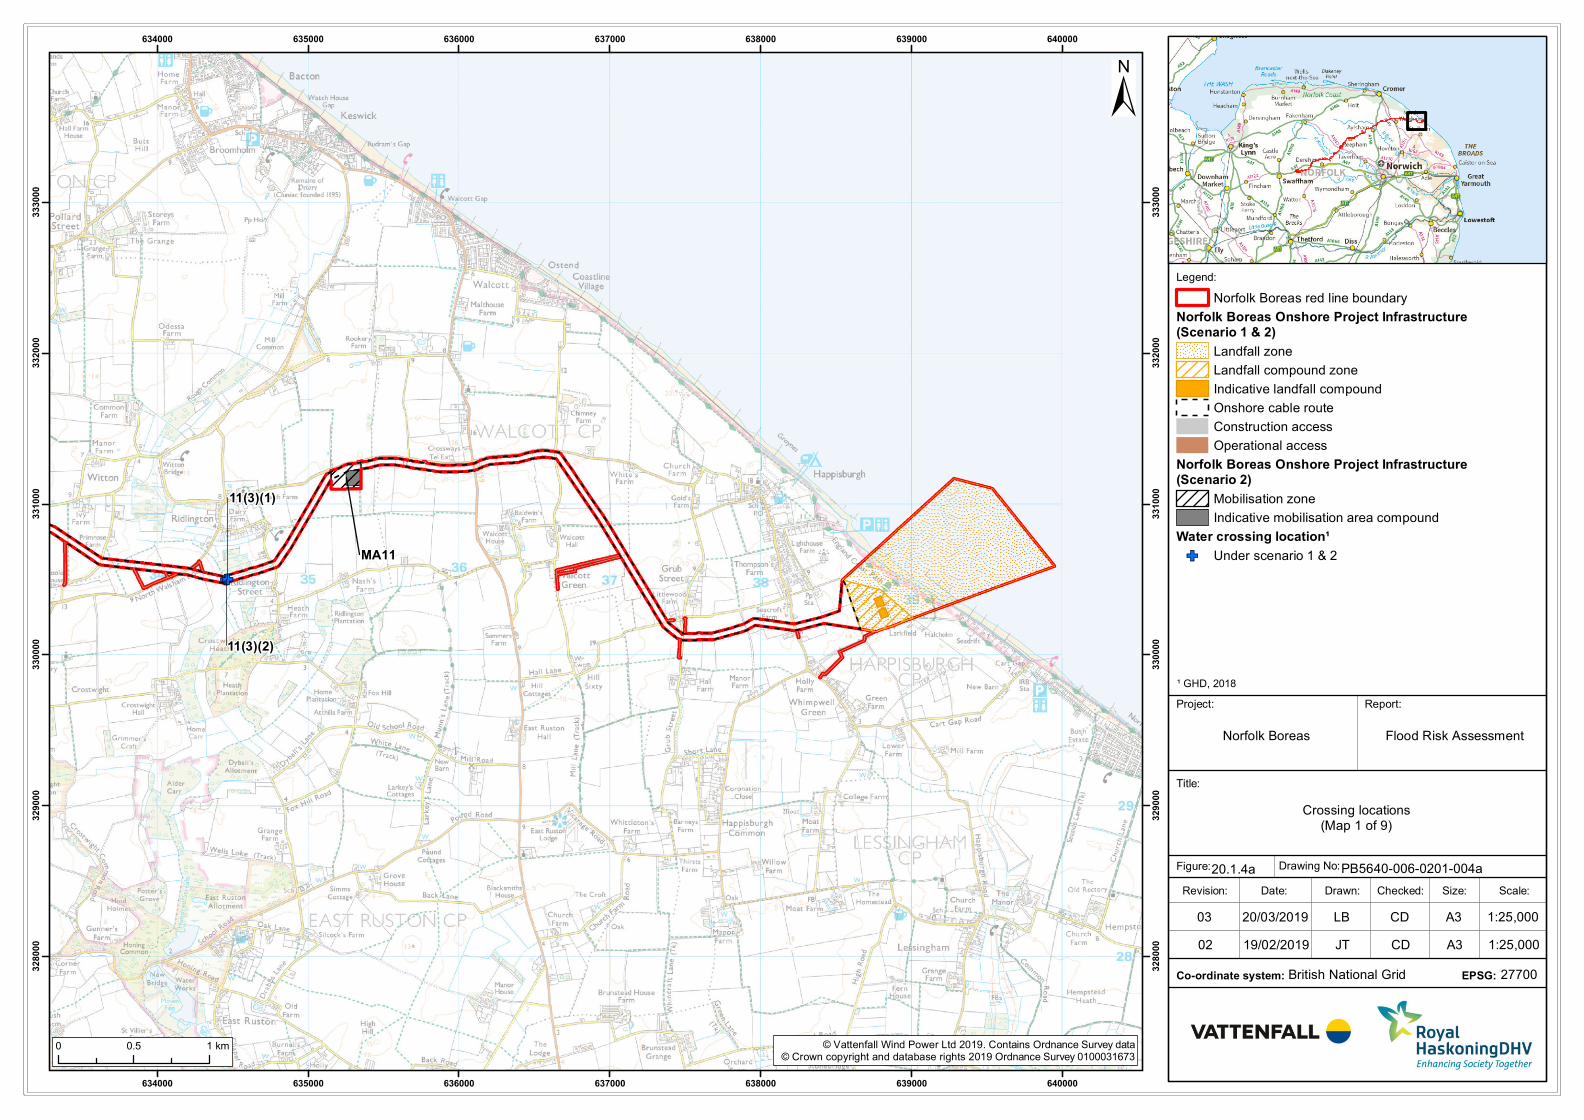
Legend:
Title:
Report:
Norfolk Boreas
Drawn: Scale:Checked:Date:Revision:
Drawing No:
Size:
British National Grid
Figure:
Co-ordinate system:
GFGF
11(3)(1)
11(3)(2)
MA11
634000
634000
635000
635000
636000
636000
637000
637000
638000
638000
639000
639000
640000
640000
328000
328000
329000
329000
330000
330000
331000
331000
332000
332000
333000
333000
© Vattenfall Wind Power Ltd 2019. Contains Ordnance Survey data© Crown copyright and database rights 2019 Ordnance Survey 0100031673
±
1:25,00020/03/201903 LB CD A3
0 0.5 1 km
Crossing locations(Map 1 of 9)
20.1.4a PB5640-006-0201-004a
27700EPSG:
Project:
Flood Risk Assessment
Norfolk Boreas red line boundary
Norfolk Boreas Onshore Project Infrastructure(Scenario 1 & 2)
Landfall zone
Landfall compound zone
Indicative landfall compound
Onshore cable route
Construction access
Operational access
Norfolk Boreas Onshore Project Infrastructure(Scenario 2)
Mobilisation zone
Indicative mobilisation area compound
Water crossing location¹
GF Under scenario 1 & 2
¹ GHD, 2018
1:25,00019/02/201902 JT CD A3
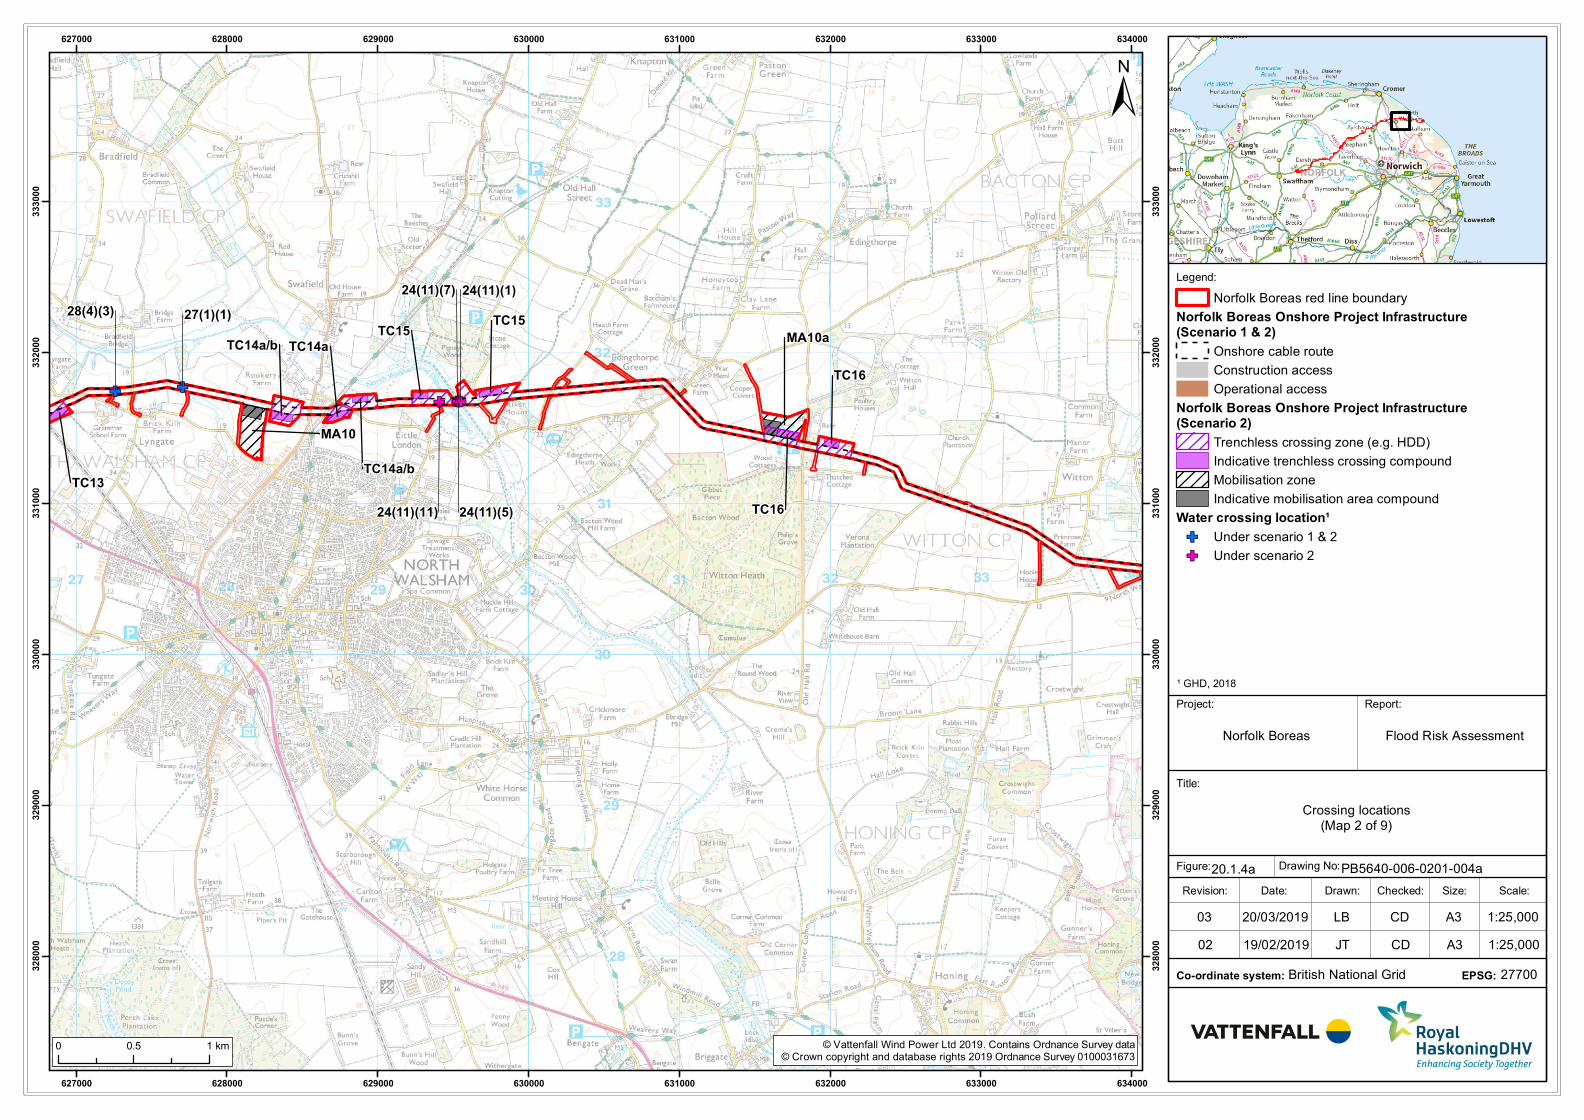
Legend:
Title:
Report:
Norfolk Boreas
Drawn: Scale:Checked:Date:Revision:
Drawing No:
Size:
British National Grid
Figure:
Co-ordinate system:
GF
GF
GFGFGFGF
24(11)(11)
24(11)(1)24(11)(7)
24(11)(5)
27(1)(1)28(4)(3)
TC16
TC15
TC13
TC16
TC15
TC14a/b
TC14a/b TC14a
MA10
MA10a
627000
627000
628000
628000
629000
629000
630000
630000
631000
631000
632000
632000
633000
633000
634000
634000
328000
328000
329000
329000
330000
330000
331000
331000
332000
332000
333000
333000
© Vattenfall Wind Power Ltd 2019. Contains Ordnance Survey data© Crown copyright and database rights 2019 Ordnance Survey 0100031673
±
1:25,00020/03/201903 LB CD A3
0 0.5 1 km
Crossing locations(Map 2 of 9)
20.1.4a PB5640-006-0201-004a
27700EPSG:
Project:
Flood Risk Assessment
Norfolk Boreas red line boundary
Norfolk Boreas Onshore Project Infrastructure(Scenario 1 & 2)
Onshore cable route
Construction access
Operational access
Norfolk Boreas Onshore Project Infrastructure(Scenario 2)
Trenchless crossing zone (e.g. HDD)
Indicative trenchless crossing compound
Mobilisation zone
Indicative mobilisation area compound
Water crossing location¹
GF Under scenario 1 & 2
GF Under scenario 2
¹ GHD, 2018
1:25,00019/02/201902 JT CD A3
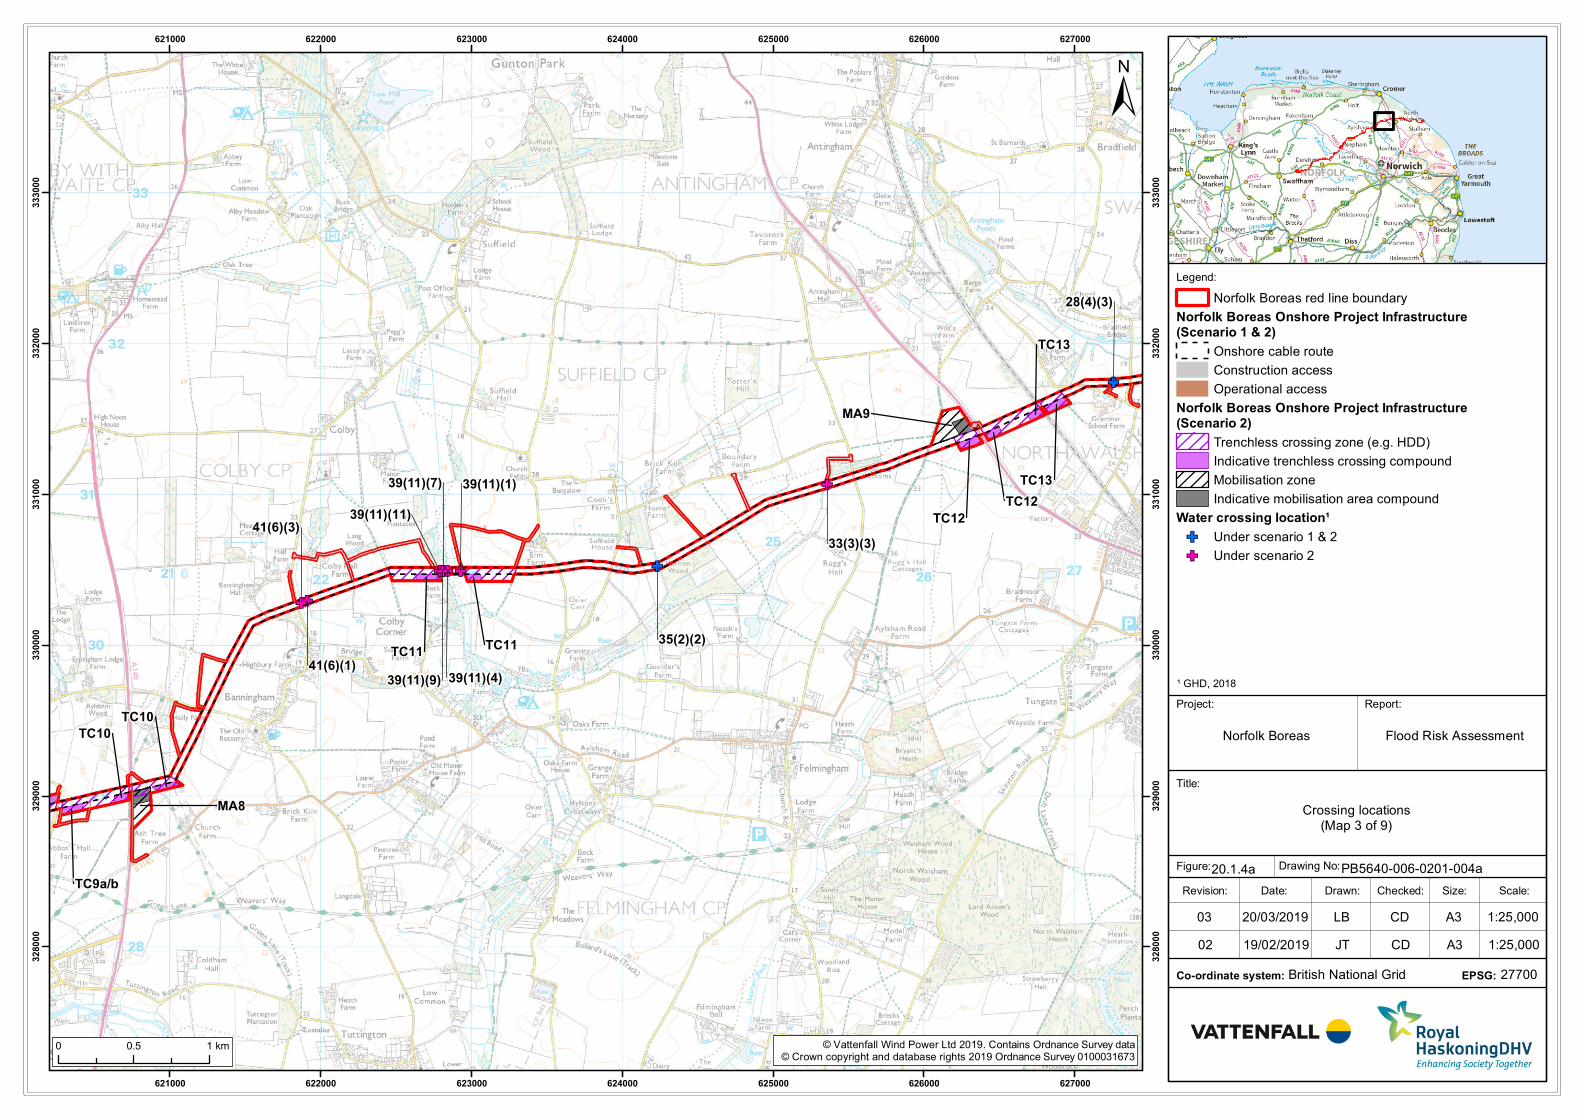
Legend:
Title:
Report:
Norfolk Boreas
Drawn: Scale:Checked:Date:Revision:
Drawing No:
Size:
British National Grid
Figure:
Co-ordinate system:
GF
GF GFGF
GF
GFGF
GF
GF
GF
28(4)(3)
33(3)(3)
35(2)(2)
41(6)(3)
41(6)(1)
39(11)(1)
39(11)(4)
39(11)(11)
39(11)(9)
39(11)(7) TC13
TC10
TC10
TC9a/b
TC12
TC13
TC12
TC11TC11
MA8
MA9
621000
621000
622000
622000
623000
623000
624000
624000
625000
625000
626000
626000
627000
627000
328000
328000
329000
329000
330000
330000
331000
331000
332000
332000
333000
333000
© Vattenfall Wind Power Ltd 2019. Contains Ordnance Survey data© Crown copyright and database rights 2019 Ordnance Survey 0100031673
±
1:25,00020/03/201903 LB CD A3
0 0.5 1 km
Crossing locations(Map 3 of 9)
20.1.4a PB5640-006-0201-004a
27700EPSG:
Project:
Flood Risk Assessment
Norfolk Boreas red line boundary
Norfolk Boreas Onshore Project Infrastructure(Scenario 1 & 2)
Onshore cable route
Construction access
Operational access
Norfolk Boreas Onshore Project Infrastructure(Scenario 2)
Trenchless crossing zone (e.g. HDD)
Indicative trenchless crossing compound
Mobilisation zone
Indicative mobilisation area compound
Water crossing location¹
GF Under scenario 1 & 2
GF Under scenario 2
¹ GHD, 2018
1:25,00019/02/201902 JT CD A3
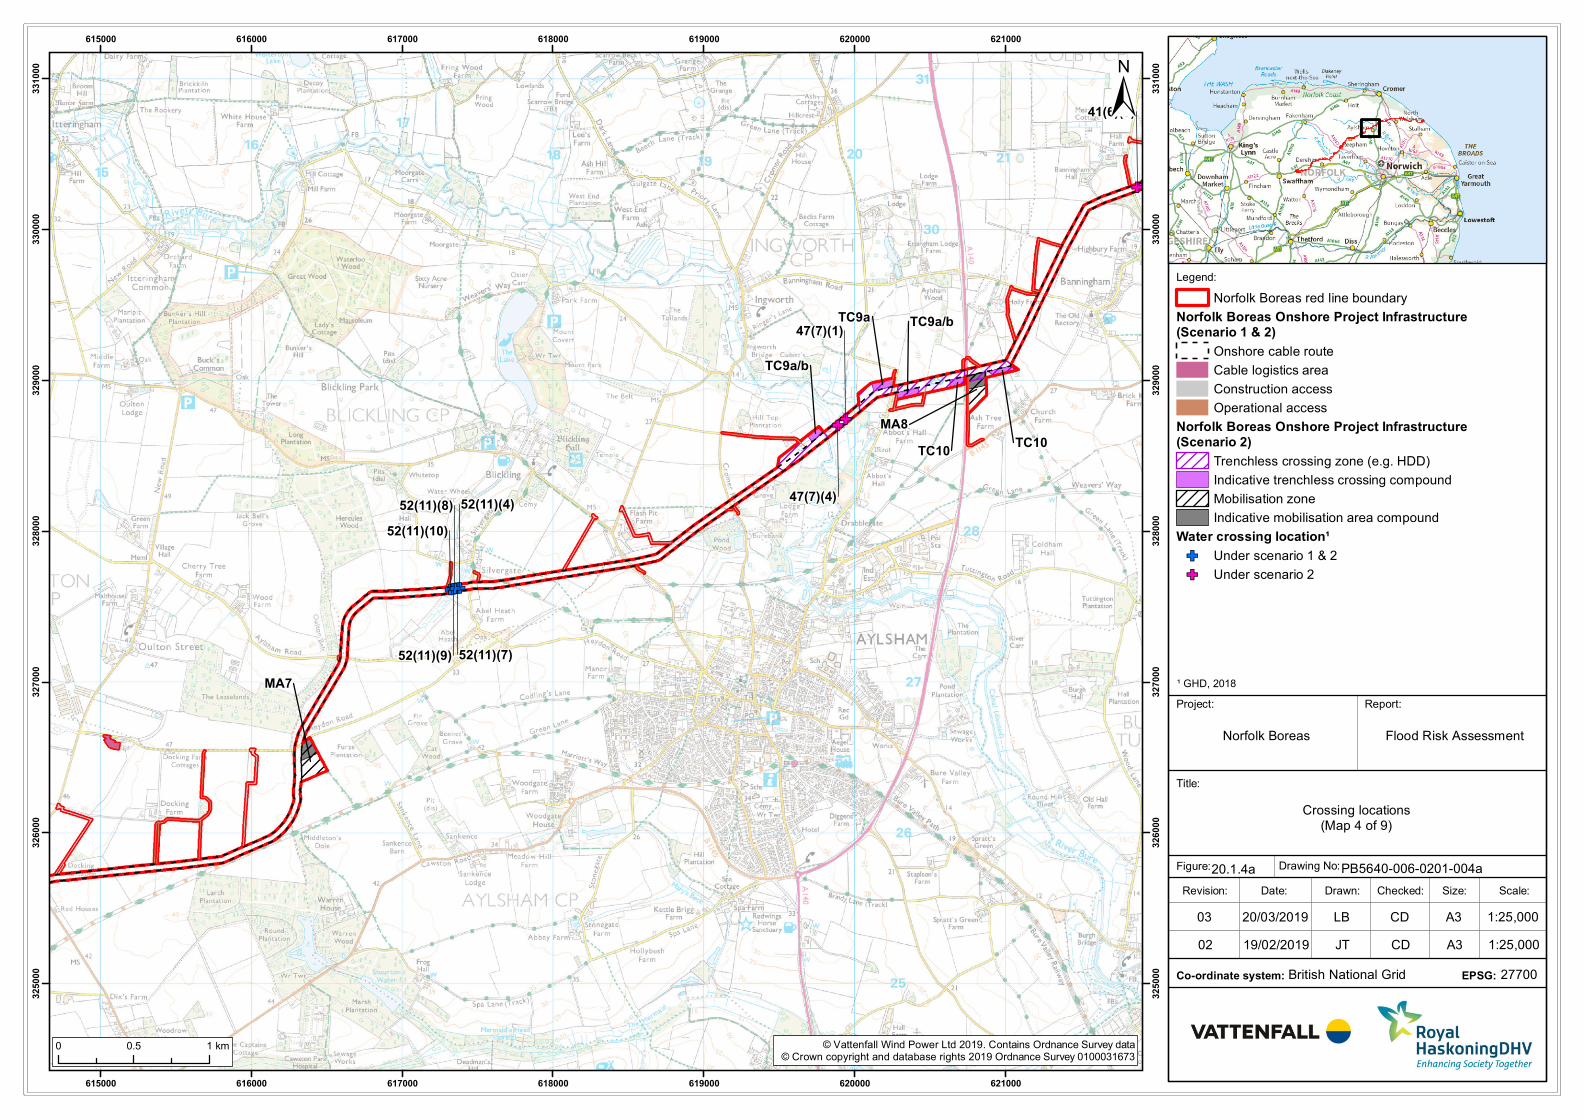
Legend:
Title:
Report:
Norfolk Boreas
Drawn: Scale:Checked:Date:Revision:
Drawing No:
Size:
British National Grid
Figure:
Co-ordinate system:
GFGFGFGF
GF
GF
GF
GF
GF
41(6)(3)
4
47(7)(1)
47(7)(4)
52(11)(10)
52(11)(9)
52(11)(8)
52(11)(7)
52(11)(4)
TC10TC10
TC9a/b
TC9a/b
TC9a
MA8
MA7
615000
615000
616000
616000
617000
617000
618000
618000
619000
619000
620000
620000
621000
621000
325000
325000
326000
326000
327000
327000
328000
328000
329000
329000
330000
330000
331000
331000
© Vattenfall Wind Power Ltd 2019. Contains Ordnance Survey data© Crown copyright and database rights 2019 Ordnance Survey 0100031673
±
1:25,00020/03/201903 LB CD A3
0 0.5 1 km
Crossing locations(Map 4 of 9)
20.1.4a PB5640-006-0201-004a
27700EPSG:
Project:
Flood Risk Assessment
Norfolk Boreas red line boundary
Norfolk Boreas Onshore Project Infrastructure(Scenario 1 & 2)
Onshore cable route
Cable logistics area
Construction access
Operational access
Norfolk Boreas Onshore Project Infrastructure(Scenario 2)
Trenchless crossing zone (e.g. HDD)
Indicative trenchless crossing compound
Mobilisation zone
Indicative mobilisation area compound
Water crossing location¹
GF Under scenario 1 & 2
GF Under scenario 2
¹ GHD, 2018
1:25,00019/02/201902 JT CD A3
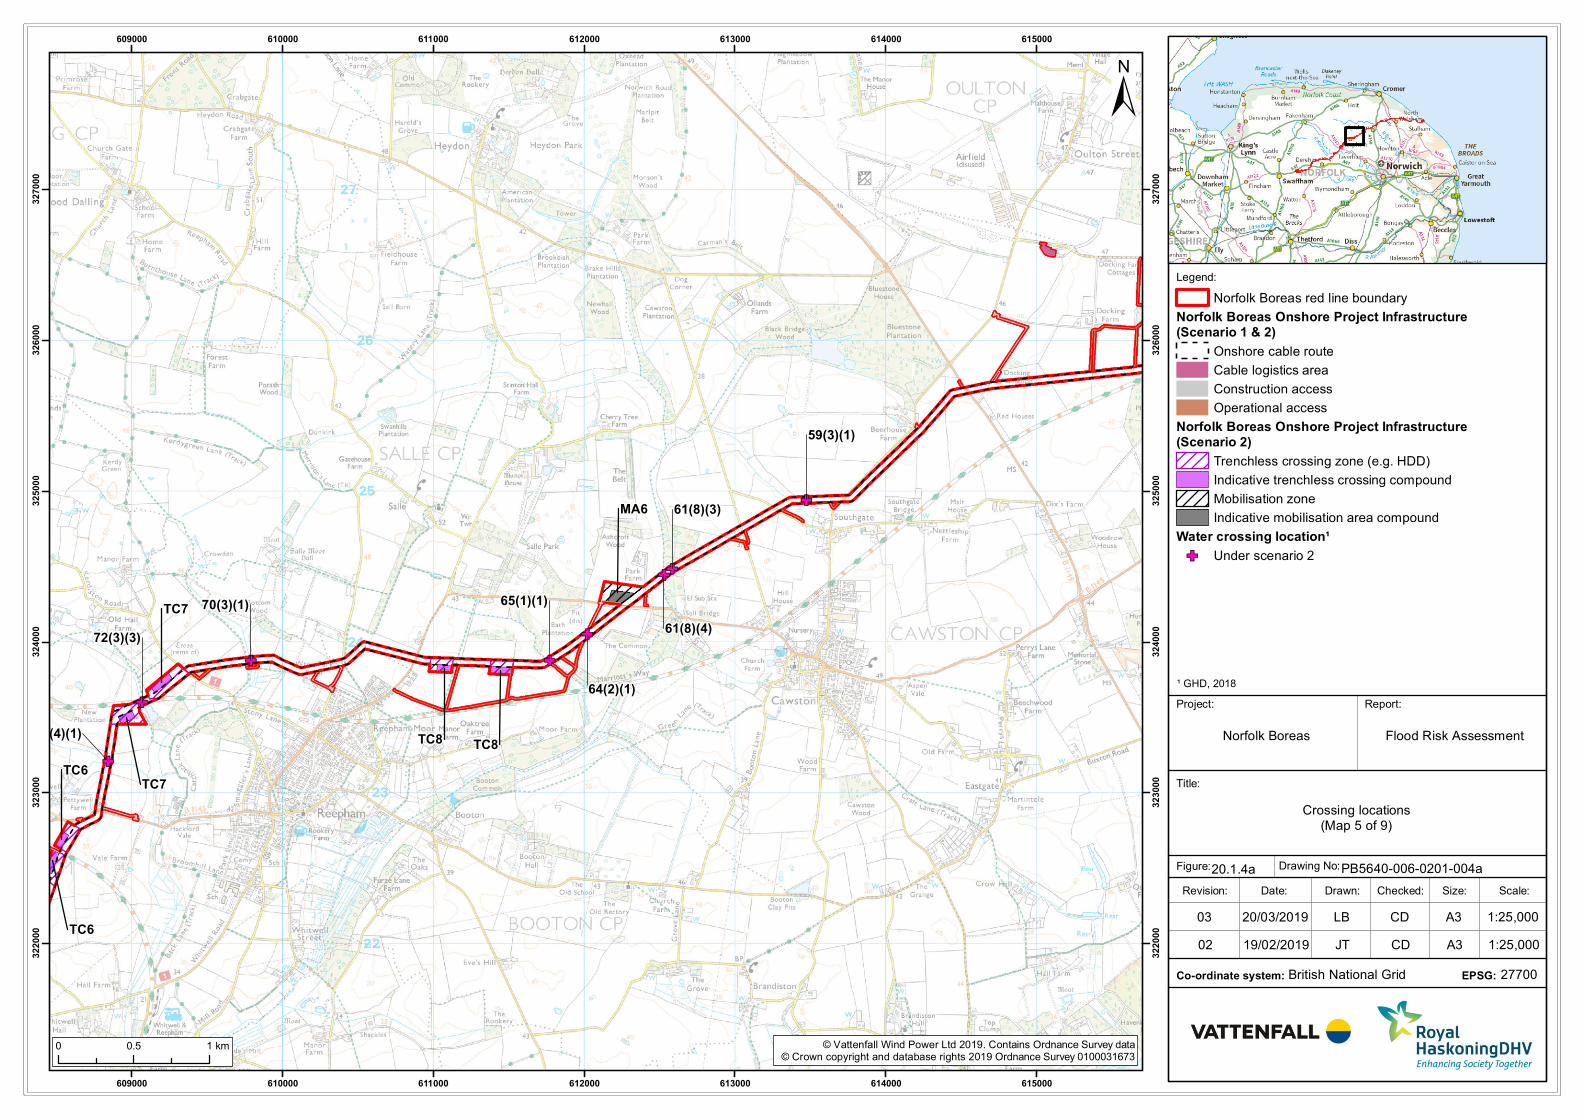
Legend:
Title:
Report:
Norfolk Boreas
Drawn: Scale:Checked:Date:Revision:
Drawing No:
Size:
British National Grid
Figure:
Co-ordinate system:
GF
GF
GF
GF
GF
GFGF
GF
59(3)(1)
61(8)(3)
61(8)(4)
64(2)(1)
65(1)(1)70(3)(1)
72(3)(3)
73(4)(1)TC8TC8
TC6
TC6
TC7
TC7
MA6
609000
609000
610000
610000
611000
611000
612000
612000
613000
613000
614000
614000
615000
615000
322000
322000
323000
323000
324000
324000
325000
325000
326000
326000
327000
327000
© Vattenfall Wind Power Ltd 2019. Contains Ordnance Survey data© Crown copyright and database rights 2019 Ordnance Survey 0100031673
±
1:25,00020/03/201903 LB CD A3
0 0.5 1 km
Crossing locations(Map 5 of 9)
20.1.4a PB5640-006-0201-004a
27700EPSG:
Project:
Flood Risk Assessment
Norfolk Boreas red line boundary
Norfolk Boreas Onshore Project Infrastructure(Scenario 1 & 2)
Onshore cable route
Cable logistics area
Construction access
Operational access
Norfolk Boreas Onshore Project Infrastructure(Scenario 2)
Trenchless crossing zone (e.g. HDD)
Indicative trenchless crossing compound
Mobilisation zone
Indicative mobilisation area compound
Water crossing location¹
GF Under scenario 2
¹ GHD, 2018
1:25,00019/02/201902 JT CD A3
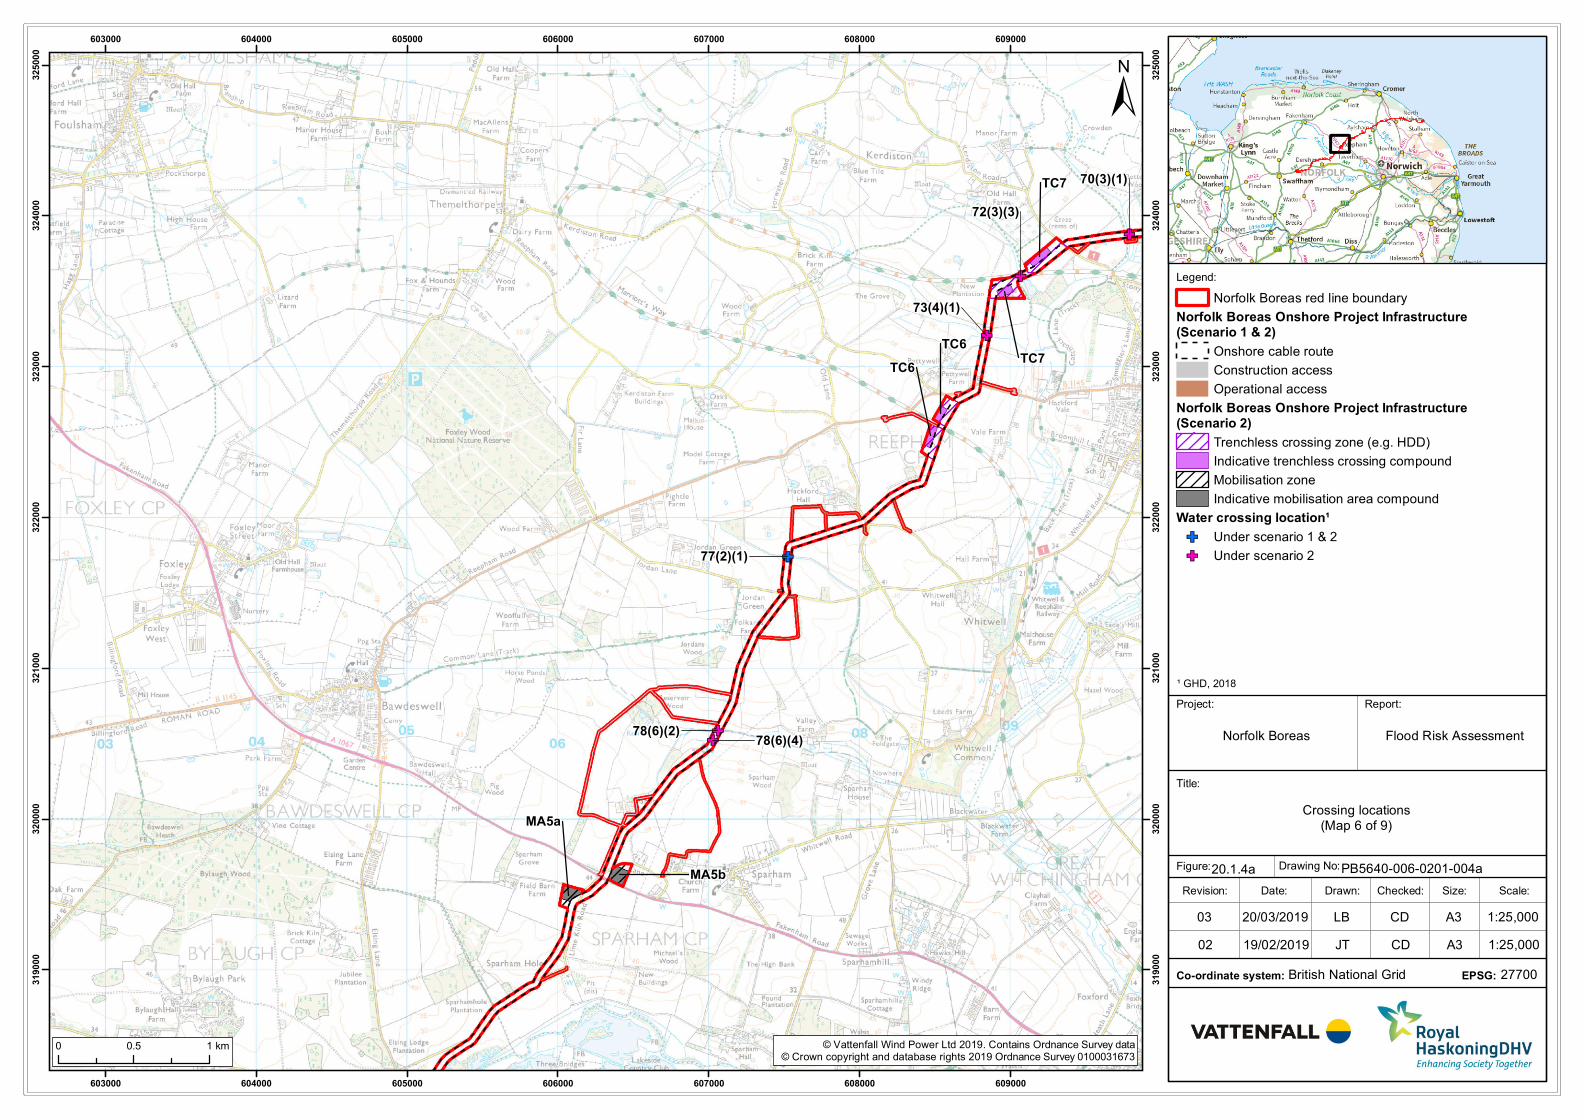
Legend:
Title:
Report:
Norfolk Boreas
Drawn: Scale:Checked:Date:Revision:
Drawing No:
Size:
British National Grid
Figure:
Co-ordinate system:
GF
GF
GF
GF
GF
GF
70(3)(1)
72(3)(3)
73(4)(1)
77(2)(1)
78(6)(2)78(6)(4)
TC6
TC6
TC7
TC7
MA5b
MA5a
603000
603000
604000
604000
605000
605000
606000
606000
607000
607000
608000
608000
609000
609000
319000
319000
320000
320000
321000
321000
322000
322000
323000
323000
324000
324000
325000
325000
© Vattenfall Wind Power Ltd 2019. Contains Ordnance Survey data© Crown copyright and database rights 2019 Ordnance Survey 0100031673
±
1:25,00020/03/201903 LB CD A3
0 0.5 1 km
Crossing locations(Map 6 of 9)
20.1.4a PB5640-006-0201-004a
27700EPSG:
Project:
Flood Risk Assessment
Norfolk Boreas red line boundary
Norfolk Boreas Onshore Project Infrastructure(Scenario 1 & 2)
Onshore cable route
Construction access
Operational access
Norfolk Boreas Onshore Project Infrastructure(Scenario 2)
Trenchless crossing zone (e.g. HDD)
Indicative trenchless crossing compound
Mobilisation zone
Indicative mobilisation area compound
Water crossing location¹
GF Under scenario 1 & 2
GF Under scenario 2
¹ GHD, 2018
1:25,00019/02/201902 JT CD A3
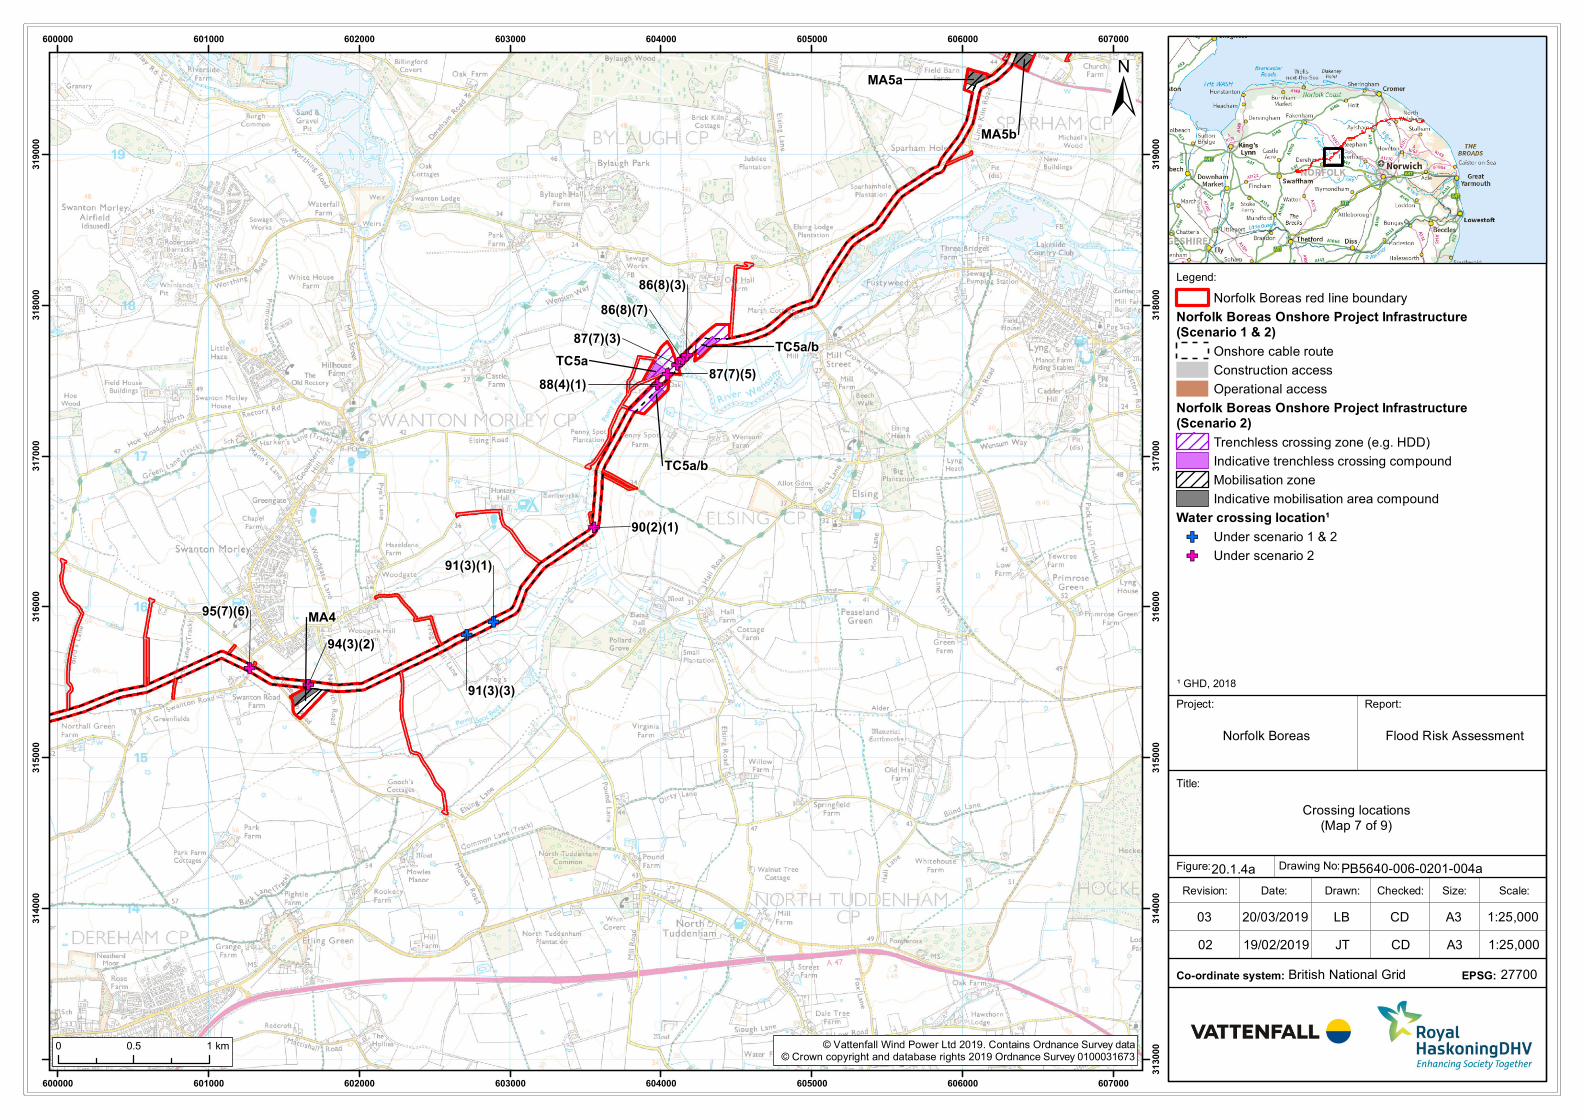
Legend:
Title:
Report:
Norfolk Boreas
Drawn: Scale:Checked:Date:Revision:
Drawing No:
Size:
British National Grid
Figure:
Co-ordinate system:
GF
GF
GF
GFGF
GF
GF
GF
GF
GF
90(2)(1)
86(8)(3)
86(8)(7)
87(7)(3)
87(7)(5)88(4)(1)
91(3)(1)
91(3)(3)
94(3)(2)
95(7)(6)
TC5a/b
TC5a/b
TC5a
MA4
MA5b
MA5a
600000
600000
601000
601000
602000
602000
603000
603000
604000
604000
605000
605000
606000
606000
607000
607000
313000
314000
314000
315000
315000
316000
316000
317000
317000
318000
318000
319000
319000
© Vattenfall Wind Power Ltd 2019. Contains Ordnance Survey data© Crown copyright and database rights 2019 Ordnance Survey 0100031673
±
1:25,00020/03/201903 LB CD A3
0 0.5 1 km
Crossing locations(Map 7 of 9)
20.1.4a PB5640-006-0201-004a
27700EPSG:
Project:
Flood Risk Assessment
Norfolk Boreas red line boundary
Norfolk Boreas Onshore Project Infrastructure(Scenario 1 & 2)
Onshore cable route
Construction access
Operational access
Norfolk Boreas Onshore Project Infrastructure(Scenario 2)
Trenchless crossing zone (e.g. HDD)
Indicative trenchless crossing compound
Mobilisation zone
Indicative mobilisation area compound
Water crossing location¹
GF Under scenario 1 & 2
GF Under scenario 2
¹ GHD, 2018
1:25,00019/02/201902 JT CD A3
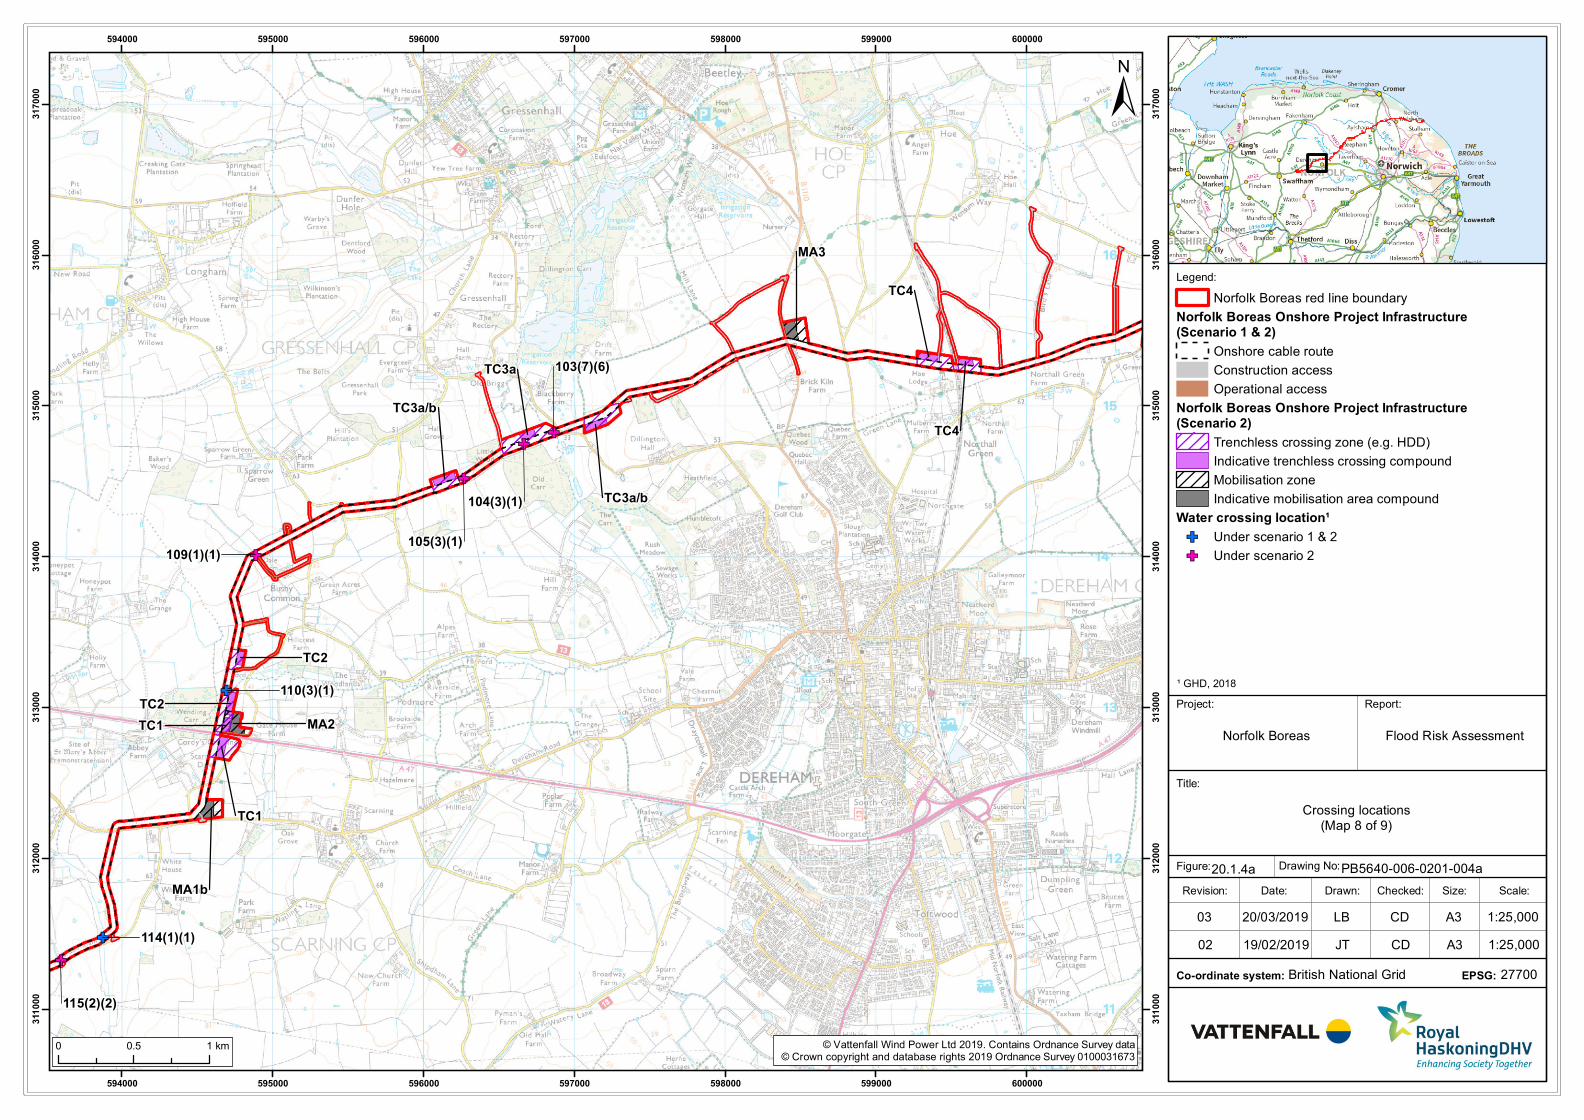
Legend:
Title:
Report:
Norfolk Boreas
Drawn: Scale:Checked:Date:Revision:
Drawing No:
Size:
British National Grid
Figure:
Co-ordinate system:
GF
GF
GF
GF
GF
GF
GF
103(7)(6)
104(3)(1)
105(3)(1)109(1)(1)
110(3)(1)
114(1)(1)
115(2)(2)
TC4
TC4
TC3a/b
TC3a
TC3a/b
TC1
TC1
TC2
TC2
MA1b
MA2
MA3
594000
594000
595000
595000
596000
596000
597000
597000
598000
598000
599000
599000
600000
600000
311
000
311
000
312000
312000
313000
313000
314000
314000
315000
315000
316000
316000
317000
317000
© Vattenfall Wind Power Ltd 2019. Contains Ordnance Survey data© Crown copyright and database rights 2019 Ordnance Survey 0100031673
±
1:25,00020/03/201903 LB CD A3
0 0.5 1 km
Crossing locations(Map 8 of 9)
20.1.4a PB5640-006-0201-004a
27700EPSG:
Project:
Flood Risk Assessment
Norfolk Boreas red line boundary
Norfolk Boreas Onshore Project Infrastructure(Scenario 1 & 2)
Onshore cable route
Construction access
Operational access
Norfolk Boreas Onshore Project Infrastructure(Scenario 2)
Trenchless crossing zone (e.g. HDD)
Indicative trenchless crossing compound
Mobilisation zone
Indicative mobilisation area compound
Water crossing location¹
GF Under scenario 1 & 2
GF Under scenario 2
¹ GHD, 2018
1:25,00019/02/201902 JT CD A3
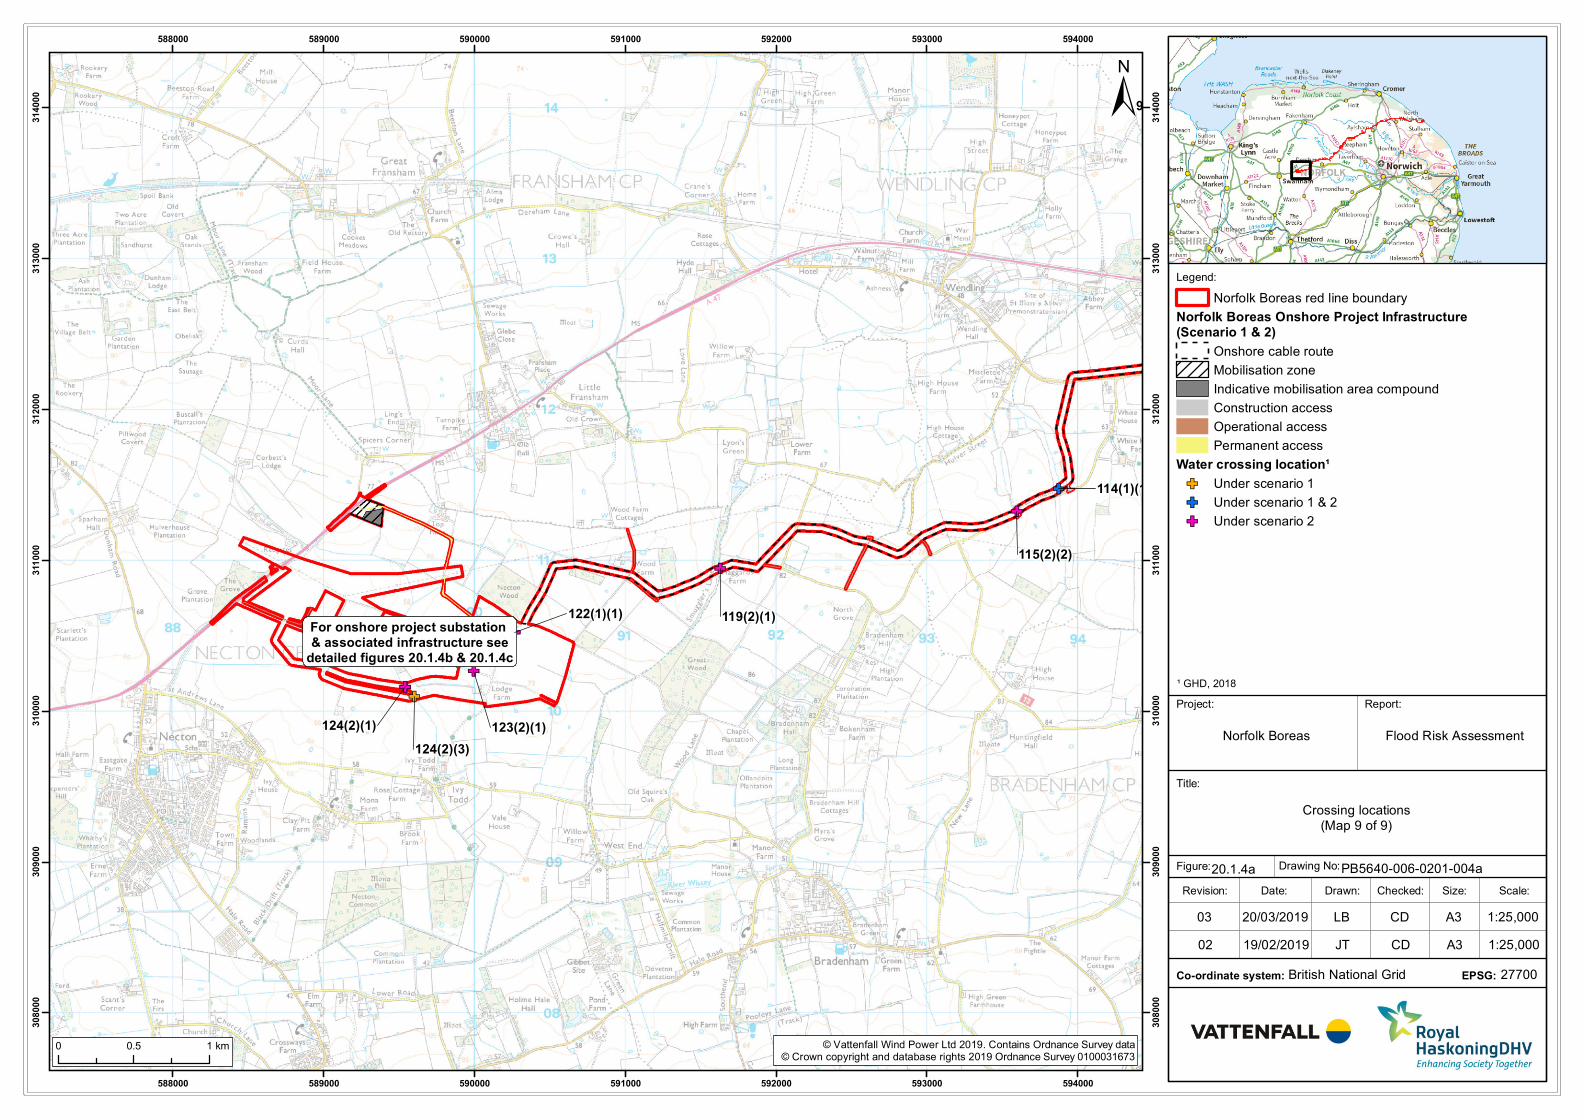
Legend:
Title:
Report:
Norfolk Boreas
Drawn: Scale:Checked:Date:Revision:
Drawing No:
Size:
British National Grid
Figure:
Co-ordinate system:
GF
GF
GF
GF
GF
GFGFGF
For onshore project substation & associated infrastructure see
detailed figures 20.1.4b & 20.1.4c
109(1
114(1)(1)
115(2)(2)
119(2)(1)122(1)(1)
123(2)(1)124(2)(1)
124(2)(3)
588000
588000
589000
589000
590000
590000
591000
591000
592000
592000
593000
593000
594000
594000
308000
308000
309000
309000
310000
310000
311
000
311
000
312000
312000
313000
313000
314000
314000
© Vattenfall Wind Power Ltd 2019. Contains Ordnance Survey data© Crown copyright and database rights 2019 Ordnance Survey 0100031673
±
1:25,00020/03/201903 LB CD A3
0 0.5 1 km
Crossing locations(Map 9 of 9)
20.1.4a PB5640-006-0201-004a
27700EPSG:
Project:
Flood Risk Assessment
Norfolk Boreas red line boundary
Norfolk Boreas Onshore Project Infrastructure(Scenario 1 & 2)
Onshore cable route
Mobilisation zone
Indicative mobilisation area compound
Construction access
Operational access
Permanent access
Water crossing location¹
GF Under scenario 1
GF Under scenario 1 & 2
GF Under scenario 2
¹ GHD, 2018
1:25,00019/02/201902 JT CD A3
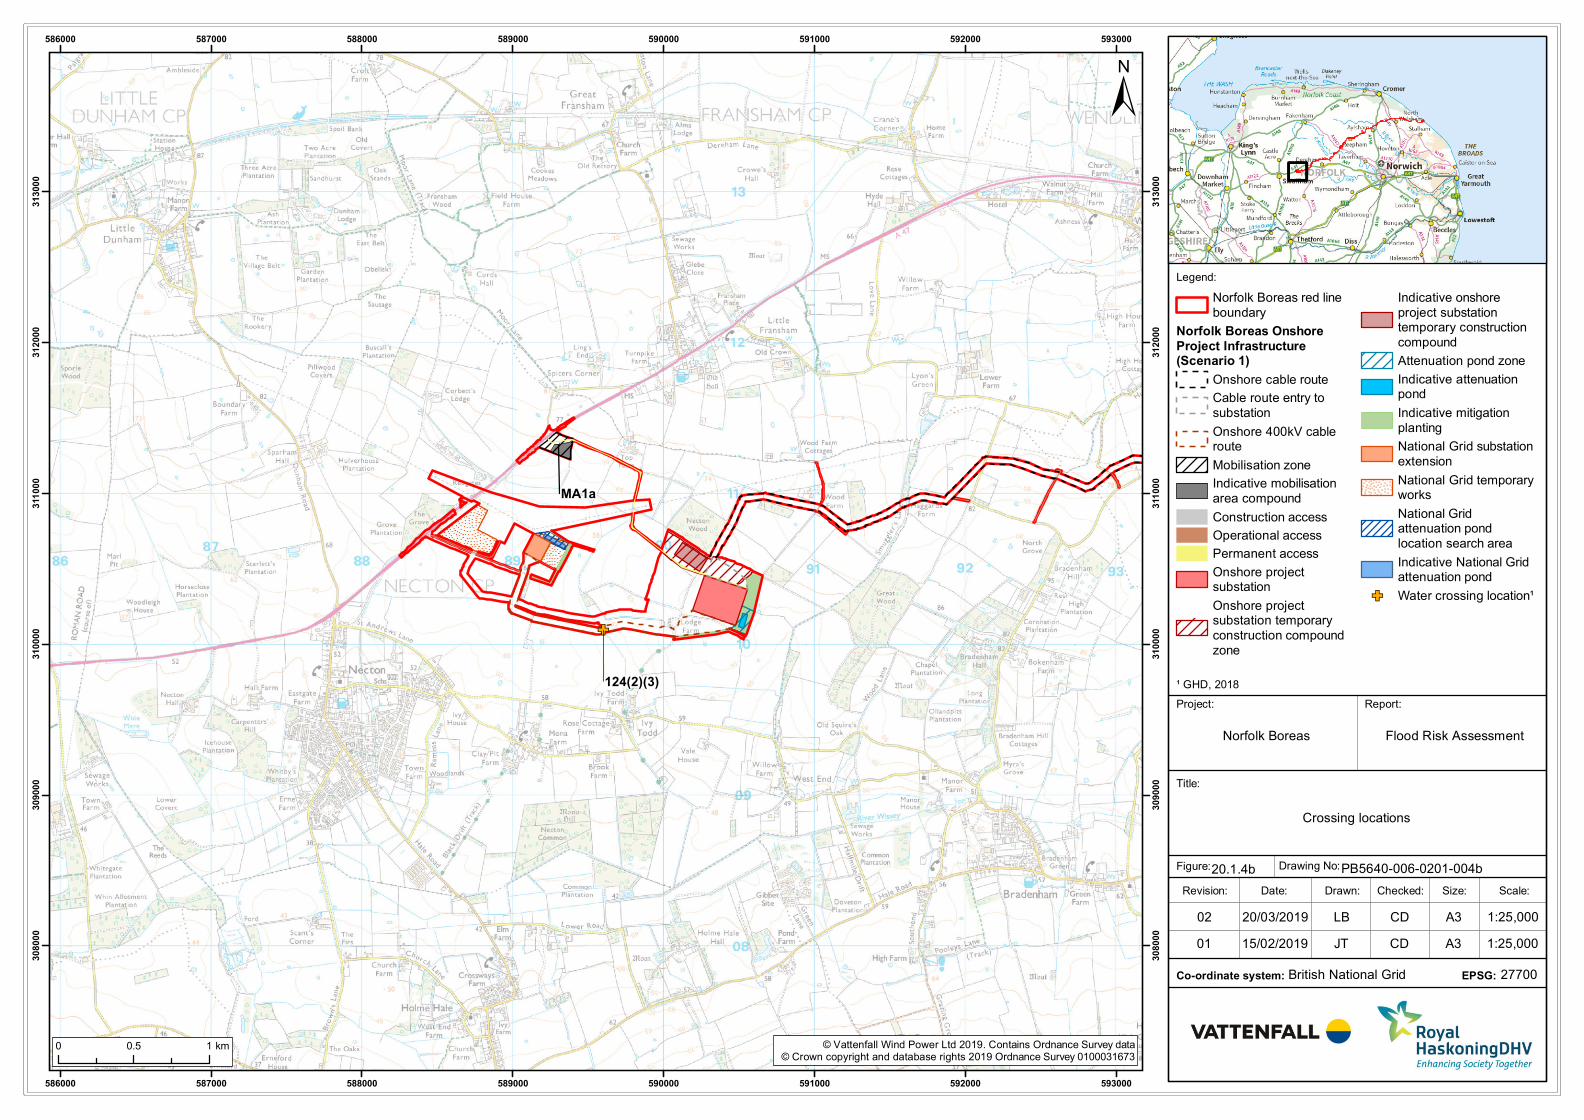
Legend:
Title:
Report:
Norfolk Boreas
Drawn: Scale:Checked:Date:Revision:
Drawing No:
Size:
British National Grid
Figure:
Co-ordinate system:
GF
124(2)(3)
MA1a
586000
586000
587000
587000
588000
588000
589000
589000
590000
590000
591000
591000
592000
592000
593000
593000
308000
308000
309000
309000
310000
310000
311
000
311
000
312000
312000
313000
313000
© Vattenfall Wind Power Ltd 2019. Contains Ordnance Survey data© Crown copyright and database rights 2019 Ordnance Survey 0100031673
±
1:25,00020/03/201902 LB CD A3
0 0.5 1 km
Crossing locations
20.1.4b PB5640-006-0201-004b
27700EPSG:
Project:
¹ GHD, 2018
Flood Risk Assessment
Norfolk Boreas red line
boundary
Norfolk Boreas Onshore
Project Infrastructure(Scenario 1)
Onshore cable route
Cable route entry to
substation
Onshore 400kV cableroute
Mobilisation zone
Indicative mobilisation
area compound
Construction access
Operational access
Permanent access
Onshore projectsubstation
Onshore projectsubstation temporary
construction compound
zone
Indicative onshore
project substationtemporary construction
compound
Attenuation pond zone
Indicative attenuationpond
Indicative mitigation
planting
National Grid substation
extension
National Grid temporaryworks
National Gridattenuation pond
location search area
Indicative National Gridattenuation pond
GF Water crossing location¹
1:25,00015/02/201901 JT CD A3

Legend:
Title:
Report:
Norfolk Boreas
Drawn: Scale:Checked:Date:Revision:
Drawing No:
Size:
British National Grid
Figure:
Co-ordinate system:
GF
GF
GF
GFGF
119(2)(1)122(1)(1)
123(2)(1)124(2)(1)
MA1a
586000
586000
587000
587000
588000
588000
589000
589000
590000
590000
591000
591000
592000
592000
593000
593000
308000
308000
309000
309000
310000
310000
311
000
311
000
312000
312000
313000
313000
© Vattenfall Wind Power Ltd 2019. Contains Ordnance Survey data© Crown copyright and database rights 2019 Ordnance Survey 0100031673
±
1:25,00020/03/201903 LB CD A3
0 0.5 1 km
Crossing locations
20.1.4c PB5640-006-0201-004c
27700EPSG:
Project:
¹ GHD, 2018
Flood Risk Assessment
Norfolk Boreas red lineboundary
Norfolk Boreas OnshoreProject Infrastructure(Scenario 2)
Onshore cable route
Cable route entry tosubstation
Onshore 400kV cableroute
Mobilisation zone
Indicative mobilisationarea compound
Highways temporaryworks area
Construction access
Operational access
Permanent access
Onshore projectsubstation
Onshore projectsubstation temporaryconstruction compoundzone
Indicative onshoreproject substationtemporary constructioncompound
Attenuation pond zone
Indicative attenuationpond
Indicative mitigationplanting
National Grid substationextension
National Grid new /replacement OHL towersearch area
National Grid temporaryworks
Overhead line temporaryworks
National Gridattenuation pond
GF Water crossing location¹
1:25,00019/02/201902 JT CD A3