
Decision Making and Uncertainty: Bayesian Analysis of Potential Flood Heights
Upload
khangminh22Category
view
2download
0
Decision Support Systems for
Participatory Flood Risk and Disaster Management
Panayiotis Sophronides
A dissertation submitted in fulfillment of the requirements for the degree of
Doctor of Philosophy of the National Technical University of Athens.
Athens
Fall 2016
SCHOOL OF RURAL AND SURVEYING ENGINEERING
NATIONAL TECHNICAL UNIVERSITY OF ATHENS
DEPARTMENT OF GEOGRAPHY AND REGIONAL PLANNING

Decision Support Systems for Participatory Flood Risk and Disaster Management
by
Panayiotis Sophronides
who holds
a Diploma in Rural and Surveying Engineering of
the National Technical University of Athens, 2010
and
a Master of Science and a Diploma of Imperial College in
Hydrology and Water Resources Management, Imperial College London, 2011.
A dissertation submitted in fulfillment of the requirements for the degree of
Doctor of Philosophy
in
Rural and Surveying Engineering
of the
National Technical University of Athens
Advisory Committee in charge:
Professor Maria Giaoutzi (Supervisor), National Technical University of Athens
Professor Henk Scholten, Vrije Universiteit Amsterdam
Professor Demetris Koutsoyiannis, National Technical University of Athens
Fall 2016

Decision Support Systems for Participatory Flood Risk and Disaster Management
Copyright 2016
by
Panayiotis Sophronides
All rights reserved
Keywords:
Multi-layered water safety, geodesign, flood risk communication and management, virtual 3D
city models, open data standards, 3D information system, flood emergency response,
shared situational awareness, common operational picture, network-enabled capabilities,
network-centric information systems, information quality, system quality.

«Πάντα πάντα περνάς τη φωτιά για να φτάσεις τη λάμψη.
Πάντα πάντα τη λάμψη περνάς
για να φτάσεις ψηλά τα βουνά τα χιονόδοξα».
Οδυσσέας Ελύτης, Το Άξιον Εστί, Τα Πάθη, Ε’ (1959).
«Always you pass through fire to reach the glow.
Always you pass through the glow
to reach the high snow-resplendent mountains».
Odysseas Elytis, The Axion Esti - It is worthy, The Passion, Psalm V (1959).
Translated by Jeffrey Carson and Nikos Sarris (1997).

i
Preface and acknowledgements.
This PhD thesis entitled “Decision Support Systems for Participatory Flood Risk and Disaster
Management” purports to critically review the existing knowledge and to identify and propose
innovative solutions towards improving situational awareness for better supporting decisions
for flood risk and disaster management. The thesis is consisted of two theoretical and two
empirical studies. The first theoretical study (chapter 2) includes a literature review on multi-
layered water safety and a theoretical systematization of this integrated flood risk
management approach in a thorough, multidisciplinary and collaborative methodology for
complex problems solving inspired by geodesign towards improving situational awareness,
cooperation and decision making. The second theoretical study (chapter 4) through an
extensive literature survey across disciplines explores the contribution of a common
operational picture in improving situational awareness for emergency response operations.
The first empirical study (chapter 3) investigates the information potential of virtual 3D city
models and it exploits their capabilities by developing a virtual 3D city model for
Heerhugowaard case study area in the Netherlands. Furthermore, it conceptualizes a 3D
information system based on virtual 3D city models and extended by open international data
standards towards defining a system framework capable to support situational awareness for
effective flood risk management and emergency preparedness. Finally, the second empirical
study (chapter 5) organizes a field exercise with realistic flood scenarios and the
participation of professionals for measuring the added value service of network centric
support tools in achieving shared situational awareness based on a common operational
picture for flood emergency response.
This PhD thesis has been a long research journey full of knowledge, full of experiences, “full
of adventure, full of discovery” to recall Ithaka (1911) of the eminent Greek poet Constantine
P. Cavafy. Furthermore, it has been a remarkable opportunity to unwrap my potential and
spearhead innovation in a creative endeavor. An endeavor inspired by my personal vision to
serve and promote the science of engineering and research towards contributing to the
protection of human life. This thesis through its findings aspires to reinforce society in its
battle against floods which are the most common and dominant natural hazards causing a
lot of human fatalities, enormous social disruption, environmental and economic impacts
worldwide.
At this point, I would like to express my deepest gratitude to all those who believed,
supported and encouraged me during the course of this PhD thesis. First and foremost, I
would like to thank my PhD thesis advisor and mentor Prof. Dr. Maria Giaoutzi whose

ii
prominent academic quality, talent and enthusiasm, scientific value and human status
strengthened substantially my personality in academic and personal level. I am indebted to
Prof. Giaoutzi who has been for me an inexhaustible source of knowledge and wisdom
during this long research journey. I thank her for teaching me how to look at the essence of
the things, I thank her for believing in my potential, I thank her for giving me the opportunity
to become a doctor of engineering under her supervision but above all I thank her for being a
spiritual motivator and good friend.
The exceptionally important, long and enjoyable stay at the SPatial INformation laboratory
(SPINlab) of the Department of Spatial Economics of Vrije Universiteit (VU) Amsterdam
would not have taken place without the member of the advisory committee of this PhD
thesis, supervisor at VU and Geodan bv, Prof. Dr. Henk Scholten. I am lucky to have had the
opportunity to work with an international leading and acknowledged academic and
entrepreneurial personality in the field of Geographic Information Science (GIS). I would like
to thank him for being a mentor, inspirator and advisor whose versatility, insightful
suggestions, enthusiasm, dedication, view on GIS and geospatial technologies along with
many more academic and personal attributes make him an outstanding supervisor for me. I
am especially grateful to Prof. Scholten for his instrumental role in my success to the highest
academic accomplishment. But I thank him even more for being a great supporter and
wonderful friend throughout the course of this PhD thesis.
Special thanks and respect goes to Prof. Dr. Demetris Koutsoyiannis, Dean of the School of
Civil Engineering of the National Technical University of Athens (N.T.U.A.) and member of
the advisory committee of this PhD thesis. I feel deeply honored to have had the opportunity
to be advised and guided by this distinguished, esteemed and world-leading academic in the
field of hydrology and water resources management. I will always admire and be inspired by
his unique character and spirit as well as by his remarkable profoundness and simplicity.
I also want to thank all my colleagues at N.T.U.A. for their invaluable support and
encouragement. Many thanks go to my collaborators at the Unit of Spatial Planning and
Regional Development of the Department of Geography and Regional Planning of N.T.U.A.,
Elias Grammatikogiannis, Chrysaida-Aliki Papadopoulou, Anastasia Biska and Georgia
Koutsiouri for being pleasant, cordial and great colleagues.
I sincerely thank all my colleagues at the Department of Spatial Economics of VU
Amsterdam, above all, the members of SPINlab for the very special, warm and stimulating
environment they create. I sincerely thank all my collaborators at the disaster management

iii
research group of SPINlab. I feel indebted to Dr. Ir. Ing. John Steenbruggen for being an
invaluable and inspirational collaborator as well as for his decisive support in the
organization of the field exercise of this thesis. I greatly appreciate his deep scientific
knowledge on traffic incident management in the Netherlands. I thank Luis Bausá López for
our exciting brainstorming sessions and also for being an amazing colleague. Many thanks
are due to Christiana Aristeidou for being a wonderful and helpful colleague and friend.
Special thanks to all the other members of SPINlab, Maurice de Kleijn, Niels van Manen,
Eduardo Dias, Azarakhsh Rafiee, Vasco Diogo, Simeon Nedkov, Bart Kusse, Erik van der
Zee, Mark Opmeer, Xander Wilcke, Sanne Hetttinga, Bo Andree, Anna Kolomijeva and Ting
Zhou, for being great colleagues and friends. I wish also to thank members and ex-members
of the Department of Spatial Economics, Zhiling Wang, Hugo Silva, Jan Möhlmann, Ifa
Rosidin, Harry van der Weijde, Vincent van den Berg, Maria Dementieva, Ioannis Tikoudis,
Alexandros Dimitropoulos, Emmanouil Tranos, Xinying Fu, Gilberto Mahumane, Hengky
Kurniawan, Or Levkovich, Jorge Diaz, Jamie Chen, Jingjing Liu, Ana Barufi, Elena Calegari
for the unique and friendly atmosphere they maintained at our office in the 4th and 9th floor of
VU Amsterdam over the years. Thanks to the secretaries of the Department, Elfie Bonke and
Jenny Wiersema, who were always welcoming and ready to help.
I thank Geodan bv for being an excellent hosting environment for research and innovation.
Many thanks are due to Tom van Tilburg, Steven Ottens, Maurice Willekens, Niek
Speetjens, Brian de Vogel and Graziella Barrow who have been valuable collaborators and
they were greatly supportive.
I want to thank Hogheemraadschap Hollands Noorderkwartier (HHNK) in the Netherlands
and in particular its Dijkgraaf Luc Kohsiek for hosting me at the water board office as well as
for providing access to the waterboard’s databases in order to acquire data regarding the 3D
models developed for Heerhugowaard area. Thanks to Kier van Gijssel for being supportive
and helpful during the data acquisition process at HHNK. Credit is also due to the Dutch
Rijkswaterstaat (Ministry of Infrastructure and the Environment) and in particular to Margriet
Rosier, service manager at the department of water management of this ministry for her
important arrangements in order the field exercise of this thesis with participation of
professionals from her organization to be possible.
I also feel deeply honored by the support and contribution of Bodossaki foundation during
different stages of my doctoral research. I am sincerely grateful to the great philanthropist,
national benefactor and founder of this foundation, Prodromos Athanasiadis-Bodossakis
(1890 – 1979). I especially thank the vice-chairman of Bodossaki foundation Ioannis Detsis,

iv
the secretary Ioannis Mathioudakis and also Eleni Detsi whose appreciation of my research
is really gratifying.
I want to thank N.T.U.A. for its magical ambience as well as for awarding me with academic
titles and prizes throughout my academic life. Many thanks are due to Imperial College
London for honoring me with a Master of Science and also with its Diploma of Imperial
College. Special thanks to the Greek State Scholarships Foundation for its awards based on
my academic achievements. I am truly thankful to the Cyprus State Scholarship Foundation
which based on academic excellence it has been supportive and generous to me since my
first steps in academia.
I dedicate this thesis to my parents Georgios and Eleni and my grandparents Panayiotis
Kinnis (1932 – 2003) and Andrianthi Kinni Papacharalambous (1929 – 2009). I cordially
thank my parents for my whole essence. I thank them for their invaluable presence in my life.
I thank them for their selfless and endless love, confidence in me and constant
encouragement throughout my whole life. I thank them for their immense support in my
endeavors, pursuits and aspirations. Many thanks to my brother Andreas for always giving
me special consideration and keeping me in high spirits. With deep respect, I am truly
thankful to two significant and great personalities, my legendary grandparents Panayiotis
and Andrianthi who rightfully deserve my gratitude. I wish they could be there and witness
the finalization of this long research journey towards my Philosophiae Doctor (Ph.D.) degree.
I am more than sure that they would be very proud of my achievement.
Last but not least, I am forever grateful to my Lord Almighty God who has blessed
abundantly every single day of my life.
Athens/Amsterdam,
June 2016

v
LIST OF CONTENTS
Preface and acknowledgements…………………………………………………... i
Introduction……………………………………………………………………………. xv
1. SETTING THE SCENE………………………………….…………………….... 1
1.1 The flood disaster management cycle………………………….……………… 1
1.2
Novel information concepts towards achieving situational awareness in
support of decision making……………………………………….……………...
4
1.2.1 3D information concepts to support situational awareness……….… 4
1.2.2 A common operational picture to support situational awareness…... 5
1.3 Research aim and objectives of the PhD thesis…………………………….… 7
1.4 Structure and outline of the PhD thesis…………………………………….….. 8
2. GEODESIGN THE MULTI-LAYERED WATER SAFETY…………………… 13
2.1 Introduction……………………………………………………………………..…. 13
2.2 Flood safety in Europe……………………………………………………..…….. 15
2.2.1 The main recommendations for flood safety………………….………. 15
2.2.2 Flood maps and safety practices in Europe…………………….…….. 17
2.3 The Dutch perspective to flood safety…………………………………….……. 18
2.3.1 The multi-layered safety concept for flood risk management…….…. 18
2.3.2 Analysis of the multi-layered safety system……………………….….. 20
2.3.3 The need to methodologically frame the multi-layered safety
concept…………………………………………………………….………
21
2.4 Methodological framework: Geodesign…………….………………………….. 23
2.4.1 Geodesign: Definitions…………………………………………….…….. 23
2.4.2 Geodesign framework and models……………………………….……. 24
2.5 Geodesign the multi-layered safety concept: The case of the
Netherlands………………………………………………………………….…….
25
2.5.1 Information needs…………………………………………………..….... 26
2.5.2 Implementing geodesign on the multi-layered safety concept…….... 26
2.6 Final remarks on the geo-design of the multi-layered water safety…………. 30

vi
3. 3D INFORMATION CONCEPTS FOR FLOOD RISK COMMUNICATION
AND MANAGEMENT IN THE CONTEXT OF COMPLEX URBAN
SPACES……………………………………………………………………..……
33
3.1 Introduction………..…………………………..…………………………...……… 33
3.2 Flood risk communication and management……….………………...……….. 35
3.3 Virtual 3D city models for flood risk communication and management: The
case of Heerhugowaard………..………………………………...………………
39
3.3.1 Virtual 3D city models in the context of managing and
communicating complex urban information……………………....…...
39
3.3.2 A virtual 3D city model for flood risk communication and
management: The case of Heerhugowaard…………..………….……
41
3.4 GIS, BIM domains and existing international standards for risk
communication and management in the context of virtual 3D city
models………………………………………………………...………………..…..
47
3.4.1 GIS domain: The CityGML concept in support of risk
communication and management………………………….……….…..
47
3.4.2 BIM domain and standards in support of risk communication and
management……………………………...…………………….…..….....
55
3.5 A concept proposal for efficient flood risk communication and
management: Αn interoperable 3D information system based on virtual 3D
city models………………………………………………………………..…….....
64
3.6 Final remarks on the role of 3D information concepts in flood risk
communication and management……………………..…...........................….
67
4. A COMMON OPERATIONAL PICTURE IN SUPPORT OF
SITUATIONAL AWARENESS FOR EFFICIENT EMERGENCY
RESPONSE OPERATIONS………………………………………………..…..
71
4.1 Introduction…………………………………………………………………...….... 71
4.2 Natural Disasters…………………………………………………………….....… 73
4.2.1 Incidents versus disasters and emergency response……...…….….. 77
4.2.2 Delays during an emergency response…………………………...…... 79
4.3 Design principles for an emergency response system……………………….. 80
4.4 Network centric enabled capabilities for emergency response…………...…. 83
4.5 Situational Awareness……………………………………………………………. 86
4.5.1 Individual SA: Definitions and models…………..………………....….. 87
4.5.2 Shared and team SA backgrounds……………..………………..…..… 89

vii
4.6 A common operational picture for emergency response…………………..…. 90
4.6.1 Background to a COP………………………….……………………..…. 90
4.6.2 Challenges in achieving a COP……………………………………….... 96
4.6.3 The added value service of a COP in emergency response………... 98
4.7 Final remarks on the contribution of a COP in emergency response
operations......................................................................................................
101
5. AN EMPIRICAL APPROACH TO THE ASSESSMENT OF THE
EFFECTIVENESS OF NETWORK-CENTRIC SUPPORT TOOLS FOR
FLOOD EMERGENCY RESPONSE: RESULTS OF A FIELD
EXERCISE…………………………………………………………………..……
105
5.1 Introduction……………………………………………………………...……...…. 105
5.2 Theoretical background to the field exercise……………..........................….. 109
5.2.1 Information quality……………………………………………………..… 109
5.2.2 System quality………………………………….…………………..…….. 114
5.2.3 Hierarchical vs. network centric structure of information
coordination in public safety networks………………………....…...….
117
5.3 Design of the case study………………………………………………...…..….. 119
5.3.1 Treating disasters in the Netherlands………………………..………… 120
5.3.2 Set-up of the field exercise………………………………………….….. 121
5.3.3 Participants of the field exercise……………………………………..…. 123
5.3.4 Technology: The network-centric software tool……………...……..… 124
5.3.5 Description of the flood scenarios…………………………………..….. 128
5.3.6 The experimental protocol………………………………………….…… 129
5.3.7 Limitations of the study……………………………………………….…. 131
5.4 Results of the field exercise………………………………………………….….. 132
5.5 Final remarks on the empirical assessment of the effectiveness of network-
centric support tools in flood emergency response………………..……….….
144
6. CONCLUSIONS………………………………………………………………..... 149
6.1 Conclusions of explorative studies…………………………………………..…. 149
6.1.1 Geodesign the multi-layered water safety………………………..….... 150
6.1.2 A common operational picture in support of SA for efficient
emergency response……………………………………………..……...
151

viii
6.2 Conclusions of empirical studies…………………………………………..….… 153
6.2.1 3D information concepts for flood risk management and emergency
preparedness…………………………………………………………..….
153
6.2.2 Field exercise for the assessment of the effectiveness of network
centric support tools in flood emergency response…………………...
156
6.3 Recommendations for future work………………………………………….…... 158
7. REFERENCES……………………………………………………………...…… 161
APPENDIX A...……………………………………………………………..............…. 223
ΠΕΡΙΛΗΨΗ – SUMMARY IN GREEK…………………………………..….............. 241

ix
LIST OF FIGURES
Figure 1.1: Disaster management cycle…………………………………………………. 2
Figure 1.2: Structure of the PhD thesis…………………………………………………... 8
Figure 1.3: Contribution of the PhD chapters to the different phases of risk and
disaster management…………………………………………………………
9
Figure 2.1: The three layers of the Dutch multi-layered safety concept which reduce
the probability of floods (layer 1) and their consequences in case of
occurrence (layers 2 and 3)……………………………………………….….
19
Figure 2.2: Failure of the multi-layered safety concept as a serial vs. a parallel
system………………………………………………………………………….
21
Figure 2.3: The geodesign framework…………………………………………………… 24
Figure 2.4: Overview of the information categories needed for the multi-layered
safety concept………………………………………………………………….
26
Figure 3.1: Risk (S-P-R) model for assessing and informing the environmental risk
management……………………………………………………………………
36
Figure 3.2: The risk management cycle……………………………………………….…. 37
Figure 3.3: Photorealistic Visualization…………………………………………………... 41
Figure 3.4: Abstract Visualization…………………………………………………………. 41
Figure 3.5: The virtual 3D city model of Heerhugowaard case study area…………… 44
Figure 3.6: Part from the Building Model………………………………………………… 50
Figure 3.7: Part from ISO 19107 ''Spatial Schema''…………………………………….. 50
Figure 3.8: The five LoDs of the CityGML open standard……………………………… 52
Figure 3.9: Building interior………………………………………………………………... 54
Figure 3.10: Accessibility graph deduced by the topological adjacencies of a room
for the estimation of escape routes………………………………………….
54
Figure 3.11: The interlocking BIM fields in a Venn diagram showing BIM clusters,
overlaps and interactions……………………………………………….…….
61
Figure 3.12: Comparison between “traditional” and “new” processes…………….….... 63
Figure 3.13: Overview of the conceptual 3D information system……………………..... 64
Figure 4.1: Numbers and types of historical natural disasters………………………… 74
Figure 4.2: Geographical distribution of loss events during 2014…………………….. 75
Figure 4.3: Loss events in 2014 ordered by continent…………………………………. 76
Figure 4.4: Phases and decision points with indicative amount per unit time of
immediate response and decisions that need to be made following an
IE……………………………………………………………….………………..
79
Figure 4.5: The value chain of Network Enabled Capabilities…………………………. 85

x
Figure 4.6: Network-Centric Maturity Model……………………………………………... 96
Figure 4.7: 3D cube for measuring Situational Awareness for emergency response... 100
Figure 5.1: Client-server network…………………………………………………………. 125
Figure 5.2: Peer-to-peer network…………………………………………………………. 125
Figure 5.3: Field exercise’s layout………………………………………………………… 130
Figure 5.4: Schematic representation of the experimental protocol…………………... 131

xi
LIST OF TABLES
Table 2.1: Flood maps and their uses for flood safety in European countries……… 17
Table 2.2: Data inventory for the multi-layered safety concept in the Netherlands… 28
Table 2.3: Theoretical implementation of geodesign on the Multi-Layered water
Safety concept (MLS)…………………………………………………………
29
Table 3.1:
Data sources used for the development of 3D models of
Heerhugowaard………………………………………………………………..
42
Table 3.2: Data used for the development of 3D models of Heerhugowaard………. 43
Table 4.1: Classification of natural disasters…………………………………………… 74
Table 4.2a: Design premises for a DERMIS…………………………………………….. 81
Table 4.2b: Design premises for a DERMIS…………………………………………….. 82
Table 4.3a: Examples of common and variable elements included in a COP……….. 93
Table 4.3b: Examples of common and variable elements included in a COP……….. 94
Table 4.4: Potential roles and functions of a COP……………………………………... 95
Table 4.5: The NEC value chain components and the emergency response
process phases………………………………………………………………..
99
Table 5.1: Overview of the IQ dimensions most relevant for the emergency
services……………………………………………………………..................
111
Table 5.2: Synopsis of the IQ constructs selected for the field exercise of this study. 113
Table 5.3: Outline of the SQ constructs selected for the field exercise of this study... 116
Table 5.4: Demographics of the participants in the field exercise………………….... 123
Table 5.5a: Description of the scenarios used for the field exercise………………..… 128
Table 5.5b: Description of the scenarios used for the field exercise………………….. 129
Table 5.6a: Results of the questionnaires regarding the Quality of the Information
(IQ) that the participants (stakeholders) experience in their daily
practice…………………………………………………………………………
133
Table 5.6b: Results of the questionnaires regarding the Quality of the Information
(IQ) that the participants (stakeholders) experience in their daily
practice………………………………………………………………………..
134
Table 5.7a: Results of the questionnaires regarding IQ that the participants
(stakeholders) experienced during Scenario 1 of the field exercise……..
134
Table 5.7b: Results of the questionnaires regarding IQ that the participants
(stakeholders) experienced during Scenario 1 of the field exercise……..
135
Table 5.8a: Results of the questionnaires regarding IQ that the participants
(stakeholders) experienced during Scenario 2 of the field
exercise…………………………………………………………………………
135

xii
Table 5.8b: Results of the questionnaires regarding IQ that the participants
(stakeholders) experienced during Scenario 2 of the field
exercise…………………………………………………………………………
136
Table 5.9a: Results of the questionnaires regarding the Quality of the System (SQ)
that the participants (stakeholders) experience in their daily practice…...
138
Table 5.9b: Results of the questionnaires regarding the Quality of the System (SQ)
that the participants (stakeholders) experience in their daily practice…...
139
Table 5.10: Results of the questionnaires regarding SQ that the participants
(stakeholders) experienced during both Scenarios…………..……………
140

xiii
LIST OF PICTURES
Picture 5.1: Stakeholders respond to the flood emergencies………………………. 122
Picture 5.2: Common Operational Picture in text form…………………………….... 122
Picture 5.3: Common Operational Picture in map form…………………………..…. 122

xiv

xv
Introduction.
This PhD thesis aims to identify, explore and propose innovative solutions towards improving
Situational Awareness (SA) for better supporting decisions for flood risk and disaster
management. Firstly, the thesis concentrates on identifying how geodesign can contribute to
the improvement of SA and decision making in regards to optimal water safety in a particular
area of interest. Secondly, the thesis focuses on exploring how 3D information concepts
through their information and communication potential can improve SA which in turn can
support better decisions for efficient flood risk management and emergency preparedness.
Thirdly, the thesis focuses on the investigation of the added value service of introducing
network centric information systems to the safety agencies for better supporting the
achievement of SA based on a common operational picture, that can lead to better decisions
with better effects in the flood emergency response domain.
The thesis is consisted of both theoretical and empirical studies. A presentation of the six
chapters of this thesis follows:
Chapter 1: It offers a literature review on the disaster management cycle along with its
different stages and it briefly introduces and discusses novel information concepts towards
achieving SA in support of decision making for flood risk and flood disaster management.
Motivated mainly by these, it presents the research aim, objectives and structure of the PhD
thesis, proceeding with previewing the subsequent chapters and results of this dissertation.
Chapter 2: It provides a literature survey on the Dutch multi-layered water safety concept
and it theoretically systematises the latter in a geodesign framework towards improving
situational awareness, collaboration and decision making.
Chapter 3: It employs a case study area in the Netherlands for exploring the usefulness of
virtual 3D city models in flood risk communication and management. Furthermore, it
conceptualizes a 3D information system based on virtual 3D city models as a step towards
defining a system framework for flood risk management and emergency preparedness.
Chapter 4: It delivers a literature survey on the contribution of a common operational picture
in improving SA and it investigates how this can be employed by the emergency services in
their response operations.

xvi
Chapter 5: It organizes a field exercise with realistic flood scenarios and the participation of
real emergency response professionals. In addition, based on constructs about information
quality and system quality identified through an extensive literature survey, it reports the
results of an empirical analysis regarding the effectiveness of network centric information
systems in flood emergency response operations.
Chapter 6: It concludes by summarizing the main results of this dissertation along with their
implications, proceeding to recommendations for public safety policy makers, professionals
and researchers.
In the appendices of this thesis, the questionnaires (in Dutch) about information and system
quality that have been answered by the participants (real emergency response
professionals) of the field exercise of this dissertation are provided.

1
1. SETTING THE SCENE.
Although flood risks and flood disasters are related to each other, they are not the same. In
this context, the chapter purports to shed light on these concepts presenting a widely
acceptable perspective of the disaster management cycle along with its different stages.
Thereafter, it briefly introduces novel information concepts towards achieving situational
awareness for supporting decision making at different stages of the disaster management
cycle. In view of this, the thesis is motivated to research how situational awareness can be
improved towards better supporting decisions for flood risk and disaster management. The
remaining of this chapter presents the research aim and objectives of the thesis. Finally, it
delineates the structure of this dissertation, providing a preview of its chapters and results.
1.1 The flood disaster management cycle.
Flood hazards are the most common and catastrophic of all the natural disasters which
cause each year devastating socioeconomic and environmental impacts as well as many
casualties around the world (Leskens et al., 2014; Mayomi et al., 2013; Espada et al., 2012;
Tingsanchali, 2012; Vanneuville et al., 2011). Furthermore, floods have the highest
occurrence frequency among all the natural disasters (Leskens et al., 2014; Chang et al.,
2007). Population growth, urban expansion and increase in wealth are among the major
causes for increasing economic losses in flood-prone areas (Koks et al., 2014; Bouwer,
2011; Nicholls et al., 2008). In order to deal with floods, it is important to review the main
concepts of the disaster management cycle.
In general, the disaster management cycle (see figure 1.1) accepted by several agencies
worldwide is consisted of four phases: mitigation, preparation, response and recovery
(Vanneuville et al., 2011; Zlatanova and Fabbri, 2009; Lumbroso, 2007). The concept of
flood disasters has been approached from various disciplines such as hydrologists and
geographers among others (Oruonye, 2012). Furthermore, denotation of terms in the context
of flood disaster management often varies depending on the sector in which is applied
(Coste, 2001). For example, the terms risk management, hazard management, disaster
management, crisis management are found interchangeably (Zlatanova and Fabbri, 2009).
This thesis considers the first phase of the disaster management cycle as the risk
management process while the last three as the pillars of the disaster management.

2
Although flood risk and flood disaster are related to each other, they are no synonyms.
Lumbroso (2007) distinguishes between risks and disasters in terms of impact. In particular,
while risk is associated with any measurable consequence, a disaster signifies a large or
catastrophic event. Vanneuville et al. (2011) consider that flood risk management applies to
a wide range of events while flood disaster (emergency) response attempts to minimize the
impacts from a particular flood disaster. The following example is characteristic of the
difference between flood risk and flood disaster management. When flood risk drops below a
certain threshold, additional measures can be considered superfluous in the risk
management process. During a flood disaster every plausible measure and action is
justifiable towards minimizing its adverse consequences. Nevertheless, the picture is not
black and white as flood risks and flood disasters are interconnected. In particular, flood
emergency response and preparation phases are supported by the outcomes of flood risk
management. Furthermore, risks are inevitable in the sense that even optimizing the results
of risk management towards achieving better safety situations, there will always be a
residual risk (Grothe et al., 2005). Nature cannot be controlled and since one can hardly
predict when and where the next emergency situation will strike (Borkulo et al., 2005), the
subsequent phases of the disaster management cycle, i.e. preparation and effective
response, they are of utmost importance for minimizing the consequences of a potential
flood.
Figure 1.1: Disaster management cycle.
(Adapted from Lumbroso, 2007)
Phase 1: Prevention &
Mitigation
Phase 4:
Recovery
Before the event
After the
event Phase 3:
Response
Phase 2:
Preparation
Event

3
In short, the four phases of disaster management cycle are interrelated, but simultaneously,
they have their own distinct characteristics. Zlatanova and Fabbri (2009) describe them as
following: Prevention and mitigation concentrates on measures in the long-term horizon
capable to reduce vulnerability and/or exposure to flood hazards towards minimizing flood
risks; Preparation is about framing the institutional and organizational arrangements which
underpin the emergency response operations. Furthermore, this phase deals with
preparation activities which include evacuation plans, early warning systems, temporary
physical measures, training sessions, preparatory field exercises. Response operations take
place after the occurrence of a flood event and it is the most challenging phase of the cycle
due to the complex, unpredictable and dynamic nature of emergencies; Recovery is the
phase after the response operations and in particular after the normalization of an
emergency situation. It includes all the required measures for removing damages as well as
the long term supply of irreversible detriments.
For successful flood risk and disaster management, spatial information is of critical
importance. Flood risks require static and model information for statistics (Vanneuville et al.,
2011) while flood emergencies need semi-static, model and most importantly real time
information for the response operations (ACIR, 2005). In particular, emergency response
operations are defined by the actual situation. For instance, the actual number of the
inhabitants during an emergency defines the number of evacuations in a particular area of
interest. On the contrary, in risk management, what matters is the average number of
inhabitants over a year.
Risk management can be considered to be explicitly spatial discipline while disaster
management is even more implicitly spatially-oriented (Zlatanova and Fabbri, 2009). Typical
applications in both risk and disaster management are tied to a possible large geographical
area (Björkbom et al., 2013) and thus awareness of the importance of spatial information is
crucial (location awareness). Furthermore, the entire disaster management cycle depends
on large volumes of information of high-quality that various safety agencies create and
maintain (Oosterom et al., 2005). Therefore, information should be effectively shared and
exchanged via geo-information and communication systems within the entire disaster
management cycle.

4
1.2 Novel information concepts towards achieving situational awareness in support
of decision making.
Situation Awareness (SA) is a complex concept and therefore it is hard to define the term
(Sandom, 2012; Charness, 1995; Hopkin, 1995). However, Endsley (1995) proposed a
definition of SA which is widely applicable across different domains and disciplines and it has
been highly cited and highly influential in cognitive science research (Steenbruggen, 2013;
Sandom, 2012; Yin et al., 2012; Roy, 2007). Based on the role of SA in human decision
making in dynamic systems, Endsley’s definition suggests that this is “the perception of
elements in the environment within a volume of time and space, the comprehension of their
meaning and the projection of their status in the near future” (Endsley, 1995). Although SA is
rooted in the military domain, it has been recognized as a critical part of making effective
decisions in emergency response (Madey et al., 2006; Blandford and Wong, 2004) and risk
management (McLucas, 2003). For achieving SA, an appropriate set of perception elements
have to be identified and coupled with higher level comprehension patterns and forecast
operators (Yin et al., 2012).
1.2.1 3D information concepts to support situational awareness.
Risk management is one of the key foundations of disaster management cycle. It provides
inputs for decision making and simultaneously it purports to increase risk awareness among
stakeholders (US Department of Health and Human Services, 2002). Risk communication is
at least as important as the risk assessment (Kemec et al., 2010a). In this context, the three
dimensional visualization of natural disasters in an area of interest, it has seen significant
growth in the last few years (Bandrova et al., 2012). Although stakeholders formulate risk
management measures that often have a 3D component (e.g. elevation of constructions)
without realizing it, it is much more effective when their decisions are aided by 3D
visualizations. According to the experiment of Treichler (1967), most of the information
received by humans is by the sense of sight which indicates that information visualization is
important for communication and information distribution (Wu and Hsieh, 2012; Lu et al.,
2012). Effective visualization support people to efficiently obtain the required information (Lu
et al., 2012). Furthermore, increase of realism and dimensionality can increase awareness of
a particular situation (Kibria et al., 2009).
An increasing number of applications is based on 3D geo-information (Stadler and Kolbe,
2007). Availability, management and presentation of geospatial information, play a pivotal
role in the management of risks. However, information has to be represented within a

5
consistent framework such as a virtual 3D city model (Döllner and Hagedorn, 2008). In this
context, virtual 3D city models are applied for risk management (Stadler and Kolbe, 2007;
Shiode, 2001; Döllner et al., 2006a) forming a firm ground for 3D decision support systems
(Döllner et al., 2006a). They represent spatial and geo-referenced data, allowing up-to-date
and flexible access to 3D city models which is of critical importance for risk management
(Zlatanova and Holweg, 2004). Furthermore, 3D city models can serve as a medium to
manage, integrate and distribute complex geo-information based on a uniform
communication metaphor, the virtual 3D city model. In particular, virtual 3D city models
enable visual integration of heterogeneous geo-information within a single framework and
thus they can create and maintain complex information spaces (Döllner et al., 2006a). In
short, virtual 3D city models are key components of geo-information infrastructures providing
important information of different aspects of the disaster management cycle (Kolbe et al.,
2005).
In risk management, the required data is derived from distributed sources which are often
thematically and spatially fragmented (Stadler and Kolbe, 2007). Furthermore, in risk
management, only 3D geometry and appearance information is not sufficient, as for querying
and analysis applications complex semantic data is required. Data standards can provide a
high degree of interoperability (Döllner et al., 2006a) and also they can facilitate seamless
data integration and explicit determination of semantics. In this way, massive,
heterogeneous and distributed risk related data from different domains such as GIS and BIM
can be integrated into virtual 3D city models towards supporting awareness of flood risks
situations. 3D information systems based on 3D models can act as effective tools for
decision support during the risk management process by enabling dynamic adaptations of
the focused aspects of a discussion; by allowing variations in the visualizations as well as by
supporting investigations at different scales. Therefore, 3D information systems have the
potential to stimulate awareness of a particular flood risk situation towards supporting
stakeholders to obtain a clearer perception of the characteristics of hazards, potential
pathways and receptors which their linkage imposes risk.
1.2.2 A common operational picture to support situational awareness.
One of the main causes of organizational failure in emergency response is the lack of shared
SA (Sapateiro and Antunes, 2009; McManus et al., 2007). Therefore, constructing and
maintaining SA is instrumental in the success of decision making during the different phases
of the disaster management cycle and most especially in the response operations. In this
context, a Common Operational Picture (COP) has the potential to facilitate the development

6
of SA through depicting all acquired and shared data derived from several sources in a
single presentation to the user (Björkbom et al., 2013; Hager, 1997). More simply, a COP
can provide information and knowledge about what is going on around its user. Major
hurdles for efficient and effective multi-agency disaster management and simultaneously key
antecedents for information systems success are Information Quality (IQ) and System
Quality (SQ) (Lee et al., 2011; Steenbruggen et al., 2015). Both IQ and SQ are important
requisites for achieving SA.
Disasters’ treatment requires information sharing and coordination between several
autonomous safety agencies (Bharosa et al., 2009a; Bharosa et al., 2009b; Bharosa et al.,
2009c). Network centric systems have the potential to enable efficient information sharing for
supporting SA, through the deployment of a COP. In particular, a COP is widely utilized to
support SA during network centric operations (Steenbruggen, 2013; Wark et al., 2009). The
added value service of the network enabled capabilities is reflected in their value chain (see
Steenbruggen et al., 2012; UK Ministry of Defense, 2005). According to this, in the
information domain, better networks can enable better information sharing through
constructing a COP which in turn can support better shared awareness of a particular
situation that can lead to better decisions in the cognitive domain. Effective decisions are
related to better actions with better effects in the physical domain. Nowadays, a growing
interest in the introduction and utilization of network centric information concepts has been
observed towards improving cooperation between the different safety agencies. The basic
idea that underpins such concepts is sharing information once with all via a peer-to-peer
network rather than once with each that is the logic behind hierarchical information
coordination structures. Nevertheless, information coordination architectures in public safety
networks are traditionally based on hierarchy (Bharosa et al., 2011; Mackenzie et al., 2007;
Bigley and Roberts, 2001; Hale, 1997). This can hinder efficient information sharing,
communication and cooperation among the several safety agencies and stakeholders.
SA goes far beyond than just reading “dots” on maps (Lambert and Scholz, 2005). SA is
related to the psychological, mental and cognitive status of the end user of a system and it is
about comprehending the significance of the distributed information in an operational context
during the decision making process. There are many factors that can influence SA.
According to Harrald and Jefferson (2007), the introduction of concepts such as SA, COP
and network centric working from its safety and combat origins to the complex and
heterogeneous structure of the safety organizations is extremely difficult and short term
strategies based on the assumption that shared SA will be easily achieved are doomed to
fail. Therefore the introduction and use of novel information concepts should be done

7
carefully and in different stages with consideration of the human factor and strong
involvement of the management of the different safety organizations.
1.3 Research aim and objectives of the PhD thesis.
This PhD thesis through its theoretical and empirical foundation aims to identify and explore
how situational awareness can be improved towards better supporting decisions for flood
risk and disaster management. The associated research questions are listed below:
1. How can geodesign frame the multi-layered water safety towards improving situational
awareness and better supporting decisions in regards to achieving optimal flood security
measures (Chapter 2)?
2. How can 3D information concepts support information dissemination and visualization
towards improving flood risk communication, awareness and management (Chapter 3)?
3. How can novel concepts in information technology contribute to the improvement of
information sharing, communication, awareness and co-operation between safety
agencies (Chapter 4)?
4. What is the effect of employing network centric information systems in terms of
information and system quality towards improving situational awareness and flood
emergency response operations (Chapter 5)?

8
1.4 Structure and outline of the PhD thesis.
The PhD thesis is consisted of six chapters and it includes two empirical studies. In figure
1.2, the relationship between the different chapters of this dissertation is delineated.
Figure 1.2: Structure of the PhD thesis.
The chapters of this PhD thesis carry out an in-depth research towards improving situational
awareness during the different phases of risk and disaster management. Effective decision
making relies on access to and interpretation of static and model information in the
prevention and mitigation and also in the preparation phase of the disaster management
cycle depicted in figure 1.1; while in the response phase, semi-static, model and dynamic
information is required. In this context, a common operational picture that can piece together
all the required information has the potential to improve awareness of a situation at a
particular point of the disaster management cycle which can lead to better actions with better
effects in the real world. The subsequent four interrelated chapters which are shown in figure
1.3, expand on how decisions can better be supported for flood risk and disaster
management.
Empirical Foundation
and
Evaluation
2. Geodesign the multi-layered water safety.
Theoretical
Foundation
4. A Common Operational Picture in support of situational awareness for
efficient emergency response operations.
Reflection 6. Conclusions.
3. 3D information concepts for risk management and
communication in the context of
complex urban spaces.
Research problem
& Objectives
5. An empirical approach to the assessment of the effectiveness of
network centric support tools for flood emergency response: Results of a field exercise.
1. Setting the scene.

9
Figure 1.3: Contribution of the PhD chapters to the different phases of
risk and disaster management.
Chapter 2 frames the Dutch multi-layered water safety concept in the context of a
systematic, thorough, multidisciplinary and collaborative methodology for complex problems
solving i.e. geodesign. Initially, the chapter describes the main recommendations for flood
safety and practices in Europe. In this context, the multi-layered water safety concept which
the Netherlands has introduced as a response to the European Flood Risk Directive
(2007/60/EC) is delineated and analyzed. In short, this multi-layered water safety is an
integrated flood risk management concept which does not base only on flood probability
minimization through preventive measures (layer 1) but also on consequences’ reduction in
the case of a flood event via spatial solutions (layer 2) and emergency response (layer 3).
The chapter proceeds with qualitative assessment of the multi-layered water safety concept
and it demonstrates the need of a methodological framework that urges stakeholders’
participation and active citizenship, experimentation and impact assessment towards
reaching optimal combination of safety measures, tailored to the specific characteristics and
conditions of an area of interest. Optimal safety measures should not only be based on their
economic efficiency but also on their social acceptability. In view of these, the chapter
introduces geodesign and outlines geodesign framework and models. Furthermore, it
theoretically systematizes the multi-layered water safety concept in a geodesign framework.
After the event
Prevention &
Mitigation Preparation Response
Before the event
EVENT
Risk Management
Semi-Static 3D COP
(Chapter 3)
Simulated dynamic COP
(Chapter 4)
Dynamic COP
(Chapter 5)
Geodesign the Multi-layered Water Safety (Chapter 2)
Network centric emergency response
D i s a s t e r M a n a g e m e n t
EVENT

10
The implementation of geodesign indicates that it has the potential to provide awareness of
the current situation of a particular area of interest which in turn it may support the allocation
of weights regarding the three layers of the multi-tier safety concept. Furthermore, it
indicates that participation and interaction of the safety policy makers as well as iterations for
achieving maximum consensus between them concerning the more balanced safety
measures, taking into account their economic efficiency, their impact on the environment, the
local circumstances and the values of the people at place are methodologically enabled.
Chapter 3 provides an overview of novel information concepts through an extensive
literature review, organization of a case study and system conceptualization which can
contribute to the improvement of risk communication and management. Firstly, the chapter
presents a conceptual model for risk identification and it discusses the needs on risk
communication that support stakeholders to become risk aware and participate in the risk
management decision making process. Thereafter, 3D virtual city models which reveal high
information potential are introduced and their contribution in integrating, managing and
communicating complex geo-information for risk management in the urban suburbs is
investigated and qualitatively assessed. In this context, a virtual 3D city model for
Heerhugowaard area of interest in the Netherlands has been developed. This model can
enable stakeholders to obtain dynamic 3D renderings of the flood risk components and their
relations and thus it contributes to the achievement of shared awareness regarding a
particular flood risk situation. Afterwards, the chapter explores open data standards from GIS
(CityGML) and BIM domains (IFC) and it identifies their role in risk management. Building
upon the virtual 3D city models, an interoperable 3D information system which utilizes these
existing open international standards from GIS and BIM domains is conceptualized and its
functionalities are explored in the context of risk communication and management. Such an
information system can support both information and communication processes, building
capacity for participatory risk minimization, preparedness and response. In particular, it can
provide up-to-date information on demand regarding the physical and functional
characteristics and relations of the city objects and components at both the city and the
facility scale. Furthermore, it has the potential to provide information about the external
environment and also about the buildings’ interior structures which are important in the
management of risks and residual risks as well as in the preparation of evacuation plans for
emergency response. Through the employed data standards, the system can enable not
only navigation functionalities but also easy-to-use querying and analysis capabilities.
Chapter 4 through an extensive literature survey, it provides an overview of novel
information concepts and it investigates how these can be employed in emergency

11
response. Initially, the chapter gives a literature review on natural disasters. Thereafter, it
differentiates between incidents and disasters; and it describes in details the different
phases of an emergency. Also, characteristic types of delays during the response operations
are identified and presented. Afterwards, the design premises for an efficient emergency
response system are delineated based on literature. The chapter continues by discussing
the network enabled capabilities for information sharing and it demonstrates their added
value service in response operations. In essence, this is reflected in their value chain
according to which better networks can lead to better information sharing in the information
domain which in turn can drive to better awareness regarding a particular situation and
better decisions in the cognitive domain. Such decisions can have better actions and effects
in the physical domain. Next, situational awareness is reviewed exploring how individual,
shared and team situational awareness can be achieved. Then, a background to a common
operation picture is provided and challenges in developing such a picture are explored in the
context of emergency response operations. The real benefit of creating a common
operational picture is theoretically explored and a basis for its quantitative and qualitative
measurement is delineated based on literature. In order to cope with the complexity,
uncertainty and dynamic nature of an emergency, information, communication, multi-
disciplinary collaboration and coordination among the safety agencies aided by flexible
information and communication systems is required. A common operational picture achieved
through network centric systems is a promising emergency response tool which can
contribute to the achievement of shared situational awareness towards faster normalization
of an emergency situation.
Chapter 5 reports the results of an empirical analysis regarding the effectiveness of network
centric information systems in emergency response operations. Firstly, the chapter provides
the theoretical foundation of the field exercise organized for acquiring the experts’ judgment.
In this context, a number of constructs suitable for measuring information quality and system
quality in emergency response operations are identified and described. The constructs
utilized for the field experiment of the chapter are shortlisted and tabulated. Through
extensive literature review, it has been identified that information quality and system quality
are major hurdles for efficient and effective multi-agency response, simultaneously being key
components for the success of information systems. In addition, information quality and
system quality are important requisites for achieving situational awareness which in turn is
essential for decision making and effective response actions. However, despite the wealth of
literature on information quality and system quality in the profit-oriented business
environment; research on the quality of information sharing among the various emergency
services and the systems used for information distribution in public safety domain where

12
ensuring the public good is of crucial importance is very limited and empirical support is
almost non-existent. The chapter proceeds by discussing the hierarchical (traditional) vs. the
network centric information coordination structures, identifying pros and cons. Thereafter,
the chapter describes the design of the case study. In particular, it delineates the set-up of
the exercise; the demographics of the professionals participated in the field experiment; the
network centric technology used; the flood scenarios utilized; the experimental protocol and
the limitations and assumptions of the case study. Afterwards, the chapter tabulates and
qualitatively discusses the results of the exercise i.e. the experts’ judgment on selected
information quality and system quality dimensions. The main empirical findings of this
chapter indicate that the network centric tools seem that they tend to improve situational
awareness by enabling better information sharing and by achieving a common operational
picture. Nevertheless, the introduction of such concepts to safety agencies should be done
carefully and in different stages with strong involvement of the management of the
emergency response organizations taking into account organizational structures, institutional
rules, norms and most especially the human factor.
Chapter 6 concludes by summarizing the main findings of this PhD research along with their
implications, proceeding to recommendations for public safety policy makers, professionals
and researchers that can be drawn from this thesis.

13
2. GEODESIGN THE MULTI-LAYERED WATER SAFETY.
This chapter aims to frame the multi-layered water safety concept in the context of a
systematic, thorough, multidisciplinary and collaborative methodology for complex problems
solving i.e. geodesign. Multi-layered safety is an integrated flood risk management concept
based not only on flood probability reduction through prevention (layer 1) but also on
consequences’ minimization in the case of a flood through spatial solutions (layer 2) and
crisis management (layer 3). It has been introduced in the Netherlands in 2009 following the
European Flood Risk Directive adopted in 2007. In this study, the multi-layered safety is
qualitatively assessed, demonstrating that it resembles more a parallel system and that
collaboration is required for deciding the most desirable safety measures which should not
only be based on their economic efficiency but also on their social acceptability. In light of
these, the multi-layered safety concept is attempted to methodologically be systematized
following the geodesign framework. The latter indicates that through its implementation,
understanding of the current situation of a particular area of interest which in turn it may
support the allocation of weights regarding the three layers of the multi-tier safety concept is
facilitated. Furthermore, the geodesign of the multi-layered safety shows that participation
and interaction of the safety policy makers as well as iterations for achieving maximum
consensus between them concerning the more balanced safety measures, taking into
account their economic efficiency, their impact on the environment, the local circumstances
and the values of the people at place are methodologically enabled.
2.1 Introduction.
Flood risk management in the Netherlands currently focuses on technical flood prevention
measures such as levees and dykes (Moel et al., 2013). However, in Europe, flood
management is moving towards an integrated risk management approach where measures
about exposure and adverse consequences are considered (Büchele et al., 2006). This
movement is motivated by the European Flood Directive (2007/60/EC) which urges EU
member states to adopt a risk-based approach that takes into account potential
consequences of floods next to their probability (Kellens et al., 2013). In the Netherlands, the
multi-layered safety concept which is consisted of three layers i.e. (1) prevention; (2)
damage reduction via sustainable spatial solutions and (3) preparation for emergency
response has been introduced as a reaction to the European Flood Directive in order to
support a flood risk-based management approach (Ministry I & E, 2009). Nevertheless, the

14
application of this concept is still in its infancy and a focus on preventive measures (layer 1)
is obvious (Moel et al., 2013).
The implementation of the multi-layered safety concept needs the combination of objectives
and funding from various policy domains at different spatial scales and for several temporal
horizons, the involvement of various disciplines and the collaboration between stakeholders
with several interests and means (e.g. Potter et al., 2011). Required protection levels may
vary between different areas which may have different flood regimes. The optimal solution
for Dutch flood safety can be a combination of measures from the three layers that jointly
can minimize the overall flood risk (Ministry I & E, 2009). Without discussion and
visualization of the impact of alternative water safety measures, their context cannot be
understood so that they reflect local conditions and specificities. Furthermore, different
stakeholders have different expectations regarding water safety. For instance, residents of a
study area may aim to maintain high level of flood security irrespective of economic and
environmental costs, technocrats may seek to preserve a significant level of water safety but
considering the economic efficiency of the different measures while the public officials may
see the same area as a vehicle to implement programs to achieve their political goals.
In the context of multi-layered water safety, a single methodological framework which
determines the roles of different stakeholders, promotes dynamic visualization and
communication of the current situation, enables the comprehension and evaluation of
proposals and permits feedback in the necessary phases does not exist. In order to
overcome the lack of methodology, the main goal of this study is to orchestrate the multi-
layered safety concept in a geodesign framework-oriented decision-making process
(Steinitz, 2012).
This study commences its mission by describing the main recommendations for flood safety
and practices in Europe (section 2) followed by the Dutch perspective (section 3). In this
context, the multi-layered safety concept is analyzed attempting to demonstrate the need for
a methodological framework which stimulates stakeholders’ participation and active
citizenship, experimentation and impact assessment in order to reach optimal combination of
safety measures tailored to the specific characteristics and conditions of an area of interest.
The remainder of this chapter is organized as follows: Section 4 provides definitions of
geodesign and outlines geodesign framework and models. Section 5, firstly describes data
underlying the multi-layered water safety concept and secondly it attempts to theoretically
systematize this concept in a geodesign framework. Finally, section 6 presents the
conclusions of this chapter.

15
2.2 Flood safety in Europe.
Floods are the most dominant natural hazards in Europe (Bakker et al., 2013). According to
European Environmental Agency (2010), only between 1998 and 2009, Europe suffered
over 213 major damaging floods, which have caused some 1126 deaths, the displacement
of about 500 000 people and at least €52 billion in insured economic losses. However, by
taking the right measures their likelihood can be reduced and their impacts can be limited.
The need for developing comprehensive European water legislation was initially identified by
the council in 1988 which has resulted to bilateral meetings of officials from France and the
Netherlands to discuss the integration of European Water policy legislation (Bakker et al.,
2013). Following an informal meeting in April 1995 between the Netherlands, France,
Germany, the United Kingdom and Spain, a joint position paper was drafted which formed
the basis for a wider consultation between water directors of all European Union (EU)
member states. This process led to the adoption of Directive 2000/60/EC of the European
Parliament and of the Council of 23 October 2000 establishing a framework for Community
action in the field of water policy known as the Water Framework Directive (WFD). Although
Europe has already adopted in 2000 WFD which deals with integrated water management,
water quality and ecology (EU, 2000), the flood protection is not explicitly faced in it. Thus, a
European approach to flood protection was put on the agenda resulting firstly in a Flood
Action Programme in 2004 and later in the adoption of the Directive 2007/60/EC of the
European Parliament and of the Council of 23 October 2007 on the assessment and
management of flood risks known as the Floods Risk Directive (FRD) (Bakker et al., 2013).
FRD along with the Hyogo Framework for Action (HFA) which form two key
recommendations for the protection of those at risk are introduced and the main safety
practices in Europe are explored.
2.2.1 The main recommendations for flood safety.
Floods cannot be completely eradicated (Mostert and Junier, 2009) and for this, in the
European level attention has been moved from protection against floods to managing flood
risks (e.g. Klijn et al., 2008; Twigger-Ross et al., 2009; Hecker et al., 2009; Vinet, 2008;
Manojlovic and Pasche, 2008), fact which is reflected in FRD entered into force on 26
November 2007. FRD is the first directive of the EU (Mostert and Junier, 2009) that deals
with floods, requiring from the member states to perform a preliminary assessment of flood
risks mapping the flood extent, assets and humans at risk, prepare flood risk management
plans for the regions under significant flood risk and take adequate and coordinated
measures to reduce this risk (EU, 2007). According to the directive, EU member states have

16
to facilitate public participation, reinforcing public rights to access information and related
measures about flood risks and to influence the planning process (ICPDR, 2012). In
addition, EU member states have to coordinate the implementation of the FRD with the
WFD. The driving force for this coordination is that physical flood protection infrastructures
are some of the key drivers for determining ecological status of waters with regards to hydro-
morphological quality elements (Santato et al., 2013). In addition, a number of measures
which focus on flood risk reduction can have multiple benefits for water quality, nature and
biodiversity as well as in terms of regulating water flows and groundwater restoration in
water scarce areas (Brättemark, 2010). In brief, preparation of river basin management
plans under WFD and flood risk management plans under FRD are elements of integrated
river basin management and thus their mutual potential for common synergies and benefits
must be used.
FRM purports to reduce the likelihood and/or the impact of floods on human health,
environment, cultural heritage and economic activity (Santato et al., 2013). In this context,
EU member states should develop, periodically review and if necessary update plans for
flood risk management with focus on prevention, protection and preparedness (EU, 2007).
Prevention will be feasible via a suitable land use practice which prevents floods’ damage by
avoiding construction of houses and industries in present and future flood prone areas and
by adapting future developments to the risk of flooding (EC, 2004). Furthermore, according
to the European Spatial Development Perspective (1999), flood prevention in the major
European river catchment areas can only be made effective through the imposition of
explicitly defined conditions and intervention in land uses.
HFA along with FRD are two key policies for the protection of communities at risk (Bakker et
al., 2013). “HFA for Action 2005-2015: Building the resilience of nations and communities to
disasters” has been adopted in January 2005 by 168 governments during the World
Conference on Disaster Reduction, held in Kobe, Hyogo, Japan and is about building
resilience of nations and communities to disasters targeting to make the world safer from
natural hazards substantially reducing the disaster losses, in lives and in the social,
economic and environmental assets of communities and countries (UNISDR, 2007). HFA is
essentially a global blueprint for disaster risk reduction which provides guiding principles,
priorities for action and practical means for achieving disaster resilience for vulnerable
communities. It focuses on the development and strengthening of institutions, mechanisms
and capacities to build resilience to hazards and it encourages the adoption of disaster risk
reduction logic in sustainable development policies and planning as well as in emergency
preparedness, response and recovery programmes (UNISDR, 2007). For the monitoring of
the implementation of HFA, responsibilities are allocated to governments and also to
17
regional and international organizations and partners in the United Nations International
Strategy for Disaster Risk Reduction (UNISDR1) secretariat. HFA is related to flood risk
management, since floods are one of the main hazards which annually affect millions of
people all over the world (Bakker et al., 2013).
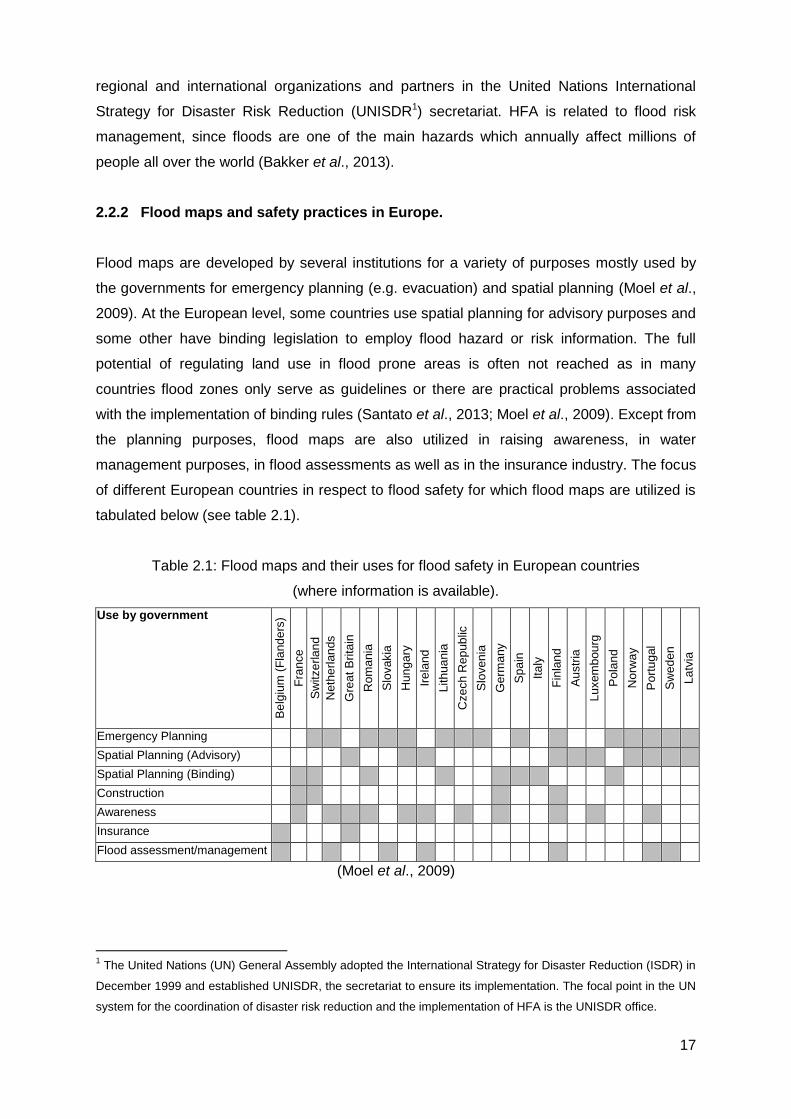
2.2.2 Flood maps and safety practices in Europe.
Flood maps are developed by several institutions for a variety of purposes mostly used by
the governments for emergency planning (e.g. evacuation) and spatial planning (Moel et al.,
2009). At the European level, some countries use spatial planning for advisory purposes and
some other have binding legislation to employ flood hazard or risk information. The full
potential of regulating land use in flood prone areas is often not reached as in many
countries flood zones only serve as guidelines or there are practical problems associated
with the implementation of binding rules (Santato et al., 2013; Moel et al., 2009). Except from
the planning purposes, flood maps are also utilized in raising awareness, in water
management purposes, in flood assessments as well as in the insurance industry. The focus
of different European countries in respect to flood safety for which flood maps are utilized is
tabulated below (see table 2.1).
Table 2.1: Flood maps and their uses for flood safety in European countries
(where information is available).
Use by government
Be
lgiu
m (
Fla
nd
ers
)
F
ran
ce
Sw
itze
rla
nd
Neth
erl
an
ds
Gre
at
Bri
tain
Rom
ania
Slo
vakia
Hun
ga
ry
Ire
land
Lith
ua
nia
Cze
ch R
ep
ub
lic
Slo
ven
ia
Ge
rma
ny
Sp
ain
Ita
ly
Fin
lan
d
Au
str
ia
Lu
xem
bou
rg
Po
lan
d
Norw
ay
Po
rtu
gal
Sw
ed
en
La
tvia
Emergency Planning
Spatial Planning (Advisory)
Spatial Planning (Binding)
Construction
Awareness
Insurance
Flood assessment/management
(Moel et al., 2009)
1 The United Nations (UN) General Assembly adopted the International Strategy for Disaster Reduction (ISDR) in
December 1999 and established UNISDR, the secretariat to ensure its implementation. The focal point in the UN
system for the coordination of disaster risk reduction and the implementation of HFA is the UNISDR office.

18
2.3 The Dutch perspective to flood safety.
For over a millennium, people in the Netherlands have been both fighting against and
enjoying the benefits of water from the sea, the major rivers Rhine and Meuse, precipitation
and seepage of groundwater (De Lange et al., 2014; Ven, 1993). The Netherlands is
considered as one of the safest deltas in the world largely focusing on the flood prevention
through its defense system. However, an evaluation of the water safety policy demonstrated
that the country is not prepared for extreme flooding (Kolen et al., 2012). In addition, risk
analysis for the Netherlands in 2008 (BZK, 2008) and 2009 (BZK, 2009) demonstrated that
although a flood disaster is “highly unlikely”; it is the disaster type with the most catastrophic
consequences in case of occurrence. For this, the multi-layered safety concept which is
currently the Dutch perspective to flood safety is introduced and analyzed.
2.3.1 The multi-layered safety concept for flood risk management.
As a response to the EU FRD, the Netherlands in its National Water Plan 2009-20152 has
introduced the multi-layered safety concept which bases on the widely adopted
recommendations of both the FRD and the UNISDR’s HFA. In essence, the multi-layered
safety concept is a three-tier approach to flood risk management (Gersonius et al., 2011)
which integrates measures for reduction of probability and mitigation of loss in a flood
protection system (Tsimopoulou et al., 2013). Multi-layered safety reinforces flood protection
and operationalizes flood resilience by distinguishing three safety layers: (1) prevention; (2)
spatial solutions and (3) emergency response (Hoss, 2010; Tsimopoulou et al., 2013;
Gersonius et al., 2011; Herk et al., 2014). It is both a risk-based and a resilience-based
approach as it focuses not only on the reduction of the probability of flooding via preventive
measures such as dykes’ reinforcement but also on the reduction of the consequences of
flooding (e.g. human fatalities and economic losses) through spatial measures and
preparedness for emergency response (e.g. emergency management plans) (Rijke et al.,
2014; Hoss, 2010). Such a framework has been developed in Belgium’s Flanders
(Cauwenberghs, 2013). In USA and Canada [see for instance (Lopez, 2009; Lopez, 2006)
and (Fraser Basin Council, 2008) respectively] similar approaches are used but called
“multiple lines of defense” (Kolen et al., 2012).
2 “The National Water Plan: The Netherlands, a safe and livable delta, now and in the future” describes all water-
related measures which have to be taken during the period 2009-2015 in order the Netherlands to stay safe and
prospering for the future generations exploiting the opportunities of water (Hoss, 2010; Deltacommissie, 2008).

19
The three layers of the multi-layered safety (see figure 2.1) which forms an integrated flood
risk approach are presented below (Hoss, 2010; Tsimopoulou et al., 2013). The first two
layers are physical measures while emergency response focuses on institutional
(organizational) measures taken before the event (Hoss et al., 2011).
Layer 1: Prevention.
This is about preventing rivers and seawater from inundating areas that are usually dry by
constructing flood defenses or preventing high river discharges.
Layer 2: Spatial Solutions.
These are pro-active measures which focus on the decrease of loss in the case of flood
occurrence by spatial planning, adaptation of buildings and protection of vital
infrastructure. Solutions include location of urban and industrial land uses in areas with
lower flood risk; raise of the constructions’ ground levels etc.
Layer 3: Emergency Response.
This focuses on flood emergency preparedness by setting the organizational framework
of the emergency response as well as by developing evacuation plans, early warning
systems, temporary physical measures such as sand bags and medical treatment.
Figure 2.1: The three layers of the Dutch multi-layered safety concept which reduce the
probability of floods (layer 1) and their consequences in case of occurrence (layers 2 and 3).
(Rijke et al., 2014)
In the Netherlands, multi-layered safety is considered a shift from the past where attention
was traditionally paid on the first layer of flood prevention, to the exploration of the potential
of sustainable spatial planning and emergency preparedness whose measures are intended
to be tailored to local areas for minimizing the magnitude of the flood damage in case of
such an event. However, multi-layered safety makes the task of water security more
Layer 1
Layer 2
Layer 3
Application of the multi-layered safety in the case of
Dordrecht island.

20
complex, as it is broader in scope and it requires multi-actor based work across multiple
locations (Gersonius et al., 2011). While only Rijkswaterstaat (Directorate-General for Public
Works and Water management) and local waterboards are responsible for the first layer of
dyke rings, the second and third layer involve several parties including provinces,
municipalities, safety regions and private parties which call for much higher level of
coordination. Furthermore, the complexity of multi-layered safety lies on the need to account
for future changes such as population increase or decrease, changes in economic and
spatial developments.
2.3.2 Analysis of the multi-layered safety system.
The Dutch shift from a predominantly prevention policy to multi-layered safety implies
alteration of the flood risk management from a serial to a parallel system (Hoss, 2010).
Furthermore, Jongelan et al. (2012) mention that the multi-layered safety represents the
relationship between the different phases or strategies as a parallel system rather than a
serial system which means that the different layers are not as weak as the weakest link fact
which is falsely described by the safety chain concept. In this context, multi-layered safety
requires interventions across its three layers to effectively reinforce the overall system’s
resilience to floods (Rijke et al., 2014; Gersonius et al., 2011). Hoss (2010) concluding that
there will never be absolute safety, suggests implementation of multi-layered safety with
respect to optimal allocation of resources instead of attempting to achieve maximum security
at any price. Rijke et al. (2014) state that it is more efficient to invest in the layer(s) with the
highest return on investment and to skip or minimize the use of the other(s).
For the description of how the multi-layered safety system will function as a serial vs. a
parallel system in case of a flooding, equations (1) and (2) are used and the respective Venn
diagrams are employed for visualization purposes (see figure 2.2). As layer 1 is about
reducing the probability of occurrence of flooding through preventive measures, in the case
of flooding, layer 1 de facto fails. In a serial system, if one of its components fails, means
that the whole system immediately fails. In a parallel system this fails only if all its three
layers fail. In case that one or two out of its three layers fail, the entire system does not fail.
However, for multi-layered safety, neither the one nor the other system definition can be
valid, while currently a definition regarding this has not been indicated (Tsimopoulou et al.,
2013). Jongejan et al. (2012) justify the latter by the following paradigm: If a levee system
were to fail, less or more humans could be saved through emergency response, but the
immediate damages could not be undone, nor could crisis response bring the immediate
flood victims back to life.

21
L2 L3
L1
(1) (2)
Venn diagram for a serial system Venn diagram for a parallel system
where:
: Failure of Layer 1 (prevention);
: Failure of Layer 2 (spatial solutions) given the failure of Layer 1 (prevention);
: Failure of Layer 3 (emergency response) given the failure of Layer 1 (prevention).
Figure 2.2: Failure of the multi-layered safety concept as a serial vs. a parallel system.
(Adapted from Tsimopoulou et al., 2013)
In multi-layered safety, if Layer 1 fails leading to a flooding, Layers 2 and 3 can minimize the
consequences of this flood event. However, the measures taken in multi-layered safety
should not only focus on the reduction of either the flood probability or the damage in case of
flooding, but on both parameters simultaneously. The explicit definition of failure in each
safety layer in the form of exceedance of certain thresholds can significantly contribute to the
management of multi-layered safety systems, as it introduces safety classification added in a
system by means of decrease of flooding probability; reduction of environmental and
economic damage and minimization of human fatalities (Tsimopoulou et al., 2013).
2.3.3 The need to methodologically frame the multi-layered safety concept.
The multi-layered water safety concept more closely resembles a parallel system in which
Jongejan et al. (2012) mention that it is more cost-effective to invest in one component
rather than dispersing the available budget over all of them. From an economic perspective,
attention should be paid on how the different investment strategies affect the probability of
adverse consequences, based on the rational assumption that smaller losses are desirable
over greater ones. However, local conditions could lead to different optimal balances
between measures corresponding to the three layers of this multi-tier safety concept i.e.
between measures for flood probability reduction and damage minimization in case of
flooding.
L3
L1
L2

22
Economically speaking, beyond low cost investments in damage mitigation measures, how
effective could heavy investments in this direction be? In 2007, Taskforce was established to
improve disaster preparedness (TMO, 2009) considering strong investments in emergency
planning, evacuation routes and equipment. The purchasing and maintenance costs of a
fleet of aerial rescue means (helicopters) is enormous taking into account that they will be
rarely used on average to save some people from their rooftops. But even in this case the
huge economic impact of a flood disaster and the inevitable injuries and human fatalities are
unavoidable. In this situation, the minimization of the probability of flooding would be the
more efficient strategy. Another example is the case of a flooding in a densely populated
area, where an additional investment in prevention is likely to yield a far greater return
compared to an additional investment in loss mitigation measures (Jongejan et al., 2012).
However, in the case of Dordrecht city in which historic buildings line the existing flood
defenses, Hoss (2010) in a comprehensive assessment of the multi-layered safety concept
where he has explored how the flood risks can be reduced, he identified that the
improvement of emergency response preparedness or the flood proofing of buildings could
yield better compared to the strengthening of the flood defenses (flood probability reduction).
This happens due to the relatively high costs of reinforcing the flood defenses, considering
the relatively small size of the area protected by them (Jongejan et al., 2012).
Cost-benefit analysis can be applied for structuring complex decision problems (Arrow et al.,
1996) including safety regulations. However, the ability of cost-benefit analysis to produce
morally relevant outcomes has been challenged, particularly for matters related to health and
safety, where factors other than costs and benefits influence humans’ moral judgments (e.g.
Slovic et al., 2004; Slovic et al., 1984; Fischhoff et al., 1981). Hence, the results of a strict
cost-benefit analysis should not be binding for the agency heads (Arrow et al., 1996). In this
context, the multi-layered safety should not be driven only by economic factors focusing on
the estimation of some efficient balance between safety and return.
Since there is no one single multi-layered safety policy, a framework such as geodesign
which takes into account the roles and values of the people at place and the principles of
sustainability in a collaborative and interactive process for making balanced decisions is
required. In this context, this paper purports to geodesign the multi-layered safety having in
mind that collaboration and maximum consensus between the involved stakeholders has to
be achieved for deciding the most desirable, balanced and sustainable safety measures. In
the following sections geodesign is introduced and applied in order to methodologically
systematize the multi-layered water safety concept following a characteristic script of
geodesign.

23
2.4 Methodological framework: Geodesign.
Geodesign needs collaboration which In turn requires organization that asks for a framework
around which tasks can be identified and linked (Steinitz, 2012). In this context, the
methodology of this study i.e. geodesign is introduced and framed.
2.4.1 Geodesign: Definitions.
The design of land uses in the context of geographic space and natural environment is not a
recent concept (Paradis et al., 2013). The latterly dubbed geodesign has its roots thousands
of years ago, being an interdisciplinary process of place making, where design has been
variably affected by surrounding geographies and natural conditions (McElvaney, 2012).
Goodchild (2010b) supporting that geodesign is not new; he states that it represents a re-
examination and probably a repurposing of a number of established fields. However, Miller
(2012) argues that unlike the activity of geodesign, the term is relatively new and only a
small number of geo-related businesses have utilized geodesign as part of their name.
Dangermond (2009a, b) sees geodesign as a systematic methodology for geographic
planning and decision making which employs all the geographic knowledge (layers of
information, measurements and analytic models) that users collectively build, maintain and
import into a new interactive process where one can design alternatives and acquire
geography-based feedback on the consequences of these designs in a timely manner.
Flaxman (2010a, b) defines geodesign as “a design and planning method which tightly
couples the creation of a design proposal with impact simulations informed by geographic
context”. Steinitz (2012) simply specifies geodesign as changing geography by design where
design related processes are developed and applied towards changing the geographical
study areas in which they are utilized and realized. The desire to change geography goes
beyond individual buildings, looking at the broader scale plans towards better understanding
the effect on the landscape (Artz 2010[2], 21). For the practice of geodesign, interdisciplinary
collaboration between the design professions, geographical sciences, information
technologies and the people at place is a must (Steinitz, 2012).
Paradis et al. (2013), by exploring the various definitions of geodesign, they identify that the
integration of geographic sciences and geospatial technologies with design which facilitates
digital geographic analysis to inform the design processes is the fundamental characteristic
of geodesign. Fully leveraging geography during the design process can result in designs
that emulate the best features and functions of natural systems, where humans and nature

24
are mutually benefited via a more peaceful and synergistic coexistence (Artz 2010[2], 16). In
this regard, Dangermond (2010) sees geodesign as “designing with nature in mind” (Artz
2010[2], 6). Furthermore, Ervin (2011) mentions that “geodesign enhances the traditional
environmental planning and design activities with the power of modern computing,
communications and collaboration technologies, providing on-demand simulations and
impact analysis to provide more effective and more responsible integration of scientific
knowledge and societal values into the design of alternative futures”.
2.4.2 Geodesign framework and models.
Steinitz framework for geodesign illustrated in figure 2.3 (Steinitz, 2012) and previously
known as framework for landscape planning (Steinitz, 1995), it employs six questions that
can be answered by six models for the description of the overall geodesign process (Steinitz,
2012).
Figure 2.3: The geodesign framework.
(Steinitz, 2012)
The first three questions refer to the past and the existing conditions of the study area within
a geographic context, while the last three are about the future more than the past and the
present. The first three models used for answering the first three questions comprise the
assessment process, while the last three models used comprise the intervention process
respectively (Miller, 2012). Geodesign concept through its six questions, provide a rapid,
holistic, participatory, interactive and adaptive process for developing a more sustainable
future (Dangermond, 2010). Furthermore, it enables the design of various alternatives, their
evaluation in terms of impact on the natural environment as well as their utility to the human

25
population; and selection and implementation of the alternative that is projected to achieve
the best balance, thus supporting the development of the most educated and informed
decisions about the future (Dangermond, 2009a).
During a geodesign study, three iterations of the six questions of the geodesign framework
(see figure 2.3) are explicitly or implicitly performed at least once before a decision towards
implementation can ever be reached (Steinitz, 2012). In the first iteration where the
questions are asked in a sequence from 1 to 6, the geographic study area as well as the
context and the scope of the study are intended to be identified answering why the study
should take place. In the second iteration, where the questions are asked in a reverse
sequence i.e. from 6 to 1, thus making geodesign decision-driven rather than data-driven,
the methods of the study are intended to be selected and defined, simultaneously answering
to the how questions. In the third iteration, the methodology designed by the geodesign team
during the second iteration is carried out and having data as a central concern, the study is
implemented and results are provided. At this stage, the questions are asked from top to
bottom i.e. from 1 to 6, attempting to identify what, where and when.
Dangermond (2010) sees this iterative design/evaluation process as the way in which the
human brain operates i.e. try something, evaluate the results and move on. In order the
stakeholders to come to decisions, questions must be asked and answered and options for
selection must be framed and deliberated. In short, the geodesign framework can be seen
as collaboration facilitator as well as a valuable supporter in the organization and solving of
large and complex design problems, often at geographic scales ranging from a
neighborhood to a city, from the local to the national and even international level.
2.5 Geodesign the multi-layered safety concept: The case of the Netherlands.
Firstly, the information needs for the multi-layered safety concept in the Netherlands are
explored. Afterwards, geodesign is theoretically implemented to present a framework for
developing shared understanding of the current situation of an area of interest in terms of
flood safety as well as for achieving collaborative selection of the optimal multi-layered
safety measures. The latter is accomplished by taking into account the values of the people
at place, economic efficiency and environmental impacts of alternative safety measures in
an attempt to achieve maximum consensus between the stakeholders.

26
2.5.1 Information needs.
In order a study area to be described, information is needed. Adapting the information
requirements as described by ACIR (2005) for the multi-layered safety, these can be
determined as semi-static and model information. Furthermore, these information
components are clustered into 6 different categories (see figure 2.4). However, when
measures such as preventive organized evacuations are decided in the context of the
emergency response layer, their implementation needs dynamic information. This is related
to the (simulated) escalating flood and its effect on the incident location and the surrounding
environment (geographical awareness); the capacity and the activities of the emergency
response organizations to tackle it and normalize the situation.
Figure 2.4: Overview of the information categories needed for the multi-layered safety
concept.
(Adapted from ACIR, 2005)
In table 2.2, an overview of data required for the multi-layered safety concept in the case of
the Netherlands is provided. Almost all of these data have a spatial (geographical)
component.
2.5.2 Implementing geodesign on the multi-layered safety concept.
In this study, geodesign is used as a theoretical framework in its conceptual form (see table
2.3) to shed light on involving stakeholders in the identification of the most desirable water
safety measures taking into account their socioeconomic and environmental impacts. The
utilization of geodesign framework purports to increase the effectiveness of the multi-layered
safety concept, even though effectiveness is a broad concept which can include many
aspects. In addition, through its models and iterations it intends to enable communication of
stakeholders’ values. In theory, by geo-designing the multi-layered safety concept,
integration and exploration of ideas with direct evaluation at the same time is intended to be
Semi-static info
Object information
Capacity information
Planning information
Geo-information
Citizen information
Prediction
information
M L S
Model info

27
enabled. Furthermore, as geodesign is underpinned by trial and error logic, it increases the
opportunity for experimentation and learning by doing (Steinitz, 2012).
The results of framing the multi-layered safety in the context of a geodesign study are
tabulated (see table 2.3). At the end of the process, the stakeholders can say no, maybe or
yes to the alternative safety measures. No, implies that the proposed safety measures do
not meet their requirements, maybe can treated as feedback and calls for changes possibly
in the allocation of the weights regarding the three safety layers and a yes means
implementation of the proposed safety measures. The latter will be used as data in the
updates and future reviews of the multi-layered safety measures through the proposed
framework. The route for coming into an agreement regarding the most suitable, desirable
and balanced safety measures is not straight forward and normally non-linear, as many
entries of different types and of different sources may be received leading to revisit and
revision of the decisions.
Moura (2015) based on her empirical study, she mentions that the use of geodesign
framework has proven to be a system in an open box that establishes steps, presents partial
results, composes potential changes and choices, simulates alternative scenarios and
possibilities, determines responsibilities and limits of what is acceptable based on societal
values and urge people to decide about their common future employing a shared way of
communication and ideas exchanging. In this line, it can be said that geodesign is not a
linear process as it contains feedback loops for model adjustments towards identifying
optimal solutions. Stakeholders’ involvement in the identification of the most favourable
measures regarding the three layers of the multi-tier safety concept is needed to foster
credibility in decisions making. In literature, some authors including Batty (2013), Steinitz
(2012) and Goodchild (2007) discuss how geotechnologies can support stakeholders’
participation in geodesign. In particular, the potential of interactive geodesign tools in
decision making is increasingly acknowledged. (Steinitz, 2012; Dias et al., 2013). For
example, an interactive mapping device called “touch table” can be used as stakeholders’
communication platform in the implementation of geodesign on the multi-layered safety
concept, similar to previous studies (see Eikelboom and Janssen, 2015; Janssen et al.,
2014; Arciniegas et al., 2013; Alexander et al., 2012). The added value service of a touch
table which includes for instance learning by experimenting, intuitive control, geospatial
database availability has been discussed in several articles (e.g. Pelzer et al., 2014; Pelzer
et al., 2013; Eikelboom and Janssen, 2013; Arciniegas et al., 2011).

28
Table 2.2: Data inventory for the multi-layered safety concept in the Netherlands. TEMPORAL
NATURE Data Details
S E
M I
-
S T
A T
I C
Topographic data
Top10NL: Open topographic data [Street networks; Railroad networks (Rail, metro and tram lines); Water bodies (rivers, sea, lakes, etc.); Building footprints; Terrain (grassland, arable land, etc.); Design elements (noise barriers, trees, pylons, etc.); Relief elements (land contour lines, sea depth lines, etc.); Geographical and functional areas (neighborhoods, campgrounds, etc.)] that can be used at scales between 1: 5000 and 1:25000 throughout the Netherlands.
BAG - Basic registration of Addresses and Buildings (In Dutch: Basisregistraties Adressen en Gebouwen): Open geodata about building footprints and addresses.
Elevation data
AHN2 - Actual Height Data (In Dutch: Actueel Hoogtebestand Nederland): Open, detailed and precise elevation data (terrain, building and vegetation information) of 0.5 m x 0.5 m resolution. Digital Terrain Model (DTM) and Digital Surface Model (DSM) can be extracted from AHN2 providing terrain and objects' height information respectively.
Flood defenses’ specifications
Location, technical characteristics (e.g. capacity, cross-sections) of primary and regional flood defenses protecting from open (North sea, Wadden sea, rivers, Ijsselmeer and Markermeer) and inland water (lakes, streams, canals) respectively. These include weirs, barrages, sluices, dams which regulate water levels by water intake or releasing water when needed as well as dykes (floodgates or levees), natural sand dunes and storm surge barriers which manage or prevent water flow into specific land regions. Topographic information about the flood defenses at scale 1:1000 can be retrieved from DTB – Digital Topographic Database (In Dutch: Digitaal Topografisch Bestand).
Soil composition
GeoTOP from TNO – Dutch Organization of Applied Scientific Research (In Dutch: Nederlandse Organisatie voor Toegepast-Natuurwetenschappelijk Onderzoek): Detailed three dimensional (3D) model of the subsurface of the Netherlands which is divided into voxels of 100m x 100m resolution. Information regarding stratigraphy, lithology and uncertainty of the voxel appearance is included. It is currently available for the provinces of Zeeland and South Holland. For the multi-layered safety concept, emphasis is placed on the composition of the primary and regional flood defenses.
Water bodies data
Water depths at different locations from the New Amsterdam Level [In Dutch: Normaal Amsterdam Peil (NAP)]. NAP is also the Dutch point for altitude measurements (m).
Flow rates (m3/s) of water in natural and manmade open channels. Flow rate (m
3/s) of the sea water. The water services (In Dutch: Waterdienst) of the
Rijkswaterstaat and the regional waterboards can provide such information.
Cross-sectional characteristics of the water-bodies.
Precipitation and evapotranspiration data Time series of rainfall (mm) during a day, rainfall intensity (mm/h), evaporation (mm/day), transpiration (mm/day) and evapotranspiration (mm/day) for areas (ha) at different locations. This information can be derived from STOWA Meteobase, the foundation of applied water research (In Dutch: Stichting Toegepast Onderzoek WaterBeheer).
Sewerage system specifications Technical and geographical specifications of the system and its components (e.g. drains, manholes, pumping stations, screening chambers, storm overflows). Emphasis is placed on the collection of the storm water runoff. Regional waterboards and Rijkswaterstaat water services can provide such information.
Flood risk data
Risk map (In Dutch: Risicokaart): Vulnerable objects exposed to flood hazards and guidelines for emergency preparedness in case of different inundation depths.
Population
Numbers for every postcode district. (Derived from CBS - Central Bureau of Statistics (In Dutch: Centraal Bureau voor de Statistiek).
Inhabitants, density, growth, age, sex, disabled.
Land Uses
LGN6 - Nationwide Land Uses (In Dutch: Landelijk Grondgebruik Netherland).
A grid file which distinguishes 39 land uses with a spatial resolution of 25m x 25m). Its main classes are urban, forest, water, nature and agricultural crops.
Derived from CBS. Land uses per municipality for different chronologies with their coverage in hectares (ha).
Emergency capacity
Number and capacity of rescue means (ground and aerial) and emergency responders classified per emergency organization [e.g. Fire brigade operational staff (professional and voluntary) provided by CBS]. Location, number and capacity of emergency relief centers categorized by their function (e.g. medical aid, sheltering, catering, animal welfare) as well as by municipal area.
Financial indicators
Flood defenses. Unit (construction, improvement and maintenance) cost per type and function.
Security care.
Material costs per emergency response organization.
Personnel costs (per capita spending) per emergency response organization.
M O
D E
L
Prognosis data
Land-use forecasts. Flood forecasts based on different inputs and model parameters.

29
Table 2.3: Theoretical implementation of geodesign on the Multi-Layered water Safety concept (MLS).
GEODESIGN THE MLS FIRST ITERATION (WHY?)
SECOND ITERATION (HOW?)
THIRD ITERATION (WHAT, WHERE, WHEN?)
1. How should the study area be described? Representation models.
What is the location of the Area of Interest (AoI)? How the hydrologic system functions in this AoI?
What are the physical, economic and social activities in the AoI?
Where exactly is the study area and how is it bounded in hydrologic terms?
Which data are needed? At what scale, classification, and times? From what sources? At which cost? How to be represented?
Acquire the required data (An overview is provided in table 2).
Analyze and visualize them over time and space using appropriate technology [multi-scale Geographic Information Systems (2D, 3D, 4D)].
Organize them according to the needs of the three safety layers. Communicate them to the interested MLS parties using relevant (geo-) technology instruments (e.g. touch table).
2. How does the study area operate? Process models.
What are the major hydrological processes in the AoI? How these processes are affected by precipitation and evapotranspiration, infiltration and percolation?
How the surface and the sub-surface systems are linked in the AoI?
How the flood defenses are functioning in the AoI? What is their capacity?
Which hydrological processes should be considered in determining MLS policies and measures?
At what scale and for which time horizon should the safety measures operate?
What should be the level of complexity of the process models (for describing the AoI) that fit the purpose of the MLS study?
Implement, calibrate and test the selected hydrologic models (stochastic; process-based models) for the AoI. Change the model parameters and run them several times.
Explain how the model outputs pinpoint the need to focus on one or more safety layer(s).
3. Is the current study area working well in terms of flood safety? Evaluation models.
Have they been recorded high water depths in the AoI? Why?
Are there currently problems with the functioning of the flood defenses? Why? Where?
Are there developments in zones of high flood risks? How will it be tackled in the future spatial plans?
Are the people at place aware about these problems? Are they prepared? Are the emergency agencies prepared to respond?
What are the evaluation criteria for the alternative safety measures corresponding to the three MLS layers? Economic? Legal? Societal? Environmental?
What are the measures for evaluation of the success in terms of prevention (flood probability reduction), loss minimization through spatial solutions and emergency preparedness in the case of flooding?
Evaluate the flood safety condition of the AoI based on defined thresholds. Visualize and communicate the results.
Explain how the local socioeconomic activities as well as environmental factors affect the flood safety in the AoI.
Evaluate the current safety measures taken in the AoI, identify their effectiveness and classify them according to the three safety layers. Identify whether a reinforcement of the current measures or a shift is needed in the context of the MLS.
4. How might the study area be altered in order to meet the flood safety requirements? Change models.
In which of the three safety layers will the weights be placed? What are the alternative scenarios? Need visualization?
How the AoI will meet the flood safety requirements in the future? Will it be a shift from the current practice? How?
What is the time horizon and scale(s) for the alternative safety measures? Are there any assumptions and requirements for them?
What change model(s) will they be used to describe the future alternatives in terms of flood safety? Will the outcomes be simulated and/or visualized?
Example of alternative measures that can be visualized. Participants can propose more.
MLS RISK
Layer 1: Prevention Layer 2: Spatial solutions Layer 3: Crisis management
Source (hazard/ water overload)
Redistribute discharge over river arms, retain runoff; Give waterways more space.
Pathway (Exposure)
Large scale flood defenses (e.g. reinforcing or building new dykes); Flood defenses enabling controlled overflow.
Reconsider settlements location; Compartmentalization; Alleviation (e.g. elevation) of constructions
Preventive organized evacuation; Temporary flood defenses.
Vulnerability (Receptor)
Flood proofing of buildings.
Self-reliance/temporary flood proofing of buildings; Emergency relief, rescuing.
(Hoss et al., 2011)
5. What differences might the changes cause in terms of cost- efficiency? Impact models.
What is the impact of the alternatives in terms of cost-efficiency?
Are measures related to the reduction of flood probability more beneficial compared to measures related to consequences reduction in case of flooding? Why?
Are the economic impacts of the possible safety measures related to the three MLS layers regulated by legislation or regulations? How?
Which impacts even if they are cost-effective should be assessed from a legal and/or environmental perspective?
Perform a cost-benefit analysis for the alternative measures corresponding to the different safety layers of the AoI. Identify and rank the most cost-effective. Visualize and communicate the results.
Compare and explain the impacts of the measures corresponding to the different safety layers in terms of cost-effectiveness.
6. How should the study area be changed in order to meet the flood safety requirements taking into account moral factors and values of the local society, cost-efficiency of the safety measures and the impact of the measures on the environment (principles of sustainability)? Decision models.
What is the main purpose of the study? Is it more efficient to invest only in the layer with the highest return in economic terms? Is it socially acceptable?
Who are the major stakeholders and what are their positions, if known?
Are there any binding technical and/or legal limitations for the AoI that must guide the MLS study? Are there any identified implementation difficulties for any of the measures related to the three layers of the MLS?
Who will make the decisions and how? What do they need to know? What will be the basis for their evaluation? Scientific? Cultural? Legal? Ethical? Combination of the previous?
What should the decision makers consider as failure of the safety layers?
Are there issues related to the implementation of the safety measures in terms of cost and technology?
Check whether the more cost-effective alternative measures corresponding to the three safety layers of the MLS are morally relevant and thus more likely to be socially acceptable.
Check whether these measures have any side effects on the environment.
Select a number of safety measures in a multi-disciplinary driven context, taking into account their economic efficiency, the values of the people at place and their environmental impacts and decide upon their suitability: o No, which implies more feedback; o Maybe, which means that further study at different temporal and spatial scales is required; o Yes, which drives to the presentation of the most suitable safety measures to the stakeholders
for their decision and possible implementation.

30
2.6 Final remarks on the geo-design of the multi-layered water safety.
In recent years there has been considerable attention in improving the flood protection in
Europe and beyond. As a consequence, it has been a growing need to share information
and best practices in the field of flood risk management. In this context, the Netherlands has
introduced the multi-layered safety concept for flood risk management which is based on
recommendations for flood protection such as the EU flood risk directive and the UNISDR
Hyogo framework.
The multi-layered safety concept includes structural and non-structural measures
representative of its three layers which target to reduce the flood risk probability through
prevention (layer 1) as well as the consequences in case of flooding via spatial solutions and
emergency response (layers 2 and 3). By analyzing a multi-layered safety system, it can be
deduced that such a system resembles more a parallel than a serial one, as failure of the
safety measures in one layer does not mean failure of the whole system. However, it is not
exactly a parallel system because when the preventive measures fail, the immediate
consequences cannot be undone. The measures corresponding to layers 2 and 3 are able to
reduce the damage, but not to completely eradicate it. Failure of the preventive measures is
obvious when a flood occurs. But what is considered failure in layers 2 and 3 has to explicitly
be defined which will support the allocation of weights between the three layers of the multi-
layered safety concept.
The goal to promote stakeholders' participation and collaboration towards supporting
decision making in regards to the most desirable and balanced water safety measures
across different spatial and temporal scales, it has been achieved by theoretically
orchestrating the multi-layer safety concept in a geodesign structure. A primary concern for
the multi-layered safety concept is the inventory of the required data. Decisions especially
for matters related to flood safety should rest on the firm ground of relevant and of high
quality data. In this context, this contribution attempts to provide a first comprehensive
overview of the data required for the multi-layered safety concept. However, questionnaire
surveys with the participation of the involved to this multi-tier safety concept can shed more
light regarding the information requirements of each safety layer. In this way, overlaps in
terms of information needs between the three safety layers can be identified as well.
In order to develop and select optimal flood safety measures, all the stakeholders involved in
the multi-layered safety concept have to develop awareness regarding the current water
safety status in an area of interest. In particular, they have to comprehend the current

31
functioning of an area of interest and also the way(s) in which flood safety is presently
addressed. Furthermore, the stakeholders have to work together respecting each other
values, considering local circumstances and searching for the most balanced and
sustainable solutions. Cost-benefit analysis can extract the measures which can yield better
from an economic perspective. However, in matters related to health and safety, the human
judgments are influenced not only by economic factors but also by their ethical values. In this
context, the systematization of the multi-layered safety concept following the geodesign
framework creates surplus value for the local society, economy and environment through its
different and iterative feedback driven processes. The geodesign of the multi-layered safety
concept motivates collaboration between the involved to the multi-layered safety parties
without losing their identities. It underpins trial and error logic so that all stakeholders can
assess the impact of the safety measures resulting from their own points of view. In this way,
the stakeholders can identify overlaps in terms of the proposed measures which in turn can
create maximum consensus between them leading to the selection of the most desirable
future water safety measures that consider their cost efficiency, their impact on the
environment and the values of the people at place. But in order the geodesign of the multi-
layered safety concept to be successful, it should be seen useful by those working with it. If
intentionally deviate from the principles of this framework, the decisions i.e. the safety
measures can leave the stakeholders unsatisfied who in turn will reject them.
Further research is needed towards transferring the implementation of geodesign on multi-
layered safety from theory to practice. In particular, the geodesigned multi-layered safety
concept should be experimented, tested and experienced in workshop settings and in
different contexts for identifying optimal safety measures. Furthermore, during such
workshops, technology driven tools which empower society by enabling their participation in
the decision making should be employed and assessed in the context of practicing
geodesign for arriving at sustainable arrangements regarding water safety.

32

33
3. 3D INFORMATION CONCEPTS FOR FLOOD RISK COMMUNICATION
AND MANAGEMENT IN THE CONTEXT OF COMPLEX URBAN SPACES.
Nowadays, an increasing number of applications are utilizing 3D city models for their
purposes as they reveal high information potential. In the context of the rapidly urbanizing
world, the contribution of the virtual 3D city models in integrating, managing and
communicating complex geo-information for risk management in the urban suburbs is
explored and qualitatively assessed in this article. For this, a virtual 3D city model for
Heerhugowaard case study area in the Netherlands which is situated below mean sea level
has been developed, using open data. This model provides the stakeholders with dynamic
3D renderings of the flood risk components and their relations, facilitating the development
of shared awareness regarding a particular urban flood risk situation. Furthermore, building
upon the virtual 3D city models, an interoperable 3D information system which utilizes
existing open international standards from the GIS and BIM domains is conceptualized.
Such a concept additionally provides up-to-date information on demand regarding the
physical and functional characteristics and relations of the city objects and components at
both the city and the facility scale. It supplies information not only about the external
environment but also about the buildings’ interior structures which are important in the
management of risks as well as in the preparation of evacuation plans for managing the
residual risks.
3.1 Introduction.
According to the United Nations (2014), the world has urbanized rapidly since 1950 and
projections indicate that it will continue to urbanize in the coming decades. In 2014, just over
the half of the global population was residing in urban cities while this distribution is expected
to shift further over the next 35 years (UN, 2014). Cities are centers of economic activity and
growth and as more population move to the cities and businesses invest locally, more lives
and assets accumulate in disaster prone areas (Swiss Re, 2013). The thread to city
population and local economies is real and is relentlessly increasing as cities continue to
expand and risk management practices fail to keep up with the pace of change. Therefore,
strengthening the resilience of cities becomes a matter of utmost importance.

34
Geospatial researchers have learned that the availability, management and presentation of
geospatial information, play a pivotal role in the management of potential disasters
especially in the urban spaces (Lee and Zlatanova, 2008). Treicher (1967), an experimental
psychologist, through his famous psychological experiment about determining how human
beings obtain information, he proved that 83% of the information received by humans is by
the sense of sight. This indicates that the information visualization is necessary for
communication and information distribution (Wu and Hsieh, 2012; Lu et al., 2012). Effective
visualization assists people in effectively and efficiently obtaining the required information
(Lu et al., 2012). Kibria et al. (2009) have experimentally demonstrated that the increase of
realism and dimensionality, increase the user perception of understanding of a particular
situation. 3D maps are probably more understandable to users, especially those with limited
map reading skills as they allow thematic data to be presented in a format that more closely
resembles natural conditions and offer visualization advantages not available in traditional
2D mapping (Patterson, 1999; Basic et al., 2003). However, both classical 2D and 3D maps
do not provide sufficient support for decision making because they can only offer views
prepared in advance (Döllner et al., 2006a).
Nowadays, a high interest exists in the use of 3D models for interaction (Kibria et al., 2009)
as interactive 3D models are valuable tools in improving awareness regarding incidents such
as floods (Duzgan et al., 2011; Mioc et al., 2011; Stanchev et al., 2009; Basic et al., 2003).
Virtual 3D city models which are applied for an increasing number of applications (Mao,
2011; Stadler and Kolbe, 2007; Döllner et al., 2006a; Shiode, 2001) can be utilized for
managing risks in the urban context. Kolbe et al. (2005) report that virtual 3D city models
memorize the shape and configuration of a city and they enable 3D visualizations. Sadek et
al. (2002) state that if a picture worth a thousand words, a virtual 3D city model is worth a
thousand pictures. Mao (2011) mentions that 3D city models make easier the understanding
of the spatial properties of urban objects by the stakeholders, since the real world is in 3D
and it is natural for the human brain to interpret 3D scenes.
In the context of risk management, only 3D geometry and appearance information is
frequently not sufficient, as complex semantic information is required for querying and
analysis purposes. However, the needed data are typically derived from distributed sources
and often are thematically and spatially fragmented (Stadler and Kolbe, 2007). Therefore,
standards are required to be employed for seamless data integration and explicit
determination of semantics. In this way, massive, heterogeneous and distributed risk related
data from different domains such as GIS and BIM can be integrated into virtual 3D city
models in the context of a 3D information system. This 3D system should act as an effective

35
tool for decision support during the risk management process permitting dynamic
adaptations of the focused aspects of a discussion, enabling variations in the visualizations
and supporting investigations at different scales. For such virtual 3D city models-based
information systems for risk communication and management, little information exists.
The main purpose of this study is to present and explore different information concepts
which can contribute to the improvement of risk communication and management. The
paper, commences its mission by presenting in section 2 a conceptual model for risk
identification, discussing the requirements on risk communication that support the
stakeholders to become risk aware and participate in the risk management decision making
process. In section 3, the data underlying a virtual 3D city model developed for
Heerhugowaard case study area are described and the role of this model in risk
communication and management is qualitatively assessed. In section 4, the CityGML open
data standard from GIS domain is delineated and its role in the context of virtual 3D city
models for risk management is demonstrated. In addition, BIM domain and standards are
introduced and the role of BIM fields in risk management is discussed. In section 5, a
conceptual 3D information system based on virtual 3D city models and extended by open
international standards i.e. IFC from BIM domain and CityGML from BIM domain is
presented and its functionalities are explored in the context of risk communication and
management. Finally, section 6 summarizes the most important findings of this contribution.
3.2 Flood risk communication and management.
United Nations International Strategy for Disaster Risk Reduction (UNISDR) (2009) defines
risk management as the systematic approach and practice of managing uncertainty to
minimize potential harm and loss which is comprised of assessment and analysis of risks
and the implementation of strategies and specific actions to control, reduce and transfer
them. The assessment and analysis of a particular risk, requires a thorough understanding
of the components of a risk system which are described by the Source-Pathway-Receptor
(S-P-R) model; where sources are the origins of the hazards; receptors are the entities that
potentially can be harmed by a hazard including people, the manmade and the natural
environment and pathways are the routes by which a hazard can reach those receptors
(McGahey, 2009). According to the Office of Public Works (OPW) of the Government of
Ireland (2009), the S-P-R model has been widely adopted for the assessment,
communication and management of environmental risks. In addition, the S-P-R model is
closely related to the framework utilized by the Organization for Economic Cooperation and

36
Development, the European Union and the UK for the State of the Environment reporting
(Evans et al., 2003). This S-P-R model which is conceptually illustrated below including
interactions between its components in the case of flooding, is adopted and used in this
study as the basis for risk visualization and communication (see figure 3.1).
Figure 3.1: Risk (S-P-R) model for assessing and informing the environmental risk
management.
(OPW of the Government of Ireland, 2009)
Risk assessment requires identification of all the three components of the S-P-R model
including their relation. Therefore, probability and magnitude of the source(s), the
performance and response of pathways as well as barriers to pathways and the
consequences to the receptors including people, properties and the environment must be
explored. There can be no risk unless a connectivity between S-P-R is identified (Kandilioti
and Makropoulos, 2011; Sayers et al., 2003). The OPW of the Government of Ireland (2009)
states that flood risk assessment ultimately aims to combine the S-P-R components through
visualization and description of risks on a spatial scale which allow the analysis of their
consequences.
Lang et al. (2001) mention that the transition of risk management from a traditionally
depicted linear process to a cyclic process with risk communication at its heart is not a
coincidence (figure 3.2). Reynolds and Seeger (2012) state that the importance of risk
communication, it has been signified by the field of environmental health.
Source river or sea
Pathway e.g. flood defense (dykes) Receptor
people/housing
Overland flooding
Sewer flooding
Groundwater flooding

37
Figure 3.2: The risk management cycle.
(Adapted from Chorus and Bartram, 1999)
Risk communication as defined by Glik (2007) is “the exchange of information about health
risks caused by environmental, natural, technological, agricultural or industrial processes,
products or policies”. Lang et al. (2001) determine risk communication as “any purposeful
exchange of information about risks between interested parties”. In this context, the
communicator of risks should convey or transmit information to interested parties about
hazards as well as about the magnitude of the consequences either weak or strong resulting
from a behavior or exposure. Interested parties include public or private institutions, industry
groups, scientists and individual citizens (Covello, 1991).
Bennett and Calman (1999), mention that risk management inherently incorporates
reciprocal (two-way) risk communication among all the interested parties. In addition, they
point out that risk communication is not just about dissemination of information, as its key
component is the process through which the necessary information and opinion for effective
risk management are incorporated in the decision. Covello (1998) notes that risk
communication should target to produce informed, involved, interested, cautious, rational,
solution-oriented and collaborative stakeholders.
Hazard Identification
Risk Assessment
Implement Risk Mitigation
Plans
Develop Risk Mitigation
Plans
Monitor & Review
Risk Communication & Participation

38
Based on Lang et al. (2001), it can be said that strong relationships between stakeholders is
an advantage during a crisis situation. Marra (1998) identifies six characteristics which
appear consistently in management and communication literature as a measure of a
relationship. These are trust, understanding, credibility, satisfaction, co-operation and
agreement. Therefore, risk communication tools should target to fulfill all these
characteristics that contribute in building relations between the involved stakeholders during
the risk management process.
Finally, a number of goals that a risk communication program should aim to fulfil have been
identified through literature (Lang et al., 2001; Renn and Levine, 1991; Kasperson and
Palmlund, 1989; Covello et al., 1986; Zimmermann, 1987; Renn, 1987) and they are
presented:
Enlightenment role focusing on the improvement of risk understanding among target
groups;
Right-to-know aiming to the provision of information about the source of a hazard to those
who may be exposed;
Attitude modification role in order to legitimize risk-relevant decisions, improving the
acceptance of a specific risk source or challenging such decision simultaneously rejecting
specific risk sources;
Legitimate function explaining and justifying risk management practices targeting to the
enhancement of trust in the competence and fairness of the risk management process;
Risk reduction role in order to reinforce public protection through information about risk
mitigation measures;
Behavioral alteration role in order to facilitate protective behavior or supportive actions
towards the communicating agency;
Emergency preparedness role supplying the target groups with guidelines or behavioral
advices for emergency situations;
Stakeholders involvement role focusing on the education of decision makers about public
concerns and perceptions;
Participation role in order to support the reconciliation of conflicts regarding risk related
controversies.

39
In brief, effective risk communication should enable the stakeholders to identify, comprehend
and be aware of risks and residual risks3 during the risk management process. In addition,
open channels of communication must be incorporated, allowing them to exert their
influence and actively participate providing their own inputs and insights in the decision
making for mitigation of risks to socially tolerable levels. However, most of the times, risks
are communicated to a variety of audiences. Hence, risk communication should facilitate
timely provision of factual information, via authoritative and accessible sources with clear,
precise and understandable messages tailored to the needs of the different audiences-
stakeholders that are likely to have different education, knowledge and level of intelligence,
interests, values and understanding. In the following section, the contribution of virtual 3D
city models in effectively communicating risks in a realistic, understandable and
comprehensive fashion, simultaneously enabling stakeholders’ participation, it will be
qualitatively assessed.
3.3 Virtual 3D city models for flood risk communication and management: The case
of Heerhugowaard.
In this section, the virtual 3D city models are introduced. In addition, a virtual 3D city model
prototype developed for Heerhugowaard case study area is presented and its role in risk
communication and management is explored.
3.3.1 Virtual 3D city models in the context of managing and communicating complex
urban information.
Virtual 3D city models are increasingly utilized in different sectors of economy, enterprises
and public administration which call for visualization of geographic information. Döllner et al.,
(2006b) state that the virtual 3D city models represent spatial and geo-referenced urban data
by means of 3D GeoVirtual Environments (GeoVEs) that basically include terrain, building
and vegetation models as well as models of roads and transportation systems. The virtual
3D city models have capabilities for storing and referencing of both classical georeferenced
3 UNISDR (2009) defines residual risk as the risk that remains in unmanaged form, even when effective disaster
risk reduction measures are in place, and for which emergency response and recovery capacities must be
maintained. The presence of residual risk implies disaster management preparedness and development of
evacuation plans for emergency response.

40
raster and vector data. These data can be visualized for instance as an image layer over a
DTM layer.
In essence, virtual 3D city models depict urban spatial geo-referenced data via a common
platform known as the virtual city. Furthermore, as the city models can be classified in the
3D GeoVirtual Environments (GeoVEs), they act as interactive interfaces between city model
and users (Döllner et al., 2006b). Generally, GeoVEs serve as mediums for dissemination of
geo-information to users, facilitating exploration, analysis and management of storage for
geo-information. In this context, virtual 3D city models enable the presentation, exploration,
analysis and management of urban data allowing the visual integration of heterogeneous
geo-information within a single framework, thus developing and maintaining complex urban
information spaces. These spaces contain integrated thematic and application oriented geo-
referenced data which can jointly be presented and related to the geometric entities stored,
maintained and managed by the virtual 3D city models (Döllner et al., 2006a; Döllner et al.,
2006b). Therefore, virtual 3D city models form a significant concept in 3D geoinformation
systems.
Analysis of the thematic spatially correlated objects and the associated information is
widespread in applications related to 2D Geographic Information Systems (GIS) while the
potential of virtual 3D city models to serve as the mean for conveyance of complex urban
information has not been extensively investigated in the context of risk management. The 3D
representation of a city can communicate spatially correlated thematic information in a
comprehensive way which may prove useful in fields directly and indirectly related to risk
management and crisis response. The requirements on virtual 3D city models depend on the
context of each application. On the one hand, if a high degree of photorealism is desired in
order to give a realistic overview of a landscape with the associated S-P-R components
which their connectivity forms a risk, the 3D visualization quality is directly related to the
proximity between the virtual and the actual city model. On the other hand, if analytical and
exploratory functionalities are attempted to be provided, the visual details of the landscape
objects are not of primary importance (Döllner et al., 2006a). In the following figure 3.3,
photorealistic 3D visualization provides a concrete overview of existing or planned
environments while in the figure 3.4, abstract 3D visualization encodes thematic information
in a selected urban area.

41
Different requirements on 3D visualization based on the context of each application
Figure 3.3: Photorealistic Visualization. Figure 3.4: Abstract Visualization. Developed using CityEngine Developed by the Berlin’s Senate Department
of Urban Development (Döllner et al., 2006a)
3.3.2 A virtual 3D city model for flood risk communication and management: The
case of Heerhugowaard.
The role of a simple virtual 3D city model in risk communication and management will be
qualitatively investigated. For this, a case study area in Heehugowaard city which is located
in the west of the Netherlands has been selected for 3D modelling. This city and municipality
which is part of the province of North Holland and the region of West Frisia is situated on
average around 3 meters below Mean Sea Level (MSL). In addition, the land of
Heerhugowaard is flat, as it is constituted of polders. Therefore, it is crucial to ensure
identification and communication of risks by delineating the S-P-R model in the context of a
virtual 3D city model.
Data underlying the virtual city model of Heerhugowaard.
The 3D modelling process of Heerhugowaard case study area starts from a comprehensive
inventory of all the required geographical data. The data acquisition process for the
particular area of interest has been carried out in collaboration with the regional water board
Hoogheemraadschap Hollands Noorderkwartier (HHNK)4. The 2D and 3D information used
in this project are derived from various open sources. In particular, the 2D TOP10NL,
Basisregistraties Adressen en Gebouwen (BAG) and Open Street Map (OSM) as well as the
elevation Actueel Hoogtebestand Nederland (AHN)2 data which are described in details in
table 3.1, they have been utilized for the modelling of selected part of Heerhugowaard case
study area.
4 HHNK is a governmental body charged with the responsibility of carrying out a number of functional tasks such
as water management, water control, water quality assurance and roads management in the region of North
Holland, above the North Sea Canal.

42
Table 3.1: Data sources used for the development of 3D models of Heerhugowaard.
2D spatial information extracted from open geo-data.
TOP10NL
TOP10NL is a detailed digital topographic database provided by the Dutch cadastre. TOP10NL are open geodata that can be used at
scales between 1: 5000 and 1:25000 throughout the Netherlands. They are considered suitable for viewing and editing of geographic
information. Also, they can be used as substrate for data visualization and as geometrical reference in GIS applications.
TOP10NL data are originated from aerial photographs, field measurements and other external sources of information. They include
different topographical features and in particular the following object classes:
Street networks;
Railroad networks (Rail, metro and tram lines);
Water bodies (rivers, sea, lakes, etc.);
Building footprints;
Terrain (grassland, arable land, etc.);
Design elements (noise barriers, trees, pylons, etc.);
Relief elements (land contour lines, sea depth lines, etc.);
Geographical and functional areas (neighborhoods, campgrounds, etc.).
BAG
BAG are open geo-data which include information regarding buildings and addresses. The Dutch municipalities are responsible for both
the recording and the quality of these data which are centrally available through the national BAG data infrastructure. The management
of this data infrastructure is charged to the Dutch cadastre which also has to ensure BAG data availability to the various customers.
OSM
OSM are by definition open data providing information about street and rail networks, rail stations, rivers, borders etc. These data are
collected and stored in a freely accessible database. It is worth mentioning that anyone can voluntarily contribute to the Implementation
and modification of the OSM's geographic information.
3D spatial information extracted from open geo-data.
AHN2 AHN is a multiannual cooperation program between Rijkswaterstaat and the water boards which aims to produce height information for
the water system and the flood management needs of the whole Netherlands (Zon, 2013). Since 6 March 2014, AHN are open data. In
essence, AHN provide detailed and precise elevation information. In particular, AHN2 data contain terrain, building and vegetation
information of 0.5 m x 0.5 m resolution. Laser altimetry from an airplane or helicopter is used for the determination of the heights. The
height measurements can be described by 3D point clouds and grids. In general, the grids downsize the larger 3D point cloud datasets
from which they can be exported by employing filters and different interpolation techniques. These grids are linked with the DTM and
Digital Surface Model (DSM) which provide terrain and objects' height information respectively. For the texturing of both the DTM and
DSM, aerial photographs can be projected on top of them.

43
The architecture of the virtual 3D city model of Heerhugowaard.
In this section, the virtual 3D city model of Heerhugowaard which integrates 2D and 3D geo-
information, developing and maintaining 3D models from 2D footprints (features) using
procedures (rules) for risk communication is presented. The data requirements for 3D
modelling of selected part of Heerhugowaard case study area are summarized in the
following table 3.2:
Table 3.2: Data used for the development of 3D models of Heerhugowaard.
Data source Used to extract
Top10NL Street and railroad networks, water bodies
BAG Building footprints
OSM Street and railroad networks
AHN2 Elevation information for the development of DTM and DSM
Aerial Photograph Landscape (terrain and building roofs) texture
The virtual 3D city model of Heerhugowaard which is outlined in figure 3.5, it is formed by
the following components:
3D Authoring and Editing System: It is responsible for developing and editing the virtual
3D city models and their components towards fulfilling the needs of applications and
users. Also, it is charged with the geometric modelling of 3D objects such as architectural
building models, transportation networks, water masses, trees. The system’s 3D
modelling software is the Environmental Systems Research Institute's (ESRI's)
CityEngine which relies on feature geometry, feature attributes and procedurally defined
rules towards automation. In essence, CityEngine through the procedural approach
applies procedures in the form of rules and python scripting for the interactive generation
of 3D models in a time-efficient way compared to the handcrafted (manual) modelling.
Roumpani (2013) suggests that the procedural modelling which is directly related to
complexity theories enables models' development that can be disaggregated to a very
fine Level of Detail (LoD). Furthermore, CityEngine allows the mathematical models'
visualization in a 3D manner by incorporating interactive controls and simulating
modifications in real time. The CityEngine's capabilities of interaction enable models
testing on existing environments as well as their communication at large, providing a
powerful tool for improved understanding of risks in the context of the natural and
manmade environment.

44
3D Geodatabase System: It serves as the database for the storing and managing of the
virtual 3D city model. Its principal objects which are the city objects represent geo-
referenced geometric entities. This is a simple database which does not follow the logic of
any data standards.
3D Presentation System: It provides real time visualization and interaction with the virtual
3D city model and it targets to communicate the risk to the stakeholders. The 3D city
models can be viewed as web scenes at the web browser via the CityEngine WebViewer
which is based on WebGL technology. In addition, the 3D city models can also been
exported and viewed at earth browsers such as ArcGlobe or Google Earth.
3D Geodatabase System
DTM & DSM Textured
DTM - Terrain Height DSM - Building Heights Aerial Photo - Texture
3D Authoring & Editing System
ESRI's CityEngine:
Procedures Extrusion & Texturing
Figure 3.5: The virtual 3D city model of Heerhugowaard case study area.
3D Open Data: AHN2
Digital Aerial Photograph
3D info
2D features
2D
Footp
rints
Footprints: Top10NL, BAG, OSM
3D Models
2D Open Data
Top10NL
BAG
OSM
3D Presentation System
Real time virtual 3D city model presented at
ESRI’s CityEngine Web Viewer.
Spatial Models’ Outputs

45
Qualitative assessment of the role of Heerhugowaard’s virtual 3D model in flood risk
communication and management.
Kemec et al. (2010b) mention that useful 3D geovisualization tools contain suitable
presentation of information and appropriate tools for interaction. In addition, through
literature (Duzgan et al., 2011, Mioc et al., 2011, Stanchev et al., 2009 and Basic et al.,
2003) it has been identified that interactive 3D models are useful and valuable tools for
improving awareness regarding a particular risk e.g. flooding. The virtual 3D city model of
Heerhugowaard allows interactive visualization, attempting to provide a realistic depiction of
risks (S-P-R components and linkage) to the stakeholders. The quality of the 3D
visualization which is associated with the proximity between the modelled city objects and
the reality, it is strongly considered by the virtual city model of Heerhugowaard as it aims to
produce informed, involved, collaborative, and rational solution oriented stakeholders. In
figure 3.5, the 3D city model of Heerhugowaard which is presented at CityEngine Web
Viewer, it provides a concrete overview of the potential flood risk in a photorealistic way
taking into account the geometries as well as the attributes of the components of the risk (S-
P-R) model. In this case, Source is considered the canal, as Pathway the polder while
Receptors include the natural and manmade environment (e.g. urban land, buildings and
transportation networks) and consequently the society and the local economy.
For visual data mining purposes, the city objects are geometrically described while the
attribute tables maintain related information in the context of the virtual 3D city model of
Heerhugowaard. These tables contain sets of key value pairs and are developed by filtering,
merging and importing data sets into the 3D city model’s authoring and editing component
supported by CityEngine. Therefore, non-graphic information such as year of construction
becomes visible in the CityEngine’s inspector. In addition, the stakeholders can explicitly
select one or more individual city objects, spatially select one or more city objects by drawing
a polygon into the CityEngine’s viewport or select city objects of a category (e.g. buildings)
and components (facades) in a rule-driven context by defining a filter condition based on the
attribute table of the objects. Afterwards, rules can be assigned to the selected city objects
which are generated according to the procedures of the rules’ files. In the context of risk
management, rules can contain for example colorization of the buildings’ facades which their
height is below a certain threshold and are affected by the evolution of a flood event
according to their alternative simulated scenarios. For such buildings, the stakeholders can
decide that temporal barriers are not sufficient and that either vertical or horizontal (following
predefined suitability criteria for each case) evacuation plans must be developed in the
context of formulating flood preparedness measures. In addition, rules can apply colorization

46
of the roofs of buildings which their height is above a certain threshold, their roof type is flat
and their roof area is above a defined limit which makes them suitable for deployment of
horizontal evacuation plans. However, such procedures alter the actual appearance of the
buildings. Furthermore, queries in the context of rule-based modelling have a level of
complexity as in the case of Heerhugowaard’s virtual 3D model, they require knowledge of
scripting usage of the CityEngine’s Computer Generated Architecture (CGA) shape grammar
which is a unique programming language specified to generate architectural 3D content
(ESRI R & D Center, 2014).
Steenbruggen (2013) states that the “communication processes can be divided in three
related domains: information, cognition and physical”. In the context of risk management, the
information domain is about risk related data while the cognitive domain focuses on human
mental processes. Finally, the physical domain includes activities in the real world. In the
information domain, better communication of information can lead to better awareness of a
particular situation. In the cognitive domain, this better understanding of the situation can
drive to better decisions which in turn can lead to better actions and effects in the physical
domain. In the context of the virtual 3D city model of Heerhugowaard, the information
domain provides the raw material, the basis for risk communication contributing to the
development of shared understanding of a particular risk situation by the stakeholders. In
addition, as the virtual 3D city model of Heerhugowaard which is a prototype that enables
interactive stakeholders’ participation and real time modifications through its procedures
during the management of a particular risk, it purports to drive to better decisions in the
cognitive domain and better outputs in the physical domain.
Nevertheless, in the context of virtual 3D city models, not only effective and interactive
communication of risks must be facilitated, but also a high degree of interoperability as well
as easy-to-use querying and analysis functionalities which will satisfy the needs of the safety
agencies involved in risk management and crisis response. For risk management
applications, only geometry and appearance of 3D city models is not sufficient. Semantic
and thematic information in regards to 3D city objects (e.g. buildings) and components (e.g.
walls, roof, columns, beams) with their functions and use (e.g. residential, commercial,
industrial) as well as topological relations for validating that city objects are correctly aligned
to each other are also required. In this context as well as for validity, reliability and usability
of the virtual 3D city models, international standards from GIS and BIM domains which can
integrate massive, heterogeneous and distributed information towards supporting the
cognition of risk-based spatial situations and functional relations, they will be explored in the
following sections.

47
3.4 GIS, BIM domains and existing international standards for risk communication
and management in the context of virtual 3D city models.
Nowadays, a growing number of applications and systems employ virtual 3D city models
(Döllner et al., 2006a). In the context of risk management and communication, accurate
representations of 3D city objects and information regarding their geometry, semantic,
thematic and topological context are required. In addition, 3D city models should support the
identification and understanding of spatial patterns and processes either visually observed or
not, thus creating knowledge and raising awareness for the stakeholders involved in risk
management.
In Spatial Data Infrastructures (SDIs), distributed risk-related data come from different
sources. Often, these data are varying in terms of spatial, geometrical and thematic context.
For the complete exploitation of the capabilities of virtual 3D city models, widely accepted
data models which facilitate interoperability, storage, visualization and distribution of
geometry, semantics and relations of the modelled characteristics are required. Kolbe et al.
(2005) mention that with the GIS domain’s standard, CityGML, which bases on XML, an
open data model for the storage and interoperable access to 3D city models that covers all
their aspects maintaining different Levels of Detail (LoDs), becomes available. In addition,
with Building Information Modelling (BIM) domain’s technology and standards (e.g. IFC) the
digital construction of accurate and detailed virtual models of buildings (Azhar et al., 2012;
Azhar, 2011) which cover all their properties in a simulated environment becomes feasible.
Furthermore, through BIM process, collaboration is enabled and integration of the roles of
the stakeholders is encouraged. In this context, GIS’ CityGML and BIM will be explored in
the following sections focusing on the utilization of their concepts in risk communication and
management.
3.4.1 GIS domain: The CityGML concept in support of risk communication and
management.
An emerging standard from the GIS domain for the representation and exchange of 3D city
models at multiple scales, called CityGML is presented and extensively analyzed, paying
attention to the benefits that are resulting from its employment in the risk management
process.

48
CityGML: The background.
The City Geography Markup Language (CityGML) is an OGC5 encoding data standard
released as version 1.0 in 2008 (Gröger et al., 2008) and as version 2.0 in 2012 (Gröger et
al., 2012). It is an open and application independent profile of GML3 initially specified by the
graphical Unified Modelling Language (UML) as described by Booch et al. (1997). GML3 is
an OpenGIS standard, driven by International Standardization Organization’s (ISO)
standards which bases on XML abstract format for the determination of application specific
spatial data formats that provide support to either simple or complex 3D geometries and
topologies (Kolbe et al., 2005). The data model behind CityGML, it bases on ISO 191xx
standard family while its implementation is an application schema for GML3 (Kolbe, 2009).
Τhe XML figures of CityGML result from the UML diagrams by applying transformation rules
provided by Cox et al. (2004), towards making them processable to standard GML3 readers.
As it is based on GML 3.1.1 (Cox et al., 2004) which in turn is based on XML, the exchange
of CityGML take advantages from all the techniques compatible with GML for data access,
exchange, analysis, processing, cataloguing and storing provided by OGC, including the
Web Feature Service (WFS)6, the Web Processing Service (WPS) and the OGC Catalogue
Service.
CityGML has been developed by the Special Interest Group on 3D of the initiative GeoData
Infrastructure North-Rhine Westphalia (GDI NRW). The idea behind CityGML is the
development of a common definition regarding the basic feature classes, attributes and
relations in the context of a 3D city models' ontology with respect to geometric, topological,
semantic and appearance properties (Gröger et al., 2006). This is crucial for the efficient and
cost-effective maintenance of 3D models as well as for their reuse in various application
domains (Stadler and Kolbe, 2007).
Representation, storage end exchange of 3D city models for a variety of purposes and
applications including risk management and crisis response is feasible in the framework of
the open and application - independent CityGML (Löwner et al., 2013). Beyond the
geometric representations of 3D objects, CityGML enables storage of both their semantics
and their interrelations. Furthermore, it supports the generalization and aggregation of
5 OGC is besides the official International Standards Organization (ISO) the most notable standardization
organization in the field of geospatial information technologies (Löwner et al., 2013).
6 WFS is a standarized web service that applies and integrates methods for access and management of geodata
in the context of SDIs. The native data format of WFS is GML (Vretanos, 2002).

49
semantically determined features. Hence, CityGML not only supports 3D content
visualization, but also manifold analytical capacity (Löwner et al., 2013).
In the context of CityGML, topology can also have explicit representation. Each space
component can be modelled once and thereafter it can be referenced by all those features
characterized by equal geometry. Therefore, pleonasm is eliminated and explicit topological
relations between components are preserved (Stadler and Kolbe, 2007).
The modelling principle of CityGML bases on class taxonomy of features as well as on
disintegration in both semantic and spatial parts. CityGML distinguishes real world features
providing 98 classes with or without geometric properties. These classes account for totally
372 well defined attributes (Löwner et al., 2013). Regarding disintegration, this for instance
can start from the whole city over the city objects such as buildings, down to minor
components like balconies. The outcomes of these decompositions are basically two
hierarchical structures (see Kolbe and Gröger, 2003).
The semantic model of CityGML includes class definitions for the most significant features of
3D city models. These features contain DTMs, buildings, water masses, transportation
networks, different vegetation types and even furniture. An illustration of a selected part of a
semantic model employed for buildings' representation is shown in the following figure 3.6.
The model class’s result from ''Feature'' (class) determined in ISO 19109 and GML3 for the
delineation of spatial objects and their associated aggregations. Features contain spatial and
non-spatial attributes specified in GML3 feature properties with related data types (ISO,
2005). From figure 3.6 the following can be extracted (Stadler and Kolbe, 2007):
A building may recursively be constructed by building parts;
A building may be confined by several types of surfaces including walls and roofs which
in turn they may contain openings such as windows and doors;
A building may have exterior building installations;
The semantic as well as the geometry models, enable aggregations on different levels.
The geometry model of GML3 represents via its objects the spatial attributes of CityGML.
This model rests on the standard ISO 19107 ''Spatial Schema'' (Herring, 2001), which
represents 3D geometry in accordance with the Boundary Representation (Foley et al.,
1995). Figure 3.7 displays a small part of this ISO 19107 ''Spatial Schema''. The GML3's
geometry model comprises of primitives which depending on different connectivity
requirements; they can be combined to form aggregate or composite geometries for every

50
dimension. It is noted that while aggregate geometries are considered as arbitrary collection
of primitives, composite geometries solely represent primitives which are topologically
connected along their borders (Stadler and Kolbe, 2007). Generally, CityGML uses just a
subset of the whole GML3 geometry package.
UML class diagram of part of both the semantic and geometry model of CityGML.
Figure 3.6: Part from the Building Model. Figure 3.7: Part from ISO 19107
''Spatial Schema''.
(Stadler and Kolbe, 2007; Booch et al., 1997)
CityGML is highly scalable and the datasets can include several urban entities supporting
modelling at varying scales, from the smaller which correspond to individual buildings to the
larger which include sites, districts, cities, provinces and even countries. CityGML is
organized in 13 thematic modules which allow vertical scaling of a city model. This vertical
modularization into independent and interchangeable modules which is achieved by various
XML-Schemas with different name spaces, it enables the development of thin CityGML
instance models without requiring the execution of the whole standard. Löwner et al. (2013)
suggest that the most significant thematic modules of CityGML are both the fundamental
Core and the Building modules. Bridge and Tunnel modules are modelled as the Building
one while the remaining modules are modelled in less detail (see Gröger et al., 2012).
Löwner et al. (2013) state that CityGML can be either confined by using only selective
modules and the LoD concept (see section 5.2) or can be expanded, given that specific
applications typically have additional information requirements to be modelled and
exchanged. In order this to be achieved, the Application Domain Extension (ADE) concept
has emerged. In essence, the ADE enables the user firstly to add attributes or relations to

51
CityGML classes and secondly to determine new classes by generalization from CityGML
classes. It is pointed out that all attributes and classes must be defined in a discrete and
individual ADE namespace.
In short, CityGML is a multi-functional, multi-scale, interoperable and semantic information
model which has capabilities for storage, exchange and representation of 3D city models at
varying degrees of complexity with respect to geometry, topology semantics and
appearance. This contributes to the flexible and sustainable utilization of CityGML as an
exchange format in terms of data and applications (Stadler and Kolbe, 2007).
CityGML and Multi-Scale Modelling.
CityGML open standard supports the LoDs concept in order to meet the requirements of
different application fields including risk management and crisis response. In particular, it
employs five consecutive LoDs to structure both the spatial and the semantic properties of
the city models (Gröger et al., 2012). Consequently, every single object can be
simultaneously represented in up to five different, clearly defined and discrete LoDs within a
dataset, enabling the analysis and visualization of this object in multiple degrees of
resolution. Gröger et al. (2007) note that two CityGML data sets which include the same
object in different LoDs can be combined and integrated. While an object can have different
representation for every LoD, different objects from the same LoD can be generalized in
order to be represented by an aggregate object in a lower LoD. This can be achieved due to
the fact that CityGML enables the decomposition and aggregation by supplying
generalization connection between any CityObjects (Gröger et al., 2007).
Kolbe (2009) indicates that the LοDs of CityGML are progressively expanding from LoD0
which is basically a coarse regional model to LoD4 which represents indoor features i.e.
building interiors. This expansion from a simple DTM to the more complicated structural
model with interior details becomes feasible through the utilization of feature classes valid
just for a particular range of LoDs. For instance, Stadler and Kolbe (2007) note that the
building feature class is applicable for LoDs 1 to 4, while the boundary surface feature class
is valid for LoDs 2 to 4.
In figure 3.8, the five different LoDs of CityGML are illustrated. LoD0 which is basically the
coarsest in terms of details in the range from LoD0 to LoD4, it is a two and a half
dimensional DTM which may be overlaid by an aerial photo or a map. LoD1 is essentially a
blocks’ model which contains prismatic buildings without textures and roof structures, while

52
LoD2 has recognizable varying roof structures and thematically distinguishable and
differentiated surfaces with representations of potential vegetation objects. LoD3 indicates
architectural models with comprehensive representations of wall and roof structures with
high resolution textures, balconies, bays and projections. In addition, LoD3 is consisted of
vegetation and transportation objects. Finally, LoD4 builds over the LoD3 model by adding
interior structures and features for 3D objects such as rooms, interior doors, stairs and
furniture (Gröger et al., 2007).
Figure 3.8: The five LoDs of the CityGML open standard.
(Gröger et al., 2007)
Gröger et al. (2007) indicate that LoDs are described by different accuracies and minimum
objects' dimensions where accuracy is the standard deviation (σ) of the absolute coordinates
of the 3D points in the space. In LoD1, the positional and height accuracy of 3D points is
equal to 5 m or less, while all the objects with a footprint of at least 6m by 6m have to be
taken into account. In LoD2, the positional accuracy should be 2 m while the height accuracy
should be 1 m. Moreover, the objects that should be considered in this LoD, they must have
a footprint of at least 4 m by 4 m. In LoD3 both the positional and the height accuracies are
the same and equal to 0.5m while an object in order to be considered may have a footprint
of 2 m by 2 m. Finally, in LoD4, both the accuracies should be 0.2 m or less. This data
categorization in five LoDs contributes to the evaluation of the 3D city model data sets
quality. This quality is critical when a spatial approximation of the extent of a particular risk is
LoD3 LoD4
LoD0 LoD1 LoD2

53
attempted in the framework of improving the awareness of the stakeholders regarding
certain risks. In addition, the data classification enables data comparability which in turn it
assists the integration processes of these data sets (Kolbe et al., 2005; Kolbe, 2009).
CityGML in the context of virtual 3D city models for risk management.
Risk management process incorporates geo-information during its different stages. Basic et
al. (2003) argue that the dominance of GIS in risk management and in particular to risk
analysis procedures is evident. The various aspects of geographical information can be
either distinct such as maps or hidden like tables. Virtual 3D city models enable the direct
communication of the participants of the risk management decision making process with the
geo-information space through an easily understandable and comprehensive representation
of a particular area of interest. For the multilateral and multifunctional exploitation of the
advantages of 3D city and landscape models, the CityGML international open and
interoperable data semantic model and exchange standard can be employed. The coherent
semantic modelling of the spatial and thematic attributes of the 3D objects with their
associated aggregations can be seen as a meaningful capability of CityGML. Also, the
thematically rich properties of object classes can provide a firm ground for certain queries
during the risk management process. In the preparation phase of horizontal evacuation
plans as part of the implementation of risk mitigation measures, such queries can explore
either the number of the buildings' floors or the different types of buildings and roofs. For
example, buildings with flat roofs and roof area above a specified threshold can serve as
landing base for aerial rescue means such as helicopters.
In the framework of risk management, 3D city models via CityGML data standard can
facilitate incorporation of high resolution DTMs corresponding to specific areas of interest
such as most vulnerable areas to natural disasters e.g. floods, into large area DTMs of low
resolution, as a terrain model can be consisted of different parts with varied resolutions. In
addition, 3D models enable the estimation of volumes and masses as their geometry is
represented leastwise by a closed solid. Thereby, when for instance flood risk is assessed,
the capacity of the installed drainage systems (e.g. ditches, drainage channels, culverts or
sewers) and the inlets (e.g. gullies) can be computed.
In the context of CityGML, 3D objects can be correlated with data sets of external references
like the cadastral database. Such a database can provide significant information regarding
the details of the owners of buildings which for instance are prone to flooding. In addition, the

54
properties of the objects such as buildings’ installations can be related to databases with
associated technical information that is important in the planning of risk mitigation measures.
During the implementation of risk mitigation measures which can include preparation of
evacuation plans by the fire services or other aid providers and rescue organizations,
information regarding the building storeys with their corresponding height information above
as well as beneath the ground level can prove useful. For example, this information can
support the development of alternative evacuation plans for addressing different extents of
building affection during an incident.
Kwan and Lee (2005) have experimentally demonstrated that emergency response delay
within multi-level structures due to indoor route uncertainty can be much longer than delays
in ground transportation in terms of the street network uncertainty. In addition, Gröger et al.
(2006), have stressed that the modelling of passages between the neighboring rooms in
buildings is of critical importance. Hence, the representation of the internal structures of the
buildings particularly of the high-rise, can significantly improve the speed of crisis operations.
In the paradigm of the building model of CityGML, the interior free spaces are modelled by
rooms (see figure 3.9) which are considered semantic objects. The room solids are
topologically connected by those surfaces which are used for the representation of doors or
other closure surfaces that seal the doorways. In order the rooms to be determined as
adjacent, common openings or closure surfaces must be identified. Kolbe et al. (2005),
mention that this adjacency is accompanied by a graph of accessibility which can be used
for instance either for the determination of the potential spread of a fire or for the calculation
of escape paths incorporating algorithms regarding the shortest route during the preparation
of the evacuation plans (see figure 3.10). Furthermore, the edges of the accessibility graph
can be labelled by the associated distances and types of connection.
Figure 3.9: Building interior. Figure 3.10: Accessibility graph deduced
by the topological adjacencies of a room
for the estimation of escape routes.
surfaces. (Gröger et al., 2006)

55
In brief, virtual 3D city models through CityGML, deliver substantial information during the risk
management process. More precisely, CityGML in the context of virtual 3D city models not only
supports the identification, analysis and assessment of risks but also it can enable the
implementation of risk mitigation measures such as preparation of alternative evacuation plans
in an anticipated emergency. In addition, CityGML provides five LoDs with varying degrees of
sophistication which can potentially contribute to the communication and management of risks.
3.4.2 BIM domain and standards in support of risk communication and management.
Building Information Modelling (BIM) is a growing knowledge domain in the Architecture,
Engineering, Construction and Operations (AECO) industry (Succar, 2009) which through
Building Information Models (BIMs) enables interoperability and facilitates data sharing and
exchange between software applications (Isikdag et al., 2008). In addition, BIM enables
generation of 3D visualizations (Azhar, 2011; Azhar et al., 2008; Howard and Björk, 2008). In this
context, BIM is introduced and its applicability to risk management is explored.
Introduction to BIM.
The construction industry is highly fragmented and several information systems are utilized
within each organization (Isikdag and Underwood, 2010). These information systems store and
maintain buildings-related information that can be used in the risk management process for
identification, assessment and communication of risks as well as for the preparation of risk
mitigation plans including the development of alternative evacuation routes based on the
construction characteristics (e.g. resistance, height, external passages, roof types) and the
interior structures of the premises. Therefore, constant and consistent transfer of information
between the different systems is and continues to be an apparent necessity (Isikdag and
Underwood, 2010). In this context, BIM has emerged in order to address all the matters
associated with interoperability, sharing, exchange and integration of building information over
its entire building lifecycle (Isikdag and Underwood, 2010; Isikdag et al., 2008).
The Building Information Models (BIMs) of today have resulted from the exchange of drawing
formats such as Drawing eXchange Format (DXF) via semantic Architectural, Engineering and
Construction (AEC) information models which are in principle based on the technologies of the
STandard for the Exchange of Product (STEP) data model (Isikdag and Underwood, 2010;

56
Isikdag et al., 2008). STEP also known as ISO 10303 (Industrial Automation Systems-Product
Data Representation and Exchange) is an ISO standard which has emerged in order to
overcome the shortcomings related to the translation of Computer Aided Design (CAD) data and
also to meet the needs of the industry-based research groups for a new generation of standards
effort (Isikdag and Underwood, 2010). In particular, in 1984, ISO through the development of
STEP standard, it aspired to improve the communication of engineering information and also to
allow its integration via the coordination of open standards for data sharing and exchange. For
data storage and exchange, STEP identifies four implementation levels (Isikdag and
Underwood, 2010): The data storage and exchange, the file exchange, the working form as well
as the database and knowledgebase levels. The first level is charged with the information
exchange between applications while the second and the third level supply methods for
handling the product data and information sharing (Isikdag and Underwood, 2010).
BIM and BIMs: Definitions.
Succar (2009), states that BIM is a growing field of study which incorporates multiple knowledge
domains in the context of AECO industry. BIM can be defined as a set of interacting policies,
processes and technologies which develop a methodology for the management of the
necessary building design and project data in digital format throughout the building’s lifecycle
(Succar, 2009; Penttilä 2006). Hu et al. (2008), see BIM as a mature digital framework which
models building components and their relationships and it digitizes complete building data,
contributing to the protection of the facility-related information from possible loss during its
transfer from one phase to another or from one stakeholder to another. BIM is classified by the
National Building Information Modelling Standard (NBIMS) initiative as (Isikdag and Underwood,
2010; NIBS, 2007):
A product which digitally represent a building in an intelligent manner;
A collaborative process which support business drivers, automated process functionalities
and utilization of open standards for information viability and accuracy;
A facility of information exchanges, workflows and processes which functions as an
information based environment during the building lifecycle.

57
NIBS (2007), determines the process helix, the knowledge core and the external suppliers of
products and services as key components of the building lifecycle. The knowledge core acts as
the information supplier for historical and current building-related data that are exchanged
between all the stakeholders involved in the building lifecycle processes. In this context, BIM is
defined as a new way of developing, sharing, exchanging and manipulating information during
the entire building’s lifecycle (Isikdag and Underwood, 2010).
According to Eastman (1999), BIMs stem from the concept of building product model. The
associated General Contractors Guide (AGC, 2006) determines BIMs as data rich, object
oriented, intelligent and parametric digital representations of a particular facility where facility
views and data that meet the needs of different users can be exported and analyzed in order to
generate reliable information which in turn can be utilized in the decision making process as well
as in the improvement of the delivery process of the facility itself. The National Institute of
Building Sciences (NIBS) (2007) defines BIMs as computable representations of the physical
and functional attributes of a facility and its associated project and lifecycle information, aiming
to serve as an information library and thus a shared knowledge resource for the building owner
and/or administrator to use and maintain during the building’s lifecycle. Isikdag et al. (2008),
perceive BIMs as data rich for representing a high amount of geometric and semantic
information, comprehensive, open, extensible and vendor neutral (open) which are usually in
three dimension geometrical form where geometries are spatially related to each other and
represented within an object oriented structure. Azhar et al. (2008) note that BIMs describe the
geometry, spatial relations, geographic information, quantities and properties of building
elements, cost estimates, material inventories and project schedule. CRC Construction
Innovation (2007) considers as BIMs' most important strength, the precise geometrical
representation of a building in an integrated data environment.
For the description of the multi-facets of a building, BIMs are organized in clusters with a certain
hierarchy, where each cluster corresponds to an aspect of building information (Shen et al.,
2010). The different aspects of building information include building elements such as walls,
columns and beams, building structures like group of walls that form a room or a floor,
equipment e.g. Heating, Ventilating and Air-Conditioning (HVAC), plumbing and electrical wiring
and material. For the reutilization of common information, later BIMs use the object-oriented
approach with inheritances from an extensive parent-child hierarchy (Shen et al., 2010).

58
Succar (2009) exploring many writings, seminars and workshops, identifies that BIM is seen as
a catalyst for change (Bernstein, 2005) which will reduce AEC industry’s fragmentation
(Dawson, 2004), improve its efficiency and effectiveness (Hampson and Brandon, 2004) and
reduce the costs of inadequate interoperability (Gallaher et al., 2004). Isikdag et al. (2008) state
that BIM focuses on addressing issues related to interoperability and information integration. In
this context, BIMs serve as interoperability enablers and also as information sharing and
exchange facilitators between software applications (Isikdag et al., 2008; Motamedi and
Hammad, 2009). The several model views that can be generated from a single BIM (Isikdag et
al., 2008) will always serve as important facilitators of information sharing and exchange. For
the exchange of BIMs, physical files can be used that are transferred through physical mediums
e.g. CDs and DVDs or computer networks e.g. internet (Isikdag et al., 2007). For the sharing of
BIMs, Application Programming Interfaces (APIs), central databases, federated project
databases and web services can be utilized (Isikdag et al., 2007). In the context of APIs, if for
instance the BIM physical file is based on XML, the model can be shared through suitable XML
interfaces.
BIM and Standardization.
The European Commission (EC) in (2008) pinpoints the significant role of standardization in the
way towards innovation. Cerovsek (2011) states that “standards provide three important roles:
(1) inter-operability, (2) trust and (3) comparability”. United Nations Industrial Development
Organization (UNIDO) (2006) mentions that the role of standards can be labelled by “3C”:
Competitiveness, Conformity and Connectivity. EC (2008) considers standardization an
important tool towards innovation.
In the context of BIM standardization, the current efforts are the CIMSteel Integration Standards
2 (CIS/2) and the Industry Foundation Classes (IFC) (Isikdag et al., 2008). CIS/2 are open multi-
part standards for the digital exchange and sharing of information for a structural steel-framed
building while IFC is the effort of buildingSMART, formerly International Alliance for
Interoperability (IAI), who aims to define a common language for technology in order to improve
the communication, efficiency, productivity, delivery time, cost and quality throughout the
design, construction and maintenance processes of a facility (Isikdag et al., 2008).

59
Shen et al. (2010) determine CIS/2 as a standard which supports analysis, design and detailing
of the steel frame of a building as well as the transfer of the resulting design information to the
shop fabrication. The data model of CIS/2 is called Logical Product Model. According to Shen et
al. (2010) the key feature of this standard is the detailed design of the main and secondary
structural steelwork of a facility including purlins, side rails, cleats and cladding, the full
manufacturing assembly of the frame composed of parts and joints systems as well as the
structural analysis of the steel frame using combination of rigid, plastic and elastic analysis
models.
The initial version of IFC has been released in 1997 while in 2005 it became an ISO Publicly
Available Specification as ISO 16739 (Isikdag et al., 2008). IFC has matured as a standard BIM
aiming to support and facilitate interoperability as well as information sharing and exchange
between different AEC disciplines throughout a building’s lifecycle (Motamedi and Hammad,
2009; Isikdag et al., 2008). Nowadays, BIMs are increasingly represented and exchanged using
IFC (Stadler and Kolbe, 2007; Adachi et al., 2003). Motamedi and Hammad (2009) determine
IFC as an object-based, non-proprietary building data model which captures information about
all the aspects of a facility throughout its lifecycle towards interoperability. Khemlani (2004) sees
IFC as medium for model-based information exchange between models based applications in
AECO industry supported by most of the major CAD vendors as well as by other applications. In
addition, as IFC is an open data exchange format, public access is provided and thus it can be
employed by various applications, including commercial, for data exchange (Khemlani, 2004).
Isikdag et al. (2008) indicate that IFC provides generalized and relatively high level description
of both physical and non-physical object types related to the construction process and the
building itself. The IFC objects enable sharing of a central project model allowing the involved
stakeholders to formulate their own view of the objects contained on that model. In the context
of IFC standard, each commonly agreed specification termed “class” is utilized in the description
of a range of entities with common characteristics i.e. wall, window, door, column, beam etc.
Regarding the geometry of an IFC object, this is determined by its relative or absolute
placement in 3D space as well as by its geometrical representation in the form of Sweeping,
Constructive Solid Geometry (CSG) and Boundary Representation (BRep) individually or
combined (Isikdag et al., 2008). Concerning, the spatial relationship between elements, this is
specified by the spatial structure of the model. The IFC spatial structure is defined as a
decomposition of the model into manageable subsets according to spatial arrangements
60
(Isikdag et al., 2008). More information about the geometric representations of building
elements and their spatial relationships are provided at Liebich (2004).
Shen et al. (2010) determine as IFC standard’s key contents, the conceptual model and the
space utilization of a building; the information about the construction site in terms of location,
dimension etc.; the product structure and the detailed model of a building so that the various
facility elements including relations between them such as number of storeys, shape and
properties of each wall, door, floor, etc. to be feasible to be captured; the structural elements
(e.g. footings, reinforcements etc.) and the structural analysis of a building, the equipment
specifications and the information on the actual units installed in a building like HVAC, filter,
pump, reservoir with their associated capacity etc.; the electrical wiring and the plumbing details
of a facility.
Works that implement and employ BIMs and in particular IFCs can be found at Halfawy and
Froese (2007); Song et al. (2007); Plume and Mitchell (2007); Nour (2007); Schevers et al.
(2007); Bletzinger and Lähr (2006); Chen et al. 2005; Halfawy and Froese (2005); Tanyer and
Aouad (2005); Stephens et al. (2005); Lee et al. (2003); Yu et al. (2000) and Vanlande et al.
(2008). Cerovsek (2011) considers that BIM standards such as IFC have achieved partial but
important progress in terms of interoperability, but still they do not exhibit trust or allow
comparability.
BIM fields in the context of risk management.
Succar (2009) determines technology, process and policy as the overlapping fields of BIM (see
figure 3.11). Each one is consisted of two sub-fields: the stakeholders and the deliverables.

61
PUSH
PULL
According to Compact Oxford English Dictionary (2014), technology is termed as “the
application of scientific knowledge for practical purposes”. In the context of BIM’s technology
field all the stakeholders e.g. organizations involved in the development of software, hardware
and network systems are grouped in order to increase the collaboration, efficiency and
productivity throughout the building’s lifecycles (Succar, 2009). Eastman et al. (2008) note that
with BIM technology, the digital construction of a precise virtual model of a building i.e. Building
Information Model which carries all its physical and functional characteristics is feasible. In
particular, this computer generated model includes accurate geometry and other information
associated with the construction e.g. structural and anti-seismic details, construction materials,
building elements, interior structures etc., fabrication and procurement of a particular facility
which can prove useful in the risk management process. For instance, structural elements,
construction materials and possible fabrication defects are taken into account in the estimation
of building exposure and resistance to identified hazards while building geometry, installed
equipment and interior structures including openings of the doors are used in the preparation of
evacuation plans as part of risks' mitigation measures throughout the facility lifecycle.
Furthermore, information related to building infrastructure including the energy, water, electricity
supply and communication systems is important in the identification of potential internal hazards
which can form secondary sources of large magnitude with severe consequences on their
Safety
agencies
BIM interactions between and within fields.
Figure 3.11: The interlocking BIM fields in a Venn diagram showing BIM clusters,
overlaps and interactions (adapted from Succar, 2009).

62
receptors in the case of incidents such as floods, fires, earthquakes etc. These incidents can
cause building’s natural gas pipes failure and explosion, crack of its water and drainage pipes
and short circuit of its electric and communication wiring with high impact on the facility itself, its
residents and its surrounding environment.
Isikdag et al. (2008), mention that as a Building Information Model is by definition covering the
entire lifecycle of a building, when the status and usage of its elements change in time given
that the usage of this building evolves, the updated information about the current condition and
usage of the building elements can always be found in the BIM databases. For instance, a door
represented as an exit in a building evacuation plan can later become permanently closed when
the usage of a room alters. Therefore, BIMs (e.g. in the form of IFC) will always be more
accurate as they represent the current condition of the building elements compared to the
information in the evacuation plan which is prepared in advance. In brief, significant real time
geometric and semantic information can be extracted on demand from BIMs’ databases in the
context of risk management and crisis response.
Davenport (1993) defines process as “a specific ordering of work activities across time and
place, with a beginning, an end, and clearly identified inputs and outputs: a structure for action”.
In BIM’s process field, all the stakeholders who are charged with the design, construction, use,
management and maintenance of buildings i.e. architects and engineers, contractors and
property developers, facility owners and managers are clustered in order to urge collaboration
during building’s lifecycle, from inception onwards. Azhar et al. (2012) see the BIM’s virtual
process as a way to encompass all aspects, disciplines and systems of a facility within a single
virtual model, enabling all the involved stakeholders to collaborate more accurately and
efficiently than traditional processes. In addition, they point out that as the BIM foundations are
laid on the pillars of communication and collaboration, the successful implementation of BIM
calls for early involvement of all project stakeholders which means that traditional project
delivery systems have limited role in BIM-based projects. Azhar et al. (2008) state that in
contrast to the “new” BIM process, the “traditional” 3D CAD delineates a building by
independent 3D views such as plans, sections and elevations. In addition, data in 3D CAD are
represented by graphical entities e.g. lines, arcs and circles while in the intelligent contextual
semantic BIM models information is defined in terms of buildings elements and systems e.g.
spaces, walls, columns, beams. Figure 3.12 demonstrates the difference between “traditional”
and BIM processes.

63
“Traditional” process: Conventional CAD “New” process: BIM
Concept & Design
Documents & Drawings
Construction & Operation
Relational Database which contains design, documents, data
Access, Sharing & Data Use
Construction & Operation
Figure 3.12: Comparison between “traditional” and “new” processes.
(Azhar et al., 2012; Azhar et al., 2008)
Clemson (2007) defines policies as “written principles or rules to guide decision-making”. In
BIM’s policy field all the stakeholders dealing with education and research, risk mitigation and
management, identification and minimization of conflicts are clustered (Succar, 2009). These
stakeholders include research centers, educational institutions, safety agencies, insurance
companies and regulatory bodies who play significant role in the definition of the contractual and
construction rules as well as in the regulation of the facilities. In the context of risk management,
special attention must be paid by the policy stakeholders in the determination of the general
terms and conditions of the buildings at high risk (Isikdag et al., 2008) which include hospitals,
secondary and primary schools, civic and heritage facilities, retail and department stores. For
these premises which can potentially host vulnerable population such as disabled people, elder
population and children, provisions for evacuations plans must be regulated towards mitigation
of risks throughout buildings’ lifecycle.
Succar (2009) states that BIM interactions are push-pull knowledge transactions which take
place within or between fields or sub-fields (see figure 3.11), where push mechanisms
(Holsapple and Joshi, 2006) transfer knowledge to another field or sub-field, while pull
mechanisms transfer knowledge to answer a query from another field or sub-field. In the context
of risk management, this two-way (reciprocal) transfer of knowledge between all the interested
parties at the smaller scale of a building, it can enable them to become informed and risks-
aware. Furthermore, the BIM overlapping fields can be seen as an opportunity for
communication, collaboration and integration of the roles of all the participants involved in a
particular project including those dealing with risk management and mitigation. In this respect,

64
Databases
efficiency and unity between the stakeholders who in the past could see themselves as
opponents can be delivered. In addition, intelligent, transparent and shared digital
representations of buildings founded on open standards, for instance IFC, can be achieved. In
brief, BIM through its fields and sub-fields, can contribute to participatory identification and
assessment of risks at the building scale as well as to the development of emergency
preparedness plans including shortest alternative building’s (internal and external) evacuation
routes for crisis response.
3.5 A concept proposal for efficient flood risk communication and management: Αn
interoperable 3D information system based on virtual 3D city models.
The conceptual 3D information system which bases on the virtual 3D city model presented at
figure 3.5 and extended by open standards i.e. CityGML and IFC (see figure 3.13), it aims to
provide all the stakeholders involved in risk management and crisis response with an innovative,
versatile and intuitive platform to access, visualize and comprehend risk related spatial
information. In particular, this system through standards, workflows and rules, intends to
integrate heterogeneous and distributed data from GIS and BIM domains into a cross-
disciplinary and multifunctional integration conceptual platform which targets to support the
cognition of risk situations and functional relations in the context of the S-P-R model. In this
frame, the proposed system via its components purports to enable equal and interoperable
access to spatial information towards communicating risks, ensuring transparency, building
trust, raising awareness and engaging stakeholders to an interactive and solution oriented risk
management process.
Figure 3.13: Overview of the conceptual 3D information system.
Open Standards Module (Editors & Encoders)
IFC objects (BIMs)
CityGML Converter (to LoDs)
3D Authoring & Editing System
3D Geodatabase System
Virtual 3D City Models
3D Presentation System
Real-Time 3D City Models
Facilities Cities

65
Detailed risk-related information at the micro (building) and/or the macro (regional-city) scale is
of utmost importance in the participatory management of risks and the preparation of evacuation
plans. Döllner and Hagedorn (2008) mention that the integration at the data level, it transforms
and converts data into a unified (target) model which must be powerful enough in order the
different schemata to be mapped in a lossless way. Mao (2011) states that since IFC models
are designed for a more detailed level, CityGML is the most suitable standard to represent a
whole 3D city which through its different LoDs can be utilized for modelling small to large areas.
In addition, since IFC is lacking concepts for spatial objects such as streets, vegetation objects
and water bodies is not appropriate for the representation of complex city models (Kolbe et al.,
2005). Meanwhile, BIM data in IFC format can be converted into CityGML data, thus becoming
important source of 3D city objects. In this context, in the system’s open standards module,
facilities-related data (e.g. buildings) are initially edited in IFC format recognizing that IFC
provides detailed specifications of buildings' models including their internal technical
infrastructure and development history. Afterwards, they are converted to CityGML LoDs,
therefore becoming geo-referenced. The remaining city-related objects e.g. terrain,
transportation networks, water bodies, vegetation, plants etc., are directly converted to
CityGML. The LoD in which the city objects are eventually represented should correspond to the
accuracy of the available data. With IfcExplorer (2007), a complete IFC model can be exported
into CityGML or vice versa. In addition, Laat and Berlo (2011) have described a CityGML
extension called GeoBIM to get semantic IFC data into a GIS context and convert IFC to
CityGML. Also, Isikdag and Zlatanova (2009) have presented a general overview of semantic
and geometric information transformation from BIM and in particular from IFC into CityGML
models. By supporting regional 3D models, CityGML can consist of hundreds of buildings
integrating all the information derived from the individual IFC models. Nevertheless, it should be
recognized that the construction of CityGML LoDs is challenging while considerable time and
effort are required for the representation of data in a lossless way. In addition, attention must be
paid in the collection of semantics as well as in the check of the validity of the city objects’
geometry.
The presented conceptual 3D information system through its components, it delineates the
physical and functional characteristics and relations of the city objects in a detailed geometric
way at the macro and micro scale and it facilitates analysis functionalities. During the risk
management process, it can be required for example to identify all the buildings which their

66
designated internal evacuation routes lead to emergency exits (doors) that have width and
height above a specified threshold and are located along a specified street. The geometric and
semantic information derived from the detailed open data models of the system, are very
important in the querying of the city model which leads to a report with the corresponding
buildings having the required attributes. Otherwise, all the building models along the specified
street should be virtually explored. The widths and heights of the buildings’ doors (emergency
exits) as well as other key structural elements are stored semantically in IFC which are
converted to CityGML, thus becoming geo-referenced in the context of the proposed 3D
information system. In the preparation of the evacuation plans, other queries that can be
satisfied on-demand through the conceptual 3D system can ask for example for combined
information at both the macro (city) and micro (facility) scale. Such queries may request at the
macro scale, the identification of the shortest routes in terms of street networks with width above
a threshold that in a specified buffer zone are not intersected by water bodies, driving to a
facility with particular location; while at the micro scale, they can ask for the indoor route e.g. the
right side of this building where natural gas and water pipes are not installed based on its
internal structures and equipment.
The conceptualized 3D information system is planned to enable interoperability7 throughout the
risk management process, thus playing significant role in efficient and time-effective
management of risks. In terms of risk management, interoperability means that the involved
stakeholders should be enabled to work together in a collaborative manner. But when
stakeholders work together, they need to communicate in a common language ending up to
mutually agreed decisions for risk minimization. For achieving semantic interoperability, the
7 The European Interoperability Framework (EIF) for European Public Services (EIF, 2008) defines interoperability as
"the ability of disparate and diverse organisations to interact towards mutually beneficial and agreed common goals,
involving the sharing of information and knowledge between the organisations, through the business processes they
support, by means of the exchange of data between their respective ICT systems." The EIF in its version 1.0 (IDABC,
2004) introduces three levels of interoperability i.e. organizational, semantic and technical while in its version 2.0
adds a legal level and a political context to the interoperability levels. EIF (2008) determines organizational
interoperability as the coordinated processes in which different organizations achieve a mutually beneficial and
commonly agreed goal; semantic interoperability as the precise meaning of exchanged information which is
preserved and understood by all parties; technical interoperability as the planning of technical issues involved in
linking computer systems and services; legal interoperability as the aligned legislation so that exchanged data is
accorded proper legal weight while in the political context it is required to ensure cooperating partners with
compatible visions, aligned priorities and focused objectives.

67
system employs open XML-based standards which are essentially shared dictionaries, common
sets of definitions. At the technical interoperability level, the system through its explicitly defined
data interfaces, it facilitates seamless exchange and reuse of information. In the context of
organizational interoperability, the system through its virtual 3D city models irrigates the risk
management process with transparency and openness towards building trust, educating and
raising awareness of stakeholders, facilitating cooperation and discussion between them which
can lead to informed decisions that in the political context follow the stakeholders’ values,
objectives and priorities. The system’s data models which underpin the virtual 3D city objects
are inherently legitimized due to their open nature.
In short, the 3D information system intends to bring together all the stakeholders involved in the
risk management process and through its 3D presentation system, it purports to provide them
with accurate and interoperable digital 3D representations of risk related objects founded on
open international standards, tailored to their specific needs and stored and maintained in the
system’s 3D geodatabase. The system based on virtual 3D city models, it intends to visually
communicate risks to the stakeholders who can interactively identify S-P-R linkages, provide
their inputs, adapt, query, analyze the 3D city models and evaluate the impact of their decisions
in terms of risk mitigation.
3.6 Final remarks on the role of 3D information concepts in flood risk communication
and management.
The world is becoming increasingly urbanized, while more inhabitants and assets are
accumulated in disaster prone urban areas. In light of this, the cities should become more
resilient to threads and the society must be prepared to tackle associated risks and residual
risks. In order this to be achieved; risks should be identified, assessed, communicated to the
interested parties and participatory managed.
Virtual 3D city models are certainly excellent media for communication of risk related
information, fact which has been verified through extensive literature survey. They can integrate,
manage, present and distribute complex risk related geo-information in an understandable
manner close to what the stakeholders are used to see in the real (3D) world towards nurturing
transparency and trust and promoting collaboration. These 3D city models intend to educate

68
and inform the interested parties about risks and they purport to raise their awareness regarding
the seriousness of a particular situation. In this way, they become capable to participate, exert
their influence and judge the alternatives for risk minimization during the decision making
process. Nevertheless, the quality of the representations of the 3D city objects is directly related
to the availability and accuracy of data.
In this study, a virtual 3D city model for the case of Heerhugowaard has been developed which
delineates the geometrical and appearance characteristics of the city objects providing dynamic
rule-driven 3D renderings of the flood risk components on the basis of the S-P-R model. It
provides concise information (graphic and non-graphic), thus enabling visual data mining,
analysis and navigation. Furthermore, it facilitates interaction which urge the stakeholders to
play an active role in the decision making process for managing flood risks. In essence, this
virtual city model offers dynamic 3D Common Operational Pictures (COPs) or 4D COPs taking
into account the temporal variable (time) and it aims to create shared understanding among the
involved stakeholders regarding flood risks. In addition, it enables the interested parties to
examine their alternatives by modifying the city model parameters in real time and visually
assess their implications. In this context, better decisions can be made in the cognitive domain
resulting to better actions in the physical domain concerning the minimization of flood risks in an
area of interest.
However, in the management of risks and residual risks where the stakeholders should be
prepared in the case of an emergency and evacuation plans including internal and/or external
routes should explicitly be defined; semantic, topological and thematic information in regards to
the 3D city objects and their components are required. This information intends to satisfy the
needs of the safety agencies for querying and analyzing the 3D city models.
A key aspect for efficient risk management and emergency preparedness is the capability of the
involved organizations to inter-operate i.e. work together. However, the fact that the data
required for risk management are derived from different sources and are often in different
formats, it calls for adopting a “common language” between the involved safety agencies which
will overcome this data fragmentation.
A 3D information system based on virtual 3D city models and extended by open existing
international standards from GIS and BIM domains such as CityGML and IFC respectively, it

69
has conceptually been deployed and presented aiming to make a step towards defining a
system framework for risk management and emergency preparedness. Overcoming limitations
of the virtual 3D city model developed for Heerhugowaard area, the conceptual system purports
to enable semantic interoperability throughout the risk management process. Additionally, it
aims to provide the stakeholders with not only navigation functionalities but also easy-to-use
querying and analysis capabilities. These are intended to be granted to them via the standards
employed by the conceptual system which will provide semantic, topological and thematic
information besides the geometrical and appearance characteristics of the 3D city models.
Furthermore, the 3D information system via the detailed description of the physical and
functional characteristics and relations of the city objects at the macro (city) and micro (facility)
scale, it aspires to allow the development of alternative external and internal building evacuation
routes for management of the residual risks. In the context of this 3D information system,
CityGML has been selected as target model for the representation of the complex urban space
since it is more capable of modelling objects at the macro scale using five distinct LoDs while
IFC classes are designed for representing information in a very detailed way at the micro scale.
BIM data in IFC format is a valuable source of information in regards to city facilities which
contains updated information regarding their status and structures while a literature survey
demonstrated that work has already been done in the direction of their conversion to CityGML
format. However, the CityGML LoD in which the city objects are eventually represented, it
depends on the accuracy and availability of the required data. In addition, the construction of
CityGML LoDs is challenging while the collection of semantics and the check of the validity of
the city objects’ geometries is demanding in terms of time and effort.
For the integration and seamless exchange of massive risk related information derived from
heterogeneous and distributed sources, agreed standards should be followed. However, as risk
related data can be under the control of different ownership and rights, a legal framework that
must govern these data sets must be determined at the political level, following discussions
between stakeholders including the public, the experts and the decision makers.
Governments and safety agencies should support the adoption and utilization of 3D city models
in risk management as they purport to facilitate the cognition of risk related situations by
providing a level field for equal access to information, simultaneously increasing transparency,
trust and cross-disciplinary collaboration. The overlapping BIM fields indicate an opportunity for
collaboration, knowledge transfer and integration of the roles of all the involved stakeholders at

70
the facilities’ level. However, collaboration neither can be imposed nor can work being just a
notion in the context of a risk related institutional framework. Virtual 3D city model-based
information systems can facilitate collaboration but for its practice, alterations in institutional
behaviors are required.
In short, a 3D information system based on virtual 3D city models forms an ambitious concept
which has the potential to support both information and communication processes towards
building capacity for participatory flood risk minimization, preparedness and response. For fully
setting the framework of a system for flood risk management and extending the potential as well
as the academic and institutional standing of the presented conceptual system, further
investigations in collaboration with interested stakeholders are needed.

71
4. A COMMON OPERATIONAL PICTURE IN SUPPORT OF SITUATIONAL
AWARENESS FOR EFFICIENT EMERGENCY RESPONSE OPERATIONS.
Efficient emergency response needs a multi-disciplinary approach which in turn it calls for a high
level of collaboration and coordination among the involved safety agencies. Furthermore, in
order to cope with the complexity, uncertainty and dynamic nature of an emergency, flexible
information and communication systems are required. Based on experiences from the military
domain, strategic concepts which can improve information sharing and collaboration can be
derived and adapted towards enhancing emergency response information systems and
operational effectiveness. This study purports to review the state of the art in this field providing
recommendations for emergency response policy makers, professionals and researchers.
4.1 Introduction.
Natural disasters strike since the ancient times and despite the advancements in science and
technology, they still have enormous socioeconomic and environmental impacts each year
(Helbing and Kühnert, 2003, Chang et al., 2007). In the context of the dynamic and complex
task environment of a disaster, multiple organizations and stakeholders are required to convert
from autonomous actors to interdisciplinary and interdependent emergency response teams
(Janssen et al., 2010). The probably most significant question that arises for these responding
teams is what is going on (Oomes, 2004)? For the latter, timely access to all relevant (geo-)
information is critical (Suri et al., 2010).
During an emergency, several operational field units at different levels with various functional
command structures coming from different organizations which may have different
backgrounds, professional languages and operational expertise, they should share information
acquired from various sources, communicate, co-operate and coordinate their actions within a
short period of time towards normalizing an emergency situation (Comfort and Kapucu, 2006).
The quality and timeliness of information can shape the effectiveness of the emergency
response operations (Horan and Schooley, 2007). Furthermore, accurate and relevant
information can play a pivotal role towards reducing the potential damages in lots of threatening
situations (National Research Council, 2007). Finally, the need of coordination in emergency

72
response is axiomatic as its absence drives to a number of possible failures which often result in
the escalation of an incident to a disaster and even higher number of victims (Bharosa et al.,
2010). In this connection it should be mentioned that a number of studies (e.g. Junglas and
Ives, 2007; Helsloot, 2005; Pan et al., 2005; Dawes et al., 2004) verify that poor information
sharing and coordination during inter-organization emergency response has a negative impact
on decision making and actions. In addition, information gaps along with lack of fluent
communication and absence of a common operation picture in use have been identified as the
major factors that hinder the emergency response organization (Seppänen et al., 2013).
Information sharing and coordination stay at the top of the research agenda, despite the
progress that may have been done through time (Bharosa et al., 2010). In order to overcome
the information management and dissemination problems, the emergency response
organizations support the employment of more advanced and better equipped information
systems derived from the logic of network enabled capabilities (Wolbers and Boersma, 2013;
Boersma et al., 2012). Such systems should assist emergency response stakeholders to
achieve shared situational awareness by deploying a Common Operational Picture (Wolbers
and Boersma, 2013; Comfort, 2006; Endsley, 1995). Having shared situational awareness, the
responding organizations can dynamically understand “what is going on” while their subsequent
decisions and actions highly depend on it.
In short, emergency response organizations still struggle with information sharing,
communication and coordination (Wolbers and Boersma, 2013; Bharosa et al., 2010; Comfort,
2007; Netten and Someren, 2011; Quarantelli, 1997). The unforeseen, dynamic and complex
nature of an emergency in which multiple groups of professionals need to cooperate is seen by
various scholars (e.g. Kapucu, 2006; Heide, 1989) as the reason for which the responding
agencies battle to share and coordinate information. Although information sharing and
coordination in emergency response are of apparent importance, they have received relatively
little scientific attention (Bharosa et al., 2010; Chen et al., 2008a; Ren et al., 2008).
Consequently, the main goal of this study is to provide through extensive literature survey an
objective and systematic overview of strategic information concepts and to illustrate their
empirical usefulness and benefits for effective emergency response.
In this context, the paper commences its mission by presenting in chapter 2 a literature review
on natural disasters providing a thorough classification of their different types as well as

73
numbers and losses worldwide. Moreover, after distinguishing between incident and disaster a
detailed description of the different phases of an emergency followed by characteristic types of
delays during emergency response operations is provided. Next, in chapter 3 the design
premises of a flexible and dynamic emergency response system are delineated based on
literature. Thereafter, in chapter 4 the network centric enabled capabilities for information
sharing during emergency response are analyzed and their real benefit which is reflected in
their value chain is explained. Then, in chapter 5 situational awareness and in particular
individual, shared and team situational awareness and models are explored. Afterwards, in
chapter 6 a background to a common operation picture is presented and challenges in its
achievement are identified. Furthermore, the added value service of a common operation
picture in emergency response is theoretically investigated and a basis for its qualitative and
quantitative assessment is proposed. Finally, this contribution concludes by discussing the main
findings and providing recommendations for emergency response policy makers, professionals
and researchers.
4.2 Natural Disasters.
Natural disasters have stigmatized the human history, causing peaks in terms of mortality and
morbidity (Leaning and Guha-Sapir, 2013). Τhe Centre for Research on the Epidemiology of
Disasters (CRED) (Guha-Sapir et al., 2014) defines disaster as “a situation or event which
overwhelms local capacity, necessitating a request to a national or international level for
external assistance; an unforeseen and often sudden event that causes great damage,
destruction and human suffering”. The United Nations International Strategy for Disaster
Reduction (UNISDR) terminology (2009) determines disaster as “a serious disruption of the
functioning of a community or a society involving widespread human, material, economic or
environmental losses and impacts, which exceeds the ability of the affected community or
society to cope using its own resources”. The International EMergency Disasters DATabase
(EM-DAT) (2013) classifies natural disasters in 5 groups which in turn cover 12 disaster types
(see table 4.1).

74
Table 4.1: Classification of natural disasters.
Hydro-Meteorological
Biological Geophysical Hydrological Meteorological Climatological
Epidemic
Infectious Disease
Viral
Bacterial
Parasitic
Fungal
Prion
Earthquake
Ground Shaking
Tsunami
Flood
General River
Flood
Flash Flood
Storm
Surge/Coastal
Flood
Storm
Tropical Storm
Extra-Tropical
Cyclone
Local/Convective
Storm
Extreme
Temperature
Heat Wave
Cold Wave
Extreme Winter
Conditions
Volcano
Mass Movement
(Dry)
Rockfall
Landslide
Avalanche
Subsidence
Mass Movement
(Wet)
Rockfall
Landslide
Avalanche
Subsidence
Drought
Wildfire
Forest Fire
Land Fires
(grass, scrub,
bush, etc.)
Insect Infestation
Animal Stampede
(EM-DAT, 2013)
Over the past five decades (see figure 4.1), the number of the overall natural disasters present
an increasing linear trend causing severe economic losses while the hydro-meteorological
disasters are the most dominant in terms of numbers and economic damages. Biological events
are not considered here, as they require specific approaches and often are not directly related
to geophysical and hydro-meteorological events (Leaning and Guha-Sapir, 2013).
Linear trend (All Events)
Figure 4.1: Numbers and types of historical natural disasters.
(Adapted from Leaning and Guha-Sapir, 2013)

75
Only in 2014, the NatCatSERVICE of the Munich RE (2015) has recorded 980 loss events
distributed all over the world (see figure 4.2) that have caused overall 7 700 human fatalities
and losses of around $110 billion of 2015 US dollars. From these, 900 were hydro-
meteorological events which caused 6 900 human deaths and losses of $97 billion of 2015 US
dollars. Looking at the geographical distribution of the events in 2014, Asia following the trend of
the past three decades (UNESCAP, 2013) is the most disaster-prone region with the largest
number of people killed and the greatest economic damages. In particular, according to Munich
RE (2015) (see figure 4.3) Asia was the continent hit by most of the natural disasters (37%)
followed by North America including Central America and Caribbean (20%), Europe (16%),
Africa (10%), South America (9%) and Oceania (8%). In addition, Asia in 2014 accounted for
75% of global disaster victims followed by Africa (10%). Furthermore, Asia suffered from the
46% of the global damages followed by North America including Central America and
Caribbean (29%) and Europe (16%).
Loss events Geophysical events Hydrological events
Selection of catastrophes
Overall losses ≥ US $1 500m
Meteorological events Climatological events
Figure 4.2: Geographical distribution of loss events during 2014.
(Munich Re NatCatSERVICE, 2015)

76
Figure 4.3: Loss events in 2014 ordered by continent.
(Adapted from Munich RE, 2015)
Natural disasters, particularly floods and storms present an increasing trend in terms of
frequency and seriousness affecting the mortality, morbidity and welfare of the society.
Montanari and Koutsoyiannis (2014) mention that the growing impacts of extreme events, along
with the observation that the environment alters in a phenomenal manner, stresses that human
facilities are becoming more exposed to natural hazards and risks. Furthermore, the level of
vulnerability of an exposed community to such hazards, it specifies the extent to which a hazard
can cause a disaster (EEA, 2010). In the years ahead, the international community should face
the root causes of crises (Leaning and Guha-Sapir, 2013). In this context, transnational
solutions enabled via an effective framework for regional cooperation by allocating resources
towards better preparedness as well as by reinforcing the early warning systems are needed
(UNESCAP, 2013). Humanitarian relief is and will always be required due to unforeseen natural
events which call for effective emergency response during a crisis situation.
0
10
20
30
40
50
60
70
80
90
100
Loss Events Fatalities Overall Losses
Africa Asia Europe North America incl. Central America and Caribbean South America Oceania
7 700 Fatalities
980 Total Loss Events
2015 US $ 110 billion
%
77
4.2.1 Incidents versus disasters and emergency response.
Oxford Dictionaries (2015) determine incident as “an instance of something happening; an event
or occurrence” while disaster as “a sudden accident or a natural catastrophe that causes great
damage or loss of life”. In order an incident not to escalate to a disaster effective emergency
response is required. According to UNISDR (2009) response is “the provision of emergency
services and public assistance during or immediately after a disaster in order to save lives,
reduce health impacts, ensure public safety and meet the basic subsistence needs of the
people”. In this context, plans and institutional arrangements that involve and guide the efforts of
the multiple safety agencies in a comprehensive and a coordinated fashion towards responding
to the entire spectrum of emergency needs are engaged.
Emergencies are considered as high stress situations which need organizations to respond in a
way that is different from their normal operating procedures (Raman et al., 2012; Otim, 2006;
Jennex, 2004; Turoff, 2002). Walle and Turoff (2008) note that emergencies are by definition
situations in which the stakeholders are not familiar with nor likely to become familiar with; and
their occurrence evokes intense feelings of stress, anxiety and uncertainty. During an
emergency situation, not only will they have to manage these feelings, but also they should
comprehend the situation among conflicting or missing information, deciding for the appropriate
response actions in a short period of time.
Jennex (2007) see emergencies as a series of four phases (see figure 4.4) i.e. Situational
Analysis (SAn), Initial Response (IR), Emergency Response (ER) and Recovery Response (RR)
and five decision points i.e. the Initiating Event (IE), the Control Event (CE), the Restoration
Event (RE), the Normalizing Event (NE) and a Terminating Event (TE) which are described
below in details:
SAn phase: During this first phase, information is acquired and assessment of the situation is
performed by the safety agencies. It has a base level of activities which include monitoring
and analysis of a set of predetermined conditions for detection of unusual or pre-identified
deviations, identification of the IE and training and preparation of the emergency responders.
When an IE is determined during the SAn phase, an emergency is considered that initiates
and it causes the start of the IR phase.

78
IR phase: This is a short duration phase in which verification of the emergency is being done,
followed by generation of early warning notices, initialization of preplanned preliminary
actions and introduction of the emergency response plan.
ER phase: It begins directly after assuming control by the emergency response teams i.e.
after a CE and in general after the completion of the immediate response actions and early
warning notifications. This phase implements the emergency response plan and begins the
coordination of the responders, the deployment of the assets and the allocation of the
resources. Being the command and control phase of emergencies, it requires from the
emergency responders to monitor conditions and progress of the response operations,
adjusting them accordingly. The ER phase reaches the maximum activity level during an
emergency, ending with the RE. At this point, the emergency responders deduce that the
emergency conditions are under control and hence no further response actions are needed
leading to the termination of the command operations of the emergency control center and
the entrance of the emergency into the RR phase.
RR phase: This phase has a declining level of activities during which is verified that the
emergency is under control and organization, management and coordination of long term
activities and reconstruction for the normalization of the situation takes place. Furthermore,
lessons learned from the management of the emergency are identified and documented
towards better preparation for potential future emergencies. The RR phase ends when the
NE is formally declared. At this point, all the emergency response actions are completed.
Moreover, long term response activities as well as a basic level of restoration have been
made, the situation is normalized and the safety agencies are operating in their routine
procedures being in the SAn phase.
TE can occur in the case of a false detection of an incident or in the case where another
emergency has been prioritized or in the case of any event that could cause the suspension of
the response. In general, TE can take place in any phase and time denoting the termination of
an emergency. This is also the reason for which is not illustrated in the diagram of phases and
timelines of activity levels of a typical emergency (see figure 4.4).

79
Figure 4.4: Phases and decision points with indicative amount per unit time of immediate
response and decisions that need to be made following an IE.
The figure does not correspond to scale and it is a general illustration of an emergency timeline.
(Jennex, 2007)
4.2.2 Delays during an emergency response.
Chen et al. (2007), see emergency response as a social activity where multiple agencies across
functional disciplines and jurisdictions are involved. In particular, during an emergency, several
response teams from various safety agencies with different organizational goals and cultures
must cooperate in order to minimize the potential negative effects of an emergency (Schaafstal
et al., 2001). For this, good coordination and communication not just within a response team,
but also among the several teams involved is required.
During the emergency response operations, Chen et al. (2007) identify three characteristics
types of delay:
Type 1: This delay is related to the dispatch process of the emergency responders due to a
limited Situational Awareness (SA) and comprehension of the extent of an incident.
Coordination and decision making in a limited amount of time lacking relevant, complete and
accurate geo-information is crucial. Novel information concepts with the capability to
integrate and present up-to-date information about the incident, the surrounding environment
and the response operations in real time are often needed. Furthermore, decision support
systems which build upon such information concepts incorporating and adjusting decisions
are often necessary. As the understanding of the situation may change and improve through
time, the capacity of adjusting the decisions accordingly is of critical importance. Such a
Phase
Activity Level
IE CE RE NE
RR SAn SAn IR ER

80
change can occur as individual observations of the scene are often biased by the observer’s
comprehension, background, reminiscence and verbiage. First responders, mention that
these observations are frequently contradictory resulting in delays in regards to actionable
decisions, as puzzling out conflicting information is hard and time consuming. Finally, the
systems used to support decisions for emergency response should not refuse information
seemingly useless, but maintain and analyze such information for potential useful content.
Type 2: This refers to the time spent on the preparation of the responders for the
implementation of their tasks and it can be reduced by organizing ex ante relevant training
exercises. This preparation time can include identification of proper outfit and suitable
equipment related to the type and severity of the emergency to be managed and travel time
required to reach the hot zone (location awareness). Better preparedness for emergency
response as well as better coordination during the emergency may contribute to the
minimization of this delay.
Type 3: This delay can occur during the process of information acquisition, communication
and decision making. It can be addressed by facilitating Shared Situational Awareness (SSA)
among the responders. SA and SSA are defined and discussed in a later section.
4.3 Design principles for an emergency response system.
Information and communication of varying scopes and proportions are of utmost importance
during crisis situations (Walle and Turoff, 2008). Furthermore, teams of people who often
represent different organizations, resources and roles are required to work effectively in a
coordinated fashion supporting each other’s’ objectives even when they have never before
worked together (Carver and Turoff, 2007). For this, flexible and dynamic emergency response
information systems resting on generic design principles and tailored to the needs of the
different safety organizations are required. Based on historic experience, Turoff et al. (2004 a,
b) suggest nine design premises for a Dynamic Emergency Response Information System
(DERMIS) (see table 4.2a, b).

81
Table 4.2a: Design premises for a DERMIS.
Design premises Discussion
System training
and simulation
An emergency response system which has functions for the day-to-day
operations, it partly eliminates the need for training and simulation. This occurs
due to the fact that the professionals who must operate the system, they
already gain extensive experience with it just by using it for their daily routine.
Information focus The professionals dealing with the emergency response are often flooded with
information and hence the emergency response systems should filter
information according to the needs of the different actors. However, these
should still be able to access all contextual information related to an
emergency as information elements that are filtered by the system may be of
utmost importance under unforeseen conditions.
Crisis memory The system should enable logs of the events’ chain during an emergency,
without charging the emergency responders with extra workload. The
information included in these logs can be used for system improvements for
future emergencies as well as for analysis of the emergency situation itself.
Expectations as
norms
Most of the emergencies are unique and hence a planned response to an
emergency is not feasible to be followed in details. Furthermore, the majority of
the actions are expectations to the earlier defined norms. Therefore, an
emergency response system should be flexible enough to enable alterations in
the configuration and allocation of resources during response operations.
Scope and nature
of crisis
Depending on the nature of an emergency, the different response teams may
have to be structured with members who will provide the appropriate
knowledge and experience for fulfilling the teams’ tasks. In addition, attention
should be paid on the fact that some teams may operate for a specific amount
of time transferring their tasks to other teams or actors. This applies also for
individual team members who due to exhaustion may need to be replaced by
others.
Role transferability Emergency responders must be able to pass their roles to others when they
are not capable to deal with an emergency. This means that an emergency
response system’s software should explicitly describe these roles and also the
tasks, responsibilities and information needs of each of them.
(Walle and Turoff, 2008; Turoff et al., 2004 a, b)

82
Table 4.2b: Design premises for a DERMIS.
Design premises Discussion
Information validity
and timelines
During emergency situations, actions are taken based on incomplete
information. Thus, it is of utmost importance for an emergency response
system to be capable to store all the available information in a central database
equally open to all those involved in the management of an emergency
situation. In this manner, all the involved stakeholders can count on a wide
base of information which in turn it may support them towards more effective
and efficient decision making for the management of an emergency.
Furthermore, when these stakeholders require unexpected (unpredicted by
humans or technology i.e. the system) information, they need to be able to
identify whether this exists or not and also who can or must be providing it.
Free exchange of
information
During an emergency response, a vast amount of information should be
shared and exchanged between the involved stakeholders in order these to
become aware, gain control of the situation and supervise the response
operations. However, a large amount of exchanged information can lead to
information overload which can have negative contribution to the emergency
response. Hence, the system must prevent the information overload of its
users by assuming all the bookkeeping of communications and all the
organization occurred.
Coordination
Due to the unforeseen nature of an emergency, the actions that should be
taken as well as the responsibilities of the emergency response teams and
individuals cannot be predetermined. In this context, an emergency response
system should support flow of authority towards where the actions take place
(usually on a low level of hierarchy) and simultaneously reverse flow of
accountability and situational information upward and sideways through the
organization.
(Walle and Turoff, 2008; Turoff et al., 2004 a, b)
People can deal with a high degree of uncertainty to make timely decisions as long as they
know that these are not based on hidden information which will make their actions to look wrong
later. In this context, the persons required to make decisions during an emergency should be
ensured that they can find and precisely understand all the information relevant to their decision
in a timely manner; as in an emergency what might be considered the most relevant, may
simply not exist (Turoff et al., 2004b).
83
An emergency management system should face the reality of an emergency situation which
requires movement of authority to lower levels and rapid responses (Turoff et al., 2004b).
Otherwise, the system will be designed inadequately without being capable enough to handle
the oversight function in a timely and effective manner during an emergency. As many serious
decisions are irreversible (Pauwels et al., 2000), the latter can lead to incorrect decisions which
cannot be altered or to delays in making a decision that eliminates the opportunity for choosing
the best alternatives.
The nine design premises suggested by Turoff et al. (2004 a, b), can lead to an emergency
response system flexible, robust, dynamic and capable to support the information and
communication needs of the emergency responders at all the levels. Furthermore, according to
Eede et al. (2006), they can allow the development of a dynamic emergency response
information system capable to support and be integrated across different organizations.
4.4. Network centric enabled capabilities for emergency response.
When a disaster strikes, coherent coordination requires acquisition of relevant information from
multiple sources, verification of its accuracy and sharing among responding organizations, all
within a short period of time (Janssen et al., 2010). Information quality and timeliness can shape
the effectiveness of the emergency response operations (Horan and Schooley, 2007).
Furthermore, accurate and relevant information can significantly reduce the potential losses in
lots of threatening situations (National Research Council, 2007). Lack of information and
knowledge, their incorrect interpretation or discharge as irrelevant are among the main reasons
of disaster management failure (Cooper and Block, 2006; Wiese, 2006; Dyson, 2006; US Select
Bipartisan Committee, 2006). Furthermore, at the peak of an emergency when information
accessibility, flow and distribution are of utmost importance; the lack of interoperability among
the variety of databases, the information generation systems and the telecommunication
platforms utilized by these systems are some of the most obtrusive contributors to
mismanagement (Lubitz et al., 2008b; Lubitz and Wickramasinghe, 2006a; Lubitz and
Wickramasinghe, 2006b; Lubitz and Wickramasinghe, 2006c; Lubitz and Patricelli, 2007;
Dizard, 2006).

84
Architectures to support complex problems solving as well as coordination and information
sharing during emergencies can be traditionally characterized as hierarchical solutions (Bigley
and Roberts, 2001; Simon, 1996). Furthermore, Janssen et al. (2010) state that hierarchical
control is often viewed as a necessity for managing disasters. However, Comfort and Kapucu
(2006) mention that under the urgent and dynamic conditions of a disaster, such procedures
almost always crash. In addition, Comfort (1999) points out that under cumulative stress, the
hierarchical organization tends to fail and personnel are obstructed by a lack of information,
constraints on innovation and an inadequacy to shift resources and actions to timely meet new
demands. Schraagen et al. (2010) experimentally demonstrated that in complex environments,
the network centric structures were more efficient in terms of speed, accuracy, information
distribution, knowledge sharing and decision making compared to the hierarchical structures.
For complex, time dependent operations carried out in dynamic environments, the concept of
“network-centric warfare” based on extensive use of information technology, information
management and progressively increasing incorporation of knowledge management techniques,
it has been introduced several years ago by the US Department of Defense (DoD) (Alberts et
al., 2001). In particular, the Network Centric Operations (NCOs) have emerged as the solution
to the major information and knowledge deficiencies and requirements during complex, large-
scale crisis management operations (Cebrowski and Garstka, 1998; Lubitz and
Wickramasinghe, 2006a; Lubitz and Wickramasinghe, 2006b; Lubitz and Wickramasinghe,
2006c; Lubitz and Patricelli, 2007). The NCOs' concept recognizes the need of empowering
humans during emergency response. By incorporating NCOs, the military aimed at a broad
sharing of situational awareness through the utilization of a Joint Operational Picture (Alberts et
al., 2002). According to Alberts and Hayes (2007), DoD has identified four propositions of a
NCO and a set of governing principles for a network centric force which are the tenets of
netcentric warfare: i) a robustly networked force improves information sharing; ii) information
sharing and collaboration reinforce the information quality and share situational awareness; iii)
shared situational awareness allows self-synchronization and strengthens sustainability and
command speed; iv) All these in turn are significantly increasing the mission effectiveness.
Lubitz et al. (2008b) mention that the concept of network-centricity has emerged in two parallel
approaches. These are the Doctrine of Network-centric Warfare (DNW, Wilson, 2004) and the
Network Enabled Capabilities (NEC, NATO, 2005) also known as Network Enabled Operations
(NEO). From the two approaches, Lubitz et al. (2008b) identify that the NEC concept is more

85
adaptable to the conditions of emergency response in which multiple uncoordinated and
disorganized governmental, non-governmental, local and volunteer organizations are required
to collaborate within the same operational environment, yet entirely without common information
sharing capability. This is because unlike the network centric doctrine, NEC enables effects-
based operations at the level of command and control as well as on the level of operational
capability. Lubitz et al. (2008b) state that the “NEC may be the essential tool required to change
the persisting individualism of the participating organizations”. Furthermore, NEC is a potential
enabler of an adaptive management philosophy which can allow collaborative and flexible
responses to future disasters (Wiese, 2006).
Networks, information and humans are the three overlapping and mutually dependent
dimensions of NEC, which need continuous development for achieving full realization of the
concept (UK Ministry of Defense, 2005). The networked information environment offers the
capability to acquire, generate, manipulate and distribute information which in turn is crucial for
the decision makers. The real value of NEC is reflected in its value chain (see figure 4.5). In
essence, NEC value chain corresponds to the tenets of net-centric working (Alston, 2005;
Alberts, 2002) and it attempts to indicate the NEC cause and effects chain that leads in “Better
effects” i.e. the desired emergency response outcomes.
Figure 4.5: The value chain of Network Enabled Capabilities (NEC).
(Steenbruggen et al., 2012; UK Ministry of Defense, 2005)

86
NEC timely provides and exploits information and intelligence to enable effective decision
making and versatile actions (UK Ministry of Defense, 2005). However, despite the fact that they
offer decisive advantages in emergency response, they have some deficiencies. For example,
Lubitz et al. (2008b) mention that these concepts are technology driven, with technology itself
being one of the first victims of a major emergency. As a solution to this, Patricelli et al. (2008),
suggest that preparation and planning can contribute in assuring that in spite of severe
infrastructure damage, the essential network capabilities either keep operational or are timely
restored to an acceptable functional level. Some other issues on NCO have been identified by
Bharosa et al. (2009b, 2009c), who have done field research and in particular empirical analysis
on the implementation of NCO and the resulting problems. Through their research, they
identified that the implementation of NCO can unveil some shortcomings which cannot be
addressed by NCO descriptions. In addition, they found that NCO can highlight some issues
such as information overload making also the validation of information quality a difficult task.
Furthermore, they acknowledged that despite the technological advances, the NCO concept’s
effectiveness depends on the formulation of new institutional policies and roles in regards to
information sharing. For all these matters, further research needs to be carried out. Therefore,
the concept of net-centricity is not a panacea which solves all the crisis management problems,
but it is a part of the solution.
4.5 Situational Awareness.
Many definitions of Situational Awareness (SA) exist (Endsley, 1988a; Fracker, 1988). Most of
them converge that SA is about “knowing what is going on” (Endsley, 1995). According to
Gilson (1995), the concept of SA has been identified during the World War I by Oswald Boelke
who understood “the importance of gaining an awareness of the enemy before the enemy
gained a similar awareness, and devised methods for accomplishing this” (Lagervik et al., 2006;
Stanton et al., 2001). In technical and academic literature, the area did not receive much
attention until the late 1980s, but thereafter diligent work has been done (Stanton et al., 2001).
The aviation industry where pilots and air traffic controllers are required to develop better SA
has been the driving force for research and development in this domain (Jenson, 1997). In this
context, Nofi (2000) mentions that the concept of SA entered military usage through the aviation
community. Both the concepts of SA and Common Operational Picture (COP) have been

87
employed by the military as a guiding principle to define and/or supervise warfare operations
(Steenbruggen et al., 2012).
Lack or inadequte SA has been found as one of the main causal factors in accidents attributed
to human error (see Steenbruggen et al., 2012; Hartel et al., 1991; Redding, 1992; Merket et al.,
1997; Nullmeyer et al., 2005). For example in the aviation industry, a review of over 200 aircraft
accidents revealed that their main cause was the poor SA. Despite the fact that SA has its roots
in aviation, the concept is equally applicable to human supervisory control for ground based
industries (Kaber and Endsley, 1998). Some researchers criticize the concept for being very
subjective (Gilson, 1995), very intuitive (Flach, 1995) and lacking a coherent definition (Sarter
and Woods, 1991) while other researchers overcome these accusations, claiming that SA is a
useful concept with utmost importance for operational settings (Gilson, 1995). Steenbruggen et
al. (2012) see SA as especially important in work domains where the information flow can be
quite high and poor decisions can cause disastrous results. Klein (2000) considers SA as a
critical concept because: it is linked to performance; limitations in SA may result in errors; it may
relate to expertise; it forms the ground for decision making. SA can be distinguished as
individual or shared/team SA which will be analyzed in the following sections.
4.5.1 Individual SA: Definitions and models.
A commonly accepted definition of the SA of individuals is still missing (Sarter and Woods,
1991). In a high level of simplification, SA can be seen as an appropriate awareness of a
situation (Smith and Hancock, 1995). Individual SA can be considered as a personal attribute
(Nofi, 2000). The world around the individuals is approached in personal terms, based on their
cultural background, education and experiences as well as on the strengths and limitations of
their senses (Nofi, 2000).
According to Stanton et al. (2001), three main definitions dominate in the literature: Ensdsley’s
(1988) which focuses on an information processing framework; Smith’s and Hancock’s (1995)
that pinpoints the reflective quality and Bedney’s and Meister’s (1999) which presents an
embedded world view. In essence, Endsley’s (1988) definition focuses on the perception and
understanding of the world employing future projection of its current situation. In contrast to the
latter, Smith and Hancock (1995) determine SA in terms of the interaction between the person
and the world and hence it focuses on the way in which the two main systems cooperate.
88
Bedney and Meister (1999) pinpoint the reflective perspective of SA and in particular the relation
with mental models incorporating understanding of the present system. The differences
between these definitions are identified on the orientation of SA either as cognitive process
used to develop and maintain SA or tangible product; as well as in terms of the underlying
psychological approach.
As suggested by Stanton et al. (2001), three main theoretical approaches dominate in the SA
domain: the information processing approach which is represented by Endsley’s theoretical
three - level model (Endsley, 1995); the activity theoretic approach which is best described by
Bedney’s and Meister’s interactive sub-systems model (Bedney and Meister, 1999) and the
ecological approach which is delineated by the Smith’s and Hancock’s perceptual cycle model
(Smith and Hancock, 1995). In terms of SA orientation, the interactive sub-systems and the
perceptual models focus on the process while the three-level model mainly concentrates on the
product. However, Stanton et al. (2001) mention that in measuring SA none of these product-
process perspectives should be ignored as the latter can be determined by the former.
From the theories of individual SA, based on Salmon et al. (2007), Endsley’s three tier model of
information processing has been the most useful for describing SA of an operator as well as for
informing system design and evaluation (e.g. Endsley et al., 2003). In addition, Gorman et al.
(2006) mention that many SA researchers have agreed in principle on Endsley’s three part
definition of SA. Endsley (1988) defines SA as: “the perception of the elements in the
environment within a volume of time and space, the comprehension of their meaning and the
projection of their status in the near future”. Therefore, SA is about perceiving critical factors i.e.
status, attributes and dynamics of relevant elements in the environment (Level 1),
understanding of the meaning of these elements after being synthesized, in light of the decision
maker’s goal (Level 2) and at the highest level (Level 3) predicting of what will occur with the
system in the near future. Higher SA levels are dependent on the success of the lower levels
(Wickens, 2008). An extensive review of Mica Endsley’s articles on SA theory and
measurement can be found in Wickens (2008).
Endsley’s theories do not employ concepts such as COP and network centric operations in the
definition of individual SA. The latter is more determined as a set of goals and decisions tasks
for a certain job or activity of individuals within an organization and thus its context depends on
what is the right information to support a SA environment (Steenbruggen et al., 2012). However,

89
when the individuals work as team members and are required to perform their tasks in a
network centric environment based on individual SA, there is an interrelation between the
qualities of shared SA in terms of interaction. In addition to the different SA levels of the
environment, relevant is the SA of the own organization also known as organizational
awareness which is defined by Oomes (2004) as “an understanding of the multiple parties that
make up the organization and how they relate to each other”.
4.5.2 Shared and team SA backgrounds.
Perla et al. (2000) mention that “With all the imprecision and debate surrounding the basic
meaning of the idea of situational awareness, it is hardly surprising that the broader concept of
shared situational awareness suffers from similar conceptual and semantic difficulties”. In
general, when actors are working together towards achieving a common goal, a “compatible”
understanding of the situation is supportive (Seppänen et al., 2013). Endsley et al. (2003),
introduce shared SA as the degree to which team members have the same SA on shared SA
requirements where shared SA is dependent not on a complete sharing of awareness between
team members, but only on a shared understanding of that subset of information which is
necessary for each of their goals. Therefore, shared SA is about the level of overlap in common
SA elements between team members (Seppänen et al., 2013). However, each team member
has specific SA requirements of its task, from which some may overlap with other team
members' requirements (Seppänen et al., 2013). The latter is related to what team SA is about.
Endsley (1995) defines team SA as “the degree to which every team member possesses the
situation awareness required for his or her responsibilities”. Shared SA and team SA are not the
same. Endsley (1989) and Endsley and Jones (2001), make the distinction between the two.
However for successful team performance, the individual team members should have good SA
on their specific elements and simultaneously the same SA for those elements that are shared
(Endsley and Robertson, 2000).
Seppänen et al. (2013) state that interaction is critical in building SA, while communication is in
the heart of interaction being the driving force in the formation of an adequate shared SA.
Salmon et al. (2008) identify that most researchers have focused on communication as the key
component in the development of team SA. In this line, Nofi (2000) finds communication as the
most crucial element in the formation of team or shared SA. Endsley (1995) reflects the latter by
suggesting that a team member’s SA of shared elements can provide team coordination or

90
communication. Entin and Entin (2000) stress that communication is a prerequisite for achieving
a high level of team SA. Furthermore, Salas et al. (1995) pinpoint the significance of
communication in the acquisition of team SA.
Nofi (2000) point out that “shared situational awareness obviously differs from individual SA
because it involves a number of persons trying to form a common picture”. For the development
of shared SA, Bolstad and Endsley (2000) identify four factors: (1) shared SA requirements (e.g.
the degree to which team members understand which information is required by other team
members); (2) shared SA devices (e.g. network systems, communication devices, shared
displays and the share environment); (3) shared SA mechanisms (e.g. shared mental models)
and (4) shared SA processes which is about efficient team processes that enable sharing of
relevant information. However, for the development of SA for the team as a whole, Endsley and
Jones (2001) state that this depends on: (1) a high level of SA among individual team members
for the aspects of the situation relevant to their job and (2) a high level of shared SA between
members, based on an accurate common operational picture of those aspects of the situation
common to the requirements of each member.
4.6 A common operational picture for emergency response.
During emergencies, agencies with heterogeneity in terms of background, specific operational
expertise and professional language need to organize their actions across jurisdictional and
institutional boundaries in a coordinated fashion for efficient and timely response operations
(Comfort and Kapucu, 2006). In this context, a Common Operational Picture (COP) can be
utilized for overcoming coordination and information management problems throughout
emergency response. Following, the COP concept is introduced and its contribution to
emergency response operations is explored.
4.6.1 Background to a COP.
According to Hager (1997), early studies of Common Operational Pictures (COPs) were carried
out in the eighties. A major milestone was the deployment of a large group display to facilitate
the development of SA in military command posts (Deschamps et al., 2002). However, as
Wolbers and Boersma (2013) suggest, a single definition of a COP does not exist both in the

91
operations field and the literature. Copeland (2008) stresses that disagreements exist in terms
of COP considerations as it is treated as a product, process or operating environment. In the
literature, two types of definitions are the most common: the first focuses on the capabilities of
information distribution while the second pinpoints the need for developing an adequate level of
shared understanding (Wolbers and Boersma, 2013).
Based on Merriam-Webster’s Collegiate Dictionary (2015), a picture can be seen as a design or
representation made by several means or as a description so vibrant or graphic which provides
either a mental image or an accurate idea of something. Also, it can be a mental image itself.
Similarly, this dictionary defines common as something that belongs to or is shared by two or
more individuals or things or by all group members which has a connotation to widespread or
general knowledge. Finally operational is of, or relating to, or utilized for or in operations
(Merriam-Webster’s Collegiate Dictionary, 2015). Kuusisto et al. (2005) building upon these
frames, consider a COP, as a shared representation of widespread and general knowledge
regarding operation.
A COP provides stakeholders with a “common picture” of the field of operations at the same
time, on a terminal device at their location (Hager, 1997), while the operational picture refers to
a predefined representation of information related to the operations. The US military Doctrine for
Joint Operations (Shelton, 2001) defines COP as “a single identical display of relevant
information shared by more than one command”. Furthermore, the doctrine sees the COP as a
facilitator of collaborative planning which supports all echelons to achieve SA. In emergency
response, COP can be seen as an auspicious solution towards improving the quality of
information sharing and supporting the development of SA (Comfort, 2007).
A COP can also be treated as a boundary object because its deployment is about sharing and
building information in regards to the response operations by enabling users to constantly
redefine and adapt their relationships (Wolbers and Boersma, 2013). By utilizing a COP,
coordination and negotiation of the polyphony of the experts’ perspectives via general
procedures of exchange without making their points of view uniform or completely transparent to
each other are facilitated (Trompette and Vinck, 2009; Hsiao et al., 2012).
A COP often represents geographic information as typical applications are tied to a possible
large geographic area (location awareness) (Björkbom et al., 2013). In this line, COP is

92
considered as a geographical representation (geo-COP) combined with a checklist that
delineates the evolution of an emergency along with the characteristics and progress of the
emergency response operations. The information tailored in terms of content and detail is
merged into a common frame of reference and visualized on a screen, supporting the
comprehension by the response organizations of the current view of the situation (Björkbom et
al., 2013).
The US Department of the Army mentions that a COP which may cross horizontal, vertical and
functional boundaries is made of three components (Bessler, 1998): (1) situation maps and
overlays (the current status of an emergency, the projected emergency situation and the
available resources); (2) friendly battlefield resource report and (3) intelligence products. In a
network centric information environment, a COP is fed with (automatically updated) data derived
from different sources such as reconnaissance and surveillance assets, emergency response
teams in contact, intelligence acquired from analysis, information from higher echelons and
estimates about incomplete information (Blais et al., 2005). By employing networks as well as
emerging technologies, the different emergency response organizations can use current
positional information to obtain the desired operational picture on one display. Access to a
common picture that displays the evolution of an emergency and the progress of the response
operations can enable these organizations to collaboratively plan and execute comprehensive
tactical operations (Hager, 1997).
In emergency response operations, a COP depicts static information predetermined in the
preparedness phase of emergency management as well as dynamic information related to the
evolution of an event which needs to be shared between different emergency response chain
members (see table 4.3a, b). It may contain geographical displays of emergency resources and
assets, alternative evacuation routes as well as other tactical information all on a single display.
In essence, a COP contains elements common to all the types of emergencies as well as critical
variables which can be extracted at the time of the event through different sources of
information including emergency responders. For example, by taking advantage of inputs from
different intelligence sources all the deployed units in the field of operations can be mapped in
real-time (Phillips et al., 2002). Therefore, with the suitably implemented information/knowledge
management services, all the relevant to an emergency factors can automatically be
incorporated into a comprehensive, real time description of the present and future needs, which
may include availability of resources and assets, their appropriate deployment and field control

93
i.e. actionable knowledge (see Lubitz et al., 2008b). In short, Hager (1997) mentions that a COP
displays all acquired and combined data derived from different means in a single presentation to
the user. As a consequence of realizing a COP, SA can be increased because every
emergency responder can have the same information regarding the evolution of an emergency
and the progress of the response operations.
Table 4.3a: Examples of common and variable elements included in a COP.
COP considerations
Common elements Specific elements (related to an emergency)
Incident/Disaster Digital maps at national level which
include hazards, vulnerable objects and
risk analysis results related to different
potential types of events.
The nature and the magnitude of the
critical event;
Geographic location of the event, size
of the affected area, location and
magnitude of the affected population.
Networks
(e.g. streets)
Networks infrastructure is depicted in
maps;
Networks accessibility, condition and
capacity are known;
Alternative evacuation routes are
predetermined during the preparedness
phase of emergency management.
These take into account the nature of a
potential emergency, estimated
numbers of evacuees based on the
population of different areas as well as
time availability for the evacuation.
The maximum size of an area affected
by the emergency and consequently
the networks became or about to
become inaccessible;
Degraded and destructed networks
due to event related conditions,
weather;
Non-forecasted networks’ degradation
due to traffic congestion.
Resources Material resources such as ambulance
and police vehicles, fire brigade
engines, trucks, aerial means, supplies.
Degradation due to event related
specific factors which can cause for
example damage of the resources,
inaccessibility of the place(s) in which
they are located;
Due to allocation of the emergency
resources to the response operations’
scene, the number of the available
resources changes dynamically as the
response operations escalate.
(Adapted from Lubitz et al., 2008b)

94
Table 4.3b: Examples of common and variable elements included in a COP.
COP considerations
Common elements Specific elements (related to an emergency)
Assets The number of personnel in all
categories (e.g. policemen, firemen,
field medics, support staff) available for
deployment to the response operations’
scene is known;
Personnel requirement for traffic control,
barrier maintenance, evacuated territory
security patrol;
Deployment sites for personnel
predetermined in the preparedness
phase of emergency management;
based on different types of events with
different magnitudes and the associated
evacuation sizes.
The required personnel number for the
emergency response operations which
depends on the nature of the event.
Due to allocation of the personnel to
the operations’ scene, its availability
changes dynamically as the response
operations escalate.
The unavailable personnel who are
unable to reach the deployment sites
due to specific factors related to the
evolution of the emergency.
Shelters/ Healthcare Units
Location and capacity of available
short/long term shelters and field
medical facilities as well as optimal
access routes predetermined during the
preparedness phase of emergency
management;
Location and capacity of local and
national healthcare resources/advanced
treatment facilities and
triage/treatment/evacuation plans.
Need for ad-hoc facilities arising from
the evolution of an event;
Unavailability of facilities due to event-
related specific factors (e.g. location
within a radius of influence, damaged).
Spatial models’ outputs
Simulations’ forecasts based on
hypotheses related to different types of
emergencies. Risk maps are based on
such forecasts.
Forecasts based on dynamic inputs
(real observations) derived from the
evolution of an event.
(Adapted from Lubitz et al., 2008b)
Regarding the role and the function of a COP within multi-agency operations, McMaster and
Baber (2009) suggest that there are several perspectives. The potential alternatives of a COP
are delineated in table 4.4. However, for facilitating multi-agency planning and implementation

95
of response to a complex environment, the distributed cognition point of view can be seen as
the only one in which the COP product becomes part of the decision making process enabling
the different agencies to share multiple perspectives on the problem and achieve a common
understanding of the situation (McMaster and Baber, 2009).
Table 4.4: Potential roles and functions of a COP.
Nature of interaction Product Process
Passive Static view Live COP
(observe the dynamic COP as it
is updated)
Active Demand feeding
(COP as the product of
information, surveillance, target of
emergency response operations
acquisition and reconnaissance).
Distributed cognition
(process of command driven by
the COP).
(Adapted from McMaster and Baber, 2009)
A robust network for information sharing can contribute in achieving shared SA based on a COP
which in turn will result in improved decision making. Nevertheless, in order the emergency
response organizations to gain maximum advantage from the network centric working logic;
they should attempt to implement self-synchronization which can lead to improved use of
capabilities to control the situation. Self-synchronization needs a level of shared SA which
means cross-domain SA as well as SA across domains (Ven et al., 2008). To achieve shared
awareness, all teams are required to share information and share understanding of the situation
(Alberts and Hayes, 2007). Self-synchronization is described in a maturity model (see figure 4.6)
suggested by Alberts et al. (2002). In essence, this model proceeds from the traditional
command and control process (Level 0) to self-synchronization (Level 4).

96
Command and control mode of operation Level 0: Baseline, traditional command and
control;
Level 1: Substantial amount of information
sharing;
Level 2: Collaboration across location,
function and organization among participants;
Level 3: Improved level 2 by not focusing on
sharing information but on its meaning;
Level 4: Enables self-synchronization.
Traditional Collaboration Self-
synchronization
De
ve
lop
ing
Situ
atio
na
l
Aw
are
ness
Shared
Awareness
3 4
Information
Sharing 1
2
Organic
Sources 0
Figure 4.6: Network-Centric Maturity Model.
(Adapted from Alberts et al., 2002)
The implementation phase of network centric working for achieving shared SA based on a COP
by the emergency response organizations is not easily described. In order to move on to the
different levels of the maturity model, the focus of the response organizations should not only be
on technical capabilities but also on the preparation and training of the emergency responders
employing operating procedures which will eventually enable their self-synchronization. The
latter is not always easy as it may stumbles upon legal issues related for instance to the
structure of the emergency response organizations. Emergency response organizations have to
become capable in responding to an emergency using network centric approach for information
sharing as it intends to improve information processes, communication and coordination leading
to the development of a COP-based shared SA. However, this requires the development of
individual network centric capabilities in the emergency response stakeholders’ cognitive
domain.
4.6.2 Challenges in achieving a COP.
Coherent, accurate and timely SA as well as vertical and horizontal information integration at all
command levels; they enable the emergency responders to share common knowledge at the
operations' field. However, one of the major challenges is information overload (Endsley and
Kiris, 1995). In the context of a COP, all information is made available to everyone, but not all
information is relevant to the tasks of the different emergency organizations (Hager, 1997). Also,
different command levels do not need the same level of detail and hence it must be determined
which level of information is relevant to their duties.

97
Coordination between actors with heterogeneity in terms of institutional background can be
seen as a process of dialogic coordination where professionals can confront their different
professional languages via scientific contestation achieving collective sensemaking (Faraj and
Xiao, 2006). However, during complex emergencies, responders should make rapid
coordination decisions in order to support fast response (Chen et al., 2008b). Achieving a
shared goal among the emergency responders in a limited amount of time, it is extremely
challenging due to the dynamic nature of the emergencies where the situation continuously
changes and the goal becomes outdated. As a result, the responders frequently do not share
information because from their perspective, they consider this information no longer significant
or even outdated. This can lead to a dynamic information sharing situation constantly in flux, but
dependent on the perceived by the response actors’ information relevance (Wolbers and
Boersma, 2013).
An extensive literature survey demonstrates that emergency response organizations struggle
with information sharing, communication and coordination (Wolbers and Boersma, 2013;
Bharosa et al., 2010; Comfort, 2007; Netten and Someren, 2011; Quarantelli, 1997).
Furthermore, Wolbers and Boersma (2013) based on empirical research mention that despite
the fact that emergency response organizations rely upon each other’s information to align work
processes, they do not share information tending to operate within their own professional
boundaries.
Information management can play a critical role in addressing the coordination and information
sharing problems between the involved organizations’ boundaries (Donahue and Tuohy, 2006;
Manzi et al., 2002). Information management can also be seen as both the problem and the
solution for adequate SA to support coordination (Wolbers and Boersma, 2013). However,
emergency response organizations may attempt to solve the information management problems
through information systems which support its users to reach shared SA by deploying a COP
(Comfort, 2007; Endsley, 1995). Such systems can be derived from the logic of Network
Enabled Capabilities (see section 3) (Boersma et al., 2012).

98
4.6.3 The added value service of a COP in emergency response.
The familiar three Cs (Communication, Coordination and Control) of emergency response
necessitate an interdependent, evolving process of organizational management. In the
language of practice, creating a COP is crucial for clear communication and coordination of
actions as it enables the achievement of a sufficient level of shared information among the
different organizations participating in emergency operations. In particular, a COP enables data
fusion providing a collection of correlated recognized pictures which facilitate a shared picture of
operations (Chmielewski, 2008; NATO, 2006). In this way, all the involved actors can
understand each other’s constraints as well as the potential combinations of collaboration and
support among them under a given set of conditions (Comfort, 2007)
SA is about how individuals and teams know and comprehend what is going on around them
(Endsley, 2000). Furthermore, good SA provides a firm ground for effective decision making.
The development of this good SA is facilitated through the deployment of an effective COP
which visualizes the relevant information (Eide et al., 2013). Furthermore, a COP can ease
collaborative planning and it can support several levels of command across the various
agencies involved in an operation to achieve shared SA (McMaster and Baber, 2009). On the
contrary, Comfort (2007) stress that the lack of a COP tend to drive the emergency response
operations to a hierarchical structure of control, fact that creates asymmetry in the information
processes. This asymmetry results from the fact that organizations with higher level of
responsibility and authority transmit their orders to lower levels without having any operational
feedback from the ground of field operations outside the formal chain of command. Thus, a
COP tends to support the development of a shared perspective on priorities for emergency
operations.
For achieving shared SA based on a COP between different emergency response
organizations, systems underpinned by the network centric working logic must be employed.
The relation between the NEC value chain components and the emergency response process
phases (adapted from Zwaneveld et al., 1998) is attempted to be demonstrated in table 4.5. The
basic idea is that better networks can lead to better information which feeds detection, warning
and verification processes, which in turn can contribute to the development of better situational
interface. Better information leads to improved response by the emergency organizations which
in turn it contributes to the more efficient utilization of resources and assets so that better

99
actions can take place in the field of operations. Better actions lead to better outcomes i.e.
faster normalization of the situation and hence minimization of the incident’s or disaster’s
consequences (socioeconomic and environmental losses).
Table 4.5: The NEC value chain components and the emergency response process phases.
NEC value chain Emergency response phases Benefits
B E
T T
E R
Networks Technical infrastructure Emergency organizations and
responders
Information sharing Detection, warning Better situation interface
Shared understanding Verification Based on better situation
interface
Decisions Respond, driving and arrival Optimal use of resources and
assets
Actions Site management operations More efficient response
operations
Effects Normalization Faster treatment of the situation
and minimization of
socioeconomic and
environmental consequences
(Adapted from Steenbruggen et al., 2012)
For measuring the added value service of SA for emergency response, a 3D cube (see figure
4.7) is introduced which bases on: 1) SA levels derived from Endsley’s definition (see Hone et
al., 2006); 2) SA components of emergency response; 3) emergency response process phases
(adapted from Zwaneveld et al., 1998).

100
SA components
SA
leve
l
Figure 4.7: 3D cube for measuring Situational Awareness for emergency response.
(Adapted from Steenbruggen et al., 2012)
The proposed 3D cube can form the basis for quantitative and qualitative measurement of the
value added service of a COP in supporting emergency response processes between the
involved organizations. The qualitative aspects focus on the economic effects (Blackstone et al.,
SA components
SA Levels
1. Incident
2. Environment (Incident surroundings)
3.Organization (Emergency services)
Level 1 Perception of elements in the environment within a volume of time and space.
What is the location of the incident?
What is the type of the incident?
Have properties in the surroundings been affected?
Where are the property users?
Which organizations are involved?
Where are the Incident managers & the emergency responders?
Level 2 Comprehension of their meaning.
What type of hazard caused the incident?
How many have been affected?
Have dangerous substances been released?
How the incident has been escalated?
Are the surroundings accessible?
What are their alternatives?
Which strategy should be followed?
Level 3 Projection of their near future.
When will the situation be normalized?
What are the secondary risks in the incident surroundings (e.g. chemical releases)?
What will be their activities?
What time will they arrive at the incident location?
Respond, arrival at incident location
Detection, Warning
and Verification
Site management operations
Normalization of the situation
SA
leve
l

101
2007) in the sense of reduction of losses and casualties which may result from a false detection
of an incident or disaster. The quantitative aspects focus more on cooperation, system and
information quality (Steenbruggen et al., 2012; Strong et al., 1997; Perry et al., 2004; Singh et
al., 2009; Bharosa et al., 2009a).
4.7 Final remarks on the contribution of a COP in emergency response operations.
Emergencies are unique, dynamic and complex situations where it is virtually impossible to
forecast their evolution. Furthermore, during the emergency response operations several teams
coming from different safety organizations with different backgrounds, cultures and goals have
to cooperate in order to minimize the negative impacts of an emergency in terms of human
injuries and casualties, environmental disruption and economic losses. Nowadays, information
systems have become increasingly important in supporting emergency response tasks which
can range from management of routine and small scale incidents to the more severe and large
scale disasters. Nevertheless, information sharing between different emergency response
organizations is still in its infancy. Noteworthy is that one of the primary factors in accidents
attributed to human error is the lack or inadequate information which limits situational
awareness (Chmielewski, 2008).
For effective response, flexible information and communication systems which facilitate
communication and coordination not only within but also among the multiple teams involved are
required. In this context, the concept of network centricity which is rooted in the military domain,
it can be seen as a vehicle towards better information sharing which in turn can support faster
decision making and enhanced spatiotemporal organization of resources and assets in the
increasingly fluid environment of the emergency response. In particular, by working in a network
centric way, information sharing advantage can be gained through technology and effective
network mechanisms delivered for geographically dispersed resources and assets. Military
battlefield situations can be as chaotic as emergency response operations and they may require
even faster response times. Therefore, the concept of network centricity can be adapted from
the military field and it can be applied for emergency situations tailored to their specific
conditions towards creating a surplus value for the response operations. However, the
successful adoption of such a concept requires its careful introduction in different stages based

102
on a maturity model. In addition, it requires training of the emergency response stakeholders in
order to overcome potential lack of knowledge.
Network centric information systems facilitate networking of emergency response stakeholders
towards achieving operational effectiveness as well as integration of new information derived
from multiple sources with other knowledge. Furthermore, they enable unobstructed flow of
information and knowledge among the entirety of the emergency response administrative
structure. Instead of information passed vertically within the command chain where it may be
lost or even discarded, it is circulated freely among all the involved emergency response actors.
In essence, the information shared for developing a common operational picture is conveyed to
all the parties involved in the operation, the field team and people in the command post. As a
consequence, while officers at the uppermost levels of the involved safety agencies are aware
of the real time conditions at the emergency response site through a common operational
picture, the field personnel can have readily access to tactically relevant information if needed
as much as to this common operational picture, if such may affect their operations. In general,
by incorporating the network enabled capabilities in emergency response, the attributes and
flexibility needed by adaptive management can be facilitated, which as suggested by Wiese
(2006) it can be the most effective management approach to potential disasters.
Data acquisition from multiple sources and dissemination of the collaborative information
through network centric systems contribute to the development of a common operational picture
which can support all the responding units to have the same understanding and awareness
(shared situational awareness) of information and emergency status when conducting
operations. Thus, network centric systems and a common operational picture are basic
components to achieve improved situational awareness. Developing shared situational
awareness in the complex and dynamic environment of an emergency, it can drive to self-
synchronization and better coordination of the emergency response stakeholders. As a
consequence, operational risk can be reduced and at the same time the total performance of
decision-makers as well as the speed of operations and responsiveness in the physical domain
can be increased towards improving mission effectiveness.
In the context of emergency response, the criteria which should drive the design of information
systems in order to meet the requirements of the end-users, they go beyond the technological
capabilities. Such information systems must satisfy the information requirements of the

103
emergency response agencies but also they should support cognitive and psychological
capabilities in the information-rich and complex dynamic environment of emergency situations.
In particular, special attention needs to be paid to the cognitive domain. Humans are limited by
working memory and attention. New information from multiple sources must be integrated with
other knowledge. How people direct their attention when acquiring new information has a
fundamental impact on which elements are incorporated in their situational awareness.
Therefore, network centric information systems should be designed to support working memory
and attention which in turn they can assist in addressing information overload. Otherwise, the
limits of working memory can cause constraints on situational awareness (Endsley, 1988b).
Furthermore, as not all the information is relevant to the tasks of all the safety agencies, a
comprehensive inventory of which information is relevant for each safety organization needs to
be done towards preventing information overload.
In short, a common operational picture achieved through network centric systems, it can
contribute to create shared situational awareness towards faster normalization of an emergency
situation. Hence, it can be seen as an emergency response tool with an added value not only in
effective sharing of information but also in understanding the real meaning and the temporal
value of the required and used information for the operation, communication and coordination
processes. In the cognitive domain, technology combined with organization, processes and
people can provide efficient decision making behaviors with better actions and effects in the
physical domain. This article has shown through an extensive literature survey from different
domains and perspectives that the utilization of a common operational picture is a promising
instrument for smart emergency response. However, more work still needs to be done towards
empirically measuring in a statistical consistent way the added value of incorporating such
systems in emergency response operations. Furthermore, not only training of the emergency
response professionals in a network centric way of thinking and handling of information is
required, but also the institutional and legal implications of utilizing such networks for sharing
and exchanging information between the involved safety organizations have to be addressed.

104

105
5. AN EMPIRICAL APPROACH TO THE ASSESSMENT OF THE EFFECTIVENESS
OF NETWORK-CENTRIC SUPPORT TOOLS FOR FLOOD EMERGENCY
RESPONSE: RESULTS OF A FIELD EXERCISE.
Successful emergency response operations require capable systems to support efficient
information sharing, communication and coordination of the multiple involved safety agencies.
Μany authors have identified that Information Quality (IQ) and System Quality (SQ) are major
hurdles for efficient and effective multi-agency response and simultaneously they are key
components for the success of information systems. Furthermore, IQ and SQ are important
requisites for achieving Situational Awareness (SA) which in turn is essential for decision
making and effective response actions. Nevertheless, literature on the quality of information
sharing among the various emergency services and the systems used for this purpose is very
limited and empirical support is almost non-existent. In this context, this chapter reports and
qualitatively discusses the results of an empirical research study on the effectiveness of network
centric information systems which aim to improve the interaction and cooperation among the
involved safety agencies. In particular, this research comprises a field experiment with
alternative realistic flood scenarios and the participation of emergency response professionals.
During the experiment, experts’ judgment is acquired through field research techniques such as
questionnaire surveys and observers’ notes. Drawing on two opposing information coordination
approaches and systems, traditional (hierarchical) vs. network-centric, the main findings imply
that a network-centric system tends to improve information sharing by helping to create a
Common Operational Picture which can be used as a means of better supporting SA, decision
making and effective emergency response operations. However, for successfully implementing
such a system, this system needs to be carefully introduced in different stages, taking into
account organisational structures, institutional rules, norms and in particular the human factor.
5.1 Introduction.
Disasters caused by large floods have increased worldwide as a result of the changing physical
and built environment, despite the improvements in terms of infrastructure, forecasting systems
and spatial planning and management (Efstratiadis et al., 2014). Furthermore, the European
Environmental Agency (2016), on the basis of historical data between 1980 and 2010, has

106
observed significant increase in terms of floods and floods' consequences which will only get
worse as time goes on. In light of all this, increasing flood response preparedness by
implementing emergency response planning activities is just as instrumental as mitigating the
flood risks with engineering and spatial solutions designed to make areas safe.
The response to emergencies is a complex (Bigley and Roberts, 2001; Chen et al., 2008b; Lee
et al., 2011; Bharosa et al., 2009a; Bharosa et al., 2009b), dynamic and information-intensive
process (Bruijn, 2006; Davenport and Prusak, 1998) during which multiple autonomous safety
agencies and stakeholders are involved on the basis of available information, they have to make
decisions and coordinate their actions under time pressure (Smithson and Hirschheim, 1998;
Smith and Hayne, 1997) and high uncertainty (Longstaff, 2005; Argote, 1982). Furthermore,
emergencies need fast and effective treatment in order to minimise their socio-economic and
environmental impacts. In this context, professionals from different fields and with varying
backgrounds and expertise are required to communicate, interact and cooperate with one
another (Luokkala and Virrantaus, 2014).
Response operations are based on the relevant facts regarding the situation concerned and
therefore access to information in a timely manner is essential. In particular, professionals
require real-time, spatio-temporal situational information in order to respond in an efficient
manner (Luokkala and Virrantaus, 2014; Seppänen et al., 2013; Steenbruggen et al., 2012;
Goodchild, 2010a). However, information itself is not sufficient if the quality of that information
does not satisfy the stakeholders’ needs (Seppänen and Virrantaus, 2015). Achieving a high
level of information quality is a crucial and also challenging requirement of successful response
operations (Bharosa et al., 2009a; Bharosa et al., 2009b; Bharosa et al., 2009c; Bharosa et al.,
2008; Helsloot and Scholtens, 2007; Davenport and Prusak, 1998; Bruijn, 2006; Fisher and
Kingma, 2001; Turoff et al., 2004b). Conversely, poor information quality can be fatal for the
emergency responders and the victims (Lee et al., 2011; Turoff et al., 2004b; Fisher and
Kingma, 2001).
For effective emergency response, professionals with a high-level of Situational Awareness
(SA) need to get involved (Luokkala and Virrantaus, 2014). SA is normally supported by
information systems that improve information sharing and facilitate the development of a
Common Operational Picture (COP). In essence, a COP allows the involved stakeholders to
achieve and share situational information in a geographically distributed environment (Luokkala

107
and Virrantaus, 2014; Steenbruggen et al., 2015; Steenbruggen et al., 2012; Vesterinen, 2009;
Fanti and Beach, 2002; Shelton, 2001). Through a COP, the on-scene and off-scene
stakeholders can have the same information about the status of an emergency, its impact on
the surrounding environment and the progress of the response operations including resources
and assets availability and location, as well as the condition and location of requests for
assistance. Nevertheless, information sharing, along with coordination and SA, are some of the
most common challenges in emergency response operations (Seppänen and Virrantaus, 2015;
Salmon et al., 2011; Bharosa et al., 2010; Comfort et al., 2004; Quarantelli, 1988).
In the context of the multi-agency emergency response which is characterised by highly volatile,
chaotic, temporary, fragmented and ad-hoc environments, the assurance of information and
system quality is certainly not easy. Furthermore, the professionals involved in the response
operations may have no history of working together, they may not have developed trusting or
understanding of their abilities (Walle and Turoff, 2007) and they may have different
organisational goals (Aedo et al., 2010). Nevertheless, under these circumstances the
stakeholders have to make fast decisions which can put them under significant psychological
stress given the potentially disastrous consequences of a wrong decision (Lee et al., 2011).
Although there is an abundance of literature on information quality and information systems
success in the profit-oriented business environment, research on the success of information
systems in the civic safety sector, which targets the public good, is relatively scarce and
empirical support is almost non-existent (Steenbruggen et al., 2015; Lee et al., 2011; Bharosa et
al., 2009a; Bharosa et al., 2009b; Bharosa et al., 2009c). Moreover, in contrast to the business
environments where information and communication needs are relatively predictable, the
respective requirements in emergency response are highly diverse and massive in terms of their
nature (Bharosa et al., 2009a; National Research Council, 2007). This also reflects the various
purposes, activities and needs for information and communication which occur at different times
and locations with respect to a particular emergency situation. Hence, previously developed
models for information and system quality in a business environment are likely to fall short in
terms of applicability in the public domain of emergency response operations. This study,
through a series of steps (literature survey, field exercise with realistic flood scenarios and
questionnaires for the acquisition of the experts’ judgment) aims to assess the effectiveness of
network centric information systems tailored for flood emergency response operations. In
particular, it intends to explore the appreciation of the participants i.e. the professionals with
respect to selected IQ and SQ attributes, initially based on the systems experienced in their

108
daily practice and later based on the experience gained with the network centric system used
during this exercise. Furthermore, it purports to identify capabilities and constraints associated
with the network-centric system experienced by the end users (the professionals) during this
exercise. In addition, it aspires to identify the effects of scenario complexity on the benefits of
network-centric systems. In this connection, a field exercise was organised in order to provide
researchers with more opportunities for the acquisition of professional opinions (data collection)
compared with the opportunities for collecting such data during the unforeseeable dangerous
nature of a real flood and the turbulent processes of the response operations. Nevertheless,
data collection is difficult even in simulated emergency field studies because of various
contexts, events, scope, control and time-related issues (Killian, 2002).
This chapter is organised as follows. Firstly, it describes the theoretical foundation of the field
exercise in section 2. In particular, through a literature review it identifies a number of constructs
relevant to measure Information Quality (IQ) and System Quality (SQ) in emergency response
operations and it shortlists and tabulates those utilised for the field experiment of this study.
Thereafter, it analyses the hierarchical (traditional) vs. the network centric information
coordination structures in the context of public safety networks, identifying the pros and cons.
Next, in section 3, the design of the case study is described. More precisely, after a short
introduction to Dutch civil security procedures, this section elaborates on the set-up of the
exercise; the demographics of the professionals who participated in the field experiment; the
network-centric technology used and the flood scenarios utilised in order to achieve the
objective of this chapter; the experimental protocol and finally the limitations and assumptions of
the case study. Then in section 4, the chapter proceeds by tabulating and qualitatively
discussing the results of the exercise i.e. the experts’ judgment on selected IQ and SQ
dimensions. The chapter concludes in section 6 by discussing the main empirical findings of this
study and their implications and then proceeding to make recommendations for the successful
introduction of network-centric systems in flood emergency response services. In short, based
on the experts’ judgment, it can be concluded that it would appear that the network-centric tools
tend to improve SA by facilitating better information sharing and by achieving a COP. However,
their introduction to safety agencies should be done carefully and in different stages, with the
strong involvement of those in the upper echelons of the emergency response organisations.

109
5.2 Theoretical background to the field exercise.
In this section, based on an extensive literature survey, constructs for measuring Information
Quality (IQ) and System Quality (SQ) during emergency response are identified and described.
Furthermore, the IQ and SQ constructs selected for the field experiment of this study are
tabulated. Thereafter, the theoretical foundation which underpins the hierarchical (traditional) vs.
the network centric information coordination structures is elaborated.
5.2.1 Information quality.
A common denominator of all the activities related to emergency response is information (Bui et
al., 2000). During the complex (Bigley and Roberts, 2001; Chen et al., 2008b), pressing
(Smithson and Hirschheim, 1998), uncertain (Longstaff, 2005) and dynamic environment of
emergency response, several autonomous organisations need to develop a response network
and share information at strategic, tactical and operational levels (Bharosa et al., 2009a;
Bharosa et al., 2009b; Bharosa et al., 2009c). Accurately and timely information is as critical as
fast and coherent coordination among the emergency response organisations (Walle and Turoff,
2007). The information should delineate the emergency along with its consequences and it must
feed the response needs (ACT, 1998; The Economist, 1997; Harrald et al., 1992). Based on this
information, the emergency response stakeholders can make decisions under severe
constraints which are likely to have long-lasting consequences (Lautze et al., 1998).
In information systems literature, quality of information is considered as ill-defined (Nelson et al.,
2005). However, the concept of quality is frequently considered as fitness for use (Juran and
Godfrey, 1999) and it is widely utilised in business, as well as in information systems-related
domains (Lee et al., 2011). Broadly, information quality (IQ) can be seen as the extent to which
information meets the requirements of its users (Singh et al., 2009; Stvilia et al., 2007). In
Oxford dictionaries (2016), quality is determined as “the degree of excellence of something”
which, in this study, is about the degree of excellence of information acquired, shared and
distributed during the emergency response operations. In information systems research, IQ is
not something new and despite its relatively brief history, it has been studied extensively (e.g.
Miller, 1996) and has experienced significant developments (Wang, 1998). IQ can be seen as a
comprehensive social concept as well as a key forerunner of the success of information
systems (Delone and McLean, 1992).

110
During emergency response, IQ is the most important issue (Sagun et al., 2009) and it is about
the quality of the content of the information exchanged (Lu and Yang, 2011). Information
sharing and dissemination can be seen at the same time as critical and problematic (Manoj and
Baker, 2007), whilst poor IQ can be disastrous for both the emergency responders and the
victims (Fisher and Kingma, 2001), as it hinders the efficiency and effectiveness of multi-agency
response activities (Lee et al., 2011). As the emergency responders’ operations are information
intensive (Bruijn, 2006) and their effectiveness relies on the available information (Davenport
and Prusak, 1998), high IQ is of the utmost importance. Furthermore, as IQ is a basis for good
decision making (Petter et al., 2013), the provision of high IQ can contribute to the achievement
of shared SA during the response operations. However, while it is necessary to achieve a high
degree of IQ, it is also a challenging requirement for successful emergency response operations
(Bharosa et al., 2009a; Bharosa et al., 2009b; Bharosa et al., 2009c; Bharosa et al., 2008;
Bruijn, 2006; Turoff et al., 2004b; Fisher and Kingma, 2001; Davenport and Prusak, 1998).
Many scholars have investigated the IQ concept (e.g. Ballou and Tayi-Kumar, 1999; Strong et
al., 1997; Miller, 1996) and as a consequence, many frameworks for identifying IQ dimensions
have been proposed (e.g. English, 1999; Levitin and Redman, 1995; Wang and Strong, 1996).
In the literature, IQ is not defined (Bharosa et al., 2011) and it can even be considered to be a
confusing concept (Evans and Lindsay, 2005). IQ is a multi-dimensional concept (Lee et al.,
2011) determined by a set of attributes that are important for end-users and it can be measured
through its multiple dimensions (Miller, 1996). The multi-dimensional nature of IQ is verified by a
number of studies (Huang et al., 1999; Wang and Strong, 1996; Ballou and Pazer, 1985; Wand
and Wang, 1996). However, the number and types of IQ dimensions proposed by scholars are
different (Bharosa et al., 2011). A literature review demonstrates that there is no general
agreement on data quality dimensions (Wang et al., 1995a; Wang et al., 1995b). Furthermore,
despite extensive discussion in the data quality literature, there is no consensus regarding what
is considered a good set of IQ dimensions and what is a suitable definition of each dimension
(Wand and Wang, 1996). In short, until now, a uniform list which includes all the IQ attributes
(constructs) cannot be found (Steenbruggen et al., 2015). For example, Miller (1996)
distinguishes 10 dimensions for IQ, while Pipino et al. (2002) suggest 16 dimensions. Lee et al.
(2002), in a thorough overview of IQ dimensions, propose the categorisation of 21 constructs in
four categories. Strong et al. (1997) also group IQ dimensions in four main categories, all with a
similar degree of information quality. These categories are: accessibility, contextual, intrinsic
and representational and are broadly accepted in the literature (Li et al., 2002), being the only

111
framework provided over the years. In addition, this framework proposes items, empirically
tested for measuring IQ (Lee et al., 2002). However, not all IQ items are relevant for multi-
agency emergency response (Bharosa et al., 2009a; Bharosa et al., 2009b; Lee et al., 2002).
For this, Steenbruggen et al. (2015), by analysing 12 papers from the literature, distinguish
between generic IQ dimensions (Miller, 1996; Wang and Strong, 1996; Strong et al., 1997; Lee
et al., 2002; Delone and McLean, 2003; Eppler, 2003; Wixom and Todd, 2005; Parker et al.,
2006) and specific IQ dimensions for emergency response agencies (Perry et al., 2004; Singh
et al., 2009; Bharosa et al., 2009a and Bharosa, 2011), identifying five IQ categories which are
most suitable for the purposes of the emergency services (see table 5.1).
Table 5.1: Overview of the IQ dimensions most relevant for the emergency services.
IQ categories IQ constructs
Accessibility Accessibility, access security.
Contextual Timeliness, completeness, relevance, value added, quantity (information
overload).
Intrinsic Accuracy, objectivity, believability, reputation.
Representational Interpretability, understandability, conciseness, consistency,
comprehensiveness.
Others Availability, correctness, currency, precision, format, availability, reliability
(validation), personalisation.
(Adapted from Steenbruggen et al., 2015 and Bharosa et al., 2009a)
The accessibility IQ dimension focuses on the role of information systems in storing,
manipulating and providing access to the end-user so that information relevant to the tasks of
the emergency response agencies can be securely and easily accessed and retrieved (Lee et
al., 2002). Steenbruggen et al. (2015) state that it is debatable whether accessibility relates to
IQ or SQ, while some scholars perceive accessibility more as the SQ dimension. Contextual IQ
pinpoints the necessity to consider IQ within the context of the task at hand, being relevant,
timely, complete and efficient in terms of quantity-creating added value (Wang, 1998; Lee et al.,
2002). Intrinsic IQ suggests that information has quality in its own right (Wang, 1998; Lee et al.,
2002) and consists of dimensions which are context-independent. Representational IQ is about
the way (easily interpretable, understandable, concise, consistent and comprehensive) in which
information is presented. Another point that can be made is that both accessibility and
representational IQ highlight the role of information systems (Wang, 1998; Lee et al., 2002).

112
Other IQ dimensions which are relevant to emergency response can be found in the literature.
For example, correctness is mentioned as an important IQ dimension which is related to the
contextual IQ construct completeness; data validation is significant and it is associated with
correctness and reliability, while personalisation and context awareness are two relatively new
dimensions which are interrelated with the contextual IQ dimension quantity (Steenbruggen et
al., 2015). As Bharosa et al. (2011) mention, the relative importance of each IQ category
depends on unforeseen events during the life cycle of an emergency. For example, at the
starting point of an emergency, accessibility to information is the greatest concern, while, later
on, issues related to the contextual, intrinsic and representational attributes of information may
arise. If any difficulty faced along one or more quality dimensions makes information completely
or largely unsuitable for use, this is recorded as an IQ problem (Strong et al., 1997).
Wand and Wang (1996) state that the intrinsic IQ dimension accuracy, the contextual IQ
constructs completeness and timeliness, as well as the representational IQ attribute consistency
are frequently mentioned in the literature and their choice is based on intuitive understanding
(Ballou and Pazer, 1985), industrial experience (Firth and Wang, 1996), or literature survey
(Kriebel, 1979). For emergency response, Lee et al. (2011) mention that a recent study (Singh
et al., 2009) on information dimensions has shown that only three attributes of IQ, i.e. two
accessibility IQ dimensions (information accessibility and security) and one contextual IQ
dimension (timeliness) were emphasised in large scale disaster management situations.
Furthermore, other studies (e.g. Cooper and Block, 2006; Dawes et al., 2004; Horan and
Schooley, 2007; Quarantelli, 1997) verify that accessibility (accessibility IQ dimension) and
timeliness (contextual IQ dimension) are seen as important dimensions in emergency response.
Nevertheless, for the latter, empirical support is relatively absent (Lee et al., 2011).
Generally, in the emergency response literature the most used representational quality
dimension is consistency (Singh et al., 2009; Perry et al., 2004; Strong et al., 1997) while the
most utilised contextual IQ constructs are timeliness (Singh et al., 2009; Walle and Turoff, 2007;
Horan and Schooley, 2007; Cooper and Block, 2006; Dawes et al., 2004; Quarantelli, 1997),
completeness (Townsend, 2006; Samarajiva, 2005) and relevance (Singh et al., 2009). Special
attention should be given to the contextual IQ dimension information quantity, as in an
information-rich environment, users can be easily overloaded (Endsley and Kiris, 1995) in the
sense of receiving too much information compared with what they need. In this context, Bharosa
et al. (2010), claim that emergency responders are very concerned about being distracted by

113
information overload during their operations. Furthermore, Oh et al. (2013) mention that, from
the emergency responders' point of view, too many inquiries and reports, many of which are not
reliable or correct, hamper the vision of emergency response teams to efficiently deliver the
right information to the right responders at the right moment. The IQ constructs used for the field
(emergency response) exercise of this study are listed below in table 5.2.
Table 5.2: Synopsis of the IQ constructs selected for the field exercise of this study.
IQ category IQ Construct Description
Contextual Timeliness
(Currency)
The degree to which the currency of information is
appropriate for its use (Perry et al., 2004). Timely
information is up to date and it represents the current
state of the ground truth (Singh et al., 2009).
Completeness The degree to which information is not missing with
respect to the relevant ground truth. (Singh et al., 2009;
Perry et al., 2004). The literature considers a set of data
as complete when all necessary values are included
(Wand and Wang, 1996; Ballou and Pazer, 1985).
Quantity
(Information
Overload)
Occurs when the amount of acquired information
exceeds the processing capacity of a receiver (Lee et al.,
2011).
Relevance The proportion of information collected that is applicable
and supportive for the task at hand (Singh et al., 2009;
Perry et al., 2004).
Representational Consistency The degree to which information is in accordance with
related or prior information (Perry et al., 2004).
Others Correctness The extent to which information is in accordance with
ground truth (Perry et al., 2004).
Reliability
(Validation)
Indicates whether the data is correct and can be counted
on to convey the right information (Wand and Wang,
1996).
In short, information assurance requires the right people to get the right information at the right
time (Singh et al., 2009), so that emergency response stakeholders can have enough resources
to comprehend the situation and achieve SA (Aedo et al., 2010). However, it should be

114
mentioned that SA is not achieved only by having the right information at the right moment, as it
is a condition of each individual (emergency response stakeholder) and hence many factors,
such as background, previous experience, expectations and organisational goals, influence
each individual's awareness of a situation as well as the ability to take required actions for the
effective and fast normalisation of an emergency situation.
5.2.2 System quality.
System Quality (SQ) is considered to be a key component for effective emergency response
(Bharosa et al., 2009a). While IQ is about the attributes of the information derived and/or shared
through an information system, SQ is used to delineate the attributes of an information system
itself (e.g. Nelson et al., 2005; Delone and McLean, 1992). In the Delone and Mclean (1992)
information systems success model, which is one of the highest cited models (Jun and Jung,
2013), SQ measures technical success, while IQ measures semantic success. According to
Shannon and Weaver (1949), the technical level is the accuracy and efficiency of the system
which produces the information, while, the semantic level is the success of the information in
transmitting the intended meaning.
In the information systems literature, SQ has received less attention compared with IQ (Lee et
al., 2011; Bharosa et al., 2009a; Steenbruggen et al., 2015). Jun and Jung (2013) state that the
definitions of SQ are not consistent, as some studies consider it as user-friendliness or ease of
use (e.g. Rai et al., 2002; Doll and Torkzadeh, 1988), while other studies look at the
performance characteristics of the system, such as reliability, flexibility, response, time,
integration (e.g. Delone and McLean, 2003; Delone and McLean, 2004; Nelson et al., 2005).
Furthermore, Nelson et al. (2005) mention that the SQ dimensions are frequently intermixed
with components associated with service quality and ease of use, a fact which demonstrates the
importance of ensuring conceptual clearness in terms of specification and distinction of
constructs.
In essence, SQ is a concept utilised to assess the multiple dimensions of the information system
needed to generate the output (Delone and McLean, 1992; Lee et al., 2011). The information
system stores, processes and distributes information which is communicated to the end-users,
who subsequently maybe influenced or not by this information (Delone and Mclean, 1992).
Regarding SQ requirements, these represent end-user views on dynamic interaction with the

115
system (Bharosa et al., 2009a). In the context of emergency response, SQ attributes can be
seen as the required functionalities and capabilities of a response system.
SQ leads to user satisfaction and intention to use and thus is judged as important (Seddon,
1997; Delone and McLean, 2003; Nelson et al., 2005; Wixom and Todd, 2005). According to
Delone and Mclean (2003), higher SQ can lead to higher user satisfaction and use, which, in
turn can have positive impacts on individual productivity, resulting in organisational productivity
improvements. Five studies (Wixom and Watson, 2001; Teo and Wong, 1998; Etezadi-Amoli
and Farhoomand, 1996; Goodhue and Thompson, 1995; Seddon, and Kiew, 1994) have all
examined the relationship between system quality and individual impact and have verified that
those associations are statistically significant.
Examples of variables identified by Delone and McLean (1992) for SQ are: system flexibility,
accessibility, ease of use, integration, efficiency and response time, while Nelson et al. (2005),
in addition to system flexibility, integration and response time, include system reliability in the
most commonly used system performance measures. SQ constructs such as system reliability
and availability are traditionally addressed as technical engineering requirements (Bharosa et
al., 2009a). Flexibility and interoperability can be seen as requirements for determining SQ,
taking into account that technical systems are becoming increasingly tightly coupled (Bharosa et
al., 2009a). Moreover, system flexibility and information integration functionalities are of
particular importance, as information demand and supply are dynamically changing over time
during emergency response operations (Bharosa et al., 2009a). In this connection it should also
be mentioned that systems which integrate data from various sources can improve
organisational decision making while system flexibility can facilitate decision makers in easily
modifying their applications as their information needs change (Gray and Watson, 1998;
Sakaguchi and Frolick, 1997). A description of selected constructs which are considered to be
the most relevant for measuring SQ during the emergency response field exercise of this study
is provided in table 5.3. Most of the selected SQ constructs reflect the more engineering-
oriented performance attributes of the system under consideration.

116
Table 5.3: Outline of the SQ constructs selected for the field exercise of this study.
SQ category SQ construct Description
System-related Accessibility The level to which a system and its related
information can be accessed with fairly low effort
(Nelson et al., 2005).
System reliability The level to which a system is reliable (e.g.
technically stable) over time (Nelson et al., 2005).
System response time The level to which a system provides fast or timely
responses to requests for information or actions
(Nelson et al., 2005).
Task-related Format The extent to which a system is arranged for
processing, storing or displaying information in an
effortlessly comprehensible, interpretable, concise
and consistent way (based on Oxford dictionaries,
2016).
Integration The level to which a system eases the combination
of information from multiple sources to support
decision making (Nelson et al., 2005).
Memory The degree to which a system is capable of storing
for retrieval (semi-static, dynamic and model)
information and knowledge (based on Oxford
dictionaries, 2016).
Situational awareness The level to which a system helps a user to
undestand what is going around him/her (Salmon
et al., 2008; Endsley, 1995).
Perceived
operational
satisfaction
Ease of use The users’ level of satisfaction regarding the
system’s interface (Nelson et al., 2005).
Usability Appropriateness for a purpose of any particular
system (Brooke, 1996) which is based on the
degree to which can be utilised by specified users
to achieve specific goals with effectiveness,
efficiency and satisfaction in a specified context of
use (ISO 9241-11, 1998).
(Adapted from Steenbruggen et al., 2015)

117
5.2.3 Hierarchical vs. network centric structure of information coordination in public
safety networks.
The traditional approach in complex problem-solving has been hierarchical, involving multiple
stakeholders and tasks (Simon, 1996). Furthermore, most of the information coordination
architectures in public safety networks are based on hierarchical structures (see Mackenzie et
al., 2007; Bigley and Roberts, 2001; Hale, 1997). This is because the hierarchical approach is
seen as a means of stability, transparency and accountability (Bharosa et al., 2011). In addition,
a hierarchy is used to establish and maintain control, allocate tasks and responsibilities, as well
as to report processes and probably to gain reliability and efficiency in workflow (Janssen et al.,
2010). In a hierarchical coordination system, strictly speaking, the commands flow from top
down and feedback information flow from bottom up, while the relationships among
commanders and subordinates are limited to “master-slave” connections between parent and
child nodes in a tree-shaped hierarchy (Bongaerts et al., 2000). Bharosa et al. (2011) state that
the advantage of the hierarchical approach is that interactions and interdependencies between
emergency responders are frequently known and limited as their linkage is based on predefined
relationships and procedures.
However, the hierarchical approach has some limitations. For example, the information sharing
flow in the hierarchical structure is coordinated via adjacent steps by controlling and directing
information to the higher and lower echelons (Malone et al., 1987). However, as the decisions
taken at the higher levels move down to the lower levels, they are enriched with more details
(top-down and bottom-up tactic) that can result in asymmetry of the information load, which, in
turn, can create fragmented SA (see Militello et al., 2007). The hierarchical approach works
reasonably well on routine occasions when time for planning actions, training personnel,
identifying problems and correcting mistakes exists (Janssen et al., 2010). Nevertheless, under
the urgent, complex and dynamic conditions of emergencies, such procedures almost always
tend to fail (Comfort and Kapucu, 2006). In brief, hierarchical conditions imply structural features
which can restrict the flexibility of public safety networks to effectively cope with the complex,
uncertain and unsteady emergency environment (see Adler et al., 1999). Furthermore, system
and task complexities, combined with the need for immediate local adaptation, may limit
direction from the superior hierarchical echelons in an efficient and timely manner (Weick,
1990).

118
On the other hand, the network-centric approach which is rooted in the military domain focuses
on horizontal communications among peers rather than vertical communication among higher
and lower echelons in the hierarchy (Bharosa et al., 2011). Alberts et al. (2002) delineate the
four tenets of network centric operations which basically form the benefits of adopting them: (1)
information sharing is improved through robust networks; (2) the quality of information and
shared situational awareness are strengthened by information sharing and collaboration; (3)
shared situational awareness allows self-synchronisation and reinforces sustainability as well as
command tempo (4), which in turn remarkably increase the mission effectiveness.
Emergency response agencies are showing an increasing interest in the concept of network-
centric operations, as they prepare for complex response operations (Stanovich, 2006).
However, the military field is different from the emergency response environment. Although both
cases have to deal with complicated, perilous and unforeseen events, public safety networks
are characterised by heterogeneity that can hamper the emergency response stakeholders from
gaining maximum advantage from the capabilities of network-centric operations (Bharosa et al.,
2011). In particular, public safety networks consist of a variable set of agencies, where each one
has its own information coordination procedures and technologies (Bharosa et al., 2010).
In an information-rich environment, emergency response stakeholders can be easily overloaded
(Endsley and Kiris, 1995). Information overload is seen as the amount of data that exceeds the
finite limits of information which can be processed and acted upon by a human functioning in a
demanding and complex multi-tasking environment (Stanovich, 2006). Network-centric
information coordination has inherently a large number of participating nodes and thus
information overload may occur more often compared with the case of hierarchical coordination
(Bharosa et al., 2011). Therefore, in a network-centric environment, special attention should be
paid to information overload. The quantity of information should be in accordance with the
bounded rationality concept (Simon, 1972), as overload can obstruct the response stakeholders
from filtering the right and high quality information from noise and hence it can delay the
response stakeholders in making timely and effective decisions (Bharosa et al., 2011).
Other concerns that Bharosa et al. (2011) have identified regarding network-centric information
coordination are the dilution of decision making and responsibility boundaries, as well as
bottom-up freelancing. In particular, the dilution of decision making and responsibility
boundaries, which is addressed as an advantage of hierarchical information coordination, can

119
be seen as a concern in a network-centric environment which enables all the responders to
have access to all information in the network (Bharosa et al., 2011). For the latter, Stanovich
(2006) observed that the availability of a large amount of near real-time information frequently
makes commanders wrongfully believe that they have the same comprehension and SA as the
local responders who have to deal with an emergency at the scene. Regarding bottom-up
freelancing, this can be less problematic in the case of hierarchical coordination compared with
the network-centric approach (Bharosa et al., 2011) which is justified by the argument that, in a
hierarchy, the lower echelons receive partial information in the context of decisions and
instructions. In a network-centric environment, owing to the availability of a COP, freelancing
can be seen as a deviation from higher intent and can cause severe disruption in the unified
emergency response effort (Bharosa et al., 2011).
Finally, in order to effectively deal with the unforeseen nature and the unpredictable information
requirements during emergency response operations, the adaptability level of an information
coordination approach has to be addressed as a matter of utmost importance (Bharosa et al.,
2011). In essence, adaptability is a broad and multidimensional concept and hence, in the case
of the complex and dynamic environment of emergency response, it can be limited to the
capability of the information sharing structure in delivering the right information at the right
moment to the right person. Johansson and Hollnagel (2007) mention that the ability to adapt to
situations can make things work, in spite of technical constraints, the dynamics of the task and
contextual factors. By exploiting the human and technical network capabilities, a high level of
adaptability can be achieved (Bharosa et al., 2011). In this context, the network-centric
approach tends to utilise the autonomy of individuals (emergency responders), helping them to
be able to adapt to the dynamic conditions of an emergency. Conversely, as the hierarchical
structure inherently involves vertical communication and piecewise information flow among
commanders and subordinates, it can be characterised by limited adaptability.
5.3 Design of the case study.
This section contains a detailed description of the design of the field experiment. In this context,
the set-up of the experiment is explained; the profiles of the participants (professionals) are
described; the network-centric technology and the flood scenarios used during this exercise are

120
described; the experimental protocol is illustrated and finally, the limitations of the study are
discussed.
5.3.1 Treating disasters in the Netherlands.
The civil security system in the Netherlands has been greatly influenced by the ubiquity of water
and the flood potential (Kuipers and Boin, 2013). According to The Netherlands Red Cross
(2010), the main aim of Dutch security policy is the enhancement of both the efficiency of
disaster response and its quality. In the Netherlands, legislation considers both emergencies
and crises to be subtypes of disasters, where emergencies are triggered by a single event and
crises occur due to a combination of factors (The Netherlands Red Cross, 2010). Furthermore,
Dutch legislation distinguishes between emergencies and crises, in the sense of having a
separate line of command (responsibilities) when it comes to disaster management on the local,
regional and the national level. In particular, for emergency management, the authority and
responsibilities lie with the municipality or the safety region, while the coordination of emergency
responders in a crisis situation is performed at the national level (Ministry of Interior Affairs,
2008). Currently, the responsibilities for these disasters are legally institutionalized, in
accordance with the Safety Regions Act (2010) (Ministry of Security and Justice, 2013), which
provides the administrative and operational framework for the physical aspects of civil
protection.
In order to respond to an emergency, safety regions, the fire service, emergency medical
services and the police implement policy at the local and regional level, while, the municipalities
have the responsibility for local crisis communication, the provision of shelters and aftercare and
the listing of missing persons (Kuipers and Boin, 2013). In particular, the safety regions are in
charge of planning, logistics, monitoring of emergency management preparation, recruitment of
qualified personnel, training, the exercise and implementation of safety regulations and
prevention policies, the operation of an emergency room for the call centre, emergency
response and provision of relief in their jurisdiction (Kuipers and Boin, 2013). In general, Kuipers
and Boin (2013) state that the Dutch constitutional, legal and organisational framework has
fragmented responsibilities and authority for emergency response and thus coordination and
cooperation among the multiple involved safety agencies are vital.

121
Chaotic situations require efficient response operations in the form of fast and coordinated
actions, as events can escalate and then the efforts needed for relief can be much greater.
Furthermore, fast and effective response can minimise the number of injuries and casualties, as
well as the economic and environmental impacts. However, such a response requires a high
and wide range of expertise, as well as experts from several fields and teams to interact and
cooperate with each other and develop shared awareness about a particular situation (Luokkala
and Virrantaus, 2014). Information systems can facilitate the development of SA through the
provision of real-time, spatio-temporal information in the context of a common operational
picture. An operational picture shared by more than one actor enables the involved stakeholders
to distribute and acquire situational information in a geographically-distributed environment
(Fanti and Beach, 2002; Shelton, 2001; Steenbruggen et al., 2011; Vesterinen, 2009). This
information is needed by the emergency stakeholders in order to carry out their response tasks
in an efficient way (Goodchild, 2010a; Seppänen et al., 2013; Steenbruggen et al., 2011).
Nevertheless, the shared information delivered to relevant stakeholders in minimal time should
be of high quality, as missing or bad information quality can obstruct the activities and contribute
to failures and damage (Seppänen and Virrantaus, 2015).
5.3.2 Set-up of the field exercise.
During the field exercise, novel information concepts including network-centric working and a
common operational picture have been employed in order to improve information and system
quality. In particular, the real value of the network-enabled capabilities, which is reflected in its
chain (see UK Ministry of Defense, 2005), can be utilised in order to normalise the flood
emergencies in a fast and efficient way. In the context of this value chain, in the information
domain, the network-centric information coordination aims to achieve better information sharing
through a realised COP, which, in turn, can lead to the achievement of shared SA and better
decisions in the cognitive domain and consequently to better response actions and effects in the
physical domain of operations.
A national exercise with two flood scenarios simulated for this purpose took place on the 10th
December 2015 at the headquarters of the Rivierenland Water Board in the city of Tiel (in the
Netherlands). The two scenarios had increasing complexity and severity, involving multiple
safety agencies and response stakeholders (see picture 5.1), in order to measure the added
value of network-centric systems. The network-centric software tool used in this exercise is

122
called the national crisis management system (in Dutch: Landelijk Crisis Management
Systeem), abbreviated as LCMS. The network-centric system has enabled the participants in
the exercise to exchange information in both textual and map format at the same time, thus
being able to view the evolution of the flood scenarios and the progress of the response
operations, as well as the allocation of resources and assets on the response scene in real time
(see pictures 5.2 and 5.3). The participants in the exercise were emergency response
stakeholders (panel of experts). Questionnaires with five ordered response levels were handed
to all of them. Before the start of the exercise, the stakeholders had to fill out the first part of the
questionnaire, which consisted of questions about the quality of the information, as well as
about the quality of the system that they experience in their daily practice which is based on a
hierarchy. After the exercise was initiated, at the end of each scenario, the stakeholders had to
answer questions about information quality, while, at the end of both the scenarios, they had to
answer questions about the quality of the system experienced.
Picture 5.1: Stakeholders respond to the flood emergencies.
Picture 5.2: Common Operational Picture Picture 5.3: Common Operational Picture in text form. in map form.

123
5.3.3 Participants of the field exercise.
The participants of the field exercise were emergency response stakeholders (panel of experts).
The following table 4 shows their demographics which have been extracted from their answers
to the questionnaires (see Appendix A) and include the number of participants, average age,
gender, organisation, education, work experience and experience with coordinated regional
incident management procedures (in Dutch: Gecoördineerde Regionale Incidentbestrijdings
Procedure, abbreviated as GRIP) (see Info point safety, 2011).
Table 5.4: Demographics of the participants in the field exercise.
Number of participants 8 Experience n
Average age 48.6 years 0-1 year 1
Gender n 1-5 years 0
Male 4 5-10 years 4
Female 4 10-20 years 3
Organisation n 20-30 years 0
Rijkswaterstaat’s VWM (Traffic and water management services)
3 More than 30 years 0
Rijkswaterstaat Oost-Nederland (Regional information and crisis management center)
3
DCC-IenM Departmental Coordination Center for Crisis management of the Dutch Ministry of Infrastructure and the Environment.
2 Experience emergencies n
at GRIP 2 level or higher
0 times 0
1-5 times 3
5-10 times 1
10-20 times 3
20-40 times 1
More than 40 times 0
Education n
Primary education
Lager onderwijs (Basisschool)
0
LBO, LAVO, MAVO, MULO 1
Secondary education
MBO, VMBO, HAVO 0
MMS, HBS, Atheneum, Gymnasium
0
Higher education
HBO, Universiteit 7

124
5.3.4 Technology: The network-centric software tool.
All the disaster events have temporal and spatial dimensions that identify the duration of
impacts, together with their geographical extent on the Earth’s surface (ground truth) (National
Research Council, 2007). In this context, geospatial data and tools are useful in response
operations in order to facilitate real-time data fusion and analysis, location mapping and
visualisation of dynamic conditions (Chen and Peña-Mora, 2010). However, despite the massive
efforts and investments made in the development of geo-tools and spatial data infrastructures,
the special needs of emergency response have only roughly been considered (Neuvel et al.,
2012; National Research Council, 2007).
Safety agencies rely on accurate and up-to-date information in order to respond to emergency
situations. However, data are frequently scattered among multiple jurisdictions, in different and
incompatible formats (National Research Council, 2007). For effective network centric
emergency response, various institutional factors have to be addressed and the relevant
technology has to be deployed. In order for the benefits of network-centric working in response
operations to be utilised, the operationalisation of a system based on its principles is required.
The requirements of the network-centric emergency response dictate the incorporation of novel
geographical systems and particularly architectures (Neuvel et al., 2012). In this context, the
architecture of geo-enabled network centric software solutions should underpin the connection
of all the involved safety agencies, stakeholders, services and networks, so that existing (semi-
static) and dynamic in-situ and model data can be available and easily accessible upon request.
During an emergency, the existing technological infrastructure may encounter serious damage
(Lubitz et al., 2008a). Furthermore, a constant network with enough capacity for all the involved
stakeholders and particularly for the field workers is not ensured and therefore peer-to-peer
(P2P) networks can be utilised to connect actors in the field between them (lower hierarchy
echelons) as well as with those in the coordination centers (upper hierarchy echelons) (Neuvel
et al., 2012). Bortenschlager et al. (2007) mention that P2P technology allows systems to be
functional even when a constant network connection with a server is not available because a
P2P network enables the exchange of information via other available nodes such as a wireless
local area network (WLAN) or mobile network or ad hoc P2P networks. Hence, a P2P network
permits offline working and information can sync when online connection is regained.

125
Although P2P technology is widely adopted and used in military command (Wilson, 2004;
Jonas, 2005) where the network-centric concept is also rooted, it is still inadequately explored in
applications related to national civil security and in particular in emergency response operations
(Lubitz et al., 2008b; Bortenschlager et al., 2007). Nevertheless, despite the limited civilian
implementation of network-centricity, it has been credited with significant operational value
(Tucker, 2008; IBM, 2006; Cisco, 2006; Cebrowski and Garstka, 1998). In the context of a P2P
network, information is not shared in a hierarchical way, where a central point of information
normally does the distribution. The latter forms the basis of the more traditional (hierarchical)
client-server architecture in which a relatively low number of servers (sources) provide
information to different clients or applications (recipients) (see figure 5.1). Instead, in a P2P
network which underpins the logic of the network-centric approach, the safety organisations and
stakeholders involved are considered as equal entities (peers or nodes) which serve both as a
source and a recipient of information (see figure 5.2). It is therefore apparent that in a P2P
network, a distinction between clients and servers does not exist.
Figure 5.1: Client-server network (Hierarchical approach of information sharing
– once with each).
Figure 5.2: Peer-to-peer network (Network-centric approach of information
sharing – once with all).
The network-centric technology has the potential to address issues related to the inadequate,
vertical distribution of knowledge and information during emergency response. Furthermore, as
an instrument of adaptive management (Wiese, 2006) that provides unobstructed access to
information and knowledge to all actors in the response space, it can overcome the limitations of
rigid vertical control of operations which, during the complex environment of emergency
situations, can rapidly become another layer of chaos (Cooper and Block, 2006; Wiese, 2006;
Walter, 2005). Therefore, a network centric system can contribute to the achievement of the

126
vision of "the right information at the right moment to the right person" and in a way that is
cognitively and physically usable for its end users (stakeholders) (Endsley, 2000), so that
emergency responders can have enough resources to comprehend the situation and achieve
SA (Aedo et al., 2010). The latter can result in a better deployment and also in increased
efficiency during the response operations.
In a network-centric environment underpinned by the relevant technology, information is derived
in a reciprocal relationship from multiple sources and areas of knowledge and expertise. This
information, which is distributed to the different involved stakeholders, inherently incorporates
the geospatial dimension (location awareness). This is because the emergency under treatment
along with the resources and assets that have to be deployed at the scene and also the routes
which will be utilised for the response operations are spatially correlated. In this connection, it
should also be mentioned that, although all the information is made available to all the involved
actors at once in a network-centric system, these retain their roles in the hierarchy. More
precisely, decision making always takes place within the management hierarchy. In this context,
a COP in text and map form (alternatively called, respectively sitreps-situation reports and
sitplots-situation plots); it both facilitates and supports the decision makers.
Regarding the functionalities of the LCMS (see section 5.3.2), a text application for typing and
sending messages between the involved actors is included. In order to check whether the sent
messages have been read, relevant signs are used. Furthermore a Geographic Information
System (GIS) is incorporated and enables users to acquire, create, edit, share, combine,
analyse, interpret and visualise data. In this GIS, users are provided with tools for adding,
editing and deleting geographic features (polygons, polylines and points) and symbols related to
the evolution of the emergency and the progress of the response operations on the map
interface. Overall, LCMS can be seen as a fit-for-purpose system that can be expanded to
employ more facilities, functionalities, data and participants if required.
Traditionally, a COP was shared in text form via static sitreps whose distribution followed a
hierarchical approach. Although these situation reports have been useful in providing
information about the evolution of an emergency and the progress of the response operations to
the involved stakeholders, they are credited with a number of weaknesses (Ven et al., 2008). In
particular, these sitreps can be delayed in arriving at the interested stakeholders, especially to
those in the upper echelons of the hierarchy, which may result in their receiving outdated

127
information. In addition, as these sitreps frequently have information spread over pages of text,
they require the end-users (stakeholders) to spend considerable time reading and
comprehending them and therefore they can cause extra delays in communicating their content.
Furthermore, in the hierarchical way of sharing the sitreps, not all the stakeholders who need
their information can have immediate access to them. The network-centric LCMS effectively
addresses the weaknesses of the traditional hierarchical systems through its P2P network-
based architecture and interface that support sharing of both textual and map information
simultaneously in the context of a COP.
The LCMS system component used for sharing textual information is known as sittext (situation
text). In essence, sittext is a collective workspace influenced by a location driven approach that
enables its users to create, edit, send and receive (spatial) information in text form. It includes
different tabs for the different safety agencies involved in the response operations. Furthermore,
the system’s interface shows which users are online. In short, sittext can provide a dynamic
view of the actual situation in text form that can be shared and exchanged between all the
involved actors in a fast and efficient way.
The LCMS system component utilised for the visualisation and communication of information is
known as sitplot (situation plot). Basically, sitplot is a geographic interface which allows its users
to create, edit, view, analyse and share (spatial) information in order to create a complete and
up to date COP of the situation under treatment. Sitplot’s interface includes different layers of
semi-static, dynamic and model data. Furthermore, it allows different users to add, edit and
delete geographic features and symbols. Online users are displayed in the interface and if they
add or amend data in a sitpot, a notification message is generated. In addition, when a user is
clicked, the map layers created by him/her are added to the total list of map layers. In general,
the shared picture presented in the context of sitplot is a result of various inputs from different
sources and actors and is available on every PC where sitplot is installed and running.
Therefore, all the interested safety organisations and actors can have access to the shared
picture at once. In addition, the different organisations have the ability to create, through their
plotters, a situation picture separately.
In brief, the network-centric LCMS system through its sittext and sitplot components supports
the interested stakeholders to gain access to all the available information, as well as to have a
thorough and dynamic overview of the location of an emergency, the impacts on the

128
surrounding environment and the progress of the response operations in achieving shared SA.
This, in turn, can support the decision making process at both the policy and operational levels
for the timely and efficient normalisation of an emergency situation.
5.3.5 Description of the flood scenarios.
During this field exercise, two alternative simulated flood scenarios with increasing complexity
that required multiple emergency response agencies to collaborate and coordinate their actions
were employed and played out in near-real time. In order for the scenarios to be realistic, these
were based on inputs from well-trained emergency actors, as well as on reports such as the
National High Water and Flooding Emergency Response Plan (The Dutch Ministry of the Interior
and Kingdom Relations, 2007), which describes how the national response has to be
coordinated and scaled up towards improving coordination for the effective management of
major flood events. In the following table 5.5a, b, a brief description of both the scenarios used
during this exercise, along with their goals, is provided.
Table 5.5a: Description of the scenarios used for the field exercise.
Scenario 1: Dyke failures and evacuation (GRIP 2).
Description: Dyke failures are visible in the Zaltbommel municipality and in particular within
the Tieler and Culemborgerwaard dyke rings of the province of Gelderland in the Netherlands.
The water depth is increasing and the area in the vicinity of the dyke is flooding progressively.
Schools and healthcare facilities which host vulnerable population and are located in the
surroundings of the emergency location have to stop functioning immediately. The emergency
response agencies have to decide about and organise the evacuation of all the people who
are located within the radius of effect from the potential dyke failure, giving priority to the most
vulnerable.
Goal of the Scenario 1: This is a large flood emergency which involves various emergency
services. The aim of this scenario is to show that fast information exchange among all the
involved safety agencies and an early shared COP can support them to better coordinate
their actions and apply effective measures in order to normalise the situation more rapidly.

129
Table 5.5b: Description of the scenarios used for the field exercise.
Scenario 2: Dam failure, dyke failures, hazardous gas networks in the radius of effect
and evacuation (GRIP 3/4).
Description: A dam failure is observed in the municipality of Culemborg which is located in
the province of Gelderland in the Netherlands. The embankment has subsided over a depth
of approximately 16 meters. A berm needs to be constructed as soon as possible.
Furthermore, the water depth is increasing and the area in the vicinity of the dam is flooding
progressively. Several municipalities in the surroundings, including Zaltbommel,
Geldermalsen, Lingewaal and Neerijnen of the province of Gelderland are affected. More than
1000 field workers, such as policemen and firemen, are deployed in the area of the
emergency. Because of extensive water overflow and overtopping, the risk of dyke failure in
the Zaltbommel area is high. Furthermore, due to high water pressure, pipes of the gas
network near Gamersedijk in Zaltbommel area are in danger of exploding (secondary hazard).
It is necessary to organize the evacuation of all the people located within the radius of effect
from the dam and the gas networks giving priority to those located in De Zandkampen. Both
ground (police vehicles, fire trucks) and aerial means (helicopters and aircrafts) will be used
for the evacuation. The shortest evacuation paths have to be identified, given that network
blockages and traffic jams occur progressively as the flood escalates.
Goal of the Scenario 2: This is a full, complex and severe flood scenario where several
emergency services are involved. As the scenario includes secondary hazards, it requires the
emergency services to efficiently allocate and manage their assets and resources over the
different incidents. The aim of this scenario is to demonstrate that a COP can improve the
decision making process in chaotic situations. As a result the necessary actions can be taken
in a fast and effective manner. In such cases, the safety agencies traditionally struggle to
acquire a good overview of the impact of the emergency and consequently there are many
issues associated with applying the most suitable measures to normalise the situation.
5.3.6 The experimental protocol.
This field exercise employs realistic flood scenarios with different complexities and involves
diverse emergency response stakeholders (panel of experts) who have to coordinate their
actions and share information and knowledge using network centric technology (LCMS) to
normalise the flood situations in an efficient and timely manner. The network-centric working
method incorporated during this exercise is fundamentally different from the hierarchical

130
(traditional) way which these stakeholders experience in their routine operations. The scenarios
were facilitated by the experiment’s organisers (field exercise staff) who entered messages in
text form in the network centric system in order to generate a starting point for each scenario.
The following figure 5.3 shows the layout of the field exercise.
Sce
na
rio S
taff
Sta
keh
old
ers
(P
ane
l of
exp
ert
s)
Figure 5.3: Field exercise’s layout.
Information on individuals’ perceptions about the tools used during the field exercise was
acquired from the responses of the participants (stakeholders) to the questionnaires. Before the
start of the exercise, the participants had to respond to a questionnaire about the quality of both
the information and the systems experienced in their current practice. After the start of the
exercise and in particular after each scenario, the participants had to fill in a questionnaire on
Information Quality (IQ), while, after both the scenarios had played out, they had to complete a
questionnaire on System Quality (SQ). Furthermore, after the end of the first scenario (mid-
exercise), a central evaluation of the participants’ experience took place, while, after both
scenarios were considered (at the end of the field exercise), an evaluation of the overall

131
experience of the participants gained from this exercise was carried out by members of the case
study’s organisation. In addition, during the exercise, the organisers shadowed the participants
using a pre-constructed form. Figure 5.4 below shows the experimental protocol along with its
timelines.
Before the start of the exercise
After the start of the exercise
Scenario 1 (90 min.)
Scenario 2 (120 min.)
Panel of experts
Figure 5.4: Schematic representation of the experimental protocol.
5.3.7 Limitations of the study.
This exercise which employs network-centric emergency response operations is based on
realistic scenarios and involves well-trained professionals (panel of experts). However, an
important constraint, resulting from the need and ambition to play the scenarios with
stakeholders was that operational organisations such as the Dutch Ministry of Infrastructure and
the Environment (In Dutch: Rijkswaterstaat) had to be asked for the provision and use of
essential resources and assets. This proved to be extremely difficult, given that the activities
have had to be planned in a really busy operational environment. An additional limitation is that
not all the organisations and stakeholders that should normally get involved in the response and
normalisation of the flood events described in the scenarios participated in this field exercise.
For example, stakeholders coming from safety regions, municipalities, the fire brigade, the
emergency medical services and police did not participate in the exercise. In total, the panel of
experts of the field test consisted of 8 persons. Due to this relatively small group of experts, the
results (responses) of the questionnaire should be treated with care. A relevant assumption
Questionnaire IQ
(5 min.)
Questionnaire SQ
(5 min)
Evaluation of mid-exercise experience (25 min.)
Evaluation of overall experience
of the exercise (50 min.)
Questionnaire IQ
(5 min.)
Questionnaire IQ
(5 min.)
Questionnaire SQ
(5 min)
GRIP 2 GRIP 3/4

132
made was that it was impossible to have a larger group of experts due to the unavailability of
certain stakeholders.
The participants in the exercise were well trained stakeholders but with different backgrounds,
whose work experience varied between 1 and approximately 20 years. All the participants had
experienced severe and complex emergencies (at GRIP 2 level or higher), but had a different
number of such experiences. Regarding their educational background, most of them (7 in all)
had higher education except for one who had reached the secondary level of education.
However, none of them practised and/or had hands-on experience of network-centric
information systems. In order to overcome this limitation, the Dutch Ministry of Infrastructure and
the Environment, in collaboration with the Dutch Institute of Safety (In Dutch: Instituut Fysieke
Veiligheid – IFV) organised educational sessions (between Spring and Autumn 2015) on novel
information concepts which included the network-centric concept and the COP in order to
achieve SA. Furthermore, the participants (stakeholders) were trained in using the network-
centric technology (system) i.e. LCMS, utilized during this exercise.
5.4 Results of the field exercise.
This study purports to evaluate the effectiveness of the network-centric information systems
compared with systems based on the hierarchy that selected Dutch stakeholders experience in
their daily practice. In order to identify whether network centric information systems can improve
the stakeholders’ (i.e. professionals’) appreciation of Information Quality (IQ) and System
Quality (SQ), their perceived IQ and SQ are carefully considered with regard to what they
experience in their daily practice vs. their perceived IQ and SQ about the network-centric
environment experienced during this exercise. The results of this exercise are expected to
reveal how the different stakeholders have different opinions on and knowledge of various
information and system quality dimensions.
For measuring IQ, seven constructs were utilised and three statements (in Dutch)
corresponding to each one were rated in order to validate them (see Appendix A). However,
these statements were placed in the questionnaires in random order. Furthermore, the
statements were formulated in positive and negative forms in order to minimise the
acquiescence bias, as well as extreme response bias (Sauro, 2011).

133
The outcomes of the stakeholders’ (i.e. experts’) perceptions of IQ and in particular of the
attributes of the information that they experience in their daily practice are presented in table
5.6a, b. The stakeholders’ perceptions of the same IQ dimensions but based on the experience
gained during the two scenarios of this exercise, are provided in tables 5.7a, b and 5.8a, b.
From the combination of the tabulated results, as well as from the organisers’ observations, it
can be deduced that, as the participants (stakeholders) gain more hands-on experience in the
network-centric environment of emergency response, their appreciation increases with regard to
the IQ shared in such an environment. In this context, the stakeholders’ judgment (answers) on
IQ after considering scenario 2 (see table 5.8a, b) is clearly influenced by the network-centric
manner of working compared with their opinions (answers) on IQ resulting from the traditional
(hierarchical) way of information coordination experienced in their daily practice (see table 5.6a,
b). Furthermore, as the complexity and the severity of the scenarios increases (Scenario 1
corresponds to a GRIP 2, while Scenario 2 resembles a GRIP 3/4), the need for information
sharing escalates; and the appreciation of the end-users (stakeholders) of the network-centric
information coordination also grows.
Table 5.6a: Results of the questionnaires regarding the Quality of the Information (IQ) that the
participants (stakeholders) experience in their daily practice (Statements are rated in a 5 point
scale: -- = strongly disagree, - = disagree, 0 = neutral, + = agree, ++ = strongly agree.
n.a. = no answer).
Rating
Scale Item Statement -- - 0 + ++ n.a.
Timeliness (currency)
1 The information shared with me is up to date. 0 2 4 2 0 0
2 The information provided to me is outdated. 0 3 3 2 0 0
3 The information that I receive is timely. 0 3 5 0 0 0
Completeness
1 The information that I get from others is complete.
0 3 4 1 0 0
2 The information shared with me is incomplete. 0 2 3 3 0 0
3 The information offered to me lacks detail. 0 2 4 2 0 0
Quantity (Information overload)
1 In general, the information supplied to me is too much compared with what I need.
1 1 3 2 1 0
2 I can share all the information that I cannot retain.
0 3 4 1 0 0
3 The information that I get is very limited. 0 2 3 3 0 0

134
Table 5.6b: Results of the questionnaires regarding the Quality of the Information (IQ) that the
participants (stakeholders) experience in their daily practice (Statements are rated in a 5 point
scale: -- = strongly disagree, - = disagree, 0 = neutral, + = agree, ++ = strongly agree.
n.a. = no answer).
Rating
Scale Item Statement -- - 0 + ++ n.a.
Relevance
1 The information that I get from others is relevant to my tasks (directly usable).
0 2 3 3 0 0
2 I receive a lot of information that is not necessary in the performance of my duties.
0 4 2 2 0 0
3 I receive needless information. 0 3 2 3 0 0
Consistency
1 The information shared with me is contradictory. 0 1 5 2 0 0
2 The information that I get from others is different from the information that I already have.
0 1 5 2 0 0
3 The information that I get from others is conflicting.
0 1 5 2 0 0
Correctness
1 The information shared with me is correct. 0 2 3 3 0 0
2 The information shared with me contains errors. 1 1 6 0 0 0
3 The information that I receive is incorrect. 0 4 4 0 0 0
Reliability (Validation)
1 For me, it is unclear whether the information that I get from others is reliable.
1 2 2 3 0 0
2 I am able to verify the correctness of the information shared with me.
0 0 3 5 0 0
3 I use available personal information to verify the correctness of the information received.
0 0 4 3 1 0
Table 5.7a: Results of the questionnaires regarding IQ that the participants (stakeholders)
experienced during Scenario 1 of the field exercise (Statements are rated in a 5 point scale:
-- = strongly disagree, - = disagree, 0 = neutral, + = agree, ++ = strongly agree.
n.a. = no answer).
Rating
Scale Item Statement -- - 0 + ++ n.a.
Timeliness (currency)
1 The information shared with me is up to date. 0 2 3 3 0 0
2 The information provided to me is outdated. 1 2 4 1 0 0
3 The information that I receive is timely. 0 0 4 3 1 0
Completeness
1 The information that I get from others is complete.
0 3 4 1 0 0
2 The information shared with me is incomplete. 0 4 1 3 0 0
3 The information offered to me lacks detail. 1 3 1 3 0 0
Quantity (Information overload)
1 In general, the information supplied to me is too much compared with what I need.
0 4 2 2 0 0
2 I can share all the information that I cannot retain.
0 8 0 0 0 0
3 The information that I get is very limited. 1 3 3 1 0 0

135
Table 5.7b: Results of the questionnaires regarding IQ that the participants (stakeholders)
experienced during Scenario 1 of the field exercise (Statements are rated in a 5 point scale:
-- = strongly disagree, - = disagree, 0 = neutral, + = agree, ++ = strongly agree.
n.a. = no answer).
Rating
Scale Item Statement -- - 0 + ++ n.a.
Relevance
1 The information that I get from others is relevant to my tasks (directly usable).
0 0 1 4 3 0
2 I receive a lot of information that is not necessary in the performance of my duties.
0 5 2 1 0 0
3 I receive needless information. 0 2 4 2 0 0
Consistency
1 The information shared with me is contradictory. 0 1 6 1 0 0
2 The information that I get from others is different from the information that I already have.
1 2 3 2 0 0
3 The information that I get from others is conflicting.
0 2 3 3 0 0
Correctness
1 The information shared with me is correct. 0 2 4 2 0 0
2 The information shared with me contains errors. 0 2 5 1 0 0
3 The information that I receive is incorrect. 1 2 5 0 0 0
Reliability (Validation)
1 For me, it is unclear whether the information that I get from others is reliable.
0 5 2 1 0 0
2 I am able to verify the correctness of the information shared with me.
0 0 1 6 1 0
3 I use available personal information to verify the correctness of the information received.
1 0 0 6 1 0
Table 5.8a: Results of the questionnaires regarding IQ that the participants (stakeholders)
experienced during Scenario 2 of the field exercise (Statements are rated in a 5 point scale:
-- = strongly disagree, - = disagree, 0 = neutral, + = agree, ++ = strongly agree.
n.a. = no answer).
Rating
Scale Item Statement -- - 0 + ++ n.a.
Timeliness (currency)
1 The information shared with me is up to date. 0 0 2 5 1 0
2 The information provided to me is outdated. 1 4 2 1 0 0
3 The information that I receive is timely. 0 0 2 6 0 0
Completeness
1 The information that I get from others is complete.
0 1 3 4 0 0
2 The information shared with me is incomplete. 1 5 2 0 0 0
3 The information offered to me lacks detail. 1 4 1 2 0 0
Quantity (Information overload)
1 In general, the information supplied to me is too much compared with what I need.
0 4 2 1 1 0
2 I can share all the information that I cannot retain.
0 8 0 0 0 0
3 The information that I get is very limited. 0 6 1 1 0 0

136
Table 5.8b: Results of the questionnaires regarding IQ that the participants (stakeholders)
experienced during Scenario 2 of the field exercise (Statements are rated in a 5 point scale:
-- = strongly disagree, - = disagree, 0 = neutral, + = agree, ++ = strongly agree.
n.a. = no answer).
Rating
Scale Item Statement -- - 0 + ++ n.a.
Relevance
1 The information that I get from others is relevant to my tasks (directly usable).
0 0 2 5 1 0
2 I receive a lot of information that is not necessary in the performance of my duties.
0 3 4 1 0 0
3 I receive needless information . 1 3 2 2 0 0
Consistency
1 The information shared with me is contradictory. 0 2 3 3 0 0
2 The information that I get from others is different from the information that I already have.
0 3 4 1 0 0
3 The information that I get from others is conflicting.
1 2 4 1 0 0
Correctness
1 The information shared with me is correct. 0 1 2 5 0 0
2 The information shared with me contains errors. 1 2 5 0 0 0
3 The information that I receive is incorrect. 0 4 4 0 0 0
Reliability (Validation)
1 For me, it is unclear whether the information that I get from others is reliable.
0 5 3 0 0 0
2 I am able to verify the correctness of the information shared with me.
0 1 2 5 0 0
3 I use available personal information to verify the correctness of the information received.
0 0 3 3 2 0
Scenario 1, where the participants had to respond to a flood scenario in a network-centric
manner using particular technology (LCMS), includes a large flood emergency that required a
considerable amount of information sharing between the involved emergency services for its
normalisation. Scenario 2 is a full, complex and severe flood emergency which involves all the
safety services, as well as multiple incidents that complicate communication between
stakeholders and also their coordination and the decision making process. From the results, it
can be deduced that the experience gained during their participation in Scenario 1 helped the
stakeholders to improve their performance during their participation in Scenario 2. Furthermore,
the benefits of the coordination of network-centric information during the emergency response
operations in terms of IQ become more visible. Regarding the IQ construct timeliness, while the
stakeholders’ opinions on whether they receive information in their daily routine in a timely
manner look divided; after their network-centric experience in Scenario 1, the majority of them
seem to agree that with the coordination of network-centric information they receive timely
information. This result looks even stronger in Scenario 2, as except for one stakeholder (who
responded differently to item 2), all the others are neutral or point out that they receive timely

137
information in a network-centric working environment. For the IQ construct completeness, the
stakeholders’ perception does not change after practising the network-centric response
operations during the Scenario 1. However, after their experience gained via Scenario 2, the
majority of the stakeholders except for one, judge the information shared during the network-
centric system to be more complete compared with the information shared during their daily
practice that is based on hierarchical systems. Furthermore, after the network-centric
experience of the Scenario 2, only two stakeholders still think that the information shared with
them lacks detail. Concerning the IQ construct quantity, after their network-centric information
sharing experience, the participating stakeholders do not alter their opinion about the quantity of
the information that they receive. Nevertheless, after the experience gained during the second
scenario, almost all of them state that the information received is in no way too limited for the
fulfilment of their tasks. But in the corresponding question answered on the basis of their daily
experience, stakeholders looked divided. Regarding the IQ construct relevance, the
stakeholders believe that they obtain more relevant information when this is shared in a
network-centric manner compared with when it is shared through a traditional (hierarchical)
system. However, some of the participants (two), even after their network-centric experience
(Scenarios 1 and 2), still think that they are receiving needless information. The latter is
associated with the filters of personalisation of the network-centric system which for them were
too complicated to use. For the IQ construct consistency, the experts’ judgment does not seem
to be affected by their participation in the network-centric exercise. With regard to the IQ
construct correctness, the network-centric experience gained during the first scenario looks as if
it did not have an impact on the stakeholders’ perception about the correctness of the
information received. However, after acquiring more experience in working with a network
centric information system, i.e. after Scenario 2, stakeholders’ appreciation of the correctness of
information shared via such a system appears to have strengthened. Concerning the IQ
construct reliability, almost half of the participating stakeholders were not sure whether the
information shared with them in their daily practice is reliable. However, after sharing
information in a network-centric manner, the majority of the participants perceived the net-
centric distributed information to be more reliable. Overall, the IQ constructs timeliness and
reliability clearly show an increase in terms of appreciation when the participants responded in a
network-centric environment and in particular after the experience gained during the second
scenario.

138
For measuring SQ, nine constructs grouped in three categories were utilised and two, three or
five statements (in Dutch) related to them were rated for their validation (see Appendix A). The
statements were placed in the questionnaires in random order and they were formulated in
positive and negative forms in order to minimise both acquiescence bias and extreme response
bias (Sauro, 2011).
The outcomes of the perceptions of the stakeholders (i.e. experts) on SQ and in particular on
the attributes of the systems that they experience in their daily practice, are presented in table
5.9a, b. The stakeholders’ perceptions of the same SQ dimensions, but based on the
experience gained during participating in the two scenarios of this exercise, are given in table
5.10. From the organisers’ observations, it can be seen that the participants (stakeholders)
performed relatively better after the experience gained from working with the network-centric
system (LCMS) utilised for the response operations during Scenario 1. Furthermore, the
stakeholders’ judgment (answers) on SQ after participating in both the scenarios (see table
5.10) is evidently influenced by the network system used for information sharing during this
exercise, compared with their opinions (answers) on SQ based on the systems which they
utilise in their daily practice (see table 5.9a, b).
Table 5.9a: Results of the questionnaires regarding the Quality of the System (SQ) that the
participants (stakeholders) experience in their daily practice (Statements are rated in a 5 point
scale: -- = strongly disagree, - = disagree, 0 = neutral, + = agree, ++ = strongly agree.
n.a. = no answer).
Rating
Scale Item Statement: The information system that I experience in my daily practice,
-- - 0 + ++ n.a.
System-related
Accessibility 1 It gives me immediate access to the information that I need.
0 5 2 1 0 0
2 It gives me immediate access to information that is outside the scope of my organisation.
1 5 2 0 0 0
System reliability
1 It always works properly. 0 3 4 1 0 0
2 It works reliably. 0 2 6 0 0 0
3 It sometimes malfunctions. 0 3 4 1 0 0
System response time
1 It lets me wait for response. 0 2 4 2 0 0
2 It quickly responds to a command. 1 1 4 2 0 0
Task-related
Format
1 It displays information in an explicit manner. 1 3 4 0 0 0
2 It clearly presents all the information to me. 1 3 3 1 0 0
3 It protects me from information overload. 0 3 5 0 0 0

139
Table 5.9b: Results of the questionnaires regarding the Quality of the System (SQ) that the
participants (stakeholders) experience in their daily practice (Statements are rated in a 5 point
scale: -- = strongly disagree, - = disagree, 0 = neutral, + = agree, ++ = strongly agree.
n.a. = no answer).
Rating
Scale Item Statement: The information system that I experience in my daily practice,
-- - 0 + ++ n.a.
Integration
1 It brings together information derived from different organisations.
1 2 3 2 0 0
2 It has sufficiently supported me to share information within my own organisation.
1 3 3 1 0 0
3 It integrates information coming from different sources.
2 2 4 0 0 0
4 It has sufficiently supported me to share information with other organisations.
1 2 4 1 0 0
5 It brings all the information in one place. 0 4 2 2 0 0
Memory
1 It ensures that no important information is lost. 0 0 5 3 0 0
2 It makes it possible to retrieve older information. 0 1 4 3 0 0
3 It makes it possible to store data (situational knowledge).
0 0 7 1 0 0
Situational Awareness
1 It provides a good overview of the handling progress an emergency.
2 2 3 1 0 0
2 It provides a comprehensive picture of handling of an emergency.
2 2 3 1 0 0
3 It depicts in a comprehensive picture all the changes related to the evolution of an emergency.
2 2 2 2 0 0
Perceived operational satisfaction
Ease of use
1 It is easy to use. 1 3 3 1 0 0
2 It requires little training time. 1 2 2 3 0 0
3 It easily does what I want. 0 1 6 1 0 0
Usability
1 It enables me to acquire the information that I need.
1 2 3 2 0 0
2 It is not sufficient to provide the information that I need.
0 0 3 4 1 0
3 It is sufficient when dealing with an emergency. 1 3 3 1 0 0

140
Table 5.10: Results of the questionnaires regarding SQ that the participants (stakeholders)
experienced during both Scenarios (Statements are rated in a 5 point scale: -- = strongly
disagree, - = disagree, 0 = neutral, + = agree, ++ = strongly agree. n.a. = no answer).
Rating
Scale Item Statement: The information system that I experience during the field exercise,
-- - 0 + ++ n.a.
System-related
Accessibility 1 It gives me immediate access to the information that I need.
0 0 1 3 3 1
2 It gives me immediate access to information that is outside the scope of my organisation.
0 0 1 5 1 1
System reliability
1 It always works properly. 0 1 4 2 0 1
2 It works reliably. 0 1 1 5 0 1
3 It sometimes malfunctions. 0 1 2 4 0 1
System response time
1 It lets me wait for response. 1 4 0 2 0 1
2 It quickly responds to a command. 0 0 2 5 0 1
Task-related
Format
1 It displays information in an explicit manner. 0 1 1 4 1 1
2 It clearly presents all the information to me. 0 1 4 2 0 1
3 It protects me from information overload. 0 3 3 1 0 1
Integration
1 It brings together information derived from different organisations.
0 0 1 4 2 1
2 It has sufficiently supported me to share information within my own organisation.
0 0 2 4 1 1
3 It integrates information coming from different sources.
0 0 1 5 1 1
4 It has sufficiently supported me to share information with other organisations.
0 0 2 4 1 1
5 It brings all the information in one place. 0 0 2 4 1 1
Memory
1 It ensures that no important information is lost. 0 1 2 3 1 1
2 It makes it possible to retrieve older information. 0 3 3 1 0 1
3 It makes it possible to store data (situational knowledge).
0 0 2 5 0 1
Situational Awareness
1 It provides a good overview of the handling progress of an emergency.
0 0 2 4 1 1
2 It provides a comprehensive picture of handling an emergency.
0 2 2 2 1 1
3 It depicts in a comprehensive picture all the changes related to the evolution of an emergency.
0 0 2 5 0 1
Perceived operational satisfaction
Ease of use
1 It is easy to use. 0 0 1 5 1 1
2 It requires little training time. 0 0 3 4 0 1
3 It easily does what I want. 0 0 3 3 1 1
Usability
1 It enables me to acquire the information that I need.
0 0 0 6 1 1
2 It is not sufficient to provide the information that I need.
0 5 1 1 0 1
3 It is sufficient when dealing with an emergency. 0 0 4 3 0 1

141
For the system-related SQ attributes, three constructs were utilised: accessibility, reliability and
response time. Regarding the system-related SQ construct accessibility, while the stakeholders
believe that the system which they experience in their daily practice do not give them immediate
access to the required information, the situation seems to be completely different after their
experience with the network-centric system. In this context, the stakeholders perceive a network
centric system as a facilitator of immediate access to essential information. The latter can be
justified by the P2P network-based architecture of such a system, which consists of equal
entities (peers or nodes) that serve both as clients and servers to other nodes and allow a large
amount of information to be shared, including in real-time. The stakeholders’ opinion with regard
to the (SQ construct) reliability of the system that they experience in their daily practice is
neutral or negative. However, the majority of them (except for one neutral and one negative)
perceive the network-centric system experienced during this exercise as being generally
reliable. Nevertheless, half of them think that a network-centric system sometimes malfunctions.
This is logical given the network-based nature of the system utilised during the exercise.
Sometimes network connectivity was lost, which is basically a technical issue that can be easily
resolved. Regarding the SQ construct response time of the system that the stakeholders
currently experience in their daily practice, they seem to be divided in their opinions, while half
of them are neutral. After experiencing the network centric system, almost all the stakeholders
(except for two neutral ones) consider that the network-centric system quickly responds to their
commands. Furthermore, the majority of the stakeholders believe that this system does not let
them wait for a response. Only two have responded negatively to the latter statement, which
possibly has to do with network connectivity problems that they experienced during this
exercise.
For the task-related SQ dimensions, four constructs have been used: format; integration;
memory and situational awareness. Regarding the SQ construct format, the results indicate that
half of the stakeholders believe that the systems used in their daily practice do not delineate
information in an explicit manner, while the other half are neutral about this construct. After
experiencing the network-centric system, the majority of them believe that such a system clearly
depicts the required information. However, in terms of information overload, the stakeholders’
judgment does not appear to be affected by any system. In this context, the stakeholders are
neutral, or believe that neither the system that they experience in their daily practice nor the
network-centric system experienced during this exercise do not protect them from information
overload. This is related to the particular IQ construct as well as to the information rich

142
environment of the emergency response. Regarding the SQ construct integration, it is clear that
the stakeholders’ judgment is affected by their experience with the network-centric system. In
contrast to their opinions related to the systems that they experience in their daily practice, after
their network-centric experience there are no stakeholders who negatively rate any statement
related to integration. Most of them believe that a network-centric system enables them to
acquire and integrate information from different sources, as well as to share information with
multiple actors inside and across emergency response organisations. These stakeholders’
opinions are in harmony with one of the tenets of network-centric working, according to which a
robustly networked force improves information sharing. For the SQ construct memory, while
almost all the stakeholders are neutral except for one positive response on whether the system
that they experience in their daily practice has the potential to store data, which, in turn,
supports situational knowledge; after their experience with the network-centric system, their
views seem different. More precisely, although two stakeholders still remain neutral, the others
perceive a network-centric system to be an enabler of data storage. Nevertheless, the
stakeholders’ judgment on the other two statements used for validating the SQ construct
memory do not seem to improve after using the network-centric system. Regarding the SQ
construct situational awareness, half of the stakeholders are dissatisfied with the ability of the
system that they experience in their daily practice to create a COP, which, in turn, and in
accordance with the value chain of the network-enabled capabilities, can lead to better shared
understanding (awareness) of a situation (UK Ministry of Defense, 2005). Furthermore, the
majority of the remaining stakeholders are neutral with regard to the capability of the system
experienced in their daily practice to support SA. However, after their experience with the
network-centric system, the majority of the stakeholders believe that a network-centric system
provides a good overview of both the evolution of an emergency and the progress of the
response operations. In particular, they consider that such a system can establish a COP, which
means better information sharing compared with what they experience in their daily practice.
The latter is in agreement with one of the tenets of network-centric working, which suggests that
information sharing and collaboration reinforce information quality and disseminate SA.
Nevertheless, two stakeholders have negatively rated only one of the statements used to
validate the capability of the network-centric system to support SA. This may relate to limited
training with the network system or to misinterpretation of the statement.
For the perceived operational satisfaction, two SQ constructs have been employed: ease of use
and usability. Regarding the SQ construct ease of use, half of the stakeholders consider that the

143
system which they experience in their daily practice is too complicated to use. Concerning the
other half of the participants, three are neutral, while one considers this system to be easy to
use. However, the stakeholders’ judgment is completely different after experiencing the
network-centric system during this exercise. In particular, except for one neutral response, all
the other stakeholders perceive the network-centric system to be easy to use. Their judgment is
possibly influenced by the ease of sharing of information when using this system. With regard to
the training time that is required by the system practised in daily operations, the stakeholders’
opinions look divided. However, for the network-centric system, they seem to have different
judgment. In particular, expect for three neutral responses, all the other stakeholders believe
that such a system does not require a lot of training time. The explanation for this is that, before
this exercise, the stakeholders had participated in some training sessions organised by the
Dutch Ministry of Infrastructure and the Environment in collaboration with the Dutch Institute of
Safety. Moreover, during the exercise a learning effect was visible to the organisers of the
exercise, as the stakeholders, after gaining experience with the network-centric system in
Scenario 1, performed better during Scenario 2. With regard to whether the system experienced
in their daily practice easily does what the stakeholders want, most of them are neutral. But, for
the network-centric system, there is no stakeholder who believed that such a system does not
easily perform what they require. Regarding the SQ construct usability, the stakeholders
perceive the network-centric system used during this exercise to be more usable compared with
the system that they experience in their daily practice. In particular, after using the network-
centric system, all the stakeholders consider that a network-centric system can enable them to
acquire all the required information, in contrast to the system that they experience daily.
Furthermore, the majority of the stakeholders believe that, in contrast to a network-centric
system, the traditional (hierarchical) system currently utilised for their operations is not adequate
to provide the necessary information. Finally, while half of the stakeholders (most of the rest are
neutral) consider that the traditional system experienced in their daily practice does not
sufficiently support them to deal with emergencies, there are no stakeholders who have such an
opinion about the network-centric system used during this exercise.
Overall, the SQ constructs which indicate an increase in terms of appreciation when a network
centric system is used for the flood emergency response operations are: accessibility, which is
classified as system-related, integration and situational awareness, which are considered as
task-related and usability and ease of use, which are related to the end users’ perceived
operational satisfaction. The experts’ (stakeholders) judgment on these SQ dimensions showed

144
that they have recognised the added value of a network-centric system during the flood
emergency response.
5.5 Final remarks on the empirical assessment of the effectiveness of network-centric
support tools in flood emergency response.
This study has aimed to provide valuable insight regarding the added value of network-centric
systems in flood emergency response operations. In this context, it evaluates the effectiveness
of the network-centric support tools by acquiring and qualitatively comparing the experts’
judgment regarding the system that they experience in their daily practice which is based on a
hierarchy versus a network-centric system used during this exercise. But, although real
emergency response professionals have participated to this exercise, there were a limited
number of participants due to the busy operational environment of the emergency response and
the experts’ unavailability. Nevertheless, their opinions acquired during this exercise are
extremely valuable, given the very limited amount of such data in the emergency response
domain (Steenbruggen et al., 2015; Lee et al., 2011; Bharosa et al., 2011; Bharosa et al.,
2009a; Bharosa et al., 2009b; Bharosa et al., 2009c;). Nevertheless, these experts’ judgment
can be seen as support of the chosen mode of inquiry, as well as a reason to continue future
research in this direction.
The evaluation framework of this exercise is based on constructs associated with Information
Quality (IQ) and System Quality (SQ) that have been identified through an extensive literature
survey. IQ dimensions have been utilised for identifying whether a Common Operational Picture
(COP) leads to a better shared understanding of a particular emergency situation, while SQ
dimensions have been used for determining whether a network-centric system is capable of
facilitating better information sharing and establishing a COP.
Overall, the IQ dimensions that have shown an increase in terms of appreciation by the
professionals when they responded in a network-centric environment are timeliness and
reliability. This can be explained by the peer to peer technology that underpins a network centric
system which allows its end-users to get timely information immediately. Furthermore, the
speed of information sharing that such a system offers enables its users to quickly identify the
extent to which the shared information is correct and reliable. In contrast, the system that the

145
participants (professionals) experience in their daily practice is based on a hierarchy. Such a
system is underpinned by a more traditional client-server architecture that allows information
sharing on a one-to-one basis and often lets its end-users wait in order to get the necessary
information. During the scenarios of this exercise, a learning effect was observed. In particular,
after the experience gained by the participants during Scenario 1 in which emergency response
took place in a network centric environment, the stakeholders performed better in the more
complex Scenario 2. Furthermore, from the results of the questionnaire used in this exercise, it
can been seen that, as the complexity and the severity of the scenarios increases and the need
for more information escalates, the appreciation of the experts on the quality of the information
shared in a network centric environment also tends to rise.
Regarding the SQ dimensions which indicate an increase in terms of the experts’ appreciation
after their experience with the network-centric system, these are the system-related
accessibility; the task-related integration and situational awareness; and the end users’
perceived operational satisfaction related usability and ease of use. These SQ dimensions can
also be viewed as the design principles of an adaptive emergency response system which,
based on the experts’ judgment of this study; they can better be supported by network-centric
tools. In particular, the results on SQ dimensions first indicate that the experts perceive a
network-centric system to be convenient in effectively facilitating accessibility to all the required
information. Furthermore, they show that the experts seem to consider that such a system can
enable them to integrate information derived from multiple sources leading to the creation of a
COP which, in turn, can support them to achieve awareness about a particular flood emergency
situation. Moreover, the results suggest that the experts tend to perceive a network-centric
system as being easy to use, possibly due to the training sessions in which they participated
before this exercise. Finally, by acknowledging the usability characteristics of such a system,
the professionals tend to appreciate its usefulness in the response operations. The experts, by
admitting the ease of use and usability characteristics of a network-centric system, can be
considered satisfied with the operational capabilities of such a system, perhaps because the
system experienced in the field exercise enabled them to more easily achieve their goals.
Overall, the experts appear to appreciate the capabilities of a network-centric system. This
seems reasonable, as the architecture of such a system is designed to exploit the network-
enabled capabilities reflected in their value chain, according to which better networks can
improve information sharing in the information domain. This in turn, can lead to a better
understanding of a situation and better decisions in the cognitive domain, resulting in better

146
actions and effects in the physical domain. On the contrary, the current architecture of the
systems that the professionals experience in the flood emergency response domain is mono-
disciplinary and characterised by hierarchical (top-down) information flows that mainly lead to
the development of static-oriented and organisation-specific operational pictures. In brief, the
main findings suggest that the experts tend to appreciate the added value of network centric
systems in flood emergency response operations. However, as technology evolves and
information can be derived from a variety of sources that increase with time (for example social
media, cameras and sensors mounted even on unmanned aerial vehicles), there is a need to
continuously improve and adapt the technical characteristics of such systems to include more
functionalities.
However, the introduction of a network-centric system in the flood emergency response
operations of the safety agencies is by no means an easy task. Response operations involve
multiple safety agencies which are both autonomous and heterogeneous in their daily
operations and they have specialised structures, policies and processes. This has traditionally
contributed to the fragmented policy and organisational environment of information sharing and
coordination among the multiple involved emergency agencies. Therefore, the adoption and
implementation of a network-centric system by the relief agencies may require major
institutional reforms. For instance, changes should be made in the information coordination
architectures (network-centric instead of hierarchical). Furthermore, it should be determined
which organisations and individuals must provide what information to which organisations and
individuals during the response operations. The latter was a critical issue at the beginning of this
field exercise, revealing that real emergency response professionals suffer from lack of
information availability awareness. In particular, the professionals did not know who had the
information that they required, which resulted in unnecessary research, a low information reuse
rate and a waste of valuable time for the response operations. This indicates that the roles and
capabilities regarding information sharing and coordination are currently set for hierarchical
operations and they do not adapt to situational requirements.
Supplying the right information at the right moment to the right person and in a usable and
reliable form (Endsley, 2000; Dawes et al., 2004) has been a major challenge in emergency
response operations. Based on the experts’ judgement of this exercise, it can be concluded that
the network-centric technology has the potential to enable better information sharing, as well as
to establish a COP and improve SA towards supporting effective decision making in flood

147
emergency response. However, this technology itself cannot be a panacea for all the underlying
organisational problems. Policy makers and emergency response chiefs often mistakenly
assume that technology will solve all their problems (Dawes et al., 2004). Furthermore, SA is a
psychological, mental and cognitive status of the end-user of a system and is not something
created by a system in black box logic. Therefore, there are many factors that can influence the
perception of a situation (SA), such as previous experience and individual educational
background, organisational culture, goals and expectations. Harrald and Jefferson (2007)
mention that the introduction of such concepts is extremely difficult and it is very likely that
strategies with a short-term horizon will fail. This means that, in order, for the network-centric
systems to be successfully adopted, these should be carefully introduced in different stages with
consideration of the human factor and the strong involvement of the management of the
emergency response organisations. Furthermore, central to the adoption strategy of such
systems should be their gradual utilisation in the management of emergencies, starting with the
simplest incidents and proceeding to the more complex and chaotic situations.

148

149
6. CONCLUSIONS.
Flood risk and disaster management require effective decision making, which in turn it requires
stakeholders to be aware of the situation at hand. Furthermore, effective decisions need
information within the context of the overall environment at any particular point in time along
with communication and coordination of the interested actors. In particular, actors who are
experts in different domains and with different institutional backgrounds should work together,
interact and cooperate with one another. Situational Awareness (SA) and decision making
which are associated with human mental processes, they are usually supported by effective
support systems that lye in the information domain. There are different innovative avenues
towards improving SA, where innovation according to Rogers (2003) denotes an idea, practice
or project perceived as new by an individual or other units of adoption (group of individuals). In
this context, the PhD thesis aims to identify and explore how SA can be improved towards
better supporting decisions for flood risk and disaster management. For this, two explorative
surveys which delineate the theoretical foundation of the thesis and two empirical studies have
been conducted during the PhD research. Firstly, the thesis focuses on identifying how
geodesign can contribute to the improvement of SA about water safety in a particular area of
interest and also to better decision making in regards to optimal and more balanced flood safety
measures taken in the context of the multi-layered water safety concept. Secondly, the thesis
focuses on exploring how 3D information concepts via their information and communication
potential can improve SA which in turn can support better decisions in the context of flood risk
management and emergency preparedness. Thirdly, this thesis focuses on investigating how
the traditional way of information sharing among the safety agencies can be improved through
the introduction of a network centric approach. Information and system quality constructs which
better fit the needs of the safety agencies towards improving SA; they are instrumental in this
study.
6.1 Conclusions of explorative studies.
The theoretical foundation of the thesis is delineated by two explorative studies related to SA,
flood risk and disaster management: a) a literature review on multi-layered water safety and
theoretical systematization of the latter concept in a geodesign framework towards improving

150
situational awareness, collaboration and decision making; b) a literature survey which explores
the contribution of a common operational picture in improving SA for efficient emergency
response operations. In the following sections, the main findings are highlighted and their
implications are discussed.
6.1.1 Geodesign the multi-layered water safety.
Chapter 2 has provided an extensive literature survey on flood safety and practices in Europe
with focus on the Dutch perspective which is termed multi-layered water safety. Given that
floods are the most dominant natural hazards in Europe, the Dutch multi-tier concept which is
an integrated approach to flood risk management based on recommendations for flood
protection such as the EU flood risk directive and the UNISDR Hyogo framework, it purports to
reinforce flood protection and operationalize flood resilience through three safety layers:
prevention (layer 1) for reduction of flood risk probability; spatial solutions and preparation for
emergency response (layers 2 and 3) towards minimizing the consequences in case of a flood
event.
A multi-layer safety system resembles more a parallel than a serial system, because failure of
the safety measures corresponding to one layer does not mean failure of the whole system.
Nevertheless, such a system is not exactly a parallel one because in case of failure of the
preventive measures, these which correspond to layers 2 and 3 can reduce the damage but not
completely eradicate it. In this context, what is considered failure in layers 2 and 3 has to
explicitly be agreed at the policy level. The latter will support optimal allocation of weights
between the three layers of the multi-layered safety concept.
A primary concern for the multi-layered safety concept is the inventory of the required
information. During this chapter an attempt to provide a comprehensive overview of the needed
information is made. However, questionnaire surveys with the participation of the involved
actors to this multi-tier safety concept, they can shed more light regarding the information
requirements of each safety layer. In this way, overlaps in terms of information needs between
the three safety layers can be identified as well. Generally, the information requirements of the
multi-layered safety concept can be determined as semi-static and model information.
Nevertheless, when measures such as preventive organized evacuations are decided in the

151
context of the emergency response layer, their implementation needs dynamic information.
Almost all of the required information has a spatial (geographic) component.
The value of this chapter in relation to previous research is that it theoretically orchestrates and
systematize the multi-layered water safety concept in a geodesign-oriented methodological
framework that motivates participation and enables interdisciplinary collaboration, determines
the roles of the different actors, employs all the geographic information and knowledge,
promotes communication of the situation at hand, allows the comprehension and evaluation of
proposals and permits feedback when required. The systematization of the multi-layered safety
concept in a geodesign framework can efficiently support decision making and it can create
surplus value for the local society, economy and environment through its different and iterative
feedback driven processes. It underpins trial and error logic so that all stakeholders can assess
the impact of the safety measures resulting from their own points of view. In this manner, the
stakeholders can achieve SA regarding the water safety status in an area of interest.
Furthermore, they can identify overlaps in terms of the proposed measures which in turn can
create maximum consensus between them leading to the selection of the most desirable and
balanced water safety measures across different spatial and temporal scales that consider their
cost efficiency, their impact on the environment and the values of the people at place.
6.1.2 A common operational picture in support of SA for efficient emergency response.
Chapter 4 provided an overview of novel information concepts such as network centric
information sharing which can contribute to the improvement of cooperation and SA during
emergency response operations through the deployment of a COP. In particular, the network
centric concept which is rooted in the military domain, it can be seen as a vehicle for better
information sharing which in turn can improve decision making and support enhanced
spatiotemporal organization of resources and assets in the complex and dynamic environment
of emergency response. In essence, network centric information systems enable networking of
emergency response stakeholders towards achieving operational effectiveness as well as
integration of new information derived from different sources with other knowledge.
Furthermore, the network centric concept enables unobstructed flow of information and
knowledge among the entirety of the emergency response administrative structure. Instead of
information passed vertically within the command chain based on the logic of a hierarchical
structure of information sharing where it may be lost or even discarded as useless, this is
152
circulated freely among all the involved emergency response actors. However, in the
information-rich and increasingly fluid environment of the emergency response, network centric
systems should support both the information requirements of the emergency services and the
cognitive and psychological capabilities of the involved actors taking into account that humans
are limited by working memory and attention. Furthermore, attention should be paid towards
preventing information overload given that not all the information is relevant to the tasks of the
different safety agencies.
Through a network centric system, the same information is made available to everyone at the
same time and a COP simply provides knowledge regarding “what is going on around you” in a
single identical display. Based on Endsley’s definition of SA (Endsley, 1988), the latter is
distinguished by three levels. Firstly, SA is about perceiving critical factors i.e. status, attributes
and dynamics of relevant elements in the environment (Level 1); secondly it is about
understanding the meaning of these elements after being synthesized, in light of the decision
makers’ goal (Level 2); and thirdly at the highest level (Level 3) SA is about predicting of what
will occur with the system in the near future. Furthermore, three components delineate a
situation: information about the emergency situation; information related to the environment of
the emergency (location awareness) and information about the emergency services involved in
the response operations.
Communication processes can be divided in three related domains: the information domain
which is about relevant data in context; the cognitive domain that is related to human mental
processes and the physical domain which focuses on activities in the real world. Network centric
systems can enable better information sharing through the deployment of a COP in the
information domain which in turn it can support all the responding units to achieve the same
understanding (shared situational awareness) of information and emergency status when
conducting operations. Therefore, a network centric system can be seen as an emergency
response tool with an added value not only in effective sharing of information but also in
comprehending the real meaning and the temporal value of the needed and used information for
operations, communication and coordination of emergency services. Furthermore, network
centric systems and a COP are basic components for achieving improved SA. In the cognitive
domain, organizations, processes and stakeholders irrigated by better shared SA and aided by
technology can exhibit efficient decision making behaviors with better actions and effects in the
physical domain.

153
The concept of network centricity can be adapted from the military field and it can be applied for
emergency situations tailored to their specific conditions, creating a surplus value for the
response operations. Furthermore, it can provide the attributes and flexibility needed by
adaptive management which according to Wiese (2006) it can be the most effective
management approach to potential disasters. However, the successful adoption of such a
concept requires its careful introduction in different stages based on a maturity model and
respecting that short term strategies which assume that shared SA will be easily achieved are
doomed to fail. In addition, it requires training of the emergency response stakeholders in order
to overcome potential lack of knowledge.
6.2 Conclusions of empirical studies.
The empirical part of the PhD thesis is consisted of two studies: a) a case study for exploring
the usefulness of virtual 3D city models in flood risk communication and management; and
conceptualization of a 3D information system based on virtual 3D city models as a step towards
defining a system framework for risk management and emergency preparedness; b) a field
experiment in order to measure the effectiveness of network centric support tools for flood
emergency response. The scientific contribution of the empirical part of the PhD thesis is that it
builds on existing theories and methodologies that apply in risk management and emergency
response. The novel information concepts presented in the empirical studies of this thesis, they
can be utilized in the design of flood risk management and emergency response systems. The
underlying assumption is that the added value service of such concepts is the improvement of
SA.
6.2.1 3D information concepts for flood risk management and emergency preparedness.
Chapter 3 through a series of steps (literature review, case study and model conceptualization)
has introduced novel information concepts that can contribute in the improvement of SA,
communication, perception, management of flood risks and emergency preparedness. In order
to explore the added value service of the virtual 3D city models in risk communication and
management, a case study in Heerhugowaard area in the Netherlands has been set up. The
virtual 3D city model that has been developed, it provides dynamic rule-driven 3D renderings of

154
the flood risk components on the basis of a source-pathway-receptor (risk) model and it
delineates the geometrical and appearance characteristics of the city objects. In particular, this
model provides concise information (graphic and non-graphic), enabling visual data mining,
analysis and navigation; and facilitate interaction which urge the stakeholders to play an active
role in the decision making process for managing flood risks. In short, the virtual 3D city model
developed in this chapter, it offers dynamic 3D Common Operational Pictures (COPs) or 4D
COPs taking into account the temporal variable (time), purporting to improve SA among the
stakeholders regarding flood risks in the area of interest. Furthermore, it enables the involved
actors to examine and judge their alternatives and visually assess their implications by
modifying the city model parameters in real time through procedurally defined rules. In this way,
transparency and trust among the stakeholders can be achieved and collaboration can be
facilitated. Furthermore, the cognitive capabilities of the participants are reinforced towards
exerting their influence during the decision making process. Nevertheless, the quality of the
representations of the 3D city objects is directly related to the availability and accuracy of data.
Virtual 3D city models can be seen as excellent media for integrating, maintaining, presenting,
distributing and communicating risk related geo-information in an understandable manner close
to what the stakeholders are used to view in the real (3D) world. This has also been confirmed
by the extensive literature survey that has been conducted in this chapter. However, in
emergency preparedness where stakeholders should develop plans such as internal and/or
external evacuation routes, topological and semantic information regarding the 3D city objects
and their components are required. This information intends to satisfy the needs of the safety
agencies for querying and analyzing the 3D city models. Furthermore, a key aspect for efficient
risk management and emergency preparedness is the capability of the involved agencies and
actors to inter-operate i.e. work together. The fact that the required data are derived from
different sources and are often in multiple formats, it calls for adopting a “common language”
between the different safety organizations which has the potential to overcome this data
fragmentation. In this context, a 3D information system based on virtual 3D city models and
extended by existing open international standards from GIS and BIM domains such as CityGML
and IFC respectively, it has conceptually been deployed and presented aiming to make a step
towards defining a system framework for risk management and emergency preparedness.

155
The 3D information system conceptualized in this chapter, it overcomes limitations of the virtual
3D city model developed for Heerhugowaard area purporting to enable semantic interoperability
during the risk management and emergency preparedness. In addition, it aims to provide the
involved actors with not only navigation functionalities but also easy-to-use querying and
analysis capabilities via the standards employed by the conceptual system. In particular, these
standards offer semantic, topological and thematic information besides the geometrical and
appearance characteristics of the 3D city models. Furthermore, the 3D information system via
the detailed description of the physical and functional characteristics and relations of the city
objects at the macro (city) and micro (facility) scale, it aspires to allow the development of
alternative external and internal building evacuation routes for management of the residual risks
and emergency preparedness. This 3D information system selects the CityGML data standard
from the GIS domain as the target model for the representation of the complex urban space
since it is more capable of modelling objects at the macro scale using five distinct LoDs while
BIM data in IFC classes are designed for representing information in a very detailed way at the
micro scale being a precious source of information in regards to city facilities with up-to-date
information regarding their status and structures. During this chapter, a literature survey has
demonstrated that work has already been done in the direction of the conversion of BIM data in
IFC format to CityGML format. Nevertheless, the CityGML LoD in which the city objects are
eventually represented depends on the accuracy and availability of the needed data. Moreover,
the construction of CityGML LoDs is a challenging task and the collection of semantics and the
check of the validity of the city objects’ geometries are demanding in terms of time and effort.
Governments and safety agencies should consider the adoption and utilization of 3D information
systems based on virtual 3D city models in flood risk management and emergency
preparedness since they form an ambitious concept that has the potential to support both
information and communication processes towards building capacity for participatory risk
minimization, emergency preparedness and response. In particular, such a system it can
provide the stakeholders with a level field for equal access to information, thus facilitating the
cognition of risk related situations and simultaneously increasing transparency, trust and cross-
disciplinary collaboration for better decisions with better effects in the physical domain (real
world). The overlapping BIM fields indicate an opportunity for collaboration, knowledge transfer
and integration of the roles of all the involved actors at the facilities’ level. Nevertheless,
collaboration neither can be imposed nor can work being just a notion in the context of a risk

156
related institutional framework. Virtual 3D city models-based information systems can facilitate
collaboration but for its practice, alterations in institutional behaviors are required.
6.2.2 Field exercise for the assessment of the effectiveness of network centric support
tools in flood emergency response.
Chapter 5 through a series of steps (literature review, field exercise with realistic flood scenarios
and questionnaires for acquisition of experts’ judgment) has assessed and reported the results
of an empirical analysis regarding the value added service of network centric systems in flood
emergency response. In particular, it has evaluated the effectiveness of the network centric
support tools by acquiring and qualitatively comparing the experts’ judgment regarding the
system that they experience in their daily practice which is based on hierarchy vs. a network
centric system used during this exercise. The current systems in the emergency response
domain are traditionally mono-disciplinary based, that allow top-down and bottom-up
(hierarchical) information flows and create static agency-specific operational pictures. On the
contrary, the architecture of the network centric system used during the exercise, it focuses on
facilitating horizontal information sharing and communication among peers. Furthermore, it is
designed to exploit the network enabled capabilities reflected in their value chain according to
which better networks can improve information sharing in the information domain, which in turn
can lead to better understanding of a situation and better decisions in the cognitive domain
driving to better actions and effects in the physical domain.
In the field exercise that has been set-up during this thesis; real emergency response
professionals have participated. Although, there were only few participants due to the
demanding operational environment of the emergency response and the professionals’
unavailability, the experts’ opinions acquired during this exercise are extremely valuable given
the very limited amount of such data in the emergency response domain. The evaluation
framework of this exercise bases on constructs about Information Quality (IQ) and System
Quality (SQ) that have been identified through extensive literature survey. In order to identify
whether a COP leads to better shared awareness of a particular situation, IQ constructs have
been employed, while for determining whether a network centric system can enable better
information sharing and generate a COP, SQ constructs have been used. IQ is associated with
attributes of information and how this can satisfy the needs of the end-users. SQ focuses on
system-related; task-related and perceived operational satisfaction dimensions. Both, IQ and

157
SQ are requisites for creating a COP and gaining maximum advantage from the potential of
shared SA.
Regarding the IQ dimensions that have shown an increase in terms of appreciation by the
professionals after their experience with the network centric system, these are timeliness and
reliability. This is strongly related to the peer to peer technology that underpins a network centric
system which enables its end-users to get timely information at once. Furthermore, the speed of
information sharing offered by such a system, it enables its users to quickly identify the extent to
which the shared information is correct and trustful in contrast to the system that the
professionals experience in their daily practice that often lets its end-users to wait for acquiring
the needed information. In particular, the system currently used by the involved actors is based
on hierarchy and is underpinned by a more traditional client-server architecture that allows
information sharing on a one-to-one basis. During the field exercise of this thesis, a learning
effect has been observed due to the fact that the participants (professionals) after the
experience gained in the first scenario where emergency response has been carried out in a
network centric environment, they have performed better in the second and more complex
scenario. From the experts’ judgment that is reflected in the questionnaires’ results of the
exercise, it can be deduced that as the complexity and the severeness of the scenarios escalate
and the need for more information increases, the appreciation of the professionals on the quality
of the information shared in a network centric environment also tends to rise.
Regarding the SQ dimensions which have shown an increase in terms of experts’ appreciation
after their experience with the network centric system, these are the system-related
accessibility; the task-related integration and situational awareness; and the end users’
perceived operational satisfaction related usability and ease of use. These SQ dimensions can
also be viewed as the design principles of an adaptive emergency response system framework
which based on the experts’ judgment of this study; they can better be supported by network
centric tools. The results on SQ dimensions indicate that the experts perceive a network centric
system as convenient in effectively facilitating accessibility to all the required information.
Furthermore, the results suggest that the experts seem to recognize that a network centric
system can allow them to integrate information derived from multiple sources towards creating a
COP which in turn can support them to achieve awareness about a particular flood situation. In
addition, the results show that the experts tend to consider a network centric system as easy to
use possibly due to training sessions held before this exercise. Overall, the involved

158
professionals seem to appreciate the usefulness and capabilities of a network centric system in
emergency response operations.
Based on the experts’ judgement of the field experiment of this thesis, it can be concluded that
the network centric systems have the potential to enable better information sharing towards
generating a COP and improving SA which in turn can better support effective decision making
in flood emergency response. However, the introduction of a network centric system in the
emergency response services is by no means an easy task given the multiple safety agencies
involved in the response operations. In particular, these agencies are both autonomous and
heterogeneous in their daily operations and they have specialized structures, policies and
processes, fact that traditionally contributes to the fragmented policy and organizational
environment of information sharing and coordination among the emergency services. The
adoption and implementation of a network centric system by the relief agencies may require
major institutional reforms. The existing information systems have to be critically redesigned
based on novel information coordination architectures (network-centric instead of hierarchical)
and the data management and the current work methods should be reconsidered towards
achieving collective intelligence among the safety agencies grounded on real-time information
distribution. Furthermore, it should be determined which organizations and actors must provide
what information to which organizations and actors during the response operations. The latter
has been a critical issue at the beginning of the field exercise of this thesis revealing that real
emergency response professionals suffer from lack of information availability awareness. More
precisely, the professionals did not know who had the information that they required which
resulted in unnecessary research, low information reuse rate and waste of valuable time for the
response operations. This confirms that the roles and capabilities regarding information sharing
and coordination are currently set for hierarchical operations and they do not adapt to situational
requirements.
6.3 Recommendations for future work.
The theoretical systematization of the multi-layered safety concept in a geodesign framework is
very promising towards improving collaboration, SA and decision making for achieving optimal
flood safety measures that take into account their economic efficiency, their impact on the
environment, the local circumstances and the values of the people at place. Further research is

159
required for transferring the implementation of geodesign on multi-layered safety from theory to
practice. The geodesigned multi-layered water safety concept should be experimented, tested
and experienced in workshop settings and in different contexts engaging safety agencies for
identifying optimal measures. Furthermore, during such workshops, technology driven tools
which empower stakeholders by enabling their participation in the decision making should be
employed and assessed in the context of practicing geodesign for arriving at sustainable
arrangements regarding water safety.
The 3D information system delineated in this thesis is based on virtual 3D city models and is
extended by open existing international standards from GIS and BIM domains and it forms an
ambitious concept proposal towards supporting information and communication processes for
participatory flood risk minimization, emergency preparedness and response. For the integration
and seamless exchange of massive risk related information derived from heterogeneous and
distributed sources, agreed standards such as these employed in the 3D information system
conceptualized in this thesis (CityGML from GIS domain and IFC classes from BIM domain)
should be followed. However, as risk related data can be under the control of different
ownership and rights, a legal framework that must govern these data sets must be determined
at the political level, following discussions between stakeholders including the public, the
experts and the decision makers. Furthermore, for fully setting the framework of a system for
risk management as well as for extending the potential and the academic and institutional
standing of the proposed conceptual 3D information system, further investigations in
collaboration with interested stakeholders are needed. The conceptual form of the 3D
information system can be the basis for its operationalization in a real proof of concept
environment. This would make it possible to confirm and extend the findings of this thesis in
regards to the added value service of 3D information systems in flood risk management and
emergency preparedness.
An extensive literature survey from different domains and perspectives showed that the
utilization of network centric systems and a common operational picture are promising
instruments for improving SA towards smart emergency response. Further research is required
towards identifying and overcoming the legal and institutional implications of employing such
novel concepts for information sharing between the involved safety organizations.

160
During the field exercise of this thesis, the participants were real emergency response
professionals. Although the experts’ participation was limited due to the busy operational
environment of the emergency response and their unavailability, the opinions acquired during
the exercise are really valuable given the very limited amount of such data in the emergency
response domain. Furthermore, as research on the success of information systems in the civic
safety sector which targets the public good is relatively scarce and empirical support is almost
non-existent, the experts’ judgment of this thesis can be seen as support of the chosen mode of
inquiry as well as a reason to continue future research in this direction. In short, the main
findings of the field exercise of this thesis indicate that the experts tend to appreciate the added
value service of network centric systems in flood emergency response operations. As the
effectiveness of network centric support tools has been assessed in the context of simulated
floods scenarios, a further direction could be their utilization in real flood emergencies’ response
environment. In this way, the findings of this thesis could be verified and extended. The results
of the field exercise of this thesis contribute to the research and development of novel
information systems based on network centric technology for emergency response. However,
as technology evolves and information can be derived from a variety of sources that increase
with time such as social media, cameras and sensors mounted even on unmanned aerial
vehicles (drones), there is a need to continuously improve and adapt the technical
characteristics of emergency response systems to include more functionalities. Such
functionalities can allow new data sets to be integrated in a more sophisticated COP which in
turn can lead to enhanced SA.
The findings of this thesis form a step towards developing and adopting innovative information
systems that can efficiently support information sharing, communication and cooperation among
the safety agencies and professionals based on improved SA for efficient flood risk
management, flood incident and large-scale flood disaster response operations. However, a
system itself cannot be the panacea for all the underlying organizational problems. Moreover,
SA is not something created by a system in black box logic. SA is related to the psychological,
mental and cognitive status of the end user of a system. In addition, previous experiences,
individual educational backgrounds, organizational culture, goals and expectations can
influence the achievement of shared SA. Therefore, there are many factors that can affect the
development of SA. In order the introduction of novel information systems in safety agencies to
be successful, it should be done carefully and in different stages with consideration of human
factor and strong involvement of the management of these organizations.

161
7. REFERENCES.
A
ACIR (2005) The Laxity Beyond. Towards an effective multidisciplinary information provision
from large-scale joint action in our decentralized unitary state. [In Dutch] De Vrijblijvendheid
Voorbij. Op naar een effectieve multidisciplinaire informatievoor-ziening bij grootschalig
gezamenlijk optreden in onze gedecentraliseerde eenheidsstaat. Adviescommissie
Coördinatie ICT Rampenbestrijding, Dutch Ministry of Internal Affairs and Kingdom
Relations.
ACT (1998) Dateline ACT Afghanistan: Assistance for earthquake victims. Action by Churches
Together Alliance.
Adachi, Y., Forester, J., Hyvarinen, J., Karstila, K., Liebich, T. and Wix, J. (2003) Industry
Foundation Classes IFC2x. Modeling Support Group, International Alliance for
Interoperability. IFC2x Edition 2.
Adler, P.S., Goldoftas, B. and Levine, D.I. (1999) Flexibility versus efficiency? A case study of
model changeovers in the Toyota production system. Organization science. [Online] 10 (1),
43-68. Available from: http://dx.doi.org/10.1287/orsc.10.1.43 [Accessed 20th January 2016].
Aedo, I., Díaz, P., Carroll, J.M., Convertino, G. and Rosson, M.B. (2010) End-user oriented
strategies to facilitate multi-organizational adoption of emergency management information
systems. Information processing & management. [Online] 46 (1), 11-21. Available from:
doi:10.1016/j.ipm.2009.07.002 [Accessed 20th January 2016].
AGC (2006) The contractor’s guide to Building Information Modeling (BIM). Associated General
Constructors of America.
Albert, C. and Vargas-Moreno, J.C. (2012) Testing GeoDesign in Landscape Planning–First
Results. In: Buhmann, E., Pietsch, M. & Kretzler, E. (eds.) Proceedings of Digital
Landscape Architecture 2012, Wichmann, Berlin/Offenbach, Germany. Anhalt University of
Applied Science. pp. 219-226.

162
Alberts, D.S., Garstka, J.J., Hayes, R.E. and Signori, D.A. (2001) Understanding information
age warfare. [Online] Washington DC, Assistant secretary of defense (C3I/Command
control research program). Available from: Url:ADA395859 [Accessed 16th October 2015].
Alberts, D.S. (2002) Code of best practice: experimentation. Washington DC, Office of the
Assistant Secretary of Defense, Command and Control Research Program (CCRP).
Alberts, D.S., Garstka, J.J. and Stein, F.P. (2002) Network-centric warfare: Developing and
leveraging information superiority. [Online] Washington DC, Assistant secretary of defense
(C3I/Command control research program). Available from: Url:ADA406255 [Accessed 16th
October 2015].
Alberts, D.S. and Hayes, R.E. (2007) Planning: complex endeavors. [Online] Washington DC,
Assistant Secretary of Defense (C3I/Command Control Research Program). Available from:
Url:ADA465653 [Accessed 16th October 2015].
Alexander, K.A., Janssen, R., Arciniegas, G., O'Higgins, T.G., Eikelboom, T. and Wilding, T.A.
(2012) Interactive marine spatial planning: siting tidal energy arrays around the Mull of
Kintyre. PLoS ONE. [Online] 7 (1), e30031. Available from:
doi:10.1371/journal.pone.0030031 [Accessed 18th November 2015].
Alston, A. (2005) Extending the NEC concept. [Online] Malvern, United Kingdom, Qinetig Ltd.
Available from: Url:ADA463886 [Accessed 29th October 2015].
Arciniegas, G., Janssen, R. and Omtzigt, N. (2011) Map-based multicriteria analysis to support
interactive land use allocation. International Journal of Geographical Information Science.
[Online] 25 (12), 1931-1947. Available from: doi:10.1080/13658816.2011.556118
[Accessed 18th November 2015].
Arciniegas. G., Janssen, R. and Rietveld, P. (2013) Effectiveness of collaborative map-based
decision support tools: Results of an experiment. Environmental Modelling and Software.
[Online] 39, 159-175. Available from: doi:10.1016/j.envsoft.2012.02.021 [Accessed 18th
November 2015].

163
Argote, L. (1982) Input Uncertainty and organizational coordination in hospital emergency units.
Administrative Science Quarterly. [Online] 27 (3), 420-434. Available from:
doi:10.2307/2392320 [Accessed 20th January 2016].
Arrow, K.J., Cropper, M., Eads, G., Hahn, R., Lave, L., Noll, R., Portney, P.R., Russell, M.,
Schmalensee, R., Smith, V.K. and Stavins, R. (1996) Benefit-cost analysis in
environmental, health, and safety regulation. USA, American Enterprise Institute, The
Annapolis Center and Resources for the Future, AEI press.
Artz, M. (2010[1]) Geodesign: New Concept or New Name? Geospatial TODAY, 34-35.
Artz, M. (2010[2]) Changing Geography by Design: Selected Readings in Geodesign. [Online]
ESRI Press. Available from: http://www.esri.com/library/ebooks/geodesign.pdf [Accessed
10th November 2014].
Azhar, S., Nadeem, A., Mok, J.Y. and Leung, B.H. (2008) Building Information Modeling (BIM):
A new paradigm for visual interactive modeling and simulation for construction projects. In:
Lodi, S.H., Ahmed, S.M., Farooqi, R.U. and Saqib, M. (eds.) Advancing and integrating
construction, education research and practice: Proceedings of the First International
Conference on Construction in Developing Countries (ICCIDC-I), 4-5 August 2008, Karachi,
Pakistan. Karachi, Department of Civil Engineering, NED University of Engineering and
Technology. pp. 435-446.
Azhar, S. (2011) Building information modeling (BIM): Trends, benefits, risks, and challenges for
the AEC industry. Leadership and Management in Engineering. [Online] 11 (3), 241-252.
Available from: http://dx.doi.org/10.1061/(ASCE)LM.1943-5630.0000127 [Accessed 22nd
September 2014].
Azhar, S., Khalfan, M. and Maqsood, T. (2012) Building information modeling (BIM): now and
beyond. Australasian Journal of Construction Economics and Building. [Online] 12 (4), 15-
28. Available from: http://dx.doi.org/10.5130/ajceb.v12i4.3032 [Accessed 22nd September
2014].

164
B
Bakker, M.H.N., Green, C., Driessen, P., Hegger, D., Delvaux, B., Rijswick, M.v., Suykens, C.,
Beyers, J.C., Deketelaere, K., Doorn-Hoekveld, W.v. and Dieperink, C. (2013) Flood Risk
Management in Europe: European flood regulation. STAR-FLOOD Consortium, Utrecht,
The Netherlands. Report number: 1_D1.1.3_2013_06_11.
Ballou, D.P. and Pazer, H.L. (1985) Modeling data and process quality in multi-input, multi-
output information systems. Management science. [Online] 31 (2), 150-162. Available from:
http://dx.doi.org/10.1287/mnsc.31.2.150 [Accessed 20th January 2016].
Ballou, D.P. and Tayi-Kumar G. (1999) Enhancing data quality in data warehouse
environments. Communication of the ACM. [Online] 42 (1) 73–78. Available from:
doi:10.1145/291469.291471 [Accessed 20th January 2016].
Bandrova, T., Zlatanova, S. and Konecny, M. (2012) Three-dimensional maps for disaster
management. In: ISPRS Annals of the Photogrammetry, Remote Sensing and Spatial
Information Sciences, XXII ISPRS Congress, 25 August - 1 September 2012, Melbourne,
Australia. International Society for Photogrammetry and Remote Sensing, I-4 pp. 19-24.
Basic, F., Cartwright, W. and Handmer, J. (2003) Geographic visualization tools for
communicating the risk of floods. In: Proceedings of the 21st International Cartographic
Conference, 10-16 August 2003, Durban, South Africa. International Cartographic
Association, Document Transformation Technologies. pp. 2033-2044.
Batty, M. (2013) Defining geodesign ( = GIS + design ?). Environment and Planning B: Planning
and Design 2013. [Online] 40 (1), 1–2. Available from: doi:10.1068/b4001ed [Accessed 16th
November 2015].
Bedny, G. and Meister, D. (1999) Theory of activity and situation awareness. International
Journal of Cognitive Ergonomics. [Online] 3 (1), 63-72. Available from:
doi:10.1207/s15327566ijce0301_5 [Accessed 29th October 2015].

165
Bennett, P. and Calman, K. (eds.) (1999) Risk Communication and Public Health. Oxford,
Oxford University Press.
Bernstein, P. (2005) Integrated Practice: It’s Not Just About the Technology. [Online] Best
Practices, The American Institute of Architects. Available from:
http://www.ddscad.com/Integrated_Practice_Bernistein.pdf [Accessed 1st December 2014].
Bessler, J.E. (1998) Army Battle Command System (ABCS) Capstone Requirements Document
(CRD). Leavenworth, USA, TPIO-ABCS, US department of the Army. Technical report:
Revision 1.0.
Bharosa, N., Janssen, M., Rao, H.R. and Lee, J. (2008) Adaptive information orchestration:
Architectural principles improving information quality. In: Fiedrich, F. and Walle, B.v.d.
(eds.) Proceedings of the 5th International Conference on Information Systems for Crisis
Response and Management, ISCRAM 2008, 4-7 May 2008, Washington DC, USA. pp. 556-
565.
Bharosa, N., Appelman, J.A., Zanten, B.v. and Zuurmond, A. (2009a) Identifying and confirming
information and system quality requirements for multi-agency disaster management. In:
Landgren, J. and Jul, S. (eds.) Proceedings of the 6th International Conference on
Information Systems for Crisis Response and Management, ISCRAM 2009, 10-13 May
2009, Gothenburg, Sweden. ISCRAM.
Bharosa, N., Lee, J., Janssen, M. and Rao, H.R. (2009b) A case study of information flows in
multi-agency emergency response exercises. In: Proceedings of the 10th annual
international conference on digital government research: Social networks: Making
connections between citizens data and government, 17-21 May 2009, Puebla, Mexico.
Digital Government Society of North America, pp. 277-282.
Bharosa, N., Zanten, B.v., Janssen, M. and Groenleer, M. (2009c) Transforming crisis
management: Field studies on the efforts to migrate from system-centric to network-centric
operations. In: Wimmer, M.A., Scholl, H.J., Janssen, M. and Traunmüller, R. (eds.)
Proceedings of the 8th International Conference on Electronic Government, EGOV 2009, 31
August - 3 September 2009, Linz, Austria. Berlin, Springer-Verlag, pp. 65-75.

166
Bharosa, N., Lee, J. and Janssen, M. (2010) Challenges and Obstacles in Sharing and
Coordinating Information during Multi-Agency Disaster Response: Propositions from Field
Exercises. Information Systems Frontiers. [Online] 12 (1), 49-65. Available from:
doi:10.1007/s10796-009-9174-z [Accessed 29th October 2015].
Bharosa, N., Janssen, M. and Tan, Y.H. (2011) A research agenda for information quality
assurance in public safety networks: Information orchestration as the middle ground
between hierarchical and netcentric approaches. Cognition, Technology & Work. [Online]
13 (3), 203-216. Available from: doi:10.1007/s10111-011-0172-9 [Accessed 20th January
2016].
Bigley, G.A. and Roberts, K.H. (2001) The incident command system: High-reliability
organizing for complex and volatile task environments. Academy of Management Journal.
[Online] 44 (6), 1281-1299. Available from: doi:10.2307/3069401 [Accessed 20th January
2016].
Björkbom, M., Timonen, J., Yiğitler, H., Kaltiokallio, O., García, J.M.V., Myrsky, M., Saarinen, J.,
Korkalainen, M., Cuhac, C., Jäntti, R. and Virrankoski, R. (2013) Localization services for
online common operational picture and situation awareness. Institute of Electrical and
Electronics Engineers (IEEE) Access. [Online] 1, 742-757. Available from:
doi:10.1109/ACCESS.2013.2287302 [Accessed 30th October 2015].
Blais, C.L., Goerger, N.C., Richmond, P., Gates, B. and Willis, J.B. (2005) Global Information
Grid services and generation of the mobility common operational picture. [Online] Fall
Simulation Interoperability Workshop (SIW). Available from:
http://hdl.handle.net/10945/31180 [Accessed 29th October 2015].
Blandford, A. and Wong, B.W. (2004) Situation awareness in emergency medical dispatch.
International journal of human-computer studies. [Online] 61 (4), 421-452. Available from:
doi:10.1016/j.ijhcs.2003.12.012 [Accessed 25th April 2016].
Bletzinger, K.U. and Lähr, A. (2006) Prediction of interdisciplinary consequences for decisions in
AEC design processes. ITcon. [Online] 11, 529-545. Available from:
http://www.itcon.org/2006/38 [Accessed 17th November 2014].

167
Boersma, K., Wagenaar, P. and Wolbers, J. (2012). Negotiating the “Trading Zone”. Creating a
Shared Information Infrastructure in the Dutch Public Safety Sector. Journal of Homeland
Security and Emergency Management. [Online] 9 (2), 6. Available from: doi:10.1515/1547-
7355.1965 [Accessed 29th October 2015].
Bolstad, C.A. and Endsley, M.R. (2000) The effect of task load and shared displays on team
situation awareness. [Online] In: Proceedings of the Human Factors and Ergonomics
Society Annual Meeting, July 2000 44 (1), pp. 189-192. SAGE Publications. Available from:
doi:10.1177/154193120004400150 [Accessed 17th November 2015].
Bongaerts, L., Monostori, L., McFarlane, D. and Kádár, B. (2000) Hierarchy in distributed shop
floor control. Computers in Industry. [Online] 43 (2), 123-137. Available from:
doi:10.1016/S0166-3615(00)00062-2 [Accessed 20th January 2016].
Booch, G., Rumbaugh, J. and Jacobson, I. (1997) Unified Modeling Language User Guide.
Reading, Addison-Wesley.
Borkulo, E.v., Scholten, H.J., Zlatanova, S. and Brink, A.v.d. (2005) Decision making in
response and relief phases. In: Oosterom, P.J.M.v., Zlatanova, S. and Fendel, E.M. (eds.)
Geo-information for disaster management - late papers, pp. 47-54.
Bortenschlager, M., Leitinger, S., Rieser, H. and Steinmann, R. (2007) Towards a P2P-based
geocollaboration system for disaster management. In: Probst, F. and Keßler, C. (eds.) GI-
Days 2007 - Young Researchers Forum, 10-12 September 2007. pp.167-172.
Bouwer, L.M. (2011) Have disaster losses increased due to anthropogenic climate change?
Bulletin of the American Meteorological Society, 92 (1), 39-46.
Brättemark, M. (2010) European Floods Directive and progress in developing flood risk
management plans. [Online] In: Conference on Flood Risk Management Approaches
Worldwide: From Theory to Practice, 30 November – 1 December 2010, Washington DC,
USA. Available from: http://www.nfrmp.us/ifrma/docs/pre/summary/HormandingerPaper.pdf
[Accessed 14th November 2014].

168
Brooke, J. (1996) SUS: A “quick and dirty” usability scale. In: Jordan, P.W., Thomas, B.,
Weerdmeester, B.A. and McClelland. I.L. (eds.) Usability evaluation in industry. London,
UK, Taylor and Francis, pp. 189-194.
Bruijn, H.D. (2006) One Fight, one Team: The 9/11 commission report on intelligence,
fragmentation and information. Public Administration. [Online] 84 (2), 267-287. Available
from: doi:10.1111/j.1467-9299.2006.00002.x [Accessed 16th February 2016].
Büchele B., Kreibich H., Kron A., Thieken, A., Ihringer, J., Oberle, P., Merz, B. and Nestmann,
F. (2006) Flood-risk mapping: contributions towards an enhanced assessment of extreme
events and associated risks. Natural Hazards and Earth System Sciences. [Online] 6 (4),
485-503. Available from: doi:10.5194/nhess-6-485-2006 [Accessed 9th November 2015].
Bui, T., Cho, S., Sankaran, S. and Sovereign, M. (2000) A framework for designing a global
information network for multinational humanitarian assistance/disaster relief. Information
Systems Frontiers. [Online] 1 (4), 427-442. Available from: doi:10.1023/A:1010074210709
[Accessed 20th January 2016].
BZK (2008) National Security, National risk assessment 2008. [In Dutch] Nationale Veiligheid -
Nationale Risicobeoordeling Bevindingenrapportage. Dutch Ministry of the Interior and
Kingdom relations.
BZK (2009) National Security, National risk assessment 2008. [In Dutch] Nationale Veiligheid -
Nationale Risicobeoordeling Bevindingenrapportage. Dutch Ministry of the Interior and
Kingdom relations.
C
Carver, L. and Turoff, M. (2007) Human-computer interaction: the human and computer as a
team in emergency management information systems. Communications of the ACM.
[Online] 50 (3), 33-38. Available from: doi:10.1145/1226736.1226761 [Accessed 28th
September 2015].

169
Cauwenberghs, K. (2013). Multilayer water safety: Results of the ORBP study [In Dutch]
Meerlaagse waterveiligheid: resultaten van de ORBPstudie. [Presentation] Symposium
Meerlaagse Waterveiligheid Antwerp, Belgium, 17th June 2013.
Cebrowski, A.K. and Garstka, J.J. (1998) Network-centric warfare: Its origin and future. US
Naval Institute Proceedings. 124 (1), 28-35.
Cerovsek, T. (2011) A review and outlook for a ‘Building Information Model’ (BIM): A multi-
standpoint framework for technological development. Advanced engineering informatics.
[Online] 25 (2), 224-244. Available from: doi:10.1016/j.aei.2010.06.003 [Accessed 12th May
2014].
Chang, M.-S., Tseng, Y.-L. and Chen, J.-W. (2007) A scenario planning approach for the flood
emergency logistics preparation problem under uncertainty. Transportation Research Part
E: Logistics and Transportation Review. [Online] 43 (6), 737-754. Available from:
doi:10.1016/j.tre.2006.10.013 [Accessed 29th September 2015].
Charness, N. (1995) Expert performance and situation awareness. In: Garland, D.J. and
Endsley, M.R. (eds.) Experimental Analysis and Measurement of Situation Awareness.
Daytona Beach, USA, Embry-Riddle Aeronautical University Press, pp. 35-42.
Chen, A.Y. and Peña-Mora, F. (2010) Decentralized approach considering spatial attributes for
equipment utilization in civil engineering disaster response. Journal of Computing in Civil
Engineering. [Online] 25 (6), 457-470. Available from: doi:10.1061/(ASCE)CP.1943-
5487.0000100 [Accessed 20th January 2016].
Chen, P.H., Cui, L., Wan, C., Yang, Q., Ting, S.K. and Tiong, R.L. (2005) Implementation of
IFC-based web server for collaborative building design between architects and structural
engineers. Automation in construction. [Online] 14 (1), 115-128. Available from:
doi:10.1016/j.autcon.2004.08.013 [Accessed 17th November 2014].

170
Chen, R., Sharman, R., Rao, H. R. and Upadhyaya, S. (2007) Design principles for critical
incident response systems. Information Systems and E-Business Management. [Online] 5
(3), 201-227. Available from: doi:10.1007/s10257-007-0046-0 [Accessed 30th September
2015].
Chen, R., Sharman, R., Chakravarti, N., Rao, H. R. and Upadhyaya, S. J. (2008a) Emergency
response information system interoperability: development of chemical incident response
data model. Journal of the Association for Information Systems, 9 (3/4), 200-230.
Chen, R., Sharman, R., Rao, R. and Upadhyaya, S. (2008b) Coordination in emergency
response management. Communications of the ACM. [Online] 51 (5), 66-73. Available
from: doi:10.1145/1342327.1342340 [Accessed 29th September 2015].
Chmielewski, M. (2008) Data fusion based on ontology model for Common Operational Picture
using OpenMap and Jena semantic framework. In: Proceedings of the Military
Communications and Information Systems Conference MCC2008, Kraków, 22-24
September 2008.
Chorus, I. and Bartram, J. (eds.) (1999) Toxic Cyanobacteria in Water. A Guide to Their Public
Health Consequences, Monitoring and Management. London, E & FN Spon, Routledge,
published on behalf of UNSECO, WHO and UNEP.
Cisco (2006) Boeing, Cisco business alliance accelerates network-centric technology
development and deployment. Cisco press releases.
Clemson (2007) Definition of policy. Clemson University – Office of Research Compliance,
Definitions of Research Compliance Terms.
Comfort, L.K. (1999) Shared risk: Complex systems in seismic response. Amsterdam,
Pergamon.
Comfort, L.K., Ko, K. and Zagorecki, A. (2004) Coordination in rapidly evolving disaster
response systems. The role of information. American Behavioral Scientist. [Online] 48 (3),
295-313. Available from: doi:10.1177/0002764204268987 [Accessed 20th January 2016].

171
Comfort, L.K. (2006) Cities at risk hurricane Katrina and the drowning of New Orleans. Urban
Affairs Review. [Online] 41 (4), 501-516. Available from: doi:10.1177/1078087405284881
[Accessed 12th October 2015].
Comfort, L.K. and Kapucu, N. (2006) Inter-organizational coordination in extreme events: The
World Trade Center attacks, September 11, 2001. Natural hazards. [Online] 39 (2), 309-
327. Available from: doi:10.1007/s11069-006-0030-x [Accessed 29th September 2015].
Comfort, L.K. (2007) Crisis Management in Hindsight: Cognition, Communication, Coordination,
and Control. Public Administration Review. [Online] 67 (s1), 189-197. Available from:
doi:10.1111/j.1540-6210.2007.00827.x [Accessed 21st October 2015].
Cooper, C. and Block, R. (2006) Disaster: Hurricane Katrina and the failure of homeland
security. New York, Times Books, Henry Holt and Company.
Copeland, J. (2008) Emergency Response: Unity of Effort through a Common Operational
Picture. [Online] US Army war college, Carlisle barracks. Available from: Url:ADA479583
[Accessed 23rd October 2015].
Coste, L. (2001) Several definitions of risk and their implications on forecasting, prediction and
prevention. [In French] Sur plusieurs définitions du risque, et leurs conséquences en
matière de prévision, prédiction et prevention. La Houille Blanche. [Online] 2, 16-22.
Available from: doi:10.1051/lhb/2001015 [Accessed 25th April 2016].
Covello, V.T., van Winterfeldt, D. and Slovic, P. (1986) Risk communication: A review of the
literature. Risk Abstracts, 3 (4), 171-182.
Covello, V.T. (1991) Risk comparisons and risk communication: issues and problems in
comparing health and environmental risks. In: Kasperson R.E. and Stallen P.J.M. (eds.)
Communicating Risks to the Public. [Online] Technology, risk and society, part 1, vol. 4,
Dordrecht, The Netherlands, Springer Netherlands, pp. 79-124. Available from:
doi:10.1007/978-94-009-1952-5_6 [Accessed 7th November 2014].

172
Covello, V.T. (1998) Risk communication. In: Callow, P. (ed.) Handbook of environmental risk
assessment and management. Oxford, Blackwell Science, pp. 520–541.
Cox, S., Daisey, P., Lake, R., Portele, C and Whiteside, A. (2004) OpenGIS® Geography
Markup Language (GML3.1), Open Geospatial Consortium, Inc., Implementation
Specification Version 3.1.1, OpenGIS® Recommendation Paper, OGC Doc No. 03-105r1.
CRC Construction Innovation (2007) Adopting BIM for Facilities Management: Solutions for
Managing the Sydney Opera House. [Online] Brisbane, Cooperative Research Center for
Construction Innovation, for Icon.Net Pty Ltd. Available from:
http://eprints.qut.edu.au/27582 [Accessed 9th May 2014].
D
Dangermond, J. (2009a) GIS: Designing our future. ArcNews, ESRI, Summer 2009 [Online] 31
(2), 1. Available from: esri.com/news/arcnews/summer09articles/gis-designing-our-
future.html [Accessed 10th November 2014].
Dangermond, J. (2009b) GIS: Design and evolving technology. ArcNews, ESRI, Fall 2009.
Dangermond, J. (2010) GeoDesign and GIS–Designing our Futures. In: Buhmann, E., Pietsch,
M. & Kretzler, E. (eds.) Proceedings of Digital Landscape Architecture 2010, Wichmann,
Berlin/Offenbach, Germany. Anhalt University of Applied Science. pp. 502-514.
Davenport, T. (1993) Process Innovation: Reengineering Work through Information Technology.
Cambridge, MA, Harvard Business School Press.
Davenport, T.H. and Prusak, L. (1998) Working knowledge. How organizations manage what
they know. Boston, USA, Harvard Business School Press.
Davis, R. (1998) SABRE [Online] Available from: Url:http:/Zusers.oxac.uk/
~pemh0595/wwwboard/19-sa.html [Accessed 20th November 2014].

173
Dawes, S.S., Creswell, A.M. and Cahan, B.B. (2004) Learning from crisis: Lessons in human
and information infrastructure from the World Trade Center response. Social Science
Computer Review. [Online] 22 (1), 52–66. Available from: doi:10.1177/0894439303259887
[Accessed 29th September 2015].
Dawson, A. (ed.) (2004) The building technology and construction industry technology roadmap
report. Melbourne, Collaborative Working In Consortium (CWIC).
De Lange, W.J., Prinsen, G.F., Hoogewoud, J.C., Veldhuizen, A.A., Verkaik, J., Essink, G.H.O.,
Walsum, P.E.v., Delsman, J.R., Hunink, J.C., Massop, H.T. and Kroon, T. (2014) An
operational, multi-scale, multi-model system for consensus-based, integrated water
management and policy analysis: The Netherlands Hydrological Instrument. Environmental
Modelling & Software. [Online] 59, 98-108. Available from:
http://dx.doi.org/10.1016/j.envsoft.2014.05.009 [Accessed 27th November 2014].
DeLone, W.H. and McLean, E.R. (1992) Information systems success: The quest for the
dependent variable. Information systems research. [Online] 3 (1), 60-95. Available from:
http://dx.doi.org/10.1287/isre.3.1.60 [Accessed 16th February 2016].
Delone, W.H. and McLean, E.R. (2003) The DeLone and McLean model of information systems
success: A ten-year update. Journal of management information systems. [Online] 19 (4),
9-30. Available from: doi:10.1080/07421222.2003.11045748 [Accessed 16th February
2016].
Delone, W.H. and McLean, E.R. (2004) Measuring e-Commerce Success: Applying the DeLone
& McLean Information Systems Success Model. International Journal of Electronic
Commerce. [Online] 9 (1), 31-47. Available from: doi:10.1080/10864415.2004.11044317
[Accessed 16th February 2016].
Deltacommissie. (2008) Working with Water – A country that lives, building the future. [In Dutch]
Samen werken met water - Een land dat leeft, bouwt aan zijn toekomst. [Online]
Deltacommissie. Available from: http://www.deltacommissie.com/doc/2008-12-
10%20publieksversie.pdf [Accessed 27th October 2014].
174
Deschamps, A., Greenlee, D., Pultz, T.J. and Saper, R. (2002) Geospatial data integration for
applications in flood prediction and management in the Red River Basin. [Online] In:
Geoscience and Remote Sensing Symposium. IGARSS '02, 2002, 24-28 June 2002. IEEE
International, 6, pp. 3338- 3340. Available from: 10.1109/IGARSS.2002.1027175 [Accessed
16th October 2015].
Dias, E., Linde, M., Rafiee, A., Koomen, E. and Scholten, H. (2013) Beauty and brains:
integrating easy spatial design and advanced urban sustainability models. Planning support
systems for sustainable urban development. In: Geertman, S., Toppen, F. and Stillwell, J.
(eds.) Planning support systems for sustainable urban development. Lecture notes in
geoinformation and cartography, Volume 195. [Online] Berlin, Springer, pp. 469-484.
Available from: doi:10.1007/978-3-642-37533-0_27 [Accessed 18th November 2015].
Dizard, W.P. (2006) Internet "cloaking" emerges as new Web security threat. Government
Computer News.
Doll, W.J. and Torkzadeh, G. (1988) The measurement of end-user computing satisfaction. MIS
quarterly. [Online] 12 (2), 259-274. Available from: doi:10.2307/248851 [Accessed 18th
January 2016].
Döllner, J., Baumann, K. and Buchholz, H. (2006a) Virtual 3D City Models as Foundation of
Complex Urban Information Spaces. [Online] In: Schrenk, M. (ed.) Real Corp 2006:
Sustainable Solutions for the Information Society: Proceedings of the 11th International
Conference on Urban Planning and Spatial Development for the Information Society, 13-16
February 2006, Vienna, Austria. CORP 2006, Geo Multimedia 06. pp. 107-112. Available
from:http://citeseerx.ist.psu.edu/viewdoc/download?doi=10.1.1.83.4098&rep=rep1&type=pd
f [Accessed 20th May 2014].
Döllner, J., Kolbe, T.H., Liecke, F., Sgouros, T. and Teichmann, K. (2006b). The Virtual 3D City
Model of Berlin - Managing, Integrating and Communicating Complex Urban Information. In:
Fendel, E. and Rumor, M. (eds.) Proceedings of the 25th Urban Data Management
Symposium (UDMS), 15-17 May 2006, Aalborg, Denmark. Urban Data Management
Society.

175
Döllner, J. and Hagedorn, B. (2008) Integrating urban GIS, CAD, and BIM data by service-
based virtual 3D city models. In: Coors, V., Rumor, M., Fendel, E.M. and Zlatanova, S.
(eds.) Urban and Regional Data Management: 26th Urban Data Management Symposium
(UDMS), 10-12 October 2007, Stuttgart, Germany. London, Taylor and Francis Group.
pp.157-170.
Donahue, A., Tuohy, R. (2006) Lessons we don't learn: A study of the lessons of disasters, why
we repeat them, and how we can learn them. Homeland Security Affairs. [Online] 2 (2).
Available from: http://www.hsaj.org/?article=2.2.4 [Accessed 29th September 2015].
Duzgan, H.S., Yuceman, M.S., Kalaycioglu, H.S., Celik, K., Kemec, S., Ertugay, K. and Deniz,
A. (2011) An integrated earthquake vulnerability assessment framework for urban areas.
[Online] Natural Hazards, 59 (2), 917-947. Available from: doi:10.1007/s11069-011-9808-6
[Accessed: 7th November 2014].
Dyson M.E. (2006) Come Hell or High Water: Hurricane Katrina and the Color of Disaster. New
York, Basic Books.
E
Eastman, C.M. (1999) Building Product Models: Computer Environments Supporting Design
and Construction. Boca Raton, CRC Press.
Eastman, C., Eastman, C.M., Teicholz, P., Sacks, R and Liston, K. (2008) BIM Handbook: A
Guide to Building Information Modeling for Owners, Managers, Designers, Engineers and
Contractors. Hoboken, John Wiley and Sons, Inc.
EC (2004) Communication from the Commission to the European Parliament, the Council, the
European Economic and Social Committee and the Committee of the Regions on flood risk
management - flood prevention, protection and mitigation. COM (2004), 472 final.
EC (2008) Communication from the Commission to the Council, the European Parliament and
the European Economic and Social Committee – Towards an Increased Contribution from
Standardisation to Innovation in Europe. COM (2008), 133 final.

176
EEA (2010) Mapping the impacts of natural hazards and technological accidents in Europe: An
overview of the last decade. [Online] Copenhagen, European Environmental Agency.
Technical Report Number: 13/2010 Available from: doi:10.2800/62638 [Accessed 29th
September 2015].
Eede, v.d.G., Walle, v.d.B. and Rutkowski, A. F. (2006) Dealing with risk in incident
management: An application of high reliability theory. [Online] In: Proceedings of the 39th
Annual Hawaii International Conference on System Sciences (HICSS'06), 04-07 January
2006. Institute of Electrical and Electronics Engineers (IEEE). Available from:
doi:10.1109/HICSS.2006.112 [Accessed 23rd October 2015].
Efstratiadis, A., Koussis, A.D., Koutsoyiannis, D. and Mamassis, N. (2014) Flood design recipes
vs. reality: can predictions for ungauged basins be trusted? Natural Hazards and Earth
System Science. [Online] 14 (6), 1417-1428. Available from: doi:10.5194/nhess-14-1417-
2014 [Accessed 18th January 2016].
Eide, A.W., Haugstveit, I.M., Halvorsrud, R., Borén, M. (2013) Inter-organizational collaboration
structures during emergency response: a case study. In: Comes, T., Fiedrich, F., Fortier, S.,
Geldermann, J. and Müller, T. (eds.) Proceedings of the 10th International ISCRAM
Conference - Baden, Germany, May 2013. pp. 94-104.
EIF (2008) European Interoperability Framework (EIF) for European Public Services Version
2.0. [Online] European Communities, Draft document as basis for EIF Version 2.0.
Available from: http://www.bigwobber.nl/wp-content/uploads/2009/11/European-
Interoperability-Framework-for-European-Public-Services-draft.pdf [Accessed 15th
December 2014].
Eikelboom, T. and Janssen, R. (2013) Interactive spatial tools for the design of regional
adaptation strategies. Journal of Environmental Management. [Online] 127, S6-S14.
Available from: doi:10.1016/j.jenvman.2012.09.019 [Accessed 18th November 2015].

177
Eikelboom, T. and Janssen, R. (2015) Collaborative use of geodesign tools to support decision-
making on adaptation to climate change. Mitigation and Adaptation Strategies for Global
Change. [Online] 1-20. Available from: doi:10.1007/s11027-015-9633-4 [Accessed 18th
November 2015].
EM-DAT (2009) General classification. [Online] Available from:
http://www.emdat.be/classification [Accessed 21st September 2015].
Endsley, M.R. (1988a) Design and evaluation for situation awareness enhancement. [Online] In:
Proceedings of the Human Factors and Ergonomics Society Annual Meeting. SAGE
Journals, 32 (2), 97-101. Available from: doi:10.1177/154193128803200221 [Accessed 10th
November 2015].
Endsley, M.R. (1988b) Situation Awareness Global Assessment Technique (SAGAT). [Online]
In: Aerospace and Electronics Conference, 1988. NAECON 1988, Proceedings of the IEEE
1988 National, 23-27 May 1988, Dayton, USA. IEEE. pp. 789 - 795 Available from:
doi:10.1109/NAECON.1988.195097 [Accessed 10th November 2015].
Endsley, M.R. (1989) Final report: Situation awareness in an advanced strategic mission.
Hawthorne, USA, Northrop Corporation. Report number: NOR DOC 89-32.
Endsley, M.R. (1995) Toward a theory of situation awareness in dynamic systems. Human
Factors: The Journal of the Human Factors and Ergonomics Society. [Online] 37 (1), 32-64.
Available from: doi:10.1518/001872095779049543 [Accessed 10th November 2015].
Endsley, M.R. (2000) Theoretical underpinnings of situation awareness: A critical review. In:
Endsley, M.R. and Garland, D.J. (eds.) Situation awareness analysis and measurement.
Mahwah, Lawrence Erlbaum associates, publishers, pp. 3-32.
Endsley, M.R. and Kiris, E.O. (1995) The out-of-the-loop performance problem and level of
control in automation. Human Factors: The Journal of the Human Factors and Ergonomics
Society. [Online] 37 (2), 381-394. Available from: doi:10.1518/001872095779064555
[Accessed 10th November 2015].

178
Endsley, M.R. and Robertson, M.M. (2000) Training for situation awareness in individuals and
teams. In: Endsley, M.R. and Garland, D.J. (eds.) Situation awareness analysis and
measurement. Mahwah, Lawrence Erlbaum associates, publishers, pp. 349-366.
Endsley, M.R. and Jones, W.M. (2001) A model of inter- and intrateam situation awareness:
Implications for design, training and measurement. In: McNeese, M., Salas, E.
and Endsley M. R. (eds.) New trends in cooperative activities: Understanding system
dynamics in complex environments. Santa Monica, USA, Human Factors and Ergonomics
Society (HFES), pp. 46-67.
Endsley, M.R., Bolte, B. and Jones, D.G. (2003) Designing for situation awareness: An
approach to human-centered design. London, CRC press, Taylor and Francis group.
English, L.P. (1999) Improving data warehouse and business information quality: methods for
reducing costs and increasing profits. New York, John Wiley & Sons.
Entin, E.B. and Entin, E.E. (2000) Assessing team situation awareness in simulated military
missions. [Online] In: Proceedings of the Human Factors and Ergonomics Society 44th
Annual Meeting, San Diego, USA. SAGE Journals. 44 (1), pp. 73-76. Available from:
doi:10.1177/154193120004400120 [Accessed 23rd October 2015].
Eppler, M.J. (2003) Managing information quality. Increasing the value of information in
knowledge-intensive products and processes. Berlin, Springer.
Ervin, S. (2011) A System for GeoDesign. In: Buhmann, E., Pietsch, M. & Kretzler, E. (eds.)
Proceedings of Digital Landscape Architecture 2011, Wichmann, Berlin/Offenbach,
Germany. Anhalt University of Applied Science. pp. 145-154.
ESDP (1999) Towards Balanced and Sustainable Development of the Territory of the EU.
Committee on Spatial Development, European Communities.

179
Espada, R.Jr, Apan, A. and McDougall, K. (2012) Spatial modelling of adaptation strategies for
urban built infrastructures exposed to flood hazards. [Online] In: Proceedings of the
Queensland Surveying and Spatial Conference: The Future of Surveying and Spatial
Science is Open (QSSC 2012), 13-14 September 2012, Brisbane, Australia. Surveying
and Spatial Sciences Institute Queensland. Available from:
https://eprints.usq.edu.au/22090/1/Espada_Apan_McDougall_QSSC2012_PV.pdf
[Accessed 19th April 2016].
ESRI R&D Center (2014) CityEngine Help. [Online] Available from:
http://cehelp.esri.com/help/index.jsp?topic=/com.procedural.cityengine.help/html/manual/cg
a/basics/toc.html [Accessed 23rd February 2014].
Etezadi-Amoli, J. and Farhoomand, A.F. (1996) A structural model of end user computing
satisfaction and user performance. Information & management. [Online] 30 (2), 65-73.
Available from: doi:10.1016/0378-7206(95)00052-6 [Accessed 18th January 2016].
EU (2000) Directive 2000/60/EC of the European Parliament and of the Council of 23 October
2000. Establishing a Framework for Community Action in the Field of Water Policy. Official
Journal of the European Union, L 327/1 - L 327/72.
EU (2007) Directive 2007/60/EC of the Parliament and of the Council of 23 October 2007 on the
assessment and management of flood risks. Official Journal of the European Union, L
288/27 - L 288/34.
European Environmental Agency (2010) Mapping the impacts of natural hazards and
technological accidents in Europe. An overview of the last decade. European
Environmental Agency, Copenhagen. Technical report number: 13/2010.
European Environmental Agency (2016) Flood risks and environmental vulnerability Exploring
the synergies between floodplain restoration, water policies and thematic policies. [Online]
Denmark, European Environmental Agency. EEA Report number: 1/2016 Available from:
doi:10.2800/039463 [Accessed 15th March 2016].

180
Evans E.P., Penning-Rowsell E.C. and Hall, J.W. (2003) Foresight Flood and Coastal Defence
Project. Office of Science and Technology, UK. Phase 1 Technical report. Drivers,
scenarios and work plan.
Evans, J.R. and Lindsay, W.M. (2005) The management and control of quality. 6th edition,
Cincinnati, USA, Thomson Learning.
F
Fanti, L. and Beach, D. (2002) NATO initial common operational picture capability project.
[Online] In: Proceedings of the International Society for Optics and Photonics, SPIE,
Battlespace Digitization and Network-Centric Warfare II. 4741, pp.80-89. Available from:
doi:10.1117/12.478702 [Accessed 18th January 2016].
Faraj, S. and Xiao, Y. (2006) Coordination in fast-response organizations. Management
Science. [Online] 52 (8), 1155-1169. Available from:
http://dx.doi.org/10.1287/mnsc.1060.0526 [Accessed 10th November 2015].
Firth, C.P. and Wang, R.Y. (1996) Data quality systems: Evaluation and implementation.
London, Cambridge Market Intelligence Ltd.
Fischhoff, B., Lichtenstein, S., SIovic, P., Derby, S. and Keeney, R. (1981) Acceptable risk.
Cambridge, Cambridge University Press.
Fisher, C.W. and Kingma, D.R. (2001) Criticality of data quality as exemplified in two disasters.
Information & Management. [Online] 39 (2), 109-116. Available from: doi:10.1016/S0378-
7206(01)00083-0 [Accessed 18th January 2016].
Flaxman, M. (2010a) Fundamentals of Geodesign. In: Buhmann, E., Pietsch, M. & Kretzler, E.
(eds.) Proceedings of Digital Landscape Architecture 2010, Wichmann, Berlin/Offenbach,
Germany. Anhalt University of Applied Science. pp. 28-41.
Flaxman, M. (2010b) Geodesign: Fundamentals and Routes Forward. [Presentation] Geodesign
Summit, Redlands, USA, 6th January.

181
Foley, J., van Dam, A., Feiner, S. and Hughes, J. (1995) Computer Graphics: Principles and
Practise in C. 2nd edition, Reading, Addison Wesley Professional.
Fracker, M.L. (1988) A theory of situation assessment: Implications for measuring situation
awareness. In: Proceedings of the Human Factors and Ergonomics Society 32nd Annual
Meeting. SAGE Publications. 32 (2), pp. 102-106.
Fraser Basin Council (2008) Lower fraser communities at risk from Fraser River flooding. Fraser
Basin Council.
G
Gallaher, A.C., O' Connor, A.C., Dettbarn J.L.Jr. and Gilday L.T. (2004) Cost analysis of
inadequate interoperability in the U.S. capital facilities industry. [Online] Gaithersburg, MD,
Building and Fire Research Laboratory, National Institute of Standards and Technology
(NIST), NIST GCR: 04-867. Available from: http://dx.doi.org/10.6028/NIST.GCR.04-867
[Accessed 22nd September 2014].
Gersonius, B., Veerbeek, W., Subhan, A., Stone, K. and Zevenbergen, C. (2011). Toward a
more flood resilient urban environment: The Dutch multi-level safety approach to flood risk
management. In: Otto-Zimmermann, K. (ed.) Resilient cities: Cities and Adaptation to
Climate Change. Proceedings of the Global Forum 2010. Netherlands, Springer. pp. 273-
282.
Gilson, R.D. (1995) Situation awareness - special issue preface. [Online] Human Factors, 37
(1), 3-4. Available from: doi: 10.1518/001872095779049426 [Accessed 23rd October 2015].
Glik, D.C. (2007) Risk Communication for Public Health Emergencies. Annual Review of Public
Health. [Online] 28, 33-54. Available from:
doi:10.1146/annurev.publhealth.28.021406.144123 [Accessed online 5th November 2014].

182
Goodchild, M.F. (2007) Citizens as voluntary sensors: Spatial data infrastructure in the world of
web 2.0. International Journal of Spatial Data Infrastructures Research. [Online] 2, 24–32.
Available from: http://ijsdir.jrc.ec.europa.eu/index.php/ijsdir/article/view/28/22 [Accessed
16th November 2015].
Goodchild, M. (2010a) Twenty years of progress: GIScience in 2010. Journal of Spatial
Information Science. [Online] 1, 3–20. Available from: doi:10.5311/JOSIS.2010.1.2
[Accessed 18th January 2016].
Goodchild, M.F. (2010b) Towards geodesign: Repurposing cartography and GIS? Cartographic
Perspectives, (66), 7-22.
Goodhue, D.L. and Thompson, R.L. (1995) Task-technology fit and individual performance. MIS
quarterly. [Online] 19 (2), 213-236. Available from: doi:10.2307/249689 [Accessed 18th
January 2016].
Gorman, J.C., Cooke, N.J. and Winner, J.L. (2006) Measuring team situation awareness in
decentralized command and control environments. Ergonomics. [Online] 49 (12-13), 1312-
1325. Available from: doi:10.1080/00140130600612788 [Accessed 23rd October 2015].
Government of Ireland (2009) The planning system and flood risk management. Guidelines for
planning authorities. Dublin, Environment, Heritage and Local Government, OPW,
Stanionery office.
Gray, P. and Watson, H.J. (1998) Present and future directions in data warehousing. ACM
SIGMIS Database. [Online] 29 (3), 83-90. Available from: doi:10.1145/313310.313345
[Accessed 18th January 2016].
Gröger, G., Kolbe, T.H. and Czerwinski, A. (eds.) (2006) Candidate OpenGIS® CityGML
Implementation Specification. Open Geospatial Consortium, Version 0.3.0, Candidate
OpenGIS® Implementation Specification, OGC Doc No. 06-057r1.

183
Gröger, G., Kolbe, T.H. and Czerwinski, A. (eds.) (2007) Candidate OpenGIS® CityGML
Implementation Specification. Open Geospatial Consortium, Version 0.4.0, OGC Best
Practices Document, OGC Doc. No. 07-062.
Gröger, G., Kolbe, T.H., Czerwinski, A. and Nagel, C. (eds.) (2008) OpenGIS® City Geography
Markup Language (CityGML) Encoding Standard. Open Geospatial Consortium, Version
1.0.0, OpenGIS® Encoding Standard, OGC Doc No. 08-007r1.
Gröger, G., Kolbe, T.H., Nagel, C., Häfele, K.-H. (eds.) (2012) OGC City Geography Markup
Language (CityGML) Encoding Standard. [Online] Open Geospatial Consortium, Version
2.0.0, OpenGIS® Encoding Standard, OGC Doc No. 12-019. Available from:
http://www.opengis.net/spec/citygml/2.0 [Accessed 23rd May 2014].
Grothe, M.J., Landa, H.C. and Steenbruggen, J.G. (2005) The value of Gi4DM for transport &
water management. [Online] In: Oosterom, P.v., Zlatanova, S. and Fendel, E.M. (eds.) Geo-
information for Disaster Management. Berlin, Springer, pp. 129-153. Available from:
doi:10.1007/3-540-27468-5_10 [Accessed 19th April 2016].
Guha-Sapir, D., Hoyois, P. and Below, R. (2014) Annual Disaster Statistical Review 2013: The
Numbers and Trends. [Online] Brussels, CRED. Available from:
http://www.cred.be/sites/default/files/ADSR_2013.pdf [Accessed 21st September 2015].
H
Hager, R.S. (1997) Current and future efforts to vary the level of detail for the common
operational picture. [Online] MSc Thesis, Monterey, California, Naval Postgraduate School.
Available from: http://hdl.handle.net/10945/8179 [Accessed 23rd October 2015].
Hale, J. (1997) A layered communication architecture for the support of crisis response. Journal
of Management Information Systems. [Online] 14 (1), 235-255. Available from:
doi:10.1080/07421222.1997.11518160 [Accessed 8th February 2016].

184
Halfawy, M. and Froese, T. (2005) Building Integrated Architecture/Engineering/Construction
Systems Using Smart Objects: Methodology and Implementation. Journal of Computing in
Civil Engineering. [Online] 19 (2), 172–181. Available from:
http://dx.doi.org/10.1061/(ASCE)0887-3801(2005)19:2(172) [Accessed 17th November
2014].
Halfawy, M. and Froese, T. (2007) Component-Based Framework for Implementing Integrated
Architectural/Engineering/Construction Project Systems. Journal of Computing in Civil
Engineering. [Online] 21 (6), 441-452. Available from:
http://dx.doi.org/10.1061/(ASCE)0887-3801(2007)21:6(441) [Accessed 17th November
2014].
Hampson, K and Brandon, P. (2004) Construction 2020: A Vision of Australia's Property and
Construction Industry. [Online] Brisbane, Australia, Cooperative Research Centre for
Construction Innovation for Icon.Net Pty Ltd. Available from:
http://eprints.qut.edu.au/40762/1/40762.pdf [Accessed 20th November 2014].
Harrald, J.R., Cohn, R. and Wallace, W.A. (1992) “We were always re-organizing...”: some crisis
management implications of the Exxon Valdez oil spill. Organization & Environment.
[Online] 6 (3), 197-217. Available from: doi:10.1177/108602669200600303 [Accessed 22nd
February 2016].
Harrald, J. and Jefferson, T. (2007) Shared situational awareness in emergency management,
mitigation and response. [Online] In: Proceedings of the 40th Annual Hawaii International
Conference on System Sciences, (HICSS, 2007), 3-6 January 2007, Waikoloa, Hawaii,
USA. Washington DC, USA, Institute of Electrical and Electronics Engineers (IEEE).
Available from: doi:10.1109/HICSS.2007.481 [Accessed 26th January 2016].
Hartel, C.E.J., Smith, K. and Prince, C. (1991). Defining aircrew coordination: Searching
mishaps for meaning. In: Jensen, R.S. (ed.) Proceedings of the 6th International Symposium
on Aviation Psychology, Columbus, USA.

185
Hecker, E.J., Zepp, L.J. and Olsen, J.R. (2009) Improving Public Safety in the United States –
From Federal Protection to Shared Flood Risk Reduction. In: Samuels, P., Huntington, S.,
Allsop, W. and Harrop, J. (eds.) Flood Risk Management: Research and practice:
Proceedings of the European Conference On Flood Risk Management Research Into
Practice (Floodrisk), 30 September – 2 October 2008, Oxford, UK. Leiden, CRC
Press/Balkema. pp. 973-978.
Heide, E.A.d (1989) Disaster response: Principles of preparation and coordination. Toronto,
Canada. C.V. Mosby Company.
Helbing, D. and Kühnert, C. (2003) Assessing interaction networks with applications to
catastrophe dynamics and disaster management. Physica A: Statistical Mechanics and its
Applications. [Online] 328 (3), 584-606. Available from: doi:10.1016/S0378-4371(03)00519-
3 [Accessed 10th November 2015].
Helsloot, I. (2005) Bordering on reality: Findings on the bonfire crisis management
simulation. Journal of Contingencies and Crisis Management. [Online] 13 (4), 159-
169. Available from: doi:10.1111/j.1468-5973.2005.00472.x [Accessed 10th November
2015].
Helsloot, I. and Scholtens, A.C.J. (2007) Description of national crisis management. Dutch
Ministry of Interior and Kingdom Relations. [In Dutch] Ministerie van Binnenlandse Zaken
en Koninkrijksrelaties (BZK), The Hague, The Netherlands.
Herk, S.v., Zevenbergen, C., Gersonius, B., Waals, H. and Kelder, E. (2014) Process design
and management for integrated flood risk management: exploring the multi-layer safety
approach for Dordrecht, The Netherlands. Journal of Water and Climate Change. [Online] 5
(1), 100-115. Available from: doi:10.2166/wcc.2013.171 [Accessed 9th November 2015].
Herring, J. (2001) The OpenGIS Abstract Specification, Topic 1: Feature Geometry (ISO 19107
Spatial Schema), Version 5.0. Open Geospatial Consortium, OGC Doc No. 01-101.

186
Holsapple, C.W. and K.D. Joshi, K.D. (2006) Knowledge Management Ontology. In: Schwartz,
D.G. (ed.) Encyclopedia of Knowledge Management. Hershey, PA, Idea Group Reference,
pp. 397-402.
Hone, G., Martin, L. and Ayres, R. (2006). Awareness - does the acronym “SA” still have
practical value? In: Proceedings of the 11th International Command and Control Research
and Technology Symposium: Coalition Command and Control in the Networked Era,
Washington DC, USA. US DoD Command and control research program.
Hopkin V.D. (1995) Human factors in air traffic control. London, UK, Taylor and Francis.
Horan, T.A. and Schooley, B.L. (2007) Time-critical information services. Communications of
the ACM. [Online] 50 (3), 73-78. Available from: doi:10.1145/1226736.1226738 [Accessed
26th January 2016].
Horan, T.A., Schooley, B.L. (2007) Time-critical information services. Communications of the
ACM. [Online] 50 (3), 73-78. Available from: doi:10.1145/1226736.1226738 [Accessed 10th
November 2015].
Hoss, F. (2010) A comprehensive assessment of Multilayered Safety (Meerlaagsveiligheid) in
flood risk management. Delft, Master Thesis, TU Delft.
Hoss, F., Jonkman, S.N. and Maaskant, B. (2011) A comprehensive assessment of multilayered
safety in flood risk management - The Dordrecht case study. In: ICFM5 Secretariat at
International Centre for Water Hazard Risk Management (ICHARM) and Public Works
Research Institute (PWRI). Proceedings of the 5th International Conference on Flood
Management (ICFMS), 27-29 September 2011, Tokyo, Japan. IAHS-AISH publication. pp.
57-65.
Howard, R. and Björk, B.C. (2008) Building information modelling – Experts’ views on
standardisation and industry deployment. Advanced Engineering Informatics. [Online] 22
(2), 271-280. Available from: doi:10.1016/j.aei.2007.03.001 [Accessed 21st May 2014].

187
Hsiao, R.L., Tsai, D.H. and Lee, C.F. (2012) Collaborative Knowing: The Adaptive Nature of
Cross-Boundary Spanning. Journal of Management Studies. [Online] 49 (3), 463-491.
Available from: doi:10.1111/j.1467-6486.2011.01024.x [Accessed 23rd October 2015].
Hu, Z., Zhang, J. and Deng, Z. (2008) Construction process simulation and safety analysis
based on building information model and 4D technology. Tsinghua Science & Technology.
[Online] 13 (1), 266-272. Available from: doi:10.1016/S1007-0214(08)70160-3 [Accessed
15th May 2014].
Huang, K.T., Lee, Y.W. and Wang, R.Y. (1999) Quality information and knowledge
management. Upper Saddle River, USA, Prentice-Hall.
I
IBM (2006) Network-centric operations center launches crisis management program. [Online]
USA, IBM press release. Available from: http://www.icaa.eu/company/IBM/page/155/
[Accessed 22nd February 2016].
ICPDR (2012) Preliminary Flood Risk Assessment in the Danube River Basin Summary Report
on implementation of Articles 4, 5 and 13(1) of the European Floods Directive in the
Danube River Basin District. International Commission for the Protection of the Danube
River. Document number: IC 166.
IDABC (2004) European Interoperability Framework (EIF) for Pan-European eGovernment
Services. [Online] Luxembourg, European Communities. Version 1.0. Available from:
http://ec.europa.eu/idabc/servlets/Docd552.pdf?id=19529 [Accessed 15th December 2014].
IfcExplorer (2007) IfcExplorer CityGML Export [Online] Available from:
http://www.ifcwiki.org/index.php/IfcExplorer_CityGML_Export [Accessed 28th October 2014].
Info point safety (2011) GRIP reference framework and requirements of Safety Regions Act. [In
Dutch] Referentiekader GRIP en eisen Wet veiligheidsregio’s. Kennispublicatie. [Online]
Dutch Association of Mayors. Available from:
http://www.burgemeesters.nl/node/2993#.V3FDftJ9670 [Accessed 26th January 2016].

188
Isikdag, U., Aouad G., Underwood, J. and Wu, S. (2007) Building information models: a review
on storage and exchange mechanisms. In: Rebolj, D. (ed.) Bringing ITC Knowledge to
Work: W78 24th Conference on Information Technology in Construction: Proceedings of the
24th CIB W78 Conference, Maribor, Slovenia. pp. 135-144.
Isikdag, U., Underwood, J. and Aouad, G. (2008). An investigation into the applicability of
building information models in geospatial environment in support of site selection and fire
response management processes. Advanced engineering informatics. [Online] 22 (4), 504-
519. Available from: doi:10.1016/j.aei.2008.06.001 [Accessed 12th May 2014].
Isikdag, U. and Zlatanova, S. (2009) Towards Defining a Framework for Automatic Generation
of Buildings in CityGML Using Building Information Models. In: Lee, J. and Zlatanova, S.
(eds.) 3D Geo-Information Sciences. [Online] Berlin, Springer, pp. 79-96. Available from:
doi:10.1007/978-3-540-87395-2 [Accessed 7th November 2014].
Isikdag, U. and Underwood, J. (2010) Two design patterns for facilitating Building Information
Model-based synchronous collaboration. Automation in Construction. [Online] 19 (5), 544-
553. Available from: doi:10.1016/j.autcon.2009.11.006 [Accessed 19th May 2014].
ISO (1998) ISO 9241-11. Ergonomic requirements for office work with visual display terminals
(VDTs). The International Organization for Standardization.
ISO (2005) ISO/FDIS 19109. Geographic Information - Rules for Application Schema.
J
Janssen, M., Lee, J., Bharosa, N. and Cresswell, A. (2010) Advances in multi-agency disaster
management: Key elements in disaster research. Information Systems Frontiers. [Online]
12 (1), 1-7. Available from: doi:10.1007/s10796-009-9176-x [Accessed 23rd October 2015].

189
Janssen, R., Eikelboom, T., Verhoeven, J. and Brouns, K. (2014) Using geodesign to develop a
spatial adaptation strategy for Friesland. In: Lee, D.J., Dias, E. and Scholten, H.J. (eds.)
Geodesign by Integrating Design and Geospatial Sciences. GeoJournal Library, Volume
111. [Online] Switzerland, Springer international publishing, pp. 103-116. Available from:
doi:10.1007/978-3-319-08299-8 [Accessed 18th November 2015].
Jennex, M.E. (2004) Emergency response systems: The utility Y2K experience. Journal of
Information Technology Theory and Application (JITTA), 6 (3), 85-102.
Jennex, M.E. (2007) Modeling emergency response systems. [Online] In: Proceedings of the
40th Hawaii International Conference on System Sciences – 2007, Waikoloa, Hawaii, USA.
Washington DC, USA, Institute of Electrical and Electronics Engineers (IEEE). Available
from: doi:10.1109/HICSS.2007.386 [Accessed 26th January 2016].
Jensen, R.S. (1997) The boundaries of aviation psychology, human factors, aeronautical
decision making, situation awareness and crew resource management. The International
Journal of Aviation Psychology. [Online] 7 (4), 259-267. Available from: doi:10.1207/
s15327108ijap0704_1 [Accessed 23rd October 2015].
Johansson, B. and Hollnagel, E. (2007) Pre-requisites for large scale coordination. Cognition,
Technology & Work. [Online] 9 (1), 5-13. Available from: doi:10.1007/s10111-006-0050-z
[Accessed 26th January 2016].
Jonas, K.W. (2005) Network-centric operations: European capabilities. Defence Committee,
Inter-parliamentary European Security and Defense Assembly. Report A1899.
Jongejan, R.B., Jonkman, S.N. and Vrijling, J.K. (2012) The safety chain: A delusive concept.
Safety Science. [Online] 50 (5), 1299-1303. Available from: doi:10.1016/j.ssci.2011.12.007
[Accessed 20th November 2014].

190
Jun, J. and Jung, J. (2013) A model of information system quality: A system integrator
perspective. [Online] In: Proceedings of Global Business and Finance Research
Conference, 28-29 October 2013, Howard Civil Service International House, Taipei,
Taiwan. Available from: http://www.wbiworldconpro.com/uploads/taiwan-conference-
2013/management/1382526867_427-Jun,_Jung.pdf [Accessed 8th February 2016].
Junglas, I. and Ives, B. (2007) Recovering IT in a disaster: Lessons learned from Hurricaine
Katrina. MIS Quarterly Executive, 6 (1), 39–51.
Juran, J.M. and Godfrey, A.B. (1999) Juran’s quality handbook. [Online] 5th edition, New York,
McGraw-Hill. Available from: http://www.pqm-online.com/assets/files/lib/books/juran.pdf
[Accessed 15th March 2016].
K
Kaber, D.B. and Endsley, M.R. (1998) Team situation awareness for process control safety and
performance. Process Safety Progress. [Online] 17 (1), 43-48. Available from:
doi:10.1002/prs.680170110 [Accessed 23rd October 2015].
Kandilioti, G. and Makropoulos, C. (2011) Preliminary flood risk assessment: the case of
Athens. Natural Hazards. [Online] 61 (2), 441-468. Available from: doi:10.1007/s11069-011-
9930-5 [Accessed 22nd October 2014].
Kapucu, N. (2006) Interagency communication networks during emergencies boundary
spanners in multiagency coordination. The American Review of Public Administration.
[Online] 36 (2), 207-225. Available from: doi:10.1177/0275074005280605 [Accessed 23rd
October 2015].
Kasperson, R.E. and Palmlund, I. (1989) Evaluating risk communication. In: Covello, V.,
McCallum, D. and Pavlova, M. (eds.) Effective risk communication: The role and
responsibility of government, New York, Plenum Press, pp. 143-160.

191
Kellens, W., Vanneuville, W., Verfaillie, E., Meire, E., Deckers, P. and Maeyer, P.d. (2013)
Flood risk management in Flanders: past developments and future challenges. Water
Resources Management. [Online] 27 (10), 3585–3606. Available from: doi:10.1007/s11269-
013-0366-4 [Accessed 9th November 2015].
Kemec, S., Duzgun, S., Zlatanova, S., Dilmen, D.I. and Yalciner, A.C. (2010a) Selecting 3D
urban visualisation models for disaster management: Fethiye tsunami inundation case. In:
Proceedings of the 3rd International Conference on Cartography and GIS, 15-20 June,
2010, Nessebar, Bulgaria. International Cartographic Association/University of Architecture,
Civil Engineering and Geodesy.
Kemec, S., Zlatanova, S. and Duzgun, H. S. (2010b) A framework for defining a 3D model in
support of risk management. In: Konecny, M., Zlatanova, S. and Bandrova, T.L. (eds.)
Geographic Information and Cartography for Risk and Crisis Management. [Online] Berlin,
Springer. pp. 69-82. Available from: doi:10.1007/978-3-642-03442-8_5 [Accessed 17th
November 2014].
Khemlani, L. (2004) The IFC building model: A look under the hood. AECbytes feature, 1-8.
Kibria, M.S., Zlatanova, S., Itard, L. and Dorst, M.v. (2009) GeoVEs as tools to communicate in
Urban Projects: requirements for functionality and visualization. In: Lee, J. and Zlatanova,
S. (eds.) 3D Geo-Information Sciences. [Online] Berlin, Springer, pp. 379-395. Available
from: doi:10.1007/978-3-540-87395-2 [Accessed 7th November 2014].
Killian, L.M. (2002) An introduction to methodological problems of field studies in disasters. In:
Stallings, R.A. (ed.) Methods of disaster research. Philadelphia, USA, Xlibris, pp.39-93.
Klein, G. (2000) Cognitive task analysis of teams. In: Schraagen, J.M., Chipman, S.F. and
Shalin, V.L. (eds.) Cognitive task analysis. Psychology Press, Taylor and Francis Group,
pp. 417-429.
Klijn, F., Samuels, P. and Os, A.v. (2008) Towards flood risk management in the EU: State of
affairs with examples from various European countries. International Journal of River Basin
Management, 6, 307-321.

192
Koks, E.E., Moel, H.d., Aerts, J.C. and Bouwer, L.M. (2014) Effect of spatial adaptation
measures on flood risk: Study of coastal floods in Belgium. Regional environmental change.
[Online] 14 (1), 413-425. Available from: doi:10.1007/s10113-013-0514-7 [Accessed 20th
April 2016].
Kolbe, T.H. and Gröger, G. (2003) Towards Unified 3D City Models. In: Schiewe, J., Hahn, M.,
Madden, M. and Sester, M. (eds.) Proceedings of the ISPRS Commision IV Joint Workshop
on Challenges in Geospatial Analysis Integration and Visualization II, 8-9 September 2003,
Stuttgart.
Kolbe, T.H., Gröger, G. and Plümer, L. (2005) CityGML - Interoperable Access to 3D City
Models. In: Oosterom, P.v., Zlatonova, S and Fendel, E.M. (eds.) Geo-Information for
Disaster Management: Proceedings of the First International Symposium on Geo-
Information for Disaster Management (GI4DM), 21-23 March 2005, Delft. Berlin, Springer -
Verlag, pp. 883-899.
Kolbe, T.H. (2009) Representing and Exchanging 3D City Models with CityGML. In: Lee, J. and
Zlatanova, S. (eds.) 3D Geo-Information Sciences. [Online] Berlin, Springer, pp. 15-31.
Available from: doi:10.1007/978-3-540-87395-2 [Accessed 7th November 2014].
Kolen, B., Hommes, S. and Huijskes, E. (eds.) (2012) Flood preparedness in The Netherlands:
a US perspective. Netherlands US Water Crisis Research Network (NUWCReN).
Kriebel, C.H. (1979) Evaluating the quality of information systems. In: Szyperski, N. and
Grochla, E. (eds.) Design and implementation of computer based information systems.
Sijthoff and Noordhoff, pp.29-43.
Kuipers, S. and Boin, A. (2013) Country study: The Netherlands. [Online] Analysis of Civil
Security Systems in Europe (ANVIL) project, Universiteit Utrecht. Available from:
http://anvil-project.net/wp-content/uploads/2013/12/Netherlands_v1.1.pdf [Accessed 26th
January 2016].

193
Kuusisto, R., Kuusisto, T. and Armistead, L. (2005) Common Operational Picture, Situation
Awareness and Information Operations. In: Proceedings of the 4th European Conference on
Information Warfare and Security. Glamorgan, UK. pp. 175-185.
Kwan, M-P. and Lee, J. (2005) Emergency response after 9/11: the potential of real-time 3D
GIS for quick emergency response in micro-spatial environments. Computers, Environment
and Urban Systems. [Online] 29 (2), 93-113. Available from:
doi:10.1016/j.compenvurbsys.2003.08.002 [Accessed 25th November 2014].
L
Laat, R.d. and Berlo, L.v. (2011) Integration of BIM and GIS: The development of the CityGML
GeoBIM extension. In: Kolbe, T.H., König, G. and Nagel, C. (eds.) Advances in 3D Geo-
Information Sciences. [Online] Berlin, Springer, pp. 211-225. Available from:
doi:10.1007/978-3-642-12670-3_13 [Accessed 15th December 2014].
Lagervik, C., Norstedt-Larsson, M. and Gustavsson, P.M. (2006) A System Theoretical
Approach to Situation Awareness, A Holistic View of Purposeful Elements. In: Proceedings
of the 9th International Conference on Information Fusion, 10-13 July 2006. IEEE
conference publications.
Lambert, D. and Scholz, J.A. (2005) Dialectic for network centric warfare. [Online] In:
Proceedings of the 10th International Command and Control Research and Technology
Symposium (ICCRTS), MacLean, VA, USA, 13-16 June 2005. Available from:
Url:ADA460913 [Accessed 23rd February 2016].
Lang, S., Fewtrell, L. and Bartram, J. (2001) Risk communication. In: Fewtrell, L and Bartram, J.
(eds.) Water Quality: Guidelines, Standards and Health: Assessment of Risk and Risk
Management for Water-related Infectious Disease. London, IWA Publishing, WHO, pp. 317-
332.

194
Lautze, S., Jones, B.D. and Duffield, M. (1998) Strategic humanitarian coordination in the Great
Lakes, 1996-1997: An independent assessment. [Online] Policy, Information and Advocacy
Division Office for the Coordination of Humanitarian Affairs, United Nations. Available from:
https://interagencystandingcommittee.org/system/files/legacy_files/IASC%20Report%20on
%20Great%20Lakes%201996-97.pdf [Accessed 8th February 2016].
Leaning, J. and Guha-Sapir, D. (2013) Natural disasters, armed conflict, and public health. The
New England Journal of Medicine. [Online] 369 (19), 1836-1842. Available from:
doi:10.1056/NEJMra1109877 [Accessed 23rd October 2015].
Lee, J. and Zlatanova, S. (2008) A 3D data model and topological analyses for emergency
response in urban areas. In: Zlatanova, S. and Li, J. (eds.) Geospatial information
technology for emergency response. London, UK, Taylor and Francis Group, pp. 143-168.
Lee, J., Bharosa, N., Yang, J., Janssen, M. and Rao, H.R. (2011) Group value and intention to
use—A study of multi-agency disaster management information systems for public
safety. Decision Support Systems. [Online] 50 (2), 404-414. Available from:
doi:10.1016/j.dss.2010.10.002 [Accessed 26th January 2016].
Lee, K., Chin, S. and Kim, J. (2003) A core system for design information management using
Industry Foundation Classes. Computer‐Aided Civil and Infrastructure Engineering. [Online]
18 (4), 286-298. Available from: doi:10.1111/1467-8667.00318 [Accessed 17th November
2014].
Lee, Y.W., Strong, D.M., Kahn, B.K. and Wang, R.Y. (2002) AIMQ: a methodology for
information quality assessment. Information & management. [Online] 40 (2), 133-146.
Available from: doi:10.1016/S0378-7206(02)00043-5 [Accessed 26th January 2016].
Leskens, J.G., Brugnach, M., Hoekstra, A.Y. and Schuurmans, W. (2014) Why are decisions in
flood disaster management so poorly supported by information from flood
models? Environmental modelling & software. [Online] 53, 53-61. Available from:
doi:10.1016/j.envsoft.2013.11.003 [Accessed 26th January 2016].

195
Levitin, A. and Redman, T. (1995) Quality dimensions of a conceptual view. Information
Processing & Management. [Online] 31 (1), 81-88. Available from: doi:10.1016/0306-
4573(95)80008-H [Accessed 17th February 2016].
Li, Y.N., Tan, K.C. and Xie, M. (2002) Measuring web-based service quality. Total quality
management. [Online] 13 (5), 685-700. Available from: doi:10.1080/0954412022000002072
[Accessed 26th January 2016].
Liebich, T. (ed.) (2004) IFC2x Edition 2 - Model Implementation Guide. International Alliance for
Interoperability. Version 1.7.
Longstaff, P.H. (2005) Security, resilience and communication in unpredictable environments
such as terrorism, natural disasters and complex technology. [Online] Cambridge MA, USA,
Center for Information Policy, Harvard University. Available from:
http://www.pirp.harvard.edu/ [Accessed 17th February 2016].
Lopez, J.A. (2006) The Multiple Lines of Defense Strategy to Sustain Coastal Louisiana. Lake
Pontchartrain Basin Foundation. Metairie, Louisiana.
Lopez, J.A. (2009) The multiple lines of defense strategy to sustain coastal Louisiana. Journal of
Coastal Research, Special Issue. [Online] 54, 186-197. Available from:
http://dx.doi.org/10.2112/SI54-020.1 [Accessed 1st December 2014].
Löwner, M.-O., Benner, J., Gröger, G. and Häfele, K.-H. (2013) New Concepts for Structuring
3D City Models - an Extended Level of Detail Concept for CityGML Buildings. In: Murgante,
B., Misra, S., Carlini, M., Torre, C.M., Nguyen, H.-Q., Taniar, D., Apduhan, B.O. and
Gervasi, O. (eds.) Computational Science and its Applications - ICCSA 2013: Proceedings
of the 13th International Conference on Computational Science and its Applications
(ICCSA), 24-27 June 2013, Ho Chi Minh City, Vietnam. Berlin, Springer-Verlag, Part III,
LNCS 7973, pp. 466-480.

196
Lu, S.R., Wu, I.C. and Hsiung, B.C.B. (2012) Applying building information modelling in
environmental impact assessment for urban deep excavation projects. [Online] In:
International Association for Automation and Robotics in Constructions: Proceedings of the
29th International Symposium on Automation and Robotics in Construction and Mining
(ISARC) 2012, Eindhoven, The Netherlands. Available from:
http://www2.kuas.edu.tw/prof/kwu/docs/cp029.pdf [Accessed 17th June 2014].
Lu, Y. and Yang, D. (2011) Information exchange in virtual communities under extreme disaster
conditions. Decision Support Systems. [Online] 50 (2), 529-538. Available from:
doi:10.1016/j.dss.2010.11.011 [Accessed 17th February 2016].
Lubitz, D.v. and Wickramasinghe, N. (2006a) Healthcare and technology: the doctrine of
networkcentric healthcare. International Journal of Electronic Healthcare. [Online] 2 (4),
322-344. Available from: http://dx.doi.org/10.1504/IJEH.2006.010440 [Accessed 21st
September 2015].
Lubitz, D.v. and Wickramasinghe, N. (2006b) Networkcentric healthcare: applying the tools,
techniques and strategies of knowledge management to create superior healthcare
operations. International journal of electronic healthcare. [Online] 2 (4), 415-429. Available
from: http://dx.doi.org/10.1504/IJEH.2006.010429 [Accessed 21st September 2015].
Lubitz, D.v. and Wickramasinghe, N. (2006c) Networkcentric healthcare and bioinformatics:
Unified operations within three domains of knowledge. Expert Systems with Applications.
[Online] 30 (1), 11-23. Available from: doi:10.1016/j.eswa.2005.09.069 [Accessed 21st
September 2015].
Lubitz, D.v. and Patricelli, F. (2007) Network-centric healthcare operations; data warehousing
and the associated telecommunication platforms. International Journal of Services and
Standards. [Online] 3 (1), 97-119. Available from:
http://dx.doi.org/10.1504/IJSS.2007.011830 [Accessed 21st September 2015].

197
Lubitz, D.v.K., Beakley, J.E. and Patricelli, F. (2008a) Disaster management: the structure,
function, and significance of network-centric operations. Journal of Homeland Security and
Emergency Management. [Online] 5 (1). Available from: doi:10.2202/1547-7355.1411
[Accessed 21st September 2015].
Lubitz, D.v.K., Beakley J.E. and Patricelli F. (2008b) “All hazards Approach” to disaster
management: The role of information and knowledge management, Boyd’s OODA Loop
and network-centricity. Disasters. [Online] 32 (4), 561-585 Available from:
doi:10.1111/j.1467-7717.2008.01055.x [Accessed 21st September 2015].
Lumbroso, D. (2007) Review report of operational flood management methods and models.
[Online] FloodSite Consortium, HR Wallingford UK. Report number: T17-07-01. Available
from:http://www.floodsite.net/html/partner_area/project_docs/Task17_report_M17_1review_
v1_1.pdf [Accessed 26th January 2016].
Luokkala, P. and Virrantaus, K. (2014) Developing information systems to support situational
awareness and interaction in time-pressuring crisis situations. Safety science. [Online] 63,
191-203. Available from: doi:10.1016/j.ssci.2013.11.014 [Accessed 17th February 2016].
M
Mackenzie, C., Hu, P.F.M., Fausboll, C., Nerlich, M., Benner, T., Gagliano, D., Whitlock, W.,
Lam, D. and Xiao, Y. (2007) Challenges to remote emergency decision-making for
disasters or homeland security. Cognition, Technology & Work. [Online] 9 (1), 15-24.
Available from: doi:10.1007/s10111-006-0051-y [Accessed 14th April 2016].
Madey, G.R., Szabo, G., Barabási, A.L. (2006) WIPER: The integrated wireless phone based
emergency response system. In: Alexandrov, V.N., Albada, G.D.v, Sloot, P.M.A. and Jack
Dongarra, J. (eds.) Computational Science–ICCS 2006. [Online] Berlin, Springer, pp. 417-
424. Available from: doi:10.1007/11758532 [Accessed 14th April 2016].
Malone, T.W., Yates, J. and Benjamin, R.I. (1987) Electronic markets and electronic
hierarchies. Communications of the ACM. [Online] 30 (6), 484-497. Available from:
doi:10.1145/214762.214766 [Accessed 17th February 2016].

198
Manoj, B.S. and Baker, A.H. (2007) Communication challenges in emergency response.
Communications of the ACM. [Online] 50 (3), 51-53. Available from:
doi:10.1145/1226736.1226765 [Accessed 17th February 2016].
Manojlovic, N. and Pasche, E. (2008) Integration of resiliency measures into flood risk
management concepts of communities. In: Proverbs, D., Brebbia, C.A. and Penning-
Roswell, E. (eds.) 1st International Conference on Flood Recovery, Innovation and
Response (FRIAR), 2-3 July 2008, London, UK. WIT press. pp. 235-245.
Manzi, C., Powers, M.J. and Zetterlund, K. (2002) Critical Information Flows in the Alfred P.
Murrah Building Bombing: A Case Study. Washington DC, Chemical and Biological Arms
Control Institute. Terrorism studies series, Special report 3.
Mao, B. (2011) Visualisation and generalisation of 3D City Models. Doctoral thesis, Royal
Institute of Technology (KTH).
Marra, F.J. (1998) The importance of communication in excellent crisis management. Australian
Journal of Emergency Management, 13 (3), 7.
Mayomi, I., Dami, A. and Maryah, U.M. (2013) GIS based assessment of flood risk and
vulnerability of communities in the Benue floodplains, Adamawa State, Nigeria. Journal of
geography and geology, 5 (4), 148-160.
McElvaney, S. (ed.) (2012) Geodesign: Case Studies in Regional and Urban Planning.
Redlands, California, USA, Esri Press.
McGahey, C. (2009) Integrated Flood Risk Analysis and Management Methodologies.
Methodology for a DSS to support long-term Flood Risk Management Planning. HR
Wallingford, UK. Report number: T18-09-02.
McManus, S., Seville, E., Brunsdon, D. and Vargo, J. (2007) Resilience management: a
framework for assessing and improving the resilience of organisations. [Online] New
Zealand, Resilient Organisations. Research report: 2007/01. Available from:
http://hdl.handle.net/10092/2810 [Accessed 14th April 2016].

199
McMaster, R. and Baber, C. (2009) Common Operating Pictures and their Potential for Multi-
agency Work. UK Human Factors Integration Defence Technology Centre, BAE Systems.
Merket, D., Bergondy, M. and Cuevas-Mesa, H. (1997) Making sense out of teamwork errors in
complex environments. In: Proceedings of the 18th Annual Industrial/Organizational-
Organizational Behavior Graduate Student Conference, Roanoke, USA.
Merriam-Webster’s Collegiate Dictionary (2015) Common, Picture, Operational. [Online]
Available from: http://www.merriam-webster.com/ [Accessed 16th October 2015].
Militello, L.G., Patterson, E.S., Bowman, L. and Wears, R. (2007) Information flow during crisis
management: challenges to coordination in the emergency operations center. Cognition,
Technology & Work. [Online] 9 (1), 25-31. Available from: doi:10.1007/s10111-006-0059-3
[Accessed 17th February 2016].
Miller, H. (1996) The multiple dimensions of information quality. Information Systems
Management. [Online] 13 (2), 79-82. Available from: doi:10.1080/10580539608906992
[Accessed 17th February 2016].
Miller, W.R. (2012). Introducing Geodesign: The Concept. Redlands, California, ESRI.
Ministry I&E (2009) National water plan. [In Dutch] Nationaal Waterplan. Ministry of
Infrastructure and the Environment, The Netherlands.
Ministry of Interior Affairs (2008) Manual preparation emergency management, structuring
documentation emergency management. The Netherlands, Dutch Ministry of Interior
Affairs.
Ministry of Security and Justice (2013) Safety Regions Act [In Dutch] Wet veiligheidsregio’s. The
Hague, The Netherlands. Report number: J-18732.

200
Mioc, D., Anton, F., Nickerson, B., Santos, M., Adda, P., Tienaah, T., Ahmad, A., Mezouagh, M.,
MacGillivray, E., Morton, A. and Tang, P. (2011) Flood progression modelling and impact
analysis. In: Jo, C. (ed.) Efficient decision support systems: practice and challenges in
multidisciplinary domains. [Online] InTech, pp. 227-246. Available from: doi:10.5772/18398
[Accessed 7th November 2014].
Moel, H.d., Alphen, J.V. and Aerts, J.C.J.H. (2009) Flood maps in Europe-methods, availability
and use. Natural Hazards and Earth System Sciences, 9 (2), 289-301.
Moel, H.d., van Vliet, M. and Aerts, J.C. (2014) Evaluating the effect of flood damage-reducing
measures: a case study of the unembanked area of Rotterdam, the Netherlands. Regional
environmental change. [Online] 14 (3), 895-908. Available from: doi:10.1007/s10113-013-
0420-z [Accessed 9th November 2015].
Montanari, A. and Koutsoyiannis, D. (2014) Modeling and mitigating natural hazards:
Stationarity is immortal!. [Online] Water Resources Research, 50 (12), 9748-9756.
Available from: doi: 10.1002/2014WR016092 [Accessed 23rd October 2015].
Mostert, E. and Junier, S.J. (2009) The European flood risk directive: challenges for research.
Hydrology and Earth System Sciences Discussions. [Online] 6 (4), 4961-4988. Available
from: doi:10.5194/hessd-6-4961-2009 [Accessed 14th November 2014].
Motamedi, A. and Hammad, A. (2009) Lifecycle management of facilities components using
radio frequency identification and building information model. Journal of Information
Technology in Construction (ITcon). [Online] 14, 238-262. Available from:
http://www.itcon.org/2009/18 [Accessed 22nd September 2014].
Moura, A.C.M. (2015) Geodesign in parametric modeling of urban landscape. Cartography and
Geographic Information Science. [Online] 42 (4), 323-332. Available from:
doi:10.1080/15230406.2015.1053527 [Accessed 16th November 2015].
Munich RE (2015) Weather-related loss events worldwide 2014. Münchener
Rückversicherungs-Gesellschaft, Geo Risks Research, NatCatSERVICE.

201
N
National Research Council (2007) Successful Response Starts With a Map. Improving
Geospatial Support for Disaster Management. [Online] Washington DC, The National
Academies Press. Available from: doi:10.17226/11793 [Accessed 23rd October 2015].
NATO (2005) NATO Network Enabled Capability; Feasibility Study. Brussels, NATO
Consultation, Command and Control Agency.
NATO (2006) NATO Common Operational Picture (NCOP). NATO Consultation, Command and
Control Agency (NC3A), 16.11.2006 r.
Nelson, R.R., Todd, P.A. and Wixom, B.H. (2005) Antecedents of information and system
quality: an empirical examination within the context of data warehousing. Journal of
management information systems. [Online] 21 (4), 199-235. Available from: doi:
10.1080/07421222.2005.11045823 [Accessed 17th February 2016].
Netten, N. and Someren, M.v. (2011) Improving Communication in Crisis Management by
Evaluating the Relevance of Messages. Journal of Contingencies and Crisis Management.
[Online] 19 (2), 75-85. Available from: doi:10.1111/j.1468-5973.2011.00636.x [Accessed
23rd October 2015].
Neuvel, J.M., Scholten, H.J. and Brink, A.v.d. (2012) From spatial data to synchronised actions:
The network-centric organisation of spatial decision support for risk and emergency
management. Applied Spatial Analysis and Policy. [Online] 5 (1), 51-72. Available from:
doi:10.1007/s12061-010-9059-z [Accessed 17th February 2016].
NIBS (2007) United Sates National Building Information Modeling Standard Vision 1 – Part 1:
Overview, Principles and Methodologies, Transforming the Building Supply Chain Through
Open and Interoperable Information Exchanges. NIBS.

202
Nicholls, R.J., Hanson, S., Herweijer, C., Patmore, N., Hallegatte, S., Corfee-Morlot, J.,
Château, J. and Muir-Wood, R. (2008) Ranking port cities with high exposure and
vulnerability to climate extremes: Exposure estimates. [Online] OECD environment working
papers, OECD publishing. Number: 1. Available from: doi:10.1787/011766488208
[Accessed 14th April 2016].
Nofi, A.A. (2000) Defining and measuring shared situational awareness. [Online] Center for
naval analyses Alexandria, USA. Report number: CRM-D0002895.A1. Available from:
Url:ADA390136 [Accessed 3rd November 2015].
Nour, M. (2007) Manipulating IFC sub-models in collaborative teamwork environments. In:
Rebolj, D. (ed.) Bringing ITC Knowledge to Work: W78 24th Conference on Information
Technology in Construction: Proceedings of the 24th CIB W78 Conference, Maribor,
Slovenia. pp. 111-117.
Nullmeyer, R.T., Stella, D., Montijo, G.A. and Harden, S.W. (2005). Human factors in Air Force
flight mishaps: Implications for change. In: Proceedings of the 27th Annual
Interservice/Industry Training, Simulation, and Education Conference, Arlington, USA.
National Training Systems Association.
O
Oh, O., Agrawal, M. and Rao, H.R. (2013) Community intelligence and social media services: A
rumor theoretic analysis of tweets during social crises. MIS Quarterly, 37 (2), 407-426.
Oomes, A.H.J. (2004) Organization awareness in crisis management. In: Carle, B. and Walle,
B.v.d. (eds.) Proceedings of the International Workshop on Information Systems on Crisis
Response and Management (ISCRAM), 3-4 May 2004, Brussels.
Oosterom, P.v., Zlatanova, S. and Fendel, E.M. (eds.) (2005) Geo-information for disaster
management. [Online] Berlin, Springer-Verlag. Available from: doi:10.1007/b139115
[Accessed 3rd June 2013].

203
Oruonye, E.D. (2012) The challenges of urban flood disaster management in Nigeria: A case
study of Jalingo LGA, Taraba state Nigeria. International journal of
recent scientific research. [Online] 3 (1), 37-42. Available from:
http://www.recentscientific.com/sites/default/files/Download_152.pdf [Accessed 14th April
2016].
Otim, S. (2006) A case-based knowledge management system for disaster management:
fundamental concepts. In: Walle, v.d. and Turoff, M. (eds.) Proceedings of the 3rd
International ISCRAM Conference, Newark, USA. pp. 598-604.
Oxford Dictionaries (2014) Technology. [Online] Available from:
http://www.oxforddictionaries.com/definition/english/technology?searchDictCode=all
[Accessed 24th September 2014].
Oxford Dictionaries (2015) Incident. [Online] Available from:
http://www.oxforddictionaries.com/definition/english/incident [Accessed 16th October 2015].
Oxford Dictionaries (2016) Quality, Format, Memory. [Online] Available from:
http://www.oxforddictionaries.com/ [Accessed 8th February 2016].
P
Pan, S.L., Pan, G. and Devadoss, P. (2005) E-government capabilities and crisis
management: Lessons from combating SARS in Singapore. MIS Quarterly Executive.
[Online] 4 (4), 385-397. Available from: http://ssrn.com/abstract=2254474 [Accessed 3rd
November 2015].
Paradis, T., Treml, M. and Manone, M. (2013) Geodesign meets curriculum design: integrating
geodesign approaches into undergraduate programs. Journal of Urbanism: International
Research on Placemaking and Urban Sustainability. [Online] 6 (3), 274-301. Available from:
http://dx.doi.org/10.1080/17549175.2013.788054 [Accessed 3rd November 2014].

204
Parker, M.B., Moleshe, V., Harpe, R.d.l. and Wills, G.B. (2006) An evaluation of information
quality frameworks for the World Wide Web. [Online] In: 8th Annual Conference on WWW
Applications, 6-8 September 2006, Bloemfontein, Free State Province, South Africa.
Available from: http://eprints.soton.ac.uk/id/eprint/262908 [Accessed 17th February 2016].
Patricelli, F., Beakley, J.E., Carnevale, A., Tarabochia, M and Lubitz D.K.v. (2008) Disaster
management and mitigation: the telecommunications infrastructure. Disasters. [Online] 33
(1), 23-37. Available from: doi:10.1111/j.1467-7717.2008.01060.x [Accessed 3rd November
2015].
Patterson, T. (1999) Designing 3D Landscapes. In: Cartwright, W., Gartner, G. and Peterson.,
M. (eds.) Multimedia Cartography. Berlin, Springer-Verlag, pp. 217-229.
Pauwels, N., Walle, B.v.d., Hardeman, F. and Soudan, K. (2000) The implications of
irreversibility in emergency response decisions. Theory and Decision. [Online] 49 (1), 25-
51. Available from: doi:10.1023/A:1005155426945 [Accessed 3rd November 2015].
Pelzer, P., Arciniegas, G., Geertman, S. and Kroes, J.d. (2013) Using MapTable® to learn about
sustainable urban development. In: Geertman, S., Toppen, F. and Stillwell, J. (eds.)
Planning support systems for sustainable urban development. Lecture notes in
geoinformation and cartography, Volume 195. [Online] Berlin, Springer, pp. 167-186.
Available from: doi: 10.1007/978-3-642-37533-0_10 [Accessed 18th November 2015].
Pelzer, P., Geertman, S., Heijden, R.v.d. and Rouwette, E. (2014) The added value of planning
support systems: A practitioner’s perspective. Computers, Environment and Urban
Systems. [Online] 48, 16-27. Available from: doi:10.1016/j.compenvurbsys.2014.05.002
[Accessed 18th November 2015].
Penttilä, H. (2006) Describing the changes in architectural information technology to understand
design complexity and free-form architectural expression. Journal of Information
Technology in Construction (ITcon). [Online] 11, 395-408. Available from:
http://www.itcon.org/2006/29 [Accessed 19th May 2014].

205
Perla, P.P., Markowitz, M., Nofi, A.A., Weuve, C., Loughran, J. (2000) Gaming and shared
situation awareness. [Online] Center for naval analyses, Alexandria, USA. Report number:
CRM-D0002722.A2. Available from: Url:ADA390137 [Accessed 16th October 2015].
Perry, W.L., Signori, D. and Boon, J. (2004) Exploring information superiority: a methodology for
measuring the quality of information and its impact on shared awareness. Santa Monica,
USA, National Defense Research Institute, Rand Corporation.
Petter, S., DeLone, W. and McLean, E.R. (2013) Information systems success: The quest for
the independent variables. Journal of Management Information Systems. [Online] 29 (4), 7-
62. Available from: doi:10.2753/MIS0742-1222290401 [Accessed 17th February 2016].
Phillips, C.E.Jr., Ting, T.C. and Demurjian, S.A. (2002) Information sharing and security in
dynamic coalitions. [Online] In: Proceedings of the seventh ACM symposium on Access
control models and technologies, SACMAT '02. New York, USA, ACM. pp. 87-96. Available
from: doi:10.1145/507711.507726 [Accessed 16th October 2015].
Pipino, L.L., Lee, Y.W. and Wang, R.Y. (2002) Data quality assessment. Communications of the
ACM. [Online] 45 (4), 211-218. Available from: doi:10.1145/505248.506010 [Accessed 17th
February 2016].
Plume, J. and Mitchell, J. (2007) Collaborative design using a shared IFC building model -
Learning from experience. Automation in Construction. [Online] 16 (1), 28-36. Available
from: doi:10.1016/j.autcon.2005.10.003 [Accessed 17th November 2014].
Potter, K., Ward, S., Shaw, D., Macdonald, N., White, I., Fischer, T., Butler, D. and Kellagher, R.
(2011) Engineers and planners: sustainable water management alliances. Proceedings of
the Institution of Civil Engineers Engineering Sustainability. [Online] 164 (ES4), 239-247.
Available from: doi:10.1680/ensu.2011.164.4.239 [Accessed 9th November 2015].

206
Q
Quarantelli, E.L. (1988) Disaster crisis management: A summary of research findings. Journal of
Management Studies. [Online] 25 (4), 373-385. Available from: doi:10.1111/j.1467-
6486.1988.tb00043.x [Accessed 17th February 2016].
Quarantelli, E.L. (1997) Problematical aspects of the information/communication revolution for
disaster planning and research: Ten non-technical issues and questions. Disaster
Prevention and Management: An International Journal. [Online] 6 (2), 94-106. Available
from: http://dx.doi.org/10.1108/09653569710164053 [Accessed 16th October 2015].
R
Rai, A., Lang, S.S. and Welker, R.B. (2002) Assessing the validity of IS success models: An
empirical test and theoretical analysis. Information systems research, 13 (1), 50-69.
Raman, M., Ryan, T., Jennex, M.E. and Olfman, L. (2012) Wiki technology and emergency
response: An action research study. [Online] In: Jennex, M.E. (ed.) Managing Crises and
Disasters with Emerging Technologies: Advancements. USA, Information Science
Reference, IGI Global. Available from: doi:10.4018/978-1-4666-0167-3.ch005 [Accessed
16th October 2015].
Redding, R.E. (1992) Analysis of operational errors and workload in air traffic control. [Online]
In: Proceedings of the Human Factors and Ergonomics Society Annual Meeting. SAGE
journals. 36 (17), pp. 1321-1325. Available from: doi:10.1518/107118192786749252
[Accessed 16th October 2015].
Ren, Y., Kiesler, S. and Fussell, S.R. (2008) Multiple group coordination in complex and
dynamic task environments: Interruptions, coping mechanisms and technology
recommendations. Journal of Management Information Systems. [Online] 25 (1), 105-130.
Available from: doi:10.2753/MIS0742-1222250105 [Accessed 3rd November 2015].

207
Renn, O. (1987) Evaluation of risk communication: Concepts. strategies, and guidelines. In:
Managing environmental risks; Proceedings of an APCA International Speciality
Conference, October 1987, Washington, D.C. Washington, D.C., APCA. pp. 99-127.
Renn, O. and Levine, D. (1991) Credibility and trust in risk communication. In: Kasperson R.E.
and Stallen P.J.M. (eds.) Communicating Risks to the Public. [Online] Technology, risk and
society, part 2, vol. 4, Dordrecht, The Netherlands, Springer Netherlands, pp. 175-217.
Available from: doi:10.1007/978-94-009-1952-5_10 [Accessed 7th November 2014].
Reynolds, B. and Seeger, M. (2012) Crisis Emergency and Risk Communication. Be first, be
right, be credible. 2012 edition, US Department of Health and Human Services, Centers for
Disease Control and Prevention.
Rijke, J., Smith, J.V., Gersonius, B., Herk, S.v., Pathirana, A., Ashley, R. Wong, T. and
Zevenbergen, C. (2014) Operationalising resilience to drought: Multi-layered safety for
flooding applied to droughts. Journal of Hydrology. [Online] 519, 2652-2659. Available from:
http://dx.doi.org/10.1016/j.jhydrol.2014.09.031 [Accessed 18th November 2014].
Rogers, E.M. (2003) Diffusion of innovations. 5th edition, New York, USA, The Free Press.
Roumpani, F. (2013) Developing Classical and Contemporary Models in ESRI's CityEngine.
[Online] UCL Centre of Advanced Spatial Analysis. Working Papers Series, Paper 191.
Available from: http://www.bartlett.ucl.ac.uk/casa/pdf/paper191 [Accessed 26th May 2014]
Roy, J. (2007) A Knowledge-Centric View of Situation Analysis Support Systems. [Online]
Valcartier QUE, Canada, Defence R&D Canada. Technical Report Number: TR 2005-419.
Available from: http://cradpdf.drdc-rddc.gc.ca/PDFS/unc56/p527184.pdf [Accessed 14th
April 2016].

208
S
Sadek E., Jamaludin A., Rosdi B. and Kadzim M. (2002) The Design and Development of a
Virtual 3D City Model. [Online] Available from:
http://www.hitl.washington.edu/people/bdc/virtualcities.pdf?q=itm [Accessed: 5th November
2014].
Sagun, A., Bouchlaghem, D. and Anumba, C.J. (2009) A scenario‐based study on information
flow and collaboration patterns in disaster management. Disasters. [Online] 33 (2), 214-
238. Available from: doi:10.1111/j.1467-7717.2008.01071.x [Accessed 17th February 2016].
Sakaguchi, T. and Frolick, M.N. (1997) A review of the data warehousing literature. Journal of
Data Warehousing, 2 (1), 34-54.
Salas, E., Prince, C., Baker, D.P. and Shrestha, L. (1995) Situation awareness in team
performance: Implications for measurement and training. Human Factors: The Journal of
the Human Factors and Ergonomics Society. [Online] 37 (1), 123-136. Available from:
doi:10.1518/001872095779049525 [Accessed 3rd November 2015].
Salmon, P.M., Stanton, N.A., Jenkins, D.P., Walker, G.H., Young, M.S. and Aujla, A. (2007)
What really is going on? review, critique and extension of situation awareness theory. In:
Harris, D. (ed.) Proceedings of the 7th International Conference on Engineering Psychology
and Cognitive Ergonomics, EPCE 2007, HCII 2007 International, Beijing, China. Berlin,
Heidelberg, Springer, LNAI 4562, pp. 407-416.
Salmon, P.M., Stanton, N.A., Walker, G.H., Baber, C., Jenkins, D.P., McMaster, R. and Young,
M.S. (2008) What really is going on? Review of situation awareness models for individuals
and teams. Theoretical Issues in Ergonomics Science. [Online] 9 (4), 297-323. Available
from: doi:10.1080/14639220701561775 [Accessed 3rd November 2015].
Salmon, P., Stanton, N., Jenkins, D. and Walker, G. (2011) Coordination during multi-agency
emergency response: issues and solutions. Disaster Prevention and Management: An
International Journal. [Online] 20 (2), 140-158. Available from:
http://dx.doi.org/10.1108/09653561111126085 [Accessed 17th February 2016].

209
Samarajiva, R. (2005) Mobilizing information and communications technologies for effective
disaster warning: Lessons from the 2004 tsunami. New Media and Society. [Online] 7 (6),
731-747. Available from: doi:10.1177/1461444805058159 [Accessed 17th February 2016].
Sandom, C. (2012) Do you get the picture? Situation awareness and system safety. In: Cant, T.
(ed.) Proceedings of the Australian System Safety Conference (ASSC 2012) 23-25 May
2012, Brisbane, Australia. Darlinghurst, Australia, Australian Computer Society, Inc. 145,
pp. 107-115.
Santato, S., Bender, S. and Schaller, M. (2013) The European Floods Directive and
Opportunities offered by Land Use Planning. Climate Service Center, Germany. CSC
Report number: 12.
Sapateiro, C. and Antunes, P. (2009) An emergency response model toward situational
awareness improvement. In: Landgren, J. and Jul, S. (eds.) Proceedings of the 6th
International Conference on Information Systems for Crisis Response and Management,
ISCRAM 2009, 10-13 May 2009, Gothenburg, Sweden. ISCRAM.
Sarter, N.B. and Woods, D.D. (1991) Situation awareness: A critical but ill-defined phenomenon.
The International Journal of Aviation Psychology. [Online] 1 (1), 45-57. Available from:
doi:10.1207/s15327108ijap0101_4 [Accessed 3rd November 2015].
Sauro, J. (2011) Measuring usability with the System Usability Scale (SUS). [Online]
MeasuringU Available from: http://www.measuringu.com/sus.php [Accessed 17th February
2016].
Sayers P.B., Gouldby, B.P., Simm, J.D., Meadowcroft, I. and Hall, J. (2003) Risk, Performance
and Uncertainty in Flood and Coastal Defence – A Review. Defra/Environment Agency.
R&D Technical Report number: FD2302/TR1.
Schaafstal, A.M., Johnston, J.H. and Oser, R.L. (2001) Training teams for emergency
management. Computers in Human Behavior. [Online] 17 (5-6), 615-626. Available from:
doi:10.1016/S0747-5632(01)00026-7 [Accessed 3rd November 2015].

210
Schevers, H., Mitchell, J., Akhurst, P., Marchant, D., Bull, S., McDonald, K., Drogemuller, R. and
Linning, C. (2007) Towards digital facility modelling for Sydney opera house using IFC and
semantic web technology. ITcon, 12, 347-362.
Schraagen, J.M., Veld, M.H. and Koning, L.d. (2010) Information sharing during crisis
management in hierarchical vs. network teams. Journal of contingencies and crisis
management. [Online] 18 (2), 117-127. Available from: doi:10.1111/j.1468-
5973.2010.00604.x [Accessed 3rd November 2015].
Seddon, P.B. and Kiew, M.-Y. (1994) A partial test and development of the DeLone and McLean
model of IS success. In: DeGross, J.L., Huff, S.L. and Munro, M.C. (eds.) Proceedings of
the 15th International Conference on Information Systems, (ICIS 94), Vancouver, Canada.
Atlanta, GA, USA, Association for Information Systems, pp. 99-110.
Seddon, P.B. (1997) A respecification and extension of the DeLone and McLean model of IS
success. Information systems research. [Online] 8 (3), 240-253. Available from:
http://dx.doi.org/10.1287/isre.8.3.240 [Accessed 17th February 2016].
Seppänen, H., Mäkelä, J., Luokkala, P. and Virrantaus, K. (2013) Developing shared situational
awareness for emergency management. Safety Science. [Online] 55, 1-9. Available from:
doi:10.1016/j.ssci.2012.12.009 [Accessed 3rd November 2015].
Seppänen, H. and Virrantaus, K. (2015) Shared situational awareness and information quality in
disaster management. Safety Science. [Online] 77, 112-122. Available from:
doi:10.1016/j.ssci.2015.03.018 [Accessed 17th February 2016].
Shannon, C.E. and Weaver, W. (1949) The mathematical theory of communication. Urbana,
USA, University of Illinois Press.
Shelton, H.H. (2001) Doctrine for Joint Operations. US military joint chiefs of staff. Joint
Publication 3-0.

211
Shen, W., Hao, Q., Mak, H., Neelamkavil, J., Xie, H., Dickinson, J., Thomas, R., Pardasani, A.
and Xue, H. (2010) Systems integration and collaboration in architecture, engineering,
construction, and facilities management: A review. Advanced Engineering Informatics.
[Online] 24 (2), 196-207. Available from: doi:10.1016/j.aei.2009.09.001 [Accessed 1st
December 2014].
Shiode, N. (2001) 3D urban models: Recent developments in the digital modelling of urban
environments in three-dimensions. GeoJournal. [Online] 52 (3), 263-269. Available from:
doi:10.1023/A:1014276309416 [Accessed 14th April 2014].
Simon, H.A. (1972) Theories of bounded rationality. In: McGuire, C.B. and Radner, R.
(eds.) Decision and organization. North Holland Publishing Company, pp. 161-176.
Simon, H.A. (1996) The sciences of the artificial. 3rd edition, Cambridge, Massachusetts, USA,
The MIT press.
Singh, P., Singh, P., Park, I., Lee, J. and Rao H.R. (2009) Information Sharing: A study of
information attributes and their relative significance during catastrophic events. In: Knapp,
K.J. (ed.) Cyber-Security and Global Information Assurance: Threat Analysis and Response
Solutions. [Online] IGI Global. Available from: doi:10.4018/978-1-60566-326-5 [Accessed
16th October 2015].
Slovic, P., Fischhoff, B. and Lichtenstein, S. (1984) Behavioral decision theory perspectives on
risk and safety. Acta psychologica, 56 (1), 183-203.
Slovic, P., Finucane, M.L., Peters, E. and MacGregor, D.G. (2004) Risk as analysis and risk as
feelings: Some thoughts about affect, reason, risk, and rationality. Risk analysis, 24 (2),
311-322.
Smith, C.A.P. and Hayne, S.C. (1997) Decision making under time pressure. Pressure. An
investigation of decision speed and decision quality of computer-supported groups.
Management Communication Quarterly. [Online] 11 (1), 97-126. Available from:
doi:10.1177/0893318997111005 [Accessed 16th October 2015].

212
Smith, K. and Hancock, P.A. (1995) Situation awareness is adaptive, externally directed
consciousness. Human Factors: The Journal of the Human Factors and Ergonomics
Society. [Online] 37 (1), 137-148. Available from: doi:10.1518/001872095779049444
[Accessed 16th October 2015].
Smithson, S. and Hirschheim, R. (1998) Analysing information systems evaluation: Another look
at an old problem. European Journal of Information Systems. [Online] 7 (3), 158-174.
Available from: doi:10.1057/palgrave.ejis.3000304 [Accessed 17th February 2016].
Song, Y., Hamilton, A. and Wang, H. (2007) Built environment data integration using nD
Modeling. ITcon. [Online] 12, 429–442. Available from: http://www.itcon.org/2007/28
[Accessed 17th November 2014].
Stadler, A. and Kolbe, T.H. (2007) Spatio-semantic Coherence in the Integration of 3D City
Models. In: Stein, A. (ed.) WG II/7: Proceedings of the 5th International ISPRS Symposium
on Spatial Data Quality, 13-15 June 2007, ITC, Enschede, The Netherlands. [Online]
International Society for Photogrammetry and Remote Sensing. (ISPRS), XXXVI-2/C43.
Available from: http://www.isprs.org/proceedings/XXXVI/2-C43/Session1/paper_Stadler.pdf
[Accessed 19th May 2014].
Stanchev, H., Palazov, A. and Stancheva, M. (2009) 3D GIS for flood risk assessment of Varna
Bay due to extreme sea level rise. Journal of Coastal Research, 56, 1597-1601.
Stanovich, M. (2006) Network-centric emergency response: The challenges of training for a new
command and control paradigm. Journal of emergency management. 4 (2), 57-64.
Stanton, N.A., Chambers, P.R.G. and Piggott, J. (2001) Situational awareness and safety.
Safety Science. [Online] 39 (3), 189-204. Available from: doi:10.1016/S0925-
7535(01)00010-8 [Accessed 16th October 2015].

213
Steenbruggen, J., Nijkamp, P., Smits, J.M. and Grothe, M. (2011) Traffic incident management:
A common operational picture to support situational awareness of sustainable mobility.
[Online] Amsterdam, Faculty of Economics and Business Administration,
Vrije Universiteit Amsterdam, Research Memorandum 2011-33. Available from:
http://degree.ubvu.vu.nl/repec/vua/wpaper/pdf/20110033.pdf [Accessed 17th February
2016].
Steenbruggen, J., Nijkamp, P., Smits, J. and Grothe, M. (2012) Traffic Incident Management, A
Common Operational Picture to support Situational Awareness of Sustainable Mobility.
International Journal of Transport Economics. XXXIX (1), 131-170.
Steenbruggen, J. (2013) Road traffic incident management and situational awareness. PhD
thesis, Vrije Universiteit Amsterdam.
Steenbruggen, J., Krieckaert, M., Rietveld, P., Scholten, H. and Vlist, M.v.d. (2015) The
usefulness of net-centric support tools for traffic incident management. Amsterdam, Faculty
of Economics and Business Administration, Vrije Universiteit Amsterdam, Research
Memorandum 2015-8.
Steinitz, C. (1995) A Framework for Landscape Planning Practice and Education. Process
Architecture, 127.
Steinitz, C. (2012) A Framework for Geodesign. Redlands, California, ESRI.
Stephens, J., Leonard, D., Groom, C. and Nisbet, N. (2005) Life-cycle data for buildings:
Opportunities for the IFC model based operation and maintenance (Ifc-mBomb). IAI UK Ltd.
Strong, D.M., Lee, Y.W. and Wang, R.Y. (1997) Data quality in context. Communications of the
ACM. [Online] 40 (5), 103-110. Available from: doi:10.1145/253769.253804 [Accessed 16th
October 2015].

214
Stvilia, B., Gasser, L., Twidale, M.B. and Smith, L.C. (2007). A framework for information quality
assessment. Journal of the American society for information science and technology.
[Online] 58 (12), 1720-1733. Available from: doi:10.1002/asi.20652 [Accessed 18th January
2016].
Succar, B. (2009) Building information modelling framework: A research and delivery foundation
for industry stakeholders. Automation in construction. [Online] 18 (3), 357-375. Available
from: doi:10.1016/j.autcon.2008.10.003 [Accessed 22nd September 2014].
Suri, N., Benincasa, G., Tortonesi, M., Stefanelli, C., Kovach, J., Winkler, R., Kohler, U.S.R.,
Hanna, J., Pochet, L. and Watson, S. (2010) Peer-to-peer communications for tactical
environments: Observations, requirements, and experiences. [Online] IEEE
Communications Magazine, 48 (10), 60-69. Available from:
doi:10.1109/MCOM.2010.5594678 [Accessed 16th October 2015].
Swiss Re (2013) Mind the risk. A global ranking of cities under threat from natural disasters.
[Online]. Available from: http://preventionweb.net/go/34728 [Accessed 5th November 2014].
T
Tanyer, A.M. and Aouad, G. (2005) Moving beyond the fourth dimension with an IFC-based
single project database. Automation in Construction. [Online] 14 (1), 15-32. Available from:
doi:10.1016/j.autcon.2004.06.002 [Accessed 17th November 2014].
Teo, T.S. and Wong, P.K. (1998) An empirical study of the performance impact of
computerization in the retail industry. Omega [Online] 26 (5), 611-621. Available from:
doi:10.1016/S0305-0483(98)00007-3 [Accessed 17th February 2016].
The Dutch Ministry of the Interior and Kingdom Relations (2007) National high water and
flooding: Emergency response plan. Driebergen, The Netherlands, Crisis Control
Department, Directorate-General for Public Safety and Security.
The Economist (1997) The lesson of hurricane Pauline. [Online] Available from:
http://www.economist.com/node/102891 [Accessed 22nd February 2016].

215
The Netherlands Red Cross (2010) Legal Aspects of International Disaster Response in Dutch
Emergencies and Crisis Situations. [Online] The Hague, The Netherlands. Available from:
http://www.bibalex.org/Search4Dev/files/402035/345817.pdf [Accessed 8th February 2016].
Tingsanchali, T. (2012) Urban flood disaster management. Procedia engineering. [Online] 32,
25-37. Available from: doi:10.1016/j.proeng.2012.01.1233 [Accessed 20th April 2016].
TMO (2009) Report of findings. [In Dutch] Rapport van bevindingen. Den Haag, Taskforce
Management Overstromingen.
Townsend, F.F. (2006) The federal response to hurricane Katrina: Lessons learned. [Online]
Washington DC, USA, The White House. Available from:
http://www.floods.org/PDF/Katrina_Lessons_Learned_0206.pdf [Accessed 17th February
2016].
Treichler, D.G. (1967) Are you missing the boat in training aid? Film and audio-visual
communication, 1, 14-16.
Trompette, P. and Vinck, D. (2009) Revisiting the Notion of Boundary Object. Revue
d'Anthropologie des Connaissances. [Online] 3 (1), 3-25. Available from:
doi:10.3917/rac.006.0003 [Accessed 21st September 2015].
Tsimopoulou, V., Jonkman, S.N., Kolen, B., Maaskant, B., Mori, N. and Yasuda, T. (2013) A
multi-layered safety perspective on the tsunami disaster in Tohoku, Japan. In: Klijn and
Schweckendiek (eds.) Proceedings of the Flood Risk 2012 conference, Rotterdam, The
Netherlands. London, Taylor and Francis Group. pp. 981-990.
Turoff, M. (2002) Past and future emergency response information systems. Communications of
the ACM. [Online] 45 (4), 29-32. Available from: doi:10.1145/505248.505265 [Accessed 21st
September 2015].

216
Turoff, M., Chumer, M., Hiltz, S.R., Klashner, R., Alles, M., Vasarhelyi, M. and Kogan, A.
(2004a) Assuring homeland security: continuous monitoring, control, and assurance of
emergency preparedness. Journal of Information Technology Theory and Application, 6
(3), 1-24.
Turoff, M., Chumer, M., Walle, B.v.d. and Yao, X. (2004b) The Design of a Dynamic Emergency
Response Management Information System (DERMIS). Journal of Information Technology
Theory and Application, 5 (4), 1-35.
Twigger-Ross, C., Fernandez-Bilbao, A., Colbourne, L., Tapsell, S., Watson, N., Kashefi, E.,
Walker, G. and Medd, W. (2009) Putting People and Places at the Centre: Improving
Institutional and Social Response to Flooding. In: Samuels, P., Huntington, S., Allsop, W.
and Harrop, J. (eds.) Flood Risk Management: Research and practice: Proceedings of the
European Conference On Flood Risk Management Research Into Practice (Floodrisk), 30
September – 2 October 2008, Oxford, UK. Leiden, CRC Press/Balkema. pp. 849–854.
U
U.S. Department of Health and Human Services (2002) Communicating in a crisis: Risk
communication guidelines for public officials. [Online] Washington DC, USA, US
Department of Health and Human Services. Available from:
http://www.orau.gov/cdcynergy/erc/content/activeinformation/resources/HHSRiskCommPri
mer.pdf [Accessed 20th April 2016].
UK Ministry of Defense (2005) Networked Enabled Capability. UK Ministry of Defence. JSP 777.
UN (2014) Population facts: Our urbanizing world. United Nations Department of Economic and
Social Affairs Population Division. Report number: 2014/3.
UNESCAP (2013) Statistical yearbook for Asia and the Pacific 2013. [Online] Thailand, United
Nations Economic and Social Commission for Asia and the Pacific (UNESCAP). Available
from: http://www.unescap.org/stat/data/syb2013/ESCAP-syb2013.pdf [Accessed 16th
October 2015].

217
UNIDO (2006) Role of standards – A guide for small and medium-sized enterprises. Working
paper. Vienna, UNIDO.
UNISDR (2007) Hyogo Framework for Action 2005-2015: Building the Resilience of Nations and
Communities to Disasters. United Nations. Extract from the final report of the World
Conference on Disaster Reduction (A/CONF.206/6).
UNISDR (2009) Terminology on disaster risk reduction. Geneva, Switzerland, United Nations
International Strategy for Disaster Risk Reduction.
US Select Bipartisan Committee (2006) A failure of initiative. Final Report of the Select
Bipartisan Committee to Investigate the Preparation for and Response to Hurricane Katrina.
[Online] Washington DC, USA, Select bipartisan committee, House of Representatives.
Report 000-000. Available from: http://www.gpoacess.gov/congress/index.html [Accessed
16th October 2015].
V
Vanlande, R., Nicolle, C. and Cruz, C. (2008) IFC and building lifecycle management.
Automation in Construction. [Online] 18 (1), 70-78. Available from:
doi:10.1016/j.autcon.2008.05.001 [Accessed 17th November 2014].
Vanneuville, W., Kellens W., Maeyer P.D., Reniers G. and Witlox F. (2011) Is ‘Flood Risk
Management’ Identical to ‘Flood Disaster Management’? [Online] EarthZine, IEEE
Committee on Earth Observation (ICEO). Available from: http://earthzine.org/2011/03/21/is-
flood-risk-management-identical-to-flood-disaster-management/ [Accessed 20th April 2016].
Ven, G.P.v.d. (1993) Man-made Lowlands, History of Water Management and Land
Reclamation in the Netherlands. International Commission on Irrigation and Drainage
(ICID), Utrecht, The Netherlands.

218
Ven, J.v.d, Rijk, R.v., Essens, P. and Frinking, E. (2008) Network centric operations in crisis
management. In: Fiedrich, F. and Walle, B.v.d. (eds.) Proceedings of the 5th International
Information Systems for Crisis Response and Management (ISCRAM) Conference, May
2008, Washington DC, USA. pp.764-773.
Vesterinen, S. (2009) SHIFT: Shared Information Framework and Technology. [Online]
Department of Military Technology, Finnish Defence University. Concept version 0.9.
Available from: Url:ADA597645 [Accessed 23rd February 2016].
Vinet, F. (2008) From hazard reduction to integrated risk management: Toward adaptive flood
prevention in Europe. In: Proverbs, D., Brebbia, C.A. and Penning-Roswell, E. (eds.) 1st
International Conference on Flood Recovery, Innovation and Response (FRIAR), 2-3 July
2008, London, UK. WIT press. pp. 113-122.
Vretanos, P.A. (ed.) (2002) Web Feature Service Implementation Specification. Open GIS
Consortium Inc., Version1.0.0, OpenGIS® Implementation Specification, OGC Doc. No. 02-
058.
W
Walle, B.v.d. and Turoff, M. (2007) Emergency response information systems: Emerging trends
and technologies. Communications of the ACM. [Online] 50 (3), 29-31. Available from:
doi:10.1145/1226736.1226760 [Accessed 23rd February 2016].
Walle, B.v.d. and Turoff, M. (2008) Decision support for emergency situations. Information
Systems and E-Business Management. [Online] 6 (3), 295-316. Available from:
doi:10.1007/s10257-008-0087-z [Accessed 21st September 2015].
Walter, J. (ed.) (2005) World disasters report: Focus on information in disasters. [Online]
Geneva, Switzerland, International Federation of Red Cross and Red Crescent Societies.
Available from: http://www.ifrc.org/Global/Publications/disasters/WDR/69001-WDR2005-
english-LR.pdf [Accessed 22nd February 2016].

219
Wand, Y. and Wang, R.Y. (1996) Anchoring data quality dimensions in ontological foundations,
Communications of the ACM. [Online] 39 (11), 86-95. Available from:
doi:10.1145/240455.240479 [Accessed 15th February 2016].
Wang, R.Y., Reddy, M.P. and Kon, H.B. (1995a) Toward quality data: An attribute-based
approach. Decision Support Systems. [Online] 13 (3), 349-372. Available from:
doi:10.1016/0167-9236(93)E0050-N [Accessed 23rd February 2016].
Wang, R.Y., Storey, V.C. and Firth, C.P. (1995b) A framework for analysis of data quality
research. IEEE Transactions on Knowledge and Data Engineering. [Online] 7 (4), 623-640.
Available from: doi:10.1109/69.404034 [Accessed 23rd February 2016].
Wang, R.Y. and Strong, D.M. (1996) Beyond accuracy: what data quality means to data
consumers. Journal of management information systems. [Online] 12 (4), 5-33. Available
from: doi:10.1080/07421222.1996.11518099 [Accessed 23rd February 2016].
Wang, R.Y. (1998) A product perspective on total data quality management. Communications of
the ACM. [Online] 41 (2), 58-65. Available from: doi:10.1145/269012.269022 [Accessed
23rd February 2016].
Wark, S., Lambert, D., Nowina-Krowicki, M., Zschorn, A. and Pang, D. (2009) Situational
awareness: Beyond dots on maps to virtually anywhere. [Online] In: Proceedings of
SimTecT Conference, 15-18 June 2009, Adelaide, Australia. Defence Science
and Technology Organization (DSTO) publications. Available from:
http://dspace.dsto.defence.gov.au/dspace/handle/1947/9841 [Accessed 20th April 2016].
Weick, K.E. (1990) The vulnerable system: An analysis of the Tenerife air disaster. Journal of
management. [Online] 16 (3), 571-593. Available from: doi:10.1177/014920639001600304
[Accessed 23rd February 2016].
Wickens, C.D. (2008) Situation awareness: Review of Mica Endsley's 1995 articles on situation
awareness theory and measurement. Human Factors: The Journal of the Human Factors
and Ergonomics Society. [Online] 50 (3), 397-403. Available from:
doi:10.1518/001872008X288420 [Accessed 21st September 2015].

220
Wiese, C.R. (2006) Organizing homeland security after Katrina: Is adaptive management what’s
missing? Public Administration Review. [Online] 66 (3), 302-318. Available from:
doi:10.1111/j.1540-6210.2006.00587.x [Accessed 21st September 2015].
Wilson, C. (2004) Network Centric Warfare: Background and Oversight Issues for Congress.
[Online] Library of congress Washington DC congressional research service. Available
from: Url:ADA476256 [Accessed 21st October 2015].
Wixom, B.H. and Watson, H.J. (2001) An empirical investigation of the factors affecting data
warehousing success. MIS quarterly. [Online] 25 (1), 17-41. Available from:
doi:10.2307/3250957 [Accessed 15th February 2016].
Wixom, B.H. and Todd, P.A. (2005) A theoretical integration of user satisfaction and technology
acceptance. Information systems research. [Online] 16 (1), 85-102. Available from:
doi:10.1287/isre.1050.0042 [Accessed 15th February 2016].
Wolbers, J. and Boersma, K. (2013) The common operational picture as collective
sensemaking. Journal of Contingencies and Crisis Management. [Online] 21 (4), 186-199.
Available from: doi:10.1111/1468-5973.12027 [Accessed 21st September 2015].
Wu, I. and Hsieh, S.H. (2012) A framework for facilitating multi-dimensional information
integration, management and visualization in engineering projects. Automation in
Construction. [Online] 23, 71-86. Available from: doi:10.1016/j.autcon.2011.12.010
[Accessed 5th November 2014].
Y
Yin, J., Lampert, A., Cameron, M., Robinson, B. and Power, R. (2012) Using social media to
enhance emergency situation awareness. IEEE Intelligent Systems. [Online] 27 (6), 52-59.
Available from: https://delvalle.bphc.org/pluginfile.php/13922/mod_resource/content/2/YIN-
IS2012.pdf [Accessed 5th November 2014].

221
Yu, K., Froese, T. and Grobler, F. (2000) A development framework for data models for
computer-integrated facilities management. Automation in construction. [Online] 9 (2), 145-
167. Available from: doi:10.1016/S0926-5805(99)00002-3 [Accessed 17th November 2014].
Z
Zimmermann. R. (1987) A process framework for risk communication. Science, Technology,
and Human Values, 12 (3-4), 131-137.
Zlatanova, S. and Holweg, D. (2004) 3D Geo-information in emergency response: A framework.
[Online] In: Proceedings of the 4th International Symposium on Mobile Mapping Technology
(MMT2004), 29-31 March 2004, Kunming, China. Available
from:http://www.gdmc.nl/publications/2004/3D_Geo-information_Emergency_Response.pdf
[Accessed 5th November 2014].
Zlatanova, S. and Fabbri, A.G. (2009) Geo-ICT for risk and disaster management. [Online] In:
Scholten, H.J., Velde, R.v.d. and Manen, N.v. (eds.) Geospatial Technology and the Role of
Location in Science. Dordrecht, Netherlands, Springer, pp. 239-266. Available from:
doi:10.1007/978-90-481-2620-0_13 [Accessed 20th April 2016].
Zwaneveld, P., Wilmink, I., Immers, B., Malipaard, E. and Heyse, D. (1998) An overview of
Incident Management projects in the Netherlands. In: Pan-European transport issues.
Traffic management and road safety. proceedings of seminars J and K held at AET
European transport conference, Loughborough university, England, 14-18 September 1998.
[Online] London, England, PTRC Education and Research Services Limited 428, pp. 289-
301. Available from: http://worldcat.org/isbn/0860503100 [Accessed 3rd December 2015].

222

223
APPENDIX A: QUESTIONNAIRES ANSWERED BY THE PARTICIPANTS OF THE
FIELD EXERCISE.
The appendix provides the questionnaires (in Dutch) that have been used during the field
exercise of this thesis (chapter 5). The questionnaires have been answered by the eight
participants of the field exercise who were well trained emergency response professionals.
Initially, the questionnaire briefly introduces the participant to its purpose and content.
Thereafter, it includes general questions regarding age, gender, organization, professional
experience and educational background of the participants. Then the questionnaire is consisted
of two parts. The first part aims to acquire the opinion of the professionals in regards to the
quality of the information and also about the quality of the systems that they experience in their
daily practice. This part should be answered before the start of the flood scenarios of the field
exercise. The second part purports to acquire the professionals’ appreciation on information
quality and system quality dimensions based on the experience gained through their
participation in this exercise. In this context, the participants are required to rate statements in a
five point scale (from stongly disagree to stronlgy agree) about the quality of the information
experienced during the first scenario as well as about the quality of the information experienced
during the second scenario. Furthermore, they are asked to rate statements in a five point scale
concerning the quality of the system experienced during both the scenarios. Below, the
questionnaires answered by the eight respondents of the field exercise are presented in
scanned form.

224
Respondent 1:

225

226
Respondent 2:

227

228
Respondent 3:

229

230
Respondent 4:

231

232
Respondent 5:

233

234
Respondent 6:

235

236
Respondent 7:

237

238
Respondent 8:

239

240

241
ΠΕΡΙΛΗΨΗ – SUMMARY IN GREEK.
Η διδακτορική διατριβή με τίτλο «Συστήματα Στήριξης Αποφάσεων για Συμμετοχική Διαχείριση
της Πλημμυρικής Διακινδύνευσης και των Πλημμυρικών Καταστροφών», έχει ως στόχο να
διερευνήσει κριτικά την υφιστάμενη γνώση και να εξεύρει και να προτείνει λύσεις προς την
κατεύθυνση βελτίωσης της επίγνωσης μιας κατάστασης προκειμένου οι διαδικασίες λήψης
αποφάσεων για διαχείριση της πλημμυρικής διακινδύνευσης και των πλημμυρικών
καταστροφών να υποστηρίζονται με τρόπο αποτελεσματικό. Προς επίτευξη τούτου, η διατριβή
πραγματοποιεί δύο θεωρητικές καθώς και δύο εμπειρικές μελέτες.
Γεωσχεδιάζοντας ένα πολυεπίπεδο σύστημα προστασίας από πλημμύρες.
Η πρώτη θεωρητική μελέτη (κεφάλαιο 2) περιλαμβάνει βιβλιογραφική ανασκόπηση όσον αφορά
στο σχέδιο πολυεπίπεδης ασφάλειας από πλημμύρες. Αυτό το σχέδιο έχει υιοθετηθεί από την
Ολλανδία κατόπιν της ευρωπαϊκής οδηγίας (2007/60/EC) και αποτελεί μια ολοκληρωμένη
προσέγγιση στη διαχείριση της πλημμυρικής διακινδύνευσης η οποία αποτελείται από τρία
επίπεδα: 1. Ελαχιστοποίηση της πιθανότητας πλημμυρών μέσω προληπτικών μέτρων; 2.
Ελαχιστοποίση των επιπτώσεων στην περίπτωση ενός πλημμυρικού γεγονότος μέσω χωρικών
λύσεων και 3. Προετοιμασία για απόκριση σε περίπτωση εκδήλωσης πλημμύρας. Ένα τέτοιο
πολυεπίπεδο σύστημα προστασίας από τις πλημμύρες είναι περισσότερο παράλληλο παρά
σειριακό. Αυτό αιτιολογείται από το γεγονός ότι σε περίπτωση αστοχίας των μέτρων
προστασίας που αντιστοιχούν σε ένα επίπεδο δε συνεπάγεται αστοχία ολόκληρου του
συστήματος. Ωστόσο το σύστημα δεν είναι ακριβώς παράλληλο καθώς σε περίπτωση αστοχίας
των προληπτικών μέτρων που αντιστοιχούν στο επίπεδο 1, τα μέτρα που αντιστοιχούν στα
επίπεδα 2 και 3 δύνανται να μειώσουν τις συνέπεις μιας πλημμύρας αλλά όχι να τις εξαλείψουν.
Επομένως, τί θεωρείται αστοχία όσον αφορά στα επίπεδα 2 και 3 πρέπει να συμφωνηθεί σε
επίπεδο πολιτικής. Μια τέτοια απόφαση θα βοηθήσει στη βέλτιστη κατανομή βαρών μεταξύ των
τριών επιπέδων του πολυεπίπεδου συστήματος προστασίας από πλημμύρες. Όμως, τα
βέλτιστα μέτρα ασφαλείας για πλημμύρες δεν πρέπει να βασίζονται μόνο στην οικονομική τους
αποδοτικότητα αλλά και στην κοινωνική τους αποδοχή. Η ποιοτική ανάλυση του πολυεπίπεδου
αυτού συστήματος προστασίας από πλημμύρες κατέδειξε την ανάγκη ενός μεθοδολογικού
πλαισίου το οποίο θα παροτρύνει τη συμμετοχή των ενδιαφερόμενων μερών, την ενεργό

242
συμμετοχή των πολιτών, τον πειραματισμό και την εκτίμηση των επιπτώσεων προς την
κατεύθυνση επίτευξης του βέλτιστου συνδυασμού μέτρων ασφαλείας τα οποία θα
ανταποκρίνονται στα ιδιαίτερα χαρακτηριστικά και στις συνθήκες μιας περιοχής μελέτης.
Στο πλαίσια αυτό, το κεφάλαιο εισάγει την έννοια, τη μεθοδολογία καθώς και τα μοντέλα του
γεωσχεδιασμού. Το συγκριτικό πλεονέκτημα αυτής της μελέτης σε σχέση με τις προηγούμενες,
είναι ότι ενορχηστρώνει θεωρητικά και συστηματοποιεί το πολυεπίπεδο σύστημα προστασίας
από τις πλημμύρες σε ένα μεθολογικό πλαίσιο προσανατολισμένο στο γεωσχεδιασμό που
παρακινεί τη συμμετοχή και αλληλεπίδραση, επιτρέπει τη διεπιστημονική συνεργασία,
προσδιορίζει τους ρόλους των διαφόρων φορέων, αξιοποιεί όλη την γεωγραφική πληροφορία
και γνώση, προωθεί την επικοινωνία της υπό εξέταση κατάστασης, διευκολύνει την κατανόηση
και αξιολόγηση προτάσεων και υποστηρίζει την ανάδραση των συμμετοχόντων όποτε αυτή
χρειάζεται.
Πολύ σημαντική για το πολυεπίπεδο σύστημα προστασίας από πλημμύρες είναι η καταγραφή
όλης της χρειώδους πληροφορίας. Κατά τη διάρκεια αυτής της θεωρητικής μελέτης,
πραγματοποιήθηκε απόπειρα περιεκτικής ανασκόπησης της ζητούμενης πληροφορίας, παρόλο
που έρευνα βασισμένη σε ερωτηματολόγια δύναται να φωτίσει περισσότερο τις απαιτήσεις σε
πληροφορία που αφορούν στο κάθε επίπεδο πλημμυρικής ασφάλειας ξεχωριστά. Με αυτό τον
τρόπο, είναι δυνατόν να εξευρεθεί και κατά πόσον η ίδια πληροφορία ανταποκρίνεται στις
ανάγκες περισσότερων του ενός επιπέδων ασφαλείας. Γενικά, η απαιτούμενη πληροφορία είναι
χωρικά συσχετισμένη και διακρίνεται σε ημι-στατική καθώς και σε εξαγόμενη από μοντέλα.
Ωστόσο, η εφαρμογή μέτρων που αφορούν σε προληπτική οργανωμένη εκκένωση χώρου στα
πλαίσια προετοιμασίας για απόκριση σε μια πλημμυρική κατάσταση, απαιτεί δυναμική
πληροφορία.
Εν κατακλείδι, η συστηματοποίηση του πολυεπίπεδου συστήματος προστασίας από πλημμύρες
σε ένα πλαίσιο γεωσχεδιασμού έχει τη δυνατότητα αποτελεσματικής υποστήριξης της
διαδκασίας λήψης αποφάσεων μέσα από τις διάφορες κυκλικές διαδικασίες της που
καθοδηγούνται απο την ανατροφοδότηση των συμμετεχόντων, δημιουργώντας προστιθέμενη
αξία για την τοπική κοινωνία, οικονομία και περιβάλλον. Επίσης, υποστηρίζει μια λογική δοκιμής
και λάθους έτσι ώστε όλα τα ενδιαφερόμενα μέρη να δύνανται να αξιολογήσουν τις επιπτώσεις
των μέτρων ασφαλείας από τη δική τους οπτική γωνία. Έτσι, οι εμπλεκόμενοι είναι εφικτό να
δημιουργήσουν επίγνωση της κατάστασης σχετικά με το επίπεδο ασφάλειας από πλημμύρες σε

243
μια περιοχή ενδιαφέροντος ενώ τους δίνεται η ευκαιρία να διερευνήσουν και να αναγνωρίσουν
όμοιες προτάσεις τους όσον αφορά σε πλημμυρικά μέτρα προστασίας, με αποτέλεσμα να είναι
κατορθωτή η επίτευξη μέγιστης δυνατής συναίνεσης μεταξύ τους. Ως εκ τούτου, η επιλογή των
πιο επιθυμητών και ισορροπημένων πλημμυρικών μέτρων ασφαλείας σε διαφορετικές χωρικές
και χρονικές κλίμακες τα οποία λαμβάνουν υπόψη το κόστος τους, τις επιπτώσεις τους στο
περιβάλλον καθώς και τις αξίες και απόψεις της τοπικής κοινωνίας είναι δυνητικά εφικτή.
Μια κοινή επιχειρησιακή εικόνα για υποστήριξη της επίγνωσης μιας κατάστασης προς
την κατεύθυνση αποτελεσματικής απόκρισης σε περίπτωση έκτατης ανάγκης.
Η δεύτερη θεωρητική μελέτη αυτής της διατριβής (κεφάλαιο 4), μέσα από μια εκτεταμένη
βιβλιογραφική έρευνα παραθέτει επισκόπηση καινοφανών πληροφοριακών εννοιών και
διερευνά πώς αυτές μπορούν να αξιοποιηθούν σε περίπτωση απόκρισης σε έκτακτη ανάγκη.
Συγκεκριμένα, ένα δικτυοκεντρικό σύστημα που έχει τις ρίζες του στο στρατιωτικό τομέα μπορεί
να αποτελέσει όχημα προς την κατεύθυνση καλύτερης ανταλλαγής πληροφοριών που με τη
σειρά τους δύνανται να βελτιώσουν τη διαδικασία λήψης αποφάσεων και να υποστηρίξουν
καλύτερη χωροχρονική οργάνωση πόρων και ανθρώπων στο περίπλοκο και δυναμικό
περιβάλλον των επιχειρήσεων απόκρισης σε έκτακτη ανάγκη. Ένα δικτυοκεντρικό
πληροφοριακό σύστημα ουσιαστικά δικτυώνει όλους τους εμπλεκόμενους στη διαχείριση μιας
κρίσης ώστε να ενσωματώνονται νέες πληροφορίες και γνώση από διάφορες πηγές και να
επιτυγχάνεται επιχειρησιακή αποτελεσματικότητα. Επιπλέον, ένα τέτοιο σύστημα επιτρέπει
ανεμπόδιστη ροή πληροφοριών και γνώσης σε όλα τα διοικητικά στρώματα απόκρισης σε μια
έκτακτη ανάγκη. Αντί οι πληροφορίες να διαχέονται κάθετα ακολουθώντας τα επίπεδα της
διοικητικής δομής σε μια ιεραρχική λογική, αυτές διανέμονται ελεύθερα μεταξύ όλων των
εμπλεκομένων στην αντιμετώπιση μιας κατάστασης έκτακτης ανάγκης με μια οριζόντια λογική.
Ωστόσο, στο ολοένα αυξανόμενα ρευστό και πλούσιο σε πληροφορίες περιβάλλον της
απόκρισης σε έκτακτη ανάγκη, τα δικτυοκεντρικά συστήματα πρέπει να υποστηρίζουν όχι μόνο
τις απαιτήσεις σε πληροφορίες των υπηρεσιών ασφαλείας αλλά και τις γνωστικές και
ψυχολογικές ικανότητες των εμπλεκομένων λαμβάνοντας υπόψη ότι οι άνθρωποι διαθέτουν
περιορισμένες δυνατότητες μνήμης και προσοχής. Επιπλέον, έμφαση πρέπει να δίνεται προς
την κατεύθυνση αποφυγής υπερφόρτωσης πληροφοριών δεδομένου ότι αυτές δεν είναι όλες
σχετικές με τα καθήκοντα των διαφόρων οργανισμών ασφαλείας.

244
Μέσω ενός δικτυοκεντρικού συστήματος, η ίδια πληροφορία είναι δυνατό να καθίσταται
διαθέσιμη την ίδια στιγμή σε όλους. Μια κοινή επιχειρησιακή εικόνα παρέχει πληροφορίες και
γνώση σχετικά με το τί συμβαίνει γύρω από τους εμπλεκόμενους σε μία και μόνο απεικόνιση.
Σύμφωνα με τον ορισμό του Endsley (1988) σχετικά με την επίγνωση μιας κατάστασης, αυτή
διακρίνεται σε τρία επίπεδα: Κατά πρώτον, επίγνωση μιας κατάστασης αποτελεί την αντίληψη
κρίσιμων παραμέτρων όπως είναι η εξέλιξη, οι ιδιότητες και η δυναμική σχετικών στοιχείων στο
περιβάλλον. Κατά δεύτερον, είναι η κατανόηση της σημασίας αυτών των στοιχείων μετά τη
σύνθεσή τους υπό το πρίσμα του στόχου των φορέων λήψης αποφάσεων. Κατά τρίτον, στο
υψηλότερο επίπεδο, επίγνωση μιας κατάστασης αφορά στην πρόβλεψη σχετικά με το τί θα
συμβεί στο σύστημα στο εγγύς μέλλον. Επιπλέον, τρία συστατικά συνθέτουν μία κατάσταση:
1. Πληροφορίες σχετικά με την κατάσταση έκτακτης ανάγκης; 2. Πληροφορίες σχετικά με το
περιβάλλον της κατάστασης έκτακτης ανάγκης (επίγνωση του χώρου) και 3. Πληροφορίες
σχετικά με τις εμπλεκόμενες επιχειρησιακά υπηρεσίες διαχείρισης έκτακτης ανάγκης.
Οι διαδικασίες επικοινωνίας μπορούν να διαιρεθούν σε τρεις σχετιζόμενους τομείς: τον
πληροφοριακό τομέα που αφορά σε σχετικά δεδομένα, τον γνωστικό τομέα που συνδέεται με τις
ανθρώπινες διανοητικές διεργασίες και το φυσικό τομέα που εστιάζει σε δραστηριότητες στον
πραγματικό κόσμο. Τα δικτυοκετνρικά συστήματα δύνανται να επιτρέψουν καλύτερη ανταλλαγή
πληροφοριών μέσα από την ανάπτυξη μιας κοινής επιχειρησιακής εικόνας στον πληροφοριακό
τομέα που με τη σειρά της μπορεί να υποστηρίξει όλες τις μονάδες απόκρισης να επιτύχουν την
ίδια κατανόηση (κοινή επίγνωση μιας κατάστασης) των πληροφοριών και της εξέλιξης μιας
κατάστασης έκτακτης ανάγκης όταν διενεργούν τις επιχειρήσεις τους. Επομένως, ένα
δικτυοκεντρικό σύστημα μπορεί να θεωρηθεί σαν ένα εργαλείο απόκρισης σε καταστάσεις
έκτακτης ανάγκης με προστιθέμενη αξία όχι μόνο στην αποτελεσματική ανταλλαγή
πληροφοριών αλλά και στην κατανόηση του πραγματικού νοήματος και της χρονικής αξίας της
μεταχειρισμένης αλλά και απαιτούμενης πληροφορίας για διενέργεια επιχειρήσεων, επικοινωνία
και συντονισμό των υπηρεσιών διαχείρισης κρίσεων. Επιπλέον, τα δικτυοκεντρικά συστήματα
καθώς και η κοινή επιχειρησιακή εικόνα αποτελούν βασικά συστατικά για την επίτευξη
βελτιωμένης επίγνωσης μιας κατάστασης. Στο γνωστικό τομέα, οργανισμοί, διαδικασίες και
εμπλεκόμενοι στηριγμένοι σε καλύτερη κοινή επίγνωση μιας κατάστασης και υποβοηθούμενοι
από την τεχνολογία μπορούν να επιδείξουν καλύτερες συμπεριφορές προς την κατεύθυνση
αποτελεσματικής λήψης αποφάσεων με αποτέλεσμα να εξάγονται καλύτερες δράσεις και
ενέργειες με καλύτερες επιδράσεις στο φυσικό τομέα.

245
Εν συντομία, ένα δικτυοκεντρικό σύστημα προσασμοσμένο στις ιδιαίτερες συνθήκες των
καταστάσεων έκτακτης ανάγκης δύναται να εφαρμοστεί με επιτυχία δημιουργώντας
προστιθέμενη αξία για τις επιχειρήσεις απόκρισης. Επιπρόσθετα, μπορεί να προσφέρει την
ευελιξία και τα χαρακτηριστικά της προσαρμοζόμενης διαχείρισης κρίσεων που αποτελεί μια
από τις πιο αποτελεσματικές προσεγγίσεις για απόκριση σε δυνητικές φυσικές καταστροφές.
Ωστόσο, η επιτυχής υιοθέτηση ενός δικτυοκεντρικού πληροφοριακού συστήματος απαιτεί την
προσεκτική εισαγωγή του σε διαφορετικά στάδια βασισμένη σε ένα μοντέλο ωριμότητας και
λαμβάνοντας υπόψη ότι βραχυπρόσθεσμες στρατηγικές που υποθέτουν ότι η κοινή επίγνωση
μιας κατάστασης μπορεί να επιτευχθεί εύκολα είναι καταδικασμένες να αποτύχουν. Επιπλέον, η
εισαγωγή ενός τέτοιου συστήματος στους εμπλεκόμενους φορείς αντιμετώπισης καταστάσεων
έκτακτης ανάγκης απαιτεί εκπαίδευση του προσωπικού τους προκειμένου να υπερπηδηθούν
τυχόν προβλήματα δυνητικής έλλειψης γνώσης.
Τρισδιάστατες πληροφοριακές έννοιες για διαχείριση και επικοινωνία της
διακινδύνευσης στο σύνθετο αστικό χώρο.
Η πρώτη εμπειρική μελέτη αυτής της διατριβής (κεφάλαιο 3), διενεργεί μια μελέτη περίπτωσης
προκειμένου να διερευνήσει τη χρησιμότητα των τρισδιάστατων εικονικών μοντέλων πόλης στην
επικοινωνία και διαχείριση της πλημμυρικής διακινδύνευσης. Επίσης, εννοιολογικοποιεί ένα
τρισδιάστατο πληροφοριακό σύστημα βασισμένο στα τρισδιάστατα εικονικά μοντέλα πόλης ως
βήμα προς την κατεύθυνση προσδιοριμού ενός πλαισίου για συστήματα διαχείρισης της
πλημμυρικής διακινδύνευσης και προετοιμασίας για απόκριση σε έκτακτες ανάγκες.
Για την διερεύνηση της προστιθέμενης αξίας των τρισδιάστατων εικονικών μοντέλων πόλης, έχει
επιλεχθεί ως μελέτη περίπτωσης, η πόλη Heerhugowaard στην Ολλανδία. Τα τρισδιάστατα
εικονικά μοντέλα που έχουν αναπτυχθεί για αυτή την πόλη βασίζονται σε κανόνες και εντολές
και περιγράφουν τα γεωμετρικά και εμφανισιακά χαρακτηριστικά των αντικειμένων της πόλης
προσφέροντας δυναμικές τρισδιάστατες απεικονίσεις των συστατικών της πλημμυρικής
διακινδύνευσης στη βάση ενός σχετικού μοντέλου πηγής - διόδου - υποδοχέα. Τα τρισδιάστατα
αυτά εικονικά μοντέλα παρέχουν γραφικές και μη γραφικές πληροφορίες επιτρέποντας οπτική
εξόρυξη δεδομένων, ανάλυση και πλοήγηση. Επίσης, διευκολύνουν την αλληλεπίδραση των
ενδιαφερόμενων μερών παροτρύνοντάς τους να διαδραματίσουν ένα ενεργό ρόλο στη
διαδικασία λήψης αποφάσεων για διαχείριση της πλημμυρικής διακινδύνευσης. Επιπλέον, τα

246
μοντέλα πόλης που αναπτύσσονται σε αυτό το κεφάλαιο προσφέρουν δυναμικές τρισδιάστατες
επιχειρησιακές εικόνες ή τετραδιάστατες επιχειρησιακές εικόνες λαμβάνοντας υπόψη τη χρονική
μεταβλητή και στοχεύουν στη βελτίωση της επίγνωσης της κατάστασης μεταξύ των
εμπλεκόμενων φορέων όσον αφορά στην πλημμυρική διακινδύνευση της περιοχής
ενδιαφέροντος. Επιπρόσθετα, τα τρισδιάστατα αυτά μοντέλα επιτρέπουν στους εμπλεκόμενους
να εξετάσουν και να κρίνουν τις εναλλακτικές τους προτάσεις καθώς και να αξιολογήσουν
οπτικώς τις επιπτώσεις τους σε πραγματικό χρόνο, κατόπιν τροποποίησης των παραμέτρων
των μοντέλων της πόλης με την επικουρία καθορισμένων διαδικαστικών κανόνων και εντολών.
Έτσι, υποστηρίζεται η διαφάνεια, ενισχύεται η εμπιστοσύνη και διευκολύνεται η συνεργασία
μεταξύ των εμπλεκομένων. Επίσης, ενισχύονται οι γνωστικές ικανότητες των συμμετεχόντων
ούτως ώστε να δύνανται να ασκούν αποτελεσματικά την επιρροή που απορρέι από τη θέση
τους κατά τη διαδικασία λήψης αποφάσεων. Ωστόσο, η ποιότητα της αναπαράστασης των
τρισδιάστατων αντικειμένων της πόλης είναι άμεσα συνδεδμένη με τη διαθεσιμότητα και
ακρίβεια των δεδομένων.
Τα εικονικά τρισδιάστατα μοντέλα πόλης μπορούν να θεωρηθούν ως εξαιρετικά μέσα για
ενσωμάτωση, συντήρηση, παρουσίαση, διάχυση και επικοινωνία με κατανοητό κι εύληπτο
τρόπο, πιο κοντά στον πραγματικό τρισδιάστατο κόσμο, των γεω-πληροφοριών που σχετίζονται
με τη διακινδύνευση. Αυτό επιβεβαιώνεται μέσα από την εκτεταμένη βιβλιογραφική έρευνα που
έχει πραγματοποιηθεί σε αυτό το κεφάλαιο. Ωστόσο, στο στάδιο προετοιμασίας για απόκριση σε
καταστάσεις έκτακτης ανάγκης όπου οι εμπλεκόμενοι φορείς πρέπει να αναπτύξουν σχέδια που
περιλαμβάνουν για παράδειγμα εσωτερικές ή/και εξωτερικές διαδρομές εκκένωσης, απαιτούνται
επιπρόσθετα, τοπολογικές και σημασιολογικές πληροφορίες όσον αφορά στα τρισδιάστατα
αντικείμενα της πόλης και των συστατικών τους. Αυτές οι πληροφορίες μπορούν δυνητικά να
ικανοποιήσουν την ανάγκη των διαφόρων οργανισμών ασφαλείας για αναζήτηση και ανάλυση
των τρισδιάστατων μοντέλων πόλης. Επιπλέον, μια βασική παράμετρος για την αποτελεσματική
διαχείριση της διακινδύνευσης και την ετοιμασία για απόκριση σε έκτακτες ανάγκες είναι η
ικανότητα των εμπλεκομένων να διαλειτουργούν (να λειτουργούν μαζί). Καθώς τα απαιτούμενα
δεδομένα προέρχονται από πολλαπλές πηγές και συνήθως έχουν ποικίλες μορφές, είναι
αναγκαίο να υιοθετηθεί μια «κοινή γλώσσα» μεταξύ των διαφόρων υπηρεσιών ασφαλείας η
οποία εν δυνάμει να μπορεί να επικουρήσει στην υπερπήδηση αυτού του καταρκεματισμού των
δεδομένων. Σε αυτό το πλαίσιο, ένα τρισδιάστατο πληροφοριακό σύστημα που βασίζεται στα
εικονικά τρισδιάστα μοντέλα πόλης και επεκτείνεται με υφιστάμενα ανοικτά διεθνή πρότυπα
δεδομένων από τους τομείς των Συστημάτων Γεωγραφικών Πληροφοριών και των Μοντέλων

247
Κτιριακών Πληροφοριών όπως είναι η γεωγραφική γλώσσα σήμανσης δεδομένων πόλης
(CityGML) και οι θεμελιακές κλάσεις της βιομηχανίας (IFC) αντίστοιχα, έχει αναπτυχθεί και
παρουσιάζεται εννοιολογικά στοχεύοντας να κάνει ένα βήμα προς την κατεύθυνση
προσδιορισμού ενός πλαισίου για συστήματα διαχείρισης της πλημμυρικής διακινδύνευσης και
ετοιμασίας για απόκριση σε έκτακτες ανάγκες.
Το τρισδιάστατο σύστημα που έχει εννοιολογικοποιηθεί σε αυτό το κεφάλαιο, δύναται να
ξεπεράσει τους περιορισμούς των εικονικών τρισδιάστατων μοντέλων που έχουν αναπτυχθεί
για την περιοχή της Heerhugowaard σκοπεύοντας να επιτρέψει σημασιολογική
διαλειτουργικότητα κατά τη διάρκεια της διαχείρισης της διακινδύνευσης και της προετοιμασίας
για έκτακτες ανάγκες. Επιπλέον, στοχεύει να προσφέρει στους εμπλεκομένους όχι μόνο
λειτουργίες πλοήγησης αλλά και εύχρηστες δυνατότητες αναζήτησης και ανάλυσης των
τρισδιάστατων μοντέλων μέσω των υιοθετημένων προτύπων του εννοιολογικού συστήματος.
Συγκεκριμένα, αυτά τα πρότυπα προσφέρουν, σημασιολογικές, τοπολογικές και θεματικές
πληροφορίες εκτός από τα γεωμετρικά και εμφανιακά χαρακτηριστικά των τρισδιάστατων
μοντέλων πόλης. Επιπρόσθετα, το τρισδιάστατο αυτό σύστημα πληροφοριών μέσα από τη
λεπτομερή περιγραφή των φυσικών και λειτουργικών χαρακτηριστικών αλλά και σχέσεων των
αντικειμένων της πόλης στη μακροκλίμακα (πόλη) καθώς και στη μικροκλίμακα (εγκατάσταση),
φιλοδοξεί να επιτρέψει την ανάπτυξη εναλλακτικών εξωτερικών και εσωτερικών διαδρομών
εκκένωσης κτιρίων για διαχείριση της εναπομείνουσας διακινδύνευσης και ετοιμασία για
καταστάσεις έκτακτης ανάγκης. Το προτεινόμενο τρισδιάστατο πληροφοριακό σύστημα επιλέγει
το πρότυπο δεδομένων CityGML από τον τομέα των Συστημάτων Γεωγραφικών Πληροφοριών
ως μοντέλο για την αναπαράσταση του πολύπλοκου αστικού χώρου καθώς είναι περισσότερο
ικανό στη μοντελοποίηση αντικειμένων στη μακροκλίμακα χρησιμοποιώντας πέντε διακριτά
επίπεδα λεπτομέρειας ενώ τα Μοντέλα Κτιριακών Πληροφοριών σε μορφή κλάσεων IFC είναι
σχεδιασμένα να αναπαριστούν την πληροφορία με μεγάλη λεπτομέρεια στη μικροκλίμακα με
αποτέλεσμα να αποτελούν μια πολύτιμη πηγή ενημερωμένων πληροφοριών όσον αφορά στις
εγκαταστάσεις μιας πόλης, τις κατασκευές της και την κατάστασή τους. Κατά τη διάρκεια αυτού
του κεφαλαίου, η βιβλιογραφική έρευνα κατέδειξε ότι υπάρχουν παραδείγματα μετατροπής των
δεδομένων από μορφή IFC των Μοντέλων Κτιριακών Πληροφοριών σε μορφή CityGML των
Συστημάτων Γεωγραφικών Πληροφοριών. Όμως, το επίπεδο λεπτομέρειας της τελικής
αναπαράστασης των αντικειμένων της πόλης σε CityGML, εξαρτάται από την ακρίβεια και τη
διαθεσιμότητα των απαιτούμενων δεδομένων. Επίσης, η κατασκευή των διαφορετικών
επιπέδων λεπτομέρειας της CityGML αποτελεί δύσκολο έργο ενώ η συλλογή της σημασιολογίας

248
καθώς και ο έλεγχος της εγκυρότητας των γεωμετριών των αντικειμένων της πόλης είναι
απαιτητικά τόσο σε χρόνο όσο και σε προσπάθεια.
Οι κυβερνήσεις καθώς και οι οργανισμοί ασφαλείας πρέπει να εξετάσουν την υιοθέτηση και
αξιοποίηση τρισδιάστατων πληροφοριακών συστημάτων βασισμένων σε εικονικά τρισδιάστατα
μοντέλα πόλης μιας και αυτά φιλοδοξούν να υποστηρίξουν αποτελεσματικά διαδικασίες
διάχυσης πληροφοριών και επικοινωνίας, δημιουργώντας προϋποθέσεις για συμμετοχική
διαχείριση της πλημμυρικής διακινδύνευσης και ετοιμασία για απόκριση σε καταστάσεις
έκτακτης ανάγκης. Ένα τέτοιο τρισδιάστατο σύστημα δύναται να παρέχει στα ενδιαφερόμενα
μέρη ίσες ευκαιρίες πρόσβασης στις απαιτούμενες πληροφορίες προς την κατεύθυνση
διευκόλυνσης της δημιουργίας επίγνωσης όσον αφορά σε καταστάσεις διακινδύνευσης,
ενισχύοντας τη διαφάνεια, την εμπιστοσύνη και τη διεπιστημονική συνεργασία για καλύτερες
αποφάσεις με καλύτερα αποτελέσματα στον πραγματικό κόσμο. Τα επικαλυπτόμενα πεδία των
Μοντέλων Κτιριακής Πληροφορίας δεινκύουν μια ευκαιρία για συνεργασία, μεταφορά γνώσης
και ενσωμάτωσης των ρόλων όλων των εμπλεκόμενων φορέων στη μικροκλίμακα. Ωστόσο, η
συνεργασία ούτε μπορεί να επιβληθεί, ούτε επίσης να επιτευχθεί όντας έννοια ενός θεσμικού
πλαισίου που αφορά στη διαχείριση της διακινδύνευσης. Τα πληροφοριακά συστήματα
βασισμένα σε εικονικά τρισδιάστατα μοντέλα πόλης, μπορούν δυνητικά να διευκολύνουν τη
συνεργασία, αλλά για την εφαρφμογή της στην πράξη απαιτούνται μεταβολές σε θεσμικές
συμπεριφορές.
Μια εμπειρική προσέγγιση στην αξιολόγηση της αποτελεσματικότητας των
δικτυοκεντρικών εργαλείων υποστήριξης της απόκρισης σε πλημμυρικές καταστάσεις
έκτακτης ανάγκης: Αποτελέσματα άσκησης πεδίου.
Η δεύτερη εμπειρική μελέτη αυτής της διατριβής (κεφάλαιο 5) μέσα από μια σειρά βημάτων τα
οποία περιλαμβάνουν βιβλιογραφική ανασκόπηση, οργάνωση άσκησης πεδίου με ρεαλιστικά
πλημμυρικά σενάρια και ερωτηματολόγια για καταγραφή της κρίσης των εμπειρογνωμόνων
αξιολογεί και παραθέτει τα αποτελέσματα μιας εμπειρικής ανάλυσης όσον αφορά στην
προστιθέμενη αξία των δικτυοκεντρικών συστημάτων σε πλημμυρικές καταστάσεις έκτακτης
ανάγκης. Στα πλαίσια αυτού του κεφαλαίου, η εκτίμηση της αποτελεσματικότητας των
δικτυοκεντρικών συστημάτων βασίζεται στη λήψη και ποιοτική σύγκριση της κρίσης και άποψης
των εμπειρογνωμόνων αναφορικά με το σύστημα που χρησιμοποιούν στην καθημερινή τους

249
πρακτική και το οποίο εδράζεται σε μια ιεραρχική λογική σε σχέση με ένα δικτυοκεντρικό
σύστημα το οποίο χρησιμοποιείται κατά τη διάρκεια αυτής της άσκησης. Τα τρέχοντα
συστήματα στον τομέα των επιχειρήσεων απόκρισης σε καταστάσεις έκτακτης ανάγκης
χαρακτηρίζονται παραδοσιακά ως μονοεπιστημονικά και επιτρέπουν τη ροή των πληροφοριών
από πάνω προς τα κάτω καθώς και από κάτω προς τα πάνω δημιουργώντας επιχειρησιακές
εικόνες στατικές και εξειδικευμένες για συγκεκριμένες υπηρεσίες ασφαλείας. Αντιθέτως, η
αρχιτεκτονική του δικτυοκεντρικού συστήματος αυτής της άσκησης πεδίου, εστιάζει στη
διευκόλυνση της οριζόντιας ανταλλαγής πληροφοριών και επικοινωνίας μεταξύ των
εμπλεκομένων. Το σύστημα είναι σχεδιασμένο με γνώμονα την αξιοποίηση των δικτυοκεντρικά
ενεργοποιημένων ικανοτήτων οι οποίες αντανακλώνται στην αλυσίδα αξίας τους με βάση την
οποία καλύτερα δίκτυα μπορούν να βελτιώσουν την ανταλλαγή πληροφοριών στον
πληροφοριακό τομέα που με τη σειρά τους μπορούν να οδηγήσουν σε καλύτερη κατανόηση
μιας κατάστασης καθώς και σε καλύτερες αποφάσεις στο γνωστικό τομέα οδηγώντας σε
βέλτιστες ενέργειες με υπέρτερες επιδράσεις στο φυσικό τομέα.
Στην άσκηση πεδίου που έχει οργανωθεί σε αυτή τη διατριβή, οι συμμετέχοντες ήταν
πραγματικοί και καλά καταρτισμένοι επαγγελματίες για απόκριση σε καταστάσεις έκτακτης
ανάγκης. Παρόλο που οι συμμετέχοντες ήταν λίγοι λόγω μη διαθεσιμότητάς τους σε συνδυασμό
με το απαιτητικό επιχειρησιακό περιβάλλον της διαχείρισης κρίσεων, οι απόψεις τους ως
εμπειρογνώμονες, που ελήφθησαν κατά τη διάρκεια αυτής της άσκησης κρίνονται ως εξαιρετικά
σημαντικές και πολύτιμες δεδομένου του πολύ περιορισμένου αριθμού τέτοιων δεδομένων στον
τομέα της απόκρισης σε έκτακτες ανάγκες. Το πλαίσιο αξιολόγησης αυτής της άσκησης
βασίζεται σε δομές όσον αφορά στην ποιότητα των πληροφοριών καθώς και στην ποιότητα των
συστημάτων που έχουν εξευρεθεί μέσα από εκτεταμένη βιβλιογραφική επισκόπηση. Οι δομές
που αφορούν στην ποιότητα των πληροφοριών έχουν χρησιμοποιηθεί για τη διερεύνηση της
συμβολής μιας κοινής επιχειρησιακής εικόνας στην επίτευξη καλύτερης κοινής επίγνωση μιας
κατάστασης, ενώ οι δομές που σχετίζονται με την ποιότητα των συστημάτων έχουν αξιοποιηθεί
για την αξιολόγηση της συμβολής ενός δικτυοκεντρικού συστήματος στην καλύτερη ανταλλαγή
πληροφοριών και στην ανάπτυξη μιας κοινής επιχειρησιακής εικόνας. Η ποιότητα των
πληροφοριών σχετίζεται με τα χαρακτηριστικά τους καθώς επίσης και με το βαθμό στον οποίο
αυτές δύνανται να ικανοποιήσουν τις ανάγκες των τελικών χρηστών τους. Η ποιότητα των
συστημάτων εστιάζει σε διαστάσεις που αφορούν στα συστήματα αυτά καθαυτά, στην
εκπλήρωση των καθηκόντων των εμπλεκομένων καθώς και στην αντιληπτή λειτουργική τους
ικανοποίηση. Τόσο η ποιότητα των πληροφοριών όσο και η ποιότητα των συστημάτων

250
αποτελούν προϋποθέσεις για την ανάπτυξη μιας κοινής επιχειρησιακής εικόνας καθώς και για
την αξιοποίηση στο μέγιστο βαθμό της δυναμικής της επίτευξης κοινής επίγνωσης μιας
κατάστασης.
Οι διαστάσεις της ποιότητας των πληροφοριών για τις οποίες έχει επιδειχθεί αύξηση της
εκτίμησής τους από μέρους των επαγγελματιών μετά από την εμπειρία τους με το
δικτυοκεντρικό σύστημα σε αυτή την άσκηση πεδίου, είναι η επικαιρότητα καθώς και η
αξιοπιστία της πληροφορίας. Αυτό αιτιολογείται από τη φύση της ίσου προς ίσον (peer-to-peer)
τεχνολογίας που υποστηρίζει ένα δικτυοκεντρικό σύστημα το οποίο επιτρέπει στους τελικούς
του χρήστες να λαμβάνουν άμεσα έγκαιρες πληροφορίες. Επιπλέον, η ταχύτητα στην
ανταλλαγή πληροφοριών που προσφέρεται από ένα τέτοιο σύστημα, επιτρέπει στους χρήστες
του να ανακαλύπτουν γρήγορα το βαθμό στον οποίο η πληροφορία που ανταλλάσσεται είναι
ορθή και έμπιστη. Αντίθετα, το σύστημα που χρησιμοποιούν οι επαγγελματίες στις καθημερινές
τους λειτουργίες, συχνά τους αφήνει να περιμένουν μέχρι να λάβουν τις χρειώδεις πληροφορίες.
Συγκεκριμένα, το τρέχον σύστημα που μεταχειρίζονται οι εμπλεκόμενοι βασίζεται σε μια
ιεραρχική λογική και υποστηρίζεται από μια παραδοσιακή αρχιτεκτονική διακομιστή-πελάτη
(client-server) που επιτρέπει ανταλλαγή πληροφοριών στη βάση του ένας προς έναν. Κατά τη
διάρκεια της άσκησης πεδίου, έχει επίσης παρατηρηθεί μαθησιακή επίδραση ένεκα του
γεγονότος ότι οι συμμετέχοντες μετά την εμπειρία που απέκτησαν κατά τη διάρκεια του πρώτου
ρεαλιστικού πλημμυρικού σεναρίου όπου οι επιχειρήσεις απόκρισης έλαβαν χώρα σε ένα
δικτυοκεντρικό περιβάλλον, λειτούργησαν καλύτερα κατά τη διάρκεια του δεύτερου και πιο
σύνθετου πλημμυρικού σεναρίου. Από τις κρίσεις των εμπειρογνωμόνων που αντανακλώνται
στα αποτελέσματα των ερωτηματολογίων αυτής της άσκησης, μπορεί να εξαχθεί ότι όσο η
πολυπλοκότητα και η κρισιμότητα των σεναρίων αυξάνει και η ανάγκη για περισσότερες
πληροφορίες μεγαλώνει, τόσο περισσότερο οι επαγγελματίες τείνουν να εκτιμούν την ποιότητα
των ανταλλασσόμενων πληροφοριών σε ένα δικτυοκεντρικό περιβάλλον.
Οι διαστάσεις της ποιότητας των συστημάτων για τις οποίες έχει επιδειχθεί μια αύξηση στην
εκτίμησή τους από τους ειδικούς μετά την εμπειρία τους με το δικτυοκεντρικό σύστημα αυτής
της άσκησης πεδίου, είναι η σχετιζόμενη με το σύστημα αυτό καθαυτό προσβασιμότητα, οι
σχετιζόμενες με τα καθήκοντα των επαγγελματιών, ενσωμάτωση και επίγνωση μιας κατάστασης
και οι σχετιζόμενες με την αντιληπτή λειτουργική ικανοποίηση των τελικών χρηστών,
χρηστικότητα και ευκολία στη χρήση. Αυτές οι διαστάσεις της ποιότητας των συστημάτων
μπορούν να θεωρηθούν και ως οι αρχές σχεδιασμού ενός πλαισίου για προσαρμοζόμενα

251
συστήματα απόκρισης σε καταστάσεις έκτακτης ανάγκης που με βάση την κρίση των
εμπειρογνωμόνων υποστηρίζονται καλύτερα από δικτυοκεντρικά εργαλεία. Τα αποτελέσματα
που αφορούν στις διαστάσεις της ποιότητας των συστημάτων δεικνύουν ότι οι εμπειρογνώμονες
αντιλαμβάνονται ένα δικτυοκεντρικό σύστημα ως κατάλληλο για αποτελεσματική διευκόλυνση
της προσβασιμότητας σε όλες τις απαιτούμενες πληροφορίες. Επιπλέον, τα αποτελέσματα
υποδηλώνουν ότι οι εμπειρογνώμονες φαίνεται να αναγνωρίζουν ότι ένα δικτυοκεντρικό
σύστημα μπορεί να τους επιτρέψει να ενσωματώσουν πληροφορίες προερχόμενες από
διάφορες πηγές προς την κατεύθυνση δημιουργίας μια κοινής επιχειρησιακής εικόνας ικανής να
τους υποστηρίξει στην ανάπτυξη επίγνωσης σχετικά με μια συγκεκριμένη πλημμυρική
κατάσταση. Επιπρόσθετα, τα αποτελέσματα δεικνύουν ότι οι εμπειρογνώμονες τείνουν να
θεωρήσουν ένα δικτυοκεντρικό σύστημα εύκολο στη χρήση του πιθανόν λόγω των
εκπαιδευτικών σεμιναρίων που προηγήθηκαν και είχαν στόχο την εξοικείωσή τους με το
σύστημα που χρησιμοποιήθηκε σε αυτή την άσκηση. Συνολικά, οι εμπλεκόμενοι επαγγελματίες
φαίνεται να εκτιμούν τη χρησιμότητα και τις ικανότητες ενός δικτυοκεντρικού συστήματος στις
επιχειρήσεις απόκρισης σε έκτακτες ανάγκες.
Με βάση την κρίση των εμπειρογνωμόνων που συμμετείχαν στο πείραμα πεδίου αυτής της
διατριβής, συμπεραίνεται ότι τα δικτυοκεντρικά συστήματα έχουν τη δυνατότητα να επιτρέψουν
καλύτερη ανταλλαγή πληροφοριών προς την κατεύθυνση ανάπτυξης μιας κοινής επιχειρησιακής
εικόνας και βελτίωσης της επίγνωσης μιας κατάστασης από τους εμπλεκομένους,
υποστηρίζοντας αποτελεσματικά τη λήψη αποφάσεων για απόκριση σε πλημμυρικές
καταστάσεις έκτακτης ανάγκης. Ωστόσο, η εισαγωγή ενός δικτυοκεντρικού συστήματος στις
υπηρεσίες αντιμετώπισης κρίσεων, σίγουρα δεν είναι εύκολη υπόθεση καθώς στις επιχειρήσεις
απόκρισης εμπλέκονται πολλές και διάφορες υπηρεσίες ασφαλείας. Αυτές οι υπηρεσίες είναι
συνήθως αυτόνομες και ετερογενείς στην καθημερινή τους λειτουργία και έχουν εξειδικευμένες
δομές, διαδικασίες και στόχους που συντείνουν τόσο στην κατακερματισμένη πολιτική όσο και
στο κατακερματισμένο οργανωτικό περιβάλλον της ανταλλαγής πληροφοριών και συντονισμού
μεταξύ των υπηρεσιών εκτάκτων αναγκών. Η υιοθέτηση καθώς και η εφαρμογή ενός
δικτυοκεντρικού συστήματος από τους οργανισμούς αρωγής ίσως να απαιτούν σημαντικές
θεσμικές μεταρρυθμίσεις. Τα υφιστάμενα συστήματα πληροφοριών πρέπει να
επανασχεδιαστούν με κριτικό πνεύμα και στη βάση καινοφανών αρχιτεκτονικών συντονισμού
των πληροφοριών (δικτυοκεντρικών αντί ιεραρχικών). Επίσης, η διαχείριση δεδομένων καθώς
και οι τρέχουσες μέθοδοι εργασίας που είναι βασισμένες στη διανομή πληροφοριών σε
πραγματικό χρόνο πρέπει να αναθεωρηθούν προς την κατεύθυνση επίτευξης συλλογικής

252
νοημοσύνης μεταξύ των υπηρεσιών ασφαλείας. Επιπρόσθετα, πρέπει να προσδιοριστεί ποιοί
οργανισμοί και ποιά μέλη τους πρέπει να προσφέρουν συγκεκριμένες πληροφορίες σε
συγκεκριμένους οργανισμούς και μέλη τους κατά τη διάρκεια των επιχειρήσεων απόκρισης σε
έκτακτες ανάγκες. Το τελευταίο, αποτέλεσε ένα κρίσιμο ζήτημα στην αφετηρία της άσκησης
πεδίου αυτής της διατριβής αποκαλύπτοντας ότι οι εμπλεκόμενοι στη διαχείριση κρίσεων
υποφέρουν από έλλειψη επίγνωσης όσον αφορά στη διαθεσιμότητα των πληροφοριών. Πιο
συγκεκριμένα, οι επαγγελματίες δεν γνώριζαν ποιοί διέθεταν τις πληροφορίες που χρειάζονταν
γεγονός που οδήγησε σε περιττή έρευνα, χαμηλό ποσοστό επαναχρησιμοποίησης
πληροφοριών καθώς και σε χάσιμο πολύτιμου χρόνου για τις επιχειρήσεις απόκρισης. Αυτό
επιβεβαιώνει ότι οι ρόλοι και οι δυνατότητες ανταλλαγής πληροφοριών και συντονισμού στις
επιχειρήσεις απόκρισης σε έκτακτες ανάγκες είναι επί του παρόντος ρυθμισμένες στη βάση
ιεραρχικής λογικής και δεν προσαρμόζονται εύκολα στις απαιτήσεις μιας κατάστασης.
Καταληκτικά.
Τα ευρήματα αυτής της διατριβής αποτελούν βήμα προς την κατεύθυνση ανάπτυξης και
υιοθέτησης καινοτόμων πληροφοριακών συστημάτων που υποστηρίζουν αποτελεσματικά την
ανταλλαγή πληροφοριών, την επικοινωνία και τη συνεργασία μεταξύ των υπηρεσιών ασφαλείας
και των επαγγελματιών τους, οι οποίοι βασισμένοι σε βελτιωμένη επίγνωση μιας κατάστασης
δύνανται να διαχειριστούν αποδοτικότερα τη πλημμυρική διακινδύνευση σε μια περιοχή μελέτης
ή να αντιμετωπίσουν τελέσφορα ένα περιστατικό πλημμύρας μικρής κλίμακας ή μια πλημμυρική
κατάσταση μεγάλης κλίμακας. Ωστόσο ένα σύστημα από μόνο του δεν αρκεί για να λύσει όλα τα
εν δυνάμει οργανωτικά προβλήματα των υπηρεσιών ασφαλείας ενός κράτους. Επιπλέον, η
δημιουργία επίγνωσης όσον αφορά σε μια κατάσταση δεν αναπτύσσεται από ένα σύστημα με
λογική μαύρου κουτιού. Η δημιουργία επίγνωσης μιας κατάστασης σχετίζεται με τη ψυχολογική,
νοητική και γνωσιακή κατάσταση του τελικού χρήστη ενός συστήματος. Επιπρόσθετα, η
επίτευξη επίγνωσης μιας κατάστασης μπορεί να επηρεαστεί από διάφορους παράγοντες όπως
οι προηγούμενες εμπειρίες, το εκπαιδευτικό υπόβαθρο, η οργανωσιακή κουλτούρα, οι στόχοι
καθώς και οι προσδοκίες των διαφόρων φορέων ασφαλείας. Προκειμένου η εισαγωγή και χρήση
καινοτόμων πληροφοριακών συστημάτων από τους διάφορους φορείς ασφαλείας να στεφθεί με
επιτυχία, πρέπει να γίνεται προσεκτικά και σε διαφορετικά στάδια με ενεργό συμμετοχή της
διεύθυνσής τους, λαμβάνοντας υπόψη το θεσμικό πλαίσιο, τις οργανωτικές δομές, πρότυπα και
κανόνες και κυρίως τον ανθρώπινο παράγοντα.
Copyright © 2022 FDOKUMEN


![.Noah's Flood WTJ2004[1]](https://static.fdokumen.com/doc/165x107/631c39e73e8acd997705cf6b/noahs-flood-wtj20041.jpg)