
Simulation-based decision support system for flood damage assessment under uncertainty using remote...
19
ORIGINAL PAPER Simulation-based decision support system for flood damage assessment under uncertainty using remote sensing and census block information Honghai Qi • M. S. Altinakar Received: 25 November 2009 / Accepted: 16 April 2011 / Published online: 30 April 2011 Ó Springer Science+Business Media B.V. 2011 Abstract The level of damage of flood events does not solely depend on exposure to flood waters. Vulnerabilities due to various socio-economic factors such as population at risk, public awareness, and presence of early warning systems, etc. should also be taken into account. Federal and state agencies, watershed management coalitions, insurance companies, need reliable decision support system to evaluate flood risk, to plan and design flood damage assessment and mitigation systems. In current practice, flood damage evaluations are generally carried out based on results obtained from one dimensional (1D) numerical simulations. In some cases, however, 1D simulation is not able to accurately capture the dynamics of the flood events. The present study describes a decision support system, which is based on 2D flood simulation results obtained with CCHE2D-FLOOD. The 2D computational results are complemented with information from various resources, such as census block layer, detailed survey data, and remote sensing images, to estimate loss of life and direct damages (meso or micro scale) to property under uncertainty. Flood damage calculations consider damages to residential, commercial, and industrial buildings in urban areas, and damages to crops in rural areas. The decision support system takes advantage of fast raster layer operations in a GIS platform to generate flood hazard maps based on various user-defined criteria. Monte Carlo method based on an event tree analysis is introduced to account for uncertainties in various parameters. A case study illustrates the uses of the proposed decision support system. The results show that the proposed decision support system allows stake holders to have a better appreciation of the consequences of the flood. It can also be used for planning, design, and evaluation of future flood mitigation measures. H. Qi (&) M. S. Altinakar National Center for Computational Hydroscience and Engineering (NCCHE), The University of Mississippi, University, Oxford, MS 38677, USA e-mail: [email protected] M. S. Altinakar e-mail: [email protected] Present Address: H. Qi NMP Engineering Consultants, Inc., Hunt Valley, MD 21031, USA 123 Nat Hazards (2011) 59:1125–1143 DOI 10.1007/s11069-011-9822-8
Transcript of Simulation-based decision support system for flood damage assessment under uncertainty using remote...

ORI GIN AL PA PER
Simulation-based decision support system for flooddamage assessment under uncertainty using remotesensing and census block information
Honghai Qi • M. S. Altinakar
Received: 25 November 2009 / Accepted: 16 April 2011 / Published online: 30 April 2011� Springer Science+Business Media B.V. 2011
Abstract The level of damage of flood events does not solely depend on exposure to
flood waters. Vulnerabilities due to various socio-economic factors such as population at
risk, public awareness, and presence of early warning systems, etc. should also be taken
into account. Federal and state agencies, watershed management coalitions, insurance
companies, need reliable decision support system to evaluate flood risk, to plan and design
flood damage assessment and mitigation systems. In current practice, flood damage
evaluations are generally carried out based on results obtained from one dimensional (1D)
numerical simulations. In some cases, however, 1D simulation is not able to accurately
capture the dynamics of the flood events. The present study describes a decision support
system, which is based on 2D flood simulation results obtained with CCHE2D-FLOOD.
The 2D computational results are complemented with information from various resources,
such as census block layer, detailed survey data, and remote sensing images, to estimate
loss of life and direct damages (meso or micro scale) to property under uncertainty. Flood
damage calculations consider damages to residential, commercial, and industrial buildings
in urban areas, and damages to crops in rural areas. The decision support system takes
advantage of fast raster layer operations in a GIS platform to generate flood hazard maps
based on various user-defined criteria. Monte Carlo method based on an event tree analysis
is introduced to account for uncertainties in various parameters. A case study illustrates the
uses of the proposed decision support system. The results show that the proposed decision
support system allows stake holders to have a better appreciation of the consequences of
the flood. It can also be used for planning, design, and evaluation of future flood mitigation
measures.
H. Qi (&) � M. S. AltinakarNational Center for Computational Hydroscience and Engineering (NCCHE), The Universityof Mississippi, University, Oxford, MS 38677, USAe-mail: [email protected]
M. S. Altinakare-mail: [email protected]
Present Address:H. QiNMP Engineering Consultants, Inc., Hunt Valley, MD 21031, USA
123
Nat Hazards (2011) 59:1125–1143DOI 10.1007/s11069-011-9822-8
Keywords Numerical simulation � Decision support system � Flood damage �Uncertainty � Remote sensing � Census block
1 Introduction
Due to rapid population increase, urbanization, and climatic changes, floods are causing
considerable damages every year around the globe. From many historical flood events, it is
observed that the level of damage during a flood event does not solely depend on exposure
to flood waters, or the presence and degree of protection measures. Vulnerabilities that
involve consideration of various socio-economic factors such as population at risk, public
awareness, and early warning systems, etc. should also be taken into account in assessing
damages due to flood events. The recent practice defines flood management as a broad
spectrum of water resources aimed at reducing the loss of life and property damage, and at
the same time obtaining the social, environmental, and economic benefits from the
floodplains (Simonovic 1998). Federal and state agencies, watershed management coali-
tions, insurance companies, consultant engineers need reliable decision support systems to
evaluate flood risk, to plan and design flood management strategies and mitigation systems,
to prepare emergency management plans which may involve both structural and non-
structural measures. Such decision support systems can also be used to evaluate and
compare cost effectiveness of alternative solutions, to assess loss of life and property
damages, and to plan for emergency management operations.
In current practice, the United States Hydrologic Engineering Center’s Flood Damage
Reduction Analysis (HEC-FDA, or FDA) program developed by US Army Corps of
Engineers has been widely used to estimate flood damages (California Department of
Water Resources 2004). This program uses risk-based analysis method to integrate
hydrologic, hydraulic, and economic relationships. The two primary outputs from HEC-
FDA include expected annual damage estimates and project performance statistics.
Expected annual flood damage is the average of all possible damage values, taking into
account all expected flood events and associated hydrologic, hydraulic, and economic
uncertainties. Project performance statistics provide information concerning the risk within
an area of annual (or long-term) flooding and the ability to survive flood events of given
magnitudes.
However, HEC-FDA program is generally carried out based on results obtained from
one dimensional (1D) numerical simulations (i.e., HEC-RAS). 1D simulation results are
then converted almost manually into two dimensions using rather crude interpolations.
Except for floods in well-defined narrow valleys, however, such interpolations could lead
to significant errors in capturing the dynamics of the flood events, i.e., flow velocities,
flood-wave arrival time, and flood duration, which may result in serious errors in sub-
sequent flood damages evaluation. In addition, various analyses in HEC-FDA undertake
highly inefficient procedures which require the user to input numerous information, i.e., all
the structural survey data along various river reaches. Increased remote sensing data
availability at higher resolutions, which facilitate data preparation, and the advances in
robust, fast numerical schemes, make it feasible to develop decision support systems based
on two dimensional (2D) hydrodynamic computations for flood simulations. The present
research describes a decision support system, which is based on 2D flood simulation results
obtained with CCHE2D-FLOOD. The 2D computational results are complemented with
information from various resources, such as census block layer, detailed surveyed data, and
1126 Nat Hazards (2011) 59:1125–1143
123

remote sensing images, to estimate loss of life and direct damages to property under
uncertainty.
The decision support system uses Monte Carlo simulation method to account for
uncertainties in various input variables and parameters. Loss-of-life computation considers
uncertainties in flood severity, warning time, population at risk (PAR), and fatality rate.
Urban and agricultural damage computations consider uncertainties in number of structures
(residential, commercial, and industrial), value of a given structure, content value of a
structure, and value of a farmland or cropland, quantities of the crop yield, depth versus %
damage relationships, etc. In addition, an event tree is used to cover the uncertainty with
regard to the season, day, and time of the flood event. The system takes advantage of fast
raster layer operations in a GIS platform to generate flood hazard maps based on various
user-defined criteria. A case study of a catastrophic dam-break flood of Oconee River near
Milledgeville, Georgia, USA is carried out to illustrate the potential uses of the proposed
decision support system. The results of the case study clearly show that this new approach
based on 2D simulation results allows the stake holders to have a better appreciation of the
consequences of the flood. The developed flood damage assessment system can be effi-
ciently used in planning, design, and evaluation of various flood mitigation measures.
2 Decision support system for integrated flood damage assessment using GISand remote sensing technology
This research aims to develop an innovative decision support system for integrated flood
damage assessment that allows a detailed evaluation of the consequences of a flood event
based on two-dimensional realistic, reliable numerical simulations with various GIS, RS
information, etc. The organizational structure of the proposed decision support is depicted
in Fig. 1. A state-of-the-art 2D numerical model, CCHE2D-FLOOD, and a collection of
GIS-based decision support modules constitute the core of the proposed system. The
decision system can be used for risk and uncertainty-based urban and rural flood damage
Fig. 1 Organizational structure of the decision support system for integrated flood damage assessment
Nat Hazards (2011) 59:1125–1143 1127
123

computation, loss-of-life analysis, emergency response planning, and alternative selection
by Spatial Compromised Programming (Qi et al. 2005a).
The numerical model provides the information about the extent of the flooded area,
spatial distributions of flood depth and flood velocities, arrival time of the flood and its
duration at each point of the computational domain. To carry out the simulation, the model
receives information from various sources. The topography is supplied from DEMs. The
data on the water infrastructure to be analyzed is retrieved from a special database. In
addition, information on structural or non structural (Simonovic 1998) flood protection and
mitigation measures, if any, should be provided.
GIS system takes a multitude of data from numerous sources and graphically displays the
information. It allows us to not only reach information about the geographical, geophysical,
and socioeconomic characteristics of the research area, but also, more importantly, to
determine, visualize, and analyze the possible extent of flood disasters (Gunes and Kovel
2000). Based on the 2D flow simulation results computed by CCHE2D-FLOOD, which are
converted into raster layers, the collection of GIS-based decision support systems carry out
analyses of loss of life, urban damage, rural and agricultural damage, and risk and uncer-
tainty, which is explained in detail in the followings. To carry out these tasks, the GIS
decision support system needs complementary information regarding various geospatial
information, such as land use, census data, infrastructure data, urban data, agricultural data,
economic data, etc. It also allows evaluation of the efficiency of emergency response plans,
structural and non structural flood protection and mitigation measures, etc. Engineering
alternatives for flood control and management, emergency response, etc. can be compara-
tively evaluated and ranked using recently developed SCP technique, which takes into
account spatial variations of the relative efficiency of the alternatives (Qi et al. 2005a).
2.1 Flood simulation using CCHE2D-flood model
The numerical model CCHE2D-FLOOD solves the two-dimensional shallow water
equations, i.e., Saint–Venant Equations, over arbitrary topography, defined by a regular
Cartesian mesh in x–y plane, using a conservative upwinding finite volume scheme (Ying
et al. 2004):
oU
otþ oFðUÞ
oxþ oGðUÞ
oy¼ SðUÞ ð1Þ
where U, F(U), G(U), and S(U) are the vectors of conserved variables, fluxes in the x and ydirection, and sources, respectively. They are defined as:
U ¼h
hu
hv
264
375 F ¼
Qx
Q2x=h
QxQy=h
264
375 G ¼
Qy
QyQx=h
Q2y=h
264
375
S ¼
0
� gh oZ=oxð Þ � g uffiffiffiffiffiffiffiffiffiffiffiffiffiffiffiu2 þ v2
p=C2
� �
� gh oZ=oyð Þ � g vffiffiffiffiffiffiffiffiffiffiffiffiffiffiffiu2 þ v2
p=C2
� �
26664
37775
ð2Þ
in which Z represents the water surface elevation and C the Chezy friction coefficient. Cell-
centered finite volume discretization of Eq. 1 over a rectangular control volume leads to
the following explicit scheme:
1128 Nat Hazards (2011) 59:1125–1143
123

Unþ1ij ¼ Un
ij �Dt
DxiFiþ1=2;j � Fi�1=2;j
� �� Dt
DyjGi;jþ1=2 � Gi;j�1=2
� �þ Dt Sij ð3Þ
where Dx and Dy are the cell dimensions in x and y directions, and Dt is the time step. In
CCHE2D-FLOOD, the intercell fluxes are computed using the following first-order
upwinding suggested by Ying et al. (2004):
Fiþ1=2j ¼Qx
Q2x=h
QxQy=h
264
375
iþk
k ¼ 0 Qx� 0
1 Qx\0
�and Gijþ1=2 ¼
Qy
QyQx=h
Q2y=h
264
375
jþm
m ¼ 0 Qy� 0
1 Qy\0
�ð4Þ
The dry bed condition is handled by maintaining a small water depth. This numerical
code has been fully tested and validated using the data from laboratory experiments and
model tests, as well as limited field data available from past events (Ying et al. 2003, 2004;
Ying and Wang 2004). It has been shown that the model is stable, oscillation-free, robust,
and rigorously conserves mass.
CCHE2D-FLOOD can directly use a Digital Elevation Model (DEM) as a regular
rectangular mesh input. This simplifies data preparation and cuts down the model set-up
time considerably. The numerical model provides the information about the extent of the
flooded area, spatial distributions of flood depth and flood velocities in two horizontal
directions, arrival time of the flood and its duration at each point of the computational
domain (Fig. 2). A special version of this model has also been used for solving complex
real-life problems related to dam-break floods (Jorgeson et al. 2005).
2.2 Loss-of-life estimation with census block information
Loss of life due to a flood event is usually estimated by determining a fatality rate, which is
defined as the fraction of mortalities among the exposed population (Jonkman et al. 2003).
According to Graham (1999), fatality rate resulting from a flood event is highly influenced
by three major factors: (1) the number of people occupying the floodplain, which is also
called population at risk (PAR); (2) the amount of warning that is provided to the people
exposed to dangerous flooding; and (3) the severity level of the flooding. In order to
determine the PAR value, the census block data, which is usually a vector polygon layer,
are used in GIS environment. Census blocks are areas bounded on all sides by visible
features, such as streets, roads, streams, and railroad tracks, and by invisible boundaries,
such as city, town, and county limits, property lines, and short, imaginary extensions of
streets and roads. After importing this layer into GIS, the population density is first
Fig. 2 Set of results provided by CCHE2D-FLOOD model. Asterisk values are recorded at each time stepduring simulations
Nat Hazards (2011) 59:1125–1143 1129
123

calculated by using the total population of each census block and its area. Then this feature
polygon is converted to a raster which has the same cell size as the flood computation
results. The cell value, which represents the PAR living and working inside each cell, is
reclassified according to the product of population density and the cell area. This operation
creates a raster layer showing the PAR distribution (Qi et al. 2005a).
The typical definition of warning time of a flood is the length of time from when the first
public warning is issued until the flood wave reaches the first person in the PAR (Aboelata
et al. 2002). Since the time that the flood event occurs is defined as time ‘‘0’’, warning time
can be either positive which indicates warning is issued after the flood event, or negative
which means warning is issued before the flood event. The flood severity definition is
usually associated with the flood depth. Low, medium, and high severity can be catego-
rized according to Graham (1999). Using the flood severity–based method for estimating
life loss, the intersection of modified census block information with inundation depth and
warning time in raster layers can produce a map showing the spatial distribution of the
loss-of-life information shown in Fig. 3 (Qi et al. 2005a).
2.3 Flood damage calculation for urban and rural area
The actual amount of flood damage generated by a specific flood event refers to all types of
hazards caused by flooding. It encompasses a wide range of effects on humans, their
properties and belongings, on public infrastructure, cultural heritage, ecological systems,
industrial production, and the competitive strength of the economy (Messner and Meyer
2005). Flood damage effects can be further categorized into direct and indirect effects.
Direct flood damage covers all varieties of harm which relate to the immediate physical
contact of flood water to humans, property, and the environment, which includes, for
example, damage to buildings, loss of standing crops and livestock in agriculture, and
contamination of ecological systems. Indirect or consequential effects comprise damage,
which occurs as a further consequence of the flood and the disruptions of economic and
social activities (Green et al. 1994). This damage is usually more difficult to evaluate and
thus is often unjustly neglected.
In current practices, there are two integral parts in the state-of the-art estimation of flood
damages (Messner and Meyer 2005). The flood expected damage is generally calculated
using flood depth and percentage damage relationships. Based on the analysis of damages
Fig. 3 Loss-of-life estimation with census block information in decision support system (USBR: UnitedStates Bureau of Reclamations)
1130 Nat Hazards (2011) 59:1125–1143
123

occurred during past flood events, such curves are prepared for different types of structures
(residential, commercial, industrial, etc.) and their contents, infrastructures (bridges,
highways, etc.), crop lands, agricultural installations, etc.
Over the past decades, a great variety of methods emerged for the estimation of flood
damages. Each method is suitable for a specific purpose. Gewalt et al. (1996) roughly
divides these methods into three categories based on their scale and goal: macro-, meso-
and micro-scale analyses. Macro-scale analyses consider areas of national or international
scale and should provide decision support for national flood mitigation policies. For meso-
scale analyses, the planning level corresponds to design of flood mitigation strategies for
large-scale flood events. The aim of micro-scale analyses is the assessment of flood pro-
tection measures at a local level. Characteristics of macro, meso, and micro approaches of
flood damage analysis for different spatial scales are listed in Table 1. For this research,
meso-scale flood damage analysis is performed for urban area with the aid of RS images,
while micro-scale flood damage analysis for crops of rural area based on detailed survey
database is carried out.
The flowchart of the procedure to compute urban and rural flood damage is presented in
Fig. 4. The information regarding the building and infrastructure stock and the agricultural
exploitation data is normally extracted from field surveys. If field surveys are not available,
the tool also accepts classified remote sensing data. The damage to a given property,
whether urban or rural, is calculated based on the maximum water depth and maximum
velocity information provided by the numerical model. A knowledge base provides the
depth (and/or velocity) versus percent damage relationship for various building types
(residential, public utility, industrial, etc.), infrastructures (roads, bridges, railroads,
electric lines, etc.), crop fields, farm houses, fish ponds, agricultural installations, etc.
The knowledge base also provides the property values and their contents. Details of
the computational method and the percent damage curves can be found in Qi et al.
(2005a and b).
2.3.1 Meso-scale urban flood damage calculation with remote sensing image
Within meso-scale analyses, the damage potential is derived from aggregated data. As in
the macro-scale approach, the data on valuables stem from official statistics at the
municipality level. However, in order to enable a more realistic localization of the valu-
ables within the municipalities, each of the categories for the valuables is assigned to one
or more corresponding land-use categories. For example, residential capital is assigned to
residential areas, fixed assets and inventories of the commercial sector are assigned to
industrial areas, and livestock is assigned to grassland. This approach allows a
Table 1 Characteristics of macro, meso, and micro approaches of flood damage analysis
Scale Size of theresearch area
Management level Demand onaccuracy
Possible dataresource
Applied for thisresearch
Macro- (Inter)-national Comprehensive floodmanagement practices
Low Feature maps No
Meso- Regional Large scale of floodmanagement strategies
Medium RS images Yes, for urbanarea
Micro- Local Single- or small-scale floodprotection works
High Detailed surveydatabase
Yes, for ruralarea
Nat Hazards (2011) 59:1125–1143 1131
123

differentiation between areas of high-value concentration, such as urban areas and espe-
cially city centers on the one hand, and areas with very low damage potential like non-
urban land or forests on the other hand (Lo and Choi 2004).
Today, high-resolution Remote Sensing image (RS) becomes more and more available
for flood damage assessment (Shan et al. 2009). Three categories of urban features from
RS are considered in this research: high-intensity residential area, low-intensity residential
area, and commercial/industrial/transportation area (Olofsson et al. 2010). The estimated
dollar value for the above three category, and the depth—percentage damage relationship
can be entered via a user-friendly interface and stored in the knowledge base. With
overlaying of this classified RS image with the flood inundation image, the flood damage
calculation can be achieved in the decision support system.
2.3.2 Micro-scale rural flood damage calculation with detailed survey database
Within micro-scale analyses, damage potentials and expected damages are evaluated on an
object level, i.e., single valuables of one category, such as specific types of residential for
urban flood damage calculation or non-residential properties, i.e., farms for rural area flood
damage evaluation, are differentiated. Field surveys or interviews with the property owners
are the two primary sources of the data used to develop detailed survey database. The
survey database table includes the following items, farm/owner name, geographical
locations (x/y coordinates), area, crop types, unit crop yield quantities, etc. Crop prices are
also obtained for the research area. According to the general procedure developed by
Natural Resources Conservation Services (NRCS), damage calculations are based on stage-
yield-% damage functions which are derived either from past flood data analysis, or
through analytical descriptions of flood damage to various crops considering the possible
Fig. 4 Procedure for the estimation of urban and rural (including agricultural) damage (USACE: UnitedStates Army Corp of Engineer)
1132 Nat Hazards (2011) 59:1125–1143
123

damage ratio to a given flood depth, the crop yield quantity, and the time that flood occurs.
Table 2 shows the detailed floodwater damage percentage per acre (0.004 km2) by month,
yields, and depths of for northern US (NETSC Technical Note—Watersheds-16 Rev. 2,
1978). It is interesting to note that negative numbers in the table mean some flood event
could even increase the potential production return of certain crops (Table 2).
In this research, detailed survey database of the farms is first converted and imported in
GIS as a point feature layer. The user is prompted to enter parameters for different crops
entering into the computation, i.e., crop price, damage curve files (MS excel format), and
one of five interpolation methods (linear, logarithmic, 2nd-order polynomial, power, or
exponential). Based on the parameters supplied by the user, the farm damage is estimated
by using the interpolated flood depth at each farm location from the raster layers of
computational results, crop yield, and event happened time in the region of interest.
Finally, the result is displayed as a point feature layer, which is drawn with different
symbol sizes to show damage quantities.
3 Risk and uncertainty analysis for flood damage assessment
As a spatial decision-making problem, flood damage assessment problem is subject to
multiple sources of uncertainty (Qi et al. 2005b). The first type of uncertainty arises from
the natural variability (inherent randomness) of the variables entering into analysis and can
be spatial or temporal. The second type of uncertainty, the epistemic uncertainty,
encompasses the knowledge uncertainty due to lack of sufficient knowledge in modeling
the physical processes and the parameters involved, as well as the decision model
Table 2 Crop floodwater damage percentages by months, yields, and flood depth
Crop and depthof flooding (m)
Yield Damage per 0.004 km2 as a percent of flood-free gross return by months
April May June July August September October November
Corn grain0–0.61
75 bu 0 4 30 31 14 9 10 3
125 bu 0 3 29 32 15 9 10 4
175 bu 0 3 28 32 15 9 10 4
Corn grainover 0.61
75 bu 0 5 41 60 38 27 23 8
125 bu 0 4 41 62 39 27 24 8
175 bu 0 4 39 63 39 28 24 8
Soybeans0–0.61
25 bu 0 3 40 67 64 45 33 10
40 bu 0 2 40 70 66 46 34 11
60 bu 0 2 40 71 68 47 35 11
Soybeansover 0.61
25 bu 0 4 54 86 86 65 38 11
40 bu 0 3 53 89 89 67 40 11
60 bu 0 2 51 91 91 69 40 11
Oats0–0.61
50 bu 15 16 46 54 24 0 0 0
70 bu 12 0 46 53 21 0 0 0
90 bu 11 –9 46 52 20 0 0 0
Oatsover 0.61
50 bu 23 25 75 81 38 0 0 0
70 bu 19 0 75 78 33 0 0 0
90 bu 16 –14 75 77 31 0 0 0
Nat Hazards (2011) 59:1125–1143 1133
123
uncertainty. The proposed decision support system takes into uncertainties by means of
Monte Carlo method, which uses stochastic sampling based on user-defined probability
distributions of uncertainties to compute the expected values of loss of life and flood
damage and their standard deviation.
3.1 Natural variability of various input parameters
The effect of parameter uncertainty on the total flood damage is taken into account in this
research, because it may have large effects on the output, and it is relatively easy to
quantify and important in the context of the decision support system. Parameter uncertainty
derives from statistical considerations and is usually described by either confidence
intervals or probability distributions. It relates to accuracy and precision with which
parameter can be inferred from field data, judgment, and technical literature (CRA 2000).
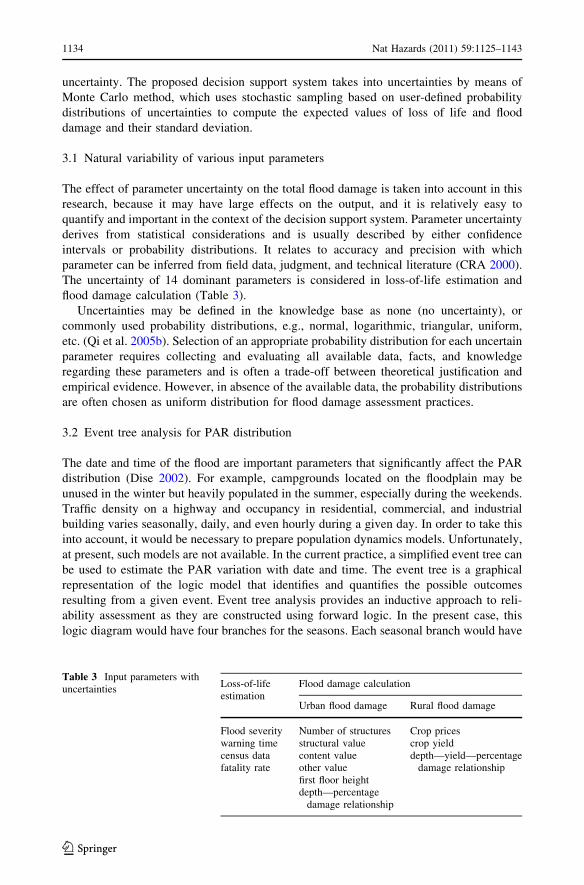
The uncertainty of 14 dominant parameters is considered in loss-of-life estimation and
flood damage calculation (Table 3).
Uncertainties may be defined in the knowledge base as none (no uncertainty), or
commonly used probability distributions, e.g., normal, logarithmic, triangular, uniform,
etc. (Qi et al. 2005b). Selection of an appropriate probability distribution for each uncertain
parameter requires collecting and evaluating all available data, facts, and knowledge
regarding these parameters and is often a trade-off between theoretical justification and
empirical evidence. However, in absence of the available data, the probability distributions
are often chosen as uniform distribution for flood damage assessment practices.
3.2 Event tree analysis for PAR distribution
The date and time of the flood are important parameters that significantly affect the PAR
distribution (Dise 2002). For example, campgrounds located on the floodplain may be
unused in the winter but heavily populated in the summer, especially during the weekends.
Traffic density on a highway and occupancy in residential, commercial, and industrial
building varies seasonally, daily, and even hourly during a given day. In order to take this
into account, it would be necessary to prepare population dynamics models. Unfortunately,
at present, such models are not available. In the current practice, a simplified event tree can
be used to estimate the PAR variation with date and time. The event tree is a graphical
representation of the logic model that identifies and quantifies the possible outcomes
resulting from a given event. Event tree analysis provides an inductive approach to reli-
ability assessment as they are constructed using forward logic. In the present case, this
logic diagram would have four branches for the seasons. Each seasonal branch would have
Table 3 Input parameters withuncertainties
Loss-of-lifeestimation
Flood damage calculation
Urban flood damage Rural flood damage
Flood severitywarning timecensus datafatality rate
Number of structuresstructural valuecontent valueother valuefirst floor heightdepth—percentage
damage relationship
Crop pricescrop yielddepth—yield—percentage
damage relationship
1134 Nat Hazards (2011) 59:1125–1143
123
two branches: one for weekdays and one for weekends. In turn, each of these could have
two branches: one for the daytime the other for the nighttime. Ranges for PAR could then
be estimated for each of the 16 end branches. Each PAR associated with the given time
frame would be stored as database file (raster layer) separately. The user is prompted to
specify season of the year, day of the week, and time at the beginning of the analysis. This
information is then used by the decision support system to retrieve the associated PAR
database for loss-of-life estimation.
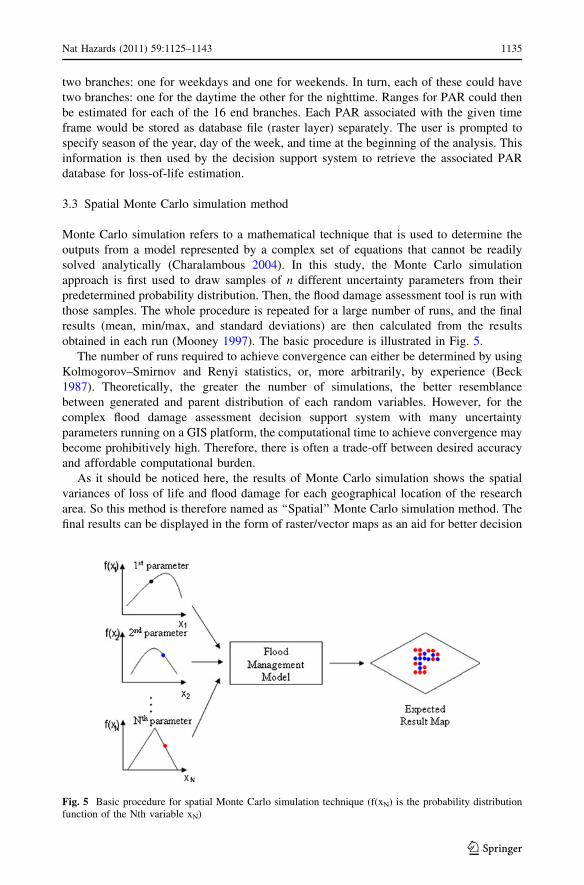
3.3 Spatial Monte Carlo simulation method
Monte Carlo simulation refers to a mathematical technique that is used to determine the
outputs from a model represented by a complex set of equations that cannot be readily
solved analytically (Charalambous 2004). In this study, the Monte Carlo simulation
approach is first used to draw samples of n different uncertainty parameters from their
predetermined probability distribution. Then, the flood damage assessment tool is run with
those samples. The whole procedure is repeated for a large number of runs, and the final
results (mean, min/max, and standard deviations) are then calculated from the results
obtained in each run (Mooney 1997). The basic procedure is illustrated in Fig. 5.
The number of runs required to achieve convergence can either be determined by using
Kolmogorov–Smirnov and Renyi statistics, or, more arbitrarily, by experience (Beck
1987). Theoretically, the greater the number of simulations, the better resemblance
between generated and parent distribution of each random variables. However, for the
complex flood damage assessment decision support system with many uncertainty
parameters running on a GIS platform, the computational time to achieve convergence may
become prohibitively high. Therefore, there is often a trade-off between desired accuracy
and affordable computational burden.
As it should be noticed here, the results of Monte Carlo simulation shows the spatial
variances of loss of life and flood damage for each geographical location of the research
area. So this method is therefore named as ‘‘Spatial’’ Monte Carlo simulation method. The
final results can be displayed in the form of raster/vector maps as an aid for better decision
Fig. 5 Basic procedure for spatial Monte Carlo simulation technique (f(xN) is the probability distributionfunction of the Nth variable xN)
Nat Hazards (2011) 59:1125–1143 1135
123
making related to flood hazard management (Qi et al. 2005b). It can also be used to evaluate
the cost effectiveness of alternative approaches to strengthening flood control measures.
4 Case study
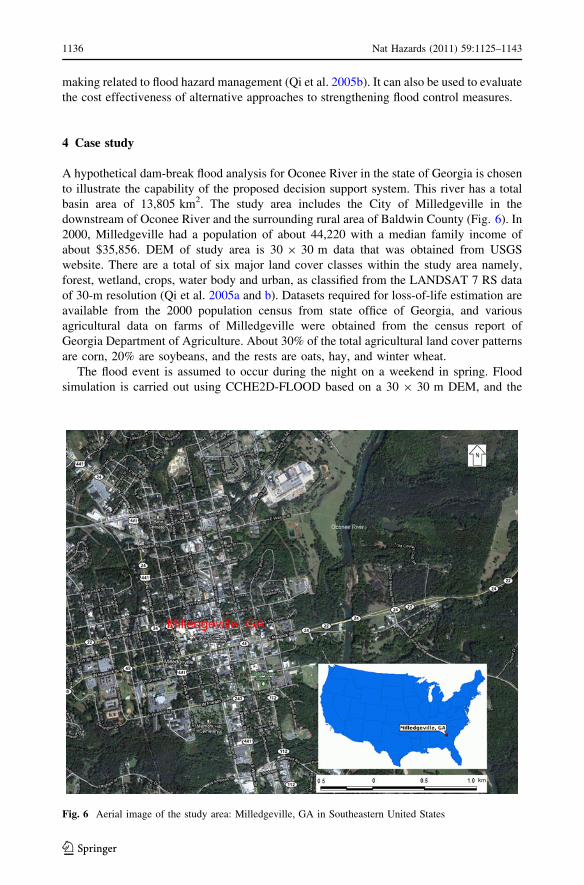
A hypothetical dam-break flood analysis for Oconee River in the state of Georgia is chosen
to illustrate the capability of the proposed decision support system. This river has a total
basin area of 13,805 km2. The study area includes the City of Milledgeville in the
downstream of Oconee River and the surrounding rural area of Baldwin County (Fig. 6). In
2000, Milledgeville had a population of about 44,220 with a median family income of
about $35,856. DEM of study area is 30 9 30 m data that was obtained from USGS
website. There are a total of six major land cover classes within the study area namely,
forest, wetland, crops, water body and urban, as classified from the LANDSAT 7 RS data
of 30-m resolution (Qi et al. 2005a and b). Datasets required for loss-of-life estimation are
available from the 2000 population census from state office of Georgia, and various
agricultural data on farms of Milledgeville were obtained from the census report of
Georgia Department of Agriculture. About 30% of the total agricultural land cover patterns
are corn, 20% are soybeans, and the rests are oats, hay, and winter wheat.
The flood event is assumed to occur during the night on a weekend in spring. Flood
simulation is carried out using CCHE2D-FLOOD based on a 30 9 30 m DEM, and the
Fig. 6 Aerial image of the study area: Milledgeville, GA in Southeastern United States
1136 Nat Hazards (2011) 59:1125–1143
123

computed flood depths, velocity components, arrival times, and flood durations are saved for
further analysis. The dam-break flood simulation results show that although it is a hypothetical
event, a dam-break flood can inundate almost half of the town by flood waters as deep as 32 m
(Fig. 7). The flood wave reaches the town of Milledgeville with a speed of 10 km/h, which is
strong enough to destroy many buildings. The number of Monte Carlo runs is set to 5,000 for
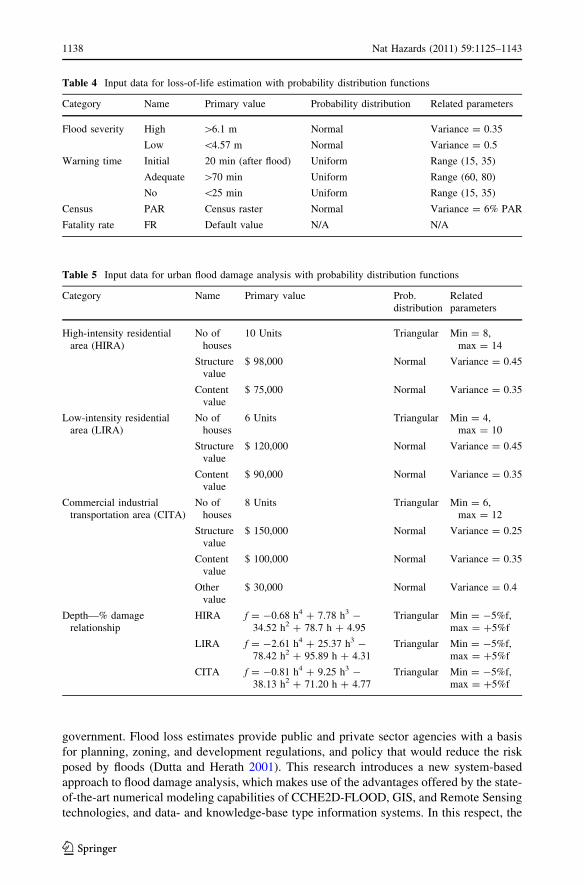
each analysis. The input data used for the spatial Monte Carlo Analysis of loss of life and flood
damage for both urban and rural areas are presented in Tables 4, 5, and 6 (data sources:
Department of Spatial Data Infrastructure and Department of Agriculture, GA, USA).
Figures 8 and 9 show the spatial distribution of expected value of loss of life and urban
flood damage (in US dollars) resulting from the spatial Monte Carlo analysis. Figure 10
shows the detailed farm damage in selected regions on study. Estimated different cate-
gories of flood damage by the system are shown in Table 7. The results indicate that levels
of loss of life and economic damage greatly vary spatially over the floodplain, which can
be used effectively for enhancing integrated flood damage assessment decision-making
process, as well as for designing future flood protection measures.
5 Conclusions and final remarks
An estimate of losses from future floods is essential to preparing for a disaster and
facilitating good decision making at the local, regional, state, and national levels of
Fig. 7 Flood inundation map of dam-break flood from Sinclair dam
Nat Hazards (2011) 59:1125–1143 1137
123
government. Flood loss estimates provide public and private sector agencies with a basis
for planning, zoning, and development regulations, and policy that would reduce the risk
posed by floods (Dutta and Herath 2001). This research introduces a new system-based
approach to flood damage analysis, which makes use of the advantages offered by the state-
of-the-art numerical modeling capabilities of CCHE2D-FLOOD, GIS, and Remote Sensing
technologies, and data- and knowledge-base type information systems. In this respect, the
Table 4 Input data for loss-of-life estimation with probability distribution functions
Category Name Primary value Probability distribution Related parameters
Flood severity High [6.1 m Normal Variance = 0.35
Low \4.57 m Normal Variance = 0.5
Warning time Initial 20 min (after flood) Uniform Range (15, 35)
Adequate [70 min Uniform Range (60, 80)
No \25 min Uniform Range (15, 35)
Census PAR Census raster Normal Variance = 6% PAR
Fatality rate FR Default value N/A N/A
Table 5 Input data for urban flood damage analysis with probability distribution functions
Category Name Primary value Prob.distribution
Relatedparameters
High-intensity residentialarea (HIRA)
No ofhouses
10 Units Triangular Min = 8,max = 14
Structurevalue
$ 98,000 Normal Variance = 0.45
Contentvalue
$ 75,000 Normal Variance = 0.35
Low-intensity residentialarea (LIRA)
No ofhouses
6 Units Triangular Min = 4,max = 10
Structurevalue
$ 120,000 Normal Variance = 0.45
Contentvalue
$ 90,000 Normal Variance = 0.35
Commercial industrialtransportation area (CITA)
No ofhouses
8 Units Triangular Min = 6,max = 12
Structurevalue
$ 150,000 Normal Variance = 0.25
Contentvalue
$ 100,000 Normal Variance = 0.35
Othervalue
$ 30,000 Normal Variance = 0.4
Depth—% damagerelationship
HIRA f = -0.68 h4 ? 7.78 h3 -34.52 h2 ? 78.7 h ? 4.95
Triangular Min = -5%f,max = ?5%f
LIRA f = -2.61 h4 ? 25.37 h3 -78.42 h2 ? 95.89 h ? 4.31
Triangular Min = -5%f,max = ?5%f
CITA f = -0.81 h4 ? 9.25 h3 -38.13 h2 ? 71.20 h ? 4.77
Triangular Min = -5%f,max = ?5%f
1138 Nat Hazards (2011) 59:1125–1143
123

proposed system significantly improves the current practice by providing simulation and
analysis capabilities with unprecedented realism and robustness. Table 8 compares the
unique features offered by the proposed new methodology with the currently used flood
damage evaluation software—HEC-FDA, which is based on 1D simulation.
The research described an integrated system which combines a two-dimensional
numerical model with a series of GIS-based decision support tools to estimate probable
loss of life as well as urban and rural flood damage by interfacing numerical results with
spatial socio-economic data obtained from field surveys and/or classified remote sensing
maps. The decision support tools use the Monte Carlo method to simulate uncertainties
associated with different variables. The numerical model includes a cut-cell boundary
capability to represent linear terrain features that cannot be captured in the DEM. A special
version of the cut-cell boundary method couples 1D and 2D simulations for carrying out
levee breach simulations in a single run. The integrated system can be used to establish
Table 6 Input data for rural flood damage analysis with probability distribution functions
Crop name Items Primaryvalue
Probabilitydistribution
Related parameters
Corn grain Yield (bu/0.004 km2)
75 Normal Variance = 0.25
Price ($/bu) 458 Normal Variance = 0.35
% Damage From Table 2 Triangular Min = -5%v,max = ?5%v
Corn silage Yield (bu/0.004 km2)
65 Normal Variance = 0.35
Price ($/bu) 557 Normal Variance = 0.25
% Damage From Table 2 Triangular Min = -5%v,max = ?5%v
Soybeans Yield (bu/0.004 km2)
45 Normal Variance = 0.30
Price ($/bu) 655 Normal Variance = 0.40
% Damage From Table 2 Triangular min = -5%v,max = ?5%v
Hays Yield (bu/0.004 km2)
100 Normal Variance = 0.40
Price ($/bu) 152 Normal Variance = 0.35
% Damage From Table 2 Triangular min = -5%v,max = ?5%v
Oats Yield (bu/0.004 km2)
60 Normal Variance = 0.25
Price ($/bu) 536 Normal Variance = 0.30
% Damage From Table 2 Triangular min = -5%v,max = ?5%v
Winterwheat
Yield (bu/0.004 km2)
50 Normal Variance = 0.30
Price ($/bu) 469 Normal Variance = 0.30
% Damage From Table 2 Triangular min = -5%v,max = ?5%v
Nat Hazards (2011) 59:1125–1143 1139
123

Fig. 8 Expected value of loss of life from Monte Carlo analysis
Fig. 9 Expected value of urban flood damage from Monte Carlo analysis
1140 Nat Hazards (2011) 59:1125–1143
123

Emergency Action Plans (EAP) for high-hazard and significant hazard dams, as well as
emergency management planning.
The ultimate aim of this research is, thus, to reconcile the practice of flood simulation
and flood damage analyses with the currently available state-of-the-art numerical methods,
GIS and remote sensing technologies, data- and knowledge-base type information systems.
In this respect, the developed software radically changes the practice of dam and levee
breach analysis and offers cost-effective simulation and analyses capabilities with
unprecedented realism and robustness.
Fig. 10 Expected value of rural (farm) damages from Monte Carlo analysis
Table 7 Estimated flood dam-age by category (flood damagedisplayed in million dollars)
Category Items Results
Loss of life Number of fatalities 132 person
Urban flood damage High-intensityresidential area
365
Low-intensityresidential area
247
Commercial, industrialtransportation area
581
Total 1,193
Rural flood damage Total 1.64
Nat Hazards (2011) 59:1125–1143 1141
123

It is also important to underline the fact that the currently available relationships used
for estimating property damage are generally expressed as a function of flood depth only.
The accuracy of predictions can probably be improved by taking into account other
detailed information provided by 2D flood modeling, such as flood velocity and duration.
Research is needed to develop such improved damage relationships.
Acknowledgments This work is a result of research sponsored by the USDA Agriculture Research Ser-vice under Specific Research Agreement No. 58-6408-2-0062 (monitored by the USDA-ARS NationalSedimentation Laboratory) and The University of Mississippi. The authors also thank for the support fromthe School of Engineering, the University of Mississippi.
References
Aboelata M et al (2002) GIS model for estimating dam failure life loss. In: The tenth engineering foundationconference on risk-based decision making in water resources: protection of the homeland’s waterresources systems, November 2002, Santa Barbara, California
Beck MB (1987) Water quality modeling: a review of the analysis of uncertainty. Water Resour Res23(8):1393–1442
California Department of Water Resources (2004) Colusa basin integrated watershed management plan:flood damage analysis. http://www.economics.water.ca.gov/. Accessed 05/26/2006
Table 8 Comparison between the proposed flood damage assessment decision support system with HEC-FDA
HEC-FDA (US army corp of engineers) Proposed flood damage assessment decisionsupport system
Floodsimulation
HEC-FDA uses discharge-frequency, stage-discharge relationships and water surfaceprofiles computed from a 1D hydraulicmodel such as HEC-RAS
Flood propagation computations are carriedout using a 2D model, CCHE2D-FLOOD.Flood depths, velocities, flood arrival time,and duration are stored in raster format thatcan be imported into ArcGIS
Data source Damage reaches, structure inventory fromsurvey database are defined. Hydrologicand economic information are entered intabular forms via graphical user interfaces(GUI)
GIS feature layers (census block layer,infrastructure layer, surveyed database,etc.) and Remote Sensing image are used.User-defined depth – percentage damagerelationship and various other digital dataresources can be used
Floodprotectionalternatives
A study in HEC-FDA model allowsformulating and evaluating several plans
Each plan requires an individual run ofCCHE2D-Flood and the results are usedfor evaluation
Risk anduncertaintiesanalysis
Risk-based analysis in HEC-FDA considersuncertainty in discharge-frequency,elevation-discharge, and elevation-damage relationships and variouseconomic information. Monte Carloanalysis is used for computing expecteddamage
Uncertainties in various economic data,depth-% relationship, number ofpopulation at risk, and date and time theevent occurs enter into the computation ofloss of life and flood damage. SpatialMonte Carlo simulation is performed for asingle event case
Results HEC-FDA provides final results asequivalent annual damage report and planperformance in forms and charts. Resultsof various plans can be compared andevaluated
Various maps showing spatially distributedloss of life and flood damage informationand statistical analysis are provided.Spatial Compromised Programming (Qiet al. 2005a) toolbox is used to comparevarious flood mitigation plans
1142 Nat Hazards (2011) 59:1125–1143
123

Charalambous J (2004) Application of Monte Carlo simulation technique with URBS runoff-routing modelfor design flood estimation in large catchments, Masters of Engineering (Honor) Thesis, University ofWestern Sydney, Sydney, Australia
CRA (Committee on Risk-Based Analyses for Flood Damage Reduction, Water Science and TechnologyBoard), Commission on Geosciences, National Research Council (2000) Risk analysis and uncertaintyin flood damage reduction studies. National Academies Press, ISBN-0309071364
Dise KM (2002) Estimating potential for life loss caused by uncontrolled release of reservoir water. Riskanalysis methodology appendix O, US Bureau of Reclamation, Technical Service Center, Denver, CO
Dutta D, Herath S (2001) GIS based flood loss estimation modeling in Japan. In: Proceedings of the US-Japan 1st workshop on comparative study on urban disaster management, Feb 2001, Port Island, Kobe,Japan
Gewalt M, Klaus J, Peerbolte EB, Pflugner W, Schmidtke RF, Verhage L (1996) EUROflood—technicalannex 8: economic assessment of flood hazards. Regional Scale Analysis-Decision Support System(RSA-DSS), Munich, Germany
Graham WJ (1999) A procedure for estimating loss of life caused by dam failure, Report No. DSO-99-06,Dam Safety Office, US Bureau of Reclamation, Denver, CO
Green C, van der Veen A, Wierstra E, Penning-Rowsell E (1994) Vulnerability refined: analyzing full floodimpacts. In: Penning-Rowsell E, Fordham M (eds) Floods across Europe—flood hazard assessment,modeling and management. Middlesex University Press, London
Gunes AE, Kovel JP (2000) Using GIS in emergency management operations. J Urb Plan Dev126(3):136–149
Jonkman SN, van Gelder PHAJM, Vrijling JK (2003) An overview of quantitative risk measures for loss oflife and economic damage. J Hazard Mater 99:1–30
Jorgeson J, Ying X, Wardlaw W (2005) Two-dimensional modeling of dam breach flooding. In: Proceedingsof the first US-China workshop on advanced computational modeling in hydroscience and engineering,September 2005, Oxford, Mississippi, USA
Lo CP, Choi J (2004) A hybrid approach to urban land use/cover mapping using landsat 7 enhanced thematicmapper plus (ETM?) images. Int J Remote Sens 25(14):2687–2700
Messner F, Meyer V (2005) Flood damage, vulnerability and risk perception—challenges for flood damageresearch. In: Schanze J, Zeman E, Marsalek, J (eds) Flood risk management—hazards, vulnerabilityand mitigation measures. Nato Science Series, Springer Publisher, USA
Mooney CZ (1997) Monte Carlo simulation, Sage University Paper Series, Sage Publications Inc, 2455Teller Road, Thousand Oaks, CA 91320
NETSC Technical Note—Watersheds-16 Rev. 2 (1978) United States Department of Agriculture (USDA)soil conservation services—Northeast Technical Service Center, Broomall, PA 19008
Olofsson P, Torchinava P, Woodcock CE, Baccini A, Houghton RA, Ozdogan M, Zhao F, Yang X (2010)Implications of land use change on the national terrestrial carbon budget of Georgia. Carbon BalanceManage 5(1):4–10
Qi H, Altinakar MS, Ying X, Wang SSY (2005a) Flood management decision making using spatial com-promise programming with remote sensing and census block information. In: Proceedings of XXXIIAHR Congress, Sep 2005, Seoul, Korea
Qi H, Altinakar MS, Ying X, Wang SSY (2005b) Risk and uncertainty analysis in flood hazard managementusing GIS and remote sensing technology. In: Proceedings of 2005 AWRA annual conference, Nov2005, Seattle, WA, USA
Shan J, Hussain E, Kim K, Biehl L (2009) Flood mapping and damage assessment—a case study in the stateof Indiana. Geospatial Technology for Earth Observation, pp 473–495
Simonovic SP (1998) Social criteria for evaluation of flood management decisions. Can Civil Eng15(6):8–12
Ying X, Wang SSY (2004) Two-dimensional numerical simulations of Malpasset dam-break wave propa-gation. In: Proceeding of 6th international conference on hydroscience and engineering (CD ROM.),Brisbane, Australia
Ying X, Wang SSY, Khan AA (2003) Numerical simulation of flood inundation due to dam and leveebreach. In: Proceeding of ASCE world water and environmental resources congress 2003 (CD-ROM),June 2003, Philadelphia, USA
Ying X, Khan AA, Wang SSY (2004) An upwind conservative scheme for saint venant equations.J Hydraulic Eng 130(10):977–987
Nat Hazards (2011) 59:1125–1143 1143
123


![.Noah's Flood WTJ2004[1]](https://static.fdokumen.com/doc/165x107/631c39e73e8acd997705cf6b/noahs-flood-wtj20041.jpg)