Measurement Uncertainty - NFOGM
17
Measurement Uncertainty PROBABILITY DISTRIBUTIONS By Rick Hogan AND DIVISORS FOR ESTIMATING The Complete Reference Guide to
-
Upload
khangminh22 -
Category
Documents
-
view
2 -
download
0
Transcript of Measurement Uncertainty - NFOGM

Probability Distributions & Divisors for Estimating Measurement Uncertainty
1
©2015 isobudgets llc
β
Measurement Uncertainty
PROBABILITY DISTRIBUTIONS
By Rick Hogan
AND DIVISORS FOR ESTIMATING
The Complete Reference Guide to
Probability Distributions & Divisors for Estimating Measurement Uncertainty
2
©2015 isobudgets llc
Probability Distributions and Divisors
For Estimating Measurement Uncertainty By Richard Hogan | © 2015 ISOBudgets LLC. All Rights Reserved.
Copyright © 2015 by ISOBudgets LLC
All rights reserved. This book or any portion thereof may not be reproduced or used in any manner
whatsoever without the express written permission of the publisher except for the use of brief
quotations in a book review.
Printed in the United States of America
First Printing, 2015
ISOBudgets LLC
P.O. Box 2455
Yorktown, VA 23692
http://www.isobudgets.com
Probability Distributions & Divisors for Estimating Measurement Uncertainty
3
©2015 isobudgets llc
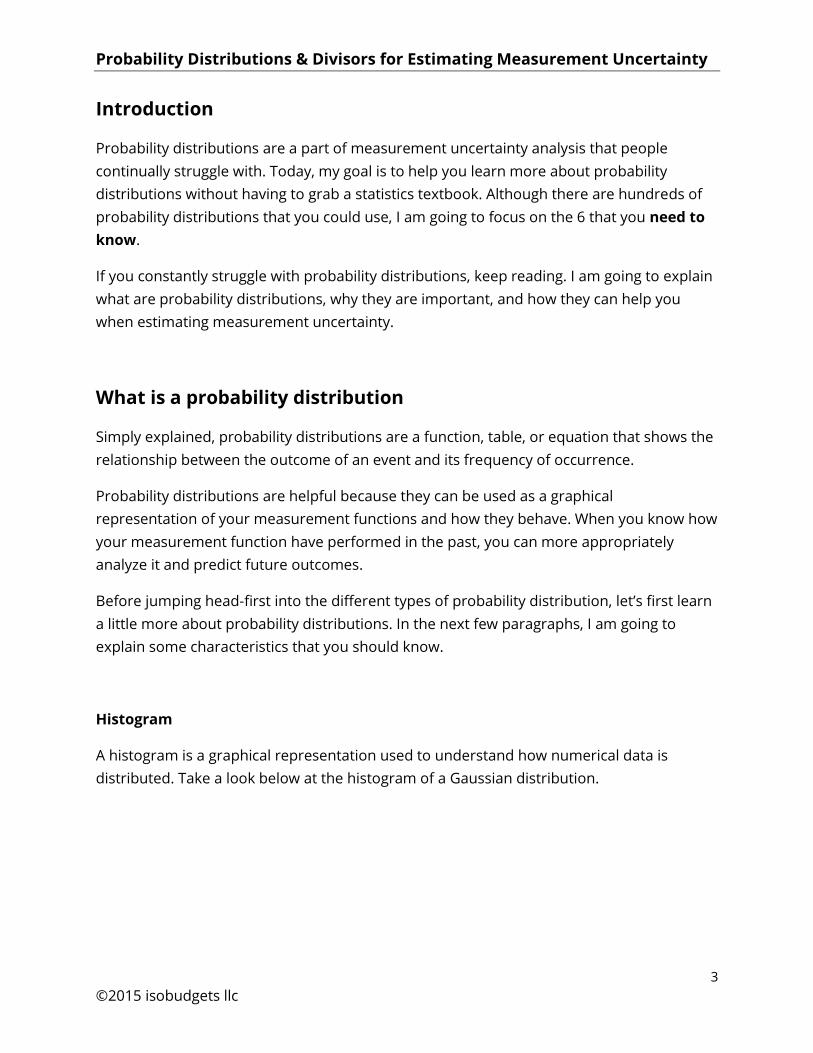
Introduction
Probability distributions are a part of measurement uncertainty analysis that people
continually struggle with. Today, my goal is to help you learn more about probability
distributions without having to grab a statistics textbook. Although there are hundreds of
probability distributions that you could use, I am going to focus on the 6 that you need to
know.
If you constantly struggle with probability distributions, keep reading. I am going to explain
what are probability distributions, why they are important, and how they can help you
when estimating measurement uncertainty.
What is a probability distribution
Simply explained, probability distributions are a function, table, or equation that shows the
relationship between the outcome of an event and its frequency of occurrence.
Probability distributions are helpful because they can be used as a graphical
representation of your measurement functions and how they behave. When you know how
your measurement function have performed in the past, you can more appropriately
analyze it and predict future outcomes.
Before jumping head-first into the different types of probability distribution, let’s first learn
a little more about probability distributions. In the next few paragraphs, I am going to
explain some characteristics that you should know.
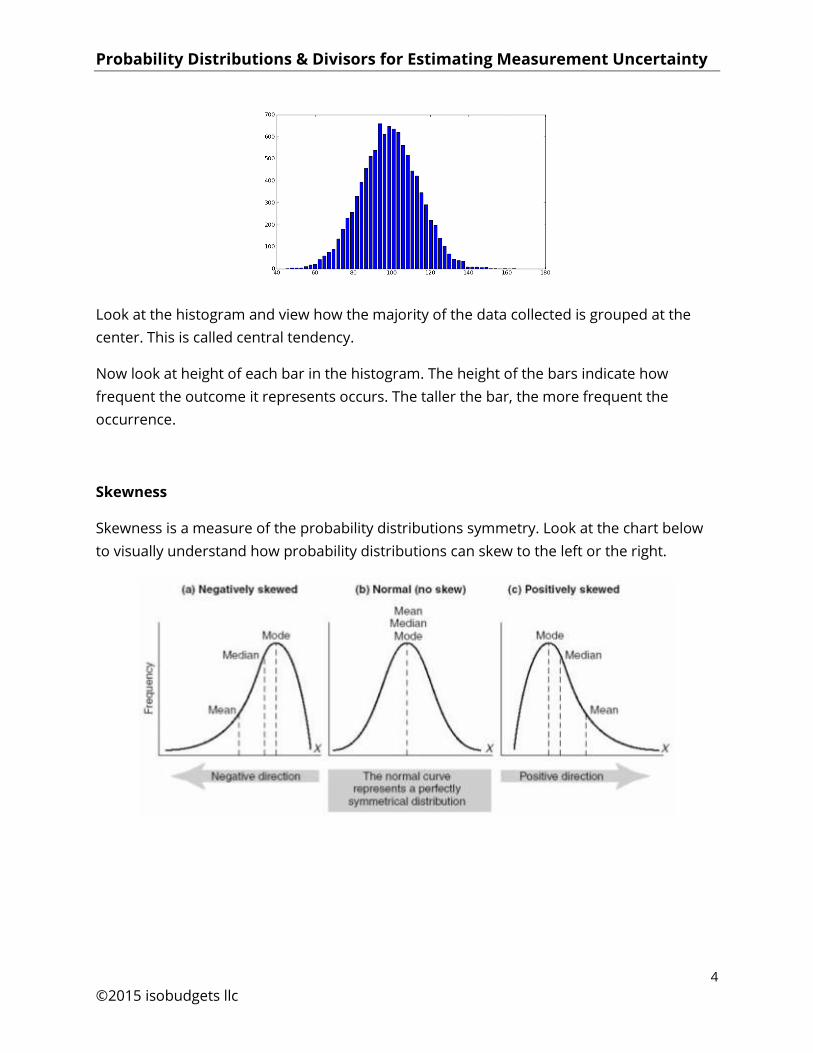
Histogram
A histogram is a graphical representation used to understand how numerical data is
distributed. Take a look below at the histogram of a Gaussian distribution.
Probability Distributions & Divisors for Estimating Measurement Uncertainty
4
©2015 isobudgets llc
Look at the histogram and view how the majority of the data collected is grouped at the
center. This is called central tendency.
Now look at height of each bar in the histogram. The height of the bars indicate how
frequent the outcome it represents occurs. The taller the bar, the more frequent the
occurrence.
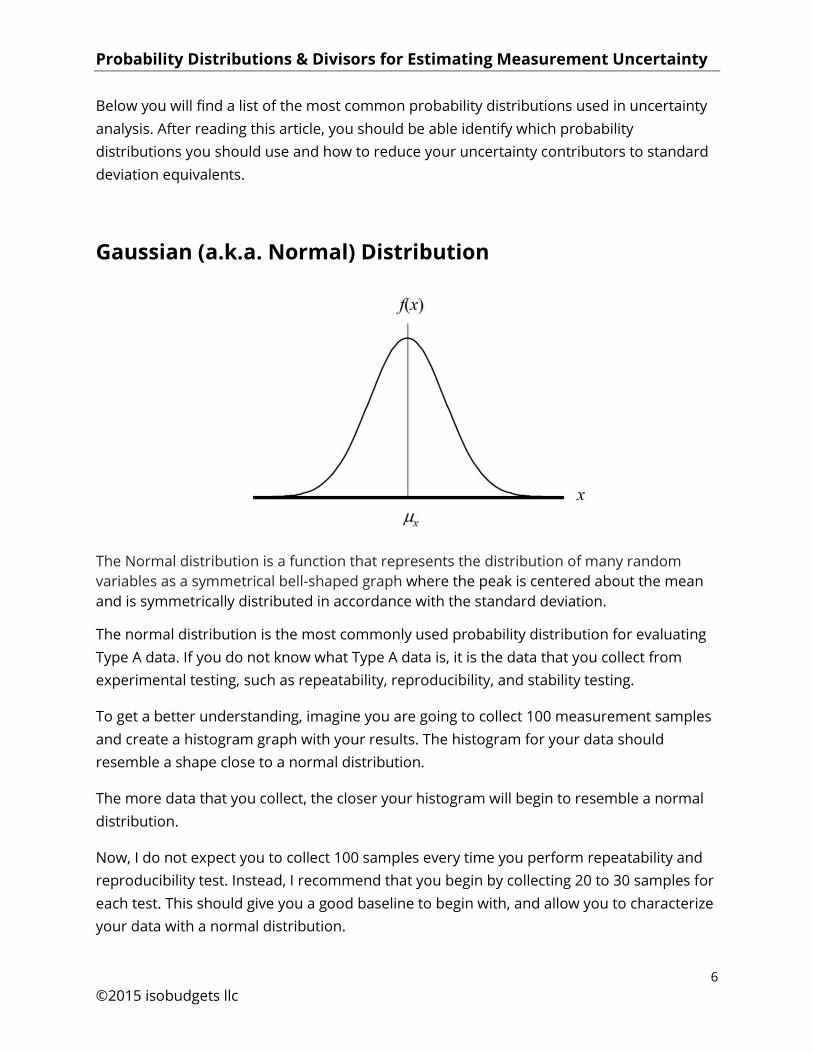
Skewness
Skewness is a measure of the probability distributions symmetry. Look at the chart below
to visually understand how probability distributions can skew to the left or the right.

Probability Distributions & Divisors for Estimating Measurement Uncertainty
5
©2015 isobudgets llc
Kurtosis
Kurtosis is a measure of the tailedness and peakedness relative to a normal distribution. As
you can see from the image below, distributions with wider tails have smaller peaks while
distributions with greater peaks have narrower tails. Do you see the relationship?
Why is it important
I know it seems like I am making you read more information that you want to know, but it
is important to know these details so you can select the appropriate probability distribution
that characterizes your data.
If you are uncertain how your data is distributed, create histogram and compare it to the
following probability distributions.
Most commonly used
The most commonly used probability distributions for estimating measurement
uncertainty are;
Normal
Rectangular
U-Shaped
Triangle
Log-Normal
Rayleigh
Probability Distributions & Divisors for Estimating Measurement Uncertainty
6
©2015 isobudgets llc
Below you will find a list of the most common probability distributions used in uncertainty
analysis. After reading this article, you should be able identify which probability
distributions you should use and how to reduce your uncertainty contributors to standard
deviation equivalents.
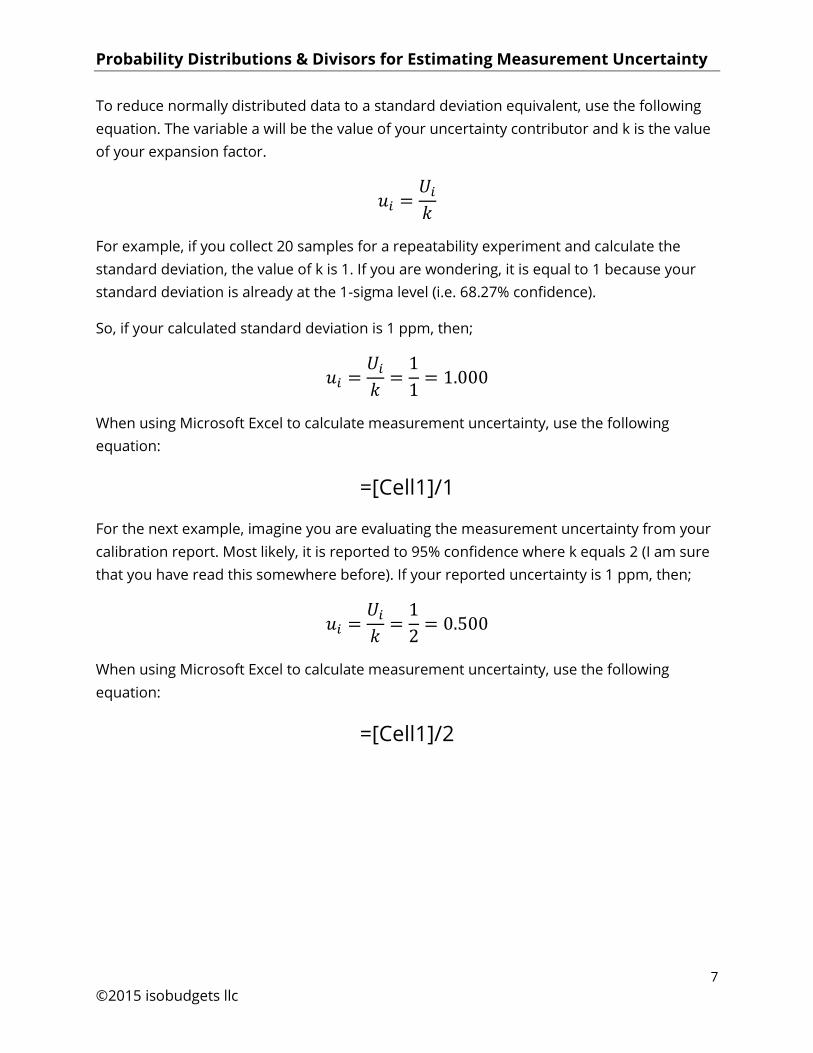
Gaussian (a.k.a. Normal) Distribution
The Normal distribution is a function that represents the distribution of many random
variables as a symmetrical bell-shaped graph where the peak is centered about the mean
and is symmetrically distributed in accordance with the standard deviation.
The normal distribution is the most commonly used probability distribution for evaluating
Type A data. If you do not know what Type A data is, it is the data that you collect from
experimental testing, such as repeatability, reproducibility, and stability testing.
To get a better understanding, imagine you are going to collect 100 measurement samples
and create a histogram graph with your results. The histogram for your data should
resemble a shape close to a normal distribution.
The more data that you collect, the closer your histogram will begin to resemble a normal
distribution.
Now, I do not expect you to collect 100 samples every time you perform repeatability and
reproducibility test. Instead, I recommend that you begin by collecting 20 to 30 samples for
each test. This should give you a good baseline to begin with, and allow you to characterize
your data with a normal distribution.
Probability Distributions & Divisors for Estimating Measurement Uncertainty
7
©2015 isobudgets llc
To reduce normally distributed data to a standard deviation equivalent, use the following
equation. The variable a will be the value of your uncertainty contributor and k is the value
of your expansion factor.
𝑢𝑖 =𝑈𝑖
𝑘
For example, if you collect 20 samples for a repeatability experiment and calculate the
standard deviation, the value of k is 1. If you are wondering, it is equal to 1 because your
standard deviation is already at the 1-sigma level (i.e. 68.27% confidence).
So, if your calculated standard deviation is 1 ppm, then;
𝑢𝑖 =𝑈𝑖
𝑘=1
1= 1.000
When using Microsoft Excel to calculate measurement uncertainty, use the following
equation:
=[Cell1]/1
For the next example, imagine you are evaluating the measurement uncertainty from your
calibration report. Most likely, it is reported to 95% confidence where k equals 2 (I am sure
that you have read this somewhere before). If your reported uncertainty is 1 ppm, then;
𝑢𝑖 =𝑈𝑖
𝑘=1
2= 0.500
When using Microsoft Excel to calculate measurement uncertainty, use the following
equation:
=[Cell1]/2
Probability Distributions & Divisors for Estimating Measurement Uncertainty
8
©2015 isobudgets llc
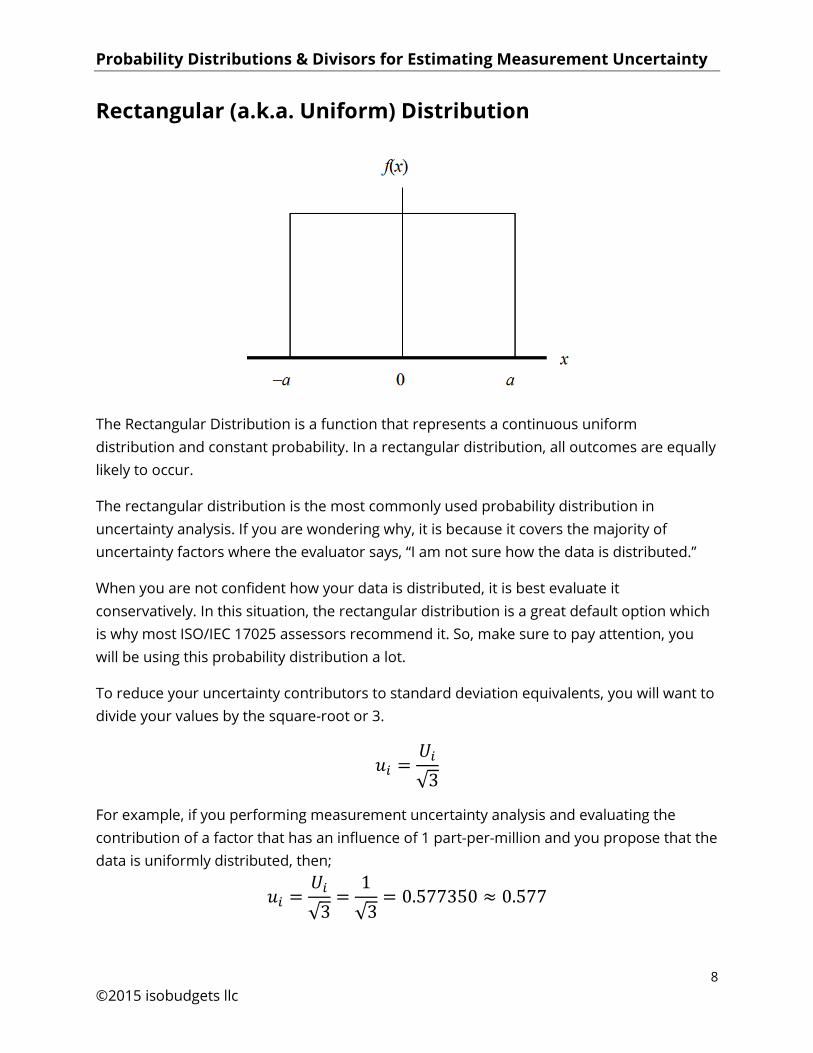
Rectangular (a.k.a. Uniform) Distribution
The Rectangular Distribution is a function that represents a continuous uniform
distribution and constant probability. In a rectangular distribution, all outcomes are equally
likely to occur.
The rectangular distribution is the most commonly used probability distribution in
uncertainty analysis. If you are wondering why, it is because it covers the majority of
uncertainty factors where the evaluator says, “I am not sure how the data is distributed.”
When you are not confident how your data is distributed, it is best evaluate it
conservatively. In this situation, the rectangular distribution is a great default option which
is why most ISO/IEC 17025 assessors recommend it. So, make sure to pay attention, you
will be using this probability distribution a lot.
To reduce your uncertainty contributors to standard deviation equivalents, you will want to
divide your values by the square-root or 3.
𝑢𝑖 =𝑈𝑖
√3
For example, if you performing measurement uncertainty analysis and evaluating the
contribution of a factor that has an influence of 1 part-per-million and you propose that the
data is uniformly distributed, then;
𝑢𝑖 =𝑈𝑖
√3=
1
√3= 0.577350 ≈ 0.577

Probability Distributions & Divisors for Estimating Measurement Uncertainty
9
©2015 isobudgets llc
When using Microsoft Excel to calculate measurement uncertainty, use the following
equation:
=[Cell1]/SQRT(3)
U-shaped Distribution
The U-shaped Distribution is a function that represents outcomes that are most likely to
occur at the extremes of the range. The distribution forms the shape of the letter ‘U,’ but
does not necessarily have to be symmetrical.
The u-shaped distribution is helpful where events frequently occur at the extremes of the
range. Consider the thermostat that controls the temperature of your laboratory. If you are
not using a PID controller, your thermostat controller only attempts to control temperature
by activating at the extremes.
For example, imagine that your laboratory thermostat is set at 20°C and controls
temperature to 1°C. Most likely, your thermostat does not activate your HVAC system until
the laboratory temperature reaches either 19°C or 21°C. This means that your laboratory is
not normally at 20°C. Instead, your laboratory temperatures are floating around the limits
of the thermostat’s thresholds before activating or deactivating.
For this reason, it is best to characterize your laboratory temperature data using a u-
shaped distribution.
Probability Distributions & Divisors for Estimating Measurement Uncertainty
10
©2015 isobudgets llc
To reduce your uncertainty contributors to standard deviation equivalents, you will want to
divide your values by the square-root or 2.
𝑢𝑖 =𝑈𝑖
√2
So, if you performing measurement uncertainty analysis and evaluating the contribution of
a factor that has an influence of 1 part-per-million and you propose that the data for this
factor is u-shaped distributed, then;
𝑢𝑖 =𝑈𝑖
√2=
1
√2= 0.707107 ≈ 0.707
When using Microsoft Excel to calculate measurement uncertainty, use the following
equation:
=[Cell1]/SQRT(2)
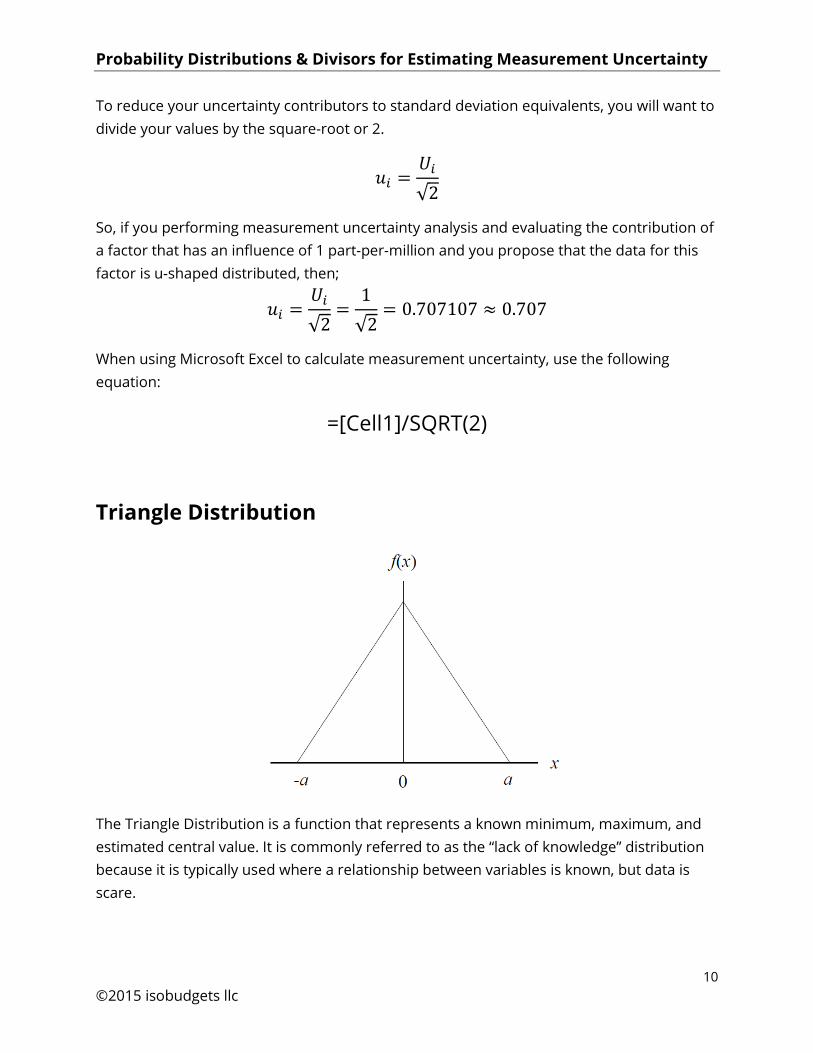
Triangle Distribution
The Triangle Distribution is a function that represents a known minimum, maximum, and
estimated central value. It is commonly referred to as the “lack of knowledge” distribution
because it is typically used where a relationship between variables is known, but data is
scare.
Probability Distributions & Divisors for Estimating Measurement Uncertainty
11
©2015 isobudgets llc
Additionally, the triangle distribution is commonly used where the data collection is difficult
or expensive.
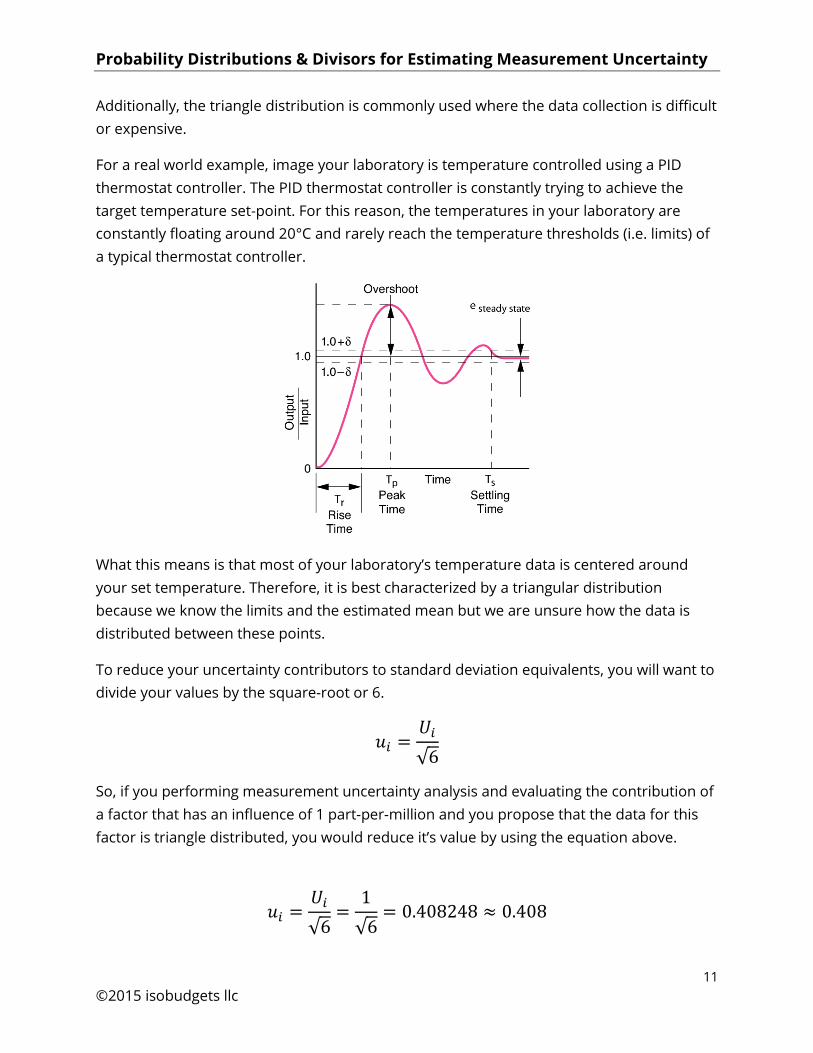
For a real world example, image your laboratory is temperature controlled using a PID
thermostat controller. The PID thermostat controller is constantly trying to achieve the
target temperature set-point. For this reason, the temperatures in your laboratory are
constantly floating around 20°C and rarely reach the temperature thresholds (i.e. limits) of
a typical thermostat controller.
What this means is that most of your laboratory’s temperature data is centered around
your set temperature. Therefore, it is best characterized by a triangular distribution
because we know the limits and the estimated mean but we are unsure how the data is
distributed between these points.
To reduce your uncertainty contributors to standard deviation equivalents, you will want to
divide your values by the square-root or 6.
𝑢𝑖 =𝑈𝑖
√6
So, if you performing measurement uncertainty analysis and evaluating the contribution of
a factor that has an influence of 1 part-per-million and you propose that the data for this
factor is triangle distributed, you would reduce it’s value by using the equation above.
𝑢𝑖 =𝑈𝑖
√6=
1
√6= 0.408248 ≈ 0.408
Probability Distributions & Divisors for Estimating Measurement Uncertainty
12
©2015 isobudgets llc
If you using Microsoft Excel to calculate measurement uncertainty, use the following
equation:
=[Cell1]/SQRT(6)
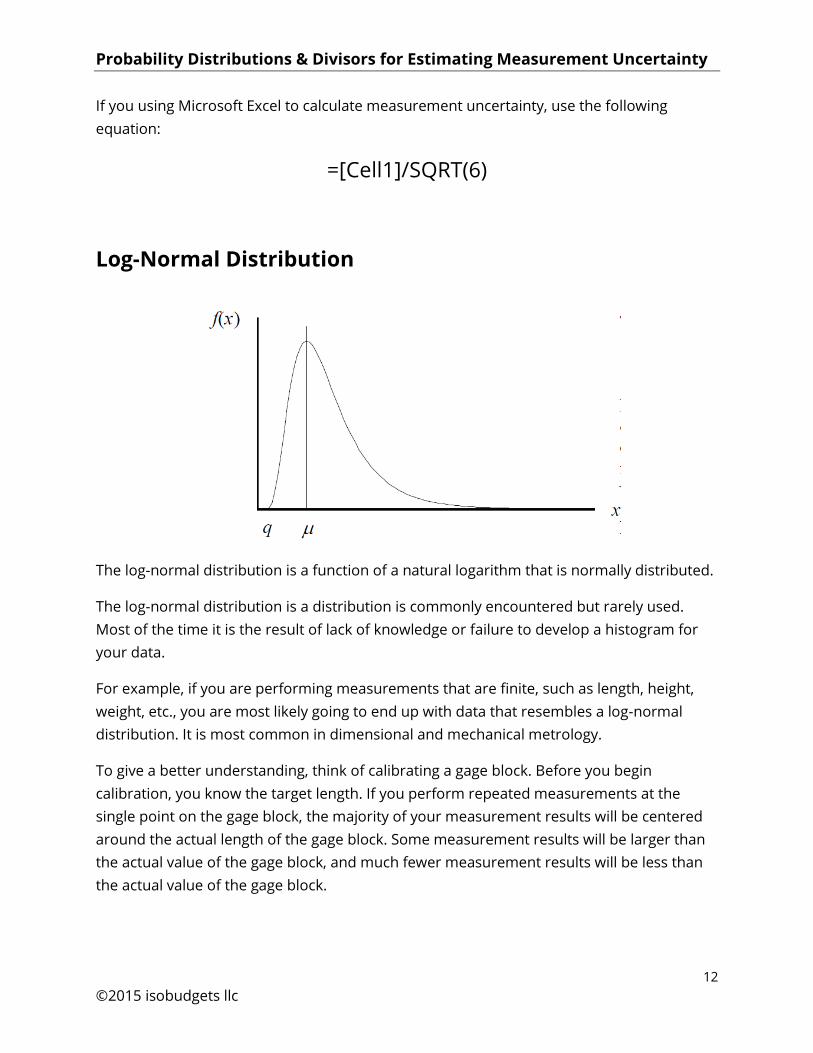
Log-Normal Distribution
The log-normal distribution is a function of a natural logarithm that is normally distributed.
The log-normal distribution is a distribution is commonly encountered but rarely used.
Most of the time it is the result of lack of knowledge or failure to develop a histogram for
your data.
For example, if you are performing measurements that are finite, such as length, height,
weight, etc., you are most likely going to end up with data that resembles a log-normal
distribution. It is most common in dimensional and mechanical metrology.
To give a better understanding, think of calibrating a gage block. Before you begin
calibration, you know the target length. If you perform repeated measurements at the
single point on the gage block, the majority of your measurement results will be centered
around the actual length of the gage block. Some measurement results will be larger than
the actual value of the gage block, and much fewer measurement results will be less than
the actual value of the gage block.
Probability Distributions & Divisors for Estimating Measurement Uncertainty
13
©2015 isobudgets llc
The reason this happens is your measurement results are limited by the length of the gage
block. Realistically, you cannot measure less than the length of the block; so, your
measurement results are finite or limited.
Make sure to consider the log-normal distribution next time you are performing
measurements that are finite. It may prevent you from encountering measurement errors
and mis-calculated uncertainties.
To reduce your uncertainty contributors to standard deviation equivalents, you will want
use the following equation.
𝑢𝑖 = (𝑚 − 𝑞)𝑒𝜆2
2 √𝑒𝜆2− 1
Where,
m = median
q = limit
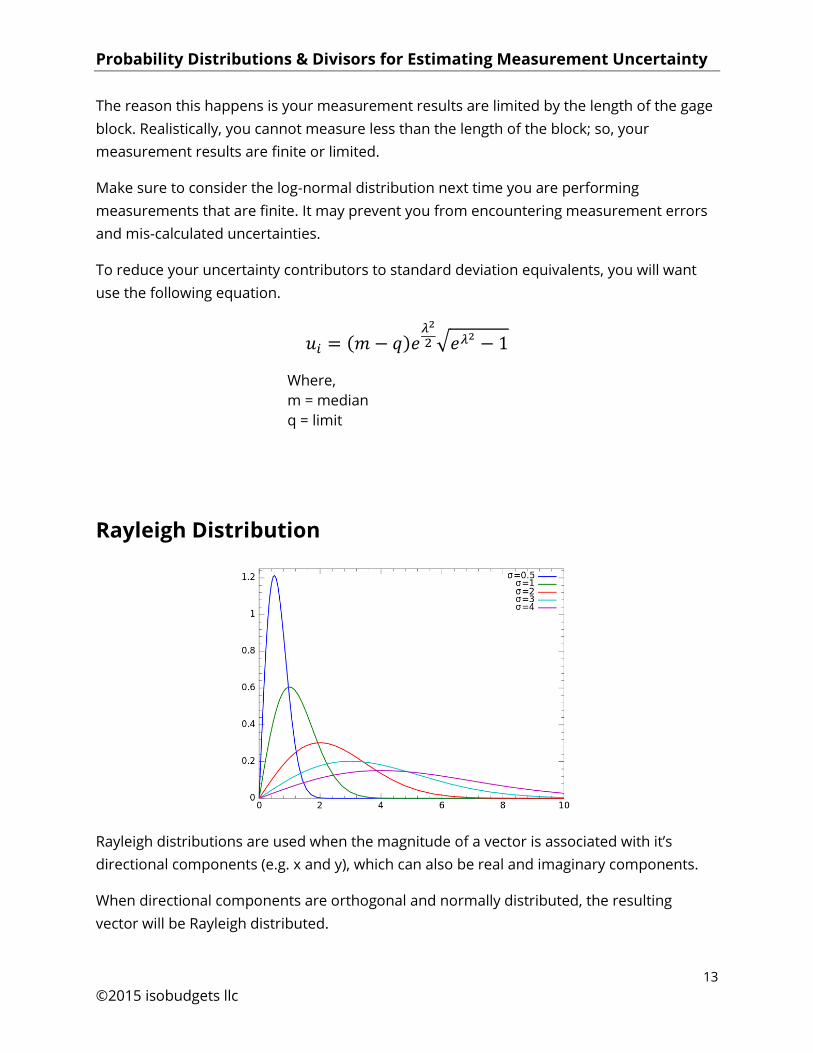
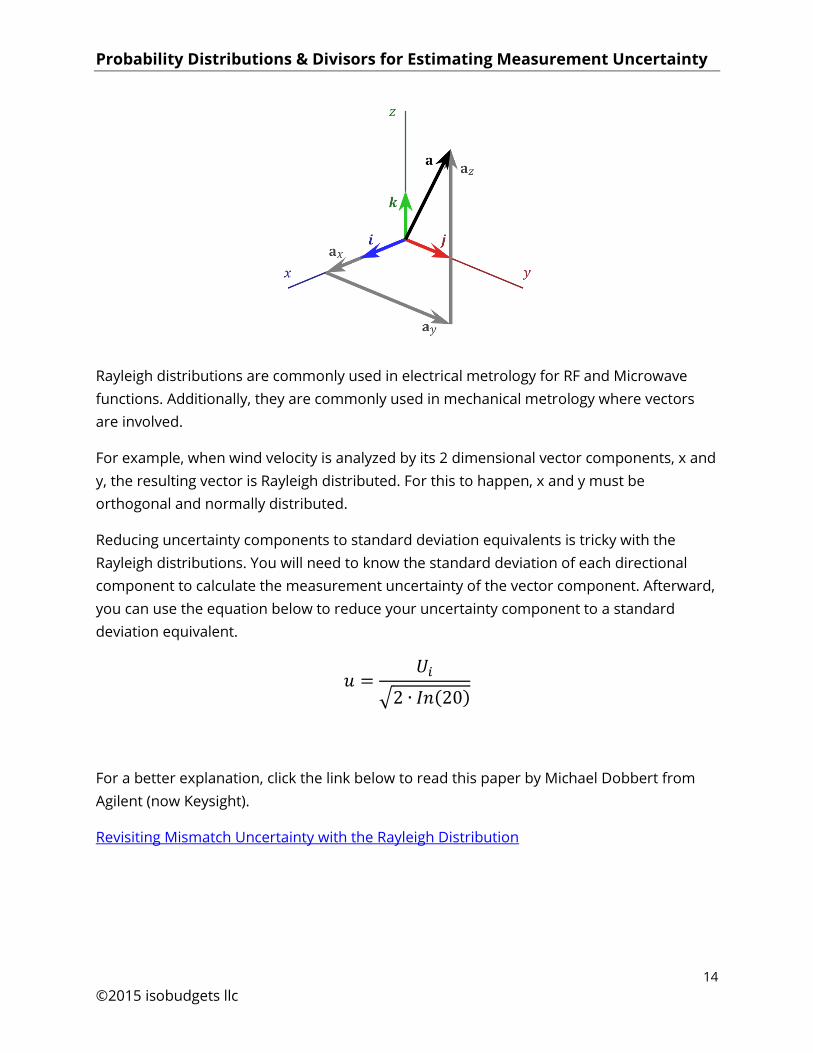
Rayleigh Distribution
Rayleigh distributions are used when the magnitude of a vector is associated with it’s
directional components (e.g. x and y), which can also be real and imaginary components.
When directional components are orthogonal and normally distributed, the resulting
vector will be Rayleigh distributed.
Probability Distributions & Divisors for Estimating Measurement Uncertainty
14
©2015 isobudgets llc
Rayleigh distributions are commonly used in electrical metrology for RF and Microwave
functions. Additionally, they are commonly used in mechanical metrology where vectors
are involved.
For example, when wind velocity is analyzed by its 2 dimensional vector components, x and
y, the resulting vector is Rayleigh distributed. For this to happen, x and y must be
orthogonal and normally distributed.
Reducing uncertainty components to standard deviation equivalents is tricky with the
Rayleigh distributions. You will need to know the standard deviation of each directional
component to calculate the measurement uncertainty of the vector component. Afterward,
you can use the equation below to reduce your uncertainty component to a standard
deviation equivalent.
𝑢 =𝑈𝑖
√2 ∙ 𝐼𝑛(20)
For a better explanation, click the link below to read this paper by Michael Dobbert from
Agilent (now Keysight).
Revisiting Mismatch Uncertainty with the Rayleigh Distribution
Probability Distributions & Divisors for Estimating Measurement Uncertainty
15
©2015 isobudgets llc
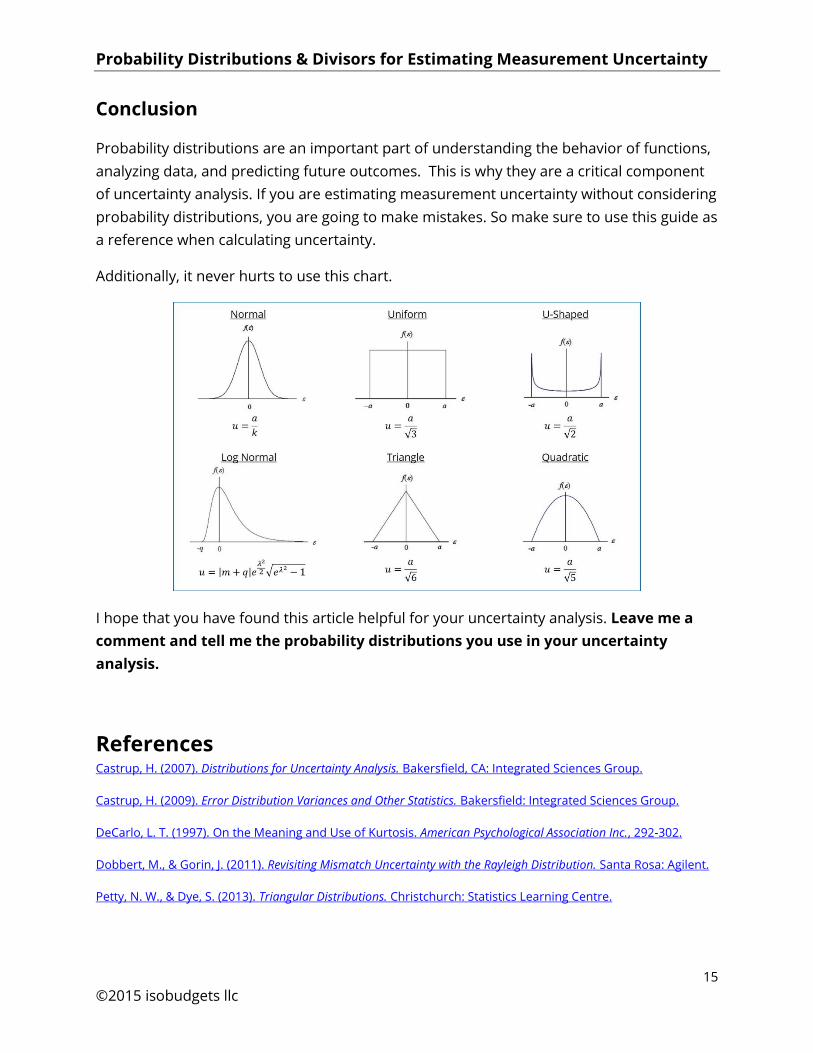
Conclusion
Probability distributions are an important part of understanding the behavior of functions,
analyzing data, and predicting future outcomes. This is why they are a critical component
of uncertainty analysis. If you are estimating measurement uncertainty without considering
probability distributions, you are going to make mistakes. So make sure to use this guide as
a reference when calculating uncertainty.
Additionally, it never hurts to use this chart.
I hope that you have found this article helpful for your uncertainty analysis. Leave me a
comment and tell me the probability distributions you use in your uncertainty
analysis.
References Castrup, H. (2007). Distributions for Uncertainty Analysis. Bakersfield, CA: Integrated Sciences Group.
Castrup, H. (2009). Error Distribution Variances and Other Statistics. Bakersfield: Integrated Sciences Group.
DeCarlo, L. T. (1997). On the Meaning and Use of Kurtosis. American Psychological Association Inc., 292-302.
Dobbert, M., & Gorin, J. (2011). Revisiting Mismatch Uncertainty with the Rayleigh Distribution. Santa Rosa: Agilent.
Petty, N. W., & Dye, S. (2013). Triangular Distributions. Christchurch: Statistics Learning Centre.

Probability Distributions & Divisors for Estimating Measurement Uncertainty
16
©2015 isobudgets llc
If I have left anything out of this guide or if you can think of any additional tips that would
improve this list, please leave a comment or contact me to share your advice.

Probability Distributions & Divisors for Estimating Measurement Uncertainty
17
©2015 isobudgets llc
Help & Feedback All good things have to come to an end, including this ISO/IEC 17025:2005 preparation
guide. Don’t worry. If you need additional help, I am only an email or phone call away from
helping you overcome your challenges. Enjoy this accreditation preparation guide, share it
with your friends, and be sure give me feedback.
Contact Information
Richard Hogan
Phone: 757.525.2004, option 1
Email: [email protected]
Web: isobudgets.com
Feedback
Please tell me what you think.
1. What do you like?
2. What do you hate?
3. What improvements you would suggest?
4. Leave me a testimonial.
Testimonials
Want to be famous? Leave me a testimonial and I will put it on my website. Be sure to
include a photo and your contact information.