District Census Handbook, 8, Kathua - Linguistic Survey Of India
Upload
khangminh22Category
view
1download
0
CENSUS OF INDIA 1971
SERI ES-14
MYSORE
PART.II C(ii)
SOCIAL. AND CULTURAL. TABLES AND
FERTILITY TABLES
P. PADMANABHA OF THE INDIAN ADMINISTRATIVE SERVICE
Director of Census Operations Karnataka

Portrait of Population
Part I-A-Vol. I
Part I-A-Vol. II
Part I-B
Part I-C
Part II-A
Part II-BCi)
Part II-BCii)
Part II-B(iii)
Part II-CCi) &
Part V-A
CENSUS OF INDIA 1971-MYSORE STATE PUBLICATION PROGRAMME
-A Descriptive Analysis
-Fiat part of the General Report (Chapters I to V)
-First part of the General Report (Chapters VI to IX)
-Second part of the General Report
-Subsidiary Tables
-General Population Tables (A-Series)
-Economic Tables (B Series)
-Economic Tables (B Series)
-Economic Tables (B Series)
-Distribution of population by Religic;:, Scheduled Castes & Scheduled Tribes (c-serieS)}
-Special Tables on Scheduled Castes and Scheduled Tribes
(Q,mbined volume)
Part II -C(ii) -Selcia1 and Cultural Tables and Fertility Tables-Tables on Household Composition, Marital Status, Ejucational Levels, Single Year Age, Mother Tongue and Bilingualism (C & F. Series)
Part II-D
Part III-Vol. I
Part III-Vol. II Part IV
Part V-B
Part VI-A
Part VI-B
Part VI-C Part VIII-A Part VIII-B
PartIX
Part IX-A
Part X
-Migration Tables (D-Series)
-Report on Establishments (Reports and Subsidiary Tables)
-Report on Establishments (Main Establishment Tables) -Report on Housing
-Ethnographic Notes on Scheduled Castes and Scheduled Tribes
-Town Directory
-Special Survey Reports on selected Towns
-Survey Reports on Selected Villages -Administration Report-Enumeration -Administration Report-Tabulation } Not for sal~for official USe only
-Census Atlas
-Administrative Atlas
-District Census Hand Books :
Part A & B-ViHage & Town Directory and Village & Town Primary Census Abstract
Part C-Analytical Report, Administrative Statements and District Census Tables
Special Studies and Other Miscellaneous Reports.
(i) Report on Bhuta Cult in South Kanara District.
ALL INDIA PUBLICATIONS Volumes similar to those indicated above are being published at the All India level. Apart from these, All India Census Tables on
1 % Sample basis being Part II (SpI.) and a Special Report on Graduat es and Technical Personnel (G Series) being Part VII are published.
The District C~nsus Handbooks will be available for sale at the Government Central Press, Bangalore and other publications af tbe O;nce of the D:rc;tor of C),UUS O,)!rations in Karnataka, No. 21/1 Kaitichay's Ccrnplex: Mission Road, Bangalore-27 and the Controller of publications, Civil Lines, Delhi-ll0006.

PREFACE
The 1971 Census Publication Programme contemplates presentation of Social and Cultural tables (C series) and the Fertility tables (F series) under the title Part II-C. As in 1961 Census, special detailed tabulation for Scheduled Castes and Scheduled Tribes was done this time also to facilitate comparability. These tables are referred to as SCT series.
For convenience, the above tables are presented in two volumes, namely, Part II-CO) & Part V-A (combined valume) and Part II-C(li). Part II-C(i) & Part V-A, already published, covers tables on Religion, Scheduled Castes and Scheduled Tribes population classified according to livelihood classes and literates and special tables on Scheduled Castes and Scheduled Tribes. All these tables have been generated on full count.
The present volume, Part II-C(ii), contains tables on composition of households, agewise distribution according to Marital status, Literacy and Educational levels, Single year age returns, Bilin_ gualism and Fertility, all based on samples, together with mother tongue tables which have been generated on full cOlLnt. It is hoped that the data presented in this volume, will be of immense use for various agencies.
I must express my deep sense of gratitude to Sri A. Chandrashekar, Ex-Registrar Oenelal, India and Sri R. B. Chari, Registrar General, India for their valuable guidance, inspiration and support. I am also grateful to Sri K.K. Chakravorty, Assistant Registrar General, India, Sri S. C. Srivastava, Assistant Central Tabulation Officer, Sri Madn Singh, Research Officer and his st8ft', for scrutiny of the tables and for their valuable suggestions.
In my Office, Sri l3. S. Narasimha Murthy, Deputy Director of Census Operations has been in charge of the pr e paration of this volume. The credit is shared by him and a ba nd of his dedicated staff, particularly Sri R. Y. Revashetti, Assistant Director of Census Operations (Technical), Sri M. Somashekar, Sri N. Lakshminatasimhanand Sri B. Venkatachala Rao, Tabulation Officels, Sri S. R. Raghavendra Rao an d Sri H. R. Keshava Murthy, Senior Technical Assistants, Sri N. H. Chandra Mouli, Head Assistant, Sri B. Sakharam Shetty, Smt. P. V. Vanaja Bai, Sri K. V. Parthasarathy, Sri O. B. Chaugala, Sri S. Anjaneyulu and Sri K. R. Narayana and Sri M. S. Nagaraj, Statistical Assistants and to each one of them thanks are due.
Our thanks are also due to the Manager, Govemmmt of India Press, Nasik, and his staff for the excellent printing of this Volume so expeditiously.
Bangalore,
August. 1977
P. PADMANABHA
Director of Census Operations, Karnataka.


CONTENTS
Page No.
INTRODUCTION
C-l Part A
C-I Part BO)
C-I Part B(ii)
C-Il
C-lll Part A
C-lII Part B
C-IV
C-IV Appendix
C-V Pa.rt A (i)
c-V Part ACii)
C-V Part B(i)
C-V Part B(ii)
C-VI
F- I Part A
F-I Part B
F-I-App~ndix for S.C.iS.T.
F-T-Appendix for S.C/S.T.
." C-SERIES-SOCIAL & CULTURAL TABLES
Members of housebolds by Relationship to Head of Household classified by Age-groups (State and districts) 2-15
Households where the bead is a Male by relationship of members with the head (State and districts) 16-18
Households where the h~ad is a Female by relationship of members with the head (State and districts) 19-21
Age and Marital Status (State and districts) 64
Age, Sex and Education in All Areas 72-81
Age, Sex and Education in Urban Areas only 82-95
Single Year Age returns (State level only) 97-105
Distribution of persons by five year age-groups for State and districts . 106-115
Distribution of Languages (inclusive of Moth::r tongues grouped under eacb) specifijO;d in Schedule VIII to the Constitution of India for State and districts 122-129
Speakers of Languages/Mother tongut's (i nclusive of Mother tongues where grouped) specified in Schedule VIn to th;: Constitution of India for districts, taluks and City/Towns l30-177
Speakers of Languages/Mother tongues (i ndusive of Mother tongues where grouped) otber than those specified in Schedule VIn to the Constitution ofIndia for Stab and districts. . . . . 178-184
Speakers of Languages/Mother tongues (inclusive of Mother tongues where grouped) specified in Schedule VIII to the Constitution of India for Districts, Taluks and cit) /Towns . .• 18 5~209
Bilingualism (State level onI}) 211-217
F-SERIES-FERTILlTY TABLES
Distribution of currently married women and the related births during the last year by religion, present age and age at marriage (for Rural areas only) 230-233
Distribution of currently m'lrried women and the related births during the last year by reJ igion, present age and age at marriage (for Urban areas onI)-) . .'. . . . . . 234-237
Distribution of currently married women and the related births dur-ing the last year by Sch~duled Castes/Scheduled Tribes, present
age and age at marriage (for Rural areas only) . 238-239
Distribution of currentl} married women and the related births during the last )~8r b} SCheduled Castes/Scheduled Tribes, present age· and age at marriage (for Urban areas od}) 238-239
F-Il Part A Distribution of currently married women and the rell'tcd births during th~ la"t ye&r b)' education, pr~scnt age and n-ge at marriage (for Rural areas 0111)). • • • • • • • • 244-245
F -II Part B Distrlbl..'tion of ,urrentl} married women and the related births during the last year> by education, present age and age at marriage (for Urban areas onl)) • • • •• • 246-247
1-1 Census Karnatak/78

F-III Part A
F-lli Part B
F-Ill-Appendix for S.c./S.T.
F-UI-Appendix for S.C/S.T.
P-IV Part A
F-1V Part B
F-V Palt A
F-V Part B
Distributioll ot currently matried women and the related births during the last )ear b) religion, duration of marriage _and age at marriag'!
Page No.
(for R~ral areaS only) 252-255
Distribution of currentl) married women and tbe related births during the last year by religion, duration of marriage ar:d age at marriage (for Urban areas only) 256-259
Distribution of currentl)' married wom:!n and the r~lat-cd births during tre' last year by Scheduled CastesjSchedulea Tribes, duration of marriage and age at marriage (for Rural areas onl)) . 260-261
Distribution of currently married women and the rdated births during the last year by Scheduled Castes/Set-eduled Tribes, dura-tion of marriage and age at marIiage (for lJrban areas only). 26()--.26 1
Distribution of curreptl) married ,vomen and the related births dur-ing the last year by education, duration of marriage and age at marri-age lfor Rural ar~ai> onl») . 266-267
Distribution of currently man ied women and the leIatcd births dur-during the la"t )ear by' education, duration of marriage and age at marriage (for Urban areas onl)).. . . . . . 268-269
Distribution of CUllentl), married women and the related bhtlls during the last )-ear by teligion, education groups, pJesent age and age at marriage (for Rural aleas only). 274-283
Distribution of currentl) married women and the related births during the last year by religion, ~ducation groups, prefent age <'nd age at marriage (for Urban areas only).. . . .. 284-297

INTRODUCTION
The 1971 census publications of this State are made up of several parts. Part II of the census publications
, will cover tbe main census tables. This part is divid"d into serveral sub-parts each of which will be published as a separate book. Part II-A which is already published covers General Population Tables. or the A series tables and the Primary Census Abstracts of the districts. The Economic Tables of
1971 are included in the B series which are being published as Part H-B. The migration tables are included in part lI-D volume.
C-I Part A
C-l Part B(i) and B(il)
C-I1
C-III Part A
C-IlI Part B
C-IV
Appendix to C-IV
c-V Part A(i)
c-v Part A(ii)
c-V Part B(i)
C-V Part B(ii)
C-VI
C-VII
C-VIlI
The Social and Cultural Tables and Fertility Tables are included in C and F series respectively which are published as Part II-C. The C and F series tables envisaged in 1971 census are as follows:
CSoclal and Cultural Tables
Members of households by Relationship to Head of Househuld classified by Age-group for (State and districts).
Households where the head is a Male/Female by relationship of members with the head for (State and districts).
Age and Marital status for (State and districts).
Age, Sex and Education in All Areas.
Age, Sex and Education in Urban Areas only.
Single Year Age returns (State level only).
Distribution of persons by five year age-groups for State and districts.
Distribution of Languages (inclusive of mother tongues grouped under each) specified in Schedule VIII to the Constitution of India - for State and districts.
Speakers of Languages/Mother tongues (inclusive of mother tongues where grouped) specified in Schedule VIII to the Constitution of India for districts, taluks and city I towns.
Speakers of Languages f Mother tongues (inclusive of mother tongues where grouped) other than those specified in Schedule VIn to the Constitution of India - for State and districts.
Speakers of Languages/Mother tongues (inclusive of mother tongues where grouped) other than those specified in Schedule VIII to the Constitution of India for districts,taluks and city/towns).
Bilingualism (State level only).
Religion (for State, districts, tMuks and city ftowns).
Scheduled Castes and Scheduled Tribes (Part A and Part B): Classifica· tion by Literacy and industrial category of workers and non-workers according to main activity among Scheduled Castes/Scheduled Tribes (for State, districts, taluks and city I towns).
(i)

(ii)
F-Fe[tititr Tables (Sta.te level only)
F-I Distribution of currently married women and the related births during the last year by religion. present age and age at marriage. (Part A for Rural areas and Part B for Urban areas).
Appendix to F -I Distribution of currently married women and the related births during the last year by Scheduled CastesJ Scheduled Tribes. present age and age at marriage (Rural/Urban).
F-Il Distribution of currently married women and the related births during the last year by education, present age and age at marriage (Part A for Rural areas and Part B for Urban areas).
F-III Distribution of currently married women and the related births during the last year by religion, duration of marriage and age at marriage (Part A for Rural areas and Part B for Urban areas).
Appendix to F-IlI Distribution of currently married women and the related births during the last year by Scheduled Castes J Scheduled Tribes, duration of marriage and age at marriage (Part A for Rural areas and Part B for Urban areas).
F-I'l Distribution of currently married women and the related births during the last year by education. duration of marriage and age at marriage (Part A for Rural areas and Part B for Urban areas).
F-V Distribution of currently married women and the related births during the last year by religion. education groups, present age and age at marriage. (Part A for Rural areas and Part B for Urban areas).
Ail the above tables except Tables C-V, C-VII and eYIlI have been prepared on sample basis. Table CoY. C-YII and CoVill are based on full count. To facilitate easy handling. Part II-C volume has been published in two parts. namely Part II-C(i) covering Tables C-VlI, C-Vlll and Special tables on Scheduled Castes and Scheduled Tribes. and Part llC(ii), the present volume which covers the remaining tables of Q and F series.
There has been a change this time in grouping of languages/mother tongues. Table C-Y (A & B) gives figures for languages J mother tongues, each of which has returned 10,000 or more speakers at All India Level in 1971. The figures now presented in this volume supercede all previous figures published earlier on a provisional basis in the Pocket Book of Population Statistics and Census Centenary Monograph No. 10 issued by the Registrar General, India and General Report-Part I-A Yol. II Mysore. 1971 and Portrait of population, Mysore. 1971 brought out by this Directorate.
The tables presented in this volume, reflecting the different Social, Cultural and Fertility characteristics of the population were built up from the data available in the population record and from the various questions of the individual slip which were canvassed at the 1971 census.
The processing of the data collected through individual slips was done in various stages. The tabulation was carried out manually for processing data on sex, mother tongue, religion. literacy. scheduled castes and tribes, and for Primary Census Abstract on full count. The detailed cross-tabulation was done manually based on a 10% sample of the individual slips in case of rural areas and a 20% samp!~ of the individual slips in case of urban areas. The data from these sampled slips were transferred on to punch cards and processed on electronic computer in the Data Processing Unit of the Registrar General's Office. A 4% sample of the population record too was similarly processed on electronic computer. The sample tables thus prepared were estimated by using multipliers. The technical notes given in Appendices I. II and III provide an insight about the details of the entire sampling and estimation procedure. These tables prepared on the basis of the sample. presented here, are estimated with reference to the main characteristic of the table using different set of multipliers. Hence, in a few cases the figures of a particular characteristic presented in other tables full count or estimated. may vary marginally. In appendix-IV talukwise distribution of towns are indicated.
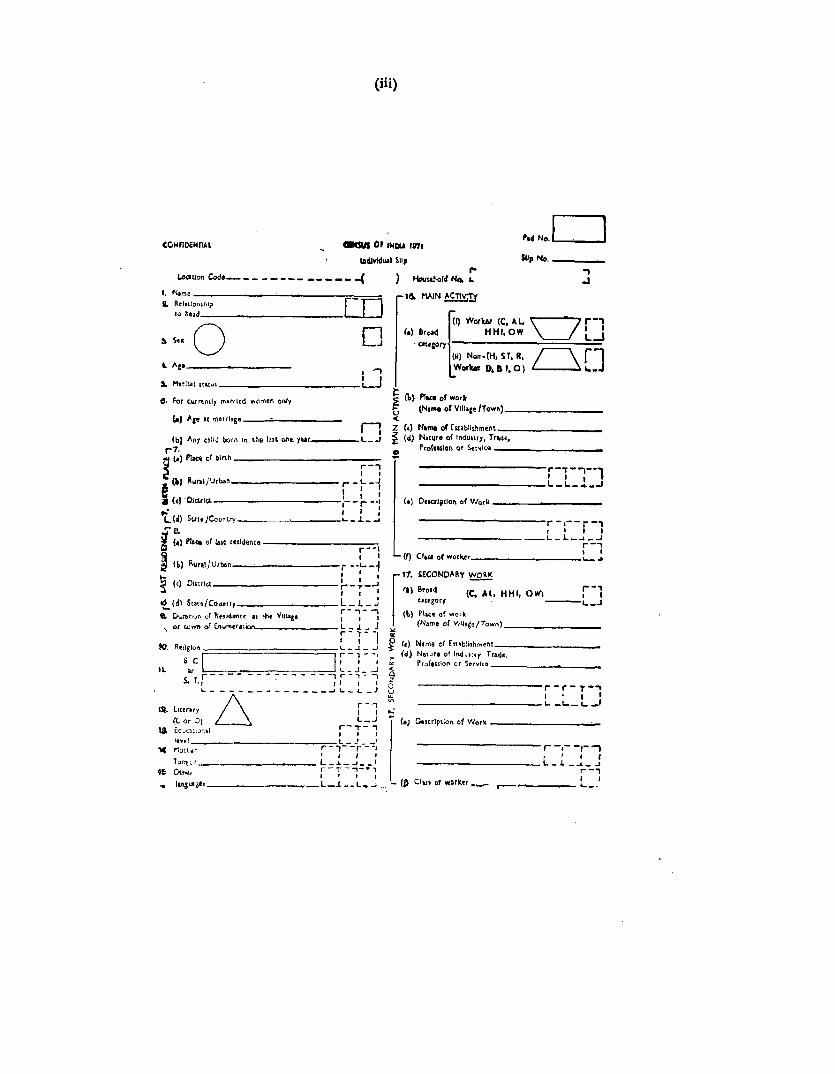
Specimen copies of the Individual slip and Population Record canvassed in the 1971 census are reproduced below for the general appreciation of the reader.
(iii)
(ONnDEHIlA~ GJISUS 0, INOlA leT,
Iadlvkl .. 1 Slip
,"dNo.D Slip No. ___ _
LDatlon Code _______________ (
f. Name ____________________ ~~_~
a. Re-Inlon$hJp IT] '0 h •• d ____________ _
o o ~ ~,.------------- ,., 5. Mtrltal ltatl.ll _____________ U e. For c.wrtnd, mHrltd women ool.,
~) I'oP" m"rl.g. __ ~ _____ _
n Ib) Any <~lId born In the ta.t OII~ y.ar ____ I.. _ _'
r 7.
,..-, I I 3
(0) Pia., of birth
A ") RuroljUrbon __________ r - L _J
W r : : • (e) ·OlUrloe.------------~,--r _., ... f , : L(~) Stitt /Country .... _ J. _ ....
'-6. iJ 1.1 PI, .. of last resldene. __________ _ 2i ,..--1 ~ I I ~ (L) lIurll!Urbe.n ...... __________ j ..... _~
... : : ' :i (e) 01""" ____________ ,_.,._..1 I I I 't (d\ S",,/Co""uy ___________ L _l_ J
.. O""tloO 01 1'..".",,, II ,h_ 'IlIlog. r --: -i , or "" .. " of Enu"''' Olio L _ .l _ J
i - T - -,
)
115. MAIN ACllV;~
(.) Br0a4 HHI, OW
~I) Worker (C. U.
. cotegory H) Non·{H, ST. R,
Worbr D. a I. a}
., .J
or] ~ (\) Pl_ of work r; (N.me of VIII.,./Townj ________ _
< Z (c} Nlme off,ubllshm.nt _________ _
~ (d) N.IUI. of Indumy, Tr04e.
:2 Prof,,,ton '" Se"". ----------
,..--r-'--1 ----________ L_LL_, (0) OucriptlOI\ of Work _____ ~ ___ _
;-:--,-1 _ ___________ L _ L_-, _..I
r-' (I) CI'SI of wor~r· __________ L.. ~
f17. SECONDARy ~
'a) Bro'd (Co At, HHI, OW) r-1 e"'gory -1.._ . .J
{h) PI",. of work '" (N.me of YIII.g./Town) ________ _
f It) N,me of E"'blt'hrn<nt _________ _
10. R'lIg'O~F===========:;~:: ~:: =: s. c , • ,; (d) Netu,. 01 Indu",y. T",d •.
Pro(eulot'l or Sfrvlcs ______ ..... __ _
or r --..,::'-:';"!.~ ~ So T., I I I I Z
L _____________ -I'-_4.._J § I\.
18 f:duca~I.)f1al ,-- T - , I I I
r-r- T-"I I I , • -----------1.. _1..._1..._'
O""r1ptlOI\ of Work _________ __ ~ ~t:;'~) D [J ;l' CoJ
Itvfl ____________ =-. ' '14 110'"" r - 'I.----r---:; r -,- -,-.,
To~l" L_1_J_ .. : ~ I , , tfi Othor r - ., - ., __ , L _.l - .... - oJ
I I I I ~-; ... l .. g ..... ' __________ L_l __ L __ ~ If! CI,,, of VlOllt.t1.~_ ..-______ '-_.

(iv)
POPULATION RECORD CONFIDENTIAL CENSUS 1971
(To be compiled from the individual slip)
Location Code: ............... ................. ... House Hold I\o. : ....................... . Name of Village or Town: .....................
Sex S1. Name Relationship -----No. to head M F
1 2 3 4 5
Signature a Enumerator: ............. ..
Date: .............................. .. ...... .
The scope of each of the tables and the explanation of the terms used in the tables have been given in the explanatory notes that precede each table.
The following extracts from the manual of instructions to enumerators relating to questions 2. 3, 4, 5, 6(a), 6(b), 10, 11, 12, 13, 14 and 15 of the Individual Slip, on the basis of which these tables are compiled will be helpful in appreciating the contents of these tables.
'" * '" Question 2: Relationship to Head
In the case of the Head of the household write 'Head'. The Head of the Household for census purposes is a person who is recognised as such in the household. He is generally the person who bears the chief responsibility for the maintenance of the household and takes decisions on behalf of the household. The Head of the household need not necessarily be the eldest male member. but may even be a female or a younger member of either sex. You need not enter into any long argument about it but record the name of the person who is recognised by the Household as its Head.
In the case of institutions like boarding houses. messes or friends living together in one census house which should be regarded as households of unrelated persons living together. which may be c~ned institutional Households, the Manager or Supenntendent or the person who has administrative responsibility or who by common consent is regarded as the head should be recorded as the Head of the household.
The Manager or Superintendent who does not stay normaly in the institution should be enumerated at bis place of normal residence. You should make
If the Head belongs to S. C. or S.T. ?
Age Marital Literacy Description of status (L or 0) Main Activity
6 7 8 9
Signature of SupeLVisor : ................... ..
Date_: ........................................... .
sure ~efore IDling up the slip for the Manager or Supenntendent etc., of an institutional household, that he/she has not been enumerated at any other household.
In the case of absence of a normal 'Head', the person on whom the responsibility of managing the affairs of the household falls, should be regarded as the Head.
All relationships in this question should be recorded in relation to the Head of the household. Write the relationship in full. Do not use words like 'nephew'. 'niece or uncle'. but state whether brother's or sister's son or daughter (for nephew or niece) or father's or mother's brother (for uncle), 'Son' will include 'adopted son' or 'step son'; similarly for a daughter. In the case of visitors, boarders. or employees, write 'visitor'. 'boarder', or 'employee' as the case may be. In the case of institution, the members should be recorded as 'unrelated'.
If on the check of revisional round between 1st and 3rd April 1971 the Head of the household as recorded previously is found to have died, the person in tue huusehold who succeeds him by common consent as head should be recorded as Head and the relationships in all other slips will have to be suitably corrected. The slip of the deceased Head of the household will. of course. be cancelled.
Question 3: Sex
For males write 'M' and for females write 'F within the circle indicated against this question. Even for eunuchs and hermaphrodites, write 'M' only. Verify with reference to the name and relationship to Head against que~ tions 1 and 2 respectively that you have noted the sex correctly.

Question 4: Age Record the age of the person in total years com-
leted last birthday. Very often there is a tendency p n the part of the individuals to return 'years running' ~lther than the 'years completed'. Make sure that o'nly the actual number of years completed is recorded.
In respect of infants who might not have completed one year by the day of enumeration their age in completed years should be invaribly shown as '0' as they have not yet completed one year of age and add 'Infant' in brackets. As. was stated u?der general instructicns make sure that mfants even If a day old are invariably enumerated. You should not enter the age in months. The age of an infant who has not yet ccmpleted one year should invariably be noted as '0' only.
Age is one of the most important items of demographi~ data and you should ascertain the age with greatest care. Many persons particularly in the rural areas cannot give their age correctly. They should be assisted to state the correct age by stimulating their memorv with reference to any historical event etc., well known -in the area. Sometimes the age can be ascertained with reference to the age of another person of a known age that may in the same household or in the neighbouring household or that of the well known person of the village such· as Headman of the village. A person can more easily say whether he was older or younger to such a person and by how many years. This will help you to record the age more accurately.
QueSition 5: Marital Status In answering this question use the following
abbreviations :
~M Never Married M Currently Married W Widowed S Separated or Divorced.
For a person who has never been married at any time before, write 'NM'. For a person currently married, whether for the first or another time and whose marriage is subsisting at the time of enumeration with the spouse living, write 'M'. Write 'M' also for persons who are recognised by custom or society as married and for the persons in stable defacto union. Even if a marriage is disputed in the locality write 'M' jf the person concerned says he or she is maliried or is in stable defacto union. For a widowed person whose husband or wife is dead, and who has not been . married again, write 'W'. For a person who has been separated from wife or husband and is living apart with no apparent intention of living together again or who has been divorced either by a decree of a law court or by an accepted social or religious custom but who has not remarried, write'S'. For a prostitute return her marital status as declared by her.
Question 6(a): Age at Marriage
Age at marriage: You should ascertain the age at which the currently married woman whom you are
(v)
enumerating was married and record that age in completed years. If the currently married women had been married more than once, the age at which she got married for the first time should be recorded.
Question 6(b): Any Child Born in the last one year Any child born in the last one year : You should
ascertain if the currently married women whom you are enumerating gave birth to a child in the last one year prior to the date enumeration. Since it may be difficult for a person to reckon the exact year with reference to the English calender dates, the period of one year may be ascertained with reference to a well known festival day which falls close to Feb-March, as determined by the Director of Census operations of the State. You should ask if a child was born on or after this festival day last year to the date of enumeration. Only if the child was alive, even if the child had died soon after birth, shouId the answer be 'Yes', to this question. StilI birth i e., a child which is born dead should not be taken into account for this purpose. So while you should make sure that every case of birth of child born alive, even if it is not alive on the date of enumeration, is reported, you should not reckon it if the child was born lifeless.
It is common experience that the birth of the child may not be reported readily if the child is not actually surviving at the time of enumeration. Infant deaths, are still high in the country. There is a chance of a number of such cases being missed unless specifically questioned about them. It is necessary to record all live births even if the child had died soon thereafter or had not survived to the day of enumeration. Therefore where the initial answer to this question is 'no', you should ask a specific question if there has been a case of child having been born alive in the last one year and later dying before the enumeration date. This is a delicate question and should be asked with tact in a manner not to offend sensibility of the res.pondent. Where a currently married woman first answers that she had no child born in the last one year, you may perhaps question her as follows:
"It has been found in some houses that a child was born and had died soon after or a few days or months later and such cases had not been reported. It is my hope that there are no such cases here. Am I right ?"
This may bring in the required response. If she reports 'no' then you can be sure that no birth has been missed. You have to make sure that any live birth that has occurred to the currently married woman in the last one year is netted whether the child is surviving till the date of enumeration or not. Similarlv, probe to eliminate still births may be necessary. For example, when the answer is 'yes' under question 6(b) the enumerator might ask if the child is here in this house. If the answer is 'yes' no further question" is needed. If 'no' the enumerator might ask where he has gone. The answer may be 'dead' or he has gone elsewhere. If 'dead' then the enumerator might ask when did the child die and this will bring out the fact whether or not it was a still birth.

Write 'Yes' if the currently married woman had given birth to a live child from the prescribed festival day last year to the date of enumeration or 'No' if she had not. In case of two of multiple births, write 2, 3 etc., as the case may be within round brackets after the entry 'Yes'.
NOTE :-You may find on your revisiona1 round from 1st to 3rd April, 1971 that a child is born to a married woman in a household after your last visit but before the sunrise of 1st April, 1971. You will have to take this into account and correct the answer against the Q. 6(b) accordingly. You must enquire specifically if any such births has taken place. While ignoring still births all other births where the child was born alive if it did not survive long should be taken into account.
Question 10: Religion In answering this question use the following
abbreviations:
H : Hinduism
I : Islam
C : Christianity
S : Sikhism
B : Budhism
J : Jainism
for others record the actual religion as returned fully.
If a person says that he has no religion it may be recorded accordingly. Do not mistake religion for caste which. will not be recorded here.
Question 11: Scheduled Caste or Scheduled Tribe You have been furnished with a list of scheduled
castes and scheduled tribes notified for your State. Ascertain if the person enumerated belongs to a scheduled caste or scheduled tribe and if he does, then record the name of the scheduled caste or scheduled tribe which should find place in the list furnished to you. The answer should be recorded against the correct rectangle provided for the purpose against this question. For a person who is not a member of any scheduled caste or scheduled tribe write 'X' in both the rectangles.
If the person belonging to a scheduled caste or scheduled tribe returns his caste or tribe by synonym or generic name of a caste or a tribe it should be entered only if it finds a place in the list furnished to you. Do not write the names of scheduled castes in general terms as 'Harijan' or 'Achhut'. You should ascertain the name of the caste when it is returned and write it in the· rectangle provided for recording the name. Similarly, do not write the names of scheduled tribes in general term as 'Adivasi'. You should ascertain the name of the tribe when it is returned and write it in the rectangle with broken lines provided for recording the same. If a person is negligent
(vi)
and insists on calling himself merely 'Harijan' or 'Achhut' or 'Advasi' as the case may be, tell him that this description is not adequate for census purposes and persuade him to give out the actual name of the caste or tribe. You should make all efforts to ascertain the correct name of the sch,eduled caste or scheduled tribe as found in the notified list. If the person merely claims to be a scheduled caste or scheduled tribe but says that he does not belong to any of the notified communities applicable to the area, he will not be entered as a scheduled caste or scheduled tribe.
Scheduled castes can belong only to the Hindu or Sikh religions. If a person belongs to scheduled easte, there will be either 'H' or'S' in the answer to question 10. Scheduled tribes may belong to any religion.
Question 12: Literacy (L or 0)
Definition of a literate: A person who can both read and write with understanding in any language is to be taken as literate. A person who can merely read but cannot write is not a literate.
It is not necessary that a person who is literate should have received any formal education or should have passed any minimum educational standard.
For a person who is literate i.e., who can both read and write, record 'L' in the triangle against question 12. If there is any doubt about a person's ability to read or write. the test that may be applied for reading is his/her ability to read any portion of the printed matter in the Enumerator's Instructions and similarly for writing he! she should be able to write a simple letter. Ability merely to sign one's name is not adequate to qualify a person as being able to write with understanding. If a person claims to be literate in some other language with which the enumerator is not acquainted, the respondent's word has to be taken as correct. Other member of the household may also be able to testify to the literacy of the person enumerated.
For a person who is literate i.e. who can neither read nor write or can merely read but cannot write, in any language. write '0' in the triangle against question 12. All children of the age of 4 years or less should be treated as illiterate even if the child is going to a school and may have picked up reading and writnig a few odd words.
Question 13: EdncationaI Level
This question will be asked of those for whom 'L' has been recorded against question 12. For a person who is illiterate and '0' has been put against him in the answer to question 12. there is no advantage in ascertaining the educational level even if he had at some sta_ge attended school and passed a standard and had relaosed into illiteracy. In such a case you should put 'X'. You have to ascertain and record the highest educational level attained by a person for whom 'L' is recorded in answer to question 12.

For a person who is still studying in a particular class. the highest educational level attained by him will be one that he has actually passed and not the ,)He in which he is studying. For example, a person ~tlldying in I~t year B.A. should be recorded as only 'PUC' or 'HIgher Secondary', as the case may be. S!rnilarly, a person studying, say, in the 4th year of 'MBBS' should not be noted as 'MBBS' but as 3rd year 'MBBS' which is the highest level he has actually attained. If you are not sure whether a person has passed Primary, Middle, Higher Secondary or other definite levels, you may record the actual standard passed such as say IIIrd standard, VIIIth standard, 1st year B.Com. etc.
The highest educational level attained by the person enumerated should be recorded. When a oerson holds both general and technical qualifications both of which are of equivalent level such as say BSc. (Zoology) and M.B.B.S. or B.A. (Maths) and BE. (Bachelor of Engineering), the technical quaLfication should be given preference in recording ihe highest educational level attained. Where the general educational level is higher than the technical educational level or where it is not possible to decide which of the two levels is relatively higher, the highest level of education as returend by the person COl' cemed should be recorded.
In recording the highest educational level of a g:raduate or a post-graduate, subject of specialisation ~l1ch as B.Sc. (Maths.), M.A. (Economics), M.Sc. (Botany), B.Sc. (Agriculture), etc., should be noted. You should not use abbreviations which are not in common use. In such cases, the degree or diploma should be spelt out fully.
Whenever you come across graduates or postgraduates as also those with a technical diploma or degree, you will have to issue him a "Degree-holder and Technical Personal Card" and ask the person concerned to fill it. You should note the location code on the card while issuing it. Put a tick ( y) after noting the educational level against question 13 immediately after you issue a card. When you collect it after some time but before you complete the enumeration of your area, cross the tick and put a circle as (y ).
You will have to ensure that the card issued to all the Il'raduates and the technical degree or diploma holders are collected back. The non-crossed tick, if any, ar.minst question 13 will show that the card has not been collected.
Question 14: Mother-Tongue
Definition: Mother-tonQue is the lanQuage spoken in childhood by the nerson's mother to the person. If the mot~er died in infancy. the language mainly ~floken In the per~on's home in childhood will be the mother-tOil!!ue. In the case of infants and deaf mu~('<; the lanr:u'1£f' usuallv spoken by th~ mother shall be recorded. -2-1 Cen'1.Us Kar!711
(vii)
Record mother-tongue in full whatever be the name of the language as returned and avoid use d abbreviations. YOLl are 1<ot eApecteJ to Jetermine if the language returned by a person is the dialect of another major language and so on. You should not try to establish any relationship between religion and mothertongue. You are bound to record the language as returned by the person a", his mother-tongue and you should not enter into any argument with him and try to record anything other than what is returned. If you have ,reason to suspect that in any area due to any organised movement, mother-tongue was not being truthfully returned, you should record the mothertongue as actually returned by the respondent and make a report to your sUjJerior Census Officers fair verification. You are not authorised to make any correction of your own.
Question 15 : Other Langua&!cs
After recording the mother-tongue in question 14 enquire whether the person knows any other language(s), Indian or foreign and record language(s} returned by him against this question. In case he does not know any language apart from his mothertongue put 'X' against this question.
The number of languages recorded under this question need not be ll1IJre than two. These languages should be other than his mother-tongue and they should be recorded in the order in which he speaks and understands best and can use with under-standing in communicating with others. He need not necessarily be able to read and write these languages. It is enough if he has a working knowledge of these subsidiary languages to enable him to converse in that language with understanding.
* * * Population Record
Soon after you complete the enumeration of an the persons in the household you arc expected to transfer certain items of information of all the individual members of each household to the Population Record. Population Record form has been reproduced earlier. If you feel that the filling of the Population Record in the field is likely to take cons:derable time there is 110 objection to the details being posted by you later at home at the end of the day. However, soon after you complete the enumeration of all persons in a household you must note down the Location Code Number and the Household number on the Population Record and also copy out in Column 2 all the names of the persons enumerated in the household. This will help you to check with the members of the household and verify if all the persons qualified to be enumerated in the household have been fully enumerated.
The Population Record forms would have been supplied to you in convenient books and each page will normally take the- entries of one household. However, if in a large household there are more number of 'persons than \vhat a single Popu1ation Record form can accommodate, you may continue the entries on the next form but note boldly~n the top of the continued Population Record as "Continued".
(viii)
The Population Record hardly calls for any detailed explanation. On the top of each form please note correctly the Location Code Number and the Household number. It is il1lportant that you note the household number correctly. Do not fail to note boldly "INST" in respect of institutional househulds and '0' in respect of houseless households.
You will be required to furnish information III
the Enumerator's Abstract on the total number of occupied :residential houses, the census households, the imstitutional households and houseless h;ouseholds in v'Our block with reference to the entries made in this Population Record. So please make sure that you have entered the Household Number correctly as this will guide you in 'posting the required particulars in the Enumerator's Abstract. At the [fight hand side helow the Hlousehold number, you will have to record information if the household belongs to SC / ST. You would have already ascertained if the head of the household belongs to a Scheduled Caste/Scheduled Tribe with reference to Question 11 of the Individual
Slip. If the head belongs to any S.C./S. T., write S.c./S.T. as the case may be and alSi.) the name of S.C./S.T. to which the head of the household belongs.
The culumns in the main body pf the Population Rccord are lOclf-explanatory. You havc tu post them with refclrence to the information you have collected of each member of the household in the Individual Slip against the relevant questions. However, column 9 of the Population Record may require some explanation. For those who have returned themselves as workers for their main activity against Question 16(a)(i) of the Individual Slip, while you may note 'C', 'AL' as the case may be, as recorded in the box against Question 16(a)(i), in respect of those otheir than cultivators and agricultural labourers, you may please indicate briefly the description of work as recorded in Question 16(e) of the Individual Slip. For those who have returned themselves as non-workers for their main activity you may note the same abbreviation as recorded against Question 16(a)(ii).

ApPENDIX I
A NOTE ON THE SAMPLING PROCEDURE ADOPTED IN 1971 CENSUS FOR C-I PART-A, C-I PART-B (i) AND C-J PART-B (ii)
Sample Size : For the preparation of tables Col Pi;[l-A, Col Part-B (i) and Col Pa!t-B .(ii) on houseltJld composition, a sample of resldential households was drawn in two stages. In .the .fir~l stage, a twenty percl:nt sysl'~matlc sample of effective enymeratlOn blocks (defined later) was selected systematically. In the second stage, a twenty percent .sample of population rC~'0rJs relatmg to resIdential households was again sy~tematically selected from each of the sample block.
Selection Procedure: For the purpose of sample selection, the rural and urban parts of each district welC treated as separate strata. Within each stratum, a list of blocks was prepared by merging those conraining less than 50 households with the neighbouring blocks. Blocks formed in this way were called 'effective enumeration blocks' Or simply 'effective blocks'. The list of effective blocks so formed served as a frame for the selection of the first stage unit. A twenty percent sample of effective blocks was then selected systematically. Having identified the first stage units, the popu-
(ix)
lalion record books for the selected effective blocks were assembled. Within each selected effective block, the popUlation records relating to residential households were serially numbered. To do this effectively, instructions were issued to fold the population record relating [I) 'houseless households or institutional households'. Care was also taken to see that only one serial number was assigned [0 a population record, whenever the record relating to a household covered more than one page. In cases where 'effective blocks' were formed by mergtllg two or more blocks, the population record books corresponding to all the census enumeration blocks constituting the effective block, were assembled together and then the households were selected. Fresh random numbers were selected for each t:ffective block. The population records corresponding to the selected households were marked'S' at the dght hand top corner with a stamp provided.
Estimation Procedure: The tables prepared for each of the stratum were multiplied uniformally hv 25 to give the final estimated table.

A P PEN D I X~ II
A NOTE ON THE SAl\1PLING PROCEDURE ADOPTED IN THE 1971 CENSUS FOR SOCIAL Al~D CULTURAL TABLES (EXCEPT C-I & CoY)
Sample Size: A ten percent sample of the :.;lips was selected Imear systematically w;th a random start from the individual slip\) lciali!lg to the rural pal ts \)f a taluk. In the urban pan of the district, a twenty percent systematic sample 10£ the indiviuuai slips was selected with a separate random start. The sample sizes were ado'Pted on consideration of required precision, available res;:mfces and operational convenience.
Selection Pro'ceilule: The sample design adopted in the 1971 census was a stratified sy"tematic sample of individual slip.;. For the purpose of sample selection, each districL was dlviJed .into three sub-regions: (1) Taluk (Jura~), (2) Non-city urban di~trict and (3) City (urban unit including Agglomeration with 100,000 and marc population).
These sub-regions were termed as operational units. 1f, however, any of the operational unit was unduly large. it was S'fl'lit into sub-operational units of at least 20,000 persons. Similarly, small-sized operational units were either clubbed t:;gethetr or tagged on to' a continuous larger unit so as to form an 'effective operational unit' of the required minimum size. Adoption of those operational units ensured accuracy in sample selection, maintaIning at the same time stability in the sampling fraction w;thin the sampled areas. This proceuure has ensured effective control over sample selection within each block, as also in the entire operational unit.
For the purpose of the Primary Census Abstract (PCA) the individual slips were sorted into ten broad industrial categories and nine broad age groups for each of the sexes. The ten indut:.tr:al categories of workers and non-workers we;<e as foil0W:S: (I) Cultivators; (ll) Agricultural labourers; (Ill) Livestock. forestry. fishing, hUllting and plantations, orchards & allied activities (IV) Mining & quarrying; (Va) Manufacturing. processing. servicing & repairs in household industry: (Vb) Manufactulring, processing, servlcmg & repairs in other than household industry; (VI) Construction; (VID Trade & commerce; (VIII) Transport, storage & communications (IX) Other services and (X) Non-workers.
The nine age groups into which the slips belongin~ tlo each industrial category were sorted were 0-14,
(x)
15-19. 20-24. 25-29. 30-39, 40-49. 50-59, 60+ and 'age not stated'. Thus the individual slips of a particular operatiO'nal unit were sorted into 11 X 9 = 99 cells. separately for males and females. Sampling was done in each of the operational units independently by taking separate random starts. The slips were then distributed into 10 (O'r 5) pigeon-holes for mral/urban samples and one pigelJn-holc was selected at random. [he slips falling in the selected pigeon-hole constituted the sample. For operational details of tile samplillg procedure and instructions, the 'Manual of instructions or sorting, compilatioll (manmd processiilg) & sampling procedures' may be consulted. All tables except A-I to A- V (Population tables), B-1 Part A, BII (economic tables) C-V (mother tongue), C-VII (Religion) and CoVIll (Scheduled Castes & Tribes) have been prepared on a sample basis.
Estimatron Procedure: The tables prepared for each of the districts/states from the ten percent rural and twenty percent urban sample slips have been inflated to give the final estimatt:d tables. Estimates have been obtained by making use of the cell frequencies (usually labelled as 'controls') available from the tables prepared On full count basis, namely. peA and H-I Part A. In order to ensure the maximum possible inter-table consistency. it became necessary to use the estimated frequencies of a few .of the linal tables as controls for estimating some cell frequencies of other tables.
This way of estimating the cell frequencies ensured that marginal totals of estimated tablt<s tallied with that 'of the full-count table~. This is convenient to the user because, after adjiliStment. the identical marginal totals are found in tables having the same marginal specification. "The adjustment diminishes the sampling variance to some extent; the more the controls, the smaller the sampling variance of the adjusted frequencies"!. Further, adjustment to known control totals has at the same time the effect of eliminating biases in the nature of inherent differences between the sample and complete count.
For the purpose of estimation of final tables. a set of multipliers was prepared for each table. A multiplier ig the ratio of full-count frequency of some

charact~ristics from PCA (Primary Census Abstract) or Table B-1 Part A and the correSipOnding sample frequency of the same characteristics from the sample tables. The following statement gives the level of presentation of the tables and the related controls on which the multi'pliers are based. The details will be presented in the report on sampling procedures to be published later ;-
Table
ClI CII1A C III B C IV
Level of Presentation
District B Do. Do.
State C IV Appendix District
I
" " " "
Control based from tables
Part A & peA
" " II
" As no such control was readily available for C VI
(Bilingualism), these were estimated by multiplying the sample values by 10 and 5 in rural and urban areas respectively.
1. Deming, W. E. Statistical adjustment of data Ch. VII.
Reliability of estimates : No exact formula cali
be given for the precision of the esHmate& in view of the systematic sampling design adopted. The relative standard error can be estimated roughly on the basis of simple random sampling, estimated roughly as
\!(l-f)I-::p where 'f' is the proportion sam-op
pies, (01-10 in case of rural areas & 0-20 in case of urban areas); 'p' is the estimated proportion in any cell and 'n' the sample size being equal to ten percent of individual slips in rural areas and twenty percent in urban areas. In the present census, slips were sorted by sex, industrial category and age-group befiore sampling. It is expected that the efficiency must be considerably higher than a simple randiJm sample of identical size. Extensive studies conducted have indicated that systematic sampling of individuals is mOire efficient than random sampling especially when the slips were pre-sorted for most of the socio-economic characteristics covered in census2• Thus the estimates prepared on the basis of the systematic sampling in the present cenliUs can be expeot:ed to be quite reliable.
2. Lahiri, D. B. "An eXPerimental approach on the basis of Censue enumeration slips"-Studies in population sampling, Vol. I. (Deoember 1957, 1959).

A P P E ~ N D I X III
A NOTE ON THE SAMPLING PROCEDURE ADOPTED IN THE 1971 CENSUS FOR FERTILITY TABLES
Sample size : A ten percent sample of the slips was selected linear systematically wita a random stan f110m the individual slips relating to the rural parts' of a taluk. In the urban part of the district, a twenty percent systemat:c ;,ampie of the individual slips was selected with a separate random start. The sample slzes were adopted on co.[\sideration of req I.med precision, available resources and ope:atioaal coevcnience.
Selection procedure: The sample design adopted in the 1971 census was a stratified ~y&tematic :,amplc of individual slips. For the purpose Jf sample selection. each district was divided into three sub-regions: (1) Taluk (rural): (2) Non-city urban district and (3) City (urban unit including Agglomeration with 100,000 and more population).
These sub-regions were termed as opeJrational units. If. however. any of the operau . .:>nal unit was unduly large, it was split into sub-operational units of at least 20,000 persons. Similarly, small-sized operational units were either clubbed together or tagged on to a contiguous larger unit so as to form an "effective operational units" of the requir~cl minimum size. Adoption of the&e ,operational units ensured accuracy in sample selection, maintainll1g at the same tim~ stability in the sampling fraction within the sampled areas. This 'procedure has ensured effective control over sample selection within each block, as also in the entire operational unit.
For the purpose of the Primary Census Abstract (PCA) the individual slips were sort~d into ten broad industrial categories and nine broad age groups for each of the sexes. The ten industrial categories of wOlrkers and non-workers were as follows : (1) Cultivators; (II) Agricultural labourers; (Ill) Livestock, forestry. fishing, hunting and plantations, lorchards & allied activities (IV) Mining & quarrying; (Va) Manufacturing, processing, servicing & repairs in household industry; (V~) Manufacturing, processing. servicing & repairs in other than household illci:lstry: (VI) Construction; (Vll) Trade &. Commerce; (VIII) Transport, storage & communications (IX) Other services and (X) Non-workers.
The nine age gflJups into which the slips belonging to each industrial categOify were sorted were 0-14, 15-19, 20-24, 25-29, 30-39, 40-49, 50-59, 60+ and 'age not stated'. Thus the indiviuual slips of a particular operational unit were s::nted int.o 11 x 9 = 99 cell,>, separately for male" and females. Sampling was done in each of the operational units independently by taking separate random starts. The slips were then disltributed into 10 (or 5) pigeon-holes for mral/urban samples and one pigeon-hole was selected at random. The slips falling ill the selected pigeon-hole constituted the sample. For operational details of the sampling procedure and instructions, the 'Manual of ll1structions 18n sorting, compilation tmanual processing) & sampling procedures' may be consulted.
Estimation procedure: An the tables F-I to F-V are presented at state level. The sample table F-I to F-V have been multiplied by '10' in case of rural area and by '5' in case of urban area to estimate the final tables.
Reliability of e!.1:imates : No exact formula can be given for the precision of the es~imates in view of the systematic sampling design adopted. The relative "tandard ermr can be estimated roughly on the basis of simple random sampling. as V(l-rYi where 'f' IS the propOiftion samples, (0.10 in case of rural areas & 0.20 in case of urban areas); 'p' is the estimated proportion in any cell and 'n' the sample size being equal to ten percent of individual sli'ps in rural areas and twenty percent in urban areas. In the present census, slips were sorted by sex, industrial category and age-group before sampling. It is expectel that the effic:ency must be oonsiderably higher than a simple random sample of identical size. Extensive studies oonducted have indicated that systematic sampling of individuals is more efficient than random sampling especially when the slips were pre-sorted for most of the socio-economic characteristics covered in a census!. Thus the estimates prepared on the basis of the systematic sampling in the present census can be expected to be quite reliable.
I. Lahiri, D. B.-"An experime)ltal approach on the basis of Census enumerationslips'''-Studies in population Sampling, Vol.I. (December 1957. 1959.)
(xii)

APPENDI X IV
TOWNS ARRANGED BY DISTRICTS AND TALUKS ----------------~----------~---------------------
Name of District Name of Taluk
1. Bangalore 1. Anekal
2. Bangalore North
3. Bangalore South
4. Channapatna 5. Devanahalli
6. Doddaballapur 7. Hoskote 8. Kanakapura 9. Magadi
10. Nelamangala
] 1. Ramanagaram
2. Belgaum 1. Athani 2. Belgaum
3. Chikodi
4. Gokak
5. Hukkeri
6. Khanapur
7. Parasgad 8. Raibag
_------------(xiii)
Name of Town
AneKal (M) Sarjapur (M) BangaloJ;e City (C) and Trust Board Area
B.E.L. Town<;hip (SA) Devarajeevanahalli (TP) H.M.T. Township (SA) Jalahllli (Excluding H.M.T.Township) (P) Kadugondanahall j (P) Yelahanka (M)
H.A.L. Sluitary B,)a.d (Excluding H.A.L, Township) (SB)
H.A.L. Township (SA) LT.L Notified Area (Duravaninagar)
(NAC). Channapatna (M) Devanahalli (M) Vijayapura (M) DoddabaHapur (M) Hoskote (M) Ka nakapura (M) Magadi (M) Nelamangala (M) Tyamagondlu (M) Ramanagaram (M)
Athani (M) Belgaum Cantonment (CB) Belgaum City (M) Chikodi (TP) Nippani (M) SadaIga (TP) Gokak (M) Gokak Falls (NAC) Konnur (TP) Mudalgi (TP) Hukkeri (TP) Sankeshwar (TP) Khanapur (TP) Londa ep) Saundatti Yellamma (M) Kudachi (TP) Raibag (TP) ----~--------------

Name of District
3. Hellary .
4. Bidar
5. 'Bijapur
6. Chikmagalur
(xlv)
Name of Taluk
9. Ramdurg 10. Sampagaon
1. Bellary 2. H~dagalli 3. Harpa nahalli 4. Hospet
S. KUdligi 6. Mallapuram 7. Sandur 8. Siruguppa
1. Aurad 2. Basavakalyan 3. Bhalki 4. Bidar 5. Humnabad
1. Badami
2. 8agalkot 3. "8asawana Bagewadi 4. Bijapur S. Bilgi 6. Hungund
7. Indi 8. Jamkhandi
9. Muddebihal
10. Mudhol
11. Sindgi
1. Chikmagalur 2. Kadur
3. Koppa 4. Mudigere
Name of Town
Ramdurg (M) 13a.ilhongal (M)
Bellary City (M) Hadagalli (TP) Harpanahalli (TP) Amaravathi (TP) Hampi Notified area (NAG) Hospet (M) Kamalapur (TP) Kampli (TP) Kottur (TP)
Siruguppa (TP) Tekkalkota (TP)
'Basavakalyan (M) 'Bhalki (M) Bidar (M) Chitaguppa (M) Humnabad (M)
Badami (TP) Guledgud (M) Kerur (TP) "8agalkot (M) Bas wan a Bagewadi (TP) Bijapur City (M)
Hungund (TP) Ilkal (M) lndi (TP) lamkhandi (M) Rabkavi Banhatti (M) Terdal (TP)
Muddebihal (TP) Talikot (TP) Mahalingapur (M) Mudhol (M) Sindgi (TP)
Chikmagalur (M) Birur (M) Kadur (M) Koppa (M) Mudigere (M)

Name of District
7. Chitradurga
9. Coorg
9. Dharwar
3-1 Census Kar./78
(xv)
Name ofTaluk
5. Narasimharajapura 6. Sringeri 7. Tarikere
1. Challakere
2. Chitradurga
3. Davanagerc
4. Harihar 5. Hiriyur 6. Holalkere 7. Hosdurga 8. Jagalur 9. Molakalmuru
1. Mercara 2. SJillvarpet
3. Virajpet
1. Byadgi 2. Dhat'war 3. Gadag 4. Hangal 5. Haved 6. Hirekerur 7. Hubli 8. Kalghatgi C;. Kundagol
10. Mundargi 11. Nargund 12. Navalgund
13. Ranibennur 14. Ron
Name of Town
Narasimharajapura (M) Sringeri (M) Ajjampura (M)
Tarikere (M) Challakere (M) Nayakanhatti (M) Chitradurga (M) Turuvanur (M) Davanagere City (M)
Mayakonda (M) Harihar (M) Hiriyur (M) Holalkere (M) Hosdurga (M) Jagll.lur (M) Molakalmuru (M)
Mercara (M) Hcbbale (M) Kodlipet (M) Kushalnagar (M) Sanivarsanthc (M) Somvarpet (M) Suntikoppa (M) Uluguli (P) Gonikoppal (M) Ponnampet (M) Virajpct (M)
Byadgi (M) Alnavar (TP) Gadag-Be1geri (M) Hangal (TP) Haveri (M)
Hubli-Dharwar CorporDtion (C)
Kundagol (M)
Nargund (M) Annigeri (TP) Navalgund (M) Ranibennur (M) GagendragDd (TP) Naregal (TP) Ron (TP)

Name of District
10. Guibarga
il. Hassan .
12. Kolar
Name of Taluk
15. Savanur 16. Shiggaon 17. Shirahatti
1. Afzaipur 2. Aland 3. Chincholi 4. Chitapur
5. Guibarga 6. Jevargi 7 .. Sedam 8. Shahapur 9. Shorapur
10. Yadgir
1. Alur 2. Arkalgud
3. Arsikere
4. Belur
(xvi)
5. Channarayapatna
6. Hassan 7. Holenarasipur 8. Manjarabad
1. Bagepalli 2. Bangarpet
3. Chikballapur 4. Chintamani 5. Gauribidanur
6. Gudibanda 7. Kolar
8. Malur
9. Mulbagal
10. Sidlaghatta
11. Srinivaspur
Name of Town
Savanur (M) Shiggaon (TP) Lakshmeshwar (M) Shirahatti (M)
Aland (M) Chincholi (M) Chitapur (M) Shahabad (M) Shahabad A.C.C. Notified Area (NAC) Wadi A.C.C. Notified Area (NAC) Guibarga City (M)
Sedam (M) Shahapur (M) Shorapur (M) Gurmatkal (M) Yadgir (M)
Alur (M) Arkalgud (M) Konanur (M) Arsikere (M) Banavar (M) Belur (M) Channarayapatna (M) Sravanabelagola (M) Hassan (M.) Holenarasipur (M) Sakleshpur (M)
Bagepalli (M) Bangarpet (M) Kolar Gold Fields (S.B.) Robertsonpet (M) Chikballapur (M) Chintamani (M) Gauribidanur (M) M.anchenahalli (M) Gudibanda (M) Kolar tM)
Malur (M)
Mulbagal (M)
Sidlaghatta (M)
Srinivaspur (M)

(xvii)
Name of District Name of Taluk Name of Town
13. Mandya. 1. Krishnarajpet Krishnarajpet (M) 2. Maddur Maddur (M) 3. Malavalli Belakavadi (M)
Malavalli (M) 4. Mandya Mandya (11.1) 5. Nagamangala 'Bellur (11.1)
Nagamangala (M) 6. Pandavapura Melkote (M)
Pandavapura (M) 7. Srirangapatna Srirangapatna (M)
14. Mysore . 1. Chamarajanagar Chamarajanagar (M) 2. Gundlupet Gundlupet (M) 3. Heggadadevanakote Heggadadevanakote (M)
Sargur (1\1) 4. Hunsur Hunsur (M) 5. Kollegal Kollegal (TP) 6. Krishnarajanagar Krishnarajanagar (M) 7. Mysore Mysore City (M) 8. Nanjangud Nanjangud (M) 9. Periyapatna Periyapatna (M)
10. Thirumakudlunarasipur Bannur (M) Thirumakudlunarsaipur (M)
11. Yelandur Yelandur (M)
15. North Kanara . 1. Ankola 2. Bhatkal Bhatkal (M) 3. Haliyal Dandeli Notified Area (NAC)
HaIiyal (M) 4. Honavar Honavar (M) 5. Karwar Karwar (M) 6. Kumta Kumta (M) 7. Mundgod 8. Siddapur 9. Sirsi Sirsi (M)
10. Supa II. Yellapur Yellapur (TP)
16. Raichur • I. Deodurg Deodurg (M) 2. Gangavati Gangavati (M) 3. Koppal Koppal (M)
Munirabad Project Area (SA) 4. Kushtagi Kushtagi (M) 5. Lingsugur Lingusugur (M)
Mudgal (M) 6. Manvi Manvi (M) 7. Raichur Raichur (M) 8. Sindhnur Sindhnur (M) 9. Yelburga

(xviii)
Name of District Name ofTaluk Name of Town
17. Shimoga 1. Bhadravati Bhadrava.ti (M) Bhadravati Ntw Town (TB)
2. Channagir i Channagiri (M) 3. Honnali Honnali (M)
Nyamati (M) 4. Hosangar Hosanagar (M) 5. Sagar Sagar \M) 6. Shikaripur Shikaripur (M)
Shiralkoppa (M) 7. Shimoga Kumsi (M)
Shimoga City (M) 8. Sorab Sorab (M) 9. Tirthahalli Tirthahalli (M)
18. South Kanara 1. Belthangady 2. Buntwal 3. Coondapur Coondapur (TP)
Gangolli (P) 4. Karkal Karkal (TP)
Pranthya (TP) 5. Mangalore Derebail (P)
Kankanadi (P) Manga10re City (M) Mulki (TP) Padavu (TP) Someswar (P) UBal (TP)
6. Puttur Puttur (TP) 7. Sullia 8. Udipi Malpe (TP)
Shirva (P) Shivalli (P) T onse West (P) Udipi (M) Udayavar (P)
19. Tumkur • 1. Chiknayakanahalli Chiknayakanahalli (M) 2. Gubbi Gubbi (M) 3. Koratagere Koratagere (~ 4. Killligal Kunigal (M) 5. Madhugiri Madhugiri (M) 6. Pavagada Pavagada (M)
Y. N. Hoskote (M) 7. Sira Sira (M) 8. Tiptur Tiptur (M) 9. Tumkur Tumkur (M)
10. Turuvekere Ammasandra Notified Area (NAC) Turuvekere (M).

C-I PART A
C-I PART B(i)
C-I PART B(ii)
MEMBERS OF HOUSEHOLDS BY RELATIONSHIP TO HEAD OF HOUSEHOLD CLASSIFIED BY AGE GROUPS.
HOUSEHOLDS WHERE THE HEAD IS MALE BY RELATIONSHIP OF MEMBERS WITH THE HEAD.
HOUSEHOLDS WHERE THE HEAD IS A FEMALE BY RELATIONSHIP OF MEMBERS WITH THE HEAD.
(xix)


C-I HOUSEHOLD COMPOSmON TABLES
Table C-I is presented here in two main parts, namely Part-A and Part-B. Part B is further subdivided into Part-S(i) and Part-B(ii).
For the preparation of Table C-I Part-A, C-I Part-B(i) and C-I Part B(ii) a 4 percent sf\mple of households was drawn in two stages from the population records. In the first stage a 20 percent sample of effective Enumeration Blocks was selected systematically with a random start. In the second stage a 20 percent sample of Populati:on Records was selected f110m each sampled block again systematically with a random start. Detailed procedure far selection of sample has already been given in Appendix-I earlier.
Household: A household is a group of peil"sons who commonly live together and Wlould take their meals from a common kitchen unless the exigencies of work prevented any of them from doing so. There may be 'one-member household, two-member household or multi-member household'. For census purposes each one of these types is regarded as a 'Household'. Again, there may be a household of perso.ns related by blood or ho.usehold of unrelated persons; the latter are Bioarding Houses, Hostels, Residential Hotels, Orphanages, Re5Cue Homes, Ashrams etc. These are called "Institutional Households".
Each household will be listed according to the instructions that follow (see paras 44 & 45 of the instructions to. enumeral'ers) and a distinguishing number allotted to each househOld. As each h,ousehold will be related to the physical structure of a census house, the household number as such need not be painted on the door of each census house. Only the building and census house number will be painted.
All the "Institutional HousehJolds" and "Houseless Households" were excluded while selecting the second-stage sample of Population Records. The selected Population Record sheets of the households were marked'S' and folded to identify their selection. The entire process of selection was done in the respective divisional tabulation offices.
The sampled populat1on record pads were forwarded to the coding and punching cell at Bangalore where further processing was d"one. On the basis of the punched data the tabulation was do.ne in the
Central Mechanical Tabulation Unit of th~ Registrars General's Office. The sample figures in the tables thus prepared were estimated by uniformly multiplying by 25.
The CIOntentg and scope of three tables namely. Table C-I Part-A C-I Part B(i) and Part-Beii) wre briefly explained below :
TABLE C-I PART-A: MEMBERS OF HOUSEHOLDS BY RELATIONSHIP TO HEAD OF HOUSEHOLD CLASSIFIED BY AGE-GROUPS
This table gives figures for Total/Rural/Urban areas down to the district level. This table gives the composition ,of households by relationship to the head of household classified by three broad age groups namely less than 30 years, 30-49 years and 50 + years. "Age not stated" is included in "All ages". Related and unrelated persons and single member households are shown separately. The relationship to heads of househiolds who can be either males or females are presented for married sons, brothers, father, mother, other males and females and to for the same relations for other marital status combined.
This table is of sociological interest as it helps to assess the extent lof the joint family system. The dis~ tribution of the heads of households by age and their relations classified by marital status further gives an idea about the future trend of the joint family system. During 1961 census the corresponding table C-I was prepared on 20% sample basis for rural, urban and total population separately. The relationship flO the head was sho\}'n as "marrIed sons" and "other married relations," and were not classified by broad age-groups.
TABLE C-I PART-B(I) AND PART .. B(lI) Hou~holcls where the head is a Male/Female by
relationship of members with the head.
1
The two parts of this table taken tlOgether cor:responds largezy to Table C-I of 1961. It gives composition of households where head is male or female by relationship of members with the head of households. It would be of much interest to sociologists as it would reveal composition of households having married relations also.

AgeGroup
St~te fDistrict oflhehead of household
2
All Ago, Lessthao 30
,\0.......49
50+
AU AJ~.} .
Less thao 30 30-49
50+
All Ages. Lessthao 30
30-49
50+
~,3H,S50
491,225 2,308,925 1,581,025
j,ll7,n; 335,775
1,703,175 1.257,850
1,084,925 1;), IjJ
605,}50
323,175
BANGALORE All ages. 533,425
D)STRJCr Less Ih",130 67,850 30-49 290,925
50+ ! 74,450
All ages. Less than30
30-49
50+
All ages. Lessthan30
30--49
50+
232,875 21,575
ll),700
95,475
3W,550 46,275
175,225 87,975
2 BELGAUM All ages . 366,050 43,375
188,625 133,975
ISTRICT. Lesstl\an30
30-49
50+
All :tg~'i. !) 1,025 Lessthan 30 32,350
30--49 149,275 50+ 110,325
Allages • Lessthan30
3(\ -49
50 t-
74,025 11,025 39,350 23,650
2
C.I PART A-MEMBERS OF HOUSEHOLDS BY RELATIONSHIP
4 5
611,150 5,J21,OO() 42,425 533,650
288,250 2,597,175 313,150 1,894,175
H3,55.l l, HO,575 31,750 367,525
225,450 1,928,625 241,225 1,499,075
145,500 1,230,425 1 J,J I'; 62,800 11,925
56,400 4,550
23,600 23,200
30,400 2,100
12,375 15,900
26,000 2,450
ll,225 12,300
46,700 3,800
20,500 22,350
35,025 2,800
15,125 17,050
11,675 1,000 5,375 5,300
16;},1l5 668,550 395,100
589,825 72.400
314,525 202,650
263,275 23,675
128,075 111,375
326,_i50
4s.725 186,450
91,275
412,750 47,175
209,125 156,325
327,050 35,150
164,400 127,375
85,700 12,025 44,725 28,950
Total household population
Numberofmembors by relationship to head
S;'-;;-s-;,:f-Head';- - - - - - M;;'rled r-;;l;t1ons Qf Heads of Household S
of households ________ _____ Son Brothers Father Mother Other Other Males
6
14,580,800 1,056,325
1,312,700 6,201.175
11,016,550 123,950
5,405,325 4,884,650
3,564,150 JJl,315
1,907,375 1,323,125
1,691,725 141,600 876,075 673,800
758,150 45,400
349,575 363,1)00
933,575
,96,200 526,500 310,800
1.233,200 n,475
611,375 527,000
985,075 70,075
482,675 431,975
248,125 24,400
128,700 95,025
Females Males Females Males Females
7 8 9 10 11 12 13 14 15
TOTAL
14,088,100 24,250 3,792,625 916,115 321,400 62,100 109,900241,225 1,806,625 1,008,450 3,800 298,275 915 31,525 15,615 33,600 15,325 66,725
7,328,750 14,050 2,135,700 113,600 214,625 42,150 67,915 80,200 516,125 5,141,025 6,400 1,356,675 861,550 75,125 4,200 8,225 145,6251,223,475
RURAL
10,151,550 17,625 2,858,915 788,615 2.60,515 46,975 80,300 183,1751,450,300 741,900 2,600 207.825 750 24,875 11,800 24,025 11,125 52,200
5,479,475 10,050 1,573,550 90,125 173,250 31,725 49,800 57,450 410,050 4,527,425 4,975 1,076,950 691,750 62,325 3,375 6,375 114,525 981,825
URBAN
3,336,550 266,550
1,849,275 1,219,600
TOTAL
1,564,150 115,950 848,575 599,300
RURAL
722,550 41,400
354,600 326,400
URBAN
6,625
1,200 4,000
1,425
2,100 575
1,150 375
900
150 500 250
841,600
74,550 493,975 272,900
1,200 425 650
125
TOTAL
1,186,075 J2,800
611,250 41H,750
RURAL
955,450 72,350
487,950 394,875
URBAN
230,625 20,450
123,300
86,875
1,375 175
900 300
750 125 450
175
625 sO
450
125
93 ~,650 187,500 60,825 90,450 225 6,650
563,150 23,415 41,315 279,725 163,800 12.800
471,675 89,250 27,575 43,525 50 2,600
275,825 7,975 17,750 152,250 8,125 7,225
207,400 49,825 14,475
13,725 1,175 (l0,575 3,675 8,450 83,075 46,150 4,850
264,275 39,425 13,100 29,800 50 1,425
165,250 4,300 9,300 69,175 35,075 2,375
316,000 100,800 38,400 26,250 75 5,150 174,425 12,650 26,100 115,250 88,075 7,150
252,900 84,375 33,250 19.825 75 4,325
138,200 10,300 22,400 94,800 74,000 6,525
63,100 16,425 6,425
36,225 2,350 20,450 14,075
5,150 825
3,700
625
15,125 3,815
10,425 825
29,600 58,050 356,325 9,575 4,200 14,525
18,175 22,750 106,075
1.850 31,100 235,650
8,650 16,250 25,975 1,800 4,200 1,375
6,225 10,850 9,825
159,325 5,125
41,650 112,550 625 1,200 14,775
3,550 550
2,625 375
5,950 11,075
1,175 275 4,125 3!025
650 7,775
86,675 2,225
19,625 64,825
5,100 10,300 14,900 - 72,650 1,250 3,600
250
4,675 1,250 3,175
250
3,850 1,150 2,525
175
825 100 650
l'
3,025 6,725
550
1,100 6,800 7,000
8,200 16,525 2,675 1,275 5,000 5,625
525 9,625
6,500 13,500 2,175 1,050 3,900 4,475
425 7.975
1,700 500
1,100 100
3,025 225
1,150 1,650
2,900
22,025
47.725
18[,250
7,275 56,575
117.400
152,725 5,925
47,800 99,000
28,525 1,350 8,775
18.400

3
TO HEAl> OF HOUSEHOLD CLASSIFIED BY AGE-GROUPS
Numberof members byrelationship to head ----------------N~ver m.lrried, Widowed and Divorced of separated relati\)Os Unrelated persons Single member
Households State/District
Son Brother Daughter Sister Father Mother Other Other Males Females Males Females
16
275,850 209,150
3,772,100 2,293,000
4,680,825 149,150
2,773,175 1,757,575
1,595,025 60,000
998,925 3 5,425
766,125 28,H5
457,025 28 0,200
335,850 9,350
183,775 142,700
430,275 .1 9,525
273,250 137,500
511,150 18,125
310,400 182,375
4J3,425 13,275
242,675 147,225
107,725 4,850
67,725 . 35,150
17
401,350 170,775 199,550 30,900
278,800 116,415 138,115 24,025
122,550 54,300 61,315 6,875
57,075 23,615 29,950
3,425
18,875 8,125
.9,075 1,650
38,200 15,550 20,875
1,775
35,025 16,600 15,875
2,550
26,250 12,175 12,075 2,000
8,775 4,425 3,800
550
18
5,175,075 204,400
3,336,215 1,633,025
3,855,075 146,500
2,460,050 1,247,650
1,320,000 51,900
816,225 385,315
627,000 25,850
4\)5,625 195,400
273,950 7,975
168,225 97,700
353,050 17,875
237,400 97,700
405,375 16,275
263,850 125,100
320,200 12,125
207,700 100,225
85,175 4,150
56,150 24,875
19
285,550 119,150 119,875 46,450
211,850 87,275 87,025 31,415
73,700 31,875 32,850 8,915
31,875 12,500 15,300 4,075
12,600 4,925 5,575
2,100
19,275 7,575 9,725 1,975
25,925 11,500 10,550
3,875
20,450 8,950 8,175 3,325
5,475 2,550 2,375
550
20
36,325 4,500
26,315 5,425
29,075 3,100
21,525 4,425
7,250 1,400 4,850 1,000
4,550 700
3,225 625
2,400 300
1,700 400
2,150 400
1,525 225
2,775 300
2,075 375
2,250 225
1,750 250
S25 75
323 125
Males
.21 22
TOTAL
642,725 161,100 401,950 79,400
1,611,025 70,450
435,100 1,105,350
RURAL
518,200 130,550 322,625 64,115
1,246,350 48,750
321,975 815,500
URBAN
124,525 30,550 79,325 14,625
364,675 21,100
113,125 229,850
TOTAL
55,550 12,800 34,925 7,775
152,100 8,375
41,800 101,925
RURAL
29,100 6,500
17,625 4,925
77,475 2,775
16,875 57,825
URBAN
26,450 6,300
17,300 2,850
74,625 5,600
24,925 44,100
TOTAL
64,650 17,775 39,375
7,500
54,725 14,800 33,550
6,375
142,675 5,450
40,175 97,050
RURAL
114,700 3,925
31,775 79,000
URBAN
9,925 2,975 5,825 1,125
27,975 1,525 8,400
18,050
Females
23
1,587,850 79,450
441,425 1,066,675
1,25,225 59,800
338,750 852,450
336,625 19,650
102,615 214,225
140,150 7,025
37,950 95,175
75,575 2,750
16,250 56,575
64,575 4,275
21,700 38,600
135,850 7,125
39,850 88,875
111,575 5,650
32,775 73,150
24,275 1,475 7,07$
15.725
24
248,250 42,925
106,025 99,175
186,650 19,550 84,100 82,315
61,600 23,375 21,325 16,850
24,900 5,725
10,225 8,950
10,850 1,125 4,175 5,550
14,050 4,600 6,050 3,400
13,750 2,700 5,775 5,175
10,700 1,400 4,975 4,325
3,050 1,300
800 9S0
25
43,600 3,325
20,115 19,950
26,975 1,975
12,115 u,700
16,625 1,350 8,000 7,250
5,925 375
2,850 2,675
900 25
225 650
5,025 350
2,625 2,025
2,125 125
1,125 875
1,350 100 725 S25
775 25
400 ) 150
26
158,575 52,475 59,900 45,850
110,075·
31,625 41,850 36,425
48,500 20,850 18,050
9,425
19,500 8,525 6,450 4,475
7,100 2,550 2,050 2,450
12,400 5,975 4,400 2,025
13,225 4,300 4,925 4,000
9,850 2,825 3,800 3,225
3,375 1,475 1,125
775
27
136,075 MYSORE 8,375 STATE
42,100 85,375
110,700
6,100 34,150 69,675
25,375 1,675 7,950
15,700
ll,850 L BANGA-1,300 LORE DIS-3,325 TRICT. 7,175
7,600 675
2,075 4,825
4,250 625
1,250 2,350
11,750 800
. 3,250
7,675
9,475 625
2,600 6,225
2,275 175 6S0
1,450
2. BELGAUM. DISTRICT

4
C·I pART-A-MEMBERS OF HOUSEHOlDS :BY }(ElATICI'-HHp
Statel Di.trict Age Hoad'of Total Total household Oro 111' Households lila. of population' orthe heild -----___ house- _______ __
of houJehold Males Females h()lds
3 BELL;\.RY DISTRICr.
Allages • Lns Ih'l1l30
30_49
50+
Allasos • Loss than30
30-49 50+
Allages • Less tban30
30-49 50+
3
166.750 17.575
92.175 56.915
lll.IOO 16.650
67.550 41.875
44.650 5.925
24.625 14.050
4. BIDARDIS. Allages • ',li2.000 TRICT. Loss tban30 14.900
5. BIJAPUR DISTRICT.
30-49 60.27~
50+ 46.800
Allages • Lossthan 30
30-49 50+
103.225 12.500 51.775
40.925
Aliages. 16.775 Loss than 30 2.400
30-49 8.500 50+ 5.875
All ages. 290.625 Less than 30' 36.675
30-49 152.775 50+ 101.025
Allagos. 117.400 Less thanJO 27.150
30-49 119.975 50+ 80.175
All ages • Less than30
30_49
50+
63.225 9.525
32.800 10.850
4
34.100 2.025
14.650 17.4:15
2G~.850
19.600 106.825 74.350
25.S15 1.500
11.300 11.125
147,615 13.150
78.850 5S.600
8.575 525
3.350 4.700
8.075 525
3.725 3.82.5
6.925 475
3.300 3.150
1.150 SO
425 675
45.575 3.225
20.100 H.175
3S.0()0 2.300
15.575 17.075
IMH 925
4.5l5 5,100
53.225 6.450
27.975 13.750
130.075 15.425 64.000 50,615
112.150 12.915 55.075
44.075
11,925 2.450 8.925 6.550
336.200 39.900
172.875 Ill.200
262.400 2'),450
135.550 91.250
73.800 10.450 37,ll5 25.9$0
Male.
565.400 37.575
292.800 234.8:15
414.300 25.550
214.82S 173.875
151.100 12.025 77.975 60.950
399.700 30.575
190.315 178.775
339.975 25.950 160.675 153.325
59.725 4.625 29.650 25.450
969.125 78.525
491.200 399.050
755.750 58.115
3H.0/5 313.1.15
213.375 lO.350
107.125 85.775
Fomales
7
TOTAL
H~.SOO
36.850 291.100 120.17S
aURAL 404.225
25.175 213.800 164.650
URBAN
14t.575 11.075 77.300 56.125
TOTAL
383.350 32.300
189.950 161.075
RURAL
327.575 27.600 161.950 138.000
URBAN 55.175 4.700
28.000 23.075
TOTAL
951.925 81.400
498.000 372.125
RURAL 747.400
63.300 J)l,250
291.H5
URBAN
204.525 18.100
105,750 80.550
Number of members byrelalionship 10 head
Si>OLlSOS ofHoads Marr edrelationsof Heads of Homeholds of households .-:---___________ _
------- Son Brothera alher Wolher Olher Other ales Female. Males Females
8
1.525 300 800 415
975 250 500 225
550 SO
300 200
450 100 27S
75
375 100 200 75
75
75
1.000 175 500
325
5S0 100
275 175
450
75 215 ISO
9 10
143.375 43.675 12.275 25 83.850 6.450 47.::100 37.200
104.350 33.125 8.200 25
61.250 4.950 34.900 28.1 SO
H.025 11).550 4.075
22,600 12.300
1.500 9.050
11
12.075 1.000 8.350 :I.ns
9.200 775
6.175 2.250
2.875 225
2,175 475
109.025 38.675 11.100 10.125 75 57.300 5.650 41,575 32,950
93.650 34.275 8.600 75
48.925 5.150 36.100 29.050
1.000 7.850 l.150
9.525 900
6.750 1.875
15.375 4.400 1.575 1.52! 100 8.375 500 1.100 5.475 3.900 375
244.425 83.725 31.425 21.900 25 4.425
138.275 11.975 21.700 84.175 71.725 5.l00
191.40J 63.50,) 26.225 16,300 25 3.600
10d.625 9.200 18.325 66.425 59.275 4.300
53.025 15.22~
~.600
29,650 17.750
2.775 12.450
5.:WO 825
3.375 1.000
11 13 14
2.225 4.250 ll.075 575 1,250 325
1.525 2.675 4.075 125 115 6.67.5
1.600 400
1.075 125
623 175 450
3.075 875
2.025 IB
2.850 850
1.825 175
225 25
200
3.025 8iS
1.92S 225
1.800 8.550 800 200
1.775 3.175 l15 5.175
1.450 2.525 450 125 900 900
100 1.500
5.300 1.475 3.4l5
400
5.n5 450
1.425 3.850
4.975 4.625 1.375 350 3.200 1.125
400 3.150
325 1.100 100 100 225 300
6.075 2.325 3.375 175
700
17.175 1.300 5.875
10.000
76.125 1.000
22.92S 51.100
51.015 1.41$
17.150 38.400
19.100 n5
5.775 1l.800
61.125 1.975
18.175 40.97S
53.400 1.725 16.100
35.575
7.725 250
2.075 5.400
159.700 7.975
54.150 97.575
2.SlS 775
1.600 ISO
4.950 2.000
2.675 275
1M2' 1:19.150
500 100 3lS 7$
1,125 315 700 100
1.075 4,450
8.000
3.650 225
1.425 2.000
6.450 44.075 78.625
30.5$0 1.525
10,075 18,PSO

S
TO HE,o\D OF HOUSEHOLD CLASSIFIED BY AGE-GROUPS-Conta.
Son
H;
238.475 9.575
148.62S 80.17.5
171.27.5 6.900
101.175 tS6.600
67.200 2.675
40.8S0 23.575
161.125 6.075
9.5.42.5 59.625
135.915 5.475
79.800 50.700
25.150 600
15.625 8.925
387.875 14.025
246.200 127.500
300.600 10.500
192.700 97.325
87.275 3.525
53.500 30.175
Brother
17
14.250 4.97S 7.900 1.375
10.075 3.250 5.925
900
4.175 1.725 1.975
475
12.025 5.050 5.950 1.025
9.950 4250 4.825
875
207S 800
1.125 150
24.775 11.875 11.125 1.775
18.415 9.050 8.000 1.425
6.300 2.825 3.125
351)
Number of members byrealtionshiptohead
Ne er married.Widowedand DiyorcJd or sa)aratedra~tion. ----------------~~--------Unrelated persons Single member State/District Households
Mother Other Male.
Other Malel Female. Males Femalea
18
193.375 9.075
127.92S S6.350
,39.97S 6.32S
92.97S 40.675
53.400 2.750
34.9S0 15.675
128.550 6.92S 81.000 40.625
108.250 5.875
67.625 34.750
20.300 1.050
13.375 S.875
304.700 14,350
205.975 84.275
234.975 10,850
160.400 63.700
69,725 3.500
45,575 20.575
19
9.875 3.400 4.650 1.825
7.250 2.400 3.4'0 1.400
2.625 1.000 1.200
42S
6.775 3.150 2.750
875
S.500 2.S00 2,275
725
1,275 650 475 ISO
20,800 8,925 8,175 3.700
16.025 6,650 6,300
3.075
4,775 2.275 1.875
1125
20
1,525 250
1.150
12'
1.350 US
1.000
US
175 25 150
1.150
175 750
22S
1.000 ISO 675 175
150 25 75 SO
2.150 ISO
1.675 l25
1.625 100
1.250 275
525 SO
425 SO
21
TOTAL
23.200 4.700
15.57S 1.915
66,475 1.850
18.9S0 45.1I1S
RURAL 17.600
3.47S H.800 2.ll5
50.87.5
1.375 14.375 35.125
URBAN
5.600 1.225 3,775
600
22.400 6.150
13 • .52.:1 2.72S
19.825 5.450
12,025 2.350
15.600 475
4.575 10.550
TOTAL
43.025 1.62S
10.275 ~1.12S
RURAL
35,250 1.225 8.300
25.725
URBAN
2,575 700
1.500 375
7.715 400
1.975 5.400
TOTAL
57.550 15.650 36.175 5.675
47.115 12.825 29,9l5 4.375
10,375 2,82.5 6,250 1.300
115.800 5.850
32.675 77.275
RURAL
81.S7S 4.275
24,375 58.925
URBAN
28,225 1.575 8.300
18.'50
Femalea
23
63.350 2,075
18.200 43.07S
49.IU 1.600
13.725 33.800
14,225 475
4.475 9.175
41,500 1,900
10.000 19.600
34.575 1.550 8,450
24.575
6.925 350
1.550 S.02S
111,750 6.925
31.275 73.450
87.750 5.850
24.325 57.475
24.000 1,075 1I.9S0
15.97S
24
7.350 1.125 2.800 3.400
:1.175 500
2.325 2,llS
2.175 625 475
1,075
1.350 250 425 675
925 75
250 600
425 175 175 75
11.550 3,150 4.775 3.575
8.750 1.525 3.925 3.250
2.800 1.625
850 ns
25
1.150 SO
1150 450
375 200
575 SO
275 250
600 75 SO
475
475 50 SO
375
125 25
100
1.350 125 500 725
975 7S
350 S50
375 SO
150 175
6.475 1.62S 2.1125 l.llS
4.725 1.000 1.825 1.900
1.750 625 800 325
3.325 900
1.200 1.225
2.750 675
1.000 1,075
575 225 200 ISO
10,450 2.875 4.425 3.100
7.800 2.000 3.275 2.500
2.650 875
1.150 GOO
27
6.475 3. BELLARY 275 DISTRICT.
2.350 3.850
4.950 200
1.875 2.875
1.525 75
475 975
1.950 4 BIDAR SO DISnICT
300 1.1100
1.500 SO
275 1.175
450
25 425
H.800 650
3.550 7.525
9.425 475
2.800 6.100
2.375 175
750
1.425
5. BIJAPUR DISTRICT

6
C .. I PART A-MEMBERS OF HOUSEHOLDS BY RELATIONSIUP
.)~ -t .e} DistriCt Age- Headsof Total
Group housellolds No. of Tota I household
population of the head --------- house-
of household Males Females holdS Males
2 3
6. CfJIKMA- All ages. 121.350 14,125 65.SS0
41.375
GALUR DIS- Less than30
TRIer 30-49
7. CtI[TR<\· DURGA OI'HRICr
8. COORG DISTRICT.
50+
All AgOs . Less than30
30-49 50+
All ages . Less than 30
3 (}_49 5(}+
All tges . Lessthan 30
31-49 50+
All ages. Less than 30
30_49
50+
All ages. Less than30
30-49 50+
102.875 11.450
55.475 35.950
18,475 2,675
1(),37S
5,425
lOJ,OJ(}
19,325 : )3,200
17,450
159,225 13,725 80,675 64,825
4().725 5.600
22.525 12.625
All ages. 64.175 Less than 30 9.325
30-49 35.275 50+ 20.125
All ages. Less than 30
30-49
50+
All alles. tAss than 30
30-49
50+
54.850 7.800
29.200 17.850
9.925 1,525
6,075
2.275
4
12,150 950
6.5"25 4,675
10.350 825
5.625 3.900
I.SOO 125 9()0
775
!g,225
1,575 [t,4]S
13,17S
24,650 1.275
12,525 10,850
4.575 300
1.950
2.32S·
6.175 875
3.575 2,300
5,550 675
2.925 1.950
1.225 200
650 350
5
133.500 15.075
72.375 46.050
6
389.725 29,775
200.825 159.125
113.225 329.450 12.275 23.725 61.100 168.350 39.850 137.375
20.275 2.800
11,275 .J,20,)
229.225 20. 900
117.675 ')0.625
183.875 15.000 13.200 75.675
45.350 5.900
24.475 14.950
6 J. 2 75 6,050
32,475 11.15)
692.350 12,650
335,450
313.225
548.650 30.525
262.075 256.050
143.700 12.125 14.375 57.115
71.550 186.850 10.200 18.025 38.850 101.975
22,425 66.775
60.400
8.475 32.125 19.800
11.150 1.725
6.725 2.625
158.175 15.100
83.825 59.250
28.675 2.925
18.150 1.525
Females
7
TOTAL 359.200
26.025 196.700 136.475
RURAL 305.750
21.875 166.825 117.050
URBAN
53.450 4.150
29,875 1. 125
TOTAL
658.975 38.100
137.[ 75 LB.70)
RURAL
521,175 28.850
265.275 233.050
URBAN 131.800
9.250 71.900 50.650
TOTAL
177.675 15.500 99.150 62.400
RURAL
151.975 13.075
83.225 55.615
URBAN
25.700 2.425
16.525 6.125
Number of members t-y rela tionship to head
Spouses of heads of Ilousehold s
Married relations of Heads of Households
Son Brothers Father Mother Other Other Males Females
8
225 25
150 SO
9 10
10.225 18.475 1.875
59.715 1.675 34.575 16.800
11
6.225 375
4.100 1.750
12
1.450 350
1.000 100
200 25
125 50
86.950 1S.875 6.725
5.550 1.225 350 250
50.150 1,425 30.075 14.450
3,600 875 1.600 100
25
25
15.215 1,\50 9,625 ~,3\) )
2,600
25(}
~,J50
675
25 500 15~
1.025 150
725 150
173.525 47.425 13.525 12.225 50 1.100
gS.375 4.425 8.800 65,9}.5 42.950 3.625
825 138.125 125 8.825 550 73.975 150 55.325
200 25
175
175 50
100 25
75
SO 25
100 SO 50
35.400 3.400
21.400 10.600
53.650 5.375
31.300 16.975
45.775 4.650
26.000
15.125
7.875 725
5.300 1.850
39.625 10.850 50 87S
3.825 7.175 35.750 2,800
7.800
600
7.200
5.850 25
750 5.075
5.250 25
650 4.575
600
100 500
2.675 225
1.625 825
1.650 375
1,000 275
1.475 300 900
275
11S 75
100
225 100 125
3.750 850
2.675 225
3,300
750 2.350
200
450 100
325 25
425 125 250
SO
275 125 125
25
150
125 25
Males Female.
2.350 675
1,425 250
1.900 375
1.300 225
450 300
llS 25
14
4.725 450
1.'725 2.550
3.925 350
1.425 2.150
800 100 300 400
S.125 10.450 1.300 500 3.600 2.825
225 7.125
4,100 8,275 975 400
2.925 2,005 200 5.825
1.025 325 675 25
1.425 575
725 125
1.17S 575
500 100
250
225 2S
2.175 100
775 1.300
2.575 300
1.300 975
2.275 250
1.150 875
300
SO 150 100
15
31.975 1.075
8.575 22.325
27550 9.00
7.275 19.375
4.425 175
1.306 2.950
82.675 1,925
20.500 60.250
68.250 1.475
16,750 50,025
14.425 450
3.750
10.225
10.800
125 3.075 7.000
9.525 525
2.625 6.375
1.275 200 450 625

7
TO HEAD OF HOUSEHOLD CLASSIFIED BY AGE-GROUPS~Contd.
Number of members by relationship to head
-·------:-N-e-v-er-m-a-r-ri-ed-,":W~i:-d-ow-ed-a-nd~D::-i-v-oIc'ed or separated rolations Unrelated persons Single member State/District Households
-·s:n--~-DaughteI Sister Father Mother Other Ott,er Males Females Males Females
16
177,875 5,815
I )t,450
67.550
150,875 5,250
87,175 58.450
27,000 625
11,275 9.100
194.175 9.500
175.275 109.400
228.7SO 7.050
134.850 86.850
.65.425 2.450
40,425 22.550
87,415 3.550 53,400 30.500
74,150 3,200
43.850 27,100
13,325 350
9,550 3.400
17
11,475 4,950 5,425 1.100
9,000 3.475 4,600
925
2.475 1,475
825 175
16.775 6,350 9,000 1,425
13,225 4.800 7.150 1.275
3,550 1,550 1.850
ISO
4.525 2,250 2,100
175
3,400 1,750
1,550 100
1,125 500 550
75
18
151,475 5,375
93,475 47,625
128.575 4.650
83,150 40,115
22,900 125
15,325 6,850
244,650 8,900
158,500 77.250
190,415 6,850
122,625 61.000
54,115 2,050
35,875 16,250
81,675 3,325
51.025 27,325
70,250 2,675
43,100 24.475
11,425 650
7.925 2,850
19
7,700 4,125 2,625
950
6,350 3.100 2,425
825
1,350 1,025
200 125
12,175 4,075 5,350 2.150
9,800 3.100 4,425 2.215
2,315 975 925 475
4,1.50 2,400 1,550
200
3.400 2,050 1,200
150
750 350 350
50
20
1,200 100 875 225
1,050 50
775 225
150 50
100
2,150 225
1,550 375
1,825 125
l.350 350
325 100 200 25
300 25
275
275 25 250
25
25
Males
21 22
TOTAL
13,750 3,500 8,825 1,425
35,025 1,675
10,450. 22.900
RURAL
12,325 3,150 8,050 1,150
1,425 350 800 275
29,225 1,400 8,500
19,325
URBAN
5,800 275
1,950 3.575
TOTAL
26,050 5,350
17,050 3,650
83,925 2,650
20,350 60,925
RURAL
21.300 4,275 13,950 3,075
67.300 1,925 15,675
49.700
URBAN
Females
23
35,475 2,175 9,675
23,625
29,950
1.925 8,175
19,850
5,525 250
1.500 3,175
84,015 2,675
21,700 59,700
69,425 2,050 17,650
49,725
24
1l,700 1,850 5,125 4,725
9,650 1,125 4,375 4,150
2,050 725 750 575
19,150 1,950 7,625 9,575
15,450 700
6,425 8,325
4.HO 1,075 3,100
16,625 14.650 3,700 1,250 1,200 1,250 575
5,150 1,375
3,450 325
725 625 4,675 4,050
II ,225 9,975
TOTAL
12.100 925
4,100 1,075
11,975 1.000 750 1,075
4,025 3,425 7.200 2.500
RURAL
4,425 1,250 2,900
275
725 125 550 50
10,1 SO 10,250 6,000 725 575 900
3,250 3,250 2,850 6,175 6,425 2,250
URBAN
1,950 200 850 900
1,725 1,000 175 175 775 575 175 250
25
2,100 275 800
1,025
1,800 225 700 875
300 50
100 150
1,475 75
625 775
1,050 25
450 57S
425 50
175 200
2,075 100
1,025 950
1,625 100 725 800
450
300 150
26
6,100 2,025 2,500 1,525
4,950 1,550 2,125 1,275
1,150 475 425 250
6,425 1.925 2,200 2.275
5,025 1,450 1,675 1,900
1,400 475 525 375
4,325 1,825
1,575 875
3,325 1.400 1,250
675
1,000 425
325 200
27
2,375 6. CHIKMA, 250 GALUR 825 DISTRICT
1,300
2,075
250 700
1,125
300
125 175
6,075 7. CHITRA· 325 nURGA
2,600 DISTRICT 3,150
5,550 325
2,425 2.800
525
175 350
925 200 150 575
775 175 125 475
ISO 25 25
100

8
C.I PART A-MEMBERS OF HOUSEHOLDS BY RELATIONSHIP
State/District Are. Heads or " Oroup household.
of the head --------of household Males Females
1 3 4
Total No. of households
5
Total household population
Males Females
6 7
TOTAL
6.DHARWAR All agOs. 337,400 42,125
178.300 116.550
54.350 3.525
24.600 26.225
391,750 1,169,JB 1.124.975 91.575
590.650 442,200
DISTRICT. Les. than30 30-49
50+
All ages. Less !han30
30-49 50+
All ago •• Le •• than30
30-49 SO+
226,275 26,575 117,550 81,950
111,115 15,650 60,750 34,600
10.0ULBAROA All ages. 174,650 DISTRICT. Le •• than 10 36.750
30-49 145,550 50+ 92,175
All agos. 226,500 Less than 30 29,050
30-49 119,325 50+ 77,97'5
All ages. Le •• thanlO
10_49
50+
48.150 7.700
26.225 14.200
11. HASSAN All ages 162.025 DISTRICT. Les. than30 15.575
30-49 87.325 50+ 59.100
All ago., 139,550 Less than 30 12.715
30_49 73.925
50+ 52.87$
All ages 22,475 Less than 30 2.850
30-49 13.400 .50+ 6,225
45.750 95.850
37,100 2,350 17,000 17,750
17,150 1.175 7,600 8,475
36.825 2,750
16.450 17,625
30.115 2,175
13,725 14,825
6,100 575
2,725 2800
21,750 1.275
10,600 9,87'5
19,015 1,115 9.300
'8,'500
202.900 142,775
263.375 28.925 134,550 99,700
128,3" 16.825 68,350 43,075
111,475 39,500
162,000 109,800
257,215 31.225
133,050 92,800
54,250 8,285
28.950 17,000
138.775 16.850 97,925 68,975
158.515 1l.950 83,225 61,375
2.725 25,200 50 2,900
1.300 14.700 1,375 7,600
593.850 478,750
795.225 62.675
398,175 333,800
174,100 33.175
195.675 144,950
861,125 78.175
440,950 344,125
708,200 61.625
359,050 287,075
155.525 16,550 81.900 57,050
644,450 32.950
279,3'50 232,125
471,050 27.150
238.IB 205,650J
73,400 I 5,700
41.225 26,475
RURAL
767.125 63.450
396,900 307,025
URBAN
357,250 28.125
193,750 135,175
TOTAL
847,400 78.800
444,950 323,200
RURAL
702,37'5 65,875
364,825 271,225
URBAN
145.025 12,9H 80,IH 51,975
TOTAL
532,175 32.725
281,450 218.000
RURAL
463,150 28.900
241,125 ';193,725
URBAN
68.425 3,825 40,325 24,275
Number of members by relationship to head
:!Ipuoses of Heads Married relations or heads of households or Households -----------------
-------- Son Brothers Father Mother Other Other Males Ferrules Males Females
8
1,475 225 850 400
950 125 625 200
515 100 225 200
1.250 3B 600 325
975 250 450 275
275 75 150
SO
9 10 11
280,900 74,975 30,000 23.175 100 3,050
161.400 7.975 20,825 96,175 66.900 6.075
187,100 52,750 21,325 14.875 100 2.325
105.575 5,325 14.600 66.575 47,325 4,350
93,800 22.225 8,675 8.300 115
55,825 2.650 6,225 29,600 19,575 1,725
240.615 74.900 25,400 23,275 100 3.275
136,500 12,775 16,900 80,175 62,025 5,175
199,575 64,37' 21,725 19,250 SO 2,750
112,150 11.200 14,425 68,100 53,125 4,500
41,050 4,025
24,350 12,675
10.525 50
1.575 8,900
3,675 n5
2,475 675
550 143.075 32,650 8.675 450
6,000 2,225
75 9,323 375 82.075 2,925 100 51,675 29.725
SOO 124,200 29,050 7S 8,100
350 69,975 2,400 75 46,125 26,650
50 18,875 ,3,600 1,225
25 12,100 52S
25 5,550 3.075
7,825 425
5,350 2,050
850 25
650 175
12
3,575 900
2,400 250
2,450 625
1,57'5 225
1,125 275 825 25
4,100 1.375 2,550
12'5
3,350 1,150 2.025
125
750 225 525
2,175 425
1.600 150
1.950 175
1,450 125
225 SO
150
25
6,25 2.375 3,800
400
14
19,775 1,425 6,575
11,775
15
151,125 7,025
45,175 98,850
4,200 1.450 2,325
15,075 109,500 1.025 5,500 4,900 32,825
375 9,150 71,100
4,700 400
1,675 2,625
8.075 13,475 2.725 1,175 4,750 4,350
550 7,900
6,225 11.525 2.125 1,02,5 3.650 3,750
400 6,700
1,850 600
1,100 150
4.300 1,200 2,700
400
1,950 150 600
1,200
8,600 425
2.57'5 5,600
3,525 7,525 925 425
2,275 2.100 325 ~S,OOO
275 425 475
75 600
41,625 1,525
12,350 27,750
130,725 6,850
40,950 82,825
112,175 5,800
35,025 71,250
18,550 1.059 5,925
11,575
56,850 1,7'50
13,150 41,950
50,675 1,600
U.625 37,450
~6,175
ISO 1,525 4,500
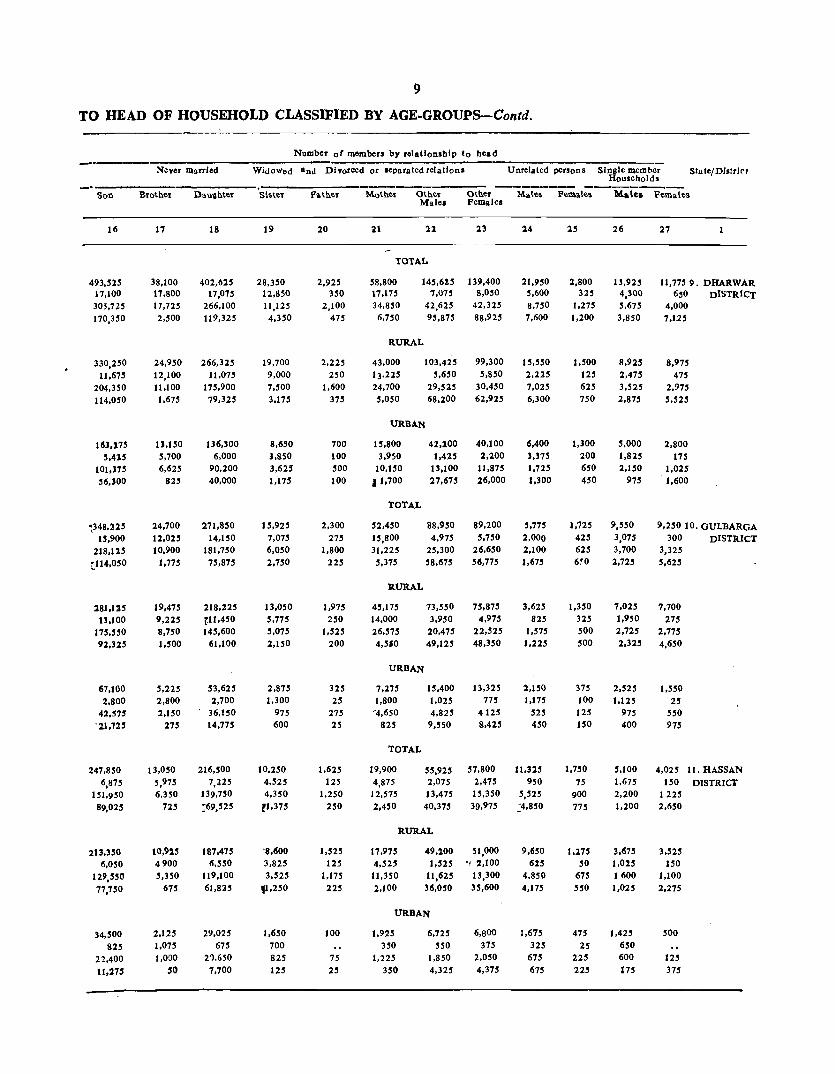
9
TO HEAD OF HOUSEHOLD CLASSIFIED BY AGE-GROUPS-Contd,
Son
16
493,525 17,100 303,725 170,350
330,150 11,675
204,BO 114,050
16J,:I15 5,415
101.115 56,100
~348.225
15.900 218.U5
[114.050
281.125 H.I00
175.550 92.325
67.100 2.800
42,575 "21.725
247,850 6,87S
151,950 89,025
213,350 6,050
119."0 77,"0
34,500 825
22,400 11.275
Neyer Illarrled
'Brother
11
38,100 17,800 11,725 2,500
24,950 12,100 11,100 1,675
lJ.150 5,700 6,625
825
24,700 12,025 10,900
1.'75
19,475 9,225 8.750 1.500
5,225 2,800 2,150
275
13,050 5,975 6,350
725
10,925 4900 5.350
675
2,125 1,075 1.000
50
Dauihtet
18
402,625 17,075
266,100 119,325
266,325 11,075
175,900 79,325
136,300 6,000
90,200 40,000
271,850 14,150
181.750 75,875
218,225 t:lI ,450 145,600
61.100
53,625 2,700
36,150 14,775
216,500 7,225
139,750
:69.525
187,475 6,550
119,100 61,825
29.025 615
2~,650
7.700
Number of members by relationship 10 head
Widowed and DiVorced or leparatedrolations
Sbter
19
28,350 12,850 11,125
4,350
19,700 9,000 7,500 3,115
8,650 3,850 3,625 1.115
15,925 7,075 6,050 2,750
13,050 5,775 5,075 2,150
2,875 1,300
975 600
10,250 4,525 4,350 e1,375
"8,600 3,825 3,525
11,250
1,650 700 825 125
20
2,925 350
2,100 475
2,225 250
1,600 375
700 100 SOO 100
2,300 275
1,800 225
1,975 250
1.525 200
325 25
275 25
1,625 125
1,250 250
1,525 125
1,175 225
100
75 25
21
Other Mille.
21
TOTAL
58,800 17,175 34,850 6,750
145,615 7,075
42,625 95,875
RURAL
23
139.400 8,050
42,325 88,925
43,000 13,225 24,700
103,425 99,300 5,650 5,850
29,525 30,450 5,050 68,200 62,925
URBAN
15,800 3,950
10,150 1 1,700
TOTAL
52,450 15,800 31,225 5,375
RURAL
45,175 14,000 26,575 4,5'0
42.:100 1,425
13,100 27,675
88,950 4,975
25,300 58,675
73,550 3,950
20,475 49.125
URBAN
7,275 1,800
-4,650 825
TOTAL
19,900 4,875
12,575 2,450
15,400 1,025 4,825
9,550
55,n5 2,075 13,475 40,375
RURAL
17,975 4,525
11,350 2,100
49,100 1,525
11,625 36,050
URBAN
1,925 350
1,225 350
6,725 550
1,850 4,325
40,100 2,100
11,87S 26,000
89,200 5,750
26,650 56.775
15,875 4,975
22,525 48,350
13,325 775
4125 8,425
57,800 2,475 15,350 39,975
51,000 '1 2,100
13,300 35,600
6,800 375
2,050 4,375
Unrelated persons Single member Households
Sla tel Dis!ri<- I
24
21,950 5,600 8,750 7,600
15,550 2,225 7,025 6,300
6,400 ',375 1,725 1.300
5,775 2,000 2,100 1,675
3,615 825
1,575 1,225
2,150 1,175
525 450
lI,325 950
5,525 ~4,850
9,650 615
4,850 4,175
1,615 325
675 675
25
2,800 325
1,275 1,200
1,500 125 625 750
1,100 100 650 450
1,125 425 625 6~0
1,350 325 500 500
375 100 12S 150
1,750
75 900 775
475 25
225 225
26
13,925 4,300 5,675 3,850
8,925 2,475 3,525 2,875
21
11,775 9, DHARWAR 650 DISTRICT
4,000 7.125
8,975 475
2,975 5,525
5,000 2,800 1,825 175 2,.,0 - 1,025
975 1,600
9,550 3,075 3,700 2,725
7,025 1,950 2,725 2,325
2,525 1,125
975 400
5,100 1,675 2,200 1,200
3,675 1,015 1600 1,025
1,425 650 600 175
9,250 10, GULBARGA 300 DISTRICT
3,325 5,625
7,700 275
2,775 4,650
1,550 25
S50 975
4,025 II, HASSAN
150 DISTRICT 1225 2,650
3,525 ISO
1.100 2.275
500
125 375

10
C-l PART A-MEMBERS OF HOUSEHOLDS BY RELATIONSHIp
Age- Heads of Total S,nte/Oistrict Group Households No. of
ofthehead ------- houseo hous~hold Males Feltl1les holds
12. KOLAR DISTRICT
2 3
All ages 229,275 Less thanJO 22,125
30-49 116,725 50+ 90,375
All lies
Less th3n 30 30-49
50+
All agcs Less thanJO
30-49
50+
181,325 14.925 90.000 16.315
47.950
7. ZOO
26.725 14.000
13. MANDYA All age. 172.000 13.275 89.075 69.625
DISTRICT Loss than30 30-49
50+
14·MYSORE OISTRICT
All agcs Less than 30
30-49 50+
146.850 10.050 75.450 61.350
All ages 25.150 Less than 30 3.225
30-49 13.625
50+ 8.275
All Clge.
Less than 30 30_49
50+
All ages L~iS thln 30
30_49
50+
All ages
Less than 30 30_f9
50+
314,125 23.100
162.250 123,600
237.17.5 19,825
120.100 97.175
16.950 8,275
14 2•150 25,425
4
31,050
1.875 13.650 15.500
24.500 1.400
10.925 12.250
6,450 475
2,725 3.250
23.775 1.050
10,025 12.700
20,300 900
8.550 10.850
5
260.325 24.000
130.375 105.875
2()5.925
26,325 J()0,92 5 88,625
7,675
54.400
29.450 17.250
195.775 14.325 99.100
82.325
167.150 10.950 84.000
72.200
3.475 28.625 ISO 3.315
1,475 15,100 1.850 10.125
50.425 2.650
20,775 26,975
38.500 1.975
16.075
20.450
ll.n5 675
4,700 6,525
364,550 30,750
183.025 150.515
27.5.675 21,800
136.175 117.67.5
88,875 8.950
146,850 32.950
Total Household nopulation
Number of members byrelatioo.hip to head
Spouses of Heads Married relationsofHcnds of househod.
Males Females
of Households -------------------------- Soo Brothers Father Mother Other Other Males Females Males Females
6
749.225 46,850
362,925 )39.325
593925 30,900
277.950 285.025
15.300 15.9S0 84.975 54.300
573.750 25.925
277.07.5 210,700
1)5.150 20.025
236.375 238.750
78.600 5.900
40,100 31.950
1,034,050 56.900
489.300 481.325
771.9.50 38.600
359.325 319.71.5
256,100 18.300
129,975
107.450
720.650 45.550
364,200
310.850
572.050 32.900
279.325 259.175
148.600 12.650
84.875 51.075
548.175 24.675
276.500 246.950
8
1.425 225 850 350
RURAL
1.075 150 625 300
URBAN
350
75 225
50
TOTAL
475 75
275 125
RURAL 474,050 20,225
236.875 216.950
14,125 4.450
39,625
30.000
998.975 56.850
501.100 4tO.325
7.51,800 41.650
370,700 339.225
2H.115 15.200
130.400 101.100
350 75
175 100
URBAN 125
100
25
TOTAL
1,325 250 700 315
RURAL
1.025 250
550 225
URBAN 300
150 ISO
9 10 II
201,950 51.150 16,850 13.650 50 850
1l0,450 5.275 10.550 77.825 45.825 5.450
160.300 44.460 15.125 9.350 50 72S
85.200 4.225 9.350 55.725 40.115 5.050
41.650 4.300
25.250 12.100
6,700
1,050
5.650
158.500 35.775 8.550 50
85,925 2.325
64.000 33.400
1.125 125
1,200 400
10.500 425
7.225 2.850
136.300 31,875 9,415 6~75 50 375
13,100 2.015 6375 56,425 29,150 27,25
22.200 3.900 1,025 1.775 50
12,825 250 850
7.575 3.650 l25
282.425 15,325 17.775 25
16,075 1,300
154.700 6,150 10.700 109.175 69,150 4.050
214.950 60,815 12.300 13.450 1.050
114.725 4.850 8.315 86.100 56.025 2.850
61.415 14.450 4,325 25
39.975 (,300
23.075 13.125
3.775 250
2.325 1,200
12
4.525 975
3.225 325
3,675 800
2.600 275
850 175 625 50
3.050 675
2,100
275
2.650 550
1.850 250
400 125 250 25
3.225 575
2.250 400
2.250 275
1.625 350
975 300 625
sO
13 14
6,325 15,050 1,650 925
4.175 4.025 500 10.100
5,225 12.725 1.325 600 3.525 3,400
315 8,725
4,100 325 650
125
4.075 925
2,650 500
3.650 750
2.425 475
2,325 325 625
1.37.5
7.475 300
2.450
4.125
6.250 250
2,025 3.975
425 1.225 175 50 225 425 25 750
6.425 16.850 1,600 900
4.075 5.000 750 10.950
4,675 950
2.915 650
1.850 650
1.100 100
12,050 500
3.325 8.225
4.800 400
1.67.5 2.725
IS
92.025 2.700
23.675 65.650
79.11S 22,000 20.050 51.525
12,250 500
3.625
8.125
63.225 1.125
15.650 46.450
56.150 925
13.900 41.325
7.015 200
1,150
05.125
119.650 3.100
26.500 89,915
93.300
2.125 19.700
71.475
26,350 975
6.800 IS,500

11
TO HEAD OF HOUSEHOLD CLASSIFIED BY AGE-GROUPS-Contd.
Numberor JJ)'lUb~rs by r~l"tionship to head
Never mlTried Widowed and Divorced or separated re ations U nrda ted r,f\ ~. -us Single member Households
- .. --------.--------------------------- -------- ----------Son Brotber Daughter Sister F,Llher Mother Other Other Males Fem31.s Males Females
16
316,000 ),725
I iI,OJ
121.450
241.45l)
6,250
137,375 97,800
74,550
3,475
47,425
23,650
:5 1,250
5,150 1;3,500
110,575
~~1,~50
4,475 122,000 97,075
35,700 675
21,500
13,500
469,525
10,650
261.550 197,025
351.350 g,150
191,350
151,825
118,175
2,500 70,200
45,200
17
20,775 7,150
II. 15J
2,175
15,325
4,550 8,gOO
1,975
5,450 2,600
2,650
200
10,275
3,375 5,975
92S
8, !:!5
2,450 5,100
675
2,050
925 875 250
24,475 9,400
13,075 1,975
17,225
5,825 9,925
1.450
7,250
3,575 3,150
525
18
259,115 9,300
195,500
6,650
121,875 66,975
64,lrT5
2,650
43,775
17,850
209,300 5,575
127,350
'/6,350
17),350
4,700
103,300 66,350
2~,950
875 19,050 10,000
380,675
II. 700
237,275
131,400
280,925 8,825
173,550 98,450
99,750
2,875 63,125
32,950
4..-1 Census Karnatak/78
19
14,575 5,150 j,37 j
3,550
I i),SSO
3,350
4,200 3,000
4,025
1.800 1,675
550
7,025 2,000 3,450
,1,515
5,875 1,625
2,750 1,500
1,150
315 700
15
16,975 6,425
8,125
2,425
11,775
4,000 5,800
1,975
5,200
2,425 2,325
450
20
2,200 225
l, 550
425
1,925
150
1,375 400
275
75 175
25
1,425 150
850
425
I, 215 125 800 350
150
25 50
15
2,225
275
1..550 400
1,100
150
1,325
225
525
125 225
175
21
31,150 1,300
19,350
4,600
Males Females
22 23
TOTAL
83,225 82,025 3,250 3,900
2J,825 20,300
59,150 57,825
RURAL
25,700
5,700
15,975 4,025
69,800
2,325 16,900 50,575
69,425 2,900
11,075 49,450
URBAN
6,050 J,600 3,g75
575
22,850 3,950
14,975
3,925
20,550
3,450
13,450
3,650
1,300 500
1,525 Z75
41,300 9,175
25,900
6,150
33,475
7,625 21,025
4,775
13,425 12,600 925 1,000
3,925 3,225
8,575 8,375
TOTAL
55,775 1,075
15,015 39,675
RURAL
48,150
850 13,050 34,850
URBAN
7,025
225 1,915 4,825
TOTAL
97,775 3,950
20,350
73,475
RURAL
72,225
2,125
14,675 56,425
57,200 1,350 15,500 40,350
49,975 1,050
13,625
35,300
7,225 300
1,875
5,050
98,975
4,275 22,900
71.750
73,275
2,675 16,475
54,125
URBAN
7,825
1,550
4,875 1,375
25,550
1,825 6,675
/1,050
25,100
1,600
6,425
11,625
24
8,750 1,350 3,650
3,700
7,050
375 3,300
3,375
1,700
975 350
325
17,750 1,375
8,275
8,100
25
1,115
25 575
575
975
25 500 450
200
75
125
2,225 150 975
1,100
15,900 1,900
175 50 7.415 715 7,650 1,075
01,850 600 800 450
13,125
1.475 5,725
5,925
9,775
450
4,225
5,100
3,350
1,025 1,500
825
325 100 200 25
2,125 150
850
1,125
1,025
25
375 625
1,100
125 475
500
26
1,125 2,150 2,000
2,975
5,225
1,275
1,475 2,475
1,900
875 525 500
4,675
1,650 1,750 1,215
3,500
1,125 1,300
1,075
1,175 525 450
lOO
7,425 2,725
2,300
2,400
4,750
1,525 1,450
1,775
2,675 {,200
850
625
27
8,375 12. KOLAR 475 DISTRICT
2,375 5,500
7,175 450
2,025 4,675
1,200
25 350
825
4,800 13. MANDY
125 DISTRICT 1,350
3,3l5
4,275 125
1,175
2,975
175 350
9,500 '4. MYSORE 525 DISTRICT
2,825
6,150
7,700
425
2,150 5,125
1,800
100 675
1,025

12
C-I PART A-MEMBERS OF HOUSEHOLDS BY RELATIONSHIp
Age- Headso Total Group Households No. of State/District of the h", ad ________ house-
of household Males Females holds
U. NORTH Alla~es
KANARA Loss tlun 30
DISTRICT 30_49
50+
3
12 2,000
14.725 62,975
4UOO
All ages 100,250
Less th,n30 11,400 30_49 50,950
50+ 37,900
All ages 21,750
Less finn 30 3,325 30_49 12,025
50+ 6,400
16. RAICHUR Allages 217,625
DISTRICT Less Clnn 30 28,350 30_49 119,825
50+ 69,400
All ages 181,950
Less than 30 23,400 30-49 99,625
50+ 58,875
All ages 35,675
Less than ~O 4950 30-49 20,200
50+ 10,525
17. SHIMOGA All ages DISTRICT Less than 30
30_49
50+
All ages Less thln 30
30_49
50+
All ages Less than 30
30-49
50+
193,675
23,500
107,875 62,225
145,000
15,600
78,925
~50,400
48,675
7,900
28,950
11,825
4
2.1,125
2,225
10,775 10,125
18,450
1,625
8,775
8,050
4,675
600
2,000
2,075
41,275
2,750
18,975
19,525
34,900
2,300
16,100
16,475
s
145,125
16,950
73,750
54,425
118,700
13,025
59,725
45,950
26,425
3,925
14,025
8,475
258,900
31,100
138,800
88,925
216,850 25,700
115,725
75,350
6,375 42,050
450 5,400
2,875 23,075
3,050 13,575
20,800
1,775
10,400
8,625
15,900
1.350
8,150 6,400
4,900
425
2,250
2,225
214,475
25,275
118,275
70,850
160,900
16,950
87,075
56,800
53,575
8,325
~31 ,200 14,050
Number ofmell'bers byrefationshipto head
Total Household population
Spouses of Heads ofhonseholds
Marriedrolations of eads of Households
Son Brothers Father Mother ther Other Males
6
422,475
32,725
212,550
177,200
Females
7
406,650
31.200
210,200
165,250
Males Females
8
TOTAL
725 150
450
125
9 lQ
98,475 21,825
7,800 50
55,325 2,325
35,350 19,450
11
9,500
525 5,925
3,050
RURAL
348,575 334,050
25,200 25,000
172,250 169,250
151,125 139,800
375
25 275
75
81,225 19,100
6,125 50
44,675 2,025
30,425 17,025
8,075
400
5,125
2,550
URBAN
73,900
7,525
40,300
26,075
72,~00
6,200
40,950
25,450
350
125
175
50
17,250 2,725
1.675 10,650 300
4,925 2,425
1,425
125 800
5'00
TOTAL
704,825 60,625
369,075
275,000
693,150
62,825
371,800
258,375
1,425
175 1,050
200
182,275 56,600 20,025
17,325 50 2,875 106,925 10,525 13,500
58,000 46,000 3,650
RURAL
590,000
49,700
307,900
232,275
585,375
53,450
312,475
219,300
1,025
75 750
200
f 52,300 48,325
14,425 50
88,650 8,975
49,200 39,275
17,675
2,425
12,175
3,075
URBAN
114,825 107,775
10,925 9,375
61,175 59,325
42,725 39,075
659,175 612,025 53,550 47,000
353,825 341,400
251,675 223,425
400 29,975
100 2,900
300 18,275
8275 2,350
450
1,550 1,325
6,725 575
TOTAL
450
50
250
150
800
169,100 28,925 11 ,325
14,650 50 850
100,500 3,500 7,850
53,900 25,375 2,625
RURAL
500,650 470,625
35,675 35,100
262,625 255,000
202,225 180,325
158,525
17,875
86,400
49,450
141,400
11,900
91,200
43,100
350 126,800 23,500
50 10,075 50
175 73,350 2,550
125 43,325 20,900
URBAN
100
75
25
42,300
4,575
27,150
10,575
5,425
950
4,475
9,300
575 6,425
2,300
2,025
275
1,425
325
Males Females
12
1,125 600
500
25
975
525
425
25
150
75
75
2,500
750 1,625
125
2,225
625 1,500
100
275
125
125
25
3,700
1,275
2,175
250
2,475
725 1,575
175
13
1,925
1,050
825
50
1,600
825
725
50
32' 225
100
5,,700
1,950
3,225
525
4,7~0
1,675
2,725 350
14
6,600
525 2,175
3,900
5,550
400
1,850
3,300
1,050
125
325
600
14,100
1,125
4,650
8,325
11,92~
975 4,00
6,950
950 2,175
275 150
500 650
175 1,375
4,850
1,875
2,700
275
11 ,000
900
4,450
5,625
3,300 7,950
1,275 625
1,875 2,850
ISO 4,450
1.225 1,550 3,050
275 1,600
1,175
550 600
600 825
75 125
IS
44,375
1,350
12,200
38,825
37,200
1,050
9,800
26,350
7,175 300
2,400
4.475
108,675
5,575 37,175
65.900
93.4';5
4,925
32,550
55,975
15,200
650 625
9,925
55,175
2,300
17,250
35,625
43,450
1,750
13,025
28,675
11 ,725
550
4,225 6,950

13
TO HEAD OF HOUSEHOLD CLASSIFIED BY AGE-GROUPS-Contd.
Never married,
--S;;-Br;;ihe-r --Daughter
16
181.875 6,500
112,400 62,975
150,575
5,175 91,';50
53,850
31,300
1,325
~0,850
9,125
284,325 12,700
181,775 89,800
216.225
100400 ! :; ),3 25
74,950
48,100 2,300
30,950
14,850
306,725
10,375 183,)25 1)3,300
233,875
7,575 149,900
85,375
7~,g53
2,3eO
H,125
22,n5
17
12,100 5,325
5,575
1.200
9,500
4,125 4,400
975
2,600 1,200
1,175 225
18,775
8,750 8,525 1,500
14,925 7,100
6,575
1.250
3,850 1,650
1,950
250
20,325 9,000
10,125 ],200
14,350 6,150
7,275
925
5,975
2,850 2,850
275
18
156,700 7,050
10],025
48,625
127,475 5,300
81,050
41,125
29,225 1,750
19,975 7,500
223,775 12,000
151,775 59,950
186,550 9,325
125,925 50,750
37,225 2,175
25,850 9,200
263,975 10,575
171,825
81,525
203,875 8,225
129,850
65,750
60,100 2,350
41,975
15,775
Number of members by relationship to head ----------------------Widowedand Divorcsed or eparatedrehtions Unrelatod personS Single mombor State/District Households
Sister
19
8,675 4,325 3,250
1.100
7,425
3,775
2,675
975
1,250 550
575
125
15,775 7,300 6,000
2,475
13,550 6,200
5,225 2,125
2,225
1,100
775 350
II ,500 5,475 4,650
1,375
9,025
4,325
3,525 1,175
2,475 1,150
1,125
200
Father
20
625 25
500 100
575
25 450
100
50
50
1,475
375 925
175
1,250
275 800 175
225 100
125
2,025
375
1.475 175
1,550 250
1.150 150
475
125 325
25
Mother
21
17,575 4,650
10,975 1,950
15,025
4,050 9,250
1,725
2,550 600
1,725
225
38,825
10,750 24,225
3,825
34,475 9,650
21,325
3,475
4,350
1,100 2,900
250
23,025 6,200
14,325 2,500
18,100 4,900
11,150
2,050
4,925
1,300 3,175
450
Other Other Males Females Males Males Females
22
TOTAL 52,525 2,050
13,375 37,100
RURAL
23
52,700
2,375 14,500
35,825
42,650 43,250
1,625 1,975 9,600 11,200
31,425 30,075
URBAN 9,875
425 3,775
5,675
TOTAL
9,450
400 3,300
5,750
79,800 76,075
4.375 5,175 22,625 23,100
52,800 47,800
RURAL 67,975
3,600
19,450
44,925
URBAN II ,825
775 3,175
7,875
TOTAL 62,525
3,575 19,850 39,100
RURAL
64,675 4,450
19,650
40,575
11,400
725 3,450
7,225
61,200
3,850
U!.575 38,775
48,000 48,200
2,325 2,975 13,950 13,100
31,725 32,125
URBAN 11,525
1,250 5,900
7,375
13,000
875 5.47~
6,650
24
13,575 2,250 6,350
4,975
25
3,100
375 1.325 1,400
10,950 2,400
1,450 275 5,600 1,100
3,900 1,025
2.625 800 750
1,075
8,175 1,100 4,500 3,025
6,500
775 3,225
2,500
1,675
325
825 525
18,500 3,600
8,250 6,650
1,4300 1,750 6,850
5,700
4,200
1,850 1,400
950
700 100 225
375
775
400 375
700
325
375
75
75
2,400 300
1,175
825
1,975
225 975
675
425 7~
200
150
26
7,475
2,325 2,900
2,250
5,700
1,675 2,250
1,775
1,775 650 6$0
475
9,400 2,950
4,125 2,~125
7,300
2,050 3,275
1,975
2,100 900
850 350
7,500
2,925
2,850 1,725
5,250 1,750 2,100
1,400
2,250
1.175 750
325
Females
27
5,350
375 1,350 3,625
4,37~
125
1.175 2,875
975 50
175 750
15. NORTH KANARA DISTRICT
9,12516. RAJCHUR 600 DISTRICT
3,175
5,350
7,775 500
2,650
4,625
1,350 100
525
725
4,275 17. SHIMOGA 375 DISTRICT
1,375
2,525
3,250
300
1,125 1,825
1,025
75 250
700

14
C-I PART A._MEMBERS OF HOUSEHOLDS BY RF,I,ATIONSHIP
Age- Heads of ta,' ) trict group Households
of the head ---------
Total Household papulation
Number of members byrelationshipto hend
Spouses of Heads ofhonseholds
Marriedrelations of Heads of Households
Son Brothers Father Mother Other Other of household Males Fem,les
Total No·of
households Males Females Males Females Malos Females
2
13. SOUTH KA- Allages NARADIS- Lessthan30 TRICT. 30_49
50+
235,300 22,075
115,175 98,000
AI1ages 188,325 Less than 30 J 7,000
30_49 90,750
50+ 80,525
All ages Less than 30
30-49
50+
19. TUMKUR Allages DISTRICT Less than30
30-49
50+
Allages Less than30
30_49
50+
Allages Less than30
30_49
50+
46,975 5,075
24,425 17,475
259,800 21,375
134,750 103,550
228,150 17,025
116,950 94,050
31,650 4,350
17,800 9,500
4 5
65,900 3,012,100 3,000 25,075
28,350 143,525 34,550
53,150 2,625
22,975 27,550
12,750 375
5,375 7,000
35,875 2,025
16,500 17.300
32,575 1,875
15,125 15,525
3,300
I-50 1,375 1,775
132,550
241,475 19,625 113,725 108,075
59,725 5,450
29,800 24,475
295,675 23,400
151,250 120,850
260,725 18,900
132,075 109,575
34,950 4,500
19,175 11,275
6 7 8 9 10 11
TOTAL
909,725 55,800
430,550 423,325
978,125 56,825
464,175 456,900
6,200 193,275 42,750 16,300 600 10,575 50 900
3,350 101,300 3,225 9,925
2,250 81,350 39,475 5,475
RURAL
726,725 786,850 43,325 45,575
339,700 370,275
343,650 37u,775
5,275 550
2,725 200
183,000 12,475 90,850 79,675
822,000 43,775
402,225 375,650
719,675 34,475
347,775 337,075
J02,325 9,300
54,450 38,575
URBAN
191,275 11,250 93,900
86,125
795,650 41,500
409,825 343,950
925 50
625 250
TOTAL
1,075 100 700 275
RURAL
70u,800 35,550
356,850 308,025
1,075 100 700 275
URBAN
94,850 5,950
52,975 35,925
154,850 35,550 13,475 8,250 650
79,725 2,650 8,325 66,825 32,900 4,500
38,425 2,325 21,575 14,525
7,ZOO 50 575
6,575
2,825 250
1,600 975
228,125 53,425 14,775 12,625 125 1,000
125,475 5,050 9,575 89,925 48,225 4,200
200,825 47,975 13,725 10,300 75 875
108,725 4675 8,950 81,700 43,200 3,900
27,300 2,325
16,750 8,225
5,450 50
375 5,025
1,050 125 625 300
12
2,850 875
1,875 100
2,250 775
1,400 75
600 100 475 25
4,000 550
3,050 400
3,550 525
2,700 325
450 25
350 75
13 14
6,750 22,150 2,525 1,250 3,975 7,275
250 13,625
5,675 16,425 2,125 975 3,325 '5,075
225 10,375
1,075 400 650 25
5,725 275
2,200 3,250
5,875 11,925 1,250 400 4,025 4,000
600 7,525
5,225 10,425 1,150 375 3,575 3,300
500 6,750
650 100 450 100
1,500 25
700
775
IS
129,125 4,950
35,350
88,825
106,700 iI,900
28,825 73,975
22,425 1,060
6,5255 14,850
92,700 1,925
23,425 67,325
83,600 1,725
21,325 60,525
9,100 200
2,100
6,800

15
'fO IlEAD OF HOUSEHOLD CLASSIFIED BY AGE·GROUPS-Concld.
Nam'Jer of m,m'JJrs by relationship to head
----··---N;;;-;;;;ri;;i,wid~-;._;;dD~;~;~;;;;ct~:i;;;_;;;;;--Un_;.~;d;~;---SingJ;;-;-;;b;;---State,
District Households --_ .... _- -------------
Son Brother Daugbter Sister Fatber other Otber Other Males Females Males Females Males Females
16 17 18 19 20 21 22 23 24 25 26 27
TOTAL
312,825 24,150 356,425 24,000 1,125 35,375 151,875 160,725 14,200 6,550 7,575 6,600 18. SOUTH
9,975 10,575 10,225 9,525 100 7,750 6,850 8,175 2,550 100 2,250 350 KANARA
229,225 11,875 212,675 9,950 875 22,775 42,275 46,350 5,475 3,450 2,775 1,375 DISTRICT
153,625 1,700 133,375 4,525 150 4,850 102,750 106,175 6,175 3,000 2,550 4,875
RURAL
313,825 18,475 285,100 19,225 950 28,975 122,175 129,825 10,000 3,350 5,525 5,575
8,225 8,575 8,600 7,850 75 6,200 4,975 5,950 1,525 75 1,450 350
182,375 8,500 170,325 7,675 750 18,900 32,925 36,600 4,225 1,925 1,975 1,100
123,225 1,400 106,025 3,700 125 3,875 84,275 87,250 4,250 1,350 2,100 4,125
URBAN
79,000 5,675 71,325 4,775 175 6,400 29,700 30,900 4,200 3,200 2,050 1,025
1,750 2,000 1,625 1,675 25 1,550 1,875 2,225 1,025 25 800
46,850 3,375 42,350 2,275 125 3,875 9,350 ~9,750 1,250 1,525 800 275
30,400 300 27,350 825 25 975 18,475 18,925 1,925 1,650 450 750
TOTAL
J51,450 18,700 296,675 13,225 2,575 32,575 85,900 88,425 18,375 2,175 9,000 9,80019. TUMKUR 8,6(1) 5,675 9,450 4,425 300 6,175 2,800 3,425 2,850 200 2,450 600 DISTRICT
2l)~,225 10,650 188,725 6,100 1,925 21,375 20,600 23,200 7,700 1,000 3,675 3,375
IJ8,5JJ 2,375 93,300 2,700 350 5,025 62,425 61,800 7,825 975 2,875 5,775
RURAL
30-1,351) 16,175 257,625 11.700 2,350 29,275 76.050 78.200 15.850 1,775 7,675 9.025
7.075 4.600 7,975 3.875 225 5,500 2,175 2,950 1,425 200 1,875 550
174,750 9,200 162.775 5.250 1,825 19,125 17,675 20.150 7,050 800 3.175 3,025
122.400 2,375 86.675 2.575 300 4.650 56.125 55,100 7.375 775 2.625 5.400
URBAN
47,100 2,525 39,050 1,525 225 3.300 9,850 10,225 2525 400 1,325 775
1.525 1,075 1.475 550 75 675 625 475 1,425 575 50 29,475 1.450 25,950 850 100 2.250 2.925 3,050 650 200 500 350
16.100 11.625 125 50 375 6,300 6,700 450 200 250 375
Note; "Age'. not Stated" is included in All "ages".

o
00
o o l~
o
° <'l N Of")
o Of")
O. N N
o o 00 N
N
o o 00
r--
o Of") . '":, N N
Of")
N
"'. 00
o o "l
o o v:)
i6
o o Of")
o Of")
0\
$
o on <'l
Oil .... o
8 00
o o «>
o o
'"
N
o -
on r.:>. o -
o o 00 • o N
o Of")
I-.
~
::
o o 00
o o ").
o o <') v:) 0\
o Of")
0, 00
Of")
N -.
V)
N 00 .,; N ifl,
'<t -
o o O. I-
o o -",'
o o "). r--
o V)
V)
r--0, N
o ° '<to 00 r-
o o "". 0\
o o o:_ 0\
o V'I
"l 00 -o o 0, 0\
o o 00
0-N
o o Of")
r--
o o N •
0\
o o V'I
V'I N -o -
o o 00,
V)
r--0\. N N N
<::> <::> o 0\

N N
00
o o t-
o o C", 0\
o on
o o 00
o o t-;, c<1 N
0.. 00
N
o on 00
Cf;
o o
o on 00 o· I'-
o o
'"
o on N
o o «)
00
o o O. «)
o on
vi'
V)
t"'<)-
on t-
'"
o o 00
.n
o on 00
N
or, N ( ~
o o N
o on ~. 0\ t-
o "" on
o on
i1
o on ....-,
o o N
M
Co oro 00
on .... o
8
o on O. 0\
o o .'-1
iii
o N
o o o iii '<t
o o
0\ '"
o u ~ N o
o on N
on r-0\ 00
o on
o on
o o
N -
on to iii o
o o o.
o o en
<::> o (~.
o on <')
00
o o oro
on N 00
'"
Co o N
o on ~. 00
o on '<i;, rr-
o on "! N
o on
<::>
° -.
o on c<1
o on r-. N
o on 00
vi'
o o N
o o v. N
o o o.
on r-
o on oro N «)
o o N
oro roo
<::> o N
o o '" vi'
o o vi'
oro tN
N
00 -
o on 00
~.
o on 00
«)
o on
'"
on N o .;

... o
r
I
I
<" (,.
o f")
00 N
I.l') .... .... ....
o I.l') ....
o If)
'--. N r--
o V)
o o O. M N
o V)
co If)
O· N
8 ::l ('j OJ)
i
If)
N 00
o ° "1 r-N
o o
If)
N O.
o If)
o II')
18
o V)
'7. 0'1
v o
ef o
8
o o '--.
o V)
N
c c_,
o~ 00
'n r--
i. .. ::;' c
.;
o
° "1 N
N
o V)
0\
o ~ o
o o
o V)
00
N
on r-
c;.) C
10 -
o c (')
0\ <'I
o o
o V)
r--- 00 -
V)
N
o o V)
o o
o o

a o
Ul
o
00
lI'I N ... =-=
<::> lI'I ... i
o '"
o o >0
o o
N
o '" 00
o o <'1
o
'" 'D
a o r-..0 -;-
o o (')
.;
o o -;-
o a 'D
o o o· -;-
a a <')
o o 00. 00 <'1
.... C<S "0 .~
o o 'D
o o c_
o a 00.
19
o o {oj
'" (-, C;..
V)
roo v) <'1
V)
r-1-
'" ( , "''"
c .f)
( i '"
o -
v o
o Q M
'" r-oo. M o
o V)
'" N
.;
V) r-
00 00
o a If)
'"
o o if)_
'"
•
o In
o
""
o o 00.
o o
V) r-N
1 u .~
c <;> fX;
a V)
a o ".
a o 00_ o N
o o o. o 00
'" N 00
o o , -_
o o c'! \0
o o o;_ 'r> \0
o '"
c o 00
~
o '" o ci. --

(:\
Q '-"
o o ~
,--,.
o o v)
Of)
C\
Of)
N
.... j _ 1
o 'J)
'i-, , .
or) ,.
V) (, ('1
or)
('l
o o "l o ....
o o
,, -.~ ..
20
-ov
OF) r-cr.
o o on
V)
f·
o OJ)
cr.. 00
o o N
o o
o o
c:5 ,-,
OF)
r--
o o <"l
o o 00
o on
o o
on r-""l. 00
o o N
o o r-
:i
o o t-
o o ....
or, r--
o o M
M N
o o <';_
OF)
N N
o o N
o o o 0;'
OF)
r-
o o '<t
o V) (<)
o o
o o I.C
o OF) o .,;
o o
o o
<::> o '<:t
on N
o OF)
N
V) N N
V) N
o o M
o ~. :::
OF)
N
o OF) -.
V)
N
o V)
Of)
r--

to-( • u
o <"l
o o 0. o
o 0 V") 0 'D r--
o V")
o !;!. 00 00
g 2 ('!_ 0 .. 00 00
a 0 V") V")
N ").
V")
N
o 0 V") <rl
V") <:;) <rl N 't) N "l 0.. 00
11'1 t-
o 't)
'7 oi
o o o oi
<rl r--
V")
N ,.,
o V") (')
<rl N
o 't)
'7
o II")
't)
N N
o V")
o.
o V")
V")
N
o o <rl
II")
N 00
o o I-
't)
lN
o o
o o N
oJ) .... o 8
o o \0.
o 't)
V")
N c;.,
'" o N
o V")
o o o.
o 't)
o on
o o '7
o o N.
'" N
o ." 00
N -
'" l-'D
o 't)
o on r--
o V")
\0 o
o o '7.
o on
o on N
o o '<I'
on N
on N
o o N
o II")
'"
o '"
on Io. 00
o o
o o
.... ::I
..r::: o '~
II'> I-
'" r--o o
o Of)
o 't)
O. N
. 00
o '" '"
o o
o o '<I'


C-II AGE AND MARITAL STATUS


con AGE AND MARITAL STATUS
This is a very important demographic table which presents information about marital status by sex and quin-quennial age-groups separately for total, rural and urban components of population. This table has been prepared for the state and down to the district level. The same table was prepared at the 1961 census on fun count basis and in 1951 on a 10% sample data. The popUlation is classified in each agegroup under four categories viz. Never married, Married, Widowed and Divorced or Separated. Marital status "Unspecified" wiII also be. found in the table.
During the tabulation a uniform principle was adopted on an All-India basis to treat all persons in the age-group 0-9 as 'Never Married' irrespective of the entries made against question No. 5 in the indivi· dual slip.
Regarding classification by marital status it may be pointed out here that for persons who are acknow· ledged by custom or society as married and persons in stable de-facto union the marital status was recorded as 'Married'. Even if a marriage is disputed in the region or locality, the status was recorded as 'Married' provided the respondent declares so.
A 'Widowed' person is one whose husband or wife is deceased and who has not remarried.
For a person who was divorced in a lawful manner, either by a decree of law or by an accepted social or religious custom but who has not remarried, or a person who had been separated from wife or husband and was living apart with no apparent intention of living together, the status recorded was "Divorced or Separated".
For a prostitute the return on marital status was as declared by her.
For a pe.rson who has never been married at any time before, the marital status was recorded as "Never Married".
This table provides an elaborate base for comparing regional variations of marital status conditions in different age-groups since the last two censuses.
Statements 1 to 4 given at the end of ,his note show the percentage of population under each marital status separately for males and females in each agegroup to the total population of that age-group, for Total, Rural and Urban areas of the state respectively. Statement 5 indicates the distribution of 1,000 Males/ Females according to marital status by sex for the state and districts.
The majority of unmarried persons among males and females observed in these tables have obviously come from an enormous prc-ponderance of child and adolescent popUlation, thus making for a relatively small proportion of the married persons.
The proportion of unmarried persons is higher among males than among females throughout life. The age at marriage for male, is relatively higher than for females. This is reflected in the higher proportions of males under "Never Married" and relatively small proportions under "Married" upto the age 29.
The proportion of married persons is higher among females than among males upto the age of 30 to 34.
It is significant that the proportion of the wives to total females begins to decline as soon as the age period 25 to 29 is crossed owing to casualities among husbands.
The proportion of widowed persons also naturally increases with each quin-quennium but is at its highest in the age-group 70 and above. The preponderance of widows over widowers found, is caused as there is greater scope of remarriages of widowers than that of widows.
The incidence of divorce and separation does not show any significant variation with the increase in age. However the proportions are quite small.
'STATEMENT 1 PERCENTA&E DISTRIBUTION OF POPULATION BY MARITAL STAlUS IN RURAL AND URBAN AREAS
OF MYSORE STATE---1971
Marital Status
Total . Never Married Married Widowed DiVorced or Separated Unspecified .
Source: Ta hIe C II
Total
Males
100.00 59.35 38.11
2.27 0.20 0.07
25
Feru.ale~
100.00 48.05 41.19 10.35 0.37 0.04
Rl;raJ Urban ----------
Male, Females Males Female~
100.00 109.00 100.00 100.00 5R ,i!l 17 .211 62 .22 50.50 :;R .f, i ": 1 .50 36.01 dO.20
.- /-. L .'./ 10.77 1.65 9.00 0.:3 0/0 0.09 0.29 0.(9 n.ns 0.03 0.01

~ ... ... ""
... ...
26
~ ~ ~ q ~ ~ ~ s q ~ s ~ ~ 00000 0 0 0 0 0 0 0 0
~ ~ N N ~ ~ n ~ ~ ~ ~ 0 ~ ~ ~ ~ q 0 0 ~ 0
o 000 0 0 0 000 000
N ~ ~ ~ 0 ~ ~ 00 00 N ~ ~ ~ N ~ ~ ~ ~ ~ ~ ~ ~ ~ ~ ~ o 0 Q 0 0 000 0 0 0 0 0
~ 00
o
(4 r-- r-- ("~ V) 00 r- to v)
~ ~ ~ ~ ~ ~ ~ ~ ~ ~ o 0 0 0 0 0 0 0 0 0 0 0 o
s ~ ~ ~ g ~ ~ ~ ~ ~ ~ ~ ~ o 0 ('1 V"> 0\ 00 ~ ~ In $ ;t ~ t-.
s ~ ~ ~ ~ ~ ~ ~ ~ ~ ~ ~ ~ o 0 0 0 M ~ ~ ~ M ~ ~
~ ~ ~ C; ~ ~ ~ ~ ~ ~ ~ ~ ~ ~ ~ ~ ~ ~ ~ ~ ~ ~ ~ ~ ~ ~ ~
~ ~ ~ ~ N ~ ~ ~ ~ ~ ~ ~ ~ ~
o ~ ~ ~ - N 00 ~ ~ 00 ~ ~ ~ q C",! \0. ~ VI M c;-., t'_,_ ~ ~ 00 V) If) V)
o 0 0 Coo 0 C
~ ~ ~ ~ ~ ~ ~ ~ I ~ ~ ~ ~ ~ o 0\ V) 00 O'! r,) ('l o Q'\ C1\ r---- ("~
M n
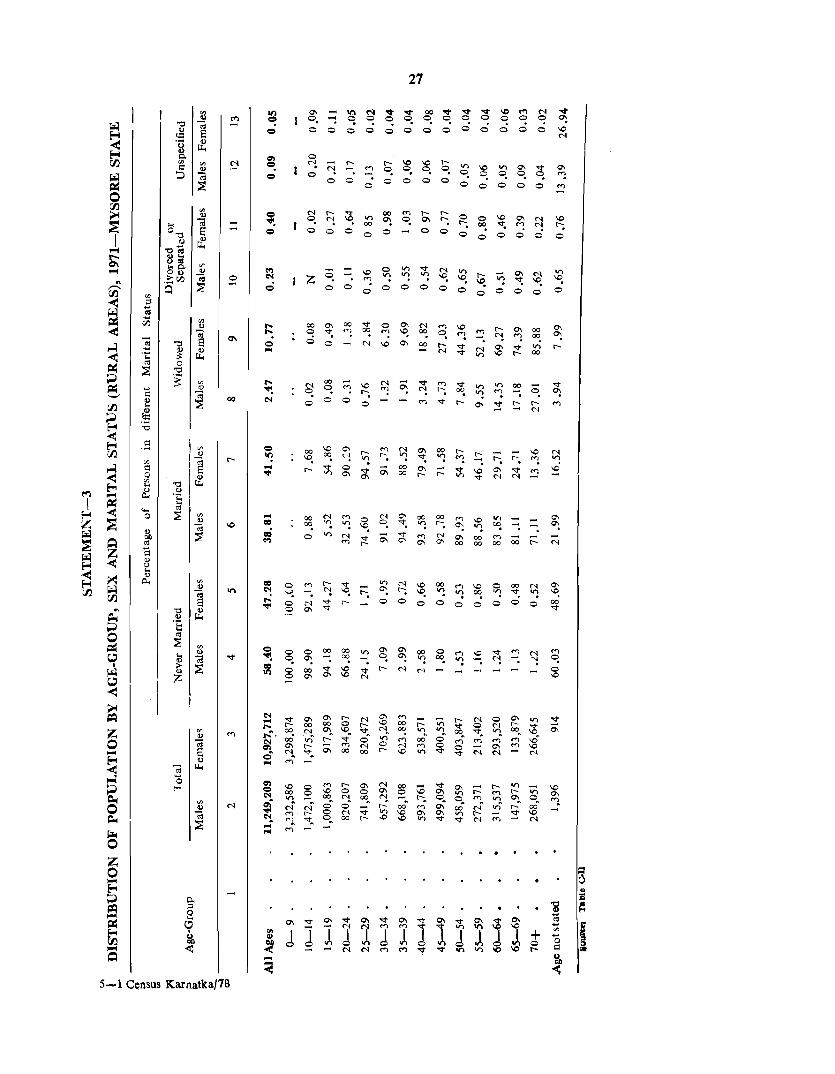
00
5-1 C~nsus Karnatka/7B
... ..,.
27
~ - ~ ~ v V 00 V V V ~ ~ ~ v ~ ~ q 0 0 q q q 0 0 000 ~
o 0 0 0 0 ccc coo 0 c
IZ ~. ,,,:!. r- ._ 0\ N Vi - ~ .; "': ~ ~ 0 0
0 00 0 0 0 0 000 0
000 0 0 0 0 0 0

28
q q g g 0 z ~ ~ ~ 8 0 ~ Z o 0 000 0 0 0 0 0 0
- ~ 00 M ...., ~ ~ 0 ...., ~ M ~ ~ ~ 00 00 ~ 0 0 0 0 000 0 0
- ~ ~ ~ ~ v ~ N ~ ~ 0 _ N ~ N N N
o 0 000 0 0 0 0
g q ;2 q ~ o 0 0 N ""'"
:! 00 00 o ~ ...., o _
""'" ~ 00 - MOO""," ~ ...., ""'" M M ""'" ~ ~ ~ ~ ~ ~ M N _ ~ M ~ _
N ~ ~ ~ ~ ~ ~ ~ ~ ~ ~ ~ ~
g~3~~~-.~ ~ o N ~ ~ ~ ~ ~ ~ ~ ~ ~ ~ ~ ~
~ ~ ~ ~ ~ ~ ~ ~ ~ £ ~ ~ ~ ~ q g ~ ~ ~ ~ = ~ M ~ ~ ~ -
•
•
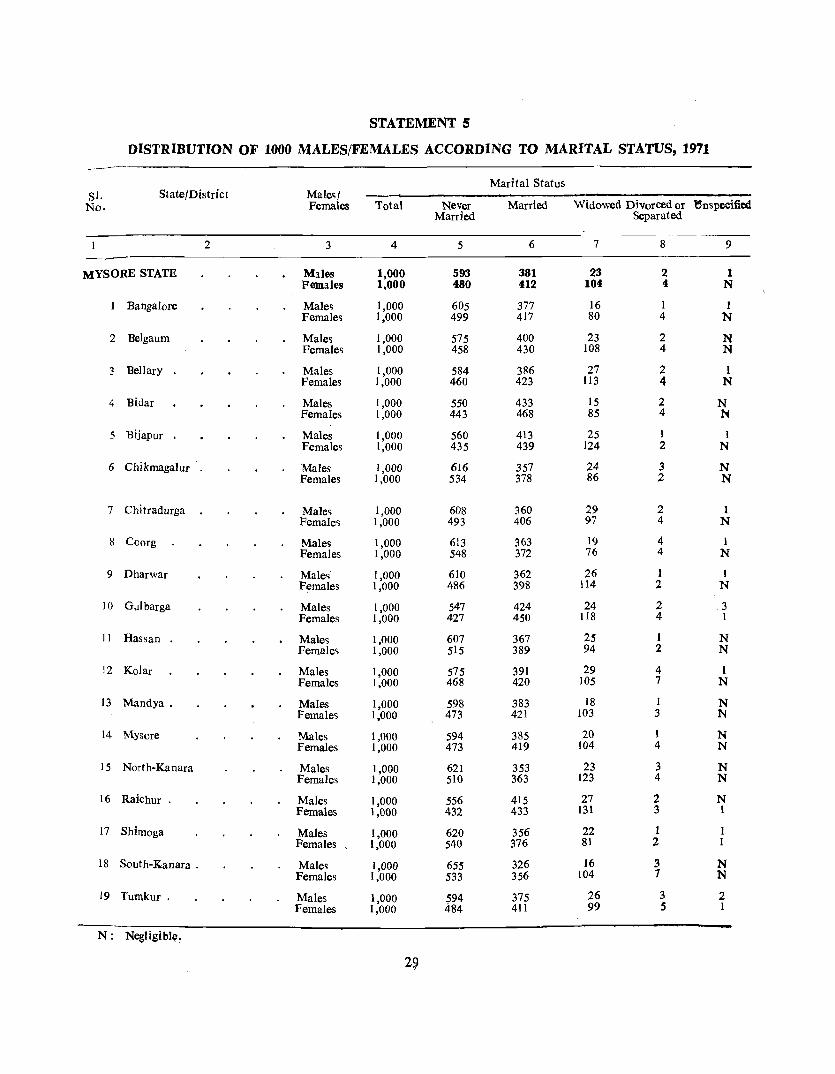
STATEMENT 5
DISTRIBUTION OF 1000 MALES/FEMALES ACCORDING TO MARITAL STATUS, 1971
Marital Status SI. State/District Male~/ No. Females Total Never Married Widowed DiVorced or -enspecified
Married Separated
2 3 4 5 6 7 8 9 --MYSORE STATE Males 1,000 593 381 23 2 1
Females 1,000 480 412 104 4 N
Bangalore Males 1,000 605 377 16 I J Females 1,000 499 417 80 4 N
2 Belgaum Male5 1,000 575 400 23 2 N Females 1,000 458 430 108 4 N
3 Bellary Males 1,000 584 386 27 2 1 Females 1,000 460 423 113 4 N
4 Bidar Males 1,000 550 433 15 2 N Females 1,000 443 468 85 4 N
5 Bijapur Males 1,000 560 413 25 1 1 Females 1,000 435 439 124 2 N
6 Chikmagalur Males 1,000 616 357 24 3 N Females 1,000 534 378 86 2 N
7 Chitradurga Male~ 1,000 608 360 29 2 1 Female~ 1,000 493 406 97 4 N
8 Coorg Males 1,000 613 363 19 4 1 Females 1,000 548 372 76 4 N
9 Dharwar Male~' 1,000 610 362 26 1 1 F~males 1,000 486 398 114 2 N
10 Gulbarga Males 1,000 547 424 24 2 3 Females 1,000 427 450 Jl8 4 I
II Hassan Males 1,000 607 367 25 1 N Females 1,000 515 389 94 2 N
12 Kolar Males 1,000 575 391 29 4 1 Females 1,000 468 420 105 7 N
13 Mandya. Males 1,000 598 383 18 1 N Females 1,000 473 421 103 3 N
14 Mysore Males 1,000 594 385 20 1 N Females 1,000 473 419 104 4 N
15 North-Kanara Males 1,000 621 353 23 3 N Females 1,000 510 363 123 4 N
16 Raichur . Males 1,000 556 415 27 2 N Females 1,000 432 433 131 3 1
17 Shimoga Males 1,000 620 356 22 1 1 Females 1,000 540 376 81 2 1
18 South-Kanara . Males 1,000 655 326 16 .3 N Females 1,000 533 356 104 7 N
19 Tumkur . Males 1,000 594 375 26 3 2 Females 1,000 484 411 99 5 1
N: Negligible~
29
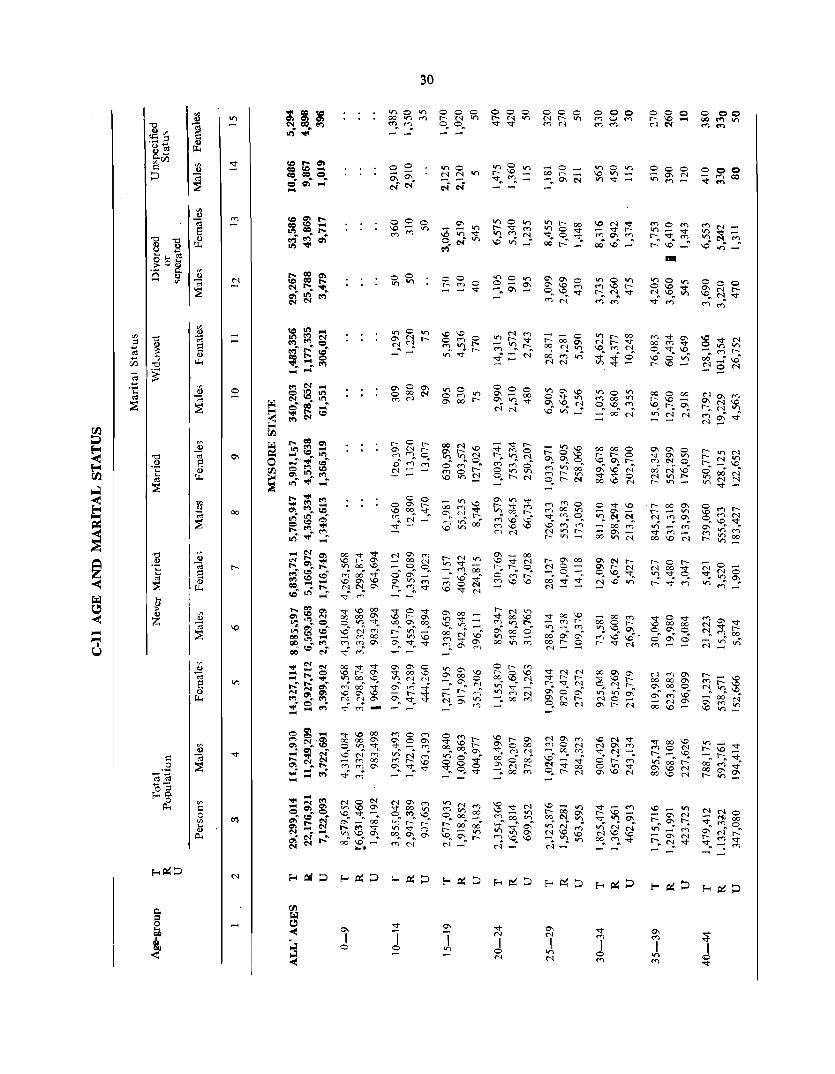
--o
00
N
",,"~oo
~~~ ~. N M ........ M 00 ~r'10\
""" M
00""",,,," 'ig~$ ("1.) 00 7'" ~O'I~ r"!_ c,! 0\
"" M
0'1
I o
0 0
""""
30
--0 t-000'l 00 r-t lr)
cO~v) NN
't- 00 0'1 r- - II) NM~ or) M """ M_ OO~N
t-OtNco",," "" """ O. r-"' ~'" ("'!")
~-"" -O'IN t-#\ ~ r-;. ""_M -O'IN f-,. ~ """ - -

--
00
000 ~OON
~ 10 0'1 '" _"' t-.. N
<')OM 0'1 l- N 10-'<:1" 7"' (.;_roo
31
000 0'\ C"l. tNO'IM tr) ('1")'" _'"
",OV) - N 0'1 N"'''' O· M ",. 1'-0'\1'M N
000 0'1'<:1"10
NO'\M "'f'-oo 000-0\"' ~ VI"
'" M M - -
<')0010 r- 00 00 ("f') 0"1 ... ('!")
I'- 00 00
~~IO
+ o r-
0'10'\

N .-
01
00
00 <"l <"l
00 NN
on on
32
00 0101
o 0 N N
000 on'<t
01010 "'" N N - - <;; '<t'''; C ~<"l<')
- .- 0 '<t M.-'<tr-r-:'MM !'-r-O .-
OI!'-N ONOO on <'1 _
..; t-:' r-' <')<'101 M -.-
o 0 .- .-
Non!'O~OO <') <') 01 v).o~ <"lone-
e-Oloo ~N<"l -0-N~~ '<tonoo
000 <tr-.-
~<"lM _'<tt-_ 00 N
on' N N OI'<ton
V'I 0 "" .- .-
0·..; 0
~~oo
=~oo NMoo ~~~O O'<t~
o M 00
\D. Vl O.
000 t---\D
000 ~IJiOO
000 NOI..., 00 \D

.... .... • u
::
°
00
° ° '" '"
000 ",0", MOO II') 00 r-N
~~~ 00 .. l--... .-
0·
t-M"T 0\0\0 o N 00
NNo\ "TN-
00 --
+ ° t-
00 00
OOON t- on
",0", t-O\oo OOM"T ~O~ ~ M
t-"'-

Ii l~ I'"
I~
'" c:: o '" .... ~
'<t -
N --
00
00 0000 NN
00 \0\0
OON\O onNM "'00_ O'\*' N r-: - on \0 MN
00 '" 11'1
~o -=
"'NrMNon-'<t 00 0'" 00" OooN
'" -J,
00 \0\0
34
00 on on
o 0 N N
'r\ 0 on "./) C VI \0 on_
'" 1 N
00 M M
000 onoor'<tM
00 NN
000 O\O'<t \O'<t
000 - - 0 t;, - .. N
00
00 on '"
~'Vl '" -00 f'1MO ~ ~ o· '<t<')-
'" 1 "<t
00 -00 .....

V'l -
o
00
00 -
000 00rMN
00 NN
o 0 MM
000 '<tM
00 NN
00 '<t'<t
000 '<tM
000 001 N
00 00
NN NN
t-<~O l-<~O E-<~O E-<~O E-<~O
'0 <!>
E '" ... o I::
N<,)OI "if'\Crw.,...N ~. ~~.
00 --
o 0 \C\C
Mr-\C M§:N
.,) f'." 00
3';:M
00 -
0\
1

"C:l ,~
I~ I I
... <U
~ Z
_i::: 03,,9 --003 f-<-
5. ~
o
00
,1:'
I
I
11'1011'1 00'1 N-
000 00 \010 0 -. O. -. -0-'<t ....
~3~ 0'1_ 00
'<to N' N' '<t .... -
000 oo'<t'<t N N
o 0 N N
000 N~N
II'IN<'1 _<')00 Noo<') t-. \0. O· <')N-
\0010 - <') 00 <')<')0'1
.; M O· t-, 11'1 N
11'1 tn
eo -
o 0 M ..,
v>01l'l - -
t-M"<t __ 0
<')0<')
M'r-"'\l:;" N
_ 0
t-Nv> 1011'\
o 0 -- --
00 0'10'1
00 M M
000 0'100
ONOO \0\09 v",~-... "<t«"l-
-t-"<t NQ\N Of'lt-_"' 00 c--r
00 ........
00 "<t:!
00 0000

o
00
00 --
00 N N
~::oo "<to -, ~ - -
~
1 \Q
""0.,.. 00 00
00
""""
+ o r--
--
N 00 N
00
37
It')
It') ... It') ...
"<t
J -
00 M M
v>ov> 00 M M
v>ov> 00t-
00t-NV>t\ONM 0'" .n v) M N
t-M"<t .,., t- 00 0",«1 "<to M 0 \0.,.,-
000 o
M M

1.2 1 01
15 1[.1., I J '" I~ I~ I
I~ ICtl
I~ I I l~ ICtl I~
o
00
000 S!
r--;..c>"'0'" _00'" o;',oN
0'1",\0 N-II>'<t-M~"~ N -
38
00 r-- r-- '" ° '" 00 00
0-0'1 ooM'<t 00'1-
\O~ ~ N
000 0'100
00.q.<I" II>C'" -_ '<to r--_ "'M- -
co (<) M 0::
co
00 .q. <I"
+ o t-
o o
o

.... .... I
U
o
00
39
~OO
o 0 NN
NOI<'l 00 00 01 ('f') l- 'l1 00 0"" t-
S!5: N
-.t
1 o
o 00 N \O-<t _ (') 00
00 00" 0-," In-.t
00000 NON 00 (y) lr)
0' _' ~ 00\0-
I on
00 NN
00 r- r-
Cr-<'l Nr--.t 0"1 l£) C"'"l
~~M
.,.. 0.,.,
00 -
COC N-.tOO .,.. (')
MO.,., .,.. \0 01 r-, \0, 0, 001_ .,.. <'l _

t=: o -.....
<':I~
- <':I 0-1:-<::1
2
I~
o
00
o o .....
00 00 o 0
000 N
40
00 NN
co
00
00
00
00 NN
+ o r-
'" 00 ONOO N
0\
J

.. .. • u
o -
00
00 -
000 C\ W
00 <'IN
('I-won..., """"0 ...; r-" ~" ",,('I
'"
00 ('I ('I
00 00
00 -00 r-r-
000 <"'l0 <")
000 _ 0 000 ~on
00 00 00
r--~ <:1"..000 .£') t")-
00 r-"' _ ..
000 Q\ 00
00 ~('I
00 M ...,

o
00
00 V)V)
00
000 V)";-
00 NN
0 0
42
+ o t-
t-t-
00
M N_ V)'OO'I ~f"")"'d" r-. 00'" ~ O"'M N-
00 N N
00 t-t-
_t-'<t ",00t'<j"MO
N'Mo\' 0'It--
00 NN
000 M 00
Q'\t-
Nt-V) Nt-.,;O. o;_ O. V)M_ NO'IM

o
6-1 Census Karnatafca/78
00 <')<')
0\
1 N
00 Nt:'f
00
43
00 NN
00 \0\0
ONoo \ON<') t-.... ("I') ~
<')"'''; N
00<,)V) <') <') 0 <')~O\
t-" N~· NN
\0""<') ~o~ \00000
0\000 '7'7
0;:
o 0 \0\0
00 N N
00 NN

o
00
00 <') <'l
so
+ o t-
11)11)
N ('1
44
H U
~ is
~ o o u
0<'1tNon'" "'i \0 ... ~ .- ('f) tII)"<!"
0'1
d
00 NN
""" 1 o
o 0 t- t-
o 0 0'1 0'1
I() 0 II)
\0 '"
0'1
J
00 NN
000 o
000 '" II)
00
"'''"
0'1 ..... 00 -1()>0 o 'I""~ 00
00 M" ~ ('-1 r'l
0'1 N
I V> N

~ ~
I
U
I~ I~
~ o '" ....
I~ I
o
00
N
00 -<
or-- .... ~C--t""l M ~ 00 o\~~
V)0V) 0\ 00
co ('1'", an 1.1') I.i") 0 0\"'';-~OO~
t.(')(,-OO 0\\0<") \J;if')C'<.OOO ('"1')_'~ (-"'~ ... M - _,
00000 ONOO V)~
00
o 0
000 '-' 0\
00 .....
00 ...., ....
~ \J;i
I o ~
00 C'<C'<
0\
'" .1 '"
00
00
00 C'< N
000 ~NN
+ o r--

rn -
--
•
00 00 00
00 '" M
00 NM
000 '""f'l
00 I{) I{)
v
1 o ,...,
46
00 M N
00
0\ ,..., , I{) ,...
00 00 f'lf'l
00 - ,..., -,...,
v
I o M
o
00 00 QIO
0\
I I{)
M
o v
00000 0 .... .-00 \0 ,_..,
~Nr-r
V M
I o
'"
v>0v> 00 NM
00'1_ 0'1'-'00 0"\ (~ [--... V· r-.: t-I{) M
"'M'" V '""" '" OI{)l{)
r----- 00 00 I{)f')
00000
"'0'" --0 or} 0'1" .c .- M
00 V 0
0\
i v> v
'"

::::: o
I", I., J<ii J ~ I~ J I.., 1.2 J~ I", I~ 1-I~ I~ I J '" I~ I~
I I I", J§ J~ J&! I
--o
co
t--
onO <:;> on
",.
1 o .,.,
00 ........
00
00 t--t--
00 ....
000 t--",.
0_0'1 t- 0 \~ \() f"'4 ('f)
N-OI.Ci' N_
",.
'I o 1.0
47
00
00 \0 11') 0
00 ooonO
<')
00 .... ....
+ o r-
1 I
1 I
I·
I I
00 00 00 1.01.0
00 NN

00 t:t:
o S
o
00
00 00 00 <'IN
00 S;r--
48
00 Vl Vl
00 - ---00 ("j (")
000 \OVl
MN
0\
J M
o 0 \0\0
os
000 $~-q-
00 M M
o 0 r-- r-
000 ::!::C'i
-q-O\Vl O\OM r- on _
\J;)r. .n _.: \0 I() _
o 0 r-- r-
r-t- O NMO\ C'l ('1 00 00' or) N" --
000 Vl-q-
o 0 0000
00

'" " "0; "0
" III S
.'fJ ;::l ~ gE PotZl <IJ
<IJ ~ t:I OJ
;:J ~
'" Q)
"0; .... 0 s "0] " Il.. " .. oOj ........ o ~ III
~~l~
'" " "0 "0;
J ~ s '" I~ :::l l.g .... OJ
~ til "0; I~ .. .... .... 0$
rn ~ ;;;J '" ~
Q)
"0 ";
~ .~ S .... Q) rn ....
0$ .Il.. ~ ~ -< '" =-- Q) ..... "; ~ ;;g -< :g
"0
~ Q) '" .;: Q)
Z .... "; OJ S -< ,:g Q)
r-iI .... Il..
~ Q)
> -< Q)
'" Z Q) ... ~ ...
I
U
'" Q)
"; S Q)
Il.. d
_.2 OJ- '" _OJ Q)
0- "0; I:-<g_ ~ 0 p...
..... -o -,
00 <'1 <'1
00 <'1 <")
N
00 00
100\10 r-V'lr- ID -0\ 10' ,;
+ o r-
.....
49
00\ 00 0 «l 0 o· • ::! N
0\00\ 00000 <") <'1 0
o· • \O:!~
00 NN
00 NN
00 NC'of
00 0 N
00 <'1 <'1
00 1010
00
00 10""
00 «l (")
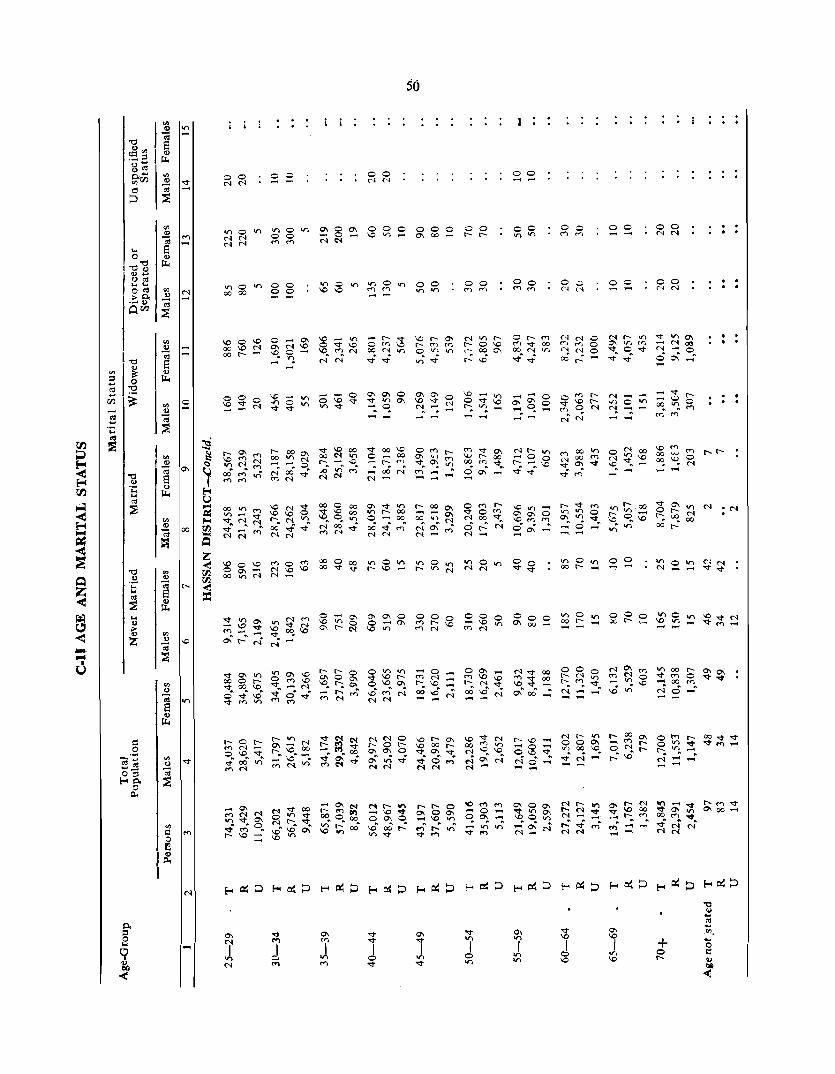
... <lJ > Q) z \0
00 NN
>r> 0 1r) 00 0000 00
50
00 <'I N
000 ~ Ii"\
0'I'<t1O >r>t-oo O~oo
oO~m NN
Mr--on ~\O..".
00'l~ ~ooton..".
000 0'100
00 >r>>r>
~~o N N ..... - ....
0'1
i on '<t
00 t- t-
00
'" '"
v '" I o 1r)
00
00 1r)V"l
00
"''''
000 0'1 00
t-~ -0 0\0 No .... -
01
J 1r)
00
00
0'1 \0 , 1r) \0
00 N N
00 NN
+ o r--
:N
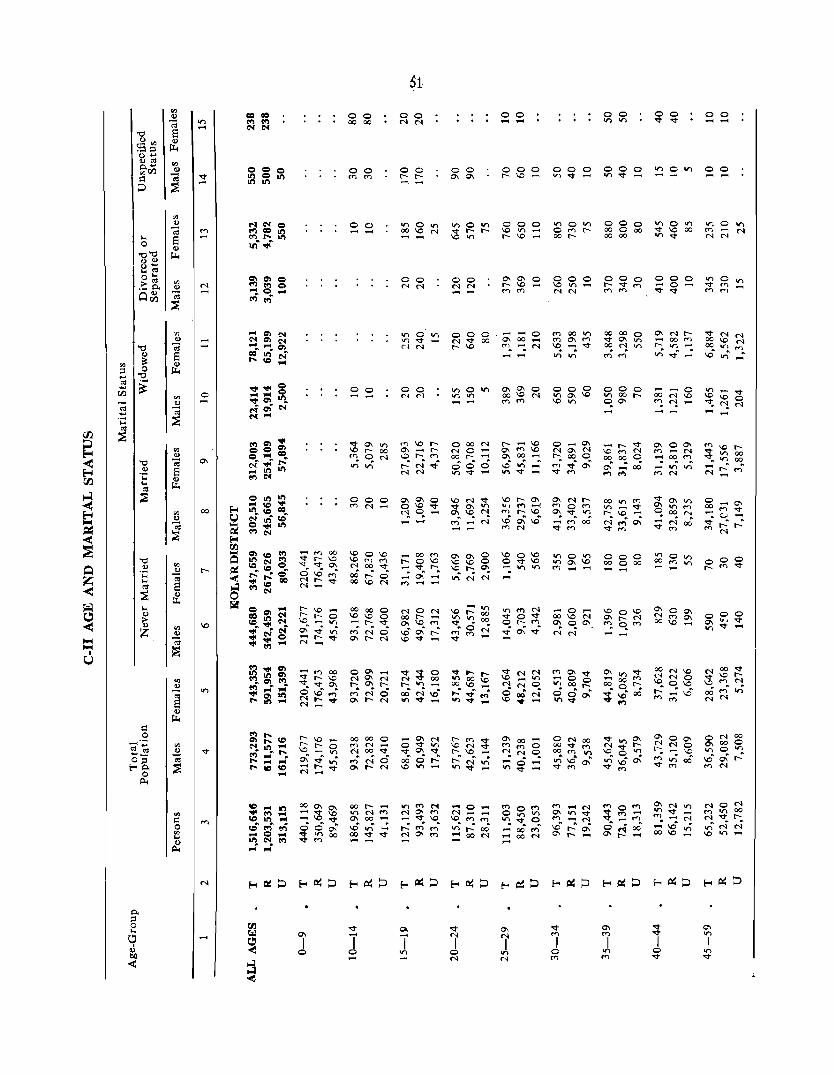
.... Q
t Z
o
0\
00
0\
I o
00 00 00
00
"" '"
00
00
000 "'N
\00\0 \0 ('t"j C'f')
NOO'<l" oOf-O OO\oN
00000 \0\00
1-. '<I" ....,NO O'II-N
000._ NO'IN ,...... ~,..... ("I") NO o.r-N
00000 '" N ..... NOO'<l" ~NO oo.t-N
00 I- -II)N'" 01 00 V; tn ~ 00'<1"'<1"
~1
00 NN
00 1-1-
00 NN
00 N N
",,\01-0'1 ..... 1-~I-'" r-:'N'''; NN
O\N 0'<1" on ~0'I'<1" 00 Or--:' \0'"
00 0'10'1
00 NN
000 ~ \b 00
-0_ N ..... _ \0. ('I") M V'I r-: 00" "'ooN
'<I"
I o N
00 .....
000 I- \0
000 \0 '" 1-\0
\01-01 ltl (1") '"""':
'" r- \0 v5",v5 '" N
""'0'" o on'" "''<1"0 ...... 00 M'" "'ooN ....
000 ", '<I"
000 \0 Vl NN
O'INI
""0'" 0\ ... V", II")
..... ...., 00 '<1"""
'<I"
'" I o ""
00 Vl 10
000 "''<I"
000 00000 00 00
000 00000
VlOIO .....
000
~~
00 -00
ONOO 0\000 onOon v;;'" 0\ r"" N
0\ Vl
I '" '<I"

.... 0'0
"" '0-""til 0 .... .... tIl 0'"' >"" ·~Vl
A
.... "" > .., Z
ell I'l o '"
I~ I
'<t -
--
00
00
00 -
000 '<t'" NN
00
000 00 r--_
'" N"" -'" 7 .. ""':.~ '" -N -
'" Oil'> -000
'" '" "" ",,,,
00 "'''' N r--", '" ON ('I')"'O~ NN
"" '" I o '"
00 ('" l'i
00 NN
00
"''''
00 ",,,,
'" '" I '" '"
00
00 r--r--
"""'"''''''' ""-'" ",' ..,; N' --
11'>"'''' ""-N "''''0 "';N'N' -
00000 "'0'" 0\ ('-i r--:-~M N _
+ o r--
0000
.., • <
...
...
r--\O_ 00\_ vi UO \.0 """'" 00'" N t-""N -~~~ 00 M '" ""-N t-"'N ....
NII'>tt- V) _
00 "" '" M~N t-"'N
"' ..... 00 t-"'N ('<) N
v)Ov)
""0"" ('<) ('<)
0'\
I o
00
""""
00
00
""""
00t-_ (Y~ r- \0 Mont('f') ~ 0\'"
t- '"
"'""II'> NII'>t--('<) "'. '" ('<) N O' II'> ('<) N
"" -J ....

.... 4>
t z
N
o
00
1.0
00 00 I/") -
000 oot-
00
0'1
1
00 NN
00 0'10'1
0'1
l N
00
00000 ONOO Nt- .... .nO"; MM
..0 <j" N: 1/")1.00'1 OONI/") 0'I • .n,,; NN
00 NN
0-00 M
00 - 00 -

II> ... I~
.... ....
o
00
00 N N
00
'" '"
00000 o N 00 "<1"00'" . . . .., - -
+ ~
00
- -NN
S4
00
J
00 00 -00 <"l <"l
"<I"
J -
00 - 00 \Q\Q
000 l- N V')
'" I'"

... ... I
U
'" 1:1 o
I~ ,
v -
-
t-
....
000 '-0 0000 '-0 7
ss
00 ",,,,
'"' .0
00
C7I .,., J. If)
00
00 - 00 N N
° "'00 N
+ ° t-

I '" I'; a ..,
lJ"
.... .....
o
0'1
00
........ ...... ~~
0'1
J
o 0
0;:, ...
o oor--0'100
00"'''' ~O'IN 0'I7">t "';-00\ "'7
r--Nor) - 00 '" 7"'0 0\0\0 </)7
56
00
00 10'"
00 <") M
00
10 0 10 00 r--
00
00
00
000 0'100
00 NN
100 00 ;q

I~
en ~
, 0
I~
o
00
57
00 C'lC'l
V)OV) ,?OO 000 V)OV) V)OV) r---. \0 M C"4 _ ("-.I .......
000 00 '"
00
+ o r--
v)'" NN
0\
J
0 0 00 NN
00 ",f'1
"<t
J
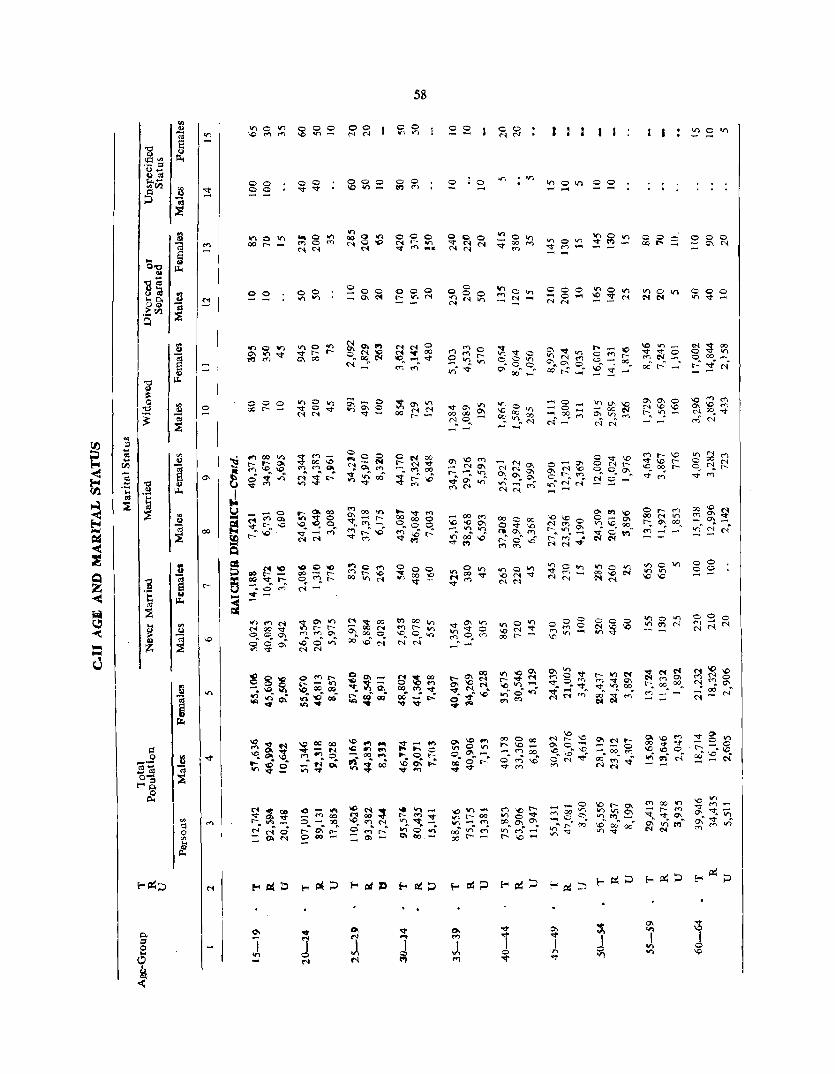
c
00
00 00
co o 0 ",,,",
00 NN
000 'C'"
58
o 0
_00<,> "''Do, - "''''' ~~~
00000
"''''- ..... 00
o· '" v:: ..,. .....
J I I I I
000 OCf"_
10 on_ "<I"~O ("1"", N _ r:£ r-"' _'"

g-O o fo -<
M -
o -0'1
00
M /
7-1 Census Karnatak/78
00 e'iN
00 e'iN
00 NN
o
+ o t-
00
rII")
o r-
00
rII")
S9
NN ...... ""''''''
00 00 00 M M
00
00 NN
00
=
0'1
1
00 -00 o~

--o
''l
\-~ 0 f'4 1- )Q Cf' ~ .... ?o'" 0\ l~ -
- - 0 .;..o...-t-(-"-1 -- c:-.l 00 0.," ~ «)N
00
'I") 0 '"
"'t-co - N CO NNo\ N ..; t-" .., N
60
"'00r--0\ C'" V) 0\ l-- r ..... V'" C""-; _'"
o 0
00 00 00
00 ("")..,
0'1
'" I '" '"
00 Vv
00
00 .... ~I
+ o r-
00 - -

o
00
'" ~
I~ I
00 ltIltI ......
(")0\<:1" r-N'<t 0;, <:I" '" on ..,) 0'" CO <'l '" NN
01
I o
V) 'I)
00 ' .. M
61
00 '<t
000 1'- <.0
000 o 01
00
o 0 NN
00 NN
o 0 (") ("f")
00
01
1 V)
01
."';; 0
N '"
~OO P) 0 (") NN
0-NNO 1---;' -._ \0 0101
Monoo 00_<.0 - 00 M
N -" 0 V)'<t-
- - 0 0I'<tV"l 1.0_'1) 00 0" 00" f". (")
000 00 00 t'..( oo::t.,. ... ? 00
("'~ - -0101<') 001 1-OOv)'N
ooV')M \Oaoao MM'"
e; :i -"
\Or-OI (") 0'. (""'") 0I'l _ '"
~ _ .. ("'I')
OooN
'0\ 0 0\ (" V) r-V)~O'\
7' ("f"j
01<:1"'1) (~ 00 qM ~-- ".::t' ~ v) 0" <:1""'-
\0 0I'l _
0101<') 0l<.OOI'l
000" _" V"l M _
c c 00

.] t: <I!
I~ I,... I~ Iz I
°
co
00 <'IN
"'".,-0'\0\0 l'i ("t') 0 ....
.; r:- t("C)<'I
62
3° 00
CO,<!"'<!"
"'0'" 00 .. 00 0 ..
NOO'<!" N-
+ <:;> t-
00
0\
I o
00
° ° -

.... .... I
U
o
co
00
'" '" NN
00 ('IN
000 ('l
00 "'<'>
00 1010
00 COco
00 NN
00
"''''
co '" '"
00
'" '"
QO ....
000 '" 01
00100 0;,000
~~ ('f) - (~ 01 ,~
('I")('!jO '" _ 00
<'"IN-v;)N-i ('1 M
00 0101
00
000 NON or) on
10 _ or) Noo'<t ("fj ~,,~
- r- <'> (')01
000 "'CO
(') _ 01
O'\r-N 10 coco ",. v:; N <'IN
co",or) 0_'" O'<ton v) _ .... ("t')'"
<'"l '"
-'<trOCOr-N'<t -i 00 v;) 10 on
00
~oor) _. 10. :g 0\ r- • - - -

64
I", on 0 0 0 0 0\ 0\ ~
II") II") l- t-0;
!'" s ~
..... ::s .... 0 ...
l &~ -.t ~ :;:) l- I-
'e: Vl '" <". n
..2 l;:l 01 !~ I
I~ II") 0 '" 0 0 '" :;:) 'n
1 <"l ~ or, " 'T 0 0,
I 1-< l~ -'-0 OJ ~ 'C.... ~
8~1 0 c '" c
'" 0 c C' 0\
'-<01 N 0 00 oc 0 0
~ nol ~ ~, 1'1 ("', «,
I· .... ~ ..2 0 1 01
I~
I'" '" <'l 1'1 r-- t- O or, .0 0, 0\ 00
00 0\ 0, N N 0 I- 'T N
I~ ~. "l". '" r--. ~ . 't:i .... r--. r-- ~. U 18
N _' c- '0 'T
VJ :;> ~ 0 Ir.e -;;; "0
til ~ I '" N 0\ N I- 0\ 0\
1 if, N ;:: t- "l" N t- '" N 0 N
] 0\. ":. «) 00 II")
I~ '" -;_ 0\. v$ .n ..... 1 00 M '" N '-< !~ 00. oj
;;;J ~
E I ,~ ~ 0 - N <'l 0; M 00 00 00 0, 0 ... 0 l~ 0\
'" '" 1"* t- ~ (,' q N r--. '" N
"l::s 'd. ~. N 'ri
I~ <:. <'1 N '<t <:t-oo. .~ :::
'-< II-!. e ~ '-< oS I
~ ~ ~ 00 0\ 0\ 0 0\ '" ~ ~ '0
I", 00 N 00 <') 00 ~ 00 N - ~ '0
'""" I~ u '" cr. 0, '7. ,- I- <;, 0 <;, ~ I~ ~
o· 00' 0'\ 00' r-- 'd.
-< N
E-< ~ I
tLJ .... Q c 0 0 c c c '" '"
~ I", 0 '" n
l:- oe N (" «;t v "0 1..2 ~ Z ~
-< .~ d2 ~ 1;; r"l ~ I~ ~
" ~ I ~
0 0 C 0 II") 0 II") r-- t-
1i:J E-< '" '" 0\ N '" '" -< \0 r-- '" N 0 I- '" l~
~ M '" c~ N N
'""" z f-'""" I~ • u I
M 00 0\ C 0'\ 0\ 0'\ :;; 0
Ie" N \0 '" 00 \0 M N «) 00 ... I~ '" t-_ co. 00 \0. r-- 0\
('1 -t 00.
0'\ t- o ~ 0,'
18 N
I ,U I .....
i:: 1 - '" '" 00 00 co .,S 0 N 0\ '"
L~ <:t- 'T M 0\ 00 0 ~ 0\ \0 or, '" ... c-;_ -t. <;, 00. 0\ 0'\ <'!_
«) ~ -'" o· "'- "'" N N "'" N .... ;::I
I~ ,'-I N N N
Cop. f-<Q I p..
! N (C) 0\ - (Y) 00 "i" <:t- o 0\ I VO \0 0\ :£ co «) 00 <') '"
00 (C)
'T. "'" 0'\ 0\
I~ N. It'), 1-. 00. n 00. r--. N N
<:t- o ~ N ~ ",'
~ <')
"i" <:t- N "i"
I~
I-~;:l N f-< P::: :::> I- P::: ::J f-< P::: ::J I- ~ ::J
-~ p. ~ ~ 0 <:t- 0\ ... \0 'I
., 0 I + '0 0 0 or, 0 r.: ell \0 \0 r-- <U <: C1l
<:

C Ill-PART A AGE, SEX AND EDUCATION IN ALL AREAS
C III-PART B AGE, SEX AND EDUCATION IN URBAN AREAS ONLY
65

C-lli AGE, SEX AND EDUCATION
This table deals with educational standards of the population classified by sex and age-groups, presented down to the district level. It has two parts, viz. Part-A for all areas and Part-B for urban areas. The agegroups are quin-quennial upto 24 and grouping thereafter is 25-34 and 35 + and age not stated.
This table helps to assess the growth of literacy in the population as well as in the different age-groups since the last census. A similar table C-III Part A and B was prepared on full count in 1961 census with slightly different educational levels and age-groups, and in 1951 census, this table was prepared on lO% sample basis.
The concepts and definitions adopted in preparing this table are explained below:-
1. Illiterate: Is a person who can neither read nor write or can merely read but cannot write in any language.
2. Literate: Is a person who can both read and write with understanding in any language. The test for reading is ability to read any portion of the printed matter in the Enumerator's Instructions and similarly for writing the person should be able to write a simple letter. Ability merely to sign one's name is not adequate to qualify a person as being able to write with understanding. If a person claims to be literate in some other language with which the enumerator is not acquainted, the respondent's word has to be taken as correct.
All the children of the age of 4 years or less should be treated as illiterate even if the child is going to school and may have picked up reading and writing a few odd words.
3. Educational Levels: If a person could both read and write and had also passed a written examination as proof of educational level attained, the highest examination passed was noted in the individual slip instead of merely "literate". The variety of entries relating to educational levels found in the individual slips were fitted in against the broad educational levels adopted for the preparation of this table.
In Part-A for the table which is for all area,~, data are presented by:-
(i) Illiterate
(ii) Literate* (Without educational level)
(iii) Primary (iv) Middle (v) Matriculation or Higher Secondary (vi) Non-technical diploma or certificate not
equal to d<:!gree.
67
(vii) Technical diploma or certificate not equal to degree.
(viii) Graduates and above. * Includes educational le"els not classifiable.
In Part-B, which is for urban areas only, in addition to the above mentioned first seven characteristics, figures are also given for the following educational levels which together corresponds to 'Graduates and above' in Part-A of the table.
(i) Graduate degree other than technical degree.
(ii) Post-Graduate degree other than technical degree.
(iii) Professional degree or diploma equal to degree or Post-graduate degree in-
Ca) Engineering and Technology
(b) Medicine
(c} Agriculture, Veterinary and Dairying
(d) Teaching
(e) Others.
The various diplomas falling under categories : Viz. (i) non-technical diploma or certificate not equal to degree and (ii) technical diploma qr certificate not equal to degree broadly cover the foh~wing:-
Non-technical diploua or certificate not equal to degree :
R.attan, Bhushan, Prabhakar, Budhiman. Vidwan, Giani, Adib. Adib-Alam, Adib-Fazal, Prajana. Munshi. Munshi-Alam. Munshi-Fazal. Maulvi, Maulvi-Alam. Maulvi-Fazal, Diploma in French, Proficiency in oriental languages (Sanskrit, Persian, Arabic, Urdu, Hindi. Punjabi), Visual and graphic arts, Acting, Music, dancing, sewing, art, embroidery, domestic science, statistics (except S.1. diploma equivalent to a post-graduate degree) Diploma in Library Science.
Technical diploma or certificate not equal to degree: Diploma in :
(a) Engineering
Aeronautical engineering, Automobile engineering, Chemical engineering, Civil engineering, draughtsman, Overseers, Surveyors, Computors etc. Electrical engineering, Mechanical engineering, Metallurgical engineering. Mining engineering, Tele-communication/Radio and communication engineering. Architecture, Electronics. Textile, Costume design, Dress making, Cinematography and sound ell g.in( ering.

('b) Medical Human medicine J Surgery, Nursing, Ayurvedic. Unani and other systems of medicine. Dispensing. Midwifery, Pharmacy and dressers course, L.M.P .• L.M.F.
(c) Technology Glass & Ceramic technology, Leather technology, Wireless technology, Textile technology, Printing, Food Fisheries. Forestry. Dental technology, X-Ray technology. Laboratory technology, Pulp and Paper technology, Handloom technology. Fuel technology.
(d) Animal husbandry, Livestock.
Veterinary and dairying.
Statements 1, 2 and 3 given at the end of this section, show the proportions of population in different educational levels to the total population in each age-group, for total, rural and urban areas respectively.
From statement 1 it is seen that out of the total population of 29,299,014 in this state, the literate popUlation accounts for 31.5%. Literacy rates among males and females are 41.6% and 20.9% respectively. The primary and above levels together form 25.6%, 34.5% and 16.3% for persons, males and females respectively.
Out of the 315 persons who are literate among every 1000. 59 have no educational level, 146 have passed primary, 61 have passed middle school examination. 42 have passed matriculation or equivalent examination. one each has passed non-technical or technical diploma or certificate not equal to degree and another 5 have attained graduation or higher level of education.
Of the 416 males who are literates among every 1000, 71 have no educational level, 191 have passed primary, 80 'have passed middle school examination. 63 have attained matriculation or equivalent stage, one has passed non-technical diploma or certificate not equal to degree 2 have passed technical diploma or certificate not equal to degree and 8 have attained graduation or higher level of education.
68
Speaking of femaies. of the 209 females out ot every 1000. 46 have no educational standards. 100 have passed primary stag~. 40 have passed middle school examination, 21 have attained matriculation or equivalent level and hardly 2 have completed graduation and above level.
The following statement illustrates the RuralUrban differentials as pronounced in educational levels in Mysore State.
Proportion of 1000 population by educational levels (1971)
Rural Urban Level of Education
Males Fe- Males Fe-males males
Total
Males Females
1. Illiterate 646 855 396 585 584 791
2. Literate* (Without 55 27 120 107 71 46 educational level) .
3. Primary' 19.9 88 169 137 191 100
4. Middle • 62 23 135 97 80 40
5. Matriculation or 35 7 147 66 63 21 Higher Secondary.
6. Non-technical dip- N N lorna or Certificate not equal to degree.
7. TeChnical diploma or Certificate not equal to degree.
8. Graduate & above'
N N 5 N
2 N 27 6
*lncluc',es educational level not Classifiable.
2 N
8 2
The above figures bring out the gap in between rural and urban areas and the relatively low literacy of females as compared with males. But the higher education appears to have made a fairly good impact among females in urban areas. Among 415 females who are literate in every 1000 in the urban areas. 107 are without any formal education. 137 have passed primary standard, 97 have passed middle school examination, 66 have passed matriculation Or equivalent examination and 6 have attained graduation level.

()9
STATEMENT-i
PROPORTION OF POPULATION IN DIFFERENT EDUCATIONAL I,EVELS TO TOTAL POPULATION IN EACH AGE.GROUP, 1971, MYSORE STATE
TOTAL
Age-Group Persons Total Total Illiterate Literate Prim~ry Middle Matricu- Non-Tech- Techni- Graduate Males Population (without iation or nkd dip- cal andabovl Females educa- Higher loma or diploID:}
tional Secondary certific'lte or cetri-level)* not equal ficate not
to degree equal to degree
2 3 4 5 6 7 8 9 10 11 12
ALL AGES Persons 29,299,014 1,000 685 5~ 146 61 42 1 1 5
Males 14,971,9()0 1,000 584 71 191 80 63 1 2 8
Females 14,327,114 1,000 791 46 100 40 21 N N 2
0-4. Persons 4,221,763 I,LOO 1,000
Males 2,127,449 1,000 1,000
females 2,094,314 I,CO:) 1,000
5-9. Persons 4,357,889 1,000 717 167 116
Males 2,188,635 1,000 670 190 140
Females 2,169,2:54 1,000 763 145 92
10-14. Persons 3,855,042 1,000 496 84 305 108 7
Males 1,935,493 1,000 395 98 367 i31 9
Fem'tles 1,919,549 1,000 598 70 242 84 6
15-19. Person, 2,677,035 1,000 493 35 171 169 129 N 2
Males 1,405,840 1,000 395 38 190 212 ,62 2 N
Females 1,271,195 1,000 601 33 151 121 92 1'1 N 2
20-24. Persons 2,354,366 1,0eO 641 38 161 99 142 2 2 15
Males 1,198,496 1,000 394 47 196 126 210 4 4 19
Females 1,155,870 1,000 693 29 124 70 73 N 10
25-34. Persons 3,951,350 1,000 635 41 162 72 71 3 15
Males 1,926,5:'8 1,000 473 55 223 99 liS 2 6 27
Females 2,024,792 1,000 788 27 103 46 30 N N {j
35+ Persons 7,8'7~.203 1,000 724 41 144 50 32 7
Males 4,187,453 1,000 583 58 218 74 52 2 12
Females 3,690,750 1,000 884 21 61 24 9 N N
Age not stated Persons 3,366 1,000 844 35 57 18 34 N 3 J Males 1,976 1,000 805 31 63 25 56 N 5 15
Females 1,370 l,ouO 900 41 48 7 4
'Includes figures for educational levels not classifiable. N : Negligible. SourCe: C-III Part-A.

56
STATEMENT-2
PRdpaRtlO~ OF P.)pULATION IN DIFFERENT EDUCATIONAL LEVELS TO TOTAL POPULATION IN EACH AGE-GROUP, 1971, MYSORE STATE
RURAL
Proportion per I,veo of Rural Pepu htic n ----------------
Total Literate Matricu- Non-TecL- 1echnical Age-Group Persons Population Total Illiterate (withcut PrimarY Middle lation 01 nical dip- diplcma or Graduate
Males educa- Higher kma cr certificate and Females tional SecondarY certificll.te net equal ab'Jv~
level) not equal tJ Gegree to degree
2 3 4 5 6 7 8 9 10 11 12
All Ages Persons 22,1'16,921 1,000 749 41 144 43 21 N 1 1 Males 1l,2i'l,209 1,000 646 55 199 62 31 1 N 2 Females 10,927,712 1,000 855 27 81 23 7 N N N
0-4. Persons 3,273,590 1,000 I,COO
Male. 1,648,642 1,000 I,COO
I-emalell 1,644,948 I,OCO I,CCO
5-9. Persons 3,357,870 I,ceo 774 94 132 Males 1,683,944 I,OCO /21 116 163 Fe f11'lles 1,673,926 1,000 827 72 101
10-14 Persons 2,947,389 1,000 569 64 278 83 6 Males 1,472,100 1,000 453 78 350 110 9
Females 1,475,289 1,000 684 49 207 57 3
15-19 Persons 1,918,852 i ,OCO 585 31 Ito 128 75 1 N N Males 1,000,863 1,000 475 3'! 208 173 107 2 N 1 Females 917,989 1,000 706 27 1~0 78 39 N N N
20-24 Persons 1,654,814 1,000 641 32 \68 74 71 3 N 4 M'iles 820,207 1,000 485 44 221 107 131 5 I , Females 834,607 1,000 794 21 116 42 25 N
25-34 Persons 2,924,842 1,000 716 33 160 49 36 1 1 4 Males 1,399,101 1,000 551 52 241 78 66 3 2 7 Females 1,525,741 1,000 867 17 85 23 8 N N N
35+ Persons 1,697,254 1,000 'i83 32 139 31 13 N Males 3,222,956 1,000 649 51 222 52 23 1 N 2
Female~ 2,874,298 1,000 934 11 45 8 2 N N N
Age not Persons 2,310 1,000 834 44 61 17 30 N 5 9 stated Males 1,396 1,000 807 36 64 22 50 7 14
Females 914 1,000 876 57 56 11

71
STATEMENT-3
PROPORTION OF POPULATION IN DIFFERENT EDUCATIONAL LEVELS TO TOTAL POPULATION IN EACH AGE-GROUP, 1971, MYSORE STATE
URBAN
Persons Proportion per 1,000 of Urban Population Educational level Males
Females All Ages 0-4 5-9 10-14 15-19 20-24 25-34 35+ ANS
:L. 3 4 5 6 7 8 9 10 II
Total Population Persons 1,000 1,000 1,000 1,000 1,000 1,000 1,000 1,000 1,000 Malfs 1,000 1,000 1,000 1,000 1,000 1,00tl 1,000 1000 1,900 Females 1,000 1,000 1,000 1,000 1,000 1,000 1,000 1,000 1,000
Illiterate Per~cn~ 486 1,000 524 261 259 304 402 521 867 Males 396 1,000 500 210 197 196 265 364 802 Females 585 1,000 549 314 330 430 547 706 947
Literates (With:>ut educa- Persons 114 413 151 47 52 62 70 14 tionallevel) Males 120 436 162 46 52 64 81 17
Females 107 390 139 49 52 60 56 11
PrimarY . Persons 154 63 390 149 144 167 165 47 Males 169 64 419 145 141 176 2{)5 60 F males 137 61 360 153 147 158 119 32
Middle. Persons 117 187 274 156 137 115 19 Males 135 198 309 169 155 145 34 Fenlf1 es 97 175 234 142 Ll) 79
Matriculation or Higher PerSons 108 II 266 296 174 98 43 Secondary Males 147 II 298 381 246 152 69
Females 66 12 229 196 97 34 10
Non-lechllical Diploma Persons N 2 2 or Certificate not Male~ 1'1 2 2 equal to Degree Female~ 1'1 I 2
Technical Diploma or Per~ons 3 1 6 9 3 Certificate not equal Males 5 I II 17 6 to Degree. Females N N 1 N N
Graduate Degree other- Persons 12 4 31 29 16 5 than Technical Degree Males 17 4 35 45 27 9
Females 5 5 26 12 3
PO'lt·Graduate ~gree Persons 2 3 6 4 5 Other than Technical Male~ 3 2 9 6 9 Degree Females I :;I 3 I
Engineering Technology . Persons 1 3 5 2 Males 3 6 10 4 Females N 1'1 N N
Medicine Per,om I I 3 2 Males 2 2 5 3 Females N 1 1 N
Agriculture, . .veterinary Persons N N I N and D'llrylng. Males N I 2 I
Females N 1'1 N N
Teaching Penons I 3 3 Males 2 3 4 Females 1 2 I
Others. Persons 1'1 I N N Males N I 1 I Fern·lIes N " N N N
N: Negligible.

72
C .. II PART A AGE, SEX AND
Age-Group Total Population [[literate Literate (without Educational level) *
Persons Males Females Males Females Males Females
2 3 4 5 6 7 8
MYSORE
All age! 29,l99,014 14,971,900 14,327,114 8,740,537 11,323,350 1,061,989 658,049
0-4 4,221,763 2,127,449 2,09i,314 2,127,449 2,094,314
5-9 4,357,889 2,188,635 2,169,254 1,466,799 1,656,280 415,308 314,202
10-14 3,855,042 1,935,493 1,919,549 764,467 1,148,102 189,968 134,485
15-19 2,677,035 1,405,840 1,271,195 554,967 764,241 53,050 41,736
20-24 2,354,366 1,198,496 1,155,870 472,199 800,826 55,585 33,831
25-34 3,951,350 1,926,558 2,024,792 910,846 1,596,466 106,197 55,309
35+ 73,73,203 4,187,453 3,690,750 2,HZ,219 3,261,869 241,821 78,429
Age not stated. 3,366 1,976 1,390 1,591 1,252 60 57
BANGALORE
All ages 3,365,515 1,762,525 1,602,990 857,843 1,069,838 123,993 100,977
0-4 455,404 230,050 225,354 230,050 225,354
5-9 483,280 241,105 242,175 132,828 153,548 66,804 59,978 10-14 405,526 200,466 205,060 63,160 93,245 16,670 14,129 15-19 334,509 177,141 157,368 52,766 70,233 4,316 3,658 20-24 318,772 170,550 148,222 49,415 74,832 5,721 4,179 25-34 496,744 258,433 238,311 91,116 154,705 9,495 7,277
35+ 870,871 -\8f,56\ 336,310 238,344 29775\ 20,982 11,746
Age not stated 409 219 190 164 170 5 10
BELGAUM
All ages 2,423,342 1,244,815 1,178,527 715,732 962,967 41,713 33,589
0.-4 358,335 182,397 175,938 1!i2,397 175,938
5-9 355,541 178,927 176,614 124,604 139740 16,255 14,659 10-14 319,958 161·,971 154,987 57,723 94,356 7,324 5,708 15- 19 223,700 121,740 101,960 45,049 66,399 2,029 2,883 20-24 194,553 101,138 93,415 37,892 68,439 2,737 2,406 :.1.5-34 320,528 158,675 161,853 70,85" 131,357 4,945 3,474 35+ 650,523 336,845 313,678 196,507 286,666 8,423 4,459
A'f:,e not stated 204 122 82 102 72
BELLARY
All ages 1,122,686 570,804 551,882 369,277 471,409 59,660 30,626
0.-4 160,152 80,400 79,752 80,400 79752
5-9 169,029 85,939 83,090 62,439 68,329 20,939 13,415 10_14 145,133 73,459 71,674 39,252 50,558 10,533 7,449 15-19 97,588 51,164 46,424 26709 34,054 3,346 2,187 20-24 88,550 43,558 44,992 21,530 35,749 :'\,142 1,675 25-34 159,558 77,964 81,594 42,677 69971 6,414 2,624 35+ 302532 l58,258 I .. H,274 96,223 132,920 15,286 3,276
Age not stated 144 62 82 47 77
*Includ.e~ figure) for eJucational levels notclassifiablt'.
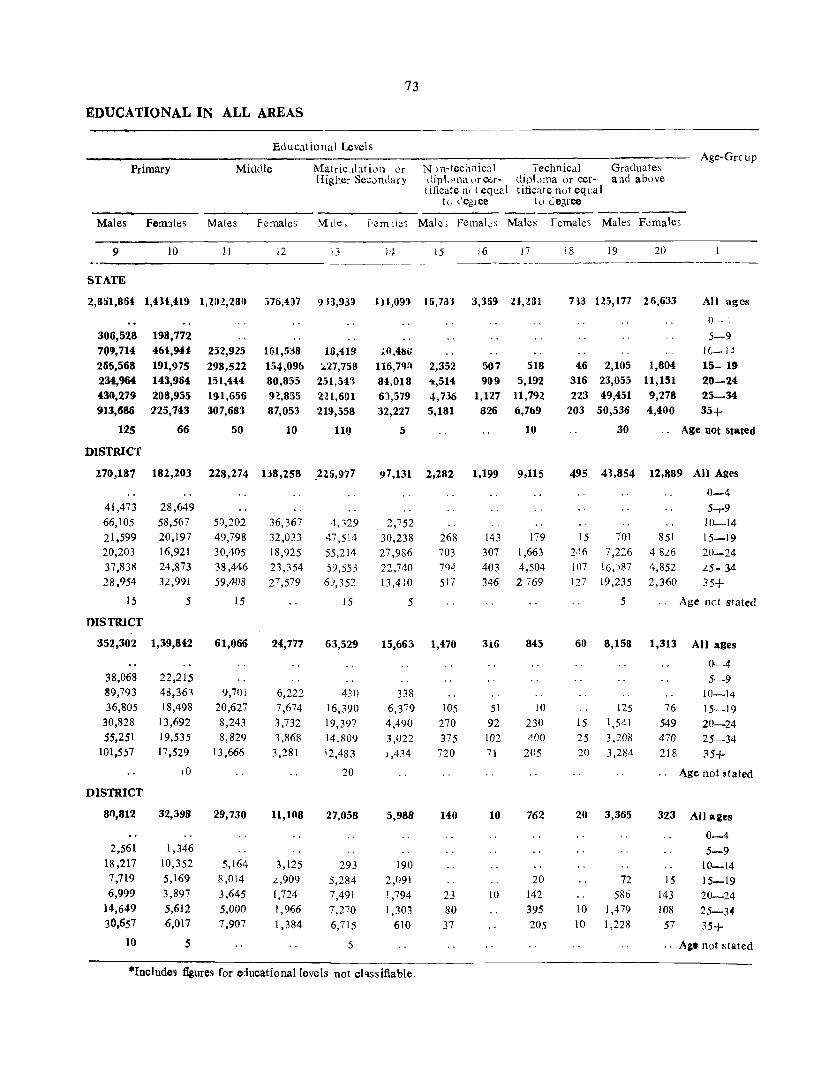
73
EDUCATIONAL IN ALL AREAS
Educational Levels Age-Grcup
Primary Millclle Matric,[lati.Jn or N J ll-techi1ic~1 Technical Graduates Higher Se>:Jndary diplc)lna ur cer- di pLlma or cer- and above
tificate 11( t equal tific'lte nut eqL:al tu l'.egree to (et\ree -----
Males Femlies Mates f~males Mde; h~md.!, Male" FemaLs Males Females Males Females
9 10 11 12 13 14 15 16 17 i8 19 20 -------------
STATE
2,8:;1,8S1 1,4H,419 1,2tH,280 376,41)7 9H,9]!) 3)l,09!) IS,733 3,369 24,231 713 125,177 26,633 All ages
0- !
306,528 198,772 5-9 709,714 461,941 252,925 161,538 18,419 ;O,4tsiJ le-, Ie!
266,568 191,975 298,522 154,09& '-27,758 116,71)1\ 2,352 507 518 46 2,105 1,804 15- 19 234,964 143,964 151,444 80,855 251,543 84,018 'i,514 909 5,192 316 23,055 11,151 20-24 {3(1,279 208,955 191,656 92,855 221,6()1 61,579 4,736 1,127 11,792 223 49,451 9,278 25-34 913,686 125,743 307,683 87,053 219,558 32,227 5,181 826 6,769 203 50,536 4,400 35+
125 66 50 10 110 5 10 30 .. Age not stated
DISTRICT
270,187 182,203 228,274 138,258 .225,977 97,131 2,282 1,199 9,115 495 43,854 12,889 All Ages
0-4 41,473 28,649 5-r9 66,105 58,567 50,202 36,367 4,.129 2,752 10-14 21,599 20,197 49,798 32,033 47,514 30,238 268 143 179 15 701 851 15-19 20,203 16,921 30,405 18,925 55,214 27,986 703 307 1,663 246 7,226 48L6 20-24 37,838 24,873 38,446 21,354 59,553 22,740 7<)4 403 4,504 107 16,')87 4,852 L5- 34 28,954 32,991 59,408 27,579 6'),352 13,410 517 346 2769 127 19,235 2,360 35+
1.5 5 15 15 5 5 .. Age not stated
DISTRiCT
352,302 1,39,842 61,066 24,777 63,529 15,663 1,470 3i6 845 60 8,158 1,313 All ages
0-4 38,068 22,215 5-9 89,793 41l,361 9,701 6,222 430 338 10-14 36,805 18,498 20,627 7,674 16,390 6,379 lOS 51 10 125 76 15-19
30,828 13,692 8,243 3,732 19,397 4,490 270 92 230 15 1,541 549 20-24 55,251 19,535 8,829 1,868 14.809 3,022 375 102 ~OO 25 3,20B 470 25-34
101,557 17,529 13,666 3,281 12,483 1,434 720 71 205 20 3,284 218 35+ [0 20 " Age not stated
DISTRICT
81),812 32,398 29,730 11,108 27,058 5,988 140 10 762 20 3,365 323 All alles
0-4 2,561 1,346 5-9
18,217 10,352 5,164 3,125 293 190 10-14 7,719 5,169 8,014 ,::,909 5,284 2,091 20 72 15 15-19 6,999 3,897 3,645 1,724 7,491 1,794 23 10 142 586 143 20-24
14,649 5,612 5,000 1,966 7,270 1,303 80 395 10 1,479 108 25-34 30,657 6,017 7,907 1,384 6,7 15 610 37 205 10 1,228 57 35+
10 5 5 .. A,. not stated
*Includes figures for educational levels not chssifiable.

74
C.III PART A AGE, SEX AND
Literate Age-Group Total Pvpulation Ilti terate (Withcut
Educational evel)
Persons M:tles Females Males Females Males Females
2 3 4 4 6 7 8
DIDAR
All ages 8Z4,059 419,812 404,247 289,973 369,116 43,731 1 ,814
0-4 135,713 67,990 67,723 67,990 67,723
5-9 i21,394 62,334 62,060 48,354 56,014 12,664 5,308 10-14 98,901 52,044 46,857 23,983 36,099 10,361 4252
15-1.9 62,260 31,966 30,294 13,958 23,638 1,974 1,446
20-24 64,057 30,628 33,429 15,669 29,014 2,449 915
25-34 115,928 57,082 58,846 33,863 54,357 5,215 1,058
35+ 222,794 117,766 105,028 86,154 102,261 11,068 835
Age not stated 12 2 10 2 10
BUAPUR
All ages 1,985,591 1,005,567 980,024 599,974 839,884 32,893 20,244
0-4 297,964 150,t;P5 147,959 150,C05 147,959
5-9 292,852 148,388 144,464 101,750 117,614 12,357 9,415
10-14 264,450 136,068 128,382 55,3fO 89,175 5,383 3,829
15-19 172,590 91,762 80,828 38,724 58,154 2,063 1,123
20-24 153,2.99 76,736 76,563 33,i72 61,921 1,898 1,291
25-34 265,201 127,964 137,237 63,838 118,261 3,593 1,906
35+ 539,0:6 274,518 264,508 157,034 246,632 7,599 2,680
Age not stated 209 126 83 71 68
CHIKMA&ALUR
All ages 736,M7 380,297 356,350 213,407 265,935 45,506 29,801
0-4 104,170 51,845 52,325 51,845 52,325
5-9 114,865 56,519 58,346 37,1:L9 43,(;,24 16,572 13,820
10-14 103,967 52,513 51,454 18,687 25,884 9,049 6,826
15-19 68,471 35,089 33,382 12,312 17,064 2,477 1,860
20-24 56,911 29,349 27,562 10,545 17,444 2,143 1,602
25-34 97,628 47,410 50,218 21,034 37,630 4,236 2,570
35+ 190,520 107,497 83,023 61,790 72,524 11,029 3,123
Age not stated 115 75 40 65 40
CHITRADURGA DISTRICT
All ages 1,397,456 720,642 &76,1114 417,962 540,018 34,572 30,113
0-4 196,976 99,300 97,676 99,300 97,676
5-9 220,283 110,106 110,177 73,131 87.190 14,076 121350 10-14 187,456 92,461 94,995 37,756 58,854 4,944 6,483
15-19 125,02:2 66,544 58,478 26,169 33,143 1,645 2,514
20-24 .ll~,944 57,626 53,318 22,327 37,962 1,737 1,980
25-34 . 184,153 91,035 93,118 41,897 74,543 3,666 3,105
35+ 372,300 203,374 168,926 117,231 150,545 8,504 3,5/1
Age not stated 322 196 126 151 105

75
EDUCATION IN ALL AREAS
Educational Levels ----Primary Middle Ma'ric'_dation N.Jn-Technical Technical dip- Graduates Age-Group
:-or Higher diploma or certifi- loma Qr certifi- and above Secondary cate not t:qual care not equal
Co degree to degree
M1I~3 F~ nale~ Males F~:nales Male; Fe:nales Males Ff'm'-ll,s Males Females Male~ Females
9 10 11 lL 13 14 15 l6 17 18 19 20
DISTRICT
43,966 12,759 25,761 6,203 14,614 2,132 50 16 342 1,375 207 All ages
0-4 1,316 738 5-9
14.180 4,923 3,470 1,487 50 96 10-14 4,790 2,306 8,314 2,078 2,907 804 5 18 22 15-19 3,018 1,72u 4,153 1,077 5,128 597 35 176 106 20-24 7,174 1,838 5,288 1,049 4,461 480 35 11 267 779 53 25-34
13,488 1,234 4,536 512 2,068 155 15 5 35 402 26 35+
.. Age not stated
l)JSTRICT
280,141 96,827 39,823 13,425 46,342 9,149 668 50 596 5 5,130 440 All ages
0-4 34,281 17,435 5-9 67,065 30,958 7.803 4,113 437 307 10-14
24,054 12,577 14,102 4,008 12,727 4,925 26 10 15 51 31 15-19
21,913 9,453 4,167 1,758 14,484 1,922 84 10 136 5 882 203 20-24
43,454 13,418 4,976 2,015 9,607 1,388 192 30 276 2,028 119 25-34
89,354 12,971 8,770 1,531 9,062 607 366 169 2,164 87 35+
20 15 5 25 5 .. Age not stated
DISTRICT
63,577 36,391 34,9tl 17,145 20,558 6,887 162 342 1,804 191 All ages
0-4
2,818 1,502 5-9
16,995 13,638 7,296 4,876 486 230 10-14
6,611 6,383 8,524 5,168 5,111 2,902 10 44 5 15-19
6,176 4,377 4,851 2,368 5,171 1,685 20 54 389 86 20-24
10,507 5,696 5,544 2,674 "5,042 1,563 59 193 795 85 25-34
20,470 4,795 8,716 2,059 4,748 507 83 85 576 15 35+
10 Age not ~tated
DISTRICT
135,167 66,267 76,260 29,761 50,904 10,092 1,406 127 788 10 3,583 426 All ages
0_4
22,899 10,637 5-9
29,924 19,134 17,799 9,610 2,038 915 10-14
10,107 10,622 14,569 7,355 13,660 4,704 338 64 56 66 15-19
9,645 6,663 8,979 4,230 13,697 2,287 523 26 192 526 170 20-24
18,544 8,872 14,032 4,790 10,653 1,542 250 26 358 5 1,635 135 25-34
44,028 10,318 20,871 3,776 10,841 645 295 11 238 5 1,366 55 35+
20 21 10 15 .. Age not stated
8-1 Census Karnataka/78

76
C-1I1 PART A AGE, SEX AND
Literate
Age-Group Total Population Illiterate (Without
Educational levII)
Persons Males Females Males Females Males Females
2 3 4 5 6 7 8
COORG
All ages 371,291 191,109 110,112 98,613 112,18' 25,824 17,610
• 0- 4 50,442 25,44u 25,002 25,440 25,002
5- 9 53,187 26,969 26,218 16,442 16,940 9,165 7,915
10-14 50,673 25,774 24,89P 8,321 1,},786 4,271 3,nO
15-19 39,651 19,8'\5 19,816 5,531 6,967 1,387 I,C62
20-24 33,080 16,952 16,128 5,024 7,218 1,754 977
25-34 50,795 25,547 25,248 9,507 14,992 2,875 1,702
35+ 100,394 57,550 42,8~4 28,321 31,159 6,372 2,72
Age noht_ted 69 42 27 27 22 5
DHARWAR
All ages 2,342,213 1,203,594 1,138,619 516,431 '53,679 58,64!J 43,994
0- 4 343,100 173,661 169,439 173,661 169,439
5-9 342,441 172,406 170,035 110,170 122,797 21,513 19,62.7
10-14 330,190 168,244 161,946 53,692 83,954 10.824 8,766
15-19 220,044 118,663 101,381 38,060 57,945 3,311 2,622
20-74 195,155 103,691 91,464 30,941 60,042 3,755 2,439
25-34 304,365 151,530 152,835 49,526 111,560 6,257 4,391
35+ 606,719 315,287 291,432 130,309 247,855 12,979 6,149
Age not stated 199 112 87 72 87 10
GULBARGA
All ages 1,739,221"1 878,142 861,078 625,943 787,302 80,202 29,082
0- 4 277,108 140,176 136,932 140,176 136,932
5- 9 259,029 129,614 129,415 102,675 116,243 24,743 11,872
10-14 201,433 105,881 95,552 55,584 75,283 17,747 7,740
15-19 134,428 68,301 66,127 34,227 53,153 4,495 2,583
20-24 132,638 62,895 69,743 33,747 60,675 4,222 2,214
25-34 254,081 122,537 131,544 77,606 120,566 9,667 2,645
35+ 480,373 248,672 231,701 181,872 224,396 19,328 2,OJ8
Age not stated 130 66 64 56 54 10
HASSAN
All Ages 1,102,370 558,456 543,914 328,913 436,536 62,193 35,129
0-4 159,492 79,503 79,989 79,503 79,989
5-9 162,797 81,397 81,400 53,672 61,345 24,945 17,754
10-14 157,292 77,682 79,610 32,723 48,781 11,6.69 8,442
15-19 106,197 54,860 51,337 23,15 1 31,686 2,969 2,405
20-24 82,761 41,998 40,763 17,205 29,235 3,040 1,586
25-34 140,723 65,834 74,889 31,915 61,586 5,698 2,379
3.5+ 293,011 157,134 135,877 90,701 123,875 14,072 2,553
Age not stated 97 48 49 43 39 10

77
EDUCATION IN ALL AREAS
Educational Levels
Primary Middle M'itriculation or Non-Technical Age-Group
Technical dip- Gndu«tes Higher Seconaary diploma or lorna or certi- and above
certificate not ficate not equal equal to degree to degree
Males Females Males Females Males Females Males FemaleS Males Females Males Females
9 10 11 12 13 14 15 16 17 18 19 20
DISTRICT
35,912 25,561 20,441 15,557 14,648 8,888 20 5 155 1,496 475 All ages
0-4 1,362 1,363 5-9 9,766 8,306 2,735 3,483 681 104 10-14 4,197 3,303 5,139 4,983 3,532 3,491 49 10 15-19 3,496 2,421 2,955 2,453 3,406 2,794 25 292 265 20--24 5,348 3,956 3,734 2,606 3,403 1,827 5 50 630 160 25-34
12,738 6,212 5,878 2,032 3,616 672 20 80 525 40 35+
5 10 " Age not Itat<!d
DISTRICT
408,015 192,368 67,937 28,694 67,404 17,367 1,908 583 1,406 55 11,874 1,879 All ages
0-4 40,723 27,611 5-9 91,664 60,923 11,476 7,876 588 427 10-14
38,851 25,054 21,274 8,096 16,963 7,436 75 25 20 10 109 193 15-19 36,849 19,308 8,852 ),794 19,909 4,785 174 137 329 10 2,882 949 20-24 65,572 28,319 9,951 4,776 14,081 3,033 714 228 658 30 4,771 498 25-34
13~,336 31,153 16,354 4,152 15,853 1,686 945 193 399 5 4,112 239 35+
20 10 ' , Age not stated
DISTRICT
84,879 26,436 51,112 12,651 31,051 5,043 240 821 5 3,894 559 All ages
0-4
2,196 1,300 5-9
23,703 9,252 8,571 3,134 276 143 10-14
8,919 4,296 14,503 4,131 6,097 1,933 25 35 31 15-19
6,499 3,175 7,917 2,196 9,614 1 ,314 45 236 5 615 164 20-24
14,554 4,777 9,340 2,102 8,980 1,218 75 440 1,875 236 25-34
29,008 3,636 10,781 1,088 6,084 435 120 110 1,369 128 35+
10 " Age not stated
DISTRICT
15,767 41,38!J 49,fit7 21,886 28,715 a,fit7 201 527 2,553 327 All A~es
0-4
2,780 2,30.1 5-9
2j,871 15,618 8,953 6,397 566 372 10-14
9,071 7,341 12,544 5,997 7,075 3,861 5 5 40 47 15-19
7,721 4,528 6,485 2,991 6,979 2,277 25 129 414 146 20-24
12,412 6,118 8,022 3,297 6,557 1,411 30 239 J ,061 118 25-34
2',852 5,483 13,638 3,204 7,538 726 141 154 I,03g 36 35+
5 " Age not stated

78
C.III PART A AGE, SEX AND
Literate (Without
Educational Age-Group Total POPulation Illi terate level)
persons Males Females Males Females Males Females
2 3 4 5 6 7 8
KOLAR
AU Ages 1,516,646 773,293 743,353 49D.46~ 615,846 25,862 17,71~
0-4 205,834 101,186 104,648 101,186 104,648 5-9 234,284 118,491 115,793 79,744 92,032 12,477 9,749 10_14 186,958 93,238 93,720 41,064 60,281 3,573 2,706
15-19 127,125 68,401 58,724 29,080 37,145 868 742
20-24 115,621 57,767 57,854 26,246 44,177 . 1,081 677
25-34 207,896 97,119 110,777 54,659 93,637 2,243 1,491
35+ 438,784 237,020 . 201,764 158,439 183,853 5,620 2,354
Age not stated 144 71 73 51 73
MANDYA
All Ages 1,154,374 588,914 565,460 402,875 491,632 47,88& 24,109
0-4 167,621 84,852 82,769 84,852 82,769
5-9 177,758 89,020 88,738 63,544 72,032 22,152 14,344
10-14 153,329 75,160 78,169 37,918 56,025 7,621 5,033
15-19 104,175 56,827 47,348 30,746 35,455 1,949 1,119
20-24 84,799 42,559 42,240 23,063 34,711 1,793 750
25-34 145,996 66,746 79,250 41,000 70,499 3,518 1,335
351- 320,600 173,689 146,911 121,706 140,106 10,848 1,528
Age not stated 96 61 35 46 35 5
MYSORE
All Ages 2,077,238 1,069,904 1,007,334 715,108 829,911 84,488 49,317
- 0-4 285,559 142,611 142,948 142,611 142,948
5-9 302,616 148,437 154,179 107,920 123,(1(18 34,825 26,726
10-14 262,164 133,525 128,639 71,541 87,280 13,760 9,363
15-19 204,508 109,701 94,807 59,394 64,476 4,523 2,9E6
20-24 169,122 87,302 81,820 45,806 61,522 4,226 1,780
25-34 281,189 136,517 144,672 80,082 119,171 8,257 3,421
35+ 571,918 311 ,709 260,209 207,652 231,446 18,897 5,031
Age net ,tated 162 102 60 102 60
NORm KANARA
All Ages 849,105 433,946 415,159 218,738 285,219 15,030 12,224
0-4 119,764 60,746 )9,018 60,746 59,018
5-9 127,915 62,482 65,433 40,100 46,663 5,515 5,350
10-14 116,606 59,652 56,954 16,011 23,~76 2,686 2,197
15-19 82,981 43,269 39,712 12,127 16,593 656 589
20- 24 67,374 34,504 32,870 10,031 16,979 920 638
25-34 109,954 54,112 55,842 19,924 36,075 1,639 1,563
35+ . 224;470 119,165 105,305 59,783 85,990 3,614 1,887
Age not stated 41 16 25 16 25

79
:eDt) CATION IN ALL AREAS
Educational Levels
primary Middle Matriculation or Non-Technical Technical dip- Graduates Age-Group Higher Secondary diploma or lomaorcerti- and above
certificate not ficate not equal equal to degree to degree
M1I~s P:mlles Males F~males Males Females Males Females Males Females Males Females
9 10 11 12 13 14 IS 16 17 18 19 2(!
DISTRICT
133,228 64,292 69,935 30,754 47,513 13,963 1,535 220 1,286 15 3,465 544 All Ages
0-4 26,270 14,012 5-9 29,008 2~\~!)4 17,353 9,159 2,240 1,070 10-14 10,801 6,396 14,893 8,374 12,178 5,936 492 . 92 15 74 39 15-19 8,369 4,859 8,249 4,186 12,468 3,581 492 92 211 10 651 272 20-24
16,821 8,444 10,684 4,677 10,361 2,309 336 36 749 5 1,266 178 25-34 41,959 10,077 18,756 4,358 10,256 1,067 215 311 1,464 55 35+
10 10 M Age not stated
DISTRICT
65,671 28,060 41,343 15,794 28,266 5,666 145 22 554 2,174 177 Ail Ages
0-4 3,324 2,362 5-9
20,668 11,82 1 8,143 4,944 810 346 10-14 6,308 4,080 10,190 4,306 7,589 2,361 II 45 16 15-19 4,859 2,834 5,110 2,349 7,257 1,5/30 20 90 367 66 20-24 8,520 3,820 6,468 2,418 6,100 1,097 50 II 237 853 70 25-34
21,982 3,143 11,432 1,777 6,510 332 75 227 909 25 35+
10 .. Age not stated
DISTRICT
117,299 61,312 73,470 38,987 67,133 24,909 248 30 1,516 10 10,642 2,858 All Ages
0-4 5,692 4,435 5-9
32,481 21,680 14,892 9,551 851 765 10-14 11,154 8,531 17,456 9,322 16,828 9,323 25 34 287 169 15-19 9,573 6,007 8,173 4,927 17,217 6,329 64 10 272 10 1,971 1,235 20-24
17,787 9,312 11,779 6,762 14,462 4,956 85 5 622 3,443 1,045 25-34 41',612 11,347 21,170 8,425 17,775 3,536 74 15 588 4,941 409 35+
.. Age not stated
DISTRICT
142,863 90,209 29,371 16,972 23,759 9,945 440 82 492 25 3,253 483 All Ages
0-4 16,867 13,420 5-9 35,185 26,764 5,571 4,001 199 I16 10-14 14,215 11,271 9,566 6,608 6,640 4,592 5 35 10 30 44 15-19 12,363 9,430 3,751 2,429 6,533 3,093 69 10 71 5 766 286 20-24 21,258 14,342 4,117 2,257 5,459 1,465 99 41 231 10 1,385 89 25-34 42,975 14,982 6,366 1,677 4,928 679 272 26 155 1,072 64 35+
.. Age not stated
-.--~

80
C.III PART A AGE, SEX AND
Literate Age-Group Total Population Iiliterate (Without
Educational level)
Persons Males Females Males Females Males Females
2 3 4 5 6 7 I
RAlCHUR
All Aaes 1,415,740 714,750 700,990 494,056 635,675 81,261 25,~1
0-4 216,021 109,294 106,727 109,294 106,727 5-9 194,548 108,408 86,140 82,998 73,520 23,388 9,465
10-14 193,981 89,675 104,306 49,497 86,857 15,105 7,017 15-19 112,742 57,636 55,106 31,171 45,109 5,206 2,240 20-24 107,016 51,346 55,670 27,449 47,698 5,508 2,044 25-34 206,202 99,940 106,262 60,182 96,544 11 ,349 2,652 35+ 385,073 198,370 186,703 133,394 179,144 20,712 2,520
Age not stated 157 81 76 71 76
SHIMOGA
All Ages 1,301,485 673,976 627,509 366,347 458,671 24,3111 1',3"
0-4 192,900 98,527 94,373 98,527 94,373 5-9 208,740 101,436 107,304 65,323 75,711 11,735 10,072
10-14 188,608 94,049 94,559 31,867 46,866 3,719 3,186 15-19 125,198 66,319 58,879 22,714 30,305 1,007 9~9
20-24 100,767 51,894 48,873 16,181 29,976 1,128 967 25-34 168,314 83,081 85,233 34,016 62,542 1,953 1,734 35+ 316,525 178,315 138,210 97,374 118,840 4,759 2,433
Age not stated 433 355 78 345 58
SOUTH KANARA
All Alles 1,939,315 942,495 996,820 449,216 647,505 149,106 111,082
0-4 274,996 140,603 134,393 140,603 134,393 5-9 286,546 145,370 141,176 84,975 92,443 56,956 ~5,513
10-14 272,904 134,746 138,158 28,566 53,916 31,182 26,321 15-19 192,698 88,533 104,165 19,626 41,454 7,857 8,071 20-24 155,991 74,651 81,340 18,630 38,985 7,011 4,981 25-34 227,777 102,910 124,867 33,607 74,607 11 ,758 8,605 35+ 528,279 255,620 272,659 123,147 2Il ,645 33,342 17,504
Age not stated 124 62 62 62 62
TUMKUR
All Aies 1,627,721 831,859 795,862 499,660 650,121 25,112 13,3'5
0-4 220,212 108,863 111,349 708,863 III ,349 5-9 247,784 121,287 12~,497 79,001 98,087 8,227 6,860
10-14 215,513 105,885 109,628 41,742 67,026 2,647 1,818 15-19 143,148 18,089 65,059 32,853 41,269 972 680 20-24 122,956 63,352 59,604 27,326 44,247 1,320 730 25-34 214,318 102,122 112,196 53,539 9.3,763 3,519 1,227 35+ 463,491 252,103 211,388 156,238 194,261 8,387 2,028 Ago not stated 299 158 141 98 119 40 22
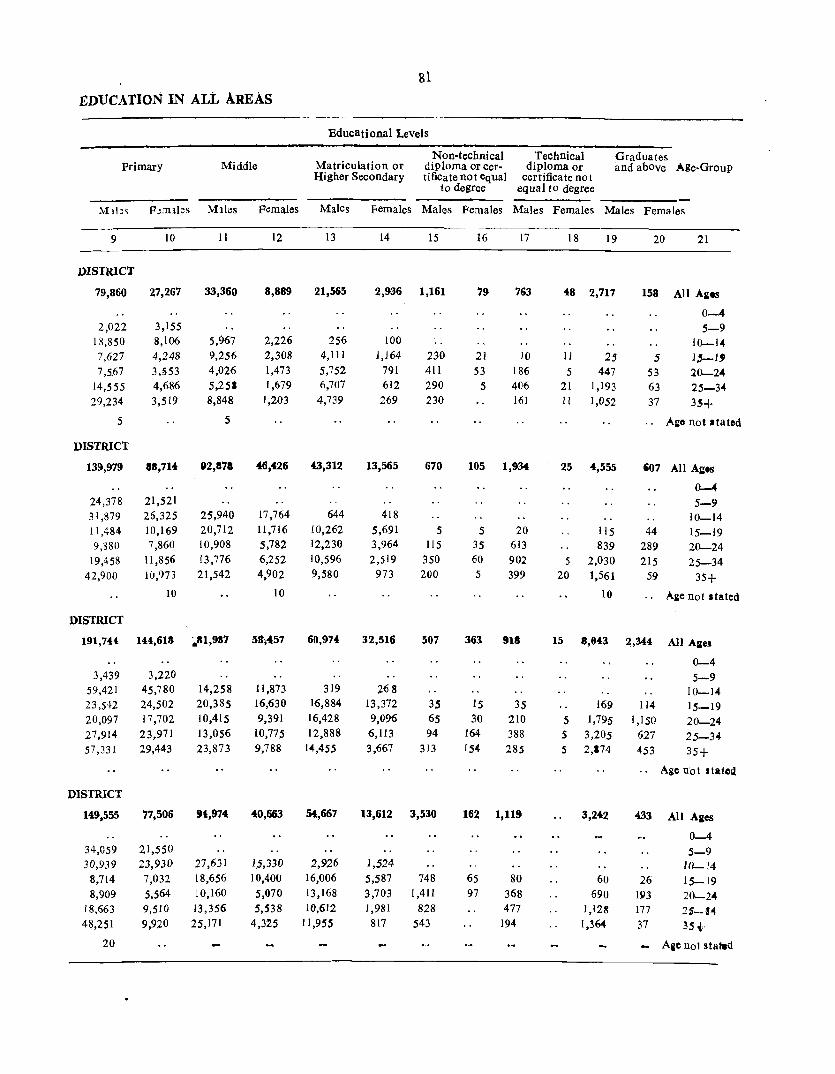
81
£DUCATION IN ALL AREAS
Educational Levels
Non-technical Technical Graduates Primary Middle Matriculation or diploma or cer- diploma or and above Age-Group
Higher Secondary tificate not equal certificate not to degree equal to degree
Mlb~ FJ::nlbs Mlles Females Males Females Males Pemales Males Females Males Females
9 10 11 12 13 14 15 16 17 18 19 20 21
DISTRICT
79,860 27,267 33,360 8,889 21,565 2,936 1,161 79 763 48 2,717 158 All Ai'S
0_4 2,022 3,155 5-9
18,850 8,106 5,967 2,226 256 100 10-14 7,627 4,248 9,256 2,308 4,]]] ],]64 230 21 10 11 25 5 1'-1' 7,5.67 3,S53 4,026 1,473 5,752 791 411 53 186 5 447 53 20-24
14,555 4,686 5,251 1,679 6,707 612 ,290 .5 406 ,21 1,193 63 25-34 29,234 3,519 8,848 1,203 4,739 269 230 161 11 1,052 37 35+
5 5 " Aile not .rated
DISTRICT
139,979 11,714 82,17. 46,426 43,312 13,565 670 105 1,934 25 4,555 i07 All Ai'S
0-4 24,378 21,521 5-9 31,879 26,325 25,940 17,764 644 418 10-14 11,484 10,169 20,712 11,716 10,262 5,691 5 5 20 115 44 15-19 9,880 7,860 10,908 5,782 12,230 3,964 115 35 613 839 289 20-24
19,458 11,856 13,776 6,252 10,596 2,519 350 60 902 5 2,030 215 25-34 42,900 10,973 21,542 4,902 9,580 973 200 5 399 20 1,561 59 35+
10 10 10 " Aile not atated
DISTRICT
191,744 Hi,6IS ;"111,9117 51J,.t:57 60,974 32,516 507 363 918 15 8,843 2,344 AIl Aies
0-4 3,439 3,220 5-9
59,421 45,780 14,258 11,873 319 268 10-14 23,542 24,502 20,3 85 16,630 16,884 13,372 35 15 35 169 114 15-19 20,097 17,702 10,415 9,391 16,428 9,096 65 30 210 5 1,795 1,150 20-24 27,914 23,971 13,056 10,775 12,888 6,113 94 164 388 .5 3,205 627 25-34 57,331 29,443 23,873 9,788 14,455 3,667 313 154 285 5 2,174 453 35+
.. Age not statclil
DISTRICT
149,555 77,506 '1:,974 40,663 54:,667 13,612 3,530 162 1,119 3,242 433 All Aies
0-4 34,059 21,550 5-9 30,939 23,930 27,631 15,330 2,926 1,524 10-14
8,714 7,032 18,656 10,400 16,006 5,587 748 65 80 60 26 15-19 8,909 5,564 10,160 5,070 13,168 3,703 1,411 97 368 690 193 20-24
18,663 9,510 13,356 5,.538 10,612 1,981 828 477 1,12S 177 2$-34 48,251 9,920 25,171 4,325 11,955 817 543 194 1,36.( 37 3H
20 Aile not stat.d

o
0\
00
-;::; 'I)
82
C'I c::) C'I
N -.j< ...
M"i"<'1'-O (~ '"",( l-'" Cq
(.~ ('<""j 0)
J...; _ •• fA ~j l - V)
''-l '~ ""- \(, ~-
[-:_ f-:, '.J" v.:..
0\ N I.tl "'-J.
'" 'D ~ .... -7 NO
""" I.t) (j l ~ N ('!.
UO\f'-oo l-' V) V ("-1 '-J' 0\ 0 ("')
MMr--
~~~~r-"'1"" (~ I{") r- N M ("'l I.C)"" r-" 0\0\('1'")0..
0\0<'100('.1\07 If) 00 ~. \0 tn 00
0000 qv;,r--",<"l ~N['.('rjOO~
~01O-~~!2
c::) N N
00 ('i')M_f'. 0070_-..:::1"("1') rqC,)o\0lr--M
N M f"j"" v) r-:
'0 c

I] 10:1 I~ IP-< I Vl
I~ \~ I~ I";; I~ Ill-I'" I~ I~
1.1l
I~
o C')
N N
o N
00
<D ... ...
... e'l ...
Ie
~~ .... ....
o :?l~ .... ...
o III III ..,. ....
83
o ....
"'" .... It')
l"CC)
0\\0\0 \D r~ "i" ("t")0'("fj
....: ("'4 N
OOO("r)O\V) I,£)\DOr-.... 1.0 4') 0 \0
..;: 0 .
i 0\, ..,. 0\, ;.% ~ ov.Jv.JJ
NN
o ....
<D 0::> ... ... ... III
III ...
0::> l"N
<.c .... ...
... "'" CC)
01/)
000 \0 I/) 1.0

o
00
.... ,'<t
'" I ~O ~ -~
('-I'," 0 00
10(')00 .&rl\,O \0 \0 '-'\ \0 r--. (~NV...,("I")r-...
~
I.OO"''3"O\'<t ~g~~~~
N
Ntr)\CI.Ot-lf) 00 ~Mr--O\ {~ ~ N ("r) -.::t N
M
\OO\~('f)~O <'l'<t'<tOO <"iqoo~
('f') .... N M V)
;;:OO~~M~:;O 0'1 0 rrJ
00 \Cl .,) I.() 00 M
<o::t "d" 0 ~ ~ ('I") t""J _ ~ ~ r-.... N ('f")
(:J\(".lMI.()t()
0-," ........ l..O" v1 00 v)
'<t-'<tN 000r,",",[,-00
o \(). 00 _ .... ('1
• ....
.... I/') <.e ..... ....
6
r----f""'lI""""l['.CNOO_M~ ",O"':>O<r)
'<to
0(11)
'" o . r-

'"' N
on N
.-N
o N
00
= ...
N ... N
... = N
,",0 r- on
ono
= ...
~ ...
~ ...
= ...
... C'l N
-<
o
oon
'0 <l)
~
'" +'0 on <:: M <l)
"" ~
co ...
In ...
co ..... N
Q'I CO C'l
o on
~O\~
~ ill I 'I CI) 0"'0,,",0 ~ N
<

,
e o
It')
00
tnaoCO("'r)t-7MMt-00. 0'1. 0. N. -"""NN
O~ 'l)
~~~~~~ M
86
o ...
co ... N
ei' ...
'T<at-">c<) V ('oj 00 r---. ('r~ N 00. v;_ 0. 'T
N
~8°~~tr) r--. r--. 7, N, 'T1O'Tv>
Nv>r--,,>IO ("I')Otr) r--r- N t--.... 00 ... N M - N'
OONO\MIJ'i (---l()("<'1O\\O ("'f) ~ \0 ~ f'I'1
~v)N"'Mv)
~~8(O~g N, 10 v> 0'1 'T, "<t_
o,.c) N"'-'" M M
otnNOlrl ..q-OOOOOV'lO MOOt-", M f--. .. 00 ....
OONNMr-E-< U
~ is ~ o o u
o ...
o N CO e<')'
V>C<)7c<)N
~~,~$,~O • -d!;~~~~!j"" NOO .. \Or--.. M
- N

87
l~ \ ,~ ('II It) .,.. "',
",'" iJ.,;8
'" I] '" ~
'" 0 .... .,.. .,.. Ir) '" .,.. .... It) 1;1) I;E '" ..... '" '0 ill ';; I ~ I <!) 0 Q 0 0 0 .,.. 0 If\ .,.. ~ Ill- If\ '0
I: ! 0") N
c, oj 00l .... ~
~ _-C 0
0 "' 0- Q .,.. ,,-, <r1 r- <') '" '" .,.. If") Il.l '" ~ E-< I;E ," r-- ,J 'T <D 0 ", '" 7 'T .... N
° <!) V> <!) '0 <!)
~ .... 1;1) ~I': ""@ oc - <!) ~ojOOl E c'l J::: '0 -;.,1': <:l <!)
\.) ° a~'~ iJ.,;
I ~ ·'i:.e.; V>
'" :1 ~ OOl';jO
I~ <.0 0 '" 0' <~ r- Q 0 <D 0 .,.. '" ? ''l N N N N ...
'" Z oj
0 8 en
° 'J
rJ:J :e <lJ -; 0 0 ~ 8 '" '" on Q '" If") -< '0 '0 '"
''l N ~ .... '.(j iJ.,; ~ ° <!)
-< ~ vo
'" I.E <!)
"' .,..
Q '" <r) N N If\ .,.. .,.. .,.. ~
.. .... ~ N N '" '" 0- N '" '" ~ ... o!' o!'
'" N ;> '0 I:Q .. '0 V>
~ ~ ~ ~ <!)
E-< ~ oj;., -; E-< ;;J ";; 8 7 t.) <r1 ,9 ooOQ N .... t.) '" ~
I'< ° '" ~ .... Z .9 ~ iJ.,; r:.: E-<
'" '-0 E-< ~ 'OJ ..... [l~ rJJ E-< t.)
° "'~ V> .... rJJ ..... Z 0 " ~o .... ~ ::I ~ OJ Cl <r) Ir) <.0 r- '" Q 0 0 0 .- '" ~ M
Q Cl <D 7 N 7 E-< '" N '0 ~E-< 0") M ~ ~
N ~ ... rJJ ~ ~ ;::l < 0") ....
~ \ ~
C!) Cl < It C!) U
;:; '" '" C!) 0 ~ ;;J '" Cl OJ"", -; < Q 0 on 0 0 If\ .,.. 0 Q .... ~ .... N < If\ N N
" .... l!4I E N ~ ... 0") 0 ~ ::1 .... 0) ~ iii! ~ :; '0",'0 E-<
~ ~=~ - ~ :r ~'OO
V> t.) t.)
-< I~e] 0)
Q .,.. 0 <r) ... V"1 '" '" Q 0 .,.. V; -; 0") '" r- OO 7 CCl N 7
~ ~ 111)0
~ N ... o!'
"'OJ 0")
~ '0 .... rJ:J
~ o . .! '" ~r:: '" -; '" V'l <r1 0 <r) If") 7 V'l C e<'l 0 N 0 I;I)~ '" 8
0 Q 7 '" o!' " M 00 7 CCl 0- <.0 N -< ",0 <!) N ... ... ... '0 OJ .... 0) e<'l
~I;I) iJ.,; I:Q <!) =: 0)
... ,,'0
~ ~=~ '" "0 .... 0 '" e<'l l(') 0 0- 0- • <.0 V'l I- .... CCl 0 V; 7 0-"0 ""@ 0- on 00 0 '" . '" \0 N I- ... N N N 7
-< ... ~ <D (" '" '" N <.0 '" '" rJ 0- ~ r-- o!'.
~ ° ..... JooC ~ " V> JooC a- Il.l Il.l
U 0°0) -; V'l Ir) -~ .... S 00 Q
'~2~ '" ...
'0 oj '0 iJ.,;
-;¥O u· _ _. .-.~ V> ~~"; '" If\ on V'l N If\ on 0 ~O~ -; on 0- 00 0 I- Q N 0- 00 '" N '" If") Q N r-0 .... 0' ~ N ... N ... ~O<!) '"
'0 '0 "0 (!) '" Po '" ';; 7d ::I
77 Cis ..., 7 7 ';;', ° 7 0- .... 7 0- 7 7 0\ 7 ....
"'7 "I "I N '" <./J
"I "I 'I '" - .... 'I '" -0 0 0- I I + '0 "'7 0- I +'0 "'7 0- I I I + , ~ I I 0 I/) 01/) I/) .:: ~I I 0 I/) 0 I/) on .:: ~I I 0 <r) 0 I/) I/) .:: '" .. <0 V) NN M <0 I/) N N M <0 V"1 N N M
< - '" '" ~ '" ;;: 1;1) ..( !II)
< < <C

," 0"
~~
.. 4)
1
'" 0)
l
\0 -
-o
00
... CCI ... .:; It'l
~ It'l ,..; It'l ...
88
c::> • ...
... .., ... •
= N :. It'l ...
- ~ - '" o. ~
~~t'!g;tc1, <'I."" .,., .,., 0 """ co f'r) _'" N
It'l N
~ ... ... ... .... .... e ...
... ... "" ~ ...

·0 "0 "
'" ~ to '" '0
<Is !:l o '" '" r2 o ~
00 N
tN
00
= ...
= ~ ...
tC = 0 • ....
000 MOO'<t"
89
~ ...
~ «I ....
~ «I ...
V)O
V)O\ t- -N
00
V)O 0\0\
~ QI = . ...

o
01
""
... r-. N ~"
N ..., CO" ... N
co <:> N eo" ...
CD ... r-. .... CD ... on ... ... ",," ... ...,
~~~~:2 "i ~. ~. "". 01 ~<r>NNN
~~~~~?l ~ 1..0 t.n V) '-... 0 ... ~ ... e>-f ("")
90
NOI ""'"r-. 00" 01 o . -""
01"" <r> <r> 01. V)
o - -
= N ...
... <::> .... ...; tI'l N
r-. ... <::> CD" r-. N
N OIMN ...., 1.0 - 0 <r> "i 1.0. "'. ":.
0\ '"
~~I-;;!;fl V) 0 "",". 01 I!i I!i '" v· .-:
OIM-'ON ('f')Ol-_OO N.M'OOI-00 00 (1')'" v) O~
~~g~gti 0\ '" I£) 00... tr) f1')
(',1-- "'~Nv)r-

91
11> 1"1 III '" 0 01 M ...
Vl S .... ~ ~ ~ ..<::
I~ 0 en - III V"l 0 0 III '" r-. '" '<:j' OC
'" r') III V eN ..;- II) N
011 '" eN ~ ::E
11 I~ 0 III '" 0 III '" ... - 00
11 C') eN N "'"
N ..... -t<l
k I=:
't ~ ./0 01
I~ 0'1 r-. '" 0'1 M C) '" '" CI '" 'T 0
0 ~ 1"1 r-. '" C) Nt- ID 0 '" il< f-< eN 1"1 ... "'"
M .... 0 0
'1:i 0 .'0 en .... 00 ... 011 01=: 0
::: 0 ::lo1Oll '" 1"1
0 'tj ..... >a c:: S t> 0 :, ~.~ 0
~ .~
01=: ... ~
'" 'Cocoa Vl t- III 0 '" 0 III '" 0 C") on '<:j -t
::s 1>Il0Q <U 1"1 ID M 1"1 C") 1"1 eN ." '" ~ C' <" '"
... Z <U '> ::E 01 0 S Vl 0 r/'l 0 'CJ III V) C") \0 1- 0
]. <U
1"1 "'" N 1"1 r-. \f') 0'1
-< 0 '" ... I';Iil 'tj I=: S ~
... '0 0 0 ~
-< <U ''; .,-, CI 0 0 0'1 C) '" .,-, III M NO
'" '" Vl 1"1 "'" .... V 0'1 III 1"1 1"1 "'" 0 00\0
Z k ::E '" I>Il '" ... <Q
_ M
-< 0
~ 'tj ::E
on ~ ~ 'tj Vl ..;- III '" ~ I=: <U N ;> .g I=:
'" ~ ol;>,
Z Vl 1>Il0ll S Eo< f-< ~
'" I'@ 1=:0 «) Eo< t,) t,)
Z 'CO ~ t,) ... ... I=: d:: 01"" ... III '<I' 00 M '" III 0 ",0 '" III N OM
0 0 "'..<:: Vl M '" ID V") .,-, .,-, Eo<
... (") ..;-v Eo< = M ~ \0
I,:: ~ '" N Eo< C") ... =. N MV ~ ~
'" l'Jl l'Jl
~ 01 , ~f-< l'Jl .... ... ... (J
,::?J ... CI CI ::s ~ CI
U .,., < f.l;l
~ ~ ~ >c '" < '<I' .,-, V") V") v, 0 0 t-
ii "'" (") N CI = 0 r-. Q 1"1 ~ ID 0= 0'1 0 0'1
Z ... til 1"1 I';Iil ~;...,~ 1"1
~ >- "'" ... «) (J < Q ~='B ~ ::s ~ z 'tj 0"<:: '" ~
01 (J'"
-< 1~~~)~ CN In 00 <:1\ 0 V"l0 = M _\0
! ~ ~~~ - CI 1"1 V III \0\0 ..;- _00 on C") "'" ~ "''''01 <U 1"1 CN ... r-. \00'1
~ £-o.z '" ..: ~ ..
t3 CI . 0'1 N <"'l '" '" '1")0 0 0'1 M t-t-
'" Vl 0
"'" • M r- ... 1"1 <:I 'I") \0 1"1 ID
'" '" 0\0 0 '" N
..... "'" 0= 0'1 t-N -< ~c_ -; C") ... C)
",0101 S N
= 'O'<::0<U '" 0.>-'- 0.> ~ ..... $..td'-'
fo4 cd 0.>...0' ~ V") \0.,-, M '" \0 .... t- 000-::f..c: 0 1) CI t-
~ '"d ~ d) "0 0'1 = 1"1 1"000 1"1 CI t- MV ID M "'MM Vl <"IV t- III <"1M III
-< 01 0 ~ <!) ID. eo "" 1"1 --: t-.. ("1") ..
.... '" ttl __ 1"1
~ 0 ~ -~ ~ ~ • 01 U en III = 0
E~ 0 00 11'1 ... 00'" -;;; ~c::~ s l:a~ ~ OJ
_ol'O ~ 010 o td 0 ID
'" <"I V")<"I CN 0 \0 \0 c.e ''';- N NOO '8': ~ Vl
t- ... '" 1"11"1 "'" t- M <"I CI • M t- f-
A ~c; '" CI "'1"1
C") eN 1"1 <r>V
oo::s -;;; ..: <U .... C' ~ f-< 0 '.J
I .~ .'0
'0
'" <l)
t:lo ~ ~ ~ ::s v<:I\'<I' '<I' - ";-O'IVv ~ til ";-0'1";- ..;- ~ 0
:'<1'0'1111 M '" ~lil111+0 .. .- .-
1 M
k I +0 CIlv 0'1
1 ,
1 +-!!II) < 1 1 II'! 0 , ~ 110"'0 0 .,-, 011'1
<U OV")~""'N
V") 11'1 Q O.,-,OV")'" I=: -0V") NN M I=: I>Il 1"1 <"I v\""",,:""'NNM :( '" ~ - '" - '" iii)
~ 011 < ... < « «
9-1 Cenus Karanatka/78

o
00
• ...
on ... o
'<f"V"l0\00«) V"lt-'<f"vv
O. v. 00 v N
~O\~~~ 00 ::! -.. 0
• N - -"...:
;:!i~$:!~ t-... 00 N .. t-.. 0 .... -N--rr)
'''0
~ '"
92
Q ...
= ~ ..; ...
~ IN ... ...
o
O'\Oln_tOv ooOON"'VN IJ')~V .. Ci."'l"l
('.1- ..... --
I.CO\-_O O\OOMMO\
f11. "' ... r-.. \C ...., N

o <'l
00 N
10 N
'" N
-N
o N
00
t"ll'l ...
ll'l
ll'l ...
... N ...
ce CCI C'I
0",
• IN
c ... ...
t"ll'l ...
t"ll'l ...
ce ...
ce ." ...
o N
"" ll'l
c ~ ...
«I t"O N
." N
~ . ...
0"''''
00 ['-0\
"'0 N
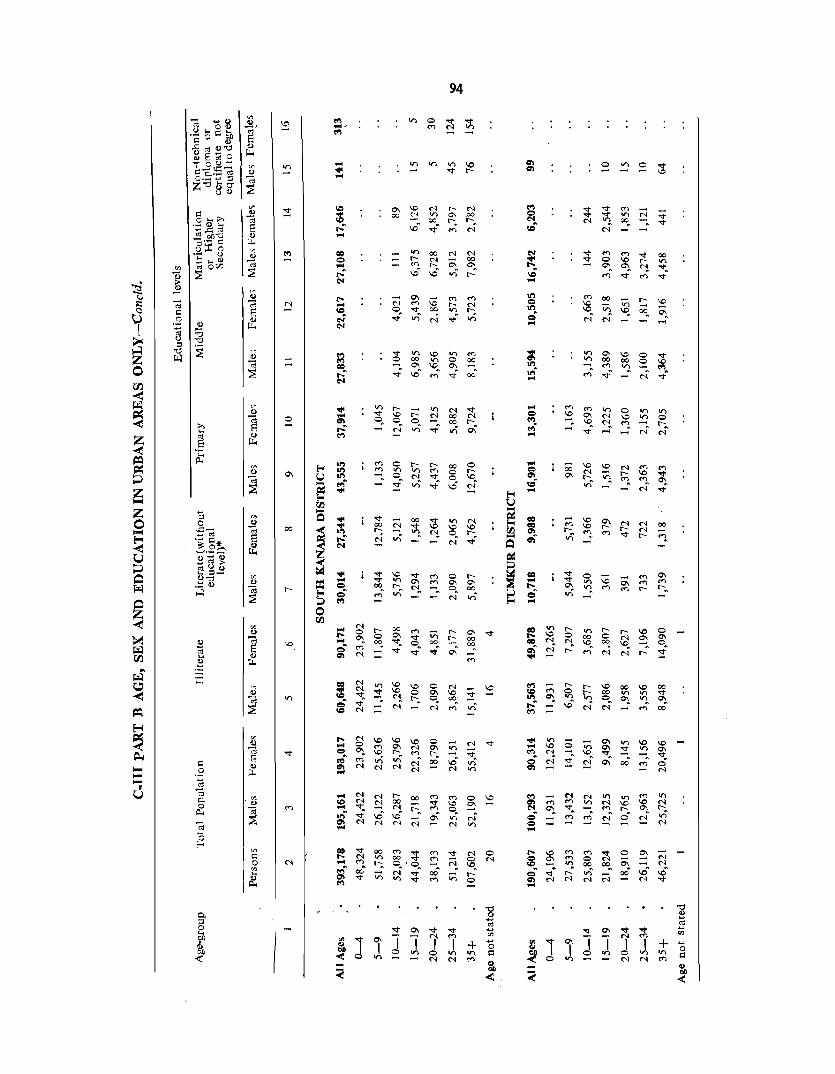
o
00
... "" ...
... Ie ... ''''~ CI ...
00 <'l '<I" <'l IT) 00 -.::t M I-;_ 0'0
N '<1". 00
'" '" '<I" <'l
94
co ... J:'oo e ...
-00 0\
o o
\D 0 00 0
'" -N
('I")tr)ov)
0\ N \D '" \OC'i('l")-~ ........... N
'" o t-. N
\D 0 0\ 0\ _. 0.
t'- '<I"

</1
I~
-M
o M
00 N
-N
o N
00
c ...
o N ...
95
V) N \C) 0'1
\0 00 \0 00 r'-l 00
M
lJ') ...
'" o ...
... N M
V) 0


C-IV SINGLE YEAR AGE RETURNS


C-IV SINGLE YEAR AGE RETURNS
This table has been prepared separately for total, rural and urban population at the state level only. This is also a very important demographic table which helps the census actuary in computing the mortality rates from the age data of the earlier censuses and in preparing the life tables. This table affords a useful study on bias in age returns at the census. The corresponding table was prepared in 1961 census on full count and on 10% sample basis in 1951 census.
An appendix to this table has been presented for the state and districts giving population figures by sex for five year age-groups viz. 0-4, 5-9, 10-14 etc.
The accurate enumeration of the age of the per· sons in a population census involves many difficulties. There are errors in the reporting ages mainly due to ignorance and misstatement of age. Generally the tendency is to return one's age in round numbers usually ending in 5 or O. In a large illiterate popula· tion. as in India, where the importance of returning one's age accurately is not understood, special care has had to be exercised in collecting the data on age.
The enumerators were provided with a list of important events in each district to help them jog the memory of the respondent and they were advised to apply elementary tests for consistancies among the ages of close relations such as parents. brothers .. sisters and others. In spite of all these precautions census age returns everywhere are subject to inaccuracies and biases in age returns are mainly due to misstatements of age. The single year age data when plotted on a graph show the familiar concentrations and deep troughs at regaular intervals which are attributable to age distortions due to preference for particular digits and ages.
As was observed in previous censuses, these single year age returns do not have much significance unless expres~ed in terms of appropriate say 5 year age group totals which is the most suitable. These totals would have to be smoothed so that the age biases cancel out within the age group. Smoothed (adjusted) ages as worked by the Census Actuary for Mysore State are given below which compares the adjusted and unadjusted figures at various ages.
ADJUSTED AND UNADJUSTED FIGURES OF MALE AND FEMALE FOPUIATWl\ BY SI1\GIE YEAR OF AGE, 1971
(Figures in hunc'recs)
Males Females
Unadjusted Aujusted Difference Unajju~c(ed Acjusted Difference Single Year Age population population between population. populaticn between
according (Census Cols.2 &3 according (Census Cols.5&6 to cen~us ActuarY) (Cols.2- to census ActuarY) (Cols.5-returns Col.3) returns Cols.6)
2 3 4 5 6 7
All ages 149,719 149,719 143,271 143,271
O. 4,650 5,462 812 4,604 4,946 342
1. 2,819 4,903 2,084 2,786 4,697 1,911
2. 4,635 4,615 + 20 4,501 4,441 + 60
3. 4,461 4,540 79 4,547 4,434 + 113
4. 4,710 4,453 + 257 4,505 4,400 + lOS
0-4. 21,275 23,973 2,698 20,943 22,918 1,975
5. 4,488 4,355 + 133 4,405 4,340 + 65 6. 5,087 4,248 + 839 4,837 4,258 + 579
7. 3,739 4,134 395 3,8 15 4,158 343
8. 5,278 4,013 + 1,:65 5,171 4,042 + 1,129
9. 3,294 3,889 595 3,465 3,915 450
5-9. 21,886 20,639 + 1,247 21,693 20,7i3 + 980
10. 5,499 3,771 + 1,728 5,863 3,778 + 2,085
11. 2,178 3,660 1,482 2,575 3,6:'6 1,061
12. 5,680 3,533 + 1,147 5,103 3,428 + 1,675
13. 2,581 3,395 814 2,461 3,321 860
14. 3,417 3,249 + 168 3,193 3,216 23
99
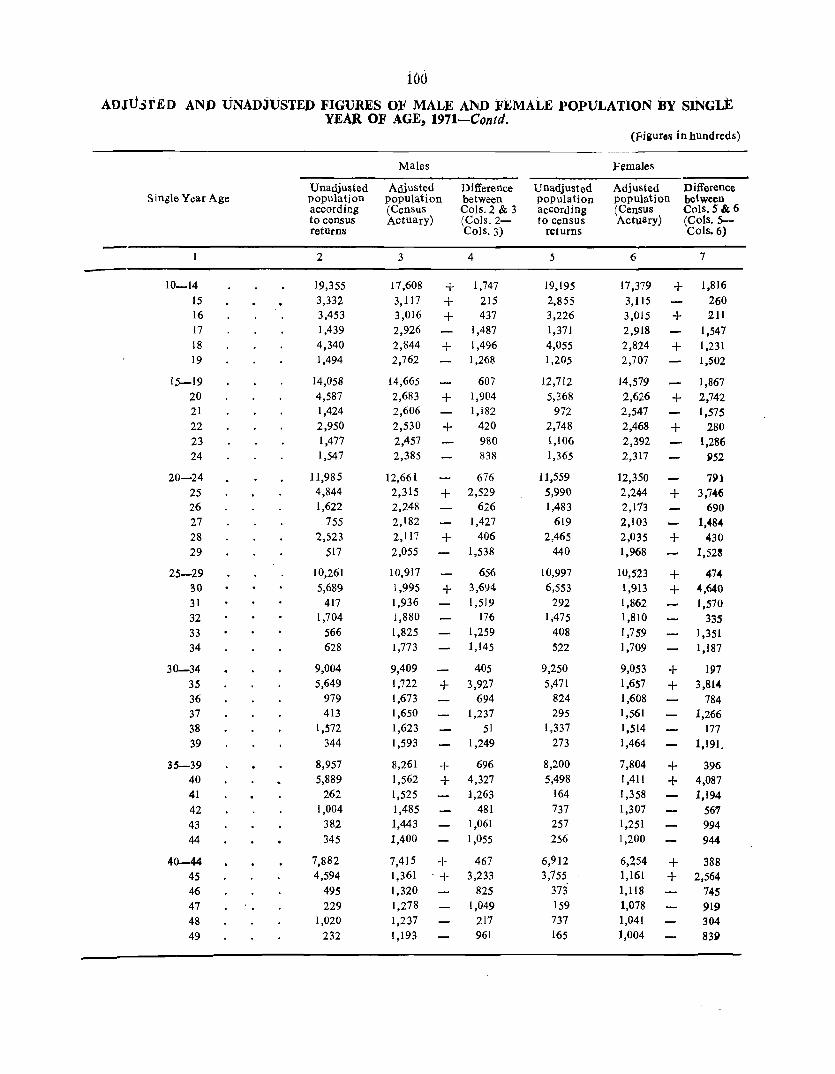
iOo ADJU.3fED AND UNADJUSTED FIGURES OF MALE A~D FEMALE POPULATION BY SINGLE
YEAR OF AGE, 1971-Contd. (fiiuros in hundreds)
Males Females
Unadjusted Adjusted Difference Unadjusted Adjusted Difference Single Year Age population population between population population between
according (Census Cols.2 & 3 according (Census Cols.5 & 6 to census Actuary) (Cols.2- to census Actuary) (Cols.5-returns Cols.3) returns Cols.6)
2 3 4 .5 6 7
10-14 19,355 17,608 + 1,747 19,195 17,379 + 1,816 15 3,332 3,117 + 215 2,855 3,115 260 16 3,453 3,016 + 437 3,226 3,015 + 211 17 1,439 2,926 1,487 1,371 2,918 1,547 18 4,340 2,844 + 1,496 4,055 2,824 + 1,231 19 1,494 2,762 1,268 1,20,5 2,707 1,502
15-19 14,058 14,665 607 12,712 14,579 1,867 20 4,587 2,683 + 1,904 5,368 2,626 + 2,742 21 1,424 2,606 1,182 972 2,547 1,575 22 2,950 2,530 + 420 2,748 2,468 + 280 23 1,477 2,457 980 1,106 2,392 1,286 24 1,547 2,385 838 1,365 2,317 P52
20-24 11,985 12,661 676 11,559 12,350 791 25 4,844 2,315 + 2,529 5,990 2,244 + 3,746 26 1,622 2,248 626 1,483 2,113 690 27 755 2,182 1,427 619 2,103 1,484 28 2,523 2,117 + 406 2,465 2,Q35 + 430 29 517 2,055 1,538 440 1,968 1,523
25-29 10,261 10,917 656 10,997 10,523 + 474 30 5,689 1,995 + 3,694 6,553 1,913 + 4,640 31 417 1,936 1,519 292 1,862 1,570 32 1,704 1,880 176 1,475 1,810 335 33 566 1,825 1,259 408 1,7,59 1,3,51 34 628 1,773 1,145 522 1,709 1,187
30-34 9,004 9,409 40,5 9,250 9,053 + 197 35 5,649 1,722 + 3,9').7 5,471 1,657 + 3,814 36 979 1,673 694 824 1,608 784 37 413 1,650 1,237 295 1,561 1,266 38 1,572 1,623 51 1,337 1,514 177 39 344 1,593 1,249 273 1,464 1,191.
35-39 8,957 8,261 + 696 8,200 7,804 + 396 40 5,889 1,562 + 4,327 5,498 1,41l + 4,087 41 262 1,525 1,263 164 1,358 1,194 42 1,004 1,485 481 737 1,307 56'7 43 382 1,443 1,061 257 1,251 994 44 345 1,400 1,055 256 1,200 944
40-44 7,882 7,415 + 467 6,912 6,254 + 388 45 4,594 1,361 '+ 3,233 3,755 1,161 + 2,564 46 495 1,320 82,5 373 1,118 745 47 229 1,278 1,049 159 1,078 919 48 1,020 1,237 217 737 1,041 304 49 232 1,193 961 165 1,004 839

10i
ADJUSTED AND UNADJUSTED FIGURES OF MALE AND FEMALE POPULATiON BY SINGLE YEAR OF AGE, 1971-Concld.
Single Year Age Males Females
Unadjusted Adjusted Difference Unadjusted Adjusted Difference population population between population population between according (Census Cols. 2 & 3 according (Census Cols.5 & 6 to census Actuary) (Cols.2- to census Actuary) (Cols.5-returns Cols.3) returns Cols.6)
2 3 4 5 6 7
45-49 6,570 6,389 +181 5,159 5,402 -243 50 4,617 1,136 +3,481 4,307 950 +3,357 51 191 1,085 -894 102 910 -808 52 581 1,033 -452 387 869 -482 53 217 979 -762 145 826 -681 54 288 925 -637 208 783 -575
50-54 5,894 5,158 +736 5,149 4,338 +811 55 2,368 892 +1,476 1,980 765 +1,215 56 370 846 -476 252 728 -476 57 124 804 -680 83 695 -612 58 471 768 -297 346 670 -624 59 125 735 -610 80 647 -567
55-59 3,458 4,045 -587 2,741 3,505 -764 60 3,373 684 +2,689 3,266 603 +2,663 61 95 654 -559 64 583 -519 62 261 622 -361 209 562 -353 63 110 588 -478 74 536 -462 64 119 550 -431 89 506 -417
60-64 3,958 3,098 +860 3,702 2,790 +912 65 1,444 527 +917 1,359 493 +866 66 99 486 -387 73 458 -385 67 55 445 -390 43 423 -380 68 196 407 -211 173 389 -216 69 48 372 -324 43 359 -316
65-69 1,842 2,237 -395 1,691 2,122 --431 .. 70+ 3,334 3,244 +90 3,368 3,271 +97

i02 THE PERCENTAGE OF DISTORTION AT DIFFERENT AGES IN RESPECT OF MYSORE STATE IS
REPRODUCED BELOW
MYSORE STATE, 1971
Age
00
10 20 30 40 50 60
05 15
25 35 45
55
02 12 22 32 42 52
08 18 28 38 48 58
04 14
24 34 44 54
(A)
(B)
(C)
Males
2
-14.9
+45.8 +71.0
+185.2 +277 .0 +306.4 +393.1
+3.1 +6.9
+109.2 +228.0 +237.5 +165.5
+0.4 +60.8 +16.6 -9.4
-32.4 -43.8
+31.5 +52.6 +19.2 -3.1
-17.5 -38.7
+5.8 +5.2
-35.1 -64.6 -75.4 -68.9
Females
3
-6'9
+55.2 +104.4 +242.6 +289.7 +353.4 +441.6
+1.5 -8.3
+166.9 +230.2 +220.8 +158.8
+1.4 +48.9 +11.3 -18.5 -43.5
-55.5
+27.9 +43.6 +21.1 -11.7 -29.2 -48.4
+2.4 -0.7
-41.1 -69.5 -78.7 -73.4
It is interesting to note from the above statement that the distortions are not much in the younger ages below 10. This is because the birth of a child would have occurred only a few years before and a high
Age
06 16 26 36 46 56
03 13 23 33 43 53
07 17 27 37 47 57
01 ll. 21 31 41 51
09 19 29 39 49 59
(C)
(D)
(E)
Males
2
+19.8 +14.5 -27.8 -41.5 -62.5 -56.3
-1.7 -24.0 -39.9 -69.0 -73.5 -77.8
-9.6 -50.8 -65.4 -75.0 -82.1 _84.6
-42.5 -40.5 -45.4 -78.5 -82.8 -82.4
-15.3 -45.9 -74.8 -78.4 -80.6 -83.0
Females
3
+13.6 +7.0
-31.8 -48.8 -66.6 -65.4
+2.5 -25.9 -53.8 -76.8 -79.5 -82.4
-8.2 -53 .0 -70;6 -81.1 -85.3 -88.1
-40.7 -29.2 -61.8 -84.3 -87.9 -88.8
-11.5 -55.5 -77.6 -81.4 -83.6 -87.6
level of literacy is not necessary for the recollection of the event. Consequently. the age-group 0-9 may be taken as fairly accurate. Beyond this age-group age knowledge begins to diminish with age.

103
C'.IV SINGLE YEAR AGE RETURN8-MYSORE STATE
Age Total Rural Urban
Males Females Males Females Males Females
2 3 4 5 6 7
All Ages 14,971,900 14,327,114 11,249,209 10,927,712 3,722,691 3,399,402
0 465,035 460,424 365,640 361,678 99,395 98,746
1 281,845 278,662 211,418 210,721 70,427 67,941
2 463,480 450,068 361,900 350,242 101,580 99,826
3 446,141 454,666 343,221 350,904 102,920 103,762
4 470,948 450,494 366,463 351,403 104,485 99,091
5 448,798 440,543 344,192 340,622 104,606 99,921
6 508,722 483,712 398,201 375,684 110,521 108,028
7 373,870 381,460 283,131 290,192 90,739 91,268
8 527,847 517,092 412,400 405,207 115,447 111,885
9 329,398 346,447 246,020 262,221 83,378 84,226
10 549,932 586,361 428,591 463,487 121,341 122,874
11 217,754 257,468 152,648 188,761 65,106 68,707
12 567,980 510,282 444,879 401,448 123,101 108,834
13 258,125 246,072 188,198 180,211 69,927 65,861
14 341,702 319,366 257,784 241,382 83,918 77,984
15 333,228 285,452 248,245 209,313 84,983 76,139
16 345,319 322,587 258,025 241,987 87,294 80,600
17 143,921 137,138 89,002 88,742 54,919 48,396
18 433,936 405,472 317,028 301,211 116,908 104,261
19 149,436 120,546 88,563 'Z6,736 60,873 43,810
20 458,674 536,847 336,518 408,214 122,156 128,633
21 142,406 97,204 84,429 61,199 :57,977 36,005
22 295,034 274,773 204,696 196,405 90,338 78,368
23 147,714 110,596 92,829 72,409 54,885 38,187
24 154,668 136,450 101,735 96,380 52,933 40,070
25 484,444 599,032 368,786 461,605 115,658 137,427
26 162,185 148,318 112,528 106,547 49,657 41,771
27 75,489 61,842 44,942 38,973 30,547 22,869
28 252,282 246,521 184,421 183,872 67,861 62,649
29 51,732 44,031 31,132 29,475 20,600 14,556
30 568,924 655,297 429,633 511 ,672 139,291 143,625
31 41,658 29,215 24,36-1 19,562 17,294 9,653
32 170,429 147,501 122,185 109,849 48,244 37,652
33 56,561 40,824 37,131 26,947 i9,430 13,877
34 62,854 S2,2Il 43,979 37,239 18,875 14,972
35 564,866 547,050 431,088 425,211 133,778 121,839
36 97,909 82,382 70,625 60,494 27,284 21,888
3/ 41,308 29,544 26,1[0 18,453 15,198 1 1,091
38 157,265 133,739 117,840 100,700 39,425 33,039
39 34,386 27,267 22,445 19,025 11,941 8,242
40 588,881 549,755 453,525 435,297 135,356 114,458
41 26,217 16,439 16,960 11,630 9,257 4,809
42 100,384 73,744 73,602 55,'292 26,782 18,452
43 38,164 25,734 25,667 17,781 12,497 7,953
44 34,529 25,565 '24,007 18,571 10,522 6,994
-

104
C-IV SINGLE YEAR AGE RETURNS-MYSORE STATE-Concld.
Age Total Rural Urban
Males Females Males Females Male$ Females
2 3 4 5 6 7
45 459,438 372,471 357,370 293,153 102,068 79,318 46 49,503 37,272 35,752 27,858 13,751 9,414 47 22,917 15,939 14,000 10,940 8,917 4,999 48 101,946 73,704 16,684 56,302 25,262 17,402 49 23,150 16,467 15,288 12,29& 7,862 4,169
50 461,729 430,729 367,444 341,347 94,285 - 89,382 51 19,137 10,190 13,239 7,462 5,898 2,728 52 58,122 38,666 43,198 29,034 14,924 9,632 53 21,656 14,541 14,144 10,371 7,512 4,170 54 28,756 20,824 20,034 15,633 8,722 5,191
55 236,815 198,023 192,404 156,714 44,411 41,309 56 36,953 25,179 27,361 18,804 9,592 6,375 57 12,433 8,257 7,840 5,760 4,593 2,497 58 47,075 34,604 36,198 26,242 10,877 8,362 59 12,532 8,004 8,568 5,882 3,964 2,122
60 337,343 326,578 274,361 260,458 62,982 66,120 61 9,459 6,468 6,580 5,128 2,879 1,340 62 26,100 20,893 19,174 15,898 6,926 4,995 63 10,973 7,394 7,130 5,269 3,843 2,125 64 11,885 8,882 8,292 6,767 3,593 2,115
65 144,369 135,925 118,472 108,767 25,897 27,158 66 9,865 7,269 7,231 5,459 2,634 1,810 67 5,499 4,254 3,560 2,979 1,939 1,275 68 19,595 17,291 15,292 13,456 4,303 3,835 69 4,829 4,323 3,420 3,218 1,409 1,105
70 140,306 145,330 115,183 116,720 25,123 28,610 71 5,084 2,889 3,260 2,090 1,824 799 72 11,229 10,985 8,501 9,096 2,728 1,889 73 3,589 2,558 2,310 1,779 1,279 779 74 3,889 3,253 2,710 2,499 2,179 754
75 ,,6,793 54,353 47,379 43,748 9,414 10,605 76 4,905 3,966 3,580 3,041 1,325 925 77 1,350 875 830 530 520 345 78 5,275 4,634 4,100 3,569 1,175 1,065 79 1,310 1,225 860 960 450 265
80 55,266 60,594 45,797 48,081 9,469 12,513 81 890 1,025 570 820 320 205 82 2,814 2,255 1,910 1,700 904 555 83 1,224 800 870 590 354 210 84 984 960 630 660 354 300
85 13,495 13,927 11,001 10,850 2,494 3,077 86 1,265 1,025 910 750 355 275 87 510 550 330 370 180 180 88 1,230 850 970 650 260 200 89 640 410 460 280 180 130

105
C.IV SINGLE YEAR AGE RETURNS-MYSORE STATE-Coneld.
Total Rural Urban Age ----------- ---------- --------
Males Females Males Females Males Females
2· 3 4 5 6 7
90 10,273 11,782 8,360 9,202 1,913 2,580 91 240 180 180 120 60 60 92 545 605 390 480 155 125 93 255 125 200 80 55 45 94 185 280 140 240 45 40
95 3,170 3,715 2,650 2,920 520 795 96 430 300 360 240 70 60 97 185 255 140 220 45 35 98 675 730 560 510 115 220 99 365 420 220 140 145 280
100 2,009 3,089 1,770 2,550 239 539 101 310 495 300 480 10 IS 102 55 105 40 60 15 45 103 30 40 20 10 10 30 104 10 10 10 10
105 205 229 170 160 35 69 106 15 55 10 40 5 15 107 200 275 200 270 5 108 30 20 20 10 20 109 10 20 10 20
110 100 110 60 70 40 40 III 5 5 112 45 40 5 113 5 5 1I4 5 5 lIS 10 10 116 20 20 1I8 20 20 120 45 30 15 125 5 30 30 5 127 5 5 130 5 5 Age not stated 1,976 1,390 1,396 ·914 580 476

106
C.IV SINGLE YEAR AGE RETURNS
APPENDIX
DISTRIBUTION OF PERSONS BY FIVE YEAR AGE GROUPS
Age-group Total Rural Urban
Males Females Males Females Males Females
2 3 4 5 6 7
MYSORE STATE
All Ages 14,971,9[)0 14,327,114 11,249,209 10,927,712 3,722,691 3,399,402 0-4 2,127,449 2,094,314 1,648,642 1,624,9-<8 478,F07 469,366 5-9 2,188,635 2,169,254 1,683,944 1,673S26 504,691 495,328
10_14 • 1,935,493 1,919,549 1,472,100 1,475,289 463,393 444,260 15-19 • 8,405,840 1,271,195 1,000,863 917,989 404,977 353,206 20-24 . 1,198,496 1,155,870 820,207 834,@7 378,289 321,263 25-29 • 1,026,132 1,099,744 741,809 820,472 284,323 279,272 30-34 • 900,426 925,048 657,292 705,269 243,134 219,779 35-39 • 895,734 819,982 668,108 623,883 227,626 196,099 40-44 • 788,175 691,237 593,761 538,571 194,414 152,666 45-49 • 656,954 515,853 499,094 400,551 157,860 115,302 50-54 • 589,400 514,950 458,059 403,847 131,341 111,103 55-59 • 345,808 274,067 272,371 213,402 73,437 60,665 60-64 • 395,760 370,215 315,537 293,520 80,223 76,695 65-69 • 184,157 169,062 147,975 133,879 36,182 35,183 70-74 • 164,097 165,015 131,964 132,184 32,133 32,831 75-79 • 69,633 65,053 56,749 51,848 12,884 13,205 80-84 • 61,178 65,634 49,777 51,8.51 11,401 13,783 85-89 • 17,140 16,762 13,671 12,900 3,469 3,862 90-94 • 11,498 12,972 9,270 10,122 2,228 2,850 95-99 • 4,825 5,420 3,930 4,030 895 1,390
100+ 3,094 4,528 2,690 3,710 404 818 Age not stated 1,976 1,390 1,396 914 580 476
BANGALORE DISTRICT
All Ages 1,762,525 1,602,990 769,998 729,763 992,527 873,227 0_4 230,050 225,554 106,616 104,435 123,434 120,919 5-9 241,105 242,175 III ,845 116,616 129,260 125,559
10_14 • 200,466 205,060 93,258 99,418 107,208 105,642 15_19 • 177,141 157,368 73,431 63,896 103,710 93,472 20-24 • 170,550 148,222 59,831 54,993 110,719 93,229 25-29 • 142,167 135,302 53,029 55,315 89,138 79,987 30-34 • 116,266 103,009 43,396 46,442 72,870 56,567 35-39 • 110,217 91,714 45,484 40,217 64,733 51,497 40-44 • 91,645 71,510 40,383 34,533 51,262 36,977 45-49 • 77,515 55,589 34,627 26,676 42,888 28,913 50-54 • 64,392 49,859 31,109 24,092 33,283 25,767 55-59 • 38,083 29,505 18,942 15,053 19,141 14,452 60-64 • 42,097 36,633 22,293 20,054 19,804 16,579 65-69 • 20,826 16,717 11,891 8,543 8,935 8,174 70-74 • 19,203 16,066 11 ,061 8,564 8,142 7,502 75-79 • 7,901 6,514 4,650 3,498 3,251 3,016 80-84 • 7,232 7,197 4,500 4,427 2,732 2,770 85-89 • 2,603 2,178 1,680 1,179 923 999 90-94 • 1,703 1,677 1,060 999 643 678 95-99 • 714 676 480 350 234 326
100+ 430 475 370 400 60 75 Age not stated 219 190 62 63 157 127

107
C.IV SINGLE YEAR AGE RETURN S
APPENDIX
D"fSTR1 BUTlON OF PERSONS BY FIVE YEAR AGE GROUPS-Contd.
A.!W£roup 10',[.\ Rud Urban ------ -----
Moles Fe.u·.Ie' M.le' Fe,n~les M,.les Fem,.jes
2 3 A- S 6 7
BELGAUM mSTRlCT
All Ages I,Ul,313 1,173,527 931,814 9l!),735 26!),OOI 237,79 0-4 182,397 175,938 148,S93 143,752 33,5C4 32,H6 5-9 178,927 176,614 144·,593 143,152 34,334 33,4G2
10_14 16,1,971 15~,987 130,152 122,670 34·,819 32,; 17 15_19 • 121,740 101,960 92,150 77 ,552 29,590 2,,,408 20_24 • 101,138 93,4 15 74 ,653 71,f5 1 26/85 21,5E4 25-29 . 84,9::5 87,' 44 66, 03 68,660 18,8:;2 18,184 30-34 73,7(0 74·;;09 5' ,708 59,5\ 1 16,0:;2 15,19R 35-39 • 70,800 68,591 56,'~5 5<,662 14,655 13,99 40-44 . 63,"42 59,770 50,376 47,982 13,(66 II,78S 45-49 • 53,011 43,S63 42,: 55 35,396 10,756 8,507 50-54 • 4·9,141 4.4,668 39,6;'6 36,174 9,515 8,6~4
55-59 • 30,815 23,259 25,2:9 19,047 5,586 4,212 60-64 3 \ ,885 30,590 26,088 24,868 5,797 5,722 65-69 13,5'6 14,585 10,802 12,i82 2,714 2,403 70_74 12,002 13/55 9,752 11,192 2,250 2,268 75-79 4,41;9 5,001 3,671 4,061 778 943 80-84 • 4,899 5,962 4,'41 4,851 758 1,111 85-89 • 1,275 1,577 1,030 1,270 245 317 90-94 . 900 1,036 730 850 170 186 95-99 . 285 556 230 420 S5 136
100+ 425 655 380 560 45 95 Age not stated 122 82 107 72 15 10
BELLAl1Y DISTRICT
All Ages 570,B!)i 551,882 413,073 404,841 157,731 147,041 0-4 80/00 79,752 59,843 60,'67 20,557 19.585
5-9 85,939 83,GSO 63,C23 6J ,::~6 22S1tS 21.1194
10_14 . 73/59 71,674 54·,192 52,r15 19,267 18,f59 15-19 • 51,164 46,t24 35,444 32,:61 15,/20 14,063 20-24 • 43,558 44,992 29,514 32,:10 14,044 12,£82 25-29 • 40,863 44,379 29,;'02 31 ,7~8 11,661 12,591 30_34 • 37,101 37,215 26,498 26,8:2 10,603 10,383 35-39 • 35,164 31,568 24,199 23,237 10,365 8,331 40_44 • 30,1)98 26,450 21,852 19,6Yli 9,146 6,752 45-49 • 25,4·76 20,453 18,66\~ 15,390 6,810 5,063 50-54 • 21,635 21,088 15,938 15,722 5,697 5,366 55-~9 • 12,887 10,:69 9,813 7,92:l 3,074 2,tt6 60_64 • 14,132 15,256 10,502 11,216 3,630 4,O~0
65-69 • 6,843 6,395 5,315 4,752 1,5:28 1,643 70_74 • 5,731 6,429 4,263 4,642 1,468 1,787 75-79 • 2,232 2,247 1,771 1,721 461 526 80-84 • 2,007 2,596 1,511
, 1,951 496 645
85-89 • 541 644 460 520 81 124 90_94 • 331 499 240 '::00 91 99 95-99 • 201 180 150 130 51 50
100+ 80 100 70 70 10 30 Age not stated 62 82 7 55 8,. 10- 1 Census Karnataka/78

108
C.IV SINGLE YEAR· AGE IlETURNS
APPENDIX
DISTRIBUTION OF PERSONS BY FIVE YEAR AGE GROUPS-Contd.
'iotal Rural Urban Age-group
Male, Females Males Females Males Females
2 3 4 5 6 7
BIDAR DISTRICT
All Ages 419,812 404,247 357,828 347,100 61,984 57,147 0_4 67,990 67,723 58,701 58,078 9,289 9 ,t'i4 5 5-9 62,334 62,060 53,220 53,217 9,114 8,843
10_14 • 52,044 46,857 44,130 39,878 7,914 6,979 15-19 • 31,966 30,294 25,726 25,158 6,240 5,136 20_24 • 30,628 33,429 25,257 28,416 5,371 5,013 25-29 • 30,405 31,638 25,715 27,156 4,690 4,482 30-34 • 26,677 27,208 22,846 23,510 3,831 3,698 35-39 • 23,014 20,958 19,568 18,135 3,446 2,823 40-44 . 22,529 21,727 19,413 18,970 3,116 2,757 45-49 • 15,690 13,434 13,491 11,765 2,199 1,669 50-54 • 17,000 15,9 11 14,711 13,979 2,289 1,932 55-59 • 8,822 6,336 7,864 5,540 958 796 60_64 • 13,532 11,726 12,122 10,143 1,410 1,583 65-69 • 5,702 4,611 4,958 4,104 744 507 70_74 • 5,678 5,142 4,998 4505 680 637 75-79 • 2,006 1,671 1,809 1,462 197 209 80-84 • 2,509 2,211 2,159 1,932 350 279 85-89 • 525 481 480 451 45 30 90-94 • 454 540 390 471 64 69 95-99 • 140 155 120 140 20 15
100+ 165 125 ISO 90 15 3$ Age not stated 2 10 2 10
BIJAPUR DISTRICT All Ages 1,00.5,567 980,054 787,811 776,605 217,756 23,419
0-4 150,005 147,959 120,316 119,886 29,689 28,073 5-9 148,388 144,464 118,794 116,C90 29,594 28,374
10-.14 • 136,068 128,382 107,123 100,789 28,945 27,S93 15-19. 91,762 80,828 67,437 61,308 24,325 19,520 20-24 . 76,736 76,563 55,554 58,911 21,182 17,652 25-29 . 68,016 71,838 53,187 56,333 14,829 15,550 30-34 . 59,948 65,399 46,923 5] ,996 13,025 13,403 35-39 . 59,012 54,562 46,893 42,989 12,119 11,573 40-44 . 53,877 50,524 42,131 40,15] 11,746 10,373 45-49 • 42,629 35,369 34,047 28,535 8,582 6,834 SO-54 • 40,666 39.12] 32,596 31,418 8,070 7,703 55-59 . 22,801 20,020 18,287 16.023 4,514 3,997 60-64 . 26,463 28,846 21,122 23,145 5.341 5,701 65-69 . 10,305 11,421 8.240 9,075 2.065 2,346 70-74 . 9,3;5 11,961 7,480 9.715 1,835 2,246 75-79 • 3.775 4,313 3.070 3,612 705 701 80-84 . 3,675 5,SOS 2.930 4,322 745 1,183 85-89 • 870 1,168 650 910 220 258 90-94 . 675 889 540 680 135 209 95-99 • 240 409 220 320 20 89 100+ . 215 400 190 350 25 50 Age not stated 126 83 81 47 4S 36

109
C-IV SINGLE YEAR AGE RETURNS
APPENDIX DISTRIBUTION OF PERSONS BY FIVE YEAR AGE GROuPS-Contd.
Total Rural Urban Ase-Stoup
Males Females Males Females Males Females
2 3 4 5 6 7
CHIKMAGALUR DISTRICT
All Aces 380,297 356,350 320,316 301,253 59,981 55,097 0-4 51,845 52,325 44,279 44,6tJ2 7,566 7.723 5-9 56,519 58,346 48,201 50,203 8,318 8,143
H)-14. 52,513 51,454 44,230 43,341 8,283 8,113 15-19 • 35,089 33,382 28,539 27,351 6,550 6,031 20-24 • 29,349 27,562 23,776 22,679 5,573 4,883 25-29 • 25,189 27,699 20,887 23,285 4,302 4,414 30-34 • 22,221 22,519 18,388 19,058 3,833 3,46] 35-39 • 24,912 21,402 20,983 18,177 3,929 3,225 40-44 • 20,028 16.342 16.942 14,064 3.086 2,278 45-49 • 18,252 11,7]1 15.651 9.982 2.601 1,7:9 50-54 . 14,734 10,553 12.813 9,050 1,921 1,~03
55-59 . 8,471 5,808 7,211 4,860 1,260 948 60-64 . 9.004 7,215 7,874 6,194 1,130 1,021 65-69 • 4,370 3,308 3,743 2,790 627 518 70-74 • 3,674 7,947 3,205 2,404 469 54. 75-79 • 1,824 l,662 1,617 1,467 207 195 80-84 • 1,256 1,251 1,088 1,047 168 204 85-89 • 518 389 459· 319 59 70 90-94 • 284 145 240 130 44 15 95-9P. 115 135 90 100 25 35
100+ 55 155 50 130 5 25 A,e Dot stated 75 40 50 20 25 20
CHITRADURGA DISTRICT
All Alles 720,642 676,814 570,246 544,258 150,396 132,556 0-4 99.300 97,676 79.536 78.917 19.764 18.759 5-9 110,106 110,177 88,963 89,445 21,143 20,732
10-14 • 92,46) 94,995 73,387 76,005 19,074 18,99u 15-19 • 66,544 58,478 49,318 44,659 17,226 13,819 20-24 • 57,626 53,318 41,560 41,298 16,C66 12,C20
25-2' • 48,308 51,558 37,253 40,955 1.1055 10,603 30-34 • 42,727 41,560 33,421 33,454 9,306 8,106 35-39 • 43,155 37,942 34,395 30,703 8,760 7,239 40-44 • 36,576 31,445 28,996 25.904 7,580 5,541 45-49 • 30,837 23,230 24.952 19.274 5,885 3.956 50-54 . 27,338 22,308 22,433 18.370 4,905 3,938
55-59 . 16.832 13,127 14,347 10.990 2.485 2,137
60-64 . 19,374 16,696 16,257 13.825 3,117 2,871 65-69 • 10,537 7,725 9,097 6,558 1,<140 1.167 70-74 • 8,704 7.764 7,395 6,538 1,309 1,226 75-79 • 4,281 3,552 3,753 2,989 528 563 80-84 • 3,535 3.147 3.122 2.659 413 488 85-89 . 1,070 930 941 780 129 150 90-94 • 630 635 550 520 80 lIS 95-99 • 375 245 340 190 35 55 100+ . 130 180 90 140 40. 40 Ale not stated 196 126 J40 85 56 041

110
C .. IV SINGLE YEAR AGE RETURNS
APPENDIX DISTRmUTION OF PERSONS BY FIVE YEAR AGE GROUPS-Contd.
Total Rural Urban Age-group
Males Females Males Females Males Females
2 3 4 S 6 7
COORG DISTRICT
A~e group. 198,109 180,182 166,750 152,850 31,359 27,332 0-4 25,440 25,002 2J,865 21,388 3,:75 3,614
5-9 26,969 26,218 22,965 22,265 4,((4 3S53 10-14 • 25,774 24,899 Zl,775 20,915 3,S'S'9 3,!.'f4
15-19. 19,835 19,816 16,670 16,:64 3,1 f: 3,2;2 20-24 • 16,952 16,128 13,661 13,~98 3,1.9J 2,7:0 25-29 • ; 3,955 14,064 11,352 11,749 2,€C3 2,;65 30-34 . 11,592 11,184 9,427 9,603 2,165 1,1 f 1 35-39 • 13.852 11,143 11.562 9.513 2,2.9( 1,6:0 40-44 • lO,624 8,G85 9,028 7,022 1,596 I,CO 45-49 • 9,554 6,437 8,017 5,597 1,537 840 50-54 • 7,329 5,360 6,272 4,709 1,(157 651 55-59 . 5,314 3,3i 1 4,619 2,763 695 548 60-64 . 4.678 3,4j 8 4,124 2,941 554 477 65-69. 2,486 1,947 2,208 1,606 278 341 70-74 . 1,696 1,389 1.419 1.218 277 171 75-79 i ,058 684 959 609 99 75 80"':"84 • 579 595 490 499 89 96 85-89 • ;50 270 100 240 50 10 90-94 • 125 115 ~20 110 5 5 95-99 • 105 65 ,CO 60 5 5 100+ 75 20 5 Age not stated 42 27 \7 1 J 25 16
DHARWAR DIS'I'RICT All Ages 1,203,591 1,133,619 817,037 737,203 386,557 351,416
0-4 173,661 169,439 122,754 120,047 50,907 49,392 5-9 172,406 170,035 121,294 119,828 51,112 50,207
10-14 168,244 161,946 115.452 113,250 52,792 48,696 15-19 . 118,663 101,~81 75,214 66,041 43,449 35,340 20-24 • 103,691 91,464 63,092 59,944 40,599 31,520 25-29 . 80,203 81,729 52,808 55,4[0 27,395 26,319 30-34 • 71,327 71,106 47,666 49,173 23,661 21,933 35-39 • 66,578 62,5:6 45,261 42,366 21,317 20,170 40-44 • 60,999 54,169 41,151 37,949 19,848 16,220 45-49 • 50,593 40,36>f 34,853 28,029 15,740 12,335 50-54 • 45,520 43, 113 31,858 30,714 13,662 12,399 55-59 • 27,106 21,843 19,299 14,887 7,807 6,956 60-64 • 29,744 30,224 21,440 21,571 8,304 8,653 65-69 • 12,651 12,834 9,057 9,170 3,594 3,664 70-74 • 11,665 12,819 8,237 9,260 3,42& 3,559 75-79 • 4,057 5,210 2,899 3,830 1,158 1,380 80_84 • 3,977 5,175 2,83Q 3,580 1,138 1,595 85-89 • 1,051 1,115 780 750 271 365 90-94 • 711 1,030 520 650 [91 380 95-99 • 445 595 310 400 135 195 100+ . 190 405 160 280 30 125 Age not stated 112 87 93 74 19 13
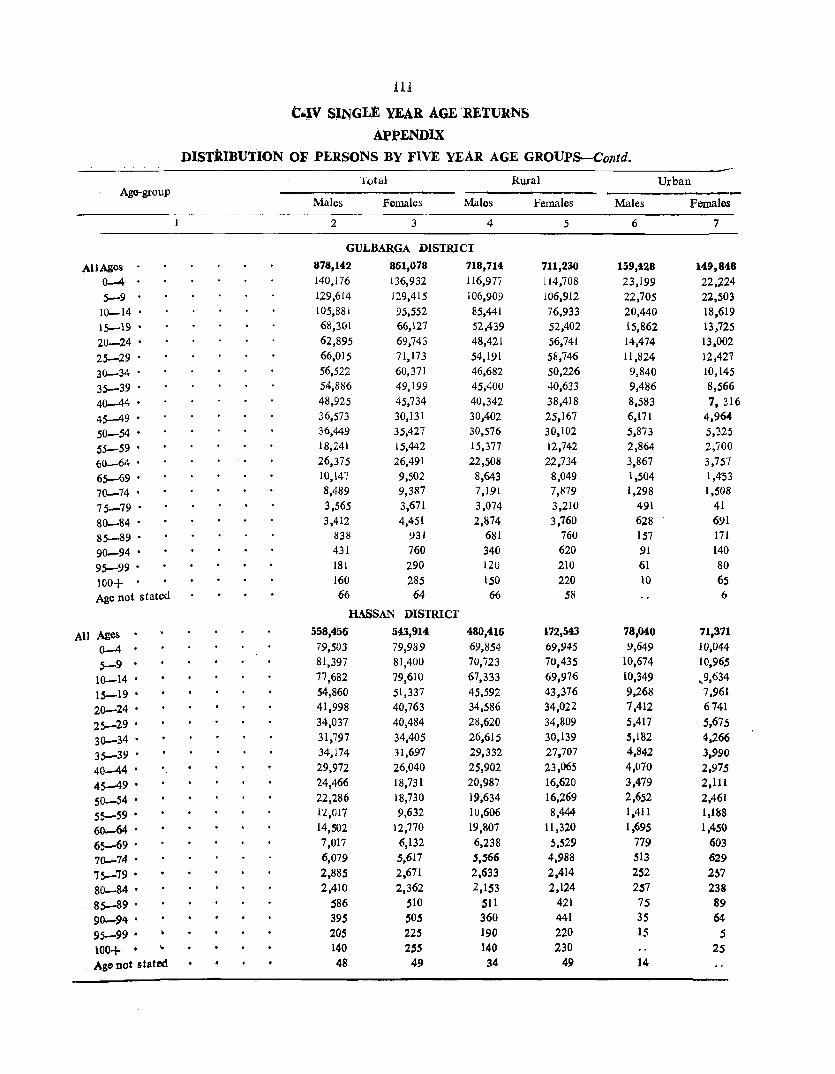
111
C.JV SINGLE YEAR AGE ·RETURNS
APPENDIX DISTiUBUTION OF PERSONS BY FIVE YEAR AGE GROUPS-Contd.
Total Rural Urban Age-group
Males Females Males Females Males Females
2 3 4 5 6 7
GULBARGA DISTRICT
All Ages 878,142 861,078 718,714 711,230 159,428 149,848
0-4 140,176 136,932 116,977 114,708 23,199 22,~24
5-9 129,614 129,415 106,909 106,912 22,705 22,503 10--14 • 105,881 95,552 85,441 76,933 20,440 18,619 15-19 • 68,301 66,127 52,439 52,402 15,862 13,725 20-24 • 62,895 69,743 48,421 56,741 14,474 13,002
25-29 • 66,01:; 71,173 54,191 58,746 11,824 12,427
30--34 • 56,522 60,371 46,682 50,226 9,840 10,145
35-39 • 54,886 49,199 45,40U 40,633 9,486 8,566
40-44 • 48,925 45,734 40,342 38,418 8,583 7, 316
45--49 • 36,573 30,131 30,402 25,167 6,171 4,964
SO-54 • 36,449 35,427 30,576 30,102 5,873 5,325
55-59 • 18,Z41 15,442 15,377 12,742 2,864 2,700
(Jo-64 • 26,375 26,491 22,508 22,734 3,867 3,757
65-69 • 10,147 9,502 8,643 8,049 1,504 1,4'53
70-74 • 8,489 9,387 7,191 7,879 1,298 1,508
75-79 • 3,565 3,671 3,074 3,210 491 41
80--84 • 3,412 4,451 2,874 3,760 628 691
85-89 • 838 931 681 760 157 171
90-94 • 431 760 340 620 91 140
95-99 • lSI 290 120 210 61 80
100+ . 160 285 150 220 10 65
Age not stated 66 64 66 58 6
HASSAN DISTRICT
All Ages 558,456 543,914 480,416 172,543 78,040 71,371
0-4 · 79,503 79,989 69,854 69,945 9,649 10,044
5-9 · 81,397 81,400 70,723 70,435 10,674 10,965
10-14 • 77,682 79,610 67,333 69,976 10,349 ~9,634
15-19 • 54,860 51,337 45,592 43,376 9,268 7,961
20-24 • 41,998 40,763 34,586 34,022 7,412 6741
25-29 • 34,037 40,484 28,620 34,809 5,417 5,675
30-34 • 31,797 34,405 26,615 30,139 5,182 4,266
35-39 • 34,174 31,697 29,332 27,707 4,842 3,990
40-44 • 29,972 26,040 25,902 23,065 4,070 2,975
45-49 • 24,466 18,731 20,987 16,620 3,479 2,111
50--54 • 22,286 18,730 19,634 16,269 2,652 2,461
55-59 • !'l,Ol7 9,632 10,606 8,444 1,411 1,1&8
60-64 • 14,502 12,770 19,807 11,320 1,695 1,450
65-69 • 7,017 6,132 6,238 ~,529 779 603
70-74 • 6,079 5,617 5,566 4,988 513 629
75-79 • 2,885 2,671 2,633 2,414 252 257
80-84 • 2,410 2,362 2,1S3 2,124 237 238
85-89 • 586 510 511 421 75 89
90-94 • 395 505 360 441 35 64
95-99 • 205 225 190 220 15 5
100+ · ~ 140 255 140 230 25 _ Ago not stated 48 49 34 49 14

112
C.JV SINGLE YEAR AGE RETURNS
APPENDIX
DISTRIBUTION OF PERSONS BY FIVE YEAR AGE GROUPS-Contd.
Total Rural Urban Ale-Ifoup
Mal~s Females ldah;:; Females Males Fcmalei
1 2 3 4 j 6 7
KOLAR DISTRICT
All Ages · 773,293 743,353 611,577 591,954 161,716 151,399
0-4 · 101,186 104,648 79,701 83,887 21,485 20,761 5-9 · 118,491 115,793 94,475 92,586 24,016 23,207
10-14 • 93,238 93,720 72,828 72,999 20,410 20,721 15-19 • 68,401 50,724 50,949 42,544 17,4,52 16,180 20-24 • 57,767 57,85"1- ~2,623 44,687 15,144 13,167 25-29 • ~1,239 60,264 40,238 48,212 lI,OOI 1:!,O,52 30-34 • 45,880 50,513 36,342 40,809 9,538 9,704 35-39 • 45,624 44,819 36,045 36,085 9,579 8,734 40-44 • 43,729 37,628 35,120 31,022 8,609 6,606 45-49 • 36,590 :,,(8,642 29,082 23,368 7,508 5,274 SO-54 • 34,095 27,495 28,174 22,705 5,921 4,790 55-59 • 20,469 14,617 16,896 12,160 3,573 2,457 60-64 • 23,328 20.269 20.075 16,955 3,253 3.314 65-69 • 11,217 8.750 9,759 7,161 1,458 1,589 70-74 • 10,761 10,339 9.439 9.021 1.322 1,318 75-79 • 4,383 3.121 3,790 2,59U 593 531 80-84 • 4,857 3,878 4,309 3,271 .548 607 85-89 • 886 996 77U 840 116 156 90-94 • 726 835 640 680 86 ISS 95-99 • 230 255 160 200 70 j5 100+ · 125 120 100 100 25 20 Ago not stated 71 73 62 72 9
MANDYA DISTRICT
AU Ages 588,914 565,460 505,934 489,652 82,980 75,808 0-4 84.852 82.769 73,893 71,9:::7 lC,5;9 1(;,£.42 5-9 89,020 88,73S 77,462 76,969 11,.5.58 11.769
10-14 • 75,160 78,169 64,707 67,947 10,453 .10.222 15-19 • 56.827 47,348 47,772 37,813 9,CSS 7,53.5 20-24. 42,559 42.240 35.010 35.526 7,549 6.714 25-29. 34,191 41,731 28,478 35,756 5.713 5,975 30-34 • 32,555 37,519 27,4()4 32,669 5,151 4,850 35-39. 35.096 32,O~0 30,052 27,585 5,(i44 4,465 40-44 • 31,847 28,298 27,162 25.(,:1 4,(~5 3,:67 45-49. 27,090 19,488 2:,4;:.2 17 ,('~.2 :,U8 2,;5.6 50-54. 25.133 19.987 21.8.51 17,:C3 3,;;'E2 2,:t4 55-59 • 13,8.58 9.:82 12,312 8,lh6 1,5';6 j,(~6 60-64 • 16,675 14,320 14,liW 12.():;'7 1,81,5 l,t93 65-69. 7,573 7.823 6.723 7,009 850 814 70-74. 7,668 7,111 6,843 6,169 825 942 75-79. 3,272 2,9,54 2,971 2,640 301 314 80-84. 3,348 3,298 3,061 2,94S1 287 349 85-89. 698 719 620 660 78 j~ 90-94. 828 868 750 770 78 98 95-99. 334 289 3JO 250 l4 3~ 100+ · 269 424 230 360 3i 64 Ale not stilted 61 35 41 101 20 lJ

113
C.IV SINGLE YEAR AGB RETURNS
APPENDIX DISTRmUTION OF PERSONS BY FIVE YEAR AGE GROUPS-Contd,
Age-group Total Rural Urban
Males Females Males Females Males Females
2 3 4 5 6 7
MYSORE DISTRICT
AU Ages 1,069,904 1,007,334 793,887 754,233 •
276,017 253,101
0-4 142,611 142,948 110,591 110,159 32,(j~() 32,/t y
5-9 148,437 154,179 112,572 117,640 35,865 36,5:'9 10-14, J 33,525 128,639 98,580 95,631 34,945 33,(]()8
15-19 . 109,701 94,807 77,196 66,9; I 32,~05 27,896 20-24 • 87,302 81,820 58,713 58,158 28,589 23,~62
25-29 . 72,209 78,047 52,697 57,759 19,512 20,18S 30-34 , 64,30S 66,625 47,446 49,396 16,862 17,229 35-39 . 64,277 57,232 47,440 42,627 16,837 14,605 40-44 . 58,174 47,608 43,605 35,959 14,569 {j ,(;49 45-49 • 48,222 :J6,4J7 35,555 27,625 12,667 S,792 50-54 . 44,321 35,999 33,719 27,659 10,602 8,240 55-59 . 24,265 18,690 18,542 14,350 5,723 4,34U 60-64 • 30,414 27,161 23,842 21,379 6,572 5,782 65-69 . 14,0;9 11,831 10,952 9,027 3,G67 2;804 70-74 . ;3,744 12,405 10,962 9,907 2,782 2,498 75-79 . 5,985 4,528 4,707 3,519 1,278 1,009 80-84 • 5,361 5,158 4,337 3,969 1,024 1,189 85-89 . 1,483 1,385 1,169 1,060 314 325 90-94 • 959 1,100 789 890 170 21IJ 95-99 • 270 405 230 300 40 105 100+ 215 290 180 260 35 30 Asc not ~tated 102 60 63 48 39 12
NORTII KANARA DISTRICT
All Ages 433,946 415,159 357,132 341,476 76,814 73,683 0-4 60,746 59,018 50,471 48,716 10,275 10,302 5-9 62,482 65,433 51,681 55,040 10,801 10,393
10-14 • 59,652 56,954 49,612 47,416 10,040 9,538 15-19 • 43,269 39,712 35,140 31,826 8,129 7,886 20-24 • 34,504 32,870 27,604 26,014 6,900 6.856 25-29 • 28,825 30,551 23,.l71 24,693 5,6$4 5,858 30-34 , 25,287 25,291 20,078 20,660 5,209 4,631 35-39 • 26,445 24,380 21,561 20,018 4,884 4.362 40-44 • 22,694 ]8,904 18,691 15,738 4,003 3,166 45-49 • 19,202 15,712 16,032 13,002 3,170 2,710 50-54', 15,735 14,250 13,300 j J ,810 2,435 2,44(" 55-59 • 11,209 9,104 9,429 7,527 1,780 1,577 60-64 • 10,386 10,236 8,739 8,394 1,647 1,842 65-69 • 6,030 5,395 5,31J 4,625 719 770 70-74 • 3,844 3,776 3,288 3,143 5S6 633 75-79 • 1,847 1,634 1,544 1,244 303 390 80-84 • 1,035 1,244 857 1,006 ]7~ 238 85-89 • 353 309 279 279 74 30 90-94. 210 166 170 120 40 46 95-99 • 165 160 160 150 5 10 100+ . 10 35 30 10 5 Ale not stated 16 2S 14 2' l

114
'(.IV SINGLE YEAR AGE RETURNS
APPENDIX
DISTRIBUTION OF PERSONS BY FIVE YEAR AGE GROUPS-Contd.
Total Rural Urban Age-group
Males Fe.nales M"le.l Fe.nlle:; Males Females
2 3 4 5 6 7
RAICRUR DISTRICT
All Ages 714,750 700,990 602,652 595,617 112,098 105,373 0- 4 • .. 109,294 106,727 93,754 91,927 15,540 14,800 5- 9 • 108,408 86,140 91,477 69,624 16,931 16,516
10-14 • 89,675 104,306 76,036 91,705 13,639 12,601 1)-19 • 57,636 55,106 46,994 45,600 10,642 9,506
20-24 51,346 55,67.0 42,318 46,813 9,028 8,857 25-_9 • 53,166 57,460 44,833 48,549 8,333 8,911 J!;-34 • 46,774 48,802 39,071 41,364 7,703 7,438 35-39 • 48,059 40,497 40,906 34,269 7,153 6,228 40-44 • 40,178 35,675 33,360 30,546 6,818 5,129 45-49 • 30,692 24,439 26,076 21,C05 4,616 3,434 50-54 • 28,119 28,437 23,812 24-,545 4,307 3,892 55-59 • 15,689 13,724 13,646 11,832 2,043 1,892 60-64 • 18,714 21,232 16,109 18,326 2,605 2,906 65-69 • 6,340 7,743 5,404 6,654 936 1,089 70-74 • 6,040 8,294 5,174 7,145 866 1,149 75-79 • 1,866 2,482 1,541 2,211 325 271
80-84 • 1,785 2,824 1,431 2,382 354 442 85-89 • 384 560 310 490 74 70
90-94 • .. 339 556 270 430 69 126
95-99 • 110 140 90 110 20 30
100+ . 55 100 40 90 15 10
Age not stated 81 76 81 76
SHIMOGA DISTRICT
All Ages 673,976 627,509 512,124 482,048 161,852 145,461
0- 4 • 98,527 94,:i73 77 ,~85 72,832 21,(:42 21,541
5- 9 • 101,436 107,304 78,644 84,572 22ii92 2';.,732
10-14 • 94,04·9 94,559 72,6/2 74,';.62 21,377 20,';.97
15-19 • 66,319 58,8/9 48,273 43,';.28 18,<A6 15,651
20-24 • 51,894 48,873 36,139 35,037 15,755 13,836
25-29 • 43,374 46,852 31,432 34,807 1l,942 12,045
30-34 • 39,707 38,381 28,988 29,111 10,719 9,270
35-39 • 40,033 34,954 29,:'90 27,076 10,743 7,878
40-44 • 33,833 26,114 25,<:98 20,378 8,335 5,736
45-49 • 29,288 19,435 22,666 15,012 6,622 4,363
50-54 • 24,942 18,555 19,617 14,560 5,325 3,995
55-59 • 13,882 9,547 11,182 7,445 2,'CO 2,IC2
60-64 • 15,904 12,304 12,995 9,720 2,909 2,584
65-69 • 7,966 6,179 6,709 4,887 1,257 1,292
70-74 • 5,981 7,382 4,859 6,435 1,122 947
75-79 • 2,736 2,544 2,270 2,068 466 476
80-84 • 2,140 736 1,750 300 390 436
85-89 • 80S 230 650 90 155 140
90-94 • . ' 405 115 310 60 9S ,S 95-99 • 180 35 140 40 35
100+ . 220 80 200 30 20 SO Age not stated 355 78 355 78

115
C.IV SINGLE YEAR AGE RETURNS
APPENDIX
DISTRIBUTION OF PERSONS BY FIVE YEAR AGE GROt;pS-Concld.
Total Rural Urban Age-group
Mde3 Females Males Females Males Females
2 3 4- 5 6 7
SOUTH KANARA DISTRICT
All Ages 912,495 9~5,820 747,334 793,803 195,161 198,017 0-- 4 • 140,603 J34,~93 116,181 110,491 24,422 23,902 5- 9 • 145,370 141,176 119,248 115,540 26,122 25,636
10-14 • 134,746 138,158 108,459 112,362 26,287 25,796 15-19 • 88,533 104,165 66,815 81,839 21,718 22,326 20-24 • 74,651 81,340 55,308 62,550 19,343 18,790 25-29 • 55,742 67,499 42,035 53,331 13,707 14,:68 30-34 • 47,168 57,368 35,812 45,385 11,356 11,983 35-39 • 50,226 58,025 38,695 46,136 11,531 11,889 40-44 • 43,180 46,765 33,913 37,561 9,267 9,204 45-49 • 41,867 42,027 33,271 33,<.86 8.596 8,541 5C-54 • 35,557 34 ,396 28,607 27,395 6,950 7,001 55-59 • 23,::5:0 25,9: 0 18,848 20,469 4,542 5,461 fO-64 • 22,8;2 25,107 19,350 20,245 4,462 4,862 65-69 • 14,720 15,475 11,942 12,398 2,778 3,077 '10-74 • j 1,546 12,032 9,529 9,579 2,017 2,453 75-79 • 6,413 6,:93 5,299 4,879 1,114 1,514 80-84 • 2,924 4,044 2,374 3,239 550 805 85-89 • 1,248 1,310 971 950 277 360 90-94 • 557 800 481 640 76 160 95--99 • 140 270 110 200 30 70 100+ . 40 85 40 70 IS
Age not stated 62 62 46 58 16 4
TUMKUR DISTRICT
All Ages 831,859 79';,862 731,566 705,548 100,293 90,314 0-4 • 108,863 111,349 96,932 99,084 11,931 12,265 5- 9 • 121,287 126,<-97 107,855 112,396 13,4·32 14,101
10-14 • 105,885 109,628 92,733 96,977 13,152 12,651 15-19 • 78,089 65,059 65,764 55,560 12,325 9,499 20--24 • 63,352 59,604 52,587 51,459 10,765 8,145 25-29 • 53,293 60,332 46,578 53,109 6,715 7,223 30-34 • 48,829 51,864 42,581 45,931 6,248 5,933 35-39 • 50,210 46,713 44,297 41,748 5,913 4,965 40-44 • 44,925 38,449 39,896 34,580 5,029 3,869 45-49 • 39,407 30,281 35,042 27,470 4,365 2,811 SO-54 • 35,008 29,693 31,413 26,871 3,595 2,822 55-59 • 21,657 14,521 19,922 13,161 1,735 1,360 60-64 • 24,741 19,721 22,430 17,863 2,311 1,858 65-69 • 11,892 10,689 10,983 9,760 909 929 70-74 • 12,277 10,700 11,303 9,880 974 820 75-79 • 5,098 4,201 4,721 3,824 377 377 80-84 • 4,237 4,000 3,941 3,583 296 417 85-89 • 1,256 1,050 1,130 931 126 119 90-94 • 83.5 701 770 661 6,5 40 95-99 • 390 335 380 280 10 5S 100+ . 170 334 150 280 20 S4
Ago not stated 158 141 1,58 140 1


C~V MOTHER TONGUES
117


TABLE C-V-MOTHER TO~GUES OF THE 1971 CENSUS
Part A : Distribution of languages (inclnsive of mother-tongues grouped under each) specified in Schedule vrn to the Constitution of India.
Part B : Speakers of languages/motber-tongues (mclusive of mother-tongues where grouped) other than those specified in Schedule vm to the Constitution of India.
These tables correspond to the all-India language tables of the census of India 1951 published in Census of India Paper I of 1954 and the language tables C-V of the census of India 1961 published in volume I Part II C(ii) - Language tables and volume XI -Mysore Part II-C(i) Social and Cultural tables.
The question on mother-tongues at the 1971 census and instructions to enumerators were as follows. "Question 14 : Mother-tongue
Definition :-Mother-tongue is the language spoken in childhood by the person's mother to the person. If the mother died in infancy. the language mainly spoken in person's home in childhood will be the mother-tongue. In the case of infants and deaf mutes the language usually spoken by the mother shall be recorded.
Record mother-tongue in full whatever be the name of the language as returned and avoid use of abbreviations. You are not expected to determine if the language returned by a person is the dialect of another major language and so on. You should not try to establish any relationship between religion and mother-tongue. You are bound to record the language as returned by the person as his mother-tongue and you should not enter into any argument with him and try to record anything other than what is returned. If you have reason to suspect that in any area due to any organised movement, mother-tongue was not being truthfully returned, you should record the mother-tongue as actually returned by the respondent and make a report to your superior Census Officers for verification. You are not authorised to make any correction on your own",
Table C-V Part A· is in two sections: (i) showing the distribution of speakers of lan~uages (inclusive of mother-tonmIes grouped under each) specified in Schedule WI to the Constitution of India for the state and its nineteen districts separately for total. rural and urban areas cross-classified by sex and (ii) showing the distribution of speakers of these languages for nineteen districts. one hundred and seventy five taluks and two hundred and forty five towns in the state for total areas only cross-classified by selC. The data for the rural areas of the taluk are not presented but they can be derived by subtracting data in respect of towns within the taluk from the total taluk figures. TaIukwise list of towns are furnished in Appendix-IV.
119
Table C-V Part B presents speakers of languages/ mother-tongues (inclusive of mother-tongues where grouped) other than those shown under Part A for the state, districts, taluks and [owns. This table is also being presented in tW(I :sections (i) showing the speakers of these 1ani<uagcs/mother-tongues for the state and its districts for total, rural and urban areas cross-classified by sex and (ii) showing the distribution of these languages/mother-tongues for total areas of districts, taluks and towns cross-classified by sex.
In both parts A and B. mother-tongues have been grouped in some cases under the relevant Ianguge(s), This has been done on the basis of information readily available or in the light of studies already made. Those 'Identifiable' mether-tongues which returned 10,000 or more speakers each at the all-India level have been grouped in parts A and B as shown below.
Part A
GUJARATHI
HINDI
KANNADA MALAYA LAM ORIYA SINDHI TAMIL
TELUGU
Part B
SAURASHTRA
BANJARI, BHOJPURI; BRAJ BHASHA; GARHWALI; HINDUSTANI; KANGRI; KULVI; KUMAUNI; LAMANI/LAMBADI; MAlTHTLI; MARWARI; MEWARI; *PAHARI; RAJASTHANI. BADAGA YERAVA RELLI KACHCHHI KAIKADl; YERUKULA VADARI
YERUKALAj
PARADHI; VARLl WAR
BHILl/BHILODI KHASI LAHNDA - MULTANI
All other mother-tongues falling under Part Band which returned less than 10,000 speakers each at the all-India level or were not 'identifiable' on the basis of information available as of date are included in the category 'Others' occurring as the last entry in Part B.
·PAHARI is a combination of various speeches spoken over long stretches of areas where the speakers preferred to give a general name as Pahari. Similar is the case with NAGA appearing in table C-V Part B and marked by asterisk therein.

120
STATEMENT 1
DISTRIBUTION OF 1971 POPULAlION BY LANGUAGES
(Inclusive of L/MT'$ grouped under each)
Statel Total Schedule VIII District Population Languages
2 3
MYSORE STATE 29,29~,014 27,547,379 (100.00) (94.02)
Ba11&alorc 3,365,51,5 3,329,982 (100.00) (9S.94)
Belgaum 2,423,342 (100.00)
2,40S,871 (99.40)
'Sellary . 1,122,686 1,121,072 (100.00) (99.S6)
Bidar 824,059 823,825 (100.00) (99.97)
Bijapur' 1,985,591 1,983,474 (100.00) {99.S9)
Chikmagalur . 736,647 669,924 {100.00) {90.94)
Chitradurga 1,397,456 1,393,762 (100,00) (99.74)
COQrg • 378,291 276,209 (100.00) (73.01)
Dharwar 2,342,213 2,307,192 {100.00) (98.50)
Gulbargu 1,739,220 1,737,857 (100.00) ~99.92)
Hassan 1,102,370 I,OSO,790 (100.00) (98.04)
Kolar 1,516,646 1,514,512 (100.00) (99.86)
Mandya 1,154,374 1,152,727 (100.00) (99.86)
Mysore 2,077,238 2,062,953 (100.00) (99.31)
North Kanara 849,105 644,590 (100.00) (75.91)
RaichUr 1,415,740 1,413,204 (100.00) {99.,82)
Shimoga J .301 ,485 1,271,130 (100.00) (97.67)
South Kanara 1,939,31,5 72S,663 (100.00) (37.57)
Tumkur 1,627,121 1,626,642 (100.00) (99.93)
INDIA. 518,159,652 522,759,625 (100.00) (95.37)
SQ~rce : Part n CCi) Socilll lind Cultural Tables, India, 1911,
Other Languages
4
17,51,635 (5.98)
35,533 (1.06)
14,471 (0,60)
1,614 (0.14)
234 (0.03)
l!,1l7 {O .11)
66,723 (9.06)
3,694 (0.26)
102,082 (26.99)
35,021 (1.50)
1,363 (0.08) 21,580
(1.96)
2,134 (0.14)
1,647 (0.14)
14,285 (0.69)
204,515 (24.09)
2,536 (0.18)
30,355 (2.33)
1,210,652 (62.43)
1,079 (0.07)
25,400,027 (4.63)

."
~ ... u
!-
j 1 ... -'" fIl
f -
• ..::._ '" .. . '11'-iltj6
I .,._ 6~
GO -
o
N
;z; Z
...
III
"" ...
;z; z
"" Z
z
;z; Z Z Z Z Z
121
z
z
z ;Z; Z
o 00 00 o f'l"
z z
to 0'1
z Z 'V
z
N N
z z
z -
z
oc ;z; Z Z ;z; Z z
z ;z; Z Z z z z z z
gg lei
z z z z
z
z z
z z
z z
z
o 0 0 0 0 0 0 0 0 0 0 0 0 0 000 0 0
g g ~ g ~ g ~ ~ ~ g ~ ~ g ~ ~ ~ g g g ~ g ~ 0 0 0 0 0 0 0 0 0 0 ~ 0 0 0 0 0 0 0 ~ ~ ...
z
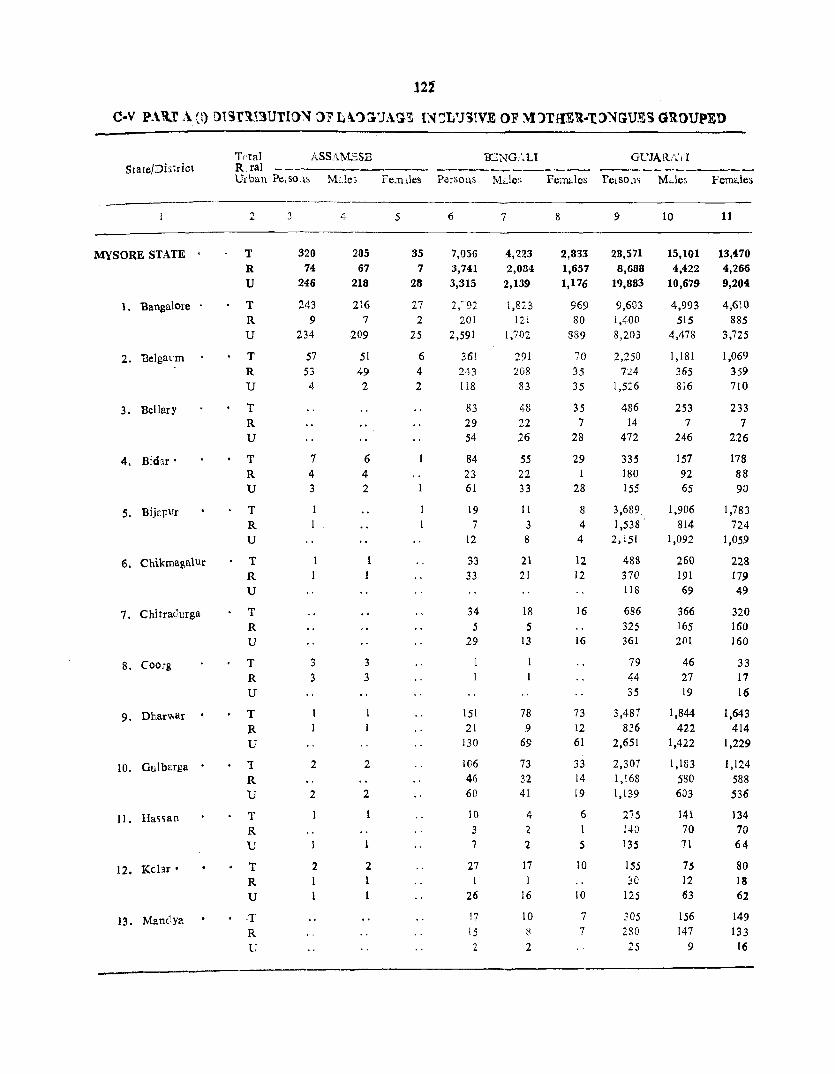
State/Dbtrict
MYSORE STATE
1. Bangalore •
2. Belgat:m
3. Bellary
4. Bidu'
6. Chikmagalur
7. Chitraclurga
8. Coorg
9. Dharwar
10. Gulb~rga •
11. Ha~san
12. Kchr'
13. Mant1.ya
Tnal ASSAM.SSE R.ral Urban Pe,so_ls Mdc:;
2
l' R U
T R U
T R U
T R U
T R U
T R U
T R U
T R U
T R U
T R U
T R U
T R U
T R U
•. 1' R U
3
320 74
246
243 9
234
57
53 4
7 4 3
3 3
2
2
2
285 67
218
216 7
209
51 49 2
6 4
2
3 3
2
2
2
5
35 7
28
27 2
25
6 4 2
Persons Mde,
6
7,056 3,741 3,315
2,-92 201
2,591
83 29 54
84 23 61
19 7
12
33 33
34 5
29
15i 21
130
106
46 60
10 3 7
27
26
!7 i 5 2
7
4,'Z?3
2,084 2,139
1,823 121
1,702
291 208
83
48 22 26
55 22 33
II
3 8
21 2l
18 5
13
78 9
69
73 32 41
4
" '2
17 I
16
10
8
2
Fel1llJes
8
2,833 1,657 1,176
969 80
889
70 35 35
35 7
28
29
28
8 4 4
12 12
16
16
73 12 61
33 14 19
6 1
5
10
10
7
7
GUJARATI
9
28,571 8,688
19,883
9,603 1,400 8,203
2,250 7:24
1,526
486 14
472
335 180 155
10
15,101 4,422
10,679
4,993 515
4,478
1,181 365 8i6
253 7
246
157 92 65
3,689, 1,906 1,538 ' 814
2,151 1,092
488 260 370 191 118 69
686 366 325 165 361
79 44 35
3,487 836
2,651
2,307 1,168
1,139
275 140
135
155 ~O
125
305
2SD 25
201
46 27 19
1,844 422
1,422
1,183 580 603
141
70 71
75 12 63
156
147 9
Femdes
11
13,470 4,266 9,204
4,610 885
3,725
1,069
359 710
233 7
226
178 88 90
1,783 724
1,059
228 179 49
320 160 160
33 17 16
1,643 414
1,229
1,124 588 536
134 70 64
80 18 62
149
133 16

123
UNDER EACH) SPECIFIED IN SCHEDULE VIII TO THE CONSTITUTION OF INDIA
HINDI KANNADA KASHMIRI MALAYALAM
Persons Males Females Persons Males Fenialt;s Persons Males Females Persons Males Females
)2
526,692 408,074 118,618
50,242 13,726
36,516
23,496 17,}25
6,371
43,072 36,385 6,687
22,812 19,816 2,996
63,185 53,378 9,807
15,107 13,754 1,353
35,734 31,513 4,221
978 699 279
41,471 30,327 fl,144
103,346 91,195 12,151
9,412 7,985 1,427
9,932 6,266 3,666
1,950 857
1,093
)3
275,478 208,691 66,787
29,292 7,198
22,094
12,578 9,051 3,527
22,281 18,598 3,683
11,867 10,283 1,584
32,655 27,455 5,200
7,889 7,139 750
18,384 16,000 2,384
516 363 153
21,605 15,483 6,122
52,885 46,454 6,431
4,988 4,176
812
5,225 3,173
2,052
982 424 558
14 15 16 17
251,214 19,328,950 9,871,500 945,7450 199,383 16,116,620 8,180,183 7,936,437 51,831 3,212,330 169,117 1,521,013
20,950 6,528
14,422
10,918 8,074 2,844
20,791 17,787 3,004
10,945 9,533 1,412
30,530 25,923
4,607
7,218 6,615 603
17,350 15,513 1,837
462 336 126
19,866 14,844 5,022
50,461 44,741
5,720
4,424 3,809
615
4,707 3,093 1,614
968 433 535
1,705,243 1,080,678
624,565
1,619,784 1,395,494
224,290
823,594 677,707 145,887
886,929 553,451 333,478
818,314 527,227 291,087
831,336 788,448 713,528 681,966 117,808 106,482
416,665 341,489 75,176
406,929 '336,218 70,711
422,022 215,564 206,458 378,592 192,453 186,139 43,430 23,111 20,319
1,633,664 1,358,520
275,144
525,417 458,441 66,976
826,774 683,335 143,439
268,838 234,097 34,741
1,036,296 534,498 867,698 444,123 168,598 90,375
155,838 133,430 22,408
1,875,919 1,425,299 450,620
1,157,342 1,023,926
133,416
950,459 857,710 92,749
368,420 326,480 41,940
1,064,207 951,974 112,233
79,902 68,343 J 1,559
962,754 725,274
237,480
585,298 515,8()O 69,498
478,334 429,720 48,614
188,992 166,727 22,265
541,883 483,216
58,667
806,890 675,185 131,705
256,579 224,344
32,235
501,798 423,575 78,223
75,936 65,087 10,849
913,165 700,025 213,140
572,044 508,126 63,918
472,125 427,990 44,135
179,428 159,753 19,675
522,324 468,758 53,566
11-1 Census Karnatka/78
18
220 28
192
150 2
148
10
10
2 2
1
1
2
2
4
4
4
4
7
7
19
91 27
64
30 2
28
8
8
1
1 1
2
2
2
2
4
4
7
7
20
129 1
128
120
120
2
2
1
2
2
21
425,196 287,835
137,361
60,152 5,388 54,764
2,160 1,209
951
1,790 393
1,397
288 115 173
237 104 133
18,500 16,285 2,215
1,689 340
1,349
78,669 68,319 10,350
1,931 223
1,708
869 232 637
9,308 7,322
1,986
3,342 138
3,204
2,636 1,448 1,188
22
240,197 157,130 83,067
38,436 3,577
34,859
1,533 895 638
1,167 279 888
209 108 101
173 70
103
10,702 9,325 1,37'1
1,161 287 874
44,478 38,052 6,426
1,179 172
1,00'
S46 162 384
5,839 4,505
1,334
2,049 109
1,940
1,875 1,085
790
23
184,999 130,705 54,294
21,716 1,811
19,905
627 314 313
623 114 509
'19 "I
"I'l.
64 34 30
7,798 6,960
838
528 53
475
34,191 30,267
3,924
752 51
701
323 70
253
3,469 2,817
652
1,293 29
1,264
761 363 398

124
C.V PART A (i)-DISTRIBUTION OF LANGUAGES (INCLUSIVE OF MOTHER-TONGUES GROUPED
Total MARATHI ORIYA PUNJABI StatefDistrict Rural
UrMn Persons Males Females Persons Males Females Persons Male~ Females
2 24 25 26 27 28 29 30 31 32
MYSORE STATE T 1,187,133 605,043 582,090 1,798 1,041 757 7,027 4,628 2,399 R 789,244 400,667 388,577 1,071 529 542 1,174 913 261
U 397,889 204,376 193,513 727 512 215 5,853 3,115 2,138
I. Bangalore T 76,191 38,691 37,500 349 314 35 4,685 3,022 1,663 R 9,343 4,654 4,691 18 11 7 432 290 142 U 66,846 34,037 32,809 331 303 28 4,253 2,732 1,521
2. Belgaum T 539,801 276,516 263,285 125 101 24 494 384 110 R 390,487 198,980 191,507 100 85 IS 231 209 22 U 149,314 77,536 71,778 25 16 9 263 175 88
3. Bellarr T 9,461 4,893 4,568 78 41 37 85 53 32 R 2,744 1,388 1,356 73 37 36 36 28 8 U 6,717 3,50" 3,212 5 4 49 :l5 24
4. Bidar' T 179,963 91,152 88,811 151 35 116 213 135 78 R 166,995 84,454 82,541 144 33 III 75 69 6 U 12,968 6,698 6,270 7 2 5 138 66 72
5. Bijapur T 44',909 22,838 22,071 61 39 22 109 68 32 R 19,056 9,712 9,344 56 38 18 H! 16 2 U 2S,8~3 13,126 12,727 5 4 82 52 30
6. Chikmagalur T 7,906 4,061 3,845 81 42 39 13 7 6 R 3,963 2,020 1,943 75 40 35 3 3 U 3,948 2,041 1,902 6 2 4 10 4 6
7. Chitradurga T 14,387 7,374 7,013 252 12't 125 77 7';. 5 R 3,797 1,896 1,901 215 104 111 48 48 U 10,590 ~,478 5,112 37 23 II. 29 24 5
8. Coorg' T '2,435 1,210 1,225 ~O 26 24 R 1,681 820 861 48 25 23 U 754 390 364 2
9. Dharwar T 48,800 24,609 24,191 42 :.1.6 16 413 249 164 R 11,290 5,618 5,672 28 17 II 8 7 U 37,510 18,991 18,519 14 9 5 405 242 163
10. Gul barga . T 5011f77 25,670 25,307 380 199 181 196 '33 63 R 28,884 14,464 14,420 130 66 64 12 8 4 U 22,093 11,206 10,887 250 133 117 184 125 59
11. Hassan T 7,221 3,688 3,533 16 10 6 R 3,557 1,807 1,750 6 4 2 U 3,664 1,881 1,783 10 6 4
12. KoJar T 12,268 6,290 5,978 2 2 52 29 23 R. 8,540 4,370 4,170 6 5 I U 3,728 1,920 1,808 46 24 22
13. Mandya T 5,458 2,793 2,665 27 17 10 R 2,536 1,299 1,237 27 17 10 U 2,922 1,494 1,428

125
UNDER EACH) SPECIFIED IN SCHEDULE VIII TO THE CONSTITUTION OF INDIA-Contd.
SANSKRIT SINDHI TAMIL TELUGU URDU
P~r- Ma- Fe- Per- Ma- Fe- Persons Males Females Persons Males Females Persons Males Females sons les males sons les males
33 34 35 36 37 38 39 40
111 72 39 9,651 .,825 4,826 990409 517,597 55 37 19 196 130 66 317,284 167,194 5'; 35 209,4554,6954,760 673,12S 350,403
44 10 34
1
3 3
1 1
2 2
5
5
1
1
27 1
20
1 1
2 2
3
3
17 5,8472,834 3,013 528,284 274,473 3 22 10 12 95,585 49,088
145,8252,824 3,001 432,699 225,385
1
2 2
2
2
1
706 372 334 6,986 4,141 31 23 8 4,203 2,540
675 349 326 2,783 1,601
137
137
65 5
60
62
62
39 3
36
75 15,888 3,440
75 12,448
26 2
24
747 537 210
8,605 1,912 6,693
403 299 104
624 293 331 2,565 1,201 1,364
1,436 669 767
11 5 6 613 288 325
19
19
9 1 8
11
11
4 1 3
35,520 18,952 •• 29,452 15,740
6,068 3,212
8 17,294 9,171 7,753 4,115
8 9,541 5,056
5 22,165 12,119 .• 17,954 9,888 5 4,211 2,231
835 430 405 10,629 5,717 582
5,135 9 2 7 989
826 428 398 9,640
182 5
177
1
11
U
13 4 9
112 4
108
1
5
5
5 2 3
70 1
69
2,841 '1,534 ] ,356 695 1,485 839
. . 25,720 ] 3,479
.• 17,023 9,018 8,697 4,461
6 137,582 69,728 •. 44,008 22,208 6 93,574 47,520
8 19,820 10,391 2 .11,025 5.734 6 8,795 4,657
41 42 43 44- 45 46 47
472,812 2,397,557 1,225,581 1,171,976 2,636,688 1,349,866 1,286,822 150,090 1,717,296 873,430 843,866 1,223,228 620,791 602,437 322,722 680,261 352,151 328,110 1,413.460 729,075 684.385
253,811 46,497
207.314
2,845 1,663 1,182
7,283 1,528 5,755
344 238 106
1,129 532 597
16,568 13.712 2,856
8.123 3,638 4,485
10,046 8,066 1,980
4,912 407
4,505
1,307 661 646
12,241 8,005 4,236
67,854 21,800 46,054
9,429 5,291 4,138
537,296 226,720 310;576
22,329 12,615
9,714
112,028 57,352 54,676
43,667 37,220
6,447
17,066 11,547 5,519
20,970 13,637 7,333
182,094 158,684
23,410
5,145 2,743 2,402
34,100 9,775
24,325
119,873 106,028 13,845
27,696 18,936 8,760
828,720 733,991 94,729
16,772 10,163 6,609
277,947 116,088 161,859
11,819 6,654 5,165
57,145 29,043 28,102
22,308 18,931 3,377
8,801 6,021 2,780
10,791 7,03] 3,760
93,392 81,138 12,254
2,692 ],440 1,252
17,723 5,031 12,692
59,059 52,148 6,911
14,340 9,896 4,444
420,467 371,786 48,681
8,683 5,274
3,409
259,349 1l0,632 148,717
10,510 5,961 4,549
54,883 28,309 26,574
21,359 18,289 3,070
8,265 5.526 2,739
10,179
6,606 3,573
88,702 77,546 11,156
2,453 1,303 1,]50
16,377 4,744 11 ,633
60,814 53,880 6,934
13,356 9,040 4,316
408,253 362,205 46,048
8,089 4,889
3,200
348,861 64,727
284,134
190,31.2 98,963 91,349
114,367 39,369 74.998
153,47() 101,186 52,284
217,352 118,427 98,925
45,885 24,897
20,988
105,196 43,389 61,807
10,836 3,761 7,075
289,409 123,266 166,143
299,427 176,599 122,828
50,666 21.,120 29,446
153,999 83,969 70,030
41,521 16,686
24,835
184,615 34,105
150,510
97,136 50,158 46,978
58,704 20,072 38,632
77,740 51,050 26,690
109,481 59,383
50,098
23,811 12,944 10,867
54,044 21,988 32,056
5,630 1,905 3,725
149,073 63,280 85,793
150,6:8 88,101 62,557
26,148 11,138 15,010
79,329 43,121 36,208
21'207 8,374
12,833
164,246 30,622
133,624
93,176 48,805 44,371
55,663 19,297 36,366
75,730 50,136 25,594
107,871 59,044 48,827
22,074 11,953 10,121
51,152 21,401 29.751
5,206 1,856 3,350
140,336 59,986 80,350
148,769 88,498 60,271
24,518 10,087 14,436
74,670 40,848 33,822
20,314 8,312
12,002

126
C.V PART A (i)-DISTRIBUTION OF LANGUAGES (INCLUSIVE OF MOTHER.TONGUESGROUPED
Total ASSAMESE BENGALI GUJARATI State/District Rural
Urb'lll Persons Males Females Persons Males Females Persons Males Females
2 3 4 5 6 7 8 9 10 11
14. Mysore T 129 89 40 882 ,00 382
R 17 11 6 320 173 147
U 112 78 34 562 327 235
15. North Kanara T 72 44 28 586 393 193 R 15 11 4 329 154 7,
U 57 33 24 257 U9 118
16. Raichur T 3,013 1,547 ·1,466 58S 19. 2Pl
R 3,013 1,547 1,466 81 40 41
U 504 254 250
17. Shimoga T 28 15 13 881 462 419
R 7 7 539 278 1~1
U 21 8 13 342 184 158
lB. SouthKanara T 87 69 18 ).140 688 45.1 R 59 51 8 188 166 21 U 28 18 10 952 521 430
19. Tumkur T 9 9 352 203 149 R 2 2 182 104 78 U 7 7 170 99 71

127
UNDER EACH) SPECIFIED IN SCHEDULE VIII TO THE CONSTITUTION OF INDIA-Concld.
HINDI KANNADA KASHMIRI MALAYALAM ------------ ------------P<)rsons MaleS Females Persons Males Females Persons Males Females Persons MaleS Females
12 13 14 15 16 17 18 ~-
19 20 21 22 23
11,079 5,716 5,363 1,735,104 891 224 843,880 9 6 3 10,757 6,769 3,9g8 4,495 2,155 2,340 1,414,177 723,156 691,021 3,743 2,327 1,416 6,584 3,561 3,023 320,927 168,068 152,859 9 6 3 7,014 4,442 2,572 5,605 3,006 2,599 480,436 248,567 231,869 5,074 3,423 1,651 2,776 1,434 1,342 430,940 222,571 208,369 3,338 2,275 1,063
2,829 1,572 1,257 49,496 25,996 23,500 1,736 1,148 588 27,031 13,841 13,190 1,096,599 552,931 543,668 830 !i22 208
21,559 10,869 10,690 983,790 494,626 489164 370 284 86 5,472 2,922 2,500 112,809 58,305 54,504 460 338 122
37,921 19,507 18,414 971,169 501,679 469,490 9,803 5,985 3,81~ 34,490 17584 16,906 804,513 413,363 391,150 4,654 2,821 1,833 3,431 1,923 1,508 166,656 88,316 78,340 5,149 3,164 1.985 6,965 3,576 3,389 396,546 189,169 207377 23 23 215,943 113,344 102,5%
5,689 2,903 2,786 348,216 164,584 183,632 . 18 18 173,694 90,537 83,157 1,276 673 603 48,330 24,585 23,745 5 5 42,249 22,807 19,442
17,354 8,685 8,669 1,310,891 670,163 640,728 8 7 1,218 707 511 16,039 7,949 8,090 1,199035 610,327 588,708 5 5 520 260 260 1,315 736 579 111,856 59,836 52,020 3 2 698 447 251
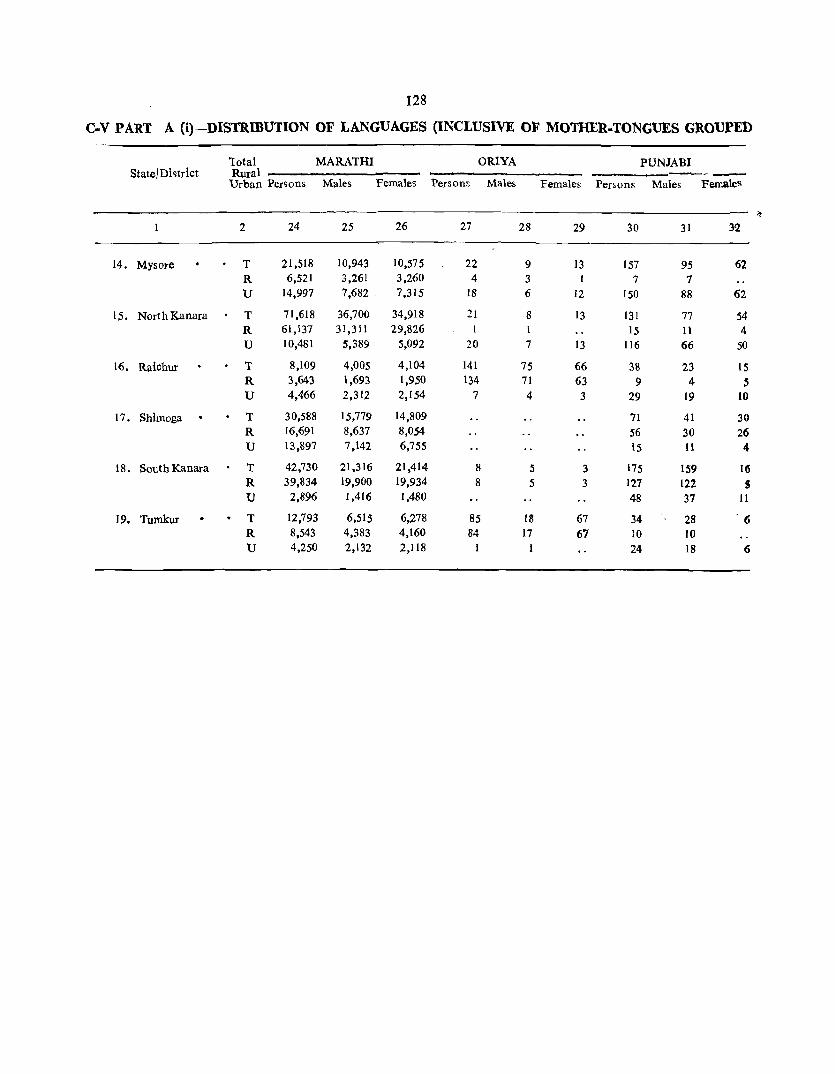
128
C .. V PART A (i)-DISTRIBUTION OF LANGUAGES (INCLUSIVE OF MOTHER"TONGUES GROUPED
lotal MARATHI ORIYA PUNJABI Statel Di~trict Rural ~--
Urban Per80ns Males Females Persons Males Females Persons Males Females
~
2 24 25 26 27 28 29 30 31 3-2
14. Mysore T 21,518 10,943 10,575 22 9 13 157 95 62 R 6,521 3,261 3,260 4 3 1 7 7 U 14,997 7,682 7,315 18 6 12 150 88 62
15. NorthKanara T 71,618 36,700 34,918 21 8 13 131 77 54 R 61,137 31,311 29,826 1 1 15 11 4 U 10,481 5,389 5,092 20 7 13 116 66 50
16. Raichur T 8,109 4,005 4,104 141 75 66 38 23 15 R 3,643 1,693 1,950 134 71 63 9 4 S U 4,466 2,312 2,154 7 4 3 29 19 10
17. Shimoga T 30,588 15,779 14,809 71 41 30 R 16,691 8,637 8,054 56 30 26 U 13,897 7,142 6,755 15 11 4
18. South Kanara T 42,730 21,316 21,414 8 5 3 175 159 US R 39,834 19,900 19,934 8 5 3 127 122 !I U 2,896 1,416 1,480 48 37 II
19. Tumkur T 12,793 6,515 6,278 85 IS 67 34 28 6 R 8,543 4,383 4,160 84 17 67 10 10 U 4,250 2,132 2,118 24 18 6

129
ONDER EACfI) SPECIFIED IN SCHEDULE VIII TO THE CONSTITUTION OF INDIA-Concld.
SANSKRIT SINDHl 'TAMIL TELUGU URDU
Per- Ma- Fe- Per- Ma- Fe- Persons Males Females Persons Males Females Persons Males Females sons les males sons les males
33 34 35 36 37 38 39 40 41 42 43 44 45 46 47
11 11 857 444 413 84.415 44,075 40,340 72,231 37,655 34,576 12,578 64,784 60,997 ., 43,267 23,068 20,t99 34,203 17,973 16,230 35,627 18,688 16,939
11 11 857 444 413 41,148 21,007 20,141 38.028 19,682 18,346 90,154 46,096 44,058
140 71 69 3,917 2,353 j,564 10,151 5,382 4,769 66,838 32,736 34,102 54 26 28 2.501 1,470 1,031 6,524 3,471 3,053 35,863 17,652 18,211 86 45 41 1,416 883 533 3,tm 1,911 1,716 30.975 5,084 15,891
67 38 29 8,750 4,517 4,233 122,698 61,962 60,736 145,343 73,537 71,806 2 2 5,780 2,866 2,914 99,045 50,065 48,980 79,418 39,820 39,598
65 36 29 2,970 1,651 1.319 23,653 11.897. 11.756 65,925 33,717 32,2.08
2 1 1 30 21 9 48,646 25.654 22,992 52,094 27,069 25,025 119,897 62,173 57,724 2 1 1 .. 21,629 11,483 10,146 29.692 15,466 14,226 66,235 34,443 31,792
30 21 9 27,017 14,17J 12,846 22,402 11,603 10,799 53,662 27,73() 25,932
25 12 13 74 63 11 8,333 5,382 2,951 3,707 2.054 1,653 51,907 25,966 26,941 2S 12 13 50 50 5,148 3,466 1,677 1,916 1,116 810 28,184 l3,470 14.714
24 13 11 3,190 1,916 1,274 1,781 938 843 24,723 12,496 12,227
16 14 2 34 20 14 10.307 5,467 4,480 168,920 86,292 82,628 104,621 53,094 51,527 13 13 2 2 4,438 2,353 2,085 146,495 74,858 71,637 61,442 31,099 30,343 3 1 2 32 18 14 5,869 3,114 2,755 22,425 11,434 10,991 43,179 21,995 21,184

130
C~V PART A (ii) DISTRIBUTION OF LANGUAGES (INCLUSIVE OF MOTHER·TONGUES GROUPED DISTRICTS, TALUKS AND
ASSAMESE BENGALI GUJARATI District/Taluk/City/Town
Persons Males Females Person5 Males Females Persons Males Females
2 3 4 5 6 7 8 9 10
Bangalore District 243 216 27 2,792 1,823 969 9,603 4,993 4,61\)
1. ANEKAL T ALUK
Anekal(M)
Surjapura (M)
2. BANGALORE NORTH T ,\LUK 241 215 26 2,646 1,728 918 8,179 4,463 3,716 B'lngalore City ~C) and
Trust-Board Area* • 127 109 18 1,797 1,072 725 8,042 4,373 3,669 13. E. L. Township (S.A.)* 97 51 46 Devarajeevanahalli(T.P.)* 4 2 2 H. M. T. Township (S.A.)* 43 24 19 11 8 3 lalahall i~E:xcluding H. M. T.
TownshiP)(P)*· • 102 98 4 547 485 62 50 44 6 KadugondanahaIli *(P) 4 2 2 2 Yelah<mh (M) 5 4 1
3. BAN GALORE SOUIH TALUK 131 83 48 105 55 50
H.A. L. Sanitary Board (Excluding H. A. L. Town- S ship*(S.B.)· • • 34 27 7 7 2
H. A. L. Township (S .A.)* . 9 4 5 LT.!. Notified Area (Dura-Vaninagar)(N.A.C.)* • 58 34 24 15 5 10
4. CHANMPATN,A Tj\LUK • 38 16 22 Channapatna (M) • 35 15 20
5. DEV ANAJIALU TALUK 15 13 2 Devanahall i (M)
Vijayapura (M) • 8 6 2
6. DODD;\BAI..Lj\PUR T ,\LUK 413 20 393
DoddabaUapur (M) 2S 18 7
7. HOSKOTB T ,ALUK • 7 6 31 16 15 Hoskote(M) 4 4
8. KANAKAPUAA T ALUK 260 131 129 Kanakapura (M)
9. M,AG,Al)1 T ,<\LUK . 464 232 232 Magadi(M)
10. NBLAMAr.GJ\LJ\ T ,<\LUK 8 6 2 4 2 2
Nelamangala (M)
Tyamagondlu (M)
.Denotes constituent units of Banglore Urban Agglomeration. Consolidated figuresof Bangalore Urban Agglomeration whichspreads overBan8E11ore North ilnd .aangalore South taluks are givenin the Annexure totable C·V part A (ii) after Tumkur district.
The following abbreviations have been used for thesta tus of a Town given within brackets ago ins! names of the towns:
C Municipa I Corpora tion
CB Cantonment BOard
M MunicipalTown
NAC Notified Area Committee
P panchayat
SA SpecialArea
SB Sanitllry Board
TB TOWn Board TP Town Pancha)at

131
UNDER EACH) SPECIFIED IN SCHEDULE VIII TO THE CONSTITUTION OF INDIA FOR CITYtTOWNS-
HINDI KANNADA K-\SHMIRI MALAYALAM ------------
Persons Males Females Persons Males Females Person~ Mats Females Persons Males Females
11 12 )3 14 15 16 17 18 19 20 21 22
51),242 29,292 20,950 1,705,243 886,929 818,314 150 30 120 60,152 38,436 21,716 418 .213 205 40,025 21,128 18,897 92 68 24
49 23 26 4,187 2,175 2,012 40 29 11 4 3 620 326 294 12 10 2
35,252 21,280 13,972 593,,02 317,711 275,7<)1 149 29 120 49,897 32,1 f5 17,712
31,229 18,265 12,964 503,771 270,662 233,109 145 25 120 43,612 27,873 15,739 139 69 70 1,312 665 647 1,085 530 555
13 9 4 834 443 391 182 133 49 116 59 57 4,289 2,275 2,014 688 389 299
2,207 1,901 306 1,899 1,048 851 2 2 2,130 1,751 397 65 42 23 454 233 221 74 48 26
101 50 51 3,103 1,616 1,487 188 111 77
1,485 840 645 91,649 47,860 43,789 9,007 5,286 3,721
359 231 128 8,021 4,226 3,795 2,563 1,636 927 98 45 53 3,015 1,578 1,437 2,960 1,573 1,387
164 76 88 2,390 1,219 1,171 734 413 321
946 706 240 147,844 75,851 71,993 123 77 46 712 588 124 14,475 7,408 7,067 90 55 35
70 42 28 82,049 41,817 40,232 107 77 30 12 10 2 5,637 2,881 2,756 53 40 13 16 5 11 4,651 2,360 2,291 5 4
1,646 891 755 109,601 55,596 54,005 89 64 25 391 225 166 18,002 9,357 8,645 77 61 16
1,127 621 506 76,569 39,182 37,387 433 349 84 338 210 128 3,424 1,749 1,675 78 52 26
5,996 2,957 3,039 186,970 96,298 90,672 138 110 28 66 42 24 14,390 7,700 6,690 97 80 17
1,388 730 658 150,578 76,018 74,560 99 94 5 132 81 51 9,020 4,649 4,371 30 28 2
538 324 214 121,205 61,256 59,949 75 63 17 14 10 4 6,565 3,412 3,153 9 5 4
4,086 2,099 1,987 1

131 C.V PART A (ii) DISTRIBUTION OF LANGUAGES (INCLUSIVE OF MOnIER·TONGUES GROUPED
DISTRICTS, TALUKS AND
MARATHI ORIYA PUNJABI District/Taluk/City/Town
Per~ons Males Females Persoll8 Males Females Persons Males Females
23 24 25 26 27 28 29 30 31
Bangalore District 76,191 38,691 37,500 349 314 35 4,685 3,022 1,663 1. Ar.IlKAL TALUK 1,567 676 891
Anekal{M) 493 241 252 SarJapura (M) 77 39 38
2. 'B,ANOALQRE NORT':l T ALUK 61,804 31,446 30,358 336 304 32 4,523 2,900 1,623 'BangaloreCity(C) and Trust
'Board Area'" • • • 58,678 29,781 28,897 164 139 25 3,158 1,826 1,332 B.E. L.Township(S.A.)* • 323 164 1,59 I 1 41 24 17 Devarajeevanahall i(T .P.)* •. 285 145 140 H. M. T. To'waship{S.A.)*· 712 351 361 49 24 25 Jalahalli(Excluding H.M.T.
Township, (P)* • • 409 284 125 156 155 874 766 108 Kadugondanahall i(P)* 29 12 17 4 3 Yelahanka (M) • 461 221 240
3. 'BMOALQRE SoU1''i T AWK 2,759 1,364 1,395 13 10 3 Ul 114 37 H. A. L. Sanitary Board (Excluding H. A. L. Town-ship){S.B.)"'· • • 346 189 157 9 7 2 77 54 23
H.A.L. Township (S.A.)* 348 179 169 .5 4 I. T. I. Notified Area (Dura-vaninagar)(N.A.C.)* • 372 178 194 42 29 13
4. C'iANr.APi\TN/\ T ALU'K 1,023 539 484
Channapatna (M) 458 260 198
5. DBVAl'IAIlALU TALUK 585 323 262
Devanahall i(M) 115 61 54
Vijayapura (M) 77 39 38
6. DODD,ABALLAPUR T ALU'K 1,619 860 759 Doddaballapur (M) • 1,102 575 527
7' HOSKOTIl TALU'K ;. 991 513 478
Hoskote(M) 426 243 183
8. KANAKAPtJRA T ,AWK 2,293 1,227 1,066 2 I
Kanakapura (M) 831 434 397 2 I
9, M,AOADI T AWK 1,164 571 593
Magadi(M) 236 120 1I6
10. NELAMANOAL,A T ,ALUK 843 415 428 7 5 2 Nelamangala (M) 299 153 146
Tyamagondlu (M) 7 4 3
"Denotes constituent units of Banglore Urban Asslomera tion. Consolidated figures of ;oangalore Urban ~gg!omeration which spreads over Banga IOle Nothr and Bangal ore SouthtaIuksare given in the Annexure to table C-V ~art ~ ~h) after Tum~r dlstnct.
The following abbrev ations have been used for the status of a Town given w,th'n braCketsagalnst names of the towns. C MUnicipal Corporation CB Cantonment Board M _ Municipal Town NAC - Notified Area C~lDIDittoe p _ Pachayat SA _ Specia I Area
SB _ Sanitary Board
TB Town Board TP - Town Panchayat

133
l1NI)ER :£ACU) SPECIFIEI) IN SCHEDULE VIII TO THE CONSTITUTION OF INDlA FOk CITY ITOWNS-Oontd.
SANSKRIT SINDHI TAMIL TELUGU URDU
Pllr- Ma- Fo- P.:r- Ma- Fo- P.:rsoos Males Females Person~ Males Females Persoos Males Females soos los males sons les males
32 33 34 35 36 37 38 39 40 41 42 43 44 45 46
44 27 17 5,8472,834 3,013528,284 274,473 253,811 517,296 l77,947 259,349 348,861 184,615 164,246 .. 28,187 14,252 13,935 52.694 26,820 25,874 6,552 3,422 3,130
1,038 519 519 5,013 2,537 2,476 1,783 916 867 913 462 451 2,275 1,164 1,111 770 403 367
30 16 14 5,825 2,821 3,004 414,829 216,525 190,304 279,897 146,240 133,657 234,558 124,671 lC9,887
30 16 14 5,791 2,8022,989 383.044 199.759 183,285 251,681 131,563 120,118 217,734 115,647 102,e87 3 3 1.718 873 845 1,622 819 803 262 143 119
8.251 4.233 4,018 638 316 322 7,411 3,837 3,574 8 4 4 2,496 1.260 1,236 1,840 942 898 506 259 247
11 8 3 1,769 1,134 635 1,986 1,178 808 208 153 55 3,334 1,682 1,652 1,298 650 648 490 322 168 1,311 686 625 3,951 2,111 1,840 1,262 654 608
12 8 4 50,151 25,742 24,409 67,333 34,913 32,420 11,460 6,196 5,264
9,613 5,072 4,541 10,333 5,337 4.996 2,429 1,304 1,125 5,563 2,808 2,755 2,127 1,099 1,018 776 415 361
3,903 1,967 1,936 1.759 879 880 189 112 77
5 2 3 3,077 1,580 1,497 3,442 1,578 1,864 16,312 8,462 7,850 5 2 3 1,747 895 852 1,410 487 923 13,488 7,093 6,395
5,556 2,701 2,855 35,030 17,738 17,2~2 6,953 3,532 3,421 .. 1,249 487 762 3,724 2,024 1,700 1,141 574 567 I
1,272 659 613 3,156 ],541 1,614 2,311 1,173 1,138
14 11 3 4 2 2 1,979 990 989 29,730 ] 5,357 14.373 9,400 4,991 4,409 4 4 4 2 2 1,085 574 511 7,746 4.077 3,669 7,031 3,734 3,297
15,774 8,076 7.698 41,946 21.418 20,528 ]6,774 8,757 8,017 2,175 1,])7 1,058 3,128 ],565 ],563 2,554 1,326 1,228
4,749 2,550 2,199 9,332 4.847 4.485 10,000 5,283 4,717 476 270 206 1,394 705 689 3,010 1,610 1,400
1,166 682 484 5.723 2,759 2,964 11,865 6,191 5.674 239 124 115 1,284 623 661 2,358 1,253 1,105
551 286 265 4,720 2,397 2,323 6,900 3,519 3,381 104 4S 59 872 461 411 899 481 418
46 22 24 698 359 339 1,649 837 812

134
C~V PART A (ii) DISTRIBUTION OF LANGUAGES (INCLUSIVE OF MOTIIER~TONG{fES GROUPED DISTRICTS, TALUKS AND
ASSAMESE BENGALI GUJARA1I Dlstrict/Talu:k/City/Town ---------~- --------.-----
P~rsons Males Females Persons Males Females Persons Males Femalee
2 3 4 5 6 7 8 9 10
I I. RAMANAGARAM T ,A.LUK 94 45 49 Ramanagaram (M)
Belgaum Distl'h:t 57 51 6 361 291 70 2,250 1,181 1,069
I . A1'llANJ T ALUK 265 118 147 Athani(M) • 126 72 54
2. BIlLGAUM T ALUK • 57 51 6 356 287 69 890 483 407 13elgaum (U.A.) 4 2 2 118 83 35 817 432 385
(a) Belgaum City (M) 3 2 43 26 17 657 346 3it
(b) Belgaum Cantonment (C.B.) . 75 57 18 160 86 74
3. CllIKODI T ,,\LUK 518 275 248
Chikodi(T.P.) 30 21 9
Nippani(M) 249 123 126
Sadalga (T.P.) 24 II I'
4. GOKAK 'T ALUK III 50 61
Gokak (M.) 36 20 16
Gokak Falls(N.A.C.} 19 7 12
Konnur(T.P.) 3 2 I
Mudalgi(T.1>.) 12 7 S
5. HUKKIlRl TALUK. 51 35 16
Hukkeri(T.P.) SankeshwadT.P.) • 19 18
6. KHANAPUR TALUK 2 2 140 66 74
Khanapur(T.P.) 104 49 55
Londa (1'.) 22 10 12
7.PARASGAD TALUJ{ 2 11 7 4
Saundatti-YeJlamma (M.) • 9 7 2
8. RAlBAG TALUK • 122 72 50
Kudachl(T.P.) • 37 22 15
Raibag(T.P.) 10 7 3
9. RAUDURO T ALUK 123 61 62
Ramdurg (M.) • 4 3
10. SAMPAGAON TALUK. 19 14 5
BallhongaHM.) 5 5
Bellary District 83 48 35 486 253 233
I. BBLLARY TALUK 25 11 14 166 92 74
Bellary Ci ty (M) 25 II 14 166 92 74
2. HADAGAU,.1 TALUK 3 2
Hadagalli(T.'P.) •
3. HARPANAllAlLl TALUK Harpanahall i(T .r)
4. HoSPllt TALUl(i • 29 IS 14 242 122 120
Amaravathi(T. 1') .• 3 2 1
Hampi Notified Area (N.A.C.) 7 4 3

135
UNDER EACH) SPECIFIED IN SCHEDULE VIII TO THE CONSTITUTION OF INDIA FOR CITY/TOWNS-Contd.
. Persons·
11
J ,376 291
2 J, t96 341 190
5,700 4.658 3,564
1,094
348 71
215 9
587 331 143
9,939 10
132
523 241
44
1,736 106
139 7
15
4,115 150
68 47
-&3,072 5,284 3,llO
9,663 88
11,074 200
6,317 III 63
HINDI • KANNADA
Males Females Persons Males Females
12 13 14 15 16
688 150
12,578 172
94
3,517 2,605 1,918
687
194 42
125 4
289 165 75
5,073 7
82
280 123 30
859 56
77 7 8
2,076 76
41 27
22,281 2,855 1,730
4,960 61
5,629 110
3,308 64 66
688 105,251 141 10,420
10,918 1,619,784 169 204,055 96 15,029
2,183 2,053 1,646
407
150,565 60,267 56,768
3,499
154 182,019 29 9,211 90 5,024 5 9-,576
298 241,743 166 21,344 68 6,346
12,718 9,195
4,866 181,661 3 8,151
50 9,897
243 48,869 Il8 2,461 14 676
877 166,238 50 13,216
62 130,957 3,780
7 8,385
2,039 117,492 74 14,054
27 196,185 20 14,950
20,791 2,429 1,380
823,594 147,081 38,864
4,703 107,604 27 6,793
5,445 120,031 90 11,782
3,009 118,301 47 3,112 30 434
54.212 5,397
831,336 104,856
7,830
79,255 32,605 30,682
1,923
94,883 4,905 2,750 4,977
123,255 ll,071 3,290 6,534 4,702
93,921 4,298 5,222
25,062 . 1,364
384
83,800 6,705
67,683 1,991 4,419
59,314 7,150
99,307 7,61\
416,665 75,495 20,752
53,886 3,565
60,836 6,127
59,714 1,541
247
5]'039 5,023
788,448 99,199
7,199
71,310 27,662 26,086
1,576
87,136 4,306 2,274 4,599
118,488 10,273 3,056 6,184 4,493
87,740 3,853 4,675
23,807 1,097 292
82,438 6,511
63,274 1,799 3,966
58,178 6,904
96,878 7,339
406,929 71,586 18,112
53,718 3,228
59,195 5,655
58,587 1,571
187
KASHMIR! MA LAYA LAM
Persons Males Females Persons Males Females
17 18 19 20 21 22
10
10 , 10
4
6
2
8
8 8 3
5
1
2
2 2
1
92 56
2,160 21 16
1,506 833 459
374
26 4
16
25 3
14
238
to
58 13 31
104
131
II
9
40
1,790 667 648
11
11
II
776
274
63
37
1,533 20 16
1,062 545 313
232
25 4
16
13 3 8
168
52 12 26
85
64
7 5
37
1,167 432 422
8
5 5
485 157
29 19
627
444
288 146
142
1
12
6
70
9
6 I
5
19
67
4 4
3
623 235 226
3
6 6
291 117

136
C~V PART A (ii) DISTRIBUTION OF LANGUAGES (INCLUSIVE OF M01HER. TOl\Gl''ES GROlJP'ED DISTRICTS, TALUKS AND
MARA1HI ORIYA PUNJABI olstrictITaluk/City/1owD
Persons Males Females Persons Males Females Persons Males Females
23 24 25 26 27 28 29 30 31
11. RAMAl'oAOARAM T ALUK • 1,543 757 786 Ramanagaram (M) 762 364 398
Belga11lll District • 539,801 276,516 263,285 125 101 24 494 384 110 1. ATBANJT ALUK 49,864 25,444 24,420 9 4 5
Athani(M) 3,677 1,810 1,867 9 4 5
2. BELOAUMTALUK • 205,301 106,306 98,995 101 91 10 466 361 105 Belgaum (U.A.) 96,175 50,594 45,581 11 10 259 172 87 (a) Belgaum City (M) 89,258 46,490 42,768 1 lOS 57 48 (b) Belgaum Cantonment
(C. B.) · 6,917 4,104 2,813 10 9 154 liS 39
3. CHI1tODl T ALUK • 149,274 76,789 72,485 Chlkodi(T.P.) • 3,639 1.872 1.167 Nippani(M) 23,160 11,829 11.331 Sadalga (T.P.) • 1,716 853 863
4. GOKAK TALUK · 4,338 2,200 2,138 Gokak(M.) 1,392 664 728
Gokak Falls(N.A.C.) 1,037 526 511 KonnurCT.P.) • 445 233 212 .. Mudalgi(T.P.) • 73 34 39
5. H~BRI TALUK • 33,543 16,942 16,601 13 9 4 Hukkerl (T.P.)· 552 283 269 SankeshwarCT.P.) 6,311 3,269 3,042
6. KBANAPUR TALUK 86,585 43,114 43,471 KhanapurCT.P.) • 4,635 2,297 2,338 Londa(P.) 2,208 l,i05 1,103
7. l'AaASOAD TALUK 1,563 900 663 6 6 Saundatti-Yellamma (M.) • 463 239 224
8. RAIBAO TALUK' 6,548 3,327 3,221 Kudachi(T.l'.) • 998 498 500 .. Ralbag(T.P.) · 1,176 585 591
9. RAMDUllo TALUK 1,661 879 788 Ramdurg (M.) • 1,285 659 626
10. SAMPAOAON TALUK 1,124 621 503 7 6 Bailhongal (M.) 372 186 186 3 2
DellarY District 9,461 4,893 4,568 78 4. 37 85 53 32 1. BBLLARY T ALUK 4,090 2,121 1,969 40 18 22
B~lIary City (M.) 3,900 2,032 1,868 40 18 22
2. HADAGALLI TALUK 631 302 329 35 18 17
Hadagalli(T.P.) 140 66 74
3. HARPANAHALLI T ALUK 371 193 178 12 7 5 Harpanahalli(T.P.) • 299 149 150
4. HOSPBT TALUK • 2,290 1,174 1,116 5 4 9 7 2 Amaravathi(T.P.)· . 95 51 44 5 4 Hampl Notified Area (N.A.C.) 14 5 9

137
UNDER EACH) SPECIFIED IN SCHEDULE VI11 TO THE CONSTITUTION OF INDIA FO~ CITY ITOWNS_:_Contd.
SANSKRIT SINDHI TAMIL TELUOU URDU
Per- Ma- F e- Per- Ma- Fe- Persons Males Females Persons Males Females Persons Males Female sons les males sons les males
32 33 34 35 36 37 38 39
1 1 1
I
2,265 1,089 1.353 737
706 372 334 6,986 239 22
112 54 58 112 54 58
525 267 258 2,172 519 263 256 1,635 506 254 252 718
13 9
33 31
12 11 8 8
4
to
10
14
14
8
137 130 130
3
5
5
8
8
4
62 57 57
4
2 1
917
784 125 110
58
400 37
54 204
6
5 1,947 13
5 38
6 303 78
6 51
4
505 82
155 1
58
360 203
121
8
75 15,888 73 5,050 73 4,847
349 43
297 148
4,141
158 20
1,330 924 437
487
421 64 60 30
234 22
35 117
6
1,167 13 28
195 57 35
280 45
87 I
34 .
182 103
87 7
8,605 2,631 2,527
176
25
162 83
7 2 8,334 4,575 3,568 1,968
13 8
40
1,176 616
2,845 81 2
84:1 711 281
430
363 6] 50 28
166 15
]9
87
780
10
108 21 16
225 37
68
24
178 100
34
7,283 2,419 2,320
173 18
135 65
41
7,449 2,64]
22,329 2,515
624
5,873 4,827 3,2.98
1,529
2,976 390 428 143
1,641 281
5 335 179
2,434 28
197
683 86
172
1,314 213
2,721 207 747
1,289 470
883 382
117,028 59,519 36,410
1,823 106
2,673 497,
3,759 23,806 1,600 2,910
5 221
42
3,880 1,421
11,819 ] ,352
399
3,227 2,588 ] ,786
802
1,525· ]48
225 69
824 158
3 159 88
1,228 15
103
365 50 85
710 106
1,483 112
440
653 226
452 191
57,145 30,195 18,647
950 56
1,356 241
12,365 1,560
107
43 44
3,569 18,087 1,220 15,873
10,510 ] ,163
225
2,646 2,239 1,512
190,312 20,692
4,510
45,913 35,166 31,343
727 3,823
1,451 27,839 242 4,772 203 5,818
74 972
817 123
2 176
91
1,206 13 94
3'8 36 87
23,603 6,335
1,943 2,103 1,086
10,900 3,687 2,282
11,665 2,053
903
604 11,022 107 1,877
1,238 95 307
636 244
431 191
54,883 29,324 17,763
873 50
1,317 256
11,441 1,350
114
14,790 9,034 1,747
7,901 3,408
15,987 3,653
114,367 42,608 36,425
7,175 3,261
11,134 6,714
27,168
839 21
45
9,591 8,264
97,136 10,448 2,237
24,039 18,387 16,329
2,058
14,425 2,531 3,001
50]
11,960 3,222
985 1,083
532
5,442 1,838 1,143
5,881 1,045
455
5,481 907
7,631 4,651
892
3,886 1,706
7,943 1,862
58,704 22,037 18,912
3,677 1,688
5,677 3,406
14,001
455 10
46
8,486
7,609
93,176
10,244 2,273
21,874 16,779
15,014
],765
]3,414
2,241 2,817
474
11,643 3,113
958 1,020
554
',458 1,849 1,139
5,784 1,008 448
5,541 970
7,159 4,383
855
4,015 l,7Q2
8,044 1,791
55,663 20,S71 17,513
3,498 1,573
5,457 3,308
13,167
384 11

138
C.V PART A (ii) DISTRIBUTION OF LANGUAGES (INCLUSIVE OF MOTHER.TONGUES GROUPED DISTRICTS, T ALUKS AND
ASSAMESE BENGALI GUJARATI District/Taluk/City/Town ------------Persons Males Females Persons Males Females Persor_s Males Females -
2 3 4 5 6 7 8 9 10
Hospet (M.) 26 I3 13 53 30 23 Kamalapur(T. P.) Kampli(T.P.) • 178 85 93
5. KUOUGI TALUK 67 34 33 KotturfT.P.) 67 34 33-
6. MALLAPURAM TALU.K
7. SANDUR TALUK 29 22 7 8 4 4
8. SIRUGUPPA TALU& Siruguppa (T.P.) Tekkalkota(T.P.)
Bidar District . 7 6 1 84 55 29 335 157 178 1. AURAD TALUK 11 7 4
2. BASAVAKALYAh TALUIC 54 24 30 Basavakalyan (M) 11 6 5
3. BHALKI TALUK 71 38 33 Bhalki tM)
4. BIOAR TALUK 7 6 81 53 28 162 69 93 Bidar (M) 3 :1 6] 33 28 136 55 81
5. HUMNABAD TALUK 3 2 37 19 18 Chi taguppa (M) Humnabad (M) 8 4 4
Bijapur District . 1 1 19 11 8 3,689 1,906 1,783 1. BADAMI T ALUK 76 42 34
Badami (T.P.) 8 5 3 Guledgud lM) . Kerur IT.P.)
2. BAOALKOT TALUIC 14 9 5 795 411 384 Bagalkot tM) • 12 8 4 688 357 331
3. BASAWANA BAOEWADITALUK 77 42 35 Basawana Bagewadi n.p.) 40 21 19
4. BUAPUR TALOK 1 1,467 781 686 Bljapur City (M) 708 378 330
5. BILOI TALUK 63 28 35
6. HUNGUND TALUK 24 17 7 Hungund (T.P) Ilkal (M) • 7 5 2
7. INDI TALUK" 589 317 272 Iudi (T.P.) 399 214 185
8. JAMKHANDI TALUK 111 61 50 .Jamkhaudi (M) 25 10 15
Rabkavi-Banhatti (M) 57 32 25 Terdal (TP)

139
UNDER EACH) SPECIFIED IN SCHEDULE VIII TO THE CONSTITUTION OF INDIA FOR CITY/TOWNS-Contd.
HINDI KANNADA KASHMIRI MALAYALAM
Persons Males Females Persons Males Females Persons Males Females Persons Males Females
11 12 13 14 15 16 17 18 19 20 21 22
1,512 844 668 37,288 18,914 18,374 335 224 11 1,014 502 512 7,818 3,920 3,898 54 27 27
344 190 154 1l ,258 5,717 5,541 46 33 13
4,495 2,306 2,189 138,918 70,157 68,761 14 8 6 120 80 40 1l ,124 5,760 5,364
3,685 1,923 1,762 29,613 14,801 14,812 31 17 14
1,601 824 777 69,353 35,450 33,903 2 251 192 59
953 476 477 92,693 46,326 46,367 29 20 9 116 64 52 8,422 4,157 4,265 12 10 2
6 2 4 8,992 4,476 4,516 16 9 7
2Z,812 11,867 10,945 422,022 215,564 206,458 1 1 288 209 79 7,334 3,725 3,609 61,675 31,511 30,164 23 23
4,312 2,335 1,977 77,135 39,443 37,692 367 193 174 7,344 3,935 3,409
2,813 1,388 1,425 75,694 38,445 37,249 2 2 184 101 83 6,371 3,307 3,064 ..
5,162 2,822 2,340 llO,597 56,982 53,615 252 177 75 1,993 1,090 903 18,021 9,825 8,196 173 101 72
3,191 1,597 1,594 96,921 49,183 47,738 11 9 2 78 48 30 5,130 2,628 2,502
374 152 222 6,564 3,416 3,148
63,185 32,655 30,530 1,633,664 826,774 806,890 2 2 237 173 64 4,351 2,292 2,059 167,441 83,404 84,037 6 4 2
54 31 23 9,062 4,666 4,396 1,204 653 551 21,506 10,761 10,745 5 3 2
5 3 2 8,494 4,234 4,260
5,746 2,922 2,824 120,398 60,905 59,493 2 2 60 50 10 988 534 454 32,684 17,493 15,191 2 2 58 50 8
6,434 3,323 3,111 153,781 77,378 76,403 8 7 1 1,115 588 527 9,715 4,942 4,773
21,610 1l,388 10,222 206,489 106,243 100,246 81 55 26 2,172 1,209 963 5),738 30,202 25,536 59 40 19
1,949 993 956 76,400 37,946 38,454
1,494 743 751 168,289 83,595 84,694 10 10 7 4 3 10,977 5,766 5,211
433 233 200 22,559 11,542 11,017 S S
8,975 4,601 4,374 172,884 89,690 83,194
1,599 792 807 7,442 3,865 3,577
1,392 696 696 172,213 88,400 83,813 4 3 505 257 248 16,108 8,331 7,777 4 3
336 163 173 29,021 15,046 13,975
228 126 102 11,033 5,637 5,396
12-1 Census Karnatak/78

140
c.v PART A (ii) DISTRIBUTION OF LANGUAGES (INCLUSIVE OF MOTHER.TONGUES GROUPED DISTRICTS, TALUKS AND
MARATHI ORIYA PUNJABI ---------District!Taluk/City/Town Persons Males Females Persons Males Females Persons Males Females
23 24 25 26 27 28 29 30 31
Hospet (\1.) 1,486 749 737 9 7 2 Kamalapur(T.P.) 182 103 79 Kampli(T.P.) • 212 104 108
5. KUDLlGl TALUK 723 411 312 7 4 3 KOitUr (T.P.). 271 188 83
6. MALLAPURAM TALUK 93 47 46
7. SA,NDUR. TALU~ 1,069 547 522 19 8 11 34 26 8
8. SIRUQUPPA, TALUK 194 98 96 2 2 Sirusuppa (T.P.) 91 44 47 Tekkalkota (T.P.) 27 14 13
BIDAR DISTRICT . 179,963 91,152 88,811 151 35 116 213 135 78 1. AURA,D T ALUK 54,042 27,382 26,660 24 11 13 1
2. BASAVAICALYAl'l TALUK 48,350 24,619 23,731 95 7 88 8 4 4
Basavakalyan {M) 3,491 1,800 1,691 8 4 4
3. BHAL~I TALuJo;; 57,464 28,814 28,650 5 2 3
Bhalki {M) 2,672 1,365 1,307
4. BmAR TALUK 9,604 4,913 4,691 24 15 9 .194· 123 71 Bidar (M) 4,296 2,268 2,028 4 2 2 130 62 68
5. HUM:-lABAD TALUK 10,503 5,424 5,079 3 3 10 7 3
Chitaguppa tM} 1,071 525 546
Humnabad (M) 1,438 740 698 3 3
BIJAPUR DISTRICT 44,909 22,838 22,071 61 39 22 100 68 32
1. BADAMI TALUIC . 836 418 418 Badami (TP) . 136 68 I 68
Guledgud (M) 368 185 183
Kerur (TP) 181 88 93
2. BAOALICOT T ALUIC 4,635 2,398 2,237 5 4 34 25 9
Bagalkot tM) • 4,180 2,175 2,005 5 . 1 4 34 2S 9
3. BASWANA BAGEWADI TALUK 2,312 1,205 1,107
~a~awana BagewaJi (TP) 593 313 280
4. BIJAPUR TALUK • 18,083 9,321 8,762 58 37 21 Bijapur City (M) 9,426 4,766 4,660 41 22 19
5. BILOI TALUK 155 82 73
6· HUNauND TALUK 1,634 815 819 Hunguud (TP) 98 51 47
Ilkal (M) 718 368 350
7. INDI TALUK 3,777 1,823 1,954 Iudi (TP) 689 382 307
8. JAMKHANDI TALUIC 7,461 3,738 3,723 J.1 9 2 6 4 2 Jamkhandi (M) 4,303 2,145 2,158 1 Rabkavi-Banhatti (M) 1,174 560 614 5 ) ;2 Terdal (TP) 406 267 139

141
UNDER EACH) SPECIFIED IN SCHEDULE VIII TO THE CONSTITUTION OF' INDIA FOR CITY/TOWNS-Contd.
SANSKRIT SINDHI
Per' sons
Males Fe· Per· Males Fe· males sons males
32 33 34 35 36 37
Persons
38
7 5 2 1,985
65
65 60
39
39 36
26
26 24
624 293 331
192 88 104 192 88 104
2 2
204 101 103
204 101 103
66 31 35
66 31 35
5 5 5 5
120 54 66 1I3 51 62
734
1,056
573
313 48
304
960
281 142
25
747 67
81
102 4
394 186
103 7
12
2,565 170
83 19
9
238 195
76
5
345 260
25 292
5 129
113 7
573 228
92 157
TAMIL
Males
39
1,119
553 288
173 33
173
562
153 79 10
403
35
37
50 3
218 89
63
5 6
1,436 102
50 11 8
140 1I0
41
5
173 117
13 168
5 76
63
336 138
51 92
Females
40
866 503 285
140 15
131
398
128 63 15
344
32
44
52
176 97
40 2 6
1,129 68 33 8
98 85
35
172 143
12 124
53
50 7
237 90
41 65
Persons
41
6,925 1,379
3,534
6,278 166
660
10,904
6,365 1,866
662
43,667 6,955
15,032 1,164
2,717 456
9,742 2,589
9,221 1,126 1,112
17,066 1,692
158 62
167
685
252
2,058 253
2,143 859
185 1,529
27 791
1,806 150
2,332 327
645 752
TELUGU
Males
42
3,602 714
1,827
3,087 82
370
5,660
3,162 937 329
22,308 3,581
7,678 610
1,397
252
4,965 1,338
4,687 561 616
8,801 817
82 31 76
374 159
1.109 126
I j121 447
91 750 12
390
910
69
1,173 160
308 384
Females
43
3,323 665
1,707
3,191 84
290
5,244
3,203 929 333
21,359
3,374
7,354 554
1,320 204
4,777 1,251
4,534 565 496
8,265 875
76 31 91
311 93
Persons
44
15,175 2,363 3,706
6,592 1,054
1,508
8,606
9,576 4,242 1,198
153,470
13,548
29,61 I 13,186
17,575 3,412
54,370 22,849
38,366 5,993 6,844
217,352 9,082 2,099
2,924 1,955
16,279 12,058
949 20,912 127 2,2.79
1,022 55,239 412 34,114
94 3,816 779 12,254 15 1,563
401 5,248
896 23,883 81 3,446
1,159 22,372 167 8,178
337 6,013 368 2,756
URDU
Males
45
7,806 1,190 1,942
3,246 505
763
4,490
4,813 2,093 625
77,740
6,843
14,873 6,623
8,992 1,789
27,765 11,763
19,267 3,038 3,477
109,481 4,475 1,043 1,443
949
8,154 6,053
10,444 1,155
27,981 17,415
1,886 6,109 779
2,634
12,220 1,850
1I,3 17
4,108
3,108 1,373
Females
46
7,369 1,173 1,764
3,346 549
745
4,116
4,763 2,149
573
75,730
6,705
14,738 6,563
8,583 1,623
26,605 11,086
19,099 2955 3,367
107,871 4,607
1,056 1,481 1,096
8,125 6,005
10,468 1,124
27,258 16,699
1,930 6,145 784
2,614
11,663 1,596
11,055 4,070
2,905 1,383

142
C.V PART A (ii) DISTRIBUTION OF LANGUAGES (INCLUSIVE OF MOTHER.TONGUES GIWUPFD DISTRICTS, TALUK AND
District/Taluk/City/Town ASSAMESE BENGALI GUJARAlI
Persons Males Females Persons Males Females Persons Males Females
2 3 4 5 6 7 8 9 10
9. MUDDEBIHAL TALus: 9 5 4 MUDDEBIHAL (TP)
TALIKOT (TP) 9 5 4
10. MUDHOL TALus: 4 3 154 39 115 MAHALINGAPUR (M) 84 84 MUDBOL (M) 61 33 28
11. SINDGI T ALUK • 324 163 161 SINDOI (TP) 65 32 33
CHlKMAGALUR DISTRICT 1 1 33 21 12 488 260 228 1. CHtKMAOALUll T ALUK 8 6 2 76 41 35 Chikmagalur (M) 47 26 21
2. KADUR TALUK Birur (M) . 167 100 67
Kadur (M) • 42 31 II
3. KOPPA TALUS: 9 4 5 Koppa (M)
'4 2 2 4. MUDIGBRE T ALUK 25 15 10 20 10 10 Mudigere (M)
5. NARASIM1JARAJAPURA 'hLUK: 30 14 16 Narasimharajapura (M) 25 10 15
6. SlUNOERI TALUK . Sringeri (M)
7. T ARIKERE T ALUK 186 91 95 Ajjampura (M)
Tarikere (M)
CHITRADURGA DISTRICT 3. 18 16 686 366 320 1. CHALLAKEIU! TALUK Challakere tM) Nayakanhatfi tM)
2. CHlTRADUROA T ALUC • .. . . 17 9 8 42 22 20 Chitradurga (M) • 12 4 8 42 22 20 'Iuruvanur lM) • 3. DAVANAOERB T,4.LUK 16 8 8 228 128 100 Davanagere City lM) 16 8 8 226 127 99 Mayakonda tM)
4. HARllJAll T ALUK 1 89 50 39 Harihar (M) 1 89 50 39 5. HIlUYUll TALUK .
282 144 138 Hiriyur (M)
6. HOL"LKIlltE T.u.UK 22 II 11 Holalkere (M) 3 1 2

143 UNDER EACH) SPECIFIED IN SCHEDULE VIII TO THE COl'STl1UTION OF INDIA FOR CITY/TOWNS-Contd
HINDI KANNADA KASHMIRI MAl,AYALAM
Persons Males F"male~ Penons Males Females Perions Male5 Females Persons Males Females
II 12 13 14 IS 16 17 18 19 20 21 22
4,881 2,447 2,434 130,843 65,338 65,505 59 38 21 234 128 106 5,952 3,139 2,813 1 1 577 295 282 7,374 3,757 3,617 1 I
834 413 421 110,445 55,778 54,667 9 6 3 46 25 21 10,071 5,227 4,844
136 73 63 10,200 5,151 5,049
5,S19 2,837 2,682 154,481 78,097 76,384 168 86 82 7,208 3,680 3,528
15,107 7,889 7,218 525,417 268,838 256,579 18.500 10.702 7.798 1,490 773 717 118,195 60,045 58,1:;0 4.514 2,543 1,971
594 325 269 20,350 10,480 9,870 948 560 388
7,957 4,175 3,782 156,298 79,660 76,638 450 269 181 142 69 n 9,757 5,032 4,725 SO 29 21 188 115 73 7,938 4,142 3,796 118 84 34
237 134 103 42,147 21,818 20,329 2,461 1,55l 909 83 50 33 1,921 1,024 897 112 73 39
506 283 223 50,530 26,183 24,347 3,729 2,391 1,338 167 93 74 1,834 1,021 813 439 303 136
147 80 67 22,512 11,685 10,827 5,183 2,774 2,409 8 6 2 2,918 1,519 1,399 255 142 113
30 17 13 22,725 11,782 10,943 265 178 87 12 6 6 2,692 1,446 1,246 97 63 34
4,740 2,427 :.1.,313 113,010 57,665 SS,34S 1,898 995 903 10 7 3 5,660 2,888 2,772 3 1 2
149 79 70 13,906 7,189 6,717 .. .. . . 193 122 71 35,734 18,384 17,350 1,036,296 534,498 501,798 ~ 2 2 1,689 1,161 528
5,315 2,712 2,613 107,038 55,700 51,338 ... 34 20 14 74 43 31 8,673 4,536 4,137 24 IS 9 5 4 2,249 1,179 1,070 1 1
5,112 2,673 2,439 153,295 79,858 73,437 4 2 2 368 300 68
1,002 621 381 28,343 15,854 12,489 4 2 2 178 120 58
4,254 2,191 2,063
8,434 4,400 4,034 210,959 109,865 101,094 682 458 224
2,272 1,243 1,029 77,855 41,635 36,220 662 444 218
12 3 9 3,625 1,839 1,786
1,238 655 583 97,544 50,893 46,651 207 142 6S
434 219 215 18,937 10,123 8,814 176 116 60
3,168 1,652 1,516 119,958 61,852 58,106 233 131 102
309 187 122 6,554 3,465 3,089 197 114 83
5,921 3,075 2,846 li5,040 58,049 56,991 41 30 11
37 23 14 5,180 269(:1 2,490 12 8 4

144
C.V PART A (ii) DISfRIBUnON OF LANGUAGES (INCLUSIVE OF MOTHER.TONGUES GROU.PE!) DISTRICTS, TALUK AND
MARATHI ORIYA PUNJABI DistrictfTalukfCityfTown
Persons Males Female;; Persons Males Females Persons Males Females
23 24 25 26 27 28 29 30 31
9. MUDDEBlHAL TALUK 1,427 720 707 45 29 J6 MUDDEBIHAL (TP) 187 88 99 T ALIKOT (TP) 706 348 358
10. MUDHoL TALUK 3,428 1,753 1,675 MAHALINGAPUR (M) 141 69 72 MUDHOL (M) 2,369 1,156 1,213
11. SU'lDOI T ALUK 1,161 565 596 SINDOI <TP) 178 97 81
CHlKMA,GALUR DISTRICT 7,906 4,061 3,845 81 42 39 13 7 6 1. CHlKMAOALUR TALUK 1,382 715 667 30 18 12 10 4 6
Chikmagalur (M) 1,085 564 521 9 3 6
2. KADUR T ALUK 2,373 1,214 1,159 39 18 21 Biror (M) . 841 436 405 Kadur (M) . 691 352 339 6 2 4
3. KOPPA TALUK 890 459 431 12 6 6 Koppa (M) 159 82 77
4. MUDIOERE TALUK 379 200 179 2 2 Mudigere (M) 81 38 43
5. NARASIMHARAJAPURA T ALUK 574 308 266 Narasimharajapura (M) 244 134 110
6. SruNOERI T ALUK 467 235 232 Sringeri (M) 28 17 11
7. T ARIKERE T ALUK 1,841 930 911
Ajjampura ~M) 295 149 146
Tarikere ~M) 519 269 250
CHITRADURGA DISTRICT 14,387 7,374 7,013 252 127 125 77 72 5 1. CHALLAKERE T ALUK 501 261 240 84 49 35
Challakere ~M) 135 69 66 17 10 7 Nayakanhatti (M) 16 8 8
2. CHITRADUROA T ALUK 1,801 911 890 6 5 6 6 Chitradurga (M) . 1,652 845 807 5 5 Turuvanur (M)
3. DAVAMOERE lALUK 4,649 2,388 2,261 12 5 7 29 25 4 Daval1agere City (M) 3,874 2,026 1,848 27 23 4 Mayakonda (M) . 48 21 27
4. HARlHAR T ALUK 3,010. 1,559 1,451 5 3 2 Harihar (M) 2,731 1,421 1,310
5. HIRIYUR lALUK 1,115 569 546 8 4 4 2 2 HiriYUr (M) 416 210 206 8 4 4
6. HOLALKER.E T ~LUK 436 243 193 12 6 6 Holalkere (M) 137 72 65
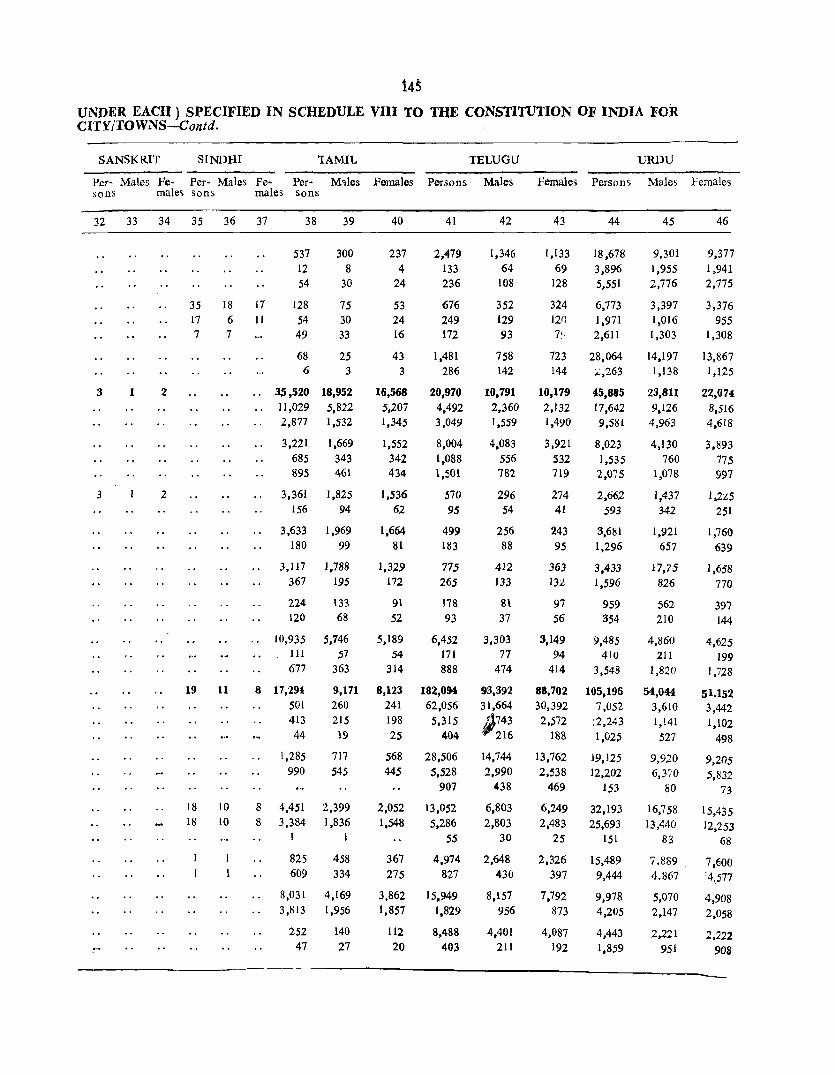
145 UNDER EACH) SPECIFIED IN SCHEDULE VIII TO THE CONSTITUTION OF INDIA FOR CITY/TOWNS-Contd.
SANSKRIT SINDHI lAMIL TELUGU URDU
Per- Males Fe- Per- Males Fe- Per- M'lles Females Persons Males Female~ Persons Males Females sons male~ sons males sons
32 33 34 35 36 37 38 39
3 1 2
3 2
537 12 54
300 8
30
35 18 17 128 54
49
75 30 33
17 6 II 7 7
19
18 18
11
10 10
68 25 6 3
. . :IS ,520 18,952 11,029 5,822 2,877 1,532
3,221 1,669 685 343 895 461
3,361 1,825 156 94
3,633 180
3,117 367
224 120
10,935 111
677
1,969 99
1,788 195
133 68
5,746 57
363
8 17,291 501 413 44
9,171
260 215 19
8 8
1,285 990
4,451 3,384
717 545
2,399 1,836
825 458 609 334
8,031 4,169 3,813 1,956
252 140 47 27
40
237 4
24
53 24 16
43 3
16,568 5,207 1,345
1,552
342 434
1,536 62
1,664 81
1,3,2,9 172
91 52
5,189 54
314
8,123 241
198 25
41
2,479 133 236
676 249 172
1,481
286
20,970 4,492 3,049
8,004 1,088 1,501
570 95
499 183
775 265
178
93
6,452 171 888
182,094 62,056
5,315 404
568 28,506 445 5,528
2,052 1,548
367 275
3,862 1,857
112 20
907
13,052 5,286
55
4,974 827
15,949 1,829
8,488 403
42
1,346 64
108
352 129 93
758 142
10,791 2,360 1,559
4,083 556 782
296 54
256 88
412 133
81
37
3,303 77
474
93,392
31,664 ,::1743 '216
14,744 2,990
438
6,803 2,803
30
2,648 430
8,157 956
4,401
211
43
1,133 69
128
324 12!J 7'
44
18,678 3,896 5,551
6,773 1,971 2,61J
723 28,064 144 ':,263
10,179 2,132 1,490
3,921
532 719
274 41
243 95
363 132
97 56
3,149 94
414
88,702 30,392 2,572
188
13,762 2,538
469
6,249 2,483
2S
2,326 397
7,792 873
4,087 192
45,885 17,642 9,581
8,023 1,535
2,075
2,662 593
3,681 1,296
3,433 1,596
959 354
9,485 410
3,548
105,196 7,052
:2,243 1,025
19,125 12,202
153
32,193
25,693 151
15,489 9,444
9,978 4,205
4,443 1,859
45
9,301 1,955 2,776
3,397 1,016 1,303
14,197 1,138
23,811 9,126 4,963
4,130 760
1,078
1,437 342
1,921 657
17,75 826
562 210
4,860 211
1,820
54,044 3,610 1,141 527
9,920 6,370
80
16,758
13,440 83
7.889
4.867
5,070 2,147
2,221 951
46
9,377 1,941 2,775
3,376 955
1,308
13,867 1,125
22,074 8,516 4,618
3,893 775 997
I,U5 251
1,760
639
1,658 770
397 144
4,625 199
1,728
51.152 3,442 1,102
498
9,205 5,832
73
15,435 12,253
68
7,600 '4,.;;77
4,908 2,058
2,222 908
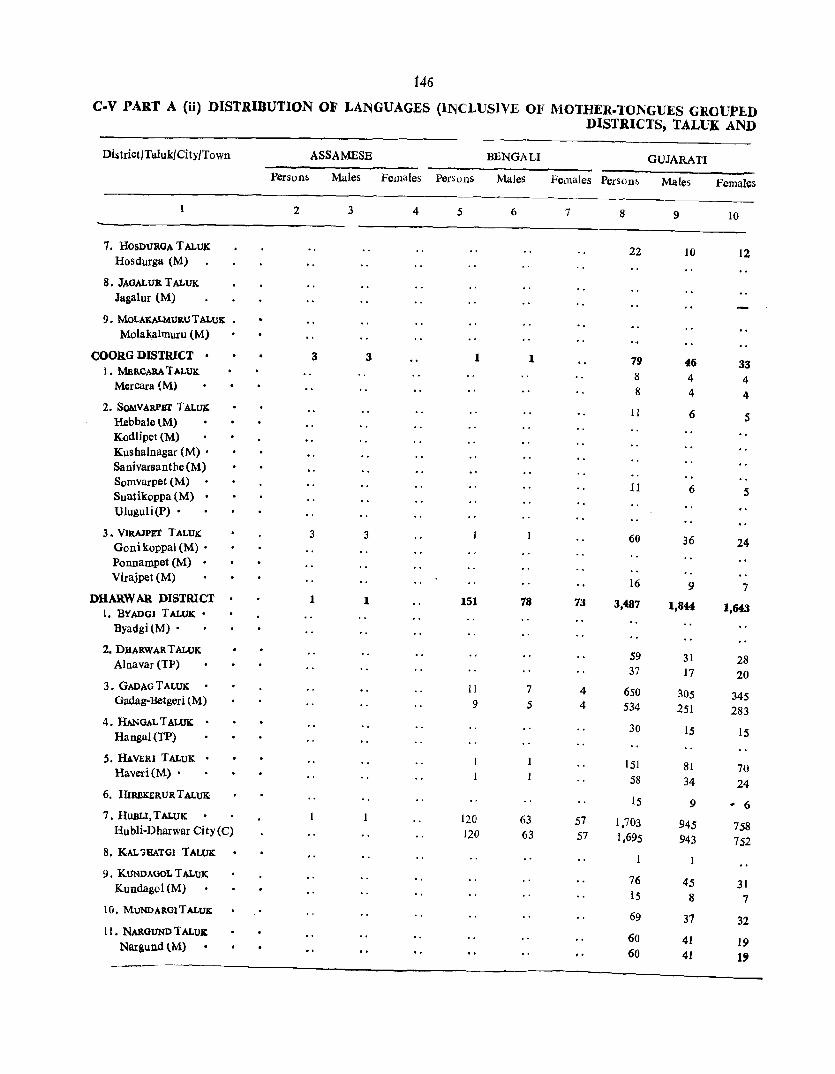
146
c·v PART A eii) DISTRIBUTION OF LANGUAGES (INCLUSIVE OF MOTHER.TOl\GUES GROUPED DISTRICTS, TALUK AND
District/Taiuk/City/Town ASSAMESE BENGALI GUJARATI
Persons Males Females Persons Males Females PerSonb Males Females
2 3 4 5 6 7 8 9 10
7. HOSDlJROA T ALOlC 22 10 12 Hosdurga (M)
8. JAOALlJR T ALUK Jagalur (M)
9. MOLAKA!.MlJltU T ALUK • Moiakalmuru (M)
COORG DISTRICT · 3 3 1 1 79 46 33 t. MURCABA T ALUK 8 4 4 Mercara (M) 8 4 4 2. SOMVARPET T ALUK II 6 5 HebbalelM)
Kodlipet (M) Kushainagar (M) • Sanivarsanthe (M) Somvarpet (M)
11 6 5 Suntikoppa (M) · UiuguIi(P) •
3. VIRAJPI!T T ALUK 3 3 60 36 24 Gonikoppal(M) • Ponnampet (M) . Virajpet (M) 16 9 7
DHARW AR DISTRICT 1 1 151 18 73 3,487 1,844 1,643 1. BYADOI TALUK • Byadgi(M) •
2. DHARWAR T ALUK 59 31 28 Alnavar (TP) 37 17 20
3. GADAG T ALUK II 7 4 650 305 345 Gadag-Betgeri (M) 9 5 4 534 251 283 4. Hi\NOAL TALUK · 30 15 IS Hangal(TP)
S. fu VEIU T ALUK · 151 81 70 Haveri(M) • 58 34 24
6. HIRllKllRUR T ALUK 15 9 # 6
7. HUBLI, T ALUK 120 63 57 1,703 945 758 Hubli-Dharwar City(C) 120 63 57 1,695 943 752 8. KAL'JUATOI TALUK
9. KUNDAOOL T ALUK 76 45 31 Kundagol (M) 15 8 7
10. MUNDARGITALUK 69 37 32
II. NMOUND T ALVE 60 41 19 Nargund tM) 60 41 l'

141
UNDER EACH) SPECIFIED IN SCHEDULE VIII TO THE CONSTITUTION OF INDIA FOR C(TY/TaNN~-CQntd.
HINDI
Persons Males
11 12
4,420 39
2,022 13
94 24
978 361 171
372 I
6 5 3 4 2
245 31 10 45
41,471 1,176
134
654 309
4,161 1,953
3,615 296
2,166 287
2,064
5,828 5,751
2,264
1,103 426
1,224
325 177
2,250 24
918 6
49 II
516 208 97
181 I
5 3 2 3 2
127 17 4
19
21,605 687
77
353 160
2,194 1,063
1,836 146
1,146 173
1,027
3,258 3,225
1,130
530 205
610
167 98
KANNADA KASHMIRI MALAYALAM
Females PerSOil5 Male> females Per.'iom Male'> Female~ Persons Males Females
13 14 15 16 17 18 19 20 21 22
2,170 116,800 15 5,963
1,104 73,735 7 5,083
45 41,927 13 1,882
462 155,838 153 38,367 74 7,561
191 78,455 2,382
1 1,239 2 2,414
1,1l0 3,867
251 1,027
118 39,016 14 423 6 763
26 1,371
19,866 1,875,919 489 65,922
57 11,137
301 108,635 14.9 2,852
1,967 168.199 890 65,351
1,779 109,434 150 7,076
1,020 118,704 114 19,398
1,037 119,688
2,570 2,526
275,701 203,894
59,401 3,177
37,289 2,654
21,591 1,032
79,902 19,712 3,956
39,902 1,187
645 1,242
571 1,975
118 519
20,288 227 388 731
962,754 33,809
5,727
55,587 1,527
85,926 34,432
56,752 3,704
61,417 10,255
61,769
146,242 109,654.
57,399 2,786
36,446 2,429
;!O,336 850
75,936 18,655 3,605
38,553 1,195
594 1,172
539 1,892
133 508
18,728 196 375 640
913,165 32,113 5,410
53,048 1,325
b2,273 30,919
52,682 3,372
;7,287 9,143
57,919
129,459 94,240
1,134 69,018 35,870 33,148
573 221
614
158 79
87,358 7,839
67,170
49,727 14,072
44,384 3,968
34,067
24,770 7,118
42,974 3,871
33,103
24,957 6,954
4
4 4
4
4 4
60 38
52 52
12 9
78,669 16,562 2,429
20,533 2
91 431 97 58
432 1,116
41,574 1,056
870 3,237
1,93,1 6 6
17 11
74 68
9 6
32 32
13
1,563 1,563
7
14 2
27 10
43 23
29 29
8 5
44,478 9,563 1,520
11,363 I
61 284 67
398 296 583
23,552 753 523
1,940
1,119 1
10 6
46 42
8 6
23 23
7
914 914
6
8 2
17 5
17
15
23 23
4 4
34,191 6,999
909
9,170 1
30 147 30
191 136 533
18,022 303 347
1,297
752
5 :;
7
5
28 26
9
9
6
649 649
6
10
5
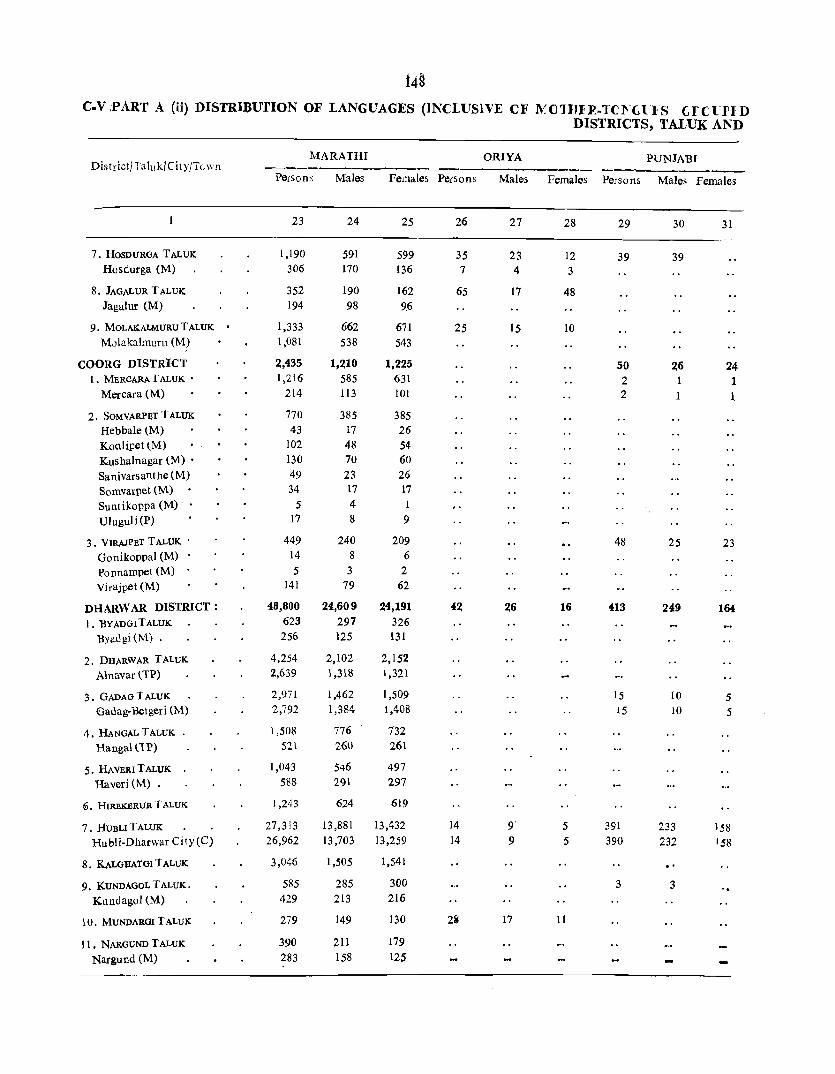
t48 c.v iPART A (ii) DISTRIBUTION OF LANGUAGES (INCLUSIVE OF lV01H1R.TCl' (.l'}S Cfct])ID
DISTRICTS, TALUK AND
MARATHI DistrictiTalu ki City}Tc wn
ORIYA PUNJABI
Persons Males Females Persons Males Females Persons Males Females
23 24 25 26 27 28 29 30 31
7. HOSDUROA T ALUK 1,190 591 599 35 23 12 39 39 Hosdurga (M) 306 170 136 7 4 3
8. JAGALUR TALUK 352 190 162 65 17 48 Jagalur (M) 194 98 96
9. MOLAKALMURU T ALUK 1,333 662 671 25 15 10 M01akalmuru (M) 1,081 538 543
COORG DISTRICT ~,435 1,~10 1,~~5 50 ~6 24 1. MERCARA'lALUK • 1,216 585 631 2 1 1
Mercara (M) 214 113 101 2 1 1. 2. SOMVARPET TALUK 770 385 385
Hebbale (M) 43 17 26 KooIipet (M) 102 48 54 Kushalnagar (M) • 130 70 60 Sanivarsanthe (M) 49 23 26 Somvarpet (M) 34 17 17 Suntikoppa (M)' • 5 4 I
Ulugu1i(P) 17 8 9
3. VlRA;JPET T ALUK . 449 240 209 48 25 23 Gonikoppal (M) 14 8 6 Ponnampet (M) 5 3 2 Virajpet (M) 141 79 62
DHARWAR DISTRICT: 48,800 ~4,609 24,191 4~ 26 16 413 249 164 l. 'BYADOITALUK 623 297 326
'Byadgi(M) . 256 125 131
2. DHARW AR T ALUK 4,254 2,102 2,152 Alnavar (TP) 2,639 1,318 1,321
3. GADAG T ALUK 2,971 1,462 1,509 15 10 5 Gadag-'Betgeri (M) 2,792 1,384 1,408 15 10 5
4. HANGAL T ALUK 1,508 776 732 Hangal(1P) 521 260 261
5. HAVERI T ALUK 1,043 546 497 Haveri(M) . 588 291 297
6. HIREKERUR T ALUK 1,243 624 619
7. HUBLI T ALUK 27,313 13,881 13,432 14 9' 5 391 233 158 Hubli-Dharwar Cily(C) 26,962 13,703 13,259 14 9 5 390 232 158
8. KAL<iBATOI T ALUK 3,046 1,505 1,541 .. 9. KUNDAOOL T ALUK. 585 285 300 3 3
Kundagol (M) 429 213 216
10. MUNDAROI T ALUK 279 149 130 2~ 17 11
11. NARGUND T ALUK 390 211 179
Nargund (M) 283 158 125

149 UNDER EACH) SPECIFIED IN SCHEDULE VIII TO THE CONSTITUTION OF INDIA FOR CITY ITOWNS-Contd.
SANSKRIl SINDHI TAMIL 1ELUGU URDU
Per- Males Fe- Per- Males Fe- Per- Males Female3 Persons Males Females Persons Males son~ male~ sons males sons
32 33 34 35 36 37 38 39
1 1 9 8 8
4 3 3
1,634 135
96 24
219 81
867 72
59 16
102 35
5 ~2,165 12,119 5 2,884 1,609 5 1,107 581
.. 10,977 16 42
577 44
448 160 704
8,304 343 250 520
6,060 11
25 307 28
245 84
356
4,450 189 134 271
835 430 405 10,629 5,717 56 25 21. 9
116 75
189 lui 88 1,016 181 100 81 959
25 25
9 16 9 16
31 II
LI0
193
78
73 47
546 508
2S 10
109 96
59
621 320 301 7,956 4,203 620 319 301 7,927 4.191
37
19 11
116
181 74
35
8
5
60
100 47
40 41 42 43 44
767 9,180 4,679 4,501 6,211 1,620 63 617 330 287
37 15,732 8,193 7,539 5,229 1,422 8 770 411 359
117 24,157 12,103 12,054 5,476 1,790 46 1,469 696 773
10,046 1,275
526
4,917 5
17 270
16 203
76 348
3,854 1M 116 249
4,912 31 13
43 28
470 451
6
101 97
19
3,753 3,736
2
11 6
56
81 27
5,145 1,358
945
2,224 2
38 545 44 151 71 23
1,563 200
71 312
34,100 346 256
762 507
2,851 1,728
1,474 12
1,089 829
1,830
18,310 18,073
633
295 83
592
109 54
2,692 684 486
1,177 1
25 278 20 82 36 10
831 103 38
173
17,723 180 132
408 278
1,449 884
781
5
548 416
922
9,659 9,532
337
140 39
316
65 35
2,453 674 459
1,047 I
13 267 24 69 35 13
7'],2 97 33
139
10,836 3,214 2,599
3,479 8
524 537 372 473 263
49
4,143 252 270
1,728
16,377 289,409 166 8,616 1:24 2,444
354 229
11,845 3,183
1,402 22,69u 844 17 ,845
693 26,022 7 5.806
541 413
908
8,651 8,541
17,173 5,906
17,323
89,517 86,120
296 5,377
155 11,257 44 2,326
276 3,692
44 3,571 19 2,564
45
3,099 859
'L,699 699
2,778 892
5,630 1,713 1,415
1,801 6
265 283 180 247 137 31
2,116 127 132 902
149,073 4,351 1,224
6,003 1,648
11,416
9,020
13,418 2,974
8,740 3,048
9,179
46,711 44,956
2,773
5,653 1,190
1,898
1,818 1,318
Females
46
3,112 761
2,530 723
2,698 898
5,206 1,501 1,184
1,678
2 259 254 192 226 126 18
2,027 125 138 826
140,336 4,265 1,220
5,842 1,535
11,274 8,825
12,604 2,832
8,433 2,858
8,144
42,806 41,164
2,604
5,604 1,136
1,794
1,753 1,246

do c·v PART A (ii) DISTRIBUTION OF LANGUAGES (INCLUSIVE OF MOTlIER.TOl.'\GUES GRO U PI L
DISTRICTS, TALUK Al\D
ASSAMESE BENGALI GUIARATI District I Taluk/CityJTown
Females Persons Males Per:;ons Males Females Persons Males Females
2 3 4 5 6 7 8 9 10
12. N.W,ALGUt.D T ALUK 270 135 135 Annigeri (TP) I 1
Navalgund (M) . 203 100 103
13. R,ANmENNlJRTALUK . 19 7 12 23 6 17
Railibennur (M) . 10 5 5
14. RONTALUK 317 158 159 Gajendragad (TP) Naregal (TP) Ron (TP) 4 2 2
15. SAVANUR. TALUK 41 22 19 Savanur (M) 21 11 10
16. SSIGGAON Tt\LUK 8 4 4 Shiggaon(T.P.)
17. S'llR..AUATl'r T ALUK 14 9
Lakshmeshwar (M) II 8
Shirahatt i(M) 2
GULBAKGA DISTRICT 2 2 106 73 33 2,307 1,183 1,124
1. AFZALPUR TALUK 48 24 24
2. AL,\ND TALlJK 485 226 259 Aland (M) 85 42 43
3. CHIl'lCIJOLI T ALUK 21 9 12
Chincholi (M) 3 2
4. CHI'l'APUR. T ALUK 46 29 17 533 282 251
Chitapur (M) 18 9 9 Shahabad (M) 55 26 29
Shahabad A.C.C. Notified 29 19 10 146 79 67 Area (NAC)
Wadi A.C.C. Notified Area 14 10 4 16 11 5 (NAC)
5. GULBARGA lALUK 2 2 17 12 5 896 471 425
Gulbarga City(M.) 2 2 17 12 5 654 350 304
6. Illv ARGl T ALUK . 125 69 56
7. SEDAM TAL UK 43 32 11 26 17 9
Sedam(M) • 12 8 4
8. SHAI:JAPUR T ALUK 2 2
Shahapur (M) 2 2
9. S':fOR.,APUR TALUK 7 4 3
Shorapur (M)
10. Y,4DGIR T ALUK • 164 79 85
Gurumatkal (MY • 3 3
Yadgir(M) 145 74 71

151
UNDER EACH) SPECIFIED IN SCHEDULE VIII TO THE CONSTITUTION OF INDIA FOR CITY/TOWNS-Contd.
HINDI KANNADA KASHMIRI MALAYALAM
Per>ons Males F:::males Persons Males Females Persons Males Females Persons Males Females
11 12 13 14 15 16 17 18 19 20 21 22
400 217 183 102,745 51,571 51,174
75 42 33 10,798 5,397 5,401 19 16 3 9,623 4,962 4,661
4,409 2,254 2,155 144,204 74,303 69,901 160 132 28 458 248 210 29,313 15,280 14,033 7 5 2
1,947 947 1,010 159,082 78,619 80,463 6 4 2 779 394 385 11,725 5,953 5,772
12 7 5 11 ,411 5,898 5,513 11 6 5 10,684 5,330 5,354
2,723 1,409 1,314 57,990 29,762 28,228 166 94 72 7,123 3,618 3,505
2,186 1,149 1,037 12853 37,569 35,284
45 20 25 7,227 3,758 3,469
5,~16 2,691 2,525 99,489 50,337 49,152 2 2 165 91 74 15,078 7,715 7,363 2 2
81 57 24 6,019 3,184 2,835
103,346 52,885 50,461 1,157,342 585,298 572,044 1 7 869 546 323 3,646 1,846 1,800 87,885 44,982 42,903 6 5
5,974 3,003 2,971 147,661 75,779 71,882 3 2 170 123 47 7,198 3,779 3,419
14,838 7,444 7,394 78,026 39,277 38,749 15 12 3 80 41 39 4,068 2,064 2,004 2
22,089 11,194 10,895 130,812 65,485 65,327 388 251 137 1,160 607 553 5,852 2,976 2,876 1 1 1,055 526 529 10,181 5,233 4,948 52 35 7
425 217 208 2,001 1,076 925 223 139 84
39 24 15 182 104 78 79 54
16,202 8,397 7,805 184,061 95,591 88,470 7 7 261 145 116 .1,321 2,261 2,060 63,255 33,830 29,425 7 7 260 145 115
4,833 2,459 2,374 107,188 53,500 53,688
5,637 2,888 2,749 45,448 22,749 22,699 76 55 21 815 414 401 5,811 2,993 2,818
6,469 3,196 3,273 124,954 61,962 62,992 25 25 151 80 71 6,794 3,451 3,343
9,480 4,945 4,535 137,938 68,928 69,010 75 48 27 884 . 475 409 10,554 5,261 5,293 3 2
14,178 7,513 6,665 113,369 57,045 56,324 19 8 11 1,414 822 592 1,059 570 489 1,637 841 796 16,461 8,161 8,300 17 7 10

152
C.V PART A (ii) DISTRIBUTION OF LANGUAGES (INCLUSIVE OF MOTHER.TONGUES GROUPED DISTRICTS, T ALUK AND
DistrictITaluk/City/Town MARATHI ORIYA PUNJABI
Persons Males Females Persons Males Females Persons Males Females
23 24 25 26 27 28 29 30 31
12. NAV,ALGUNOTALUK 471 225 246 Annigeri (TP) 93 43 50 Navalgund (M) 34 13 21
13. RANlBl!NNUR T ALUK 764 403 361 4 3 Ranibennur (M) 447 238 209
14. RON TALUlC 806 410 396 Gajendragad (TP) 291 148 143 Naregal (TP) 50 24 26 Ron (TP) 82 47 35
15. SAVANUR. T ALUK 1,063 454 609 Savanur (M) 842 420 422
16. SSIOOAON T ALUK 867 476 391 Shiggaon(TP), 128 49 79
17. SHlRAliAT1'I T,ALUK 1,574 803 771
Lakshmeshwar (M) 447 243 204
Shirahatti(M) 626 314 312
GULB U.GA DlSfRICT 50,977 25,670 25,307 380 199 181 196 133 63 1. AFZALPUR T ,ALUK 3,324 1,718 1,606
2. ALAND TALUK • 14,959 7,524 7,435 5 4 Aland (M) 3,272 1,686 1,586 5 4
3. CHINCHOLI, TALUK 2,780 1,347 1,433
Chincholi (M) 278 129 149
4. CHITAPUR T ALUK 7,644 3,773 3,871 5 3 2 95 68 27 Chitapur (M) 1,208 593 615
Shahabsd (M) 1,741 866 875 17 II 6
Shahabad A.C.C. Notified 671 351 320 57 42 15 Area (NAC)
Wadi A.C.C. Notified Area 104 55 49 12 10 2 (NAC)
5. GULBAROA T ,ALUK 14,059 7,155 6,904 250 133 117 88 56 32 Gulbarga City (M) 11 ,191 5,713 5,478 250 133 117 88 S6 32
6. JEVARGI T ALUK • 997 487 510 8 5 3
7. SEDAM T ALUj(; 1,412 712 700 20 10 10 3 3 Sedam (M) 296 162 134 1
8. SHAHAPUR T ALUK 2,163 1,120 1,043 32 16 16
Shahapur (M) 1,179 586 593
9. SHORAPUR T ,ALUK 2,117 1,080 1,037 35 18 17 2 2 Shorapur (M) 1,123 551 572
10. YADOIR T ALUK . ') ,522 754 768 30 14 16 3 3 Gurumatkal (M) 199 97 102
Yadgir (M) 831 417 414 3 3

153
UNDER EACH} SPECIFIED IN SCHEDULE VIII TO THE CONSTITUTION OF INDIA FOR CITY/TOWNS-Contd.
SANSKRIT SINDHI TAMIL TELUGU URDU
P()r- Ma- Fe- Per- Ma- Fa- Persons Mlle. Females Persons Males Females Persons Males Females sons les males sam Jes males
32 33 34 35 36 37 38 39
2 2
43 23 22 14 7 4
139 90 84 50
129 84 12 10 9 9
12 11
16 12 10 6
446 231 194 100
40 34 18 18
182 112 70 2,841 14
1,534
3
7 5 2 168 7 5 2 74
75 45 30
54 30 24
19 13 6
2 2
86 54 32 84 53 31
2
11 10
2
6
5
5
5
90 13
901 44 71
496
77
643 570
78
61
3
118 38
503 14
265 33
52
78 37
58 13
489 24 39
264
43
380 342
42
32 3
48 14
268 10
136 19 31
40
20 8 3
49 34
45 2
4
4
215 94
6
1,307 11
90 37
32
412 20 32
232
34
263 228
36
41
369 36
222
840 335
1,634 582 378
57
1,066 457
609 94
1,291 569
53
119,873 1,732
1,796 316
14,774 424
9,375 683
2,267
455
54
6,786 3,306
1,775
29 39,976
70 24
284
1,204 72
235 5,122 4 607
129 37,333 14 4,922
21 455
42
187 16
113
426 169
784 280 191
21
555 222
311 53
655 276
30
59,059 864
905 158
7,239 196
4,755 325
1,178
242
31
3,535 1,750
899
43 44
182 7,132 20 3,553 109 1,826
414 15,194 166 9,868
850 6,208 302 1,371 187 834 36 2,219
511 15,697 235 9,525
298 18,850 41 4,146
636 9,245 293 4,132
23 2,475
6a,814 299,427 868 15,113
891 26,045 loS'S 10,400
7,535 22,015 228 2,494
4,620 358
1,089
213
23
3,251 1,556
44,725 5,203 8,007
1,595
131
81,732 61,007
876 21,350
19,595 20,381 14,607 4,156 150 134
566 '}.7
2,804 322
17,897 2,280
242
638 24,377 35 6,021
2,318 285
19,436 2,642
213
20,169 7,856
29,294 2,836
13,122
45
3,584 1,763
938
7,853 5,089
3,120 713 415
1,113
8,167 4,943
9,610 2,128
4,779 2080 1,233
150,658 7,712
13,148 5,210
11,161 1,333
22,434 2,631 4,118
813
75
41,907 31,552
10,597
7,320 2,057
11,917 2,928
9,991 3,830
14,471 1,373 6,637
46
3,548 1,790
888
7,341 4,779
3,088 658 419
1,106
7,530 4,582
9,240 2,018
4,466 2,052 1,242
148,769 7,401
12,897 5,190
10,854 1,161
22,291 2,572 3,889
782
56
39,825 29,455
10,753
7,287 2,099
12,460 3,093
10,178 4,026
14,823 1,463 6,485
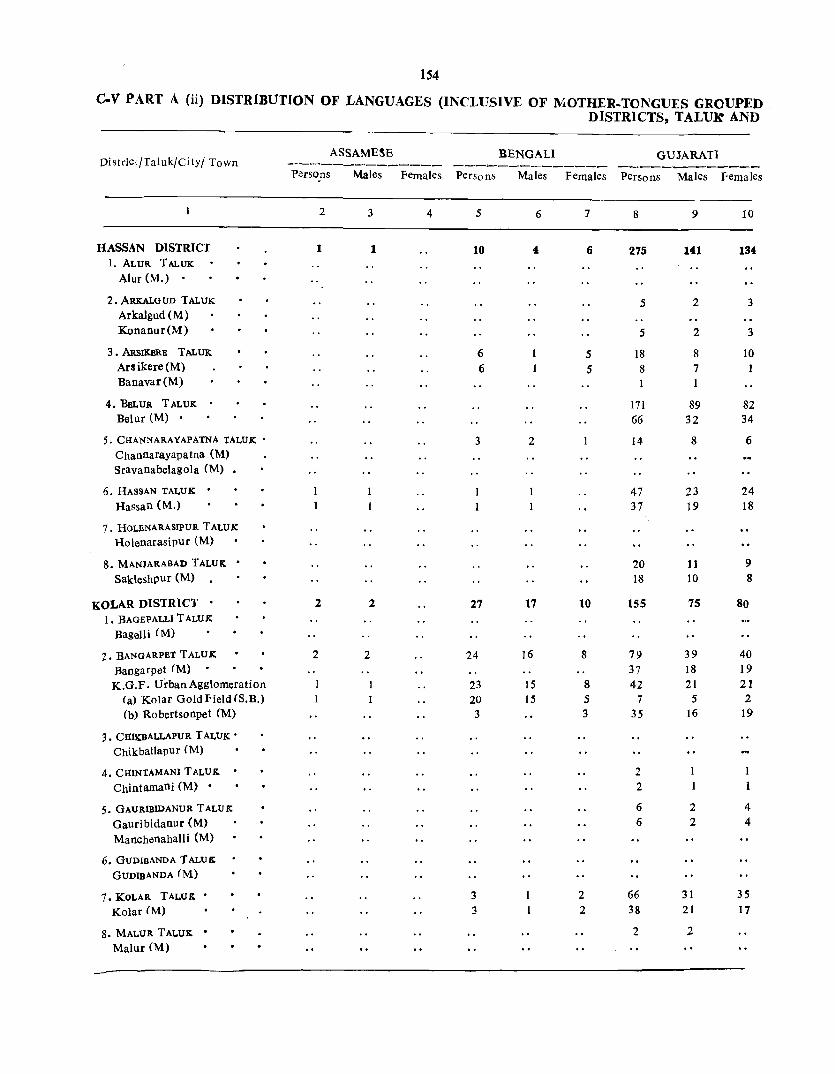
154
C.V PART A (ii) DISTRIBUTION OF LANGUAGES (INCLUSIVE OF MOTHER.TONGUES GROUPED_ DISTRICTS, TALUR AND
ASSAMESE BENGALI GUJARATl District/Taluk/City/ Town -------------- ---0.--_--------- -------------P<!rsons Males Females Persons Males Females Persons Males Females
2 3 4 5 6 7 8 9 10
HASSAN DISTRICT 1 1 10 4 6 275 141 134 I. ALUR T ALUK
Alur (M.) . 2. ARKALGUD TAL UK 5 2 3
Arkalgud (M) Konanur(M) 5 2 3
3. ARSIKBRB TALUK 6 1 5 18 8 10 Ars ikere (M) 6 1 5 8 7 Banavar(M)
4. BBLUR TALUK 171 89 82 Belur (M) 66 32 34
5. CltANNARAYAPATNA TALUK • 3 2 14 8 6 Channarayapatna (M) Sravanabelagola (M) •
6. HASSAN TALUK . 47 23 24 Hassan (M.) 37 19 18
7. HOLENARASIPUR T ALU K Holenarasipur (M)
8. MANJARABAD TALUK: . 20 11 9 Sakleshpur (M) 18 10 8
KOLAR DISTRICT 2 2 27 17 10 155 75 80 I. BAGEPALLI TALUK
Bagelli (M)
2. BANGARPET T ALU K 2 2 24 16 8 79 39 40
Bangarpet (M) 37 18 19 K.G.F. Urban Agglomeration 23 15 8 42 21 21
(a) Kolar Gold Field (S.B.) 20 IS 5 7 5 2 (b) Robertsonpet eM) 3 3 35 16 19
3. CItIKBALLAPUR T ALUK • Chikballapur (M)
4. CIlINTAMANI TALUK . 2 I 1
Chintamani (M) . 2 1 1
5. GAURIBIDANUR TALUIC 6 2 4
Gauribidanur (M) 6 2 4
Manchenahalli (M)
6. GUDIBANDA TALUK GUDIBANDA (M)
7. KOLAR TALUK • 3 2 66 31 35
Kolar (M) 3 2 38 21 17
8. MALUR TALUK . 2 2
Malur (M)

155
UNDER EACH) SPECIFIED IN SCHEDULE VIII TO THE CONSTITUTION OF INDIA FOR CITV/TOWNS-Contd.
HINDI KANNADA KASHMIRI MALA YALAM ----------------- -------.;,._-_....___ ......... _--- ---------_"--_--"--- -"-------------Persons Males Females Persons Males Females Persons Males Females Persons Males Females
11
9,412
132 21
89
5
8 011 469 135
223 94
152 52 9
511 397
18 14
276 231
9,932 2,410
34
3,154 319
2,18B
577 1,611
148 135
415 105
1,764
108 6
65 16
741 360
701 172
12
4,988
38 IS
4()
3
4,245 261
65
113 53
74 25
6
297 229
12 9
169 146
5,225 1,306
19
1,763 154
1,263 423 840
79
72
219 59
772 57 2
46 11
385 197
378 85
13
4,424
94 6
49 2
3,766 208
70
110
41
78 27 3
214 168
6 5
107 85
4,707 1,104
15
1,391 165 925 154 771
69 63
196 46
992 51 4
19 5
356 163
323 87
13-1 Census Karnatak/78
951),459
53,290 2,571
\17,334 6,674
3,973
171,309 II ,371
2,654
99,780 5;691
161,141 7,002 3,108
186,760 32,326
98,398 11,916
62,447 5,463
368,420 3,704
723
42,507 2,245 4,469 1,724 2,745
31,260 6,931
22,111 3,144
53,746
3,307 952
1,655 464
87,855 10,700
50,096 1,873
15
478,334 26,612 1,319
58,984 3,441
2,072
86,972 5,977 1,363
50,330 2,896
79,478 3,629 1,541
94,913 17,478
49,426 6,008
31,719 2,890
188,992 2,082
378
22,108 1,125 2,491
990 1,501
15,869 3,680
11,372 1,751
27,7j8
1,793 458
866 235
44,936 5,601
25,345 965
16
472,125 26,678 1,252
58,350 3,233 1,901
84,437 5,394 1,291
49,450 2,795
81,663 3,373 1,567
91,847 14,848
48,972 5,908
30,728 2,573
179,428 1,622
345
20,399 1,120 1,9 7 8
734 1,244
15,391 3,251
10,739 1,393
26,008 1,514
494
789 229
42,919 5,099
24,751 908
17 18 19 20
9,308 656 38
438 35 49
245 148
17
1,660 138
114 51 2
976 702
93 36
5,126 770
3,342 18 18
2,785 102
2,619 1,492 1,127
97 94
51 49
81 48
5
9 9
181 171
26 11
21
5,839 381 24
278 24 39
158 93
7
886 98
71 32 2
643 449
75 27
3,347 539
2,049 14
14
1,692 69
1,577 922 655
59 56
34 32
69
37 4
6 6
93 87
23 9
22
3,469
275 14
160 11
10
87
55 10
774 40
43 19
333 253
18 9
1,779 231
1,293
4 4
1,093 '. 33
1,042 570 4i2
38 38
17 17
12 11
1
;, 3
88 84
3 2

\56
C.V PART A (ii) DISTRIBUTION OF LANGUAGES (INCLUSIVE OF MOTHER.TONGUES GROUPED DISTRICTS, TALUK AND
MARATHI' ORIYA PUNJABI lOistrict/Taluk/City/Town ------_....._.----------- -_ ...... _----- -------------_ Persons Males Females Persons Males Females Persons Males Females
23 24 25 26 27 28 29 30 31
HASSAN DISTRICT 7,221 3,688 3,533 16 10 6 1. ALUR T .ALUK 372 193 179
Alur (M) . III 57 54
2 ARKALGUD T ALUK 236 117 119 Arkalgud (M) . 21 IS 6 Konanur (M) 79 39 40
3. ARSIKERE T ALUK 2,135 1,055 1,080 2 2 Arsikere (M) 727 370 357 Banavar (M) 445 216 229
4. BELUR T ALUK . 1,016 530 486 4 2 2 Belur (M.) 226 124 102
5. CfJANNARAYAPATNA TALUK • ~ ~681 , 360 321
Channarayapatna (M) • 229 117 112 Sravana belagola (M) . 32 16 16
6. HASSAN TALUK . 1,978 1,025 953 3 3 Hassan (M.) 1,433 746 687 3. 3
7. HOLENARASIPUR T ALUK ~. 472 230 242 Holenarasfpur (M): 288 141 147
8. MANJARABAD T ALUIC . 331 178 153 7 3 4 SakIleshpur. (1.\1) 73 40 33 7 3 4 ..
KOLAR DISTRICT· 12,268 6,290 5,978 2 2 52 29 23 I. BAGEPALLI TALUK 155 93 62
Begepalli(M) 27 16 11
2. BANGARPET T ALUK 4,073 2,107 1,966 47 24 23 Bangarpe t (M) 263 140 123 K.G.P. Urban Agglomeration 983 521 462 45 23 22
(a) KolarGoldFields(S.B.) 272 145 127 31 17 14 , (b) R0bertsonpet (M.) 711 376 335 14 6 8
3. CIUKBALLAPUR TALUK' 493 248 245 Chikballapur (M) 303 150 153
4. CHIN TAMAN I TALUK . 1,020 497 523 Chintamani (M) • 488 238 250
5. GAURIBIDANUR T ALUK 2,975 1,551 1,424 4 4 Gauribidanur (M.) 368 183 185 Manchenahalli (M) 84 41 43
6. GUDIBANDA TALUIC 152 79 73 Gudibanda(M) 34 18 16
7. KOLAR T ALUK . 1,057 538 SI9 Kolar(M) • 541 296 24,5
8. MALUR TALUK . 1,718 864 854 Ma1ur tM) • 447 227 220

157
UNDER EACH) SPECIFIED IN SCHEDULE VIII TO THE CONSTITUTION OF INDIA FOR C [TY ITOWNS-Contd.
SANSKRIT SINDHI TAMIL TELUGU URDU .. -------- ________ ~____________ -----""--0--_------ _~""'_ _________ _ per- Males Fe'Ions males
Per- Males Pe· Persons Males Females Persons Males Females Persons Males Pemales sons mal!'s
32 33 34 35 36 37 38 )9 40 41
5
4 4
3
2 2
2
2 2
1
11
11 11
1 . . 25,720 13,479 12,241 657 47
27,695 232
80
1
5
5
5
1,331 674 100 53
3,065 1,594 108 63 169 76
4,360 2264 3,554 1,830
24 14
2,624 1,334 728 372
1,067 577 130 61
83 52
6,201 3,166 2,907 1,477
1,1'63 260
835 I 17
1,471 45 93
2,096 1,724
10
1,290 356
490 69 36
3,035 1,430
828 143
2,343 468 558
11,609 2,262
249
2,814 573
2,743 357
59
4,281 2,504
2,598 939
5,409 3,035 2,374 1,076 711 629 346 283
6 137,582 69,728 200 112
87 47
.. 97,369 f9,397 3,521 1,831
. . 80,240 40,655
.. 61,651 31,300
.. 18,589 9,355
1,078 708
1,120 8]0
60! 206
62
99 51
574 358
582 420
329 106
35
54 33
6 14,857 7,383 6 3,693 1,873
.. 15,358 7,886 2,7J~ 1,415
67,854 88 40
47,972 1,690
39,585 30,351 9,234
828,720 88,140
2,888
96,949 3,844
11,982 6,475 9,507
504 68,902 350 13,953
538 112,618 390 14,281
272 106,082 100 6,135 27 2,789
45 28,131 18 3,306
7,474 53,466 1,820 11,792
7,472 J ,383
39,087 3,145
42
14,340 127 43
1,179 233 267
6,023 1,159
126
1,421 315
1,391 179 21
2,289 1,293
1,361 459
549 349
420,467 45,288
1,503
48,882 1,932 8,269 3,132 4,937
34,838 7,053
57,333 7,385
54,378 3,163 1,449
14,295 1,658
26,860 6,130
19,635 1,573
43
13,356 105 37
1,164
235 291
5,586 1,103
123
1,393 258
1,352 178 38
1,992 1,211
1,237 480
527 362
408,253 42,852 1,385
48,067 1,912 7 ;713 3,143 4,570
j4,064
6,?00
55,285 6,896
51,704 2,972 1,340
13,836 1,648
26,606 5,662
19,452 1,572
44
50,666 2,001
780
4,228 1,395
657
10,790 5,444
847
7,687 2,663
4,453 2,406
289
12,597 9,978
3,863 2,047
5,470 2,517
153,999 7,2G6
1,579
24,783 4,380
10,862 2,869 7,993
9,968 6,978
19,032 7,759
13,417 2,622
964
2,422 1,205
26,737 15,954
45
26,148 1,019
381
2,185 723 332
5,639 2,787
429
3,935 1,341
2,237 1,210
139
6,533 5,175
1,%5 1,201
2,635 1,292
79,329 3,645
807
12,851 2,219 5,784 1,574 4,210
5,126 3,5~9
9,942 4,085
6,928 1,369
488
1,213 617
13,756 8,219
10,305 5,323 1,933 1,(140
~
46
24,158 982 399
2,043 672 325
5,151 2,657
418
3,752 1,322
2,216 1,196
150
6,064 4,803
1,85'8 1,269
2,412 1,225
74,670 3,561
772
11,932 2,161 5,078 1,295 3,783
4,842 3,379
9,0<]0 3,674
6/89 1,253
476
1,209 588
12,981 7,735
4,982 [ 84'3
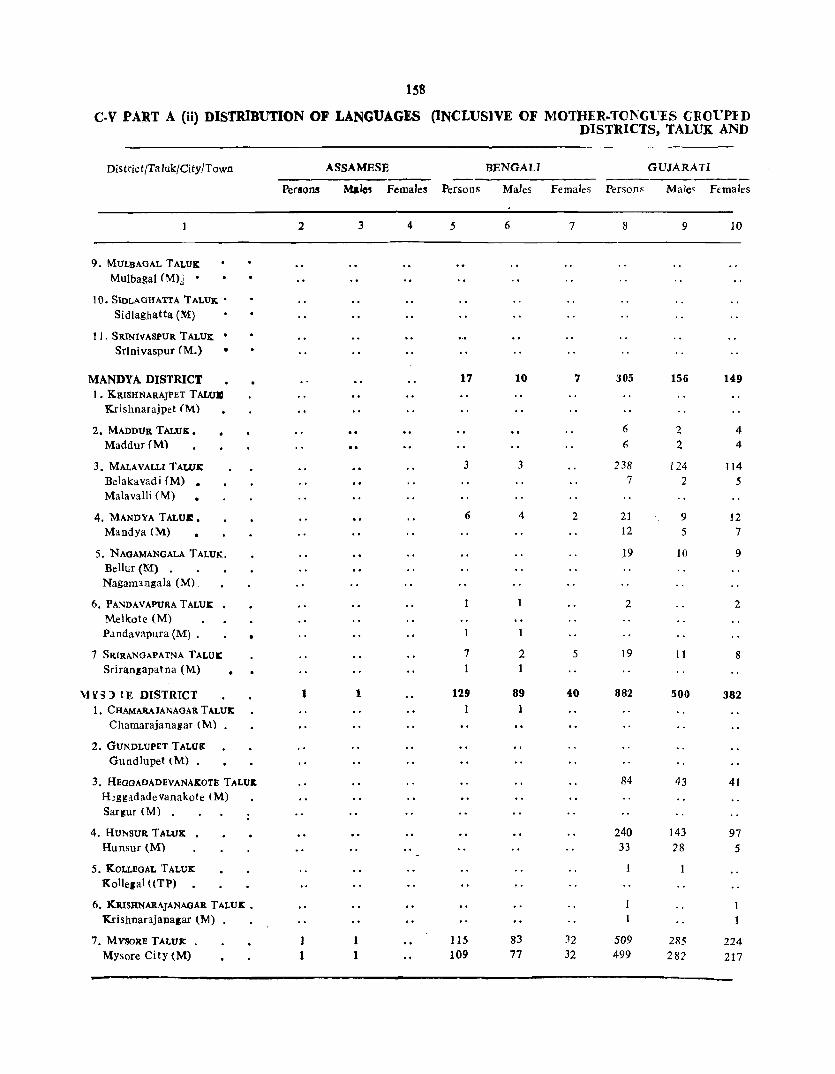
IS8
C-V PART A (ii) DISTRIBUTION OF LANGUAGES (INCLUSIVE OF MOTllER-TO)'.'C'lTES GIWVPID DISTRICTS, TALUK AND
District/Taluk/City/Town ASSAMESE BENGALI GUJARATI
Persons Male' Females Persons Males Females Persom Male' Ffmales
2 3 4 5 6 7 8 9 10
9. MULBAGAL TALUK Mulbagal (M)j .
to. SIDLAGHATTA TALUK • Sidlaghatta (M)
11. SRINIV'ASPUR TALUK: . Srlnivaspur (M.) •
MANDYA DISTRICT 17 10 7 305 156 149 1. KRISHNARAJPET T ALUII
Krishnarajpet (M)
2. MADDUR TALUK. 6 2 4 Maddur (M) 6 2 4
3. MALAVALLl TALUK 3 3 238 124 114 Belakavadi (M) . 7 2 5 Malavalli eM)
4. MANDYA TALU&!. 6 4 2 21 9 12 Mandya (M) 12 5 7
5. NAGAMANGALA TALUK. 19 10 9 Bellur (M) Nagamangala (M)
6. PANDAVAPURA TALUK 2 2 Melkote (M) Pandavapura (M) .
7 SRIRANOAPATNA TALUIC 7 2 5 19 11 8 Srirangapatna (M)
MYo;::> tE DISTRICT I 1 129 89 40 882 500 382 1. CHAMAltAJANAOAR T ALUE: 1
Chamarajanagar 1M) •
2. GUNDLUPET TALUK Gundlupet 1M) •
3. HEGOAOAOEVANAKOTIl TALUE 84 43 41 H~ggadadeV'anakote 1M) Sargur (M)
4. Hu:r-.sult TALUK 240 143 97 Hunsur (M) 33 28 5
5. KOLLEGAL TALUK KolleJal «TP)
6. KRISHNARAJANAOAR T ALUE • Krishnarajanagar (M) •
7. MVSORE TALUK . 1 115 83 32 509 285 224 Mysore City (M) 1 109 77 32 499 282 217

159
UNDER EACH) SPECIFIED IN SCHEDULE VIII TO THE CONSTITUTION OF ]l\DJA rOR CITY/TOWNS-Goutd.
HINDI KANNADA KASHMIRI MA LA YA LA M
Persons Males Female; Penons Males Females Persoos Malc~ Females Persons Males Females
II
146 121
116 95
272 7
1,950 111
25
261 49
183
35
748 677
65
13
121
15 59
461 220
11,079 966
12
160 52
1S64 12 22
531 200
1,913 51
108 63
5,954 5,890
12 13 14 IS 16 17 18 19 20 21 2'2
83 71
69 57
125 5
982 73 19
143 28
32
21
434 396
26
7
69 10 33
205 44
5,716 455
10
90 28
452 7
13
141 100
978 25
61 34
3,206 3,174
63 21,475 50 2,718
-J.7 39,933 38 2,651
147 14,078 2 1,763
968 1,06-1,207 38 148,162 6 8,179
118 184,865 21 7,726
151 176,159 4,967
14 15,685
314 231,559 281 48,140
39 123,735 2,890
6 5,025
52 105,231 5 2,166
26 6,601
256 94,496 176 10,854
5,363 1,735,lot 511 209,027
2 22,673
70 131,660 24 10,908
412 122,289 5 3,505 9 4,610
390 114,022 100 1l,890
935 152,643 26 18,466
47 146,645 29 10,232
~,748
2,716 332,012 198,731
11,069 1,439
20,317 1,374
7,290 975
541,883 73,415 4,157
94,788 4,062
90,644 2,461 8,095
119,914 25,637
60,820 1,483 2,701
53,657 1,070 3,499
48,645 5,502
891,224 106,935
11,624
66,382 5,644
62,223 1,867 2,368
57,879 6,107
78,384 9,490
74,846 5,314
10,406 1,279
19,616 1,277
6,788 788
522,324 74,747 4,022
90,077 3,664
85,515 2,506 7,590
111,645 2:l,503
62,915 1,407 2,324
51,574 1,096
3,102
45,851 5.352
843,880 102,092
11,049
65,278 5,324
60,066 1,638 2,242
56,143 5,783
74.259 8.976
71.799 4.918
173,907 158.105 105,082 93.649
9
o 9
6
6 6
3
3 3
40 34
28 18
26 26
2,636 92 18
196 59
933 3
35
1,040 931
76 4
30
168 8
77
131 23
10,757 281 182
152 92
2,088 94 32
901 417
205 181
250 166
5,704 5,531
25 22
18 11
16 16
1,875 33 II
155 50
751 1
18
687 610
49 4
22
119 8
51
81 15
6,769 181 114
96 59
1,379 78 26
649 331
119 109
186 118
3,S06 3,383
15 12
10 7
10 10
761
59 7
41 9
182 2
17
353 321
27
8
49
26
50 8
3.988 100 68
56 33
709 16 6
252 86
86 72
64 48
~.19S 2,148

1~O
C .. V PART A (ii) DISTRIBUTION OF LANGUAGES (INCLUSiVE OF MOTHER.TONGUES GROUPED DISTRICTS, TALUK AND
MARATHI ORIYA PUNJABI District/TalukjCity/Town ------____ 0..-____
--_.;....._.-----'----- -----_----------Persons Males Females Persons Males f.emales Persons Males Females
23 24 25 26 27 28 29 30 31
9. MULBAOAL TALUK 171 84 87 MulbagallM) 64 33 31
10 SrDLAoHATTA TALUK • 181 85 96 Sidlaghatta (M) 65 31 34
11. SRrNlvAsPUR TALUK' 273 144 129 Srinivaspur (M) 61 26 35
MANDYA DISTRICT 5,458 2,793 2,665 27 17 10 I. KRISHNARAJPET TALUK. 352 193 159 14 9 5
KrishnarajPet (M) 36 16 20
2. MADDUR TALUK. 506 239 267 Maddur (M). 125 61 64
3. MALAVALLI TALUK 513 247 266 4 3 Belakavadi (M) 5 2 3 Malavalli (M) 132 74 58
4. MANDYA TALUK. 2,078 1,084 994 Mandya (M) 1,476 757 719
5. NAOAMANOALA TALUK 371 176 195 Bellur (M) • 165 76 89 Nagamangala (M) 75 38 37
6. PANDAVAPURA TALUK • 619 314 305 Melkote (M) 10 5 5 Pandavapura (M.) 369 187 182
7. SRIRANOAPATNA T ALUK 1,019 540 479 9 7 2 Srirangapatna ~ M) 529 278 251
MYSORE DISTRICT 21,518 10,943 10,575 22 9 13 157 95 62 1. CHAMARAJANAOAR T ALUIC 5::.3 263 260 Chamarajana~ar tM) 356 195 16t
2. GUNDLUPET TALUK 488 244 244 Guodlupet (M) 321 164 157
3. HEGGADADEVANAKOTE T ALUK 597 314 )83 HeggadadevJnakof, (M) 74 32 42 Sargur (M) 99 56 43
4. HUNSUR TALUlC • 4,708 2,346 2,362 Hunsur (M) 930 490 440
5. KOLLEGAL TALUK 4CO 219 181 Kollegal (TP) 117 61 56
6. KRISHNARAJ~AGAR T ALUK . 1,810 907 903 Krishnarajoagar (M) 758 360 398
7. MySORE TALUK • J 1,436 5,85Z 5,584 18 6 12 151 ::;9 62 Mysore City (M) 11,360 5,818 5,542 18 6 12 150 88 62

161
UNDER EACH) SPECIFIED IN SCHEDULE VIII TO THE CONSTITUTION OF INDIA FOR CITY/TOWNS-Contd.
SANSKRIT SINDHI 'IAMIL
tcr- Males Fe- Per- Males Fe- Per- Males Females Persons sons males sons males sons
32 33 34 35 36 37 38 39
1
11 11
11 11
11 11
1 13
4
9
9
5
2
3 3
4,684 2,312 787 426
1,670 834 476 262
546 265 135 59
8 19,820 10,391 763 395 130 68
2 2,502 1,318 682 368
1,440 814 159 133 297 163
6 9,062 4,795 6 5,141 2,726
461 243 27 12
128 62
2,762 1,364 402 193
1,164 573
2,830 1,462 665 359
857 444 413 84,415 44,075
5 2 3 4,769 2,586 5 2 3 1,215 635
5 5
3
3
3,198 1,754 9113 531
9,051 5.047 106 58 199 104
3,888 1,982 1,257 652
2 19,149 10,291 2 1,426 731
1,298 574
669 290
847 439 408 33,905 17,227 847 439 408 32,851 16,683
40
2,372 361
836 214
281 76
9,429 368
62
1,184 314
626 26 134
4,267 2,415
218 1~
66
1,398 209 591
1,368 306
40,340 2,183
580
1,444 452
4,004 48 95
1,906 605
9,458 695
629 284
16,678 16,168
41
90,936 6,196
57,214 6,995
87,195 3,423
16,77:l 937 177
2,279 372
2,428 ISO
515
5,598 3,790
946 36
275
1,749 97
643
2,835 554
72,231 3,093 1,291
1,368 609
6,281 195 475
5,089 1,398
18,033 6,284
2,180 1,064
25,971 24,156
TELUGU URDU
Males Females Persons Males Females
42
45,556 3,200
28,995 3,577
44,407 1,789
8,ea3 451 85
1,186 192
1,243 81
257
2,906 1,963
520 18
ISS
924 54
329
1,453 275
37,655 1,532
633
712 324
3,346 100 248
2,716 755
9,279 3,146
1,135 545
13,575 12,612
43
45,380 2,996
28,219 3,418
42,788 1,634
',089 486 92
1,093 180
44
18,553 6,468
9,214 6,029
12,362 3,297
41,521 3,716 I,Oll
6,244 2,999
1,185 7,600 69 246 258 2,'239
2,692 1,827
12,474 ll,364
426 5,052 18 1,178
120 3,002
825 2,980 43 16
314 1,676
1,382 3,455 279 1,104
34,576 1,561
658
656 285
2,935 95
227
2,373 643
8,754 3,138
1,045 519
12,396 1l,544
125,781 8,598
5\rl
2,024 1,641
3,630 393 142
6,924 3,508
7,809 2,010
6,292 2,295
70,029 68,467
45
9,5/9 3,351
4,763 3,109
6,203 1,521
46
8,S: 4 3,117
4,451 2,520
6,1':9 1,776
21,207 20,314 1,893 1,823
526 485
3,196 1,543
3,7[7 86
1,143
6,443 5,854
2,608 610
1,568
1,543 14
862
1,8{J7 627
&i,784
4,394 2,598
1.047 839
1,909 200
72
3,541 1,719
4,)[6 1,064
3,228 1,155
35,847 35,000
3,048 1,456
~,883
160 1,096
6,031 5,510
2,444 568
1,434
1,437 2
8[4
1,648 477
60,997 4,204 2,493
977 802
1,721 [93 70
3,383 1,789
3,693 946
3,064 1,140
34,182 33,467

162
C .. V PART A (ii) DISTRIBUTION OF LANGUAGES (INCLUSIVE OF MOTHER-TONGUES GROU.l»ED DISTRICTS, TALUK AND
ASSAMEES BENGALI GUJAR,ATI Di~trict/1aluk/City/1own
Females --Persons Males Persons Males females Persons Males Females
2 3 4 5 6 7 8 9 10
8. NAN1ANOUD TALUK . 3 2 18 11 7 Nanjan&ud (M) 3 2
9. PERIYAPATNA TALUK • 10 4 6 29 17 12 PeriYapatna (M) 29 17 12
lu. TmRUMAKUDLU NARASJPtlRA TALUK. Bannur(M) 1 hirumakudlunarasipura (M)
11. YELAr.DUR T ALUK Yelandur (M) .
NORTH KANARA DISTRICT 1 1 72 44 28 586 393 193 1. ANKOLA TALUK • 97 85 12
2. BqATKAL TALUI< Bhatkal(M)
3. HALlYAL TALUK 54 30 24 151 80 71 DandeJi Notified Area (NAC) 54 30 24 110 58 52 Halliyal (M) 14 7 7
4. HONAVARTALUK. 23 14 9 Honavar (M) . 8 S 3
S. KARWAR TALUK' 88 7S 13 Karwar (M) 32 21 11
6. KUMTA TALUK. • 3 3 76 56 20 Kumta(M) 2 2 4S 25 20
7. MUNDOOD 1ALUK 33 15 18
8. SIDDAPUR TALUI< 24 16 8
9, SIRSI TALUI: 28 18 10 Sirsi(M) • 10 7 3
10. SoPA TALUI< 6 5 28 18 10
11. YELLAPUR TALUI< 7 4 3 38 16 22 Yellapur (TP) 38 16 22
RAICHUR DISTRICT 3,013 1,547 1,466 585 294 291 1. DeoDUROTALUK
Deodurg (M) . 2. GANOAVATITALUK 38 20 18
Gangavati (M) • 13 8 5
3. KOPPAL T ALUK. • 8 4 4 65 32 33 Koppal (M) 58 29 29 Munirabad project Area (SA) 7 3 4
4. Ku'iB'l'AOI T ALUK 7 3 4 Kushtagi (M) .

161 UNDER EACH) SPECIFIED IN SCHEDULE VIII TO THE CONSTITUTION OF INDIA FOR CITY/TOWNS-Con/d.
Persons
II
273 199
140 42
163
4 30
7 7
5,605 92
4
4
2,673 2,282
122
15
98 93
17 11
1,763
112
450 :.1.84
253
128 32
27,031 2,830
19
3,341 1,095
3,767
526 162
1,684
53
HINDI KANNADA KASHMIR! MALAYALAM
Males Females Persons Males Females Persons Males Females Persons Males Females
12 13 14 15 16 17
159 120
83 27
87
4 15
4
4
3,006
52
2
2
1,477
1,2'13 64
15
57
52
10 8
894
60
236 153
140
63 19
13,841 1,444
14
1,751
607
1,904
291 88
843
32
114 209,471 79 15,tl34
57 100,463 15 5,698
76 170,365
8,506
15 5,211
3 46,507 3 4,603
108,162
8,245
51,016 2,916
87,679
4,350 2,706
23,811
2,355
2,599 40
480,436 248,567 48,692 24,573
2 45,784 2 3,817
1,196 21,743 1,009 6,723
58 3,556
22,744 1,968
J.1,624 3,658 1,827
101,309
7,589
49,447 2,782
82,686
4,156
2,505
22,696 2,248
231,869 24,119
23,040 1,849
10,119
3,065 1,729
61,096 30,397 30,699 2,322 1,231 1,091
41 27,546
41 9,552
7 70,835 3 8,391
869 22,717
52 64,413
214 85,968 131 13,333
113 6,075
65 25,567 13 1,802
13,190 1,096,599 1,386 108,684
5 6,107
1,590 126,962 488 19,475
1,863 134,823
235 16,582 74 1,934
841 119,686
21 7,008
14,085
4,994
35,320 4,303
12,075
34,086
46,523 7,048
3,383
13,757 967
552,931
54,359 3,075
64,267 10,018
68,151 8,602 1,042
60,034
3,553
13,461
4,558
35,515 4,088
10,642
30,327
39,445
6,285
2,692
11,810
835
543,668
54,325 3,032
62,695 9,457
66,672
7,980
892
59,652
3,455
18 19 20
379 141
732 131
48
21 16
17 10
5,074 319
417
173
536 441
17
650 240
602
395
455 190
661
246
507 221
329
352 59
830 36 6
51 44
279
99
21 22
223 94
386 99
32
15 10
12
6
3,423 220
218
85
379
294 17
437 168
452 268
276 119
383
184
315 146
269
290 51
622
32
5
43 38
216
63
156 47
346 32
16
6 6
5 4
1,651
99
199 88
157 147
213
72
150 127
179 71
278
62
192
75
60
62 8
208 4
8 6
63
36

164 C.V PART A (ii) DISTRIBUTION OF LANGUAGES (lNClt'SlVE OF MOTlJER.TC!'Gl'FE (TCl'PID
DISTRICTS, T ALUK AND
MARA1HI ORIYA PUNJABl DistrictfTa1uk/CityfTown -.
Pers,)lls Males Females Per~Ons M'lles Females Persons Male~ Females
23 24 25 26 27 28 29 30 31
8. NANJANGUD TALUK 984 490 494 NanjangUd (M). 700 361 339
9. PERIYAPATNA TALUK • 244 131 113 .4 3 6 6 PeriYap:ltm (M) 161 80 81
10. TJIIRUMAKUDLU NARASIPURA TALUK 321 172 149 Bannur (M) 96 50 46 Thirumakudlunarasipura (M) 18 10 8
II. YELAND UR T ALUK 7 5 2 Yelandur (M) 7 5 2
'0 UH IHN\.;H. DISTRICT 71,618 36,700 34,918 21 a 13 131 77 54 1. ANKOLA T ALUK . 1,297 667 630
2. BHATKAL T ALUK 943 508 435 Bhatkal (M) 68 23 45
3. HALlYAL T ALUK' 36,691 18,842 17,849 20 7 13 101 60 41 Dandeli Notified Area (NAC) 3,252 1,752 1,500 20 7 13 101 60 41 Haliyal (M) , 3,763 1,905 1,858
4. HONAVAR TALUK 282 152 130 Honavar(M) 61 31 30
5. KARWARTALUK' 3,735 1,868 1,867 11 5 6 Karwar (M) 1,610 785 825 11 5 6
6, KUMTA TALUK 1,017 SI9 498 4 3 Kumta (M) 163 78 85
7. MUNDGOO TALUK 3,.:70 1,658 1,612 8 6 2 8. SIDDAPUR T ALUK 658 332 326
9. SIR,SI T ALUK 4,142 2,184 1,958 Sirsi(M) 951 509 442
10. SuPA TALUK 13,995 7,138 6,857 3 2
11. ¥m.LAPUR J ALUK 5,588 2,832 2,756 3 2 Yellapur (TP) 613 306 307 3 2
RAICHUR DISTRICT 8,109 4,005 4,104 HI 75 66 38 23 15 1. DEOOURG TALUK 275 142 133
Deodurg (M) 146 81 65
2. GANGAVATI TALUK 1,459 752 707 22 13 9 II 6 5 GangaVati (M) , 974 494 480 6 4 L,
3. KOPPAL TALlJK . 1,329 701 628 18 8 10 Koppal(M) 430 235 195 Munirabad project Area ,(SA) 128 66 62
4. KUSHTAOI1ALTJK 209 102 107 34 17 17 Kushtagi (M) 110 50 60

16$
UNDER EACH) SPECIFIED IN SCHEDULE VIII TO THE CONSTITUTION OF INDIA FOR CITY/TOWNS-Contd.
SANSKRIT SINDHI TAMIL TELUGU URDU ---
Per' sons
Ma· Fe· Per· Ma· Fe· Persons Males les males sons les males
Persons M'lles Females Persons Males Females
32 33 34 35 36 37 38 39
140
21
21
2 2
71
8 8
5,970
1,672
879 .. ) 191
1,149
268
340
S59 66
3,258
873
493 104
598
138 176
170
32
69 3,917 ~,353
318 247
61 33
15 9
13 832 445 13 481 252
86 54
229
9
778 468
118
7
527 346
30 21 9 153 91
32 29 20 9 50
43 19 24 212
169
429 252
130
34 34
10
67
25 25
14 12
....
16 16
6
38
14 14
8
6
18 18
4 574
162
55
96
235 146
332
99 37
~9 8,750 4,517 57 28
3 2
11 1,330 734
II 515 309
6 1,593 861
6 497 258
580 292
246
39 153 28
-'!o
2,712 799
386
87
551
130 164
389
34
1,564 71
28
6
387
2'29
32
III
2
251
122
62 18
82
73
194 106
242
63 18
4,233
29
596
206
732
239
288
93
11
41
5,575 1,4<;0
1,996
192
2,157
113 664
.:188
97
10,151 144
58
3,864
2,739
291
145
27
252 140
175
37
3,006
153
791 276
1,013
550 li6
122,693 1,783
190
2'1,000
1,939
4,267 156
1,231
636
124
42
2,880
767
984
91
1,135
61
326
361
54
5,382 101
33
1,999 1,416
156
83 16
156 92
103
25
1,529
81
440 142
558
299 63
61,952
899 94
12,510
962
2,229
90 640
298
52
1:3
2,695
703
1,012
101
1,022
52
338
127
43
4,769
43
25
1,865
1,323
135
62 11
96
48
72 12
1,477
72
351 134
455
251 53
60,736 884 96
11,490
977
2,038
66 591
338
72
5,431
2,304
5,998
906
7,842
2,616 453
1,704
328
66,838 2,012
15,291 11,496
12,337
5,883 3,153
6,465
828
4,610 2,078
4,596 1,407
6,201
2,252
8,2i3 4,560
1,707
3,154 1,570
145,343
12,673 3,194
21,148
10,226
16,214
8,877
1,756
6,081
1,678
45
1,864 1,207
3,153
469
4,049
1,334 247
636
192
52,736
1,033
6,434
4,981
6,427
3,119 1,610
3,007
442
2,221 I,Od5
2,239 700
3,269
1,200
4,260 2,3f6
917
1,629 801
73,537
6,382 1,644
10,687
5,176
8,278 4,541
944
3,083
877
46
2,567 1,097
2,845
437
3,793
1,282 206
568 136
34,102
979
8,857
6,515
5,910 2,764
1,543
3,458 386
2,389 1,033
2,357 707
2,932
1,052
3,853 2,174
790
1,525
769
71,806
6,291
1,550
10,461 5,050
7,936 4,336
812
2,998
801

166 C.V PART A (ii) DISTRIBUTION OF LANGllAGES (INCLUSIVE OF MOTHER-TONGUES GROUPED
DISTRICTS, TALUK AND
District,1 aluk, City, Town ASSAMEES BENGALI GUJARATI Persons Males Females Persons Males Females Persons Males Females
2 3 4 5 6 7 8 9 10
5. LII'<GASUGUR TALUK 4 2 2 37 18 19 Lingasugur (M) MudgallM)
6. MA1WI T ALUK 49 23 26 Manvi (M) • 38 17 :.0
7. RAICBUR T ALUK • 336 174 162 Raichur (M) 335 173 162
8. Sn ... DHANUR TALUX' 3,000 1,541 1,459 53 24 29 Sindhanur (M) • 53 24 29
9. YELBURGA TALUK
SHlMOGA DISTRICT 28 15 13 881 462 419 I. BHADR,o\VATI T ALU,," 15 7 8. 202 113 89 Bhadravati Urban Agglomera-
11 8 161 tion' . 3 90 71 (a) Bhadravati (M) 60 27 33 (b) Bhadravati New Town (TB) 11 3 8 101 63 38
2. CflAI'<NAGIRI TALUK 137 66 71 Channagiri (M) • 5 2 3
3. HOI'<NALI T ALUK • Honnali (M) Nyamathi lM) .
4. HO'3ANAOAR T ALUK 17 9 8 Ho~anagar (M) •
5. SAGAR T ALUK 183 92 91 Sagar (M) • 60 27 33
6. SIIIKARIPUR T ALUK 17 10 7 Shikaripur (M) •
Shiralkoppa (M) 10 7 3 7. SHlMOOA T ALUK • 10 5 5 176 94 82
Kumsi (M) 2 2 Shimoga City (M) 10 5 5 102 54 48
8. SOMB T ALUK 122 64 58 Sorab (M.)· 2 2
9. TIRTHAHALLI T ALUK 3 3 Tirthahalli (M.)
27 14 13
SOUTH KANARA DISTRICT 87 69 18 1,140 688 452 I. BELT':IANOADY T ALUK 1
2. BUNTW AL 1 ALUK
3. COONDAPUR T ALU'l. 10 3 7 29 20 9 Coondapur lTP) 10 3 7 9 2 7 GangollilP) •

167
UNDER EACH) SPECIFIED IN SCHEDULE VIII TO THE CONSTITUTION OF lNDJA FOR CITYITOWNS-Contd. .
HINDI KANNADA KASHMIRI MALAYALAM
Persons
11
8,141
293 226
1,448 67
3,421
2,634
774 397
1,625
37,9121
5,974
1,099 808 291
11,756 58
4,131 1
8
201 4
462
233
7,066 284 213
6,966 103
1,388
1,154 14
211 26
6,965 976
837
219 22
Males Females Persons Males Females Persons Males Females Persons Males
12
4,148 153 136
745 44
1,773 1,380
429 227
804
19,507 3,168
632 470
162
5,922 28
2,150 1 3
103
249 132
3,643 156 120
3,587 53
774
582 8
103 15
3,576 473
446
115 16
13
3,993 140
90
703
23
1,648 1,254
345
14
137,514
8,398 5,469
127,189 7,531
99,426 31,729
108,202
15
69,562 4,152 2,704
63,699 3,770
51,681 16,958
54,042
16
67,952 4,246 2,765
63,490 3,761
47,745 14,771
54,160 170 8,576 4,431 4,145
821 134,113 67,136 66,977
18,414 2,806
467 338 129
5,834 30
1,981
5
98 3
213 101
3,423 128
93
3,379 50
614
572 6
108 11
3,389 503
391
104 6
971,169 116,742
53,61(J 14,737 38,873
135,927 6,190
119,001 5,862 5,568
69,944 2,589
108,864 14,950
96,694 10,764 4,049
126,397 3,436
52,033
105,183 3,238
92,417 4,367
396,546 10,438
13,008
192,171 14,351 2,848
501,679
61,259
28,450 7,786
20,664
68,403 3,'l.27
60,547 3,016 2,850
36,161 1,3,+1
57,164 7,851
49,838 5,600 2,074
66,41L 1,761
28,087
54,586 1,711
47,309 2,348
469,490
55,483
25,160 6,951
18,209
67,524 2,963
58,454 2,846 2,718
33,783 1,248
51,700 7,099
46,856 5,164 1,975
59,985 1,675
23,946
50,597 1,527
45,108 2,019
189,169 207,377 5,237 5,201
6,655
89,428 7,148 1,364
6,353
102,743 7,203 1,484
17 18 19
23 23
20
115 10
32 17
271 256
43 27
3
9,8D3
3,236
2,581 1,613
968
40 15
30 18
908 124
2,438 782
113 44 19
1,774
1,223 1,270
120 71
1,044 202
215,943 19,729
51,249
4,949 1,396
261
21
73 10
26 13
191 181
39 27
2
5,985
1,922
1,554 1,035
519
27 10
22 13
557 69
1,507 497
75 27 15
1,084 13
792
135 41
656 133
113,344 10,078
26,202
2,815 774
129
Females
22
42
6 4
80
75
4
3,818 1,314
1,027 578 449
13
5
8
5
351 55
931
285
38 17 4
690 10
478
85 30
388
69
102,599 9,651
25.047
2,134
622 132

168
C-V PART A (ii) DISTRIBUTION OF LANGUAGES (INCLUSiVE OF MOTHER-TCNGUES GFctTFI D DISTRICTS, TALUK AN D
DIitrict/Taluk/City/Town MARATHI ORIYA PUNJABI
Persom Males Females Persons Male, Females Persons Males Females
23 24 25 26 27 28 :L9 30 31
5. LINGASUGUR T ALUK 1,266 440 826 10 4 6 Lingasugur (M) • 158 83 75 Mudgal (M) 161 80 81 6 3 3
6. MAIWI TALUK 415 204 211 11 8 :.; Manvi (M)' 100 42 58
7. RAIC<illR T ALUK 2,243 1,173 1,070 6 3 3 22 14 ~
Raichur (M) 2,007 1,043 964 22 14 &
8. SllmHANuR T ALUK 630 332 298 28 17 11 4 2 2 Sindhanur (M) 252 138 114
9. YELBURGA TALliK 283 159 124 12 5 7
)H~,\f ):i\. DISTRICT 30,588 15,779 14,809 7I 41 30 I. BHADRAVATI T ALUK 11,189 5,817 5,372 3 3
Bhadravati Urban Agglomera-tion· 5,505 2,895 2,610 3 3
(a) Bhadravati (M) 3,055 1,607 1,448
(b) Bhadravati New Town (TB) 2,4~0 1,288 1,162 J 3
2. CHAl'oNAGIRilALUK 1,321 807 514
Channagiri (M) • 129 67 62
3. HONN,\LITALUK • 1,655 834 821
HonnaJi (M) 255 121 134
Nyamati (M) 184 96 88
4. HOSANAGAR TALUK 1,448 727 721
rtosanagar (M) 114 52 62
5. SAGAR T ALUK 2,478 1,233 1,245 7 4 3
Sagar (M) • 1,040 518 522 2 1
6. SHIKARlpUR TALUK 2,414 1,206 1,208
Shikaripur (M) • 1,089 559 530
Slliralkvppa (M) 414 201 213
7. SHIMOGA T ALUK • 6,338 3,217 3,121 60 ')3 27
Kumsi (M) 175 74 101
Shimoga City (M) 4,272 2,189 2,083 9 6 3
8. SORABTALUK 1,183 621 562
Sorab (M) 449 239 210
9. TIRT'lAHALLIT ALUK 2,562 1,317 1,245
Tirthahalli ~M) • 271 131 140
SOUTH KANARA DISTRICT· 42,730 21,316 21,414 8 5 3 175 159 16
l. 13ELTftANGAD y T ALUK 2,770 1,379 1,391
2. BUNTWAL T ALUK 4,097 2,109 1,988
3. COONDAPUR TALUK 4,151 2,122 2,029
Coondapur tTP) 16 7 9
Gangoll i tP) 7 5 2

169
UNDER EACH) SPECIFIED IN SCHEDULE VIII TO THE CONSTITUTION OF INDIA FOR CITY/TOWNS-Contd.
SANSKRIT SINDHI 1AMIL TELUGU URDU
Per- Ma- Fema- Per- Ma- Fema- Persons Males Females Pers~ns Males Femaies Perscm Maies Females sons les les 5:)05 les les
32 33 34 35 36 37 38 39
2 1
2
2,740 1,221
95 55 127 72
514 294 165 106
28 16 12 1,053
28 16 12 909
591
509
1 30 21 10 9
10 9
9 8
20 12
20 11
1,006
40
211
525 20
llO
9 48,646 25,654 23,056 11,925
I 14,489 6,930
7,559
947 81
7,499 3,581 3,918
493 44
766 417 17 10 45 26
560 31& 101 65
2,588 1,374
657 368
1,906 1,022 489 264
242 134
8 17,560 9,357
93 52 8 10,349 5,475
276 149 136 70
987 318
599 164
25 12 13 74 63 11 8,333 5,382 208 113
643
363
72 4
367
232 37
2
40
1,519 40 55
220 59
462 400
481 20
101
22,992 11,131
6,990 3,349 3,641
454 37
349 7
19
242 36
1,214 289
884
225 108
8,203 41
4,874
127
66
388
154
2,951
9S
276
131 35
2
41
2,986 573 108
10,2:,W 1,257
66,088
17,854
11,849 221
869
52,094 18,087
11,266 4,600 6,666
7,616 146
2,597 113 142
478
72
2,049 509
5,092 603 450
12,390 159
8,235
2,696 64
1,089 643
3,707 278
209
192
9
42
1,285 274
53
5,099 630
32,790
8,974
6,404 128
448
27,069 9,339
5,f.ll1 2,373
3,438
3,966 68
1,363 71
75
268
43
1,093 268
2,642 306 229
6,409
82 4,251
1,368 31
621 368
2,054 160
129
88
6
43
1,701
299
55
5,121 627
33,298 8,880
5,445
93
421
44
18,068 2,778
4,392
16,922 4,703
36,159
23,607
14,314
4,714
3,764
25,025 119,897 8,748 23,363
5,4;5 2,227
3,228
3,650 78
11,49L 7,814
3,678
17,908
2,997
1,234 8,242
42 2,003 67 546
2\0 2,316 29 431
956 8,075
211 4,846
2,450 16,375 297 3,678
221 3,779
5,981 77
3,984
1,328
33
468 275
31,660 650
20,567
7,049 1,219
4,909 1,454
45
9,184
1,431
2,202
8,578
L,433
18,252
12,009
7,236
2,460
1,857
62,173 12,248
5,982 4,108
1,874
9,201
1,545
4,285 1,040
285
1,213
224
4,160 2,492
8,415 1,876 1,918
46
8,884
1,347
2,190
8,344 2,270
17,907
11,598
7,078
2,254
1,907
57,724 11,115
5,510
3,706
1,804
8,707
1,452
3,957
963 261
1,103 207
3,915 2,354
7,960 1,802
1,861
16,385 15,275 319 331
10,638 9,929
3,621 3,428
631 588
2,645 780
2,264 674
1,653 52,907 25,966 26,941 118 1,044 532 5t:L
80
l04
3
1,3:L4
10,857
1,204
2,148
646
5,176
61 I
1,047
678
5,681
593 1,101

170
C.V PART A (ii) DISTRIBUTION OF LANGUAGES (INCLUSIVE OF MOTHER.TONGUES GROUPED DISTRICTS, TALUK AND
District/Taluk/Ci tyll Own ASSAMBSB BENGALI GUJARATI
Parsons Males Females Parsons Males Females Persons Male~ Female~
2 3 4 5 6 7 8 9 10
4. KARKAL TALUK 4 4 Karkal (TP) 3 3 Pranthya tTP)
5. M ANGALORE T ALUK 54 44 10 906 49~ 411 Mangalore Urban Agglome. ration 11 9 2 85.1. 453 398 (a) Derebail (P) (b) Kankanadi (P) 5 3 2 (c) Mangalore City (M) 11 9 2 835 442 393 (d) Padavu (TP) 3 2 1 (e) UUal (TP) 8 6 2
Mulki tTP) • Some'>war tP)
6. PUTTUR TALUK Puttur OP)
7. SULLIA T ALUK
8. UOIPITALUK 21 20 200 168 32 Malpe tTP) Shirva (P) • Shivalti{P) 6 11 59 47 12 10nse West tP) • Udipi 1M) • 30 17 13 Udyavar (P)
TUMKUR DISTRICT 9 9 352 203 149 1. CmKNAYA KANAHALLI TALUK 3 2
Chiknayakanahalli (M) 3 2
2. GUBBI T ALUK. 2 2 14 11 3 Gubbi (M) 11 8 3
3. KOYATAGllRE T AWK Koratagere (M) •
4 •. KUNIOAL TALUK • 131 73 S8 Kunigal (M)
5. MADHUOIRI T ALUK Madhugiri (M) •
6. PAVAO ADA TALUK Pavagada (M) Y. N. Hoskote (M)
7. SIR ... TALUK Sira (M) .
8. 1JPTUR TALUK 137 72 65 TiPtur (M) 137 72 65

171
UNDER. EACH) SPECIFIED IN SCHEDULE VIII TO THE CONSTITUTION OF INDIA FOR CITY /TOWNS- Contd. .
HINDI KANNADA KASHMIRI MALAYALAM
?e 'so 1~ Mal::s F.:male·; P~rs()ns Males Females Persons Males Females Persons Males FelT'.aks
il
675
15 9
! ,SS9
575 8
44 395
88 40
9 77
967
219
297
1,405 60 17 98
12 159
4
17,354
;,967
13
295 53
I,ISI
+40 50
1,374
85
+,620 21
4
2,552 101
304
304
12
316
6 6
868
299
4
21
208
50 16
3
·W
·IR9 i is
149
720 38 6
64
5 75
8,635
2,483
8
136
24
588
21S
23
659 71
2,254 12
1,325
52
424 160
13
359
9 3
721
276
4 23
187 38 24
6
37
47X 104
148
14
17,270
2,124
515
26,799
17,654
307 318
15,793
912 324
667
344
11,706
2,801
27,772
685 97,3S2
22 533 IJ 268 34 801
7 416
84 4,520 4 478
3,659 1,310,891
2,484 123,060 5 j 0,230
i59 151,156
29 7,204
593 89,453
4,000
222 158,963 27 6,596
7h5 122,716
14 7,855
2,:66
9
1,227
49
413
144
54,888 2,641
1,491
152,379
9,091
124,144
12,297
14-1 Census Karnatak/78
15
8,3i9 1,046
254
14,040
9,155 146 ISO
8,235 466 158
318 176
6,165
1,489
14,333
44,992
275 116
433 195
2,387
229
670,163
63,025
5,234
76,376
3,635
45,868
2,123
79,629 3,340
63,538 4,171
28,527 1,443
779
77,792
4,782
63,371
6,85 1
16
8,951 1,078
261
12,759
8,499 161 168
7,558 446 166
359 168
5,541 1,312
13,439
52,390
258 152 368
221 2,133
249
640,728
60,035 4,996
74,780
3,569
43,585 1,877
79,334
3,256
59.178 3,684
26,361 1,198
712
74,587
4,309
60,773
5,446
17
4
2
2
18
2
8
18
1
1
4
2
2
IS
2
7
19
1
20
4,652
588 343
82,650
29,554 627 '713
17,227
974 10,013
1,512
3,750
31,954
3,221
13,358
7,402 116
316 368
49
753 22
1,218
189
54
42
13
8
92 48
33
23
45
39 27
165 124
21
2,512
297 186
43,489
16,134
331 337
7,773
519 5,174
799
1,825
16,862 1,779
7,433
3,953 61
161
LI4
26 409
13
707
76
34
29 8
4
61
34
18 15
27 18
107
80
22
2,140
291
157
39,161
13,420
296 376
7,454
455 4,839
713
1,925
15,092 1,442
5,925
3/49
55 155 154
23 344
9
511 113
20
13
5
4
31 14
15
8
44
12
9
58 44

172
(:..V PART A {il} DISTRIBUTION OF LANGUAGES (INCLUSIVE OF MOTHER-TON GUES GRpUPED DISTRI CTS, TALUK AND,
MARATHI ORIYA PUN JAB I District/TalukjCity/Town
Persons Males Females PerSons Males Females Persons Males Females
23 24 25 26 27 28 29 30 31
4. KARKAL 1,.u.UIC • 7,768 3,721 4,047 :l ,t.
Karkal (TP) 496 244 2.52 2 2 PranthYa (TP) 20 13 7
5. MANGALORE TALUIC 1,704 927 777 7 4 3 58 50 8 Mangaiore Urban Aggiome-ration • • • • 583 318 265 JO 7 3
tal Derebail {P} • 22 10 12 (b) Kankanadi (P) I
(c) Mangalore City (M) 388 217 171 10 7 3 (d) Padavu (1P) 172 91 81 (e) Dllal (TP) Mulki (TP) 20 12 8 Somes war (P) • 9 4 5
6. PtrrrUR TALUK 6,671 3,360 3,311
Puttur OP) 263 118 145
7. SULLlA T ALUK . 3,487 1,855 1,632
8. DDIPITALUK 12,082 5,843 6,239 115 107 8 Malpe (1P)' 21 12 9 Shirva (P) . 606 263 343 Shivalli (P) • 475 238 237 35 27 8
Tonse West (P) 1 I
Udipi (M) • 366 177 189 Udyavar (P) 13 5 8
TUMKUR DISTRICT 12,793 6,515 6,278 85 18 67 34 28 6 I. CHIKNAYAKANAHALU TALUK 1,421 729 692
ehiknayakanahaIJi (M) 93 45 48
2. GUBllI T ALUK 1,585 839 746 Gubbi lM) • 196 103 93
3. KORAT AGI!RE T ALUK 1,145 565 $80 Koratagere (M) • 112 57 5.5
4. KUNIOAL TALUK • 1,108 542 566 Kunigal (M) 233 114 1\9
S. MADHUOI1U T ALUK 878 52.2 356 8 8 Madhugiri (M) : 207 105 102
6. PAVAGADA TALUK 407 201 206 59 59 pavagada (M) 189 83 106 Y. N. Hoskote (M) . 64 30 34
7. SIRA T ALUK 1,182 .590 592 18 10 8 Sira (M) 463 233 230 I
8 . TIPTUR T ALUK . 1,278 662 616 16 10 6 Tiptur (M)' 871 446 425 16 10 6

173
UNDER EACH) SPECIFIED IN SCHEDULE VIII TO THE CONSTITUTION OF INDIA FOR CITY/TOWNS-Contd.
SANSKRIT SIND HI TAMIL
Persons
Males Fe- Per- Males Fe- Persons Males Females male~ sons males
32 33 34 35 36 37 38 39
,.., 1,
8
16
8
4
14
12 12
3 3
9
4
2
2 2
411 188 25
233 106
15
47 37 10 3,516 2,071
18 8 10 2,156 1,311
135 69 42 22
18 8 10 1,758 1,092
27 26
6 5
34 20
164 95 57 33 37 39
684 151
378
20 17
470 88
217
2,130 1,679 10 6 58 32
281 187 3 2
140 77 26 16
14 10,307 5,467 701 394 171 98
653 94
382 60
899 436
521 174
197 77 22
515 206
351 53
189 33
441 221
272 91
90 38 10
271 105
26 12 14 1,770 948 619 26 12 14 1,169
40
178 82 10
1,445
845
66 20
666 69 24 17
22
214 63
161
451 4
26 94
1 63 10
4,840 307 73
302 41
193 27
458 215
249 83
107 39 12
244 101
822 550
Persons
41
312 104 40
1,551
1,088
67 1
927 42 51 30 6
279 57
55
831 2
174 133
112 26
168,920 6,228
722
2,680 300
7,704 641
3,303 1,234
48,606 2,720
79,088 4,797 3,437
6,548 991
5,823 3,044
TELUGU
Males
42
162 54 21
860
606
37
526 20 23 17 2
168 38
26
461 I
22 104
55 12
86,292 3,188
3,S5
1,314 141
3,789 319
1,642 595
24,664 1,354
40,573 2,394 1,768
3,356 519
3,056 1,556
Females Persons
43
150 50 19
44
5,479 1,683
836
691 19,302
482 12,1,59
30 25 III
401 II ,671 22 222 28 130 13 4
III 19
29
370 1
152 29
57 14
82,628 3,040
367
1,366 1,59
3,915 322
1,661 639-
23,942 1,366
38,515 2,403
1,669
3,192 472
2,767 1,488
liD
177
1,067 199
132
13,702 1,133
266 246
2,034 1,903
625
104,621 7,781 1,769
8,700 1,627
4,732 976
15,121 4,766
7,936 3,002
5,350 1,273
1,152
12,078 7,349
7,743 4,498
URDU
Males
45
'l,,579 79l)
394
9,634
6,254
12 60
5,994 123
65 53 88
572 130
74
6,753 582 150 136 972 973 308
53,094 3,907
850
4,294 824
2,438 512
7,590 2,383
4,110 1,574
2,826 695
609
6,06) 3,668
4,O()4
2,323
Females
46
2,900 885 442
9,668
5,905
13 51
5,677 99 65 57 89
495 69
58
6.949 551 116 110
I,C62 930 317
51,527 3,8~4
919
4,4C6 803
2,294 464
7,531 2,383
3,E:6 1,428
2,524 578 543
tJ,015 3,68
3,73~
2,175

174
C.V PART A (ii) DISTRIBUTION OF LANGUAGES (INCLUSIVE OF MOTHER-TOl'lGVES GFOUPI.D DISTRICTS, TALUK AND
Oi>trictl raluklCity/Townl Urban Agglvmeration
9. TUMKUR TALUK
Tumkur (M)
10. TURUVEKIlRE TALUK
Ammasandra Nutified Area lNAC)
Turuvekere lM) •
Bangalore Urban Agglomeration
I. Bangalore City tC) and Trust Bo_rd Area. .
2. B.E.L. 10wnship (SA)
3. Devarajeevanahall i (TP)
4. H.M.T. Township (SA)
5. lalahalli (Excluding H.M.T., Township) (P) • •
6. K;l,dug:mdanahalli (P)
7. H.A.L. Sanitary Beard (Ex-clllding H.A.L. Town5hip) (SB) . .
8. H.A.L. Towmhip (SA)
9. LT.I.NctifiedArea(Duravani-nagar) (NAC) .
ASSAMESE BENGALI
Persons Males Females Persons Male,
2
234
1 I I
} II
I J
1 I
I I J
3
209
4 5
6 6
6
6 6
25 2,587 1,698
See Banga1crc North Taluk.
See BangaIcre S( lith Talllk.
GUJARAlI
Females Per,on~ Male, Females
7
889
8
67 19
8,129
9
45 17
4,434
10
22 2
ANNE 3,695

175
UNDER EACH) SPECIFIED IN SCHEDULE VIII TO mE CONSTITUTION OF INDIA TOR CITY/TOWNS-Contd.
HINDI K"'-NN\DA K,\SHMIRI MALAYALAM
Persons Males Females Persons Males Females Persons Males Females Persons Males Females
II 12 13 14 15 16 17 18 19 20 21 22
914 509 405 217,634 113,488 104,146 8 7 406 254 152 605 338 267 44,448 24,364 20,084 3 2 298 185 113
174 89 85 116,498 58,549 57,949 199 130 69
61 36 25 670 379 291 90 54 36 17 8 9 5,333 2,735 2,598 21 19 2
XURE
34,390 20,697 13,693 525,985 ~82,349 243,636 148 28 120 54,028 34,322 19,682
See Bangalore North Taluk.
See Banga10re South Taluk.

176
C-V PART A (ii) DISTRIBUTION OF LANGUAGES (INCLUSIVE OF MOTHER·TONGUES GROUPED DISTRICTS, TALUK AND
Di ;trict/Taluk/City/Town/ Urban AggLmeratkn
9. TUMKUR TALUK • Tumkur (M)
10. TURlJVEKEB.E T ALUK
Ammasandra Notified Area (NAC) .
Turuvekere (M) .
Ballgakore Urban Agglomeration •
1. BangaloreCity(C)andTrust ). Buard Area • • • I
I • I 2. B.E.L. Township (SA)
3. Devarajeevanahalli (TP) ,
4. H.M.T. Township (SA) r s. Jalahalli (Excluding H.M.T. I'
Township) tP)· . •
6. Kadug,mdanahalli (P) . J 7. H.A.L. Sanitary Board EX-1
eluding H.A.L. Township) (SB) • • • •
8. H.A.L. Township (SA) . t 9. I.T.I.Notified Area(Durava- I
ninagar) (NAC) • • J
MARATHI
Persons Males
23 24
3,029 1,491 1,652 840
760 374
39 18 131 58
61,188 31,126
ORIYA PUNJABI
Females Persons Males Females Persons Males Females
25 26 27 28 29 30 31
1,538 17 17 812 8 8
386
21 73
ANNE
30,219 331 303 28 4,@0 2,730 1,520
See 'Bangalore 'Ncrth Taluk.
See Bangaioro South Taluk.

171
UNDER EACH) SPECIFIED IN SClIEDULE VIII TO TIIE CONSTITUTION OF INDIA FOR CITY/TOWNS-Contd.
SANSKRIT SINDHI TAMIL TELUGU URDU
Per- Males Fe- Per- Males Fe- Per~on8 Males Females Persons Males Females Persons Males Females sons males SOns males
32 33 34 35 36 37 38 39 40 41 42 43 44 45 46
8 8 3,733 1,991 1,742 7,116 3,774 3,342 30,037 15,337 14,700 6 6 2,896 1,525 1,371 4,243 2,276 1,967 15,911 8,118 7,793
936 520 416 1,824 936 888 5,143 2,525 2,618
454 259 195 97 55 42 142 76 66 110 62 48 199 102 97 714 363 351
XURE
3[) 16 14 5,815 2,819 2,991) H9,691 218,788 20(),9()3 273,284 142,783 130,501 230,005 122,192 lO7.81S
See Bangll.lore North Taluk
See Bangalore South Taluk.

1713
C.V PART B (i) SPEAKERS OF LANGUAGESiMOTHER.TO~GUES (INCLUSIVE OF MOTHEP. TO~GU[S WHERE GROUPED) OTHER THAN THOSE SPECIFIED IN SCHEDULE VIII TO THE
CO:IJSTITUTION OF INDIA FOR STATE AND DISTRIC1'g
Total Rural Urban Sl. State/District No. Persons Males Females Persons Males Females Persons Males Females
2 3 4 S 6 7 8 9 10 11
ANGAMI
MYSORE STATE 5 5 5 5 1 Bangalore 3 3 3 3 2 Bellary 3 Dharwar
AO
MYSORE STATE 4 4 4 4 1 Bangalcre . 4 4 4 4
ARABICJARBI
l\{YSORE STATE 6,909 3,685 1,224 6,154 3,255 2,899 755 4'30 325 1 Bangakre 101 57 44 36 17 19 65 40 25 2 Be!gaum 9 4 ~ 9 4 5 3 Bellary 7 S 2 2 1 5 4 4 Bi]apur 26 16 10 26 16 10
5 Chikamaga1ur 1,293 778 515 1,237 744 493 S6 34 22 6 Chitradurga 75 43 32 75 43 32 7 Coorg 812 444 368 668 365 303 144 79 65 8 Dharwar S 2 3 5 2 3 9 Gulbarga 4 1 3 1 1 3 3
10 Hassan 493 276 217 438 243 195 55 33 22 11 Kolar 3 3 3 3 12 Mandya 7 4 3 7 4 3
13 Mysore S 4 2 2 3 2 14 North Kanara 54 31 23 54 31 23
15 Raichur 11 2 9 8 2 6 3 3 16 Shimoga 880 467 413 705 355 350 175 112 63 17 South Ka naTa 3,119 1,549 1,570 2,970 1,474 1,496 149 7S 74 18 1umkur 5 2 3 5 2 3
BHILI/ BHILODI
MYSORE STATE 164 P2 72 147 8'3 64 17 9 8 Belgaum I I
2 BellarY 4 I 3 4 I 3
3 Bitlar 10 6 4 10 6 4
4 Gulbarga 119 66 53 119 66 53
5 Tumkur 30 19 II 14 10 4 16 9 7
BODO/BORO
MYSORE STATE 5 5 4 4 1 1 1 Bangalore 2 2 I I
2 Belgaum 3 3 3 3

179
C·V PART B (i) SPEAKERS OF LANGUAGES/MOTHER.TONGUES (INCLt1SlVE OF MOTHER. TONGUES WHERE GROUPED) OTHER THAN THOSE SPBCIFIED IN SCHEDULE VIl J TO THE
CONSTITUTION OF INDIA FOR STATE AND DISTRICTS-Contd.
SI. No.
State{District
2
MYSORE STATE I Bangalore. 2 Bellary 3 Chitradurga 4 Gulbarga 5 Kolar 6 Raichur 7 SouthKanara
M\"SORE STATE
1 Bangalore 2 Belgaum 3 Bellary
4 Bidar 5 Bijapur 6 Chikmagalur 7 Chitradurga 8 Coorg 9 Dharwar
10 Gulbarga 11 Hassan 12 Kolar 13 Mandya 14. Mysore 15 North Kanara 16 Raichur 11 Shimoga . 18 South Kanara 19 Tumkur
MYSORE STATE 1 Coorg
MYSORE STATE 1 Bangalore 2 Belgaum 3 BeBary 4 Bidar 5 Bijapur 6 Coorg 7 Dharwar 8 Gulbarga 9 South Kanara
3
127 78
6 I
II
I
3 2';
70,985 2,375
36 17 3
5 601
41 6~,461
31 6
565 35
110
1,802 15 26
189 635
32
3 3
204 155
29 4 8
I
3 I
2
Total RurrI
M.>les PennIes Percc TIc Malec Females
4
81 42
2 I
R
I
26
35,354 i ,258
23 12 3 1
327 26
31,848 22
2 304 23 53
967 9
10 99
349 18
2 :2
157 119 22
I
7
1
3 1
2
5 6
CHI NESEjCH! 1'< 1
46 36
4
3
2
1
COORGI{KODAO U
35,611 I,; i 7
13
5
4
274 i5
32,613
9 4
261 12 57
R35 (>
16 90
286 14
DlMASA
1
DOOR}
47 36
7 3
60,800 X4
5 I
405 6
59,307
421
62 215
2
52 221
12
S4 24 20
4
I
1
2
7
30,125 44
4
3
227 6
29,308
221
29 116
2
27 130
7
47 24 13
4
I
2
8
30,675 4(j
3
178
29,999
200
33 99
25 91
5
7
7
Urban
Person~ M,les Femdes
9
127 78
6
11 I
2 27
10,185 2,291
29 12
5 196
35 5,154
31
6
144
35 48
1,587 13
26 137 414
20
3 3
150 131
9 4 4
2
10
81 42 2
1
8
I
26
5,229 1,214
19 9
2
100
20 2,540
22 2
83 23 24
851 7
10
72 219 II
2
2
110 95
9 1
3
2
II
46 36
4
3
2
4,956 1,07/
10
3
4
96 15
2,614 9 4
61 12 24
736 6
16
65 195
9
40 36
3

is6
C .. V PART B {i} SPEAKERS OF LANGUAGES/MOTHER·TONGUES (INCLUSIVE OF MOTHER. TONGUES WHERE GROUPED) OTHER THAN THOSE SPECIFIED IN SCHEDULE VIII TO THE
CONSTITUTION OF INDIA FOR STATE AND DISTRICTS-Contd.
SI. No.
State/District
2
MYSORE STATE Blngaiore
2 Balgaum 3 Bellary 4 Bidar 5 Bijapur 6 Chikmagaiur 7 Chitradurga 8 Coorg 9 Dharwar •
10 Guibarga 11 Hassan 12 Kolar 13 Mandiya 14 Mysore 15 North Kanara 16 Raichur 17 Shimoga . 18 South Kanara 19 'fumkur
MYSORE STATE Banga10re
MYSORE STATE Bangalore •
2 Bidar
MYSORE STATE Bangalore
2 Belgaum • 3 Bellary 4 Bidar 5 Bijapur 6 Chickmalalur 7 Chitradurga 8 Coor, 9 Dharwar •
10 Gutbarla 11 Hassan 12 Kolar 13 Mandya 14 Mysore 15 North Kanara •
Total
P~rsons Males Females P~rsons
3
16,931
10,082 643 309 26 53
404 l1i 305
1,053 115 i29
1,356 90
926 126 272 l86
693 53
2 2
122
121
1,605
558 109 101
7
22 43 26 22
124 101 28 18 25 44
115
4
8,453
4,9 i 1 320 155 16 43
222 72 \;4
559 73 70
685 62
462 49
153 103
348 36
2 2
56
55
5
ENGLISH
8,478
5,171 323
154 10 10
182 39 191 494 42 59
671
28 464 76
119 83
345 17
GARO
GONDI
66
66
6
1,763 449 3l
36 11
22 370
6 241 23 34
107 29 57 51 21
\42 37 84 J 1
GORKHALl/NEPALl
1,164 393 90 74 7
16 30 18 19 86 70 22 17 23 29 87
441
165 19 27
6 13
S 3
38 31 6
2 IS 28
414 98 35 14
3 4
32 7
18 3 9
11 4
10 4
14
Rural Urban
Males Females Persons Males Females
7
9U 233 19 21 7
16 207
6
89 J 1 19
58 16 4i 36 II SO 24 40 9
311
75 24 11 3 3
24 6
15 2 9 9 4
10 3
13
8
820 216
13
J5 4
6 163
152 12 15 49 13 16 15
10 62 13 44
2
103 23
11 3
1 8 1 3
2
9
15,168 9,633
611
273
15 3; 34
105 64
1,030
81 22
l 327 33
875 104 130 149 609 42
2
2
122 1
121
1,191
460 74 87 4
18 11 19 4
121 92 17 14 15 40
101
10
7,510
4,678 301 134
9 27 15 66 25
548 54
12
669 21
426 38 73 79
308 27
2 2
56
55
853
318 66 63
4 13
6
12 4
84 61
13 13 13 26 74
11
7,658
4,955 310 139
6 4
19
39
39 482 27 10
658 12
449 66
57
70 301
15
66
66
338
142 8
24
5 5 7
37 3j
4
2 14 27

181
C·V PART B (i) SPEAKERS OF LANGUAGES/MOTHER.TONGUES (INCLUSIVE OF MOTHE~. TONGUES WHERE GROUPED) OTHER THAN THOSE SPECIFIED IN SCHEDULE, VIII TO THE
CONSTITUTION OF INDIA FOR STATE AND DISTRlCTS-Contd.
Total Rural Urban SI. State/District No. Persons Males Fem~lles Persons Males Females P~rsons Males Females
2 3 4 5 6 7 8 9 10 11
G;)RKHALI/NEPA LI-Concld.
16 Raichur . 97 71 26 52 43 9 45 28 17 17 Shimoga 76 53 23 46 24 22 30 29 18 South Kanara 67 47 20 43 29 14 24 18 0
19 Tumkur 22 12 10 7 4 3 15 8 7
KHASI
MYSORE STATE 6 5 1 1 1 5 4 1
1 Ba ngaiore 5 4 1 1 4 3 J 2 Mysore 1 1
KONKANI
M\'3C>RE STATE 575,111 283,012 291,099 374,808 18t,439 190,369 200,303 98,573 101730 1 Bangalore . 13,569 6,997 6.572 554 312 242 13,015 6,685 6,330 2 Belgaum i 1,449 5,775 5,674 3,769 i ,881 1,888 7,680 3,894 3,786 3 Ballory 70] 372 329 278 145 ]33 423 227 196 4 Bidar 24 20 4 6 5 18 15 3
5 Bijapw 602 286 316 97 54 43 505 232 273
6 C r1i k.lnagalu.r 15,855 8,270 7,595 12,043 6,330 5,713 3,822 1,940 1,882 7 Chi tradurga 2.031 1,077 954 473 241 232 1,558 836 722 8 Coorg 5,904 2,962 2.942 3,761 ( ,915 1.846 2.143 .1,047 1,096 9 Dharwar 12,910 6,706 6,204 2,014 1,044 970 10.896 5,662 5,2:4
10 Gulbarga 311 175 136 23 13 10 288 162 126
i 1 Hassan 3,825 1,957 i ,868 2,825 1,474 1,35 i 1,000 483 517
12 Kolar 283 114 169 15 II 4 268 103 165
13 Mandya 534 262 272 IS3 84 69 381 178 203
14 Mysore 2,901 1,445 1,456 319 159 160 2,582 1,286 1,296
15 NorthKanara 198.585 97,632 100.953 150,189 73.700 76,489 48.396 23,932 24.464
16 Raichur 863 455 408 252 133 119 611 322 289
17 Shimoga 19,275 9,767 9.508 8,333 4,217 4.116 10,942 5,550 5,392
is South Kanara 285,089 138,521 146,568 189,598 92,657 96,941 95,491 45,864 49,627
J9 Tumkur 390 219 171 106 64 42 284 155 129
KURUKH!ORAON
MYSORE STATE 3 3 3 3
1 South Kanara . 3 3 3 3
LAHNDA
MYSORE STATE 21 14 7 21 14 7 1 Bangalore 18 11 7 18 11 7
2 Gulbarga . 3 3 3 3
LOTHA
MYSORE STATE . 7 7 7 7
1 Banlalore 3 3 3 3
2 Bellary 3 3 3 3
3 Dharwar . 1 1

182
c.v PART B (i) SPEAKERS OF LANGUAGES/MOTHER.TONGUES (INCLUSIVE OF MOTHER. TONGUES WHERE GROUPED) OTHER THAN THOSE SPECIFIED lN SCHEDULE VIIl TO THE
CONSTITUTION OF INDIA FOR STATE AND DISTRICTS-Con/d.
Sl. State/District Total Rural Urban No.
P.;:rSO;JS Males Females Persons Males Females Persons Males Fcma (s
2 3 4 5 6 7 8 9 10 11
LUSHAI/MIZO
MYSORE STATE 30 22 8 30 22 8
B.:tngalore 2.; ; 8 5 23 i 8 5 2 Belgaum 5 2 3 5 2 3
3 BvllarY 2 2 2 2
MANfPURI/METHE1
MYSORE STATE li9 53 6 12 10 1 47 43 4
1 B.lngalorc 24 21 3 ~ 3 2 ,<) i8 J
2 B~lgaum 8 8 5 5 3 3
3 BdlarY 1
·f Dharwar 16 ;6 16 16 5 Mysore 1 I 6 Sout it Kanara 8 5 3 8 5 3
7 Tumkur
MUNDARI
MYSORE STATE 5 3 2 4 2: 2 1 1 I Bangalore • 5 3 2 4 2 2
NAG A
MYSORE STATE 6 6 6 6 Bangalore . 5 5 5 5
2 Mysore 1 1
PAITE
MYSORE STATE 3 3 3 3
B:lllgalore 1 1
2 Mysorc 2 2 2 2
PERSIAN
MYSORE STATE 107 46 61 8 4 4 99 42 57
1 Bangalore 42 27 15 7 3 4 35 24 II
2 B~lgaum 21 7 i4 21 7 14
3 Dharwar 4 4 4 4
4 Gulbarga 5 Mysore 33 5 28 33 5 28
6 Raichur ]
7 Shimoga 5 4 5 4
SAN TALl
MYSORE STATE 99 53 46 94 50 44 5 3 2 1 Bangaiore . 3 3 3 3
2 Belgaum 88 46 42 88 60 42
3 Chikmagalur :I 2 3 2 4 Mandya :1 :I :'I 3
5 Mysore 2 2 2 2

183
C.V PART B (~ SPEAKERS OF LANGUAGES/MOTHER.TONGUES (Il'iCI.rSIVE CF MCTl1.ER. TONGUES WH RE GROUPED) OTHER THAN THOSE SPECIFIED IN SCHEDULE VIII TO THE
CONSTITUTION OF INDIA FOR STI\TE AND DISTRICTS-Contd.
SI. State!Distric\ Total Rural Urban No.
P.:rsons Males Females Persons Males Females P,rsons Males Females
3 4 5 6 7 8 9 10 11
SEMA
MYSORE STATE 2 2 2 2
I Bellary
2 Dharwar . SIKKIM BHOTIA
MYSORE STATE 22 3 14 22 8 14
1 Blngalore
2 Be'.gaum 3 Bidar. 4 S;limoga . 19 5 14 ]9 5 14
TANGKHUL
MYSORE STATE 3 3 3 3
Blngalore . 3 3 3 3
TIBETAN ,
'\1Y~,)lE STATE B,982 5,031 3,951 8,883 4,994 3,889 99 37 62
B'l;:atore 34 16 i8 34 16 18
2 Coorg 8 5 3 8 5 3
3 Mysore 4,724 2,474 2,250 4,667 2,458 2,209 57 16 41
4 North Kanara 4,216 2.536 1,680 4,216 2,536 1,680
TRIPURI
MYSORE STATE 1 1 1 1
1 Mysore 1 1 ! 1
TULU
MYSORE STATE . 1,042,865 504,975 537,890 847.339 407,671 439,668 195,526 97,304 98,222
Blngalore 5,062 2,988 2,074 11)7 133 64 4,865 2,855 2,010
2 Belgaum 954 652 302 92 63 29 862 589 273
3 Bellary 402 221 181 27 12 15 375 209 ]66
4 .Bidar 26 21 5 26 21 5 5 Bijapur 232 154 78 22 10 12 210 144 66 6 C:likm'lgalur 48,499 25,285 23,214 46,550 24,222 22,328 1,949 1,063 886 7 Chi tradurga 1,037 588 449 225 108 117 812 480 332
8 Coors 30,546 16,079 14,467 26,917 14,J87 12,730 3,629 1,892 1,737
9 Dharwar 1,999 1,278 721 91 64 27 1,908 1,214 694
10 Gulbarga 279 154 125 160 80 80 JI9 74 45
11 Hlssan 16,484 8,810 7,674 J5,222 8,043 7,179 1,262 767 495 12 Kolar 420 227 193 43 24 19 377 21)3 174 13 Mandya 863 497 366 269 177 92 594 320 274 14 :Mysore 3,586 2,061 1,525 474 287 187 3,112 1,774 1,338 15 North Kanara 1,316 788 528 604 344 260 712 444 268 16 Rlichur 325 179 146 53 30 23 272 149 123 17 Shimoga 9,548 5,014 4,534 6,345 3,297 3,048 3,203 J,717 1,<186
l8 South Kanara 920,790 439,676 48,114 749,909 356,507 393,402 170,881 83,:69 87,712 19 Tumkur 497 303 194 139 83 56 358 220 138

184
C.V PART B (i~ SPEAKERS OF LANGUAGES/MOTHER.TONGUES (INCLUSIVE OF MOTHER. TONGUES WH RE GROUPED) OTHER THAN THOS~ SPECIFIED IN SCHEDULE VIII TO THE
CONSTITUTION OF INDIA FOR STATE AND DISTRICTS-Contd.
SI. State/Distr;ct Total Rural Urban No. -----------
Pilfsons Males Females persons Males Females Persons Males Pemales
2 3 -1 5 6 7 8 9 10 11
OTHERS
MYSORE STATE 27,237 14,065 13,172 1,827 975 852 25,410 13,090 12,320
1 Bangalore 3,374 1.990 1,384 38 26 12 3,336 1,964 1,372 2 Belgaum 1,115 415 700 20 11 9 1,095 404 691 3 Bellary 55 35 20 3 2 52 33 19 4 .Bidar 8 5 3 8 5 3 5 Bijapur 1,176 573 603 380 190 ;90 796 383 413 6 Chikmagalur 15 8 7 15 8 7 7 Chitradurga 372 197 175 20 10 10 352 187 165 8 Coors 20 7 13 2 I 18 6 12 9 Dharwar 18,873 9,623 9,250 36 17 19 i 8,837 9,606 9,231
10 Gulbarga 412 227 185 13 8 5 399 219 180 11 Hassan 56 41 15 33 32 23 9 14 12 Kolar 18 16 2 9 8 9 8 1 13 Mandya 15 8 7 10 6 4 5 2 3 14 Mysore 256 130 126 7 <-I 3 249 126 123 15 North Kanara 89 53 36 14 7 7 75 46 29 16 Raichur 938 486 452 918 477 441 20 9 11
17 Shimoga 177 81 96 146 67 79 31 14 17 18 South Kanara 219 143 76 149 95 54 70 48 22 19 Tumkur 49 27 22 14 6 8 35 21 14

185
C.V PART B(ii)-SPEAKERS OF LANGUAGES/MOTHER.TONGUES (INCLUSIVE OF MOTHER. TONGUES WHERE GROUPED) OTHER THAN THOSE SPECIFIED IN SCHEDULE VIII TO THE
CO~STlTUrION OF INDIA FOR DISTRICTS/TALUKS/AND CITY/TOWNS
SI. District/TalukfCity/Town No.
Persons Males Females Sl. Di ,trictfTalukfCHy/Town No.
Persons Males Females
2
ANGAMI
BANGALORF DISTRICE
Bangalore North Taluk • Bangalore City* (c) and Trust Board Area
2 BELLARY DISTRICT
BeJlary Taluk BeJlary City (M)
3 DHARWAR DISTRICT
HubJi Taluk Hubli Dharwar City (C)
BANGALORE DISTRICT
Bangalore North Taluk Bangalore City* (C) and Trust Board Area
ARABIC/ARBI
1 BANGALORE DISTRICT
Bangalore North Taluk Hoskote Taluk Kanakapara Taluk
2 BELGAUM DISTRICT
Belgaum Taluk Belgaum (U.A.) (a) Belgaum City (M) (b) Belgaum Cantt. (CB)
Chikodi Taluk Nippani (M)
Gokak Taluk Gokak (M)
Khanapur Taluk Londa (P)
:3 BELLARY DISTRICT
Bellary Taluk BeJlary (M)
Hospet Taluk 4 BUAPUR DISTRICT
Basawana Bagewadi Taluk 5 CHIKMAGALUR DISTRICT •
Chikmagalur Taluk Chikmagalur (M)
Kadur Taluk Birur (M)
Koppa Taluk Koppa (M)
3
3 3
3 1
1 1 1
4
4
4
101 65 4
32
9 2 2
1 2 2 2 2 3 3 7 5
5 2
26 26
1,293
315 9 5 3
353 41
4
3 3
3 1
4 4
4
57 40 2
15 4
2 2
1 5 4 4 1
16 16
778 177
5 4 2
208 24
5
44 25 2
17 5 2 2 1 1
1
2 2 2
10 10
515 138
4 1 1
145 17
2
ARABIC/ARB! (COn/d.)
Mudigere Taluk Mudigere (M)
Narasimharajapura Taluk Sringeri Taluk Tarikere Taluk
6 CHrrRADURGA DISTRICT'
Challakere Taluk • Nayakanhatti (M)
Chitradurga Taluk Chitradurga (M)
Harihar Taluk Harihar (M)
Holalkere Taluk Holalkere (M)
7 CoORG DISTRICT
Mercara Taluk Mercara (M)
Somvarpet Taluk Kushal nagar (M)
Virajpet Taluk 8 DHARWAR DISTIUCT
HubJi Taluk Hubli Dharwar City (C)
Kundagol Taluk Kundagol (M)
Shirahatti Taluk Lakshmeshwar (M)
9 GULBARGA DIST.RICT
Chitapur Taluk Gulbarga Taluk Gulbarga City (M)
10 HASSAN DISTRIot
Alur Taluk • Arsikere Taluk Belur Taluk Belur (M)
Channarayapatna Taluk Channarayapatna (M)
Hassan Taluk Hassan (M)
Manjarabad Taluk Sakleshpur (M)
11 KOLAR DISTRICT
Mulbagal Taluk Mulbagal (M)
3
461 3
134 19 6
75 1
26 26 1
47 47
812 465 138 105
6 242
5 2 2 1 1 2 2 4 1 3 3
493
98 14
173 14 9 9
21
12 178 20
3 3 3
4
301 3
76 9 3
43 1 1
20 20
1 1
21 21
444 244
75 64 4
136 2 1 1
1 1 1 1
276 53 9
91 9 4 4
11 6
108 14
"Denotes constituent units of B8ngalore Urban Agglomeration, Consolidated figures of ~anllalore Urban At'glcmeration spread ov~r Blingalore North and Bang810re South taluks arc given in the Annexeufe to table C-V Part B(II)
Note-I. Units with 'NIL' ~ntri~s havll ~en omitt~d.
5
160
58 10 3
32
6 6
26 26
368 221
63 41 2
106 3 1 1 1 1 1 1 3
3 3
217 45 5
82 5 5 5
10 6
70 6 3 3 3
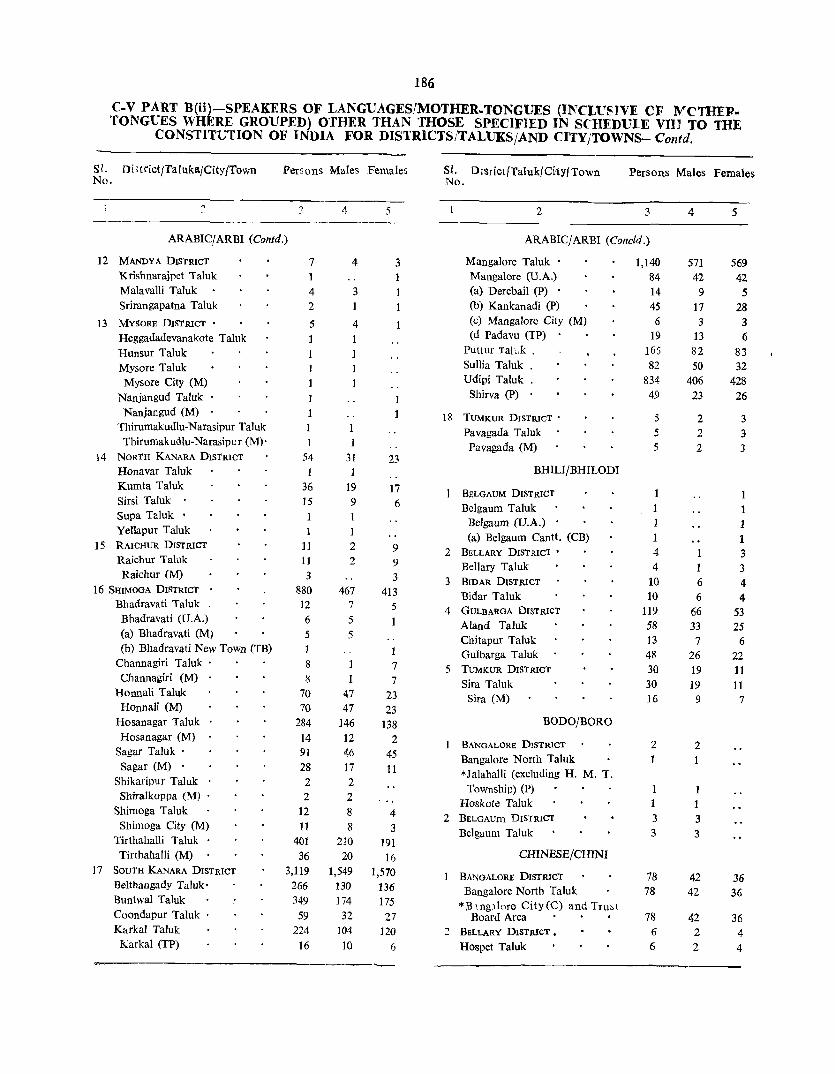
186
c.v PART B(ii)-SPEAKERS OF LANGUAGES/MOTHER.TONGUES (INCt'P8JVE OF lVCTlIIP. TONGUES WHERE GROUPED) OTHER THAN THOSE SPECIFIED IN SCHEDUlE VII} TO THE
CONSTITUTION OF INDIA FOR DISTRICTS/TALUKSjAND CITYjTOWNS~Contd.
SI. Di>trictfTalukafCity/Town Persons Males Females S1. Dtsrict(Taluk/CitY(l'own Persons Males Females No. No.
~. ~- 5 2 3 4 5
ARABIC/ARBI (Con/d.) ARABIC/ARBI (Concld.)
12 MANDY A DISTRICT 7 4 3 Mangalore Taluk . 1,140 571 569 Krishnarajpet Taluk 1 1 Mangalore CU.A.) 84 42 42 Malavalli Taluk 4 3 1 (a) Derebail (P) 14 9 S Srirangapatna Taluk 2 (b) Kankanadi (P) 4S 17 28
13 MYSORE DISTRICT' 5 4 (c) Mangalore City (M) 6 3 3
Heggadadevanakote Taluk 1 (d Padavu (TP) 19 13 6
Hunsur Taluk PlIttlir Tal"k . 165 82 83
Mysore Taluk Sullia Taluk . 82 50 32
Mysore City (M) Udipi Tallik . 834 406 428
Nanjangud Taluk • Shirva (P) 49 23 26
Nanjangud (M) 18 TUMKUR DISTRICT . 5 2 3 Thirumakudlu-Narasipur Taluk Pavagada Taluk 5 2 3
Thirumakudlu-Narasipcr (M)' I Pavagada (M) 5 2 3 14 NORTH KANARA DISTRICT 54 31 23
Honavar Taluk 1 .1 BHlLl/BHILODI
Kumta Taluk 36 19 17 BELGAUM DISTRICT 1 Sirsi Taluk 15 9 6 Belgaum Taluk 1 Supa Taluk •
BeJgaum eU.A.) 1 Yellapur Taluk 1 1 (a) Belgaum Cantt. (CB) 1 15 RAICHUR DISTRICT 11 2 9 2 BELLARY DISTRICT' 4 3 Raichur Taluk I I 2 9 Bellary Taluk 4 3 Raichur (M) 3 3 3 BIDAR DISTRICT 10 6 4 16 SHIMOGA DISTRICT 880 467 413 Bidar Taluk 10 6 4 Bhadravati Taluk 12 7 5 4 GULBARGA DISTRICT 119 66 53
Bhadravati (U.A.) 6 5 1 Aland Taluk 58 33 25 (a) Bhadravati (M) 5 5 Chitapur Taluk 13 7 6 (b) Bhadravati New Town (TB) 1 Gulbarga Taluk 48 26 22
Channagiri Taluk . 8 7 5 TUMKUR DISTRICT 30 19 11 Channagiri (M) 8 1 7 Sira Taluk 30 19 11
HonnaH Taluk 70 47 23 Sira (M) 16 9 7 Honnali (M) 70 47 23
Hosanagar Taluk 284 ]46 138 BODO/BORO
Hosanagar (M) 14 12 2 BANGALORE DISTRICT 2 2 Sagar Taluk . 9] 46 45 Bangalore North Taluk 1 Sagar (M) 28 17 11 *Jalahalli (excluding H. M. T. Shikaripur Taluk 2 2
Township) (P) 1 Shiralkoppa (M) 2 2 Hoskote Taluk 1 1
Shimoga Taluk 12 8 4 2 BELGAUm DISTRICT 3 3 Shimoga City (M) 11 8 3 Belgaum Taluk 3 3
Tirthahalli Taluk . 401 210 191 Tirthahalli (M) 36 20 16 CHINESE/CHINI
17 SOUTH KANARA DISTRICT 3,119 1,549 1,570 BANGALORE DISTRICT 78 42 36 BeIthangady Taluk· 266 130 136 Bangalore North Taluk 78 42 36 Buntwal Taluk 349 ]74 175 *B.tngll()re City(C) and Trll~l Coondapur Taluk 59 32 27 Board Area 78 42 36 Karkal Taluk 224 104 120 2 BELLARY DISTRICT. 6 2 4 Karkal (TP) 16 10 6 Hospet Taluk 6 2 4

187
C.V PART B(ii)-SPEAKERS OF LANGUAGES/MOTHER.TONGUES (lNCll'S]VE OF M011IER· TONGUES WHERE GROUPED) OTHER THAN THOSE SPECIFIED IN SOmDULE VIII TO THE
CONSTITUTION OF INDIA FOR DISTRICTSfTALVKSfAND CITYjTOWNS-Contd.
SI. istd tlIa uk/City/Town Persons Males Females Sl. District/laluk,CitYITown Persons Males Females No. No.
Z 3 4 5 Z 3 4 5
CHINESEjCHINI (CQlfCld.) COORGI/KODAGU (Contd.)
Hospet (M) 6 2 4 Ramanagaram Taluk 2 2 3 CmTRADURGA DISTRICT • 1 1 Ramanagaram (M) 2 2
Davanagere Taluk • 1 2 BELGAUm DISTlUCT 36 23 13 Davanagere City (M) 1 Belgaum Taluk 24 15 9
4 GULBARGA DISTRICT 11 8 3 llelgaum (U.A.) • 20 13 7 Gulbarga Taluk 9 6 3 (a) Belgaum City (M) • 12 7 5 Gulbarga City (M) 9 6 3 (b) Belgaum Cantt. (CB) 8 6 2
Yadgir Taluk 2 2 Gokak Taluk 2 2 Yadgir (M) 2 2 Gokak Falls (NAC) 2 2
5 KOLAR DISTRICT · 1 1 Khanapur Taluk · 10 6 4 Bangarpet Taluk 1 1 Khanapur (TP) 7 4 3
K.G.F. Urban Agglomeration 1 3 BELLARY DlSTRlCT • 17 12 5 (a) Robert Sonpet (M) • 1 1 Bellary Taluk 7 5 2
6 RAICHUR DISTlUCI' 3 1 2 Bellary (M) 7 5 2 Raichur Taluk 3 1 2 Hospet Taluk 5 4 I Raichur (M) 3 1 2 Hospet (M) 5 4 1
7 SoUTH KANARA DISTRICT 27 26 Sandur Taluk 5 3 2 Karkal Taluk 2 2 4 BIDAR DISTlUCT 3 3 Karkal (TP) 2 2 Bidar Taluk 3 3
Mangalore Taluk 9 8 1 Bidar (M) 2 2 Mangalore (U.A.) 9 8 1 5 BUAPUR DISTRICT • 5 1 4 (a) Mangalore City (M) 9 8 1 BagaIkot Taluk 5 1 4
Udipi Taluk 16 16 Bagalkot (M) 5 1 4 Shivalli (P) • 16 16 6 {'HlI{MAGALUR DISTRICT • 601 327 274
Chikmagalur Taluk 368 198 170 COORGIfKODAGU Chikmagalur (M) 134 73 61
BANGALORll DISTRICT 2,375 1,258 1,117 Kadur Taluk 23 12 11 Anekal Taluk 5 3 2 Birur (M) 17 10 7
Bangalore North Taluk • 2,158 1,142 1,016 Kadur (M) • 1 1
Bangalore City (C) and Trust Koppa Taluk 52 17 35 Board Area* · . 1,951 1,046 905 Koppa (M) 26 7 19
BEL Township (SA)* 36 14 22 Mudigere Taluk · 75 51 24 Devarajeevanahalli (TP) Mudigere (M) 7 4 3 H M T Township (SA)'" 110 47 63 Narasimharajapura Taluk 45 28 17 Jalahalli (Excluding'" H. M. T. Narasimharajapura (M) 3 1 2
Township) (P)* 23 17 6 Tarikere Taluk 38 21 17 YeIahanka (M) 6 4 2 Tarikere (M) 8 4 4
Bangalore South Taluk • 196 105 91 7 CmTRADUROA DISTRICT' 41 26 15 H.A.L. SanitaryBoarM (excIud- Chitradurga Taluk 15 8 7 ing HAL. Township) (S.B.)· 83 36 47 H.A.L. Township (SA) Chitradurga (M) · 15 8 7 51 33 18 I.T.I. Notified Area (Duravani-
Davanagere Taluk • 21 13 8 nagar (NAC)* · 23 14 9 Davanagere City (M) 20 12 8
Channapatana Taluk 8 5 3 Harihar Taluk 5 5
Devanahalli Taluk 2 8 CooRG DISTlUCT 64,461 31,848 32,613
Vijayapura (M) 2 1 1 Mercara Taluk 20,484 9,898 10,586
Hoskote Taluk 4 2 2 Mercara (M) 2,107 1,028 1,079
Hoskote (M) 4 2 2 Somvarpet Taluk 6,317 3,246 3,071 Kushalnagar (M) • 169 86 83
tS-l Census KatQataka/78
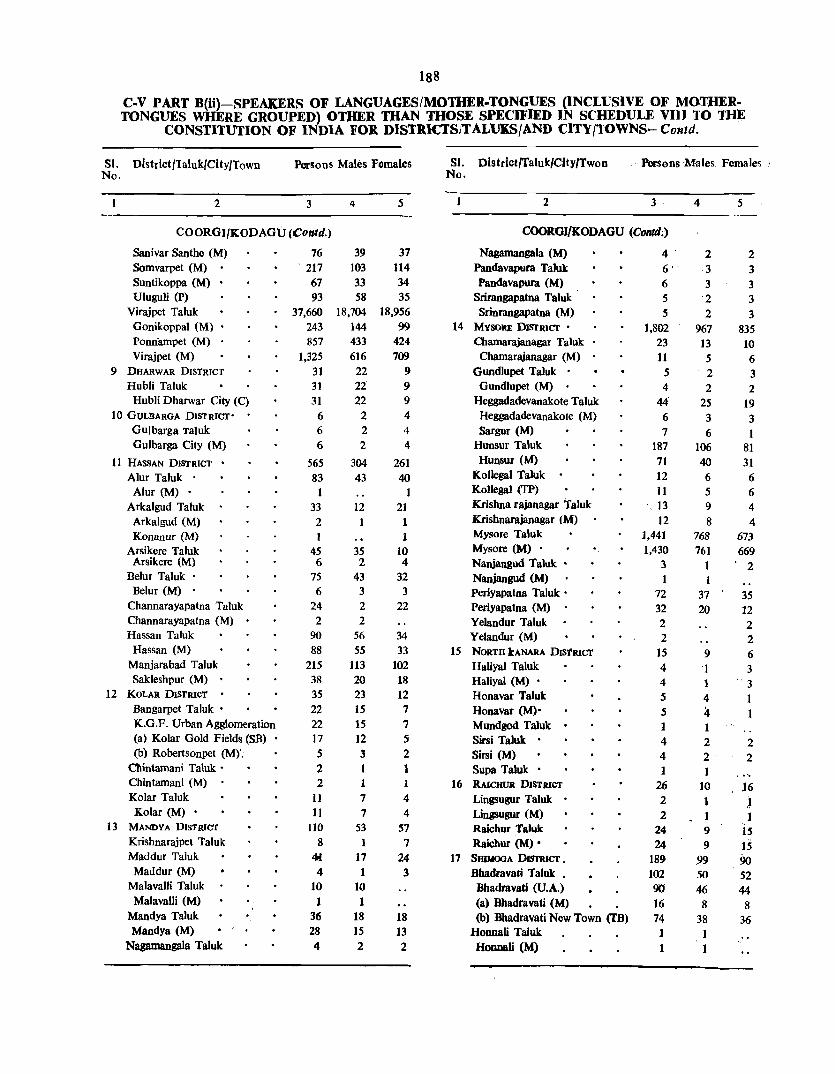
188
C·V PART B(ii)-SPEAKERS OF LANGUAGES/MOTHER.TONGUES (INCLUSIVE OF MOTHER-TONGUES WHERE GROUPED) OTHER mAN THOSE SPECIFIED IN SCHEDULE VII) TO THE
CONSTITUTION OF INDIA FOR DISTRICTSlTALUKS/AND CITY/TOWNS-Contd.
SI. District {laluk{City{TowD Persons Males Females SI. Dlstrict/Taluk/CltY/Twon ' Persons :Males, Females <
No. No.
2 3 4 5 2 3 4 5
COORGI/KODAGU (Con/d.) COORGI/KODAGU (Contd;)
Sanivar Santhe (M) 76 39 37 Nagamangala (M) 4' 2 2 Somvarpet (M) , 217 103 114 Pandavapura Taluk 6" 3 3 Suntikoppa (M) • 67 3.3 34 Pandavapura (M) 6 3 3 U1uguli (P) 93 58 35 Srirangapatna Taluk 5 2 3
Virajpet Taluk 37,660 18,704 18,956 Srinrangapatna (M) 5 2 3 Gonikoppal (M) , 243 144 99 14 MVSORE DISTRICT • 1,802 967 835 Ponnampet (M) 857 433 424 Chamarajanagar Taluk 23 13 10 Virajpet (M) 1,325 616 700 Chamarajanagar (M) 11 5 6
9 DHARWAR DISTRICT 31 22 9 Gundlupet Taluk . 5 2 3 Hubli Taluk 31 22 9 Gundlupet (M) 4 2 2 Hubli Dharwar City (C) 31 22 9 Heggadadevanakote Taluk 44 2S 19
10 GULBARGA DISTRICT' 6 2 4 Heggadadevanakote (M) 6 3 3 GUlbarga Taluk 6 2 4 Sargur (M) 7 6 1 Gulbarga City (M) 6 2 4 HUDsur Taluk 187 106 81
11 HASSAN DISTRICT 56S 304 261 Hunsur (M) 71 40 31 Alur Taluk 83 43 40 Kollegal Taluk 12 6 6 Alur (M) • 1 1 KoUegal (TP) 11 5 6
Arkalgud Taluk 33 12 21 Krishna rajanagar Taluk ,13 9 4 Arkalgud (M) 2 1 1 Krishnarajanagar (M) 12 8 4 Konanur (M) 1 1 Mysore Taluk 1,441 768 673
Arsikere Taluk 4S 35 10 Mysore (M) • 1,430 761 669 Arsikere (M) 6 2 4 Nallian8ud Taluk • 3 1 2
Belur Taluk • 75 43 32 Nanjangud (M) 1 Belur (M) . 6 3 3 Periyapatna Taluk ' 72 37 35
Channarayapatna Taluk 24 2 22 Periyapatna (M) 32 20 12 Channarayapatna (M) 2 2 Yelandur Taluk 2 2 Hassan Taluk 90 56 34 Yelandur (M) 2 2 Hassan (M) 88 55 33 15 NORTH kANARA DIstRICT 15 9 6
Manjarabad Taluk 215 113 102 Haliyal Taluk 4 3 Sakleshpur (M) , 38 20 18 Haliyal (M) • 4 1 3
12 KOLAR DISTRICT . 35 23 12 Honavar Taluk 5 4 1 Bangarpet Taluk • 22 15 7 Honavar (M). 5 4 K.G.F. Urban Agglomeration 22 15 7 Mundgod Taluk . 1 1 (a) Kolar Gold Fields (SB) 17 12 5 Sirsi Taluk . 4 2 2 (b) Robertsonpet (Mr 5 3 2 Sirsi (M) 4 2 2
Chintamani Taluk ' 2 1 1 Supa Taluk 1 1 Chintamani (M) 2 1 1 16 RAICHUR DIST nCT 26 10 16 Kolar Taluk 11 7 4 Lingsugur Taluk 2 1 J
Kolar (M) • 11 7 4 Ling8ugur (M) 2 1 1 13 MANDYA DISTRICT 110 53 57 Raicbur Taluk 24 9 IS
Krishnarajpet Taluk 8 1 7 Raicbur (M) • 24 9 15 Maddur Taluk "" 11 24 17 SHDIOOA DISTRICT • 189 ,99 90 Maddur (M) 4 1 3 Bhadravati Taluk • 102 50 52
Malavalli Taluk 10 10 Bbadravati (U.A.) 90 46 44 Malavalli (M) . 1 1 (a) Bbadravati (M) 16 8 8
Mandya Taluk 36 18 18 (b) Bhadravati New Town (TB) 74 38 36 Mandya (M) 28 15 13 Honnali Taluk 1 1
Nagamangala Taluk 4 2 2 HonnaJi (M) 1 1

189
C-V PART B(ii)-SPEAItERS OF LANGUAGESfM.PTHER-TONGUES (INCLUSIVE OF MOTHERTONGUES WHERE GROUPED) OTHER THAN THOSE SPECIFIED IN SCHEDULE VIII TO mE
CONSTITUI'ION OF INDIA FOR DISTRICTS/TALUKS/AND CITY/TOWNS-Contd.
SI. Di.trict/Taluk/Ch)'/Towil PelSOllb Males Females No.
1 2 3 4 5
COORGI/KODAGU-(Concld.)
Hosanagar TaJuk • Hosanagar (M) •
Sap&" Taluk. Sagar(M) •
Sbikaripur Taluk Shikaripur (M)
Sbimoga TabU: Sbimoga aty (M) Kumsi(M) ,
Sorab Taluk Tirtbahalli Taluk
Tirthahalli (M) 18 SouTH KANAJlA DISTIUCT
IIeltbangady Taluk Buntwal Taluk Coondapur Taluk • Coondapur (TP) .
Karkal Taluk Karkal (TP) Pranthya (TP)
Mangaiore Taluk Mangalore (U.A.) (a) Kanknadi (P) (b) Mangalore City (M) UDal (TP) .
Puttur Taluk PuUur (TP)
SuUia Taluk Udipi Taluk Malpe (TP) Shivalli (P) • U4ipi (M) •
19 Tmaua DIsTRICT •
Gubbi Taluk
Sira Taluk •
Tiptur TabJk
Tiptur (M) •
Tumkur Taluk
Tumkur (M) • Turuvetere Taluk •
Ammasandra Notified Area (NAC)
DlMASA
Coo.a DISTRICT
Mercara Taluk
Mcrcara (M) •
•
•
4 1
14 3 1
41 36 4 1
25 1
635 42 18 14 14 19 4 6
259 211
5 205
1 96 20 16
171 7 4
148 32 2
5
8
6
13
10
4
4
3
3 3
3 1 3 1 1 1
22 21
19
349 27 9 8 8 9 2 5
P7 , 113
2 110
63 13 9
87 3 2
73 18
2
6
4
8
5 2
2
2
2 2
1
11 2
19 15 3 1 6
286 15 9 6 6
10 2 1
122 98
3 95
33 7 7
84 4 1
7' 14 2 3
2
5 , 2
2
1 1 1
SI. Mo.
Dlstrict/Taluk/CUy/Town Persons Males F~males
1 2
DOGRI
1 BANGALOIlB DISTIlIct
Bangaiore North Taluk . Bangalore aty (C)* Trust-Board
Area! • • lalahalli (Excluding H.M.T. . Township) (P)
Bangalore South Taluk . H.A.L. Sanitary Board* (Ex
cluding H.A.L. Town Sbip) (SB)
2 BELOAUM DISTIlICT •
Belgaum Taluk Belgaum (U.A.) (a) Belgaum Gty (M)
(b) Belgaum Cantt. (C.B.) Hulleri Taluk
3 BELLAP.Y DISTRICT •
Hospet Taluk Kamalapur (TP)
4 BmAR DISTRICT
Bidar Taluk • Bidar (M) •
5 BUAPUIl DISTRICT
Bljapur Taluk 6 Cooao DlSTIlICT
Virajpet Taluk 7 DHARWAR DISTRICT
Hubli Taluk . Ranibennur Taluk. Ranibennur (M)
8 GULDAROA DISTIlICT
levargi Taluk 9 SourH UNARA DlS1'RICl •
Udipi Taluk •
ENGLISH
1 BANOAWRII DISTRICT
Anekal Taluk Bangalore North Talwk . Bangalore Gty (C)* •
and Trust-Board Area B. E. L. townsbip (SA)*
Devarajevanahalli (T)P*. H.M.T. Township (SA) . lalaballi (Excluding H.M.T.
Township) (P) • Kadwgondanahalli (P) * . Yelabanka (M) •
Bansalore South Taluk •
3
ISS 149
92
34 6
, 29 13 9 2 7
16 4 4 4 8 8 4
1 1
3 1 2 2 1 I 2 2
10,082 17
9,530 9,187
62 114 44
36 4 3
455
4
119 114
60
31 5
4 22 13 9 2 7 9 1 1
7 7 3 1 1 1 1 3 1 2 2 1 1 2 2
4,911 17
4,649 4,446
28 67 21
30 2 3
lOS
5
36 35
32
3 1
1 7
7 3 3 3
5,171
4,881 4,741
34 47 23
6 2
250

190
C-V PART B(ii)-SPEAKERS OF LANGUAGES/MOTHER.TONGUES (INCLUSIVE OF MOTHER. TONGUES WHERE GROUPED) OTHER THAN TIlOSE SPECIFIED IN SCHEDULE VIn TO THE
CONSTITUTION OF INDIA FOR DISTRICTS/TALUKS/AND ClTY/TOWNS-Contd.
SI. D'strict/Taluk/City/Town Persons Males Females SI. Distriet/1 aluk/CitY/Town PerSons Males Females No. No.
2 3 4 5 2 3 4 5
ENG LISH (Contd.) ENGLISH (Contd.)
H.A.L. Sanitary Board "'(Ex- Kampli (TP). 1 1 eluding H.A.L. Township) Sandur Taluk 29 17 12 (SB) 4 3
H.A.L. Town ship (SA) * 43 20 23 Siruguppa Taluk 2 2
IT! Notified Area (Duravani-Siruguppa (TP) 1
nagar) (NAC) . 77 37 40 4 BIDAR DIS'IRICT 26 16 10 Channapatna Taluk 27 26 Basavakalyan Taluk 2 1 1 Channapatna (M) . 27 26 Bidar Taluk . 14 10 4 Devanahalli Taluk 3 3 Bidar (M) . 11 7 4
Vijayapura (M) 1 1 Humnabad Taiuk • 10 5 5 Doddaballapur Taluk 6 4 2 Chitaguppa (M) . 2
Doddaballapur (M) 6 4 2 Humnabad (M) 2 Hoskote Taluk 14 9 5 5 BOAPUR DISTRICT 53 43 10 Hoskote (M) 7 2 5 Badami Taluk 4 4
Magadi Taluk 14 12 2 Badami (M). 3 3 Magadi (M) 4 3 Guledgud (M)
Nelamangala Taluk 4 2 2 Bagalkot Taluk 16 16 Nelamangala (M) 3 2 Bagalkot (M) 16 16
Ramanagaram Taluk 12 9 3 Basavanabagewadi Taluk 1 1 Ramanagaram (M) 11 8 3 Bijapur Taluk 27 19 8
2 BELGAUM Dis'IRICT . 643 320 323 Bijapur City (M). 10 6 4 Athani Taluk Bilgi Taluk 2 1
Athani (M) 1 Jamkhandi Taluk . 3 2 1 Belgaum Taluk 587 292 295 lamkhandi (M) 1 1 Belgaum (U.A) 568 280 288 6 CmKMAGALUR DrS'IRrCf 404 222 182
(a) Belgaum City (M) . 88 59 29 Chikmagalur Taluk 159 76 83 (b) Belgaum cantt. (C.B) 480 221 259 Chikmagalur (M) 31 12 19
Chikodi Taluk 9 4 5 KadurTaluk 10 4 6 Chikodi (TP) 4 1 3 Koppa Taluk 4 2 2
Nippani (M) 1 Mudigere Taluk 189 114 75 Gokak Taluk 9 7 2 Narasimharajapura Taluk 14 11 3
Gokak (M) 2 2 Tarikre Taluk 28 15 13 Gokak falls (NAC) 6 4 2 Tarikere (M) 3 3 Mudalgi (TP) 7 CHrTRADURGA DISTRICT 111 72 39 Hukkeri Taluk 7 6 Chitradurga Taluk 16 11 5 Sankeshwar (TP) 7 6 Chitradurga (M) 10 5 5 Khanapur Taluk 23 12 11 Davanagere Taluk 86 54 32 Khanapur (TP) 14 7 7 Davanagere City (M) 86 54 32 Londa (P) 1 1 Harihar Taluk 3 3 Sampagaon Taluk . 7 3 4 Harihar (M) 3 3
Bailhongal (M) 6 2 4 Hiriyur Taluk 4 3 3 BELLARY DISTRICT 309 155 154 Hiriyur (M) 4 3 1
Bellary Taluk 237 111 126 Hosdurga Taluk 1 Bellary (M) . 237 111 126 Hosdurga (M) 1
Hadagalli Taluk Molakalmuru Taluk 1 Harpanahalli Taluk. 11 4 7 Molakalmuru (M) 1 1 Harpanahalli (TP) . 11 4 7 8 CooRG DISTRICT 305 114 191 Hospet Taluk 29 20 9 Mercara Taluk 146 28 118 Hospel (M) 23 17 6 Mercara (M) 50 20 30

191
C.V PART B(ii)-SPEAKERS OF LANGUAGES/MOTHER·TONGUES (INCLUSIVE OF MOTHER. TONGUES WHERE GROUPED) OTHER THAN THOSE SPECIFIED IN SCHEDULE VBl TO THE
CONSTITUTION OF INDIA FOR DISTRICTSjTALUKS/AND ClTY/TOWNS-Contd.
SI. Di ,triet/Talu klCitY/Town Persons Males Females Sl. Districl/Taluk/CitY/Town Persons Males FemaIc~ No. No.
2 3 4 5 2 3 4 :
ENGLISH (Contd.) ENGLISH (Contd.)
Somvarpet Taluk 43 21 22 12 KOLAR DISTRlcr 1,356 685 671 Kushalnagar (M) 9 2 7 BagepaIli Taluk 5 2 3 Suntikoppa (M) 1 BagepaIli (M) 5 2 3
Virajpet Taluk 116 65 51 Bangarpet Taluk 1,307 652 655 Gohikopal (M) 3 1 2 Bangarpet (M) 23 13 10
Virajpet (M) 1 1 K.G.F. Urban Agglomeration 1,255 623 632 9 DHARW AR DISTRICT 1,053 559 494 (a) Kolar Gold Fields (SB) 890 438 452
Dharwar Taluk 6 5 (b) Robertsonpet (M) 365 185 180 Alnavar (TP) 5 5 Chikballapur Taluk 5 5
Gadag Taluk 85 42 43 Chikballapur (M) 5 5 Gadag Betgeri (M) 84 41 43 Chintamani Taluk . 1 1
Hangal Taluk 1 1 Chintamani (M) 1 Hangal (TP) 1 Gauribidanur Taluk 6 4 2
Haveri Taluk 4 4 Gauribidanur (M) 6 4 2 Haveri (M) . 4 4 Kolar Taluk . 17 ~ 8
Hubli Taluk . 939 500 439 Kolar (M) 17 9 8 Hubli·Dharwar City (C) 101 69 32 Srinivaspur Taluk 15 12 3
Kalghatgi Taluk 2 2 Srinivaspur (M) 15 12 3 Kundagol Taluk 1 13 MANDYA DISTRICT 9() 62 28 Kundagol (M) 1 Maddur Taluk 3 3
Nargund Taluk 2 2 Malavalli Taluk 29 21 8 Nargund (M) 2 2 Malavalli (M) g 7 1
10 GULBARGA DISTRICT 115 73 42 Mandya Taluk 49 32 17 Chineholi Taluk 1 1 Mandya (M) 17 9 8 Chineholi (M) 1 1 Nagamangala Taluk 5 3 2
Chitapur Taluk 76 41 35 Bellur (M) 4 2 Shahabad (M) 19 9 10 2
Shahabad ACC Notified Area Nagamangala (M) 1 1 (NAC) 27 17 Srirangapatna Taluk 4 3 1
Wadi ACC Notified Area Srirangapatna (M) 3 2 1 (NAC) 3 2 1 14 MYSORE DISTRICT 926 462 464 Gulbarga Taluk 28 22 6
Gulbarga City (M) 27 21 6 Chamarajanagar Tal uk 7 7
Sedam Taluk 1 Chamarajanagar (M) 6 6
Shorapur Taluk. Heggadadevanakote Taluk 17 17
Yadgir Taluk 8 7 Hunsur Taluk 6 4 2 Yadgir (M) . 4 4 Hunsur (M) 6 <I. 2
11 HASSAN DISTRICT 129 70 59 Kollegal Taluk 8 5 3 AIur Taluk . 3 1 2 Kollegal (TP) 8 5 3 Arsikere Taluk 13 7 6 Krishnarajanagar Taluk 12 9 3
Arsikere (M) 10 6 4 Mysore Taluk 838 399 439 Belur Taluk . 37 27 10
Channarayapatna Taluk . 31 14 17 Mysore City (M) 827 394 433
Hassan Taluk 15 6 9 Nanjangud Taluk 8 6 2 Hassan (M) 7 3 4 Nanjangud (M) . 8 6 2
Holenarsipur TaJuk 2 1 1 Periyapatna Taluk 9 3 6 Manjarabad Taluk . 28 14 14 Thirumakudlu Narasipur Taluk 2 2 Sakleshpur (M) 5 3 2 Bannur (M) 2 2

192
C.v PART B(ii~-S.PEAKERS OF LANGUAGES/MOTHER·TONGUES (INCLUSIVE 0' MOTDEk. TONGUES WH RE GROUPE~ OTHER THAN THOSE SPECIFIED IN SCHEDULE VIII TO mE
CONsrITUrION OF I DIA FOR DISTRICTS/TALUKS/AND CITY/TOWNS-Contd.
Sf. District/laluk/City/Town Persons Males Females SI. District/Taluk/Cityll own Persona Malos Fo_ls No. No.
2 3 4 1 , .. • ENGLISH (Contd.) ENGLISH (Cofk!'d.,
15 NORTH KANARA DISTRIct 12S 49 16 Mangalore Taluk • S83 282 301 Haliyal Taluk 34 IS 19 Mangalore (U.A.) '46 268 278 Dandeli Notified Area (N.A.C.) 34 IS 19 (a) Kankanadi (P) 2 2 Honavar Taluk 1 (b) Mangalore City (M) 535 263 272 Karwar Taluk 39 18 21 Padavu(TP) S 2 3 Karwar (M) 36 16 20 UUal (TP) .. 3 1 Kumta Taluk 33 6 27 Puttur Taluk 13 9 .. Kumta(M) 31 S 26 Puttur (TP) 13 9 .. Mundgod Taluk 8 2 6 Udipi Taluk . '7 36 21 Sirsi Taluk 2 2 Shirva (P) 2 2 Sirsi (M) 2 2 Shivalli (P) . 27 18 9 Supa Taluk 7 5 2 Tonse West (P) S .. I YeUapur Taluk 1 1 Udipi (M) 12 5 1 Yellapur (TP) .. 1 Udyavar (P) 3 3
16 RAICHUR DISTRICT 272 153 119 19 TUMKUR DISTRICT 53 36 11 Deodurg Taluk 1 1 Gubbi Taluk 8 6 2 Gangavati Taluk 12 11 Madhugiri Taluk 1 1 Gangavati (M) 12 11 1 Madhugiri (M) 1 1 Koppal Taluk 11 6 5 Sira Taluk . 2 2 Koppal (M) 1 1 Sira(M) 2 2
Lingsugur Taluk 127 68 S9 Tumkur Taluk 23 IS 8 Lingsugur (M) 2 1 Tumkur(M) 20 12 8
Mudgal(M) 4 1 3 Turuvekere Taluk 19 12 7 Manvi Taluk 4 3 Ammasandra Notified Area
Manvi (M) 2 (NAC) 19 12 7 Raichur Taluk 108 57 51 GARO
Raichur (M) 107 56 51 BANOALORE DISTRICT 2 Sindhnur Taluk 8 6 2 2
Sindhnur (M) 2 2 Bangalore North Taluk . 2 2 Bangalore City (C) and trust
Yelburga Taluk . 1 Board Area 1 17 SHlMOOA DISTRICT 186 103 83 Jalahalli (Excluding H.M.T.
Bhadravati Taluk • 26 17 9 Township)(P) . Bhadravati (U.A.) 26 17 9 GONDI
(a) Bhadravati (M) 8 4 4 (b) Bhadravati New Town (TB) 18 13 5 BANGALORE DISTRICT
Sagar Taluk . 53 37 16 Bangalore North Taluk • Sagar (M) 17 14 3 Bangalore City (C) and Trust
Shikaripur Taluk Board Area· I I
Shimoga Taluk 103 46 57 2 BIDAR DISTRICT 121 55 66 Shimoga City (M) 103 46 57 Bidar Taluk. 121 55 66
Tirthahalli Taluk . 3 2 1 Bidar(M) 121 5S 66
Tirthahalli (M) 3 2 1 GORKHAU/NEPALI 18 SOUTH KANARA DISTRICT 693 348 345 BANOALORE DISTRICT 558 393 16' Belthangady Taluk 11 S 6·
Bangalore North Taluk • 488 337 1St Buntwal Taluk 3 3 Bangalore City (C) and Trust Board Coondapur Taluk . 14 11 3 Area 40.5 286 tt9
Coondapur (TP) 1 B.E.L. Township (SA)· • 4 I 3 Karkal Taluk 12 2 10 H.M.T. Township (SA)· 9 2 7

1'93
C-V PART B(ii}-SPEAKERS OF LANGUAGESfMOmER.TONGU£S (INCLUSIVE OF Mo'flJEll. TONGUES WHERE GROUPED) OTHER THAN THOSE SPECIFIED IN SCHEDULE VIII TO THE
CONSTITUTION OF INDIA FOR DISTRICTS/TALUKS/AND CITYjTOWNS-Contd. '~I
Sf.. No.
I)i;trict/l aluk/City/Town Person& Males Females SI. No.
Distrfct/Taluk{City/Town Persons males Females
. I 2 3 4 , 2 3 4 5
GORKHALI/NEPALI-Contd. GORKHALI/NEPA LI-Contd.
Jalahalli (Excluding H.M.T.) Tekkalkot (TP) 3 1 2 Township (P)· • • • 12 10 2 4 BIDAR DISTRICT 7 7 Kadugondanahalli (P) 4 3 1 Bidar Taluk • 7 7 Yelahanka (M) • 3 1 2 Bidar (M) 4 4
Bangalore South Taluk • 58 44 14 5 BUAPUR DISTRICT 22 16 6 H.A.L. Sanitary Board (Exclu· Badami Taluk 3 2 1 ding H.A.L. Town Ship) (S.B.) 13 7 6 I. T.I. Notified Area (DUR VA·
Guladgud (M) 1
NINAG AR) CNAC) 5 3 2 Bagalkot Taluk 5 3 2
Channapatna Taluk 1 Bagalkot (M) 5 3 2 Channaptna (M) • 1 Bijapur Taluk 2 1
Devanahalli Taluk 4 4 Bijapur City (M) 2 1 Devanahalli(M) . 4 4 Hungund Taluk 1
DoddabalJapur Taluk 2 2 Indi Taluk 1
Doddaballapur (M) 2 2 Iudi (TP)
Hoskote Taluk 3 3 Jamkhandi Taluk • 5 4 1
Magadi Taluk 2 2 Jamkhandi (M) 2 2
Magadi (M) 1 1 Rabkavi-Barhatti (M). 1
2 BELOAUM DISTRICT 109 90 19 Terdal(TP) 2 1 1
Athani Taluk 15 8 7 Muddebihal Taluk 4 3 1 Belgaum Taluk 75 66 9 Muddebihal (TP) : 1 1
Belgaum (U.A.) 66 59 7 Talikot (TP) • 3 2 1
(a) Belgaum City (M) 15 15 Sindgi Taluk 1
(b) Belgaum Cantt. (CB) 51 44 7 6 CUlKMAMALUR DISTRICT 43 30 13
Chikodi Taluk 5 4 1 Chikmagalur Taluk 7 3 4 Chikodi (TP) 3 2 Chikmagalur (M) 3 1 2
Nippani (M) 2 2 Kadur Taluk 1 1
Hukkeri Taluk 4 4 Kadur (M) . 1 1
Khanapur Taluk 1 1 Koppa Taluk 12 8 4
Londa (P) Kappa(M) . 5 3 2
Paras gad Taluk 3 3 Mudigere Taluk 14 12 2
Saundatti-Yeflamrna(M}. Nacasimharajapura Taluk 4 3 1
Raibag Taluk 1 Narasimharajapura: (M) 2 1 1
Raibag (TP) 1 Tarikeri Taluk 5 3 2
Sampagaon Taluk 5 3 2 7 CHlTRADUROA DISTRICT 26 18 8
3 BELLARY DISTRICT 101 74 27 ChalJakere Taluk 7 4 3
Bellary Taluk 27 23 4 Qallakere (M) 7 4 3
Bellary City (M) 25 21 4 Cbitradurga Taluk 5 3 2
Hadagalli Taluk 2 1 1 Chitradurga (M) 3 1 2
Hospct Taluk 54 37 17 Davanagere Taluk 9 7 2
Amarvathi (TP) 12 11 1 Davanagere City (M) 5 4 1 Hospet (M) 29 16 13 Harthar Taluk
Kamalapur (TP) 4 3 1 Harihar(M) t 1
Kampli (TP) 9 7 2 Hiriyur Taluk 3 2
Kudligi Taluk 1 Hiriyur (M) . 3 2
Kottur (TP) 1 1 Holalkere Taluk 1
Sandur Taluk 10 8 2 8 Cooao DISTRICT 22 19 3 Siruguppa Taluk 7 4 3 Mercara Taluk 3 3 Siruguppa (TP) 4 3 1 Mercara (M) 2 2

194
C.V PART B(ii)-SPEAKERS OF LANGUAGES/MOTHER.TONGUES (INCLUSIVE OF MOTHER· TONGUES WHERE GROUPED) OTHER THAN THOSE SPECIFIED IN SCHEDULE VIII TO THE
CONSTITUTION OF INDIA FOR DISTRICTSjTALUKS/AND CITY/TOWNS-Contd.
SJ. Sl. t\o. DistrictjTalukjCity/Town Persons Males Females No. District/Taluk/City/Town Persons Males Females
2 3
GORKHALIfNEPALI-COnfd.
Somvarpet Taluk . Kushalnagar (M)
Virajpet Taluk 9 DHARWAR DISTRICT
BYadgi Taluk Byadgi (M)
Gadag Taluk Gadag--Betgeri (M) Haved Taluk
Haveri (M) . Hirekerur Taluk HubIi'Taluk . HubIi-Dharwar City (C) Kalghatgi Taluk Kundagol Taluk Kundagol (M) NargUnd Taluk
Nargund,(M) 10 GULBARGA DISTRICT
Aland Taluk Aland (M) .
Chincholi Taluk Chincholi (M)
Chitapur Taluk Shahabad A. C. C. Notified Area (N.A.G)
Wadi A.C.C. Notified Area (N.A.C.)
Gulbarga Taluk Gulbarga City (M)
Javargi Taluk Sedam Taluk Shahapur Taluk Shahapur (M) Shorapur Taluk Yadgir Taluk
Yadgir (M) . 11 HASSAN DISTRICT •
Alur Taluk Alur (M)
Arkalgud Taluk Arsikere Taluk Arsikere (M)
Hassan Taluk Hassan (M).
Manjarabad Taluk Sakleshpur (M) ..
12 KOLAR DISTRICT
Bangarpet Taluk
13 2 6
124 3 3
11 11
3
3
101 101
2
1 2 2
101
1 1 1
58 25
33
24 23 1 2 3 2 3 8 7
28 1 1 2 3 3
19 12
3 1
18 5
4
11
2 5
86 3 3 6 6 3 3
69 69
2
1
2 2
70 1
1 1
37
16
31
18 17
1 2 2 1 3 5 4
22 1 1 2 2 2
14 9 3 I
17 4
5
1 38
5 5
1 32 .32
31
21 9
12
6 6
1
1
3 3 6
1 1 5 3
1
-------------_._-- -
2 3
GORKHALI/NEPALI Contd.
K.G.F. Urban Agglomeration (a) Robertsonpet (M) Chikballapur Taluk Chikballapur (M)
Chintamani Taluk . Chintamani (M) .
Gauribidanur Taluk Kolar Taluk . Kolar (M)
Mulbagal Taluk Siddlaghatta Taluk Srinivasapur Taluk Srinivasapur (M) .
13 MANDYA DISTRICT.
Krishnarajpet Taluk Krishnarajpet (M)
Maddur Taluk Malavalli Taluk Malavali (M)
Mandya Taluk Mandya (M)
Nagamangala Taluk Pandavapura Taluk Pandavapura (M)
Srirangapatna Taluk 14 MYSORE DISTRICT •
Chamarajanagar Tal uk Gundlupet Taluk
Gundlupet (M) Hunsur Taluk Hunsur (M)
Krishnarajanagar Taluk Mysore Taluk Mysore City (M) .
Nanjangud Taluk • Nanjangud (M)
Thirumakudlu Narasipur Taluk Thirumakudlu Narasipur (M)
15 NORTH KANARA DISTRICT
Ankola Taluk Bhatkal Taluk Bhatkal (M)
Haliyal Taluk Dandeli Notified Area (N.A.C.)
HaJiyal (M). Honavar Taluk
Honavar (M) Karwar Taluk
5 5 4 4 1 1 1 3 3 1 1 2 1
25 4 4 1 3 3
10 6 1 2 2 4
44 2 6 6 6 6 2
22 22
5 5 1
115 6 2 2
70 64 6 2 2 9
4
4 4 4 4
3 3 1 1 2 1
23 4 4 1 3 3 8 4
2 2 4
29 2 2 2 4 4 1
15 15
4 4 1 1
87 5 2 2
54 51 3 1 1 6
s
1
2
2 2
15
4 4 2 2 1 7 7 1 1
28
16
13 3 1 1 3

195 c.v PART B(ii)--SPEAKERS OF LANGUAGES/MOTHER.TONGUES (INCLUSIVE OF MOTHER.
TONGUES WHERE GROUPED) OTHER THAN THOSE SPECIFIED IN SCHEDULE VIB TO THE CONSTITUTION OF INDIA FOR DISTRICTS/TALUKS,AND CITYjTOWNS-Contd.
S1. S]. No. District/Talok/City/Town Persons Males F~male No. District/Taluk/City/Town Persons Malts FOLalu
2 3 4 5 2 3 4 5
G HKi-IALI/NEPALI-Contd. GORKHALI/NEPALI-Contd.
Karwar (M) 9 6 3 Coondapur Taluk • 1 Kumta Taluk. 8 5 3 GangoIIi (P) 1 1 Kumta (M) . 8 5 3 Karkal Taluk . 2 2
Mundgod Taluk 1 Karkal (P) • 2 2 Siddapur Taluk 1 1 MangaJore TaJuk 24 17 7 Sirsi Taluk 11 7 4 Mangalore U.A. 14 10 4
Sirsi (M) 9 5 4 (a) Mangalore City (M) 14 10 4 Supa Taluk 4 4 Puttur TaJuk . 9 7 2
Yellapur Taluk 1 Puttur (TP) . 7 5 2
Yellapur (TP) Sullia Taluk . 1 1
16 RAICHUR DisTRICT. 97 71 26 Udipi TaJuk . 19 10 9
Deodurg Taluk 5 3 2 19 TUMKUR DISTRICT. 22 12 1\::1
Deodurg (M) 3 1 2 Gubbi TaJuk . 4 2 2
Gangavati TaJuk 3 3 Gubbi (M) 4 2 2
Koppal TaJuk 22 16 6 K unigal Taluk 2
Koppal (M) 4 3 1 Madhugiri TaJuk 1
Munirabad Project Area (S.A.) 14 12 2 Madhugiri (M) 1
Kushtagi Taluk 1 Pavagada Taluk 1
Kushtagi (M) 1 Y.N. Hoskote (M)
Lingsugur Taluk 39 33 6 Tiptur Taluk . ·8 4 4
Manvi Taluk 2 2 Tiptur (M) . 3 1 2
Raichur Taluk 20 10 10 Tumkur Taluk 5 2 3
Raichur (M) 20 10 10 Tumkur (M) 5 2 3
Sindhnur Taluk 5 3 2 Turuvekere TaJuk 1
Sindhnur (M) 3 2 Turuvekere (M)
17 SHiMOGA DISTRICT 186 103 83 KHASI Bhadravati Taluk 15 14
Bhadravati U.A. 6 6 BANGALORE DISTRICT 5 4
(a) Bhadravati (M) 1 BangaJore North Taluk . 4 3
Bangalore City (C) 4 3 (b) Bhadravati New Town(T.B.) 5 5 and Trust Board Area
Channagiri Taluk . 3 3 Hoskote Taluk 1 1 HonnaH Taluk 3 2 2 MYSoRE DISTRICT. 1 Hosanagar Taluk 6 6 Mysore Taluk Hosanagar (M) 6 6 Mysore City (M) . Sagar Taluk . 10 9
Sagar (M) 2 2 KONKANI
Shikaripur TaJuk 4 4 BANGALORE DISTRICT 13,569 6,997 6,572 Shikaripur, (M) 3 3 Anekal Taluk 27 17 10 Shiralkoppa (M) . 1 AnekaJ (M) 14 10 4
Shimoga Taluk 14 13 1 BangaJore North Taluk • 12,604 6,438 6,616
Shimoga City (M) 10 9 1 Bangalore City (C) *.
Sorab Taluk . 1 and Trust Board Area • 12,214 6,242 5,972
Tirthahalli Taluk 21 2 19 B.E. L. Township (SA)*' 85 44 41 Devarajeevanahalli (TP)* 2 1 1
Tirthahalli (M) 2 2 H.M.T. Township (SA)* 156 74 82 18 SouTH KANARA DISTRICT. 67 46 20 Jallahalli (excluding *H.M.T. 50 39 11
Belthangady Taluk 6 4 2 Township) (P)
Buotwal Taluk 5 5 Yelahanka (M) 4 3 1

19()
C.V PART B(ii) -SPEAKERS OF LANGUAGES/MOTHER.TONGUES (INCLUSIVE OF MOThER. TONGUES WHERE GROUPED) OTHER THAN THOSE SPECIFIED IN SCHEDULE VIII TO THE
CONSTITUTION OF INDIA FOR DISTRICTSjTALUKSjAND CITY/TOWNS-Cvntd.
SJ. SI. N,), District/Taluk/City/Town Persons Males Females No. District/Talut/Cit)'/TowD Persons Males Females
2 3 4 5 :l 3 4 5
K:ONKANI-Contd. KO'MKAtCl-co.td.
Bangalore South Taluk . 605 347 258 Raibag (TP) 67 36 31 H.A.L. Sanitary Board* • Ramdurg Taluk 550 285 265 (excluding H.A.L. Township (SB) 25 16 9 Ramdurg (M) 34 16 18 H.A. L. Township (SA) • 13 53 66 Sampagaon Taluk • 50 22 28
I.T.l. Notified area *(Duravaninagar 86 48 38 Bailhongal (M) 6 4 2 (N.A.C.)· 3 BIlLLARY DISTIUCT • 701 372 329
Channapatna Taluk 87 52 35 Bellary Taluk 161 81 80 Channapatna (M) • 83 51 32 Bellary City (M) • 158 79 79 Devanahalli Taluk 58 35 23 Haagalli Taluk 148 81 67
Devanahalli (M) 26 15 11 Hadagalli (TP) 24 14 10 Vijayapura (M) 29 18 11 Harpanahalli Taluk 73 35 38
Doddaballapur TalUk 23 11 12 Harpanahalli (TP)' 5 3 2 Doddaballapur (M) 16 9 7 Hospet Taluk' 217 121 96
Hoskote Taluk 45 28 17 Amaravathi (TP) • 13 7 6 Hoskote (M) 17 9 8 Hospet (M) • 174 98 76
Kanakapura Taluk 39 26 13 Kamalapur (TP) 1 1 Kanakapura (M) • 28 20 8 Kampli(TP) 25 11 14
Magadi Taluk 18 9 6 Kudligi Taluk 44 24 20 Magadi (M) 13 7 9 Kottur (TP) 22 13 9
Nelamaogala Taluk 23 10 13 Mallapuram Taluk 39 14 24 Nelamangala (M) 14 5 9 Sandur Taluk' 18 15 3 TYamagondlu (M) 7 3 3 Siruguppa Taluk .1 1
Ramanagaram Taluk 40 24 16 Siruguppa UP) 1 1 Ramanagaram (M) 27 18 9 4 BIDAR DISTRIct 24 20
2 BJlLGAUM DISTRICT 11,449 5,775 5,764 Aurad Taluk' 2 Athani Taluk 53 29 24 Basavakalyan Taluk 7 5 2
Athani (M) 21 12 9 Basavakalyan (M) 7 5 Belguam Taluk 7,256 3,756 3,600 Bidar Taluk . 15 14 Belgaum V.A. 6,432 3,247 3,176 Bidar (M) II 10
(a) Belgaum City (M) . 4,186 2,226 1,960 Humnabad Taluk 1 1 (b) Belgaum Cantt. (CB) 2,237 1,021 1,216 5 BUAPUR DIStRICT 602 286 316
Chikodi Taluk 219 111 108 Badami Taluk 97 46 51 Chikodi (T.P.) 70 35 35 Badami (TP) 18 9 9
Nippani (M) 76 39 37 Guledgud (M) 27 5 22 Gokak Taluk 138 70 68 Kerur (TP) • 9 4 5 Gokak (M) . 28 15 13 Bagalkot Taluk 172 85 87 Gokak Falls (NAC) 69 35 34 Bagalkot (M) 166 82 84 Konnur (TP) S 4 4 Basawana Bagewadi Taluk: 8 4 94
Hukkeri Taluk 108 63 46 Bijapur Taluk 164 69 95 Hukkeri (TP)" 21 13 8 Bijapur City (M) • 146 58 88 Sankeshwar (TP) 29 13 16 Bilgi Taluk 1
Khanapur Taluk 2,855 1,373 1,482 Hungund Taluk 35 18 17 Khanapur (TP) 456 235 221 Hungund (TP) 6 3 3 Landa (P) . 346 176 170 Indi Taluk 1
Paras gad Taluk 3 20 12 Indi (TP) 1 1 Saundathi-Yellamma eM) 11 6 5 Jamkhandi Taluk 79 41 38
Raibag Taluk 87 46 41 lamk.handi (M) 70 38 12 Kudachi (TP) 5 3 2 Rabkavi Banhatti (M) 4 2 12

191 C·V PART B(il)-SPEAKERS OF LANGUAGES/MOTHER.TONGUES (INCLUSIVE OF MOTHER. TONGUES WHERE GROUPED) OTHER THAN THOSE SPECIFIED IN SCHEDULE VIII TO THE
CONSTI11JTION OF INDIA FOR DISTRICTS/TALUKSjANU CITYjTOWNS-Contd.
Sl. S!. No. District/TalukfCI ty fTown Persons Males Females No. DistrictfTalukfCity/Town Persons Males Female'
2 3 4 5 1 2 3 4 5
lCONKANI-Contd. KONXANl-contd.
Muddebihal Taluk • 29 18 11 8 CooRO DISTRICT 5,904 2,962 2,942 Muddebihal (TP) • 2 2 Mercara Taluk 1,236 620 616 Talikot (TP) 26 15 11 Mercara (M) 823 394 428
Mudhol Taluk 11 3 86 Somvarpet Taluk 2,230 1,163 1,067 Mabalingapur (M) 2 2 Kodlipet M) 16 9 7 Mudhol (M)' 9 3 6 Kushalnagar (M) . 60 34 26
Sindgi Taluk • 5 4 Sanivarasan The 56 28 28 Sindgi (TP) • 4 1 3 Somvarpet (M) 140 82 58
6 CUIIC:MAOALUR DISTRICT 15,865 8,2701 7,595 Suntikoppa (M) 96 44 52 Chikmagalur Taluk 4,105 2,153 1,952 Uluguli (P) . 97 51 46 Chikmagalur (M) 2,246 1,131 1,115 Virajpet Taluk 2,438 1,179 1,259
Kadur Taluk 447 184 263 Gonikoppal (M) . 91 40 51 Birur(M) . 25 14 11 Ponnampet (M) 101 46 545 Kadur (M) • 157 75 82 Virajpet (M) 663 318 345
Koppa Taluk 3,393 1,751 1,642 9 DHARWAR DISTRCIT 12,910 6,706 6,204
Koppa (M) • 502 251 251 Byadgi Taluk 140 61 79 Mudigere Taluk 5,401 2,890 2,511 Byadgi (M). 76 33 43 Mudigere (M) 404 207 197 Dharwar Taluk 716 366 350 Narasimharaia pura Taluk 1,606 817 789 Alnavar (TP) 659 338 321 Narasimharajapura (M) 87 42 45 Gadag Taluk 704 368 336
Sringeri Taluk " 541 264 277 Gadag Betgeri (M) 628 321 307 Sringeri (M)' 265 134 131 Hangal Taluk 424 217 207
Tarikere Taluk 372 211 161 Hangal (TP) 90 42 48 Ajjampura (M) 52 30 22 Haveri Taluk. 319 156 163 Tarikere (M) 84 56 28 Haveri (M) 153 78 75
7 OuTRADUROA DISTRICT • 2,031 1,077 994 Hirekerur Taluk 420 215 205 Challakere Taluk . 14 2 12 Hubli Taluk . 8,641 4,501 4,140 Nayakanhatti (M) 12 12 Hubli Dharwar City (C) 8,592 4,479 4,113
Chitradurga Taluk 112 67 45 Kalghatgi Taluk 320 151 169 Chitradurga (M) . 88 53 35 Kundagol Taluk 99 54 45 Turuvanur (M) Kundagol (M) 50 24 26
Davanagere Taluk . 1,284 686 598 Mundargi Taluk 35 15 20 Davanagere City (M) 1,177 623 554 Nargund Taluk 21 14 7
Mayakonda (M) . 4 3 Nargund (M) 21 14 7
Harihar Taluk 270 135 135 Navalgund Taluk 136 80 56
Harihar (M) 190 Annigeri (TP) 93 51 42
108 82 Navalgund (M) 13 9 4 Hiriyur Taluk 22 14 8 Ranibennur Taluk 155 87 68 Hiriyur (M) 15 10 5 Ranibennur (M) . 125 64 61
Holalkere Taluk 113 66 47 Ron Taluk 187 97 90 Holalkere (M) 31 17 14 Gajendragad (TP) . 55 22 33
Hosdurga Taluk 160 89 71 Naregal (TP). 7 2 5
Hosdurga (M) 26 16 10 Ron (TP) 27 20 7
Jagalur Talule 50 15 Savanur Taluk 142 78 64 35
Jagalur (M). 8 4 Savanur (M). 117 66 51
4 Shiggaon Taluk 254 Molakalmuru Taluk
132 122 6 3 3 Shiggaon (TP) 254 132 122
Molakalmuru (M) 6 3 3 Shirahatti Taluk 197 114 83

198
C-V PART B{ii)-SPF,AK£RS Of LANGUAGES/MOTHER.TONGUES (INCLUSIVE OF MOTHER. TONGUES WHERE G!:~OlJP£D) O"iHER 'fHAN THOSE SPEC!}<'!ED IN SCHEDULE YIn TO THE
CONSTITUnON Oli' lll-lD;!!, 1'0]1 DISTRICTS/TALUKSjAND CITYjTOWNS-Contd.
SI. p,> Si. Fe-No. District /Taluk/Ci ty IT own Persc i,,, ]\iaL:i; maks NO. JistrictjTalak/City/Town Persons Males male'
2 3 4 5 Z 3 4 5 --_. __ .- --._-
KDNK/\NI-Colltd. KONKANI-Contd.
Lakshmeshwar (M) 108 56 52 Chintamani (M) 14 8 6 Shirahatti (M) 18 11 7 Gauribidanur Taluk 12 8 4
10 GULBARGA DISTRICT 311 175 136 Gauribidanur (M) 11 7 4 Afzalpur Taluk 1 1 Manchcnahalli (M) 1 Chitapur Taluk 113 62 51 Kolar Taluk , 60 31 29 Shahabad (M) 9 3 6 Kolar (M) . 54 26 28
Shahabad A.C.C. Notified area 74 41 33 Malur Taluk . 13 7 6 (NAC).
Wadi A.e.e. Notified area 15 8 7 Malur (M) 10 4 6 (N.A.c.) Mulbagal Taluk 1 Gulbarga Taluk 184 105 79 Mulbagal (M) 1 Gulbarga City (M) IliO L04 76 Sidlaghatta Taluk 11 5 6 Shorapur Taluk 4 2 2 Sidlaghatta (M) 5 2 3 Shorapur (M) 1 Srinivaspur Taluk 5 4
Yadgir Taluk 9 5 4 Srinivaspur (M) 5 4 1
Gurmatkal (M) 4 2 2 13 MANDYA DISTRICT 34 262 272 Yadgir (M) 5 3 2 Krishnarajpet Taluk 18 7
11 HassAN DISTRICT 3,825 1,957 1,868 Ktishnarajpet (M) 10 6 4 Alur Taluk 309 175 134 Maddur Taluk 55 40 15 Alur (M) 7 2 5 Maddur (M) 8 7 1 Arkalgud Taluk 82 53 29 Malavalli Taluk 57 31 26
Arkalgud (M) 12 6 6 Malavalli (M) 43 24 19 Konanur (M) 23 17 6 Mandya Taluk 285 110 175
Arsikere Taluk 251 154 97 Mandya (M) 260 110 150 Arikere (M) 89 33 56 Nagamangala Taluk 20 11 9
Banavar (M) 25 14 11 Bellur (M) 11 5 6 Belur Taluk . I,03\) 52\) 510 Nagamangala (M) 4 2 2 Belur (M) 8') 47 42 Pandavapura Taluk 33 17 16
Cnannarayar a' na Taluk 28 IS 13 Melkote (M) 1 Channarayapatna (M) ':J 5 4 Pandavapura (M) , 20 11 9
Sravanabelagola (M) 6 2 4 Srirangapatna Taluk 59 35 24
Hassan Taluk 521 259 262 Srirangapatna (M) 24 13 11
Hassan (M) 443 227 216 14 MYSORE DlSTRICT 2901 1,445 1,456 Holenarasipur Taluk 50 11 39 Chamarajanagar Taluk 121 63 58
Holenarasipur (M) 15 ':) 6 Chamarajanagar (M) 71 37 34 ManJarabad Taluk. 1,545 [61 784 GUlldlupet Taluk 57 42 15
Sakleshpur (M) 282 J21 161 Gundlupet (M) 34 23 11
13 KOLAR DIstRICT 283 114 169 Heggadadevanakote Taluk 99 44 55 BagepalJi Taluk 11 4 7 Heggadadevanakote (M) 7 4 3 BagepaIli (M) 11 4 7 Sargur(M) • 1 1
Bangarpet Taluk 110 28 82 Hunsur Taluk 50 19 31 Bangarpet (M) Hunsur (M) 42 16 26
K.G.F. Urban Agglomeration 109 27 82 Kollegal Taluk 91 39 52 (a) Kolar Gold Fields (M) 81 13 68 Kollegal (TP) 65 28 37 (b) Robertsonpet (M) 28 14 14 Krishnarajanagar Taluk 82 45 37
ChikbaUapur Taluk 46 18 28 Krishnarajanagar (M) 50 26 24 Chikballapur (M) 46 18 28 Mysore Taluk 2,240 1,115 1,125
Chintamani Taluk . 14 8 6 Mysore City (M) . 2,221 1,104 1,117
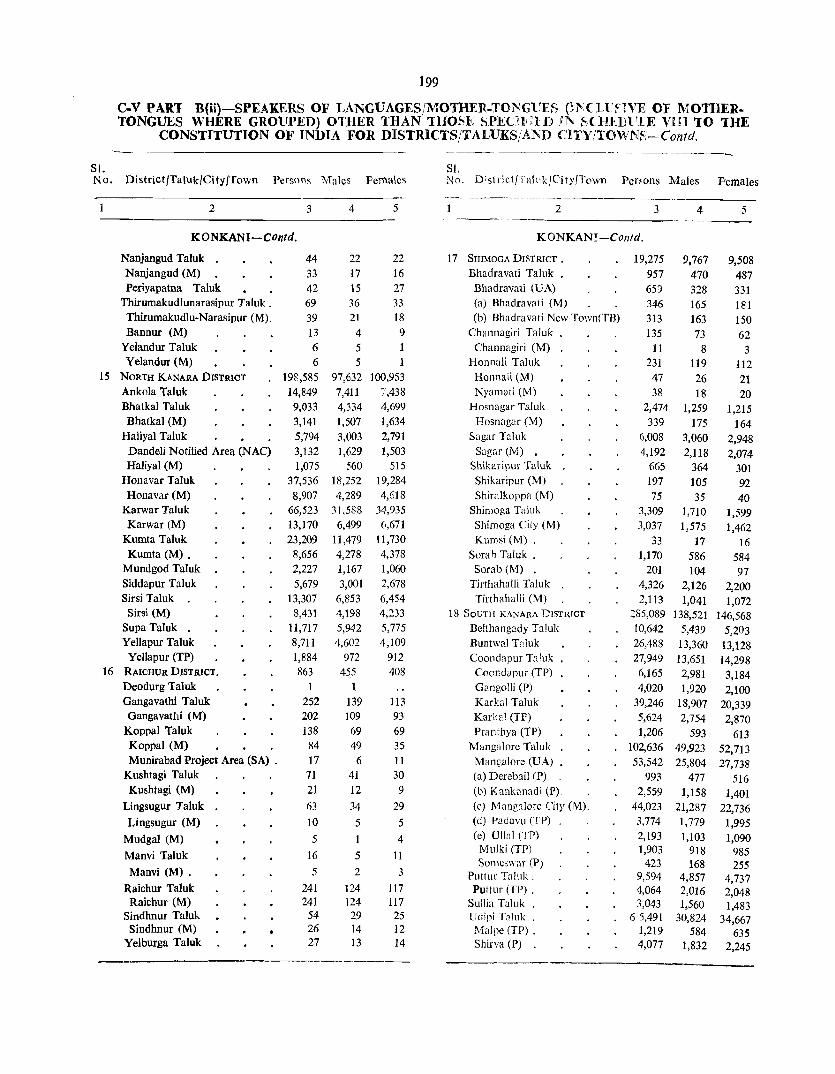
199
C.V PARI B{iik-SPEAKERS OF LANGUAGES/MOTHER.TONGlTS (Jl\CIl.'fTVE OF MOTHER. TONGUES WH RE GROUPED) OTHER THAN 'IHOSE SPEOb'lD rl', SC}IJ_UrIE VIU 'IO 'IHE
CONSTITUTION OF INDIA FOR DISTRICTS/TALUKS/AND CITY/TOWNS-Contd.
SI. SI. No. District/Taluk/City/Town Pers()n~ Males Females No. D; stri ct/Tall.;k lei ty IT own Pcrwns Males Females
2 3 4 5 2 3 4 5
KONKANI-Contd. K ONKANI -Contd.
Nanjangud Taluk 44 22 22 17 SHIMOGA DISTRICT. 19,275 9,767 9,508 Nanjangud (M) 33 17 16 Bhadravati Taluk • 957 470 487 Periyapatna Taluk 42 15 27 Bhadravati (UA) 65) 328 331
Thirumakudlunarasipur Taluk . 69 36 33 (a) Bhadravati (M) 346 165 181 Thirumakudlu-Narasipur (M). 39 21 18 (b) Bhadravati New Town(TB) 313 163 150 Bannur (M) 13 4 9 Channagiri Taluk . 135 73 62
Yelandur Taluk 6 5 1 Channagiri (M) 11 8 3 Yelandur (M) 6 5 1 HonnaH Taluk 231 119 112
15 NORTH KANARA DISTRIOT 198,585 97,632 100,953 Honnali (M) 47 26 21 Ankola Taluk 14,849 7,411 7,438 Nyamati (M) 38 18 20 Bhatkal Taluk 9,033 4,334 4,699 Hosnagar Taluk 2,474 1,259 1,215 Bhatkal (M) 3,141 1,507 1,634 Hosnagar (M) 339 175 164
Haliyal Taluk 5,794 3,003 2,791 Sagar Taluk 6,008 3,060 2,948 Dandeli Notified Area (NAC) 3,132 1,629 1,503 Sagar (M) 4,192 2,118 2,074 Haliyal (M) 1,075 560 515 Shikaripur Taluk 665 364 301
Honavar Taluk 37,536 ]8,252 19,284 Shikaripur (M) 197 105 92 Honavar (M) 8,907 4,289 4,618 Shiralkoppa (M) 75 35 40
Karwar Taluk 66,523 31,588 34,935 Shimoga Tnluk 3,309 1,710 1,599 Karwar (M) 13,170 6,499 6,671 Shimoga City (M) 3,037 1,575 1,462
Kumta Taluk 23,209 11,479 11,730 Kumsi (M) . 33 17 16 Kumta (M) • 8,656 4,278 4,378 Sorab Taiuk . 1,170 586 584
Mundgod Taluk 2,227 1,167 1,060 Sarab (M) 201 104 97 Siddapur Taluk 5,679 3,001 2,678 Tirthahalli Taluk 4,326 2,126 2,200 Sirsi Taluk 13,307 6,853 6,454 Tirthahalli (M) 2,113 1,041 1,072
Sirsi (M) 8,431 4,198 4,233 18 SOUTH KANARA DISTRICT 285,089 138,521 146,568 Supa Taluk 11,717 5,942 5,775 Belthangady Taluk JO,642 5,439 5,203 Yellapur Taluk 8,711 4,602 4,109 Buntwal T"luk 26,488 13,360 13,128
Yellapur (TP) 1,884 972 912 Coondapur Taluk 27,949 13,651 14,298 16 RAICHUR DISTRICT. 863 455 408 Coondapur (TP) 6,165 2,981 3,184
Deodurg Taluk 1 1 GEngolli (P) 4,020 1,920 2,100 Gangavathi Taluk 252 139 113 Karka! Taluk 39,246 18,907 20,339 Gangavathi (M) 202 109 93 Kark"l (TP) 5,624 2,754 2,870
Koppal Taluk 138 69 69 Pranthya (TP) 1,206 593 613 Koppal (M) 84 49 35 Mangalore TaJuk 102,636 49,923 52,713 Munirabad Project Area (SA) . 17 6 11 MangaJore (UA) • 53,542 25,804 27,738
Kushtagi Taluk 71 41 30 (a) Derebail (P) 993 477 516 Kushtagi (M) 21 12 9 (b) Kankanadi (P). 2,559 1,158 1,401
Lingsugur Taluk 63 34 29 (r) MangRlore City (M). 44,023 21,287 22,736 Lingsugur (M) 10 5 5 (d) Padavu (TP) 3,774 1,779 1,995
Mudgal (M) 5 1 4 (e) Ullal (TP) 2,193 1,103 1,090
Manvi Taluk 16 5 11 Mulki (TP) 1,903 918 985 Somes\var (P) 423 168 255
Manvi (M) . 5 2 3 Puttur Ta!:lk . 9,594 4,857 4,737 Raichur Taluk 241 124 117 Puttur (Tr) . 4,064 2,016 2,048 Raichur (M) 241 124 117 SulJia Talilk . 3,043 1,560 1,483
Sindhnur Taluk 54 29 25 Udipi TOllnk . 65,491 30,824 34,667 Sindhnur (M) 26 14 12 MaJpe (TP) . 1,219 584 635
Yelburga Taluk 27 13 14 Shirva (P) 4,077 1,832 2,245
------

200
C-V PART B(ii)-SPEAKERS OF LANGUAGES/MOTHER.TONGUES (INCLUSIVE OF MOTHER-TONGUES WHERE GROUPED) OTHER THAN THOSE SPECIFIED IN SCHEDULE VIII TO THE·
CONSTITUTION OF INDIA FOR DISTRICTS/TALUKS/AND CITY/TOWNS-Contd.
sl. Di; tricl/Talut/City/Town Persons Males remales Sl. DistrictITaIulc/City/Town Persons Males Females No. No.
2 3 4 5 2 3 4 S
KONKANI (Cone/d.) LOTHA-Conld.
Shivalli (P) 3.331 1,618 1,719 3 DHARWAR DISTRICT 1 1 Tonse west (P) 1,026 418 608 Hubli Taluk • 1 Udipi (M) 6,910 3,333 3,577 Hubli Dharwar City (C) 1 Udayavar (P) 1,975 925 1,050
LUSHAljMIZO 19 TUMKUR DISTRiCT 390 219 171
Chiknayakanahalli Taluk 19 10 9 BANOLORE DISTRICT 23 18 5 Chiknayakanahalli (M) 4 4 Bangalore North Taluk 23 18 5 Gubbi Taluk . 37 18 19 Bangalore City (c)* and Trust 23 18 5
Gubbi (M) . 10 5 5 Board. Area
Koratagere Taluk 3 3 2 BELOAUM DISTRICT 5 2 3
Koratagere (M) 3 3 Belgum Taluk 5 2 3
Kunigal Taluk 64 34 30 Belgaum (U.A.) • 5 2 3
Kunigal (M). 34 15 19 (a) Belgaum City (M) 5 2 3
Madhurgiri Taluk 5 4 3 BllLLARY DISTRICT 2 2
Madhurgiri (M) 2 2 Bellary Taluk 2 2
Pavagada Taluk 10 7 3 Bellary City (M) . 2 2
Y. N. Hoskote (M) 4 2 2 MANIPURI/MEITHEI
Sira Taluk 31 15 16 Sira (M) 26 13 13 BANOALORE DISTRICT 24 21 3
Tiptur Taluk . 60 34 26 Bangalore North Taluk 24 21 3 Tiptur (M) . 55 29 26 Bangalore City (C)* and Trust 11 11
Tumkur Taluk 155 91 64 Board Area. Tumkur (M) 146 82 64 lalahalli (Excluding H.M.T. Town 8 7 Turuvekere Taluk 6 3 3 Ship) (P)
2 BELOAUM DISTRICT 8 8 KURUKH!ORAON Belgaum Taluk 8 8
1 SOUTH KANARA DISTRICT 3 3 Belgaum (U.A.) 8 8
Mangalore Taluk . 3 3 (a) Belgaum Cantt. (C.B.) 8 8
Mangalore (UA) . 3 3 3 BELLARY DISTRICT . 1 1
(a)Mangalore City (M) . 3 3 Sandur Taluk
4 DHARWAR DISTRICT 16 16 LAHNDA Hubli Taluk • 16 16
BANOALORE DISTRICT 18 II 7 Hubli Dharwar City (C) 16 16
Bangalore North Taluk . 18 11 7 S MYSORE DISTRI .T .
Bangalore city (c)* and Trust- 18 11 7 Mysore Taluk 1 1
Board Area. Mysore City (M) 1 1
2 GULBAROA DISTRICT 3 3 6 SOUTHKANARA DISTRICT . 8 5 3 Chitapur Taluk 3 3 Mangalore Taluk . 8 5 3 Wadi ACC Notified Area (NAC) 3 3 Mangalore (UA) . 8 5 3
(a) Mangalore City (M) 8 5 3 LOTHA
'I TUMKUR DISTRICT. 1
BANOA.LORE DISTRICT 3 3 Tumkur Taluk
Bangalore North Taluk 3 3 MUNDARI Bangalore City (C) and Trust 3 3 Board Area BANOALORE DISTRICT 5 3 2
2 BELLARY DISTRICT. 3 3 Bangalore North Taluk 5 3 2 Bellary Taluk 3 3 Bangalore City (C)* and Trust 1 1 Bellary City (M) . 3 3 Board Area.
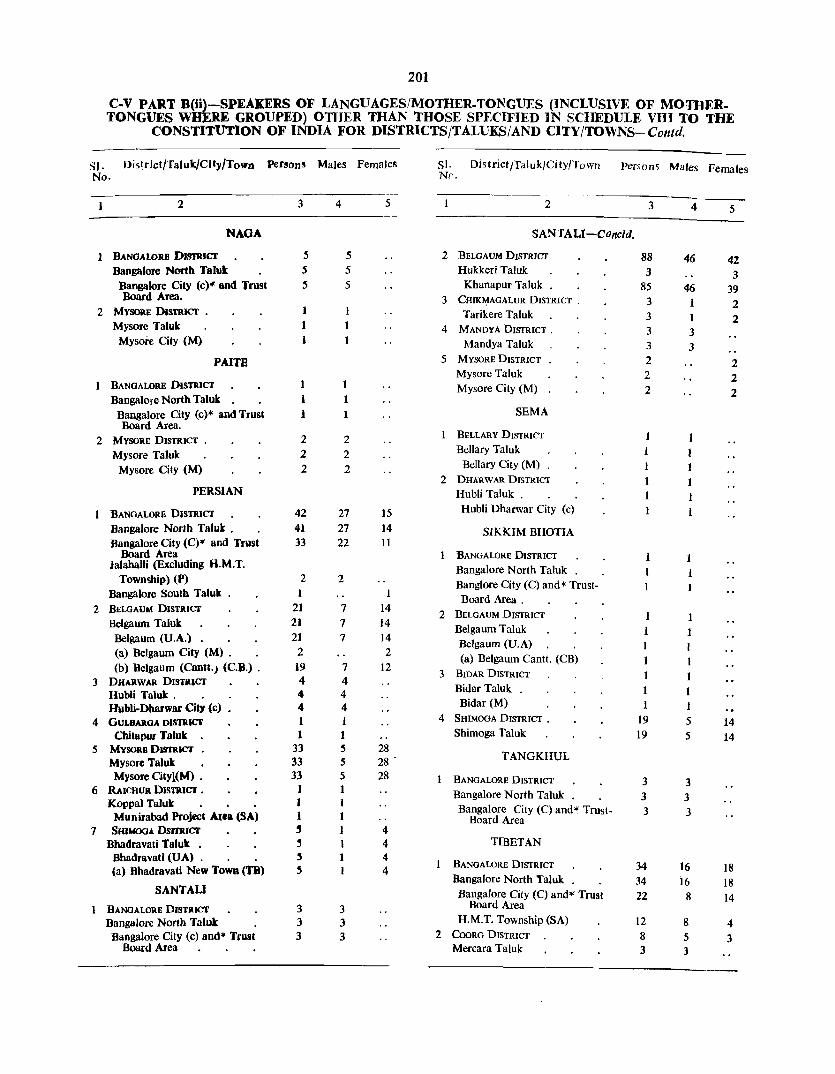
201
C.V JlART B(U)-SPEAKERS OF LANGUAGES/MOTHER.TONGUES (INCLUSIVE OF MOTlJER. TONGUES WHERE GROUPED) OTHER THAN THOSE SPECIFIED IN SCHEDULE VIII TO THE
CONSTITUTION OF INDIA FOR DISTRICTSjTALUKS/AND CITY/TOWNS-Contd.
s,. District/Taluk/Clty/ToIlfD PersonS Males Females Sl. Dis trict /TaJuk/Ci ty/To wn persons Males Females No. Nr.
2 3 4 5 2 3 4 5
NAOA SANTALI-Concld.
BANOAI.ORE DISTRICJ' 5 5 2 BEWAUM DISTRICT 88 46 42 Bangalore North Taluk 5 5 Hukkeri Taluk 3 3
Bangalore City (c)* and Trust 5 5 Khanapur Taluk . 85 46 39 Board Area. 3 CHIKMAGALUR DISTRICT . 3 2
2 MySOIUl DISTRICf . Tarikere Taluk 3 1 2 Mysore Taluk. 1 1 4 MANDYA DISTRICT. 3 3 Mysore City (M) 1 1 Mandya Taluk 3 3
PAITE 5 MVSORE DISTRICT 2 2 Mysore Taluk 2 2
BANOALORE DISTRICf 1 Mysore City (M) 2 2 Bangalore North Taluk 1 1 Bangalore City (c)* and Trust 1 SEMA Board Area.
BELLARY DISTRICT 2 MYSORE DISTRICf . 2 2
Mysore Taluk 2 2 BeUary Taluk
Mysore City (M) 2 2 BeUary City (M) . 1 2 DHARWAR DISTRICT 1 1
PERSIAN HubJi Taluk . 1 1
BANOALORE DISTRICf 42 27 15 HubJi Dharwar City (c) 1
Bangalore North Taluk. . 41 27 14 SIKKIM BHOTIA Bangalore City (C)*' and Trust 33 22 11
Board Area BANGALORE DISTRICT lalabaJli (Excluding H.M.T. Bangalore North Taluk
Township) (P) 2 2 Banglore City (C) and* Trust-Bangalore South Taluk . 1 I Board Area.
2 BEWAUM DISTRICT 21 7 14 2 BELGAUM DISTRICT 1 Belgaum Taluk. 21 7 14 Belgaum Taluk
Belgaum (U.A.) . 21 7 14 1
(a) Belgaum City (M) . 2 2 Belgaum (U.A) 1 I
(b) Belgaum (Cantt.) (C.B.) . 19 7 12 (a) Belgaum Cantt. (CB) 1 1
3 BIDAR DISTRICT 1 3 DHARWAR DISTilICT 4 4
Bidar Taluk . Hubli Taluk. . 4 4 1 1
Hllbli-Dharwar City (c) • 4 4 Bidar (M) 1 4 GULBAROA D1STilICT 1 1 4 SHIMOOA DISTRICT . 19 5 14
Cbitapur Taluk. 1 1 Shimoga Taluk 19 5 14 5 MYSORIl DISTRICT • 33 5 28
TANGKHUL Mysorc Taluk 33 5 28·
Mysore Cityl(M) . 33 5 28 BANGALORE DISTRICT 3 3 6 RAICHUR DISTRICJ' • 1 1 Bangalore North Taluk 3 3 Koppal Taluk. 1 1
Bangalore City (C) and" Trust-Munirabad Project Area (SA) 1 1 3 3
Board Area 7 SHlMOOA DSITilICf , 1 4
Bbadravati Taluk • , 1 4 TIBETAN Bhadravati (UA) . 5 1 4
BANGALORE DISTRICT (a) Bhadravati New Town (TB) , 4 34 16 18
Bangalore North Taluk 34 16 18 SANTALI Bangalore City (C) and*' Trust 22 8 14
BANOALORE DISTilICT 3 3 Board Area
Bangalore North Taluk 3 3 H.M.T. Township (SA) 12 8 4 Bangalore City (c) and* Trust 3 3 2 CooRG DISTRICT 8 5 3
Board Area Mercara Taluk 3 3

202
C·V PART ll(ii)-SPEAKERS OF LANcnAGESjMOTHER.TOl'\Cl'FS (JNCIXSJVF OF lVC,T}-1FP. TONGUES WHERE GROUPED) OTHER THAN THOSE SPECIFIED lN SCHEDlJLE VIII TO 'HIE
CONSTITUTION OF INDIA FOR mSTRICTSITAI,eKSjAND CITYjTOWNS-Contd.
SI. Dhtri t!Taluk/City/Town No.
Persons M~les Fem'1les
2 4 ---_._--_._ -----------
Mercara (M)
TIBETAN- Contd.
3 5 Somvarpet Taluk
Kushalnagar (M) . 3 MYSORE DISTRICT .
Mysore Taluk Mysore City (M) .
Periyapatna Taluk .
4 NORTH KANARA DISTRICT
Mundgod Taluk
TRIPURI
MYSORE DISTRICT •
Mysore Taluk Mysorc City (M) .
TULU
BANGALORE DISTRICT
Anekal Taluk. Anekal (M) .
Sarjapura Bangalore North Taluk . Bangalore City (C) and*" Trust Board Area B. E. L. Township (SA)* H. M. T. Township (SA)* Jalahalli (excluding H.M.T. Township) (P)* Kadugondannhalli (P) . Yelahanka (M) Bangalore Soulh Taluk . H.A.L. Sanitary Board* (excluding H.A.L. Township) (P) H.A.L. Township (S.A.) I.T.1. Notified area (Dura Vani Nagar (N.A.C.) Channapatana Taluk Channapatana (M)
Devanahalli Taluk Devanahalli (M)
Vijayapura (M) Doddaballapur Taluk DoddabaJlapur (M). Hoskote TaJuk
Hoskote (M) Kanakaprra Taluk. Kanakapura (M) Magadi Talu Magadi (M) .
5 4,724
57 57
4,667 4,216 4,216
1
1
5,062 16 12 4
4,554 4,341
34 40 12
3 31
218
53 46
35 57 57 45 20 21
109 108 14 8 5 1
32 32
3 2 2
2,474 16 16
2,458 2,536 2,536
2,988 11 9 2
2,694 2,569
16 24 6
:l 14
119
27 17
19 37 37 24 10 12
59 68 8 5 5
21 21
3 3
2,25 41 41
2,209 1,680 1,680
2,074 5
3 2
1,860 1,772
18 16
6
17 99
26 29
16 20 20 21 10 9
50 50
6
3
11 11
Sl. n'siri t/T:lh:k/Ciiy!Town PdSOSS Males Females No·
2 3
Nelamangala Taluk Nelamangala (M) • Ramanagaram Taluk Ramanagaram (M)
TULU-Contd.
6 1 6
6 2 BELGAUM DISTRICT
Athani Taluk Athani (M)
Belgaum Taluk Belgaum Urban Agglomeration
(a) 13elgaum City (M) . (b) Belgaum Cantt. (C.B.)
Chikodi Taluk Chikodi (T.P.) Nippani (M)
Gokak Taluk Gokak (M)
Gokak Falls (N.A.C.) Mudalgi (T.P.).
Hnkkeri Taluk Hnkkeri (TP) Sankeshwar (TP)
Khanapur Taluk Khanapur (TP) Londa (P) Parasgad Taluk Saundatti-Ycllamna (M)
Raibag Taluk Kudachi (TP)
Ramdurg Taluk Ramdurg (M)
Sampagaon TaJuk . Bailhongal (M)
3 Br:LLARY DISTRICT.
Bellary Taluk B eHary City (M) .
Hadagalli Taluk Harpanahalli Taluk Harpanahalli (TP)
Haspet Taluk Amaravathi (TP) . Hospet (M) Kmnalapur (TP) Kampli (TP)
Kudligi Tnluk Sandur Taluk
4 BIDAR DISTRICT
Basavakalyan Taluk Basavakalyan (M)
954 52 41
611 589 583
6 5 2 3
38 21 9 4
48 1
18 78 43 34 43 24 5 5
62 60 12
8 402 134 127
7 27 27
225 28
158 4
31
4 5
26 13 13
6
4
1 4 4
652 39 31
411 395 391
4 5 2 3
21 13
5 2
32
12 51 28 22 29 16 4 4
52 50 8
5 221
74 69
13 13
130 13 94 3
17
2 2
21 13 13
5
2 2
302 13 10
200 194 192
2
17 8 4 2
16
6 27 15 12 14
8 1 1
10 10
4 3
181 60 58 7
14 14 95 15 64
1 14 2 3 5
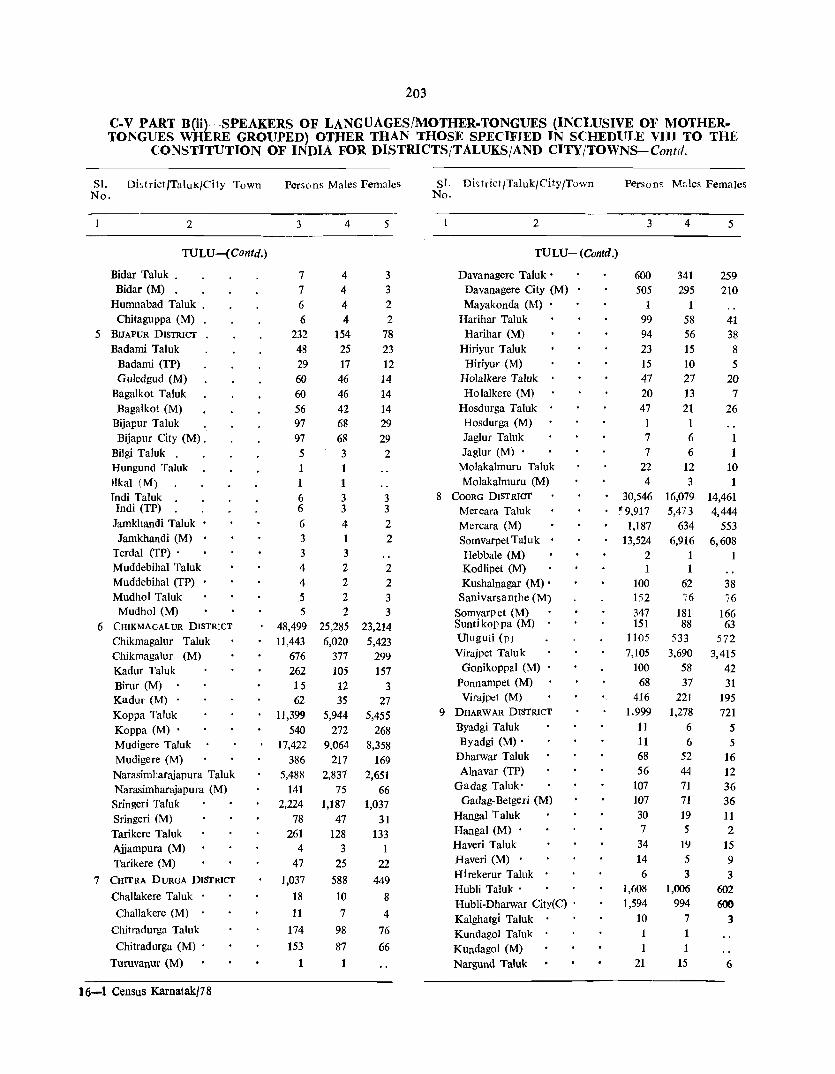
203
C.V PART B(ii)-SPEAKERS OF LANGUAGES/MOTHER.TONGUES (INCLUSIVE OF MOTHER· TONGUES WHERE GROUPED) OTlIER THAN THOSE SPECIFIED IN SCHEDULE VIII TO THE
CONSTITUTION OF INDIA FOR DISTRICTS/TALUKS/AND CITY/TOWNS-Contd.
SI. DistrictJTaluK/City Town Persons Males Females SI. District /Taluk/City /Town Persons Mdes Females No. No.
2 3 4 5 2 3 4 5
TULU-(Contd.) TULU- (Contd.)
Bidar Taluk . 7 4 3 Davanagere Taluk • 600 341 259 Bidar (M) 7 4 3 Davanagere City (M) 505 295 210
Humnabad Taluk . 6 4 2 Mayakonda (M) 1 Chitaguppa (M) 6 4 2 Harihar Taluk 99 58 41
5 BUAPUR DISTRICT 232 154 78 Harihar (M) 94 56 38 Badami Taluk 48 25 23 Hiriyur Taluk 23 15 8
Badami (TP) 29 17 12 Hiriyur (M) 15 10 5 Guledgud (M) 60 46 14 Holalkere Taluk 47 27 20
Bagalkot Taluk 60 46 14 Ho lalkere (M) 20 13 7 Bagalkot (M) 56 42 14 Hosdurga Taluk 47 21 26
Bijapur Taluk 97 68 29 Hosdurga (M) 1 1 Bijapur City (M) . 97 68 29 Jaglur Taluk 7 6 1
Bilgi Taluk 5 3 2 Jaglur (M) • 7 6 Hungund Taluk 1 Molakalmuru Taluk 22 12 10 I1kal (M) 1 Molakalmuru (M) 4 3 1 Indi Taluk 6 3 3 8 COORG DISTRICT 30,546 16,079 14,461 Indi (TP) 6 3 3 Mercara Taluk ' 9,917 5,473 4,444
Jamkhandi Taluk 6 4 2 Mercara (M) 1,187 634 553 Jamkhandi (M) 3 2 Somvarpet Tal u k 13,524 6,916 6,608
Terdal (TP) • 3 3 Hebbale (M) 2 1 1 Muddebihal Taluk 4 2 2 Kodlipet (M) 1 1 Muddebihal (TP) 4 2 2 Kushalnagar (M) • 100 62 38 Mudhol Taluk 5 2 3 Sanivarsanthe (M) 152 76 /6 Mudhol (M) 5 2 3 Somvarp et (M) 347 181 166
6 CHIKMAGALUR DISTRICT 48,499 25,285 23,214 Sunti kop pa (M) 151 88 63 Chikmagalur Taluk 11,443 6,020 5,423 UluguJi (P) 1105 533 572
Chikmagalur (M) 676 377 299 Virajpet Taluk 7,105 3,690 3,415 Kadur Taluk 262 105 157 Gonikoppal (M) 100 58 42 Birur (M) 15 12 3 Ponnampet (M) 68 37 31 Kadur (M) . 62 35 27 Virajpet (M) 416 221 195 Koppa Taluk 11,399 5,944 5,455 9 DHARW AR DISTRICT 1,999 1,278 721 Koppa (M) . 540 272 268 Byadgi Taluk 11 6 5 Mudigere Taluk 17,422 9,064 8,358 Byadgi (M)' 11 6 5 Mudigere (M) 386 217 169 Dharwar Taluk 68 52 16
Narasimharajapura Taluk 5,488 2,837 2,651 Alnavar (TP) 56 44 12 Narasimharajapura (M) 141 75 66 Gadag Taluk' 107 71 36 Sringeri Taluk 2,224 1,187 1,037 Gadag-Betgeri (M) 107 71 36
Sringeri (M) 78 47 31 Hangal Taluk 30 19 11
Tarikere Taluk 261 128 133 Hangal (M) . 7 5 2
Ajjampura (M) 4 3 1 Haveri Taluk 34 19 15
Tarikere (M) 47 25 22 Haveri (M) 14 5 9
7 CHITRA DURGA DISTRICT 1,037 588 449 Hlrekerur Taluk 6 3 3
Challakere Taluk . 18 10 8 Hubli Taluk • 1,608 1,006 602
Challakere (M) Hubli-Dharwar City(C) . 1,594 994 600
11 7 4 Kalghatgi Taluk 10 7 3 Chitradurga Taluk 174 98 76 Kundagol Taluk 1 1 Chitradurga (M) . 153 87 66 Kundagol (M) 1 1
Turuvanur (M) 1 Nargund Taluk 21 15 6
16-1 Census Karnatak/78

204
C.V PART B(ji)-SPEAKERS OF LANGUAGES/MOTHER.TONGUES (INCLUSIVE OF MOlHER. TONGUES WHERE GROUPED) OTHER THAN THOSE SPECIFIED IN SCHEDl.JLE VIII TO THE
CONSTITUTION OF INDIA FOR DISTRICTS/TALUKS!AND CITY/TOWNS-Contd.
SI. Di ,trict!Taluk!City Town Persons Males females SI. Distri ct/Taluk/Ci ty/Town Persons Males females No No
2 3 4 S 2 3 4 5
TULU-(Contd.) TULU-(Contd.)
Nargund (M) 21 15 6 Manjarabad Taluk 9,463 4,994 4,469 Navalgund Taluk 37 28 9 Sakleshpur (M) 385 222 163 Annigeri (TP) 10 8 2 12 KOLAR DISTRICT 420 227 193 Navalgund (M) 27 20 7 Bageppalli Taluk 28 19 9
Ranibennur Taluk . 4 2 2 Bagepalli (M) 28 19 9 Ranibennur (M) . 4 2 2 Bangarpet Taluk 37 25 12
Ron Taluk 21 20 Bangarpet (M) 30 18 12 Gajendragad (TP) • 9 8 K.G.F. Urban Agglomeration 6 6 Nargal (TP) 6 6 (a) Kolar Gold Fields (S8) 2 2 Savanur Taluk 18 11 7 (b) Robertsonpet (M) 4 4 Savanur (M) 18 11 7 Chikl'lallapur Taluk 91 50 41 Shirahatti Taluk 23 IS 5 Chikballapur (M) 70 38 32 Lakshmeshwar (M) 19 16 3 Chintarnani Taluk . 28 17 11 Shirahatti (M) 4 2 2 Chintarnani (M) . 28 17 11
10 GULBARGA DISTRICT 279 154 125 Gauribidanur Taluk 17 14 3 Mzalpur Taluk 10 7 3 Gauribidanur (M) 9 6 3 Aland Taluk • 4 4 Kolar Taluk . 68 37 31 Aland (M) • 4 4 Kolar (M) . 68 37 31
Chincholi Taluk 19 11 8 Malur Taluk 3 2 1 Chincholi (M) 16 8 8 Malur (M) . 3- 2 1
Chitapur Taluk 12 5 7 Mulbagal Taluk 55 21 34 Shahabad ACC Notified Area 5 3 2 Mulbagal (M) 52 18 34 (NAC)
Sidlaghatta Taluk . 86 38 48 Gulbarga Taluk 77 48 29 Sidlaghatta (M) 79 38 41 Gulbarga City (M) 77 48 29 Srinivaspur Taluk . 7 4 3 Jevargi Taluk 2 2 Srinivaspur (M) 4 4 Shorapur Taluk 140 67 73 MANDYA DISTRICT • 863 497 366 13 Shorapur (M) 3 2
Krishnarajpet Taluk 47 23 24 Yadgir Taluk 15 10 5 Krishnarajpet (M) 41 22 19 Yadgir (M)· 15 10 5
Maddur Taluk 128 81 47 11 HASSAN DISTRICT 16,484 8,810 7,674 Maddur (M) 59 36 23 Alur Taluk 1,695 882 813
Malavalli Taluk 441 34 7 Alur (M) 10 6 4 Malavalli (M) 9 5 Arkalgud Taluk 105 60 45 Mandya Taluk 323 178 145 Arkalgud (M) 8 6 2 Mandya (M) 281 147 134 Konanur (M) 19 7 12
Nagamangala Taluk 33 16 17 Arsikere Taluk 140 99 41 Bellur (M) 8 3 5 Arsikere (M) 53 26 27 Nagamangala (M) 2S 13 12 Banavar (M) 7 4 3 Pandavapura Taluk 110 62 48 Belur Taluk • 4,263 2,262 2,001
Melkote (M) 12 5 7 Belur (M) 187 113 74 Pandavapura (M) 36 15 21 Channarayapatna Taluk . 72 41 31
Srlrangapatna Taluk 181 103 78 Channarayapatna (M) 42 24 18 Srirangapatna (M) 118 70 48 Sravanabelagola (M) 24 15 9
MYSORE DIS'I'RIcT 3,586 2,061 1,525 14 Hassan TaIuk 682 441 241
Chamarajanagar Taluk 127 72 Hassan (M) 472 318 154 55
HolenarasiPur Taluk 64 31 33 Charnarajanagar (M) 124 70 54 Holenarasipur (M) 55 26 29 Gundlupet Taluk . 34 17 17

205
C-V PART B(ii)-SPEAKERS OF LANGUAGES/MOTHER-TONGUES (INCLUSIVE OF MOTHER-TONGUES WHERE GROUPED) OTHER THAN THOSE SPECIFIED IN SCHEDULE VI11 TO THE
CONSTITUTION OF INDIA FOR DISTRICTS/TALUKS/AND CITY/TOWNS Contd. --~~
SI. District/Taluk/City/Town Persons Males Bemales SI. DistrictlTaluk/City/Town Persons Males Females
No. No.
2 3 4 5 2 3 4 5
TULU-(Contd.) TULU-( Contd.)
Gundlupet (M) 32 16 16 Kushtagi Taluk 15 13 2
Heggadadevanakote Taluk 23 12 21 Kushtagi (M) 14 12 2
Hunsur Taluk 342 190 152 Lingsugur Taluk 11 7 4
Hllusur (M) 220 118 102 Lingsugur (M) 8 6 2
KoJl egal Taluk 100 55 45 Manvi Taluk 24 14 10
Kollegal (TP)' 82 45 37 Manvi (M) . 24 14 10
Krishnarajanagar Taluk . 139 92 47 Raichur Taluk 46 32 14
Krishnarajanagar (M) 124 79 45 Raichur (M) . 45 31 14
Mysore Taluk 2,323 1,334 989 Sindhnur Taluk 2 2
Mysore City (M) 2,291 316 975 Yelburga Taluk 10 7 3
Nanjangud Taluk 184 98 86 17 SHIMOGA DISTRICT. 9,548 5,014 4,534
Nanjangud (M) 153 80 73 Bhadravati Taluk • 423 234 189
Periyaratna Taluk 86 67 19 Bhadravati (U.A.) 317 179 138
Periyapatna (M) • 29 21 8 (a) Bhadravati (M) 198 113 85
Thirumakudlu-Narasipur Taluk 222 121 101 (b) Bhadravati New Town (TB) 119 66 53
Thirumakudlu-NarasinUl' (M) . 47 24 23 Channagiri Taluk . 38 22 16
Bannur (M) 4 2 2 Channagiri (M) 15 6 9
Yelandur Taluk 6 3 3 Honnali Taluk 35 22 13 Yelandur (M) 6 3 3 HonnaJi (M) 26 18 8
15 NORHHKANARA DISTRICT' 1,316 788 528 Hosanagar Taluk 480 280 200 Ankola Taluk 43 17 26 Hosanagar (M) 46 25 21 Bhatkal Taluk 63 33 30 Sagar Taluk . 427 225 202 Bhatkal (M) . 15 9 6 Sagar (M) 249 129 120 Haliyal Taluk 162 116 46 Shikaripur Taluk 111 67 44 Dandeli Notified Area (N.A.C.) 68 45 23 Shikaripur (M) 49 33 16
Haliyal (M) . 76 61 15 Shiralkoppa (M) 8 5 3 Honavar Taluk 82 51 31 Shimoga Taluk 1,487 807 680 Honavar (M) 31 18 13 Shimoga City (M) 1,238 675 563
Karwar Taluk 170 107 63 Kumsi (M). 2 2 Karwar (M) 160 103 57 Sorab Taluk . 98 68 30
Kumta Taluk' 90 40 50 Sarab (M) 45 35 10 Kumta (M) . 85 38 47 Tirthahalli Taluk 6,449 3,289 3,160
Mundgod Taluk 87 50 37 Tirthahalli (M) 1,208 610 598 Siddapur Taluk 95 57 38 18 SOUTH KANARA DISTRICT. 920,790 439,676 481,114
Sirsi Taluk 329 186 144 Belthangady Taluk 91,123 45,136 45,987 Sirsi (M) 209 124 85 Buntwal Taluk 128,482 63,490 64,992
Sura Taluk 35 29 6 Coondapur Taluk . 1,793 924 869 Yellapur Taluk 160 103 57 Coondapur (TP) 562 291 271 Yellapur (TP) 68 46 22 Gangolli (P) 88 57 31
16 RAICHUR DISTRICT' 325 179 146 Karkal Taluk 136,394 62,249 74,145 Deodurg Taluk 7 4 3 Karkal (TP) . 7,740 3,695 4,045 Deodurg (M) 6 4 2 Pranthya (TP) 2,837 1,370 1,467
Gangavati Taluk 155 62 93 Mangalore Taluk 247,655 118,286 129,369 Gangavati (M) 121 45 76 Mangalore (UA) . 96,004 47,450 48,554
Koppal Taluk 55 38 17 (a) Derebail 0') 6,026 2,925 3,101 Koppal (M) 50 33 17 (b) Kankanadi (P) 5,068 2,463 2,605
Munirabad Project-Area (SA) . 4 4 (c) Mangalure City (M) 71,298 35,333 35,965
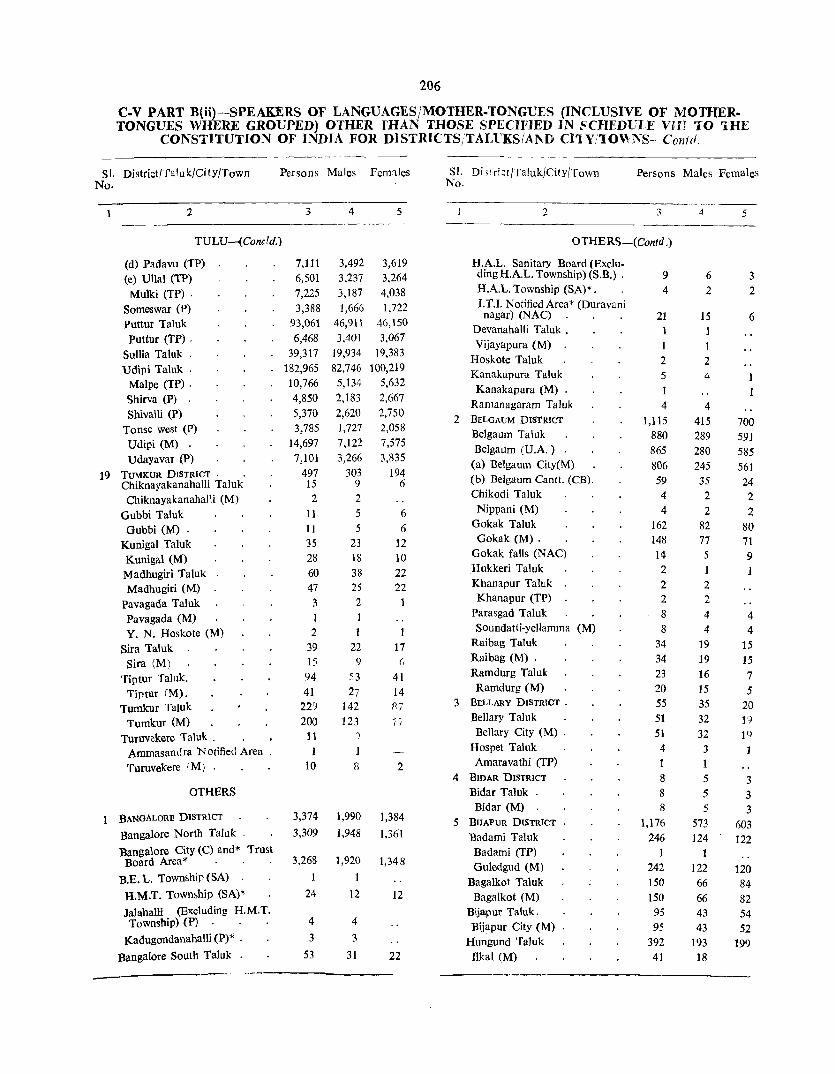
206
C.V PART B(ii)-SPEAKERS OF LANGUAGES/MOTHER.TONGUES (INCLUSIVE OF MOTHER. TONGUES WHERE GROUPED) OTHER fHAN THOSE SPECIFIED IN SCHEDUlE vm TO THE
CONSTITUTION OF INDIA FOR DISTRICTSjTALrKSIAl\D CI1Y/l0Wl\S- Con/d,
S!. District/Talu k/Ci ty/Town Persons Males Femo·tles SL Di) r ri ~t /Taluk/City/Town Persons Males Females No. No.
---- --.---2 3 4 5 2 3 4 5
---_ ------ - -
TULV-(Conc/d.) OTHERS-(Contd .)
(d) Padavu (TP) 7,111 3,492 3,619 H.A.L. Sanitary Board (Exclu-
(e) Ullal (TP) 6,501 3,237 3,264 dingH.A.L. Township) (S.B.) . 9 6 3
Mulki (TP) . 7,225 3,187 4,038 H.A.L. Township (SA)*. 4 2 2
Someswar (P) 3,388 1,666 1,722 I. T.I. Notified Area* (Duravani nagar) (NAC) 21 15 6
puttur Taluk 93,061 46,911 46,150 Devanahalli Taluk . 1
PUttUf (TP) . 6,468 3,401 3,067 Vijayapura (M) 1 1
Sullia Taluk . 39,317 19,934 19,383 Hoskote Taluk 2 2
Udipi Taluk . 182,965 82,746 100,219 Kanakapura Taluk 5 4
Malpe (TP) . 10,766 5,134 5,632 Kanakapura (M) . 1
Shirva (P) 4,850 2,183 2,667 Ramanagaram Taluk 4 4
Shivalli (P) 5,370 2,620 2,750 2 BELGAUM DIS'I'RICT 1,115 415 700
Tonse west (P) 3,785 1,727 2,058 Belgaum Taluk 880 289 591
Udipi (M) 14,697 7,122 7,575 Belgaum (V.A. ) 865 280 585
Udayavar (P) 7,101 3,266 3,835 (a) Belgaum City(M) 806 245 561
19 TUMKUR DISTRICT . 497 303 194 (b) Belgaum Cantt. (CB). 59 ChiknayakanahaJli Taluk 15 9 6 35 24
Chiknayakanahalli (M) 2 2 Chikodi Taluk 4 2 2
Gubbi Taluk 11 5 6 Nippani (M) 4 2 2
Gubbi (M) . 11 5 6 Gokak Taluk 162 82 80
Kunigal Taluk 35 23 12 Gokak (M) . 148 77 71
Kunigal (M) 28 18 10 Gokak falls (NAC) 14 5 9
Madhugiri Taluk 60 38 22 Hukkeri Taluk 2 1
Madhugiri (M) 47 25 22 Khanapur Taluk 2 2
Pavagada Taluk 3 2 1 Khanapur (TP) 2 2
Pavagada (M) Parasgad Taluk 8 4 4
Y. N. Hoskote (M) 2 Soundatti-yellamma (M) 8 4 4
Sira Taluk 39 22 17 Raibag Taluk 34 19 15
Sira (M) 15 9 (, Raibag (M) . 34 19 15
Tiptur Taluk. 94 :;3 41 Ramdurg Taluk 23 16 7
Tiptur (M). 41 27 14 Ramdurg (M) 20 15 5
Tumkur TaJuk 22') 142 117 3 BELLARY DISTRICT . 55 35 20
Tumkur (M) 200 123 77 Bellary Taluk 51 32 19
Turuvekere Taluk . 11 ,) Bellary City (M) . 51 32 je)
Ammasandra Notified Area, 1 Hospet Taluk 4 3
Turuvekere rM) . 10 p, 2 Amaravathi (TP) 1 1 4 BIDAR DISTRICT 8 5 3
OTHERS Bidar Taluk . 8 5 3 Bidar (M) 8 5 3
BANOALORE DISTRICT 3,374 1,990 1,384 5 BUAPUR DISTRICT . 1,176 573 603 Bangaiore North Taluk . 3,309 1,948 1,361 Badami Taluk 246 124 122 Bangalore City (C) and'" Trust
3,268 1,920 Badami (TP) 1
Board Area". . 1,348 Guledgud (M) 242 122 120 B.E. L. Township (SA) 1 1 Bagalkot Taluk 150 66 84
H.M.T. Township (SA)'" 24 12 12 Bagalkot (M) 150 66 82 lalahalli (Excluding H.M.T. Bijapur Taluk. 95 43 54 Township) (P) 4 4 Bijapur City (M) 95 43 52
Kadugondanahalli (P)* . 3 3 Hungund Taluk 392 193 199 Bangalore South Taluk 53 31 22 Ilkal (M) 41 18

207
C-V PART B(ii) -SPEAKERS OF LANGUAGES/MOTHER-TONGUES (INCLUSIVE OF MOTHERTONGUES WHERE GROUPED) OTHER THAN THOSE SPECIFIED IN SCHEDULE VIII TO THE
CO~STITUTION OF INDIA FOR DISTRICTSjTALUKSIAND CITYjTOWNS-Contd.
51· No.
District! raluk/City/Town Persons Males Females
2 3
o fHERS-(Contd.)
Jamkhandi Taluk. . Iamkhandi (M) Rabkavi-Banhatti (M)
6 CHIKMAGALUR DISTRICT •
Mudigere Taluk. Narasimharajapura Taluk
7 CHlTRADURGA DISTRICT .
Davangere Taluk Davangere City (M)
Harihar Taluk Harihar (M)
3 COORG DISTRICT
Somvarpet Taluk Kushalnagar (M) .
Virajpet Taluk Gonikoppal (M) .
Virajpet (M) 9 DHARWAR DISTRICT
Dharwar Taluk Alnavar (TP)
Gadag Taluk Gadag Betgeri (M)
Haveri Taluk. Haveri (M) .
Hubli Taluk . Hubli-Dharwar City (C)
Navalgund Taluk Navalgund (M)
Ranibennur Taluk . Ranibennur (M)
Ron Taluk
Gajendragad (TI')
Savanur Taluk
Savanur (M)
Shiggaon Taluk
Shiggaon (TP)
Shirahatti Taluk
Lakshmeshwar (M)
10 GULBARGA DISTRICT
Aland Taluk .
Aland (M) .
Chitarur Taluk
Chitapur (M)
Shahabad (M)
Shahabad A.C.C. Notified Area (NAC.)
293 113 154
15
14 372 23 3
349 349 20 11 10 9 1
7 18,873
40 40
3,174 3,161
15 l)
14,756 14,756
9
9 96 96
690 685
23 23 27 16
43
43 412
36
36 84 51
32
4
147 56 77
8
8 197 13 3
184 184
7 5 4 2
2 9,623
22 22
1,654 1,647
9 6
7,456 7,456
5 5
51 51
372
371
11 11
19 13
24 24
227
21 21 44 24
20
5
146 57 77 7
6 175 10
165 165
13 6 6 7
5
9,250 16 16
1,520 1,514
6
2 7,300 7,300
4 4
45 45
318 314
12 12 8
3
19 19
185 15 15 40
27
12
S1. No.
Dist,i ;tjTaluklCi Iy/Town
2
OTHERS-( Contd.)
Gulbarga Taluk Gulbarga City (M)
Yadgir Taluk Gurmatkal (M)
11 HASSAN DISTRICT
Arasikere Taluk Arasikere (M)
Belur Taluk . Belur (M)
Channarayapatna Taluk . Channarayapatna (M) Sravanabelaga (M)
Hassan Taluk Hassan (M)
Holenarasipur Taluk 12 KOLAR DISTRICT
Bangarpet Taluk K.G.F. Urban Agglomeratioll
(a) Kolar Gold Fields (SB) (b) Robertsonpet (M)
Kolar Taluk . Kolar (M)
13 MANDYA DISTRICT
Mandya Taluk Pandavapura Taluk
Mclkote (M) Pandavapura (M)
14 MYSORE DISTRICT
Chamarajanagar Taluk Chamarajanagar (M)
Kollegal Taluk Krishnarajanagar Taluk . Krishnarajanagar (M)
Mysore Taluk Mysore City (M)
Nanjangud Taluk . Nanjangud· (M)
Pcriyapatna Taluk . 15 NORTH KANARA DISTRICT
Haliyal Taluk
Dandeli Notified Area (NAC.)
Honavar Taluk
Honavar (M)
Karwar Taluk
Karwar (M).
Kumta Taluk
Kumta (M).
Persons Males Females
3
253 251 39 28 56 10
5 11 3
14 4
10 2
19 18 17 8 2
6
1 1
15 10
5 3 2
256 33 32 2
13 13
165 165
39 39 4
89 20
20 3
3
13
13
6
6
4
136 134 26 20 41
7 2 8
7 1 6
19 16 15 7 1
6
8 6 2
1
130
15 14
7 7
84 84 21 21 2
53 10
10
1
1
10
10 3
3
5
117 l17 13 8
15 3 3 3 3 7 3 4 2
2 2
1
7 4 3 2 1
126 18 18 1 6 6
81 81 18 18 2
36 10
10 2
2
3
3
3
3

208
C.V PART B(ii)-SPEAKERS OF LANGUAGES/MOTHER.TONGUES (INCLUSIVE OF MOTHER .. TONGUES WHERE GROUPED) OTHER THAN THOSE SPECIFIED IN SCHEDULE VIII TO THE
CONSTITUTION OF INDIA FOR DISTRICTS/TALUKSjAND CITY/TOWNS-Contd.
SI. District/TalukfCityfTown Persons Males Females SI. Di ;trict/Taluk/City/Town Persons Males Females No. No.
2 3 4 5 2 3 4 5
OTHERS-( Contd.) OTHERS-(Concld.)
Mundgod Taluk 10 5 5 18 SOUTH KANARA DISTRICT 219 143 76 Supa Taluk . 4 2 2 Belthangady Taluk 1 1 Yellapur Taluk 33 22 11 Buntwal Taluk 73 35 38 Yellapur (TP) 33 22 11 Coondapur Taluk . 39 35 4
16 RAICHUR DISTRICT 938 486 452 Kafkal Taluk 5 4 Gangavati Taluk 5 4 1 Karkal (TP).
Koppal Taluk 901 471 430 Mangalore Taluk 62 38 24 Munirabad Project Area (SA) 8 5 3 Mangalore U. A. 40 22 18
Kushtagi Taluk 20 7 13 (a) Kankanadi (P) 2 2
Raichur Taluk 6 2 4 (b) Mangalore City (M) 38 22 16 Raichur (M) 6 2 4 Mulki (TP) . 1
Sindhnur Taluk 6 2 4 Udipi Taluk . 39 30 9 Sindhnur (M) 6 2 4 Shivalli (P) . 25 25
17 SHlMOGA DISTRICT . 177 81 96 Udipi (M) 3 3 Bhadravati Taluk . 22 10 12 19 TUMKUR DISTRICT . 49 27 22 Bhadravati U.A. . 22 10 12 Chiknayakanahalli Taluk 12 6 6
(a) Bhadravati (M) 3 3 Gubbi Taluk 16 8 8 (b) Bhadravati New Town (TB) 19 10 9 Gubbi (M) . 14 8 6 Channagiri Taluk 143 65 78 Kunigal Truuk 12 7 5 Sagar Taluk . 5 3 2 Kunigal (M) 12 7 5
Sagar (M) 3 2 Sirl;) Taluk 8 6 2 Shikaripur Taluk 6 2 4 Sira (M) 8 6 2
Shikaripur (M) 6 2 4 Tiptur Taluk 1 I Shimoga Taluk 1 1 Tiptur (M) . 1 1

209
C.V PART B(Ii)-SPEAKERS OF LANGUAGES/MOTHER.TONGUES (INCLUSIVE OF MOTHER. TONGUES WHERE GROUPED) OTHER THAN 1HOSE SPECIFIED IN SCHEDULE VIII TO THE
CONSTITUTION OF INDIA FOR DISTRICTSjTALUKSjAND CITYjTO~S-Concld.
SI. District/laluk/City/Tl wn/ No. Urban Agglomeration
2
ANNEXURE
Per- Males Fe- SI. Dl>trict/Taluk/City/Town/ Persons Males Females N li. Urban Agglomeration sons males
3 4 5
BANGALORE URBAN AGGLOMBRATION
ANGAMI
3 3
AO
4 4
ARABlC/ARBI
65 40 25
BODO/BORO
CHINESE/CHINI
78 42 36
COORGI/KODAGU
2,277 1,207 1,070
DOGRI
95 36
ENGLISH
9,571 4,654 4,917
GARO
2 2
GONDI
GORKHA LI/NEPA LI
452 312
KHASI
4 3
KONKANI
140
12,737 6,517 6,120
2 3 4 5
LAHNDA
18 II 7
LOTHA
3 3
WSHAI/MIZO
23 18 5
MANIPURI/MEl1 Hf:J
19 18
MUNDARI
NAGA
5 5
PAlTE
PERSIAN
35 24 II
SANTALI
3 3
SIKKIM BHOTIA
lANGKHUL
3 3
T1BEIAN
34 16 18
TULU
4,564 2,681 1,883
OTHERS
3,334 1,963 1,371

C-VI BILINGUALISM
2It


C-VI BILINGUALlSl\1
This table corresponds to table D-I Part II of the 1951 and C-VI of the 1961 censuses.
The question on bilingualism at the 1971 census was: Question 15: Other Languages.
"Afrer recording the mother-tongue in question 14, enquire whether the person knows any other language(s), Indian Or foreign. and record language(s) returned by him against this question. In case he does not know any language apart from his mother-tongue put 'X' aglamst this question.
The number of languages recorded under this question need not be more than two. These Ianguagei should be other than his mother-tongue and they should be recorded in the order in which he speaks and understands best and can USe with understanding in communicating with others. He need not necessarily be able to read and write these languagos. It is enough if he has a working knowledgo of these subsidiary languages to enable him to converse in that language with understanding".
213
In this table, data on bilingualism are presented only for selected languages j mother-tongues (L j MTs). The selection of these L j MTs has been done on the basis of all India table C-VI-Bilingualism of 1961 and a list of L/MTs was devised for all India. This list formed the basis for preparing the table on bilingualism as estimated from the processing of 10% rural and 20% urban sample slips. The irural table was processed manually and the urban table on the computor. The estimated tables for rural and urban area,<; as pooled are presented here.
Columns 2, 3 and 4 of the table give the total number of speakers of L/ MTs inclusive of MTs grouped under it. Columns 5, 6 and 7 give figures of such of the speakers who returned a second language, that is to say, any other LjMT not accounted for in columns 2, 3 and 4. Column 8 contains in 'run on' fashion the names of subsidiary LjMTs inclusive of L/MTs wherever grouped by number of male and female speakers within brackets.

214
C. VI-BILINGUALISM
LanguagelMothertongue Total Speakers Number also sp~aking a second Columns (6 & 7) classified by second Lanjuage/Mot her Tongue Language/Mother-tongue
P,;:rsons Males Females Persons MaleS Females
2 3 4 S 6 7 8
1. ASSAMESE 320 285 35 207 191 16 B!ngali(M-5), English (M-I04, F-5), l:lindi (M-72, F-IO), Kannada (M-IO, F-!).
2. BENGALI 7056 4,223 2,833 3,100 2,145 955 English (M-1390, Assumese (M-S), F-545), Hindi (M-615, F-309), Ho (M-5), Kannada (M-lIS, F-76), Konkani CF-5), Marathi (M-~, TamiJ (F-15), Telu,u (M-5), Ur u (M-5, F-5).
3. BoDO/BoRO • 5 5 4 4 English (M-3), Kannada (M-I)
·l. COORGI/KoDAOU 70,985 35,354 35,631 56,110 28,770 27,340 English (M-2365, F-1870), Hindi (M-145, F-50), Kannada (M-26045. F-25295), Malayalam (M-J 20, F-.50), Marathi (M-5, F-IO), TamiI(M-40, F-W), Telugu (F-S), Tulu (M-50, F-4.5), Urdu(F-5).
5. DIMASA 3 2 Kaunada (F-1).
6. DOORI 204 IS7 47 55 35 20 English (M-2.5), Kannada(M-5).
Hindi (M-5, F-20),
7. ENGLISH 16,931 8,453 8,478 12,437 5,998 6,439 Assam;)se (F-5), Gujarat i (M-22 F-lS), Hindi (M-1592,F.1430), Kannada (M-1696, P-1402), Ka-silmiri (M-S), Konkani (M-21O, FAtS), Malayalam (M-n, F-140) Marathi (M-I07, P-95), Punjab'i (M-lS), Sindhi(M-5, F-15), Tamil (M-1840, F-2470), Tangh kllUi
(F-S), TeJugu (M-135, F-90), Tulu (M-29, F-92), Urdu (M-1l5. F-70). Ot hers (M-B5, F-195).
8. GdNDl 122 56 66 61 S6 5 En.lish (M-3), Hindi(M-53),Kannada (F-5).
'J. GORl<fl\LljNEPALl 1,605 },164 441 723 583 140 English (M-88, F-30), Hindi (M-374, P-75), Kannada (M-94, F-30), Marathi (M-W), Tami] (M-5, F-S), Urdu (M-l2).
10. GUJARATHI . 28,57 J 15,101 13,470 19,827 11 196 8,631 Coorgi/Kodagu (F-S), Dogri (!Vi-S), En&1ish (M-2579, F-145J), Hindi (M-1942, P-J640), Kannada (M_ 5722,P-4629), Konkani(M-lO P-lO) Malayalam (M-S, F-5), MaratI11 (M-605, F-606), Tami1 (M-70 F-lOS), TeluJu (M-50, F-40), Tul~ (M-25, F-35), Urdu (M-168, F-I05) Others(M-15). •
11. HINDI 526,692 175,478 251,214 301 284 165803 135,481 Bengali(IVJ.-55, F-lO), Dogri (M-5) Enslish (1VJ.-14330" F-3855), Gondi (M-JO), Gorkhalt/Nepali (M-25 F-IS), Gujarati (M-150 F-90) , Halaki(P-5), Ho (M-5), 'Kannad~
(M.-138,593, F-118519), Konkani (M-25, F-25) , MalaYalam (M-35 F-16.5)" Marathi (M-4940, F-4771), PunJabl (M-2S0, F-(60), Sindhi (M-15, F-40) , Tamil (M-1265 F-1050), Telugu (M-4739, F-545l)' Tulu(M-220, F-270), Urdu (M-l03}, F.101S), Others (M-SO. F-40). '

L 111gUage /Mother-tongue
12. KANNADA
13. KASHMIRI •
14. Khasi
15. KONKANI •
16. LUSHAI!MIZO
]7. MALAYALAM
18. MANIPURI,IMEITlJI
215
C. VI-BILINGUALISM-Contd.
Total speakers Number also speaking a >ccond Columns (6 & 7) classified by second Language/MO her Tongue Ll nguage/Moihcr-tongue
Persons Males Females Persons Males Females
2 3 4 5 6
19,328,9509,871,500 9,457,450 1,262,430 1,488,650
220
6
91
5
575,111 283,012
22
129 69
4
64
3
292,C99 404 269 208,934
8 10 10
42:;,196 240,197 184,999 235,C41 147,355
5') 53 6 34 30
7 8
77\780 Assamese (M-5),Bengali (M-5,F-IO), Bhi i/Bhilodi (F-S), Bhumij (M-5), CoorgilKodagu (M-165S, F-163SJ, Dimosa (M-5, F-IO), Dogri (M-S), English (M-644,37(', F-191630), Gondi (M-S), Gorkhali/Nepali M-5, F-5) Gujarati(M-295,F-245), Kalab i (M-S), Hindi (M-207460, F-57755), Ho(M-IO,F-5) Khandeshi (M-H), Khas,itM-S, F-5), Konkani (M-12270, F-11150), Kaku (M-S), Kui (M-S), Mal;\yalam (M-4300, r-!j.525), M1nipuri{t11"ithei (F-5), Marathi (M-125,55~, F-95570), Sindhi (M-,(" F~2='), Tami (M-17915, F-2(070), Tangkhul(F-5), Tc!ugu (M-?57,PSCl. F-J2339S), Thado (M-s, F-5), Tripuri (M-5), Tulu (MA6035, F-372 10), Urdu (M-52835, F-22450), Others (M-2995, F-2065).
EngUsh (M-tH, F-5), Hinc i (M-7), Kannada (M-3), Urdu (M-6). English (M-~, F-l).
195, 335 A~s;uncs( (M-S, F-5), CoorgilKodagu (M-lD, F-lO), Dimosa (M-S, F-5), E ngli sh (M-18636, F-1292S), Guja. rat i (M-5, F-IO), Hindi (M-2165, F-!260), Kannada (M-f5070S F-, 133510), Kashmiri (M-JO, F-5), Malayalam (M-225, F-490), Marathi (M-8905, F-1506S), Tami (M-160, F-22S), Tclugu (M-50, F-lS), Tulu (M-27760, F-31045), Urdu (M-22=" F-165), Others (M-6S, F-60e).
.. English (M-5), Hindi(M-5).
87,686 Be ng:!1 i (M- J(l, F-5), tJhil!Bh;loc':j (M-5), "BishnupurYa (M-5), Coorgi/Koclagu I M-170, F-7S), Dimosa (M-S), English (M-2217(1, F-I0019) Hindi (M-i!600, F-1014, Kannada (M-7425,":, F-:l5058), Konkani 1M-lOS, F-13(5) Marahig (M-70 F-30) Punjab, (M-lD), Sindh i IM-S), Tamil 1M-9030, F-4875), Te ugu (M-325, F-185), Thado (F-5), Tulu (M-33330, F-34120), Urdu (tvL-2740 F-67<'), Others (M-520, F-:?35).
4 English (M3), Hindi (M-7), Kannada, (M-20, F-4)
19. MARATHI • • 1,187,133 605,043 582,090 480,230 269,575 210,655 Bengali (F-5), English (M-24670, P·9400) Gujarati (M-195, F-140) Hindi IM-30035, F-1114S). Ho IM.IO, F-S), Kannada (M-200195, F-173630), Kashmiri (F-S), Konkani (M-905, F-J440), Malayalam (M.20 P-23S), Mikir (M-S), Punjabi (M-tO' F-S), Sindl. i (p_l r). T;'m;J (M-110S: F-J375),Tc!ugu (M-~C/f", F-:295) Tulll (M-6945, P-6R15), Urdu (M-1340, F-IO(iS), Other5 (M·IOO, F-85),

216
C. VI-BILlNGUALlSM-Contd.
Language/Mother"tongue Numberalsospelking a Column'O ( 6& 7) classified by ~econd Total speakers second Llnguagt!Mothert ongue Language/Mother.tongue
Persons Males Females Persons Males Females
2 3 4 5 (; 7 8 ----
20. MUNDARl • 5 3 2 3 3 Hindi (M-2). Kannada (M-l).
21. ORIYA 1,798 1.041 757 430 360 70 Bengali (M-5),Engllsh (M-175, F-lO), Hindi(M-90, F-34), Kannada (M-SO, P-26), Tamil (M-5). Telugu CM-5).
22. PUNJABl 7,027 ,t,628 2,399 5,779 Ik~L::() i ,759 English(M-2005, F-687), Gujarat i(F-5), Hindi(M-1605, F-820), Kanuada (M-340, F-167), Kashmiri (M-S), Kon-kani (F-5), Marathi (M-5. F-S), Tamil (M.-25, F-35), Tulugu (P-S), Urdu (M-35, F-30).
23. SAN TALI 99 53 46 35 33 2 Enlgish (M-n. Hindi (M-I, F-2), Kannada (M-2I) Marathi (M-IO]).
24. SINDlH 9,651 4,825 4,826 6,749 3,564 3,185 English (M-1683, F-lO! 5), Gujarathi (M-25,F-90), Hindi (M-943, F-ll JO), K.annada tM-753, F-68(), Malayal2m (F-S), Marathi (M-90, F-210)' Punjabi(F-I0), T amiJ(M-20, F-30): Telugu (M-JO). Urdu (M-40, F-30),Othcr s (F-5).
25. TAMIL 990,409 517.597 472,812 50! ,455 282,0: 8 2 J 9,427 Bengali (M-JO, P-2S), Bodo /Boro (M-5), CoorgifKoda~u (M-5, F-1O), English (M.-59244, F-3828(), Gadaba (M-5), Gondi (M-S), Gujarat i (M-lO, F-15), Hindi (M-681O F-2820), Ho (M-5), Kannada (M: 188713, F-l50350), Konkani (M-JO, F-245), Malayalam (M-lOSO F-1315) Marathi (M-365 ,F-910): Sindhi (M-IO, F-S), Tangkhul (M-IO) Telugu (M-21815, F-2I777) Thad~ (M-5, F-5), Tulu (M-541, 'P-665), Urdu (M-2275, P-1810), OtlHrc
3 3 3 (M-126J, F-1195). "
26. TAAOKHUL 3 English (M-l), Hindi(M-l),Kannada (M-1).
27. TELUGU 2,397,557 1,225,581 1,171,976 1,201,185 677,185 524,000 B~ngal.i (F-lO), Bodo/Boro (F-5), Coorgl!Kodagu (F-5), EngliSh (M-31675, F-15120), Gujarati (F-lD) Hindi (M-4975, F-2015), Jatapu (M-S, F-S), Kannada (M-613, 715 F-43S,075), Kashmiri (M-S), Kon: Kani (M-l50, F-2S), Malayalam (M-120, F-470), Marathi (M-3460 F-2490), Miri/Mishing (F-lO)' Santali (M-lO), Sindhi (M-lO) , Tamil (M-1805S, F-15735), Thad~ (M-5, F-5), Tulll (M-2620, P-260) Urdu (M-23lS, F-I%O), Others' (M-65, F-80(\),
28. TRIPURI .. ICannada (M-l).
29. TULU 1,042,865 504,975 537,890 459,806 255,512 204,294 Assamcsc (M-5),Coorgi/Kodagu (M-] ( 5 F-70) ,English (M-7380, P-4261). Rh.( i (M-nO, F-22S), Kannada (M-243S:~) F-19(718), Konkani (M-20S,F-15:f'. Malayahm (M-2215, P-860),Mar tl i (M-:m, F-235), MirifMis] i g (M-S), Tamil (M-Z60 F-145), Tel, " , (M-30, F-W), Tripuri (M.-5) Urdu (M-70, F-205),Others (M-Po' F-S). '
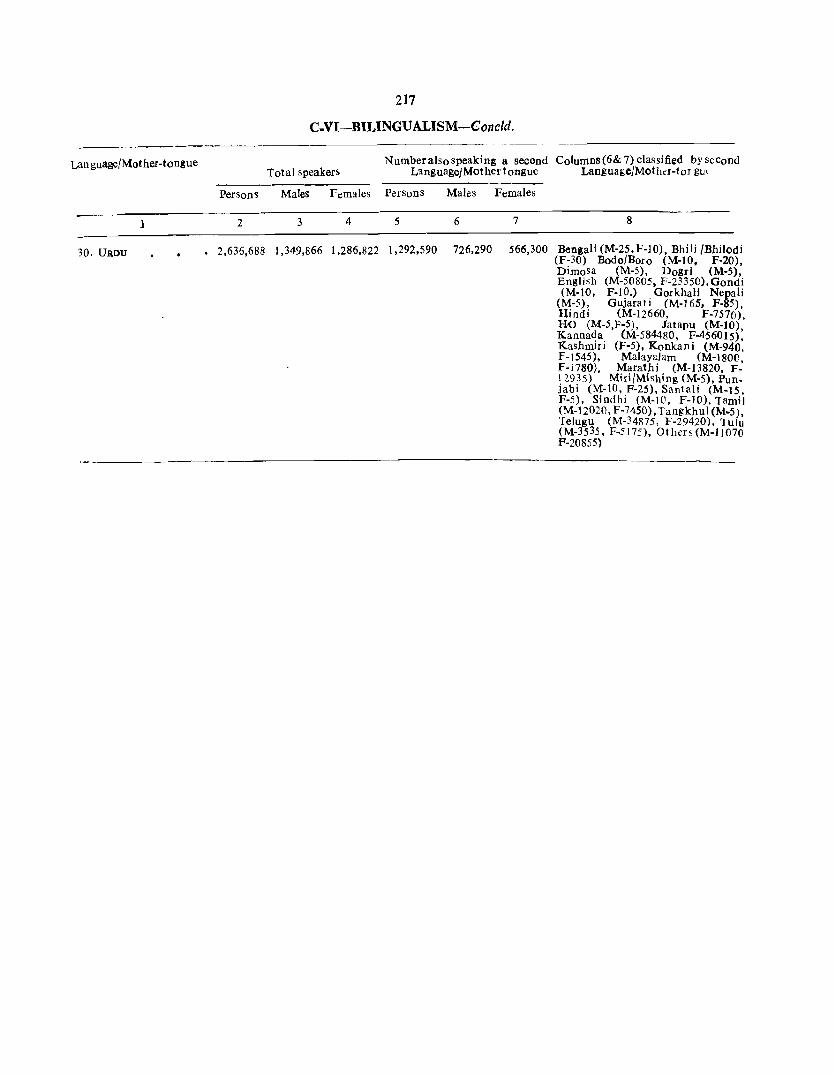
Lan guage/Mother-tongue
1
30. URDU
Persons
2
217
C.VI-BILINGUALISM-Concld.
N umber also speaking a second Columns (6& 7) classified by second Total speakers Language/Mother tongue Langua~eIMothcr-tor gUl
Males Females Persons Males Females
3 4 5 6 7 8
2,636,688 1,349,866 1,286,822 1,292,590 726,290 566,300 Benlali (M-25,F-10), Bhili /Bhilodi (F-30) Bodo/Boro (M-I0, F-20), Dimosa (M-5), Dolri (M-5), English (M-50805, F-23350), Gondi (M-IO, F-IO.) Gorkhall Nepali
(M-5), Gujarat i (M-16S, F-85) Hindi (M-12660, F-7570)', HO (M-S,P-5) , Jatapu (M-I0) Kannadll. (M-584480, F-456015)' Kashmiri (F-5), Konkani (M-940: F-IS45), Malayalam (M-180e F-1780), Marathi (M-13820, F: \ 29?S) Miri/Mishing (M-5), PunJabl (M-IO, F-25), Santali (M-IS F-5), Sindhi (M-IO, F-IO), Tamii (M-12020, F-7450), Tangkhul (M-5), Telugu (M-34875, F-29420), TuJu (M-3535, F-5175:), Others{M-l1070 F-2085S)


F - FERTILITY TABLES
219 17-1 Census Karnatak/78


F-FERTILITY TABLES
The fertility tables are a new feature of 1971 census. There are 5 main tables in this series, namely F -Ito F -V. The data presented in this series will be of immense urility to the planners, demographers and research scholars connected with family welfare progiTammes,.
The compilation of these tables are based on replies furnished against the following questions in the Individual enumeration slips:-
Q.4 Age
Q. 5 Marital Status
Q. 6 For currently married women only (a) Age at Marriage
(b) Any child born in he last one year
Q. 10 Religion
Q. 11 Scheduled Castes !illd Scheduled Tribes
Q. 12 Literacy
Q. 13 Educational level.
Relevant extracts from the Manual InstructioD<; to the Enumerators whicb have bearing on the above questions have already been given in the Introductory note to tbis volume.
For filling up Q. 6(b)-.Any child born in tbe last one year. certain additional instructions were issued to fhe enumerators. The enumerators were asked to ascertain from the currently married women only (i.e. all women whose marital stahIs was recorded as 'M' aQ;ainst Q. 5) whether she had given birth to anv child within a period of one year prior to the date of enumeration. Since it was considered difficult for a respondent to reckon the exact calender year wirh ref~renee to the date of enumeration, the enumerators were instructed that thev might convenientlv ask if a child was born on or after 'Sankranthi' which 'is' a maior festival which fell on 14-1-1970 and was approximateIv a year priOr to the enumeration. This. as in the case of age, was sUl'gested to have a convenient reference point to job one's memory.
It was intended to collect the information on births occurring to currently married women durin!!, the last one year only. But due to obvious limitations on the part of the respondent for re,::a1Iing the date of birth the said festival was however reckoned as a reference point in cases where the respondent was unable to r~call the event properly. Hence statistics presented in these tables may not necessarily pertain to the stipulated one year as required. No adiustments however have been made in the data presented here on this account.
221
The fertility data are based on 10% sample in case of rural areas and 20% sample in case of urban areas. The sample figures were inflated by uniformly multiplying by 10 and 5 for rural and urban areas respectively, to estimate tbe final tables.
A note on the sampling procedure adopted in the 1971 !Census fOT fertility tables has already been given earlier as AppendiX-III.
All the five main tables and two appendices presented in this volume give data for State level only. The cross-classified data on fertility are presented here with reference to Age at marriage, present age, religion. education. and duration of marriage. Similar data for Scheduled Castes and Scheduled Tribes are presented in the appendices to tables F-I and F-ill. The data presented in these tables help in deriving) differentials by religionfeducarion in median age at marriage/duration and in age specific fertility rates, total fertility rate and general fertility rate for various ag~ at marriage groups. A note which precedes each table gjves a brief introduction to the tables presented.
A few statements based on the fertility tables are presented here and salient features therein are briefly highlighted.
Statements 1-4 give age specific marit'al fertility rates fCir present age-groups of the currently married women by religion and literacy. The marital age specific fertility rate means the number of live births in a year to LOOO mfll'ried women in any specified agegroup. The vari(ltioD in age specific rates show how fertility of WI)!'1en \'[lries with age.
The marital fertility rates of women above age 13+' are !!iven ac~ordin!! to the characteristic relizion in statements 1 & 2 for mral and urban areas respectiveIv. The !!:eneral marital fertility rate in rural areas of the state is 170 and that in urban areas is 156. Fertilit" armears to be at its peak in the age-Q:roup of 18-22 and declines thereafter in both rural and urban areas. The dedine in fertility is ranir! from age 27 onwards. The marital fertiHtv raies :Ire found to be appreciably lower in urban areas compared to rural areas in all ages and as wen as in the different age-groups.
The study of fertility pattern by different characteristics throws light on the conditions which influence fertilitv. There may be differenrial fertility rates between different ethniC groups, between rural and mban population. between illiterate and literate Or highly educated and SO on. Pronounced differentials are observed in the fertility levels in the different! religions in both rural and urban areas. The relatively smaller size of women 8nd the related births do not pennit a critical comparison of fertility differentials among:

religious groups viz. Jams. Buddhists and Sikhs. The only clear CU~ differential as brougbt out by these statements is between Muslims and Hindus. The fertility rates are higher than the rates for 'all religions' in case oil Muslims and Christians in rural areas. and Muslims. Buddhists and Jains in urban areas.
The fertility pattern in case of Scheduled Castes generally follows that of the "total". with "urban" areas showing lower order of fertility.
The fertility rate for 'all ages' is hig)ler in rural areas than in urban areas in case of Scheduled Tribes but between the age-groups a varying picture is obtained.
Statements 3 and 4 clearly bring out rhe ruralurban differentials in fertility rates among the illiterates and literates. The marital fertility rates are appreciably lower in urban areas ..
222
Age at marriage assumes a special significance in the study of fertility. for, with the higher age at marriage, the duration or span of the married life decreases. The effective reproductive span of the women consequently decreases which has a definite bearing on the number of births. Statements 5 and 9 indicate the proportion of currently married women in '!aial' religious ~TOUpS, Scheduled Castes and Tribes. These proportions help to ascertain the age at which most of the marriages takes place according different customs and practices in different religions.
Generally. the ages 13 'to 17 appear to be the ages mostly favoured for marriage in case of women. While higher concentration is seen in rural areas in these ages in the urban areas the pattern though similar. the proportions reveal higher age at marriage.
AmOllg the most numerous religious groups namely. Hindus, Muslims and Christians. similar patrern is observed. However among cihristians comparatively higher ~ at marriage is indicated.

223
AGE SPECIFIC MARITAL FERTILITY RATES, MYSORE STATE (RURAL), 1971 CHARACTERISTIC~ RELIGION
All Chris- Scheduled Scheduled Present Age Religions Hindus Muslims tians Sikhs Buddhists Jains Castes Tribes
1 2 3 4 5 6 7 8 9 10
All Ages 170 168 238 186 67 97 167 165 183
13-17 134 130 189 151 0 125 150 138 113
18-22 271 269 294 311 0 111 265 247 293
23-27 265 262 287 355 250 171 284 255 262
28-32 212 209 251 244 0 185 204 218 253
33-37 148 146 168 168 0 167 115 155 179
38-42 81 80 98 96 0 65 99 74 81
43-47 39 37 58 49 0 49 48 52
48+ 16 15 17 18 0 35 88 16 31
Source : F_t Part A and ita Appendix
AGE SPECIFIC MARITAL FERTILITY RATES, MYSORE STATE (URBAN), 1971 CHARACTERISTIC: RELIGION
All Chris- Scheduled Scheduled Present Age Religions Hindus Muslims tians Sikhs Buddhists Jains Castes Tribes
1 2 3 4 5 6 7 8 9 10
All Ages 156 148 182 155 139 192 161 160 173
13_17 130 118 164 203 0 0 99 124 145
18-22 255 247 277 298 214 429 267 241 222
23-27 246 239 267 278 250 333 279 240 271
28-32 181 173 206 196 158 0 191 190 190
33-37 116 108 146 131 105 0 103 129 177
38-42 59 56 75 54 0 0 48 71 94
43-47 25 23 35 15 0 0 43 32 8li
48+ 8 8 10 3 0 0 6 13 13
Sourc. : 1'_ I Part B and It. Appendix
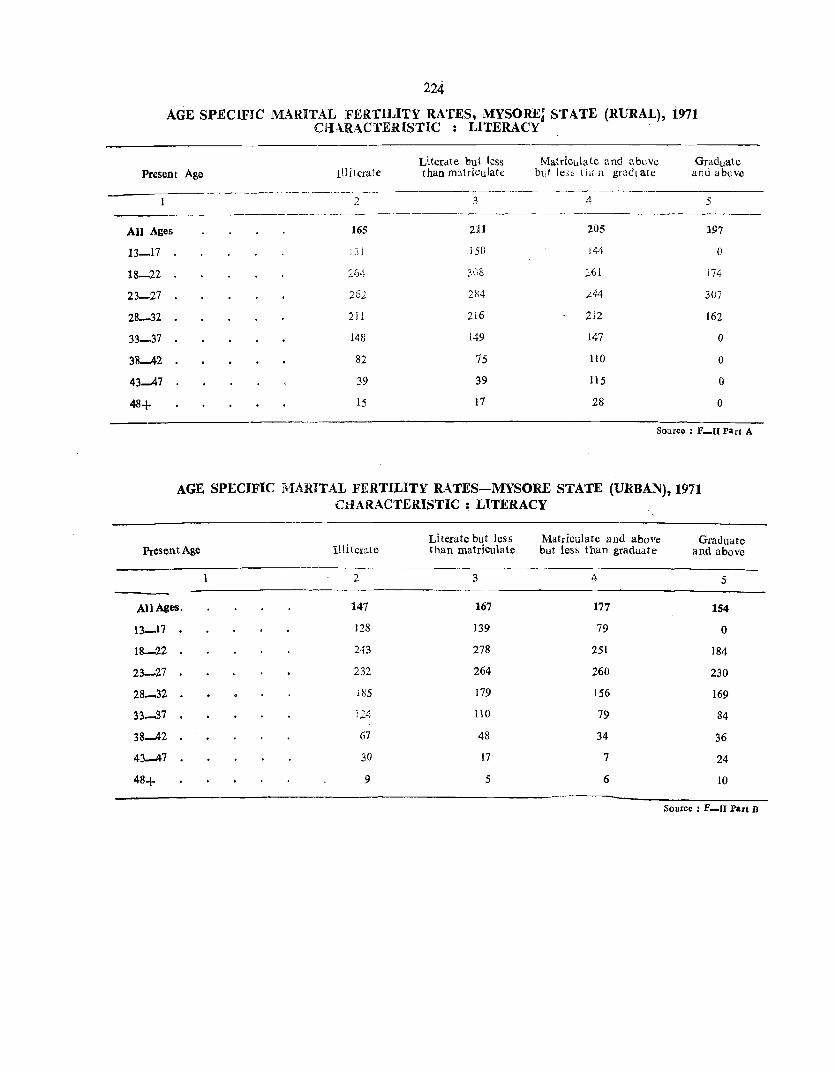
224
AGE SPECIFIC MARITAL FERTILITY RATES. MYSORE~ STATE (RURAL), i971 CHARACTERISTIC : LITERACY .
Present Age
All Ages
13_17
18-22
23-27
28_32
33_37
38--42
43--47
48+
Illil crate
2
165
2il
148
82
39
15
Literate but less than matriculate
3
211
150
308
2114
216
149
75
39
17
Matriculate and above bd les;· t j;, n grad late
4
205
144
:.61
244
212
147
110
115
28
Graduate and above
5
197
0
174
307
162
0
0
0
0
Source: F_II part A
AGE SPECIFIC I\1AlUTAL FERTILITY RATES-MYSORE STATE (URBAN),1971 CHARACTERISTIC: LITERACY
Present Age
All Ages.
13_17
18_22
23-27
28-32
33_37
38......42
43-47
48+
Illi terate
2
147
128
243
232
HI5
J24
67
30
9
Literate but less than matriculate
3
167
139
278
264
179
110
48
17
5
Matriculate and above Graduate but less than graduate and above
4 5
177 154
79 0
251 184
260 230
156 169
79 84
34 36
7 24
6 10
Source: F_1I Part B

225
PERCENTAGE DISTRIBUTION OF CURRENTLY MARRIED WOMEN BY RELIGION AND AGE AT MARRIAGE
MYSORE STATE {RURAL),1971
Age at marriage All Hindus Muslims Chris- Sikhs Buddhists lains Scheduled Scheduled Religions tians Castes Tribes
2 3 4 5 6 7 8 9 10
All Ages 100.00 100.00 100.00 100.00 100.00 100.00 100.00 100.00 100.00
Less than 13. 17.60 17.82 15.37 11.29 46.67 10.43 21.64 19.89 14.06
13_17 . 55.86 55.90 58.32 41.44 26.67 16.55 56.00 55.18 50.34
18_22 • 17.34 17.08 17.48 35.37 13.33 42.81 15.95 15.65 25.30
23-27. 1.10 1.08 0.91 3.13 , 6.67 13.67 0.88 0.72 1.91
28+ 0.82 0.83 0.64 1.15 0 10.43 0.71 0,40 0.68
Unspecified 7.28 7.29 7.28 7.62 6.66 6.11 4.82 8.14 7.71
Source; P_III Put A and ita Appendix
PERCENTAGE DISTRIBUTION OF CURRENTLY MARRIED WOMEN BY RELIGION AND AGE AT MARRIAGE
MYSORE STATE{URBAN),1971
Age at marriage All HindusJ Muslims Chris- Sikhs Buddhists lains Scheduled SCheduled Religions tians Castes 11'ibes
2 3 4 5 6 7 8 9 10
All Ages 100.00 100.00 100.00 100.00 100.00 100.00 100.00 100 eo 100.00
Less than 13. 10.27 1l.35 7.83 3.04 3.96 23.08 7.18 15.63 14.41
13-17 • 50.19 49.88 54.13 34.86 40.60 38.46 52.94 50.85 54.02
18-22 • 25.65 25.14 24.65 39.88 37.62 23.08 28.50 19.~ 19.14
23-27 • 2.48 2,43 1.51 8.48 5.94 3,84 2.47 1.23 1.76
28+ 0.71 0.66 0.56 2.54 1.98 0.42 0.51 0.55
Unspecified 10.70 10.54 11 .32 1l.20 9.90 11.54 8.49 12,14 10 12 5'-<
Souroe : F-IU part B alld its Appendix


F-I DISTRIBUTION OF CURRENTLY MARRIED WOMEN AND THE RELATED BIRTHS DURING TH E LAST YEAR BY RELIGION, PRESENT AGE
AND AGE AT MARRIAGE (RURAL/URBAN)
227


F-l DISTRIBUTIONS OF CURRENTLY MARRIED WOMEN AND THE RELATED BIRTHS DURING THE LAST YEAR BY RELIGION, PRESENT AGE AND AGE AT
MARRIAGE (RURAL/URBAN) i
This table is presented in two parts viz. Part A relating to rural areas and Part B relating to urban areas. The distribution of the currently married women and their related births during the last one year cross classified by religion. age and ag~ at marriage of the mother is provided in the table. An appendix is also provided for the table presenting similar data separately for Scheduled Castes and Scheduled Tribes only.
The 'age at marriage' is classified into 6 groups viz. less than 13. 13-17.. 18-22. 23-27. 28+ and un-
229
specified. 'Nil' entries against Q. 6(a) are included under 'Unspecified'.
The present age of the currently married women in ages 10+ are grouped into 9 age-groups. namely, less than 13, 13-17, 18-22, 23-27. 28-32, 33-37, 38-42. 43-47, 48 + and age unspecified.,
Further, the data are presented for major religions viz·: Hindus. Muslims. Christians, Sikhs, Buddhists. Jains. Others and religion not stated.

230
F.1PART A DISTRIBUTION OF CURRENTLY MARR1ED WOMEN A]\D l11E REl.A1ED BJR1'llS
MYSORE
PRESENT AGE
Aic of Marrla.e All Ages Less than13 13-17 18-22 '23-27 _o _____
W B W B W B W B W B
2 3 4 5 6 7 8 9 10 11
(i) ALL RELIGJ.ONS
All Ales • 4,534,720 172,250 55,720 580 301,660 40,460 860,560 233,240 732'&20 193,930
Less .han 13 798,270 137,410 48,010 460 95,490 12,390 157,510 43,900 122,380 32,010
13-17 · 2,533,020 471,490 182,700 27,050 529,680 153,440 420,930 115,590
18-22 786,170 136,210 122,920 31,910 135,790 39,990
2:J-27 49,870 8,020 11,420 2,770
28+ 37,340 4,310
Unspecified • 330,050 14,810 7,710 120 23,380 1,020 50,450 3,990 42,300 3,570
(ii) HINDUS
All Ages · 4,155,810 698,660 51,740 500 276,480 35,880 786,460 211,530 670,840 175,620
Less thanl3 740,450 125,840 44,600 400 88,460 11,140 145,950 40,190 113,150 '29,420
13-17 2,322,990 427,660 166,700 23,820 483,910 13.9,380 385,900 105,090
18-22 710,080 11<;,770 110,700 28,430 12'2,660 35,4:<0
23-27 44,890 7,190 10,370 2,500
28+ 34,:;60 4,050
Unsp$ified • 303,040 13,150 7,140 iDO 21,320 no 45,900 3,530 :38,7(;0 3,190
(iii) MUSLIMS
All Ages 292,630 58,390 2,930 40 20,510 3,880 60,980 17,950 48,670 13,980
Less than 13 44,980 9,530 '2,430 20 5,490 .1,100 9,440 3,100 7,310 2,030
13-17 170,670 36,600 13,260 2,690 38,500 11,980 29,340 8,680
18-22 51,160 10,360 9,310 2,470 8,690 2,930
23-27 2,650 360 520 SO
28+ 1,860 160
Unspecified • '21,310 1,380 500 20 1,760 90 3,730 400 '2,810 290
(iv) CHRISTIANS
All Ages . 53,690 9,980 330 1,840 280 7,250 2,250 8,460 3,000
Less than 13 6,060 J,150 280 680 110 1,170 330 940 350
13-17 22,250 4,060 1,050 170 3,550 1,090 3,230 1,060
18-22 18,990 4,100 2,OiD 78(9 3,320 1,330
23-27 1,680 370 410 190
28+ 620 80
Unspecified • 4,090 220 50 110 520 50 560 70
(v) SIKHS
All Ages 150 10 20 10 20 40 10 . Leas than13 70 20 10 20
13-17 40 10 10
18-22 20 10
23-27 10 10 10 10
28+ Unspecified. 10

231
DURING THE LAST YEAR BY RELIGION, PRESENT AGE AND AGE AT MARRIAGE (RURAL)
STATE
PRESENT AGE
28-32 33-37 38-42 43-47 48+ Unspecified
W B W B W B W B W B W B
12 13 14 15 16 17 18 19 10 21 22 23
(i) ALL RELIGIONS
8()0,190 169,400 511,580 75,610 499,610 40,600 274,560 10,670 497,860 7,760 160 131,920 29,050 67,850 10,810 71,020 6,180 34,080 1,520 69,980 1,090 30
450,660 992,80 292,180 44,210 265,510 22,040 147,830 5,680 243,410 4,200 30 U5,82 0 34,110 96,380 15,560 110,030 10,350 59,530 2,570 115,700 1,720 13,800 2,700 7,210 1,500 7,470 660 4,070 190 5,880 200 20 7,280 960 10,780 2,020 5,460 570 4,870 390 3,950 370
50,710 3,300 37,180 1,510 40,120 800 24,180 320 53,940 180 80
(ii) HINDUS
735,550 151,470 458,930 68,640 458,070 36,540 251,670 9,420 455,930 7,060 130 122,740 26,730 62,95Q 10,020 65,410 5,620 31,810 1,330 65,370 990 JO 415,120 90,430 268.490 40,140 244,060 ]9,920 135,440 4,980 223,340 3,900 30 131,400 30,080 . 86,370 }3,850 99.780 9,180 54,]90 1,310 104,880 1,500
12,930 2,490 6,290 1,300 6,730 570 3,570 160 4,980 170 20 6,710 850 10,290 1,970 4,910 540 4,400 360 8,050 330
46.660 2.890 34,540 1,360 37,180 710 22,160 280 49,310 170 70
(iii) MUSLIMS
50,290 12,640 31,850 5,340 31,740 3,120 16,390 950 29,250 490 20 7,330 1,920 3,770 640 4,320 480 1,620 140 3,260 100 10
2,9140 7,470 18,770 3,310 17,420 1,690 9,500 560 14,740 220 9,760 2,750 6,620 1,110 6,820 800 3,160 170 6,800 130
470 100 480 120 510 60 240 20 430 10 360 70 320 30 350 20 330 20 500 20
3,230 330 1,890 130 2,320 70 1,540 40 3,520 10 10
(iv) CHRISTIANS
9,290 2,270 7,010 1,180 6,550 630 .4,250 210 8,700 160 10 780 220 550 70 700 40 290 30 660 10
3,700 800 2,910 480 2,390 300 1,790 80 3,630 80 3,690 1,060 2,490 540 2,700 250 1,570 80 3,210 60
330 80 320 50 190 30 160 10 270 10 150 30 150 20 130 10 70 10 120 10 640 80 590 20 440 370 ilO
(v) SIKHS
10 20 10 20 10 10
20 10
10
-

232
F-l PART A DISTRIBUTION OF CURRENTLY MARRIED WOMEN AND THE RELATED BIRTHS
MYSORE
PRESENT AGE
Age at Marriage All Ages Less than 13 13-17 18-22 23-27
W B W .B W B W B W B
2 3 4 5 6 7 8 9 10 11
(vi) BUDDHISTS
All Ages 2,780 270 40 80 10 270 30 410 70 Lessthan 13 290 60 40 20 60 10 50 20 13-17 460 50 30 120 20 120 10
18-22 1,190 110 50 200 40 23-27 380 30 40
28+ 290 10 Unspecified. 170 10 30 10 40
(vir) JAINS
All Ages 29,660 4,940 660 40 2,740 410 5,580 1,4110 4:,400 1,250 Lessthan13 6,420 830 640 40 840 40 880 270 910 190 13-17 16,610 3,120 1,740 370 3,600 970 2,330 750 18-22 4,730 870 840 230 920 270 23-27 260 60 70 20 28+ 210 10
U n~p~cified 1,430 50 20 160 2(',0 10 , 170 20·
W-Women B-Births.
N0~e Figures with nil entries have b~n omitted.

233
DURING THE LAST \'EAR BY RELIGION, PRESENT.AGE AND AGE AT MARRIAGE (RURAL)
STATE
PRESENT AG1!
28-32 33-37 38-42 43-47 48+ Uns,ecied
-'-W JJ W B W B W B W 11 W B
12 13 14 15 16 17 18 19 20 21 22 23
(vi) BUDDHISTS
3.0 70 300 50 310 20 420 .570 20 60 20 40 10 10 10 90 10 20 40 10 20 20
200 30 170 20 160 10 250 160 10 20 10 70 20 20 70 160
50 50 196 10 10 30 20 40
(VII) IAlNS
4,660 950 5.470 400 2,930 2!JO 1,830 90 3,390 30 1,010 160 540 70 570 40 350 20 680 2,610 570 1,970 280 1,600 120 1,080 60 1,680
770 190 730 40 570 tlO 260 10 640 20 50 20 50 10 20 30 40 10 60 10 20 20 20 90
160 160 150 20 90 260
W-Women B-Births NQT~ : Fi,ure5 with nil cl1triel have been omitted.

234
F.J PART B DISTR"BUTION OF CURRENTLY MARRIED WOMEN AND THE RELATED lulnHs· MYSORE
PRESENT AGE Age at Marri~ge
All Ages Less than 13 13_17 18-22 23-27
w B W B W B W B W B
2 3 4 5 () 7 8 9 10 11
Ii) ALL RELIGIONS
AllAges 1,366,795 212,720 4,480 40 57,555 7,460 264,%75 67,490 250,680 61,755 Lesstban n 140,310 21,590 3,595 40 12,450 1,715 27,360 6,935 22,900 5,705 13-17 686,1>20 118,880 '38,975 5,540 153,755 41,195 121,165 . 30,820 18-22 '350,560 60,140 60,480 15,815 77,070 21,550 23-27 33,860 6,060 8,195 2,225
28+ 9,720 935
Unspecified 146,305 5,115 885 6,nO 205 22,680 1,545 21,350 1,455
(ii) HINDUS
All Ages 1,020,993 151,615 3,865 20 42,650 5,030 194,690 48,075 186,555 44,530 Le5sthan 13 115,875 16,620 3,105 20 10,115 1,300 21,750 5,310 18,035 4,290
13-17 509,240 830,30 28.080 3.595 112.015 30,300 88,325 21,365 18-22 256,715 43,205 44,575 11,350 58,265 16,180
23-27 24,795 4,~35 6,3:L:> 1,690
28+ 6,740 635
Un~pecified 107,625 3,590 760 4,455 135 16,350 1,115 15,605 1,005
(til) MUSLIMS
All Ages 278,355 50,565 555 20 13,720 2,245 59,965 16,635 51,465 1'3,705
Less than 13 21,785 4,515 440 20 '2,150 39, 5,115 1,485 4,285 1,280
13_17 150,680 31,235 10,095 1.795 36,945 11,410 28,325 8,080
18-22 68,610 12,550 12,430 3,360 13,285 3,700
23_27 4,:05 815 .. ~ 910 265 '"
28+ 1,555 130
Unspecified :11,520 1,320 115 1,475 ~5 5,475 380 4,660 380
(iv) CHRISTIANS
All A2es ~2,445 8,155 15 665 135 6,650 1,985 9,920 2,760
Le<;sthan \3 1,595 280 25 80 310 90 365 90
13-17 18,280 3,315 450 \25 3,095 1,020 3,280 J,OOO
18-22 20,915 3,605 2,590 845 4,545 1,390
23-27 4,4~0 625 840 230
28+ 1,330 170
Unspecified 5,875 160 to 135 10 655 30 890 50
(v) SIKHS
All Ages 50S 70 5 70 15 120 30
Lessthan 13 20 5 5
13_17 205 45 5 30 10 50 20
18-22 190 20 3S 5 60 10
23-27 30
28+ 10
Unspecified 50 5 5

2:JS
DVRING THE LAST YEAR BY RELIGION, PRESENT AGE AND AGE AT MARRIAGE (URBAN)
STATE ~.--,
PRESENT AGE
28-32 33-37 38-42 43-47 48+ Unspecified
W B W B W B W B W B W B
12 13 14 15 16 17 18 19 20 21 22 23
(i) ALL RELIGIONS
247,840 44,800 166,060 19,295 146,905 8,720 80,235 1,990 148,700 1,170 65
27,650 4,220 13,675 1,835 13,900 785 7,040 230 16,760 125
119,485 22,945 84,390 10,515 67,965 4,370 37,995 1,020 62,265 475 25
70,145 13,695 43,760 5.325 41,225 2,775 20,830 525 '36,845 455 5
9,810 2,520 5,855 840 4,495 350 2,260 100 1,245 25
1,480 US 1,695 155 1,815 180 1,495 45 1,210 20 5
24,070 1,085 16,685 425 17,485 260 10,615 70 26,175 70 30
(Ii) HINDUS
185,565 32,070 125,025 11,490 110,565 6,170 60,915 1,'385 111,095 845 45
18.480 3,375 11,365 1,410 11,890 615 6,155 185 14,980 115
88,815 16,245 63,450 7,345 51,695 3,160 29,305 700 47,540 320 15
51,760 9,570 32,255 3,580 29,815 1,835 14,860 :l80 25,185 310
7,615 1,89G 4,330 615 3,115 275 1,560 50 1,850 15
1,130 250 1,230 230 1,285 115 1,060 20 2,035 20
17,765 740 12,395 310 12,765 170 7,995 50 19,505 65 30
(Iii) MUSLIMS
50.280 10.405 11,650 4,610 18,360 2,135 14,450 505 17,890 285 10
3.720 770 2,040 345 1,775 165 755 45 1,505 10
26,155 5,825 17,080 2,675 13,225 1,045 7,015 270 11,830 135 10
13,925 3,160 8,265 1,330 8,540 760 4,130 110 8,030 130 5
1,080 315 695 100 680 50 300 40 540 5
160 35 190 35 300 40 265 20 635 5
5,240 300 3,380 105 3,840 75 1,985 20 5,350 5
(iv) CHRISTIANS
9,5SS 1,865 7,470 980 6,425 '345 1,875 60 7,870 25
260 50 180 45 165 5 55 155
3.225 635 2,810 385 2,200 105 1,205 35 2,015 10
3,935 795 2,675 370 2,450 170 1,560 20 3,160 15
1,035 290 770 80 625 25 365 815
180 ~O 265 90 230 25 150 5 505
900 45 710 10 755 IS 540 1,220
95 15 95 10 65 (v) SIKHS
20 35
IS 5
SO 5 4~ to 15 to
25 5 25 15 10 20
5 10 10 5
5 5 10 20 ~ 5
18-1 Census KarnatakanS

236
F.I PART B DISTRIBUTION OF CURRENTLY MARRIED WOMEN Al'D 1HE RF.IA'Ur BIRTHS
MYSORE
PRESENl AGE
All Ages Lessthan 13 13_17 18-22 23-27 Age at Marriage
W B W B W B W B W B
2 3 4 5 6 7 8 9 10 11
(vi) BUDDHISTS
All Ages no 25 5 35 15 30 10 Less than 13 30 10 10 5 10 5 13 .• _17 50 5 S 10 18-22 30 10 10 5 S S 23-27 5 28+ .,
Unspecified 15 5 10 5 5
(vii) iJAINS
All Ages 14,195 2,280 25 505 50 2,845 760 2,580 720 Lessth8n 13 1,020 160 25 105 20 175 45 195 40 13-17 7,515 1,255 335 25 1,650 455 1,170 355 18-22 4,045 745 835 245 910 265 23-27 350 80 120 40 28+ 60 Unspecified l,20S 40 65 5 185 15 185 20
(viii) OTHERS
All Ages 160 10 5 15 5 10 Lessthan 13 5 5 13_17 45 5 10 5 18_22 45 5 5 5 23-27 25 5 28+ 25 Unspecified 15
OJ() RELIGION NOT STATED All Ages 15 5
Less than 13 . 13-17 5 5 18-22 10
23-27 28+ Unspecified
W: Women B: Birth

in DURING THE LAST YEAR BY RELIGION, PRESENT AGE AND AGE AT MARRIAGE (URBAN)
STATE
PRESENT AGE
28-32 33-37 38-42 43-A7 48+ Unspecified
W B W B W B W 8 W B W B
12 13 14 15 16 17 18 19 20 21 22 23
(vi) BUDDIUSTS
15 10 10 5 20 5 5
10 5 5 10
5 10
5
(vii) JAINS
2,330 445 1,800 185 1,455 70 935 40 1,720 10 170 20 90 35 70 70 120
1,225 235 1,000 100 820 60 465 15 850 10 695 165 535 45 390 10 265 15 415
75 25 50 5 55 30 10 20 5 15 20 20
165 120 105 85 295
(viii) OTHERS
10 HI 25 15 60 5
5 5 5 10
5 15 5 15 5 20 5
10 15 JU 5
(ix) RELIGION NOT STATED
10
10

238
F·I DISTRIBUTION OF CURRENTLY MARRIED WOMEN AND THE RELATED BIRTHS AND AGE AT
MYSORE
APPEN ---
PRESENT AGE
~ All Ages Less than 13 13-17 18-22 23-27 A,e at Marriage
W B W B W B W B W B
2 3 4 .5 6 7 8 9 10 11
(RURAL)
(I) ALL SCHEDULED CASTES
All Age5 668,940 110,190 10,820 160 46,290 6,400 129,850 32,100 105,880 26,970 Less than 13 133,040 23,870 9,520 }60 } 6,.540 2,420 28,.580 7,070 20,930 .5.890 13-17 · 369.100 6.5.640 26.680 3,900 77.470 JO,780 60,940 15,620 18-22 104.690 11,170 1.5.480 3,630 16.290 4.660 23-27 4,820 760 930 210
28+ 2,670 260
Unspecified .54,620 2,490 1,300 3,070 80 8.320 620 6,790 .590
(II) ALL SCHEDULED TRIBES
All Ages 38,2,60 6,990 430 2,030 230 6,870 2,010 5,830 1,530 Less than 13 5,380 1,080 410 670 100 1.140 370 690 236 13-17 19,260 4,180 1,200 120 4.140 1,360. 2,970 890
18-22 9,680 1,520 1,250 260 1.510 330
23-27 · 730 110 190 30
28+ 260
Unspecified 2.950 100 20 160 10 340 20 470 SO
F.I DISTRIBUTION OF CURRENTLY MARR)FD WOMEN AND THE RELATED BIRTHS AND AGE AT
MYSORE
APPEN (URBAN)
(I) ALL SCHEDULED CASTES
All Ages 133,110 21,310 915 5 7,355 910 27,000 6,510 23,870 5,470 Less than 13 20,800 3,595 815 5 2,305 305 4.430 1,170 3,580 915 13-17 67,685 12,180 4,400 575 15.490 3,965 12,265 3,055
·18-22 26,140 4,600 4.300 1,145 5,305 1.535 23-27 · 1.640 240 325 90
28+ · 685 30
Unspecified 16,160 665 100 650 30 2.780 230 2.395 145
(II) ALL SCHEDULED TRIPES
All Ages 4,545 785 10 275 40 970 215 700 190 LeSs than 13 655 145 10 95 20 150 SO 105 30 13-17 · 2,455 465 160 20 580 140 390 110 18-22 · 870 150 165 25 125 45 23-27 80 10 20
28+ · ~5 5 Unspecified 460 10 20 75 60 5

239
D~JRlNG TII~ L\8f YE<\.R BY SCHEDULED CASTES/SCHEDULED TRIBES, PRESENT AGE MARRIAGE
STATE
DIX
PRESENT AGE
28-32 33-37 38-42 43-47 48+ Unspecified
W B W B W B W B W B W B
12 13 1.4 15 16 17 18 19 20 21 22 23
(RURAL)
(I) ALL SCHEDULED CASTES
114,770 25,010 73,680 10,960 73,000 5,430 38,970 1,860 78,670 1,270 10 20,540 5,090 10,710 1,970 11,140 880 5,180 210 9,900 180 65,700 14,820 40,630 6,230 39,180 2,910 21,200 990 37,290 390 10 19,640 4,110 13,340 2,360 14,970 1,360 8,100 490 16,870 560
880 220 660 150 900 90 720 SO 730 40 310 SO 340 60 610 70 540 50 870 30
7,700 750 5,000 190 6,200 120 3,230 70 13,010 70
(II) ALL SCHEDULED TRIBES
6,870 1,740 4,800 860 4,340 350 2,900 ISO 3,890 120 300 800 220 590 120 410 20 240 20 430 ••
3,290 1,020 2,340 490 2,130 160 1,440 80 1,750 60 2,180 460 1,320 200 1,400 160 870 50 1,150 60
120 40 170 40 90 60 100
40 40 70 30 80 440 340 10 240 10 260 380 330
DURING THE LAST YEAR BY SCHEDULED CASTES/SCHEDULED TRIBES, PRESENT AGE MARRIAGE
STATE
DIX (URBAN)
(I) ALL SCHEDULED CASTES
H,820 4,715 15,8115 2,070 13,955 985 6,815 220 12,290 155 5 .. 3,605 715 1,940 280 1,935 145 785 45 1,405 15
12,630 2,650 3,440 1,210 6,345 545 3,195 120 4,915 60 5 5,300 1,135 3,255 440 3,345 245 1,640 45 2,995 55
340 70 325 55 295 20 130 225 5 60 5 65 15 145 10 155 260
2,885 140 1,960 70 1,890 2U 1,010 10 2,490 20
(II) ALL SCHEDULED TRIBES
975 185 425 75 530 50 285 25 375 5
110 30 65 10 50 35 35 5 515 110 240 50 300 20 110 15 160
210 40 45 10 110 20 100 10 115
25 5 20 5 5 10 10 5 10 5
115 55 55 5 20 60
W-Women B-Births


F-II DISTRIBUTION OF CURRENTLY MARRIED WOMEN AND THE RELATED BIRTHS DURING THE LAST YEAR BY EDUC,ATION, PRESENT
AGE AND AGE AT MARRIAGE (RURAL/URBAN)
2H


lttl DiStRIBUTioN OF CVRRENTl Y MARkIED WOMEN ANn TIm RELATED BIRTHS DURING THE LAST YEAR BY EDUCATION, PRESENT AGE AND AGE
AT MARRIAGE (RURAL/URBAN)
This table is in two 'Parts, viz., Part-A relating to the rural and Part-B relating to the urban areas. The distribution of women. and births by education, present age and age at marriage is provided in this table.
This table is similar to table F-I, but here the data are presented for illiterates and literates by various educational lev,ls insRd of religion. The educational
243
levels adopted are:
(i) LiteraJte but less than Matriculate.
(H) Matriculat~ and above. but lesg than graduate. and
(iii) Graduate and above.
Levels of education not classifiable "elsewhere" arc included in item (i) above.

~4
F .. II PART A DISTRIBUTION OF CURRENTLY MARRIED WOMEN AND THE RELATED BIRTHS
MYSORE
PRESENT AGE Age at Marriage ---------_---------------------
All Ages Less than 13 13-17 18-22 23-27 ------- -----_
W B W B W B W B W B
2 3 4 5 6 7 8 9 10 11
(i) ILLITBRATB
AU Ages 3,975,520 654,380 51,110 5Z0 257,420 33,840 713,700 188,51)0 617.100 161.38 L~ss than 13 7U,060 127,390 44,110 430 85,690 10,920 144,690 <to, 300 113,100 29,930 13-17 2,215,810 399,310 151,540 22,030 436,010 122.170 357,490 97,630
18-22 653,210 105,530 90,280 22,660 102,400 29.080 23-27 38,880 5,430 8,360 1,730
28+ 33,330 3,770
Unsp~cifbd 292,230 12,950 7,000 90 20,190 890 42,720 3,450 35,750 3,010
(ii) *LITERA'IE BUT LESS THAN MATRICULATE
All Alles 518,82() 1()3,6()O 4,610 60 42,220 6,350 135,350 41,680 106,290 30,190 Less than 13 52,73u 9,270 3,900 30 9,500 1,410 11,810 3,360 8,700 2,000 13-17 301,050 68,950 29,770 4,810 88,660 29,830 60,060 17290 18-22 119,470 27,190 28,130 8,030 29,470 9,590 23-27 8,590 2,070 ,2,260 8CO
28+ 3,320 430
Unspe~ified 33,660 1,690 710 30 2,950 130 6,750 460 5,80U 510
(iii) MATRICULATE AND ABOVE BUT LESS THAN GRADUATE
All Ages 38,500 7,900 2,020 270 11,250 2,940 8,550 2,090 Less than 13 3,450 750 300 60 1.010 240 580 80 13-17 15,690 3,120 1,480 210 4,960 1,430 3,000 570 18-22 12,860 3,370 4,330 1,190 3,620 1,240 23-27 1,940 410 630 180 28+ 630 110 Unspecified 3,930 140 240 950 80 720 20
(iv) GRADUATIl~AND ABOVl!
AU Ages 1,880 370 260 40 880 270 l.e3s than 13 30
13-17 470 110 50 10 380 100 18-22 630 120 180 30 300 80 23-27 460 110 170 60 28+ 60 UnspeGified 230 30 30 30 30
"InclUdes Education not cl assified elsewhere
W ~ Womell
B :Births

~s
DURING THE LAST YEAR BY EDUCATION, PRESENT AGE AND AGE AT MARRIAGE (RURAL)
STATE
PRESENT AGE - ----------------- -----28_32 33-37 38_42 43_47 48+ Unspecified ----- ------ -- -----W B W B W B W B W B W B
12 13 14 15 16 17 18 19 20 21 22 23 -(i) ILLITERATE
703,300 118,5;0 451,840 67,190 457,330 37,340 252,810 9,760 467,750 7,220 160 124,000 27,380 63,940 10,100 67,830 5,870 32,180 1,420 66,490 1,040 30 43),080 88,740 "1.61,540 39,590 243,190 20,100 136,280 5,200 229,650 3850 30 118,170 ~7,160 81,620 13,170 98,510 9,500 54,200 2,320 108,030 1,640
10,460 1,690 5,360 1,130 6,260 550 3,400 150 5.020 180 20 6,400 670 9,030 1,850 4,940 560 4,550 350 8,410 340
4-l,190 2,910 33,350 1,350 36,600 760 22,200 320 50,150 170 80
Iii) *LITERATB BuT LESS THAN MATRIOULATB
89,310 19,260 52,050 7,750 39,930 3,010 20,860 810 28,200 490 7,330 1,470 3,530 620 2,890 240 1,830 100 3,240 40
48,400 10,190 28,150 4,280 21,510 1,800 11,300 430 13,200 320 24,870 6,210 13,660 2,250 10,940 820 5,140 210 7,260 80
2,550 780 1,560 330 1,010 110 640 30 570 20 500 240 1,620 120 420 10 300 40 480 20
5,660 370 3,530 150 3,160 30 1,650 3,450 10
(iii) MATRICULA1E AND ABOVE BUT LESS THAN GRADUA1E
7,210 1,530 4,570 670 2,270 250 870 100 1,760 50 580 200 360 90 300 70 70 250 10
2,170 350 2,480 340 790 140 250 50 560 30 2,710 730 1,050 140 560 30 190 40 400
590 180 270 40 190 30 10 230 340 50 120 50 90 20 60 10 820 20 290 10 340 10 310 260
(iv) GRADUATE AND ABOVE
370 60 120 80 20 150 10 20 10 10 20 70 10 50 20 10
200 50 20 10 60 40 10 10 40 10 20 20 80

24~
F.II.PART B DISTRmUTION OF CURRENTLY MA~RJED WOMEN Al'D TilE RELATED IURTlJS
MYSORE
PRESENT AGE
Age at Marriage All Ages Less than 13 1~_17 18_22 23-27 ------W B W B W B W B W B
2 3 4 5 6 7 8 9 10 11
(i) ILLITERATE
All Ages 805,365 118,100 3,610 30 36350 4,650 145,975 35,400 132,795 30,850 Less than 13 107.925 16,835 2,975 30 9,670 1,290 21,235 5,275 17,395 4,410
13-17 422,515 71,045 22,890 3,220 89,255 23,795 72,055 17,765 18-22 167,810 25,365 22,445 5,420 29,695 7,5]5 23-21 9,890 1,465 1,570 355
28+ 4,725 245
Unsp:~lfied 92,500 3,145 635 3,790 140 13,040 910 12,080 805
(ii) LtrERATB BUT LBSS THAN MATRIOULATE
All Ages tH,865 74,725 865 10 18,835 2,625 90,895 25,285 87,180 23,025 Less1han 13 30,155 4,380 615 10 2,635 415 5,635 1,525 5,020 ],175 13-17 235,]6:5 42,9]0 14,205 2,150 54,855 16,700 43,890 11,835 18-22 127,980 23,680 23,395 6,575 29,685 8,835 23-27 10,840 1,875 2,225 670
28+ 2,415 300 Un~p!cified 41,310 1,580 250 1,995 60 7,010 485 6,360 510
(iii) MATRICULATE AND ABOVE BUT LESS THAN GRADUATE
All Alles . 102,360 18,165 5 2,345 185 26,125 6,570 27,090 7,050 LesS than 13 2,060 340 5 140 10 450 115 430 115 13-17 27,490 4,830 1,865 170 9,515 2,670 5,020 1,170 18-22 49,820 10,235 13,700 3,640 15,8]5 4,685 23-27 10,105 2,130 3,325 955
28+ 1,870 265
Unsp~cified 11,015 365 340 5 2,460 145 2,500 125
(iv) GRADUATE AND ABOVE
All Ages . 11,205 1,730 . 25 1,280 235 3,615 830 Less than 13 190 35 5 40 20 55 5 13-17 850 95 15 130 30 200 50 18-22 4,950 860 940 180 1,875 515 23-27 3,025 590· 1,075 245
28+ 710 125
UnspeCified 1,480 25 5 170 5 410 15

247
DURING THE LAST YEAR BY EDUCATION, PRESENT AGE AND AGE AT MARRIAGE (URBAN)
STATE
PRESENT AGE
28-32 33-37 38--42 43-47 48+ Unspecified
W B W B W B W B W B W B
12 13 14 15 16 17 18 19 20 21 22 23
(i) ILLITBRATB
142,095 26,355 97,315 12,125 92,455 6,215 50,630 1,520 104,090 955 50 17 535 3,345 10,155 1,505 11,220 660 5,370 215 11,770 105 74,460 14,945 52,345 7,015 43,070 3,160 24,660 780 43,755 365 25 32,905 6,800 21,730 2,985 23,775 1,900 11,815 360 25,445 385 2,185 530 1,625 275 1,945 220 960 70 1,605 15
290 50 445 60 990 80 875 35 2,120 20 5 14,720 685 10,415 285 11,455 195 6,950 60 19,395 65 20
(ii);jc LiTllRATB BUT LESS THAN MATRICULATE
82,665 14,805 55,705 6,135 46,055 2,220 25,785 435 39,865 185 15 4,625 800 2,705 300 2,545 120 1,590 IS 4,785 20 ~(),620 7,410 28,925 3,320 22,790 1,160 12,405 230 17,475 105 27,000 5,370 16,720 1,945 13,910 755 7,530 150 9,735 50 5
3,080 780 2,165 320 1,480 75 785 25 1,105 5 435 120 445 125 405 50 400 5 730
6,905 325 4,745 125 4,925 60 3,075 10 6,035 5 10
(iii) MATRICULATE AND ABOV'il BUT LESS THA,N GR.ADUA~B
20,185 3,150 11,560 910 7,U5 250 3,393 25 4,230 25 460 70 195 25 125 5 65 190
4,255 585 2,950 170 2,005 50 890 10 990 5 9.400 1,395 4,840 375 3,185 105 1,355 15 1,525 20 3,440 925 1,690 205 825 45 400 425
520 105 585 120 315 40 170 280 2,110 70 1,300 15 970 5 515 820
(iv) GRADUATE AND ABOVE
2,895 490 1,480 125 970 35 425 10 515 5 30 5 20 5 10 15 15
150 5 170 10 100 40 45 1,040 130 470 20 355 15 130 140 1,105 285 375 40 245 10 115 5 110 5
235 60 220 50 125 10 50 5 80 335 5 225 135 75 125
W: Women B: Births *Includes education not claSSified elseWhere.


F-III DISTRIBUTION OF CURRENTLY MARRI ED WOMEN AND THE RELATED BIRTHS DURING THE LAST YEAR BY RELIGION, DURATION
OF MARRIAGE AND AGE AT MARRIAGE (RURAL/URBAN)
249


F W, DISTRmUTION OF CURRENTLY MARRIED ""OMEN AND THE RELATED BIRTHS DURING THE LAST YEAR BY RELIGION, DURATION OF MARRIAGE
. AND AGE AT MARRIAGE (RURAL/URBAN)
This table is in two parts, namely, Part-A relating to the rural and Part-B relating to the urban areas. This table is similar to Table F-I but here the "Presentage" is replaced by "Duration of marriage". The duration Of marriage which was not directly elicited from the respondent is derived as the difference between the 'Present age' and 'age at marriage'. The following are
19-1 Consul Karnataka178 251
the duration groups for which data are presented; Less than 1. 1-4, 5-9, 10-14, 15-19, 20-24, 25-29. 30+ and 'unspecified' .
An appendix is also provided fOr the table presenting similar data separately for Scheduled Castes and Scheduled Tribes only.

252
F.III PART A DISTRIBUTION OF CURRENTLY MARRIED WOMEN AND TilE RELATED MARRIAGE
MYSORE
DURUION OF MARRIAGE Age at Marriage
All Duration Less than 1 1-4 5-9 ---- -----------W B W B W B W B
2 3 4 5 6 7 8 9
(i) ALL RELIGIONS
All agel 4,5:H,720 772,250 46,270 3,180 633,980 137,160 702,740 191,790 Less than 13 798,270 137,410 11 ,650 1,090 94,910 8,520 127,960 28,000 13-17 2,533,020 471,490 24,880 880 . 393,360 9J,380 424,470 124,460 18-22 786,170 136,210 8,130 1.050 133,120 34.720 131.4~0 36,560 23-27 49,870 8,020 840 90 8,490 2,770 13,790 2,180
18+ 37,340 4,310 770 70 4,100 770 5,040 590 Unsp~cified 330,050 14,810
(ii) HINDUS
AI) ages 4,155,810 698,660 41,990 2,700 579,730 123,370 642,960 173,48 Less than.I3 74:),450 125,840 11,110 1,040 88,350 7,680 119,010 25,500 13-17 2,322,990 427,660 22,450 510 359,380 81,860 387,920 112,880 18-22 710,080 120,770 7,020 1,000 120,890 30,640 118,500 32,570 23-27 44,890 7,190 720 80 7,510 2,520 12,980 2.010 28+ 34,360 4,050 690 70 3,600 670 -4,550 520 Ullsp~cified 303,040 13,150
(i i i) MUSLIMS
All ages. 292,630 58,390 3,550 430 43,340 10,750 47,260 14,340 Less than 13 44,980 9,530 440 40 5,130 730- 7,300 2,090 13-17 • 170,670 36,600 2,240 360 28,730 7,220 30,180 9,490 18-22 51,160 10,360 780 30 8,660 2,640 9,090 2,660 23-27 2,650 360 60 490 90 360 60 28+ • 1,860 160 30 330 70 330 40 Unspecified 21,310 1,380
(jv) CHRISTIANS
All ages. 53,690 9,980 520 40 6,140 2,020 7,550 2,580 Less than 13 6,060 1,150 60 570 70 740 210 13-17 • 22,250 4,060 130 10 2,410 640 3,540 1,190 18-22 • 18,990 4,100 230 20 2,630 1,150 2,840 1,070 23-27 1,680 370 60 10 380 130 340 90 28+ 620 80 40 150 30 90 20 Unspecified 4,090 220
(V) SIKHS
All ages 150 10 20 30 10 10 Less than 13 70 20 20 13-17 40 10 18- ·22 20 23-27 10 10 10 10 28+ U 11specifted 10
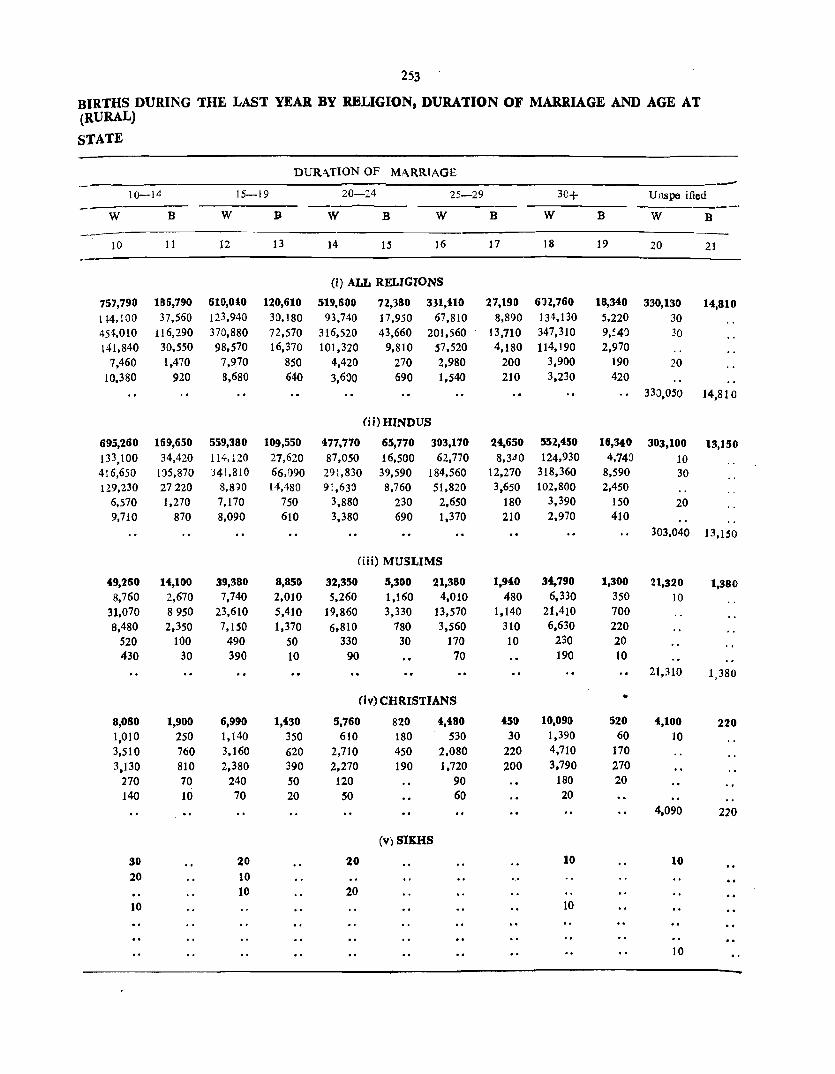
253
BIRTHS DURING THE LAST YEAR BY RELIGION, DURATION OF MARRIAGE AND AGE AT (RURAL)
STATE
DURATION OF MARRIAGE -10-14 15-19 20-24 25-29 30+ Unspe ified _-W B W B W B W B W B W B
}O 11 12 13 14 15 16 17 18 19 20 21
(i) ALL RELIGIONS
757,790 185,790 6IO,OiO 120,610 519.600 72,nO 3 Jl,!10 27,190 6112,760 18,340 330,130 14,810 1 ~4,lOO 37,550 123,940 30,180 93,740 17,950 67.810 8,890 134,130 5,220 30 454,010 115,290 370,880 72.570 315,520 43,660 201,560 13,710 347,310 9,:40 30 141,840 30,550 98,570 16.370 101,320 9,810 57.520 4,180 114,190 2,970
7,460 1,470 7,970 850 4,420 270 2,980 200 3,900 190 20 10.380 920 8,680 640 3,600 590 1,540 210 3,230 420
330,050 14,810
(ii)HINDUS
695,260 169,650 559,380 109,550 "77,770 65,770 303,170 2<1,650 552,"50 16,340 303,100 13,J50 133,100 34,420 114,120 27,620 87,050 16,500 62.770 8,3.10 124,930 4,743 10 416,650 135,870 341,810 66,090 291,830 39.590 184,560 12,270 318,360 8,590 30 129,230 27220 8,8)0 14,480 91.630 8,760 51,820 3,650 102,800 2,450
6,570 1,270 7,170 750 3.880 230 2,650 180 3,390 150 20 9,710 870 8,090 610 3,380 690 1,370 210 2,970 410
303.040 13,150
(iii) MUSLIMS
49,260 H,100 39,380 8,850 32,350 5,300 21,380 1,940 34,790 1,300 21,320 1,380 8.760 2,670 7,740 2,010 5,260 1,160 4,010 480 6,330 350 10
31,070 8950 23,610 5,410 19,860 3,330 13,570 1,140 21,410 700 8,480 2,350 7,150 1,370 6,810 780 3,560 310 6,630 220
520 100 490 SO 330 30 170 10 230 20 430 30 390 10 90 70 190 10
21,310 1,380
(Iv) CHRISTIANS .. 8,060 1,900 6,990 1,430 5,760 820 4,480 450 10,090 520 4,100 220 1,010 250 1,140 350 610 180 530 30 1,390 60 10 3,510 760 3,160 620 2,710 450 2,080 220 4,710 170
3,130 810 2,380 390 2,270 190 1,720 200 3,790 270 270 70 240 50 120 90 180 20
140 10 70 20 SO 60 20 4,090 220
(vo) SIKHS
30 20 20 10 10 20 10
10 20 )0 10
10

254
F.I1I .PART A DISTRmUTlON OF CURRENTLY MARRIED WOMEN AND THE RELATED MARRIAGE
MYSORE
DURATION OF MARRIAGE
All duration less than 1 1-4 5-9 A,e at Marriag.,
W B W B W B W B
2 3 4 5 6 7 8 9
(vi) BUDDHISTS
All ages 2,780 270 30 270 40 380 60 Less than 13 290 60 40 40 10 13-17 460 50 10 70 10 iDO 10 18-22 1,190 110 20 90 2) 190 40 23-27 380 30 60 10 20 28+ 290 10 10 30 UnsPecified 170 10
(vii) JAINS
All ages 29,660 4,940 160 10 4,470 980 4,580 1,320 Le,s ~han 13 6,420 830 20 10 800 40 870 190 13-17 16,610 3,120 50 2,760 650 2,730 890 18-22 4,730 870 80 850 270. 860 220 23-27 260 60 50 20 80 10 28+ 210 10 10 10 40 10
Un5pecified 1,430 50
W:Women B: Births Lin: with Nil entries have been omitted.

255
BIRTHS DURING THE LAST YEAR BY RELIGION, DURATION OF MARRIAGE AND AGE AT (RURAL)
STATE
DURATION OF MARRIAGE
10-14 15-19 20-?4 25-29 30+ UnsPeci lied
W B W B W B W B W B W B
10 11 12 13 14 15 16 17 18 19 20' 21
(vi) BUDDHISTS
560 60 280 30 330 50 240 10 520 10 170 10 70 SO 20 50 30 20 20
170 20 20 20 30 10 40 200 10 140 10 110 20 110 330 10
SO 20 30 80 60 80 70 10 40 70 20 SO
170 10
(vii) JAINS
4,620 1,080 3,990 750 3,370 440 2,140 140 4,900 170 1.430 SO 1,140 220 880 180 770 80 480 40 1,460 70 2,610 690 2,270 450 2,080 290 1.320 70 2.790 80
790 160 710 120 500 60 310 20 630 20 50 10 40 10 10 10 10 20 30 90 10 20
1.430 SO


258
F.III PART B-DISTRIBUTION OF CURRENTLY MARRIED WOMEN AND THE RELATED MARRIAGE
MYSORE
DURATION OF MARRIAGE
All Durttion Le,s than 1 1-4 5-9 Age at M miage
W B W B W B W B
"- :; 4 5 6 7 8 9
<vi> BUDDHISTS
All ages 130 25 15 5 15 5 Lessthan 13 30 10 13-17 50 5 10 111-22 30 10 10 5 5 5 23-27 5 28+ Unspecified 15 5
(vii) JAlNS
All ages 14,195 2,280 175 2,250 650 2,355 640 Lessthan13 1,020 160 70 10 Il5 20 13-17 7,515 1,255 65 1,125 265 1,280 375 18-22 40,45 745 95 910 320 90S 235 23-27 350 80 15 140 S5 45 10 28+ 60 5 10
U J ;p:cified 1,205 40
(viiJ) OTHERS
All ages 160 10 25 5 10 Lessthan13 , 5 13-17 45 10 10 18-22 45 5 S 5 23-27 25 5 28+ 25 10 U;}sp.:cified 25 "
(i:&) RELIGION NOT STATED
All ages 15 5 Lessthan13 , 13-17 5 S 18-22 10 23-27 28+ U mp.!cified

259
BIRTHS DUlUNG THE LAST YEAR BY RELIGION, DURATION OF MARRIAGE AND AGE AT (URBAN)
STATE
I'DURATION OF MARRIAGE
10-14 '{-., 15-19 20-24 25-29 30+ UnSpecified
W B k, W B W B W B W B W B
10 11 12 13 14 15 16 17 18 19 20 21
(vi) BUDDHISTS
30 5 20 5 10 25 15 5 15 5 10 5 5 10 5 10 10
5 10 5 ..
15 $
(vB) JAINS
2,195 485 1,805 240 1,525 145 935 60 1.750 20 1.205 40 255 70 160 25 140 25 50 10 230
1.245 290 1.070 170 980 95 645 40 1.105 20 625 120 495 45 380 15 235 10 400
55 5 50 25 10 5 15 15 30
1.205 40
(vUI) OTHERS
20 35 5 10 45 15 5 5 5 15 S 20 15 S 5 S 5 10
10 S 15
(la) REUGION NOT STATED
5 5
5 5
W: Women B : BirthS

F.II1 DISTRIBUTION OF CURRENTLY MARRJED WOMEN AND 'IRE RELA'IED BIR'IlIS Dl'RING AND AGE AT
MYSORE
APPEN
DURATION OF MARRIAGE @
Age at Muriage All duration Less than I 1-4 5-9
W B W B W B W :B
2 3 4 5 6 7 8 9 ...
(1) ALL SCHEDULED CASTES-RURAL ..
An ages 668,9.0 110,190 5,240 260 91,450 18,160 97,790 25,530
Lessthan 13. 133,040 23,870 1,390 70 16,970 1.530 21,000 4,550
13-17 369,100 65,640 2,880 110 5.8,750 12,440 59,140 ]6,320
lS;_22 104,690 17,170 760 50 14,7JO 3,950 16,540 4,400
23-27 4,820 760 150 20 170 210 820 210
28+ 2,670 260 60 10 230 30 290 50
U nsp~cified 54,620 2,0490
(U) ALL SCHEDULED TRIBES
AU alert 38,260 6,990 440 40 4,990 1,150 5,690 1,740
Less than i 3 • 5,380 1,080 ;3U 20 5iO 50 900 220
13-17 19;260 ·~,180 190 10 2,nO 740 3,120 1,090
18-22 9,680 1,520 110 10 1,370 330 1,520 400
23-27 730 110 10 160 30 '·120 30
28+ 260 30 30
U 11>p!cified 2,950 100
F.III DISTRIBUTION OF CURRENTLY MARRIED WOMEN AND THE FELATED BIRTHS DURING AND AGE AT
Age at Marriage All Juration ---------W B
2 3
(1) ALL
All ages. 133,110 21,310 Less than 13 20,800 3,595
13-17 67,685 12,180 18-22 26,140 4,600
2:>-27 1,640 240
28+ 685 30 Unspecified 16,160 665
(Ii) ALL
All ages. 4,545 785
Lesstban 13 655 145
13-17 2,455 465
18-22 870 150
23-27 80 10
28+ . 25 5 Unspecified 460 10
DURATION OF MARRIAGE
Less than 1-4 ~---------
W :B W B
4 5 6 7
SCHEDULED CASTES-URBAN
1,010 35 18,920 4,165 75 5 2,110 ZIO
550 5 11.515 2,415 355 10 4,800 1,425 10 10 395 100 10 5 100 15
SCHEDULED TRIBES
30 715 145 5 55 10
10 455 95 15 175 40
30
MYSORE
APPEN
5-9 ------W B
8 9
20,835 5,485 3,425 795
11,770 3,160 5,315 1,470
275 50 50 10
680 180 165 45 365 90 130 40 20 5

2(il
THE LAST YEAR BY SCHEDULED CASTES/SCHEDULED TRmES, DURATION OF MARRIAGE MARRIAGE
STATE
DIX ---,----
DURATION OF MARRIAGE
10-14 15-19 20-24 25-29 30+ Unspecified -----
tJ B W B W B W B W 'B W 'B
10 11 12 13 14 IS 16 17 18 19 20 21
0) ALL SCHEDULED CASTES-RURAL
!1l,480 27,090 9a,580 18,640 75,870 10,430 48,940 4,490 92,960 3,100 54,630 2,490
25,970 6,590 21,000 5,410 15,280 3,380 10,820 1,490 20,6:0 850 65,430 16,310 53,970 10,510 45,510 5,710 29,610 2,400 53,300 1,840 10 18,560 3,920 14,210 2,580 14,240 1,290 8,050 580 17,600 400
710 130 750 110 610 50 370 20 640 10 810 140 650 30 230 90 310
54,620 2,490
(li) ALL SCHEDULED TRIBES
6,350 1,630 ",920 1,150 4,610 710 3,390 250 4,920 220 2,950 100 970 280 820 i70 660 230 650 100 740 10
3,150 940 2,700 770 2,460 350 1,830 120 2,890 160
[,960 360 1,310 210 1,380 130 900 30 1,130 50 190 50 50 60 10 130 80 40 50 30
2,950 " 100
THE LAST YEAR BY SCHEDULED CASTES/SCHEDULED TRIBES, DURATION OF MARRIAGE MARRIAGE
STATE
DIX
DURATION OF MARRIAGE
10-14 15-19 20-24 25-21 30+ UnlPCC.fted ------- ----~--- ------- -------W B W B W B W B W B W B
10 11 12 13 14 15 16 17 18 19 20 21
(1) ALL SCHEDULED CASTES-URBAN
22765 5,245 17,500 3,055 14,520 1,775 8,120 565 13,275 320 16,165 665 4,120 1,015 3,670 820 2,520 450 1,845 165 3,035 1~5 ..
13,410 3,220 9,985 1,790 8,700 1,100 4,535 360 7,21S 130 5 4,690 945 3,385 435 3,080 225 1,625 35 2,890 55
365 65 245 10 135 105 5 100 180 215 85 10 35
16,160 665
(il) ALL SCHEDULED TRIBE·S
815 215 540 110 490 80 385 25 430 20 460 10 90 30 115 35 65 IS 80 5 80 5
505 140 375 70 295 4.5 205 10 245 15 185 35 45 5 llS 20 100 10 105 20 5 .. 10 15 S 5 5
460 10
W I Women B; Births


F-IV DISTRIBUTION OF CURRENTLY MARRIED WOMEN AND THE RELATED BIRTHS DURING THE LAST YEAR BY EDUCATION, DURATION
OF MARRIAGE AND AGE AT MARRIAGE (RURAL/URBAN)
26)

F-IV DISTRIBUTION OF CURRENTLY MARRmD WOMEN AND THE RELATED BIRmS DURING THE LAST YEAR BY EDUCATION, DURATION OF MARRIAGE
AND AGE AT MARRIAGE (RURAL/URBAN)
This table is similar to rable F-llI and is present· ed in two parts. Part-A for rural areas and Part-B for urban areas. Here the data are presented for illite·
rates and literates by various educational levels as in table F-II. instead of religion.

266
ll'.lV PART A DISTRIBUTION OF CURRENTLY MARRIED WOMEN AND THE RELATED MARRIAGE
MYSORE
DURATION _...,._--------..__._..._--------Age at marriage All duration Less than 1 1-4 5-9
-------- --------- ----------W B W B W B W B
2 3 4 5 6 7 8 9
(i) IWTERATE
All Ages. 3,975,520 654,380 38,300 2,790 5H,710 105,090 587,590 156,860 Loss than 13 742,060 127,390 10,860 1,000 85,320 7,500 116,620 25,290 13-17 2,215,810 399,310 20,740 720 322,980 71,100 355,220 102,990 18-22 653,210 105,530 5,480 940 97,890 23,410 100,380 26,600 23-27 38,880 5,430 540 60 5,220 1,490 10,970 1,470
28+ 33,330 3,770 680 70 3,310 590 4,400 510 Unspecified 292,230 12,950
(ii) *LITERATE BUT LESS THAN MATRICULATE
All Ages. 518,820 109,600 1,140 340 109,250 29,030 104,620 32,000 Less than 13 52,730 9,270 760 90 8,940 900 10,540 2,420 13-17 301,050 68,950 3,880 120 67,640 17,570 63,930 20,060 18-22 119,470 27,190 2,210 1\0 29,680 9,500 27,690 8,850 23-27 8,590 2,070 200 20 2,340 910 2,030 610
28+ 3,320 430 90 650 150 430 60 Unspecified 33,660 1,690
(iii) MATRICULATE ANI> ABOVE BUT LESS THAN GRADUATE
All Agel. 38,500 7,900 760 50 9,520 2,900 9,930 2,780 Lcasthan 13 3,450 750 20 650 120 800 290 13-17 15,690 3,120 240 40 2,730 710 5,070 .1,350
18-22 12,860 3,370 410 5,230 1,730 3,270 1,070 23-27 1,940 410 90 10 770 310 630 50
28+ 630 110 140 30 160 20 UaspoclfSod 3,930 140
(Iv) GRADUATE AND ABOVE
AD Agel. 1,880 370 70 490 140 600 150 Losathan 13 . 30 10 13-17 470 110 20 10 250 60 18-22 630 120 30 320 80 140 40 23-27 460 110 10 160 60 160 SO 28+ 60 SO
Unspecified 230 30
W:Women B : Birtha "'Includes education not classified else-whore

267
BIRTHS DURING THE LAST YEAR BY EDUCATION, DURATION OF MARRIAGE AND AGE AT (RURAL)
STATE
01' MARRIAGE -------------------------_ ... _---------------------------------_
10-14 15-19 20-24 25-29 30+ U nspecc'fied ---------- -------- -------- -------- -------- -----_--W B W B W B W B W B W B
10 11 12 13 14 IS 16 17 18 19 20 21
(i) ILLITERATE
651,73i) 162,110 542,191) 108,340 470,630 65,210 302,900 24,830 565,150 16,200 292,310 12,950 131,570 34,900 115,340 28,370 88,340 16,820 6~,720 8,520 J28,280 4,950 10
395,750 100,240 328,860 64,380 285,720 38,680 183,070 12,210 323,420 7,990 50 118,480 "25,090 83,260 14,210 89,560 8,&10 5J,100 3,7('0 !o7,060 7,710
5,630 1,060 6,860 780 3,670 260 2,590 150 3,380 160 20 9,300 820 7,870 600 3,340 640 1,420 190 3,010 350
292,230 12,950
(ij) "'LITERATE BUT LESS THAN MATRICULATE
89,350 23,380 64,020 11,880 46,960 7,010 27,280 2,300 35,540 1,970 33,660 1,690 10,610 2,480 8,100 1,720 5,120 1,100 2,960 370 5,700 190 H,no 15,410 39,980 8,010 29,750 4,860 17,760 1,470 23,390 1,450 21,630 5,040 14,210 2,060 11,190 990 6,090 390 6,770 250
1,500 380 1,010 60 670 10 360 50 480 30 890 70 720 jO 230 50 IlO 20 200 50
33,660 1,690
Ciii) MATRICULATE AND ABOVE BUT LESS THAN GRADUATE
6,410 1,250 3,750 390 1,940 160 1,200 60 1,060 170 3,930 140 920 180 500 90 270 :;0 120 170 40
3,380 590 2,030 180 1,040 120 730 jO 470 100
1,640. 420 1,060 100 560 10 330 30 360 10 280 3U 70 10 40 20 40
190 30 90 10 30 20 20 3,930 140
(iv) GRADUATE AND ABOVE
300 50 80 70 30 10 230 lQ 10 10
160 50 10 10 10
90 40 10
50 30 40 10 10
230 30
70- 1 Census Karnatka/78

268
F.IV PART B DISTRIBUTION OF CURRENTLY MARRIFD WOMEN Al"D 'IHE REI ATID MARRIAGE
MYSORE
DURATION OF MARRIAGE
All duration Less than-l 1-4 ~-9 Age at Marria,c
W B W B W B W B
'1 3 4 5 6 7 8 9
0) IILITERATE
All Ages. 8!JS,365 118,100 5,100 115 97,385 21,710 121,295 31,185 Less than 13 107,925 16,835 410 15 8,340 830 15.715 3.585 13-17 422,515 71,045 2,715 45 61.740 13,845 73.185 19,610 18-22 167,810 25,365 1,795 45 24,780 6,445 29,950 7,520 23-27 9,890 1,465 110 :2,045 525 1,810 405
28+ 4.725 245 70 IO 400 65 635 65 Unspecified . 92,~00 3,145
(ii) *LITERATE OUT LESS THAN MATRICULATE
All Ages. 4P,865 74,725 5,000 100 73,415 20,450 81,675 23,585 Lass than 13 30,155 4,380 105 2,145 265 4,015 1,005 13-17 235,165 42,910 2,4 5 25 39,980 10,400 45,555 13,775 18-22 127,980 23,680 2,205 50 27,820 8,735 28,930 8,090 23-27 10,840 1,875 255 20 2,895 880 2,740 620
28+ 2,415 300 50 5 575 170 435 95 Unspecified 41,310 1,'i80
(iii) ,\I \T.l.fCUL \TE AND A'30VE BUT LESS THAN GRADUATE
All Ages. 102,360 18,165 2,695 45 31,395 9,490 21.990 5,295 Less than 13 2,060 340 90 10 245 65 13-17 27,490 4,830 470 5 7,675 1,915 6,195 1,710 18-22 49,820 10,235 1,630 25 18,755 6,045 12,445 2,840 23-27 10,105 2,130 475 10 4,190 1,360 2,6()(l 585 28+ 1,870 265 120 5 685 160 505 95 U ll~p~ci fled 11,015 365
(iv) GRADUATE AND ABOVE
All Ages. 11,205 1,730 420 5 3,620 1,010 2,320 500 Less than 13 190 35 5 15 5 13-17 850 95 60 5 165 45 18-22 4,950 860 190 5 1,890 520 1,210 275 23-27 3,025 590 205 1,355 405 750 140 28+ 710 125 25 310 80 180 35 Unspecified 1,480 25

269
BIRTHS DURING THE LAST YEAR BY EDUCATION, DURATION OF MA\t.RIAGE Al"D AGE AT (URBAN)
STATE
DURATION OF MARRIAGE
10-14 15-19 20-24 25-29 30+ Unspecified
W B W B W B W B W B W B
10 11 12 13 14 15 16 17 18 19 20 21
(i )ILLITERATE
IH,i)) 21,115 1B,5)) 17,'H5 9t,HS D,1l3\) 55,950 3,275 108,140 1,880 92,530 3,145 20,335 4,840 !1,IJ5 3,905 13,720 2,140 10,5".5 920 21,745 600 76,755 17,650 5),920 10,815 5 ~,500 6150 32,610 2,005 61,065 915 25 30,365 5,91)5 22,465 2,980 22,070 1,680 12,035 340 24,350 360
1,865 280 1,645 190 970 50 650 10 795 5 1,280 70 1,425 25 585 10 140 185 5
92,500 .3,145
Cii) *LITERATE BUT LESS THAN MATRICULATE
77,H~ 1J,150 5',nS 7,570 45,185 3,7j5 25,585 905 41,855 340 41,315 1,380
5,620 1,375 4,975 1,025 3,615 455 2,355 190 7,325 65 44,655 10,375 32,165 4,880 28,780 2,630 16,450 600 25,165 225 24,150 4,370 16,045 1,635 12,830 640 7,270 110 8,725 50 5
2,130 300 1,145 30 725 20 420 5 560 485 30 465 235 90 80
41,310 1,580
(iii) ~ \ TlHCULATE AND ABOVE BUT LES~ THAN GRADUATE
U,360 1,955 8,655 675 6,210 270 2,895 50 3,145 20 11,015 365
415 85 465 95 380 75 160 10 305 4,445 735 3,410 315 2,550 120 1,385 25 1,360 5 7,745 975 4,045 245 1,795 75 1,120 15 1,285 H 1,515 ISS 595 20 395 155 180
240 5 140 90 75 IS 11,015 365
ltv) GRADUATE AND ABOVE
1,535 115 680 40 605 35 260 285 1,480 25 30 10 45 10 40 10 25 30
715 35 125 160 10 55 70 790 25 360 30 190 5 105 115 375 35 140 115 10 50 35 125 10 10 25 35
1,480 25
W : Women; B Births; "'Includes education not classified else where.


F~V DISTRIBUTION OF CURRENTLY MARRIED WOMEN AND TH E RELATED BIRTHS DURING THE LAST YEAR BY RELIGION, EDUCATION
GROUPS, PRESENT AGE AND AGE AT MARRIAGE (RURAL/URBAN)
271


F-V DiSTRIBUTION OF CURRENTLY MARRIED WOMEN AND THE RELATED 8IRTHS DURING THE LAST YEAR BY RELIGION, EDUCATION GROUPS, PRESENT
AGE AND AGE AT MARRIAGE (RURAL/URBAN)
This table provides the distribution of women and births by Religion-cUll-Education, present age and age at marriage. This table, in fact. is the combination of tables F-I and F-II and seek to give the summed up picture these two tables separately give. These data
273
will help in deriving differentials by Religion-cumEducation in mediam age at marriage and in age specific fertility rate, total fertility rate and general fertility rate for various age at marriage.

274
F-V PART-A DISTRIBUTION OF CURRENTLY MARRIED WOMEN AND TlIE RELA'IED AGE AND AGE AT
MYSORE
PRESENT AGE
All Ag~s Lessthan13 13-17 18-22 23-27 A~e at M~rriage ----- --------
W B W B W B W B W B
2 3 4 5 6 7 8 9 10 11
(i) HINDUS: ILLITERATE
MI Ages 3,666,330 595,760 47,430 440 236,930 29,990 656,080 171,850 569,120 147,460 L~ss than 13 . 639,530 116,930 40,95G 370 79,450 9,790 13·1,430 37,0~0 104,860 27,560 13-17 2,044,410 363,980 ; 39,090 19,4l0 400,340 111,240 329,590 89,450 18-22 596,420 94,720 82,180 20,530 93,950 26,120 23-27 35,380 4,940 7,710 1,610 28+ 30,710 3,570 Unspecified 269,880 11,620 6,480 70 18,390 790 39,130 3,080 33,010 2,720
(ii) HINDUS: "LITERATE BUr LE3S TH\N MATRICULATE
AU Ages . 45f,660 95,700 4,310 60 37,780 5,670 120,230 37,030 9",770 26,190 Less shan 13 . 47,650 8,200 3,650 30 8,720 1,300 10,6JO 2,960 7,750 1,780 13-17 264,860 60,980 26,310 4,240 79,270 26,910 53,530 15,150 18-22 101,890 22,930 24,410 6,760 25,400 8,160 23-27 7,410 1,810 1,950 680 28+ 3,030 380 Unsp~cified 29,820 1,400 . 660 30 2,750 130 5,940 440 5,140 420
(iii) HINDUS: MATiHCULATE AND ABOVE BUT LESS THAN GRADUATE
All Ages 33,330 6,850 1,770 220 9,970 2,620 7,220 1,710 L'~ss than 13 3,240 710 29U 50 910 230 540 80 13-17 13,270 2,590 1,300 170 4,270 1,220 2,400 390 18-22 11,360 3,020 3,980 1,120 3,150 1,070 23-27 1,660 330 540 150 28+ 570 100 Unspecified 3,230 100 180 810 50 590 20
(iv) HINDUS: GRADUATE AND ABOVE
All Ages • 1,490 350 180 30 730 260 Lessthanl3 30 13-17 450 110 30 10 380 100 18-22 410 100 130 20 160 70 23-27 440 110 170 60 28+ SO Unspecified 110 30 20 20 30
(j) \,{USLIMS : [LLITERATE
All Ages WI,940 49,160 2,760 40 16,880 3,290 49,250 14,540 40,160 11,600 L~ss than 13 41,000 8,630 2,290 20 4,960 990 8,390 2,760 6,530 1,890 13-17 143,600 30,610 10,380 2,210 31,010 9,750 24,220 7,060
18-22 42,110 8,300 6,830 1,710 6,680 2,350 23-27 2,300 320 440 50
28+ 1,710 140
Unspecified 18,220 1,160 470 20 1,540 90 3,020 320 2,290 250

275
:BIRTHS DURING THE LAST YEAR BY RELIGION, EDUCATION GROUPS, PRESENT MARRIAGE (RURAL)
STATE
PRESENT AGE
28-32 33-37 38-42 43-47 48+ Unspecified ------- -------- --------
W B W B W B W B W B W B
12 13 14 15 16 17 18 19 20 21 22 23
0) HINDUS: ILLITERATE
651,140 135,540 420,330 61,450 421,650 33,760 233,320 8,670 430,200 6,600 130 115,6.20 25,270 59,450 9,370 62,680 5,380 30,000 1,240 62,USO 950 10 371,100 81,380 2 ~2 ,')60 35,080 2.~ l,610 18,220 125,900 4,590 211,660 3,610 30 10 7,560 24,130 7~,300 11,970 9),150 8,470 49,750 2,080 98,530 1,420
9,950 1,580 4,700 990 5,700 480 3,050 130 4,250 150 20 5,870 570 8,610 1,820 4,490 530 4,150 350 7,590 300
41,040 2,610 31,210 1,220 33,990 680 20,470 280 46,090 170 70
(h) HINDUS: *LlTERATE BUT LESS THAN MATRICULATE
77,800 16,530 44,570 6,620 34,410 2,540 17,560 650 24,230 410 6,540 1,270 3,150 570 2,43 j 170 1,740 90 3,060 30
42,190 8,7S0 24,220 3,740 18,750 1,560 9,340 340 11,250 260 21,380 5,260 11,220 1,790 9,130 690 4,360 190 5,990 80
2,280 720 1,320 280 880 90 490 20 490 20 470 230 1,570 110 340 J 0 230 10 420 20
4,940 270 3,090 130 2,880 20 1,400 3,020
(iii) HINDUS: MATRICULATE AND ABOVE BUT LESS THAN GRADUATE
6,280 1,340 3,940 570 1,940 240 770 100 1,440 50 570 190 330 0<J 300 70 70 230 10
I,S20 270 2,20) 320 650 140 200 50 430 30 2,390 6S0 820 90 480 20 180 40 360
510 140 250 30 140 30 10 190 340 50 100 40 70 20 40 10 650 10 240 10 300 10 270 190
(iv) HINDUS: GRADUATE AND ABOVE
340 60 90 70 20 60 10 20 10 10 20 70 10 30 20
190 50 20 10 50 30 10 10
30 10 20 10
(i) MUSLIMS: ILLITERATE
42,720 10,810 27,270 4,730 Z8,j60 2,880 14,570 850 26,950 420 20 6,730 1,750 3"190 580 3,960 420 1,530 130 3,110 90 10
24,590 6,380 16,120 2,990 15,460 1,550 8,230 500 13,590 170 7,990 2,270 5,370 920 6,050 760 2,950 160 6,240 130
400 80 410 100 430 60 200 20 420 10 340 70 290 30 330 20 290 46 20
2,670 260 1,590 110 2,130 70 1,370 40 3,130 10

i76 F-V PART-A DISTRIBUTION OF CURRENTLY MARRIED WOMEN AND 'lEE REtA'IED
AGE AND AGE AT
MYSORE
PRSS:SNT AGE -----------------------------_._-------------------
Age at Marriage All Ages Less than 13 13-17 18--22 23-27 --------- -------- ---_._._--- ----------- -------_
W B W B W B W B W B
2 3 4 5 6 7 8 9 10 11
[iI) MUSLIMS: LITERATE BUT LESS THAN MATRICULATE
All Ages 40,190 8,590 170 3,420 550 10,710 3,150 7,720 2,190 Lessthan 13 3,780 860 140 520 100 960 330 740 140 13-17 . 25,120 5,570 2,730 "~50 6,900 2,060 4,670 1,480 18-22 8,320 1,930 2,260 710 1,810 530
23-27 310 30 70
28+ 130 20 UIlsp,cificd 2,530 180 30 170 590 50 430 40
(iii) MUSLIMS: M\TKICULATE AND ABOVE BUT LESS THAN GRADUATE
All Ages 3,290 620 210 40 970 250 740 18
Less than 13 200 40 10 10 90 10 40
13-17 1,940 420 150 30 580 170 450 140
18-22 630 110 180 40 16() 40
23-27 40 10 10
28+ 10
Unspecified 470 40 50 120 30 80
(if) MUSLIMS: GRADUATE AND ABOVE
All Ages 210 20 50 10 50 10
Less than 13 13-17 10 10
18-22 . 100 20 40 10 40 10
23-27
28+ 10
Unspecified 90 10
(i) CHRISTIANS ILLITERATE
All Ages 3",290 6,080 3()0 1,610 222 4,790 1,430 4,600 1,490
Less than 13 5,780 1,080 260 680 110 1,130 310 880 310
13-17 15,750 2,730 840 110 2,460 750 2,100 6-+0
18-22 10,840 2,010 880 330 1,150 470
23-27 680 100 130 50
28+ 450 40
Unspecified 2,790 120 40 90 320 40 340 20
(iI) CHRISTIANS: LITERATE BUT LESS THAN MATRICULATE
All Ages 15,660 3,530 30. 210 60 2,190 770 3,270 1,33
Lellsthan 13 270 70 20 30 20 60 40
13-17 6,180 1,250 200 60 1,000 310 1,030 390
18-22 7,270 1,870 980 430 1,800 740
23-27 760 210 210 110
28+ 120 "3D
Unspecified 1,060 100 10 10 180 10 170 50

271
BIRTHS DURING THE LAST Y~AR BY RELIGION, EDUCATION GROUPS, PRESENT MARRIAGE (RURAL)
STATE
PRESENT AGE
28-32 33-37 38-42 43_47 48+ Un>pccified
'tV B W B W B W B W B W B
12 13 14 15 16 17 18 19 20 21 22 23
lm MU3LI.\1:3 : Llf£RATE BUT LESS ,(HAN MAT.RI<::UUTE
6,990 1,710 4,210 580 3,180 240 1,750 100 2,040 70 590 160 250 50 360 60 90 10 130 10
4,230 1,020 2,450 310 1,840 140 1,240 60 1,060 50 1,630 450 1,150 190 720 40 200 10 550
70 20 60 10 60 40 10
10 20 20 40 20 40
460 60 280 20 180 140 250 10
(iii) MUSLIMS : MATRICULATE AND ABOVE BUT LESS UlAN GRADUATE
560 120 350 30 200 70 190 10 10 30 10 20
320 70 200 10 120 30 90
140 30 80 50 10 10 10 10 20 10
90 to 20 10 30 70
(iv) MUSLIMS: GRADUATE ANI> ABOVE
20 20 70
20
10 10 70
(i) CHRISTIANS : ILLITERATE
5,850 1,SOIl 4,430 640 4,680 480 2,960 1'70 7,060 150 10
740 210 510 70 650 40 290 30 630 10
2,520 570 1,860 300 1,770 220 1,230 70 2,970 70
2,030 640 1,390 :240 1,770 200 1,060 70 2,560 6u
90 20 140 10 100 10 70 150 10
130 20 110 80 10 40 90 10
340 40 420 20 310 270 660
(ii) CHRISTIANS : LITERATE BUT LESS THAN MA TRICULA TE
'1,100 710 ! 2,340 470 1,740 140 1,260 40 1,520 10
40 10 40 50 30
1,160 220 100 170 610 80 540 10 640 10
1,490 400 970 250 900 40 510 10 620
160 30 170 40 60 20 90 JO 70
20 10 30 10 30 30 10 10
230 40 130 90 90 150

278
F-V PART.A DISTRIBUTION OF CURRENTLY MARRIED WOMEN AND Tl:IE RELATED AGE AND AGE AT
MYSORE
PRESENT AGE Ageat Marriage -------~----.___--------------------------------------
All Ages Less than 13 13-17 18-22 23-27 ----------- -------- -------- -----_--- ---------
W B W B W B W R W B
2 3 4 5 6 7 8 9 10 JJ
(iii) CHRISTIANS: MATRICULATE AND ABOVE BUT LESS THAN GRADUATE
All Ages 1,570 370 20 240 50 490 180 Less than 13 10 10 13-17 310 80 10 80 30 100 30 18-22 770 220 140 20 270 120 23-27 220 60 70 30
28+ 50 10 Unspecified 210 10 10 50
(iV) CHRISTIANS: GRADUATE AND ABOVE
All Ages 170 30 100 Less than 13 13-17 10 10
18-22 110 10 100
23-27 20
28+ Unspecified 30 10
(i) JAINS:ILLITERATE
AIlAges . 21,210 3,130 560 40 1,910 300 3,300 740 2,830 760 Less than 13 5,390 690 550 40 580 30 670 220 760 ISO 13-17 11600 1,960 1,190 300 2,090 420 1,470 470
18-22 2,730 400 330 90 450 110
23-27 150 30 40 10
28+ 180 10 Unspecified 1,160 40 10 140 210 10 UO 20
(ii) JAINS : LITERATE BUT LESS THAN MATRICULATE
All Ages 8,140 1,750 100 810 70 2,210 720 1,470 470
Lessthan 13 1,030 140 90 260 10 210 SO 150 40
13-17 4,840 1,130 530 60 1,480 540 810 270
18-22 1,900 450 480 130 430 150
23-27 90 20 20 10
28+ 30
Unspecified 250 10 10 20 40 60
(iii) JAINS: MATRICULATE AND ABOVE BUT LESS THAN GRADUATE
All Ages. 310 60 20 10 70 20 100 20
Less than 13 13-17 170 30 20 10 30 10 50 10
18-22 100 20 30 10 4') 10
23-27 20 10 10
28+ Unspecified 20 10

279
BIRTHS DURING THE LAST YEAR BY RELIGION, EDUCATION GROUPS, PRESENT MARRIAGE (RURAL)
STATE
PRESENT AGB
28-32 33-37 38-42 43-47 48+
--W B W B W B W B W B
12 13 14 15 16 17 18 19 20 21
(iii) CHRISTIANS: M.HRICULATE AND ABOVE BUT LESS THAN GR.ADUATE
330 60 230 70 120 10 '30 110
20 10 50 10 10 20 20
170 20 130 50 30 10 30
70 30 10 30 40 10 10 20 20
70 30 30 10
(iv) CHRISTIANS : GRADUATE AND ABOVE
10 10 10 10
10 10
10 10
(i) JAINS : ILLITERATE
'3,240 640 2,500 320 2,,50 200 1,540 70 2,980 30
850 130 450 70 520 30 350 20 660
1,790 410 1,460 220 1,290 100 900 40 1,410 410 90 400 20 390 60 190 10 560 20
10 40 10 10 10 40 10 60 10 20 20 80
120 130 140 10 70 230
(ii) JAINS : LITERATE aUT LESS THAN MATRICULATE
1,380 300 920 80 570 90 290 20 390
160 30 90 50 10 20
810 160 480 60 300 20 180 20 250
35C 100 310 20 180 50 70 80
30 10 10 10 20 20 10
30 30 10 10 20 30
(iii) JAINS : MATRICULATE AND ABOVE BUT LESS THAN GRADUATE
40 10 50 10 20
10 30 10 20
10 20 10 10
10
Unspecified
W B
22 23

280
F.V PART.A DISTRIBUTION OF CURRENTLY MARRJED WOMEN AND IHE REIA1ED AGE AND AGE AT
All Ages Lessthan 13 13-17 18-22 23-27
28+ Unspecified
All Ages . Less than 13 13-17 18-22 23-27
n+ U nspeci tied
All Ages . lAss than 13 13-17 18-22 23-27
28+ Unspecified
All Ages . Less than 13 13-17 18-22 23-27 28+ Unspecified
All Ages • Less than 13 13-17 18-22 23-27 28+ Unspecified
MYSORE
PRESENT AGE ---------------------------- _-------------------------
All Ages Less than 13 13--17 18-22 23-27
W B W B W B W B W B
2 3 4 5 6 7 8 9 10 11
(Iv) JAINS: GRADUATE AND ABOVE
(I) BUDDHISTS: lLLITERAT~
2,610 240 40 80 10 260 20 350 60 2S0 60 40 20 60 10 50 20 410 30 30 110 10 100 10
1, 100 100 50 170 30 360 30 30 280 10 170 10 30 10 40
(iI)BJDD:USTS: J.ITERATE BUT LESS THAN MATRlCULATE
170 30 10 10 60 10
50 20 10 10 10 20 90 10 30 10 20 10
10
(iii) BUDDHISTS: MATI\lCULATE AND ABOVE BUT LESS THAN GRADUATE
(iv) BUDDHISTS: GRADUATE AND ABOVE
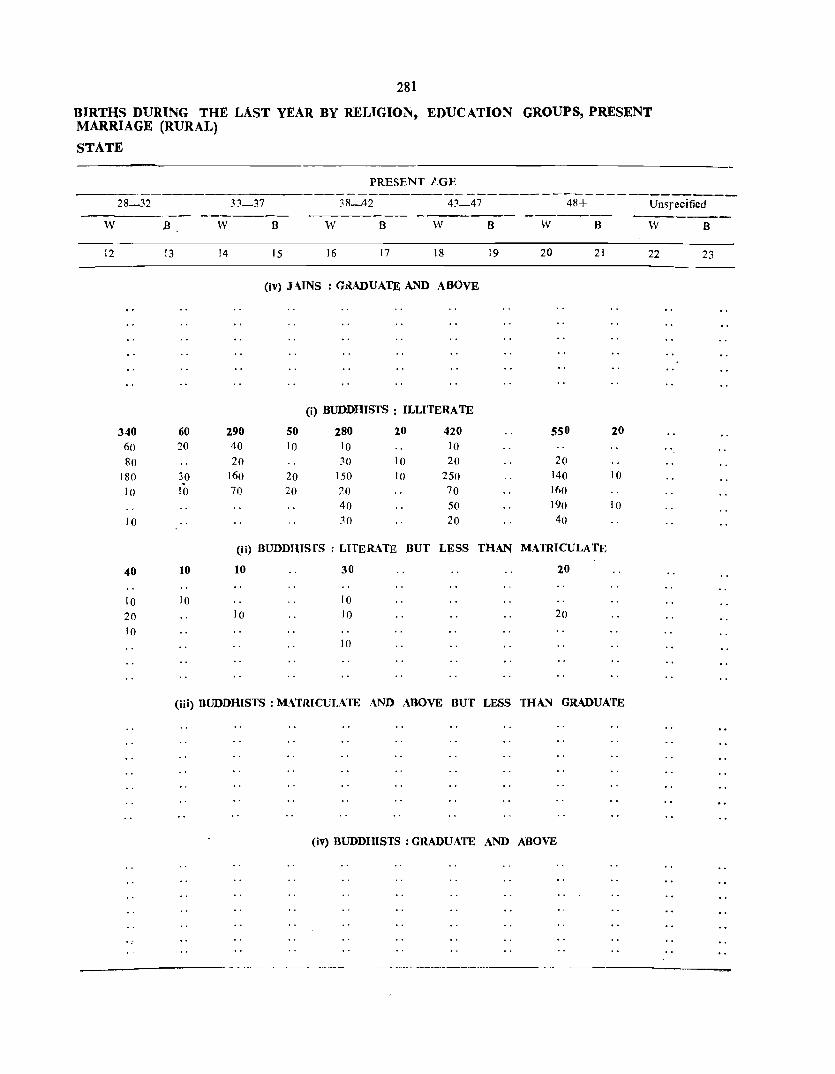
281
BIRTHS DURING THE LAST YEAR BY RELIGION, EDUCATION GROUPS, PRESENT MARRIAGE (RURAL)
STATE
PRESENT AGE
3~-37 4~-47 48+ Unsrecified
w B w B w B w B w B w B
12 13 14 15 16 17 18 19 20 21 22 23
(IV) JAINS : GRADUATE AND ABOVE
(i) BUDDHISTS : ILLITERATE
340 60 290 50 280 20 420 550 20 60 20 40 10 10 10
80 20 30 10 20 20
180 30 160 20 150 10 250 140 10
10 10 70 20 20 70 160 40 50 190 10
10 30 20 40
(Ii) BUDDHISrS : LITERATE BUT LESS THAN MATRICULATE
40 10 10 30 20
10 10 10
20 10 10 20
10 10
(iii) BUDDHISTS: MATRICULATE AND ABOVE BUT LESS THAN GRADUATE
(Iv) BUDDHISTS: GRADUATE AND ABOVE

282
F.V PART-A DISTRIBUTION OF CURRENTLY MARRIED WOMEN AND THE RELATED AGE AND AGE AT
Aa' a t Marriage
All Ages . Less than 13 13-17 18-22 23-27 28+ Unspecified
All Ages • Less than 13 13-17 18--22 23-27 28+ Unspecified
PRESENT AGE
All Ages Less than 13 13-17
W B W B W B
2 3 4 5 6 7
(i) SIKHS: ILLITERATE
140 10 20 10 70 20 40 10 10
10 10
10
(ii) : *SIK;HS: LITERATE BUT LESS THAN
18-22
W B
8 9
20 10
10
MATRICULATE
fiii) SIMIHS: MATRICULATE AND ABOiVE BUT LESS THAN GRADUATE
All Ages . Less than 13 13-17 18-22 23-27 28+ Unsp;,cified
All Ages • Less than 13 13-17 18--22 23-27 28+ Unspecified
W,: Women B: Births
(iv) SIKHS: GRADUATE AND ABOVE
10
10
",Includes ed'lcation not classiii~d elsewhere.
MYSORE
23-27
W B
10 11
40 1 20 10
10 10

283
BIRTHS DURING THE IJAST YEAR, BY RELIGION, EDUCATION GROUPS, PRESENT MARRIAGE (RURAL)
STATE
28-32
W B
12 13
10
10
33-37
W B W
14 15 16
20
20
PRESENT AGE
38-42 43-47
B W B
17 18 19
(i) SIKHS: ILLITERATE
10 10
W
20
48+
10 10
(ii) surns : *LlTERATE BUT LESS THAN MATRICULATE
B
21
(iii) SIKHS: MATRICULATE AND ABOVE BUT LESS THAN GRADUATE
(iv) SIKHS: GRADUATE AND ABOVE
10
10
W : Women B: Births *Includes education not classified elsewr.ere
Unspecified
W
22
""_
B
23

284
F-V PART-B DISTRIBUTIoN OF CURRENTLy MARRIED WOMEN AND THE RELA'IED AND AGE AT
MYSORE
PRESENT
----...._...,_--.....__----------------------.__-...._-.__-----------.__..---~-All Ages Lessthan 13 13-17 18-22 23-27 Age a t Marriage --------"""""-- _---_.__.__------ -----_--.,__ --_" --------- ------
W B W B W B W B W B
2 3 4 5 6 7 8 9 10 II
(i) HINDUS: ILLITERATE
All Ages 504,170 85,22 3,145 15 27,510 3,180 11)8,21)0 15,335 93,310 22,085 Lessthan 13 89,570 13,260 2,580 15 7,940 990 17,095 4,140 13,935 3.400 13-17 314,810 50,780 16,750 2,090 6~,740 11,070 52,850 12,510 18-22 120,195 17,750 1~,155 3,700 21.585 5.400 23-27 7,095 960 1,115 220 28+ 3,430 175 Unspecified 69,070 2,295 565 2,820 100 9,610 675 8,895 555
(in :-((N'OU3: 'liL1:t&RATE BUT LESS THAN MATRICULATE
AI) Ages 325,955 50,715 720 5 13,210 1,700 163,790 17,070 63,()55 16,130 Lessthan 13 24,435 3,075 525 5 2,050 300 4,210 1,070 3,715 800 13-17 171,135 28,485 9,805 1,370 38,295 11,115 31,280 7,975 18-22 92,345 16,570 16,630 4,570 22,035 6,,515 23-27 7,700 1,395 1,645 500 28+ 1,605 205 Unspecified 28,735 985 195 1,355 30 4,595 315 4,390 340
(iii) HINDUS: \IAT"Q.ICULATE AND ABOVE BUT LESS THAN GRADUATE
All Ages 81,730 14,340 1,910 150 21,620 5,260 22,065 5,625 Less than 13 1,715 265 120 10 355 90 340 85 13-17 22,640 3,720 1,515 135 7,900 2,110 4,055 845 18-22 40,030 8,185 11,370 2,935 13,025 3,825 23-27 7,565 1,710 2,675 775 28+ 1,200 170 Unspecified 8,580 290 275 5 1,995 125 1,970 95
(iv) Hl'NOUS: GRADUATE AND ABOVE
All Ages 9,135 1,340 20 1,080 160 3,045 699 Loss than 13 155 20 5 30 10 45 5 13-17 655 45 10 80 5 140 35 18-22 4,145 700 820 145 1,~20 440 23-27 2,435 470 890 195 28+ ,505 85 Unspecified 1,240 20 5 150 350 15
(i) xmSLlMS : ILLrrERATE
All Ag.s 180,250 29,760 420 15 8,360 1,390 34,875 9,065 31,010 7,840 Less than 13 16,600 3,245 350 15 1,615 290 3,795 1,045 3,100 900 13-17 97,340 18,460 5,840 1,065 21,765 6,235 17,490 4,750 18-22 42,000 6,795 6,105 1,570 7,160 1,840 23-27 2,210 420 395 125 28+ 1,085 65
Unspecified 21,015 775 70 905 35 3,210 215 2,865 225

285
)J1RfHS DURING THE LAST YEAR BY RELIGION, EDUCATION GHOUPS, PRESENT AGE MARRIAGE (URBAN)
STATE
AOE -------
28-32 33-37 38-42 43-47 48+ Unspecified
W B W B W B W B W B W B
12 13 14 15 16 17 18 19 20 21 22 23
(i) IlINDUS : ILLITERATE
106,880 19,245 7~,860 8,755 70,115 4,555 38,520. 1,095 77,525 705 ~5
14,520 2,760 9,035 1,160 9,580 525 44,645 175 [0,240 95 55,835 10,875 39,545 5,075 32,635 2,355 18,740 560 32,700 245 15 23,705 ;4,760 15,850 2,040 '17,181) 1,:110 8,390 265 17,730 275
1,525 320 1,225 200 1,455 175 750 35 1,025 10
205· 35 350 60 7,+0 45 665 15 1470 20 11,090 495 7,855 220 8,525 145 5,330 4~ 14,360 60 20
(ii) HINDUS: *LITERATE BUT LESS THAN MATRICULATE
51),850 10,005 40,776 3,985 ~4,145 1,4JO 19,610 270 30,785 140 10 3,550 560 2,140 225 2,200 85 1,445 10 ;4,540 20
29,360 4,920 21,330 2,130 17,280 765 9,780 135 14,005 75 19,520 3,665 12,145 1,235 9,990 445 5,420 105 6,605 35 2,355 575 1,590 240 1,005 65 490 10 615 5
330 95 290 75 270 30 265 5 450
4,735 190 3,275 80 3,400 20 2,210 5 4,570 5 10
(iii) HINDUS: MATRICULATE AND ABOVE BUT LESS THAN GRADUATE
16,425 2,440 ~9,200 675 5,550 175 2,490 15 2470
385 50 175 25 100 5 55 185
3,500 450 2,440 135 1,690 40 745 5 795
7,675 1,060 3,880 290 2,360 65 955 10 765
2,810 755 1,205 150 490 30 230 155
405 75 425 65 185 30 100 85
1,650 50 1,075 10 72S 5 405 485
(iv) ftINDUS : GRADUATE AND ABOVE
2,410 '380 1,195 7S 755 10 115 5 115
2S 5 15 10 10 15
120 135 5 90 40 40
860 85 380 15 285 IS 95 85
925 240 310 2; 165 5 90 5 55
190 45 165 30 90 10 30 30
290 5 190 115 50 90
(i) MUSLIMS: ILLITERATE
'Jl,710 6,340 20,755 2,975 19,980 1,520 10,470 385 22,655 230 15 2,750 535 1,550 280 1,485 130 635 40 1,320 10
16,830 3,6<10 11,400 1,725 9,310 740 5,155 200 9,;40 105 10
8,240 1,815 5,135 850 5,880 535 2,955 80 6,525 1(15
525 160 325 60 400 40 165 30 400 5
85 15 70 220 30 180 20 525 5 3,280 175 2,275 60 2,685 45 1,380 15 4,345 5

286
F-V PART-B DISTRIBUTION OF CURRENTLY MARRIED WOMEN AND THE RELATED AND AGE AT
MYSORE
PRESENT AGE
Ase at Marriale All Ages Less than13 13-17 18-22 23-27
W B W B W B W B W B
1 :2 3 4 5 6 7 8 9 10 11
(d) MUSLIMS: *LITERATE BUT LESS THAN MATRICULATE
.tIl All" • 89,340 18,830 130 5 5,005 835 22,305 6,720 18,315 5,245 l.eSI than 13 4,970 1,215 85 5 520 105 1,235 420 1,130 355 13-17 50,195 11,980 3,960 710 14,035 4,740 10,210 3,135 18-2) 22,950 4,830 5,040 1,400 5,105 1,545 13-:l7 . },470 250 340 75 28,. 345 40 U n.peclfied 9,410 SIS 45 525 20 1,995 160 1,530 13
(iii) MUSLIMS: MATRICULATE AND ABOVE BUT LESS THAN GRADUATE
.111 Aiel 8,070 1,795 5 350 20 2,660 795 1,955 565 Len than 13 185 40 5 15 75 10 45 25 13-11 3,000 760 290 20 1,100 410 600 195 18-21 3,370 855 1,220 370 935 285 23-1' 405 100 125 40 28+ • 85 10 Unspecified 1,025 30 45 265 5 250 20
(iV) MUSLIMS: GRADUATE AND ABOVE
All Ages • 695 180 5 125 55 185 55 Le&sthanl3 30 15 10 10 10 13-17 • 145 35 5 45 25 25 18-22 · 290 70 65 20 85 30 23-27 120 45 50 25 28+ 40 15 Unspecified 70 5 15
(i) CHRISTIANS: ILLITERATE
All Ages · 15,420 2,325 25 290 65 2,095 565 2,580 685 Less than13 1,060 210 25 50 240 60 230 80 13-17 7,360 1,330 195 60 1,230 360 1,270 375 18-22 · 4,435 640 450 130 780 200 23-27 505 75 55 10 28+ 180 5
Unspecified. 1,880 65 45 5 175 15 245 20
(ii) CHRISTIANS: *LITERATE BUT LESS THAN MATRICULATE
All Ages • 24,640 3,880 10 340 65 3,095 1,015 4,410 1,240 Lesstnan13 405 40 30 55 15 100 5 13-17 · 9,405 1,680 235 60 1,485 540 1,715 500 18-22 · 10,315 1,850 1,265 455 2,040 635 23-27 1,475 195 200 75 28+ 425 5S Unsp.::cifted . 2,SSS 60 10 75 5 290 5 355 25
-

287
BIRTH, DURING THE LAST YEAR BY RELIGION, EDUCATION GROUPS, PRESENT AGE MARRIAGE (URBAN)
STATE
PRESENT AGE
28-32 33-37 38-42 43-47 48+ Un~pecified
W B W B W B W B W B W
12 13 14 15 16 17 18 19 20 21 22 23
(ii) MUSLIMS: *LlTERATE BUT LESS THAN MATRICULATE
16,855 1,715 10,170 1,565 7,830 585 3,78U 120 4,945 4G 5 935 230 485 60 280 35 120 5 180
8,800 2,075 5,435 925 3,760 300 1,785 70 2,210 25 5,000 1,170 2,865 460 2,455 210 1,095 30 1,385 15 5
370 110 280 50 235 5 125 IO 120 50 10 65 25 45 5 &0 105
1,700 120 1,040 45 1,055 30 575 5 945
(iii) \fUSLIMS : MATRICULATE AND ABOVE BUT LESS THAN GRADUATE
1,510 295 630 75 515 30 175 270 15 30 5 10 S
495 105 210 20 155 5 75 75 5 600 155 2:50 20 190 t5 65 JlO 10 135 25 85 30 35 5 10 15
10 30 5 35 5 5 .5 240 5 :55 90 20 60
(iV) MUSLIMS: GRADUATE AND ABOVE .1Ili
205 55 95 15 35 25 20 5 5 5
30 5 35 5 5 85 20 15 15 1:5 10 50 20 5 10 5 15 10 25 5 20 10 10 10
(i) CHRISTIANS,: ILLITERATE
2,645 555 '2,030 295 '1,730 125 1,150 25 '2,875 10 145 35 95 30 110 5 35 ' 130
1,345 300 '1,000 160 775 50 520 20 '1,025 5 735 160 615 85 555 55 350 5 950 5 120 45 65 15 70 5 35 160
20 25 5 15 120 300 15 235 5 195 5 195 490
(Ii) CHRISTIANS: *LITERATE BUT LESS THAN MATRICULATE
4,565 870 "3,660 495 3,240 170 1,931) 20 1,170 S 80 5 65 15 40 10 15
1,655 305 1,555 210 1,210 50 615 10 875 S 2,080 440 1,340 220 1.250 90 875 10 1,525
315 90 255 25 195 5 145 36~
55 15 85 25 80 IS SO US 380 15 360 405 10 U5 4,U
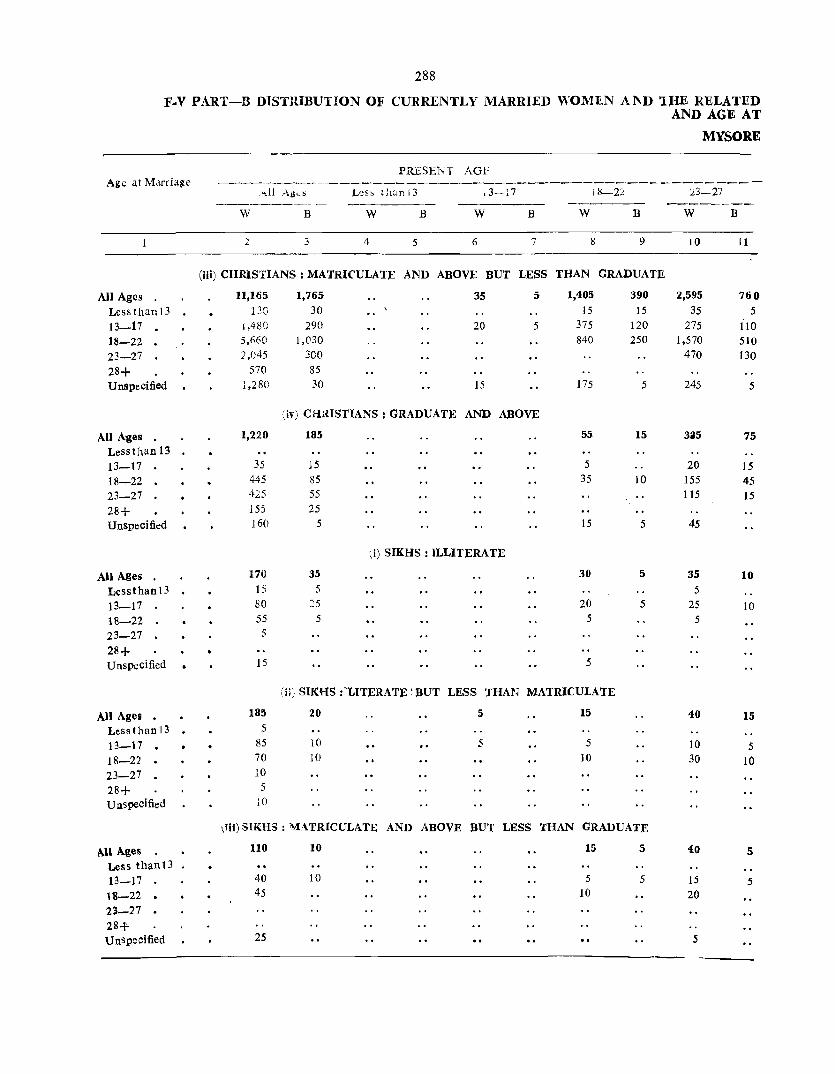
288
F-V PART-B DISTlUBUTION OF CURRENTLY MARRIED WOMEN AND lHE RELATED AND AGE AT
MYSORE
PRESEN1 AGE Age at Marriage ~------.---------- -
,;"11 AIO<.S Les> than 13 ;3-17 ;lJ-2:L 23-27 ------- ----_-
W B W B W B W B W B
2 3 4 5 6 7 8 9 10 11
(iii) CHRISTIANS: MATRICULATE AND ABOVE BUT LESS THAN GRADUATE
All Ages 11,165 1,765 35 5 1,405 390 2,595 760
Lessthanl3 130 30 15 15 35 5
13-17 · 1,48C 290 20 5 375 120 275 110 18-22 5,660 1,030 840 250 1,570 510 23-27 2,045 300 470 130
28+ 570 85
Unspecified 1.280 30 15 175 5 245 5
(iv) CHlHSTIANS : GRADUATE AND ABOVE
All Ages 1,220 185 55 15 3a5 75 Lessthan 13 13-17 35 15 5 20 15 18-22 445 85 35 10 155 45 23-27 425 55 115 15
28+ 155 25
Unspecified 160 5 15 5 45
(i) SIKHS: ILLITERATE
All Ages 170 35 30 5 35 10 Less t han13 . 15 5 5
13-17 80 25 20 5 25 10 18-22 55 5 5 5 23-27 5
28+ Unspecified 15 5
(iii SIKHS :'LITERATE 'BUT LESS THAN MATRICULATE
All Ages · 185 20 5 15 40 15 Lessthan13 . 5
13-17 · 85 10 5 5 10 5 18-22 · 70 10 10 30 10 23-27 · 10
28+ 5
Unspecified 10
\iii) SIKHS: MATRICULATE AND ABOVE BUT LESS THAN GRADUATE
AU Ages 110 10 15 5 40 5 Less than 13 13-17 40 10 5 5 15 5 18-22 · 45 10 20
23-27 · 28+ Unspecified 25 5

289
BIRTHS DURING TaE LAST YEAR BY llELIGION, EDUCATION GROUPS, P;R)ESENT AGE MARRIAGE (URBAN) .
STATE
PRESENT AGE
28-32 33-37 38-42 43-47
W B W B W B W B W B
12 13 14 15 16 17 18 19 20 21
(iii) CHRISTIANS: MATRICULATE AND ABOVE BUT LESS THAN GRADUATE
1,070 305
:ll' 1,035
475 100 200
255
8S 125 25 20
45 10
15 20
40 5
30
5
10
S 5
390 10
30 170 135 30 15
50
25 20
5
15 5 5 5
1,625 20
255 665 400 130 155
155
55 $0 30 20
25
10 10
5
155 1,296 45 695 10 IS 10
15 145 .5 70 5 60 595 25 315 , 25 295 10 160 50 95 5 6$ 5 145 75
(iV)_CHRISTIANS : GRADUATE AND ABOVE
35 165 5 80 5
10
5 50 20 IS 65 5 25 IS 30 20 .5
10 IS
(I) SIKHS : ILLITERATE
5 20
5 5 10 5
1,450
liS 640 245 180 270
175
45 45 50 35
15
5 5
5
(il) SIKHS: LITERATE BUT LESS THAN MATRICULATE
40 5 20 10 15
25 10
5
5 5 .5
10
.5
.5
5 10
10
10
(iii) SIKHS: MATRICULATE AND ABOVE BUT LESS THAN GRADUATE
15 15 10 5
10 5 oS
.5 10 .5
Unspecified
W B
22 23

290
F-V i»ART -B DISTRIBUTiON OF CURRENTLY MARRIED WOMEN AND THE RELATED AND AGE AT
Ale at Marriage
All Ages • Less tban13 13-17 18-22 23-27 • 28+ Unspecified
AU Ages • Less than13 I3_Ii 18-22 23-27 • 28+ Unspecified
All Ages • Less than13 13-17 • 18-22 23-27 28+ Unspecified
All Ages • Less than 13 13-17 • 18-22 23-27 • 28+ U nipecified
All Ages • .... " than 13 13-17 •
18-22 13-~7 . 28+ UuspecUied
•
PRESEN"j AGE
All Ages L~ss t]1an;3 :-;7 ,8-~2
W B W B W B W B
2 3 4 5 6 7 8 9
(iv) SIKHS: GRADUATE AND ABOVE
40 5 10 5
20 5 10 5 15 5
(i) BUDDHISTS: ILLITERATE
65 15 5 20 10
25 10 10 5
25 5 5
10 5 5 5
5
(ii) BUDDHISTS: LITERATE BUT LESS THAN MATRICULATE
40 5 15 5
15 10 5 5
10 5 10 5
(iii) BUDDHISTS: MATRICULATE AND ABOVE BUT LESS THAN GRADUATE
20
10
10
5 5
5
5
(iv) BUDDHISTS: GRADUATE AND ABOVE
MYSORE
2?-27
W B
10 11
5
5
15 5 10 5
5
5
5
10 5
5
5 5

291
BlRTI-lS DURING THE LAST YEAR BY RELIGION, EDUCATION GROUPS, PRESENT AGE MARRIAGE (UlUJAN) -
STATE
28-32
w
12
15 5
10
B
. 13
3:-37
w
14
15
5 10
PRESENT AGE
38-42 43-47
B w B w B
15 17 18 19
(iV) SIKHS: GRADUATE AND ABOVE
10
5 5
(i) BUDDHISTS: ILLITERATE
w
20
10
5 5
48+
(Ii) BUDDHISTS: LITERATE BUT LESS THAN MATRICULATE
5 5
5
5
10
5 5
B
21
(iii) BUDDHISTS: MATRICULATE AND ABOVE BUT LESTS THAN GRADUATE
5
5
5
5
(iv) BUDDHISTS: GRADUATE AND ABOVE
5
5
Unspecified
w B
22 23
__ .------------------------

292
F·V PART-B DISTRIBUTION OF CURRENTLY MARRIED WOMEN AND 'filE RELATED AND AGE AT
MYSORE
PRESENT AGE Age at Marriage
Ail Ages Lessthanl3 13_17 18-22 23-27
W B W B _l:7i.; W B W B W B
2 3 4 5 6 7 8 ~ 10 II
(i) JAINS : ILLITERATE
All Ages 5,235 745 20 180 15 745 170 770 225 Less than 13 • 650 105 20 65 10 95 2S 110 25 13-17 2,870 450 95 .5 485 125 420 120 18-22 1,105 170 125 15 165 75 23-27 70 10 5 28+ 30
Unspecified 510 10 20 40 5 70 5
eii) JAINS : LITERATE BUT LESS THAN MATRICULATE
All Ages 7,660 1,275 5 275 25 11.670 .... .75 1.345 395 LesS than 13 340 50 5 35 10 7S 20 75 IS 13-17 4,315 755 200 10 1,030 305 670 220 18-22 2,210 420 445 150 475 130 23-27 175 35 40 20 28+ 30
Unspecified 590 15 40 5 120 8. 10
~iii) JAINS : M\f.RICULATE AND ABOVE BUT LESS THAN GRADUATE
All Ages · 1.205 245 50 10 420 111 425 90 LesS than 13 • 30 5 5 5 10 13-17 · 320 50 40 10 135 25 7(} 15 18-22 680 155 255 80 260 60 23-27 80 20 55 10 28+ Unspecified 95 15 5 25 10 30 5
(iV) JAINS : GRADUATE AND ABOVE
AU Ages 95 15 10 40 10 · LeSS than13
•• 13-17 10 .. 10 18-22 50 10 10 23-27 25 15 20 10 28+ .. Unspecified 10
(i) OTHERS : ILLITERATE
All Ages 50 5 5 5 Less thln 13 • 5 5 13_17 25 5 5 18-22 10
23-27 ·5
28+ Unspecified 5

193
BIR.rIt~ DURING THE LAST YEAR. BY RELIGION, EDUCATION GROUPS, PRESENT AGE MARRIAGE (URBAN)
STATE
PRESENT AGE -----------
28-32 33-37 38-42 43--47 48+ Unspecified
W B W B W B W B W B W B
12 13 14 15 16 17 II< 19 20 21 22 23
<I) JAINS : ILLITERATE
795 200 640 95 605 15 485 15 995 10 105 10 75 35 . 45 55 80 420 125 390 50 345 15 240 475 10
205 60 120 10 145 120 10 225 1~ 5 10 15 10 5 15
5 5 15 5 50 40 50 45 195
(ii) BINS: LITERATE BUT LESS THAN MATRICULATE
1,355 215 1,060 85 805 55 435 25 710 55 5 15 25 15 40
775 110 575 50 470 45 225 IS 370 400 95 360 30 210 10 135 5 185 35 5 40 ~ 35 20 5 5
10 ~ 15 90 70 . 55 35 95
(Iii) JAINS : MATRICULATE AND ABOVE BUT LESS THAN GRADUATE
160 25 80. 5 40 15 15 10 5 30 35 5 5 80 10 40 5 30 10 5 20 10 5
20 5 5 5
(iv) JAINS : GRADUATE AND ABOVE
20 5 20 5
10 15 5 '.
5 5
5 5
<i) OTHERS : ILLITERATE
5 5 5 5 15
5 5 5 5 5
5
5 "

294 F-V PART-B DISTRIBUTION OF CURRENTLY MARRIED WOMEN AND THE RELATED
AND AGE AT
Age at Marriage
All Ages Less than 13 • 13-17 18-22 23-27 28+ Unspecified
All Ages . LesS than 13 • 13_17 18-22 23-27 28+ Unspecified
All Ages LeSS than 13 • 13_17 18-22 23-27 28+ Unspecified
All Ages . Less than 13 . 13_17 18-22 23-27 28+ Unspecified
All Ages . Less than 13 . 13-17 18-22 23-27 28+ Unspecified
PRESENT AGE
All Ages Less than 13 13_17 18-22
w B w B w B w B
2 3 4 5 6 7 8 9
liJ) OTHERS: LITERATE BUT LESS THAN MATRICULATE
'15 5
15 S 10
5 5
(iii) OTHERS: MATRICULATE AND ABOVE nUT LESS THAN GRADUATE
60 5 5 5
25 5 5 5 10 15 10
(IV) OTHERS : GRADUATE AND AnOVE
15 5
5
5 5 S
(I) RELIGION NOT STATED: ILLITERATE
5 5
5 5
(Ii) RELIGION NOT STATED: LITERATE BUT LESS THAN MATRICULATE
10
10
MYSORE
23-27
w B
10 II
5
~

195
BIRTHS DURING THE LAST YEAR BY RELIGION, EDUCATION GROUPS, PRESENT AGE MARRIAGE (URBAN)
STATE
PRESENT AGE
28-32 33-37 38-42 43-47 48+ UllSPecified
W B
12 13
--------W B w B w B W B
14 15 16 17 18 19 20 21
(Ii> OTHERS: LITERATE BUT LESS THAN MATRICULATE
10
s
s
S 10
s
(IIi) OTHERS: MATRICULATE AND ABOVE BUT LESS THAN GRADUATE
10 5.. 10 10 20
5
5
00
10 s
5 5
(1'9) OTHERS: GRADUATE AND ABOVE
<I> RELIGION NOT STATED: ILLITERATE
10 10
5 5
5 5
(Ii) RELIGION NOT STATED: LITERATE BUT LESS THAN MATRICULATE
10
10
.. .. o • .. ., • 0 .. o. . .
w B
12 23
'0 ..

296
F-V PART--B DISTRIBUTION OF CURRENTLY MARRIED WOMEN AND THE RELATED AND AGE AT
MYSORE
PRESENT AGE
All Ages Less thanJ3 13-17 18-22 23-27 Age at Marriage ------ _----- -----_
W B W B W B W B W :B
2 3 4 5 6 7 8 9 10 II
(iii) RELIGION NOT STATED: MATRICULA1F AND ABOVE BUT lESSTHANGRADUA1E
All Ages Less than 13 . 13-17 18-22 23-27 28+ Unspecified
All Alles. . Less than 13 . 13_17
18-22 23-27
28+ Unspecified
(Iv) RELIGION NOT STATED: GRADUATE Ar-.D ABOVE
------------------------------------------------------------------------W : Women. B: Births.

297
B1RTH~ DUR1NG THE LAST YEAR BY RELlGION, EDUCATION GROUPS, PRESENT AGE MARRIAGE (URBAN)
STATE
PRESENT AGE
28-32 33-37 38-42 43-47 Unspecified
w B w B w B w B w B w
12 13 14 15 16 17 18 19 20 21 22 23
(i ,) RELIGION :'fOr STATED: MATRICULATE AND ABOVE LESS THAN GRADUATE
(I.,) RSLlGION NOT STATED: GRADUATE AND ABOVE
W : Women; B Births. .. Includes education not classified elsewhere.
Ji,~ ,-1J-1 C'!<l~US Klrnataka!78_3.10·79-S00


LIS1' Ot: AG&N'IB so. TBB BALB OJ GOVERNMENT 0' INDIA PUBLICATIONS ~ ON .11-1976
llatioo St. No. Name of tho part)' Cal. 01 Aaentl
1
AQa.A-I Natioaa.! 800It HOUIICI, Jeoni Mudl ; Wedwa " Co. 4S. Civil LiDes. l Ibrwui Lal laill, hbIIlberI. Motl KIn. ~ AM aam BaldlY Dass .t 5001, 8qh Muzallarput. 1 lee.an Book Depot, Raja Mandi.
AHMEDABAD-, Bah,oviQd Book SeUen, Gandhi Road. , Chandr. Kanl CbimanJaJ VOrl, 57·1 Oandhi ItotuI,
P.B. No. 163. 8. New Order Boot Co., Gandhi Road, Ellis Bridge , Sastu Kit_Is Ghar, Near Relief Talkies, .... tthar KU~l
ReHef ROId. to Oujarat Law House. Near Municipal Swimming Bath. 11 M_hajao Bros.. Super Market Basement. A,hram Road,
NavralllJlUrl • 12 Him.ostiu Boot Co.. 10 Mission Markel, ncar Gujarat
CoIIcIlC. !l 'Academic Book Centre. Bisket Gall. 14 Dimsb Book HOUIICI, Madalpur.
AHMl!ONAClAIl-l~ Friend'i Book Houso, Muslim U~vctsit)' M.rket.
AlMER-J6 Book Land. 663, Mldar Gate, n Rajputaoa Book HoUle, Statibo Road.
ALIGARH-
18 . Friend's Book HOllie. Muslim University Markel. 19 New Kitab Gbar. MiD Market. 20 Shalis Ram .t; Soos, ll. Mother Gate.
ALlAHABAD-21 Kitabist.n. 17·A, Kaml. Nehru Road. 22 L." Book Co .• Sardar Patel Marl, P.B.-4. 23 Ram Narain Lal Beni Madho. 2·A. Katta Road. 24. Universal Book Co., 20. M. G. Road. .25 University Book Asenc)' (of Lahore) Elain Road. 26 Bharat Law House. IS. Mahatma Gandhi Marg. 27 Chandralock Prakashan. 73. Darbhal1ga Colony. 28 Ram Narain La! Beni Prasad. 2/4. Katra Road. 29 SIS A. H. Wheeler &; Co .• Pvt. Lid., City Book Sh!lP. 30 New Book House. 32. Tashkant Road. 31 Law Publishers. Sardar Patel MlJra.
AMBALA CANIT-32 English Book Depot, Ambala Cantt.
AMRITSAR-33 Amar Nath &; Sons. Near P.O. Majith Mandi. 34 Law Book Agency. G.T. Road. Polliaarh. 35 The Book Lovers Retreat. Han BulU.
ANAND-36 Vijaya Stores, Station Road.
ANANrPUR-37 Sri Vani Stores. Kamala Nagar.
AURANOABAD-38 Marathwada Boot Distributors. Aurangabad.
BALLABOARH-39 Om Trade Well. Unchagaon Oatc.
BALDEOGHAR-.co Bhakal Brothers. S. B. Roy Road.
BANOALORE-41 Bana.lore Pta &: Publishing Co., Pvt. Ltd.. 88. Mysore
ROlId. P.O. B. No. 1807. 42 International Boot House. P. Ltd .. 4F. M.G. Road. 43 M. P. P. House. 87 lot Cross. Oandhinaaar. 44 Balajee Book Co., No.2. East Tanl< Bank Road.
Rarnakri,hnapllrI 45 S .. S. Book Emporilum. 118. Mount Joy Road. Ranumant
Nagar. 46 Standard Book Depot, Avenue Road.
'Rca.) (Rca·) tllAlst.) \R~.) (Rest.)
(Rest.)
(llIg.) (Rea·)
(Rest.) (Rest.)
(Rest.)
(llAIst.) ( .... ) (Rest.)
(Re,.)
(RtI.) (Rea.)
(Rea ) rRest.) (Rm.)
(Rea.) (Reg.) (ReB.) (Reg.) (Rea.)
(Re't.) (Rcst) (Rest.) (Reg) (Reg.) (Reat.)
(Reg.)
(Reg,) (Reg.) (Reg.)
(Rest.)
(Rest.)
(Rest.)
(Rest.)
(Rest.)
(Rcg) (Reg.) (Reg.)
(Res!.)
(Reg.) (Rea.)
(i)
Station st. No. Name of the party Cat. of AleRtI
3
BANGALORE-Collld. 47 'Vichara Sahil)'a Ltd., BaJcpet. 48 Atam Stores, Sth Crou MalIeswarllJll. 49 Comill8 Mall, IleIideIicy Road, Banaalore.
BANSORONl-SO SIS "'-i Book Conw, B.ltI, NiraDiau Pally. 24-
Psrpoa. BAamuv-
Sl Agarwal Bros.. Ban Baaat. 52 Pathak Pustalt Bhann. Ram Harain Park.
BARODA-Sl New Medic:al Book House. 540. MadenzamPl! Road. 54 Chandrakant Mohan La! Shah Seinl. . Ambellaonk~;*
Wada. Ra""", •. 5S .Baroda Productivity Council (Boot Div.) Bafllda. ~ Hemdip Aaencics. Madanum", Road.
BELGHARIA-S7 Granthaloka. sn. AJllbica Mukhcrji Road, 24 Paralnas.
W.B.
BHAGALPU1l-51 ..,. StatlOllClY Stores. D. }'II. Ii. RO-d;
BHAVNAGAIt-59 Shah Parsolam Dua Gipbhai,' M. G. Road.
BHOPAL-60 Lyall Book Dep'll. MoM. Din. Bldl. Sultani. Road. 61 Bhopal SIIhity3. Sadan. Pu1?Iisbers. Booksellers &:
Stllioaers, 37, Lalwani PrellS. Road.
BHUBANESHW AR-62 Prabbat K. ·Mahapatra. Bhabaneshwar Marg.
BUAPUR-63 Sh. D. V. De!hpande. Recognised taw Book Sellers
Prop: Vinod Book Depot, Near Shiralshetti Chowk
BIKANER-64 Bhadaoi Bros.. Ooga Gate. 6$ Gadodia Postak Shanda.. Fed Bazar.
BOLPUR-66 BoIpur Postakalaya. Rabindra Sarai. P.O. Dolpur.
BirbhulD (W.B.). BOMBAY-
"67 Charles Lambert &; Co.. 101. M. O. Road. 68 Cooperalors Book Depot, S/32. Ahmed Sailor Building.
Dadar. 69 Cunent Book House. Maruli Lane. Raghunath DaJajl
St_t. 10 Current Tecbnical Literature Co. P. Ltd .• India Hnuse.
ht Floor 71 C. lamnadu &; Co.. Booksellers. I 46-C. Princess
Streel. 72 International Book House Ltd.. 9 Ash Lane. M. G.
Road 73 Kothari Book Depot. KinR Edward ·Road. 74 Lakhani Book Depot. Girgaum. H Minerva Boot Shop 10. Kailash Darshan. 3rd Floor.
Nava Chowk. 76 N M Tripathi P Ltd.. Princess Street. 77 Lok Vanamaya Griha Pvt. Ltd.. 190/B. Khelwadi Main
Road. 78 World Literature. Pyare Singh Chug House. Agr3 Road. 79 69·A. International Subscription Agency, Police Court
Lane. Bombay.!. 80. Swa.tik Sales Co.. Scientific &; Technical Booksellers.
P.B. 6007. 81 M. &; J. Services. 2.A. Bahri Building. 82 Popular Book Depot. LamingtoR Road. 83 Sunderdaa Gian ChaDd. 601, Girgaum Road. near Princess
Street. 84 Thacker .t Co .• Rampart Row. " All ladia Book Supply Co.. 342, Kalbadevi Road.
4
(Rea'.) (RelIl.) (Real)
(ReI.)
(Reg.) (Rest.)
(Rest.)
(R""t.) ~Res.t.) (RelIt.)
(Rest )
(Rea.)
(Rest.)
(Reg.)
(Rest.)
lReg.)
(Rest.) (Resl.)
(Rest.)
(R .. ~.)
IReg.)
(Reg.)
(Rill.)
(Rill.)
lReg.) (Reg.) (Reg.)
(Reg. I (Reg.)
(ReB.) (Rest.)
(Rest.)
(Rest.) (Reg.) (Reg.)
(Reg.)
(Rea) (Rell·)

if
LIST OF AGENTS POR THE SALE OF GOVERNMENT OF INDIA pUBIflCAnONS AS ON 25011-76
StAtion 51. No. Name of tbe party Cal. of ABellts
I· 3
BOMBAY-Contd.
~6 Amalgam3ted PI"'!S5, 41, Hamam Street. (Re!t.)
87 Asian Tradini Co., 310, the Mirabalec P. M. 1505. (Rest.)
88 Secretary, Salestax Practitioners' Association, Room No.8. ?aJton Road. (Rest.)
89 Usha Book Depot, 585. Crura Bazar. (Reg.)
90 SIS Taxation Publications. B/22. Se .. Gull Apartment. 4·"'. Dhula Bhai Desai Road. (Rest.)
91 Indian Book House, Subscription Aseney. Road.
92 Dhon La! Brothers. S. Gandhi Road.
93 International Publications. P.B. 7170. Xurla. 94 International Book Links. Marine Unes. 95 Bh~YQni Book n~pot. 150, Princes'i Street,
Dr, D. N.
% National Book Centre, Tardeo Air Conditioned Market. 97 Univer&al Book Co",n., Dhabi TullO. 96 Subscribers Subscription Servkes. India. !90. B~zar
Gat. Stree:.
CALCllTl'A-
Y9 Curren! Literature Co .• :lOS, M. G. Road. 100 Do" GUN. & Co. LId., 54/2, Collego Street. !()! Firma K. L. M'~khopsdhyaya, 6/1A. Bachh.ram Akrut
LaJ'1e. 102 Oxford Book 5t.Honery Co .• 17. Park Street. 103 R. Cf"mbrary I!: Co., Ltd .• Kant House, P-33, Mission
'.?tvw £xtcn~ion.
liM S. C. Sa,.~or (/< Sons P. Ltd. I.e. Collese Street. IuS S. K. Lobif; & Co. Ltd., Coliege Street. lCfi W. 'Newman & Co. Ud .. , Old Court Hou,. Street 107 Iodian Book Dis!. Co .. C·52. M. G. Road. J08 K I<. Roy. 55. Gariahat Road. P. B No. 10210. 109 r.hnimala, 123, Bow Bna, Street. 110 Morlern Book Depot, 78 ChowriDghee Centres. III New Script. li2i3, Rash 13.I1,r; Avenue 112 Mukherjoc Library, 1. Gopi Mohan Datta Lane. 113 S. Bhattacharya &. Co" 49. Dhn~·&mtallo. Street. 114 Sci<ntific Book Ager.c),. 103 Netaii Subh .. sh Road. !IS P. D. i)p.dhyay, i6. Munshi Sardaruddin Lane 116 Univer:J81 Soak Dist. 8/2. Has~inl!3 Street. 117 N. M. Roy Chowdhury Co. P. Ltd .• 72. M. G. Road. Ila "MaiNslta Granthaleyr. P. Ltd .• 4/3·B. Ballki", <"ltauerji
Street. 119 Sushanta Kumar De, JUG, Gopal Botal Street. no K 1'. l.la~ch!, ': .. 6, i:I B. Gan~uli Street. l2! Ove:s~.s PubliCAtions. 14 Hare Street. ;:2 A. G. tow Heok Stal!. 5/i·B, Go~ Lane. I:!3 Pass Book Ag.:acy, 4, Seth Gagao Road. 124 Book earllOralion. I·Mangoc LlUle, CalCJlta.
CAUCUT-
1:15 Tooting Book Stall, CO\l.'1 Road.
CRANOIGAllH-
126 1*'0 Law Agell';Y, Shop No. 5, ~~lor 22-D. 11" Mehta 8r"5 .• 1933, Sector 22-5. 12~ RamI>. New. Allency, Booksellers, Sector 22. 129 Unlversal Book Store, Sector 11-D. 130 Engtish Book Shop i4. Sector-22-D. 131 Ja'" General Hous., s.,ctor No. 77-7'21.2). 17-0. 132 la;n &; Co.. 1165. Sector 18-<:. 13J MRn'k BODk ~h(\p, 70·72, ~ See. 17-D. 134 Navecn Book Agency, ;0·82. Sec. 17-D. PS Chanl'lliarh ta,. HOIl\C, 1001, Sec. 11-'8,
(Rest.)
(Reg.)
(Resl .. )
lRe.t.) (Rtg.) (Rest.) (Rest)
(Rest.)
(Rest.} (Rei·)
(Reg.)
(Rca·)
(1\'8·) (Reg.) (Reg.) (Reg.) (Rest.) (Resl ) IReg.) (Reg.) (Reg.)
\Rest.) (Rest.) (Rest.) (Reg.)
(Rest.) (Rest.)
(Rest.) (Rest.) (RcS·) (Rest.) (Re,t) (Rest.) (Rest.)
(Rest.)
(Res·) (Reg.) (Reg.) <ReB,) (Resc.) (Rei.)
<Ret.) CRest.) (Rat.) (Rat,)
S~tioD SI. No. Name of the pan,. Cat. of Io.pnla
1 3
COIMBATORE-136 Marry Marlin. 9/79. Ookhale Street I
131 Dina' Mooi 5tor(8, 8/1. Old Post OIIIee lto_ct. 138 Continental ABenciel. 4·A. Sakthi Vihar. 1;9 R.dh. Mani Stores. 6O-A, Raja Street,
CUTTACK-140 Cutt.tk Law Times. 141 D. P. Soor '" Sana, Manlll_had. 142 New Students Store.
DEHRADUN-143 Dishan Sinah .t: Mabendra Pal Sintb. 311, Chukbu •• l •• 144 Juaul Kishorc '" Co.. llajpur Road. 14~ Notion.1 News Agency. Paltan &zar. 146 Sant Sinah I: Sonl. 18. Ratna Market, 147 Universal Book House. 39A. Rajpur R.oacl. 148 Natraj Publishers. 52. llajpur Road,
DELHI-149 Alma R_ I: Sons, X •• broero Gate. ISO Bahri Br01.. 243, tajpat Rai Markot.
,
151 Raw. Harltisban Dau Bodi (Wj."a 0eDera1) AItIIlCJ' Delhi Ahata Kedara Chamellian Road.
152 Bookwel15. 85. Sant Naranlwi CoIoD,f. P.B. 1S6J • Delhi-ll 0009,
153 Dbaowant Medical &: Law Dook HoORl. 1522. La"t Rai Market.
154 Federal Law Depot. Kalhmero Oate. ISS Imperial PubUshina Co., 3. Fail: .BaD!'. DaryapnJ. 156 IndiaQ Army Book Depot, 3. Anaari Road. DaryllpDj. 157 J. M. Jaina ok B,03., Mori Gate. 1~8 Kitab Mahal (Wh('lesalo Division) l>. Ltd.. 28. Fail
Bazar. . 159 K. L. Seth, Supplien of Law Commcn:ial A Tedmiw
Books. Slt,ntinallar. Gaoeahpura·. 160 Metropolitan Rook Co.. I. Faiz Bazar. 161 Pllblil:ation CenIJe. Subzi Mandi. Opp. Bid.. Mills. 162 Sat Naraio A SOlIS. 2, Shivaji StadlUIII Jain Mandir Roacl,
Ne ... Delhi. 163 Universal Book "Stationery Co.. 16, Netaji Subbaa
Mara. 164 Univenal Book Traders. 80. Golth.1e Market. 165 YOlllllmen &. Co., Nal Sank. 166 Amsr Hindi Book Depot, Na.i Sarak. 167 AU ladia EdDcatiotial Sllppl" Co" Sri Ram DuildlIIIS.
lawahar Naaar. 168 B. N.th " Bros., 3808, ChorkawaJan (CboWli Bazar). 169 General Book Depot. 1691. Nai Sarak. 170 Hindi Sahitya Sanser, U43. Nai Sarak. 171 La... Literature House. 2646. BalilDaran. 172 Mun,hi Ram Manobar Lal. Oriental Book Sellen a:
Pubti~he~. P.R. No. lUiS. Nai Sank. 173 Premier Book Co.. PrinteJ'l, PubIisherw ADd Boo~n.
Nai Sarak. 174 Ovenea. Book AaeIlCY, 3810. David Street. Dar,a Gel-
110006. 175 Amir Boot Depot, Nai Sara". 176 Raipai &; Sons. Kashmir! Oale. In Saini Law Publishint Co.. oary.,.nj. 178 Moli bl Banlrs; Dau. RansUo'" Road, J ..... har ...... 179 Slngam Book Depol. Main Market, Gupla CoIoD,f, 180 Summer Bros., PO. Birla Unes. 181 Univenity Book HOORl, U. U.B. Banp)ow Road.
Jaw.h.r Nallar, 182 Om Law Doole House, Civil Court Compound. 183 Ashoka Book Agency, 2/29, Roop Nagar. 184 Educalional Book Agency (India). ~··D. Kamll Nagar. 18S D. K. Book Organisation. 74.0. Anand Naaar. 186 Hindustan:Book Agencies (India), 17-UB. lawabar Natar. 187 EIRI. Book Service. Gane.hurt.
(Rca.) (R""t.) lJlest.' (Jlest.)
CRet.) tRest.) (Jlest.)
CRet.> (Rea.) (Rca.) ~t,)
CJl""t.) CRet.)
(Roc.) CJlq.)
~.) ... ) CJlea.) (Rea.) (IteR.) (.Rea.) (Rea.)
CJlea.)
(Rca.)
CJlea.) (Reg.)
(Jlea.)
(Rea.) (a...) (ROIl.) (bit.)
'Rat.) ' .... ) (Jlea.) \Ilost.) (RM.)
(aeat.)
caca.)
{Rea.) (Rest.) (Jlesl.) CRea.) <Rea.) <Rea.) (Rest.)
(Rest.) Olea.) (Rca·) (Rea.) <Rea.) (Reg.) (Rest.)
188 Krishna taw House. Tis HazarI. 139 ~j Book .\aeDey. A·J9. 'biVJlllri.
CRcaulv) l .... )

LIst 0' AGENTS FOR THE SALe OF GOVEi\N'MEN'f OF INOLA PUBr~ICATIONS AS ON 25-H.7t>
Station Serial No. Name of the party Cat. of Alena
:2 3
DELHI-CoII,d.
190 Indian Documentatio" Sefvi~, Ansari Road.
191 192
193
194 19S
Kall5hik !)tationery. Padm Nagar. Standard Bool< SeUers, 402, Kucha (Chandni Chowk) Balaqi, Dariba Kalan Modern Book Centre, Municipal F. No.8, Banllalow Mira, Delhi. Delhi Law House. Tis Hazari Court, Civil Winlls. Capital Law House. ViBwas Nallar, Shahdra.
DEORIA-
196 Madan1a1 Radhakrishna, Deoria (U.P.).
DHANBAD-
1&1 New Sketch Press. Po.t BOI 16.
DHARWAR-
\ 98 Bharat Book Depot & Praka,halJ. Sub h.. Road 199 Akalwadi Book Depot, Vljay Road
ERNAKULAM-
200 Pai &: Co., Broad .. ay.
ERODE-
201 Kurnaran Book Depot.
FEROZPUR CANTT.-
202 Enalish Book Depot, 78, Jhokc Road.
GAUHATI-
203 United Publishen, Pan Bazar. Main Road. 204 Ashok Publisbioa House, Murlidhar Sharma Road.
GAYA-
205 Sahitya Sadan, Gautam Buddha Mara. 206 Bookmano, Naamatia Ganalle, Swarajpuri Road
GHAZIABAD--
4
(R •• t.)
(Rest.)
(Res·)
(Reg.) (Rea·) .
(Rest.)
(Rest.)
(Rest.)
(Res!.) (Re,t)
(Rest.)
tROIt.)
(Res·)
(Rest.) (Rest.)
(Regular) (Rest.)
201 Iayan. Book Asency, Outside S. D. leter CoUese, G. T. Road.
208 S. Gupta, 342, Ram Nallar.
GOA-
(Rest.) (Reg.)
209 Sinllbal's Book House, P.O. B. No. 70, Near the Churcb (Rest.)
GURGAON-
210 Prabbu Book Service. Nai Subzi Mandi. (Re.t.)
GUNIlJR-
211 Book Lover> P. Ltd., Arundelpet, Cbowra,,-. (Res·)
GWALIOR-
212 Loyal Book DePt')t. Patankar Bazar, Laiihkar (Rest.) 213 Titer Bros .• Strafa. (Rest.) 214 Anand Pustak Sadln, 3l, Prem Nasar. (Resular) 215 M. C. Daftari, Prop. M. B. lain & Brol. Booksellen.
Sarafa. Lasbkar. 216 Grover Law House, Nr. HiSb Court Gall. 211 Kitab Gbar, High Court Road. 218 Adarash Pustak Sadan. S/26, Bhau Ka Bazar.
HARDWAR.-
219 SCYa Kunj. Kansha1 Bb.wan Bara Hampuri.
HATHRAS-
220 laiD Book DePOI, Robtak Wala Nobra, Alra Road. 221 Sbri Ram Prakasb Sharma, lIatbru.
(Rest.) (Rest.) (Rest)
(Regular)
(Rest.)
(Rest.) (Rest.)
Station Serial No. Name of tbe party Cat. of Alcnll!
2
HUBLI-
222 Pervaji's Book House, Station Road.
HYDERABAD--
223 Tbe Swaraj Book Depot. Lakdikapul. 224 Dbasba Prakashan, 22-5-69 Gharkaman. 225 Book Syndicate. Dcvka Mahal, Opp. Central Bank.
226 Labour Law Publications. 873, Sultan Bazar.
4
(Rea·)
(Reg.) (Rest.) tRes·)
(Reg.) 227 Asia Law Law House, Opp. Hi"h Court. 228 Book Link. Corporation. Narayangoda.
(Regular) (Rcg.)
INDORE-
229 Wadhwa & Co., 27. MabatmJ Gandhi Rond 230 Madhya Pradesh Book Centre. 41. Ah:;y~pura.
2Jl Modern Bcdi Ho;_;_v:, Shiv \'11z:, PdIJ;;:e '.::.ll Swarup Bros., Kb ... \~r .. ..).ill'.r ~J3 Vi.nay Pustak Bha.r.<l.;i.(
JABALPUR·-234 ModclD BOGk House, 2815, Ja\;,.'aha·,tp.D.J.
23' Popular Laws House. Nr. Oroti P.O 236 Paras Book Depot. 129, CaotL
JAIPlJR-
237 India Book House. Fatehpurik. Darwaz3. 238 Dominion Law Depot, Sbah Bld~., S. M. Hillb .... y,
P.B. No. 23. 239 Pitaliya Pustak BhaDdar, Mishra Rajajika Rasta. 240 University Book House, Cho'll'a Rasta.
IAIPUR CITY-241 Bhorat Law House, Booksellers & Publishers, Opp. Prom
Praka)h Ci!1ema. 242 Popular Book Depot. Chaura Rasto. 243 Vani Mandir, Swami Mansing Highway. 244 Raj Book & Subs. Agency, 16, Nehru Bazar. 245 Kri'hoa Book Depot, Chanr. Rasta. 246 Best Book Co., S. M. S. Highway. 247 Kishore Book Depot, Sardar Patel MalA. 248 Rastogi Brothers, Tripatia Bazar, Jaipuc.
IAMMU TAWI-249 Rainas News Agency, Dak Bungalow.
JAMNAGAR-250 Swadcshi Vastu Bbandar. RatD.bai Ma$iid Road.
JAMSHEDPUR-lSI Amar Kitab Ghar. Disgonal Road. P.B. No. 78. 252 Gupta Stores, D!!atkidith. 253 SaDyal Bros. Booksellers & News Ascnts, 26,
Road. 254 Solr.bey Treading Co.. Diagonal Road.
IEYPORB-2SS BbasbatIU Postal:: Bhlndar, Main Road.
lHANSl-256 Universal Law House, 186, Chanda! Shekhar And.
JHUNJHUNU (Raj.)-251 Shashi Kumar Sbarat Chandra.
JODHPUR-2S8 Chopra Bros., Tripolia Bazar.
Main
259 Dwarka Das Ratlll, Wholesale Books and New. Alimlq. 260 Kltab Ghar, Soj",i Gate. 261 Rajasthan Law House, High Court Road.
JULLlJNDUR-262 Hazoorin. Bro... Main Gate.
JULLUNDlJR CITY-263 University Publish"s, Railwav Roarl.
264 Law Book Depot, Adda BlUti, G. T. Road.
(Rei.) (Rest.) (Rei·) <.n",,'Z ) (Re:o:,)
Re~.)
~Rf.>\.)
(R .. t.)
(Reot.)
(Rest.) (Rest.)
(Rest.)
(Reg.)
(Reg.)
(Reg.) (Rest.) (Reat.) tRest.) (Reg.)
(Reg.)
(Rea.)
(Rei·)
(Rell.)
(Rca·)
(Rest.) (Real.)
(ReI!.)
(Rest)
(ReB.)
(R.eg.) (Reg.) (Res.) (Rest.)
(Rest.)
(Re>U (Rest.)

IV
. LIST OF AGENTS PaR THE SALE OJ GOVERNMFlO' OF INDIA PUBLICATIONS AS ON 25-11·1976
Station Serial No. Name of the party Cat of Aaenta
2 3
I<ANPUR-265 Advani & Co .. P. Bolt 100, The Mall. 266 Sahitya Niketan, Sharadhanand Parle 261 Uoiyersal Book Stall, The Mall. 263 Gandhi Shant; Pratisthan Kendra. Civil Lines 269 Law Book Emporium, 16{60, Civil Lines.
KAPSAN-
4
(ReB·) (Rei.) (ReB.) (Rest.) (Rest.)
2iO Parkashan Par~saran, -1}91>. Namdar Niwas. Alao MaTg. \Rejl.)
KHURDA--271 Kilab Mabal, Khllrda (Dislt. Puri).
KOLHAPUR-272 Mahar.sbtra Granth Dh.nd.r. Mahadwa, Road.
KUMTA-273 S. V. Kamat. Booksellers'& Sttltioners (S. Kanar.).
KURSEONG-274 A.oke Brothers, Darjeeling.
LUCKNOW-275 Balkr;,hna Book Co. n, II·A. Nirala Nagar. 17f British B"ook Depot. 84 H:1n.if3tganj. 277 Eo,tern Book Co,. }4, Lulba,h Road. 218 Ram Auvani. Hala,atl:ani. P.Il. 154. 279 AC'lU3Tium Supply Co. 213. Faizab.d Road. 280 Ciyil & Miiitary Edu~ational Stores. .J06{B.
Bazar.
LUDHIANA-281 Lyall Book Depot. Chaura .Bazar. 282 Mohindra Bro$.. Katchori Ko,d. 283 Nanda Stationery Bhandar. Pustat Bazar. 284 The Pharmacy News, Pindi Street.
MADRAS-
285 Account Test Institute. P.O. 760. Esmoregore.
Sadar
286 C. Sub!>iah Chetty & Co.. 62, Big. Street. Triplicane. 281 K. Krishnamurthy. Post Box 384. 288 P. Vardhachary &. Co .. 8. Lingbi Chett)' Street. 289 C. Sitaraman & Co .. 33. Royapeltach High Road. 2<)0 M. Sacnecna\"m S; Ce .• \4, Sankurama Chetty Succt. 291 Madra, Book Agency, 42. TirwnanllallUD Road. 291 The Rex Trading Co.. P.B. 5049, 111. Pedariar Jo:oil
Street. 293 Mohan Pathippagam &. Book Depot. 3, Pyecraft"
Triplicane. 294 Swamy Publishers, P.B No. 246S. 29~ Naresh Co .• 3. Dr. Rang.chari Road. Mylapore. 296 Sangom Publishers. II. S. C. Street.
MADURAl-287 Ezhil Enterprises, 116. Palace Ro.,j
MANDASAUR-298 Nahata Bros.. Booksellers &. Stationers
MANGALOR.E-299 K. Bhoja Rao & Co., Kodial Bail
MANIPUR-300 P. C. Jain & Co .. Impha!.
MEERUT-301 Loyal Book Depot. Chhipi Tank. 302 Prakash Educational Stores. Subh •• Bazar. 303 Bharat Educational Stores, Chhi"i Tank. 304 Nand Traders. Tyagi Market
MHOW CANTr.-305 Oxford Book Depot, Main Street.
MORADABAD-306 Ram. Book Depot. Main Street.
MUSSOURI-
(Rest.)
(Res!.)
(Re,t.)
(Res!.)
(Reg.) (Reg.)
(R.eg.) (Reg.)
(Rest)
(Rest.)
(Reg.) (Rest.) (Ree.)
(Rest.)
(Reg.) (Reg.) (Reg.)
(Reg.) (Reg.) lRcol.) (Rest.)
(Rest,)
(Rest.) (Rest,) (Rest.) (Rest.)
(Rest.)
(Rest.)
(Rest.)
(Rest.)
(Reg.) (Reg.) (Reg.) (Rest,)
CRest.)
<Rest.)
301 Hind Traden. N. A. A, Centre. Dkk Road. (llest.)
Station Serial No. Nallle of the party Cat. of Alents
1 3
M UZAfF ARNAGAR 308 B. S. Jain & Co.. 71. Abupur •. 309 Gargya & Co .• 139. G. New Market.
MUZAFFARPUR-310 Scienlific & Educational Supply Syndicate.
MYSOllE-HI H. Van!:ataramiah & Sons, Krishnarajendra Circie. 312 People Book House. Opp : Jagan Mohan Palace. 313 Geeta Book House. New State Cird •.
NADIAD-314 R. S. Desai. Staticn Road.
NAGPUR:-
" (ReI.) (Rest.)
(Rest.)
(Reg.) (Reg.) (ReB.)
(Rest.)
315 Western Book Depot. Residency Road. (Rell·) 316 The Executive Secretary. Mineral Industry Association,
Mineral HO'Js<. uear All Incia Radio Square. (Rest.)
NAINITAL-J 17 Con sal Book Depot. Bara Bazar. (Rea.)
NEW l)ELHI-31 ~ :;'9 32IJ 321
322 323 324 325 326 321
323 329 330
331 332 333 334 335 336 337 338
339
340
341
342
343
344 345 346 347 348 349 350 351
352 353 354 355
3'6
Arndt flook Co., Connaught Cin:us. Rhaw~mi & Son..;" SF. Conn'du~ht Circus-. Central News Agen~y. 23/90. Connuught Cit~us,
En~lish Book Stores. 7·L, Coonaught Circus. No. 328.
P.B
Jain Book Agency. C/9. Prem House. Connaught Place. J·,yana Book Depot, P.B, No. 2505. Karol Ballh. Lu~mi Book Stores. 72. laopa:h, P.O. Box No. SH. Mehra Bro, .• 50-G. Kalkaji. New Delbi·19. Navyu~ Traders. Desh Bandhu Gupta'Road. De. Nagar. New Book Depot. Latest Books. Periodicals Sty.. P .B. No. 96. Connough! I'lace. ' Oxford Book & Stationery Co .. Seindia House. Peaples Publishing House (P) LId.. Rani lh.n.i Road. Ram Kri,hana & Sons (01 Lahore), 16{B COlina light Place. R. K, Puhlishers. 23. Beadonpura. Karol Bqh. Sharma Bros .. 17. New Market. MOli Nagar. The Secretary. Jridian Met Society, Lodi Road. Sun'i' Book Centre. 24190. Connaullht Place. United BC'ok Agency, 29/1557. Naiwaia, Karol Baah. Hindi Book House. 82. Jaop.lb. lakshmi Book Depot, 51. Ragarpura, Karol Baah. N. C. Kansil & Co.. 40, Model ,Basil, P,O. Karol Bagh. New Delhi, Ravindra Book Agency. 4D/50. Double Storey, Lajpat Nagar. Saot Ram Booksellers. 16. New Municipal Market. Lodi Colony. Subhas Book Depot. Shop No. Ill, Central Market. Srinivaspuri. The Secy. Federation of Association of Small Industry of India. 23·B/2. Rohtak Road. Educational & Commercial Aaencies. Nagar. '
SlISt.
Delhi Book Company. M1l2. Connauaht Circus. Nayrang. R.B,·1. Inderpuri. Commercial Contacts (India), Subbas Nagar. A. Khosla & Co. Anand Niket.an
SUbbasb
(Rell.) (Reg.)
(Rell.)
(Reg.) (Rell.) (Rea.) (ReB.) (Reg.), (Rea.)
(Rea) (Reg.)
(Rea·)
(Reg.) <Rea.) (Rea·) (Reg.) (Rea.) (ReB.) (Rell.) (Rest.)
(Rest.)
(Rest.)
(Rest.)
(Rest.)
(Rm.)
(Rest.) (Rest.) (Rest.) (Re<lt.) (Rest.)
Books tndia Corporation. New _ohtak Road. S. Chand & Co. Pvt. Ltd.. Ram Nallar. Globe Publications. C-33, NizamUddin East.
(Regnlar) (Rest.) (Rest.)
Sciell.litic: Instruments Stores. A-lSS. New Rajendra Nagar. Jain Map & Book Agency. K~rol Ballh. Hukam Chand &. Sons. 3226, Ranji! Nagar. Star Publications Pvt. Ltd .• 4{S{B. Anf AU Road. Indian Publications TradinB Corporation, A·7.
(Rest) (Rei·) (Rest.) <Re!lt.)
Nizamuddin East. (Rest.) Sb~ Trading CorporatiDD. '15771. Saul Nari Daa M~. ~)

v
LIST OF AGe.NTS FOR THE SALE OF GOYERN,'~iENT OF INDIA PUBLICATIONS AS ON 15-11-19'16
Station Serial lio. Name of the patty Cat. of Agent!
2 3
NEW DELHl-contd. 357 Supreme Trading Corporation. Harrison Chamber 358 Jaio Brotht:rs. New Delhi.
PALOHAr--
359 Educational Supplies Depot. Sullanpel.
PATNA-
360 tumi Tradina Co.. Padri Ki Haveli. 361 1. N. Allarwal'& Co.. Padri Ki Haveli. 362 Mali tal BaDarsi Dass .. Co .. Padri Ki IJ.v~li. 363 Today .. lomorrow. Ashol< Rajpatb. 1M Books " 'Books. Ashok R.ajpal\\.
PONDICHERRY-365 Honesty Book House. 9 Rue Dupleix.
POOl'lA-366 Deccan Book Slitll. Deccan Gvmkhana. 367 Imperial Book Depot. 266. M. G. Road. 368 Saraswat, 1321/1. 1. M. Road. Opp. Modern Hish
(Rest.) (Reit.)
(Rest)
(Rea) (Reg)
(Res.) (Rest.) (Re1ot.)
(Rest.)
(Reg.) (Reg.)
School. Bombay-Poona Road. 369 International Book Service. Deccan OYDlkhana.
IReguL~r) (Reg.)
370 Raka Book Aaency. Opp Nathu's Chawl, Near Appa Balwant Chowk.
371 Varma Book Centre. 649. NarayaD Peth. 372 Secy .• Dbarat Itihasa SamsllOdhana Mandir. 1321. Sadashiv
Peth. 373 Vidya Co_ee House, 319-A. Sbanwar Pcth.
PRAYAG-314 Om Poblishina House, 842. Daraaani.
PUDUkKOTIAl-315 Meenakashl Patuppalam, 4142, East Main Street. 376 P. N. Swaminatban .t. Co., Bazar Stred. Main Road.
PUNALUR-
3" M. l. Abraham (lCerala).
RAJARMUNDl\Ay-378 PllDch.yal Aids, 10-1-40, Fori Gate.
RAlKOT-379 Mohan La! Dossbhai Shab, Bookaeller. .. ·Subs. " Advc.
Aacot. 380 8bnpatrai Plrasram Shah &: 8ro! .• B. B. Street 381 Vinay Book Depot, Govt. Qt. No.1. behind S. B. I.
RAlPUR-382 Potalt Pratistban, Sati Bazar.
RANCHI-383 CroWD Book Depot. Upper Bazar.
REWARI-384 11ka Ram SiDllh Lal.
IlOH1'AK-385 National Book House. Civil lloac\
llOO1lkEE-386 Vashpal I: Bcothcn, Station Road
SANORUll-
381 <'Uojab Edncatloml Emporium. Dhlll'i Glre. 188 Gandhi Mara Darshan Pustlkllaya. Sanarur (lb.).
SAOOAR-
389 Vadav Book StaD. Publishers " BooltscDers.
SECUNDERABAD-390 Hindu.staD Dairy Poblish~. Market Street. 391 Minerva Book Centre. 8/78. New Alwa1.
SHl1.LONO-391 AWe4 Publicadolll, 13, Oak Janda.
(Reg.) (Rest)
(Rest_) (Rest.)
(Rest.)
(Rest.)
(Rea·)
(~.)
<Rest.)
(Ile,.) (Rest.) (Rest.)
\Rq.)
(Rest.)
(Rcu.)
(A"".) (Reg.)
CRat.)
(Res.) lRest.)
(ltoac.)
Slation Serial No. Name of tho party Cat. of Aaellta
2 3
SHOLAPUR-393 Gajanao Book Stores: Main Road. (Rest.)
SILlGURI-394 N. B. Modern Asencie', Hill Court Road. - (Resl.)
SJMLA-395 Minerva Book Hc>\ISC. 46. The Mall. (Resl.)
SIVAKASI-396 Ganosb Stores. South Car Street. (Rest.)
SOLAN-397 Jain Magazine Agency. Ward 4/218. Rajsarh R.oad. (Reaular)
~RAT-398 Shri Oajanan Puslak.laya, Tower Road. (Rei.) j99 Gujsrat SUbs. Agency, lawahar Lal Nehru Marg, Atwa
Uno,. lRe,I.) 400 B. P. Traders. Bhasia Building. (Rest.)
TEZPUR-401 lyoti Prakashan llhawan, TeZllut. Assam. (kest.)
TIRUPATI-402 Ravindra Book Centre, Balaji Colony. (Rest.)
TRICHINOPOLLl-403 S. Krishnaswami &: Co., 3S, Subhash Chandra Bose
Road. Oleaular)
TRICHURAl'PALL y-404 Sri Vidya.
TRIPUllA-40S G. R. OIlUa &: Co •• Scientifll: Equipment Supplitn.
TRIVANDRUM-406 International Book Depot, MaiD Road. 407 Reddiar Press .. Book Depot. P.B. No.4. 408 BballYa Enterpriscs, M. G. Road. 409 Sree Devi Book House, Cbenthitta, Triv.ndrum.
TUTICORIN-410 K. rbiaaataia... SI. Fresh Chapai Road. 4th, ArIISan Book Centre. 462. V. E. Road.
UDAJPUR-412 Book Centre, Mabarana Bhopal CoDeae. 413 Jqlfiah Ii Co.
UJlAIN--414 :a.- Broa.. 41, MaliJIIWa.
ULHASNAOAR-41S Raj Book Servi~.
VARANASI-416 Chowkhamba Sanslerit Series Office. Gopal Mandir
P.B. Ma. 8. 417 Kohinoor Stores, University Road, Lanka. 418 Viswavidyalaya Prakashan, Cbowk. 419 Globe Book Centre. P.O. Hindu University. 420 Chaukbamha Viava Bharati. Cbowk
VELLOR.E-421 A. VeokatasubI\an, Law BookseDers.
VUAYAWADA-422 Visalandhra PIlblishilll HOllIe.
VIZAGAPATAM-
Lane.
423 Gupta Bros.. (Books), Yam Buildiol. 424 The Secretary, Audhra Uoivcrait:r
Main Road. (lcneral Co • ..()p.
Stores.
WARDIIA-415 lwarajya BlwIdar. bUd .wlrel.
(ReI'.)
Otest.)·
(Ilest.) (Rest.) (am.) (Rest.)
tRest.) (Rest.)
(Rest.) (Rest.)
(Rest.)
(Ilest.)
(Rea.) (Rea·) (llq.) Otest.) (Rest.)
(Rea.)
(Rat.)
(Rat.)
(Rat.)
Ute..)

LIST OF AGENTS FOR THE SALE QF GOVERNMENT OF INDIA PtmLlCATION5 AS {IN 25-11-76
FOR LOCAL SALES
Govt. of India Kitab Mahal. Unit No. 21. I'mpori. BuUdi!li. Baba Kbarak Sinah Mara. New DeLbi (PhCllle 343708).
2 Gon. of India Book Dept.. 8. Ks. Roy Road. Calcutta (Pbone No. 23-3813).
3 Sales Counter. Publication Branch. lJdyog Bhawan. New O¢lhi. (Phone No. 372081).
4 Sales Counter. Publication Branch. C.B.R. Buildinll. New Delhi.
5 Govt. of India Book Depot. Ground Flo~r. New C.G.O. BulldiDi. Marine Lines. Bombay-lO.
S" R AGENTS The Assistant Director. Extension Centre. Dhuli Road. Dhan .... ~.
2 The Asstl. Director. Ellteosion Centre. Santnaaar• Hyderabad-IS. . ' '
3 The Assn. Director. Govl. of India. S.I.S.l. MmlStry of C " I. Elltension' Centre, Kapitesbwar Road, Belaaurn.
4 The AssU. Director; Extension Centre. Krishna Dislt. (A.I.) .
• 5 The Asstt. Director, Footwear. Extension Centre, Polo Ground No. I. Jodhpur.
6 The A .. tt. Director. Industrial ExtensioD Centre. N.diad (Guj.).
1 The Development Commissioner, Sm_1I Scale Industries. Ud)'oe Dbawan, New Delhi.
8 lbe 0)'. Director. Incharae. S.),S.1.. Clo Chief Civil Admn. Goa. Panjim.
9 The Director. Gov!. Press. Hyderabad. 10 The Director. Indian BIlfe8U of Mines. Gon. of Indi ••
Ministry of Steel. Mines " Fuel. NalPur. 11 The Director; S.l.S.l.· Industrial Extension Centre. Udhoe.
Soral. 12 The EmpI07lMnt 0IIieer. Employment Ellchanle. Dbar.
Madll)'a Pradesh. 13 The Employment OftIcet •. Emplo:rment Ellchanae. Gopal
Bhann. Morena. 14 The Employment OftIcer. Employment Exchange. Jhabua. 15 The Ikad Ouk. Govt. Book Depot. Ahmedabad. 16 The Head Ckrk. Photozincoaraphic Press. 5. Finance
Road. roooa. 11 Tho OIl\cor-in..cbaqe. .Assam Govt. B. D.. G.uhati. II The OIIIcer-in-Charae. ExteJllion centre. Oub Road.
Muza«arpur . • '" The OIIIcer-in-Cbarae. ExteJIIiOD Centre. Industrial Estate,
)tokar. Raochi. 20 The OfIicer-in-Charae. Slate Information centre. Hyder_bad. 21 Tho O!Iicer·m-Cbarae. S,l.S.l, ExtellllioD Centre. Maida. 22 The OIIIcer-in_Cbarae. S.I.S.l. Habra. Tabaluria. 24 Paraanla. 23 The OftIcer-iD-Cbarae. University EmplO)'lllCDt Bureau.
Luckoow. 24 The (JIIicer-in-Chargc. S.I.S.I. Chrontannlq Extension
centre. Tear •• 33/1. North Topsia Road. Caleutta-46. :z; The OIfieer-in-C'harae. 5.1.5.0. Ezteasion Centre (Foot-wear).
Calcutta-'2. 26 The Offieer-in-Charae. S.1.S.I. Model Carpentr)' Workshop.
Puyali Nagar. P.O. Bumapur. 24 Parlanas. 27 Publication Division. SaIea Depot. Nortb Block. New
DeIbi. 28 the Press OIlieer. Orissa Scctt.. CuUaclt. 29 Tho Regi.lrar of Compani~. Andhra B_nk Bldl.. 6.
Linabi Chetty Street. P.R. 1530. Madras. 30 The Registrar of Companies. Assam. Manipur and Tripura.
ShiUODg. 31 The Registrar of Companies. Bibar Journal Road. Patna-I 32 The Registrar of Companies. 162. Brigade Road. Ban.alore. 33 'rbe Registrar of Companies. Everest. 100. Marine Drive.
Bombay. 34 lbe Rqiatrar of Companies. Gujarat State Samaehar Bide ..
Ahmedabad. 3S Tbe Reaistrar of CoDl1lanies. o..uor (M.P.). 36 The Registrar of Compania. H. No. 3-5-837. Hyder
Ooda. Hydenhad. 31 The ReaiItrv of COIIIpaAiea. 1Ccrala. 10. Feet • .....,.
fIraatuIua.
38 The Registrar of Companies, M. G, Road. West Cotto Building. P.O, Box 334. Kanpur.
39 The Rellistrar of Comp_nie,. Naryani Bldll·. Brabourn. Road. Calcutta.
40 The Registrar of Companies. Orissa. Cuttack, Chandi. Cuttac:k.
41 The Registrar of Companies. Pondichert)'. 42 The Registrar of Companies. Punjab &: Himachal Pradesh.
Link Road. lul1undur City. 43 The Relistrar of Companies. Rajasthan " Ajmer.
Sh. Kumta Prasad House. lst Floor. 'C' Scheme, Asi-.ok Mara. laipur.
44 Tbe Re,istrar of Companies. SunliRht Insurance Bldl·. Ajmeri Gate. Elltension. New 0¢}1u.
45 The RClLfstrar of Trade Vnions. Kanpur. 46 Sooehn. Sahita Depot. (State Book o.:pol). Lueknow. 47 Supdt.. Bhupcndra State Press. Patial •. 48 Supdt.. Govt. Press &: Book Depot. NalPur. 49 Supdt.. Govt. PreiS. Mount Road. Madras. ~ Supdt .. Govl. Stationery. Stores and Pub ... P.O. Gulzarbaah.
Pat~8.
51 Supdt.. Govt. Printing and Stationery Depot. Raja5than. laipur City.
52 Supdt .• Govt. Printina and. Stationery. Rajkot 53 Supdt.. Govt. Ptinting and Stati()nery, Punjab. Chandig_rh. 54 Supdt .• Govt, State Emporium. V. P. Re'N'. 5S 0)'. ControUer. Printi'll &: Stationery OfIice. Himachal
Pradesh. Simla, 56 Supdt.. Printinll and Stationery. ADahabad. Uttar Pradesh 57 Supdt .• Printina and Stationery. Madhya Prad •• h. Gwalior. 58 Supdt.. Printir.g and St.tiooeey. Charm Road. Bombay. 59 SUlldt., State Govt. Press. Bhopal. 60 The Assistant 'Director. Publicity & Information. Vidhln
Saudha. BaDlalore-1. 61 SUpdl.. GOyt. Press. Trivandrum. 62 Asstl. Information OftIcer. Press Information s.ue.u.
Informalion Centre. Srioapr. 63 Chief Con traDer of Impor" .t Exports Panjim. Go •. 64 Employment OtRcer. Employment 2xc;hanae (Near Bu,
Stop) Sidhi (M.P.). 6S The Director. Regional Meteoroloaica1 Centre. Alipur.
Calcutta. 66 The Assn. Director. Slale Information CeDtre. HubB. 67 The Director of Supplies and Disposals. Deptt. of Supply.
10. Mount Road. Madras·2. 68 Director General of Supplies aDd Disposals. N.r.C. BId, .•
New Delhi. 69 The Controller of Imports and Exports. Rajkot. 70 The Inspector. Dock Safety. M/I&E Madras H.rbour.
Madrla. 71 The Inspectina Asstt. Commiuioner of Income Tax,
Kerala. Emakulam. 72 The Under Secretary, Rajy_ Sabb. Sew.. Parliament
Home. New Delld. '73 Controller of Imports &: £"ports, 7. Portland Park.
Viszkhapatnam. 74 The Senior Inspector. Dock Safety. Bot.wana Chambers.
Sir P. M. Road. Bombay. 75 ControRer of Imports It:. Exports. I.B .. I4-P. Pondicnerry. 76 Dy. Director Incharae. S.I.S.I.. Sahakar Bhawan. Trikon
Balicha. bjkot. n The Publicity and Liaison OlIieer. Forest Research Insti.
tute and Colleses. Near Forest. P.O. Deht_dun. 78 The As.tt. ControUer of lpIports and Exports, Gon. of
India. Ministry of Commerce. New Kandla. 79 The Deputy Director (S.D.). Esplanade East. Calcutta. 80 The Director. Govt. of India 5.1.S.I .• Minislt)' of I . .t S.
Industrial Areas-B. Ludhiana. 81 The Gon. Epigrsphi.t for Indi •. 82 The Assu. Director, J IC. S.I.S.t. Extension Centre.
Varan.si. 83 The Director of Supplies, Swamp Na,... Kanpur. 84 The Asstt Direc:tor (Admn.). OlIice of the Direc:torate of
Supplies " Disposals. Bombay'. as The Chief ControUer of I .t B. Minlslt)' of InterWltionaJ
Trade. Madras. " The Dr. Controller of CualolDl. Coatocn HOQaC. Viaatba.
.-tDaIII.
17 The Principal OfIker. Marcantile Mari!lO Deptt .• Caledtta.
81 The Director. S.I.S.I.. Karan Nasar. Srin ... r. 89 The Director. S.I.S.I .• 107. Industrial Estate. Kanpur. 90 The Director of Inspection. New Marine Lines. Bombay·l. 91 The ny. Chief Controller of imports .t Exports. T. D.
Road. ernakulam. 92 The Autt. Director. GOYI. Stationery Book Depol.
Auransabad. 93 The A.tt. Director. I/C. S.I.S.I. Oub Road. HubD. 94 The Employment OIIIccr. Talcher. 9!1 The Director of Inspection. Directorate General of Supplies
a; Disposal. I. Ganesh Chandra Avenue. Calcutta. 96 The CoDet:tor of Customs. New Custom House. Bombay. 97 The Controller of Imports It Exports. Baogalore. !IS The Admn. Mcer. Tarill Commission. 101. Queen's
Road. Bombay. 99 The Commissioner of Income ·ru. Paliala.
100 The Director. Ministry of I. " Supply. (Dcptl. of Industry) Cuttack.
101 The 0)'. Director of Public Relations. Stete Information Centre. Patna.
102 The Olllcer·in·Charge. State Information Centre. Madras. IG3 The Asstt. Director. S.I.S.M.I. Road. Jaipur. 104 The Collector of Cusloms. Madras. 10.5 National Building Organisation. Nirman Bhawan. New
Deihl. 106 The Controller of Communication. Bombay Rosion.
Bombay. 107 The Karnatak Univenity. Dharwar. 1GS The Sardar Patel ·University. VaUabh Vidyanallar. 109 The Director of Industries &: Commerce. Bangalore·l. 110 The Principal Publications Olllcer. Sendin. Commission
for Scientific &: Tech. Terminologv. UOC BuildinS. New Delhi. .
III The Ollleer I/C. Information Centre. Swai Ram Sinah Road. Jaipur.
112 The Director General of Civil Aviation. New Deihl. 113 Contr(lll~r of Aerodrome~. Delhi. 114 Controller of Aer"dromes, CalclJtta. 115 Controller of Aerodromes, Bomba,..' 116 Controller of Aerodromes. Madras. 117 The Registrar. Punjab Agril. University, Ludhiana. H8 The land &. DeveloJ!ment Officer. M;oistry of Healtb and
Family Planning. W. H. &: 0., Nirman Bhawan. New Delhi.
119 Acting Secretary. Official LanKualle (lell.) Commission. Ministry of Law, Bhagwan Dass Road. New Delhi.
1211 Rqistrar General Indi.. 2/A. Mansingh Road. New Delhl-Jl.
121 The Director of Cer.sus Operations. Andhra Prad~h. Khusro Manzil. Hyderabad-4.
122 The Director of Census Operations. ALum. G.S. ROlId. Ulubari. Gauhati· 7.
123 The Director of Censu~ Operations. Bihar. Borina Canal Road. Patna.
124 The Director of' Census Operations. Guiarat. Ellis Bridge. Ahmedabad-6.
12.5 The Director of Census Operations. Haryana. ICothi No.1. Sector.I()"A. Chandiaarb.
126 The Director of eellS\ll. Operation~. Himachal PradeAA, Bonrel. Simla·S.
127 The Director of Census Operations. Jammu It Kashmir. 19 Karan Nasar. Srin8ltar.
128 Tho Director of Census Operations. Kerala. Kowdiar Avenue Road. Trivandrum·3.
12' The Director of Cenms Operations. Madhya Pradesh. Civil Lines. Bhopal-2.
130 The Director of Cen..us Operltions. Maharasbtra. Sprott Road. Bombay-I (BR).
131 The Di~ector of Census Operations. Manipur. Imphal. 132 The Director of Census Operations. Mellhalaya, Nan,ri
Hills. Shillong·3. 133 The Director of Census Operations. Mysore. Basappa Cross
Ruad. Shanti Nagar. Bangalore·1. 134 The Director of Census OperatiC'ns, Nalilaland. Kobima
135 The Director of CensQS Operatiops. OriSQ. Chandlli ' Chon. Cuttack·l.
vii
s. iI R •• \GENl'S
134S The DItectQr of CeIllUl Operadoal. Puajab. No. 72. Sector·S. Chandlaarb. •
137 The Director of Census OperatioDl. Raiutban. Rambaa Palaeo. Jaipur.
138 The Director 01 CcIIIUI Operadoll •• Tamil Nadu. 10, Poea G.rd"n. Madru-86.
139 The Director of Cenaus Operations. Tripura. Duraa Bari. West Compound. A.prtaIa.
140 The Director of Census Opentiona. Uttar Pradesh. 6 Park Road. Luclmow.
141 The Director of CeIllUl Operations. West Denial. 20. British India Street. 10th Floor. Calcuttl·l.
142 The Director of CeIlSUS Operations. Andamao lod Nicobar Ia1ands. Port Blair.
143 The Director of CeIlSUl Operations. Chandiaarh. S.C.D. Ne. 18. Floor No. I. Madbya Mara. Sector-26. Ch.ndiprh·I60026.
J44 The Director of Censua OpentiODs. Dadra and Napr Haveli. Panap.
I04S The Director of Census Oper.tiona. n.thi. 2 Under HiI .. Road. Delbi~.
I~ The Director of Census Operatioea. Goa. Daman .t Diu. Dr. A. Borkar Road. Panaji.
147 The Director of Census Operationa. L. M . .t A. hlanch. Kavaratti.
148 The DirectM of Cenaua Operatinns. Tamil NI4D _ Pondicherry. 10. Poes Garden. Madras.
149 The Director of Ceoslll Operations. UoIo" Territory. Chandisarb.
1.50 The Director of Social Scieoce' Documentation Centre. New Delbi.
1.51 The District Employment OfIIeer. Dislt. Employment Excbange. Malappuram <Kerala St.).
152 The AL,tt. Collector (Hqrs.). Custom " Central }!xci ... ShillOD ••
IS) The As"lt. Collector of Central Excise. I.D.O.I Div,. Visakhlpatnam.
154 The Hqrs. Asslt. Collector. Centra] Excise, Hyderabad
ISS The Public: Relations Olllcer. CoUec:torate of Cust.oma. New Custom House. Bombay-I.
156 The Divisional Officer. Collel:torate of Central Excise. Integrated Division. Jabalpur.
1.57 The A •• tt. Collector ~Hqrs.). CoDectorate of Central Excise. Madhya Pradesh &: Vidarbha. Naspur-440 001.
158 The Hqrs. Asstt. Collector of Central Excise. Guntar (A.P.).
159 The Asstt. Collector of Central Excise. Emakulam-I. Division Ernalculam. Cochio·tl.
160 The Asstt. Collector (Hqrs.). Collector of Central Excise. Nunaambakkam. Hilh Road. Madras·34.
J61 The Asstt. CoUector of Central Excise. Divisional OIlice. Uiiain.
162 The Divi\ional 08icer. Central Excise. Division Oftice Arnravati.
163 The Asstt. CoUector. Central Excise. Division. Bhopal (M.P.).
164 The A •• tt. CoUector. Central Exei ... M.O.D.I .• New Delhi.
16.5 The Autl. CoDector of Central Excise. Int. Division. Indore.
166 The Director of H.A.U. Book Shop. Nehru Library Bldl .. H.A.U. Hi..., (Huyana).
.67 The Asstt. Collect,}r. Central Exci,. .t Customa. Dhubri.
163 The Asstt. CoUector. Central Exci .. Cuttaek (Ori ... ).
169 The Afstt. Codtctor. Central Excise. V.ranasi (U.P.).
170 The A.stt. Coneetor. Central Exclae a CII.toma. Romtela.
17] The Asstt. CaDcetor (Hqrs.) Central EJ:cise. New Excise BidS.. Cburchpte. Bombay.oCOO 020.
172 The Autt. CaUector (Hqn.). Central E:rci... BbubaDeswar (Oriasa).
173 fbi ~t. CoIkctor (fIqfll.). Ceatnl Escile. AlIahaIle4.

S •.• Jl. AGENTS
114 The Ala". Collector (Hqn.). 0ast0IIII.t CeIltral f!Xc!IIO. Coc:IIIa-U.
1'5 The !)y. ~ of Ceaual Excite. Coimba'lOfe.ll. 176 The Alltt. Collector. Ceatral Excise Division. Sitapur. 171 TIle 1oJIU. Collector of Cectral - 'Excise I: CustOllll.
.. mba ... 171 Tbe AMtl. Collector (Hqrs.), Ceaual Exc:illO. ICanpaJ'. 179 TIle Alall. CoIIeoIol' (Cenual CImcnnI .t 'Excise, JorQI. 180 The Aalt. CoUec:tor (Hql'l.). Central Excise. Paw. Clo
ColIec:tonte of Ce1Itnl EsciIII a; Cuat_. Plltn •• 181 TIle AIItt. CoIleI:lar of C.--. Custom H~. MDw ......
RAlLWA'Y' BOOQTALL HOLDERS
I 5/. A. H. Wbeeler I; Co.. IS. BIIiD Road. ......w. 2 5/. HiaIIn~ Il Co. Ltd .• MoulI' Road. Madras. , 5/. Oalllot Brot •• K.E.M. Road. BiJcanft.
FORSIGN
1 Sis I!duutlan EntUJ)rite l'I'lftte UtI. Katbmandu (Hepa!). 2 s/. Alttiebo!a.t, C.E. Fritzee Kuql. HoYbokhandel.
Fred .. atlon·1, Box 16S6. Stockholm 16. (Sweden). , ReilC-Ilnd.Ver Kohrcaverlaao Stutt (ian POIt 730.
Oatonleel'llStriee 21. Stuttaon Mr. 1124' Stuttaort. Den (Gorafany West).
4 SPS Book Centre, LItWDi MUllion, 49. TIle Mall. Lahore (Pakistan).
S S I. Oralhi Ranch! International Boobel1ers, VIa Cavoo,. T-9-U- 35000 PodQ'la (Italy).
6 Sf' Wept .t Co ... Booksellorl, Enalish Deptt. Eisena_ 1 S B.sel (Switr.erJand).
7 0110 HarraHOwitz Buc:hhlndiuq ond Antjquarial. 6200 Wisebad~ TaoDuaua (Oermany).
8 SIs A. A_her .t Co •• N. V. Keizersaracht. 516. Amsterdam-c: (HoUandi.
9 5(. S_tt .t Zeitlinser N. V. 471 .1\ 487 lteiZenaraCht Amsterdam (Hoiland):
SO M. F. Von Piers. Redlitract 61. SlndboYell (HoDand). 11 H. K. LoMs .t Co. Ltd., 136. Gower Street, London
W.C .• ,. U ff~rbett Willson Ltd., Booksellers a Sub A_nls, 161
Broulh mlh Street. London S.E.I. (Enlland). J3 Bucb ond Zejtaelui&Cn. M.B.H. I-Ind Export Cross ulld,
Koonissi Onbuc:h Handlinl IDternatioo Verl .... ·UslieCerundem Hamblltli (Gormany).
14 Sf. Store Nordislce Viclenlkaboahandel. Reme,..acle, 17 DK 1362. Cupenhaaen K. (Denmark).
15 The Ex·Libris, BucbhandeiSielischa.. Harinnon Oswo1d a Co.. X.G. Franltfort Main (Germany).
16 Dr. LudwiC H."tascbeI UJIlversitytasoBuchbandluoa. J4.C. Ottinaen (German),).
t1 Otto Koelitz Aotiqnalat, 614. KoonillStiOC TIUDUS. RemJllrlldllr-6 (w Germany).
18 Asia Librar,- Service. 1841, 69th A~nyea. Californil. (1].S.A.).
19 Publlshin. and Distributi1l8 Co. Ltd.. Mitre Hoose. I'n, Relent Street. London W·I.
20 Reise-U.verk Ehl'llverlal 7. Stultaart-V.ibinaeo. PoItefaib-8()·0830, Hosiawiesenstr-2S (Oermlny).
21 Arthur Probsthain Oriental Boole: Sel1en I: Publi!lher. 41. Grelt Russel Street (London W.c.·n.
11 Independent Publishina Co.. 38. ICeJlninaton Laaae. London S.B. n.
2' Jnter Continental Mlrketinl Corpoflcioa. Tokyo Oap.n). 24 FriUer Kunal Hovbokhoodal A.B. Stockholm. 16/(Sweedell). 2$ Ratna PIt.tat Shandar. Bhotanlt1. Kathmandu. (Nepal). 26 Steeberl MacmJUlon IDe.. nso. W_ fi,,4 Ayen". JIlow
Jeney-OSUO.
REOISTRAR OP.NERAL I; DUU!CTOR Of CENSUS OfFiCES
Reiiatrat Genen1, lDoSIa.", A. MauiDah llDaC. Mew DeIJIj-lI00ll. Pho_ : 313761. 381284.
'1. The Director of CeNus OpcntiODt, A.,db.rll PndeIIl • Kbusro MalUil. H)'derabad-4.
3 The Dltoctar of eeu.o. ()poratiODt. Assam. BomfrJe ... lhillooa-t.
4 The DireCtor of CeasDl ()peratiOQA. Bibar. BariDa CmtI Road. 1'IbIa.
5 Tbe Ditoctor of Ce_ Oper.tioo.. Oajarat.. EJIIa ....... A1uDecIabad-4.
6 The Director or CeDIDI C)pcrations. Harrlaa. KodII 'No. I. Seaor 10-A., cuDdlprtl.
7 Tho: Director of CeIlIUJ Operaliolll. Himae'" ~ Botftl. SimIa·S.
a The DirectOl' of Ce_ Operations. Jam_ &: 'KaIbmir. 19. 'Karu Naaar. Sriuaaar.
9 The Dire.:~ ~r of C'eIUuI Opentlons.· 1Cerala. Kowcllar Aveuue Road,TriVlndrwD-J.
10 The Diroctor of Census ()peratiOIlS. Madhya Pradesh. Civil U-. Bhopal·2 (M.P.).
11 The Di~ of CenlUJ ()pcratioaI, Mallarlllblra. Sprott Road, Bombay·1 (8R).
l1 1he Director ol CeDIUJ ()zIeratiom. Maa.iaIat, y_ Lciltai, Imphal.
13 The Director ot ee..s Operations. ~. Naqrim HiU. SbiUona_l.
14 The Director of ~ Opa-atiOIlS, MY$ON. .. .. ppa Crou Rold. SbaDti Nailer,. Baaplozc.l,
IS The Director of Census OperatioDS, Ntiplaud. KoIIIma. 16 The Director of CA_ OperatiOna. Orlsu. Chaadal Chaut.
Cottatk.1.
11 The DirC':tor of CeImu Opcn\i.~ Plmjab. No. 72. Seclor·S. Chandlaarh
18 The Director of CetmIa Ooenti-. "jaatbaD. RuDbq Palace. Jaipur.
19 The Director of CcnlUJ Operalions, Tamil fiulu. 10. Poa Garden. Madras·81S.
20 The Director of CcDSU3 ()peradoDS. Tripara. Durp Sari West Compowid. AprlaIa,
21 The Director of CeIllUi OperatJona. Uttar PradeIh. 6-Putt: Road. LuGow.
22 The Director of CollINS ()peratiOIlS. West 8eap1, 20. Britiab lncllan Street, Calcutta-I.
23 The Director of Censua Operations. Andamlln .t NiI:obu Islands, Pon 8lair.
2A Tho Director of CenIUS OpcratiOJlS. ArlInac:ha1 Pradesh. Lailhulllkhrah. Sbi1Ioaa.
25. . The Dlrnctor of Ce_ Operations. Chandlprh. Kothi No. 1012. Sec:tor. s.c. Chaodiprh.
26 Tho Director of Ceaaus Operationa. Dadra and N.r HaveJi. P_ii.
27 TIle Director of CoJISUS ()pcrations, Delhi. 2 Under Hill Road. DeIIIi·ll0006.
28 The Direc:t.)!' of Census Operation~, Goa. Daman &: Diu. Dr. A. Barhr Road. Paaaji.
29 The DIrector of Consus Operations. L. M. &: A. IaIands, ~varatti I5landJ via Caliwt.
30 The Director of CeIllllS OpcratioQS. Pondit:ben')', 10, Poea (judea. Madru-l6,
Copyright © 2022 FDOKUMEN