District Census Handbook, Kannauj, Part XII - Linguistic ...
Upload
khangminh22Category
view
3download
0
CENSUS 1961
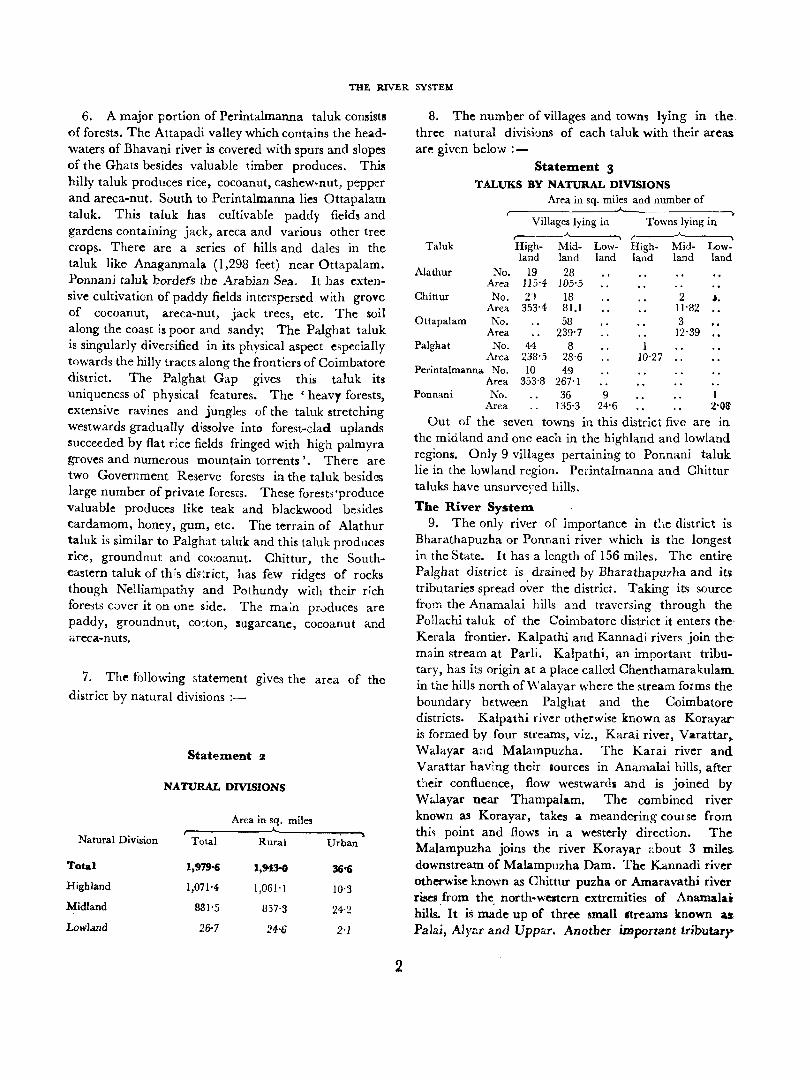
KERALA STATE
DISTRICT CENSUS HANDBOOK
3
PALGHAT
M. K. DEVASSY:. B. A., B. L.
OF THE INDIAN ADMINISTRATIVE SERVICE
SUPERINTENDENT OF CENSUS OPERATIONS, KERALA AND
THE UNION TERRITORY OF LACC,\DlVE. MINI COY AND AMINDIVI ISLANDS
1965
PRINTED BY THE S. G. P. AT THE GOVERNMENT PRESS ... SHORANUR
1965
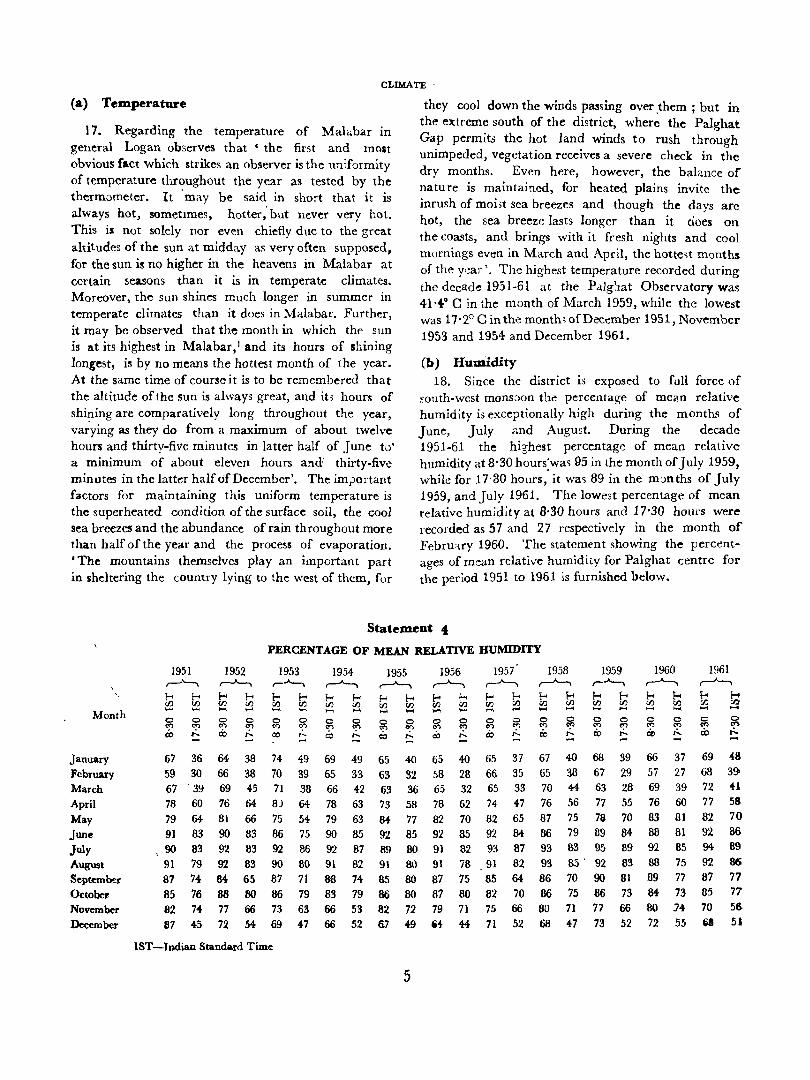
PREFACE
The District Census Handbooks were started fDr the firs.e time' in the 'history of the decennial censuses in India in 1951. The Hand:boQks. ~f t~le 'Travancore-Cochin and Madras States in the 1951 Census contained'~ ,besides a' short account of the district and the people, important census tab1,eJ for the district and a village directory consisting of the area, houses, population, number of literates, the distribution of population by livelihood classes, the number of institutions and general information on amenities, etc., in respect of every vill,age. In the 1961 Census it was decided with the concurrence of the State Government to continue the publication of the District Census Handbooks. The contents of the District Census Handbooks of the 1961 Census are, however, a little more ambitious than those of the 1951 Census Handbooks in that besides the items of information mentioned above a large number of tables giving general information about the district have been added. The number of such tables comes to 40 besides 48 inset tables excluding those given in respect of Census data. As far as possible, an attempt has been made through these tables to give an epitome of the progress made by the district in various fields during the intercensal period 1951-61. The book is divided into three parts. Part-A gives a general description of the district, the progress made during the last decade, a review of the population, literacy, employment and unemployment, household economic data, etc., of the district based on Census data and a Gazetteer. The appendices to this part contain the various tables of general information on which the review of progress has been based. Part-B contains the Census data of 1961 comprising the general population tables, economic tables including household economic tables, social and cultural tables and $pecial tables for Scheduled Castes and Scheduled Tribes. Part C is the Village Directory. It is hoped that this handbook will serve as a useful reference book on the Palghat district.
A book of this kind could not have been compiled but for the hearty co-operation and goodwill extended by the various departments of the State and Central Governments to whose kindness I am deeply indebted. The District Census Handbook Section of my office consisting of a Statistical Assistant and a couple of Compilers has been in charge of the entire work of collection and compilation of the data for this handbook. At the time of addressing the various departments for collection of information for the District Census Handbook 5hri H. Padmanabha Iyer of the Bureau of Economics and Statistics was the Statistical Assistant in charge of the section. After a short period of work in this section he was transferred to the Tabulation Office, Kozhikode, as the Tabulation Officer. He was succeeded by Shri S. Jayashanker of the Bureau ,of Economics and Statistics as Statistical Assistant in charge of this handbook.
While Shri Padmanabha Iyer has rendered excellent service in piloting thework of the collection of data fOT the handbooks, ShriJayashanker who succeeded him has borne the brunt of the work in the preparation of this handbook which involved a good deal of careful analysis and laborious compilation. I feel' happy in acknowledging the valuable contribution made by them and parti-~ cularly Shri Jayashanker in the compilation of this important book. I should also acknowledge the good work of the Compilers of the District Census Handbook Section, Sarvashri K. N. Raman and E. V. Unnikrishnan Nair and ot draftsman Shri S. Krishna Pillai who has prepared the entire set of maps given in the book.
I should express my deep sense of gratitude to Shri P. K. Abdulla, I.A.S·, Secretary to Government and Shri K. Swaminathan, Superintendent of' Government Pre.ses for the warm co-operation extended by them for the timely printing of this handbook.
Above all I am grateful to Shri Asok Mitra, I. C. S., Registrar General< for the valuable guidance and help extended to me in this work.
Trivandrum, 15th November, 1965 M. K. DEVA5Sr
II
:PREFACE
IART A-GENERAL
History of the district Situation Administrative units
CONTENTS
Area, physical features and natural divisions The river system Mountains Backwater~ Soils Geology Climate Forests Land tenures Agriculture Irrigation Live-stock Educational institutions Public health Vital statistics Electric power Communications Industries Trade Fisheries Community development Revenue Local Self-Government Co-operative societies Criminal justice Registration Small Savings Scheme 1!rinting presses and periodicals Employment Exchange activities Important events Occupi~d houses and households Growth of population Population by taluks Population by rural-urban distribution Population by natural regions Population density Sex-ratio Age Marital status Religion Literacy and education Lan~ages Birthplace Workers and JlOll-workers Household economic data Gazetteer
PAGE
I I I I 2 3 3 3 4 4 7 7
19 23 24 24-28 29 30 30 33 36 36 37 37 37 39 40 41 41 41 41 41 41 44 45 45 46 47 49 50 51 51 52 56 57 57 64-68
APPENDICES
Appendix 1
Appendix 2
Appendix 3 Appendix 4 Appendix 5 Appendix 6 Appendix 7
Appendix 8 Appendix 9 Appendix 10
Appendix 11
Appendix 12
Appendix 13
Appendix 14 Appendi.x 15
Appendix 16
Appendix 17
Appendix 18 ""-
Appendix 19
Appendix 20
Appendix 21
Appendix 22
Appendix 23
Appendix 24
Appen'dix 25
Appendix 26
Appendix 27 Appendix 28
Appendix 29
Appendix 50
Normals of rainfall and rainy days (based on available data for the period 1901 to 195'0) for Alathur, Cherplachery, Chittur, Mannarghat,Ottapalam, Palghat (Obsy.), Palghat, Parli, Perintalmanna and Ponnani centre,
Rainfall data for Alathur, Cherplachery, Chittur, Mannarghat, Ottapalam, Palghat (Obsy.), Parli, Perintalmanna: and Ponnani centres
Temperature data for Palghat observatory Major and minor forest products Production of important crops for the last six years Live-stock and poultry (Live-stock Census, 1961) Agricultural ffi2.chinery and implemell'ts (Live.stock
Census, 1961) Colleges for the academic year 1960-61 Technical institutions Number of persons treated for the period 1950-51 to
1960-61 Patients treated m various hospitals by diseases for
1960-61 Rural sanitation for the period 1950-51 to 196)-61
Allti~adulteration activities for the period 1956-57 to 1960-61
Polymetric table of distances
Facilities at various railway stations
List of Post Offices
Connections provided from telephone- exchanges during the period 1957-58 to 1960-61
Handicrafts
Annual average earnings of workmen m a category of work for the period 195i-58 to 1960-61
Number of industrial disputes resulting in work.stoppages for the period 1957 to 1960
Number of indu~trial disputes resulting in wOTk ... stoppages by causes for the period 1957 to 1960
Tonnage of vessels entered or cleared with cargbes at Ponnani Port for the period 1951-52 to 1959-60
Import into the port of Ponn~ni for the period 1951-52 to 1959-60
Export from the port of Ponnani for the period 1951--52 to 1959~60
Physical achievements and people's contribution for the period 1956-57 to 1960-61
Receipts unde:r Excise Revenue for the period 1950-51 to 1960-61
Sales-tax revenue for the period 1950~51 to 1960,,61
Agricultural Inco~e·tax and Agricultural Super.tax classified by grade of income fonhe period 1957-58 to 1960-61 -
I~cidence ofland revenue assessment for the period 1950-51 to 1960-61
Receipts under entertainment tax for the period 1950-51 to 1959-60
IV
PAGE,
77
78 81 82-83 84
88, 88,
89
89
89' 90
90 90-
93 94
9~
98
93
100\
103
105-105
106-
108
108,
Appendix 31
Appendix I 32
Appendix 33 Appendix 34
Appendix 35
Appendix 36
Appendix 37
Appendix 38
Appendix 39
Appendix 40
Income of Municipalities for the period 1955-56 to 1960-61
Expenditure of Municipalities for the period 1955-56 to 1960-61
Income of Panchayats for the peri'od 1955-56 to 1960-61 Expenditure of Panchayats for the period 1955-56 to
1960-61 Nature and length ot sentence of convicts in jails for the
period 1950-51 to 1960- 61 Number of Police f>tations, strength of police personnel,
etc., for the period 1950-51 to 1960-61 Number of registered documents and value,:> of property
tramferred for the perio<l 1950 to 1960 Number of printing presses for the period 1950-51 to
1960-61 Employment exchange activities for the period 1958 -59 to
1960-61 Important events during the last decade
PART B-CENSUS DATA
(i) STATE T4BLES I AREA, HOUSES AND POPULATION
II VARIATION IN POPULATION DURING SIXTY YEARS
III WORKERS AND NON-WORKERS CLASSIFIED BY SEX
(ii) PALGHAT DISTRICT TABLlfS
A-General Population Tables
A-I AREA, HOUSES AND POPULATION
Fly-leaf
Table A·I
Appendix
Appendix
Appendix
I Statement showing 1951 territorial units constituting the present set up of Pal ghat district
II Number of villages with a population of 5,000 and over and towns with a population under 5,000
III Houseless and institutional population
A-II VARIATION IN POPULATION DURING FORTY YEARS
Fly-leaf
Table A·II Appendix Statement showing 1951 population according to their territorial
jurisdiction in 1951,_changes in area and the population involved in those changes
A-III VILLAGES CLASSIFIED BY POPULATION Fly-leaf
SPECIAL TABLE A-III DESOMS CLASSIFIED BY POPULATION
Fly-leaf Table A-III Special Table A-III
v
PAGE
109
110 III
III
112
112
113
113
113 114
3 4-6
11
14-
16
18
18
19
20
21
23
23 24-24
A-IV TOWNS (AND TOWN-GROUPS) CLASSIFIED BY POPULATION IN 1961 WITH VARIATION SINCE 1901 Fly-leaf Table A-IV Appendix I New towns added in 1961 and towns in 1951 declassified
in 1961 Appendix II Details of constituti~m of towns with their area and
jurisdiction Appendix III List of places which were taken into account for
striking class totals of population at some census or other but which were excluded from reckoning in certain census when they did not enjoy urban status
lI-EcOIlOnllC Tables NOTE
B-1 WORKERS AND NON-WORKERS CLASSIFIED BY SEX AND BROAD AGE-GROUPS Fly-leaf Table B-1
B-III INDUSTRIAL CLASSIFICATION OF WORKERS AND NONWORKERS BY EDUCATIONAL LEVELS Fly-leaf Table B-IJI Part-A Table B-III Part-B
... B-IV INDUSTRIAL CLASSIFICATION BY SEX AND CLASS OF
WORKER OF PERSONS AT WORK OTHER THAN AT CULTIVATION Fly-leaf Table R-IV Part-A Table B-IV Part-B Table B-IV Part-C Appendix to Table B-IV Part-C Table B-IV Part-C (i)
B-V OCCUPATIONAL CLASSIFICATION BY SEX OF PERSONS AT WORK OTHER THAN CULTIVATION Fly-leaf Table B-V Appendix
B-VI OCCUPATIONAL DIVISIONS OF PERSONS AT WORK OTHER THAN CULTIVATION CLASSIFIED BY SEX, BROAD AGEGROUPS AND EDUCATIONAL LEVELS IN URBAN AREAS ONLY Fly-leaf Table B-VI
B-VII Part-A PERSONS WORKING PRINCIPALLY (i) AS CULTIVATORS, Oi) AS AGRICULTURAL LABOURERS OR' (iii) AT HOUSEHOLD INDUSTRY CLASSIFIED BY SEX AND BY SECONDARY WORK (i) AT HOUSEHOLD INDUSTRY, (ii) AS CULTIVATOR, OR (iii) AS AGRICULTURAL LABOURER; AND Part-B INDUSTRIAL CLASSIFICATION BY SEX OF PERSONS WORKING IN NON-HOUSEHOLD INDUSTRY~ TRADE, BUSINESS, PROFESSION OR SERVICE WHO ARE ALSO ENGAGED IN HOUSEHOLD INDUSTRY Fly-leaf Table B-VII Part-A Appendix Table B-VII Part-B
VI
fACE
26 27
29
30
30
31
33 34
36 37 38
40 49 51 55 59 62
64 65 92
95 96
lOOt.. 101 103 104
.B-VIII PERSONS UNEMPLOYED AGED 15 AND ABOVE BY SEX, BROAD AGE-GROUPS AND EDUCATIONAL LEVE:{.S Fly-leaf' I 15 Table B-VIn Part-A 116 Table B-VIII Part-B 118
B-1 X PERSONS NOT AT WORK CLASSIFIED BY SEX, BROAD AGEGROUPS AND TYPE OF ACTIVITY Fly-leaf 11 9 Table B-IX 120
B-X SAMPLE HOUSEHOLDS (i) ENGAGED NEITHER IN CULTIV AT ION NOR HOUSEHOLD INDUSTRY, (ii) ENGAGED EITHER IN CULTIVATION OR HOUSEHOLD INDUSTRY, BUT NOT IN BOTH, AND (iii) ENGAGED BOTH IN CULTIVATION AND HOUSEHOLD INDUSTRY FOR ALL AREAS Fly-leaf 124-Table B-X 12~
B-XI SAMPLE HOUSEHOLDS ENGAGED IN CULTIVATION CLASSIFIED BY INTEREST IN LAND AND SIZE OF LAND CUL TIVATED IN RURAL AND URBAN AREAS SEPARATELY Fly-leaf 126 Table B-XI 127
B-XII SAMPLE HOUSEHOLDS ENGAGED IN CULTIV ATT-=-8 ONLY CLASSIFIED BY SIZE OF LAND CULTIVATED A).JD NUMBER OF FAMILY WORKERS AND HI~ED WORKERS IN RURAL AND URBAN AREAS SEPARATELY Fly-leaf 129 Table B-XII 130
B-XIII SAMPLE HOUSEHOLDS ENGAGED BOTH IN CULTIVATION AND HOUSEHOLD INDUSTRY SHOWING SIZE OF LAND CULTIVATED CLASSIFIED BY PRINCIPAL HOUSEHOLD INDUSTRY IN RURAL AND URBAN AREAS SEPARATELY F~~f 1M Table B-XIII 135 Appendix 135
B-XIV SAMPLE HOUSEHOLDS ENGAGED ONL Y IN HOUSEHOLD INDUSTRY CLASSIFIED BY PRINCIPAL HOUSEHOLD INDUSTRY IN ALL AREAS Fly-leaf 136 Table B-XIV Part-A 137 Appendix 138 Table B-XIV Part-B 139
B-XV SAMPLE HOUSEHOLDS ENGAGED BOTH IN CULTIVATION AND HOUSEHOLD INDUSTRY CLASSIFIED BY SIZE OF LAND IN RURAL AND URBAN AREAS SEPARATELY Fly-leaf HI Table B-XV 142
E.XVI SAMPLE PRINCIPAL HOUSEHOLD INDUSTRY CLASSIFIED BY PERIOD OF WORKING AND TOTAL NUMBER OF
WORKERS ENGAGED IN HOUSEHOLD INDUSTRY IN ALL AREAS Fly-leaf Table B-XVI Appendix
.. Vll
147 148 152
B-XVII SAMPLE HOU~EHOLDS CLASSIFIED BY SIZE AND PARTICIPATION IN HOUSEHOLD CULTIVATION OR INDUSTRY
Fly-leaf Table B-XVII
C-Social and Cultural Tables NOTE
C-I COMPOSITION OF SAMPLE HOUSEHOLDS BY RELATIONSHIP TO HEAD OF FAMILY CLASSIFIED BY SIZE OF LAND CULTIVATED
Fly-leaf Table C-I
C-II AGE AND MARITAL STATUS Fly-leaf Table C-II
C-III AGE, SEX AND EDUCATION Fly-leaf Table C-HI Part-A Table C-III - _lrt-B Table C-I1I Part-C
C-V MOTHER TONGUE Fly-leaf Table C-V
C-VII RELIGION Fly-leaf Table C-VII
C-VIII SCHEDULED CASTES AND SCHEDULED TRIBES Fly-leaf Table G-VII I Part-A Table C-VIII Part-B
D-Migration Tables NOTE
E-Housing and Establishment Tables NOTE
SCT, SC & ST-Special Tables for Scheduled Castes and Scheduled Tribes NOTE
SGT-I INDUSTRIAL CLASSIFICATION OF PERSONS AT WORK AND NON-WORKERS, BY SEX' FOR SCHEDULED CASTES AND SCHEDULED TRIBES
Fly-leaf Table SGT-I Part-A Table SCT-I Part-B
Vlll
PAGE
153 154
156
157 158
1 tiO hI
1::;4 165 166 168
169 :172
175 176
177 17a 178
180
180
181
183 184 188
seT-II AGE AND MARITAL STATUS FOR SCHEDULED CASTES AND SCHEDULED TRIBES
Fly-leaf
Table seT-II Part-A
Table SCT-II J:lart-B
SCT-III 'SCHEDULED CASTES AND SCHEDULED TRIBES CLASSIFIED BY EDUCATIONAL LEVELS
Fly-leaf
Table seT-III Part-A (i)
Table seT-III Part-A (ii)
Table SeT-III Part-B (i)
Table SCT-Ill Part-B (ii)
SCT-IV RELIGION FOR SCHEDULED CASTES AND SCHEDULED TRIBES
Fly-leaf Table SCT-IV Part-B
SCT-V SAMPLE HOUSEHOLDS ENGAGED IN CULTIVATION CLASSIFIED BY INTEREST IN LAND AND SIZE OF LAND CULTIVATED FOR SCHEDULED CASTES AND SCHEDULED TRIBES
Fly-leaf
Table SCT-V Part-A
Table SC T -V Part-B
SC-l PERSONS NOT AT WORK CLASSIFIED BY SEX, TYPE OF ACTIVITY AND EDUCATIONAL LEVELS FOR SCHEDULED CASTES
PAGE
191
192
196
198
199
200
201
202
203 204-
205
206
206
Fly-leaf 207
Table SC-l 208
ST-I MOTIIER TONGUE AND BILINGUALISM FOR SCHEDULED TRIBES
Fly-leaf 211
Table ST-I 212
ST-II PERSONS NOT AT WORK CLASSIFIED BY SEX AND TYPE OF ACTIVITY FOR SCHEDULED TRIBES
Fly-leaf Table ST-II
. ' IX
214-215
PART C-VILLAGE DIRECTORY
(i) PRIMARY CENSUS ABSTRACT
Fly-leaf
Palghat district
Perintalmanna taluk
Ponnani "
Ottapalam "
Palghat "
Alathur "
Chittur "
(ii) AMENITIES
1 Educational and reading facilities
2 Medical facilities
3 Drinking water facilities
4 Communication and Transport facilities
5 Elec trifica tion facilities
6 Miscellaneous
(iii) INDUSTRIAL ESTABLISHMENTS
(jv) INDEX OF VILLAGES AND DESO MS
LIST OF MAPS
Palghat district
Perintalmanna taluk
Ponnani "
Ottapalam "
Palghat "
Alathur "
Chittur "
x:
PAGE
1
4
4
14 26
38
50
54
67
71
73
71
80 82
89
97
N
o 11
E
PALGHAT DISTRICT _-_._ ........ _ ................... -.. .. ...... .. ..
STATE BOUNDARY '
DISTRICT BOUNDARY
TALUK BOUNDARY
Miles to 8 6 4 2 0 ttL' td ..... ,.., .... to
I L i 20
f t
108 6 4 2 0 10 20 30 Kilometres
KOZHIKODE DISTRICT
TRICHUR DISTRICT
LEGEND NATIONAL HIGHWAY
= ==- .STATE HIGHWAY
LOCAL ROAD
RAILWAY
LAKE AND CANAL
RIVER
MADRAS STATE (NilGIRIS DISTRICT) .-.
.~ .... _'.... ./)' 1...i ._._.-. .,.... , '\ ,,.I ) ~
'>I'I.~
') .., r ~ ',_,,,,
.r· ...... _' - / MADRAS STA l (COIM~ATORE.::J~ ~ • DISTRICT) ~R
........ ( Q"f("J
-',-, q_°o~ '" ,"\., (.j - "-.
,,_. .__ . '? - ) _._ ............ ,
E
o 11
T ALUI( HEADQUARTERS
DJSTRICT HEADQUARTERS ~ ______ ~~~~==~================~~~ ________________ ~ ____ ~N ,
so
Printed at C,S.O. Trivanctrum A.O.1'"

PART A
GENERAL
PART A-GENERAL
History of the District
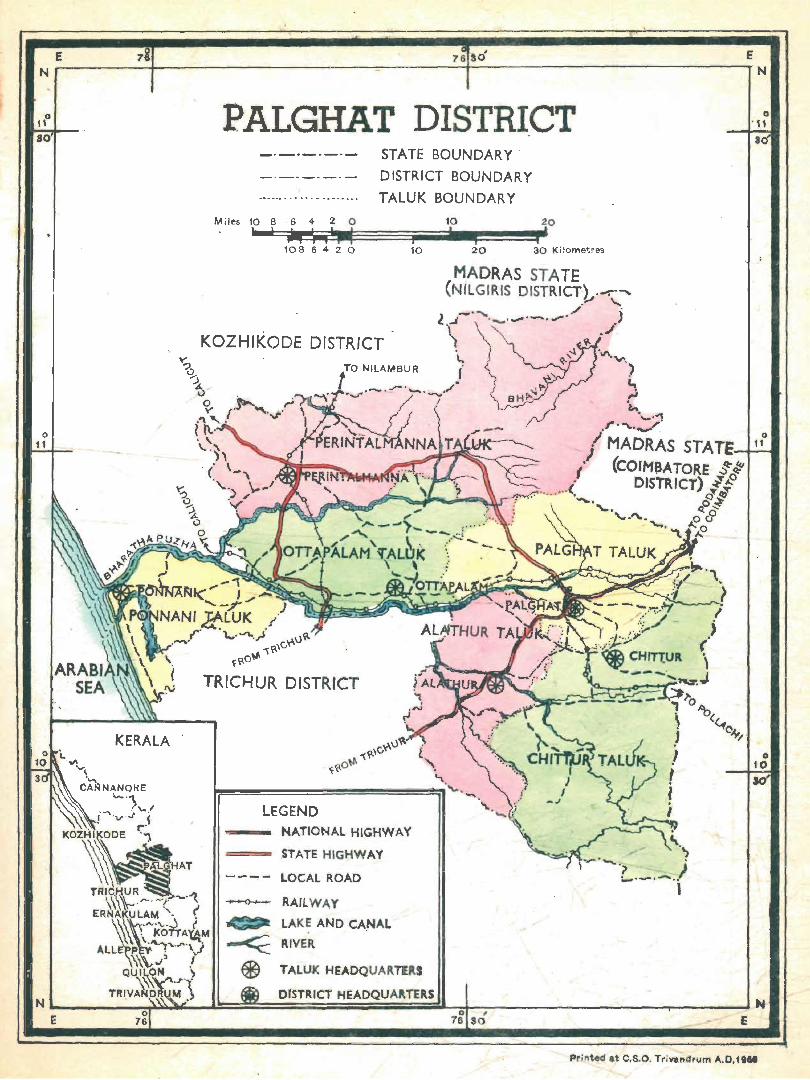
1. The present Kerala State Was formed as a result -of the States Reorganisation Act of 1956 (Central Act 37 of 1~56). With this 'enactment the former Malabar district (except Laccadive and Minicoy 1slands) and the old Kasaragod taluk of South Kanara district of Madras State were added together to form a new Malaba.r district. nn 1st January 1957 this Malabar district was trifurcated into three new revenue districts • of Cannan ore, Kozhikode and Palghat. The Palghat district thus formed consisted of old Walluvanad, Pa1ghat and portion of Ponnani taluks of Malabar district and Chittur taluk of the erstwh_ile TravancoreCochin State. On the same date the old Walluvanad taluk Was bifurcated into Perintalmanna and Ottapalam taluks, while the Palghat taluk was trifurcated to form Palghat, Alathur and portion of Chittur taluk. The present Chittur taluk is formed by taking the entire Chittur taluk of the former Travancore-Cochin State and 14 villages of old Palghat tal uk. The old Ponnani t-aluk was divided into three forming the existing Ponnani tal uk, the existing Chowghat taluk and portion of Tirur taluk. Chowghat taluk and fortion of Tirur taluk were included in the Trichur and Kozhikode districts respectively on the same ~ate.
Situation
2. Lying between north latitudes 10° 19' and 11 0
14' and e~St longitudes 75° 55' and 76° 54' the Palghat llistrici is bounded by Kozhikode and Nilgiris districts on the north, Coimbatore district on the east, Trichur district on the south and Arabian Sea on the west.
Administrative units
S. The district is constituted of six taluks, viz., Alathur, Chittur, Ott<lpalam, Palghat, Perintalmanna and Ponnani. This district has 304 revenue villages which are distributed among the taluks as follows ;-
Taluk
Alathur Chittur Oltapalam Palghat Perintalmanna ponnani
Statement 1
DISTRIBUTION OF VILLAGES
Area in sq. miles
220·91 446'24 252·12 277-42 620·91 161'96
Total number Number of villages of revenue lying in towns
villages Wholly Partly
47 39 2 61 3 52 13 59 %
25/343-2 b
4. Chittur-Thathamangalam and Palghat are the two Municipal towns in the district. Besides thu there are 112 Panchayats and 12 Development Blocks. Of the Development Blocks four are of Stage I, four of Stage II, one Community Development Block and the rest Pre-extension Blocks.
Area, Physical Features and Natural Divisions
5. With art area of 1,979·56 * sq. miles this district ranks fourth in the State in regard to area. The narrow coastal strip with a length of 13 miles at the western extremity of the district bordering the Arabian Sea is famous for its lagoons, cocoanut fringed backwaters and river banks and wide expanses of paddy fields. For purpose of convenient demarcation this region known as the lowland may be put at below 25 feet above the mean sea level. About 27 sq. miles of the western littoral region of Ponnani taluk come under this category. To th~ ea.t of the lowlands lies the midland region con listing of valleys and the plains broken here and there by isolated hills leading to the forest clad uplands. The low laterite table lands lying betw~en 25 feet and 250 feet above the mean sea level referred to above are ccmspicuous for the cultivation of pepper-vine, paddy, cocoanut palm and cashew-nut. The midlands are succeeded by the highlands consisting of high mountain peaks, long spurs, extensive ravines, dense forests and tangled jungles. These areas lie beyond 250 feet above mean sea level. One of the striking features of the WCftern Ghats is ' the great Palghat Gap, a complete opening some twenty miles across in this great backbone of the peninsula. Here, by whatever great natural agency the break occurred, the mountains appear thrQwn back and he"ped up, as if some overwhelming deluge had burst through, sweeping the:n to left and ri;sht'. On either hand tower the giant .. NiIgiris and Anamalas, overtopping the chain of ghats by several thousand feet, while through the gap the north-east winds blow spreading its wings right up to the coast throughout the breadth of the gap. The gap also helps the passage of roads and railway from the Carnatic to Kerala. 'The unique character-as a point of physical geography-of this gap in an otherwise unbroken wall high mountains, six hundred miles long, is only equalled by its great economic value to the countries lying on either hand of it'.
• 5,127-0,4 sq.km.
THE RIVER SYSTEM
6. A major portion of Perintalmanna taluk consists of forests. The Attapadi valley which contains the headwaters of Bhavani river is covered with spurs and slopes of the Ghats besides valuable timber produces. This hilly taluk produces rice, cocoanut, cashew-nut, pepper and areca-nut. South to Perintalmanna lies Ottapalam taluk. Thi5 taluk has cultivable paddy fieId~ and gardens containing jack, areca and various other tree crops. There are a series of hills and dales in the taluk like Anaganmala (1,298 feet) near Ottapalam. Ponnani taluk bordefs the Arabian Sea. It has extensive cultivation of paddy fields interspersed with grove of cocoanut, areca~nut, jack trees, etc. The soil along the coast is poor and sandy: The Palghat taluk is singularly diversified in its physical aspect especially towards the hilly tracts along the frontiers of Coimbatore district. The Palghat Gap gives this taluk its uniqueness of physical features. The' heavy forests, extensive ravines and jungles of the taluk stretching westwards gradually dis~olve into forest-clad uplands succeeded by flat rice fields fringed with high palmyra groves and numerous mountain torrents' . There are two Government Reserve forests in the taluk besides large number of private forests. These forests 'produce valuable produces like teak and blackwood besides cardamom, honey, gum, etc. The terrain of Alathur taluk is similar to Pal ghat taluk and this taluk produces rice, groundnut and cocoanut. Chittur, the Southeastern taluk of this district, has few ridges of rocks though Nelliampathy and Pothundy with their rich forests cover it on one side. The ma;n pr0duces are paddy, groundnut, co~ton, sugarcane, cocoanut and areca-nuts.
7. The following statement gives the area of the district by natural divisions :-
Statement 2
NATURAL DIVISIONS
Area in sq. miles
Natural Division Total Rural Urban
Total 1,979'6 1,943'0 36-6
Highland 1,071'4 1,061'1 10'3
Midland 831'5 857'3 24·2
Lowland 26'7 24-6 2'1
2
8. The number of villages and towns lying in the. three natural divisions of each taluk with their areas are given below :-
Statelllent 3 TALUKS BY NATURAL DIVISIONS
Area in sq. miles and number of
Villages lying in Towns lying in
,---------"-------Taluk High- Mid- Low- High- Mid- Low-
land land land land land land Alathur No. 19 28
Area 115'4- 105'5 Chitiur No. 2') 18 2 I.
Area 353'4 81.1 11'82 Ottapalam No. 58 3
Area 239'7 12'39 Palgliat No. 44 8 1
Area 238'5 28'6 10'27 Perintalmanna No. 10 49
Area 353'8 267'1 Ponnani No. 36 9 I
Area 135'3 24'6 2'01t
Out of the seven towns in this district five are in the midland and one each in the highland and lowland regions. Only 9 village~ pertaining to Ponnani taluk lie in the lowland region. Perintalmanna and Chittur taluks have unsurve~"ed hills.
The River System 9. The only river of importance in t:le district is
Bharathapuzha or Ponnani river which is the longest in the State. It has a length of 156 miles. The entire Palghat district is drained by Bharathapuzha and its tributaries spread o~er the district. Taking its source· from the Anamalai hills and traversing through the Pollachi taluk of the Coimbatore district it enters the· Kerala frontier. Kalpathi and Kannadi rivers join the' main stream at Parli. Kalpathi, an important tributary, has its origin at a place called Chenthamarakulam. in the hills north ofWalayar where the stream forms the boundary between Palghat and the Coimbatore districts. Kalpathi river otherwise known as Korayar' is formed by four streams, viz., Karai river, Varattar,. W'alayar and Malampuzha. The Karai river and Varattar having their Sources in Anamalai hills, after t~ejr confluence, flow westwards and is joined byWalayar near Thampalam. The combined river known as Korayar, takes a meandering course from this point and flows in a westerly direction. The Malampuzha joins the river Koraya.r ;~bout 3 miles. downstream of Malampuzha Dam. The Kannadi river otherwise known as Chittur puzha or Amaravathi river rises from the. north-western extremities of Anamalai hills. It is made up of three small itreams- known as: Palai, AJrar and Uppar. Another important tributary·
SOlI,!'
knowm as Gayathri (Kollengode or Cheerakuzhi) river Bhavani river in Kerala comes to 220 sq. miles yielding an annual run-off of 27,000 million cubic feet.
Mountains
11. The Western Ghats, which is the chief ,lory of this district, maintain an average height of 5,000 feet' barring two peaks of above 6,000 feet. The unique gap which breaks through the long chain of Ghats known as the' Palghat Gap' has already been referred to. The important mountains in this district with their heights are given helow :-
Mountain
Anginda peak Karimala Nellikotta or Padagiri Karimalagopuram
Kalladikode Vellachimudi Valiyavana ridge Myanmudi Valvachan Mulankunnu Kuvayali
")
I
Height
7,828 feet 6,556 " 5,200 " 4,721 "
about 4,000 "
- which rises from the Kollengode bluff traverse~ a long ,distance towards west up to Kallepadam and then takes .a north-west direction till it joins the Bharathapuzha at Kuthiampalli near Tiruvilwamala. Five streams join this tributary during its course. They are Mangalam river, Aylurpuzha, Cherukunnapuzha, Vandazhipuzha and M~enkara river. Thuthapuzha otherwise known as Pilanthol river originates from the Mannarghat forests and joins as a tributary of Ponnani river about a mile west of the Pallipuram Railway Station, This tributary is formed by four streams, viz., Kunthipuzha, Kanhirapuzha, Ambankadavuthode and Thuppanadpuzha. During its course of flow Bharathapuzha traverses through all the taluks of Palghat district and discharges itself into the sea at the port of Ponnani. It has a drainage arca of 2,100 sq. miles of which 603 sq. miles lie in the Madras State. It" annual runoff is estimated at 311,800 million cubic feet. This river has a navigable length of 25 mile). There are ,several irrigation projecH already completed and under construction in thi~ river basin. Malampuzha, Walayar, Mangalam, Meenkara, Cheerakuzhi, Pothundy and Kanhirapuzha are the important schemes. . Vimpalakavala t
J
10. The Bhavani river rise, in the Kunda mountains nearabout Bhawaniar Betta in Nilgiris and after flowing a: circuitous course through the Attapadi valley, in which it barely escape') tumbling over Ghats westward, it returns again to the shadow of the ~~ilgiri mountains before leaving Palghat district. '-Vithin six miles of it! starting point, two other streamlets join the main stem of the river, all of which being in the Madras State. Immediately below the confluence of these streamlets, it flows ~outlnvard and enters K~rala State boundary. About 11 miles from its entry into Kerala, it takes a righ(-angled turn and flows thereafter more or less in a north-easterly direction draining ,along its course a few more tributaries until it pa.,ses beyond the Kerala border. Situvani, an important tributary of Bhavani river originates from the crest of the lofty fOIe.t clad mountains on the northern edge of the Palghat Gap and joins the Bhavani river at the boundary of the Coimbatore district. At the head of the Siruvani, which rises in the southern corner of the Attapadi valley, there is a fall down which the water drops from A height of some two thousand feet into a deep pool below. 'The pool, which is called Muthukulam, is regarded with much superstitious awe, and there are many legends associated with the noises which .ate! said to issue from it'. The catchment area of the
Pannimudi Sherunelli Valiyalavara Tothivara Kantalpara
Pranakod Ananganmala
")
] about 3,000
1,792 1,298
"
"
" "
Besides the above important peaks there are several outlying hills.
Backwaters
12. Veliyangod lake is situated about three miles east of Ponnani. It extends about eight miles in a nonh-north-we,t direction and then it takes an abrupt turn toward, west and thence south-west, and continues for another five miles before it empties itself into the Arabian Sea at Veliyangod.
Soils
13. The soils of Palghat district are divided into five classe" viz., sandy, peaty (kari) , laterite, forest and black soil. Sandy soil exists only on the sea-coast of Ponnani taluk. This soil varie5 in texture from sandy loams to pure sand and is highly porous having very little retentive capacity. It is also extremely deficient in all the major plant foods and lime. There ill a small area at the centre of the same taluk with peaty
CLIMATE
soil. Peaty soil is characterised by deep black colour. Moreover they are rich in nitrogen, fair in potash and deficient in phosphorous. Laterite soil occurs in the residuary portion of Ponnani taluk and major portions of Perintalmanna, Ottapalam, Palghat, Alathur and Chittur taluks. The laterite soil is formed by weathering mainly acidic rocks under alternate wet and dry tropical conditions. The typical laterite soil is characterised by a vesicular structure and' the accumulation of hydrated oxides or iron and aluminium. Most of the bases and .silica has been removed by drastic leaching. At or near water table the soil material is soft and can be cut into blocks :which harden on exposure. The material makes excellent bricks for building purposes. The soil is porous and well drained and has poor retentive capacity and fertility. Where the rainfall is only 70" to SOw the soil has not developed into true laterites. There is accumulation of iron and aluminium in such type of soil and it shows many of the properties of laterite~. It does not have the vesicular structure peculiar to true laterites and cannot be used as building,. stones. This soil is more fertile than pure laterite soils. Forest soil is confined to the eastern regions of Perintalmanna and Ottapalam taluks and a narrow strip of land along the western boundaries of Palghat and Alathur taluk, and along the southern boundary of Chittur taluk. This 'soil is characterised by a surface layer 0'1' organic matter derived from forest growth. It is ri ch in nitrogen but extremely poor in bases due to leaching. The phosphate content is also very low. When the forests are cleared this soil gradually undergoes laterization. The major portion of black soil, which is suitable for cotton cultivation, is confined to the eastern sector of Chittur taluk and to a small region of Palghat taluk. This soil expands when wet and shrinks when dry. It is deficient in organic matter, low in nitrogen and phosphate. The level of potassium and calcium is satisfactory.
Geology
14. The Palghat district from east to west may be divided into four belts according to the geological formations. The belts are orientated more or less
- north to south and consists of (i) a high mountain belt made up of crystalline rocks of the Archaean group, (ii) a broad belt of residual laterite, (iii) a narrow belt of the warkalli beds of the Tertiary group and (iv) the westernmost coastal belt of recent deposits. The most extensively occurring rocks are gneisses, probab ly belonging the Peninsular suite. Mica schist ~xposures of the Dharwar system are seen near
Kollengode. Pink granite as well as Charnockile is seen at a number of place,. Re,idual laterite occurs as a broad belt west of the Archaean crystallines and has been formed as a result of the in situ alteration of the crystalline rocks. Warkalli beds are sedimentary rocks of upper Miocene to Pliocene age and consi"t of variegated clays and sand stone, at times carrying lignite. These bed, are capped by laterite. 'The coa~tal deposits include the marine, alluvial and lacustrine deposits of the coaital region.
Economic Minerals
15. Seven kinds of economic minerals exist in tkis district. Perintalmanna taluk wa, once the centre of flourishing native iron industry. Low grade magnetic iron ore~ occur at several localities such as Irukunnu, Kizhakkumparambu, Madamkunnu, Mankada, Mudikode, Sankarankunnu, Talikode etc. It is also found to occur at Kollengode, Mannarghat and Muthalama~a. Whether any of these will warrant economic development is now being studied. Kankar limestone i, seen developed in the Chittur and Kozhinjampara firkas of Chittur taluk. The large demands of lime of the entire Palghat district are supplied by the Vannamada and Mookinada villages. Muscovite Mica is reported to occur in the Sholayar VIllage and also at Talikode where two concession aries are currently engaged in
,developing the depo~its. The Mica bearing pegma-tities in the S.holayar village are found to carry Beryl in small quantities. Amethyst exists sporadically in several places like Karalmanna, Meenakshipuramand Pallassena. This mineral does not have any economic significance. Crystalline rock~ are used for building purpose~ and also as road metal. Laterite is also widely, used as a building stones in this district. Ilmenite, monazite, zircon, rutile. etC .• are the im portant mineral sands which occur on the Ponnani beach.
Clhnate' 16. The climate of this district represents more or
less the climate of the intertropical countries similarly situated. Like other parts of the State this district has also four seasons, the dry weather from December to February, hot weather from March to May, southwest monsoon from June to September and the retreating or north-east monsoon from October to November. The climate along the sea-coast is generally temperate more or less throughout the year but in the eastern taluks it is very hot in the months of April and May. Palghat district never enjoys the exhilarating and bracing cold of Northern India and it never suffers its great heat. .....
CLIMATE '
(a> Temperature
17. Regarding the temperature of Mah.bar in general Logan observes that C the first and most obvious fact which strikes an observer is the uniformity of temperature throughout the year as tested by the therm0meter. It 'may be said in short that it is always hot, sometimes, hotter,' but never very hot. This is not solely nor even chiefly due to the great altitudes of the sun at midday as very often supposed, for the sun ill no higher in the heavens in Malabar at certain seasons than it is in temperate climates. Moreover, the sun shines much longer in summer in temperate climates than it does in Malabar. Further, it may be observed that the month in which the sun is at its highest in Malabar, I and its hours of shining longest, is by no means the hottest month of the year. At the same time of course it is to be remembered that the altitude of the sun is always great, and it5 hours of shining are comparatively long throughout the year, va~ying as they do from a maximum of about twelve hours and thirty-five minutes in latter half of June tv' a minimum of about eleven hours a!'ld thirty-five minutes in the latter half of December'. The imjJortant factors for maintaining this uniform temperature is the superheated condition of the surface soil, the cool sea breezes and the abundance of rain throughout more than half of the year and the process of evaporation. 'The mountains themselves play an important part in sheltering the country lying to the west of them, for
they cool down the winds passing over ,them; but in the extreme south of the district, where the Palghat Gap permits the hot land winds to rush through unimpeded, vegetation receives a severe check in the dry months. Even here, however, the balance of natu re is maintained, for heated plains invite the inrush of moilt sea breezes and though the days are hot, the sea breeze lasts longer than it ooes on the coasts, and brings with it fresh nights and cool mornings even in March and April, the hotte,t months of the y~ar'. The highest temperature recorded during the decade 1951-61 at the Palg;lat Observatory was 41'4° C in the month of March 1959, while the lowest waS 17'2° C in the month, of December 1951, November 1953 and 1954 and December 1961.
(b) Humidity 18. Since the district is exposed to full force of
muth-wcst mons:)on the percentage of me".n relative humidity is exceptionally high during the months of June, July and August. During the decade 1951.61 the hishest percentage of mean relative humidity at 8'30 hourS:wa~ 95 in the month of July 1959, while for 17·30 hours, it wa, 89 in the m::mths of July 1959, and July 1961. The lowest percentage of mean relative humidity at 8·30 hours and 17'30 hours were recorded as 57 and 27 respectively in the month of Febru'1ry 1960. The statement showing the percentages of mean relative humidity for Palghat centre for the period 1951 to 1961 is furnished below.
Statement 4
PERCENTAGE OF MEAN RELATIVE HUMIDITY
1951 1952 1953 1954 1955 1956 1957 1958 1959 1960 1961 ~ ,...-.A--, ,-.....___, ,-A-., ,-A-., ,---"--, ~ ,-.....___, ,-.....___, ,---'-, r--"'-> !-< !-< !-< !-< !-< fi; !-< !-< f-< !-< fi; !-< f-< !-< f-< ~ f-< f-< f-< I-< f-< ~ tf.l tf.l tf.l tf.l tf.l tf.l tf.l tf.l tI.l tI.l tf.l tI.l tf.l Vl tf.l tf.l tI.l tf.l V>
""' ""' .... ..-< - .... ,..., .... ,..., .... ..... .... .... Month
...... ...... ""' H .... .... ,.., '"" "" 0 0 0 0 0 0 0 0 ~ 0 g 0 0 0 0 0 0 0 ~ 0 0 g
"" C'l ..., <!" "" <!" <!" <!" <!" t<') .., .., "" <!" "" ~ "" "" ro ,:.. a, ,... co ..... co ..... co ..... eO ,:.. eO ,:.. a, ..... eO ..... eO ,:.. cil r:.. .... .... -January 67 36 64 38 74 49 69 49 65 40 65 40 65 37 67 40 68 39 66 37 69 48
February 59 30 66 38 70 39 65 33 63 32 58 28 66 35 65 38 67 29 57 27 68 390 March 67 39 69 45 71 38 66 42 63 36 65 32 65 33 70 44 63 28 69 39 72 41
April 78 60 76 64 8) 64 78 63 73 58 78 62 74 47 76 56 77 55 76 60 77 58
May 79 64 81 66 75 54 79 63 84 77 82 70 82 65 87 75 78 70 83 81 82 70
June 91 83 90 83 86 75 90 85 92 85 92 85 92 84- 86 79 89 Il4 88 81 92 86
July ,90 83 92 83 92 86 92 87 89 80 91 82 93 87 93 83 95 89 92 85 94 89
August 91 79 92 83 90 80 91 82 91 80 91 78 91 82 93 85 ' 92 83 88 75 92 86
September 87 74 84 65 87 71 88 74 85 80 87 75 85 64 86 70 90 81 89 77 87 77
October 85 76 88 80 86 79 83 79 86 80 87 80 82 70 86 75 86 73 84- 73 85 77
November 82 74 77 66 73 63 66 53 82 72 79 71 75 66 80 71 77 66 80 74- 70 56
Pecember 87 45 7'J. 54 69 47 66 52 67 49 i4 44 71 52 68 47 73 52 72 55 tiS 51
1ST-Indian Standard Time
5
CLIMATE
(c) Rainfall 19. As stated above the year may be broadly
divided into four seasons. 'the following statement shows the rainfall in millimetres during these seasons.
Statem.ent 5
RAINFALL BY SEASONS
Dry Hot South-west North-east weather weather Monsoon Monsoon
Year December • March June to October and to February to May September November
mm. mm. mm. mm'
Normal ** 48-8 281-~ 1,726'9 401'7
1951 3'3 34-7·7 1,475'2 497'8
1952 68'0 166-1 1,210'7 28404
1953 69'7 201'1 1,336'1 339'2
1954 13'7 273'1 1,655'8 264'9
1955 32'8 596'7 1,355'0 475'1
1956 25'5 365'0 1,362'9 450'8
1957 3'1 450'3 1,620'0 441'7
1958 9-6 576'6 1,643'5 352'3
1959 2'4 304'1 2,484'5 369'1
1960 39'0 586'5 1,50% 662·1
Average for the decade 26'7 386'7 1,56..J,·7 413'7
* Data for December relate, (0 previous year.
** Based on available figures relating to the period 1901 to 1950.
20. The dry weather sealon commences by the latter half of December and prevails upto February. During this season a strong east or land wind from the burning plains of Coimbatore blows almost incessantly through the Palghat Gap at night and morning, which makes the weather very trying. On an average the rainfall recorded is 1'6 days in December, 0·5 day each in January and February. During the decade 1951-61 the driest d~y weather season was in 1959.
21. The hot weather season begins by the first week of March and lasts up to the second or third week of May. During this season temperature rises rapidly and pressure decreases. The position of rainfall is slightly better in this season. It is presumed that the first shower of the season would fall on 22nd March at 2 p.m. Logan states that' this was not altogether a haph'lzard guess, for the 22nd of March is the vernal equinox and 2 p.m.· in the day is precisely the hour at whiCH - most frequently the daily' battle between sea breeze' and 'land wino begins. In s~me seasons, though not in all, the first distant rumble of thunder along the
line of ghats betokens that 2 p.m, has just struck or is about to strike. This daily battle begins as soon as nature's pendulum (so to speak) commences slowly to swing with the passage of the sun across the equator into the northern hemisphere'. During this season on an average the rainfall recorded is 1-6 days in March, 4'5 days in April and 7·5 days in May. The driest hot weather season during the decade 1951-61 was in 1952.
22, South-west monsoon wind obtains the mastery towards the end of Mayor beginning of June and continues till September. During this period the district is deluged by heavy and incessant showers. This wet season is characterised by clouded skie3, high humidity and copious rain and ab3ence of thunderstorms. 'The south-west monsoon breaks with fierce squalls and floods of rain. After the first violent burst, persistent rain sets in, and on the coast the air current is steady rather than strong. But inland as it advances nearer to the funnel of the Palghat Gap. its velocity increases, and furious gusts sweep the rain abng almost parallel with the ground. The value of th~ south-we;t monsoon to western naviga~ion was discovered as early as the beginning of the Christian Era by Hippalus the pilot; but scientific opinion is still divid ed whether it is merely drawn from a reservoir of air over the equatorial zone fed by the south-east trades, or whether it is the trade wind itself by the specific gravity' of the air and by the physiographic fec.tures of the region over which it blows'. The number of rainy days during this season comes to 21'3 days in June, 24'6 days in July, 18'1 days in August and 11'2 days in September. Dldring the decade the wettest s:>uth-we~t monsoon was in 1959 and the mildest in 1952.
23. The south-west monsoon is followed by the north-east monsoon or the retreating monsoon. 'This rain locally known as Thul~Darsham establis\~3 its supremacy during the month3 of OctClb::r and November. On an ave!'age thi, district has 12'4 day,' rain in October and 7'0 days' rain in November. During this intercensal period Thulavarsham was heaviest in 1960 and mildest in 1954.
24. Normal rainfall and rainy days and r.linfal( data for the period 1951-1961 for Alathur, Cherplasseri, Chittur, Mannarghat, Ottapalam, Palghat, Palghat (Observatory), Parli, Perintalroanna and Ponnani centreS are furnished in -Appendices 1 and 2.i Temperature data recorded anhe Palghat Observatory are furnished in Appendix 3.
FORESTS
Forests 25. Only Perintalmanna, Palghat and Chittur
taluks have reserve forest areas. They come under Palghat and Nemmara Forest divisions. For administrative purposes Palghat division is divided into four
. :ranges Mannarghat East range, Mannarghat West range, Olavakot range and Palghat range. Of these, 'portion of Mannarghat East range falls unier the revenue jurisdiction of Kozhikode district also. The reserve forests coming under the jurisdiction of this -division are Silent Valley, Attapady (Block I to V), Panakadan, Attapadi (Block VI), Chenat Nair, Dhoni, Puliampulli Tope and Walayar. Major portion of Silent Valley is situated within the Ernad taluk of Kozhikode district. Nemmara Forest division which was constituted in 1958 consists of Sun,om, Parambikulam and Nemmara ranges. The reserve forests within this division are Kanjiramkode, Chinna Govinda Mala, Athanad, Kundali, Ayilmudi, Tekkady and Nelliampathy.
26. The forests of this district can be classified into southern-west temperate forests, the tropical west evergreen fore3ts or Ihola. and the southern tropical dry deciduous forests. The southernwest temperate forests usually become distinct above an elevation of 5,000 feet and thrive best at higher elevations. Species like Galophyllum elatum, ActinoJaphinl hookiri litsea stocksi, etc., are found in these forests. Several species of Strobilanthes form extensive thickets of undergrowth. T hi, type is met with mostly in Silent Valley, Attapadi Block I, V and VI and over a small area on top of Palamali in the Chenat Nair Reserve.
27. The tropical west evergreen forests or sho1a are characterised by the great lu~uriance of its vegetation a>nsisting of several tiers, the highest of which containing lofty trees, often with blank buttresses at the base, reaching a hundred and fifty feet or more in height and lowest containing dense, evergreen shrubby undergrowth. A heavy rainfall, high atmospheric humidity, a short dry season, striking absence of gregraiousness, trees with smooth bark sparing in branches with leaves often leathery or glo,sy, thick stemmed climbers, climbing palms and woody or herbaceons epiphites are the characteristics of these forests. lhe first tier consists generally of Gallenia excelstl, Machillus macrentha, etc., while the second one has Myristica laurifolia, Hyrdnocrons laurifolia, etc. The shrubby third tier is represented by Euonymus angulalius agrostachys indica, etc. The climbers are not as abundant or as numerous as in semi deciduous forests. Herbacius ground flora are meagre1y represented within the shola by cardamom~. curcuma, etc.
7
28. The southern tropical moist deciduous forests rise from the plains to elevations up to 800 feet. On westerly or souther:ly slopes where soil and moisture conditions are bad, on easterly slopes and where two forests were subjected to shifting cultivation in the past. tqele may be met with up to 2,000 feet or more. The chief species tha t prevail are Kytia Xylocarpa, Terninatia paniculatJ, Anogeissus latiJolia, etc. The lower slopes of Chen at Nair reserve up to an elevation of 800 feet, Dhoni reserve and PuliampuIli reserve come under this category. The' Kumrid' slopes in Attapadi Block I to V round Thadikunnu, Murugali, Chindaki, Sundanisi and Gothayakandi fan under this type.
29. The southern tropical dry deciduous forests can be seen in the Walayar reserve. This supports a good type of mixed deciduous species with a high proposition of teak, terminalia panicuiala ptlrocarpus marsflpi14m and Albezzia oderatissima. Among other species met with are Xylia Xylozarpa, Dalbergia Latifolia, etc. During the financial year 1959-60 Palghat and Ncmmara divisions have produced major and minor forest produces to the tune of Rs. 36'5 lakhs. The table showing the production and value of major and minor forest produces for the decade Hl50-51 to 1959-60 for these divisions are given in Appendix 4. Land Tenures
30. The Kerala Agrarian Relations Act. 1960 dealing with the tenanciell in Kerala as a whole came into force in part on 15th February 1961. .But consequent on the decisions of courts on certain questions arising out of this Act, the operation of the Act was suspended by a Proclamation dated 18th December 1962 and the Act was repealed when the Kerala Land Reforms Act, 1963 was enacted. Thus the position with regard to land tenures as on Ist March 1961, the reference date for 1961 CensuJ, is as if the Kerale Agrarian Relations Act, 1960 had not been in force. Subsequently, the Kerala Land Reforms Act, 1963 was passed which vit"ally affects the tenancies in Kerala. It is, therefore, necessary to give an account of the land tenures as they stood on 1st March 1961 without taking into account the Kerala Agrarian Relations Act, 1960 and as after the enactment of the Kerala Land Reforms Act, 1963.
Land Tenures in Malabar as on 1st March 1961
JenmoID 31. There are various theories about the origin of
Jenmom right. The traditiona'l account that Sree Parasurama made an entire gift of the land in Kerala to Brahmans has not found acceptance with most of
LAND TENURES
the authorities on the subject. It is, however, evident from the trend of authorities that a considerable portion of the land in Kerala was owned by certain individuals or families among whom were a large number of Namboothiris and Nairs. The Jenmie, recognised by the early British administrators of the former Malabar include Brahmans, Nairs, Thiyas and Mukkuvans. The right possessed by the Jenmi over the Jtnmom land is one of ownership in the soil as complete as ever was enjoyed by a freeholder in England. The title of the Jenrni is inherent and the JI nmi is a little territorial sovereign over his land by virtue of this ownership. Barring a few cases, the Jenmis used to let out the Jenmom land for cultivation to others enjoying only the benefit of rent derived therefrom, the manner of' so letting the land varying according to the tenure created.
lnams 32. There are two kinds ofinams, viz., personal and
service inams. The former are granted for the support of individuals or families either as reward for the service rendered or as a mark offavour as distinguished from service inams granted for future performance or services. The latter are conditional on the performance of future services and as such do not carry with them absolute proprietorship. In respect of most of the perscmal inarns the grant carries absolute proprietorship with the right of alienation while in the case of the rest conditions like prohibition of alienation or resumption after the lifetime of the inam-holder are se~n incorporated in the grant. Wherever such conditions are incorporated the inam does not confer absolute proprietorship. An inam may be granted either by Sirkar or by private individuals. In either case there is no difference in the features· of the tenure. The following are some of the personal inams:-
(a) Anubhogam: This means land given as a kudiyirupfJu or otherwise to persons belonging to the same caste as that of the gr,lntor bearing a small rent or tax for their maintenance for no service of any description like, for instance, gifts made by a goodwill ()f the sovereign.
(b) Adima: Adima is a grant of land by Rajas or petty chieftains generally made to their domestics for cultivation for personal serviceo, polot or future. , The adima grant for past services is not resumable and the grantee ~njoys absolute powers of disp)oal cf the same.
-There are several kinds of irW'n.s ea'~h d;',(nguished from th~ other accnrd;ng to the term, of the inam. Gurudakshina, rakshabhogam, dana,brr;'nana.m, etc., are som'~ of them.
8
Ka.om
33. Kanom means a transfer for consideration in .. money or in kind or in both by landlord of an interest. in specific immovable property' to another (called kanomdar). for the latter's enjoyment, the incidents of' which transfer include
(a) a right in the transferee to hold the said property liable for a consideration paid by him or due' to him which consideration is called kanartham;
(b) the liability of the transferer to pay the transferee interest on the kanartham; and
(c) the payment of michavaram by the transferee. The kanom tenant enjoys fixity of tenure unless the kanom relates to commercial sites or the katlom is one the cOllsideratioR for which exceeded 40 per cent of the -value of the Jenmi's right in the holdings. But, in the case of kanoms pertaining to commercial sites the tenant enjoys fixity of tenure if immediately before the commencement of the Malabar Tenancy Act, 1~29, the tenant had fixity of tenure in such sites or a right to obtain renewal of his tenancy in respect of it. The' landlord enjoys the right of resumpti~n on the termination of the term of the kanom for self cultivation and irrespective of the expiry of such term on grounds like denial of the landlord's title, intentional and wilful act of waste and collusi'vely perm:tting a .stranger to encroach upon the land. On the termination of the term of the kanom the landlord can evict the tenant for self cultivation by the landlord's tarwad, thavazhi, etc., for bonafide purpose of constructing a building for landlord's tarward, thavazhi, etc., and for the extension of a Temple, Mosque, Church or other places certified by the C:)llector of the district where the landlord is the trustee thereof. The eviction in these case'> shall not apply to the holding or that portion of a holding which consists of kudiyiruppu or protected ul"udi. The tenant has a right to sue for restoration of the holding if the land is not used for the purpo:e for which the eviction W,iS sought within a specifi~d period.
Kanom-Kuzhikanom
34. T;,is m2ans and includes a transfer by a landlord to another (calka kanorn-kit::.hikanom:far) of garden lands or o:her la:lds or of both with fruit· b~axi'lg trees, if any, s~anding thf~reon at the tim~ of transfer for the enjoy~nent of those trees and for the purpose of pLnting such fruit-bearing trees thereon. The incidents of SUC:l transf._;r include
1.AND· TENURES
(a) a right in the transferee to hold the said land 'liable for the consideration paid by him or due to him which consideration is called kanartham; and
(b) the liability of the transferor to pay the transferee interest on the kanartham unless otherwise agree'd to by the parties. The incidents of this tenure
_ are the same as in the case of kanom.
KuzhikanODl
35. Kuzhikanom means and includes a transfer by the landlord to another called kuzhikanomdar of garden lands or other lands or both with the fruit-bearing trees, if any, standing thereon at tho time of transfer, for the enjoyment of those trees and for the purpose of planting such fnlit-bearing tree.; thereon. The incident; of this tenure are the same as in the ca3C of kanol7lku::hikanom.
Customary Venunpattam.
36. Customary verurllpattomdar mean<; any verumpattomdar, who, before the commencement of the Malabar Tenancy (Amendment) Act, 1951, (Madras Act XXXI I I of 1951) was entitled by the cmtom of the locality in which the land was situated to possession of the land for definite period of years and for whose continuance thccreon "fter t~rmination of that p~riod, for a further p~r:od a renewal fee had to be paiJ to the landlord as an incidccnt of the tenure and cmtomary verum-
- pattom is the holding of the customary ~'erumpatto.'T!da,. The incidents of this tenure are the same as in the case
·of kanom.
Kudiylruppu
37. Kud~yiruppu means and include~ the site cf any residential b~ilditlg, the site or sites of other bu:ldings appurtenant thereto, such other lands as are nfc~ssary for the convenient enjoyment of such re,idential building and the easements attached thereto, but does not include an ulkudi. The tenant enjoys fi~:ity of tenure. The tenancy right is heritable and transferable if the tell ant is actually cultivating the lal'ld. The tenant is evictable on the grounds m~ntioned Lr kano:n and in addition, on tr.e non-rayment of rent .... ithin 3 mrlllths of the due date. He enjoys a right of pl:rcnase from the i<.ndlord if the klldiyiruppu has been occupied for not less than 10 consecutive years.
Separate Kudiyiruppu
. 38. A separate kudiyiruppu meanS a kudiyiruppu which -1S the sole property comprised in a holding. The rights -of the tenaut are same as in the case of a tenant in 1cudiyiruppu.
25/343-3b
Separable Kudiyiruppu 39. This means a kUdiyiruppu which is included with
other property in a holding and which is not necessary for the convenient enjoyment as umal of any other part of the holding. The rights of the tenant are the same a s that of a tenant in the case of a separate kudiyirupplI.
Cultivating VerUDlpattoDl
40. Verurnpattomdar means a tenant other than ,a kanomdar, kanom-kuzhikanomdar or kuzhikanomdar of a holding for agricultural purposes. Cultivating verumpattomdar in respect of a holding means any verumpattomdar who not being a jtmmi, intermediary' or customary verumpattomdar of that holding has, expreSSly or impliedly, contracted to cultivate the lands in that holding and is actually cultivating the same. Cultivating vemmpattom means a holding of a cultivating verumpattomdar. The tenant enjoys the same rights as the holder of a kudiyiruJlPlI except the right of purchase.
Ulkudi
41. This means a hu t in any portion of a land in the occupation of a person who has been permitted by the person entitled to posse,sion of such land to occupy the hut and who othel wise ha2 no interest in such land. He has no fixity of tenure.
Protected Ulkudi
42. This is an ulT:udi which has been in the contim;ous occupation of tl:e holder or any member of his tarwad, thauazhi, illom, kudttmbakavaru or family for not less than one year. The t~nant enjoys fixity of tenure.
Land Tenures in the Form.er Cochin Area
Proprietary Ownersh:p
43. The categdies of tenures In the Cochin area fdll in the same groupings as in the Travancore are~. Tllcre are, however, some tenures which carry different rights and having different incidents. The Jenmom tenure of Cochin is substantially the same as tne Jenmom of Travancore, the Pandaral'aka verumpattom tenure of Cochin the sa.me as the Pandarapattom or Pandaroo'aka of Travancore and the Pandaravaka kanom 'Of Cochin the same as the PandaralJaka otti of Travancore. In regard to inams also the same types of inams as in Travancorc both in respect of PCl sona1 and service exist in Ccch:n. But the service inams of Cochin ar:e not so· numerous in variety as in Travancore. The title deed issued to the grantee specifies the nature of the lervices to be performed. If the grant is conditiona't, breach of any of the conditions or alienation entail forfeiture. If it is an unconditional one alienation does not work forfeiture.
LAND T:r.NURES
Laads Held UDder Goverameat 4-4. In Cochin it is licensing that was in vogue
instead of KutliakaptJttom. The terms and incidents of licensing are the same as in the case of . K uthakapattom.
Tell1lftS UDder Private PersoDs or WtitutiOIlS Kau ... 45. The ',"ancm' tenure of Cochin is substantially
the same as the kanom tenure of Travancore. But the kanom tenure of Travancore had the benefit of an earlier legislation in the Jenm.i and Kudiyan Act, 1071 which practically conferred the ownership of the kllnOm lands on the tenants subject to the payment of jenmikaram to Government and even this liability was removed and the kanom lands of Travancore were enfranchised by the Jenmikaram Abolition Act of 1960. But so far as Cochin area is concerned the Cochin Tenancy Act II of 1090 had only conferred permanency of tenure on the knn.m tenants subject to certain conditions. The Kanorn Tenancy Act of 1955, however, is a parallel legislation on the lines of the Jenmi and Kudiyan Act, 1071 of Travancore. Settlement of the kanom lands in Cochin has been done in accordance with this Act. The tenants have only to pay jenmikaram to the Government and su~ject to this the tenants are the owners of kanom lands. The right held by the tenant is heritable and transferable.
Verumpattom 46. This is the same as the verumpattom of Travan
core which means an ordinary lease. But this has received fixity of tenure as early as 1943 by the enactment of the Cochin Verumpattomdars' Act of 1118 (M.E.)
Val'om 4-7. This is the same as in Travancore. Both in
Travancore and Cochin this was not recognised as a land tenure and the varomdar had never the privilege of being a tenant. It is only the temporary enactments which stayed the eviction of varomdars and the Kerala Land Reforms Act, 1963, that improved the position of the varomdars and gave them the same status as other tenants.
After the EnactmeDt of the Keral. Laud Reforms Act, 196, 48. The Kerala Land Reforms Act, 1963, repealed
the Kerala Agrarian Relations Act, 1960, the Malabar Tenancy Act, 1929, the Cochin Verumpattom,dar.s Act, VIII of 1111, the Madras Cultivating Tenants (Payment of Fair Rent) Act, 1956 and the TravancoreCochin Prevention of Eviction of Kudikidappukars Act, 1955 and enacted a lingle statute governing the relationship between landlord and tenant throughout the State.
10
Esemptio.. from the Provisiolls rep.rding: Te .... cies
49. SUbject to certain provisos, the provisions regarding tenancies in this Act are not applicable to (i) leases, of lands or buildings or both belonging to or vested in the Government of Kerala or the Government Gf any other State in India or the Government of India or a local authority or a Corporation owned or controlled by any of the altove Governments, (ii) leases only of buildings and the site thereof, with the land, if any •. appurtenant thereto, (iii) leases of land or of buildings or of both specifically granted for indu!trialor commercial purposes, (iv) tenancies of land or buildings or of both created by the Administrator-General or the Official Trustee or an Official Receiver orOfficer appointed by a Court of Wards, or by any penon holding under or deriving titles from any of the officers, or the court, (v) tenancies in respect of land or buildings or of both created by mortgagees in poS!;ession or by persons deriving title from such mortgagees except a.cultivating tenant holding land in the taluks of Hosdrug or Kasaragod to which the Malabar Tenancy Act, 1929, did not extend under a lease granted before 15th February 1961 by a usufructuary mortgage as defined in the Transfer of Property Act, 1882, (vi) tenancies in respect of land or of buildings or of both created by persons having only life interest or other limited interest in it, (vii) leases of private forests except where a person was entitled t. fixity of tenure immediately before 21 5t January 1961 under any law then in force, (viii) tenancies in respect of plantations exceeding thirty acres in extent, (ix) tenancies in respect of kayal 'patasekharams' of Kuttanad area specified in Schedule IV of the Act so long as such 'patasekharams' are used for the cultivation of paddy or such other crops a$ may be notified by Government, (x) tenancies in respect of sites, tanks and premises of any temple, mosque or church including sites on which religious ceremonies are conducted and sites of office buildings and other buildings attached to such temple~ mosque or church created by the owner, trustee or manager of such temple, mosque or church, (xi) lands transferred for felling trees and (xii) any transaction relating only to the usufruct of trees or to the tapping of cocoanut or other palmtrees or to tapping of rubber trees. The exemption mentioned above in respect of Government leases is subject to the proviso that in the case of kandukrishi lands sub-leased by a tenant holding such lands under Government, the provisions of Sections 13 to 26 of the Act shall. so long as the lease granted by the Government subsists apply to the tenants holding under the sub-lease as they apply to tenants holdin6
LAJm TaJIURaS
lands other than Government lands. In respect of the exemption relating to tenancies created by the Adminimator-General, etc., mentioned above, the exemption shan cease to apply to any tenancy created by the Court of Wards, when the landlord on whose behalf the tenancy was created does not termiruHe the tenancy by a registered notice within a period of six months from the date on which the property was released from the superintendence of the Court of Wards. Provisions of Sections 13 to 26 of the Act, relatin, to fixity of tenure will apply to exemptions granted to tenancies created by mortgagees in posseSiion or by persons deriving title from such mortgagees or by persons having only life interest or other limited interest in the land or buildings or both 80 long as the mortgage or the life interest or other limited interest subsists. Where a tenancy is created by a nissanthathi kavaru as defined in the Madras Aliyasanlhana Act, 1949, in respect oflands or buildings or both over which the nissanthathi kavaru has only a life interest the exemption will apply only regarding Sections 53 to 72 and not others governing tenancies. In the case of tenancies in respect of agricultural lands which are treated as plantations under subclause (c) of sub-section 44 of Section 2 of the Act the exemption referred to supra shall apply only to Sections 55 to 72 of the Act. Provisions of Sections 4 to 52 and 73 and 74- of the Act will apply to tenancies in respect of kayal padasekharams of the Kuttanad area in spite of the exemption mentioned about them supra. The Government are also given limited powers of exemption under the Act.
1lae Scope and Objects ot the Act
50. The main objects of the Kerala Land Reforms Act, 1963 are:-,
(1)' To confer fixity of tenure on tenants; (2) To fix the fair rent in respect of a holding; (3) To confer the right of purchase of the land-
lords' rights, title and interest on the cultivatin~ tenants ;
(4) To defin~ the rights and liabilities of kudikidappukars; and
(5) To place a ceiling' on the ownership and possession of land and provide for the disposal of excess land.
There are also some provisions of secondary importance in addition to the above.
Fisity ot Tenure-Tenants and TeDallcies
51. For a proper appreCIatIon of the provisions relating to tenancies as a whole the definitions of
11
tenants and tenancies are of supreme importance. A tenant means any person who has paid or has agreed to pay rent 'or other consideration, for his being allowed by another to possess and enjoy the land of the latter, and includes an intermediary, a kanomdar, a kanom-kuzhikanomdar, a kuzhikanomdar, a mulgenidar, a verumpattomdar of any description (including a customary vlrumpattomdar), the holder of a chal geni lease, the holder of a kudiyirippu, the holder of a vaidageni lease, an odacharthudar or a person claiminc under an odacharthudar who was actually cultivating on the 11 th day of April 1957 and was continuing to cultivate at the commencement of this Act, the land or any portion of the land to which the odacharthu relates, a mortgagee with possession of immovable property situate in Cochin jf the property comprised in t he mortgage consists of agricultural land other than planted with rubber, coffee, tea or cashew and the interest on the mortgage amount is less than forty per cent of the total rent fixed in the mortgage document, a mortgagee with possession of immovable property situate in Cochin if the property comprised in the mortgage consists of agricultural land, he was by himself or through any member of his family or tarwad, holding the property comprised in the mortgage as a verumpattomdar on or after 1st Chingom 11 I 1 and the verumpattom was terminate. after 1st Chingom 1111 and before the commencement of this Act but he continued in possession of the property without interruption by himself or through any member of his family or tarwad, as a mortgagee with possession from the date of such termination till the commencement of this Act, any person who, on lIth April 1957 was continuously in occypation of the land of another situate in Malabar, for not less than two years, honestly believing himself to be tenant and continued to be in.,occupation ef such land at the commencement of this Act, any person who, by virtue of the provisions of Section 6 of the Kerala Stay of Eviction Proceedings Act, 1957, was entitled to cultivate any nilam after 11th April, 1957, and was cultivating the nilam at the commencement of this Act, a tenant who, on or after 11th April, 1957, was holding land less in extent than the ceiling area and had executed a deed surrendering his leasehold right to the landlord hut had not actually transferred possession of the land to the landlord before the commencement of this Act, a pUllam or kumri cultivator. a licensee in Kuttanad area, a voramdar, a vechupakuthidar and a person holding land situate in any part of the Hosdrug or Kasaragod taluks to which the Malabar Tenancy Act, 1929, did not extend under a transaction
LAND TENURES
described in the document evidencing it as bhogya, oUi, nattotti, arwar, illidarwar or krithasartha illidarwar, but not being a usufructuary mortgage as defined in the Transfer of Property Act, 1882. Where, in a document, a person is described as a sambalapattomdar, sambalachittudar or coolipattomdar in respect of any nilam situate in the Palghat district, he shall be presumed to be a tenant unless it is proved that he has not undertaken any risk of cultivation. A' Cultivating tenant· meam a tenant who is in actual possession of, and i3 entitled to culri-
. vate the land comprised in the holding. Kanom means the transfer for consideration, in money or in kind Of
both, by a landlord of an interest in specific immovable property to [.nother person for the latter's enjoyment, whether described in the document evidencing the transaction as kanom or rarla/attom the incidents of
which transf~r include :-
(a) a light in the transferee to hdd the said property liable fClr the cOI'.sideration paid by
him or due to him;
(b) the liabj]jty of the transferor to pay to the transf~ree interest on such consideration unless otherwise agreed to by the parties; and
(c) payment ofmichol'aram or customary dues, or renewal on the expiry of any specified
period, and in areas other than 'Malabar, includes 5:1ch transfer of iatereit in. specific' immovable pr.)perty vihich is described in the document evidencing the transaction as olti, karipana),am, panayam, nerpa.~ayam or by anyotller name and which ha3 tLe incident:o specified in subclauses ( a) and (b) aiJove and also the following
incidents :-(i) renewJ.l on the expiry of any specified period;
and
(ii) payment of cu:tomary due,.
Kanapattom or any o:her demi:e governed by the Travancore Jenmi and Kudiyan Act of 1071 or the Kanom Tenz:ncy Act, 1955, is not a kanom for the purposes of thi~ Ac~. Wh,;re there has be~!l no ~tipubtion in. the document evidencing the tran~action for renewal on the expiry of any specified period, but there has been a renewal or ph)ment of renewal fees; it shall be deemed that there had been a provision for such renewal in the docurn~nt. Kanomkuzhikanom m~aU3 and include3 a transfer by a landlord to another per$on of garden lands or of other lands or of both, with the fruit-bearing trees, if any, standing thereon at the time of the transfer> for the enjoyment of those trees and for
the ~u~pose of planting such fruit-bearing trees thereon, the lncldents of which transfer include :-
(a) a right in the transferee to hold the said lands liable for the consideration paid by him or due to him, which consideration is called konartham and
(b) the liability of the transferor to pay to the transferee in:erest on the kanartham unless otherwise agreed to by the parties. A usufructuary mortgage as defined in the Transfer of Property Act, 1882 (Central Act 4 of 1882), is not a kanomkuzhikanom • Kudiyilllppu meanS a holding or part of a holding consisting of the site of .,ny residential building, the site or sites of other buildings appurtenant thereto, such other lands as are necessary for the convenient enjoyment of such residential building and easements attached thereto, but does not include a kudikidappu. Kuzhikanom means and includes a transfer by a landlord to a::-.other per~on of garden lands or other 1and~ or of both with the fruit-bearing trees, if any, s"anding thereon, at the time of the transfer, for the enjoyment of those trees and for the purpos~ of pbniing such fruit-bec:.ring trees thereon but shall not include.a usufructuary mortgage as defined in the Transfer of Property Act, 1882. Punam or kumri cultivation means fugitive or intermittent cul~iva,ion of paddy on drylands in Malabar and pUi!om or humri cultivator means a person who has raised crops by punam or kwnri cultivation in z,ny year be~wcen 1953 and 1959 and where there are successive cultivato:s in respect of the same land the cultiva.tor who raised crops last by such cultivalion during the said period. "Holder of a cholgani l%se" means a lessee or sub-lessee of specific immovable property situate in the taluk of Bosdrug or Kasa~'2..;od in the district of Cannanore who has COll
tracted either cxprcs31y or impliedly to hold the same under a lease, whether for a specified period or not. lv/ulgeni means a tenancy in perpetuity at a fixed invariable rent created in favour of a person called rr..ulgenidar. Vaidageni means a lea~<) for a term of years. Varom means 8.11 agre'~'nc!lt for the cultivation of nilam wilh pzddy and sharing the produce, made between the owner and the person w:1.0 undertakes cultivation under such arrange:ncnt and includes the arrangements known <;s pathivaram, pankuvaram and pan,l,.upattom; and varamdar means the person who undertakes cultivatien under a varam agrl,;~ment. Vechupa~uth'y means a transJ.etion where under a land-ownec pefmits another pcrs_,n to be in joint possession with him of any land with the following stipulations :-
12
(i) Vechupakuthidar shall improve the land
within a specified period;
LAND TENURES
(ii) at the end of the period so specified
(a) the land shall be partitioned between the land-owner and the vechupakuthidar ;
(b) upon such partition all the rights of either party over the portion of the land set apart for the other shall stand transferred to and vest in the other; and
(iii) during the period between the date of the transaction af.Jfesaid and the partition of the land to vechupakuthidar shall pay to the land-owner such rent as may be specified. Verumpattomdar means a lessee or sublessee of immovable property, whether called verumpattomdar or veTlpattorndar who has expressly or impliedly contracted to hold the same under a lease with or without security for rent and includes a tharikuthukaran in the PaJghat district but does not includ~ a kanJmdar, kanomkuzhikanomdar or kuzhikanomdar. Customary verumpattomdar means any verumpattomdar of immovable property situate in any area to which the Malabar Tenancy Act, 1929, extended, who before the commencement of the Malabar Tenancy (Amendment) Act, 1951, was entitled by the custom of the locality in which the land was situated to possession of the said Jand for a definite period of years, and for whose continuance thereon, after the termination of that period, for a further period, a renewal fee had to be paid to the landlord as incident of the tenure.
Fixity of Tenure
52. The Act confers fixity of tenure on every tenant in respect of his holding except where the tenant holds under a landlord who is a member of the armed forces or is a seaman if the tenancy was created by such landlord
\ • within a period of three months before he became a
member of the armed forces or seaman or where the tenant holds under the legal representative of the landlord. Resu'inption is allowed in the following cases :-
(a) for the purpose of extending a place of public religiQus worship provided the Collector of the district certifies that the same is so needed;
(b) for the bona fide purpose of constructin-z a building fur the residence of a landhrd (o:hcr than a sthani or the trustee or owner of a place of public religious worship) or any member of his family;
(c) for the [onafide purpose of cultivc.tir'n by the landlord (other than a sthani or the trustee or the owner of a place of public religious worship) or any member of his family;
Cd) in respect of agricultural lands interspersed w;thin lhe boundaries of the at'ca cultivated
(e)
with plantation crops, where such holding or part thereof is necessary for the purposes of plantation; and
if the tenant of the agricultural lands mentioned under (d) above wilfully commits any act of material waste in the plantation.
In the case of (b) above resumption is allowed only up to 20 cent; where resumption is sought on behalf of one person and up to 50 cents where it is sought on behalf of two or more persons. The total extent of land in the posse3sion of the landlord shall not be raised above five standard acres and the total extent of land in the posse3sion of the tenant shall not be reduced below 20 cen.ts in the case of such resumptions. Any land held by memb~r of a scheduled caste or scheduled tribe as tenant is exempted from such resumption. In the case of resumption under (c) above the total extent of land in the possession of the landlord shall not be raised above the ceiling area. and the total extent of land in the possession of cultivating tenant shall not be reduced below the c<;iling area by such resumption. The resumption is allowed only from a tenant who is in possession of land above the ceiling area. A small holder (c>ther than a sthanit or the trustee 01' owner of a place of public religious worship) is however, allowed \0 resume from his tenant a portion of the holding not exceeding one-half provided that by such resumption t~e total extent of land in the possession of the small holder shall not be raised above four standard acres or four acres in extent, whichever is greater and that except as provided in sub-sections (2) and (3) of Section 53 of the Act no land shaH be resumed from a tenant who was enti:led to fixity of tenure in respect of his holding immediately before 21st January 1961 under any law there in force. "A small holder" means a landlord who does not have interest in land exceeding eight standard acres or 24 acreS in extent, whichever is less, as owner, intermediary or cultivating tenant or in two or more of the above capacities so however that the exte:lt of non.resumable land in his possessio:l as owner or as cultivating tenant, or partly as owner and partly a~ cultivating tenant does not exceed four standard acres or four acres in extent whichever is greater. A person ""ho was in possession of, or had interest in land exceeding the limits mentioned above before I ~t De,;;ember 1957 but such extent of land was reduced to the said limirs or below by partition or transfer effected aLer the above date shall not be deemed to be a small holder nor shall such partition or tf2.11Sfer entitle the allottee or transferee to exerci~e the rights of <J. small h<?lder in respect?f the lc.,nd. ~l~otte~ or transfc, red to hIm. No resumption of a tCUdt)'lflPPU IS
13
LAND TBNURES
allowed whether it is sought by small holder or not. Subject to certain exemptions a time limit of one year from the commencement of the Act has been fixed for preferring applications for resumption. The Act also contains provisions for the grant of compensation for improvements and solatium to the tenant from whom any land is resumed.
53. An application for restoration by a cultivating tenant from whom land was resumed for construction of a residential building or for personal cultivation or on the ground of the land being necessary for purposes of plantation will lie if within '3 years of such resump. tion the person who resumed the land fails without reasonable excuse to use the land for the purpose for which it wa~ resumed. The restoration is allowed only subject to certain limitations enjoined by the Act.
Fair Rent 54. The fair rent in respect of a holding is the rent
payable by the cultivating tenant to his landlord and it shall be the rent calculated at the rates specified in Schedule III applicable to the class of lands comprised in the holding, or the contract rent, whichever is less. When the fair rent in respect of a holding has been determined under any law in force immediately before 2 1st January 1961, the fair rent so determined shall be deemed to be the contract rent. Where a cultivating tenant or an intermediary is holding under a small holder, the fair rent shall, at the option of the small holder, be the rent calculated at the rates specified in Schedule III applicable to the class oflands ~omprised in the holding; or where the fair rent in respect of the holding has been determined under any law in force immediately before 21st January 1961 such fair rent, or, where the fair rent has not been 10 determined 75 per cent of the contract rent. The fair rent payable by a cultivating Kanorndar or a cultivating customary verttmpattomdar shall not exceed the michavaram payable by such kanomdar or the rent payable by such customary verumpattomdar as the case may be where any land included in a holding is set apart for communal purposes and is used for such purposes, the_ extent of the land so set apart shall not be taken into account in fixing the fair rent of such holding. The cultivating tenant or any landlord may apply in the prescribed form to the Land Tribunal for determining the fair rent in respect of a holding. Where in respect of a holding there is an intermediary at the commencement of this Act and as a remit of the determination of the fair rent there has been a reduction or increase in the rent payable by the cultivating tenant, the rent payable by the intermediary to his land lord shall be reduced or increased in the same
proportion as the rent to which he waS' entitled was reduced or increased. The landlord and the tenant are competent to agree as to what shall be the fair rent payable and where such an agreement is filed with the Land Tribunal, the latter shall pass orders determining such agreed rent as to fair rent. When the rent payable has not been determined by the Land Tribunal the landlord shall be entitled to receive and the tenant shall be bound to pay the rent that was payable immediately before th e commencement of this Act. In the case of a varamdar such rent shall mean the average of the share of the landlord in the produce for the three years immediately preceding such commencement, or, where the varamdar was not cultivating the land continuously for the said period of three years, the share of the landlord for the year in which the varamdar cultivated the said land immediately before such commencement. Where there has been a damage to, or failure of crops, owing to causes beyond the control of the tenant in any holding, the tenant shall be entitled to a remission of the rent payable by him in proportion to the extent of such damage or failure. The remis3ion is to be ordered by the District Collector or any other officer authorised by Government by notification in the Gazette.
14
Purchase of Landlords' Rights by Cultivating Tenants 55. The Act enables the cultivating tenants entitled
to fixity of tenure to purchase the landlords' rights in the holding. The provisions in this respect have, however, not yet been enforced. A summary of the salient provisions in this respect is given below:
A cultivating tenant (including the tenant of a kudiyirippu) who is entitled to fixity of tenure under Section 13 is also entitled to purchase the right, title and interest of the land-owner and the intermediaries, if any, in respect of the land comprised in the holding provided he or the family .f which the cultivating tenant is a member does not own an extent of land not less than the ceiling area. When he or the family of which he u a member owns land less than the ceiling area the right of purchase is allowed only to the extent of land al will, together with the land already owned, make up the ceiling area. If the landlord is entitled to resume any portion of the holding and he applies for such resumption the right of purchase will extend only to the remaining area. Where the land-owner or an intermediary is a small holder and the cultivating tenant was entitled to fixity of teaure immediately before 2ht January 1961 under any law then in force the cultivating tenant shall not be entitled te purchase
LAND TENURES
the right, title and interest of the land-owner and the intermediaries unless the cultivating tenant agrees in writing that the small holder may exercise the right of resumption in respect of the holding under Section 17. In the event of such agreement the small holder shall, notwithstanding anything contained in the second proviso to Section 17 and notwithstanding the expiry of the period fixed under clause (1) of Section 18 for making application for resumption, be entitled to exercise the right of resumption and the cultivating tenant shall be entitled to purchase the right, title and interest of the land-owner and the intermediaries in respect of the remaining part of the holding left after resumption. An application for the purchase of landlord's right shall be made by the cultivating tenant to the Land Tribunal. The purchase price payable by the cultivating tenant shall be the aggregate of-
(i) sixteen times the fair rent in respect of the holding or part thereof to which the purchase relates;
(ii) the value of structures, wells and embankments of a permanent nature belonging to the land-owner or the intermediaries if any; and
(iii) one-half of the value of the timber trees belonging to the land-owner or in termediaries, if any.
The Act provides for the apportionment of such price between the landlord and intermediaries, if any. The Land Tribunal shall pass orders, where the purchase is to be allowed, allnwing the application for purchase ,:.od specify details relating to the purchase price, the 'value of encumbrances, etc., and the amount payable to the land-owner and each of the intermediaries after d~ducting the value of the encumbrances or the claim for maintenance or alimony. The purchase price shall be payable in sixteen equal instalments. But where the purchase price is less than Rs. 160 the number of instalments shall be so fixed by the Land Tribunal that the amount payable in each instalment shall not be less than Rs. 10.' It shall be open to the cultivating tenant to pay the entire price in a lump in which case the amount payable shall be only 75 per cent of the purchase price. The purchase price payable will bear interest at 4t per cent per annum from the date on which the right, title and interest from the land-owner and interm~diaries vested in the cultivating tenants. Where the purch;::.se price is paid in instalments the second and subsequent instalments shall be deposited together with interest on the amount outstanding on the date of deposit. A cultivating tenant shall be liable to pay rent to his landlord until he makes the deposit.
25/343-4
15
56. Where in respect of a holding the land-owner or the intermediary is a religious, charitable or educational institution of a public nature such institution is given the option to choose as to whether the right, title and interest of the institution in respect of the holding may be permitted to be purchased from the institution by the cultivating tenant on payment of the purchase price or such right, title and interest should be vested in the Government in consideration of the payment of an annuity in perpetuity by the Government. The annuity payable to the institution in the latter case shall be a sum equal to the annual rent which the institution was entitled to receive immediately before 21st January 1961 after deducting 21 per cent thereof by way of collection charges. Where in respect of a holding held by a tenant referred to in Sections 4, 5, 6, 7, 8, 9, 10 or II there was no stipulation for payment of any rent immediately before 21st January 1961 the annuity shall be an amount equal to -i! per cent of 16 times the fair rent in respect of the holding. The Government shall pay the annuity payable to the institution every year in perpetuity. Where, however, the right, title and interest of the institution are subject to any encumbranc:e the value of the encumbrance shall be paid to the holder of the encumbrance and 5 per cent of the value of the encumbrance shall be deduced from the annuity and the balance, if any, alone shall be paid to the institution.
57. Where the value of the encumbrance is more than 20 times the annuity if there is only one encumbrance 20 times the annuity shall h LJaid to the holder of the encumbrance and if there .ue more than one encumbrance 20 times the value of the encumbrances shall b~ paid to the holders thereof in their order of priority and no a lOunt by way of annuity shall be pa yable to the institution. The filing of an application ty a religious, charitable or educational institution Jf a public nature under subsection (i) of Section 66 or the vesting of the right, title and interest vf the institution in the Go\-ernment under sub-section (5) of Section 66 of the Act, ~hall not affect the right of the cultivating tenant to purchase such right, title and interest in accordance with the provisions 53-64 of the Act already referred to. Where a cultivating tenant does not apply for a purchas~ of the right, title and interest vested in the Government under Section 66 the )enant holding directly u:1der the religious, charitable or educational institution of a public nature shall continue as tenant under the Government. The Aet contains provisions for scaling down the arrears of rent in accordance with
LAND TENUREl>
the schedule given under SectioIJ 73. After the commencement of this Act no tenancy shall be created in respect of any land. But where any land-owner is a minor or a widow or an unmarried woman or a divorced woman or a person incapable of cultivating th·~ land by reason of any physical or mental disJ.biLty or a serving member of the armed force, or seam 1n such person may create a tenancy, but the tenant shall not be entitled to a right of purchase. Any ten'\l1CV created in contravention of the above provisi'Jn sha a be inva~id.
Rights and liabilities 01 Kudikidappukars
58. A kudikidappukaran me~ns a pc:rson who h;ts neithe~' a homestead nor any land <':'5 owner or ~.s t-::nant in pos,ession, 0-:1 which he could errct a homestead and
(i) who has been permitted v\'ith or without an obligation to pay rent by a person in lawful pnsses,ion of any land to have the use and occupation 0: a p~rtion of slIch land for the purpose of erec:i!1~ a h;)lr.es~ead; 0r
(.ii) who has been permitted by a person in lawf;}l possession of any land to occupy, with cr Wd10Ut the obligation to pay rent a hut belonging to such P::f3(Jil
and sitJl'lte in the said land but otherwise ha3 no interest in the land; and
Kudikidappu means the Jand or the homestead or hut so permitted to be erected or occupi<?d togl~ther
with the easement attached thereto. A person shall not be deemed to be a kudikidappukaran if the aforesaid permissiQn was granted after the 11 th of April 1957 by a mortgagee in possession or by a tenant from whom the land in which the kudikidappu is situa,e is liable to be resumed. A pernn shall not also be deemed to be a kudikidappukaran if the permission was grant!'d in respect of any hut not belonging to him and situate in a plantation or in any area of land which is appurtenant to a mill, factory or workshop and in connection with employment of such person in the plantation mill, factory or workshop unless he was, immediately before the commencement of the Act. entitled to the rights of a kudikidappukaran or the holder of a protected ulkudi or kudikappu under any law then in force. A hut means any dwelling house which was constructed at a cost not exceeding Rs. 400 ('f could have at the time of construction yielded a monthly rent not exceeding Rs. 4. Any person who was in occupation of a kudikidappl.l on the 11 th day of April 1957 and who continues to be in such occupation at the commencemel:t of the Act, shall be deemed to be in occupation of such klldikidapfJ!l ""i'th permission as required above. Also, where any kudikidappukaran secures :my mortgnge with permission over
16
the land in which the kudikidapju is situated his kl.ldikida}!pu right shall revive on the redemption of the mortgage, provided th::tt he ha~ a t the time of the redemption neither a ho:ncstead nor any land, either as owner or as tenant in po<;session, on which he could erect a homestead. No kudikidappul~(;.ran shall be eviCled from his kudikidappll except on 6e ground that he has zJienatcd his rig':1t of kudikidaPJm to another person or he has rented or leased out his kudikidappu to 8.nother person or he h::5 ceased to reside in the kudikidappu c,)l1tinuoasly for a period of two years or he h3.s another kudikidapp:l or has obtained ownership and pos,essio:-l of land for erectiEg a h )mestead. A kudikidapp:;karan skdl not be d:emcd t') have cea5ed to reside in a kudikidajJi'u notwithstandi!1g the fa~t tha~ he was not actually residing therein jf any of his near rektives, viz., husband or wife, children, Gr~;ndchildrcn, father, mother, brothe:- or sister who ,vas residing with him in the kudikidappu for a continuous period of not less than one year cf)ntinues to reside in the kudikidcjhpu. A person in possession of the land on whIch :here is a homestead or hut ill the occupation of a kwlikidappukaran may, if he bona fide requir es the land [oJr building purpose for himself or a'1y membel' of his family including major sons and daughters or for purposes in conrection wit)1 a town planning scheme approved by the competent auth0rity or for any industrial purpose require the kudikidappukaran to shift to a new site belonging to him subject to the following conditions :-
(i) The bnd-owner shall pay to the kudikidappukaran the price of the homestead if any ~rected by the kudihdappukarGIl ;
(ii) the new site shall be fit for erecting a homestead and shall be within a distance of one mile from the existing kudikidappu;
(iii) the extent of the new site shall be the extent of the kudikidappu subject to a minimum of 3 cl:"n_s and a maximum of 10 cents; and
(iv) the landholder fhall transfer ownership and possession of the new site to the kudikidappukaran and shall pay him the reasonable cost of shifting the kudikidappu to the new site.
Where the above conditions are complied with the kudikidappukaran ~hall be bound to shift to the new sileo
59. Where a person does not hold Irore than 25 cents of land and there is a hut in the occupation of a kudikidappukcran on such land, he may, if he requires the land occupied by st~ch hu:: for constructing a building for his own residence apply to the Governm<nt for acqui~iti()n of land to which the kudikidappu
LAND TENURES
may be shifted whereupon Government after oCollecUng the cost of acquisition from the applicant, may acquire the land and give pos5ession of the land to the kudikidappukaran and require him to shift to the said land. The kudikida
ppukaran shall then be bound to shift to the new site. But he will be entitled to the expenses as determined by an officer authorised by Government to be reasonably required to shift to the new site. The site acquired for the purpose shall be subject to a minimum of 3 cents ana a maximum of 10 cents. Again where the owner of the land in which there is a kudikidappu considers that the kudikidappu is so located as to cause inconvenience to him he may require the kudikidappukara71 to shift to another part of his land provided that the site to which the Ir.udikidappu is required to be shifted is fit for the location of the Kudikidappu and the owner of the land transfers to the kudikidappukaran -ownership and pos~ession of land equal to the extent of the existing kudikidappu subject to a minimum of 3 cents and a maximum of 10 cems and PdY the price of the homestead if any erected by the kudikidappukaran and the cost of shifting' the kudikidappu. The Act scales down the arrears of rent payable by a kudikidappukaran to one year's rent or the actual amount in arrears whichever is less and fixes the maximum of the future
I rent.
Restriction on Ownership and Possession of Land in Excess of Ceiling Area and Disposal of Excess Lands
60. The next salient provisions of the Act relate to the ceiling of, ownership and possession of land and the dispmal of exceSS lands. These provisions have not been enforced so far. Subject to the exemptions given under Section 8t.,of the Act the ceiling area ofland has been fixed to be 12 standard acres in the case of an adult unmarried person or a family consisting of not more than 5 members; and 12 standard acres increased by one standard acre for each member in excess of 5, so, however, that the t,Jtal extent of ce:Jing area shall not exceed 20 standard acres' in the case of a family consisting of more th"n 5 members. The ceiling are.l. shall in no case be less than 15 acres in extent or more than 36 acres in extent. All the lands owned or held individually by the members of a family or jointly by some or all of the members of such family shall be deemed to be owned or held by the family. In calculating the extent of land owned or held by a family or an adult unmarried person the shares of the members of the family or the adult unmarried person, as the case may be, in the lands owned or held by a co-operative
25/343-4b 17
society or by an institution or by a joint family shall be taken into account. Where a person has two or more legally wedded wives living, the husband, one of the wives named by him for purpose and their unmar. ried minor children shall be deemed to be one family; and the other wife or each of the other wives and their unmarr:ed minor children shall be deemed to be a separate family. An adult unmarried person shall include a divorced husband or divorced wife who has not remar. ried, provided that if such divorced husband or divorced wife is the guardian of any unmarried minor ' child, he or she together with such unmarried minor child shall be deemed to be, a family. It shall be lawful for any adult member in a family to own or hold land in excess of the ceiling area to the extent necessary to make up the ceiling area of his lineal descendants other than his minor unmarried children who are alive on the date notified under sub-section (i) of Section 83 and who would inherit his lands on his death provided that the aforesaid adult member shall take into account all acquisitions of lands or interests in land made by such lineal descendants or the members of their families for fixing the total extent that such adult member shall be entitled to own or hold [rom time to time and shall be bound to surrender the excess. In the case of lineal descendants who are members of other families the ceiling area shall be that applicable to their families. Where a family or an adult unmarried person owns or holds land in excess of the ceiling area on the notified date such excess land shall be surrendered by the persoll who is competent to do so within such time and to such authority as may be prescribed. Where, R,)WeVer, any person who bona fide believes that the ownership or possession of any land owned or held by him or by the members of his family is liable to be purchasei by the cultivating tenant or to be resumed by the hnd-owner or the intermediary under provisions of this Act, the extent of the land sa liable to be pur. ch'1sed or tJ be resumed shall not be taken into account in calculating the e;;:tent of land to be surrendered. The Land Board is to finally determine the extent of land liable to be surrendered. Where ownership or possession or both of any land is surrendered by or assume::!. from a person or is vested in the Government under Section 86 or 87 such person shaU:be entitled to compensation. Where the rights of an intermediary are extinguished, such intermediary shaH also be entitled to compensation. The compensation payable to an owner for the surrender or <.ssumption of ownership and pos.ession of lan:l shall be 55 per cent of the
LAND TENURES
market value of the land and improvements, if any, thereon. The compensation payable to the land-owner, the intermediary or cultivating tenant for the surrender, assumption, vesting in the Government or extinguishment of their rights shall b~ the pJrtion of 55 per cent of the market value of the land and improvements, if any, thereon that will fall to his share if such values are apportioned among the land-owner, cultivating tenant and intermediary, if any, in respect of the land
according to the following provisions :-
(1) the portion of the compensation for any building or other improvements shall be set apart to the person to whom such building or other improvement belongs;
(2) ninety per cent of the portion of the compensation for the site of any homestead or hut in the occupation of a kudikidappukaran shall be deducted from the total amount of compensation;
(3) the balance remaining after deducting the amounts referred to in clauses (i) and (ii) shall be apportioned among the land-owner, the intermediaries and the cultivating tenant in proportion to the profits derivable by them (rom the land immediately before the surrender, assumption or vesting in the Government, as the case may be. "Profits derivable from the land" shall be deemed to be equal to (i) in the case of a land-owner, the rent which he was enitled to get from the tenant holding immediately under him; (ii) in the case of an intermediary, the difference between the rent which he was entitled to get from his tenant and the rent for which he was liable to hi5 landlord; and (iii) in the case of a cultivating tenant, the difference between the net ~ncome and the rent payable by him. The rent payable by the cultivating tenant and the intermediary for this purpose shall be as calculated under the provisions of this Act.
(4-) where a mortgagee in possession surrenders possession of the land mortgaged to him;
(i) where the owner-ihip of the land mortgaged has been surrendered by the owner of the land, the mortgagee shall be treated as a holder of an encumbrance in respect of the land, and the encumbrance shall be discharged as provided in Sections 91 and 92 ;
18
(ii) in other cases, the Government shall pay to.
the mortgagee the amount to which he would have been entitled under clause (i} if the ownership of the land mortgaged had been surrendered to the Government, And hold the land as mortgagee with possession with all the rights and liabilities of th~ mortgagee.
61. The compensation or the amount of encumbance, as the case may be, shall be paid either in cash or negotiable bond redeemable in 16 years and carrying interest at t'1e rate of 42 per cent per annum with effect from the date on which the ownership or possession or both of the land has or have vested in the Government under Section 86 or Section 87 or partly in cash and partly in such bonds in such manner as may be prescribed. The Act also makes provision for payment of advance towards compensation. Where the land-owner whose ownership of land is vested in the Government or the intermediary whose rig~lts are extinguished under sub-section 4 of Section 86 W23 a. small holder and the cultivating tenant of the holdingwas entitled to fixity of tenure immediately before 21st January 1961 under any law then in force the ownership or possession or both of such land vested in the Government shall be assigned to such small holder. Where there are more than one such small holder in respect of such land the small holder nearest to the cultivating tenant shall have priority for such assignment. The purchase price payabl~ by the small holder for assignment of the ownership or pcss~sion or both of the land shall be 55 per c:ent of the market value of such rights. The purchase price shall be payable either in a lump or 16 equal annual instalments. Any person who does not possess any land or possesses only less than 5 acres of land in extent may appiy to the Land Board for assignment on registry of lands to him. The Land Board shall, after reserving in each village the lands necessary for public purpo'les, assign on registry the remaining lands vested in the Government as specified below :-
(i) The holdings in which there are kudikidappukars shall, as far as possible, be assigned to such kudikidappukars ;
(ii) Out of the remaining area available for assignmen t
(a) fifty per cent shall be assigned to the landless agricultural labourers of which one-half shall be a<signed to the landless agricultural labourers belonging to Scheduled Castes or Scheduled Tribes residing in the same village or adjacent villages;
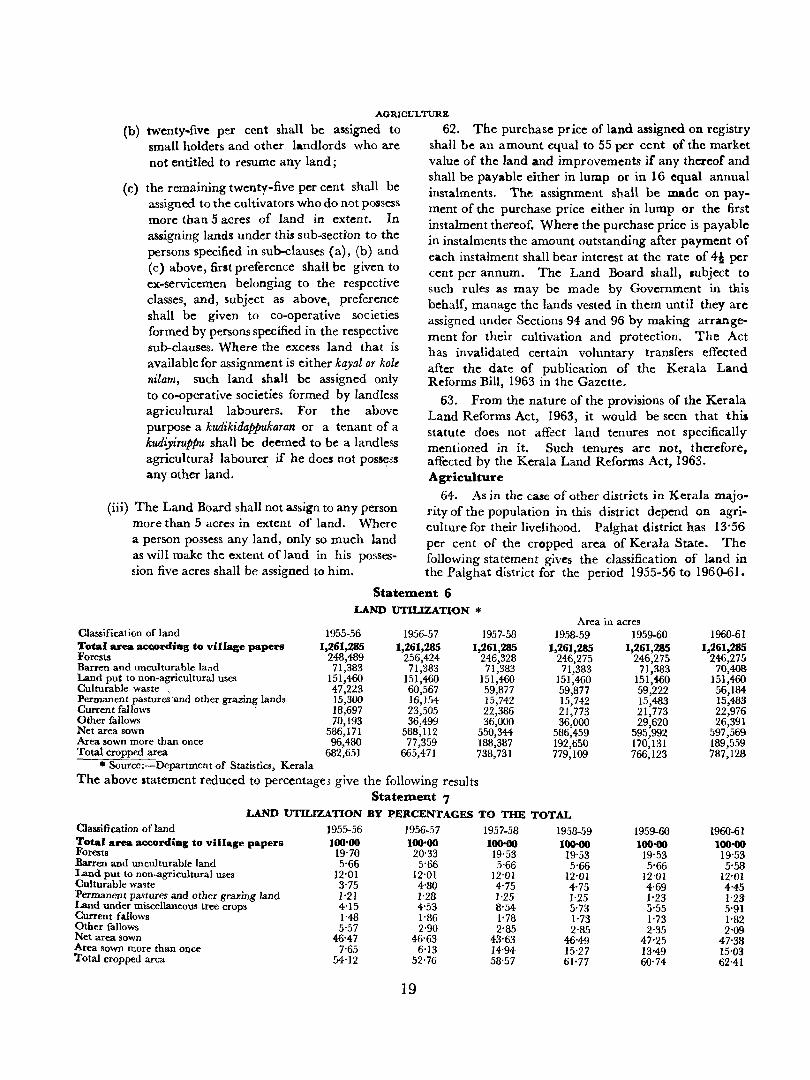
AGRICULTURE
(b) twenty-five per cent shall be assigned to 62. The purchase price of land assigned on registry small holders and other landlords who are shall be an amount equal to 55 per cent of the market not entitled to resume any land; value of the land and improvements if any thereof and
(c) the remaining twenty-five per cent shall be assigned to the cultivators who do not possess more than 5 acres of land in extent. In assigning lands under this sub-section to the persons specified in sub-clauses (a), (b) and (c) above, first preference shall be given to ex-servicemen belonging to the respective classes, and, subject as above, preference shall be given to co-operative societies formed by persons speCified in the respective sub-clauses. Where the excess land that is available for assignment is either kayal or kole nilam, such land shall be assigned only to co-operative societies formed by landless agricultural labourers. For the above purpose a kudikidappukaran or a tenant of a kudiyiruppu shall be deemed to be a landless agricultural labourer if he doeJ not pos~ss any other land.
(iii) The Land Board shall not assign to any person more than 5 acres in extent of land. Where a person possess any land, only so much land as will make the extent of land in his possession five acres shall be assigned to him.
shall be payable either in lump or in 16 equal annual instalments. The assignment shall be made on payment of the purchase price either in lump or the first instalment thereof. Where the purchase price is payable in instalments the amount outstanding after payment of each instalment shall bear interest at the rate of 4! per cent per annum. The Land Board shall, subject to such rules as may be made by Government in dJ.is behalf, manage the lands vested in them until they are assigned under Sections 94 and 96 by making arrangement for their cultivation and protection. The Act has invalidated certain voluntary transfers effected after the date of publication of the Kerala Land Reforms Bill, 1963 in the Gazette.
63. From the nature of the provisions of the Kerala Land Reforms Act, 1963, it would be seen that this statute does not affect land tenures not specifically mentioned in it. Such tenures are not, therefore, affected by the Kerala Land Reforms Act, 1963. Agriculture
64. As in the case of other districts in Kerala majority of the population in this district depend on agriculture for their livelihood. Palghat district has 13'56 per cent of the cropped area of Kerala State. The following statement gives the classification of land in the Palghat district for the period 1955-56 to 1960-61.
Statement 6 LAND UTIUZATION *
Area in acres Classification of land Total area acc::prding to village papers Forests Barren and unculturable land Land put to non-agricultural uses Culturable waste , Permanent pastures'and other grazing lands Current fallows . Other fallows Net area sown Area sown more than once Total cropped area
• Source:-Department of Statistics, Kera1a
1955-56 1,261,285
248,489 71,383
151,460 47,223 15,300 18,697 70,193
586,171 96,480
682,651
1956-57 1,261,285
256,424 71,383
151,460 60,567 16,154 23,505 36,499
588,112 77,359
665,471
1957-58 1,261,285
246,328 71,383
151,460 59,877 15,742 22,386 36,000
550,344 188,387 738,731
1958-59 1,261,285
246,275 71,383
151,460 59,877 15,742 21,773 36,000
586,459 192,650 779,109
The above statement reduced to percentage3 give the following results . Statement 7
LAND UTILIZATION BY PERCENTAGES TO THE TOTAL Classification of land Total area according to village papers Forests Barren and unculturable land Land put to non-agricultural uses Culturab1e waste Permanent pastures and other grazing land Land under miscellaneous U'ee crops Current fallows Other fallows Net area sown Area sown more than once Total cropped area
1955-56 1956-57 1951-58 1958-59 100'00 100-00 106-00 100'00
19'70 20'33 19'53 19'53 5'66 5'66 5'66 5'66
12'01 12'01 12-01 12'01 3·75 4'80 4-75 4'75 1-21 1-28 1'25 1'25 4-15 4-53 8'54 5-73 1-48 1'86 1'78 1'73 5'57 2-90 2'85 2-8.5
46'47 46'63 43'63 46'49 7'65 6'13 14'94 15'27
54'12 52·76 58'57 61'77
19
1959-60 1,261,285
246,275 71,383
151,460 59,222 15,483 21,773 29,620
595,992 170,131 766,123
1959-60 100'00
19'53 5'66
12'01 +69 1'23 5'55 1'73 2'35
47'25 13-49 60'74
1960-61 1,261,285
246,275 70,408
151,460 56,184 15,483 22,976 26,391
597,569 189,559 787,128
1960-61 100'00 19'53 5'58
12'01 4'45 1'23 5'91 1'82 2'09
47'38 15'03 62'41
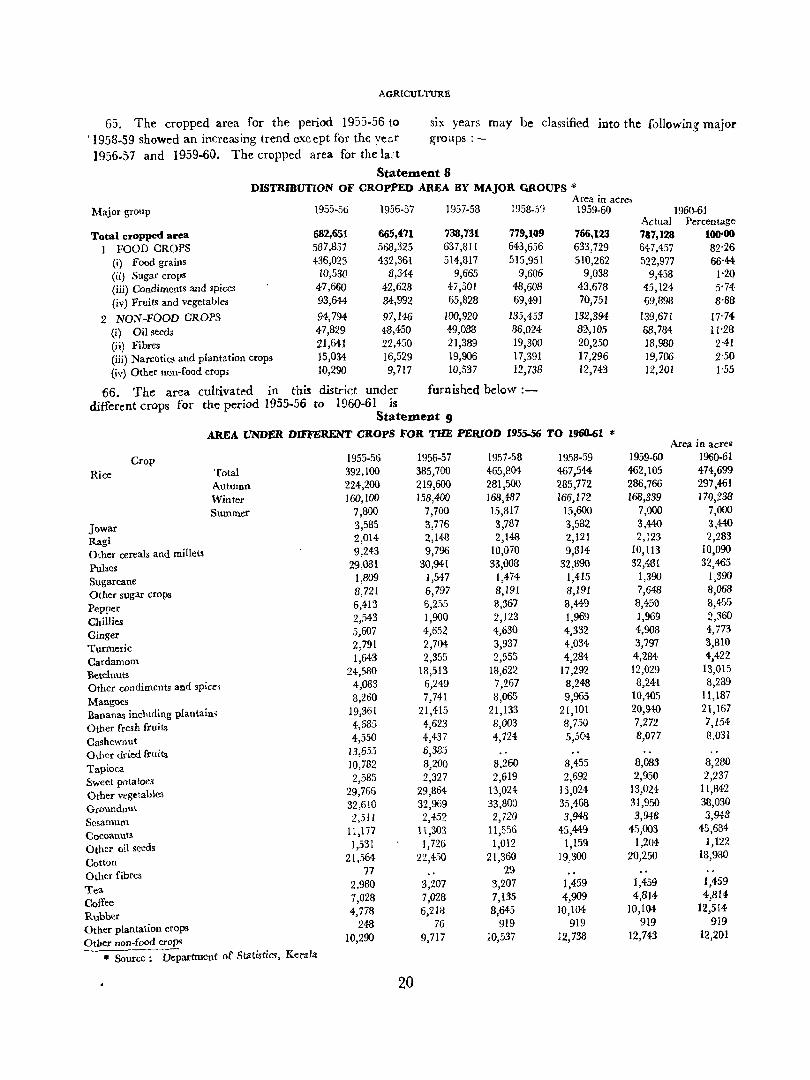
AGRICUL 'fURE
65, The cropped area for the period 1955.56 to , 1958.59 showed an increasing trend except for the year 1956.57 and 1959-60. The cropped area for the la,t
six years may be classified into the following major groups :-
Statement 8 DISTRIBUTION OF CROPPED AREA BY MAJOR GROUPS *
Area in acreS Major group 1955-56 1956-57 1957-58 1958-59 1959-60 1960-61
A.ctual Percentage Total cropped area 682,651 665,471 738,731 779,109 766,123 787,128 100'00
I FOOD CROPS 587,857 568,325 637,811 643,656 633,729 647,457 82-26 (i) Food grains 436,023 432,361 514,817 515,951 510,262 522,977 66'44 (ii) Sugar crops 10,530 8,344 9,665 9,606 9,038 9,458 1'20 (iii) Condiments and spices 47,660 42,628 47,501 48,608 43.678 45,124 5'74 (iv) Fruits and vegetables 93,644 84,992 65,1328 69,491 70,751 69,898 S-88
2 NON-FOOD CROPS 94,794 97,146 100,920 135,453 132,394 139,671 17-74
(i) Oil seeds 47,829 48,450 49,038 36,024- 82-,105 (;B,784 11-28
(ii) Fibres 21,641 22,450 21,339 19,300 20,250 18,980 2-41 (iii) Narcotics and plantation crops 15,034 16,529 19,906 17,391 17,296 19,706 2'50 (iv) Other non-food crops 10,200 9,717 10,537 12,738 12,743 12,201 I-55
66. The area cultivated in this district under furnished below :-different crops for the period 1955-56 to 1960-61 IS
Statement 9 AREA UND£R DIFFERENT CROPS FOR THE PERIOD 1955-56 TO 1960-61 *
Area in acres
Crop 1955-56 1956-57 1957·58 1958-59 1959·60 1960-61
Rice Total 392,100 335,700 465,p.04 467,544 462,105 474,699 Autumn 224,200 219,600 281,500 235,772 286,766 297,461
Winter 160,100 158,400 168,487 166,172 168,339 170,238
Summer 7,800 7,700 15,817 15,600 7,000 7,000
Jowar 3,585 3,776 3,787 3,582 3,440 3,4:4{)
Ragi 2,014 2,148 2,148 2,121 2,123 2,283
Other cereals and millets 9,243 9,796 10,070 9,814 10,113 10,090
Pulses 29,081 30,94 { 33,008 32,890 32,481 32,465
Sugarcane 1,809 1,547 1,474 1,415 1,390 1,390
Other sugar crops 8,721 6,797 8,191 8,191 7,648 8,068
Pepper 6,413 6,255 8,367 8,449 8,450 8,455
Chillies 2,543 1,900 2,123 1,969 1,969 2,360
Ginger 5,607 4,652 4,630 4,332 4,90B 4,773
Turmeric 2,791 2,704 3,937 4,034 3,797 3,810
Cardamom 1,643 2,355 2,555 4,284 4,284 4,422
lkte1nuts 24,580 18,513 18,622 17,292 12,029 13,015
Other condiments and spice.1 4,083 6,249 7,267 8,248 8,241 8,289
Mangoes B,260 7,741 8,065 9,965 10,405 11,187
Bananas including plantain, 19,361 21,415 21,133 21,101 20,940 21,167
Other fresh fruits 4',685 4,623 8,003 8,750 7,272 7,154
Cashewllut 4,550 4,437 4,724 5,504 8,077 8,031
Other dried fruits 13,655 6,333
Tapioca 10,782 8,200 8.260 8,455 8,OB3 8,280
Sweet potatoes 2,585 2,327 2,619 2,692 2,950 2,237
Other vegetable3 29,766 29,B64 13,024 [3,024 13,024 11,842
Groundnut 32,610 32,969 33,800 35,46B 31,950 38,030
Sesamulll 2,51l 2,452 2,720 3,948 3,948 3,948
Cocoanuts 11 ,177 11,303 11,556 45,449 45,003 45,684
Other oil seeds 1,531 1,726 1,012 1,159 1,204 1,122
Cotton 21,564 22,450 21,360 19,300 20,250 18,980
Other fibres 77 29
Tea 2.980 3,207 3,207 1,459 1,459 1,459
Coffee 7,028 7,028 7,135 4,909 4,814 4,3[4
Rubber 4,778 6,218 8,645 10,104 10,104 12,514-
Other plantation crops 243 76 919 919 919 919
Otber non-food crops 10,290 9,717 10,537 12,738 12,743 12,201
" Source: Department of SU1tistics, Kerala
20
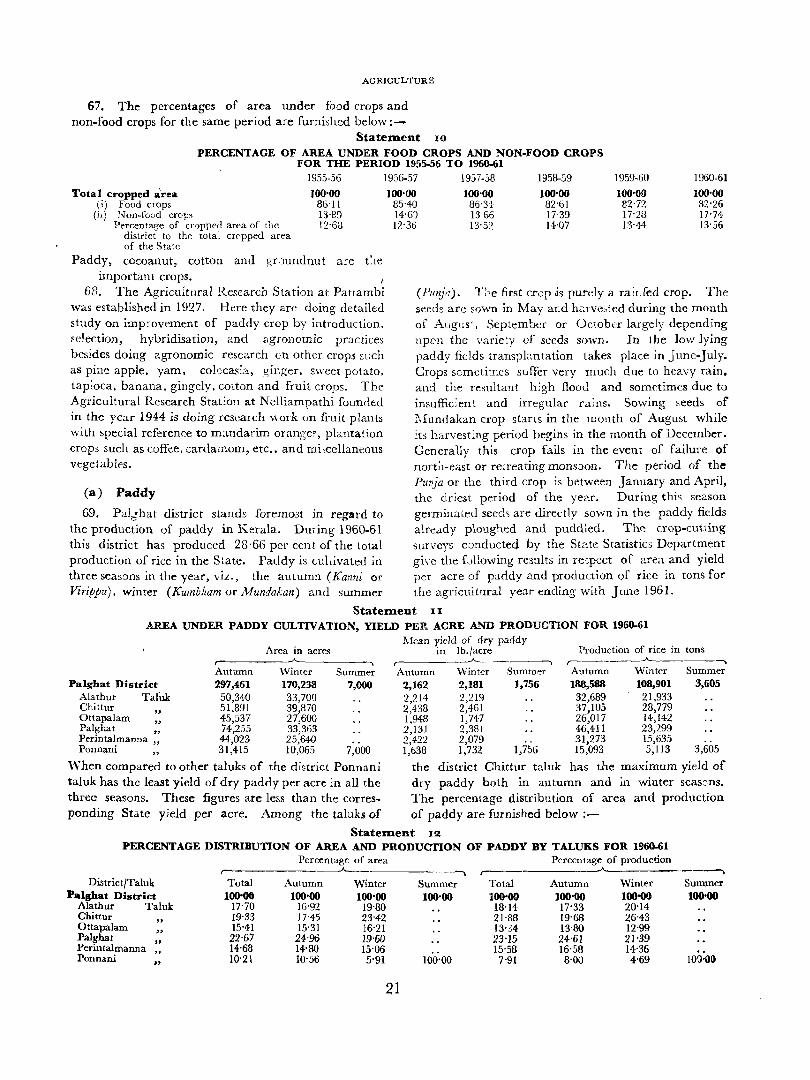
AGRICULTURE
67. The percentages of area under food crops and non-food crops for the same period are furnished below:
StateJnent 10
PERCENTAGE OF AREA UNDER FOOD CROPS AND NON-FOOD CROPS FOR THE PERIOD 1955-56 TO 1960-61
Total cropped area (i) Food crops
(il) Non-food crops Percentage of cropped area of the
district to the total cropped area of the State
1955-56
100'00 86'11 13·89 12'68
1956-57
100'00 85'40 14'6') 12'36
1957-58
100-00 86'34 1366 13'52
1958·59
IOO'OO 82'61 17·39 14·07
1959-60
lOO'CO 82"72 P'23 13-44
1960-61
100'00 82'26 17'74 13'56
Paddy, cocoanut, cotton and gr,)undnut a:'e important crops. I
68. The Agricultural Research Station at Pattambi was established in 1927. Here they arc doing detailed study on imvovement of paddy crop by introduction, selection, hybridisation, ,md agronomic practices besides doing agronomic research on other crops s\;ch as pine apple, yam, colccasia, ginger, sweet potato. taploca, banana. gingely, colton and fruit crops. The Agricultural Research Station at Nclliampathi founded in the year 1944 is doing research work on fruit plants with special reference to m:l.lldarim orange~, plantation crop5 such as coffee, cardamom, etc .. and mi,cellaneous vegetabies.
(a) Paddy
(PUl/ja). Tile first crop ~s purely a rair!fed crop. The seed~ arc sown in May and hr.rve,ted during the month of Angus', September or October largely depending UpCll the varie:y of seeds sown. In the low lying paddy fields transpbntation takes place in June-July. Crops someti:nes suffer very much due to heavy rain. and the resultant high flood and sometimes due to insufficient and irregular rains. Sowing ,eeds of I\.fundakan crop stans in the month of August while ~ts harvesting period begins in the month of December. Generally this crop fails in the event of failure of nortl1-east or retreating mOllSJon. The period of the PunJa or the third crop is between January and April, the driest period of the year. During this season
69. Pal6hat district stands foremost in regard to germinated seed~ are diredly sown in the paddy fields the production of paddy in Kerala. During 1960-61 already ploughed and puddled. Th~ crop-cutting this district has produced 28 ,66 per cent of the total surveys conducted by the St2.te Statistics Department production of rice in the State. Paddy is cuhivated in give the following results in respect of are" and yield three seasons in the year, viz., the autumn (Kanni or per acre of paddy and production of rice in tons for Virippu) , winter (Kumbltam or Mundakan) and summer the agricultural year ending with June 1961.
Statement II
AREA UNDER PADDY CULTIVATION, YIELD PER ACRE A..l~'D PRODUCTION FOR 1960-61
Palghat District Alathur TalUk Chittur " Ottaflalam " Palghat ., Perjntalmanna " Ponnani
Area in acres r---------~.~-------._. Autumn 297,461
50,340 51,891 45,537 74,255 44,023 31,415
\\Tinter Summer 170,238 7,000 33,700 39,870 27,600 33,363 25,640 10,065 7,000
lVhen compared to other taluks of the district Ponnani taluk has the least yield of dry paddy per acre in all the three seasons. These figures are less than the corresponding State yield per acre. Among the taluks of
Mean yield of dry paddy in lb./acre Production of rice in tons
, __.A._ ,--__ ~ __ ~_-,
Autumn 'Winter Summ,," Autumn Winter Summer 2,162 2,181 1,756 188,588 108.901 3.605 2,214 2,219 32,689 21,933 2,438 2,461 37,105 28,779 1,948 1,747 26,017 14,142 2,131 2,381 46,411 23,299 ') 4')2 2,079 31,273 15,63.') 1;638 1,732 1,756 15,093 5,113 3,605
the district Chittur taluk has the maximum yield of dry paddy both in autumn and jn winter seasons. The percentage distribution of area and production of paddy are furnished below :-
StateJnent 12
PERCENTAGE DISTRIBUTION OF AREA AND PRODUCTION OF PADDY BY TALUKS FOR 1960-61
District/Taluk Palghat District
Alathur Taluk Chittur " Ottapalam " Palghat " Perintalmanna " Ponnani .,
Percentage of area r-----------____A._,-------__ -,
Total 100'00
17'70 19'33 15'41 22'67 14-68 10·21
Autumn 100'00
16'92 17-45 15'31 24-'96 14'80 10'56
Winter l00'OO
19'80 23'42 16'21 19'60 15'06 5'91
21
Summer loo·oo
100'00
Percentage of production ,----_______ ---A-____ . ___ ---.
Total Autumn Winter Summer 100'00 lOO'OO IOO,,()() lOO'OO 18'14 17'33 20'14 21·88 19'68 26'43 13'34 13'80 12'99 23'15 24'61 21'39 15'58 16'58 14-36 7'91 8'00 4'69 100·00
AGRICULTURE
70. The duration in days and average yield of improved strains of paddy evolved in the Pattambi
Agricultural Research Station are furnished below :-
Statement 13
IMPROVED VARIETIES OF PADDY
Season I Average yield per
Variety Duration in days acre in lb. Modan
Single Croplands Broadcast
Transpl~nt
PTB 28 Kottanadan 120 1,000 PTB 29 Karuthamodan 110 600 PTB 30 Chuvannamodan 110 600
PTB 10 Thekkancheera 90--100 2,500 PTB 32 Aruvakkari 125 2,500 PTB 7 Parambuvattan 120 2,500
Doable Croplands
FIRST CROP (i) Broadcast
(ii) Transplant
PTB 22 Veluthavattan 120 2,000 PTB 23 Cheriya Aryan 110 2,000 PTB 24 Chuvannavattan 115 2,000 PTB 25 Thonooran 120 2,000 PTB 31 Elappapoochambuan llO 2,000 PTB 1 Aryan 145 300 PTB 2 Ponnaryan 135 2,500 PTB 5 Veluthari-Kayama 145 3,000 PTB 8 Thavalakannan-Rcd 130 2,500 PTB 9 Tbavalakannan-White 130 2,500 PTB 26 Chenkayama 125 2,500
SECOND CROP Transplant PTB 4 Vellari 140 3,000
PTB 12 Chitteni s. Malabar 125 2,500 PTB 15 Kavaunginpoothala 165 3,000 PTB 16 Do. 155 3,000 PTB 18 Eravapandi 130 2,500 PTB 20 Chitteni N. Malabar 125 2,500 PTB 21 Thekkan 125 2,500 PTB 27 Kodyam 130 2,500 PTB 33 Arikari 130 2,500
Punja PTB 10 Thekkencheera !O-IOO 2,500
annual yield and income from one acre of pure (b) Cocoanut
71. Economically the most important crop, the cocoanut palm grows practically in all areas of the district. Cocoanut palm, otherwise known as . Devavriksham' or 'Kalpavriksham' thrives best on the alluvial deposits of silt and sand found on the coast in the vicinity of estuaries and backwaters but it also flourishes with careful cultivation on the lower slopes of laterite hills of interior which dominate the paddy flats. This district has a total area of 45,684 acres under cocoanut cultivation which is 37'02 per cent of State area under cocoanuts. This district has produced 119 million nuts in 1960-61. Cocoanut is extensively cultivated in Ponnani and Perintalmanna taluks. the other taluks having only lesser area under cocoanut cultivation.
72. A sample survey (2nd round) sponsored by the Indian Central Cocoanut Committee was conducted by the State Statistics Department during 1960-61. The survey gave the following results on the average
22
cocoanut plot in the Palghat district. Average number of bearing palm per acre 60
27 Average yield from a bearing palm Total yield from an acre Price of 100 cocoanuts Total income from one acre of pure
cocoanut plot
1,620 Rs. 21'00 Rs.340·20
73. The month-wise production of cocoanuts reduced to percentages fpr this district for 1960-61 is as follows :-
Statement 14
MONTH-WISE PERCENTAGE OF PRODUCTION
Month Total July 1960 August September " October November " December January 1961 February March April May June
" .. ..
Percentage of producti()11 100'00
2'58 4'06 6-61 7·16 8·63 6·i5
11·77 14,09 7-17
12'09 12·62 6-67
IRRIGATION
74. 61'5 per cent of the total cocoanut palms are of bearing Jtatus, while the rest belong to the nonbearing group. The following statement gives the distribution of cocoanut palms with reference to age and bearing status reduced to percentages. The number of palms under study was 1,00?
StatelDeDt 15
PERCENTAGE DISTRIBUTION OF COCOANUT PALMS BY BEARING STATUS
Age-group of palm
Below 5 years
5- 9 " 10-14 " 15-19 " 20 years and above
Percentage distribution r----~
Total Bearing Non-bearing
1l'96 22'43 5'44 3'73
56'44
2'00 1-69 1'97
55'84
1l'96 20'43 3'75 1'76 0'60
75. The survey also gives data on the various methods of disposal of cocoanuts in the district.
StatelDent 16
PERCENTAGE OF HARVESTED PRODUCE USED FOR VARIOUS PURPOSES
Type of disposal
Total (i) Home consumption
(ii) Religious purpose (iii) Sold as cocoanuts (iv) Other purposes
(c) Cotton
Percentage of total harvested produce
100'00 15-40 0'02
82'62 1'96
76. Out of 24,270 acres of cotton cultivation in the .State, I ~,980 acres are confined to this district aI d particularly to the Chittur taluk. The total production of cotton in this district comes to 7,530 bales of 392 lb. each.
(d) Groundnut
77. Graundnnt is cultivated in the Sta.te in two ·districts, Palghat and Trivandrum. This district had a total area of 38,030 acres in 1960-61 under groundnut cultivation producing 12,900 tons of nuts. This crop is raised in two tduks, viz., Chittur and Palghat. A table giving the production of important crops Jor the period 1955-56 to 1960-61 is furnished in ~ppendix 5.
. lrrigation
78. Malampuzha, Walayar, Mangalam, Meenkara, 'Cheerakuzhi and Pothundi are the major irrigation :schemes in the district under different stages of con.struction in the Bharathapuzha river valley.
25/343-5 23
79. The Malampuzha Reservoir is formed b, building a dam partly of masonry and partly of earth, of total length 6,066 feet across the Malampuzha river, a tributary of Bharathapuzha. The length of the masonry dam is 5,337 feet. The capacity of the reservoir is 8,000 million cubic feet. Two canal systems, one on either bank of the river command a total ayacut of 47,600 acres. The length of the main left bank canal is 19! miles, while the main right bank canal has a length of 17 miles. The total length of the distributaries is 170 miles. Besides irrigation, provision hal"> also been made for future generation of electricity by providing two ~ets of penstock pipes in the masonry dam. A pipe sluice has also been provided for supplying drinking water to Palghat town.
80. The Walayar dam, constructed on the Walayar river, is situated near the boundary of Madras and Kerala and is about 14 miles from Palghat along the Palghat-Coimbatore road. There are two sluices in the masonry dam, one for letting out water into the river and the other intended to take water to the right side when necessity arises. The main canal having a length of 7 i miles takes off from the river from above the existing anieut called Nellessery Anicut, lower down the dam site and irrigates the entire ayacut of 8,000 acres. The total length of the branch canal~
comes to 9~ miles.
81. The Mangalam dam, which irrigates a total ayacut of 6,000 acres is located across the Mangalam river, near Kizhakkancherry village the distance from Palghat being 30 miles and from Alathur 15 miles. Two canals, one on each side of the river branches off from a common sluice from the dam. The right bank • canal takes off the lefe bank canal at its first furlong and after crossing the parent Jiver, traverses:! length of 8 miles, and irrigatCi 2,000 acres. The left bank canal with a length of 14i miles commands an ayacut of 8,lOO acres. The total length of the branch canals comes to 41 miles.
82. The Meenkara dam, another irrigation project in this district with a total ayacut of 5,960 acres, is located within a mile of the Kollengode-Pollachi road at mile 21/6. The nearest railway station is Muthalamada. The right bank canal has a total length of 5i miles, while the left bank canal has 3i miles .
83. The Cheerakuzhi irrigation scheme ~nvisages l.hlee schemes. The construction of a river regulator(open weir) across the Cheerakuzhi (Mangalam) river at Kuzhippillipara, about a mile upstream of Cheerakuzhi Bridge, is first among them. A head regulator
IRRIGATION
at the off-take of the main canal in the left bank is the second important scheme on this pr0ject. The main canal in the left bank of the river has a length of 'l5j miles. The length of branch canals comes to 231 miles. TheSe channels with a network of. cistributaries when completed, will irrigate the paddy fields of KilJimangalam, VenganeUur. Panja.l, Painkulam. Cherumuruthy, Nedumpara and Desamangalam villages.
84. The Pothundy irrigation scheme, started in February 1958, envisages (i) t~le construc~ion of an earthen dam 7,035 feet long to imp;:mnd 836'76 million cubic feet of water across Ayalurpuzha, formed by the confluence of two streams Meenachadipuzha and Padipuzha, just at the downstream of the confluence of the two streams, (ii) a surplus weir at the rjght bank end of the river, (iii) an outlet sluice on the left bank of the river and (iv) 23!- miles of canals for irrigating the lands in Nernmara firka in Chittur taluk. The main canal has a length of I mile 5 furlongs and 320 feet. The length of branch canal comes to
211 miles. This scheme is expected to irrigate 9,128 acres of land.
85. The other major and medium irrigation schemes proposed in this river basin are Chulliyar Reservoir Project (Meenkara !lecond stage), Kanhirapuzha Scheme and construction of a bridge-cum-regulator across Bharathapuzha near Kuttipuram.
86. The Chulliar Reservoir is proposed to be constructed in the village limit of Muthalamada near 17/2 of Pollachi-Kollengode road. The reservo:r is expected to irriga:e an ayacut of 3,200 acres.
87. The proposed Kanhirapuzha dam across the Kanhirapuzha js located in Pottasseri v]l.-age in Perintalmanna taluk, at a distance of about 6 miles from Mannarghat. The dam will be 6,545 feet long, consisting of a masonry spillway of 138 feet long, masonry bulk head section ,586 feet long and earthen dam portion 5,821 feet long to impound 2,100 million cubic feet. A main canal on the left bank 35 miles long to irrigate 20,000 acres of land and right bank .:anaI8,m;les long to irrigate 4,000 acres have been proposed.
88. The Bridgt:-cum-regulator across Bharatha~' puzha will irrigate vast areas of paddy fields in Pal ghat ' taluk. Two canals will take off from the propvsed anieut or regulatJf, one on the left and other on the nght to irrigate 15,000 acres of lands on either bank.
24
Live-stock
89. The following statement gives the number of' live-stock and poultry according to the 1961 Live-stock Census for the district:-
Statem.C!nt 17
LIVE-STOcK AND POULTRY, 1961
1961 Category Live-stock Percentage::
Census
A Total Live-stock 696,099 100'00 I CATTLE Total 332,291 47-74
(a) Males over 3 years Total 93,511 13'43 (i) Breeding 941 0'13
(ii) 'Breeding and working' and' working' only
89,586 12'87
(iii) Others 2,984 0'43 (b) Females over 3 years Total 127,216 18·28
(i) Breeding 123,918 17'80 (a) In milk 51,582 7'41 (b) Dry and not calved 72,336 10'39-
(ii) Working 2,160 0,31
(iii) Others 1,138 0'17 (c) Young stock 111,564- 16'03
II BUFFALOES Total 178,736 25'68 (a) Males over 3 years Total 128,981 18'53
(i) Breeding 320 O'Os. (ii) 'Breeding and working' 126,156 18'12
and ' working' only (iii) Others 2,505 0'36
(b) Females over 3 years Total 27,555 3'96 (i) Breeding 24,645 3'54-
(a) In milk 12,483 1'79' (b) Dry and not calved 12,157 1'75
(ii) Working 2,599 0·37 (iii) Others 311 0,05
(c) Young stock 22,200 1I·19
III SHEEP 9,935 1'43
IV GOATS 174,065 25'00
V HORSES AND PONIES 147 0·02
VI OTHER LIVE-STOCK 925 0'13
B Total Poultry 907.545
90. A detailed tal uk-wise c1ass;fication of the livestock and poultry as per the 1961 Live-stock Census is given in Appe:ldix 6. Another,table giving the tal ukwise figures qf agricultural implements is furnished as,
Appendix 7.
Educational Insdtutions (a) General Education 91. While discussing the historical backgr;'lUnd of
th,,~ educc.tional reforms of this dis,rict it is ine\'itable to mention the imp:>rtant st.~ps taken by b:)th Madras. and Co chin Governments. The M ... dras Local Boards.. Act of 1834 was mainly respoasiblc for the rapid expansion of edJcational institutions in the whole c.iistrict barring a major portion of Chittllr taluk. The
" EDUCATIONAL INSTITUTIONS
.momentum for establishing new elementary schools was accelerated by the promulgation of the Elementary Education Act. Grant-in-aid to the private schools was paid by the District Educational Councils constituted under the provis:ons of the Elementary Educa
"lion Act. The Di~trict Educaticnal Councils were abolished in June 1939 and the reponsiOility for the paying of the grant-in-aid to private schools was ·entrusted with the District Educational Officers. In the Chittur taluk which was part of the erstwhile Cochin 'State the system of State education on modern lines "was started in 1818 during the time of Col. Munro. According to the Proclamatien issued in 1818 Sirkc.r Vernacular Schools were established in each village. Fourteen years later these Sirkar Vernacular schools were aboli!:hed because they were not an improvement 'on 'the old Village schools. Malayalam schcols were established in eac:;h taluk in 1835 and they survived till tl,e formation of English schools.' The decision to give grants-in-aid to private agencies in 1889 enabled
"to start a number of schools in the private sector. The progress of education during the period 1911 to 1932
,<:an be summarised as follows: In 1921 a committee .appointed by the Government revised the 'Cochin Education Code. By following this new Code the
:Curriculum of studies W2.S modified by introducing new optional subjects like Botany, Agriculture and "Typewriting for the School Final Scheme. In this period the primary educaticn had received considerable attention. The educational system has undergone Temarkable changes during the last decade especially after the formation of Kerala State. The duration of ~chool course was raised from 11 to 12 years in 1956-57. Thus the primary grade covered the first eight standar~s, the initial five being lower primary while the rest 'upper primary. Standards IX to XII constituted the secondary grade. The admission to :schools was restricted to pupils who attaine,d the age of 51 or over in 1958-59. During, this year the number 'Of years of primary education was once again reduced from 8 to 7 thus re-introducing the 11 year duration
, 'Of course again. In 1959-60 ten year course of study was introduced by admitting pupils who had passed the 'new IV and V standards of primary schools to the VI standard. The upper primary lectioIlB of high :school. were permitted to couduct standard V even though standard V was allowed to continue in certain
25/343-5b. 25
primary schools. At present standards I to IV con stitute the lower primary section, while standards V to VII form the upper primary section. The sCi:condary school has standards VIII to X. During the academic year 1957-58 the schcols in Malabar were brought under the control of a Deputy Director whose office is situated at Kozhikode. For effective and proper control over the development of primary education an Assistant Educational Officer was appointed in each educational sub-district. The Government fishery Ichools in the Malabar region which were under the
'administrative control of the Fisheries Department were tramferred to the Department of Public Instruction during the same year. All educational institutions managed by the Malabar District Board and Municipal Councils were handed over to the Department of Public Instruction with effect from 1-10-1957.
92. Out of 18 lakhs persons who. constituted the 1961 population of the district more than 6 lakhs persons are' literate and educated }:ersons'. Of these , 358,850 are males and 246,128 are females. This gives a litency percentage of ::4'1 for the total population, 42'1 for males and 26'6 for females. This district has the lower percentage of literacy when compared to other districts of the State.
93. The following statement gives the number of school-going children by age-groups of this district during the academic years 1950-5 I, 1955-56 and 1960-61.
Statement 18
SCHOOL-GOING CHILDREN
Age-group 1950-51 1955-56 1960-61
Less than 5 years 85 155
5- 9 "
89,460 110,452 114,535
10-14 " 56,396 89,725 91,258
15-19 "
19,917 26,142 32,346
20 years and above 476 705 988
The number of school-going children in 1960-61 has increased by 43'93 per cent since 195()"51.
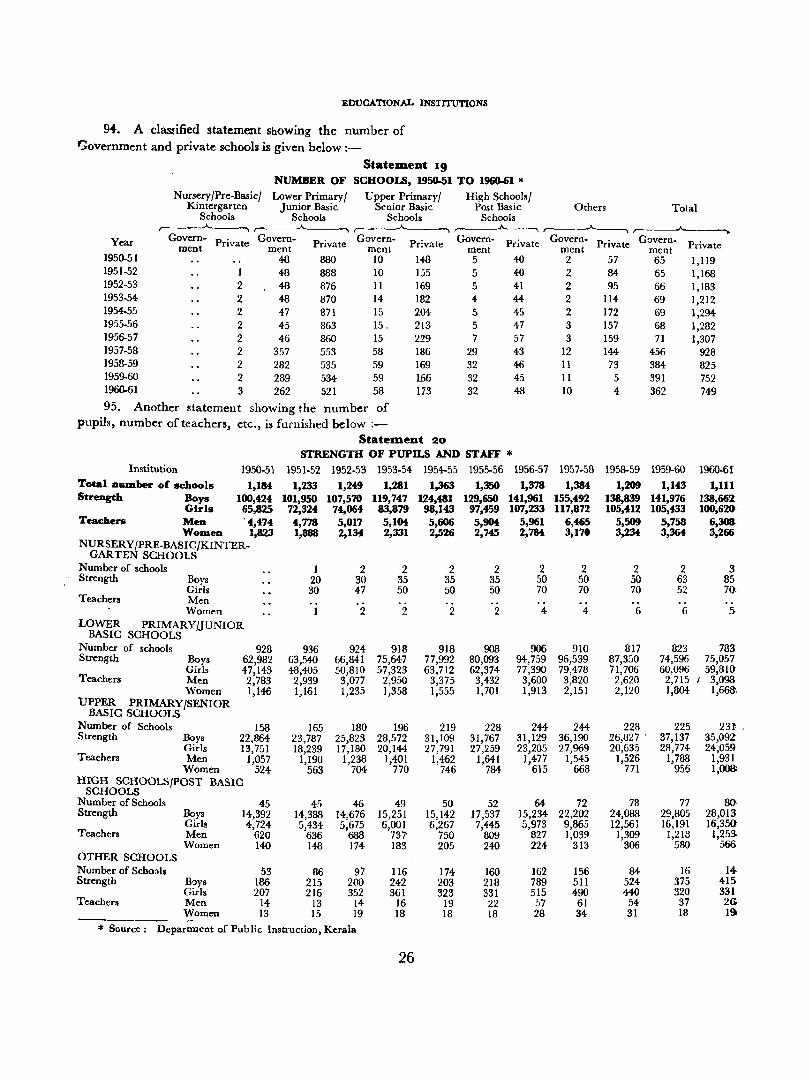
EDUCATIONAL INSTITUTIONS
9 .... A classified statement Showing the number of t}overnment and private schools is given below :-
StatelDent 19 NUMBER OF SCHOOLS, 1950-51 TO 1~1 *
Nursery/Pre-Basic/ Lower Primary/ Upper Primary/ High School~1 Kintergarten Junior Basic Senior Basic Post Basic Others Total
Schools Schools Schools Schools ,---__ .A.
\ ~----. ,---____....______, ,-----"-----,.
Year Govern- Private Govern- Private Govern- Private Govern- Private Govern- Private Govern- Private ment ment ment ment ment men! 1950-51 48 880 10 148 5 40 2 57 65 1,119 1951-52 1 48 888 10 155 5 40 2 84 65 1,168 1952-53 2 48 876 11 169 5 41 2 95 66 1,183 1953-54 2 48 870 14 182 4 44 2 114 69 1,212 1954-55 2 47 871 15 204 5 45 2 172 69 1,294 1955-56 2 45 863 15. 213 5 47 3 157 68 1,282 1956-57 2 46 860 15 229 7 57 3 159 71 1,307 1957-58 2 357 553 58 186 29 43 12 144 456 928 1958-59 2 282 535 59 169 32 46 II 73 384 825 1959-60 2 289 534 59 l66 32 45 11 5 391 752 1960-61 3 262 521 58 173 32 48 10 4 362 749
95. Another statement showing the number of pupils, number of teachers, etc., is furnished below ;-
Statelnent 20
STRENGTH OF PUPILS AND STAFF * Institution 1950-51 1951-52 1952-53 1953-54 1954-55 1955-56 1956-57 1957-58 1958-59 1959-60 1960-61
Total Dumber of schools 1,184 1,233 1,249 1,281 1,363 1,350 1,378 1,384 1,209 1,143 1,111 Strength Boys 100,424 101,950 107,570 119,747 124,481 129,650 141,961 155,492 138,839 141,976 138,662
Girls 65,825 72,324 74,064 83,879 98,143 97,459 107,233 117,872 105,412 105,433 100,620· Teachers Men ·4,474 4,778 5,017 5,104 5,606 5,904 5,961 6,465 5,509 5,758 6,308
Women 1,823 1,888 2,134 2,331 2,526 2,745 2,784 3,170 3,234 3,364 3,266 NURSERY/PRE-BASIC/KINTER-
GARTEN SCHOOLS Number of schools 1 2 2 2 2 2 2 2 2 3 Strength Boys 20 30 35 35 35 50 50 50 63 85
Girls 30 47 50 50 50 70 70 70 52 7fP Teachers Men
Women 2 2 2 2 4 4 6 6 5 LOWER PRIMARY/JUNIOR
BASIC SCHOOLS Number of schools 928 936 924 918 918 908 906 910 817 823 783 Strength Boys 62,982 63,540 66,841 75,647 77,992 80,093 94,759 96,539 87,350 74,596 75,057
Girls 47,143 48,405 50,810 57,323 63,712 62,374- 77,390 79,478 71,706 60.096 59,81<t Teachers Men 2,783 2,939 3,077 2,950 3,375 3,432 3,600 3,820 . 2,620 2;715 I 3,098
Women 1,146 1,161 1,235 1,358 1,555 1,701 1,913 2,151 2,120 1,804 1,668'. UPPER PRIMARY/SENIOR
BASIC SCHOOLS Number of Schools 158 165 180 196 219 228 244 244 228 225 231 . Strength Boys 22,864 23,787 25,823 28,572 31,109 31,767 31,129 36,190 26,827 . 37,137 35,092'
Girls 13,751 18,239 17,180 20,144 27,791 27,259 23,285 27,969 20,635 28,774 24,059 Teachers Men 1,057 1,190 1,238 1,401 1,462 1,641 1,477 1,545 1,526 1,788 1,931
Women 524 563 704 770 746 784 615 668 771 956 1,()()8; HIGH SCHOOLS/POST BASIC
SCHOOLS Number of Schools 45 45 46 49 50 52 64 72 78 77 8~ Strength Boys 14,392 14,388 14,676 15,251 15,142 17,537 15,234 22,202 24,088 29,805 28,013
Girls 4,724 5,434 5,675 6,001 6,267 7,445 5,973 9,865 12,561 16,191 16,350 Teachers Men 620 636 688 737' 750 809 827 1,039 1,309 1,218 1,253-
Women 140 14£ 174 183 205 240 224 313 306 580 566 OTHER SCHOOLS Number of Schools 53 86 97 116 174 160 162 156 84 16 14· Strength Boys 186 215 200 242 203 218 789 511 524 375 415
Girls 207 216 352 361 323 331 515 490 440 320 331 Teachers Men 14 13 14 16 19 22 57 61 54 37 2&
Women 13 15 19 18 18 18 28 34 31 18 19
* Source: Department of Public Instruction, Kerala
26
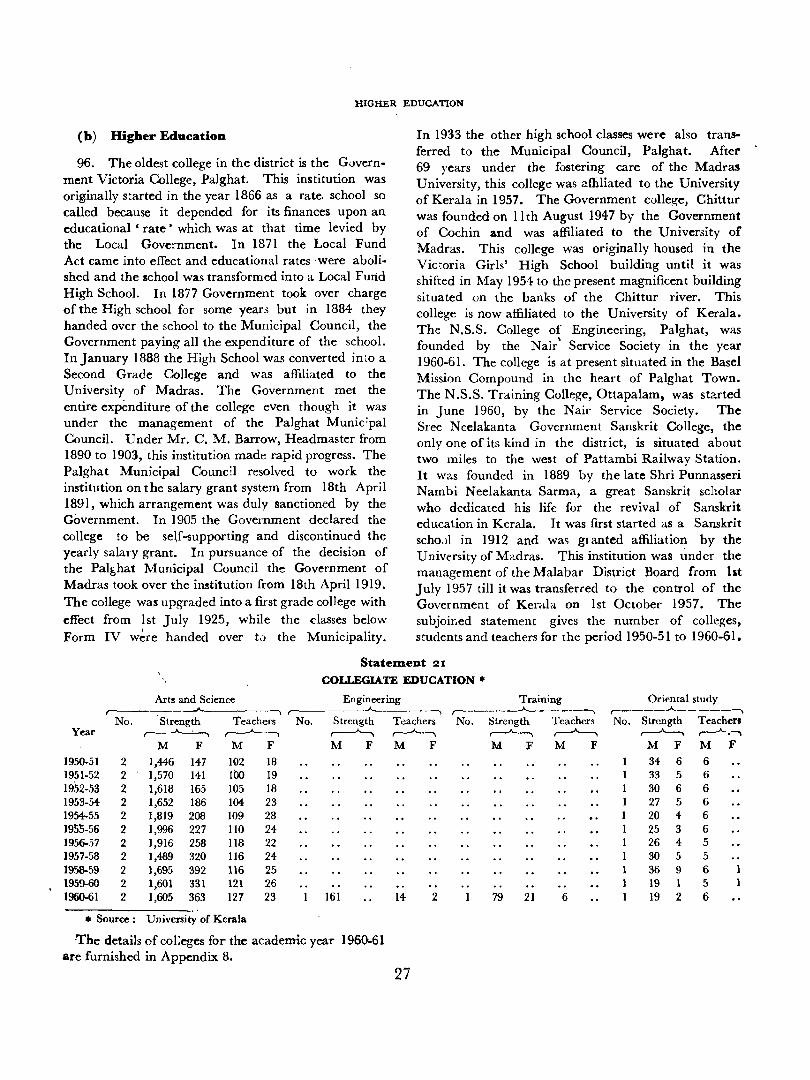
HIGHER EDUCATION
(b) Higher Education
96. The oldest college in the district is the Government Victoria College, Palghat. This institution was originally s~arted in the year 1866 as a rate, school so called because it depended for its finances upon an educational ' rate' which was at that time levied by the Local Government. In 1871 the Local Fund Act came into effect and educational rates 'were abolished and the school was transformed into a Local Fund High School. In 1877 Government took over charge of the High school for some year" but in 1884 they handed over the school to the Municipal Council, the Government paying all the expenditure of the school. InJanuary 1888 the High School was converted into a Second Grade College and was affiliated to the University of Madras. The Government met the entire expenditure of the college even though it wall under the management of the Palghat Munic:pal Council. Under Mr. C. M. Barrow, Headmaster from 1890 to 1903, this institution made rapid progress. The Palghat Municipal Counc] resolved to work the institution on the salary grant system from 18th April 1891, which arrangement was duly sanctioned by the Government. In 1905 the Government declared the college to be sdf-suppocting and discontinued the yearly salary grant. In pursuance of the decision of the Palf,hat ?vlunicipal Council the Government of Madras took over the institution from 18th April 1919. The college was upgraded into a first grade college with effect from 1st July 1925, while the classes below Form IV w~re handed over to the Municipality.
In 1933 the other high school classes were also transferred to the Municipal Council, Palghat. After 69 years under the fostering care of the Madras University, this college was afhliated to the University of Kerala in 1957. The Government college, Chittur was founded on 11th August 1947 by the Government of Cochin and was affiliated to the University of Madras. This college was originally housed in the Victoria Girls' High School building until it was shifted in May 1954 to the present magnificent building situated on the banks of the Chittur river. This college is now affiliated to the University of Kerala. The N.S.S. College of Engineering, Palghat, was founded by the Nair' Service Society in the year 1960-61. The college is at present situated in the Basel Mission Compound in the heart of Palghat Town. The N.S.S. Training College, Ottapalam, was started in June 1960, by the Nair Service Society. The Sree Neelakanta Government Sanskrit College, the only one of its kind in the district, is situated about two miles to the west of Pattambi Railway Station. It was founded in 1889 by the late Shri Punnasseri Nambi Neelakanta Sarma, a great Sanskrit scholar who dedicated his life for the revival of Sanskrit education in Kerala. It was first started as a Sanskrit schoJI in 1912 and was granted affiliation by the University of Madras. This institution was under the management of the Malabar District Board from 1st July 1957 till it was transferred to the control of the Government of Kerala on 1st October 1957. The subjoir,ed statement gives the number of colleges, students and teachers for the period 1950-51 to 1960-61.
StatelDent 21
COLLEGIATE EDUCATION * Arts and Science Engineering
----"'-----., _A____-, No. Strength Teachers No. Strength Teachers
Year ~ ~ ~ ~ M F M F M F M F
1950-51 2 1,446 147 102 18 1951-52 2 1,570 141 100 19 1952-53 2 1,618 165 105 18 1953-54- 2 1,652 186 1<J4. 23 1954-55 2 1,819 208 109 28 1 95!i-56 2 1,996 227 110 24 1956-57 2 1,916 258 118 22 1957-58 2 1,489 320 116 24 1958-59 2 1,695 392 116 25 1959-60 2 1,601 331 121 26 1960-61 2 1,605 363 127 23 161 14- 2 -------_.'
• Source: University of Kerala
The details of col:eges for the academic year 1960-61 are furnished in Appendix 8.
27
Training ,---_ __.A_ ___ -,
No. Strength Teachers ~ ~ M F M F
79 21 6
Oriental study r----..A-----"'""\ No. Strength Teachers ~ ,..---A-.-,
M F M F 34- 6 6 33 5 6
1 30 6 6 1 27 5 6 1 20 4- 6 1 25 3 6 1 26 4- 5
30 5 5 36 9 6 1 19 1 5 1 19 2 6
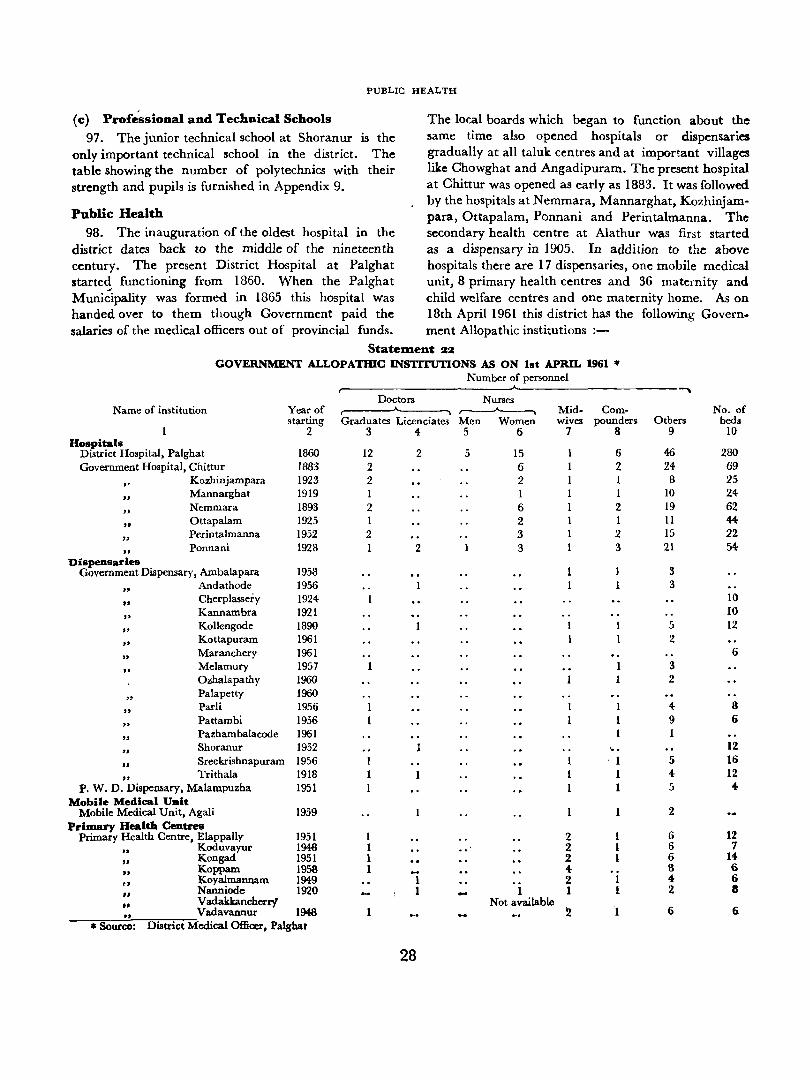
PUBLIC HEALTH
(c) Profe'ssional and Technical Schools
97. The junior technical school at Shoranur is the only important technical school in the district. The table showing the number of polytechnics with their strength and pupils is furnished in Appendix 9.
Public Health 98. The inauguration of the oldest hospital in the
district dates back to the middle of the nineteenth century. The present District Hospital at Palghat started functioning from 1860. When the Palghat Muni;ipality was formed in 1865 this hospital was handed over to them though Government paid the salaries of the medical officers out of provincial funds.
The local boards which began to function about the same time also opened hospitals or dispensaries gradually at all taluk centres and at important villages like Chowghat and Angadipuram. The present hospital at Chittur was opened as early as 1883. It was followed by the hospitals at Nemmara, Mannarghat, Kozhinjampara, Ottapalam, Ponnani and Perintalmanna. The secondary health centre at Alathur was first started as a dispensary in 1905. In addition to the above hospitals there are 17 dispensaries, one mobile medical unit, 8 primary health centres and 36 maternity and child welfare centres and one maternity home. As on 18th April 1961 this district has the following Govern. ment Allopathic institutions :-
Statement 22
GOVERNMENT ALLOPATHIC INSTITUTIONS AS ON 1st APRIL 1961 '" Number of personnel
~
Doctors Nurses Name of institution Year of ~ Mid- Com- No. of
starting Graduates Licenciates Men Women wives pounders Others beds I 2 3 4- 5 6 7 8 9 10
Hospitals District Hospital, Palghat 1860 12 2 5 15 6 46 280 Government Hospital, Chittur 1883 2 6 2 24- 69
.' Kozhin jam para 1923 2 2 1 8 25
" Mannarghat 1919 1 I 1 10 24-
" Nemmara 1893 2 6 2 19 62
" Ottapalam 1925 1 2 I 11 44-
" Perintalmanna 1952 2 3 2 IS 22 .. Ponnani 1928 1 2 3 3 21 54:
Dispensaries Government Dispensary, Ambalapara 1958 3
" Andathode 1956 3 .. Cherplassery 1924 10
It Kannambra 1921 10
" Kollengode 1890 5 12 .. Kottapuram 1961 2
" Maranchery 1961 6
It Melamury 1957 3 Ozhalapathy 1960 2
" Palapetty 1960
" Parli 1956 4 8 .. Pattambi 1956 9 6
It Pazhambalacode 1961 1 .. Shoranur 1952 ... 12 II Sreekrishnapuram 1956 1 5 16 .. Trithala 1918 1 4- 12
P. W. D. Dispensary, Malampuzha 1951 1 5 4-Mobile Medical Uait
Mobile Medical Unit, Agali 1959 2 Primary Health Centres
6 12 Primary Health Centre, ElappaUy 1951 1 2 1
" Koduvayur 1948 1 2 1 6 7
,. Kongad 1951 1 2 1 6 14 .. Koppam 1958 1 4 8 6 .. Koyalmannam 1949 1 2 1 4- 6
" Nanniode 1920 1 1 1 1 2 8
II Vadakkancherrf Not available 1 .. Vadavannur 1948 2 6 6
* Source: District Medical Officer, Palghat
28
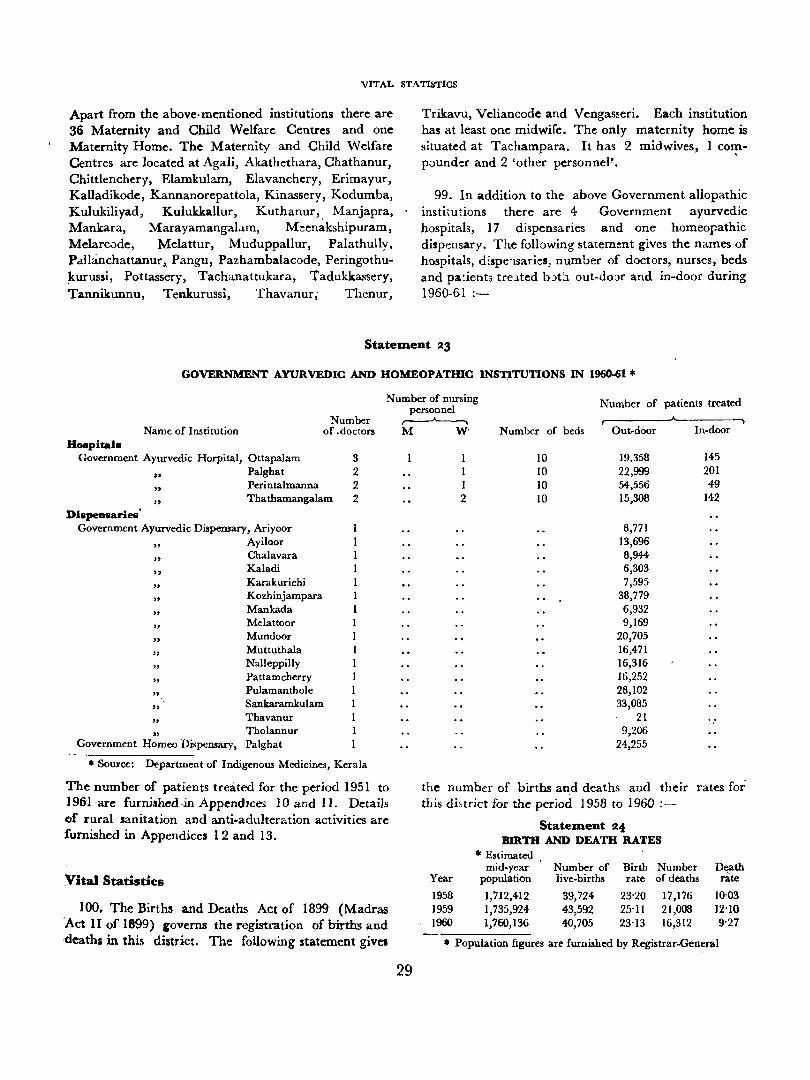
VITAL STATISTICS
Apart from the above· mentioned institQtions there are 36 Maternity and Child Welfare Centres and one Maternity Home. The Maternity and Child Welfare Centres are located at Agali, Akathethara, Chathanur, Chittlenchery, Elamkulam, Elavanchery, Erimayur, Kalladikode, Kannanorepattola, Kinassery, Kodumba, Kulukiliyad, Kulukkallur, Kuthanur, Manjapra, Mankara, Marayamangal.lm, Meen~kshipuram, Melarcode, Melattur, Muduppallur, Palathully, Pallanchattanur,. Pangu, Pazhambalacode, Peringothu;kurussi, Pottassery, Tachanattukara, Tadukkassery, Tannikunnu, Tenkurussi, Thavanur; Thcnur,
Trikavu, Veliancode and Vengas!eri. Each institution has at least one midwife. The only maternity home is situated at Tachampara. It has 2 midwives, 1 compounder and 2 'other personnel'.
99. In addition to the above Government allopathic institutions there are 4 Government ayurvedic hospitals, 17 dispensaries and one homeopathic dispensary. The following statement gives the names of hospitals, dispe"lsaries, number of doctors, nurses, beds and pa:ient3 tre.l.ted b.)t:l out-dO::Jr and in-door during 1960-61 :-
Statement 23
GOVERNMENT AYURVEDIC AND HOMEOPATmc INS~TUTIONS IN 1960-61 * Number of nursing
personnel Number ~
Name of Institution of .doctors M W' Hospitals
Government Ayurvedic Horpital, Ottapalam
Dispensaries'
" Palghat
" "
Perintalrnanna Thathamangalam
Government Ayurvedic Dispensary, Ariyoor " Ayiloor ,. " " " " " " " " " " )l
" ., Government Homeo Dispensary,
Chalavara Kaladi Karakurichi Kozhinjampara Mankada Melattoor Mundoor Muttuthala Nalleppilly Pattamcherry Pulamanthole Sankaramkulam Thavanur Tholannur Palghat
3 2 2 2
1 1 1 1
1 1
* Source: Department of Indigenous Medicines, Kerala
1 2
Number of patients treated
~--, Number of beds Out-door In-door
10 10 10 10
19,358 22,999 54,556 15,308
8,771 13,696 8,944 6,303 7,595
38,779 6,932 9,169
20,705 16,471 16,316 16,252 28,102 33,085
21 9,206
24,255
145 201 49
142
The number of patients treated for the period 1951 to ] 961 -are furnished .in AppendJCC3 10 and II. Details of rural sanitation and anti-adulteration activities are furnished in Appendices 12 and 13.
the number of bi.rths and deaths and their rates for this di,trict for the period 1958 to 1960 :-
Vital Statistics
100. The Births and Deaths Act of 1899 (Madras -Act II of 1899) coverns the registration of births- and deaths in this district. The following statement gives
29
Statement 24 BIRTH AND DEATH RATES
* Estimated mid-year Number of Birth Number Death
Year population Ii ve-births rate of deaths rate
1958 1,712,412 39,724 23'20 17,176 10·03 1959 1,735,924 43,592 25'11 21,008 12'10 1960 1,760,136 40,705 23'13 16,312 9'27
* Population ftgures are furnished by Registrar-General
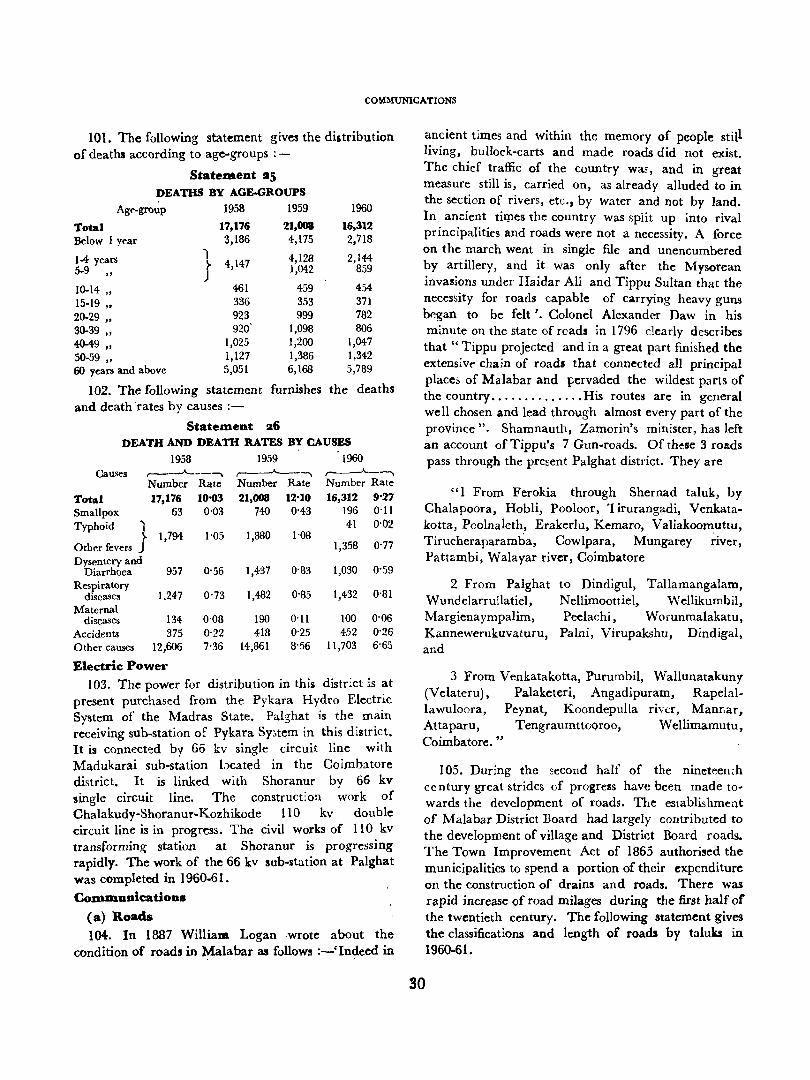
COMMUNICATIONS
101. The following statement gives the distribution of deaths according to age-groups :-
Statement ~5 DEATHS BY AG&.GROUPS
Age-group 1958 1959 1960
Total 17,176 Below 1 year 3,186
1-4 years 1 r 4,147 5-9
" J 10-14 " 461
15-19 " 336
20-29 " 923
30-39 " 920'
40-49 " 1,025
50-59 " 1,127 60 years and above 5,051
102. The following statement and death rates by causes ;-
21,008 4,175
4,128 1,042
459 353 999
1,098 1,200 1,386 6,168
furnishes
Statement 26
16,312 2,718
2,144-859
454 371 782 806
1,047 1,342 5,789
the deaths
DEATH AND DEATH RATES BY CAUS~ 1958 1959 1960
Causes r------'----, r------"----., ,------A----., Number Rate Number Rate Number Rate
Total 17,176 10'03 21,008 12'10 16,312 9'27 Smallpox 63 0'03 740 0'43 196 O'll Typhoid 1 41 0'02
Other fevers J 1,794 1'05 1,880 1'08 1,358 0'77
Dysentery and Diarrhoea 957 0'56 1,437 0'83 1,030 0'59
Respiratory 1,247 0'73 1,482 0'85 1,432 O'BI diseases
Maternal diseases 134 O'OB 190 0'11 100 0'06
Accidents 375 0'22 418 0'25 452 0'26 Other causes 12,606 7'36 14,861 8'56 11,703 6'65
Electric Power 103. The power for distribution in this distr~ct is at
present purchased from the Pykara Hydro Electric System of the Madras State. Palghat is the main receiving sub~station of Pykara SY.>tem in this district. It is connected by 66 kv single circuit line with Madukarai sub-station bcated in the Coimbatore district. It is linked with Shoranur by 66 kv single circuit line. The construct:on work of Chalakudy-Shoranur-Kozhikode 110 kv double circuit line is in progress. The civil works of llO kv transforming station at Shoranur is progressing rapidly. The work of the 66 kv sub-station at Palghat was completed in 1960-61.
CODlmunicadons
<a) Roads 104. In 1887 William Logan wrote about the
condition of roads in ~alabar as follows :-'Indeed in
ancient times and within the memory of people still living, bullock-carts and made roads did not exist. The chief traffic of the country waE, and in great measure still is, carried on, as already alluded to in the section of rivers, etc., by water and not by land. In ancient tirpes the country was split up into rival principalities and roads were not a necessity. A force on the march went in single file and unencumbered by artillery, and it was only after the Mysorean invasions under Haidar Ali and Tippu Sultan that the necessity for roads capable of carrying heavy guns began to be felt'. Colonel Alexander Daw in his minute on the state of reads in 1796 clearly describes that" Tippu projected and in a great part finished the extensiv(" chain of roads that connected all principal places of Malabar and pervaded the wildest parts of the country .............• His routes are in general well chosen and lead through almost every part of the province". Shamnauth, Zamorin's minister, has left an account of Tippu's 7 Gun-roads. Of these 3 roads pass through the present Palghat district. They are
"1 From Ferokia through Shernad taluk, by Chalapoora, Hobli, Pooloor, 1 irurangadi, Venkatakotta, Pcolnaleth, Erakerlu, Kemaro, Valiakoomuttu, Tirucheraparamba, Cowlpara, Mungarey river, Pattambi, Walayar river, Coimbatore
2 From PaIghat Wundelarrullatiel, Margiena ympalim, Kannewerukuvaturu, and
to DindiguI, Tallamangalam, Nellimoottiel, Wellikumbil, Peelachi, Worunmalakatu,
Palni, Virupakshu, Dindigal,
3 From Venkatakotta, Purumbil, Wallunatakuny (Velateru), Palaketeri, Angadipuram, Rapelal~
la wuloora, Peynat, Koondepulla river, Mannar, Attaparu, Tengraumtto<:>roo, Wellimamutu, Coimbatore. "
105. During the second half of the nineteen;h century great strides of progress have been made towards the development of roads. The establishment of Malabar District Board had largely contributed to the development of village and District Board roads. The Town Improvement Act of 1865 authorised the municipalities to spend a portion of their expenditure on the construction of drains and roads. There was rapid increase of road milages during the first half of the twentieth century. The following statement gives the classifications and length of roads by taluks in 1960-61.
30

DistrictfTaluk I
Palghat District Alathur taluk Chittur Ottapalam Palghat
" "
Perintalmanna " Ponnani
District roads .---_____ __.A..
Length in km. II
745'13 6H6
162'54 115'87
Length per 100 sq. km.
12 14'53 10'69 14'06
17'75 17'02
162'54 l r 'll 120'71 INS
COMMUNICATIONS
Statement 27 ROADS, 1961 *
Total National highway State highway ,-------'--_------, , , ___ ---A--_----""
Length Length Length Length per Length per Length per
Length in per 100 1 lakh Length in per 100 1 lakh Lmgth in per 100 11akh km. sq. km. ropulation km. sq.km. popUlation km. sq. km. population
2 3 4 5 6 7 8 9 10
2,119'18 '1'33 119'29 67'59 1'32 3'81 170'59 3'33 9'60 253-27 44'27 104'88 33'79 5'91 13'99 432'00 37'37 158'66 46'67 4'04 17'14
275'60 42'21 84'91 25'75 3'94 7'93
464'93 64'71 156'96 33'80 4'71 IHI 20'92 2'91 7'07
388'~5 24'19 114'70 77-25 4'80 22'78
304-43 44'01 100'50
Village roads t Others r---------~-------_.. ,------_ ....... _--------..
Length per Length Length per Length Length per Ilakh Length in per 100 Ilakh Length in per 100 llakh
population km. sq. km. population km. sq. km. population 13 14 15 16 17 18 19
41'94 1,000'96 19'52 56'34 134'91 2'63 7'60 25'33 158'32 21'67 65'56 59'70 192'51 16·65 70'70 30'28 2'62 I 1'12
35'70 133·98 20'52 41'28 41'29 183'27 25'51 61'87 104'63 14'56 35'32
47'93 149'16 9'28 43'99 39'85 183'72 26'56 60'65
* Source :--Executive Engineer, Buildings and Roads, Palghat, Director of Panchayats and Director of Municipalities
t Inclusive of Panchayat roads of 'mote than local importance'
106. An account of road surface for this distr:ct is furnished bdow.
Total Road type km.
Bituminous 436'33
-Concrete 12'88
Water Bound Maccadam 1,177'01
Unmetalled 358'05
Others (unclassifiable) 134'91
Statement 28
ROAD SURFACE
National State high- high- District Village WdY way roads roads· Q,hers km. km. km. km. km.
61'13 123'92 238'[8 13'08
6'44 6'44
40'23 506'93 629'83
35805
134-91
* Inclusive of Panchayat roads of 'more than local importance'
A polymetric table of distances 1:5 furnished ill
Appendix 14.
25/343-6 31
(b) Railways
107. The Southern Railway enters thi:; district at Walayar through the PaIghat Gap of the Western Ghats. The broad-gauge railway line having a length of 65 miles connecting Pattambi with Podanur of Coimbatore district of Madras State was opened for traffic with eff';ct from 14th April 1862. This line runs through Palghat and Ottapalam taluks. The Shoranur-AngJ.dipliram section of Shoranur-Nilambur broad-gauge railway line was first opened for traffic in February 1927 and was further extended up to Nilambur Road in October 1927. This line passes through Ottapalam, Perintalmanna and Ernad taluks. The metre-gauge railway line connecting Palghat with Pollachi was opened for traffic in April 1932. It traverses through Palghat and Chittur taluks. No addition of railway line was made thereafter. Thus the present Palghat district has a total railway line of 103 miles. Facilities provided at the various railway stations of this district are furnished in Appendix 15.
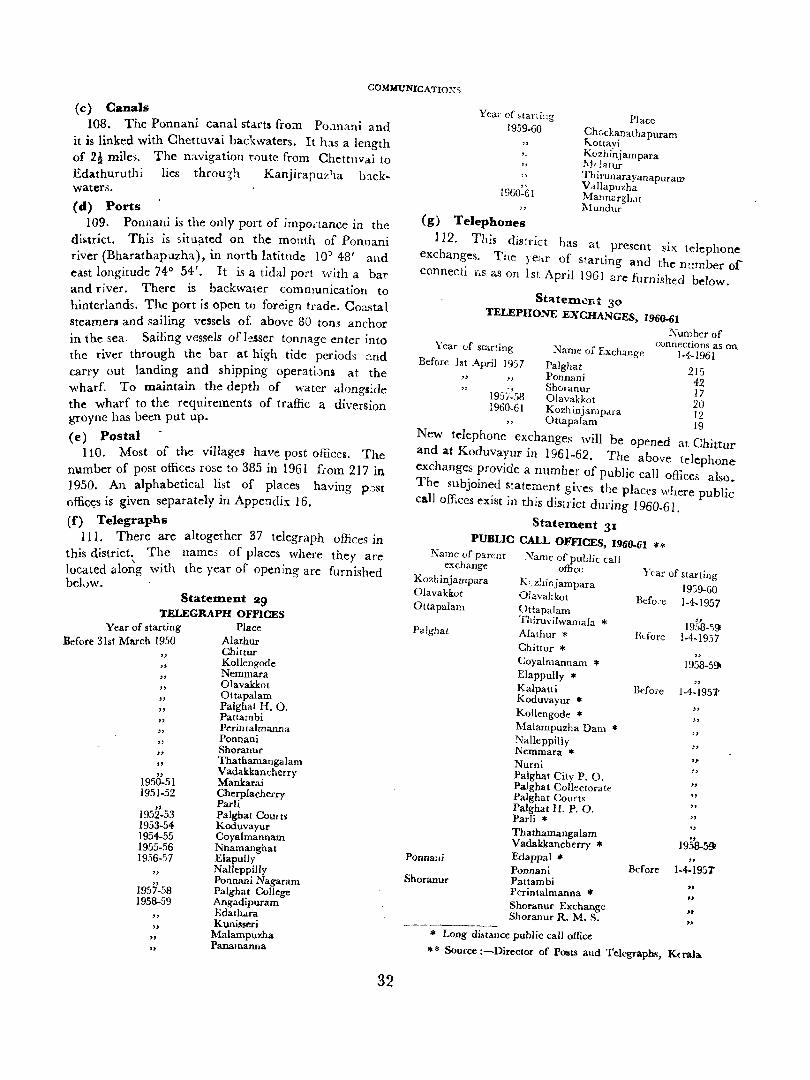
COMMUNrCA TIO~~5
(c) Canals 108. The Ponnani canal starts fro~ Po.mani and
it is linked with Chettuvai backwaters. It has a length of .2! mile;;. The navigation route from Chettllvai to Edathuruthi lies throu5'h Kanjirapuz1la lnck~ waters.
(d) Ports 109. Ponnani is the only port of irnpot'tance in the
district. This is situiJ.ted on the mouth of Ponnani river (Bharathapuzha), in north latitude 10J 48' and east longitude 74° 54'. It is a tidal port with a bar and river. There is backwater communication to hinterlands. The port is open tl) foreign trade. Coastal steamers and sailing vessels of above 80 tons anchor in the sea, Sailing vessels of t~sser tonnage enter into the river through the bar at high tide periods :.:.nd carry out landing and shipping operati,)ns at the wharf. To maintain the depth of water alongside the wharf to the requirements of traffic a diversion groyne has been put up.
(e) Postal 110. Most of the villages have post offices. The
number of post offices rose to 385 in 1961 f.-om 2 I 7 in 1950. An alphabetical list of places having P,)st offict;s is given separately in Appe!1dix 16.
(f) Telegraph &
111. There are altogether 37 telegraph offices in this district. The name3 of places where they are located alo~g with the year of opening are furnished be],)w.
Statem.ent 29 TELEGRAPH OFFICES
Year of starting Before 31st March 1950
" "
" "
" " " " " 1950-51
1951-52
" 1952-53 1953-54 1954-55 1955-56 1956-57
" 1957-58 1958-59
" " " "
Place Alathur Chittur Kollcngode Nemmara 01avakkot Ottapalam Palghat H. O. Pattambi Perin talmanna Ponnani Shoranur Thatbamangalam Vadakkancherry Mankarai Cherplacherry Parli Palgbat Courts Koduvayur Coyalmannam Nhamanghat Elapully Nalleppilly Ponnani Nagaram Palgbat College Angadipuram Edath ... ra Kunisseri
Malampu7.ha Panamarma
32
Yea" of , tar. i,,!~ 1959-60
Place Chc,ckanathapuram Kottavi Kozhinjampara M'htur Tbil"Unarayanapura1l1 Vallapuzha J\fanna rgh.\ t 1\Iundur
(g) Telephones
112. This dis:rict h as at present HX telephone
exchanges. The ye"r of starting and the number of connecti r,s as on 1st April 196] are furnished below.
StatemoJnt 30
TELEPHONE EXCHANGES, 1960-61
~umbcr of Year of starling
Before 1st April 1957
connections as on Name of Exchange 1-4-1961
Pa!ghat 215 Ponnani 42 Sholanur 17
1957:58 Olavakkot 20 1960-61 Kozhinjampara 12
"
"Ottapalam 19
New telephone exchanges will be opened at Chittur and at Koduva~uJ' in 1961~62. The above tdephone exchanges proVide a number of public call oflices also. The subjoin~d ~tate~len.t gives the places where public call offices eXist m thIS d!strict during 1960-61.
StatelUent 31
PUBLIC CALL OFFICES, 1960-61 ** Kame of parent i'i'amc of puLlic call
exchange office Year of starting Kozhinjampara K':z~linjampara 1939-60 Olavakkot Olavakkot Befo:e 1-4-1957 Ottapalam Ottapalam
Thiruvilwamala * " 19,')8·')9 Palghat Alathur * Blfore 1-4-1957 Chittur * Coyalmannam * 1958·59t Elappully *
" Kalpatti Before 1-4-1951' Koduvayur *
" KoUengode * " Malampuzha Dam * " Nalleppilly " Nemrnara *
Nurni .. Palghat City P. O. " Palgbat Collectorate " Palghat Courts " Palghat H. P. O. " Parli * " Thathamangalam
" Vadakkancherry * 1958-59: Ponna"j Edappal ...
" Ponnani Before 1-4-1951' Shoranur Pattambj
" Perintalrnanna * .. Shoranur Exchange
" Shoranur R. M. S. .. * Long distance public call office
** Source :--Direetor of Posts and Telegraphs, KO'ala
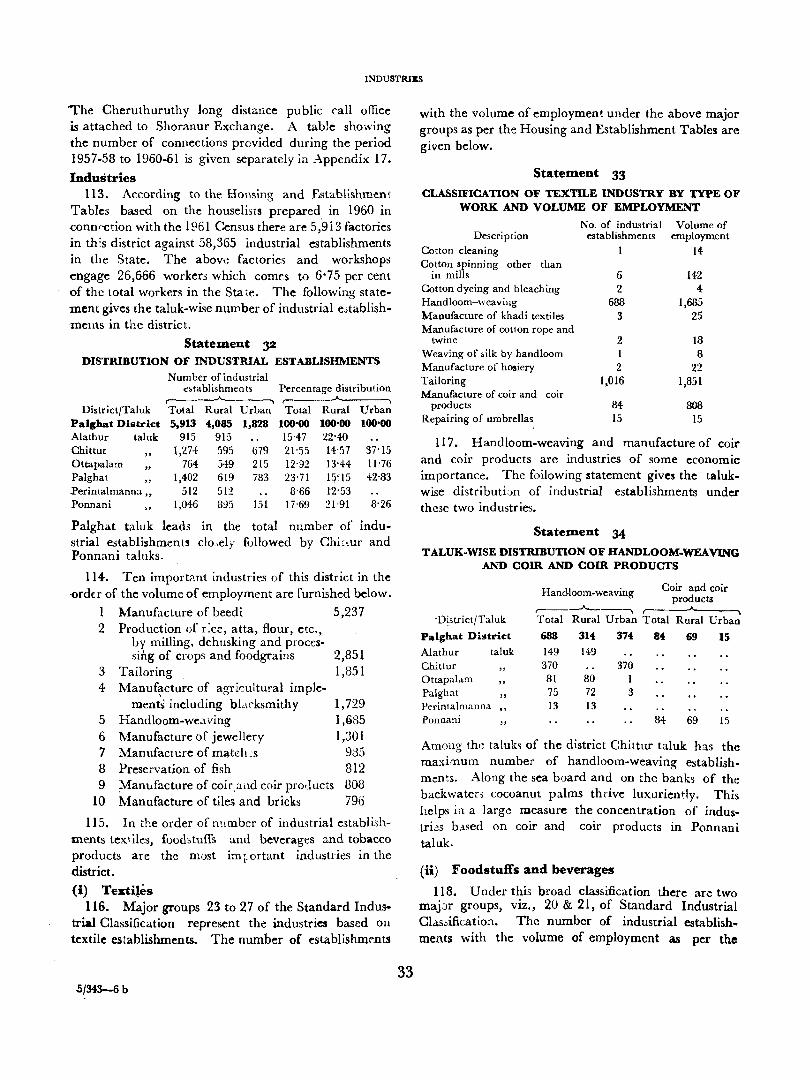
INDUSTRIES
J:'he Cheruthuruthy long distance public call office is attached to Shoranur Exchange. A table showing the number of connections provided during the period 1957-58 to 1960-61 is given separately in Appendix 17.
Industries 113. According to the Housing and Establishment
Tables based on the houselists prepared in 1960 in <:onnr'ction with the 1961 Census there are 5,913 factories in th:s district against 58,365 industrial establishments in the State. The above factories and workshops engage 26,666 workers which comes to 6'75 per cent of the total workers in the State. The following statement gives the taluk-wise number of industrial establish'ments in the district.
Statement 32 DISTRIBUTION OF INDUSTRIAL ESTABLISHMENTS
Number of industrial ~"tablishments Percentage distribution
,.--_J,,___--, ,-__.A.,_---------, DistrictJTaluk
Palghat District Alathur taluk
Total Rural Urban Total Rural Urban 5,913 4,085 1,828 100'00 100'00 100'00
Chittur ,.
" Ottapalam Palghat .Perintalmanna " Ponnani
915 915 15-47 22'40 1,2H 595 679 21'55 14'57
764 549 215 12'92 13'44 1,402 619 733 23'71 1~~15
512 512 8'66 1:2'53 1,046 895 151 17'69 21'91
37'15 11'76 42'83
8'26
Palghat taluk leads in the total number of industrial establishments clo->ely followed by Chiftur and Ponnani taluks.
114. Ten import?nt industries of this district in the -ordn of the volume of employment are furnished below.
1 Manufacture of beedi 5,237 2 Production of r:ce, atta, flour, etc.,
by milling. dehusking and processing of crops and foodgrabs
3 Tailoring 4 Manuf~cture of agricultural imple-
5 6 7
ments'including bldcksmithy Handloom-wea ving Manufacture of jewellery Manufacture of mCj.tch:8
8 Preservation of fish 9
10 Manttfacture of coir,and coir products Manufacture of tiles and bricks
2,851 1,851
1,729 1,685 1,301
935 812 808 796
115. In the order of n~imber of industrial establi3hments textiles, fomhtufi"s and beverages and tobacco products are the most im l-0rtant industries in the district.
(i) Texti!es 116. Major groups 23 to 27 of the Standard Indus
trial Classification represent the industries based on textile establishments. The number of establishments
5/343-6 b 33
with the volume of employment under the above major groups as per the Housing and Establishment Tables are given below.
Statement 33
CLASSIFICATION OF TEXTILE INDUSTRY BY TYPE OF WORK AND VOLUME OF EMPLOYMENT
No. of industrial Volume of Description establishments employment
Cotton cleaning 14 Cotton spinning other than
in mills 6 142 Cotton dyeing and bleaching 2 4 Handloom-weaving 688 1,685 Manufacture of khadi textiles 3 25 Man~facture of cotton rope and
2 18 twme Weaving of ;,ilk by handloom I 8 Manufacture of hosiery 2 22 Tailoring 1,016 1,851 Manufacture of coir and coir
products 84 808 Repairing of umbrellas 15 15
117. Handloom-weaving and manufacture of coir and coir products are industries of some economic importance. The following statement gives the talukwise distributi;:m of indmtrial establishments under these two industries.
Statement 34
TALUK-WISE DISTRIBUTION OF HANDLOOM-WEAVING AND COIR AND COIR PRODUCTS
'D~strict/Taluk
Palghat District
Alathur tal uk Chittur Ottapalam Palghat
" Perintalmanna " Ponnani
Hand.loom-weaving Coir and coir products
,---_.,.__-----, ,-~-. Total Rural Urban Total Rural Urban
6S8 314 374 84 69 15 149 149 370 370 81 80 1 75 72 3 13 13
84 69 15
Among the ta!uk5 of the district Chittur taluk has the maximum number of hand loom-weaving establishments. Along the sea board and on the banks of the backwaters cocoanut palms thrive luxuriendy. This helps in a larg~ measure the concentration of industri~s b.lsed on coir and coir products in Ponnani taluk.
(ii) Foodstuffs and beverages
118. Under this broad classification there are two majJr groups, viz., 20 & 21, of Standard Industrial CI.1s&ification. The number of industrial establishments with the volume of employment as per the
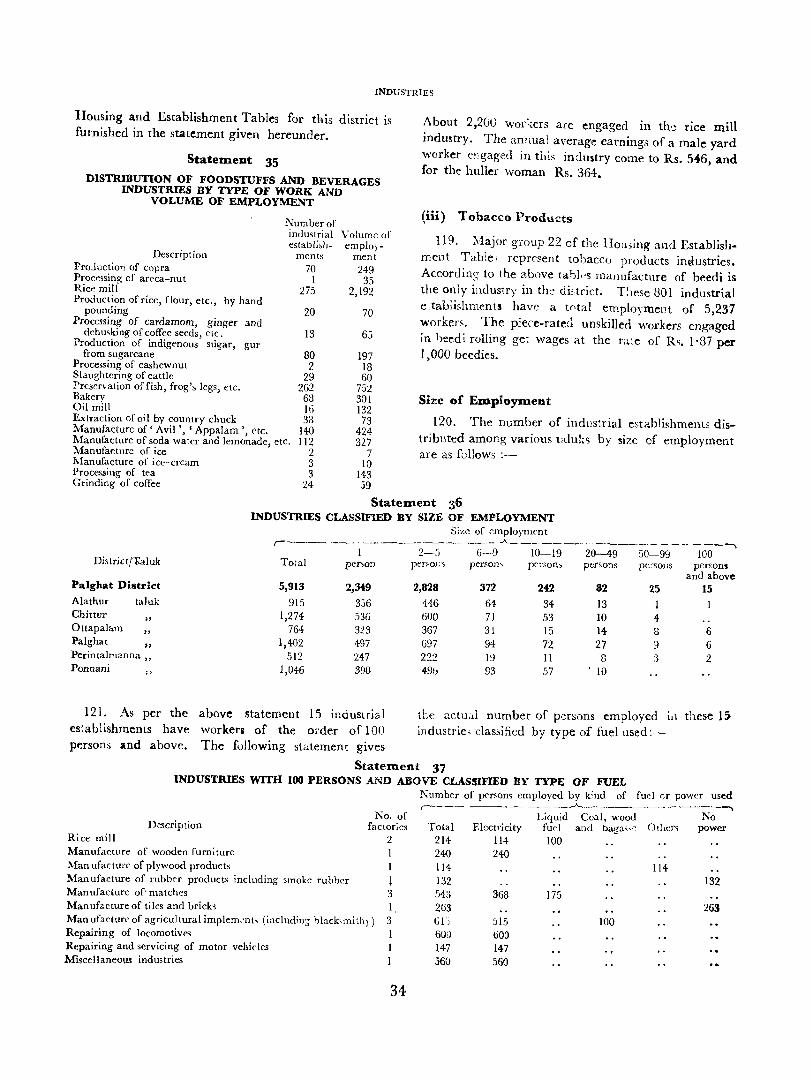
INDUSTRIES
Housing al~d Establishment Tables for this district is furnished in the statement given hereunder.
Statement 35
DISTRIBUTION OF FOODSTUFFS AND BEVERAGES INDUSTRIES BY TYPE OF WORK AND
VOLUME OF EMPLOYMENT
Number of industrial Volume of establi.h- emplo)-
Description ments ment ProJuction of copra Processing of areca-nut RiCt~ mill Production of rice, flour, etc., by hand
pounding Proc{."Ssing of cardamom, ginger and
dehu,king of coffee seeds, etc. Production of indigenous sugar, gur
from sugarcane Proce,sing of cashewnut Slaughtering of cattle Preservation of fish, frog's legs, etc. Bakery Oil mill Extraction of oil by country chuck :Manufaeturc of' Avil " • Appalam " ('te. l\lanufacture of soda waler and lemonade, etc. Manufacture of ice I\lanufacture of ice-cream Processing of tea Grinding of coffee
70 I
275
20
13
80 2
29 262 68 Iti 33
140 112
2 3 3
24
249 35
2,192
70
65
197 18 60
752 301 132 73
424 327
7 10
143 59
,o\bout 2,200 wor'~ers are engaged in th,~ rice mill indmtry. The annual ayerage earnings of a male yard worker ('~!gaged in this industry come: to Rs. 546, and for the huller woman Rs. 364.
(iii) Tobacco Produ~ts
119. ~fajor group 22 of the Homing and Establishment Table; represent tobacco products industries. Accordin~ to the above tahl,·s manufacture of beedi is the only industry in the di:;trict. T:lese 801 industrial e,tab!ishments have a t<'tal employment of 5,237 workers. The piece-rated unskilled workers engaged in beedi rolling get wages at the ra.:e of Rs. 1'87 per 1 ,000 beedies.
Si:z:e of Employm.ent
120. The number of indus!rial establishments distributed among various talub by size of employment are as follows ;-
Statem.ent 36 INDUSTRIES CLASSIFIED BY SIZE OF EMPLOYMENT
Size of employment ,-----~--_~_---------~~----'---- -----_------ - --- ---.,
1 2-J 6-9 10-19 20--49 50-99 100 District/'taluk Total penon
Palghat District 5,913 2,349 Alathur taluk 915 3:)6 Chittu,
" 1,274- 536 Ottapalam
" 764 323 Palghat
" 1,402 497 Perintalmanna " 512 247 Ponnani
" 1,046 390
121. As per the above statement 15 industrial es:ablishmems have workers of the order of 100 persons and above. The fullowing statement gives
per,o;:~ penon, penon, persons pcrSOllS person, and above
2,828 372 242 82 25 15 446 64 34 13 I 600 71 53 10 4 357 3i 15 14 8 6 697 94 72 27 9 6 222 19 II 8 :3 2 4% 93 57 '10
the actu,:d number of p'~rsons employed ill these 15 industrie, classified by type of fuel used ;--
Statement 37 INDUSTRIES WITH 100 PERSONS AND ABOVE CLASSIfiED BY TYPE OF FUEL
Description Rice mill Manufacture of wooden furniture Man ufactmc of plywood products Manufacture of rubber product~ including smoke rubber Manufacture of'matches Manufacture of tiles and bricks
Kumber of persom employed by kind of fuel or power used r---- .------~~~-- - ----'>
No. of Liquid Coal, wood No factories Total Electricity fud and baga,,'~ 0lhen power
2 214 114 100 I 240 240 I j 3 I.
114 132 543 263
368 175
114 132
263 Man ufacturc of agricullural implem<>nt~ (includin~ bhck<mith)) 3 Repairing of locomotives
Clj
6Ull 515 100 600
Repairing and servicing of motor vehicles 1>fiscellaneoU$ industries
34
147 560
147 560
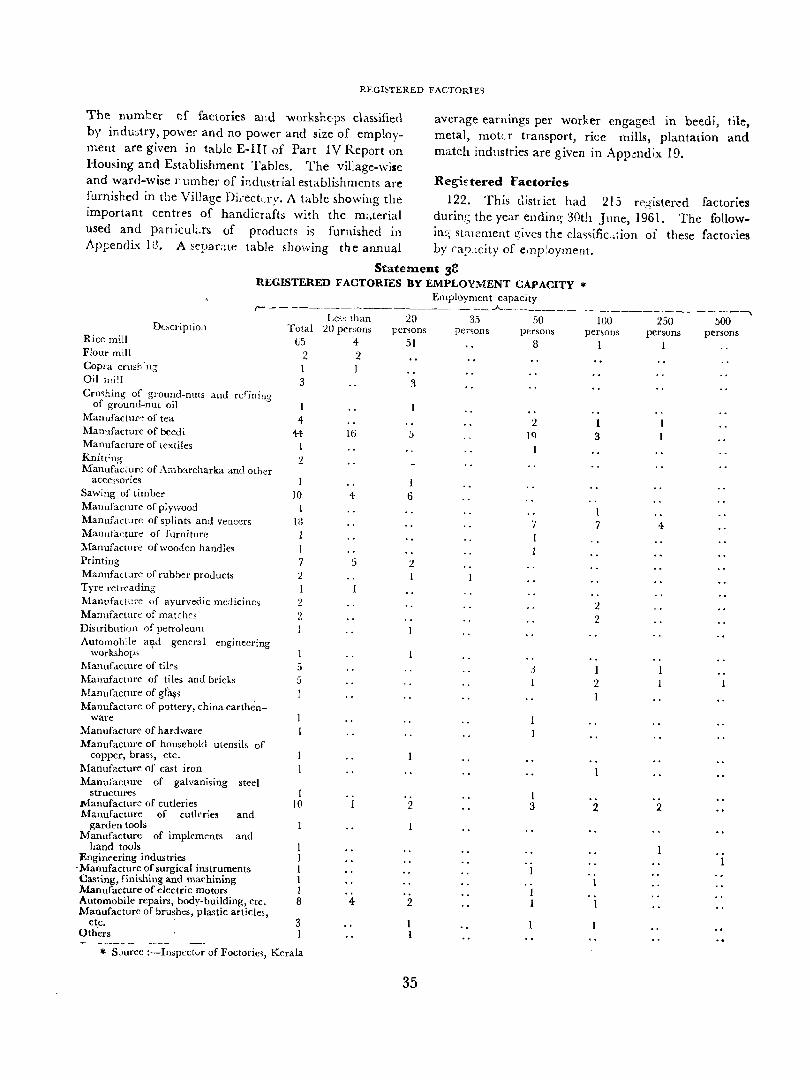
REGISTERED FACTORIES
The number of factories alld workshops classified by industry, power and no power and size of employment are given in table E-Ill of Part IV Report on Housing and Establishment Tables. The village-wise
average earnings per worker engaged in beedi, metal, moter transport, rice mills, plantation match industries are given in App~ndix 19.
and ward-wise Lumber of industrial establishments are Regl£tered Factories
tile. and
furnished in the Village Di,-ect"ry. A table shov,ing the 122. This district had 215 registered factories important centres of handicrafts with the material durinG the year endin2; 30th June, 1961. The follow-used and panicul:.rs of products is furnished in ing statement I!,"ivcs the cla~sific_.(ion of these factories Appendix 18. A separate table shO\,."ing the annual by cap_icity of e1np!oyment.
Statement 38 REGISTERED FACTORIES BY EMPLOYMENT CAPACITY *
Employment capacity r- - - ---------~----------__ --"--_________________________ -,
Less than 20 35 SO 100 250 500 Docriptioll
Rice mill Total 20 persons Fenons per~ons persons persons persons persons
65 4 51 8 I I Flout mill Copra crus;; 11;;Oil mi~1
2 2
Crmhing of ground-nuts and refining of ground-nut oil
Manufactllr'~ of tea Manufacture of beedi
I 3
I 4-
44 Manufacture of textiles I Knitt;ng 'l. Manufac:ure of Amb:ucharka and other
acces'5ories Sawing of timber 10 Manufacture of plywood Manufacture of splints and veneers JG :Manufacture of furniture 1 :Manufacture of wooden handles I Printing 7 Manufacture of rubber products 2 Tyre retreading ?>1anufacture of ayurvedic meJicine~ 2 Manufacture of matches Distribution of petroleum Automob;le a~d general engineering
workshop3 ?>Ianufacture of tilFs Manufacture of tiles and bricks Manufacture of gl~, Manufacture of paUery, china earthen
ware Manufacture of hardware Manufacture of household utensils of
copper, bras~, etc. Manufacture of cast iron Manufacture of galvanising steel
structures l\'Ianufacture of cutleries Manufacture of cutleries and
garden tools Manufacture of implements and
hand tools Engineering industries
-Manufacture of surgical instruments Casting, finishing and machining Manufacture of electric motors Automobile repairs, body-building, etc. l-.fanufacture of brushes, pla~tic articles,
etc. Oth-ers
'l.
:> 5 1
1 10
1 1 1 1 1 8
3 I
* S_)urcc :-Inspector of Foctorie" Kerala
10
4-
5
4
3
5
6
2
2
2
I 1
35
2 lCJ
7 I
:i
1
1 3
1 3
1 7
2
2
I 2
2
4-
Fn!IEmES
123. About half of the total registered factories in the di3trict arc confined to Palghat taluk. The folbw. ing statement gives the taluk-wise distribution of the registered factor;t's in the dis:rict.
Statetnent 39
T ALUK-WISE DISTRIBUTION OF REGISTERED FACTORmS
Number of register .. d Percentage
Di.>trictrraluk factories distribution
Palghat Pilltrict 215 11»00 Alathur taluk 20 9'30 Cbittur
" 38 17-68 Ottapalarn " 39 18'14-Palghat
" 106 49'30 Pcrintalm:lnna II 6 2'79 Ponnani
" G 2'79
Strikes and Lockouts
124. Two tables, one showing the number of indus· trial disputes resulting in work stoppa:ses for the period 1957 to 1950 and ano~her showing the number of industrial disputes by cames for the p·~r lod 1957 to 1960 are "h'en in Appendices 20 and 21. " ,
Trade
125. The total vabe of imports and exports of Ponnani p0rt for the period 1951-52 to 1959-66 IS
furnished below.
Statetncnt 40
TOTAL VALUE OF IMPORTS AND EXPORTS * Year
Imports Exports R:!. Rs.
19:; I-52 12,84,093 21,05,387 1952-5~ 11,33,256 15,78,908 1953-54 11,01,537 22,28,229 1954-5!> 12,73,280 20,28,340 1935-56 13,38,319 15,49,429 1956-57 10,04,535 11,66,675 1957-58 13,94,527 12,84,786 1958-59 12,76,130 5,95,133 1959-60 6,44,267 9,60,322
* Source:-Department of Statistics, Kerala
Detailed tabl~s showing tonnage of vessels for the period 1951-52 to 1960.61 and imports and e~ports f?r the period 1951-52 to .l959.60 are furmshed in
Appendices 22, 23 and 24.
Fisheries
126. The coastal line of this di)tric.t trending from nort:l ,0 sout:l is about 13 miles in length. There are seVen (viz., Ponnan i , Kadavanad, Veliyancode, Ayirur, Kadikkad, Punnayur and Edakkazhiyur) fishing villages in this district of which Ponnani is the most importar,t one. The fish-curing yards in the district are Ponnani, Puciuponnani, Veliyancode, Palapetty, Mannalamkunnu and Edakkazhiyur. The inland fisheries in the di~tnct are confined to fresh water fisherie~. They comtitute riven, canals, tanks and Ieservoirs. :Malampuzha, vValayar, Mangalam, Meenkara and Pothundy are the reservoirs of this district where various Varieties of fingerlings have been stul.ked by the Department of Fisheries. Fresh and cured fish are sold in local markets, Curing by salt is the only methcd of preservation now in force. Fish is iced and sent to distant markets from Ponnani where ther~ are better transport facilities.
127. A survey conducted by the Department of
Fisheries on fishermen's assets and liabilities in 1957.58 leveals the following:-
Statetnent 41
ASSETS AND LIABILITIES OF FISHERMEN
Item
Average household ',;ze Big boats (a) Plank
(b) Dugout~ (c) Average per Louse
hold Small bo"ts (a) Plank
(0) Dugouts (c) Average per
hou;ehold
Catamaran Nets (a) Rhore seine (b) Boat seine (c) Drift net (d) Average per household
Line and Hooks (a) Sets (0) Numbers
Income Average income ~r household Debt Asset
Average debt pet household (a) For debtors only (b) For all
Palgbat district
6'8 308 35'1 0'23
37 ZB 0'02
11 1,662 3,844
1'95 913
20,350
R:!. 13,03,503 Rs. 461 R~. 17,10,368 Rs. 7,17,803
Rs. 658 Rs. 605
Kerala State
6'4-1,943 4,435
0'15
1,230 4,319
0'13
R,280 4,501
21,281 3Cl,778
i'46 16,312
168,078
2,27 ,72,297 54-2
1,35,08,837 29,49,643
401 322
36 -
LOCAL SELl'-GOVERNMENT
Community Development 128. The particulars of the development block;, the
stage of each block, the year of ~tarting, area and the
number of villages or pal:chayats included III each blvck in this distr:ct are furnished below.
Statement 42 DEVELOPMENT BLOCKS.
Present Taluk Name of block status
Perin talmallna I Mankada Pre-cxteNsion 2 Perint'llmanna
" 3 Mannarghat Stag~ I Ponnani 4 Andatl;lode
5 Ponnani Pre-cxten,ion Ottapalam 6 Pattambi Stage I Palghat Pa1ghat and Chittur
7 Palghat 8 Kollengod-~
Stage II
Alathur 9 Alathur Alathur and Chittur 10 Coyalmannam
" Chittur II Chittur C. D. 12 Nemmara Stage I
• Source :- The Development Commissioner, Kerala
The achi~vcments under all the blocks to?·~ther for the p~riGd 1956-57 to 1960-61 are given in Appendix 25.
Revenue
129. Statements of the following items of revenue have be·.~n given in Appendice~ 26 to 30:-
Receipts under excise revenue f jf the period 1950-51 to 1960-61.
2 Sales:ax rev~nue for the pe,oio:! 1950-51 to 1960-61.
3 Agricultural incometax and supertax for the period 1~57-58 to 1930-61.
4 Inciden:e of land revenue assessment for \ the period 1950-51 to 19f)0-61.
5 Receipts under entertainment tax for the ~eriod 1950-51 to 1959-60.
The eXLise re~enue collected from th:; district has increased from Rs. 26,597 icl 1950-51 to Rs. 71,340 in 1960-61 while salestax revenue has incredsed from Rs. 22,09,630 to R~. 29,25,360 for the same period. The agricul!ural incometax and sup~rtax has increased considerably from Rs. 12,37,1:23 ill 1957-58 to Rs. 21,08,365 in 1960-61. The l;>.nd revenue of fully assessed area has shown a slight increas~. Land revenue al>scssed per head of population has come down from 1'18 in 1950-51 to H7 in 1960-61. The entertainment tax has registered an increase fr.lm Rs. 47 lakhs in 1950-51 to Rs. 104 lakh') in 1959-60.
Local Self-government
130. Local self-government consists of three important institutions, viz., Municipalities, District Boards and Panchayats;
Year of Area in sq. Number of \'illages or panchayat, starting miles Remarks
1-4-60 91'9il 19 1-4-61 112'02 19
18 1-4-57 410 Including Attapadi hill< 1-4-58 20'58 16 P. 1. Block converted into Stage I
Oil 1-4-1959 1-10-61 ::3' 3 15 2-10-57 84'05 21 N. E. S. 2-10-52 152'8 36") Palgllal, Kollengode, Alathur and 2-10-52 113·.J "0 I Coyalmannam post intensive
~4 ~ blork, of the Malampuzha pro-2-10-52 152'12 32 J j~ct wt'Te "plit up on 1-10-1956 2-10-52 185'94
2-10-54 110'5 19 Converted into C. D. on 2-1O-1~57 2-10-53 30'2G 6 N. E. S.
37
(a) Municipalities 131. The Town Tmp;'ovement Act X of 1865
enucted by the l'vfadras Government was the first statLltl~ est.1bli;hing municipalities. Prior to the enact:nent of this statute the municipalit:es were nothing but voluntary organimtions. The Palghat Municipc'.lity was formed in 1866 by extending the abo\'e Act. This Act was in force till 1871 and it was repeal~d by Act III of 1871. This was again amended by th,~ Act IV of 1884. In 1884, the Dis~rict Municipalities Act w<:s passed by the :;\1adras Government which pro-:ided lor an elected Vice-President and the election ()f the 75 per cent of the members of the c:mncil by tax payers. "Here the experim~nt of local self-Government has proved a decided succeS3, and in its annual review Government rarely hid occasion to find fault with the general adminis:ration of the municipality. No doubt the conditions of the town ar,; favourable to the growth of municipal ins"Litutio:1S. Its situatio:l on the railway in the middle of a r:ch tal uk with roads converging from every direction enable! the municipality to levy contributions in the shape of tolls upon a large volume of trade pa,sing through the town and in spite of the share of the receipts paid to the local boards, the council's incom~ from this source is nearly double that of Calieut where so much of the trade is tea-borne. Continuity of administration, hJwever, has also contri-buted to the success of the Municipality ........ The council was given the privilege of electing its Chairman in 1912 and under the Act of 1930 councillors will all be elected. "1 The Act of 1930 abolished the system of no:ninations and provision was made for the reservation
1. Malasar District Gazetteer by C. A. Innes (1951 Editioa). page 402
LOCAL SELF-GOVERNMENT
of seats for minority communitie; by a system of election by all voters in each wzo.rd. A~l1endment Act XV of 1933 made it obligatory on the part of GovernmenL to appoint Municipal Commi,sioners. In pursuance of this Act the Madras Government appointed Commillsjoners to all municipalities in 1934. The Adult Franchise which was introduced in 1938 made the municipalities full-fledged democratic institutions. Chittur-Thathamangalam municipality was established in 1096 M.E. (1920 A. D.). This municipality was governed by the enactments and regulations promulgated by the Governm~nt of 9xhin. "In 1910 the Government of Cochin passed the Municipal and Sanitary Improv~ment Regulation of 1085 K. E. (1910) according to which the Sanitary Boards were reconstituted into Town Councils for the conservancy and sanitary improvement of the urban areas. It may be noted that the Regulation was promulgated on the pattern of the Madras District Municipalities Act of 1884. The Regulation conferred powers of taxation on the Town Council,. In the early stages these councils were nominated bodie~ with nominated Pre3idents. In 1093 K. E. (1918) they were made partly elected and panly nominated with elected Presidents. Later, the Regulation of 1085 K. E. (1910) was repealed in 1921 when the Cochin Municipal Regulation (Regulathn XI of 1906) was p..issed. By the new regulation the councils were sufficiently enlarged to co.lsist of elected and nominate:! members in the ratio of 2 : 1. The nominated members included officials and non-officials. The officials were chosen from different departments, e.g., Assistant Engineer of the local Publi: Works Department, Civil Surgeo:1, etc. Extended powers of taxation so as to i!lclude tal( on property (house and land), profe,sion, vehicleJ and animals were conferred on the council. Remunerative enterprises such as markets, cart stand" public baths, etc., wer,: also permitted to be maintained by the councils. They were given pJwers to lice;lse various tra:les within the town limits. A large measure of autonomy was exercised by the chairman and the c')uncils in the expenditure or municipal funds. Another important reform in the field of municipal administration was introduced with the enactment of the Coc'~in Municipal Act XVIII of 1113 K.E. (1938 A.D.). The new Act fixed the strenCtth of the council ou the bJ.sis of <> population. The nominated element wa~ limited to 1/5 of the total strength. Provision was made for the election of both the Chairman and Vice.Chairman, of whom the latter was expected to function in the ab;ence of the former. A noteworthy feature of this Act is that for the fir3t time provision was made for the
appointment of a fulkime Commissioner by the Government. The Commissioner became the chief executive officer of the municipality, and the Chairman was shorn of the executive powers formerly vested in him. The taxing powers of the municipalities were also enhanced. In 1939 the municipalities were authorised t. levy tax on entertainments conducted within their respective jurisdictions. The Cochin Municipal Act 1113 K. E. (1938) was amended by Act X VII of 1952 which widened the electorate on the basis of Adult Franchise" 1. Chittur-Thathamangalam Municipality was bifurcated in June 1938 I to form two separate municipal towns, Chittur and Thathamangalam. It was re-united again after a span of nine years on 10th October 1947. The Kerala Municipalities Act, 1960 which was brought into force on 1st September 1961 now governs the municipalitiell of this district also. The income and expenditure of Palghat and ChitturThathamangalam municipalities are given separately in Appendices 31 and 32. (b) District Board
132. The Malabar District Board was established in 1859 with the main object of promoting primary education in the rural areai. In 1863 it wa; empowered to collect an Education Ge3s. By the Road Cess Act of 1866 it wa~ entrusted with the maintenance of bad roads, etc. In 1871 the constitution of the board was placed on a par with that of the municipalities with the Collector as the President and three nominated members, the C:>lb:tor being the supreme authority. Various legi~lations were passed gradually improving the status of the Di,trict Boards and clothing them with more powers. The Acts of 1881:, 1920 and 1930 deserve mention in this connection. The second of this serie~ provided for the election of two-thirds of the members by Adult Franchise who h;·.ve attained the age of 25 and also by those who are assessed to land revenue or annual rental value or profession tax of Rs. 10, The franchise was filrther extended in 1930 and the reservation of seat; was provided for minority communities. The last general elections to the District Boaed was hdd in October 1954 and the term of the Board expired on 27th Octob.er 1957. A special officer was appointed to exercise the powers and function" of the Malabar District Board. All the educational institutions,
• hospitals and dispensaries a; also major roads under the District Board were taken over by the Government. The Malabar District Board was finally abolished by the Kerala. Panchayats Act, 1960.
1 Trichur District Gazetteer (1962), page 513-514-I Actual date of bifurcation is 29th Edawm 1113 M.E.
38
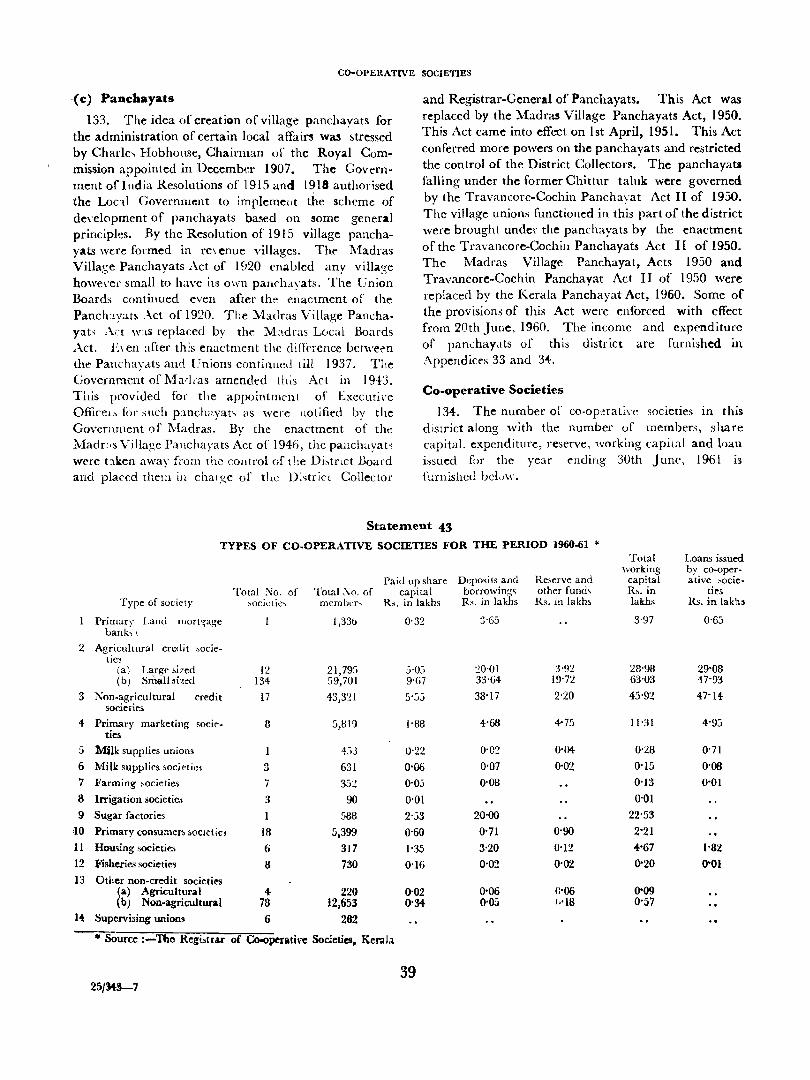
CO-OPERATIVE SOCIETIES
'( c) Panchayats
133. The idea (Jf creation of village panchayats for the administration of certain local affairs was stressed by Charle., Hobhonse, Chairman of the Royal Commission appointed i.n December 1907. The Government ofIndia Resolutions of 1915 and 1918 authorised the Loc;tl Government to implemellt the scheme of deyelopment of panchayats based on !lome general principles. By the Resolution of 1915 village panchayats were formed in re\ enue villages. The IVladras Villase Panchayats ,\ct of 1~20 enOlbled any villa:~e
howe\<er small to have its own pan,hayats. The Cnion Boards continued even after th~ enactment of the Panch:lyats .\ct of 1920. The Madras Village Panehayat, Ad w:\s replaced by the Madras Local Boards Act. h en after th:s enactment the dilTf'rence bem'et'n the Panchay.tts and Cnions continueJ lill 1937. The Government of Marh'as amended this Act in 19·n. This provided tor the appointmt'nl of Execlltive Officer> for such p:mchavab as were notified bv the Government of _Madras: By the enactment ~f the :Madr:.s Village Panchayats Act of 194(j, the panchayat'i were taken away from the cOlltrol of the Di~trlct Board and placed theIll ill charge of the Di~tricl Collector
and Registrar-General of Panchayats. This Act was replaced by the Madras Village Panchayats Act, 1950. This Act came into effect on 1st April, 1951. This Act conferred more powers on the panchayats and restricted the control of the District Collectors. The panchayats falling under the former Chittur taluk were governed by the Travancore-Cochin Panchayat Act II of 1950. The village unions functioned in this part of the district were brought under the panchayats by the enactment of the Travancore-Cochin Panchayats Act J[ of 1950. The Madras Village Panchayat, Acts 1950 and Travancore-Cochin Panchayat Act II of 1950 were replaccfl by the Kerala Panchayat Act, 1960. Some of the provisions of this Act were enforced with effect from 20th June, 1960. The income and expenditure of pan,;haY.lts of this district are furnished in Appendices 33 and 3i-.
Co-operative Societies
134. The number or co-operatl\<c societies 111 this district along with the number of members, share capital. expenditure, reserve, working capital and loan issued for the year ending 30th June, 1961 13
furnished beLm'.
Statement 43
TYPES OF CO.OPERATIVE SOCIETIES FOR THE PERIOD 1960-61 * Total Loans issued
Paid up ,hare Depo,its and working by co-oper-
Re;erve and capital ative bocie-Total :\'0. of Total So, of capital borrowin"~ other fund, R,. in ties
Type of society ~oci~tie'" member, Rs. in lakhs Rs. in lakhs Rs. in Jakh" lakhs Rs. in lakhs
PrimaC)- Land rnortgage 1,3St> 0'32 3-65 3'97 0-65 banb,
2 Agricultural cretlit ;,ocie-tie3
(a) Large ,i7ed 12 21,79:) 5'05 :20'01 3'92 28'98 29'08 (b) S~llsiz~d 134 59,701 9·67 3:H4 19'12 63'03 47'93
3 Kon-agricultural credit 17 43,3,!1 5',)5 38'17 2'20 45'92 47'14 societies
4 Primary marketing soei!"- 8 5,810 1'88 4'68 +75 11'31 4'93 ties
5 ~lk supplies unions I 4:;3 0'')') 0'02 O·fl4 0'28 0'71
6 Milk supplies 5Ocit"tici 3 631 0-06 0-07 0'02 0·15 0'08
7 :Farming wcieties i 352 O'Oj 0'08 0'13 0·01
8 Irrigation societiel 3 90 0'01 0'01
9 Sugar factories 588 2'53 20'00 22·53 ,10 Primary consumer;, ,oereticl lR 5,399 0'60 0·71 0-90 2'21
11 Hou~ing societie.~ 6 317 1'35 3'20 0·12 <f.·67 1·82
12 Fisheries soeietie<i 8 730 0'16 0·02 0·02 0-20 0'01
13 Other non-credit SOCieties (a) Agricultural 4- 220 0-02 0·06 r.·06 0-09 (b) Non-agricultural 73 12,653 0'34- 0'05 IdS 0·57
11 Supervising uniom 6 282
• Source :-Tho Regi.trar of Co-operllth'e Societies, Keral.1
39 25/)1.3-7
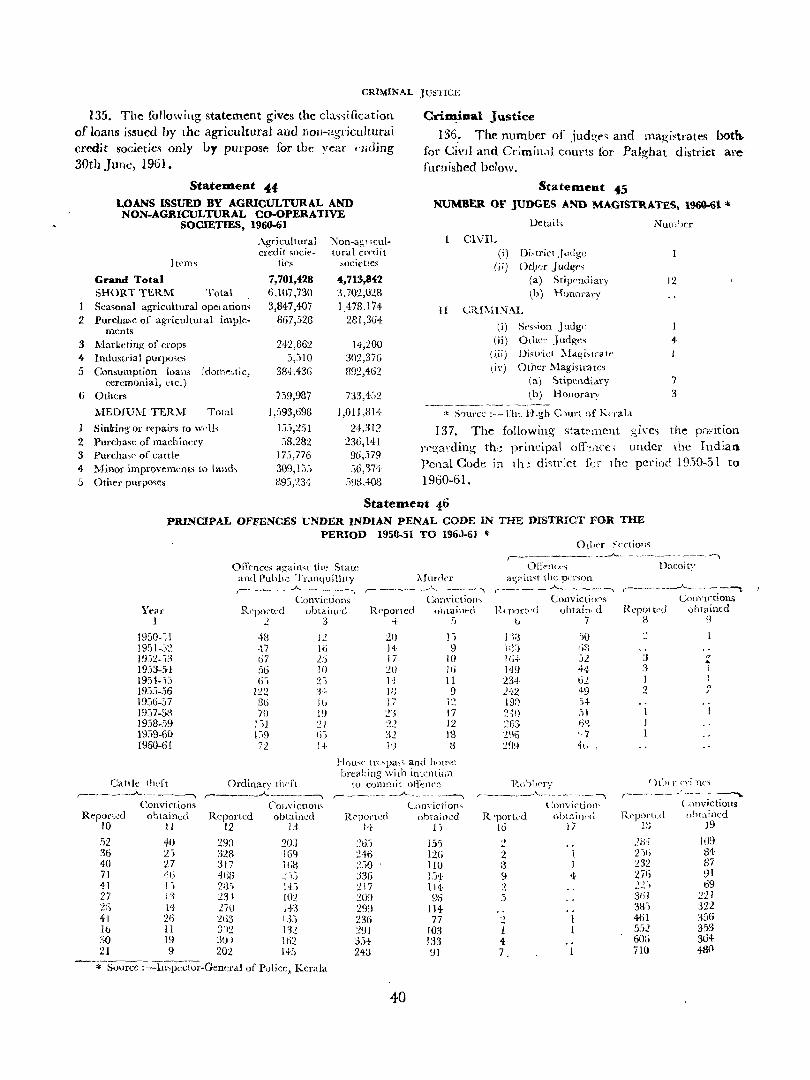
CRIMINAL JUSTICE
135. The following statement gives the cla~"ification of loans is~ued by the agricultural and nOll-agricultural credit societies only by purpose for the year f'llding 30th June, 1961.
Crin;inal Justice
136: The number of .illdg("~ and l11agi~trates both. for Civil and Crimill,lI courts for Palghat district arefurnished below.
Statelllent 4:4 LOANS ISSUED BY AGRICULTURAL AND NON.AGRICULTURAL CO·OPERATIVE
SOCIETIES, 1960..61
Gralld Total SHORT TERM Total
.\gricultural credit socit'
ti('s
~on-ag! u::ul ... lural en'dit
,ocietlcs
Stateltlent 45
NUMBER OF JUDGES AND MAGlSTRA'rES, 1960-61 '"
Detail>
CIVIL (i) Di,trict J "dge
Iii) Otl,l'cr judge; (a) Stipendiary \b) HonOl"ary
Nun::_J)cr
12
1 Sca<;onal agricultural OpCI ation, 2 Purchasc of agricultUlal implc
fl'lcnts
7,701,428 6,107,730
3,847,407 867,528
4,713,842 3,702,O:m 1,478.174-
281,361 II CRC\ll~.'\L
(i) Scs-;ion Judge (ii) Otlt,:,- .Judges
I
4-3 4 5
6
2 3 4-5
Markcring of crops 24-2,862 14,200 Industrial purposes 3,310 302,376 Consumption l,)ans (dOIl1f~',tic, 384,436 892,462
(iii) lJistI'ict .\f<lgi,(rar<·
1)\') Other ::vIagistrlltes (a) Stipmdi.1ry \ b) Honorary
7 3
ceremonial, etc.)
Others 739,987 733,4:,2
~iEOIU11 TERM Total 1,:)93,698 1,011,81+ 'k Srmrcc:- rh" H.gh C)w·t of 1-:;<"!·3.Ll
Sinking or r~pail's to wdh 1.33,251 24,312 Purchase of machinery .18,282 236,141 Purcha,,' of cattle' 173,776 96,379 Minor improvements to lamh 309,1:i;, .")(},'174
137. The following state-ment g,i\'e~ the p(}~ition
l'f'!2;arding th,~ principal ofLnce, under ,he Indian Pellal Code in th~ di,tl<ct for the period 1950-51 to 1960-61. Other purjJo,cs 893,234 :)93.408
Statement 46 PRINCIPAL OFFENCES UNDER INDIAN PENAL CODE IN THE DISTRICT FOR THE
PERIOD 1950-51 TO 196J-61 '"
Year 1
1950--d 195 1-:)2 19j2- ,3 19'}3-5-1-1954-1., 19."i.'i-.,)6 19'}6-57 1937-5B 19:>8-:;9 19:i9-60 1960-61
Cattle tlwft
Offence,; ag-ain<t th': State and Pubhc Tranquilhty ,. ___ _..A.._~ _______ ....
ConvictioTI$ Rqw:·tcd obt.lil\"cl
2 3
48 J2 ·n Hi 67 2:5 56 10 (j") 'J" - )
1:!2 .+!.
l)b Ib 70 19
1 ';1 21 1~,9 Ii; 72 11
;\fnrd"r r--'~----"-""'-~-' -~
Com'ict ion-; Reponed olJtaill,·tl
4 ~)
21) 14 17 20 H p~
17 :L'S 22 32 1 'J
1 "i 9
10 JG 11 9 l~ 17 )2 13 ~
Ordinary th<'ft
Hou~I' trc'pa"s and h,)u'\c. brL31:ing wilh intelltion
to C0l11111it oHt~n(':::
Other :-:cetion., r-------- ___ ...A-. __ "_~ ______ - . ~
OE-"ncr-; Dacoit? ~~2in"t ihe p(~r'j()n
r-------"-- ---~ ~ Couvictiof'S
R. Tl'Jr~,·d obtain'. d b 7
J ',;~ ')0 ):):) {,!1 lIi-1- 52 149 44 234- til :L').2 49 [90 5-1-~iO .'ll :203 (0 ),
2<\5 '·7 2(J9 4\J
H,oblwry
,. ____ ..A.. ___ . _ ~
UClli"lctions RepOl t,-o obtained
R 9
3 " .. :3 I 1 2 " "
r-----~------"-------......., , ____ ..A.. ______ , ,.- _______ __A. _______ ....--, ~ __ ~ ____ __.A...~ ____ ~ ___ \
()tlH 1- (Ti'nc-; ,.--_._- j.- --~
Convictions Reported obtained
10 11
52 40 36 L") 40 '27 71 'IG 41 1-) 27 r'1 '2n 41 Ib ::;0 21
14-26 II 19 9
COIJ\'ictlOll ....
Reported oblained 12 13
29~) 203 323 16'l :J17 Hjl{
4tiH .; ).J 2H;"l ;~.j
:!3} 102 27\.) H3 263 U:i ]'12 In 3(J I 162 202 14:'
--* Source :-lmpcc[or-Gencral of Pulice, Kerala
L,o!l\'icl'iop, R"j)ol',,:d obtained
H lj
:!Ii"i ~46 2,0 33G 217 :!O'l 2'):J 236 2'Jj 3.")4 248
40
J.'}5 126 Ill) ).j4
114 %
114-77
103 J:-l3 91
R']JOl"lc'd 16
2 3 9 2 .)
2 I 4-7.
Cnu\iicti(l))' (Jbt~in('cl
17
1 J 4
R''POl"lcd 1" ,.)
2(:;-1 2")1, 232 271; ~~-)
3i5j 38-) 461 55..? 60,; 710
C()nvictions ohlaincd
19
109 134 87 91 69
221 322 356 3.')3 31)4 48(1
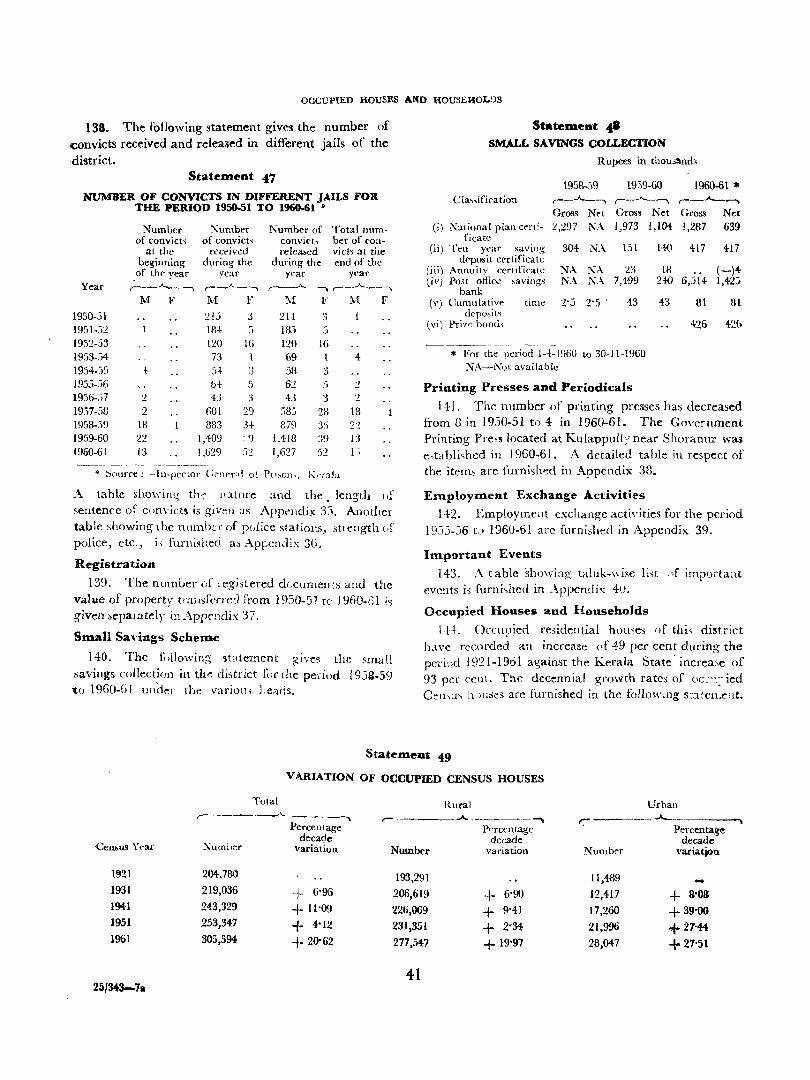
OCCUPIED HOUSES AND HOUSEHOLDS
138. The foHowing statement gives the number of convicts received and released in different jails of the district.
StateJDent 47
NUMBER OF CONVICTS IN DIFFERENT JAILS FOR THE PERIOD 1950-51 TO 1960-61 *
Number ","umber Number of Totalnum-of convict, of convict, convict... bel' of COll-
at the rcct"ivcd relea,ed vict<; at the beginrling during the during the end of the of the year Veal' year year
Year ,.:_~ r---A------., ,---._-'-_---. ,.-_.A.._------,
M F :tv[ F 1\1 F M F
1950-51 21.1 J 214 3 1951-52 18-\- :) 18:; 5 1932-53 120 Hi 120 16 1953-54 i3 69 I 4 1954-55 -I- ~>4 3 58 3 1935-56 b+ :; 62 :; 2 1956-57 2 43 3 43 3 2 1937-58 2 601 29 ::iSj 28 18 1958-59 18 333 3+ 379 3:; 2:! 1959-60 22 1,409 :9 1,418 39 13 1960-61 13 1,629 ~)~ 1,627 52 1 ;
.. Source: -In'peclor C~!leral 01 PtbOlh. K,.raJa
A table showing the' nature and the. length of sentence of convicts is giv(:n as Appendix 3:1. Another table showing the nllmbel' of pdice stations, st,ength (.f police, ctc., i, furnished as ApF-cndix 30.
Registration
139, The number (Jf legi;tered dccuments and the value of property transferred from 1950-51 t(l 1960-61 is given ,eparately in Appendix 37.
Small SU'~ngs Scheme
140. The fi,IIowing 'itatement give3 the ~mall
savings collecti(Jll in th,~ district ILlr the period I gSa-59 to 1960-61 under The variOlY, llearls.
Stateme.t 4' SMALL SAVINGS COLLECTION
Rupees in thOlli!lnd~
1958-59 19:)9-60
Cla"ification r---"---, ,--"------,
Gross N ... t Gross
(i) National plan ceni- 2,297 N,\ 1,973 ficatc
(ii) Tt"ll year saving 304 NA 151 deposit crrtificate
(iii) Annuity certificate NA NA 23 (iv) P03t offic~ ,avings NA N.\ 7,499
bank (v) Cumulative
dcpo,it~ tin1e 2'j 2'5 ' 43
(vi) Prize homL
* I'()r the period 1-4-1960 to 30-11-1960 NA-Not available
Printing Presses and Periodicals
Net 1,104-
1.J..O
18 2ffi
43
1960-61 * r----"--_.., Gross Net 1,287 639
417 417
(-)4-6,,)14 1,42j
81 81
426 426
141. The number of printing presses has decreased from 8 in 1950-51 to 4 in 1960-61. The Government Printing Pre;s located at Kulappull;1 near Shorannr was e,tabli,hed in 1960-61. A detailed table in respect of the item:> are furni~hed in Appendix 38 •
Employment Exchange Activities
142. Employmcnt exchange acti\'ities for the period 19j5-56 t..> 1960-61 arc furnished in Appendix 39.
Impnrtant Events
143. A t able showing taluk-\\ ise li,t .>[ important events is furni.,hed in .\ppenclix 4u.
Occupied Houses and Heuseholds
IH. OCTu!Jied re,idential homes of thi~ di~trict
have r('corded an increase (If 49 per cent during the peri:ld 1921-1961 against the Kerala State'increase of 93 per rent. The decennial growth rates of (lC:',:-ied Cw,u, h·-)uses are furnished in the follOWIng s::lten.ent.
Statement 49
Cemus Y"al'
1!l21
1931
1941 1951 1961
25/343-711
VARIATION OF OCCUPIED CENSUS HOUSES
Total
,- -------"-----, Percentage
decade I\umher variation
204.7S0
219,036 + 6'96
243,329 + ll'~1 253,347 + 4·12 305,594 + 20·62
Rural ,,- ______ ,.A._~ _______ ......
Number
193,291
206,619
226,069
231,351
277,547
41
Percentage dectule
variation
+ 6'90
+ 9'41
+ 2-34: + 19'97
Urban
r------ ""--- -----, Percentage
decade Number variation
11,4S9
12,417 + a·OB 17,260 + 39'00
21,996 +27'14 28,047 + 27'51
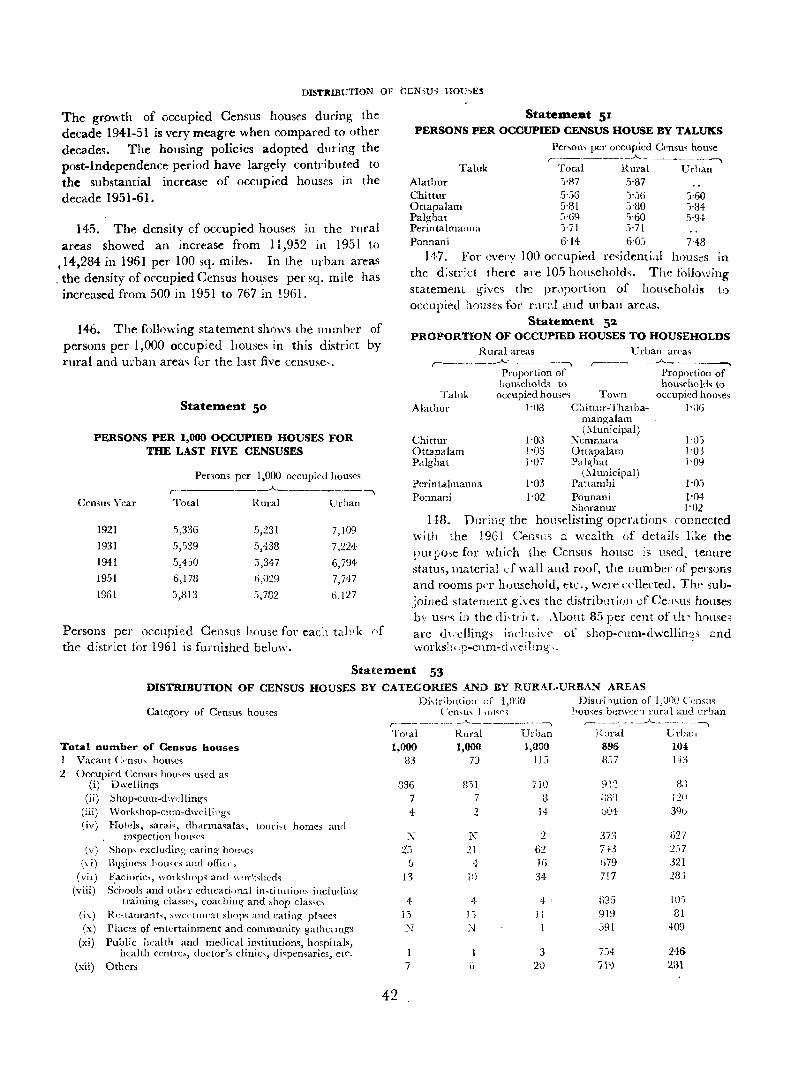
DISTlUBVTION OF CCNsU;; HOV,ES
The growth of occupied Census houses during the decade 1941-51 is very meagre when compared to other decades. The housing policies adopted during the post-Independence period have largely contributed to the substantial increase of occupied houses in the decade 1951-61.
145. The density of occupied houses 111 the rural areas showed an increase from 11 ,952 in 1951 to
,14,284 in 1961 per 100 sq. miles. In the urban areas , the density of occupied Census ho~ses per sq. mile has increased from 500 in 1951 to 767 in 1961.
146. The following statement shows the number of persons per 1,000 occupi ed houses in this district by rural and urban area~ fur the last five censuse"
Statement 50
PERSONS PER 1,000 OCCUPIED HOUSES FOR THE LAST FIVE CENSUSES
Per~ons per 1,000 occupied hou~es
r-..--A-________ -.,
Censm Year Total Rural Urban
1921 5,336 5,231 7,109
1931 5,539 5,438 7,224,
1941 5,450 3,347 6,794
1951 6,178 6,029 7,747
1961 J,813 5,7C2 6,127
Persons per occupied Census 110use for each tabk nf the district for 1961 is furnished beluw.
Statemeat 51 PERSONS PER OCCUPIED CENSUS HOUSE BY TALUKS
Tallik Alathur Chittur Ottapalam Palghat Perintalmanaa Ponnani
Per,on~ per occupi~d Censm home r----------...A...--___ ~
Total Rlll"al Urban -"87 5'87 5'.36 )'3() )'60 5'131 ,)'130 )'34 :;'69 ~'60 5'9+ ),71 ,)'71
6'14 6'03 1'48 147. For e\'ery 100 occupied re<idclltiaJ houses in
the d;str;ct there: are lOS household,. The following statement give'S the pr,)portion of hou.,ehold~ to occupied hOuses fur l'llrd and urban areas.
Statelnent 52 PROPORTION OF OCCUPIED HOUSES TO HOUSEHOLDS
Rural areas Urban areas .--------"'-. ~
___ ..A. _______ ----.,
Talnk Alathllr
Chittur Ottapalam Palghat
Pcrintalmanna Ponnani
Proportion of Proportion of Lou,>ehold, to
occupied hom('~ Town hou~dlOld~ to
occupied homes 1-06 J -03 Chittur-Thatba-
j·oa J-03 ]-07
1-03 1'02
mangalam (~funjcipal}
:\" emmara Otlapalam Palghat
(:\lunicipal)
h))
J'03 1-09
Pa~tambi 1-0,) Ponnani 1'04 Shoranur 1'02
H8. Durillg the houselisting operd.tiom connected with the 1961 Cemm a wealth of details I;ke the pur po,e for which the Census house is used, tenure status, m<:.terial c,f wall and roof, the lIumber of persons and rooms p,'r huusehold, etc., were collected. Tht' subjoined statemellt g:ves the cli~tribllti()n of Cen'us houses by use~ in the dj,trj, t. _\bout 85 per cent ofth' house, are d\,-elling, inchlSi\-c of shop-cum-dwellin2,s und worksllr ,p-cnm-d \\ eilmg_,.
Statement 53 DISTRIBUTION OF CENSUS HOUSES EY CATEGORIES AND BY RURAL-URBAN AREAS
Category of Censm homes
Total number of Census houses 1 Vacant (>nsm hou,c,
2 Occupied Cemm hou,es med as (i) Dwellings
(ii) ~hop-cllm-dwr:llings
(iii) \Vork<,hop-cum-dwellillg, (iv) Hotels, s~rai', dhdCmasala" touri,t homes and
lmpcctJon hOll"'~ (v) Shop, ('xeluding eating homes
(d) Blf1.iness homes and ollie, , (vii) Factories, wOlbhnp'l ane! wor'"hc(h
(viii) Schools and oth, ,. educational in'titUliom inclurting" , trainin,g classes, coachillg and "hop c1as'e'> '-
(ix) Rc.l.llll'ant" swe<'lllwat silnps and eating phces (x) Places Qf ('nlntainment and community gathcllngs
(xi) Public health and medical imtitutiom, hospitals, health centre", doctor's clinics, dispensaries, etC,
(xii) Others
Di,lribulion c[ I,O:JO Ceno;u"i 1 \)tl'~(";
r---- ----_ ---- --'----~------~ TOlal Rural Urban 1,000 1,000 1,OaO
83 7) 1 L)
836 8:;1 710
7 7 a 4 2 H
"\J N 2 2',) 21 62
);, .} J6 I'~ -, ]1) 34
4 .} +, 1.-' J -, J]
='[ :..J
I 3 7 \) 2\)
42
Dist6hWion of 1.01l() (_'"nsus )'ouses b,:(w"en ru~al and w'ban
r- _____ , ___ _A_ _____ ~
R~Jl"a1 L rball 596 10i Ki7 1+3
9 ~'~ 8" ., ;~8il 120
004 3%
373 0'27 71-3 2C,7 G79 321 717 283
O~};-u ...... ) Wi 919 HI 391 -l09
7,14 246-71<) 231
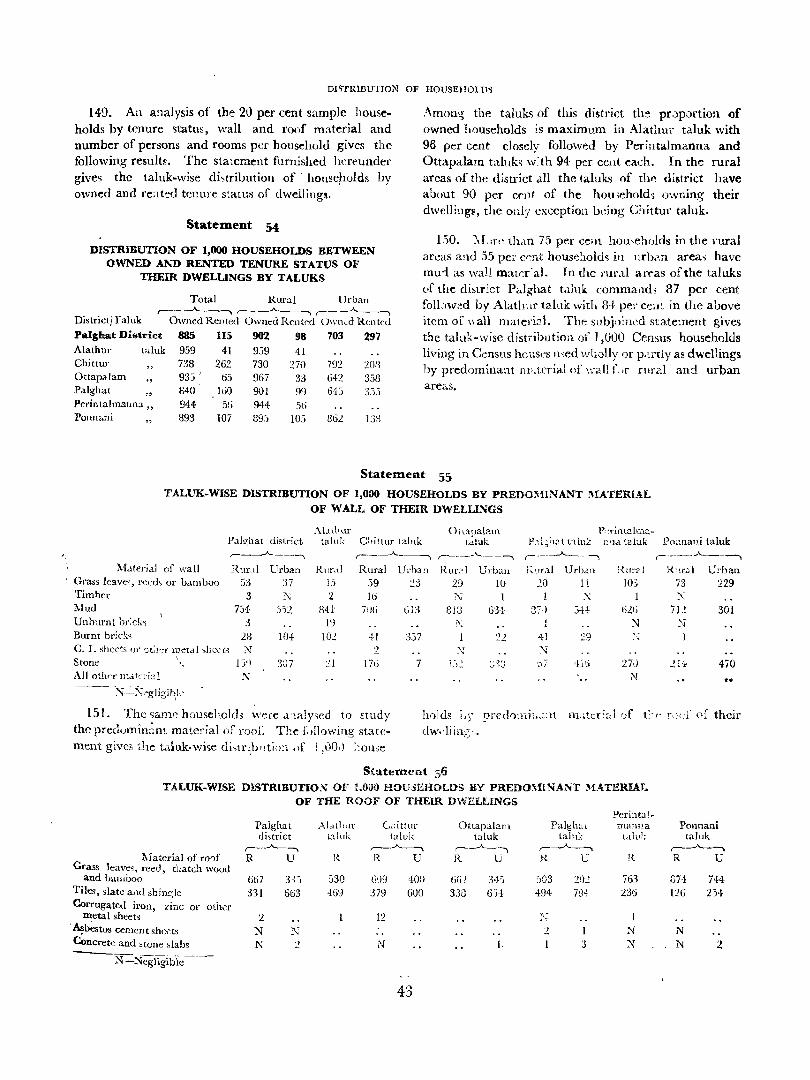
,
DISTRIBUTION OF HOUSEHOLD.,
149. An analysis of the 20 per cent sample households by tenure status, wall and roof material and number of persons and rooms per household gives the following results. The statement furnished hereunder gives the tal uk-wise di~tribution of' housetlOlds by owned and rea ted tenure slaws of dwellings,
Statement 54
DISTRIBUTION OF 1,000 HOUSEHOLDS BETWEEN OWNED AJI."D RENTED TENURE STATUS OF
THEIR DWELLINGS BY TALUKS
Total Rural Urban
District}faluk r---........A-__.~ ,-____.A. __ -" ,-__ ..A.. __ -,
Owned Rented Owned Rented O\\'n~d Renteu Palghat District 885 115 902 98 703 297 Alathur t"luk 959 41 959 41 Chittur 738 262 730 270 792 :wa Ottapalam 933 " 65 967 33 642 358 Palghat
" 840 lliO 901 99 64:> 3:>:>
Perintalmann3 " 944 5G 944 56 Ponn"ni 89:3 107 S93 105 862 13~
Amon~ the taluks of this district the pr.)portion of owned households is maximum in Alathm- taluk with 96 per cent closely followed by Perintalmanna and Ottapalam talllk; w:th 94 per cellt each. In the rural areas of the district all the taluks of the district have about 90 per cmt of the hou;ehold~ owning their dwellings, the only exception being Chittur taluk.
150. :\Lre th.1.U 75 per cent hou-cholds in the rural areas alld 55 per c'~nt house:lOld~ in nrbil,n area, have mwl. as wall mater'a!' In the rur,ll areas of the taluks (·f the di~tr:ct P«.lghat t,lJUk: command, 37 per cent folbw~d by Alathur table with 3..J: per cen:: in the above item of \\all materi::ll. The subjnill.::d state:nent gives the taluk-wise distribution of 1,(1)0 Census households living in Census hO\~s('~ n'5ed wh,')lly or p.~rtly as dwellings by predominant nhterial of \\-al1 e)r wral and urban arc;;.s.
Statement 55
TALUK-WISE DISTRIBUTION OF 1,000 HOUSEHOLDS BY PREDO::ifINANT MATERIAL
OF WALL OF THEIR DWELLL~GS
Al.Hhur Ottanalam P(~rintahn2.-P.lI~hat district taluk Cl1ittur taluk t~luk P"L;i13t ('lluk I)'M (aluk ,,-----.-A- ___ --.. r-----..A---., ,-----'-----, ,..-_ ___,A.. _____ -,
Matel'ial of wall Rur.11 Urban Rural Rural Ueban Rut .. 1J Urban }~}Jr.l1 Urban rturt:1l Grass leave·" reed, or bamboo ';3 37 J5 59 .. -) _" 29 10 20 11 103 Timber 3 ~ 2 Hi J\j 1 I ~ 1 Mud 7:>4- c - ')
.)J_ 34l' 71)6 G13 8Ig G3{ 3:,) 3+1: 626 Un burnt br:ck~ :} 19 ~~ ."J Burnt brick, :W lOt 102 41 3:>7 ~2 41 ~9 :'J C. I. sheet, or ot:",,- met"l ,[Jeet, N :2 ~ 'J Stone 1')'1 307 n 176 7 1:)": " ')" '.17 4 [I.} 27,)
~ 'J
All othl:'f n:"tn-i21 .'\j N ~_:_;\J';gli;';Tj~l~ -
Pormani taluk ,-----_,,\.....__~
R'lr.:>i Urban 73 229 :'.J
712 301 ?-J
I
214 470
151. The same household, wece ,J.'laly,ed to Etudy the predt)min~nt material of roof. The iiJllowing statement gives the t.lluk·wise di,tr~bllti<J!i .)f ] ,00,) ;'ou,;e
holds Lj- pred0:nil,.::1l l11,;ttr;~, 1 (jf t:- ,- "',;d~ or their dwdlin~;·_
Statement ,56 TALUK-WISE mSTRIBUTIO:-J OF LOa!) HOUjEHOLDS BY PREDO:\l[INANT M.4.TERIAr.
OF THE ROOF OF THEIR DWELLINGS
Palghat di,trict
,-_.A._-, Uaterial of ro')[ R U
Grass leave~, reed, tlLatch wood and bamboo
Tiles, slate and shinc;lc
Corrugated iron, ,inc or other . ~etal sheet; ,'~bestos cement shCd~
Concrete and ,tone ,labs
N -Ncgligibie---
667 331
2 N N
31)
663
::\' ~
AL,thal' taluk
R
530 469
c..;citlUl' talll!;:
,-_ _A._~
R U
G'')9 400 379 6UO
12
N
43
Ottapalam taluk
,~---"----,
R U
662 3·E, 3JG 6'i4
1,
Perint3.~-Pa1gh", manna
taink (..till!; ,-----A-_~
j{ U R
.')03 21)2 763 494 79~ 236
~'1
2 ~
:.l ~
Ponnani taluk
,---...A....-.-.., R U
3i4 744 126 2H
N J\J 2
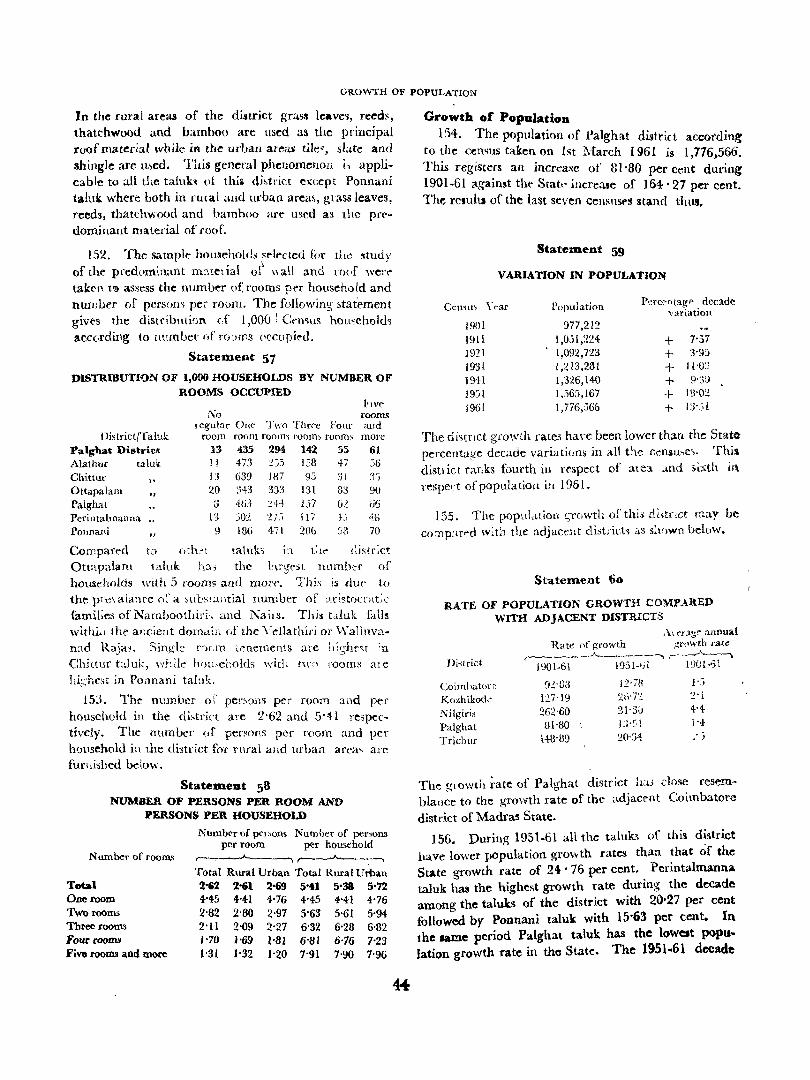
GROWTH OF POPULATION
In the rural areas of the di,trict grass leave~, reeds, thatchwood and bamboo are lIsed as the principal roof material while in the urban areai tile<, slate and shingle arc med. This general phenomenon i_~ applicable to all the taluk3 of thii di~tric[ except Ponnani ta.luk where both in rUlal ~Illd urban area~, grass leaves, reed3, thatehwood and bamboo are used a3 the prl'dominant material of roof.
l52_ The sample hou~ehold,; selected for the study of the predc.minant In:1.telial or IlaU and rr){·f wen" taken 1'9 assess the number (If rooms pet household and number of persoll'> per roum. The following statement giv('s the distriblltion e:f 1,000: Ct'mus homehoH; acc(,rding to number (If rO~Hns (Iccupieu_
Statement 57
DISTRIBUTION OF 1,000 HOUSEHOLDS BY NUMBER OF ROOMS OCCUPIED
District/Taluk Palghat District Alathur talul~
Chittur o ttapal am Palghat
Perintalmanna Ponnani
,.
"
[\0 regular One Two Three four
room room room~ roonb room:; 13 435 294 142 55 l! 473 :!:JS EB +7 13 639 187 9.:i 3t 20 343 333 131 83 3 4G3 ;!+4 157 62
H jO:! ?'"T,--I,) 117 -t:;
9 laG 471 206 S8
rooms aud mote
61
,,-,II
90 06 40 70
Compan'd Ott;).palam households
to (lth'~l taiuk, in t:l<" distr:ct taluk h:l, the hrg{"st numbtr of
with 5 rooms and mort" Thi~ is due to the prt::\'alanre of a ~l1b5!~\lltial number of :.tristocr'lt;c
famil:es of Namboothiri-, and 1'\ails_ Thi3 t"luk fall~
withi,t the ar,Clellt domain (If the Vel1athiri or \\'alluvan:1d Raja~, Singl:: FJr.m ,~nements are Iti~~hr~t :u Chittur taluk, while hou_,eholds with f\\'(l rooms ,ll e hj:;h{"~t in Ponnani taluk_
153. The number of per~f)j)~ per room and per household in the di~trict are 2-62 and 5'41 respectively, The number of penons per room and per household ill the di$trict for rural .alld urban area, arc fllflli,hed bdo\\',
Statement 58 NUMBER OF PERSONS PER ROOM AND
PERSONS PER HOUSEHOLD
Number of rooms
Total One room 'fworooms Three rooms Four roomJl Five fOOJIlS and mo~
Number of pel;,ons Number of persons per room per household
~----"") ~--..
Total Rural Urbl\u Total Rural Urban 2'62 2"61 2-69 S'i1 5'38 5'72 4-45 4-4-1 4-76 4-45 4-41 4-76 2-62 2-80 2-97 5'63 5-61 5-94-2-11 2-09 ').-27 6-32 6'28 6-82 1-70 l-69 1-81 6-81 6'76 7'23 1-31 1-32 1-20 7-91 7'90 7-96
Growth of Population 154. The population of l)alghat district according
to the cenqus taken on 1st :March 1961 is 1,176,566, This registers an incrca-~e of 81'80 per cent during 1901-61 again~t th(' Stak increase of 164' 27 pel' cent, The re.ults of the last seven Censuses stand thus.
Statement 59
VARIATION IN POPULATION
Cen'u, \'''a1' Population Perc'~ntagt" decade variation
19l)1 977,212 1911 1,051,224 + 7-57 1921 1,092,723 + 3-95
1931 1,213,281 + 11-03
1941 1,326,140 + 9-30
19:)1 1,565,167 + lS-O:!
1961 1,776,566 + n.:;i
The distnct growth rates ha\'c been lower than the State percentage decade variations in all the ccusw,e,- This distlict ranks fourth in respect of ,ne). J.nd sl-;>;th in. respect ofpopula(ion in 1961.
155_ The popul,.tion f:;rowth of this dL,tnct may be co:np:wt'd with the adjacent dist;'ich il.S S~I()W!1 below.
St-ateDlent 60
RATE OF POPULATION GROWTH COMPARED WITH ADJACENT DISTRICTS
Di,trict
Coimuatof" Kozhikodc ~ilgiris
Palghat Trichur
,\\t'og:- :lnnual Rate "f growth gnl\\'th rate
r----- --........_______- ....... r- _ __.)'---.-., 190[-61' 1951-11>1 1901,.,1
9~-83 12'7f1 1':;
127-19 2tl-n Z'i
'262-60 31'3~ 4-4
81·80 J:Y·l j '4-
14l:l'89 20<]4 _. j
The HlOwth rate of Pal<Yhat district ha3 dose reSem~ " " blance to the growth rate of the ~\djacent Coirnbatot'e
district of Madras State.
156. During 1951-6l all the talllk.~ or this d~strict have lower population gro-wth rates than that of the State growth rate of 24 • 76 per cent •. Perintalmanna. taluk has the highest growth rate durmg the decade among the taluks of the district with 20·27 per cent followed by Ponnani taluk with 15'63 per cent. In the same period Palghat tatuk has the lowest popu .. lation growth rate in the State. The 1951 .. 61 decade
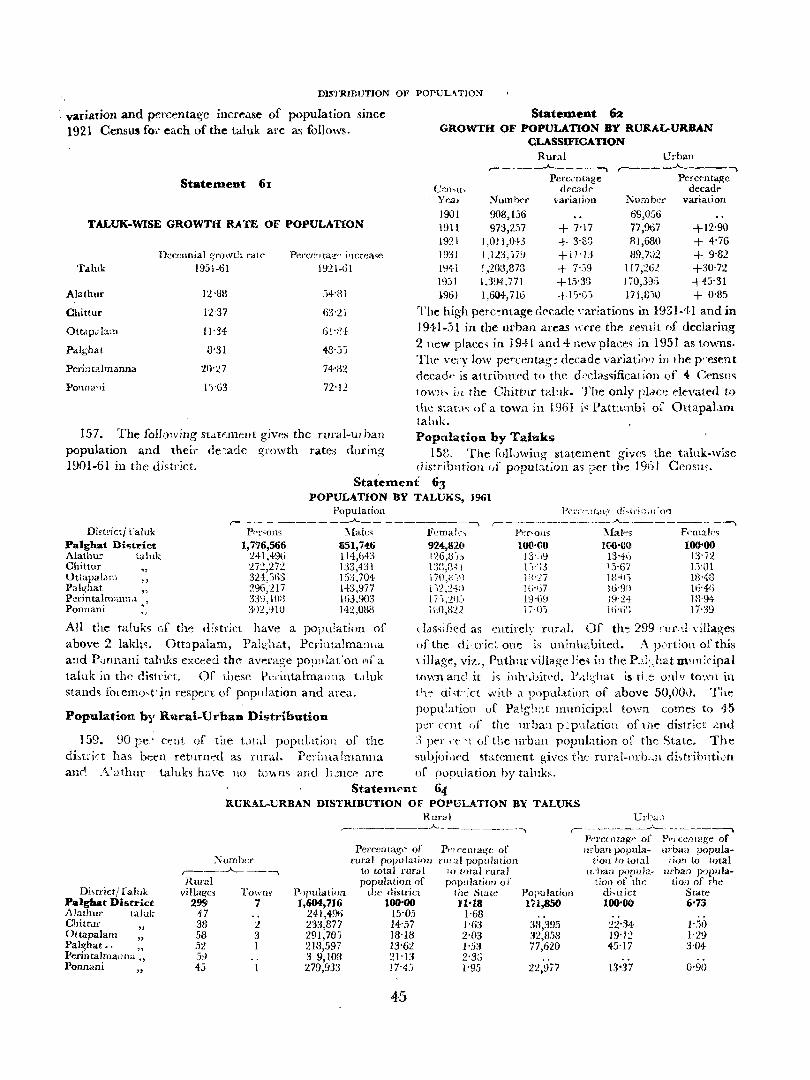
DISTRIBUTION OF POPUL.ATIO~
: variation and percentage increase of population since 1921 Census fOf each of the tal uk are as follows.
Statement 62 GROWTH OF POPULATION BY RURAL-URBAN
CLASSIFICATION
Statement
Rural ,-- ----"------,
Pcrc~ntage C.~n'lb decatl ...
Urban ,-____ .A.. ____ ,
PerCf'lltage decad"
YeaI' Number variation Numb<,,- variation
1901 69,056 1911 77,967 +12'90 TALUK-WISE GROWTH RATE OF POPULATION
908,156 97:3,2:')7 + 7'17
Alathul'
Chittur
OttapJlam
Pa1b'hat
D~cennial gTowtil ['ale
1951-61
12'8H
12,37
11'31-
3'31
20'n
l c)'G3
lY21-G!
63'21
61'~{
43·.})
72'12
1921 HI,080 + 4'76 I,Oll,IH3 + 3'S~ 1931 89,7<)2 + 9'82 1,123, ji9 +11'13 1941 117,26Z +30'72 1,203,873 + 7',i9 19:) 1 I iO,39" +45'31 1.394.771 +15'3~
.961 1,604-,716 + Fj"}') 171,8;0 + 0'85
The high perc-:ntage deca.de '-ariations in 1931-41 and in 1941.51 in the urban areas m~re the remit of declaring 2 new place, in 19+ 1 and 4 new place~ in 195 J as towns. Tilt' very low rcrcentag~ decade variatil)) ill the p"esent decad.· is a1tributt·d to the d:~das~ificat;ol1 of 4 Cf'nsu<; tmVlh ilL the Chittnr td:lk. The only place I:"!('vated to the StatU'; of a tOWil in 1961 i~ Patu.n1bi of Ottapabm talnk.
157. The folJl)wing st.itF.mellt gives the ruraI-U1ban population and their de~ade !Srowth rates during 190}·61 in the district.
Poptllation by Taluks 158. The foll,)wing statement give, the tal\lk-wise
dis;riblltion (If popubt;on as per the 1961 Cenm". Statement 63
POPULATION BY TALUKS, J961 Population Pel'o:nt,H} di~t6D\J(Or]
,------------___..,}I._-- _"~ ___ ~ __ ~ r-~------------..A------ ----___.., Distt'icti faluk P"!.'iions: :\fales
Palghat District 1,776,566 851,746 Alathu~ '<lInk 241,{% IH,b43 Chittur
" '27'2,27'2. 1:)3,431
Ottapalam "
324,:;63 153,704 Pah;hat
" 2%,217 H3,977
Pcrintalmctl1l1.l .' 339, lOR lG3,903 Ponnani
" 3<)2,910 142,088
All the ta!uk<; of the di~trict have a pOj)u!ation of above 2 lakli~. OtLlpaiam, Palghat, Perimalma:ll1a a!ld Punnani taluks exceed the averag;e populafon (')f a taluk in the dislrict.. or these PCl-intalmaJJna t.lluk stands fOtemo't\~n respect of pop,llation and area.
Population by Rural-Urban Distribution
Fema!c.., P"r'on~ :\fale~ F,'maks 924,820 100'(10 100'(10 100'00 1:26,U· .• .) 13',-,') 13'4,', 13'72 1:1G,S-11 1'\"-;:) 15·67 1,)'01 J 711,(0,-,') Jil'27 w,o; W'48 1 i:!,:!4:) H;·lj7 ]tj'')!) Hi'41; IT),2 t ),:. 19'()~' 19,24 18,94-1\;.0,B22 J7'[)) lti'G'> 17'39
dasdled as t~lltirely fllfdI. Of th~ 299 rur.d \'i!lages of the di·,trict one is uninh"bited. A p,'rt;on of this ,ilIage, viz., Puthar village lie'! i!l the P.).l:_.hat m~lllicipal town and it i~ inh''\)it(·d. 1'.th:;hat is the only to'Sl1 in the di,t";ct .vith a p<1pula.tion of above 50,OOi}. The popu'ation uf Palg!1;,;t municip:d town comes to 45 pCI' ccnt (Jf tIle llrba:l p =pulation of ,he district ;~nd
159. 90 pc.' C'?llt of tile t,)t.J PDpUl.ltiol1 of the :) PCT ,T 1t d the urban popubtion or thc~ State. The di~t~'i(,t has been ret!lrn~d as fllral. PC'illla lmanna subjoi.wd staternent gives thf_' rur;d-Ilrh, .. ll di.,triblltioll awl A.'<2thur taluks h<ive no to'A11'l and h.;nce are of population by taluk~.
Statement 64 RURAL-URBAN DISTRIBUTION OF POPULATION BY TALUKS
Rural ~ ___ ~ _____ A.._ __________ -, ,...--------'---------.
Di\uict/ faluk Palghat District AI:lthm' taluk ChiuUl' Ottapalam " Pahs-hat.. " Perintalmallna" Ponnani
"
}\'umbe,. ,-----"-- ----. RllI'al
villag-es Towm 299 7
47 33 2 53 3 52 I 5y 45
P')rulatlnl1 1,604,716
2414% 233'877 291>0, 213,597 3 9,101) 279,933
Percenta<'l' of m;al pop~) latil)n
to total rural popUlation of
the distl'ict 100'00
15'05 14'57 13'18 13'62 21'13 IN,}
45
Pn rent a!.{(~ of nnal population
to totall'uraJ population of
Ihe State J1-18
1,68 1'63 2'03 1'53 2'3:; 1'95
Population 1(1,850
33,395 32,858 77,620
22,9i7
P'TC('llt8W' of p"! cemage of w-ban popula- urban popula-
,:011 to total I ion to total tlthan popuJa.- urban JnpuJa-
~it}n of the tioll of the di, tl iet State 100'00 6'73
22-:34- )'.')0
19')2 1'29 45'17 3'04-
13'37 0'90
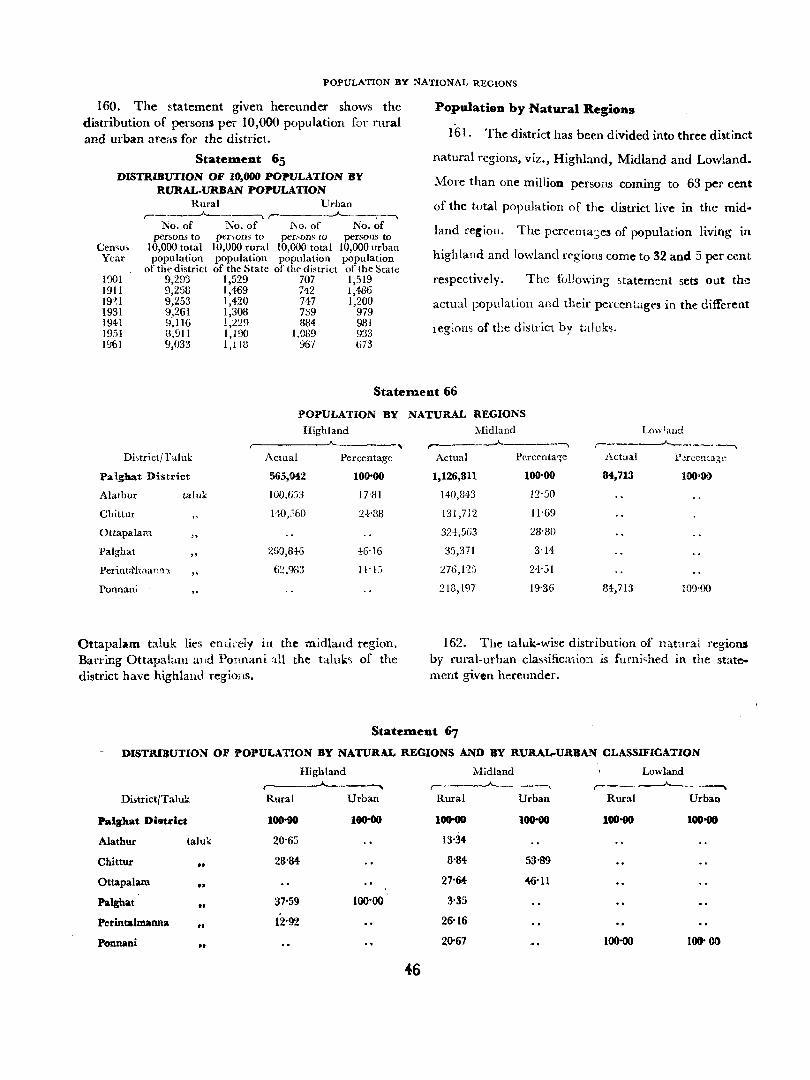
POPULATION BY NATIONAL REGIONS
160_ The statement given hereunder shows the distribution of persons per 10,000 population for rural and urban are<iS for the district.
Statement 65 DISTRIBUTION OF 10,000 POPULATION BY
RURAL·URBAN POPULATION Rural Urban
,-------"--------. ,- ---"--_-.-....., No_ of .l\"o. of 1'\0. of No_ of
per&ons to pt:T,on5 to pt:r"ons to persons to Cen'U5 10,000 total 10,000 rural 10,000 total 10,000 urban Year population population population population
of the district of the State of the district of the State 1 'Xl 1 9,293 1,529 707 1,519 1911 9,258 1,4£9 T'l2 1,486 19'H 9,253 1,420 747 1,200 1931 9,261 1,30B 7:19 979 1941 9,1l6 1,229 884 981 1951 3.911 1,190 ].089 933 1%1 9,()33 1,lW 967 673
Population by Natural Regions
161_ The district has been divided into three dist inct
natural regions, viz., Highland, Midland and Lowland.
More than one million persons coming to 63 per cent
of the tutal population of the district live in the mid
land re~ion_ The perccnta:;es of population living in
highland and lowland regions come to 32 and 5 per cent
respectively _ The following "tatement sets out the
actual population and their pel'cent<tgl."s in the different
regions of the district by taluk~_
Statement 66
POPULATION BY NATURAL REGIONS
Di,>trict/ ralu!':
Palghat Distrit:t
Alathur taluk
Cbittur
Ottapalam
Palghat
Perint~lma!!!'n
Ponnani
Highland
Actual Percentage
565,042 100-00
100,6::;3 17·S1
140,:;60 2.J:·S8
260,84-6 16'16
6::,983 11'lj
Ottapalam taluk lies en[ireIy in the midland region. Barring Ottapalam alld Ponnani all the taluks of the district have highland regions.
, Midland Lowland
_..A. -""\ ,------"---"-- ._....., Actual Perccnta3'c Actual p ~rccn,a;;:e
1,126,311 100-00 84,713
140,243 12'::;0
131,7]2 11'69
324,563 28'80
35,371 3'14
276,12'i 24<:;1
2W,197 19'36 B-1,7!3 l(Y){)O
162_ The taluk-wise distribution of natural regions by rural-urban c1as~ification is fumj'hed in the statement given hereunder_
StateDlent 6,
DISTRIBUTION OF POPULATION BY NATURAL REGIONS AND BY RURAL-URBAN CLASSIFICATION
District/Taluk
Palghat District
Alathur talu1;;
Chittur .. Ottapalam .. Palghat It
Perintalmanna "
Ponnani ..
Highland r-__ _.J.,--___ --.,
Rural
100-90
20-65
26-84
37-59
12-92
Urban
100'00
100-00 ..
46
MidlaBd Lowland
r-------~.------~ ,-____ .A
Rural Urban Rural
100-00 100-00 100-90 100-00
13-34
8-84 53-89
27'&1- oW-II
3-35
26-16
20'67 100-00 100'00
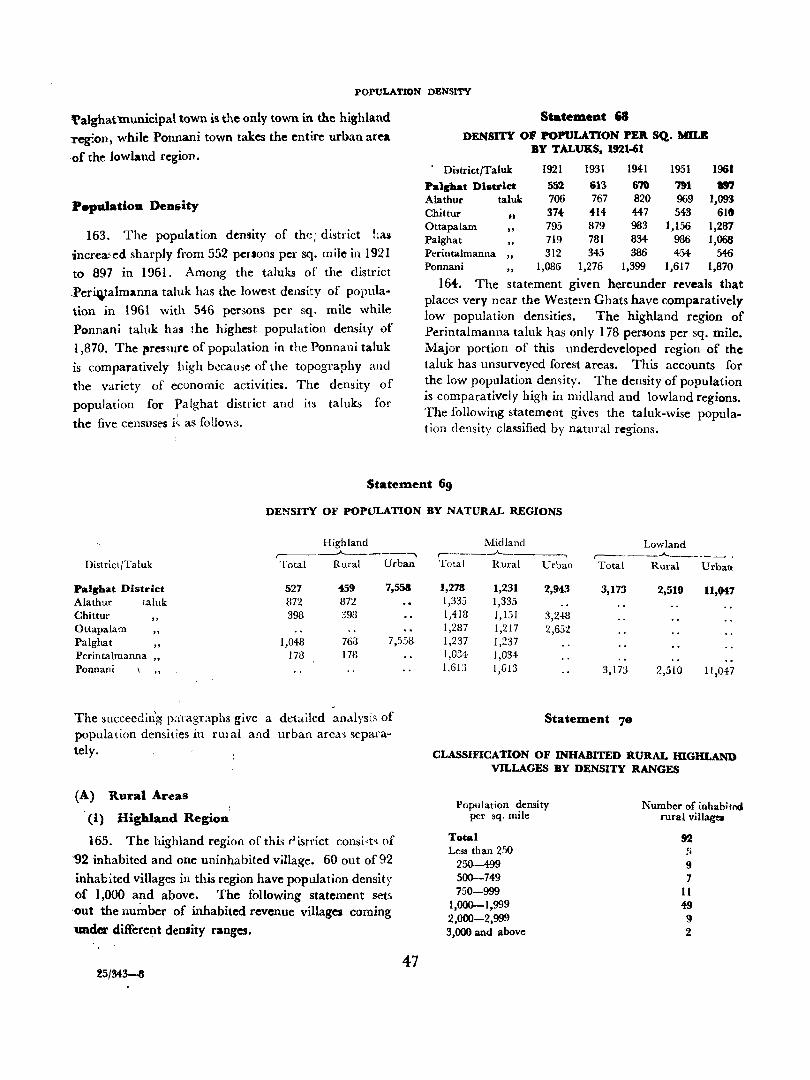
POPULATION DENSITY
t'alghatlnunicipal town is the only town in the highland
Teg:on, while Ponnani town takes the entire urban area
'of the lowland region.
P.pmatioll Density
163. The population density of the, district has
increa!'ed sharply from 552 penons per sq. mile in 1921
to 897 in 1961. Among the taluks of the district
.Per~talmanna taluk has the lowe;;t density of popula
tion in 1961 with 546 persons per sq. mile while
Ponnani taluk has the highest population density of
1,870. The l'res3Urc of population in the Ponnani tal uk
is comparatively high because of the topography and
the variety of economic activities. The density of
population for Palghat district and its taluks for
the five censlIses ~~ as follo,~g.
Statemellt 68 DENSITY OF POPULATION PER SQ. MILE
BY TALUKS. 1921-61
District/Taluk 1921 1931 1941 1951 1961 Pa1chat Di.trict 552 613 670 791 m Alathur taluk 706 767 820 969 1,093 Chittur .. 374- 414 447 543 618 Ottapalam
" 795 879 983 1,156 1,281
Palghat 719 781 834- 986 1,068 Perintalmanna
" 312 345 386 454 546
Ponnani "
1,086 1,276 1,399 1,617 1,870
164. The statement giv«:n hereunder reveals that places very near the Western Ghats have comparatively low population densities. The highland region of Perintalmanna taluk has only 178 persons per sq. mile. Major portion of this underdeveloped region of the taluk has unsurveyed forest areas. This accounts for the low population density. The density of population is comparatively high in midland and lowland regions. The following ~tatemellt gives the tal uk-wise population density classified by natural regions.
$tatctnent 69
DENSITY OF POPULATION BY NATURAL REGIONS
Highland r-----_,A.___---......
District ITa luk Total Rural Urban
Palghat District Alathur taluk Chittur
527 459 7,558 372 8n 398 ;;93
Ottapalam Palghat 1,048 763 7,558 Perintalmanna " 173 17!l Ponnani
The succeeding paragnphs g,ive a detailed analysis of population densities in rmal and urban area', separately.
(A) ;Rural Ar~as
, (i) Highland Region
165. The highland region of thi~ (1 istrict consi ,t~ of
'92 inhabited and one uninhabited village. 60 out of 92
inhabited villages in this region have population densitr 6£ 1,000 and above. The following statement sets out the number of inhabited revenue villages coming
-under different density ranges.
47
Midland Lowland r----~ r-----...A... ___ ~ __ . Total Rural Urban Total Rural Urban
1,278 1,231 2,943 3,173 2,510 U,~1 1,335 1,335 1,418 1,1,)1 3,248 1,287 1,217 2,652 1,237 1,237 1,034 1,034 1,613 1,613 3,173 2,510 11.047
StateDlent 78
CLASSIFICATION OF INHABITED RURAL IUGHLAND VILLAGES BY DENSITY RANGES
Population density per sq. mile
Total Less than 250
25(}-499 500-749 750-999
1,000-1,999 2,000-2,999 3,000 and above
Number of inhabitoo rural villagea
92 " .' 9 7
11 4-9 9 2
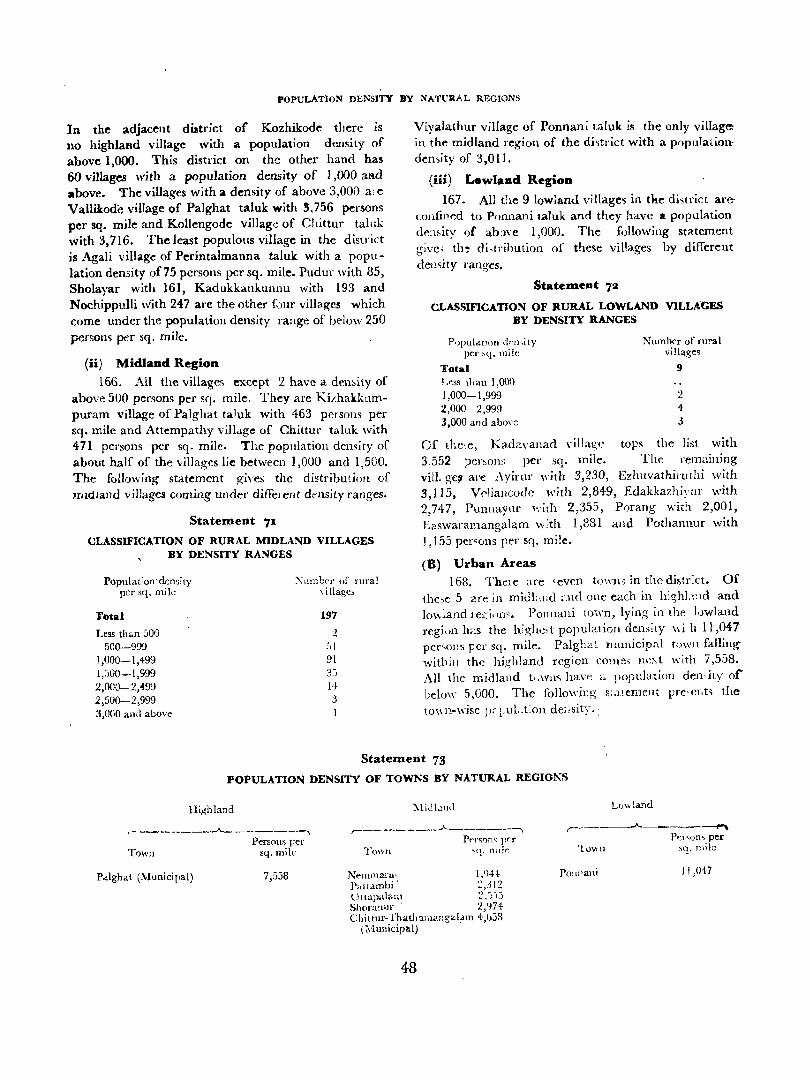
POPULATIoN DENSITY BY NATUR .... L REGIONS
In the adjacent district of Kozhikode there is no highland vi.lIage with a population density of above 1,000. This district on the other hand has 60 villages with a population density of 1,000 aRd above. The villages with a density of above 3,00n a, e Vallikode village of Palghat tal uk with 3,756 persons per sq. mile and Kollengode village of Chittur taluk with 3,716. The least populous village in the district is Agali villag..: of Perintalmanna taluk with a population density of75 persons per sq. mile. Pudur with 85, Sholayar with 161, KadukkankunllU with 193 and Nochippulli with 247 are the other [.)ur villages which come under the population density range of below 250 persom per sq. mile.
(ii) Midland Region
166. All the villages except 2 have a demity of above 500 persons per sq. mile. They are KL~hakkumpuram village of Palghat taluk with 463 persons per sq. mile and Attempathy villdge of Chium taluk with 471 persons per sq. mile. The poplllation density of about half of the villages lie between 1,000 and 1,500. The following statement gi"es the distribution of nndland villages coming under different density ranges.
Statement 71
CLASSIFICATION OF RURAL MIDLAND VILLAGES BY DENSITY RANGES
Population' density per sq. mile
Total
Less than SOO 500-999
1,000-1,499 1,300-1,999 2,000--2,499 2,500-2,999 3,000 and above
:\ulI1bl"r of rural Yillagc,
197
2 .~1
91 3J H 3
Viyalathur village of Ponnani taluk is the only village in the midland region of the di~trict with a populationdensity of 3,011.
(iii) Lewland Region
167. All the 9 lowland viUage~ in tlie di~trict areconfii1~d to Ponnani taluk and they have a population de:l~ity of ab:)\'e 1,000. The following statement give; th~ di,trihulion of these villages by different density ranges.
State anent 72
CLASSIFICATION OF RURAL LOWLAND VILLAGES BY DENSITY RANGES
P')pui.itJon dnl ,i t y per 'q. llli Ie
Total L~ss than 1,000 i ,000-1,999 2,000--2,999 3,000 and above
Numher of rural village~
9
2 4 3
Of thc,e, Kadavanad \'i1la2,'e tops the list with 3,552 per~ons pel' sq. miie. The remaining vilI. ge~ are Ayirur with 3,230, Ezhuvathiruthi with 3,115, V(')iallcodc with 2,849, Edakkazhi:.'ur with 2,747, PUl111ayur with 2,355, Porang with 2,001, Easwaramangalam with 1,381 and Pothannur with 1,155 per'ons per sq. mil~.
(B) Urban Areas 168. There are 'even towns in the distr:ct. Of
the~e 5 a1'e in midLnd ;-,\lel one each in hj~hb!ld and lo,dand I ec:i, 1l1~. Ponnani town, lyin~ in the l.)wland regi0n h;:s the high~,t population dens;\y 'v\i h 11,047 per~ons Fcr sq. mile. Palghat municipal t0wn falling withiil the highland region come, !lI~:'-.t with 7,558. All the midland t'JWll<; have" population dencity 01 belo\\- 5,000. The following s:atement pre'er,t~ the to\\n-wise pc l_uL.t:Oll de;!sity."
Statement 73
POPULATION DENSITY OF TOWNS BY NATtJRAL REGIOKS
Highland L'J\,land
. - --_._---'----------., Persons per
Town 5Y_. mik
,-________ A--______ .,
Pt~l·s')n\: pt'r rrov.·Jl "q. n11lc
(------~-------~ 1'C1'011' per
10wI1 'q. mile
]\;('mmam' I.'H! P"llamhi' :'::,:!l2
P.,.ighat (:\;Iunicil'ai) 7,558 POlll'ani J J ,047
Utlapaiaal :':::i ')j Shor:1!l1ll' ' 2, '174 Chiltur-Thathalilangal~m 4-,llj3
( N[unicipai)
48
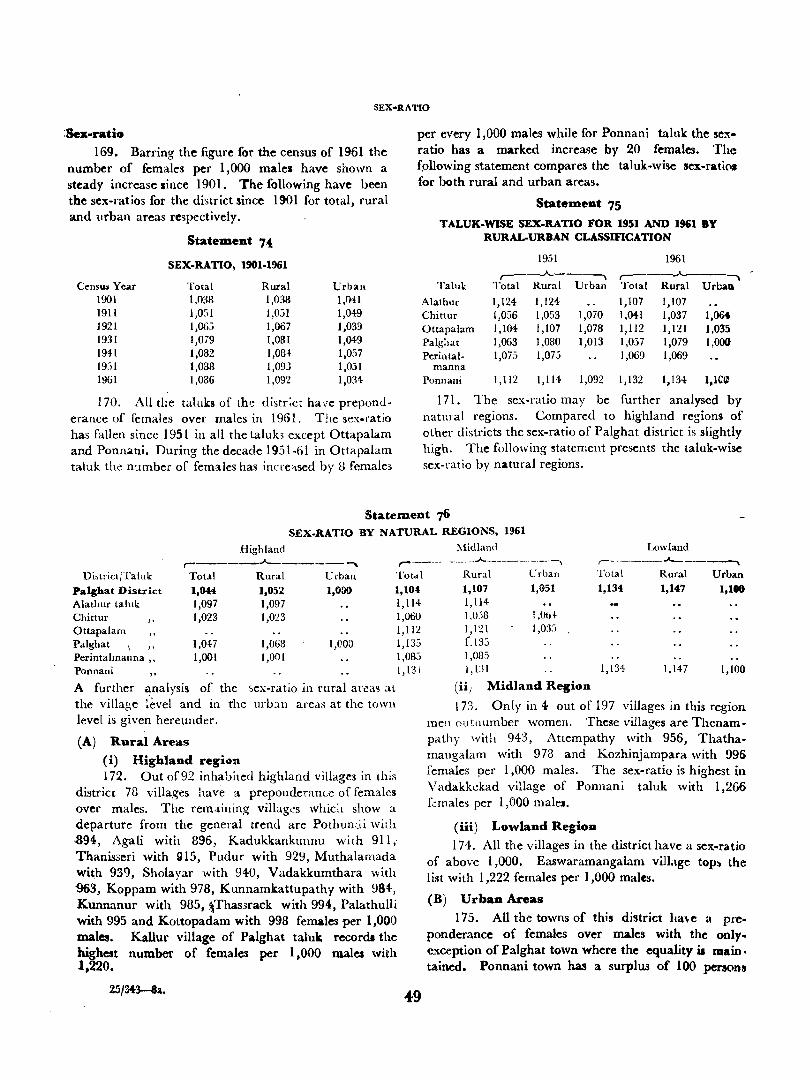
SEX-RATIO
:SeK-ratio
169. Barring the figure for the census of 1961 the number of females per 1,000 male. have shown a steady increase since 1901. The following have been the sex-ratios for the district since 1901 for total, rural and urban areas respectively.
Censw Year 1901 1911 1921 1931 1941 19~)\
1961
StatelDent 74
SEX-RATIO, 1901-1961
Total Ru.ral 1,036 1,036 1,051 1,031 1,063 1,067 1,079 1,061 1,082 1,084-1,088 1,093 1,086 1,092
Urban 1,041 1,049 1,039 1,049 1,057 1,031 1,034
170. AU the taluks of the distr:ct have preponderance of females over males in 1961. The sex-ratio has fallen since 1951 in all the talub except Ottapalam and Ponnani. During the decade 1951-61 in Ottapalam taluk the number of females has increctsed by 8 female,
per every 1,000 males while for Ponnanl talnk the se:'tratio has a marked increase by 20 females. The following statement compares the taluk-wise sex-ratios for both rural and urban areas.
StatelDent 75
T ALUK-WlSE SEX-RATIO FOR 1951 AND 1961 BY RURAL-URBAN CLASSIFICATION
1951 1961 r---.A.---, r----.A.---~
Taluk Total Rural Urban Total Rural Urbata
Alathuf 1,124 l,l24 1,107 1,107 Chittur 1,056 1,053 1,070 1,04-1 1,037 1,064 Ottapalam 1,104- 1,107 1,078 1,112 1,121 1,035 Palghat 1,063 1,080 1,013 1,057 1,079 1,000 Perintal- 1,075 1,073 1,069 1,069
manna Ponnani 1,112 1,114 1,092 1,132 1,134- l,lCl:
171. The sex-ratio may be further analysed by n-atural regions. Compared to highland regions of other districts the sex-ratio of Palghat district is slightly high. The following statement presents the taluk-wise sex-ratio by natural regions.
Statem.ent 76 SEX-RATIO BY NATURAL REGIONS, 1961
Highland Midland Lowland
r-----.J,._----""" r-------------.A.-------~.., ,-~~ __ .A-. ~ ________
Di>trictjTaluk
Palghat District Alathur taln!. Chittur Ottapalam
Tot:11 Rural Drban Tota 1 Rural C rban Total Rural Urban
1,044 1,052 1,000 1,10t 1,107 1,051 1,134 1,147 1,1" 1,097 1,097 1,114 1,114 1,023 1,023 1,060 l.Oj8 I ,ObI-
1,112 1,121 Palghat \ 1,047
1,001 1,063 1,001
1,000 1,135 [.13j
Perintalmanna " Ponnani
1,083 1,08.,)
A further ~nalysis of the sex-ratio in rural area~ aL
the village ievel and in the urb:m areas at the town level is given hereunder.
(A) Rural Areas
(i) Highland region 172. Out of92 inhabited highland villages in this
districl 7B villages have a preponderance of females over males. The rem:liuing villag~>s which show a departure from the general trend are POlhuncii with .894, Agali with 896, Kadukkankunnu with 911 i Thanisseri with 915, Pudur with 929, Muthalamada wi~h 939, Sholayar with 940, Vadakkumthara \~ith
963, Koppam with 978, Kunnamkattupathy with 984-, Kunnanur with 9B5, ~Thassrack with 994, Palathulli with 995 and Kottopadam with 998 females per 1,000 males. Kallur Village of Palghat talue recorda the highest number of females per 1,000 males with 1,220.
25/343-8.1.
1,131 1,131 1,134 1,147 1,100
49
(iii Midland Region
173. Only in 4 out of 197 villages in this region men outnumber women. These villages are Thenampathy with 943, Attempathy with 956, Thathamangalam with 973 and Kozhinjampara with 996 females per 1,000 males. The sex-ratio is highest in Vadakkckad village of Ponnani taluk with 1,266 f~males per 1,000 male •.
(iii) Lowland RegioJl
174. All the villages in the district have a sex.ratio of above 1,000. Easwaramangalam vilbge top:. the list with 1,222 females per 1,000 males.
(B) Urban Areas
175. All the towns of this district ha\e ~I pre. ponderance of females over males with the onlyexception of Palghat town where the equality iJ main. tained. Ponnani town has a surplus of 100 persons
-
of the weaker sex for every 1,000 males. The follow
ing statement illustrates this.
Statement 77
SEX-RATIO OF TOWNS BY NATURAL REGIONS
HIghland Midland Lowland
r--..A..---, r----,.A..---, r--..A.----.., Town Sex-ratio Town Sex-ratio Town Sex-ratio
l'alghat 1,000. Ottapalam 1,0.78 Ponnani 1,100.
Nemmara 1,0.73
Chittur-Thatha-mangalam ~,o.61
Pattambi 1,0.32
Shoranur 1,0.0.6
176. Sex-ratio is highest in the age-group 25-29.
The sex-ratio in the older age-groups is also com
paratively high and particularly in the age-group 70
years and more. The following statement gives the
AGE
sex-ratio under diff~rent age-groupes.
Age-group Under 1 year
1 2 3 4 '1 6 7 8 9
10-14 15-19
Statement ,8 SEX-RATIO BY AGE-GllOUPS
Sex-ratio Age-group 1,0.17 2Q.-24
998 25-29 992 30.-34
1,00.3 35-33 977 40.-44 969 45-49 963 .10-54 91)7 55-59 941 60-64
1,0.]1 65-69 998 70+
1,134
Sex-ratio. 1,216 1,274 1,20.2 1,094 ].071 1;05& J,132 1,080. 1,188 1,142 1,256
177. Sex-ratio is further al~alysed by industrial clas.,ification of ,vorkers and Eon-workers. In theworker category of agricultural labourers females exceed males. Thi~ proportion is highest in Alathurtaluk with 1,463 females per 1,000 males. Among the various taluk~ of the di,trict sex-ratio is highest in the category of household industry in Ponnani taluk. This is largely Gue to the prevalence of industries based on coil' and copra. The ff)llowing ,t",tement ilbstrate<; thi'.
Statem.ent 79
SEX-RATIO CLASSIFIED BY INDUSTRIAL CATEGORIES Workcls Non-wvrkcrs
r-________ ~ ______ . _______ ,..A__ ___ . ____ ~. ____________ - ----"1
Di ,trict/Taluk Palghat District Alathur taJuk
" "
Chittur Ottapalam Palghat It
Pel'intalmanna " Ponnani
"
Total 573 726 663 522 587 492 477
I II III 433 1,289 166
554 1,463 54 487 1,270 424 428 1,003 96 560 1,462 76 376 1,057 140
287 1,349 10.2
178. Sex-ratio by major l'diisiuns is fmn -shed behw.
Age
Statement 80 SEX-RATIO BY MAJOR RELIGIONS
Religion
Christians Hindus !vIuslims
Sex-rati)
966 1,033 1,06!
179. The popuLHion ,,[ th: disuic.t may be b:w:tdly divided into five categon :S, V lZ., ( illidnt-; and yO:lng children', 'boys and s-;rh " ( yo mg men and wom,~n' 'middle ageJ 'men and W,)lTIen' and' elderly person:l'. The foIl )wing stat:.;mellt give the percentage under
_ each categol y to the total poplllation of the district.
50
IV V \ I 733 154 125 660 93 31 65, 60 214 837 132 23 655 78 114: 623 IG9 48
I,09~ 4G7 26
VII VIII 66 13
106 13 8') 13 49 11 81 22 70 7 21 4
JX 4'17 52J 466 52G 463 503 4Q -JJ
X 1,630
J /1l7 1,507 1,694 1,574 1,681 1,744
DISTRIBUTION OF POl"ULATION BY BROAD CATEGORIES
Category
InCmN and young child,-en
B0Y, and g:rls
YUU:lg mcn and women
lI-ljddk a:;:d m,'n ancl women
Eid'crly penon,
'A2,,'-group p, ,ccltage
0-4 14:7
5-H 26-2
1.5-34 31-2
SJ-5-! 18-13
55 and ab,)\ e 9'1
Amorg the elderly pelsons there are 74 centCnari<lLS. Ther e '.rc two pers(ns (one man ~md one woman) at the age ef 115 during the pe,'jod of enumeration.
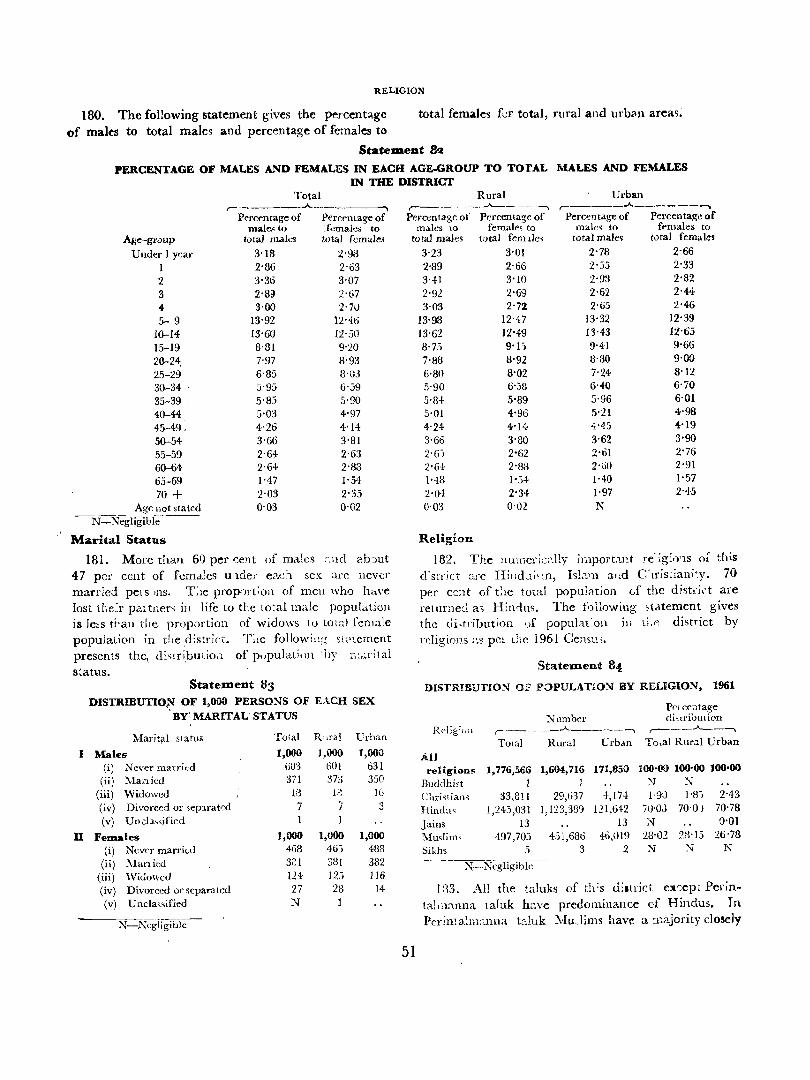
RELIGION
180. The following statement gives the percent~ge total female') f':f total, rural and urb<ln area');
of males to total males and percentage of females to
StateJlleDt 82
PERCENTAGE OF MALES AND FEMALES IN EACH AGE-GROUP TO TOTAL MALES AND FEMALES IN THE DISTRICT
Total r--------"------""""\
Percentage of Percentage of male~to ;femaks to
Age--gruup total males total females
Under 1 yeal" 3'18 2'98 I 2'86 2"63 2 3'36 3'07 3 2-8) 2·ti7 4- 3'00 2-70 5-9 13,92 1Z'46
10-14: 13'60 12'50 15-19 8'81 9'20 20-24: 7'97 8,93
25-29 6'85 8'03 30-34 5'95 6'39 35-39 5'8:i 5,90
40-44 5'03 4'97 45-49 : 4'26 4'14 50-54 3'66 3,81
55-59 2'64 2'63 60-64 2'6+ 2'83 65-69 l'47 1-54
70 + Z'03 2'35 Age not stated 0'03 0'02
--N-=-Negligibl(;---
Marital Status
181. More th3,n 60 pet cent of males ;"ucl ab)ut 47 per cent of fi;ma!es u del' e;v:h sex are never married pel's ms, T;1e prop')l't;on of men who howe
lost tr,c.'r p2,1 tGer~ in life to the w~al male population is Ie~s d,an the prop0rtion of widows to tow] fel'nale population in the district. cl';le followill~ st<:>tement presents the\ distributio'l of pllpulati.-lll 'hy li:.~rital
s~atus.
I
U
,Statement 83 DlSTRIBUTIO;N OF 1,000 PERSONS OF EACH SEX
. BY', MARITAL' STATUS
Marit;tl status Total Rural Urban
Males 1,000 1,000 1,000 (i) Never married 60'3 601 631
(ii) :\Ianicd 371 373 350
(iii) Widowed 13 I" n 16
(iv) Divorced or sep:1rated 7 7 3
(v) Uncl.l·"ificd 1
Females 1,000 1,000 1,000 (i) Never marriu] 468 46:) 488
(ii) .'\lanicd 321 3tH 382
(iii) Widowed 124- ],)-~.I 116
(iv) Divorced or separated 27 28 14-(v) Unclassified N 1
-N N--ziligible-
Rural Urban r---------"'--- --~~
,---___ ....A... ______ -,
Percentage of Percenta~e of Percentage of Percentage of f('males to males lO femal ... to male, to
total maie§ total feuules total male~ total female!
51
3'23 3'01 2'78 2'66
2-89 2-66 2-,).') 2'33
3-H 3'10 2-93 2'82
2'92 2·69 2,62 2'44 3,03 2'72 2'65 2,46
13'98 lZ'47 13-32 12'39
13'62 12·49 13'43 12'65
8'75 g·I') 9'41 9'66
7'88 8'92 8'80 9'00
6'80 8'02 7'24 S'12
:i'90 6'.58 6'40 6,70
5'8-1: 5·89 5·96 6'01
5'01 4'96 5'ZI 4'98
4'24 4'14 4·45 4'19
3'66 3'SO 3'62 3·90
2'6') 2·62 2'61 2'76
2·6+ 2'83 Z'60 2'91
1'48 1·5-1: 1'40 1-57
:Z'0-1: 2'34- 1'97 2'4·5
0'03 0'02 N
Religion
182. The llumcficdly import.l.Et re' ig:lv1S of th~s cFstrict ::l.fe Hind.J;' en, 151.:.'11 altd C'1ris:iani·y. 70 per cent of t:1C total population vf the dist,.ict are returned a;; Hindus. The t~)Howing ,tatement gives the di,trihution ,)f popu!a(on in t);p. district by r'~ligions ;:~ pee the 1961 Censtll.
Statement s,!
DISTRrBUrIO:'ll" Of' POPULAT£O:'Il" BY REUGIO:--l, 1961
Number r _____ ..A.. ______ -,
TOlal Rural Urban All religions 1,776,56G 1,604,716 171,850
Buddhi<t I J
Chrj"tian-; 33,811 29,637 4,17-1: Hind:!, 1,243,031 1,123,339 121,642
Jains 13 13 ~Iu,lim' 497,703 4-51,686 46,019
Sikh~ 5 3 2 -~- ;-;. Neglii£iblc ~
Pelcentage di~lribulion
,...--__ ..A..__--,
To,al Rur;).1 Urban
100·00 100·00 100·00 .:-J .:-J 1·90 J'8) 2'43
10'OJ 70'0 ) 70'78
N 0'01
28'02 23'15 26'78 N N N
l!i3. All the taluks of th:s district excepc Per;ntalm;:t.nna. taluk have predominance of Hindus. In Per;nt3.1m~mna tduk l\.fuJims have a :11ajority closely
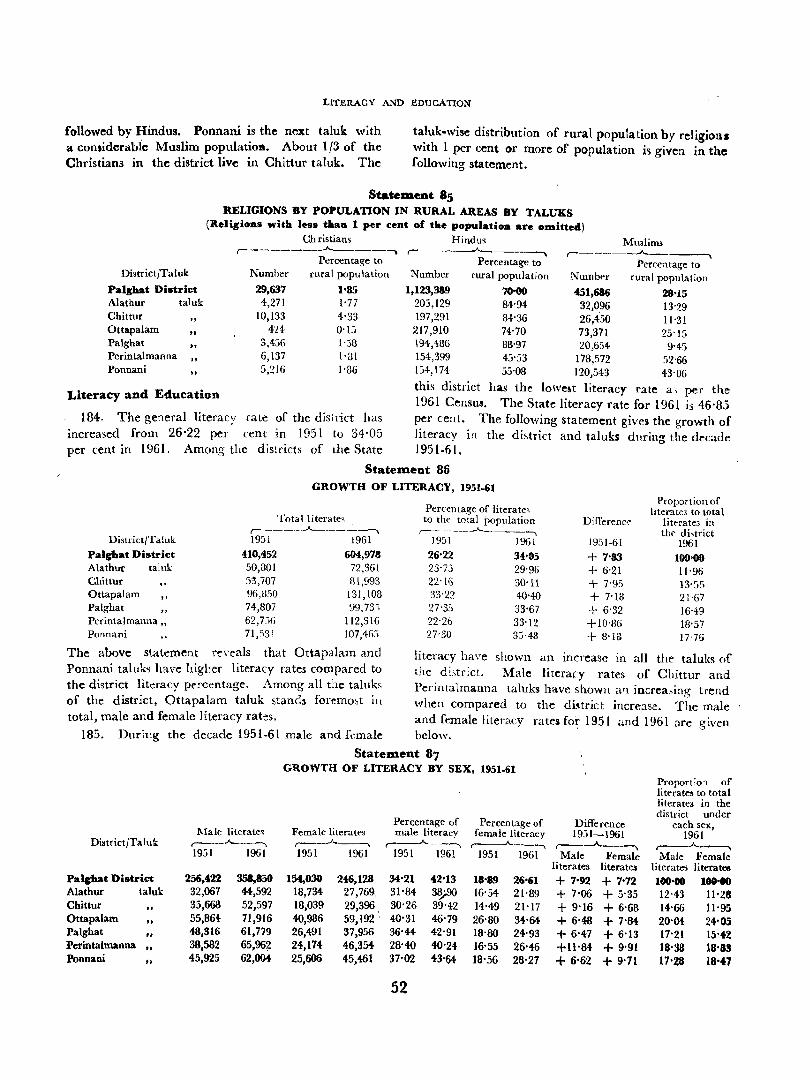
LITERACY AND EDUCATION
followed by Hindus. Ponnani is the next taluk with a considerabie Muslim populatiOJl. About 113 of the Christians in the district live in Chittur tal uk. The
taluk-wise distribution of rural population by religions with 1 per cent or more of population i') given in the following statement.
Statelllent 85 RELIGIONS BY POPULATION IN RURAL AREAS BY TALUKS
(Religions with lest tha1l 1 per cent of tlae population are omitted)
District/Taluk
Palghat District Alathur taluk Chittur
" Ottapalam .. Palghat
" Perintalmanna l'onnani
" Literacy and Education
Christians Hindus Muslims r--------"-------, r--------'---------. ,-___ ~ __ ___,.
Percenta!{e to Percentage to Percentage to Number
29,637 4,271
10,133 424
3,436 6,137 5,216
rural population Number rural population Numb!,f rural population
I'S5 1'77 4'33 0'1':; 1'38 ('31 1'36
1,123,389 70-00 451,686 28'15 203,129 84'94 32,0.96 13'29 197,291 84'36 26,450 11'31 217,910 74'70 73,371 25'15 194,486 8B'97 20,654 9'45 154,399 45'53 178,572 52'66 Lj4,174 55'08 120,543 43'06
this district has the lowe~t literacy rate a, per the 1961 Census. The State literacy rate for 1961 i:i 46'85
184. The general literacy rate of the disirict has per cent. The following statement give~ the growth of increased from 26'22 per cent in 1951 to 34'05 literacy in the district and taluks during the decade per cent in 1961. Among the districts of the State 1951-61.
StatelDeot 86 GROWTH OF LITERACY, 1951-61
Proportion of Percentage of literate, literate3 to total
Total literates to the total population Difference literate3 in r----.--.A.-..-..-_:..-, ,-- ___ ._....A.. ___ ----., the di~trict
District/Ta!uk 19::;1 1961 1951 1961 19::;1-61 1961 Palghat District 410,452 604,978 26'22 34'05 + 7'83 100'00 AlathUf taluk 50,801 72,361 23'7:; 29'96 + 6'21 11'96 Chittur 5:1,707 fll,993 22'16 30'1l + 7'95 13'55 Ottapalam 96,8.'i0 131,108 33'22 40'40 + 7'18 21'67 Palghat 74,S07 99,73; 27'3:. 33'67 + 6'32 16'49 Perintalmanna" 62,7.)6 112,316 22'26 33'12 +10'S6 IS'57 Pormani 71/>3! 107,46:> 27'30 3.1'43 + S'Ia 17'76
The above statemeat reveals that Ottapalam and literacy have shown an increase in all the taluks of Ponnani taluks have higher literacy rates compared to the di5tr:ct. Male literary rates of Chittur and the district literacy pe-rcentage. Among all the taluks Perintalrnanna taluks have shown an jncrea~ing trend of the district, Ottapalam taluk stands foremo,t ilt whell compared to the district increase. The male total, male and female literacy rates. and female literacy rates for 1951 and 1961 are given
185. During the decade 1951-6i male and female below.
Statement 87 GROWTH OF LITERACY BY SEX, 1951-61
Proport;o"l of literates to total Ii terate. in the district under
Percentage of Percentage of Difference each sex, Male literates Female literates male literacy female literacy 1951_'1961 1961
DistrictfTalul;; ,.------.A---, ,....-.---..-A.----, ,---.-A--":'" ,..--..-.A._---, ,----.A.-""", ,---.--'------, 1951 1961 1951 1961 1951 1961 1951 1961 Male Female Male Female
literates literatC3 literate~ literates Palghat District 256,422 358,850 154,030 246.128 34'21 42'13 18'89 26'61 + 7'92 + 7'72 100-00 100-00 Alathur taluk 32,067 44-,592 18,734- 27,769, 31'S4- 3~ 16'54 21'89 + 7'06 + 5'35 12'4-3 11'28 Chittur "
35,668 52,597 18,039 29,396,. 30'26 39'42 14'49 21'17 + 9'16 + 6'68 14'66 11'95 Ottapalam
" 55,86" 71,916 40,986 59,192 ' 40'31 46'79 26'SO 34'64- + 6'48 + 7'84- 20'04- 24'05 Palghat .. 48,316 61,779 26,491 37.956 36'44- 42'91 18'80 24-'93 + 6'47 + 6'13 17'21 15'42 Perintabnanna .. 38,582 65,962 24,174 46,354- 28'40 40'24 16'55 26'46 +11'84 + 9'91 18'33 18'8S Ponnani .. 45,925 62,004 25,606 4-5,4-61 37'02 is'54 18'56 28'27 + 6'62 + 9'71 17'28 18','1
52
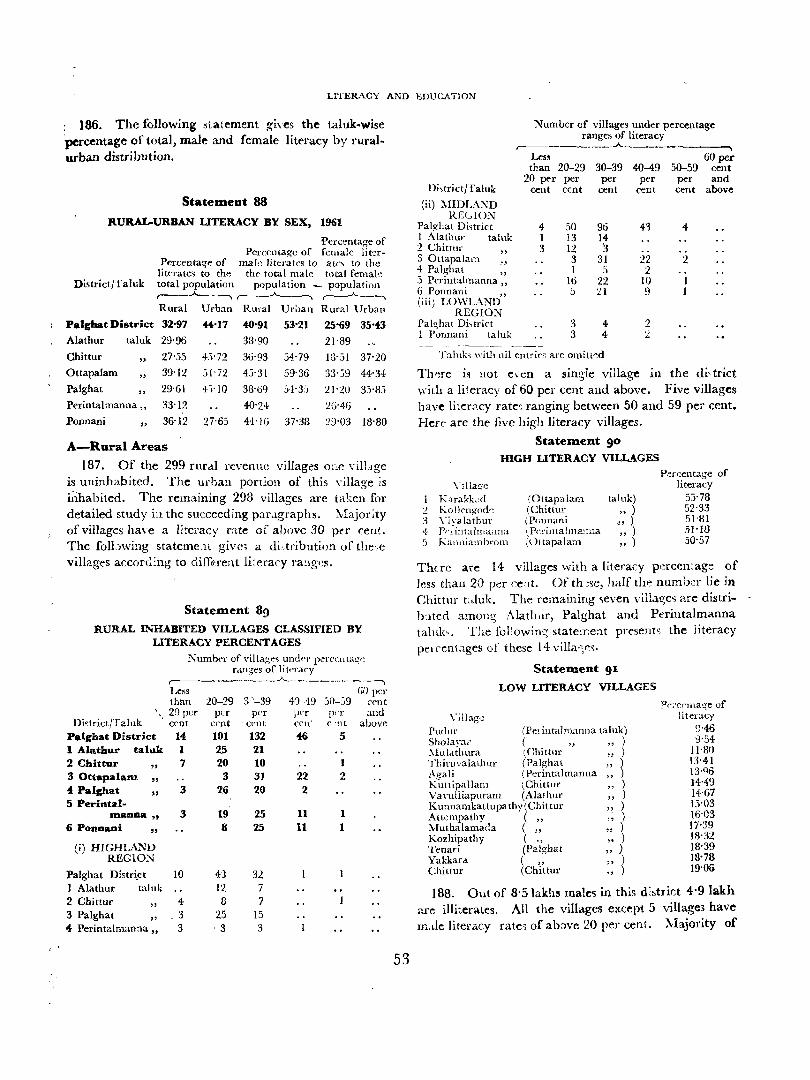
LITERACY AND EDUCATlON
186. The following statement gives the tal uk-wise percentage of total, male and female literacy by ruralurban distribution.
Statement 88
RURAL-URBAN LITERACY BY SEX, 1961
Percentar.:e of Percentage of female lit'~r-
Percentag-I': of mak litcrates to atc, to the literates to the the total male total fcmale
District/Taluk total population population _ population r----~'----------, ,-------"----, ,----~---,
Rural Urban Rural Ur0all Rural Urban
Palghat District 32·97 44·17 40·91 53·21 25·69 35·43 Alathur (aluk 29'96 38'90 21'89
Chittur " 27'55 4:)072 36'93 54'79 W'51 37'20
Ottapalam "
39'12 51'72 45'3! 59'36 33'39 44'3{
Palghat " 29'61 4-)'10 33'69 5i:'3.'j 21'20 3,)'85
Perintalmanna " 33'12 40'24 26'46
Ponnani "
36'12 27-65 4-J'IG 37'38 29'03 18'80
A-Rural Areas
187. Of the 299 rurdl re\'enuc villages O;ie vilLlge is uninhabited. The urban portioll of this \'illage is iiihabited. The remaining 293 villages are ta!;:en for detailed study i;l the succeeding parJ.graphs. Majority ofviI1ages ha\'e a literacy r:l.te of above 30 pa cent. The folbwing stateme,lt give, a diotribution of the',c villages acconEng to diff€:fent Ii~eracy ra'lgt~s.
Statement 89
RURAL INHABITED VILLAGES CLASSIFIED BY LITERACY PERCENTAGES
Numbel' of village~ und<'r 'perceHta!!,~ r.mges of Ii (crary
r----- ,A ______ ----,
Less GO pel' than 20-29 3 '-39 40-49 50-59 cent
'- 20 pcr per P<'1' per pn' and . cent cent' c('nt cen' c 'nt above Di~trict/Taluk
Palghat District 1 Alathur taluk 2 Chittur 30ttapalam 4 Palghat 5 Perintal-
" " "
14 1 7
3
Olanlla" 3 6 Ponnani "
(i) HIGHLA.L~D REGlO~
Palghat Distr~ct
1 A1athur taluk
" 2 Chittur 3 Palghat
" 4 Perintalman:ta"
!O
4 , 3
3
101 132 46 5 25 21 20 10 1
3 3J 22 2 26 20 2
19 25 11 1 8 25 11 1
43 32 12 7 I} 7
25 15 ,3 3
53
Number of villages under percentage ranges of literacy
D;,trict/Taluk
(ii) ~IIDLAl\JD REGION
Palghat Di~trict 1 Alathur taluk 2 Chittur 3 Ottapalam 4 Palghat " ,) Perilltalmanna" 6 Ponnani " (iii) LOWLAND
REGIO:'l) Pal~hat Di,trin 1 1'onnani (aluk
r--------_.A Less than 20-29 30-39
20 pn pel' per cent cent cent
4 50 96 ) 13 14 3 12 '3
3 31 1 ,,)
16 22 5 21
3 4 :3 4
Taluks with nil entries are ol11itl~d
---. 40-49 50-59
60 per cent
per per and cent cent above
4'3 4-
22 2 2
10 I 9 1
2 ,) ..
Th~re is not e,,-en a single village in the di~trict
with a literacy of 60 per cent and above. Five villages have literc,cy rate'~ ranging between 50 and 59 per cent. Here are the five high literacy villages.
Statement 90 HIGH LITERACY VILL.~GES
Ydla~e
K:lrakbd :2 Kolkngode 3 "j\"alathur { PI'; intalnlanna :) Kanniambrom
(Ottapalam (ChitlUl' (Pnllnani rPerintalmanna (uttapalam
talnk)
" ) "" ) " ) " )
Pf:rcelltage of literacy
5j'78 52'33 5l'81 51']8 50'57
There are 14 villages with a literacy p~rcen:age of Jess than 20 per cent. Of th ~"e, half the numb~r lie in Chittur bluk. The remaining ~even villa!Se~ are distritnted amoll~ Alathur, Palghat and Perintalmanna taluk,. The iollowim; staten':e;'lt presents the literacy pel ('('l1'lages of these 14 vilIa'~<;s.
Statement 91
LOW LITERACY VILLAGES
Pf"n;t-'nla~e of Yil!ag'~ literacy
Pudur (Pel intalmanna taluk) '}46 Sholav:lr ( " " ) 9'54 ~Iul.itllUra \ Chittur " ) 11 '80 'fhiruvalalhur (Palghat " ) 13'41 Acrali (Perintalmanna " ) 13,Q6 K~ttipallam (Chittur " ) 14'49 Vavuliiapuram (Alathur " ) 14'67 Kunnamkattupathy(Chittur " ) 13'03 Altcmpathy ( " ,; ) IG'03 Muthalamada (" " ) 17<39 Kozhipathy ( ., ,. ) 18'32 Tenari (Palghat " ) 18'39 Yakkafa ( " " ) 18·78 Chittur (Chiltul' ., ) 19'05
138. Out of 8'51akh~ male'! in this d:~trict 4·9 lakh are illi~erales. All the villages except 5 village3 have Ill,tle literacy rate, of ab:>ve 20 per cent. :Majority of
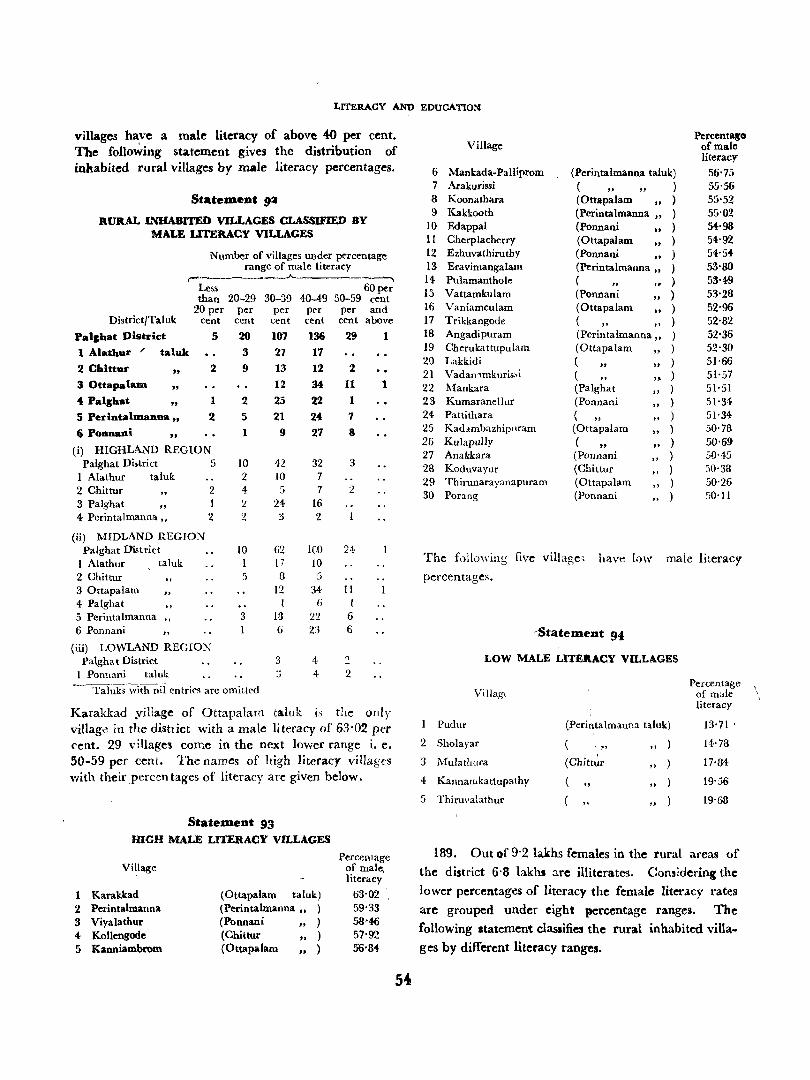
LITERACY AND EDUCATION
villages have a male literacy of above 40 per cent. The follo~ing statement gives the distribution of inhabited rural villages by male literacy percentages.
Statement ~
RURAL INHABITED VILLAGES CLASSIFIED BY MALE LITERACY VILLAGES
Number of villages under percentage range of male literacy
,-_____ A-
Le,s --60 per than 20-29
20 per per cent cent
30-39 per
cent
40-49 50-59 cent per per and
District/Taluk
Palghat J)istrict
cent cent above
1 Alathur /'
2 Chittu ..
3 Ottapalatn
4 Palghat
taluk
" " "
5 Perintalmanna"
., Ponnani "
5
2.
1
2
(i) HIGHLAND REGION Palghat District 5
1 Alathur taluk 2 Chittur 3 Palghat " 4 Perintalmanna"
(ii) MIDLAND REGIO~ Palghat District
1 Alathur taluk 2 Chittur 30ttapalam 4 Palghat 5 Perintalmanna " 6 Ponnani ,.
2 I 2
(iii) LOWLAND REGIO;>; Palgha t Di~trict
1 Ponnani talu!'::
20
3
9
2
5
1
10 2 4 2 2
10
5
3
~uks with nii entries are omitted
107 21 13 12 25 21
9
42 10
24 3
62 17 8
12 I
HI 6
3
136 17 12 3t
22
24
27
32 7 7
16 2
leo 10 5
34-6
22 23
4 4
29
2
11
1
7
8
3
2
24
11 ! 6 6
2
1
1
Karakkad .village of Ottapalam taluk IS tlle only villag\~ in the disttict with a male literacy of 63'02 per cent. 29 villages come in the next lower range i. e. 50-59 per cent. The names of high literacy villages with their percen tages of literacy are given below.
Statement 93 HIGH MALE LITERACY VILLAGES
Village
1 Karakkad 2 Perintalmanna 3 Viyalathur .. Kollengode 5 Kanniambrom
(Ottapalam taluk) (Perintalmanna" ) (Ponnani ,,) (Chittur ,,) (Ottapalam ..)
Percentage of male. literacy
63-02 59'33 58'46 57'92 56'84
54
Village Percentago
of male literacy
6 Mankada-PaIliprom (Perintalmanna tal uk) 56-7J 7 Arakurissi (
" " ) 55-56
8 Koonathara (Ottapa1am "
) 5J-52 9 Kakkooth (Perintalmanna " ) 55-02
10 Edappal (Ponnani "
) 54-98 11 Cherplacherry (Ottapalam
" ) 54-92 12 Ezhuvathiruthy (Ponnani
" ) 54-54 13 Eravimangalam (Perin tal manna .. ) 53-80 14 Pulamanthole (
" ) 5:3049 IS Vattamkulam (Ponnani
" ) 53-28 16 Vaniamculam (Ottapalam
" ) 52-96 17 Trikkangode ( .. ) 52-82 18 Angadipuram (Perilltalmanna " ) 52'36 19 Cheruka ttupulam (Ottapalam
" ) 52-30 20 Lakkidi (
" " ) 51-66
21 Vadan ~mkuris;,i ( "
,. ) 51-57 22 !\'fankara (Palghat
" ) 51-51 23 Kumaranellur (Ponnani
" ) 51-34 24 Pattithara (
" " ) 51-34
25 Kad~mbazhipuram (Ottapalam " ) 50'78
26 Kulapully ( " "
) 50'69 27 Anakkara (Ponnani .. ) 50-45 28 Koduvayur (Chittur ) 30-38 29 Thirunarayanapuram (Ottapalam
" ) 50-26
30 Porang (Ponnani "
) 50'11
The following five village, have low male literacy
percentages.
-Statement 94
LOW MALE LlTEltACY VILLAGES
Percentage Villagt of male
literacy
1 Pudur (perintalmanna taluk) 13-71 '
2 Sholayar ," " ) 14-78
3 Mulathura (Chitt~r "
) 17-84-
4- KannaTlikattLtpathy " .. ) 19-56
5 Thiruvalathur "
) 19-68
189. Out of 9-2 lakhs females in the rural areas of
the district 6-8 lakhs are illiterates. Comidering the
lower percentag~s of literacy the female literacy rates
are grouped under eight percentage ranges. The
following statement classifies the rural inhabited villa
ges by different literacy ranges.
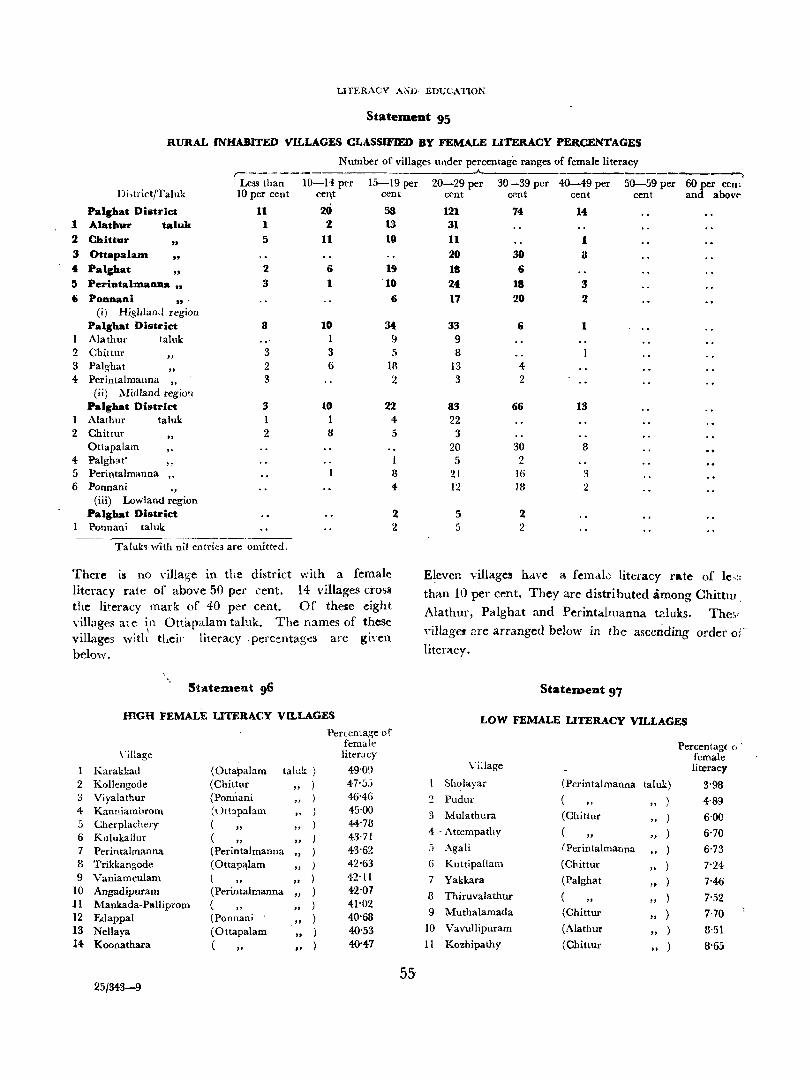
LITERACY A;-;V' EDUCATION
Statement 95
RURAL INHABITED VILLAGES CLASSIFIED BY FEMALE LITERACY PERCENTAGES
Number of villages under percentage ranges of female literacy r-
Less than 10-14 per 15--19 per Di>trictfTaluk 10 per cent cent cent
Palghat District 11 20 58 1 Alathur taluk I 2 13 2 ChittaI'
" 5 11 10
3 Ottapala_ " 4 Palghat "
2 6 19 5 PerintalmaDlla .. 3 1 10
6 PODnaai ... 6 (i) Highland region
Palghat District 8 10 34 Alathur taluk I 9
2 Chittur "
3 3 5 3 Palghat
" 2 6 If!
4 Perintalmanna "
3 2 (ii) Midland regio!l
Palgbat District 3 10 22 Alathur ta\uk I I 4
2 Chittur 2 8 5 Ottapalam
4 Palghat' ,. 1 5 Petintalmanna .. 8 6 Ponnani
" 4-
(iii) Lowland region Palghat District 2 Ponnani taluk 2
Taluk~ w'ith nil entrii;3 are omitted.
There i3 no village in the district with a female literacy rate of above 50 per cent. 14 villages cross the literacy mark of 40 per cent. Of these eight villages alC in Ott::tpalam taluk. The names of these villages witl; tlleir literacy percentag~3 are given below.
Statenlent 96
mGH FEMALE UTERACY VILLAGES
Percentage of female
\'iIlage liter;a:y
1 Karakkad (Ottapalam taluk ) 49'09 2 Kollengode (Chittur
" ) 47'55
3 Viyabthur (Ponnani "
) 46'46 4 Kauniambrom (,)H::tp:llam ,. J 45'00 5 Cherplachery (
" ) 44·78
6 Kulukallur ( " "
) 43'71 7 Perintalmanna (Perintalmauua
" ) 43'62
B Trikkangode (Ottapa,lam "
) 42'63 9 Vaniamculam (
" ) 42'11
10 Angadipuram (Perintalmanna "
) 42'07 11 Mankada-Palliprom (
" ) 41'02
12 Edappal (Ponnani "
) 40'68 13 Nellaya (Ottapalam .. ) 40'53 14- Koonathara (
" " ) 40'47
25/343-9 55-
___.A._._ -~
20-29 per 30-39 per 40-49 per 50-59 per 60 per Cell' cent cent cent cent and abov("'
121 74 14 31
11 1 20 30 U
18 6 24 18 3 17 20 2
33 (; 1 9 8
13 4 3 2
83 66 13 22
3 20 30 8 5 2
21 16 3 12 18 2
5 2 5 2
Eleven villages have a fenuk literacy rate of le<:
than 10 per cent. They are distri buted among Chittur .
Alathur, Palghat and PerintaImanna t21uks. The,'
villages 2re arranged below in the ascending order oiliteracy.
Statement 97
LOW FEMALE UTERACY VILLAGES
Percentage 0"
female Village literacy
Sll(~layar ( Perin tal manna taluk) 3'96 2 Pudul' ,.
" ) 4'89 3 Mulathura (Chiuur
" ) 6'00 4 - Attempathy
" ) 6'70 5 Agali IPerintalmarma
" ) 6'73 6 Kuttipallam (Chittur
" ) 7'24-7 Yakkara (Palghat .. ) 7-46 8 Thiruvalathur (
" " ) 7'52
9 Muthalamada (Chittur " ) 7'70
10 Vavullipuram (Alathur "
) 8'51 11 Kozhipathy (Chittur
" ) 8'65
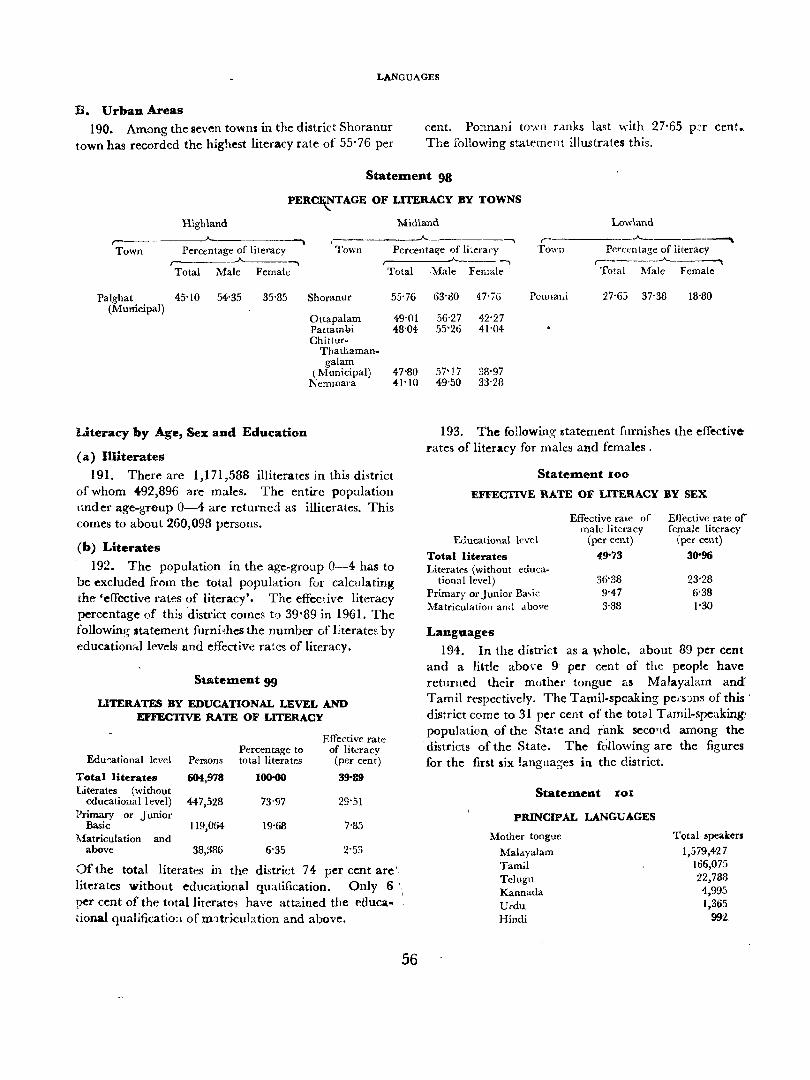
LANGUAGES
B. Urban Areas 190. Among the seven towns in the district Shoranur
town has recorded the highest literacy rate of 55'76 per cent. Po:mani to'Nll ranks last with 27'65 pc:r cent •. The following statement illustrates this.
Highland
Statement 98
PERC~TAGE OF LITERACY BY TOWNS
Midland Lowland • _____ __A._ ______ -, r----- .A. _____ ___
Town Percentage of literacy Town Percenta~e of li~eracy Town Percentage of iiteracy , --, Total Male Female Total
Palghat 45'10 54'35 35'85 Shoranur 55'76 (Municipal)
Ottapalam 49'01 Pattambi 48'04 Chitlur-
Thathaman-galam
( Municipal) 47'80 Nemrnara 41'10
Literacy by Age, Sex and Education
( a) Illiterates
191. There are 1,171,588 illiterates in this district of whom 492,896 are males. The entice population under age-gr€>up 0-4 are returned as illiterates. This comes to about 260,098 persons.
(b) Literates
192. The population in the age-group 0-4 has to be excluded from the total population for calculating the 'effective rates of literacy'. The effective literacy percentage of this district comes t·') 39'89 in 1961. The following statement furni;hes the number of literates by educationallevds and effective rates of literacy.
Statement 99
LITERATES BY EDUCATIONAL LEVEL AND EFFECTIVE RATE OF LITERACY
Effective rate
Edusational level Percentage to of literacy
Persons total literates (per cent)
Total literates 604,978 106-00 39'119 Literates (without
educational level) 447,528 73'97 29'51 Primary or Junior
Basic 119,064 19-68 7-85 Matriculation and
above 38,386 6-35 2-53
Of the total literates in the district 74 per cent are', literates without educational qualification. Only 6', per cent of the total literates have attained the etluca- ' tional qualificatio:l of matricubtion and above.
56
--, ,'Male Female Total Male Female
63'llO 47'i6 Ponnaui 27-6:1 37'38 18'80
56'27 42'27 55'26 41'04
57'17 38'97 49·50 33'28
193. The following &tatement furnishes the effectiverates of literacy for males and females.
Statement 100
EFFECTIVE RATE OF LITERACY BY SEX
Educational level
Total literates Literates (without educa
tional level) Primary or Junior Ba,ic Matriculation and "bove
Languages
Effective rate of male literacy
(per cent)
49'73
36'38 9'47 3'88
Effective rate of' female literacy
(per cent)
30'96
23'28 6'38 1'30
194. In the district as a whole. about 89 per cent· and a little above 9 per cent of the people have returned their mother tongue as Malayah:.m and Tamil rt'Spectively. The Tamil-speaking pe,nns of this'
,dis:rictcome to 31 per cent of the totGlI Tamil-speaking· population. of the State and rank secO!ld among the districts of the State. The foUowing are the figures for the first six languages in the district.
Statement 101
PRINCIPAL LANGUAGES
Mother tongue
Malayalam Tama Tclugu Kannada Urdu Hindi
TQtal 8peakers
1,579,427 166,075 22,788 4,995 1,36,'}
992.
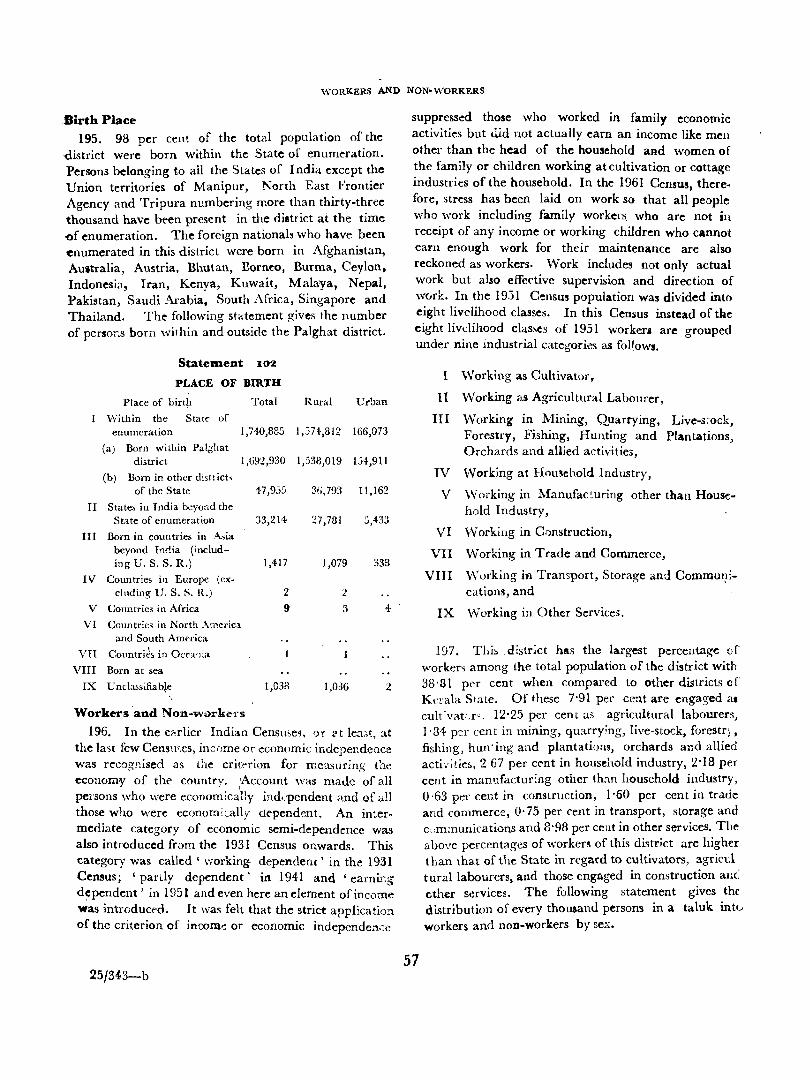
\VORKERS AND NON-WORKERS
.Birth Place 195. 98 per cellt of the total population of the
<listrict were born within the State of enumeration. Persons belonging to all the States of India except the Union territories of Manipur, North East Frontier Agency and Tripura numbering more than thirty-three thousand have been present in the di.trict at the time 'Of enumeration. The foreign nationals who have been enumerated in this district were born in Afghanistan, Australia, Austria, Bhutan, Borneo, Burma, Ceylon, Indonesia, Iran, Kenya, Kuwait, Malaya, Nepal, Pakistan, Saudi Arabia. South Africa, Singapore and Thailand. The following statement gives the number of persor:s born within and outside the Palghat district.
I
II
III
IV
V VI
VII VIII
IX
StatelDent 102
PLACE OF BIRTH
Place of birth Total
Within the State of enumeration 1,740,885
(a) Born within Palghat district 1,692,930
(b) Born in other di$uict, of the State 47,9J~'
State:) in Tndia b.:~yond the Str.le of enumeration :33,214
Born in countries in Ao;ia beyond India (includ-ing U. S. S. R.) 1,417
Countries ill Europe (ex-cluding U. S. S. R.) 2
Countries in Africa 9
Countries in North America and South America
Countri~:; in Oceania
Born at sea
U nclassifuble 1,038 ,
Workers and Non-workers
Rural l:rhan
1,:;74,812 166,073
1,538,019 15'1-,911
:16,793 ll,162
27,781 5,433
1,079 333
" <.
5 4
1,036 2
196. In the,ealier Indian Censme5, ')f "t lea:;t, at the last few Censmes, income or economic independence was recogr.ised as the critt"rion for measuring t~'le
economy of the country. ;Account was made of all persons viho were economically indo 'pendent and of all those who were economiLally dependent. An intermediate category of economic semi-dependence was also introduced from the 1931 Census onwards. This category was called' working dependent' in the 1931 Census; 'partly dependent' in 1941 and' eamir.g dependent) in 1951 and even here an element of income was introduced. It was felt that the strict application of the criterion of income or economic independen,~e
25/343-b
suppressed those who worked in family economic activities but clid not actually earn an income like men other than the head of the household aRd women of the family or children working at cultivation or cottage industries of the household. In the 1961 Census, therefore, stress has been laid on work so that all people who work including family workers, who are not in receipt of any income or working children who cannot earn enough work for their maintenance are also reckoned as workers. Work includes not only actual work but also effective supervision and direction of w(Jrk. In the 193 I Census population was divided into eight livelihood classes. In this Census instead of tAe eight livdihood clas~es of 1951 workers are grouped under nine industrial categori,::5 as follows.
57
I Working as Cultivator,
n \Vorking as Agricultural Labourer,
III Working in Mining, Quarrying, Live.-s~ock, Forestry, Fishing, Hunting and Plantations, Orchards and allied activities,
IV Working at HOU3ehold Industry,
V Working in Manufacturing other than Household Industry,
VI vVorking in Construction,
VII Working in Trade and Commerce,
VIII vVorking in Transport, Storage and Commul!ications, and
IX Working in Other Services.
197. This ,distr;ct has the largest percentage of worken among the total population of the district with 38·81 per cent when compared to other districts of K'l~!'ala State. Of these 7'91 per cent are engaged al cult 'vat;,r', 12'25 per cent as agricultural labourers} 1'84 per cent in mining, quarrying, live-stock, forestr;., fishing, hun'ing and plantations, orchards and allied acti·,'ities, 2 67 per cent in household industry, :l'18 per cent in manufactur:ng other th:m household industry, 0·63 per cent in construction, 1'60 per cent in trade and commerce, O' 75 per cent in transport, storage and ciJm:nunications and 8'98 per cent in other services. The above percentages of worker5 of this district are higher t han ,hat of the State in regard to cultivators, agricd tural labourers, and those engaged in construction aIK'
"ther services. The following statement gives the distribution of every thousand persons in a taluk intv workers and non.workers by sex.
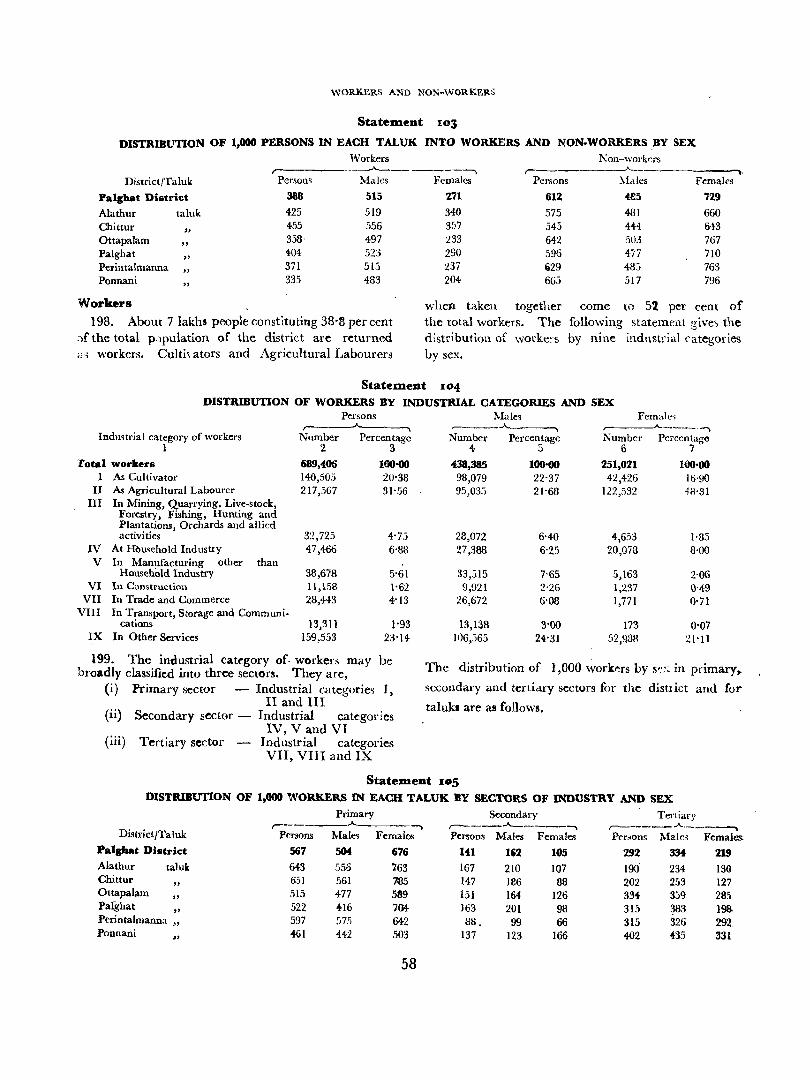
WORKERS AND NON-WORKERS
Statement 103
DlSTRIBt.lTION OF 1,000 PERSONS IN EACH TALUK INTO WORKERS AND NON-WORKERS BY SEX Workers Non-workers .A..-. ____ -----, , ______ ----A-_______ ---"\,
District/Taluk Persons Males
Palshat District 388 515
Alathur taluk 425 519 Chittur
" 455 556
Ottapalam "
358, 497 Palghat
" 404 523
Perintalmanna "
371 51:i Ponnani
" 335 483
Workers
198. About 7 lakhs people constituting 38'3 per cent "f the total p,)puiation of the district are returned a., workers. Culti, ators and Agricultural Labourers
:Fewalcs Persons ~,{dles Females
271 612 .re5 729
340 575 481 660 357 545 444 643 233 642 503 767 290 596 477 710 237 ~29 48:i 763 204 66j 517 796
when taken together come to 52 per cent of the total workers. The following statement gives the distribution of worke::s by nine industrial categoric!> by sex.
Statement 104 DISTRIBUTION OF WORKERS BY INDUSTRIAL CATEGORIES AND SEX
Persons , Industrial category of workers Number Percentage
1 2 3
'Cotal workers 689,406 100'00 1 As Cultivator 140,505 20'38
II As Agricultural Labourer 217,567 31'56 III In Mining, Quarrying, Live-stock,
Forestry, Fishing, Hunting and Plantations, Orchards and allied
32,72,') activities 4'73 IV At HOusehold Indust[y 47,466 6'83 V In Manufacturing other than
Household Industry 38,678 5-61 VI In Construction 11,158 1'62
VII In Trade and Commerce 28,443 4'13 VIII In Transport, Storage and Communi-
cations 13,311 ]'93 IX In Other Services 159,553 23'14
199. The industrial category of. workers may be broadly classified into three sectors. They are,
(i) Primary sector - Industrial categories J, II and III
(ii) Secondary sector - Industrial categories IV, V and VI
(iii) Tertiary sector Industrial categories VII, VIII and IX
Males Femalc~ ~ -~
Nwnber Percentage Number Perccnlao-e 4- 5 6 7 "
438,385 100'00 251,021 100-00 98,079 22'37 42,426 10'90 95,03-> 21'68 122,532 41l'81
28,072 6'40 4,653 1'83 27,388 6'25 20,078 8'00
33,515 7-65 5,163 2'06 9,921 2-26 1,237 0'49
26,672 6'08 1,771 0'71
13,138 3-00 173 0'07 106,565 24'31 52,988 21-1l
The distribution of 1,000 \','Orkers by S":~ in primary,.
secondary and tertiary seetor~ for the distr iet and for
talukl are as follows.
StatemeDt 105 DISTRIBUTION OF 1,000 WORKERS IN EACH TALUK BY SECTORS OF INDUSTRY AND SEX
Primary Secondary Tertiary r-
A _____ ., r------'------, , ______ A ___ ---,
District/Taluk Persons Males Females Persons Males Females Pcr.;ons Male.; Females Palghat District 567 504 676 141 162 105 292 334 219 Alathur ta!uk 643 556 763 167 210 107 190 234 130 Chittur
" 651 561 ?85 147 186 88 202 253 127
Ottapalam "
515 477 589 151 164 126 334- 359 285 Palghat
" 522 416 704- 163 201 98 315 383 198-
Perintalmanna " 597 575 642 H8, 99 66 315 326 292 Ponnani
" 461 442 503 137 123 166 402 435 331
58
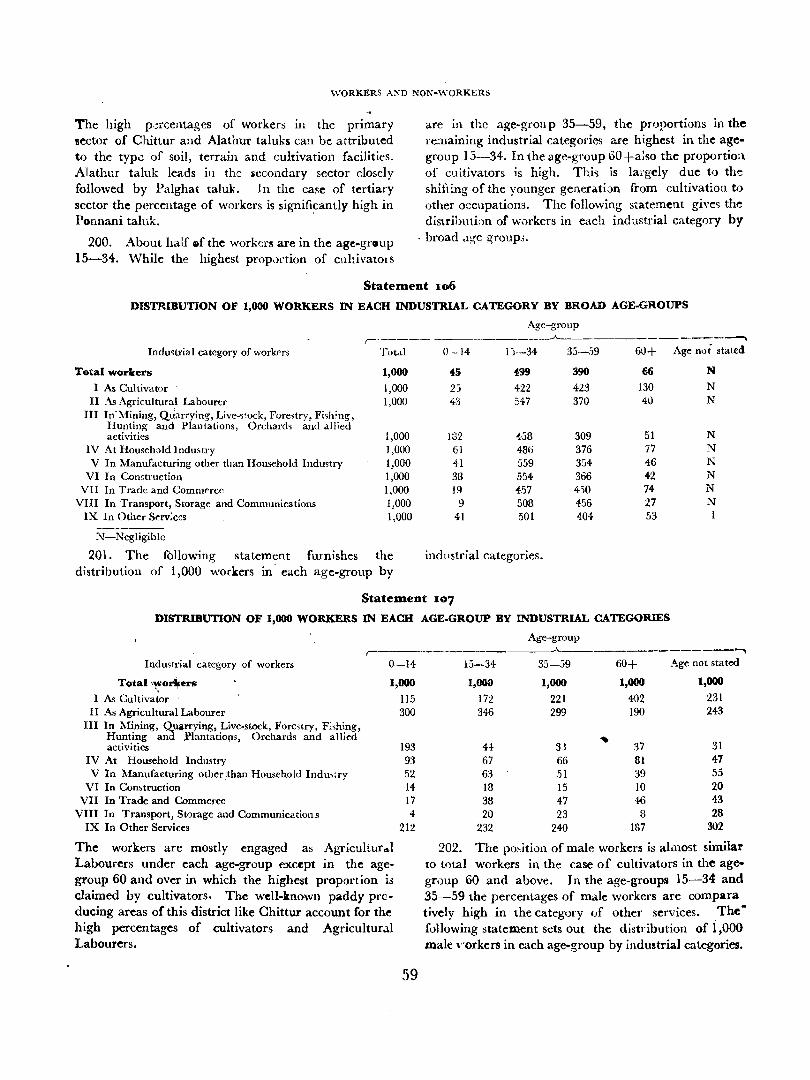
WORKERS AJ'\D NON-WORKERS
The high p~rcentagcs of workers in the primary sector of Chiuur and Alathur taluks can be attributed to the type of soil, terrain and cultivation facilities. Alathur taluk leads ill the iccondary sector closely followed by Palghat taluk. I n the case of tertiary sector the percentage of workers is significantly high in Ponnani taluk. '
200. About half of the workers are in the age.greup 15-34. While the highest prop0ftion of cultivatOls
are in the age-group 35-59, the proportions in the re:naining industrial categories are highest in the age- . group 13-34. In the age-group 60+a:so the proportion of cultivators is high. This is largely due to the shifting of the younger generati;)n from cultivation to other occupations. The following statement gi\'e~ the distributi;m of workers in each industrial category by
. broad .1ge groupo.
Statement 106
DISTRIBUTION OF 1,000 WORKERS IN EACH INDUSTRIAL CATEGORY BY BROAD AGE-GROUPS
Agc-group ,..-. ________ ~~ _______ .A_ _______________ ___""\
Industrial category of workt"n Total 0-14 11-34 35-59 60+ Age not stated
Total workers
I As Cultivator II As Agricultural Labourer
III In~Mining, Qtlarrying, Live-~tock, Fore,try, Fi~hing, Hunting and Plantations, Orchard5 and allied activities
IV At Household Indmtry V In Manufacturing other than Household Industry
VI In Construction VII In Trade and Commt"rce
VIn In Transport, Storage and Communications IX In Other Serv:ces
N-Neg1igible
1,000
1,000 1,000
1,000 1,000 1,000 1,000 1,000 1,000 1,000
the 201. The following statement furnishes distribution of 1,000 workers in each age-group by
45 499 390 66 N
25 422 423 130 N 43 547 370 40 N
132 438 309 51 N
61 486 376 77 N
41 559 354 46 N 38 554- 366 42 N
19 457 4jO 74 N
9 508 4.56 27 N
41 501 404 53 1
indtlstrial categories.
Statement 107
DISTRIBUTION OF 1,000 WORKERS IN EACH AGE.GROUP BY INDUSTRIAL CATEGORIES
Age-group ,..-____ . __________ __..A._ ____________ -,
Indus~'ial categ'ory of workers
Total '~or~ers
0-14 15-34 35-59 60+ Age not stated
1,000 1,000 1,000 1,000 1,000
I As Cultivator II As Agricultural Labourer
III In Mining, Quarrying, Live-stock, Fore,try, F;,hing, Hunting and ,Plantations, Orchards and allied activities
IV At Household Industry V In Manufacturing other ,than Household Indu<ry
VI In Comtruction VII In Trade and Commerce
VIn In Transport, Storage and Communications IX In Other Services
The workers are mostly engaged as AgriculturAl Labourers under each ag~group except in the agegroup 60 and over in which the highest proportion is claimed by cultivators. The well-known paddy producing areas of this district like Chittur account for the high percentages of cultivators and Agricultural Labourers.
115 172 221 402 231 300 346 299 190 243
193 93 52 J4. 17
4-212
59
H 3.1 ..
37 31 67 66 81 47 63 51 39 55 18 15 10 20 38 47 46 43 20 23 :3 28
232 240 187 302
202. The po~jtion of male workers is ahnost similar to total workers in the case of cultivators in the agegroup 60 and above. In the age-groups 15-34 and 35-59 the percentages of male workers are com para tively high in the category of other services. Thefollowing statement sets out the distribution of i,oOO male ,"orkers in each age·group by industrial categories.
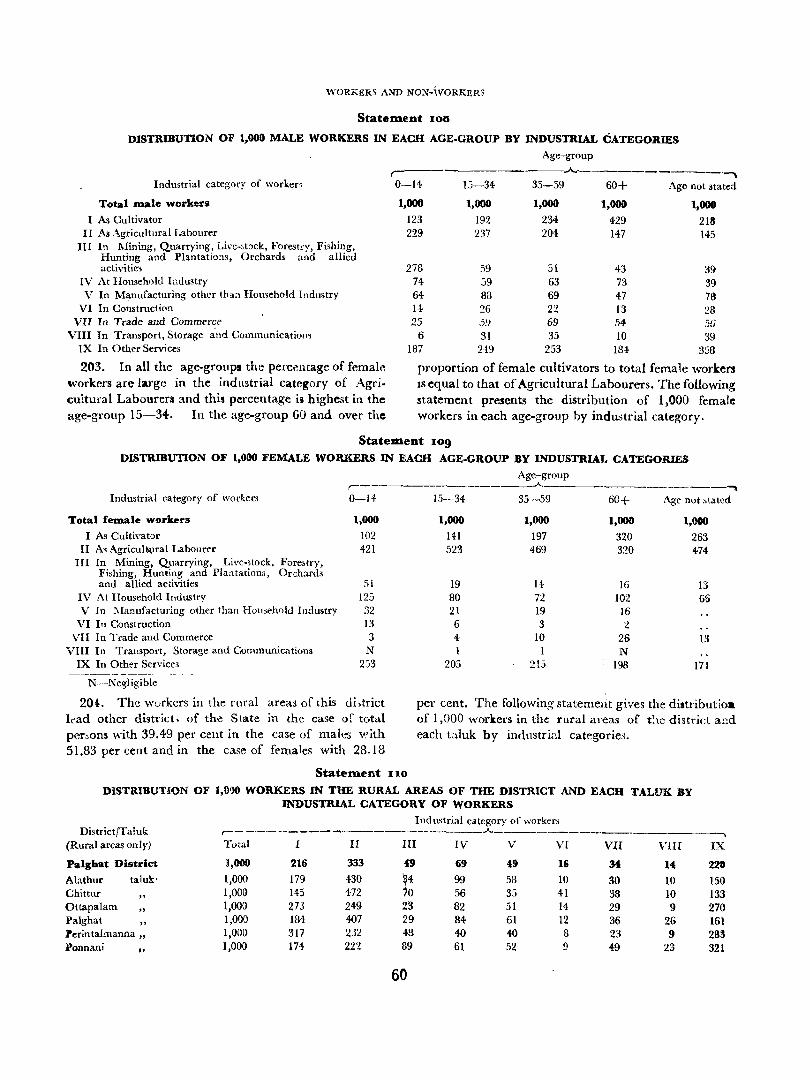
\'\"ORKERS AND NOX-\VORKERS
Statement 100
DISTRIBUTION OF 1,000 MALE WORKERS IN EACH AGE-GROUP BY IN'DUSTRIAL CATEGORIES
Age-group
Industrial categot'y of worken
Total male workers
I As Cultivator II As Agricultural Labourer
III In Mining, Quarrying, Li\"e-~tock, Forestry, Fishing, Hunting and Plantations, Orchard~ and allied activities
IV At Household Industry V In M~nufacturing other than. Homehold Industry
VI In Construction VII In Trade and Commerce
VIII In Transport, Storage and Communicatiom IX In Other Services
203. In all the age-groups the percentage of female workers are large in the industrial category of Agricultural Labourers and this percentage iii highest in the age-group 15-34. In the age-group 60 and over the
,---------____ ..A., ___ _
0--14 IS--34 35--59
1,000
123 229
278 74 64 H 2.5
1,000
192 237
59 59 88 26 59
1,000
234 204
51 63 69 22 69
6 31 35
60+
1,000
429 147
43 73 47 13 54-10
---'""'"\
Age not stated
1,000
218 145
39 39 78 28 56 39
187 249 253 184 358
proportion of female cultivators to total female workers IS equal to that of Agricultural Labourers. The following statement presents the distribution of 1,000 female: workers in each age-group by industrial category.
Statement log DISTRIBUTION OF 1,000 FEMALE WORKERS IN EACH AGE-GROUP BY INDUSTRIAL CATEGORIES
Industrial category of workers
Total female workers
I As Cultivator II A~ Agricuhvra1 Laboufe-f
III In Mining, Quarrying, Live-~tock, Fore5try, Fishing, Hunting and Plantations, Orchard, and allied activities
IV At Household Industry V In :'.lanufacturing other than Houst'hold Industry
VI In Construction VII In Trade and Commerce
VIII In Transport, Storage and Communications IX In Other Services
N--Negligible
r-0--14
1,000
102 421
51 125 32 13 3
N 2:i3
204. The workers in the rural areas of this di,trict lc:ad other district. of the State in the case of total per~ons with 39.49 pel' cellt in the case of males ",ith 51.83 per cent and in the case of females with 28.18
StatelDent 110
Age-group .A ---------,
15--34 35--59 60+ Age not stated
1,000 1,000 1,000 1,000
141 197 320 263 523 469 320 474
19 H Ifi 13 80 72 102 66 21 19 16 6 3 2 4 10 26 13
I N 205 215 198 171
per cent. The following state merit gives the distributioa of 1,000 workers in the rural areas of tlte district aDd each t:liuk by indnstrid categorie"
DISTRIBUTION OF I,GOO WORKERS IN THE RURAL AREAS OF THE DISTRICT AND EACH TALUK BY Th.'DUSTRIAL CATEGORY OF WORKERS
District/Taluk Industrial category of workers r--- -,-------_________________ .A. _____________ ~-______ _.
(Rural areas only) Total I II HI IV V VI VII VIII IX
P.lghat District 1,000 216 333 49 69 49 16 34 14 220 Alathur taluk' 1,000 179 430 ~4 99 58 10 30 10 150 Chittur 1,000 145 472 10 56 35 41 38 10 133 Ottapalam
" 1,000 273 249 23 82 51 14 29 9 270
Palghat " 1,000 184 4()7 29 84 61 12 36 26 161
Perintalmanna " 1,000 317 232 43 40 40 8 23 9 283 Ponnani "
1,000 174 222 89 61 52 9 49 23 321
60
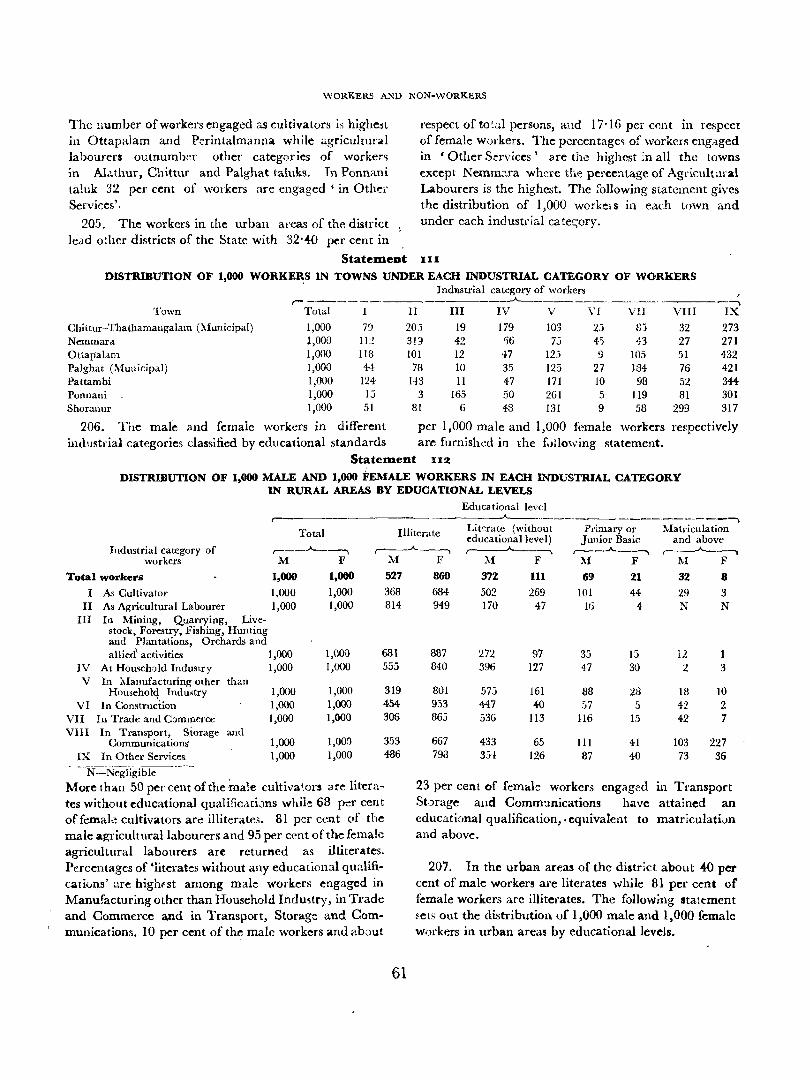
WORKERS A.."<D NON-WORKERS
Thc number ofwGrkers engaged as cultivators is highest in Ottapalam and P~rintalmanna while agricultural labourers outnumbr:f other categories of workers in Al.:tthuf, Chittur and Palghat taluks. In Ponnani ta!uk 32 per cent of workers are engaged' in Other Services'.
205. The workers in t.he urban areas' of the district lead o~ber districts of the State with 32'40 per cent in
respect of to ~al persons, and I 7 '16 per c~n t in respect of female workers. The percentages of workers engaged in 'Other Services' ore th~ highest;n all the towns except NemmJ.ra whcl-e the percentage of Agricultural Labourers is the highest. The [ollowing statement gives the distribution of 1,000 workel s in each town and under each industri~l cates;ory.
Statement II I
DISTRIBUTION OF 1,000 WORKERS IN TOWNS UNDER EACH INDUSTRIAL CATEGORY OF WORKERS Industrial category of workers
I ,- _________________ --A-_____________ .__ Town Total I II III IV V VI VII VIII IX
Chittur-Thathamangalam (Municipal) 1,000 79 203 19 179 lOS 23 8) 32 273 Nemmara. 1,000 11:! 319 42 '16 7j 4) 43 27 271 Ottap'al>lm 1,000 118 101 12 47 123 9 105 51 432 Palghat (~[ullicipal) 1,000 H 78 10 35 125 27 184 76 421 Pattambi 1,000 124 l-l3 II 47 171 10 98 52 344 Ponnani 1,000 13 3 165 50 261 5 119 81 301 Shoranuf 1,000 51 81 6 43 131 9 58 299 317
206. The male and female workers in different per 1,000 male and 1,000 female workers respectively industrial categories classified by educational standards are furnish..:d in the f,_,llowing statement.
Statement 112
DISTRIBUTION OF 1,000 MALE AND 1,000 FEMALE WORKERS IN EACH INDUSTRIAL CATEGORY IN RURAL AREAS BY EDUCATIONAL LEVELS
Educational level r-------
_______ ____A..___ __________ . __________ --.
Industrial category of workers
Total
f--.A-.-__,
Illiterate
f---A----,
Lit>::rate (without Primary or Matriculation educa.tionallevel) Junior Basic and above ,--_~ ,..---_.A. __ .__ , _ ____.A._----'\
M F M F M F M F 1\1 F Total workers 1,000
1,000 1,000
1,000
1,000 1,000
527 860 372 111 69 21 32 8
I As Cultivator II
III As Agricultural Labourer In Mining, Quarrying, Live
stock, Forestry, Fishing, Hunting and Plantations, Orchards and
368 814
allied\ activities 1,000 1,000 681 IV V
At Household Industry 1,000 1,000 555 In :\Ianufacturing other than
Household Indu:ltry 1,000 319 VI
VII In Congtru~iion
1,000 1,000 1,000
1,000 454
In Trade and C:Jmmerce 1,000 306
VIII In Transport, Storage and Communication$
IX In Other Service~ 1,000 1,000
1,003 1,000
353 486
- -N--Negligihle----
More tnan 50 per cent of the tnale cultiva~ors 3re literates without educational qualificatbns while 68 per cent of femal~ cultivators ar<! illiterate3. 81 per ccnt of the male agricultural labourers and 95 per cent of the female agricultural labourers are returned as illiterates. Percentages of 'literates without any educational qualifications' are highfst among male workers engaged in Manufacturing other than Household Industry, in Trade and Commerce and in Transport, Storage and Communications. 10 per cent of the male workers and ab;)ut
61
684 949
887 840
801 933 863
667 793
502 269 101 44 29 3 170 47 16 4 N N
272 97 396 127
573 161 447 40 536 113
433 65 35'f. 126
35 15 47 30
88 28 57 5
116 15
111 41 87 40
12 2
18 42 42
103 73
1 3
10 2 7
227 36
23 per cent of female workers engag~d in Transport St-Jrage and Comm:mications have attained an educational qualification, . equivalent to matriculati»n and above.
207. In the urban areas of the district about 40 per cent of male workers are literates while 81 per cent of female workers are illiterates. The following statement ~ets out the distribution of 1,000 male and 1,000 female workers in urban areas by educational levels.
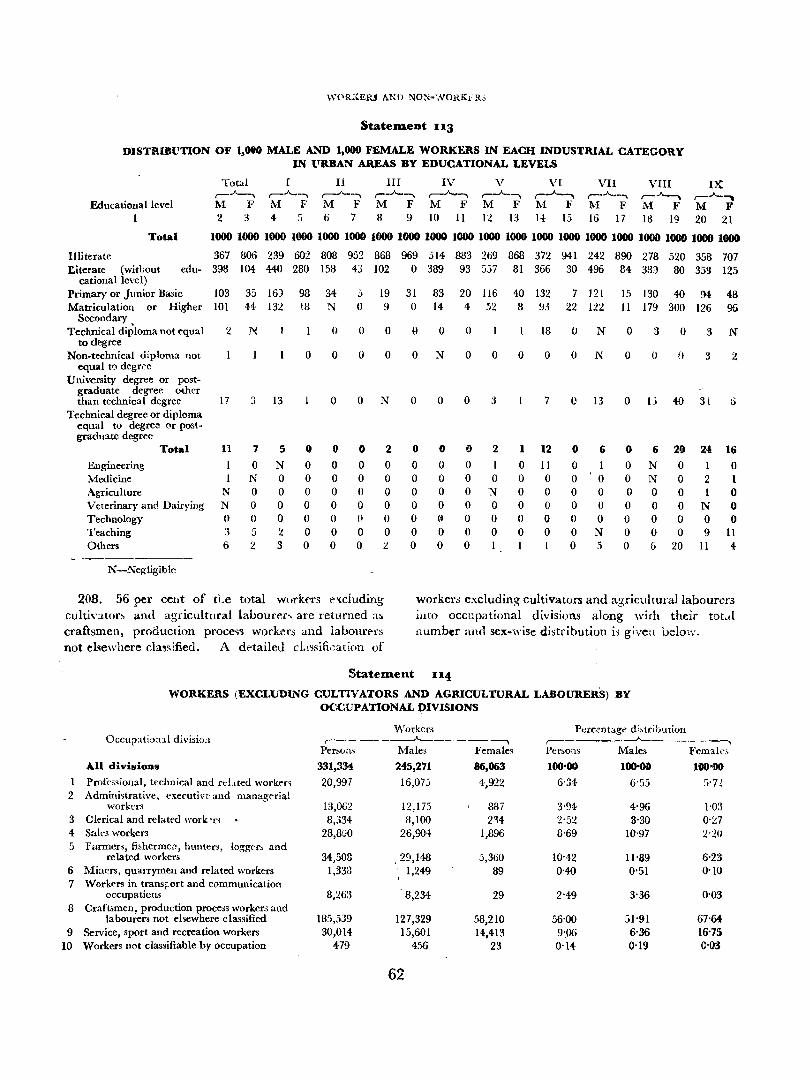
W0RKER5 ANI) NO~-'NORKLR,
Statement 113
DISTRIBUTION OF I,OtO MALE AND 1,000 FEMALE WORKERS IN EACH INDUSTRIAL CATEGORY IN {TRBAN AREAS BY EDUCATIONAL LEVELS
Total I Il III IV V VI VII VIn IX
Educational level 1
,--~ ,--.A..., ,--..A....., ,_.A._., ,--.A. • ., ,_.A._., , • .A.._" ,.-_.A. • ., ,--.A..-" ,--.A..""""
M FM FM FM FM FM FM FM FM FM F 2 3 4 5 6 7 8 9 10 II 12 13 It 15 16 1 7 113 19 20 21
Total
Illiterate
10001000100010001000100010001000100010001000100010001000100010001000100010001000
367 806 239 602 808 952 868 969 514 883 269 868 372 941 242 890 278 520 358 707 Literate (without edu- 398 104 440 280 158 43 102 0 389 93 557 81 366 30 496 84 389 80 358 125
cational level) Primary or Junior Basic Matriculation or Higher
Secondary Technical diploma not equal
to degree Non-technical diploma uot
equal to degree University degree or post
graduate degree other than technical degree
Technical degree or diploma equal to degree or postgraduate degree
Engineering Medicine Agriculture
Total
Veterinary and Dairying Technology Teaching Others
N-Negligible
103 101
2
17
n
N N o
6
35 16')
44 132
7
o N o o o 5 2
13
5
N o o o o 2 3
98 18
o
o o o o o o o o
34 N
o
o
o
o o o o o o o o
5 o
o
o
o
o o o o o o o o
19 9
o
o
N
2
o o o o o o 2
208. 56 per cent of tLe total wurkers excluding culti'l::l.tor~ and agricultural labourer ... are returned a~ craftsmen, production proce~s workers and labourer$ not elsewhere cla~sified. A detailed cl.'.~sification of
31 o
{}
o
o
o o o o o o o o
83 14
o
N
o
o o o o o @
o o
20 116 4
o
o
o
o o o o o o o o
52
o
3
2
o N o o o
40 132 8 93
o
1
o o o o o o
18
o
7
12
11 o o o o o
7 121 22 122
o
o
o o o o o o o o
N
N
13
6
1 o o o o N 5
15 130 40 94-11 179 300 126
o
o
o
o o o o o o o o
3
o
6
N N o o o o 6
o
o
20
o o o o o o
20
3
3
3!
24 1 2 1
N o 9
11
48 96
N
16
o 1 o o o
It 4-
workers excluding cultivators and agricultural labourers .into occupational divisions along with their tot.,l l1umber and sex-wise distribution i, given below.
Statement 114
WORKERS (EXCU.JDlNG CULTIVATORS AND AGRICULTURAL LABOURERS) BY OCCUPATIONAL ~IVISIONS
All divisions
1 Professional. technical and rd"ted work!"r, 2 Admini~trative. executi\T and managerial
workers 3 Clerical and related work: '1"
4 Sales workers 5 Farmers, fi;hermeD, hunters, logger" and
related workers 6 Miners, quarrymen and rdated workers 7 Work<:'rs in transj:ort and communication
occupations 8 Craftsmen, production proce;;s workers and
labourer; not elsewhere classified 9 Service, sport and recreation workers
10 Workers not classifiable by occupation
""orkers r--'~- - ----'-----------,
Persons :Males Females
331,334
20,997
13,062 8,334
28,8(j0
34,508 1,33S
8,263
185,539 30,014
479
245,271
16,07.:i
12,175 8,100
26,904
,29,148 '\ 1,249
, 8,234-
127,329 15,601
456
62
86,063
4,922
887 214
1,896
5,360 89
29
58,210 14,413
23
Pcrcent:.ge di,tribution r- -A--__ ---,
Per,ons Males Female;
100'00
6'34
3'94 2'52 8'69
10'42 0'40
2"49
56'00 9'.00 0'14
100-00
4'96 3'30
10'97
11'89 0'51
3'36
51'91 6'36 0'19
100'00
1'03 0''1.7 2<W
6'23 0'10
0'03
67'64-16'75 0'03
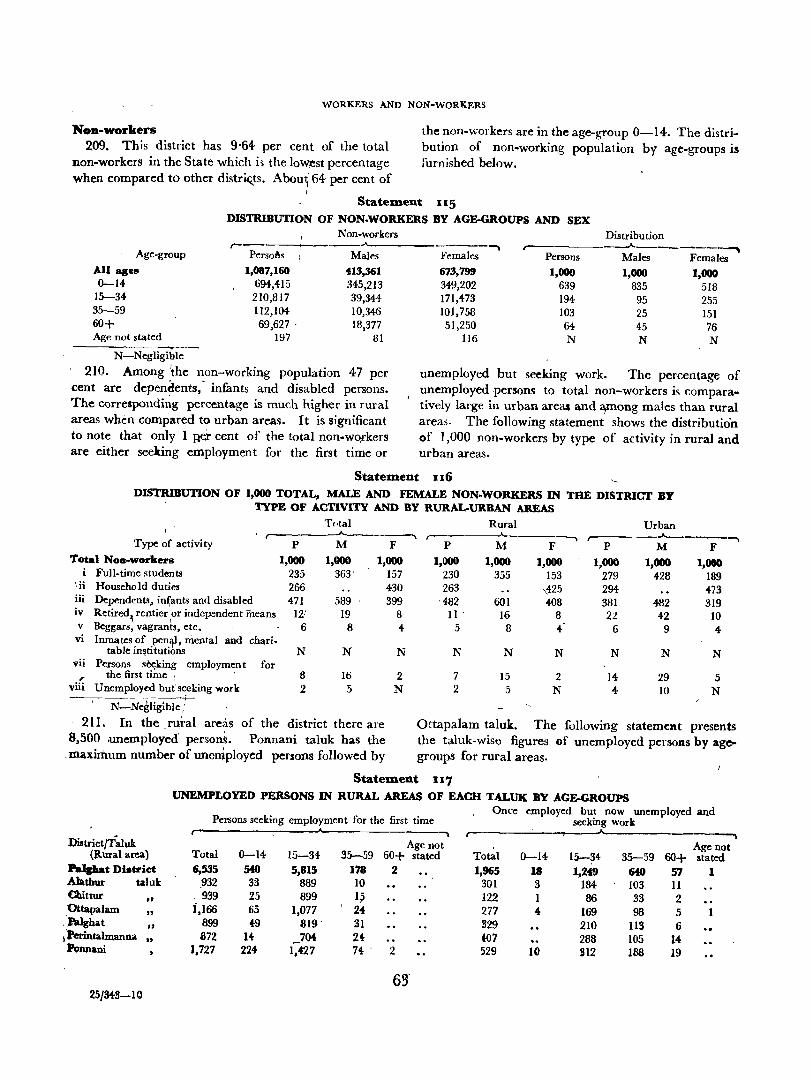
WORKERS AND NON-WORKERS
Non-workers 209. This district has 9·64 per cent of the total
non-workers in the State which i, the 10~l'!st percentage when compared to other distri«,ts. Abou~ 64 per cent of
I
the non-workers are in the age-group 0-14. The distribution of non-working population by age-groups is furnished below.
StateIDent 115 DISTRIBUTION OF NON·WORKERS BY AGE-GROUPS AND SEX
Non-workers Distribution r- --'--------"""'\ ---A
---~ Age-group PersQl\s Males Females Persons Males Females All ages 1,087,160 413,361 673,799 1,000 1,000 1,000 0-14 694,415 345,213 349,202 639 835 518
15-34 210,817 39,344 171,473 194 95 255 35-59 112,104 10,346 101,758 103 25 151 60+ 69,627· 18,377 51,250 64- 45 76 Age not stated 197 81 116 N N N
N-Negligible
210. Among ~he non-working population 47 per cent are dependents, - infants and disabled persons. The corresponding percentage is much higher in rural areas when compared to urban areas. It is significant to note that only 1 ReI" cent of the total non-wo,ckers are either seeking employment for the first time or
unemployed but seeking work. The percentage of unemployed persons to total non-workers is comparatively large ill urban areas and a,mong males than rural areas. The following statement shows the distribution of 1,000 non-workers by type of activity in rural and urban areas.
Statement 116 DISTRIBUTION OF 1,000 TOTAL, MALE AND FEMALE NON.WORKERS IN THE DISTRICT BY
TYPE OF ACTIVITY AND BY RURAL-URBAN AREAS Total Rural Urban
r------A-- r- ---. ~--"""'\ Type of activity P M F P M F P M F
Total Noa-workers 1,000 1,000 1,000 1,000 1,000 1,000 1,000 1,000 1,000 I i Full-time students 235 363' 157 230 355 153 279 428 189 'ii Household duties 266 430 263 ,,425 294 473 iii Dependents, in(ants and disabled 471 589 . 399 '482 601 408 381 482 319 iv Retired, rentier ,or independent means 121 19 8 II' 16 8 22 42 10 v Beggars, vagrants, etc. 6 8 4 5 8 4- 6 9 4-vi Inmates of pen~, mental and chari-
table in~tituti$ns N N N N N N N N N vii Persons s~king employm~nt for ,. the first trme " , 8 16 2 7 15 2 14 29 5
viii Unemployed buf.seeking work 2 5 N 2 5 N 4- 10 N N-Neg1igible ,:
211. In the .rlltal areas of the district there are Ottapalam taluk. The following statement presents 8,500 unemployed persons. Ponnani taluk has the the taluk-wise figures of unemployed persons by age-
,maximum number of unem.ployed persons followed by groups for rural areas.
DistrictriaIuk (Rural area)
Palpat District AJatbur tal uk (lhittur
If
Ottapalam " ,Palghat " I"erintalmanna ..
Ponnani
25/3+3-10
Statement 1.17 UNEMPLOYED PERSONS IN RURAL AREAS OF EACH TALUK BY AGE-GROuPS
Persons seeking employment for the first time
Total 0-14 6,535 MO
.932 33 939 25
i,l66 65 899 (9
872 14 1,727 224
15-34 5,815
889 899
1,077 819·
_704 1,427
35-59 178 10 1~ 2.f. SI 24-74 '
"""'\
Age not 60+ stated
2
2
Once employed but now unemployed and seeking work
35-59 Age not
Total 0-14 15-34 60+ stated 1,965 18 1,249 640 57 1
301 3 1M 103 11 122 1 86 33 2 277 4- 169 98 5 1 329 210 113 6 f07 288 105 14-529 10 312 188 19
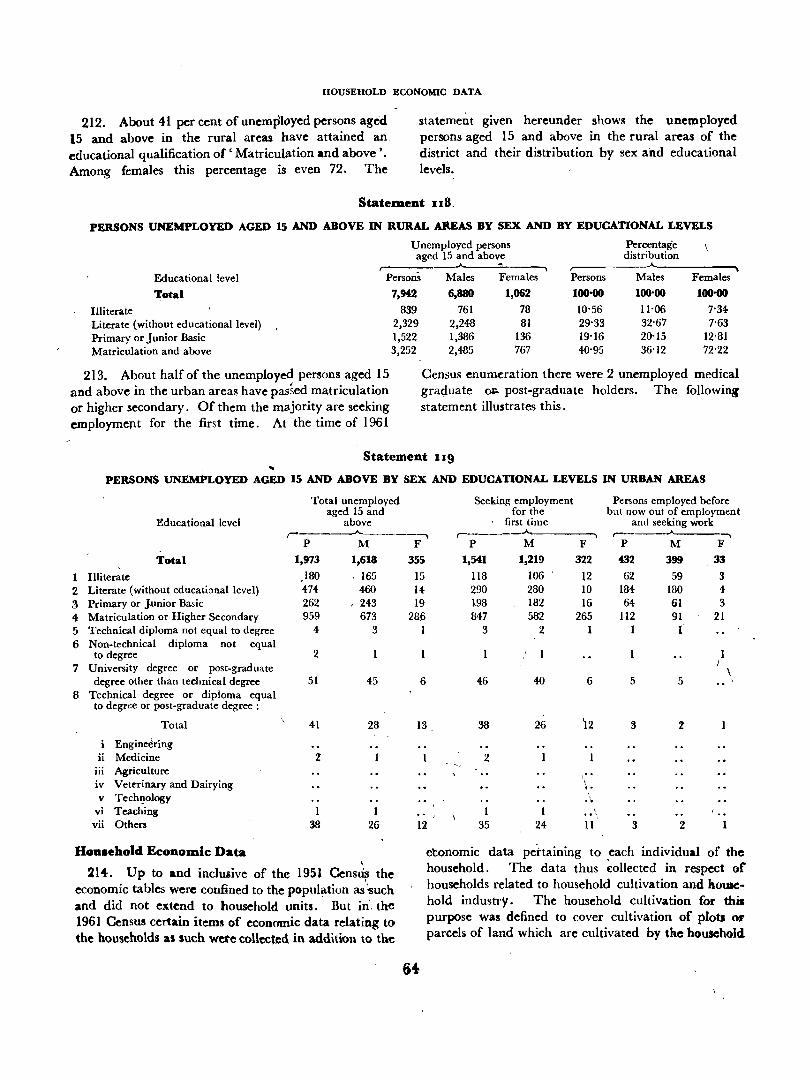
HOUSEHOLD ECONOMIC DATA
212. About 41 per cent of unemployed persons aged 15 and above in the rural areas have attained an. educational qualification of ' Matriculation and above' • Among females this percentage is even 72. The
statement given hereunder shows the unemployed persons aged 15 and above in the rural areas of the district and their distribution by sex and educational levels.
Statement 118.
PERSONS UNEMPLOYED AGED 15 AND ABOVE IN RURAL AREAS BY SEX AND BY EDUCATIONAL LEVELS
Unemployed persons Percentage aged 15 and above distribution ~
Educational level Persons Males Females Persons Males Females
Total 7,942 6,880 1,062 100'00 100'00 100-00
Illiterate 839 761 78 10'56 11-06 7'34 Literate (without educational level) 2,329 2,248 81 29'33 32'67 7'63 Primary or Junior Basic 1,522 1,386 136 19'16 20'15 12'81 Matriculation and above 3,252 2,485 767 40'95 36'12 72'22
213. About half of the unemployed persons aged 15 and above in the urban area!! have passed matriculation or higher secondary. Of them the majority are seeking employment for the first time. At the time of 1961
Census enumeration there were 2 unemployed medical graduate ()I:. post-graduate holders. The following statement illustrates this.
Statement J 19 .. PERSONS UNEMPLOYED AGED 15 AND ABOVE BY SEX AND EDUCATIONAL LEVELS IN URBAN AREAS
Total unemployed aged 15 and
Seeking employment for the
Educational level above r-------"---_.
first time r--------.~-------_.
PeThons employed before but now out of employment
and seeking work ,--------"----,
P M F P M F P M F
Total
1 Illiterate 2 Literate (without educational level) 3 Primary or Junior Basic 4: Matriculation or Higher Secondary 5 Technical diploma not equal to degree 6 Non-technical diploma not equal
to degree 7 University degree or post-graduate
degree other than technical degree 8 Technical degree or diploma equal
to degree or post-graduate degree:
Total
Engine~ring ii Medicine
iii Agriculture iv Veterinary and Dairying v Techl}ology
vi Teaching vii Others
Household Economic Data
1,973
)80 474 262 959
4
2
51
41
1 38
1,618
. 165 460
, 243 673
3
\
45
28
1 26
214. Up to and inclusive of the 1951 Cens~ the economic tables were confined to the popUlation as ''Such and did not extend to household units. But in', the 1961 Census certain items of economic data relating to the households as such were collected in addition to the
355
15 14 19
28.6 1
6
1,541 1,219 322
118 106 12 290 280 10 198 182 16 847 582 265
3 2 1
I 1
46 40 6
432 399 33
62 184 64
112 1
5
59 180 61 91 1
5
3 4 3
21
1 !
\
13 38 26 12 3 2
., , 12
2
1 35 24
.. \ 11 3 2
etonomic data pettaining to each individual of the household. The data thus ~ollected in respect or households related to household cultivation and homehold industry. The household cultivation for this purpose was defined to cover cultivation of plots or parcels of land which are cultivated by tbe household
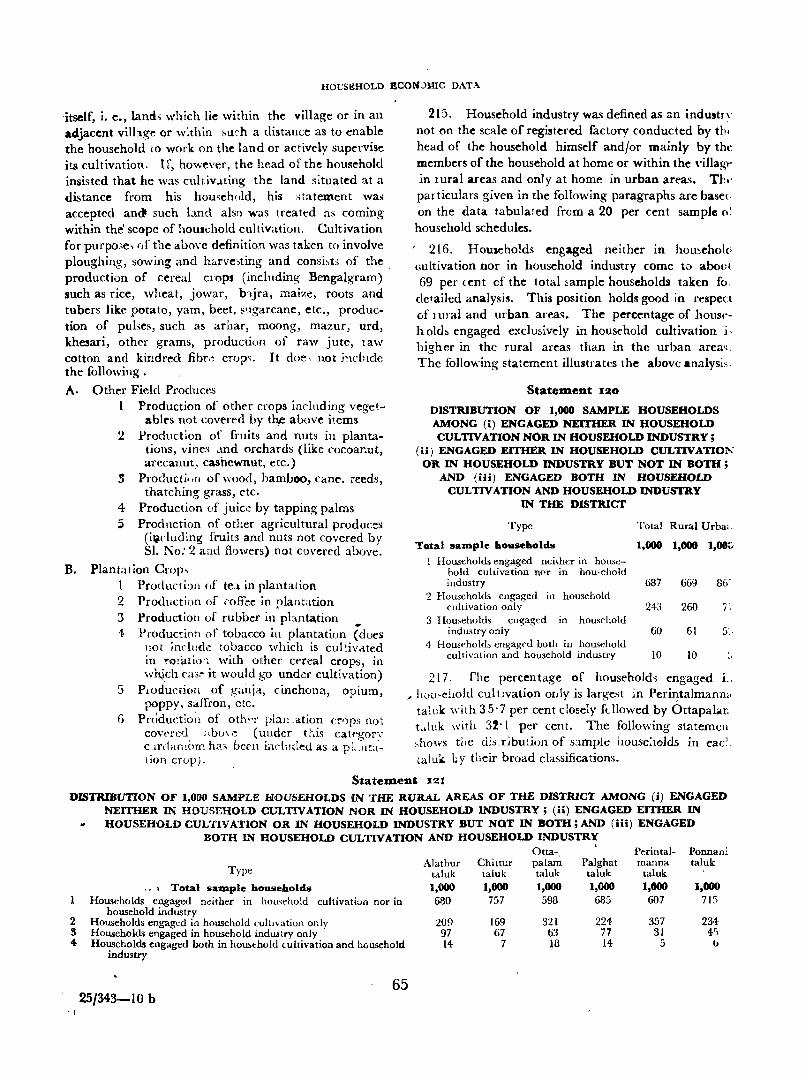
HOl:SEHOLD ECONJ!>UC DATA
itself, i. e., land, which lie within the village or in an adjacent vilhge or withill sUc'h a distance as to enable the household to work on the land or actively supervise its cultivation. If, howeycr, the head of the household insisted that he W:lS cuhiv.l.ting the land s;tuated at a distance from his hou~ehold, his : .. tatement wa,; accepted andt such bnd also was treated as coming within the' scope of household cultivation. Cultivation for purp03e, .,f the abO\-e definition was taken to involve ploughing, sowing and h;,.rve>ting and consi,t:; of the. production of cereal crops (including Bengalgrarn) such as rice, wheat, jowar, b'ljra, maize, roots and tubers like potato, yam, beet. sugarcane, etc., produc. tion of pulses, such as arhar, moong, mazur, urd, khesari, other grams, production of raw jute, law cotton and kindred fibrr~ crop~. It doe, not jndnele the following.
A. Other Fielel Produces I Production of other crops including veget~
abl~s not covered by th,e above items 2 Production of fruits and nuts ill planta.
tions, vine~ .md orchards (like cocoar.ut, arecanut, casnewnut, etc.)
3 Producti.,n of wood, hamboo, cane. reeds, thatching grass, etc.
4 Production of juic~ by tapping palms 5 Procluction of otller agricultural produces
(i,.ch,lding fruits and nuts not covered by S1. No: 2 and flowers) not covered above.
B. Plantation Crop.; Production of te.l in plantation
2 Production of conee in plantation 3 Production of rubber in pbnta,tion 4 Production of tobacco in plantation (does
110t incll!de tobacco which is cultiVated in rotatio'l with other cereal crops, in wh_\ch ca31' it would go under cultivation)
5 Ploduc[i(>ll of g"nja, cinchona, opium, poppy, saffron, etc.
6 P["()ductio;l of oth,'l' pblLation Ct'0PS noJ. covered ;,.bu\,~ (under this catf'"gory c,Ln(aTll()rn ha:, been ii1dilded as a pi-.llta. lion crop).
215. Household industry wa~ defined as an industry not on the sC:lle of registered factory conducted by th. head of the household himself and/or mainly by the member5 of the household at home or within the \'illagr in IUral areas and only at home in urban area~. Th· particulars given in the following paragraphs are basec on the data tabulated from a 20 per cent sample 0: household schedules.
216. Hou:leholds engaged neither in homehol(i Gultivation nor in household industry come to ahovt 69 per (ent of the total ~ample households taken fo.
detailed analysis. This position holds good in respect of 1 ural and urban areas. The percentage of houst>· h old, engaged exclusively in household cultivation i, higher in the rural areas than in the urban area'L The following statement illustrates the above analysis,
Statement 120
DISTRIBUTION OF 1,000 SAMPLE HOUSEHOLDS AMONG (i) ENGAGED NEITHER IN lfOUSEHOLD CULTIVATION NOR IN HOUSEHOLD INDUSTRY;
(ii) ENGAGED EITHER IN HOUSEHOLD CULTIVATIO .... -OR IN HOUSEHOLD INDUSTRY BUT NOT IN BOTH ;
AND (iii) ENGAGED BOTH IN HOUSEHOLD CULTIVATION AND HOUSEHOLD INDUSTRY
IN THE DISTRICT
Type Total Rural Urba1.
Total sample households 1,000 1,000 1,00;:'
I Households engaged neither in house-hold cultivation nor in hou·chold industry 687 669 86:
2 Households engaged III household cultivation only 243 260 7;
3 Homeholds engaged in household industry only 60 61 5:·
4 Householcb engageu both ill household culti\'ation and hou5ehold industry 10 10 .'
217. The percentage of household, engaged 1.. .. hOLl·e!lOld cultIvation oILly is largest in Peri~talmanm'
tahlk ,,·ilh 35'7 per cent closely fdlowed by Ottapalar; Lluk with 32'1 per cent. The following statemell ~hows tlle u;scriburion of sample house:lOlds in eac~_
La.lu'- h y their broad classifications.
Statement 121
DISTRIBUTION OF 1,000 SAMPLE HOUSEHOLDS iN THE RURAL AREAS OF THE DISTRICT AMONG (i) ENGAGED NEITHER IN HOUSEHOLD CULTIVATION NOR IN HOUSEHOLD INDUSTRY; (ii) ENGAGED EITHER IN
.. HOUSEHOLD CUL-llVATION OR IN HOUSEHOLD INDUSTRY BUT NOT IN BOTH; AND (iii) ENGAGED BOTH L."'i' HOUSEHOLD CULTIVATION AND HOUSEHOLD INDUSTRY
Type
,., Total sample households Households engaged neither in household cultivation nor in
household industry 2 Households engaged in household culltvation only 3 Households engaged in household industry only 4 Households engaged both in how,t:hold Lultivation and household
industry
65 25/343-10 b
'I
Alathur taluk 1,000 680
209 97 14
Chittur taluk 1,000
757
169 67
7
Ottapalam taluk 1,000 598
321 63 18
Palghat taluk 1,000
685
224 77 14
Perintal- Ponnan; manna taluk
taluk 1,000 1,000 607 715
357 234-31 45
5 b
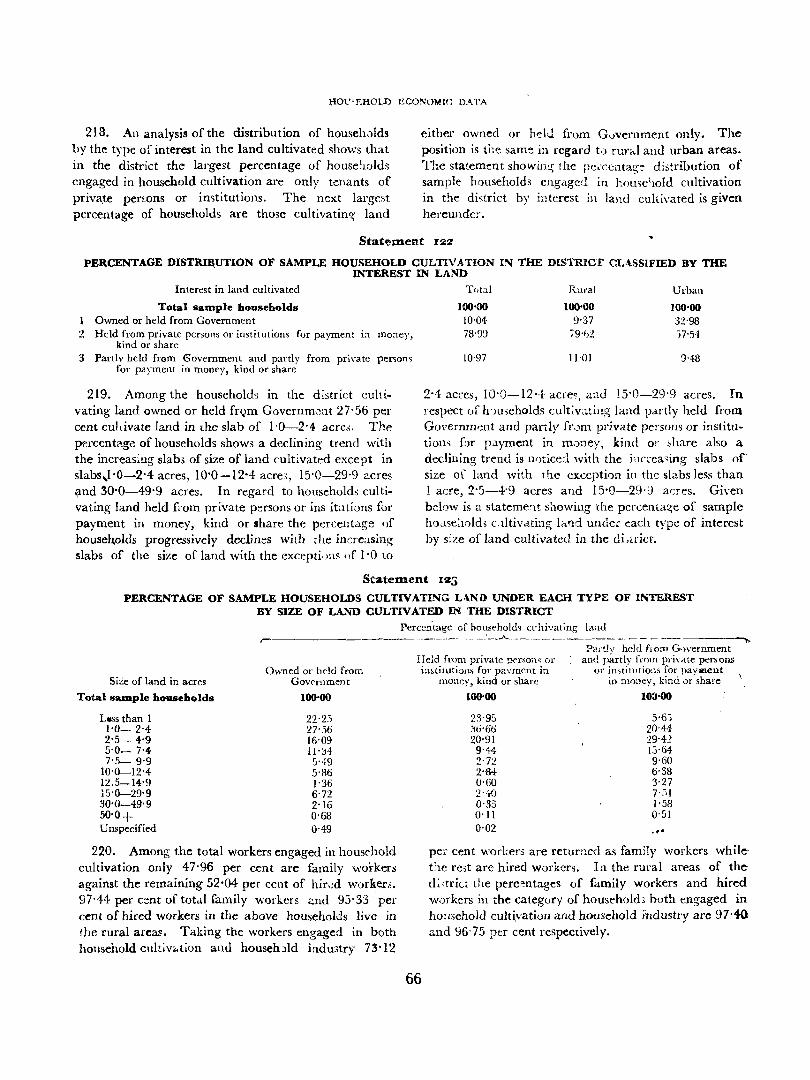
1I0C'EHOLl) ECO~OM:C: DATA
218. An analysis of the distribution of househ.:>lds hy the type of interest in the land cultivated shO'livs that in the district the largest percentage of house:lOlds engaged in household cultivation are only tenants of priva.te perwns or imtitutions. The next largest percentage of households are those culti'/atin'S land
either owned or hdJ from Guvernment only. The position is the sam~ ia regard to runJ and urban areas. The statement showin~ lhe pC"C(;ilta~~ distribution of sample households engaged in home11Old cultivation in the di,trict by interest in land culti\'ated is given hereunder.
Statoement 122
PERCENTAGE DISTRIl\UTION OF SAMPLE HOUSEHOLD CULTIVATION IN THE DISTRICT CLASSIFIED BY THE INTEREST IN LAND
Interest in land cultivated
Total sample households Owned or held from Government
2 Held from private persons or institutions for payment i;l rnO:1ey, kind or share
3 Partlv held fram <Sovernment and partly from pri\'ate persom for payment in money, kind or share
219. Among the households in the district cultivating land owned or held frQm Governm~nt 27·56 per cent cultivate land in the slab of }'0-2'4 acre". The percentage of households shows a declining trend with the increasing slabs of size of land cultivated except in slabs,1·O-2·4 acres, 10·0-12'4 acre:;, 15·0--29'9 acres Ilnd 30·0-49·9 acres. In regard to households cultivating land held from private p::rsons or ins itLltions for payment in money, kind or share the percentage of households progressively declines with [he inereasin~ slabs of the size of land with the excepti.Jlls of 1·0 to
Total Rural Urban
100·00 100·00 100·00 10'04 9'37 32'98 78'99 79'1)2 17'54
10'97 ll'OI 9'48
2·4 acres, 10·0-12·4 acre<, a:1d 15·0-29'9 acres. In respect of h,meholds cultivating land partly held from Governm~nt and partly fr.)m private pe:"sons or jnstitu~ tiol1~ [:)r payment in money, kind or ~hare also a declining trend is nntice::l with the inrreasing slabs of' size or land with the exception in the slabs less than 1 acre, 2·5-4'9 acres and 15·0-29'9 acres. Given bciow is a statement s:lowillg the percenta~e of sample h01l5c;}01d, c.Iltivati3g }<.l1d undei' each type of interest by s:ze of land cultivated in the di,u·ict.
Seatement lit:)
PERCENTAGE OF SAMPLE HOUSEHOLDS CULTIVATL1'oJG L.\.NO UNDER EACH TYPE OF INTEREST BY SIZE OF LA..'II"D CULTIVATED IN THE DISTRICT
Pcrccn'tage of bousehold~ cdti\"ating land ,-._--- ----~ - ·-·--'-~'-------7-------- - - --- -------.,.
Size of land in acres
Total saDlple households
L8SS than 1 1-0- 2'4 2'5- 4'9 5'0~ 7'4.-7'5- 9'9
10'0-12'4 12.5-14'9 15'0-29'9 30-0--49'9 50'0+ Unspecified
Owned 01' held from Gov('rnment
100·00
22"2.) 27'56 16'09 Il'J4 5"'19 5'86 1'36 6'72 2'16 0'68 0'4·9
220. Among the total workers engaged in household cultivation only 47·96 per cent are family 'workers against the remaining 52·04 per cent of hir,:d wor~er.,. 97'44 per cent of tot .. l family workers <:nd 93·33 per cent of hired workers in the above households live in the rural areas. Taking the workers engaged in both household cultiv .. tion anti househJld industry 73·12
Held from private persons or in~litutiollS for payment in
money, kind or share
Partly held flOm GlVernment and partly fmm Pi·i\·..tle persons
or institutions for pay;nent in money, kind or share
66
100000 103·00
23'95 5'6") 31)-66 20'44 20'91 29+! 9'44- Ij'64 2'7'1. 9·60 2'M 6'38 0'60 3'27 2'4-0 ViI 0-35 1'58 O'll 0-51 0'02 ...
pel' cent Vl'orl,ers are returned as family workers whilehe rcst are hired w0rkers. In the rural areas of thedi·,trict the perc~ntages of family workers and hired w0rkers ill the category of household3 buth engaged in homehold cultivatiun and household hldustry are 97·4-() ;;.nd 96·75 ptr cent respectively.
HOU-,EHOLD ECONOllfIC DATA
221. The percentage of hired workers 1) total workers employed by the households engaged in household cultivation only shows an increasing trend with the increase in size of land cuhi'iated except in respect of slabs 10'0-12·4 aCft'.Q, and 50'0 2.crt.:s and above. In the case of households ellgaged both in household cultivation and house-bold industry the percentage of hired workers to total workers shows an increasint{ trend with increase in the si7.c of land cultivated except in
respect of slabs 7'5-9'9 acres, 15'0-29-9 acres and 30·0-49·9 acre'l. The average numher of workers in hou<eholds engaged in household cultivation only is 4·27 person3 against 4'26 in the households engaged in both household cultivation ::nd household industry. The following statemen~ presents the average number of family workers and hired worker; eng2.ged in the type.; of households m~!1:il)ned above.
Statement 124
THE AVERAGE NUMBER OF FAMILY AND HIRED WORKERS AND THE PERCENTAGE OF HIRED WORKERS OUT OF THE TOTAL WORKERS ENGAGED BY THE SAMPLE HOUSEHOLDS IN HOUSEHOLD
CULTIVATION ONLY AND HOUSEHOLDS ENGAGED IN BOTH HOUSEHOLD CULTIVATION Al\'D HOUSEHOLD INDUSTRY
HOlbdlOJdi ell!!":l'2;{'d in houschold cult i';ation only
Hou<,.holds e'l~agt-d in both homdlOld cuhivation alld homehold indmtry
r--------- -- ---- ___ ..,A._ _____________ ~ r-------- ______ o _______ .A. _____ ----------..,
Av('rag'c number of Pl'fCclltac:t: /\':erage nnmber of P<:rcentage r----- - ______ .A. __ ----------, of hilcd r-- ------- ---"---------.., of hired
workers Size of la,ld Total Family Hil-cd
in acrc~ workers worh,rs \\'orkers
All sizes 4'27 2'05 2'22 Lels than 1 2'05 Hj.! 0'43 1-0- 2'4 3-00 1'99 1'01 2'5- -1-9 4'33 2'24 2-09 5'0- 7·4 5·75 2'32 3'4-3 7'5- 9'9 7-87 2'35 5'52
10'0-12'4 8'18 2'48 5'70 12'5-14'9 9°83 2'37 7'46 15'0:'_29'9 10-69 2'43 8'26 30'0-49'9 26'59 2'09 24:-50 50'0+ 20'33 2'35 17'97 Unspecified 2'82 1'91 0'91
\
222. The number of households engaged in household industry cbssified by the principal household industry in tbe district has been given in table B-XIV of this volume. The following ~tatement shows the first ten r~n,ks of homehold industrie, on the basis of this table.
State~ent 125
THE FIRST TEN RANKS OF HOUSEHOLD INDUSTRIES IN THE DISTRICT BASED ON 20 PER CENT SAMPLE
HOUSEHOLDS
Rank
I
II
III
IV
Household Indmtry
lI.fanufacture of materials from c.)l°k, bam!no, canc, leave~ and other allied products
Production of indigenous sU\~ar, gur iioom sugarcane or palm juice and production of candy
Cotton weaving in handlo')ms
Manufacture of sundry hardwares such as G. I. pipe, wire net, bolt, screw, bucket, cutlery
\\'Orkel ...
to total work{'r>
32'04-21'13 33'74 48-23 59'69 70'17 69'64 75°93 77'27 92-15 8!l'3G 32'26
Rank
v
YH
YII[
IX
X
Total Family Hired to total \~orker, \\ ork~r~ workers workers
4'26 3'12 1'14 26'83 2'9') 2-6j 0'34, !l-33 3'jg 3'0\) 0'52 14-63 5'01 3'63 1-38 27-60 6-38 3-63 3-20 46-45 6-50 4'29 2'21 34'07 1'11 0'33 0·78 70'51
11-33 2'33 9·00 79'41 12'43 3-43 g·on 72'41 15°33 3'33 12-01) 78-26 11·0') 1-00 10·00 90'91
HOU'oc!lold Indu<.try
rl'O<luc~jon of other food products sucll a~ S\",(°ct-meat a .d condimt'nts
:,Janufacture of jcwellt-ry, silverware and wares u-,ing !;,old and orhe, precious metah
jHanufactw'c of earth(,llwart' aOld earthen pott~ry
;-'·Ianufacture of coir and coil' products
Manufacture of bidi
CottOn 'pinning other than in m;ll-;
223. The largest percentage ofhousehvld; in all the three categor:e; of households given in the following sta:ement have 4 to 6 members while the lowest percentage are cenfined to single memher households. The following statement sets out the percentage of sample households classified by size and participation in household culti,-ation or household industry in rural areas.
67
GAZETTEER-AY.ATHUtl TALt;K
StatemeDt 126
PERCE~'TAGE OF SAMPLE HOUSEHOLDS CLASSIFlED BY SIZE AND PARTICIPATION IN HOUSEHOLD CULTIVATION OR IN HOUSEHOLD INDUSTRY IN RURAL AREAS OF THE DISTRICT
Percentage of ,----------------..A..---_______________ ---, Households engaged neither in hO'lSChold cultivation nor in
Size of s~mpk households
Total sample households Single member hou"cholds 2-3 members 4-6 membe-r.~ 7-9 members
10 members and ov("1'
GAZETTEER
household industry
100-00 6'26
23'35 45'50 19'12 ,)"47
Alathor Talak (Area: 220'9 ~q. miles; populdtion: 241,496)
22-1-. Alathur taluk is bounded on the north by the Palghat taluk, on the east by the Chittur taluk, on the south by the Mukundapur:lm taluk and on the we5t by Trichur and Talappilly taluks. Alathur taluk, formerly a sub-taluk of Palghat taluk ef Malabar district. wa, railed to the :status of a full-fledged taluk on 1st January 1957. Con~isting of 47 rt:venue villages, this taluk is divided into two firkas, viz., Alathur and Kozhalmannam. The chief crops are rice and cocoanut.
Alathur
225. ' Alathur " meaning the town of' ala' lree5, is situated 13 miles south-we:.t of Palghat on the National Highwa~ connecting Palghat with Tr:chur. This place was ckvatcd to the :-.tatus of a taluk headquarters on 1st January 1957. In the vicinit? of Aiathur lie') tht'" Alathur hill Of Velimab which is 1,202 feet hi!{h. Ab(/~t half way up is a small cave which, judging fr~ml the remnants of mud partition walls and a' small mill, appear> to have been inhabited at onc time. A littlt! higher up are the rcm<.tith \,f a te,nple <md..l natural spring which is never dry. The oldest and famo,Us Syrian Christian church known a~ Malarkot Palli is situated in the Vadakkcihara amsom. Thi; church was built towalds the end of the 18th century by the Syrian Christian settlers from Trichur. There i; also a mo~que and a Roman Catholic church here.
The Mangalam Dam
226. Situated 15 miles from Alathur, Mangalam Dam is mainly intended to irrigate a total ayacut of 6,000 acres. The dam is constructed across Cherukunnapuzha in the \'iIlage limits of Kizhakkancheri and Vandazhi of this taluk. The dam, 450 feet long, h'ls a. reservoir capacity of 626 million cubic feet.
68
Homehold_ engaged in homehold Hotl,t'hold. engaged in household indu5try only cultivation
100-00 100-00 1'75 2'24
18'49 1'2'32 46'78 38'46 24'82 30·73 8'16 16'25
Puduuagaram
227. This place is IJc.lted about six miles due suuth cf Palghat. There iJ a large temple dedic·tted t,) Siva and aho a mosque.
Vadakkuucheri 228. Vadakkuncheri, an important place on the
Nati"nal Highway connecting Palghat with Trichur is situated about 7 miles 50uth-west of AJathur and very near the Txichur district boundary. There is an old Roman Catholic church here. An important Hindu temple named TJrunara is situated close to Vadakkun· cheri. This is held to be of great antiquity, and the tank or spring popularly known by name Brahma· kundam att.-\ched to the temple is held in great veneration by the people, believing it to be, as the name implies, a place where 'Brahma' performed yaga or sacrifice. .\ handful of earth taken from the bed of this s.cred tank i~ comidered essential for the perform4
ance of 3:t('Tific':S by Nambuthiri Brahmans.
Chittur Taluk (Area 446.3 ~q. mile-; ~~pulation: 272,272)
229. Chittur, the sJuth-eastern ta~uk of the district, is bounded on the north by the Palghat tal uk, or:t the east by the Pollachi taJuk ofCJimbatore disu·jct, on the south by the Mu;(Uudapuram taluk and on the we"t h}' the Alathur taluk. The entire taluk has 39 revenue villages. This taluk i..; situated in the cent~e of the Palghat Gap and hence its meteorological conditions are very similar to the adjoining Coimbatore district of Madras S:ate. S~veral river, take their origin from th:s taInk. They include Chitturpuzha, Nelliampathi and Parambikulam rivers. The chief crops of this taluk are paddy, jowar, ragi, castor, groundnut and cotton.
Ayilur
230. Ayilur, a census town of 1951 but declassified in 1961, is situated 18 mile.> away from Chittur. This place appears to have grO\-\'ll up round the Ayiluf temple. This is an important_centre of cotton we~ving.
GAZETTEER-CHITTUR TALUK
«::hittar-Thathalllaagalam
231. It is located by the Chittur river. This is one among the two municipal town,; of the district. The Arts and Science C()ll~!{e, Cilittm' is situ lted on the banks of the Chittur or Anamalai river Wit:l a picturesque background. "The pe )ple of' Ch iuur and its neighbourhood 1 akc considerable interest in a festival, called Kongapad \, which is celeb,ated every year in March. It is said to be the commemoration of a
. victory gained by Cochin over invad~rs from Kongu country. Tradition makes out that the godie>s of the local temple in person led the Cochjn army and slew the Kongu chief with her own nand. All the incidents of the battle, toge her with the cil'curmtances fkat led to it, ~re enacted on the night of the festival. The sham fight is accompanied hy the beatin~ of numerous Paraya drum~, blowing of h 11'ns, racing of horses, torchli~ht proce,~ions, etc., and in the course of it some act al the w.lUnded and some fall dow;} on the field of action as dead. These dead and wounded are immediately taken up and carried to their ~upposed respective houses accompanied by torchlights, beating ,of drums, beating of brea.,t and crying and weeping. At the end of the fight a procession is formed from the battle field and move, through the Nair quarter~ to the temple where it reache~ ju~t before day-break, when there is a display of fire-works ...... Chittur taluk is said to have been once an in~egral part of the territory of the Palghat Raja~, \ .... ho ceded it to the Raj a of Cochin for the assistance rendered by him in defending the eastern frontier of the gap against Kongu jnvader~ . "
Kolleagode
232. K:Qllengode, an important place in the pre:ent Chittur talilk is situated' 12 miles south of Palghat. It was formerly the seat of a p~tty ch'eftain known as Venganatt Nambidi who reigne.:l in the..;e parts before it was fallen into the hahds of the British administratOT'J. The descendants of this ancient family have their residence here. -'The famous Kac~1ankurushi temple dedicated to Vi.hnu is located h~:re. 'As a preliminary step to the p~rformance of a YC/t~ or sacrifice by any Nambutiri Brahman in the district, it is said that the intended sacrificer OUg:lt to come first to this t.empJe and receive from the hands of the Veng4matt Nambidi, the moon-plant (CYTlanchum acidum), the black wood (Mimosa catechu) and the skin of a black antelope all of which are required for the purpose. Six and three miles respectively from this temple on the hills (Tenmala) there are two natural springs called the Govindathirtham and the Sithakundu. Both of these
69
are held in, veneration and. re,orted to by the people. The origin of the form~r ~acred sp'ing is popularly ;.scribed to De:;endra while i,l resp~ct 0;' the latter the tradition current i~ that it wa, crea: ed by Sita, "I_\"il'~ of Rama, the hero of the Ramay.ma, for the purpose of her b.lthing in Ganga, the wa:e,' of th~ Ganges) during th,·ir time of sojourn in tho",: pJ.~'l'> ;n the da:'s of cheir retirement to the jungle for hvly purpQ~es.
Kozhinjampara
233. Kozhilljampara i" located 6 mile:; to the east ofChittur. This place wa" a census town in 1931 but it ,,\as declas"Jied in 1961.
Nallepilly
234. Situated three m:Jes nonh-c?st of Chittur, Nallt-pilly i, an imponant centn: of Tamil Brahmans and it ha~ a subs a'l'ial numb~r of landholders.
Nelliampathi
235. Nelliampathi hills, which lies six miles .tv ihe 50mh of Nemmara and twenty miles from Palghat has great importance both in regard to ecollomic and hydro-electric potentialities. (The Nelliamp.lthi range varies in height f1'O;n 1,500 to 5,000 feei: above t.h~ sea, and consi-;ts of a :Jucce,sion (Jf ridges cut off from one another by valleys containing dark evergreen forests. In the centre or the range is an extensive plateau, the average elevation of which is over 3,000 feet. The hig'hest peak in the range is Nellikotta or Padagiri, 5,201) feet abwe sea level. Vellachimudi, Valiyavana ridge, Myanmudi and Valavacham are other peak,;, each over 4,000 fet!t in height. The climate of the range is cool and pleasant during the greater part of the year, but is feverish in March, April and May. The monsoon rains are heavy, the ;.lvt"rage annual fall bein~ 155 inche~. The tempemture ranges from about 60° F. in December to 85° K in April, the mean temperature being 72° F. The Nelliampathi contains a large number of teak and other valuable treeS of immense ht'ight and girth, but they cannot be exploited for want of a ~uitable outlet to the plains. On the plateau abov~ referred to, land was opened out for coffee growing in 1864. A cnntinuation of the Nelliampathi range toward.> south-east meets Parambikulam. Its highest peak, Karimala gopuram is +,721 feet above the sea level, but the average elevation of the range is considered less than that or the Nelliampathi. Its virgin forests are the most valuable in the State; the teak and other treeS growing there are superior both in grain and in size to the produce of (jther fore~ta. '
OAZRTTEER--OTTAPALAM TALUK
Nemmara 236. Nemmara, an important cotton weaving
centre, is situated fifteen miles to the west of Chittur. More than is per cent of the people are engaged in non-agricultural pursuits, the important trade being cotton weaving.
Ottapalam Taluk (Area: 252'1 sq. miles; population: 324,563)
237. Ottapalam taluk i, bounded on the north by the Perintalmanna tal uk, on the east by the Palghat taluk, on the south by the T~lappilly taluk and on the west by Ponnani and Tirur taluks. This new taluk was carved out from the old Walluvanad taluk on ht January 1957. Consi1ting of 61 revenue villages, this taluk is divided into three firkas, viz., Sreekrishnapllram, Ottapalam and Pattambi. The chief crop:> are
r.ice and cocoanut.
Cherukod 238. Seven miles south-west of Cherplachery on the
Pattambi Road are the remains consisting of walls, wells and bastions, of what must have been one of the strongest Mysorean forts in Malabar. In 1870 after the defeat of Makhdum Ali at Tirurangadi the Mvsoreans fell back on this fort; and, after dislodging th~m, Col. Humberstone made it his base during his advance on Palghat ..
Cherplachery 239. Cherplachery, an important place in the
Ottapalam taluk is located about 10i miles from Ottapalam. On the western border of Aliparamba desom just north of the Thntha'river, between Cherpla~ chery and Perintalmanna, are tr~ces of the walls of a fort,enclosing a deep ,vell and a Bhagavathi temple. The fort is said to have belonged to Kuth.iravattathu Nayar, orice one (,f the Zamorin',; mo~t powerful feuda~ tori~s.... Some old ,epulchr.ll urns h:we been found
there:
Lakkidi 240. The place' Killikutis,imangalam' in Lakkidi
_ viHage is well-known to the people of Kerala. This place had the pri'<iiege of giving birth to an illustrious -son of Kerala, Kunchan Kambiar, the originator of Tulla! Prasthanorn. 'There is a ~trong individuality about his works. From any collectio~ of quotations, his lines could be easily picked out. The, cadences of the verses are perfect. His verses flow with, a grace and elegance that are charming indeed; now and then, they are 'spirited; at other times they ri~e to an ind.ignant and dignified eloquence ; here and there,
are passages of keen sarcasm. His works are strewn with jewels that will sparkle for ever '.
Ottapalam
241. Ottapalam, the headquarters of Ottapalam tal uk, is situated 20 miles west of Palghat. There are a number of temples here. The Trikkang()d temple near Ottapalam is one of the most famous temples in the taiuk. This temple, dedicated to Sankaranarayana, is sacred both because of Siva and Vishnu. An inscription in an unknown tongue is engraved on a granite slab in the building. The temple is much resorted to by women afflicted of fits or possessed of devils. Another important temple, Killikulangarakavu dedicated to Bhadrakali is located about two miles south-we~t of Ottapalam town. "{he period of pooram festival commences from 1st Medarn (April) of every year imd lasts up to 12th Medam. Situated about 3 miles east of Ottapalarr town, the Chenakkathurkavu also dedicated to Bhadrakali, attracts large number of people. The Thalapoli festival of Chathankal1door kavu of Va rode desom attracts about 6,000 persons. At the Ottapalam mosque Nacha festival is conducted every year. About 20,000 devotees attend this function. There are two colleges here, one Arts and Science College and a Training College. The Ottapalam High School is nne of the earliest educational institutions in the district.
70
Pattambi 242. Pattambi was elevated the status of a census
town in 1961. It is located on the right arm of Bharathapuzha, the distance from Shoranur being nine m:les. The Sree Neelakanta Government Sanskrit College, the only one of its kind in the di~trict, is situated about two miles to the west of PattambiRailway Station. It was founded in 1889 by the bte Blmna5seri Narnbi Neela-'kant a Sarma, OJ. great sanskrit: scholar,. who dedicated, his life for the revi.val of Sam:k;rit education in Kerala. The Agricultural Research Station situated about a mile from Pattambi Railway Station was e~tablished in 1927.
Shoranur
243.' Shoranur is an important Railway junction on the Southern Railway, Situated on the right bank of Bharathapuzha, Shoranur is abo an important industrial centre. More than a doz~n metal industries are located here. Shoranur rOSe to prominence by starting a new Government Press, third of its kind in the State, and installing the 110 K.V~ Electric substation. On the other side of the river'facing Shoranur i.i Cheruthuruthy, the seat bf Kerala Kala Mandalam.
GAZETTEZR--PALOHAT TALUK
Vaaiamkulam. 244. Situated four miles west of Ottapalam on the
Ottapalam-Shoranur road, Vaniamkulam has the most important fair in the district. Cattle, grains, nuts, fish (dried), clothes of varioU') sorts, condiments and 'vegetables, are sold here.
Palghat Tab"': (Area: 277·4 sq. miles; Population. : 296,217)
245. Palghat talu~) is bounded on the north by the "Perintalmanna tal uk, on the east by the· Coimbatore taluk, on the south by Alathur and Chittur taluks and on the west by the Ottapalam taluk .. This taluk has ~2
, villages lying in three firkas viz, Palghat town, Elappulli . and Parli. The Pal ghat Municipal town was formed , in 1866. The chief crops of thii taluk are rice, cocoanut and groundnut.
Kallekulangara 246. Situated 5· miles north of Palghat town in
Akathethara village, Kallekulangara is the seat 0f an ancient temple owned by the Palghat Raja and now managed by the Devaswom.
Malam.puzha 247. The ¥alampuzha project with its picturesque
surroundings is situated almost 5 miles from Palghat. This is one of the biggest Irr ',ation Projects in Kerala.
" Costing nearly 5·3t crores the project has an ayacut.of 47,600 acres. There is a fine garden attached to the
,. dam. A convenient and comfortable tourist house ha, 'been provided at the dam site for tourhts. On week ends, the g:lrden is we-ll illuminated.
Olavakkot \
248. Olavakkot is a major railway junction on the Southern Railway and it is 2 miles away from Palghat town. The Indl-htrial Estate, Olavakkot, is situated about 3 miles llo~th 01' Palghat.' Electrical switches and other electric,d equipmcnts, motfJfS, etc., are manufactured here: Timber i, larg-t'ly exported by rail from here. . .
Palghat J
249. Palghat is the headquarters of the district. The fort at Palghat i, historically important. Hyder Ali built thi.> fort, not in the present form, in 1766 as a garrison for his possC's,>ions in the &ou[h. He g,lVe orders for the erection of l:le present Palghat 10rt \'\'hich lies in the centre of the gap in the line of ghats. It was 'judiciously dwsen as an advanced post and depot to facilitate communications with the newly subdued
" province'. It was maintained well during the period <ofTippu Sultan. All round lhe fort there i> a deep
25j343-11 . 71
moat square in shape, the fort, with waUsofimmense thicknes~ and strong bastions at the four comers and in the centre, must have seemed almost impregnable in the days of Tippu Sultan. Palghat was declared as a Municipal town in 1866. Big bazaar is the busiest centre. About 2 miles to the north of the town is situated Kalpathi, the sea.t of Lord Viswanatha. The tempk is owned by the Palghat Raja. An inscription on a stone to the east of the temple reads that the temple was built in 1425 A.D., by Itti Kombi Raja of Palghat. In the last day of Thulam (in November) a car festival is held to which nearly a lakh of people flock from far and near. Surrounding the temple there is a cl uster of Agraharams occupied by Tamil Brahmans. The oldest College in the district; vi;;:., Government Victoria College, is situated on the Palghat-Olavakkot road.
'Iheneri 250. About 8 miles to the louth-east of P~lghat is
$ituated the Theneri temple famous for its' Saraganga , . ThiR sacred spring i~ said to have been created by Sree Rama during his peregrinations towards Ceylon at the instance of his brother Lakshmana who tired of carrying bows and arrows for both, thought of throwing them away, but repented. He confe'sed h:s sin to his brother and w.t:i ordered ~ bath i'l the Ganges by the Ri~hies, Rama shot an arrow into the ground and water from the Ganges bubbled up. The water is said to remain at the same level all the year round.
Walayar 251. The vVdayar uam con'tructed on the Walayar
ri\er ,5 situated nr>ar the boundary of Madras and KeraL, a;:d is about 14 miles from Palghat town along the Palghat-Coimbawre road. This dam irrigates about 8,1)00 acre~.
Perintalmanna Taluk (Area: 620·9 sq. miles; Population: 339,]08)
252. Perintalmanna, the biggest taluk of the di3trict, is bl)undeu on the Inrth by Oottacamunt! and CO(Jlloor taluk, of Madras State and the Ern:1d taluk of Ko;;:hikode district, on the east by Avan •• shi and Coimbatore talil~'s of Madras State, on the south by Ottapalam and Palghat taluks and on the we~t by the T'irur taluk of Kozhikode d;strict. Tllis new taluk was carved Gilt of the old Walluvanad on 1st January 1957. It is treated as an entirely mral t::.luk in 1961. Perintalmanna taluk has been divided into three firkas, viz., Perintalmanna, Mannarghat and Mankada consi~ting of 59 revenue villages. The chief crops of this taluk are paddy, cocoanut, ca~hewnut, pepper and areca-nut
GAZ,ETTEER-PEIUNTALMANNA TALUK
Angadippur 253. Angadippura'fJ( IS an Important raihvay station
in the Shoranur-Nilambnr railway line. It has a beautiful temple called Tirumandhamkunnu situated on the top of a hill. Varioas legends are current about the origin of the temple. According to one tradition a female of Cheruma caste while loppinv, the brancl1es of a tree happened to sh~rpen he;: knife on a stone closeby whereupon the sLne began to bleed. Thi~ nev.s was carried to one K<.ttillamiuath Namhnthiri who believing in the sanctity of the stone, cleared the jungle aroutld~ 'While Chenamakandath N:un-outhiri c;:leared the ground, Pandalakkott Nambuth;ri erected a pandal over the stlne and commenced to make pujas and eventually a temple \va" erected on th~ spot. Another legend is more ambiti0us, and relateS' that the temple was built owr the very lingam th .tt Parvathi
. worshipped daily, presented by Siva to an. aged Brahman in reward for hi, piety. The thicket round the temple i;; considered to be a part of the old f()rest and i'i holy ground, where no twi~s may be cut. It IS
s2.id that Poonthanctni Nambuth;ri, an illu'Strious COil
temporary of Melpathoor had many a;soclJ.tiOl13 with the Tirumandhamkunnu temple. The P'lth~\n;mg;1,di ml)sque is situated one mile from Angad:ppurain 0:1 the Kolathur road. The mosque has an inscfip:ion in Arahic engraved on planks and ~et up in the wdis expbinin'; the benefit<; of ercctin,s a mosCjl~e. This Pa'li consists of two separate buildings, close to c:lch oth~r.
Originaliy there was o.lly a single building, hut another Was b:liit dose by sulx,c llle'ltly f(x
the follo\\"ing reasons given lJy tradition. K;]'l'Uvayur Ivlussad, the Pfime Minister of the Walluva!i::d Raj'1, took oath to pull clown the origind n1osquc. Oil the other hand one I\'furikunnan Pokel' Muppan aLa t(_l':}k oath that he wOllld take ofT the head of the M:llsmd if he were to pull down the mosque, and exhibit the sall1~ for public view on the spot as a sign of rev, n~~'c £lEd
also that two mosques shall be erected in the plac,; of one. TIle Mus5ad and Muppan both ",ccompli~hed their respective anns. Hence the presence (if twd
mosques now m the same ccmpound adjoining each other.
Karimpuzha
254. SituaieJ eight milC"s [I)m I\L~!ll1;.r~:ha:t,
Karimpuzha is tl;c seat of the Eralppad or Second Raja of the Zamorin's fam:!),. Attac~ecl to the palace is a WeJ]·k,o\\'n 1cmple ded;cated to SIC':; Rarr:a. The cclebr~"ted poet, Th,mchat Ezhuthach<.n ];yca here for some time.
72
Kolathur 253. Situated six miles from Perilltalm",'ll1a j it waS.
the scene of the mem)fable out-rages of 1851 and 1373~ In the ne;ghbauritl~' am<;om of Pang arc thrf:":e rock-cut cave~ and a Va,t.ez/ltilll inscription of M. E. 934-(1759 A.D.) carved l)11 :': rock. Palurkoita in Pm~hakattiri amsom ;5 an old £\1't of wh ;ch nothing i;; known ..
Mannarghat 256. Situated 19 Il"liles dne C lst of Perintahnanna
:Mannarg'hi\t is an important placr: ill Pl~rintalmanna taluk. This place took its importance ;:lS the centre of com,merce in ()lden 6nes. This phce wa, a chief centre of the Mappila rebelli')D_ of 1921. The different product') from the Attl.]1p:uli V 111,:,)' and ne~g}ll)()u"ing hills ;tre br()u~;ht down here :mJ taken to V<ll'iCnlS place,.
Perintaln'lanna 257. Perinta:m;mud., the hcadquitrtcrs ()f Pcrintal
manua taluk is situated 42,mi!cs fr,)m Palghat on the l\1,ldras-Calicut Toad. Tlie:e is a network of roads con:lcciing Pcrintalmanna with Kolathl1l', !v[anjeri~
~1alc;.ppuram, Pandikad a:1(1 ;vlclathur, Nlannarghat,. . C~le:'plachel'Y and Pattanlbi. The Government tre.lsury 'W<l$ loote:1 in this place cady i:1 the outbr,~ak of the :Vhppila r.::bdlion of 1921.
Ponual1~ Talult (Arc.l: 162·00 Sf!. mile~; PopuLti()11 : 302,910)
258. P.:'nnani, the only tClluk j'l the disLiCl having a $::a~coa~t is bounded on the north by the Tirnl" taluk" on the cast by Ottapalam and Tah.pp:l!y talu:-:s, on the south by Talappilly and C110wghat tal\lks all J 0:1 the weil hy the Arabian Suo This taJlI;';. is di ;ided into three firka3, vi?:. Pon'1<tn:, Trithj.\a, and Ald~tll:)de
consisting of 45 revenue villages. This talnk has extens;ve cultivatjon of paddy fields int'~i'sp;:rseJ with groves of co'~oa~mt, areca-nut, jack tree", etc.
!{oottanad 259. This 'is in Na,;dLt~':,ri am;Olrl. Fom mlles ~,()uth
uf 'I't'l'JLda, a Lw lUlldl"er! yard, ca;t 'or the Chalisserl road m'l~ tE1e ruilic,l \\1;.-b1L of dl~ l~.ol)ttanatl furt with a clc('p hC\\'it Olit of latc!·ite: The f,)c:, 20') yards in length anJ 176 yard" in bre:Hhh, appo:ars to hl.Vt~ h.~e·l at one lime the principal pl<lcC b this t,',:ct or th~ om'1try for it hac; g;'lcn a name-Kut,an,ld -~o the ll:1d iying south of tl1': Ponnani river, which p:':Qr to the reorganill'atiop of talt{;~·; in W61 fCl.rme(l the Kuttanarl tallik. At one time the fort \'"as p~:~b(lbly' thl': p.lbce of a forgottell Hindu R~lja, and, judging 'In the number of wells in the \"1(; i.ai ty. the <;cn trc of a Jarge town~'" h)cal-·tFadi~ tiO!lS also assign the f~l~t it) Tippu Sulta41. About three mileR r!-()rth-e~s~ or th;s fort is a small building caned
GAZETTEER-I'ONNANI TALCK
Kathilma(;:l.m, built e,1tire1r of granite slabs and in the form uf a Hindu shrine. It is ten feet sq'..larc and of the :;,ame height, having a round dome formed of single slab. Tradition a~Cl ibes its con)otruction to 811pern;.tural agency.
Morkuthala 260. This j, a place i[l Pallikkara amsom of this
taluk. There is a famol1~ Hi'ldu temple here dedicated to ' Devi '.
Panniyur 261. Palliliyur (Iiter;"llr, pig village) is located six
miles west of 1'1 ithala un the Pudirangadi rO<ld. Historically it is an imp:Jrtant place. TJ1I~' Keralolpathi sets forth that the first Brahmans who arrived from various pL(c(':s,did not remain in Keralam owing to their dread of lhe myriads of serp:mts infesting the countl y. Then Parasurama fetched more Brahmam f~om the north and located them in sixty-four villages or gramams'. One of the sixty-four gramamr is Panniyur gramam. Panniyur gramam adopted Vaishnavite faith with V:'i,hnavitc emblem, pig or boar while Chovur gramam that of Saiva. 'The only two villages mentioned in the Syrian's deed of A. D. 774 are PanniJ-llr and Chovur (Choval'am, i.e., Sivapuram= Siv:iI's town) ; so it is difficult to resist the conclullion that there were but two organi'ed villages of Br,\l1mans in "Malab:lf at that time, both Vedic, but of opposite religious views.' Here there is a temple of some archapological importance. The temple is dediGatcd ,to Varahmurti, the third incal nation of Vishnu. It i, beli~v.~d ,thatthetemple was. comtructed by the gre,lt ethical architect 'Uliyannore Thachan' of 'P~rachipetta Panthirukulam'. The Sivapuram temple dedicated to • Dakhimmurthi' is rOllnd in shape and is of ma~sive latel ite ('on'trnction.
Pel'umpadappa
262. Here, it is s.lid, the Cochin Royal Family (Pennnpadappu Swaroopam) had their original place in ancient tim~s and it was from h0re that they subsequently moved to TrippllnithuLI. Here i~ a big wdl of some size attrihuted to the paL\ce which existed here. The Juma Musjid situ1.ted here is held in great esteem due to the exi,knce of the temple of a saint where 'Snake poison is treated with holy water supplied at the tank.
2j/34-3:'__11 (b)'
Ponnani 263. Ponnani is the headquarters of the Ponnani
taluk. The name is traced from 'POll Nanayam' after the ci,'culation of Arab gold coins illtroduced by Arabs and Pers;ans. It is here that the Ponnani river, other. wise known as Bharathapuzha, joins the sea. The well-known Canoly canal also has its route through Ponnani. There is an ancient Muslim mosque (Juma Musjid) of great import,mce to the Muslim community. Muslim~ in general from other parts of Kerala consider the place in great veneration. This was once a centre of religiom education for the 11uslims. There is a regislered association under the caption 'Maunath UI Islam Sabha' which undertakes welfare and cultural works for the 11uslim community and also conversion to Islam. There is also an ancient temple known as Trikkavu temple dedicated to Durga Bhagavathi with a big tank attached to it. The tank is almost square' in ~hape and measures more than two acres in extent. It is here tha.t the English retired from Cochin in 1662 and repulsed Tippu in 1782. Ponnani is a place. where fishermen live in large numb,~rs.
Tavanur
26-1. This is an important village on the banks of Bhar,tthapuzha. It is.here that the ashes of Mahatma Gandhiji were immersed in the holywiiters oi Bharatha. puzha. There is an ancient temple dedicated to Brahma and also an 'Othammar Madham' where the Namboothiries are taught. Vedas.·
Tritha'la 265. Situated 17 _miles ea~t of P,mnani, TriLhala
is an important business centre.
Veliyancode
266. Veliyal1code wa, in olden days a port. The VeliyancoJe puzha vents it up to Viyyam dam pre. venting the flow of salt water entering the Viyyam lake extending s'lUthward and forming almost the eastern boundary of the villages Kanhiramukku, Maranchery, Eramangahm, Perumpadappa a11d Punnayurkulam. There is an ancient mosque here with the tomb of a great religious scholar 'Ummar Quasi' and the p-lace is c\)nsidered in esteem by Muslims. Fishermen live here in large numbers.


APPENDICES

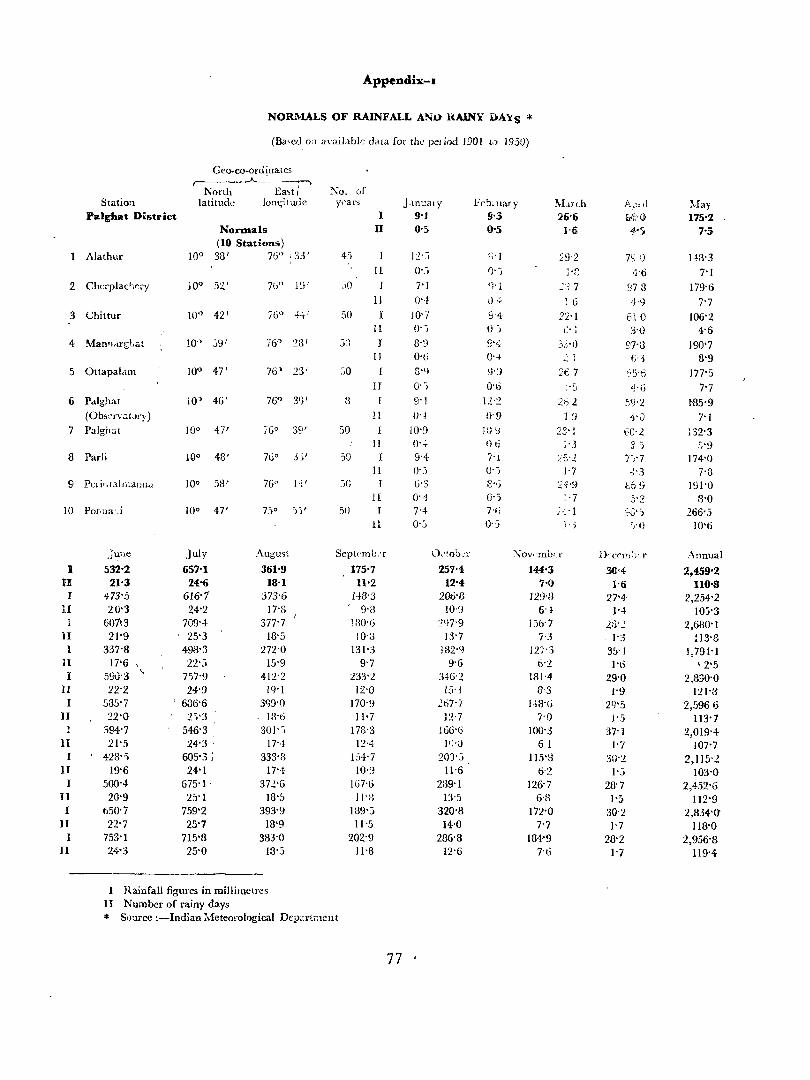
Appendix-I
NOIUI1ALS OF RAINFALL ANO RAINY DAYS * (Ba'cd 0;] avaiLlbk data for the pel iod 1901 t,) 1950)
Station Palghat District
Alathur
3 Chittur
4 Man'lilq:;Lat
5 Ottapalam
6 Palghar
(Obs('rv.:lt"r~ ) 7 Palghat
8 Parli
9 Peri,;(almann.:.\
10 Ponna',i
i fJ: I
II I
1I I
11 I
II I
IJ I
II I
lJ I
II I
11
II
June
532'2 21-3
473'5 20'3
607'3 21'9
337-8 17'6 \
5W·3 ". 22-2
585'7 I
22'0 394'7 21'5
423'') 19'6
5OO-.j. 20'9
650'7 22'7
753'} 24'3
Gco-co-ordinates ,----______..A._. _~ .......
North Ea,t! latitude lon~iluclc
Normals (10 Stations)
10° 38' 7Go : 33'
lOQ 42'
10" 59'
10° 47'
10' 46'
100 47'
H)O 48'
100 58'
100 47'
July
657'1 24'6
616'1 24'2
709'4 25'3
498-3 22':;
757'9 24'9
686'6 2')'3
546'3 24'3 .
605'3 ; 24'1
675-1 25'1
759'2 25'7
715'8 25'0
7Gn 19'
76' 23'
August
361'9 18'1
373-6 17-8
377"7 ]8'5
272"0 15'9
412-2 19-1
399-0 ]8-6
301') 17-·1
333-8 17'{-
372'6 18'S
393'9 18'9
383-0 13<)
Rainfall figures in roillimetres II Number of rainy days
Ko_ of y,'al'l
I II
45 II
II
.50 II
II 50
3
50
50
II
I
If
II I
II I
1I
11
Sep(cmiJ.-r
175'7 11'2
148-3 . 9'8
180'0 10':3
131'3 9'7
233'2 12'0
170'9 11'7
17S-3 12'4·
154-7 IO'~
167-6 11\:)
la9''"} 11-5
202-9
1l'8
* Source :-Indian ::V[cteoroiogical Dep:lrlracnt
j,lnualY 9'1
0''''
12',) 0-.)
7'1
0'4 10-7 0-)
8'9 0'6 S'lf
0'-,
g'! O-j
10-9 0-';'
9'4-0',)
u'3 0'4 7'4 0-:)
77 '
251'4 12'4
20ti'S JO'1)
:!'l7-9 13'7
132-9 9-6
346'2 15'1
2ti7-7 1:n
lW'(j 1';'0
20Y) 1l'6
239-1 13'5
320-8
14'0 286-8
12-6
Feb: nary 9'3 0'5
144'3 7'0
129'8 6- }
1.}(j·7 7·3
rD':) 6-2
181'4 8·3
143-()
7'0 10(),3
6 I lIS'S
6'2 126-7
6·8 172'0
7'7 184'9
7'0
16
22-1
3Z·1) ::. I
2fi 7 t·,)
262 1 ')
2Z'j >3
'1'£'2 J-7
24'9 J'7
:.~ ·1 }·3
A,)! ,I &>\?t;}
4l'5
4'6
978 4<)
610 3'0
97-3 I'd
"5'6 4'0
::·9'2 Lj<i)
60'2
7)-7
->3 1069
:)'2
:ro'{l
t'6 27'4-
]'.J.
. ]-3 35-] hi
29-0 ]-9
2')'.5 }'S
37'] 1'7
30-2 I'j
28'7 J-:,
30'2 )'7
28'2 1'7
May 175'2
7'5
1·m-]
7'1
179'6
7'7 106'2
4-6
190'7 8'9
177'5
7'7 t8S-9
7-1
,32'3 :,'9
174'0 7-8
191'0 3-0
266-,1 10'6
Annual
2,459'2 110'S
2,254'2 10')'3
2,680'1 !13'/3
1,791-1 , 2'S
2_890'0 121-3
2,.5966 113'7
2,019'4 107'7
2,115'2 103-0
2,452'6 112'9
2,834'Q 118'0
2,956'8 119'4-
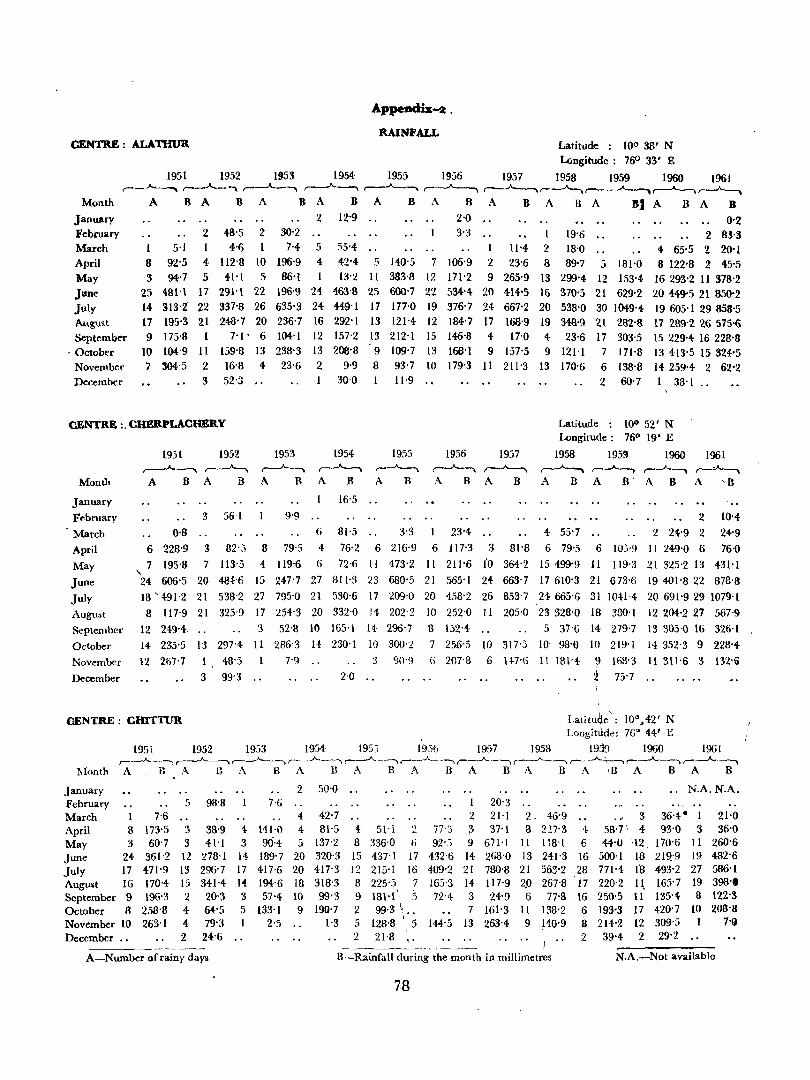
Appendis-2 ,
RAINFALL CENTRE: ALATHUR Latitude : 100 38' N
Longitude: 7fP 33' E
1951 1952 1!J53 1954 1955 1956 1957 1958 1959 1960 1961 ,-_......._~ r--A..--, ,--.A.-. ,--..A.---,\ ,.--~ ~ ,--...._____ .-~~,......-A----,~
Month
January February March April May
JWle July August
September , October
November December
Month
January
February
March
April
May
June
July August
September
October
November
December
. A B A B A 8 A B A B A B A B A B A BJ A B A B
2 12'9 2'0 0'2 2 4-8'5 2 30'2 3'3 1 19-6 2 83-3
5'1 1·1-6 ,.... 5 55'4- ., I 11-4 2 18'0 4 65'5 2 20'1 8 92'S 4 ll2'8 10 196'9 4 42'4 5 14-0'5 7 106'9 2 23-6 8 89'7 5 181'0 8 122'8 2 45'5 3 94'7 5 ~1'1 5 86'1 1 13'2 11 383'8 12 171'2 9 265'9 13 299'4- 12 153'4 16293-2 II 378-2
25 481-1 17 291'1 22 196'9 24 463'8 25 600'7 22 534'4 20 414-5 16 370'5 21 629'2 20449'521 850'2 14 313'2 22 337'8 26 635'3 24 #9'1 17 177'0 19 376'7 24 667'2 20 538'0 30 1049-4- 19605'1 29858'5 17 195-3 21 248-7 20 236'7 16 292'1 13 121'4 12 184'7 17 168'9 19 348'9 21 282'8 11 289'2 26 575~ 9 175'8 7'1' 6 104'1 12 157'2 13 212-1 15 146'S 4 17'0 4- 23'6 17 303'5 15229-4 16228-8
10 104'9 II 159'8 13 238'3 13 208'S 9 109'7 13 166'1 9 157'5 9 121'1 7 171'8 13413-5 15324'5 7 304'5 2 16'8 4 23-6 2 9'9 8 93'7 10 179'3 Il 211'3 13 170'6 6 138'8 14259'4 2 62-2
3 52'3 30'0 11,9 2 60'7 1 38'1
1931 1952 1953 1954 r--"---. A B
16'5
1955 ..---.A...-; A B
1956 19j7 ,---'----. __ .A..-....,
A B A B
Latitude : 10° 52' N Longitude: 76° 19' E
1958 195~ 1960 1961 ~ ,-_"'_--, r-~ r--:A.~ A B A B' A B A 'B
3 56 1 9'9 2 10'4
0·8 6 SI'5 3'3 1 23'4 4 55'7 2 24'9 2 24'9
6 228·9 3 82'5 8 79-5 4 76'2 6 216'9 6 1I7'3 3 81'8 6 79-5 6 10,';'9 11 249'0 6 76'0
7 195'S 7 113'5 4 !I9'6 6 72-6 11 473'2 11 211'6 io 364'2 15499'9 11 119'3 21 325'2 13 431'1 \ 24 606'5 20 484'6 15 247'7 27 811·3 23 680'5 21 565'1 24 663'7 17610'3 21 67% 19401'822 87S'8
18 '491'2 21 538'2 27 795'0 21 530'6 17 209'0 20 458'2 26 853'7 24665'6 31 1041-4· 20691'9291079'1
8 117'9 21 325'9 17 254'3 20 332'0 14 202'2 10 252'0 11 205'0 23 328'0 18 380'1 12 204'2 27 567'9
12 249'4 3 52'8 10 165-1 14 296'7 8 152'4 ., 5 37'6 14 279'7 13 305'0 16 326'1
14 235'5 13 297'4 11 286'3 It 230'1 10 300'2 7 256'5 10 317'5 10 98'0 10 219'1 14 352-3 9 228'4-
12 267'7 1 48'S 7'9 3 90'9 6 207'8 6 14-7-6 11 181:4 ? 16B'3 11 311'6 3 13Z'{i
3 99'3 2'0 r 7'5'7
(lENTRE: CHITTUR Latitu4e': 10".42' N Longit~de: 76~ 44' E
1951 1952 1953 1954 195j 1936 19~7 1958 1910 1960 1961 - r---__"_--..,-~r--_.o\..--..r--~.A.--"r-___.A.---"r--.A..---..r-__;"_.-.. r--__"'__-"r-_..A..-\-'--"r--.A..~-.. r---A.-,
Month A nAB:\ BAll A B A B A B A B A ,B A B A B
January 2 50'0 ., N,A. N.A. February 5 98'S 7'6, , I 20'3 March 7'6 4 42'7 2 2H 2- 46'9 April 8 173'5 :3 38'9 4 lRO 4 81'5 4 51'1 2 77'S ~ 37'1 8 227'3 4 May 3 60'7 3 41'1 3 90'4 5 137-2 8 336,0 Ii 92<> 9 671'1 11 118'1 6 June 24 361'2 12 278'1 14 189'7 20 320'3 15 437'1 17 432'6 14 268'0 13 241'3 16 July 17 471'9 13 296'7 17 417-6 20 417'3 12 215-1 16 409'2 21 780'8 21 563'2.28 Augu~t 16 170'4 15 341-4 1{ 194'6 18 SIS'S 8 225'5 7 165'3 14 1I7'9 2,0 267'8 17 September 9 196'3 2 20'3 3 57'4 10 99'3 9 ISH \ 5 7:N 3 24'9 6 77-8 16 October 8 258'8 4 64'5 5 133'1 9 190'7 2 99·3 \:,. 7 161'3 11 138'2 6 November 10 263'1 4 79'3 1 2'5 1'3 5 128'8 I 5 144'5 13 263'4 9 140'9 8 December ,. 2 24'6 2 21,8 ',. 2
A-Number of rainy days B-Rainfall during the month ill millimetres
78
3 58'7\ 4 44'0 12.
500'1 18 77l'4 1'8 220'2 1~. 250'5 11 193-3 17 214'2 12 39'4 2
36'4· 1 93'0 3
170'6 Jl 2W'9 19 493'2 27 165'7 19 135'4 8 420'7 10 309'5 I 29'2
21-0 36'0
260'6 482'6 586'1 398" 122'3 20S-8
7'Q
N,A,-Not available
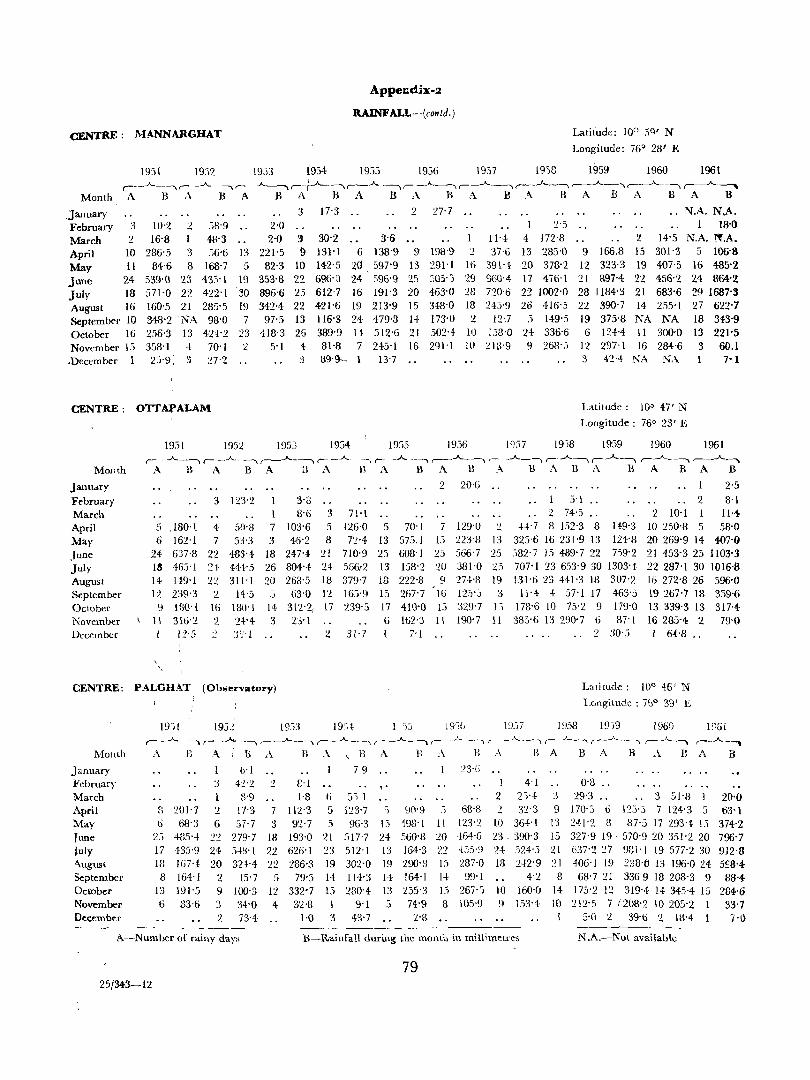
Append.ix-2
RAlNFALL-(contd.)
CENTRE: MANNARGHAT Latit'ude: 100 5Q' N
Longitude: 76 Q 28' E ,
1951 1932 1%3 1954 19:;:; 1936 1937 19)8 1959 1960 1961 , __ .A. __ -., _.A. -'''''''' ~ ,-+-,-,_-.,---.A. ___ r- _.A.~ ,_.A._-.~ ,_.A.---,,.-_.A._-, ~
Month A B A B A B A B A B A B A B A B A B A B A B
.January 3 17'3 2 '1.7·7 " N.A. N.A. February 3 10'2 '1. 58'9 2'0. , 2'5 1 18'0 March 2 16'8 I 48'3 2'0 ~ 30'2 3'6 I H· 4 172'8 2 14'5 N,A. N.A. April 10 286'5 3 56'6 13 221'5 9 131'1 6 138'9 9 198·9 '1. 37'6 13 285'0 9 J66,8 15 301'3 5 106'8 May 11 84·6 8 168'7 5 82'3 10 142'5 20 597'9 13 291'1 16 39]-4, 20 378'2 12 323-3 19 407'5 16 485'2 June 24 539'0 23 43~'1 19 353'8 22 696'0 24 596'9 25 :;05' ') 29 960'4 17 476'1 21 897'4 22 456'2 24 864'2 July 18 571'0 22 422'1 30 896'6 25 612'7 16 191'3 20 463'0 28 720'6 22 1002'0 28 1184'3 21 683'6 29 1687'3 August 16 160'5 21 285'5 19 342'4 22 421'6 19 213'9 15 348'0 18 243'9 26 416'5 22 390'7 14 255'1 27 622'7 September 10 348'2 NA 98'0 7 97'S 13 116'3 24 479'3 1+ 173'0 2 12'3 :; 149'5 19 375'8 NA NA 18 343'9 October 16 256'3 13 424'2 23 418'3 26 389'9 H 312'6 21 502'4 10 138'0 24 336'6 6 12·H· II 300'0 13 221'5 November 15 358'1 .~ 70'1 2 :>'1 4- 81'8 7 2.Jc5·1 16 291'1 10 213'9 9 268'.; 12 297'1 16 284'6 3 60.1 ,December 1 25'9: :3 27'2 .. :3 (39-~- 1 13'7 3 4-2'{ NA N'\ 7-1
CENTRE: OTTAl'ALAM Latitude: 10" 47' N
Longitude: 760 23' E
Month
Jallu"ry February March April May Tune July August September October Novembtr December
19;)1 1954 1953 1954 1955 1956 l 1l57 19}8 1959 1960 1961 r- - ..A-_~ r- __ .A..._ -~ r--.A..~ r- _ _A..._ --I r- _...A.. --~ ,--~----.. r- _...A-_--.., f..-A..~ r----"---....., ,...---"------... r------A..--"'""\
A 11 ABA HA HA BA B ABABA BA BA B
2 20'6 1 2>5
3 123'2 3'3 5·\ 2 8'1 1 8'6 3 71,1 2 74'5 2 10'1 11,4-
5 ,WO'1 4- 50-8 7 103>6 5 !26'0 5 70'[ 7 129'0 2 H-7 8 152'3 8 H9'3 10 250'8 5 58'0 6 162'! 7 53'3 3 46'2 8 7:!-+ 13 575.! 15 223'8 13 325·6 16231'9 13 124'8 20269'9 14 407'0
24 637'8 22 483-4 18 247-4 21 710·9 23 608'1 25 500'7 25 .182'7 15 489'7 22 7'i9'2 21 453>325 1103'3 13 463·1 21 444-5 26 804'4 24 500;2 13 158'2 :20 381'0 25 707'1 23653'930 1303'4 22 287'1 30 1016,8 14 149-1 2:! 311'1 20 268'5 18 379'7 18 222'8 9 274-8 19 131-623 Hl'3 18 307'2 16272'326 596'0 U 239'3 2 14'5 .) 63'0 12 163'9 15 267'7 16 125'.) 3 11'4 + 57'1 17 463'5 19267'7 18 359'6 9 ~80-1 16 180'l 14 3\2'2: 17 239'5 17 410-0 13 329'7 I; 178'6 10 7,)'2 9 179'0 13339'313 317'4-
\ II 31\)<.1. 2 24'4 3 23-1 6 162-3 1\ 190'7 11 385'6 13 290>7 I) 87-1 16 285-4 2 79'0 1 12-5 ,) 3i)-1 2 31'7 I 7'1 2 :lO-5 1 6-4:'8 ..
CENTRE: PALGHAT (Observatory) Latitude: 10° 46' N
Longitude: 7bo 39' E
19}2_ 195::1 19-,~ 1 SS 19:;7 1958 1%0 I~S[
r- __ ..A.. --~ r- _.A --I ,----"-~, r- _ _A_ __ ~ r- -_,).._~1 r- _ _,"_ ----, r- _-A. __ -." r--~ ,-_ __..A- ---"-) r-__.}"_-~ r--~--.
MOlltl!
January February March April May Tune July August September October November December
A B A J n A II,\, 13 A R.\ B _,\ B A B A B A B A B
1 {J'I 1 7 9 23·6 3 4~'2 2 (;-1 ,_ 1 4'1 0'8 .. 1 8'9 1·8 ti ~)'i 1 2 2,)'4 3 29'3" 3 51-8 20'0
3 201'7 2 17·3 7 112'3 5 123·7 'i ~(l.g .) 68·8 2 32'3 9 170'::; I) 1~5-::; 7 124'3 3 63-1 ti 68'3 6 57'7 3 92-7 :1 96-3 Li 493-1 11 123'2 10 364-1 1::1 241-2 3 87'S 17 293'4 13 374'2
2,) 485'4 "~'I 279-7 18 193'0 21 ::;17,7 24 560'8 20 .J.6{·G 23,390'3 15 327'9 19,570'920 351'2 20 796'7 17 43"'9 24 .'i.J.tH 22 626'1 23 512'1 13 164'3 22 ~55'9 24 524'3 21 637'2 '27 91Ji'1 19 577'2 30 912-8 18 I(iN 20 32!-4 22 286'3 19 302'0 19 290-3 IS 287·0 111 242>9 21 406'1 19 238,t! 13 196'024- 5£8'4-8 164·1 2 15'7 5 79'3 14 114'3 14 164'1 H 99'1 4'2 8 68'7 21 3369 18 208'3 9 88'4-
13 191-::; 9 100'3 12 332·7 15 230'4 13 255'3 15 267""; 10 160'0 14 175-2 1'2 319-4 14345>4 15 284'6 6 83'6 3 34'0 4- 32'8 I 9-1 5 74'9 (3 105·9 9 153-4 10 212-5 7 i 208-2 10 205'2 1 33'7
'l. 73'4 l'{) 3 43-7 2'8 s-n 2 39'6 '2 18'4 7-0 ----------------------
A-Number of raiuy day, B-Rainfall duri.ng the monlh in millimetres N ,A.-Not available
79 25/343-12
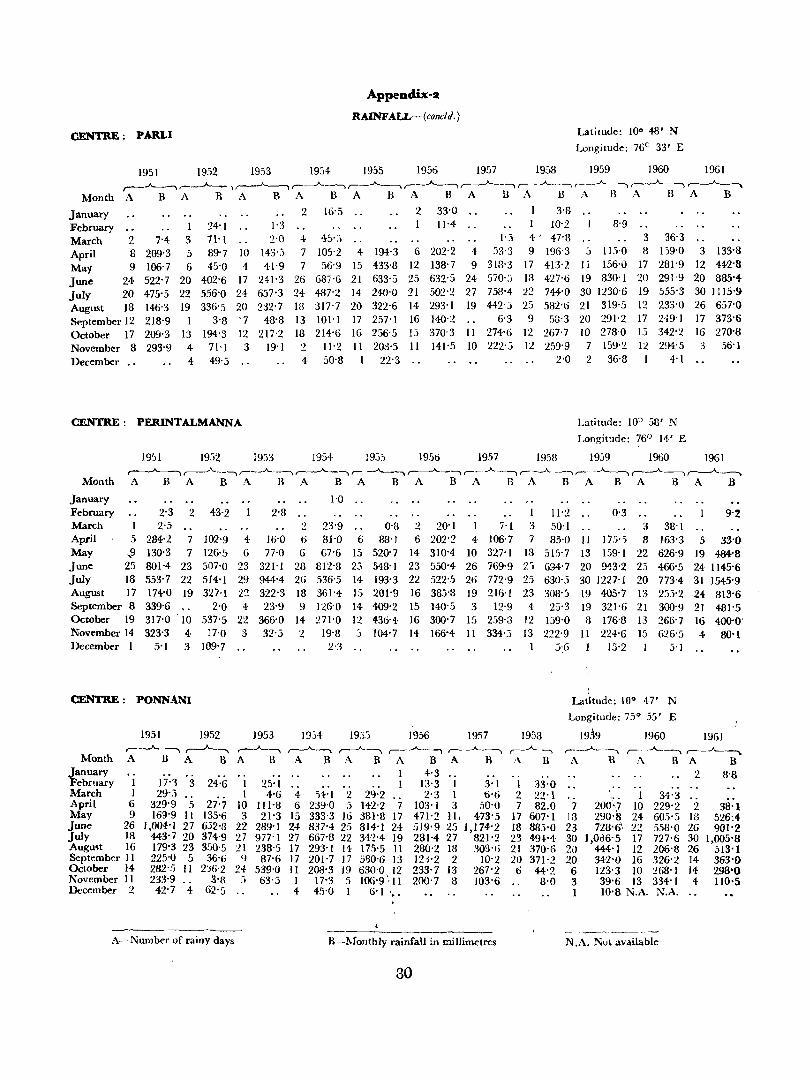
Appenclix:-a
RAlNFAU.-(concld.)
CENTRE: PARLI Latitude: 100 48' N
Longitude: 76° 33' E
1951 1952 1953 19:i4 1955 1956 1957 1953 1959 1960 1961 ,--~,--.-...-A-- 1,----"----. ,-_...A.._, ,-_.A..____" ,-_.A.-----, ,-__.A.-_, ,-_.A. ___ --, r---"- -, ,..----..1<..---.., ,..---.-.-..A.--.,.
ABA BA BA BA BA BA SA 13:\ BA J3A B Month
January February March 2 April 8 May 9 June 24 July 20 August 18 September 12 October 17 November 8 December ._
7'4-209'3 106'7 6 522'7 20 475'5 22 146'3 19 218'9 I 209'3 13 293'9
1 3 5
4-4
2 16'5 2 33'0 I 3'8 24'1 1'3 IH 71'1 Z'O 4 '15' ~l 1-:1 89'7 10 143-5 7 105'2 4 194'3 6 202'2 4 :i3'3 45'0 4 41'9 7 56'9 15 433'8 12 138'7 9 313'3
402'6 17 241'3 26 687'6 21 633-;> 25 632'5 24 570':; 556'0 24 637'3 24 487'2 14 2W'0 21 502'2 27 758-4 336'5 20 232'7 18 317'7 20 322'6 H 293'1 19 442'')
3'8 '7 48'8 13 101'1 17 257'1 16 140'2 6'3 194'3 12 217'2 18 214-'6 16 256'5 1,) 370·3 II 274'6
71'1 3 19'1 2 1l'2 II 20g'5 11 141'5 10 222'5 49·.) 4 50'8 22'3
JO'2 4' 47'8
8'9 3 36'3
9 196'3 j 115·0 8 1)9'0 3 133-8 17 413'2 Ii 156'0 17 281'9 12 442'8 IB 427-6 19 830'1 20 291'9 20 885-4 22 744'0 30 1230'6 19 555'3 30 1115'9 25 582'0 21 319'5 12 233'0 26 657'0 9 58'3 20 291'2 17 N9'I 17 373'6
1:.1 267-7 10 278'0 Li 342'2 16 270'8 12 259'9 7 159'2 12 294'5 ::> 56'1
2'0 2 36'8 4'1
CENTRE: PERINTAi.MANNA Latitude: 10'} 58' N
Longitude: 760 14.-' E
January February March April 5 May ,9 June 25 July 18 August 17 September 8 October 19 November 14 December 1
1951
2'3 2 43'2
7 102'9 2'5
284'2 130-3 801'4 23 553'7 22 174'0 19 339'6 317'0 323-3
7 126-5 507-0 23 514-1 29 327'1 n
4 G
5'1
2'0 4 . IO 537'5 22
4 17'0 3 3 109'7
CENTRE: PONNA.."'U
1933
2'8
16'0 no
321'1 944'4-322'3 23'9
366'0 32'5
1954
1'0
.) 23'9 6 81'0 6 6 67'6 15
28 812'8 2~
26 536'5 14 18 361'4 15 9 126'0 14
14- 271'0 12 :2 19'8 .)
2'3
1955
0'8 88'1
520-7 548'1 193'3 201'9 409'2 436'4 104'7
19Sti 1957 1958 1959
I 11'2 0'3 :2 20'1 7'1 3 50'1 6 202'2 4 106'7 7 85·0 II 17.':.':;
14 310'4 10 327'1 18 515'7 13 159-1 23 550-4 26 769'9 2. 694'7 20 943'2 22 522'5 26 772'9 25 630'5 30 1227'1 16 333'8 19 216'1 23 30S'3 19 405'7 IS 140'5 3 12'9 4 25'3 19 321'6 16 300'7 15 259';3 12 139'0 8 176'8 14 166-4 11 334'3 13 222'9 Jl 224'6
I j:G 1 15'2
,
1960 1961
3 38'1 8 163'3 5 33'0
22 626'9 19 484'8 23 466'5 24 1145'6 20 773'4 31 1545-9 13 255'2 ·24 813'6 21 300'9 21 481'5 13 266'7 16 400'0 15 626'5 4- SO-I
5'1
Latitude: 10° 47' N
Longitude: 75° 5.)' E
1951 1952 1953 1934 1953 19.')6 1957 1953 1960 1961
Month ,----A- ----. ~ ,--~ ,--"-----. A 1.1 A HA B A B
,-_..A.---, ,-_"""'__, ~~_~ A B A B A B
r--...A...~ ;\ H
,.....~- ~""""_-----. ,---~
A B A B January February 1 March I April 6 May 9 June 26 July 18 Augu~t 16 September II October 14 November II December :2
17''3 3 24'6 I 29'5 I
329'9 5 27:7 10 169'9 11 135'6 3
I,OO'H 27 632'8 22 443'7 20 374'9 27 179'3 23 350'5 21 225'0 5 36'6 <J 282':j I I 2]6'2 24-233'9 3'H 42'7 4- 62'5
A--Number of rainy days
25'1 4'6 4-
I II'B 6 21'3 IS
289'1 U 977'1 27 238'5 17 87-6 17
539'0 II 63<> 1
4
54'1 :.1 239'0 5 333'3 Iti 837'4 25 667'8 22 293'1 14 201'7 17 208'3 19
17'3 5 45'0
I {'3 I !i3'3 I 3'1 1
29'2 142'2 7 381'S 17 814'1 24 34'2-4 19 17')'5 II 5'30'6 13 630'0 12 106'9"11
(jol I,.
2'3 I 6'6 2 103' 1 3 50'0 7 471'2 It, 473'5 17 519'9 25 1,174'2 18 281'4 27 821'2 23 280'2 18 30B·t) 21 121'2 2 10'2 20 233'7 13 267'2 6 200'7 8 103'6
B-Monthly rainfall in millimetres
30
2 8'S 33'0 22'1 82.0 7
607'1 IS 883'0 23 49H 30 370·f) 2i) 371'2 20 44'2 6 8'0 3
1
1 34'3 200~7 10 229'2 2 290'8 24 605' 5 18 728'6\ 22 558'0 26
I,Od6'5 17 727'6 30 444'1 12 206'8 26 342'0 16 326'2 14 123'3 10 268'1 14 39-6 13 334'1 4 10-8 N.A. N.A.
--------N.A_ Nv' available
38'1 526:4 901'2
1,005'8 513'1 363-() 298'0 110-5
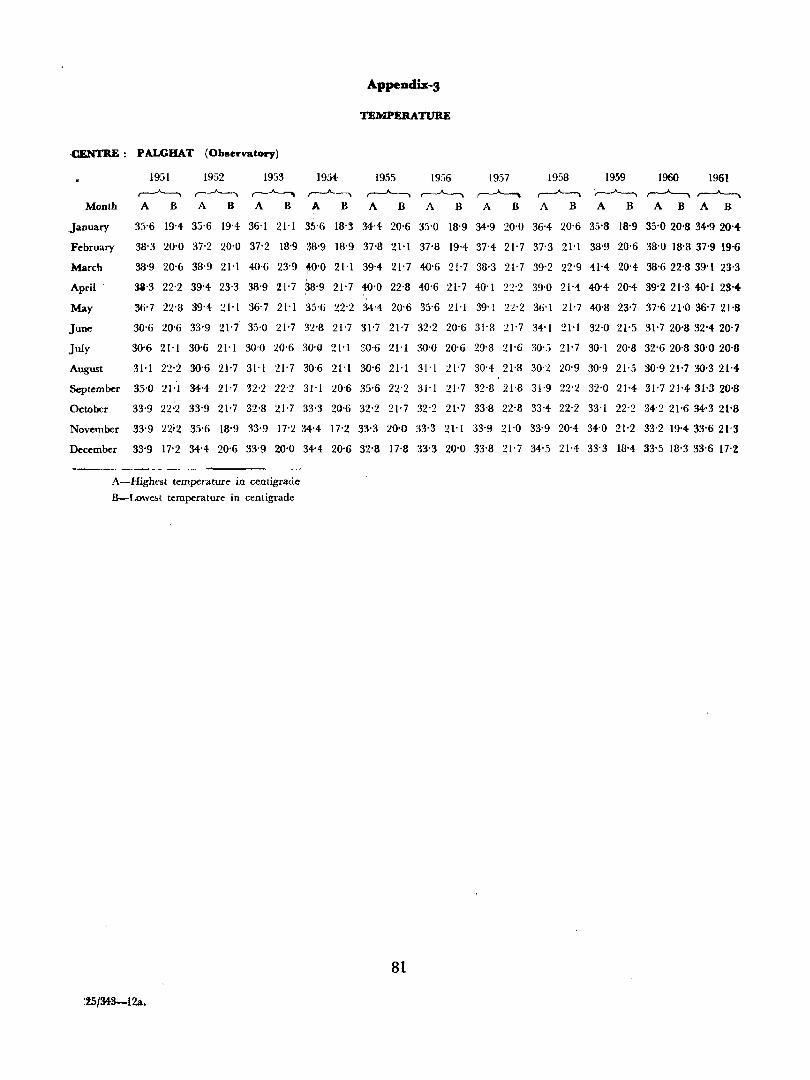
Appendix-3
TEMPERATURE
-CENTRE : PALGHAT (Observatory)
1951 1952 1953 1954 1955 1956 1957 1958 1959 1960 1961
r---"----. r---"----. r--~ r-"----. r--"-------.. r-"----. ~ r-"-----. -r---"----. r-"----. r-"-------.. Month A B A B A B A B A B A B A B A B A B A B A B
January 35-6 19-4 35-6 19-4 36-1 21-1 35-6 18-3 34-4 20-6 35-0 18-9 34-9 20-0 36-4 20-6 35-8 18-9 35-0 20-S 34-9 20-4-
February 38-3 20-0 37-2 20-0 37-2 18-9 38-9 18-9 37-8 2I-l 37-S 19-4 37-4- 21-7 37-3 21-1 3S-9 20-6 38-0 18-S 37-9 19-6
March 38-9 20-6 38-9 21-1 «l-6 23-9 fO-O 21'1 39-4 21-7 4{)-6 21,7 38-3 21-7 39-2 22-9 41-4 20-4 38-6 22'8 39-1 23-3
April 3a-3 22-2 39-4 23'3 38-9 21-7 as-9 21-7 4{)-0 22'8 4{)-6 21-7 40-1 22-2 39-0 2l'4 4{)-4 20-4 39-2 21-3 4{)'1 23'4-
May 36-7 22-8 39-4 21-1 36-7 21-1 35-6 22-2 3·H 20'6 35-6 2I-l 39-1 22-2 36-1 21-7 «l-S 23-7 37-621-036-721-8
June 30-6 20-6 33-9 21-7 35-0 21-7 32-8 21-7 31-7 21-7 32-2 20-6 31-8 :n-7 34-1 21-1 32'0 21-5 31-7 20-S 32-4, 20-7
July 30-6 21'1 30-6 21'1 30-0 20'6 30'0 21'1 30-6 21'1 30'0 20'6 29'8 21'0 30'5 21'7 30'1 20'8 32'6 20'8 30'0 20-8
August 31'1 22'2 30'6 21'7 31'[ 21'7 30'6 21'1 30-6 21'1 31'1 21'7 30'4 21'8 30-2 20'9 30-9 21'5 30'921'7 30-3 21-4,
September 35'0 2H 34'4- 21'7 '32'2 22'2 31'1 20-6 35'6 22-2 31'1 21'7 32'8 21'8 31'9 22'2 32'0 21-4 31'721'4,31-320-8
October 33-9 22:2 33'9 21'7 32'S 21'7 33-3 20'6 32-2 21'7 32-2 21'7 33'8 22'8 33'4- 22'2 33'1 22-2 34'2 21'634'321-8
November 33-9 22~2 35'6 18-9 33'9 17'2 34'4- 17'2 33-3 20-0 33'3 21-1 33'9 21'0 33-9 20-4 34'0 21-2 33'2 19'4 33'6 21-3
December 33'9 17'2 34'4 20'6 33'9 20'0 34-4 20'6 32'S 17-8 33'3 20-0 33'8 21'7 34'5 2l'4 33'3 18'4 33-5 18'3 33'6 17'Z
A-Highest tempel'ature in centigrade
B--Lowe~t temperature in centigrade
81
:25/343-12a.
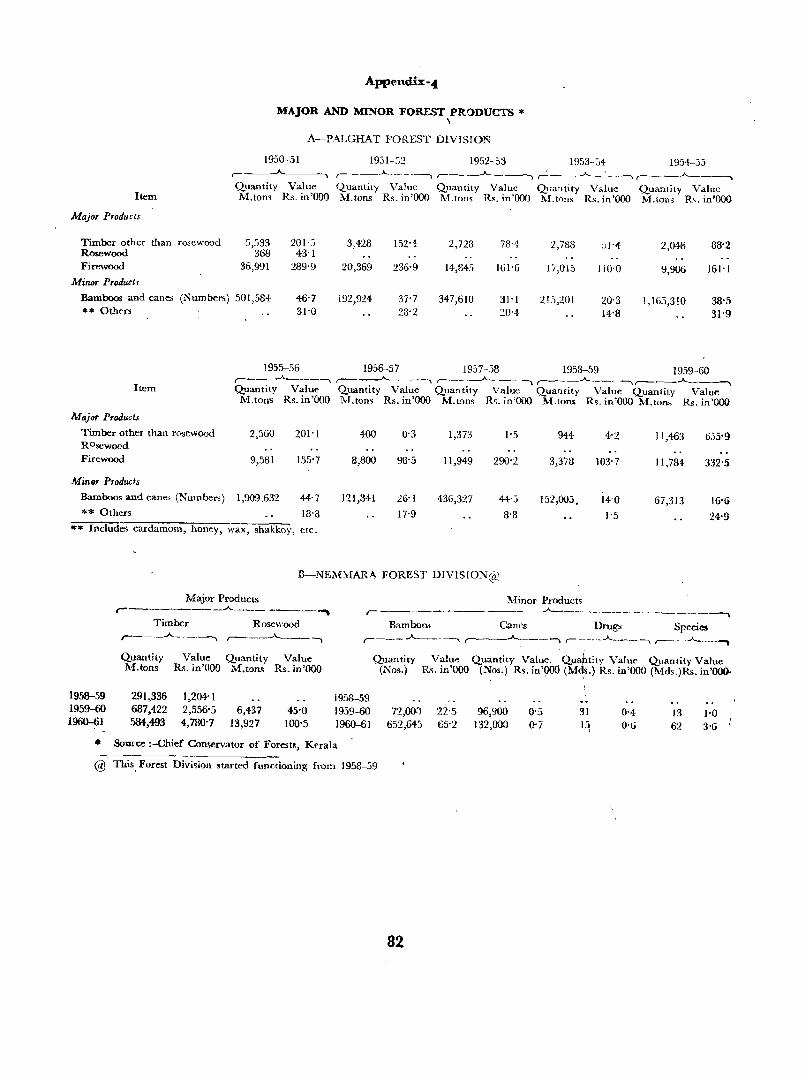
Appendix-of
MAJOR AND MINOR FOREST PRODUCTS * \
A-PALGHAT FOREST DIVISION
1950 51 1951-52 1952-53 1953--54 1954-55 ,-__ ____.e......._~ ,-____ .Jo..... __ ._~ ,-__ _A,._ __ ~ ,!-_ __,,__. __ ~~. ___ ~_---------...
Item Quantity Value Quantity Value Quantity Value Quantity Value Quantity Value M.tom Rs. in'OOO M.tons Rs. in'ooo M.tons R •. in'OOO M.tons Rs. in'OOO M.tons R,. in'OOO
Major Products
Timber other than rosewood Rosewood Firewood
Minor Productr
5,533 368
36,991
201'5 43'1
289'9
Bamboos and canes (Numbers) 501,584 46'7 31'0 ** Others
1955--56
3,428
20,369
192,924
236'9
37'7 23'2
1956---57
2,723
14,84:>
347,610
78'4
161'6
31 '1 20'4
1957-58
2,788
17,Oi5
215,201
110'0
20'3 14'8
1958-59
2,048
9,906
1,165,310
161'1
38'5 31'9
1959-60
Item r--- ----"----------, r--------"---------, ,.- ____ ------A-__ --- -. ,-____ .A. ____ .., ,.----__ .A__---. Qpantity Value Quantity Value Quantity Value Quantity Value Quantity Value
lVI.tons Rs. in'ooO M.tom Rs. in'OOO M.tons R~_ in'OOO M.tom R~. in'Ooo M.tom Rs. in'OOO
Major Products
Timber other than rosewood ROsewood Firewood
Min91 Products
2,560
9,581
Bamboos and cane, (Number.;) 1,909.632
** Others
201'1
155'7
44·7
18'8
"' .. Includes cardamom, honey, wax, shakkoy, etc.
400
8,800
121,8-1-1
0'3
26-1
17'9
1,373
11,949
436,327
290'2
#-3
8'8
944
3,373
152,005,
4'2
103'7
14'0
1-5
11,463
11,734-
67,313
635'9
332'5
16'u
24'9
B-NEl\·ryrARA FOREST DIVISlON@
Major Products :Minor Products r----------"----- -----""" --------------,
Timber Rosewood Bamboo& Canes Drugs Species ~ _ __A __ --. r----~-. r----- -"----------, ,------'--:---, ,- ____ ..A. __ -, r-----"----.
1958-59 1959--60 1960-61
Quantity Value Quantity Value M.tons Rs. in'OOO M.tons Rs. in'OOO
291,336 687,422 584,493
1,204'1 2,556'5 4,780'7
6,437 13,927
45'0 100'5
1958-59 1959--60 1960~1
• Source :-Chief Conservator of Forests, Kerala
Quantity Value Quantity Value, _ Quahtity Value Quantity Value (Nos.) R~. in'OOO (~os.) R~. in'ooo (Mds.) Rs. in'ooO (Mds_)Rs. in'OOO'
72,OO~
652,645 22',5 65'2
96,900 132,000
0'5 0'7
31
I~ 0'4 0'6
13 62
1,0 3'6
@ This. Forest Divi~ion stal'ted functioning from 1958-39
82
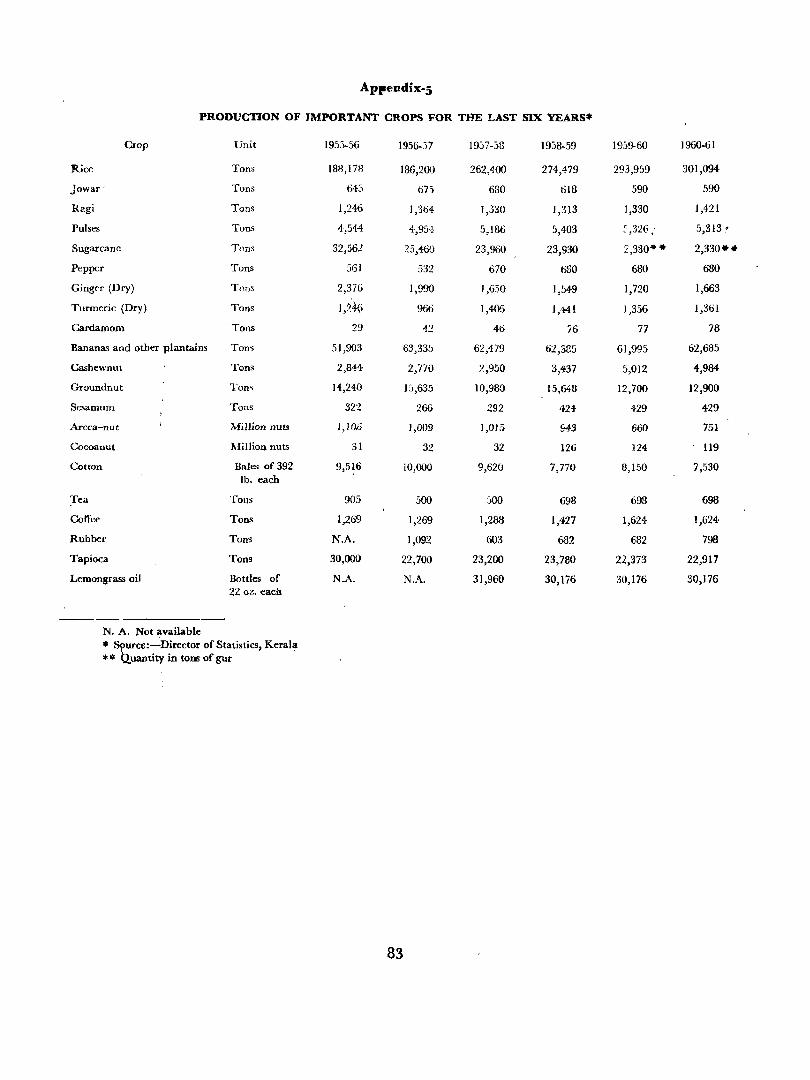
AppendiX:-5
PRODUCTION OF IMPORTANT CROPS FOR THE LAST SIX YEARS*
Czop Unit 1955-56 1956-57 19:17-58 19:i8-59 1959-60 1960-61
Rice Tons 188,178 186,200 262,400 274,479 293,959 301,094
Jowar' Tons 645 67'i 680 618 590 .'>90
Ragi Tons 1,246 1,364 1,330 1,313 1,330 1,421
Pulses Tons 4,544 4,954 5,186 5,403 2,326 : 5,313 ~
Sugarcane Tons 32,562 25,460 23,960 23,930 2,330" • 2,330 ••
Pepper Tons 561 532 670 680 680 680
Ginger (Dry) Tons 2,376 1,990 1,650 1,549 1,720 1,663
Turmeric (Dry) Tons <)'\
1,-4\) 966 1,406 1,441 1,356 1,361
Cardamom ' Tons 29 42 46 76 77 78
Bananas and other Rlantains Ton~ 51,903 63,335 62,479 62,335 61,995 62,685
Cashewnut Tons 2,844 2,770 2,950 3,437 5,012 4,984
Groundnut Tons 14,240 15,635 10,980 15,648 12,700 12,900
Sesamum Tons 322 266 292 424 429 429
Areca-nut Million nut, 1,10.6 1,009 1,015 ~3 660 751
Cocoanut Million nuts 31 32 32 126 :124 119
Cotton Bales of 392 9,.516 10,000 9,620 7,770 8,1,'j0 7,530 lb. each
Tea Tons 905 500 500 698 698 698
Colfee Tons 1,269 1,269 1,288 1,427 ],624 1,624
Rubber Tons N.A. 1,092 603 682 682 798
Tapioca Tons 30,000 22,700 23,200 23,780 22,373 22,917
Lemongrass oil Bottles of Nw'\. N.A. 31,960 30,176 30,176 30,176 22 oz. each
-----N. A. Not available * ~ce:-Director of Statistics, Keral, :10 * uantity in tons of gur
83
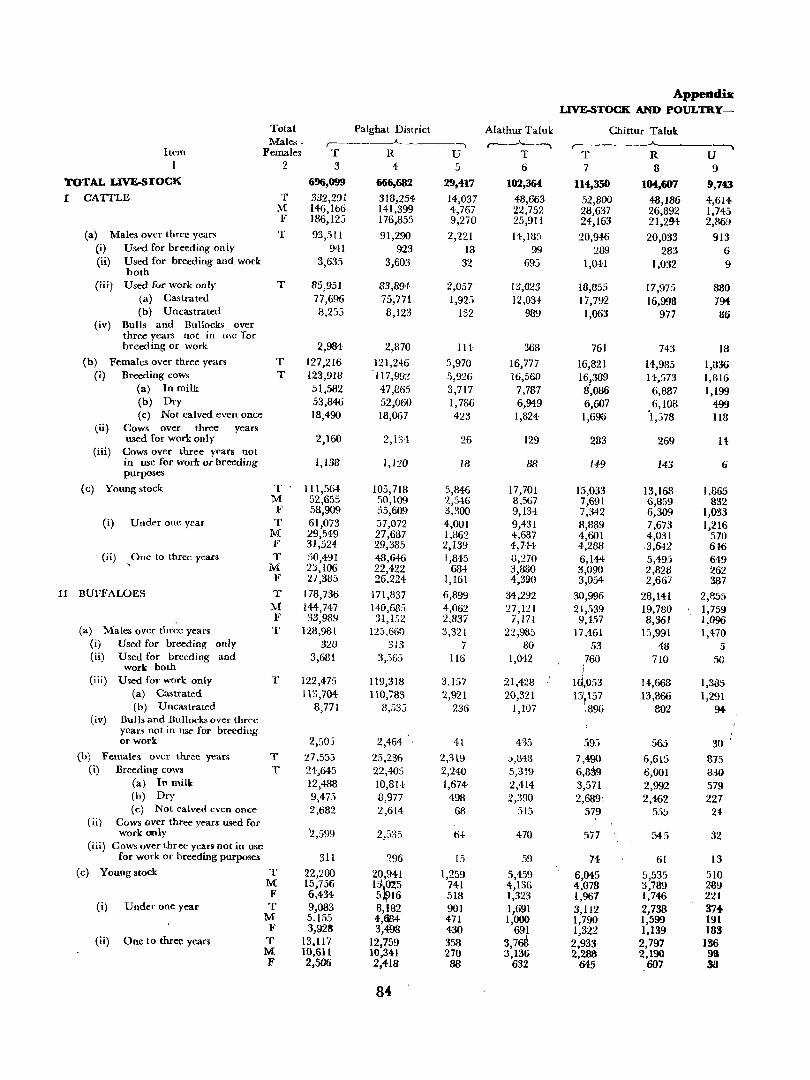
Appeactix LIVE-STOCK AND POULTRY-
Total Palghat District Alathur Taluk Chittur Taluk: Males . r----______.A. --. ,--.....~ r--- ....__,.
Item Females T R U T T R U 1 2 3 4 5 6 7 8 9
TOTAL LIVE-STOCK 696,099 666,682 29,417 102,364 114,350 104,607 9,743 I CATTLE T 332,291 318,254- 14,037 48,663 52,800 48,186 4,614
M 146,1h6 141,399 4,767 22,752 28,637 26,892 1,745 F 186,123 176,855 9,270 25,911 24,163 21,294- 2,869
(a) Males over three years T 93,511 91,290 2,221 14,laS 20,946 20,033 913 (i) Used for breeding only 941 923 13 99 289 283 6 (ii) Usc:d for breeding and work
both 3,635 3,603 32 693 1,041 1,032 9
(iii) Used for work only T 85,951 83,8!H 2,057 13,023 18,855 17,975 800 (a) Casttated 77,696 75,771 1,925 12,034 17,792 16,998 794-(b) Uncastrated 8,255 8,123 132 989 1,063 977 86
(iv) Bulls and Bullocks over three years not in me 'for breeding or work 2,984 2,870 114 368 761 743 18
(b) Females over three years T 127,216 121,246 5,970 16,777 16,821 14,985 1,336 (1) Breeding cows T 123,918 117,992 5,926 16,560 16,389 14,573 1,816
(a) In milk 51.582 47,£65 3,717 7,787 8',086 6,887 1,199 (b) Dry 53,846 52,060 1,786 6,949 6,607 6,108 499 (c) Not calved even once 18,490 18,067 423 1,824 1,696 '1,378 118
(ii) Cows over three years used for work only 2,160 2,134 26 129 283 269 U
(iii) Cows over three years not in use for work or breeding 1,138 1,120 18 88 149 143 6 purposes
(c) Young stock T 111,564- 105,718 5,846 17,701 15,033 13,168 1,865 M 52,655 50,109 2,546 8,567 7,691 6,S59 832 F 58,909 55,609 3,300 9,134 7,342 6,309 1,033
(i) Under one year T 61,073 37,072 4,001 9,431 8,889 7,673 1,216 :rvr 29,549 27,687 1.862 4,687 4,601 4,031 570 F 31,524 29,385 2,139 4,744- 4,288 .3,642 646
(ii) One to three yeae. T 50,491 48,646 1,845 8,270 6,144 5,49:; 649 M 2j,106 22,422 6l:H 3,880 3,090 2,828 262 F 27,385 26.224 1,161 4,39Q 3,054 2,667 387
II BUFFALOES T 178,736 171,837 6,899 34,292 30,996 28,141 2,855 WI 144,747 140,685 4,062 27,121 21,539 19,780 1,759 F 33,989 31,152 2,837 7,171 9,457 8,361 1,096
(a) Males over three: years T 128,981 125.660 3,321 22,98" 17.461 15,991 1,470 (i) Used for breeding only 320 313 7 80 53 48 5 (ii) Used for breeding and 3,681 3,565 llti 1,042 760 710 50
work both I (iii) Used for work only T 122,475 119,313 3,157 21.428 1~,053 a,668 1,385
(a) Castrated 113,704- 110,783 2,921 20,321 1:>,157 13,866 1,291 (b) Uncastrated 8,771 8,.t)35 236 1,107 ',896 802 9.(-
(iv) Bulls and Bullucks ove!> thce-e years not in U'>e for breeding
"
or work 2,503 2,464 41 4'35 ~95 565 30 (b) Females over three year. T 27,555 25,23Q 2,319 5,848 7,490 6,615 875
(i) Breeding cows T 24,645 22,405 2,240 5,319 6,839 6,001 8:10 (a} In milk: 12,488 1O,8H 1,674 2,414 3,571 2,992 579 (b) Dry 9,473 8,977 498 2,390 2,689, 2,462 227 (c) Not calved even once 2,682 2,614- 68 515 579 555 24-
(ii) Cows over three years used for work only 2,~)99 2,53.~ 6-1: 470 577 54-5 32
(iii) Cows over three years not in use for work or breeding purposes 311 296 15 59 74 61 13
(c) Young stock T 22,200 20,941 1,259 5,459 6,045 5,535 510 M 15,756 1~!5 741 4,136 4,078 3,789 2S9 F 6,434 5 16 518 1,323 1,967 1,746 221
(i) Under one year T 9,083 8,182 901 1,691 3,1l2 2,738 37+ M 5.155 4,684 471 1,000 1,790 1,599 191 F 3,928 3,498 430
6;I 1,322 1,139 183 (ii) One to three years T 13,Il7 12,759 358 3,7 2,933 2,797 136
M 10,611 10,341 270 3,136 2,288 2,190 91) F 2,506 2,418 88 632 645 607 38
84
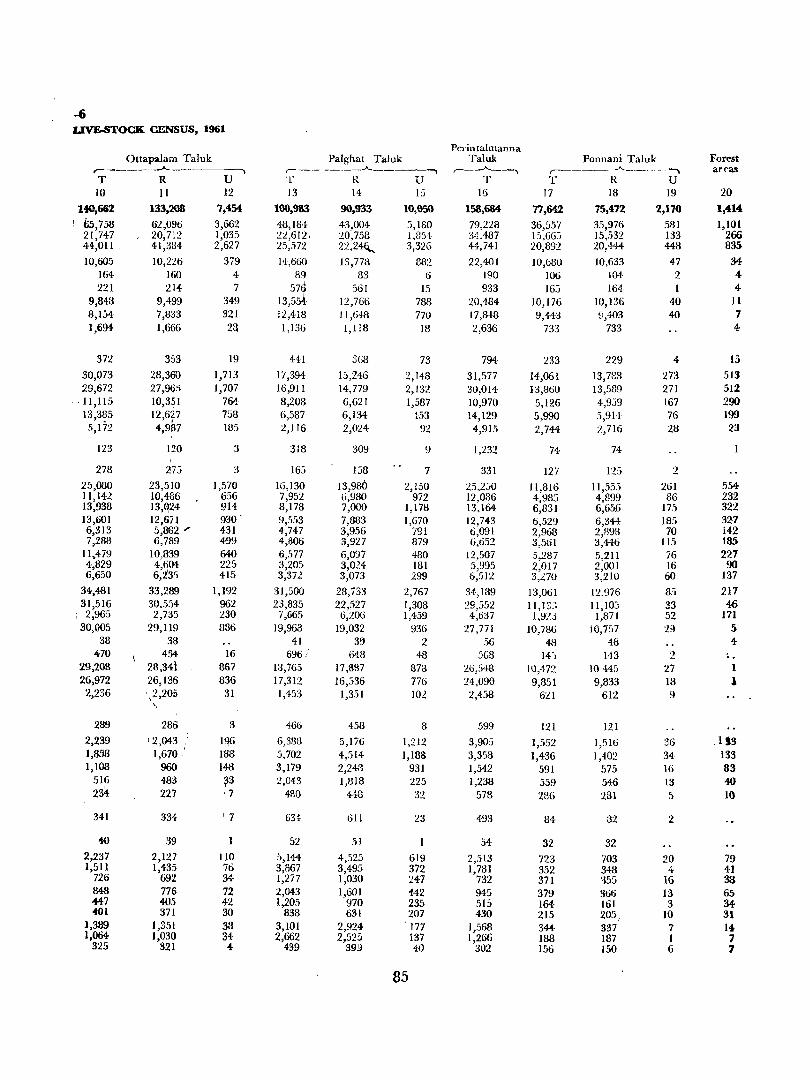
-6 LIVE-STOCK CENSUS, 1961
Pe,-intalmanna Ottapalam Taluk Palghat Taluk Tal uk Ponnani Taluk Forest
r-----~~~_,._------, r--~-----_""__ ,--- -"-----, r---~---_A.,_---~--~ areas T R U T R U T T R U 10 11 12 13 14 15 16 17 18 19 20
140,662 133,208 7,454 100,983 90,933 10,050 158,684 77,642 75,472 2,170 1,414 , 65,758 62,096 3,662 48,18+ 43,004 3,180 79,223 36,557 35,976 581 1,101 21,747 20,712 1,035 22,6121 20,758 1,854 3<1.487 1.'>,665 15,532 133 266 44,011 41,384 2,627 25,572 22,2~ 3,325 H,741 20,892 20,"144 448 835
10,605 10,226 379 14,660 13,778 882 22,401 10,680 10,633 47 34 164 160 4 89 83 6 190 106 1M 2 4 221 21~ 7 57~ 561 15 933 16:1 164 4
9,843 9,499 349 13,55+ 12,766 788 20,484 10,176 10,136 40 11 8,154 7,833 321 12,418 11,648 770 17,lH3 9,443 9,403 40 7 1,694- 1,666 23 1,136 1,113 18 2,636 733 733 4
372 353 19 HI 3G8 73 794- 233 229 4 15
30,073 28,360 1,713 17,394- 15,746 2,148 31,577 14,061 13,788 273 513 29,672 27,96.'> 1,707 16,911 14,779 2,132 30,014 13,860 13,589 271 512
- -11,115 1O,3~1 764 8,208 6,621 1,587 10,970 5,126 4,939 167 290 13,3~5 12,6*7 758 6,537 6,134 453 14,129 5,990 .J,9H 76 199 5,172 4,987 185 2,116 2,024 92 4,91.5 2,744 2,716 23 23
123 120 3 318 309 9 1,232 74 74
278 275 3 165 138 7 331 127 125 2 25,080 23,510 1,570 16,130 13,980 2,150 25,250 11,816 11,55J 261 554 11,142 10,486 656 7,952 6,980 972 12,086 4,985 4,899 BG 232 13,938 13,Q24 914 8,178 7,000 1,178 13.164 6,831 6,651) 17:) 322 13,601 12,671 930 " !.I,.5S3 7.883 1,670 12,743 6,529 6,344 185 327 6,313 5,832 ", 431 4,747 3;956 791 6,091 2,968 2,g98 70 142 7,288 6,789 499 4,306 3,927 879 6,652 3,561 3,446 115 185
11,479 10,839 640 6,577 6,097 480 12,507 5,287 5,211 76 227 4,829 4,604 225 3,205 3,024 181 5,995 2,017 2,001 16 90 6,650 6,23:' 415 3,372 3,073 299 6,512 3,270 3,210 60 137
34,481 33,289 1,192 31,500 28,733 2,767 34-,189 13,061 12.976 85 217 31,516 30.554 962 23,835 22,527 1,308 29,552 11, J 3:; 11,103 33 46
: 2,965 2,735 230 7,665 6,206 1,459 4,637 1,923 1,871 52 171 30,005 29,119 886 19,968 19,032 936 27,771 10,786 lO,7~17 29 5
38 38 41 39 2 56 4B 48 4-470 454 16 696 1 648 48 568 143 143 2 "
29,208 28,341 867 18,765 17,S87 878 26,54-8 10,472 10 {4:} 27 1 26,972 26,136 336 17,312 16,J36 776 24,090 9,851 9,833 18 1
2,236 2205 31 1,453 1,351 102 2,4.)8 621 612 9 \' ,
"-
289 286 3 466 458 8 599 121 121 2,239 12,043 1% 6,388 5,176 1,212 3,905 1,.552 1,516 36 _I S3 1,858 1,670 188 J.702 4,5[4 1,188 3,358 1,436 1,402 34 133 1,108 960 148 3,179 2,243 931 1,542 591 575 16 83
516 483 ~3 2,043 1,818 225 1,238 559 :J46 13 40 234 227 17 480 448 32 578 2S6 281 .5 10
341 334- ' 7 63t 611 23 4-93 8'1- 32 2
40 39 52 51 54 32 32 2,237 2,127 110 5,1{-4 4,525 619 2,:)13 123 703 20 79 1,511 1,435 76 3,867 3,495 372 1,781 352 348 4: 41
726 692 34· 1,277 1,030 247 732 371 355 16 3S 848 776 72 2,043 1,601 442 945 379 366 13 65 +47 405 42 1,205 970 235 515 164 161 3 34-.. 01 371 30 838 631 207 430 215 205,. 10 31
1,389 1,351 38 3,101 2,924 177 1,568 344· 337 7 14-1,064 1,030 34 2,662 2,525 137 1,266 188 187 1 7
325 321 ... 439 399 40 302 156 150 6 7
85
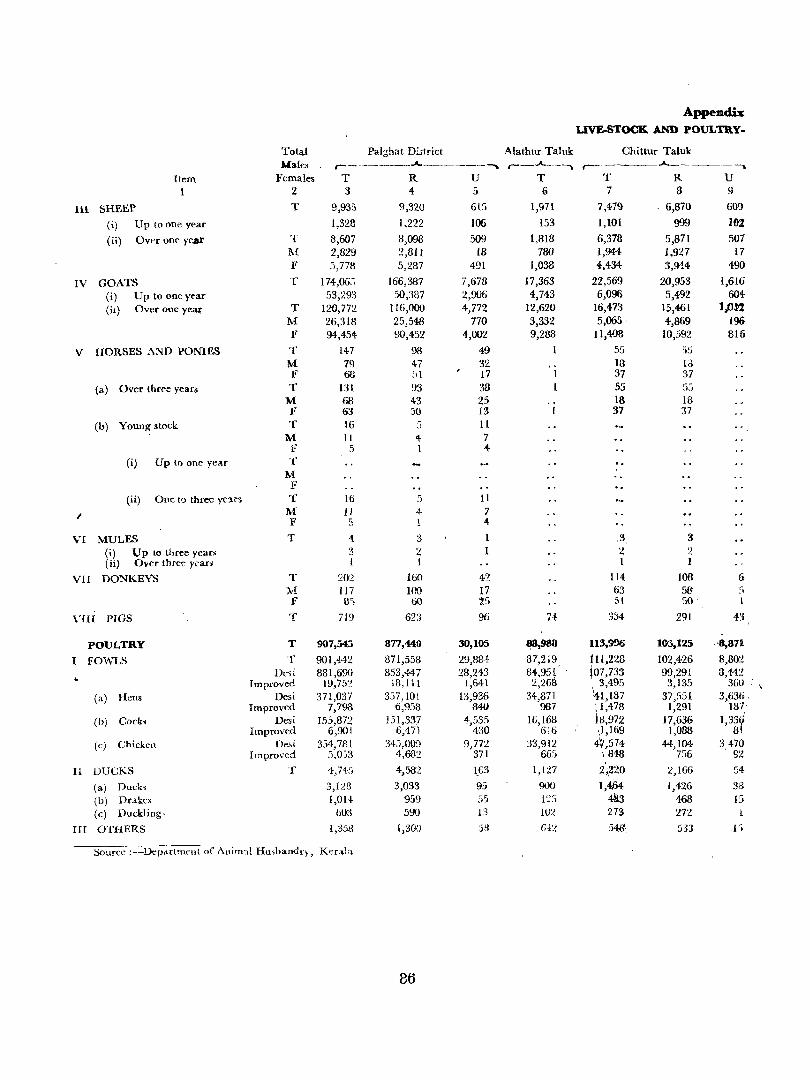
Appendix LIVE-STOCK AND POULTRY.
Total Palghat Dl;triet Alathur Taluk Chittur Taluk ).laic .• r--~----..A..-------..... r--..A.._--, r--'- .A..___ ____ -.
Item Females T R U T T R U 1 2 3 4 5 6 7 8 9
III SHEEP T 9,935 9,320 615 1,971 7,479 6,870 609
(i) Up to one year 1,328 1,222 106 153 1,101 999 19l ( ii) Over 001' year T 8,607 8,098 509 1,818 6,378 5,871 507
M 2,829 2,811 18 780 I,m 1,927 17 1" 3,778 5,287 491 1,038 4,434- 3,944- 490
IV GOATS T I 74,06j 166,387 7,678 17,363 22,569 20,953 1,616
(i) Up to one year 53,293 50,387 2,906 4,743 6,096 5,492 604
(il) Over one year T 120,772 116,000 4,772 12,620 16,473 15,461 lJl~2 M 26,318 25,548 770 3,332 5,065· 4,869 196 F 94,454 90,452 4,OO'L 9,288 1l,408 10,592 BI6
V HORSES AND PONIES T 147 98 49 1 55 55 M 79 47 32 18 13 F 68 51 17 37 37
(a) Over three yeara T lSI 93 38 55 "" '-)~)
M 68 43 25 18 18 F 63 30 13 37 37
(b) Young stock T 16 :1 II .. M II 4 7 F 5 I 4-
(i) Up to one year T M
1" (ii) One to three ye:l.r:; T 16 5 11
I M 11 4- 7 F 5 i 4
VI MULES T 4 3 1 .3 3 (i) Up to three years 3 2 2 2 (ii) Over three years ! 1 I 1
VII DONKEYS T :202 160 42 114 108 Ii M 117 100 17 63 58 :; F I}') '60 t5 5\ 50' 1.
nIl PlGS T 719 623 96 74 334- 291 43
POULTRY T 907,545 sn,440 30,105 ~988 113,996 105,125 ".,811
I FOWLS T 901,442 871,558 29,884 87,219, ~ tl,228 102,426 8,802 Dc>. 881,690 853,447 28,243 84,95L t07,733 99,291 3,442
Improved 19,752 18,111 1,641 2,268 . 3,4% 3,135 3ol)
(a) Hens Desi 371,037 357,101 13,936 34,871 \1-1,187 37,551 3,636. Improved 7,798 6,958 840 987 ',1,478 1,291 '187'
{b) Cock< Desi 155,872 151,337 4,535 16,168 18,972 17,636 1,33.;i Improved 6,901 6,471 430 616 '.1,169 1,088 8i
(c) Chicken De.. 354,781 34.>,009 9,77'2 33,912 47,574 44,104 3,470 Improved 5,0:'3 4,682 371 665 .. 848 7::6 92
II DUCKS T 4,745 4,582 t63 1,127 2~220 2,166 54
(a) Duck. 3,1'28 3,033 95 900 1,4,64 1,426 38
(b) Drakes 1,014, 959 ;,5 1"° 483 468 15 ~,)
(c) Duckling, 6U3 590 13 102 273 272 1
III OTHERS 1,:358 I,30U 5S GJ2 548,. 533 .l':i
Saure" :--Departme!l! of ,\"im:,l Hu,bandry, KeraL,
86
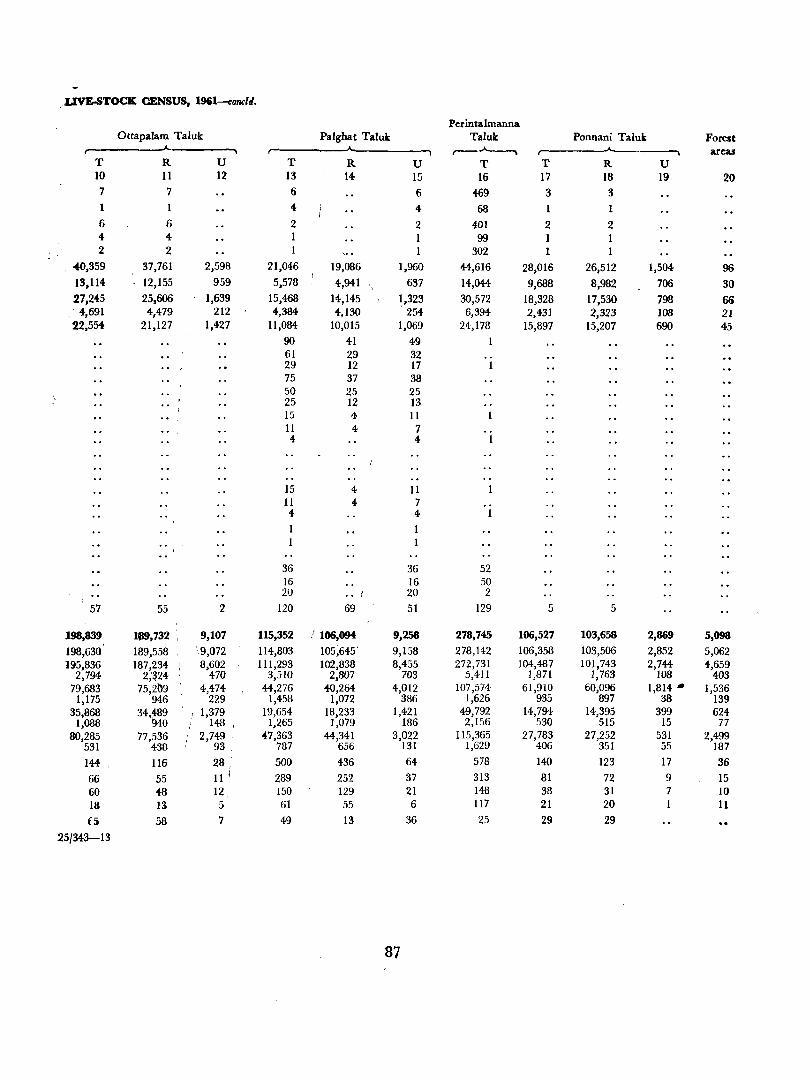
.,.uvE-STOCK CENSUS, 1961-condi.
Perintalmanna Ottapalam Taluk Palghat Taluk Taluk Ponnani Taluk Forest
r--.A....---. r---J.-_.~ areas T R U T R U T T R U 10 11 12 13 14 15 16 17 18 19 20 7 7 6 6 469 3 3 1 1 4 4 68 1 1 6 6 2 2 401 2 2 4 4 1 1 99 1 I 2 2 302
40,359 37,761 2,598 21,046 19,086 1,960 44,616 28,016 26,512 1,504 96 13,114 12,155 959 5,578 4,941
\ 637 14,044 9,688 8,982 706 30
27,245 25,606 1,639 15,468 1'1-,145 ~,323 30,572 18,328 17,530 798 fiG , 4,691 4,479 212 4,384- 4,130 254 6,394 2,431 2,323 108 21 22,554 21,127 1,427 11,084 10,015 1,069 24,178 15,897 15,207 690 45
90 41 49 1 61 29 32 29 12 17 75 37 38 50 25 25 25 12 13 15 4 II 11 4 7 4 4
15 4 11 11 4 7 4 4
1
36 36 52 16 16 50
I, •• 20 20 2
57 55 2 120 69 51 129 5 5
198,839 1,9,732 I 9,107 115,352 I 106,094 9,258 278,745 106,527 103,658 2,869 5,098
198,630 189,558 \9,072 114,803 105;645' 9,158 278,142 106,358 103,506 2,852 5,062 195,836 187,234 , 8,602 111,293 102,838 8,455 272,731 104,487 101,743 2,744 4,659
2,794 2;~24 470 3,510 2,807 703 5,411 1,871 1,763 108 403 79,683 75,209 4,474 44,276 40,264- 4,012 107,574 61,910 60,096 1,814 .. 1,536
1,175 946 229 1,458 1,072 386 1,626 935 897 38 139 35,868 34,489 1,379 19,654 18,233 1,421 49,792 14,794- 14,395 399 624
1,088 940 148 1,265 1,079 186 2,156 530 515 15 77 80,285 77,536 2,749 47,363 44,341 3,022 115,365 27,783 27,252 531 2,499
531 438 93 , 787 656 131 1,629 406 351 55 187
144- 116 28,' 500 436 64 578 140 123 17 36 66 55 111 289 252 37 313 81 72 9 15 60 48 12 150 129 21 148 38 31 7 10 18 13 5 61 55 6 117 21 20 1 11 £5 58 7 49 13 36 25 29 29
25/343-13
87
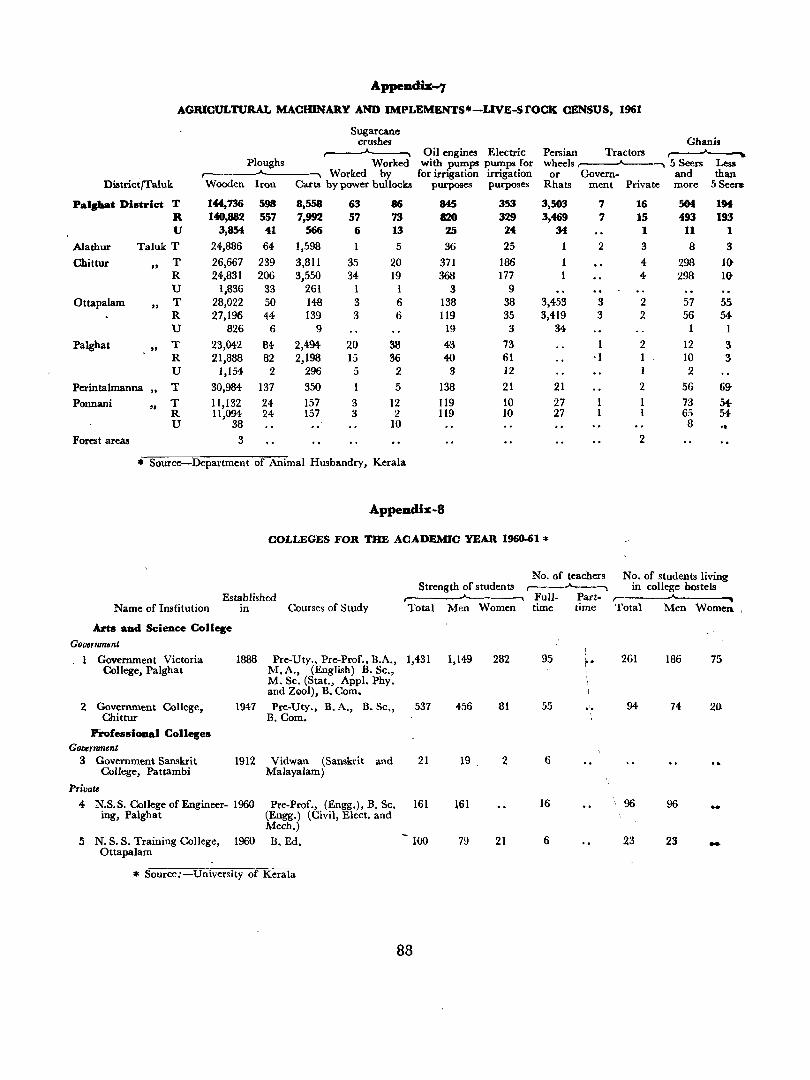
Appendis-?
AGRICULTURAL MACHINARY AND IMPLEMENTS*-LIVE-SrOCK CENSUS, 1961
Sugarcane crushes Ghanis .A- I Oil engines Electric Persian Tractors ~
Ploughs Worked with pumps pumps for wheels....----A----... 5 Seers Less Worked by for irrigation irrigation or Govern- and than
District/Taluk Wooden Iron Carta by power bullocks purposes purposes Rhats ment Private more 5 Seers:
Palghat Di.tric:t T 144,736 S98 8,558 63 86 845 353 3,503 7 16 S04 194 R 140,882 557 7,992 57 73 820 329 3,469 7 15 493 193 U 3,854 41 566 6 13 25 24 34 1 11 1
Alathur Taluk T 24,886 64- 1,598 1 5 36 25 2 3 8 3
Chittur "
T 26,667 239 3,811 35 20 371 186 4 298 lO R 24,831 206 3,550 34- 19 368 177 4 298 It) U 1,836 33 261 1 1 3 9
Ottapalam "
T 28,022 50 148 3 6 138 38 3,453 3 2 57 55 R 27,196 44 139 3 6 119 35 3,419 3 2 56 54 U 826 6 9 19 3 34 1 1
Palghat "
T 23,042 84 2,494 20 38 43 73 1 2 12 3 R 21,888 82 2,198 15 36 40 61 'I 1 10 3 U 1,154 2 296 5 2 3 12 1 2
Perintalmanna " T 30,984- 137 350 1 5 138 21 21 2 56 6~
Ponnani "
T 11,132 24 157 3 12 II9 10 27 73 Sf. R 11,094 24- 157 3 2 119 10 27 65 54 U 38 10 8 .,
Forest areas 3 2
* Source-Department of Animal Husbandry, Kerala
Appendix-8
COLLEGES FOR THE ACADEMIC YEAR 1960-61 *
No. of students living in college hostels
No. of teachers Strength of students r---~
Full- Part- r-----A..-___ ""
Name of Institution Established
in Courses of Study
An. _d Sc:iellCe College
GOll6mment
Government Victoria 1888 Pre-Uty., Pre-Prof., B.A., College, Palghat M. A., (English) B. Sc.,
M. Sc. (Stat., Appl. Phy. and Zool), B. Com.
2 Government College, 1947 Pre-Uty., B.A., B. Sc" Chittur B.Com.
Profes.ioaal College. Government
3 Government Sanskrit 1912 Vidwan (Sanskrit and College, Pattambi Malayalam)
Private
4- N.S. S. College of Engineer- 1960 Pre-Prof., (Engg.), B. Sc. ing, Pa1ghat (Engg.) (Civil, Elect. and
Mech.)
5 N. S. S. Training College, 1960 B. Ed, Ottapalam
* Source:-University of Kerala
Total Men Women time time Total Men Women
1,431 1,149 282 95 r' 261 186 75
537 456 81 55 94- 74 20
21 19 2 6
161 161 16 '96 96
100 79 21 6 23 23 ,-
88
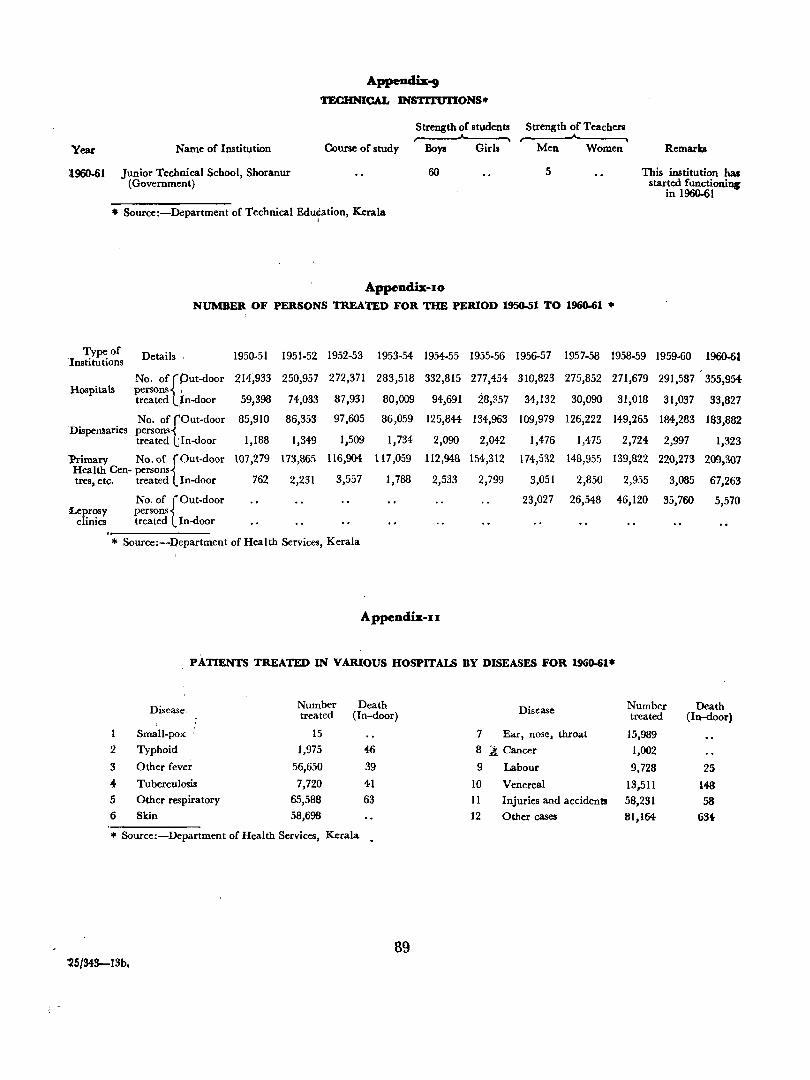
Appendix..,
TECHNICAL INSTlTVTIONS*
Strength of studenu Strength of Teachen
Year Name of Institution
1960-61 Junior Technical School, Shoranur (Government)
Course of study Boys
60
• Source:-Department of Technical Education, Kerala I
Appendix-Io
Girls Men
5
Women Remarks
This institution has started functioninc
in 1960-61
NUMBER OF PERSONS 'fREATED FOR THE PERIOD 1950-51 TO 1960-61 •
Type of Details 1950-51 1951-52 1952-53 1953-54 1954-55 1955-56 1956-57 1957-58 1958-59 1959·60 1960-61 'Institutions
No. of {Out-door 214~933 250,957 272,371 283,518 332,815 277,454 310,823 275,852 271,679 291,587 355,954 Hospitals persons I
87,931 80,009 28,357 34,132 treated ,In-door 59,398 74,033 94,691 30,090 31,018 31,037 33.827
No. of rOut-door 85,910 86,353 97,605 86,059 125,844- 134,963 109,979 126,222 149,265 184,283 183,882 Dispensaries persons-<
1,509 1,734 1,476 2,724 treated LIn-door 1,188 1,349 2,090 2,042 1,475 2,997 1,323
l'rimary No. of {Out-door 107,279 173,865 116,904 117,059 112,948 154,312 174,532 148,955 139,822 220,273 209,307 Health Cen· persons
3,557 1,788 2,533 2,799 tres, etc. treated In-door 762 2,231 3,051 2,850 2,955 3,085 67,263
No. of {Out.door 23,027 26,548 46,120 35,760 5,570 Leprosy persons
clinics treated In-door
* Source:-Department of Health Services, Kerala
A ppenm-II
PATIENTS TREATED IN VARIOUS HOSPITALS BY DISEASES FOR 1960-61*
Disease Number Death Disease Number Death treated (In-door) treated (In-door) ,
Small-pox 15 7 Ear. nose, throat 15,989
2 Typhoid 1,975 46 8 2 Cancer 1,002
3 Other fever 56,650 39 9 Labour 9,728 25
4- Tuberculosis 7,720 41 10 Venereal 13,511 148 5 Other respiratory 65,588 63 11 Injuries and accidents 58,231 58 6 Skin 58,698 12 Other cases 81,164 63t-
* Source:-Department of Health Services, Kerala .
89 ::I5/M3-1Sb.
Appendix-12
RURAL SANITATION FOR THE PERIOD 1950-51 TO 1960-61 •
Items 1950-51 1951-52 1952-53 1953-54- 1954-55 1955-56 1956-57 1957-58 1958-59 1959-60 1960-61
Number of wells constructed 34 29 38 31 33 47 27 45 35 33 26 2 Number of wells cleaned and
:repaired 15 19 20 9 17 31 26 14- 17 12 17 3 Number of borehole latrines
constructed 54 25 72 24- 23 19 25 32 88 82 4{)
4- Number of other type latrines put up 62 103 138 75 54 23 51 49 61 61 225
5 Number of markets inspected 44 55 70 39 46 66 59 55 71 67 71
6 Number of Fairs and Festivals for which sanitary arrangements were made 4- 4 4 4 4- 4 4 4- 30 82 46
7 Number of offences detected under public health 331 325 630 217 399 308 182 319 198 238 219
8 Number of offenders convicted 14- 66 35 5 4- 30 13 12 -----
* Source :-Department of Health Services, Kerala
Appendix-I 3
ANTI-ADULTERATION ACTIV1TIES FOR THE PERIOD 1956-57 TO 1960-61 •
Fine realised
Total No. of Number of Cases Total No. of reported .........
Year samples used adulterated Prosecutions Disposl:d Convicted
2 3 4- 5
1956-5'1 64- 28 27 28 1957-58 452 211 152 138 1958-59 558 210 202 193 1959-60 588 210 220 210 1960-61 634 236 244 226
* Source :-Department of Health Services, Kerala
Kuttipuram R. S. (Kozhikode District)
Appendix-1 4
POLYMETRIC TABLE OF DISTANCES •
I West Cdast Road
Vattamkulam Chalisseri
6
27 138 186
194-220
Total Rs.
7
1,633 5,270 5,374 8,225
12,517
Kuttipuram Kuttipuram R. S.
Vattamkulam 8--1
'_ Chalisseri
• Source:-The Executive Engineer (B & R), Palghat
90
(Ponnani -{ Trithala lPattambi
{
Trithala Pattambi R. S. Akkikavu Kunnamkulam
(0-{)
(7-5) (7-5)
(11-6) (6-0) (9-0) (3-0) (6-0)
Average amount
Rs.
8
60 31 29 42 57
Walayar Kanhikode Palghat
Walayar 5-0 15-0
Kanhikode 10-0
Palghat·
Appendix-14
POLYMETRIC TABLE OF DISTANCES-eontd. n Madras-Calicut Road
(Note.-The road overlaps the National Highway for the first 15 miles)
Kuttilangadi Bridge
Perintal- Angadi- (District Mundur Ma.lmarghat Ariyampavll manna puram Boundary)
I
22-5 39-0 42-0 57-0 59-0 68-0 (State Boundary 1. Coimbatore Walayar R. S.
17-5 ·34-0 \ 37-0 52-0 54-0 63-0 Kanhikode R. S.
7-5 24-0 27-0 42-0 44-0 53-0 f Palghat R. S. Olavakkote R. S. ParH l Alathur Kollengode
Mundur 16-3 19-3 34-3 36-3 45-3 {MRS Kongad Thiruvazhiyode Cherplaehery Perintalmanna (via)
Cherplaehery Pattambi (via)
l Cherplaehery
Mannarghat 3"'() 18-0 20-0 29-0 ( Attapadi i. Melattur
Ariyampavu 15-0 17-0 26-0 J Thiruvazhiyode lOttapaJam R. S.
Perin tal- 2-0 11-0
r'Ia"~ manna Pandikad (via) Melattur
Manjeri (via) I Pandikad Karuvaramkundu
~ (via) Melattur Nilambur (via)
Karuvaramkundu Pattambi Cherplachery
IOttapalam (via) l Cherplaehery
Angadi- 9-0 J Angadipuram R. S. puram l Kuttipuram R. S.
K uttilangadi J Bridge Ma~appuram
l Caheut
91
(0-3) ( 15---0) (1-0)
(1-0)
( 1"'() (2-2) (7-4)
(15-2) (14-0)
(4-4) (5---0)
(14-4) (19-4)
(28-6)
(30-5)
(15"'() (16-0)
(9-0) (17-4)
(7-6)
(11-7)
(19-7}
(10-6)
(37-5) (14-0) (10-4)
(21-0)
(2-0) (17-0)
(1-1) (33-4)
Walayar
,Walayar
Palghat
Palgbat
Palghat
15-0
Palghat
Appeaclis-14 POLYMETBIC TABLE OF DISTANCES--con/cti.
m Coim.!-tore-Trichar Road (NatiODal Highway)
(Not,.-The first 15 miles is common to Madras-Calicut Road)
Kuzhalmannam Alatbur Vadakkancherry Vaniampara
22-2 30-2 37-2 41-7 { Coimb"ott Kozhinjampara Pollachi (via) Kozhinjampara Chittur
7-2 ' U-2 22-2 26-7 r Kollengode Koduvayoor t KoWmj.,."". Thathamangalam Pollachi (via) Kozhinjampara Chittur Pollachi (via) Chittur Pudunagaram
Kuzhalm~nam 8-0 15-0 19-5 { Thathamangalam Meenakshipuram
Alathur 7-0 11-5 rChittur Nemmara Kunisseri
Kollengode
~15-O) 27-0) ~42-O) 26-0)
(14-0~ (6-3
(13-5) (9-4)
(25-0) (13-4) , (30-{) (8-0)
(8-0) (21-0)
(10-0) (9-4) (54))
(11-0) 1 Kod=yu' (".) K",,""'i (10-4) Meenakshipuram (via) Kollengode (31-0) Pollachi (via) Kollengode State Boundary
Vadakkancherry 4-5 { Vallangi
Kollengode (via) Vallangi
Vaniampara Trichur
IV Palghat-Po_ani Road
, Vaniam-Parli Mankarai Ottapalam kulam Kulappalli
7-4 12-4 20-2 23-5 27-4 ParU 5-0 12-6 16-1 20-0
Maakarai 7-6 11-1 15-0
Ottapalam 3-3 7-2
Vaniamkulam 3-7
Kulappaili
KumaraPattambi Trithala naUur
34-6 38-4 44-1 27-2 31-0 36-5
22-2 26-0 31-5
14-4 18-2 '23-7
11-1 14-7 20-4
7-2 11-0 16-5
Pattambi 3-6 9-3
rrithala 5-5
Vattamkulam
46-1 38-5
33-5
25-7
22-4
18-5
11-3
7-5
Kumara-nallur 2-0
Vattamkulam
Ponnani
53-6 46-2 (ParH R.S.
Mundur 41-2 [Mankarai R.S.
tPalghat (Loop line)
Kongad
33-4{Ottapalam R.S. Mannarghat Cherplachery
, ~O-l (' Kothakurissi Cherplachery
26-2 tShoramu R.S. ~ Trichur
19-0f!:attambi R.S. .... oottanad l>erintalmanna
I Vadapuram l ~erplachery
15-2 {C~lissery Kunnamkulam Guruvayoor Chowghat
9-5 Kuttipuram R.S.
, {Cbalissery i-5 Kunnamkulam
Edappal
POnnani{Tirur R.S. (via) Puthiyangadi
Malappuram Manjeri
92
(31-4) (17-0)
(7-0) (13-0)
(15-3)
(0-0) (4-4) (1-0)
(12-0) 1.(8-6)
(0-4) (18-3) (10-4)
(3-6) (9-2)
(2-0) (22-0)
(0-3) (3-1)
( 14-0) (38-3) (11-1 )
(6-0) (13-4) (19-0) (21-0)
(9-0) (16-0) (23-0) (2-4)
, (10-0) (25-2) (32-2)
Appenm-15
FACILInES AT VARIOUS RAILWAY STATIONS
i Broad Gauge Distance from
Olavakkot Junction Parcell Invalid Tele- Free Railway Station Waiting Cloak Plat- Advance Chairs, gramsl clean-
Room room form Booking Stret- Tele- ing Book Name of Railway Station kIn. miles facilities facilities tickets facilities chers phones service stalls
2 3 : 4 5 6 7 8 9 10 11
Pattambi 56 35 III PL P Karakkad 50 31 III PL
44 28 U"U(L) PL,C P DI I, S TL,TP FCS B Shoranur Ju~ction III, III(L)
Mannanur III
Ottapalam 32
Palappuram H
20 U, III; U (L)
Lakkidi 24 15 III Mankarai 17 10 III Parli 10 6 III Vallikode H
Olavakkot J~ction 0 0 U, U(L) I1I,III(L)
Kanhikode " 14 9 III ChuJlimada 20 12 III Walayar 25 16 III
Distance from Shoranur Junction Railway Station
,.---J------., km. miles
Vallapuzha 10 6 III Kulukallur H Cherukara 21 13 III Angadipuram 28 18 III Melattur 41 25 III
Distance from Palghat Railway
Station Waiting Name of Railway r:----"--....... ROOIll
Station km. miles facilities
2 3 4
Palghat 0 0 U,IlI Pudunagararn 11 7 III Vadakannikapuram H Kollengode 18 12 U, III Muthalamada I 27 17 III
I
U-Upper Class Waiiing Room
U (L)-Upper Class Waiting Room for Ladies
III-Third Class Waiting Room
III (L)-Third Class Waiting Room for Ladies
PIr-Parcel facilities
C-Cloak Room facilities
P-Platforrn Tickets
DI-Advance Boolting
PL P
PL TL PL TL PL TL ..
PL,C P DI S TL,TP FCS B
PL TL PL PL TL
PL
PL PL TL S PL
ii Metre Gauge
Parcell Invalid Tele- Free Cloak Plat- Advance Chairs, gramsl clean-room form Booking Stret- Tele- ing Book
facilities tickets facilities chers phones service stalls
5
PL,C PL
PL PL
6
P
7 8 9
S TL,TP
I-Invalid Chairs
S-Stretchers
TL
FCS-Free Cleaning Service
B-Book Stalls
10 11
FAE-First Aid Equipment
V-Vegetarian Refreshment Room
N-Non-Vegetarian Refreshment RoolD
AMRV -Accidental Medical Relief Van
,. Source:-Divisional Superintendent (Commercial), Olavakkot
93
Medi- Refresh-cal ment
facili- stalls, ties etc.
12 13
AMRV FAE
V,N
FAR
FAE V,N
FAE
Medi- Refresh-cal ment
facili- stalls ties etc.
12 13
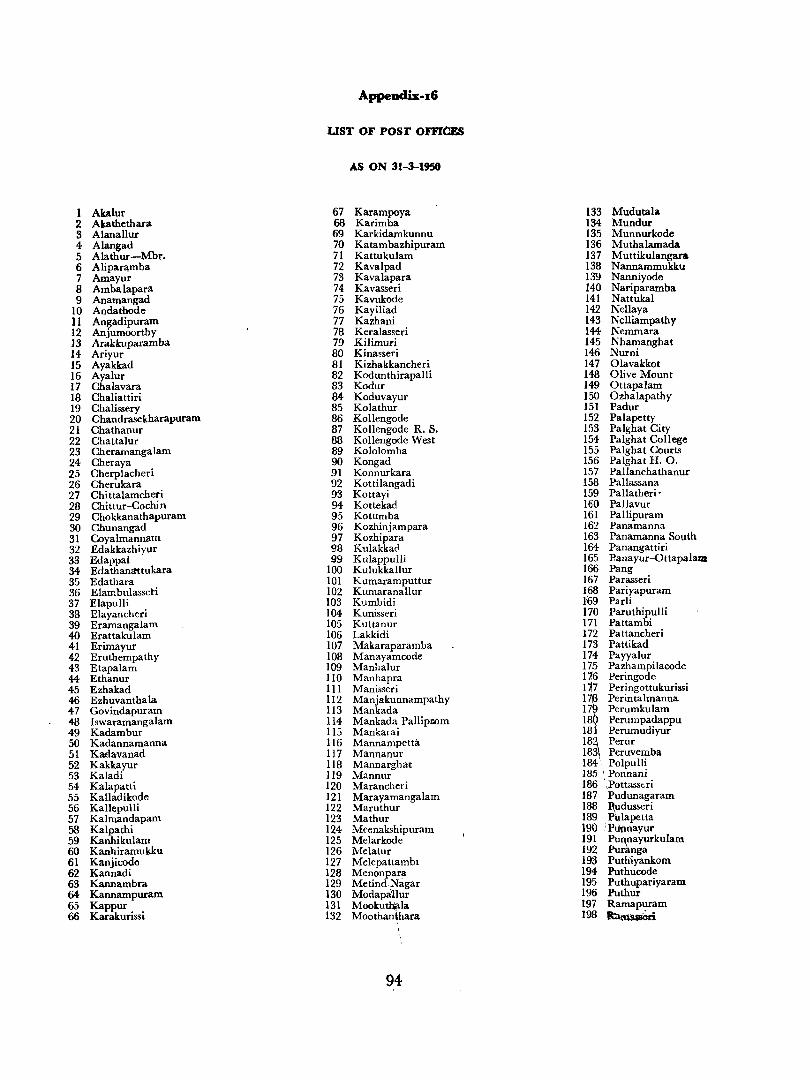
AppencUx-16
UST OF posr OFFICEs
AS ON 31-3-1950
1 Akalur 67 Karampoya 133 Mudutala 2 Akathethaca 68 Karimba 134 Mundur 3 Alanallur 69 Karkidamkunnu 135 Munnurkode 4 Alangad 70 Katambazhipuram 136 Muthalamada 5 Alathur-Mbr. 71 Kattukulam 137 Muttikulangara 6 Aliparamba 72 Kavalpad 138 Nannammukku 7 Amayur 73 Kavalapara 139 Nanniyode 8 Ambalapara 74 Kavasseri 140 Nariparamba 9 Anamangad 75 Kavukode 141 Nattukal
10 Andathode 76 Kayiliad 142 Nellaya 11 Angadipuram 77 Kazhani 143 Nelliampathy 12 Anjumoorthy 78 Keralasseri 144 Nemmara 13 Arakkuparamba 79 Kilimuri 145 Nhamanghat 14 Ariyur 80 Kinasseri 146 Nurni 15 Ayakkad 81 Kizhakkancheri 147 Olavakkot 16 Ayalur 82 Kodunthirapalli 148 Olive Mount 17 Chalavara 83 Kodur 149 Ottapalam 18 Chaliattiri 84 Koduvayur 150 Ozhalapathy 19 Chalissery 85 Kolathur 151 Padur 20 Chandrasekharapuram 86 Kollengode 152 Palapetty 21 Chathanur 87 Kollengode R. S. 153 Palghat City 22 Chattalur 88 Kollengode West 154 Palghat College 23 Cheramangalam 89 Kololomba 155 Palghat Courts 24 Cheraya 90 Kongad 156 Palghat H. O. 25 Cherplacheri 91 Konnurkara 157 Pallanchathanur 26 Cherukara 92 Kottilangadi 158 Pallassana 27 Chittalamcheri 93 Kottayi 159 Pallatheri' 28 Chittur-Cochin 94 Kottekad 160 Pallavur 29 Chokkanathapuram 95 Kotumba 161 Pallipuram 30 Chunangad 96 Kozhinjampara 162 Panamanna 31 Coyalmannam 97 Kozhipara 163 Panamanna South 32 Edakkazhiyur 98 Kulakkacl 164 Pflnangattiri 33 Edappal 99 Kulappulli 165 Panayur-Ottapalam 34 Edathamtttukara 100 Kulukkallur 166 Pang 35 Edathara 101 Kumaramputtur 167 Parasseri 36 Elambulasseti 102 Kumaranallur 168 Pariyapuram 37 Elapulli 103 Kumbidi 169 Parli 38 Elayancheri 104 Kunisseri 170 Paruthipulli 39 Eramangalam 105 Kuttanur 171 Pattambi 40 Erattakulam 106 Lakkidi 172 Pattancheri 41 Erimayur 107 Makaraparamba 173 Pattikad 42 Eruthempathy 108 Manayamcode 174 Payyalur 43 Etapalam 109 Manhalur 175 Pazhampilacode 44 Ethanur 110 Manhapra 1'i16 Peringode 45 Ezhakad III Manisseri 1~7 Peringottukurissi 46 Ezhuvanthala 112 Manjakunnampathy 178 Perintalmanna 47 Govindapuram 113 Mankada 17t Perumkulam 48 Iswaramangalam 114 Mankada Pallipr.om 18 Peruil1padappu 49 Kadambur 115 Mankalai 18i Perumudiyur 50 Kadannamanna 1I6 Mannampctta 18~ Perur 51 Kadavanad 117 Mannanur 183 Peruvemba 52 Kakkayur 1I8 Mannarghat 184' . Polpulli 53 Kaladi 119 Mannur 185 \ Ponnani 54 Kalapatti 120 Marancheri 186 ',Pottasseri 55 Kalladikode 121 Marayamangalam 187 Pudunagaram 56 Kallepulli 122 Maruthur 188 ~dusseri
57 Kalmandapam 123 Mathur 189 ~lapetta
58 Kalpathi 124 Meenakshipuram 190 PUpnayur 59 Kanhikulam 125 Melarkode 191 Punnayurkulam 60 Kanhiramukku 126 Melatur 192 Purlmga 61 Kanjicode 127 Melepattambl 193 Puthiyankom 62 Kannadi 128 Menonpara 194 PuthUcode 63 Kannambra 129 Metind.Nagar 195 Puthupariyaram 64 Kannampuram 130 ModapliUur 196 Puthur 65 Kappur 131 Mookutl\!lla 197 Ramapuram 66 Karakurissi 132 Moothanthara 198 b~ri
94
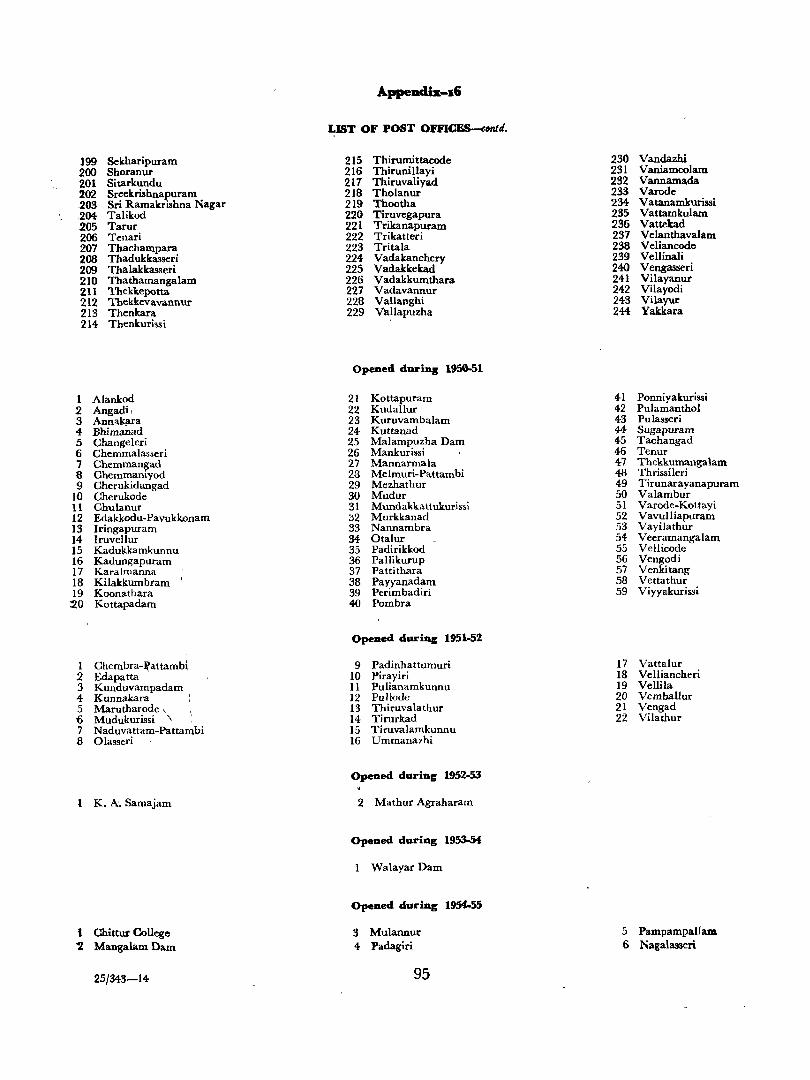
Appeaclix-.6
LIST OF POST OFFl~onti.
199 Sekharipuram 215 Thirumittacode 230 Vandazhi 200 Shoranur 216 ThiruniUayi 231 Vaniamcolam 201 Sitarkundu 217 Tbiruvaliyad 232 Vannamada 202 Sreekrishnapuram 218 Tholanur 233 Varode l03 Sri Ramakrishna Nagar 219 Thootha 234- Vatanamkurissi 204 Talikod 220 Tiruvegapura 235 Vattamkulam 205 Tarur 221 Trikanapuram 236 Vattekad 206 Tonari 222 Trikatteri 237 Velanthavalam 207 Thachampara 223 Tritala 238 Veliancode 208 Thadukkasseri 224- Vadakanchery 239 VeIIinali 209 Thalakkasseri 225 Vadakkekad 240 Vengasseri 210 Thathamangalam 226 Vadakkumthara 241 Vilayanur 211 Thekkepotta 227 Vadavannur 242 Vilayodi 212 Thekkevavannur 228 Vallanghi 243 Vilayur 213 Thenkara 229 va~lapuzha 244 Yakkara 214- Thenkurissi
Opened during 1950-51
1 Alankod 21 Kottapuram 41 Ponniyakurissi .2 Angadi, 22 Kudallur 42 Pulamanthol 3 Annalt._ara 23 Kuruvambalam 43 Pulasseri 4- Bhimanad 24 Kuttanad 44- Sugapuram 5 Changeleri 25 Malampuzha Dam 45 Tachangad 6 Chemmalasseri 26 Mankurissi 46 Tenur 7 Chemmangad 27 Mannarmala 47 Thekkumangalam 8 Chemmaniyod 28 Melmuri-Pattambi 48 Thrissileri 9 Cherukidangad 29 Mtlzhathur 49 Tirunarayanapuram
10 Cherukode 30 Mudur 50 Valambur 11 Chulanur 31 Mundakkattukurissi 51 Varode-Kottayi 12 Edakkodu-Pavukkonam 32 Murkkanad 52 Vavulliapuram 13 Iringapuram 33 Nannambra 53 Vayilathur 14 Iruvellur 34 Otalur 54 Veeramangalam 15 Kadu~kamkunnu 35 Padirikkod 55 Vellicode 16 Kadungapuram 36 Pallikurup 56 Vengodi 17 Karalmanna 37 Pattithara 57 Venkitang 18 Kilakkumbram I 38 Payyanadam 58 Vettathur 19 Koonathara 39 Perimbadiri 59 Viyyakurissi
:20 Kottapadam 40 Pombra
Opened during 1951-52
1 Chembra-~'lttamb, 9 Padinhattumuri 17 Vattalur 2 Edapatta 10 Pirayiri 18 Velliancheri 3 Kunduvampadam , 11 Pulianamkunnu 19 Vellila 4- Kunnakara 12 Pullode 20 Vemballur 5 Marutharode \ 13 Thiruvalathur 21 Vengad '6 Mudukurissi \ 14 Tirurkad 22 Vilathur 7 Naduvattam-Pattarr\.bi 15 Tiruvalamkunnu g 01asseri ' 16 Ummanazhi
Opened during 1952-53
t K. A:. Samajam 2 Mathur Agraharam
Opened during 1953-54
1 WalayarDam
Opened during 1954-55
t Chittur College 3 Mulannur 5 PampampaUam '2 Mangalam Dam 4- Padagiri 6 Nagalasseri
25/343-14 95
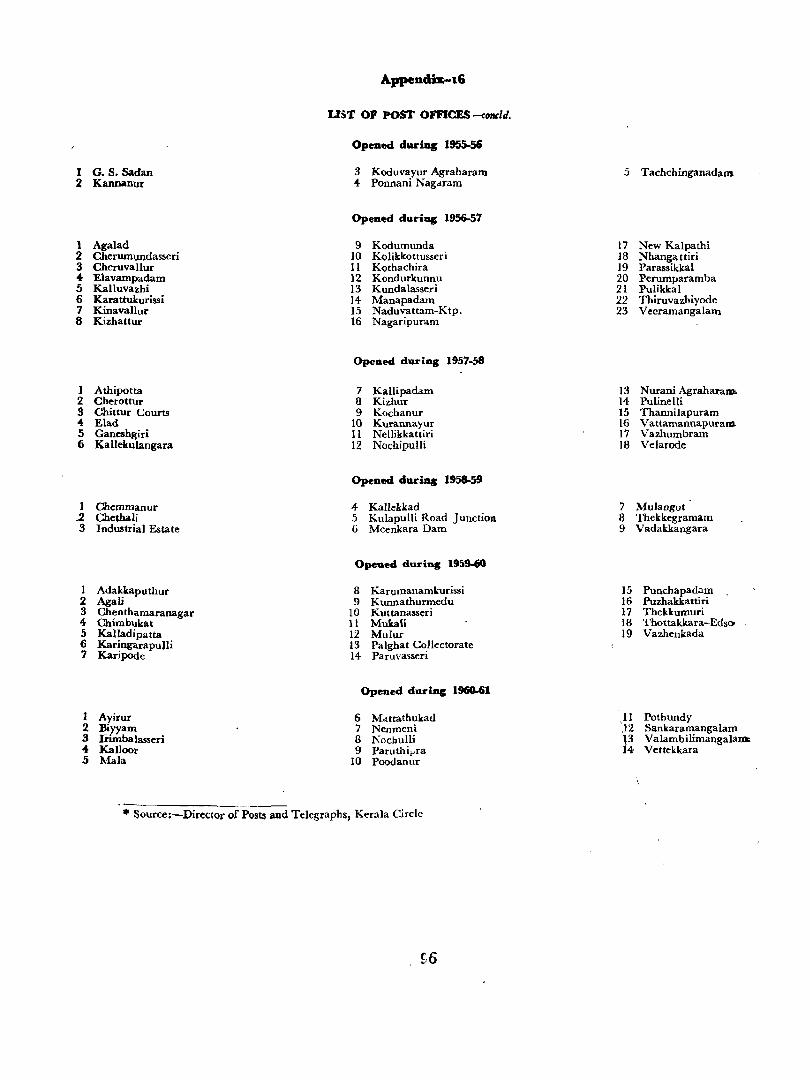
Appendix-I6
UST OP POST OmCES--ttmtIJ.
Opeaed duriq 1955-56
J G. S. Sadan 3 Koduvayur Agraharam .) Tachchinganadam 2 Kannanur f Ponnani Nagdram
Opened duri .. 1956-57
1 Agalad 9 Kodumunda 17 New Kalpathi 2 Cherumundasseri 10 Kolikkottusseri 18 Nhanga ttiri 3 Cheruvallur 11 Kothachira 19 Parassikkal 4- Elavampadam 12 Kondurkunnu 20 Perumparamba 5 Kalluvazhi 13 Kundalasseri 21 Pulikkal 6 Karattukurissi 14 Manapadam 22 Thiruvazhiyode 7 Kinavallur 15 Naduvauam-Ktp. 23 Veeramangalam 8 Kizhattur 16 Nagaripuram
Opened during 1957-58
1 Athipotta 7 Kallipadam 13 Nurani Agrahararn. 2 Cherott\)r 8 Kizhur 14 Pulinelli 3 Chittur Courts 9 Kochanur 15 Thannilapuram 4- Elad 10 Kurannayur 16 Vattamannapuram 5 Ganeshgiri 11 Nellikkattiri 17 Vazhumbram 6 Ka llekulangara 12 Nochipulli 18 Velarode
Opened duriag 1958-59
1 Chemmanur 4- KaHekkad 7 MuJangot .2 Chethali 5 Kulapulli Road Junction 8 Thekkegramam 3 Industrial Estate 6 Meenkara Dam 9 Vadakkangara
Opeaed during 1959-60
1 Adakkaputhur 8 Karumanamkurissi 15 Punchapadam 2 Agali 9 Kunnathurmedu 16 Puzhakkattiri 3 Chenthamaranagar 10 Kuttanasseri 17 Thekkumuri 4- Chimbukat 11 Mukali 18 Thottakkara-Eds~ 5 Kalladipatta 12 Mulur 19 Vazhenkada 6 KaringarapuUi 13 Palghat Collcctorate 7 Karipode 14 Paruvasseri
Opened durmg 1960-61
1 Ayirur 6 Mattathukad ,11 Pothundy 2 lliyyam 7 Nenmeni
i1 Sankaramangalarn
3 Inmbalasseri 8 Nochulli ValambilimangalaY~
" Kalloor 9 Paruthil'ra Vettekkara 5 Mala 10 Poodanur
* Source:-Director of Posts and Telegraphs, Kerala Circle
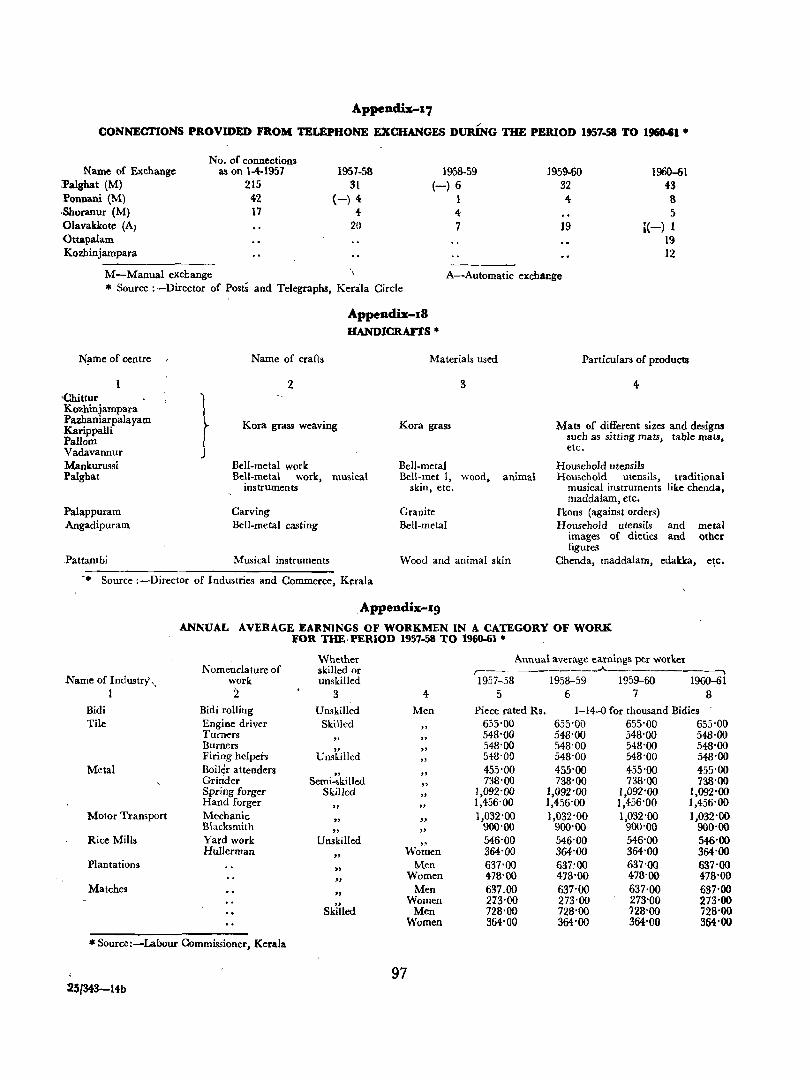
Appendix-17
CONNECTIONS PROVIDED FROM TELEPHONE EXCHANGES DURiNG TIlE PERIOD 1957-58 TO 1960-61 •
No. of connections Name of Exchange as on 1-4-1957 1957-58 1958-59 1959-60 1960-61
Palghat (M) 215 31 (-) 6 32 43 Ponnani (M) 42 (-) 4 1 4 S .Shoranur (M) 17 4 4 5 Olavakkote (A) 20 7 19 l(-) 1 Ottapalam 19 Kozhinjampara 12
M-Manual excl:ange A-Automatic exchange * Source :-Director of PostS and Telegraphs, Kera]a Circle
N!lme of centre
'Chittur
} Kozhinjampara Pazbaniarpala yam Karippalli Pa1Ioro Vadavannur Mankurussi Palghat
.Palappuram Angadipuram
Name of crafts
2
Kora grass weaving
Bell-metal work
Appendix-IS HANDICRAFl'S *
Materials used
3
Kora grass
Bell-metal Bell-metal work, musical Bell-met J, wood,
instruments skin, etc.
Carving Granite Bell-metal casting Bell-metal
animal
,Pattarobi Musical instruments Wood and animal skin
-. Source :-Director of Industries and Commerce, Kcrala
, Appendix-19
Particulars of products
4:
Mats of different sizes and designs such as sitting mats, table mats, etc.
Household utensils Household utensils, traditional
musical instruments like chenda, maddalam, etc.
Ikons (against orders) Household utensils and metal
images of dieties and other figures
Chenda, maddalam, edakka, e~c.
ANNUAL AVERAGE EARNINGS OF WORKMEN IN A CATEGORY OF WORK FOR THE, PERIOD 1957·58 TO 1960-61 "
Whether Annual average earnings per worker Nomenclature of skilled or ,-
_.A. _______ ~
Name of Industry '_ work unskilled 1957-58 1958-59 1959--60 1960--61 1 2 3 4 5 6 7 8
Bidi Bidi rolling Unskilled Men Piece rated Rs. 1-14-0 for thousand Bidies Tile Engine driver Skilled
" 655'00 655'00 655'00 655'00
Turners " "
548'00 548'00 548'00 548·00 Burners
Unskilled " 548'00 548-00 548'00 548'00
Firing helpers "
548'00 54S'00 548'00 548'00 Melal BoHdr a ttenders
" " 455'00 455'00 455'00 455'00
Grinder Semi-skilled "
738'00 738'00 738'00 738'00 Spripg forger Skilled "
1,092'00 1,092'00 1,092'00 1,092'00 Hand forger
" " 1,456'00 1,456'00 1,456'00 1,456'00
:Motor Transport Mechanic " "
1,032'00 1,032'00 1,032'00 1,032'00 Blacksmith
" " 900'00 900'00 900'00 900'00
Rice Mills Yard work Unskilled "
546'00 546'00 546'00 546'00 Hullerman
" Women 364'00 364'00 364'00 364'00
Plantations "
Men 637'00 637:00 637'00 637'00
" Women 478-00 478'00 478-00 478'00
Matches "
Men 637.00 637-00 637'00 637-00
" Women 213'00 273'00 273'00 273'00
Skilled Men 728'00 728'00 728'00 728'00 Women 364'00 364'00 364'00 364'00
* Source:-Labour Commissioner, Kerala
97 . 25[343-14b
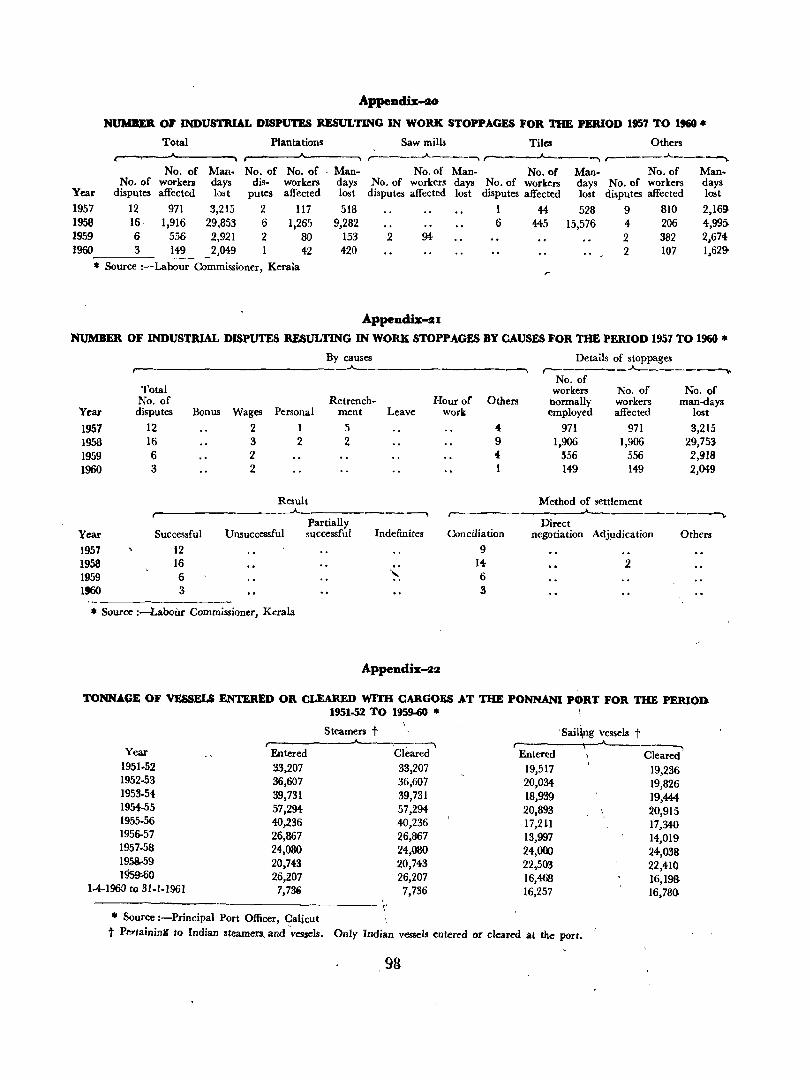
Appendix .... o
NtJMBER OF INDUSTlUA.L DISPUTES RESULTING IN WORK STOPPAGES FOR THE PERIOD 1957 TO 1_"
Total Plantations Saw mills Tiles Others ;. ____ ..A. ___ -, ,--._--"--___ -, ,-___ ..A. ___ --.,_
No. of Man- No. of No. of - Man- No.of Man- No.of Man- No.of Man-No. of workers days dis- workers days No. of workers days No. of workers days No. of workers days
Year disputes affected lost putes affected lost disputes affected lost disputes affected lost disputes affected lost
1957 12 971 3,215 2 117 518 1 44 528 9 810 2,169-1958 16- 1,916 29,853 6 1,265 9,282 6 445 15,576 4 206 4,99;) 1959 6 556 2,921 2 80 153 2 94 2 382 2,674 1960 3 149 2,049 1 42 420 2 107 1,629-
* Source :-Labour Commissioner, Kerala
Appendix .... ! NUMBER OF INDUSTRIAL DISPUTES RESULTING IN WORK STOPPAGES BY CAUSES FOR THE PERIOD 1957 TO 1960 ..
By causes Details of stoppages .A._ ...., r--------.A._-------~ No. of
Total workers No. of No. of No. of Retrench- Hour or Others normally workers man-days
Year disputes Bonus Wages Personal ment Leave work employed affected lost
1957 12 2 I 5 4- 971 971 3,215 1958 16 3 2 2 9 1,906 1,906 29,753 1959 6 2 " .'156 556 2,918 1960 3 2 149 149 2,049
Result Method of settlement r-------------------A-----------------, _.A. ________ ----,.
Direct Year 1957 1958 1959 l~
Successful
12
Unsuccessful Partially successful Indefinites Conciliation negotiation Adjudication Othe1'll
16 6 3
• Source :-Laooilr Commissioner, K.:rala
9 14
" 6 3
Appendix-211
2
TONNAGE OF VESSELS ENTERED OR CLEARED WITH CARGO~S AT THE PONNANI Pc\lRT FOR THE PERIOD 1951-52 TO 1959-60 *
Year 1951·52 1952·53 1953.54 1954·55 1955-56 1956-57 1957.58 1958.-59 I~O
1-4-1960 to 31-1-1961
Entered 3;3,207 36,607 39,731 57,294 40,236 26,867 24,080 20,743 26,207
7,73(ij
• Source :-Principal Port Officer, Calicut
Steamers t , -----. Cleared 33,207 36,607 39,731 57,294 40,236 26,867 24,000 20,743
- 26,207 7,736
'Sail¥tg vessels t ~-----,
Entered I Cleared 19,517 19,236 20,034 19,826 18,939 19,444-20,893 20,915 17,21I 17,340 13,997 14,019 24,000 24,038 22,50:J 22,410 16,468 16,19S 16,257 16,78()'
t p~,.taining to Indian steamers.. and 'vessels. Only Indian vessels entered or clear~ at the port. ;
98
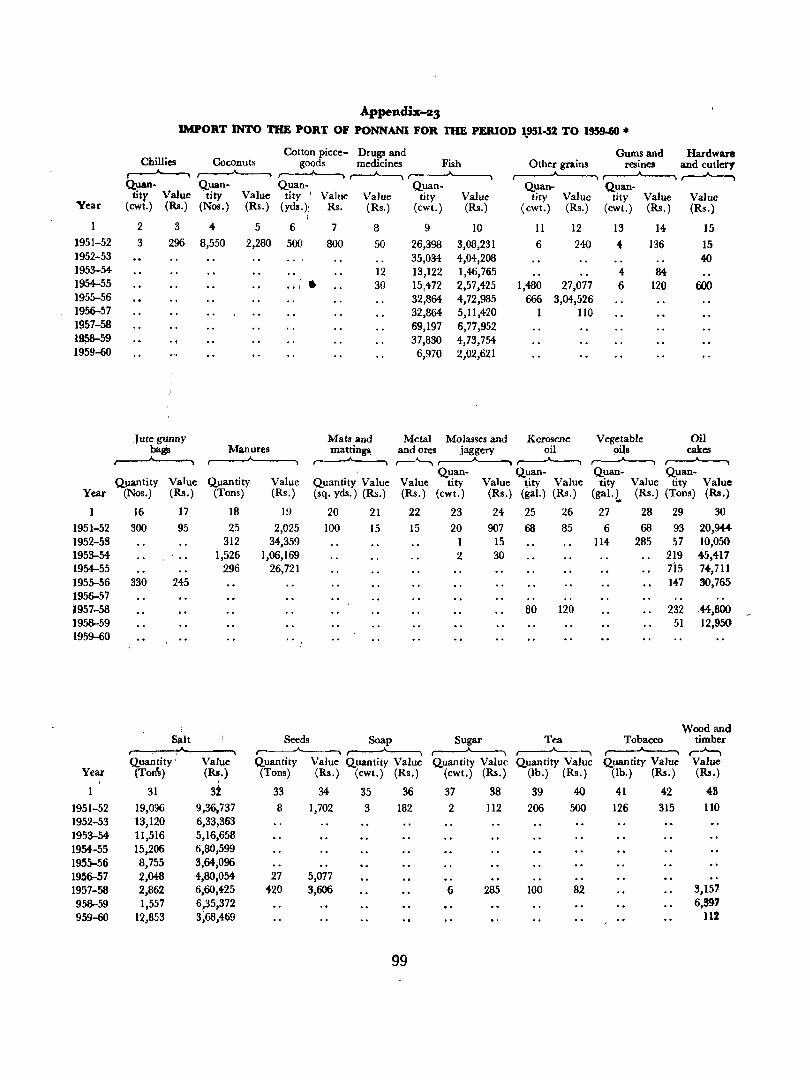
Year
1951-52 1952-53 1953-54 1954-55 1955-56 1956-57 1957-58 1958-59 1959-60
Year
1951-52 1952-59 1953-54 1954-55 1955-56 1956-57 ~957-58 1958-59 1959-60
Year
1951-52 1952-53 1953-54 1954-55 1935-56 195~57 1957-58 .958-59 959-60
Appenclix-23 IMPORT iNTO THE PORT OF PONNANI FOR THE PERIOD 1.951-52 TO 1959-60 *
Cotton piece- Drugs and Chillies Coconuts goods medicines Fish ~ ,----A----. ~ ~,------"-----, Quan- Quan- Quan-. Quan-
tity Value tity Value tity I Value Value tity (cwt.) (Rs.) (Nos.) (Rs.) (yds.): Rs. (Rs.) (cwt.)
234 5678 9
3 296 8,550 2,280 500 800 50 26,398
.. ! •
.,
Jute gunny Mats and bags Manures matlings
12 30
35,034 13,122 15,472 32,864 32,864 69,197 37,830 6,970
Metal and ores
Value (Rs.)
10
3,08,231 4,04,208 1,46,765 2,57,425 4,72,985 5,11,420 6,77,952 4,73,754 2,02,621
Molasses and jaggery
Gums and Hardware Other grains resines and cutlery
,----A------, ,.......-A--.. ~ Quan- Quan-
tity Value tity Value Value (cwt.) (Rs.) (cwt.) (Rs.) (Rs.)
II 12 13 14 15
6 240 .. 136 15
1,480 27,077 666 3,04,526
110
Kerosene oil
4 6
Vegetable oils
84 120
40
600
Oil cakes
~ ,.----"------, ~ ~ ~ r---"---. r---"---. r---"---. Quan- Quan- Quan- Quan-
Quantity Value Quantity Value Quantity Value Value tity Value tity Value t~ty Value tity Value (Nos.) (Rs.) (Tons) (Rs.) (sq. yds.) (Rs.) (Rs.) (cwt.) (Rs.) (ga!.) (Rs.) (gal.L (Rs.) (Tons) (Rs.)
16 17 18 19 20 21 22 23 24 25 26 27 28 29 30
300 95 25 2,025 100 15 15 20 907 68 85 6 68 93 20,944-312 34,359 1 15 114 285 57 10,050
.. 1,526 1,06,169 2 30 219 45,417 296 26,721 7i5 74,711
330 245 147 30,765
80 120 232 44,800 51 12,950
Wood and Salt Seeds Soap Sugar Tea Tobacco timber
Quantity: ,----A------, r-----'-----. r-----'-----. ~ r--~ ,.A.-...,
Value Quantity Value Quantity Value Quantity Value Quantity Value Quantity Value Value (Ton's) (Rs.) (Tons) (Rs.) (cwt.) (Rs.) (cwt.) (Rs.) (lb.) (Rs.) (lb.) (Rs.) (Rs.) ,
31 3t 33 34 35 36 37 38 39 40 41 42 43 19,096 9,36b737 8 1,702 3 182 2 112 206 500 126 315 110 13,120 6,33,363 11,516 5,16,658 15,206 6,80,599 8,755 3,64,096 2,048 4,80,054 27 5,077 2,862 6,60,425 1-20 3,606 6 285 100 82 3,157 1,557 6,35,372 6,397
12,853 3;68,469 112
99
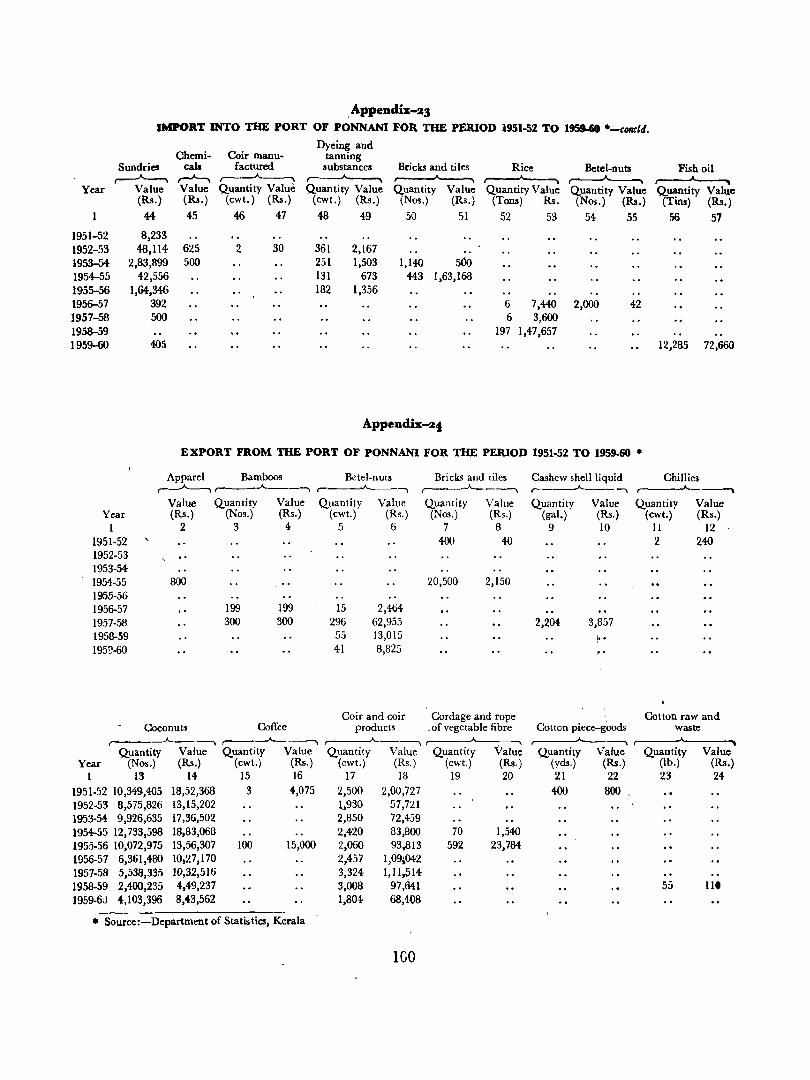
, Appendix-23 IMPORT INTO THE PORT OF PONNANI FOR THE PERIOD 1951-52 TO 195!J.4iO .-CMICld.
Dyeing and Chemi- Coir manu- tanning
Sundries cals factured substances Bricks and tiles Rice Betel-nuts Fish oil ~ r-"---. ,..--~ ~ ~ r---'-------.. ,..--..-A----.. ~
Year Value Value Quantity Value Quantity Value Quantity Value Quantity Value Quantity Value Quantity Value (Rs.) (Rs.) (cwt. ) (Rs.) (cwt.) (Rs.) (Nos.) (Rs.) (Tons) Rs. (Nos.) (Rs.) (Tins) (Rs.)
44- 45 46 47 48 49 50 51 52 53 54 55 56 57
1951-52 8,233 1952-53 48,114 625 2 30 361 2,167 .. 1953-54 2,83,899 500 251 1,503 1,140 560 1954-55 42,556 131 673 443 1,63,168 1955-56 1,64,346 182 1,356 1956-57 392 6 7,440 2,000 42 1957-58 500 6 3,600 1958-59 197 1,47,657 1959-60 4{)5 12,285 72,660
Appendix.-24
EXPORT FROM THE PORT OF PONNANI FOR THE PERIOD 1951-52 TO 1959-60 •
Apparel Bamboos Betel-nuts ,-~ ( .A. __ ...... r-_____..A..--......
Value Quantity Value Quantity Value Year (Rs.) (Nos.) (Rs.) (cwt.) (Rs.)
1 1951-52 1952-53 1953-54 1954-55 1955-56 1956·57 1957-58 1958-59 1959-60
2 3 4 5 6
800 .. 199 199 15 2,464 300 300 296 62,955
55 13,015 41 8,825
Coir and coir Coconuts Coffee products ,--__ _A._---.
~----,
Quantity Value Quantity Value Quantity Value Year (Nos.) (Rs.) (cwt.) (Rs.) (cwt.) (Rs.)
1 13 14 15 16 17 13 1951-52 1O,349,4{)5 18,52,368 3 4,075 2,500 2,00,727 1952-53 8,575,826 13,15,202 1,930 57,721 1953-54- 9,926,635 17,36,502 2,850 72,459 19~55 12,733,598 18,83,068 2,420 83,800 1955·56 10,072,975 13,56,307 100 15,000 2,060 93,813 1956-57 6,361,480 10,27,170 2,457 1,09,042 1957·58 5,538,335 10,32,516 3,324 1,1l,~14 1958-59 2,400,235 4,49,237 3,008 97,641 1959·6:) 4,103,396 8,43,562 1,804 68,408
• Source:-Department of Statistics, Kerala
IGO
Bri cks and tiles Cashew shell liquid Chillies .A._ __ --.. ,..--_.A. ___ --.. .A._~
Quantity Value Quantity Value Quantity Value (Nos.) (Rs.) (gal.) (Rs.) (cwt.) (Rs.)
7 8 9 10 II 12 400 40 2 240
20,500 2,150
2,204 3,857 ) .. ,.
Cordage and rope Cotton raw and of vegetable fibre Cotton piece-gOods waste
--,----:---. ~~ Quantity Value Quantity Value Quantity Value
(cwt.) (Rs.) (yds.) (Rs.) (lb.) (Rs.) 19 20 21 22 23 24
400 800
70 1,540 592 23,784
55 11.
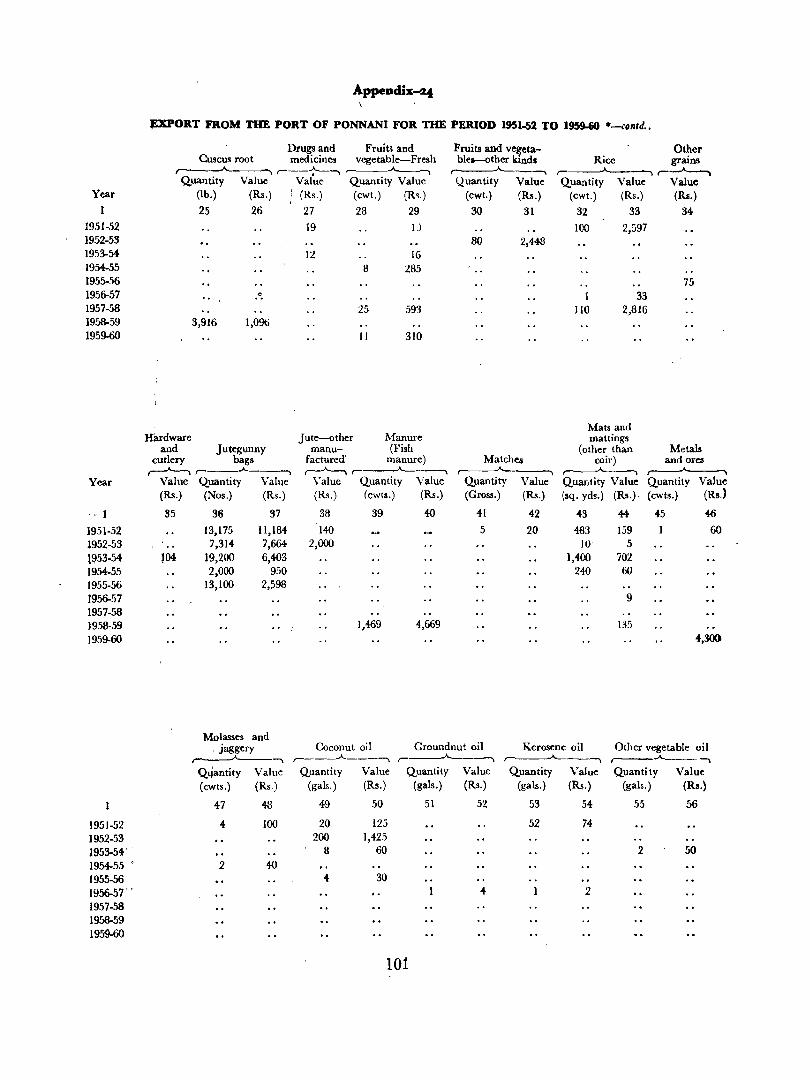
Year
1
1951-52 ]952-53 1953-54 1954-55 1955-56 1956-57 1957-58 1958-59 1959-60
Year
'0 I
1951-52 1952-53 l!)53-54 1954-55 1955-56 1956-57 1957-58 1958-59 1959-60
1951-52 1952-53 1953-54' . 1954-55 0
1955-56 1956-57' ,
1957-58 1958-59 1959-60
Appeadix-lZ.j
~ORT FROM THE PORT OF PONNANI FOR THE PERIOD 1951-52 TO 1959-60 *-(ontJ .•
Drugs and Fruits and Cuscus root medicines vegetable-Fresh
r---~, ~ Quantity Value
(lb.) (Rs.)
25 26
0
3,916 1,096
Hardware and Jutegunny
cutlery bags ~r---.A.
Value (Rs.)
35
}04
Quantity Value (Nos.) (Rs.)
36 37
13,175 11,184 7,314 7,664
19,200 6,403 2,000 950
13,100 2,598
Molasses and , jaggery
,--..---"'----., Qtiantity Value (cwts.) (Rs,)
47 48
4 100
2 40
Value Quantity Value (Rs.) (cwt.) (R~.)
27 28 29
19 IJ
12 16 8 285
25 593
11 310
Jute-other !\:[anure manu- Wish
factured' manure) .---"---, ,-_ __.A__--,
Value Quantity Value (Rs.) (cwts.) (Rs.)
3B 39 40
140 2,000
1,469 4,669
101
Fruits and vegeta- Other blea--other kinds Rice grains
...----'----, ,-~~ Quantity Value Quantity Value Value
(cwt.) (Rs.) (cwt.) (Rs.) (Rs.)
30 31 32 33 34
100 2,597 80 2,448
75 33
110 2,816
Mats and mattings
(other than Metals Matches coir) and orcs
r-----"-----, ,----.A._---, ~ Quantity Value Quantity Value Quantity Value (Gross.) (Rs.) (sq. yds.) (Rs.). (cwts.) (Rs.)
41 42 43 44 45 46
5 20 483 159 60 II) 5
1,400 702 240 60
9
135 4,300
AppeDdix-!&4
EXPORT FROM THE PORT OF PONNAN! FOR THE PERIOD 1951-5:£ TO 1959-60*-concltl.
Other kinds of oil Oil cakes Palmnut chips Pepper
Quantity Value Quantity Value Quantity Value Quantity Value Year (gal.) (Rs.) (cwt.) (Rs.) (ewt.) (Rs.) (ewt.) (RI.)
1 57 58 59 60 61 62 63 64
1951-52 28 56
1952-53 28
1953-54-1954-55
1955-56 42 9.100 1956-57 12 298 9,990 10
1957-58 2,056 ·57.256
1958-59 815 23,430
1959-60 76 1,625
Provision and Oilman store Salt Seeds Soap Sugar
~ ~ ...... Quantity Value Quantity Value Quantity Value Quantity Value Value
Year (cwt.) (Rs.) (Tons) (Rs.) (Tons) (Rs.) (ewt.) (Ra.) (Rs.)
1 65 66 67 68 69 70 71 72 73
1951-52 4 142 504- 16,236 3 120
1952-53 6,295 1,80,770 73 2,500
1953-54- 5,724 95,622 251 15,341
1954-55 138 7,550 8 5,100 21 484 -1955-56 465 5,058 161 7,600 2 990 ... 1956-57 77 3,675 5
1957-58 192 7,800 .. ' 4 165 'I"'
1958-59 ", 80 4,900
1959-60
Textiles Wood Wood manu- Tobaeco-unmanu- and manu-
Tea faetured faetured timber faetured Sundries Confectionary ~ A._~ ~ ,....-"--. ~ ,.-~
Quantity Value Value Quantity Value Value Value Valqe Quantity Value Year (lb.) (Rs.) (Ra.) (lb.) (Rs.) (Rs.) (Rs.) (Ra., (cwt.) (Rs.)
1 74 75 76 77 78 79 80 81 82 83
1951-52 125 250 136 336 70 20 15,419 1952-53 9,145 -1953-54- 3,00,958 -... 1954-55 12,205 11,858 30,655 1955-56 450 10,591 24,033 ... 1956-57 9 12 6,916 7,132 ... 1957-58 18 859 3,679 476 1958-59 100 800
1959-60 22,419 .. 9,837 38 1,036
* Source :-Department of Statistics, Kerala
102
AppelMlis-ll5 JIIYSICAL ACIUEVEMENTS AND no,u's CON'l'lUllVTlON FOR 'I1IE PERIOD 1956-57 TO 196Ut·
Particulan 1956-57 1957-58 1958-59 1959-60 19ID-61
1 Composed pits (Nos.) 358 12,026 3,601 3,000 5.259
2 Chemical fertilisers (Mds.) 192'7 4,347 72,585 99,783 99,767 (tons) (tons)
3 Insecticides (cwt.) 1'25 39 100 1,145 656 (tons) (tons) (tons) .. Plants sprayed (Nos.) 47,618
5 Improved seeds (Mds.) 200 37,202 2,904 13,336 3,979 (paras) (paras)
6 Green manure seeds distributed (lb.) 593'5 1,037 293 20,984- 58,627 (cwt.) (cwt.) (cwt.)
1 Green tnanure cuttings (Nos.) 539,205
8 Cocoanut seedlings (Nos.) 2,150 12,206 11,569 18,293 38,735
9 Fertilizer and cultural demonstration (Nos.) 54- 1,243 817 899
10 Holdings taken up 971
U Area under Japanese method or paddy cultivation (acres) 141 103,479 72,732 8,226 103,317
12 Area under vegetable/! (acres) 2,721
13 'Quantity of vegetabie seeds (lb.) 1,217
14 Area brought under 'fruit trees (acres) 939
15 Additional area bro~ht under cultivation 2,740
16 Additional area brolfght under assured water-ilupply (acres) 5,320
17 Improved implements (Nos.) 137 166 118 3,423 943
18 Young farmer's clubs (Nos.) 14 22 8 65 15
19 Crop competition (Nos.) 5 931 52~ 531 100 20 Persollll participated (Nos.) NA NA NA NA 284
21 Breeding centres-Natural (NOS.) 8 4 8 10
22 BR!eding centres-Artificial (Nos.) 5 5 12
23 Pedigree bulls suppJied (Nos.) 44 21 24 13
24- Insemination-Natural (Nos.) 145 2,524 2,205 2,024 4,473
25 Insemination-Artificial (Nos.) 2,947 978 1,217 6,433
26 Veterinary dispensaries (Nos.) 12 5 5
27 Animals innocullit~d and vaccinated (including cattle) (Nos.) 4,047 145,198 98,487 28,757 100,501
28 ~ulls cas tra ted (Nos.) 9,907 4,893 3,195 7,400
29 Poultry centres opened (Nos.) 6 4 179 10 30 Pedigree birds supplied (Nos.) 722 763 345 2,810 2,860 31 Hatching e¥s distributed (NOS.) .' 728 8,311 4,873 269 4,162
32 Poultry treated and ')lac~inated including birds innoculated (Nos.) 5,741 14,975 14,506 28,824 16,210
33 Cattle show conducted (Nos.) 11 29 14 22
. 34 Quantity of mineral', mixture (Mds.) 3,024-
35 Area under fodder cultivation (a,cres) 28
36 Pump sets supplied (~os.) 50 39 32 88
37 Tanks improved (Nos.») 9 38 Canals and channels cqnstructed (Nos.) 6 39 Wells { 1 223 40 Tanks 9,490 41 Canals 108 r 15,775 42 Others ) 1,042
43 Area reclaimed (acres) 941 117 310 61
44 Demonstration plots for soil copservation (Nos.) 27 9 22 45 Surface wells constructed (Nos.) 259 52 39 171 46 Surface wells renovated (Nos.) 22 20 11 17
4:7 Fisheries and fingerlings (Nos.) 53,271 17,783 5,751 14,950
48 Soakage pits (Nos.) 16 1,929 267 92 981 49 Rural latrines (Nos.) 30 1,665 341 330 2,143
N. A.-Not available
103 25/343-15.
AppeDdix-25 PHYSICAL ACHIEVEMENTS AND PEOPLE'S CONTlUBUl'lON FOR 'I1IE PEIuOD 1956-57 TO 1960-61*-contld.
Particulars 1956-57 1957-53 1958-59 1959--60 1960-61
50 Drains constructed (Yds.) 550 15,770 8,741 115 1,581
51 Bathing ghats 3 5 2
52 Secondary/primary health centres (Nos.) 41 14 28 2
53 Existing dispensaries converted (Nos.) 2
54 Maternity and child-'\Velfare centres (Nos.) 10
55 Family planning advising clinies (Nos.) 9
56 ' Village houses constructed (Nos.) 998 258 25 51
57 Village houses reconstructed (Nos.) 330 237 15 1
58 Aid given to existing schools (Nos.} 140
59 Community centres (Nos.) 24 23 4 13
60 Children's park (Nos.) 16 18 15 16 18
61 Sports clubs (Nos.) 35 84 36 21 3a
62 Aid given to sports clubs (Rs.) 1,200 63 Adults literacy centres 2 172 51 80 70
64 Adults benefited (Nos.) 268 9,782 7,903 1,713 6,477 65 New libraries and reading rooms (Nos.) 16 58 104- 12 44
66 Aid given to existing libraries (Nos.) 4 67 Books supplied (Nos.) 1,085 5,943 1,034 1,248 3,343 68 Entertainments (Nos.) 27 755 713 278 834
69 Cultural clubs (Nos.) 28 133 34 120,
70 Members (Nos.) 1,131
71 Women's clubs (Nos.) 8 26 40 25 21 72 Members (Nos.) 1,433-
'73 Village leaders' organisations (Nos.) 24 47 27 57 74 Vi'llage leaders' camps 1 32 ". 52 74-75 Training centres opened ').
76 Village leaders trained (Nos.) 4,135, 77 N. C. C., A. C. C., B. S. S. Camps '). ti 6 19 11
78 Cinema shows 321 79 Pucta roads (miles) 162 18 2 32" 80 New k~tcha roads (miles) 12 243 91 5 322 81 Existing roads improved (miles) 202 82 Culverts constructed (Nos.) 18 598 62 49 359 83 Foothridge coostructed (Nos.) ! 84 Productioll.-cum-training centres (Nos.) 7 8 24- 2~
85 Crafts adopted 16 86 Students trained 399 87 Bee-hives supplied (Nos.) 52 374 . I'll 49 197, 88 Credit/Multipurpose Oxlperative Societies (Nos.) 40 41 89 Membership in Credit/Multipurpose Co-operative Societies .. 9,077 23,525-90 Industrial Co-operative Societies (Nos.) 15 29 43 42 91 Membership in Industrial Co-operative Societies (Nos.) NA . NA NA 5,699 92 Farming Co-operative Societies (Nos.) \ 6 12 2 93 - Membership in Farming Gl-operative Societies (Nos.) 465 291 163 9+ Other Co-operative Societies (Nos.) 100 ~3 20 20 95 Memb¢rship in other Co-operative Societies (Nos.) NA NA NA 4,244-96 Labour vah,le (Rs. 'OOO) 4()'46 252 716 685 96'34 97 Land (acres) 3'47 75 .9 '. 9 28'50' 98 Land value (Rs. '000) "18 68 14- 62 99 Cash and other contributions (Rs.'OOO) 1{U5 687 629 96'2 361'41
* Source :-Development Commissioner, Kerala N. A.-Not available
104
Append.is-s16
RECEIPTS UNDER EXCISE REVENUE FOB. THE PBlUOD 1950-51 TO 1~1 •
Arrack: and Coco-Total brandy Foreign Liquor Opium and Ganja Spirituous preparations OtheR
.A. • - .. ---_... f .... Demand Collection Demand CoIJ,ection Demand. Collection Demand Collection Demand Collection Demand Collection
Year lU_ RI_ RI. is_ ltl_ Rs. :as. Rs. RI. RI. Rs. lU_
1950-51 26,597 26,597 105 105 23,977 23,977 186 186 2,329 2,329
1951-52 14,761:- 14,764 12 12 105 185 12,667 12,667 123 123 1,857 1,857
1952-53 11,062 11,062 34 .34- 9,227 9,227 224 224 1,577 1,577
1953-54- 19,073 19,073 4,690 4,690 13,788 13,788 595 595
1954-55 34,434 34,434- 25 25 86 ' SO 4,831 4,831 27,897 27,897 1,595 1,595
Jq55-56 21,566 21,566 9 9 3,225 3,225 16,600 16,600 1,732 1,732
1956-57 4,334- 4,334 9 9 2,403 2,403 512 512 1,410 I,HO 1957-58 3,823, 3,823 91 91 3,077 3,077 235 235 420 420
1958-59 1,06,072 1,06,072 12 12 2,114 2,114 1,03,316 1,03,316 630 630
1959-60 ' J,20,35i 1,20,352 12 12 1,658 1,658 1,17,961 1,17,961 721 721
1900-61 7p4Q 71,340 23 23 1,440 1,440 69,650 69,650 227 227
* Source :-Boatd of Revenue, Kera1a
AppendiS:-27
SALES TAX REVENUE FOB. THE PERIOD 1950-51 TO 1960-61 *
(Rupees in 'OOJ)
Sales tax Sales tax Sales tax on Registration Licence Year Total Ordinary Additional Motor .pirit Fee Fee Miscellaneous
1950-51 , 2,209'63 2,131-30 6'80 20-60 go'13 20'80 1951-52 2,357'90 2,278'50 4-30 1-10 24-00 27-10 22'90 1952-53 2,1'25-90 2,033'40 9-60 3'40 23-40 30-10 26'00 1953-54 2,371'30 2,294'()6 17'80 6'50 2H:10 20'30 10'74-1954-55 ',2,109-60 2,037'60 12'50 4'60 23'40 19'80 11'70 1955-56 1,765'35 1,671'75 24-40 3'30 22'40 33-90 9-60
195&-57 1',841'30 1,679-50 86-60 9-30 22-40 S3-90 9'60 1957-58 2;404'65 2,001'60 210'45 63'90 43'60 5'10 .1958-59 1,932'10 1,754'10 7'50 23'00 41'00 106'50 195~ 2,290'45 2,102'00 6'75 7'29 25'70 39'80 109-()()
1~1 2,925-36 2,484'70 55-64 25'91 31-31 327'80
• Source :-Board of Revenue, Kerala
105 25/343--15 b.

AppeDdis-a&
AGRICULTURAL INCOMETAX AND AGRICUL"n1RAL SUPERTAX CLASSIFIED BY GRADE OF INCOME FOR THE PERIOD 1957-51 TO 1960-61*
Grade or Income 1
Total Up to 5,000
5,001 to 10,000 10,001 to 25,000
25,001 to 50,000 50,001 to 1,00,000
1,00,001 to 2,00,000 2,00,001 and over
Marumakkathayam tarwad ,---
A.I.T.
9 .,-273
24,757 33,472
8,186
Grade of Income 1
Total Up to 5,000
5,001 to 10,000 10,001 to 25,000 25,001 to 50,000 50,001 to 1,00,000
Supertax
10
13,51'
5,425 1,304-6,790
1,00,001 to 2,00,000 2,00,001 and over
Marumakkathayam tarward
A.I.T.
9
1,58,_ 17,666 49,110 34,756 6,481
48,670
S\1~ertax
10
24,811
2,393 22,~8
Total
A.I.T. Supertax Total
2 3 ~
U57-5.
10,12,499 2,24,624 12,37,123 22,077 22,877
1,26,901 1,26,901 5,43,739 1,05,602 6,49,Ml
62,180 35,181 97,361 38,932 45,412 84,344-
1,20,202 38,429 1,58,631 98,468 98,468
Tenants in common
A.LT.
11
4,722 811
1,136
A.I.T. 2
2,775
ll,61,6tO 1,95,617 3,77,854 3,68,825
39,128 1,24,885
55,331
Supertax
Total
Supertax 3
62,768
7,747 11,665 43,356
12
4,081
4,081
Total 4
12,24,_ 1,95,617 3,77,854 3,76,572
50,793 1,68,241
55,331
Tenants in common
A.LT. Superta.x
11 12
25,763
1,348 17,760 6,655
A. I. T.-Agricultural Incometax
106
Individual
""" A.LT. Supertax
5 6
2,52,703 80,917 13,011 ~9,636
1,27,876 48,449 62,180 18,393
14,069
Unregistered firm and other usociations
~
A.I.T. Supertax
13 14
51,471 16,200 843
17,205
40,423 16,200
IMividual
A.I.T. 5
5,35,314 1,22,970 :2,37,015 1,38,300
16,272 20,757
Su~ax 6
16,446
1,614, 14,832
Unregistered firm and other associations
A.I.T. Supertax
13 14-
14,501 24 7~'
1,551
12,171
Undivided family
A.I.T. Supertax
7 8
5,47,857 1,05,091 5,041
50,055 3,53,740 47,647
15,478 10,774 24,553 29,779 17,413 98,468
Companies and other concerns assessable at company rate -AJ.T. Supertax
15 16
82,058 4,816 2,098 1,317 8,671
19,972 50,000 4,816
Undivided family
A.LT. 7
3,33,108 53.~2 89,621
1,53,586 9,720
26,379
Supertax 8
13,764
7,658 6,106
'fompanies and other concenis \ assessable at company rate ~-------~~
; A.I.T.
15
96,266 1,155
" .. 22,8'12
16,908
55,331
Supertax:
16 7,747
7,747 ,.
-..
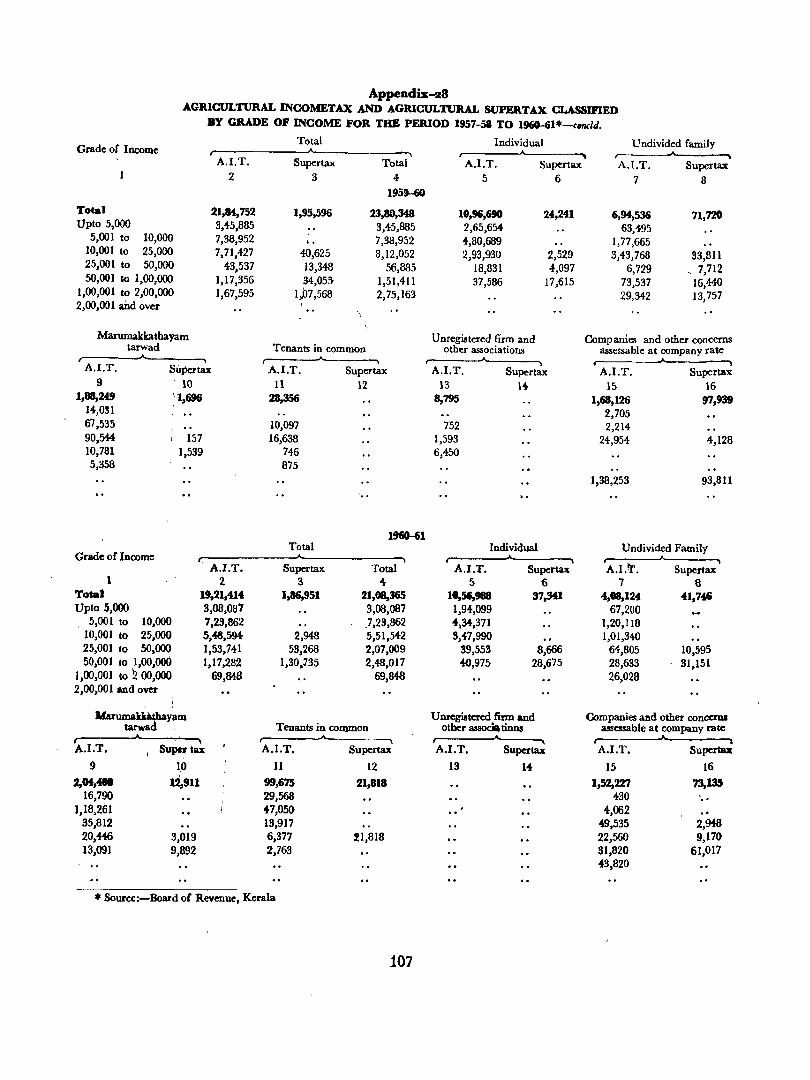
Appendix-28 AGRICULTURAL INCOMETAX AND AGRICULTURAL SUPERTA.X CLASSMED
BY GRADE OF INCOME FOR THE PERIOD 1957-58 TO l~l.--cMlCld.
Grade of Income
Total Upto 5,000
5,001 to 10,000 10,001 to 25,000 25,001 to 50,000 50,001 to 1,00,000
1,00,001 to 2,00,000 2,00,001 and over
Marumakkathayam tarwad
A.I.T. 2
21,84,752 3,45,885 7,38,952 7,71,427
43,537 1,17,356 1,67,595
A.I.T. Supertax: 9 10
1,88,249 ,'1,696 14,031 67,535 90,544- 157 10,781 1,539 5,358
Grade of Income
1 Total Upto 5,000
5,001 to 10,000 10,001 to 25,000 25,001 to 50,000 50,001 to 1,00,006
1,00,001 to 2 00,000 2,00,001 and over '
Marumakk&dlaYllm tarwad :
. A.I.T. 2
19,21,414 3,08,087 7,23,862 5,48,594-1,53,741 1,17,282
69,648
A.I.T.
9
2,CH,-16,790
Supe~ tax:
1~
t2,'11
1,18,261 35,812 20,446 13.091
3,019 9,892
Total
Supertax: Total 3 4
195~
1,95,596 23,80,348 ,. 3,45,885 L. 7,38,952
40,625 8,12,052 13,348 56,885 34,05~ 1,51,411
1»7,568 2,75,163
Tenants in common
A.I.T. 11
28,356
10,097 16,638
746 875
Total
Supertax 3
1,86,951
2,948 53,268
1,30,,735
Supertax: 12
' ..
1!Hi0-61
Total 4
21,08,365 3,08,087 .1,23,862 5,51,542 2,07,009 2,48,017
69,848
Tenants in common
A.LT.
11
99,675 29,568 47,050 13,917 6,377 2,763
Supertax:
12
21,818
21,818
• Source:-Board of Revenue, Kerala
107
Individual
A.LT. Supertax: 5 6
10,96,690 24,241 2,65,654 4,80,689 2,93,930 2,529
18,831 4,097 37,586 17,615
Unregistered firm and other associations
A.LT. Supertax: 13 14
8,795
752 1,593 6,450
Individual
A.I.T. S
11,51,_ 1,94,099 4,34,371 3,47,990
39,553 40,975
Supertax: 6
37,Ml
8,666 28,675
Unregistered firm and other associa tiIlIlll
A.I.T.
13
Supertax:
14
Undivided family ,.----.-.A--~ A.LT. Supertax:
7 8
6,94,536 71,720 63,495
1,77,665 3,43,768 33,811
6,729 , 7,712 73,537 16,440 29,342 13,757
Companies and other concerns assessable at company rate .__ A.LT. Supertax
15 16 1,68,126 97,939
2,705 2,214
24,954 4,128
1,38,253 93,811
Undivided Family
A.LT . 7
4,18,124 67,200
1,20,118 1,01,340
64,805 28,633 26,028
Supertax: 8
41,746
10,595 31,151
Companies ud other concerns assessable at company rate
A.I.T. Supertax
15 16 1,52,227 73,135
430 .. 4,062
49,535 2,948 22,560 9,170 31,820 61,017 43,820
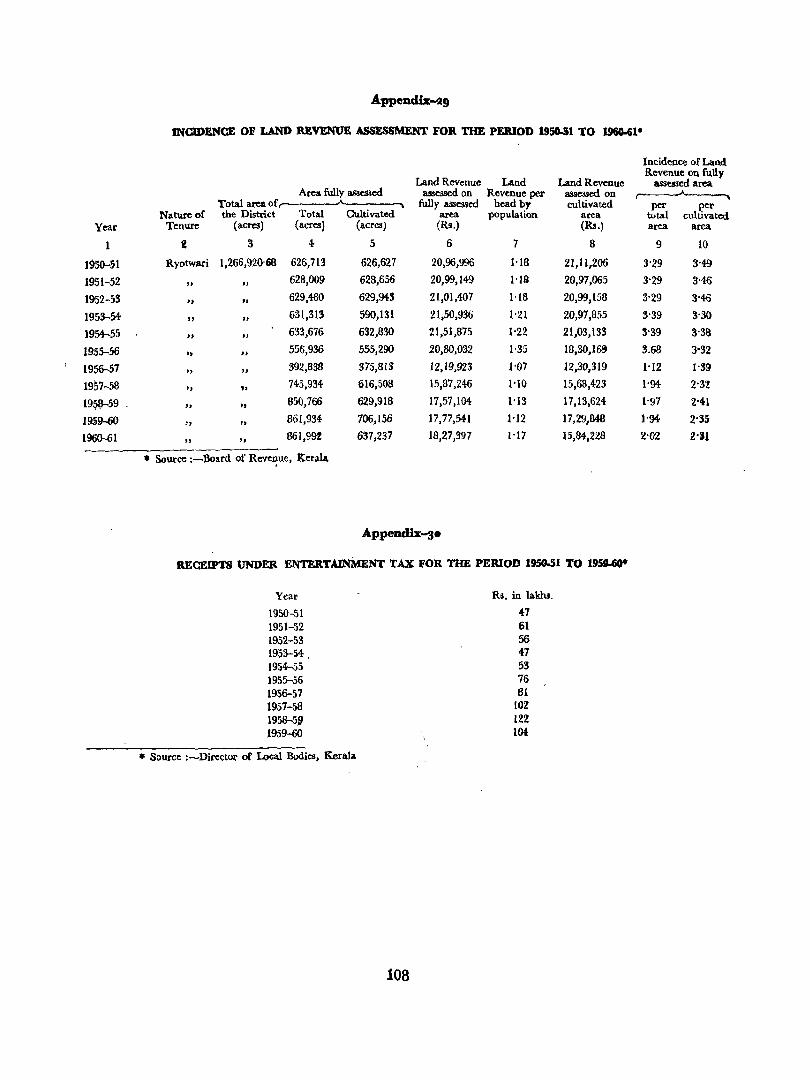
Year
1
1950-51 1951-52
1952-53
1953--54
1954-55
1955-56
1956-57
1957-58
19~1,)--59
1959-60
1900-61
Appeaclix-ll9
lNomENCE OF LAND REVENUE ASSESSMENT FOR THE PERIOD 1950-51 TO 1960-61·
Land Revenue Land Land Revenue Areli fully a.83essed assessed on Revenue per lIlISeMed on
Total area of fully assessed head by cultivated Nature of the District Total Cultivated area population area
Tenure (acres) (acrQ) (acres) (Rs,) (Rs,)
2 3 4 5 6 7 8
Ryotwari 1,266,920'68 626,713 626,627 20,96,996 1'18 21,11,206
" " 628,009 628,656 20,99,149 1'18 20,97,065
" " 629,480 629,943 21,01,407 1'18 20,99,158
" .. 631,313 590,131 21,50,936 1'21 20,97,855
" " 633,676 632,830 21,51,875 1'22 21,03,133
It " 556,936 555,290 20,80,032 1-35 18,3O,16!9
" .. 392,838 375,813 12,19.923 1-07 12,30,319
" to 745,934 616,508 15,87,246 1'10 15,68,423
" " 850,766 629,918 17,57.104 1-13 17,13,624
" It 861,934- 706,156 )7,77,54-1 1'12 17,29,848
" " 861,99% 637,237 18,27,397 1'17 15,84,228
.. Source :-Board of Reve~ue, lterala.
RECEIPTS UNDER ENTERTAINMENT TAX FOR THE PERIOD 1950-51 TO 19~
Year
1950-51 1951-52 1952-53 1953-M 1954-55 1955-56 1956-57 1957-58 1958-5,9 1959-60
... Source :-Director of ~1 Bodies, Kerala
108
Re. in lakhs.
47 61 56 47 53 76 61
IOZ 1%2 1()4.
Incidence of Land Revenue on fuRy
assessed area
P"'..x total
per cultivated
area area
9 10
3'29 3'4-9
3'29 3'4-6
3'29 3'46 3'39 3'30
3'39 3'38
3,68 3'32
1'12 1'39
1-94 2'32
1'97 2'4'1 )'94- 2'35
2'02 2-31
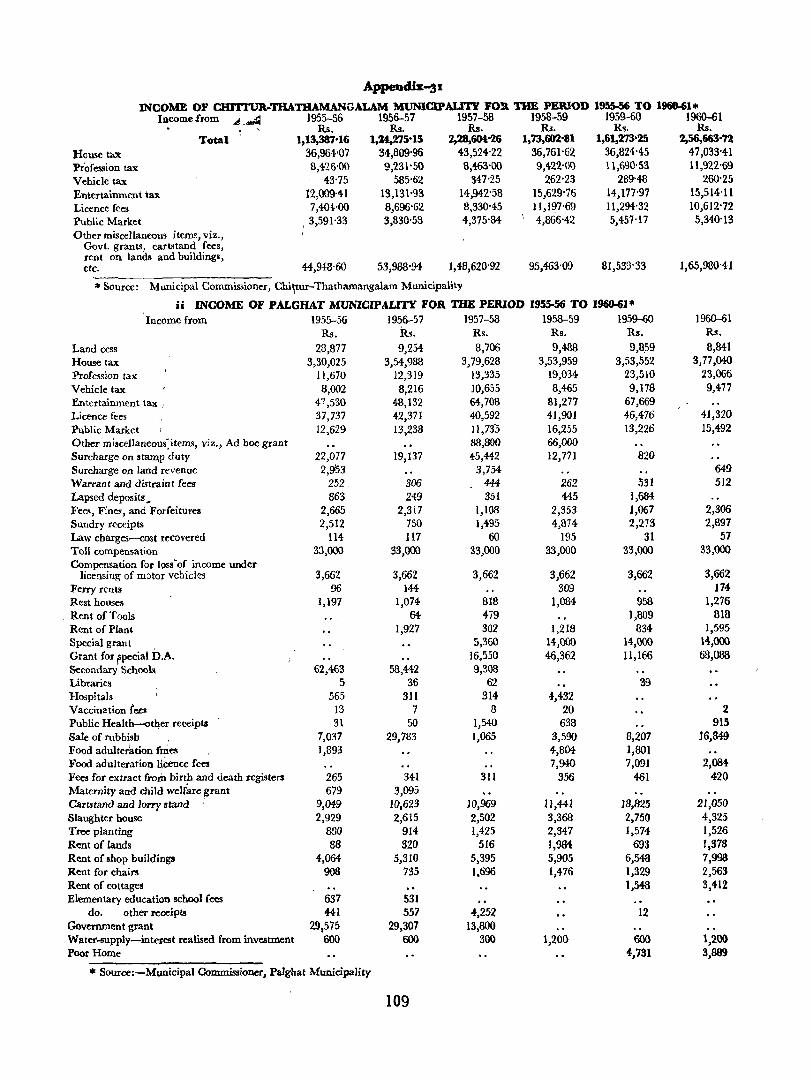
INCOME OF CHITl1.JA..THATBAMANGALAM MVNlCIPALITY FOR TIm PElUOD 1955-56 TO 1960-61* Incomefrom A ~ 1955-56 1956-57 1957-58 1958-59 1959-60 1960-61
, Rs. Rs. Rs. Rs. Rs, RB.
House tax 'Profession tax Vehicle tax Entertainment ta1t Licence fees Public Market
Total
Other miscellaneous items, viz., Govt. grants, carbtand fees, rent on lands and buildings, etc.
1,13,387'16 1,H.275·15 2,28,604'26 1,73,6G2'81 1,61,273-25 2,56,663'72 36,964'07 34,809'96 43,524'22 36,76l'62 36,824045 47,033'41 8,426'00 9,231'50 8,463'00 9,422'00 11,690'53 11,922'69
43'75 585'62 347'25 262'23 289'48 260'25 12,009'41 13,131'93 14,942'58 15,629'76 14,177'97 15,51Hl 7,4{)4'OO 8,696'62 8,330'45 1l,1~7'69 11,294'32 10,612'72
,3,591'33 3,830'58 4,375'84 \ 4,866'42 5,457'17 5,34{)'13
44,948'60 53,988'94 1,48,620'92 95,463'09 81,539'33 1,65,980'41
* Source: Municipal Commissioner, Chi~tur-Thatharnangalam Municipality ,
ii INCOME OF PALGHAT MUNICIPALITY FOR THE PERIOD 1955-56 TO 1960-6J* Income from 1955-56 1956-57 1957-58 1958-59 1959-60 1960-61
Rs. Rs. Rs. Rs. Rs. Rs. Land cess 28,877 9,254 8,706 9,488 9,859 8,841
House tax 3,30,025 3,54,988 3,79,628 3,53,959 3,53,552 3,77,040 Profession tax 11,670 12,319 13,335 19,034 23,510 23,066
Vehicle tax 8,002 8,216 10,655 8,465 9,178 9,477
Entertainment tax : 47 ,530 48,132 64,708 81,277 67,669 Licence fees 37,737 42,371 4{),592 41,901 46,476 41,320
Public Market 12,629 13,238 11,733 16,255 13,226 15,492 Other miscellaneou(items, viz., Ad hoc grant 88,800 66,000 Surcharge on stalZl'p duty 22,077 19,137 45,442 12,771 820 Surcharge on land revenue 2,953 3,754 649 Warrant and distraint fees 252, 306 444- 262 531 512 Lapsed deposits, 863 249 351 445 1,684 Fees, Fines, and Forfeitures 2,665 2,317 1,108 2,353 1,067 2,306 Sundry receipts 2,512 750 1,495 4,874 2,273 2,891 Law charges--cost recovered 114 117 60 195 31 57 Toll compensation 33,000 33,000 33,000 33,000 33,000 33,000 Compensation for Il)Ss·of income under
licensing of mi)tor vehicles 3,662 3,662 3,662 3,662 3,662 3,662 Ferry rents 96 144 309 174-Rest houses 1,197 1,074- 818 1,084 958 1,276 Rent of Tools .. , 64 479 1,809 818 Rent of Plant 1,927 302 1,218 834 1,595 Special grant 5,360 14,000 14,000 14,000 Grant for fpecial b.A. 16.550 46,362 11,166 68,088 Secondary Schooh 62,463 58,442 9,308 Libraries 5 36 62 39 Hospitals 565 311 314 4,432 Vaccination t (!CIl 13 7 8 20 2 Public Health-<lther receipts 31 50 1,54{) 638 915 Sale of rubbish 7,037 29,783 1,065 3,590 8,207 16,849 Food adulterktion ft~es 1,893 4,804 1,801 Food adulteration litence fed 7,940 7,091 2,084-Fees for extract froro birt? and death registers 265 341 311 356 461 420 Maternity and child welfare grant 679 3,095 Cartstand and lorry stand I 9,049 10,623 10,969 11,441 18,825 21,050 Slaughter house 2,929 2,615 2,502 3,363 2,750 4,325 Tree planting 880 914- 1,425 2,347 1,574 1,526 Rent of lands 88 320 516 1,9M 693 1,378 Rent of shop buildings 4,064 5,310 5,395 5,905 6,548 7,998 Rent for chairs 908 735 1,696 1,476 1,329 2,563 Rent of cottages 1,548 3,412 Elementary education school fees 637 531
do. other receipts 441 557 4,252 12 (;()vernrnent grant 29~575 29,307 13,800 Watet-supply-intel'cst realised from investment 600 600 300 1,200 600 1,200 Poor Home 4,731 3,889
'" Source:-Municipal Commissioner, Palghat Municipality
109
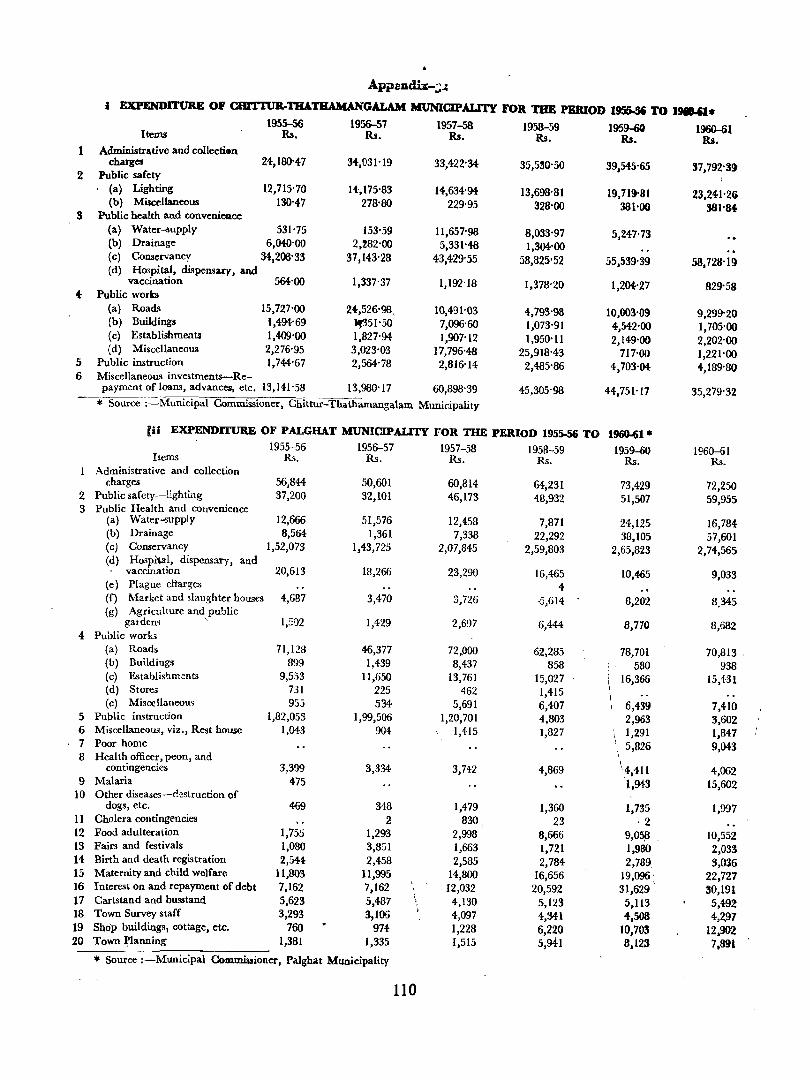
Appaam-:;..z i EXPENDITURE OF CBI.TI1JR..TlUTllAMANGALAM MtJNICIPALITY FOB. THE PlUUOD 1!J55.5i TO IHD-Q.
1955-56 1956-57 1957-58 1958-59 1959-60 l~l Items Rs, Rs, Rs, Rs, Rs. Rs, 1 Administrative and collectien
charges 24,180'47 34-,031'19 33,422'34- 35,530'50 39,545'65 S7,792'3~ 2 Public safety
(a) Lighting 12,715'70 14-,175'83 14,634'94- 13,698'81 19,719'81 23,241'2& (b) Miscellaneous 130'47 278'80 229'95 328'00 381-00 381'84
S Public health alld convenieo.ce (a) Water-.'iupply 531'75 153-59 11,657'98 8,033'97 5,247-73 (b) Drainage 6,040'00 2,~82'00 5,331-48 1,304'00 (c) Conservancy 34,208-33 37,143'28 43,429-55 58,825'52 55,539'39 58,728'19 (d) Hospital, dispensary, and
564-00 vaccination 1,337-37 1,192'18 1,378'20 1,2()t.·27 829'58 4- Public works
(a) Roads 15,727'00 24,526-98, 10,491-03 4,793'98 10,003'09 9,299'20 (b) Buildings 1,494'69 }lf351'50 7,096'60 1,073'91 4,542'00 1,705'00 (c) Establishmen.ts 1,400'00 1,827'94- 1,907'12 1,950-11 2,149-00 2,202'00 (d) Miscellaneous 2,276'95 3,023'03 17,796'48 25,918'43 717'00 1,221'00
5 Public instruction 1,744'67 2,564'78 2,816'14 2,485'86 4,703·()t. 4,189'80 6 Miscellaneous investments-Re-
payment of loans, advances, etc. 13,141'58 13,980'17 60,898'39 45,305'98 44,751'17 35,279'32 * Source :-Municipal Commissioner, Chittur-Thathamangalam Mlmicipality
[ii EXPENDITURE OF PALGHAT MUNICIPALITY FOR THE PERIOD 1955-56 TO 1960-61-1955-56 195~57 1957-58 1958-59 1959-00 1960-61 Items Rs. Rs_ Rs. Rs. Rs. Rs.
Administrative and collection charges 56,844 50,601 60,814 64,231 73,429 72,250
2 Public safety-lighting 37,200 32,101 46,173 48,932 51,507 59,955 3 Public Health and convenience
(a) Water-supply 12,666 51,576 12,458 7,871 24,125 16,784-(b) Drainage 8,564- 1,361 7,338 22,292 38,105 57,601 (c) Conservancy 1,52,073 1,43,725 2,07,845 2,59,803 2,65,823 2,74,565 (d) Hospi1ai, dispensary, and
vaccination 20,613 18,266 23,290 16,465 10,465 9,033 (e) Plague cliarges 4-(f) Market and 51aughter houses 4,687 3,470 3,726 ..5,614 8,202 6,345 (g) Agriculture and public
1,502 1,429 gal den> '. 2,697 6,444 8,770 8,682 4- Public work>
(a) Roads 71,123 46,377 72,900 62,285 78,701 70,813 (b) Buildings 899 1,439 8,437 858 580 938 (c) Establishments 9,553 11,650 13,761 15,027 16,366 15,431 (d) Stores 731 225 462 1,415 (e) MiSe( llaneou~ 935 534 5,691 6,407 6,439 7,410
5 Public instruction 1,82,053 1,99,506 1,20,701 4,803 2,963 3,602 6 Miscellaneous, viz_, Rest house 1,043 904 1,415 1,827 1,291 1,847 7 Poor home I 5,826 9,043 8 Health officer, peon, and
I contingencies 3,399 3,334 3,742 4,869 \4,411 4,062 9 Malaria 475 '1,943 15,602
10 Other diseases-c.estruction of dogs, etc. 469 348 1,479 1,360 1,735 1,997
11 Cholera contingencies 2 830 23 ,2 12 Food adulteration 1,755 1,293 2,998 8,666 9,05!i 10,552 13 Fairs and festivals 1,080 3,851 1,663 1,721 1,980 2,033 14 Birth and death registration 2,544- 2,458 2,585 2,784 2,789 3,036 15 Maternity and child welfare 11,803 11,995 14,800 16,656 19,096 22,727 16 Interest on and repayment of debt 7,162 7,162
\. 12,032 20,592 31,629 30,191
17 Cartstand and busstand 5,623 5,487 4,130 5,123 5,113 5,492 18 Town Survey staff 3,293 3,106
, 4,097 4,341 4,508 4,2f}7
19 Shop buildings) cottage, etc. 760 974 1,228 6,220 10,703 12,902 20 Town Planning 1,381 1,335 1,515 5,941 8,123 7,891
* Source :-Municipal CoDlIIliaaioner. Palghat Municipality
110
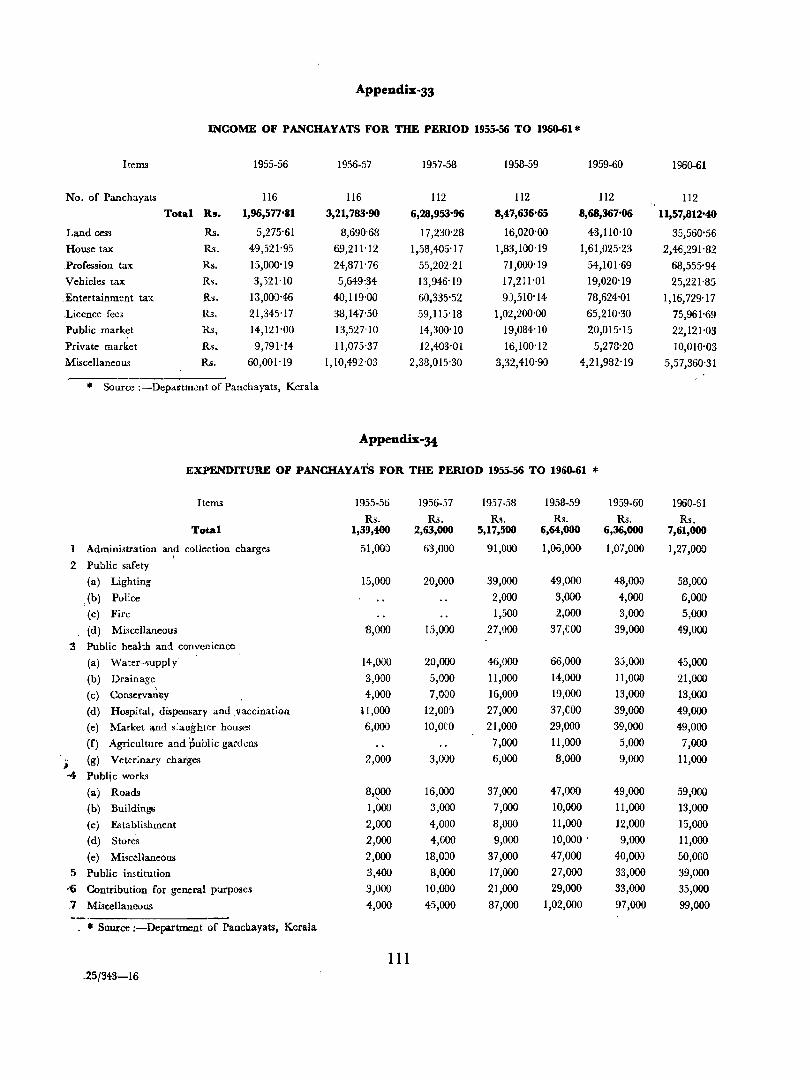
Appendix-33
INCOME OF PANCHAYATS FOR THE PERIOD 1955-56 TO 1960-61*
Items 1955-56 1956-57 1957-58 1958-59 1959-60 1960-61
No. of Panchayats 116 116 112 112 112 112
Total Rs. 1,96,577'81 3,21,783'90 6,28,953'96 8,4'1,636'65 8,68,367'06 11,57,812'40
Land cess Rs. 5,275'61 8,690'68 17,230'28 16,020'00 43,110'10 35,560'56
House tax Rs. 49,521'95 69,211'12 1,58,406'17 1,83,100'19 1,61,025'23 2,46,291'82
~Profession tax Rs. 15,000'19 24,871'76 55,202'21 71,000'19 54,101'69 68,555'94
Vehicles tax Rs. 3,521'10 5,649~~4 13,946'19 17,211'01 19,020'19 25,221'85
,Entertainment tax Rs. 13,000'46 40,119'00 60,335'52 9),510'14 78,624'01 1,16,729'17
,Licence fees Rs. 21,345'17 38,147'50 59,115'18 1,02,200'00 65,210'30 75,961'69
Public market Rs. 14,121-00 13,527'10 14,300'10 19,084'10 20,015'15 22,121'03
Private market Rs. 9,791'14 11,075'37 12,403'01 16,100'12 5,278'20 10,010'03
Miscellaneous Rs. 60,001'19 1,10,492'03 2,38,015'30 3,32,410'90 4,21,982'19 5,57,360'31
'" Source :-Depa.~tm,!nt of Panchayats, Kerala
Appendix-34
EXPENDITURE OF PANCHAYATS FOR THE PERIOD 1955-56 TO 1960-61 *
Items 1955-56 1956-57 1937-58 1958-59 1959-60 1960-51
Rs. Rs. R~. Rs. Rs. Rs. Total 1,39,400 2,63,000 5,17,500 6,64,000 6,36,000 7,61,000
1 Administration anld collection charges 51,000 63,000 91,000 1,06,000 1,07,000 1,27,000
2 Public safety
(a) Lighting 15,000 20,000 39,000 49,000 48,000 58,000
I (b) Police 2,000 3,000 4,000 6,000
(c) Fire 1,500 2,000 3,000 5,000
(d) Miscellaneous S,OOO 15,000 27,000 37,COO 39,000 49,000 .~ Public health and convenience
(a) Water-suppl y l4,000 20,000 46,000 66,000 3,),000 45,000
(b) Drainage 3,000 5,000 11,000 14,000 11,000 21,000
(c) Conserva~tly 4,000 7,000 16,000 19,000 13,000 13,000
(d) Hospital, disponsary and ,'vaccination 11,000 12,00Cl 27,000 37,COO 39,000 49,000
(e) Market "nd s:aughter hoj.lses 6,000 10,OCO 21,000 29,000 39,000 49,000
(f) Agriculture and,public g~rd,;ns 7,000 11,000 5,000 7,000
I (g) Veter;nary chat'ges 2,000 3,000 6,000 8,000 9,000 11,000
--4 Public works
(a) Roads 8,0JO 16,000 37,000 47,000 49,000 59,000
(b) Buildin~ 1,000 3,000 7,000 10,000 11,000 13,000
(c) Establishment 2,000 4,000 8,000 11,000 12,000 15,000
(d) Stor~s 2,000 4,000 9,000 10,000 ' 9,000 11,000
(e) Miscellaneous 2,000 18,000 37,000 47,000 40,000 50,000
5 Public institution 3,400 8,000 17,000 27,000 33,000 39,000
-1i Contribution for general purposes 3,000 10,000 21,000 29,000 33,000 35,000
.7 Miscellaneous 4,000 45,000 87,000 1,02,000 97,000 99,000
, * Source :-Department of Pancb.ayats, Kerala
111 .25/343-16
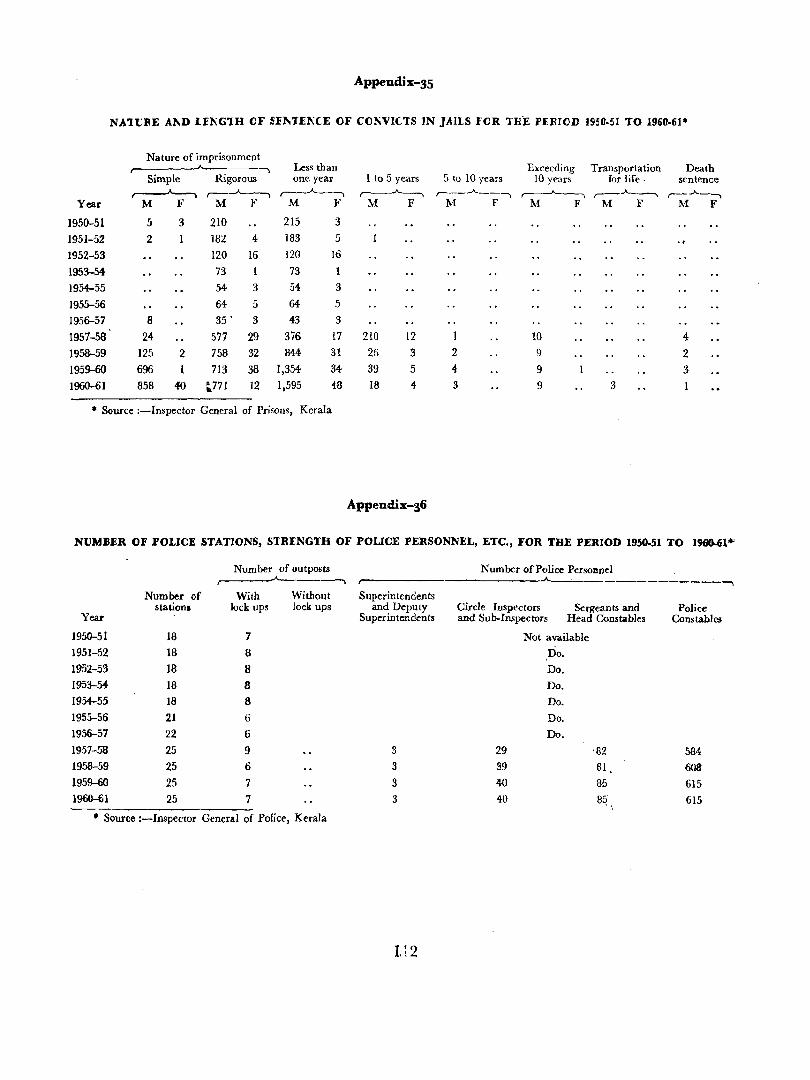
Appendix-35
NA'lt:l~E Al\D Ul\G'lH OF SI,lI.,tEl\(E OF COl.\VKTS IN JAIlS fOR TEE PIRIVD 195(1-51 TO 1960-61*
Nature of imprisonment Less than Exceeding Transportation Death
Simple Rigorous one year 1 to 5 years 5 to 10 years 10 years for life· sentence ~ r---"-----I ~ r---A--., r---. ..Jo._--~ ~ r--..A.-----, ,..-..A._.,
Year M F M F M F M F M F M F M F M F
1950--51 5 3 210 215 3 1951-52 2 182 4- 183 5
1952-53 120 16 120 16
1953-54 73 1 73 1
1954-55 54 3 54 3 1955-56 64 5 64 5 1956-57 8 35 . 3 43 3 1957-58 24- 577 29 376 17 210 12 10 4-
1958-59 125 2 758 32 844- 31 26 3 2 9 2 1959-60 696 713 38 1,354- 34 39 5 4- 9 3 1960-61 858 4=0 ~771 12 1,595 48 18 4- 3 9 3
• Source :-lnspector General of Prisons, KeraJa
NtJMBER OF POLICE STATIONS, STRENGTH OF POLICE PERSONNEL, ETC., FOR THE PERIOD 1950-51 TO 1960-61*'
Number of outposts --.,
Number of With Without station. lock ups lock ups
Year
1950--51 18 7 1951-52 18 8 1952-53 18 8 1953-54- 18 8
1954-55 18 8 1955-56 21 6 1956-57 22 6 1957-58 25 9 1958-59 25 6 1959-60 25 7 1960-61 25 7
• Source :-Inspector General of Police, Kerala
Number of Police Personnel ,--___________ _.A __ ' _____________ --,
Superintendents and Deputy
Superintendents
3 3 3
3
Circle Inspectors Sergeants and and Sub-Inspectors Head Constables
29 39 40 40
Not available
,Do. Do.
Do.
Do.
Do.
Do.
'82
Bl. 85
85
Police Constables
584
608
615
615
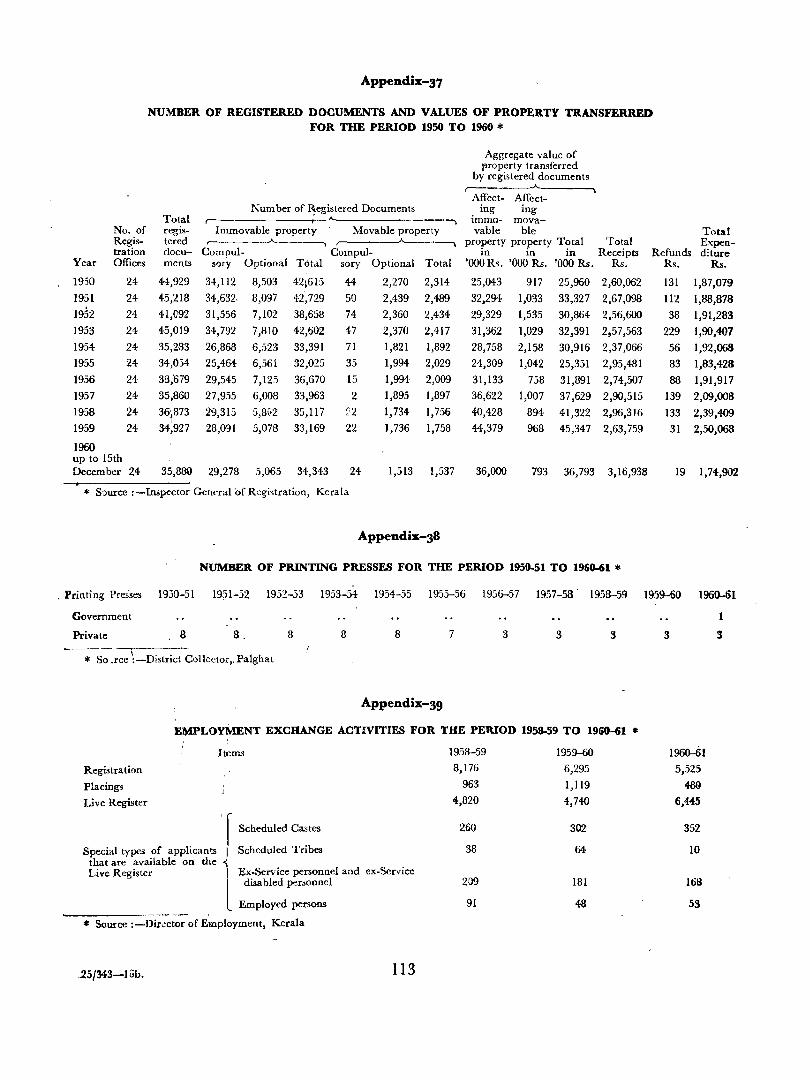
Appendix-37
NUMBER OF REGISTERED DOCUMENTS AND VALUES OF PROPERTY TRANSFERRED FOR THE PERIOD 1950 TO 1960 *
Ag!Jregate value of flroperty transferred
by registered documents r-----------A_----,
Affect- Affect-Number of ~egislercd Documents ing ing
Total 1 immo- mova-No. of regis- Immovable property Movable property vable ble Total Regis- tered 1 r------"--------, property property Total Total Expen-tration docu- Compul- Compul- in in in Receipts Refunds diture
Year Offices ments sory Optional Total sory Optional Total '000 Rs. '000 Rs. '000 Rs. Rs. Rs. Rs.
1930 24 44,929 34,112 8,503 42i615 44 2,270 2,314 25,043 917 25,960 2,60,062 131 1,87,079
1951 24- 45,218 34,632· 8,097 42,729 50 2,439 2,489 32,294 1,033 33,327 2,67,098 112 1,88,878 1952 24 41,092 31,556 7,102 38,658 74 2,360 2,434 29,329 1,535 30,864 2,56,600 38 1,91,283 1953 24 45,019 34,792 7,810 42,602 47 2,370 2,417 31,362 1,029 32,391 2,57,563 229 1,90,4{)7
1954 24 35,283 26,868 6,523 33,391 71 1,821 1,892 28,758 2,158 30,916 2,37,066 56 1,92,068
1955 24 34,054 25,464 6,561 32,025 35 1,994 2,029 24,309 1,042 25,351 2,95,481 83 1,83,428
1956 24 38,679 29,545 7,125 36,670 15 1,994 2,009 31,133 758 31,891 2,74,507 88 1,91,917 1957 24 35,660 27,955 6,008 33,963 2 1,895 1,897 36,622 1,007 37,629 2,90,515 139 2,09,008
1958 24 361873 29,315 5,8(·2 35,117 ~2 1,734 1,756 40,428 894 41,322 2,96,316 133 2,39,409 1959 24 34;927 28,091 5,078 33,169 22 1,736 1,758 44,379 968 45,347 2,63,759 31 2,50,068
1960 up to 15th December 24 35,800 29,278 5,065 34,343 24. 1,513 1,537 36,000 793 36,793 3,16,938 19 1,74,902
* Source :-Inspector Gent"ral of Regi~tration, Kerala
Appendix-38
NUMBER OF PRINTING PRESSES FOR THE PERIOD 1950-51 TO 1960-61 *
. .Printing Pres3es 1930-51 1951-52 1952-53 1953-54 1954-55 1955-56 1956-57 1957-58 . 1958-59
Government
Private 8 8. 8 8 8 7 3 3 3
--;-So "rce \ District Collector,. Palghat
Appendix-39
E~LOri.mNT EXCHANGE ACTIVITIES FOR THE PERIOD 1958-59 TO 1960-11 *
Registration
Placings
Live Register
ItJems
'f Scheduled Castes
Special types of applicants I Scheduled Tribes that are available on the ~ Live Register I Ex-Service personnel and ex-Service
l disabled personnel
Employed persons
* Source :-Dircctor of Employment, Kerala
251M3-lob. 113
1958-59 1959-60 8,176 6,295
963 1,119 4,820 4,740
260 302
38 64-
209 181
91 48
1959-S0 1960-61
I
3 3
1960--61
5,525
480
6,445
352
10
168
53
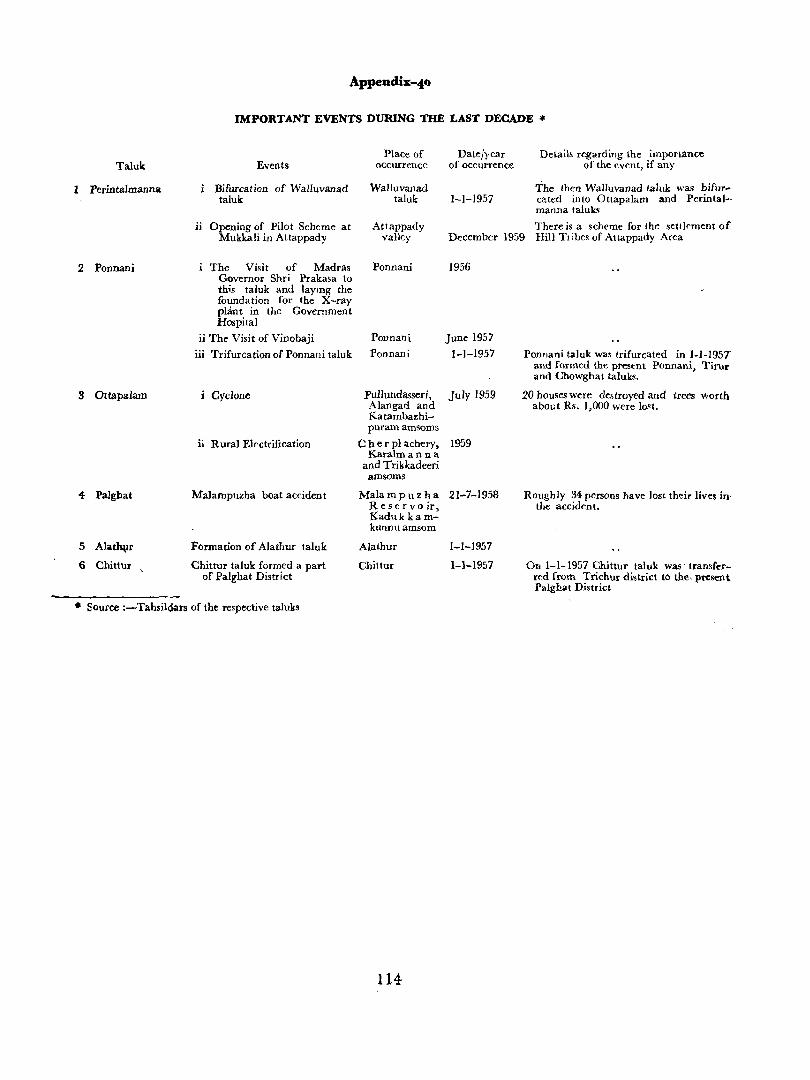
Taluk
1 Perintalmanna
2 Ponnani
3 Ottapalam
4 Palghat
5 Alat~r
6 Cbittur
Appendix-40
IMPORTANT EVENTS DURING THE LAST DECADE *
Events
Bifurcation of Walluvanad taluk
ii Opening of Pilot Scheme at Mukkali in Attappady
The Visit of Madras Governor Shri Prakasa to this tal uk and laymg the foundation for the X-ray plant in the GOvernment Hospital
Place of occurrence
Walluvanad taluk
Attappady valley
Ponnani
Date/year of occurrence
1-1-1957
Detail~ regarding the importance of the event, if any
The then Walluvanad taJuk was bifurcated into Ottapalam and Perintal-manna taluks
There is a scheme for the settlement of December 1959 Hill Tlibes of Attappady Area
1956
ii The Visit of Vinobaji Ponnani June 1957
1-1-1957 iii Trifurcation at Ponnani taluk Ponnani
Cyclone
ii Rural Electrification
Malampuzha boat accident
Formation of Alathur taluk
Chittur taluk formed a part of Palghat District
Pullundasseri, July 1959 Alangad and l{atambazhi-puram amsoms
C her pi achery, 1959 l{aralm ann a
and Trikkadeeri amsoms
Mala m p u z h a 21-7-1958 Reservoir, :Kaduk ka mkunnuamsom
Alathur
Chittur
1-1-1957
1-1-1957
Ponnani taluk was trifurcated in 1-1-1957 and formed the present Ponnani, Tirur and Chowghat taluks.
20 houses were destroyed and trees worth about Rs. 1,000 were lost.
Roughly 34 pCf50ns have lost their lives in' the accident.
On 1-1-1957 Chittur taluk was' transferred from Trichur district to the, p~sent Palghat District
• Source :-Tah5i1dars of the respective taluks
114
TALUK MAPS
25J328-a
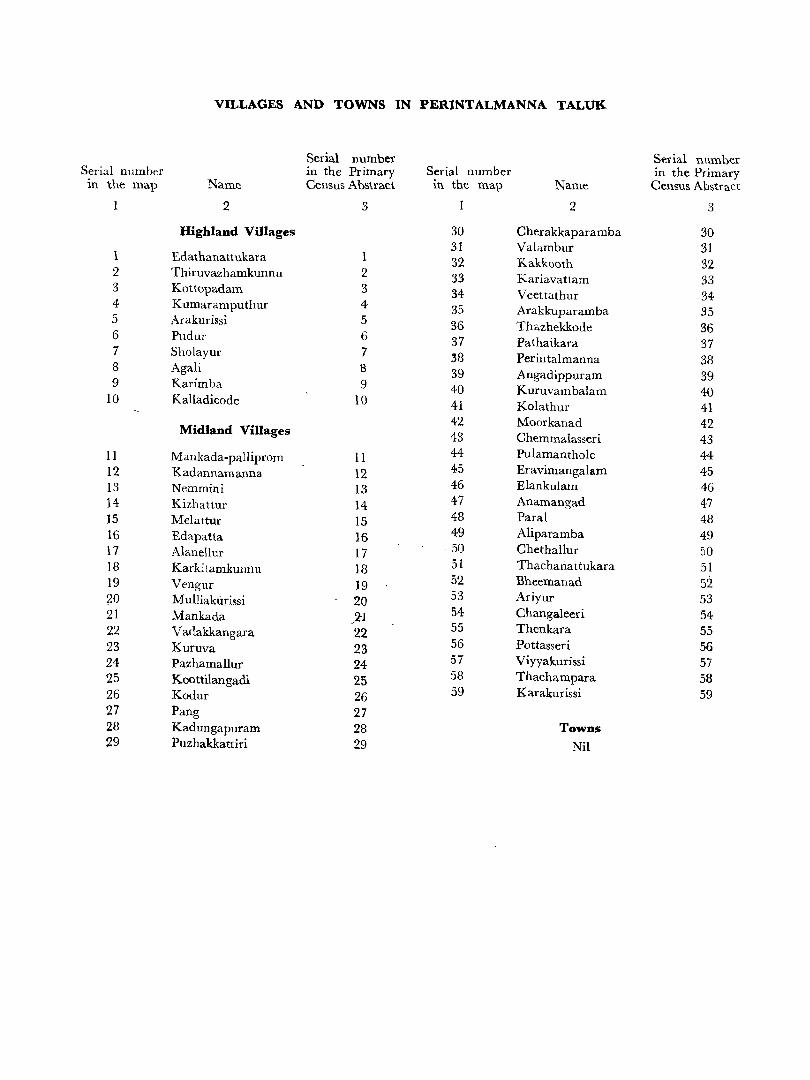
VILLAGES AND TOWNS IN PERINTALMANNA TALUK
Serial number Serial number Serial number in the Primary Serial number in the Primary 1n the map Name Census Abstract in the map Name Census Abstract
2 3 2 3
Highland Villages 30 Cherakka paramba 30 31 Valambur 31
1 Erlathanattukara 1 32 Kakkooth 32 2 Thiruvazhamkunnu 2 33 Kariavattam 33 3 Kottopadam 3 34 Veettathur 34 4 Kumaramputhur 4 35 Arakkuparamba 35 5 Arakurissi 5 36 Thazhekkode 36 6 Pudur 6 37 Pathaikara 37 7 Sholayur 7 38 Perintalmanna 38 8 Agali 8 39 Angadippuram 39 9 Karimba 9 40 Kuruvambalam 40 10 Kalladicode 10 41 Kolathur 41
Midland Villages 42 Moorkanad 42 43 Chemmalasseri 43
11 Mankada-palliprom 11 44 Puiamanthole 44 12 Kadannamanna 12 45 Eravimangalam 45 13 Nemmini 13 46 Elankulam 46 14 Kizhattur 14 47 Anamangad 47 }5 Melattur 15 48 Paral 48 16 Edapatta 16 49 Aliparamba 49 17 Alanellur 17 ,50 Chethallur 50 ]8 Karkitamkunnu 18 51 Thachariattukara 51 19 Vengur 19 52 Bheemanad 52 2D Mulliakurissi 20 53 Ariyur 53 21 Mankada )H 54 Changaleeri 54 22 Vadakkangara 22 55 Thenkara 55 23 KlIruva 23 56 Pottasseri 56 24 Pazhamallur 24 57 Viyyakurissi 57 25 Koottilangadi 25 58 Thachampara 58 26 Kodllr 26 59 Karakurissi 59 27 Pang 27 28 Kadungapuram 28 Towns 29 Puzhakka ttiri 29 Nil
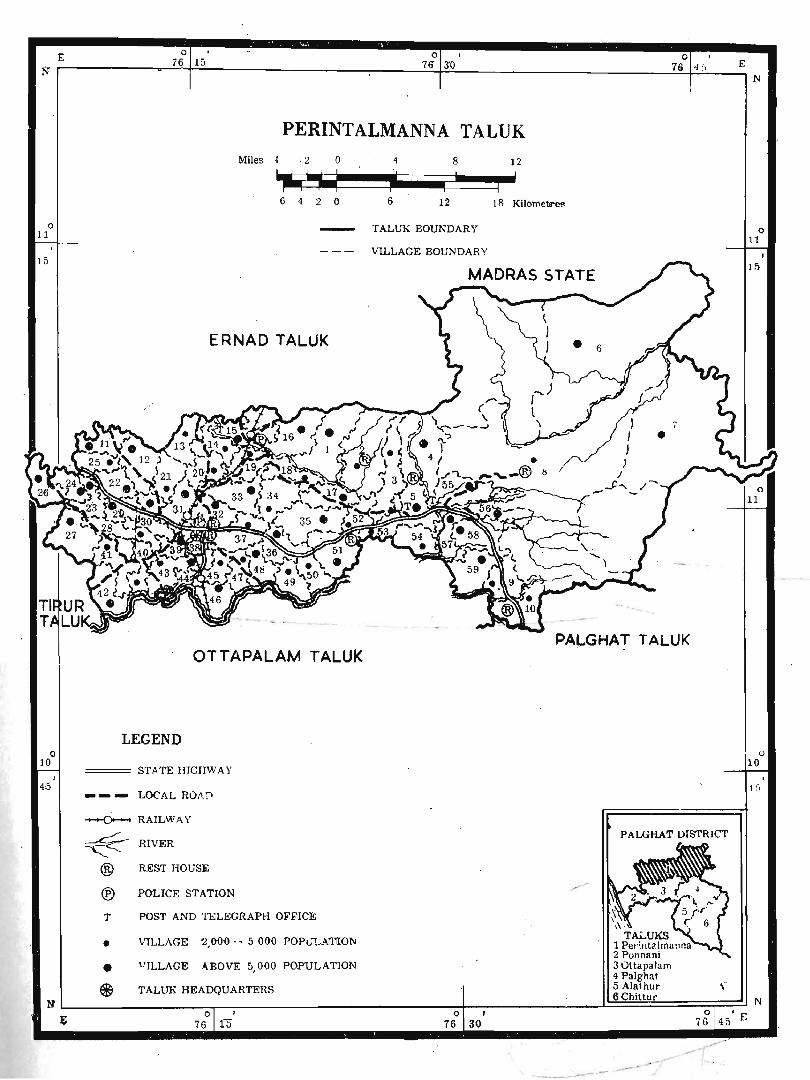
E o 0 76 15 0
Nr-----------~~~~~------~--------~------~7o~3~D~------------------------27~&+4~'~, __ ~E
o 11
15
o 10
I
45
PERINTALMANNA TALUK Miles 1 , 2 ° ~~ 6 42 0
ERNAD TALLJK
OTTAPALAM TALUK
LEGEND
=== STATE HlGHW A)'
--- LOCAL ROAf\
..........0-- RAILWAY * RIVER
® REST HOUSE
® POLICE STATION
T POST AND TELEGRAPH OFFICE
• VILLAGE 2,000·· 5 000 POPU'LA'IUOl\:
• VILLAGE ABOVE 5, 000 POPULATION
® TALUK HEADQUARTERS
8 12
i ; ! :
6 12 1 8 Kilometre~
T ALUK BOUNDARY
VILLAGE BOUNDAR Y
PAI,..GHAT T ALlJK
PALGHAT DISTRIC1'
\
/
N
o 11
I
Hi
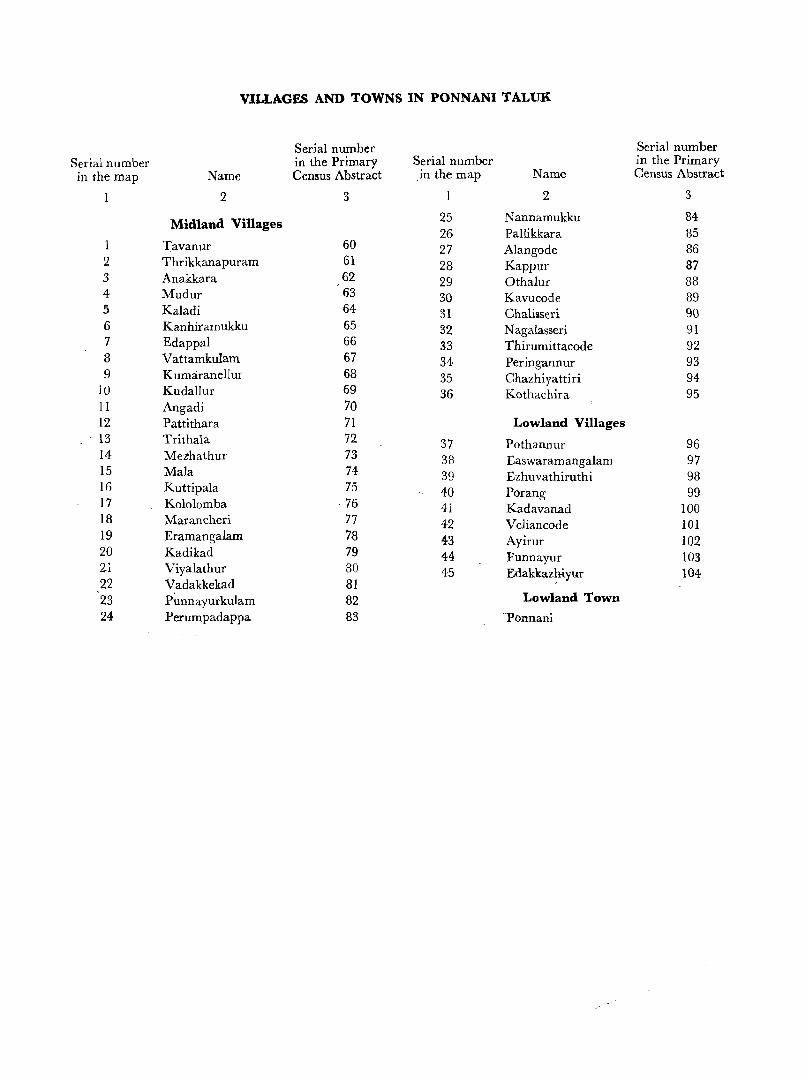
VILLAGES AND TOWNS IN PONNANI TALlJK
Serial number Serial number Serial number in the Primary Serial number in the Primary in the map Name Census Abstract ,in the map Name Census Abstract
2 3 1 2 3
Midland Villages 25 Nannamukku 84 26 Pallikkara 85
1 J:avanur 60 27 Alangode 86 2 Thrikkanapuram 61 28 Kappur 87 3 Anakkara 62 29 Othalur 88 4 Mudur 63 30 Kavucode 89 5 Kaladi 64 31 Chaliiseri 90 6 Kanhiramukku 65 32 N agalasseri 91 7 Edappul 66 33 Thirumittacode 92 8 Vattamkulam 67 34 Peringannur 93 9 K umaranellur 68 35 Chazhiyattiri 94
10 Kudallur 69 36 Kothachira 95 II Angadi 70 12 Pattithara 71 Lowland Villages 13 Trithala 72 37 Pothannur 96 14 Mezhathur 73 38 Easwaramangalam 97 15 Mala 74 39 Ezhuvathiruthi 98 16 Kuttipala 75 40 Porang 99 17 Kololomba ·76 41 Kadavanad 100 18 Marancheri 77 42 Veliancode 101 19 Eramangalam 78 43 Ayirur 102 20 Kadikad 79 44 Punnayur 103 21 Viyalathur 80 45 Edakka~yur 104 22 Vadakkekad 81 23 P~nnayurkulam 82 Lowland Town 24 Perumpadappa 83 'Ponnani
• • E -,.;,. N r_~ _____ __..!:T _____________________ ..-:I'7f6°Wl!5_-!E,..,_
Miles
TIRUR TALUK
n 10 i Perlntalmanna
, 2 Ponnani o 3 Ottapalam
4 Palgbat
4 !
2
: i I
6 4
PONNANI TALUK
() 4 8
i ! I fl I •
2 () '6 1:2 Kilometres
- TALUK BOUNDARY
- - - VILLAGE "BOUNDARY
- - -. -
TAlAPPILLY TALUK - ---_
_ -_ :.:. -
LEGEND ---
__ - LOCAL ROAD
C/JiAL
~ lUVF;R
® REST HOUSE
® POLICE ST..A'IIO~
'I: POST AND TELEGRAPH OFFICE .
• VIlLAGE 2,000 - !),OOU 'f'OPULAT1<»'l
• VILLAGE ABOVE .5,,000 'POPULAT101'l
~., ~.~~ cENSL'9 TOWN
5 AlaUlur 6 ChUtur ® TALUI{ HEADQUARTERS
N~==~========~~==~~----------------------------~~ PJ
- ./
-----..-- -
t>
o I
45
o
1L0
VILLAGES AND TOWNS IN OTTAPALAM TALUK
Serial number Serial number Serial number in the Primary Serial number in the Primary
Census Abstract in the map Name Census Abstract in the map Name
2 3 2 3
Midland Villages 32 Thiruvegapuram 136 33 Naduvattam 137
1 Vilayur 105 34 Muthuthala 138 2 Chundampatta 106 35 Perumudiyur 139 3 Kulukallur 107 36 Maruthur 140 4 Mara yamangalam 108 37 Pattambipalliprom 141 .5 Karalmanna 109 38 Kalladipetta 142 6 Veeramangalam 110 39 Vadanamkurissi 143 7 Vellinezhi III 40 Vallapuzha 144 g Karimpuzha 112 41 Kuruvattoor 145 9 Kulukiliyad 113
42 Chalavara 146 10 Elambulassery 114 43 Kothakurissi 147 11 Pulapetta ll5 44 Panamanna 148 12 Mannambatta 116 45 Cherumundassery 149 13 Sreekri~hnapuram 117 46 Vengassery 150 14 Thirunarayanapuram 118 47 Mulanhur 151 15 Moothedathumadamba - 119 48 Chunangad 152 16 Kattukulam 120 49 Kanniambrom 153 17 Thanikunnu 121 50 Vaniamculam 154 18 Kadambazhipuram 122 51 Koonathara 155 19 Pullunda!>sery 123 52 KUlapully 156 20 Alangad 124- -53 Karakkad 157 21 Vadakkumbrom 125
54 Cherukattupulam 158 22 Eledathmadamba 126 55 Trikkangode 159 23 Trikkadeeri 127 56 Palapuram l60 24-- Nellaya - 128 57 Lakkidi 161 25 Cherplachery 12g
58 Perur 162 26 Ezhuvanthala 130 27 M undakottukurissi 131 Midland Towns 28 Cherucode 132 29 Amayur 133 I Pattambi II 30 Pulassery 134 II Shoranur III 31 Rairanelloor 135 III Ottapalam IV
£: 716" 1fi 76" 30' e: N~--------------------~~~--------------------------------------~~~~N
MUea 4. !
OTTAPALAM TALUK
2 I !
o 4 !
8 I
o 11 i I i I i :
~2 Kilometres 6 4 2
)
• 10
I
4.5
,
PQNNANJ TALUI<
LEGEND
- . 'rALUK BOUNDARY
-- - VILLAGE BOUNDARY
PERINTALMANNA TALUK
T ALAPPILL Y T A LVI< =::::;:::= HTAT'8 HIGHWAY
___ I'()CAL ItOAD
~ nAlLWAY
~ RIVER
® REST HOUSE
® POLICE STATION
T POST A rJD TELEGRAPH OFFICE
• VILLAGE 2,000 - 5,000 POPULATION
• VILLAGE A.BOVE 5,000 roPlJl.ATI0N
WJ.~ ,_: .. ~ CENSUS TOWN
\ \
ALATHUR TALUK
P . .u.ot!A1 Dl::lTRIC'f
I PenntaJmar.Tw "2 Ponnam .i OttapalMTI
'1 Palgl.:ll :J Alalhu.
'Ej TAlUK HeADQUARTERS 6 ChltlU(
L_~~~~~~====~=-~r-~----------------------~~~~========~]r~=;" ~ N.f; '[6' IS' , .; J,U' 'Q
VILLAGES AND TOWNS IN PAL GHAT TALUK
Serial number Serial number Serial number in the Primary Serial number in the Primary
in the map Name Census Abstract in the map Name Census Abstract
2 3 2 3
Highland Villages 29 Kannadi 191
1 Peringode 163 30 Kinasseri 192
2 Cheraya 164 31 Thiruvalathur 193
3 Kongad 165 32 Kodumba 194
4 Kanhikkulam 166 33 Pallatheri 195
5 NochippuUi 167 34 Vengodi 196
6 Mundur 168 35 Pudusseri 197
7 Ezhakkad 169 36 Elappully 198
8 Poothanur 170 37 Thenari 199
9 Kundalassery 171 38 Olasseri 200
10 Thadukkasseri 172 39 Tassrack .201
11 Keralasseri 173 40 Thanisseri 202
12 KaJlur 174 41 Peruvemba 203
13 Vallikode 175 42 Pa1athulli 204
14 Puduppariyaram 176 43 Panayur 205
15 Akathethara 177 44 Po1puUy 206
16 Kadukkamkunnam 178 .. -lJ Kottekkad 179
Midland Villages
18 Kavalppad 180 45 Mannur 207
19 Vadakkanthara 181 46 Nagaripuram 208
20 Kodunthirapull y 182 47 Mankarai 209
21 Pirayiri 183 48 Kizhakkumpuram 210
22 Yakkara 184 49 Mankurissi - 211
23 Puthur 185 50 Thenur 212
24 Koppam 186 51 Kinavallur 213
25 KaUepuJly IS7 52 . Edathara 214
26 Marutharoad 188 27 Karinkarapully
/
, Highland Town 189
28 Kunnanur [90 Palghat
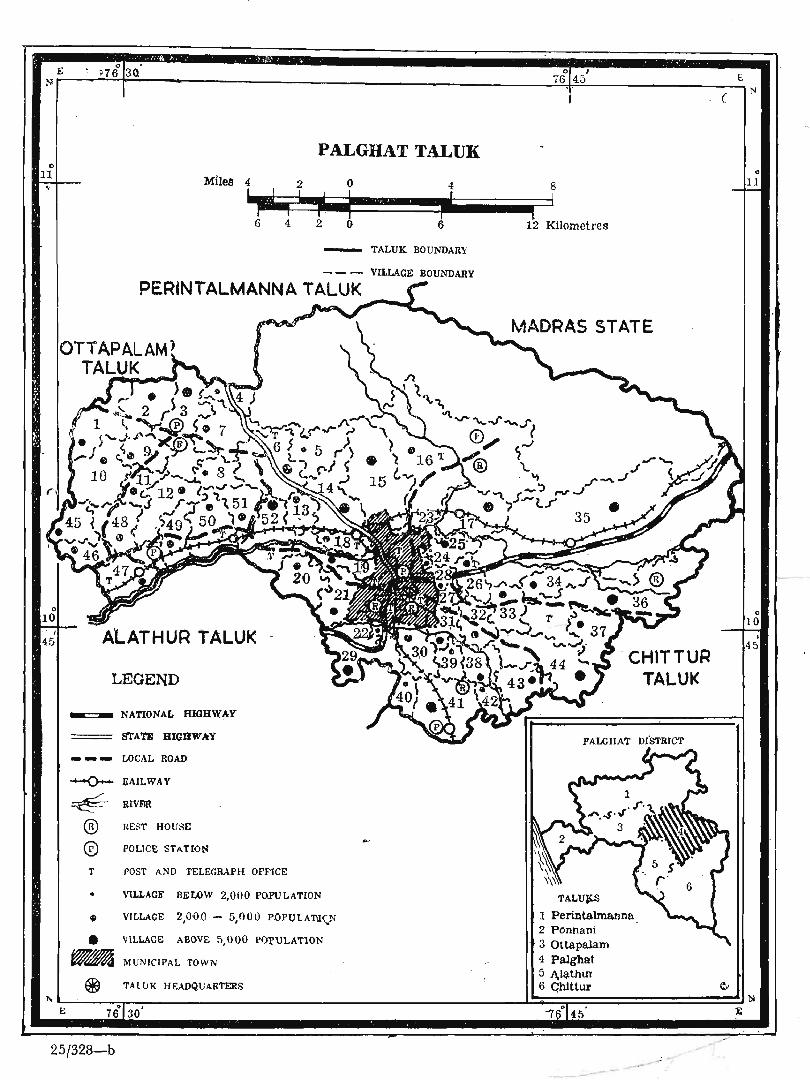
. (
PALGHAT TALUK
Mile84 2 0 4 8
_L·j~!~!_I_~'~~~! ____ ~I ~ i i r= i I ' 6 4 2 0 6 12 Kilometres
- TALUK BOUNDARY
- - - VIl.LAGE: BOUNDARY
PER'NTALMANNA TALUK
LEGEND - CHITTUR
TALUK __ NATIONAL HIGUWfY
== STATE BIGIIW",Y
- - - LOCAL ROAD
~ UAILWAY
~ aIVFlR
® nEST HOUSE
® POLlCE STA.nol'!
T POST AND TELEGRAPH OFFICE
• VILLAGIi' BELOW 2,000 POJ'ULATION
• VILLAGE 2,0'0.0 - 5,000 POPUtA11I~N
• ViLLAGE ABOVE 5,000 PO~ULATION
~~ MUNICIPAL TOWN
® TAllJK HEADQUARTERS
25/328-b
PALGHAT Di"STRICT
1 Perintalma.nna 2 Ponnani 30ttapalam 4 Palghat [> .A,l~thU1 6 Ghittur
._---_- --._
~-
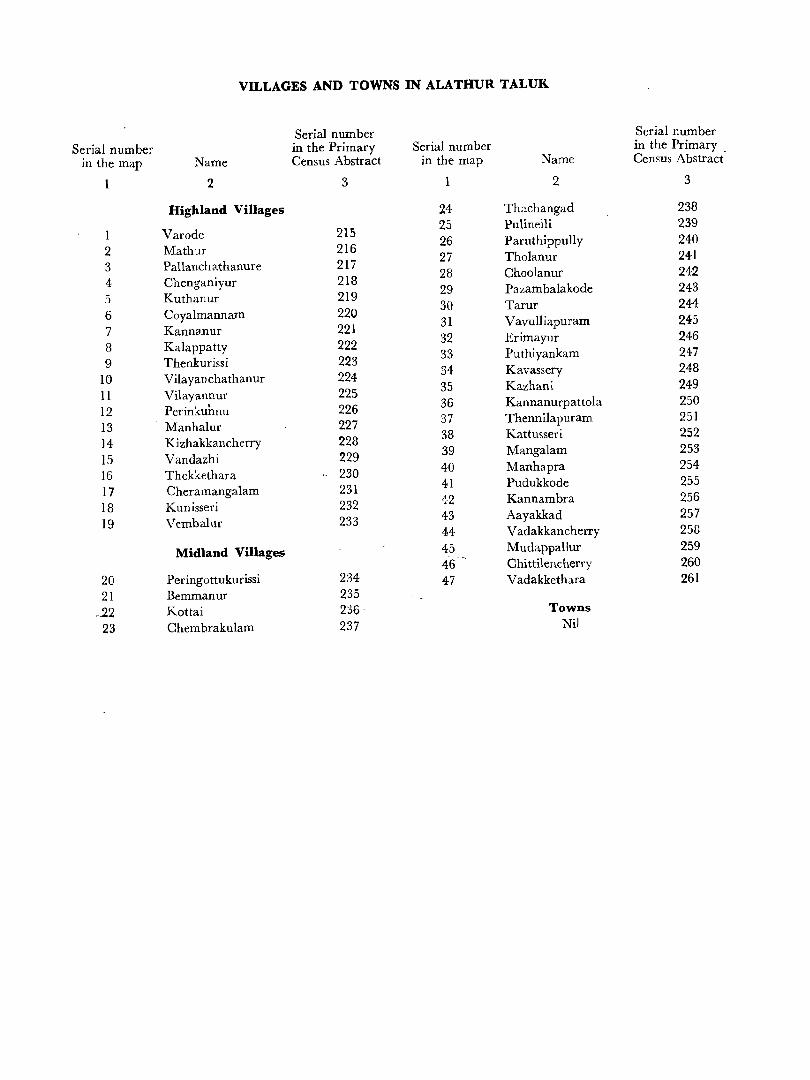
VILLAGES AND TOWNS IN ALATHUR TALUK.
Serial number Serial number
Serial number in the Primary Serial number in the Primary .
in the map Name Census Abstract in the map Name Census Abstract
2 3 2 3
Highland Villages 24 Thachangad 238
I Varode 215 25 Pulinelli 239
2 Mathur 216 26 Paruthippully 240
3 Pallanchathanure 217 27 Tholanur 24-1
4 Chenganiyur 218 28 Choolanur 242
5 Kuthanur 219 29 Pazambalakode 243
6 Coyalmannam 220 30 Tarur 24:4
7 Kanmmur 221 31 Vavulliapuram 245
8 Kalappatty 222 32 Erimayur 246
9 Thenkurissi 223 33 Puthiyankam 247
10 Vila yan cha thanur 224 34 Kavassery 248
11 Vilayannur 225 35 Kazhani 249
12 Perinkuimu 226 36 Kannanurpattola 250
13 Manhalur 227 37 Thennilapuram 251
]4 Kizhakkancherry 228 38 Kattusseri 252
15 Vandazhi 229 39 Mangalam 253
16 Thekkethara 230 40 Manhapra 254
17 Cheramangalam 231 41 Pudukkode 255
18 Kunisseri 232 12 Kannambra 256
19 Vembalur 233 43 Aayakkad 257 44 Vadakkancherry 258
Midland Villages: 45 Mudappallur 259 46 Chittilencherry 260
20 Peringottukurissi 234 47 Vadakkethilfa 261 21 Bemmanur 235
.22 Kottai 236 Towns
23 Chembrakulam 237 Nil
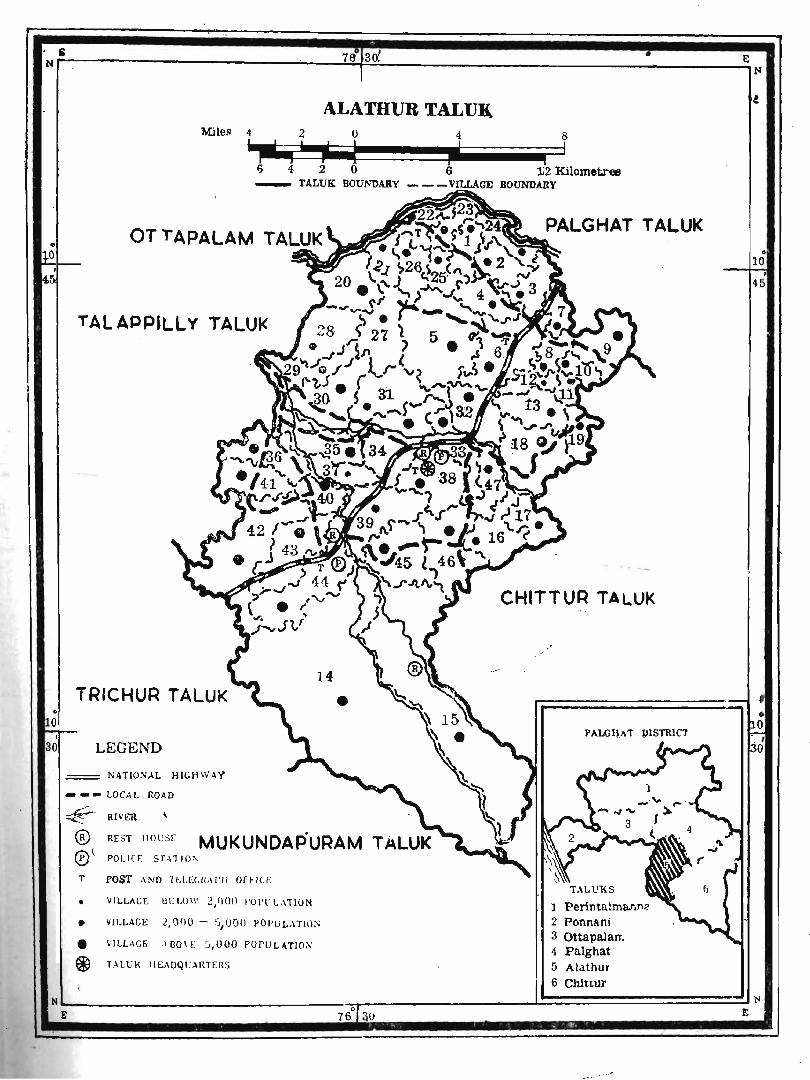
ALAmUR TALUK Miles 4 2 0 4 8
f : , ! t ! I i ; : I i i I:) 4 2 n 6 12 KilometN!e - TALUK BOUNDARY - - - VILLAGE BOUNDARY
TAL APPJLLY . TALUI<
TRICHUR TALUK
LEGEND
= NATIONAL HIGHWAY
- - - LOCAL ROAD
:::€_"-- RI V ER
® REST 110U SE MUKUNDAPURAM T ALUK ® t POll ( E S T-I1 10 "-
T POST AND H:LC·:C.Ii,II ' 11 OffI CE
• VILLACE UELOW 2,000 l'OPl"' LJ\iION
• VILLAGE c, OOO - S,UOO POI'U L .\TION
• VILL AGIi ,\ 80\ E ~/OO() POrULHIO:\ * T H ti l< 11 EADQl!ARTERS
CHITTUR TAl-UK
1 Perintalma.r,J'lp. 2 Ponnsni 3 Ottapalarr. 4 Palghat 5 Alathur
6 Chittur
--_....-_ ...
VILLAGES AND TOWNS IN CHITTUR TALUK
Serial number Serial number Serial number in the Primary Serial number in the Primary
in the map Name Census Abstract in the map Name Census Ab<tract
2 3 2 3
Highland Villages Midland Villages
1 Koduvayur 262 21 Tha thamangalam 282 2 Kuttipallam 263 22 Chittur 283 3 Kunnamkattupathy 264 23 Thekkedesom 284 4 Perumatty 265 24 Nallepilly 285
5 Vadavannur 266 25 Vadakarapathy 2.86
6 Pallassena 267 26 Era va tta par a path y 287 27 Thenampathy 288 7 Ethanoor 268 28 Ozhalapathy 289
8 Kakkayur 269 29 Attempathy 290 9 Pallavoor 270 30 Manchikunnampathy 291
10 Koodallur 271 31 Kozhin jampara 292 11 Kairady 272 32 Eruthempathy 293 1-2 Pothundi 273 33 Kozhipathy 294 13 Elavancherry 274 34 V aliavallam pa thy 295 14 Vattakkad 275 35 Vallanghi 296
--- --15 Kollangode 276 36 Ayloor 297 16 Panangattiri 277 37 Thiruvazhiyad 298 17 Payyalloor 278 38 Pattancherry 299
18 Kezhakkethara 279 Midland Towns 19 Muthalamada 280 I . Chittur~ Thathamangalam VI 20 Mulathura 281 II Nemmara VII •
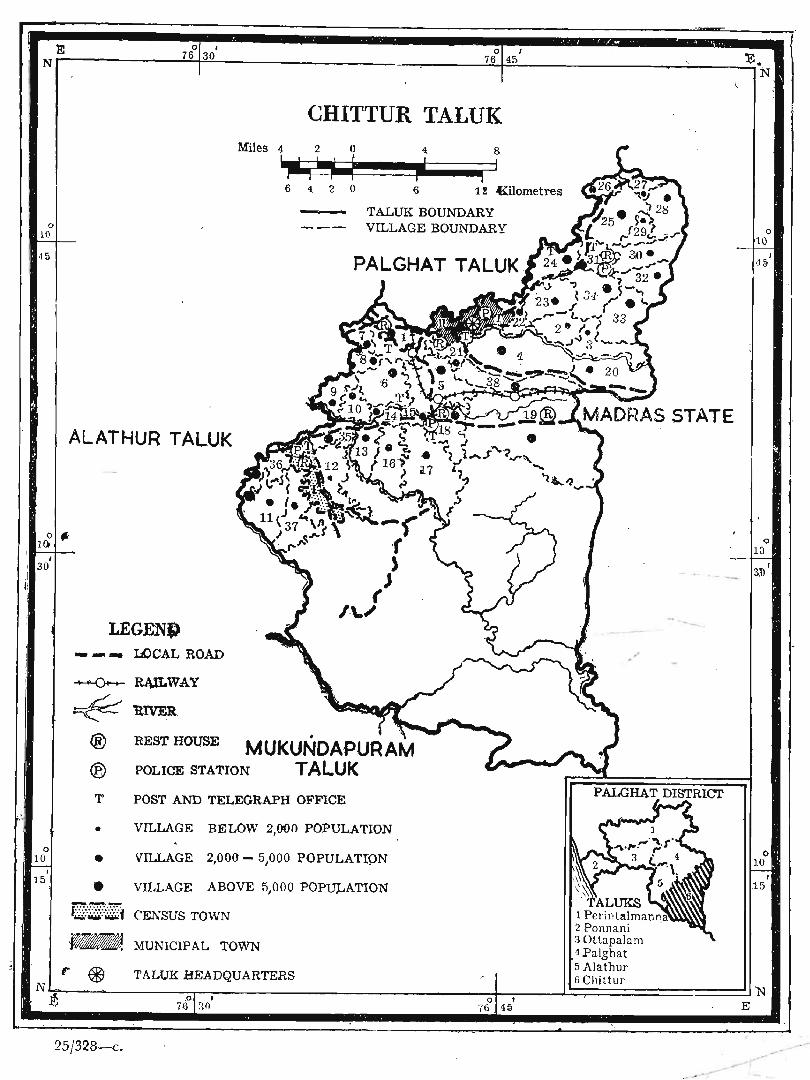
ALATHUR TALUK
CHITTUR TALUK Miles 4 2 0
"'1-" r 6- 1 2 0 i 6
4 !
I
s I
I! Kilometres
TALUK BOUNDARY - -- VILLAGE BOUNDARY
o ~
I
30
I 15
LEGENC) - - - LOCAL ROAD
---0- R4lLWAY * 'RIVER,
® REST HOUSE • MUKUNDAPURAM
® POiLlCE STATION TALUK T POST AND TELEGRAPH OFFICE
• VILLAGE BELOW 2,000 POPULATION
• VILLAGE 2,000 - 5,000 POPULATION
• VILLAGE ABOVE 5,000 POPU,LATION
iE::TZi CENSUS TOWN
,_ MUNICIPAL TOWN
o
Q
--_ "
0 10
r @' TALUK HEADQUARTERS
'~~~----~~~--------------__ ~~ __ ~~==========~N , 0 t E 31) 76 4;i
25J328-c. ~- -
ERRATA
II
Page Ite~ Column Line For Read
3 State Table " 11 1 8,541.782 8,541,788 .. 11 3 1.27,138 1,271,382 29 1lable }\-I~' ~ote B heading 2 village or villages which it
has relapsed village or villages intI)
which it has relapsed
37 1lable B-IIt Part-A 17 8 927 92
53 Table B-IV: Part-B Perintalmanna taluk 1 ,4 2 aad 3 2 and 3
1lable B-IV Part-B Ottapa'am taluk 8 10 1,09 1.409 '
u 12 7 17 60 Table B-I\t Part-C
J\ppendix 2 15 603 Total NHI (MI3) 6031lotal NHI (MI8)
61 i, , 2 8 Urban NHI (M6) Urban NHI (MS) I 2 15 873 Total NHI (M3) 873 Total NHI (M8) ~,
62 1lable B-IV Part-C (i) Perintalmanna taluk ,2 36,736 56,736
64 'fable B-V Fly-leaf I ,I 18 Nationa National • }\ppropriate industrial categories 3 25 OX IX
91 1lable B-V rJ\lathur taluk pivision, 7-8 41 Category IX 2,834 2,843
1lable B-V Chit~ur taluk' Di vision\ 6 4 1lotal
1lable ltV Chittur taluk Division 1:9 ' IV V
P.1l. O.
ERRATA~Dncld.
Page Item Column Line For Read
92 Table B-V Appendix 2 10 032 082 96 Table B-VI 12 30 11 97 Table B-VI Heading '. CLASIFIED CLASSIFIED
107 Table B-VII Part-B 1 21 Division 2 &; 3 A.W.Division 2 & 3 112 Table B-VII Part-B
Ottapalam taluk P.W. Division 9 14 W. A. Division A.W. Division
132 TableB-XII 1 16 2'~'9 2'5-4'9
" 13 2 219
135. Table B-XIII Appendix . Rural 2 34 and 35 (A-8.13-4, D-IJ 34-35 (A-8, B-4, 0-1, E-l) 145 Table B-XV 24- 2B 8 28 152 Table B-XVI Appendix 1 19 X H without cultivation X )J "
" " 20 E " " E
" without cultivation
172 'table C-V 10 9 512 542 178 Table C-VIII Part-A 9& 10 Heading II-X I-IX
Table_ C-VIII Part-B 9 & 10 Heading II-X I-IX 180 D-Migration Tables Note 1 , repors reports
" 4 duration 0 duration of 183 Table SCT-I Fly-leaf
Total population of Scheduled <
castes al\d scheduled Tribes,1961 8 17 1,557 1,757 203 Table SCT -IV Fly-leaf 2 House henee 204 Table SOT-IV 6 to 15 Ueading Religions Religion 207 Table SO-I Fly-leaf 1 5 such being as such as 214- Table ST-II Fly-leaf 1 3 as being full-time as full-time
" 2 3 Tribe Tribes

PART B .
CENSUS DATA
(i) STATE TABLES
,state/District 1
_KERALA
Cannanore •
_Kozhikodc
-Palghat
'Trichur
Ernakulam
-Kottayarn
i Alleppey
'Q.uilon
1'rivandrum
I AREA, HOUSES AND POPULATION .* Number of
Popula- villages Number Total Area in Rural ,-___ -----A. ______ ,
tion r------'---------.Number of occupied Population per Inha- Uninha- of residential,- ' _____ -A-______ ,
Sq, mile bited bited towns houses Pcnons Males FemalCi Urban Sq, miles Sq. km, 2 Sea) 3(b) 4 5 6 7 8 9 10 11
T 15,002 Ca) 15,OO2~(b)
R 14,571'1 U 431-5
T
R U
2,7H Ca). 2-;I9rnG)" 2,116'2
75'1
T 2,042 Ca) 2;-570'2(b)
R 2,509'5 U 60,7
T 1,9HZ (a) 1,97!h;--Cb)
R 1,94-3'0 U' 36,6
T I,H9 (a) 1,137:0-(G)
R 1,104'6 U 32,t
T
R U
T
R U
T
R U
T
~ U
T
R
1,270 (a) l;2S§T(bT 1,236'0
53,5
2,326 Ca) 2;t5f6 (b) 2,418'3
37,3
698 Ca) 703'l ~b) 65{'9
53'2
1,944 (a) ~,8:U':> (b) 1,812'3
13'0
~H (a) ~!f'O (b) 776,3
38,855 Ca) ~856'7 (b) 37,739'0
1,117'7
7,107 5,67::r 5 5,481'1
194'4
Ca) (b)
5,289 Ca) 6,656-:S--CG) 6,499'5
Li7'3
5,133 (a) 5~f[i-2---rb)
5,032'5 9i'7
2,976 Ca) 2~<)H8~) 2,8(;0'8
84,0
3,239 3,339'8 3,201'1
138'7
(a) (b)
6,024 Ca) 6,360'0-(0 6,263'4
96'6
1,808 (a) 1,83'f'O (G) 1,696'1
137'9
.'i,03.; (a)
4, 7:>4'7 ~b)
4,694'0 38'7
2.194 (a)
1,127 985
5,919
812 699
3,998
1,1J18 871
7,121
897 826
4,70_1
1,442 1,317 5,726 '
1,442 1,183 7,379
706 648
4,4-36
2,553 ' 2,292 5,831
1,062 99;!.
9,6-!8
1,573 1,573
235 235
311)
310
298 298
238 238
107 107
101 101
99 99
98 98
t2 t2
1 1
92
92
18
13
17
17
7
7
7
7
12
12
7
7
8
8
3
3
2,803,533 2,422,217
381,316
278,556 237,691
40,865
426,653 368,114 58,539
30j,594 277,547
23,047
265,621 236,911
23,7lU
299,903 240,914 58,99-1:
296,483 271,929 H,554
312,991 262,733 50,258
328,673 307,101 21,5?:!
2,13.)'9 CbJ 2,OG7 87 13 289,054-2,010'5 1,669 87 219,277
U 6N J 175'4 6,62ti 13 69,777
16,903,715 14,349,574 2,554,141
1,780,294 1,480,177
300,117
2,617,189 2,184,682
432,507
1,776,566 1,604,716
171,850
1,639,862 1,454,210
185,6.)2
1,859,913 1,464,603
395,310
1,732,880 1,567,411
165,469
1,811,252 1,500,821
310,431
1,941,228 1,796,992
H4,236
1,744,531 1,295,962
448,569
8,361,927 7,079,168 1,282,759
874,667 723,32.3 149,342
1,300,974 1,083,556
217,418
851,746 767,251 84,495
784,736 694,821 89,915
931,248 727,922 203,326
882,580 798,454 84,126
893,435 739,248 154,187
972,657 893,746 73,9Il
869,884-643,84-5 226,039
8,541,78Z 7,270,406 1,27,138
905,627 754,852 150,775
1,316,215 1,101,126
2J5,039
924,820 837,463
87,355
855,126 759,389
95,737
928,665 736,681 191,984
850,300 768,957 81,343
917,817 761,.571 156,244
968,571 898,24 70,325
874,641 652,117 222,530
**- Thi, tabk include; a;c'l, houie3 and popul.ttion of umurveyed forest areas also .
..Note :-1 Ullder colutllm 3(a) and 3(b), C") rcpre,enh the are). fic-l'ure; furnhhed by Surveyor General of India, and (b) represents the area figures furni;hed by the Sate Survey Department. The urban areas are ba~ed on the area of individual towns fUfni,hed by the local authoritie,. The rural area for a di,trict i3 obtained by subtracting the urban area from the State Survey area.
2 The sq, km, and dcmity figltrc-; of urban areas of Di,trict/State are W 3rked ont ming the area fi2:ures corrected upto two phces of d,.cimal, obtained by addin,. the area; of towa, ill the r";pective units and nJt u,ing the area fi~ure.s given in the table. In. addition to this the figures rdating to sq, km. are furthcr adju;ted to mak" the Di;trict/State totals agree.
3 Population per 'q, mil,. h", been calculated on area fig-ures supplied by State Survey Office.
i' The,e two ar~ only p'lrtioll< of two villages comi>ting of paddy fidd, and uncultivated land lying in the rural areil!. The Ilrb<lQ. , portion> of the>e village' lying in two municipal tOWlli are inhabited.
3 "25/328-1
• n VARIATION IN POPULATION DURING SIXTY YEARS
Decade Pel'centa!!;e State/District Year Persons variation decade variation Males [(males
1 2 3 4 :) \} 7
KERALA 1901 6,396,262 3,191,466 3,204,796 1911 7,147,673 + 751,411 + 11'75 3,559,425 3,588,243 1921 7,802,127 + 654,454 + 9'16 3,879,458 3,922,669 1931 9,507,050 + 1,704,923 + 21'85 4,702,951 4,8<14,099 1941 11,031,541 + 1,524,491 + 16'04 5,'143,296 5,588,245 1951 13,549,118 + 2,517,571 + 22'82 6,G81.901 6,867,217 1961 16,903,715 + 3,354,597 + 24'76 8,361,927 8,541,788
Cannanqre 1901 787,352 384,030 403,322 1911 841,782 + 54,430 + 0·91 +:)8,483 433,299 1921 865,447 + 23,66.5 + 2·81 414,823 430,624-1931 997,037 + 131,610 + 15·21 480,640 516,417 1941 1,123,034 + 12:;,997 + 11·64 540,449 582,60."> 1951 1,375,031 + 2:)2,027 + 22·44 668,480 71)6,595-1961 l,i80,294 + 40'i,213 + 29·47 874,667 90.5,627
Kozhik(Jt/1I 1901 1,151,981 575,567 576,414 1911 1,2'il,737 + 99,736 + 8·66 622,911 628,826 1921 1,283,622 + 33,88'5 + 2·71 635,623 649.994 1931 1,490,770 + 205,148 + 15·96 734,38') 756,396 1941 1,671,990 + 131,220 + 12·16 820,4-44 831,546 1951 2,065,284 + 393,294 + 23·52 1,024,306 1,040,97S 1961 2,617,189 + 551,903 + 26·72 1,300,97-1 1,316,215
Pal,hat 1901 977,212 479,4.'j! 497,759 1911 1,0.31,224- + 74,012 + 7·.37 512,49) 538,729 1921 1,092,723 + 41,499 + 3·95 529,131 563,592 1931 1,213,281 + 120,553 + 11·03 583,663 629,618 1941 . 1,326,140 + 112,859 + 9·30 637,0:.27 689,113 1951 1,5(D,167 + 239,027 + ]8·02 719,607 815,560 1961 1,776,566 + 211,399 + 13·31 8~1,746 924,820
Trichur 1901 658,873 32~,923 329,945 1911 742,707 + 63,834- + 12'72 36!\,799 372,908 1921 786,564 + 43,857 + 5·91 383\494 403,070 1931 961,965 + 175,401 + 22·30 463,;;>07 4-98,238
1941 1,119,56, + 157,600 + 16·38 537,941 581,624:
1951 1,362,665 + 243,100 + 21·71 648,16$ 714-,497
1961 1,639,862 + 277,197 + 20·34 784,73~ 855,126
Ernakulam 1901 669,135 3:17,097 332,038
1911 762,953 + 93,818 + 14·02 383,785 379,168
1921 833,849 + 70,896 + 9'29 424,158 409,691
1931 1,055,941 +'. 222,092 + 26·63 530,954- 524,987
194-1 1,276,323 + I. 220382 , , + 2J·87 640,997 635,326
1951 1,530,143 + ·253,820 + 19'89 763,805 766,338
1961 1,859,913 + 329,770 + 21·55 931,248 928,66.}·
4
n VARIATION IN POPULATION DURING SIXTY YEARS-concld.
Decad" Pe reen tllge "State/Dist: ict Yt'ar Person, variation decade variation l\1ales Females
'l 3 4- 5 6 7 .<.
Kottayam 1901 475,427 243,730 231,697 1911 559,989 + 84,562 + 17'79 287,513 272,476 1921 649,768 + 89,779 + 16'03 336,122 313,646 1931 889,664 + 239,896 + 36'92 458,466 431,198 1941 I,Of.l3,3:29 + 193,663 + 21'77 536,584- 526,745 19::;1 1,327,668 + 244,339 + 22'55 674,061 653,607 )961 1,732,850 + 405,212 + 30'52 882,580 850,300
Alle/Jlley 1901 668,388 336,520 331,868 1911 707,239 + 98,831 + 14'79 386,107 381~132 1921 909,535 + 142,316 + 18'53 459,690 449,865 1931 1,130,71:, + 221,160 + 24'32 567,484 563,231 19H 1,274,029 + 143,314 + 12'67 636,901 637,128 1931 1,:)21,303 + 2H,274 + 19'41 753,552 767,751 1961 I,Bll,232 + 289,94-9 + 19'06 893,435 917,817
Quilon 1901 523,401 263,449 259,952 1911 60:),570 + 77,169 + H·74 302,136 298,434 1(12l 712,~06 + 111,636 + 18'59 360,034 352,172 1931 910,806 + 198,600 + 27'89 455,898 454,908 19H I,H2,0:.t + 231,248 + 25'39 569,622 572,432 1931 1,473,993 + 331.941 + 29'07 739,252 734,743 1961 1,941,228 + 467,233 + 31'70 972,657 968,571
Triv.mdrum 1901 4114,493 242,692 241,801 1911 569,472 + 84,979 + 17'54 286,196 283,276 1921 666,393 ~ 96,921 + 17'02 336,378 330,015 1931 856,851 + 190,458 + 28'58 427,759 429,092 1941 1,015,037 + 158,205 + 18'46 503,331 511,726 19,j1 1,327,812 + 312,755 + 30'81 660,664- 667,148 1961 1,7-4--1,531 + 416,719 + 31'38 869,884- 874,647
N~te :~Di$tr,ictl formed a.fler, the Ct"n'us of 1931 are gi I'en in italics
5 -25!328~lb
III WORKERS AND NON.WORKERS,
,-----------------------------In ]\Iining,
Quarrying, Live-stock, }<'orestry,
Fishing, Hunting and Plantations,
A~ Agricultural Orchards and Total Total Population Total workers As Cultivator Lahourer allied aClivitit's Rural I-IX I II III
State IDistrict Urban ...... , ___ .A.. ...... .A.._-----,~ .......
P M F l\I F ;vI F ]\{ F ::\1 F
2 3 4- 5 6 7 8 9 !O 11 - 12 13
!tERALA T 16,903,715 8,361,927 8,541,7118 3,947,038 1,683,255 ~(J4,51l2 273,601 516,914 461,482 398,622 88,737
R 14,349,574 7,079,168 7,270,406 3,357,206 1,517,995 877,346 264,045 501,978 446,000 357,149 87,186
U 2,554,141 1,282,759 1,271,382 589,832 165,300 27,156 9,556 14,936 15,482 41,473 1,551
Cannanore T 1,780,294 874.667 905,627 420,728 208,991 92,047 60,924 47,27:J 62,776 34,046 5,818 R 1,480,177 725,325 754,8!,>2 347,784 188,138 88,734 58,254 46,032 59,844 29,001 5,692 U 300,117 149,342 150,775 72,944 20,853 3,313 2,671) 1,223 2,932 5,045 126
Kozhikode l' 2,617,18Q 1,200,£74 1,316,215 612,214 lE9,4~2 103,C~8 24,746 63,013 50,011 77,357 14,076· R 2,184,682 1,083,556 1,101,126 510,876 168,771 101,169 24,142 61,991 48,740 66,477 13,837 U L432,507 217,418 215,089 101,338 20,721 1,929 604 1,022 1,271 10,880 239
Palghat T 1,n6,5G6 851,746 924,820 438,385 251,021 Hl,Oi9 42,426 95,(33 122,332 28,072 4,653 R 1,604,716 767,251 837,465 397,687 236,033 95,823 41,3~0 92,745 118,552 26,106 4,621 U 171,850 84,495 87,33"j 40,698 14,988 2,256 1,076 2,290 3,980 1,966 32
,
Trichur 'T 1,639,862 784,736 855,1:16 357,:132 18'7,207 €4,938 25,338 34,982 48,( 49 35,919 4,799 R 1,454,210 694,821 759.389 317,473 172,451 62,280 24,323 33,888 46,415 33,612 4,464 U 185,652 89,915 95,737 39,759 14,756 2,658 1,015 1,09{ 1,634 2,307 335
Ernakulam T 1,859,913 fl31,248 928,665 437,902 179,381 89,910 36.879 39,932 46,841 35,586 3,739 R 1,464,603 727,9l2 736,681 342,771 159,600 87,446 35,999 38,~35 45,800 32,634- 2,477 U 395,310 203,326 191,984 95,127 19,781 2,464 830 1,297 1,041 2,~52 262 \
Kottayam T 1,732,880 882,580 850,300 427,057 138,058 99,479 13,918 54,~,92 30,478 95,819 46,e2!}' R 1,567.41 I 798,454 768,957 389,042 • 129,102 96,385 13,402 52,8~7 29,523 93,732 46,676 U 165,469 84,126 tl1,343 38,015 8,956 3,094 516 1,803 955 2,087 153
AIJeppey T 1,811,252 893,435 917,817 407,737 2(12,('87 92, 1lJ2 17,384 60,866 55,S68 33,127 1,981 R 1,500,821 739,248 761,573 340,660 178,154 87,333 16,254 58,103 53,150 29,672 1,82& U 310,431 154,187 156,244 67,077 U,533 4,849 1,130 2,763 " 2,818 3,455 155
Quilon T 1,941,228 972,657 968,571 445,188 186,162 169,413 30,~90 60,272 26,422 33.286 5,214 R 1,796,992 898,746 898,246 412,203 174,451 167,510 30,790 59,533 26',345 30,449 5,152 U 144,236 73,911 70,325 32,985 11,711 1,903 200 739 77 2,831 62'
Trivandrum T 1,744,531 869,884 874,647 4CO,5,g5 140,2S6 95,356 20,996 60,847 18,405 25,410 1,628 R 1,295,962 643,845 652,117 298,706 111,295 90,666 19,531 58,144 17,631 15,466 1,441 U 448,569 226,039 222,530 101,889 29,001 4,690 Ij465 2,703 774 9,944 187
6
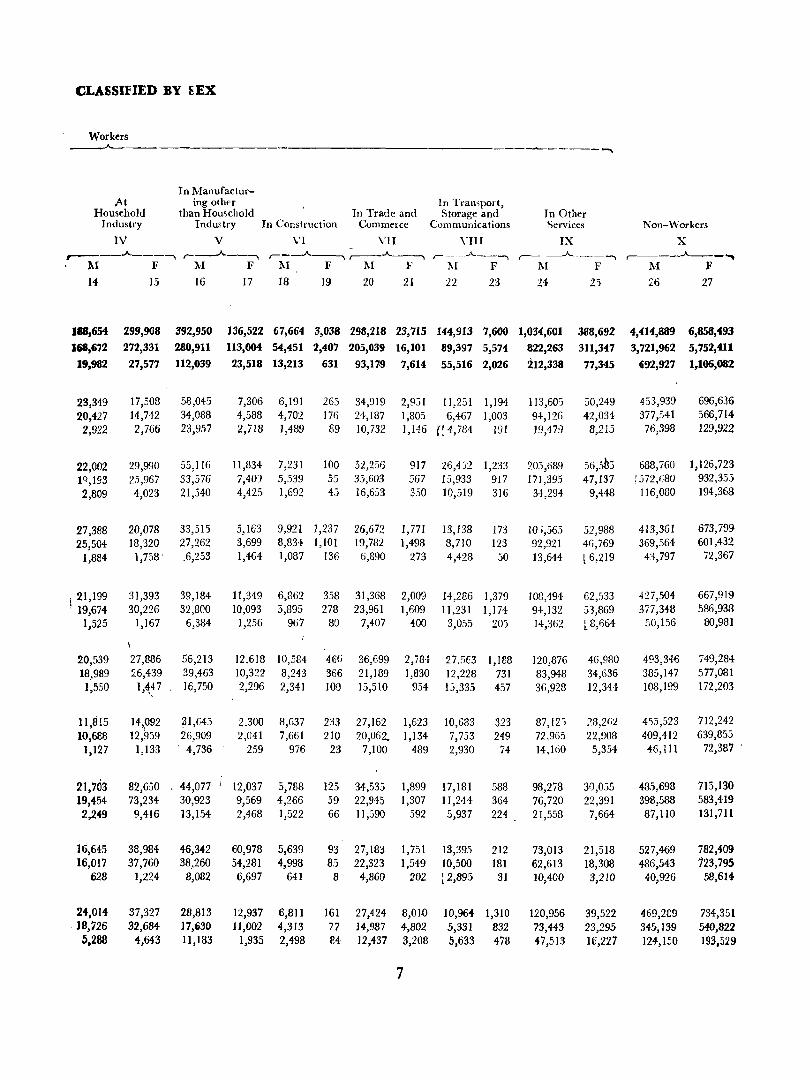
CLASSIFIED BY ~EX
Workers ___..A...--
~----""""
In Manufactur-At ing other In Tran'port,
Household than Household In Trade and Storage and In Other Industry Industry In Construction Commerce Communications Services Non-Workers
IV V VI VII YIlI IX X ,---__ .A ___ -,
r--A _-, .. _ ____....___" ,---__ .A. __ -, ,--_..A. __ ~ r--_____.A..---, ,------"---.., M F M F 1\1 F 1\1 F 1\1 F 1\1 F M F
14 15 16 17 18 19 20 21 22 23 24 25 :26 27
188,654 299,9(18 392,950 136,522 67,664 3,038 298,218 23,715 144,913 7,GOO 1,034,601 388,692 4,414,889 6,858,493 168,6'72 272,331 280,911 113,004 54,451 2,407 205,039 16,101 89,397 5,574 822,263 311,347 3,721,962 5,752,411
19,982 27,577 112,039 23,518 13,213 631 93,119 7,614 55,516 2,026 212,338 77,345 692,927 lyl06,082
23,349 17,508 ' 58,045 7,306 6,191 265 34,919 2,951 11,251 1,194 113,605 50,249 453,939 696,636
20,427 14,742 34,088 4,588 4,702 176 24,187 1,805 6,467 1,003 94,126 42,034 377,541 566,714
2,922 2,766 23,957 2,718 1,489 89 10,732 1,146 r~4,784 191 19,47il 8,215 76,398 129,922
22,002 29,990 55,116 11,834 7,231 100 52,256 917 26,4j2 1,233 203,689 56,585 688,760 1,126,723
IQ,193 25,967 33,576 7,40) 5,539 55 35,603 567 15,933 917 171,395 47,137 ;572,(,80 932,355
2,809 4,023 21,540 4,425 1,692 43 16,653 350 10,519 316 34,294 9,448 116,080 194,368
27,388 20,078 33,515 5,163 9,921 1,237 26,672 1,771 13,138 173 10>,56.3 52,988 413,361 673,799
25,504 18,320 27,262 3,699 8,834 1,101 19,782 1,498 8,710 123 92,921 41),769 369,564 601,432
1,884 1,758 ' .6,253 1,464 1,087 136 6,890 273 4,428 30 13,644 l6,219 43,797 72,367
! 21,199 31,393 39,184 11,349 6,862 358 31,368 2,009 14,286 1,379 108,494 62,533 427,504 667,919 , 19,674 30,226 32,800 10,093 5,895 278 23,961 1,609 11,231 1,174 9+,132 53,869 377,348 586,938
1,525 1,167 6,384 1,256 967 80 7,407 400 3,055 203 14,362 L 8,664 50,156 80,981
\
20,539 27,886 56,213 12.618 10,584 466 36,699 2,784 27,563 1,188 120,876 46,980 493,346 749,284 18,989 26,439 39,463 10,322 8,243 366 21,189 1,830 12,228 731 83,948 34,636 385,147 577,081
1,550 lA~7 16,750 2,296 2,341 100 15,510 954 15,335 457 36,928 12,344 103,199 172,203
11,815 14,,092 31,64.) 2.300 8,G37 233 27,162 1,623 10,683 323 87,12; 28,262 455,523 712,242
10,688 12,939 26,909 2,041 7,661 210 20,062. 1,134 7,753 249 72,965 22,908 409,412 639,853
1,127 1,133 4,736 259 976 23 7,100 489 2,930 74 14,160 5,354 46,111 72,387
21,703 82,650 44,077 1 12,037 5,788 125 34,535 1,899 17,181 588 98,278 30,055 435,698 715,130 19,454 73,234- 30,923 9,569 4,266 59 22,945 1,307 11,244 364 76,720 22,391 398,588 583,419 2,249 9,416 13,154 2,468 1,522 66 11,590 592 5,937 224 21,558 7,664 87,110 131,711
16,645 38,984 46,342 60,978 5,639 93 27,183 1,751 13,395 212 73,013 21,518 527,469 782,409 16,017 37,760 38,260 54,281 4,998 85 22,323 1,549 10,500 181 62,613 18,308 486,543 123,795
628 1,224 8,082 6,697 641 8 4,860 202 [2,895 31 10,400 3,210 40,926 58,614
24,014 37,327 28,813 12,937 6,811 161 27,424 8,01-0 10,964 1,310 120,956 39,522 469,2£9 734,351 .18,726 32,684- 17,630 1l,002 4,313 77 14,987 4,802 5,331 832 73,443 23,295 345,139 540,822
5,288 4,643 11,183 1,935 2,498 84 12,437 3,208 5,633 478 47,513 16,227 124,150 193,529
7

(ii) FALGHAT DISTRICT TABLES
A-General Population Tables

A.-I AREA, HOUSES AND POPULATION
Fly.leaf
Effect of States Reorganisation ill 1956
1. Subsection 1 (b) of section 5 of the States Reorganisatioll Act, 1956 (Act 37 of 1956) gives the constitution of the Malabar district. The whole of section 5 is reproduced below:-
"5. (1) As from the appointed day, there shall .be formed a new Part A State to be known as the State .ofKerala comprising the following territories, namely:-
(a) the territories o(the existing State ofTravancoreCochin, excluding the territo~ies transferred to the State of Madr~ by sect~on 4 ; and
(b) the territories comprised in-(i) Malabar' d iatric t, excluding the island,;
of Laccadive and Minicoy and (ii) KasaragGd taluk of South Kanara district;
and thereupon the! laid territ,)ries shall cease to 'form part of the States of Trav3ncore-C,)chin and Madras, respectively:
(2) The territories specified in clause (b)--of subsection (1), shall form a separate district to I~ known as Malabar district in the State of Kerala" .
Territorial Distributions since 1956 2. In excercise of the pow~rs conferred by the
Madras District Limits Act, 1865 the Government of ,Kerala with effect from 1st January 1957 altered the jurisdiction of Malabar district and trifurcated the same into the new districts of Cannanore, Kozhikode, and Palghat as per 'Notification No. SRN3-29174/.56 dated 19th December 1956. The district of P~lghat thus formed compris~d the following:-
Names of divisions Names of taluks Namb; of firkas comprised in the comprised in the comprised in the
district division taluk i OttapaJam 1" Perinthal- 1 Perinthalmanna
manna '2 Mankada
:25/328-2
3 Mannarghat
2 Ottapalam 1 Sreekrishnapuram 2 Ottapalam 3 Pattambi
3 Ponnani 1 Ponnani 2 Tritbala 3 And~thode
(Comprising th e existing Andathode firka and the five villages of Pookode, Perakom, lringaprom, Kadaprom, and Manathala of the existing Chowghat firka)
Names of divisions Names oftaluks Names of firkas . comprised in the comprised in the comprised in the-
district division taluk
2 Palghat 1 Palghat
2 Chittur
1 Palghat town 2 Elapulli 3 ParH
I Kollengode 2 Chittur 3 Nemmara 4' Kozhinjampara
With effect from the 15th March U57 the five villages which were tagged with the Andathode firka were transferred to Ghowghat taluk.
Area Figures 3. The area figures of the district given by the
Surveyor General, India is 1,982 sq. milt!s. This figure does not tally with the area figures given by the Director of Survey and Land Records, Kerala which is 1,979'56 sq. miles. The area figur~ given in this handbook are those furnished by the State Director of Survey and Land Records. In regard to municipal towns the figures for area have been furnished by the respe:tive Municipal Commiisioners in consultation with the Director of Survey, District Collector and Tahsildan. The area figures of non-municipal towns are supplied by the concerned Tahsildars.
Definition of urban area-A Historical Survey
11
4. It has not been possible to adopt a uniform definitivn of urban area throughout the world. It differs from country to country J even in the highly industrialised west. According to the Census Report of 1881 which applies to the erstwhile Malabar region of the present Palghat district «size, compactness and certain architectural and commercial or other industrial features were of the considerations which went to make up the definition of a town". In the census of 1901 of Madra] a census town was taken to comprise a municipality of whatever population and every other continuous collection of houses permanently inhabited by r.ot less than 5,000 persons which, the Superintendent of Census Operations, h<tVing regard to the character and relative density of its population, its importance a~ a centre of trade and its historical associations, might decide to treat as a town. Palghat is the earliest town in the district. It was formed in 1866. Ponnani was'treated as a town in 1891. Thus in the erstwhile Malabar region of the present Palghat district there were two towns in 189(, viz.' 1 Palghat and Ponnani. From this period up to 1941 there has been no change in the number of towns. In the census of 1941
, Ottapalarn and Shoranur were also treated as towns. So far as the former princely State of Cochin is concerned although the first census in Cochin was taken in 1820 followed by similar censuses in 1836, 11*9, and 1858 prior to the commencement of the Imperial Census, these furnished only rough eitimates of population. After the commencement of the Imperial Census the first census held in Cochin was in 1875 followed by subsequent censuses in 1881 and thereafter every 10 years. Till 1891 nO attempt had been made to census the urban population separately. It was in 1891 only that for the first time the towns of Cochin were censused as such. Although the limits of each town Was defined, no definite principle seems to have been _followed in their selection. Though the town, as a term, was of vague application, it was admitted that the minimum of 5,000 inhabitants was absolutely necessary to constitute it. But this minimum, by itself, was not taken to classify a place as a tOWn. Size, compactness and certain architectural, commercial or industrial features were also considerations which weighed with the authorities in selecting a town. A collection of numerous buildings near each other within a limited area, together with good roads and buildings and shops for the continuous supply of goods, especially manufactured goods, was also regarded as ~ssential. Chittur, which falls within . the revenue jurisdiction of the present Palghat district, was thus ~r..l)aied. as a town in 1891. In 1901 Thathamangalam ,was also'treated as a town. Nemmara was elevated to the status of a town in 1911. Chittur and Thathamangalam towns were united in 1920 to form the Chittur-Thathamangalam Municipal Town. But in June 1938 it was' again bifurcated to form two separate municipal towns Chittur and Thathaman~alam.
After a span of nine years it was again re-united Oil
10th October 1947. In July 1949 the States of Travancore and Co chin were integrated into Travancore-Cochin State. In the 1951 Census four places, viz., Ayilur, Eruthempathy, Kozhinjampara, and Nallepilly were treated as towns for the first time. Thus, on the eve of the 1961 Census there were 10 towns in the dlStricrt Owing to the growing importance of urbanisation the 1961 Census laid down a three-fold criterion for classification of an area' as a town besides corporations/ municipalities, civillines and cantonments which were automatically recognised as towns, According to this aiterion only places with a minimum population of 5,000 persons and density of not less (han 1,000 per-' s JUs per sq. mile with at least 75 per cent of t~e male popUlation engag€d in non-agricultural pursuits that could be recognised as a to~n. The population~
12
density and extent of male population engaged in nonaificultural pursuits were to be determined with. reference to the census fi3"ures of 1951. Exceptions were, however, al~ow.~d where an area lnay have a population of less than 5,0')0 but has definite urban characteristics and amenitie~. Similarly where a place was treated as a town in 1961 if the State Government desired that it sh')uld be treated as a town in 1961, it ~as considered as an exceptional case. Nemmara town of 1951 which does not satisfy the criterion of 1961 was treated as a town in 1961 based on the recommendation of the State Government. In pursuance of the new definition of a town adopted in th;s census, foUl' towns (viz., Ayilur, Eruthempathy, Kozhinjampara, and NaHepilly) of 1951 Census were dec1ass;fied as rural and one town, viz., Pattambi was newly added.
5. The following statement gives the number of' towns for the various censuses:-
Progrrss oj Census lou'ns since IgOI
1901 1911 1921 1931 1941 1951 1961
4 5 4 4 7 10 7
Census Village
6. For the purposes of thc 1961 Census a vill<"ge means a revenue village. These villages have desoms as the constituent uni;_" in m03t cases. Unlike in the previous cemuses the desoms have not been treated as census villages in 1961. TabLes A-I and A-III are given on the basis of revenue villages. However, in view of the different definitioll~ of a census vilJaCTe
, '" adopted in the previous cenStlS~S a special Table A-III is given furnishing the number of census villages according to the definition of census village in 1951 Census aho, i.e., according to number of desoms. Palghat district has ~O-4 vi~lage) out of which 5 village~ lie wholly in towns and )5 partly in towns. Thb \ particulars of this item are\ gi\'en in Slatement No.,'l \ of Part A supra.
Ce.sus House
7. A census house i, a stt'llcture or part of a structure inhabited or vacant, giving on the road or a common stair case or a common courtyard leading to a main gate or enjoying a separilte entrance. It may be a d~l?lljng, a shop, it shop-cum~l;:lwelling, a workshopcum-dwelling or a place of busille~s, workshop, school, etc.
Occupied Residential House
8. An occupied residential home is a census house occupied by one or more census households and includes a shop-n'lm-dwelling, workshop-cum-dwelling,.
.and a dwelling with other uses. Even where more than one household occupy one cenJus house, it is considered as only one occupied residential house.
Natural Dh·isions
9. Since 1901 the territories comprising Malabar district and Kasaragod taluk of the South Kanara district came under the sixth natural divi~ioq of Madras .designated as West Coast Division. There was no further subdivision on the basis of meteorological or geographical features. In the Cochin State no natural ,divisions were formed in any of the censuses. The reason for this has been given in the Census Report' of 1931 of Co chin as follows:-"\yith the diversity in its physical features it is no doubt possible to divide the 'State for statistical purposes into distinct areas or naturJ.l ·divisions in which the natural feat4res are more or le:s homogenous, but tht:t small area of Cochin will neith~r warrant such divisions nor justify the time and labour
, involved in the preparation of separate statistics for each of them". By 1951 the integration of Travancore and 'Cochin had already taken place. In the census of 1951 of Travancore-Cochin" therefore, the classification of the 'State into three natural divisions, viz., Highland, Midland, and Lowland, was followed, 'the highland comprising the Ghats which gradually decrease in height as they go we5t', 'the midland or the central belt
.'Consisting of series of uplands and plains which sink Ig'radually in level toWards the,~est' and' the lowland or littoral tract'. I The above classification was
: fo.llowed down to the level of the revenue villages, a pn:x:edure adopted f)f the fint time in the Census 1lepclrt of Travancore in 1941. In none of the Census
'lteports referred to., above the contour lines which ,-divide the natqral division have been given'. In the prCSe!lt census natural division. are formed based 'on the contour line3, the whole State being divided inw three natural divisions bas~<;l o.n the following qiterion:-
i Highland' cons~ting of' areas lying 250 feet and over abo.~e the ~ean sea level
ii Midland 25 feet level
comprising; areas lying between and 250 feei above the mean sea
iii Lowland consisting of the are-.as fa.lling below 25 feet above the mean sea level
25/328-2b
Since the contour maps of the Survey of India for Kerala shows the contours only up to 50 feet, it was inevitable thlt the determination of the areas falling in the classification o£. lowland had to. be done y,ith reference to the reports of the Mun,icipal Commissioners and Tahsildars who had necessarily depend upon a certain amount of approximation for the purpose. There are, indeed, some revenue villages lying partly in o.ne clas,ificatio.n and partly in another. In all such cases the village wa~ classified according to. the category in which its major portion f.-!ll. In the case of towns also the same principle was followed. It could be said wi!h ~ome amount of gratification, but not without some reservation due to the non-availability of contour maps below 50 feet above the mean sea l~vel that for th ~ first time in Kerala, the classification by natural divisions has been done on the basis of contour lines.
Appendices
Appendix I
10. This appendix give:; the 1951 territorial units constituting the present set up of Palghat district down to taluk level. All notified changes that have taken place since 1951 Census are hc JrpJrated in this Appendix.
11. The revised area figures, based on the latest village-wise figures furnished by the Director of Survey and Land Records, were adopted for preparing this Appendix.
12. The symbol numbers, viz., I, 2 and 3 are as-igned t,) the newly constituted taluks. The annexure to Appendix I gives the details involved in these change3 with reference tv the 1951 District Census Handbooks.
13. The sub-appendix to Table A-I shows the af~ of Chittur-Thathamangalam Municipal Town which had undefgone change in area since 1951.
Appendix n 14. A?p~ndix II to Table A-I shows the number or
villages with a population of 5,00J and towns with a population under 5,000 for each taluk. There is ttl)
town 'in the district with a popUlation of le.>s than 5,000 in 1961.
Appendix m 15. Appendix III to Table A-I furnishes figures or
houseless and institutional population. An. institutio, is a place where unrelated persons are living together.
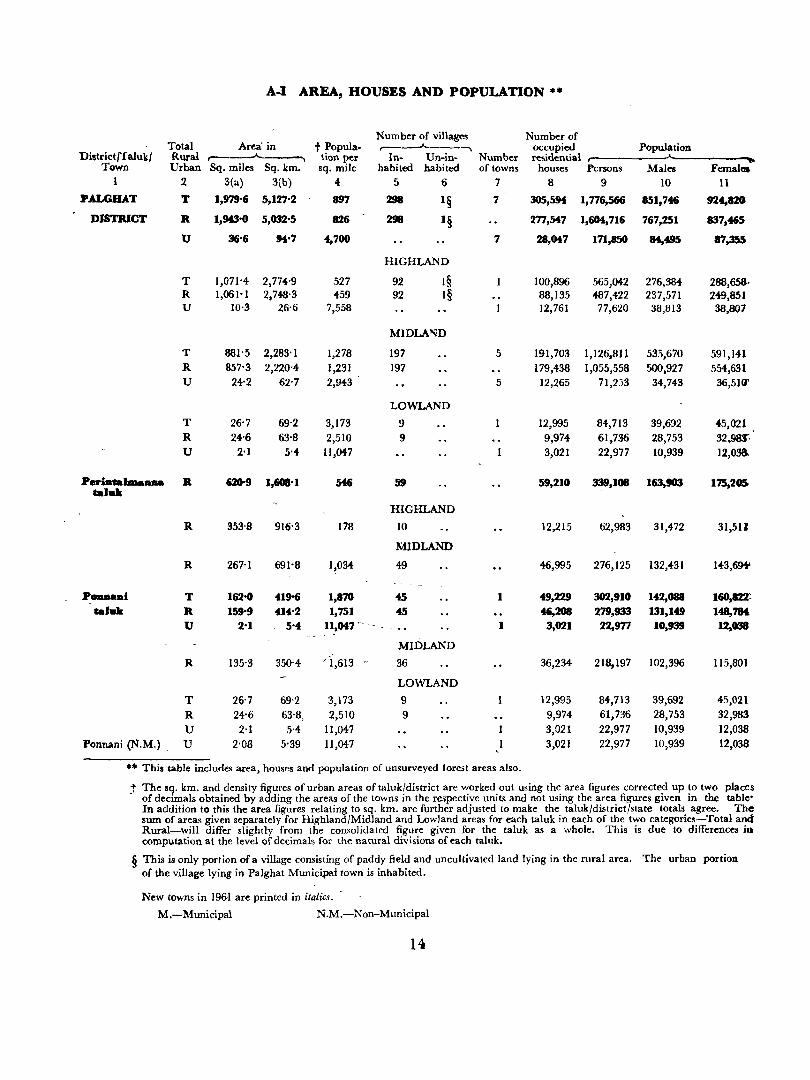
A-I AREA, HOUSES AND POPULATION U
Number of villages Number of Total Area'in t Popula- ,....--_..J..,_ __ ~ occupied Population
Diatrict{falukl Rural r------'----, tion per In- Un-in- Number residential __.,_ .. Town Urban Sq. miles Sq. km. sq. mile habited habited of towns houses Persons Males Femalea
1 2 3(a) 3(b) 4 5 6 7 8 9 10 11
PALGBAT T 1,979'6 5,127'2 897 298 1§ 7 305,594 1,776,566 851,746 924,820
DISTRICT R 1,!H3'O 5,032'5 826 298 1§ 277,547 1,604,716 767,251 837,465
U 36'6 94'7 4,700 7 28,047 171,850 84,495 87,355
HIGHLAND
T 1,071'4 2,774'9 527 92 I§ 100,896 565,042 276,384 288,658-R 1,061'1 2,748-3 459 92 1§ 88,135 487,422 237,.571 249,851 U 10·3 26'6 7,558 12,761 77,620 38,813 38,807
MIDLA~D
T 881'5 2,283'1 1,278 197 5 191,703 1,126,811 535,670 591,141 R 857'3 2,220'4 1,231 197 179,438 1,055,558 500,927 554,631 U 24'2 62-7 2,943 5 12,265 7I,2j3 34,743 36,510'
LOWLAND
T 26'7 69,2 3,173 9 12,995 84,713 39,692 45,021 R 24-6 63'8 2,510 9 9,974 61,736 28,753 32,98S-U ,2'1 5'4 11,047 3,021 22,977 10,939 12,08&
Periatalma __ R 620-9 1,608'1 546 59 59,210 339,108 163,903 175,205
tal" HIGHLAND
R 353'8 916'3 178 10 12,215 62,983 31,412 31,5U
MIDLAND
R 267'1 691'8 1,034 49 46,995 276,125 132,HI 143,69+
P_i T 162'0 419-6 1,870 45 1 ~9,229 302,910 142,088 16O,82X tal_ R 159'9 414'2 1,751 45 46,208 279,933 131,149 148,7M
U 2'1 5'4 11,047'" - 1 3,021 22,977 10,939 12,038
MIDLAND
R 135'3 350'4 '1,613 - 36 36,234 218,197 102,396 115,801
LOWLAND
T 26'7 69'2 3,173 9 12,995 64,713 39,692 45,021 R 24'6 63'8, 2,510 9 9,974 61,736 28,753 32,983
U 2-l H, 1l,047 3,021 22,977 10,939 12,038 Ponnani (N.M.) . U 2'08 5'39 11,047 3,021 22,977 10,939 12,038
•• This table includes area, houses and population of unsurveyed forest areas also.
t The sq. km. and density figures of urban areas of tal uk/district are worked out using the area figures corrected up to two places . of decimals obtained by adding the areas of the towns in the respective units and not using the area figures given in the table'
In addition to this the area figures relating to sq. km. are further adjusted to make the taluk/district/state totals agree. The sum of areas given separately for Highland/Midland and Lowland areas for each taluk in each of the two categories-Total and Rural-will differ slightly from the consolidated figure given for the taluk as a whole. This is due to differences iOe computation at the level of decimals for the natural divisions of each taluk.
§ This is only portion of a village consisting of paddy fieW and uncultivated land lying in the rural area. of the village lying in Palghat Municipal town is inhabited.
The urban portion
New towns in 1%1 are printed in italics.
M.-Municipal N.M.-Non-Municipal
14
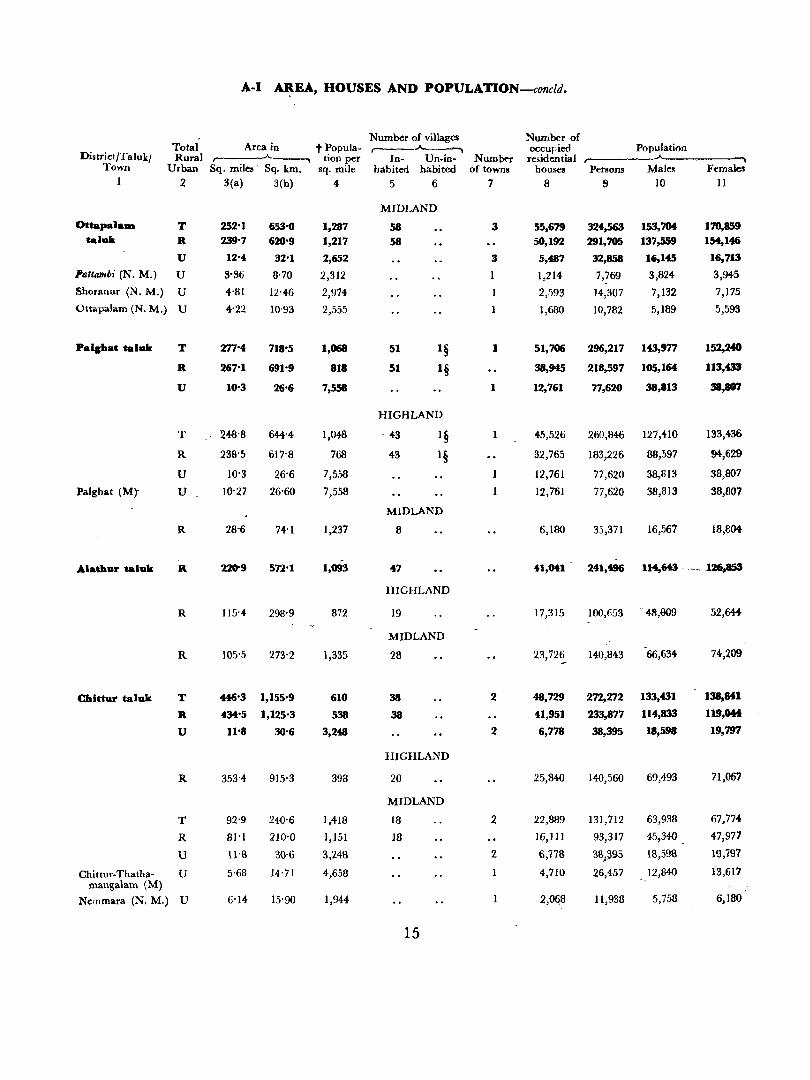
A-I AI_tEA, HOUSES AND POPULATION-concld.
Number of villages Number of Total Area in t Popula- .A occupied Population
Distriet/Taluk/ Rural -----.. tion per In- Un-in- Num~ residential ,-----~ Town Urban Sq. miles' Sq. km. sq. mile habited habited of towns houses Persons Males Females
2 3(a) 3(b) 4 5 6 7 8 9 10 11
MIDLAND
Ottapalam T 252'1 653-0 1,287 58 3 55,679 324,563 153,7Ot 170,859 talak R 239'7 620'9 1,217 58 50,192 291,705 137,559 15f,1t6
U 12'4 32'1 2,652 3 5,487 32,858 16,145 16,713
l'attambi (N. M.) U 3'36 8'70 2,312 1,214 7,769 3,824 3,945
Shoranur (N. M.) U 4'81 12'46 2,974 2,593 14,307 7,132 7,175
Ottapalam (N. M.) U 4'22 10,93 2,555 1,680 10,782 5,189 5,593
PaJahat talRk T 277'4 718·5 1,068 51 I§ I 51,706 296,217 143,977 152,240
R 267'1 691'9 818 051 1§ 38,945 218,597 105,164 113,-
U 10'3 26-6 7,558 I 12,761 '17,620 38,813 38,807
HIGHLAND
T 248'8 64-4"4 1,048 . 43 1§ 45,526 260,846 127,410 133,436
R 238'5 617'8 768 43 1§ 32,765 183,226 88,597 94,629
U 10'3 :26'6 7",).')8 12,761 77,620 38.,813 38,807
Pal ghat (M, U 10'27 26'60 7,558 12,761 77,620 38,813 38,807
MIDLAND
R 28-6 74-1 1,237 8 6,180 35,371 16,567 18,804
-Alatbllr tal .. k R 220"9 57.l"l 1,093 47 n,ou 241,496 114,643 .. -~126,_
HIGHLAND
R 115'4 298'9 872 19 17,315 100,653 '. 48,{)()9 52,644
MIDLAND
R 105'5 273'2 1,335 28 23,72~ 140,843 -66,634 74,209
Cbittur taluk T 446'3 1,155'9 610 38 2 48,729 272,272 133,431 138,841
R 434'5 1,125'3 538 38 41,951 233,877 114,833 119,044
U U'8 30'6 3,248 2 6,778 38,395 18,598 19,797
HIGHLAND
R 353'4 915'3 398 20 25,840 140,560 69,493 71,067
MIDLAND
T 92-9 240-6 1,418 18 2 22,889 131,712 63,938 67,774
R 81'1 210'0 1,151 18 16,111 93,317 45,34{) 47,977
U 11'8 30'6 3,2.48 2. 6,778 38.J95 18,596 19,797
Chittur-Thatha- U 5,68 14-71 4,658 4,710 26,452 12,840 13,617 mangalam (M)
Nemmara (N, M_) U 6'14 IS-gO 1,944 2,068 11,938 5,758 6,180
15
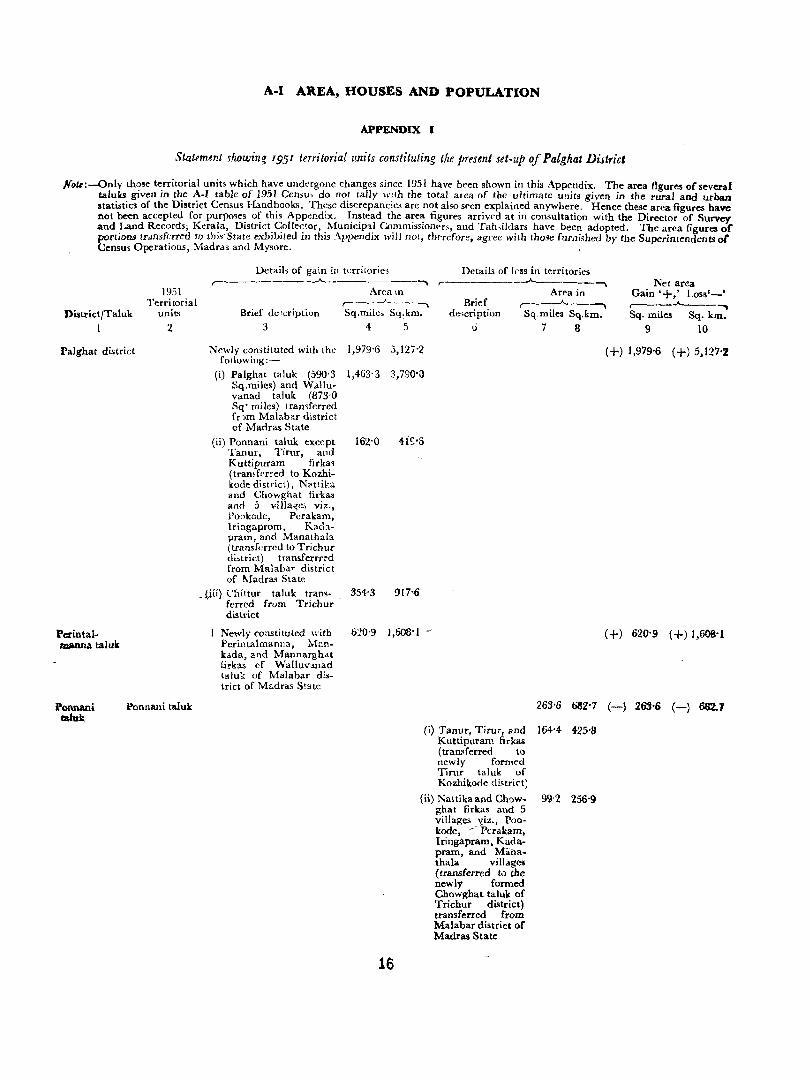
A-I AREA, HOUSES AND POPULATION
APPENDIX I
St<ztemmt showing 1951 territorial units constituting the present set.up of Palghat Di.strict
Note:-Only those territorial units which have undt'rgane changes since 1951 have been shown in this Appendix. The area figures of several taluks given in the A-I table of 1951 Censu, do not tally wlIh the total area of the ultimate units given in the rural and urban stati.stics of the District Censu5 Handbooks. These discrepancies are not also s .. en explained anywhere. Hence these area figures have not been accepted for purp05es of this Appendix. Instead the area figures arrivcd at in consultation with the Director of Survey and Land Records; Kerala, District Collector, Municipal Commissionf'rs, and Tah,ildars have been adopted. The area figures of portiOllS traruferre-ct to this'State exhibited in this .\ppendix will not, th .. refore, agree with those furnished by the Superintendents or Census Operations, Madras and Mysore.
1951 Territorial
D~ttict/Taluk unit~
I 2
Palghat district
Perintalmanna taluk
Ponnani taluk
PonnAui taluk
Detail~ of gain in tcrritorie~ Details of less in territories ,-________ -.-A--. ___ _ Net area
Area III Area in
Brief de 'cription 3
,-_.._._J_, __ -.. Sq.miks Sq~km.
Brief de-;cription
l)
,-__ --A , Gain '+,' Loss'-' r-----.A._--,
4 5
Newly cDnstituted with the 1,979'6 5,[27'2 fOllowing:-
(i) Palghat taluk (590'3 1,463'3 3,790'0 Sq.miles) and Wallu-vanad ta.luk (873'0 Sq' miles) trall,fcrred fnm Malabar district of Madras State
(ii) Ponnani taluk; (:xcept Tanur, Tirur, and Kuttipuram firka~ (tramferced to Kozhikode district), NHtika and Chowghat firkas and 5 villa({c; viz., l'o:>kode, Perakam, lringaprom. Kachpram, and Manathala (transferred to Trichur di.>trict) transferrr~d from Malaba~ district of J\'!adras State
_ (iii) Chittur taluk trans- . 354'3 ferred from Trichur district
917'~
Newly constituted with 620'9 1,608'1-Perintalmanna, 1-1;m-karla, and Mannarghat iirkas of Walluvanad talu;'; of Malabar dis-trict of Madras Stat""
Sq,rni[es Sq.km.
7 8 Sq. miles Sq. klll_
9 10
(+) 1,979'6 (+) 5,127'2
(+) 620'9 (+) 1,608'1
26% 682'7 (-) 263-6 (-) 682.1
16
(i) Tanur, Tirol', Bnd 164'4 425'8 Kuttipuram firkas ( transferred to newly formed Timr taluk of Kozhikode district)
(ii) Naltika and Chow- 99'2 256'9 ghAt firkas and 5 villages ~iz., Poo-, kode, / Pcrakam. Iringapram, Kada-pram, and Mana-thala villages (transferred to) the newly formed Chowghat taluk of Trichur district) transferred from Malabar district of Madras State
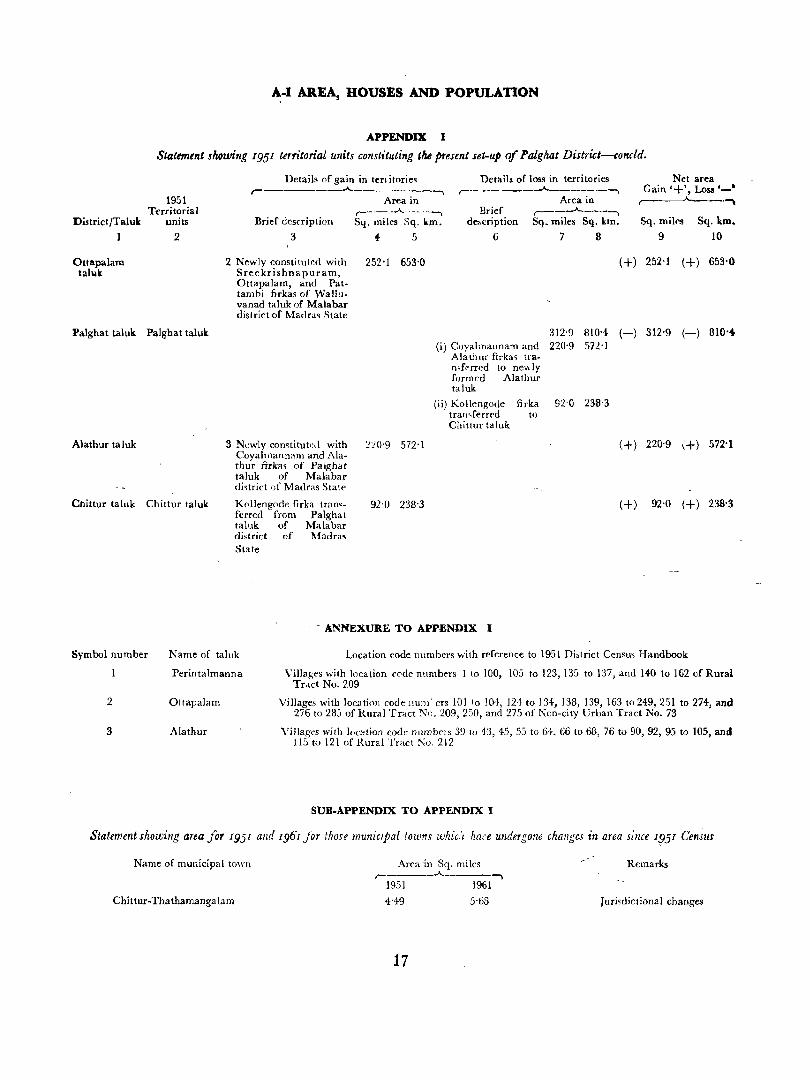
~-I AREA, HOUSES AND POPULATION
APPENDIX I
Statement showing 1951 territorial units constituting the present set-up of Palghat District-concld.
1951 Territorial
DistrictfTaluk units
1 2
Ottapalam tal",k
Pa1ghat taluk Pa1ghat taluk
A1athur taluk
Chittur taluk Chittur taluk
Details of gain in tCrt itories r--------.A.---------,
Brief description
3
Area in r----...A....~---~__"'\
Sq. miles Sq_ km.
4- 5
2 Newly constituted with 252-1 653-0 Sreekrishnapuram, Ottapalam, and Pat-tamhi firkas of Wallu-vanad taluk of Malabar district of Madra~ State
Details of loss in territories ,_ ~ _____ __J.. _____ --,
Area in Brief ,-__._____,
de,cription Sq. miles Sq. km_
678
Net area Gain '+', Loss ,_. ~--,
Sq. miles
9
Sq_ km.
10
(+) 252'1 (+) 653'0
312-9 810-4 (-) 312-9 (-) 810'4
3 Newly comtitutc,1 with :!:!0-9 572-1 Coyalmannam and Ala-thur firkas of Palghat taluk of Malabar di~trict of Madras State
Kollengode firka Iran'ferred from Palghat taluk of Malabar district of Madra. State
92-0 238-3
(i) Coyalmallnam and 220'9 572-1 Alathur flrka, tra-1l,fFrred to ne" Iy formed Alathur taluk
(ii) Kollengode Ihka 92-0 238-3 tran,ferred to Chittur taluk
. ANNEXUR.E TO APPENDIX I
(+) 220-9 ,+) 572'1
(+) 92-0 (+) 238-3
Symbol number Name of taluk Location code numbers with reference to 1951 Di,trict Census Handbook
Perintalmanna
2 Ottapalam
3 Alathur
Villages with location ('('de numbers 1 to 100, 105 to 123,135 to 137, and 140 to 162 of Rural Tr.lct No_ 209
Villages with location code mUJ1' ers 101 10 104, 124 to 134, 138, 139, 163 to 249,2.51 to 274, and 276 to 285 of Rural Tract No_ 209, 250, and 275 of Non-city Urban Tract No. 73
Villages with location code numbClS 39 to 43, 45, 53 to 64.66 to 68, 76 to 90, 92,95 to 105, and 115 to 121 of Rural Tract ~o_ 212
SUB-APPENDIX TO APPENDIX I
Statement showing area for 1951 and 1961 Jor those muniCipal lowns whic:l haee undergone changes in area since 1!)51 Cen;us
Name of municipal town Area in Sq_ miles Remarks r-----.A.-----.....
1951 1961
Chittur-Thathamangalam 4-49 5-63 Jurisdictional changes
17
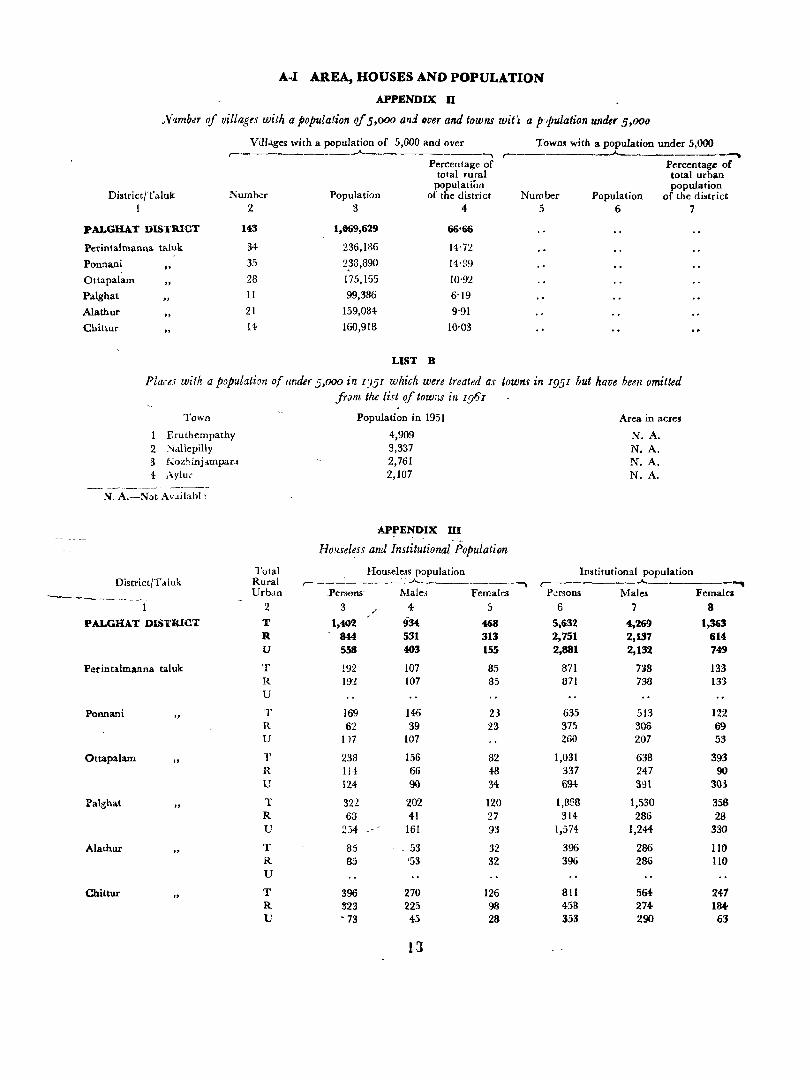
A.I AREA, HOUSES AND POPULATION
APPENDIX n /V!lmbl1r of villages with a population of 5,000 and (Jver and towns Wit'l a p Ipulation umkr 5,0011
Villages with a population of 5,000 and over r-'----- _ ___,A..._ --..
Percentage of total rural
population of the district
Towns with a population under 5,000 -Percentage of
District/Taluk 1
PALGHAT DISTRICT
Perintalmanna taluk
Ponnani
Otlapalam
Palghat
Alathur
Chittur
It
"
Number 2
143
34 35
28 11
21
14
Population 3
1,059,629
236,186
2,38,890
175,165
99,386
159,084
160,918
LIST B
4
66'66
14'72
14'39
JO'92
6'19
9'91
10'03
Number 5
total urban population
Population of the distr ict 6 7
Fla,ts with a population of IInder 5,000 in 11151 which were treated as towns in 1951 but have been omitted from the list of tOWil, in 1961
Town Population in 1951 Area in acres
1 Eruthempathy 4,909 N. A. 2 Ndllepilly 3,337 N. A. 3 Koz'tinj lmpau 2,761 N. A. 4 Aylur 2,107 N. A.
- --~----.------
N. A.-:'I'ot AV.1ilabl,
APPENDIX m Houseless and In5titution~'-Population
Total Hou5eless population Institutional population District/T .lInk Rural r---------~ --. f-------~ """
-----~- ------~-UrbJa l'ersmlS - Male. Females Pasoas Males Females
2 3 4- :; 6 7 3 ,
PALGHAT DISTRlC'1' T 1,402 934 468 5,632 4,269 1,363 R 844 531 313 2,751 2,137 614 U 558 403 155 2,881 2,132 7.9
Periutil.lmanna taluk T 192 107 85 871 738 133 R 192 107 85 871 738 133 U
Ponnani " T 169 146 23 635 513 122 R 62 39 23 375 306 69 u 1)7 107 260 207 53
Ottapalam " T 238 156 82 1,031 638 393 R 114 66 48 337 247 90 U 124 9Q 34 694 3~1 303
Palghat T 322 202 120 1,888 1,530 358 R 63 41 27 314 286 28 U 234 161 93 1,574 1,244- 330
Alalhur T 85 _ 53 32 396 286 110 R 85 '53 32 396 286 110 U
Chittur T 396 270 126 811 564 247 R 323 225 98 458 274 184-U • 73 45 28 353 290 63
13
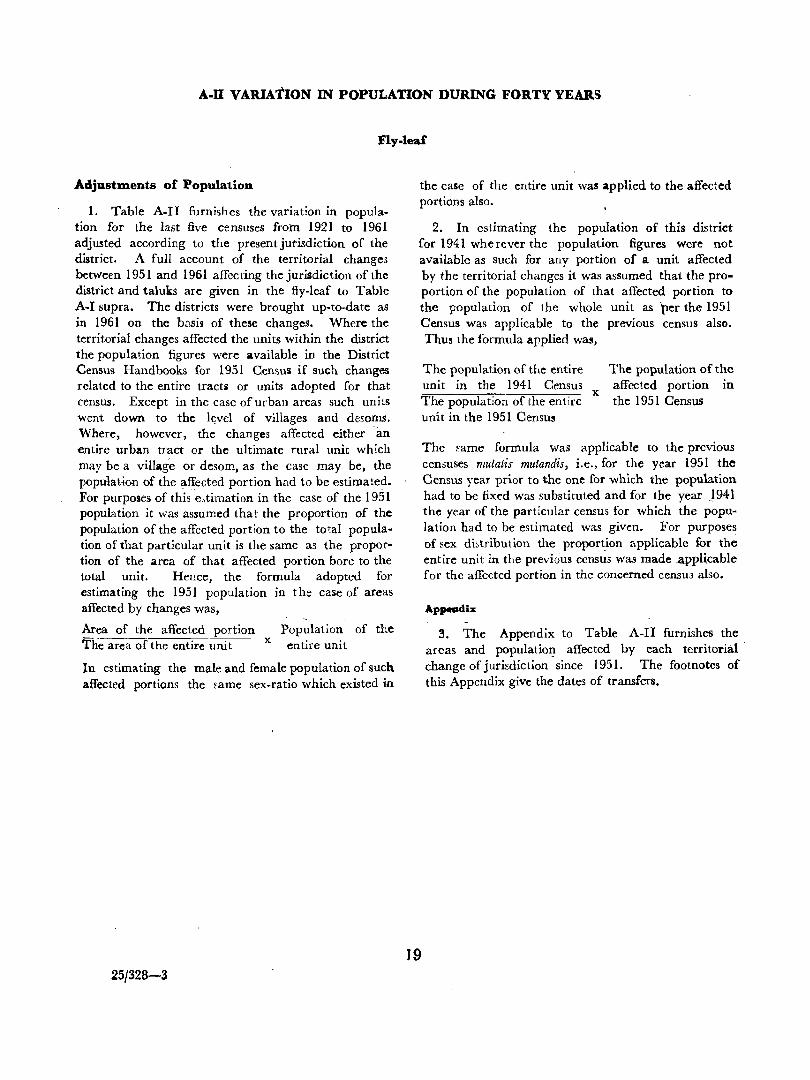
A-U VARIATION IN POPULATION DURING FORTY YEARS
Fly-leaf
Adjustments of Population
1. Table A.II furnishes the variation in population fOf the last five censuses from 1921 to 1961 adjusted according to the present jutisdiction of the district. A full account of the territorial changes between 1951 and 1961 affecting the jurisdiction of the district and taluks are given in the fly-leaf to Table A-I supra. The districts were brought up-to-date as in 1961 on the basis of these changes. Where the territorial changes affected the units within the district the population figures were available in the District Census Handbooks for 1951 Census if such changes related to the entire tracts or units adopted for that census. Except in the case of urban areas such units went down to the l~vel of villages and desoms. Where, however, the changes affected either -an entire urban tract or the ultimate rural unit which may be a village or desom, as the case may be, the populatiun of the affected portion had to be estimated. For purposes of thiscotimation in the case of the 1951 population it was assumed that the proportion of the popUlation of the affected portion to the total population of that particular unit is the same as the proportion of the area of that affected portion bore to the total unit. Hence, the formula adopted for estimating the 1951 population in the caSe of areas affected by changes was,
Area of the affected portion The area of the entire unit x
Population of the entire unit
In estimating the male and female population of such affected portions the fame sex-ratio which existed in
25/328-3
the case of the entire unit was applied to the affected portions also.
2. In estimating the population of this district for 1941 wherever the population figures were not available as such for any portion of a unit affected by the territorial changes it was assumed that the proportion of the population of that affected portion to the popUlation of the whole unit as 'per the 1951 Census was applicable to the previous census also. Thus the formula applied was,
J9
The population of the entire unit in the 1941 Census x The population of the entire unit in the 1951 Census
The population of the affected portion In
the 1951 Census
The mme formula was applicable to the previous censuses mutatis mutandis, i.e., for the year 1951 the Census year prior to the one for which the population had to be fixed was substituted and for the year J941 the year of the particular census for which the population had to be estimated was given. For purposes of sex di.~tribution the propor~ion applicable for the entire unit in the previous census was made _applicable for the affected portion in the concerned census also.
Appesadix
3. The Appendix to Table A-II furnishes the areas and populatio~ affected by each territorial' change of jurisdiction since 1951. The footnotes of this Appendix give the dates of transfers.
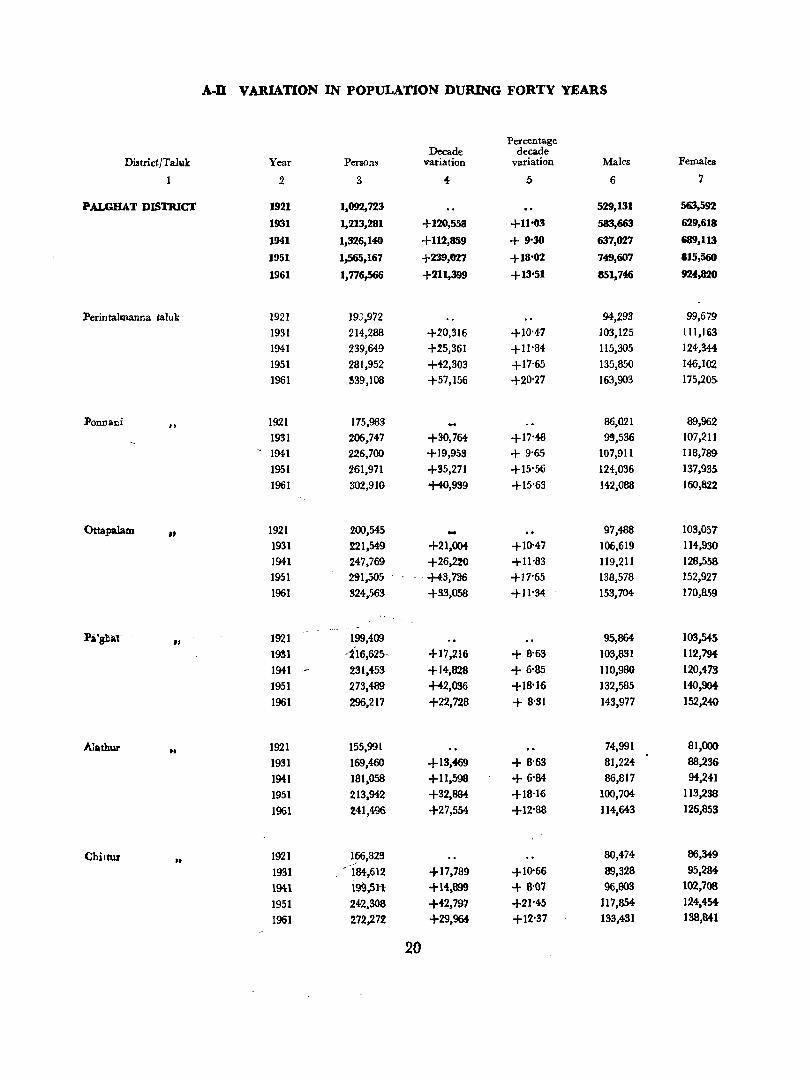
A·D VARIATION IN POPULATION DURING FORTY YEARS
Percentage Decade decade
District/Taluk Year Persons variation variation Males Females
1 2 3 • 5 6 7
PALGBAT DISTRICT 1921 1,092,723 529,131 563,592
1931 1,213,281 +120,558 +11'03 583,663 629,618
1941 1,326,I.ro +112,859 + 9'30 637,027 689,113
1951 1,565,167 +239,0'l7 +18'02 749,607 815,560
1961 1,776,566 +211,399 +13-51 851,746 924,820
Perintalmanna taluk 1921 19],972 94,293 99,679
1931 214,288 +20,316 +10-47 103,125 111,163
1941 239,649 +25,361 +11'84 115,305 124,344
1951 281,952 +42,303 +17·65 135,850 146,102
1961 339,108 +57,156 +20'27 163,903 175,205
Ponnani .. 1921 175,983 86,021 89,962 1931 206,747 +30,764 +17-48 9!,536 107,211
- 1941 226,700 +19,953 + 9-65 107,911 118,789
1951 261,971 +35,271 +15·5ti 124,036 137,935
1961 302,910 +40,939 +15'63 142,oss 160,822
Ottapa1am "
1921 200,545 - 97,488 103,057
1931 221,549 +21,004 + IN' 106,619 114,930
1941 247,769 +26,2:0 +11'83 119,211 128,558
1951 291,505 . +43,736 +17'65 138,578 152,927
1961 524,563 +33,058 +11'34 153,7M 170,fl59
'Pi~ghar •• 1921 199,409 95,864 103,545
1931 ,iI6,625- +17,216 + 8·63 103,831 112,794
1941 .- 231,453 +14,828 + 6'85 110,980 120,473
1951 273,489 +42,036 +18'16 132,585 140,9Q4.
1961 296,217 +22,728 + S'31 143,977 152,240
Alathur .. 1921 155,991 74,991 81,000
1931 169,460 +13,469 + 8'63 81,224 88,236
1941 181,058 +11,598 + 6'84 86,817 94,241
1951 213,942 +32,8M +18·16 l00,7M 113,238
1961 241,496 +27,554- +12'88 114,643 126,853
Chiltur "
1921 166,823 80,474 86,349
1931 . /i'84,612 +17,789 +10-66 89,328 95,284
19H lW,5lt +14.899 + 8'07 96,803 102.708
1951 242,308 +42,797 +21'45 117,854 124,454-
1961 272.272 +29,964 +12'37 133,431 138,841
20
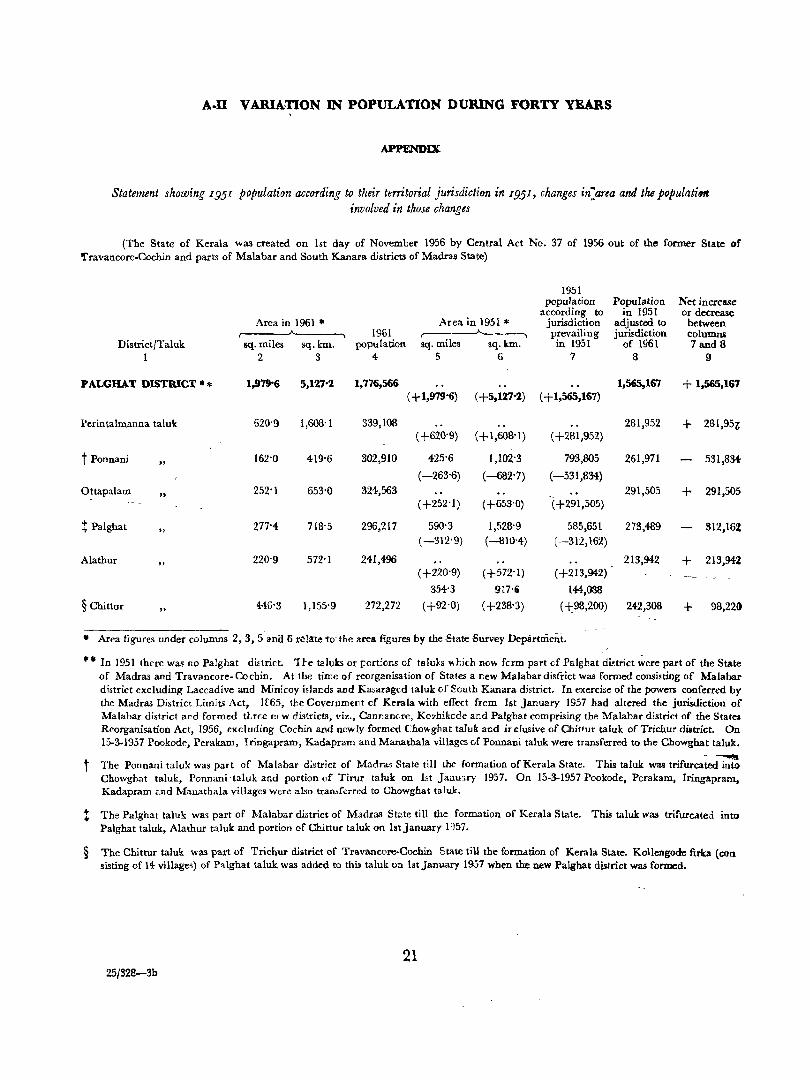
A.n VARIATION IN POPULATION DURING FORTY YEARS
APPENDIX
Statement showing 1951 population according to their territorial jurisdiction in 1951, changes in)rea and the populati"" involved in those changes
(The State of Kerala was created on lst day of November 1956 by Central Act No. 37 of 1956 out of the former State of 'fravancore.Cochin and parts of Malabar and South Kanara districts of Madras State)
1951 population Population Net increase
according to in 1951 or decrease Area in 1961 .. Area in 1951 * jurisdiction adjusted to between
1961 ,..------"----, prevailing jurisdiction coluIIlIl.i DistrictfTaluk. sq. miles sq.km. population sq. miles sq.km. in 1951 of 1961 7 and 8
1 2 3 4 5 6 7 8 9
PALGHAT DISTRICT "'* 1,979-6 5,127'2 1,776,566 1,565,167 + 1,565,167 (+1,979'6) (+5,127'2) ( + 1,565,167)
l'erintalmanna taluk 620'9 1,608'1 339,108 281,952 + 281,95(; (+620'9) (+1,608'1) (+281,952)
t Ponnani "
162'0 419'6 302,910 425'6 1,102'3 793,805 261,971 531,834-
(-263-6) (--682'7) (-531,834) Ottapalam
" 252'1 653'0 324,563 291,505 + 291,505
(+252'1) (+653'0) <+291,505)
t Palghat "
277'4 718'5 296,217 590'3 1,528'9 585,651 273,489 S12,162 (-312'9) (-810'4) (-312,162)
Alathur 220'9 572'1 241,496 213,942 + 213,942 (+220'9) <+572'1) (+213,942)
354'3 9lH 144,088
§ Chittur "
446-3 1,155-9 272,272 (+92'0) (+238'3) (+98,200) 24-2,308 + 98,22()
• Area figures under columns 2,3, 5-ana 6 relKte"to-the area figures by theState£urvey Department.
** In 1951 there was no Pal ghat di,(rict. 11-e taluks or r,ort:ons of taluks ",}:;jeh no"" {crm part of Palghat dil;trict ~ere part of the State of Madras and Travancore- Cochin. At the time of reorganisation of States a new Malabar disfrict was formed consisting of Malabar district excluding Laccadive and Minicoy islaT!ds and Kasaragod taluk of ~outh Kanara district. In exercise of the powers conferred by the Madras District Limits Act, 1£65, the Governme(1t cf Kerala with effect from lst January 1957 had altered the juriSdiction of Malabar district ar.d formed three ne w districts, viz., Cannancre, K07bikcde ar:d Palghat comprising tbe Malabar district of the States Reorganisation Act, 1956, excluding Cochin and newly formed Cho'hghat taluk and irclusive of Chittur taluk of Trichur district. On 15-3-1957 Pookode, Perakam, Iringapram, Kadapram and Manathala villages of Ponnani taluk were transferred to the Cbowghat taluk •
.. -t The Ponnani taluk was part of Malabar d:Strict of Madras State till the formation of Kerala State. This taluk was trifurcated into Chowghat taluk, Ponnani -taluk and portion of Tirur tall.lk on 1st Janulry 1957. On 15-3-1957 Pookode, Perakam, Iringapram, Kadapram <.nd Manatbala villages were also tramf~rred to Chowghat taluk.
t The Palghat taluk was part of Malabar district of Madras St.:!te till the formation of Kerala State. This taluk was trifurcated into Palghat taluk, Alathur taluk and portion of Chittur taluk on lstJanuary l'J57.
§ The Chittur taluk was part of Trichur district of Travancore·Cochin State till the fOrm.ltion of Kerala State. Kollengode firka (con sisting of 14 villages) of P'llghat taluk. was added to this taluk on htJanuary 1957 when the new Palghat district was formed.
21 25/328-3b

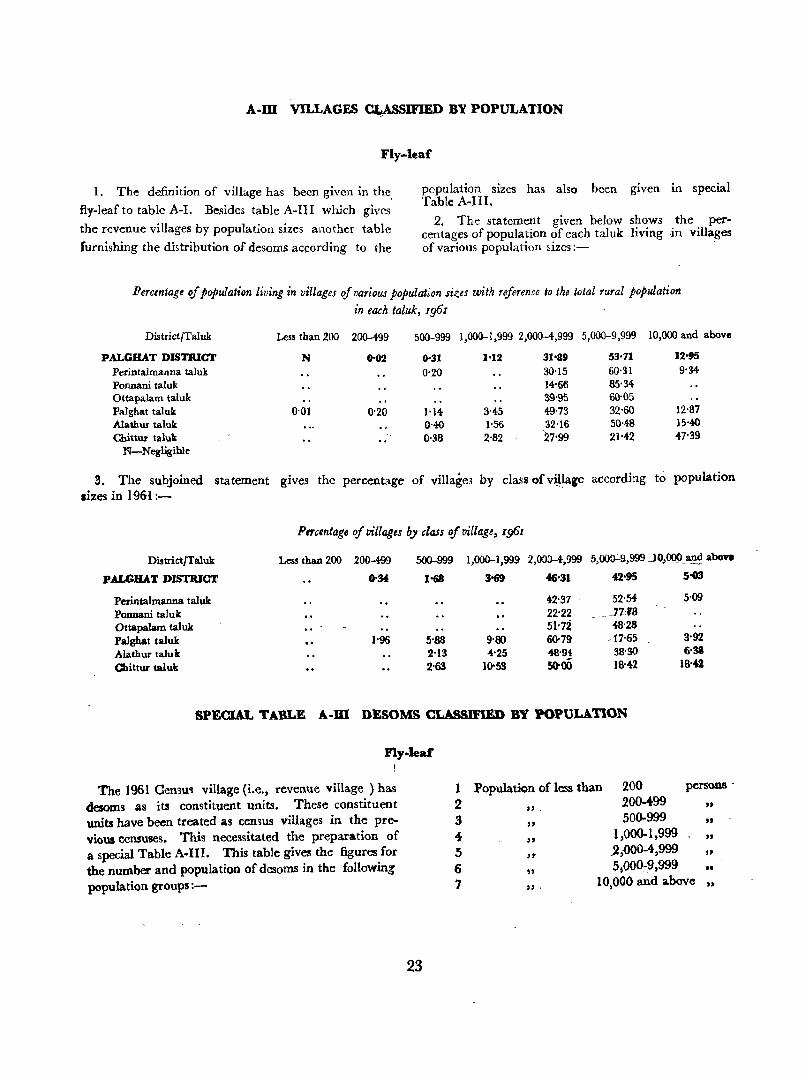
A-m VILLAGES ~SIFIED BY POPULATION
Fly-leaf
I. The definition of village has been given in the
fly-leaf to table A-I. Besides table A-HI which gives
the revenue villages by population sizes another table
furnishing the distribution of desoms according to the
population sizes has also been given in special Table A-III.
2. The statement given below shows the percentages of population of each taluk living Jin villages of various population 5izes:-
Percentage oj population living in villages of various population si:;;es with reference to the total rural population in each taluk, rg6r
DistrictfTaluk Less than 200 200-499 500-999 1,000-1,999 2,000--4,999 5,000--9,999 10,000 and above
PALGHAT DISTRICT N 0'02 0'31 1'12 31'89 53·71 12'95
Perintalmanna taluk 0-20 30-15 60-:n 9-34 Ponnani taluk 14-66 85-34 Ottapalam taluk 39-95 60-05
Pal ghat taluk 0-01 0-20 1-14 3'45 49-73 32-60 12-87 Alathur taluk 0-40 I-56 32'16 50-48 IHO Chittlll' taluk 0-38 2,82 27-99 21'42 47-39
N-Negligible
3. The subjoined statement gives the percentage of village; by class of vi!lage according to population
sizes in 1961:-
PWClntage of villages by ,lass of uillage. r¢r
District}Taluk Less than 200 200-499 500-999 1,000-1,999 2,000-4,999 5,000.:.9,999 JQ.OQO_ and above
pALGHAT DISTRICT 0-34 1"68 3'69 46'31 42'95 5-03
Perin tal manna taluk 42'37 52'54 5-09
PoJlIlaDi taluk 22-22 _7'H3 Ottapalam taluk 51'72 48'28 Palghat taluk 1-96 5-88 9-80 60-79 ,t7'65 3-92
Alathur talult 2-13 "-25 48'94 38-30 6'38
Chittur taluk 2'63 1(}O53 50'00 18'42 18'4Z
SPECIAL TABLE A·m DESOMS CLASSIFIED BY POPULATION
Fly-leaf
The 1961 CeU3u~ village (i.e_, revenue village) has 1 desoms as it! constituent units. These constituent 2 units have been treated as census villages in the pre- 3 vious censuses. This necessitated the preparation of 4-a special Table A·III. This table gives the figures for 5 the numbel' and population of desoms in the following 6 population groups:- 7
Population of less than 200 persons .
H. 200-499 "
H 5()()..999 n
" 1,000-1,999 "
n .2 ,.000-4,999 " "
5s000~9.999 .. ", 10,000 and above "
23
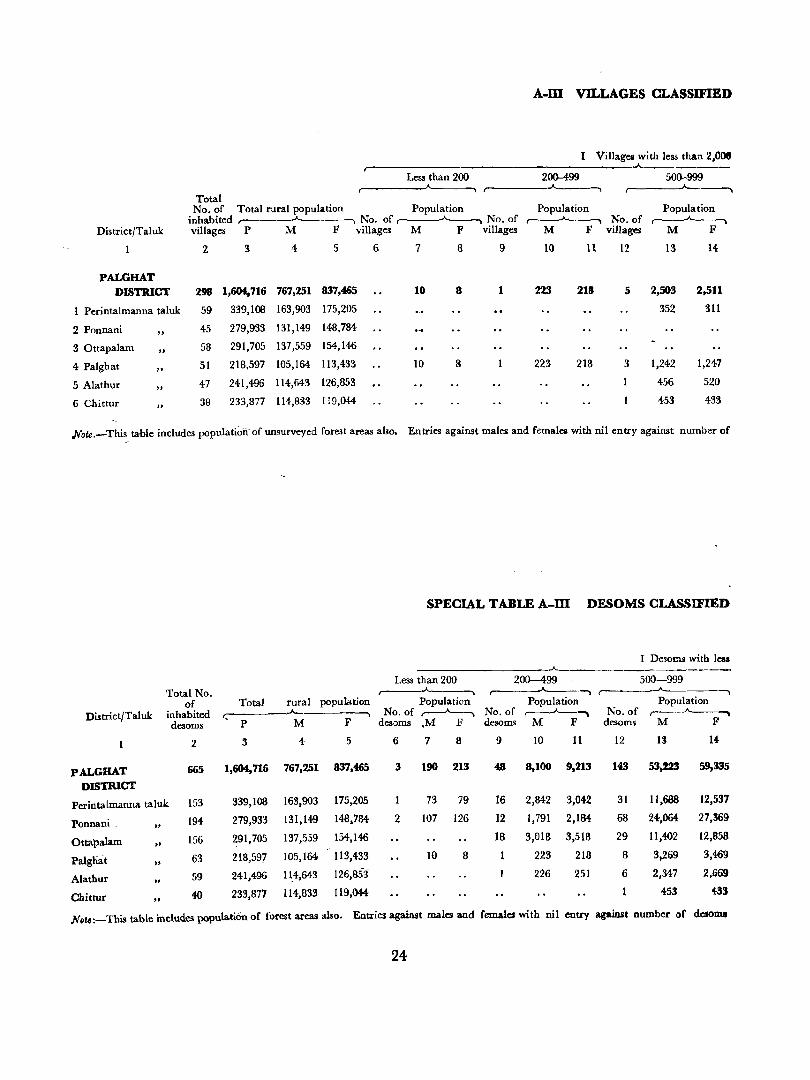
A.m vn.LAGES CLASSMED
I Villages with less than 2,001 ,-
Less than 200 200-499 500-999 ...... A...--...... --'--~
Total No, of Total rural population Population Population Population
inhabited ,--- No, of ~ No, of ~ No. of ,---~ DistrictfTaluk villages P M F villages M F villages M F villages M F
2 3 4 5 6 7 8 9 10 11 12 13 14
PALGHAT DISTRICT 298 1,604,716 767,251 837,465 10 8 1 223 218 5 2,503 2,511
1 Perintalmanna taluk 59 339,108 163,903 175,205 352 311
2 Ponnani " 45 279,933 131,149 148,784
3 Ottapalam " 58 291,705 137,559 154,146
4 Palghat " 51 218,597 105,164 113,433 10 8 223 218 3 1,242 1,247
5 Alathur " 47 241,496 114,643 126,853 456 520
6 Chittur " 38 233,377 114,333 119,044- 453 433
Note.-This table includes population: of unsurveyed forest areas also. Entries against males and females with nil entry against number of
SPECIAL TABLE A-m DESOMS CLASSIFIED
I Desoms with less --'--
Less than 200 200-499 500-999 Total No. ,-------"------...... ---.
of Total rural population Population Population Population
DistrictfTaluk inhabited ".--_--..A- No. of ,-----A--. No. of r------"----.. No. of .......---A-----.. desoms ' P M F desorns .M F desoms M F desoms M F
2 3 4 5 6 7 8 9 10 11 12 U H
PALGHAT 665 1,604,716 767,251 837,465 3 190 213 4.8 8,100 9,213 143 53,223 59,335
DISTRICT
Perintalmanna taluk 153 339,108 163,903 175,205 1 73 79 16 2,842 3,042 31 1l,688 12,537
Ponnani _ OJ 194 279,933 131,149 148,784 2 107 126 12 1,791 2,184 68 24,064 27,369
Ottapalam .. 156 291,705 137,559 154,146 18 3,018 3,518 29 11,<W2 12,858
Patgnat .. 63 218,597 105,164- 113,433 10 8 223 218 8 3,299 3,469
Alathur " 59 241,496 114,643 126,851 226 251 6 2,347 2,669
Chittur .. 40 233,877 114,833 119,044 1 453 <t-33
Note:-This table includes population of forest areas also, Entries against males and females with nil entry against number of dcsoms
24
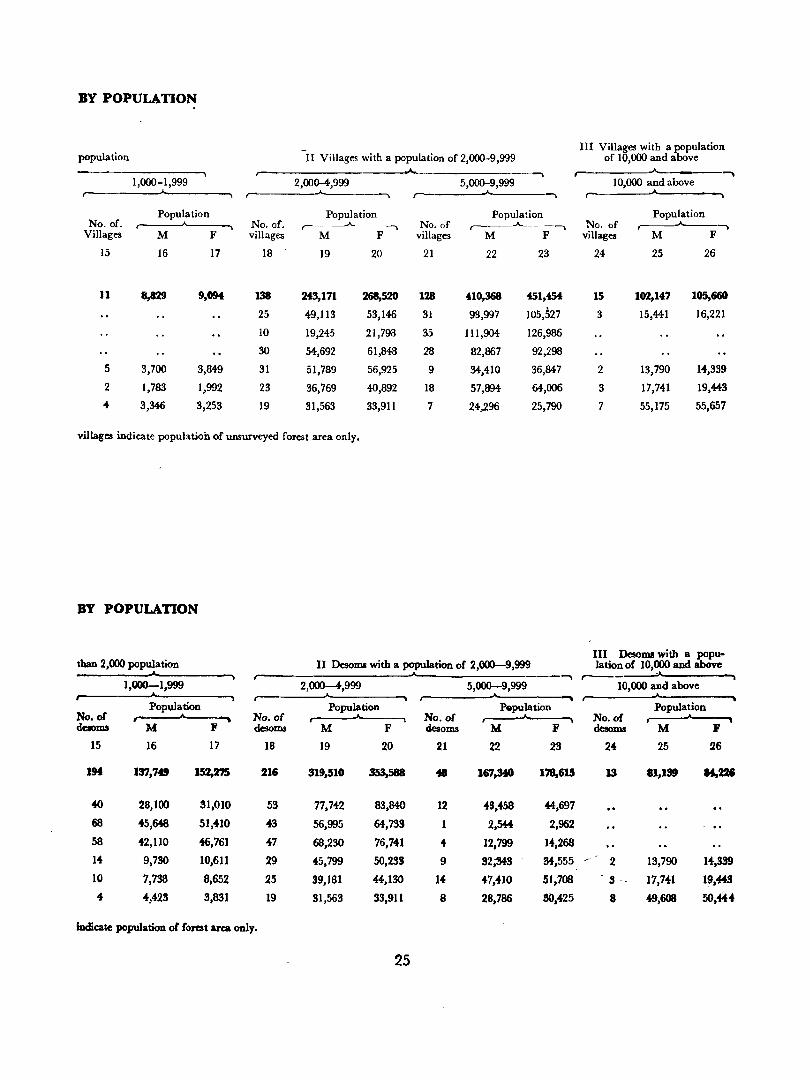
BY POPULATION
population II Villages with a population of 2,000-9,999 III Villages with a population
of 10,000 and above
--. --. 1,000-1,999 2,000-4,999 5,000-9,999 10,000 and above
Population Population Population Population No. of. No. of. r-----A No. of ,---_ _,..A____--") No. of ~--.
Villages M F villages M F villages M F villages M F
15 16 17 18 19 20 21 22 23 24 25 26
11 8,829 9,O!H: 138 243,171 268,520 128 410,368 451,454 15 102,147 105,660
25 49,113 53,146 31 98,997 105,~27 3 15,441 16,221
10 19,245 21,798 35 111,904 126,986
30 54,692 61,848 28 82,867 92,298
5 3,700 3,849 31 51,7139 56,925 9 34,410 36,847 2 13,790 14-,339
2 1,783 1,992 23 36,769 40,892 18 57,894 64,006 3 17,741 19,443
4 3,346 3,253 19 31,563 33,911 7 24,296 25,790 7 55,175 55,657
villages indicate population of unsurveyed forest area only.
BY POPULATION
III Desoma with a popu-than 2,000 population II Desoma with a population of 2,000-9,999 lation of 10,000 and above
--. r----~ 1,000-1,999 2,000-4,999 5,000-9,999 10,000 and above
--""' Population Population ~pulation Population
No. of A. ~ No. of No. of No. of
daoms M I' desoms M F desoms M F desoms M F
15 16 17 18 19 20 21 Z2 23 24- 25 26
1M 137,749 152,275 216 319,510 353,588 48 167,340 178,615 13 81,139 M,2H
40 28,100 31,010 53 77,742 83,840 12 43,458 4-4,697
68 45,648 51,410 4-3 56,995 64,733 2,544- 2,962
58 42,110 46,761 47 68,230 76,741 4- 12,799 14,268
14- 9,730 10,611 29 45,799 5O,23S 9 32;343 340,555 -- 2 13,790 14,339
10 7,738 8,652 25 39,181 44,130 14- 47,410 51,708 . 3·_ 17,741 19,443
4 4,423 3,831 19 31,563 33,911 8 28,786 30,425 8 49,608 50,444
Indicate population of forest area only.
25
A-IV TOWNS (AND TOWN-GROUPS) CLASSIFIED BY POPULATION IN l!)fil WITH VARIATION SINCE 1901 .
Fly-leaf
Definitions of town
1. This has been given m fly-leaf to table A-I supra.
Classification or cities and towns
2. The towns ale classified "ccording to their population as g;ven below:-
Class I-Towns with a population of 100,000 and above Class II-Towns with a population of 50,000 99,999 Class Ill-Towns with a population of 20,000 - 49,999
Class IV-Towns with a population of 10,000-19,999 Class V-Towns with a population of 5,000- 9,999 Class VI-Towns with a population of less than 5,OO()
There are no towns coming under Class I and Class VI in this diJtrict.
Chan£es in classification of towns with their status
3. The following statement gives the class and status of each town for the last Seven censuse1i:-
Changes in classification of towns, 1901 to 1961
Census year ,
Town 1961 1951 1941
1 POrlnani III (T) III (T) IV (T)
2 Pattambi V (T)
3 Shoranur IV (T) IV (T) VeT) 4 Ottapalam IV (T) III (T) V (T)
5 Palghat II (M) II (M) II (M)
6 Chittur-Thatha- III (M) III (M) III (M) mangalam
7 Nemmara IV (T) VeT) VeT)
8 Ayiloor D VI (T)
9 Eruthempalhy D VI (T)
10 Kozhinjamp'lra D ,VI (T)
11 Nal1epilly D VI (T)
M-Municipal Town T~Town
The Chittur-Thathamar,galam were two'·separ.ate towns in the ce~sus y.e;rs 1901, 1911 .and 1941. Their class and status in tlwse censuses are furnished below.
Town Chittur Thathamangalam
1941 . IV (M) V(M)
1911 V (T) V (T)
1901 V (T) V (T)
For striking out class totals Chittur and Thathamangalam towns are treated as a single unit in all the censuses. The total for any class in any past census has been worked out as the· total of towns of that particular class in that parti<;:~lar census in the case of remaining towns.
, A_ppelldices
Appeadbt I
" Appendi~ I to: table A-IV gives the area' and population of the new towns added in 1961 and the 195Ltowns which have been -declassmed in 1961. In
____...____:___
1931
IV (T)
III (M) IV (M)
V (T)
1921
IV (T)
III (M) IV (M)
VI (T)
1911
IV (T)
III (M) IV (T)
VI (T)
D-Declassified Town
1901
IV (T)
III (M) IV (T)
this d:strict only one town was added in 1961 while four towns of 1951 were declassified ali rural. Note A.to this Appendix furnishes the names, areas and population of the 1951 villages which constitute the newly added towns. Note B give. the names of towns which has ceased to be town in 1961 with the name, area and population of the village or village.> into which it has relapsed in 1961.
Appendix n Appendix II to table A.IV furnishes the jurisdic
tion of all the seven towns based on the 1961 set up.
Appendix m Appendix II I to table A-IV gives the list of places
which were taken into account for striking class total of population at some census or other but which were excluded from reckoning in certain censuses when they did not enjoy urban status in 196t.
26
A.IV TOWNS (AND TOWN.GROUPS) CLASSIFIED BY POPULATION IN Ig6J.
WITH VARIATION SINCE :190 :1
Percentage Status of Decade decade
Town town Year Persons variation variation Males Females
2 3 4 5 6 7 n
All classes
1901 69,056 33,828 :15,228
1911 77,967 + 8,911 + 12'90 38,040 39,921
36'56 sq. miles 1921 81,680 + 3,713 + 4'76 40,054 4:1,626
M'69 sq. km. 1931 89,702 + 8,022 + 9'82 43,782 45,920
1941 117,262 + 27,560 + 30'72 57,020 60,242
1951 170,396 + 53,134 + 45'31 83,083 87,313
1961 171,850 + 1,454 + 8'53 84,495 87,355
Class II (50,000 to 99,999)
10'27 sq.miles 1941 55,160 26,975 28,185
26'60 sq. km. 1951 69,504 + 14,344 + 26'00 34,529 34,975
1961 77,620 + 8,116 + 1l'68 38,813 38,807
Palghat Municipal 1901 44,177 21,673 22,S04
10·27 sq. miles 1911 4.4,319 + 142 + 0·32 2I,77S 22,543
26'60 sq. km. 1921 45,487 + 1,168 + 2'64 22,619 22,868
1931 49,064 + 3,S77 + 7'86 24,234 24,830
1941 55,160 + 6,096 + 12-42 26,975 28,185
1951 69,504 + 14,344 + 26·00 34,S29 34,975
1961 77,620 + 8,116 + 11-68 38,813 38,807
Class m (20,000 to 49,999)
1901 44.177 21,673 22,SM
1911 44,319 + 142 + 0'32 21,776 tt,~
7'76 sq. miles 1921 45,487 + 1,168 + 2'64 22,619 22,868
'20'10 sq. km. 1931 49,064 + 3,577 + 7'86 ,.24,234 24,830
1941 21,105 - 27,959 - 56'98 10,205 '10,900
1951 70,'647 ' + 48,942 - +231-90 '33,436 !J6,611
1961 49,434 - 20,613 - 29'43 23,m 25,655
•• Chittur-Thathaman-galam Municipal 1901 14,317 6,874 7,441
5'68 sq. miles 1911 14,706 + sOO + 2'72 7,010 7,696
14'71 sq. km. 1921 18,1S0 + 3,444- +23-42 8,673 9,477
1931 18,915 + 765 + 4'21 9,120 9,795
1941 21,105 + 2,190 + 11'58 10,205 10,900
1951 23,746 + 2,641 + 12"51 11,342 12,404
1961 26,457 + 2,711 + IH2 12,84~ 13,617
•• In 1921, 1931 and 1951 Chittur-Thathamangalam Wall formed by merging the two towns Chittur and Thathamangalam. Chittur has a population of 12,732 (Males 6,127, Females 6,605) in 1941; 8,528 (Males 4,078, Females 4,450) in 1911 and-8,095 (Males 3,897, Females 4,198) in 1901. Sinlilarly Thathamangalam has a population of 8,373 (Ma~ 4,078, Females 4,295) in 1941 ; 6,178 (Males 2,932, Females 3,246) in 1911 and 6,222 (Males 2,977 ang,__Females 3,245) in 1901. These towns were treated as a single unit in all the censuses to work out the class totals.
Towns treated as such for the first time in 1961 Census are pl'"inted in italio.,.
Area figures given in column 1 relate to 1961 Cens.us.
Status of town given in column 2 relates to 1961 Census.
27 :25/328-4
A-IV TOWNS (AND TOWN-GROUPS) CLAS~IFIED BY POPULATION IN 196J WITH VARIATION SINCE Igol-cor.cld.
Percentage Status of Decade decade
Town town Year Persons variation variation Males Female&
2 3 4 5 6 7 8
Ponnanr Non-municipal 1901 10,162 5,281 5,281 Z'08 sq, miles 1911 13,984 + 3,422 + 32'40 6,860 7,124 5'39 ~q, km, 1921 13,345 639 - 4'57 6,536 6,809
1931 16,210 + 2,865 + 21-47 ~ 7,837 8,373 1941 17,838 + 1,628 + 10'04 8,485 9,353 1951 23,606 + 5,768 + 32'34 11,283 12,323 1961 22,977 629 - 2'66 10,939 12,038
Class IV (10,000 to 19,999)
15'17 sq. SQ.i1ea 1901 24,879 12,155 12,724 39'29 sq. lun. 1911 28,690 + 3,811 + 15-32 13,870 14,820
1921 31,495 + 2,80~ + 9-78 15,209 16,286 1931 35,125 + 3,630 + 11-53 16,957 18,168 1941 17,838 - 17,287 - 49'22 8,485 9,353 1951 11,596 - 6,242 -34-99 5,694 5,902 1961 37,0'1:1 + 25,431 +219'31 18,079 18,948
Shoranur Non-municipal 1941 8,587 4,231 4,356 4'81 sq, miles 1951 11,596 + 3,009 + 35'04 5,694 5,902
12'46 sq, km_ 1961 14,307 + 2,711 + 23'38 7,132 7,175
Nemmara Non-municipal 19II 4,953 2,400 2,558 6' 14 sq, miles 1921 4,698 260 - 5'24 2,226 2,472
15'90 sq. km. 1931 -5,513 + 815 + 17-35 2,591 2,922 19+1 6,291 +-' 718 + 14'11 2,972 3,319 1951 6,135 156 - 2'4& 3,001 3,134-1961 11,938 + 5,803 + 94'59 5,758 6,180
Ottapalam - Non-municipal 1941 8,281 4,152 4,129 4'22 sq, miles 1951 /22,69~ + 14,414- +174'06 10,811 11,884
10'93 sq. km. _1961 10,782 11,913 - 52'49 5,189 5,593
Class V (5,000 to 9,999)
3'36 sq. SQ.!_ 1931 5,513 2,591 2,922 8'70 sq. kin. 1941 23,159 + 17,646 +320-08 11,355 11,804
1951 6,135 - 17,024 - 73'51 3,001 3,134 1961 7,769 + 1,634 + 26'63 3,824 3,945
Pattatllbi Non-municipal 1961 7,769 3,824- 3,945 3'36 sq, miles, 8'70sq, km.
Class VI (Less than 5,000)
1911 4,958 2,400 2,558 1921
~ - 4,698 260 5'24 2,226 2,472 1951 13,114 6,423 6,691
28
A-IV TOWNS (AND TOWN-GROUPS) CLASSIFIED BY POPULATION IN IgGl wITH VARIATION SINCE 1901
APPENDIX I
New towns added itt 1961 and towns in 1.951 declassified in l¢il
[Names of towns treated lU such for the first time (vide column 1) are printed in italics]
New town added in 1961 Town in 1951 which has been declassified ~rural in 1961
Area Population Area . Population Name of ,----'----. ~ ~ ~
town Sq. miles Sq. kIn. 1961 1951 Name of town Sq. miles Sq. km. 1961 1951
2 3 4 5 6 7 8 9 10
Pattambi 3'36 8'70 7,769 6,581 Eruthempathy 2'67 6'92 N.A. 4,909
Nallepilly 1'46 3'78 .. 3,337
Kozhinjampara 1'34 3'47 " 2,761
Ayloor 1'13 2'93 " 2,107
N. A.-Not available
Note A-Statement showing the names of towns which hay' been newly added in 1961 wiJ.h the name and population as in 1951 of each village constituting the fawn
Name of new town
Pattambi
R.-Rural tract number
r--'---
Name
Pattambi (Panchayat)
Constituent villages
Location code number
R. 209-235
1951
Area in sq. miles
3'36
f'opttlatiOll.
6,581
Note B-Statemenl showing Ihe name of town which has ceased to be town in 1¢il with th, name, area and population oft~e village or villages which it has relaPJed in I!/h •
Name of 1951 Cenllus TOllon declassi&ed in 1961
Ayloor Eruthempathy Kozhinjampara Nallepilly
N. A.-Not available
25/32e-4b
C.onstitu ent villages
r-------------------------------~-------------~--------------.....
Name N.A.
" " ..
Location code number N.A.
" " ..
29
1961
Area in sq. mi lea Population N.A. N.A.
" .. " " .. ••
A-IV TOWNS (AND TOWN-GROUPS) CLASSIFIED BY POPULATION IN 1961
WITH VARIATION SINCE 1901
APPENDIX U
Details of constitution of t,wns with their area and jurisdiction
Note :-In this appendix the jurisdiction of towns b:lSed on the 1961 set-up i3 taken into account. The jurisdiction of certain towns given in this appendix is different from that given in Note A to Appendix I to Table A-IV as the latter is based on <the 1951 set-up.
Town with area in acres
Ponnani (1,328-15)
Pattamfli (2,151-21)
Shoranur (3,075-78)
Ottapalam (2,698-44)
Palghat (Municipal) (6,573-63)
Chittur-Thathamangalam (3,635'20) (Municipal)
Nemmara (3;926'76)
Jurisd:ction with area in acres of each unit
2
Ponnani Nagaram village (1,328'15)
Netherimangalam village (2,151'21)
Mundamuka village (3,075'78)
Ottapalam village (2,698'44)
Portions of Pirayiri (893'37), Kottekkad (88'19), Puduppariyaram (32'53), Puthur (1,565-19), Yakkara (1,236'11). KaUepully (159'65), Karinkarapully (20'05), Kavalppad (293'81), Akathethara (54'72), Kunnanur (471'73) and Koppam (962'20), villages and portion of Vadakkanthara desom (620'31) in Vadakkanthara village and portion of Kannadi desom (175'77) in Kannadi village.
Portions of Chittur (1,881-60) and Thathamangalam (1,753'60) villages.
Nemmara villa!e (3,926'76) .
Note :-Towns treated as such for the first time in 1961 are printed in ita/i,s.
APPENDIXm
List of plllCes which were taken into account for striking-class totals sf population at some census or other but which were ~ - ~ ~ ~ ~ excluded frolll reckoning -iiz certain censllStS when they did not enjoy urban status
Town
Eruthempathy
Nallepilly
. Kozhinjampara
Ayloor
1901
2
•
(None of the'towns in this list had urban status in 1961)
Population
1911 - 1921 1931
3 4 5
30
1941 1951
6 7
4,909
3,337
2,761
2,107
B--Economic Table.
The 17 Economic Tables of 1961 Census are divided into two parts viz., (i) General Economic Tables (B-1 to B-IX) prepared from individual slips and (ii) Household Economic Tables (B-X to B-XVII) prepared from 20 per cent Sample Household Schedules. All the above tables pertaining to this district are presented in this volume except Table B-Il which deals
NOTE
31
with 'workers and non-workers in cities, town-groups, and towns arranged terrItorially classified by sex and broad age-groups·'. This table is furnished as table B-Il in 'Volume VII-Kecala State-Part II-B-General Economic Tables '. The concepts and definitions of workers, non-workers, etc., are also explained in that volume.

B-1 WORKERS AND NON-WORKERS CLASSIFIED BY SEX AND BROAD AGE-GROUPS
Fly-leaf
1. Table B-1 given for the total, rural, and urban ar.eas for the district is th~ basic ec)nomic table showing the total population, the total number of workers, the clas;ification of workers into nine indm1rial categories and non-workers by sex and broad age-groups. The age-groups adopted for the tables are 0--14, 15-34, 35-~9. 60+ and 'a;e not stated'. The age .. groups correspond to the different stages of life which have special significance with reference to capacity to work, viz., children, young persons, middle-aged persons, and elderly persons. The corresponding taLle in the 1951 Census gives the distribution of population by eight livelihood classes and their further subdivisions into self supporting persons, earning dependan1s and non-earning dependants. There was no classific2.tion by agegroups in that table. The livelihood classes under which the population was grouped m 1951 were the following ;- .
I Cultivators of land wholly or mainly owned and their dependants
II Cultivators of land wholly or mainly unowned and their dependants
III Cultivating labourers and their dependants
IV Non-cultivd.ting owners of land; agricultural rent receivers and their dependants
V Persons engaged in production other than cultivation and their dep~ndants
VI Persons engclged in Commerce' and their dependants
VII Persons engaged in Transport and their dependants
VIII Persons engaged in other services and miscellaneous sources and their dependants
2. As it was felt that the strict application of the criterion of income or economic independence suppressed those who worked in family economic activity but did not actually earn an income like men other than the head of the household and women of the family or children working in cultivation or cottage industries of the household, the classification of the p,)pulation into self-supporting persons and earning and nonearning dependants has been given up in the table for 1961. All persons who work including family workers who are not in receipt of any income or working children who cannot earn enough for their
33
maintenance are treated as workers and grouped under the following industrial categories instead of the eight livelihood cbuses in 1951 referred to above :-
I "Vorking as Cultivator.
II Working as Agricultural Labourer
III Working in Mining, Quarrying, Live-stock, Forestry, Fishing, Hunting and Plantations, Orchards and allied activities
IV Working at Household Industry
V Working in Manufacturing other than Hou,ehold Industry
VI Working in Construction
VII Working in Trade and Commerce
VIn Working in Transp~)rt, Storage and Communications
IX Working in Other Services
The non-workers have been classified under the following categories and dealt wiLh in Table B-IX.
1 Full-time students or children attending school who do no other work
2 Persons engaged in unpaid home duties who do no other work such as make articles at home for sale or wag~3, n'Jr help regularly even part-time in family cultivation, industry, trade or business
3 Dependants including. infants and children n)t attending sclio)ls and P:!f3o:J.s p~rmanently . diS:.l.bled from work because of illness or old age
.4, Retired p~rsons not employed again, rentiers, persons living on agricultural or 'non-agricultural royalty, rent or dividend or any other person of independent means for securing which he d . .)es not have to work and who does no other work
5 Beggars, yagnn.s, independent women without indication of source of income or others of unspecified sources of existence
6 Convicts in jails and inrr.ates of penal, mental; and charitable institutions
7 Persons seeking empbyment' for the first time
8 Persons employed before, but-'were out of employment and were seeking work during thl" reference period
B-1 WORKERS AND NON-WORKERS CLA.SSIFIED
In Mining, Quarrying, Live-stock, Forestry,
Fishing, Hunting and Plantations,
As Agricultural Orchards and Total Population Total workers As cultivator] Labourer allied activities
Total ,. I-IX I II III Rural Age r---"----. ,---~ ~ ~ Urban group P M F M F M F .M F M F
2 3 4 5 6 7 8 9 10 11 12 13
PALGHAT
Total Total 1,'776,566 851,74.6 924,820 4.38,385 251,021 98,079 42,426 95,035 122,532 28,072 4,653 0-14 725,332 364,580 360,752 19,367 11,550 2,377 1,175 4,431 4,862 5,383 585
15-34- 554,860 251,992 302,868 212,648 131,395 40,738 18,581 50,456 68,680 12,475 2,523 35-59 381,017 182,672 198,345 172,326 96,587 40,393 18,999 35,152 45,304- 8,734- 1,361
60+ 114,905 52,242 62,663 33,865 1l,413 14,532 3,651 4,970 3,650 1,472 183
Age not stated 452 260 192 179 76 39 20 26 36 7 1
Rural Total 1,604,716 767,251 837,465 397,687 236,033 95,823 41,350 92,745 118,552 26,106 4,621 0-14- 658,28) 330,502 327,778 18,237 10,831 2,357 1,162 4,357 4,762 5,227 583
15-34 498,695 225,080 273,615 192,604- 123,895 39,995 18,142 49,252 66,442 11,550 2,511
35-59 343,473 164,209 179,264- 155,351 90,623 39,346 18,492 34,270 43,801 8,000 1,346
60+ 103,817 47,201 56,616 31,317 10,608 14,086 3,534 4,840 3,511 1,322 186 Age not stated 451 259 192 178 76 39 20 26 36 7
. Urban Total 1'71,850 84,495 87,355 40,698 14,988 2,256 1,076 2,290 3,980 1,966 32 0-14 67,052 34-,078 32,974 1,130 719 20 13 74 100 156 2
15-34 56,165 26,912 29,253 20,044- 7,500 743 433 1,204 2,238 926 12 35-59 37,544 18,463 19,08! 16,975 5,964 1,047 507 882 1,503 734- 15
60+ 11,088 5,041 6,04-7 2;548 . .~ 605 446 117 130 139 150 3
Age not stated 1 1 1
34
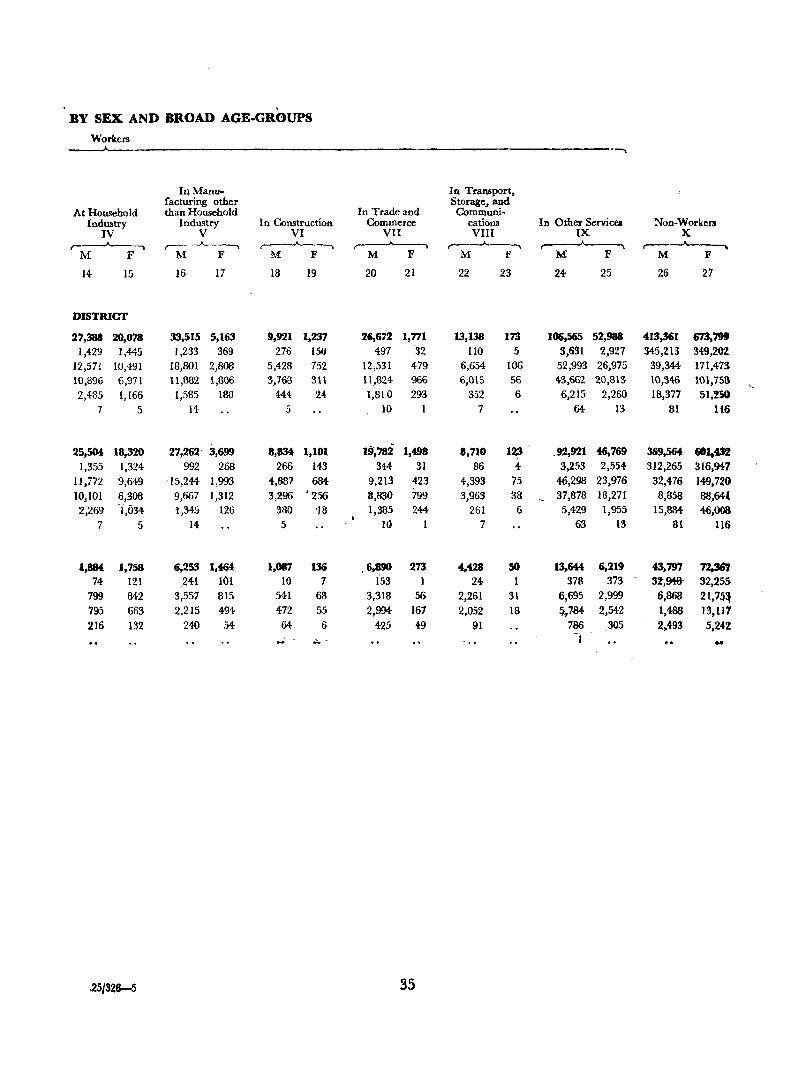
BY SEX AND BROAD AGE·GROUPS
Workers ---.
In Manu- In Transport, facturing other Storage, and
At Household than Household In Trade and Communi-Industry Industry In Co!llltructioR Commerce cations In Other Services Non-Workers
IV V VI VII VIII IX X r-----A..--...... ~ ~ .. ,-------A..-.., ~ ~ ,----A.---~
M F M F M F M F M F M F M F
14- IS 16 17 18 19 20 21 22 23 24- 25 26 2~
DISTRICT
~7,388 20,078 33,515 5,163 9,921 1,237 26,672 1,771 13,138 173 106,565 52,988 413,361 673,79!J 1,429 1,445 1,233 369 276 150 497 32 110 5 3,631 2,927 345,213 349,202
12,571 1.0,491 18,801 2,808 5,428 752 12,531 479 6,654 106 52,993 26,975 39,344- 171,473
10,896 6,971 11,882 1,806 3,763 311 11,824 966 6,015 56 43,662 20,813 10,346 101,753
2,435 1,166 1,585 180 444 24 1,810 293 352 6 6,215 2,260 18,377 51,%50
7 5 14 5 10 1 7 54 13 81 116
25,504 18,320 27,262- 3,699 8,834 1,101 19~78i 1,498 8,710 12iJ .9'2,921 46,769 369,~ 601,432 1,355 1,324 992 268 266 143 344- 31 86 4- 3,253 2,554- 312,265 316,947
11,772 9,649 -15,244- 1,993 4,887 684- 9,213 423 4,393 75 46,298 23,976 32,476 149,720
10,101 6,306 9,667 1,312 3,296 ' 256 8,830 799 3,963 38 37,878 18,271 8,858 88,641
2,269 -i,034 1,34!} 126 380 '18 1,385 244 261 6 5,429 1,955 15,884: 46,008 7 5 14 5 10 1 7 63 13 81 116
1,8M 1,758 6,253 1,464 1,087 136 ,6,890 273 4,428 50 13,644 6,219 43,797 72.361 74 121 ,241 101 10 7 153 1 24 1 378 373
~-
3!,9+&- 32,255
799 842 3,557 815 541 63 3,313 56 2,261 31 6,695 2,999 6,868 21,75~
795 663 2,215 494 472 55 2,994- 167 2,052 18 5,784 2,542 1,488 13,117
216 132 240 54- 64 6 425 49 91 786 305 2.493 5,242
_' ~~ ..
-25/328-5 35
B-m INDUSTRIAL CLASSIFICATION OF WORKERS AND NON-WORKERS BY EDUCATIONAL LEVELS
Fly-leaf
1. This table presents the data relating to literacy and educational levels of the working population under the nine industrial categories and of the non-working population. It enables to assess the literacy and educationallevels of the workers as well as the non-workers. The table is divided into two parts, Part A dealing with urban areas a.nd Part B dealin, with rural areaS of the district.
2. Besides giving the number of illiterates and literates (without educationall.evel) in both urban and rural areas, the remaining literates of these areas are classified as follows:-
Urban
1 Primary or Junior Basic
2 Matriculation or Higher Secondary
3 Technical diploma not equal to degree
4 Non-technical diploma not equal to degree
5 University degree or Post-graduate degree other than technical degree
6 Technical degree or diploma equal to degree or Post-graduate degree
(i) Engineering, (ii) Medicine,
(iii) Agriculture, (iv) Veterinary and Dairying, (v) Tt:chnology, (vi) Teaching and
(vii) Others
'6
Rural
I Primary or Junior Basic
2 Matriculation and above
3. AIl persons who have ability to read and write with understanding, i.e., to read any simple letter with felicity and write any simple letter with understanding are considered literates. Those who have passed Lower Primary or Junior Basic but have not passed Matriculation, Higher Secondary, S. S. L. C. or E. S. L. C. come under the category of Primary or Junior Basic and all those who have passed MatriculatiGn, Higher Secondary, S. S. L. C. or E. S. L. C. come under the category of Matriculation or Higher Secondary.
4. In connection with the enumeration of technical personnel, degrees in science subjects like Physics, Mathematics, Chemistry, Geology, Geo-Physics, Geography, etc., have been recognised as technical degrees. These do not CaDle under the specificitems (i.e., i to vi) covered by 'technical degree or diploma equal to degree or post-graduate degree'. Hence wherever the subject of graduation or po:;t-graduation has been given. these have been included under 'Others' (i.e., vii) in the urban areas. This accounts for the high percentage of ' others • coming under' technical degree or diploma equal to degree or post-gr a.duate degree'.
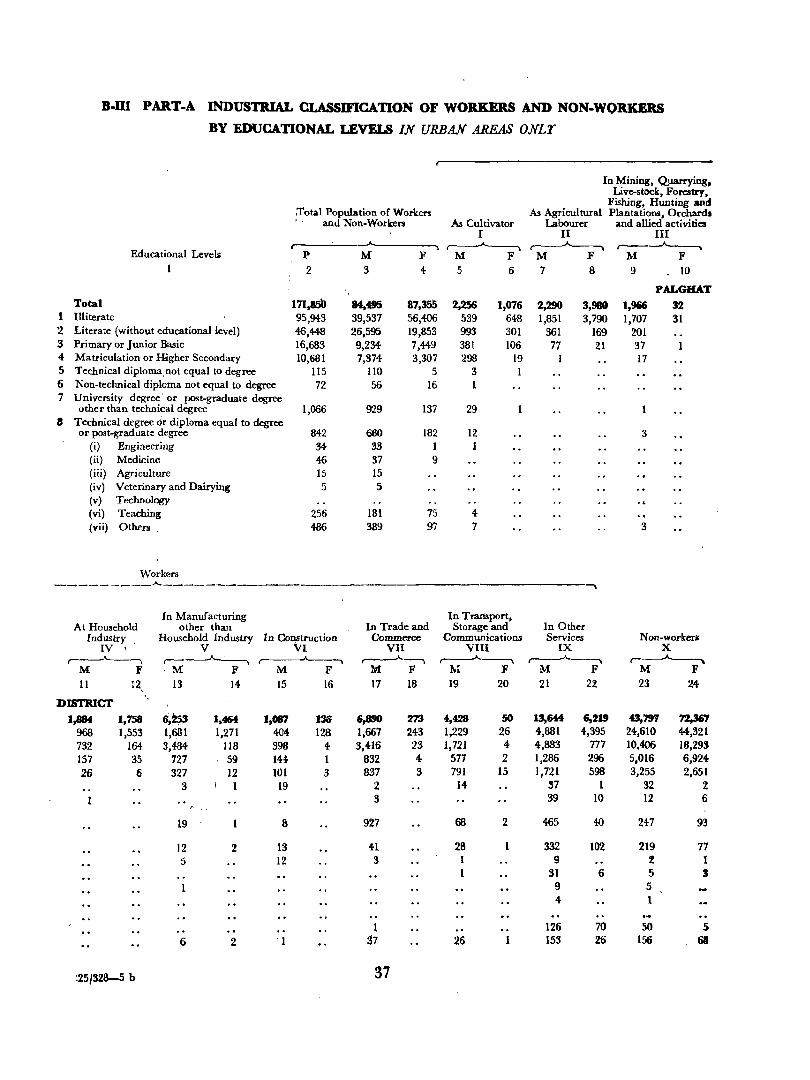
B-W PART-A INDUSTRIAL CLASSIFICATION OF WORKERS AND NON-WORKERS
BY EDUCATIONAL LEVELS IN URBAN AREAS ONLT
In Mining, Quarrying, Live-stock, Forestry,
:fatal Population of Workers Fishing, Hunting and
As Agricultural Plantations, Orchards I , and Non-Workers & Cultivator Labourer and allied activities
I II III
Educational Levels ~ ~ r----"----,.
P M F M F M F M F 1 2 3 4 5 6 7 8 9 10
PALGBAT Total 171,asO 84,495 87,355 2,256 1,076 2,290 3,980 1,966 32
1 Illiterate 95,943 39,537 56,406 539 648 1,851 3,790 1,707 31 '2 Literate (without educational level) 46,448 26,595 19,853 993 301 361 169 201 3 Primary or Junior Basic 16,683 9,234- 7,449 381 106 77 21 37 4 Matriculation or Higher Secondary 10,681 7,374- 3,307 298 19 1 17 5 Technical diploma, not equal to degree 115 110 5 3 1 6 Non-technical diploma not equal to degree 72 56 16 7 University degree' or post-graduate degree
other than technical degree 1,066 929 137 29 a Technical degree dr diploma equal to degree
or post-graduate degree 842 660 182 12 3 (i) Engineering 34 33 1 1 (ii) Medicine % 37 9 (iii) Agriculture 15 15 (iv) Veterinary and Dairying 5 5 (v) Techoology (vi) Teaching 256 181 75 4 (vii) Others , 486 389 f57 7 3
Workers _______ --A-
In Manufacturing At Household other than In Trade and
In Transport, Storage and In Other
Industry. Household Industry In Construction Commerce Communications Services Non-workeri IV \ V VI VII VIII IX X
,----"------, .--~ r----"---, ,..-----"----, ~ ~ ~ M F M F M F M F .M: F M F M F 11 !2 13 14 15 16 17 18 19 20 21 22 23 24 ,
DlSTRIcr 1,88f 1,758 6,253 1,464 1,087 136 6,890 27J 4,428 50 13,644 6,21S 43,791 72,3G1
968 1,553 1,681 ~.271 404 126 1,667 243 1,229 26 4,881 4,395 24,610 44,321 732 164 3,4M . 118 398 4- 3,416 23 1,721 4- 4,883 777 10.406 18,293 157 35 727 59 14~ 1 832 4 577 2 1,286 296 5,016 6,924 26 6 327 12 101 3 837 3 791 15 1,721 598 3,255 2,651
3 1 19 2 14 37 1 32 2 3 39 10 12 6
19 [S 927 68 2 465 40 247 93
12 2 13 41 28 332 102 219 77 5 12 3 9 2 1
31 6 5 S 9 5 4 1
1 126 70 50 5 6 2 . I 37 26 153 26 156 61
:25/328-5 b 37
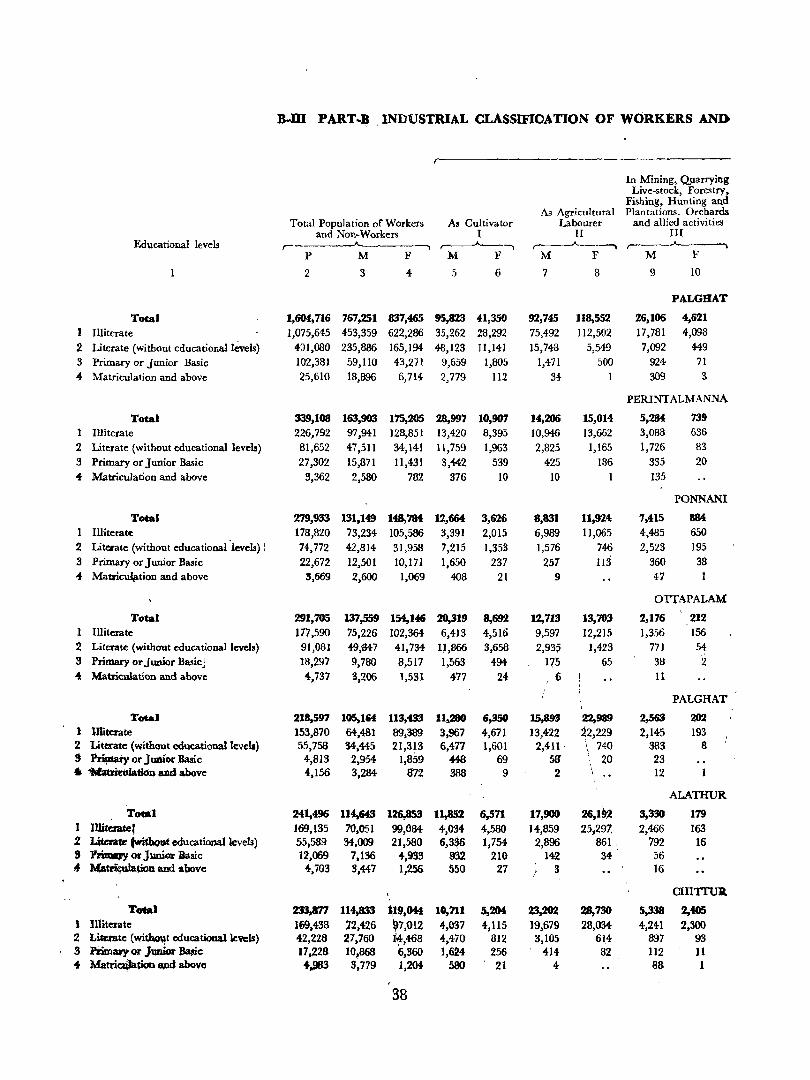
B..JII PART-I}, INDUSTRIAL CLASSIFIOATION OF WORKERS AND
In Mining, Quarrying Live-stock, Forestry.
Fishing, Hunting and As Agricultural Plantations. Orchards
Total Population of Workers As Cultivator Labourer and allied activities and Non-Workers I II nr
Educatiollal levels r------"-----. ~, ,.--.----A--~ r--P M F M F M }<' M F
2 3 4 5 6 7 8 9 10
PALGHAT
Total 1,604,716 767,251 837,465 95,823 41,350 92,745 118,552 26,106 4,621
J Illiterate 1,075,645 453,359 622,286 35,262 28,292 75,492 112,502 17,781 4,098
2 Literate (without educationallmls) 4::>1,080 235,886 165,194- 48,123 11,141 15,748 5,549 7,092 449 3 Primary or Junior Basic 102,381 59,110 43,271 9,659 1,805 1,471 500 924 71
4 Matriculation and above 25,610 18,896 6,714- 2,779 112 34- 1 309 3
PERINTALM.t\NNA
Total 339,108 163,903 175,205 28,997 10,907 14,206 15,014 5,284 739 1 Illiterate 226,792 97,941 128,851 13,420 8,395 10,946 13,662 3,088 636
2 Literate (without educational levels) 81,652 47,511 34,141 11,759 1,963 2,825 1,165 1,726 83
3 Primary or Junior Basic 27,302 15,871 11,431 3,442 539 425 186 335 20
4 Matriculation and above 3,362 2,580 782 376 10 10 135
PONNANI
Total 279,933 131,149 148,784: 12,66f 3,626 8,831 11,924 7,415 884 1 Illiterate 178,820 73,234 105,586 3,391 2,015 6,989 11,065 4,485 650 2 Litc2'ate (without educational'levels) : 74,772 42,814 31,958 7,215 1,353 1,576 746 2,523 195
3 Primary or Junior Basic 22,672 12,SOl 10,171 1,650 237 257 113 360 38 4 Matricu~tion and above 3,669 2,600 1,069 408 21 9 47
OTTAPALAM
Total 291,705 137,559 154,146 20,319 8,69'2 12,713 13,703 2,176 212 1 Illiterate 177,590 75,226 102,364 6,413 4,516 9,597 12,215 1,356 156 2 Literate (without educational levels ) 91,081 49,047 41,734- I},B66 3,658 2,935 ],423 771 54-3 Primary or Junior Basic j 18,297 9,780 8,517 1,'5&3 494 175 65 38 2 <t Matriculation and above 4,737 3,206 1,531 477 24- 6 11
PALGHAT
Total 218,597 105,164 113,433 11,. 6,350 JP,89:J 22,989 2,563 202 I Illiterate 153,870 64,481 89,389 3,967 4,671 13,422 ~2,229 2,145 193 2 Literate (without educational levels) 55,758 34,445 21,313 6,477 1,601 2,411 ' \ 740 383 8 !+ ~ or JUIlior Basic 4,813 2,954- 1,859 448 69 5S' 20 23 • ~ticln and above 4,156 3,284 872 388 9 2 12
ALATHUR
Toea) 241,496 114,643 126,853 11,852 6,571 17,900 26,1~ 3,330 179 1 Illiteratef 169,135 70,051 99,084- 4,034 4,580 14,859 25,291- 2,466 163 2 Literate fwitboot educational levels) 55,589 34,009 21,580 6,3~ 1,754- 2,896 861. 792 16 9 p~ Qr Junior Basic 12,069 7,136 4,933 S32 210 142 34- 56 .. Ma~n and above 4,703 3,447 1,256 550 27 3 16
CHITI1JR.
Total m,87'7 114,833 j~9,044 10,711 5,2CK 23,202 28,730 5,338 2,405 1 lllitet'ate 169,438 12,426 ~7,O12 4,037 4,115 19,679 28,034- 4,241 2,300 2 Lnuate (wi~t educationalleYels) 42,228 27,760 ~,468 4,470 812 3,105 61,4 897 93 3 Plimary 01' J1JDior BaJjc 17,228 10,868 6,360 1,624- 256 414 82 112 II .. Matri~~ a.ud above +.983 3,779 1,2M 500 21 4 88 1
38
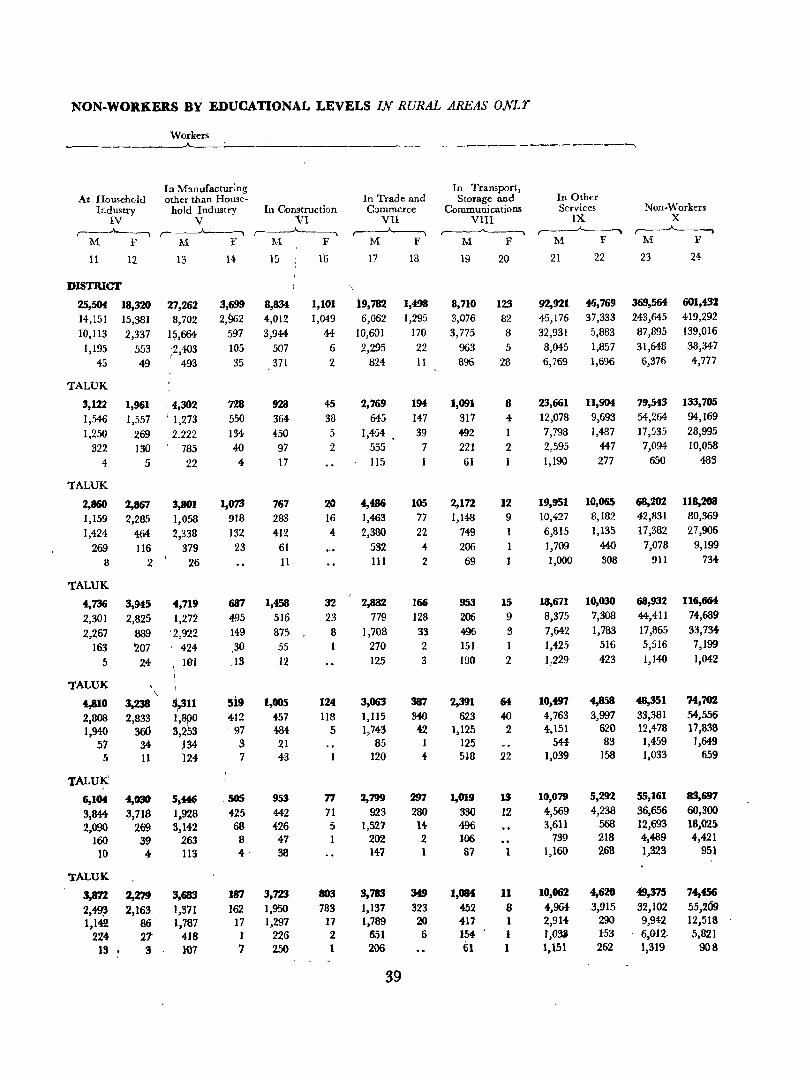
NON-WORKERS BY EDUCATIONAL LEVELS IN RURAL AREAS ONLr
Workers .A- ---...,
In Manufacturing In Transport, At Household other than House- In Trade and Storage and In Other
Industry hold Industry In Con~truction Commerce Communications Services Non-"Vorkers IV V "VI VII Vin IX X ,_.A. __ -. .---_.A..--, ,______.A....._-----.. ,.---"----.. r---........__~ ~, ,.-----A-----.
M F 1\1 f .M F M F M F M F M F
11 12 13 14 15 1'6 17 18 19 20 21 22 23 24
DISTRICT
25,504 18,320 27,262 3,699 8,834 1,101 19,782 1,498 8,710 123 92,921 46,769 369,564 601,432
14,151 15,381 8,702 2,962 4,012 1,049 6,062 1,295 3,076 82 45,176 37,333 243,645 419,292
lO,I13 2,337 1~,664 597 3,944 44 10,601 170 3,775 8 32,931 5,8B3 87,895 139,016
1,195 553 i2403 , , 105 507 6 2,295 22 963 5 8,045 1,857 31,648 38,347
45 49 493 35 371 2 824 11 896 28 6,769 1,696 6,376 4,777
TALUK
3,122 1,961 " 4,302 728 928 4S 2,769 194 1,091 8 23,661 11,904 79,543 133,705
1,546 1,557 ' 1,273 550 364 38 645 147 317 4 12,078 9,693 54,264 94,169
1,250 269 2,222 134- 450 5 1,454 , 39 492 1 7,798 1,487 17,535 28,995
322 130 785 40 97 2 555 7 221 2 2,595 447 7,094 10,058
4 5 22 4- 17 115 61 1,190 277 650 483
TALUK
2,860 2,867 3,801 1,073 767 20 4,486 lOS 2,172 12 19,951 10,065 68,202 118,208
1,159 2,285 1,058 918 283 16 1,463 77 1,148 9 10,427 8,182 42,831 80,369
1,424 464 2,338 132 412 4 2,380 22 749 6,815 1,135 17,382 27,906
269 116 , 379 23 61 532 4- 206 1,709 440 7,078 9,199
8 2 26 11 111 2 69 1,000 308 911 734
TALUK
4,736 3,945 4,n9 687 1,458 32 2,8a2 166 953 15 18,671 10,030 68,932 116,664
2,301 2,825 1,272 495 516 23 779 128 206 9 8,375 7,308 44,411 74,689
2,267 889 '2,922 149 875 8 1,708 33 496 3 7,642 1,783 17,865 33,734-
163 207 424 ,30 55 1 270 2 151 1 1,425 516 5,516 7,199
5 24 WI .13 12 125 3 100 2 1,.229 423 1,140 1,042
TALUK \
~~ll 4,810 3,238 Si9 1,005 124 3,063 387 2,391 64 10,497 4,858 48,351 '14,7O'Z
2,808 2,833 l,apo 412 457 118 ],115 34() 623 40 4,763 3,997 33,381 54,556
1,94() 36() 3,~53 ' 97 484 5 1,743 42 1,125 2 4,151 620 12,478 17,838
57 34- )34- 3 21 85 1 125 544- 83 1,459 1,649
5 11 '124 7 43 12O 4 518 22 1,039 158 1,033 659
TALUI(
6,104 4,030 5,446 ,505 953 77 2,799 297 1,019 13 10,079 5,292 55,161 83,697
3,844 3,718 1,928 425 442 71 923 280 330 12 4,569 4,238 36,656 60,300
2,090 269 3,142 68 426 5 1,527 14 496 3,611 568 12,693 18,025
160 39 263 8 47 202 2 106 739 218 4,<W9 4,421
10 4: 113 4' 38 147 1 87 1 1,160 268 1,323 951
TALUK
3,87'l 2,279 3,683 187 3,723 803 9,783 349 1,084 11 10,062 4,620 49,375 74,456
2,~ 2,163 1,371 162 1,950 783 1,137 323 452 8 4,964 3,915 32,102 55,209
1,142 86 1,187 17 1,297 17 1,789 20 417 1 2,914 290 9,942 12,518
224 21 418 1 226 2 651 6 154 1 I,03J I53 6,012, 5,821
IS 3 W7 7 250 1 206 61 1 1,151 262 1,319 908
39
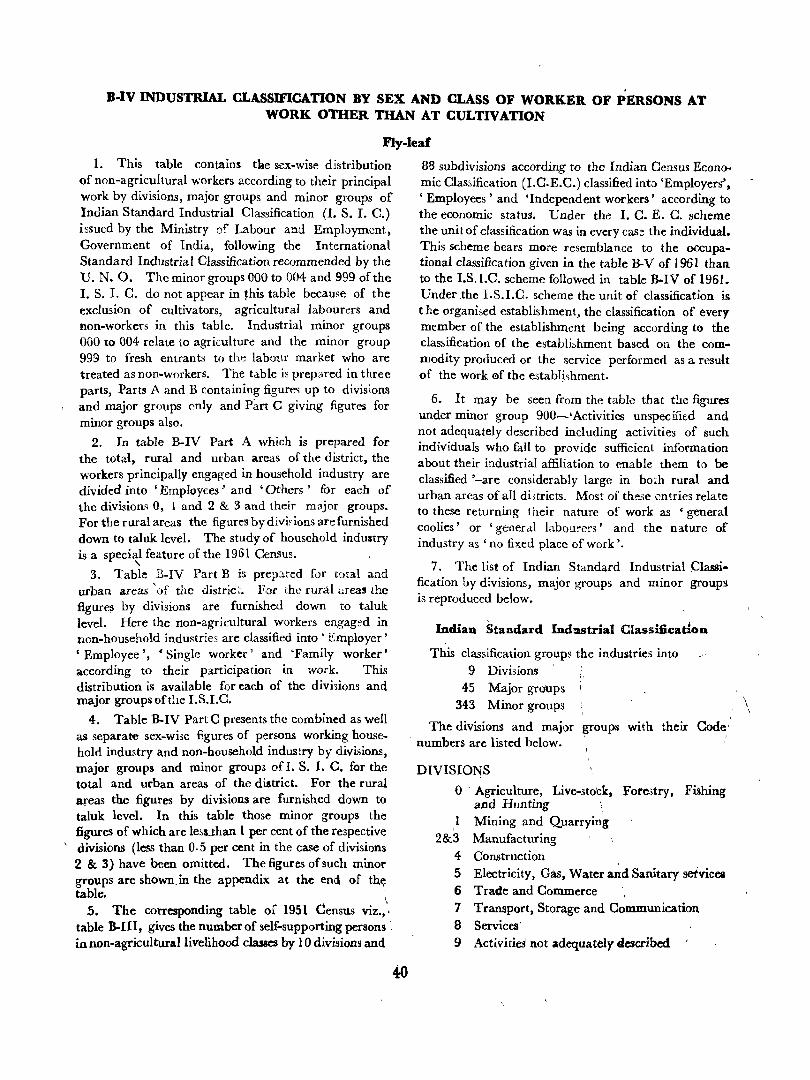
B-IV INDUSTRIAL CLASSmCATION BY SEX AND CLASS OF WORKER OF PERSONS AT WORK OTHER THAN AT CULTIVATION
Fly-leaf
1. This table contains tloie »ex-wise distribution of non-agricultural workers according to their principal work by divisions, major groups and minor groups of Indian Standard Industrial Classification (I. S. 1. C.) issued by the Ministry of Labour and Employment, Government of India, following the International Standard Industrial Classification recommended by the U. N. O. The minor groups 000 to 004 and 999 of the 1. S. 1. C. do not appear in this table because of the exclusion of cultivators, agricultural labourers and non-workers in this table. Industrial minor groups 000 to 004 relate to agriculture and the minor group 999 to fresh entrants to the labour market who are treated as non-workers. The table is prepiired in three parts, Parts A and B containing figure~ up to divisions and major groups cnly and Part C giving figures for minor groups also.
2. In table B-IV Part A which is prepared for the total, rural and urban areaS of the district, the workers principally engaged in household industry are divided into 'Employees' and 'Others' for each of the divisions 0, 1 and 2 & 3 and their mJjor groups. For the rural areas the figures by divi, ions are furnished down to taluk level. The study of household industry is a special feature of the 1961 Census. ,
3. Table B-IV Part B is prep:J.red for total and urban areas 'of the district. For the rural areas the figures by divisions are furnished down to taluk level. Here the non-agricultural workers engag:-d in non-household industries are classified into' Employer • , Employee', • Single worker' and 'Family worker' according to their participation in work. This distribution is available for each of the divisions and major groups of the I.S.I.C.
4. Table B-IV Part C presents the combined as well as separate sex-wi3e figures of persons working household industry and non-household industry by divisions, major groups and minor grOUp3 of I. S. I. C. for the total and urban areas of the district. For the rural areas the figures by divisions are furnished down to taluk level. In this table those minor groups the figures of which are lesUhan I per cent of the respective
, divisions (less than 0.5 per cent in the case of divisions 2 & 3) have been omitted. The figures of such minor groups are shown.in the appendix at the end of th~ table. I.
.5. The corresponding table 0; 1951 Census viz." table B-III, gives the number of self-supporting persons. ill non-agricultural livelihood classes by 10 divisions and
88 subdivisions according to the Indian Census Economic Classification (I.C.E.C.) classified into 'Employers', 'Employees' and 'Independent workers' according to the economic status. Under the I. C. E. C. scheme the unit of classification was in every case the individual. This scheme bears more resemblance to the occupational classification given in the table B-V of 1961 than to the I.S.I.C. scheme followed in table B-IV of 1961. Under .the I.S.I.C. scheme the unit of classification is t he organised establishment, the classification of every member of the establishment being according to the classification of the establi,hment based Oll the commodity produced or the service performed as a result of the work ef the establhhment.
6. It may be seen from the table that the figures under minor group 900-'Activities unspecified and not adequately described including activities of such individuals who fall to provide sufficient information about their industrial affiliation to enable them to be classified '-are considerably large in both rural and urban areas of all di,tricts. Most of these entries relate to these returning their nature of work as 'general coolies' or 'gt:Jleral labourers' and the nature of industry as 'no fixed place of work'.
7. The list of Indian Standard Industrial Classification by divisions, major groups and minor groups is reproduced below.
Indian Standard Industrial Classification
This classification groups the industries into 9 Divisions
45 Major groups 343 Minor groups
The divisions and major groups with their Code· . numbers are listed below.
DIVISIONS
,
o . Agriculture, Live-stock, and Hunting
1 Mining and Quarrying
ForoJtry, Fishing
2&3 Manufacturing
4 Construction , 5 Electricity, Gas, Water and Sanitary setvicea
6 Trade and Commerce 7 Transport, Storage and Communication 8 Services·
9 ActivitieS not adequately described
\ \

~JOR GROUPS
Division 0 Agriculture, Live-stock, Forestry, Fishing and Hunting
00 Field produce and Plantatif)~ crops 01 Plantation crops 02 Forestry and Logging 03 Fhhing 04 Live-stock and Hunt;ng
Division I Mining and Q.uarryfng
10 Mining and quarrying
Division 2 & 3 Manufacturing 20 Foodstuffs 21 Beverages 22 Tobacco products 23 Textile-cotton 24 Textile--jute 25 Textile-wool 26 Textile-silk 27 Textile-~iscellaneous 28 Manufaoture of wood and wooden products 29 Paper and paper products 30 Printing and publishing 31 Leather 'and leather products 32 Rubber, petroleum and coal products S3 Chemicals and chemical products
34-35 Non-metallic mineral products other than petroleum and coal
36 Basic metals and their products except machinery and transport equipment
37 MachiU~ (all kinds other than Transport) and Electrical equipment
38 Transport equipment 39 Miscellaneous Manufacturing Industries
Di~ion of CoDstra.ction
40 donstruction
Division 5 Electricity, Gas, Water and Sanitary \, . Servi~es
50 Electricity,and Gas I
51 Water sUJ?Ply and Sanitary services
Division' Trade and Comm.erce I
60-63 Wholesale trade ! 64-68 R~tail trade
69 Trade and Commerc~ Miscellaneous
Division 1 Transport, Storage and CoDllDUDication
70-71 Transport 72 Storage and Warehousing 73 Communications
41
Division 8 Services
80 Public Services 81 Educational and Scientifil( Services 82 Medical and Health Services 83 Religious and Welfare Services 84 Legal Services 85 Business Services 86 Community Services and Trade and Labour
A5sociations 87 Recreation Services 38 Personal Services 89 Services (not elsewhere classified)
Division 9 Activities not adequately described
90 Activities unspecified and not adequately described. (This includes new entrants to the labour market)
(Classification and Code numbers at the 3 digi t level in respl!Ct of minor groups are shown in the subsequent pages) -
Major Group
Minor Group
(Code) Description (Code)
Division 0 Agriculture, Live-stock, Forestry, Fishing and HUIlting
00 FmLD PRODUCES AND PLANTATION CROPS
Production of cereal crops (including Bengal gram) such as rice, wheat, jowar, bajra; maize 000
/
Production of pulses, such as arhar, moong, masur, urd, khelari, other gram
Production of raw jute and kindred fibre crops
Production of raw cotton and kindred fibre crops
Production of oilseeds, sugar-cane and other cash crops
Production of other crops (including vegetables) not covered above
Production of fruits and nuts in plantation,
001
002
oos
004
005
vines and orchards 006
Production of wood, bamboo, cane, reeds, thatching grass, etc. 007
Production of juice by tapping palms 008
Production of other agricultural produce (including fruits and nuts not CQv,'red by code number 006 and fl·:>wers) not covered above 009
Major Group (Code) Description
Minor Group
(Code)
01 PLANTATION CROPS-
Production of tea in plantation
-Production of coffee in plantation
Production of rubber in plantation
Production of tobacco in plantation
Production of ganja, cinchona, opium
Production of oIher. plantation crops not covered above
02 FORESTRY AND LOGGING-
Planting, replanti;,g a~;d conservatIOll of fore,ts Fellipg an,d cutting of trees and transportation of jogs Pre'paration of timber Production of fuel including charcoal by exploitation of forest Production of fudder by exploitatio~l of forests ' Production, f gums, resins, lac, b~wks, herbs, wild fruits and leaves by the exploi:ation of forests Production and gathering of other forest products not covered above
03 FISHIN\G-
Product.:on of fish by fishing i~ sea
Production of fish by fishing m inland waters including the operation or fish f<-lrms and fish hatcheries
Production of pearls, conch, shells, sponges by gathering or liftin~ from sea, river, pond
04 LIVE-STOCK AND HUNTING-
Production and rearing of live-stock (large heads only) mainly for milk and animal power such as cow, buffalo, goat Rearing of sheep and production of wool Rearing and production of ot,her animals (mainly for slaughter) such as pig Production of ducks, hens and other small birds, eg~' by rearing and poultry farming Rearing of bees,'for the production of honey, wax and collectivn of honey , Rearing of silk worms and production of cocoons and raw silk , Rearing of other small animals and insects Trapping of anunals or games propagation Production of other animal husbandry products such as skin, bone, ivory and teeth
010 011 012 013 014
015
020
021 022
023
024
025
026
030
031
032
040 041
042
04-3
044
045 0Irl6 ~7
048
42
Maj-x Group (Code) Descriptim
Minor Group (Code)
Division I Mining and Quarrying
10 MINING AND QUARRYING
Mining of coal Mining of iron ores Mining of gold and silver ores Mining of manganese Mining of mica Mining of other non-ferrous metallic ores Mining of crude petroleum and natl~ral gas Quarrying of stone (including slate), clay, sand, gravel, limestone Mining of chemical earth such as soda-ash Mining and quarrying of non-metallic products not classified abuve such as precious and semi-precious stores, asbestos,. gypsum, sulphur, asphalt
Division 2 and 3 Manufacturing
20 FOODSTUFFS-
Productiotl of rice, atta, fbur, etc" by milling dehusking and proces-;ing of C[OPS
and f00dgrains Production of sugar and syrup from sJ.garcane in mills Production of indigenous sugar, gur from sugar-cane or palm juice and production of canciy Production of fruit products such as jam. jelly sauce and canning and preserv~tion of fruits Slaughtering, preservation of meat a:ld 'fi:;h and canning of fish
. Production of bread, biscuits, cake and other, bakery products I '
Production of blftter, ghee, cheese and other dairy products, i
Production of edible fa~ and ?ils (other than hydrogenated oil) \ Production of hydroge'llated oil (Vanaspa'd) Production of other fo<)d products such as sweetmeat and condixrtents, muri, murki. chira, khoi, 'cocoa, ch~late, toffee, lozenge
21 BEVE~GES-Production of distilled ~pirits, wines, liquor from alcoholic malt, fru~ts and malts in distillery and brewery , Production of country liquo~ Production of irtdigenous "l~quor such ,as toddy, liquor from mabua, pa'bn juice ,Production of other liqUQlQ not covered above Production qf aera.ted and $ineral water
100 101 102 103 104-105 106
107 108
109
200
201
202
203
204
205
201 I
2~8
209
21() 211
21~
"Major <Group (Code) Doscriptinn
'21 BEVERAOES-(Concld.)
Production of ice Production of ice cream Processing of tea in factories Processing of coffee in curing works Production of other beverages
'22 TOBACCO PaoDuCTS-
Minor Gro'lp (Code)
215 216 217 218 219
Manufacture of bidi 220 Manufacture of cigars and cheroots 221 Manufacture of cigarette and cigarette tobacco 222 Manufacture of hookah tob?cco ' 223 Manttfacture of snuff 224 Manufacture of jerda' and other chewing tobacco 225 Manufacture .of other tobacco products 226
~s TEXTll,X·CO'l'TON'-
Cotton gin~ing, dca,ning, preJSing and baling 230 Cotton spinrling (other than in mills) 231 Cotton spinnjng and weaving in mills 232 Cotton dyeing, bleaching 233 Cotton weaving in power looms 234 Cotton weaving in handlooms 235 Manufacturing of khadi textile in handlooms 236 Printing of cotton textile 237 Manufacturing of cotton neti 238 Manufucturh,g of cJtton, COfldage, rupe and twine I 239
'24 TrumU.jU,'E-Jute pressing and b."Iling Jute spinning and weaving Dyeing and bleaching of jute Printit.g of jute textile
, 240 241 242 243
Manufactun: of other products like rope, ('ordage flOm'<jute and similar fib:.':: Inc:. as hemp, m~~ta, 244
:25 Tl'..x:ru.::!:-WOOL:_ W,xli baling an,1:i p«'d.,ip.g 25-0 Wool c1e,lJling land proc'$.1ing (scouring) 251 Wool, ~P*9Iling anI W~ ,v,iug:}n mill 2:;2 Wool spitlninJ oth\!r than in mills 253
\ ! Wool we .. V'"In! in power l,)Om ~54
Wool weaving in h.andloom 255 Embn.idery- and art w.>rk in ·,yool'en telttile 256
:2 'J Tarl'lLE-SIt.K-
Spinning and weaving of s:lk textile in mill 260 Dyeing and bleaching of silk 261 Spinning of silk oth~r than ill mills 262 Weaving of silk textile by power loom 263
Major GtOllP (Code)
l\Iinor Group
(Code) Description
Weaving of silk textile by handloom Printing of silk textile Manufacture of silk cordage, rope and twine
27 TEXTILE-MISCELLANEOUS-
Manufacture of carpet and all other similar
2M 265 265
type of textile products 270 Manufacture of hosiery and other knitted fabrics and glarments 271 Embroidery and making of crepe, lace and fringes 272 Making of textile garments including rain· coats and headgear 273 Manufacture of made up textile goods except wearing apparel such a~ cu~aiUl. pillow cases, bedding materials, mattreis. textile bags 274-Manufacture of waterproof textile products such as oikll)th, tarpaulin 275 Manufacture and recovery of a11 types of fibres for purp03es of padding, wadding and upholstery filling 276 Manufacture of coir and coir producH 277 Manufacture of umbrell1lS 273 Procc5sing -and manufacture of t-extite products not covered above 279
28 MA~"CFACTURE OF WOOD AND \VOODEN PRODfJCTS-
Sawing and planing of wood 28-0 Manufacture of wooden furniture and fixtur~ 281 Manufaclure of structUI at wooden go::Jds (including treated timber) such as beams, P05t5, doors, windows 282 Manufacture of wooden industrial goods other th;~ll tran port equipment such a, bobbin and similar equipment and fu(tures 233 M:.tnufac ure of other wooden product.s such ,IS ut·;mils, toy.; artware3 28+ Manufacture of Veneer and plywood 2~ ?vL~nufac'tHrc of plywood pruduct:! SUC~'l 1;\1
tea ch~.:It 2S\i Manllfarture of b )XtS and pac' ing ~, o:her t:mn plywood 2, 7 Manufacture of U1a!erials from eCJck. bamboo. cane, Ieave.~ and cthl'c .. Hied products 288 Manufacture of other wood ant! allied produc:g not covered above 289
29 PAPER AND P.\PER PRODUCTS-
Manufacture of pulp from wood, rags. waste paper and other fibre:> and the c ,nver.iion of such pulp into nny k.Uld of p .• per and paper boa.d in mill 29a
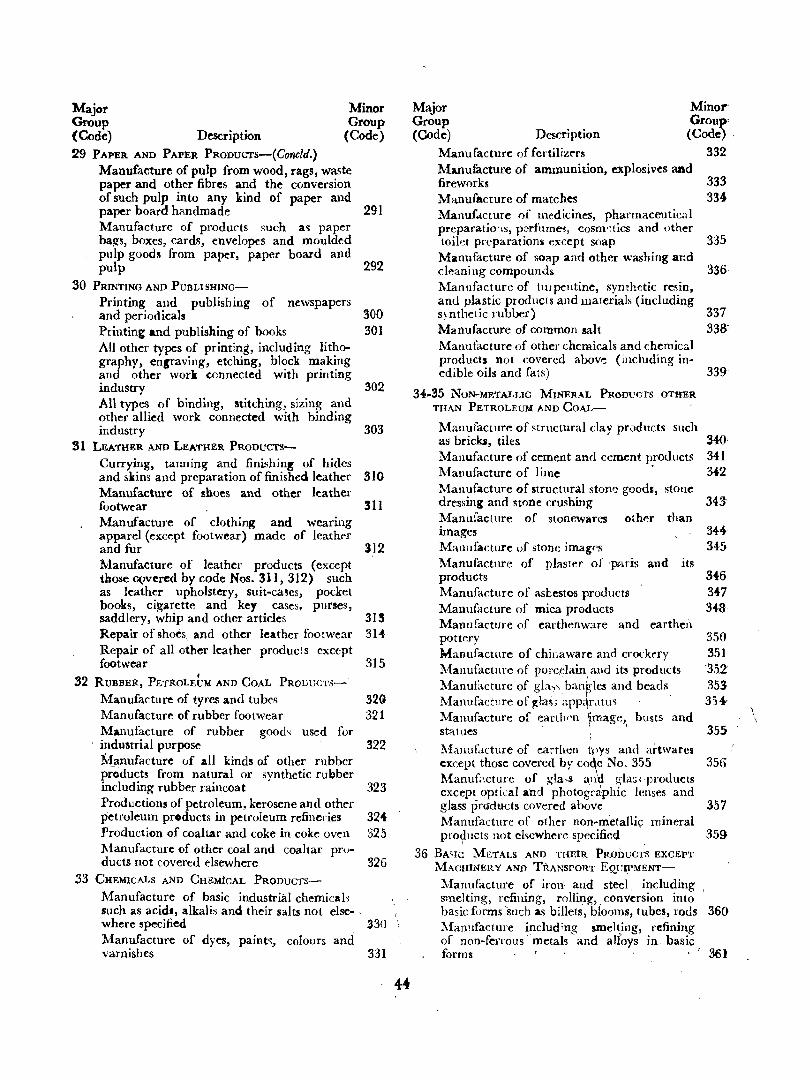
'Major Group (Code) Description
Minor Group
(Code)
29 PAPER AND PAPER PRODUcrS-( ConcIJ.) Manufacture of pulp from wood, rags, waste paper and other fibres and the conversion of such pulp into any kind of paper and paper board handmade Manufacture of products such 3'> paper bags, boxes, cards, envelopes and moulded pulp goods from paper, paper board and pulp
30 PRINTING AND PUBLISHING-
Printing and publishing and periodicals
of newspapers
Printing and publishing of books All other types of printing, including lithography, engraving, etching, block making and other work connected with printing industry All types of binding, stitching, sizing and other allied work connected with binding industry
31 LEA'rHER AND LEATHER PRODUCTS-
Currying, tanning and finishin~ of hides
291
292
300 301
302
303
and skins and preparation of finished leather 310 Manufacture of shoes and other leather footwear 311 Manufacture of clothing and wearing apparel (except footwear) made of leather and fur 312 Manufacture of leather products (except those OQvered by code Nos. 311,312) such as leather upholstery, suit-cases, pocket books, cigarette and key cases, purses, saddlery, whip and other articles 315 Repair of shoes, and other leather footwear 314 Repair of all other leather products except footwear 315
• 32 RUBBER, PETROLEUM AND COAL PRouUCTS-
Manufacture of tyres and tubes 320 Manufacture of rubber footwear 321 Manufacture of rubber good~ used for
, industrial purpose 322 Manufacture of all kinds of other rubber products from natural or synthetic rubber including rubber raincoat 323 Productions of petroleum, kerosene and other petroleum products in petroleum refineries 324 Production of coaltar and coke in coke oven 325 :ManufactUl'e of other coal and coaltar pru-ducts not covered elsewhere 326
.33 CHEMICALS AND CHEMtCAL PRODUCTS
Manufacture of basic industrial chemicah such as acid., alkalis and their salts not else-. where specified 330 Manufacture of dyes, paint5, colours and varnishes 331
Major Group (Code) Description
Manufacture of fertiliz('Ts
Minor' Group' (Code)
332 Manufacture of ammunition, explosives and fireworks 333
334 Manufacture of matches Manuf4cture of medicines, pharmaceutic:d preparatio'ls, p~rfume~, cosm~tics and other toild preparationi except soap 335 Manufacture of ~oap and other washing ar~d cleani ng compounds 336, l\lanufacturc of tUlpentine, synthetic resin, and plastic products and materials (including s~nthetic rubber) 337 Manufacture of common salt 338:: Manufacture of other chemicals and chemical products not covered above (including in· edible oils and fats) 339"
34-35 NON-METALLIC MINERAL PRODrCTS OTHER
THAN PETROLEUM AND COAL-
Manufacture of structural day praducts such as bricks, tiles Manufacture of cement and cement products l\{anufacture of lime . l'.1anufacturc of structural stone goods, stone dressing and stone crushing l\1anufac[urc of stonewares olher than images Manufacture uf stone imagrs Manufacture of plaster of pa.ris and its products Manufacture of asbestos products Manufacture of mica pr()ducts Manufacture of earthenw;ue and eartheil pottery Manufacture of chiliaware and crorkrry Manufacture of porcdain and it5 products Manufacture of gla), banklcl! and beads l\fanufacture of ~!a~; ;~pp~rLltu~ Manufacture of earLll"n image, busts and
, I , statues
\
l\hnuf<lcture of earthen tfYs and artwares except those covered by co~e No. 355 Manuf2.cturc of g!a,s ~nd gla:;qwoducts except optical a:nd photogra'phic lenses and glass pr(Jducts covered above Manufacture of other non~~etalli~ mineral pro~ucts not elsewhere specified.
36 BA<IC METALS AND THEIR PRODUCTS EXCEPT
MACHINERY AND TRANSPORT EQ.U1PMENT-
:r-"fanufacture of iron and steel, including smelting, refining, rolling" conversion into basic forms 'such as billets, blooms, tube~, rods Manufacture includ;ng sme1~ing, refining of non-ferrous "metals and alloys in basic forms
34{l
341 3"2
343
34+ 345
346 347 3i8
350 351 -352 353 354
355
356
357
359
360
361
\
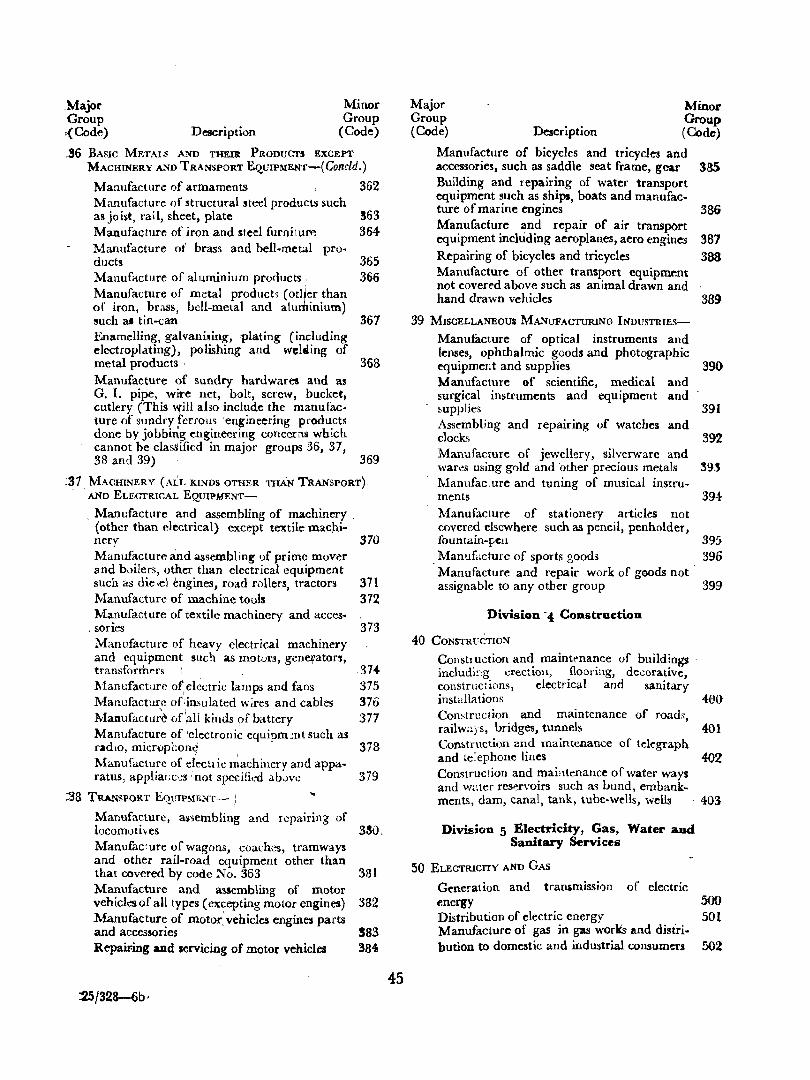
.Major Group (Code) Description
Minor Group
(Code)
.36 BASIC METALS AND THEm PRODUCTS EXCEPT
MACHINERY ASD TRANSPORT EQ.UIPMENr-(Concld.)
Manufacture of armaments 362 lvlanufacturc of structural steel products such as joht, rail, sheet, plate: 363 Manufacture of iron and steel furnitur;e 364 Manufacture ot' brass and bell-metal pro· ducts 365 Manufacture of aluminium products. 366 Manufacture of metal product,; (otller than of iron, brass, bell-metal and aluminium) such a. tin-can 367 EU2lmelling, galvanising, plating (including electroplating), polishing and wel.ing of metal products . 368 Manufacture of sundry hardwares and as G. I. pipe, wire net, bolt, screw, bucket, cutlery (This "(ill aho incl';lde t~e manufac-ture of sundry ferrous 'engmeenng products done by jobbi~g engineering concerns which cannot be classified in major groups 36, 37, 38 and 39) 369
:37. MACHINERY (ALL KINDS OTHER THAN TRANSPORT),
AND ELECTRICAL EQ.UIPMENT-
. Manufacture ~nd assembling of machinery , (other than electrical) except textile mac):li~ nery 370 Manufacture and assembling of prime mover and b,)ilers, other than electrical equipment such as clie,el engines, road rollers, tractors 371 Manufacture of machine tools 372 Ma.nufacture of textile machinery and acces·
. sories lVIanufacture of heavy electrical machinery and equipment such as motun, genefators, transformers ' .
Manufacture of, el~ctric lamps and fans Manufacture oCinsulated w;res and cables ManufactUl~ ofii<lll kinds of battery Manufacture of 'electronic equipm~nt such as radIO, IJlicropLon~ . Manufacture of electtic ~achillery and appa. ratus, appliaric>c:s ; not spcci!i<:d ab,JV':
:.38 TRANSl'ORT Eq_UIPMENT- i
373
374, 375 376 377
378
379
Manufacture, as~embling and repairing of locomotives· 380. Manufac:ure of wagons, coaches, tramways and other rail-road equipment other than that covered by code No. 363 331 Manufacture and a3Scmbling of motor vehicll!S of all types (excepting motor engines) 382 Manufacture of motor: vehicles engines parts and accessories S83 Repair.ing and servicing of motor vehicles 384
:25/328-6b, 45
Major Minor Group Group (Code) Description (Code)
Manufacture of bicycles and tricycles and accessories, such as saddle seat frame, gear 3!lS Building and repairing of water transport equipment such as ships, boats and manufac· ture of marine engines 386 Manufacture and repair of air transpOrt equipment including aeroplanes, aero engines 387 Repairing of bicycles and tricycles 388 Manufacture of other transport equipml"nt not covered above such as animal drawn and hand drawn vehicles 389
39 MISCELLANEOUS MANUFACTURING INDUSTRIES
Manufacture of optical instruments and lenses, ophthalmic goods and photographic equipment and supplies 390 Manufacture of scientific, medical and surgical instruments and equipment and ~upplies 391 Assembling and repairing of watches and clock~ 392 Manufacture of jewellery, silverware and wares using gold and 'other precious metals 393 Manufac,ure and tuning of music.!l instru-ments 39-1: Manufacture of stationery articles not covered elsewhere such as pencil, penholder, fountain.pe!l 395
. Manufacture of sports goods 396 Manufacture and repair work of goods not a~sjgnable to any other group 399
Division -4 Constrnetion
40 CONSTRUCTION
COlistluction and mainte"nance of buildings , includir-:g \:rectioll, flooring, decorative, constructions, electrical and sanitary installations 400 Construction and maintenance of roads, railw~)s, bridges, tunnels 401 Conl>truction and maintenance of telegraph and te:ephone lines 402 Construction and maintenance of water ways and w,\ter reservoirs stich a~ bund, embank. ments, dam, canal, tank, tube-wells, wells 403
Division 5 Electricity, Gas .• Water and Sanitary Se~ces
50 ELECTRICITY AND GAS
Generation and transmission of electric m~y ~ Distribution of electric energy 501 Manufacture of gas in gas works and distribution to domestic and industrial consumers 502
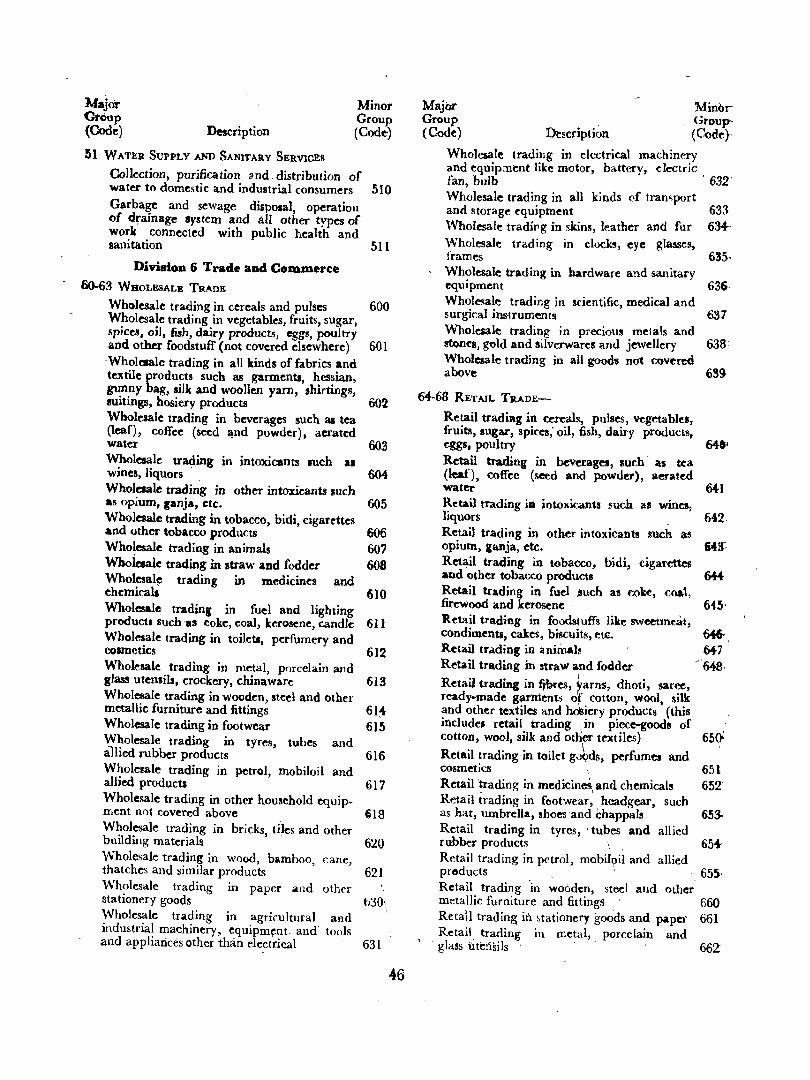
MaJdr Gtoup (Code) Description
Minor Group (Code)
51 WATER SUPPLY AND SANITARY SERVICES
Collection, purification and. distribution of water to domestic and industrial consumers Garbage and sewage disposal operation of d~ainage system and aU other types of work connected with public health and sanitation
Division 6 Trade and Commerce
60-63 WSOLE.'!ALl!. TRADE
Wholesale trading in cereals and pulses Wholesale trading in vegetables, fruits, sugar, spices. oil. fish, dairy products, eggs, poultry and other foodstuff (not covered elsewhere)
-Wholesale trading in all kinds of fabrics and textile products such as garments, hessian, gunny bag, silk and woollen yarn, shirtings, auitings, hosiery products Wholesale trading in beverages such as tea (leaf), coffee (seed ~nd powder), aerated water Wholesale trading in intoxicants IUch a. wines, liquors ' Wholesale trading in other intoxicants such as opium, ranja, etc. Wholesale trading in tobacco, bidi, cigarettes and other tobacco products Wholesale trading in animals Whoietale trading in straw and fodder Wholesale trading in medicines and chemicalS Wholesale, tradinr in fuel and lighting product. such 'as coke, coal, kerosene, candle Whol~ale trading in toilets, perfumery and COlmetlcs Wholesale trading in metal, porcelain and glass utensils, crockery, chinaware Wholesale trading in wooden, steel and other metallic furniture and fittings Wholesale trading in footwear Wholesale trading in tyres, tubes and allied rubber products Wholesale trading in petrol, mobiloil and allied products Wholesale trading in other household equipU,ent not covered above WholeSale trading in bricks tiles and other building materials ' ,
Wholesale trading in wood, bamboo cane, thatches and similar products ' Wh?lesale trading m paper and other statIOnery goods Wholesale trading in agricultural and industrial machinery, equipment. and' tools and appliances other than electrical .
510
511
600
601
602
603
604
605
606 607 608
610
611
612
613
6l~ 615
616
617
618
620
621
b30\ ,
631
46
Major Group (Code) Th:scripti~n
Minhr Group· (Code),
Wholeaale trading in electrical machincry and equip:nent like motor, battery, electric. fan, bulb 632' Wholesale trading in all kinds d tramport and storage equipment 633 'l\1holesal~ tradipg in skins, leather and fur 634-Wholesale trading in clock!!, eye glasses, fram~s 635· Wholesale trading in hardware and sanitary equipment 636, Wholesale trading in scientific, medical and surgical instruments 637 Wholeaale trading in precious metals and rton~s, gold and silverwares and jewellery 638: Wholesale trading in all goods not covered above 639
64-68 RET AlL TRADE-
Retail trading in cereals, puJse.~, vegetables, fruits, sugar, spices; oil, fish, dairy products, eggs, poult1)' 641" Retail trading in beverages, such as tu (leaf), coffee (seed and powder), aerated water 641 Retail trading ill intoxicants mch as wines, liquors , 642-Retail trading in other intoxicants such &$
opium, ianja, etc. US: Retail trading in tobacco, bidi, cigarclte8 and other tobacco products &K Retail trading in fuel ,lIuch as cok~, eoa.i, firewood and ketosc:ne ' 645· Retail trading in fo~stuffs like sweetm~at, condiments, cakes, biscuits, etc. 646- . Retail tr~ding in animals 647 Retail trading in straW and fodder -'"648·
Retail trading in ilbres, ~arni, dhoti, sarcc, ready-made garments or cotton, wool, silk and other textiles and h~iery products (this includell retail trading I~ in piece-goods of cotton, wool, silk and odler textiles) 650:
I
Retail ~rading ,in toilet gv~ds, perfumes and cosmetics 651 Retail trading in mediCines, and chemicals 652 Retail trading in footwear" headgear, such as hat, umbrella, shoes 'and i:happals 653-Retail trading in tyres,' tubes and allied rubber products '. , 654-Retail trading in petrol, mobiIoil and allied products , " 655, Retail trading 'in wooden, steel and othe; metallic furniture and fittings 660 Retail trading in htationery goods and paper 661 Retail trading 111 metal" porcelain and
, glass utensils I' 662
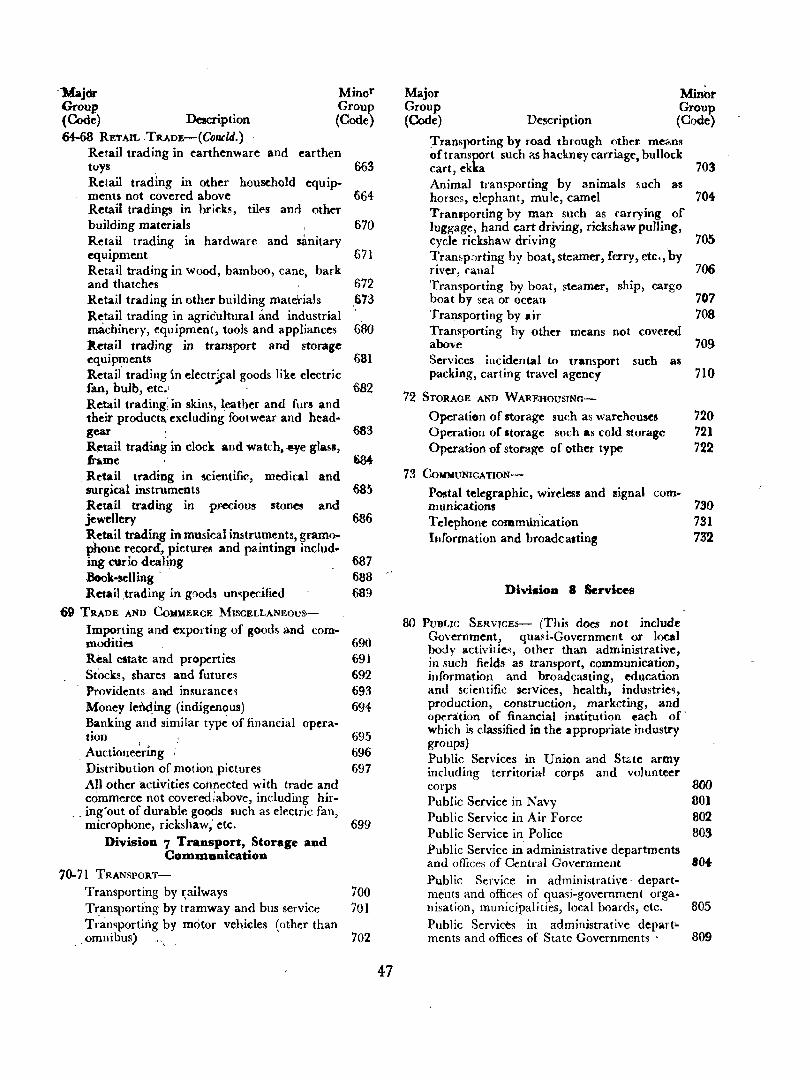
-MajOr Group (Code) De&eription
Minor Group (Code)
64-68 RETAIL .TRADE-(Concld.) Retail trading in earthenware and earthen toys Retail trading in other household equipmenU not covered above Retail tradings in bricks, tiles and other building materials Retail trading in hardware and sanitary equipment Retail trading in wood, bamboo, cane, bark and thatch('s Retail trading in other building mate!rials Retail trading in agricultural and industrial machinery, equipment, tools and appliances Retail trading in transport and storage equipments Retail trading in electr~cal goods like electric fan, bulb, etc.' . Retail trading, in skins, leather and furs and their products" excluding footwear and headgear R~tail trading in dock and watch. ~e glass, hme
663
664
670
671
672 .673
680
681
682
683
Major Group (Code) Description
Minor Group (Code)
Transporting by road through other. means of transport such as hackney carriage, bullock ~,~b m Animal tramporting by animals such as horses, elephant, mule, camel 704-Tranlporting by man such as farrying of luggage, hand cart driving, rickshaw pulling, cycle rickshaw driving 705 Tramp:Jrting by boat, steamer, ferry, etc.,by river, canal 706 Transporting by boat, steamer, ship, cargo boat by sea or ocean 707 Transporting by air 708 Transporting by other means not covered above 709 Services incidental to transport such as packing, carting travel agency 710
72 STORAGE AND VVAREHOU~NG--
Operation of storage such as warehouM!s 720 Operation of storage slich as cold storage 721 Operat10n of storage of other type 722
73 CoMMUNlCATlON-Retail trading in scientific, medical and surgical instruments Retail trading in pr-ecious stones and jewellery
685 Postal telegraphic, wireless and signal communications 730
781 732 R.etail trading in musical instruments, gramo
Phone record~ pictures and paintings including curio dealing
686 Telephone commun'ication Information and broadcasting
687 688 " Book-selling i
Retail trading in goods unspecified 689 Divi.ion 8 Services
69 TRADE AND COMMERCE MISCELl_ANEOUS
Importing and exporting of goods and com-moditie1 690 Real et.tate and properties 691 Stocks, shares and futures 692 Providents and insurance~ 693 Money le~ing (indigenous) 694 Banking and similar type of financial opera-tion 1 695 Auctione~ring ,. 696
. Distribution or'motion.pictures 697 All other activities connected with trade and commerce not coverediabove, including hir-
.. ing'out of durable goods such as electric fan, microphone, rickshaw,' etc. 699
Division 7 Transport, Storage and Communication
70-71 TRANSPORT
Transporting by r;ailways TransPQrti'ng by tramway and bus service Tntnsporting by motor vehicles (other than
, omnibus)
700 701
702
47
80 PUBLIC SERVICES- (This does not include Government, qua~i-Government or local body activilie" other than administrative, in such fields as transport, communication, information and broadcasting, education and scientific services, health, industrie~, production, construction, marketing, and operation of financial institution each of' which is classified in the appropriate industry groups) Public Services in Union and State army including territorial corps and volunteer corps Public Service in Navy Public Service in Air Force Public Service in Police
800 801 802 803
Public Service in administrative departments and offices of Centl-al Government 804-Public Service in administrative· departments and office~ of quasi-government orga· nisation, municipalities, local boards, etc. 805
Public Services in administrative depart-ments and offices of State Governments - 809
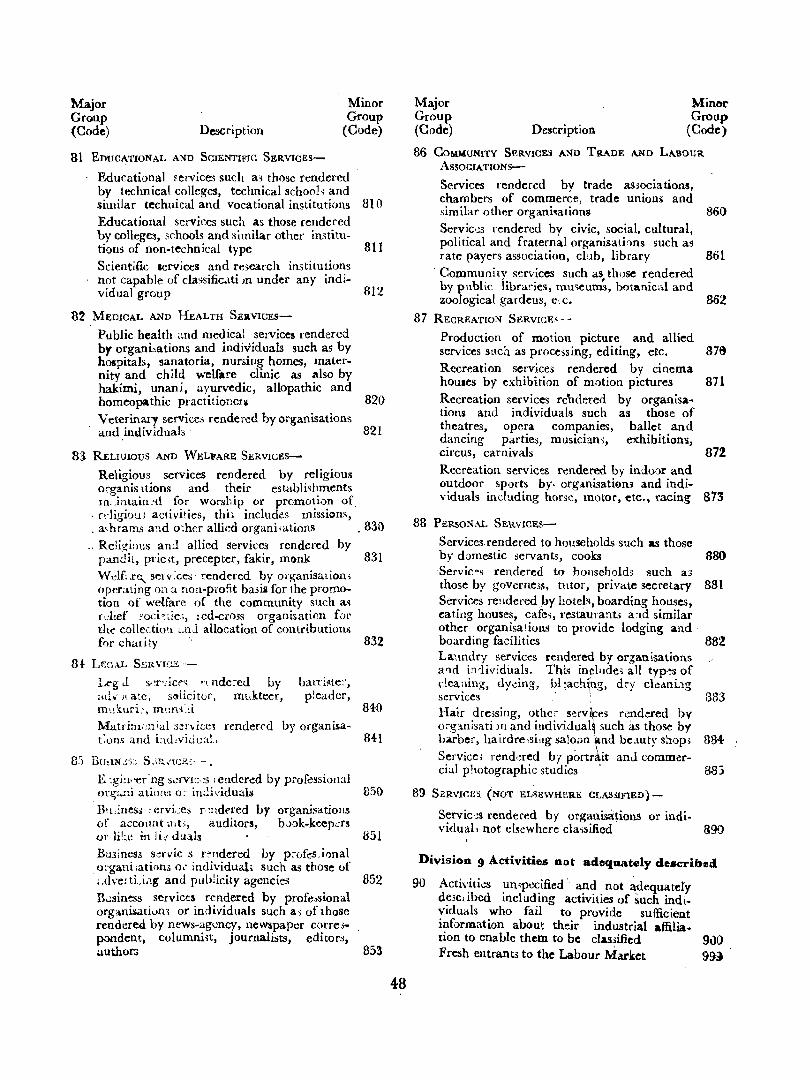
Major Group (Code) Description
Minor Group
(Cude)
81 EDUCATIONAL AND SCIENl'IFIC SERV1CES
Educational £ervices such a'l those rendered by technical colleges, technical school, and similar technical and vocational institutions 810 Educational services such as those rendered by colleges, 3c:hooh and similar other institu-tions of non-technical type 811 Scientific services and rc;;earch institutions not capable of da')sific.\ti)fl under any indi-vidual group 812
82 MEDICAL AND HEALTH SEltVlCES-
Public health and medical services rendered by organhations and individuals such as by hospitals, sanatoria, nursing homes, maternity and child welfare clinic as also by hakimi, unani, ayurvedic, allopathic and homeopathic practitionea . 820
Veterinary service,; rendered by organisations and individuals' 821
83. RELIGIOUS AND WELPARE SERVICES
Relig~ous. services rendered by religious o:gams ttlons and their establishments m. ,intain_'d for worship or promotion of
. rdigiou; activities, thil includes missions, , a,hrams a!ld o~her allied organi,ations . 830
_. Reiigbus and allied services rendered by panJit, prie,t, precepter, fakir, monk 831 W df, .re." serv:ce;:; rendered by organisation i operating on a non-pl'O!1t basill for the promo-tion of welfare of the community such a~ rdief ~oci~~ie;) lcd-cross organisation fm' th~ collectio~ l.nJ allocation of contriblltions for charity 832
8! LEGAL S~;RVIG.lf.-
Leg .1 s.~r'iicf'<; "( nde:ed by ad.')( ate, solicitor, mukteer, m\~l:{.uri:, m!Jn:)~li
barri!'\te~' , pleader,
~tatriml;n;al 3~:-"icCl rendered by organisa-
840
t:ons and i:HLviduJ.L 84}
Wi f)U,l:>i'';S:; S.m.\'tcI(-;-,
E :gi:l''ef 'ng s.:rVlC,;S tendered by professioJl:tl . on;;.ni ation.'! 0:' inci"iduab 850 B1Lines:; ; crvi.:es r·:nd('red by organisations of account '1It;, auditors, bJok-keep.:rll or JiI:e in lit ductls 851
Busincs3 s . .::rvic s rc"ndered by profesjfmal ol'gani,ati()os 0, individuali such as those of i.uvertU,1g anu publicity agencies 852 It.!sin~ss servict:5 rendered by profe>sional org<1nisativfi3 or individuals such aj of those rendered by new8-agl.:ncy, newspaper corre,.. pondent, columnht, journalists, editors, authol'3 853
48
~~ M~ G~p ~~ (Code) Description (Code)
86 CoMMUNITY SERVICES AND TRA.DE Al"lD LASOUR
ASSOCIATIONS--
Services rendered by trade a83ociations, chambers of commerce, trade unions and similar other organhations 860 Servic'~3 rendered by civic, social. cultural political and fraternal organisatirJns such a; rate payers association, club, library 861
. Community services such as those rendered by public libraries, mu,;e~, botanic ... l and zoological gardens, etc. 862
87 RECREATION SERVICE'-
Production of motion picture and allied services sllch as processing, editing, etc. 87& Recreation servi.ces rendered by cinema houles by exhibition of motion pictures 871 Recreation services rendered by organisa-tions and individuals such as those of theatres, opera companies, ballet and dancing parties, musiciam, exhibitions, circus, carnivals 872 Recreation services rendered by indoor and outdoor sports by- organisatiom and individuals induding horse, motor, etc., racing 873
88 PERSONAL SERVICES-
Services. rendered to households· such as those by d()mestic servants, cooks 880 'Servicag rendered to household, such a3 those by governe3S, tutor" private secretary 881 Services rendered by hoteh, boarding houses, eating houses, cafes, restaurants a:1d similall other organisa tiolls to provide lodaing and ' boarding facilities '" 882 La'\\udry services rendered by organisations a'1d ~!dividull;ls. Thl~ i~clude> all typ~s of deamng, dy~l1lg, bl~ach~ng, dry cle<l.nbg services .: 383 Hair drelsing, other serv~es rend~ed bv otg';tnisati Jll and individual~ such as those by barb~r, hairdre,si'lg saloon ~nd bC..luty shop> 834-
S~rvlce; rendf:r~d bl p()rtr~it and commer-Cial photograpillc studies 885
89 SERVICgS (NOT EliillWHERE CLAS3IFIED)-
Servic,~s rendered by o[O'anislitions or indio vidual, not elsewhere cla~ified' a90
Division 9 Activities not adequa~ely delJeribed
90 Activ.iti~ _un'pt.."Cified' and not adequately d~3Cjlbed mcluding activities of such indi~lduals ,who fail to provide sufficient l?formatlOn about their industrial affiliation to enable them to be clas3ified Fresh entrants to the Labour Market
91)0 999
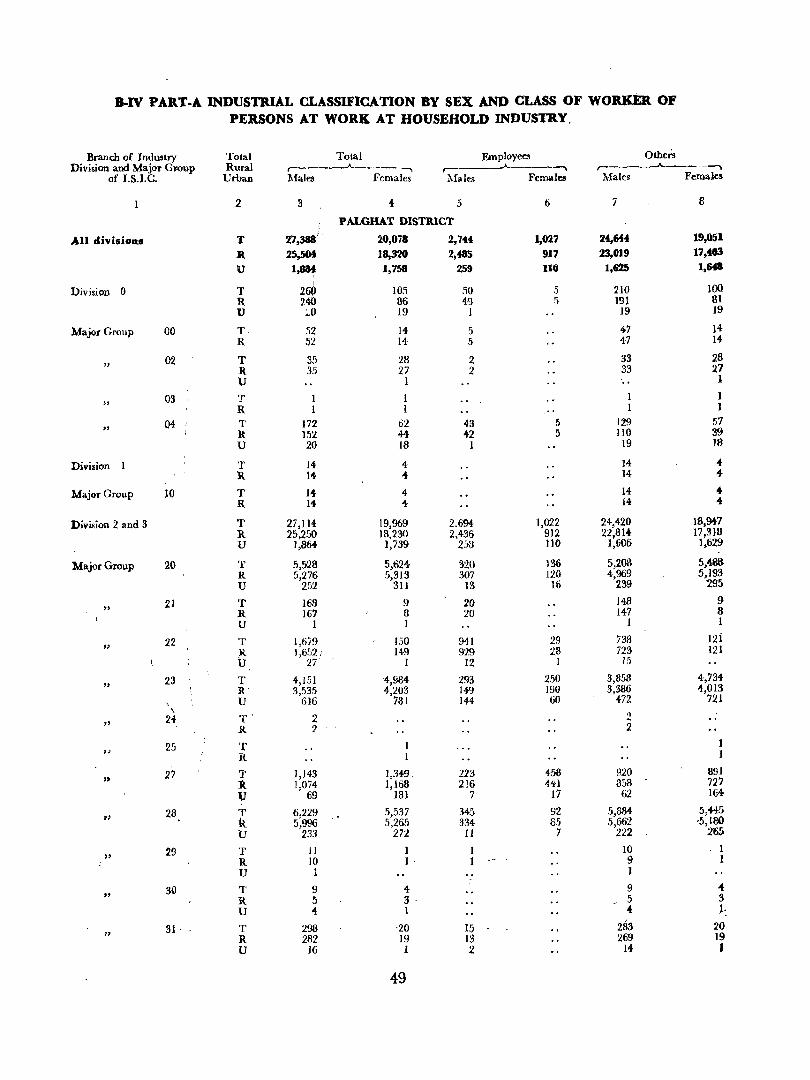
B-IV PAllT-A INDUSTlUAL CLASSIFICATION BY SEX AND CLASS OF WOR.KER OF PERSONS AT WORK AT HOUSEHOLD INDUSTRY.
Branch of Industry Total Total Employees Others Division and Major Group Rural
, __ __A. ___ ---., ,--____.A.--..-, ,..-------"- --... of I.S.I.C. Urban Males Females Males Females Males Females
2 3 4 5 6 7 8
, PALGHAT DISTRICT
All ciivisioD. T 27,388/- 20,078 2,744 1,027 2f,Mf 19,051
R 25,5M 18,320 2,485 917 23,019 17,483
U 1,~ 1,758 259 no 1,625 1,648 r
Division 0 T 2~ 105 50 5 210 100 R 24 86 49 5 191 81 U :..0 19 1 19 19
Major Group GO T, 52 14 5 47 14-R 52 14 5 47 14
" 02 T 35 28 2 33 28
R 35 27 2 33 27 U I .. 1
" 03 T
R "
" 04 I' T 172 62 43 5 1:t9 57
R. 152 44 42 5 110 39 U 20 18 1 19 18
Division 1 T 14- 4 J4 4-R 14- 4- 14 4-
Major Group 10 T 14- 4 14 ... R. 14 4- 14 ...
Division 2 and 3 T 27,114- 19,969 2.694- 1,022 24,420 18,94-7 R. 25,250 18,230 2,436 912 22,814- 17,318 U 1,864- 1,739 2.';8 llO 1,606 1,629
Major Group 20 T 5,528 5,624- 320 136 5,200 5,4138 R 5,276 5,313 307 120 4,969 5,193 U 252 311 13 16 239 295
" 21 T 168 9 20 148 9
R 167 8 20 147 8 U 1 1 1 I
" 22 T 1,6/9 150 94-1 29 738 12i
;It 1,652.' 149 929 28 723 121 U 27 1 12 I 15
" 23 T 4,151 4,984 293 2.')0 3,353 4,734
R. 3,535 4,20:3 149 190 3,386 4,013 U 616 781 114 60 472 721
\
" 24 '1" 2 2
R. 2 2
" 25 'l'
It
.. 27 T 1,)43 1,34-9. 223 458 920 891
t 1,074 1,168 216 441 358 727 69 181 7 17 62 164
., 28 T 6,229 5,537 345 92 5,884 5,445 it 5,996 5,265 334 85 5,662 '5,100 U 233 272 11 7 222 265
~, 29 T Jl 1 10 . 1
R 10 I . 9 1 U 1 1
" 30 T 9 4- 9 4-
R. 5 3· 5 3 U 4- 1 4: J.
" 31· T 298 -20 15 2113 20
R. 282 19 13 269 19 U 16 1 2 14 I
49
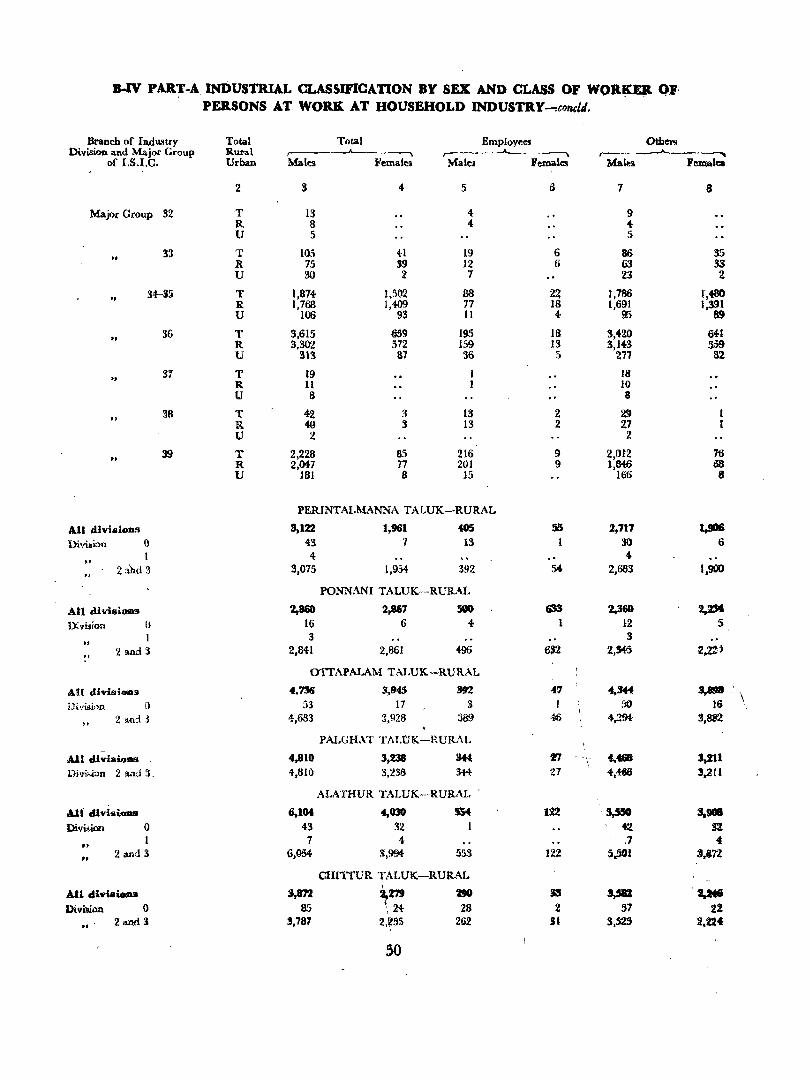
~ PART·A. INDUSTRIAL CLASSIFICATION BY SEX AND CLASS OF WOR~ ()F' PERSONS AT WORK AT HOUSEHOLD INDUSTRY -:concltl.
Brandl of bdUl!uy Total Total Employees Others Di.vision and Major Group Rlttal ,..-----"--_-..-., ,--~
of I.S.I.C. Urban Malo Females Males Females Malc:s Femalea
2 3 4- 5 I) 7 8
Major Group 32 T 13 4- 9 R B 4- 4: U 5 5
.. 33 T 10..'1 41 19 6 86 35 R 75 39 12 6 63 33 U 30 2 7 23 2
.. 34-3~ T 1,874- 1,502 sa 2~ 1,786 r,480 R 1,768 1,409 77 18 1,691 1,391 U 106 93 11 4- 95 89
.. 36 T 3,615 (159 195 18 3,420 1*1 R 3,302 572 159 13 3,143 559 U 313 87 36 5 277 82
., 3" T 19 18 R 11 10 U 8 8
.. 38 T 42 3 13 2 29 R 40 3 13 2 '1.7 tJ 2 2
.. 39 T 2,228 85 216 9 2,01'2 11)
R 2,047 77 201 9 1,846 ISS U 181 8 15 166 8
PERINTALMANNA TALUK-RURAL
&11 divisi_ 3,122 1,961 405 55 2,111 t.J06 IAvision 0 43 7 13 30 6
" 1 4 4-
2 ahd 3 3,075 l,9S4 392 54 2,683 1,900
PONNANITALUK-RU~~
All dlvisiOD!I 2.- 2,861 5QO c;.1S 2,_ 2,2'.M D;v~ion 0 16 G 4- 12 5
3 3
OJ 2 and:} 2,841 2,861 496 6n 2,345 2.Xl j
OTTAPALAM TALUK-RURAL
... It dh,{sioDS 4.736 3,945 392 of' ...,.. J.8!J8 . \ IJivisinn 0 53 17 3 1 5"0 16
2 ud 3 4,683 3,928 389 46 -t~ 3,882
PALGHAT TAL{JK-RURAl.
AU dlviaio_ 4.,810 3,238 3H 'EI .. \.
... - 3,tll L)lvihion 2 and 3. 4,810 3,238 3+4- 21 +,466 3.211
ALATHUR Tt\LUK--RURAL
.u( dlvilili_ 6,101 4,030 S54 U2 . !J,5.'lO 3,,-Divi.~jon 0 43 32 42 32 .. 1 7 4- .1 .. .. 2 and 3 G,054 3,004 553 lZ2 S.501 '.an
CHI1'TUR TALUl(-RURAL \
J3 I t.MS AU diviaioas a,m ~~ 290 3,SI3
DivilJiDn 0 85 , 28 2 !J7 U 'J
2andl 3,781 2,~5~ 2G2 st 3,525- %.22.
50

B·IV PART-B INDUSTRIAL CLASSIFICATION BY SEX AND CLASS OF WORKER OF PERSONS AT WORK IN NON.HOUSEHOLD INDUSTRY, TRADE, BUSINESS,
PROFESSION OR SERVICE
Branch of Industry Tolal Employer Employee SingJe worker Family worker Division and Major Total r---~----, , A.. ___ -, r-----A-...,. ,-___ .A. __ -, r--_J. , group of 1. s. I. c. Urban 1\1 F M F M F M F M F
1 2 3 4 5 cl 7 8 9 10 11 12
PALGHAT DISTRICT
All DivisioDs T 217,383 65,985 5,404 190 89,879 26,420 115,399 36,287 7,201 3,088 U 34,268 8,174 1,826 15 16,176 3,926 15,476 4,048 791 185
Division ° T 26,418 4,527 315 49 15,081 3,106 7,511 725 3,511 647 U 1,904 30 18 1 513 8 1,353 21 20
_Majur group 00 T 5,631 1,085 123 46 983 156 2,553 507 1,972 376 U 102 !5 3 1 4-6 3 53 1
" 01 T 4,778 2,697 52 4,515 2,664- 145 29 66 4-
U 21 3 1 16 2 4 1
" 02 T 3,170 177 14- 1,435 128 1,711 41 10 8
U 109 I 1 52 1 56
" 03 T 3,803 6 107 1,747 1 1,856 5 93
U 1,257 4- 10 193 1,050 4 4
" 04 T 9,036 562 19 3 6,401 157 1,246 143 1,370 259
U 415 17 3 206 2 190 IS 16 -Division T 1,6:i4 126 1 392 51 1,256 74 5
U 62 2 7 55 2 Major group 10 T 1,654 126 392 51 1,256 74 5
U 62 2 7 55 2 Division 2 and 3 T 33,515 5,163 821 10 17,221 2,577 15,017 2,419 456 157
U 6,253 1,464- 373 3 3,355 659 2,393 790 132 12
Major group 20 T 2,712 1,793 270 6 1,745 780 605 920 92 87 U 598 198 93 2 370 89 III 106 24 1
" 21 T 413 19 41 240 11 114- 5 18 3
U 82 19 52 9 2
" 22 T 6,257 91 117 5,152 75 957 12 31 3
U 1,260 10 28 949 5 281 5 2
" 23 T +t4 791 7 340 109 92 658 5 24-
U 69 529 4 45 8 20 512 9
" 24 T 86 42 39 5
U 25 11- 11
., 25 T 1 1
" 27 T 3,549 1,087 137 2 1,296 672 2.034- 4-11 82 2
U 1,030 516 64- 405 440 526 76 35
" 28 T 11,695 385 32 S,112 123 8,512 239 39 22
U 897 26 23 177 10 695 15 2 ., \ 29 T 13 5 6 5 7
U 1 I .. 30 T 366 2 26 290 2 43 7 I (J 194- 21 1-40 26 7
" 3't, T 322 IS 107 199 3
U 16 10 39 27 .. 32 ,T 176 3- 154 16 3 .·U 51 2 39 8 2
. ., g3 'T 968 506 46 843 486 69 %0 16 U 261 64 28 216 58 13 6 4-.. 34·85 T 1,314- 390 22 861 258 4-26 126 5 6 U 290 106 11 137 35 141 69 1 Z
., 36 T 2,519 64- 29 1,713- 38 711 16 66 10 U 398 7 17 218 7 140 23
" 37 T 136 :4 .. 114 2 18
U 45 1 3 31 1 11
" 38 T 762 4 39 575 3- 132 1 16
U +to 3- 3t 333- 3 66 10
.. 39 T 1,782 22 35 630 IS 1,043 9 U. U 536 4 19 189 3 308 1 ae
Division .(- T 9.921 1,2'37 203 6,(21) 896 3,oS8 Ml U 1,081 136 35 " 43S 28 619 198
51 25/328-7
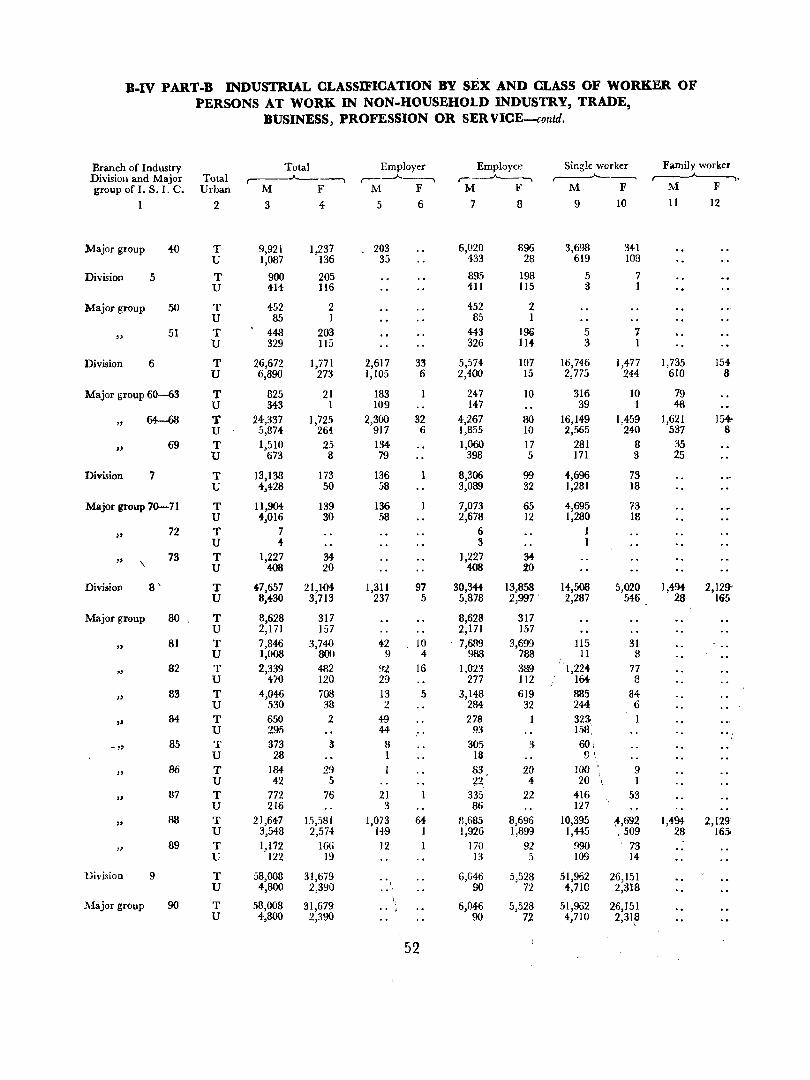
B-1Y PART-B INDUSTRIAL CLASSIFICATION BY SEX AND CLASS OF WORKER OF PERSONS AT WORK IN NON. HOUSEHOLD INDUSTRY, TRADE,
BUSINESS, PROFESSION OR SER VICE-contd.
Branch of Industry Total Employer Employee Single worker Family worker Division and Major Total ,.-.A--__ -, r----"------, ~ .. r---"--~ ,---~,
group of I. S. I. C. Urban M F M F M F M F 1\1 F
1 2 3 4 5 6 7 8 9 10 11 12
Major group 40 T 9,921 1,237 203 6,020 896 3,698 341 U 1,087 136 35 433 28 619 108
Division 5 T 900 205 895 198 5 7 U 414- 116 411 115 3 1
Major group 50 T 452 2 452 2 U 85 1 85 1
" 51 T 448 203 443 199 5 7
U 329 115 326 114 3 1
Division 6 T 26,672 1,771 2,617 33 5,574 107 16,746 1,477 1,735 154 U 6,890 273 1,105 6 2,400 15 2,775 244 610 8
Major group 60-63 T 825 21 183 247 10 316 10 79 U 343 1 109 147 39 1 48
" ~ T 24,337 1,725 2,300 32 4,267 80 16,149 1,459 1,621 15~
U 5,874- 26{ 917 6 1,855 10 2,565 240 537 8-
" 69 T 1,510 25 134- 1,060 17 281 8 35
U 673 8 79 398 5 171 3 25
Division 7 T 13,138 173 136 8,306 99 4,696 73 U 4,428 50 58 3,089 32 1,281 18
Major group 70-71 T 11,904 139 136 7,073 65 4,695 73 U 4,016 30 58 2,678 12 1,280 18
" 72 T 7 6 I
U 4 3 1
" \ 73 T 1,227 34- 1,227 34
U 408 20 408 20
Division 8' T 47,657 21,104- J,3Jl 97 30,344- 13,858 14,508 5,020 1,494 2,129-U 8,430 3,713 237 5 5,878 2,997 ' 2,287 546 28 165
Major group 80 , T 8,628 317 8,628 317 U 2,171 157 2,171 157
" 81 T 7,846 3,740 42 10 " 7,689 3,699 ll5 31
U 1,008 800 9 4 988 788 11 8 82 T 2,339 482 92 16 1,023 389
"
1,221- 77 " U 470 120 29 277 112 IGt 8
" 83 T 4,046 708 13 5 3,148 619 885 84
U 530 38 2 284 32 244 6 I .. 84 T 650 2 4-9 278 323~
U 295 44 93 158. .. , -" 85 T 373 3 8 305 3 60l
U 28 1 18 9 "
" 86 T 184 29 83 20 100 • 9
U 42 5 ~2 4 20 I, 1
" 87 T 772 76 21 335 22 416 53
U 216 3 86 127
" 88 T 21,647 15,581 1,073 64- 8,685 8,696 10,395 ,~,692 1,494 2,129"
U 3,548 2,574 H9 1 1,926 1,899 1,445 ,509 28 165.
" 89 T 1,172 IG6 12 170 92 990 73
U 122 19 13 5 109 ,14-
Division 9 T 58,008 31,679 6,G46 5,528 51,962 26,151 U 4,800 2,390 .. ' 90 72 4,710 2,318
Major group 90 T 58,008 31,679 .. , 6,046 5,528 51,962 26,151 U 4,800 2,390 90 72 4,710 2,31~
52
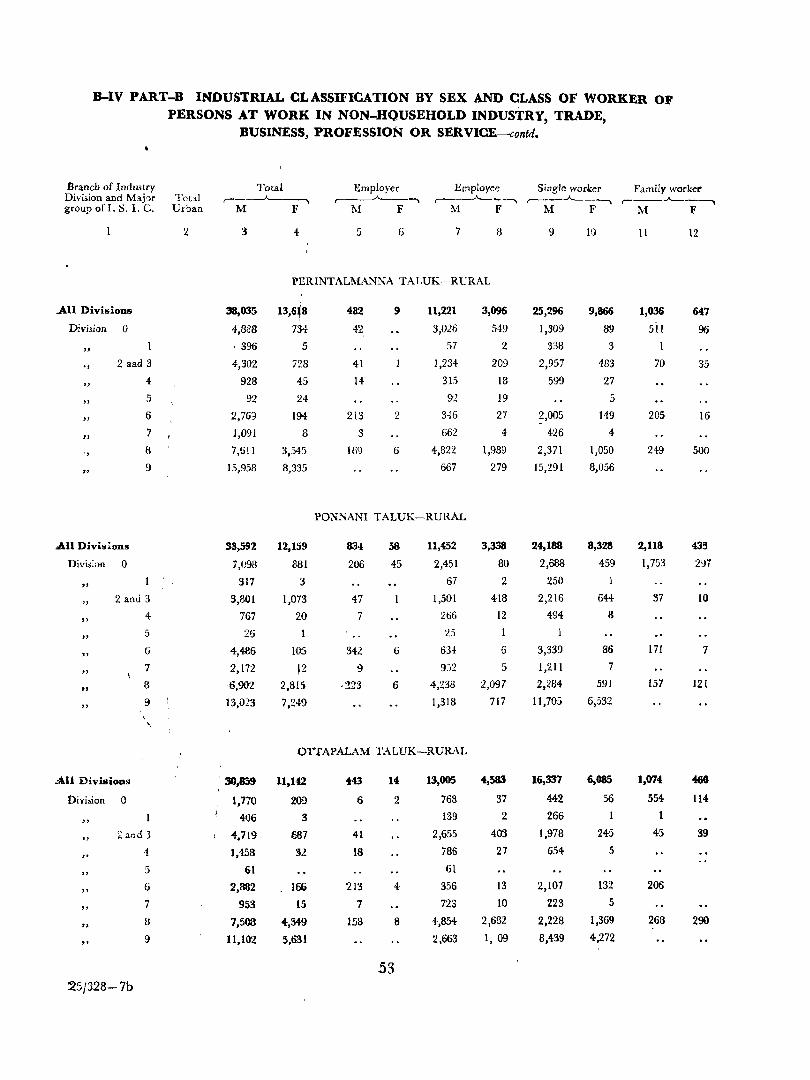
B-IV PART-B INDUSTRIAL CLASSIFICATION BY SEX AND CLASS .OF WORKER OF PERSONS AT WORK IN NON-HQUSEHOLD INDUSTRY, TRADE,
BUSINESS, PROFESSION OR SERVICE-contd.
Branch of Indrutry Division and Maj'}r group of I. S. I. c.
AU Divisions
Division
.,
" " " " .,
"
o
2 aad 3
4
5
6
7
8
9
AU Divisions
Division 0
" " "
2 and 3
4-
"
" " "
All Divisions
Divi,ion 0
5
6
7
8
9 \
"
" <: and 3
" " " " "
25J328-7b
4
5
6
7
8
9
Tot:!1 Urhan
2
Total ,-__ ..A..---,
M ]:0'
3
Employer ,..-----A----,
i\I F
5 6
Employee ,-----A-__ -..,
!vI F
7 8
PERINTALMANNA TALUK-RURAL
38,035 13,6.8
4,8H8 734
, 396 5
4,302 723
923 45
92 24
2,769 194-
1,091 8
7,611
15,953
3,545
8,335
33,59'2 12,159
7,098 881
317 3
3,801
767
26
4,485
2,172
6,902
13,023
1,073
20
105
j2
2,815
7,249
42
41
14
213
3
169
9
2
6
11,221
3,026
57
1,234
315
92
3-i6
662
4,822
667
PONNANI TALUK-RURAL
834
206
47
7
342
9
··223
58
45
6
6
11,452
2,451
67
1,501
266
25
63f
9::;2
4,238
1,318
OTTAPALAM TALUK-RURAL
. 30,859 11,142
1,770 209
406 3
4,719
1,458
61
2,882
953
7,508
11.102
687
32
166
15
4,349
5,681
443
6
41
IS
213
7
158
14
2
4-
8
53
13,005
768
139
2,655
786
61
356
723
4,854
2,663
3,096
549
2
209
18
19
27
4
1,989
279
3,338
80
2
418
12
1
6
5
2,097
717
4,583
37
2
403
27
13
10
2,632
1, 09
Single worker r----"----....__,
M F
9
25,296
1,309
338
2,957
599
2,005
426
2,371
15,291
24,188
2,688 250
2,216
494
3,339
1,211
2,284
11,705
16,337
442 266
1,978
654
2,107
223
2,228
8,439
9,866
89
3
483
27
5
149
4
1,050
8,056
8,328
459
1
644
8
86
7
591
6,532
6,085
56
1
245
5
132
5
1,369
4,272
Family worker ,...-__ ..A.. __ ----.
M F
11
1,036
511
1
70
205
249
2,118
1,753
37
171
157
1,074
554
45
206
268
12
647
96
35
16
500
435
297
10
7
121
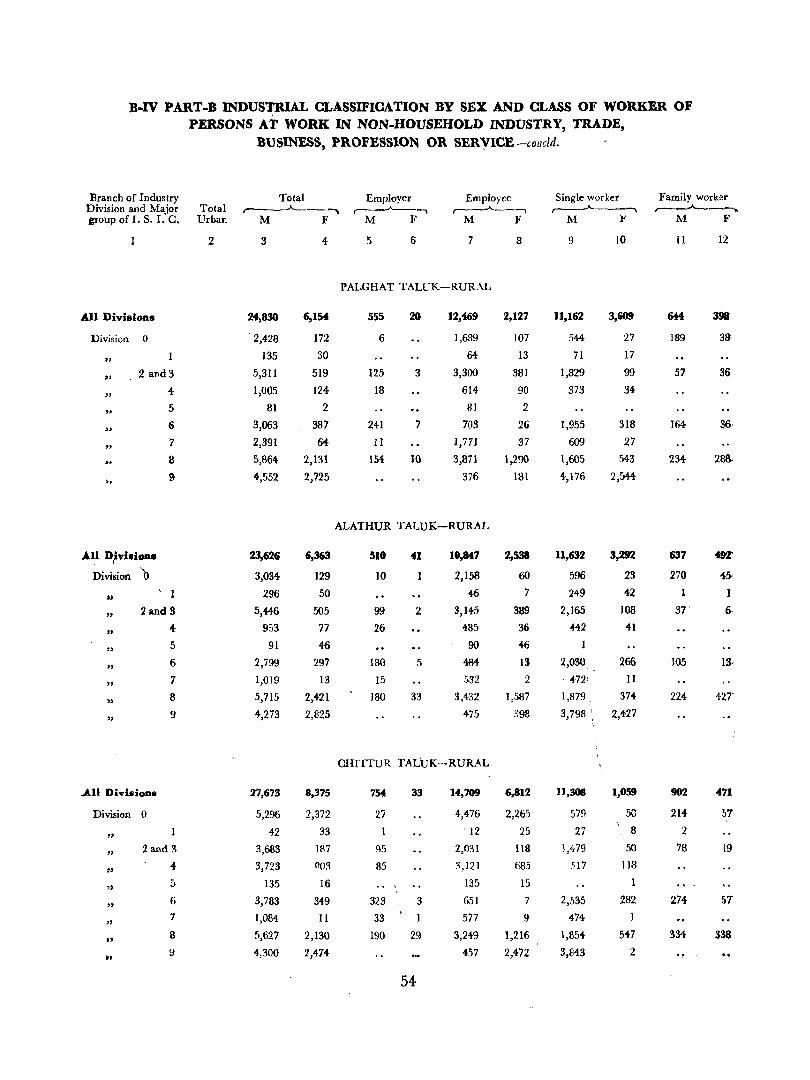
B-IV PART-B INDUSTRIAL CLASSIFICATION BY SEX AND CLASS OF WORKER OF PERSONS AT WORK IN NON.HOUSEHOLD INDUSTRY, TRADE,
BUSINESS, PROFESSION OR SERYICE-collcld.
Branch of Industry Total Employer Employee Single worker Family worker Division and Major Total r-----A--~ ,---.A.-........--, r---..A.----, ,-~ ,..---J-----,. group of 1. S. 1. C. Urban M F M F M F M 1<' M F
2 3 4- 5 6 7 8 9 10 II 12
PALGHAT TALUK-RURAL
All Divisions 24,830 6,154 555 20 12,469 2,127 11,162 3,609 644 398
Division 0 2,428 172 6 1,689 107 544 27 189 3S',
" 135 30 64 13 71 17
" 2 and 3 5,311 519 125 3 3,300 381 1,829 99 57 36-
" 4- 1,005 124 18 614 90 373 34
" 5 81 2 81 2
6 3,063 387 241 7 703 26 1,955 318 164 36,
" 7 2,391 64 1l 1,771 37 609 27
8 5,864 2,131 154 10 3,871 1,290 1,605 543 234- 288·
h 9 4,552 2,725 376 181 4,176 2,544
ALAIHUR TALUK-RURAL
All D\iviaiOll. 23,626 6,363 510 n 10,847 2,538 11,632 3,292 637 4n
Division '0 3,034 129 10 2,158 60 596 23 270 45· ,
1 296 50 46 7 249 4-2 1 .. "
2 and 3 5,4-46 505 99 2 3,145 389 2,165 108 37 6
" 4- 953 77 26 485 36 4-42 41
" 5 91 4-6 90 46 1
" 6 2,799 297 180 5 484- 13 2,030 266 105 ]3-
I·
" 7 1,019 13 15 532 2 ·472: 11
)' 8 5,715 2,421 180 33 3,432 1,587 1,1179, 374 224- 427
" 9 4,273 2,825 475 S98 3,798 :, 2,427
CHITTUR TAL'uK-RURAL
..All Divisions 27,673 8,375 754 33 14,709 6,812 11,308 1,059 902 471
Division 0 5,296 2,372 27 4,476 2,265 579 50 214 51
" 42 33 ' 12 25 27 8 2
" 2 and 3 3,683 187 g5 2,031 118 1,479 50 78 19
" 4 3,723 00:1 85 3,121 685 517 lIB
" 5 135 16 135 15 1
" 6 3,783 349 323 3 651 7 2,535 282 274 57
" 7 1,084 11 33 577 9 474 1
.. 8 5,627 2,130 190 29 3,249 1,216 1,854 547 334- 338
If ~ 4,300 2,474- 457 2,472 3,84~ 2
54
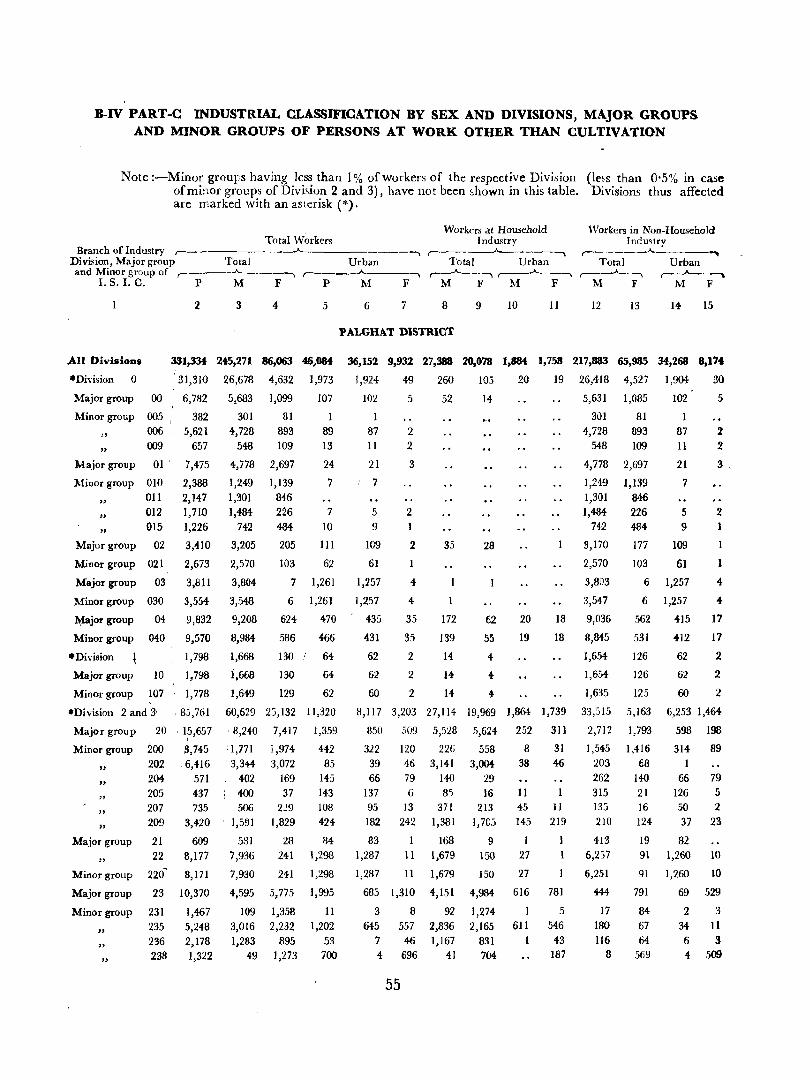
B-IV PART-C INDUSTRIAL CLASSIFICATION BY SEX AND DIVISIONS, MAJOR GROUPS AND MINOR GROUPS OF PERSONS AT WORK OTHER THAN CULTIVATION
Note :-Minor groups having less than 1 % of workers of the respective Division (le~s than 0'5% in case of minor groups of Division 2 and 3), have not been shown in this table. Divisions thus affected are marked with an asterisk (*).
Total "Vorkers Branch of Industry r-
Workers at Household Industry
Workers in Non-Household Inc!u'try
,-__ _____...A-. ____ ~
Division, Major group Total Urban Total Urban Total Urban and Minor group of ,-___ .A., ___ --, ,-__ ~ ___ .., ,-_.A._.., ,.---.A. __ , ,-----..._______, ,--"--~
I. S. 1. C. P M F P M F M F M F ~1 F M F
All Divisions
* Division 0
Major group
Minor group
" "
Major group
Minor group
" " "
Major group
Minor group
Major group
Minor group
l\dajor group
Minor group
* Division
00
005 , 006 009
01 '
010
011 012
015
02
021
03
030
04
040
Major group 10
Minor group 107 , *Division 2 and 3'
Major group
Minor group
" " " " "
Major group
" Minor group
Major group
Minor group
" " "
20
200 202
204 205 207
209
21
22
220-
23
231
235 236
238
2
331,334
, 31,310
6,782
382
5,621 657
7,475
2,388
2,147
1,71.0
1,226
3,410
2,673
3,811
3,554
9,832
9,570
1,798
1,798
1,778
, 85,761
15,657
3,745
'6,416 571 437 735
3,420
609
8,177
8,171
10,370
1,4{)7, 5,248 2,178
1,322
3 4 5
245,271 86,063 46,084
26,678 4,632 1,973
5,683
301
4,728
548
4,778
1,249
1,301
1,484-
742
3,205
2,570
3,804
3,548
9,208
8,984
1,668
1,668
1,649
1,099
81 893
109
2,697
1,139
846
226
4M
205
103
7
6
624
586
130
130
129
107
1
89 13
24
7
7
10
III
62
1,261
1,261
470
466
64
64
62
60,629 25,132 11,320
,8,240
: 1,771 , 3,344-
402
i 400 506
],591
531
7,936
7,930
4,595
109
3,016 1,283
49
7,417
1,974
3,072
169
37 229
1,829
23 241
241
5,775
1,358
2,232 895
1,273
1,359
442 85
145
143 108
424
84 1,298
1,298
1,995
11 1,202
53 700
6 7 8 9 10 11 12 13 14 15
PALGHAT DISTRICT
36,152 9,932 27,388 20,078 1,884 1,758 217,883 65,985 34,268 8,17.
1,924 49 260 105 20 19 26,418 4,527 1,904 30
102 5 52 14 5,631 1,085 102 5
1 301 81 1
87 2 4,728 893 87 2 II 2 548 109 11 2
21 3 4,778 2,697 21 3 .
7 1,249 1,139 7 1,301 846
5 2 1,4M 226 5 2 9 742 484 9
109 2 35 28 3,170 177 109
61
1,257
1,257
435
431
62
62
60
4
4
35
35
2
2
2
1
172
139
14
14
I4
62
55
4
4
4
20
19
2,570
3,803
3,547
18 9,036
18 8,845
1,654
1,654
1,63.,)
!l,117 3,203 27,114 19,969 1,864 1,739 33,515
2,712 850 509 5,528 5,624 252 311
322 39
66
137
120 226
46 3,141
79 140 6 35
558
3,004
29 16
95 13 371 213
182 242 1,381 1,70:>
83 168 9
1,287 II 1,679 ISO
1,287 II
685 1,310
3 8 645 557
7 46 4 696
55
1,679
4,151
92
2,836 1,167
41
150
4,984
1,274
2,165 831
704
8 38
Il
31
46
45 11
145 219
I 1 27
27
616
61l
781
5 546
43 187
1,545
203
262
315 133
2JO
413 6,2')7
6,251
444
17
180
116 8
103 61
6 1,257 4-
4-
17
17
2
6 1,257
562 415
531 412
126 62
126
125
5,163
1,793
1,416
68
140 21
16
124
19 91
91
791
84
67
64 569
62 2
60 2
6,253 1,464-
598 198
314 89
1 66 79
126 5 50 2 37 23
82 1,260 10
1,260 10
69 529
2 3 34 11 6 3 4 509
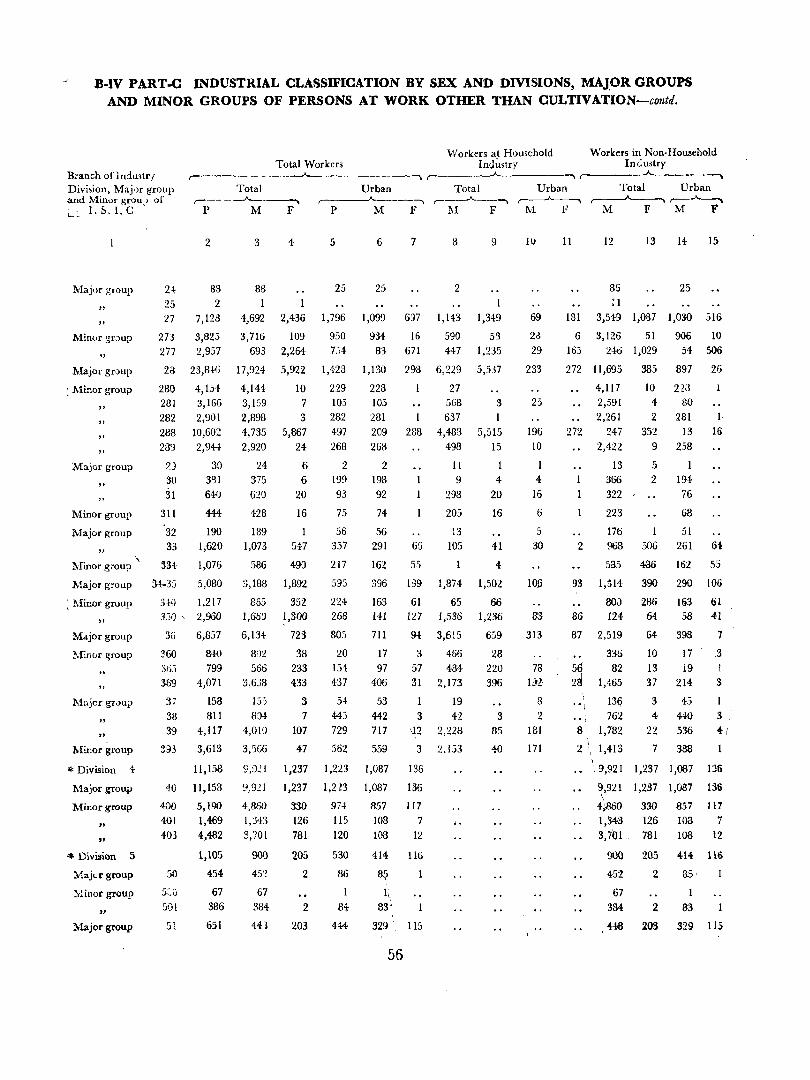
H-IV PART-C L."'lDUSTRIAL CLASSIFICATION BY SEX AND DIVISIONS, MAJOR GROUPS AND MINOR GROUPS OF PERSONS AT WORK OTHER THAN CULTIVATION-contd.
Total Workers ,-------~----
Total Urban
Workers at Household Indu>try
Workers in Non-Household Inc:ustl'Y
-. (._----"-._-- -. ~
Total Urban Total Urban Branch of Industrf Division, Maj.)r group and ~fin\)r grou,) of I..,~ I.S.I.C
,-. ____ -"--_ __. ,-_ __A,__ __ \ r------"-----., r---"----,. ~ r--'~
IvIaj.)r group
" "
:Minor gr.:>up
., Major group
: Minor group
" " " "
Major group
"
1'.finor group
Major group
. \ J'.fmor group
Major group
~ l\1inor group
" Major group
~rin()r group
" :Majcr grvllp
" "
MUlor group
'" Division 4
Major group
:Minor group
" "
'* Divillion 5
Maj<.c group
Minor group
" l\fajorgroup
P M F P M F 1\1 F
2~
25
'27
273 277
28
280 231
282
288 289
2) 30
31 311
32 33
2
83
2
7,123
3,823 2,957
23,8-1-6
4,154
3,166 2,901
10,602
2,9H
30 3>:11
640
444
190 1,620
334 1,076
~H-35 5,080
3-hl 1,217 330', 2,960
3D 6,857
~60 840
3
83
4,692
3,716
693
17,924
4,144 3,159
2,898 4,735
2,920
24 375 620
428
189 1,073
586
3,188
855 1,663
6,134
802
365 799 566
369 4,071 3,638
37 158 155
38 811 804
39 4,1l7 4,010
~93 3,613 3,566
40
400
401 403
50
51
1l,158
11,158
5,190
1,469 4,482
1,105
454
67
386
651
9,921
9,921
4,850 1,:]43
3,701
900
45'~
67 384
4.43
4
2,436
109
2,264
5,922
10 7
3 5,867
24
6 6
20
16
547
490
1,892
352 1,300
723
38 233 433
3 7
107
47
5
25
1,796
950 7':;4
1,423
229 105
282
497
268
2 199 93
75
56 357
217
595
224-268
80:;
20 151-437
5+ 443
729
562
1,237 1,223
1,237 1,U3
330 974
126 115
781 120
205 530
2
2
203
86
1
8t 444
6
25
1,099
934
83
1,130
228 105
281 209
268
2 198 92
74
56 291
162
396
163 141
711
17 97
406
53
442 717
559
1,087
1,087
857
108 lOB
4.14
8~
1\: 83'
7
6:J7
16
671
293
1
1 288
65
55
D9
61 127
9+
3
8
2
1,143
590
447
6,229
27 568 637
4,43S 498
II 9
293
205
13 105
1,874
65 1,536
3,615
466
57 484
31 2,173
19
3 42 J2 2,221)
'3 2.153
136
136
Il7 7
12
116
329'. 115
56
9
1,349
5'3
1,235
5,537
3
1
5,515
15
1
4 20
16
41
4
1,502
66 1,236
659
28 220
396
3 85
40
M F M f M F
Iv
69
2a 29
233
25
196 10
4
16
6
5 30
106
83
313
78
1:J2
8 2
181
171
11
181
6 165
272
272
2
93
86
87
}
"1
12
86 : 1
13 14
25
3,549 1,087 1,030
3,126 51 906
240 1,029 54
11,695
4,117 2,591
2,261
247 2,422
13 366
322
223
176
385 897
10 223 4 SO
2 281
352 13
9 258
5 2 194-
76
68
51
IS
516
10
506
26
I· 16
968 506 261 64
535
1,314
80J 124
2,519
336
32 1,465
136
762
486
390
286 64
64
10
162
290
16,3 58
398
17
13 19 37 214
3 45
4 440
55
106
61 41
7
.3
3
8 1,732
2 \ 1,413
22 536
7 388
3
4/
1
\ 9,921 1,237 1,087 136
9,921 1,237 1,087 136
4-)160 330 857 Il7
1,343 126 103 7 3,701. 781 108 12
900 205 414 116
452 2
67
334 2
448 203
85
1
33 1
329 115
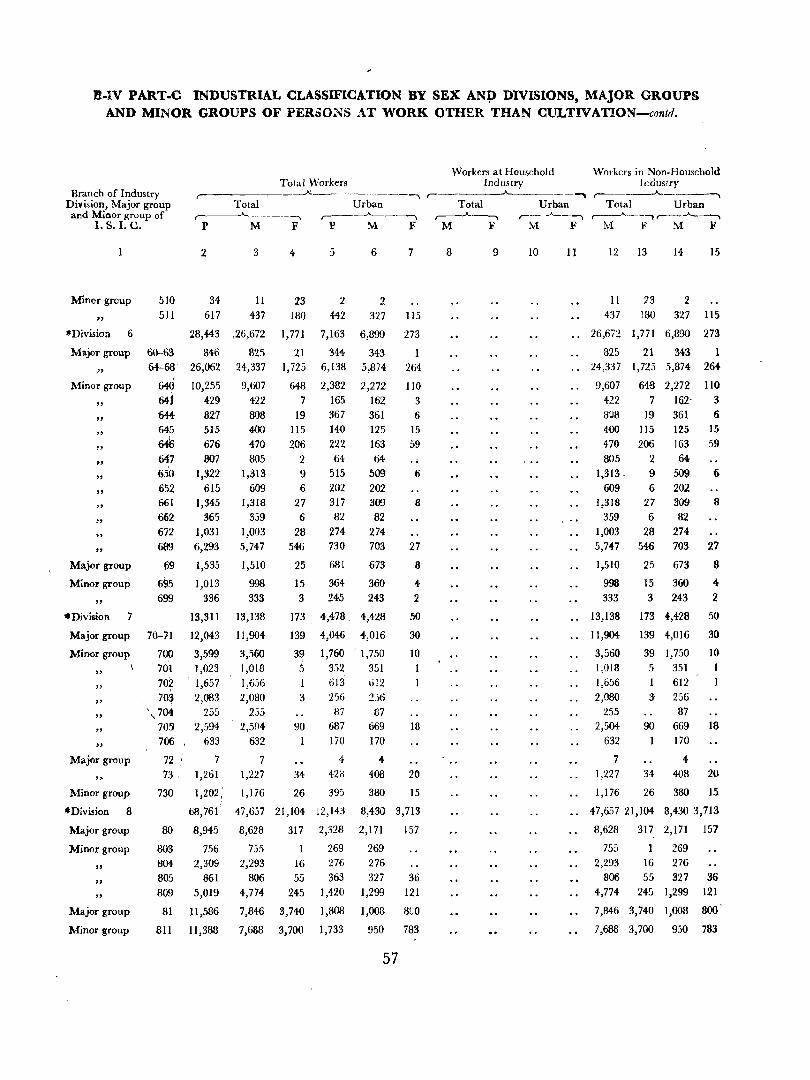
R-IV PART-C INDUSTRIAL CLASSIFICATION BY SEX AN:P DIVISIONS, MAJOR GROUPS AND MINOR GROUPS OF PERSO~S AT WORK OTHER THAN CULTIVATION-contd.
Workers at Household Workers in Non-Household Total Workers Industry Jndustry
Branch of Industry Division, Major group and Minor group of
1. S. 1. C.
...--______ __fi. _______ -, r- ____ --'-______ -..,. ,----__ --A._ _ _______
Minor group
" *Division 6
Major group
" Minor group
" " " "
" " " " " "
Major group
Minor group
.Division 7
Major group
Minor group
" \
" " "
" Major group
Minor group
.Division 8
Major group
Minor group
" " "
Major group
Minor group
Toral Urban ---,
p M F
2 3
510 34 11 511 617 437
28,443 ,26,672
60-63 846 825 64-68 26,062 24,337
640 10,255 9,607
64j 429 422
644 827 808 M5 515 400 646 676 470 647 807 805
650 1,322 1,313
652 615 609 661
6<i2 672
689
69 695
699
1,345 365
1,031
6,293
1,535
1,013
336
1,318
359 1,003
5,747
1,510
998 333
70-71
700
701 702 70~
13,311
12,043
3,599 1,023
'. 1,657
2,083 255
2,594 633
13,138
11,904
3,560
1,018 1,6:)6
2,080 , 704' '.
705 706 ,
72: 7'
255 2,504
632
7 1,227
4
23 180
1,771
21
1,725
648
7
19 115
206
2 9 6
27
6 28
546
25
15
3
173
139
39 ;. .)
3
90
34
5
2 H2
7,163
344 6,138
2,382 165 367 140
222 64
515
202
6
2 327
6,890
343 5,874
2,272
162 361 125
163
64 509
202 317 309
82 82
274 274 730 703
681 673
364 360
245 243
4,478. 4,428
4,046 4,016
1,760 '1,750
352 351
613 612
256 2_)6
87 87 687 669
liO 170
4: 4 428 408
7
115
273
264
IIO 3
6 15
59
6
8
27
8
4
2
50
30
10
18
20 73,
730
1,261,
1,202,'
68,761!
8,945'
756 2,309
861
5,019
1,176 26 395 380 15
80
803 804
805
809
81
811
11,586
11,388
47,657 21,104 12,143
8,628 317 2,328
755
2,293
806 4,774
7,846
7,688
16
55 245
3,740
3,700
269 276
363 1,420
1,808
1,733
8,430 3,713
2,171 157
269 276
327
1,299
1,008
950
57
36
121
8LO
783
Total ~
M F
8 9 10
Urban Total Urban
11 12 13 14 15
11 23 2 437 180 327 115
26,672 1,771 6,390 273
825 21 343 1 24,337 1,725 5,374 264
9,607
422 8~8
400 470
805
1,313 -
609 1,318
359 1,003
5,747
1,510
998 333
13,138
11,904
3,560 1,013
1,656
2,080 255
2,504
632
7 1,227
648 2,272 110
7 162- 3
19 361 6 115 125 15
206 163 59
2 64-9 509 6 6 202
27 309
6 82 28 274
5% 703
25 673
15 360 3 243
173 4,428
139 4,016
39 1,7.'}0
.5 351
I 612
3 256 87
90 669
170
4 3-1- 408
8
27
8
4: 2
50
30
10
18
20
1,176 26 380 15
47,657 21,104 8,430 3,713
8,628 317 2,171 157
755 1 269
2,293 16 276 806 55 327 36
4,774 245 1,299 121
7,846 3,740 1,008 800
7,688 3,700 950 783
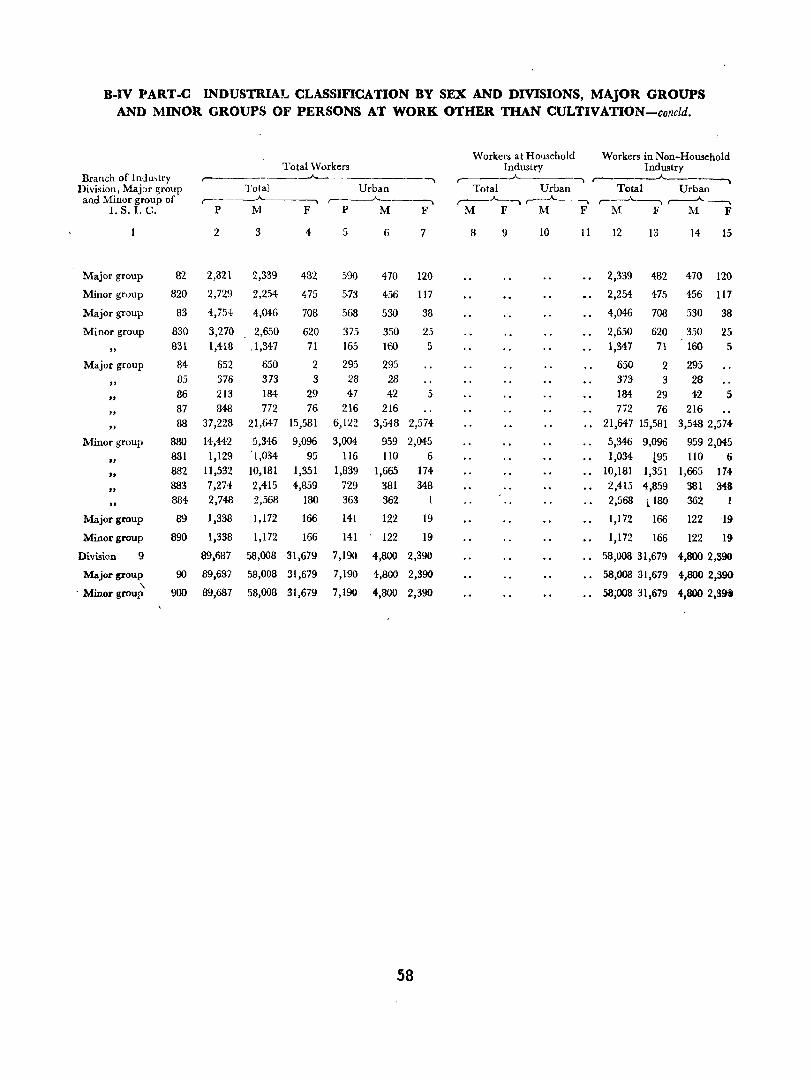
B-IV PART-C INDUSTRIAL CLASSIFICATION BY SEX AND DIVISIONS, MAJOR GROUPS AND MINOR GROUPS OF PERSONS AT WORK OTHER THAN CULTIVATION-coneld.
Workers at Household Workers in Non-Household Total 'Workers IndUitry Industry
Branch of Indmtry ,--- ., ,--- ., , ___ -A-_~
Division, Major group Total Urban Total Urban Total Urban and Minor group of , __ --A--------., ,-~-------, r----'--., ,----"-------- ,---A.-----, ,---"----.,
I. s. I. C. P M F P M F M F M F M F 1\1 F
2 3 4 5 6 7 8 9 10 11 12 13 14 15
Major group 82 2,821 2,339 482 590 470 120 2,339 482 470 120
Minor group 820 2,729 2,254 475 573 456 I17 2,254 475 456 117
Major group 83 4,754 4,046 708 568 530 38 4,046 708 530 38
Minor group 830 3,270 2,650 620 375 350 25 2,650 620 350 25
" 831 1,418 ,1,347 71 165 160 5 1,347 71 160 5
Major group 84 652 650 2 295 295 650 2 295 .. 85 376 373 3 28 28 373 3 28
" 86 213 184 29 47 42 5 184 29 42 5
" 87 848 772 76 216 216 772 76 216
" 88 37,228 21,647 15,581 6,122 3,548 2,574 21,647 15,581 3,548 2,574
Minor group 880 14,442 5,346 9,096 3,004 959 2,045 5,346 9,096 9592,045
" 881 1,129 1,034 95 116 110 6 1,034 195 110 6
" 882 11,532 10,181 1,351 1,839 1,665 174 10,181 1,351 1,665 174-
" 883 7,274 2,415 4,859 729 381 348 2,415 4,859 381 348
" 884 2,748 2,568 180 363 362 2,568 ll80 362
Major group 89 1,338 1,172 166 141 122 19 1,172 166 122 19
Minor group 890 1,338 1,172 166 141 122 19 1,172 166 122 19
Division 9 89,687 58,008 31,679 7,190 4,800 2,390 58,008 31,679 4,800 2,390
Major group 90 89,637 58,008 31,679 7,190 4,800 2,390 58,008 31,679 4,800 2,300
" . Minor group 900 89,687 58,008 31,679 7,190 4,800 2,390 58;008 31,679 4,800 2,39 •
58
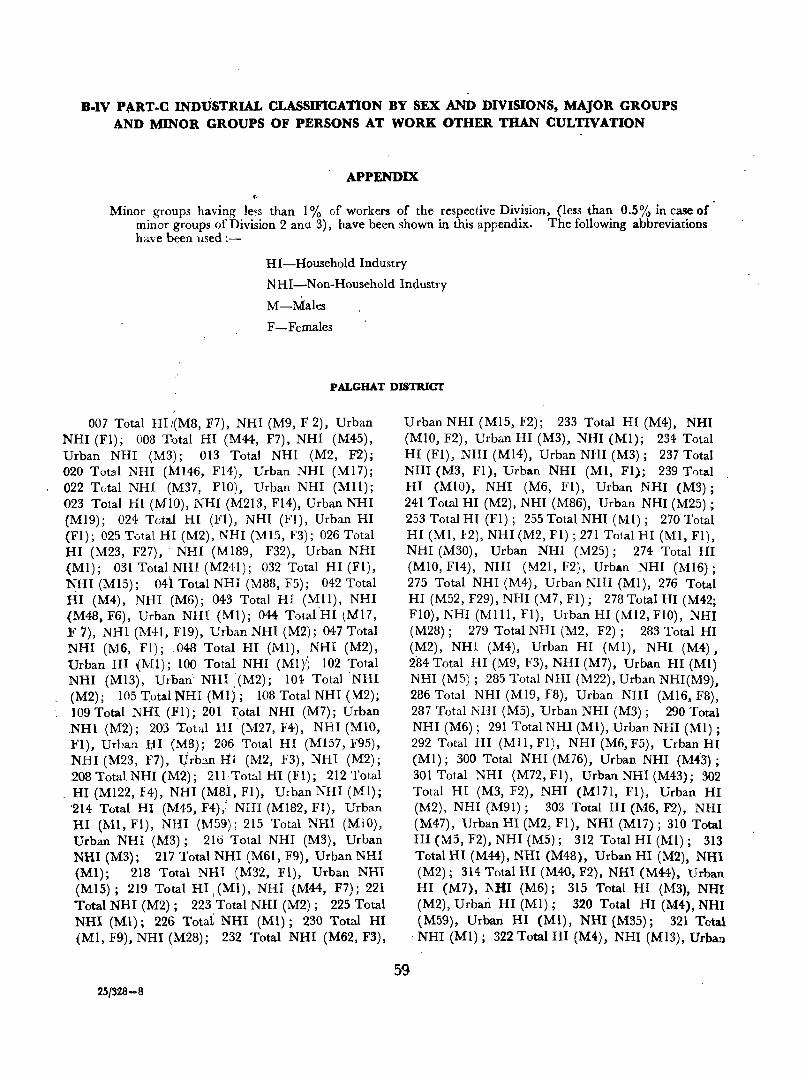
B.IV P.r\RT-C INDUSTRIAL CLASSIFICAttON BY SEX AND DIVISIONS, MAJOR GROUPS AND MINOR GROUPS OF PERSONS AT WORK OTHER THAN CULTIVATION
APPENDIX
Minor groups having le"s than 1 % of workers of the respective Division, (less than 0.5% in case of minor groups of Division 2 and 3), have been shown in this appendix. The following abbreviations have been used :-
HI-Household Industry
NHI_...Non-Household Industry
M-M:ales
F-Females
PALGHAT DISTRICT
, 007 Total HI/(M8, F7), NHI (M9, F 2), Urban
NHI (Fl); ODS TDtal HI (M44, F7), NHI (M4S), Urban NIH (M3); 013 Total NHl (M2, F2); 020 Total NIH (M146, FI4), Urban NHI (Ml7);
I 022 T<;tal NHI eM37, FlO), Urban NHI (Mil); 023 Total HI (MID), NHI (M213, FI4), Urban NHI (MI9); 024 Total HI (FI), NHI (Ft), Urban HI {Fl); 025 Total HI (M2), NHI (MIS, F3); 026 Total HI (M23, F27), NHI (MI89, F32), Urban NHI {MI); 031 Total NHI (M241); 032 Total HI (Fl), NHI (MI5); 041 Total NHI (M8S, F5); 042 Total HI (M4), NHI (M6); 043 Total HI (MIl), NHI {M48. F6), Urban NHI (MI); 044 Totat'HI (Mi7, F 7), NHI (M41, FIg), Urban NHI (M2); 047 Total NHI (M6, Fl); ,048 Total HI (Ml), NHI (M2), Urban HI (Ml); ,100 Total NHI (Ml).'; 102 Total NHI (MI3), Urban\ NHI '(M2); 104 Total NHI (M2); 105 Tutal NHI (MI); lOS Total NHI (\12); 109 Total NI-l'l (~l); 201 T:otal NHI (M7); Urban NHI (M2); 203 Total HI (M27, 1"4), NHI (MlO, Fl), Urban ljII (MS); 206 Total HI (MI57, F9S), NHI (M23, F7), llrban III (M2, F3), NHI (M2); 208 Total NHI (M2); 21l,Tot::.l HI (Fl); 212 Total
. HI (MI22, F4), NHI (MSl, FI), Urban NHI (Ml); '214 Total HI (M45, F4),,; NHI (MI82, FI), Urban HI (Mi, FI), NHl (M59); 215 Total NHI (MiO), Urban NHI (M3); 210 Total NHI (M3), Urban NHI (M3); 217 Total NHI (M61, F9), Urban NHI (Ml); 218 Total NHI (M32, FI), Urban NHI (MIS); 219 Total HI, (Ml), NHI (M44, F7); 221 Total NHI (M2); 223 Total NHI (M2); 225 Total NHl (Ml); 226 TotaL NHI (MI); 230 Total HI (MI, F9). NHI (M28); 232 Total NHI (M62, F3),
25/328-8
Urban NHI (MIS, F2); 233 Total HI (M4), NHI (MlO, F2), Urban HI (M3), NHI (MI); 234 Total HI (FI), NHI (M14), Urban NHI (M3); 237 Total NHI (M3, Fl), Urban NHI (MI, FI); 239 T()tal HI (MIO), NHI (M6, Fl), Urban NHI (M3); 241 Total HI (M2), NHI (MS6), Urban NHI (M25) ; 253 Total HI (FI); 255 Total NHI (MI); 270 Total HI (MI, 'F2), NHI (M2, FI) ; 271 Total HI (MI, FI), NHI (M30), Urban NIH (M25); 274 Total HI (MIO, FI4), NHI (M21, F2), Urban NHI (MI6); 275 Total NHI (M4), Urban NHI (MI), 276 Total HI (M52, F29), NHI (M7, FI); 278 Total HI (M42; FlO), NHI (MIll, FI), Urban HI (Ml2, FlO), NIH (M28) ; 279 Total NHI (M2, F2); 2S3 Total HI (M2), NHI (M4), Urban HI (MI), NHI (M4) , 284 Total HI (M9, F3), NHI (M7), Urban HI (MI) NHI (MS); 285 Total NHI (M22), Urban NHI(M9), 286 Total NHI (MI9, F8), Urban NHI (MI6. FS), 287 Totall'iHI (M5), Urban NHI (M3) ; 290 Total NHI (M6); 291 Total NHI (Ml), Urban NHI (MI) ; 292 Total HI (Mll, FI), NHI (M6, FS), Urban HI (MI); 300 Total NHI (M76), Urban NHI (M4'3); 301 Total NHI (M72, Fl), Urban NHI (M43); 302 Total HI (M3, F2), NHI (MI7I, Fl), Urban HI (M2), NHI (M91) ; 303 Total HI (M6, F2), NHI (M47), Urban HI (M2, Fl), NHI (Ml7); 310 Total HI (MS, F2), NHI (MS); 312 Total HI (MI); 313 Total HI (M44) , NHl (M48), Urban HI (M2), NHI (M2); 314 Total HI (M40, F2), NHI (M44), Urban HI (M7), l\HI (M6); 315 Total HI (M3), NHI (M2), Urban HI (MI) ; 320 Total HI (M4), NHI (M59), Urban HI (MI), NHI (M35); 321 Total
, NHI (MI); 322 Total HI (M4), NHI (MI3), Urban
59
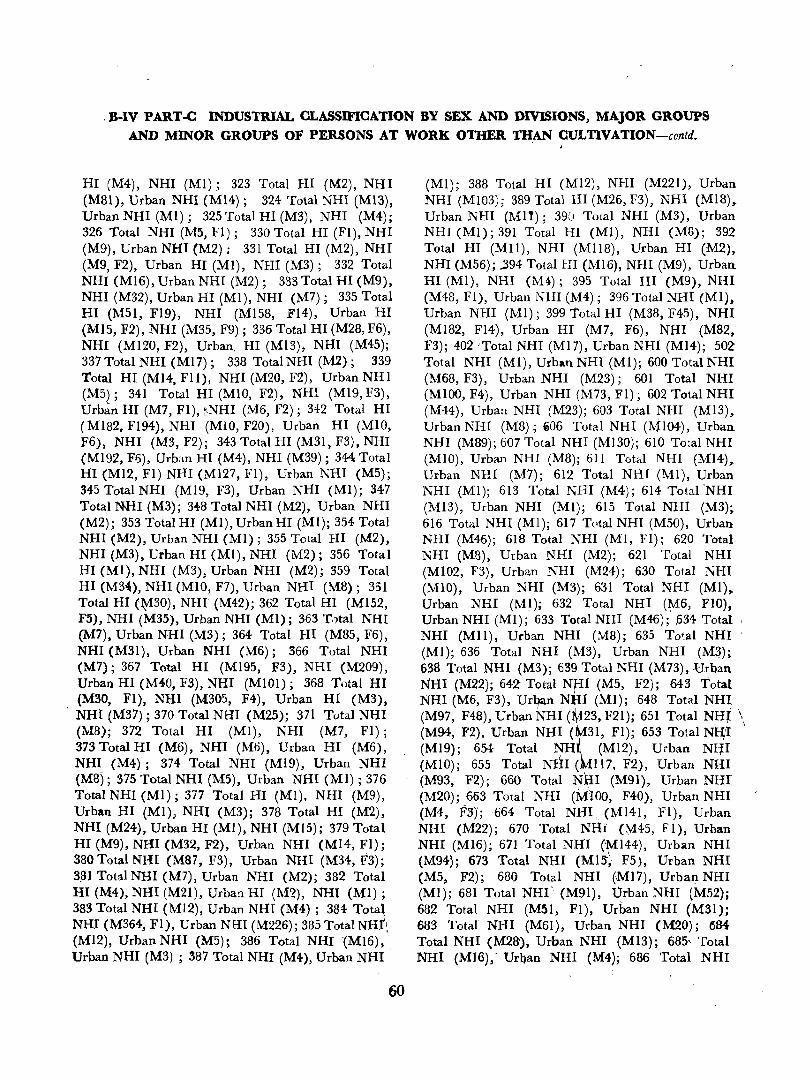
,B·IV PART·C INDUSTRIAL CLASSIFICATION BY SEX AND DIVISIONS, MAJOR GROUPS
AND MINOR GROUPS OF PERSONS AT WORK OTHER THAN CULTIVATION-contd.
HI (M4), NHI (Ml); 323 Total III (M2), NHI (M81), Urban NHI (MI4); 324 Total NHI (M13), UrbanNHI(Ml); 325 Total HI (M3), NHI (M4); 326 Total NHI (M5, Fl); 330 Total HI (Fl), NHI (M9), Urban NHI (M2); 331 Total HI (M2), NHI (M9, F2), Urban HI (Ml), NHI (M3); 332 Total NHI (M16), Urban NHI (M2); 333 Total HI (M9), NHI (M32), Urban HI (MI), NHI (M7); 335 Total III (M51, FI9), NHI (MI58, F14), Urban HI (MI5, F2), NHI (M35, F9); 336 Total HI (M28, F6), NHI (MI20, F2), Urban, HI (MI3), NHI (M45); 337 Total NHI (MI7); 338 Total NEll (M2) ; 339 Total HI (MI4, FIl), NHI (M20, F2), Urban NHI (M5); 341 Total HI (MIO, F2), NHI (MI9, F3), Urban HI (M7, FI), tNHI (M6, F2); 342 Total HI (MI82. FI94), NHI (MlO, F20), Urban HI (MIO, F6), NHI (M3, F2); 343 Total HI (M31, F3), NHI (M192, F6), Urban HI (M4), NHI (M39); 344 Total HI (M12, Fl) NHI (MI27, FI), Urban NHI (M5); 345 Total NHI (MI9, F3), Urban NHI (Ml); 347 Total NHI (M3); 34-8 Total NHI (M2). Urban NHI (M2); 353 Total HI eMl), Urban HI (MI); 354 Total NHI (M2), Urban NHI (Ml); 355 Total HI (M2), NHI (M3), Urban HI (MI), NHI (M2); 356 Total HI (MI), NHI (M3): Urban NHI (M2); 359 Total HI (M34), NHI (MIO, F7), Urban NHI (M8); 351 Total HI (:~30). NH! (M42); 362 Total HI (MI52, F5), NHI (M35), Urban NHI (Ml); 363 Total NHI (M7), Urban NUl (M3); 364 Total HI (M85, F6), NHI (M31), Urban NHI (M6); 366 Total NHI (M7); 367 Total HI (M195. F3), NHI (M209),
. Urban HI (M40, F3), ~HI (MIOI); 368 Total HI (M30, Fl), NHI (M305, F4), Urban HI (M3), NHI (M37) ; 370 Total NHI (M25); 371 Total NHI (M8); 372 Total HI (Ml), NHI (M7, FI); 373 Total HI (M6) , NHI (Mti) , Urban HI (M6), NHI (M4); 374 Total NHI (MI9), Urban NHI (MS); 375 Total NHI (M5), Urban NHI (Ml) ; 376 Total NHI (MI); 377 Total HI (Ml), NHI (M9), Urban HI (MI), NHI (M3); 378 Total HI (M2) , NHI (M24), Urban HI (Ml), NHI (MI5); 379 Total HI (M9), NIlI (M32, F2), Urban NHI (M14, Fl); 380TotalNHI (MS7, F3), Urban NHI (M34. F3); 3.81 Total NHI (M7), Urban NHI (M2); 382 Total HI (M4), NHI (M21), Urban HI (1\12), NHI (Ml); 383 Total NHI (MI2), Urban NHI (M4); 384 Tota' NHI (M364, FI), Urban NHI (M226); 385 Total NHI\ (MI2), Urban NHI (M5); 386 Total NHI ,(MI6), Urban NHI (M3) ; 387 Total NHI (M4), Urban NHI ...
60
(MI); 388 Total HI (MI2), NIH (M221), Urban NHI (MI03); 389 Total HI (M26, F3), NHI (MI8),. Urban NHI (MIt); 390 Total NHI (M3), Urban NHI (MI); 391 Total HI (MI), NHI (MB); 392 Total HI (MIl), NHI (M1I8), Urban HI (M2), NHI (M56); ...394 Total HI (M16), NHI (M9), Urban HI (MI), NHI (M"); 395 Total HI (M9), NHI (M48, Fl), Urban NHI (M4); 396 Total NHI (Ml). Urban NHI (Ml); 399 'total HI (M38. F45), NHI (M182, F14), Urban HI (M7, F6), NHI (M82, F3); 402 'Total NHI (MI7), Urban NHI (MI4); 502 Total NHI (MI), Urban NHI (MI); 600 Total NHI (M68, F3), Urban NHI (M23); 601 Total NHI (MlOO, F4), Urban NHI (M73, FI); 602 Total NHI (M44) , Urban NHI (M23); 603 Total NHI (MI3)~
Urban NHI (M8); i06 Total NHI CMI04) , Urban NHI (M89); 607 Total NHI (M130); 610 To:itl NHI (MIO), Urban NHI (M8); 611 Total NHI (MI4),. Urban NHI (M7); 612 Total NHI (Ml), Urban NHI (MI); 613 Total NHI (M4); 614 Total 'NHI (MI3), Urban NHI (MI); 615 Total NHI (M3); 616 Total NHI (MI); 617 Tc·tal NHI (M50), Urban NHI (M46); 618 Total NHI (MI, FI); 620 Total NHI (Ma) , Urban NHI (M2); 621 Total NHI (MI02, F3), Urban NHI (M24); 630 Total NHI (MI0), Urban NHI (M3); 631 Total NHI (MI)" Urban NHI (Ml); 632 Total NHI (M6, FlO), Urban NHI (Ml); 633 Total NHI (M46); .634 Total ' NHI (MIl), Urban NHI (~f8); 635 Total NHI (Ml); 636 Total NHI (M3). Urban NHI (M3); 638 Total NHI (M3); 639 Total NHI (M73). Urhan NIH (M22); 642 Tot'~l NflI (M5, F2); 643 Total NHI (M6, F3), Urban Nln (Ml); 648 Total NHI (M97, F48), Urban NHI (M.23, F21)j 651 Total NHJ \ (M94, F2), Urban NIH (M31, Fl); 653 Total N~'! (MI9); 654 Total NHt (M12), Urban NfJI (MlO); 655 Total Nl.J:r (,M] 17, F2), Urban NHI (M93, F2)j 660 Total Nt;II (M9l), Urban NHI (M20); 663 Total NHI CMilOO, F40), Urban NHI (M4, F3); 664 Total NHI. (MI4l, FI), Urban NHI (M22)j 670 Total NEll (\.145, FI), Urban NHI ,(MI6); 671 Total NHI (M144), Urban NtH
\ (M94); 673 Total NIH (Ml5", F5), Urban NHI (M5, F2); 680 Total NHI (Ml7). Urban NHI (Ml); 681 Total NHI (M91), Urban NHI (M52); 682 Total NHI (M51, Fl), Urban NHI (M3l); 683 Total NHI (M61), Urban NHI (M20); (584 Total NHI (M28,), Urban NHI (MI3); 685, Total NHI (M16), Urban NHI (M4); 686 Total NHI
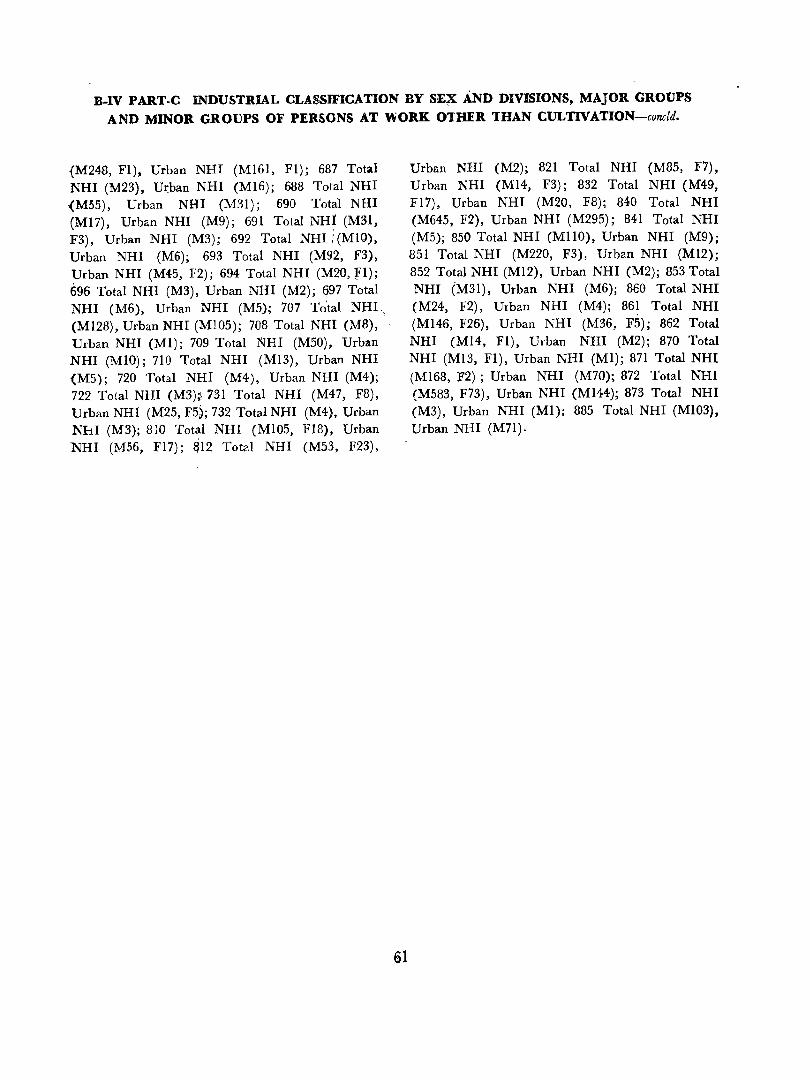
B-IV PART.C INDUSTRIAL CLASSIFICATION BY SE~ AND DIVISIONS, MAJOR GROUPS AND MINOR GROUPS OF PERSONS AT WORK O'IHER 'IHAN CULTIVATION-concld.
{M248, Fl). Urban NHI (M161, Fl); 687 Total NHI (M23), Ut:ban NHI (MI6); 688 Total NHI {M5S), Urban NHI (M3l); 690 Total NUl (M17), Urban NHI (M9); 691 Total NHl (MSl, F3), Urban NHI (MS); 692 Total NHI; (MlO), Urban NHI (M6); 693 Total NHI (M92, FS), Urban NHI (M4S, F2); 694 Total NHI (M20, 1"1); 696 Total NHI (M3), Urban NHI (M2); 697 Total NHI (M6), Urban NHI (M5); 707 Tdtal NHI \ (MI28), Urban NHI (MI05); 708 Total NHI (MS), Urban NHI (Ml); 709 Total NHI (M50) , Urban NHI (MlO); 710 Tot'll NHI (M13), Urban NHI (M5); 720 Total NIH (M4), Urban NHI (M4); 722 Total NHI (MS);i 731 Total NHI (M47, F8), Urban NHI (M25, F5); 732 Total NHI (M4), Urban Nhl (M3); 810 Total NHI (MI05, FI8), Urban NHI (M56, F17); ~12 Totd NHI (M53, F23),
61
Urban NHI (M2); 821 Total NHI (M85, F7), Urban NHI (M14, F3); 832 Total NHI (M49, F17), Urban NHI (M20, F8); 840 Total NHI (M645, F2), Urban NHI (M295); 841 Total NHI (MS); 850 Total NHI (MIlO), Urban NHI (M9); 851 Total NHI (M220, FS), Urban NHI (M12); 852 Total NHI (M12), Urban NHI (M2); 853 Total NHI eM31), Urban NHI (M6); 860 Total NHI (M24, F2), Urban NHI (M4); 861 Total NHI (M146, F26), Urban NHI (M36, FS); 862 Total NHI (M14, Fl), Urban NHI (M2); 870 Total NHI (MI3, Fl), Urban NHI (Ml); 871 Total NHI (M168, F2) ; Urban NHI (M70); 872 Total NHI (M583, F73), Urban NHI (Ml44); 873 Total NHI (M3), Urban NHI (MI); 885 Total NHI (MI03), Urban NHI (M71).
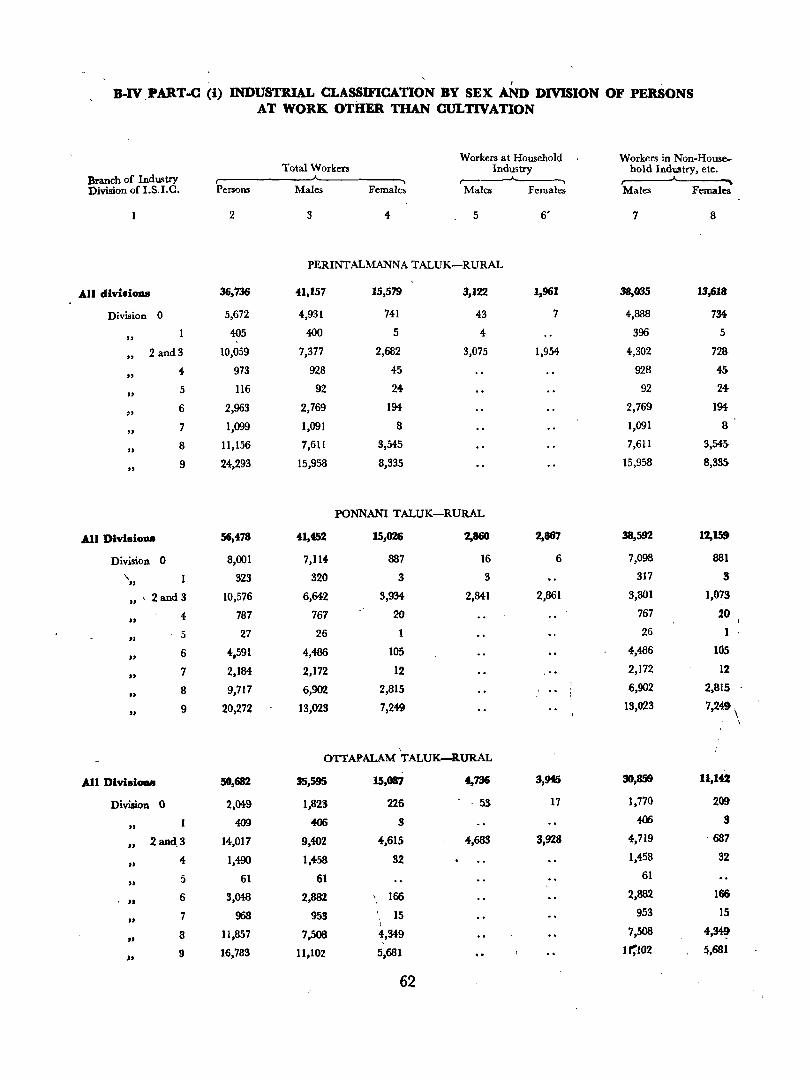
, B-IV PART-C (i) INDUSTRIAL CLASSIFICATION BY SEX AND DIVISION OF PERSONS
AT WORK. OTHER THAN CULTIVATION
Workers at Household Workers in Non-House-Total Workers Industry ho ld Industry, etc.
Branch of Industry r----"--------> , ....._ Division of 1.8.1.C. Persons Males Females Males Females Males Females
2 3 4 5 6' 7 8
PERINTALMANNA TALUK-RURAL
All divisi_s 36,736 41,157 15,579 3,122 1,961 38,035 13,61a
Division 0 5,672 4,931 741 43 7 4,888 7M
" 405 400 5 4 396 5
" 2 and 3 10,059 7,377 2,682 3,075 1,954 4,302 728
" 4 973 928 45 928 4$
" 5 116 92 24- 92 24-
" 6 2,963 2,769 194- 2,769 194-
" 7 1,099 1,091 8 1,091 8
" 8 11,156 7,611 3,545 7,611 3,545
" 9 24,293 15,958 8,335 15,958 8,335
PONNANI TALUK-RURAL
All DivlsiODS 56,478 ·U,t52 15,026 2,860 2,867 38,592 12,159
Division 0 8,001 7,114 887 16 6 7,098 881
'\ 323 320 3 3 317 3 " ",2and3 10,576 6,642 3,934 2,841 2,861 3,801 1,073
" 4 787 767 20 767 20
" 5 27 26 1 26
" 6 4,591 4,486 105 4,486 105
" 7 2,184 2,172 12 2,172 12
" 8 9,717 6,902 2,815 6,902 2,815
.. 9 20,272 13,023 7,249 13,023 7,249 \
OTTAPALAM TALUK--R.URAL
All Dlvisi_ 50,682 35,595 15,087 4,736 3,945 30,859 11,142
Division 0 2,049 1,823 226 . 53 17 1,770 209
" 4<l9 406 .!J 4(l6 3
" 2 and. 3 14,017 9,402 4,615 4,683 3,928 4,719 687
" 4 1,490 1,458 32 1,458 32
5 61 61 61 .. 6 3,048 2,882 \ 166 2,882 166 ." 7 968 953 15 953 15
" ,
" 8 11,857 7,508 4,349 7,508 4,~
" 9 16,783 11,102 5~681 1~I02 !i,681
62
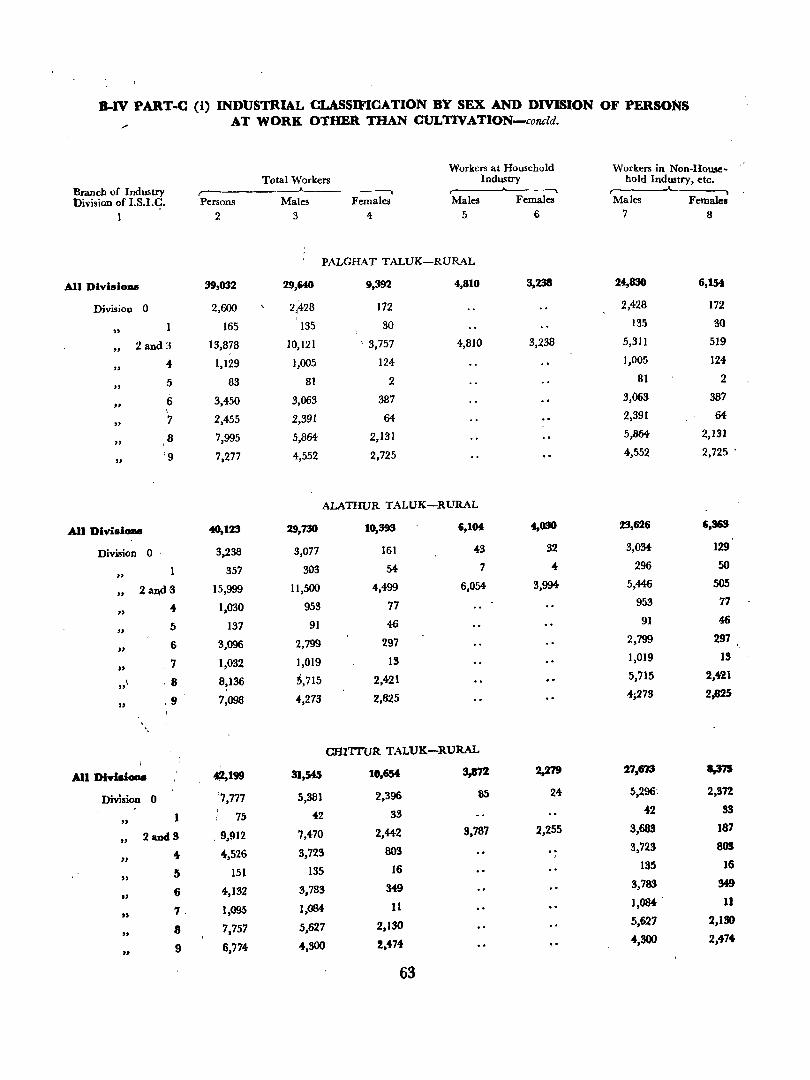
a-IV PART·C (i) INDUSTRIAL CLASsmCATION BY SEX AND DIVISION OF PERSONS ./
AT WORK OTHER. THAN CULTIVATION-concld .
Workers at Household Workers in Non-House-Total Workers Industry hold Industry, etc.
Branch of Industry r- .------"------. Division of I.S.I.e. Persons Males Females Males Females Males Females
1 2 3 4 5 6 7 8
PALGHAT TALUK-RURAL
All DivisioDS 39,032 29,640 9,392 4,810 3,238 24,830 6,154
Division 0 2,600 2,428 172 2,428 172
" 165 135 30 135 30
" 2 and 3 13,878 10,121 \ 3,757 4,810 3,238 5,311 519
" 4 1,129 1,005 124 1,005 124
" 5 83 81 2 81 2
" 6 3,450 3,063 387 3,063 387
" 7 2,455 2,391 64- 2,391 64-
" 8 7,995 5,864 2,131 5,864 2,131
" '9 7,277 4,552 2,725 4,552 2,725 '
ALATHUR TALUK-RURAL
All DivisiODS 40,123 29,730 10,393 6,104 4,030 23,626 6,365
Division 0 3,238 3,077 161 43 32 3,034- 129
" 357 303 54- 7 4 296 50
" 2 alld 3 15,999 11,500 4,499 6,054- 3,994- 5,446 505
4 1,030 953 77 953 77
" "
5 137 91 46 91 46
.. 6 3,096 2,799 297 2,799 297 ~
7 1,032 1,019 13 1,019 13
" ,,1 8 8,136 ~,715 2,421 5,715 2,4-21
" .9 7,098 4,273 2,825 4;278 2,825
CHI'ITUR TALUK-RURAL
All DI .. ld_ 4!Z.199 31,545 18,654 3,872 2,279 27,m 8,375
Division 0 :7,777 5,381 2,396 85 24 5,296: 2,372
1 75 42 33 42 33
" 2aucJ3 . 9,912 7,470 2,442 3,787 2,255 3,683 187
" .. 4,526 3,723 803 3,723 80S
" ,
5 151 135 16 135 16
" 6 4,132 3,783 349 3,783 349
" 7. 1,095 1,084 11 I,OM . 11
" 8 7,757 5,627 2,130 5,627 2,130 .. 9 6,774 4,300 %.474 4,300 2,47' ..
63
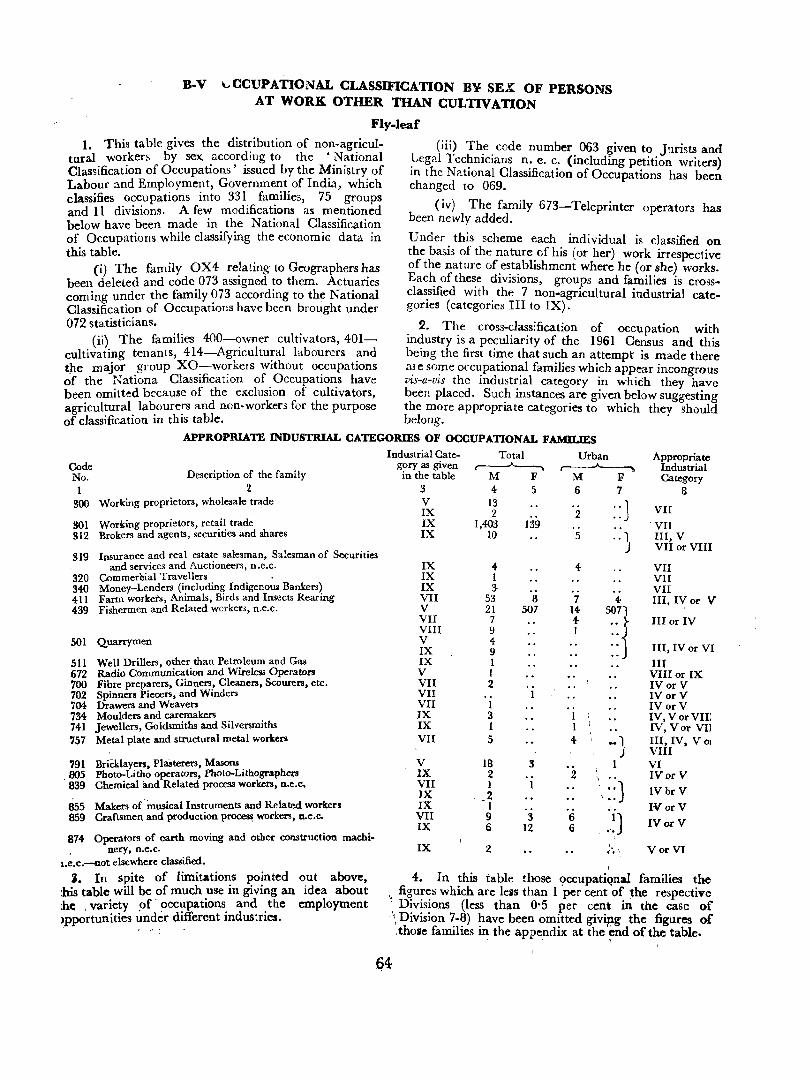
B-V \...CCUPATIONAL CLASSIFICATION B¥ SEX OF PERSONS AT WORK OTHER THAN CULTIVATION
Fly-leaf
l. This table gives the distribution of non-agricultural workers by sex according to the • National Classification of Occupations' issued by the Ministry of Labour and Employment, Government of India, which classifies occupations into 331 families, 75 groups and 11 divisions. A few modifications as mentioned below have been made in the National Classification
(iii) The code number 063 given to Jurists and Legal Technicians n. e. c. (including petition writers) in the National Classification of Occupations has been changed to 069.
(iv) The f~.mily 673-Teleprinter operators has been newly added.
of Occupations while classifying the economic data in Under this scheme each individual is classified on this table. the basis of the nature cfhis (or her) work irrespective
(i) The family OX4 relating to Geographers has of the nature of establishment where he (or she) works. been deleted and code 073 assigned to them. Actuaries Each of these divisions, groups and families is cross-coming under the family?73 according to the National classified with the 7 non-agricultural industrial cate-Classification of OccupatlODs have been brought under gories (categories III to IX).
072 statisticians. 2. The cross-classification of occupation with (ii) The families 400-~wner cultivators,401- industry is a peculiarity of the 1961 Census and this
cultivating tenants, 414-Agncultural labourers and being the first time that such an attempt is made there tpe major group XO~wo:keis without o~cupations u:e so~e occ~pation':ll families which appear incongrous of the l~ationa ClassificatiOn of OccupatIOns have 1Ils-a-VlS the mdustnal category in whiCh they have been omitted because of the exclusion of cultivators, been placed. Such instances are given below suggesting agricultural. la~oure~s and non~workef3 for the purpose the more appropriate categories to which they should of c1assificatlOn In thIS table. belong.
APPROPRIATE INDUSTRIAL CATEGORIES OF OCCUPATIONAL FAMILIES
Code No. Description of the family 1 2
SOO Working proprietors, wholesale trade
lIOi Working proprietors, retail trade SI2 Brokers and agents, securities and shares
SI9
320 340 411 439
Insurance and real estate salesman, Salesman of Securities and services and Auctioneers, n.e.c.
Commerbial Travellers Money-Lenders (including IndigenoUi Bankers) Farm workets, Animals, Birds and Insects Rearing Fishermen and Related WOlken, n.e.C.
SOl Quarrymen
511 Well Drillers, other than Petroleum and Gas 672 Radio Communication and Wireless Operators 700 Fibre preparers, Ginners, Cleaners, Scourers, etc. 702 Spinners Piecers, and Winders 704 Drawers and Weavers 734 Moulders and caremakers 741 Jewellers, Goldsmiths and Silversmiths 157 Metal plate and structural metal worken
791 BriCklayers, Plailteren, Masons . 805 Photo-Litho operators, Photo-LIthographers 839 Chemical and Related process workers, n.e.c.
855 Makers o(inusical Instruments and Related workers 859 Craftsmen and production proce~ workers, n.e.Co
874 Operators of earth moving and other construction machi-. nery, n.e.c.
l.e.c.-not elsewhere classified.
~. In spite of limitations pointed out above, :his table will be of much use in giving an idea about :hc: ,variety ~f' ~cc?pations. and . the employment )pportunities under dlfferent Indus~nes.
Industrial Category as given in the table
3 V IX IX IX
IX IX IX VII V VII VIII V IX IX V VII VII VII IX IX VII
V IX VII )X IX VII IX
IX
Total ~
M F 4 5
13 2
1,4{}3 139 10
4.-1 l
53 21 7 9 4 9 1 1 2
1 3 1 5
lB 2 1 2 1 9 6
2
8 507
3 12
Urban ,.----A----"
M F 6 7
2 ::]
5 .. 1
4
7 14.-4.-1
1 I
+
2
6 6
J
4.-5071 .. ~ .. ~ "J
-1 J
1
..} ..
Appropriate Industrial Category
B
VII
'VII III, V VII or VIII
VII VII VII III. IV or V
III or IV
III, IV or VI
III VIII or IX IVorV IVorV IVorV IV, VorVIIJ IV, Vor VI] III, IV, VOl VIII VI IVorV
IVbrV
IV or V IVOl'V
VorVI
4. In this table those occupatiqnal families the figures which are lells than I per cent of the respective
': Divisions (less than 0'5 per cent in the case of . \ Division 7-8) have been omitted givipg the figures of
,tholle families in the appendix: at the ~nd of the table.
Q4
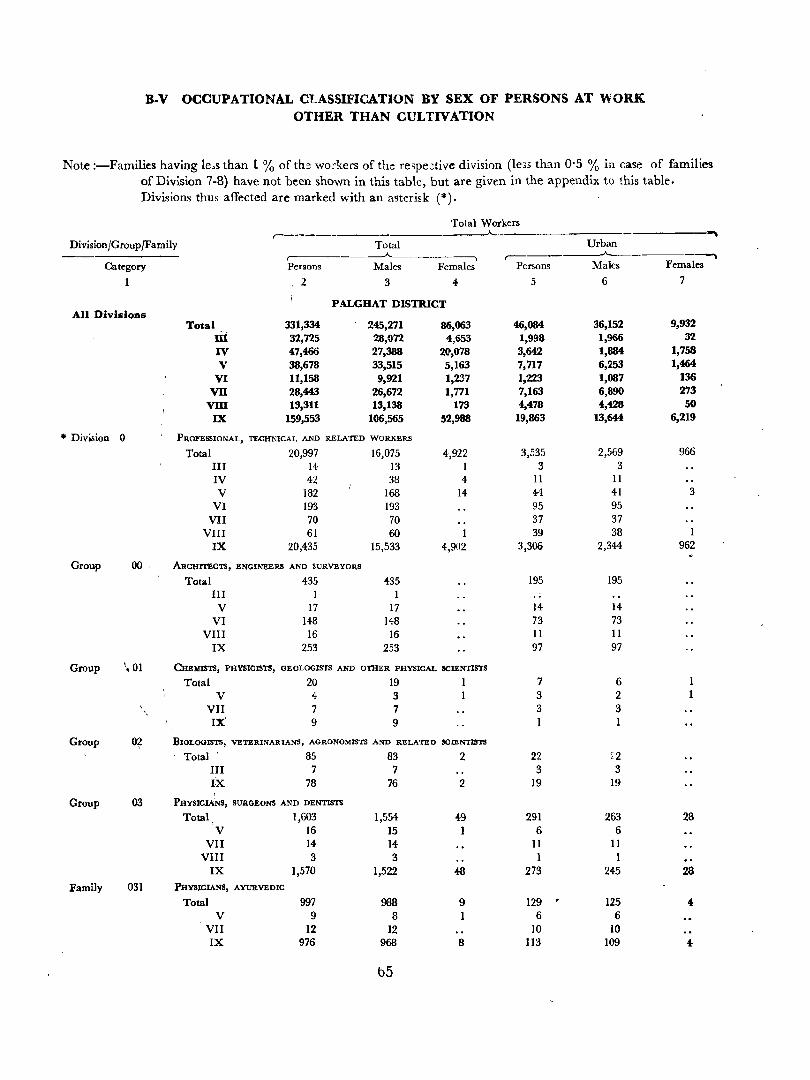
B-V OCCUPATIONAL CLASSIFICATION BY SEX OF PERSONS AT WORK OTHER THAN CULTIVATION
Note :-Families having le,s than 1 % of th~ wo:-kers of the re5pe:tive division (leB than 0-5 % in case of families of Division 7-8) have not been shown in this table, but are given in the appendix to this table. Divisions thus affected are marked with an asterisk (*).
Total Workers ,--..;- ""' Division/Group/Family Total Urban --A-_________
,--_____ ..A...___ ----. Category Persons Males Females Persons Males Females
1 2 3 4- 5 6 7
PALGHAT DISTRICT All Divisions
Total 331,334 245,271 86,063 46,084 36,152 9,932
lit 32,725 28,072 4,653 1,998 1,966 32
IV 47,466 27,388 2(.),078 3,642 1,884 1,758
V 38,678 33,515 5,163 7,717 6,253 1,464
VI 11,158 9,921 1,237 1,223 1,087 136
vn 28,443 26,672 1,771 7,163 6,890 273
vm 13,311 13,138 173 4,478 4,428 50 IX 159,553 106,565 52,988 19,863 13,644 6,219
* Division 0 PROFESSIONAL, TECHNICAL AND RELATED WORKERS
Total 20,997 16,075 4,922 3,535 2,569 966
III 14 13 I 3 3 IV 42 38 4 II II V 182 168 14 44- 41 3
VI 193 193 95 95
VII 70 70 37 37
VIII 61 60 39 38 1
IX 20,435 15,533 4,902 3,300 2,344- 962
Group 00 ARCHITECTS, ENGINEERS AND SURVEYORS
Total 435 435 195 195 III I 1 V 17 17 14 14
VI 148 148 73 73 VIII 16 16 II 11
IX 253 253 97 97
Group " 01 CHEMISTS, PHYSICISTS, GEOLOGISTS AND OTHER PHYSICAL SCIENTISTS
Total 20 19 1 7 6 1 V 4 3 3 2 1
, VII 7 7 3 3 IX' 9 9 1
Group O~ JhOLOGISTS, VETERINARIANS, AGRONOMISTS AND RELATED SCIENTISTS
Total' 85 83 2 22 ~2
IiI 7 7 3 3 IX 78 76 2 19 19 ,
Group 03 PHYSICIlliNS, SURGEONS AND DENTISTS
Total , 1,603 1,554- 4-9 291 263 28 V 16 15 1 6 6
VII 14- 14- 11 11 VIII 3 3 1 1
IX 1,570 1,522 48 273 245 28
Family 031 PHYSICIANS, AYURVEDIC
Total 997 988 9 129 . 125 4 V 9 8 1 6 6
VII 12 12 10 10 IX 976 968 8 113 109 4
05
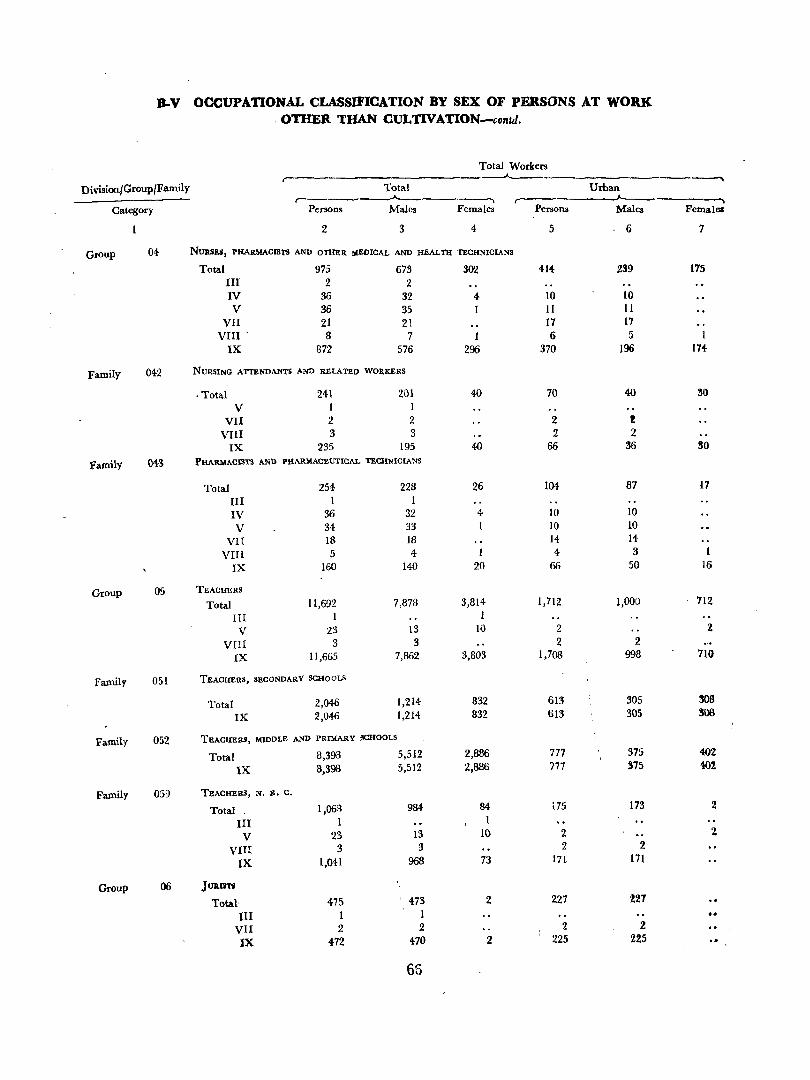
B-V OCCUPAnONAL CLASSIFICATION BY SEX OF PERSONS AT WORK. - OTHER THAN CULTIVAnON--contd.
Total Workers ~
Division/Group/Family Total Urban r-----__...___ ,..-------..J---- ---. Category Persons Mall!8 Females Persons Mala Felllalea
2 3 4 5 6 7
Group 04 NURSEs, PHAU!ACI8TS AND OTHER IIfEDICAL AND HEALTH TECHNICIANS
Total 975 673 302 414 239 175 III 2 2 IV 36 32 4- 10 10 V 36 35 1 11 11
VII 21 21 17 17 VIII . 8 7 1 6 5 1
IX 872 576 296 370 (96 174
Family 042 NURSING A'ITENDANTS AND RELATJ;V WORKERS
. Total 241 201 40 70 40 30
V 1 VII 2 2 2 !
VIII 3 3 2 2 IX 235 195 40 66 36 30
Family 043 PHARMACISTS AND PUARMACEUTICAL TECHNICIANS
Total 254 228 26 104 87 17 III 1 1 IV 36 32 4 10 10 V 34 33 1 10 10
VII 18 18 14 [4-
VIII 5 4 4- 3 1 IX 160 140 20 66 50 16
Group 05 TEACHERS
Total 11,692 7,873 3,814- 1,712 1,000 712
III 1 I
V 23 13 10 2 2
VIII 3 3 2 2
IX 11,665 7,862 3,803 1,708 998 710
Family 051 TEACHERS, SECONDARY SCHOOLS
Total 2,046 1,214- 832 613 305 308
IX 2,046 1,214 832 613 305 300
Family 052 TEAClIERS, MIDDLE "-ND PRnlARY SCllOOLS
Total 8,393 5,512 2,886 777 375 402
IX 8,398 5,512 2,886 777 375 402
Family 059 TEACHERS, N. S. c.
Total. 1,00il 9B4 84 i75 173 2
III 1 1
V 23 13 10 2 2
VIII 3 3 2 2
IX 1,041 968 73 171 171
Group 06 JUlUJ1'I
Total- 475 ' 473 2 227 %%1 III 1 1
VII 2 2 2 2
IX 472 470 2 225 225
65
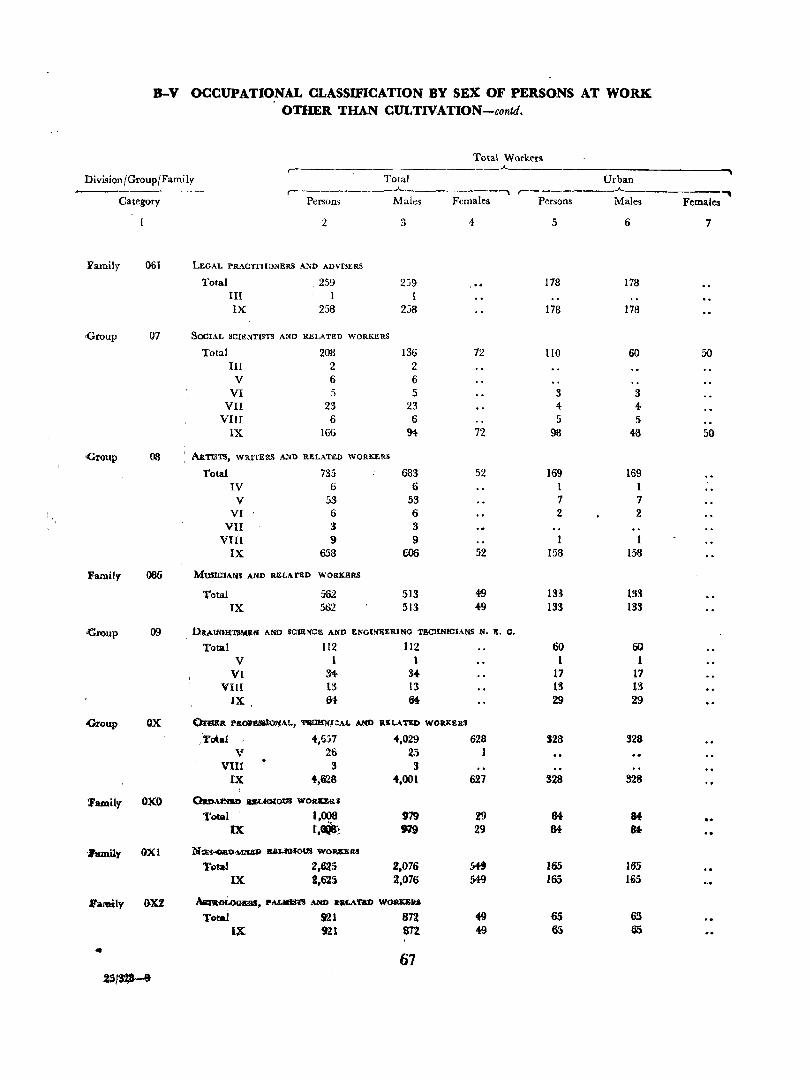
B-V OCCUPATIONAL CLASSIFICATION BY SEX OF PERSONS AT WORK , '
OTHER THAN CULTIVATION-contd.
Total Worken ,-_______________ ___.A.._
Division/Group/Family Total Urban .--___ _.,.A.._. _______ -, r----------"- ., Category Persom Males Females Persons Males Females
2 3 4 5 6 7
Family 061 LEGAL PRACTITIO~ERS AND ADVISERS
Total 259 2j9 , .. 178 178 III 1 1 IX 258 2:J8 178 178
·Group 07 SOCIAL SCIENTISTS AND RELATED WORKERS
Total 208 136 72 110 60 50 III 2 2
V 6 6 VI 5 5 3 3
VII 23 23 4 4-VIII 6 6 5 5
IX 166 94 72 98 48 50
-Group 08 ARTISTS, WRITEruI AND RELATED WORKERS
Total 735 683 52 169 169 IV 6 6 1 1 V 53 53 7 7
VI 6 6 2 2 VII 3 3
VIII 9 9 1 IX 658 606 52 158 156
Farnily 006 Mtl5WIAlfS AND RELATED WOIUCI!RS
Total 562 513 49 133 133 IX 562 513 49 133 133
Group 09 DltAUGHTSM,IUf AND sCle~1!i AND ENOl!(EERING TECHNICIANS N. B. c.
Total 112 112 60 60 V 1 1 1 1
VI 3+ 3+ 17 17 VIII L3 13 13 13
IX 6i M 29 29
Group OX ~ PIlOJll!Blllo.'fAL, TSCllN.fC .... " Al'CJ) RIU.ATlIXl WORKERS
,1''*al 4,6J7 4,029 628 328 328 V 26 25 1
VIII 3 3 IX +,628 .,001 627 328 328
!
lI'amily OXO Chto.\INSD ~OVI WORllCf,IU
ToU\! I,OQ8 979 29 84 84-IX t,Q~ 9i9 29 84 at
'hJnily OXI NGN_1).~ JUU.mSOUS WOR<M
TQtal 2.625 2,076 5+t 16) 165 IX 2,625 a,076 549 165 165
I"amily OX! Al8toioacu, Pl'\LIIIIS'ilI AND 1tU.ATBt> woauu Total 921 812 49 65 65
IX. 9'11 an 49 65 65 .. 67
~$I~
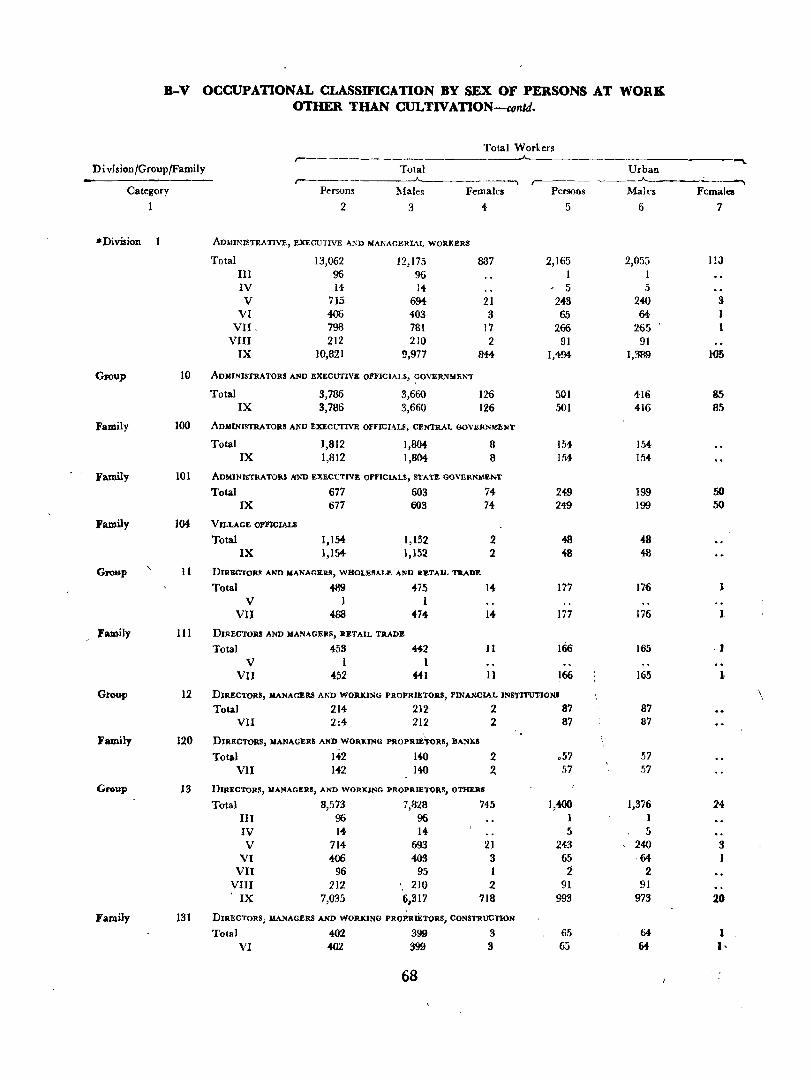
B-V OCCUPATIONAL CLASSIFICATION BY SEX OF PERSONS AT WORK OTHER THAN eUL TIV ATION-tonld.
Total Worlers ,-------- __..;..___
"""-Division ,Group /Family Total Urban
r---------A.__-----~ ~ Category Persons Males Females Persons MaIrs Females
1 2 3 4- 5 6 7
-Division ADJ.lINISTRATIVE, EXECUTIVE AND MANAGERIAL WORKBRS
Total 13,062 12,175 837 2,165 2,05.'3 113 III 96 96 1 I IV 14 14 - 5 5 V 715 694 21 243 240 3
VI 406 40S 3 65 64- 1 VII, 798 7tH 17 266 265 1
VIII 212 210 2 91 91 IX 10,821 9,977 844 1,4-94- 1,3'89 1:05
Group 10 ADMINISTRATORS AND EXECUTlva OFFICIALS, GOVERNMENT
Total 3,786 3,660 126 501 416 85 IX 3,786 3,660 126 SOl 416 85
Family 100 ADMINISTRATORS AND EXECUTIVE OFFICIALS, CENTRAL GOVERNMENT
Total 1,812 1,804 8 154 154-IX 1,812 1,804- 8 154 154-
Family 101 ADMINISTRATORS;liND EXI!.C'l)TlVl!. OffICIAU, STA'l1!. GOVERNMENT
Total 677 603 74 249 199 50 IX 677 603 74 249 199 50
Family 104 VILLAGE OFFICIALS
Total 1,154 1,152 2 48 48 IX 1,154- 1,152 2 48 48
GroUJl \, II DIRECTORS AND MANAGERS, WHOLESAU\ A!'ID RltTAIL TIlAD1t
Total 489 475 14 117 176 I V I I
VII 488 474- 14 177 176 I,
Family 111 DIRECTORS AND MANAGERS, RETAIL TRADE
Total 453 442 II Hi6 165 ,f
V 1 1 VII 452 441 11 166 165 1
Group 12 DJRECTORS, MANAGERS AND WORKING PROPRIETORS, FINANCIAL lNSTJTlJ'I'IONJ \. Total 214 212 2 87 ·87
VII 214 212 2 87 87
Family 120 DIRECTORS, MANAGERS AND WORKING PROPRIEToRS, BANKS
Total 142 140 2 .57 57 VII 142 140 Z 57 57
Group 13 DIRECTORS, MANAGERS, AND WORKING PROPRIETORS, OTHERS
Total 8,573 7,828 745 1,400 1,376 24 III 96 96 1 1 IV 14 14 5 5 V 714 693 21 243 240 3
VI 406 403 3 65 64- 1 VII 96 95 1 2 2
VIII 212 210 2 91 91 . IX 7,035 6.317 718 993 973 20
Fa.rnily ]31 DIRECTORS; MANAGERS AND WORKING PROPRIETORS, CONSTRUCTION
Total 402 399 3 65 64- 1 VI 402 399 3 65 64- 1·
68

B-V. OCCUPATIONAL CLASSIFICATION BY SEX OF PERSONS AT WORK OTHER THAN CULTIVATION-contd.
Total Workers
,-------------------------'---Division/Group/Family Total Urban
.A._ _______ ---.. .....__ Category Persons Male~ Females Person.i MaLes Females
;2 3 4 5 6 1
FMlily 133 DIRECTORS, MANAGI:RSAND WORKING PROPRIll.TORS, ldANUFACTURl:o!G
Total 717 696 21 240 237 S IV 14 14 5 5 V 703 682 21 235 232 S
Family 134 DIRECTORS, MA"fAGl!RlI Am> WORKJ:VG PROPRIETORS, TR.A~SPORT AND COMMUNICATIONS
Total 212 210 2 91 91 VIII 212 210 2 91 91
-Family BS DIRECTORS, MA.NAG.J;RS AND WOIUUN'G PilOPRIETORS, RECREATION, ENTERTAINMENT AND CATERING SERVICES
Total 6,782 6,072 710 933 913 20 V 3 3 2 2
VII 1 IX 6,778 6,0Q8 7LO 931 911 20
Family 136 DIRECTORS, MANAGERS AND WORKING PROPRIl!.TORS, OTIlER SERVICES
Total 170 165 5 48 4S IX 170 165 5 48 48
:Family 139 DIRECTORS, MANAGKRS AND WORKING PROPRIETORS, N. E. c.
Total 202 198 4- 19 19 III 59 59 V 8 B 6 6
VI 4- 4 VIC 95 94- 1 2 2 IX 35 33 3 11 11
*Divi,ion 2 CLBRICAL AND RELATED WORKERS
Total 8,334 8,100 2H 3,347 3,216 131 III 1144 144- 10 10
IV 2 2 2 2 V 577 .'i62 15 197 187 10
V[ 215 210 5 56 53 S
VII 1,293 1,283 8 579 578 1 VIII 1,058 1,038 30 450 441 9
IX 5,035 4,859 176 2,053 1,945 lOB
-Croup ZO BooK-KEBPERS AND CASHIEas
Total 722 717 5 417 417 III 15 15 3 3
V 90 89 56 56 ' ... VII 347 346 234 234
VIII 52 51 17 17 IX 218 215 3 107 107
;Family 200 BOOK-KEEPERS, BOOJl:-KEEPING AND ACCOUNTS CLERKS
Total 563 558 5 332 332 3 .
3 HI 15 15 V Bl eo 52 52
VII 287 286 198 198 VIII 32 32 11 11
IX 148 145 3 68 68
_25/328-9a. 69
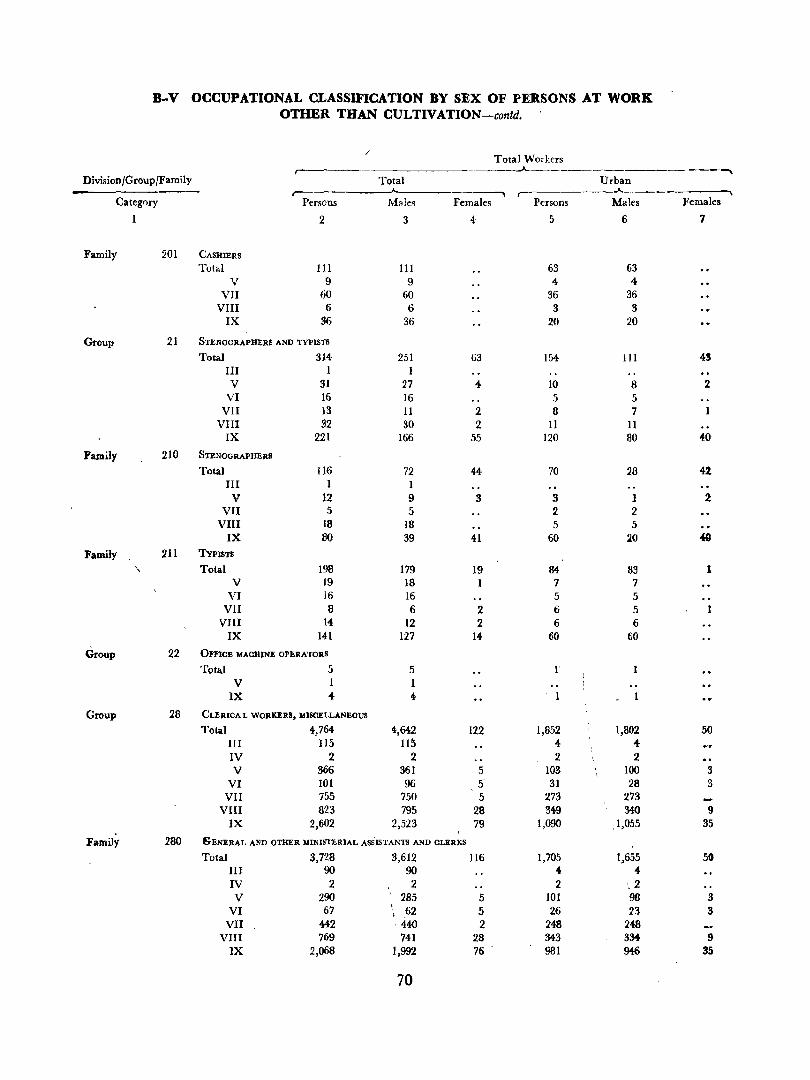
B-V OCCUPATIONAL CLASSIFICATION BY SEX OF PERSONS AT WORK OTHER THAN CULTIVATION-contd.
/ Total Workers
,-- ----A------ -"""' Division fGroupfFamily Total Urban ,-- ~
,----___ .A
Category Persons Males Females Persons Males Females
1 2 3 4 5 6 7
Family 201 CAsamRs Total III 111 63 63
V 9 9 4 4-VII 60 60 36 36
VIII 6 6 3 3 IX 36 36 20 20
Group 21 STENOGRAPJJERS AND TVPIS'fS
Total 314 251 63 154 III 43 III I 1 V 31 27 4- 10 8 2
VI 16 16 5 5 VII 13 11 2 8 7
VIII 32 30 2 11 11 IX 221 166 55 120 80 4(t
Family 210 STENOGRAPHERS
Total 116 72 44 70 28 41 III 1 1
V 12 9 3 3 1 2 VII 5 5 2 2
VIII 18 18 5 5 IX 80 39 41 60 20 4G
Family 211 TYPISTS
'\ Total 198 179 19 84- 83 1 V 19 18 1 7 7
VI 16 16 5 5 VII 8 6 2 6 5
VIII 14 12 2 6 6 IX 141 127 14- 60 60
Group 22 OFFICE MACHINE OPERATORS
Total 5 5 1 V 1 1
IX 4- 4
Group 28 CLERICAL WORKERS, MJIJOELLANEOUS
Total 4,764 4,642 122 1,852 1,802 50 III 115 115 4 4-IV 2 2 2 2 V 366 361 5 103 100 3
VI 101 96 5' 31 28 3 VII 755 750 .5 273 273
VIII 823 795 28 349 340 9 IX 2,602 2,523 79 1,090 ,1,055 35
Family 280 GENERAL AND OTHER MINISTERIAL ASS'ISTANTS AND CLER~S
Total 3,728 3,612 116 1,705 1,655 50 III 90 90 4 4-IV 2 2 2 ,,2 V 290 285 5 101 98 3
VI 67 \,
62 5 26 23 3 • VII 442 440 2 248 248
VIII 769 741 28 343 334 9 IX 2,068 1,992 76 981 94t} 35
70
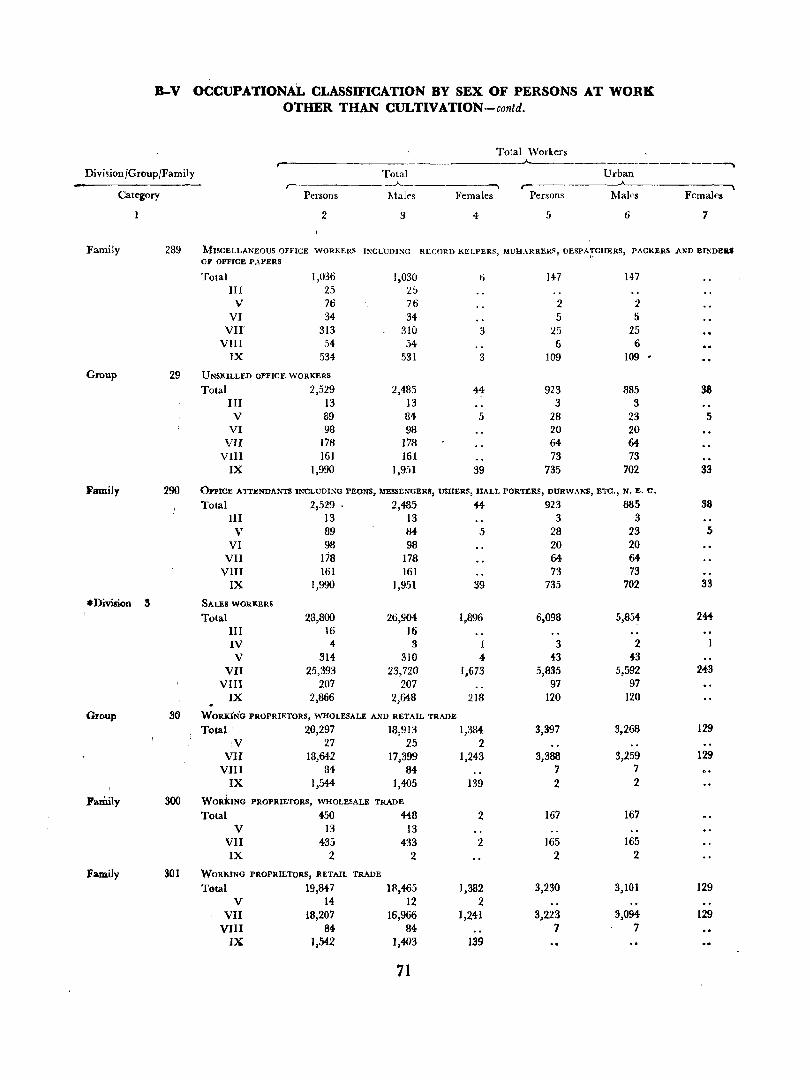
B-V OCCUPATIONAL CLASSIFICATION BY SEX OF PERSONS AT WORK OTHER THAN CULTIVATION-contd.
Total Workers r- ~--------------~
Division/Group/Family Total Urban ,--- _..A. ______ --, r----__A_.___
Category Persons Males Females Persons Males Females
2 3 4 5 6 7
Family 289 MISCELLANEOUS OFFICE WORKERS ISCLUDING RECORD KE~PERS, MUliARRERS, DESPA~CIIERS, PACKERS Al(D BI:-IDEIlI OF OFFrcE P,\PERS
Total 1,036 1,030 6 147 147 III 25 25
V 76 76 2 2 VI 34 34 5 !)
VII 313 310 3 25 25 VIII 54 .')4 6 6
IX 534 531 3 109 109 •
Group 29 UNSKILLED OFFICE WORKERS
Total 2,529 2,485 44 923 885 38 III 13 13 3 3 V 89 84 5 28 23 5
VI 98 98 20 20 VII 178 178 64 64
VIII 161 161 73 73 IX 1,990 1,951 39 735 702 33
Family 290 OFFICE ATI'ENDANTS INCLUDING PEONS, MESSENGERS, USHERS, HALL PORTERS, DURWANS, ETC., N. E. c.
Total 2,529 . 2,485 44 923 885 38 III 13 13 3 3
V 89 84- 5 28 23 5 VI 98 98 20 20
VII 178 178 64 64 VIII 161 161 73 73
IX 1,990 1,951 39 73.5 702 33
.Division 3 SALES WORKERS
Total 28,800 26,904 1,896 6,098 5,854 244-III 16 16 IV 4 3 1 3 2 V 314 310 4 43 43
VII 25,393 23,720 1,673 5,835 5,592 243 VIII 207 207 97 97
IX 2,866 2,648 218 120 120
Group 3D WORli:I'NG PROPRIETORS, WHOLESALE AND RETAIL TRADE
Total· 20,297 18,913 1,384 3,397 3,268 129
:V 27 25 2 VlI 18,642 17,399 1,243 3,388 3,259 129
VIII 84- 84 7 7 IX 1,544- 1,405 139 2 2
Family 300 WOaiING PROPRIETORS, WHOLESALE TRADE
Total 450 448 2 167 167 V 13 13
VII 435 433 2 165 165 IX 2 2 2 2
Family 301 WORKING PROPRIETORS, RETAIL TRADE
Total 19,847 11l,465 1,382 3,230 3,101 129 V 14 12 2
VII 18,207 16,966 1,241 3,223 3,094 129 VIII 84 84 7 7
IX 1,542 1,403 139
71
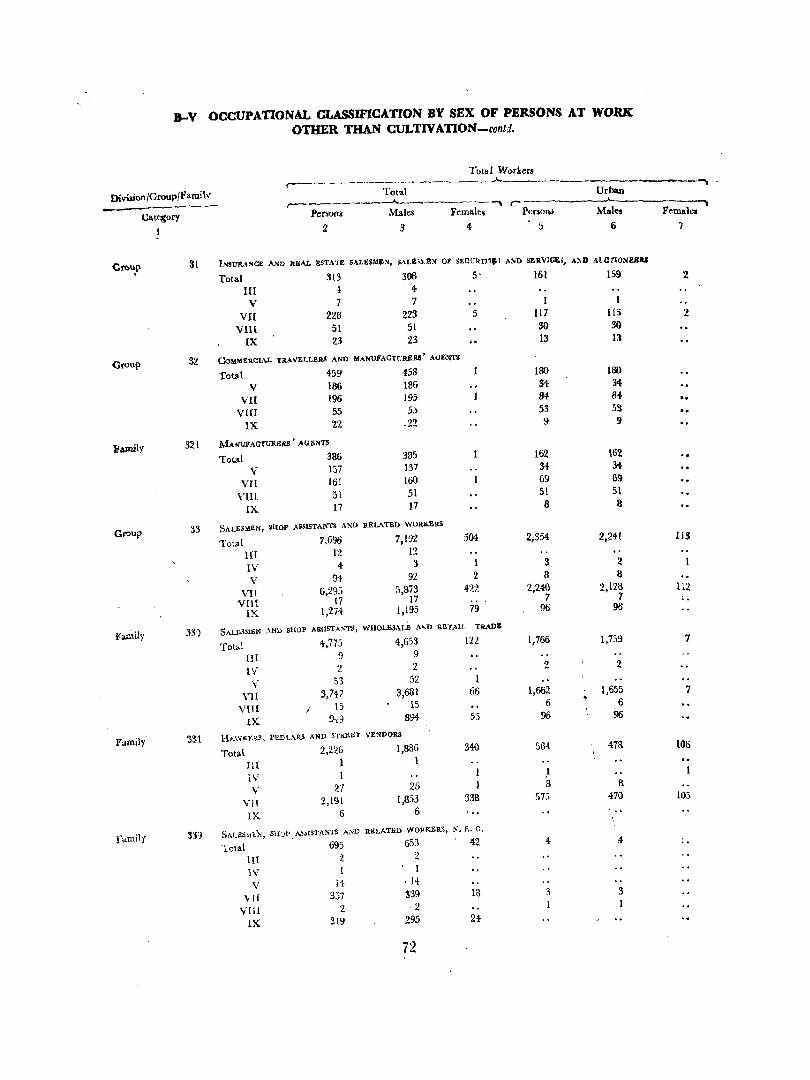
B-V OCCUPATIONAL CLASSIFICATION BY SEX OF PERSONS AT WORK OTHER THAN CULTIVATION-contd.
Total Workers ,..----- _____________________ .A.
Division/Group/Famil'! Total UrblUl. r---------.A.-------"'" r-
Category Persom Maks Females Peo:so~ Males
1 2 3 4 5 6
----.
Femal",
7
Cto'P 31 IN8t11t.\NCE AND REAL IlSTA'r11 SAI.ESMB:'I, SAI,E",£:01 OF SECtiRn-I') AN)) SEIlVI~', Al'>D AlCTlONllElIS
Total 313 308 5' 161 159 2
III 4, 4
V 7 7 I
VII 228 223 5 117 115 2
VIlI 51 51 30 SO IX 23 23 13 13
Croup 32 CoMMERCtAL TaAV'EI.I.EIlS AND MAWll'ACTURJ>R$' AGENU
Total 459 458 180 180
V 186 186 34 3<1,
VII 196 195 84 M .. VIII 55 55 53 53
IX 22 _22 9 9
Family 321 MMIUYACTtTR.ER.!l' AGENTS
Total 386 385 162 \62
V 157 157 34 34-
VII 161 160 69 69
VIn 51 51 51 51
IX 17 17 8 8
Group 33 SAl.ES:>!EN, 8ll:0P ,\.SSlSTANTS !"ND RJ>LATEI) WORKERS
Total 7,696 7,192 504 2,354 2,241 113
ur 12 12
IV <} 3 1 3 2
V ~H 9'2 2 8 8
VI[ 6,295 ;',873 422 2,240 2,128 112
VIl[ 17 17 7 i .. IX 1,274 1,195 79 96 96
f..mily 330 SAl$S)lEL'[ MID SHOP !>SSISTA>lTS, WHOl.ESALE A"D ltE'fAlL TAADE
Tot"l 4,77J 4,653 121 1,766 1,759 7
HI 9 9
IV 2 2 2 2
V 53 52 I
VII 3,747 3,681 66 1,662 1,655 7
VIII 15 15 6 ,
6 J
lX 9+9 894- 55 96 96
family !m HAWKERS, PlmLARS AND STallET VENDOltS
Total 2,2~6 1,886 340 5fH 41& 106
III 1 1
IV I 1
V 27 2G ! 8 8
Vl! 2,191 [,853 338 57:' 470 105
IX 6 6 ' .. family 3:-13 SAU~'i~N, SHOP. ASSISTANTS AND RELATliD WORKERS, N. I'.. c,
Tolal 695 653 42 4 ,. .. lH 2 2 .. IV I
V 14 1.\4-
VIf 357 339 IS 3 3
VIiI 'l. 2
IX 319 295 21-
72
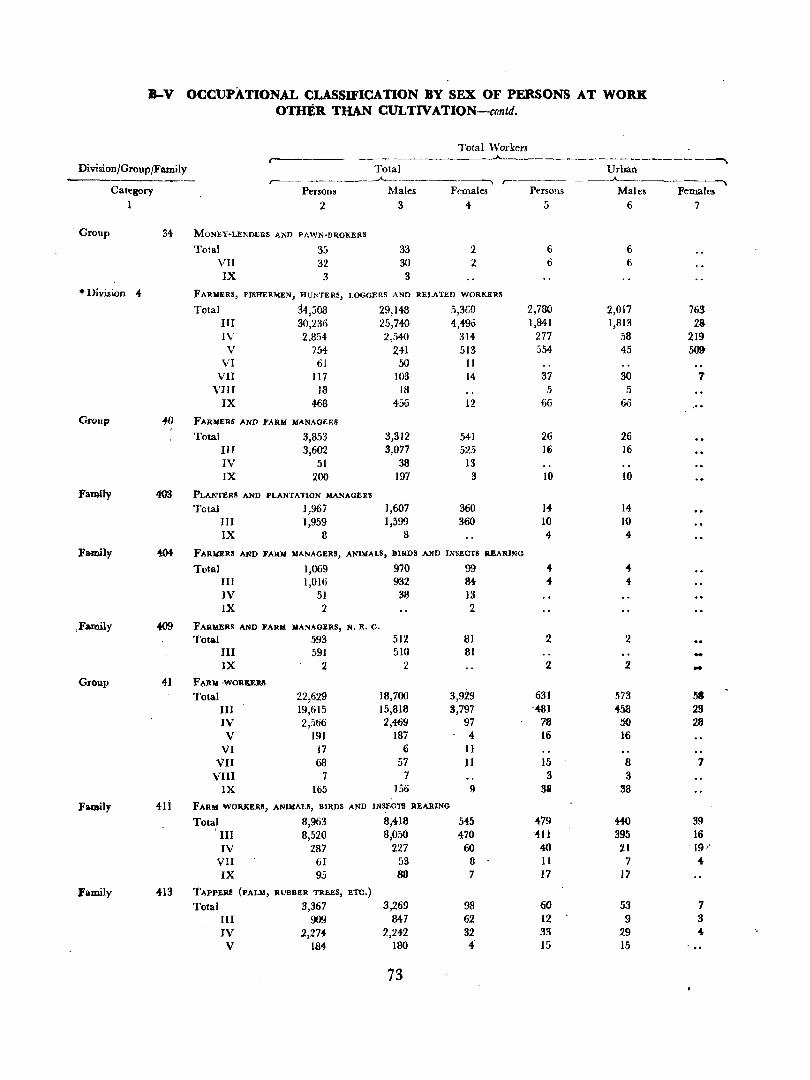
B-V OCCUPATIONAL CLASSIFICATION BY SEX OF PERSONS AT WORK. OTHER THAN CULTIV ATION-cvntd.
Total Workers _______________ .A. ____________________ ----.
Division/Group/Family Total Urban r- ------",,----- -------------, ,---- .A. __________ ~
Category Persons Males Females Persons Males FemaleB
1 2 3 4 5 6 7
, Group 34 MONEY-LENDERS AND PAWN-BROKERS
Total 33 33 2 6 6 VII 32 30 2 6 6 IX 3 3
* Division 4 FARMERS, FISHERMEN, HUNTERS, LOGGERS AND RELATED WORKERS
Total 34,308 29,148 5,3CO 2,780 2,017 763 III 30,236 25,740 4,496 1,841 1,81!1 28-IV 2,854- 2,540 314 277 58 219 V 754 2-1-1 513 554 45 5~
VI 61 50 II VII 117 103 I4 37 30 7
VIII 18 18 5 5 IX 468 456 12 66 66
Group 40 FARMERS AND FARM MANAGERS
Total 3,853 3,312 541 26 26 In 3,602 3,077 525 u; 16 IV 51 38 13 IX 200 197 3 10 10
Famffy 4'()3 PLANTERS AND PLANTATION MANAGERS
Total ],967 1,607 360 14- 14 III 1,959 1,599 360 10 lO IX 8 8 4 4-
Family -tM FARlIERS AND FARM MANAGERS, ANIMALS, BUlDS AND Il'ISECTS REARING
Total 1,069 970 99 4 4 III 1,016 932 84- 4 4 IV 51 38 13 IX 2 2
: Family 4(J9 FARMERS AND FARM MANAGERS, N. E. c.
Total 593 512 81 2 2 III 591 510 81 IX 2 2 2 2 -
Group 41 F .,.RM ·WORKER3
Total 22,629 18,700 3,929 611l 573 38 III 19,615 15,818 3,797 -481 458 23 IV 2,566 2,469 97 78 50 28 V 191 187 4 16 16
VI 17 6 11 VII 68 57 11 15 8 7
VIII 7 7 3 3 IX 165 156 9 311 38
Family 41i FARM WOUER5, ANIMALS, BIRDS AND lNSECTS IlEARING
Total 8,963 8,418 545 479 440 39 III 8,520 8,050 470 -,HI 395 16 IV 287 227 60 40 21 - 19"-
VII 61 53 8 11 7 4 IX 95 88 7 17 17
Family 413 TAPPEIll! (PALM, RUBBER TREES, ETC.)
Total 3,367 3,269 98 60 53 7 III 909 847 62 12 9 3 IV 2,274- 2,242 32 33 29 .. V 184 180 4' 15 15 ..
73
B-V OCCUPATIONAL CLASSIFICATION BY SEX OF PERSONS AT WORK. OTHER THAN CULTIVATION-contd.
Total Workers r-- """ Division/Group/Family Total Urban
--------- , """ """ Category PeriOns Males Females PersoTl& Males Females '
1 2 3 4 5 6 7
Family 415 PLANTATION LABOURERS
Total 10,082 6,342 3,240 50 46 {-
III 10,060 6,822 3,238 48 44 4-IX 22 20 2 2 2
Group 42 HUNTERS AND RELATED WORKERS
Total 4 -4: III 4 4
Group 43 FISHERMEN ,AND RELATED WORKERS
Total 4,545 3,841 704 1,979 1,278 701 III 3,792 3,786 6 1,251 1,247 {-
IV 190 1 189 188 188 V 530 21 509 523 14 5"09
VII 17 17 11 II VIII 9 9 I
IX 7 7 5 5
Family 430 FISHERMEN, DEEP SEA
Total 2,270 2,270 26 26 Ilf 2,268 2,268 24 24-
VII 2 2 2 2
Family 431 FISHERMEN, INLM'D AND COASTAL WATERS
Total 1,486 1,481 5. 1,230 1,227 3 III 1,469 1,466 3 1,219 1,218 1 IV I 1 V 2 2 2 '2
VII 8 8 5 5 IX 6 6 4- 4-
Family 439 FlSlmRMEN'AND RELATED WORKEl!.S, N. E. c.
Total 779 81 698 723 25 698 III 415 ... 3 3 8 5 3 IV 188 188 188 188 V 528 21 507 521 14- 507
VII 7 1 4 4-VIII 9 9 I 1
IX 1 1 1 1
Group 4-4- I.OGOERS (\.NO OTHER FORE.~TRY WORKERS
Total 3,477 3,291 186 14-4- HO 4-III 3,223 3,055 166 93 92 1 IV 47 32 15 II 8 3 V 33 33 15 15
VI 41 44-VII 32 29 3 II 11 -VIII 2 2 I I- .. IX 96 96 13 IS' -family 442 Lao nl,LBRlI AND WOOD CUTTl!.:lS
Total 2,760 2,724- ~ 123 I~l ! III 2,646 2,616 32 66 sa 1 IV 2 1 1 1 I V 19 19 13 13
VI 4-4- 'M VII 24- \21 , 3 10 10 -IX 23 ~ 13 13
74
B-V OCCUPATIONAL CLASSIFICATION BY SEX OF PERSONS AT WORK OTHER THAN CULTIVATION-contd.
Total Workers
Division/Group/Family Total Urban r-
Category Perso1l& Males Females Persons Males Females
1 2 3 4 5 6 7
• Division 5 MINBRS, QUARRYMEN AND RELATED WORKERS
Total 1,338 1,249 89 38 38 III 1,289 1,200 89 36 S6 IV 3 3 .v 4 4 VI 32 32 2 2 IX 10 10 .. .' .
Group 50 MINERS AND QUARRYMEN
Total 1,322 1,234 88 37 37 III '1,278 1,190 88 '. 36 36 IV 3 3 V 4 4-
VI 28 28 IX 9 9
Family 501. QUARRYMEN
Total 1,256 1,169 87 37 37 III 1,223 1,136 87 36 36 IV 3 3 V 4 4
VI 17 17 IX 9 9
Family 503 SHOT FIRERS Total 57 57
III % 45 VI 11 11
-Group 51 WELLDRILLERS AND RELA1EI> WOliKERS Total I
IX
Group 59 MINERS, Qm\RRYMEN AND RELATED WORKERS, N.E.a. ,Total 15 14
III 11 10 VI 4 4
Family 590" MINERS, 'QUARRYMEN AND REI.ATED WORKERS, N,E,C.
Total 15 14 I III 11 10 r VI 4 4-
'* Division 6 WORKE'lS IN" TRANSPORT AND COlllMUNl(l.\TION OCCUPATIONS , -
Total! 8,263 8,234 29 2,269 2,256 13 III 12 12 V 65 65 -' 36 36
VI 74- 74- .... 11 11 VII 32 32 29 29
VIII 7,876 7.841 29 2,12Q 2,116 -1'3 IX 204- 204- "". 64- 64-
Grovp 60 DECK OFFICERS, ENGINEER OFFICERS AND PILOTS, SHIP
Total 2 2 VIII 2 2
75 '25/328-10
B-V OCCUPATIONAL CLASsmCATION BY SEX OF P~ONS AT WORK OTHER THAN CULTIV ATION-cQntd.
Total Workers ~- ~
Division/GroupfFamily Total Urban -- ,-Category Persons Males Females Persons Males Females
1 2 3 4- 5 6 7
Group 61 DECIt AND ENGINE ROOM RATINGS (SHIP), BARGE CRISWS AND BOATMEN
Total 627 626 164- 164-III 1
VII I 1 VIn 624- 623 164- 164-
IX 1 1
Family 610 DECK RATINGS (SHIP), BARGE CREWS AND BOA~N
Total 627 626 164- 164-III 1
VII 1 1 VIn 624 623 164- 164-
IX 1 1
Group 62 AIRCRAFT PILOTS, NAVIGA-TORS AND FLIGHT E~QINElIRS
Total 6 6 VIII 1 1
IX 5 5
GJOUP 63 DRIVBR.8 AMD FlREMJtIf, RAILWAY BNGlNE
Total 244 244 182 182 VIII 244 244- 182 182
Family 630 DiuvsRS
Total 91 ~l 71 71 VIII 91 91 71 71
Family " 631 FIRBWBN
Total 153 153 11l 111 VIII 153 153 III 111
GI'OBP 64- DRtvEas, B.OAD TB...U1IPORT
Total 4,4-34 4,434- 1,109 1,109 III 9 9
V 56 56 28 28 VI 72 12 11 11
VII 29 .29 27 27 VIII 4,157 .,157 991 991
IX III III 52 52
Family 1f1 MOTOa Y1IHIOLB .AJGD 1I01'OR QYCLB DRlVBRS
Total 1,635 1,635 611 611 III 8 8 V 42 42 .. 24 24
VI 63 63 11 11 VII 7 7 7 7
VIII 1,441 1,441 535 535 IX 74 74 34- 34-
Family M2 CvCUUtlClWiAw DRlYBR.8 AND B.ICla!RAW P~RlI Total 148 148 70 70
VII 1 l- I 1
VIII 147 147 69 69
76
B-V OCCUPATIONAL CLASSIFICATION BY SEX OF PERSONS AT WORK OTHER THAN CULTIVATION-contd.
Total Workers r- ~
Division/Group/Family Total Urban ------.
Category Penoll8 Males Females Persons Males Fem.alct 1 2 3 4 5 6 7
Family 643 ANIMAL DRAWN VEHICLE DRIVBas
Total 2,220 2,220 370 370 III 1 1 V 5 5 1
VII 20 20 18 18 VIII 2,169 2,169 334 334
IX 25 25 17 17
Family 649 DRIVERS (ROAD TRANSPORT) N.I'I.C. (INCLUDING PALKI AND DOLY BRE,/\,QRS)
Total 430 430 58 58 V 9 9 3 3 -VI 9 9
VII 1 1 VIII 399 399 53 53
IX 12 12 1
Grou" 65 CONDUCTORS, GUARDS, AND BRAKESMEN, aAILWAY
Total 102 102 82 82 VIII 102 102 82 82
Family 651 GUARDS
Total 95 95 81 81 VIII 93 95 81 81
Group 66 INSPECTORS, SUPERVISORS, TRAl'l'tc CONTROLLERS AND DESPATCHERS (T.~ANSPORT)
Total 399 399 160 160 VIn 39!l 399 160 160
/ Family 660 INSPECTORS, SUPERVISORS AND STAT[QN MAlI'rBRS
Total 166 166 68 68 VIII 166 166 68 63
Family 662 SIGNALMEN AND POINTSMEN
Total 213 213 83 83 VIII 213 213 83 83
Group 67 TELEPllONl!:, TELEGRAPH AND RELATED TELECOMMtPIlCATION OPERATORS
Total 157 142 15 51 43 6 ·V 1 1 VI 2 2
VIII 111 96 15 45 39 6 IX 43 43 6 6 ,
Group 68 POST '.<lEN AND MESSENGERS
Total 668 668 119 119 III 2 2 V 8 8 8 8
VII 2 2 2 2 VIII 631 631 107 107
IX 2S 25 2 2
FaDlily 680 POSTMEN
Total 482 -re2 76 76 VIII -ta2 482 76 76
77 ~'l/!l"lL-lnh
B-V OCCUPATIONAL CLASSIFICATIQN BY SEX OF PERSONS AT WORK OTHER THAN CULTIVATION-contd.
Total Workers
r-Division/Group/Family Total Urban
r-Catagory , Persons Males Females Persons Males
1 2 3 4 5 6
Family 681 :M.ESSENGERS (INCLUDING DAK PEONS)
'fotal 186 186 43 43 111 2 2
V 8 8 8 a VU 2 2 2 2
VIII 149 149 31 31 IX 25 25 2 2
Group 69 WORKERS IN TRANSPORT AND COMMUNICATIONS OCCUPATIONS, N.J:.C.
Total 1,624 1,611 13 402 395 VIn 1.605 1,592 13 398 391
IX 19 19 4- 4
Females 7
7 7
Family 690 'fICKET SELLERS, TICKET INSPI!.OTORS INCLUDING USHERS AND TICKET COLLECTORS ON MOVING TRANSPORT
Total 103 102 57 56 1 VIII 103 102 57 56 1
Family 691 CoNDUCTORS (ROAD TRANSPORT)
Total 284 284- 67 67 VIII 284- 284- 67 67
Family 692 WORKERS IN TRANSPOltT OCCUPATIONS, N.E.C.
Total 1,039 1,036 3 186 184- 2 VIII 1,039 1,036 3 186 184- 2
Family 693 INSPECTORS, TRAPFtc CONTROLLERS AND D:ESPATCHERIl (COMMUNICATIONS)
Total 146 137 9- 50 46 .. VIII 127 U8 9 46 42 ~
IX 19 19 4- of-
,. Division 7-8 CaAl'TSMEN, PRODOCTION PROCESS WORKERS AND LAlIOUJtERS NOT ELSEWlmRl: Cl.ASSlFmD
Total 185,539 127,329 58,210 20,083 14,398 5,685 III 678 615 63 94- 90 4-IV 44,546 24,787 19,759 3,344- 1,806 1,538 V 35,916 31,331 4,585 6,534 ,5,603 931
VI 9,917 8,729 1,188 94{) 809 131 VII 631 582 49 306 292 14 ,
VIII 3,355 3,255 100 1,473 1,450 23 IX 90,496 58,030 S2,466 7,392 4,348 3,04+
Group 70 SPINNERS, WEAVltaJI, KNITTERS, DYERS ANtI RELA'I'Jl.D WORKERS
Total 12,588 5,165 7.423 2,063 755 1,308 IV 10,769 4,674- 6,095 1,410 64e 761 V 1,795 482 1.313 639 104 5.35-
VII 4 3 1 IX 20 6 14 14 2 12
Family 700 FIBRB PREPAREllII, GINNERS, aLEANE~, IICOUR1tRS, ETC.
Total 1,008 305 703 79 19 60 IV 727 275 45% 51 18 S3 V 266 27 239 16 1 15
VII 2 2 IX 13 1 12 12 12-
78
B-V OCCUPATIONAL CLASSIFICATION BY SEX OF PERSONS AT WORK OTHER THAN CULTIVATION--",ontd.
Total Workers --'-------- .-~
DivisionJGroupfFami1y Total Urban ------A-- .A__
~ Category Persons Males Females Persons Males Females
1 2 3 4 5 6 7
Family 702 SPINNERS, PIECE:RS AND WINDERS
Total 3,783 219 3,564 1,192 72 1,120 IV 3,089 155 2,934 644- 33 611 V 690 63 627 548 39 509
VII I I IX 3 2
Family 704 DRA WE:RS AND WEA VB RS
Total 5,463 4,076 1,387 756 631 125 IV 5,141 3,807 1,334 704 588 116 V 318 265 53 51 42 9
VII 1 1 IX 3 3
Family 709 SPINNERS, WEAVERS, KNItTERS, DYERS AND RELATED WORKERS, N.E.C.
Total 1,606 433 1,173 17 15 2 IV 1,176 334 842 5 4 1 V 429 98 331 11 10 1
IX I 1 I
Group 71 TAILORS, CUTI'BRS, JlURRIERS AND lI.EI.ATED WOIUtBRI
Total 4,081 3,962 119 1,046 1,022 24 IV 688 620 68 48 33 15 V 3,377 3,326 51 983 974- 9
VII 10 10 9 9 IX 6 6 6 6
Family 710 T An.oRS, DRESS JoL\KERS AND GARMENT JoL\KER.8
Total 3,837 3,730 '107 955 941 14-IV 642 585 57 30 25 5 V 3,184 3,134 50 915 906 9
VII 5 5 4- 4- -IX 6 6 6 6 \
Group 12 I..EATJUR CU'lTI!!BS. LASTERS AND SBWERS (EXCEPT GLO"- AND GARMaNTS) AND ULATED WORURS
'rotal 631 613 18 95 94 1 IV 309 291 18 16 15 1 V 316 316
'-78 78
VII 4- 4 1 1 IX 2 2
73 F'uRNACEMEN, ROLLBRS, DRAWIIRS, MOULDERS AND 1Ul.LATJ!D dTAL MAKING AND TJUlATlNG WORQJl,
Total 5,732 5,oro 692 474- 388 86 III 1 1
IV 4,000 3,424- 656 327 243 84-V 1,610 1,574- S6 138 136 2
VI 16 16
VII 2 2 •• VIII 16 16 7 7
IX 7 7
79
B-V OCCUPATIONAL CLASSIFICATION BY SEX OF PERSONS AT WORK OTHER. THAN CULTIVATION-contd.
Total Workers
Division/Group{Family Total Urban ,- -.. --"--- ..,
Categocy Persons Males Females Persons Males Females
1 2 3 4 5 6 7 Family 733 BLACKSMrms, RAMMERSMtnIS AND PORGEMEN
Total 4,537 4,104 433 351 322 %9 III I 1 IV 3,262 2,847 415 217 189 28 V 1,239 i,221 18 127 126 1
VI 16 16 1 1 VII 2 2
VIII IS 15 6 6 IX 2 2
Group 74 PRECISION INSTRUMENT MAKERS, WATCH MAKlI:RS, JEWELLERS AND RRLATED WORKERS
Total 3,834 3,759 75 613 610 3 IV 2,236 2,168 68 148 146 ! V 1,526 1,519 7 437 436 1
VII 71 71 27 27 IX 1 1 1 1
Family 741 JEWELLERS, GOLDSMITH AND SlLVER9M1TH
Tota1 3,634 3,559 75 543 5<W 3 IV 2,164 2,096 68 145 143 2 V 1,404- 1,397 7 376 375 1
VII 65 65 21 21 IX 1 1 1 1 ,
TOOL-MAKERS, MACHI."IIIffS, PLUlrnERll, WELDERS, PLATERS AND RELATED WORKERS Group 75 Total 2,226 2,190 36 860 832 28
III 2 2 IV 241 . 233 B B4 79 5 V 1,260 1,253 7 534 532 2
VI 223 223 2Q 20 VII 69 69 12 12
VIn 305 305 149 149 IX 126 lOS 21 61 <W 21
Group 76 ELECTR[CtANS AND RELATED ELECTRICAL AND ELECTRONICS WORKERS
Total 718 718 235 235 IV 2 2 1 1 V 67 67 32 32
VI 73 73 42 42 VII l5 15 10 10
VIII 94 94 56 56 IX 467 467 94 94
Group 77 CARPENTERS, JOlNERS, CABINET MAKERS, COOPERS AND RELATED WORKERS
Total 13,849 13,799 50 988 985 3 III 17 15 2 IV 1,675 1,659 16 38 36 V 11,464- 11,433 31 829 826 .S
VI 209 208 1 97 97 VII 9 9 7 7
VIII 31 31 12 12 IX 444 444 5 5
Family 776 CARPENTERS, JOINERS, PATTERN MAKERS (WOOD)
Tota.! 9,514 9,491 23 771 769 2 III 6 6 IV 1,612 1,599 13 37 37 V 7,260 7,250 10 625 623 Z
VI 190 190 97 91 VII 1 1 1 1
VIII 21 27 9 9 IX 418 418 2 2 ..
80
B-V OCCUPATIONAL CLASSIFICATION BY SEX OF PERSONS AT WORK OTHER THAN CULTIVATION-colltd.
Total Workers r--
Division/GroupfFamily Total Urban r- r--
Category Persons Males Female! Persons Males Females
1 2 3 4 5 6 7
Family 772 SAWERS AND WOODWORKING MACHINISTS
Total 4,171 4,162 9 192 192 III :11 9 2 IV 29 29 V 4,101 4,094 7 190 190
VI 3 3 VII 3 3
VIII 1 1 IX 23 23
Group 78 PAINTI!.RlI AND PAPI!.R HANGERS
Total 181 181 82 82 IV 3 3 V 35' 35 10 10
VI 44 44 33 33 VII 2 2 2 2
VIII 14 14 7 7 IX 83 83 30 30
Group 79 BRICKLAYERS, PLASTERltRS AND CONSTRUCTION 'WORKEII.S, N.lI.C.
Total 8,904- 8,045 859 666 579 87 III 493 462 31 23 23 IV 56 49 7 12 11 1 V 340 321 19 41 39 2
VI 7,907 7,105 802 582 498 84-VIII 7 7 3 3
IX 101 .101 5 5
Family 790 STOrm CUTrERS, STONE CARVERS AND STONE DlU!SSBlU
Total 1,471 1,335 136 91 88 3 III 461 451 10 23 23 IV 47 41 6 5 5 V 299 289 10 39 38 1
VI 625 515 110 2.f. 22 2 IX 39 39
family 79~ BIllCItLAYBRS, PLASTl!RltRS, MASONS Total 4;541 4,33.f. 207 535 471 M
III 29 8 21 V 21 18 3 1 1
VI 4,463 4,280 183 528 465 63 VIII, 5 5 3 3
IX 23 23 3 3
Family , 799 ; BRlCItLAYBRS, PLA!TEJlBRlI AND COJilBTlttroTlOPf WOBDRB, lII.B.C.
Total 2,754 2,240 514 22 3 19 III 3 3 IV 5 5 3 3 :V 11 6 5 VI 2,697 2,188 509 19 19
VIII 2 2 IX 36 36
Gum I 80 CoMPosrTORB, PRINTERS, BNGRAVIlRB, BOOIt-BINDERI AM) lIU.A'I'&D ~R8
Total 295 291 " 128 127 1 IV 10 8 2 5 " 1 V 260 258 2 121 121
IX 25 25 2 2.
81
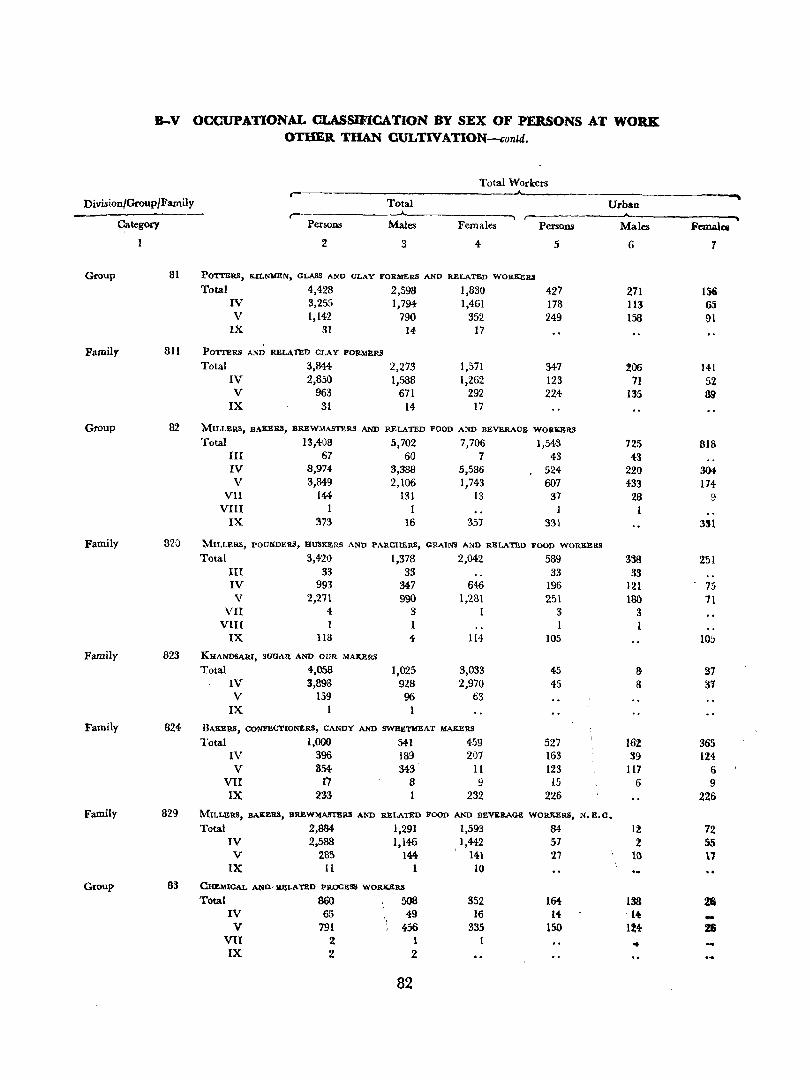
B-V OCCUPATIONAL CLASSIFICATION BY SEX OF PERSONS AT WORK OTHER THAN CULTlVATION-contd.
Total Workers ,-
Division/Group/Family Total Urban
Category Persons Males Females Persons Males Femaloa
1 2 3 4 5 6 7
Group 81 PO'lTERS, KILNVIlN, GLASS AND CLAY FORMERS AND RELATED WORKERS
Total 4,428 2,598 1,830 427 271 156 IV 3,255 1,794- 1,461 178 113 65 V 1,142 790 352 249 158 91
IX 31 14- 17
Family 811 POTI1!RS AND RELATIlD CLAY FORMERS
Total 3,844 2,273 1,571 347 %06 141 IV 2,850 1,588 1,262 123 71 52 V 963 671 292 224 135 S9
IX 31 14 17
Group 82 MILLERS, BAItERS, BREWMASTERS AND RELATED FOOD AND BEVERAGE WORKERS
Total 13,408 5,702 7,706 1,543 725 818 III 67 60 7 43 43 IV 8,974- 3,388 5,586 524 220 304 V 3,849 2,106 1,743 607 433 174
VII 144 131 13 37 28 9 VIII 1 1 1 1
IX 373 16 351 331 331
Family 820 MILLERS, POUNDERS, HUSKERS AND PARCHERS, GRAINll ANti RELATED FOOD WORdRS
Total 3,420 1,378 2,042 589 338 251 III 33 33 33 33 IV 993 347 646 196 121 75 V 2,271 9oo 1,281 251 180 71
VII 4 3 I 3 3 VIH 1 1 l
IX 118 4 114 105 105
Family 823 KHANDSARI, SUGAR AND GUR MAltERS
Total 4,058 1,025 3,033 45 8 31 IV 3,898 928 2,970 45 B 31 V 159 96 63
IX I
Family 824- BAs;ERS, CONFECTIONERS, CANDY AND SWEETMEAT MAKERS
Total 1,000 541 459 527 162 365 IV 396 189 207 163 39 124 V 354 343 11 123 117 6
VII l"7 8 9 15 6 9 IX 233 1 232 226 226
Family 829 MILLERS, BAItERS, 8REWMAnERlI ANtI RELATED FOOD AND BEVI1.RAOO WORs;ERS, N.E.C.
Total 2,884- 1,291 1,593 84- 12 72 IV 2,588 1,146 1,442 57 2 55 V 285 144 141 27 10 11
IX 11 1 10
Group 83 ClO!MlCAL Al'!D- llll\LATl!.D PROCElI8 WORI!;ERS
Total 860 508 352 164 138 28 IV 65 49 16 14 l4 V 791 456 335 150 lU 26
VII 2 1 .. IX 2 2
82
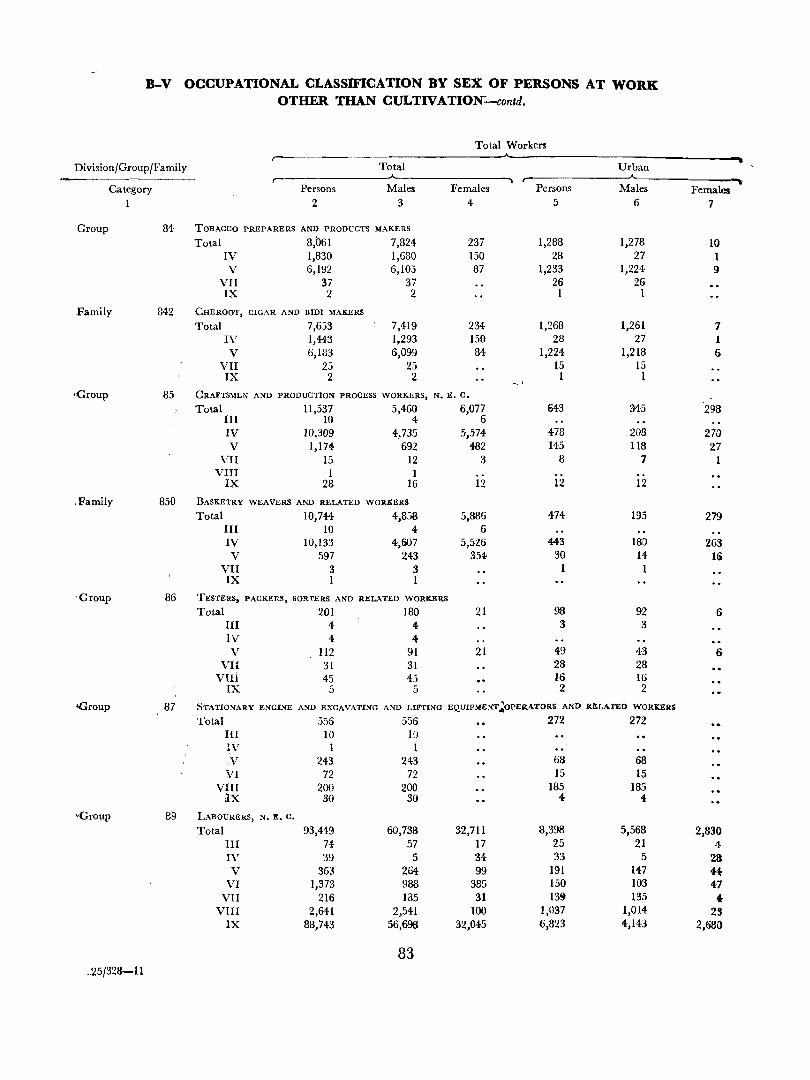
B-V OCCUPATIONAL CLASSIFICATION BY SEX OF PERSONS AT WORK OTHER THAN CULTIVATION-contd.
Total Workers
Division/Group/Family Total Urban ,.--
Category Persons Males Females Persons Males Females
1 2 3 4 5 6 7
Group 84 TOBACCO PREPARERS AND PRODUCTS MAKERS
Total 8,b61 7,824 237 1,288 1,278 10 IV 1,830 1,630 150 28 27 1 V 6,192 6,103 87 1,233 1,224- 9
VII 37 37 26 26 IX 2 2 1 1
Family 842 CHEROOT, CIGAR AND DIDI MAKERS
Total 7,653 7,419 234- 1,268 1,261 7 IV 1,443 1,293 150 28 27 J V 6,183 6,099 84 1,224 1,218 6
VII 25 25 15 15 IX 2 2 1 1
'Group 85 CRAFTS}IEN MID PRODUCTION PROCESS WORKERS, N. E. c.
Total 11,537 5,460 6,077 643 345 298 III 10 4- 6 IV 10.309 4,735 5,574 478 208 270 V 1,174 692 482 145 118 27
VII 15 12 3 8 7 I VIII 1 1
IX 28 16 12 12 12
. Family 850 BASKETRY WEAVERS AND RELATED WORKERS
Total 10,744 4,858 5,886 474 195 279 HI 10 4 6 IV 10,133 4,607 5,526 443 180 263 V 597 243 354 30 14 16
VII 3 3 1 1 IX 1 1
• Group 86 TESTERS, PACKERS, SOR"!'ERS AND RELATED WORKERS
Total 201 180 21 98 92 6 III 4 4 3 3 IV 4 4 V 112 91 21 49 43 6
VB 31 31 28 28 VIIi 45 43 16 16
IX 5 5 2 2
>Group 87, STATIO:'fARY ENGINE AND EXCAVATING AND LlFTING EQUIPMENT;OPERATORS AND RELATED WORKERS
Total 556 556 272 272 III 10 10 IV 1 1 .v 243 243 68 68 VI 72 72 15 15
VIII 200 200 185 185 ~X 30 30 4 4
>Group 89 LABOURERS, N. E. c.
Total 93,449 60,738 32,711 8,398 5,568 2,830 III 74- 57 17 25 21 1-IV 39 5 34 33 5 23 V 363 264 99 191 147 44-
VI 1,373 988 385 150 103 47 VII 216 135 31 139 135 4-
VIII 2,641 2,541 100 1,037 1,014 23 IX 88,743 56,698 32,045 6,823 4,143 2,GB!)
83 _25/328-11
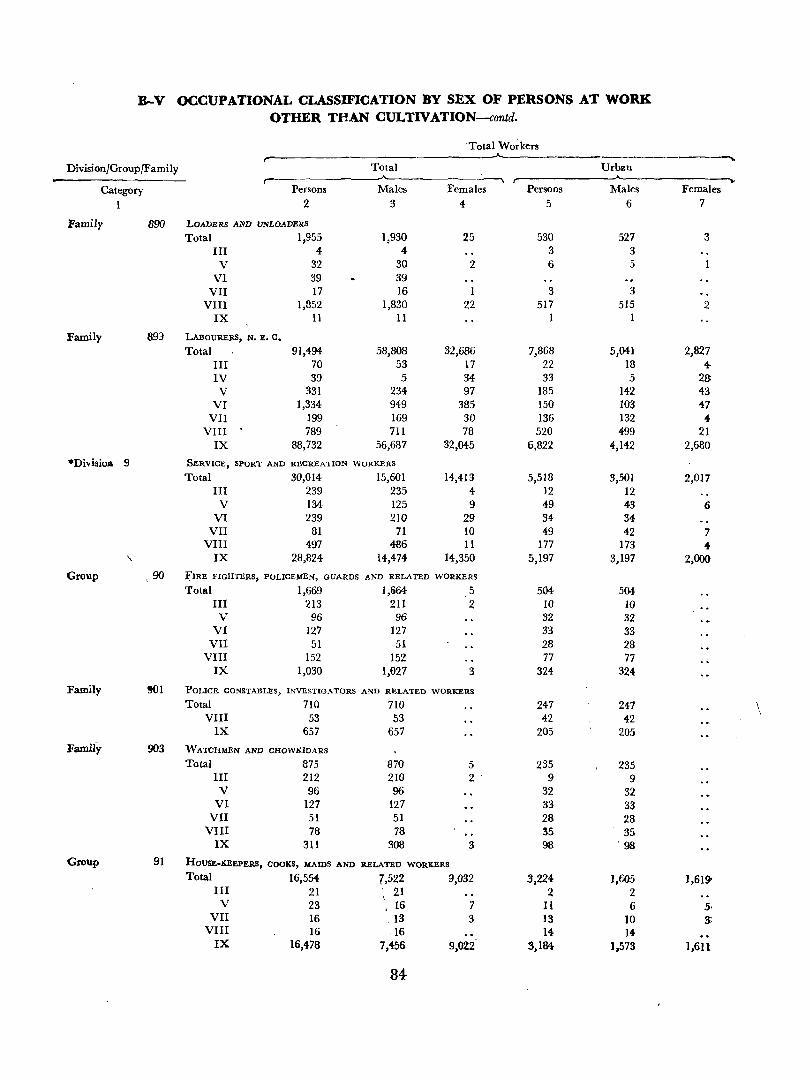
B-V OCCUPATIONAL CLASSIFICATION BY SEX OF PERSONS AT WORK OTHER THAN CULTIVATION-contd.
'Total Wo~kers --Division/Group/Family Total Urban
Category Persons Males Females Persons Males Females
1 2 3 4 5 6 7
Family 890 LOADERS AND VNLOADERS
Total 1,955 1,930 25 530 527 3 III 4 4 3 3 V 32 30 2 6 5
VI 39 39 VII 17 16 1 3 3
VIII 1,852 1,830 22 517 515 2 IX 11 11 1 1
Family 893 LABOURElUl, N. E. c.
Total 91,494 58,808 32,686 7,868 5,041 2,827 III 70 53 17 22 18 4-IV 39 5 34 33 5 28: V 331 234 97 185 142 43
VI 1,334 949 385 150 103 47 VII 199 169 30 136 132 4-
VIII 789 711 78 520 499 21 IX 88,732 56,687 32,045 6,822 4,142 2,680
*Divisio. 9 SERVICE, SPORT AND RECREATION WORKERS
Total 30,014 15,601 14,413 5,518 3,501 2,017 III 239 235 4- 12 12 V 134 125 9 49 43 6
VI 239 210 29 34- 34 VII 81 71 10 4-9 42 7
VIII 197 486 11 177 173 4-\ IX 28,824 14,474- 14,350 5,197 3,197 2,000
Group ,90 J:'IRE FIGHTElUl, POLICEMEN, GUARDS AND RELATED WORKERS Total 1,669 1,6164- 5 504- 504-
III 213 211 2 10 10 .. V 96 96 32 32
VI 127 127 33 33 VII 51 51 28 28
VIII 152 152 77 77 IX 1,030 1,027 3 324- 324
Family 901 POLICE CONSTABLES, INVESTIGATORS AND RELATED WORKERS Total 710 710 247 247 \
VIn 53 53 42 42 IX 657 657 205 205
Family 903 WATCHMEN AND CHOWKIDARS Total 875 870 5 235 235
III 212 210 2 9 9 V 96 96 32 32
VI 127 127 33 33 VII 51 51 28 28
VIII 78 78 35 35 IX 311 308 3 98 '98
Group 91 HOUSE-KEEPERS, COOKS, MAIDS AND RELATED WORKERS Total 16,554- 7,522 9,032 3,224- 1,605 1,619-
III 21 21 2 2 V 23 16 7 II 6 5,
VII 16 13 3 13 10 s: VIII 16 16 14- 14
IX 16,4-78 7,456 9,022 3,184 1,573 1,611
84
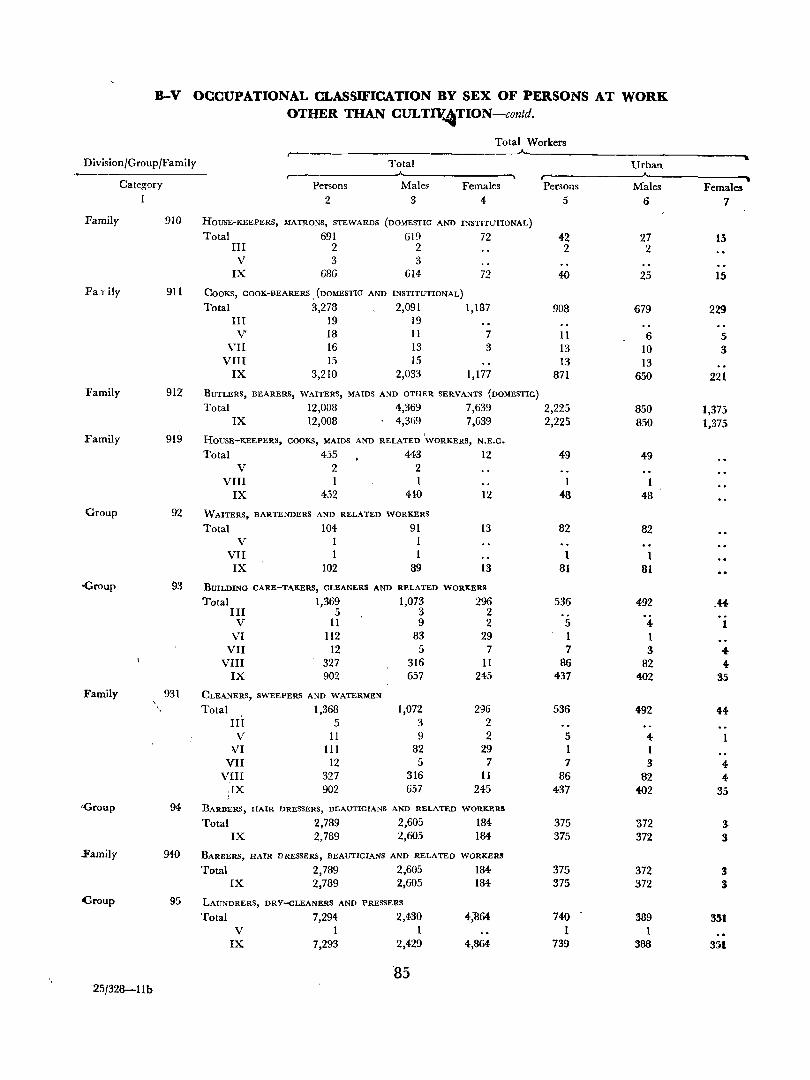
B-V OCCUPATIONAL CLASSIFICATION BY SEX OF PERSONS AT WORK OTHER THAN CULTIV4TION-contd.
Total Workers ,--
Division/Group/Family Total Urban
r--Category Persons Males Females Persons Males Females
1 2 3 4 5 6 7
Family 910 HOUSE-KEEPERS, &IATRONS, STEWARDS (DOMESTIC AND INSTITUTIONAL)
Total 691 619 72 42 27 15 III 2 2 2 2 V 3 3
IX 686 614 72 40 25 15 Fa_Tily 911 COOKS, COOK-BEARERS, (DOMESTIC AND INSTITUTIONAL)
Total 3,273 2,091 1,137 908 679 229 III 19 19 V 18 11 7 11 6 5
\'II 16 13 3 13 10 3 VIII 15 15 13 13
IX 3,210 2,033 1,177 871 650 221 Family 912 BUTLERS, BEARERS, WAITERS, MAIDS AND OTHER SERVANTS (DOMESTIC)
Total 12,008 4,369 7,639 2,225 850 1,375 IX 12,008 4,369 7,639 2,225 850 1,375
Family 919 HOUSE-KEEPERS, COOKS, MAIDS AND RELATED 'WORKERS_, N.E.C.
Total 455 443 12 49 49 V 2 2
VIn 1 1 1 I IX 452 4W 12 48 48
Group 92 WAITERS, BARTENDERS AND RELATED WORKERS
Total 104 91 13 82 82 V I I
VII 1 1 1 1 IX 102 89 13 81 81
<Group 93 BUILDING CARE-TAKERS, CLEANERS AND RELATED WORKERS
Total 1,369 1,073 296 536 492 _4+ III 5 3 2 V 11 9 2 5 4 1
VI 112 83 29 1 1 VII 12 5 7 7 3 .f..
VIII 327 316 11 B6 82 4.-IX 902 657 245 437 402 35
Family 931 CLEANERS, SWEEPERS AND WATERMEN ,
Total 1,368 1,072 296 536 492 H-III 5 3 2 V 11 9 2 5 4 VI 111 82 29 1 1
VII 12 5 7 7 3 4 VIII 327 316 11 86 82 4
,IX 902 657 245 437 402 35 <Group 94- BARBERS, HAIR DRESSERS, BEAUTICIANS AND RELATED WORKERS
Total 2,789 2,605 184 375 372 3-IX 2,789 2,605 184 375 372 3-
.Family 940 BARBERS, HAIR DRESSERS, BEAUTICIANS AND RELATED WORKERS
Total 2,789 2,605 184 375 372 :4 IX 2,789 2,605 184 375 372 3
.croup 95 LAUNDRERS, DRY-GLEANERS AND PRESSERS
Total 7,294 2,430 4,-S64 740 389 3S1 V 1 1 1 1
IX 7,293 2,429 4,864 739 388 351
85 '.25/328-11b
B-V OCCUPATIONAL CLASSIFICATION BY SEX OF PERSONS AT WORK OTHER THAN CULTIVATION-conta'.
Total Workers _.A.-- --Division/Group/Family Total Urban
"""-Category Persons Males Females Persons Males Females
1 2 3 4 5 6 7
Family 950 LAUNDRYMEN, WASHElUlEN AND DHOllIES
Total 7,287 2,423 4,864 737 386 351 IX 7,287 2,423 4,864 737 386 351
Group 96 ATHLETES, SPORTSMEN AND RELATED WORKERS
Total 1 IX 1
Group 97 PHOTOG~PHERS AND RELATl-:D CAMERA OPERATORS
Total 75 75 40 40 IX 75 75 40 40
Grall;> 99 SERVICE, SPORT AND RECREATION WORKERS, N. E. c._
Total 159 140 19 Hi 16 V 2 2
VII 1 1 VIII 2 2
IX 154 135 19 16 16 Division X WORKERS NOT CLASSIFIABLE BY OCCUPATION
Total 479 456 23 251 248 3 III 1 1 1 1 IV 1 1 V 17 15 2 17 15 2.
VI 21 20 20 19 IVII 28 28 25 25 VIII 17 17 17 17
IX 394 374- 20 171 171 Group XM WORKERS REPORTING OCCUPATIONS UNIDENTIFIABLE OR UNCU.SSIFIABLE
Total 474- 451 23 247 244 3 III 1 1 1 1 IV 1 1 V 15 13 2 15 13 2
VI 21 20 1 20 19 1 VII 28 28 25 25
VIII 15 15 15 15 IX 393 373 20 171 171
Family X80 WORKERS REPORTING OCCUPATIONS UNIDENTIFIABLE OR UNCLASSIl'IABLE
Total 4'"14 451 23 247 244- 3 III 1 1 I IV 1 I .. V 15 13 2 15 13 2'
VI 21 20 20 19 1 VII 28 28 25 25
VIII 15 15 15 15 IX 393 373 20 171 J71
Croup X! WORdRS NOT REPORTING OCCUPATION
Total 5 5 4 4 V 2 2 2 2
VIII 2 2 2 2 IX 1
Family X90 WORXERS NOT REPORTING OCCUPATJ'PN
Total 5 5 4- i V 2 2 Z 2 ..
VIII 2 2 2 2 IX 1 1 -
86 •
Division
Category
All Divisions
Division 0
Division
Division 2
Division 3
B-V OCCUPATIONAL CLASSIFICATION BY SEX OF PERSONS AT WORK OTHER THAN CULTIVATION-contd.
Total Workers Divi~ion Total Workers
-"-----Persons Males Females Category Persons Males Females
2 3 4 2 3 • PERINTALMANNA TALUK-RURAL
Divi,ion 4 FARMER~, FISHERMEN, HU:<ITERS. LOCGERS AND
Total 56,736 41,157 15,579 RELATeD WORKERS
m 6,023 5,284 739 Total 5,545 4,810 735
III 5,440 4,712 723 IV 5,083 3,122 1,961
IV 42 37 .'> V 5,030 4,302 728 V 12 12
VI 973 928 45 VII 12 10 2 VII 2,963 2,769 194 VIII 3 3
rm 1,099 1,091 8 IX 36 36
IX 35,565 23,661 11,904 Division 5 I,IINERS, Q.UARRYMEN AND RELATED WORKER·S
PROFESSIONAL, TECHNICAL AND RELATED WORKERS Total 426 421 5
Total 3,570 2,967 603 III 400 395 5 IV 3 3 III 2 2 VI 18 18 IV 22 20 2
V 7 5 2 IX 5 5
VI 3 3 Division 6 WORKERS VII :; 5
IX TRANSPORT AND COMMUNICATION OCCUPATIONS
VIn I Total 767 762 5
IX 3,530 2,931 599 VI 7 7
VIn 732 727 5 ADMINlSTRA TIVE, EXECUTIVE AND MANAGERIAL IX 28 28
WORKERS
Total 889 860 29 Division 7-8 CRAFTSM!:N, PRODUCTION PROCESS WORKERS AND
III 23 23 LAB OURERS NOT ELSEWHERE CLASSIFIED
V 34- 24 10 Total 35,543 24,454 11,089 VI 39 38 1 III 27 21 6-
··VII 145 135 10 IV 5,016 3,062 1,954-VIII 26 26 V 4,932 4,218 714
IX 622 614- 8 VI 906 862 4+ VII 57 44 13
CLERIC';L AND RELATED WORKERS VIII ?23 220 3
Total 594 579 15 IX 24,382 16,027 8,355
III 55 V 10
55 10 Division 9 SERVICE, SPORT AND RECREATION WORKERS
VII 63 62 Total 4,992 2,240 2,752 VIn 24 24 III 72 72
IX 442 428 14 V 6 4 2 VII 5 4
SALES WORKERS VIII 90 90
Total 4,350 4,007 343 IX 4,819 2,070 2,749
III 4 4-Division X WORKERS NOT CLASSIFIABLE BY OCCUPATION
V 29 29 VII 2,676 2,509 167 Total 60 57 3
IX 1,641 1,465 176 IX 60 57 3
87
Division
Category 1
All Divisions
Division o
Division
Division 2
Division 3
All DivieioDs
B-V OCCUPATIONAL CLASSIFICATION BY SEX OF PERSONS AT WORK OTHER THAN CULTIVATION-contd.
Total Workers ,.-----A--.--~
Persons Males Females 2 3 4
Division
Category I
PONNANITALUK-RURAL
Total III IV V
VI vn Vln IX
56.478
8.299 5,727 4.874
7.87 4.591 2.184
30.016
41,452 7.415 2,860 3.801
767 4,486 2,172
19,951
15,026 884
2,867 1,073
20 105
12
10,065
PROFESSIO~AL, TECllNICAL AND RELATED WORK:ERS
Total V
VII IX
3,098 8 2
3,088
2,390 8 2
2,380
ADMINISTRATIVE, EXECUTIVE AND
WORKERS
Total III 'IV
V VI
VII VIII
IX
2,285 '2 6
23 16 28 9
2,201
2,229 '2 6
22 16 28 9
2,146
CLERICAL AND RELATED WORKERS
Total 579 V 26
VI I VII 114
VIII 23 IX 415
SALES WORKERS
Total V
VII VIII
IX
4,678 36
4,394 21
227
564 25
1 113 23
402
4,570 36
4,291 21
222
708
708
MANAGERIAL
56
55
15
13
108
103
5
Division 4
Division 5
Division 6
Division 7-8
Divi!ion 9
Division X
OTTAPALAM TALUK-RURAL
Total III IV V
VI vn
VIII IX
50,682 2.388 8.,681
5,406 1,490 3,048
968 28,701
35.595 2,176 4,736 4.719 1,458 2,882
953 18,671
15,087 212
3,945
~7
32
1" 15
10,030
88
Division 0
Total Workers r----------A-----------*\
Persons 2
Males 3
Females 4
FARMERS, FISllERMEN, RELATED WORKERS
IIUNTERS, LOGGERS AND
Total 8,009 7,128 881
III 7,977 7,096 R31
IV 13 V 5
VIII IX
8 6
13 5 8 6
?fINERS, QUARRYMEN A:-ID RELATED WORKERS
Total 320 317 III 320 317
3 3
WORKERS IN TRANSPOR1' OCCUPATIONS
AND COMMUNICATION
Total VI
VII VIII
IX
1,064 5 I
1,040 18
1,063 5 1
1,039 18
CRAFTSMEN, PRODUCTION PROCESS WORKERS AND LABOURERS NOT ELSEWHERE CLASSIFIED
Total IV V
VI VII
VIII IX
32,670 5,707 1,773
765 48
1,044 20,333
21,431 2,!M() 3,7J2
745 47
1,035 13,062
SERVICE, SPORT AND RECREATION WORKERS
11,239 2,867 1,071
20 1 9
7,271
Total 3,749 1,735 2,014 V 3 3
VII VIII
IX
1 39
.3,706
1 37
1,691
WORKERS NOT CJ,ASSIFIABLE BY OCCUPATION
Total IV
VII IX
26 1 3
22
25 1 3
21
~ 2,OI~ \
1
PROFESSIONAL, TECHNICAL AND RELATED WORl{ElU
Total 4,256 3,077 1,179 III 1 1 IV 6 6 V 90 M 7
VI VII
VIII IX
3 8 5
4,143
3 8 5
2,971 1,17%
Division
Category
1
Division
Division 2
Division 3
Division 4
.All DivisioDI!I
. Division °
B-V OCCUPATIONAL CLASSIFICATION BY SEX OF PERSONS AT WORK OTHER THAN CULTIVATION-contd.
Total Workers Division Total Workers .... r- .A. Persons Male~ Female. Category Persons Males Females
2 3 4 1 2 3 4
ADMINISTRATIVE, EXECUTIVE AND M"INAGERIAL Division 5 MINERS, QUARRYMEN AND RELATED WORKERS WORKERS
Total 15 14 I Total 2,4£0 2,278 202 III 11 10 I
V 39 37 2 V 4 4 VI 23 23 Division 6 WORKERS IN TRANSPORT AND COMMUNICATION VII 232 226 6 OCCUPATIONS
VIII 18 18 Total 7;';1 747 4 IX 2,168 1,974 194 V 10 10
VI 5 5 CLERICAL AND RELATED WORKERS VIII 715 7Jl 4 Total i41 726 15 IX 21 21
III 3 3 Division 7-8 CRAFTSMEN, PRODUCTION PROCESS WORKERS AND V 101 101 LABOURERS NOT ELSEWHERE CLASSIFIED
VI 5 5 Total 32,116 21,742 10,374 VII 86 85 1 III 413 406 7
VIII 52 50 2 IV 8,094 4,166 3,928 IX 494 482 12 V 5,012 4,398 674
VI 1,452 1,420 32 , SALES WORKERS VII 23 16 7
Total 2,672 2,523 149 VIn 127 120 7
V 20 18 2 IX 16,935 11,216 5,719
VII 2,631 2,484 147 Divi;ion 9 SERVICE, SPORT AND RECREATION WORKERS
IX 21 21 Total 4,962 2,030 2,932 III 18 18
FARMERS, FISHERMEN, HUNTERS, LOGGERS AND V 31 31 RELATED WORKERS VI 2 2
Total 2,651 2,420 231 VII 4 4 III 1,942 1,738 204 VIII 51 49 2 IV 581 564 17 IX 4,856 1,926 2,930 V 39 37 2 Division X WORKERS NOT CLASSIFIABLE BY OCCUPATION
VII 64 59 5 Total 38 38 IX 25 22 3 IX 38 38
PALGHAT TALUK-RURAL
Division ADMINISTRATIVE, EXECUTIVE AND MANAGERIAL
Total 39,032 29,640 9,392 WORKERS
m 2,765 2,563 202 Total 1,820 1,694 126 IV 8,Q48 4,810 3,238 III 2 2 V 5,830 5,311 519 IV 2 2
VI 1,129 1,005 124 V 147 144 3 VII 3,450 3,063 387 VI 43 43 vm 2,455 2,391 64 VII 26 26 IX 15,355 10,497 4,858 VIII 30 30
PROl'ESSIONAL, TECHNICAL AND RELATED WORKERS IX 1,570 1,447 123
Total 2,072 1,627 445 Division 2 CLERICAL AND RELATED WORKERS III 2 2 Total 1,280 1,248 32 V 22 22 III 17 17
VI 14 14 V 110 107 3 VII 1 1 VI 56 55 1
VII 126 126 VIII 14 14- VIII 427 409 18 IX 2,019 1,574 445 IX 544 534 10
89
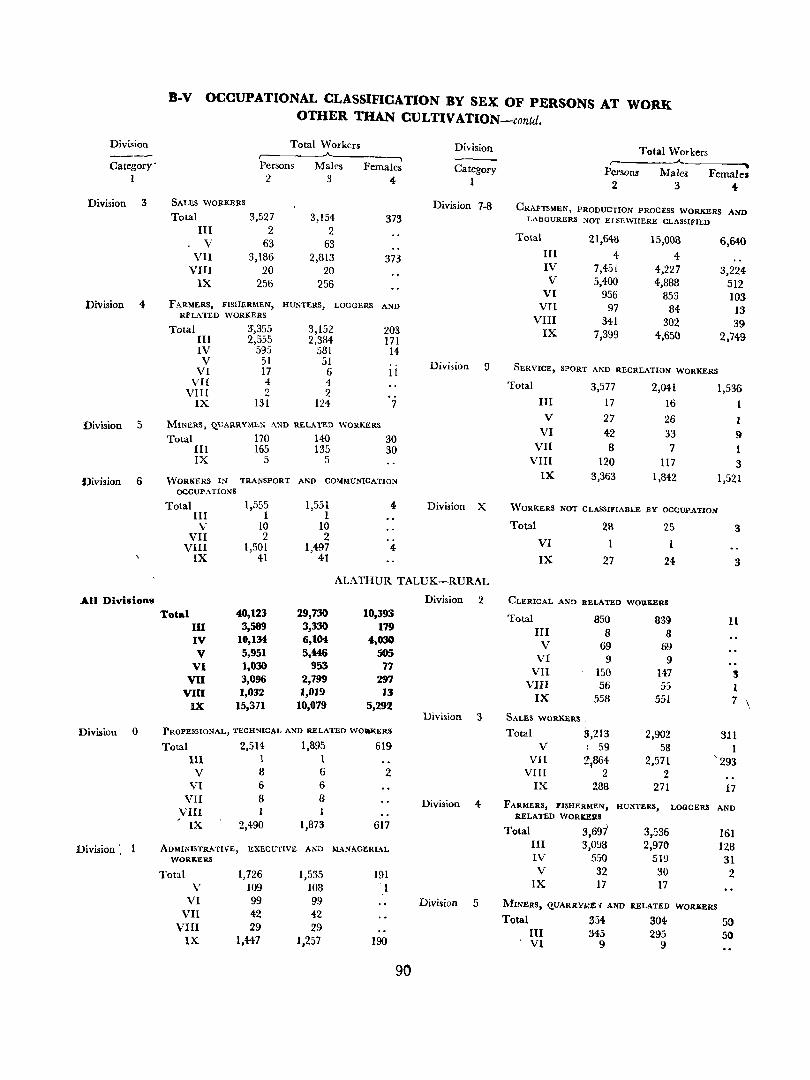
Division
Category·
1
Division 3
Division 4
Division 5
Division 6
All Divisiofts
Division 0
Division " 1
B-V OCCUPATIONAL CLASSIFICATION BY SEX OF PERSONS AT WORK OTHER THAN CULTIVATION-contd.
Total Workers Division Total Workers -_ .A. Persons Males Females Category Persons Males Females 2 3 4- 1 2 3 4
SALES WORKERS Division 7-8 CRAFTSMEN, PRODUCTION PROCESS WORKERS AND Total 3,527 3,154 373 LABOURERS NOT ELSEWHERE CLASSIFIED
III 2 2 Total 21,648 15,008 6,640 V 63 63
III 4 4 VII 3,186 2,813 373 IV 7,451 4-,227 3,224 VITI 20 20 V 5,400 4,888 512 IX 256 256
VI 956 853 103 FARMERS, FISHERMEN, HUNTERS, LOGGERS AND VII 97 84 13 RFLATED WORKERS VIII 341 302 39 Total 3',355 3,152 203 IX 7,3!J9 4,650 2,749 III 2,555 2,384 171
IV 595 581 14 V 51 51 Division 9 SERVICE, SPORT AND RECRI:ATION WORKERS VI 17 6 11
VII 4 4 Total 3,577 2,041 1,536 VIII 2 2 IX 131 124 7 III 17 16 1
V 27 26 MINERS, Q.UARRYME.N AND RELATI!.O WORKERS VI 42 33 9 Total 170 140 30
VII 8 7 1 III 165 135 30 IX 5 5 VIII 120 117 3
WORKERS IN TRANSPORT AND CO!llMUNICATION IX 3,363 1,842 1,521 OCCUPATIONS
Total 1,555 1,551 4- Division X WORKERS NOT CLASSIFIABLE BY OCCUPATION III 1 I V 10 10 Total 28 25 3
VII 2 2 VI 1 I VIII 1,501 1,497 4-IX 41 4-I IX 27 24- 3
ALATHUR TALUK-RURAL
Division 2 CLERICAL AND RELATED WORKERS
Total 4.0,123 29,730 10,393 Total 850 S3g 11
Ul 3,589 3,330 179 III 8 8 IV 10,134 6,10{ 4,030 V 69 69 V 5,951 5,446 505 VI 9 9 VI 1,030 9~ 77 VII 150 147 ~ va 3,096 2,799 297 VIU 56 55 1 VIn 1,032 1,019 13 IX 558 551 7 \ IX 15,371 10,079 5,292
Division 3 SALES WORKERS,
PROFESSIONAL, TECHNICAL AND RELATED WOIU(ERS Total 3,213 2,902 311 Total 2,514 1,895 619 V ~. 59 5a 1
III 1 1 VII 2\864- 2,571 ' 293 V 8 6 2 VIII 2 2
VI 6 6 IX 288 271 17 VII 8 8
Division 4 FARMERS, PISHERMEN, HUNTERS, LOGGERS AND VIII 1 RELATED WORkERS IX 2,490 1,873 617
Total 3,697 3,536 161 III 3,098 2,970 128 ADMINISTRATIVE, EXECUTIVE AND MANAGERIAL IV 550 519 31 WORKERS
V 32 30 2 Tot::tl 1,726 1,535 191 IX 17 17 \' 109 108 '1
VI 99 99 Division 5 MINERS, Q.UARRYME .. AND RELATED WORKERS VII 42 42
Total 354- 304- 50 VIII 29 29 III 345 295 50 IX 1,447 1,257 190 VI 9 9
90
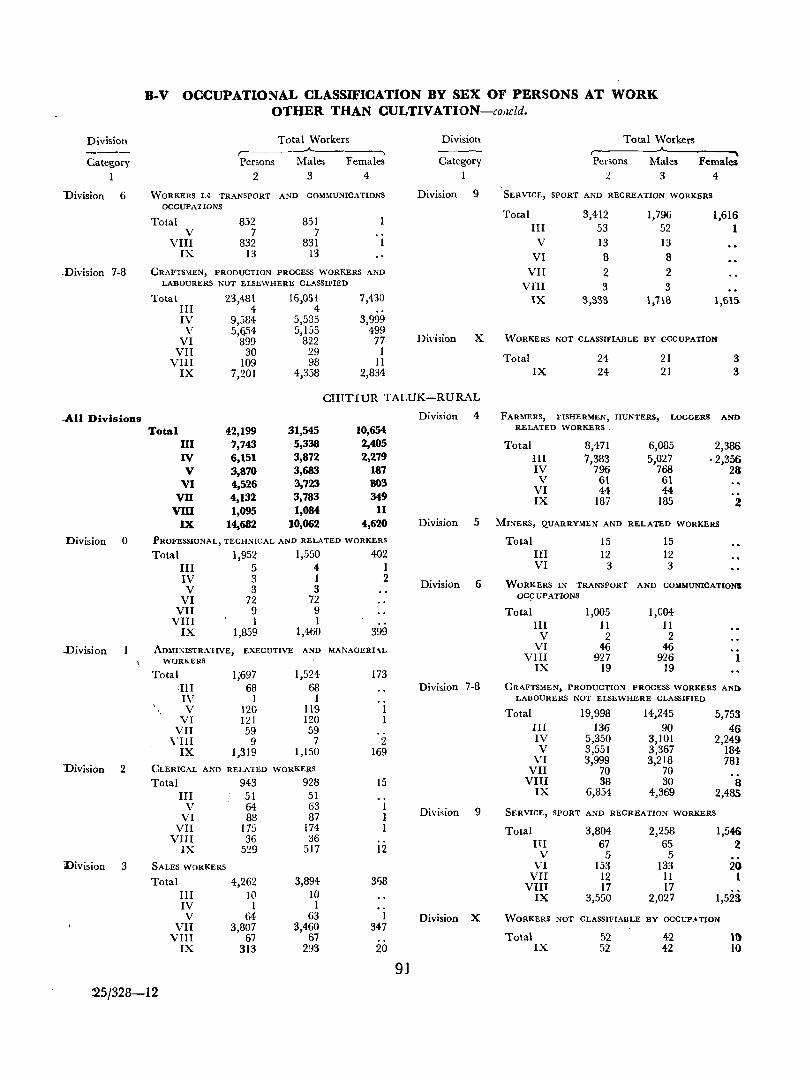
Division
Category
1
:Division 6
.Division 7-8
..All Divisions
Division 0
Division
Division 2
Division 3
B-V OCCUPATIONAL CLASSIFICATION BY SEX OF PERSONS AT WORK OTHER THAN CULTIVATION-collcld.
Persons
2
Total Workers
Males
3
Females
4
WORKERS U TRANSPORT AND COM~IUNICATIONS OCCUPATIONS
Total V
VIII IX
852 7
832 13
851 7
831 13
CRAFTS,IEN, PRODUCTION PROCESS' WORKERS AND LABOURERS NOT ELSEWHERE CLASSIFIED
Total 23,481 III 4 IV 9,584 V 5,(i54
VI 899 VII 30
VUI 109 IX 7,201
16,051 4
5,535 5,155
822 29 98
4,358
7,430
3,999 499 77 1
II 2,834
Division
Category
1
Division 9
Divi,ion x
CHITTUR TAI.UK-RURAL
Total 42,199 III 7,743 IV 6,151 V 3,870
VI 4,526 VII 4,132 vm 1,095
IX 14,682
31,545 5,338 3,872 3,683 3,723 3,783 1,084
10,062
10,654 2,405 2,279
187 803 349
11 4,620
PROfESSIONAL, TECHNICAL AND RELATED WORKERS
Total 1,952 1,550 402 III 5 4 1 IV 3 1 2 V 3 3
VI 72 72 VII 9 9
VIII 1 I IX 1,859 1,460 399
ADlII:,(ISTRA'IIVE, EXECUTIVE AND MANAGERI'\.L WORKERS '
Total 1;697 1,524 173 III 68 68 IV I I V 120 119
VI 121 120 VII 59 59
VIII 9 7 2 IX 1,319 1,150 169
CLERICAL AND RELATED WORKERS
Total 943 928 15 III '51 51
V 64 63 VI 88 87
VII 175 174 VIn 36 36
IX 529 517 12
SALES WORKERS
Total 4,262 3,894 31)8 III 10 10 IV I 1 V 64 63 1
VII 3,807 3,460 VIn 67 67
347
IX 313 293 20
Division 4
Division 5
Division 6
Division 7-8
Division 9
Division X
91
Total Workers ( "--Persons Males Females
« 3 4
SERVICE, SPORT AND RECREATION WORKERS
Total 3,412 1,796 1,616 III 53 52 I V 13 13
VI 8 8 VII 2 2
VIII 3 3 IX 3,333 1,718 1,615
WORKERS NOT CLASSIFIABLE BY OCCUPATION
Total
IX 24 24
21 21
3 3
FARMERS, FISHERMEN, HUNTERS, LOGGERS AND RELATED WORKERS,
Total
III IV V
VI IX
8,471 7,383
796 61 44
187
6,085 5,027
768 61 44
185
2,386 -2,356
28
2
MI:-IERS, QUARRYMEN AND RELATED WORKERS
Total 15 15 III 12 12 VI 3 3
WORKERS IN TRANSPORT AND COMMUNICATIONS OCCUPATIONS
Total 1,005 I,C04 III 11 11 V 2 2
VI 46 46 VIII 927 926
IX 19 19
CRAFTSMEN, PRODUCTION PROCESS WORKERS AND LABOURERS NOT ELSEWHERE CLASSIFIED
Total 19,998 14,245 5,753 III 136 90 46 IV 5,350 3,101 2,249 V 3,551 3,367 184
VI 3,999 3,218 781 VII 70 70
VIII 38 30 8 IX 6,854- 4-,369 2,485
SERVICE, SPORT AND RECREATION WORKERS
Total 3,804 2,258 1,546 HI 67 65 2
V 5 5 VI 153 133 20
VII 12 II 1 VIII 17 17
IX 3,550 2,027 1,523
WORKERS NOT CLASSIfIABLE BY OCCUP,,"TION
Total 52 42 l~ IX 52 42 10
:25/328-12
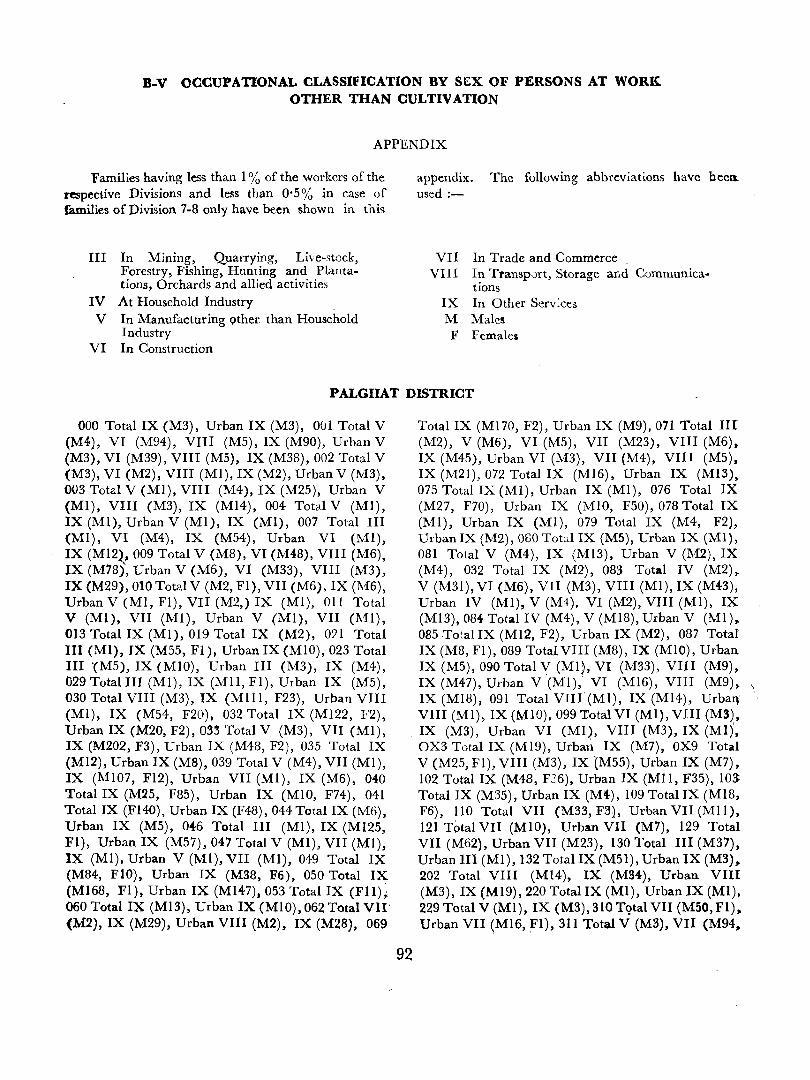
B-V OCCUPATIONAL CLASSIFICATION BY SEX OF PERSONS AT WORK OTHER THAN CULTIVATION
APPENDIX
'Families having less than I % of the workers of the respective Divisions and less than 0'5% in case of families of Division 7-8 only have been shown in this
III In Mining, Quarrying, Live-stock, Forestry, Fishing, Hunting and Plantations, Orchards and allied activities
IV At Household Industry . V In Manufacturing Qther. than Household
Industry VI In Construction
appendix. The following abbreviations have beeIl. used :-
VII In Trade and Commerce VIII In Transp,)rt, Storage and Communica
tions IX In Other Serv;ces M Males F Females
PALGHAT DISTRICT
000 Total IX (M3), Urban IX (M3), 001 Total V (M4), VI (M94), VIII (M5), IX (M90), Urban V (M3), VI (M39), VIII (M5), IX (M38), 002 Total V (M3), VI (M2), VIII (MI), IX (M2), Urban V (M3), 003 Totz.l V (MI), VIII (M4), IX (M25), Urban V (Ml), VIII (M3), IX (MI4), 004 Toted V (Ml), IX (MI), Urban V (MI), IX eMI), 007 Total III (MI), VI (M4), IX (M54) , Urban VI (Ml), IX (MI2)_. 009 Total V (M8), VI (M4B), VIII (M6), IX (M78), Urban V (M6), VI (M33), VIII (M3), IX (M29), 010 Total V (M2, Fl), VII (M6), IX (M6), Urban V (MI, FI), VII (M2,) IX (MI), OIl Total V (Ml), VII (MI), Urban V (MI), VII (MI), 013 Total IX (MI), 019 Total IX (M2), O?I Total III (MI), IX (M55, FI), Urban IX (MIO), 023 Total III -eM5), IX (MIO), Urban III (M3), IX (M4) , 029 Total III (Ml), IX (MIl, Fl), Urban IX (M5), 030 Total VIII (M3), IX (MIll, F23), Urban VIn (MI), IX (M54, F20), 032 Total IX (MI22, F2), Urban IX (M20, F2), 033 Total V (M3), VII (MI), IX (M202, F3), Urban IX (M48, F2), 035 Total IX (M12), Urban IX (M8), 039 Total V (M4), VII (MI), IX (MI07, F12), Urban VII (MI), IX (M6), 040 Total IX (M25, F85), Urban IX (MIO, F74), 041 Total IX (FI40), Urban IX (F48) , OHTotal IX (M6), Urban IX (M5), Oi6 Total III (Ml), IX (MI25, Fl), Urban IX (M57), 047 Total V (Ml), VII (MI), IX (Ml). Urban V (Ml), VII (Ml), 049 Total IX (M84, FlO), Urban IX (M38, F6), 050 Total IX (MI68, Fl), Urban IX (MI47). 053 Total IX (Fll)~ 060 Total IX (MI3), Urban IX (MlO), 062 Total VII' (M2), IX (M29), Urban VIII (M2), IX (M28), 069
Total IX (MI70, F2), Urban IX (M9), 071 Total III (M2), V (M6), VI (M5), VII (M23), VIn (M6) .. IX (M45), Urban VI (M3), VII (M4), VIII (M5), IX (M21), 072 Total IX (MI6), Urban IX (MI3), 075 Total IX (Ml), Urban IX (Ml), 076 Total IX (M27, F70), Urban IX (Mia, F50), 078 Total IX (Ml), Urban IX (Ml), 079 Total IX (M4, F2), Urban IX (M2), 080 Tot"l IX (MS), Urban IX (Ml), 081 Total V (M4), IX (MI3), Urban V (M2), IX (M4), 032 Total IX (M2) , 083 Total IV (M2),. V (M31), VI (M6), VII (M3), VIII (Ml), IX (Mi3), Urban IV (Ml), V (M4). VI (M2), VIII (Ml), IX (MI3), 084 Total IV (M4), V (MI8), Urban V (Ml),. OB5 Total IX (MI2, F2), Urban IX (M2), 087 Total IX (MB,Fl), 089 Total VIII (M8), IX (MIO), Urban IX (M5), 090 Total V (Ml~, VI (M33), VUI (M9), IX (M47), Urban V (Ml), VI (MI6), VIII (M9),. , IX (MI8)~ 091 Total VIII.(Ml), IX (MI4), Urbaq VIII (Ml), IX (MlO). 099 Total VI (MI), VIII (M3) •
.. IX (M3), Urban VI (Ml), VIII (M3), IX (Ml)" OX3 Total IX (MI9), Urban IX (M7), OX9 Total V (M25, Fl) VIn (M3), IX tM55), Urban IX (M7), 102 Total IX (M48, F26), Urban IX (MIl, F35), 103:
92
Total IX (M35), Urban IX (M4-), 109 Total IX (MI8, F6), 110 Total VII (M33, F3), Urban VII (MIl), 121 Total VII (MIO), Urban VII (M7), 129 Total VII (M62) , Urban VII (M23), 130 Total III (M37), Urban III (Ml), 132 Total IX (M5l), Urban IX (M3),. 202 Total VIII (M14), IX (M34), Urban VIII (M3), IX (MI9), 220 Total IX (Ml), Urban IX (Ml). 229 Total V (Ml), IX (M3), 310 Tqtal VII (M50, Fl),. Urban VII (MI6, FI), 311 Total V (M3), VII (M94,.
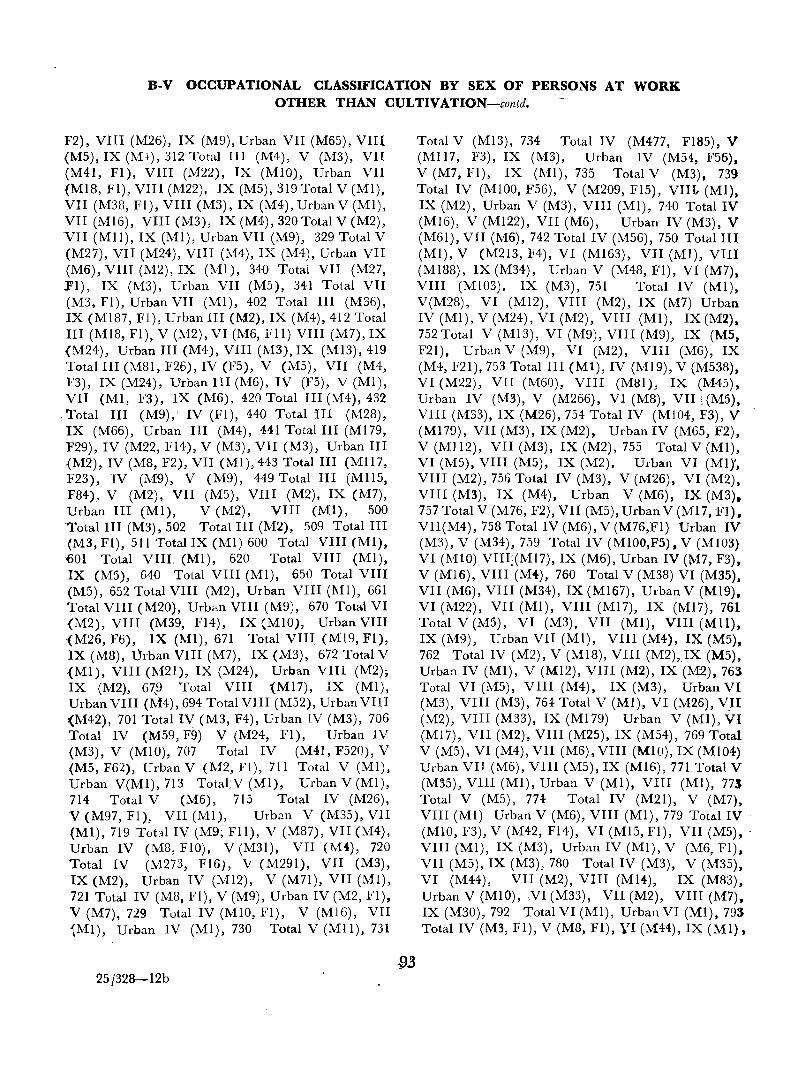
B-V OCCUPATIONAL CLASSIFICATION BY SEX OF PERSONS AT WORK OTHER THAN CULTIV ATION-contd.
F2), VIII (M26), IX (M9), Urban VII (M65), VII!. {M5), IX (M-l:) , 312 Total III (M4), V (M3), VII (M41, Fl), VIII (M22), IX (MlO), Urban VII (M18, Fl), VIn (M22), IX (MS), 319 Total V (MI), VII (M3S, Fl), VIII (M3), IX (M4), Urban V (MI), VII (MI6), VIII (M3), IX (M4), 320 Total V (M2), VII (Mll), IX (Ml), Urban VII (M9), 329 Total V (M27), VII (M24), VIII (M4), IX (M4), Urban VII (M6), VIII (M2), IX (MI), 340 Total VII (M27, FI), IX (M3), Urban VII (M5), 341 Total VII (M3, Fl), Urban VII (Ml), 402 Total III (M36), IX (MI87, Fl), Urban III (M2), IX (M4), 412 Total III (MI8, FI), V (M2), VI (M6, I'll) VIII (M7), IX (M24), Urban III (M4), VIII (1\13), IX (M13),4l9 Total III (~18l, F26), IV (F5), V (M5), VII (M4, F3), IX (M24), Urban III (M6), IV (F5), V (M1), VII (M1, F3), IX (M6), 420 Total III (M4), 432
,Total III (M9),' IV (FI), 440 Total III (M28), IX (M66), Urban III (M4), 441 Total III (MI79, F29), IV (M22, F14), V (M3), VII (M3), Urban III {M2), IV (M8, F2), VII (Ml), 443 Total III (MI17, F23), IV (M9), V (M9), 449 Total III (M1l5, F84), V (M2), VII (MS), VIII (M2), IX (M7), Urban III (MI), V (M2), VIII (Ml), 500 'Total III (M3), 502 Total III (M2), 509 Total III (M3, Fl), 511 Total IX (Ml) 600 Total VIII (Ml), tiOI Total VIII, (MI), 620 Total VIII (MI), IX (M5), 640 Total VIII (MI), 650 Total VIII (M5), 652 Total VIII (M2), Urban VIII (Ml), 661 Total VIn (M20), Urban VIII (M9), 670 Total VI (M2), VIII (M39, F14), IX (MlO), Urban VIII (M26, F6), IX (Ml), 671 Total VIII, (MI9, FI), IX (M8), Urban VIII (M7), IX (M3), . 672 Total V (Ml), VIn (M2l), IX (M24), Urban VIU (M2); IX (M2), 67,9 Total VIII ,MI7), IX (Ml), Urban VIII (M4), 694 Total VIn (M52), Urban VIII (M42) , 701 Total IV (M3, F4), Urban IV (MS), 706 Total IV (M59, F9) V (M24, Fl), Urban IV (M3), V (MIO), 707 Total IV (M41, F520), V (MS, F62), Urban V (M2, Fl), 711 Total V (MI), Urban V(Ml), 713 Total;V (Ml), Urban V (MI), 714 Total V (M6), 715 Total IV (M26), V (M97, Fl), VII (Ml), Urban V (M35), VII {Ml), 719 Total IV (M9; FIl), V (M87), VII (M4), Urban IV (MS, FlO), V (M3l), VII (M4), 720 Total IV (M273, FI6), V (M29l), VII (M3), IX (M2), Urban IV (M12), V (M71), VII (Ml), 721 Total IV (M8, Fl), V (M9), Urban IV (M2, Fl), V (M7), 729 Total IV (MID, Fl), V (MI6), VII "(MI), Urban IV (Ml), 730 Total V (Mll), 731
25/328-12b
Total V (M13), 734 Total IV (M477, FI85), V (MI17, F3), IX (M3), Urban IV (M54, F56), V (M7, FI), IX (1'\'11), 735 Total V (M3), 739 Total IV (MIOO, F56), V (M209, F15), VII1 (Ml). IX (M2), Urban V (M3), VIII (MI), 740 Total IV (MIG), V (MI22), VII (M6), Urban IV (M3), V (M61), VII (M6), 742 Total IV (M56), 750 Total III (Ml), V (M2l3, F4), VI (M163), VII (Ml), VIII (MI88), IX (M34) , Urban V (M48, FI), VI (M7), VIII (M[03), IX (M3), 751 Total IV (MI), V(M28), VI (M12), VIII (M2), IX (M7) Urban IV (Ml), V(M24), VI (M2), VIII (Ml), IX (M2), 752 Total V (MI3), VI (M9), VIII (M9), IX (M5, F2l), Urban V (M9), VI (M2), VIII (M6), IX (M4, F2l), 753 Total III (Ml), IV (M19), V (M538), VI (M22), VII (M60), VIII (M81), IX (M45) , Urban IV (M3), V (M266), VI (M8), VII f (M5). VIII (M33), IX (M26), 754 Total IV (MI04, F3), V (MI79), VII (M3), IX (M2), Urban IV (M65, F2), V (M! 12), VII (M3), IX (M2), 755 Total V (Ml), VI (M5), VIII (M5), IX (M2), Urban VI (M1)', VIII (M2), 756 Total IV (M3), V (1\126), VI (M2), VIII (M3), IX (M4), Urban V (M6), IX (M3). 757 Total V (M76, F2), VII (M5), Urban V (MI7, Fl), VII(M4), 758 Total IV (M6), V (M76,Fl) Urban IV (M3), V (M34), 759 Total IV (MlOO,F5), V (M103) VI (MI0) VIII;(M17), IX (M6), Urban IV (M7, F3), V (M16), VIII (M-('), 760 Total V (M38) VI (M35), VII (M6), VIII (M34), IX (MI67), Urban V (MI9). VI (M22), VII (Ml), VIII (MI7), IX (Ml7), 761 Total V (M5), VI (M3), VII (Ml), VIII (MIl), IX (119), Urban VII (Ml), VIII (M4), IX (M5), 762 Total IV (M2), V (MI8), VIII (M2),IX (M5), Urban IV (Ml), V (M12), VIII (M2), IX (M2), 763 Total VI (M5), VIII (M4), IX (M3), Urban VI (M3), VIII (M3), 764 Total V (Ml), VI (M26), VII (M2), VIII (M33), IX (M179) Urban V (Ml), VI (MI7), VII (M2), VIII (M25), IX (M54), 769 Total V (M5), VI (M4), VII (M6), VIII (MI0), IX (MI04) Urban VII (M6), VIn (M5), IX (MI6), 771 Total V (M35), VIII (Ml), Urban V (MI), VIII (Ml), 77$ Total V (M5), 774 Total IV (M21), V (M7), VIII (Ml) Urban V (M6), VIII (Ml), 779 Total IV . (M10, F3), V (M42, FI4), VI (M15, Fl), VII (M5), . VIII (Ml), IX (M3), Urban IV (M1), V (M6, F1), VII (M5), IX (M3), 780 Total IV (M3), V (M35), VI (M44) , VII (M2), VIII (M14), IX (M83), Urban V (MIO), ,VI (M33), VII (M2), VIII (M7), IX (M30), 792 Total VI (Ml), Urban VI (Ml), 793 Total IV (M3, Fl), V (M8, Fl), YI (M44), IX (Ml),
B-V OCCUPATIONAL CLASSIFICATION BY SEX OF PERSONS AT WORK -OTHER THAN CULTIVATION-collcld.
Urban IV (M3. F1), i V (M1), VI (M2), 794 Total VI (M56), IX (M2), Urban VI (M5), IX (M2), 795 Total VI (M21), Urban VI (M3), 800 Total V (M2), IX (M2), Urban V (M2), 801 Total V (M128, F2), IX (M6) , Urban V (M58), 802 Total V (M 1), 803 Total V (M53), IX (M7), Urban V (M31), 805 TctaL V (MI), IX r (M2), Urban IX (M2), 806 Total IV (M2), v: (M3), Urban IV (M1), V (M1), 807 Tttal IX (M1), 808 Total IV (M6, F2), V (M52), IX (MI), Ulban IV (M3, FI), V (M23), 809 Total V (MI8), IX (M6), Urban V (M6), 810 Total IV (M171, F195), V (M39, F20), Urban IV (MI7, F13), V (MI3, F1), 812 Tctal V (Ml), 813 Total IV (M8), V (M3), Ulban IV (M8), 814 Total IV (M16), V~(M3,FII), Urban IV (M16), V(M2), 815 Total IV (M5), V (M8, F1), Urban V (M2, F1), 819 Total IV (M6, F4), IV (M65, F28), Urban IV (Ml), V (M6), 821 Tctal IV (M369, FI98), V (M91, F94), VII (Ml), Urban IV (M42, F5), V (M25, F8), 822 Total III (M7, F4), IV (M66, F84) , V (M12, F5), VII (M8, F3), IX (M1, FI), 825 Total IV((MI91, F3), V (M155, F2), VII (M4), IX (Ml), Urban IV (MI, FI), V (M46), VII (M3), 8~6 Total III (MIO), IV (MI50, F36), V (M94, FI36), IX (M6), Urban III M(10), IVf(M7,F7), V(M50,F72), 827 Total III (M5), IV (M2), V (MI34), VII (M107), IX (MI), Urban VI): (MI6), 828 Total III (M5, F3), V (M47, FlO), Urban V (M5), 830 Total V (M2), Urban V (M2), 831 Total IV (M9), V (M52, F6), Urban IV (M9), V (M37, F~), 832 TotallV (M2), V (M3, Fl),
Urban V (M2), 833 Total V (M2), Urban V (M2), 334 Total V (M2), 839 Total IV (M38; F 16) , V (M395, B28), VII (MI, F1), IX (M2), Urban IV (M5), V (M8], F21), 840 Total IV (M384), V (F1), VII (M8), Urban V (F1), VII (M7), 849 Total IV
94
(M3), V (M6, F2), VII (M4), Urban V (M6, F2),. VII (M4), 851 Total IV (M9), V (M73), VIII (Ml), Urban IV (M5), V (M36), 852 Total V (M1), 853 To1al IV (M2, ~F2), 854 Total IX (M8), Urban IX (M6), 855 Total IV (M17), V (M4) , IX (Ml), UrbanIV[(Ml), V (M1), 856 Total IV (M3, F4) .. V (M3, F13), Urban IV (Ml), 859 Total IV (M97, F42), V (M368, FIlS), VII (M9, F3), IX (M6, FI2), Urban IV (M21, F7), V (Me7, F11). VII (M6, F1), IX (M6), 860 Total III (M4),. V (MI7), VII (M3), VIII (M14), IX (Ml), Urban III (M3), V (MI3), VII (M2), VIII (M8), IX (Ml), 861 Total IV (M4), V (M74, F21), VII (M28), VIII'(M31), IX (M4), Urban V (M30, F6), VII (M26), VIII (M8), IX (Ml), 870 Tetal III (M5), IV (Ml), V (M176), VI (M26), VIII (M7), IX (M20) , Urban V (M16), VI (M6), VIII (M4), 871 Total V (M17), VIII (M25), Urban V (MIl), VIII (M24), 872 Total IX (Ml), 874-Total III (M4), VI (M3), IX(M2), Urbal'l VI (M3), 876 Total V (M46), VI (MI8), VIII (M158),. IX (M3), Urban V (M38), VI (M4), VIII (MI53} IX (M3), 879 Tolal III (Ml), V (M4), VI (M25), VIII (MlO) , IX (M4), Urban V (M3), VI (M2)" VIII (M4), IX (Ml), 900 Total IX (MI3), 902 Total IX (M16), Urban IX (M16), 909 Total III (Ml)", VIII (M21), IX (M33), Urban III (Ml), IX (M5),.. 913 Total IX (FI22), 920 Total V (Ml), VII (M1), IX (M89, F13), Urban VII (M1), IX (M81), 930· Total VI (Ml), 951 Total V (Ml), IX (M6),. Urban V (Ml), IX (M2), 960 Total IX (MI),. Urban IX (Ml), 970 Total IX (MI8), Urban IX (M5),979 Total IX (M57), Urban IX (M35), 999' Total V (M2), VII (MI)~ VIn (M2), IX_ (MI3S.
FI9), Urban IX (MI6).
• B-VI OCCUPATIONAL DIVISIONS OF PERSONS AT WORK OTHER THAN CULTIVATION CLASSIFIED BY SEX, BROAD AGE-GROUPS AND
EDUCATIONAL LEVELS IN URBAN AREAS ONLY
Fly-leaf
This table is prepared cnly for the urban area'; of the district. This gives the distribution of non-agricultural workers in the II occllpa!ional division.; of National classification of occupations by educational levels and broad agc-group5. The changes made in the N. C. O. for the purpo:e of B-V t?ble are ?pplicable in the case of thi, table also. The educational levels given in the table are the same as thos.~ g-iven in table B-III Pal t-A and the age-groups are thooe followed in table B-I. The age-groups correspond to
95
different stages of life which have special significance with re:-erence to the capacity to work, viz., children, young pers()ll", middle-aged persons and elderly persens. This table gives very valuable data in aSSESsing the under-employment among educated persons and also provides useful inform~tion about those ocsupations which attract educ-ated pers mnel.
In this table the figures for age-groups of total wo:kers under each occupational divisi')n have not be;~n f,iven.
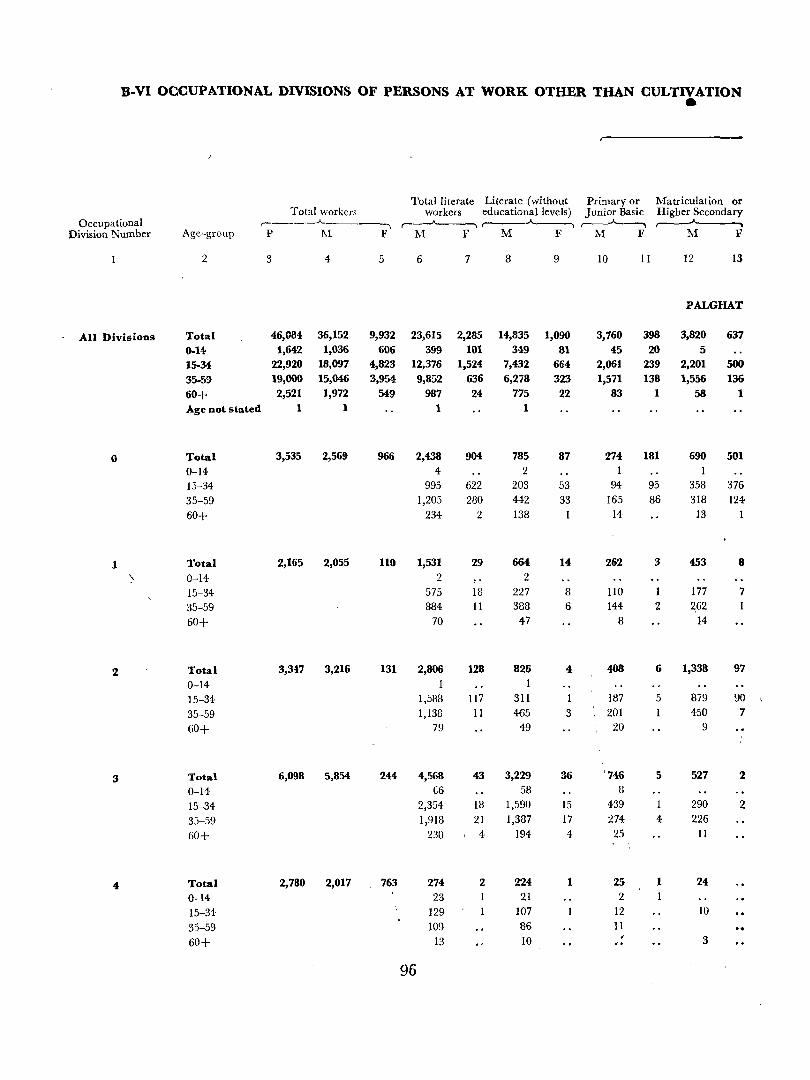
B-VI OCCUPATIONAL DIVISIONS OF PERSONS AT WORK OTHER THAN CULTIVATION •
Total literate Literate (without Primary or Matriculation or Total workers workers educational levels) Junior Basic Higher Secondary
Occupational r-----"-----, ~ -"----, r--~ ,------"------Division Number Age-group P M F M F M F M F M F
2 3 4 5 6 7 8 9 10 II 12 13
PALGHAT
All Divisions Total 46,084 36,152 9,932 23,615 2,285 14,835 1,090 3,760 398 3,820 637
0-14 1,642 1,036 606 399 101 349 81 45 20 5 15-34 22,920 18,097 4,823 12,376 1,524 7,432 664 2,061 239 2,201 500
35-59 19,000 15,046 3,954 9,852 636 6,278 323 1,571 138 1,556 136
60+ 2,521 1,972 549 987 24 775 22 83 1 58 1
Age not stated 1 1 1 1
Total 3,535 2,569 966 2,438 904 785 87 274 181 690 501
0-14 4 2 1 15-34 995 622 203 53 94 95 358 376
35-59 1,205 280 442 33 165 86 318 124
60+ 234 2 138 14 13
1 Total 2,165 2,055 110 1,531 29 664 14 262 3 453 8 " 0-14 2 2
15-34 575 18 227 8 110 177 7
35-59 884 11 388 6 144 2 262
60+ 70 47 8 14
2 Total 3,347 3,216 131 2,806 128 826 4 408 6 1,338 97
0-14 1
15-34 1,588 117 311 1 187 5 879 90
35-59 1,138 11 465 3 201 450 7
60+ 79 49 20 9
3 Total 6,098 5,854 244 4,568 43 3,229 36 '746 5 527 2 0-14 C6 58 !.l
15-34 2,354 18 1,590 15 439 290 2 3':;-59 1,918 21 1,387 17 274 4 226
60+ 230 4 194 4 25 11
4 Total 2,780 2,017 763 274 2 224 1 25 1 24
0-14 23 21 2 15-34 129 107 12 10
35-59 109 86 11
60+ 13 10 ,
3 .. 96
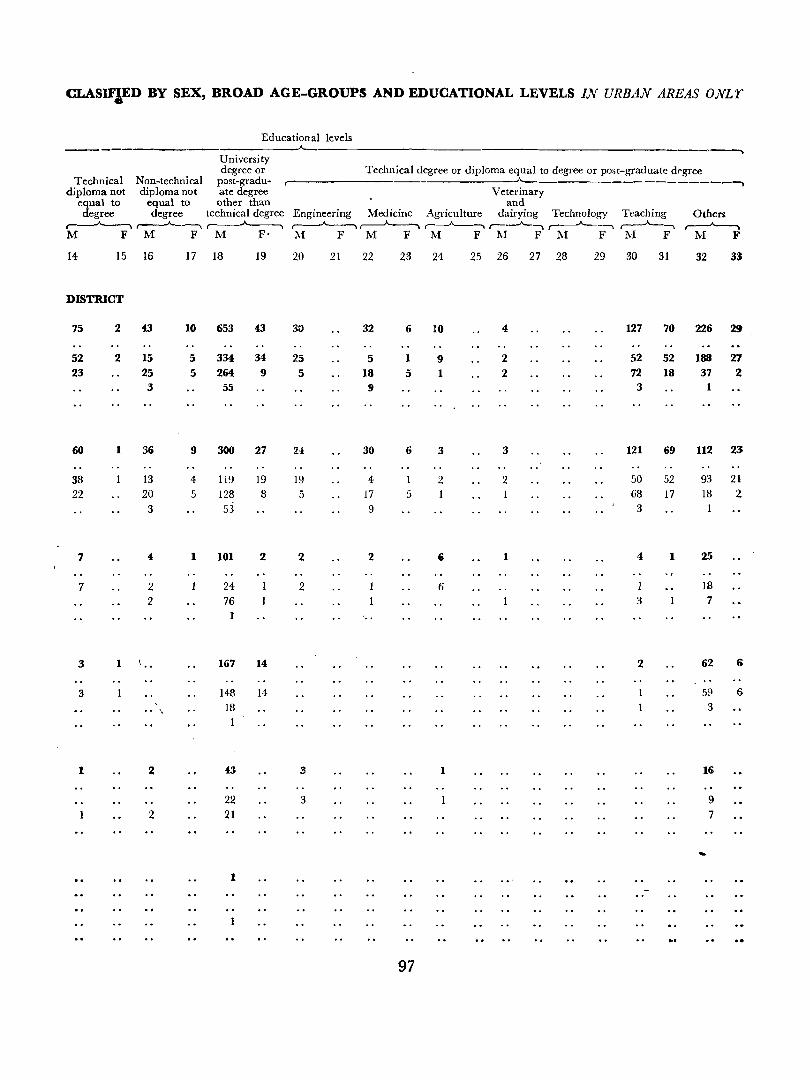
CLASIFlED BY SEX, BROAD AGE-GROUPS AND EDUCATIONAL LEVELS IN URBAN AREAS O.;VLr
Educational levels ~
University degree or Technical degree or diploma equal to degree or post-graduate degree
Technical Non"technical post"gradu" ..A.--______________ -.,
diploma not diploma not ate degree Veterinary equal to equal to other than and degree degree technical degree Engineering Medicine Agriculture dairying Technology Teaching Others ~ ,--.A----., ~---...., r----"------., ~ ,-----"----, r-~-...., ~--...., ,..---A--...., ,----A----., M F M F
14 15 16 17
DISTRICT
75 2 43 10
52 2 15 5 23 25 5
3
60 1 36 9
38 13 4 22 20 5
3
7 4 1
7 2 2
3 1
3 .. , .. ~.
1 2
2
M
18
653
334
264 55
300
119
128 53
101
24 76
167
148 18
43
22 21
1
F' M F
19 20 21
43 30
34 25 9 5
27 24
19 19 8 5
2 2
2
14
14
3
3
M F 1\1 F 1\1 F 1\1 F
22 23 24 25 26 27 28 29
32 6 10 4
5 1 9 2 18 5 1 2 9
30 6 3 3
4 2 2 17 5 9
2 , 1
6
..
1
97
l\:[ F
30 31
127 70
52 52 72 18 3
121 69
50 52 68 17 3
4 1
3
2
...
M
32
226
188 37
1
112
93 18
25
18 7
62
59 3
16
...
9 7
F
33
29
27 2
23
21 2
6
6
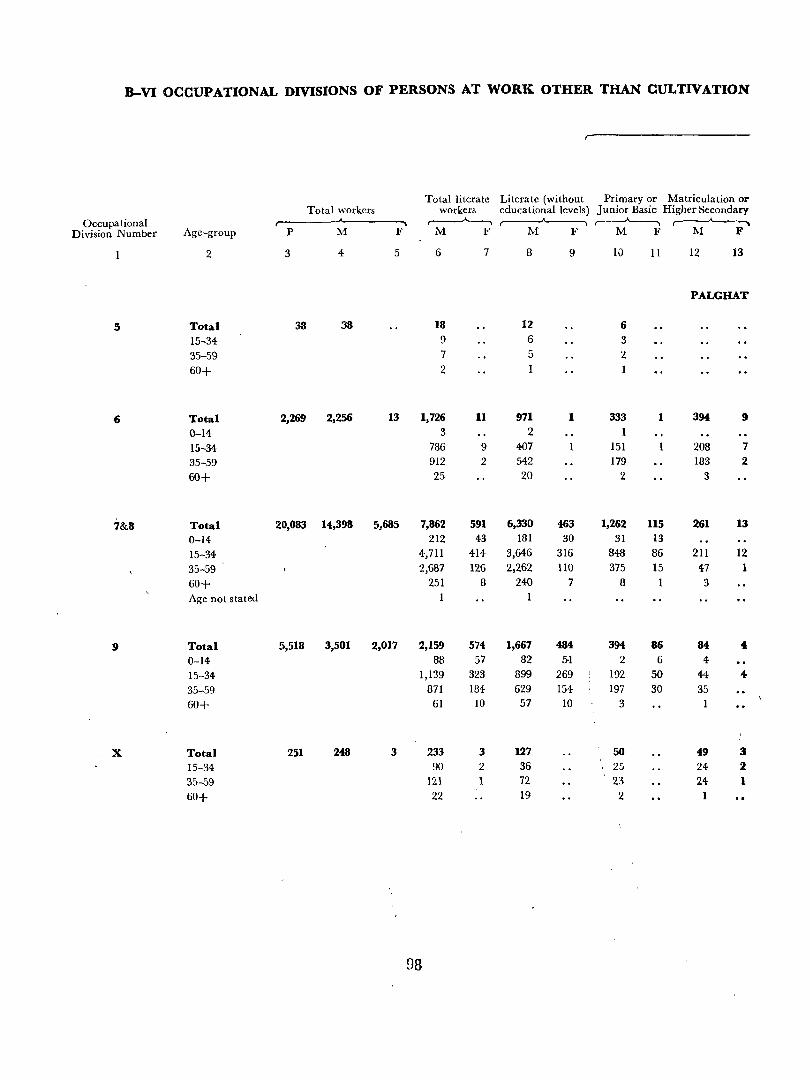
B-VI OCCUPATIONAL DIVISIONS OF PERSONS AT WORK OTHER THAN CULTIVATION
Total literate Literate (without Primary or Matriculation or Total workers workers educational levels) Junior Basic Higher Secondary
Occupational ........ ,--.A.----, ,..---A----, ,--'-----., Division Number Age-group P M F M F M F M F M F
2 3 4 5 6 7 8 9 10 11 12 13
PALGHAT
5 Total 38 38 18 12 6
15-34 9 6 3 35-59 7 5 2
60+ 2
6 Total 2,269 2,256 13 1,726 11 971 1 333 1 394 !J
0-14 3 2 15-34 786 9 407 151 208 7 35-59 912 2 542 179 183 2 60+ 25 20 2 3
7&8 Total 20,083 14,398 5,685 7,862 591 6,330 463 1,262 115 261 13
0-14 212 43 181 30 31 13 15-34 4,711 414 3,646 316 848 86 211 12 35-59 2,687 126 2,262 110 375 15 47 60+ 251 8 240 7 8 1 3 Age not stated
9 Total 5,518 3,501 2,017 2,159 574 1,667 484 394 86 84 4 0-14 88 57 82 5-1 2 6 4 15-34 1,139 323 899 269 192 50 44 4
35-59 871 184 629 154 197 30 35 60+ 61 10 57 10 3
-X Total 251 248 3 233 3 127 50 49 3 15-34 90 2 36 25 24 2 35-59 121 1 n 23 24 1 60+ 22 19 2 I
98
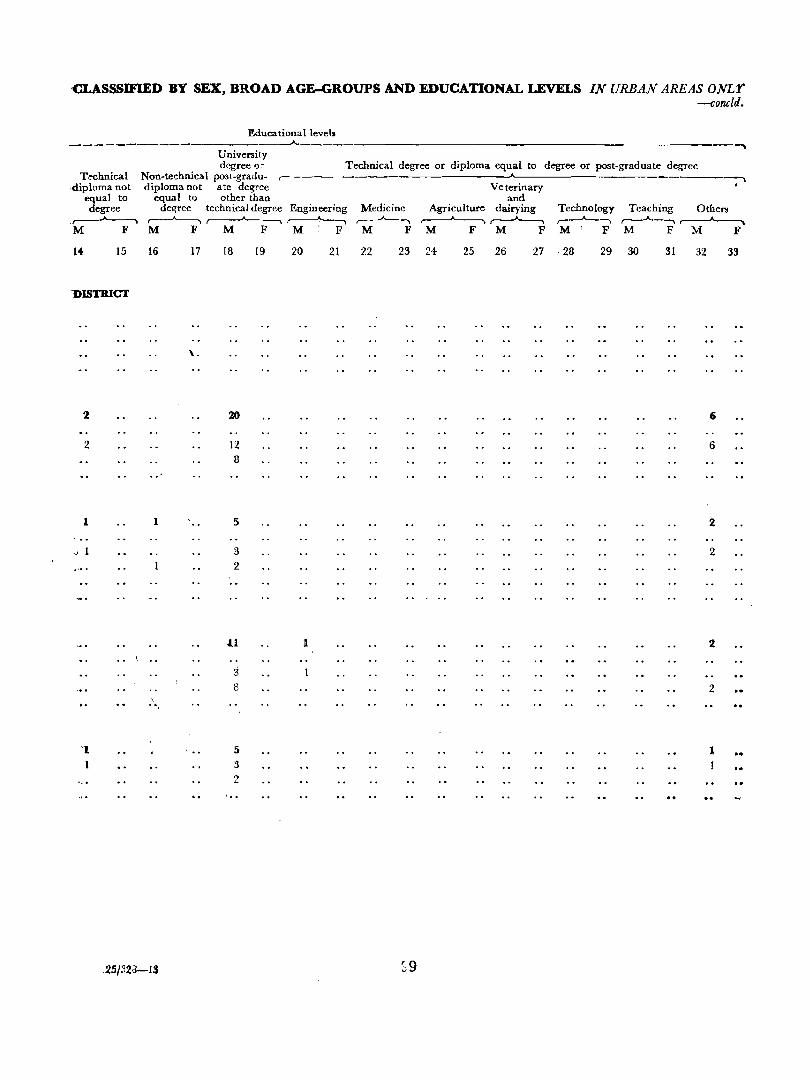
<:LASSSIFIED BY SEX, BROAD AGE-GROUPS AND EDUCATIONAL LEVELS IN URBAN AREAS ONLY -coneld.
Educational levels __A.
University degree O~
Non-technical post-gradu- rdiploma not ate degree
Technical degree or diploma equal to degree or post-graduate degree Tochnical
,diploma not equal to degree ,~ M F
14- 15
'DISTRICT
2
2
1
,) 1
"I
equal to other than degree technical degree Engineering
,.-----A----., ,-------A------~ M F M F M'F
16 17
\.
1
, ..
18
20
12 8
5
3 2
.u
3 8
5
3 2
19 20 21
1
.25/326-13
Medicine r---"----.,
M F
Veterinary and
Agriculture dairying ,-----"---, ~ M F M F
Technology Teaching Others r-'---"-----. ,.-----A----., r-----.A..---. M' FM FM F
22 23 24 25 26 27 ,28 29 30 31 32 33
6
6
2
2
2
2
1
..
~9
B.VlI PART-A PERSONS WORKING PRINCIPALLY (i) AS CULTIVATORS (ii) AS AGRICULTURAL LABOURERS OR (iii) AT HOUSEHOLD INDUSTRY CLASSIFIED BY SEX AND BY SECONDARY WORK (i) AT HOUSEHOLD INDUSTRY (ii) AS CL"'LTIVATOR OR (iii) AS
AGRICULTURAL LABOURER; PART-B INDUSTRIAL CLASSIFICATION BY SEX OF PERSONS WORKING IN NON-HOUSEHOLD INDUSTRY,
TRADE, BUSINESS, PROFESSION OR SERVICE WHO ARE ALSO ENGAGED IN HOUSEHOLD INDUSTRY
Fly-leaf
1. Thi3 table which is prepared in tw,) parts, viz., Part-A and Part-B, gives inf.mu",tion on ~>econdMY work. Tables TI-VII Part-A and Part-B are tabulated for total, rural and urban areas of the district. For rural areas it is presented by d;vi~iolls down to taluk level. Workers who h~~ve no secondary work are excluded from this table.
2. Part-A of the table is prepared in the case of workers who are principally engaged-
(i) as cultivator (ii) as agricultural labourer or
.. ··(iii) at household industry
and who are also additionally engaged in <:ony of the above three categories of work. Workers who are principally eng.i.ged at household ind~stry are also given by divisions and major groups of I. S. 1. C. This table' is important as it shows the extent to which cultivation is' supplemented by household industry or vice vt1'"a~
100
3. Part-B of the table p:cscnts data on t:l.e bash of cross-tabulati:m of principal and second",ry work in the case of persons who are principally c:lgaged in non~ household industry, trade, business, profession or service and also addi~ionally working at household industry. The household industries and non-ho~sehold industries are further classifi<:d according to divisions and m:1jor groups of r. s. I. C. Fro:n this table the extent d influence of principal work on the nature of secondary work can be studied ••
4. In TabJe B-VU Part-A the major groups of those industries where the persons engaged in auxiliary wOlk are less than 5 per ce.lt of the persons having that particular major gwup as principal work in table B-IV Part·A h ... ve bee,} omitted ('On the basis of the figures of total area. These major groups are shown in the appendix.
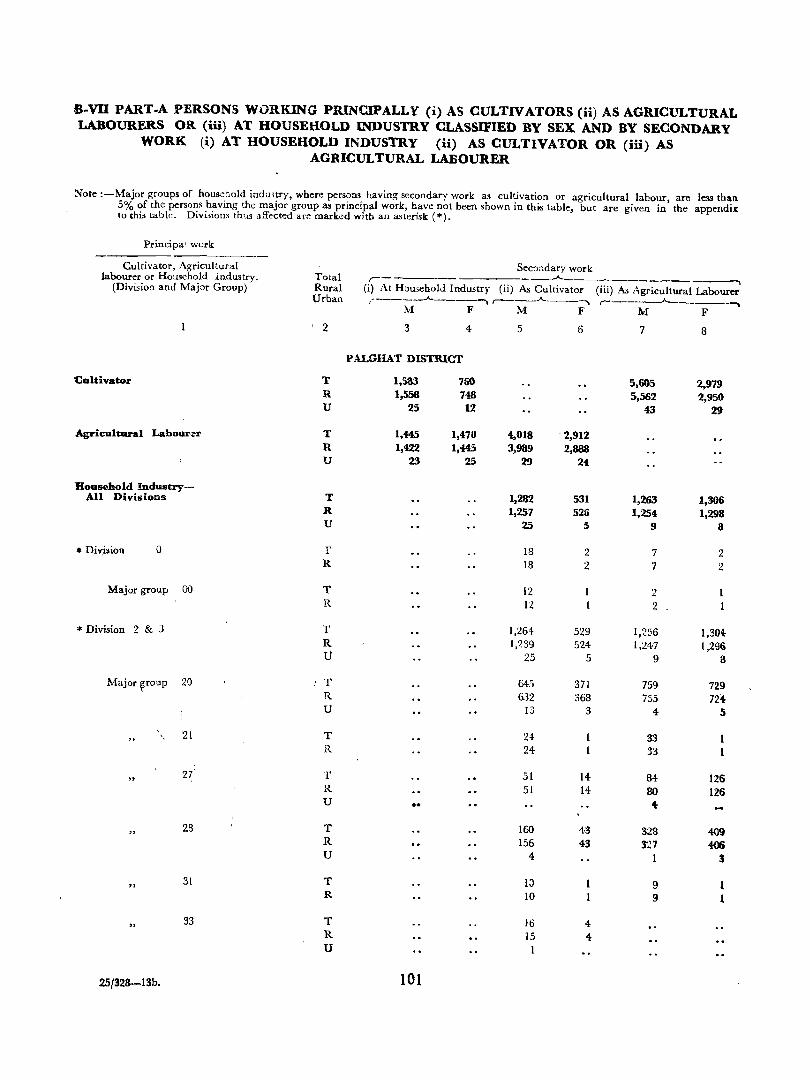
B-VU PART-A PERSONS WORKING PRINCIPALLY (i) AS CULTIVATORS (ii) AS AGRICULTURAL LABOURERS OR (iii) AT HOUSEHOLD INDUSTRY CLASSIFIED BY SEX AND BY SECONDARY
WORK (1) AT HOUSEHOLD INDUSTRY (ll) AS CULTIVATOR OR (iii) AS AGRICULTURAL LABOURER
Note :-Major groups of housebold indmtry, where persons having secondary work as cultivation or agricultural labour, are less than 5% of the persons having the major group as principal work, have not been shown in this table, but are given in the appendiJt
' to this table. Divi.;ions thus affected are marked with an asterisk (*).
Principal work ------------
Cultivator, Agricultural labourer or Household industry.
(Division and Major Group)
tlulthlator
Agricultural Labourer
Household IndustryAll Divisions
* Di..jsion o
Major group 00
Major ~roup 20
'. 21
" 27
28
.. 31
" 33
25/32S-13b.
Total Rural Vrban
2
T R U
T R U
T R U
T R
T R
T R U
T R U
T R
T R U
T R U
T R
T R U
Secondary work ,- ---- ~ '--- -----,
(i) At Howehold Industry (ii) As Cultivator (iii) As Agricultural Labourer , ____ ._.._Jo.,. ____ , ,--__ .A... __ , r---------"--------.
M F M F M F
3 4 5 6 7 8
PALGHAT DISTRIGr
1,583 760 1,558 748
25 12
1,445 1,470 1,422 1,445
23 25
101
4,018 3,989
29
1,282 1,257
25
18
18
12 12
1,264 1,239
25
645 6.32
13
24-24
51 51
160 156
4
1:)
10
16 15
2,912 2,888
24
531 526
5
2 2
371 368
3
14-14
43 43
4 4
5,605 5,562
43
1,263 1,254
9
7 7
2 2
1,256 1,247
9
759 755
4
33 33
84 80
-to
328 327
1
9 9
2,979 2,950
29
1,306 1,298
8
2 2
1 1
1,304-1,296
8
729 724
5
I 1
126 126
409 4{)6
3
I 1
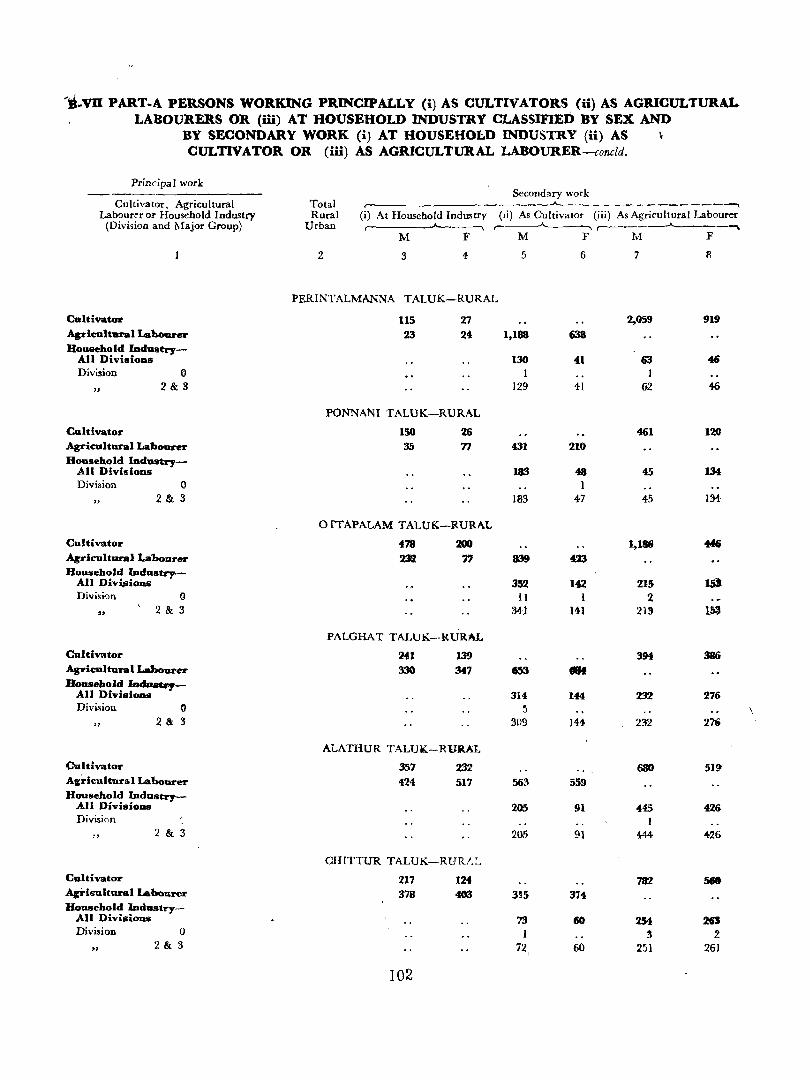
'It-VB PART-A PERSONS WORKlNG PRINCIPALLY (i) AS CULTIVATORS (ii) AS AGRICULTURAL LABOURERS OR (iii) AT HOUSEHOLD INDUSTRY CLASSmED BY SEX AND
BY SECONDARY WORK (i) AT HOUSEHOLD INDUSTRY (ii) AS \ CULTIVATOR OR (iii) AS AGRICULTURAL LABOURER-coneld.
Principal work Secondary work
Cultivator, Agricultural Total _,.A..___ ___________ ---,_
Labourer or Household Industry Rural (i) At Household Industry (Ii) As Cultivator (iii) As Agricultural Labourer (Divi,ion and Major Group) Urban A...........-------, ,----'- r-----__.A_----.
M F M F M F
2 3 4 5 6 7 P,
PERINTALMANNA TALUK-RURAL
Cultivator 115 27 2,059 919 Ap-icult1lral Labourer 23 24 1,188 638 Household Industry-
All DivisiOlls 130 41 63 46 Dlvision 0 1 I
" 2&3 129 41 62 46
PONNANITALUK-RURAL
Cultivator ISO 26 461 120 Agricultural Labourer 35 77 431 210 Household Industry-
All Divisions 183 48 45 134 Division 0 1
" 2 & 3 183 47 45 134-
o ITAPALAM TALUK-RURAL
Cultivator 4'18 200 1,186 ~
Agricultural Labourer 232 " &39 423 HOWiehold Industry.-
15) All Divi_ioDs 352 142 215 Division 0 II I 2
., 2 & 3 34} 141 213 l~
PALGHAT TALUK-RURItL
Cultivator 241 139 3M 386 Agricultural Labourer 330 347 6S3 .. Household ~_
All Divisi_ 3.14 144 232 276 Division (I 5
" 2 &: 3 309 144 232 27i
ALATHUR TALUl(-RUR.A:J~
Cultivator 357 232 680 51!)' Agricultnral Labourer 424 517 563 559 Household Industry--
All DivisiollS 205 91 445 426 Division 1
2 & 3 205 91 444- 1,26
CHrTTUR TALUK-RBR/.'.
Cultivator 217 124 782 56e Agrisultural I.bourer 378 400 315 374 Household lnd_try-
All DivisioDii 73 fiG 254 2GS Division 0 ~ 2
" 2 & 3 72 60 251 261 ,
102
\
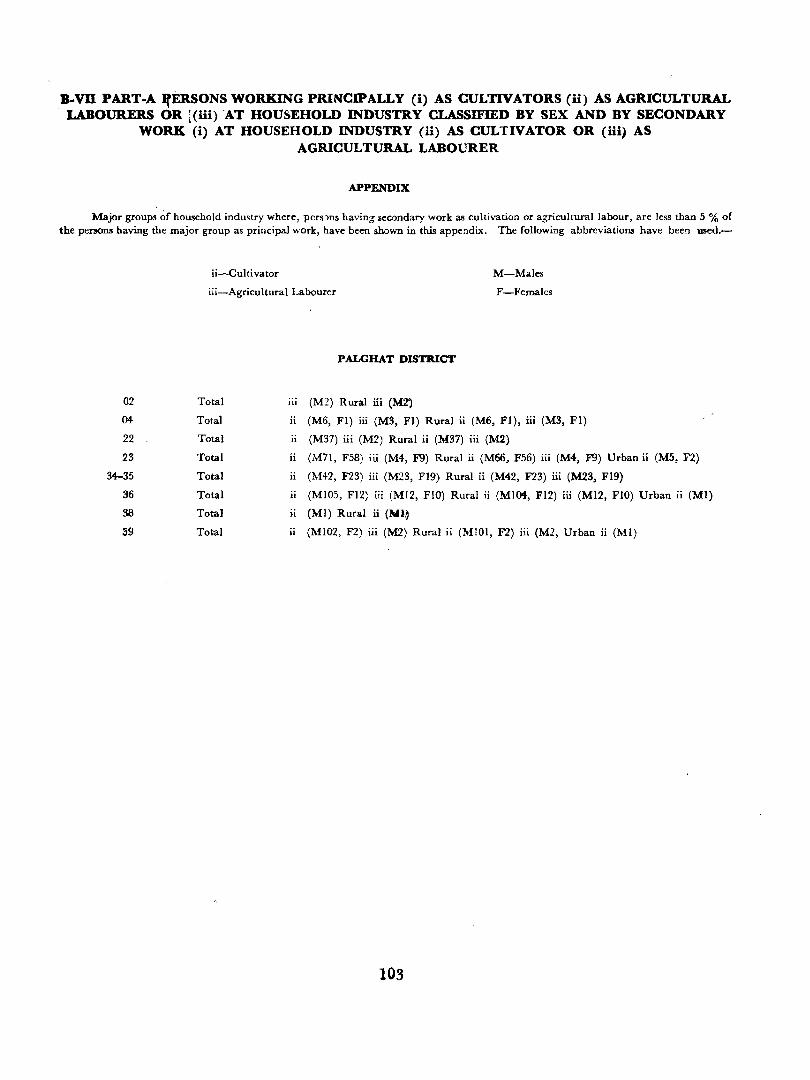
B-vn PART-A IfERSONS WORKING PRINCIPALLY (i) AS CULTIVATORS (ii) AS AGRICULTURAL , LABOURERS OR [(iii) 'AT HOUSEHOLD INDUSTRY CLASSIFIED BY SEX AND BY SECONDARY
WORK (i) AT HOUSEHOLD INDUSTRY (li) AS CULTIVATOR OR (iii) AS AGRICULTURAL LABOURER
APPENDIX
Major groups ~f household industry where, pers:ms having secondary work as cultivation or agriculrural labour, are less than 5 % of the pel'llons having the major group as principal work, have been shown in this appendix. The following abbreviations have been used.-
02
04-
22
23
34-35
36
38
S9
ii-Cultivator
iii-Agricultural Labourer
M-Males
F-Femalcs
Total
Total
Total
Total
Total
Total
Total
Total
PALGHAT DISTRICT
HI (M2) Rural iii (MZ)
ii (M6, FI) iii (M3, FI) Rural ii (M6, FI), iii (M3, FI)
11 (M37) iii (M2) Rural ii (M37) iii (M2)
ii (M71, F58) iii (M4, F9) Rural ii (M66, F56) iii (M4, F9) Urban ii (1\15, F2)
ii (1\H2, F23) iii (M23, F19) Rural ii (M42, F23) iii (M23, F19)
11 (MI05, F12) iii (MI2, FJa) Rural ii (MJ(M, F12) iii (MI2, FlO) Urban ii (MI)
ii (MI) Rural ii (Ml~
11 (MI02, F2) iii (M2) Rural ii (MIOI, F2) iii (M2, Urban ii (MI)
103
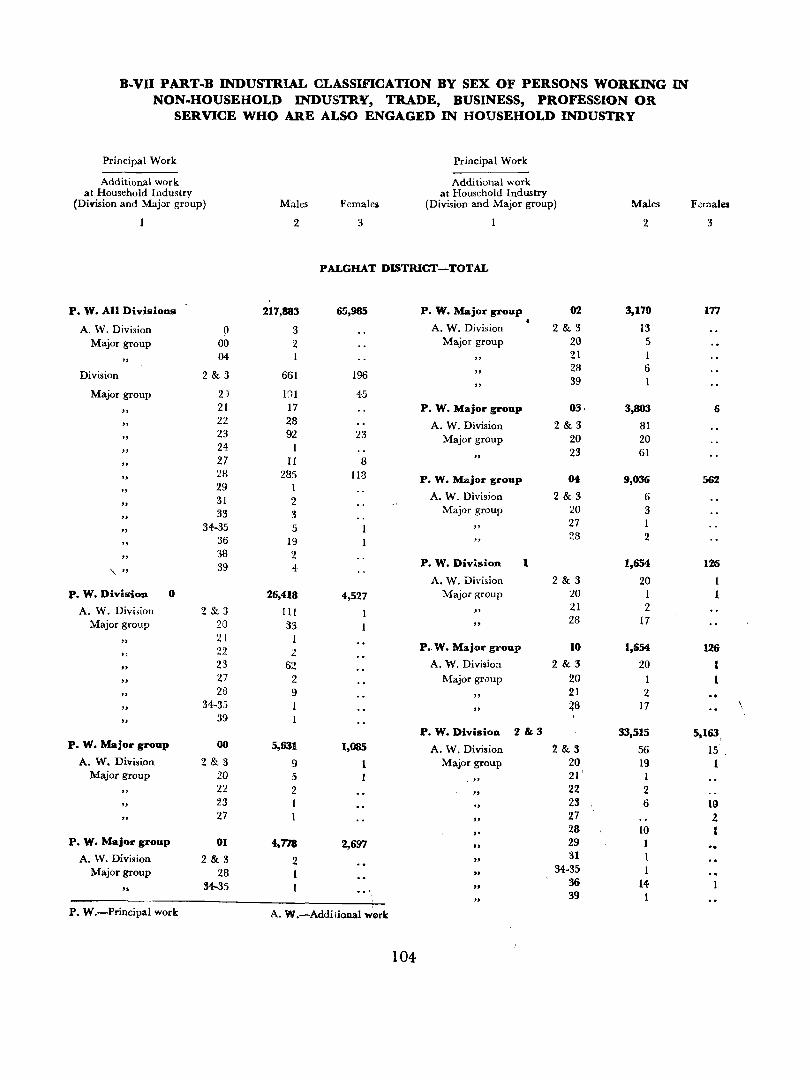
B-VII PART-B INDUSTRIAL CLASSIFICATION BY SEX OF PERSONS WORKING IN NON-HOUSEHOLD INDUSTRV, TRADE, BUSINESS, PROFESSION OR
SERVICE WHO ARE ALSO ENGAGED IN HOUSEHOLD INDUSTRY
Principal Work Principal Work
Additional work Additional work at Household Industry at Household Industry
(Division and Major group) Males Female» (Division and Major group) Males Females
2 3 2 ::I
PALGHAT DISTRIC1'-TOTAL
P. W. All Divisions 217,883 65,985 P. W. Major group 02 3,170 177
A. W. Division 0 3 A. W. Division 2&3 13 Major group 00 2 Major group 20 5
" 04 21 1
Division 2 & 3 661 196 28 6 39 I
Major group 2) 191 45
" 21 17 P. W. Major group 03· 3,803 6
" 22 28 A. W. Division 2&3 81
" 23 92 23 Major group 20 20 24 23 61
" " 27 II 8 28 285 113 P. W. Major group 04 9,036 562
" 29 I 31 2 A. W. Division 2&3 6
" 33 3 Major group 20 3 " 34-35 5 27 1 " 36 19 28 2 " " 38 2
39 4 P. W. Division 1 1,654 126 "\ "
A. W. Dh'ision 2&3 20 1 P. W. Division 0 26,418 4,527 Major group 20 I 1
A. W. Divi3ion 2&3 111 " 21 2
Major group 20 33 " 23 17
" :ll I 22 2 P •. W. Major group 10 1,654 126
" " 23 62 A. W. Division 2&3 20 1
27 2 Major group 20 1
" 213 9 " 21 2
" 34-35 " ~8 17 \,
" 39 P. W. Division 2&3 33,515 5,163,
P. W. Major group 00 5,631 1,085 A. W. Division 2&3 56 15 A. W. Division 2&3 9 Major group 2() 19 1
Major group 20 5 ." 21 ' I 22 2 "
22 2 23 1 23 6 19
" 27 "
27 2 J' 28 10 1
P. W. Major group 01 4,778 2,697 " 29 1
A. W. Division 2&3 2 " 31 1
Major group 28 ,J 34-35 1 34--35 "
36 14-" 39
P. W.-Principal work A. W.-Addilioual w4lrk
104
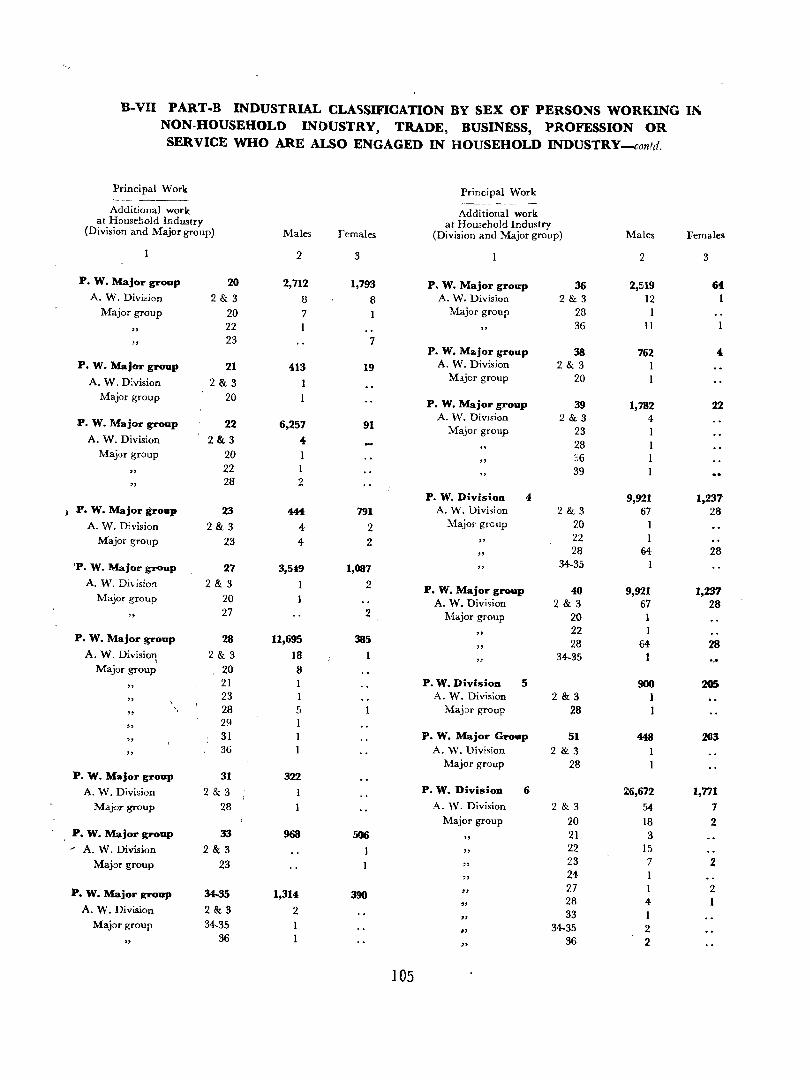
B-vn PART-B INDUSTRIAL CLA'iSIFICATION BY SEX OF PERSOSS WORKING IN. NON-HOUSEHOLD INOUSTRY, TRADE, BUSINESS, PROFESSION OR SERVICE WHO ARE ALSO ENGAGED IN HOUSEHOLD INDUSTRY-contd.
Principal Work Principal Work ------Additional work Additional work
at Housebold Industry at Hou.;ehold Industry (Division and Major group) Males females (Division and Major group) Males Females
2 3 2 3
P. W. Major group 20 2,712 1,793 P. W. Major group 36 2,519 6{ A. W. Division 2&3 8 8 A. W. Division 2&3 12 1
Major group 20 7 Major group 28
" 22 36 11
" 23 7 P. W. Major group 38 762 ...
P. W. Major group 21 413 19 A. W. Division 2 & 3
A. W. Division 2&3 1 M.ljor group 20
Major group 20 P. W. Major group 39 1,782 22
A. W. Division 2&3 4 P. W. Major group 22 6,257 91 Major group 23 I A. W. Division 2&3 4- 28 I
Major group 20 ~6 1
" 22 1 39
" 28 2 P. W. Division ... 9,921 1,23'1
P. W. Major group 23 444 791 A. W. Division 2 & 3 67 28 A. W. Division 2&3 4- 2 Major group 20 1
Major group 23 4 2 22 1
" 28 64 28 'Po W. Major group 27 3,5"'9 1,087 34-35
A. W. Division 2&3 1 2 P. W. Major group 40 9,921 1,23'1 Major group 20 A. W. Division 2 & 3 67 28
" 27 2 Major group 20 1
" 22 1 P. W. Major group 28 11,695 385 28 64 28 " A. W. Division
\ 2&3 18 34-35 1
Major group 20 8
" 21 1 P. W. Division 5 900 205
" 23 1 A. W. Division 2&3 1
" 28 5 Major group 28
" 29 I
" 31 P. W. Major Group 51 448 203
" 36 A. W. Division 2 & 3
Major group 28 P. W. Major group 31 322
A. W. Division 2&3 P. W. Division 6 26,672 1,771
Major group 28 A. W. Division 2&3 54 7 Major group 20 18 2
P. W. Major group 33 968 506 21 3 ~ A. W. Division 2&3 " 22 15
Major group 23 " 23 7 2
" 24
P. W. Major group 3M5 1,314 " 27 2 390 28 4 1 " A. W. Division 2&3 2 " 33 1
Major group 34-35 "
34-35 2
" 36 ,. 36 2
105
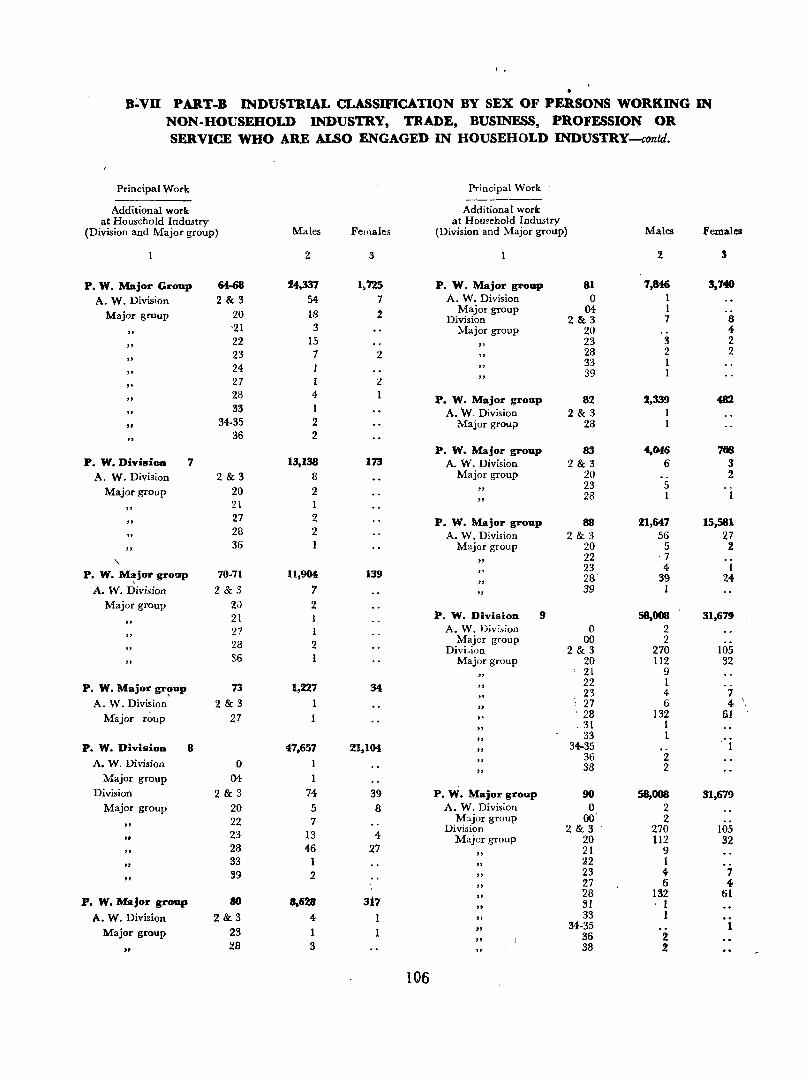
, .
B~Vn PART-B INDUSTRIAL CLASSmCATION BY SEX OF PERSONS WORKING IN NON-HOUSEHOLD INDUSTRY. TRADE, BUSINESS. PROFESSION OR SERVICE WHO ARE ALSO ENGAGED IN HOUSEHOLD INDUSTRY-contd.
Principal Work Principal Work ' -------
Additional work Additional work at Household Industry at Household Industry
(Division and Major group) Males Fenlales (Division and Major group) Males Females
2 3 ~ 3
P. W. Major Group 64-68 24,337 1,725 P. W. Major group 81 7,849 3,740
A. W. Division 2&3 54 7 A. W. Division 0 1
Major group 20 18 :z Major group 04 1 Division 2&3 7 8
" '21 3 Major group 20 4-
" 22 15
" 23 3 2 23 7 2 28 2 2
" 33 1 24 39 1 27 1 2 "
" 28 4 1 P. W. Major group 82 2,339 482 33 1 A. W. Division 2&3 1
" 34-35 2 Major group 28 1
" 36 2
P. W. Major group 83 4,046 7tl8 P. W. DivisiOll 7 13,138 173 A. W. Division 2&3 6 3
A. W. Division 2 & 3 8 Major group 20 :!
Major group 20 2 23 5 28 I
21 1
" 27 2 P. W. Major group 88 21,647 15,581 28 ~ A. W. Division 2 & 3 56 27 36 Major group 20 5 2
" 22 7
P. W. M~jor group 70-71 11,004 139 23 4 1 28' 39 24-
A. W. Division 2&3 7 " 39 I
Major group 20 2 21 P. W. Division 9 58,008 31,67t 27 I A. W. Division 0 2 28 2 Major group 00 2
DivLion 2&3 270 105 S6 Major group 20 112 32
21 9
P. W. Major gr?UP 73 1,227 34 22 1 23 4 7
A. W. Division 2&3 1 27 6 4- \
Major roup 27 28 132 61 , 31 1
" 33 1 ' ..
P. W. Division 8 47,657 21,104 " 34-35
A. W. Division 0 1 36 2
" 38 2
Major group 04- 1 Division 2&3 74 39 P. W. Major group 90 58,008 31,679
Major group 20 5 8 A. W. Division 0 2 22 7 M:>.jor group 00 2 23 13 4
'Division 2&3 270 105 .. Major group 20 112 32
" 28 46 27 21 9
" 33 I 22 1
" 39 2 " 23 4- 7
27 6 "" P. W. Major group 80 8,628 317 " 28 132 61
" 31 ' 1 A. W. Division 21k3 4- " 33 1
Major group 23 1 " 34-35
" 36 2
" 28 3 38 %
106
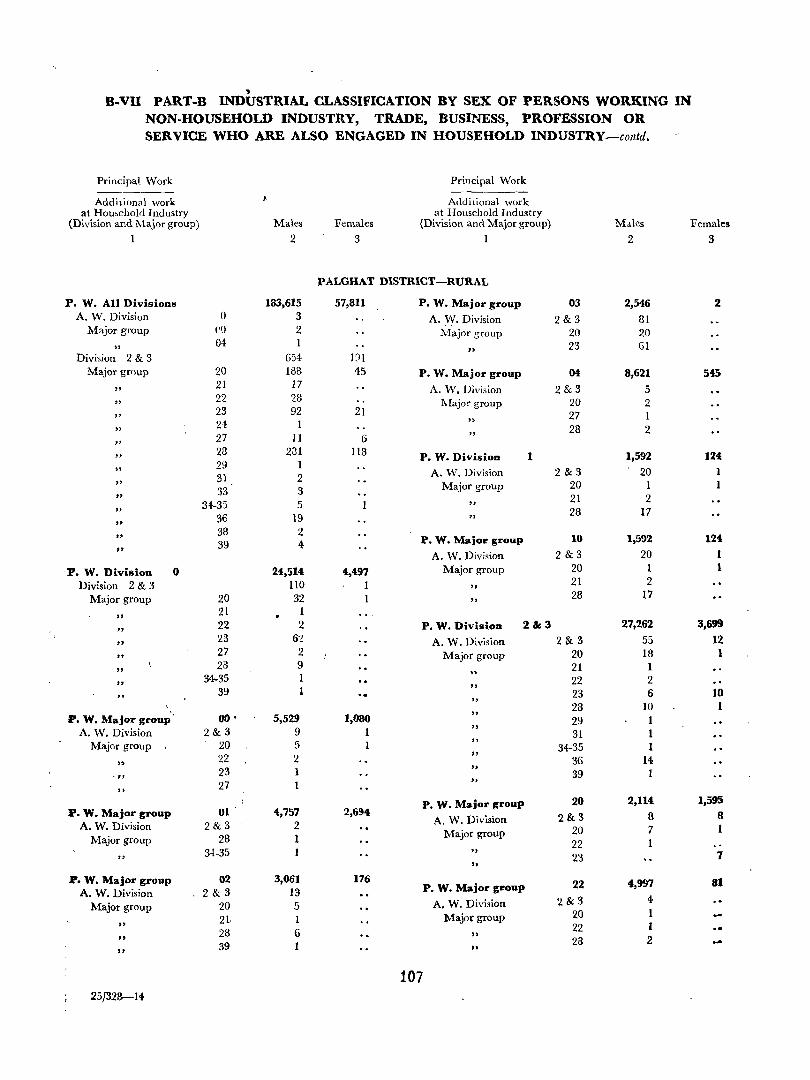
" B-VU PART-B INDUSTRIAL CLASSIFICATION BY SEX OF PERSONS WORKING IN NON·HOUSEHOLD INDUSTRY, TRADE, BUSlI"ffiSS, PROFESSION OR SERVICE WHO ARE ALSO ENGAGED IN HOUSEHOLD INDUSTRY-colltd.
Principal Work Principal Work
Additional work J Additional work at Hou,ehold Industry at Household Industry
.(Division and Major group) Males Females (Division and Major group) Males Females
1 2 3 1 2 3
'_'ALGHAT DISTRICT-RURAL
:Po W. All Divisions 133,615 57,811 P. W. Major group 03 2,546 2 A. W. Division 0 3 A. \V. Division 2&3 81
Major group ('0 2 l\fajor group 20 20
" 04- 1 23 61
" Division 2&3 654 191 Major group 20 188 45 P. W. Major group 04 8,621 56
21 17 A. W. Division 2&3 5 22 28 l\fajor group 20 2
" 23 92 21 27 1
" " 24- I 28 2 27 1 ] 6 "
" "
28 231 118 P. W. Division 1 1,592 124
" 29 I
2&3 20 1 31 2 A. W. Division
" Major group 20 1 1
" 33 3
21 2 34-35 5 " " 28 17 36 19 " "
" 38 2
10 1,592 12'1 39 4 P. W. Major group
" A. W. Division 2&3 20 1
. P. W. Division 0, 24,514 4,497 Major group 20 1 1
Division 2&3 110 ] " 21 2
Major group 20 32 " 28 17
" 21 1
" 22 2 P. W. Division 2&3 27,262 3,699
" 23 6'2 A. W. Division 2&3 55 12
" 27 2 Major group 20 18 1
" 28 9 21 1
" 34-35 ] 22 2
" "
39 1 23 6 10 " 28 10 1
P. W. Major group 00 • 5,529 1,080 " 29 1 A. W. Division 2&3 9 1 " 31 1
Major group 20 5 " 34-35 1 22 2 " ,. 36 14 23 1 " 1 -II 39 27 "
" P. W. Major group 20 2,114 1,595
P. W. Major group 01 4,757 2,694 A. W. Division 2&3 8 8
A. W. Division 2&3 2 20 7 1 Major group 28 1 Major group
1 22 3-1-35 " 7 23
" P. W. Major group 02 3,061 176 22 4,997 81
A. W. Division 2&3 13 P. W. Major group
Major group 20 5 A. W. Division 2&3 4
21 Major group 20 1
" 22 1
" 28 6 " 2 39 1 28 ...
" ..
107 25/328-14
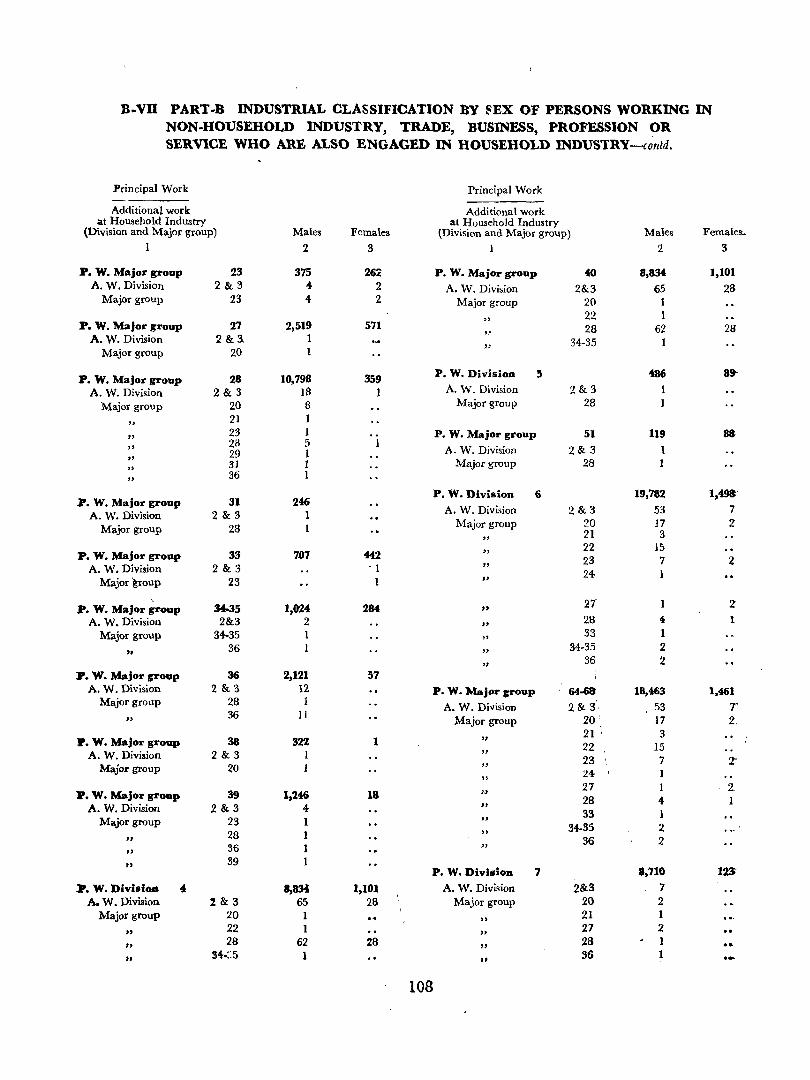
B-vn PART-B INDUSTRIAL CLASSIFICATION BY ~EX OF PERSONS WORKING IN NON·HOUSEHOLD INDUSTRY, TRADE, BUSINESS, PROFESSION OR SERVICE WHO ARE ALSO ENGAGED IN HOUSEHOLD INDUSTRY-contd.
Principal Work Principal Work -----
Additional work Additional work at Household Industry
(Division and Major group) Males Females at Household Industry
(DiviSion and Major group) Males Females-
1 2 3 1 2 3
P. W. Major group 23 375 26~ P. W. Major group 40 8,834 1,101 A. W. Division 2&3 4- 2 A. W. Division 2&3 65 28
Major group 23 4- 2 Major group 20 1
" 22 1 P. W. Major group 27 2,519 571 28 62 21t
" A. W. Division 2&3. 1 34-35 1 " Major group 20 1
P. W. Major group 28 10,798 359 P. W. Division 5 486 89·
A. W. Division 2&3 18 1 A. W. Division 2&3 1
Major group 20 S Major group 28 1
" 21 1
" 23 1 P. W. Major group 51 119 88
" 28 5
A. W. Division 2&3 29 1 " 31 1 Major group 28 " "
36 1
31 246 P. W. Division 6 19,782 1,49a'
P. W. Major group A. W. Division 2&3 53 7 A. W. Division 2&3 1
Major group 20 17 Z Major group 28 1 21 3 " "
22 15 P. W. Major group 33 707 442 23 7 2
A. W. Division 2&3 . 1 " 24 1 Major group 23 "
, 27 Z P. W. Major group 34-35 1,024 284 "
A. W. Division 2&3 2 " 28 4 1
Major group 34-35 1 " 33 1
" 36 1 "
34-35 2
" 36 2
P. w. Major group 36 2,121 57 A. W. Division 2&3 12 P. W. Major group 64-68, 18,463 1,461
Major group 28 1 A. W. Division 2& 3', 53 T
" 36 11 Major group 20 ' 17 2.
" 21 ~ 3
P. W. Major group 38 322 1 22 15 A. W. Division 2&3 1 " 23 , 7 2'
Majol' group 20 " 24 , 1 " .. 27 1 2-
P. W. Major grOl1p 39 1,246 18 28 4- 1 A. W. Division 2&3 4 " 33 1
Major group 23 1 " 34·35 2 28 1 " " 36 2 36 1 " " .. 39 1
P. W. D1villlol1 7 _,710 12$
1'. W. Divisioa 4 8,a:M 1,101 A. W. Division 2&3 7 A. W. Division 2&3 65 28 Major group 20 2
Major group 20 I "
21 1
" 22 1
" 27 2
" 28 62 28
" 28 1
" 3-1<:5 1 .. 36 1
108
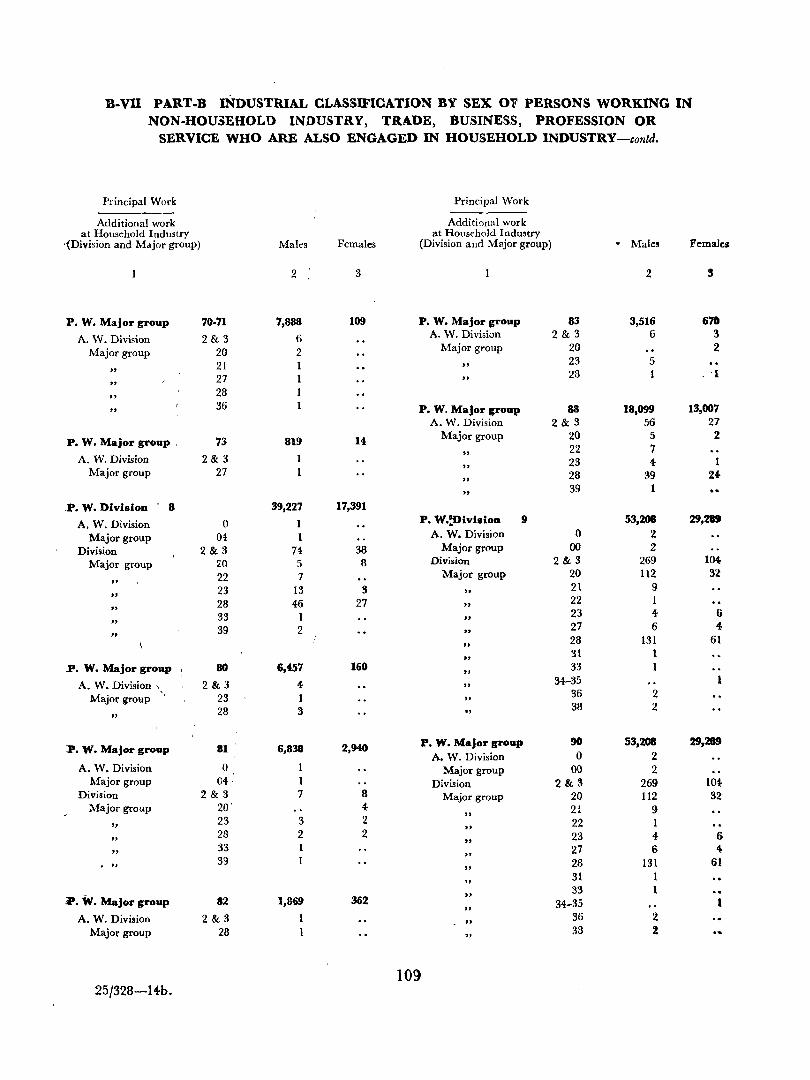
B-vn PART-B INDUSTRIAL CLASSIFICATION BY SEX Ol" PERSONS WORKING IN' NON·HOU3EHOLll INDUSTRY, TRADE, BUSINESS, PROFESSION OR
SERVICE WHO ARE ALSO ENGAGED IN HOUSEHOLD INDUSTRY-contd.
Principal Work Principal Work
Additional work Additional work at Household Industry at Household Industry
-{Division and Major group) Males Females (Division and M?Jor group) . Males Females
2 3 2 3
P. W. Major group 70·71 7,888 109 P. W. Major group 83 3,516 670
A. W. Division 2&3 6 A. W. Division 2&3 6 3
Major group 20 2 Major group 20 2
21 " 23 5
" 27 " 23 1 . -I
" 28
" 36 P. W. Major group 88 18,099 13,007
A. W. Division 2&3 56 27
P. W. Major group, 73 819 14 Major group 20 5 2
" 22 7
A. W. Division 2&3 1 23 4- 1 " Major group 27 28 39 U " "
39 1
.P. W. Division 8 39,227 17,391
A. W. Division 0 1 P. W.=DivisioD 9 53,208 29,20
Major group 04 1 A. W. Division 0 2
Division 2&3 74 38 Major group 00 2 Major group 20 5 8 Division 2&3 269 104
22 7 Major group 20 112 32 " 23 13 3 "
21 9 " 28 46 27 "
22 1 " 33 1 "
23 4 6 " 39 2 "
27 6 4-" 28 131 61
" "
31 1 P. W. Major group 80 6,457 160
" 33 1
A. W. Division , 2&3 4 " 34-35 1
Major grONP 23 1 " 36 2
28 3 " 38 2
"
:Po W. Major group 81 6,838 2,940 P. W. Major group 90 53,208 29.289 A. W. Division 0 2
A. W. Division 0 1 Major group 00 2 Major group 04, 1 Division 2&3 269 104-
Division 2&3 7 8 Major group 20 112 32 Major group 20 4- 21 9
" "
23 3 2 22 1 "
" 28 2 2 23 4- 6
" "
33 1 27 6 4-"
" 39 1 28 131 61
" "
31
" 33
P. W. Major group 82 1,869 362 34-35 1 " A. W. Division 2&3 J "
36 2 Major group 28 1
" 38 2
109 25/328-H:b.
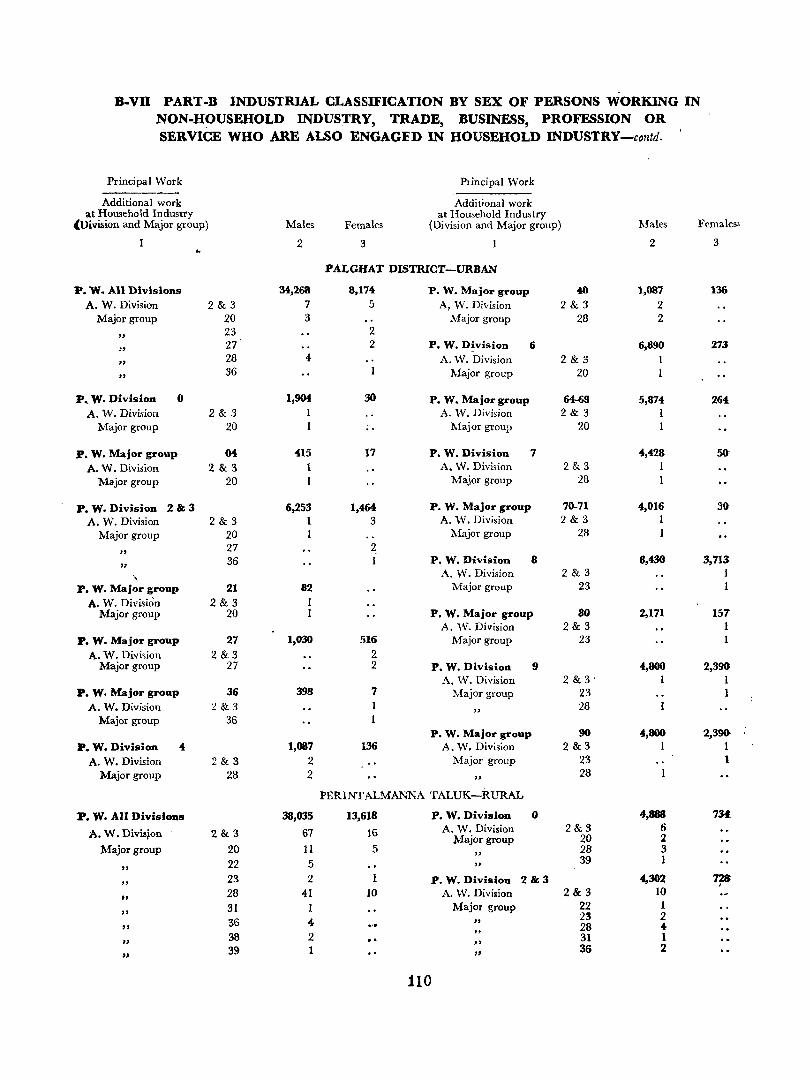
B-VII PART-B INDUSTRIAL CLASSIFICATION BY SEX OF PERSONS WORKING IN NON-HOUSEHOLD - INDUSTRY, TRADE, BUSINESS, PROFESSION OR SERVICE WHO ARE ALSO ENGAGED IN HOUSEHOLD INDUSTRY-corM.
Principal Work Principal Work
Additional work Additional work at Household Industry at Household Industry
(Division and Major group) Males Females (Division and Major group) Males Females;.
2 3 2 3 .. PALGHAT DISTRICT-URBAN
P. W. All Divisions 34,268 8,174 P. W. Major group 40 1,087 136 A. W. Division 2&3 7 5 A, W. Division 2&3 2
Major group 20 3 Major group 28 2
" 23 2
" 27 2 P. W. Division 6 6,890 273
" 28 4 A. W. Division 2&3 I
" 36 Major group 20
P •. W. Division 0 1,904 30 P. W. Major group 64-68 5,874 264 A. W. Division 2&3 I A. W. Division 2&3 I
Major group 20 1 Major group 20
p. W. Major group M 415 17 P. W. Division 7 4,428 50 A. W. Division 2&3 1 A. W. Division 2&3 1
Major group 20 1 Major group 28
P. W. Division 2&3 6,253 1,464 P. W. Major group 7()"71 4,016 30 A. W. Division 2&3 I 3 A. W. Division 2&3 I
Major group 20 1 Major group 28 1
" 27 2
" 36 P. W. Division 8 8,430 3,713
"- A. W. Division 2&3 1 P. W. Major group 21 82 Major group 23
A. W. Division 2&3 1 Major group 20 1 P. W. Major group 80 2,171 157
A. W. Division 2&3 1 p. W. Major group 27 1,030 516 Major group 23
A. W. Division 2 &3 2 Major group 27 2 P. W. Division 9
2 &3: 4,800 2,390
A. W. Division I 1 P. W. Major group 36 398 7 :Major group 23 1
A. W. Division 2&3 I "
28 Major group 36 1
P. W. Major group 90 4,800 2,390-P. W. Division 4 1,087 136 A. W. Division 2&3 1 1
A. W. Division 2&3 2 Major group 23 1 Major group 28 2 "
28
PERINTALMANNA TALUK-RURAL
P. W. All Divisions 38,035 13,618 P. W. Divisioo 0 4,888 7~
A. W. Divi8~on 2&3 67 16 A. W. Division 2&3 6 Major group 20 2
Major group 20 11 5 "
28 3 22 5 "
39 1 " "
23 2 P. W. Division 2&3 4,302 7'!B "
28 41 10 A. W. Division 2&3 10
31 1 Major group 22 1 " 23 2
36 4 " " 28 4 38 2
,. 31 1
" " 39 1 " 36 2 ..
110
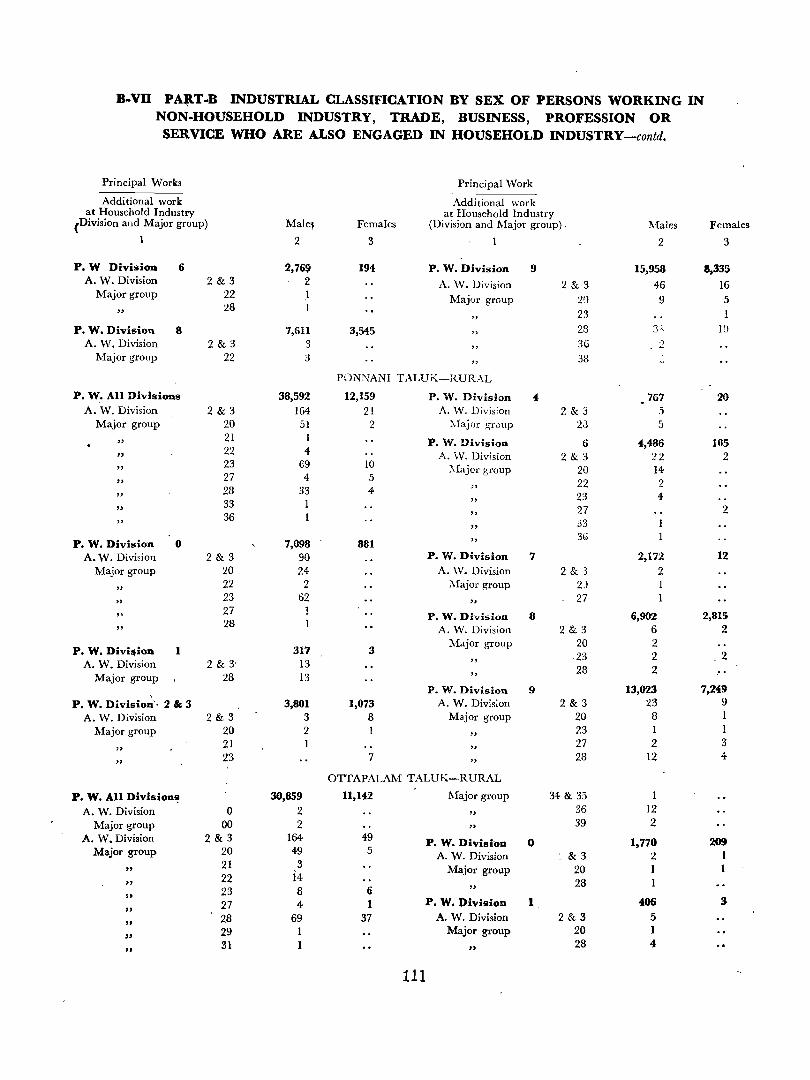
B-vn PAltT-B INDUSTRIAL CLASSIFICATION BY SEX OF PERSONS WORKING IN NON-HOUSEHOLD INDUSTRY, TRADE, BUSINESS, PROFESSION OR SERVICE WHO ARE ALSO ENGAGED IN HOUSEHOLD INDUSTRY-contd.
Principal Works Principal Work
Additional work Additional work at Household Industry at Household Industry
(Division and Major group) Male~ Females (Division and Major group). Males Females
1 2 3 1 2 3
P.W Division 6 2,769 194 P. W. Division 9 15,958 8,335 A. W. Division 2&3 2 A. W. Division 2 & 3 46 16
Major group 22 .1 Major group 2G 9 5 28
23 1
P. W. Division 8 7,611 3,545 " 23 3< 10
A. W. Division 2&3 3 36 .)
Major group 22 3 "
38
PONNANI TALUK-RUR.·\L
P. W. All Divisi~s 38,592 12,159 P. W. Division 4 767 20 A. W. Division 2&3 164 21 A. W. Division 2&3 5
Major group 20 51 2 ~,Iajor group 20 5
" 21 I P. W. Division 6 4,486 105
" 22 4 A. W. Division 2&3 22 2
" 23 69 10 Major group 20 14
" 27 4 5 22 2 " " 28 33 4 23 4
" " 33 1 27 2 " " 36 33 "
P. W. Division 0 7,098 881 " 3€)
A. W. Division 2&3 90 P. W. Division 7 2,172 12 Major group 20 24 A. W. Division 2 & 3 2
" 22 2 Major group 2)
" 23 62
" 27
" 27 1 P. W. Division 8 6,902 2,81>
" 28 1 A. W. Division 2 & 3 6 2
Major group 20 2 P. W. Divi~ion 1 317 3 23 2 .2
A. W. Division 2&3 13 " 28 2 Major group 28 13 "
P. W. Division 9 , 13,023 7,249
P. W. Division'· 2 " 3 3,801 1,073 A. W. Divis;on 2&3 23 9
A. W. Division 2&3 3 8 Major group 20 8 I
Major groljP 20 2 23 1 1 " 21 "
27 2 3 " 23 7 "
28 12 4-"
OTTAPALAM TALUK-RURAL
P. W. All Division~ 30,859 11,142 Major group 34 & 35 1 A. W. Division 0 2 " 36 12
Major group 00 2 " 39 2 A. W. Division 2 & 3 164 49 P. W. Division 0 1,770 209
Major group 20 49 5 A. W. Division &3 2 1
" 21 3 Major group 20 1 1
" 22 14 28 1 23 8 6 " ,.
P. W. Division 1 406 3 27 4- 1 " A. W. Division 2&3 5 28 69 37 " Major group 20 1 29 .,
" 31 "
28 4
111
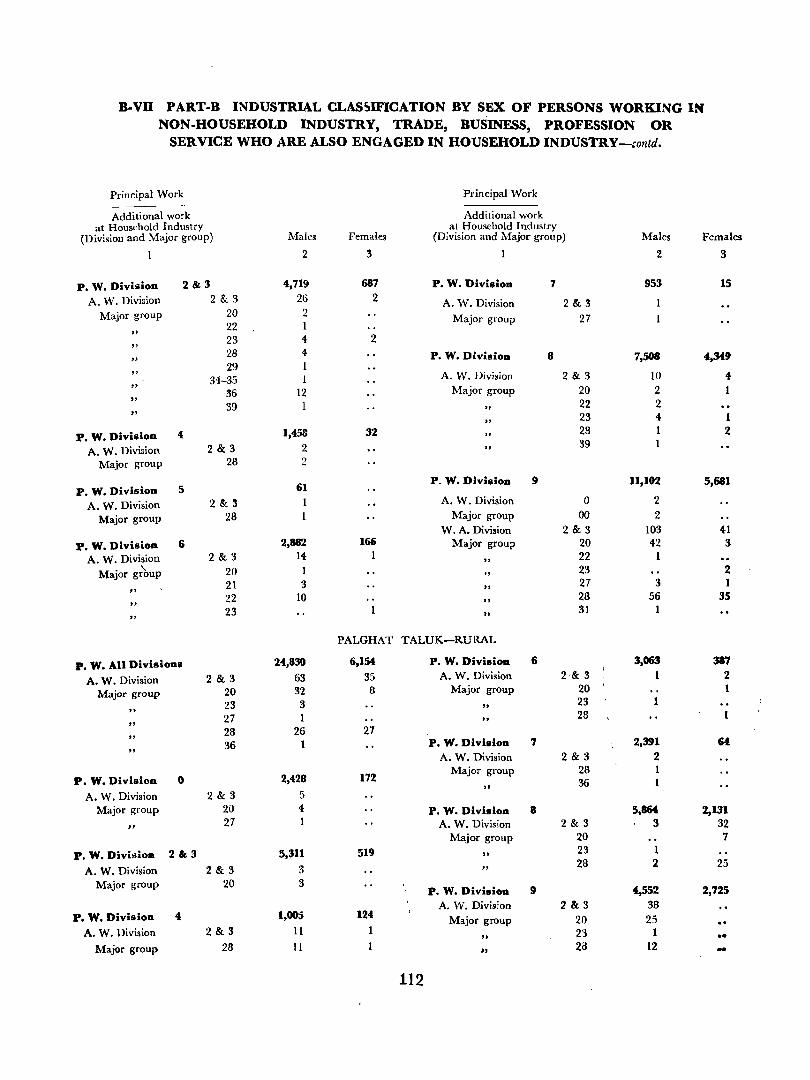
B-vn PART-B INDUSTRIAL CLAS3lFICATION BY SEX OF PERSONS WORKING IN NON-HOUSEHOLD INDUSTRY, TRADE, BUSINESS, PROFESSION OR
SERVICE WHO ARE ALSO ENGAGED IN HOUSEHOLD INDUSTRY-contd.
Principal Work Principal Work
Additional work Additional work at Household Industry at Household Industry
(Division and Major group) Males Females (Division and Major group) Males Females
1 2 3 2 3
P. W. Division 2&3 4,719 687 P. W. Division 7 953 IS A. W. Division 2&3 26 2 A. W. Division 2&3
Major group 20 2 Major group 27 22 1
" 23 4 2 " "
28 4 P. W. Division 8 7,508 4,349
" 29
34-35 I A. W. Division 2&3 10 4-" 12 Major group 20 2 36 " 22 2 39 1 " " 23 4- I
" P. W. Division 4 1,458 32 28 I 2
A. W. Division 2 & 3 2 .. 39 I
Major group 28 2
61 P. W. DivisioD 9 11,102 5,681
P. W. Division 5
A. W. Division 2&3 1 A. W. Division 0 2
Major group 28 Major group 00 2 W. A. Division 2&3 103 41
P. W. Division 6 2,882 166 Major group 20 42 3 A. W. Division 2&3 14 .. 22 I
M . \. 20 I " 23 2 aJor group
21 3 " 27 3 I ,.
22 10 " 28 56 35
" 31 1 "
23 "
PALGHAT TALUK-RURAL
P. W. All Divisions 24,830 6,154 P. W. Division 6 3,0&3 387
A. W. Division 2&3 63 35 A. W. Division 2&3 I 2
Major group 20 32 8 Major group 20 I
23 3 23 1 " 28 "
27 I " 28 26 27
" P. W. Division 7 2,391 64 36 1 " A. W. Division 2&3 2
Major group 28 I P. W. Division I) 2,428 172 36 I ,.
A. W. Division 2&3 5 Major group 20 4 P. W. Division 8 5,864 2,131
" 27 1 A. W. 1;)ivision 2&3 3 32
Major group 20 7
P. W. Division 2&3 5,311 519 " 23 1
A. W. Division 2&3 3 " 28 2 25
Major group 20 3 P. W. Division 9 4,552 2,725
A. W. Division 2&3 38 P. W. Division 4 1,005 124 Major group 20 25
A. W. Division 2&3 11 I 2'; 1 •• " Major group 28 II .. 28 12 -
112
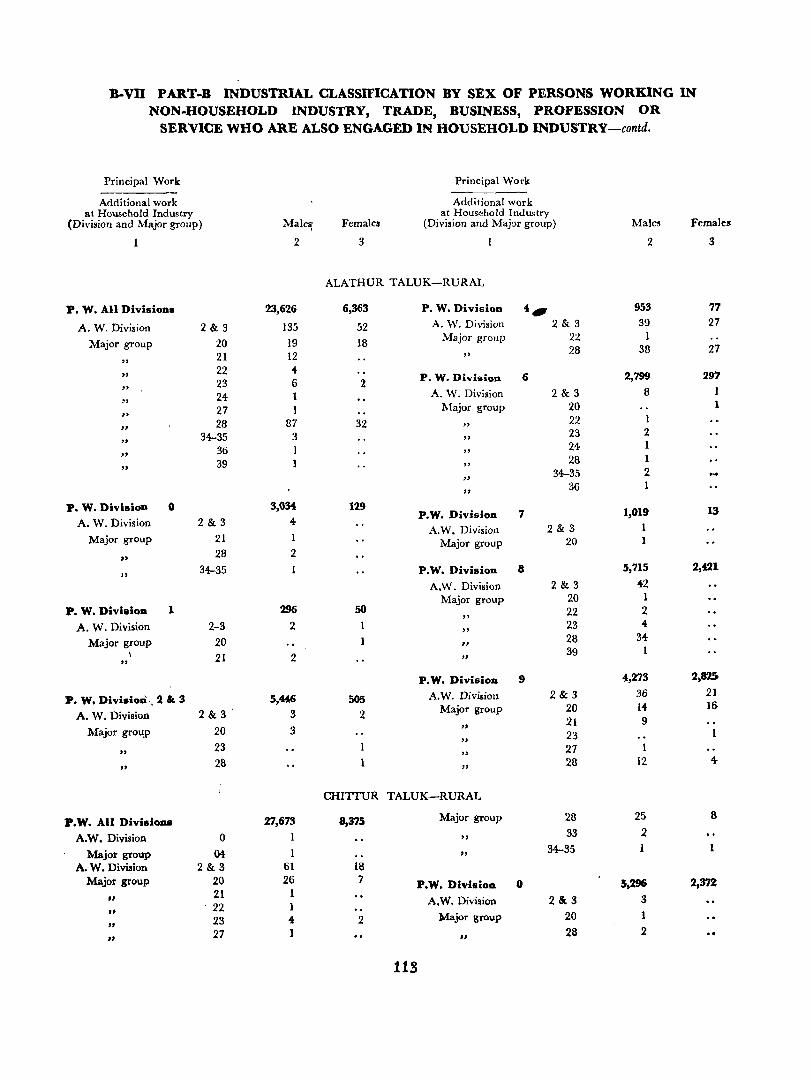
B-vn PART-B INDUSTRIAL CLASSIFICATION BY SEX OF PERSONS WORKING IN NON-HOUSEHOLD INDUSTRY, TRADE, BUSINESS, PROFESSION OR
SERVICE WHO ARE ALSO ENGAGED IN HOUSEHOLD INDUSTRY-contd.
Principal Work Principal Work
Additional work Additional work at Household Industry at Household Industry
(Division and Major group) Mal~' Females (Division and Major group) Males Females
2 3 2 3
ALATHUR TALUK-RURAL
P. W. All Divisions 23,626 6,363 P. W. Division 4, 953 77
A. W. Division 2&3 135 52 A. W. Division 2&3 39 27
Major group 20 19 18 Major group 22 1
21 12 " 28 38 27
" "
22 4 2,799 291 23 6 2 P. W. Division 6
" 24 1 A. W. Division 2&3 8 1 " 27 1 Major group 20 1 " 28 87 32 "
22 I " 34-35 3 "
23 2 " 24 I
" 36 1 " 39 1 "
28 1 " 34-35 2
" "
36 1
P. W. Division 0 3,034 129 P. W. Division 7 1,019 13
A. W. Division 2&3 4 A. W. Division 2&3 1
Major group 21 1 Major group 20 .. 28 2
" 34-35 P.W. Division 8 5,715 2,421
A.W. Division 2&3 42 Major group 20 1
P. W. Division 1 296 50 22 2 " A. W. Division 2-3 2 23 4 "
Major group 20 " 28 34
\ 21 2 " 39
" P. W. Division 9 4,273 2,82!;
P. W. Division" 2 &: 3 5,446 505 A.W. Division 2&3 36 21
2&3 3 Major group 20 14 1& A. W. Division 2
" 21 9
Major grol1P 20 3 23 1 "
" 23 27 1 28 1 28 12 4-
" " CHIITUR TALUK-RURAL
P.W. All Divisions 27,673 8,37S Major group 28 25 8
A.W. Division 0 1 .. 33 2
Major group 04- " 34-35
A. W. Diviaion 2&3 61 18 Major group 20 26 7 P.W. Division 0 5,296 2,372
" 21 1
A.W. Division 2&3 3 It ' 22 1
23 4 2 Major group 20 " "
27 1 .. 28 2
113
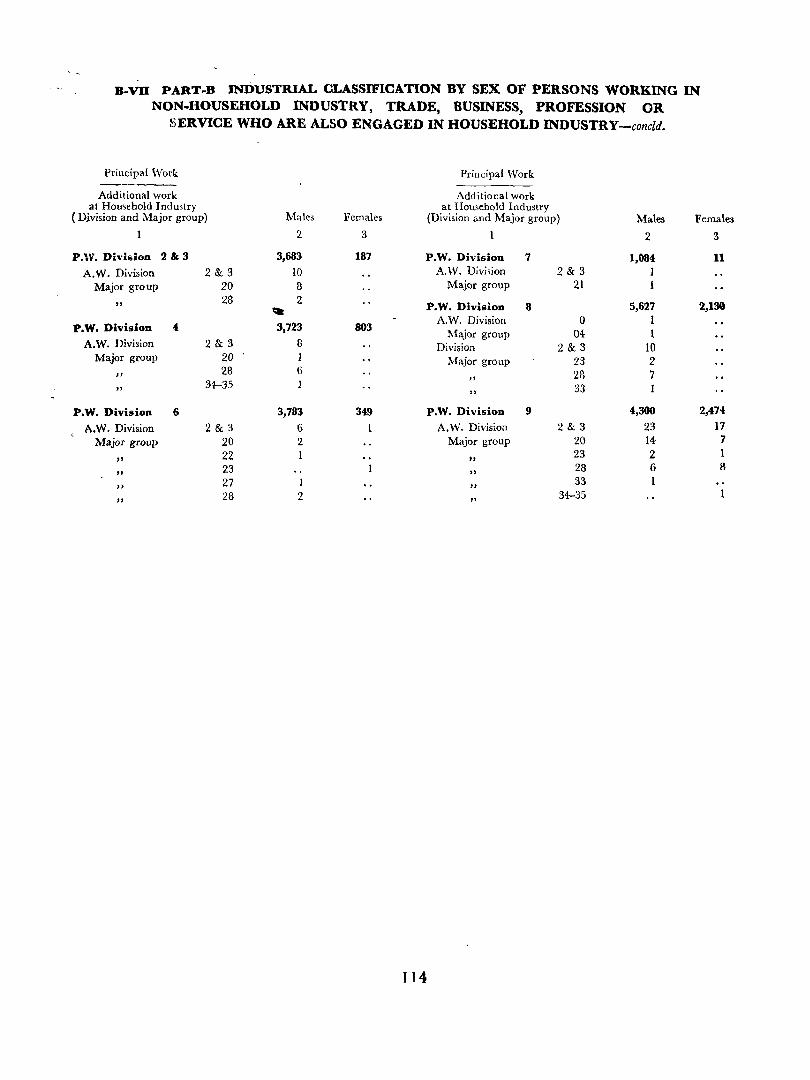
, -B-VB PART-B INDUSTRIAL CLASSIFICATION BY SEX OF PERSONS WORKING IN
NON·HOUSEHOLD INDUSTRY, TRADE, BUSINESS, PROFESSION OR SERVICE WHO ARE ALSO ENGAGED IN HOUSEHOLD INDUSTRY-concld.
Principal Work Principal 'Work
Additional work Additional work at Household Industry
( Division and Major group) Males Females at Household Industry
(Division and Major group) Males Females
1 2 3 1 2 3
P.W. Division 2&3 3,683 187 P.W. Division 7 1,084 11 A. W. Division 2&3 10 A.W. Division 2&3 1
Major group 20 8 Major group 21 1
" 28 2
P.W. Division 8 5,627 2,130 «lilt
4 3,723 803 A.W. Division 0 1
P.W. Division Major group 04 1 A.W. Division 2&3 8 Division 2&3 10
Major group 20 Major group 23 2 II 28 6 28 7 " "
34-35 1 33 "
P.W. Division 6 3,783 349 P.W. Division 9 4,300 2,474
A.W. Division 2&3 6 A.W. Division 2&3 23 17
Major group 20 2 Major group 20 14 7
22 1 23 2 1 " " "
23 " 28 6 8
" 27 "
33
" 28 2 "
34-35
)14
E-VIB PERSONS UNEMPLOYED AGED 15 AND ABOVE BY SEX, BROAD AGE-GROUPS, AND EDUCATIONAL LEVELS
Fly-leaf
1. This i~ a very important table which provides information on persons ag<>d 15 and above who are unemployed by sex and ed~cational levels in rural and urhan are:lS of ~h~ dis~rict. TLe table will be useful for purposes of pL.nning for employment and also for assessing "he available rr;an power. It is divided into two parts. Part-A relate, to urban areal! and is presented for the di~.ric·. Part-B relates to rural areas and is presented dO'Nn to taLk level.
2. Pat t-A of th.:: t..lble gi ve.s th.~ distribution of pel SOLS seeking emplGyment for the first lime in the
25/328-15 lIS
age-groups 15-19, 20-24, 25-29, 30-34 and 35+ and also the distribution of persor.s who were emplo)ed before but now out of employment and seeking work in the age-groups 15-19, 20.24,25-34, 35-44,45-59 and 60+ by educational levels, asgi\en in Table B-III Part-A.
3. Part-B of the table presents the distribution of unemployed rersons aged 15 ,md above by the same educational levels a~ given in Table B-III Part-B.
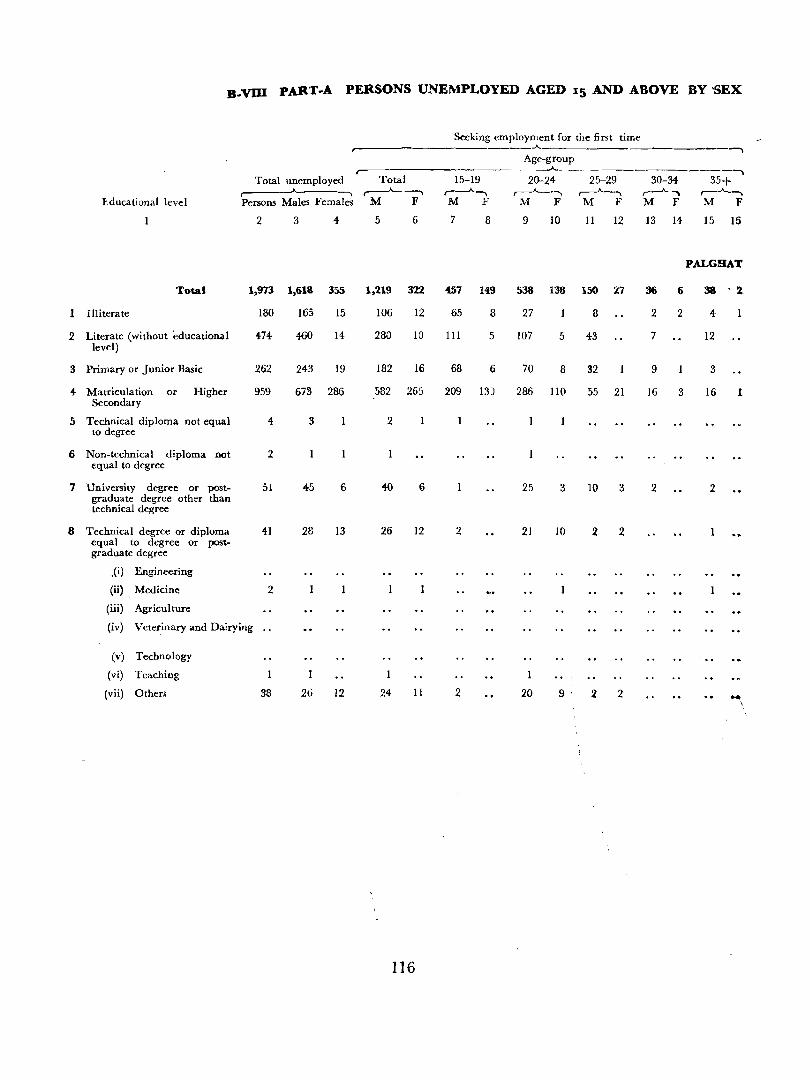
B-VD1 PART-A PERSONS UNEMPLOYED AGED 15 AND ABOVE BY 'SEX
Seeking employment for the first time ..A. ________________ --,
Age-group r--
..A--.-______________ --,
Total unemployed Total 15-19 20-24- 25-29 30-34 35+ ,.--A------. ,--A.--, ~-.. ~ ,--A.. "'\ r--"----,
Educational level Persons Males Fe:nales M F M .F M F M F M F M F
2 3 4- 5 6 7 8 9 10 11 12 13 14- 15 16
PALGHAT
Total 1,973 1,618 3:>5 1,219 322 457 149 538 138 ISO 27 36 6 38 2-
1 Illiterate 180 165 15 106 12 65 8 27 8 2 2 4
2 Literate (without educati01l41 474- 460 14- 280 10 III 5 107 5 43 7 12 level)
3 Primary or Junior Basic 262 243 19 182 16 68 6 70 8 32 9 3
4 Matriculation or Higber 959 673 286 582 265 209 13) 286 110 55 21 16 3 16 1 Secondary
5 Technical diploma not equal 4 3 2 to degree
6 Non-technical diploma not 2 equal to degree
7 University degree or post- 51 45 6 40 6 25 3 10 3 2 2 graduate degree other than technical degree
8 Technical degree or diploma 41 28 13 26 12 2 21 10 2 2 equal to degree or post-graduate degree
,(i) Engineering
(ii) ". Medicine 2
(iii) Agriculture
(iv) Vet~inary and Dairying
(v) Technology .. (vi) Teaching 1 1
(vii) Others 38 26 12 24 11 2 .20 9 2 2 ..... \
116
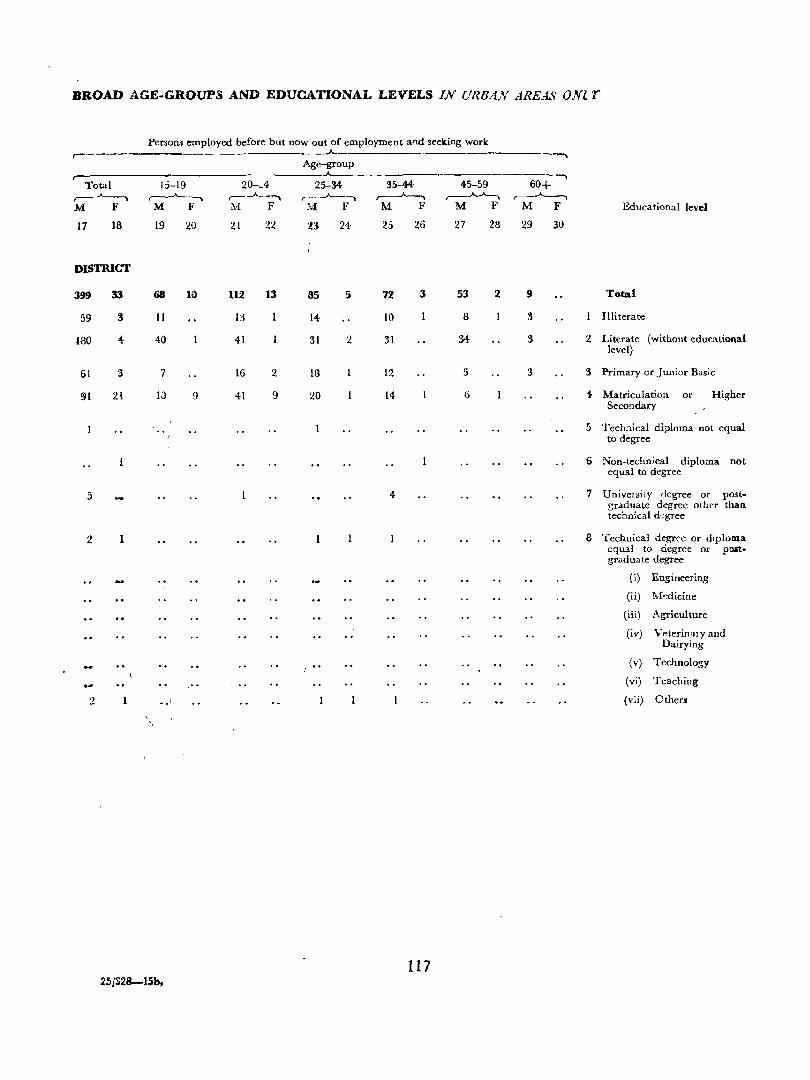
BROAD AGE-GROUPS AND EDUCATIONAL LEVELS IN URBAN AREAS ONI r
Persons employed before but now out of employment and seeking work
r---------------- -~
Total ~ M F
17 18
DISTRICT
399
59
180
61
91
5
2
2
33
3
4
3
21
1
15-19 ,.--A---, M F
19 20
68
11
40
7
1;)
.. '
10
9
25jS28-15b.
20-:"4 r-...A-.-. M F
21 22
112
13
41
16
41
13
2
9
Age-group
25-34 ~
Iv( F
!3 24
85
14
31
IS
20
2
35-44 ,----A--, M F
25 26
72
10
31
12
14
4
3
117
45-59 ~
M F
27 28
53
8
34
5
6
2
....., 60+
,-----'---, M F
29 30
9
3
3
3
Educational level
Total
Illiterate
2 Literate (without educational level)
3 Primary or Junior Basic
4 Matriculation or Secondary
Higher
5 Tech:1.ical diploma not equal to degree
6 Non-technical diploma not equal to degree
7 Univelsity degree or postgraduate degree other than technical d~gree
8 Technical degree or diploma equal to degree or postgraduate degree
(i) Engineering
(ii) Medicine
(iii) Agriculture
(iv) Veterina! y and Dairying
(v) Technology
(vi) Teaching
(v;i) Others
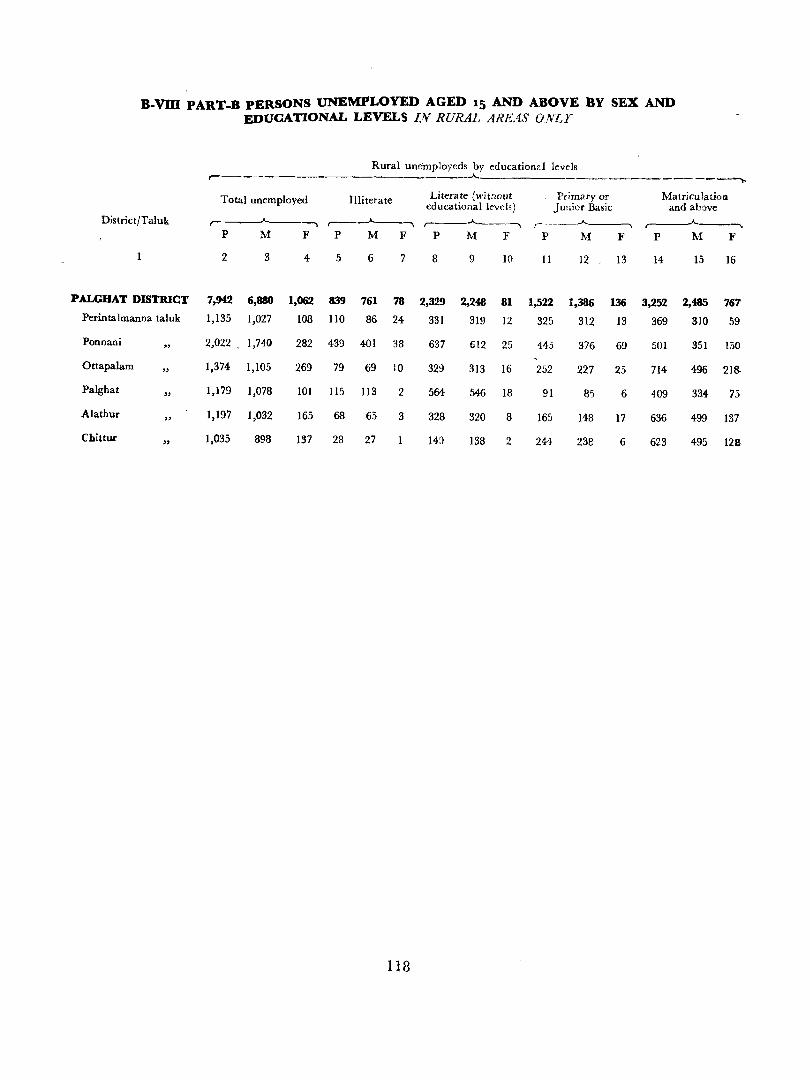
B-vm 'PART-B PERSONS UNEMPLOYED AGED 15 AND ABOVE BY SEX AND EDUCATIONAL LEVELS lTlf RURAL AREAS ONLY
Rural unemployeds by educationd levels ,---- __.A.. ___________________ ---.,
Total unemployed Illiterate Literate (wi6out Primary or Matriculation educational level,) Junior Basic and ab~ve
District/Taluk ,---"--------. ,..-----A---, ,----"---, ,-- ___,..--, P M F P M F P M F P M F P M F
2 3 4 5 6 7 8 9 10 11 12 13 14 15 16
PALGHAT DISTRICT 7,942 6,880 1,062 839 761 78 2,329 2,248 81 1,522 1,386 136 3,252 2,485 767 Perintalmanna taluk 1,135 1,027 108 110 86 24 331 319 12 325 312 13 369 310 59
Ponnani 2,022 1,740 282 439 401 38 637 612 25 445 376 69 501 351 150
Ottapalam "
1,374 1,105 269 79 69 10 329 313 16 252 227 25 714 496 218.
Palghat "
1,179 1,078 JOI 1I5 1I3 2 564 546 18 91 85 6 409 334 75
Alathur "
1,197 1,032 165 68 65 3 328 320 8 165 148 17 636 499 137
Chittur "
1,035 898 137 28 27 143 138 2 244 232 6 623 495 128.
118
B-IX PERSONS NOT AT WORK CLASSIFIED BY SEX, BROAD AGE-GROUPS AND TYPE OF ACTIVITY
Fly-leaf
1. This table gives tl:e type of activities of nonworkers. Non-workers are classified i!l~.o eight categories which are given in fly-leaf to table B-I. It i~ the first time in the history of Indian Census that information on the activities of non-workers are c.)llected and tabuhted. Any study of workers and non-workers is likely to be incomplete without getting detailed data on the tYf e of activities of non-workers especially when the figures
lJ9
of non-workers z.re mo:e -than 50 per cent of the total population.
2. The ey·:cess of 5tudent population in '-he c.gegroup 0-14 of 6is table over the literates in the agegroup 5-14 uf table C-IlI of lhis volume is due to the s::udent population in the lower standards of the primary schools, nursery s~hvols and kintergarten schools who do not know how to read and write with under,tand:ng.
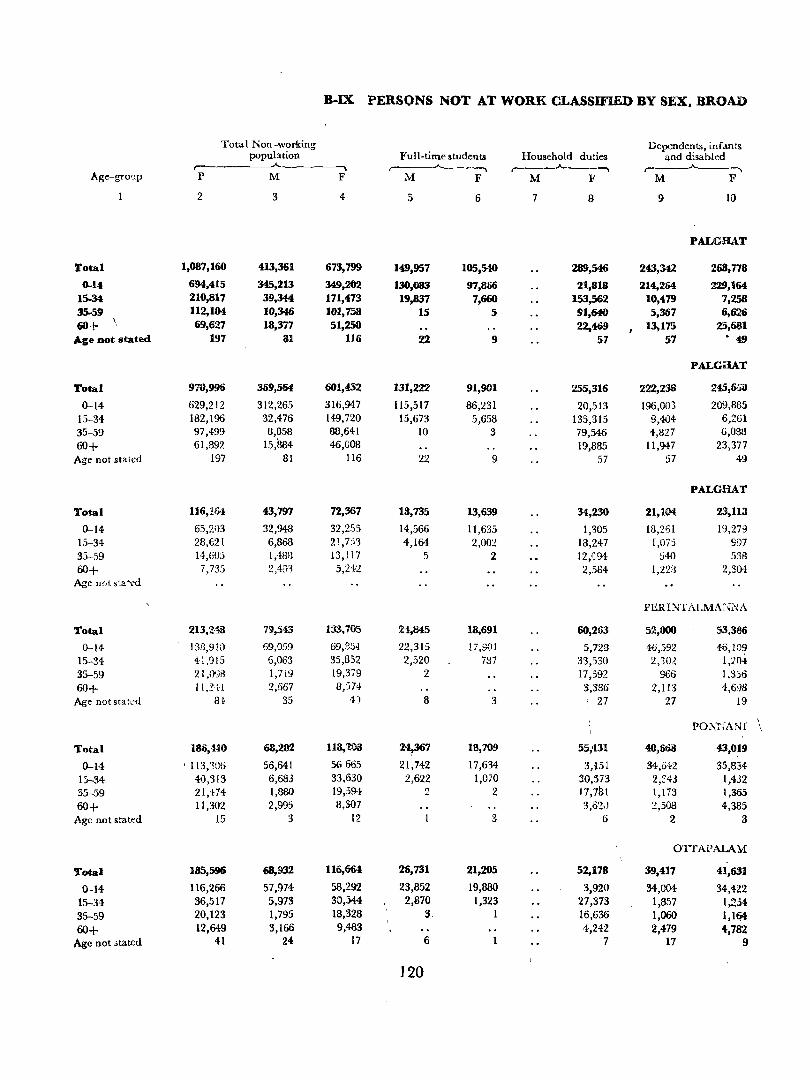
B-IX PERSONS NOT AT WORK CLASSIFIED BY SEX, BROAD
Total Non-working Dependents, inf.lnts population Full-time students Household duties and disabled
-. --------. ,---.;..____----. ,---"---------, Age-group P M F M F M 1" M F
2 3 4 5 6 7 B 9 10
PALGHAT
Total 1,087,160 413,361 673,799 149,957 105,540 289,546 243,342 268,778
0-14 694,415 345,213 349,202 130,083 97,806 21,818 214,~S4 229,164 15-34 210,817 39,344 171,473 19,837 7,660 153,562 10,479 7,258 35-5!J 112,104 10,346 101,/38 15 5 91,640 5,367 6,626
60+ 69,627 18,377 51,250 22,469 13,175 25,681 Age not stated 197 81 116 22 9 57 57 '49
PALGaAT
Total 970,!196 369,564 601,432 131,222 91,901 255,316 222,238 245,6,,1)
0-14 629,212 312,265 316,947 115,517 86,231 20,513 196,003 209,885 15-34 182,196 32,476 149,720 15,673 5,658 135,315 9,4U4 6,261 35-59 97,499 8,858 88,641 10 3 79,546 4,827 6,088
60+ 61,892 15,884 46,008 19,885 11,947 23,377 Age not stated 197 81 116 22 9 57 57 49
PALGHAT
Total 116,164 43,797 7'1.,367 18,735 13,639 34,230 21,104 23,113
0-14 65,2.03 32,948 32,255 14,566 11,635 1,305 18,261 19,279 15-34 28,621 6,868 21,7:)3 4,164 2,002 18,247 r,075 997 35-59 14,605 1,488 13,117 5 2 12,(94 540 53B
60+ 7,735 2,493 5,242 2,584 1,223 2,304 Age not s~a ,\'d
PERINTALMA~"rNA
Total 213,2,18 79,:H3 133,705 ~H,8t5 18,691 5O,2!)3 52,000 53,3!!6
0--14 138,910 69,059 69,854 22,315 17,9Dl 5,728 46,592 4-6,109
15-34 41,915 6,063 35,852 2,520 737 33,530 2,104 1,20* 35-59 21,09i3 1,719 19,379 2 17,592 966 1,336
60+ 11,241 2,667 8, ''i 74 ~,336 2,113 4,698 Age not stated 8~ 35 4) 8 3 27 27 19
PONfiANI
Total 186,UO 68,202 l13,~OO 2~367 18,709 55,'131 40,66a 43,019
0-14 ' 113,106 56,641 56 665 21,742 17,634 3,~51 34,iH2 35,834 1:)-,34 40,313 6,683 33,630 2,{)22 1,070 30,573 2,::43 1,432 35-59 21,474 1,880 19,59-1- 2 2 17,71n 1,173 1,365
60+ 11,302 2,995 8,307 3,6211 :!,508 4,385 Age not stated 15 3 12 3 6 2 3
OTTAPALAM
Total 135,596 68,932 116,004 26,731 21,205 52,178 39,417 41,631
0-14 116,266 57,974 58,292 23,852 19,880 3,920 34,004- 34,422 15-34 36,517 5,973 30,544 2,870 1,323 27,373 1,857 1,234 35-59 20,123 1,795 18,328 3 1 15,636 1,060 1,1~
60+ 12,649 3,166 9,483 4,242 2,479 4,782 Age not 3tated 41 24 17 6 7 17 9
]20
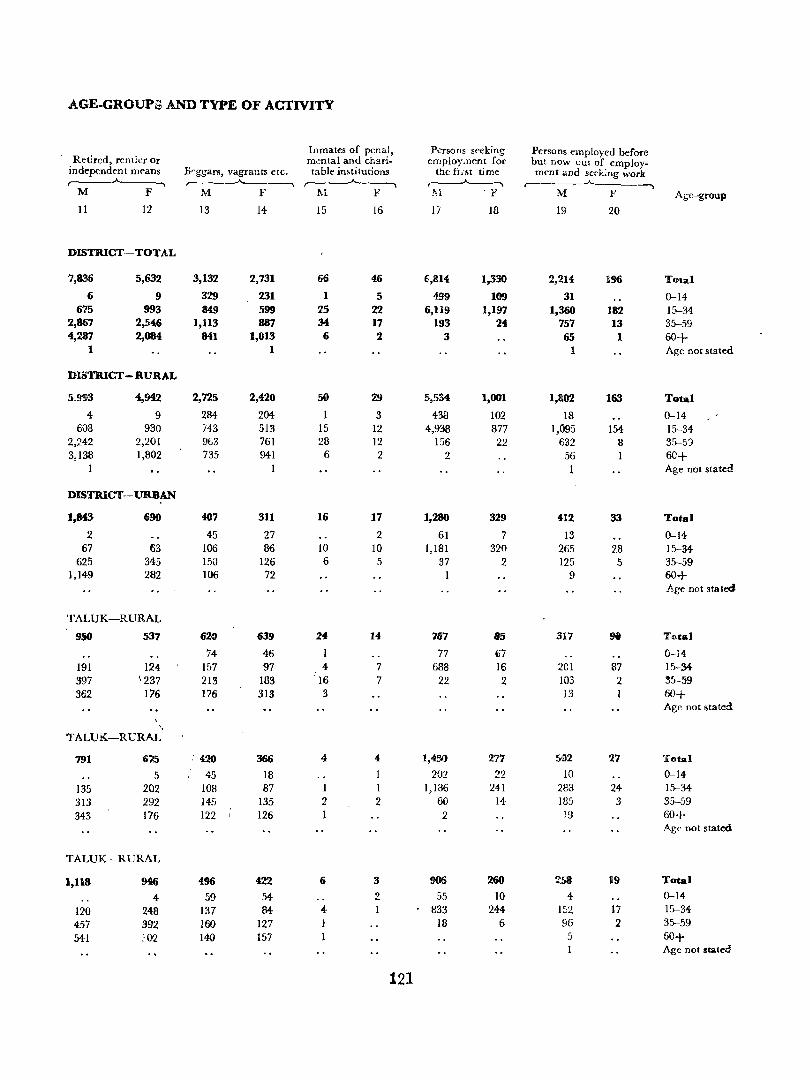
AGE-GROUPi; AND TYPE OF ACTIVITY
Inmates of penal, Persons seeking Persons employed before Retired, render or mental and chari- employ.11ent for but now out of employ-
independt"nt means E~ggars, vagrants etc, table institutions the fr.st time ment and seeking work r---~----, r--~ r---"--, ,---___ .A.
---, M F M F 1\1 _1" 1\1 ' f' M F Agc-group
11 12 13 14- 15 16 17 18 19 20
DISTRICT-TOTAL
7,836 5,632 3,132 2,731 66 46 6,814 1,330 2,214 196 TOlal
6 9 329 231 1 5 499 109 31 0-14 675 993 849 599 25 22 6,119 1,197 1,360 J82 15-34
2,867 2,546 1,113 887 34 17 193 24 757 13 35-59 4,287 2,084 841 1,013 6 2 3 65 1 60+
1 1 1 Age not stated
DISTRICT-RURAL
5_!l'S3 4,942 2,725 2,420 50 29 5,534 1,001 1,802 163 Total
4- 9 284- 204- 3 438 102 18 0-14-608 930 743 513 15 12 4,938 877 1,095 154- 15-34-
2,242 2,201 963 761 28 12 156 22 632 8 35-59 3,138 1,802 735 941 6 2 2 56 I 60+
1 1 Age not stated
D1STRICT-URBAN
1,843 690 407 311 16 17 1,280 329 412 33 Total
2 45 27 2 61 7 13 0-14-67 63 106 86 JO 10 1,181 320 265 28 15-34-
625 345 150 126 6 5 37 2 125 5 35-59 1,149 282 106 72 1 9 60+
Age not stated
TALUK-RURAL
950 537 620 639 24 14 787 85 317 9t T<>tal
74 46 1 77 ()7 0-14 191 124 157 97 4 7 688 16 2Cl 87 15-34-397 \237 213 183 16 7 22 2 103 2 ~5-59
362 176 176 313 3 13 I 60+ Age not stated
'. TALUK-RURAL
791 6',5 : 420 366 4- 4- 1,450 277 502 '1.7 Total
5 45 18 1 202 22 10 0-14 135 202 108 87 1 1 1,136 241 283 24- 15-34-313 292 145 135 2 2 60 14- 185 3 35-59 343 176 122 J 126 1 2 19 60+
Age not stated
TALUK-RURAL
1,118 946 496 422 6 3 906 260 2:58 19 Total
4 59 54 2 55 10 4- 0-14-120 248 137 84- 4- 833 244- 152 17 15-34-457 392 160 127 1 18 6 96 2 35-59 54-1 :-02 140 157 5 60+
Age not stated
121
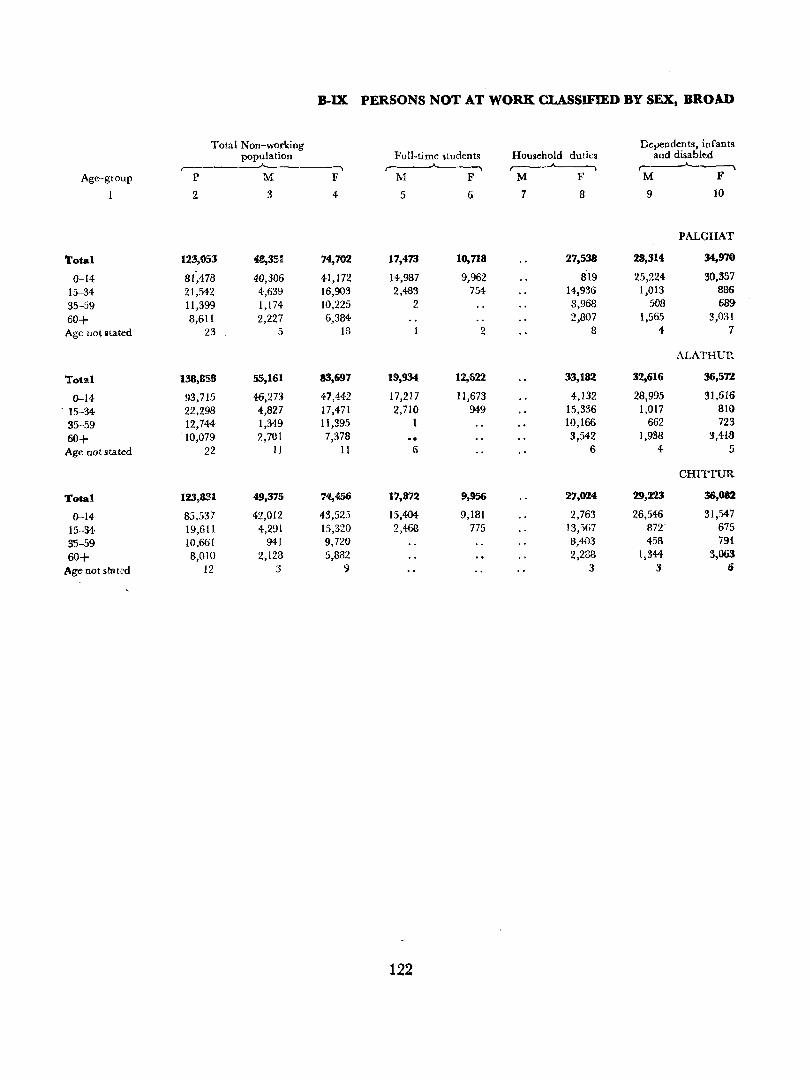
B-IX PERSONS NOT AT WORK CLASSIFIED BY SEX, BROAD
Total Non-working Dependents, infants population Full-time students Household duties and disabled
,-- --"------, ,----A------. ........ ____,._______, Age-group P M F M F M F M F
1 2 3 4 5 6 7 8 9 10
PALGHAT
'l'ota1 123,053 48,351 74,702 17,473 10,718 27,538 28,314 34,970
0-14 81,478 40,306 41,172 14,987 9,962 819 25,224- 30,357
15-34 21,542 4,639 16,903 2,483 754 14,936 1,013 886
35-59 11,399 1,174 10,225 2 3,968 508 689-
60+ 8,611 2,227 6,384 2,807 1,565 3,031
Age not litated 23 5 13 2 8 4- 7
ALATHUR
Totd 138,858 55,161 83,697 19,934 12,622 33,182 32,616 36,57Z
0-14 93,715 46,27:l 47,442 17,217 11,673 4,132 28,995 31,516
- 15-34- 22.298 "',827 17,471 2,710 949 15,336 1.017 810
35-59 12,744 1,349 11,395 1 10,166 662 723
60+ -10,079 2,701 7,378 3,542 1,938 3,418
Age not stated 22 11 11 6 6 4 5
CHITTUR
Total 123,831 49,375 74,456 17,872 9,956 27,024 29,W 36,082
0-14 85,537 42,012 43,523 15,404 9,181 2,763 26,546 31,547
15-34 19,611 4,291 15,320 2,468 775 13,5G7 an- 675
35-59 10,661 941 9,720 8,403 458 791
60+ 8,010 2,128 5,882 2,288 1,344- 3,063
Age not stat,~d 12 3 9 3 :3 Ii
122
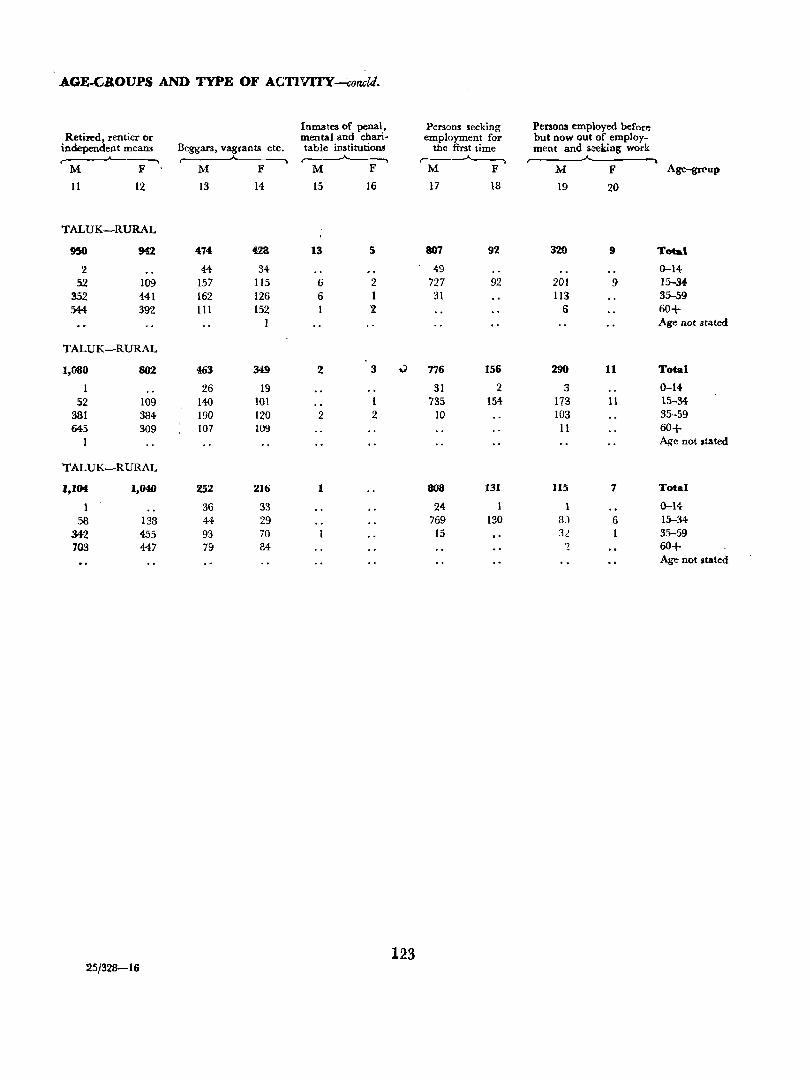
AGE-GBOUPS AND TYPE OF ACTIVITY -conclJ.
Retired, rentier or Inmates of penal, Persons seeking Penons employed before mental and chari~ employment for but now out of employ-
independent means Beggars, vagrants etc. table institutions the fint time ment and seeking work ~---.. r--~ r- -----'----,
M F M F M F M F M F Age-grrup
11 12 13 14 15 16 17 18 19 20
TALUK-RURAL
950 942 474 428 13 5 807 92 32.0 9 Total
2 44 34- 49 0-14 52 109 157 115 6 2 727 92 201 9 15-34-
352 441 162 126 6 1 31 113 35-59 544 392 111 152 1 2 6 60+
1 Age not stated
TALUK-RURAL
1,080 802 463 349 2 3 .) 776 156 290 11 Total
1 26 19 31 2 3 0-14 52 109 140 101 1 735 154 173 11 15-34-
381 384 190 120 2 2 10 103 35-59 645 309 107 109 11 60+
1 Age not stated
TALUK-RURAL
1,104 1,040 252 216 1 808 131 115 7 Total
36 33 24 1 0-14 58 138 44 29 769 130 8.) 6 15-34
342 455 93 70 15 12 35-59 703 447 79 84 'J 60+
Age not stated
123 25/328-16
B-X SAMPLE HOUSEHOLDS (i) EN3AGED NEITHER IN C!JLTIVATION NOR. HOU3EflOLD INDUSTRY, (ii) ENGAGED EITHER IN CULTIVATION OR HOUSEHOLD INDUSTRY
BUT NOT IN BOTH AND (iii) ENGAGED BOTH IN CULTIVATION AND HOUSEHOLD INDUSTRY FOR ALL AREAS
Fly-leaf
All the household economic table, p:-esente:l in this part are prepared fro:n 20% sample of h'msehold schedules. This table shows the number of homeholds in the 4 categories, viz. (i) Households engaged neither in cultivation nor in household industry, (ii) House-
124
holds engaged in cultivation only, (iii) Homeholds engaged in h:m,ehdd industry only and (iv) Households engaged in bJth cultivation and houseI1old industry, for the total, rural and urban areas of the district and for the rural areas of taluks'.

B-X SAMPLE HOUSEHOLDS (i) ENGAGE)) NEITHER IN CULTIVATION NOR HOUSEHOLD IN£U~TRY, (ii) ENGAGED ElTHER IN CULTIVATION OR HOUSEHOLD INDUSTRY
Bur NOT IN BOTH, AND (iii) ENGAGED BOTH IN CULTIVATION AND HOUSEHOLD INDUSTRY FOR ALL AREAS
(.BASED ON 20 % SAMPLE)
Households engaged Households Households neither in Households engaged in engaged both
Total Total : Cultivation engaged in Household in Cultivation Rural number of nor in Household Cultivation Industry and Household
District/Taluk Urban Households Industry only only Industry
1 2 3 4 5 6 7
PALGHAT DISTRICT T 63,884 , 43,873 15,530 3,864 617
R 58,073 38,837 15,084 3,553 599
U 5,811 5,036 446 311 18
Perintalmaana taluk R 12,147 7,375 4,341 377 54
Ponnani R 9,445 6,753 2,207 427 58
Ottapalam "
R lO,267 6,144 3,291 ., 649 183
Palghat "
R 8,313 5,691 1,867 638 117
Alathur "
R 8,835 6,C06 1,849 854 126
Chittur R 9,C66 6,868 1,529 608 61
25{328-16b. 125
· B-XI SAMPLE HOUSEHOLDS ENGAGED IN CULTIVATION CLASSIFIED BY INTEREST IN LAND,AND SIZE OF LAND CULTIVATE~ IN RURAL AND
URBAN AREAS SEPARATELY
Fly-leaf .
Thi" table gives a cross clas,ification of the cultivating households consisting of households engaged in cultivation only and households engaged in both cultivation and household industry by the interest in land and the size of land cultivated. The interest in
land is classified into (a) owned or held from Government, (b) held from private Persons or institutions for payment in money, kind or share, or (c) partly held
126
from Government and partly from priva:e persons for payment in money, kind or share. The size of holdings is grouped under less than I acre, 1'0-2'4 acres, 2'5-4'9 acres, 5'0-7'4 acres, 7'5-9'9 acres, 10'0-12'4 acres, 12'5-14'9 acres, 15'0-29'9 acres, 30'0-49'~
acres, 50 + acres and size unspecified. The table is prepared for the rural and urban area;; of the dhtrict and for the rural areas of taluks.
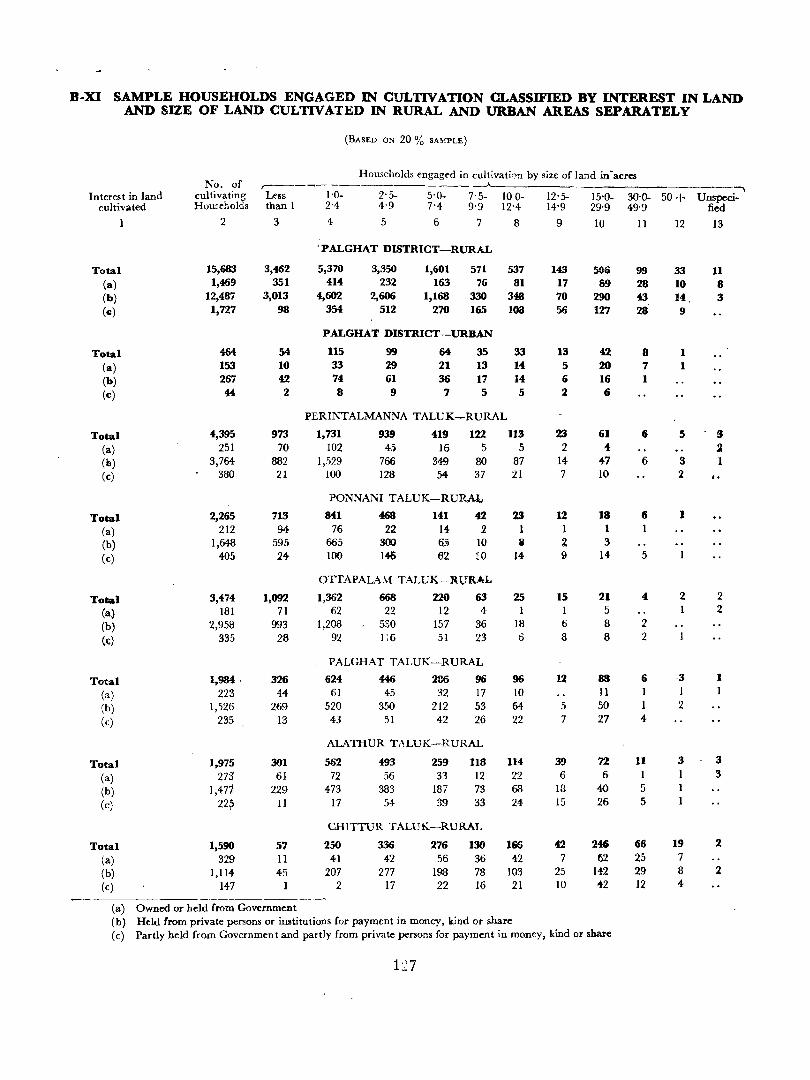
B-XI SAMPLE HOUSEHOLDS ENGAGED IN CULTIVATION CLASSIFIED BY INTEREST IN LAND AND SIZE OF LAND CULTIVATED IN RURAL AND URBAN AREAS SEPARATELY
(BASED ON 20 % SA~'PLE)
No. of Households engaged in cultivati<:>n by size of land in-acres
~------------------ -, Interest in land cultivating Less 1'0- 2'5- 5'0. 7'5- 10 0- 12'5- 15'0- 30'0- 50 + Unspeci-
cultivated Homeholcis than 1 2-4 4'9 7'4 9'9 12'4 14'9 29'9 49'9 fied 2 3 4 5 6 7 8 9 10 11 12 13
'PALGHAT DISTRICT-RURAL
Tetal 15,683 3,462 5,370 3,350 1,601 571 537 143 5~6 99 33 11 (a) 1,469 351 414 232 163 76 81 17 89 28 10 8 (b) 12,487 3,013 4,602 2,606 1,168 330 348 70 290 43 14, 3 (c) 1,727 98 354 512 270 165 108 56 127 28 9
PALGHAT DISTRICT-URBAN
Total 464 54 115 99 64 35 33 13 42 8 1 (a) 153 10 33 29 21 13 14 5 20 7 1 (b) 267 4:2 74 61 36 17 14 6 16 1 (c) 44 2 8 9 7 5 5 2 6
PERINTALMANNA TALUK-RURAL
Total 4,395 973 1,731 93!J 419 122 113 23 61 6 5 3 (a) 251 70 102 45 16 5 5 2 4 !I (0) 3,764- 882 1,529 766 349 80 87 14 47 6 3 1 (c) 380 21 100 128 54 37 21 7 10 2 ,.
PONNANI TALUK-RURAl,
Total 2,265 713 841 468 141 42 23 12 18 6 I
(a) 212 94 76 22 14 2 1 1 I
(b) 1,648 595 665 300 65 10 " 2 3
(c) 405 24 100 1+6 62 ~O 14 9 14 5
OTTAPALA.\f TALUK-Rl,JIV.L
Total 3,474 1,092 1,362 668 220 63 25 15 21 4 2 2 (a) 181 71 62 22 12 4 1 1 5 2
(b) 2,958 993 1,208 530 157 36 18 6 8 2
(~) 335 28 92 1;6 51 23 6 8 8 2
PALGHAT TALUK-RURAL
Total 1,984 . 326 624 446 286 96 96 12 88 6 ·3 1
(:1) 223 44 61 45 32 17 10 11 1 1
(b) 1,526 269 520 350 212 53 64- 5 50 2 (c) 235 13 43 51 42 26 22 7 27 4
ALATHUR TALUK-RURAL
Total 1,975 301 562 493 259 118 114 39 7'1. 11 3 3
(a) 273 61 72 56 33 12 22 6 6 1 3
(b) 1,471 229 473 383 187 73 68 18 40 5 (c) 22~ 11 17 54 39 33 24 IS 26 5
CHITTUR TALUK-RURAL
Total 1,590 57 250 336 276 130 166 42 246 66 19 2
(a) 329 11 41 42 56 36 42 7 62 25 7 (b) 1,114 45 207 277 198 78 103 25 142 29 8 2 (c) 147 2 17 22 16 21 10 .. 2 12 4
(a) Owned or held from Government (b) Held {rom private persons or institutions for payment in money, kind or share (c) Partly held from· Governmen t and partly from private persons for payment in money. kind or share
117

B-XU SAMPLE HOUSEHOLDS ENGAGED IN CULTlVAnON ONLY CLASSIFIED BY SIZE OF LAND CULTIVATED AND NUMBER OF FAMD..Y WORKERS AND
HIRED WORKERS IN RURAL AND URBAN AREAS SEPARATELY
Fly-leaf
This table shows the classification of households engaged in cultivation only according to the 'number of persons engaged in cultivation by the size of holding groups in acres. The number of persons engaged in cultivation are grouped under 1 person, 2 'persons, 3-5 persons, 6-10 persons, more than 10 persons and
129
unspecified. In the case of households where more than 1 person is working, the number of family workers a.nd hired workers have been shown separately. The table is prepared for the rural and urban areas of the district and for the rural areas of taluks.
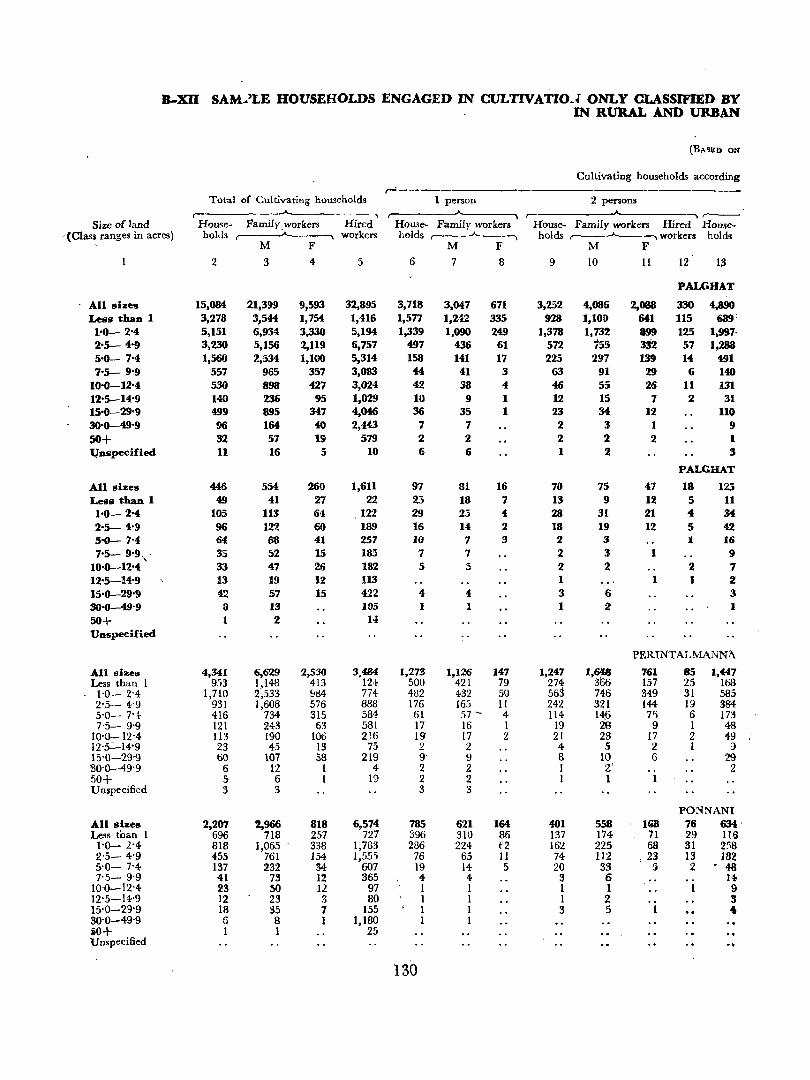
B-XU SAM2LE HOUSEHOLDS ENGAGED IN CULTIVATIO.l ONLY CLASSIFIED BY IN RURAL AND URBAN
(BAsaD ON
Cultivating households according ~
Total of Cultivating households 1 person 2 persoru r- r- r---
Size of land House- Famil Y . workers Hired House-. Family workers House- Family workers Hired House-. (Class ranges in acres) holds r----.A-.-----., workers holds r---_..A.------, holds r-------'----, workers holds
M F M F M F
2 3 4 5 6 7 8 9 10 11 12 13
PALGHAT .. All sizes 15,08<i 21,399 9,593 32,895 3,718 3,047 671 3,252 .,086 2,088 330 .,890 Less than 1 3,278 3~54f 1,75<i 1,416 1,577 1,242 335 928 1,10D 641 lI5 689' 1'0- 2'4 5,151 6,934 3,330 5,194 1,339 1,090 249 1,378 1,732 899 125 1,997, 2'5- 4'9 3,230 5,156 2,119 6,757 497 436 61 572 755 332 57 1,288 5-0- 7'4 1,560 ~,534 1,100 5,314 158 141 17 225 297 139 14 491
"5- 9'9 557 965 357 3,003 44 41 3 63 91 29 6 140 10'0-12'4 530 898 427 3,024 42 38 4 46 55 26 11 131 12'5-14'9 140 236 95 1,029 10 9 1 12 15 7 2 31 15'0-29'9 499 895 347 4,046 36 35 1 23 34 12 110 30'0----49-9 96 164 40 2,443 7 7 2 3 1 9 50+ 32 57 19 579 2 2 2 2 2 I tlnspecified 11 16 5 10 6 6 1 2 3
PALGHAT
All sizes 446 554 26Q 1,611 97 81 16 70 75 47 18 123 Less than I 49 41 27 22 23 18 7 13 9 l! 5 11 1'0- 2'4 105 U3 64 122 29 23 4 28 31 21 4 U 2'5- 4'9 96 122 60 189 16 14 2 18 19 12 5 42 5'0- 7'4 64 68 41 257 10 7 3 2 3 I 16
7'5- 9'9,' 35 52 15 185 7 7 2 3 1 9 10'0-12'4 33 47 26 182 5 5 2 2 2 7 12'5-14'9 13 19 12 Il3 1 1 1 2 15'0-29-9 42 57 15 422 4 4 3 6 3 30-0-49'9 8 13 103 1 1 1 2 1
50+ 1 2 14 Unspecified
PERINTAL!vtANNA
All si:tes 4,341 6,629 2,530 3,484 1,213 1,126 147 1,247 1,~ 761 85 1,441 Less than 1 953 1,148 413 124 SOO 421 79 274 366 157 25 168 1'0- 2'4 1,710 2,533 ~d4 774 4~2 432 50 563 746 349 31 585 2'5- 4'9 931 1,608 576 888 176 165 11 242 3~1 144 19 384 5'0- 7'4 416 734 315 584 61 57 - 4 114 l-ip 7'1 6 173 7'5-- 9'9 121 243 63 581 17 16 1 19 2S 9 1 48
10'0-12'4, 113 190 106 216 19 17 2 21 23 17 2 49 12,s.:-14·9 23 45 13 75 2 2 4 5 2 1 9 15'0-29'9 60 107 58 219 9 ~ 8 lC) 6 29 30,0-49'9 6 12 1 4- 2 2 1 Z' 2 50+ 5 6 1 19 2 2 1 1 Unspecified 3 3 3 3
PONNANI All sizes 2,207 2,966 818 6,574 785 621 164 401 558 lCi8 76 634 Less than 1 696 718 257 727 396 310 86 137 174 71 29 116 l'O-,N 818 1,065 338 1,783 286 224 f2 162 225 68 31 2'i8 2'5- 4'9 455 761 154 1,555 76 65 II 74 112 23 13 182 5'0-1'4 137 232 34- 607 19 14 5 20 33 5 2 '48 7'5- 9'9 41 73 12 365 4- 4 3 6 .. 14
10'0-12-4 23 50 12 97 1 1 1 1 9 12-5-·14'9 12 23 3 80 1 1 1 2 3 15'0-29'9 18 35 7 155 1 1 3 5 1 4 30'0-49'9 G 8 1 1,180 1 1 iO+ 1 1 25 Unspecified
130
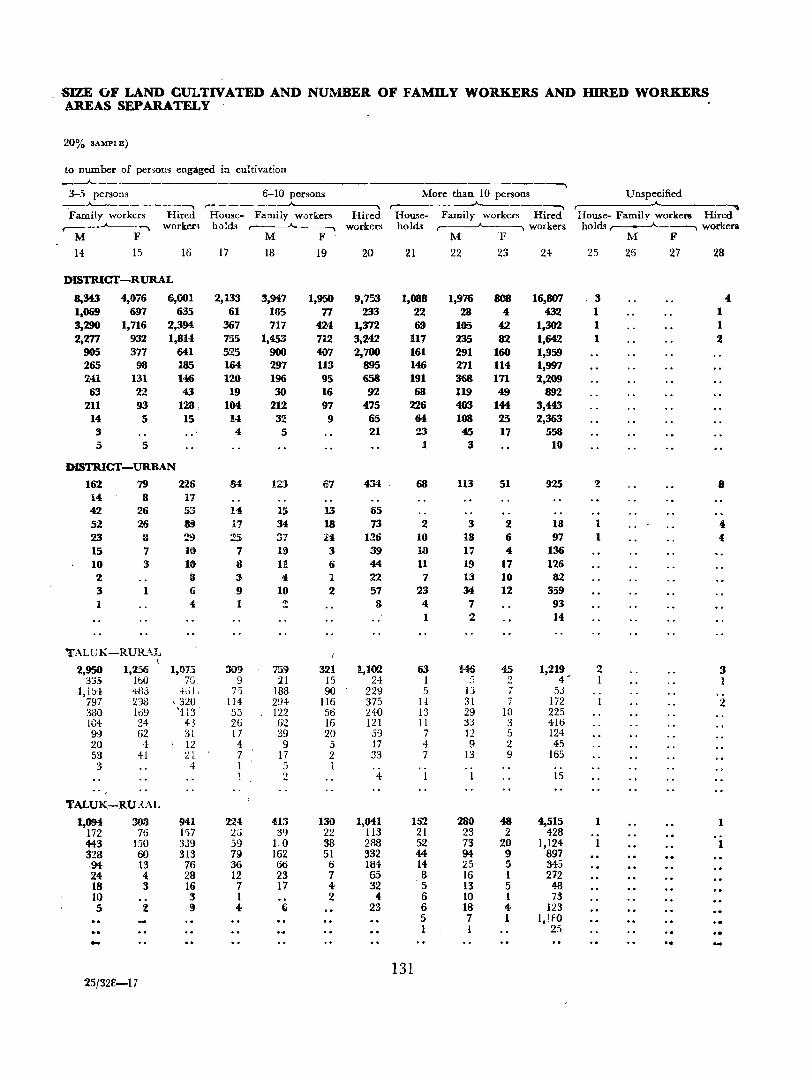
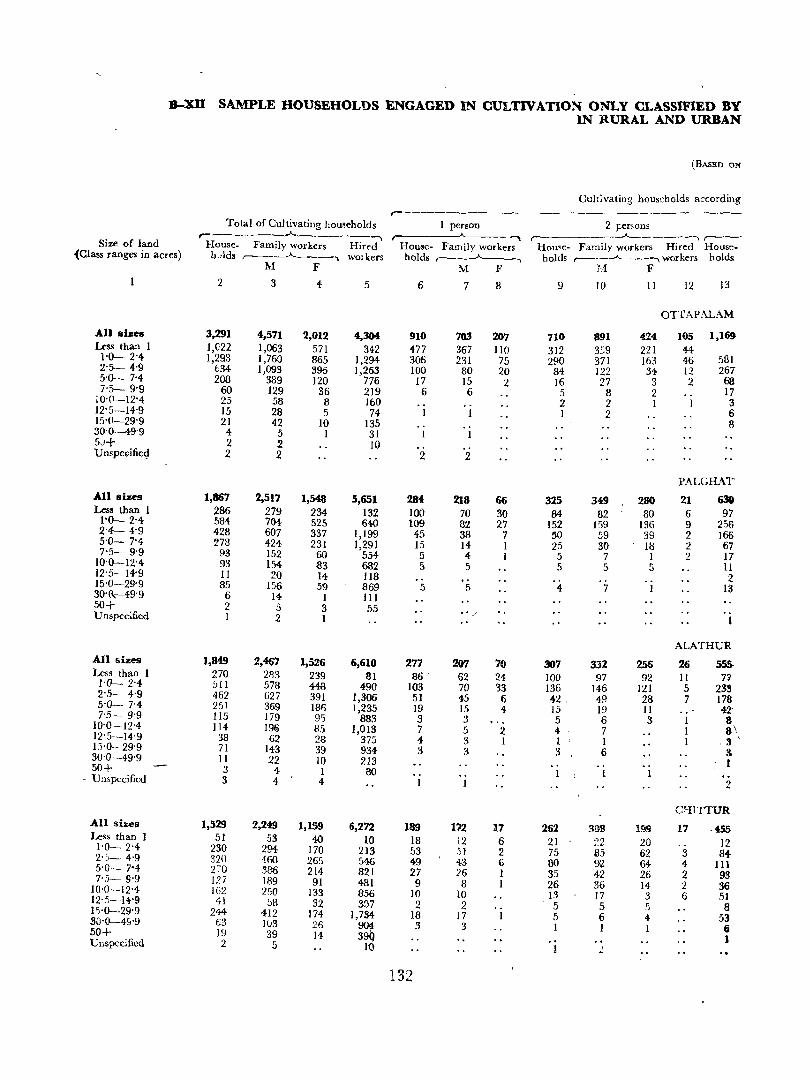
8-XU SAMPLE HOUSEHOLDS ENGAGED IN CULTIVATION ONLY CLASSIFIED BY IN RURAL AND URBAN
(BASED ON
Cultivating households according
r- -------------------------Total of Cultivating households I person 2 penOilS
r- -"-------, """ ____II...__-~----, ,--_ Size of land House- Family workers Hired Housc- Family workers Hou,e- Family workers Hired HOlls,,-
~Class ranges in acres) hJlds ,--_..A..__-----., wOlkers holds r---~ holds ,----"------, workers holds M F M F M F
2 3 4 5 6 7 8 9 10 11 12 13
OTTAPALAM
All sizes 3,291 4,571 2,012 4,304 910 703 207 710 891 414 165 1,169 Less tha::l I 1,022 1,063 571 342 477 367 110 312 3::9 221 44-1'0- 2"4 1,293 1,760 865 1,294 306 231 75 290 371 163 46 531 2'5- 4'9 634 1,093 395 1,263 100 80 20 84 122 34 12 267 5'0- N- 208 389 120 776 17 15 2 16 27 3 2 68 7-5- 9'9 60 129 36 219 6 6 5 8 2 17
10-0-12'4 25 58 8 160 2 2 1 3 12'5-14'9 15 28 5 74 I 2 6 15'0-29'9 21 42 10 135 0 30-0--49-9 4 5 1 31 5.1+ 2 2 10 Unspecifie9 2 2 2 2
PALGHAT' All sizes 1,867 2,517 1,548 5,651 284 218 66 325 349 280 21 630 Less than 1 286 279 234 132 100 70 30 84 82 80 6 97 1'0- 2'4 584 704 525 640 109 82 2.7 152. 159 136 9 256 2'4-- 4'9 428 607 337 1,199 45 38 7 50 59 39 2 166 5'0- N 278 424 231 1,291 15 14 1 25 30 IIi 2. 67 7'5- 9'9 93 152 60 554 5 4 1 5 7 I 2 17 10-0-12'4 93 154 83 682 5 5 5 5 5 11 12'5-14'9 11 20 14 118 2 15'0-29'9 85 156 59 869 5 5 4 7 I 13 30-(\-49'9 6 14 I III
50+ 2 5 3 55 Unspe6ncd I 2 1
ALATHUR All sizes 1,849 2,467 1,526 6,610 277 207 70 307 332 256 26 555-Less than 1 270 283 239 81 86 . 62 24 100 97 92 11 17 1'0- 2'4 5ll 578 448 490 103 70 33 136 146 121 5 233 2'5- 4'9 462 627 391 1,306 51 45 6 42 : 49 28 7 178 5-0- 7'4- 251 369 181) 1,235 I9 1.') 4 15 19 II 4Z 7'5- 9-9 115 li9 95 883 3 3 5 6 3 8 10'0-12-4 114 196 8.5 1,013 7 5 2 4 7 8\ 12-5-14'9 38 62 28 375 4 3 I 1 I .3 ' 15'0--29'9 71 143 39 934 3 3 3 6 3 30-0---49'9 11 22 10 213 I 50+ 3 4 I 80 .. 1 - Umpccified 3 4 4 I .2
C9:ITTUR All sizes 1,529 2,249 1,159 6,272 189 112 17 262 31)9 llgg 17 ·455 Less than 1 51 53 40 10 18 12 6 21 22 20 .. 12 1'0- 2'4 230 294 170 213 53 51 2 75 65 62 3 84-2',,- 4-9 320 460 265 .546 49 43 6 80 9\! 64 4 III 5-0- 7"4 270 386 214 821 27 26 I 35 42 26 2 93 7'5- 9'9 127 189 91 481 9 8 I 26 36 14 2. 36 ]0'0-12'4 162 250 133 856 10 10 13 17 3 6 51 12-5-14'9 41 58 32 307 2 .2 .5 5 !) 8 15'0-29'9 244 412 174 1,73,4 18 17 5 6 4 53 30'0--4S'9 63 lu3 26
~ 3 3 1 I 1 6 50+ 19 39 I4 1 Unspecified .2 5 l{) 2
132
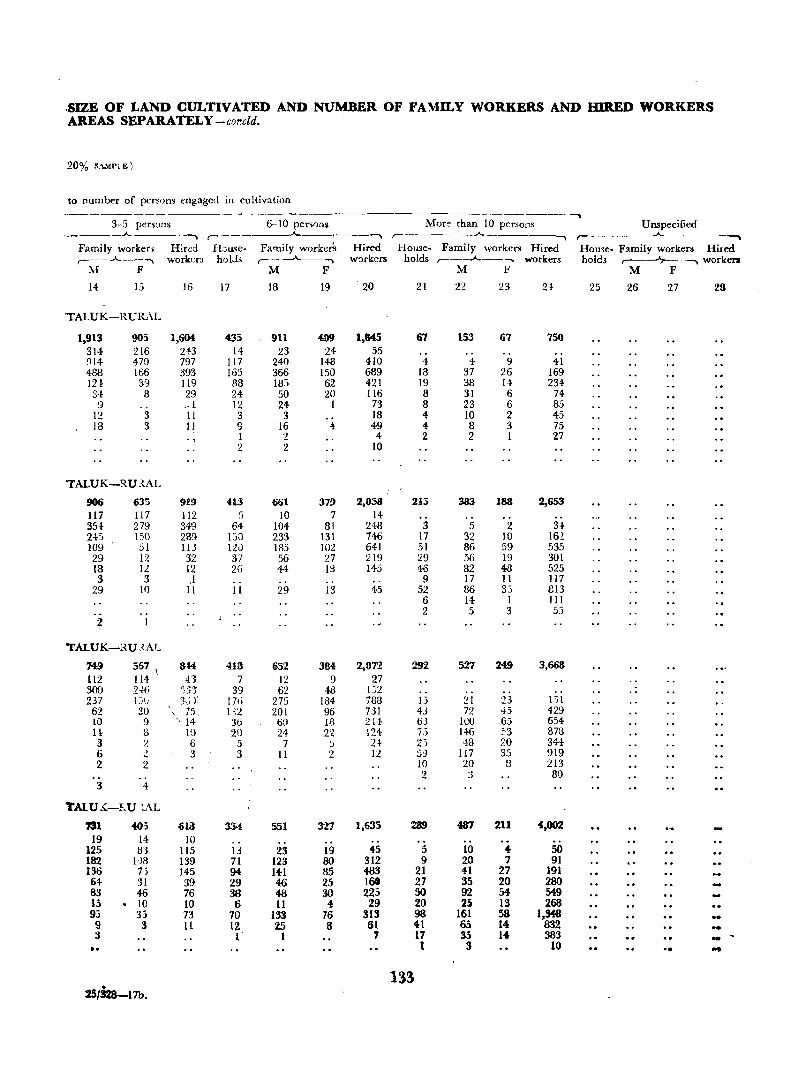
,SIZE OF LAND CULTIVATED AND NUMBER OF FAMILY WORKERS AND IDR.ED WORKERS AREAS SEP ARA TEL Y -cor.cld.
20% S:\MPI E )
to number of pcl'~l)ns engaged in cultivation -------- --~ .......
3-5 pers,-,ns 6-10 persons Mor~ than 10 per30ns Unspecified A. , ,...... ___ ___.A.._ ,--- ...A- -----.... ,......~----,
Family workers Hired H.:;use- Family workerS Hired House- Family workers Hired Home- Family workers Hiled ,---- -_--,,--- ..... workers hol.:!s r-------"--...., workers holds ,--_.A.._-.. wurkers holds r-~worken
M F M F M F M F
14- 15 15 17 18 19 20 21 22 23 24 25 26 27 26
TALUK-RURAL
1,913 905 1,604 435 911 4.09 1,845 67 153 67 750 314 216 243 14 ~3 24 55 .. !114 470 797 117 240 148 410 4- 4- 9 41 438 166 393 165 366 150 689 18 37 26 169 IH 39 119 88 185 62 421 19 38 1-4 234 34 8 29 24 50 20 116 8 31 6 74
:) .. _1 12 24 1 73 8 23 6 85 12 3 11 3 3 18 4 10 2 45 18 3 11 9 16 4 49 4- 8 3 75
. , 1 2 4- 2 2 1 27 2 2 10
'TALUK-RU _{_AL
906 635 919 413 661 37' 2,053 21:) 333 188 2,653 117 117 112 ;; 10 7 14 .. 35t- 279 349 64 104 81 248 3 5 2 3t-U5 150 289 I:;;) 233 131 746 17 32 10 162 109 51 113 12') 185 10::! 641 51 86 59 535 29 12 32 37 56 27 219 29 56 19 301 18 12 12 26 44 IS 145 46 82 48 525 3 3 .1 .. 9 17 11 117
29 10 II II 29 13 45 52 86 33 813 6 14 1 III
.. 2 5 3 5.') 2 I
TALUK-RU .tAL
749 567 \ 314 413 652 384 2,072 %9'2 S27 249 3,668 112 114 4'3 7 12 9 27 300 2-i6 f13') 39 62 48 Li2 .. -.. . . 237 I:;'J 3,_; ~ 170 275 184- 788 13 21 'J' _.) 1~1
62 SO , '75 112 201 96 7:31 43 72 15 429 10 9 " 14- 3D 60 IS 214 63 lCO 65 654-H- 8 10 20 21- 2'2 124 75 146 53 878 3 2 G 5 7 .) 24 ,,-
4) 48 20 344-6 :.! 3 3 11 2 12 59 117 35 919 2 2 10 20 3 213
.. 2 3 80 3 1-
TAl. U ;{-F, 'U ~AL
731 ~i 618 334 551 327 1,635 289 487 211 4.002 19 14 10
125 B'3 115 13 23 19 45 5 10 4 50 182 1,)8 139 71 123 80 312 9 20 7 91 136 Jj 145 91- 14-1 85 483 21 41 27 191 6t- 31 39 29 46 25 168 27 35 20 280 83 46 76 38 48 30 225 50 92 54 549 15 . 10 10 6 11 4 29 20 2S 13 268 93 35 73 70 133 76 313 98 161 58 1,348 -9 3 II 12 25 8 61 41 65 14 832 -:3 1 1 7 17 35 1. 383 -1 3 10 .. ...
133 . 25}328-17b.
B-XID SAMPLE HOUSEHOLDS ENGAGED BOTJIIN CULTIVATION AND HOUSEHOLD INDUSTRY SHOWING SIZE OF LAND CULTIVATED CLASSIFIED BY PRINCIPAL
HOUSEHOLD INDUSTRY IN RURAL AND URBAN AREAS SEPARATELY
Fly-leaf
1. This table shows the distribution of households engaged in both cultivation and household industry by the size of land cultivated. The household industries are classified according to divislons and major groups of Indian Standard Industrial ClassifiC;'.tion (1. S. I. C.). The t;lble is prepared for rural and urban areas of the district.
2. The major groups of household industry having less than 10 per cent of the figures of the respective divisi~ns are not given in th:s table. A mark of asterisk (*) is given on meh divisions and ~the figures of those major groups arc shown in the
appendix to this table.
134
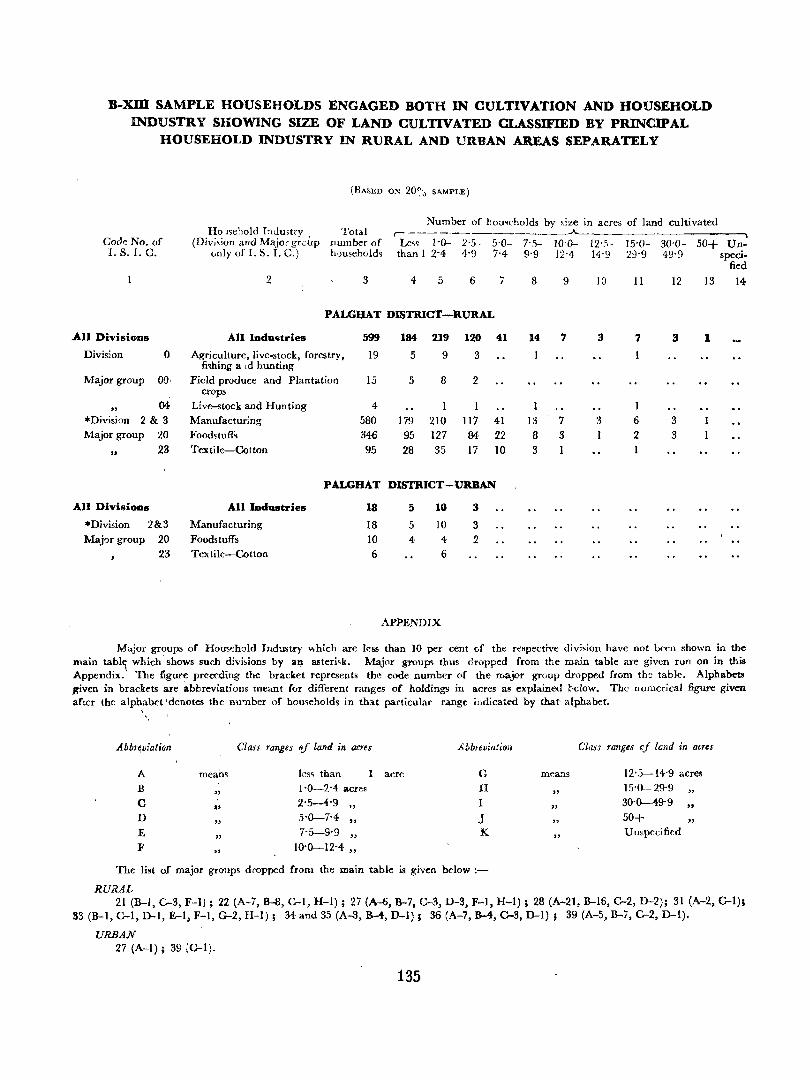
B-XID SAMPLE HOUSEHOLDS ENGAGED BOTH IN CULTIVATION AND HOUSEHOLD INDUSTRY SHOWING SIZE OF LAND CULTIVATED CLASSIFIED BY PRINCIPAL
HOUSEHOLD INDUSTRY IN RURAL AND URBAN AREAS SEPARATELY
(BASED 0:'01 20~:, SAMPLE)
Number of hou"eholds by ,;ze in acres of land cultivated Ho lse~101d I".Jmtrv Total r------ ..A..._
Code No. of (Div;,ion and Majo: g;cup number of Le,~ 1-0- 2-5- 5-0- 7'5- 10-0- 12'5- 15'0- 30-0- 50+ I. S_ I. C, only of I. S, I. C,) households than I 2-4- 4-9 7'4- 9'9 12-4- 14'9 29-9 49'9
2 3 4- 5 6 7 8 9 ]0 11 12 13
PALGHAT DISTRICT-RURAL
.All Divisions An Indu .. tries 599 184 219 120 41 14 7 3 7 3 1 Division 0 Agriculture, live-stock, forestry, 19 5 9 3
fi~hing a ld hunting Major group 00 Field produce and Plantation 15 5 8 2
crops
" 04 Live-stock and Hunting 4-
*Division 2&3 Manufacturing 580 179 210 117 41 13 7 3 6 3 Major group 20 Foodstuffs 346 95 127 84 22 8 3 2 3
" 23 Textile-Cotton 95 28 35 17 10 3
PALGHAT DISTRICT-URBAN
All Divisions All IDdustries 18 5 10 3
"'Division 2&3 Manufacturing 18 5 10 3 Major group 20 Foodstuffs 10 4- 4 2
23 Textile-Cotton 6 6
APPENDIX
-.... Un-
speci-fied
14
Major gnlUps of Household Industry which are kss than 10 per cent of the re.pective division have not been shown in the main table which shows such divi.ions by af). asteri,k. Major groups thus dropped from the main table arc given run on in this Appendix. \ The figure preceding the bracket represepts the code number of the major group dropped from tk table. Alphabets given in brackets are abbreviations meant (or different ranges of holdings in acres as explained below. The numerical figure given "after the alpha~t : denotes the nU"'Ilber of homeholds in that particular range indicated by that alphabet,
\
"
.A bbr~lJiation Class ranges (if land in acres hbbltvialioll
A means Ics, than acre G B
" 1'0-2'4 acres H
C '"
2'5-4'9 "
I
D "
5-0-704-" J
E "
7'5-9'9 "
K
F " 10'0-12'4 "
The Jist of major group" dropped from the main table is given below:
RURAL
Class ranges cf land in acres
mea.-:lS 12'5-14-9 acres
" 15-0-29'9
" 30'0--49-9
" "
50+ " "
Unspecified
21 (B-1, C-3, F-ll ; 22 (A-7, B-8, C-l, H-l) ; 27 (A-S, B-7, C-3, D-3, F-l, H-l) ; 28 (A-21 , B-16, C-2, 0-2); 31 (A-2, C-l); 33 (B-1, C-I, 0-1, E-l, F-l, G-2, H-l); 34 and 35 (A-a, B-4, D-l); 36 (A-7, B-1, C-3, 0-1); 39 (A-5, B-7, C-2, D-l).
URBAN 27 (A-I); 39,:C-l)_
135
B-XIV SAMPLE HOUSEHOLDS ENGAGED ONLY IN HOUSEHOLD INDUSTRY CLASSIFIED BY PRINCJPAL HOUSEHOLD INDUSTRY IN ALL AREAS
Fly-leaf
1. This table prepared in two part, gives the cUlssification of households engaged only in household industry by divisions, major groups and minor groups of I. S. I. C. for total, rural and urban areas of the district. Part A of the tabl~ fhows for each division and major group of 1. S. I. C. the numbC!r of households according to the number e;[ persons engaged in household industry. The number of persons engaged in household industry are grouped under 1 person, 2 persor.s, 3-5 persons, 6-::0 person', and more than 10 persons.
136
2. In table B-XIV Part A n:ajor groups of household industry having l~ss than 10 per cent of the figures of the respective divisio!1. are not given in the table. A mark of asterisk (*) is given on such divisions and the figures of thole major groups are shown in the appendix to thii table.
3. Part B of the table gives the number of households engaged only in hous~hold industry by each minor group of LS.LC.
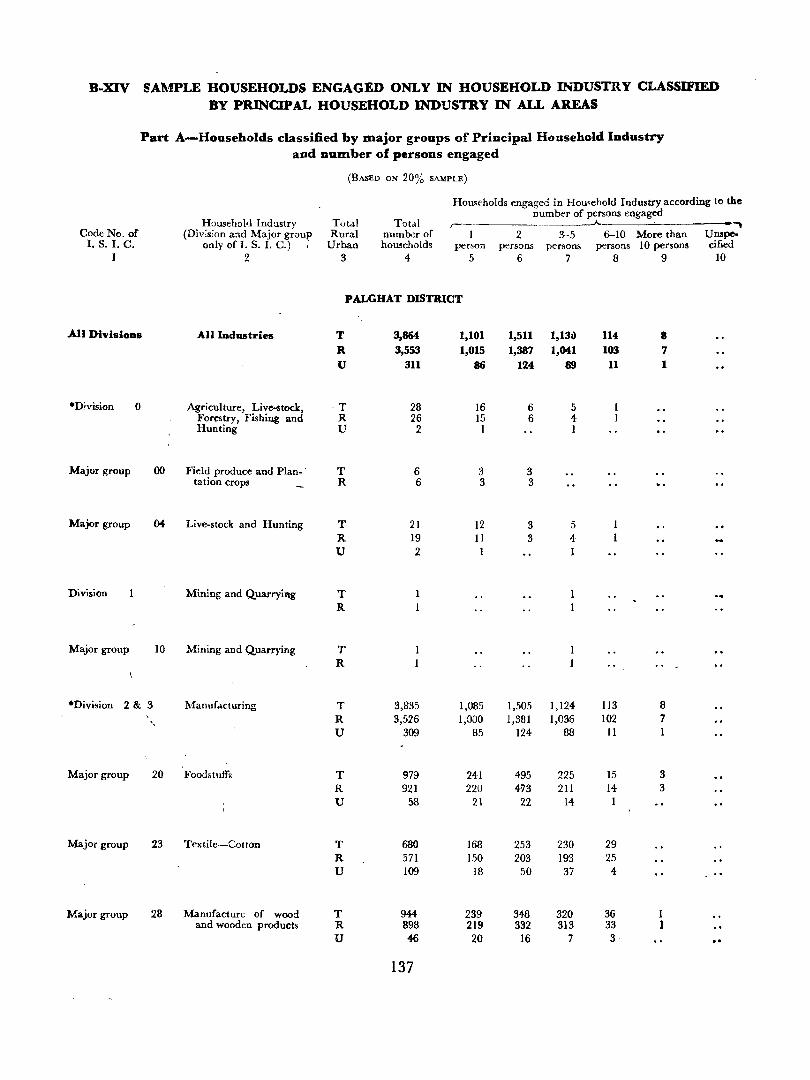
B-XIV SAMPLE HOUSEHOLDS ENGAGED ONLY IN HOUSEHOLD INDUSTRY CLASSmED BY PRINCIPAL HOUSEHOLD INDUSTRY IN ALL AREAS
Part A-Households classified by major groups of Principal Household Industry and nUDlber of persons engaged
(BASED ON 20% SAMPLE)
Households engaged in Homehold Industry according to the
Household Industrv Total number of persons engaged
Total r-----------.-A- --, Code No. of (Division a:ld Major g~ou.., Rural numbi::r of I 2 3-5 6-10 More than Unspe-
I. S. I. C. only of I. S. I. C.) , Urban households person persons persons persons 10 persons cified 1 2 3 4 5 6 7 8 9 10
PALGHAT DISTRICT
All DivisioDS All Iadustries T 3,864 1,101 1,511 1,1311 114 8 R 3,553 1,015 1,387 1,041 103 7 U 311 86 124 89 11 1
·Division 0 Agriculture, Live~tock, -T 28 16 6 5 Forestry, Fishing and R 26 15 6 4 Hunting U 2 1 1
Major group 00 Field produce and Plan- - T 6 3 3 tation crops R 6 3 3
Major group 04- Live-stock and Hunting T 21 12 3 5 R 19 Il 3 4 U 2 1 1
Division Mining and Quarryillg T R
Major group 10 Mining and Quarrying T R
·Division 2 & 3 Manufacturing T 3,835 1,085 1,505 1,124 lJ3 8 R 3,526 1,000 1,381 1,036 102 7 U 309 85 124 88 I1 1
Major group 20 Foodstuffs T 979 241 495 225 15 3 R 921 220 493 211 14- 3 U 58 21 22 14
Major group 23 Textile-Cot ton T 680 168 253 230 29 R 571 150 203 193 25 U 109 18 50 37 4-
Major group 28 Manufacture of wood T 944 239 348 320 36 1 and wooden products R 898 219 332 313 33 1
U 46 20 16 7 3
137
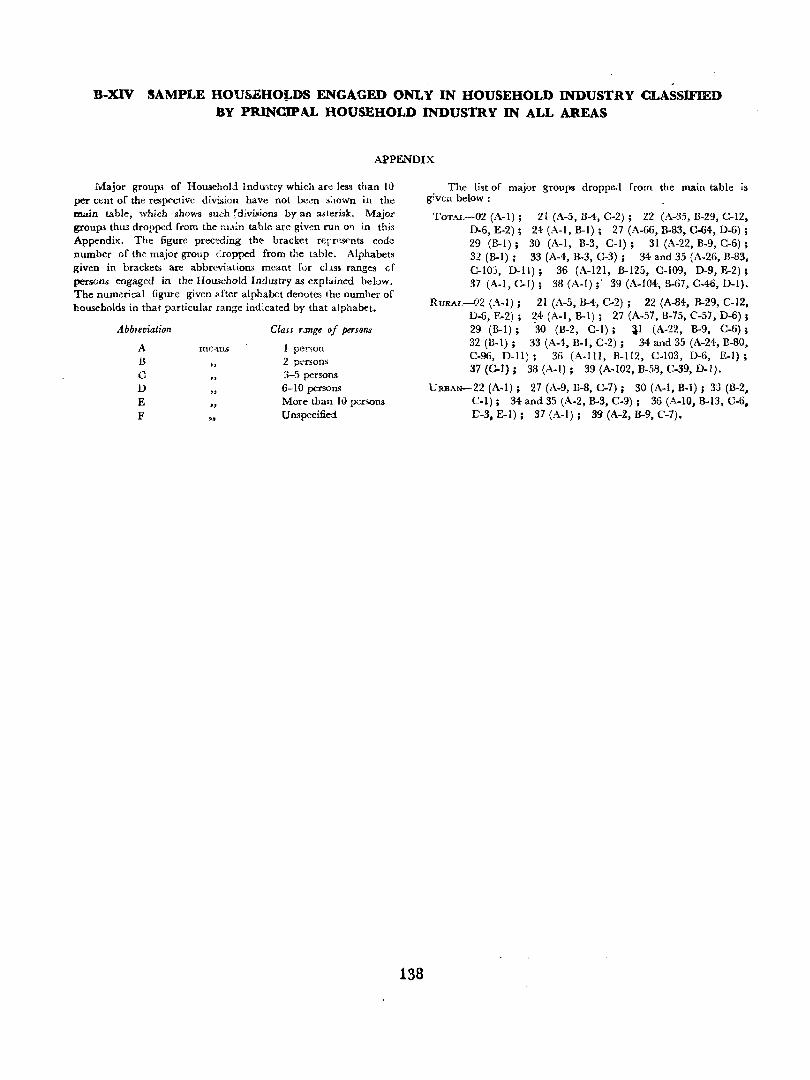
B-XIV SAMPLE HOUSEHOJ.DS ENGAGED ONLY IN HOUSEHOLD INDUSTRY CLASSIFIED BY PRINCIPAL HOUSEHOLD INDUSTRY IN ALL AREAS
APPENDIX
Major group., of Householl Indlntry which ar~ les.~ than 10 per cent of the respective division have not be~n s:lOwn in the main table, which shows such ~divisions by an asterisk. Major groups thus dropped from the nuin table are given run 0'1 in this Appendix. The figure preceding the bracket rerrC'.sents code number of the major group dropped from the table. Alphabets given in brackets are abbreviations meant for chss ranges cf persons engaged in the Household Industry as explained below. The numerical figure given after alphabet denotes the number of households in that particular range indicated by that alphabet.
Abb7eviation Class r:mge of persons
A me'\ns 1 pCrion B
" 2 p~rsons
C 3-5 persons D
" 6-10 persons
E "
More than l\) persons
F •• Unspecified
138
The list of maj<)r groups dropped from the main table is given below:
TOTAL-02 (A-I) ; 21 (A-5, 8-4, C-2); 22 (A-S5, 8-29, C-I2, D.6, E-2); 24 (A-I, B-1); 27 (A-66, B-83, C-64, D-6) ; 29 (B-1); 30 (A-I, B-3, C-I); 31 (A-22, B-9, C-6); 32 (B-1); 33 (A-4, B-3, C-3); 34 and 35 (A-26, B-83, C-lOj, D-ll); 36 (A-121, B-125, C-I09, D-9, E-2) ; 37 (A-I, C-I); 38 (A-I);' 39 (A-I04, 8-67, C-46, D-I).
RURAL--OZ (A.I) ; 21 (A-5, R-i, C-2); 22 (A-84, B-29, C-I2, D-6, E-2); 24 (A-I, B-1); 27 (A-57, B-75, C-57, D-6); 29 (B-1); '30 (B-2, C-l); ~l (A-22, B-9, C-6); 32 (B-1); 33 (A-4, H-l, C-2) ; 34 and 35 (A-24, B-80, C-96, D-ll); 36 (A-Ill, B·1l2, C-103, D-6, E-I); 37 (C-I); 38 (A-I); 39 (A-102, R-58, C·39, D-I).
URllAN-22 (A-I); 27 (A-9, B-8, C-7); 30 (A-I, B-1); 33 (B-2, C.I); 34 and 35 tA-2, B·3, e.9); 36 (A.IO, B.I3, C-6, C·3, E-I); 37 (A-I); 39 (A·2, B-9, C-7).
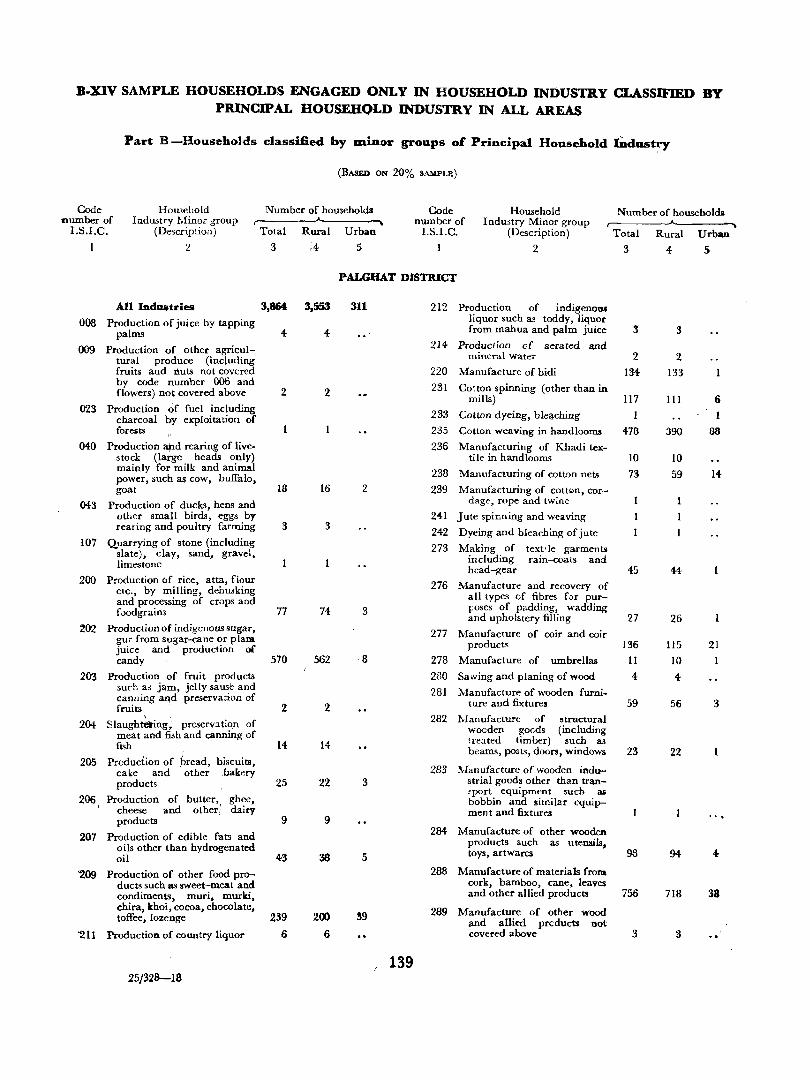
B-XIV SAMPLE HOUSEHOLDS ENGAGED ONLY IN HOUSEHOLD INDUSTRY CLASSIFIED BY PRINCIPAL HOUSEHQLD INDUSTRY IN ALL AREAS
Part B -Households classified by uUnor groups of Principal Household IDdust~
(BASED ON 20% SAMPLE)
Code number of
I.S.I.C.
Hornehold Industry Minor group
(Description)
2
Number of households r-----.-A---~
Total Rural Urban
3 5
Code number of
LS.I.C.
Household Indwtry Minor group
(Description)
2
Number of households
Total Rural Urban
3 4 5
PALGHAT DISTRICT
All md_tries 3,864 3,553 008 Production of juice by tapping
palms 4 4 009 Production of other agricul
tural produce (including fruits and DUts not covered by code number 006 and flowers) not covered above 2 2
023 Production of fuel including charcoal by exploitation of foreats
040 Production apd rearing of livestock (large heads only) mainly for milk and animal power, such as cow, buffalo, goat 18 16
043 Production of ducks, hens and other small birds, eggs by rearing and poultry farming 3 3
107 Quarrying of stone (including slate), clay, sand, gravel. limestone
200 Production of rice, atta, flour etc., by milling, dehwking and processing of crops and f00dgrains 77 74
202 Production of indigenous sugar, gur from sugar-cane or plaID. juice and production of candy 570
203 Production of fruit products such as jam, jelly sause and canning and preservation of fruits I
204 Slaught~ing; preserv:ltio,n of meat and fish and canning of fuh
205
206
207
Production of bread, biscuits, cake and' other ,bakery product~
Production of butter, ghee, cheese and other; dairy products
Production of edible fats and oils other than hydrogenated oil
Production of other food products such as sweet-meat and condiments, muri, murki, chira, khoi, cocoa, chocolate, toffee, lozenge
Production of country liquor
25/328-18
2
14
25
9
43
239
6
562
2
14
22
9
38
200
6
311
2
3
3
5
39
139
212 Production of indigenollS liquor such as toddy, liquor from mahua and palm juice 3
214 Production of aerated and mineral water 2
220 Manufacture of bidi 134
231 Co~ton spinning (other than in mills) 117
233 Cotton dyeing, blel!ching
235 Cotton weaving in hand looms 478
236 Manufacturing of Khadi tex-tile in handlooms 10
238 Manufacturing of cotton nets 73
239 rvfanufacturing of cott.m, cor-dage, rope and twine
241 Jute spinning and weaving
242 Dyeing and bleaching of jute
273 Making of text'le garments including rain-coats and head-gear 45
276 l\ianufacture and recovery of all types cf fibres f,~r purI'oses of padding, wadding and upholstery filling 27
277 Manufacture of coir and coir products 136
278 Manufacture of umbrellas 11
2ilO Sawing and planing of wood
281 Manufacture of wooden furnit ure and fix tures
282 1-Ianufacture of structural wooden goods (including lI·eated timber) such a.'!
beams, posts, doors, windows
283 l\[anufacturc of wooden ind_ strial goods other than tran'port equipment such ali
bobbin and similar equipment and fixtures
284 Manufacture of other wooden products such as u teDSils, toys, artwares
288 Manufacture of materials froID. cork, bamboo, cane, leaves and other allied products
289 Manufacture of other wood and al1i€d prcducta not covered above
4
59
23
98
756
3
3
2
133
III
390
10
59
44
26
115
10
4
56
22
94
718
3
6
88
21
1
3
...
38
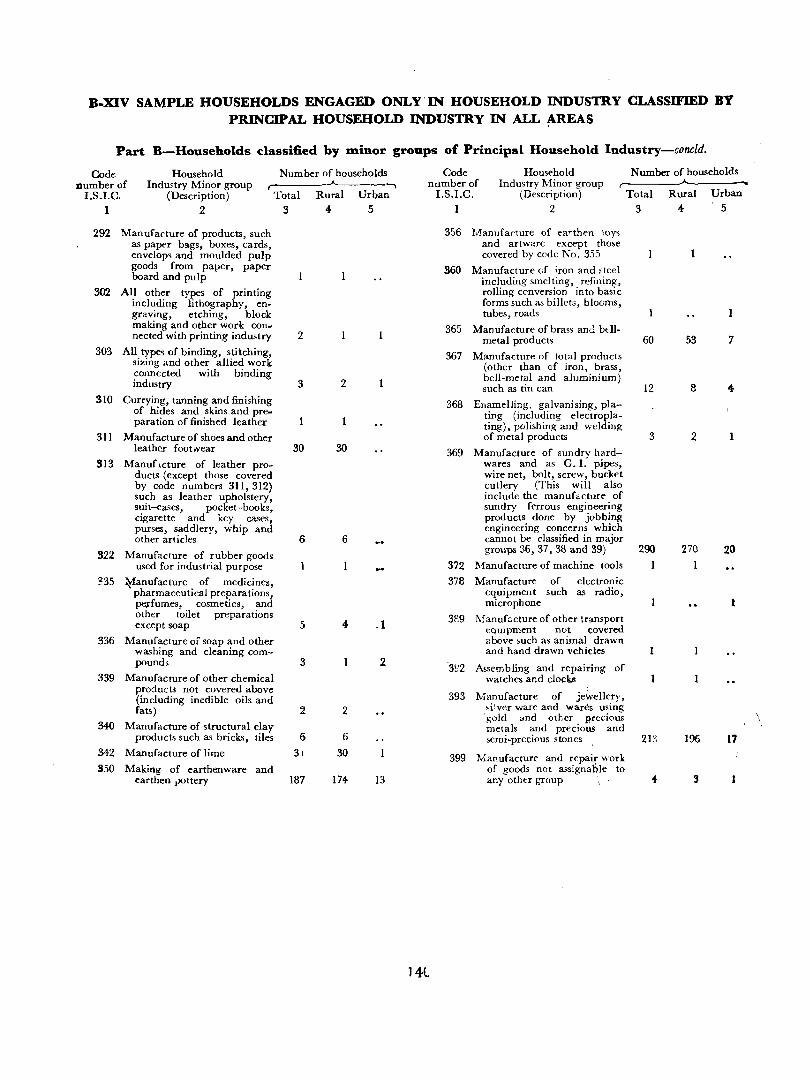
B-XIV SAMPLE HOUSEHOLDS ENGAGED ONLY'IN HOUSEHOLD INDUSTRY CLASSIFIED BY PRINCIPAL HOUSEHOLD INDUSTRY IN ALL ~REAS
Part B-Households classified by Dlinor groups of Principal Household Industry-concld.
Code Dumber of
I.S.I.C.
Household Industry Minor group
(Description)
Number of households r-______ A-_____ ~
1 2 Total
3
292 Manufacture of products, such as paper bags, boxes, cards, envelops and moulded pulp goods from paper, paper board and pulp
302 All other types of printing including lithography, engraving, etching, block making and other work connected with printing industry
303 All types of binding, stitching, sizing and other allied work: connected with binding industry
310 Currying, tanning and finishing of hides and skins and preparation of finished leather
311 Manufacture of shoes and other leather footwear
313 Manuf;cture of leather products (except those covered by code numbers 311,312) such as leather upholstery, suit-cases, pocket-books, cigarette and key cases, purses, saddlery, whip and other articles
322 Manufacture of rubber goods used for industrial purpose
~35 ¥anufacture of medicines, pharmaceutical preparations, peyfumes, cosmetics, and other toilet preparations except soap
336 Manufacture of soap and other washing and cleaning compound,
339 Manufacture of other chemical products not covered above (including inedible oils and fats)
34() Manufacture of structural clay products such as bricks, tiles
2
3
30
6
5
3
2
6
342 Manufacture of lime 31
350 Making of earthenware and earthen pottery 187
Rural Urban
4 5
2
30
6
4
2
6
30
174
_1
2
13
Code number of
I.S.I.C.
Hous.,.hold Industry Minor group
(Description)
Number of households
14L
I 2
356 M:anufacture of earth.,.n toys and artware except those covered by code No. 355
360 Manufacture of iron and ,teel including smelting, refining, rolling conversion into basic forms such as billets, blooms, tubes, roads
365 Manufacture of brass and bdlmetal products
367 Manufacture of total products (other than of iron, brass, bell-metal and aluminium) such as tin can
368 Enamelling, galvanising, plating (including electroplating), polishing and welding
Total
3
60
12
of metal products 3
369 Manufacture of sundry hardwares and as G. I. pipes, wire net, bolt, screw, bucket cutlery (This will also include the manuf"cture of sundry ferrous engineering products done by jobbing engineering concerns which cannot be classified in major groups 36, 37, 38 and 39) 290
372 Manufacture of machine tools
378 Manufacture of electronic equipment such as radio, microphone
389 Manuf .. cture of other transport toquipment not covered above ;uch as animal drawn and hand drawn vehicles
3n Assembling and repairing of watches and clocks
393 Manufacture of jewellery, "i~ver ware and wares using gold and other precious metals and precious and semi-precious stones 213
399 Manufacture and repair work of goods not assignable to any other group .
Rural
4
53
8
2
270
1
196
3
Urban
5
7
20
17
\
B-XV SAMPLE HOUSEHOLDS ENGAGED BOTH IN CULTIVATION AND HOUSEHOLD INDUSTRY CLASSIFIED BY SIZE OF LAND
IN RURAL AND URBAN AREAS SEPARATELY
1. This table shows the classification of housebolds engaged in both cultivation and: household industry by the size of land cultivated and the n~mber of persons engaged in household industry. In the
,case of households where more than 1 person is ,engaged in household industry the number of family
:25/328-18 b
workers and hired workers has been given separately. The table is prepared for the rural areas of the district and taluks ind the urban areas of, the district.
141
2. This table sho\\os the relationship between the scale of household industry and the scale of cultivation.
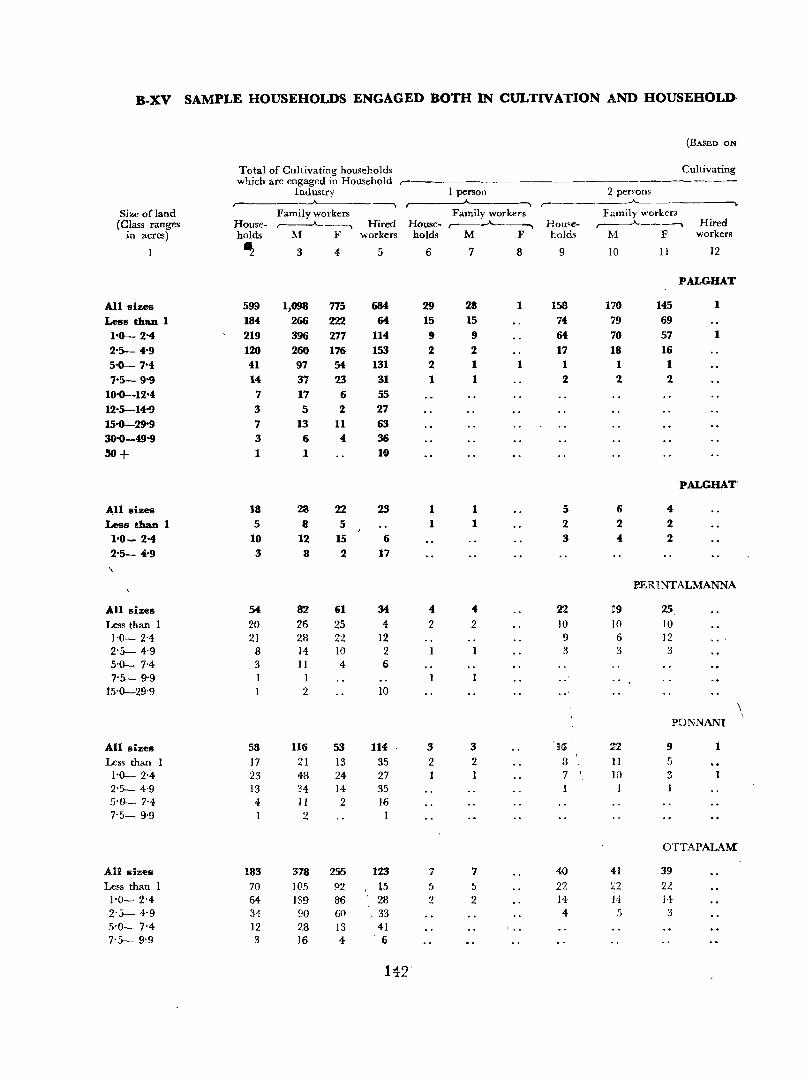
B-XV SAMPLE HOUSEHOLDS ENGAGED BOTH IN CULTIVATION AND HOUSEHOLD
(BASED ON
Total of Cultivating households Cultivating which are engaged in Household r- ----
Industry 1 person 2 permns r-- ----- ----, r- .A.
Size of land Family workers Family workers Family workers (Class ranges House- ..----"----.. Hired House- ,.---~ Hou,e- r-----"--------. Hired
in acres) holds M F workers holds M F holds M F workers
~ 3 4 5 6 7 8 9 10 11 12
PALGHAT
All sizes 599 1,098 775 684 29 28 1 158 170 145 1
Less than 1 184 266 222 64 15 15 74 79 69
1'0.- 2'4 219 396 277 114 9 9 64 70 57 1
2'5-- 4'9 120 260 176 153 2 2 17 18 16
5'0.- 7'4 41 97 54 131 2 1 1 1 1 1
7'5-- 9'9 14 37 23 31 1 1 2 2 2 10'0.-12'4 7 17 6 55
12'5--14'9 3 5 2 27 15-0-29'9 7 13 11 63 30'0-49-9 3 6 4 36
50+ 1 1 10
PALGHAT
AU sizes 18 23 22 23 1 1 5 6 4
Less than 1 5 8 5 1 1 2 2 2 1'0- 2'4 10 12 15 6 3 4 2
2'5- 4'9 3 8 2 17
\
P£RINTALMANNA
All sizes 54 82 61 34 4 4 22 19 25 Less than 1 20 26 25 4 2 2 10 10 10 1·0- 2·4 21 28 22 12 9 6 12 2·5- 4·9 8 14 10 2 "I :1 3 :1 5·0- 7·4 3 II 4 6 7·5- 9·9 I
15·0-29·9 2 IO
\ PONNANI
All sizes 58 116 53 U4 3 3 16 n 9 1 Less than 1 17 21 13 35 2 2 8 11 :. 1'0- 2'4 23 48 24 27 1 7
, l() 3 2·5- 4·9 13 34 14 35 5·0.- 7·4 4 11 2 16 7·5- 9·9 2
OTTAPALAM
AU sizes 183 378 255 123 7 7 40 41 39 Less than 1 70 105 !'2 15 5 5 22 :::2 22 1·0- 2'4 64 139 86 28 2 2 14 14 14 2·5- 4·9 31 90
, 60 .33 4 :. 3
5·0- 7'4 12 28 13 41 7·fr-- 9'9 3 16 4 "6
142"
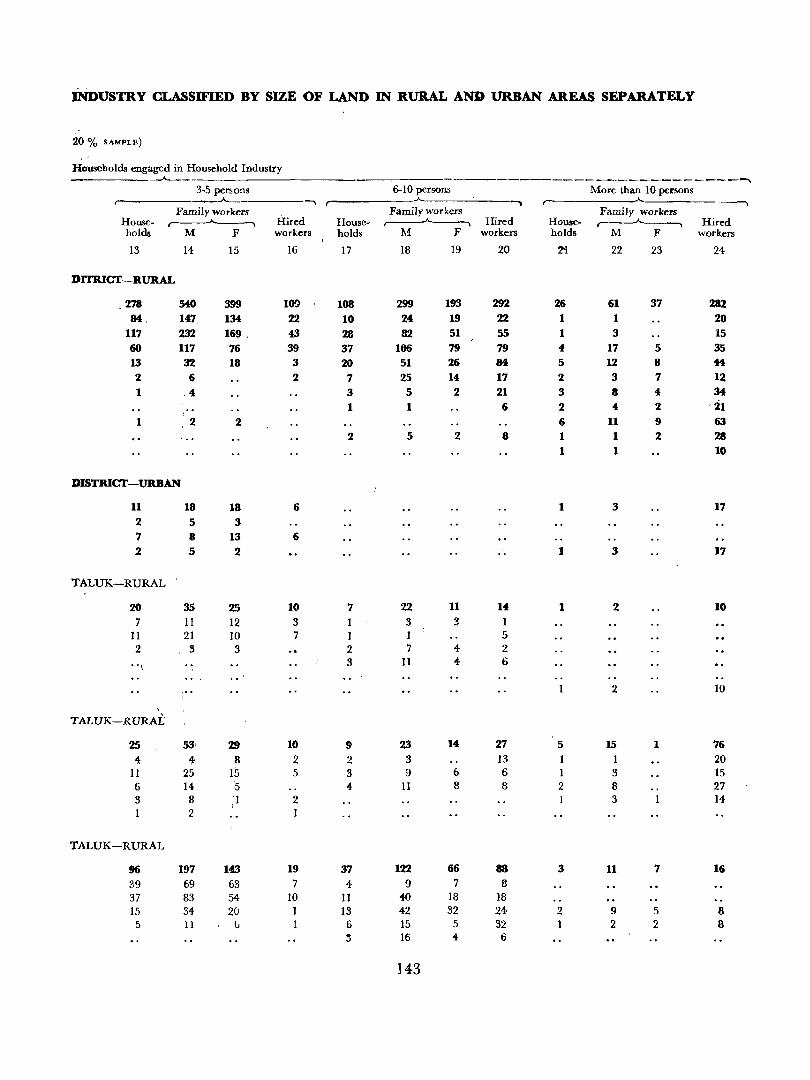
iNDUSTRY CLASSIFmD BY SIZE OF LAND IN RURAL AND URBAN AREAS SEPARATELY
20 % SAMPLE)
Households engaged in Household Industry -"--- ---.._
3-5 persons 6-10 persons More than 10 persons _.A._ --.
Family worker~ Hired
Family workers Family workers House- ,----'-----.., House- ,-------"------, Hired House- ,--____..______, Hired holds M F workers holds 1\1: F workers holds M F workers
13 14 15 16 17 18 19 20 ~ 22 23 24
DlTRICT-RURAL
278 540 399 lOS 108 299 193 292 26 61 37 282 M. 147. 134 22 10 24 19 22 1 1 20
117 232 169 . 43 28 82 51 55 1 3 15 60 117 76 39 37 166 79 79 4 17 5 35 13 32 18 3 20 51 26 84 5 12 8 44 2 6 2 7 25 14 17 2 3 7 12 1 .4 3 5 2 21 3 8 4 34
1 1 6 2 4 2 -21 :
1 2 2 6 11 9 63 2 5 2 8 1 1 2 28
1 1 10
DISTRICT-URBAN
11 18 18 6 1 3 17 2 5 3 7 8 13 6 2 5 2 I 3 ]7
TALUK-RURAL
20 35 25 10 7 22 11 14 1 2 10 7 11 12 3 1 3 3
11 21 10 7 1 1 5 2 3 3 2 7 4- 2 .. \ .. 3 11 4 6
.. ', .. 2 10
TALUK-RURAI:
25 53, 29 10 9 23 14 27 5 15 1 76 4 t 8 2 2 3 13 20
11 25 15 5 3 9 6 6 1 3 15 6 14 5 4 11 8 8 2 8 27 3 8 ;1 2 3 14 1 2 1
TALUK-RURAL
96 197 143 19 37 122 66 88 3 11 7 16 39 69 63 7 4 9 7 8 37 83 54 10 11 40 18 18 15 34 20 I 13 42 32 24- 2 9 5 8 5 11 lJ 6 15 5 32 2 2 8
~ 16 4- 6
J43
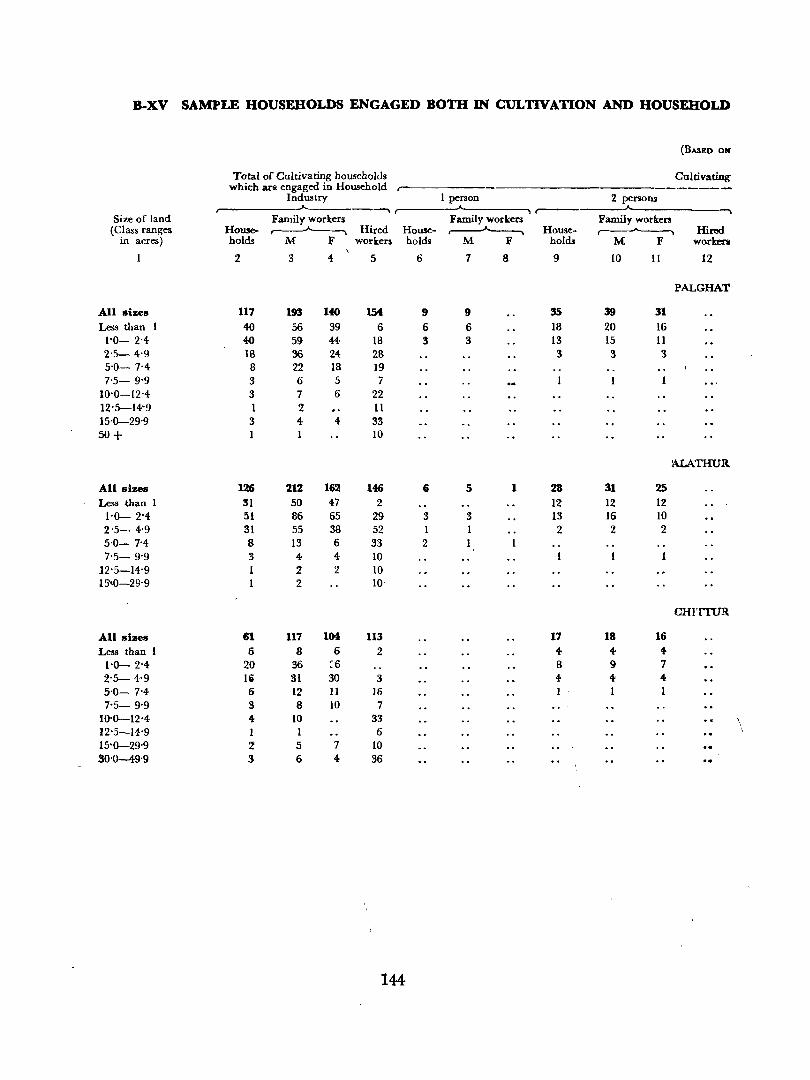
B-XV SAMI'LE HOUSEHOLDS ENGAGED BOTH IN CULTIVATION AND HOUSEHOLD
(BAllED ON
Total of Cultivating households Cultivating which arli engaged in Household
Industry I person 2 persons ~
Size of land Family workers Family workers Family worken (Class ranges House-~ Hired House-~ House- ~ Hired
in acres) holds M F workers holds M F holds M F work.en
2 3 4 5 6 1 8 9 10 II 12
PALGHAT
All sizes 117 193 140 1M 9 9 35 39 31 Less than I 40 56 39 6 6 6 18 20 16 1'0- 2"4 40 59 44- 18 3 3 13 15 11 2'5- 4-9 18 36 24 28 3 3 3 5-0- 7-4 8 22 18 19 7'5- 9'9 3 6 5 7
10-0-12-4 3 7 6 22 12-5-14'9 I 2 11 15-0-29'9 3 4- 4 33 50+ 10
'ALATHUR.
All sizes 126 212 162 1~ G 5 1 28 31 2S Less than 1 31 50 47 2 12 12 12
1-0- 2'4- 51 86 65 29 3 3 13 16 10 2'5- 4-9 31 55 38 52 1 1 2 2 2 5'0- 7-4 8 13 6 33 2 1 7-5- 9-9 3 4: 4 10
12-5-14-9 2 2 10 15'<0-29-9 2 10
CHI'ITUR
All sizes 61 117 104 113 17 18 16 Less than 1 6 8 6 2 4- 4- ..
1-0- 2-4- 20 36 ~6 8 9 7 2-5- 4-9 Ii Sl 30 3 4- 4.- 4-5'0- ]'4, 6 12 11 16 1-5- 9-9 3 8 10 1
10-0-12-4 4- 10 33 \ 12-5-14-9 1 1 6 \
15'0-29-9 2 5 7 10 30-0-49-9 3 6 4- 36
144
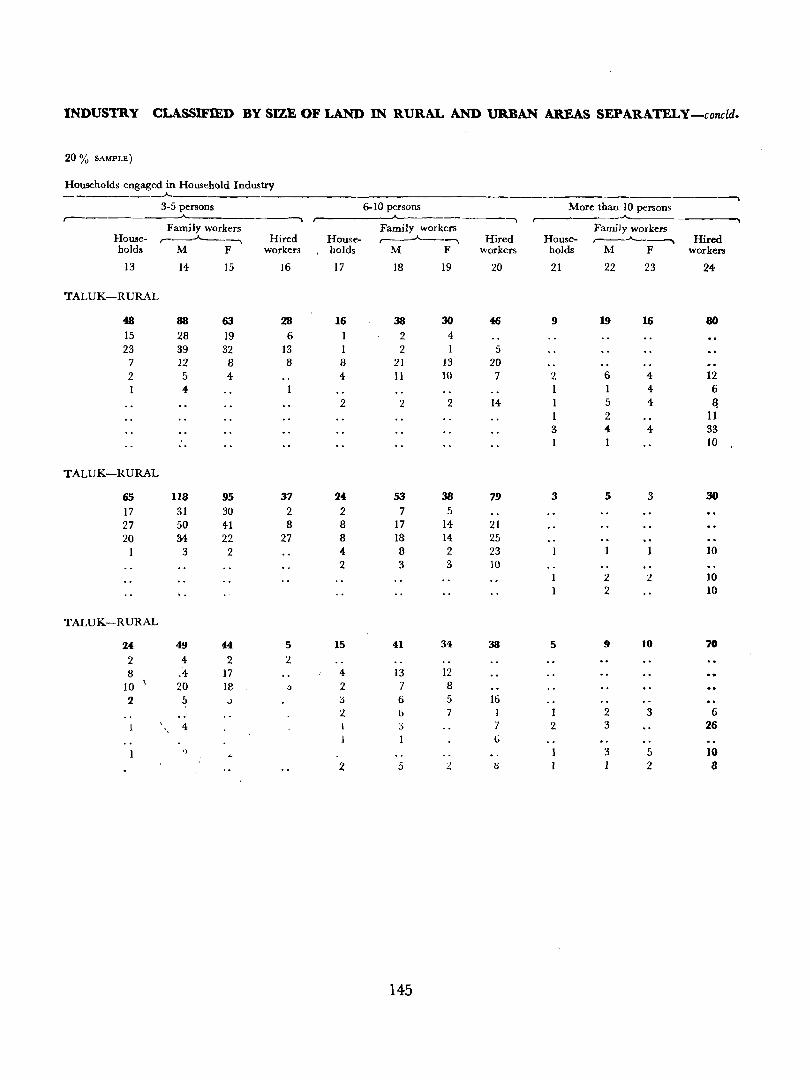
INDUSTRY CLASSlFmD BY SIZE OF LAND IN RURAL AND URBAN AREAS SEPARATELY-concld.
20 % SAMPLE)
Households engaged in Household Industry _________ .A.
3-5 persons 6-10 persons More than IO persons ,--
.A---____ -,
Family workers Family workers Family workers House- r--"""'-----, Hired House- ~--.. Hired House- ,-.-.A---...... Hired holds M F workers , holds 1\1 F workers holds M F workers
13 14 15 16 17 18 19 20 21 22 23 24
TALUK-RURAL
48 88 63 28 16 38 30 46 9 19 16 80 15 28 19 6 2 4 23 39 32 13 2 5
7 12 8 8 8 21 13 20 2 5 4 4 11 10 7 2 6 4 12
4- 1 4- 6 2 2 2 14 5 4 ~
1 2 11 3 4- 4 33
10
TALUK-RURAL
65 118 95 37 24 53 38 79 3 5 3 30
17 31 30 2 2 7 5 27 50 41 8 8 17 14 21 20 34 22 27 8 18 14 25
3 2 4 8 2 23 10 2 3 3 10
2 2 10 2 10
TALUK-RURAL
24 49 44 5 15 41 34 38 5 9 10 70
2 4 2 2 8 .'4 17 4 13 12
10 20 18 .:l 2 7 8 2 5 .) ::> 6 5 16
.. 2 6 7 1 I 2 3 6 4! j 7 2 3 26
1 t)
') "- 3 5 10
2 5 .) (j 2 8 ""
145

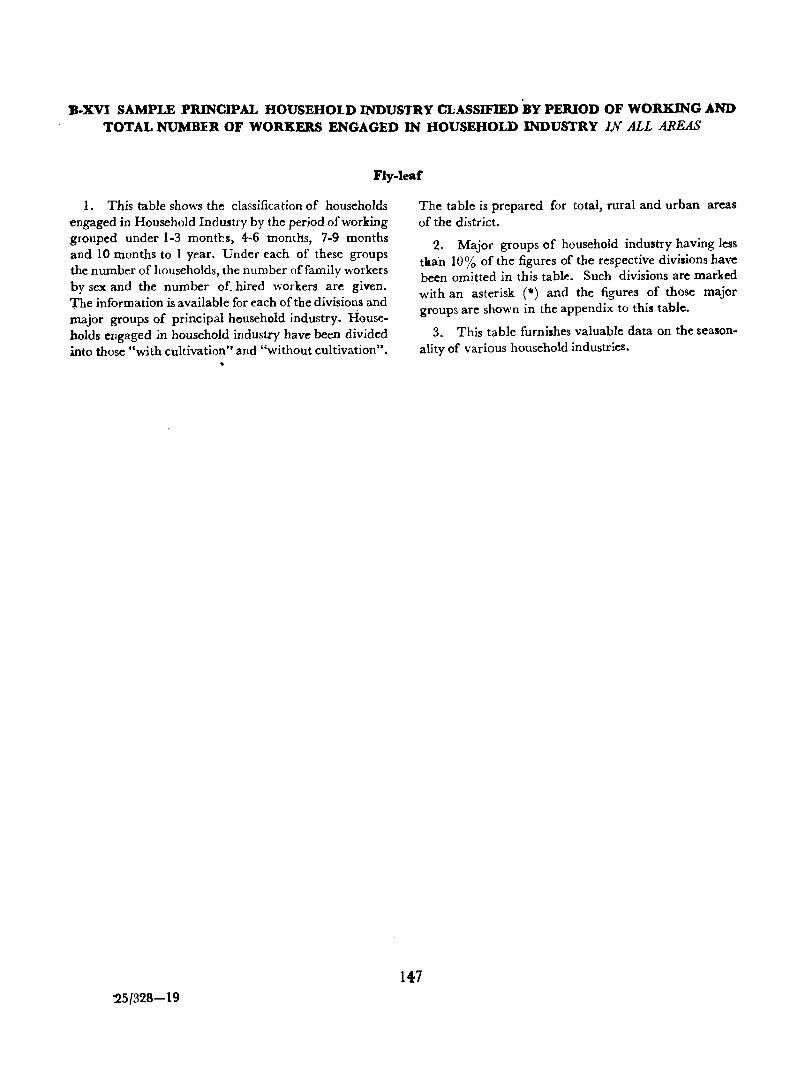
lI-XVI SAMPLE PRINCIPAL HOUSEHOLD INDUSTRY CLASSIFlED BY PERIOD OF WORKING AND TOTAL NUMBER OF WORKERS ENGAGED IN HOUSEHOLD INDUSTRY IN ALL AREAS
Fly-leaf
1. This table shows the classification of households engaged in Household Industry by the period of working grouped under 1-3 mont}:s, 4-6 months, 7-9 months and 10 months to I year. Under each of these groups the number of households, the num ber of family workers by sex and the number of. hired workers are given. The information is available for each of the divisions and major groups of principal h(!)usehold industry. Households engaged in household industry have been divided into those "with cultivation" and "without cultivation".
'25/328-19
The table is prepared for total, rural and urban areas of the district.
2. Major groups of household industry having less tltan 10% of the figures of the respective divisions have been omitted in this tabll'!. Such divisions are marked with an asterisk (*) and the figures of those major groups are shown in the appendix to this table.
3. This table furnishes valuable data on the seasonalityof various household industries.
147
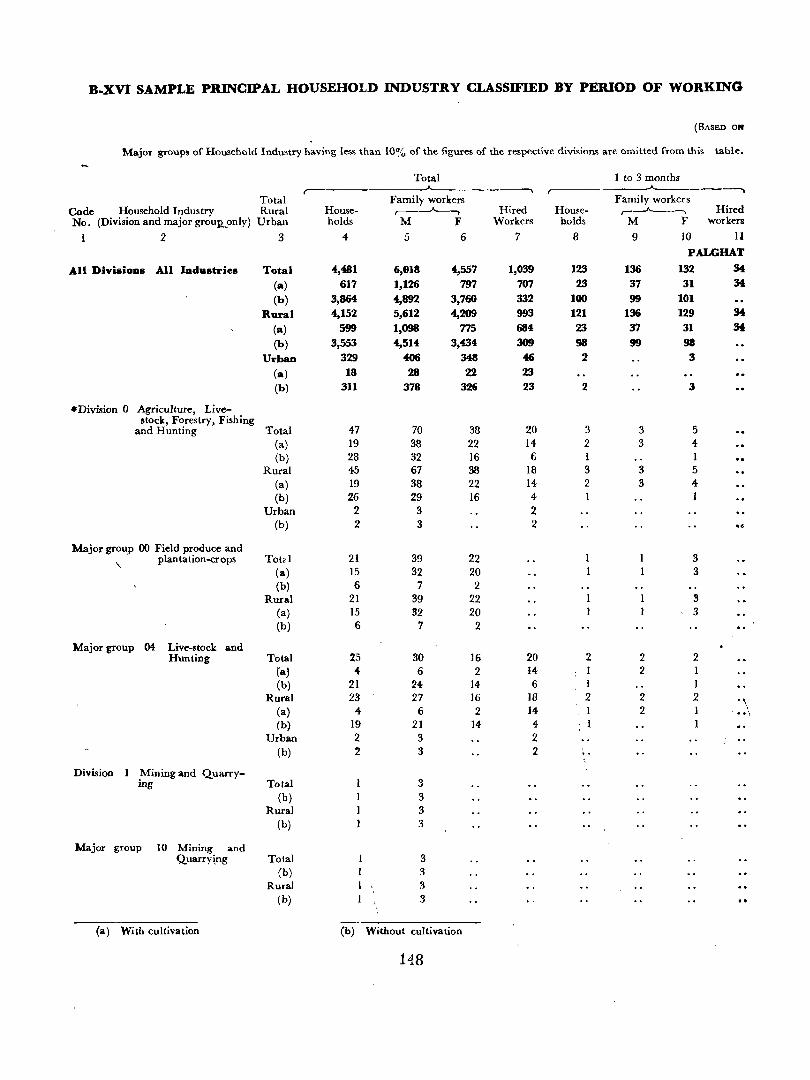
B-XVI SAMPLE PRINCIPAL HOUSEHOLD INDUSTRY CLASSIFIED BY PERIOD OF WORKING
(BASED Olt
Major groups of Household Industry having less than 10% of the figures of the respective divisions are omitted from this table.
Total 1 to 3 months r-
--..-A--____ ----. ____.A__ _____ ~
Total Family workers Family workers Code Household Industry Rural House- ~-, Hired House- r-~ Hired No. (Division and major groun.pnly) Urban holds M F Workers holds M F workers
1 2 3 4 5 6 7 8 9 10 11
PALGHAT
All DiviaiOD8 All Industries Total 4,481 6,018 4,557 1,039 123 136 132 34 (a) 617 1,126 797 707 23 37 31 34
(b) 3,864 4,892 3,760 332 100 99 101
Rural 4,152 5,612 4,209 993 121 136 129 34
(a) 599 1,098 775 684 23 37 31 34 (b) 3,553 4,514 3,434 309 98 99 98
Urban 329 406 348 46 2 3
(a) 18 28 22 23 (b) 311 378 326 23 2 3
-Division 0 Agriculture, Live-stock, Forestry, Fishing
and Hunting Total 47 70 38 20 3 3 5 (a) 19 38 22 14 2 3 4 (b) 28 32 16 6 1 1
Rural 45 67 38 18 3 3 5 (a) 19 38 22 14 2 3 4 (b) 26 29 16 4- 1
Urban 2 3 2 (b) 2 3 2
Major group 00 Field produce and
" plantation-crops Total 21 39 22 3
(a) 15 32 20 3 (b) 6 7 2
Rural 21 39 22 3 (a) 15 32 20 3 (b) 6 7 2
Major group 04- Live-stock and Hunting Total 25 30 16 20 2 2 2
(II' -4: 6 2 14 2 1 (b) 21 24- 14 6 1
Rural 23 27 16 18 2 2 2 . , (a) 4- 6 2 14 2 1 .. \ (b) 19 21 14 4- : 1
Urban 2 3 2 (b) 2 3 2
Division 1 .Mining and Quarry-mg Total 3
(b) 3 Rural 3
(b) 3
Major group IO Mining and Quarry~g Tala! 3
(b) 3 Rural 3
(b) 3
(a) With cultivation (b) Without cultivation
148
AND TOTAL NUMBER OF WORKERS ENGAGED IN HOUSEHOLD INDUSTRY IN ALL AREAS
20% SAMPLE)
Such Divisions are marked with an asterisk ("*) on their left and the figures of the major groups are given in the appendix.
4 to 6 months 7 to 9 months 10 months to 1 year Unspecified .,-- -"-- r-----"-- -, ...__
Family workers Family workers Family workers Family workers House-~ Hired Hou~e-
....----A. _______ Hired Home- ,---~ Hired House- r----"----. Hired
holds M F workers holds M F workers holds M F workers holds M F workers
12 13 14 15 16 11 18 19 20 21 22 23 24 25 26 27 DISTRICT
1,054 1,411 1,209 300 235 298 ' ZM 131 2,960 4,039 2,862 554 109 134 100 20 306 591 413 286 43 86 50 33 232 391 278 339 13 21 25 15 748 820 796 14 192 212 204 . 98 2,728 3.648 2.584 215 96 113 75 5
1,024 1,376 1,176 299 217 286 224 131 2,682 3,681 2,581 511 108 133 99 18 300 581 tOe; 285 f2 85 49 33 221 374 264 317 13 21 25 15 724 795 7'70 14 175 201 175 98 2,461 3,307 2,317 194 95 112 74 3
30 35 83 1 18 12 30 278 358 281 43 1 1 1 2 6 10 ·7 I 1 I 1 11 17 14 22
24 25 .26 17 11 29 267 341 267 21 1 1 1 2
19 33 17 4 2 23 26 14- 18 4 2 13 27 15 4- 2 3 4- 1 14 6 6 2 20 22 13 4- 1 4- 2
19 33 17 4- 2 21 23 14- 16 1 4- 2 13 27 15 4 2 3 4 1 14 6 6 2 18 19 13 2 4- 2
2 3 2 2 3 2
16 31 16 4 2 3 3 13 27 15 4- 2 3 4- 1 3 3
16 31 16 4 2 3 3 13 27 15 4- 2 3 4 3 3
2 1 . ." 20 23 13 18 4- 2 \ 3 4 1 14-
2 17 19 12 4- 4 2 2 ", I 18 20 13 16 4- 2
... 3 4 1 14-2 . 1 15 16 12 2 4 :l
2 3 2 .. 2 3 2
3 3 3 3
1 3 I 3 1 3 1 3
25/328-19b. 149
B-XVI SAMPLE PRINCIPAL HOUSEHOLD INDUSTRY CLASSIFIED BY PERIOD OF WORKING
(BASED ON
Major groups of Household Industry having less than 10% of the figures of Ithe respective divisions are omitted from this table.
Total 1 to 3 months
----, _____ -A--__ -------.
Total Family workers Family workers Code Household Industry Rural House- ~----, Hired House- ,----A-"",\ Hired
No. (Dlvision and major group only) Urban holds M F workers holds M F workers
1 2 3 4 5 6 7 8 9 10 11
*Division 2 & 3 Manufacturing Total 4,433 5,945 4,519 1,019 120 133 127 3f. (a) 598 1,088 775 693 21 34 27 34 (b) 3,835 4,857 3,744 326 99 99 100
Rural 4,106 5,542 4,171 975 118 133 124 3f. (a) 580 1,060 753 670 21 34 27 3f. (b) 3,526 4,482 3,418 305 97 99 97
Urban 327 403 343 44 2 3 (a) 18 28 22 23 (b) 309 315 326 21 2 3
Major group 20 Foodstuffs Total 1,335 1,707 1,489 500 31 42 35 18 (a) 356 705 470 383 15 26 20 IS. (b) 979 1,002 1,019 I17 16 16 15
Rural 1,267 1,636 1,415 496 31 42 35 18 (a) 346 686 461 380 15 26 20 18 (b) 921 950 954 116 16 16 15
Urban 68 71 74 4 (a) 10 19 9 3 (b) 58 52 65
Major group 23 Textile -CottOIl Total 781 915 1,038 125 3 6 (a) 101 122 172 97 (b) 680 793 866 28 3 6
Rural 666 777 890 113 3 6 (a) 95 117 159 94 (b) 571 660 731 19 3 6
Urban 115 138 148 12 (a) 6 5 13 3 (b) 109 133 135 9
Major group 28 Manufacture of wood and wooden products Total 985 1,275 1,128 24 60 62 64-
(a) 41 63 49 6 '3 4 3 (b) 944 1,212 1,079 18 57 58 61
Rural 919 1,229 1,081 22 59 62 63 \,
(a) 41 63 49 6 3 4 .3 " .. (b) 898 1,166 1,032 16 56 58 60 .. ,
Urban 46 '46 47 2 1 1 , (b) 46 46 '17 2 1 ..
_-_----(a) With cultivation (b) Without cultivatiOli
EO
AND TOTAL NUMBER OF WORKERS ENGAGED IN HOUSEHOLD INDUSTRY IN ALL AItEAS -(coneld.)
20%IIAMPu)
Such Divisions are marked with an asterisk (*) on their left and the figures of the major groups are given in the appendix
4 to 6 months 7 to 9 months 10 months to I year Unspecified ~ ,--_--A-- ---., ,---------A---~
Family workers Family workers Family workers Family workers House- ,..---"-.----, Hired HGuse- r---"'---.. Hired House- r----'------. Hired House-~ Hired holds M F workers holds M F workers holds M F workers holds M F workers 12 13 14- 15 16 17 18 19 20 21 22 23 24 25 26 27
1,035 1,378 1,192 300 234 294 252 131 2,936 4,010 2,848 536 108 130 100 18 293 564 398 286 42 82 48 33 229 387 277 325 13 21 25 15 742 814 794 14 192 212 204 98 2,707 3,623 2,571 211 95 109 75 3
1,005 1,343 1,159 299 216 282 222 131 2,660 3,655 2,567 495 107 129 99 16 287 554 391 285 41 81 47 33 218 370 263 303 13 21 25 15 718 789 768 14 175 201 175 98 2,442 3,285 2,304 192 94 108 74 1 80 35 33 18 12 30 276 355 281 41 1 2 6 10 7 1 1 1 11 17 14 22
24 25 26 17 11 29 265 338 267 19 2
760 1,073 8"9 249 105 164 89 99 412 399 459 130 27 29 37 4 263 521 364 237 25 54 27 25 48 94 44 100 5 10 15 3 497 552 505 12 80 110 62 74 364 305 415 30 22 19 22 1 743 1,048 849 248 101 158 85 99 365 359 409 127 27 29 37 4 257 511 3~7 236 25 54 27 25 44 85 42 98 5 10 15 3 486 537 492 12 76 104 53 74 321 274 367 29 22 19 22 1
17 25 20 1 4 6 4 47 40 50 3 6 10 7 4 9 2 2
11 15 13 4 6 4 43 31 48
30 10 52 6 26 13 46 697 872 906 110 25 20 28 9 6 4 10 4 6 9 7 85 106 149 86 4 3 6 7
24 6 42 2 20 4 39 612 766 757 24 21 17 22 2 29 10 51 6 21 10 37 589 738 769 100 24 19 27 7 6 4 10 4 5 8 6 80 102 137 83 4 3 6 7
23 6 Al 2 16 2 31 509 636 632 17 20 16 21 1 5 3 9 lOB 134 137 10 1 1 1 2
1 1 1 5 4 12 3 1 4 2 8 103 130 125 7 2
142 173, 158 35 33 ' 51 722 971 831 24 26 36 24 6 7 7 2 3 2 28 44 33 6 2 5 4
136 166 151 33 30 49 694 927 798 18 24 31 20 1:~6 169 153 34 31 49 684 931 792 22 26 36 24
6 7 '. 7 2 3 2 28 44 33 6 2 5 .. 130 162 146 32 28 47 656 887 759 16 24 31 20
6 4 5 2 2 38 40 39 2 .. b 4 5, 2 2 38 40 39 2
- 151
B-XVI SAMPLE PRJNCIPAL HOUSEHOLD INDUSTRY CLASSIFIED BY PERIOD OF WORKING AND TOTAL NUMBER OF WORKERS ENGAGED IN HOUSEHOLD INDUSTRY IN ALL AREAS
APPENDIX
Major groups of Household Industry which are less than 10% of the respective divisirJns have not been shown in the main table which shows such divisions by an asterisk. Major groups thus dropped from the main table are given run on in this Appendix. The figure proceeding the bracket represents the code number of the major group dropped from the table. Alphabets given in brackets are abbreviations meant for different ranges of period of wo, king in the Household Industries 'with' or 'without' cultivation a~ e-,plained below. The numerical figure given after alphabet denotes the number of households in that particular range indicated by that alphabet.
Abbreviation Class range of period of working
A means with cultivation I to 3 months B
" " 4 to 6 " C
" " 7 to 9
" D " "
10 months to I year X
" without cultivation Unspecified mor.ths
E " "
1 to 3 month~ F , ~ "
4 to 6 " G
" " 7 to 9
" H » " 1 0 n:onths to I year
y " "
U I specified months
152
The list of major groups dropped from the main table is given below :-
Palghat District
Total:-02(F-I); 21(B-3, C-I, 0·1, E-l, F.S, 0-3, H-2); 22(D-15, X-2, E-2, F-3, G-1l,H-117, Y.6); 24(F.l, G-I); 27(B-4, C-4, D-14, E-13, F-50, G-29 , H-122, Y.5); 29(H-l); 30(H-4, Y-l); 31(B-I, 0-2, E-2, F-2, H-31, Y-Z); 32(H-l); 33(A-3, B-1, C-l, D-3, F-2, G-I, H-7); 34-3S(B-S, C-l, D-8, E-3, F-16, G-9, H-193, Y-~); 36(B-3, C-2, D-IO, E-I, F-l, G-5, H-353, Y-6); ~7(H-2); 38(H-I); 39(B-l, D-15, E-l, F-S, G.S, H-203, Y.4).
Rural:-02(F-l); 2I(B-3, C-l, 0-1, E-l, F-S, G-3, H-2); 22(D-15, X-2, E-2, F-3, G-6, H-116, Y-6); 24(F-l, G-l); 27(B-4, C-4, 0-13, E-12, F-44, G-22, H-1l2, Y-5); 29(H-l); 30(H-2, Y-l); 31{B-l, D-2, E-2, F-2, H-31, Y2); 32CH-l); 33(A-3, B-1, C-I, D-3, F-2, G-l, H-4); 34-3S(B-5, C-l, D-8, £-3, F-16, G-9, H-179, Y-4); 36(B-3, C-2, D-IO, E-l, F·l, G-4, H-32I, Y-6); 37(H-l); 38(H-l); 39(B.l, 0-14, E-I, F-5, G-5, H-18S, Y-4).
Urban:-22(H-l); 27(D-l, E-l, F-6, G-7, H-I0); 30(H-2); 33(H-3); 34-35(H-14); 36(G-l, H-32); 37(H-l); 39(D-l, H-18).
B-xvn SAMPLE HOUSEHOLDS CLASSMED BY SIZE AND PARTICIPATION IN HOUSEHOLD CULTIVATION OR INDUSTRY
Fly-leaf
1. This table shows the classification of households in the 3 grcups, viz., 0) Households engaged neither in cultivation nor in household industry, (ii) Households engaged in household industry only and (iii) Howeholds engaged in cultivation, by the size of households such as households having single member, 2-3 members, 4-6 members, 7-9 members and 10 or more members. The number of male ~nd female members of the households in each of these groups also are given. The home!lOlds engaged in cultivation are further classified by the size of land cultivated. The table is prepared for the total, rural and urban areas ofthe digtrict.
153
2. The total number of .homeholds and the total household population in the total, rural and urban areas of the distrirt are given below. The total number of homeholds i~ the same as that given in the Primary CensU3 Abstract and the total homehold population is the total population as per P. C. A. excluding houseless and institutional population.
Total Household populat!on Rural Number of ,-------.A..-----_-, Urban hou~eholds Penons Males Females
T 321,353 1,769.532 846,543 922,989 R 291,446 1,601,121 764,583 836,538 U 29,907 168,411 81,990 86,451
B-xvn SAMPLE HOUSEHOLD CLASSIFIED BY SIZE AND PARTICIPATION
(BASED ON
Total Single member No. of Total sample household household 2-3memben
Total sample population ,....---J----., r-----"------. Rural house- ~ House- M F House- M F Urban holds P M F holds holds
2 3 4 5 6 7 8 9 10 11
PALGHAT
Total 63,884 353,849 168,829 185,020 3,158 1,337 1,821 12,832 14,583 18,470
Rural 58,073 320,721 152,872 167,849 2,845 1,175 1,670 11,658 13,257 16,781
(i) Households engaged neither in cultivation nor household industry 38,837 195,652 91,340 104,312 2,432 930 1,502 9,068 9,960 13,277
(ii) Households engaged in house-hold industry only 3,553 20,338 9,776 10,562 62 17 45 657 802 928
(iii) Households engaged in culti-vation 15,683 104,731 51,756 52,975 351 228 123 1,933 2,495 2,576
Size of holding group: Less than 1 acre 3,462 19,759 9,433 10,326 131 75. 56 526 616 749
1'0- 2-4 acres 5,370 34,041 16,520 17,521 113 66 47 729 938 989
2'5- 4-9 ,. 3,350 24,369 12,190 12,179 46 32 14 320 426 403
5'0- 7-4 "
1,601 11,933 6,140 5,793 20 19 1 175 251 218
7-5- 9-9 "
571 4,479 2,284- 2,195 9 6 3 46 66 56
10-0-12-4 "
537 3,915 2,003 1,912 11 10 68 98 81
12'5-14'9 "
143 1,227 625 602 1 1 15 18 22
15-0-29'9 " 506 3,866 1,977 1,889 12 12 42 62 46
30'0-49-9 "
99 801 409 392 5 5 9 15 9
50+ 33 286 149 137 3 2 I 2
Unspecified Il 55 26 29 2 3 3
Urban 5,811 33,128 15,957 17,171 313 162 151 1,174 1,326 1,689
154-
1M HOUSEHOLD CULnyATION OR INDUSTRY
20 % SAMPlB)
Size of sample households
~
4-6 members 7-9 members 10 members and over ,..----"----, ,---"----,. ,..-----A---., T;)tal
House- House- House- Rural holds M F bolds M F bolds M F Urban
12 13 14 15 16 17 18 19 20
'DISTRICT 27,738 65,254 73,176 14,591 55,303 57,699 5,573 32,3S2 33,854 Total
.25,365 59,665 67,012 13,244 SO,I27 52,364 4,961 28,648 30,022 Rural
(i) Households engaged neither in cultivation nor household
17,671 40,743 46,914 7,543 28,127 29,877 2,123 11,580 12,742 industry
1,662 4,002 4,390 882 3,318 3,451 290 1,637 1,748 (ii) Households engaged in house-
bold industry only
.fi,032 14,920 15,708 4,819 18,682 19,036 2,548 15,431 15,532 (iii) Hous~holds engaged in culti-
vatIon
1,574 3,641 4,234 985 3,767 3,1>49 246 1,334 1,438 Bize of holding group:
Less than 1 acre
"2,214 5,445 5;787 1,624 6,111 6,548 690 3,960 4,150 1'0- 2'4 acres
1,148 2,959 2,966 1,107 4,362 4,358 729 4,411 4,438 2'5- 4'9 "
512 1,352 1,264 505 2,054- 1,940 389 2,464 2,370 5'0-704 "
175 460 435 191 763 743 150 989 958 7·s.- 9'9 "
165 431 408 ·171 676 683 122 788 739 10'0-12-4 "
38 102 90 39 163 147 50 341 343 12'5-14'9 "
161 409 415 161 643 625 130 851 803 15'0-29'9 "
29 77 75 '1.7 105 III 29 207 197 30'0-49'9 " 9 27 16 7 32 24 13 86 96 50+ 7 17 18 2 6 8 Unspecified
W,365 5,589 6,164 1,347 5,176 5,335 612 3,704 3,832 Urban
155 '25/528-20
G-Soc:ial and Cultural Tables
NOTE
1. Eight Tables constitute the Social and
Cultural Tables of 1961 Census; Of these tables,
Table C-l has been prepared from 20 per cent sample
Household Schedules. All the other tables are based
€In full count. The eight tables are-
C-I Composition of sample households C-II Age and Marital Status C-III Age, Sex and Education
C-IV Single Year Age Returns
C-V Mother tongue
C-VI Bilingualism
C-VII Religion
156
C-VIII Classification of literacy and Industrial cate~~"ry of workers and non-wo"kers of Scheduled Castes/Scheduled Tribes
All the tables of this series are presented in this volume except C-IV and C-VI. These tables are published in "Volume VII-Kerala State-Part II C-Cultural and Migration Tables".
2. In addition to the above eight tables there are eight tables relating to technical personnel. They are furnished as appendices to Table C-III in 'Volume VU-KeraJa State-Part II C-Cultural and Migration Tables'.
C-I COMPOSITION OF SAMPLE HOUSEHOLDS BY RELATIONSHIP TO HEAD OF FAI' .. iIL Y CLASSIFIED BY SIZE OF LAND CULTIVATE»
Fly-leaf
1. This table gives the fa~ily composition of households which has been prepared on a 20 per cent sample basis from the household schedules ~eparately for the total, rUf::>1 and urban areas of the district. 'The merr.bers in the household have been d;vided into two gJOups, viz., fa.mily members and non-tamily members. Among the family members, heads of households and their spouses have been given by sex. Manied relations have been classified into married sons, other married males and other married females. Never married, widpwed and divorced or separated relations also have been given by sex. ,Simillirly sex-wise figures of non-family member3 or 'unrelated members are given. This table will be of
157 :25/328-20 b
sociological interest indicating the strength of the joint family system.
2. Though the above table gives only the composition of households, the corresponding table C-I of 1951 Census gives both the size and composition of households which was based on a 0'1 per cent sample households prepared from the National Register of Citizens. But in the case of Travancore-Cochin State, this table was prepared from a 4 per cent sample households.
3. In this Census the size of the households (based on 20 per cent sample) has been given separately as Table B-XVII.
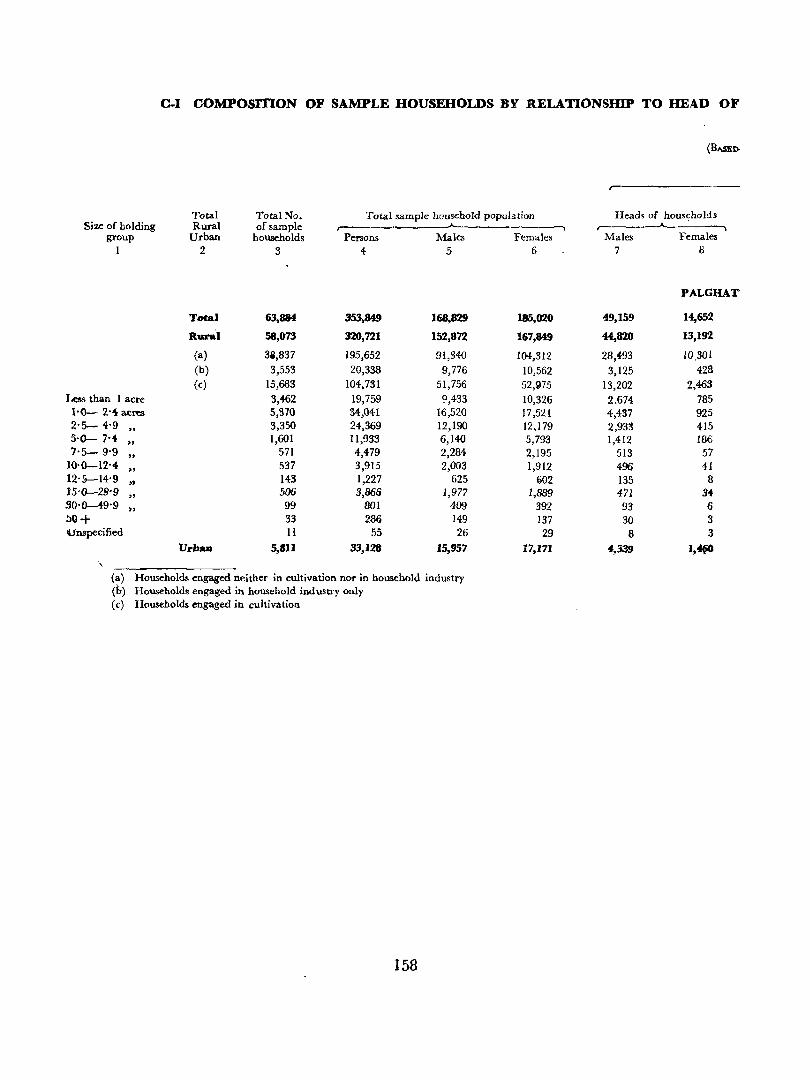
C.I COMPOSITION OF SAMPLE HOUSEHOLDS BY RELATIONSHIP TO HEAD OF
(BASED-
r-
Total Total No. Total sample household population Heads of households Size of holding Rural of sample ~
,--__ ---A.__
group Urban households Persons Males Females Males Females I 2 3 4- 5 6 7 8
PALGHAT
Total 63,884 353,849 168,829 185,020 49,159 14,652
Rural 58,073 320,721 152,872 167,849 44,820 13,192
(a) 32,837 195,652 91,340 104,312 28,.f.93 10,301 (b) 3,553 20,338 9,776 10,562 3,125 428 (c) 15,683 104,731 51,756 52,975 13,202 2,463
Less than 1 acre 3,462 19,759 ~,433 10,326 2,674 785 1'0- 2'4 acres 5,370 34,041 16,520 17,521 4,437 925 2'5- 4'9
" 3,350 24,369 12,190 12,179 2,933 415
5'0-- 7'4-"
1,601 11,933 6,140 5,793 1,412 186 7'5- 9'9
" 571 4,479 2,284 2,195 513 57
10'0--12'4-"
537 3,915 2,003 1,912 496 41 12'§-14'9 .. 143 1,227 625 602 135 8 lHJ--29'9
" 5()6 3,866 1,977 1,889 471 34
.90'0--4-9'9 "
99 801 409 392 93 6 !lO+ 33 286 149 137 30 3 \Jnspecified 11 55 26 29 8 3
Urbaa 5,8n 33,128 15,957 17,171 4,339 I,. ,
(a) Households engaged neither in cultivation nor in household industry (b) Households engaged in household industry only (c) Households engaged in cultivation
158
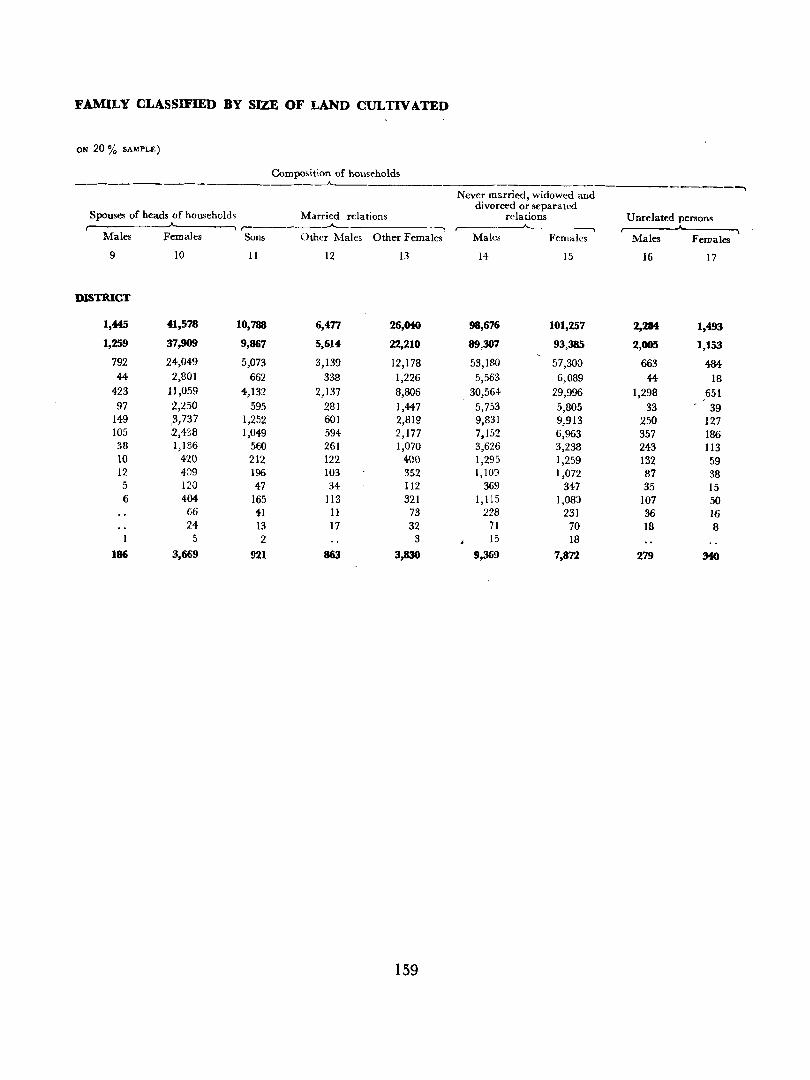
FAMILY CLASSIFIED BY SIZE OF LAND eUL TIV ATED
ON 20 % SAMPLE)
Composition of households __A.
Never married, widowed and -------.
divorced or separated Spouses of heads of households Married relations relations Unrelated persons
r-----______A._ Males Females Sons Other Males Other Females Males Females Males FeroalllS
9 10 11 12 13 14 15 16 17
DISTRICT
1,445 41,578 10,788 6,4n 26,0t0 98,676 101,257 2,214 1,493
1,259 37,909 9,867 5,614 22,210 89,307 93,385 2,005 1,153
792 24,049 5,073 3,139 12,178 53,ISO 57,300 663 484 44 2,801 662 338 1,226 5,563 6,089 44 18
423 11,059 4,132 2,137 8,806 30,564- 29,996 1,298 651 97 2,250 595 281 1,447 5,753 5,805 33 39
149 ,3,737 1,252 601 2,819 9,831 9,913 250 127 105 :2,438 1,049 594- 2,177 7,152 6,963 357 186 38 1,186 560 261 1,070 3,626 3,238 243 113 10 420 212 122 4(}0 1,295 1,259 132 59 12 4~9 196 103 352 1,10') 1,072 87 38 5 120 47 34 112 369 347 35 15 6 4M 165 113 321 1,115 1,08::1 107 50
56 41 11 73 228 231 36 16 24 13 17 32 71 70 18 8
1 5 2 3 15 18 186 3,669 921 863 3,830 9,369 7,872 279 MO
159
c-n AGE AND MARITAL STATUS
Fly-leaf
1. This t«ble gives tb~ sex-wi:,e dist,ibution of population by age-groups and marital status for the total, rural and urban areas of the d;s!rict. For rural areas, it is presented down to taluk level. The agegroups followed in this table are O-~, 1(1-14, 15-19, 20-24, 25-29, 30-34, 35-39, 40-44, 45-49, 50-54, 55-59, 60-64, 65-69, 70 + and 'age not stated' wh:ch conform to international s:andards.
2. The correspond;ng table at the 1951 Census (Table C-III Age: and c:vil ,condition) was prepared on a 10 per cent sample unlike the present one done on full count.
160
3. The mnital status groupings in 1961 Census and
the civ] condition groupings in the 1951 Census are
given below :-
Marital Status (1961) Civil Condition (1951)
1 Never Married Unmarried
2 Married 2 Married
3 Widowed 3 Widowed or Divorced
4 Divorced or Separated
5 Unspecifil!d Status
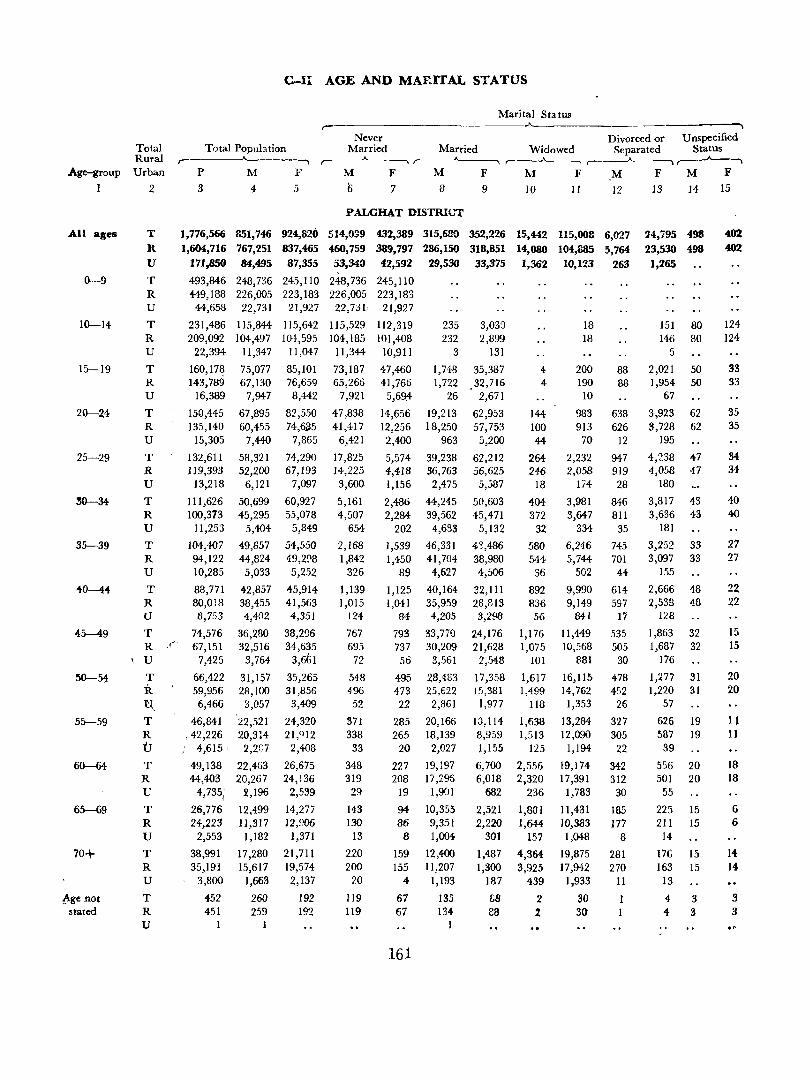
Total Rural
Age-group Urban
I 2
All ages
(}-9
15-19
25-29
30--34-
35-39
40---4~
45-49
55-59
60-64
65---69
70+
f.ge not stated
T R
U
T R U
T R U
T R U
T R U
T R U
T R U
T R U '
T R U
T R I-
IU
T :R -U, T R U T R U
T R U
T R U
T R U
C-Il AGE AND MARITAL STATUS
Marital Status r---------------------------A---------------------------~
Total Popuhtion Never
Married Divorced or Unspecified
Married Widowed Separated Status r- --., ,----~~-----, ~ r~ ,------"-----.,,-----A----.,
P M F M F M F M F ,M F M F 3 4 ;j /) 7 8 9 10 11 12 13 14 15
PALGHAT DISTRIl.'T
1,776,566 851,746 924,820 514,039 1,604,716 767,251 837,465 460,759
171,850 84,495 87,355 53,340
493,846 248,736 245,110 248,736 H9,188 226,005 223,183 226,005
44,658 22,731 21,927 22,731,
23J,486 115,844 II 5,642 115,529 209,092 104,497 104,595 104,185
22,394 11,347 II'047 11,344
160,1 7~ 75,077 85,101 73,187 143,789 67,130 76,659 65,265
16,389 7,947 8,442 7,921
150,445 67,895 82,550 47,838 135,140 60,455 74,6J;l5 41,417
15,305 7,440 7,865 6,421
132,611 58,321 74,290 17,825 ] ]9,393 52,200 67, I 93 1+,225
13,218 6,121 7,097 3,600
111,626 50,699 60,927 5,161 100,373 45,295 55,078 4,507
11,253 5,404 5,849 654
104,407 49,857 54,550 2,168 94,122 44,824 49,298 1,842 10,285 5,033 5,252 326
88,771 42,857 45,914 1,139 80,018 38,455 41,563 1,015 8,753 4,402 4,351 124
74,576 36,280 38,296 767 67,151 32,516 34,635 695
7,425 3,764 3,661 72
66,422 31,157 35,265 548 59,956 28,100 31,856 496 6,466 3,057 3,409 52
46,841 22,521 24,320 371 ,42,226 20,3!4 21,012 338
, 4,615' 2,2[;7 2,408 33
49,138 22,463 26,675 348 44,403' 20,267 24,136 319
4,735; i,l96 2,539 29
26,776 12,499 14,277 143 24,223 1],317 12,906 130
2,553 1,182 1,37 I 13
38,991 17,280 21,711 220 35,191 15,617 19,574 200
3,800 1,663 2,137 20
452 260 192 119 451 259 192 119
1
432,389 389,797 42,592
245,110 223,183 21,927
112,319 101,408
10,911
47,460 41,766
5,69;4-
14,656 12,256 2,400
5,574 4,418 1,156
2,486 2,284
202
1,539 1,450
89
1,125 1,041
84-
793 737 56
495 473 22
285 265
20
227 208
19
94 86 8
159 155
4
67 67
161
315,680 352,226 IS,H2 115,006 6,027 286,150 318,851 14,080 104,885 5,764
29,530 33,375 1,362 10,123 263
235 3,03() 232 2,899
3 131
1,748 35,387 1,722 ,32,716
26 2,671
19,213 18,250
963
39,238 36,763
2,475
44,245 39,562
4,633
46,331 41,704 4,627
40,164 35,959 4,205
33,770 30,209
3,S61
28,483 25,622
2,861
20,166 18,139 2,027
19,197 17,296 1,901
10,355 9,351 1,004
12,400 II,207
1,193
135 134
62,953 57,753
5,200
62,212 56,625
5,587
50,603 4S,471
5,132
48,486 38,980 4,506
32,1 II 28,813 3,298
24,176 21,628
2,548
17,358 15,381
1,977
la,114 8,959 1,155
6,700 6,018
682
2,521 2,220
301
1,487 1,300
187
S8 88
4 4
144 100 44
264 246
18
404 372
32
580 544
36
892 836 56
1,176 1,075
101
1,617 1,499
118
1,638 1,513
125
2,5S6 2,320
236
1,801 1,644
IS7 4,364 3,925
439
2 %
18 18
200 190 10
983 913
70
2,232 2,058
174
3,981 3,647
334
6,246 5,744
502
9,990 9,149
841
11,449 10,568
881
16,II!> 14,762
1,3S3
13,284 12,090
1,194
19,174 17,391
1,783
11,431 10,383 1,048
19,875 17,942
1,933
30 30
88 88
638 626
12
947 919 28
846 81 I
35
745 701
44
614 597
17
535 505
30
478 452
26
327 305
22
342 312
30
185 177
8
281 270
II
24,795 498 23,530 498
1,265
151 80 146 80
5
2,021 50 1,954 50
67
3,923 62 3,728 62
195
4,238 47 4,058 47
180
3,817 43 3,636 43
181
3,252 33 3,097 33
155
2,666 48 2,538 48
128
1,863 32 1,687 32
176
1,277 31 1,220 31
57
626 19 587 19
39
556 20 501 20
55
225 15 211 15
14
176 15 163 15
13
4 3 4 3
402 402
124 124
33 33
35 35
34-34
40 40
27 27
22 22
15 15
20 20
11 11
18 18
6 6
14 14
3 3
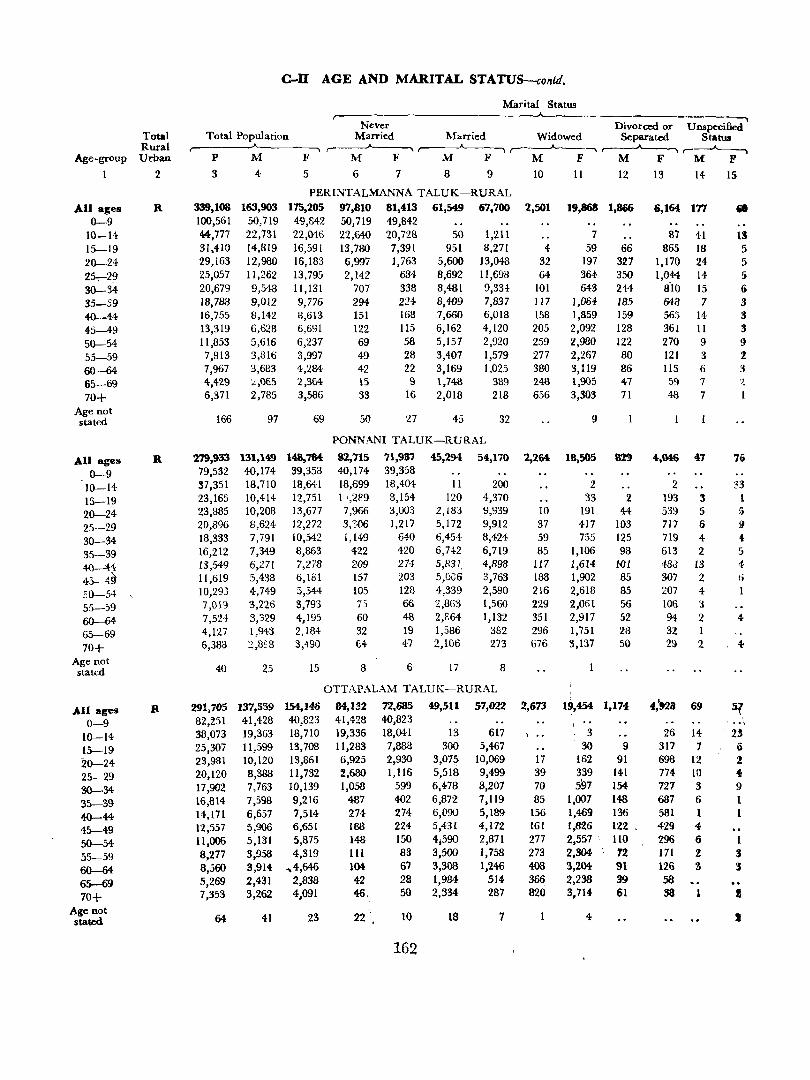
c-u AGE AN.D MARITAL STATUS-contd.
Marital Status
Never Divorced or ---.,
Unspecified Total Total Population Married Married Widowed Separated Status Rural ,---"-----.. ~~~
Age-group Urban P M F M F M F M F M F M F
1 2 3 4 5 6 7 8 9 10 11 12 13 14- 15
PERINTALMANNA TALUK-RURAL
All ages R 339,108 163,903 175,205 97,810 81,413 61,549 67,700 2,501 19,868 1,866 6,164 ITT " 0-9 100,561 50,719 49,642 SO,719 49,842 10-14 44,777 22,731 22,046 22,&10 20,nS 50 1,211 7 87 41 15 15-19 31,410 14,819 16,591 13,780 7,391 951 8,271 4 59 66 865 18 5 20-24 29,163 12,980 16,183 6,997 1,763 5,600 13,048 32 197 327 1,170 24 5 25-:-29 25,057 11,262 13,795 2,142 684 8,692 11,698 64 364- 350 1,044 14 .)
30-34 20,679 9,548 11,131 707 338 8,481 9,33-1, 101 643 244- 8-10 15 Ii 35-59 18,788 9,012 9,776 294- 224- 8,409 7,837 117 1,064- 185 648 7 3 40-44 16,755 8,142 8,613 151 168 7,660 6,018 158 1,859 159 565 14 3 45-49 13,319 6,628 6,691 122 115 6,162 4,120 205 2,092 128 361 11 3 50-54 11,853 5,616 6,237 69 58 5,157 2,920 259 2,980 122 270 9 9 55-59 7,813 3,816 3,997 49 28 3,407 1,579 277 2,267 80 121 3 % 6O---M 7,967 3,683 4,284 42 22 3,169 1,025 380 3,119 86 115 6 ~
65-69 4,429 L,005 2,364 15 9 1,748 389 248 1,905 4:7 5'l 7 '~
70+ 6,371 2,785 3,586 33 16 2,018 218 656 3,303 71 48 7
Age not 166 97 69 50 27 45 32 9 stated
PONNANI TALUK-RURAL
All ages R 279,933 131,149 l48,784 82,715 7I,m 45,294 54,170 2,264 18,505 829 4,046 47 76
0-9 79,532 40,174 39,358 40,174 39,358
10-14 37,351 18.710 18,641 18,699 18,404 11 200 2 2 33
15-19 23,165 10,414 12,751 1 \2R9 8,154 120 4,370 33 2 193 3
20-24 23,885 10,208 13,677 7,966 3,003 2,183 9,939 10 191 44 539 5 )j
25-29 20,896 8,624 12,272 3,?-O6 1,217 5,172 9,912 37 417 103 717 6 g
30-34 18,333 7,i91 10,542 1,149 640 6,454 8,424- 59 755 125 719 4 4-
35-39 16,212 7,349 8,863 422 420 6,742 6,719 85 1,106 98 613 2 5
4()-44 13,549 6,al 7,278 209 274 5,831 4,898 117 1,614 WI 4803 IS 1
45-4~ 11,619 5,438 6,181 157 203 5,006 3,763 188 1,902 85 307 2 I;
~0-54 , 10,293 4,749 5,544 105 128 4,339 2.590 216 2,618 85 207 4 1
55-59 7,01'3 3,226 3,793 7) 6& 2,863 1,560 229 2,061 56 lOG 3
60-64 7,524 3,329 4,195 60 48 2,E64 1,132 351 2,917 52 94 2 4-
65--69 4,127 1,943 2,184 32 19 1,586 382 296 1,751 28 32 1
70+ 6,388 2,808 3,490 ~4 47 2,106 273 676 3,137 50 29 2 4-
Age not 40 25 15 8 6 17 8 stated
OTTAPALAM TALUK-RURAL
.All ages R 291,705 137,559 l54,146 84,132 72,685 49,511 57,022 2,673 19,454 1,174 4,'928 69 5? 0-9 82,~51 41,428 40,823 41,428 40,823 , .. \
10-14- 38,073 19,363 18,710 19,336 18,041 13 617 ) .. 3 26 14 . %3
15-19 25,307 11,599 13,708 11,283 7;88a 300 5,467 30 9 317 7 6
20-24 23,981 10,120 13,861 6,925 2,930 3,07!) 10,069 17 162 91 696 12 %
25-29 20,120 8,388 11,732 %,680 1,116 5,518 9,499 39 339 141 774 10 {.
30-34- 17,902 7,763 10,139 1,058 599 6,478 8,207 70 597 154- 727 3 9
35-39 16,814 7,598 9,216 487 402 6,872 7,119 85 1,007 148 687 6 1
40-44 14,171 6,657 7,514 274- 274 6,090 5,189 156 1,469 136 581 1 1
45-49 12,557 5,906 6,651 188 224 5,431 4,172 161 1,826 122 , 429 4
50-54- 11,006 5,131 5,875 148 ISO 4 j 59O 2,871 277 2,557 .. 110 296 6 I
55-59 8,277 3,958 4,319 III 83 3,500 1,758 273 2,304- 72 171 2 3
60-64 8,560 3,914- ,4,646 104- 67 3,308 1,246 408 3,204- 91 126 3 :I
65--69 5,269 2,431 2,838 42 28 1,984 514 366 2,238 39 58
70+ 7,353 3,262 4,091 46, SO 2,334 287 820 3,714 61 38 ! Age not
64- 41 23 22 I. 10 18 7 4 I stated . 162
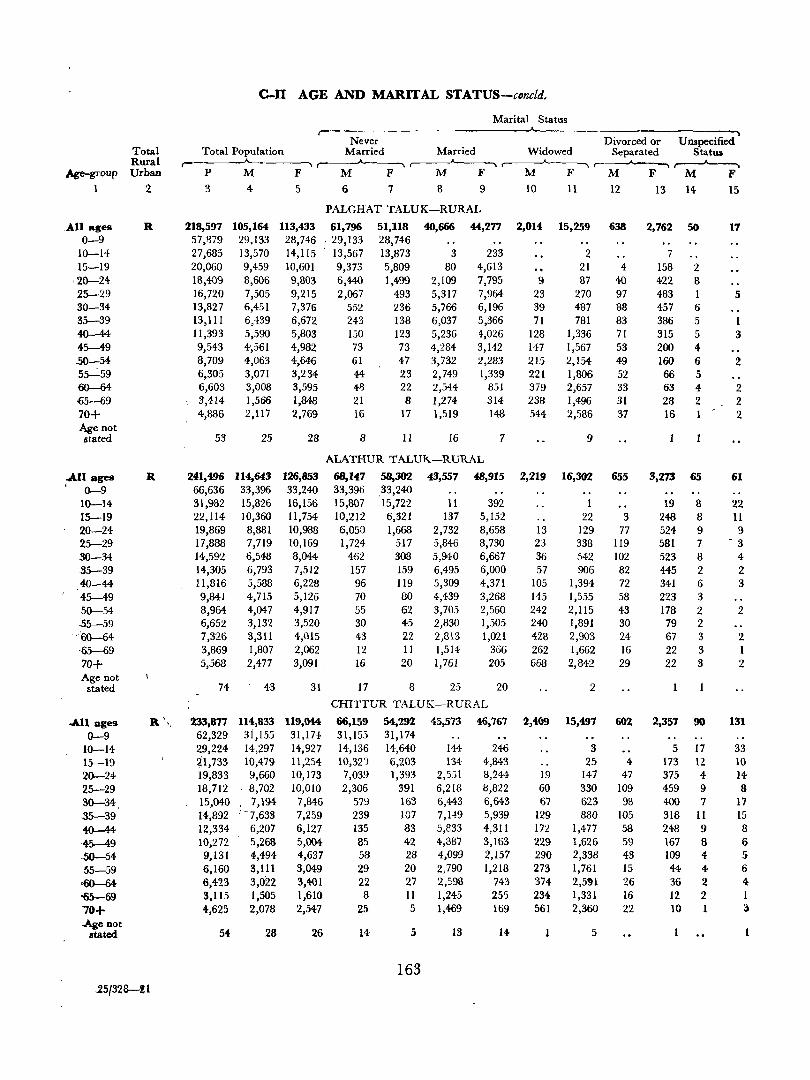
e-ll AGE AND MARITAL STATUS-coneld.
Marital Statas r-
Never Divorced or Unspecified Total Total Population Married Married Widowed Separated Status Rural r- ,..----A----.., ,.-------A----.
Age-group Urban P M F M F M F M F M F M F 1 2 3 4 5 6 7 8 9 10 11 12 13 14 15
PALGHAT TALUK-RURAL
All ages R 218,597 105,164 113,433 61,796 51,118 40,666 44,277 2,014 15,259 638 2,762 50 17 0-9 57,879 29,133 28,746 . 29,133 28,746
10-14 27,685 13,570 14,115 ' 13,567 13,873 3 233 2 7 15-19 20,060 9,459 10,601 9,373 5,809 80 4,613 21 4 158 2
, 20-24 18,409 8,606 9,803 6,440 1,499 2,109 7,795 9 87 40 422 8 25-29 16,720 7,505 9,215 2,067 493 5,317 7,964 23 270 97 483 1 5 30-34 13,827 6,451 7,376 552 236 5,766 6,196 39 487 88 457 6 35-39 13,111 6,439 6,672 243 138 6,037 5,366 71 781 83 386 5 1 40-44 11,393 5,590 5,803 150 123 5,236 4,026 128 1,336 71 315 5 3 45-49 9,543 4,561 4,982 73 73 4,284 3,142 147 1,567 53 200 4 50-54 8,709 4,063 4,646 61 47 3,732 2,283 215 2,154 49 160 6 2 Ss-:.59 6,305 3,071 3,234 44 23 2,749 1,339 221 1,806 52 66 5 60--64 6,603 3,008 3,595 48 22 2,544 851 379 2,657 33 63 4 2 -65-69 3,414 1,566 1,848 21 8 1,274 314 238 1,496 31 28 2 2 70+ 4,886 2,117 2,769 16 17 1,519 148 544 2,586 37 16 1 2 Age not stated 53 25 28 8 II 16 7 9
ALATHUR TALUK-RURAL
All ages R 241,496 114,643 126,853 68,147 58,302 43,557 48,915 2,219 16,302 655 3,273 65 61 , 0-9 66,636 33,396 33,240 33,396 33,240
10-14 31,982 15,826 16,156 15,807 15,722 11 392 1 19 8 22 15-19 22,114 10,360 11,754 10,212 6,321 137 5,152 22 3 248 8 11 20-24 19,869 8,881 10,988 6,050 1,668 2,732 8,658 13 129 77 524 9 9 25-29 17,888 7,719 10,169 1,724 517 5,846 8,730 23 338 119 581 7 - 3
30-34 14,592 6,548 8,044- 462 303 5,940 6,667 36 542 102 523 8 4 35-39 14,305 6,793 7,512 157 159 6,495 6,000 57 906 82 445 2 2 4O~44 11,816 5,588 6,228 96 119 5,309 4,371 105 1,394 72 341 6 3 45-49 9,841 4,715 5,126 70 80 4,439 3,268 145 1,555 58 223 3 50--54 8,964 4,047 4,917 55 62 3,705 2,560 242 2,115 43 178 2 2 .55-59 6,652 3,132 3,520 30 45 2,830 1,505 240 1,891 30 79 2 "'6()-64 7,326 3,311 4,015 43 22 2,813 1,021 428 2,903 24 67 3 2 ·65-69 3,869 1,807 2,062 12 11 1,514 366 262 1,662 16 22 3 1 70+ 5,568 2,477 3,091, 16 20 1,761 205 668 2,842 29 22 3 2 Age not
74 43 31 17 8 25 20 2 stated
CHITTUR TALUK-RURAL
.All ages R'" 233,877 114,833 119,1)44 ~,159 54,292 45,573 46,767 2,409 15,497 602 2,357 90 131 0-9 . 62,329 31,155 31,IH 31,155 31,174
10-14 2,9,224 14,297 14,927 14,136 14,640 144 246 3 5 17 33 15-19 ~1,733 10,479 11,254 10,32') 6,203 134 4,843 25 4 173 12 10 20-24- 19,833 '9,660 10,173 7,039 1,393 2,551 8,244- 19 147 47 375 4 14 25-29 18,712 8,702 10,010 2,306 391 6,218 8,822 60 330 109 459 9 8 30-34 15,040 7,194 7,846 57':3 163 6,443 6,643 67 623 98 400 7 17 .35-39 14,892 ! -7,633 7,259 239 lG7 7, l-!9 5,939 129 880 105 318 11 15 40-44 12,334 6,207 6,127 135 83 5,833 4,311 172 1,477 58 248 9 8 ,45-49 10,272 5,268 5,004 85 42 4,387 3,163 229 1,626 59 167 8 6 50--54 9,131 4,494 4,637 58 28 4,099 2,157 290 2,338 43 109 4 5 55-59 6,160 3,111 3,049 29 20 2,790 1,218 273 1,761 15 44 4 6
~ 6,423 3,022 3,401 22 27 2,598 743 374 2,5'1 26 36 2 4
~69 3,115 1,505 1,610 8 11 1,245 255 234 1,331 16 12 2 1
70+ 4,625 2,078 2,547 25 5 1,469 169 561 2,360 22 10 1 l ..Age not
stated 54 28 26 14 5 13 14 5
163 .2S/32B-!1
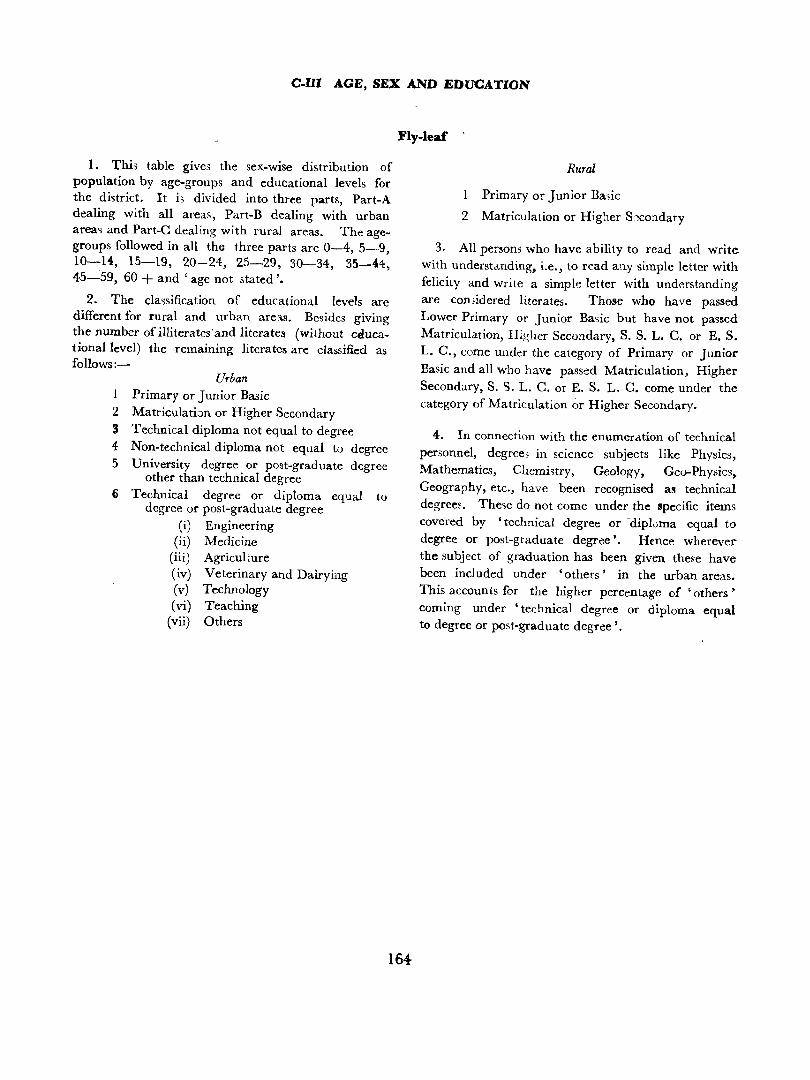
C-1l1 AGE, SEX AND EDUCATION
1. Thi3 table gives the sex-wise distribution of population by age-groups and educational levels for the district. It i3 divided into three parts, Part-A dealing with all areas, Part-B dealing with urban area') and Part-C dealing with rural areas. The agegroups followed in all the three parts are 0-4, 5-9, 10-14, 15-19, 20-24, 25-29, 30-34, 35-44, 45---":59, 60 + and' age not 5tated '.
2. The classification of educational levels are different for rural and urban are3.S. Besides giving the number of illiterates 'and literates (without educationallevel) the remaining literates are classified as follows:-
Urban
1 Primary or Junior Basic 2 Matriculation or Higher Secondary 3 Technical diploma not equal to degree 4 Non-technical diploma not equal to degree 5 University degree or post-graduate degree
other than technical degree 6 Technical degree or diploma equal to
degree or post-graduate degree (i) Engineering
Oi) Medicine (iii) Agriculture (iv) Veterinary and Dairying (v) Technology (vi) Teaching
(vii) Others
Fly-leaf
Rural
I Primary or Junior Ba,ic
2 Matriculation or Higher Sxondary
3. All persons who have ability to read and write with understanding, i,e., to read any simple letter with felicity and write a simple letter with understanding are con;idered literates. Those who have passed Lower Primary or Junior Basic but have not passed Matriculation, Higher Secondary, S. S. L. C. or E. S. L. C., come under the category of Primary or Junior Basic and all who have passed Matriculation, Higher Secondary, S. S. L. C. or E. S. L. C. come under the category of Matriculation or Higher Secondary.
4. In connection with the enumerdtion of technical personnel, degree, in science subjects like Physics, Mathematics, Chemi,try, Geology, Gco-Physics. Geography, etc" have been recognised as technical degrees. The,e do not come under the specific items covered by 'technical degree or -dipivma equal to degree or post-graduate degree'. Hence wherever the subject of graduation has been given these have been included under 'others' in the urban areas. This accounts for the higher percentage of 'others" coming under 'technical degree or diploma equal to degree or post-graduate degree'.
164
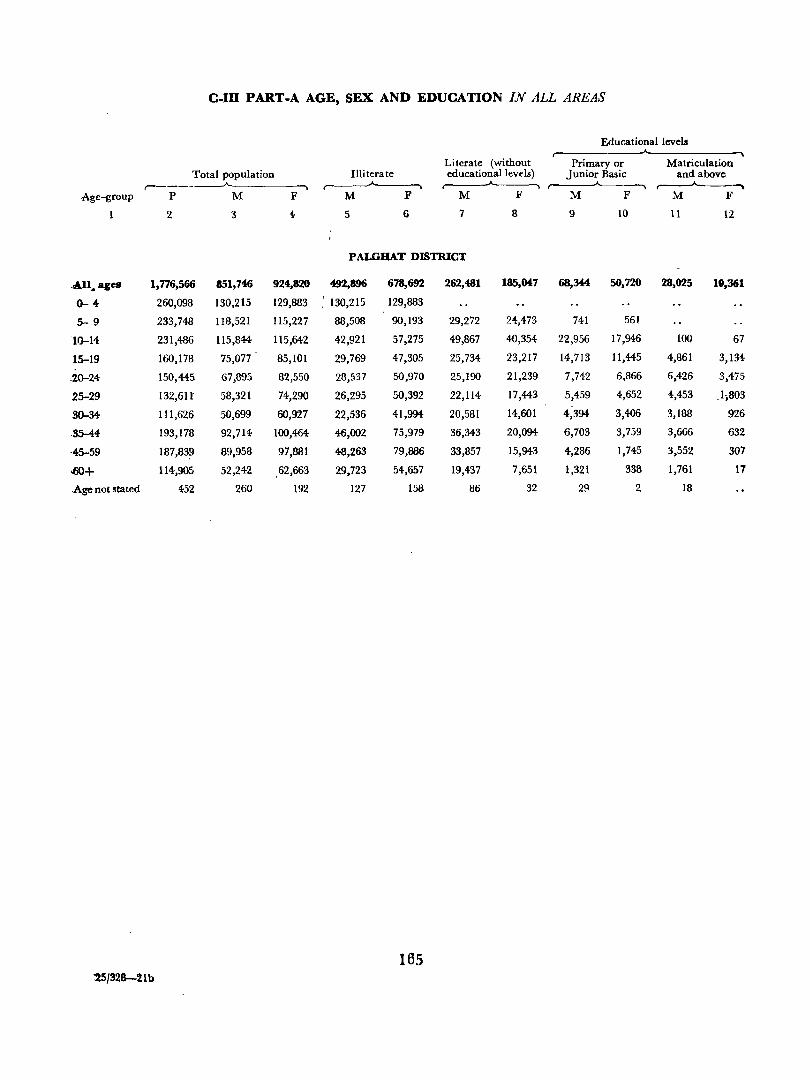
C.IU PART·A AGE, SEX AND EDUCATION IN AU AREAS
Educational levels
Literate (without Primary or Matriculation Total population Illiterate educational levels ) Junior Basic and above
r-----~-. r------""---. ~ Age-group P M F M F M F M F M F
2 3 4 5 6 7 8 9 10 11 12
PALGHAT DISTRICT
.,,\11. ages 1,776,566 851,746 924,820 492,896 678,692 262,481 185,047 68,344 50,720 28,025 11),361
0-4- 260,098 130,215 129,883 ' 130,215 129,883
5-9 233,748 118,521 115,227 88,508 90,193 29,272 24,473 741 561
10-14 231,486 115,844 115,642 42,921 57,275 49,867 40,354 22,956 17,946 100 67
15-19 160,178 75,077 85,101 29,769 47,305 25,734 23,217 14,713 11,445 4,861 3,134-
-+0-24 150,445 67,895 82,550 28,537 50,970 25,190 21,239 7,742 6,866 6,426 3,475
25-29 132,611' 58,321 74,290 26,295 50,392 22,114 17,443 5,459 4,652 4,453 ),803
30-34 111,626 50,699 60,927 22,536 41,994 20,581 14,601 4,394 3,406 3,188 926 I'
35-44- 193,178 92,714- 100,464- 46,002 75,979 36,343 20,094- 6,703 3,759 3,666 632
·45-59 187,839 89,958 97,881 48,263 79,886 33,857 15,943 4,286 1,745 3,552 307
..60+ 114,905 52,242 ,62,663 29,723 54,657 19,437 7,651 1,321 338 1,761 17
.Age not stated 452 260 192 127 158 86 32 2~ 2 18
165 ~5J328-%lb
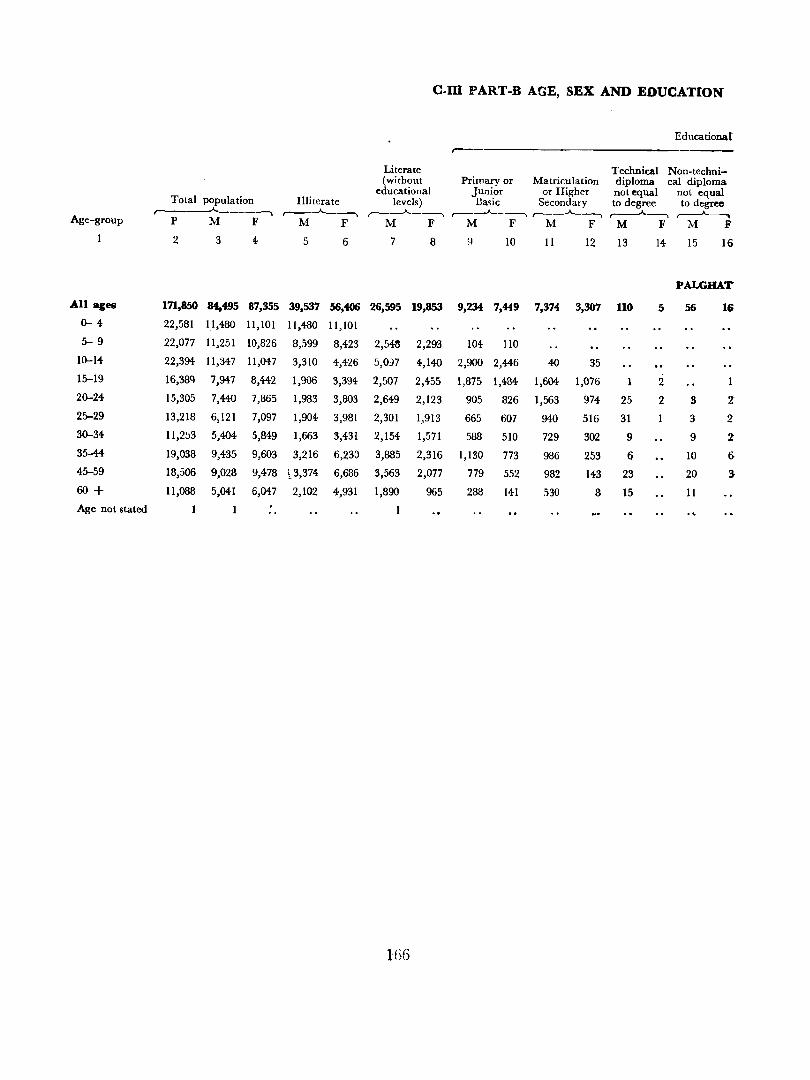
c.m PART-B AGE, SEX AND EDUCATION
Educational r---
Literate Technical Non-techni-(without Primary or Matriculation diploma cal diploma
educational Junior or Higher not equal not equal Total population Illiterate levels) Dasic Secondary to degree to degree
r-----"- r------A----., ~---A-_~ r----A._---., ,----......______, r---A---., ,..-----A---------. Age-group p M F M F M F M F M F M F M F 2 3 4- 5 6 7 8 9 10 II 12 13 14 15 16
PALGHAT
All ages 171,850 84,495 87,355 39,537 56,406 26,595 19,853 9,234 7,449 7,374 3,307 110 5 56 16 0-4 22,581 11,480 11,101 11,480 11,101
5-9 22,077 11,251 10,826 8,599 8,423 2,548 2,293 104 110
10-14 22,394 11,347 11,047 3,310 4,426 5,097 4,140 2,900 2,446 40 35
15-19 16,38Q 7,947 8,442 1,906 3,394 2,507 2,455 1,875 1,484 1,604- 1,076 1 2 1
20-24 15,305 7,440 7,865 1,983 3,803 2,649 2,123 905 826 1,563 974- 25 2 3 Z 25-29 13,218 6,121 7,097 1,904 3,981 2,301 1,913 665 607 940 516 31 3 2 30-34 11,253 5,404- 5,849 1,663 3,431 2,154 1,571 588 510 729 302 9 9 2 35--44 19,038 9,435 9,603 3,216 6,230 3,885 2,316 1,130 773 986 253 6 10 6
45-59 18,506 9,028 9,478 1.3,374 6,686 3,563 2,077 779 552 982 143 23 20 g.
60+ 11,088 5,041 6,047 2,102 4,931 1,890 965 288 141 530 8 15 11
Age not stated 1 1 1
}fiG
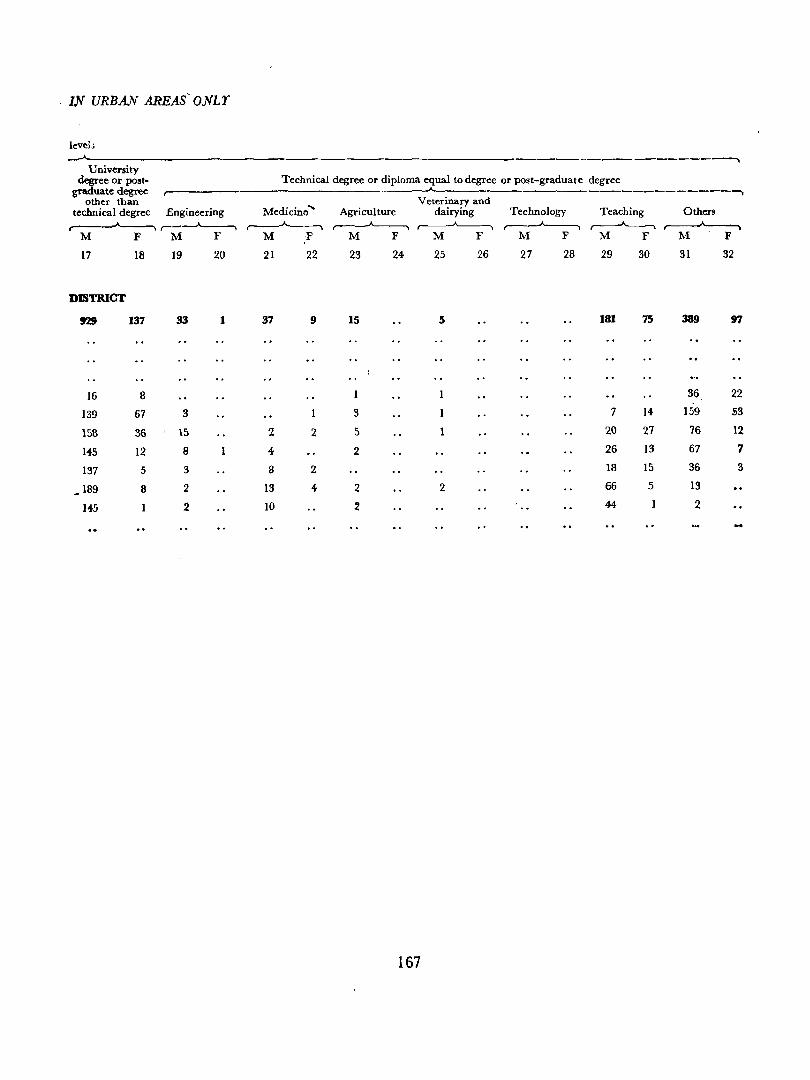
IN URBAN AREAS- ONLY
leve13
University degree or post
graduate degree other than
technical degree Engineering ,------'-----. ,--~
M F M F
17 18 19 20
DISTRICT
137 33 1
16 8
139 67 3
158 36 15
145 12 8
137 5 3
189 8 2
145 2
.. _------------.. Technical degree or diploma equal to degree or post-graduate degree
Medicine' ~
M ·F
21 22
37 9
2 2
4
8 2
13 4
10
Veterinary and Agriculture dairying
,------I'------ r---"-----, M F M F
23 24 25 26
15 5
1
3
5 1
2
2 2
.2
167
Technology ~
M F
27 28
Teaching Others r----"---. ~
M F M F
29 30 31 32
181 75 389 97
36 22
7 14 159 §3
20 27 76 12
26 13 67 7
18 15 36 3
66 5 13
44 2
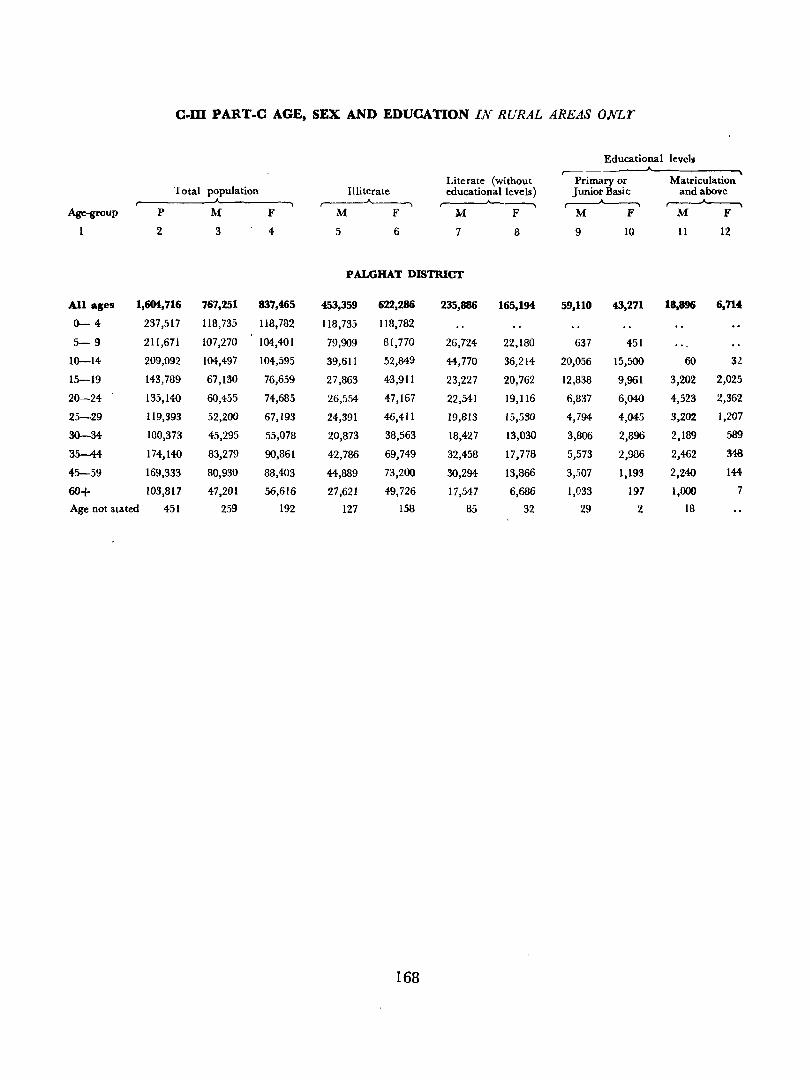
c-m PART-C AGE, SEX AND EDUCATION IN RURAL AREAS ONLr
Educational levels
Literate (without Primary or Matriculation 'f otal population Illiterate educational levels ) Junior Basic and above ....._______,
...-----"-------- ~ ~ Age-group P M F M F M F M F M F
1 2 3 4 5 6 7 8 9 10 11 12
PALGHAT DISTRICT
All ages 1,604,716 767,251 837,465 453,359 622,286 235,886 165,194 59,110 43,271 18,896 6,714
0-4 237,517 118,735 118,782 118,735 118,782
5- 9 211,671 107,270 104,401 79,909 81,770 26,724 22,180 637 451
10-14 209,092 104,497 104,595 39,611 52,849 44,770 36,214 20,056 15,500 60 32
15-19 143,789 67,130 76,659 27,863 43,911 23,227 20,762 12,838 9,961 3,202 2,025
20-24 135,140 60,455 74,685 26,554 47,167 22,541 19,116 6,837 6,040 4,523 2,362
25-29 119,393 52,200 67,193 24,391 46,411 19,813 15,530 4,794 4,045 3,202 1,207
30-34 100,373 45,295 55,078 20,873 38,563 18,427 13,030 3,806 2,896 2,189 589
35-44 174,140 83,279 90,861 42,786 69,749 32,458 17,778 5,573 2,986 2,462 348
45-59 169,333 80,930 88,403 44,889 73,200 30,294 13,866 3,507 1,193 2,240 144
60+ 103,817 4-7,201 56,616 27,621 49,726 17,547 6,686 1,033 197 1,000 7
Age not stated 451 259 192 127 158 85 32 29 2 18
168
c-v MOTHER TONGUE
Fly-leaf
This table which corresponds to Table D-I Languages (i) Mother tongue of 1951 Census give, the sex-wi~e distribution of the population under different mother tongue; for the total, rural and urban area,; of
the district ana up to taluk level for rural areas. This is finalised in consultation wilh the Linguist of Registrar General's Office. The following noles have aLo been prepared by the Linguist:-
NOTE I
1. The following mother tongues arranged in alphabetical order in below as per Table C-V have been chssified in the Linguistic Survey of India. Classification Number is mentioned against each mother tongue in column 3.
column 1 of the statement given The Linguistic Survey of India
2. If in column 3 no classification Number is given against any mother tongue of column I then it would mean that the name refers to eit11er old or middle Indo-Aryan language or a language group or branch or familyname from the Linguistic Survey of India.
3. Wherever a tongue i5 mentioned in column 3 it is to be understood that the mother tongue is either a dialect or another name or form of the tongue mentioned against it in column I which in its turn has been classified by the Linguistic Survey of India in the appropriate place for that tongue.
4. If in column I, there is a tongue which bears no classification number in the Linguistic Survey of India then in column 2 the name of the classified language or group will be given of which the mother tongue of column I is either a dialect or another name or form. In such-a case the number of cla3sifi~.j language of column 2 has been given in column 3.
5. In column 2 standardized spellings according to Linguistic Survey of India has been given against each mother tongue of column I.
Alphabetical order of mother tongue" classified by the Linguistic Survey
of India
\ I Bengali 2 Gujarati 3 Hirdi 4 Kachchhi 5 Kannada 6 Kashmiri 7 Konkani 8 Malayalam 9 Marathi
10 Nepali 11 Oriya 12 Punjabi 13 Saurashtra 14 Tamil 15 Telugu 16 Tulu 17 Urdu
Classified name in the Linguistic Survey of India
2
Bengali Gujarati Hindi Kachchhi Kanarese Ka'lhmiri Konkani Malayalam Marathi Naipali Oriya Punjabi Patanuli Tamil Telugu Tulu Urdu
169
Classification Number in the Linguistic Survey of
India
3
529 652 586 451 296 Karandi 399 494- cf., Note 2 293 Pania 455 781 Gorkhali 502 632 Sikhi 674 285 319 302 585
NOTE 2
The following mother tongues arranged in alphabetical order as per Table C·V and are indicated by asterisk and dagger or a dagger alone in that Table have beel'l tentatively classified or re-classified by the Linguist in the manner stated below:-
(T) against the mother tongue in column 1 indicates that it has been tentatively classified, (TR) means that it has been tentatively re-classified by the Linguist.
Alphabetical order of the mother tongues indicated by asterisk and dagger or a dagger
alone in Table C-V
1 '
Konkani (TR)
Manner in which tentatively classified or re-classified by the Linguist
2
A language of the Southern Group of Outer SubBranch of the Aryan Sub-Family
NOTE 3
, Mother tongues outside the Indian Sub-continent which have been printed in italics in the Table have
been arranged by the Linguist according to (a) mother tongue, of other Asian countries and (b) mother tongues
of each of·she other continents in the following manner:-
bther Asian countries
Europe
NOTE 4
Arabic/Arbi
Cey lonese JSimeluJSinghalese
Javanese/Java
Malai/Mala y /Mala ya/Malayan
English
The following mother tongues which appear in the table have been found unclassifiable by the Linguist for want of any dependable information on them so fa~:-
Kavara
170
NOTE 5
Column 2 shows variant -spellings or forms of mother tongl:e returns which are rationalized to the names given against them in column 1.
Rationalized forms of names of mother tongues as li~ted in Table C-V
Gujarati Kachchhi Kannada Kashmiri Konkani
Mar".thi Nepali Oriya Saurashtra UrdU:
25/328-22
Variant fo!'ms of the names of mother tongues recorded during enumeration and/or trans
cription
2
Gujarathi, Gujarathy Cuchi, Cutch, Cutchi, Kachi, Katch, Katchi, Kuchi Canedian, Canarese Kashrr:eri Cogani, Konganam, Konkini Maharash tra Nepalese. Oryiya Sawrashtra, Sowrashtra Urudu
171
c-v MOTHER TONGUE
Palghat district r- -"---------_. -~ ------------.
Total Rural Urban ( -A
~---- r-- -. Mother tongue Persons Males Females Persons Males Females Persons Males Females
2 3 4 5 6 7 8 9 10
1 Arabic/Arbi 109 48 61 94 45 49 15 3 12
2 Bengali 2 2 2 2
3 Ceylonese / Sirnelu / Singhalese 2 1 2 I
4 English 104 65 39 24 17 7 80 48 32
5 Gujarati 115 62 53 7 3 4 108 59 49
6 Hindi 992 525 467 746 389 357 246 136 110
7 Javanese/Java
8 Kachchhi 10 2 8 1O 2 8
9 Kannada 4,995 2,468 2,527 3,981 1,996 1,985 1,014 472 512
10 Kashmiri 3 3 2 2
11* Kavara 36 19 17 36 19 17
12t Konkani 252 184 68 93 55 38 159 129 3a
13
14
15
16
17
18
19
20
21
22
23
Malai/Malay/Malaya/Malayan 27 5 22 27 5 22
Malayalam 1,579,427 754,709 824,718 1,452,431 691,070 761,361 126,996 63,639 63,357
Marathi 12O 55 65 70 34 36 50 21 29
Nepali 13 11 2 13 II 2
Oriya 1 1
Punjabi 5 4 I 5 4 '\
Saurashtra 5 3 2 5 3 2
Tamil 166,075 81,640 84,435 127,450 63,836 63,614 38,625 17,804 20,821
Telugu 22,788 11,242 11,546 19,044 9,442 9,602 3,744 1,800 1,944
Tulu 119 56 63 73 35 38 46 21 25
Urdu 1,365 641 724 652 305 347 713 336 377
Note :- (i) Mother tongues printed in italics belong to countries outside the Indian Continent
(ii) Asterisk (.) means that the mother tongue is uncla~,sified in the Linguistic Survey of India
(iii) Dagger ( t ) denotes that the mother tongue though c1a98ified in Linguistic Survey of India is either tentatively reclassified or considered unclassifiable by the Linguist
172
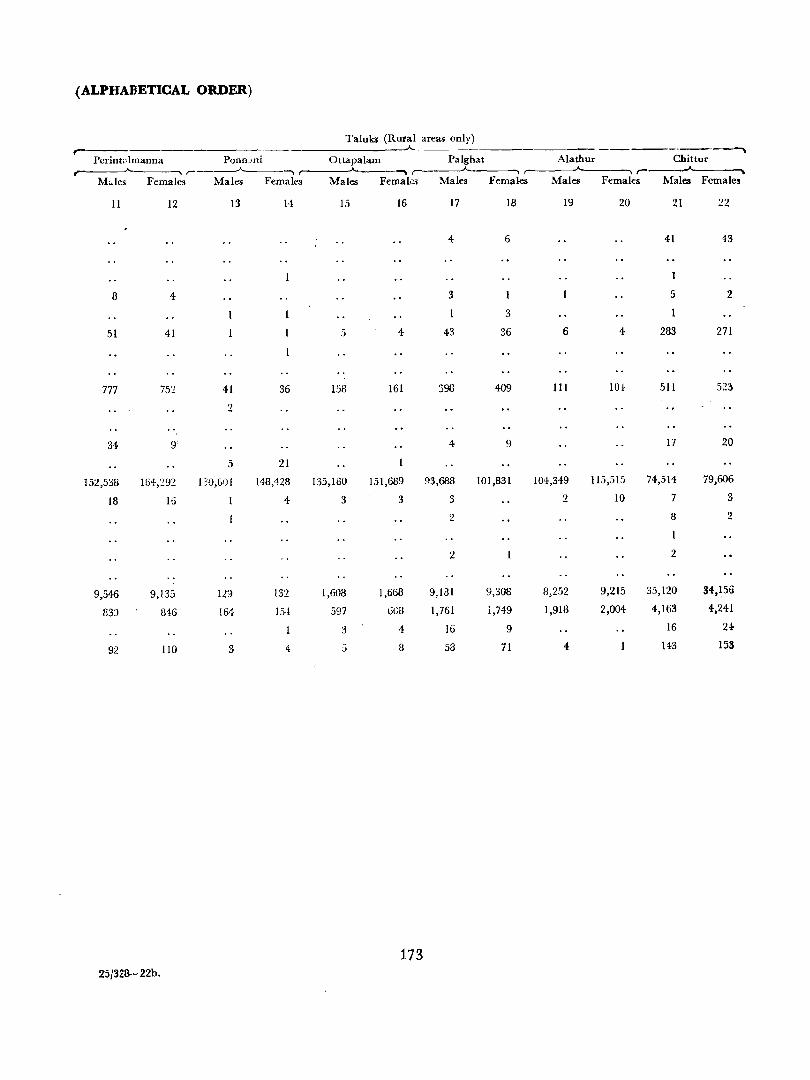
(ALPHABETICAL ORDER)
r--Perint,· Imanna
------_--~ Alathur Chittur PonnJni _--_Jo----.. ,------'-----, r------"----......
Females Males Females M .. les
,-.. ___ --' ___ -.. ,.-___ ..J-. ""'
Females Males Females Males
11 12 13 19 20 21 22
41 43
8 4 3 5 2
3
51 41 5 4 43 36 6 4 283 271
777 752 41 36 158 161 598 409 111 lOt 511 52l
2
_.
34 9: 4 9 17 20
5 21
152,538 164,:292 130,(1)1 148,428 135,ISO 151,689 93,688 101,831 104,349 115,515 74,514 79,606
18 IG 4 3 3 3 2 10 7 3
2 8 2
I
2 2
9,546 9,135 129 132 1,608 1,668 9,181 9,308 8,252 9,215 35,120 34,156
833 846 164 154 597 6G8 1,761 i,749 1,918 2,004 4,163 4-,241
::I 1, 16 9 16 24-
92 110 3 4- 5 8 58 71 4- 143 153
173 25/328-- 22b.

c. VII RELIGION
Fly-leaf
'The distribution of population by sex under different religions is given in thi~ table. In the table the figures of six major religions in India have been
175
shown. This table corre::ponds to table D-II Religion
of 1951 Census.
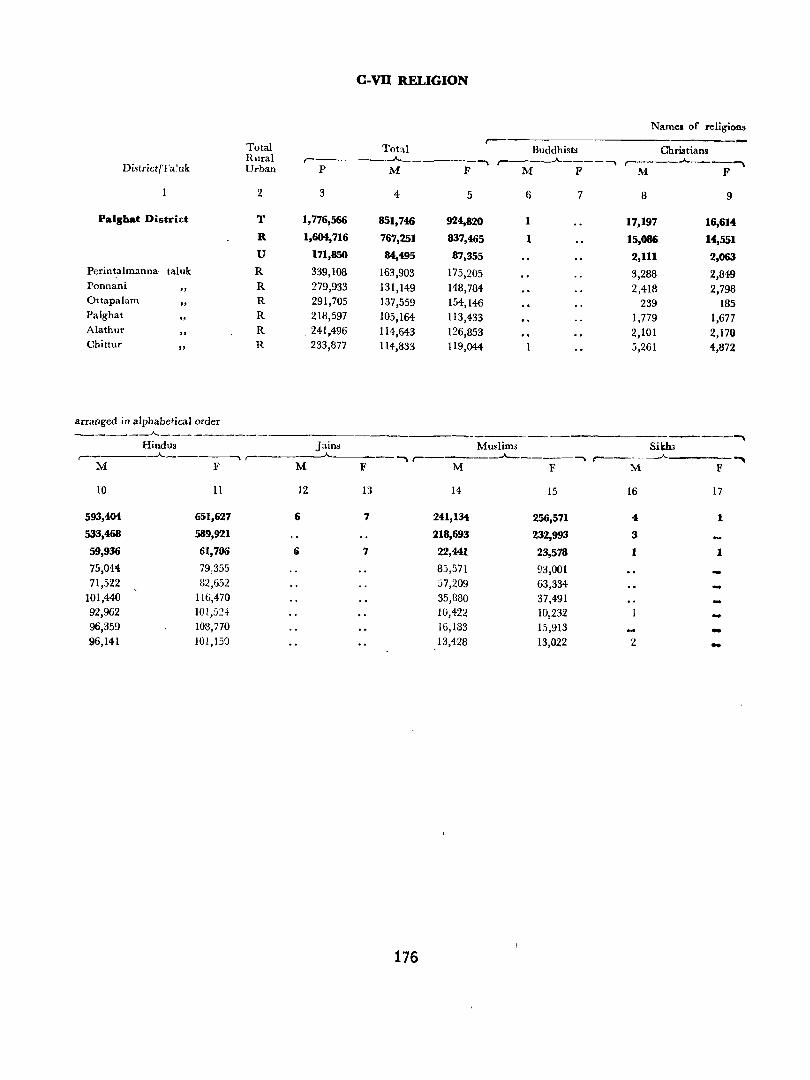
c-vn RELIGION
Names of religions
Total r----
Toted Buddhists Christians Rural r------"--
"""' ~ ____ ..A. ____ """, ,..--___ .,A._ ___ '""\
District/Ta'uk Urban P M F M F M F
2 3 4 5 6 7 8 9
Palghat District T 1,776,566 851,746 924,820 1 17,197 16,614 R 1,604,716 767,251 837,465 1 15,086 14,551
U 171,850 84,495 87,355 2,111 2,063 Perintalmanna, tal uk R 339,108 163,903 175,205 3,288 2,849 I'onnani
" R 279,933 131,149 148,784 2,418 2,798 Ottapalam
" R 291,705 137,559 154,146 239 185
Palghat " R 218,597 105,164 113,433 1,779 1,677
Alathur R . 241,496 114,643 126,853 2,101 2,170 Chittur
" R 233,877 114,833 119,044 5,261 4,872
arranged in alphabetical order ______ A.. ----_._-,.
Hindus Jains Muslims Sikh:; ,-- --A. r--
-.. ~ _____ .,A._ ____ """, r---.---"-----.. M F M F M F M F
10 11 12 13 14 15 16 17
593,404 651,627 6 7 241,134 256,571 4 1
533,468 589,921 218,693 232,993 3
59,936 61,706 6 7 22,441 23,578 I 1
75,044: 79,355 85,571 93,001 71,522 82,652 57,209 63,334
101,440 116,470 35,880 37,491 92,962 101,5::1- 10,422 10,232 -96,359 108,770 16,133 15,913 -96,141 101,15G 13,428 13,022 2 -
176
c-vm SCHEDULED CASTES AND SCHEDULED TRIBES
Fly-leaf
1. This table is prepared in two paxts, Part A d.ealing with Scheduled Caste populatioa and Part B dealing with Scheduled Tribe population. These give the sex-wi,e distribution of Scheduled Castes and S.cheduled Tribes into literates ;:;.nd illiterates and aiso into workers in the nine industrial categories and non-
171
workers for total, rural and urban areas of the district and for rural areas by taluks.
2. The correspondin_3" Table of 1951 (Table D-III Scheduled Castes and Scheduled Tribe;;;) showl only the popula:ion of Scheduled Castes and Schedul. ed Tribes without their livelihood pattern.
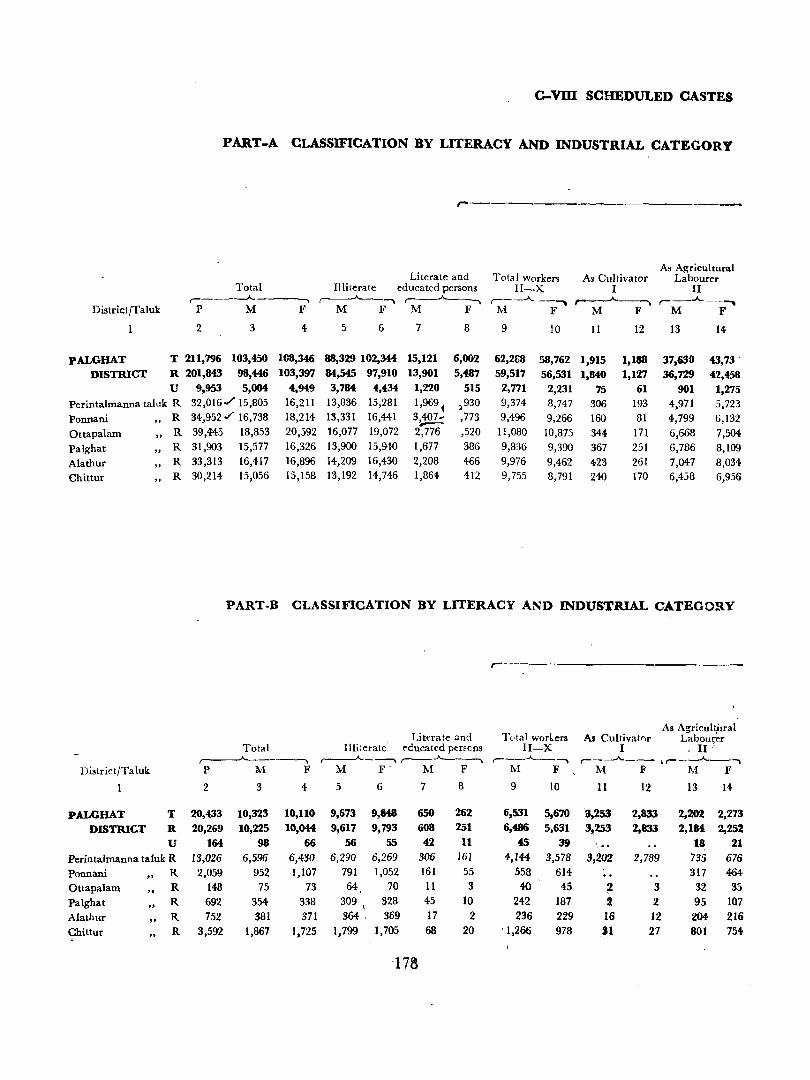
e-VIn SCHEDULED CASTES
PART-A CLASSIFICATION BY LITERACY AND INDUSTRIAL CATEGORY
Literate and Total workcrs As Cultivator As Agricultural
Labourer Total Illiterate educated persons II-X I II
,- --, ~ r--~ ,----"---'""'\ ,---A---., ,---"--,"",\ DistrictfTaluk p M F M F M F :M F M F M F
2 3 4 5 6 7 8 9 10 11 12 13 14-
PALGHAT T 211,796 103,450 100,346 88,329 102,344 15,121 6,002 62,288 58,762 1,915 1,188 37,63l) 43,73' DISTRICT R 201,843 98,4:46 103,397 84,545 97,910 13,901 5,487 59,517 56,531 1,840 1,127 36,729 42,458
U 9,953 5,004 4,949 3,784 4,434 1,220 515 2,771 2,231 75 61 901 1,275 Perintalmanna taluk R 32,016./ 15,805 16,211 13,836 15,281 1,969 ~ )930 9,374 8,747 306 193 4,971 5,723 Ponnani R 34,952./ 16,738 18,214 13,331 16,441 3407.- ,773 9,496 9,266 160 81 4,799 6,132 :.--Ottapalam "
R 39,445 18,853 20,592 16,077 19,072 2,776 ,520 11,080 10,875 344- 171 6,668 7,504 Palghat "
R 31,903 15,577 16,326 13,900 15,940 1,677 386 9,836 9,390 367 251 6,786 8,109
Alathur " R 33,313 16,417 16,896 14,209 16,430 2,208 466 9,976 9,462 423 261 7,047 8,034
Chittur " R 30,214 15,056 15,158 13,192 14,746 1,864 412 9,755 8,791 240 170 6,458 6,956
PART-B CLASSIFICATION BY LITERACY AND INDUSTRIAL CATEGORY
,--------------'
Literate and Tutal workers As Agricu1t,ura1
As Cultivator Laboll~r Total Illiterate ('ducated perEcns II-X I - II I
,-----A----------.. ,---A.-~ r--- ,..-_--A--"""" r------A.--lr------'---. DistrictfTa luk P M F M F M F M F M F M F
2 3 4 5 6 7 8 9 10 11 12 13 14
PALGHAT T 20,433 10,323 10,110 9,673 9,848 650 262 6,531 5,670 a,253 2,833 2,202 2,273
DISTRICT R 20,269 10,225 10,044 9,617 9,793 608 251 6,486 5,631 :J~253 2,833 2,184. 2,2~Z
U 164 98 66 56 55 42 11 4S 39 18 21 Perintalmanna taluk R 13,026 6,596 6,430 6,290 6,269 306 161 4-,144- 3,578 3,20% 2,789 735 676 Ponnani
" R 2,059 952 1,107 791 1,052 161 55 558 614 317 464
Ottapalam .. R 148 75 73 64 70 11 3 40 45 ~ 3 32 35
Palghat "
R 692 354- 338 309 \ 328 45 10 242 187 2 2 95 107
Alathur " R 752 381 371 364 , 369 17 2 236 229 16 12 204- 216
Chittur R 3,592 1,867 1,725 1,799 1,705 68 20 ' 1,266 978 11 27 801 754-
-178
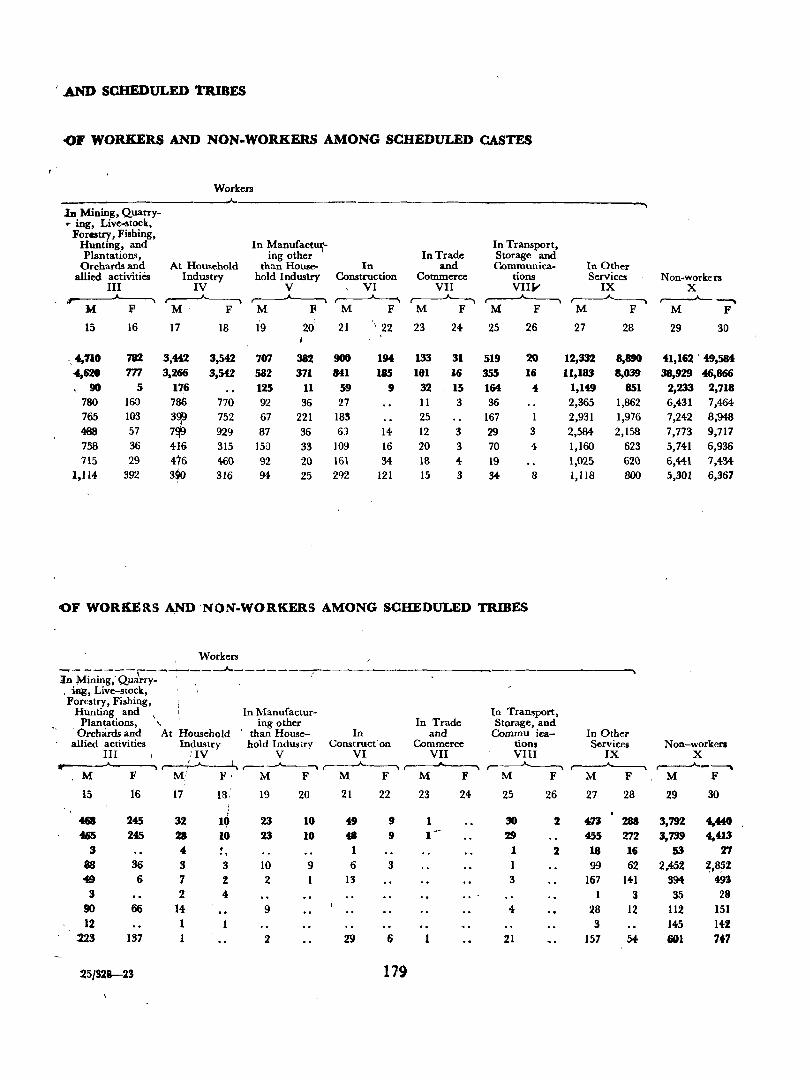
, .AND SCHEDULED TRIBES
<OF WORKERS AND NON·WORKERS AMONG SCHEDULED CASTES
Workers ---"-
111 Mining, Quarry-... ing, Live-stock,
Forestry, Fishing, In Manufactwi-Hunting, and In Transport,
Plantations, ing other In Trade Storage and Orchards and At Household than House- In and Communica- In Other
allied actiVities Industry hold Industry Construction Commerce tions Services Non-workers III IV V VI VII VIIY IX X ~ ~ ~ ,...-----A-----~ ~ r-----"-----, r----A-~
M F M, F M ~ M F M F M F M F M F
15 16 17 18 19 26 21 ' 22 23 24- 25 26 27 28 29 30
\ ~710 712 3,442 3,542 707 382 900 194 133 31 519 20 12,332 8,890 41,162' 49,584 -4,620 m 3,266' 3,542 582 371 841 185 191 16 355 1(1 11,183 8,039 38,929 4G,B66 , 90 5 176 125 11 59 9 32 15 164 4 1,149 851 2,233 2,718
780 160 78/> 770 92 36 27 11 3 36 2,365 1,862 6,431 7,464 765 103 3~ 752 67 221 18~ 25 167 2,931 1,976 7,242 8;948 488 57 7!f9 929 87 36 6} 14 12 3 29 3 2,584 2,158 7,773 9,717 758 36 416 315 15i) 33 109 16 20 3 70 4 1,160 623 5,741 6,936 715 29 476 460 92 20 16\ 34- 18 4- 19 1,025 620 6,441 7,434-
1,114 392 390 316 94 25 292 121 15 3 34 8 1,1l8 800 5,301 6,367
,()F WORKERS ~ NON-WORKERS AMONG SCHEDULED TRIBES
Workers _-------__ 4-__ ~ ________
1n Mining,'Qua'rry- '" .' , lng, Live-stock, Forestry, Fishing,
Hunting and , In Manufactur- In Transport, Plantations, ,
'At Household ing other In Trade Storage, and
Orchards and ' than House- In and Commu iea- In Other allied activities Industry hold Industry Construct -on Commerce tions Services Non-workers
III I iIV V VI VII VIII IX X ~"'"'"\ ~ -------'--"'"'"\ ------'------, ....------"'-- ,-__...._______,
~ ,------J'--~ M F M/ }<' , M F M F M F M F M F M F
15 16 17 18 19 20 21 22 23 24 25 26 27 28 29 30 I
468 245 32 I
10 23 10 49 9 1 30 2 4:73 288 3,792 4,440 465 245 28 10 23 10 48 9 1-- 29 455 272 3,739 ~g3
3 " • 1 1 2 18 16 53 'n . , 88 36 3 3 10 9 6 3 99 62 2.45% 2,852 .. 6 7 % 2 13 3 167 141 394 49l 3 2 4 1 3 35 211
90 66 14 9 4- 28 12 112 151 12 1 3 145 14%
223 137 2 29 6 21 157 54 601 7+7
25/328-23 179
D-MIGRATION TABLES
NOTE
Seven tables in this series present the migration trends analysed on the repor,s of the 1961 Census. They are-
D-I
D-II
D·III
D-III A
D-IV
D·V
D-VI
Non-Indian Nationals
Place of birth
Migrants classified by place of birth and duration 0 residence in place of enumeration'
Migrants from other States and outside India (less than 5 years of duration) classified by age-grouFs.
Migrants in cities classified by sex, broad age-groups, educational levels and in case of workers also by occupationfll divisions and groups
Cities showing population born locally, migrants from rural areas and migrants from other towns and cities
Distribution of industrial categories of workers and non-workers by place of birth
All the' above tables are published in "Volume VII-Kerala State-Part II C-Cultural and Migration Tables".
E-HOUSING AND ESTABLISHMENT TABLES
NOTE
The data for these tables have been compiled from the Houselists prepared for the 1961 CenSus. The Housing and Establishment Tables are pre~ented in the follEn~ing five tables :-
E-I
E-II
E-III
E-IV
E-V
Census houses and the uses to which they are put
Tenure status of sample census households living in census houses used wholly or partly as dwelling (based on 20 % sample)
I
Census houses used as factories and workshops classified by industry~ power and no power Uled and size of employment I,
Distribution of sample households living in census houses used Whol~ or partly as dwelling by predominant material of wall and predominant material of roof (~ed on 20 % sample)
Sample households classified by number of members and number of rO()ms occupied (based on 20 % sample)
All the above tables are published in" Volume VII-Kerala State-Part IV A & ~Report on Housing and Establishment Tables".
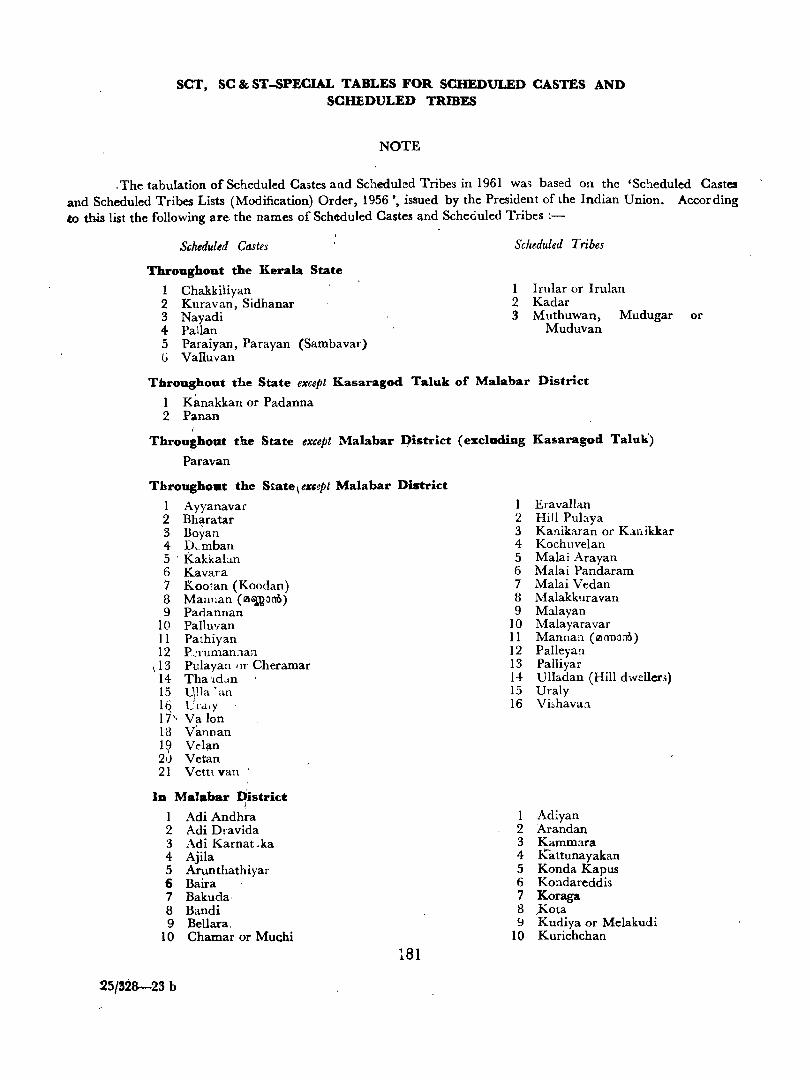
SCT, SC & ST-SPECIAL TABLES FOR SCHEDULED CASTES AND SCHEDULED TRmES
NOTE
. The tabulation of Scheduled Castes and Sch~duled Tribes in 1961 wa, based on the 'Scheduled Castes and Scheduled Tribes Lists (Modification) Order, 1956', issued by the President of the Indian Union. According to this list the following are the names of Sch¢duled Castes and Scheduled Tribes ;-
Scheduled Castes
Throughout the Kerala State
1 Chakkiliyan 2 Kuravan, Sidhanar 3 Nayadi 4 Pallan 5 Paraiyan, Parayan (Sambavar) G Vanuvan
Scheduled Tribes
1 Irular or Irulan 2 Kadar 3 Muthuwan, Mudugar or
Muduvan
Throughout the State except Kasaragod Taluk of Malabar District
1 Kanakkan or Padanna 2 Panan
Throu~hout the State except Malabar Qistrict (excluding Kasaragod Taluk)
Paravan
Throughoat the State \ eXlgpt Malabar District
1 Ayyanavar 2 Bharatar 3 Boyan 4 D"mban 5 ' Kakkabn 6 Kavara 7 Kootan (Koodan) 8 Mannan (11lIiillFloo) 9 Parlannan
10 Pallu'lan 11 Pathiyan 12 P..;ruman:1a>1
\ 13 Pulayan Ilr Cheramar 14 Tha Idelll
15 Ulla' an 1~ l;".rdlY 17', Va Ion 13 Vannan l~ Vdan 21) Vet'an 21 Veht van
In MaYabar District I
1 Adi Andhra 2 Adi Dr-avida 3 Adi Karnacka 4 Ajila 5 Arunthathiyar 6 Baira 7 Bakuda 8 Bandi 9 Bellara.
10 Chamar or Muchi
25/328-23 b
181
1 Eravallan 2 Hill Pulaya 3 Kanikaran or K3.flikkar 4 Kochuvelan 5 Malai Arayan 6 Malai Pandaram 7 Malai Vedan 8 Malakkuravan 9 Malavan
10 Malayaravar 11 Mannan (I1ltTOJoo) 12 Palleya!! 13 Palliyar 14 Ulladan (Hill dwellen) 15 Uraly 16 Vi:,havaa
1 Adiyan 2 Arandan 3 Kammara 4 K'attunayakan 5 Konda Kapus 6 Kondareddis 7 Koraga 8 Aota 9 Kudiya or Melakudi
10 Kurichchan
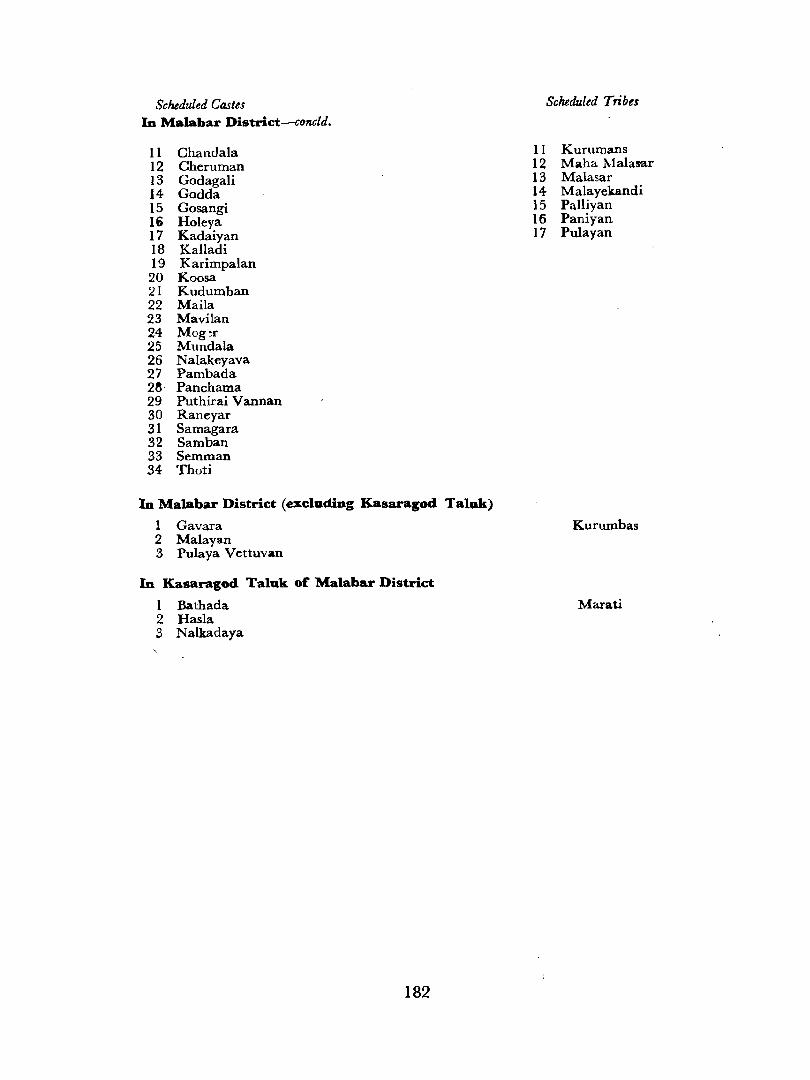
Scheduled Castes In Malabar District-concld.
11 Chand ala 12 Cheruman 13 Godagali 14 Godda 15 Gosangi 16 Holeya 17 Kadaiyan 18 Kalladi 19 Karimpalan 20 Koosa 21 Kudumban 22 Maila 23 Mavilan 24 Mog~r 25 Mundala 26 Nalakeyava 27 Pambada 28 Panchama 29 Puthirai Vannan 30 Raneyar 31 Samagara 32 Samban 33 Semman 34 Thoti
In Malabar District (excluding Kasaragod Tala)
1 Gavara 2 Malayan 3 Pulaya Vettuvan
In Kasaragod. Taluk of Malabar District
1 Bathada 2 Hasla 3 Nalkadaya
182
Scheduled Tribes
II Kurumans 12 Maha.M alasar 13 Malasar 14 Malayekandi 15 Palliyan 16 Paniyan 17 Pulayan
Kurumbas
Marati
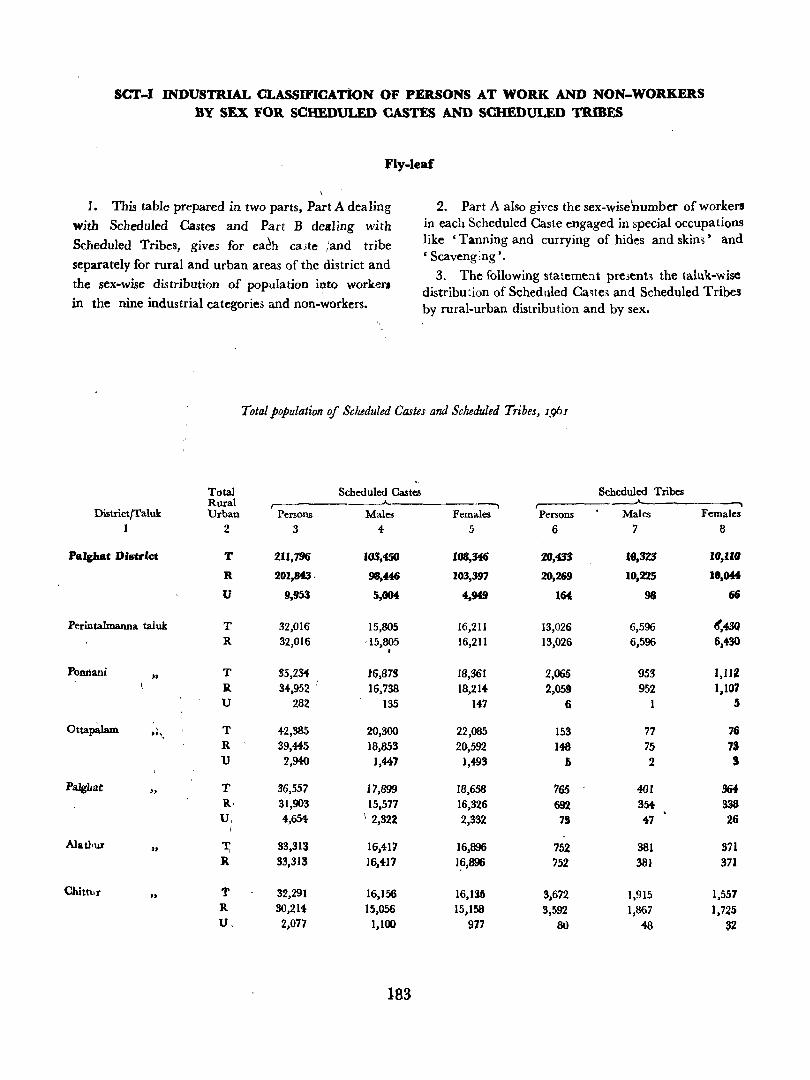
SCI'-I INDUSTRIAL CLASSIFICATlON OF PERSONS AT WORK AND NON-WORKERS BY SEX FOR SCHEDULED CASTES AND SCHEDULED TRIBES
Fly-leaf
\
1. This table prepared in two parts, Part A dealing
with Scheduled Castes and Part B dealing with
Scheduled Tribes, gives for eaeh ca3te ,'and tribe
separately for rural and urban areas of the district and
the sex-wise distribution of population into workers
in the nine industrial categories and non-.workers.
2. Part A also gives the sex-wise number of workers in each Scheduled Caste engaged in special occupations like 'Tanning and currying of hides and skim' and , Scaveng:ng'.
3. The following statement pre3ent, the taluk-wise distribu~ion of Scheduled Ca'!tes and Scheduled Tribes by rural-urban distribution and by sex.
Total population of Scheduled Castes and Scheduled Tribes, 1.961
Total Scheduled Castes Scheduled Tribes Rural ___.A.. ---.,
District/Taluk Urban Persons Males Females Persons Males Females 1 2 3 4- 5 6 7 8
hlghat Di.crict T 2U,796 163,450 108,346 2(I,m 16,m IO,llQ
R 201,843. 98,446 103,397 20,269 10,225 1.,044
U 9,933 5,004 4,949 164 98 66
Perintalrnanna taluk T 32,016 15,805 16,211 13,026 6,596 ~4SQ R 32,016 ' 15,805 16,211 13,026 6,596 6,430 ,
Ponnani .. T 35,2~ t6,87S 18,361 2,065 953 J,lJ2 .R. 34,952 f 16,738 18,214 2,059 952 1.107 U 282 135 147 6 5
Otta~ \ T 42,385 20,300 22,085 153 77 7& »,
R 39,445 18,853 20,592 148 75 7J U 2,940 1,447 1,493 & 2 S
Palghat " T 36,557 17,899 18,658 765 40J 364
R· 31,903 15,577 16,326 692 354 sas U,
i 4,65i \ 2,322 2,332 7S 47 26
Alatl'ur .. "I; 33,313 16,417 16,896 752 381 371 It 33,313 ]6,4]7 ]~,896 752 381 371
Chittt,r .. l' 32,291 16,156 16,135 3,672 1,915 1,557 R 30,211- 15,056 15,158 3,592 1,867 ],725 U, 2,077 1.100 917 80 48 ~2
183
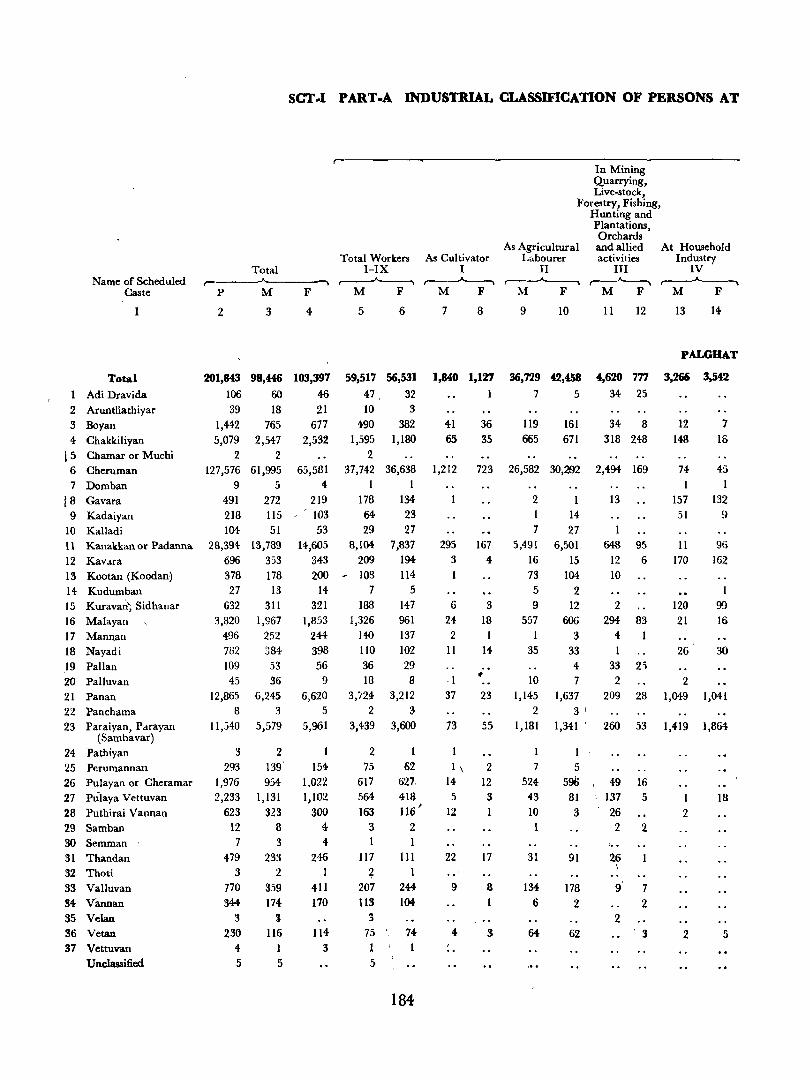
Name of Scheduled Caste
Total
1 Adi Dravida 2 Aruntliathiyar 3 Boyan 4 Chakkiliyan
15 Chamar or Muchi 6 Cheruman 7 Domhan
! 8 Gavara 9 Kadaiyan
10 Kalladi 11 Kanakkan or Padanna 12 Kav.lra 13 Kootan (Koodan~ 14 Kudumban 15 Kuravan; Sidhanar 16 Malayan 17 Mannan 18 Nayadi 19 Pallan 20 Palluvan 21 Panan 22 Panchama 23 Paraiyan, Parayan
(Sambavar) 24 Pathiyan 25 Perumannan 26 Pulayan or Cheramar 27 Pulaya Vettuvan 28 Puthirai Vannan 29 Samban 30 Semman 31 Thandan 32 Thoti 33 Valluvan 54 Varman 35 Velan 56 Vetan 37 Vettuvan
Unclassified
SCT .. I PART-A INDUSTRIAL CLASSmCATION OF PERSONS AT
Total Workers As Cultivator Total I-IX I
r-------A-------~ r-----"------. ~ p M
3
F
4
M F M F
2 5 6
201,843 98,446 103,397 59,517 56,531
106 60 46 47 . 32
39 18 21 10 3 1,442 5,079
2
765 2,547
2 127,576 61,995
9 5 491 272
677 2,532
65,581 4
219 218 115.·' 103
490 1,595
2 37,742
1 178
64 29 104 51 53
28,394 13,789 696 353 378 178 27 13
632 311 3,820 1,967
496 252 782 384 109 53 45 36
12,865 8
11,540
3 293
1,976
2,233
623 12 7
479
3 770 344
3
6,245 3
5,579
2 139'
954 1,131
323 8 3
233
14,605 8,104 343 209 200 ' 103
14 7 321 188
1,853 1,326 244 140
398 110 56 36
9 18
6,620 5
5,961
154 1,022 1,102
300 4 4
246 1
411 170
3,12~
2 3,439
2 75
617
564 163
3 1
117
~ 207 113
382 1,180
36,638 1
134 23 27
7,837 194 114
5 147 961 137
102 29 8
3,212 3
3,600
62 627, 418 116'
2
111 1
244 104
236 4 5
2 359 174
l 116
1 5
114 3
75' 74,
1 5
184
7 8
1,840 1,127
1
41 36
65 35
1,212 723
295 3 I
6 24
2 11
37
73
I \ 14 5
12
22
9
4
167
4
3 18
1 14
23
55
2 12
3 1
17
s
3
In Mining Quarrying, Live-stock,
Forestry, Fishing, Hunting and Plantations, Orchards and allied activities
As Agricultural Labourer
II ,------A-----.,
M F
9 10
36,729 42,458 7 5
119 161 665 671
26,582 30,292
2 14
7 27 5,491
16
73 5 9
557
1 35
10 1,145
2 1,181
7 524-
43
10
31
134 6
6,501 15
104
2 12
606
3 33 4
7 1,637
3' 1,341
5 596
81
3
91
178
2
62
III ,-----A---.,
M F
II 12
4,620 777 34 25
34 8 318 248
2,494 169
13
648 95
12 6 10
2 294 83
4
1 33 21
2 209 28
260 53
49 16 137 5
26 2 2
.. , 9' 7
2 2
At Household Industry
IV ~
M F
13 14
PALGHAT
3,266 3,542
12 7
148 16
74 45
I I 157 132 51 !)
11
170
120 21
26
2 1,049
1,419
1
2
2
96
162
99
16
30
1,041
1,864
18
5
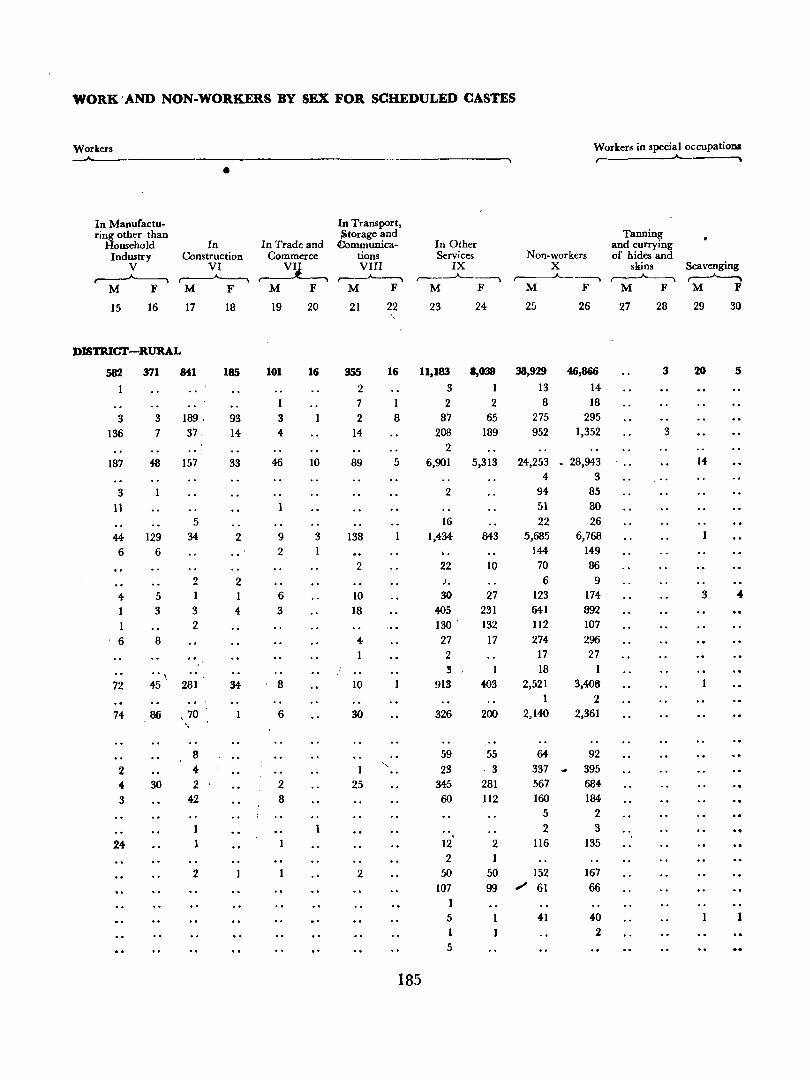
WORK 'AND NON·WORKERS BY SEX FOR SCHEDULED CASTES
Workers Workers in special occupatioDi
•
In Manufactu- In Transport, ring other than
In Trade and :&torage and Tanning
Household In Communica- In Other and currying Industry Construction Commerce tions Services Non-workers of hides and
V VI ~ VIII IX X skins Scavenging ~ ~ ,.----A------, ,.-----A------., r-----"-------.. ..--~ ,---"------,
M F M F M F M F M F M F M F M F
15 16 17 18 19 20 21 22 23 24 25 26 27 28 29 30
DISTRlGr-RURAL
582 371 841 185 101 16 355 16 11,183 8,039 38,929 46,866 3 20 5
2 3 1 13 14 1 7 2 2 8 18
3 3 189 93 3 2 8 87 65 275 -295
136 7 37, 14 4 14 208 189 952 1,352 3 2
187 48 157 33 46 10 89 5 6,901 5,313 24,253 - 28,943 .. 14-4- 3
3 2 94 85 11 51 80
5 16 22 26 44 129 34 2 9 3 138 1,434 843 5,685 6,768 6 6 2 .. 144 149
2 22 10 70 86 2, 2 .1. 6 9
4- 5 1 6 10 30 27 123 174 3 4
1 3 3 4 3 18 405 231 641 892 2 130 ' 132 112 107
6 8 4- 27 17 274 296 2 17 27 3 18
\ 72 45 281 34 8 10 913 403 2,521 3,408
1 2 74- 86 ,70 6 30 326 200 2,140 2,361
" .. S 59 55 64 92
2 4- "- 23 - 3 337 395 4- 30 2 2 25 345 281 567 684 3 42 8 60 112 160 184
5 2 .. 2 3
24- 12 2 116 135 2
2 2 50 50 152 167 107 99 / 61 66
5 41 40 1 I 2 5
185
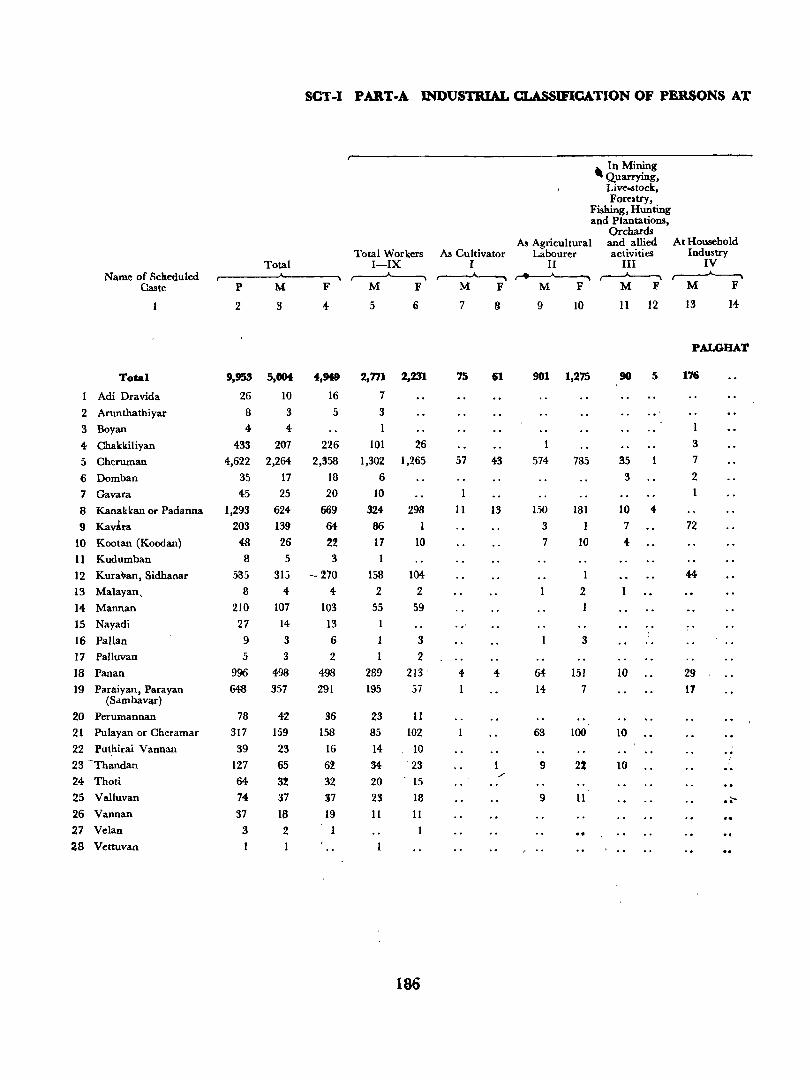
SCT-I P.Al\T-A INDUSTlUAL CLASSIFICATION OF PERSONS AT
,In Mining Quarrying, Live06tock, Forestry,
Fishing, Hunting and Plantations,
Orchards As Agricultural and allied At Household
Total Workers As Cultivator Labourer activities Industry Total I-IX I II III IV
Name of Scheduled ~ ~ ~ ~ ~ Caste P M F M F M F M F M F M F
2 3 4- 5 6 7 8 9 10 11 12 13 14
PALGHAT
Total 9,953 5,004 4,949 2,771 2,231 75 61 901 1,275 90 5 176
I Adi Dravida 26 10 16 7
2 Arunthathiyar 8 3 5 3 .. '
3 Boyan 4 4-
4 Chakki1iyan 433 207 226 101 26 3
5 Cheruman 4,622 2,264- 2,358 1,302 1,265 57 43 574 785 35 7
6 Domban 35 17 18 6 3 2
7 Gavara 45 25 20 10 I
8 Kanakkan or Padanna 1,293 624 669 324- 298 11 13 150 181 10 4
9 Kav'ra 203 139 64- 86 1 3 1 7 72 10 Kootan (Koodan) 48 26 22 17 10 7 10 4-
11 Kudumban 8 5 3 I
12 Kura{.an, Sidhanar 535 315 -270 158 104 44-
13 Malayan, 8 4 4- 2 2 2 14 Mannan 210 107 103 55 59 15 Nayadi 27 14 13 1 .,. 16 Pallan 9 3 6 1 3 3 17 PaJluvan 5 3 2 1 2 18 Panan 996 498 498 289 213 4 4- 64- 151 10 29
19 Paraiyan, Parayan 648 357 291 195 57 14 7 11 (Sdmbavar)
20 Perumannan 78 42 36 23 II
21 Pulayan or Cheramar 317 159 158 85 102 68 100 10 22 Puthirai Vannan 39 23 16 14 lO .. 23 Thandan 127 65 62 34- 23 9 2t 10
,
24 Thoti 64 3! 32 20 /
15 25 Valluvan 74- 37 37 23 18 9 11 .;-
26 Vannan 37 18 19 11 11
27 Velan 3 2 1
28 Vettuvan 1 ..
186
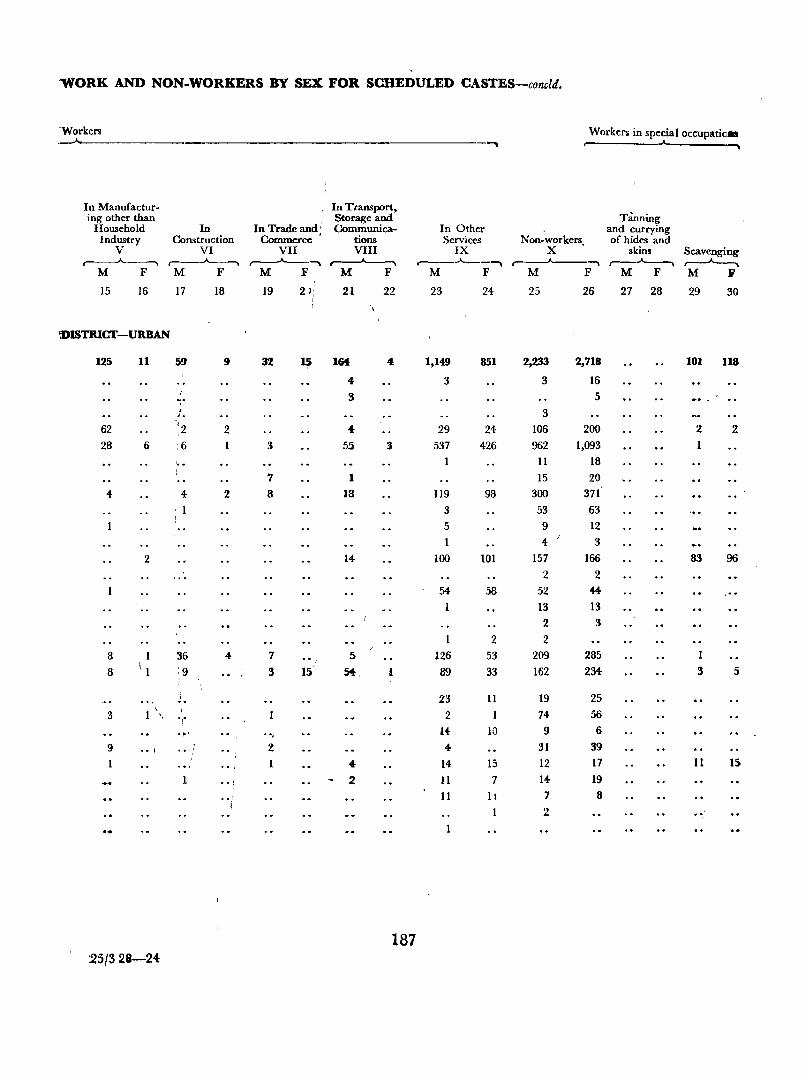
WORK AND NON·WORKERS BY SEX FOR SCHEDULED CASTES-concld.
·Workers ,__.A. _______ _ Workers in special occupaticDI
In Manufactur- , In Transport. ing other than
In Trade and; Storage and Tanning
Household In Communica- In Other and currying Industry Construction Commerce
, tions Services Non-workers. of hides and
V VI VII VIII IX X skins Scavenging ~ ~ r--"--"'"'\ ..---.A. __ ",",\
~'-"I r---~ r---'----. M F M F M F M F M F M F M F M i'
15 16 17 18 19 2) 21 22 23 24 25 26 27 28 29 30 \
:DISTRICT-URBAN
125 11 5' 9 32 ~ 1M 4 1,149 851 2,233 2,718 101 118
4- 3 3 16
". 3 5 I , 3 ,.
62 :2 2 • 29 24 106 200 2 2 28 6 .6 3 55 3 537 426 962 1,093
' .. 1 11 18 7 1 15 20
4- 4 2 8 18 119 98 300 371 . 1 3 53 63
5 9 12 1 4- 3
2 14- 100 101 157 166 83 96
1.'. 2 2 54- 58 52 44-
13 13 2 3
2 2 8 1 ;i6 4- 7 .. , 5 126 53 209 285 1
8 \ 1 :9 3 15 St, I 89 33 162 234 3 5
"
~. 23 11 19 25 \ i 74 56 3 1 '. .( 2
. ~' ", 14- 10 9 6
9 •• j 2 4- 31 39 ,
4- 14- 15 12 17 11 15 •• 1
l' . . ~ 2 11 7 14- 19 .. , 11 It 7 8
! 1 2 ..
. .:
187 '25/328-24
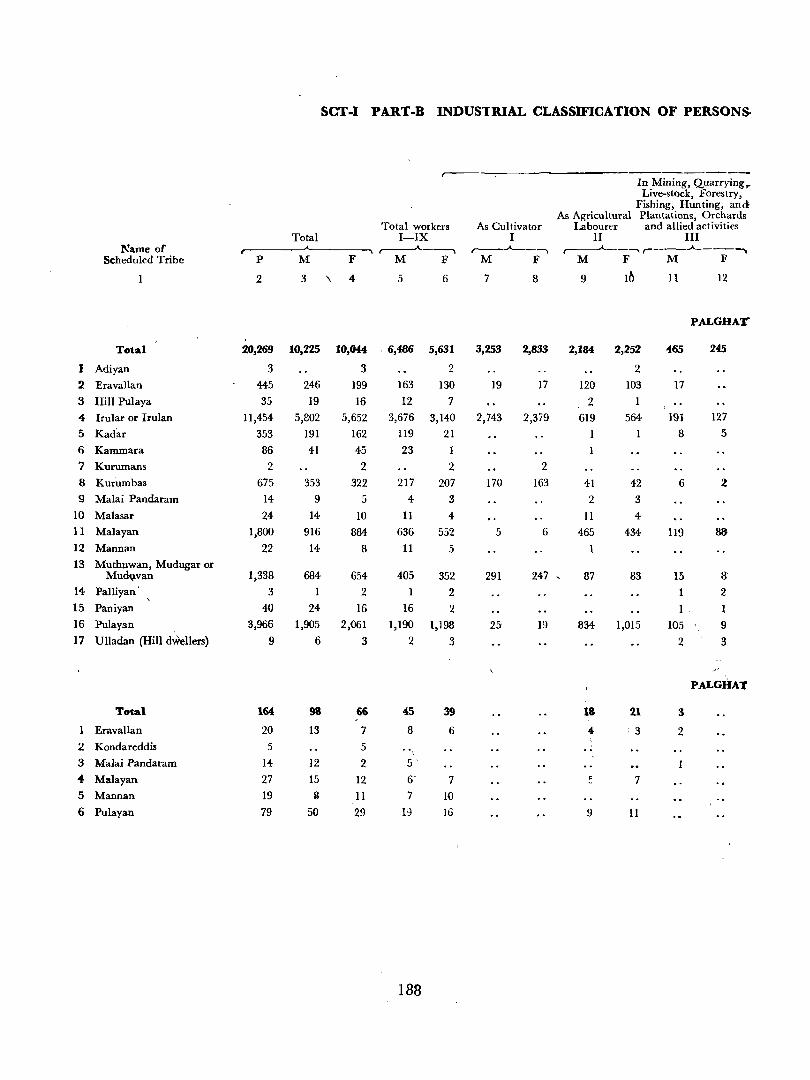
SCT-I PART-B INDUSTRIAL CLASSIFICATION OF PERSONS
r--In Mining, Quarrying,. Live-st()ck, Forestry,
Fishing, Hunting, and:
Total workers As Cultivator As Agricultural Plantations, Orchards
Labourer and allied activities Total I-IX I II III
Name of ,-----"----., ,--A---, ,.------A----, , ___ .A ____ ~
Scheduled Tribe P M F M F M F M F M F
- 1 2 3 \ 4 5 6 7 8 9 Ib 11 12
PALGHAT"
Total 20,269 10,225 10,044 6,486 5,631 3,253 2,833 2,184 2,252 465 245
I Adiyan 3 3 2 2 2 Eravallan 445 246 199 163 130 19 17 120 103 17 3 Hill Pulaya 35 19 16 12 7 2 1
4 lrular or Irulan 11,454 5,802 5,652 3,676 3,140 2,743 2,379 619 564 191 127 5 Kadar 353 191 162 119 21 1 8 5
6 Kammara 86 41 45 23 1 7 Kurumans 2 2 2 2 8 Kurumbas 675 353 322 217 207 170 163 41 42 6 2 9 Malai Pandaram 14 9 5 4 3 2 3
10 Malasar 24 14 10 II 4 11 4 11 Malayan 1,800 916 884 636 552 5 6 465 434 119 88
12 Mannan 22 14 8 11 5 13 Mutbuwan, Mudugar or
Mu~van 1,338 684 654 405 352 291 247 , 87 83 15 8 14 Palliyan', 3 1 2 1 2 1 2 15 Paniyan 40 24 16 16 2 1 , 16 Pulayan 3,966 1,905 2,061 1,190 1,198 25 19 834 1,015 105 9 17 Ulladan (Hill d*llers) 9 6 3 2 3 2 3
--,.;
PALGHAT
Total 164 98 66 45 39 18 21 3
1 Eravallan 20 13 7 8 6 4- :3 2 2 Kondareddis 5 5 ..
\
3 Malai Pandaram 14- 12 2 5 4- Malayan 27 15 12 6 7 5 7 5 Mannan 19 2 11 7 10 6 Pulayan 79 50 29 19 16 9 11
188
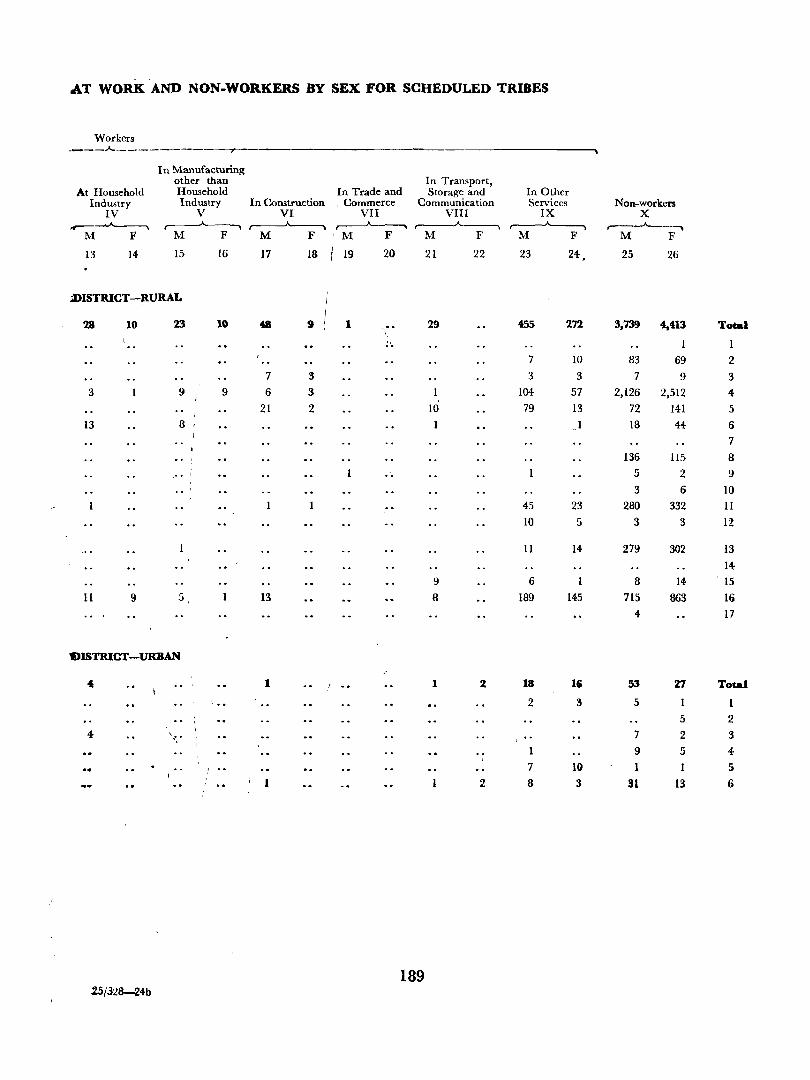
AT WORK. AND NON-WOR.KERS BY SEX FOR. SCHEDULED TRIBES
Workers ---.A.-----------r
In Manufacturing other than In Transport,
At Household Household In Trade and Storage and In Other Industry Industry In Construction f Commerce Communication Services Non-workers
IV V VI VII VIII IX X
-~ ~ ~ ~ ,---_A_----------, ,---~ ~
M F M F M F 'M F M F M F M F
14 15 16 17 18 I
19 20 21 22 23 24 25 13 ! 26 ,
.;DISTRICT-RURAL
28 10 23 10 48 9 1 .. 29 455 272 3,739 4,413 Total \
" 1 7 10 83 69 2
7 3 3 3 7 9 3 3 9 9 6 3 1 104 57 2,126 2,512 4
21 2 10 79 13 72 141 5 13 8 18 44- 6
7 136 115 8
00 5 2 9 3 6 10
45 23 280 332 II
10 5 3 3 12
11 14 279 302 13 14
9 6 8 14 ' 15 11 9 5, 13 8 189 145 715 863 16
4 17
IlISTRICT-URBAN
" 1 1 2 18 16 53 27 Total
, o. 2 3 5 1 5 2
4 '. 7 2 3
9 5 4
7 10 1 1 5
1 2 8 3 31 13 6
189 25j328-24b

SCT-ll AGE AND MARITAL STATUS FOR SCHEDULED CASTES AND SCHEDULED TRIBES
Fly-leaf
This table prepared in two parts, Part A dealing with Scheduled Castes and Part B dealing with Scheduled Tribes, gives sex-wise distribution of each Scheduled Caste and Scheduled Tribe by broa~
Age-groups
(i) 0-14 (ii) 15-44
(iii) 45 and above (iv) Age not stated
191
age-groups and marital status for the district. The age-groups and marital status followed in the table are given below:-
Marital status (i) Never married
(ii) Married (iii) Widowed (iv). Divorced or separated (v) Unspecified status
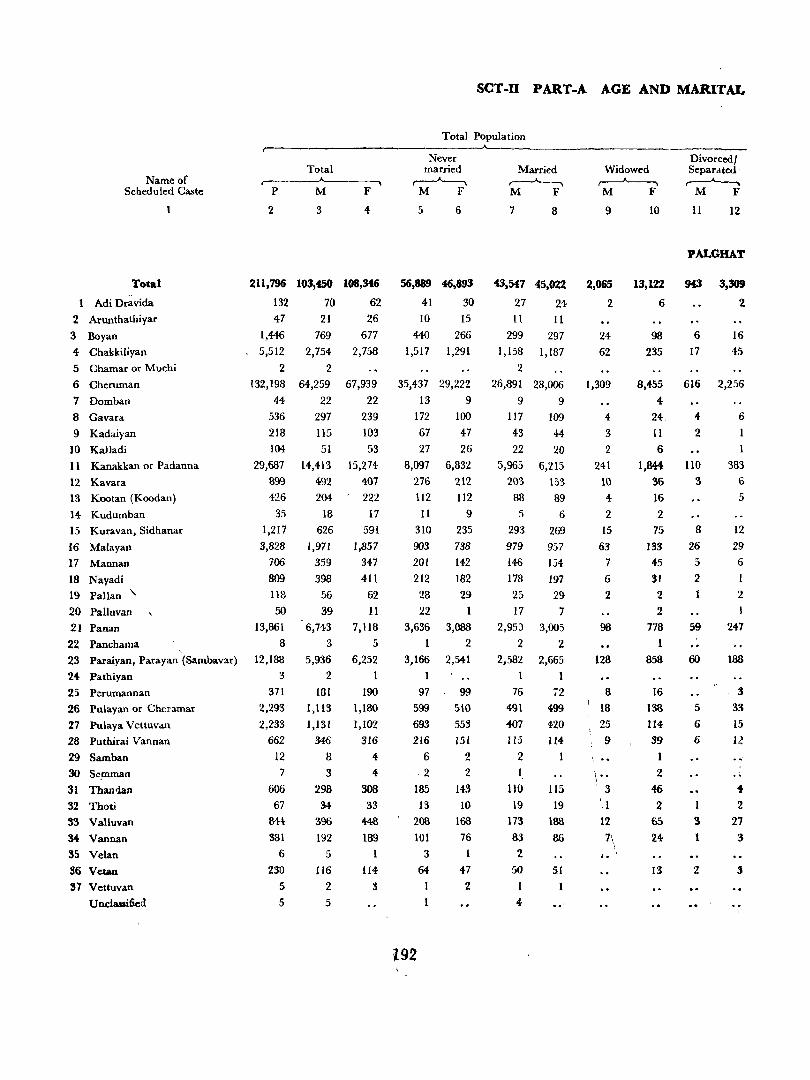
Name of Scheduled Caste
Total
1 Adi Dravida
2 Arunthathiyar
3 Boyan
4 Chakkiliyan
1
5 Chamar or Muchi
6 Cheruman
7 Dombaa
8 Gavara
9 Kadaiyan
10 Kalladi
11 Kanakkan or Padanna
12 Kavara
13 Kootan (Koodan)
14 Kudumban
15 Kuravan, Sidhanar
16 Malayan
17 Mannan
18 Nayadi
19 Pallan ' 20 Palluvan
21 Panan
22 Panchama , 23 Paraiyan, Parayan (Sambavar)
24 Pathiyan
25 Perumannan
26 Pulayan or Cheramar
27 Pulaya Vettuvan
28 Puthirai Van nan
29 Samban
30 Se!Jlman
31 Than1an 32 Thoti 33 VaUuvan
34 Vannan
35 Velan
S6 Vetan
37 Vettuvan
UncllWified
SCT-ll PART-A AGE AND MARITAL
Total Population r--.---------------------------A-------------
P
2
211,796
132
47
1,446
5,512
2 132,198
44
536
218
104
29,687
899
426
35
1,217
3,828
706 809
118
50
13,861
8 12,188
3
371
2,29'3
2,233 662
12
7
606
67
814
381 6
230 5
5
Total
M
3
103,450
70 21
769
2,754
2 64,259
22 297
115
51
14,413
492
204
18
626
1,971
359
398
56
39
6,743
3
5,936
2
131
l,ll3
1,131
346
8
3
298
34-
396
192
5
116
2
5
F
4
108,346
62
26 677
2,758
67,939
22 239
103
53
15,274 407 222
17 591
1,857
347
411
62 II
7,118
5
6,252
1
190
1,180
1,102
316
4
4
3GB 33
448
189
1I4 3
Never married ~
M F
5 6
56,889 46,893
41 30
10 15
440 266
1,517 1,291
35,437 29,222
13 9
172 100
67 47 27 26
8,097 6,832
276 212
112 112 11 9
310 235
903 738
201 142
212 182
28 29
22 1
3,636
1
3,166
I
97
599
693
216
6 \ 2
185
13
208
101
3
64
~92
3,088
2 2,541
99
510
553
15l
2
2
143
10
168 76
47
2
Married ~ M F
7 8
43,547 45,022
27 24
It 11
299 297
1,158 1,187
2 26,891 28,006
9 9 117 109
43 44 22 20
5,965 6,215
203 153
88 89
5 6
293 269 979 9.57
146 154
178 197
25 29
17 7 2,950
2
2,582 1
76
491
407 115
2 1
110 19
173 83
2
50
1
4
3,005
2
2,665
1
72
499
420
114
1
115
19
188
86
51
.. '
Widowed ,----A-----.. M F
9 10
2,065
2
24
62
1,309
4
3
2 241
10 4
2
15
63
7
6
2
98
128
8
18
25 9
1 ,..
\ .. , 3
1
12
..
13,122
6
98
235
8,455
4
24,
11 6
1,844
36
16
2
75
133
45
31
2
2 778
1
858
16
138
114 39
1
2
46 2
65
24
13
Divorcedl Separated ~
M F
11 12
PALGHAT
6
17
616
4-
2
110 3
8
26
5
2
59
60
5
6
6
I
S 1
2
3,309
2
16
45
2,256
6
1
383
6
5
12
29
6
I
2
247
188
3
33
15
U
4-2
21 3
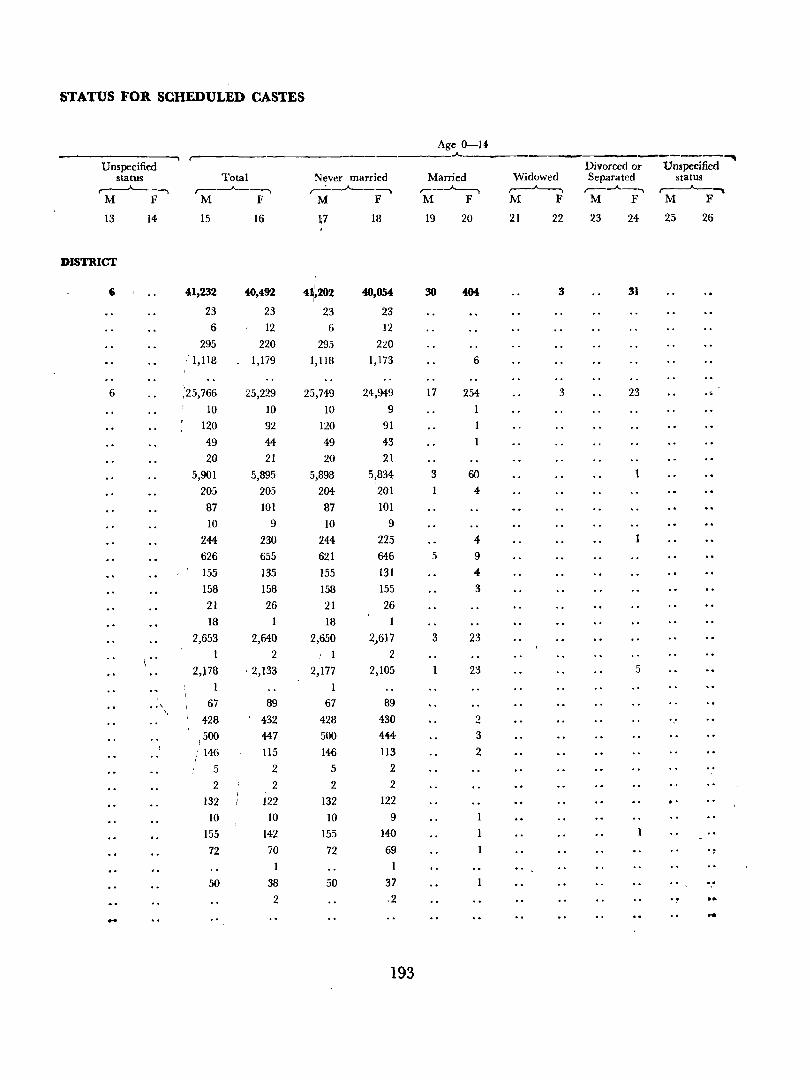
193
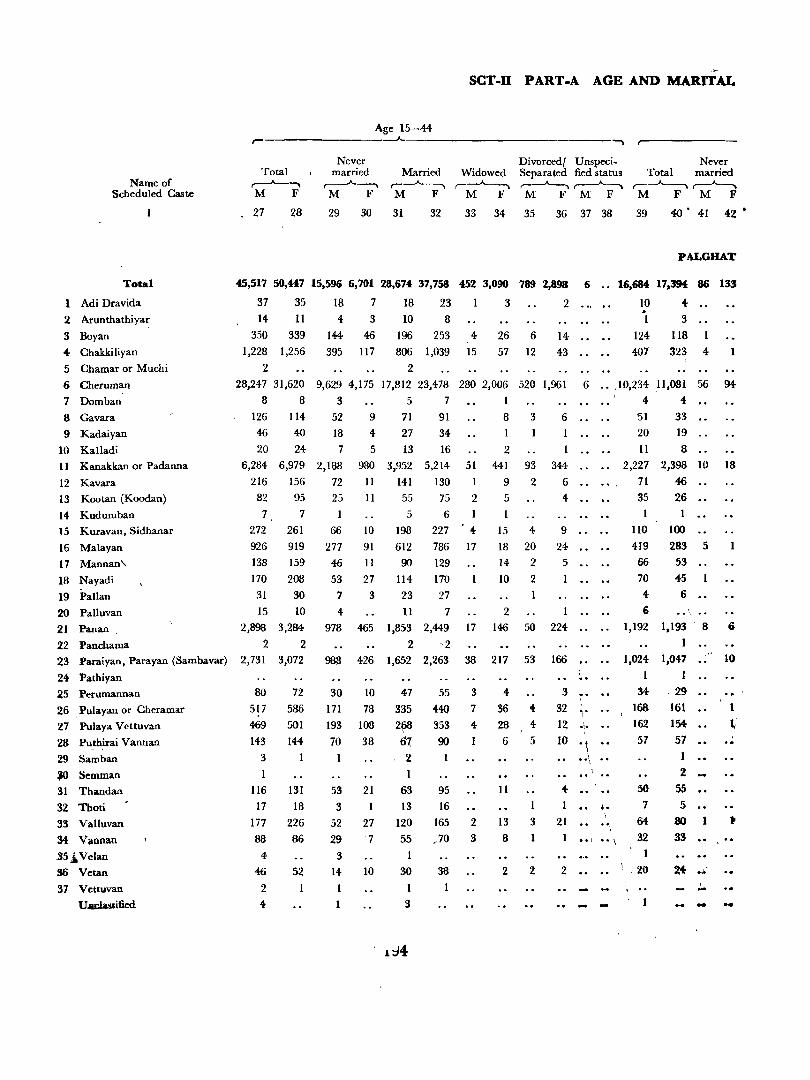
Name of Scheduled Caste
Total
1 Adi Dravida
2 Arunthathiyar
3 Boyan
.., Chakkiliyan
5 Chamar or Muchi
6 Cheruman
7 Domban
8 Gavara
9 Kadaiyan
10 Kalladi
11 Kanakkan or Padanna
12 Kavara 13 Kootan (Koodan)
14 Kudumban
]5 Kuravan, Sidhanar
16 Malayan
17 Mannan'
18 Nayadi
19 Pallan
20 Palluvan
21 Panan
22 Panchama 23 Paraiyan, Parayan (Sambavar)
24 Pathiyan
25 Perumannan
26 Pulayan or Cheramat'
27 Pulaya Vettuvan
28 Puthirai Vannan
29 Samban
J() Semman
31 Tbandan
32 Tboti
33 Valluvan
34 Vannan
35j. Velan
lI6 Vetan
37 Vettuvan
UlI,Clasiified
.~
SCT-n PART-A AGE AND MARITAL
Age 15-44 .--------------~.-------------------------------~
Total r---A--~ M F
27 28
Never married ~ M F
29 30
Married r---"--------., M F
31 32
Widowed r---'------.,
M F
33 34
Divorced! UnspeciSeparated fied status r----'---, r-----"----., M F M F
35 36 37 38
Never Total married ~ ,.---A---... M F M F
39 40' 41 42·
PALGHAT
45,517 50,447 15,596 6,701 28,674 37,758 452 3,090 789 2,898 6 16,684 17,394 86 133
37 35 18 7 18 23 1 3 2
14 11
350 339
1,228 1,256
2
4 3
144 46
395 117
10 8
196 253 4
806 1,039 15
2
26 6
57 12
14
43
10 4 . 1
124
407
3
118
323 4 1
28,247 31,620 9,629 4,175 17,812 23,478 280 2,006 520 1,961 6 .• .10,234 111,081 56 94-
8 8 3 5 7 1 126 114 52 9 71 91
46 40 18 4 27 34
20 24 7 5 13 16
6,284 6,979 2,188 980 3,952 5,214
216 156 72 11 141 130
82 95 25 11 55 75
7 7 5 6
272 261 66 10 198 227
926 919 277 91 612 786
138 159 46 II 90 129
170 208 53 27 114 170
31 30 7 3 23 27
15 10 4 II 7
2,898 3,284 978 465 1,853 2,449
2 2 2 ·2 2,731 3,072 98S 426 1,652 2,263
80
517
469
143
72
586
501
144
30 10 47 55
3
1
116
17
In 88
4-
46
2 4
131
18
226
86
52
171 78
193 108
70 38
53
3
52
29
3 14
1
1
21
27
7
10
335 440
2?8 353
67 90
2
63
13
120
55
1
30
1
3
d4
95
16
165 ,70'
38
51
I
2
4-
17
17
38
8
2
441
9
5
1
15
18
14
10
2
146
217
3 4
3
93
2
4
20
2
2
50
53
736" 4 28 4
1 6 5
2
3
11
13
8
2
3
2
6
1
344-
6
4
9
24
5
224
166
3 ••
12 .,.
10 •• \
4
1
21
.. \
1 •• I
2
.. ,
•• ., ",
.. \
4 4 '51 33
20 19
II 8
2,227 2,398 10 18
71 46
35 26
1
110 100
419 283 5
66 53
70
4
6
45
6
.. " 1,192 1,193 8 6
1 1,024 1,047 _.' 10
I I
34 29
168 161
162 154
57 57
1
2
55
5
50
7 64
32
80 1
33
20 , -
1
Ii
- -
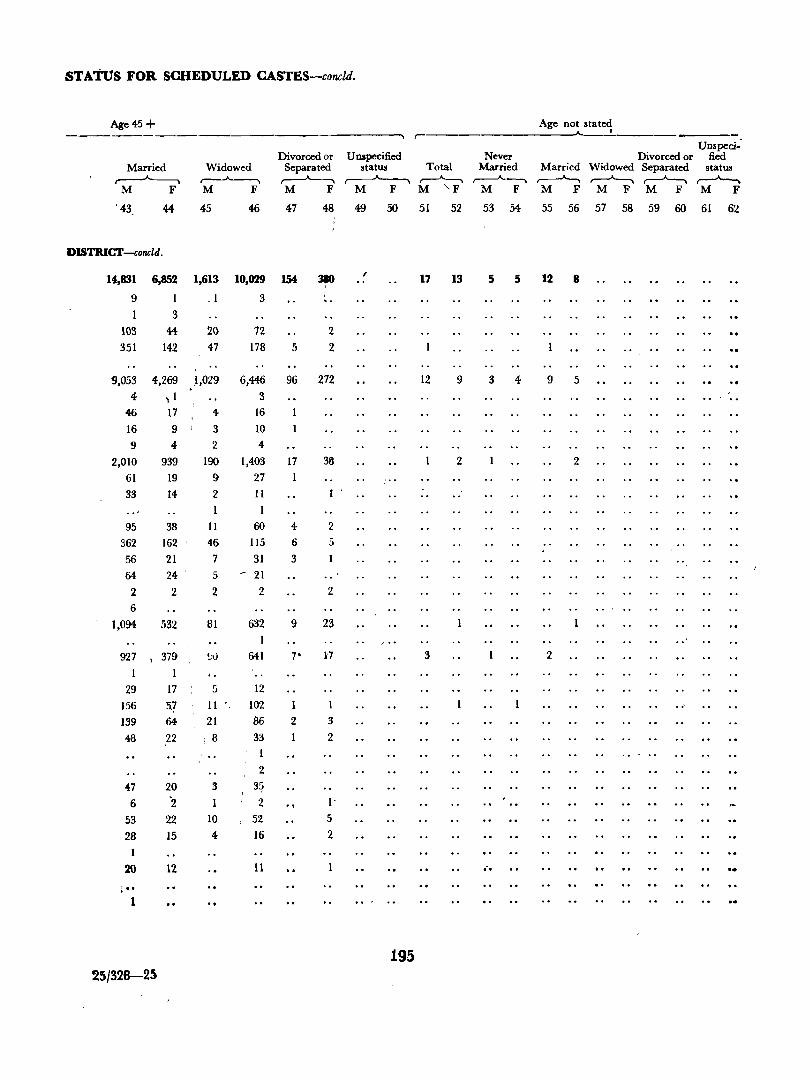
STATus FOR SCHEDULED CASTES-coneld.
Age 45 + Age not state~ r
Unspeci: Divorced or U napecified Never Divorced or fied
Married Widowed Separated status Total Married Married Widowed Separated status ,----A-----, r-~ ~ ~.., ~ r---A-----. ,------A---, ~ ,.--A--.., ,.--A--..,
M F M F M F M F M 'F M F M F M F M F M F
. 43 44 45 46 47 48 49 50 51 52 53 54 55 56 57 58 59 60 61 62
DISTRICT-concld.
14,831 6,852 1,613 10,029 154 380 ,
17 13 5 5 12 8
9 1 _ 1 3 .. 3
103 44 20 72 2
351 142 47 178 5 2
9,053 4,269 ,1,029 6,446 96 272 12 9 3 4 9 5 . 4 '; 1 3
46 17 4 16
16 9 3 10
9 4 2 4
2,010 939 190 1,403 17 38 2 2
61 19 9 27 .. , 33 14 2 11
1
95 38 11 60 4 2
362 162 46 115 6 5
56 21 7 31 3 1
64 24 ' 5 - 21
2 2 2 2 2
6
1,094 532 81 632 9 23
927 \ 379 !.II) 641 7' 1'7 3 2
1 1 .. 29 17 5 12
156 5.? 11 102 1
139 64 21 86 2 3
48 22 ; 8 33 2 , 1
2
-47 20 3 3~
6 '2 2 l'
53 22 10 52 5
28 15 4- 16 2
1
20 12 11 ... ~ ..
1
195 25/328-25
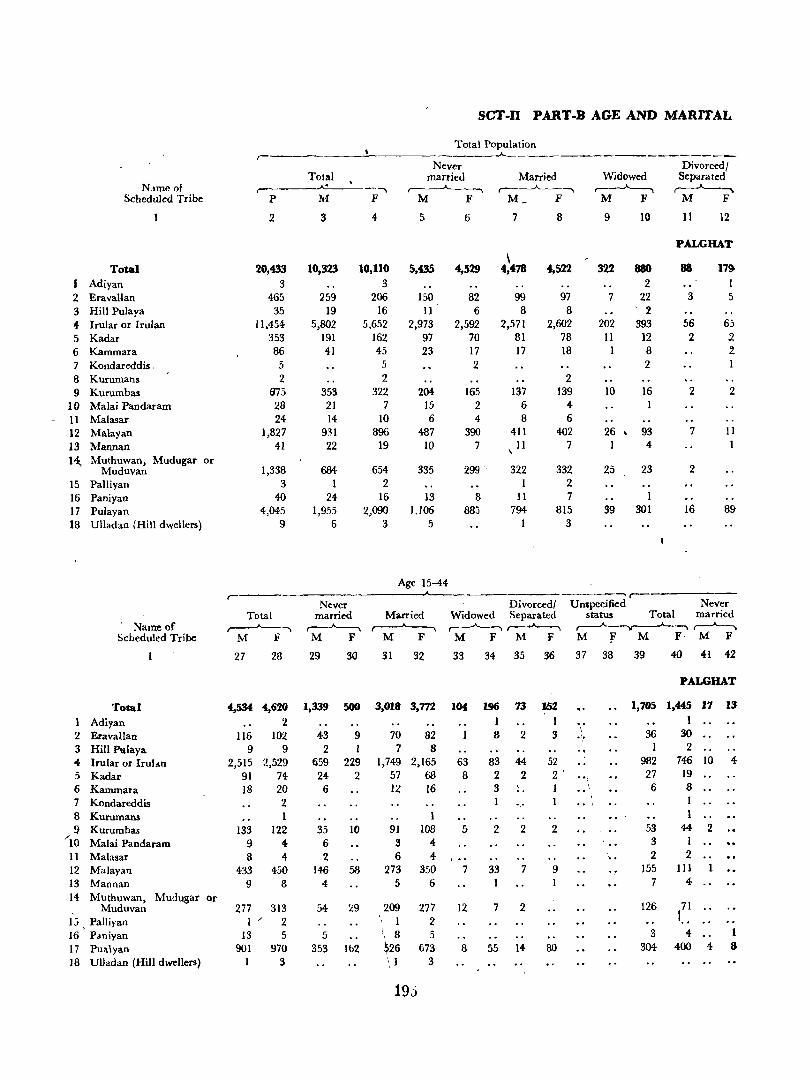
SCT-n PART-B AGE AND MARITAL
Total Population ,-
--A--________________
Never Divorced I Total married Married Widowed Separated
N,lmeof r--~-l ~ ,-----J'--""'"'\ ,--~ ,------A--....... Scheduled Tribe P M F M F M_ F M F M F
2 3 4 5 6 7 8 9 10 11 12
PALGHAT
Total 20,433 10,323 10,110 5,435 4,529 ,
4,478 4,522 322 880 88 17~
I Adiyan 3 3 2 1 2 Eravallan 465 259 206 150 82 99 97 7 22 3 5 3 Hill Pulaya 35 19 16 11 6 8 8 ' 2 f Irular or rrulan 11.454- 5,802 5,652 2,973 2,592 2,571 2,602 202 393 56 65 5 Kadar 353 191 162 97 70 81 78 11 12 2 2 6 Kammara 86 41 45 23 17 17 18 I 8 2 7 Kondareddis ' 5 5 2 2 8 Kurumans 2 2 2 9 Kurumbas 875 353 322 204 165 137 139 10 16 2 2
10 Malai Pandaram 28 21 7 15 2 6 4 I 11 Malasar 24 14 JO 6 4 8 6 12 Malayan 1,827 9~1 896 487 390 411 402 26 , 93 7 Jl
13 Mannan 41 22 19 10 7 \11 7 I 4-
14, Muthuwan, Mudugar or Muduvan 1,338 684 654- 335 299 " 322 332 25 23 2
15 Palliyan 3 1 2 2 16 Paniyan 40 24 16 13 8 11 7 1 17 Pulayan 4,045 1,955 2,090 U06 88j 794 815 39 301 16 89 18 Ulladan (Hill dwellers) 9 6 3 5 1 3
Age 15-44 r- ---A--
Never Divorcedl U lUpecified Never Total married Married Widowed Separated status Total married
Name of ,--"--, ~ r--"---. r- --"----, ,.------A--...., ,.----A~~ Scheduled Tribe M F M F M F M F M F M f M F, M F
27 28 29 30 31 32 33 34 35 36 37 38 39 40 41 42
PALGHAT
Total 4,534 0{,62O 1,339 500 3,018 3,772 104 196 73 J.52 1,705 1,445 17 13
1 Adiyan 2 1 1 2 Eravallan 116 102 43 9 70 82 8 2 3 .1,. 36 30 3 Hill Pltlaya 9 9 2 1 7 8 1 2 .0{- lrular or Irulan 2,515 :!,529 659 229 1,749 2,165 63 83 44- 52 982 746 10 4
5 Kadar 91 74- 24- 2 57 68 8 2 2 2' . .~, 27 19 6 Kammara IS 20 6 12 16 3 , 6 8 7 Kondareddis 2 8 Kurumans 1 1 9 Kurumbas 133 122 35 10 91 103 5 2 2 2 53 44- 2
/10 Malai Pandaram 9 4- 6 3 4- 3 I
11 Malasar 8 4- 2 6 4- .. 2 2 12 Malayan 433 450 146 58 273 350 7 33 7 9 155 111 13 ]\iannan 9 8 4 5 6 1 7 4
14 Muthuwan, Mudugar or Muduvan 277 313 54 49 209 277 12 7 2 126 71
15) PalJiran I / 2 I 2 I .. 16 P,miyan 13 5 5 \. 8 5 3 4 1
17 Pua\yan 901 970 353 1b2 ~26 673 8 55 14 80 304- 400 4 S
18 Ulladan (Hill dwellers) 1 3 ". I 3
19.5
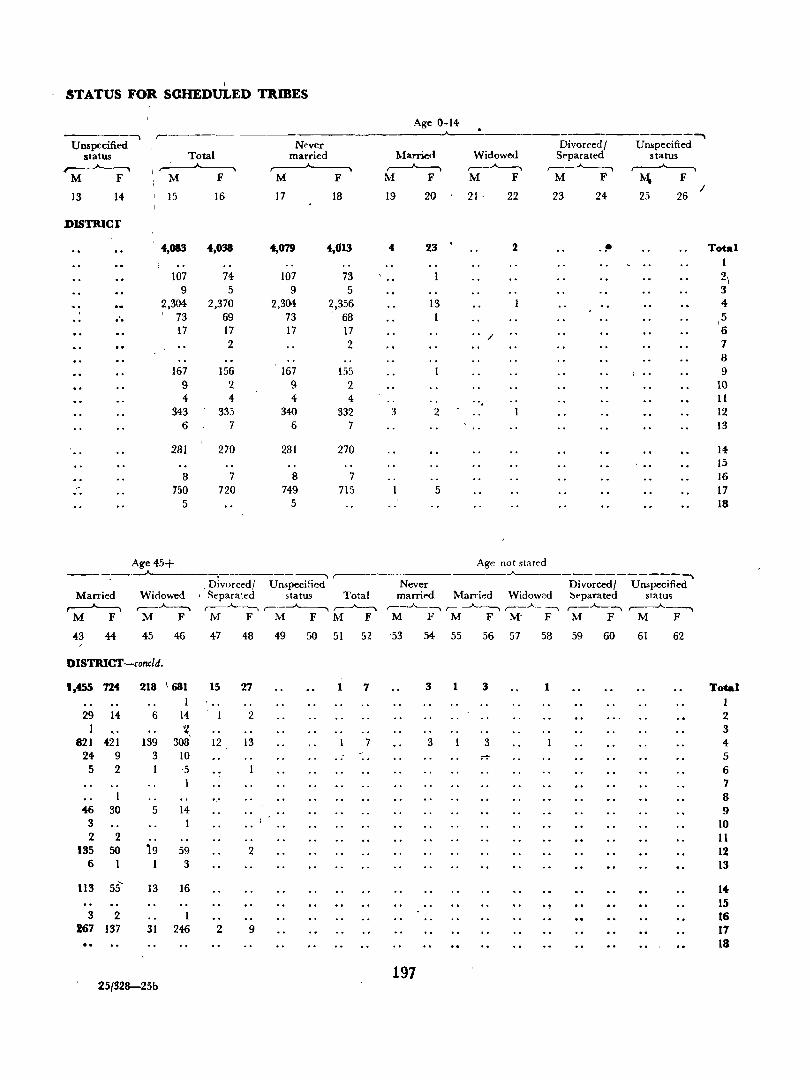
\
STATUS FOR SCHEDULED nmES
Age 0-14-r- ~
---------------~
Unspecified N .. ver Divorced I Urupecified status Total married Marrieci Widowed S .. parated status ~ ~ ~ ,----'----, ~ r---"----. ,----A-----,
M F I, M F M F M F M F M F ?\-~ F
13 14 I 15 16 17 18 19 20 21· 22 23 24- 25 26 /
DlSTRICr
I 4,083 4,038 4,079 4,013 4 23 2 .~ Total 1
107 74- 107 73 2\ 9 5 9 5 3
'2,304- 2,370 2,304- 2,356 13 4-, 73 69 73 68 1 5 .. I
17 17 17 17 6 2
/ 7 2 8
167 156 167 155 ) .. 9 9 2 9 2 10 4 4 4- 4 .. 11 .
343 335 340 332 3 2 12 6 7 6 7 13
281 270 281 270 H-15
8 7 8 7 16 ~ 750 720 749 715 5 17 ..
5 5 18
Age 45+ Age not stated ----_. ----, ,-- ~-------------.
. Divorced/ Unspecified Never Divorced/ Unspecified Married Wiclowed ' ~epara:ed status Total marri .. d Married Widowed ~ .. parated statu~
,.....---A----- r--~ ,..----'-----, ,-----A,__--., ~-. ,----"----. ,--~ ~ r--..A--~ r---..A..~ M F M F M F M F M F M F M F M- F M F M F
43 44- 45 46 47 48 49 50 51 52 53 54 55 56 57 58 59 60 61 62
DISTRICT-colICld.
'.455 724 218 \ 681 15 27 1 7 3 1 3 1 Total 1 .. 1
29 14 6 14 2 2 1 '2 3
821 421 139 308 12 13 7 3 3 4 24 9 3 IO .. .. S
5 2 5 6 7 8
46 30 5 14 9 3 10 2 2 II
135 50 '9 59 2 12 6 1 3 13
113 55' 13 16 14 15
3 2 1 16 267 137 31 246 2 9 11
18
197 25{328-25b
SCT-m SCHEDULED CASTES AND SCHEDULED TRIBES CLASSIFIED BY EDUCATIONAL LEVELS
I
Fly-leaf
1. This table prepared separately for urban and rural areas of the district g~ves the sex-wise distribution of literacy and educational levels of each Scheduled Caste and Scheduled Tribe.
2. The data relating tJ urban areas are given in Part A (i) and Part A (ii), the former deali~g with Scheduled Castes and tl.e latter dealing with Scheduled Tribes. The classification of literacy level!! is furnished below. " ..
1 Illiterate 2 Lherate (without educational level) 3 Primary or Junior Basic " Matriculation or Higher Secondary
lOB
I
5 Technical diploma n0t equal to: degree 6 Non-technical diploma not equaJ to degree 7 University degree or post-gr~duate degree
other than technical degree. S Technical degree or diploma tqual to/degree
or post-graduate degree.
3. The data relating to rural areas are given in Part B (i) dealing with Scheduled Castes and Part B (ii) dealing with Scheduled Tribes. The popUlation of each Caste and Tribe is classified into
I
1 Illiterate 2 Literate (without educational ~evel) 3 Primary or Junior Basic and '" Matriculation and above.
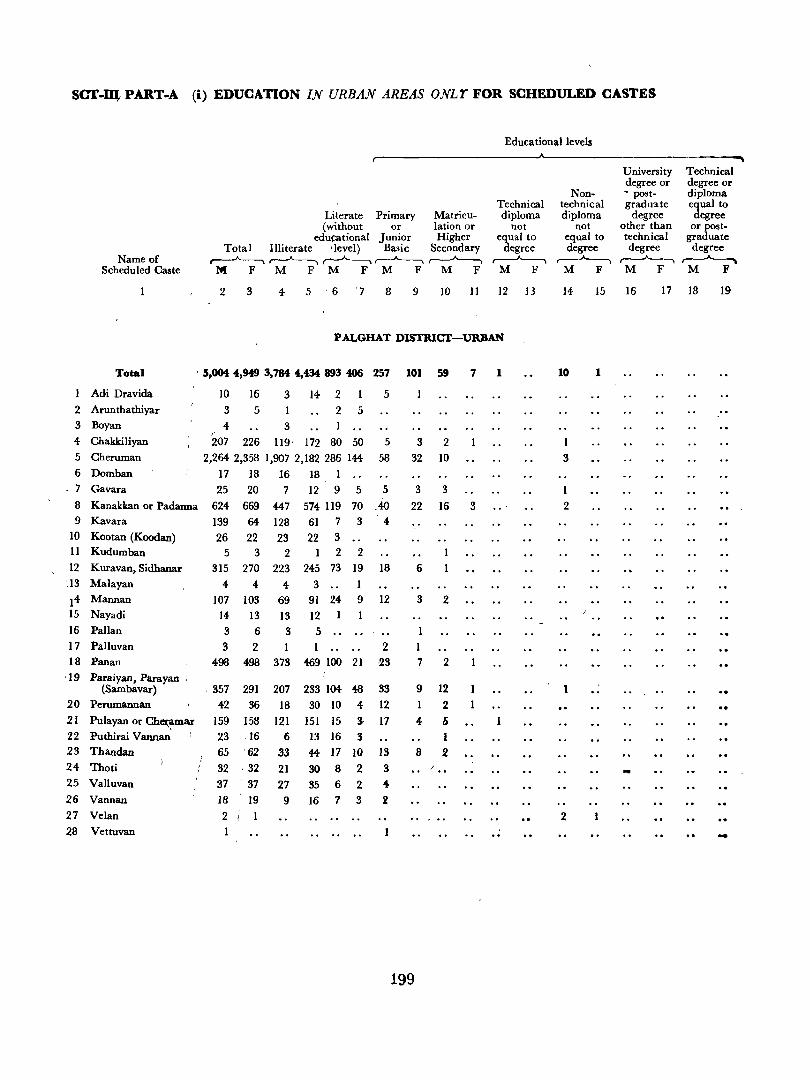
scr-Iq PART-A (i) EDUCATION IN URBAN AREAS ONLr FOR SCHEDULED CASTES
Educational levels
University Technical degree or degree or
Non- • post- diploma Technical technical graduate equal to
Literate Primary Matricu- diploma diploma degree degree (without or lation or not not other than or post-
edu(:ational Junior Higher equal to equal to technical graduate Total Illiterate 'level) Basic Secondary degree degree degree degree
Name of ~,..--......____, ~~ r---..A.....-...... ,.-----A-----, ~ ,..--A--, ,..--A--"",\ Scheduled Caste M F M F M F M F M F M F M F M F M F
2 3 4- 5 '6 7 8 9 10 11 12 13 14 15 16 17 18 19
PALGHAT DISTRICT-URBAN
Total ; 5,004 4,949 3,784 4,434 893 406 257 101 59 7 I 10 1
1 Adi Dravida 10 16 3 14 2 5 2 Arunthathiyar 3 5 1 2 5 3 Boyan 4 3
" 4 Chakkiliyan 207 226 119, 172 80 50 5 3 2 I 5 Cheruman 2,264 2,358 1,907 2,182 286 144- 58 32 10 3 6 Domban 17 18 16 18 I 7 Gavara 25 20 7 12 9 5 5 3 3 I 8 Kanakkan or Padanna 624 669 447 574 119 70 Ao 22 16 3 2 9 Kavara 139 64- 128 61 7 3 4
10 Kootan (Koodan) 26 22 23 22 3 II Kudumban 5 3 2 2 2 12 Kuravan, Sidhanar 315 270 223 245 73 19 18 6
',13 Malayan 4 4- 4- 3 1 14 Mannan 107 103 69 91 24- 9 12 3 2 15 Nayadi 14 13 13 12 16 Pallan 3 6 3 5 17 Palluvan 3 2 1 2 I 18 Panan 498 498 373 469 100 21 -23 7 2
·19 Paraiyan, Pilrayan (Sambavar) ·357 291 207 233 104- 48 33 9 12
20 Perumannan 42 36 18 30 10 4 12 1 2 21 Pulayan or Cha:~ 159 158 121 151 15 3- 17 4- 6 22 Puthirai Vannan 23 16 6 13 16 3 I 23 Thandan 65 62 33 44- 17 10 13 8 2 24 Thoti 32 ; 32 21 30 8 2 3 / .. 25 Valluvan 37 . 37 27 35 6 2 4 26 Vannan 18 19 9 16 7 3 2
27 Velan 2 2 28 Vettuvan -
199
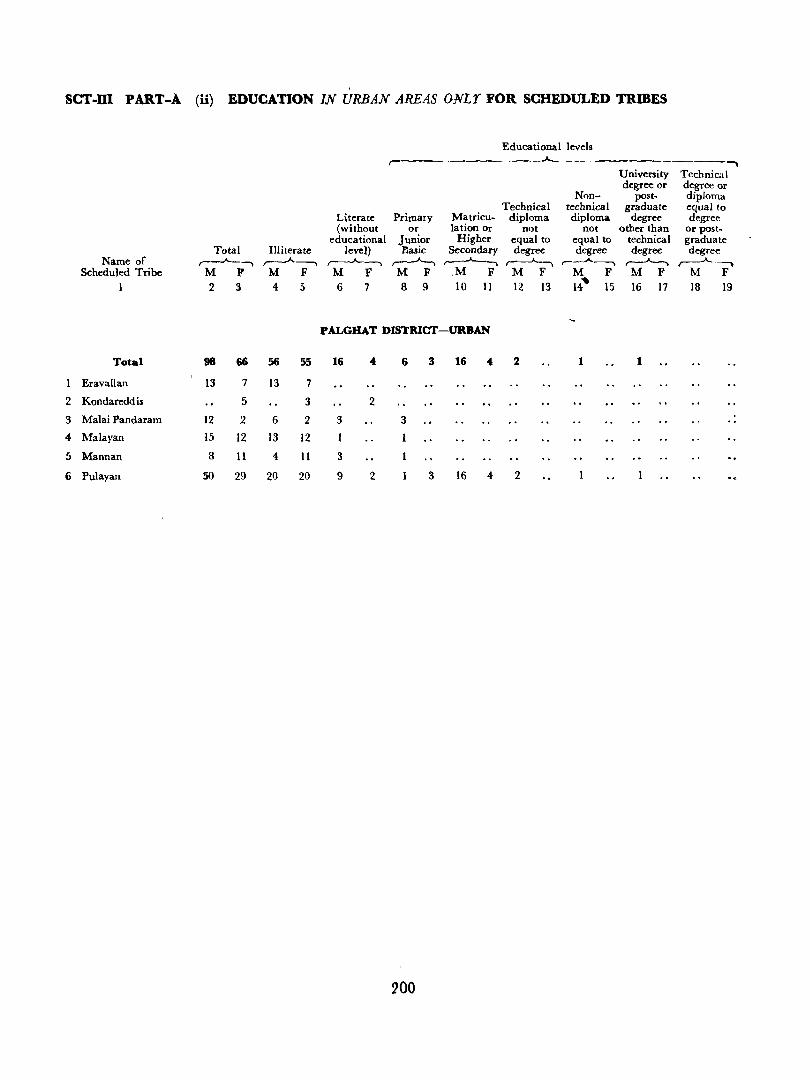
I
SCT·m PART-A (ii) EDUCATION IN URBAN AREAS ONLf FOR SCHEDULED TRmES
Educational levels
"""'I University Technical degree or degree or
Non- post- diploma Technical technical graduate equal to
Literate Primary Matricu- diploma diploma degree degree (without or lation or not not other than or post-
educational Junior Higher equal to equal to technical graduate Total Illiterate level) l'lasic Secondary degree degree degree degree
Name of ~ ,.-----A~ ~ r---"--, r---"---. r---A--.. r-_A~ r-..A-., ~ Scheduled Tribe M F M F M F M F .M F M F M F M F M F
1 2 3 4 5 6 7 8 9 10 11 12 13 14" 15 16 17 18 19
PALGHAT DISTRICT-URBAN
Total 98 66 56 55 16 4 6 3 16 4 2 I 1
1 Eravallan 13 7 13 7
2 Kondareddis 5 3 2
3 Malai Pandaram 12 2 6 2 3 3 "
4 Malayan 15 12 13 12 I
5 Mannan 8 11 4 11 3
6 Pulayan 50 29 20 20 9 2 3 16 4 2
200
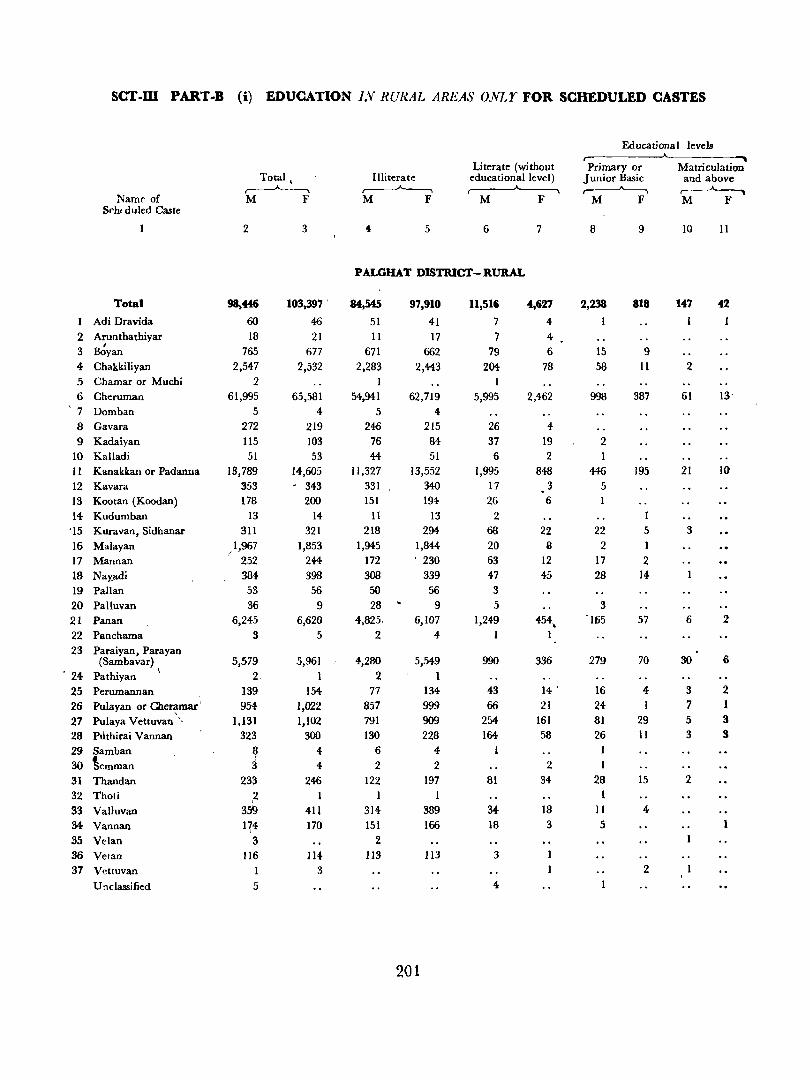
SCT-ill PART-B (i) EDUCATION l,V RURAL AREAS ONLY FOR SCHEDULED CASTES
Educational levels ,.---_---A......-_.,
Literate (without Primary or Matriculation Total, Illiterate educational level) Junior Basic and above
,---A---, ~ ~ ,-~ ~ Namr of M F M F M F M F M F
Schrduled Caste
2 3 4 5 6 7 8 9 10 11
PALGHAT DISTRlCT- RURAL
Total 98,446 103,397 . 84,545 97,910 11,516 4,627 2,238 ala 147 42
I Adi Dravida 60 46 51 41 7 4 I
2 Arunthathiyar 18 21 II 17 7 4-I
3 Boyan 765 677 671 662 79 6 15 9 4 Chakkiliyan 2,547 2,532 2,283 2,413 204 78 58 11 2 5 Chamar or Muchi 2 1 6 Cheruman 61,995 65,581 54,941 62,719 5,995 2,462 998 387 61 13'
\ 7 Domban 5 4 5 4 8 Gavara 272 219 246 215 26 4 9 Kadaiyan 115 103 76 84 37 19 2
10 Kalladi 51 53 44 51 6 2 1 11 Kanakkan or Padanria 13,789 14,605 11,327 13,552 1,995 848 446 195 21 10
12 Kavara 353 343 331 340 17 3 5 13 Kootan (Koodan) 178 200 151 194 26 6 14 Kudumban 13 14 11 13 2 '15 Kuravan, Sidhanar 311 321 218 294 68 22 22 5 3 16 Malayan /1,967 1,853 1,945 1,844- 20 B 2 1 17 Mannan 252 244- 172 ' 230 63 12 17 2 18 Nayadi 384- 398 308 339 47 45 28 14-19 Pallan 53 56 50 56 3 20 Palluvan 36 9 28 9 5 3 21 Panan 6,245 6,620 4,825. 6,107 1,249 454, '165 57 6 2 22 Pllnchama .3 5 2 4 1 1 23 Paraiyan, Parayan
(Sambavar) 5,579 5,961 4,280 5,549 990 336 279 70 30 6 , 24 Pathiyan
\ 2 1 2 I
25 Perumannan 139 154 77 134 43 14' 16 4- 3 2 26 Pulayan or Che~mar' 954- 1,022 857 999 66 21 24- 7 1
27 Pulaya Vettuvan " 1,131 1,102 791 909 254 161 81 29 5 3 28 PUthirai Vannan 323 300 130 228 164 58 26 11 3 .3
29 Samban 8 4 6 4 1 30 ~emman j 4 2 2 2 1 31 Thandan 233 246 122 197 81 34 28 15 2 32 Thoti 2 1 1 33 Valluvan 35'9 411 314 389 34- 18 11 4-34 Vannan 174- 170 151 166 18 3 5 35 Velan 3 2 36 Vetan 116 114- 113 113 3 37 Vettuvan 3 2
Unclassified 5 4
201
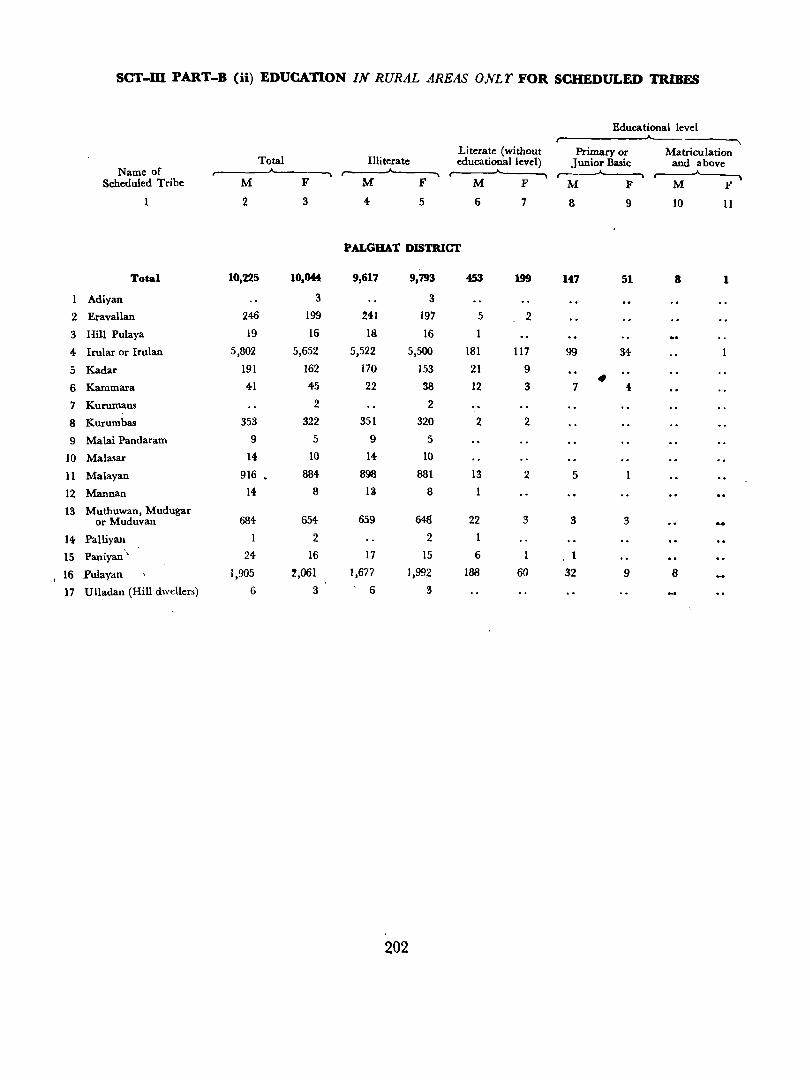
SCT-m PART-B (ii) EDUCATION IN RURAL AREAS ONLr FOR SCHEDULED TRIBES
Educational level
Literate (without Primary or Matriculation Total Illiterate educational level) Junior Basic and above
Name of A..
Scheduled Tribe M F M F M F M F M F
2 3 4 5 6 7 8 9 10 11
PALGHAT DISTRICT
Total 10,225 10,044 9,617 9,793 453 199 147 51 8 1
Adiyan 3 3
2 Eravallan 246 199 241 197 5 2
3 Hill Pulaya 19 16 18 16 1
4 Irular or Irulan 5,802 5,652 5,522 5,500 181 117 99 34
5 Kadar 191 162 170 153 21 9
6 Kammara 41 45 22 38 12 3 7 ttl
4
7 Kurumans 2 2
8 Kurumbas 353 322 351 320 2 2
9 Malai Pandaram 9 5 9 5
10 Malasar 14 10 14- 10
11 Malayan 916 • 884 898 881 13 2 5
12 Mannan 14- 8 Il 8
13 Muthuwan, Mudugar 684 654 659 or Muduvan 648' 22 3 3 3
14 Palliyan 2 2
15 Paniyan'\ 24 16 17 15 6 1 1
16 Pulayan 1,905 Z,061 1,677 1,992 188 60 32 9 8
17 Ulladan (Hill dwellers) 6 3 6 3
202
SCT-IV RELIGION FOR SCHEDULED CASTES AND SCHEDULED TRIBES
Fly-leaf
This table prepared in two parts, Part A dealing "With Scheduled Castes and Part B dealing with 'Scheduled Tribes gives the cla~ification of each Scheduled Caste and Scheduled Tribe according to -their religion for the rural and urban areas of the
:25/328-25 203
(listrict. In this district the Scheduled Castes belong to Hindu religion only and House Table SCT-IV Part-A i~ not presented as the required information is available in Table SCT-I Part-A.
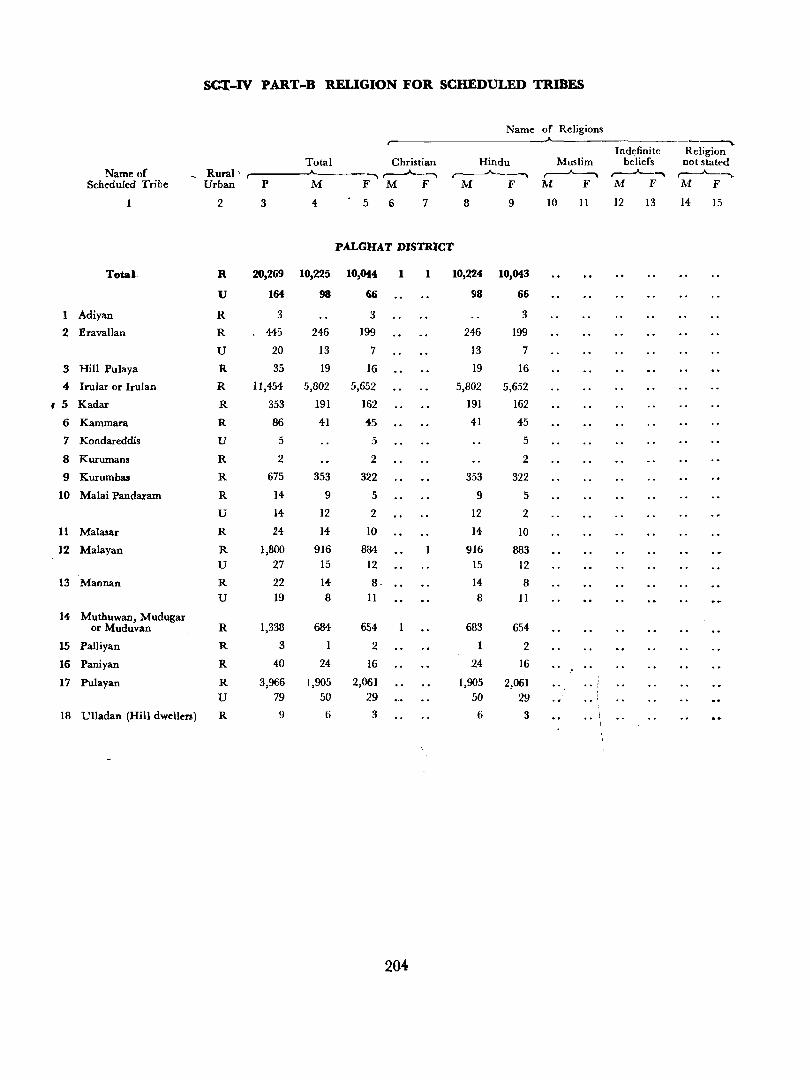
SC't-IV PART-B RELIGION FOR SCHEDULED TRIBES
Name of Religions _A---
~ Indefinite Religion
Total Christian Hindu Muslim be'liefs not stated Name of - Rural \ ......,~l ~-. ~ ,....--.-'---"'" ~
Scheduled Tribe Urban P M F M F M F M F M F 1\1 F
2 3 4 5 6 7 8 9 10 11 12 13 14 15
PALGHAT DISTRICT
Total, R 20,269 10,225 10,044 1 1 10,224 10,043
U 164 98 66 98 66
1 Adiyan R 3 3 3
2 Eravallan R 445 246 199 246 199
U 20 13 7 13 7
3 Hill Pulaya R 35 19 16 19 16
4 lrular or Irulan R 11,454 5,802 5,652 5,802 5,652 , 5 Kadar R 353 191 162 191 162
6 Kammara R 86 41 45 41 45
7 Kondareddis U 5 5 5
8 Kurumans R 2 2 2
9 Kurumbas R 675 353 322 353 322
10 Malai Pandaram R 14 9 5 9 5
U 14 12 2 12 2
11 Malasar R 24 14 10 14 10
12 Malayan R 1,800 916 884 916 883 U 27 15 12 15 12
13 Mannan R 22 14 8, 14 8 U 19 8 11 8 11
14 Muthuwan, Mudugar or Muduvan R 1,338 684 654 683 654
15 Palliyan R 3 1 2 2
16 Paniyan R 40 24 16 24 16
17 Pulayan R 3,966 1,905 2,061 1,905 2,061 U 79 50 29 50 29
18 Ulladan (Hill dwellers) R 9 6 3 6 3
20~
SCT-V SAMPLE HOUSEHOLDS ENGAGED IN CULTIVATION CLASSIFIED BY INTBREST IN LAND AND SIZE OF LAND CULTIVATED IN RURAL AREAS ONLY FOR MEMBERS
OF SCHEDULED CASTES AND SCHEDULED mmES
Fly-leaf'
This table gives data in respect of households of
-members of Scheduled Castes and Scheduled Tribes . , in a 20 per cent sample of all households in rural
.areas of the district. It is prepared in two parts,
Part A dealing with Scheduled Castes an~ Part B
-dealing with Scheduled Tribes. This table gives the
25/328-26 b
number of cultivating households and their distribution according to the interest in land cultivated such as
205
I Owned or held from Government 2 Held from private persons or institutions for
payment in money, kind or share 3 Partly held from Government and partly frolD
private persons for payment in money, kind or share.
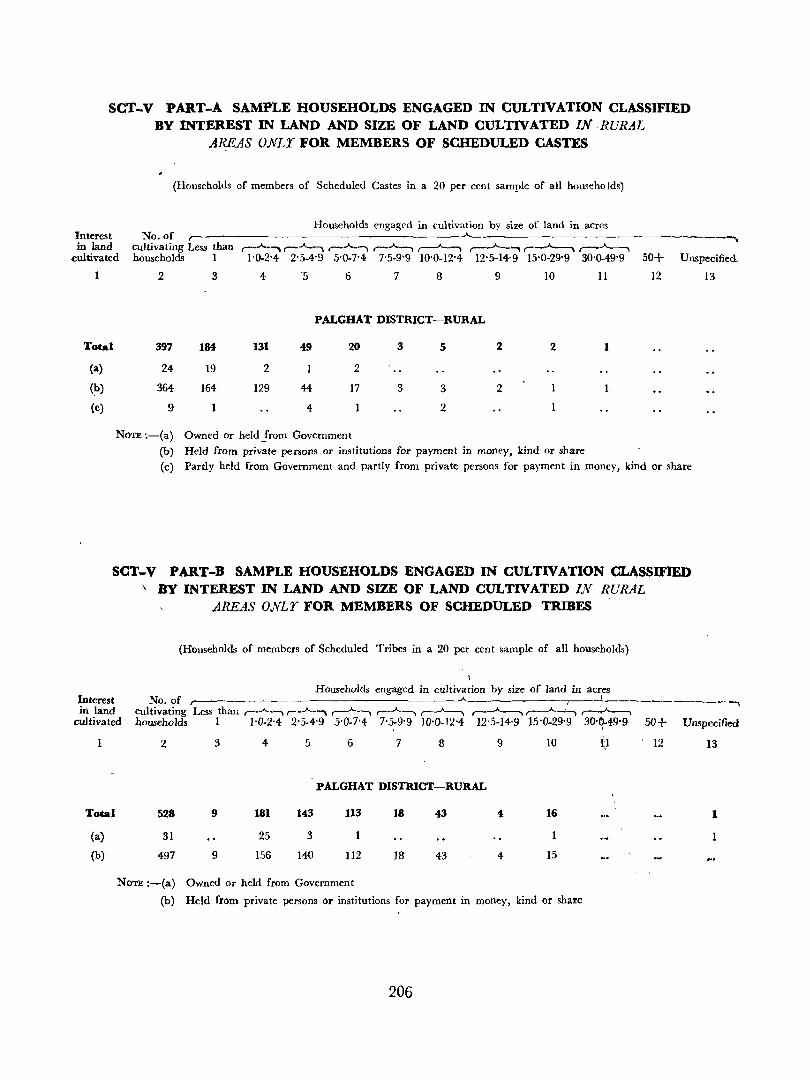
SCT-V PART-A SAMPLE HOUSEHOLDS ENGAGED IN CULTIVATION CLASSIFIED BY INTEREST IN LAND AND SIZE OF LAND CULTIVATED IN RURAL
AREAS ONLY FOR MEMBERS OF SCHEDULED CASTES
(Households of members of Scheduled Castes in a 20 per cent sample of all households)
Interest in land
cultivated
Households engagpd in cultivation by size of land in acres No. of r----------------------------- ~- --_
Total
(a)
(~)
(c)
cultivating Less than ,....A.._"",\ ,.-_..A...., ,.-_..A.._, ,.-_..A..--.,,....---'----., ,--..A.._., r_.A..~ ,---..A.......-, households 1 1-0-2-4 2'5-4'9 5-0-7'4 7'5-9'9 10'0-12'4 12'5-14'9 15'0-29'9 30'0-49'9
2 3 4 '5 6 7 8 9 10 11
PALGHAT DISTRICT-RURAL
397 184 131 49 20 3 5 2 2 1
24 19 2 2
364 164 129 44 17 3 3 2
9 4 2
50+
12
Unspecified.
13
NOTE ~-(a) Owned or held from Government
(b) Held from private persons or institutions for payment in money, kind or share
(c) Partly held from Government and partly from private persons for payment in money, kind or share
SCT-V PART-B SAMPLE HOUSEHOLDS ENGAGED IN CULTIVATION CLASSIFIED \, BY INTEREST IN LAND AND SIZE OF LAND CULTIVATED IN RURAL
AREAS ONLY FOR MEMBERS OF SClIEDULED TRIBES
(Households of members of Scheduled Tribes in a 20 per cent sample of all households)
, Households engaged in cultivation by size of land in acres
Interest in land
cultivated
No_ of r-------------------.A_-------- , +-------__ -,. cultivating Less than ,.-_..A.._, r-..A..-, ,.-_..A..--., ,--.A..-l,---A---.. ,----"-----. ,--A-......, ,---0-----. households 1 1'0-2'4 2-5-4'9 5'0-7'4 7'5-9'9 10'0-12'4 12'5-14'9 15'0-29-9 30·()..49-9 50+ Unspecified
i
1 2 3 4 5 6 7 8 9 10 12 13
PALGHAT DISTRICT-RURAL
Total 528 9 181 143 113 18 43 4 16 1
(a) 31 25 3
(b) 497 9 156 140 112 18 43 4 15
NOTE :-(a) Owned or held from Government
(b) Held from private persons or institutions for payment in money, kind or share
206
SC-I PERSONS NOT AT WORK CLASSIFIED BY SEX, TYPE OF ACTIVITY AND EDUCATIONAL LEVELS FOR SCHEDULED CASTES
Fly-leaf
This table prepared for total, 1 ural and urban . areas of the district gives the sex-wise cla~sification of
non-workers among Scheduled Castes accor1ing to their literacy and educational levels and accortling to the type of activity such being as full-time studen:s,
207
persons seeking employment for the first time, persons employed before but now out of employment and seeking work and others. The educational levels are the same as that followed in Table SCT-III Part-B.
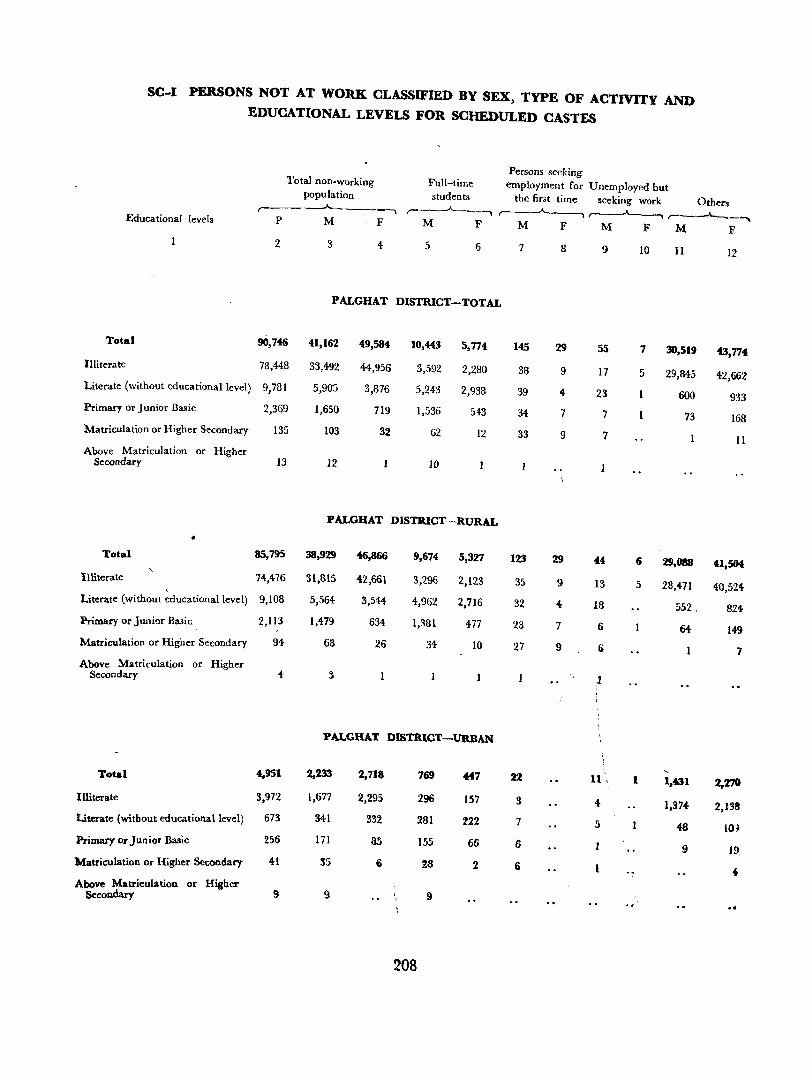
SC-I PERSONS NOT AT WOIU{ CLASSIFIED BY SEX, TYPE OF ACTIVITY AND
EDUCATIONAL LEVELS FOR SCHEDULED CASTES
Educational levels
Total
Illiterate
Literate {without educational level)
Primary or Junior Basic
Matriculation or Higher Secondary
Above Matriculation or Higher Secondary
Total
Illiterate ,
Literate (without educational level)
Primary or Junior Basic
:Matriculation or Higher Secondary
Above Matriculation or Higher Secondary
Total
Illiterate
Literate (without educational level)
Primary or Junior Basic
Matriculation or Higher Secondary
Above Matriculation or Higber Secondary
Persons seeking Total non-working
population ,------'--------.
Full-time employment for Unemployed but students the first time seeking work Others
,-----"--, ,-~ ~ ,-___"___-, P M F M F M F M F M F
2 3 4 5 6 7 8 9 10 11 12
PALGHAT DISTRICT-TOTAL
90,746 41,162 49,584 10,443 5,774 145 29 55 7 30,519 43,774 78,448 33,492 44,956 3,592 2,280 38 9 17 5 29,845 42,662 9,781 5,905 3,876 5,243 2,938 39 4 23 600 933 2,369 1,650 719 1,536 543 34 7 7 73 168
135 103 32 62 12 33 9 7 11
13 12 10
PALGHAT DISTRICT-RURAL
85,795 38,929 46,866 9,674 5,327 123 29 44 6 29,088 41,5Ot 74,476 31,815 42,661 3,296 2,123 35 9 13 5 28,471 40,524-9,108 5,564- 3,544 4,962 2,716 32 4- 18 552. 824-2,113 1,479 634 1,381 477 28 7 6 64 149
94 68 26 34 10 27 9 6 7
4- .'} 1 I
PALGHAT DISTRICT-URBAN
\ 1 4,951 2,233 2,718 769 447 22 11 " 1 1,"'1 2,270 3,972 1,677 2,295 296 157 3 4- 1,374- 2,138
673 341 332 281 %22 7 5 48 10J 256 171 85 155 166 ()
9 19 41 35 6 28 2 6 .. 9 9 9
208
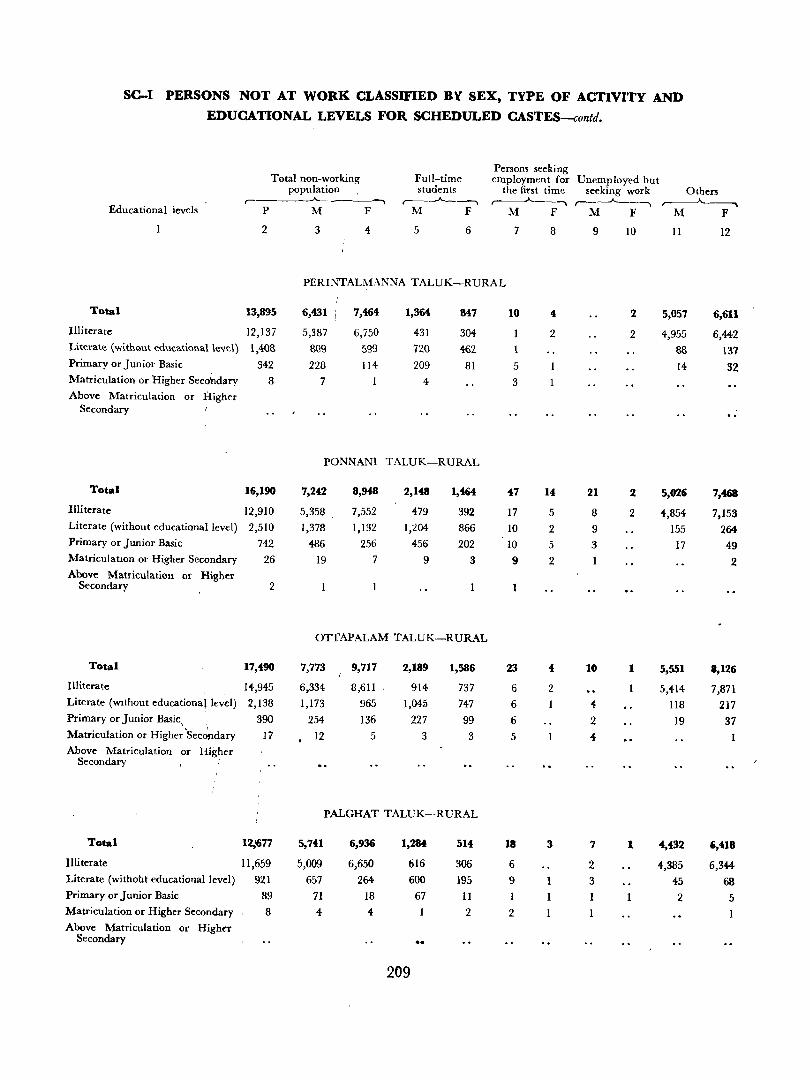
SC-I PERSONS NOT AT WORK CLASSIFIED BY SEX, TYPE OF ACTIVITY AND
EDUCATIONAL LEVELS FOR SCHEDULED CASTES--contd.
Educational levels
Total
Illiterate
Literate (with~ut edul:ationallevel}
Primary or Junior Basic
Matriculation or Higher Secondary
Above Matriculation or Higher Secondary
Total
Illiterate
Literate (without educational level)
Primary or Junior Basic
Matriculation or Higher Secondary
Above Matriculation or Higher Secondary
Total
Illiterate
Literate (WIthout educational level)
Primary or Junior Basic, I
Matriculation or Higher'Sec®dary
Above Matriculation or Higher Secondary
Total
Illiterate
Literate (withoht educational level)
Primary or Junior Basic
Matriculation or Higher Secondary
Above Matriculation or Higher Secondary
Total non-working population
r----~------~~ P M
2 3
F
4
Full-time students
r---_J.__----, M F
5 6
Persons seeking employment for
the first time ,---.J.-__ , M F
7 8
PERINTALM.\NNA TALUK-RURAL
13,895 6,431 7,464 1,364 847 10 4
12,137 5,387 6,i50 431 304- 2
1,408 809 599 720 462 342 228 114 209 81 5
8 7 I 4 3
PONNANI TALUK-RURAL
16,190 7,242 8,948 2,148 1,4Ct4 47 14
12,910 5,358 . 7,552 479 392 17 5
2,510 1,378 1,132 1,204 866 10 2 742 486 256 456 202 10 5
26 19 7 9 3 9 2
2
OTTAPALAM TALUK-RURAL
17,490 7,773 9,717 2,189 1,586 23 4
14,945 6,334 8,611 914 737 6 2 2,138 1,173 965 1,045 747 6
390 254 136 227 99 6
17 12 5 3 3 5
PALGHAT TALUK-RURAL
12j677 5,741 6,936 1,2M 514 18 3
11,659 5,009 6,650 616 306 6
921 657 264- 600 195 9 89 71 18 67 11 1
8 4- 4- 2 2
209
Unemployed but seeking work
r--~----,
M F
9 10
2
2
21 2
8 2
9
3
10 1
4
2
4-
Others r-~
M F
II 12
5,057 6,611
4,955 6,442
88 137
I4 32
5,026 7,468
4,854 7,153
155 264-
17 49
2
5,551 1,126
5,414 7,871
118 217
19 37
7 1 4,432 6,418
2 4,385 6,344-
3 45 68
2 5
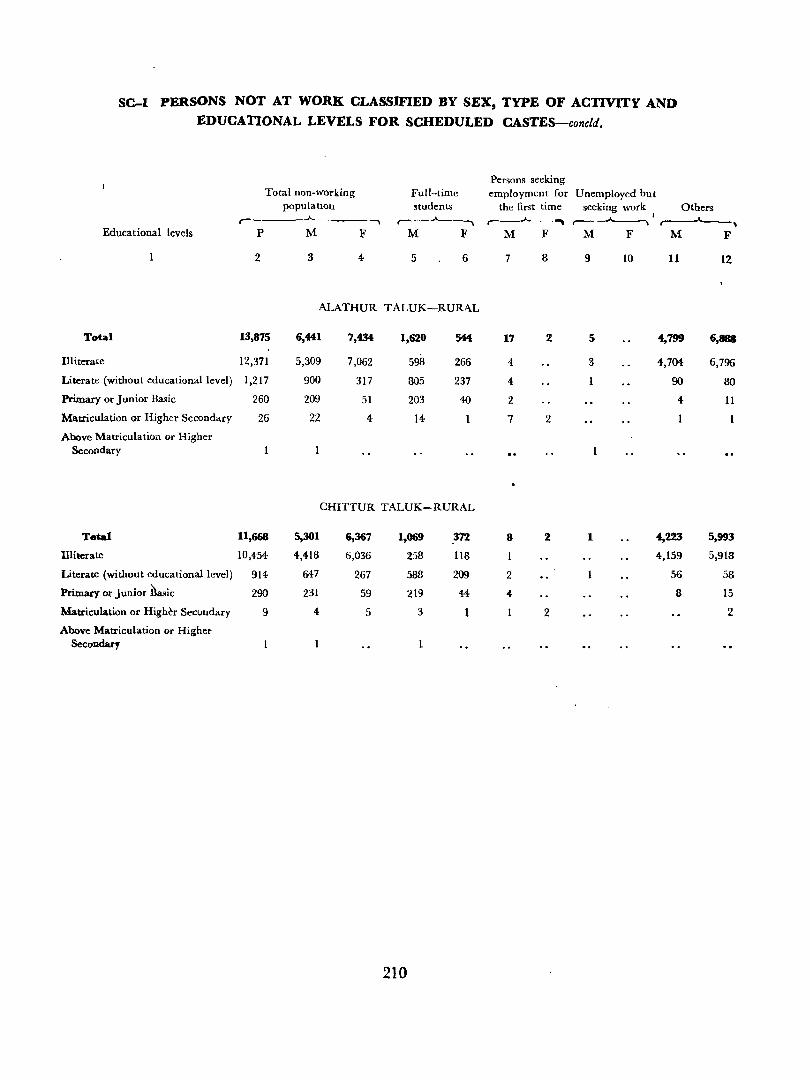
SC-I PERSONS NOT AT WORK CLASSIFIED BY SEX~ TYPE OF ACTIVITY AND
EDUCATIONAL LEVELS FOR SCHEDULED CASTES-concld.
Persons seeking Total non-working Full-time employment for Unemployed but
populatlOn students the first time seeking work I Others r-- -_ ,.-----'---_ ,.-----.J.....______ .., r--~ r----"----,
Educational levels P M F M F M F M F M F
2 3 4 5 6 7 8 9 10 11 12
ALATHUR TALUK-RURAL
Total 13,875 6,441 7,434 1,620 544 17 2 5 4,799 6,88S
Illiterate 12,371 5,309 7,062 598 266 4 3 4,704 6,796
Literate (without educationallevel) 1,217 900 317 805 237 4 90 80
Primary or Junior Basic 260 209 51 203 40 2 <1- 11
Matriculation or Higher Secondary 26 22 4 14 7 2 I
Above Matriculation or Higher Secondary
CHITTUR TALUK-RURAL
Tetal 11,668 5,301 6,367 1,069 ,372 8 2 1 4,223 5,993
Illiterate 10,454 4,418 6,036 258 ll8 4,159 5,918
Literate (without educational level) 914 647 267 588 209 2 56 58
Primary or Junior hasic 290 231 59 219 44 4- a 15
Matriculation or Hightr Secondary 9 4 5 3 1 2 2
Above Matriculation or Higher Secondary
210
ST-I MOTaElt TONGUE AND BUJNGUALISM FOR SCBEDtJl.ED TRIBES
This ltable prepared for the district give! in respect -of each Scheduled Tribe the sex-wise distribution of .speakers of different mother tongues and persona
.; ,
speaking various subsidiary languages ia additioa to ~ir m.ether tOl1iU.C$~
211
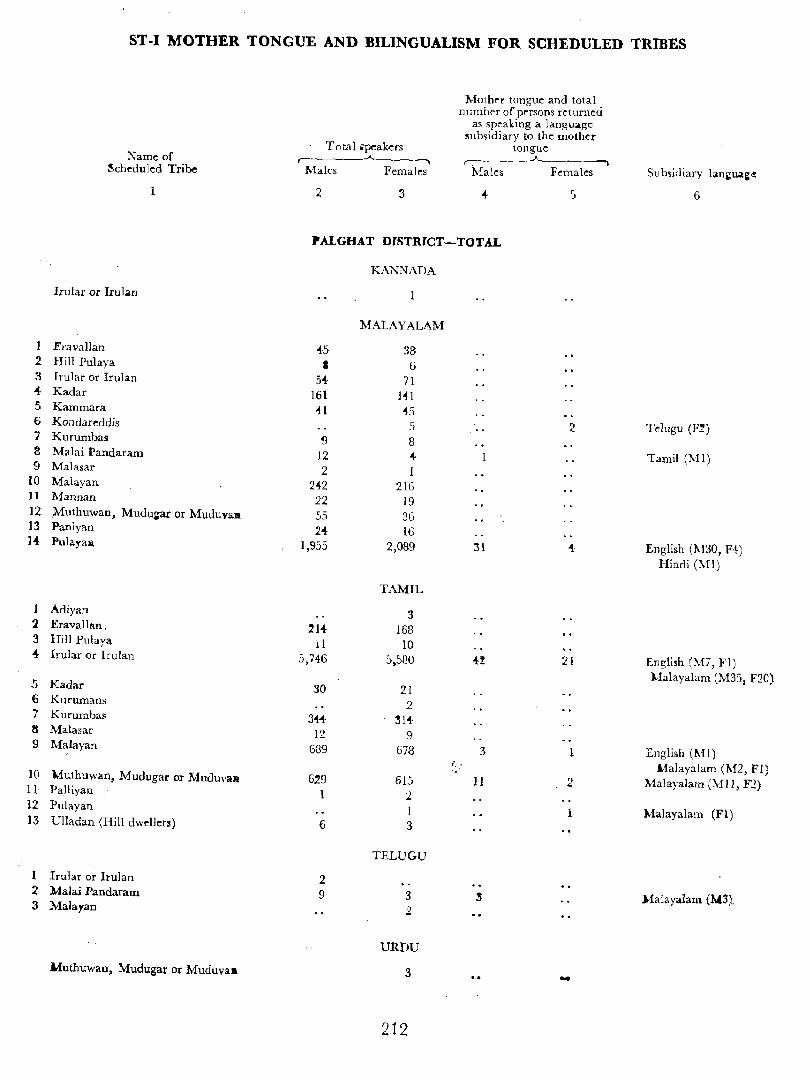
ST -I MOTHER TONGUE AND :BILINGUALISM FOR SCHEDULED TRIBES
Moth .. r tongue and total number of p~rsons rrturned
as sp~aking a language subsidiary to the mother
To ta I ipeakcrs tongue Name of .A.. , ,-___..A._
Scheduled Tribe Males Females 1\lales Females Sub~idiary lanil:u3.i:¢
1 2 3 4- 5 6
PALGHAT DISTRICT-TOTAL
KANNADA
Irular or lrulan
MALAYALAM
] llravallan -i5 33 2 Hill Pulaya a 6 3 rrular or lrulan 54 71 4 Kadar 161 HI 5 Kammara H is 6 Kondareddis .'J 2 Telugu (F~) 7 Kurumbas ~ 8 S Malai Pandaram 12 4- Tamil (Ml) 9 Malasar 2
10 Malayan 2i2 216 ]1 Mannan 22 19 12 .Muthuwan, Mudu~ar or Muduvall 55 36 13 Paniyan 24- 16 1-4: PulayaJl. 1,955 2,039 31 'i: English (M30, F+)
Hindi (:\11)
TAMIL
I Adiyan 3 !l Eravallau, .214- 168 3 Hill Pulaya 11 10 4 hular or Irulan 5,746 5,51l0 4! 21 English (M7, FI)
l.lalayalam (M35. F20), 5 Kadar 30 21 6 Kurumans 2 7 Kurumbas 3H 31-4: 8 Malasar 12 9 9 Malayan 689 673 3 English (MI)
.. <.:" l.1alayalam (M2, FI) <->f:", 10 Muthuwan. Mudugar or MuduvalQ 629 615 II 2 Malayalam (MIl, F2) 11 PaJliyau 1 2
12 Pulayan 1 1 :Ualayalam (FI) 13 Ull"dan (Hill dwellers) 6 3
TELUGU
I Irular or Irulan 2 .2 Malai Pandaram 9 3 ~ Malayalam (M3)_ 3 Malayan 2
URDU
Muthuwan, Mudugar or Muduvn. 3 -212
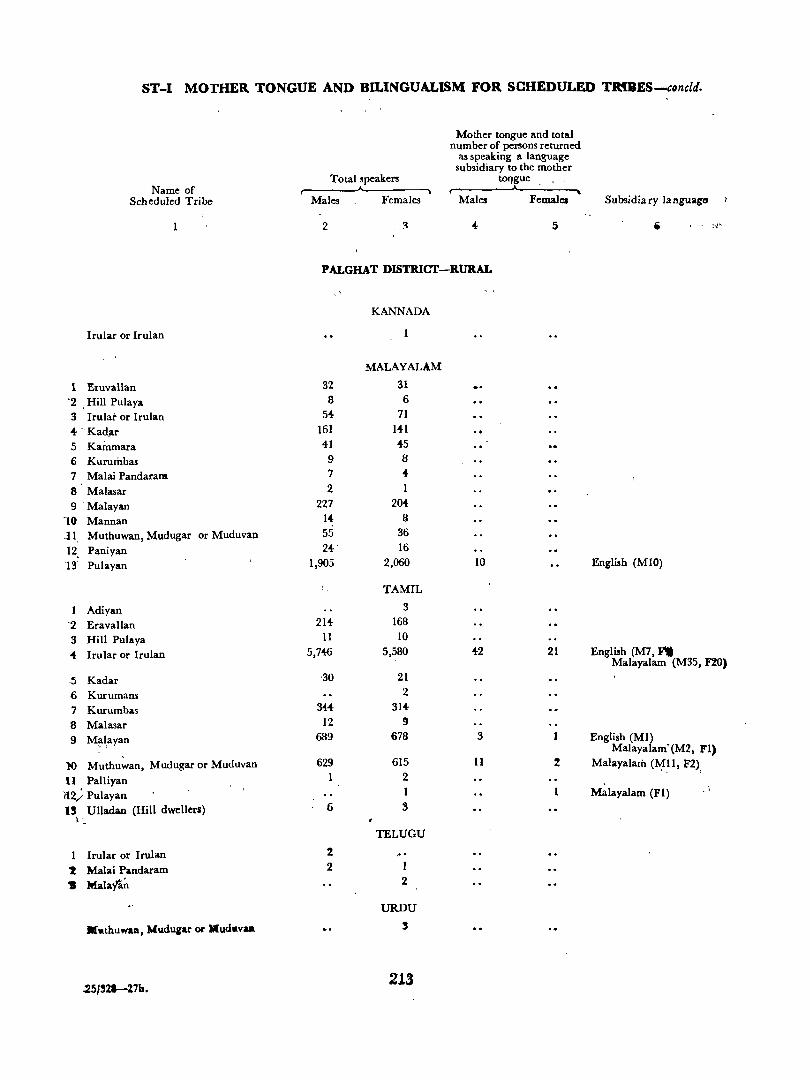
ST-I MOTHER TONGUE AND BILINGUALISM FOR SCHEDULED TMBES-concld.
Name of Scheduled Tribe
lrular or Irulan
1 Eruvallan "2 ,Hill Pulaya 3 Irular or Irulan 4 -Kadllr
5 Kammara '-6 Kururhhas 7 Malai Pandaram
8 Malasar 9 'Malayan
-'0 Mannan J 1 Muthuwan, Mudugar or Muduvan
12, Paniyan -13' Pulayan
1 Adiyan '2 Eravallan 3 Hill Pulaya 4 Irular or Irulan
!i Kadar 6 Kurumam 7 Kurumbas 8 Malasar
9 ~~ayan
lO Muthuwan, Mudugar or Muduvan
11 Palliyan l.l2; Pulayan 15 Ulladan (Hill dwellers)
I:'"
1 Irular or Irulan
'2 Malai Pandaram
'S MalaYa~
.25/S2I-27b.
Total speakers
Female3
2
Mother tongue and total number of persons returned
as speaking a language subsidiary to the mother
toq.gue
Femalea
5
P ALGHAT QISTRICT-RURAL
32 8
54 161 41
9 7
2 227
14 55
24 1,905
214 11
5,746
30
344
12 689
ti29 1
6
2
2
KANNADA
MALAYALAM
31 6
71 141 45 8 4 1
204 8
36 16
2,060
TAMIL
3 168 10
5,580
21 2
314 g
ti78
615 2 1
3
TELUGU
2
URDU
S
213
10
42 21
3
II 2
Subsidiary language
I _ ::~'"
English (MIO)
English (M7, FIt Malayalam (M35, nO)
English (Ml) Malayalam·(M2, PI)
Malayalam (Mll, F2) " ,
Malayalam (FI)
ST-D PERSONS NOT AT WOllK. CLASSIFIED BY SEX AND TYPE OF ACTIVITY FOR SCHEDULED TRIBES
Fly-leal
This table prepared for the dIstrict gives the type of activity of the non-working population of Scheduled Tribes such as being full-time students, persons seeking
214
employment for the first time, persons employed before', but now out of employment and seeking work an& others in respect of Scheduled Tribe by sex.
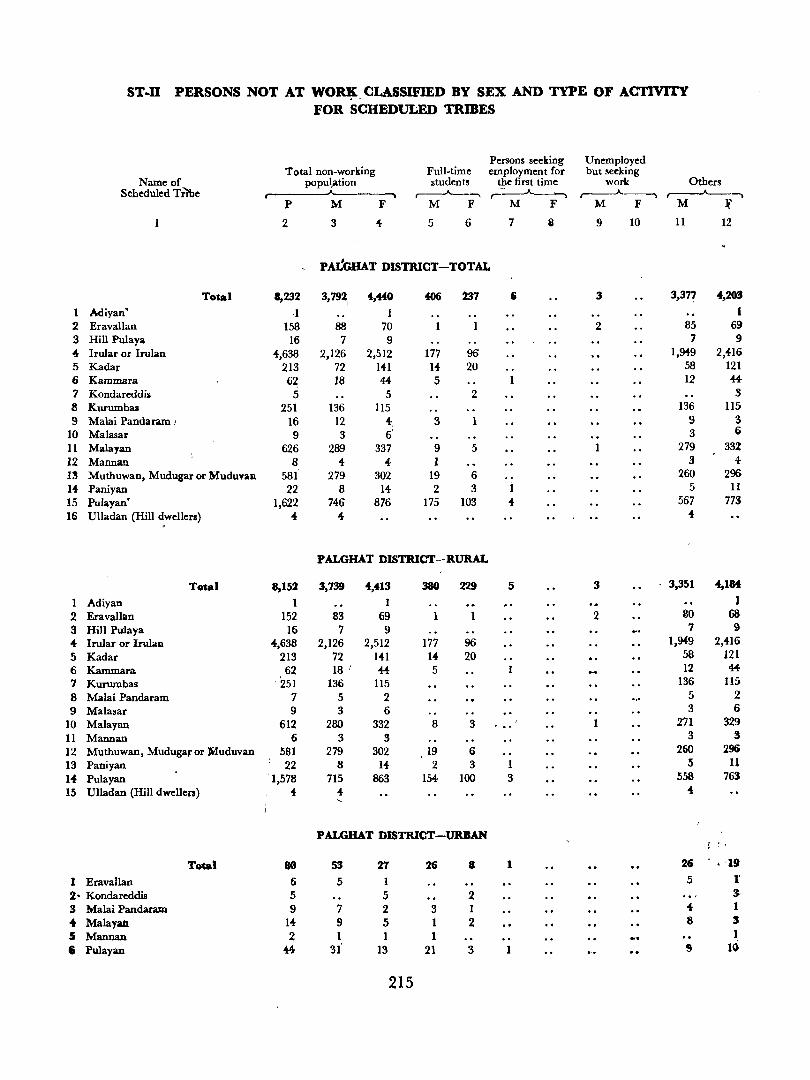
1 2 3 .. 5 6 7 8 9
10 11 12 13 Jot. 15 16
1 2 3 4-5 6 7 8 9
10 11 12 13 14 15
I
ST.ll PERSONS NOT AT WO~. CLASSIFIED BY SEX AND TYPE OF AC'I1VITY FOR SCHEDULED TRmES
Persons seeking Unemployed Total non-working Full-time employment for but seeking
Name of popul,ation students the first time work Others Scheduled TfIbe ~"""'" ,---"----., ,..:-~ ,---'----., r-----A---.
P M F M F M F M F M ~
2 3 4 5 6 7 B 9 10 11 12
PAL'hHAT DISTRICT-TOTAL
Total 8,232 3,792, 4,440 406 237 , 3 3,377 4,203
Adiyan' ,I 1 1 Eravallan 158 88 70 2 85 69 Hill Pulaya 16 7 9 7 9 Irular or Irulan 4,638 2,126 2,512 177 96 1,949 2,.U6 Kadar 213 72 141 14 20 58 121 Kammara 6~ 18 44- 5 12 « Kondareddis 5 5 2 3 Kurumbas 251 136 115 136 115 Malai Pandaram I 16 12 4, 3 1 9 3 Malasar 9 3 6' 3 6 Malayan 626 289 337 9 5 1 279 332 Mannan 8 4 4 1 3 4-Mutbuwan,Mudugaror){uduvam 581 279 302 19 6 'i
260 296 Paniyan 22 8 14- 2 3 5 11 Pulayan' 1,622 746 876 175 103 4 567 773 Ulladan (Hill dwellers) 4 4- 4
PALGHAT DISTRICT-RURAL
Total 8,152 3,739 4,413 380 229 5 3 3,351 4,IM
Adiyan 1 1 l Eravallan 152 83 69 2 BO 68 Hill Pulaya 16 7 9 7 9 Irular or Irulam 4,638 2,126 2,512 177 96 1,949 2,416 Kadar 213 72 141 14 20 ,58 121 Kammara 62 18 ' « 5 12 44-
Kurumbas :'Z5l 136 115 136 115
Malai Pandaram 7 5 2 5 2 Malasar 9 3 6 3 6
Malayan ,612 280 332 8 3 ... 271 329 Mannan 6 3 3 3 3 Muthuwan, Mudugar or Muduvan 581 279 302 19 6 2tiO 296 Paniyan 22 8 14 2 3 5 II Pulayan 1,578 715 863 154- 100 3 558 763 Ulladan (Hill dwellers) 4 4- 4
PALGHAT DISTRICT-URBAN , '
Total 80 53 21 26 8 1 26 ' 'I' Eravallan 6 5 5 l'
2- Kondareddis 5 5 2 3·
3 Malai Pandaram 9 7 2 3 1 .. I
-I Malayan 14 9 5 1 2 8 3 5 Mannan 2 1 1 1 1 .. Pulayan 44 31 13 21 3 1 S 10
215
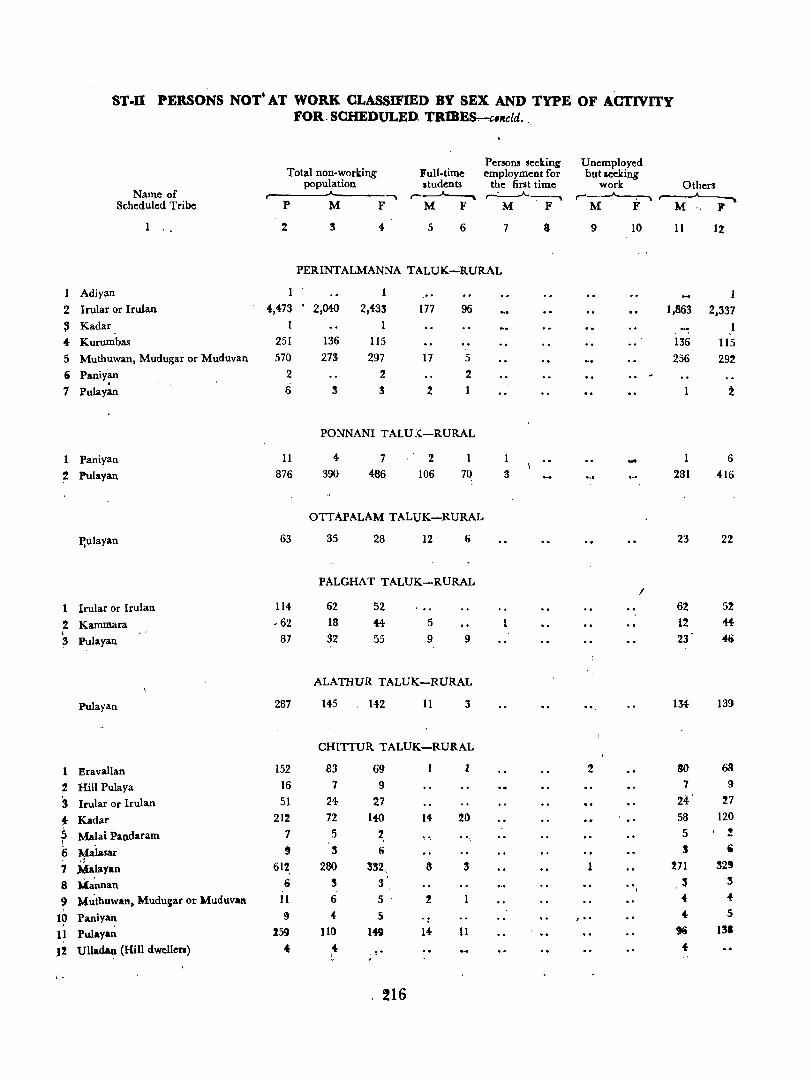
ST.U PERSONS NOT' AT WORK CLASSIFIED BY SEX AND TYPE OF ACTIvITY FOR. SCHEDULED. TRmEs"'-.e,"cld. ,
Total non-working Full-time Persons seeking Unemployed employment for but seeking
population students the first time work Others Name of r--"'---"""" ~ ,....~~
Scheduled Tribe P M F M F M F M F M '. P'
1 .. 2 3 4- 5 6 7 a 9 10 11 12
PERINTALMANNA TALUK-RURAL
1 Adiyan
2 Irular or Irulan 4,473 • 2,040 2,433 177 96 1,863 2,337
~ Kadar 1 1 .1 4 Kurumbas 251 136 115 136 ll5 5 Muthuwan, Mudugar or Muduvan 570 273 297 17 5 256 292 i Paniy;ut 2 2 2
7 Pulayan 6 3 3 2 :2
PONNANI TALU:(-RURAL
Paniyan 11 4- 7 2 6 2 Pulayan 876 390 486 106 70 3 281 416
OTTAPALAM TALUK-RURAL
p,ulayan 63 35 28 12 (; 23 22
PALGHAT TALUK-RURAL I
1 Irular or Irulan 114 62 52 .. 62 52
2 Kammara ,62 18 44 5 12 « t
87 32 3 Pulayan 55 9 9 23 46
ALATHUR TALUK-RURAL
Pulayan 287 145 142 11 3 ". 134- 139
CHITTUR TALUK-RURAL
1 l.ravallan 152 83 69 t 2 80 68
2 Hill Pulaya 16 7 9 7 9
S Irular or Irulan 51 24 27 24 '17
~ Kadar 212 72 140 14 20 58 120
5 Malai Pao.daram 7 5 2 ~ .. 5 % I
;, Malasar !t 3 (; J • d 612 280 S32, 8 3 1 %71 32' 7 Malayan
- ' i 3 3 3 3 8 Mannan .. , 9 M~thuwan. Mudu!:ar or Muduvaa 11 6 5 % " .(-
10 Paniyan !) 4 5 ," 4- 5 ,
110 149 14- 11 t6 131 11 Pulayan %59
.1% UUadan (Hill dwellen) " {- .. .. f ,
, 216
ERRATA
. Page Column Line For Read
6 9 9 134 1~ ~.-~
7 19 25 17 107
35 43 85 285
9 36 11 28 208
16 2 5 Mathirassery Mathirasseri
22 2 36 Irinagattor Iringattor
46 3 -- 18 92600 926'00 _ .. _-----48 5 29 3
49 last column 6 19 191
50 16 29 23 237
97 - 2 81. No. 87 Cheriakottapadam Cheriyakottapadam
98 4- 81. No. 139 3-322 3-3-22 4- 81. No. 203 3-231-5 3-2-31-5 3 81. No. 212 651 65'1
101 2 81. No. 452 Naduvattom Naduvattam 2 81. No. 473 Nellikkattiri Nellikkatiri
\4, SI.No.490 3-69- 3-6-9
102 4- 51. No. 594 3-317-1 3-3-17-1 3 SI.No.64O 1021 102'1
104 3 81. No, 791 129-2 129'2
PART C
VILLAGE DIRECTORY

PRIMARY CENSUS ABSTRACT
Fly-leaf
1. The Primary Census Abstract is presented down to block .level for urban areas and desom level for rural areas.
Occupied Census House 2. A census house is a structure or part of a structure,
inhabited or vacant, ,giving on the road 0: a common st~ir<:ase or a common courtyard leading to a mam gate or enJoYing a separate entrance. It may be a dwelling; a shop, a shop-~umdwelling a workshop-cum-dwelling, or a place of business, workshop, school, etc. A cemus hGuse~ that is inhabited is an occupied ceruus house.
Dwelling 3. A dwelling is a census house used exclusively for
residential purposes.
Shop-cum-dwelling , 4. A shop-cum-dwelling is a census house used both as
.a shop and as a residence.
Workshop-cum-dwelling S. A census house used both as a workshop and as a
residence is a workshop-cum-dwelling .•
Household 6. A household is a group of persons, who commonly live
together in the same census house and take their meals from a common mess unless the exigencies of work prevent them from doing so. .
Literacy and Education 7. For purposes' of enumeration the ability to read and
write was recognised as the test of literacy. The test applied for reading was the ability to read. ~ny simple. ~etter ei~her in.print or in manuscript and that for WrIting was abIlIty to WrIte a SImple letter. Persons who could both read and write and have also passed a written examination or examinations as a proof of the educational standard a,ttained were taken as educated persons.
Workers andlNon-Workers
8. A worker was defined for the purposes of this census as a person working as a "cultivat~r, or an agric~ltural labourer, or working at, hou&ehold Industry, or domg any other productive work, Or working in any possible combination of the .above four categories of work. The basis of work was deemed to be satisfIed in the case of seasonal work like cultivation, live-stock, dairying, household industry, etc., if the person has had some regular work of more than one hour a day throughout the greater part of the working season. In the case of regular employment in any trade, profession, service, ~JUsiness or commf>rce, the basis. of work was deemed to be satisfied If the person was employed dunng .any of the fIfteen days precediI).g the day of enumeration. A person who was working but absent from his work during the fifteen days preceding the day on which enumerated, or even exceeding the period of fifteen days due to illness or other causes was treated as worker. Work includes not only actual work but also effective supervisio;l and direction of work. Persons under training as apprentices with or.without stipt'nd or wages were also regarded as workers. An adult woman who was engaged in household duties but was doing no other productive work to augment the family's resources was not considered as a worker. If, however, in addition to her household work she engaged herself in work such as rice pounding for sale or ~ges or in domestic services for wages for others or minding cattle or selling
firewood, etc., or any such work, she was treated as a worker.
25/224-b
Persons like beggars, pensioners, agricultural or non-agricultural royalty, rent or dividend receivers, who might have been earning an income but were not participating in any productive work, were not treated as workers unless they also worked in cultivation, industry, trade, profession, business or commerce. A public or social service worker who was actively engaged in public service activity or a political worker who was also actually engaged in furthering the political activity of his party was regarded as "worker. A person was considered to be working as cultivator, if, he or she, was engaged either as employer, single worker or family worker in cultivation of land or supervision or direction of cultivation of land owned or held from Government, institutions or private persons. A person was considered agricultural labourer if he was working in another person's land only as labourer" without exercising any supervision or direction in cultivation for wages in cash, kind or share, such as a share of produce. He 5hould have no right or lease or contract on land on which he works, nor should he be responsible for taking decisions as to which crop to sow and when, or taking the risks of cultivation. A person was considered as working in household industry if the industry comes within the definition of the household industry. A worker may be an employer, i.e., a person who hires one or more persons in his work, or an employee, i.e., who does his work under others for wages or salary in cash 0: kind, or a single worker, i.e., who is doing his work without employing others except casually and without the help of other members of the family except casually, or a family worker, i.e., a member who works without receiving wages in cash or kind, in an industry, business or trade, conducted mainly by members of the family and ordinarily, does at least one hour of work every day during the working season. The following explanations of these categories of workers were accepted for census enumeration ;....:.
(i) An employer is not only ~esponsible for his own personal work but also for giving work to others in the business run by him. But a person who employs domestic servants for household duties or has ·subordinates under him in an office where he is employed by others is not an employer, even if he has the power to employ another person in his office on behalf of his own employer or employers.
(ii) There may be persons who are employed as managers, superintendents, agents, etc., and in that capacity employ or control other workers on behalf of their own employers. Suer. persons are only employees, as explained above, and should not be regarded as employers.
(iii) A single worker is not employed by anyone else and in his turn does not employ anybody else not even members of his household except casually. The definition of a single worker will include a person who wo~ks in joint partnership with one or several persons hiring no employees, and also a member of a producers' co-operative. Each one of the partners or members of such producers' co-operatives is a 'single worker' .
(iv) An industry in which a family worker is engaged should be on a scale larger than what is earned in Household Industry in Question 10, whether run at home or away from home, in town or village, and even away from village in rural areas, and should ordinarily be in !he nature of a recognised partnership, joint stock company or regIstered factory. For the purpose of this definition members of a family may be drawn from beyond the limits of the household by ties of blood or marriage. The family worker may not be entitled to a share of the profits in the work of the business carried on either by the person or head of the household or other relatives.
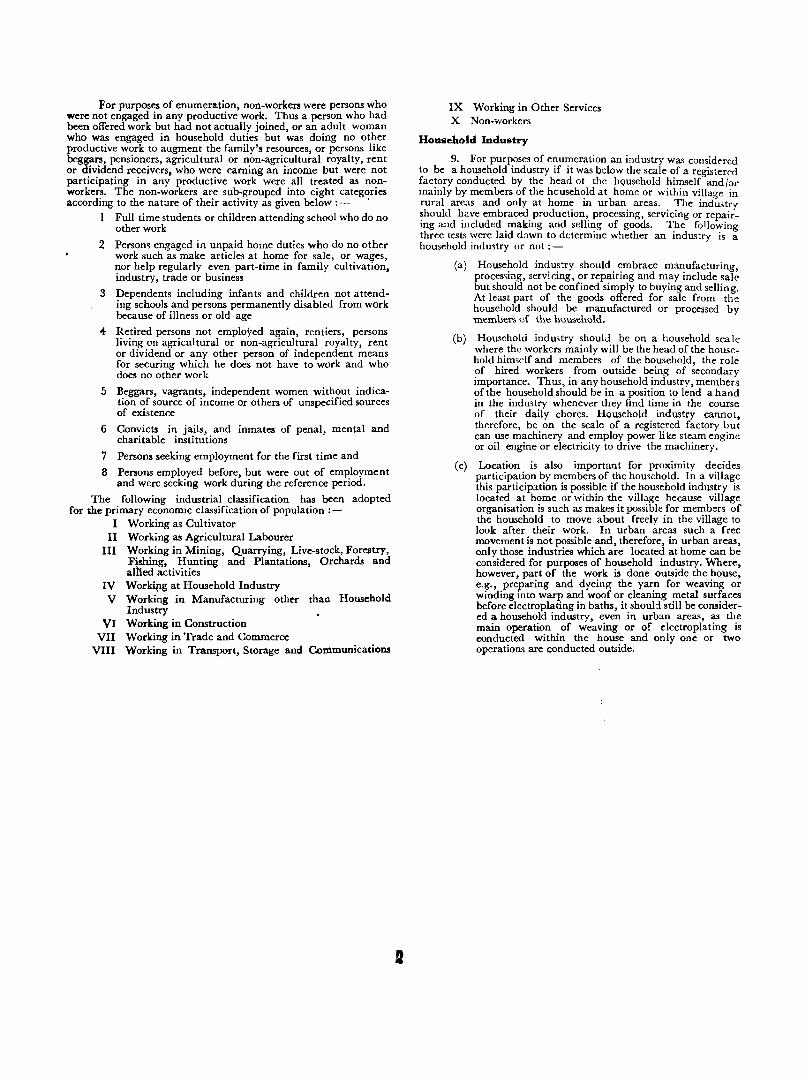
For purposes of enumeration, non-workers were persons who were not engaged in any productive work. Thus a person who had been offered work but had not actually joined, or an adult woman who was engaged in household duties but was doing no other productive work to augment the family's resources, or persons like beggars, pensioners, agricultural or non-agricultural royalty, rent or dividend receivers, who were earning an income but were not participating in any productive work were all treated as nonworkers. The non-workers are sub-grouped into eight categories according to the nature of their activity as given below ;-- .
I Full time students or children attending school who do no other work
2 Persons engaged in unpaid home duties who do no other work such as make articles at home for sale, or wages, nor help regularly even part-time in family cultivation, industry, trade or business
3 Dependents including infants and children not attending schools and persons permanently disabled from work because of illness or old age
4 Retired persons not employed again, rentiers, persons living on agricultural or non-agricultural royalty, rent or dividend or any other person of independent means for securing which he does not have to work and who does no other work
5 Beggars, vagrants, independent women without indication of source of income or others of unspecified sources of existence
6 Convicts in jails, and inmates of penal, mental and charitable institutions
7 Persons seeking employment for the first time and
8 Persons employed before, but were out of employment and were seeking work during the reference period.
The following industrial classification has been adopted for the primary economIC classification of population ;-
I Working as Cultivator II Working as Agricultural Labourer
III Working in Mining, Quarrying, Live-stock, Forestry, Fishing, Hunting and Plantations, Orchards and allied activities
IV Work4Ig at Household Industry V Working in Manufacturing other than Household
Industry VI Working in Construction
VII Working in Trade and Commerce VIII Working in Transport, Storage and Communications
IX Working in Other Services X Non-workers
Household Industry
9. For purposes of enumeration an industry was considned to be a household industry if it was below the scale of a registered factory conducted by the head 01 the hQusehold himself and/or mainly by members of the hcusehold at home or within village in rural areas and only at home in urban areas. The indllitry ~hould ~ave embraced. production,. processing, servicing or repairmg and l1lcluded .makmg and selllI~g of goods. ~he following three rests were laId down to determme whether an mdustry is a household industry or not :-
(a)
(b)
(c)
Household indus~ry should embrace manufacturing processing, servicing, or repairing and may include sal; but should not be confined simply to buying and selling. At least part of the goods offered for sale from the household should be manufactured or processed by members of the household.
Household industry should be on a household scale where the workers mainly will be the head of the household him~elf and members of the household, the role of hired workers from outside being of secondary importance. ThUl, in any household industry, members of the household should be in a position to lend a hand in the industry whenever they find time in the course of their daily chores. Household industry cannot, therefore, be on the scale of a registered factory but can use machinery and employ power like steam engine or oil engine or electricity to drive the machinery.
Location is also important for proximity decides participation by members of the household. In a village this particip:dion is possible if the household industry is located at home or within the vilbge because village organisation is such as makes it possible for members of the household to move about freely in the village to look after their work. In urban areas such a free movement is not possible and, therefore, in urban areas, only those industries which are located at home can be considered for purposes of household industry. Where, however, part of the work is done outside the house, e.g., preparing and dyeing the yarn for weaving or winding into warp and woof or cleaning metal surfaces before electroplating in baths, it shoul:l still be considered a household industry, even in urban areas, as the main operation of weaving or of electroplating is conducted within the house and only one or two operations are conducted outside.
(i) PRIMARY CENSUS ABSTRACT
PALGHAT DISTRICT
PERINTALMANNA TALUN
PONNANI
OTTAPALAM
PALGHAT
ALATHUR
CHITTUR
" " " " "
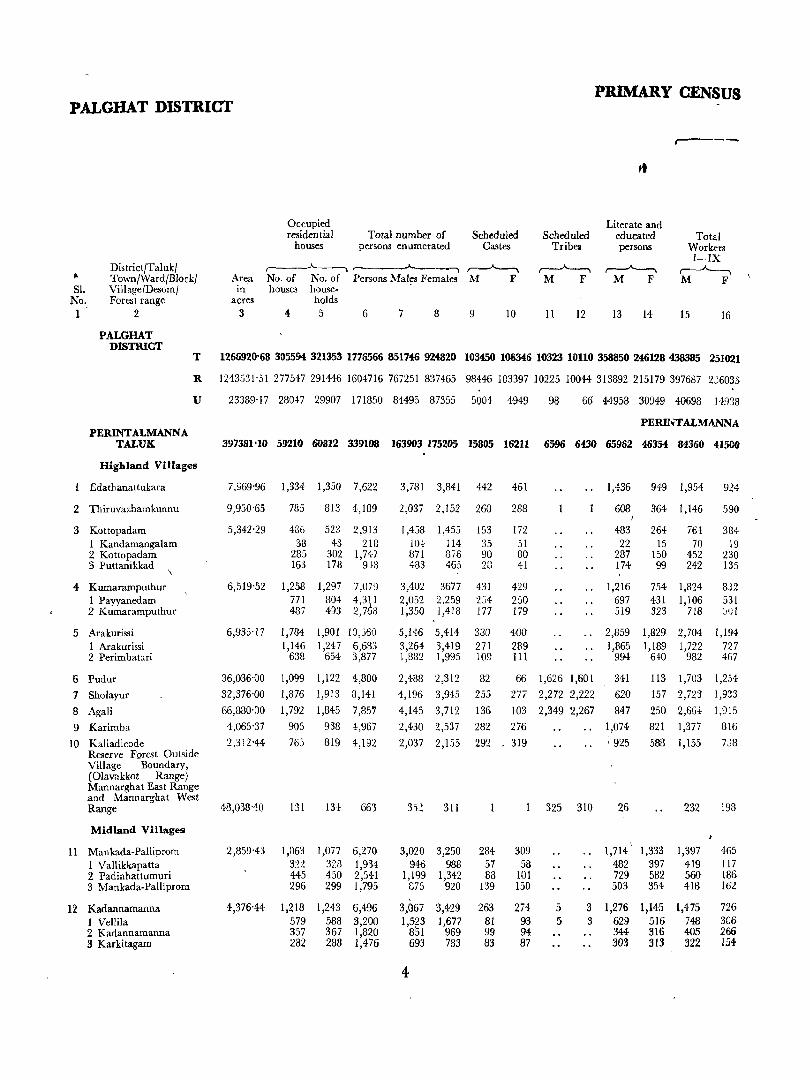
PALGHAT DISTRICT PRIMARY CENSUS
,..-----
Occupied Literate and residential Total number of Scheduled Scheduled educated Total
houses persons enumerated Castes TribCll persons Workers I-IX
DistrictJTalukJ ,_--"-----, ,---..---A----. ,_.A.---.. r---"----. ...---"---. ,~ ~ TownJWard/Block/ Area No_ of No_ of Persons Males Females M F M F M F M F 81. Village/DesomJ in houses house-
No. Fore:;t range acres holds 1 2 3 4 5 6 7 8 9 10 11 12 13 14 15 16
PALGHAT DISTlUCT
T 1266920'68 335594 321353 1776566 851746 924820 103450 108346 10323 10110 358850 246128 438385 251021
R 1243531-51 277547 291446 1604716 767251 837465 98446 103397 10225 10044 313892 215179 397687 2';6033
U 23389'17 2804-7 29907 171850 84495 87355 5004 4949 98 66 44958 30949 40698 14938
PERINTALMANNA PERlNTALMANNA
TALUK 397381'10 59210 60812 339108 163903 175205 15805 16211 6596 6430 65962 46354 84360 41500
Highland Villages
Edathanattukara 7.969-96 1,334 1,350 7,622 3,781 3,841 442 461 1,436 949 1,954 924
2 Thiruvazhamkunnu 9,950-65 785 813 4,189 2,037 2,152 260 288 608 364 1,146 590
3 Kottopadam 5,342-29 486 523 2,913 1,438 1,455 153 172 483 264 764 384 1 Kandamangalam 38 43 218 104- 114 35 51 22 15 70 19 2 Kottopadam 285 302 1,747 871 876 90 80 287 150 452 230 S Puttanikkad 163 178 9}3 483 465 2G 41 174 99 242 135
4 Kumaramputhur 6,519-52 1,258 1,297 7,079 3,402 3677 431 429 1,216 754 1,824 832 1 Payyanedam 771 804 4,3~1 2,052 2,259 2:;4 250 697 431 1,106 531 2 Kumaramputhur 487 493 2,7 3 1,350 1,418 177 179 519 323 718 ~,\) I
5 Arakurissi 6,935-17 1,784 1,901 ID,j60 5,146 5,414 330 400 2,859 1,829 2,704 1,194 I Arakurissi 1,146 1,247 6,633 3,264 3,419 271 289 1,865 1,189 1,722 727 2 Perimbat:lri 638 654 3,877 1,882 1,995 109 1 I 1 994 640 982 4li7
6 Pudur 36,036-00 1,099 1,122 4,800 2,488 2,312 82 66 1,626 1,601 341 113 1,703 1,254
7 8holayur 32,376-00 1,876 1,913 8,141 4,196 3,945 25,) 277 2,272 2,222 620 157 2,723 1,923
8 Agali 66,880-00 1,792 1,845 7,85'7 4,145 3,712 136 103 2,349 2,267 847 250 2,66-1: 1,915
9 Karimba 4,065-37 905 938 4,967 2,430 2,537 282 276 1,074 821 1,377 816
10 Kalladicode 2,312'44 763 819 4,192 2,037 2,155 292 319 : 925 588 1,155 7J8 Reserve Forest Outside Village Boundary, (Olavakkot Range) Mannarghat East Range and Mannarghat West Range 48,038-40 131 13t 663 352 311 325 310 26 232 198
Midland Villages ,
11 Mankada-Palliprom 2,859-43 1,063 1,077 6,270 3,020 3,250 284 309 1,714 1,333 1,397 465 1 Vallikkapatta 322 328 1,934 946 988 57 58 482 397 419 117 2 Padinhattumuri 445 450 2,541 1,199 1,342 88 101 729 582 560 186 3 Mankada-Palliprom 296 299 1,795 C75 920 139 150 503 354 41B 162
12 Kadannamanna 4,376-44 1,218 1,243 6,496 3,067 3,429 263 274 5 3 1,276 1,145 1,475 726
1 Velli1a 579 588 3,200 1,523 1,677 81 93 5 3 629 516 748 306 2 Kadannamanna 357 367 1,820 8'51 969 99 94 344 316 405 266 3 Karkitagarn 282 288 1,476 693 783 83 87 303 313 322 154
4
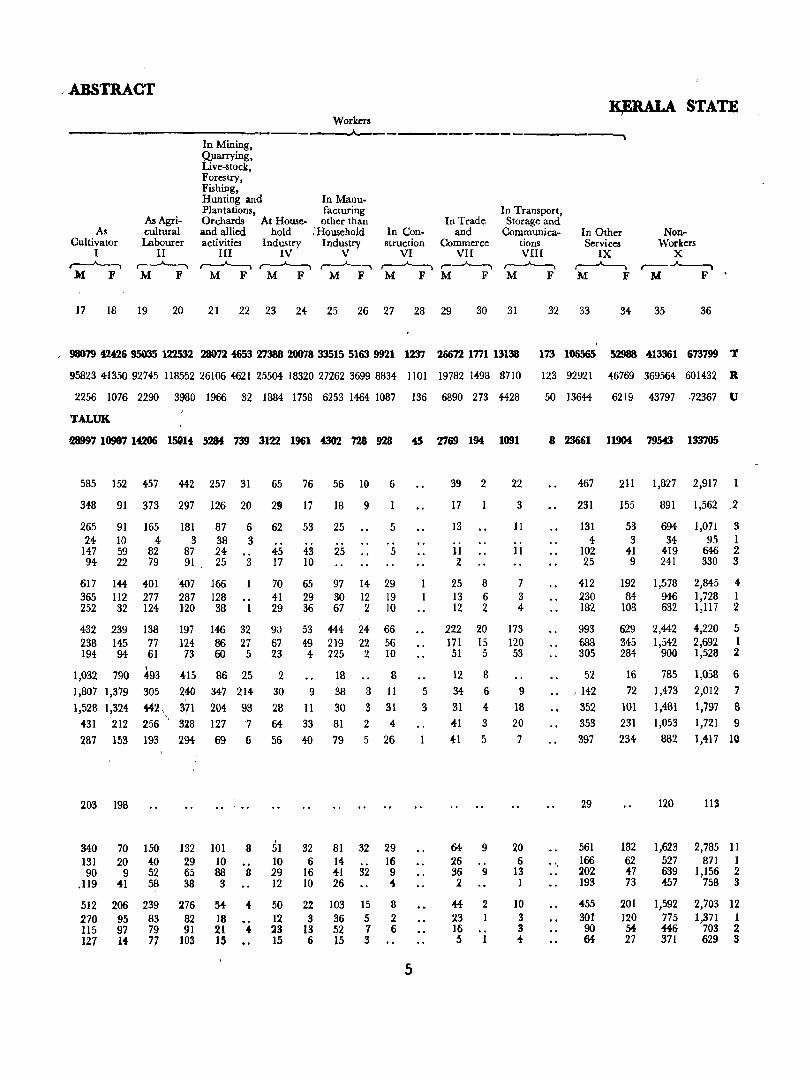
,ABSTRACT ~A STATE
Workers ------___ - _______ A ___________ _
In Mining, Quarrying, Live-stock, Forestry, Fishing,
----~
As Cultivator
I r---'----" M F
As Agricultural Labourer
II ~ M F
Hunting and In Manu-Plantations, facturing Orchards At House- other than and allied hold ; Household activities Industry Industry
III IV V ~ ~ r---"----l
M F M F M F
In Con-In Trade
and
In Transport, Storage and
Communica-struction Commerce tions
VI VII VIII ~,......-A--..., ~ M F M F M F
In Other Services
IX ~ M F
NonWorkers
X r--~
M F
17 18 19 20 21 22 23 24 25 26 27 28 29 30 31 32 33 34 35 36
98079 42426 95035 122532 28072 ~53 27388 20078 33515 5163 9921 1237 26672 1771 13138 173 106565 52988 413361 673799 T
958234135092745 118552261064621 25504 183202726236998834 1101 19782 1498 8710 123 92921 46769 369564 601432 Il
2256 1076 2290 3980 1966 32 1884 1758 6253 1464 1087 136 6890 273 4428
TALUK
a8997 10987 14206 1~14 5284 739 3122 1961 4302 728 928 45 2769 194 1091
585 152 457 442 257 31 65 76 56 10 6
348
265 24
147 94
91 373
91 165 10 4 59 82 22 79
297 126 20
181 87 6 3 38 3
87 24 91 25 3
617 144 401 365 112 277 252 32 124
407 166 287 128 120 38 1
432 238 194
1,032 1,807 1,528
431 287
239 145 94
790 1,379 1,324
212 153
203 198
138 197 77 124 61 73
~93 415 305 240 442, 371 256" 328 193 294
146 32 86 27 60 5
86 25 347 214 204 98 127 '7 69 6
29
62
45 17
70 41 29
90 67 23
2 30 28 64
56
340 131 90
,119
70 ISO 20 40 9 52
41 58
132 101 8 51 29 10 10 65 88 8 29 38 3 12
512 206 239 270 95 83 115 97 79 127 14 77
276 82 91
103
54 18 21 15
50 12 23 15
17
53
4-3 10
65 29 36
53 49 4
9
11
33
40
18
25
25
9
5
5
97 14 29 30 12 19 67 2 10
444 219 225
18 38 30 81 79
24 22 2
8
3
2
5
66 56 10
8
II
31 4
26
32 81 32 29 6 14 16
16 41 32 9 10 26 4
22 3
13 6
103 36 52 15
15 5 7 3
8 2 6
5
5
3
39 2
17
13
11 2
25 13 12
222 171 51
12 34 31 41 H
8 6 2
20 15 5
8 6
4 3
5
64 9 26 36 9 2
44 2 23 1 16 5 1
22
3
11
11
7 3 4
173 120 53
9
18 20 7
20 6
13 1
10 3 3 4
50 13644 6219 43797 .72367 U
8 23661 11904 79543 133705
",
467
231
131 4
102 25
412 230 182
993 688 305
52 , 142
352 353
397
29
561 166 202 193
455 301 90 64
211 1,827 2,917
155
53 3
41 9
192 84
103
629 345 284
16
72 101 231 234
891 1,562 .2
694 1,071 3 34 95 1
419 646 2 241 330 3
1,578 946 632
2,442 1,542
900
735 1,473 1,481 1,053
882
120
2,845 4 1,728 1 1,117 2
4,220 5 2,692 I 1,528 2
1,058 6
2,012 7 1,797 8 1,721 9 1,417 10
113
182 1,623 2,785 11 62 527 871 I +7 639 1,156 2 73 457 758 3
201 120 54 27
1,592 775 44& 371
2,703 12 1,371 1
703 2 629 3
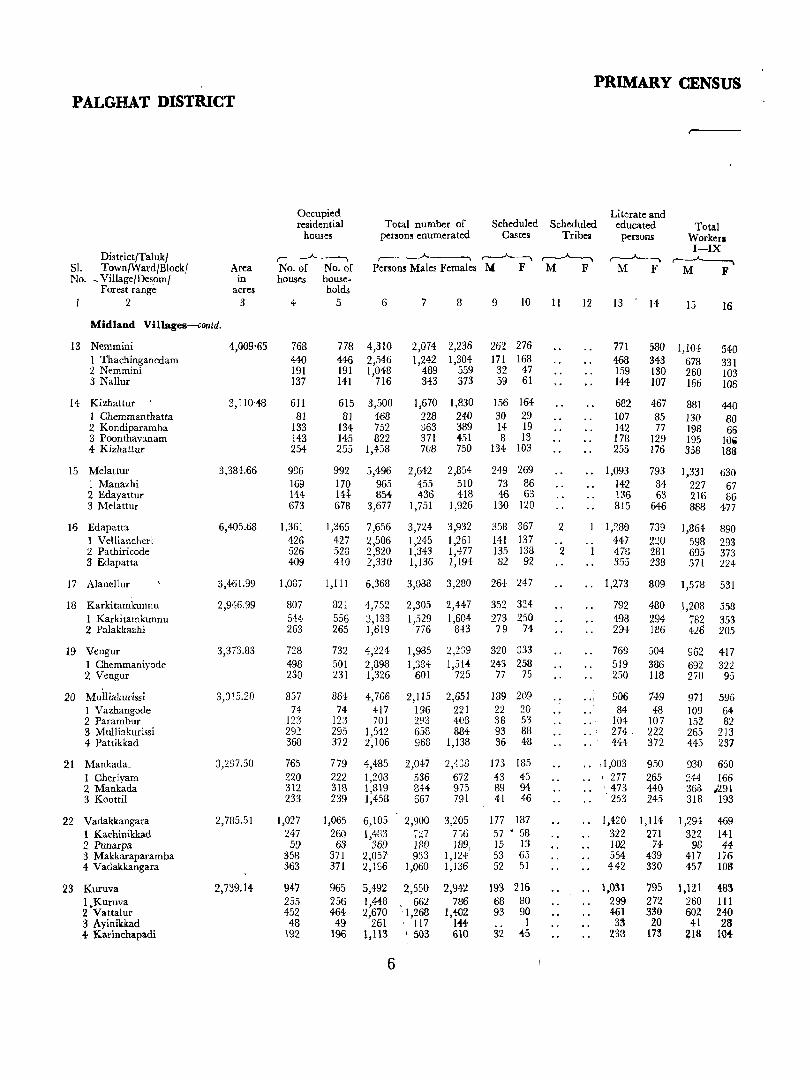
PRIMARY CENSUS PALGHAT DISTRICT
Occupied Literate and residential Total number of Scheduled Scheduled educated Total
houses persons enumerated Castes Tribes persons Workers
District/Taluk/ I-IX
~ ,-------A.------. ,------"-------. ~ ~ r----A------. SI. Town/Ward/Blockl Area No. of No. of Persom Males Females ]I,{ F M F M F M F No. _ Village/Desom/ in houses house-
Forest range acres holds 2 3 4 5 6 7 8 9 10 11 12 13 14 15 16
Midland Villages-contd.
13 Nemmini 4,009-65 768 778 4,310 2,074 2,236 262 276 771 580 1,104 540 I Thachinganedam 440 446 2,546 1,242 1,304 171 168 468 343 678 331 2 Nemmini 191 191 1,048 489 559 32 47 159 130 260 103 3 Nallur 137 141 716 343 373 59 61 144 107 166 106
[4 Kizhattur 3,! 10'48 61l 615 3,500 1,670 1,830 156 164 682 467 881 440 1 Chemmanthatta 81 81 468 228 240 30 29 107 85 130 80 2 Kondiparamba 133 134 752 ,,63 389 14 19 142 77 198 66 3 Poonthav:mam 143 145 822 371 451 8 13 178 129 195 10. 4 Kizhattur 254 255 1,45B 708 750 134 103 255 176 358 188
15 Melattur 3,384.66 986 992 5,496 2,642 2,854 2'19 269 1,093 793 1,331 630 1 Manazhi 169 170 965 455 510 73 86 142 84 227 67 2 Edayattur 144 144 854- 436 418 46 63 136 63 216 86 3 Melattur 673 678 3,677 1,751 1,926 130 120 815 646 888 477
16 Edapatta 6,405.68 1,361 1,365 7,656 3,724 3,932 358 367 2 1,:"!80 739 1,864- 890 1 Velliancheri 426 427 2,506 1,245 1,261 141 137 447 2~O 598 293 2 Pathiricode 526 523 2,820 1,343 1,'177 135 138 2 478 281 695 373 3 Edapatta 409 410 2,330 1,136 1,194- 82 92 355 238 571 224
17 Alanellur 3,461.99 1,037 1,111 6,368 3,033 3,280 264- 247 1,273 809 I,S;B 531
18 Karkitamkunnu 2,916.99 807 821 4,752 2,305 2,447 352 3::4 792 480 1,208 558 I Karkitamkunnu 544 556 3,133 1,529 1,604 273 250 498 294 782 353 2 Palakkazhi 263 265 1,619 776 843 79 74 291- le6 426 205
19 Vengur 3,373.83 n8 732 4,22·4 1,985 2,239 320 333 769 504 962 417 I Chemmaniyode 498 501 2,89B 1,384 1,514 243 258 519 386 692 322 2 Vengur 230 231 1,326 601 725 77 75 250 118 270 95
20 Mulliakurissi 3,015.20 857 864- 4,766 2,115 2,651 189 209 .. 906 749 971 596 1 Vazhangode 74 74 417 196 221 22 20 84 48 109 64 2 Parambur 123 123 701 293 408 38 53 .. 104 107 152 82 3 Mulliakurissi 292 295 1,542 658 884 93 88 .. : 274 222 265 213 4 Pattikkad 36B 372 2,106 968 1,138 36 48 444 372 445 237
21 Mankada_ 3,297.50 765 779 4,485 2,047 2,1,~8 173 135 ,1,003 950 930 650 1 Cheriyam 220 222 1,203 536 672 43 45 " \ 277 265 244 166 2 Mankada 312 318 1,819 844- 975 89 94 .. '.473 440 30a ~291 3 Kootti1 233 239 1,458 667 791 41 46 253 245 318 193
22 Vadakkangara 2,785.51 1,027 1,065 6,105 2,900 3,205 177 187 1,420 1,114 1,294 469 1 Kachinikkad 247 260 1,483 7'27 7SG 57 • 58 322 271 322 141 2 Punarpa 59 63 369 1ilO 189, 15 13 J()2 74- 98 44-3 ~akkarapararaba 358 371 2,057 933 1,IN 53 65 554 439 417 176 4 Vadakkangara 363 371 2,IS6 1,060 I,B6 52 51 442 330 457 108
23 Kuruva 2,739.14 947 965 5,492 2,550 2,942 193 216 1,031 795 1,121 483 I,Kuruva 255 256 1,448 662 786 68 80 299 272 260 III 2 Vatta1ur 452 464 2,670 ' 1,268 I,.W2 93 90 461 330 602 240 3 Ayinikkad 48 49 261 117 IH I 33 20 41 28 4- Karinchapadi 192 196 1,113 ' 503 610 32 4-5 233 In ~18 10.f.
6
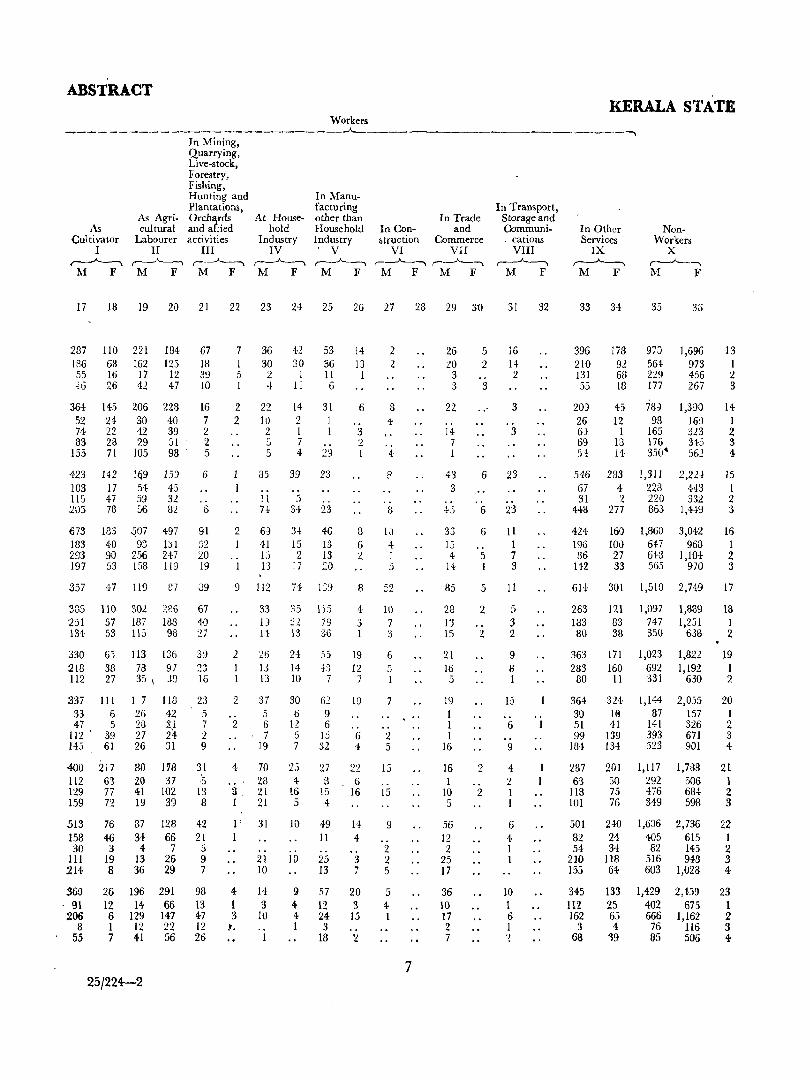
ABSTRACT
Workers --------------------------'--
As Cultivator
I r----"----.
M F
As Agricultural
Labo~lrer II ~ M F
In Mining, Quarrying, Live-stock, Forestry, Fishing, Hunting and Plantations, Orcha,rds and anied activities
III
At Household
Industry IV
In Manufacturing other than Household Industry , V
r--"-----. M F
In Con-.truction
VI
In Trade and
Commerce VII
17 18 19 20 21 22 23 24 25 26 27 28 29 3D
237 110 221 184 67 186 63 162 125 18 55 16 17 12 39 ~6 26 42 47 10
364 52 74 83
145 24 22 23 71
206 228 16 30 40 7 42 39 2 29 51' 2
155 105 98' 5
423 142 169 15) 51 45 59 32 ::;6 82
103 17 115 47 .205 78
673 183 293 197
357
183 .507 497 40 93 tJI 90 256 217 53 158 119
47 119 87
6
91 52 20 19
39
335 110 301 2~6 67 251 57 187 188 40 134 53 115 98 27
330 218 112
6j 113 IJ6 38 78 97 27 35 \ ,)9
:337 III 33 6 47 5
112' 39 145 61
400 :217 112 6'3 129 77 159 72
513 158 30
III 214
360 91
206 8
55
76 46 3
19 8
26 12 6 1 7
I 7 26 23 27 26
118 42 2) 24 31
80 178 20 37 41 102 19 39
87 34
4 13 36
196 14
129 12 41
128 66
7 26 29
291 66
147 22 56
25/224-2
39
16
23 5 7 2 9
31 ·5 IS 8
42 21
5 9 7
98 13 47 12 26
7 36 42 53 14 1 30 30 36 13 5 2 I 11 I I 4 11 6
2 2
1 I
2
2
2
22 10 2 ::; 5
85 .. !I H
6e} 41 Ij 13
112
14 2 I 7 4
39
3-1 15 2
17
H
31
.. 29
23
.. 23
46 13 13 ::0
1:::9
33 35 115 iJ ~~ 79 H 13 3U
26 U 13
37 5 6 7
19
24 5S 14 4') 10 7
30 6
12 5 7
62 9 6
15 32
4. 70 27
4 1 :3 ,.
28 21 21
31
21 10
14 3
10
1
4 16 5
10
10
9 4 4 I
8 Ei 4
49 II
25 13
57 12 24 3
18
6 .. 3 2
8 6 2
8
4 3 1
19 12
7
10
6 4
22 6
16
14 4
.. 3 7
20 3
1,) .. 2
2 2
8 4
.. 4
.. 8
lJ 4 1 :)
52
10 7 3
6 5
7
.. :.I 5
IS .. 15
9 .. 2 2 5
5 4 1
7
26 :w
3 3
22 .. 14 7 I
48 3
33 IS 4
14
85
28 1'3 15
21 16 5
19 I 1 1
16
16 1
10 5
56 12 2
25 17
36 10 17 2 7
5 2
3
6
. . 6
6 ..
"
5 1
5
2
2
2 .. 2
In Transport, Storage and Communi-. cations
VIn r-~
M F
31 32
16 14 2
3
3
23
23
I1 1 7 3
11
5 3 2
9 8 1
15 .. 6
9
4 2 1 1
6 4 I 1
10 1 6 1 ~
KERALA STATE -,
In Other Services
IX ~ M F
33 34
NonWorkers
X r--"-----, M F
35
396 li8 97:1 1,696 13 210 92 564 973 1 131 68 229 456 2 55 13 177 267 3
20:1 26 6) 69 50!
546 67 31
448
424 196 86
142
6Ji.
263 183 80
363 283
80
364 30 51 99
184
287 6'3
118 101
501 82 54
210 155
345 112 162
3 G8
45 12
1 13 14
78:} 1,390 98 160
165 323 176 345 350· 56~
283 1,311 2,224 4 228 443 2 220 332
277 863 1,449
160 100 27 33
301
1,860 647 643 565
1,5lO
3,042 963
1,104-970
2,749
121 1,097 1,889 83 747 1,251 38 350 638
171 1,023 1,822 160 692 1,192
11 331 630
324 Ie 41
J:J9 134
1,144 87
141 393 523
2,035 157 326 671 901
14 1 2 3 4
15 1 2 3
16 1 2 3
17
18 1 2
19 1 2
20 1 2 3 4
201 1,117 1,783 21 50 292 506 1 75 476 684 2 76 349 598 3
2+0 24 34
118 64
133 25 6j 4
'39
1,6:)6 405 82
516 603
1,429 402 666 76 65
2,736 615 145 943
1,{J28
2,-1-39 675
1,162 116 506
22 1 2 3 4
23 1 2 3 4
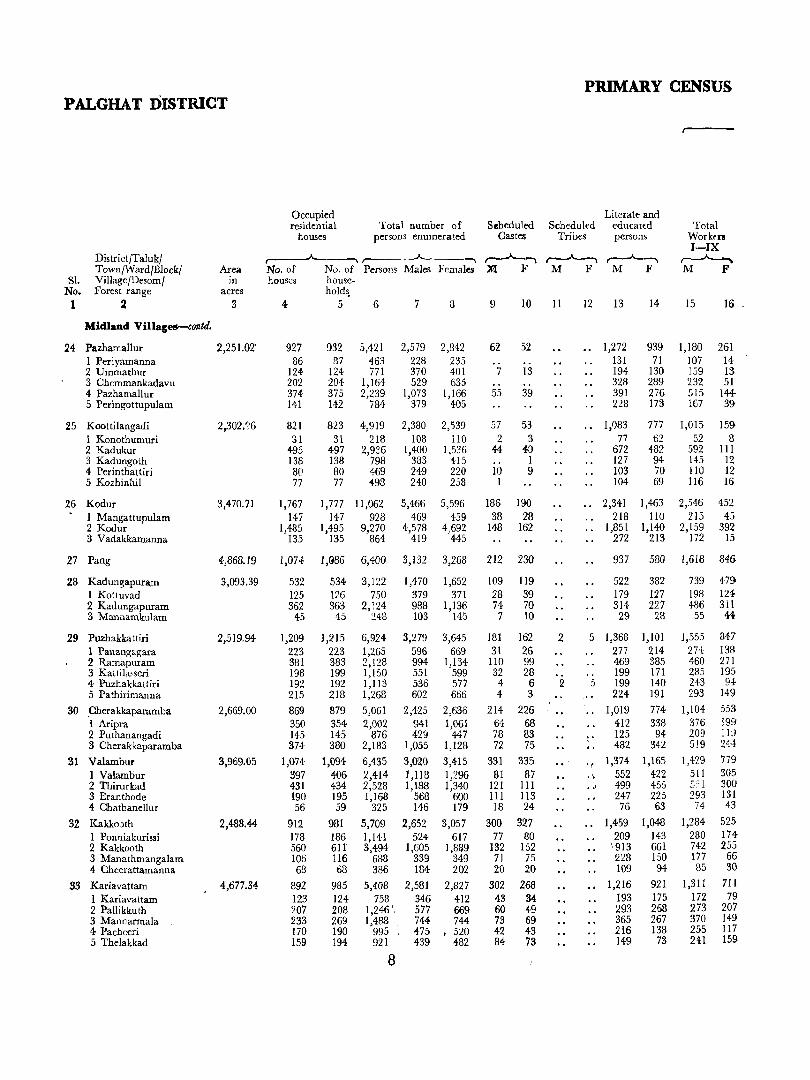
PRIMARY CENSUS PALGHAT DISTRICT
Occupied Literate and residential Total number of Scheduled Scheduled educated Total
houses persons enumerated Castes Tribes persons Workrrs I-IX
DistrictJTalukJ ,..---A----, ........ ~ r--A--........ ,....-...-A--.. ,---"--.,. Town/Ward/Block/ Area No. of No. of Persons Males Females M F M F M F M F
S1. Village/DesomJ in Louses house-No. Forest range acres hold~
1 :2 3 4 5 6 7 8 9 1O II 12 13 14 IS 16
Midland Villages-contd.
24 Pazhamalluf 2,251.02' 927 932 5,421 2,579 2,842 62 52 1,272 939 1,180 261 1 Periyamanna 86 o~ 463 228 235 131 71 107 14 0/
2 Ummathur 124 124 771 370 401 7 13 194 130 159 13 3 Chemmankadavu 202 204 1,164 529 635 328 289 232 51 4- Pazhamallur 374 375 2,239 1,073 1,166 55 39 391 276 515 144 5 Peringottupulam 141 142 784 379 405 228 173 167 39
25 Koottilangadi 2,302.96 821 823 4,919 2,380 2,,539 57 53 1,083 777 1,015 159 1 Konothumuri 31 31 218 108 110 2 3 77 62 52 8 2 Kadukur 495 497 2,936 1,400 1,536 44 40 672 482 592 III 3 Kadungoth 138 138 798 383 415 1 127 94 145 12 4- Perinthattiri 80 80 469 249 220 10 9 103 70 110 12 5 Kozhinhil 77 77 493 240 258 1 104 69 116 16
26 Kodur 3,470.71 1,767 1,777 1l,062 5,466 5,596 186 190 2,341 1,463 2,546 452
1 Mangattupulam 147 147 928 469 459 38 28 218 110 215 45 2 Kodur 1,485 1,495 9,270 4,578 4,692 148 162 1,851 1,140 2,159 392 3 Vadakkamanna 135 135 864 419 445 272 213 172 15
27 Pang 4,868.19 1,074 I,Q86 6,400 3,132 3,268 212 230 937 580 1,618 846
28 Kadungapura.,m 3,093.39 532 534 3,122 1,470 1,652 109 IJ9 522 382 739 479 I Kottuvad 125 126 750 379 371 28 39 179 127 198 124 2 Kadungapuram 362 363 2,124 988 1,136 74 70 314- 227 486 3Il 3 Mannamku1am 45 45 248 103 14-5 7 10 29 28 55 44
29 Puzhakkattiri 2,519.94- 1,209 1,215 6,924 3,279 3,645 181 162 2 5 1,36B 1,101 1,555 847
1 Panangagara 223 223 1,265 596 669 31 26 277 214 274 133 2 Ramapuram 381 383 2,128 994 1,134 110 99 469 385 460 271 3 Katti1asseri 198 199 1,150 551 599 32 28 .. 199 171 285 195 4- Puzhakkattiri 192 192 1,113 536 577 4 6 2 5 199 140 243 94-5 Pathirimanna 215 218 1,268 602 666 4 3 ," 224 191 293 149
30 _Cherakkaparamba 2,669.00 869 879 5,061 2,425 2,636 214 226 1,019 774 1,104 553
I Aripra 350 354 2,002 941 1,061 64 68 412 338 376 199 2 Puthanangadi 145 145 876 429 447 78 83 125 94 209 ILl 3 Cherakkaparamba 374 380 2,183 1,055 1,128 72 75 482 342 519 244-
31 Valambur 3,969.05 1,074 1,094 6,435 3,020 3,415 331 335 .. 'r 1,374- 1,165 1,429 779
1 ValamDur 397 106 2,414- 1,118 1,296 81 87 .', 552 422 511 305 2 Thirurkad 431 434 2,528 1,188 1,340 121 1Il .. ' 499 455 ~."l 300 3 Eranthode 190 195 1,168 568 600 III 1I3 247 225 293 131 4 Chathanellur 56 59 325 146 179 18 24- 76 63 74 43
32 Kakkooth 2,488.+4- 912 981 5,709 2,652 3,057 300 327 1,459 1,048 1,284 525
I Ponniakurissi 178 186 1,141 524 617 77 80 ,209 143 280 174-2 Kakkooth 560 611 3,494 1,605 1,889 132 152 " 913 661 742 255 3 Manathmangalam 106 116 688 339 349 71 75 228 150 177 66 4 Cheerattamanna 68 68 336 184- 202 20 20 109 94 85 30
33 Kariavattam 4,677.34 892 985 5,408 2,581 2,827 302 268 1,216 921 1,3Il 711
I Kariavattam 123 124 758 346 412 43 34 193 175 172 79 2 Pallikkuth 207 208 1,24-6 " 577 669 60 4-9 293 268 273 207 3 Malmarmala 233 269 1,488 744- 744 73 69 365 267 370 149 4 Pacheeri 170 190 995 4-75 , 520 42 43 216 138 255 117 5 Thdakkad 159 194 921 439 482 84 73 149 73 241 159
8
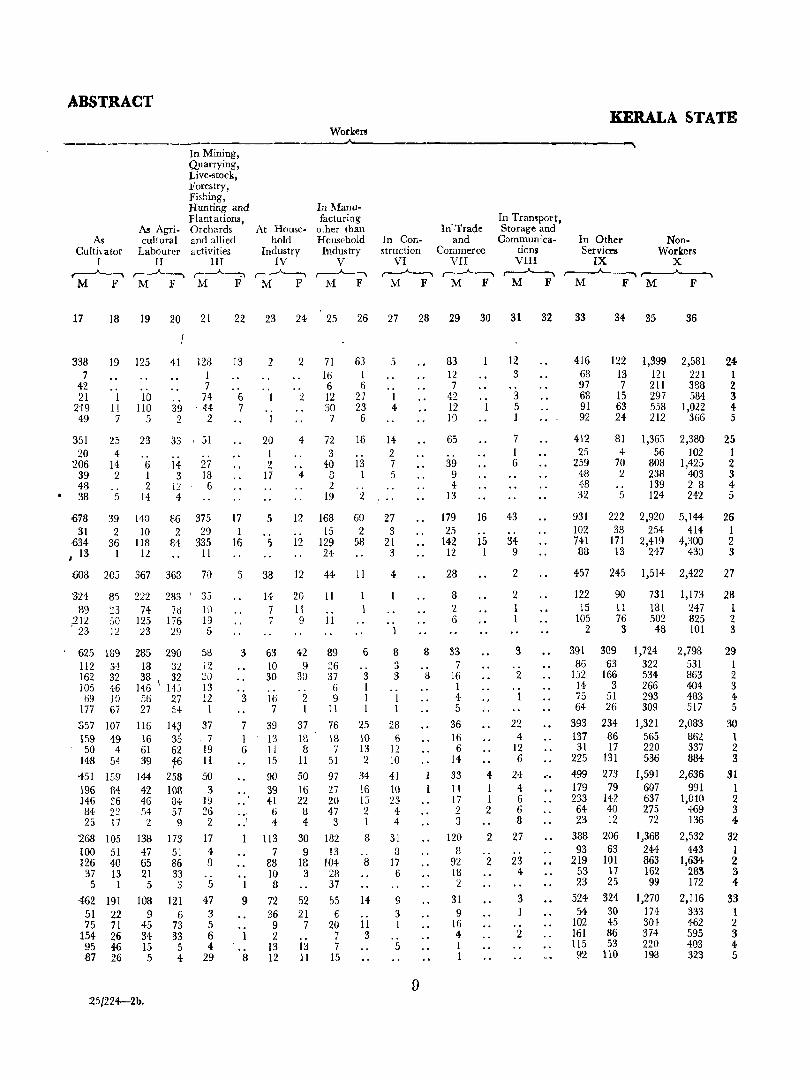
ABSTRACT
Workers ---------~----------........ ---
As Cuith-ator
I ~
M F
As Agricullural
Labourer II ~ M F
In Mining, Quarrying, Live-stock, Forestry, Fishing, Hunting and Plantations, Orchards and allied activities
III ,----A.----".,
.M F
At Household
Industry IV
r--"----... M F
In Manufacturing
other than Household industry
V r--~
M F
In Coristruction
VI ,.-~
M F
In'Trade and
Commerce VII
r----"----'I M F
In Tramport, Storage and
Communica-tions VIII ~
M F
17 18 19 20 2[ 22 23 24 25 26 27 28 29 30 31 32
338 7
42 21
219 49
351 20
206 39 48 38
678 31
634 , 13
19
1 11 7
25 4
14 2
5
39 2
36 1
10 110
5
23 .. 6 1 2
14
11-0 10
118 12
f
41 123 1 7
" '74 39 '44 2 2
33
14 3
12 4
86 2
84
51
27 18 6
375 29
335 11
u08 205 367 363 70
~24 85 222 283' 35 89 ~3 74 7d 10
212 50 125 176 19 , 23 12 23 29 5
625 139 112 34 162 32 lOS 46 69 10
177 67
357 107 159 49 50 4
148 54 451 159 196 84 146 26 84 2:2 25 17
'268 105 100 51 126 40
37 13 5 I
462 191 51 22 75 71
154 26 95 4-6 87 26
285 290 18 32 38 32
146 \ 145 56 27 27 54
116 14$ 16 35 61 62 39 t6
144 258 42 108 46 84 54 57 2 9
138 173 47 51 65 86 21 33 5 3
108 121 9 6
45 73 34 33 15 5 5 4
25/224-2b.
58 12 20 13 12 1
37 7
19 Il 50 3
19 ~G 2
17 4 IJ .. 5
47 3 5 6 4
29
13
., 6 7
17 1
16
2
., 1
20 I 2
17
5 ..
')
2
.. 2
4
4
12 .. 12
71 16 6 12 30 7
72 3
40
2 19
168 15
129 24
63 1 6
27 23 6
16
13 1
,. 2
60 2
58
5 38 12 44 11
"
3
3
7 1 6
1
9
I
8
14 20 7 11 7 9
63 10 30
16 7
39 13 11 15
90 39 41 6 4
113 7
88 10 8
72 36 9 2
13 12
42 9
30 .. 2 1
37 13 8
11
50 16 22
!:l 4
30 9
18 3
52 21
7
13 11
11 .. 11
89 ::6 37 6 9
11
76 18 7
51
97 27 20 47
3
182 13
104-28 37 55 6
20 7 7
15
1 1
6 .. 3 1 1 1
25 10 13 2
34-16 l::i 2 1
8 .. 8
14 .. 11 3
5
.. 1 4
14 2 7 5
27 3
21 3
4
1
8 3 3 .. 1 1
28 6
12 10 41 I() 23 4 4
31 8
17 6
9 3 1
.. 5
8
8
83 12 7
42 12 10
65 .. 39
9 4
13
179 25
142 12
28
8 2 6
33 7
16 1 4 5
36 16 6
14
33 11 17 2 3
120 8
92 18 2
31 9
16 4 1 1
16
15 1
4-1 1 2
2 .. 2
12 3
3 5 1
7 1 6
43
34 9
2
2 1 1
3 .. 2
1
22 4
12 6
24-4: 6 6 8
27
23 4
.. 2
KERALA STATE
In Other Non-Services Workers
IX X r--~~
M F.M F
33
416 68 97 68 91 92
412 25
259 48 48 32
931 102 741 88
34 35
122 13 7
15 63 24-
81 4
70 2 .. 5
222 38
171 13
1,399 121 211 297 558 212
1,365 56
808 238 139 124
2,920 254
2,419 247
36
2,581 221 388 584
1,022 366
2,380 102
1,425 403 2 8 242
5,144 414-
4,300 430
24-I 2 3 4-5
25 I 2 3 4 5
26 I 2 3
457 245 1,514 2,422 27
122 15
105 2
391 86
152 14 75 64
393 137 31
225 499 179 233 64 23
388 93
219 53 23
524 54
102 161 115 92
90 11 76
309 63
166 3
51 26
234 86 [7
131 273
79 142 40 12
206 63
101 17 25
324 30 45 86 53
110
3
731 1,173 28 181 247 1 502 825 2 48 101 3
1,724 322 534 266 293 309
1,321 565 220 536
1,591 607 637 275
72
1,368 244 863 162 99
1,270 174 30~ 374 220 193
2,798 531 863 404 483 517
2,083 862 337 884
2,636 991
1,0-40 469 136
2,532 443
1,634 283 172
2,116 333 462 595 403 323
29 I 2 3 4 5
30 1 2 3
31 1 2 3 4
32 I 2 3 1-
33 1 2 3 4 5
PALGHAT DISTRICT
Sl. No.
District/Taluk/ Town/Ward/Block/ Village/Desom/ Forest range
2
Area In
acres 3
Midland Villages-contd.
,34 Vettathur
35 Arakkuparamba
I Puthur 2 Arakkuparamba
36 Thazhekkode
37 Pathaikara
1 Amminikkad 2 Pathaikara
38 Perintalmanna
1 Perintalmanna 2 Kunnapp'~lli 3 Cherukara
39 Angadippuram 1 Angadippurarn._ 2 Pariyapuram
40 Kuruvambalam 1 Malaparamba 2 Kuruvambalam
41 Kolathur
42 Moorkanad I Vengad 2 Moorkanad
43 Chemmalasseri
44 Pulamanthole I Chelakkad 2 Palur 3 Pulamanthole 4 Thirunarayanapuram
45 Eravimangalam I Eravimangalam 2 Avinhikkad 3 Kizhungatholc
46 Elankulam 1 Kunnakkavu 2 Elankulalll 3 Palathole 4- Kuzhanthara 5 Elad 6 Muthukurissi
4,205.33
5,IG7.58
3,435.86
4,066.78
3,063.24
2,4-50.86
2,533.89
3,811.71
3,759.82
2,929·04"
2,4-73·36
3,042·07
3,658·86
Occupied residen tial
houses
,---..A..._---.,
No. of No. of houses house-
holds 4 5
Total numbEr of persons enumerated
r---__A..~~-~
Persons Males Females
6 7 8
Scheduled Castes
r----'--, !vi F
9 10
790
829
239 590
809 4,398 2,030 2,310 396 327
918
695
300 395
1,645
1,233 299 113
1,094-685 409
627 21
6')6
829
994 501 493
566
1,088 224 367 190 307
809 336 117 356
1,le6 388 247 318 77 54-
102
864 5,634-
244 1,480 620 4,154
944-
70.1
303 396
1,729
1,308 302 119
1,143 725 418
649 21
62d
840
1,017 514-503
5,473
4,057
1,709 2,34-3
10,040
7,514 1,840
686
6,720 4,150 2,570
3,457 152
3,3J5
4,872
6,012 2,979 3,033
2,732 2,902
731 749 2,001 2,153
2,555
1,929
825 1,101-
4,329
3,613 881 315
3,264-1,979 1,285
1,70j 73
1,632
2,373
2,892 1,4-38 1,454
2,918
2,128
881 1,244
5,211
3,8(11 959 371
3,456 2,171 1,285
l,i52 79
1,673
2,499
3,120 1,541 1,,)79
612 3,335 1,613 1,777
1,160 226 421 198 315
819 339 117 363
1,192 391 250 318 77 54-
102
6,835 1,429
. 2,177 1,261) 1,969
4,825 1,969
684-2,172
7,31 S 2,3H l,s3B 1,976
441 344 672
3,305 680
1,072 609 944
2,314 933 316
1,063
3,476 1,0'36 , 71J
10
,947 ,225 166 334
3,530 749
1,105 6';1
1,023
2,'il1
1,036 363
1,107
3,839 1,2")3
820 1,029
216 173 338
H9 4A3
67 61 382 379
275
258 238
147 139 III 99
353 344
243 225 53 47 55 72
207 204 H2 136 65 68
89 83 ..
89 8d
250
295 301 206 198
89 10~
67 77
290 305 21 21
LiS 180 29 D 82 85
27B 279 163 It7 36 55 79 77
455 499 163 2,'H
64 73 127 121 4.8 49
53 49
PRIMARY CENSUS.
Literate and Scheduled educated Total
Workers I-IX
Tribes persons
11
9
3
3
,-_.A.-------.., M F
12 13 15 16
8 6~7 356 1,075 600
721
103 613
911
770
256 514
2,865
2,263 452 ISO
1,709 1,197
512
503 51
457
737
934-401 533
751
3 1,763 3t1 ,544 378
3 505
1,245 503 175 567
1,576 394-320 526 114-92
130
413 1,359 709
37 383 197 376 976 512
575
6n~
01
158 529
2,273
1,783 368 122
1,454 1,090
3.64
329 47
282
542
601 230 351
535
1,307 275 382 250 400
I,OCl2 H2 149 411
1,321 331 282 474
75 71 85
1,171
987
4-22 563
~,270
1,690 432 148
1,579 933 646
848 36
812
1,143
472
50+
176 328
80{
469 241 91
539 307 282
278 8
270
513
1,482 66"1 784 43n 693 23c1
833 309
1,694-3:>4 ::3~ S'I)
"~~lJ
1,113 454-153 506
1,741 559 351 458 114 83
176
692 I"' ) 32[)
6.1 In
630 268 106 236
785 263 172 200 58 21 71
ABSTRACT KERALA STATE
Workers "-- --------------------------'-------------------------,
In Mining, Quarrying, Live-stock, Forestry, Fishing, Hunting and In Manu-Plantations, facturing In Transport,
As Agri- Orchards At House- other than In Tr:ldc Storage and As cultural and allied hold H~usehold In Con- ::mU Communi- In Other Non-
Cultivator Labourer activities Industry Industry structlon C0mmerce cations Services V/orkers I II III IV V VI YII VIII IX X
.----'---, ~-----, r---"-----, ,-----'---, ,--"------., ,-----'----. r---'---, ,--"---, ,-----"---, M F M F M F M F 11 F :111 F M F M F 11 F
I7 18 19 20 21
4~4 78 235 350 94
~oo 119 355 353 33 132 63 22 13 7 363 51 333 340 26
375 35 93 100 '44
239 34 317 279 29 114 17 96 95 23 173 67 221 184 1
387 112 134 18 213 83 40 11
347 65 108 37 239 28
21 j 24)
64 49 102 126 49 74
63 42 21
44 32 12
25
12 9 4
7J 34 41
275 19 87 63 33 29 5 4 2
246 14 83 61 33
418 120 231 230 27
565 109 313 95 252 14
\ 288 359 227 270
61 89 , '.
82 35 47
288 49 75 99 53
573 III 119 30 ]97 61 104 12 153 8
139 88 35 7 9
112 43 55 5' 49 13 8· I
24
374 111 308 324 141 39 115 117 58 24 60 54
39 23
3_ 13 175 48 133 153
693 155 210 38 154 30 176 43 51 15 35 9 64 20
585 462 93 125 99 109
206 129 52 41 41 10 94 48
23 5 5
12
22 23 H 23 26 27 21
16 23 27 31
5 ')8 51 20 4
16 14 12
5 H 39
2 113
5 35
5 25 10
3 1 2
129 121
4 +
52 52
3 35 .. 3 35
38 41
28 '18
16 5 12 13
19 221 13 200 6 21
35 125 35 109
16
23 ..
q') 4J
16 .. 16
47 23 37
1 1
22 II 11
10 . 24
17 .. 15.
84 9
17 15 43
72 22 15 35
62 33 7
16 .. 2 4
23 3
20
48 25 23
9 32
47 5
!7 11 H
48 14 17 17
45 31 6 6
.. 2
101 19 27 33 22
28 18 I 9
51 22 15 12 2
18
36
36
I" 14
17
17
4
13 6 'J
5
16 3
1:3
4 3 I
2
2
7
If
7
3 4
2} 16 8
:;3 23
.. :2
13
19 4
IS
7
16 1 3
11 1
9
2 7
4 2
.. 2
11
2
.. 1
9
Ii
5 12
36
32 17 13
235
217 13 5
35 75 10
20 .. 2()
47 24 23
35
72 18 8
23 23
36 6 3
27
21 5
11 2 2
20
,)
2
3
3
31
3
3
7
12 5
7
10 121
10 118 2
4: 7J 3
2 1 I
-1
4
4
4
2 2
4
24 9 6 6 :3
27
27
6
2 2
J
2
2
33 31 36
252 126 1,005 1,710
3S9 178 1,373 2,193
552 1,641
1~1 102 343 160 76 1,025
4~6 276 1,384 2,446
248 .W4
129 41 119 6)
913 376
803 3+1 60 29 45 6
732 421 419 183 313 238
376 153 3 1
373 1:';2
942 403 E>39
2,5:19
1,9}3 -1.+9 167
1,635 1,046
639
337 37
220
1,624
703 916
4,407
3,412 71j 230
2,367 I,H,1: I,Oe3
1.474 71
1,403
352 133 1,220 1,986
407 143 26·1:
157 55
102
310 137
642 86
226 109 221
220 129
11 80
296 187 58 32 3 4
12
388 41 165 34
148
142 95 10 37
119 68 24 22 2 .. S
1,410 6:'1 7~G
785
1,6il 326 540 300 443
1,201 479 163 559
2,456 1,111 1,345
1,468
2,838 614 785 536 853
1,881 768 262 851
1,735 3,054 527 995 367 648 489 829 111 158 83 157
158 267
34
35 1 2
36
37 1 2
38 1 2 3
39 1 Z
40 1 Z
41
42 I 2
43
44 1 2 3 1
45 1 Z 3
46 1 2 3 4 5 6
P ALGHAT DISTRICT
SI. No.
District/Talu!</ Town/Ward/Block/ Village / Deso:n/ Forest r..ln~e
2
Area 1U
acres
3
Midland Villages-cancld.
47 Anamangad
1 Anamangad 2 Chethanakurissi 3 l'v[uzhannamanna 4 Manalaya 5 Punnakkode
48 Paral
1 Valamkulam 2 Edathara 3 Odamala 4 Pariyapuram 5 Paral 6 Vazhenkada
49 Aliparamba
5') Chethallur
51 Thachanattukara
52 Bheemanad
1 Vadassiriprom 2 Bheemanad
53 Ariyur
5'1 Changaleeri
1 Vendakurissi 2 Kulappadam 3 Changaleeri 4 VaUuvampuzha
55 Thenkara
56 Pottasser~
57 Viyyakurissi
I Viyyakurissi 2 Pookkunnu 3 Pullisseri
58 Thachampara
I Trikkalur 2 Pallikkurup 3 Thachampara 4 Muthukurissi
59 Karakurissi
I Karakurissi 2 Pondiyambrom
2,529·30
3,399·11
2,879·98
2,962-44
5,698-04
2,117-29
2,267·89
2,707-66
4,290·24
5,084-94
4,476·57
5,546·57
4,194·33
Occupied residen tial
houses Total number of
persons enumerated
PRIMARY CENSUS
Literate and Scheduled Scheduled educated
Castes Tribes persons
r----
Total Workers
I-IX ,----A-, No. of No. of houses house-
,..--__ -A ___ ....., r---"-----, ,...------A..-- r-~ ,.-_.A..~
Persom Males Females M F M F M F M F
holds
-4 5 6 7 8 9 10 11
627
213 131 90
103 90
997
138 95 43 93
360 268
816
696
975
542
291 251
527
564
13-1 199 133 93
1,335
1,7'27
1,193
372 363 463
1,623
205 386 455 583
990
903 87
645
214 132 97
112 90
1,003
138 95 44 93
363 270
3,787
1,243 746 560 709 529
6,168
813 593 264 541
2,263 1,694
1,811
606 344 259 351 251
3,015
402 284 140 256
1,091 842
1,976
637 402 301 358 278
3,153
411 309 124 283
1,172 852
268 282
99 95 15 13 48 68 95 96 11 10
325
58 51 .. 28
101 87
334
62 62
I 39
100 70
820 48,27 2,333 2,49~ 256 267
700 3,876 1,802 2,074 161 169
981 5,783 2,833 2,955
549 3,398 1,665 1,733
295 1,848 254 1,550
940 725
908 825
529 2,999 1,430 1,569
567 3,237 1,557 1,680
13t- 804 417 337 199 1,099 504 595 135 762 357 405 99 572 279 293
1,392 7,584 3,602 3,982
394 36i
169 181
75 68 94 lI3
173 196
220 256 35 38 91 101 68 72 26 45
361 375
1,861 9,455 4,651 4,80\ 583 629
1,247
390 390 467
1,662
::06 392 463 601
1,006
918 88
7,091
2,3-14 2,135 2,612
9,110
1,209 2,268 2,547 3,086 ,
5,399
4,904 495
3,435
1,128 1,052 1,255
4,512
5:31 1,126 1,256 1,549
2,542
2,314 228
12
3,656
1,216 1,083 1,357
4,598
628 1,142 1,291 1,537
2,857
2,590 267
346 3i:.)
115 102 81 93
150 150
620 621
69 63 173 Ei4 160 174 218 230
359 396
302 320 57 76
2
12 13
865
314 164 112 133 142
1,132
103 166 32 98
444 289
14
699
250 136 89 98
126
829
83 146 23 76
259 242
15 16
906 501
272 148 174 78 155 108 181 112 124 55
1,587
232 138 82
150 550 <:·35
752
182 73 25
109 237 126
801 629 1,114 404
900 723 886 g90
937 600 1,429 559
516 290
281 235
120 170
544 357
479
126 153 96
104
344
68 128 92 56
844 314
497 160 347 154
821 544
874 553
230 72 298 286 205 129 141 66
1,433 806 2,055 1,362
8; 1,712 1,069 2,680 1,735
"1,374
472 502 400
1,8117
167 368 657 695
1,114-
1,009 105
855
319 314 222
1,206
80 272 410 444
855
777 78
1,828 917
617 256 523 243 683 418
2,462 1,216
331 144 578 251 660 334 893 487
1,436 869
1,325 794-111 75
ABSTRACT KERALA STATE
Workers ------------------.--~------~----.----------------------------,
As Cultivator
r ~
M F
As Agricultural
Labourer II ~ M F
In Mining, Quarrying, Live-stock, Forestry, Fishing, Hunting and Plantations, Orchards and allied activitie5
III ~ M F
In Manufacturing
At House· other than hold Household
Industry .. Indvustry IV ~ ,--"----.. ~I F M F
In Construction
VI r-----"----.
M F
In Trade and
Commerce VII
r----"----.. M F
In Transport, Storage and
Communica-tions VIII
In Other ServIces
IX
Non· Workers
X ..-----"----, M F
17 18 19 20 21 22 23 24: 25 26 27 28 29 30 31 32 33 34 35 36
306 119 292 295 26 67 66 57 80 36
23 95 18 39 29 61 41 56 8 41
96 4 35 11 68' 2 62 9 34
637 145 410 433,
70 26 145 152' 49 7 42 50 44 7 27 17 55 30 72 67
218 57 98 130 201 18 26 17
21 2
.0
3 12 4
501 109 177 164 20
320 81 62 62
533 191 252 168
11
5
313 209 104
82 149 41 97 41 52
243 152
327 '209 85 14
140 149 56 30 46 16
272
212
~~ 63
8
891 36 58 18 31 18
315
206 26
105 66
9 ,
54
42 10 2
23 7
595 292 254 319 202
6 31
5
1
18 1 2 3 7
75 o. to 1 6
42 16
16 38 8 2
1 5
36
7
9 11 9
21 I 3 6 7
53 1 4
o. 1
26 21
.0
I
6
00
2 4
16 10 1 1
4
8
00
6 2
31 11 60 24 11
3
3
2
2
3 52
44 27 55
41 16 25
53
52 8
21 20
3
20 5
15
36
42 7
16 14 5
16 4
12
62
28 9
14 4-I
16 87 58 143
6 15
13
4
4
12
2 .. 2
23
8
1 5 2
897 449 574 789 418 63' 102 95 70 10
80
9
483 103 345 373 J'80 141 27 110 131 '67 127 41 41 66 45 215 35 194 176 68
582
48 156 131 247
163 579
2 77 17 154 58 90 86 258
709 301
98 40 172 80 121 87 318 94
15, 9 2 i
12
10 2
88 6
16 66
61 152 5 40
12 53 4t 59
63 42
3 8 12 5 29.. 15 19 14
162
42 28 30 62
474 240 248 340 153 15 108 90 47
428 227 239 324 141 14 96 84 45 46 13 9 16 12 1 12 6 2
24 38 5 14-7 18
12 6
14 24
3 5 11 I 6 5 - 7
5 12
5 10 2
13
2
28 17 5 1 2 3
27 ,0
5
1 16 5
25
33
11
8
6 2
32
29 16 I 7 5
3
4
o. 2 1
.. I
15
o. 12 3
2
6
6
10 00
10
9
3
.. 1 2
17 80 32 32
4 51
66 21 32 13
82
12 10 42 18
49
48 1
3
3 .. 3
6
I 1 2 2
12
62 30 31 I
67
17 2
45 3
2 15
2 15
165 40 48 27 25 25
341 14-28 10 12
120 157
287
63 20 18 11 6 8
905 334-170 104-170 127
132 1,428 4 170 9 146 1 58 3 106
37 541 78 407
1,475 489 324 193 246 223
2,401 229 236 99
176 935 726
93 1,219 2,090
384 238 916 1,684
511
269 147 122
73
173 59 16 29 69
171 1,404 2,396
120 56 64
25
90 23 16 15 36
821 44S 378
609
683 187 206 152 138
1,419 748 671
1,025
1,127 315 309 276 227
582 568 1,547 2,620
547 372 1,971 3,019
414 338 1,607 2,739 188 79 511 960 165 112 524 840 61 147 572 939
602
92 125 200 185
269 2,050
32 250 51 543
127 596 59 656
3,382
484 891 957
1,050
2 330 175 1,106 1,988
2 303 136 989 1,796 27 39 117 192
47 1 2 3 4 5
48 1 2 3 4 5 6
49
50
51
52 1 2
53
54 1 2 3 4
55
56
57 1 2 3
58
1 2 3 4
59
1 2
PRIMARY CENSUS PALGHAT DISTRICT
,-----
Occupied Literate and re,idential Total nU'11ber of Scheduled Scheduled educated Total
houses person, enumerated Castes Tribe> persons Workers I-IX
District/Talukf r------..A..-~ r-----A---.-.., r-----"-----. r-~ r----"--, ,---A-----... S1. Town/Ward/Block/ Area No. of No. of Persons ]\IIaleo Females M F M F M F M F No. Village[Desom/ in houses home-
Forest range acr(:'s h()lds
2 3 4 5 6 7 8 9 10 11 12 13 14 15 16
PONNANI PONNANI TALUK T 103,655-71 49,229 5\),387 302,910 142,088 160,822 16,873 18,361 953 1,112 62,01)4 45,461 68,670 32,760
R 102,327'56 46,203 47,250 2;9,933 131,149 148,784 16,733 18,214 952 1,10757,91543,198 62,!H7 30,5i5
U 1,323'15 3,021 3,137 22,97i 10,939 12,033 135 147 5 4,039 2,263 5,723 2,HH
Lowland Town
Ponnani 1,32iH5 3,021 3,137 22,977 10,939 12,038 135 147 1 5 4,009 2,263 5,723 2,184
Ward I Ponnani Nagaram 419'65 1,935 2,013 16,109 7,702 8,407 4- 2,311 881 4,056 1,145
Block 114 150 1,356 667 639 2 329 lil3 357 5) 2 HI 135 1,151 5";6 6J5 316 130 2,,6 68 3 117 lSI 1,053 42') 63'3 .. 9} 29 157 8 4 !3S 16 ~ 1,175 ~69 607 HO 39 33O 22 5 142 1:;1 1,097 45'3 629 80 47 216 27 6 141 H6 1,29:! 616 616 36 10 342 214 7 140 1'10 917 424 493 ~7 6 213 66 " ' t, U6 146 1,133 546 592 51 6 2r:.7 201 9 141 143 1,265 638 627 2 23 8 327 ]97
" 1 ') 151- I:";,} 1,113 546 367 127 49 29:> jOi-II 142 144 1,257 6)6 6jl 26t H2 332 47 [Z iSI 13,1 1,35j 663 6Ol3 449 151 354 83 13 135 HZ 1,141 521 62;J 211 110 263 23
" 14 93 93 6'19 329 360 97 31 169 Z0
(Port) HouoeleJs Population 103 103 47 103
Ward 2 Velleri 422'21 429 433 2,913 1,3Jl 1,532 57 43 660 444 727 538
Block 15 33 47 334 151 173 75 5'/ 69. 56
" 16 138 133 1388 11I 477 45 35 .. 116 82 193 206 17 125 131 902 423 479 12 lCl .. 212 143 233 143 Ia 121l 136 789 386 403 3 227 16~ 227 133
Ward 3 l'alIa;:mran 486'29 6}7 669 3,935 1,356 2,G99 74 93 ;} 1,118 933 91-0 501
Bloc!c 19 147 148 866 395 471 20 26 131 84 205 126
" 20 136 139 773 3')4 421 10 11 1 5 212 191 180 lID 21 151 153 931 453 473 2 3-~ 252 251 102
" J,
22 145 145 8!i8 406 4)2 25 39 276 269 187 115
" 23 78 84 525 2B 232 17 22 142 142 117 43
Midland Villages
60 Tavanur 2,595'66 745 753 4,401 2,089 2,312 303 337 39 51 921 722 1,018 583
1 Mathur 142 142 788 357 431 51 60 llS 110 173 109 2 Athalur 103 108 621 309 312 24 33 22 26 146 92 152 76 3 Tavanur 23B 240 1,437 674 763 56 75 17 25 330 271 324 164 4 Muvvankara 150 151 937 447 490 90 90 186 136 229 143 5 Trippalur 110 1I2 618 302 316 82 79 144- 1I3 IW 91
14
ABSTRACT KERALA STATE
Worke~ _____________________ ..A.. ____________________ --.
In Mining, Quarrying, Live-stock, Forestry,
As Cultivator
I ~
M F
17 18
"TALUK
As Agricultural
Labourer II ~
M F
Fishing, Hunting and Plantations, Orchards and allied activities
III ,..----A--..
M F
At Household
Industry IV ~
M F
In Manufacturing other than Household
, Industry V ,_.A.----.
M F
In Construction
VI ,..-.---"----.,
M F
19 20 21 22 23 24 25 26 27 28
In Trade and
Commerce VII ~
M F
29 30
In Transport, Storage and
Communications VII[ ~ M F
31 32
In Other Services
IX ~ M F
33 34
NonWorkers
X ~
M F
35 36
12,753 3,656 8,844 11,934 8,714 89t' 2,926 3,200 4,729 2,210 806 21 5,416 112 2,814
12,664 3,626 8,831 11,924 7,415 884 2,860 2,867 3,801 1,073 767 20 4,486 105 2,172
12 21,668 10,724 73,418 128,062 T
12 19,951 10,065 68,202 118,208 R
89 30 13 10 1,299 7
89 30 13 10 1,299 7
37
5 7
.. 3 1 6
12 3
9 5
3 5
1 3 1
4:3 24
13 4-S
17 1
8 2 1 9 4
:320 92
50 24 4:8 9
il33 25 52 27 37 7
8
2
2
I 3
5
1 2 2 .
., 1
3
3
6
6
206 403
53 81 27 50 49 107 25 96 52 69
-25/224-3
1,234 4
7 4
.. 5
32 273 100 266 271 135
6 I
81 53
30
4 8 7
II
4
35 3
3 17 I 2
12
24,
3 1 2
17 1
,.
2
66 333 928 1,137 39
66 333 928 1,137 39
3 193 571 619 "7
.. I
.. J J
2
.. 2
2 .. 6
.. 183
1
.. 1
52 2 77 1 6
48 44 12 15 20B 29 66 3 12
12 191 38 98
100 1 63 9 59 6 20 13
.. 1 2 1 1 2
4 1 2 2 1
8 202 446 8
I 7
12 50 66 170 74 126 50 100 8
61 132 155 72 14
29 17 14 1
4:6 4 4
14 17 7
29 85 10 8
29
I 6
10 8 4
27 49 30 20 29
36
.. 9
11 16
21 3
27 4,
17
1 9 3 I
20
.. 9 4 3 4
15
930 7 642
1 930 7 642
.. I
710 6 489
89 94 11 85 46 17 15 7
11 42 81
109 67 36
130
14 28
. . 4
. . 1
37 1 51
90
15 9
36 8
22
35 6 1
10 11 7
10 32
121 42 38 11 33
I 10 36 25
7 9
11
103
106
16 24 39 27
47
12 10 16 5 4
30 13
'2 10 4 1
1,717
1,717
987
192 72 19
169 54 25 40 8
17 34
112 151 46 48
240
22 72 73 73
490
106 73
136 129 46
301
44 51 91 84 31
659 5,216 9,8~4- U
659 5,216 9,854 I
321 3,646 7,262
63 65 8
16 15 1
6
6 46 71 17 7
74
6 35 9
24
310 260 268 219 252 304 206 259 311 256 274 314 253 160
654
92 213 190 159
624 1 537 2 630 3 585 4 602 5 432 6 427 7 391 8 430 9 463 10 604 11 600 12 597 13 340 14
994
117 15 271 16 336 17 270 18
264
68 20 64 94 18
916 1,598
190 174 207 219 126
57 1,071
3 184 11 157 21 350 11 218 11 162
345 31l 371 337 234
19
~~ 22 23
1,729 60 322 1 236 '2 599 3 347 4 225 5
PRIMARY CENSUS "PALGHAT DISTRICT
Occupied Literate and residential Total number of Scheduled Scheduled educated Total
houses persons enumerated Castes Tribes persons Workers I-IX
DistrictfTaluk/ ,.......---.-A--~ ,.---J---.. ,---"---. .--A---. ~ Town/WardjBlockJ Area No. of No. of Persons Males Females M F M F M F M F
SI. Village/Desom! in houses house-No. Forest range acres holds
1 2 3 4 5 6 7 8 9 10 11 12 13 14 15 16
Midland V ilIages-contd.
61 Thrikkanapuram 3,650'43 1,235 1,279 7,479 3,610 3,869 798 797 1,275 920 1,830 1,076 1 Kadakasseri 180 188 1,125 550 575 110 108 194 139 298 1i8 2 Vellancherry 179 J91 1,103 549 554 160 152 189 150 265 131 3 Mathirassery 88 89 565 274 291 72 62 64- 53 112 55 4 Kurada 57 59 327 134 193 42 58 40 39 74 36 5 Thrikkanapuram 283 288 1,657 821 836 172 149 276 163 442 204 6 Maravancheri 241 246 1,421 687 734 122 125 338 224 332 245 7 Kallur 88 93 525 255 270 38 46 66 44 140 86 8 Ayamkulam 119 125 756 340 416 82 97 108 108 167 141
62 Anakkara 2,509'61 871 901 5,208 2,537 2,671 570 566 20 23 1,280 867 1,238 694 1 Melazhiyam 124 128 751 354 397 70 75 147 III 172 104 2 Perumbalam 112 117 668 312 356 1(11 90 126 110 156 100 3 Ummathoor 159 159 831 373 458 57 59 137 89 206 117 4 Thottazhiyam 137 137 827 409 418 101 102 223 US 211 78 5 Puramthilsseri 60 74 371 165 206 34 46 102 99 83 43 6 Mundarakod 63 66 360 170 190 66 67 107 97 83 57 7 Anakkara 216 220 1,400 754 646 141 127 20 23 438 216 327 195
63 Mudur 2,066'38 899 899 5,431 2,541 2,890 371 436 22 25 1,033 779 1,193 569 1 Melmuri 300 300 1,896 905 991 121 125 .. ., 336 229 411 203 2 Cbeganur 127 127 755 366 389 26 24- 6 4 163 llO 186 43 3 Pottur 92 92 549 246 303 9 14- 16 21 76 62 109 52 4 Cheralasseri 37 37 209 96 113 39 54 42 31 46 34 5 NeJIekad 54 54 299 129 170 20 20 61 59 55 42 6 Kavappra 110 110 656 308 348 49 71 151 139 131 80 7 Mudur 179 179 1,067 491 576 107 128 204 149 255 115
64 Kaladi 2,425-41 1,052 1,087 6,755 3,131 3,624 602 651 4- 9 1,314 981 1,556 988 1 Kadancheri 213 213 1,195 532 663 99 111 238 184- 259 165 2 Kaladi 24-0 247 1,924 873 1,051 87 118 4- 9! 346 240 442 183 3 Kizhumuri 243 249 1,431 695 736 186 176 :m 212 344 191) 4 Verur 155 159 933 439 494 83 85 238 194 204- 104 5 Tiruttikundayar 89 95 555 278 277 56 45 78 4-2 146 lIS 6 Mangattur 112 124- 717 314 403 91 116 117 109 161 143
65 Kanhiramukku 1,776'70 675 684 4,002 1,815 2,187 205 231 901 599 848 4-89-] Kanhitamukku 370 376 2,674- ],235 ],439 131 ]54 .. 554 331 595 340 2 Karakkad 305 308 1,328 580 748 74 77 1 347 268 253 14-9
66 Edappal 2,291'23 1,344- ],408 8,609 4,049 4,560 566 642 .. '2,226 1:855 1,991 819 1 Edappal 149 152 904- 420 484- 1I8 141 217 190 201 113 2 Polppakara 102 103 687 333 354 35 31 187 136 187 62 3 Perumparamba 161 161 895 41l 484- 75 76 '21l 193 182 80 4- Ponnazhikkara 158 158 1,005 449 556 58 72 245 215 234- 104-5 Porukkara 188 218 1,328 637 691, 83 87 3'l2 24-8 269 106 6 Thalamunda 297 324- 1,955 945 1,010 76 96 56.7 4-35 485 162 7 Thuyyam 289 292 1,835 854 981 12] 139 487 438 433 ]92
67 Vattamkulam 1,119'78 621 623 3,802 1,862 1,940 210 221 76 85 992 681 939 422 I Udinikkara 185 186 1,159 579 580 65 62 18 16 334 201 277. 79 2 Erumappara 56 56 359 171 188 28 26 79 61 87 53 3 Thaikad 156 156 920 457 463 23 20 55 63 231 164 244 113 4 Kanthalur 44 44 2W 104 136 38 46 47 52 50 49 5 Vattamkulam 139 140 861 427 434- 36 43 234 158 221 86 6 Thevalasserri 41 41 263 124- 139 20 24 3 6 67 45 60 4-2
16
ABSTRACT KERALA STATE Workers ---A-
In Mining, Quarrying, Live-stock, Forestry, Fishing, Hunting and In Manu-Plantations, facturing In Transport,
As Agri- Orchards At House- other than In Trade Storage and As cultural and allied hold HQusehold In Can- and Communica_ In Other Non-Cultivator Labourer activities Industry Industry struction Commerce tions Services Workers I II III IV 'v VI VII VIII IX X ~ ~ ,....---"--., ~ ,---~ ,__.._____" ,----A---, ~ ~~ M F M F M F M F M F M F M F M F M F M F
17 18 19 20 21 22 23 24 25 26 27 28 29 30 31 32 33 34 35 36
.536 236 582 658 82 71 63 78 4 16 78 40 347 m 1,7~ 2,793 61 103 37 85 112 17 13 10 20 2 18 5 35 18 252 397 1 84 12 118 108 12 13 6 2 7 7 22 5 284 423 2 10 5 86 48 8 1 4 1 3 1 162 236 3 18 50 35 '8 .. .. 1 1 4 1 60 157 4 139 77 101 85 21 26 II I 8 8 .. 145 16 379 632 5 87 72 46 93 29 13 14 25 3 7 18 12 1 95 62 355 489 6 55 18 39 57 6 11 7 5 5 10 3 6 4 115 184 7 40 IS 57 120 '10 6 1 13 3 37 6 173 275 8
241 92 238 254 160 39 17 46 58 35 10 56 35 423 228 1,299 1,'177 62 48 26 44 42 13 1 3 4 7 .. .. 4 3 50 31 182 293 1 38 17 30 36 11 7 8 3 I 4 64 37 156 256 2 61 17 50 45 23 7 3 4 4 8 '4 7 3 51 36 167 341 3 7 .. 8 1 8 4 2 19 5 160 75 198 340 4 18 6 2 1 32 23 .. 14 10 .. 5 3 9 3 82 163 5 14 3 24 32 19 3 13 8 1 2 • 10 II 87 133 6 55 23 80 97 54 8 11 28 8 4 4 15 21 79 35 427 451 7
267 116 222 304 181 30 72 51 57 7 21 56 2 24 293 59 1,348 2,321 63 81 22 55 89 84 23 34 24 10 5 12 3-3 6 96 40 494 788 1 50 9 11 20 ,38 3 16 8 10 1 .. 8 3 50 2 180 346 ~ 28 18 13 2+ 16 2 7 3 12 1 7 1 25 4 137 251 3 12 3 22 31 4 1 7 50 79 4 25 29 12 9 8 1 .. .. . . 9 4 74 128 5 41 23 39 46 6 .. 6 6 9 7 1 5 17 5 In 268 6 30 12 70 85 25 2 8 10 16 I 7 1 10 89 4 236 461 7
360 lSI 416 573 125 7 76 53 74 6 IS 2 70 34 386 106 1,575 2,726 64 44 11 85 \ 116 14 2 33 24 7 1 ., 13 8 54 12 273 498 1 S3 19 84 116 63 4 25 13 17 1 4 I 32 6 123 29 431 868 2 64 17 123 145 33 .. 2 1 \.) 3 6 12 8 87 24 351 546 3 58 33 33 54 ,4 1 2 27 .. 3 1 6 .. 71 15 235 390 4 63 46 42 5.3 5 2 2 I .. 2 1 29 13 132 164 5 43 25 49 89 6 .12 15 12 1 1 5 11 22 13 153 260 6
221 34 90 241 53 11 33 53 44- 42 6 39 51 311 107 967 1,698 65 168 25 81 l!I7 43 11 33 53 33 40 4 24 48 161 13 640 1,099 1 53 9 9 44 10~ 11 2 2 15 3 150 94 327 599 2 '298 76 321 396 112 9 43 59 247 10 59 4 212 12 76 623 253 2,053 3,741 66
21 8 48 82 9 10 12 22 2 16 3 70 11 219 371 1 33 2 107 41 7 .. I 3 8 13 7 4 13 11 146 292 2 40 12 20 20 6 .. I 17 .. .. 15 83 48 229 404 3 17 5 4 4 25 I 5 13 27 1 4 34 .. 5 113 80 215 452 4 21 5 56 63 10 .. 7 .. 50 3· 39 3 24 59 35 368 585 5 , 38 12 57 91 47 ~ 6 14 98 .. 8 83 1 14 134 36 460 848 6 .128 32 29 95 8 11 12 20 9 42 4- 18 8 26 151 32 421 789 7
'253 55 207 274 41 4 49 12 37 3 15 77 14 7 253 60 923 1,518 67 80 12 37 59 15 26 2 20 I 5 21 1 6 67 4- 302 SOl 1 19 8 34 41 5 3 13 2 1 4- 8 2 84 135 2 65 14 57 85 12 1 9 8 I 9 31 60 5 213 350 3 9 2 24 28 1 1 1 1 1 14 17 54 87 t 56 9 32 32 3 10 2 2 18 12 .. 100 31 206 348 5 .24 10 23 29 5 2 1 2 1 4 1 64 !l7 6
17 25/224-'3 b.
PALGHAT DISTRICT PRIMARY CENSUS
r---
Occupied Literate and residential Total number of Scheduled Scheduled educated Total
houses persons enumerated Castes Tribes persons Workers I-IX
DistrictjTalukj -, ~_..A..--.. r--"-, ~_.A.--.. r----"-----.. Town/Ward/Block} Area No. of No. of Persons Males Females M F M F M F M F
51. VillagejDesomj in houses house-No. Forest range acres holds
1 2 3 of. 5 6 7 B 9 10 11 12 13 14 15 16
Midland Villar;es--contd.
68 Kumaranellur 2,929'28 1,277 1,293 7,774 3,738 4,036 457 558 89 106 1,919 1,402 1,812 755 i Vellalur 434 446 2,655 1,267 1,388 122 146 53 64 667 497 599 267 2 Chekkod 242 245 1,594 736 858 141 183 363 311 364- 193 3 Kalladathur 136 136 830 395 435 22 25 28 32 212 180 190 56· 4 Kumaranellur 333 334 1,906 956 950 80 88' B 10 518 276 481 136 5 Amettikara 132 132 789 384 405 92 116 159 138 178 103
69 Kudallur 2,666'63 1,023 1,036 6,220 2,964 3,256 607 717 24 29 1,419 1,107 1,490 806 I Manniamperumbal am 104- 104 702 343 359 39 41 2 .. 186 149 157 49 2 Kudallur 468 474 2,855 1,360 1,495 254 310 22 29 623 455 730 409 3 Malamakavu 163 163 952 462 490 100 102 217 176 227 121 -4 Nayyur 196 200 1,179 550 629 145 184 254 194 258 171 5 Panniyur 92 95 532 249 283 69 80 139 133 118 56
70 Angadi 2,053'39 737 764 4,662 2,173 2,489 408 480 70 95 980 865 1,105 4-88 1 Arikad 121 125 759 335 424 81 102 5 8 160 139 177 75 2 Otalur 201 213 1,263 561 702 151 186 35 47 219 236 279 172 3 Kalathumpadi 131 132 785 357 428 51 56 17 17 174 184 192 100 -4 Thozhukara 119 125 780 385 395 81 71 13 23 185 147 209 72 5 Angadi 165 169 1",075 535 540 44 65 242 159 248 69
71 Pattithara 1,997~07 657 675 4,020 1,907 2,113 329 365 979 764 957 459 I Patti thara 231 239 1,381 634 747 148 165 310 261 360 182 2 Alur 4-26 436 2,639 1,273 1,366 181 200 669 503 597 277
J2 Trithala 2,924'43 962 964 6,757 3,196 3,561 563 669 1,586 1,300 1,491 536· 1 Trithala 341 343 3,051 1,473 1,578 257 314 804- 638 673 228 2 Kannanur 121 121 737 329 4{)B 120 132 167 156 174 97 3 Nhangattiri 279 2i9 1,643 772 871 85 108 362 287 352 122 4- Mattaya 221 221 1,326 622 704 101 115 253 219 292 89
73 Mezhathur 2,317'28 .' 862 884 5,314- 2,501 2,813 543 597 3 5 '1,067 864 1,261 613-1 Mezhathur 456 472 2,723 1,287 1,436 265 277 3 5 574 466 613 325 2 Modavannur 88 88 583 269 314 79 94 ' 124 121 122 8& 3 Kodanad 318 324 2,008 945 1,063 199 226 ' 369 277 521 202
74 Mala 3,027'94 925 970 5,575 2,608 2,967 486 540 139 189 1,034 804 1,325 663-1 Cheriya Kottapadam 55 59 343 170 173 33 35 30 35 54 33 86 52 2 Valiya Kottapadam 247 256 1,460 661 799 57 59 53 81 ',250 212 378 183-3 Kakkattiri 267 285 1,625 769 856 139 153 53 69 854 267 373 14{) -4 Mala 172 181 1,051 521 530 128 120 .. .. 187 137 252 112 5 Vattenad 184 189 1,096 487 609 129 173 3 4 189 155 236 17&
75 Kuttipala 1,936'16 908 920 5,490 2,627 2,863 372 410 11 13 1,087 762 1,388 642 I Sukapuram 98 101 558 269 289 36 S} 11 IS 136 106 117 68 2 Puramundekad 76 76 446 209 237 ' 18 26 mi- 93 97 41 3 Kuttipala 270 274 1,689 807 882 155 177 364 301 458 244 4 N ellisseri 168 173 1,063 515 548 77 85 190 103 298 101
- 5 Kaladithara 160 160 970 476 494 45 45 134 47 245 158 6 Naduvattam 136 136 764 351 413 41 38 144- 112 173 120
76 Kololomba 3,200'39 1,072 1,083 6,201 2,877 3,324 302 335 1,337 1;077 1,296 577 1 Ailakad 295 296 1,779 ' 864- 915 50 58 424 295 403 155 2 Venginikkara 91 91 554- '256 298 35 33 145 104 131 30 3 Pookarathara 256 263 1,424- 648 776 94- 102 314- 282 291 134-4 Kololomba 430 433 2,444- 1,109 1,335 123 142 514 396 471 258
18
ABSTRACT KERALA STATE
Workers ___________________________ -A-_
In Mining, Quarrying, Live-stock, Forestry, Fishing, Hunting and In Manu-Plantations, facturing In Transport,
As Agri- Orchards At House- other than In Trade Storage and As cultural and allied hold Household In Con- and Communi- In Other Non-
Cultivator Labourer activities Industry Industry struction Commerce cations Services /Workers I II III IV V VI VII VIII IX X
r----"---, ,..---A---, ,----"----, ,----"----, ~ ,..----"----, ,..----A---, ,..----"----, ,.-----A----, r- ---"----, M F M F M F M F M F M F M F M F M F M F
17 18 19' 20 21 22 23 24 25 26 27 28 29 30 31 32 33 34 35 36
280 60 297 321 260 50 87 47 150 17 49 132 3 42 515 257 1,926 3,281 68 82 17 71 103 60 3 36 17 42 9 10 66 2 13 219 116 668 1,121 1 61 23 59 91 60 1 30 21 19 .. 30 10 12 83 57 372 665 2 24 6 30 29 15 2 13 4 34 1 7 6 1 3 58 13 205 379 3 86 5 123 70 63 5 1 .. 20 1 42 8 137 56 475 814 4 27 9 14 28 62 39 7 5 35 7 1 8 6 18 15 206 302 5
289 40 435 458 66 5 61 47 84 10 18 93 5 439 245 1,474 2,450 69 ,
35 9 19 12 9 .. 18 4 5 1 12 4- 55 23 186 310 1 145 Iff 199 203 34 2 22 23 27 1 8 56 239 162 630 1,086 2 66 10 71 73 17 3 10 14 14 2 4 .. 45 19 235 369 3 22 2 95 128 3 9 4 31 5 9 12 1 .. 76 32 292 458 4-21 1 51 42 3 2 2 7 1 I 9 1 24 9 131 227 5
190 58 277 280 121 13 31 16 63 27 14- 69 2 64 276 92 1,068 2,001 70 35 5 77 60 14 .. 1J 5 9 " 1 3 .. 6 21 5 158 349 1 34 15 81 96 56 1 9 2 15 20 7 15 1 10 52 37 282 530 2 38 13 32 45 27 11 8 6 12 6 I 6 17 51 19 165 328 3 43 15 43 43 22 1 9 I 21 1 10 60 12 176 323 4 40 10 44- 36 2 3 3 18 1 4 24- 21 92 19 287 471 5
257 49 218 288 ,35 7 37 58 44- 4 72 18 272 56 950 1,654 71 99 14 114 150 13 15 7 9 .. 2 15 1 92 II 274 565 1
158 35 104 138 22 7 22 51 35 1 2 57 17 180 45 676· 1,089 2
312 85 174 222 37 38 33 140 14 44 94 2 98 554 179 1,705 3,025 72 110 36 108 135 8 17 15 72 ,. 23 65 56 214 41 800 1,350 1 50 14 18 27 9 11 II 19 4 3 2 1 61 41 155 311 2 89 24 37 44 14 8 7 27 9 5 1 21 1 32 119 36 420 749 3 ~3 11 11 \ 16 6 2 22 1 13 6 9 160 61 330 615 4
304 91 333 351 13 94- 52 79 11 31 82 12 313 108 1,240 2,200' 73 125 65 107 193 13 40 27 52 1 12 51 4 214 39 669 1,111 1 43 5 19 16, 9 I 59 56 147 228 2
136 21 207 142 " .. 54 25 27 I 19 30 8 40 13 424 861 3
261 52 226 232 123 43 54 50 59 3 6 33 35 528 283 1,283 2,304- 74 17 24 340 18 2 1 8 2 .. 2 2 20 8 84 121 1 72 15 75 99 70 ' 20 13 26 15 3 4 21 24 84 20 283 616 2 76 15 92 66 16 8 20 4- 11 1 5 1 151 47 396 716 3 66 12 12 11 4- II 15 8 I 1 4 2 147 70 269 418 4 30 10 ,23 22 15 2 5 4- 30 1 6 126 138 251 433 5
287 82 147 260 331 46 53 31 61 25 26 100 6 29 354 191 1,239 2,221 75 15 9 3 2 II 12 2 10 1 10 1 65 44 152 221 1 15 8 6 6 19 1 .. 5 .. 10 42 26 112 196 2
101 33 73 126 74 14 20 17 26 14 10 21 6 6 127 34 349 638 3 75 8 23 43 124 1 3 14 8 16 9 29 46 217 447 4 47 1 1 2 100 17 13 3 5 10 4 1 20 11 14 34 231 426 5 34 23 41 81 3 1 18 8 I 4 23 2 47 7 178 293 6
253 61 105 145 121 32 63 27 68 2 9 1 104 34 539 309 1,581 2,747 76 59 32 36 68 64 7 22 9 18 3 28 11 162 39 461 760 1 38 2 4 4 10 4- 18 8 17 I 1 II 2 30 II 125 268 2 45 5 ;·8 7 13 2 7 2 15 3 34- 4 162 1I8 357 642 3 fIl 22 57- 66· 34 19 16 8 18 2 2 31 17 185 141 638 1,077 4
19
PALGHAT DISTRICT PRIMARY CENSUS
Occupied Literate and residential Total number of Scheduled Scheduled educated Total
houses persons enumerated Castes Tribes persons workers I-IX
District/Taluk/ ".------'--, ,...A.--, ,...A._, r-~ ~ TownfWard/Block/ Area No. of No. of Persons Males Females M F M F M F M F
S1. Village /Desom/ in houses house-No. Forest range acres holds
1 2 3 4 5 6 7 8 9 10 11 12 13 14 15 16
Midland Villages-tontd,
77 Marancheri 1,633'66 995 999 5,772 2,828 2,944 102 96 " 1,408 753 1,366 371 1 P!nichakam 247 247 1,449 689 760 ., 370 205 352 78 2 Marancheri 743 752 4,323 2,139 2,134 102 96 .. 1,033 543 1,014 293
78 Eramangalam 1,634'46 701 706 3,932 1,886 2,046 60 63 2 2 746 399 877 296 1 Perumudisseri 273 275 1,532 7I1 821 12 14 317 209 320 121 2 Eramangalam 423 431 2,400 1,175 1,225 4B 49 2 2 429 190 557 175
79 Kadikad 2,286'40 1,456 1,472 9,014 4,084 4,930 462 490 13 9 1,966 1,525 1,713 867 1 Cheruvayur 457 457 2,672 1,207 1,465 147 175 I 490 360 507 326 2 Kadikad 456 463 2,863 1,304 1,559 130 132 776 650 522 195 3 Edakara 543 552 3,479 . 1,573 1,906 135 183 12 9 700 515 684 346
80 Viyalathur 1,334'52 1,083 1,113 6,292 2,807 3,485 307 331 68 71 1,641 1,619 1,223 731 1 Viyalathur 602 619 3,475 1,548 1,927 217 219 57 66 957 948 684- 358 2 Nhamanangad 361 366 2,072 932 1,140 55 74 11 5 465 453 400 309 3 Anhur 120 128 745 327 418 35 38 219 218 144 64
81 Vadakkekad 2,054'35 1,562 1,568 9,156 4,041 5,115 221 204 21 23 1,944 1,769 1,669 1,253 1 Vadakkekad , 453 459 2,606 1,175 1,431 56 47 .. 551 431 497 336 2 Kavukkanappetty 202 202 1,197 545 652 9 11 4: 5 290 268 241 168 3 Kochannur 231 231 1,389 599 790 72 80 351 358 231 136 4 Thekkekad 334 334 1,917 831 1,086 70 55 4 2 394 394 335 258 5 Kallur 245 245 1,486 648 838 4 4 13 16 230 187 254- 284 6 Thiruvalayannur 97 97 561 243 318 10 7 128 131 III 71
82 Punnayurkulam 2,336:20 1,331 1,337 7,753 3,537 4,216 312 288 1 3 1,613 1,326 1,529 780 1 Punnayurkulam 466 466 2,668 1,236 1,432 93 72 1 3 613 398 507 211 2 Chemannur 359 359 2,018 957 1,061 132 137 331 308 431 248 3 Parur 174- 176 975 446 529 13 3 194 167 200 124-4 Kuppravalli 332 336 2,092 898 1,194 74 76 I 475 453 391 197
-83 Perumpadappa 1,985'36 1,065 1,068 5,778 2,683 3,095 165 144 757 471 1,102 411 1 Cheruvaya 137 138 792 352 440 66 42 " I 131 113 140 87 2 Perumpadappa 593 593 3,222 1,507 1,715 62 65 441 252 597 133 3 Cheruvallur 335 337 1,764 824. 940 37 37 185 106 365 191
84 Nannamukku 2,496'18 1,087 1,103 6,243 2,967 3,276 338 377 78 68 1,338 885 1,419 559 1 Thekkumuri 187 187 1,035 471 564 20 27 ,200 107 253 95 2 Pidavannur 242 244- 1,450 703 747 167 184 ·325 217 355 194 3 Kallurma 305 314 1,779 868 911 70 88 29 22 385 249 344 50 4 Nannamukku 353 358 1,979 925 1,054 81 78 49 46 4,28 312 467 220
85 Pallikkara 2,294'30 1,291 1,314 7,417 3,479 3,938 301 332 1,490 1,056 1,645 651 1 Vadakkumury 414- 417 2,366 1,115 1,251 ' 105 100 488 349 510 2:i5 2 Kanhiyur 417 426 2,428 1,144 1,284- 113 131 505·. 346 552 191 3 Pallikkara 460 471 2,623 1,220 1,403 83 101 497 361 583 205
86 Alangode 2,304'16 1~5 1,063 6,142 2,940 3,202 414 436 ! 1,219 845 1,541 703 , 1 Panthavoor 239 242 1,782 " 878 904 83 87 2 310 . 174- 454- 177 2 Nellisserithara 10 10 57 \ 33 24- 2 1 11 8 17 3 3 Kakkadipuram 118 121 698 ',322 376 29 35 179 167 176 73 4 Alangode 383 389 1,999 955 1,044 204 205 4()S 283 522 233 5 Per\llIllllttu 295 301 1,606 752 854 96 108 311 213 372 212
20
ABSTRACT
Workers ----------------------------------~
As Cultivator
I . ,..---"---, M F
As Agricultural
Labourer II
,--..A...., M F
In Mining, Quarrying, Live-stock, Forestry, Fishing, Hunting and Plantations, Orchards and allied activities
III ~
M F
At Household
Industry IV
,..---"---, M F
In Manufacturing
other than HQusehold IIjdustry
V ,....---A---., M F
17 18 19 20 21 22 23 24 25 26
195 38
157
149 39
lIO
27 '8 19
35 15 20
359 121 119 31 115 17 125 73
50 148 6 18
44 130
33 76 6 30
27 46
106 34 72
78 38 40
119 173 2:52 79 134 39 30 26 14 10 13 199
195 62 63 35 85 35 42
42 122 39 54 1-2 19 9 31 4
316 193 82 50 69 50 41 31 73 36 38 23 13 3
II 3 4 2
2
1
107 65 16
'12 3 5 6
380 116 202 180 87 136 40 57 47 34 96 35 103 110 23 62 19 27 \ 19 9 86 22 15 4 21
250 17
117 116
66 8
24 34
94
63 31
59 45 34\ 4 ..,' 29
12
8
8
3 1 2
26
26
21 7
14
106 25 65 16
II
11
12 10 2
77 12 19 1-6
15 103 55 12 43 26 3 54 21
62 47 5 4 3
3
15
6 3 6
14
.. 14
6 8
116 40 22
9 9
28 8
79 19 17 4
39
68 31 27 10
69 30 19 5 1
12 2
38 12 8 5
13
32 13 15 4
306 59 48
102 97
54 22
105 5
19 22 59
168 207, 40 43i 6
26 6
130
10 5
40 4 8
16 12
51 11 23 11 6
8 9
15
45 38 81
.. 25
385 87 149 198 271 50 88 24 96 37 45 78 119 19 9 12 98 15 62 73 80 2 43 7
191 35 42 47 72 29 36 5
360 135
6 54 87 78
76 224 283 12 7B 85
18 15 27 21 65 61 25 66 110
322 78
6 47
1I6 75
73 15
16 34 8
42 8 3 4
23 4-
24-3
5 13 3
246 22 111 11 135 11
70 4 41 2 29 2
87 57 27 1 23 20 37 36
61 28 30 12 2~ 19
60 4-24 3 12 3
10 1 6 5
54 7 23 9 5 4-
17 3
21 1
16 4
42 12 11 9
10
48 18 20 3 II 2 17 13
48 26
1 13 8
11 9
2
III Calnatruction
VI ,..----A--, M F
In Trade and
Commerce VII
,--~ M F
In Transport, Storage and Communi
cations VIII
,.----..A.~
M F
KERALA STATE
In Other Services
IX ~ M F
NonWorkers
X ,---_..A.~
M F
27 2B 29 30 31 32 33 34 35 36
17 1
16
6 5 1
3 3
16 4 8 4
5 .. 2 .. 3
19 6 1 3 9
29 4
II 9 5
5 3 2
10
7 3
21
"
2
2
142 43 99
123 32 91
169 42 66 61
135 72 27 36
157 57 19 44 15 17 5
122 35 47 13 27
93 10 62 21
75 25 18 8
24
4 114 4 24-
.58 32
56 20
6 9
21
3
3
3 2 1
.. 1
3 2
.. 1
2
.. 1
2
2
.. 1
91 27 64
73 42 31
52 12 12 28
24 11 11 2
10 3 -4-
.. 1 2
21 4 6 4 7
14 2
11 1
22 6 5 7 4-
66 21 21 24-
21 8
2 5 6
493 92
401
324 110 214-
566 161 197 208
152 41
III
163 61
102
1,462 337
1,125
1,009 391 618
435 2,371 148 700 110 782 177 889
546 533 1,579 306 244 864 195 238 532 45 51 183
887 223
93 120 222 157 72
923 2,372 205 678 94 304 96 368
216 496 249 394 63 132
565 422 2,008 193 112 729 129 87 526 73 74 246
170 149 507
516 74
272 170
593 95
190 133 175
238 1,581 32 212 68 910
138 459
245 45
132 24 44
1,548 218 348 524 458
519 269 1,834 173 102 605 177 91 592 169 76 637
4-58 101
2 47
197 111
240 53 3
12 107 65
1,399 424
16 I
I-ffi 1-33 380
2,573 682
1,891
1,750 700
1,050
4,063 1,139 1,364 1,560
2,754 1,569
831 354
3,862 1,095
484 654 828 554 247
77 1 2
78 1 2
79 1 2 3
80 1 2 3
81 1 2 3 4 5 6
3,436 82 1,221 1
813 2 405 3 997 4
2,684 353
1,582 749
2,717 469 553 alii 834
3,287 996
1,093 1,198
2,494 727 21
298 806 642
83 1 2 3
84-1 2 3 4
85 1 2 3
86 1 2 3 4 5
PRIMARY CENSUS PALGHAT DISTRICT
Occupied Literate and residential Total number of Scheduled Scheduled educated Total
houses persons enumerated Castes Tribes persons Workers I-IX
DistrictfTalukf ,....A.~ r-~ ~ ,..----"--, Town/Ward/Blockf Area No. of No. of Persons Males Females M F M F M F ·M F
S1. ViliagefDesomf in houses house-No. Forest range acres holds
1 . 2 3 4 5 6 7 8 9 10 11 12 .. 13 14 15 16
Midland Villages--contd.
87 Kappur 2,855'22 1,120 1,127 5,964 2,888 3,076 347 353 896 608 1,584- 625
1 Kollanur 267 273 1,582 777 805 100 100 250 153 428 167 2 Kappur 388 389 2,338 1,147 1,191 135 145 388 259 624 243 3 Kozhikkara 202 202 1,145 543 602 57 60 144 109 314- 119 4 Eravakad 263 263 899 421 478 55 48 114 IJ7 218 96
88 Othalur 2,755'88 1,197 1,212 7,439 3,514 3,925 427 446 18 11 1,260 773 1,754 944-"
I Chiyyannur 270 271 2,174 1,024 1,150 146 149 7 4 364 232 518 253 2 Kokkoor 343 355 2,045 978 1,067 177 171 4 4 400 284 526 307 3 Othalur 514 516 2,849 1,345 1,504 104 126 7 3 432 220 622 350 4 Kizuakkara 70 70 371 167 204- 64 37 88 34
89 Kavucode 2,027'51 974 1,020 6,368 3,013 3,355 313 349 59 70 1,458 1,192 1,550 701
I Thannircode 174 176 1,097 506 591 120 132 2 2 246 204- 242 ll8 2 Pattisseri 234 241 1,324 639 685 43 53 42 56 220 143 349 157 3 Kavucode 566 603 3,947 1,868 2,079 150 164 15 12 992 845 959 426
90 Chalisseri 2,703'39 907 931 5,332 2,547 2,785 518 515 27 40 1,041 798 1,267 616
I Perumannur 303 308 1,777 842 935 231 215 11 20 325 268 383 256 2 Kuttanad 141 141 788 387 401 62 63 6 7 161 99 201 60 3 Alikkara 103 110 597 292 305 66 62 131 75 170 87 4 Chalisseri 360 372 2,170 1,026 1,144 159 175 10 13 424, 356 513 213
91 Nagalass~ri 3,628'94 I,OB5 1,091 6,618 3,070 3,548 675 745 1,386 1,105 1,566 714
1. Nandiyangode 148 148 956 447 509 60 68 254 167 235 87 2. Thekkevavanur 108 108 691 333 358 64 60 111 . 89 155 49 3. Vadakkevavanur 141 141 821 376 445 75 93 .. 202 164 187 125 4. Valiachalappram 170 173 1,071 506 565 85 107 191 162 237 97 5. Cheriachalappram 77 78 554 259 295 98 93 68 57 129 60 6. Nagalasseri 123 123 699 307 392 87 95 153 137 159 79 7. Pilakkattiri 185 185 1,04-9 496 553 110 116 240 201 265 Il7 8. Tolukkad 133 135 777 346 431 96 113 167 128 199 100
92 Thirumittacode 2,771'00 896 918 5,981 2,790 3,191 447 528 .. 1,044 844 1,4i8 704-
1. Nellikkatiri 163 169 889 409 480 70 90 174 123 223 106 2. Rayamangalam 107 109 655 330 325 31 35 100 67 165 61 3. Thirumittacode 92 95 882 394 488 67 76 196 177 213 8~ 4. Irumbakasseri 119 119 701 326 375 69 77 126 81 153 77 5. Ezhumangad 295 305 1,611 751 860 86 126 , 262 203 358 212 6. Irinagattor 120 121 1,243 580 '663 124- 124 ' 186 193 ' 306 166
93 Peringannur 2,592'72 738 747 4,668 2,186 2,482 375 421 13 13 900 749 I, III 501
1. Chathanur 96 101 927 448 479 114 104- 1 213 178 204- 96 2. Velladikkunnu 154 155 876 427 449 94 99 183 132 219 92 3. Cherippur 120 120 69S 336 362 60 63 I<W 102 189 60 4. Peringannur 154 157 9J.O'· 424 486 70 83 3 7 ISO 120 220 128 5. Ittonam 186 186 1,081 ' +77 604 31 49 3 6 186 189 243 104-6. Ozhuvathara 28 28 1i6 74 102 6 23 6 28 28 '36 21
22
ABSTRACT
As Cultivator
I ~ M F
As Agricultural Labourer
II ,...--A--, M F
In Mining, Quarrying, Live-stock, Forestry, Fishing, Hunting and Plantatiom, Orchards and allied activities
III ,---J<----, M F
Workers
In Manufacturing
At House- other than hold ' Household
Industry Industry IV V
r-"---. ,---J<----, M F M F
In ConstruCtiOIl
VI ,--.A--, M F
In Trade and
Commerce VII
,...--J--., M F
17 18 19 20 21 22 23 24 25 26 27 28 29 30
323
95 122 72 34-
,416
134-69
185 28
:318
78 111 129
29 249
11 55 10 103 5 7J 3 16
89 212
26 20 18 40 42 147 3 5
354 415
83 86 131 188 8$ 98 52 43
33$ 202
66 36 57 127
205 27 7 12
64 214 282 270
16 73 90 8 17 60 71 79 31 81 121 183
214 97 188 218 97
76 60 III 137 29 22 6 20 16 35 53 13 15 21 18 63 18 42 44 15
427 120 337 358 102 \
56 11 14 19 9 44 6 37 33 4 54 21 43 49 21 95 23 44, 54 5 38 19 43 " 30 6 38 5 39 40 10 55 24 59 66 28 47 11 58' 67 '19
180 142 264 293 46
101 21 30 43 6
42
15 22
5
15
9 6
101
13 88
15
--
5 4 ,6
,89 21 16 17 4 i •• 61 17 45 38 1 48 8 42 40 4 82 28 44 ~ 18 99 47 87 80 13
366
49 77 69 68 88 15
55
16 19
II 6 3
25/224-4
391 366
56 56 72' 69 90 58 87 105 78 65 8 13
43
2 6 8
15 9 3
5
.. 1
25
8 15
2
67
13 11 43
136
20 9
107
17
7 5
5
39
24 9 6
~2 22
61
10 26 11 14
46
31 13 1 I
98 20
5 8 3
85 17
72 23 69 3
14 3 ..
55 19
17 6 2
44 3
65 • 47 128
II 5 8
10 3
12
6
28 4
10 3 4
12
4
82
.. 5 8
12 46 9
13
2 4
4-3
11 5
15 3
9 3 1
43 36
., 1
2 3
82 73 8
1 7 5 4 6 9 I,
11 5 2 47 38 5 12 10
11
2
7 2
84-
21 24 5 8
24-2
8
3
2 3
16
1 14 1
16
2 5 9
15
4-7 3 1
29
4 2 3 1 5 6 2 6
42
13
6 1
12 10
8
4
2 .. 2
23
2
2
1
1
65
18 11 19 11
44-
11 12 13 a
166
7 6
153
103
28-19 1
7
7
55 1
49
28 6 4 3 I
6 1
58
9 5
11 IS 14-
4-
34
8 7 1
14-4
2
2
3
1 .. 1
.. 1
In Transport, Storage and Communi·
cations VIII ,----.....___,
M 11'
KERALA STATE
In other Services
IX ~ M F
Non· Workers
X ,........-A---M F
31 32 33 34- 35 36
56
17 14 12 13
15
6 2 5 2
29
2
27
34
6 18
10
54
11 II I
20 3 1 3 4
28
3 2 8 3 7 5
9
3
4-2
382
136 139 25 82
736
266 238 200 32
303
41 71
1 ·185
182
50 75 21 36
463
137 212' 90 24
1,304
349 52$ 229 203
1,760
506 452 723 79
2,451
638 948 483 382
2,981
897 760
l,r54 170
182 ,1,463 2,654
12 264 473 31 290 528
139 909 1,653
87
1 2 -3
'" 88
1 2 3 4,
89
1 2 3
475 273 1,280 2,169 90
98 71 78
228
375
74 42 43 56 26 41 69 24
345
54 40 64 23 95 69
163
59 29 14 24 32 5
55 37 53
128
166
44-5
39 17 II 20 18 12
459 186 122 513
679 341 218 931
1,504 2,834-
212. 422 178 309 189 320 269 4GB 130 235 148 313 231 436 147 331
1 2 3 4
91
1 2 3 4 5 6 7 8
175 1,372 2,467 92
39' 186 374 1 18 165 264 2 19 181 406 3 16 173 298 4· 56 393 648 5 27 274 497 6
64
22 4-2
12 22 2
1,075 1,981 93
244 383 1 208 357 2 147 302 3 204 358. 4 234 500 5
'38 81 &
PRIMARY CENSUS PALGHAT, DISnuCT
Occupied Literate and residential Total number of Scheduled Scheduled educated Total
houses penons enumerated _ Castes Tribes persons Workers I-IX
Distrkt/Talukl ~ , ,..--.--"--, r---+--, ,--"----, r--~ "fovm/Wara /Blod! Area No, of No_ of Persons Males Females M F M F M F M F
~1. Village/DesomJ In houses house-Ko_ Forest range acres holds
1 2 3 4 5 6 7 8 9 10 II 12 13 14 15 16
MidloUld Villages-concld,
94 Chazhiyattiri 2,593-92 666 673 3,907 1,830 2,077 255 275 16 19 831 624 926 494 1 Maduppalli 182 182 1,008 468 540 108 121 157 136 248 122 2 Akilanam 166 170 995 467 528 72 67 263 171 234 99 3 Karukaputhur 89 91 522 223 299 18 20 134 112 94- 41 4 Chazhiyattiri 147 148 820 392 428 49 56 204 165 216 164 5 Pallippadam 82 82 562 280 282 8 11 16 19 73 40 134 68
, 95 Kothachira 2,832'05 1,170 1,227 6,721 3,081 3,640 630 729 18 30 1,320 1,143 1,495 901 1 Mathur 153 161 816 356 460 90 124 136 131 165 154 2 Peringod 390 414 2,247 998 1,249 178 198 479 475 419 199 3 Kothachira 627 652 3,658 1,727 1,931 362 407 18 30 705 537 9Il 548
Lowland Villages
96 P~thannur 1,748-90 519 546 3,153 1,474 1,679 334 347 629 480 752 484 1 Nariparamba 156 165 974 462 512 84- 87 220 197 240 140 2 Thandilam 125 131 745 34:7 398 61 68 144- 90 191 120 3' Pothannur 238 250 1,434 665 769 189 192 265 193 321 224
97 Easwaramangalam 1,531-71 782 815 4,496 2,023 2,4-73 415 501 3 2 989 856 1,020 72(}
r Ea:~waramanga1am 190 194- 1,041 479 562 136 1.57 3 2 237 218 264 193 2 XeithaJlur 104 104 559 253 306 53 52 101 60 150 97 3 Cheruvaikkara ' 242 264 1,492 671 821 ~6 105 355 318 322 175 4 Po~hampuram 185 185 1,017 468 549 109 139 21.5 13::1 221- 210 ~ Kothathara 61 68 387 152 :235 31 48 81 127 60 45
9~ Ez4uvathiruthi 1,825-50 '1,456 1,514 8,878 4,182 4,696 440 409 13 8 2,281 1,720 1,967 1,062 1 Punnathiruthi 329 334 2,029 973 1,056 48 49 580 458 456 158 2 Ezhavathiruthi 353 355 2,023 937 1,086 120 128 441 337 481 315 3 Erikkamanna 230 285 1,769 844 925 139 133 439 289 385 221 4 Karukathiruthy 165 188 1,083 511 572 . 26 27 240 154 232 129 5 Theyyangad 329 352 1,974 917 1,057 107 72 12 e 581 482 413 23<}
99 P<lrang 1,630'92 959 965 5,102 2,373 2,729 31 35 li,189 760 1,OIl 447 I Po rang 561 565 3,024 1,445 1.579 28 29 :645 403 695 339 2 Panampad 398 400 2,078 928 1;150 3 6 .5+4- 357 316 108
')00 Kadavanad 1,052'95 912 965 5,861 2,727 3,134 353 404 985 662 1,213 481 I Paduponnani 379 417 2,510 1,198 1,312 37 42 238 143 558 184 2 Kaiavanad 533 548 3,351 1,529 1,822 316 362 747 519 635 297
101 Velia'1code 2,123'57 1,508 1,554 9,459 4,388 5,071 163 175 2 6 1,509 946 2,134 1,095
1 Veliancode, 758 787 4,838 2,254 2,584 104 123 637 293 1,068 596 2 Pa7,hanhi 264- 264 1,473 669 804 53 45 289 195 314 191 3 Gramam 486 503 3,148 1,465 1,683 6 7 2 6 583 458 752 308
.102 Ayirur 1,702'98 1,289 1,348 8,593 4,183 4,410 22 30 9 8 1,721 963 2,083 795
1 Puthiruthi 514 570 3,897 1,912 1,985 2 4 9 8 582 290 908 212 2 Kodathur 212 212 1,231 596 635 -, 2 352 249 290 116 3 Ayirur 563 566 3,465 1,675 1,790 20 24 787 , 4~4 885 467
103 Punnayur 2,311-11 1,347 1,390 8,502 3,880 4,622 252 245 45 53 1,437 909 1,745 853 1 Akilad· 541 554 3,825 1,798 2,027 58 54
" 520 276 850 25(}·.
2,Edal{kar<l lSI 163 921 ~93 528 8 11 14 13 181 98 195 1I5 3 l'unnaiur 655 673 3,756 1,689 2,067 186 189 31 40 736 535 700 488
, '104 £dakklzhiyur 1,79H3 1}02 1,241 7,692 3,5~3 4,169 367 394 46 40 1,507 1,069 1,524 723 . i- J\viyur' ' 134 137 814 , 348 466 22 27 170, 144- 149 92 '1, 'K:oranq!yur 225 226 1,372 63f 741 161 159
46 358 299 269 J59-
, 3' $dakka'lliiyur 843 878 5,506 2,544 2,962 184- 208 46 919 626 1;106 472
24
.ABSTRACT
As Cultivator
I ~
M F
As Agricultural
Labourer II
,:.---A----, M F
In Mining, Quarrying, Live-stock, Forestry, Fishing, Hunting and Plantations, Orchards and allied activities
III ,----~ M F
At Household
Industry IV ~
M F
Workers
In Manufacturing
other than Hou~ehold , Industry
V ,. ---'------. M F
In Co.struction
VI ~ M F
III Trade and
Commerce VII
,.---A----, 1\1 F
KERALA STATE '--------"-\
In Transport, Storage and Cornmunica- In Other
tions Services VIII IX
,..---A----, ~ M F M F
NonWorkers
X ,.-----A---..--"\
M F
17 18 19 20 21 22 23 24. 25 26 27 28 29 30 31 32 33 34 35 36
.245 53 249 260 19 57 4 73 91 5 54 9 51 73 7 36 S 16 16 I 69 28 29 4
48 50, 2 til 30 4
445 209 49 34
103 53 ,293 122
IS2 270 69 56 91 9 II 21, IO
ll5 158" 50
154 53 42 59
214 48 53 68 28 17
179 23 29 53 23 51
151 89 62
32 5
27 167
63 oW 64-
.243 70 48
125
:274-110 4Q
124 192
27 36
129
20 310 366 19 9 66 114 It 4 94 106 3 7 130 146 5
81 109 296 25 43 67 124 I 5 20 82 2
18 II 73 8 6 5 4 14 9 6 13
71 147 316 45 15 2 7 4 9 83 159 19
20 23 66 4 4 5 23 15
23 34 61 3
39 38 104 123 8 23 61 III
31 15 43, 12
19 4, 3 349 5 .. "3, 329
14 4 20 55 135 ,305 647 16 70 78 278 8 32 89 51
31 33 138 318 39, 108 304 694-12 11 23 405 9 33 64 26
18 64 217 263 96 56 256 390 26 23 81 326 24 5 6 7 46 28 169 57 81 94 258 415 '18 6 28 22 12 56 103 14 51 32 127 379
25/224-4 b.
5
3 I
8
8
4
3
~ 15 1
2 2 '
57 6
15 36
2~ '3 9
16 • :3
3
2 I
1
26 5
11 .. 6 4
44 3 5
36
7 1
.. 6
32 15 2 6 3 6
106 15 20 43 17 11
53 49 4
49 4
45 124 99
7 18
123 60 13 50
160 80 26 54
62 2 9
51
17 2 5
o.
10
24 5 4
15
4 1
3
24 10 2 8
4
257 6
85 47 52 67
189 180
9
194 3
191 331 296
9 26
280 87 15
178
81 59 3
19 83 4 5
74
60 5
31 7 9 8
57 6
44 7
"
1
4 2 2
38 3 21 Il I 6 2
58 186 17 4 6 ..
17 15 IS 167 3
250 107 58 21 52 12 62 38 21 35 57 I
133 12 73 5 60 7
93 128 40 76 53 52
191 152 63 102 36 23 92 27
123 77 20 26 19 6 2
11
24 19 1 4
11 .. 2 9
104 39 II 3 60 16 33 20
10
10
23 2
19 2
5
5
22 1 4:
13 3 1
65 12 9
17 7
20
3 3
8
3 5
5
4 1
8 1
7
9 4
5
.. 1
25
27 8 8 :3 4-4
71 6
28 37
37 13 S
16 92 22 7
36 24 3
169 55 17 29 41 27 91 51 40
74-26 48
233 165 23 45
125 57 20 48
280 127 38
115
180 28 26
126
10 1 4 5
.. 1
2 1
.. 1
2 1 1
1
6 5
.. 1
6
5
2 1
1
7
.. 4 1
11 .. 2 9
33 15 5
13
83 16 2
·14 45 6
153 49 21 55 12 16
116 85 31
57 8
49 Il3 42 24 47
214 25 35
154
51 10 7
34-
81 26 15 4(j
2 1
.. 1
283 94 61 31 74-23
593 34
197 362
149 ~40
23 86
385 77 54
149 87 18
853 238 231
99 9~
194
303
211 92
554 145 409 516 288
98 130
448 203
91 154
6 507 167 70
6 270 387 23 53
311
157 24-II 17 82 23
376 21
115 240
90 16 9
65 131
11 8
61 33 18
305 107 50 50 15 83 87 70 17
133 94-39
193 98 47 48
113 63 18 32
394 83 80
..:231
258 37 23
198
904-220 233 129 176 146
1,586 191 579 816
722 222 156 344
1,003 215 103 349 244-
92
2,215 517 456 459 279 504
1,362 750 612
1,514 640 874
2,254 1,186
355 713
2,100 1,004
306 790
2,135 948 198 989
1,999 .199 362
1;438
1,583 418 4:!9 253 264 214
2,739 306
1,050 1,383
1,19,5 372 278 545
1,753 36<:1 209 646 339 190
3,634-898 771 704 443 818
2,282 1,240 1,042
2,653 1,128
. 1,525
'3,976 1,988
613 1,375
3,615 1,773
519 1,323
3,769 1,777
413 .1,579
3,446 374-582
2,490
94-1 2 3 4 5
95 1 2 3
96 1 2 3
97 I 2 3 4-5
98 I 2 3 4-5
99 I 2
100 I 2
101 1 2 3
102 1 2 :3
103 1 2 3
104, I 2 3
PALGHAT DISTRICT
SI. No.
District/Taluk/ Town/Ward/Block/ Village/Desom! Forest range
2
Area in
acres 3
PRIMARY CENSUS
Occupied residential
houses Total number of
persons enumerated Scheduled Scheduled Literate and
Caates Tribes educated persons
,----...._-____ I .A._._~..., ~,..---A---, r---.A--__ No. of No. of ,Persons Males Females M F M F M F houses house-
holds
4 5 6 7 8 9 10 11 12 13 14
Total Workers I-IX
,.....~
M F
15 16
OTTAPALAM OTl'APALAM TALUK T 161355'91 55679 57557 324563 1537(){ 170859 20300 22085 77 76 71916 59192 76320 39803
R 153430-48 50192 51897 291705 137559 154146 18853 20592 75 73 62333 51782 68627 37482
Midland Towns
D PattaJDbi
Ward 1 Vallur
Block 1
" 2
u
Ward 2 Netherimangalam
Block
" " " " " " "
m Shoranar
3 4-5 ' 6 7 8 9
10
Ward 1 Paruthipra
Block 11 " 12
Ward 2 Mundamuka
Block 13
" " " "
14-15 16 17
Ward 3 Nedungottur
Block 18 " 19 " 20 " 21
Ward 4 Chuduvalathur
Block 22 •• ,,?3 " ,~4
7925-43 5487 5660 32858 16145 16713 1447 1493
2,151'21 1,214 1,271 7,769 3,824 3,945 431 404
902'20
1,249'01
237
140 97
977
52 145 141 145 139 130 124 101
237 1,440
140 97
866 574
660
405 255
780
461 319
84 90
45 48 39 42
1,034 6,329 3,164 3,165 347 314
52 145 144 147 155 145 137 109
350 862 895 904 922 880 875 641
169 412 443 454 438 446 443 359
181 450 452 450 484 434 432 282
52 75 66 46 38 45
1 24
47 77 56 53 43 36
1 1
3,075'78 2,593 2,656 14,307 7,132 7,175 745 762
642'80 259
133 126
847-46 602
140 134 153 165
10
595-15 460
666'71
139 151 142 28
402
125 146 .131
272 1,572
HO 132
777 795
734
353 381
838 187 198
424 414
99 120 88 78
606 3,155 1,584 1,571 173 .78
141 135 155 165
10
886 766 706 768 29
405 363 371 420
25
481 403 335 348
4
77 70 73 74 16 32 7 2
462 2,576 1,245 1,331 176 197
139 153 142 28'
735 885 804 152
347 429 394-
75
388 124 122 45~ 13 34 410 22 25
77 17 16
411 2,230, 1,101 1,129 84 84
128 147" 136
684 338 801 • 392 745 ,371
26
346 409 31t
23 27 '16 .14 45 43
2
2
2
2
3 9583 7410 7693 2326
3 2,113 1,619 1,817 _
277 265 302 140
171 144 191 102 106 121 III 38
3 1,836 1,354 1,515 348
67 3 237
229 279 267
.. '269 270 218
58 167 198 201 229 173 211 117
76 231 194 214 189 211 218 182'
42 68-56 64 47 29-28 14
. • 4,550 3,427 3,390 954
363 294 344 209 ,
182 145 160 99 181 149 184 llO
926 663 773 198.
213 200 195 136 84 167 252 173 201 301 202 190 24 4 20
95 67 30 6
791 672 512 165-
178 151 . 164 3Q7 252 166 263 234 153
43 35 29
SO 35-33 17
737 ' 598 490 17()
241 166 171 6(} 267 223 171 73 ~,29 209 148 ' 37
ABSTRACT
As Cultivator
I ~
M F
A, Agricultural
Labourer II
,----'---, M F
In Mining, Q\IlU'Iying, Live-stock, Forestry, Fishing, Hunting and Plantations, Orchards and allied activities
III ~ M F
At Household
Industry IV
,..----J'--.. M F
Worken
In Manufacturing other than In Trade Household In Con- and . Industry struction CoIIWlercc
, V VI VII ~~~
M F M F M F
17 18 19 20 21 22 23 24 25 26 27 28 29 30
TALUK
In Transport, Storage and Communi
cations VIII ~ M F
31 32
KERALA STA.TB
In Other Services
IX ~ M F
33 34
NonWorkers
X r---"---.. M F
35 36
2O!J53 8963 13172 14268 2263 218 4983 4172 59!H 794 1545 38 3700 lao 2526 29 21184 11146 77384 131051 T
20319 8692 12713 13703 2176 212 4736 3945 4719 687 14-58 32 2882 166 953
634 271 459 565 87 6 247 227 1275 107 87
223 62 178 152 23, 3 50 59 363 30 22
112 47 41 57
61 30 22 39 51 17 19 18
6
6
22 18 14
22 18 10 4
4-
3 1
7
6 I
111 15- 137 95 17 3 28 41 349 26 15
22 35 19 9 9
13 4
9
1 3
2
18 83 5 8
20 3
22 48 4 1 .
17 3
2 5 5 3 1 1
.. 2
1
20
1 3 3
2 5 8
12 4 1 7 2
6 29 31 45 60 67 70 41
1 1 4 6 8 5 1
3 4 4 3 1
146 78 148 205 25 1 103 104 516 52 35
44 31 16' 25 ' 15
18 26
8 23
5 11
13 1 ~2 . 14
44 12 63 73 2
30 11 3
5 33 ,35 .• 7 27 25
3 13
21 13 37 63 2
4-2
10 5
21
11 3 7
2 3 4-4
17
8 2 7
31 4. 2
25
15
10
56 6 1
33
21 ' .. ·12
2
.. 1
11 22 21
8 3
10 12
10 11
18 41 55
12 35 26 6 6 19
.. 1
2
9 1 1
23 14 83
14
9
9 .. 5
16 45
. 19 3
5 4 160
3 . 3 79 2 1 72
9
42
4 38
I
5
4 I
9
3 3 3
11
3 7 1
27
6 818 14 1573
223
10
7 3
213
I 3
12 24 31 36 57 49
2 120
11·
11
2 109
2 3
16 20 19 24 12 13
5 246 6 1,288
5
4
14
5 9
16
76
43 33
457
4 45 2 52
10 1 156
51
20 25
6
27
8 7
12
184 20
131
27 49 51 4
137
11
.. ~
15 18671 10030 68932 116664 R
14
9
1
4
3
2513 1116 8452 14387 U
615 lao 2,007 3,457 D
79
46 33
14
12 2
358 640
214 .. : .359 1 144 281 2
536 166 1,649 2,817
22 68
102 82 48 66 72 76
8 14 37 41 18 17 20 11
93 181 249 240 249 235 225 177
139 382 396 386 437 405 404-268
3 4 5 6 7 8 9
10
883 494 3,742 6,221 m
146 128 390 629
70 76
113
41 48 19 5
155
49 36 53 17
]04-
41 48 15
68 60
65
193 197
325 304
811 1,373
11 12
18 210 386 13 29 '196 336 14 12 170 305 15 6 230 34-2 16
73
1'2 25 23 13
69
20 32 17
5 4 17
733 1,166
183 263 241 46
308 18 421 19 377 20 60 21
611 959
167 286 22 221 336 23 223 337 24
PALGHAT DISTRICT PRIMARY CENsUS
,.----
Occupied Literate and residential Total number of Scheduled Scheduled educated Total
houses persons enumerated Casteg Tribea persons Workers I-IX
DistrictfTaluk/ r----A..----, ,,-----A.----. r---""'-----.. ~ ~ r-~ Town/Ward/Blockl Area No. of No. of Persons Males Females M F M F M F M F
81. Village/DesomJ in houses house-No. Forest range acres holds 1 2 3 .. 5 6 7 8 9 10 11 12 13 14 15 16
Midland Towns-&oncld.
Ward 5 Chiramanna 323-66 870 905 4,774 2,468 2,306 125 105 1,733 1,200 1,271 212
Block 25 128 132 821 360 461 32 30 240 275 150 68
" 26 130 132 634 335 299 62 47 249 167 163 22 27 129 134 726 366 360 " " 236 131 184 28
" 28 134 141 691 381 310 11 8 256 157 216 26 29 146 156 849 453 396 9 8 328 206 256 30
" 30 150 157 808 433 375 II 12 324 217 233 33
". 31 53 53 245 140 105 100 47 69 5
IV Ottapalam 2,698~44 1,680 1,733 10,782 5,189 5,S!J3 271 327 2.!nO 2,364 2,486 88i
Ward 1 Varode 1,385'04 453 465 2,800 1,291 1,509 117 107 613 SIS 616 348
-"'Block 32 78 79 518 250 268 21 16 128 95 115 73
" 33 142 146 891 419 472 56 61 172 131 214 119
" 34 133 138 855 387 468 16 12 211 208 173 105 35 100 102 536 235 301 24 18
~
102 81 114 51 " Ward 2 Vadanamkurissi 181'66 62 63 375 171 204- 19 20 76 83 85 48
Block ,36 31 31 200 93 107 15 17 41 46 42 22 37 31 32 175 78 97 4 3 35 37 43 26
Ward 3 Ariyoor' Thekkummuri 1,131'74 1,165 1,205 7,607 3,727 3,880 135 200 2,231 1,766 1,785 488
Block 38 119 121 687 324- 363 42 51 166 148 146 87
" 39 136 138 870 407 463 25 37 273 268 176 9,5
" 40 140 145 1,093 491 602 10 7 353 423 221 117 41 123 126 749 355 394 I 27 252 256 172 52
" 42 129 134 727 351 376 6 18 249 214 194 28 43 114 121 679 386 293 29 34 251 126 195 28 44 137 143 756 375 381 14 15 203 124 179 54
" 45 138 143 1,032 512 520 3 6 256 119 249 12
" 46 129 134 1,014 526 488 5 5 228 88 253 15
Midland Villages
105 Vila_yur 2,586'51 1,039 1,061 6,082 2,914 3,168 260 300 1,167 848 1,552 563 1 Viiayur 507 525 2,862 1,414- 1,448 136 146 519 342 777 307 2 Paradiyur 532 536 3,220 1,::'00 1,720 124 154 648 506 775 256
106 Chundampatta 2,320-81 808 839 4,880 2,313 2,567 306 349 968 732 1,070 311 1 Natiyamangalam 266 275 1,664 777 887 29 26 '- 292 214 388 91 2 Mathanampally 183 189 998 474 524 70 74 187 142 223 99 3 Chundampatta 359 375 2,218 1,062 1,156 207 249 489 376 459 121
107 Kulukallur 2,769'37 1,079 1,089 6,362 2,999 3,363 426 449 ~,497 1j470 1,472 608
108 Marayamanga1am 2,295.79 743 746 4,313 2,080 2,233 17l 186 988 814 1,002 464-
109 Karalmaooil 3,120-36 996 1,057 5,605 2,629 2,976 266 311 1,;46 1,089 1,368 873 1 Thekkumuri 273 275 1,58$ 769 816 79 96 342 271 425 274 2 Vadakkumuri 1M 184 1,02& 502 524 26 31 264 221 252 160 3 Naduvattolll - 310 339 1,720 786 934 95 116 338 !l23 418 277 4 Karalmanna 229 259 1,274- 572 702 66 68 302 274- 273 162
28
ABSTRACT
As Cultivator
I .
,-.---A-----, M }O'
As Agricultural
Labourer II ~
M F
In Mining, Quarrying, Live-stock, Forestry, Fishing, Hunting and Plantations, Orchards and allied activities
III ~---.
M F
At Household
Industry IV ~ M F
Workers ..A..-________ _
In Manufacturing
other thaa In Trade Household In Con- and Industry struction Commerce
V VI VB ~-----, ~-----, ,--~--, M F M F M F
In Transport, Storage and Communi
cations VIII
r--~ M F
17 18 19 20 21' 22 23 24 25. 26 . 27 28 29 30 31 32
16
3 2 3 3 2 3
5
.. 2 2 .. I
7
7
11
11
6
.2 3
. 1
46 23 197
1 3
11 10 5
16
1 13 3 2
4
26 6
51 46 28 19 21
6
3 1 1
1
9
5
.. 3 1
138
11 5
16 22 47 29 8
4 487
48 .. 2 .. I
112 65 63 75
107 17
4
.. 1 2
KERALA STATE
In Other Services
lX
33 34
NonWorkers
X
35 36
365 159 1,197 2,094
49 35 38 70 93 58 22
54 7
17 21 27 29
4
210 172 182 165 197 200
71
393 25 277 26 332 27 284 28 366 29 342 30 100 31
265 131 133 203 39 2 94 64 396 25 30 1 349
33
7 7
6 165 5 1,015 442 2,703 4,709 IV
161 87
31 19 34 11 58 46 38 11
21 11
11 3 10 8
83
24 10 15 12 9 I 3
9
·551 265 286
'398 .135 . 80
183
33 B
15 7 2 1
51 18 33
57 10 33 14
74 118
5 8 34 50 11 38 24 22
12 13 11 11 1 2
47 11 9 7
7 4
9
114 73 41
50 14
'36
77 25 22
5
\ . i 15 6
'3\
65 20 45
48 21
27
18
4 2
12
21
2 6 1
,. 3 8
134·' 65 69
24 14 1 9
579 216 318 216 22
427 150 123 113 13
'451 231 ;'191 103 : 68 40
107 58 • ,' 85 ' 30
292 82 55
U8 37
235 87 60 58 30'
28 9
II 5 3
2
37
1 19 5
12
7
4 3
50 15 6 6
10 (\
.. 5
7 106 4 . 86 .3 . 20
., ! 42 4
23 15
17
11 1 5
9 3 6
38
13 4 5 2 5
.. 9
114 84 30
38 5
11 22
47
5 22 15 5
8
7 1
341 17 22 55 13 17 30 23 89 70
32 18 14
56 22 24 10
81 47 53
1
31 27 32
Il5 14 36 36 29
125 20 10 62 33
65 14 6
22 23
4 12
9 .. ... 3 2
21 6 1 1 2
.. 8 1 2
51 36 15
9 8
1
18 1 9 1
.. 3 1 3
7 2 5
10 5 .. 5
37
6 17
18 9 4 .. 5
24 2 3 6
13
.. 1
29
13 6
5
1 4
311
12 26 21 22 32 32 37 70 59
64 32 32
46 31 3
12
57
19
36. 4
12 14 6
4
.. 2 1
2
•• 1
I
5 5
3
2
19
1 8 9 1
145
4 8
17 17 9
18 25 29 18
12 8 4
8 6 .. 2
9
2
8 I
, 1· 4
. 2
5
.. I 1 1 1
215
52 Btl 48 27
31
8 23
W9
61 86 99 96
110 ]05 74 58 80
532 228 304
436 157 92
187
316
332
349 108 60
106 75
118
44 47 15 12
675 1,161
135 195 32 205 353 33 214 363 34 121 250 35
• 15
5 10
309 35 52 99 43 21 II 30 9 9
86 51 3i
1,942 178 231 270 183 157 191 196 263 273
270 1,362 140 637 130 725
159 1,243 47 389 55 251 57 603
156 85 36 71 37
3,392 276 38 368 39 485 40 342 41 348 42 265 43 327 44 508 45 473 46
2,605 105 1,141 1 1,464 2
2,256 106 796 1
'" 425 2 1,035 3
128 1,527 2)55 107
168 1,078 1,769 108
260 1,261 55 344-43 250 99 368 63 299
2,103 109 542 I 364 2 657 3 540 4
PRIMARY CENSUS PALGHAT DISTRICT
Occupied Literate and residential Total number of Scheduled Scheduled educated Total
howel persons enumerated C&'Itea Tribes personJ Workers I-IX
DistrictlTaluk/ ~ ,----.A-----, ~ ~ ~ S1. Town/Ward/Blockf Area. No. of No. of Persons Males Females M F M F M F M F No. Village (Desomf in houses house-
Forest range acres holds 2 3 4 5 6 7 8 9 10 11 12 15 1{- 15 16
Midl_d ViIl~onld.
110 Veeramangalam 3,OOH8 1,04<1 1,072 5,891 2,901 2,990 219 245 1,20B 757 1,503 698 [ Karumanamlrurissi 271 Z9Z 1,687 84() 847 77 93 342 200 412 195 2 Veeramangalam 304 310 1,7M 892 892 57 63 324 215 467 184-3 Mangooe 249 253 1,239 587 652 53 59 287 182 317 159 4- Cherumannur 92 92 440 208 232 17 19 108 68 123 76 5 Poothakkad 124 125 741 374- 367 15 11 147 92 184 84-
111 Vellinezhi 2,796'70 766 767 4,112 1,966 2,146 249 252 937 837 932 490 1 Vellinezhi 591 592 3,192 1,530 1,662 ' 207 198 754 707 709 388 2 Kuttanassery 175 175 920 436 484 42 54 183 130 223 102
112 Karimpuzha 2,896'81 659 674 3,670 1,750 1,920 102 109 660 540 919 549 1 Attasseri. 23<1: 245 1,404 689 715 52 52 210 162 359 185 2 Kunnakad 138 139 807 389 418 25 30 1M 58 211 138 3 Karimpuzha 2B7 290 1,459 672 787 25 27 346 320 349 226
ll!I Kulukiliyad 3,762'42 748 758 4,036 1,917 2,119 250 275 688 511 1,082 673 I Kulukiliyad 292 297 1,719 828 891 106 119 299 248 447 24> 2 Kotta~ 456 461 2,317 1,089 1,228 144 156 389 263 .,35 426
114 Elambulassery 5,050'92 1,016 1,018 5,860 2,832 3,028 439 463 933 665 1,444 849 1 Pombra 478 480 2,767 1,353 1,414 202 222 350 249 677 414-2 Elambu1assery 538 538 3,093 1,479 1,614 237 241 583 416 767 435
115 Pulapetta 3,538·16 1,070 1,081 5,973 2,792 3,181 228 259 1,300 1,007 1,483 846 1 Pulapetta 370 374 1,909 899 1 ,OlD 107 108 419 328 496 313 2 Ummanazhi 700 707 4,064 1,893 2,171 121 151 881 679 987 533
116 Mannambatta 2,911·55 711 738 3,570 1,630 1,940 235 241 182 605 839 601 1 Mannambatta 188 190 880 4-20 460 42 46 178 120 222 149 2 Kulakkattukurissi 58 59 324 153 171 54 54 62 47 83 65 3 Neelamangalam 85 85 415 179 236 22 19 95 87 79 44 4- Thottara 112 ll3 578 271 307 63 6B 154 124 141 97 5 Parthala 75 76 422 IIl6 236 6 7 79 61 85 70 6 Kodormanna 193 215 951 4:21 530 4B 47 214- 166 ' 229 176
117 Sreekrishnapuram 3,420'97 1,013 1,034 5,629 2,613 2,956 349 394- 4 1,271 1,023 1,322 834 1 Valambirimangalam 207 216 1,148 527 621 77 86 239 205 286 248 2 Easwaramangalam 302 306 1,709 823 886 101 114- 401 306 402 271 3 Perumangode 245 253 1,383 659 724 B4 89 4 339 291 312 156 4 Sreekrishnapuram 259 259 1,389 664- 725 87 105 292 221 322 159
118 Thirunarayanapuram 2,438'30 863 875 4,505 2,145 2,360 256 290 1,078 834 1,174 680
1 Nhalakurissi 59 59 299 148 lSI 29 26 67 42 83 70 2 Kuruvattoor 330 336 1,765 863 902 98 116 ·443 332 491 290 3 Thirvazhiode 2B4 290 1,496 705 791 88 102 317 261 375 209 4: Thirunarayanapuram 190 190 945 429 516 41 46 251 199 225 III
119 Moothedathumadamba 2,463'17 1i22 ' 632 3,6$ 1,742 1,914- 242 261 827 718 881 635 . I Kulakkad 120 129 783 381 402 54 56 168 120 185 IlO 2 Pakaravoor 45 45 244- 119 125 28 31 53 50 61 34 3 Atakaputhur 159 159 972 472 500 51 ·63 215 198 242 152 4 Pothi 38 38 233 III 122 6 10 47 40 57 63 5 Kal1uva~i 260 261 1,,.24 659 765 103 10l 324- 304 336 276
30
ABSTRACT KERALA STATE
Workers . ______ _________________ ._.J"--__________________ --,.
In Mining, Quarrying, Live-stock, Forestry, FiShing, Hunting and
/" Plantations,
As Cultivator
I ~ M F
As Agri- Orchards cultural and allied Labourer activities
II III ~~
M F 1\1 F
18 19 20 21 22
·525 101 178 119 65 62
233 39 64 52 52 26
166 54 ·22 46 16 28
169 51 17 51 10 4{)
11 2 3 1
5
330 123 160 151 24 236 97 132 112" 19
94 26 28 39' 5
280 liB 201 193 28 2 122 35 70 68 11 1 73 SO 63 68 16 85 33 68 57 I 1
354 .203 151
156 262 218 67 98 62 51 47 58 200 167 20
5 5
513 236 360 390 57 10 276 142 186 222 I 15 237 94 174 168 42 10
380 87
-293
"287 86 31 24 37 26 83
390 96 94 66
134
340 31
122 112 75
115 II
104
141 42 14 7
12 15 51
192 65 57 21 49
116 24 37 30 25
262 426 122 165 176 II 97 250 III
191 238 35 37 \ 39 4 29 38 8 21 18, 4 38 ,44 19 ~3 3 47 66 -16
236 261 46; 86 188 H 79 93 1(> 36 38 10 35 42 6
183 175 1J; 19 27 1 69 56 128 61 57 31 34 35 35
:306 194 223 233 13 38 10 29 27 3 20 5 17 21 90 47 64 69 3 35 34 13 15 I
-123 98 100 101 6
25/224--5.
10
10
6 2 2 I
1
5 2
3
59 I
50 4 5
3
" 3
At Household
Industry IV
,----J----, M F
23 24
199 14{) 22 12 12 7
108 78 9 7 9 5
47 63 25 51 22 12
l#i 135 47 4S
1 9 98 78
110 99 10 8
100 91
72 53 14 18 58 35
94 113 22 4B 72 65
53 11 2 5
22
13
124 26 33 39 2p
75 14 3 4
22 5
27
107 38 47 13 9.
67 104 5 14
34 55 22 26 6 9
131 98 68 51 7
35 17 5 9
16. 21
In Manufacturing
other than In ConHousehold struction Industry
V VI r--A--v r---.A--', M F M F
In Transport, Storage and
Communica-In Trade
and Commerce
VII ,.--....-"---."""\ M F
tionll VIII ,--~ M F
25 26 27 28 29 30 31 32
28 11 I
2 14
34 16 18
37 15 18
2 2
21 9 1 5 I 5
4 25 3 21 1 4
7 7
4 1
45 16 29
35 12 23
91 6
85
51 17 1 5 6 4
18
36 5
13 11 7
54 12 16 10 16
27 7
20
8 3 5
14 G 8
4- 33 1 22 3 11
8 3 5
6 2
1 1 2
13 4 8 .. 1
4
3
1
35 24 11
61 14 .,
4 B
19 16
17
1 9 7
33
18 7 8
15
1 2
12
31
;,
"1'
75 34 13 19 1 8
14 11 3
32 13 II 8
24 8
16
17 7
10
59 15 44
17 4-4
3 I 5
58 4
27 15 12
59
7 45 7
14 6 1 5 .. 2
7 2 .. 4 1
2
2
2
2
3 1 2
4-.. 4-
4-3
1
2
1
I
2
7 5 I 1
7 5 2
9 1
8
5 1 4-
4-1 3
18 7
11
10 1 1 1 1 2 4-
22 2
16 4
5 .. 2
.3
9 .. 1 3 .. 5
..
In Other Services
IX r-----A---. M F
33
471 50
226 114-26 55
34
178 23 93 45 4
13
291 148 244 124-41 24
179 73 29 77
201 94
107
97 33 11 53
184 82
102
353 15J 144 30 209 123
422 159 263
134 4S 7
t5 26 II 27
393 53
123 122 95
238 15 95 87 41
143 34 15 41
1 52
169 75 94
135 50 8
14 18 16 29
252 43 66 SO 58
220 5
83 92 35
1().t. 21 8
13 5
52
NonWorkers
X ,--..Jo----; M F
35
1,398 428 425 270 85
190
36
2,292 110 652 1 708 2 493 3 156 .4-283 5
1,034 1,656 111 821 1,274 I 213 382 2
831 1,371 112 330 530 1 178 280 2 323 561 3
835 1,446 113 SIB 644 1 454 802 2
1,388 2,179 114-676 1,000 1 712 1,179 2
1,309 2,335 1 is 403 69? l 906 1,638 2
791 1,339 116 198 311 I 70 106 2
100 192 3 130 210 4 101 166 ,5 192 354' 6
1,351 241 421 347 342
2,122 117 373 1 615 2 568 3 566 4-
971 1,680 118 65 81 'I:
372 612 2 330 582 3 2M 405 4-
861 1,279 IIg 196 292 1 58 91 2
230 348 3 54 59 4-
. 323 (.89 i $~
PRIMARY CENSUS PALGHAT DISTRICT
Occupieti Literate and residential . Total nUJllber of Scheduled Scheduled educated Total
housell persons enumerated Castes Tribes persons Worken I-IX
District/Taluk/ ~ ,----A- -"""' ,---A---,. ~ r--~ 81. To~/Ward/Blockl Area No. of No. of Persons Males Females M F M F M F M F No. Village/Desom! in houses howe-
Forest range acres holds 2 3 4 5 6 7 8 9 10 11 12 13 14 15 16
Midland Villages-con/d_
120 Kattukulam 2,307-12 766 767 4,092 1,915 2,177 338 345 924 844- 1,020 615
1 Mangalamkunnu 172 172 861 410 451 48 49 206 162 229 162 2 ,K.inasseri 165 165 864- 403 461 70 65 170 144 220 In 3 Kattukulam 306 306 1,637 765 872 180 201 386 352 398 195 4 Thaniakal 123 124 730 337 393 40 30 162 186 173 86
121 Thanikunnu 1,443-19 453 461 2,633 1,232 1,401 211 244 612 553 602 317
1 Pookottukavu 50 52 310 132 178 50 64 65 67 73 51 2 Pulapettassery 73 73 426 211 215 41 30 101 72 1I2 50 3 Thanikunnu 125 130 765 359 406 45 65 166 178 159 82 4 Thalayakakkad 122 123 680 318 362 56 63 145 134 172 89 5 Kodormanna 83 83 452 212 240 19 22 135 102 86 45
122 ~dambazhipuram 1,824-41 512 515 2,511 1,156 1,355 131 146 587 415 624 4<l2
123 Pullundassery 1,840-52 572 573 2,904 1,354 1,550 274 304 525 362 704 451
1 Azhiyannur 300 301 1,513 703 810 170 192 265 177 379 250 2 Pullundassery 272 272 1,391 651 740 104 112 260 185 325 201
124 Alangad 2,643-81 687 688 3,794 • 1,752 2,04-2 254 307 674 591 ~928 632 1 Vettakara 250 251 1,485 701 784 155 186 218 174 367 267 2 Alangad 437 437 2,309 1,051 1,258 99 121 456 417 561 365
J25 Vadakkumbrom 3,837-97 84-7 87.7 4,872 2,247 2,625 303 34-9 38 30 870 769 1,158 878· 1 Kadambur 266 288 1,505 695 810 132 152 281 240 373 289 2 Melur 2"9 212 1,255 566 689 104 119 -. 181 201 284 261 3 Aravakkad 372 375 2,112 986 1,126 67 78 38 30 408 328 501 328.
126 E1edathmadamba 3,19l'69 677 699 4,040 1,833 2,207 464 551 668 661 870 738 1 Munnurcode 396 400 2,270 1,007 1,263 273 327 377 400 465 360· 2 Vazhur 160 164 358 165 193 23 23 .. 66 51 85 41 3 Kizhur 121 135 1,412 661 751 168 201 225 210 320 337
127 Trikkadeeri 2,667-36 1,028 1,046 6,182 2,916 3,266 382 376 1.431 1,221 1,469 94Q.. _ 1 Karuttukurissi 168 171 1,03'7 494 543 94 94 256 223 245 191
2 Kuttikode 257 263 1,553 726 827 88 103 322 275 392 260· 3 Trikkadeeri 603 612 3,592 1,696 1,896 200 179 _. '. 853 723 832 489
128 Nellaya 2,762-90 1,174 1,180 6,837 3,208 3,629 ~04- 359 .. '1,602 1,471 1,578 723 I Ezhuvanthala 728 733 4,233 2,031 2,202 236 280 .. 1,023 911 1,035 518 2 Nellaya 446 447 2,604- 1,177 1,427 68 79 \ 579 560 543 205
129 Cherplachery 2,917-89 1,348 1,417 8,134 3,875 4,25') 508 4S9 2,r28 1,907 1,879 800 I Panniyamkurissi 670 677 3,991 1,929 2,062 269 239 _. 1,073 963 914 378· 2 Vellattukurissi 109 109 708 314 394 46 50 17l 173 162 85-g Cherp1achery 569 631 3,435 1,632 1,803 193 200 884 771 803 397
130 Ezhuvanthala 1,721-52 739 801 4,226 1,976 2,250 229 218 852 790 897 413' 1 Erimbulassery 240 259 1,309 609 700 19 26 248 240 256 48· 2 Pattisseri 163 179 1,016 481 535 83 81 172 174 211 107 3 Ezhuvanthala 336 363 1,901 886 1,015 127 III 432 376 430 258-
131 Mundakottukurissi 1,580-21 oW7 504 2,792 1,326 1,466 193 208 "" 508 399 684 364',
82
ABSTRACT KERALA STATE
WorkerIJ
-----~--------------~,------------------.
As Cultivator
I ~
M F
In Mining" Quarrying, Live-stock, Forestry,
. Fishing, Hunting and Plantations, Orchards At house-A3 Agri
cultural Labourer
II ~
and allied hold activities Industry
III IV ,..._....__..,~
M F M F M F
In· Manufacturing
other than Household Industry
V
M F
In Con· .truction
VI ,--.A--........ M F
In Trade and
Commerce VII ~ M F
In Transport, Storage and
Communica-tions
VIII ,--.A----. M F
17 1.8 19 20 21 22 23 24 25 26 27 28 29 30 31 32
"359
74 96
130 59
197 50 80 43 24
118 ll2 11 32 31 9 25 40 2
51 6
7 1 54 40
204 213: 30 43
~14
30 21 45 79 39
.. 45 41 1 10 21 8
52 54 62 58 15 17
..242 117 92 127
243 71 154 259 127 37 90 148 116 34 64 111
6
7 3 4
·355 178 292 297 18 120 53 121 144 6
:235 125 171 153 12
.372 308 116 76 96 102
160 130
:311 256 146 98 36 18
129 140
·533 349 98 61
159 131 276 151
417 432 136 157 133 150 148 \ 125
286 349 155 195 26 1.4
105 14(}
142 161 84 93 2
56 68
430 96 ,435 315 258 63 348 277 172 33 87 38
21 13 4 4
10 3 1 6
13.
.~
10
20 7
13
.:34:1 158 264 207 30 134 70 162 104 17 35 10
172 78 102 103 13
'305 134 205 140 85 11 18 6 85 45 56 27
135 72 131 107
::238 106 150 130
25{224-5b.
18 7 7 4
3
5 5
69 26 26 13 4
32
11 9
11 1
51
26 15 8 2
17
6 6 1 ..
65 16 19 28 22
51
21 18 9 9
2 . 25 42 49
5 .. 5
3
3
2
.. 2
21 31 74 10 17 32 11 14 42
59 92 57 27 31 27 32 61 30
83 26
5 52
60 34 1
25
96 3
33 60
73 23
3 47
50 20
30
123 6
38 79
104-36 27 41
38 28
1 9
63 19 14 30
.. ; 107 79 28
56 96 53 53
3 43
11 4-
7
5
4
1
32 5 9
16 2
14 6 .. 4-1 3
3 17
5 27 5 15
12
4 10 4 5
11 6
5
4
4
6
6
5
23 6 2
15
19 7
11 1
52 3
22 27
5 2 3
3 91 40 205 14 18 47 20 147 9 14 6 7 13
38 13 45 5 4
4:7 11 2
34
30 5
25
45 24 8
13
55 59 43
10 1 1 8
15
33
11 11
18 5 2 9 2
II 1 2 4 2 2
37
17 7
10
12 6 6
25 5 1
19
18 12 3 3
52 2
12 38
62 42 20
1
1
2 I
1
5 3
1 1
5
4-
11
3 1 2
7 2 5
2
1 1
4 3
1
13 I 2
10
10 6 4
130 4 51 73 1 38 8
49 3 13
44-17 7
20
32
11 4
7
3
2 2
In Other Services
IX ~ M F
33
323 59 41
194 29
64
5 11 23 8
17
34
238 45 37
136 20
31 2 3 8 3
15
NonWorkers
X ~
M F
35
895 181 183 367 164
630 59 99
200 146 126
36
1,562 289 289 677 307
1,084 127 165 324 273 195
120 1 2 3 4-
121 1 2 3 4-5
145 1ll 532 953 122
153 94 64
118 53 65
111 35 15 61
124 77 6
41
505 35
145 325
6S 32 36
650 1,099 324 560 326 539
123 1 Z
61 824 1,410 124-35 334 517 { 26 490 893 ~
52 25 6
21
75 47 9
19
297 30 85
182
1,089 322 282 485
963 542 80
341
1,741 521 428 798
1,469 903 152 414
1,447 2,326 249 352 334 567 864 1,407
125 1 2 3
126 1 2 3
127 1 2 3
413 254 1,630 2,906 128 I 2
240 124 996 1,684 173 130 634 1,222
749 4-32 1,996 3,399 129 282 171 1,015 1,684 1 100 67 152 309 2 367 194 829 1,406 3
212 89 45 78
145
107 1,079 1,837 19 353 652 35 270 428 53 456 757
130 1 2 3
67 642 1,102 131
PRIMARY CENSUS l'ALGHAT:mSTRICT
..... ."" Occupied
. Scheduled Literate and
residential Total number of Scheduled educated" Total house. person. enumerated ,,': Cas!es Tribes persons Workers
I_,.,.IX, DistrictfTalukf r-~' ,------....__,__" ~ r---"-------. ~ Town/Ward/Block/ Area . No. of No. of Persons [vfales Females ~M F M F M - ~ F M F
SI. Village/Desomj in houses homc- " No. Forest range acres holJs
1 2 3 4 S 6 7 8 9 10 11 12 13 14 15 16 ,~ , "
Midland Villages-contd.
132 Cherucode 3,597'61 970 979 6,085 2,852 3,233 416 445 " 1,047 921 1,486 657 1 Mannayengode 283 283 1,719 795 924 82 97 285 249 417 210 2 Vandumthura 144 147 888 414 474 56 70 " ' 148 123 223 99 3 Ch\!l'ucode 543 549 3,478 1,643 1,835 278 278 614 549 841 348
1~3 Amayur 2,268.53 685 695 4,218 2,010 2,203 . 256 282 .. 323 641 946 368
134 Pulassery 2,363'57 799 315 4,636 2,107 2,52) 252 318· 30 34 964 921 1,067 535 1 Karinganad 280 286 1,664 iSl 933 105 148 326 326 343 173 2 Manneuciode 141 145 868 410 458 51 51 178 167 206 94 3 Pulassery 378 384 2,104 966 1,138 106 119 30 34 4:60 428 513 268
1~5 Rairanelloor 1,635'75 539 547 3,299 1,614 1,685 215 208 716 517 833 43! 1 Nedungottur 245 249 1,513 746 767 53 61 367 229 393 155 2 Edappalall). 294 298 1,786 868 918 15( 147 349 288 440 276
1~6 Thiruvegapu~a 2,454'59 1,278 1,316 7,837 3,819 4,018 373 391 1,536 1,12§ 1,842 614 I Chembra 440 446 2,648 1,307 1,34/ 151 179 504 385 619 200 2 Thiruvegapura 226 238 1,464 688 776 39 33 395 341 317 143 3 Nariparamba 293 305 1,748 876 872 107 112 269 ' 137 454 165 4 Kaipuram 319 327 1,977 948 1,029 76 67 368 262 452 106
Ig7 Naduvattam 2,635'09 1,083 1,098 6,508 3,076 3,432 568 610 1,211 981 1,523 647 1 Vilathur 398 402 2,472 1,170 1,302 205 221 440 332 580 222 2 Naduvattam 407 408 2,419 1,131 1,288 198 210 494 450 567 203 3 Kizhumuri 278 228 1,617 775 842 165 179 277 199 376 222
138 Muthuthala 3,263'06 936 969 5,722 21728 2,9S4 544- 512 1,105 915 1,322 735 1 Muthuthala 399 414 2,383 1,151 1,232 240 223 468 373 540 260 2 Melmuri 189 192 1,168 541 627 65 73 . ~ 210 168 . 271 184 3 Kozhikottusseri 348 363 2,171 1,036 1,135 239 216 427 374 511 291
(39 Perumudiyur 2,584'28 887 913 5,445 2,494 2,951 614 692 " 1,121 936 1,231 710
1 Kodumunda 298 307 1,793 835 958 108 129 .. 373 253 4:?G 188 2 Perumudiyur 589 611 3,652 1,659 1,993 SOG 563 748 683 B05 52:':
140 Maruthur 2,,367'58 690 709 4,206 2,030 2,176 231 231 .O}, 747 563 9% 45-1 I Kodalur 284 291 1,701 816 &35 52 67 .. , 383 286 367 141 2 Poovakode III 116 699 341 358 105 99 65 55 175 97 3 Mondiyannur 60 60 380 187 193 16 15 61 60 lH 47 4 Maruthur 235 242 1,426 686 740 58 50 . 235 162 3:0 16~
141 Pattambipalliprom 2,464'63 933 956 5,703 2,764- 2,939 352 401 1,192 859 1,~47 470 1 ~izhayur 290 296 1,699 804 895 188 221 3,55 314 385 214 2 Kondurkara 162 164- 90J 424 416 23 28 150 ltO 208 46 3 Palliprom 281 286 1,734 852 902 137 149 348 250 484 162 4 Karakkad 200 210 1,350 684 666 4- 3 " 339 185 370 48
H~ Kalladipetta 2,PO'75 752 782 4,618'. 2,162 2,456 307 349 916 743 1,030 452 1 Andaladi 65 67 396 I 173 223 H 15 89 81 81 15 2 Pulassarikara 78 84 46+ ' 215 248 33 38 .. 102 104 93 48 3 Kalladipetta 180 185 1,092 516 576 71 83 196 165 215 86 4- Perokara' 146 152 904 416 488· 55 61 168 130 209 110 .5 Thamarikkara 57 58 356 167 189 13 221 ". 68 38 72 26 I) Mooloorkar.l 226 236 1,406 674 732 121 130 293 22"5 325 167
34
ABSTRACT
, As Cilultivator
. I ,.--A.--\ ' ·M p,
In Mining, Quarrying, Live-stock, Forestry, Fishing, Hunting and Plantations,
As' Agri- ' Orchar~s eli! tur-af and allied
Labourer" activit'ies ' II III
At HousehoM
Industry IV
Workers
In Manufacturing
,other than , Household In Con-
Industry struction V VI
r---"'----., . ,_.A._-. M", F' 'M F
In Tnide and
Commerce' VII
,"""--. M F
17 18 19, 20' 21: 22' 23' 24 25 .26 27 28 29 30
()28 204-103 321
2,38 299' 239 '16 100 73 63 4 33 13 - 14.' 3
105 213 162, 9
335 86 163 135, 8
347 127 99 :18 62 16
186 73
172 H 57 71
187. 43 54 14 43 7 90 , 22
287 99 IS3 156 90 150 30 72 58 36 137 69 116 98 ,54
445 206
71 36 82
552 231 174 147
77 24 25 14 14
142 52 39 51
243 87 11 95 50
184 40 78 66
16G 60 10 52 44'
185 45 43 97
465 194 319 334' 174 40 114\ 105 134 84 7.5 79' IS? 70 130 150
362 221 130 ZIP 151 68 40 53 211 15.3 1I0 157
58 22
7 15 14,
49 19 13 17
58 19 7
32
73 21 52
222 ,58 43 43 78
53 124-3 27 4 go
24 9
, 122 '35
10 : 6 43 18 11 2
22 58 58 !!
318 )()4.
49 122
93 32 9
44 13
226 256 20 10 107 123
34: 19 80 89 9
1 73 5' 25
309 128 129 133 58 :28 4 11 7 2 '38 23 11 11 7 96 29 33 31
'43 30 30 34 10 14 2 6 6 .4 SO 40 38 44 35
106 28 33.' 3 11 9 62 16
21 3 3
15
l()
6 41 10 2
29
42 38 28
4
13
2
19
19 5
1 4
33 8 2
23
37 2 8
27
4 34 29 1 21 15 3 13 14
9 1 1 7
4 .. 4
103 3.5 17 43 8
79 22 31 26
76 29 21 26
96 37 59
96 29 11 1
55
51 27 2
16 6
65 13 3 8
22 2
17
66 5
19 39 3
66 21 25 20
99 56 19 24
60 26 34
105 19 17 2
67
25 10 1
13 1
33 1 2 4-
22
4·
52 21 1.5 16
9 8 2
9 17" 8 173 B 10 5
235 39 49 63 84
73 10 59 4
52 21 6
25
53 13 37
1()4.
70 3 9
22
102 2Q 50
6 26
67 3 8
12 22 4
18
37 12 6
15 4
7 2 I 4
17 10
7
23 I
22
14 11 I
2
6 2 1
3
IO 2
3
5
32 17 3
10 2
10
4 6
17 6 1
10
51 12 39
17 12 I
4:
2!J 3 1 1
19
13
1 5 7
4 _ 32 ., 5
10. 4 17
., 1
38
45 25
4: 16 .
2 24 2 14
10
129 19 25 29 56
72 38 23 11
67 38 6
23
70 28 42
36 22 ., 2
12
51 9
13 21
8
"
7 5 1 1
6
2
4
3
3
4 2 2
8 6 1
3 74 6 8 3 9
31 6' .,
3 17. 6
In Transport, Storage and Communi
cations VIII
, __ .A..._-.
M F'
31 32
1
1
16
25 .15 " 10
7 '3 4-
15 7 4 3 1
4 .. 1 3
1.5 4-2 9.
18 11 7
13 9 3
6
18 9 4-2 3
6
I 3 1
.,'
1 .. 1
KERALA 'STATB
In Other Services
IX r---"----., M F
33 34
NonWorkers
X ,_." ......... -._--, M F
35 36
342 85 83
174
138 1,366 38 378 43 " }86
2,576,' 132
297
3'31 113 51
167
136 93 ·93
582 187 130 110 IS5
500 220 184 96
714 ' r 375 2
57 802 1,487 3
96 1,064 1,840 133
169 1,040 73 3S3 24 ::(1-1 72 453
1,994 760 364 870
134-1 2 3,
123 41 82
781 1,254 135 353 612 1 423 642 2
262 99 81 45 37
1,977 68S 371 422 496
247 1,553 102 590 95· 564 50 399
:3,404 1,141
633 707 923
2,785 1,01l0 1,085
6:!0
136 ]
2 3 4;
137 1 2 3
253 79 J,~06
611 270 525
2,259 972 443 844
]3B ]
2 3
135 48 '19 I 99 30
356 188 ],263 409 854
2,241 770
1,471 103 ~ 38 248 130
284 134 66 18 66
602 91 55
227 229
309 16 27 84 49 31
102
152 92 31 10 19
83 46 16 15 6
1,094 449 166 103 376
1,317 419 216 368 314
1,722 744 261 146 571
2,169 681 430
, 740 618,
138 1,132 2,004 1 92 208
12 118 200 22 271 490 21 207 378 18 95, 163 64 349 565
139 1 2
140 ]
2 ~
.4
141 1 2t 3 4'
142 1 2 3 4· 5 6
PALGBAT DISTRICT PRIMARY CENSUS
•
Occupied Literate and residential Total number of Scheduled Scheduled educated Total
houses persona enumerated Castes Tribes persona WorkCl'l
DistrictfTalukl I-IX
~ ~ r-~ ,--..~ Town/Ward/mockl Area No. of No. of Persons Males Females M F M F M F M F
81. Village/Desom/ in houses house-No. Forest range acres holds
1 2 3 4- 5 6 7 8 ~ 10 11 12 13 H- IS 16
Midl_d VilIap8~ontd.
14-3 Vadanamkurissi 2,614'63 757 807 4,566 2,137 2,429 397 ~I .. 1,102 955 1,111 504-1 Vadanamkurissi 720 768 4,313 2,013 2,300 355 412 .- 1,033 908 1,035 474-2 Kuzhiyanamkunnur 37 39 253 124 129 42 49 69 47 76 30
144- Vallapuwa 2,488'03 1,008 1,046 6,128 2.883 3;245 2M 257 999 721 1,44-5 432
145 Kuruvattoor 3,415-23 921 962 5,145 2,389 2,756 527 606 .. 1,041 942 1,227 723 1 Kuruvattoor 285 305 1,708 816 892 122 121 347 258 412 143 2 Kayiliyad 636 657 3,437 1,573 1,864- <wS 485 694 684 815 580
1~ Chalavara 2,165'68 1,032 1,M3 5,736 2,64-2 3,094 564- 675 .. 1,008 978 1,323 628 1 Chalavara .. 599 610 3,361 1,554- 1,807 358 439 616 546 775 446 2 Puliyanarnkunnu 433 433 2,375 1,088 1,287 206 236 482 432 548 382
147 Kothakurissi 3,113-38 1,283 1,305 7,612 3,582 4,030 582 648 '. 1,521 1,291 1,816 887 1 Tharavakonam 56 57 293 123 170 25 33 81 90 61 50 Z Kothakurissi 715 733 4,248 2,002 2,246 297 328 934 789 964- 475 3 Mundanattukara 158 158 86l 388 473 117 120 128 125 195 118 4 Edakkodupavukonam 354 357 2,210 1,069 1,141 143 167 318 287 596 244-
148 Panamanna 1,962'4-5 719 774 4,319 2,051 2,268 249 248 94() 798 1,034- 591
149 Cherumundassery 2,210'61 583 686 3,417 1,587 1,830 227 206 753 591 ' 874 629 1 Puliyanamkunnu 126 175 730 328 402 17 12 160 140 174 105 2 Cherumundassery 3M 352 1,790 829 961 143 128 400 316 457 346 3 Pulapettassery 153 159 897 430 467 67 66 193 135 243 178
150 Vengassery 2,950'57 717 723 4,022 1,823 2,199 293 315 772 756 916 761
151 Mulanhur 2,363'72 549 578 3,281 1,520 1,761 139 146 623 497 774 565 1 Nellikurissi 232 252 1,489 710 779 76 73 201 162 357 223 2 Mulanhur 317 326 1,792 810 982 63 73 422 335 417 342
• 152 Chunangad 3,399'43 1,165 1,183 6,699 3,127 3,572 395 439 .• ,1,516 1,306 1,480 959
153 Kanniambrom 2,307'03 1,128 1,241 6,777 3,186 3,591 345 350 '1,811 1,616 1,489 961 J Panamanna 388 400 1,995 911 1,084 123 138 .- ' 471 454 430 369 2 Kanniambrom 380 44-7 2,470 1,189 1,261 100 101 .- ' 702 565 585 339 3 Thottakara 360 394- 2,312 1,086 1,226 122 111 ,638 59? 474 253
154 Vaniamculam 1,116'52 497 528 2,955 1,435 1,5:10 209 195 760 640 677 344-1 Kothayur 226 237 1,330 607 723 100 110 3:i1 357 301 203 2 Pulachithara 271 291 1,625 828 797 109 85 409 283 376 141
155 Koonathara 2,706-48 974 996 -5,536 2,556 2,980' 423 487 .- 1,419 (,206 1,267 932 1 Panayur 503 513 2,902 1,343 1,559 247 269 711' 612 644 488 2 Koonathara 471 483 2,634 1,213 1,421 176 218 708 594 623 444
156 Kulapully 3,027-53 949 978 5,362 ,2,519 2,843 420 510 7 5 1,277 1,097 1,244 667 1 Kanayatn 195 200 1,065 517 548 72 83 7 5 . 182 ' 123 257 99 2 Kulapully 754 778 4,297 ~,002 2,295 348 427 .. 1,095 974 987 568
157 Karakbd - 1,908'07 984- 1,165 5,606 2,691 2,915 44-9 491 -- 1,696 1,431 1,331 639 1 Karakkad 500 692 3,419 1,682 1,737 260 278 1,073 857 850 336 2 Eruppa W4 473 2,187 1,009 1,178 189 213 623 574 481 303
36
ABSTRACT
As Cultivator
I ~ ¥ F
As Agricultural
Labourer II ~ M F
In Mining, Quarrying, Li ve-s tock, Forestry, Fishing, Hunting and Plantations, Orchards At House-and allied hold activities Industry
III IV ,...---"----.. r---'--, M F M F
Workers
In Manufacturing
other than Household In Con-,Industry struction
V VI ,...---J'---, ~
M F M F
In Trade and
Commerce VII ~ M F
In Transport, Storage and Communi
cations VIII
"...._......_. M F
17 18 19 20 21 22 23 24 25 26 27 28 29 30 31 32
256 80 £75 172 36 39 35 175 10 33 233 75 150 153 35 37 32 165 10 33 23 5 25 19 1 2 3 10
442 91 180 176 64 11 71 37 102 11 38
358 141 327 420 57 146 35 78 83' 10 212 106 249 337. 47
439 '181 269 91 170 90
565 201 19 12
270 124 61 30
215 35
366 383 210 217 156 166
401 361 23 18
136 128 55 58
187 157
5 4 1
18
9 .. 9
336 186 184 237 12
232 159 273 313' 32 39 13 50 58 6
130 107 117 131 21 63 39 106 124 5
350 197 331 450 16
285 217 99 64
186 153
189 257 99' 129 90 128
11 5 6
6 1 5
.. 1
79 56 75 5 34 .. 3 22 5 1 79 53 53 33
114 63 51
170 3
148 3
16
107 69 38
77 7
39 3
28
18 10 8
51
16 7
28
3
3
20 6
14
32 3
17 6 6
54 48 87 4 35
40 35 8 11
20 20 12 4
30 8
14 1 3
38 7
25 6
2 70 58 29 7 7
18 10 8
23 1
22
19
19
95 27 55 6 40 21
301 195 221 257 53 11 158 96 144 32 36 , 245 122 203 305 ' 42 105 45 126 203 15 55 32 65 ~5 9 85 45 12 17 18
114 59 143 153 18 99 36 113 125 3 45 23 30 28 15
317 163 154
172 75 97
243 100 82 12
161 88
151 75 95 44-56 31
348 485 222 271 126 214
174 251 24 59
150 192
216 223 99 102
117 121
42 20 22
51 7
44-
13 12 1
.• '131 105 179 41
11 10 1
3
3
1 1
3 5 20 3 100 69 91 31 28 31 63 7
44 24 41 2 22 < 16 17 22 8 24
93 49 44-
68 12 56
50 32 18
92 52 40
110 17 93
63 230 9 15
54 215
59 337 33 259 26 78
7 3 4
3 1 2
7 4 3
39 15 7
17
9 6 3
43 13 30
22
22
24 10 14
37
30 28 2
123
59 46 13
26 12 14
71
39 5
27
51
34 8 8
18
18
14 12 2
2 63
•• '69 B
32 29
4 I 3
.. 1
131 8
123
56 33 23
51 14 37
76 55 21
3
4 I 11
2
2
5
3 2
1
3
3
3
1 2
6
6
13 6 7
7
7
4 1 3
53 47 6
42
II 4 7
JO 4 6
12
JO 1 1
19
14 9 5
5
7 4 3
22
53
25 28
11 2 9
32 9
23
13 2
11
82 56 26
2 2
KERALA STATE
In Other Services
IX ,.----'----,
NonWorkers
X r-__"_____'
M F M F
33 34 35 36
314 206 1,026 1,925 143 307 203 978 1,826 1
7 3 48 99 :2
383 103 1,433 2,813 144
227 105 122
325 197 128
496 13
319 57
107
95 1,162 2,033 145 16 404- 749 1
1,284 2 79 758
153 68 85
242 13
182 27 20
1,319 779 540
2,266 146 1,361 1
905 2
1,766 ,3,143 147 62 120 1
1,038 1,771 2 193 355 3 473 897 4
256 110 1,017 1,677 148
181 39
Il7 25
90
132 72 60
115 19 86 10
64
41 22 19
713 154 372 187
1,201 149 297 1 615 2 289 3
907 1,418 150
746 353 393
1,196 151 556 1 640 2
482 362 1,647 2,613 152
528 138 201 189
385 113 121 151
1,697 4Bl 604 612
2,630 153 715 1 942 2 973 3
136 100 758 1,176 1.54-31 25 306 520 1
105 75 452 656 2
226 118 J08
392 101 291
382 232 150
147 70 77
1,289 699 590
240 1,275 18 260
222 1,0.15
269 1,360 151 832 118 528
2,048 155 1,071 I
977 2
2,176 156 449 ]
1,727 2
2,276 157 1,401 J
875 2
PRIMARY CENSUS
Occupied Literate and residential Total number of Scheduled Scheduled educated Total
houses persons enumerated Castes Tribes persons Workers I-IX
District/Taluk/ ,-....A--., ,....--No, ,-~ ~, Town/Ward/Block! Area No. of No. of Persons Males Females M F M F M F M F
SI. Village/Desom/ in houses house-No. Forest range acres holds
I 2 3 4- 5 6 7 8 9 10 11 12 13 14- 15 16
Midlaad Vill.le8~ontld_
158 Cherukattupulam 1,982-96 606 617 3,533 1,677 1,856 307 306 877- 706 B41 607 1 Turangali 131 135 779 384 395 46 42 235 202 178 116 2 Cherukattupulam l68 l7l 988 474 514 89 89 210 140 261 180 3 Mannanur 145 149 900 434- 466 103 109 .. 252 221 215 131 4 Velliyad 162 162 866 385 481 69 66 ISO 143 187 180
~59 Trikkangode 2,782'60 1,001 1,010 5,575 2,603 2,972 330 373 1,375 1,261 1,148 728 I Mannisseri 564 564 3,112 1,458 1.654- 208 248 754 700 628 350 2 Trikkangode 144 147 797 366 431 1 3 229 221 187 120 3 Choroottur 293 299 1,666 779 887 121 122 .- 392 346 333 258
160 Palapuram 3,065'44- 1,297 1,341 7,878 3,79() 4,088 310 327 .. 1,772 1,186 1,888 1,076
161 Lakkidi 2,289-12 856 913 4,864 2,205 2,659 322 385 1,139 1,063 1,047 593 I Mangalam 316 334- 1,736 817 919 150 186 395 315 391 286 ! Thekkumangalam 540 579 3,128 1,388 1,740 172 199 744- 748 656 307
162 Perur 2,990-55 ,1,151 1,250 7,256 3,427 3,829 434- 448 1,533 1,180 1,576 956 1 Puthur 82 89 471 204 267 61 78 70 64 96 100 2 Akalur 565 603 3,488 1,658 1,830 157 162 735 537 808 423 3 Perur 504- 558 3,297 1,565 1,732 216 208 .- 728 579 672 433
PALGHAT PALGHAT
TALUK T 177,551'13 51,706 55,667 296,217 143,977 152,240 17,899 18,658 401- 364 61,779 37,956 75,347 44,198
R 170,977-50 38,945 41,731 218,597 105,164 113,433 15,577 16,326 354 33S 40,683 24,044 56,813 Z8,731
U 6,573'63 12,761 13,936 77,620 38,813 38,807 2,322 2,332 47 26 21,096 13,912 18,534 5,467
Highland Town
V Palghat , : (Municipal) 5,573'63 12,761 13,935 77,620 38,813 38,807 2,322 2,332 4.7 ~ 21,096 13,912 18,534 5,467
Ward I 160'51 452 557 2,934 1,377 1,557 8 4 .. 887 752 563 188
Block 1 96 130 S02 344- 458 7 3 198 135 147 121
" -2 84 134 706 349 35; -- .- .. 167 99 178 40
" 3 131 137 712 342 370 1 1 267 249 129 22
" 4 141 156 714 342 372 255 269 109 5
Ward 2 167-60 533 544- 2,745 1,277 1,46B 47 46 .. 779 754 482 219
Block 5 139 141 737 362 375 1 282 2SO 102 3
" 6 136 138 687 313 374 18 18 205 218 101 29 7 154- 154 710 351 359 19 20 146 113 178 87
" 8 104 111 611 251 360 9 8 1:1-6 143 101 100 "
Ward 3 459-02 572 611 3,116 1,418 1,698 43 41 799 862 571 277
Block 9 15 16 96 36 60 .. 14 31 11 11 ,. 10 130 142 756 " 379 377 25 24 174- 150 157 94-
11 134 138 68i I 291 394- 240 304 85 30 " 12 148 ,149 782 , 332 450 227 304 101 13 " 13 127 148 703 332 371 6 3 129 63 195 116 " 14 18 IS 94- 48 46 12, 14 15 10 22 1'\ "
38
.ABSTRACT
Worken _______ --------------..A.-------------
As Cultivator .
I .r--'---l
M F
In Mining, Quarrying, Live-stock, Forestry, Fishing, Hunting'and Plantations,
A3 Agri- Orchards cultural and allied Labourer activities
II III ~ r----"'-~
M F M F
In·Manufacturing
At House- other than hold Household
Industry ; Industry IV V
r---"---. ,--A..-..., M F M F
In Con-struction
VI ~
M F
17 18 19 20 21 22 .23 24- 25 26 27 28
212 86 253 332 64- 29 4-1 7f 50 14 107 107 51 10 58 89 47 33 47 62
242 128 185 305 116 37 77 1123 41 25 18 55 85 66 90 127
..... 1
29 8 .• 8 ..
13 1
47 1
26 9
11
122 86 15 21
60 .. 34 11 15
92 17 41 19 15
47 104 26 22 33 4 6 29 4
19 42 18
296 157 115 204 90 3 199 190 217 106
195 11() 77 51
118 59
356 222 20 24
191 110 14-5 88
'TALUK
163 188 40 .. 59 64 19 ..
104 124 21 .,
163 235 7 12
85 122 71 101
62 2 2
41 2 19 .,
96 41 55
124 1
78 45
82 70 30 24 52 46
5 2 3
99 143 35 4 3 3
48 92 30 47 48 2
10 7
3
38 18 5
15
74 2
28 11 17
26 11 7 8
In Trade and
In Transport, Storage and
Communica-Commerce tions
VII VIII ..-----"--. r---"----I
M F M F
29 30
11 2 5 3 1
40 28 8 4
1
4
4
95 lO
61 12 49
116 1
57 58
3 1 2
8 1 3 4
31
30 10 3
13 4
20 13
7
42
37 4
33
35 1
21 13
32
2 .. 2
KEB.ALA STATE
In Other Services
IX ~
NonWorkers
X ,.--........A.---,
M F M F
33
186 36 29 59 62
34
127 13 25 20 69
35
836 206 213 219 19B
368 ' 217 1,455 249 164 830
63 30 179 56 23 446
76() 403 1,902
357 144 213
551 50
236 265
203 1,158 138 426 65 732
355 1,851 56 108
108 850 191 893
36
1,249 158 279 1 334 2 335 3 301 4
2,244 159 1,304 1
311 2 629 3
3,012 160
2,066 161 633 1
1,433 2
2,873 162 167 1
1,407 2 1,299 3
.11,982 6,712 16,552 24,194 2,782 211 5,370 3,519 8,131 636 1,596 182 7,284 589 4,196 92 17,404 8,063 68,630 108;042 T
11,2806,350 15,89322,9892,563202 4,810 3,2385,311 519 1,005 IH 3,063 387 2,391
702 362 659 1,205 219 9 560 281 2,870 117 591 58 4-,221 202 1,805
702 362 659 I,WS 219 9 560 281 2,870 117 591 58 4,221 202 1,805
15 2
1
6 1 8
18
4-11 2 1
.23
7
2 10
4-
6
5 1
6
6
2 '.
.. 2
16
15 1
22
4-3
lQ 5
25/224-6
19
1 5
10 3
13 13 1, 13
.. 17 1
53
9 5
33 6.
I 7
!
5 1
38 4
2 5 3
1 " 30 1
I 1
11
13
3
5 5
6 107 13
1 19 3 64 7 1 18 5 1 6 1
19 22
.. I 4-
14
8
2
2 4
2 5 1 9 6
54
13 3 9
26 3
14
5 6 3
101 17
1 4-
86 10
11
~ . 1 4 6
39
., 14 3
86
10 20 23 33
23
11 4 2 6
65
1 12 19 19 14-
2
9
., 2
21
2
19
59
18 14 11 16
55
19 10 14-12
26
7 8 6 4 1
64 10,497 4,858 48,351 74,702 R.
28 6,907 3,205 20,279 33,340 U
28 6,go7 3,205 20,279 33,340 V
5
5
2
., 2
260 160
93 119 68 24-56 14-43 3
221 146
65 65 42 49
319
8 106 51 55 90 9
3 22 44 77
1.8:;
11 72 25 11 59 7
814
197 171 213 233
795
260 212 173 150
847
25 222 206 231 137 26
1,369
337 1 317 2 348 3 367 4-
1,249
372 5 345 6 272 1 260 8
1,421
49 9 283 11) 364 11 437 12 255 13
33 14
PALGHAT'DISnuCT
8l. No.
District/Talukl Town/Wanl/B1ock/ Village/Desom/ Forest range , 2
Highlaad Towa-Gontd.
Ward 4
Block 15
" " " "
16 17 18 19
, Ward 5
Block 20
"
" Ward 6
21 22 23 24
Block 25
" " " "
Ward 7
26 27 28 29
Block 30 31
" 32 " 33
WardS
Block 34 " 35 " 36 " 37
Ward 9
Block 36 " 39
40 " 41
Ward 10
Block 42 II 43 " 44 " 45
Ward 11
Block 46 " 4:1 " t4J " 49
Area in
acrc:s 3
701-l4
278.84
226'66
215'23
94'35
114'S3
65'26
108'00
Occupied residential
houses Total number of
persons enumerated
PRlMAB.Y CENSUS
Scheduled Scheduled Castes Tribes
Literate and educated persons
r----
,----"-----, """"I ~.,..-~ M F M F
,.-..-A---,
Total Workers I-IX ,..._..,.__,
No. of No. of Persons Males Females houses house-
holds 4, 5
598
106 142 140 134-76
501
66 145 123 100 67
569
52 119 138 123 137
363
7 148 158 50
525
103 144 150 128
403
25 140 150 88
460
52 156 146 104
448
53 148 144-103
632
lIB 144 145 143 82
630
66 149 163 159 93
631
52 141 141 160 137
364
7 148 158 51
535
104 146 153 132
424
25 155 152 92
482
54 168 156 104
471
54 161 152 104
6 7 8 9 10 11
3,384 1,638 1,746 264 288
648 741 815 693 487
322 359 389 328 240
326 76 382 131 426 40 365 'l7 247
76 139 45 28
3,210 1,591 1,619 286 292 15
337 852 745 821 455
171 398 381 419 222
166 38 454 5 364 181 402 37 233 25
3,299 1,699 1.600 107
282 8S7 686 755 719
139 537 347 359 317
143 320 8 339 87 396 8 402 4
1,998 924 1,074 69
26 761 877 334
8 328 420 168
18 433 457 69 166
3,235 1,671 1,564 37
685 820 929 801
388 424 460 399
297 396 29 469 402 8
2,370 1,177 1,193 52
130 074 859 507
63 434-432 248
2,596 1,391
323 152 1.015 582 '768 399 490 ' 258
2,922
332 919
1,076 595
40
1\476
154 467 583 272
67 1 440 23 427 25 259 3
1,205' 4-
171 433 369 4 232
1,446 6
178 452 493 6 323
38 6 10
175 9 40 29
92 3
82 4 6
59
o.
J 57
1
51
.. 20
2
I
22 1 9
22 2
21
1
2
2
1 '2 i
12
M F M F
13 14 15 16
817 584 842 542
132 78 113 70 273 220 14-l 72. 158 144
183 117 190 136 20~ 122 178 135 89 32
753 358 796 305
71 211 157 192 122
25 82 46 142 204 49 64 171 12V 66 219 46 61 120 44
., 1,036 672 614 142
100 402 120 190 224
108 87 57
158 262
45 171 165 130 103
II 18 24 72 17
725 775 351 147
6 14 276 361 304 294 139 106
3 107 57 174 67 67 23
909 411 811 70
251 88 158 15 181 58 212 17 303 207 224 30 174 58 217 8
2 757 524 563 204
2
36 255 270 196
13 187 169 155
35 199 208 121
8 67 97 32
836 427 759 134
89' 63 352 154 240 95 155 115
5 1,015
5 III S2l 382 201
744-
89 211 231 213
72 22 323 44-242 40 122 28
716 176
66 17 223 44-297 67 130 48
ABSTRACT <KOALA STA1'B
Workers I , " •
----------.------.-------------------~----------------------------------~
As Cultivator
I r----"---. M F
As Agricultural
Labourer II ~ M F
In Mining, Quarrying, Live-stock,
"Forestry , Fishing, Hunting and Plantations, Orchards and allied activities
III ,---A-, M F
In Manufacturing
At House- other than hold Household
Industry , Industry IV ' V
r----"--, ,....._.A.~
M F M F
In Construction
VI ~
M F
In Trade and
Commerce VII
,....._.A.~
M F
In Transport, Storage and
Communications VIII
r----"--l M F
17 18 19 20 21 22 23 24 25 26 27 28 29 30 31 32
103 59 37 72 4:
.. 9 12 19 26 2 3 I •
30 24- 871 19 22 10 36 1 1 2 3
35 19 25 651
9 19 2 5
6 7 2 4:
2 3 2 II
II 20 6 '20 4 11
8
4-3
11
1 6 3 I
22 11 12
7
3 3 1
5
4 1
10
1 5 3 1
13
4: 8 1
13
J lJ 7 2
3
.. 3
2 10 6 4
21
21
.. 2 1 3 5
32
32
4' 16
4
12 12
2 3 8 9 1 1,
8
3 I 4:
4:
1 -3
2 15
15
251224-6 b
2 14
14:
.. 14
3
3
8
1 7
2 I
.. 9
2
2
7
3 .. 3 1
I
.. 1
9
6 3
3
1 2
.. J
42 40 132
5 5 18 15
15 24 22
17 20 63 ' 1
25
8 2 9 3 3 2
38
4 30 3 I
18
3
15
2
" 2
7
.. 3
10
7 3
8
2 157
2
4: 49 27 t9 28
2 66
5 11 33 2
4
4
9 8
26
I 5
14 6
6 Il3
.. 6
6
.. 4 2
17 33 39 24
101
14-52 21 14
22 26 103
I 9 7 5
16
8 1 7
7 Jl 11 37 3 37 5 18
7 88
3
4
12 25 34 17
4: 21
2
2
9 5 4: 3
3 14
1 2
.. 1 ~
.. 2 8 4:
5
2 2 1
6
1 3 2
22
.. 16 4 2
4: 43
1 2 I
2 5
24: 12
5 19
3 .. ,
2
.. 5
II 3
41
2 78
2 8 23 13 22 12
6
.. I 4
5 118 19
.. 5
8 22 18 60 10
87
9 36 27 12 3
40
10 28
2
.. 5 2 4 8
2
.. 1
3
.. 3
26
2 1 9 B 6
90
8 14 21 35 12
43
9 9 5 9
11
35
14 18 3
233
60 74-39 60
2 245
82
4 20 34-24
.. 1
3
165 19
20 88 26 31
185
17 74 68 26
I 6
10 2
2
2
35 73 44-93
75
4: 30 25 16
79
8 31 22 18
92
7 40 28 ]7
o'
1
.. 1
7
.. 6
.. 1
In Other Services
IX r----"--l
NonWorkers
X
~ M F'
33
395
80 132 92 35 56
304
43 56 S4 59 62
341
19 ]01 79 65 77
213
2 73 86 52
191
43 23 91 34
250
9 59
118 64-
321
30 142 112 37
285
29 67
,131 58
34 35 36 ,
361 796 1,204
76 130 75 51 29
139 169 187 150 151
209 15 246 16 304 17 230 18 215 19
190 795 1,314
37 89 26 194 88 210 16 200 23 102
120 20 405 21 244 22 356 23 189 24
122 1,085 1,458
9 94-14 366 19 182 68 229 12 214
105'
'!J7 28 20
573.
5 221 246 101
132 25 302 26 315 27 324 28 385 29
927
18 30 376 31 390 32 143 33
43 860 1,494
11 2
24 6
230 212 236 182
162 614
5 28 40 235 93 224-24, 1~7
282 34-379 35 439 36 394 37
989
59 38 373 39 330 40 227 41
73
11 25 18 19
632 11171
80 259 157 136
14:9 42 389 43 329 44 204 45
lSI 760 1,270
17 34 60 40
88 244-286 142
161 46 408 47 426 48 275 49
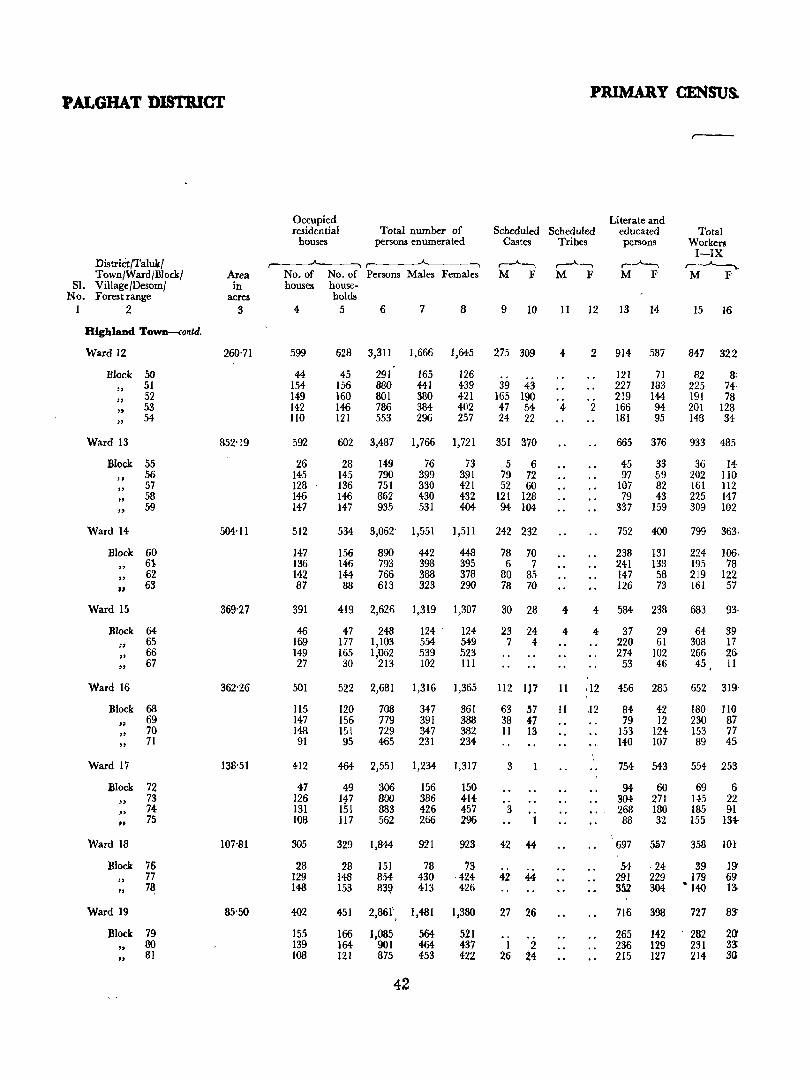
PALGHAT DlSTlUCT
District/Talukl Town/Ward/Blockl
81. Village/Desoml No. Forestrange
I 2
Highland TOWD-contd,
Ward 12
Block 50
" " " "
Ward 13
51 52 53 54
Block 55
" " "
Ward 14
56 57 58 59
Block 60 " 61-" 62 " 63
Ward 15
Block 64 " 65 " 66 " 67
Ward 16
Block 68 " 69 " 70 ~, 71
Ward 17
Block 72 " 73 " 74 .. 75
Ward 18
Block 76
" 77 " 78
Ward 19
Block 79 " 80 " 81
Area in
acres 3
260'71
852'19
504'11
369'27
362'26
138'51
107'81
85'50
PRIMARY CENSUs.
Occupied residential
houses Total number of
persons enumerated Scheduled Scheduled
Literate and educated persons
Total Workers I-IX ~ M F
Castes Tribes
,---~'------, ~-......, No. of No, of Persons Males Females houses house-
holds 4 5 6 7 8 9 10
599
44 154 149 142 110
592
26 145 128 146 147
512
147 136 142 87
391
46 169 149 27
628 3,311 1,666 1,645 275 309
45 156 160 146 121
291 880 801 786 553
165 441 380 384 296
126 439 39 43 421 165 190 402 47 54 257 24 22
602 3,487 1,766 1,721 351 370
28 145 136 146 147
149 790 751 862 935
76 399 330 430 531
73 5 6 391 79 72 421 52 60 432 121 128 404 94 104
534 3,062- 1,551 1,511 242 232
156 146 144 88
890 793 766 613
442 398 388 323
448 395 378 290
419 2,626 1,319 1,307
47 248 124 - IN 177 1,103 554 549 165 1,062 539 523 30 213 102 111
78 70 6 7
80 85 78 70
30 28
23 24 7 4
r-...A.---, M F
11 12 13 14
4
4
4
4
2 914 587
121 71 227 183 219 144
2 166 94 181 95
665 376
45 33 97 59
107 82 79 43
337 159
752 400
238 131 241 138 147 58 126 73
4 584 238
4 37 29 220 61 274 102
53 46
15 16
847 322
82 8; 225 74 191 78 201 128 148 34
933 485
36 14-202 110 161 112 225 147 309 102
799 363
224 106. 195 78 219 122 161 57
683 93-
64 39 308 17 266 2& 45 11
SOl
115 147 148 91
522 2,681 1,316 1,365 112 117 11 ; 12 456 285 652 319
412
47 126 131 108
305
23 129 148
402
155 139 108
120 156 151 95
708 779 729 465
347 391 347 231
361 388 382 234
464 2,551 1,234 1,317
49 147 151 117
306 800 883 562
329 1,344
28 148 153
151 854-83~
156 386 426 266
921
150 414 457 296
im 78 73
430 ·424 413 426
451 2,861', 1,481 1,380
166 1,085 164 901 121 875
42
564-464 453
521 437 422
63 57 38 4:7 11 13
3
3 1
42 44
42 44
27 26
1 2 26 24
II ,12 84 42 79 12
153 124 140 107
754 543
94 60 304- 271 268 180 88 32
·697 51>7
180 J 10 230 81 153 77 89 45
554 253
69 6 14-5 22 185 91 155 134
358 101
54 24 39 ]9' 291 229 179 69 352 304 .. 140 13-
716 398 727 83
265 142 282 20' 236 129 231 33: 215 127 214 sa
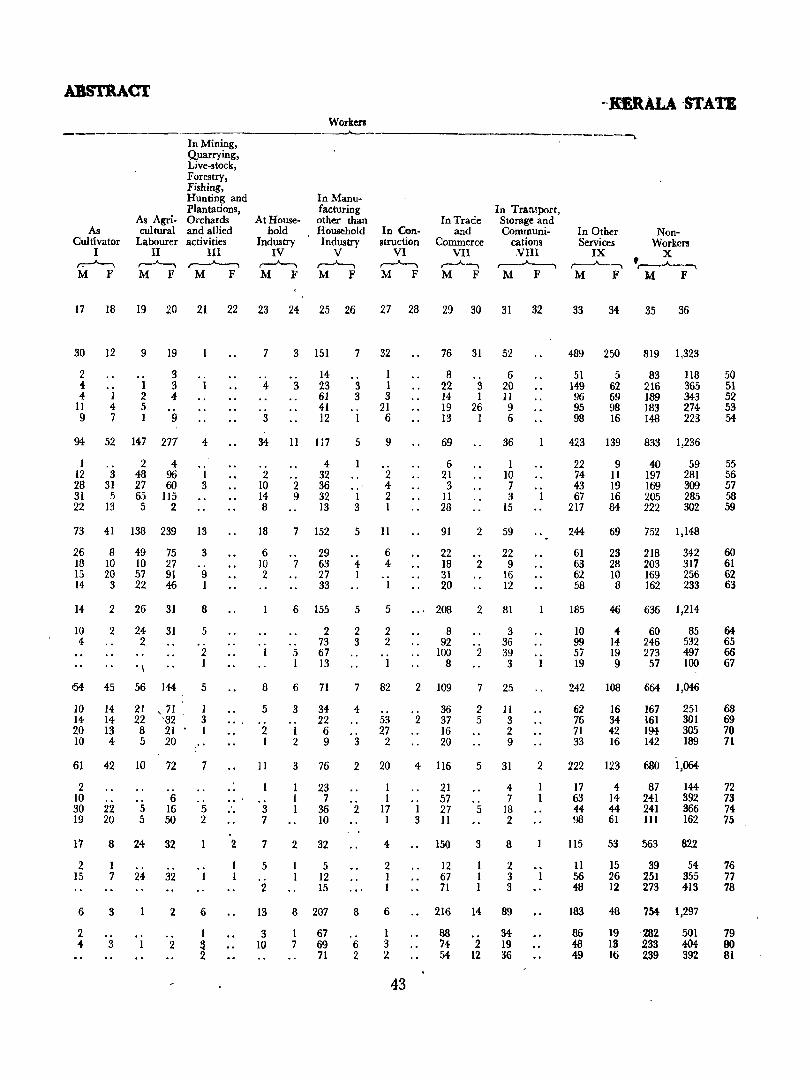
ABSTRACT
As Cultivator
I r.-"---. M F
As Agricultural
Labourer II
r-..A.....; M F
In Mining, Quarrying, Live-stock, Forestry, Fishing, Hunting and Plantations, Orchards and allied activities
III ~
M F
At Household
Industry IV ~ M F
Workers ---'--
In Manufacturing other than Household Industry
V ~ M F
In Construction
VI ~ M F
In Trade and
Commerce VII
r-.A.--, M F
In Transport, Storage and Communi
cations VIII
,--_.A.----., M F
17 18 19 20 21 22 23 24 25 26 27 28 29 30 31 32
30 12
2
9 19
.. 3 4-."
11 I 4 7
1 2 5 1
3 1 4'
9 9
94 52 147 277
I 12 28 31 22
3 31 5
13
2 4 48 96 27 60 65 115 5 2
4
.. I 3
73 41 138 239 13
26 8 49 75 18 IO IO 27 15 20 57 9l 14 3 22 46
14
10 4
2 26 31
2 24 31 2
.\
64 45 56 144
10 14 20 10
14 21 \ 71 14 22 '-32 13 8 21 4 5 20
61 42 10 72
2 10 30 19
17
2 15
6
2 4
.. 22 20
5 5
6 16 50
8 24 32
1 7
3
.. 3
... .. 24 32
2
.. 2
3 .. 9 1
8
5
2 I
5
1 3 I
7
5 2
., 1
6
1 ~ 2
...
2
7
.. 4-
3
3 151
14 23 61
.. 3
41 12
34 II Il7
2 10 14 8
18
6 IO 2
8
5
2 1
Il
3 7
7
5
2
13
3 10
.. 2 9
4 32 36 32 13
7 152
7 29 63 27 33
6 155
.. 5 I
2 73 67 13
6 71
3 .. I 2
34-22 6 9
3 76
23 7
36 10
2 32
5 12 15
8 207
1 7
67 69 71
7 32
I 1 3
3 3
.. 1
5
1 3
21 6
9
2 4-2 I
5 II
6 4
.. 4 1
5
2 3
5
2 2
1
7 82
4
3
.. 53 27 2
2 20
1 I
17 1
2
8
6 2
4
2 I I
6
I 3 2
43
76 31 52
8 22 14-19 13
69
6 21 3
II 28
91
22 18 31 20
208
8 92
100 8
2 109
2 36 37 16 20
4- 116
.. I 3
21 57 27 11
150
12 67 7l
3 I
26 1
6 20 II 9 6
36
I IO 7 3
15
2 59
22 9
16 12
.. 2
2 81
3 36 39 3
2
7 25
2 5
II 3 2 9
5 31
5
3
1 1 I
4-7
18 2
8
2 3 3
216 14 89
88 74-54
2 12
34 19 36
.. 1
.. 1
-BRALA STATE
In Other Services
IX ~ M F
33 34
489 250
51 149 96 95 98
5 62 69 98 16
423 139
22 74 43 67
217
244
61 63 62 58
185
JO 99 57 19
9 II 19 16 84-
69
23 28 10 8
46
4-14 19 9
242 108
62 76 71 33
16 34 42 16
222 123
17 63 44 98
115
II 56 48
183
86 48 49
4 14 44 61
53
15 26 12
48
19 13 16
NonWorkers
X '.---~
M F
35 36
819 1,323
83 216 189 183 148
1I8 365 343 274 223
833 1,236
40 197 169 205 222
59 281 309 285 302
752 1,148
218 203 169 162
342 317 256 233
636 1,214
60 246 273 57
85 532 497 100
664 1,046
167 161 194 142
251 301 305 189
680 1,064
·87 241 241 III
563
39 251 273
144 392 366 162
822
54 355 4:13
754 1,297
282 233 239
501 4{)4: 392
50 51 52 53 54
55 56 57 58 59
60 61 62 63
64 65 66 67
68 69 70 71
72 73 74 75
76 77 78
79 80 81
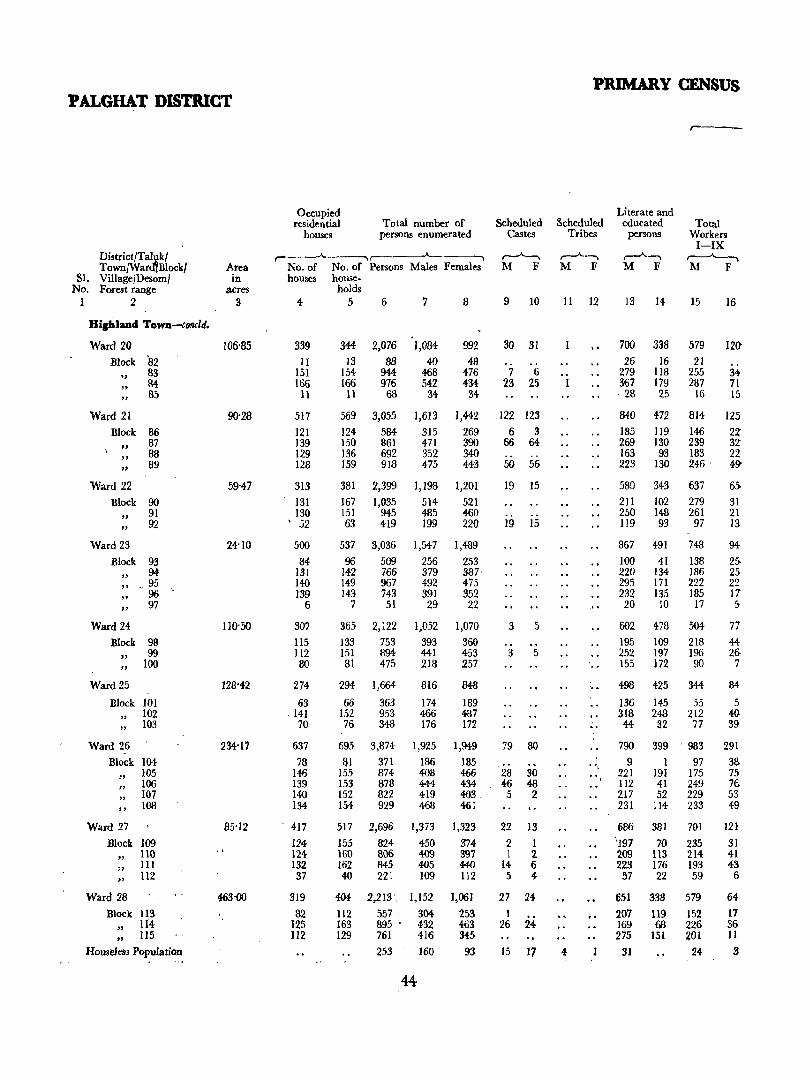
PALGBAT DISTRICT
81.
DistrictlTalukl TownJWardlBlock/ VillageJDesomJ Forest range No.
1 2
Bighl_d TO'WD-toncld.
Ward 20
Block 82 " 83 " 84 " 85
Ward 21
Block 86 " 87 " '88 " 89
Ward 22 Block 90
" 91 " 92
Ward 23
Block 93
" 9.}
" ,,95
" Ward 24
96 97
Block 98
" 99 " 100
Ward 25
Block 101 " 102 " 103
Ward 26 Block,l04-
105 106 107 108
" " " "
Ward 27
Block 109 " 110 " III " 112
Ward 28
Block 113 " li4 " 115
HOUSeJes3 Population
Area in
acres 3
106'85
90'28
59'47
24'10
110-50
128'42
234'17
85-12
463'00
Occupied residential
houses Total number of
persons enumerated
~--...I,.---, I A...-_----, No. of No. of Persons Males Females houses house·
holds 4- 5 6 7 8
339
II 151 166
11
517
121 139 129 128
313
131 130
, 52
500
84 131 140 139
6
307 liS 1I2 80
274
63 . 141
70
637 78
146 139 WI 134
417
124 124 132 37
319
82 125 112
344 2,076
13 BB 154 944 166 976
11 68
569 3,055
124 584 150 861 136 692 159 918
381 167 151 63
2,399
1,035 945 419
537 3,036
96 509 142 766 149 967 143 743
7 51
1,084
40 468 542
34
1,613
315 471 352 475
1,198
514 485 199
1,547 256 379 492 391 29
992 48
476 434
34
1,442
269 390 340 443
1,201
521 460 220
1,489
253 387 475 352 22
365 2,122 1,052 1,070
133 753 393 360 151 894 441 453 81 475 218 257
294 1,664
66 363 152 953 76 348
816
174 466 176
695 3,874 1,925
81 371 186 155 874 408 153 878 444 152 822 419 154 929 468
517 2,696
155 824-160 806 162 845 40 221
W4
112 163 129
2,213'.
557 ' 895 ., 761
253
1,373
450 409 405 109
1,152
304 432 416 160
44
848
189 4117 172
1,949 185 466 434 403, 461
1,323
374 397 440 112
1,061
253 463 345
93
Scheduled Castes
9 10
30 31
7 6 23 25
122 123 6 3
66 64
50 56
19 15
.. 19 15
3 .)
.. 3 .)
79 80
28 30 46 48 5 2
22 13
2 1 1 2
14 6 5 4
27 24-
1 26 24
15 17
PRIMARY CENSUS
Scheduled Tribes
,-...... ---, M F
II 12
Literate and educated
persons
13 14-
700 26
279 367 ·28
840 185 269 163 223
580 211 250 119
867 100 220 295 232
20
602 195 252 155
338 16
118 179 25
472
119 130 93
130
343
102 148 93
491
41 134 171 135
10
478 109 197 172
498 425
136 145 318 248 44 32
Total Workers I-IX ~ M F
15 16
579 21
255 287
16
120'
34 71 15
814 125 146 22 239 32 183 22 246' 49'
637
279 261 97
748 138 186 222 185
17
504-218 196 90
344
55 212 77
65-
31 21 13
94 25-25 22 17 5
77 44 26
7
84
5 40 39
790 399 . 983 291 3S. 75 7& 53 49
9 221 112 217 231
686
\197 2,09 223 57
651.
207 169 275
:U
1 97 191 175 41 249 52 229
114 233
381 70
113 176 22
338
119 68
151
701
235 214 193 59
579
152 226 201 24
121 31 41 43 6
64
17 36 11
3
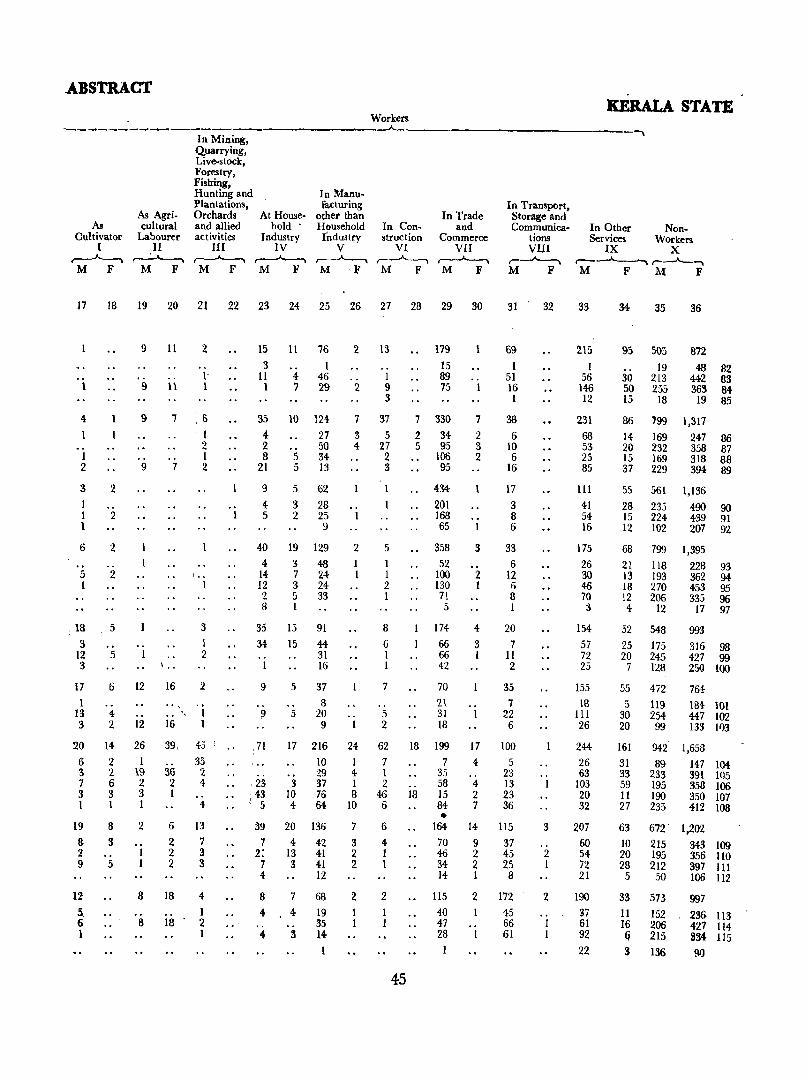
.ABSTRACT KERALA STATE
Worken , ________ .A-__________ , ____ _
As Cultivator
I ~
M F
As Agri. cultural
Labourer II ~
M F
In Mining, Quarrying, Live-stock, Forestry, Fi!hi~g, Hunting and Plantations, Orchards and allied activities
III ,~
M F
At Howe· hold -
Industry IV
,.---"----, M F
In Manufacturing
other than Household
Industry V
r--~ M F
In Construction
VI ,......--A----, M F
In Trade and
Commerce VII
.----"----. M F
In Transport, Storage and Communica
tions VIII
,.--~ M F
17 18 19 20 21 22 23 24 25 26 27 28 29 30 31 32
1
4
1
I 2
3
1 I 1
6
5 I
,18
3 12 3
17
1 13 3
20 6 3 7 3 1
19 & 2 9
12
5. 6 1
2
2
2 .. 2
5 .. 5
6
.. 4-2
14-
2 2 6 3 I
9
9
9
12
.. 12
26
I 19 2
,3 1
8 2
3 I
5 1
8
8
11
7
7
\ ..
2 .. l' 1
,6 , 1
2 1 2
I ••
3
1 2
16 2
::'. 'i 16 I
39,
36 2 I
45 35 2 4
4
6 13 2 7 2 3 2 3
18
18
4-
1 2 1
15
3 II 1
35 4-2 B
21
9
4-5
11 .. 4 7
10
5 5
76 1
46 29
124 27 50 34 13
5 62
3 28 2 25
9
40 19 129
4 3 48 14 7 24 12 3 24 2 5 33 8 1
35
34
I
9
.. 9
,71
23 43
! 5
15 91
15 44-
5
.. 5
17
. , 3
10 4
31 16
37 8
20 9
216 10 29 37 76 64
39 20 136
1 4 42 21 13 41 7 3 41 4 12
8
4 .. ..
4
7
4 .. 3
68
19 35 14
2
.. 2
7
3 4
2 1 I
.. I
24
I 4 1 B
10
7
3 2 2
2
1 9 3
37 5
27 2 3
5
1 1 2 1
8
6 1 1
7
.. 5 2
62 7 1 2
46 6
6
4 I 1
2
45
179
15 89 75
" 1
69 1
51 16 1
7 330 2 34 5 95
7
2 3 2
38
6 10 6
16
18
.. 18
106 95
434
201 168 65
.. 1
358 3
52 100 2 130 1 71 5
174 66 66 42
70 21 31 18
199
7 35 58 15 84 •
4
3 I
.. I
17 4
4 2 7
17 3 8 6
33 6
12 6 8 1
20 7
11 2
35 7
22 6
100
5 23 13 23 36
164 14 lIS 70 9 37 46 2 45 34 2 25 14 1 8
115 40 47 28
2 172 45 66 61
.. I
3
2 1
2
In Other Non-Services Worken
IX X r--~~~ M F M F
33
215
I 56
146 12
231 68 53 25 85
111
41 54 16
175
26 30 46 70 3
154 57 72 25
155
18 III 26
244 26 63
103 20 32
207 60 54 72 21
190
37 61 92
22
34
95
30 50 15
86
14 20 15 37
35
505
19 213 255
18
799
169 232 169 229
36
872
48 82 442 83 363 84-19 85
1,317 247 86 358 87 31B 88 394 89
55 561 1,136
28 235 490 90 15 224 439 91 12 102 207 92
68 799 1,395
21 118 22B 93 13 193 362 94-18 270 453 95 12 206 335 96 4 12 17 97
52 548 25 175 20 245 7 128
55 4i2
5 119 30 254 20 99
993 316 98 427 99 250 100
764 184- 101 447 102 133 11)3
161 31 33 59 11 27
942 1,658
89 147 104 233 391 HI5 195 358 106 190 350 107 235 412 lOB
63 672' 1,202
IO 215 343 109 20 195 356 110 28 212 397 111 5 50 106 112
33
11 16 (i
3
573
152 206 215
136
007 236 113 427 114-334 115 9Q
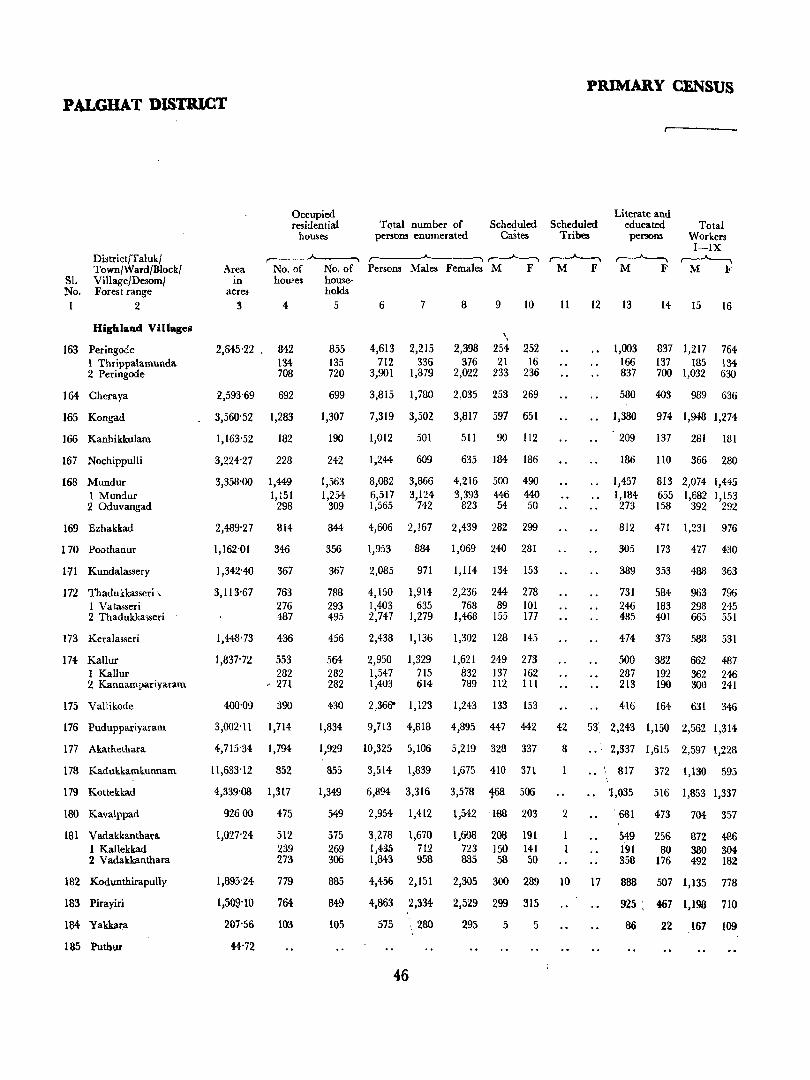
PRIMARY CENSUS P ALGHAT DISTlUCT
Sl. No. 1
DistrictJTalukJ Town/Ward/Block/ ViIlageJDesomJ Forest range
2
Highland Villages
163 Peringode 1 Thrippalamunda 2 Peringode
164 Cheraya
165 Kongad
166 Kanhikkulam
167 Nochippulli
168 Mundur 1 Mundur 20duvangad
169 Ezhakkad
1 70 Poothanur
1-71 Kundalassery
172 Thadukkasseri " 1 Vatasseri 2 Thadukkasseri
173 Keralasseri
174 Kallur 1 Kallur 2 Kannampariyaram
175 Vallikode
176 Puduppariyaram
177 Akathethara
178 Kadukkamkunnam
179 Kottekkad
180 Kavalppad
181 Vadakkanthara 1 Kallekkad 2 Vadakkanthara
182 Kodunthirapully
183 Pirayiri
Hl4 Yakkara
185 Puthur
Occupied residential
houses
,-___.,______" Area No, of No, of
III houses house-acres holds
3 4 5
2,64-5'22 , 842 134 708
2,593'69 692
3,560'52 1,283
1,163'52
3,224'27
3,358'00
182
228
1,44-9 1,151
298
2,489'27 814
1,162'01 346
1,342'40 367
3,113-67 763 276 487
1,448'73 436
1,837-72 553
400'09
282 , 271
390
855 135 720
699
1,307
190
242
1,563 1,254
309
844
356
367
788 293 495
456
564 282 282
430
Total number of persons enumerated
Scheduled caStes
,__J.___-_" ,--'"----....
Persons Males Females M F
6
4,613 712
3,901
7
2,215 336
1,879
8
2,398 376
2,022
9 10
" 254 252 21 16
233 236
3,815 1,780 2,035 253 269
7,319 3,502 3,817 597 651
1,012
1,244-
8,082 6,517 1,565
4,606
1,953
2,085
4,150 1,403 2,747
2,438
2,950 1,547 1,403
501
609
3,866 3,124
742
2,167
884
971
1,914 635
1,279
1,136
1,329 715 614
2,366'" 1,123
511 90 112
635 184 186
4,216 500 490 3,393 446 440
823 54 50
2,439 282 299
1,069 240 281
1,114 134 153
2,236 244- 278 768 89 101
1,468 155 177
1,302 128 145
1,621 249 273 832 137 162 789 112 111
1,243 133 153
Scheduled Tribes
11 12
Literate and educated pel'llOllS
Total Workers I-IX
r----"---, M ,«,
13 14 15 16
1,003 166 837
837 1,217 764 137 185 134 700 1,032 630
580 403 989 636
1,380 974 1,948 1,274
209 137 281 181
186 110 366 280
1,457 1,184-
273
812
305
389
731 246 485
474
SOO 287 213
813 2,074 1,445 655 1,682 1,153 158 392 292
471 1,231
173 417
353 488
584 963 183 298 401 665
373 588
382 662 192 362 190 300
976
430
363
796 245 551
531
487 246 241
416 164 631 346
3,002'11 1,714 1,834 9,713 4,818 4,895 44-7 442 42 53', 2,243 1,150 2,562 1,314
4,715'34 1,794
11,633'l2 852
4,339'08 1,317
92600
1,027'24
1,895'24
1,50~)olO
207-56
44'72
475
512 239 273
779
764
103
1,929 10,325 5,106 5,219 328 337 8 2,337 1,615 2,597 1,228
855
1,349
549
575 269 306
885
B49
105
3,514 1,839 1,675 410 371
6,894 3,316 3,578 168 506
2,954
3,278 1,435 1,843
1,412
1,670 712 958
1,542
1,608 723 885
188 203
208 191 150 I41 58 50
2
1 1
'. '. 817 372 1,130 595
'1,035 516 1,853 1,337
681
549 191 358
473
256 80
176
704-
872 380 492
357
486 304 182
4,456 2,151 2,305 300 289 10 17 888 507 1,135 778
4,863 2,334 2,529 299 315 925, 467 1,198 710
575 280 295 5 5 86 22 ,167 109
46
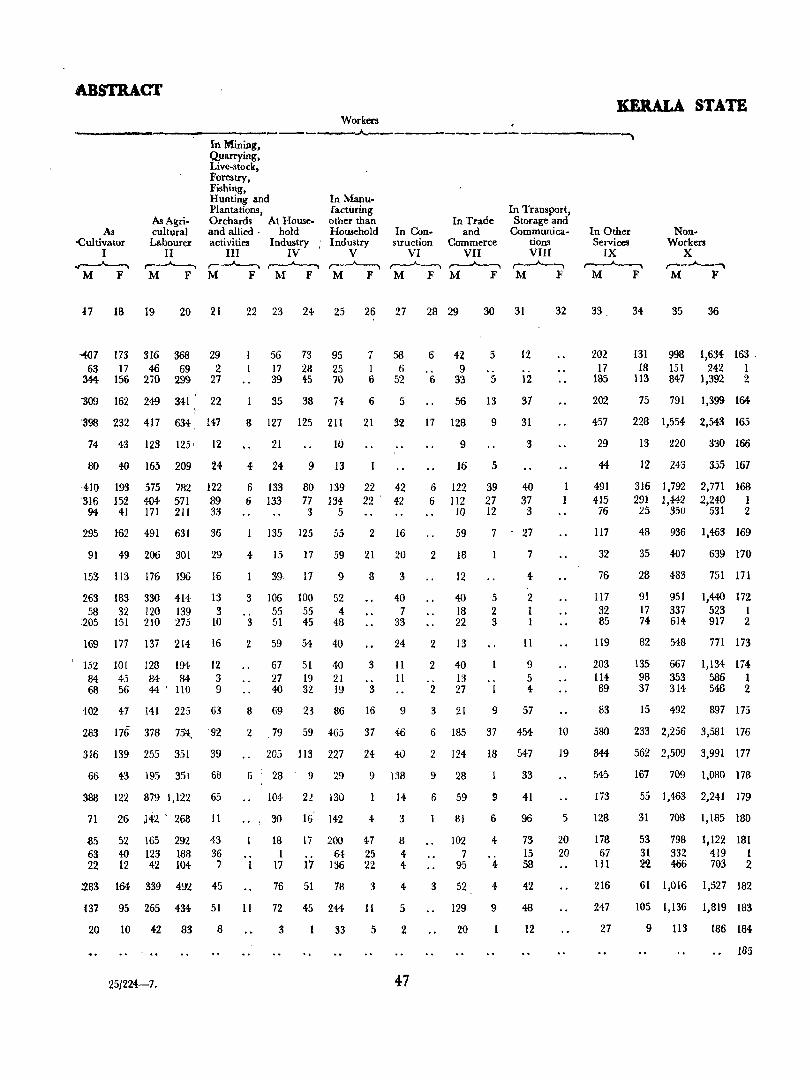
ABSTRACT
Work.en _____ . ____ - ________ A ________ _
As <All tivator
I ___..A.---,.
M F
As Agricultural Labourer
II r----"'--, M F
IIi Mining, Quarrying, Live-stock., Forestry, Fishing, Hunting and Plantations, Orchards At House-and allied . hold activities Industry;
III IV ~~ M F M F
In Manufacturing other than Household Industry
V ~---, M F
In Construction
VI ~ M F
In Trade and
Commerce VII
,..---.-A----, M F
In Transport, Storage and
C<>mmunications VIII ~ M F
U 18 19 20 21 22 23 24 25 26 27 28 29 30 31 32
--«J7 173 316 368 29 63 17 46 69 2
344 156 270 299 27
"309 162 249 341' 22
56 17 39
73 28 45
95 25 70
35 38 74
7 I 6
6
58 6
52
5
6 .. 6
42 9
33
5 .. 5
56 13
12
:398 232 417 634 147 8 127 125 211 21 32 17 128 9
12
37
31
74 43 123 125' 12
80 40 165 209 24
410 '316
94
193 575 782 152 404- 571
41 171 211
122 89 33
295 1-62 491 631 36
91 49 206 301 29
153 113 176 196 16
263 58
:205
183 330 414 I 13 32 120 139 3
151 210 275 10
169 177 137 214 16
152 101 84 43 68 56
128 194 84 84 44 ' 110
12 3 9
'102 47 141 225 63
283 176 378 75'4, 92
316 139 255 351 39
66 43 195 3St 6fJ
21
4 24
6 133 6 133
10
9 13
80 139 77 134 3 5
135 125 55
22 22
42 42
2 16
4- 15 17 59 21 20
3 .. 3
39· 17
106 55 51
100 55 45
9
52 4
48
2 59 54 40
67 27 40
51 19 32
40 21 19
8
3 .. 3
3
40 7
33
24
II II
8 69 23 86 16 9
2 ,79 59 465 37 46
205 113 227 24 41)
6 28 9 29
388 122 879 1,122 65 104 22 130
9 138
14
7! 26 l42' 268 II ..! 30 16 142
£5 63 22
52 40 12
165 123 42
292 188 104
43 36 7
~B3 164 339 492 45
.. 1
18 1
17
17
17
200 64
136
76 51 78
4
47 25 22
3
137 95 265 434 51 11 72 45 244 II
20 10 42 83 8 3 33 5
25{224-7.
3
8 4 4
4
5
2
9
16
6 122 6 112
10
59
2 18
12
40 18 22
2 13
2 .. 2
40 13 27
3 21
5
39 27 12
7
5 2 3
.. 1
9
3
40 37
3
27
7
4
2 1 1
11
9 5 4
57
6 185 37 454
2 124 18 547
9 28
6 59
81
102 7
95
3 52
129
20
9
6
4-
4-
4-
9
33
41
96
73 15 58
42
48
12
I 1
10
19
5
20 20
KERALA STATE
In Other ServiCCl
IX ~
M F
NonWorkers
X r-- ..A._"""\
M F
33
202 17
185
202
457
29
44
491 415 76
117
32
76
117 32 85
119
203 114 89
83
580
844
545
173
128
178 67
III
216
247
27
34 35 36
131 18
113
998 1,634 163. 151 242 1 847 1,392 2
75 791 1,399 164
228 1,554 2,543 165
13 :120
12 243
316 1,792 291 1,442 25 350
330 166
355 167
2,771 168 2,240 1
531 2
48 936 1,463 169
35 407
28 483
91 17 74
951 337 614
82 548
135 98 37
667 353 314
15 492
639 170
751 171
1,440 172 523 I 917 2
771 173
1,134 174 586 1 548 2
897 175
233 2,256 3,581 176
562 2,509 3,991 177
167 709 1,080 178
55 1,463 2,24t 179
31 708 1,185 ISO
53 31 22
79B 332 466
1,122 181 419 1 703 2
61 1,016 1,527 182
105 1,136 1,819 183
9 113 186 184
185
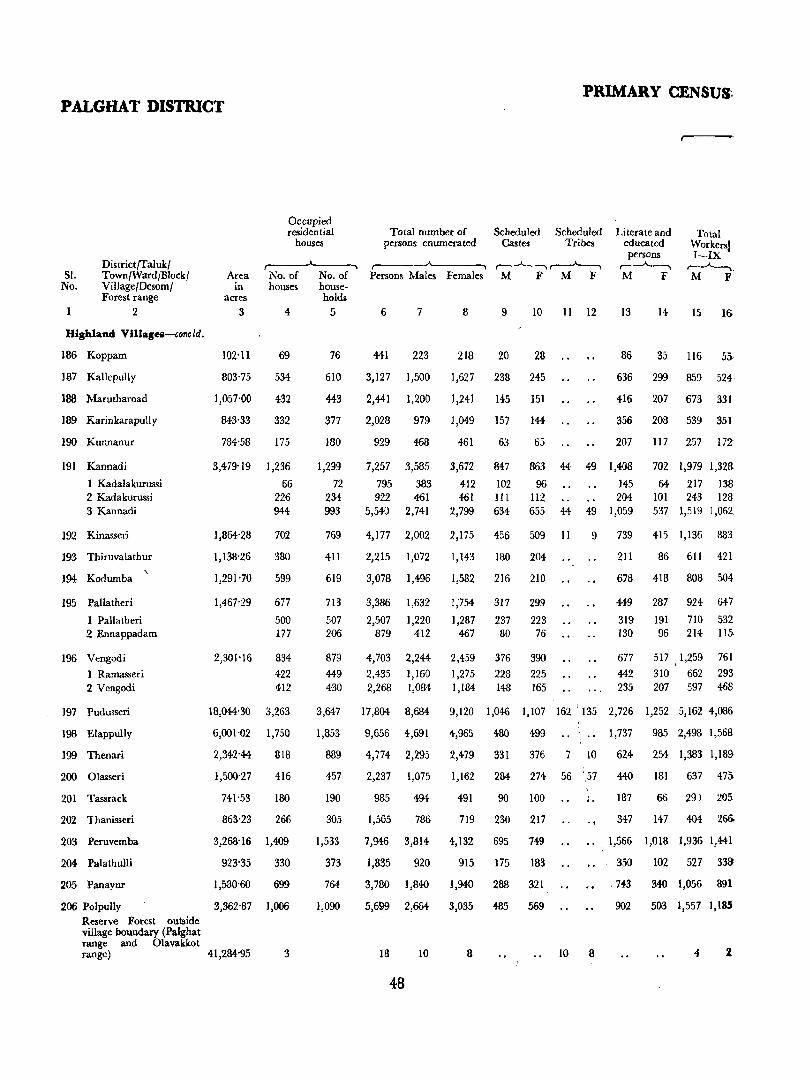
PALGHAT DISTRICT
SI. Noo
District/Taluk/ Town/Ward/Block! ViIlage!Desom! Forest range
2
Highland Villages-concldo
186 Koppam
187 Kallepully
]88 Marutharoad
189 Karinkarapully
190 Kunnanur
191 Kannadi
1 Kadalakurussi 2 Kadakurussi 3 Kannadi
192 Kinassel'i
193 Thiruvalathur
194 Kodumba
195 Palla theri
1 Pallatheri 2 Ennappadam
196 Vengodi
1 Ramasseri 2 Vengodi
197 Pudusseri
198 Elappully
199 Thenari
200 Olasseri
201 Tassrack
202 'I hanisseri
203 Peruvemba
204 PalathulJi
205 Panayur
206 Polpully Reserve Forest outside village boundary (Palghat range and OIavakkot
Area in
acres 3
1020 11
803075
1,057000
84-3033
784-58
3,4790 19
1,864--28
1,138026
1,291 070
1,467029
2,30[016
Occupied residential
houses
Noo of Noo of houses house-
holds 4 5
69
534
432
332
175
1,236
66 226 944
702
380
599
677
500 177
834
422 412
76
610
443
377
180
1,299
72 234 993
769
411
619
713
507 206
879
449 430
18,04:40 30 3,263
6,00[002 1,750
3,647
1,853
889
457
190
305
2,342-4-4
1,500027
741 0 53
8630 23
818
416
180
266
3,2680 16 1,409
923035
1,580'60
330
699
3,362 0 87 1,006
1,533
373
764
1,090
range) 41,284 0 95 3
PRIMARY CENSUS;
Total number of persons enumerated
Scheduled Scheduled Literate and educated persons
,-----'----, M F
Total Workers! I-IX
Castes Tribes
,---_...A 1
Persons Males Females r--_.A. __ -,_
M F
6 7 8 9 10 11 12 13 14 15 1&
441 223 218 20 28
3,127 1,500 1,627 238 245
2,441 1,200 1,24-1 145 151
2,028 979 1,049 157 144
929 468 4-61 63 65
7,257
795 922
5,540
3,585
383 461
2,741
3,672
412 461
2,799
84-7
102 111 634
863
96 112 655 44
4,177 2,002 2,175 456 509 11
2,215 1,072 1,143 180 204
3,078 1,496 1,582 216 210
3,386 1,632 1;754 317 299
2,507 1,220 1,287 237 223 879 412 467 80 76
4,703
2,435 2,268
2,244-
1,160 1,084
2,459
1,275 1,184
376
228 148
390
225 165
86 35 116 55
636 299 859 524·
416 207 673 331
356 208 539 351
207 117 257 17Z
49 1,408
145 204
49 1,059
702 1,979 1,328
64 217 138 101 243 128 537 1,519 1,062.
9 739 415 1,136 883
211 86 611 421
678 418 808 504
449 287 924 647
319 191 710 532 130 96 214 115
677
442 235
517 1,259
310 662 207 597
761
293 468
17,804 8,684 9,120 1,046 1,107 162" 135 2,726 1,252 5,162 4,086
9,656 4,691 4,965 480 499 1,737 985 2,498 1,568
4,774 2,295 2,479 331 376 7' 10 624 254 1,383 1,189>
2,237
985
1,505
1,075
494-
786
1,162
491
284
90
274
100
719 230 217
7,946 3,814 ~,132 695 749
1,835 920 915 175 183
3,780 1,840 1,940 288 321
5,699 2,664 3,035 485 569
18 10 8
48
56 ',57
IO 8
440
187
181
66
637 475
29) 205
347 147 404 266.
1,566 1,018 1,936 1,441
350 102 527 3Sa
, 743 340 1,056 891
902 503 1,557 1,185
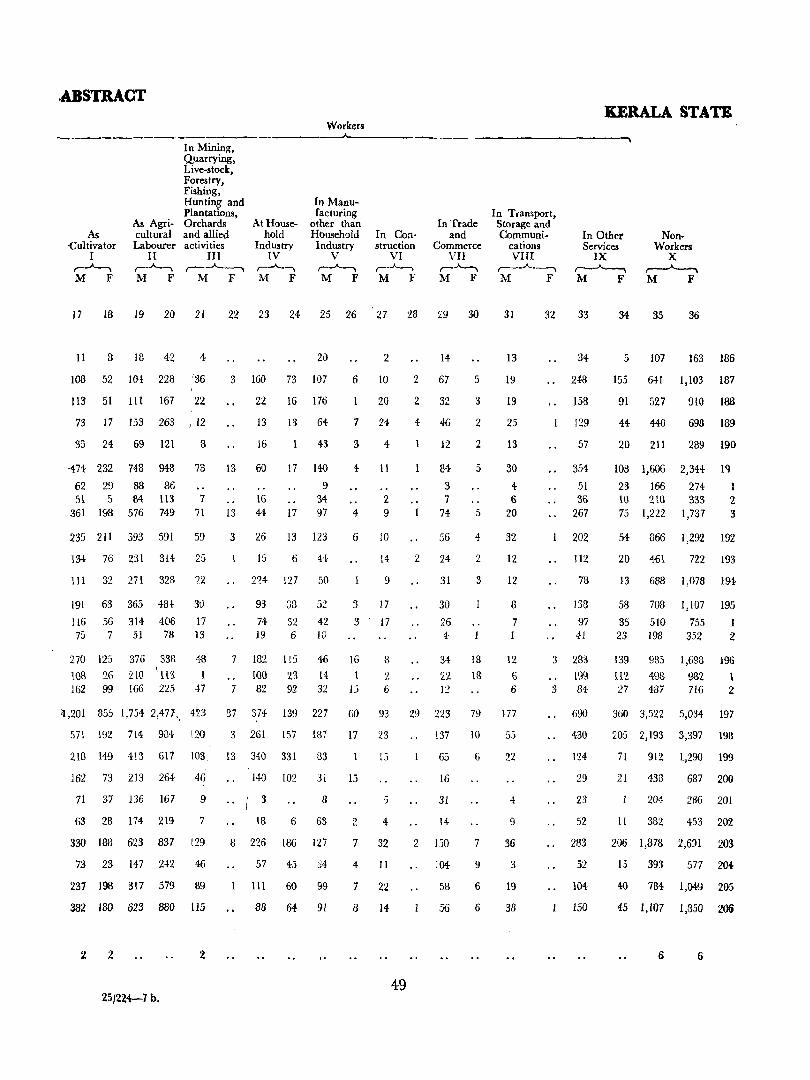
.ABSTRACT KERALA STATE
Workers
-------~----------------------------~
As -Cultivator
I ~ M F
In Mining, Quarrying, Live-stock, Forestry, Fishing, Hunting and Plantations,
As Agri- Orchards cultural and allied Labourer activities
II III ,_.A..., ,--~ M F M F
At Household
Industry IV ,_.A.._,
M F
In Manufacturing
other than Household Industry
V r-.A..., M F
In Construction
VI ,_.A---, M F
In Trade and
Commerce VII
.. .A..~
M F
17 18 19 20 21 22 23 24 25 26 27 28 29 30
11 8 18 42 4
108 52 104 223 36
113 51 III 167 22
73 17 153 263 ,12
33 24 69 121 3
474 232
62 29 51 5
361 198
748 88 84
576
948 . 73
86 113 7 749 71
235 211 393 591 59
134 76 231 314 25
111 32 271 32B '22
191 63 365 48l 30
116 56 314 406 17 75 7 51 78 13
270 125
100 26 162 99
376 338 2lO Ill3 166 225
48
1 47
20
3 160 73 107
13
13
22
13
16
60
16 44
16 176
i3 64
17
17
43
140
9 34-97
3 26 13 123
7
7
15 6 44
224 127 50
93 38 52
74 32 42 19 6 10
182 100 82
115
23 92
46
14-32
2
6 10
20
7 24
3
4
4
4
II
2 9
6 10
14-
9
3 17
3 17
16 1
15
8
2 6
14
2 67
2 32
4 46
12
84
3 7
74
56
2 24
31
30
26 4-
34-
22 12
5
3
2
2
5
5
4
2
3
IB 18
In Transport, Storage and Communi
cations VIII ,--_.A.. __ ,
M F
31
13
19
19
25
13
30 4 6
20
32
12
12
8
7
12
(}
6
32
3
:3
1l,201 355 1,754 2,471\ 423 B7 374- 139 227 60 93 29 223 79 177
571 192 714 9tH 120 3 261 157 187 17 23 137 10 55
218 149 413 611 103, 13 340 331 83
162 73 213 264 46
71 37 136 167
63 28 174 219
9
7
330 188 623 837 129
73 23 147 242 46
237 198 317 579 89
382 180 623 880 115
2 2 2
25J224-7b.
140 102 31
3
18
8
6 63
8 226 186 127
57 45 34
111 60 99
88 64 91
15
15
5
2 4
7 32
4 Il
7 22
8 14:
49
65
16
31
14
2 150
104
58
56
6
7
9
6
6
22
4
9
36
3
19
38
In Other Services
IX ~ M F
NonWorkers
X ~ M F
33
34
248
158
129
57
354
51 36
267
202
112
78
138
97 41
283
199 84
690
430
124
29
23
52
283
52
104
150
34 35 36
5 107 163 186
155 641 1,103 187
91 527
44 440
2D 211
108 1,606
23 166 10 218 75 1,222
910 188
698 189
289 190
2,344-
274-333
1,737
Iq
2 3
54 866 1,292 192
20 461 722 193
13 688 1,078 194-
58 708 1,107 195
35 510 755 1 23 198 352 2
139
B2 27
985
49B 487
1,698
982 716
196
I 2
360 3,522 5,034 197
205 2,193 3,397 198
71 912 1,290 199
21 433
204-
11 382
687 200
286 201
453 202
206 1,878 2,691 203
15 393 577 204
40 784 1,049 205
45 1,107 1,850 200
6 6
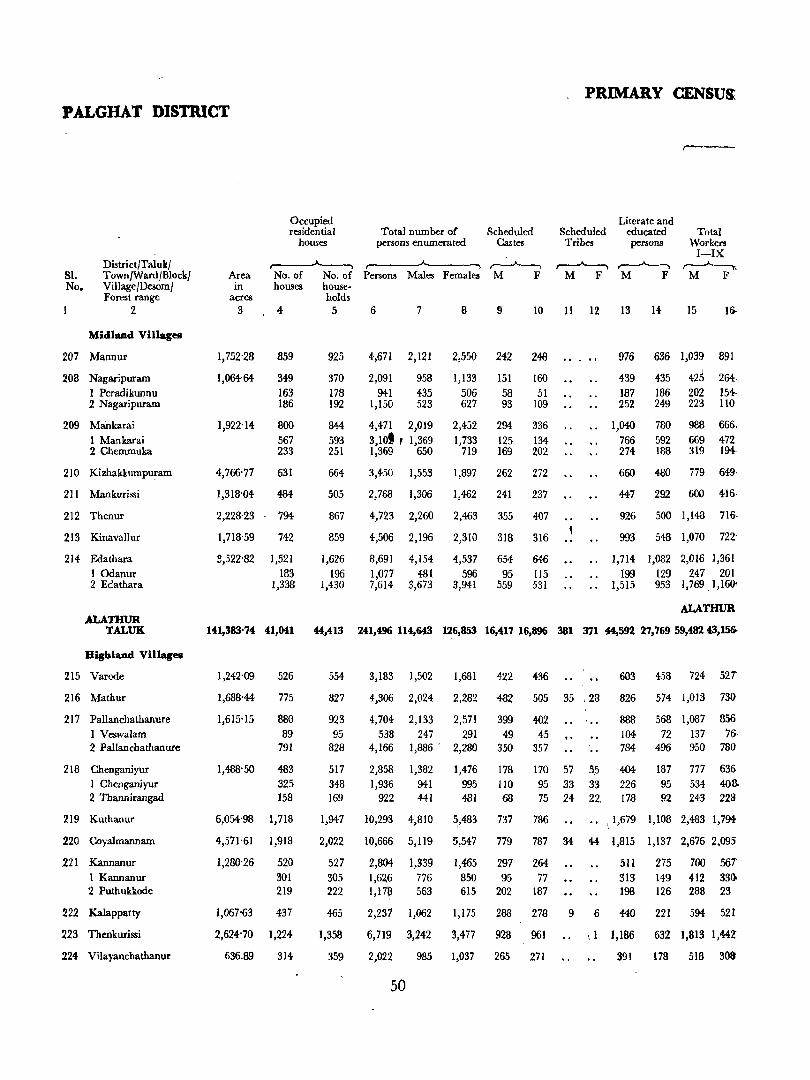
PRIMARY CENSUS P ALGHAT DISTRICT
81. No.
District/Taluk/ Town/Ward/Block/ Village/Desom/ Forest range
2
Midland Villages
207 Mannur
208 Nagaripuram
1 Peradikunnu 2 Nagaripuram
209 Mankarai
1 Mankarai 2 Chemmuka
210 Kizhakkumpuram
211 Mankurissi
212 Thenur
213 Kinavallur
214 Edathara
1 Odanur 2 Edathara
ALATI:lUR TALUK
Highland Villages
215 Varode
216 Mathur
217 Pallanchathanure 1 Veswalam 2 Pallanchathanure
218 Chenganiyur
1 Chenganiyur 2 Thannirangad
219 Kuthanur
220 Coyalmannam
221 Kannanur 1 Kannanur 2 Puthukkode
222 Kalappatty
.223 Thenkurissi
224 Vilayanchathanur
Area in
acres 3
1,752'28
1,064'64
1,922'14
4,766'77
1,318'04
2,228'23
1,718'59
~.522·82
Occupied residential
houses
~ No. of No. of houses house-
holds 4 5
859
349 163 186
800 567 233
631
484-
794
742
1.521 183
1,338
925
370
178 192
844-593 251
664
505
867
859
1,626
196 1,430
Total number of persons enumerated
Scheduled Castes
r-----~~----~ r---"----, M F Persons Males Females
6 7
4,671 2,121
2,091 958
941 435 1,150 523
4,471 2,019
3,10t , 1,369 1,369 650
8 9 10
2,550 242 248
1,133 151 160
506 58 51 627 93 109
2,452
1,733 719
294 336
125 134 169 202
3,450 1,553 1,897 262 272
2,768 1,306 1,462 241 237
4,723 2,260 2.463 355 407
4,506 2,196 2,310 318 316
8,691
1,077 7,614
4,154
481 3,673
4,537
596 3,941
654
95 559
646 115 531
r-----
Literate and Scheduled educated Total
Workers I-IX
r----..A.----..
Tribes persons
11 12
M F
13 14 15 IG-
976 636 1,()39 891
439 435 42~ 264-
187 186 202 154-252 249 223 110
1,040
766 274
780 988 666_ 592 669 472 188 319 194c
660 480 779 649·
447 292 600 416-
926 500 1,148 716·
993 548 1,070 722-
1,714 1,082 2,016 1,361
f99 129 247 201 1,515 953 1,769.1,16(}l
ALATHUR
141,383'74 41,041 44,413 241,496 114,643 126,853 16,417 16,896 381 371 44,592 27,769 59,482 43,15&
1,242'09
1,688'44-
1,615-15
1,488'50
526
775
880
89 791
483 325 158
6,054'98 1,718
4,571'61
1,280-26
1,067-63
1,918
520 301 219
437
2,624-70 1,224
636.89 314
554
827
923 95
828
517
348 169
3,183 1,502 1,681 422 436
4,306
4,704
538 4,166
2,858
1,936 922
2,024
2,133 247
1,886 .
1,382
941 441
2,282
2,571 291
2,280
1,476
995 481
482
399
49 350
178
110 68
505
402 45
357
35 ,28
' ..
170 57 3,5
95 33 33 75 24 22.
603 458 724 52T
826
888
104 784-
404 226 178
574 1,013
568 1,087
72 137 496 950
730
856 76-
780
187 95 92
777 636
534 408. 243 228
1,947 10,293 4,8]0 ~,483 737 786 1,679 1,108 2,483 1,794
2,022
527
305 222
465
1,358
359
10,666
2,804
1,626 1,1713
5,119
1,339
776 563
5,547
1,465 850 615
779
297
95 202
787 34
264-77
187
44 l,815 1,137 2,676 2.095
5Il 275 700 567 313 149 412 33G 198 126 288 23
2,231 1,062 1,175 288 278 9 6 440 221 594 521
6,719 3,242 3,477 928 961 \ 1 1,186 632 1,813 1,442
2,022 985 1,037 265 271 391 178 518 308
50
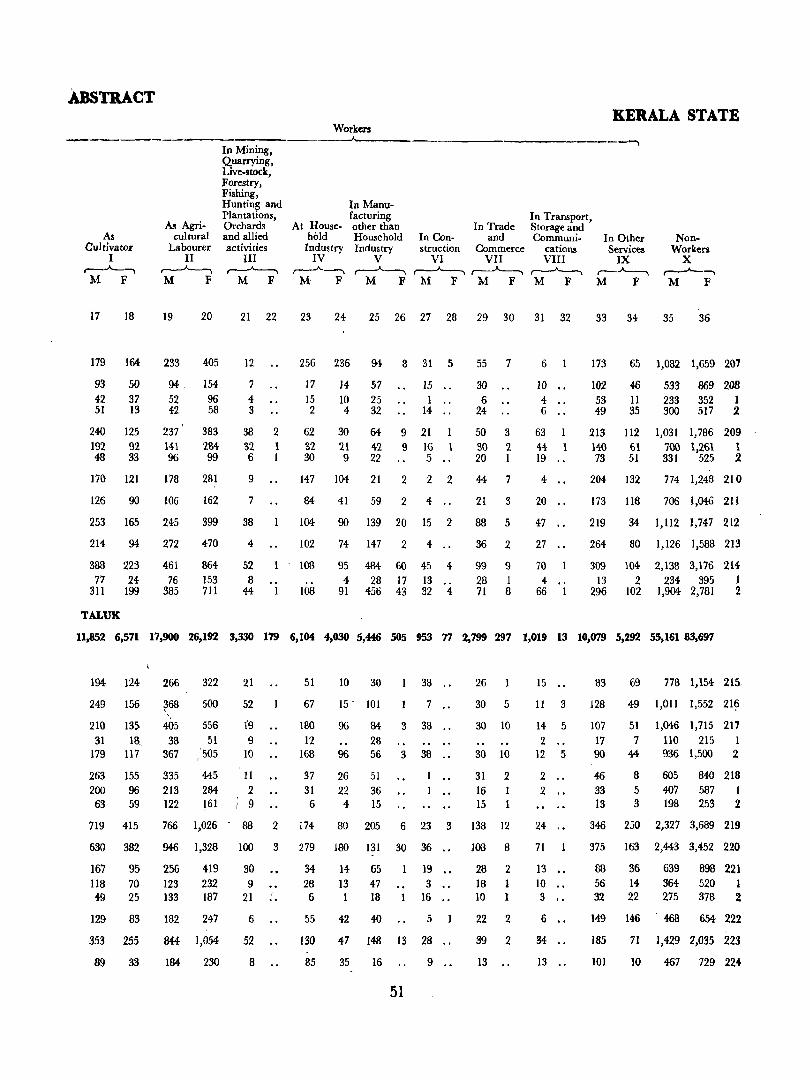
ABSTRACT KERALA STATE
Worken
In Manu-
& Agricultural
Labourer II
r----"-----. M F
In Mining, Quarrying, Live-stock, Forestry, Fishing, Hunting and Plantations, Orchards and allied activities
At Househbld
Industry IV
r---A----.
racturing In Transport, other than In Trade Storage and
As Cultivator
I r----A----, M F
17 18
179 164
93 42 51
50 37 13
240 125
192 92 48 33
170 121
126 90
253 165
214-
388 77
311
TALUK
91-
223
24 199
19
233
91-52 42
237
141 96
178
106
245
272
461 76'
385
20
405
154 96 58
383 2M 99
2111
162
399
470
864 153 7Il
III ,....-"-----.
M F
21 22
12
7 4 3
38 2 32 1 6 1
9
7
38
4
52 8
44 .. 1
Household In Con- and Communi-Industry struction Commerce cations
V VI VII VIII ,...-"---, ~ r----"----, ,---A---.,
M F M FM F M FM F
23 24 25 26 27 28 29 30 31 32
256 236 94 8 31 5
17 15 2
62
32 30
14 57 IO 25 4 32
15 .. 1 ..
14 ..
30 64 9 21 21 42 9 16 9 22 5 ••
147 104 21 2 2 2
84
104
102
108
108
41 59 2 4 •.
90 139 20 15 2
74 147 2 4 ..
95 4
91
484 60 45 4 28 17 13
456 43 32 4
55 7
30 .. 6 ..
24 ..
50 3
30 2 20 1
44 7
21 3
8B 5
36 2
99 28 71
9 I 8
6
10 •• 4- .. 6 ..
63
44-19 ..
4 •.
20 ..
47 ..
27 ..
70
4-66 I
In Other Services
IX r---"----, M F
33 34
NonWorkers
X r----.A----.. M F
35 36
173
102 53 49
65 1,082 1,659 207
46 1I 35
533 869 208 233 352 1 300 517 2
:113 112 1,031 1,7B6 209 140 61 700 1,261 1 73 51 331 525 2
204 132 774 1,248 210
706 1,046 211 173 liB
219
264
309 13
296
34 1,112 1,747 212
80 1,126 1,588 213
104 2,138 3,176 214 2 234 395 1
102 1,904 2,781 2
11,852 6,571 17,900 26,192 3,330 179 6,104 4,030 5,446 505 953 77 2,799 297 1,019 13 10,079 5,292 55,161 83,697
194 124
249 156
266
~68
322
500
21
52
210 13!) 405 556 1'9 31 18_ 38 51 9
179 117 367 505 ,10
263 155 200 96 63 59
335 213 122
445 11
284 2 161 ; 9
51
67
180 12
168
37
31 6
719 415 766 1,026 - 88 2 174
10 30
15' 101
38 ..
7 ..
96 84 338 .. 28
9656338 ..
26 51 1 .,
22 36 4 15
26
30 5
30 10
30 10
31 2 16 15
80 205 6 23 3 138 12
630 382 946 1,328 100 3 279 180 131 30 36 .. lOa 8
167 lIB 49
129
95 70 25
83
353 255
89 33
256 123 133
182
419 232 187
247
844 1,054
184 230
30 9
21
6
52
8
34-28 6
55
ISO
85
14 13 1
65 47 18
42 40
19 •• 3 ..
16
5
47 148 13 28 ..
35 16 9 ..
51
28 18 10
2 1 1
22 2
39 2
13 ..
15 ..
11 3
14 5 2 ••
12 5
2 .• 2 ••
24
71
13 •• 10 .. 3
6 •.
34 ••
13 ..
83
128
107 17 90
46
33 13
69 778 1,154 21i
49 1,011 1,552 21~
51 1,046 1,715 217
7 110 215 1 44 936 1,500 2
8
5 3
605 840 218
407 587 1 198 253 2
346 250 2,327 3,689 219
375 163 2,443 3,452 220
88
56 32
36 14 22
639 364 275
898 221 520 1 378 2
149 146 - 468 654 222
185
101
71 1,429 2,035 223
10 467 729 224
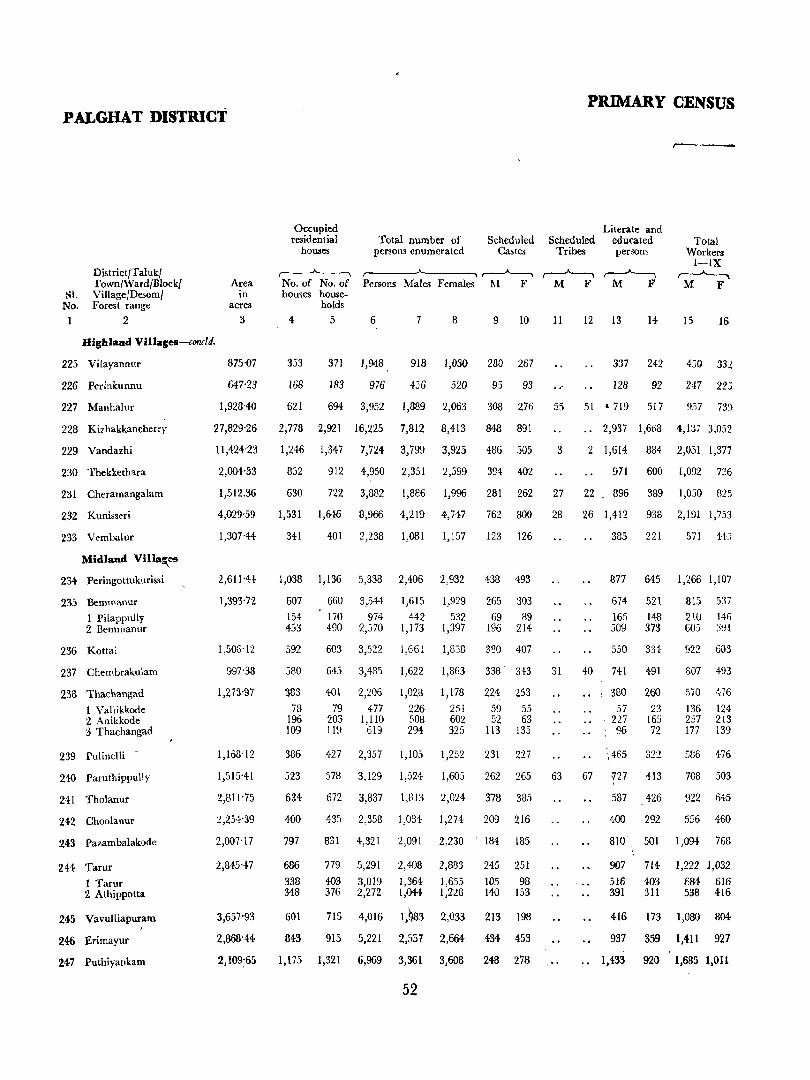
.P ALGHA T DISTRICT
:'-;1. No. 1
District/Taluk/ fown/Ward/Block! Village/Desom/ Forest range
2
Area in
acres 3
Highland Villages-concld.
225 Vilayannur 875'07
647'23 226 Perinkunnu
227 Mallhalur
228 Kizhakkancherry
229 Vandazhi
230 Thekketh"lra
231 Cheramangalam
232 Kunisseri
233 Vembalur
Midland Vnla~es
234 Peringottukurissi
235 Bemroanur
1 Pilappully 2 Bemmanur
236 Kottai
237 Chembrakulam
238 Thachangad
1 Vallikkode 2 Anikkode 3 Thachangad
239 Pulinelli
240 ParuthippuHy
241 Tholanur
242 Choolanur
243 Pazambalakode
244 Tarur
1 Taruf 2 Athippotta
245 Vavulliapuram
246 Erimayur
247 Puthiyankam
1,928'40
27,829'26
11,424'23
2,004-33
1,512.36
4,029'59
1,30N4
2,611'U
1,393'72
1,506'12
997'38
1,273'97
1,168'12
1,515'41
2,811'75
2,254'39
2,007'17
2,845'47
3,657'93
2,868"44
2,109:65
PRIMARY CENSUS
Literate and Occupied residential
houses Total number of
persons enumerated Scheduled Scheduled educated Total
Workers I-IX
,--~ M F
Castes Tribes persons
,.---A--, No. of No. of houses house-
,.------'"----..... ~ ~ r--~ Persons Males Females 1\1 F M F M F
holds 4 5 6 7 8 9 10 11 12 13 15 16
353 371 1,948 918 1,030 280 267 337 242
183 976 456 520 95 93 128 92 247 223 168
621 694 3,952 1,889 2,063 308 276 55 51' 719 517 957 739
2,778 2,921 16,225 7,812 8,413 848 891 2,937 1,668 4,137 3,052
1,246 1,347 7,724 3,799 3,925 486 505 3 2 1,614 834 2,051 1,377
8:>2 912 4,950 2,351 2,599 394 402 971 600 1,092 726
630 722 3,882 1,886 1,996 281 262 27 22 896 389 1,050 825
1,531 1,646 8,966 4,219 4,747 762 800 28 26 1,412 938 2,191 1,753
341 401 2,238 1,081 1,157 123 126
1,038 1,136 5,338 2,406 2,932 438 493
607
154 4S3
660 3,5H 1,615
170 974 442 490 2,570 1,173
1,929
532 1,397
265 :303
69 89 196 214
603 3,522 1,66+ 1,838 380 407
385 221 5 71 44~
877 645 1,266 1,107
674 521
165 148 509 373
550 334
815 537
210 146 605 :191
592
580
383
645 3,485 1,622 1,863 338· 3i3 31 40 741 491
922 603
807 493
78 196 109
401 2,206
79 477 203 1,110 llY 619
427 2,357
1,028
226 508 294
1,105
1,178
251 602 325
1,252
224 253
59 55 52 63
113 135
231 227
380
57 227
•. : 96
260
23 165 72
322
570 476
136 124 257 213 177 139
586 476 386
523
634
400
797
578 3,129 1,524 1,605 262 265 63 67 0727 413 708 503
922 645
686
338 348
601
843
672 3,837 1,813 2,024 378 385
435 2,358 1,034 1,274 209 216
831 4,321 2,091 2,230 '184 185
779 5,291 2,408 2,883 245 251
403 3,019 1,364 1,655 105 98 376 2,272 1,{)44 1,228 140 153
715 4,016 1,~83 2,033 213 198
915 5,221 2,557 2,664 434 453
1,175 1,321 6,969 3,361 3,608 248 278
52
587 426
400 292 556 460
810 501 1,094 76!l
907 714- 1,222 J,032
516 403 684 616 391 .311 538 416
416 173 1,080 804
937 359 1,411 927
." .• 1,433 920 1,685 1,011
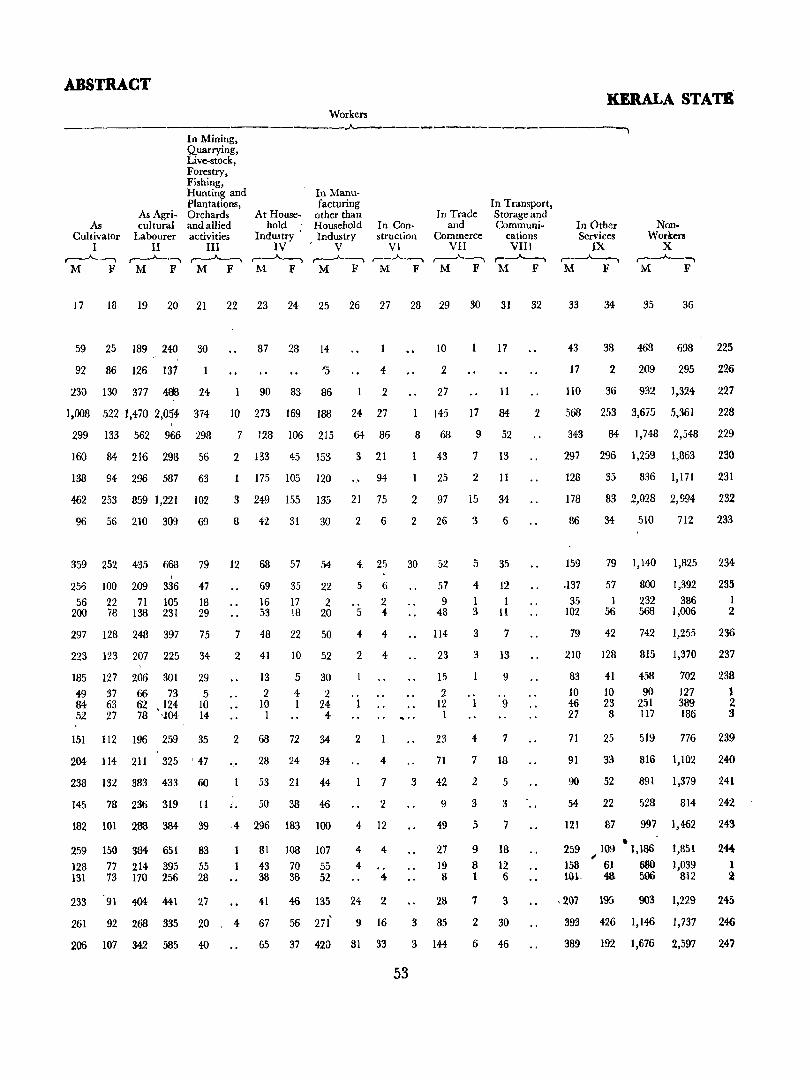
ABSTRACT KERALA STATE
Workers --"---------- '-----,
In Manufacturing
At House- other than As
Cultivator I ~
As Agricultural
Labourer II
,.---A---, M F
In Mining, Quarrying, Live-stock, Forestry, Fishing, Hunting and Plantations, Orchards and allied activities
III ~ M F
hold Household Industry' Industry
IV r V
In Construction
VI
In Trade and
Commerce VII
,-----"------, M F
In Transport, Storage and Communi-
cations VIII
,_.A-.--.. M F M F
.----'----., ,-----"-----., M F M F
,--.A.---, M F
17 18 19 20 21 22 23 24 25 26 27 28 29 30 31 32
59
92
230
25
86
130
189 240
126
377
30 87
24 90
28
83
14
'5
86
1:
2
1,008 522 1,470 2,054 374 10 273 169 188 24 27
299 133 562 966 298
160 84 216 298 56
138 94 296 587 63
462 253 859 1,221 102
96 56 210 309 69
7 128 106 215 64 86
2 133 45 153
175 105 120
3 21
.,. 94
3 249 155 135 21 75
8 42 31 30 2 6
IO
2
27
17
11
145 17 81:
8 68
43
25
9 52
7 13
2 11
2 97 15 34
2 26 3 6
359 252 435 668 79 12 68 57 54 4 25 30 52 5 35 , 256 100 209 336
56 22 71 105 200 78 138 231
47 18 29
297 128 248 397 75
223 123 207 225 34
185 127 206 301 29 49 37 66 73 5 84 63 62, 124 10 52 27 78 'J04 14
151 112 196 259 35
204 114 211 325 '47
238 132 383 433 60
69 16 53
35 17 18
22 2
20
7 48 22 50
2 41 10 52
5 30 4 2
5
5
6
2 1:
4 4
2 4
13 2
10 1 24 1 I 4
2 68 72 31:
28 24 34 .,. 53 21 44
2
145 78 236 319 11 L 50 38 46
4
7
2
12 182
259
128 131
233
101 288 381
150 384 651 77 214 395 73 170 256
91 404 441
39
83 55 28
27
261 92 268 335 20
206 107 342 585 40
4 296
81 43 38
41
183
108 70 38
46
100
107 55 52
135
1: 67 56 271'
4
4
4
24
4
.. 4
2
9 16
65 37 1:20 81 33
53
57 9
48
114
23
4
I 3
12 1
11
3 7
3 13
15 9
2 12 1 9 1
23
71
3 1:2
9
49
27 19 8
28
3 85
3 144
4
7
2
3
5
9 8 1
7
7
18
5
3
7
18 12 6
3
2 30
6 46
2
In Other Services
IX ._......-A._--, M F
33
43
17
1I0
34
38
2
36
NonWorkers
X ,----"-----, M F
35
468
209
932
36
698
295
1,324
568 253 3,675 5,361
225
226
227
228
343 84 1,748 2,548 229
297 296 1,259 1,863
128
179
86
35 836 1,171
83 2,028 2,994
34 510 712
230
231
232
233
159
.137 35
102
79 1,140 1,825 234
57 1
56
79 42
210 128
83 10 46 27
71
91
90
54
41 10 23 8
25
33
52
22
800 1,392 232 386 568 1,006
742 1,255
815 1,370
458 90
251 117
519
702 127 389 186
776
816 1,102
891 1,379
528
121 87 997
814
1,462
" 259 109 1,186 ~
1,851 1,039
812 158 61 680 !\H 43 506
,207 195 903 1,229
393 426 1,146 1,737
389 192 1,676 2,597
235 1 2
236
237
238 I 2 3
239
240
241
242
21:3
244 I 2
245
2~
247
PALGHAT DISTRICT
S1. No,
1
DistrictlTaluk/ Town/Ward/Blockl Village/Desom/ forest range
2
Midland Villaces-concld,
248 Kavassery
249 Kazhani 1 Padur 2 Kazhani
250 Kannanurpattola
251 Thennilapuram
252 Kattusseri
253 Manga!am
254 Manhapra 1 Manhapra 2 Konnancherry
255 Pudukkode
256 Kannambra 1 Kannambra 2 Rishinaradamangalam
257 Aayakkad 1 Paruvasseri 2 Aayakkad
Area in
acres 3
3,773'24
2,331'02
2,323'50
1,458'34
Occupied residential
houses Total number 0
persons enumerated
,.------A------ r----"---------., No, of No, of Persons Males Females houses house-
holds 4 5 6 7 8
1,451
1,019 479 540
875
343
1,558
1,123 540 583
8,606
5,149 2,150 2,999
4,115
2,404 962
1,442
4,491
2,745 1.188 1;557
926 5,103 2,370 2,733
350 1,827 865 962
2,744'00 1,355 1,512 8,264 4,037 4,227
3,215'89 654
1,683'83 1,078 783 295
1,710'82 1,161
6,.'41'58
2,852'89
1,676 1,489
187
917 328 589
697 4,671 2,183 2,488
1,124 801 323
1,224
1,771 1,571
200
6,164 4,384 1,780
6,704
9,429 8,442
987
951 5,191 337 1,906 614 3,285
2,770 1,923
847
3,329
4-,444 3,977
4-67
2,435 897
1',538
3,394 2,461
933
3,375
4-,985 4,465
520
2,756 1,009 1,74-7
'Scheduled Castes
9 '10
512
257 99
158
517
24-8 100 148
155 183
175 178
380 390
459 523
337 332 233 250 104 82
149 14-3
386 400 382 398
4 2
406 44-6 222 251 184 195
200 '271
220 223
PRIMARY CENSUS
Scheduled Tribes
Literate and educated persons
Total Workers I-IX
r---"-----. M F
,--Jo--. M F
11 12 13 14 15 16
2 2
.. I
,. 1,637 1,184 2,031 1,426
942 336 606
.. 1,100 478 622
750 1,231 406 448 344 783
860 563 1,218 959
408 239 411 316
,. 2,006 1,265 2,083 1,074
833 488 1,178 866
1,092 766 326
1,130
852 1,355 1,073 663 906 775 189 4-49 298
548 1,767 1,092
1,738 1,024 2,360 1,725 1,4-99 837 2,150 1,544
239 187 210 181
958 34-6 612
597 1,293 198 488 399 805
974 406 568
., 1,877 1,184 1,989 979
.. 1,124 637 1,579 1,220
258 Vadakkancherry
259 Mudappallur
260 Chittilencherry
2,941'96 1,255 1,454 8,192 3,917 4,275
2,516'09 1,090 1,215 6,514 3,077 3,437
2,818'85 1,097 1,158 6,356 3,004 3,352 164 171 35 28, 1,104 710 1,501 1,088
261 Vadakkethara 1 Pull ode 2 Vadakkethara
1,422'61 510 289 221
531 3,079 303 1,480 228 1,599
1,423 670 753
1,656 810 84-6
128 132 67 67 61 65
679 468 294 211 385 257
7lI 334 377
620 336 284
CIDTTUR
CHITfUR TALUK T 285,593-09 48,729 52,517 272,272 133,431 138,841 16,156 16,135 1,915 1,75752,597 29,396 74,206 49,599
R 278,031'13 41,951 45,343 233,877 114,833 1I9,~ 15,056 15,158 1,867 1,725 42,to7 22,032 65,458 44,588
U 7,561'96 6,778 7,174 38,395 18,598 19,797 1,100 977 48 32 10,190 7,364 8,748 5,011
Midland Towns
VI Chittur-Thath!Ul'anplam (M_icipal) 3.635-20 4,710 5,002 26,457 12,840 13,617 732 662 13 11 7,340, 5,307 5,922 3,121
Ward 1
Block 1
" 2
220'88 265 283 1,404
142 • 148 123 135
721 683
54
678
341 337
726 72
380 16 34-6 56
48
17 31:
336 220 351
162 104 172 174 .. 116 179
196
95 101
ABSTRACT
--------...,._
As 'Cultivator
I r--A .., M F
As Agricultural
Labourer II
r--A.-., M F
17 18 19 20
In Mining, Ruarrying, Live-stock, Forestry, Fishing, Hunting and Plantations, Orchards and allied activities
III r--A.-. M F
At House.' hold
Industry IV ~ M F
Workers
In Manufacturing
other than Household Industry
V r--"""'-.., M F
21 22 23 24 25 26
In Construction
VI ,....-A-, M F
In Transport, In Trade Storage and
and Communi-Commerce cations
VII· VIll ,-A-, ~ M F M F
27 28 29 30 31 32
311 140 692 918 112 306 235 185 32 33 3 86 6 45
109 99 284 5S2 59 4 181 166 71 26 120 1~4 21 2 75 93
138 73 164 348 38 2 106 73
200 106 418 &29 66 240 139
93 10 45 48 10
78 3
94 61 152 215 14 30 25 33 3
8 4 -4:
22
3
97 13 84
7
7
2
2
23 8
15
10
7
232 139 231 430 58 4- 87 107 609 20, 30
27
8
3 167 4- 44 2
216 86 395 578 110 4- 145 73 61 27 17
185 120 332 635 66 4 134- 97 164 20 123 100 253 468 41 I 93 67 105 10 62 20 79 167 25 3 41 30 59 10
187 77 272 391 60 3 659 391 76
400 166 644 1,091 278 370 136 588 1,024 266 30 30 56 67 12
33 279 33 255
24
236 122 378 628 173 10 92 102 67 153 243 51 3 76 134 55 225 385 122 7 16
\
194 .. 144 165 140 29 4
79 72 72 7 7 65
4 1 3
49 34-15
14
36 34 2
17
17
244 128 245 431 108 4- 152 131 317 42 23
190 101 414 667 94 31 296 270 170 22 24 ,
239 126 436 '. 734 95 5' 142 81 161 8 24
163 177 72 93 91 84-
TALUK
133 227 94' 151 39 76
7 4-3
4-4
.'.
104 44 60
61 39 22
67 37 30
3 2 1
13 2
11
3 62 25 20
2 1 1
53 35 18
44
100 83 17
3 27 1 9 2 18
8 5 3
36 18 18
8 10
5 5
33 24 9
7 23 2 5 5 18
2 225 30 61
109 10 25
126 23 28
21 8
13
10 3 7
KERALA STATE
----~
In Other Services
IX ~ M F
NonWorkers
X ~
M F
33
261
277 91
186
157
70
34 35
91 2,084-
123 1,173 31 514-92 659
78 1,152
10 454
625 365 1,954
152
336 204 132
70 I,C05
187 1,415 123 1,017 64 398
445 222 1,562
446 390 56
275 -£5 190
235 2,084-180 1,827 55 257
121 1,142 17 409
104 733
614 211 1,928
257 119 1,498
250 III 1,503
193 70
123
147 47
100
712 336 376
36
3,065 248
1,803 249 852- 1 951 2
1,774 250
646 251
3,153 252.
1,622 253
2,321 1,686
635
254-1 2
2,283 255
3,260 2,921
339
256 1 2
1,782 257 603 1
1,179 2
3,296 258
2,217 259
2,264 260
1,036 474 562
261 1 2
11,542 5,617 24,361 30,930 5,6992,4154,883 3,196 4,863 290 4,093 874 4,704 399 1,492 19 12,569 5,859 59,225 89,242 T
10,711 5,204 23,20228,7305,3382,4053,872 2,279 3,683 187 3,723 803 3,783 349 1,084 11 10,062 4,620 49,375 74,456 R
831 413 1,159 2,200 361 10 1,011 917 1,180 103 370 71 921 50 408 8 2,507 1,239 9,850 14,786 U •
-{89 229 622 1,232 168 6 850 766 871 58 212 15 731 33 283
27 17 63 128
12 6 29 57 15 II 34 71
15/224-8
7
3 4
19 12 35 2
9 2 27 10 10 8
8
3 5
55
22
17 5
17
10 7
4 1,690 778 6,918 1&,496 VI
153
62 91
36 327
28 169 8 158
530''>
285 245
1 2
PALGHAT DISTRICT
Sl. No.
District/Taluk/ Town/Ward/BlockJ Villagel~ml Forest range
2
Midland TOWDI-con/a.
Ward 2
Block 3
" 4 " 5 " 6
Ward 3
Block 7
" 8 Ward 4
Block 9 " 10 " II ,
Ward 5
Block 12 " 13 " 14
Ward 6
Block 15 " 16
Ward 7
Block 17 " 18 " 19
WardS
Block 20 >I 21 " 22
Ward 9
:8lock 23 " 24 " 25
Ward 10
Block 26 " 27
Ward 11
Block 28 " 29 " 30
Area in
acres
3
97'39
76'00
106'18
99'80
176'00
109'00
136'00
190'80
303'80
Occupied residential
houses
,--__ A.------.
No. of No. of ~ouses house-
holds
4 5
275
6 133 127
9
237
122 li5
229
14 121 94
178
34 132 12
230
118 112
245
19 137 89
253
37 136 80
216
53 137 26
206
114 92
308
6 It9 143
10
269
145 124
268
15 147 106
200
39 149
12
250
132 118
264
21 145 98
283
50 140 93
244
58 149 37
208
114 94
PRIMARY CENSUS.
Literate and Total number of
persons enumerated Scheduled Scheduled educated Total
Workers. Castes Tribes persons
r--'__.A.
Persons Males Females
6
1,485
37 744 654-
50
1,327
704 623
1,297
86 710 501
1,229
186 953
90
1,272
677 595
1,334-
III 708 515
1,537
269 789 479
1,332
333 784 215
7
691
16 353 295
27
638
333 305
6[9
41 350 228
558
102 413
43
589
301 288
656
53 355 248
724
117 381 226
667
165 396 106
1,019' 520
594-4-25
312 208
8 9 10 11
794 27 20
21 391 2 359 25
23
689
371 318
6
5 I
.. 20
6
5 1
678 157 166
45 3 2 360 57 73 273 97 91
671
84 540 47
683
376 307
678
58 353 267
"
"
4
.5
2 3
7
7
5
2 3
7 10
2 5
1 9
813 15 II
152 408 5 6 253 10 .5
6ti5 60 52
168 6 7
5
388 27 19 5 J09 27 26
499 15 17
282 3 6 217 12 Jl
12 13 14
I-IX ~.
1\1 F
15 16
430 3Il 358 192·
9 236 166
19
10 183 112
6
7 7 158 79 178 JOI
15 5
417 304 308 153
209 163 163 91 208 141 14j 62
368 233 314 158
27 21 18 3 239 147 Iii 51 102 65 123 104
436 566 197 - 38
77 50 52 II 323 4-70 129 24
36 46 16 3
363 3jB NO 145
238 271 103 34 .1 125 87 137 III
304 134 346 314
33 160 III
32 22 10 44- 198 191 58 126 113
427 334 342 227
93 90 40 23 260 212 173 79
74 32 129 125-
~94 276 317 180
95 86 241 155
58 35
83 35 184 108' 50 37
425 353 126 44
274 212 68 15 151 14·1 58 29
255
59 148 48
258 ' 1,375 677
153 396 128
698 37 8. 257 144 374 252
59 150 49
320 783 272
56
167 387 37 8 144
52 162 43
43 85 58 75 218 155 26 71 39
.ABSTRACT KERALA STATE
As Cultivator
I .~
M F
As Agricultural
Labourer II
r-~ M F
In Mining, Quarrying, Live-stock, Forestry, Fishing, Hunting and Plantations, Orchards and allied activities
III ~ M F
At Household
Industry IV
...----"--"""' M F
Workers
In Manufacturing
other than Household
Industry V
r---"""'____' M F
In Construction
VI ~ M F
In Trade and
Commerce VII ~ M F
-------~
In Transport, Storage and Communica-
tions VIII r-~ M F
In Other Services
IX ~
M F
NonWorkers
X r--~ M F
17 18 19 20 21 22 23 24 25 26 27 28 29 30 31 32 33 34 35 36
20 13 32 71
.. 12 4
9
3 6
4 ·2 5 9 .26 4 23 43
2 11
11
2
21 18 32 80 11
4 2
15
35
9 22
4
18 19 13
33 47
.. 1
1 10
32 15 40 62 10
12 3 2 2 20 12,38 60
25 14 5 16
3 .. 10 8 12 6 5
2 14
4 6
4
2 2
27 24 13 42· 3
2 2 6 6 9 2
12 16 3 11 2 8 29 I
32 20 46 67
13 6 4 3 17 11 16 33 2 3 26 31
10
2 8
6
2 3 1
3
3
31 35 65 113 27
8 15 11 36 21 "2.7 20 46 68 4
2 892
25-244 8b
51 41 37
7 15 44 26
.. 22 15
111 90 27
58 47 53 43
14 13
8
2 5 1
5
3 2
50 36 56 3 27
4 25 21
7
7
1 15 20
1 34 21
4 16
4 5 11
3
2
.. 2
5 37 16
5 9 2
28 14
210 222 14
12 9 146 144 52 69
2 6 6
3 66 72 35
1
3
2 2 I 2 22 19 20 42 51 14 I
25 2
9
1 8
3
3
7
1 5 1
29 22 41 3 18
5 2 10 3
4: 44
2 1 1
23 20
1
60
29 31
20
4 14 2
26
8 16 2
37
15 22
29
.. IS
6 18
3 2 1
6
5 I
8 8 2
8
6 2
10
I 3 6
13
5 8
5
5
5
14 . 1 1 4
27
4-17 6
2 27
20
8 12
25
5 22 20 2+ 3 14 2
12 10 5
18 1 2 7
8
5 3
5
2 3
3
I 2
2 82 60 56
1 2 32 44 35 22 37 23 2
2
1
7
7
11
2 8 1
51
8
4-4-
18
15 3
3
2 1
2
3
1 2
3
1 1 1
146
3 74-58 11
86
50 36
87
4-48 35
90
11 63 10
71
53 18
54
5 18 31
144-
24-87 33
93
29 60
4-
84
45 39
75
9 51 15
56 333
I 27 25 3
9 195 117 12
42 330
27 15
170 160
20 305
2 2
16
23 179 103
31 361
7 50 21 284 3 27
52 349
27 198 25 151
60 310
1 31 37 157 22 122
82 382
9 77 46 208 27 97
65 350
24- 82 38 212 3 56
37 394
12 244 25 150
38 303
1 68 30 178 7 :J7
602
14 312 258
18
536
280 256
520
42 309 169
633
73 516 44
538
342 196
364
48 162 154
586
129 329 128
485
133 280
72
455
267 188
446
109 232 IUS
3 4-S 6
7 8
9 10 11
12 13 14
15 16
17 18 19
20 21 22
23 24 25
26 27
28 29 30
. PRIMARY CENSUS. PALGHAT DISTRICT r·
S1. No. 1
District/Taluk/ Town/Ward/Block/ VilIagefD¢som/ Forest range
2
Midland Towns-contd.
Ward 12
Block 31 " 32
33 " 34
Ward 13
Block 35 " 36 " 37
Ward 14
Block 38 " 39 " 40
Ward 15
Block 41 " 42 " 43
Ward 16
Block 44 " 45
Ward 17
Block 46 " 47
Ward 18
Block 48 " 49 " 50
. Ward 19
Block 51 " 52
VB Nemmara
Ward 1 Nemmara
Block 1 2 3 4 5 6
" " .. ..
Area in
acres 3
639·73
356'70
358'65
146'57
58'00
73'00
245'00
173'00
Occupied residential
houses
,----'----, No. of No. of houses house
holds 4 5
Total number of Scheduled persons enumerated Castes
Scheduled Tribes
,.----A----, ,----..A._--., .-""'---. Persons Males Females M F M F
6 7 8 9 10 11 12
Literate and educated persons
~ M F
. 13 14
...-----
Total Workers I-IX
..--""'---. 1'1 F
15 16
522 541 2,727 1,448 1,279 91 108 2 3 819 326 723 376
91 151 152 128
304
128 145 31
298
115 140 43
242
93 132
17
194
119 75
187
66 121
202
24 134 44
.172
95 77
91 151 155 144
377 928 680 742
313 1,580
137 145 31
712 707 161
301 1,579
117 141 43
543 790 246
249 1,499
98 134 17
587 823 89
194 1,157
119 75
729 428
191 1,189
70 121
379 810
206 1,080
24 138
44-
122 705 253
172 1,035
95 77
591 44-4
214 516 351 367
770
347 341 82
780
278 378 124
764
289 424
51
527
320 207
521
161 360
517
62 333 122
496
163 412 329 375
13 21
3 54
12 17 9
70
810 74 43
365 13 10 366 37 30
79 24 5
799 50 52
265 14 12 412 36 40 122
735 54 53
293 16 16 399 38 37 33
630
409 221
663
218 450
563 51 42
60 4 1 372 47 41 131
539 7 11
288 303 7 11 208 '236
2 3
104 306 226 183
42 90 125 248 81 181 78 204
55 104 88
129
392 280 366 212
250 203 138 131 72 186
11 5 42
341 168 399
146 147 48
70 130 76 200 22 69
331 122 363
140 173
18
56 129 60 216 6 III
400 443 130
259 323 141 125
84 66
36 143 33
172
47 113 12
70
11 59
25
18 7
6 8 381 402 187 86
H 42
6 8 , .,
103 278
98 304
74 113
243 120 276 ,212
31 145 67
9 35 70 179 41 62
276 208 183
152 86 114 124 122 7I
31 122' 59
69
52 17
3,926·76 2,068 2,172 11,938 5,758 6,180 368 315 35 21 2,850 2,057 2,826 1,890<
3,926'76 2,068 2,172 11,9~ 5,758 6,180 368 315 35 21 2,850 2,057 2,826 1,890
136 140 138 136 141 150
140 144-138 137 152 152
755 853, 886 7~ 830 786
58
355 422 441 346 373 358
400 431 445 400 457 428
44 38 1
37 29
27 ,21 .. '
218 245 269 266 201 267
167 .209 231 312 219 233
166 205 199 92
156 143
107 71 go. 15 89 4&
ABSTRACT
As Cultivator
I ~ M F
As Agricultural Labourer
II ,..---"-----.. M F
17 18 19 20
59 20 129 235
6 20 18 15
8 .. 12
29 30 27 43
32 II 56 125
6 20 6
28
7 19 2
18
5 13
20
13 7
22
5
7 2 4 43
11
7 95 23
6 57 118
6 3
46 8
16 92 10
8 39 52,
2 3. 4 6 36 48
3
3
5
17 5
6 24
2 , 17 4 '. 7
19 13 25 49
1 11 7
16
8 8
7 20 2
36 II 6 5
6 II 35
6 6 32 5 3
KERALA STATE Workers __________ ...A....-__
-------------, In Mining, Q.uarrying, Live-stock, Forestry, Fishing, Hunting and Plantations, Orchards and allied activities
III ~ M F
At Housei hold
Industry IV
r--~ M F
In Manufacturing
other than Household Industry
V ~
M F
In Construction
VI ....--"----I
M F
In Trade and
Commerce VII ,-~
M F
In Transport, Storage andCommunica
tions VIII ~ M F
21 22 23 24 25 26 27 28 29 30 31 32
23
1 13 3 6
20
1 12 7
16
3 13
14
2 11 1
12
IO 2
8
3 5
36 35 162 14 59
3 3
21 9
1 4
27 3
7 51 23 81
26 31 65
17 9
I 20 10
35 ~8 2
II 22 83
6 5
2
.. 1
28
23 5
18 3 1
28 40 15
2 80
2 211 45 7
24
6 18
6 32
6 9 23
106 J06 40
25 21 58 49 23 36
2
2
4 30 6
28
23 5
7 4 3
2 9
43 5
7 10
6 I
.. I
6 4
2
I 1
3
.. 2 1
6
5 I
2 24
1 17 6
4
2 2
5 38
3 9 9 5
17
51
26 22
3
81
35 28 18
141
59 75 7
35
12 23
19
7 12
18
2 5
11
2 36
2 26 10
2 30
14 8 B
2 30
18 8 4
6 35
4 2
14 12 9
2 29
3
3
5 24
11
10 1
9
1 8
4
1 3
8
5 3
In Other Services
IX ,o.__'___"
NonWorkers
X .. _..A-. .....
M F M F
33
187
39 99 29 20
76
44 32
86
34 36 16
37
26 9 2
56
41 15
65
22 43
28
1 25 2
72
39 33
34 35
65 725
16 28 8
13
124 268 170 163
35 404
14 21
209 155 40
19 381
9 9 1
148 178 55
6 401
2 160 4 208
33
19 377
15 236 4 141
50 334
20 87 30 247
39 241
7 29
3
27 154 60
26 311
14 12
174-137
36
903
108 31 308 32 241 33 246 34
598
329 35 223 36 46 37
627
WI 38 299 39 110 40
665
287 41 340 42 38 43
605
391 44-214 45
582
174 46 408 47
351
29 43 250 49
72 50
470
251 51 219 52
342 184 537 968 193 4 161 151 309 45 158 56 184 17 125 4: 817 461 2,932 4,290 VB
342 184 53-7 968 ·193
IS S
15 25 14 16
7 2 7 2 4-6
10 12 17
4 2
33 II 24
28 13
I 6 3 .. 8 1
4 161 151 3{)9 45 158 56 1B4 17 125
13 10 3
17 21
13 5 6
12 7
26 33 30 7
43 62
16 4 3
2 2
1 6 4-3 5 1
24-25 22 9
15 7
2 1
3 1
8 10 24 8 7 5
.. 817 461 2,932 4,290
·65 95 81 40 43 28
36 189 48 217 50 242 13 254 40 217 15 215
293 360 355 385 368 382
1 2 3 4 5 i
PALGHAT DISTRICT
District/Taluk/ 81. Town/Ward/Block/ No. Village/Desom/
Forest range 2
Midl_d TOWlls-conclti.
Block 7 8 9
10 11 12 13 14-15
" " " " " " " "
JliShl_d Villas"
262 Koduvayur
1 Koduvayur A 2 Koduvayur B
263 Kuttipalllfm
264 Kunnamkattupathy
265 Perumatty
266 Vadavannur
267 Pallassen4
268 Ethanoor
269 Kakkayur
270 Pallavoor
271 Koodallur
272 Kairady
273 Pothundi
274 Elavancherry
275 Vattakkad
276 Kollangode
277 Panangattiri
278 Payyalloor
Area in
acres 3
4,871O{}5
2,211·4{j
3,208'48
8,545'20
4,231'49
4,030'47
1,146'38
1,345'59
1,876'85
1,583'89
4,283'82
3,175'60
3,334'40
1,074-89
647-23
3,488'94
7,474-02
PRIMARY CENSUS
Occupied residential
houses Total number of
persons enumerated
Literate and Scheduled Scheduled educated
Castes Tribes persons Total
Workers I-IX ,--~
M F ~ No. of No. of houses house-
r--_.A_----.. Persons Males Females
holds 4 5 6 i 8 9 10 11 12 13 14 15 16
139 144-141 145 143 160 143 149 63
3,391 1,674-1,717
347
304
140 147 153 148 150 178 157 170 66
3,590
1,744 1,846
731 7B2 859 970 879 897 795 916 253
334 388 400 474-433 453 388 449 144
397 394 459 496 446 444-407 467 109
2 39 6 8
45 33 97 28
1
4-23 8
42 26 10 89 8 33 13 2 4
21,362 10,455 10,907 1,288 1,368 28
2 26
10,111 4,899 5,212 498 542 11,251 5,556 5,695 790 826
150 100 192 206 141 215 166 147 1Bl 254 tl3 236 154 60 241
9 114 26 247 2 125 41 224 7 141 40 244-3 74 18 B5
180 161 liB 190 204 20B 195 189 27
30 5,267 3,068 5,238 2,037
1 2,B27 2,185 2,283 799 29 2,44{) 883 2,955 1,238
369 1,746 848
818
B98 168 183 32 28 188
160
65 504 461
355 1,623 805 30 35 73 4-7 B4 498 269
1,947 2,G60 10,200 4,970 5,230 631 611 64 72 1,446 669 2,915 2,536
1,844 2,045 11,186 5,310 5,876 980 959 48 36 2,366 1,626 2,714 1,787
1,519 1,713 9,067 4,21B 4,849 576 600 1,537 960 2,197 1,711
516
353
546
502
300
315
853
451
608
556
865
583 3,225 1,509 1,716 311 325 662 495 702 483
420 2,330 1,135 1,195 210 223 ", 427 298 581 472
608 3,286 1,541 1,745 396 398 626 521 756 585
572 2,924 1,390 1,534 129 158 565 307 766 660
336 2,581 1,277 1,304 B1 72 25 22. ~7 267 677 491
317 1,339 707 632 102 105 .• ' 286 113 431 216
906 4,863 2,316 2,547 384 403 .. ' 689 285 1,381 1,152
4-73 2,638 1,275 1,363 194 194 3 2 540 260 692 533
647 3,753 1,730 2,023 218 229 4 3 1,002 962 802 388
607 3,181 1,567 1,614 347 353 37 33 567 304 905 5:;1
944 4,410 2,113 2,297 514 510 60 72 677 438 1,267 911
279 Kezhakkethara 4,108'89 2,524 2,620 14,274 6,915 7,359 1,031 1,03B 170 174 2,797 1,640 3,797 2,277
280 Muthalamada
1 Muthalamada A 2 Muthalamada B
Sungom Range
- 19,677'04 4-,420
1,531 2,467
422
4,780 21,754 '\11,220 10,534
1,697 2,655
428
9,125 '4,490 10,974 5,653 1,655 1,077
60
4,635 5,321
578
1,881 832 907 142
1,7Bl
806 837 13&
97
6 53 38
60 2,972
6 1,310 28 1,231 26 431
811 7,203
398 2,642 373 3,665 40 896
4,626
1,708 2,704
214
ABSTRACT
As Cultivator
I ~ M F
17 18
21 36 28 30 53 24-16 36 2
23 19 6
31 39 11 4
23
As Agricultural Labourer
II ~
M F
19 20
45 25 6
49 97
120 81 60 9
103 55 22
131 153 148 146 86 15·
415 138 1,192 1,426
211 89 475 516 204 49 717 910
139 97 308 353
143 31 333 231
In Mining, Quarrying, Live-stock, Forestry, Fishing, Hunting and Plantations, Orchards and allied activities
III ~ M F
21
21 8
'1}
.20 32
, 29 31 22
64
18 46
6
22
.. 2 2
559 308 1,758 1,965 151 10
Workers
At Household
Industry IV
,---.A..-,,"",\
M F
In Manufacturing
other than Household Industry
V r---"----.
M F
23 24 25 26
25 19 5
14 5
24 5
29 23 1
13 3
31 8
15 7
27 22 10 8
12 4 3
2 2 9 3
1 1
265 123 1,022 33
101 12 327 B 164 III 695 25
2
99 87 55 2
10 233 178 351 29
In Construction
VI ,---.A._.-.. M F
27 28
4 1 2
16 5
37 II 14 48
79
64 15
10
.. 1
43 4 3 4
27 4-359 208 756 1,133 192
459 245 650 967 113 2 287 232 146 5 100 5
108 46 239 3113
112 67 299 344-
171 115 334 417
178 126 297 471
30
29
30.
42
123 52 396 387' 18
17 70 127 10
201 83 516 799 150
124 52 194 346
77 19 162 193
139 6 424 399
68
20
18
2
44 36
6B 31
33 16
49 33
5
2
5
3
31 ;170 114
3 78 64
37 12
2 116 41
77
4
56
27
29
12
55
65
96 8
9
96 14 405 486 403 282 85 36 33 2
442 122 1,20 I 1,531 199
981
546 435
322 2,774 3,04-2
158 1,024 1,215 164- 1,750 1,827
835 150 651 84
24 422 272 272 15
394 11
362 21
233
187 46
183
150 33
211
142 63 6
5
2 3
11 3
3 2
4
7
173 66
15
9
44 9
12
38 18
79 8
780 197
19 6 119 11 642 180
61
KERALA STAT£.
------~
In Trade and
Commerce VII
,.........-'----.. .M F
29 30
6 10 16 6 3
10 17 12 2
2
.. J 3 4
In Transport, Storage and Communica-
tions VIII
,--.A..--, M F
31 32
14 8 3
21 7 2 2 6 3
In Other Services
IX ,----A----, M F
NonWorkers
X ,......-.-"---M F
33 34 35 36
41 101 83 58 29 17 30 85 21
23 60 79 12 9 4 4-
60 8
142 173 219 238 192 206 164 205 59
217 233 341 306 242 236 212 278 82
7 8 9
10 11 12 13 14 15
1,018 22 105
452 17 70 566 5 35
1,078
565 513
295 5,217 8,870 262
157 2,616 4,413 1 138 2,601 4,457 2
11
4
72 11 40
173 8 153
73 11 33
80 17 21
6 3
17 3 12
76 4
12 6
21 3
9
6
8
76 11 14
44 10 9
72 6 36
22
34
5
13
356 28 91
240
144 81 15
37
13 24
136
67 47 22
37
16
9 144 437 263
6 320 536 264
171 153 2,055 2,694 265
470 217 2,596 4,089 266
336 2·H 2,021 3,138 267
92
57
99
81
78
liS
72 807 1,228 268
26 554 723 269
33 785 1,160 270
23 624 874 271
40 600 813 272
16 276 416 273
184 113 935 1,395 274
101 57 583 830 275
258 141 923 1,635 276
160 101 662 1,063 277
160. 72 846 t,386 278
735 276 3,118 5,082 279
963
363 473 127
446 4,017
153 1,848 280 1,988
13 181
5,908
2,927 2,617
364
280
1 2
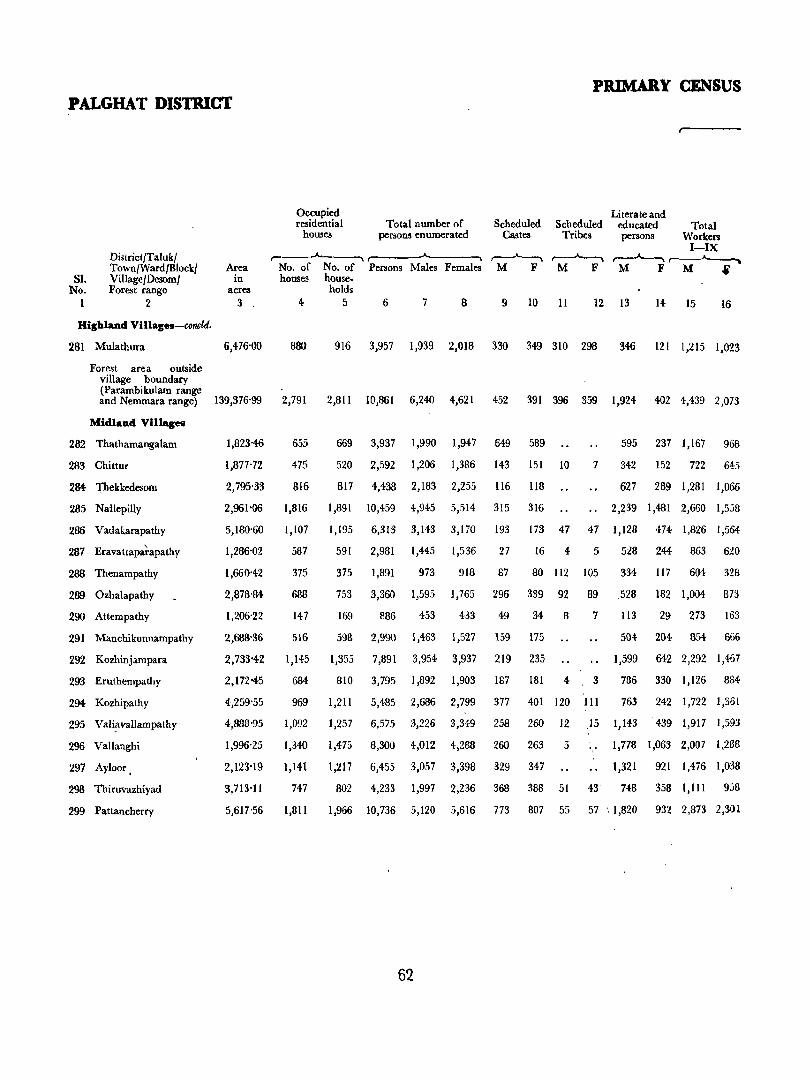
PRIMARY CENSUS PALGHAT DISTRICT
81. No.
t
District/Taluk/ Town/Ward/Block/ ViUage/Desom/ Forest range
2
Ri,hland Villares-CDm;ltf.
Area in
acres 3 ,
Occupied residential
houses Total number of
personll enumerated
r-~ r----_.A..---..., No. of No. of Persons Males Females houses house-
holds 4 5 6 7 8
Scheduled Scheduled Castes Tribes
~~ M F M F
9 10 11 12
Literate and educated Total persons Workers
I-IX ,.--""'---, ~
M F M ...
13 14 15 16
281 Mulathura 6,476·00 880 916 3,957 1,939 2,018 330 349 310 298 346 121 1,215 1,023
Forest area outside village boundary (Parambikulam range and Nemmara range) 139,376·99 2,791 2,811 10,861 6,240 4,621 452 391 396 359 1,924 402 4,439 2,073
Midland Villages
282 Thathamangalam
283 Chittur
284 11lekkedesom
285 Nallepilly
286 Vadakarapathy
287 Eravatta~apathy
288 Thenampathy
289 Ozhalapathy
290 Atternpathy
291 Manchikunnampathy
292 Kozhinjampara
293 El'uthernpathy
294 Kozhipathy
295 Vali~vallampathy
296 Vallanghi
297 Ayloor.
298 Thiruvazhiyad
299 Pattancherry
1,823-46
1,877·72
2,795'33
2,961·06
655
475
816
669 3,937 1,990 1,947 649 589
520 2,592 1,206 1,386 143 151 10
817 4,438 2,183 2,255 116 118
1,816 1,891 10,459 4,945 5,514 315 316
595 237 1,167 966
7 342 152 722 645
627 289 1,281 1,066
2,239 1,481 2,660 1,558
5,180·60 1,107 1,195 6,313 3,143 3,170 193 173 47 47 1,128 474 1,826 1,564
1.286·02
1,660·42
2,878'84
1,206·22
2,6811-36
2,733042
2,172·45
4,259·55
59! 2,981 1,445 1,536
375 1,891 973 918
27
87
16 4 5 528 244 863 620
80 112 105 334 117 604 328
587
375
688
147
516
753 3,360 1,595 1,765 296 339 92 89 528 182 1,004 873
169 886 453 433 49 34 8 7 113 29 273 163
598 2,990 1,463 1,527 159 175 504 204 854 666
1,145 1,355 7,891 3,954 3,937 219 235 1,599 642 2,292 1,467
684 810 3,795 1,892 1,903 187 181 4 3 786 330 1,126 8S4
969 1,211 5,485 2,686 2,799 377 401 120 11l 763 242 1,722 1,361
4-,888·95 1,092 1,257 6,575 3,226 3,349 258 260 12 ,15 1,143 439 1,917 1,593
1,996·25 1,340
2,123-19 1,141
3,713-11
5,617 0 56
747
1,811
1,475 8,300 4,012 4,288 260 263
1,217 6,455 3,057 3,398 329 347
5 .,. 1,778 1,063 2,007 1,288
1,321 921 1,476 1,038
802 4,233 1,997 2,236 368 388 51 43 748 358 1,111 958
1,966 10,736 5,120 5,616 773 807 55 57,1,820 932 2,873 2,30l
62
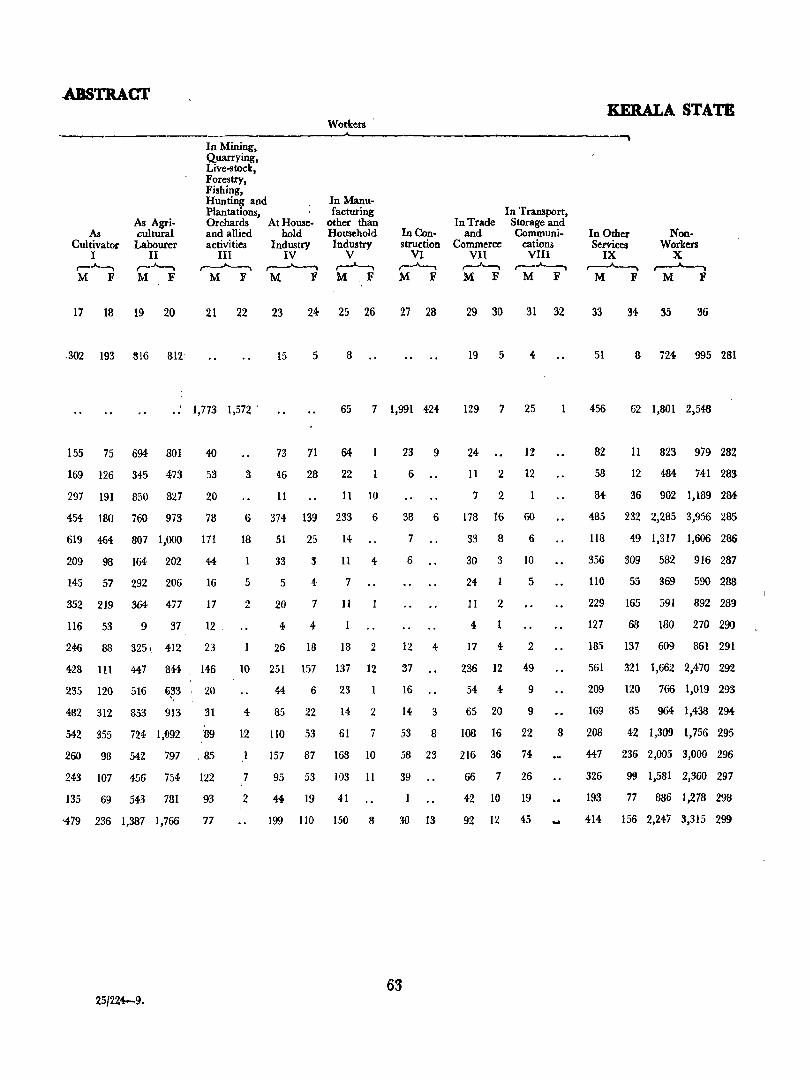
.ABSTRACT
As Cultivator
I ~ M F
As Agricultural
Labourer II
,...--A--. M F
17 18 19 20
.302 193 816 812
In Mining, Quarrying, Live-stock, Forestry, Fishing, Hunting and Plantations, Orchards and allied activities
AtHQusehold
Industry IV ~ M F
III ~
M F
Workers·
In Manufacturing
other than HOU8ehold Industry
V ,--"--, M F
21 22 23 24 25 26
15 5 8
In Construction
VI ~ M F
'1.7 28
1,773 1,572 65 7 1,991 424
155 75 694 801
169 126 345 473
297 191 850 827
454 180 760 973
40
53
20
78
619 464 807 1,000 I7l
209 98 164 202
145 57 292 206
352 219 364 477
116 53 9 37
246 88 325 \ 412
44
16
17
12 .
23
428 III 447 844 146
235 120 516 ~33 "
482 312 853 913
542 355 724 l,tl92
260 98 542 797 . 85
243 107 456 754 122
135 69 543 781
<479 236 1,387 1,766
.25/224-9.
93
77
3
73 71
46 28
11
64
22
11 10
6 374 139 233 6
18
5
2
51 25
33
5
20
4
3
4
7
4
26 13
14
11 4
7
11
13 2
10 251 157 137 12
44 6 23
85 22 14 2
1:2 110 53 61 7
.1 157 87 168 10
,7
2
95 53 103 Il
4+ 19 41
199 110 150 8
23 9
6
38 6
7
6
12 4-
37
16
14 3
53 8
58 23
39
30 13
63
In Trade and
Commerce VII
,.....-J----, M F
In Transport, Storage and Communi
cations VIII
,..--.A.---..., M F
29 30 31 32
19 5
129 7 25
24 12
II 2 12
7 2
178 16 60
33 8 6
30 3 10
24 5
1I 2
4
17 4 2
236 12 49
54 (-
65 20
9
9
108 16 22
216 36 74
66 7 26
42 10 19
92 12 45
8
...
KERALA STATE
In Other Services
IX ,.----.-A----.,
M F
NonWorkers
X ~
M F
33
51
456
82
58
84
34 35 36
8 724 995 281
62 1,801 2,548
11 823 979 282
12 484 741 283
36 902 1,189 2M
485 232 2,285 3,956 285
118 49 1,317 1,606 286
356 309 582 916 287
110 55 369 590 288
229 165 591 892 289
127 68 180 270 290
185 137 609 361 291
561 321 1,662 2,470 292
209 120 766 1,019 293
169
208
85 964 1,438 294
42 1,309 1,756 295
447 236 2,005 3,000 296
326
193
99 1,581 2,360 297
77 886 1,278 298
414 156 2,247 3,315 299

"25{224-9 b
(ii) AMENITIES
EDUCATIONAL AND READING FACILITIES
2 MEDICAL FACILITrES 3 DRINKING WATER FACILITIES
4 COMMUNICATION AND TRANSPORT FACILITIES
5 ELECTRIFICATION FACILITIES
6 MISCELLANEOUS

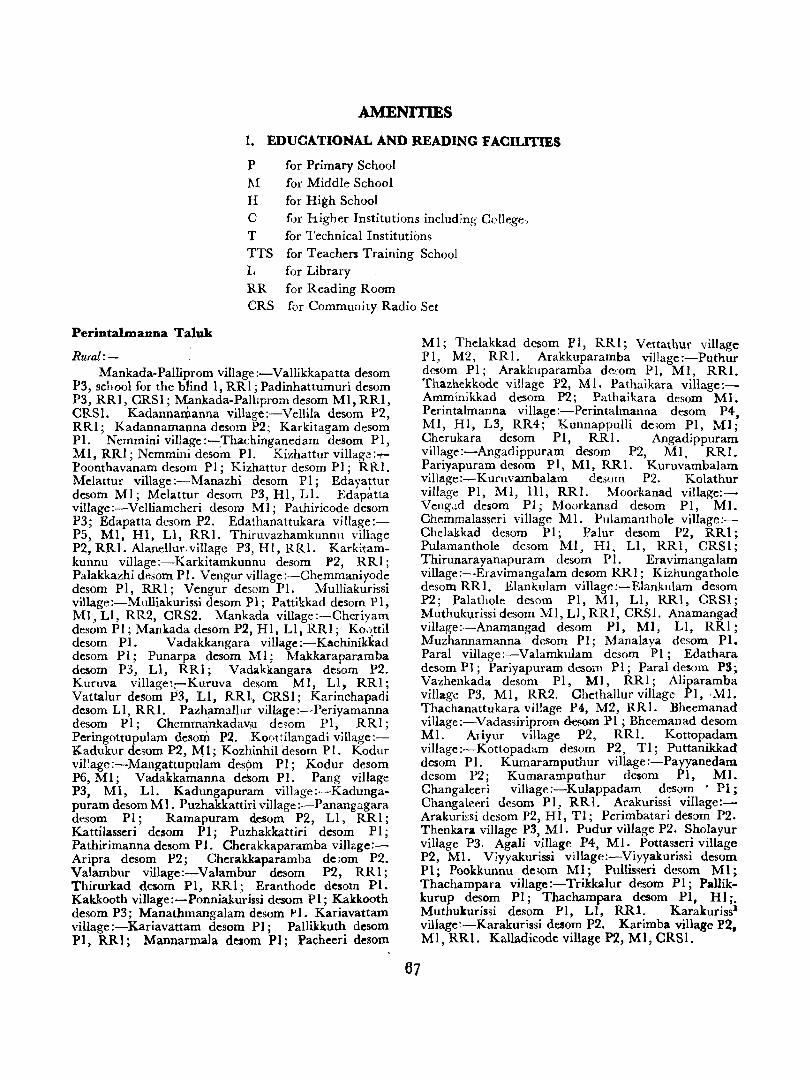
AMENITIES
1. EDUCATIONAL AND READING FACILITIES
P for Primary School 1\,1 for Middle School H for High School C for higher Institutions including Cc-Ilege, T for Technical Institutions TTS for Teachers Training School L for Llbrary RR for Reading Room eRS for Community Radio Set
Perintalmanna Taluk
Rural:-Mankada-Palliprom village:-Vallikkapa tta desom
P3, school for the blind 1, RRI; Padinhattumuri desom P3, RRI, CRSI; Mankada-Palbpromdesom MI,RRI, CRS!. Kadannamanna village:-Vellila desom P2, RRI; Kadannamanna desom P2; Karkitagam desom PI. Nemmini village:---;Thachinganedam desom PI, Ml, RRI; Nemmini desom PI. Kizhattur village:-r Poonthavanam desom PI; Kizhattur desom PI; RRl. Melattur village:-,-Manazhi desom PI; Edayattur desom MI; Melattur desom P3, HI, Ll. Edap~tta viIlage:-Velliamcheri desom MI; Pathiricode desom P3; Edapatta desom P2. Edathanattukara village:P5, MI. HI, Ll, RRI. Thiruvazhamkunnn village P2, RRl. Alanellur, village P3, HI, RRl. Karkitamkunnu viIlage:-Karkitamkunnu desom P2, RRI; Palakkazhi desom Pl. Vengur village :-Chemmaniyode desom PI, RRl; Vengur desom PI. Mulliakurissi village:-Mulliakurissi desom PI; Pattikkad desom PI, MI, LI, RR2, CRS2. Mankada village:-Cheriyam desom PI; Mankada desom P2, HI, LIt RR I; Koottil desom PI. ' Vadakkangara village :-Kachinikkad desom PI; Punarpa desom MI; Makkaraparamba desom P3, Ll, RRI; Vadakkangara clesom P2. Kuruva village::-Kuruva desom MI, LI, RRI; Vattalur desom P3, Ll, RRI, CRSI; Karinchapadi desom LI, RRI. Pazhamallur vilIage:-Periyamanna desom PI; Chcmma'nkadav:u de~om PI, RRI; Peringottupulam desom P2. .Ko(1ttilangadi village:Kadukur desom P2, Ml; Kozhinhil (lesom Pl. Kodur vil~age:-Mangattupulam des?m PI; Kodur desom P6, MI; . Vadakkamanna ddlom PI. Pang village P3, MI, Ll. Kadungapuram village:-Kadungapuram desom MI. Puzhakkattiri village :-Panangagara desom PI; Ramapuram desom P2, LI, RRI; Kattilasseri dcsom PI; Puzhakkattiri desom PI; Pathirimanna desom PI. Cherakkaparamba village:Aripra desom P2; Cherakkaparamba de;om P2. Valambur village:-Valambur desom P2, RRl; Thirurkad desom PI, RRI; Eranthode desom PI. Kakkooth village:-Ponniakurissi desom PI; Kakkooth desom P3; Manathmangalam desom ,..]. Kariavattam village :-Kariavattam desom PI; PaUikkuth desom PI, RR 1 ; Mannarmala desom PI; Pacheeri dcsom
M 1; Thelakkad desom PI, RR I; Vettath ur village PI, M2, RRI. Arakkuparamba village:-Puthur desom PI; Arakkuparamba desom PI, MI, RRI. Thazhekkode village P2, MI. Pathaikara village:Amminikkad desom P2; Pathaikara desom MI. Perintalmanna village:-Perintalmanna desom P4 MI, HI, L3, RR4; Xunnappulli de,om PI, MI; Cherukara desom PI, RRI. Angadippuram village:-Angadippuram desom P2, MI, RRI. Pariyapuram desom PI, MI, RRl. Kuruvambalam village:-Kuruvambalam desom P2. Kolathur village PI, MI, HI, RRl. Moorkanad village:Veng,~d desom PI; Moorkanad desom PI, Ml. Chemmalasseri village Ml. Pulamanthole village:Chelakkad desom PI; Palur desom P2, RRI; Pulamanthole desom MI, HI, Ll, RRl, CRSI; Thirunarayanapuram desom PI. Eravimangalam village :-Eravimangalam deaom RR I; Kizhungathole desom RRI. Elankulam village:-Elankulam desom P2; Palathole desom PI, MI, Ll, RRl, CRSI; Muthukt,lrissidesom MI, Ll, RRI, CRSl. Anamangad village:-Anamangad desom PI, MI, Ll, RRI; Muzhannamanna desom PI; Manalaya desom PI. Paral village:-Valamkulam desom PI; Edathara desom PI; Pariyapuram desom PI; Paral desom P3; Vazhenkada desom PI, MI, RRI; Aliparamba village P3, MI, RR2. Chethallur village PI, MI. Thachanattukara village P4, M2, RRI. Bheemanad village:-Vadassiriprom desom PI ; Bheemanad desom Ml. Ariyur village P2, RRI. Kottopadam village:-Kottopada.m desom P2, TI; Puttanikkad desom PI. Kumaramputhur vilIage:-Payyanedam desom P2; Kumarampnthur desom PI, Ml. Changaleeri village :-Kulappadam desom' PI; Changaleeri desom PI, RRI. Arakurissi village:Arakurissi des om P2, HI, TI; Perimbatari desom P2. Thenkara village P3, MI. Pudur village P2. Sholayur village P3. Agali village P4, MI. Pottasseri village P2, Ml. Viyyakurissi village:-Viyyakurissi desom PI; Pookkunnu demm MI; Pullisseri desom MI; Thachampara viIlage:-Trikkaiur desom PI; Pallikkurup desom PI; Thachampara desom PI, HI;. Muthukurissi desom PI, LI, RR1. Karakuriss1
village:-Karakurissi de.som P2. Karimba village E2. MI, RRI. Kalladicode village P2, MI, CRS!.
67
AMENITIES
Ponnani Taluk
Rural :-Tavanur village :-Athalur desom PI; Tavanur
de:lom P2, L 1. Thrik1canapuram village ;-VelIancherry desom PI; Thrikkanapuram desom P 1; Maravancheri dc-som PI; Ayamkulam desom P2, MI. Anakkara village :-Melazhiyam desom PI; Thottazhiyam desom PI; Puramthilsseri desom PI; Anakkara desom PI, MI, TI, LI, RRI, CRSI. Mudur village:--: Melmuri desom P2; Cheganur desom Pl. Kaladl village :-Kadancheri desom P2; Kizhumuri desom P2, M 1, L 1 ; Verur desom PI. Pothannur village :Naripparamba desom P2; Pothannur desom PI. Easwaramangalam village :-Easwaramangalam desom Pl' Cheruvaikkara desom P2, LI; Pozhampuram des~m LI; Kothathara desom Pl. Ezhuvathiruthi village :-Ezhuvathiruthi desom MI, HI, LI; Erikkamanna desom PI; Karukathiruthy desom PI; Theyyangad desom Pl. Kanhiramukku 'village:Kanhiramukku desom PI, MI, Ll; Karakkad desom PI, Ll. Edappal village:- Edappal desom PI; Ferumparamba desom PI, MI ; Porukkara desom PI ; Thalamunda desom P2, Ll; Thuyyam desom Pl,Ml. Vattamkulam village :-Udinikkara desom PI, MI, HI ; Kanthalur desom PI ; Vattamkulam desom Ml. Kumaranellur village :-Vellalur desom P3, HI, TI, RRI; Chekkod desom PI; Kalladathur ~esom Ml. Kudallur village :-Mc.nniamperumbalam desom PI ; Kudallur desom P2; Malamakavu desom PI, MI; Nayyur desom PI. Angadi village :-Arikad desom RRI' Ka1athumpadi desom RR1, CRS1; Thozhukara desom PI; Angadi desom PI. Pattithara village :-Alur desom P4,HI, RR1. Trithala ~il~age:Trithala desom P2, MI, Ll, RRl ; Nhangattm desom PI MI LI, RR1. Mezhattur village :-Mezhattur de;om in, Ll, RR1. Mala yillage :-VaIiya Kottapadam des om PI? Ka~kattiri desom. M I; Vattenad desom Ml. KuttJpala vlllage :-KuttIpala desom PI ; Nellisseri desom PI; Kaladithara desom Pl. Kololomba village :-Ailakad desom PI; Pookarathara desom P2; Kololornba desom PI, MI. Porang village :-Porang desom P2; Panampad desom PI, Ml. Kadavanad village :-Paduponnani desom PI ; Kadavanad desom PI, MI, LI. Veliancode vilIage:Veliancode desom PI, CRS1; Pazhanhi desom PI, RR1; Grarnam d<:,som PI, HI, LI, RR1. Maran: cheri village :-Parichakam desom PI; Maranchen desom P4, RR1. Eramangalam village :- Perumudisseri desom P2; Eramangalam desom PI. Ayirur village :-Puthiruthi clesom P2, MI, RR1; Koda,hur desom PI; Ayirur desom P2, RR2. Kadikad village :-Cheruvayur de-som P3; Kadikad desom PI ; Edakkara desom P2, CRSI. Punnayur village:Akilad dcsom P2; MI, LI, RRl ; Edakkara desom PI; Punnayur desom P2, Tl. Edakkazhiyur village :Aviyur desom MI; K.oranhiyur .desom PI;. Edakkazhiyur desom P3. Vlyalathur vlllage :-Vlyalathur ciesom P3, MI, TI, Ll, RRl, CRSI; Nharnanangad desom P2, RRI; Anhur desom RRI. Vadakkekad village :-Vadakkekad desom P2, CRSI; Kavukkanappetty desom PI; Kochannur desom M I ; Thekke-
68
kad desom PI; Kallur desom MI; Thlruvalayannur desom Pl. Punnayurkulam village :-Punnayurkulam desom P2, TI; Chemannur desom PI; Parur desom PI; Kuppravalli des om MI. Perumpadappa village:Perumpadappa desom P2, HI; Cheruvallur desom Pl. Nannamukku village :-Thekkummuri desom PI; Kallurma desom P2; Nannamukku desom P3. Pallikkara village:-Vadakkurnury desom PI; Kanhiyur desom PI, HI, RRI; Pallikkara desom PI. Alangode village :-Panthavoor desom PI; K2.kkadipuram desom PI, Nil; Alangode desom PI, RRI; Perumukku desom P2. Kappur village :-Kollanur de30m PI ; Kappur desom PI ; Kozh.ikkara desom PI; Eravakad desom PI. Othalur village :-Chiyyannur desom P2; Kokkoor desom PI; Othalur desom P2. Kavucode vill<:ge :-Thannircode desom MI, LI, RRI; Pattisseri descm PI; Kavucode desom P2, MI, HI, RRI. Chalisse:'i vil!age :-Peruroannur de,om P2; Kuttanad desom Pl; Chalisseri desom PI, Ll, RRl. Nagalas5eri village :-Nandiyangode desom T I ; Thekkevavanur desom Ml; Valiachalappram desom PI ; Pilakkattiri desom PI. Thirumittacode village:Nellikattiri desom PI; Thirurnhacode desom PI; Irumbakasseri desom PI, 1\11 ; Ezhumangad desom MI, LI, RRI, CRS1; Iringattor desom PI. Peringannur village :-Chathanur desom HI, RRI; Cherippur elesom PI ; Ittonam desom P2. Chazhiyattiri village :_ Akilanam desom PI; Chazhiyattiri desom PI, Ll ; Pallipadam desom Pl. KOthachira village :-Mathur demm PI; Peringod desom MI, LI, RRI: Ko:hachira desom P2 ;
Urban :-
Ponnani town :-Ponnani Nagaram ward P2, :M2, HI, LI; Velleri ward PI, LI; Pa11apuram ward PI, Ml. '
Ottapalalll Taluk
Rural:-
Vilayur village :-Vilayur ~esom P2;, Paradlyur desom P2; Chundampatta viIlage:-Natiyarnangalam desom PI; Mat han a m R a II y desom PI; Chundampatta desom ,M2. Kulukallur village P5, M2, RR1. Marayamangalam vmage P5, HI, RR2. Karalmamna village :-Thekkumuri desom P2; Vadakkumi,Iri desom PI. RRI; Naduvattom desom RRI; CRSI'; KaraImanna desom MI, Tl. Veeramangalam village :-Karumanamkurissi desom PI, Ml; Veeramapgalam desom P2, RRl; Mangode desom PI; Poothakkad desoD1 Pl. Vellinezhi village :-Vellinezhi desoi'll P2, HI, RRl; Kuttanassery desom MI, RR1. Karil'j:lpuzha village:Attasseri de,om P2; Karumpuzha desom PI, MI, RR1; Kulukiliyad village :-Kuluki}iyad desom P2, Ml ; Kottapuram desom PI. Elampulassery village:Pombra desom P2; Elampulassery desom P2, Ml. Pulapetta village :-Pulapetta desom PI, MI, RRl; Ummanazhi desom PI, MI, RR1; Mannambatta village :':'_Mannambarta desom PI; Kulakkattukurissi desom PI; Thottara desom PI. Sreekrishnapuram village :-Valambirimangalam desom PI; Easwara-
EDUCATIJNAL AND READING FACILITIES
mangalam desom PI, MI, RR2; Perumangode desom PI, HI, RR2. Thirunarayanapuram village :-Kuruvattoor desom P2, RRI; Thirvazhiode desom M2, RRI ; Thirunarayanapuram desom PI. Moothedathu Madamba village :- Kulakkad desom PI; Atakaputhur desom Ml, HI, R.RI; Pothi desom PI ; Kalluvazhi desom MI, RR1. Kattukulam village:MangaIamkunnu desom PI, RR1; Kinasse,ri desom PI ; Kattukulam desom Ml, Hl, RR2. Thanikunnu village :-Pulapettas,ery dcsom PI ; Thanikunnu desom PI; Thalayakakkad desom PI, RRI. Kadampazhipuralll village MI. Pullundassery village :-Azhiyan~ _ nur deiom MI; Pullundassery desom P2, Hl. Alangad village :-Vettakara desom PI; Alangad desom ~2. Vadakkumbrom vIllage :-Kadambur desom PI, HI; Melur desom PI; AravakIcid desom Pl. Eledathmadamba village :-Munnurcode desom P2, MI, RRl; Kizhur desom MI..' Trikkadeeri village :-Karuttukurissi desom PI :' Kuttikode desom PI; Trikkadeeri desom PI, M I, RRIl. Nellaya village :-Ezhuvanthala desom P6, MI, RRl; Nellaya desom P5, MI, RR2. Cherplachery village :-Panniyamkurissi desom P4, HI; Vellattukurissi desbm PI; Cherplachery desom P4-, RRI. Ezhuvanthaia village :-Erumbulassery desom P2, MI; Pattislleri desom PI;_ Ezhuvanthala desom P3; Mundakottukurissi village P2. Cherucode village:Mannayengode delOm PI,MI; Vandumthura desom PI, RRI; Cherucode desom P2; Amayur village P3, Ml. Pulassery village :-Karinganad desom P2; Pulassery desom P2. Rairanelloor village :-Nedungottur desom PI; Edappalam desom P2. Thiruvegapura village :Chembra desom Pl', MI, RRI; Thiruvegapura desom PI, RRI ; Nariparamba desom MI; Kaipuram desom PI. Naduvattam village :-Vilathur desom PI ; Naduvattam desom P2, MI, HI, RRI; Kizhumuri desom PI. Muthuthala village:-Muthuthala desom PI, MI. RRI; Melmuri desom P2, RRl; Kozhikottusseri delom P2. Perumudiyur village :-Kodumunda de,om PI, MI. RRI; Perumudiyur desom P3, MI, CI, RRI. Maruthur village :-KodaILlr des om P2 ; Poovakode desom PI; Maruthur desom RRI. Pattambi Palliprom village :-Kilhayur d~som Ml, RRI ~ Kondurkara desom PI; Palliprom desom PI; Karakkad desom PI. Kalladipetta village :-PuIaS3arika,a desom MI; KaUl}dipetta desom PI; Mooloorkara delom P2, Ll. Vad~U'~amkurissi village :-Vadanamkurissi de.om PII, Hl.i Vallapuzha village P4, HI, RR2. Kuruvattoor village :-Kuruvattoar desom P3; Kayiliyad desom P3. Chala~ra villag~ :-Chalavara desom P3, RRl; Puliyaniamkunnu desom PI; Kothakurissi village :-Tharavakonam desom PI; Kothakurissi desom P3. HI ; \ Mundanattukara desom PI; Edakkodupavukoruun desom Pi. Panamanna village P5, RRl. Cherumundassery village:Puliyanamkunnu desom PI; Cherumundassery desom P2; Pulapettassery desom PI. Vengassery village P3. Mulanhur village :-Nellikurissi desom PI ; Mulanhur desom PI. Chunangad village P9. RRI. Kanniambrom village:-Panamanna desom P2, RRl; Kanniambrom de30m P2; Thottakara desom PI. Vaniamculam village :-Kothayul! desom PI, HI, RRI; Pulachithara desoIll PI. Koonathara village :-Panayut desom PI ;
Koonathara desom Pl. Kulapully village :-Kanayam desom PI; Kulapully desom P2, RRI. Karakkad village :-Karakkad desom P2, RR1; Eruppa desom P2, RRI. Cherukattupulam village:-Turangali des om PI; Cherukattupulam desom PI; Mannanur desom PI ; Velliyad de£om PI. Trikkangode village :Mannisseri desom PI; Trikkangode delom PI; Choroottur desom PI. Palapuram village P5, RRI. Lakkidi vil'!age :- Mangalam desom P2; Thekkumangalam desom P3, HI, RRI. Perur village:Puthur desom Pl; Akalur desom P2; Perur desom P4, HI.
Urban:-Pattamhi town ;-Vallur w~rd PI; Netheri
mangalam ward P2, MI, HI, RRl. Shoranur town:Paruthipra ward P2, RRI; Mundamuka ward P2, RRI ; Nedungottur ward RRI ; Chuduvalathur ward PI; Chiramanna ward P2, H2. Ottapalam town:Varode ward P2; Vadanamkurissi ward PI; Ariyoor Thekkumuri ward_P4, H2, Ct, RRl, CRS}'
69
Palghat Taluk
Rural:-PeringDde village :-Thrippalamunda desom PI ;
Peringode desvm P2, Ml. Oheraya village P2. Kongad v.iJlage P4, MI, HI, LI, RRI, CRSl; Kanhikkulam village PI. Nochippulli village PI. Mundur vilbge:Mundur de.om P2, HI, Ll, RRI, CRS!. Oduvangad desom Pl. Ezhakkad } village PI, MI, RRI. Poothanur village PI. Kundalassery village Pl. Thadukkasseri village:-Vatasserl desom Ml; Thadukkasseri desom PI. Mannur village PI, M2, Ll, RRI. CRSI. Nagaripuram village :-Nagaripuram desom PI, HI. Mankarai village :-Mankarai desom PI, M2, Ll, RRI, CRSt ; Chemmukadesom Pi. Kizhakkumpuram village PI. Keralasseri village M2, HI, RRl. KalIur village :-Kallur de50m PI; Kannampariyaram desom Pl. Mankurissi village PI, RRI. Thenur village PI, RRI. Kinavallur village P2, RRI. Edathara village :-Odanur desom PI; Edathara desom PI, HI, Ll, RR2, CRS2. Vallikode village Ml. Puduppariyaram village P2. Akathethara village PS, 01, Ll, RRI, eRSI. Kadukkamkunnam village P2, L2, RR2. Kottekkad village P2. Lll, RRl. Kavalppad vnIage P3, MI, RRl. Vadakkallthara village :-Kallekkad desom PI ; Vadakkanthara deso~ P4. HI, RR2; Kodumthirapally village P2, RRI. Pirayiri village P4. M2, HI, RR2. Yakkara village P5, RR4. Puthur village P6, HI, TI, 01, Lt. RR3. Koppam village P6, MI, H3, TI, 01, LI, RRI. Kallepully village PI. Marutharoaa village ~1, RR3. Karinkarapully village PI, RR1. Kunnanur vlllage P2, T3, RRI. Kannadi village :-Kadakurussi desom PI; Kannadi desom P2, Lt, RRI. Kinasseri village P4. Thiruvalathur village PI. Kodumba village MI. Pallatheri village :-Pallatheri desom PI, RRI. eRSl; Ennappadam desom PI. Veniodi village :-Ramasseri desom PI, RRI ; Vengadi desom PI, RRI; Pudusseri village P4. M2, RRI. Elappully village PS, MI, RRl, CRSl. Thenari village Ml. Olasseri village Pl.
AMENITIES
Tassrack village Pl. Thanisseri village PI. Peruvemba village P2, HI, RRI, CRSI. Palathulli village Pl. Panayur village P2. Polpully village Ml, RR1, eRSl.
Palgh4t (Municip.l):-Ward 1 P3, MI, RRI ; ward 2 P2, RRI ; ward 3
PI, RRI ; ward 4 PI, RRI ; ward 5 Ml, RRl; ward 6 PI, RRl; ward 7 Cl, RRl; ward 8 P2, H1, Tl ; ward 9 P2, HI, RRl; ward 10 HI, Tl, Ll, RRl; ward 11 PI, Ml, Ll, RRl; ward 12 PI, RRI ; ward 13 PI, RRl, CRSI; ward 14 PI, RRl; ward 15 P2; ward 16 P2, RR1; ward 17 P2, HI, RR1; ward 18 PI, Ml, RRl; ward 19 PI, Ml, RRl; ward 20 P2, Ml, HI, Tl, RRl; ward 21 P~, Ml, RRl; ward 22 RRl; ward 24 Ml, RRl; ward 26 Ml, RR3; ward 27 RRI; ward 28 P3, RR1.
Alathur Taluk Rural:-
Peringottukurissi village P2, LI, RRl, CRSI. Bemmanur village :-Bemmanur desom PI. Kottai village PI. Chcmbrakulam village PI, HI, Ll, RRl, CRSI. Va rode village PI. Thachangad village:Anikkode desom Pl. Mathur village P3. Pallanchathanure village:-Veswalam desom P2. Chenganiyur village :-Chenganiyur desom Pl. Thannirangad desom Pl. Pulinelli village Pl. Paruthippully village PI, LI, RRl, CRS}, Kuthanur village P3, HI, LI, RRI. Tholanur village P!. Choolanur village PI.
/Pazambalakode village P2, HI, Ll, RRl, CRSl. Tarur :villag«:-Tarur desoin P2, Ll, RR1, CRS}. Athippotta desom PI, Ll, RRI. Vavulliapuram village P2. Coyalmannam village P4, HI, L3, RR3, CRS!. Kannanur village:-Kannanur desom PI. Puthukkode desom Pl. Kalappatty village P2. Thenkurissi village ·P2, L I, RRI, CRS!. Vilayanchathanur village PI, RRI. ViIayannur village PI. Perinkunnu village P2. Manhalur village P2, Ll, RRl, CRSI. Erimayur village P2, Ll. RR1, CRSl. Puthiyankam' village P4, CRSt. Kavassery village P3, HI, LI, RRI, CRSl. Kazhani village:-Padur 'desom PI; Kazhani desom P2, RRI. Kannanur Pattola village P3, LI, RRI, CRSI. Thennilapuram village PI. Kattusseri village P5, H2, Ll, RRI CRSI. Mangalam village P2, LI, RR1, CRS}' Manhapra village :-Manhapra desom P2, CRSl. Konnancherry desom PI. Pudukkode village P2, MI, HI, LI, RRI. Kannambra village:_:_Kannambra desom P4, CRSl.
70
Rishinaradamangalam desom PI, MI, Ll, RRI. Aayakkad village:-Paruvasseri desom PI. Aayakkad desom PI, HI, CRSI. 'Zadakkancherry 'village P4, M I, Ll, RRl, CRS 1. KIzhakkancherry village P7, HI, Ll, RR1,. eRS1; Vandazhi Village HI, RRI. Mud a ppallur vlllage P3, RRI, CRS 1. Chittilencherry village P2, HI, LI, RR1, CRSI. Vadakkethara vilIage:-Pullode desom PI, Vadakkethara desom P2 CRS!. Thekkethara village PI, Ll, RRl, CRSI: Cheramangalam village P2, Ll, RRl. Kunisseri village P3, HI, Ll, RRI, CRSI; Vembalur village PI;
Chittur Taluk
Rural:-
Koduvayur village P8, M3, HI, TTSl, LI, RRl CRS!. Thathamangalam village P3, MI, HI, L1 RRI, C~Sl. Chittur village P3, MI, H2, T2, Cl, LI' RRI. Thekkedesom village PI. Nal~epilly village P3: M1, HI, RR 1. Vadakarapathy vlllage P2; Eravattaparapathy village ~I, CRSI. Thenampathy village P2. Ozhalapathy vIllage Pl. Manchikunnampathy village Pl. Kozhinjampara village P4:. Eruthempathy village PI, MI, CRS I. Kozhipathy village PI. Valiavallampathy village CRSI. Kuttipallam village PI. Kunnamkattupathy village PI. Perumatty village P2, MI, RRI. Vadavannur village P4, M2, LI, RR1, eRSl. Pallassena village P3, MI, L1, RRI, CRSl. Ethanoor village PI, MI, Ll, R~I. Kakkayur village Ml, Ll, RRl, CRSI. Pallavoor vlliage P2, LI, RRI. Kocdall ur village PI, M 1 , L I , RR 1. Vallang-hi village PI, Ml, LI. Ayloer village M2, HI, RRI. Thiruvazhiyad village P2, Ll, RRI, CRSI. Pothundi village P2, Ll, CRSI. EJavancherry village MI, Ll, RRI. Vattakkad village MI, Ll, RRI. Kollangode village MI, HI, Ll, RRI. Panamgattiri village Ml, Ll, RRI. Payyalloor village MI, LI, RRl,' CRSl. Kezhakkethara village P4, MI, Ll, RRI, CRSI. Muthalamada village P8, HI, LI, RRI. Pattancherry village MI. Mulathura village .PI.
Urban:- I
Nemmara town P2, MI, H2, L2, CRS2. Chittur-1,'hathamangalam (Municipal)' ward 2 PI; ward 4: L1, RR1, eRS}; ward 6 TI; ward 9 HI, TI; ward 10 Ml, HI; ward 11 HI, '11; ward 12 CI, CRSI; ward 13 Ml, TI; ward 14 Pl'; ward 17 MI, Ll t
RR1, CRSl; ward 19 HI.
2 MEDICAL pACll.rrmS
AD RHC AHOS MPR MOW AYD AYH VETD VETH HM
for Allopathic Dispensary for Rural Health Centre f?r Allopathic Hospital for Medical Practitioner for Maternity and Child Welfare Centre for Ayurvedic Dispensary for Ayurvedic Hospital for Veterinary Dispensary for Veterinary Hospital for Horoeopathic Dispensary or Hospital
:Perintalmanna Talu~
Rural :-
Mankada-Palliprom village :-Vallikkapatta 'desoro MPR3, MCWl, AYDl; Padinhattumuri desom AYDI; Mankada-Palliprom desom MPRI, HMI. Kadannamanna village :-Vellila desom MPRl. Melattur village :-Mdattur desom ADI, MPR2, MCWI, AYD2, AYHI, HMl. Thiruvazhamkunnu village MPRl, VETDI. Alanellur village MPR3, AYD2, VETDI. Karkitarokunnu viIlage:Karkitamkunnu desom AHOSl, MCWl. Mankada village :-Mankada desorn AYHI. Vadakkangara village:-Makkaraparamba desom AYDI, VETHl. Kodur village:-Kodur desorn.MPRl, AYD7, HMI; Vadakkamanna desom MPRI, AYD2. Kadunryapuraro village :-Kadul1gapuram desorn MCWI b AYDZ. Puzhakkatriri village :-Ramapurarn deso~ A YD2 . Puzhakkat tiri desorn A YD 1. Perintalmanna village:--': Perintalmannadesom AD4, AHOSI, MPRI4, MCWI, AYDI2, AYHI, VETHl. Angadippuramvillage:Al1gadippuram desom MPR3, A )'D3 VETHl' Pariyapuram desutn MPR3, AYD3, VETI-It. Kolathu; village AD I, MPRl. Pulamanthole village :Chdakkad desom AYDI; Palur desom AYDI' P_ulamantho~e desom' MPR2, A YH 1. Eravimangdla~ 'vIllage:-Klzhungathole desom AYDI, HMl. Elankulam village :-Kunnakkavu desom MPRI· Palathol~ desom MCW L' Anamangad. village;--': Anamangad desom AYD1, HMI. . Alipd.ramha village MPR2. Chethallur village MPR4, AYD3, AYHl. Thach~n~ttukara village MCWI. Bheemanad village:Vadassmprom dcsom MPRI; 'Bheemanad deJom AYDI. Ariyur village MPRl, AYHl. Arakurissi village :-Arakurissi des0m AHOSI MPR5 AYD5 ~ETDI, VETH2. Thel1kara villa~e HMl. Agali v~llage AHOSI, MPRI, MCWI, VETDI Potta~seri VIllage MPR3, MCWI, HMI. Viyyakurissi village:Viyyakurissi desom AYDI ; Pookkunnu desom MPR2 .AYHI. Thachamp:'lr~ village :-Thachampara deso~ MPR2 ; MuthukunSSl desoro MPRI. HMl. Karakurisii village :-Karakurissi desom MPRI, AYHI. Karimba village MPR2, AYD:!, HM2. Kalladicode village MPRI, MCWI, HMl.
25/224-10 i1
Ponnani Taluk
Rural :-Tavanur village :-Tavanur desom AYDl'
Muvvankara desom MOWl. Amkkara village:'-: Thottazhiyam desom AD I. Kaladi village :Kizhumuri desom AYDl. Pothannur village:Naripparamba desom RHCl. Easwaramangalam village :-Easwaramangalam desom VETDl. Ezhuvathiruthi village :---Punnathiruthi desom A YD 1 . ~zhu,,:athiruthi desom ADI. Kanhiramukku village:"': Kanhlramukku desom MPRI. Edappal village:Porukkara desom MPR2; Thalamunda desom AHOSl. Kurnaranellur village :-Vellalur desom VETDI' Kumaranellur desom AD 1. Trithala village :-Trithal~ desoro ADl, MPRI. Mezhathur village :-Mezhathur desom MPRI ; Kodanad desom MPRl. Mala viUage:Cheriya Kottapadam desom MPRI. Kololomba viIlage:-Pookarathara desom MPRl. Porang village:Panampad . desom RHCl. Ka~avanad village:Padup.::Jll?am desom MPR2. Vehancode village:Pazhanhl .desom MCWl. Marancheri village:M~ranchen desom ADI, MPRl. Ayirur village:AYlr~r desomADl. MPRl,VETI?l. Kadikad village:Kadlkad desom MeWl. Vlyalathur village:Viyalathur desom RHCl, MPRI, VETDI. Punnayurkulam village :-Punnayurkulam desom ADI MPRI. Perumpadap;Ja village :-Perumpadapp~ de'om ADI, MPRI, VETDl; Cheruvallur desom MCWl. Pallikkara vilbge :-PalLkkara desomAYDI. VETDI. Othalur village:-Chiyyannur de~om VETDl. Kavucode village :-Kavucode desom MPRI AYDI' Nagalasseri village:-Thekkevavanur desoffi 'MPRl. Thirumittacode village :-Ndlikkatiri desom MPRI' Thirumittacode desom MPRI ; Ezhumangad deso~ MPR4. Peringannur village :-Chathanur desom MPRI, MaW1. Chazhiyattiri village :-Maduppalli des om MPRl; Karukaputhur desom MPRI. Kothachira village :-Peringod desom AHOS3' Kotha-chira desom MPRI. '
Urban:-
Ponnani town :-Ponnani Nagaram ward AHOSl' Velleri ward ADI, MPR4, AYDI, HMI. . •
AIIENI'I1ES
OttapaJam Talak R.ral:-
Vilayur. village :-Paradiyar deSOIll MeW 1. Kulukallur village RHCI. Marayamangalam village RHC!. Karalmanna village :-Naduvattom desom MPR2. Veeramangalam village :-Veeramangalam desom MPR t; Cherumannur desom MPRI; Poothakkad desom MPRI. Vellinezhi village:Vellinezhi delom MPR3. MCWI. Karimpuzha village :-Karimpuzha desom MPRI, HMI. Kulukiliyad village :-Kottapuram desom MCW 1. Elambulassery village :-Pombra desom MPRI; Elambulassery de:;om MPRI. Pulapetta village:Pula petta desom MPR2. Sreekrishnapuram village:- Perumangode desom ADI, MPR2, VETDI. Thirunarayanapuram village :-Thiruvazhiode desom MPRI. Moothedathu Madamba village :-Pakaravoor desom MPRI ; Atakaputhur desom MPRI ; Kalluvazhi desom MPRI. Kattukulam village :-Kattukulam desom MPR3. Kadambazhipuram village MPRI. PuUundassery village :-Pullundassery desom MPRI. Alangad village :-Aiangad desom MPRl. Vadakkumbrom village :-Aravakkad desom ADl. Eledathmadamba village:-Munnurcode desom MPR2. Trikkadeeri village :-Trikkadeeri desom MPRI. Cherplachery village :-Panniyamkurissi desom MPR4; Cherplachery desom ADl, MPRl. Pulassery village :Karinganad desom VETDI; Mannengode de,om RHCI. Thiruvegapura village:-Thiruvegapura desom HM1. Kaipuram dcsom RHC1. Naduvattom village;Naduvattom desom MCW 1. Muthuthala village:Muthuthala..desom A YD1. Perumudiyur village:-Kodumunda desom A YD 1. Kalladipetta village : - Mooloorkara desom VETD1. Vadanamkurissl 'Village:Vadanamku'rissi desom RHC1. Vallapuzha village VETD 1. Cherllmundassery village :-Ch~ rumundassery desom RHC1. Vengassery village MCW1. Vaniamkulam village :-Kothayar desom RHCI ; Pubchithara desom VETDI. Perur village :-Perur desom ADI. Urban:-
Pattambi town :-Vallur ward AYDI. NetheIimangalam ward ADI, AYDIO, HMI. Shoranur town :-Chiramanna ward RHC2, VETDI, AYD2. Ottapalam town :-Ariyoor Thekkummuri ward AHOSI, MCWI, MPR4, AYDI.
Palghat Taluk Rural :-
Kongad village ADI. MCWI, VETDI, AYDl. Mundur village :-Mundur desom AYDI. Mannur village MCWI, VETDI. Mankarai village:Mankarai desom MCWl. Mankurissi village AYDI. Thenurvillage MCWI, AYDI. Edathara village:Odanur desom ADI, Edathara desom ADI, VETDI. Akathethara village MCWI. Kadukkamkuanam village AD I. Kottekkad village A YD 1, V ETD I, HM 1 . Kavalppad village MPR8, MOW I, A YD4. Vadakkanthar,a village :-Kallekkad desom MPRl; Vadakkanthara dcsom MPR4. P~rayiri village MCWI, AYDI. Yakkara village MPR2, MeW!. Puthur village MPR7, MCW2, VETH2. Koppam village ADI, MCW2, MPR30. AYHI, VETDI, VETHI, . HMI. Kannadi vjJlage :-Kannadi dc-som A YDJ, HM J,
'72
Kodumba village MOW I. Pudusseri village VETHI~. Elappully village RHC 1, MPR I. VETH 1 ; Peruvemba village MCW 1 ; Polpully village HM 1.
Palghat (Municipal) :-Ward 1 MCWl, MPR4; ward 2 AHOSI, MPR2;
ward 4- MPRI, ward 5 MPRI; ward 7 MPR2, ward 8 VETHl; ward 9 MPR2, HMI ; ward 10 MCWl, MPRI, AHOSI, AYHI; ward II MPR15, ADI, AHOS2; ward 13 MPRI, ward 14 MCWI, MPRI ; ward 15 MPRl; ward 16 MCWI; ward 17 MPR} ; ward 19 MCW}; ward 21 MCWI ; ward 22 MPR2; ward 23 ADI; ward 25 MPR2; ward 28 MCWI. MPR2.
Alathur Taluk Rural:-
Peringottukurissi village MCWI, A YDI. Chembrakulam village RHCI, AYDI, VETDI, HM!. Paruthippully village HMI. Kuthanur village MCW1, AYD1, HMI. Tholanur village AYDI. Choolanur vJllage MPRI, AYDl. Pazambalakode village MCW1, AYD 1. Tarur village:-Tarur desom AYD I; Athippotta desom VETD 1. Coyalmannam village AD I, A YD I, VETHI, HMI. Kalappatty village MPRI. Thenkurissi village MCW I. Manhalur village MCW I, A YD I. ErimayurviUage MCWI, AYDI. Puthiyankam village MPRI, VETD I. Kannanur Pattola village MCW j •
Kattusseri village MPR4, AYD4, VETHI, HM2. Mangalam village MPRI, MCWl. Manhapra village:Manhapra dt'som MCWI, HMI. Pudukkode village MPR3, AYD4, HM3. Kannambra village :-Kannambradesom MCWI, AYDI, VETDI, HM2. Vadakkancherry village RHCI, MCWI, MPR2, AYDI, VETDl, HM2. Kizhakkancherry village MPR2, AYDI. Vanrlazhi village MPR2, HMl. Mudappallur village MPR3, MCW!. Chittilancherry village MPRI, MCWl, AYDl. Thekkethara village MCW}, Kunisseri vi.llage MCWl, AYDI, HMI.
Chittur Taluk Rural:-
Koduvayur village MPRi, RHCl. ThathamangaJam village Ab 1, A YD 1, VETH I. Chittur village AHOSI, MPR3, HMl. N~llepilly village AYDI. Eravattaparapathy village VETD I. Ozhalapathy village ADI. Kozhinjampara village ADI, AYDI. VETDI. Vadavannur village ADl, MPRI, MeWI, VETDI. Pallassena village VETDI. Vall,anghi village MPRI, VETHI. Ayloor village AYDI. Thiruvazhiyad village VETDI. Kezhakkethara village ADI, MPRI, VETDl. Muthalamada village VETDI. Pattancherry village AHOSl., Urban:-
Nemmara town ADI, AHOSI.Ch~ttur-Thatbamangalam (Municipal) \\-'ard 1 AHOS1, MPR2; ward 2 ADI, MPR1, AYD2; ward 3 ADI, ,MPRI, AYDl; ward 4- AYDl ; ward 5 AD2. MPR2, AYD3; ward 6 MPR 1 HM 1 ; ward 10 AD I, MPRI. A YD 1; ward 12 VETHI; ward 13'ADI. MPR2,AYDI, HMI ; ward" 14MPRI, AYDl; ward 16 ADt, MPRl; ward 11 ADI, MPRl, AYHl, HM.
3 DRINKING WATEIt FACILITIES
S for safe or protected water supply including pipes, tube-wells, etc.
.TerintalmanDa Taluk
Rural:-
PW for Pucea well KW for Kuc~ha well TK for Tank RIV for River
. Mankada.Pal1iprom village:- Vallikkapatta ·desom PW2; Padinhattumuri desom PW I ; MankadaPalliprom desom PWI J TK2. Kadannamanna village:Vellile desom PWI; Kadannamanna desom PWI; Karkitagam desom P~l. Nemmini village:'Thachinganedam desom PWHO, KW36, TK71, RIV; Nemmini desom PW84, KW22, TK32; Nallur desom PW43, KW16, TK14. Kizhattur village :-Chemmanthatta desom PW38, KW8, TK5, RIV; Kondiparamba desom PW98, KWll, TK30; Poonthavanam desom PW9.3, KW9, TK25; Kizhattur dellom PW210, KW22, TK33, RIV. Mdatturvillage:Manazhi desom PW142, KW2, TKlO, RIV; Edayattur
·desom PW137, KWl, TK8, RIV; Melattur desom PW61 1, KW4, TK178, RIV. Ed ... patta village :Velliancheri desom PW387, KWIO, TK206; Pathiricode desom PW401, KW8, TK'209, RIV; Edapatta desom PW30~, KW4, TK185. Edathanattu· kara village RIV. Thiruvazhamkunnu village PWIOOO, KW5, TKI5, RIV. Alanellur village PW4, KW6. TK46, RIV, Karkitamkunnu village :-Karkitam-· kunnu desom PW400, KWH, TK42; Palakkazhi desom PW400, KWH, TK42. Vengur village:Chemmaniyode desom PW225, KW35, TK30, RIV; Vengur desom PW90, KWI8, TKIO. Mulliakurissi village :-Vazhangode desom PW45 , KW5, TK3; Parambur desom PW40, KW2, TK2; Mulliakurissi
,desom PW95, KW4, TK3; Pattikkad desom PW195, KW4, TK7. Mankada village:-Mankada desom PWS; Vadakkangara village :-Kach:nikkad desom PW120, KW5, TK~: Pujlarpa q,esom PW50, KW2,
'TK21, RIV ; Makkaraparllrnba desom PW200, KWl4, TKlO, RIV; Vadakkangara desom PW300, KW14, "TK20. Kuruva village :-Vatt:1lur desom PWl, RIV; Karinchapadi desom R~V. Pa:zJhamaUur village:Periyamanna desom RIV; Ummathur desom PWI. RIV ; Chemmankadavu desom RIV; Pazhamallur desom TK3; Peringottupulam desom RIV. Koottilangadi village:-Konothurnuri desom PW22. TK3; Kadukur desom PW320, KW2, TKI5, RIV; Kadungoth desom PW80, KWl, TK2, RIV; Perinthattiri desom PW50, KWI, TK3; Kozhinhil desom PW48, KW3. Kodur village :-Mangattupulam desom RIV; Kodur desom PW2, KWl, TK2, RIV; VadakkamanJ\a desom PW2, RIV. Pang village PWIO, 'TK5. Kadungapuram vi1la~e:-Kottuvad des om PW72, KW60, TK64; Kadungapuram desom PW150, KW300, 'TK50j Mannamkulam desom PW70, KW20, TK50.
25/224-10 b
Puzhakkattiri village :-Ramapuram desom PWl; Puzhakkattiri desom PW 1. Cherakkaparamba village:Aripra desom PWl; Cherakkaparamba desom PWI. Valambur village :-Valambur desom PW250, KW75, TK4; Thirurkad desom PW200, KW60, TK6; Eranthode desom PWI00, KW30, TK5; Chathanellur desom PW25, KW8. Kakkooth village :-Ponniakurissi desom PW90, KWI2, TK14; Kakkooth desem PW161, KW23, TKG6; Manathmangalam de50m PW51, KW6, TK4; Cheerattamanna desom PW2S, KW2, TK9. Kariavattam village :-Kariavattam desom PW76, KWI8, TKI5; Pallikkuth desom PW90, KW20; TK20 ; Mannarmala desom PWIOO, KW25. TK25; Pacheeri desom PW62, KWI6, TK30; Thelakkad desom PW48, KW8, TK39; Vettathur village PW294, KW87, TK138. Arakkuparamba village :-Puthur desom PW82, KW4, TK12 ; Arakkuparamba desom PW504. KWI9, TK73. Thazhekkode village PW60, KW20, TK30. Pathaikara village :-Amminikkad desom PWHl, KW25, TK5; Pathaikara desom PW278, KW30, TK17. Perintalmanna village :-Perintalm21nna desom 81, PW807, KWIO, TK30; Kunnappullidesom PW210, KW4, TK14; Cherukara desom rW52, KW2, TK3. Angadippuram village :-Angadippuram delom PW3. Kurnvambalam village :-Malaparamba desom TKI. Kuruvambalam desom . TK5, RIV. Kolathur village :-PWIB6, KWI2, TK6. Moorkanad
73
village :-Moorkanad de30m RIV. Chemmalasseri village PW2, KW6. TK4, RIV. Pulamanthole village :-Chelakkad desom PWI. TKl; Palur d~som KW2, TKI; Pulamanthole desom PWI, RIV; Thirunarayanapuram desom PWl, KWl. Eravimangalam village:- Eravimangalam desom PW164, KW29, TK23; Avinhikkad desom PW51, KWIO, TK4; Kizhungathole de30m PW156, KW25, TK24. Ebmkulam village :-Kunnakkavu desom PW80, KW20, TKlO, RIV; Elamkulam desom PW30, KW18, TK4, RIV; Paiath'Jle desom PW30, KWH, TK5, RIV; Kuzhanthara desom PWlO, KW4, TK2, RIV. Elad desom PW8, KW3, TK3, RIV; Muthukurissi desom PW18, KW8, TK4, RIV. Anamangad village :-Anamangad desom PWIOO, KW20, TKlO; Chethanakurissi desom PW50, KW20. TKI2; Muzhannamanna de30m PW30, KW15, TK5 ; Manalaya desom PW30, KWIO, TK3, RIV; Punnakkode desom PW40, KW15, TK4. Paral village :-Valamkulam desom PW156, KW20, TK9; Edathara desom PW150, KW19, TK4; Odamala desom PW50. KW15, TK2; Pariyapuram desom PW120, KW18, TK1; Paral desom PW900, KWlOO,
AlIoIENlTJES
TK14, RIV; Vazhenkada desom PW800, KW75, TKIO, RIV. Aliparamba village PW546, KW76, TK130, RIV. Chethallur village PW600, KWIOO, TK150, RIV. Thachanattukara village PW700, KW75, TK50, RIV. Bheemanad village :-Bheemanad desom PWI. Ariyur village PW513, KW9, TK2. Kottopadam village :-Kandamangalam desom PW 17; Kottopadam desom PW164, KW1, TK18; Puttanikad desom PW86, TK13. Kumaramputhur village:Kumaramputhur desom RIV Changaleeri village:-Vendakurissi desom PWS8, KW23, TK16; Kulappadam . desom PW6S, KWll, TK25 ; Changaleeri desom PW4B, KWll, TK16; Valluvampuzha desom PW43, KWI1, TK8. Arakurissi village :-Arakurissi desom PW9, KWI, TK5, RIV; Perumbatari desom TK 30; Thenkara village PW 1. Pudur village PW3, RIV. Sholayur village PW3, KW5. Agali village PW4, KW1; Pottasseri village PW6, RIV. Viyyakurissi village:-Viyyakurissi desom PWI; Pookkunnu desom PWI. Thachampara village :-Pallikurup des0m TK1, RIV; Thachampara desom PWl, RIV; Muthukurissi desom PW2, RIV. Karakurissi village :-Karakuriisi desom KW4; Pondiyambrom desorn KW2. Karurnba village PW150, KW18, TK50, RIV. Kalladicode village PW2, KW4, T~6, RIV.
Ponnani Taluk
Rural :-
Tavanur village: -Mathur desom PWl; Tavanur desom PWI. Anakkara village :-Mahzhiyam desom PWllO, TK32, RIV; Perumbalam desom PW96, TK30, RIV; Ummathoor desom PWl12, TK32, RIV ; Thottazhiyam desom PW126, TK32; Puramthilsseri desom FW64, TK20; Mundarakod drsorn PW58, TK18; Ana.kkara desorn PW180, TK35. Mudur village:-Melmuri desom PWI. Kaladi village:-Kad;:;.ncheri desom PWl; Verur cle.;om PWl. Pothanur village:-Pothanur desom PWI. Easwaramang.-tlam village :-Cheruvaikkara desom PW1; Pozhampuram desom PWI. Ezhuvathiruthi village :-Ezhuvathiruthi desom PWl; Erikkamanna desom PWI. Kanhiramukku village :-Karakkad desom PWI. Eda.ppal village :-Edappal desom PWl; Porukkara desom PWl; Thalamunda desom PW2; Thuyyam desom PWl. Kumaranellur village :-Vcllalur desom PW300, TK80; Chekkod desom PW270. TK75; K'1.11adathur desom PW60, TK20; Kumarancllur desom PW260, TK35; Amettikara desom PW20, TK8. Kudallur village :-Manniamperumbalam desom PW80, TK5; Kudallur dcsom PW300, TK35; Malamakavu dcsom I;»W125, TKB.; Nayyur desom PWIOO, TKlO; Panniyur dcsom PW60, TK4. Angadi village :Arikad dcsom PWIIO, TK 20; Otalur desom PW300, TK50; Kolathump"di de,om PW175, TK30;\ Thozhukara desom PW225, TK 40 ; Angadi dcsom. 'PWl.50, TK25. Pattithara village :-Pat ithara ' desom PWl15, TK25, RIV; Nur desom PW260, TK60, RIV. Tri:haLt village :-Trithala dcsom PW250, T,K40? RIV; Kannanur desoni PW25, TK5"
RIV; Nhangattiri desom PWIOO, TK20, RIV;:Mattaya desom PW12S, TK25. Mezhathur village:Mezhathur desom PW20J, TK40; Modavannur desom PW40, TK20; Kodanad desom PW150, TK35. Mala village :-Cheriya Kottapadam dcsom PWI0, TK2; Valiya Kottapadam desom PW150, TK15, K~kkattiri desom PW180, TKI5; Mala desom PW220, TK20; Vettcnad desom PW200, TKlS. Kuttipal!i villagc.:-Kuttipala desom PWI. P orang' village :-Panampad desom PWI. Kadavanad village :-Paduponnani desom PW4; Kadavanad desom PW2. Veliancode village :-Vcliancode desom KW3; Gramam desom KWI. Marancheri vi!lage :-Marancheri desom KW2. Eramangalam village :-Eramangalam desom KWI. Ayirur village :-Ayirur dcsom KWI. Kadikad village :-Cheruvayur desom KW2; Karlikad de30m 81; Edakara desom KW3. Punnayur village:Edakkara c!esom KW2; Punnayur desom KWI. Edakkazhiyur village :-Koranhiyur desom KWI; Edakkazhiyur desom KW4. Viyalathur village:V:valathur desJm KW2; Nhamanangad de,om KW3;. Arihur des)m SI, KWI. Vadakkckad village :-Thekkekad des om KWI. Nannamukku village :-Nannamukku desom KWI. Alangode village:-Perumukku desom KWI. Kappur village :-Kollanur desom PW150, TK 60; Kappur desom PW400. TKIOO; Kozhikkara desom PW90, TK50; Eravakad desom PW120, TK30. Othalur village :-OthJ.lur desom KWI. Kavucode village :-Thannircode desom PW281 , TK22; Pattisseri desom PW318, TK28; Kavucodc desom PW520, TK78. Chalisscri village :-Perumannur desom PW160, TK95; Kuttanad desom PW150, TK60; Alikkara dc,om PW80, TK40; Chalisseri desom PW300, TK175. Nagalasseri village :-Nandiyangode de,om PW150, TK15; Thekkev<n'anur desom PW40, TK4; Vadakkevavartur dewm PW60, TK20; Valiachalappram desom PW7S, TKIJ; Cheriachalappram de50m PW40; TKI5; N:o.g;,.lassel!i desom PW80, TK9; Pilakkattiri desom PWIOO, !TK15; Tolukkad de~om PWIOO, TK6. Thirumittacope village :-Nellikkatriri desom PW60, TK4; Rayamangalam desom PW50, TK4; Thirumitt,~code deSom PW80, TK2 ;
. .Irumbakassen desom PW50, TK4; Ezhumangad desom PW75, TKIO; Iri~gattoor desom PWlOO, TKIO. Peringannur villa~e :-Chathanur desom PW120, TK20; Velladikkunml. desom PW45, TK25;, Cherippur d~mm PW130, TK 25; Peringannur des(lm PW160, TK35; Ittonam desOln PW190, TK30; Ozhuvathar... desom PW30, .TKB. Chazhiyattiri village:-Muduppali desom PW300, TK7; Akilanarn desom PW250, TKB, Karukaputhur de~om PW150, TK6; Chazhiyattiri d~som PW300, TK6; Pallippadcm -desom PWlOO, TK7. Kethachiravillage :-Mathur desom PW80, TK15; Peringod desom 53, PWIOO. TK15; Kothachira de~om PW200, TK25.
Urban :-
Ponn~ni to~n:- Ponnani Nagaram ward PW7 h
DRINKING WATER FACILITIES
Ottapalam Taluk
Rural:-
Vilayur village:-Vilayur desom PW3; Paradiyur desom PW2. Chundampatta village :-Natiyamangalarn desom PWl; Chundampatta desom PWI. Kulukallur village PW2. K1.ralmanna village:Thekkumuri desom PWlO, KW180, TK30, RIV; Vadakkumuri desom PW4, KW150, TK20, RIV; Naduvattom desom PWI6, KW280, TK48, RIV; KaralmanRa desom PW18, KW142, T~25, RIV. Veeramangalam village :-Karumanamkurissi desom PW20, KW280, TK20, RIV; Veeramangalam desom PW15, KW285, TK30; Mangode desom PWI5, KW270, TK25; Cherumannur desom PW4, KW18, TK15; Poothakkad desom PW4, KW 110, TK15. Vellinazhi village:-Vellillazhi desum PW150, KW350, TK30, RIV; KuWmassery desom PW50, KW150, TK 13, RIV. Karirppuzha village :-Attasseri desom PW12, KW190, TK21, RIV; KUllllakad desom PWlO, KW126, TK13, R~V; Karimpuzha desom 'PW22 , KW280, TKI8, RIV. KulukiliF.d v;llage:Kulukiliyad desom PW1, KW85, TK18; Kottapuram desom PWl, KW94, TKll, RIV. Elambulassery viIlage:-Pombra des0m PW25, KW300, TK50, RIV; Elambulassery desom PW30, KW400, TK75, RIV. Pulapetta village:-Pulapetta desom PW80, KW220, TK80; Ummanazhi desom PW120, KW500, TK150. Mannambatta village:-Mannambatta desom PW15, KW185; TKIO, RIV. Kulakkattukurissi de~om PW5, KW60, TK6, RIV; Neelamangalam desom PWll, KW90, TK12; 'fhottara desom PW15, KW125, TKI5; Parthala dcsom PW8, KWa8, TK5; Kodormanna desom PW23 , KW195, TK4. Sreekrishna puram village:-Valambirimangalalll desOlIl PW20, KW148, TK 26, RIV; Easwaramangalam de,om PW64, KW146, TK28, RIV; Perumallgodc de~om PW4~, ~W158, TK23; Sreekrishnapuram dtsom PW47, KW172,TK15. Thirunarayanapuram vilh:.ge:Nhalakurissi desom PW2, KW54, TK4; Kuruvattoor desom PW8, KW23\ TKI0; Thirvazhiode desom PW6, KW206, TK7; Thirunarayanapuram desom PW4, KWI05, TR5. Moothedathu Mad<imba village:-Kulakkad desQm PW15, KW125, TK70; Pakaravoor desom' PWI Q, KW50, TK20; Atakaputhur de"om PW12, KW165, TK120; Pothi desom PW5, KW40, TK20; Kalluvazhi desom PW150, KW300, TK150. , Kattukulam village:-M ... ngdamkunnu desom PW2, KW200, TK60; ! Kinasseri de~om PW3, KW180, TK50, K<.ttukulamdesom PW4, KW330, TK80; Thanaikal desom PW1, KW120, TK40. Thanikunnu village:-Pookottukavu desom KW32, TK8; Pulapetta~sery desom PW1, KW45, TK6;
. Thanikunnu desom KW84, TK14; Thalayakkad desom KW68, TK8; Kodormannadesom KW46 , TK12. Kadambazhipuram village:-PW106, KW360, TK160. Pullundassery village:-Azhiyannur desom KW300, TK18; Pul1undassery desom KW250, TK18. Alangad village:-Vettakara desom PW60, KW125, TK95; Alangad desom PW95, KW289, TK170. Vadakkumbrom village:-Kadambur desom PW3,
15
KWl; MelUI drsom PW3, KWl; Aravakkad desom PW3, KW1. Eledathmadamba village:Munnurcode desom PW15,. KW21O, TK35 ; Vazhur desom PW2, KW28, TK6; Kizhur desom PW5, KWI05, TK25. Trikkadeeri village:Karuttukurissi desom KW62, TK8; Kottikode desom PW1, KWI02, TKl1; Trikkadeeri desom PW2, KW300, TK39. Nellaya village:-Ezhuvanthala desom PWl ; Nellaya desom PW1. Cherplachery village:-Panniyamkurissi desom PW15, KW~OO~ TK4; Vdlattukurissi desom PWI0, KW50, TK2; Cherplachery desom PW21. KW300, TK5. Munda-kottukurissi village:-PW2, KW1. Cherucodevillage:........; Vandumthura de~om PW1; Amayur village PW2. Pulassery village :-Karinganad desom PWl ; Mannengode desom PW2; Pulassery desoffi PW1. Rairanelloor viUage:-Edappalam desom PW1. Thiruvegapura village:-Thiruvegapura desom PW1; Kaipuram des0m PW1. Naduvattam village:-Vilathur desorn PW1; Kizhumuri delom PW1. Muthuthala vilIage:Muthathala desom PW2. Perumudiyur village:-Kodumunda desom PW1; Perumudiyur desom PW1. Pattambi-Palliprom village :-Kizhayur desom PW1. Vallapuzha village PW1. Kuruvattoor village:Kuruvattoor desom PW2, KW1; Kayiliyad desorn PW2, KW1. Chalavara village:-Chalavara desom PW2, KW1. Kothakurissi vil1age:-Tharavakonam desom PW2, KW3; Kothakurhsi dellom PW3, KW1; Mundanattukara desum PW2, KW1; Edakkodupavukonam desom PW2, KWl ; Panamanna village PW2, KW1. Cherumundassery. villa::rc :-Cherumunda~sery desom PW2, KWl ; Veng"ls~ery village PW2, KW1. Muldmbar village:-NellikUli·si desom PW2, KW1. Chunangad village PW4, KW1. Kanniambrom village:-Panamanna des0m KW2; Kanniambrom desom PW3. Va.n;amculam village:-Kothayur desom PW2, KW1. Koon:lthara village:-Panayur desom PW2, KW1; KOOn2.t;lz:ra dcsom PW2, KW1; Kulapully village:Kanayam desom PW3; Kulapully desom KW1. Karakkad village:-Karakkad d-csom PW2, KW1. Cherukattupulam village:-Mann~nur desom PW4> KW4. Trikkangode village:-Mannisseri deso)m PW2; KWl ; Trikkan\{ode desom PW3, KW1; Choroottur desom PW2, KW1. Palapuram village, PW6, KW1. Lakkidi village:-:r..hngalam des;)m PW4, KW1; Thekk.uffiwgalam desom PW3, KW1. Perur village:Puthur dewm PW1, KW1; Akdur desom PW3,. KWI; Perur desom PW2, KW1.
Urban:-
Pattambi town :-Netherimangalam ward . PW6. Shoranur town:-Paruthipra ward PW1; Nedungottur wald PW1; Chiramanna ward PW4. Ouapatam town:-Varode ward PWZ, KW1; Vadanamkurissi ward PW2, KWI; Ariyoor Thekkummuri ward PW6, KW2.
AMENITIES
Palghat Taluk
Rural:-Peringode village :-Thrippalamunda cesom PW1;
Peringode desom PWI. Cheraya village PW2. Kong.d village PWB. Kanhikkulam village PWI. Nochippulli. village PWI. Mundu!" village :-Mundur desom PW4; Oduvangad desom PWl. Ezhakkad village PW2. Poothanur village PW2. Kundalassery village PW2. Thadukkasseri village:-Vatasseri desom PW 1; Thadukkasseri desom PWl. Mannur village PW4-. Nagaripuram village :-:Peradikunnu desom PWl; Nagaripuram desom PWl. Mankarai village :-Mankarai desom PW6; Ohemmuka desom PW3. Kizhakkumpuram "mage PW3. Keralasseri village PW2. Kallur village :-Kallur desom PWl; Kannampariyaram desom PWI. Mankurissi village PW2. Thenur village PW2. KinavaUur village PW2. Edathara village:Odanur desom PWl; Edathara desom PW2. Villikode villagePWl. Puduppariyaram village FWI. Akathethara village PW70, KW7, TK12, RIV. Kadukkamkunnu village PW80, TK2, RIV. Kottckkad village PWl12, KW5, RIV. Kavalppad village PWlOO, KW4-, TK16. Vadakkahthara village :-Kallekkad desom PWl; Vadakkanthara desom PWS, KW4-, TK7, RIV. Kodunthirapully village PW150, KW4o, 'FKH, RIV. Pirayiri village PW5, KW50, TK25, RIV. Yakkara village PW120, KW12, TK4-, RIV. Puthur village PW4-8 , KW8, TK8, RtV. Koppam village PW14. Kallepully village PW76, KW8, TK12. Marutha road village PW70, TK8. Karinkarapully village PW50, KW8, TKII. Kunnanur village PW48, TK5. Kannadi village :-Kadalakurussi desom PW 1; Kadakurussi desom PWl; Kannadi desom PW130, KWH, TK65, RIV. Kinasseri village PWI, TKI; Thiruvalathur village PW4, TKl, RIV. Kodumba village PW5 TKl, RIV. Pallatheri village :-Pallatheri desom PW3, TKl; Ennappadamdesom PWl, TKI. Vengodi village:-Ramasseri desom PWl, TKI; Vengodi desom PWl, TKl. Pudusseri village PW5, TKl, RIV. Elappully village PW5, TKI. Thenari village PW5, TK1. Olasseri village PW3, TKI, RIV. Tassrack "mage PWI, TKl. Thanisseri village PW3, TKI. Peruvemba village PWI, TKI. Palathulli village PW4-, TKI, RIV. Panayur village PW8, TKI. Polpully village PW1, TIO. .
Urban:-Palghat (Municipal) :-Ward 1 RIV; ward 2 RIV;
ward 3 IUV; ward 10 81; ward 13 RIV; ward 14 RIV; ward 15 RIV; ward 16 RIV; ward 27 RIV; ward 28 RIV.
Mathur Taluk
Ru,al:-Peringottu~urissi village PW7. Bemmanur
• iUage :-Pilappully desom PW3; Bemmanur desom
PW2. Kottai villa:ge PW2. Chembrakulam village PW3, 81. Varode vIllage PW2. Thachangad village:_ Vallikode desom PW2; Anikode desom PW 1 ; Thachan. gad desom PW3. Mathur village PW4-. Pallanchathanur village :-Veswalam desom PWI; Pallanchathanur desom PW2. Chenganiyur village:_ Chenganiyur desom PW3. PulineHi Village PW3. Paruthippully village PW 4. 'Kuthanur village PW6. Tholanur village PW2. Choolanur village PW3. Pazambalakode village PW5. Tharur village:-Tharur desom PW 4; Athippotta desom PW2. Vavulliapuram village PW5. Coyalmannam village PWli 81. Kannanur village:-Kannanur desom PW2; Puthukkode desom PW2. Kalappatty village PW3. Thenkurissi village PW5. Vulayanchathanur Village PW4. Vilayannur village PW3. Perinkunnu village PW2. Manhalur village PW",. Erimayur villa~e PW3, S1. Puthiyankam village PW4. Kavassery village PWll. Kazhani village:-Padur desom PW3; Kazhani desom PW2. Kannanur Pattola village PW4. Thennilapurm village PWl. Kottusseri village PW4, S3. Mangalam village PW2. Manhapra village :-Manhapra desom PW6 ; Konnancherry delom PW3. Pudukkode village PW3, S1. Kannambra village :-Kannambra desom PW3; Rishinaradamangalam desom PW2. Aayakkad village :-Paruvasseri desom PWI; Aayakkad desom PWI. Vadakkancherry village PW5, S1. Kizhakkancherry village PW4-. Vandazhi village PW6, SI. Mudappallur village PW3. Chittilencherry village PWl. Vadakkethara village :-Pullode desom PW5; Vadakkethara desom PW7. Thekke.thara village PW I. Cheramangalam village PW2. Kunisseri village PW8. Vembalur village PW3.
Chittur Taluk
Rural :-
Thathamangalam village RIV. Chittur village RIV. Perumatty village. RIV. Vallanghi village PWI, KWl. Aybor viUagei 81. Thiruvazhiyad village RIV. Pothundi villate RIV. Mulathura village RIV.
Urban :-
, Nemmara town SI. Chittur-ThathaIllangalam (Municipal) :-Ward 1 PW9~ KWI5, S2, TK2; ward 2 PW 205, KW5, TK1; ward 3 PW150, KWIO; ward 4 PW9,5, KW20, TK2; ward 5 PW180, KWlO, TK3;' .ward.6 PW128, KW8, TK2, SI; ward 7 PW65, KW12, TKI; ward 8 PW150, KW20; ward 9 PW80, KW,?, TKl; ward 10 PW225 KW4-; ward 11 PW50, KW10, TK2; ward 12 PW325, KW70, TK3; ward 13 PW150, KW9, TK2; ward 1+ PW125, KWI5, TK2; ward 15 PW124, KWI3, TKl; ward 16 PW126, KW20,.TK2; ward17 PW185, KW 18, TK2; ward 18 PWllO; KW22, TKlj
I. ward 19 PW1l2, KW30, TK2 .
76
4 COMMUNICATION AND TRANSPORT FACILITIES
PO for Post Office TO for Telegraphs Ph for Phone ~H for Rest House R for connected by Road W for co nnected by Water Rly for connected by Railway Ch for Choultries i
Perintalmanna Taiuk
Rural :-
Mankada-Palliprotn village :-Vallikkapatta desom R, Wi Padinhattumuri desom POI, ChI, R, W; Mankada-Palliprom dtsom POI, ChI, R, W. Kadannamanna village:- Vellila desom PO 1, R; Kadannamanna desom POI, R; KarkitJgam desom R. Nemmini village:- Tachinganedam desom POI, R. Kizhattur village:- Kondiparamba desom R; Poonthavanam de.;om R; Kizhattur ~esom PO 1. Mehttur village:Manazhi desom R; Melattur desom POI, TOI, ChI, R, Rly. Edapatta village:- Velliancheri desom POI; Pathiricode desom POI; Edapatta desom POI, R, Rly. Edathanattukara village PO 2. Thiruvazhamkunnu village PO I, RHI, R. Alanellur village PO I, R. Karkitamkunnu village:- Karkitamkunnu desom R. Vengur village:- Chemmaniyode desom POI, R, Rly; Vengur desom R, Rly. Mulliakurissi village:- Pattikkad Clesom POI ,R, Rly. Mankada village:- CheriY,Cfn crcsom R; Mankada d~som POI, R. Vadakkangara village:Kachinikkad desom R; Punarpa desom R; Makkaraparamba desom POI, R; Vadakkangara d('sorn POl. Kuruva village:- Vattalur de,om POI. Pazhamallur village :- Chemmankadavu desom POI, R; Pazhamallur, de:om pal. Kottilangadi village:Kadukur desom POI, R. Kodur village:- Kodur desom PO I, R; Vadakkamanna desom R. Pang viUage POI, R. Kadunga.f'uram village:- Kadungapuram desom POI, R. Puzhal4<attiri village:- Panangagara deaom R; Ramapuram desom POI, R; Kattilasseri desom R; Puzhakkattiri dellom POI, R; Pathirirr.anna desom R. Cherakkdparamba village:- Puthanangadi desom POI. Valambur village:~ Valambuc desom POI, R, Rly; Thirurkad desom POI, R; Chathanellur desom Rly. Kakkooth village:-r Ponniakurissi desom POI, R; Kokkooth desom RHl, R; Manathmangalam desom R; Cheerattamanna desom Rly. Kariavattam viIJage:- Kariavattam desom R; Pallikkuth desom PO 1, R; Mannarmala desom PO I, R; Pacheeri desom R j Theakkad desam R. Vettathur village PO 1, R. Arakkuparamba village :- Al'akkuparamba desom POL Thazhekkode village R. Pathaikara ,:illage :- Amminikkad cesam R, Pathaikara desom R. Perintalmanna village:Perintalmanna desom POI, TOI, PhI, RH2, R; Kunnappulli desom R; RIy; Cherukara desom R; Rly. Angadipjmram village:- Angadippuram desom PO 1, TOI, R, Rly; Pariyapuram desom·POl, TOI, R, Rly. Kuruvambalam village :-Kuruvambalamdesom POI
77
R. Kolathur villal1;e PO 1, R. Moorkanad village:Vengad desom POI, R; Moorkanad desom POI R W. Chemmalasseri village PO I, R. Pularnanthole viUage:P_ulaman~hole . deso:n POI, R. Eravimangalam vIllage:- EravImangaIam desom R; Avinhikkad desom R:. Kizhungathole desom POI, R, Rly. ElankuI~m vIllage:- Kunnakkavu desom POI, Elamkulam desom R, W; Pal2lthoI desom W; Kuzhanthara desom W; Elad desom W; Muthukurissi desom POI, W. Anamangad village:- Anamangad desom PO 1 R' Chethanakurissi desom R. Pard vilhge: - Ed~th.1.~a desom R; Paral desom POI, R; Vazhenkada desom POI. Aliparamba. village PO 1, R, W. Chethallur village P02. R. Thachanattukara village P02, RHl, R. Bheemanad vill:1ge :- Vadassiriprom desom R; Bheemanad desom PO 1, R. Ariyur village PO 1, R. Kottopadam village :_ Kanda~nangaiam desom R; Kottopadam dewm POi, ~; Puttamkkad desom R. Kumaramputhur village:Payyanedam desom pal, R; Kumaramputhur desom POI, R; Changaleeri village ;- Vend:::.kurissi de~om W; Kulappadam desom R, W; Changaleeri desom POI, Rj W; Valluvampuzha desom R, W. Arakur.issi vlllage:- Arakurissi desom PO 1, TO 1 , RH 1; R; Perimbatari desom PO 1. Thenkara village PO 1, R. Agali villa~e P02, R~2, R. ~o.ttds~eri vilbge P02. Viyyakurissi village:-V lyyakurNl desom PO I; Pookkunnu desom R; Pulisseri desom PO 1. Thachampara village:- Trikkalur desom R; Pallikkurup desom PO 1, R; Thachampara desom POI, R; Muthukurissi desom PO I, R. Karakurissi village:- Karakurissi desom P02. Karimba village POI. Kalladicode village POI, RHl, R.
Ponnani Taluk Rural :-
Tavanur village :-Mathur desom R, W; Athalur desom R; Tavanur desom POI, R, W; Muvvankara de>om R; TrippaIur desom R. Thrikkanapuram village :-Vellancherry desom POI, W; Mathirasseri desom R,W ; Kurada desom R. Trikkanapuram desom R; Ayamkulam de::;om R. Anakkara village:Melazhiyam dcsom R; Ummathoor desom R; Thottazhiam desom POI, R; Puramthilsseri desom R ; M undarakode desom R; Anakkara desom PO 1. R. Mudur village :-Mehnuri desom It; Cheganur de50m R ; Mudur desom PO 1. Kaladi village:Kizhumuri desom POI, ·R; Verur desom R. Pothanur village :-Naripparamba ddOm POI, R; Thandilam desom R. Ea\waraman~alam village :-Easwara ... manialam desom PO I, R, W ; Cheruvaikkara desom R;
Pozhampuram desom R j Kothathara desom W. Ezhuvathiruthi village ::'_Punnathiruthi desom POI, TOI, Ph I, R, W j Ezhuvathiruthi desom CH 1, R, W; Erikkamanna desom R; Karukathiruthy desom R, W; Theyyangad desom R. Kanhiramukku village :-Kanhiramukku desom PO I, R, W; Karakkad deSGm R, W. Edappal village :-Perumparamba desom R; Ponnazhikk'::',ra desom R; Porukkara desom R; Thalamunda desom R; Thuyyam deJom PO I, Phi, R. Vattamkulam village:-Thaikad desom R ; Vattamkulam desom POI, R. Kumaranellur village:Vellalur desom POI, R; Chekkod desom R; Kalladathur desom R; Kumaranellur desom R; Amettikara desom R. Kudallur village :-Manniamperumbalam desom Rj Kudallur desom POI, R; Malamakavu desom R; Nayyur de&om R. Angadi village :-Otalur desom R; Kalathumpadi desom' pal, R ; Thozhukara desom R; Angadi desom POI, R. Pattithara village :-Pattithara desom R; Alur desom PO I, R. Trithala village :-Trithala desom POI, RHI, R; Nhangattiri desom POI, R; Mattaya desom R. Mezhathur village :-Mezhathur desom PO I, R ; Kodanad desom R. Mala village :-Valiya Kottapadam desom R j Kakkattiri desom R ; Mala desom R; Vattenad desom R. Kuttipala village:Sukapuram desom PO I, R; Kuttipala desom R. Kololomba village :-Ailakad desom R; Venginikkara desom R ; Pookarathara desom PO 1, R. Po rang village :-Porang desom R, W; Panampad desom pal, R, W. Kadavanad village :-Paduponnani desom R, W. Kadavanad desom POI, W. Vdiancode village :-Veli~mcode desam POI, Rly; Gramam desom Rly. 'Marancheri village :-M<"rancheri desom PO I, R. Eramangalam village :-Perumudisseri desom R; Eramangalam desom PO I, R. Ayirur village:Puthiruthi desom R, W; Koduthur desom R; Ayirur desom POI, R, W. Kadikad VIllage :-Cheruvayur desom R, W; Kadikad desom POI, R, W; Edakara desom R, W. Punnayur village :-Akilad desom R, W. Edakkara desom W; Punnayur desom PO I, R. Edakkazhiyur village :-Aviyur desom R; Koranhiyur desom R; Edakkazhiyur desom POI, PHI, R, W. Viyalathur Village :-Viyalathur desom R; Nhamanangad desom POI, TOI, Ph2, R: Anhur desom R. Vadakkekad village:-Vadakkekad desom PO I, R ; Kavuk.k.anappetty desom R; Kochannur desom R; Thekkekad desom R. 'Punnayurkulam village:PunnayurkullJ.m desom PO I, R; Chemannur desom R; Parur desom R; Kuppravalli desom PhI, R. Perumpadappa village :-Perumpadappa desom PO I, R, W. Nannamukku viUa~e :-Thekkumuri desom W; Pidavannur desom W ; Kallurma desom W ; Nannamukku desom POI, W. Pallikkara village:Vadakkumury desom Rly; Kanhiyur desom Rly; Pallikkara desom POI, Rly. Alangode village :Panthavoor desom R ; Kakkadipuram desom R; Alangode desom POI, W; Perumukku desom R. Kappur village :-Kollanur desom R; Kappur desom POI, R; Kozhikkara desom R. Othalur village:Chiyyannur desom Rly; Kokkoor desom Rly; Othalur desom POI, Rly; Kizuakkara desom Rly. Kavucode village :-Than~ircode desom P02, R; Kavucode
78
desom POI, R. Chalisseri village :-Perumannur desom R; Kuttanad desom R ; Chalissen desom R. Nagalas5eri village :-Nandiyangode desom PO I, R; Thekkevavanur desom PO I, R; Vadakkevavanur desom R; Valiachalappram desom R; Cheriachalappram desom R; Nagalasseri desom pal R· Tolukkad desom R. Thirumittacode village :-Nelli: kattiri desom R; Thirumittacode desom R; Irumhakasseri desom PO I) R; Ezhumangad desom R. Iringattor desom R. Peringannur village :-Chathanur desom PO I, R ; Velladikkunnu desom R; Chazhiyattiri village :-Maduppalli desom R; Akilanam des0m R; Karukaputhur desom R: Chazhiyattiri d~om PO 1, R ; Pallippadam desom R. Kothachira village : -Pedngod desom PO 1, R ; Kothachira desom PO I, R.
Urban :-Ponnani town :-Ponnani Nagaram ward PO I
TOI, PhI, RhI, R, W: VeIled ward R, W; Pallapuram ward R.
Ottapalam Taluk Rural:-
Vilayur village:-Paradiyur desom pal, R. Chundampatta village :-Chundampatta desom POI, R. Kulukallur village :-POl, R, Rly. MaryamangaJam village POI, R. Karalmanna village:-Thekkumuri desom POI; Vadakkumuri desom R; Naduvattom desom POI, R; Karalmanna desom R. Veeramangalam village:Karumanamkurissi desom POI, R; Veeramangalam desom POI; Mangode desom pal, R; Cherumiinnur desom R. Vellinezhi village:-Vellinezhi des om POI, R j Kuttanassery desom POI, R. Karimpuzha village :-Karimpuzha desom PO I, R. K ulukiliyad village :-Kulukiliyad desom R; Kottapuram desom PO 1, R. Elambulassery village :-Pombra desom PO I j Elambulassery des')m PO 1. PuJapetta village:Pulapetta desom PO I, _ R ;. P mmanazhi desom PO I, R' Mannamhatta village :-Mannambatta desom R; Thottara desom POI,,R; Kbdormanna des0m R. Sreekrishna puram village f-Valambirimanga lam desom POI, R; Easwaramangalam desCj)m R; Peruman&ode desom POI, R; SreckrishnaiJuram desom R.ThiruIiarayanapuram village:-Kuruvattoor dC30m POI, PhI; Thirvazhiode desom pol, R; Thirunarayanapuram desom R. Moorhedathu "Madamba village:Kulakkad des')m POI, Rj Palliaravoor desom R; Atakaputhur desom R; Pothi deaom R; Kalluvazhi desom POI, R. Kattukulam village :-Mangalamkunnu desom R; Kinasseri desol11 R; Kattukulam desom P02, R. Thanikunnu village :-Pookottukavu desom R'; Pulapettassery desom R; Kodormanna de:;om R. K adambazhipuram village R. , Pullundassery village :'-Azhiyannur desom R; Pullundassery desom PO 1, R. Alangad village :-Alangad desom PO 1. Vadakkumbrom village:-Kadumbur desom POl, R; Melur desom pal; Aravakkad desom POI. Eledathmadamba village:-Mannurcode desom pal, R; Kizhurdesom POI, R. Trikkadeeri village:-Karuttukurissi desom POI, R; Kuttikode desom R;
COMMUNICATION AND TRANSPORT FACILITI:U
, 'Trikkadeeri desom POI, R. Nellaya village:-Ezhuvan. thala desom POI, R; Nellaya desom POI, R. Cherplachery village :-Panniyamkurissi desom R; 'Cherplachery desom PO 1, TO I, Ph 1, R. Ezhuvanthala village :-Erimbulassery desom POI, R. Mundakottukurissi village PO I. Cherucode village:Mannayengode desom POI, R; Vandumthura desom 'R; Cherucode desom POI, R. Amayur village POI, R. Pulassery village :-Karinganad desom R ; . Pulassery desom PO 1, R. Rairanelloor village:Edappalam desom PO I , R. Thiruvegapura village:-Chembra desom POI, R; Thit:uvegapura ,de30m POI, R; Nariparamba desom IPOI, R; Kaipuram desom R. Naduvattam village:-Vilathur
·desom POI; Naduvattam desom POI, R; Kizhumuri de::om POI, R. Muthuthaia village :-Muthuthala des om PO I, R; Melmuri de30m PO I, R; Kozhiko. ttusseri desom PO I, 'R. Perumudiyur village :-
··-Kodumunda desom PO 1, R; Perumudiyur desom POI, R. Maruthur' village:-Kodalur desom R; 'Poovakode desom R; Maruthur desom PO 1) R Pattambi-Palliprom village :-Kondurkara desom R ; Palliprom de::om R; Karakkad desom POI, R, Rly. Kalladipetta villar,e :-Pulassarikara desom R; Perokara desom R; M00loorkara desom POI, R. Vadanamkurissi village:-Vadanamkurissi desom PO I, R ; Kuzhiyanamkunnur desom R. VaUapuzha village POI, R; Rly. Kuruvattoor village :-Kul'llvattoor desom POI; Kayiliyad desom POI. Chalavara village: -Chalavara desom POI. Kothakurissi village :--Kothakurissi desom POI, R. Panamanna village PO 1, R. Cherumundassery village :-Cherumundassery desom POL Vengassery village POI, R. Mulanhur village :-Nellikurissi desom POI. Chunan
,gad v]lage POI, R. Kanniambrom village:Panamanna desom PO I ; Kanniambrom desom PO 1. Vaniamkulam village :-Kothayur desom POI, R: Koonathara village :-Panayur desom POI, R; Koonathara desom POI, R. Kulappully village:Kulappully desom POI, R. Karakkad village:Karakkad desom PO I; Eruppa desom PO 1. Chel'llkattupulam village :-Mannanur desom POI, R, Rly. Trikkangode village :-Mannisseri desoI? PO I, R ; Trikkangode desom POI, R. Palapuram VIllage POI, R, Rly. Lakkidi village :-Mangalam de,om POI; Thekkumangalam desom POI, R, Rly. Perur village :-Puthur d~som Fa I, R; 4kalur de30m PO 1 ; Perur desom POI, R, Rly. .
Urban:- , Pattambi Town :-Vallu~ ward R; Netheri
mangalam ward P02, TOI, PhI, R, Rly. Shoranur Town :-Pal'llthipra ward R, Rly; Mundamuka ward POI, R; Nedungottur ward R; Chuduvalathur ward POI, R; Chiramanna ward POI, TOI, PhI, R, Rly. Ottapalam Town :-Varode ward POI; Ariyoor Thekkumuri ward P02, TOt.
Palghat Taluk Rural:-
Peringode village:-Trippalamuuda desom PO I, R; Peringode' desom POI, R. Cheraya village POI,
R ; Kongad vi~age p.O~, R. Kanhikkulam village :_. POI, R. Nochlppulh vIllage POI. Mundur vilJ"ge:Mundur desom POI, R; Oduvangad dellom POI, R •. Ezhakkad village ~O I, R. Poothanur village PO 1. Kundalassery VIllage PO I, R. Thadukkasseri village :-Vatasseri desom R; Thadukkasseri desom P.Ol, R. Ma~nur Village POI, R. Nagaripuram VIllage :-Paradikunnu desom R ; Nagaripuram desom POI, R. Mankarai village :-Mankarai desom POI, TO I, R, Rly; Chemmuka desom R. Kizhakkum • puram village POI, R. Keralasseri village POI R. Kallur village :-Kannampariyaram desom POI' R. Mankurissi village PO I, R. Thenur village POI Tal, R, Rly. Kinavellur village POI, R t Rly: Edathara village :-Odanur desom R, Rly. Edathara desom POI, TOI, R, Rly. Vallikode village POI, R. -Puduppariyaram village POI, R. Akathethara village P03. Kadtikkamkunnam village P02, TO I, Ph 7, ChI, R, Rly. Kottekkad village POI, Rly. Kavalppad village POI, Tal, PhI, R, Rly. Vadak~ kanthara village:-Kallekkad desom POI, R: Vadak. kanthara desom P04, Ph7, R, Rly. Kodunthira. pully village PO 1. Pirayiri village P04-, Ph5 ChI, R. Yakkara village P02, Tal, R, Rly. Puthur village poa, T02, Ph6. Koppam village P04, T03, RH3, R, Rly. Kallepully village POI PhI. Marutharoad village POI, ChI, R. Kari~karapul1y village POI, R. Kunnanur village P02 Ph5 R. Kannadi village :-Kadalakurissi des~m R; Kadakurissi desom R; Kannadi desom POI, R. Kinasseri village POI, R. Thiruvalathur village PO 1 R. Kodumba village POI, R; Pallatheri village:Pallatheri desom POI; Ennappadam desom R. Vengodi village : - Ramasseri desom PO 1, R. Vengodi desom POI,.R. Pudus3eri village P04, ChI, R, Rly. Elappully VIllage P02, TOI, PhI, CHI, R. Thenari village POI, R. Olasseri village POI, R. Tassrack village R. Thanisseri village R. Peruvemba village POI, R Palathulli village POI, R. Panayur villc.ge POI, R. Polpully village pal, R.
Urban :-Palghat (Municipal) :-Ward I Ph3; ward 2 POI,
TOI, Ph2; ward 3POl, TOI, Ph3; ward 4 PhI: ward 7 POI, TOI, Ph9; ward a RHI, R; ward 9 POI, Tal, Ph8; ward 10 PhU; ward 11 Ph19, RHl; ward 12 P02, TOI, PhS; ward 13 Ph3; ward 14 POI, Ph32; ward IS PhI; ward 16 PhI ;ward 18 POI, TOI, Ph2;warcl I9Ph20;ward 20 Ph 100. CHI,Rly; ward 21 POI, TOI; Ph39, RHI; ward 22 POI, Ph2; ward 23 PhI2 ,ward 24 POI, Ph8; ward 25 PhI; ward 26 POI, Ph3; v.ard 27 Ph3; ward 28 POI, Tal, Ph23, Rly.
Alathur Taluk
Rural :-
Peringottukurissi village POI, R. Bemmanur village :-Pilappully desom R; Bemmanur desom R.
. Kottai village PO 1, ChI, R; Chembrakulam village POI, Tal, R. Varode village POI, R. Tachangad village :-Vallikkode desom R; Anikkode desom R; Thachangad desom pal, R. Mathur village P02 .... R.
79 25/224-11
" AMENITIES
Pallanchathanur village :-Veswalam desom R; Pallanchathanur desom PO 1, R. Chenganiyur village :-Chenganiyur desom R; ThanniranjCad desom R. Pulinelli village PO 1, R: Paruthippully village POI, R. Kuthanur vi.llage POI, R. Tholanur village PO 1, R. Choolanur Vlllage PO 1, R. Pazambalakode village:-POI, R. Tarur village :-Tarur desom POI, R . Athipotta desom POI, R. Vavulliapuram village POI, R. Coyalmannam village P03, TOI, PhI, R. Kannanur village :-Kannanur desom R; Puthurkkode desom POI, R. Kalappatty village POI, R. Thenkurissi village PO I, R. Vilayanchathanur village R. Vilayannur village PO 1, R. Perinkunnu village PO 1, R. Manhalur village PO I, R. Erimayur village PO I, R. Puthiyankam Village POI, R. Kavassery village POI, R. Kazhani village :-Padur desom PO I, R. Kazhani desom POI, R. Kannanur Pattola village P02, R. Thennilapuram village POI, R. Kattusseri village P02, TOI, PhI, RHI, R. Mangalam village POI. R. Manhapra village :-Manhapra desom POI, R; Konnancherry desom R. Pudukkode village POI, R. Kannambra village ;-Kannambra desom R; Rishinaradamangalam desom POI, R. Aayakkad village:ParuvaS$eri desom POI; Aayakkad desom POI, R. Vadakkancherry village POI, TOI, PhI, RHl, R. Kizhakkancherry village P03, R. Vandazhi village POI, RHI. R. Mudappalur village POI, R. Chittilencherry ~illage PO I, R. Vadakkethara village :-Pullode desom PO 1, R. Vadakkethara desom R. Thekkethara village PO I, R. Cheramangalam village POI, Kunnisseri village POI, R. Vembalur village PO 1.
Chittur Taluk Rural:-
Koduvayur village POI, TOI, PhI, RHI, R, Rly~ Thathamangalam village POI, TOI, PhI, RHI Chittur village PO 1, TO 1, Ph 1, Ch 1. Thekkedesom village POL Nallepully village POI, TOI, PHI. Vadakarapathy village POI. Eravattaparapathy village POI. Thenampathy village POI. Ozhalapathy village POI. Manchikunnampathy village POI. Kozhinjampara village P02, TO 1, RHI. Eruthempathy village POL Kunnamkattupathy village POI. Perumatty village POI. Vadavannur village POI, R, Rly. Pallassena village PO 1, R. Ethanoor villag~ PO 1. R. Kakkayur village POI, R. Pallavoor village POI, R. Koodallur village POI, R. Vallanghi village POI, R. Ayloor village POI. Thiruvazhiyad village PO 1. Pothundi village PO I, R. Elavancherry village PO 1, R. Vattakkad villa~e PO I, R. Kollangode village PO 1, R. Panangattiri village PO I, R. Payyalloor village PO 1, R. Kezhakethara village PO 1, TO 1, PhI, THI, R. Muthalamada village POI, RHI R, RIy. MuIathura village POI.
Urban:-Nemmara town POI, TOI, PhI. Chittur Thatha
mangalam (Municipal) ward I POI, Ph2, R ; ward 2 PhI, R; ward 3 PhI, R, ward 4 R; ward 5 POI, TOI,Ph4, ChI, R;ward6R;ward7R; ward8Ri ward 9 R; ward 10 POI, PhI, R; ward 11 R; ward 12 POI, PhI, RHI. R ; ward 13 PhI, R; ward 14 POI, PhI, R; ward 15 R; ward 16 R; ward 17 POI, TOI, Phi, R; ward 18 R; ward 19 ChI, R.
5 ELECTRIFICATION FACILITIES
Perintalmanna Taluk
Rural :--
E
E (I) E(A)
E(D)
Karkitamkunnu village:-Karkitamkunnu d~,om E (D). Vadakkangara village:-Punarpa desom E(D) ; Makkaraparamba desom E(D); Vadakkangara desom E(A) 4, E(D). Kuruva village:-Kurava desom E, E (A)I, E(D); Vattalur desom E(D); Ayinikkad desom E(D); Karinchapadi de30m E(D). Kodur village:Vadakkamanna deaom E(D). Kakkooth village:Kakkooth desom E, E(I)I; E(D); Mmathmangalam desom E, ECD). Path<tikara v:Ilage:-Pathaikarade30m E(D). Per:ntalmanna village:-Perintalmanna des)!ll E, E(I)3, E(A)I, ECD); Kunnappulli desom E(D). Angadippuram village:-AngJ.dippuram d::som E (D). Pulamanthole village:-Pubmanthol:: de30m E(O). Eravimangalam v:Ilage:-Kizhungathob deso!ll E
for Electricity
for Industrial use
for Agricultural use
for Domestic use
(M2, E(D). Elankulam vlllage:-Elankulam desom E, E(A)2, E(D). Arakurissi village :-Arakurissi desom E, E(D); Perimbatari desom E(lI). T~enkara villaf!e E(D). Viyyakurissi village:-Viyyakurissl desom E(D); Pookkunnu d;;:som E(D). Karimba village E(I)I, E
. (D). Kalladicode village E(D).
Ponnaui Taluk
Rural:-Easwaramangalam village :-Ea$waramar.galam
desom E(D); Cheruvaikkara de30m E(D); Pozham, puram d~;om E(D). Ezhuvathiruthy village:-Punna· , thiruthi desom E(D); Erikkamanna de30m E(D); " Theyya'lgad d~som E(D). Edappal village:-Edappal
desom E(A)I. EtD); Porukkara de3oD) E(I)l, E{D); Thalamunda de~om EI CD). Vattamkulam village:-
80
ELECTRIFICATION FACILITIES
Vattamkulam desom £(D); Kuttipalavillage:-Puramundekaddesom E(D). Kavucode village:-Kavucode 'desom E, E(I) I, E(D). Chalisseri village:-Chalisaeri desom E. E(D). Thirumittacode village:-Ezhumangad dcsom E, E(D). Kothachira villagc:-Peringod desam E, E(A) 3, E(D).
Urban :-. Ponnani town :-Ponnani Nagaram ward E(I) 1
E(D) ; Velleri ward E(D) ; Pallapuram ward E(D). '
Ottapalam Taluk Rural :-
Chundampatta village :-Natiyamangalam desom E. Karalmanna village:-Karalmann'l desom E(D). Veeramanga1am village:-Karumanamkurissi desom E(D). Pullundassery viUage :-Azhiyannur desom E(D). ~rikkadeeri village:-Trikkadeeri desom E(D). Nel!aya vlllage:-Ezhuvantha\a desom E; Nellaya desom E. Cherplachery village:-t-Panniyamkurissi desom E{D)· Vellattukurissi desom teD) ; Cherplacherydesom E(D): AmaylJr village E. ' Thiruvegapura village:-Thiruvegapura desom E. Vadanamkurissi viIlacre:-Vadanamkurissi desom E; Kuzhiyanamkunnu; desom E. Kothakurissi village :-Kothakurissi desom E. Panamanna village E. Kanniambrom village:-Kanniambrom' .oesom E, E(D); Thottakara desom E(D). Vaniamkulam village:-Kothayur desom E, Pulachithara desom E. Karakkad village:-Karakkad desom E, Eruppa desom E. Lakkidi village :-Mangalam dcsom E; Thekkumangalam desom E.
Vrban :-I
Pattambi town :-~etheriman!!alam ward E. Shoranur town:-Paruthipra ward"'E; Mundamuka ·ward E; Nedungottur ward E ; Chuduvalathur ward E; Chiramanna ward E.
Palghat Talak
Rural:-
Peringode 'liillage:-Peringode desom E(l) 1. Cheraya village E(D). Kongad village E(T)I, E(D). Kanhlkkulam village E(D). Mundurvillage:-Mundur desom E(l)l, E(D). Mannur village ECD). Mankarai village:-Mankarai,desoIl\ J;'.(D)j Chemmuka desom E(D). Mankurissi village E(I)I, E(D). Thenur village E(I)I, ECD). 'Kinavallur village E(D). Edathara vjl}age:-Edathara desom E(I)I, E(D). Puduppariyaram village E(l)I,; E(D). Akathethara village E(l)l, E(D). Kadukhmkunnam village E(D). K;avalppad village E(l) 1, E(D). Vadakkanthara vIllage:-Vadakkanthara desom E(I)I, E(D). Pirayiri village E(l)l, E(D). Yakkara village E(I)I, E(D). Puthur village E(l)l, E(A)I, E(D). Koppam village .E(l)I, E(D). Kallepully village E(I)I, E(D). Marutharoad village E(I)I, E(D). Kunnanur village E(I) I, E(D). Kannadi village :-Kannadi desom E(1)I, E(D). Kinasseri village E(D). Koftumba village E(D). Pallatheri village:-Pallatheri desom E(D); Ennappadam desom E(D). Vengodi vilIage:Ramasseri desom E(D); Vengodi desom ECD).
81
Pudusseri village E(D). Eiappully village E(D). Thenari village E(D). Tassrack village E(D). Peruvemba village ECD). Panayur village E(D). Polpully village E(D).
Urban:-
Palghat (Municipal):-Ward 1 Ej ward2E; ward 3 E; ward 4 E; ward 5 E; ward 6 Ej ward 7Ei ward B Ej ward 9 E; ward 10 E; ward 11 Ej ward 12 E; ward 13 E; ward 14 E; ward 15 E; ward 16 E; ward 17 E; ward 18 E; ward 19 E; ward 20 E; ward 21 E; ward 22 E; ward 23 E; ward 24 E; ward 25 E; ward 26 E; ward 27 E; ward 28 E.
Alathur Taluk Rural :-
Peri~gottukur~ssi vil~age E, E(l) 1, E(D). Bemmanur vlll~ge :-Pilappudy desom E. E(D); Bemmanur desom E, E(I) I .. E(D). Kottai village E, ECD). Chembrakulam village E, E(l) I, E(D). Varode village E, E(D). Pallanchathanurc village :-Pallanchathanure desom E, E(l) I, E(D). Pulinelli village E E(I) 1 E(D). Earuthippully village E, ECD). Kuthanu: village E, E(I) 1, E(D). Pazhambalakode village E E(I~ 1, E(D). Tarur village :-Tar:lr desom E, E(D); Athlppotta desom E, E(D). Vavulhapuram village E E(D). Coyalmannam village E. E(I) 1, E(D). Kan~ nanur village :-Puthukkode desom E, E(D). Thenkurissi village :-E, E(I) I, E(D). Vilayanchathanur village E, E(D). Vilayannm village E, E(I) 1, E(D). Manhalur VIllage E, E(I) 1, E(O). Erimayur village E, E(l) 1, E.CD). Puthiyankam village E, E(l) 1, E(D) Kava!sery VIllage E, E(I) 1, E(A) 1, E(D). Kazhani village :-Padur desom E, E(D); Kazhani desom E E(l} I, E(D). Kattusseri village E, E(l) 1, E(D): Pudukkode village E, E(I) I, E(D). Kannambra village :-Kannambra desom E, E(1), E(D); Rishinaradamangala~ desom E, E(I) 1, E(D). Aayakkad village :-Paruvas5eri desom E, E(D). Vadakkancherry villz.ge E, E(I) I, E(D). Kizhakkancherry village E, ECD). Vandazhi village E, E(D). Mudappallur village E, E(I) I, E(D). Chittilencherry village E, E(l) 1, B(D). Vadakkethara village :-Pullode desom E, E(l) 1, E(D); Vadakkethara desom E, E(I) 1, E(D). Thekkethara village E, E(l) 1, E(1)). Kunislcri village E, E(I) 1, E(D).
Chittur Taluk Rural:-
Koduvayur village E, E(I) I, E(A) I. Thathamangalam village E, E(l) I, E(A) 1, E(D). Chittur village E, E(I) 1, E(A) 1, E(D). Thekke desom E(D). Nellepilly village E(D). Vadakarapathy village E, E(A) 1. Eravattaparapathy village E, E(A) l. Thenampathy village E, E(A) 1. Manchikunnampathy village B, E(A) 1; Kozhinjampara village E, E(A) 1. Eruthempathy village E, E(A) I. Kozhipathy village E, E(A) 1. Valiavallampathy village E, E(A) 1. Kunnamkattupathy village E, E(A) I. Perumathy village E, E(D). Vadavannur village E, E(I) 1, E(A) 1. Pallassena village E, E(A) 1.
AloIENITIES
Ethanoor village E, E(A) 1. Kakkayur village E, E(A) 1. Pallavoor village E. E(A) I. Vallanghi village E(A) 1, ECD). Ayloot village E(A) I, E(D). Kairady village E, E(A) 1. Thiruvazhiyad village E, E(A) I, E(D). Elavancherry village E, E(A) 1. Kollengode village E, E(I) I, E(A) 1. Panangattiri village E, E(A) 1. Payyalloor village E, E(A) 1. Kezhakkethara village E, E( I) I, E( A) I. MuthalaIi\t\oa village E. Pattancherryvillage E(D).
UrIJ.n:-Nernrnara town E(A) I, E(D). Chittur-Thatharna
ngalam (Municipal) Ward 1 E(I) 4, E(A) I,E(O); ward 2 E(I) 2, E(D); ward 3 E(I) 5, E(D); ward 4 E(I) 6,. E(D);.ward 5 E(I) 5, E(A) 1, E(D); ward 7'E(I) 3, E(D);. ward 8 E(I) 1, E(A) 2; ward 9 E(I) I; ward 10 E(I) 2; war.d 12 E(I) 6, E(D); ward 13 E(I) 7, E(A) 2; ward 14 E(I) 8; ward 15 E(I) 3; ward 17 E(D); ward Is.. E(D); ward 19 E(I) 1, E(A) 2, E(D).
6 MISCELLANEOUS
T for Temple C for Church M for Mosque o for Others CT for Cinema Theatre DH for Dramatic Hall PH for Public Hall P for Park Mt for Market B for Bank S for Stadium
Perintalmanna Taluk
Rural:-
Mankada-Palliprom village :-Vallikkapatta desom T3, MI; Padinhattumuridesom TI, MI, BI; MankadaPalliprom desom T4, Ml. Kadannamanna village:Vellila desom T2, MI, 05; Kadannamanna de30m T3, MI, 01; Karkitagam desom TI, 02. Nemmini village:Thachinganedam desom T5, M5; Nemmini de~om TI, MI; Nallur desom T2, M3. Kizhattur village :-Ch~mmanthatta desom Tl; Kondiparamba desom T 1, M2; Poonthavanam desom TI, M2; Kizhattur de30m T3, M2. Melattur village :-Manazhi desom M2, Edayattur desom T2 ; Me1attur de>om TB, Mtl, Bl. Edapatta village:-,- Velliancheri desom M2; Pathiricode des om Tl, C3, MI; Edapatta desom T3, M2. Edathanattukara village T7, M2, OB. Thiruvazhamkunnu village'T7, M3. Alanellur village TlO, MIO, 02, Mtl, Bl. Karkitamkunnu village :-Karkitamkunnu de~om T7, MI; PaIakkazhi desom T3, Ml. Vengur village:Chemmaniyode dcsom T3, M2, 01; Vengur dcsom Ml. Mulliakurissi village :-Vazhangode de,om T, MI; Pattikkad desom TI, M8, B1. Mank21da village:-Cheriyam de;o::n MI; Mankada desom T3; Koo.tiI de;om Ml. Vadakkangara viIIage:Kachinikkad desom T2, M2, 02; Punarp'\ d'O"oom MI; Makkaraparamba desom T2, M4, Bl; Vadakk<.ngara desom M6. Kuruva village :- Kuruva desom TI, Ml; Vattalur desom TI, M2; Karinchapa.di desoql TI, Ml. Pazhamallur village :-Periyamanna
82
desom Ml;Ummathur desom M2,OI; Chemmankadavu de30m MI, 06; Pazhamallur desom TI, M2. 06; Peringottupulam des om MI. Kottilangadi village :Kadukur desom MI, Mtl; Kadungoth desom TI; Perinthattiri desom M1. Kodur village :- Mangattupulam desom MI; Kodur desom T2, M7; Vadakkamanna desom M1. Pang village T4, M2, 03, Md. Kadung.apuram village :-Ko~tuvad desom T2; Kadungapuram desom TI, M4; Mannamkulam de,om MI. Puzhakkattiri village:- Panangagara dCJom T 1 ; Ramapuram desom T3, Ml; Kattil,..s~eri desom TI, MI; Puzhakkattiri desom Tl, Ml; Pathirimanna de5:)m TI, M!. Cherakkaparamba viUage:1r-Aripr.l desom TI, MI; Puthanangadi desom M2; Cherakkaparamba desom T3, MI.· Valambur v:qage\ :- Valambur desom M4; Thirurkad desom T3, MI; Eranthode de30m T2; Chathane:lur desom M2. Kakkoo'~h village :- Ponniakuri3si de30m M3; Kakkooth d,~som M6; Manathmangahm desom T2, MI; Cheera~tamanna desom T2. Kariavattam village :-Kariavattam desom M3; Pallikkuth desom M4, Mtl; Mannarmala desom TI, M3; Pacheeri desom TI, M3; Thelakkad desum T4, Ml. Vettathur village TI, M2, 07. Arakkup-aramba village .-Purhur desom T2, MI; Arakkup:tramba desom T6, M3. Thazhekkode village TI, M3, 01, Mtl, Bl. Pathaikara village:- Amminikkad delom TI, M5, BI; Pathaikara desom T7, Ml. Perintalmanna vilh;.ge:- P~rintalmanna desom T5, C2, M2, CTl, Mtl, B6; Kunnappulli desom T3, C2, Ml; C:1erubra desom Tl. Angadi-ppuram village:Angadippuram desom 1'5, Ml; Pal'iyapuram desom TI ...
MISCELLANEOUS
Cl, MI. Kuruvambalam village:- Malaparamba desom TI; Kuruvambalam desom T7, M2. Kolathur village T7, Md. Bl. Moorkanad,village :- Venganad desom T6, M2, 02, Mtl; Moorkanad desom T2, M2, 01. Chenunalasseri village T5, M2. Eravimangalam village:- Eravimangalam desom T4, MI; Avfuhikkad desom Tl; Kizhungathole desom TI, M l. Elankulam viIlage:- Kunnakkavu desom T2, 03, BI; EIankulam desom T2, MI, 02. Palathole desom T5, MI, 01; Kuzhanthara desom Tl; Elad desom TI, 01; Muthukurissi desom TI, 01. Anatnangad village :-Anamangad desom T2, BI; Chethj1nakurissi desom TI, MI; Muzhannamannadesom T2; Manalaya desom TI, Ml; Punnakkode desom T2. Paral village :Edathara desom M 1; Odamala desom M l, 01 ; Paral desom TI, M4; Vazhenkadadesom Tl. Aliparamba village T6, M2, 01. Chethallur village T4. M2. Thachanattukara villag~ T9, M4. Bheemanad village:Vada&siriprom desom T3, M4; Bheemanad desom T3, MS. Ariyur village TS, Ml. Kottopadam village:Kandamangalam desoIll TI; Kottopadam desom TI, M2, 01; Puttanikkad desom M2. Kumaramputhur village:-Payyanedamdesom T2, MI; Kumaramputhur desom T5, Ml. Changaleeri village:- Vendakurissi desom T3, Ml; Kulappadam desom T4, Ml; Changaleeri desom T2, M2; Valhivampuzha desom Tl, Ml. Arakurissi village:- Arakuxlssidesom T6, C2, 03, CTt; Perimbatari desom T3, 01, MtI. B3. Thenkara village T7, CI, M6. Pudur village T2, MI. Sholayur village T2, CI. Agali village TI, C1. Pottasseri· village T2, Cl, M2, 03. Viyyakurissi desom T2, MI; Pookkunnu desom T2, M2; Pullisseri desom Tl, MI. Thachampara village :- Trikkalur de~om Tl, M2; Pallikkurup desom Tl, MI; Thachampara desom TI, M2, BI; Muthukurissi desom TI, C2. Karakurissi village:- Karakurissi desom C9, M2. Karimba village T4, MI. Kalladicode village T6, M2, 08.
Ponnani Taluk Rural :-
Tavanur village :- Mathur dec,om Tl; AthaIur desom MI; Tavanur desom T4, MI, One cave, Mtl; Mavvankara desom T3, One cave; Trippalur de'om TI. Thrikkanapuram -village:- Kadakasseri desom Tl, MI, One c~e; Vellflncherry desom T2, MI; Mathirasseri desom 'M!; ~urada.de,om MI; Trikkanapuram desom Tl, MI; Maravancheri deso"TI T2, MI; Kallur desom TI ; Ayamkulam descm :r2, Ml. Anakkara village :-Melazhiyam d.esom T3; Perumbalam desom T3 ; Ummathoor ddom Tl ; Thottazhiyam desom Tl, M2; PuramthiIsseri desom TI ; Anakkara desom Tl, CI, MI. Mudur villagr. :-Melmuri desom T2, M2; Cheganur desom TI, Ml; NeUekad desom TI ; Kavappra desom Tl; Mudur desom T2, MI. Kaladi villagr. :-Kadancheri desom T2, MI; Kaladi desom Tl, MI ; Kizhumuri desom Tl, Mtl ; Verur desom T2; Tiruttikundayar desom T2; Mangattur desom T1. Pothanur village :-Naripparamba desom T 1 ; Thandilam desom T2; Pothanur desom T3,
,MI. Easwaramangalam village :-Ea,>waramangalam . desom TI ; Neithallur desom T2, MI ; Cheruvaikkara desom T3, MI; Pozhampuram desom T3, Ml;
83
Kothathara desom n. Ezhuvathiruthi village:Punnathiruthi desom 1'1, MI, CTI,. Md, Bl ; ,Ezhu .. vathiruthi desom 1'1; Erikkamanna delOm CI. MI ; Karukathirutydesom Tl,Ml ; Theyyan~ad desom Tl. Kanhiramukku village :-Kanhiramukku dcsom Tl; Karakkad desom Ml. Edappal village :-Edappal desom Tl; Polppakara desom TI, Perumparamba desom T2; Porukkara desom T2, Ml, Mtl ; Thalamunda desom T2. Vattamkulam vilJage :-Udinikkara desom Tl, Ml ; Erumappara desom Tl, Ml; Kanthalur desom Tl ; Vattamkulam desom Tl. Kumaranellur village :-Vellalur desom T3, M3, Mtl; Chekkod desoin T3, Ml ; Kalladathur desom T2 ; Kumaranellur desom T~, Bl; Amettikara desom 1'1. Kudallur village:Manniarnperumbalam desom T2 ; Kudallur d~om T3, M2; Malamakavu desom Tl ; Nayyur desom T2 ; Panniyur desom T2. Angadi village :-Otalur desom Tl ; Kalathumpadi desom TI ; Thozhukara desom T3 ; Angadi desom TI, Ml. Pattithara village:-Pattithara desom T3, Ml ; Alur desom T6, MS. Trithala village:Trithala desom T3, MI, 01, BI; Kannanurdesom Tl. Nhangathiri desom T2, M1. Mezhathur village:-; Mezhathur de80m T9, MI, Mtl; Modavannur desomTl; Kodanad desom T3, M2. Mala village:-Valiya Kottapadam desom Tl; Kakkattiri desom T2, Ml ; Mala desom T2 ; Vattenad desom T2. Kuttipala village :Sukapuram desom T2; Puramundekad desom T3; Kuttipala desom T3 ; Nellisseri desom MI; Kaladithara desom Tl, Ml; Naduvattam desom T1. Kololomba village:-Ailakad desom Tl, Ml ; Venginikkara desom TI, MI; Pookarathara desom TI; Kololomba desom T2, MI. Porang village:- Porang desom T4, M I ; Panampad desom TI. Kadavanad village:-Paduponnani desom M3; Kadavanad desom T2. Veliancode village:-Veliancode desom M6 ; Pazhal'lhi desom Tl; Gramam desom T2, Ml. Marancheri village:Marancheri desom T2, M3, Mtl. Eramangalam village:-Perumudisseri desom T3; Eramangalam desom T2, MI, Bl. . Ayirur village:-Puthiruthi desom TI, MI; Kodathur desom T4, Ml ; Ayirur desom TI. M2. Kadikad viIlage:-Cheruvayur desom T2; Kadikad desom T2, MI, B2 ; Edakara de80m Tl, M!. Punn(l.yur village:-Akib.d desomM7 ; Edakkara· desom M3 ; Punnayur desom Tl, M4. Edakkazhiyur village:- Aviyur desom T2, MI; Koranhiyur desom T5, Ml ; Edakkazhiyur desom T2, Ml. Viyalathur village:-Viyalathur desom T2, C2, MI, Mtl, BI ; Nhamanangad desom T2, Ml ; Anhur desom T2, C2, Mtl, BI. Vadakkekad viUage:-Vadakkekad desom 1'1, MI ; Kavukkanappetty desom T2; Kochannur desom 1\11 ; Thekkekad desom TI, Ml ; Kallur desom Tl ; Thiruvalayannur desom Tl. Punnayurkulam vilbge:-Punnayurkulam desom T2. M2, Mtl, BI ; Chemannur desom Ml; P".rur desom Tl, MI; Kuppravalli desom Tl, M1. Perumpadappa village :Cheruvaya desom TI, Ml ; Perumpadappa desom T2, M4; Cheruvallur desom Tl, M2.Nannamukku village:Thekkumuri desom Tl; Pidavannur desom TI, CI ; Kallurma des.om TI, MI ; Nannamukka desom T2, M2: Pallikkara village:-Vadakkumury desom T3, MI: Kanhiyur desom T2, M2; Pallikkara desom T2, M2, Mtl. Alangodc viIlagc:- Panthavoor des.om TI, M2 ;
AMENITIES
Kakkadipuram desom TI; Alangode desom T3, MI, One ku.dak~l, Bl; Perumukku desom 1'1, M2, Mtl. Kappur village:-Kollanur desOln T2, MI; Kappur dcsom T4, MI; Koz4ikkara desom MI; Eravabd desom 1\4:1. Othalur village:-Chiyyannur desom T1, M2; Kokkoor desom T •• MI; Othalur desom Tl, M2; Kizuakkara desom M1. Kavucode village:Thannircode desom T3, MI; Pattisseri desom T2. MI, 01; Kavucode. desom T3, C4, M6, Mtl. Chalisseri village:-Perumannur desom T3; Kuttanad desom TI, MI; Alikkara desom T3; Chaiisilcri desom T4, M2. Nagalasseri village:-Nandiyangode desom Tl, MI, Mtl ; Vadakkevavanur desom T4; Valiachalappram desom T1, MI, 01; Nagalasseri desom TI; Pilakkattiri desom T3; To1ukkad desom T2. Thirumittacode village :-Nellikkatiri desom T2; Thirumittacode desom T1; Irumbakasseri desom MI. Ezhumangad desom T2, MI, Mtl; Iringattor desom TI, M1. Peringannur village :-Chathanur desom TI, Mtl; Velladikkunnu desom T2, 01; Cherippur desom T3; Peringannur des om T3, Ml; !ttonam desom TI; Ozhuvathara desom T1. Chazhiyattiri village :-Maduppallidesom T2, M1 ; Akilanamdesom T3; Karukaputhur desom Tl, Ml. Kothachira village :-Mathur desom T2; Peringod desom T3; Kothachira desom T3, 02.
U,ban :-Ponnani town :-Ponnani Nagaram ward M32, B2;
Velleri ward M2, B2; Pallapuram ward T2, Ml.
Ottapalam Taluk
Rural:-
ViJayur village:-Vilayur desom T2; Paradiyur desom M1, T1. Chundampatta village :-Natiyamangalam desom- Ml; Mathanampally desom TI; Chundampatta desom T1. Kulukallur village MI, T5. Marayamangalam village:-TI, Ml. Karalmanna village :-Thekkumuri desom T2 ; Vadakkumuri desom T2; Naduvattom desom T3, MI; Karalmanna desom T2. Veeramangalam village:Karumanamkurissi desom T2; Veeramangalam desom Tl, M1 ; Mangode desom T2; Cherumannur desom Tl; Poothakkad desom Tl. Vellinezhi village:Vellinezhi desom T10, BI; Kuttanassery desom T2. Karimpuzha village :-Attasseri desom T 1, M2 ; Kunnakad desom T2; Karimpuzha desom T6, MI. Kulikiliyad village :-Kulukuliyad cesom T6, MI; Kottapuram desom T7, Ml. Elambulassery village :-Pombra desom T3, Ml; Elambulassery desom T7, Ml. Pulapetta village :-Pulapetta desom T5; Ummanazhi des om T7, Ml. Mannambatta village :-Mannambatta desom T6; Kulakkattukurissi desom Tl; Neelamangalam desom T5; Thottara desom T3; Parthala desom T 1; Kodormanna desom T3. Sreekrishnapuram village:-Valambirimangalam , desom T3; Easwaramangalam desom T5, MI; Perumangode desom T3, Bl; Sreekrishnapuram desom T5. I.
Thirunara yanapuram village :-Nhalakurissi ~esom TI; Kuruvattoor desom T4; Thiruvazhiode desom T3; Thirunarayanapuram desom T2. Moothedathu
Madamba village: -Kulakkad desom T2; Pakaravoor desom T3; Atakaputhur delOm T5' Kalluvazhi desom T3. !<att~ulam village :-Ma'ngalamkunnu desom T2; Kmassen desom T2; Kattukulam desom T3. Thani~unnu village :-Pookottukavu desom T I . Thanikunnu desom Tl: Thalayakakkad desom TI! Kodormanna desom Tl. Kadampazhipuram village:"":' T6, M I, Bl. Pullundassery village :-Azhiyannur d~som T3; Pullundassery desom T4, MJ. Alangad vdlage:-Vettakara desom T8; Alangad desom T7 Vadakkumbrom village :-Kadambur deHom T2: Melur des8m Tl; Aravakkad desom T2, MI' Eledathmadamba village:-Munnurcode desom T4' Ml. Trikkadeeri village:-Karuttukurissi des om T2 ~ Kuttikode desom T3; Trikkadeeri dcsom T2, M2: Nellaya village:-Ezhuvanthala desom T2, M3; Nellaya desom T5. M3. Cherplachery village:Panniyamkurissi desom T3, M 1, Mtl, B2; Vellattukurissi desom Tl; Cherplachery desom T3, M2, Bl. Ezhuvanthala village:-Erimbulassery desom T2, Ml . Pattisseri desom. T2, MI; Ezhuvanthala desom T2: MI. Mundakottukurissi village T 1. Cherucode village :-Mannayengode desom T2, MI; Vandumthura desom Tl, MI; Ch~rucode desom T2, Ml. Amayur village TI, M1. Pulasicry village:Karinganad desom T3; Mannengode desom T3; Pulassery desom T3, Ml. Rairanelloor village:Edappalam desom TI. Thiruvegapura village:Chembra desom T1, MI ; Tlliruvegapura desom Tl ; Nariparamba desom Ml; Kaipuram dcsom Tl, Ml. Naduvattam village :-ViJathur desom T3, MI; Naduvattam desom T4, Ml; Kizhumuri desom TI, Ml. Muthuthala viIlage:-Muthuthala desom T1, MI; Melmuri desom Tl; Kozhikottusseri des om T2. Perumudiyur village:-Kodumunda desom T2, Ml; Perumudiyur desom T3, MI. Maruthur village:Kodalur desom T3, MI; Poovakode desom T4; Mondiyannur desom TI; Maruthur desom Tl, 1\11. Pattambi Palliprom viIlage:.-Kizhayur d=som T4; Kondur).<.ara deoom T2; Palliprom desom Tl, Ml : Karakkad desom MI. Kalladi Petta vilhge:-Andaladi desom Tl; Pulasser~ara desom TI ; Kalladi Petta desom T6; P~rokara dC30m T2; Thamarikkara desom T2. Vallapuzha village T5. M2, Kuruvattoor village :-Kuruvattoor '.desom'TI; KayiIiyad des om T5. Chalavara village::-Chalavara de,om T4. kothakurissi village:-Thara'vakonam desom T2; Kothakurissi desom T4; Mundan1.ttukara desom T2 ; Edakkodupavukonam. desom', T2. Panamanna village:-TI. Cherumundassery village :-Cherumundassery desom Tl. Vengassery village T1. Mulanhur village :-Nellikurissi desom T 1; Mulanhur de~om TI. Chunangad v,illage :-T4; G.T. Station 1. Kanniambrom village :-J>anamanna desom T1; Kanniambrom desom Tl. Vanioiuriculam village:-Kothayur desom Tl, Mtl; Pulachith;ara desom Tl,Cl. Koonathara village:-:-Panayur desoIlli T1. Kulapully viIlage:-KuIapuIly desom Tl, MtI. Karakkad village :-Karakkad desom T2; . Eruppa desom T3. Cherukattupulam villale :-Cherukattupulam desom Tl; Mannanur de~om T1. Trikkangode village:-
loIISCELLANEOUS
Mannu,seri desom T2; Trikkangode desom TI; Choroottur desom TI. Palapuram village Tl. Lakkidi village :-Mangalam desom T3; Thekkumangalam desom T4. Perur village:-Puthur desom Tl; Akalur desom T2; Perur desom T2, Mtl.
Urban :-Pattambi t0wn :-VaJlur ward T4-, MI ; Nethiri
mangalam ward T2, M2. Shoranur town :-Paruthipra ward T2; Nedungottur ward Tl; Chitamanna ward T2, 03, MI, DHI, PHI, PI,OTl.
Palghat Taluk
Rural:-Peringode village :-Thrippalamunda desom Tl;
Peringode desom TI3. Cheraya village T6. Kongad village T4-, MI, OT!.' Kanhikkulam village T4. Nochippulli village Tl. i Mundur village :-Mundur desom T7. Ezhakkad; village TI, Ml. Poothanur village T2. KundaIass<1ry village T3. Thadukkasseri village :-Vatasseri desQm T2, Thadukkasseri desom T2, M1. Mannur village T6, Ml. Mankarai village :-Mankarai desom TlO, M4, Bl. Kallur village :-Kallur desom T2, Ml. Mankurissi village T4. Thenur village T8, Ml. Kinavallur village Tl. Edathara villa,ge :-Odanur desom T2; Edathara desom T8, OTI, MtI, Bl. Vallikode village T5. Puduppariyaram village T6, Ml. Akathethara village T14. Kadukkamkunnam village T3, P6. Kottekkad village T7, Bl. Kavalppad village T6, M3,OTI, MTl, Bl. Vadakkanthara village :-Kallekkad desom Tl ; VadakkantHara desom 06, T6, M2, OTl, DRl. Kodunthirapully village T7, M4, 02, Bl. Pirayiri village T18, Cll. M2, 08, Bl. Yakkara village T4, M3, PHI Hydrali's fort (ancient monument). Puthur village T28, C3, 02, MS, OT 2, P2, PHI, BIO, Mt 3. Koppam village M5, T20, C3, 02, OT2, PHI, ,P2, Mt 3, BIO. Kallepully village T2, PHI. Marutharoad village T7. Karinkarapully village T2, M2. Kunnanur village T7, Ml. Kannadi village :-Kadakurussi desom TI; Kannadi desom TIO, Bl. Kinc.sseri village Tl. Thiruvalathur village T8. Kodumba village T7, MI. Pallatheri villag~ :Pallatheri desom T3. Vengodi village :-Ramasseri desom Tl ; Vengodi desom ,TI, CI', Pudusseri village T30, 011, M2, 81. Elappully village T12, 01, M3, OTI, MtI, BI. Thenari village' T3, Madhya.ranga temple and .Saranga. well (An!=-ient monuments). Tassrack village MI. Thanisseri village T2. Peruvemba village TI2, MI, CTl. Palatholli village T2, Ml.
Urban :-Palghat (Municipal):-Ward 1 T9, OTI, MTI;
ward 2 TIO, PI; ward 3 T2, Cl ; ward 4 T9, Ml ; ward 5 T6, Cl ; ward 6 TI8, MI.; ward 7 T8; ward 8 TI, M3 ; ward 9 T2, PI ; ward lOT3, GI, B4; ward II MI, PI, OT2, B4 ; ward 12 T3, Cl; ward 13 T12 ; ward 14 T2, M2, TippusuItan's Fort, BI ; ward 15 M2; ward 16 T7, MI ; ward 17 T5; ward 18 T6; ward 19 T3, MI, B3; Ward 20 T7, 01, M3, PI, Mtl, B 4;
85
ward 21 TI, OTI; ward 22 T7; war.d 23 Tl, PHI, Md, H2; ward 24 T9. Cl; ward 25 T6 DHI; ward 26 T3, 01; ward 27 Til; ward 28) T4, M2, OTl, Mtl, Bl.
Alathur Taluk
Rural:--. Peringottukuris5i village T3. Bemmanur village :-
Pllap~ul!y desoID MI; Bemmanur desom TI, Pl. Kottal vIlbge TS. Ohembrakulam village T5 MI C:T1, PI. ":arode village Tl, B1. Thach~ngad VIllage :-Valhkkode desom TI ; Anikkode desom T2; Thacnangad desom T2. Mathur village T4. Pall anchathanure villaJ;e:-Veswalam desom T2; Pallan .. chathan~re desom TI, Ml. . Ch~nganiyur village:Chengamyur desom TI. Pulmelh village T3 Ml BI. Paruthippully village T3, ¥I. Kuthanur village' T5, Ml, OTI, Bl. Tholanur Village T9. Choolanur village T6. PazambaIakode de;om T2, MI, Mtl. Tarur village T2, MI ; Athippotta desom T2. Vavulliapuram village T3, M2. Ooyalmannam vilhge T15, M3, Pl. Mtl, B2. Kannanur village:-Kannanur desom TI; Putht:.kkode desom T2. Kalappatty villaO'e T2 M2. Thenkurissi village T3. Vilayanch~thanu; village TI, Ml. Vilayannur village Tl. Perinkunnu village T2. Manhalur village T2, MI. Erimayur village TI, 01, M2. Puthiyankam village TI, MI, PI, 132. Kavassery village TID, PI, B2. Kazhani village :-Padur desom T4; Kazhani desom T2. Kanllanur village T9, M2, Mtl. Thennilapuram village T5. Kattusseri village T6, 01, MI, OTI, Mtl, B3. Mangal..tID village MI, T4. Manhapra village:Manhapra desom T4; Kannancherry desom Tl. Pudukkode village T3, M2, on, B3. Kannambra village :-Kannambra desom T4, 01, M2, OTI, PI, Bl. Rishinaradamangalam dts~,m TI, B2. Aayakkad village:-Aayakkad desom T3,01. Vadakkancherry village T5, 02, M2, OTI, PI, Mtl, B3. Kizhakkan cherry village T8, C4, M2, BI. Vandazhi "illage T3. 01, Ml. Mudappallur vi.llage TIS, Ml. OhittiJencherry village T2, MI. Vadakketha,a v;}lagc:Pullode desom T2. Vadakkethara desom T2.01. Thekkethara village T4, MI. Oheramangalam village Tl. Kunnisseri village T4, Ml. Vembalur village T2 ..
Chittur Taluk Rural:-
Koduvayur village T12, M13, OT2, Mtl, B4. Thathamangalam village T6, MI, CTl, :Mtl, B2. Chittur village T12, 01, Ml, OTI, DRI, PI, Mtl, M. Thekkedesom village Mtl. Nallepilly village T2, OTI, Mtl, Bl. Eravattaparapathy village CI, Mt2. Thenampathy village OT}. Ozhalapathy village CTI,- MtI. Kozhinjampara village TI, C2, M2, CT2, Mt2, H2. Eruthempathy village TI, 01. Perumatty village T3, Ml. Vadavannur village TlO, M2. Pallassena village T5, M2. Ethanoor village T5, MI. Kakkayur village. T5, Ml. Pallavoor village T5. Koodallur village T5, Ml. Vallanghi village T6, MI, CT}, MtI, B3.
AMENl'I1ES
Ayloor village Tl. Kairady village TI, M2. Thiruvazhiyad village TI, M1. Pothundi village TI, C1. Elavancherry village T3, MI. Vattakkad village T3, Ml. Kollangode village T4, Bl. Panangattiri village T3. Payyalloor village TI, MI. Kezhakkethara village TlO, M3, CTI, Mtl, B4. Muthalamada village T4, MS, MtI, BI, Muthalam.ada Fort (Ancient monument). Pattancherry village Tl, MI, MH. Mulathura village CT l~
86
Urban :-
Nemmara town TIO, MI, PI, PHI, B3. Chittur-Thathamangalam (MuncipaI) :-Ward I MI' ward 2 TG, DHI, Bl; ward 3 T7, Mtl, BI ~ ward 4- T8, PI; ward 5 TIO, B3; ward 6 T9· , ward 7 T5; ward 8 T5; ward 9 T4; ward 10 T5· ward 11 T4; ward 12 T6, Cl, PI; ward 13 TI2 ~ ward 14 T6, CTl, BI; ward 15 MI, PI, Mtl, BI ~ ward 16 T4; ward 17 T7, MI; ward 18 T6; ward I~ T7, PI.
(iii) INDUSTRIAL ESTABLISHMENTS

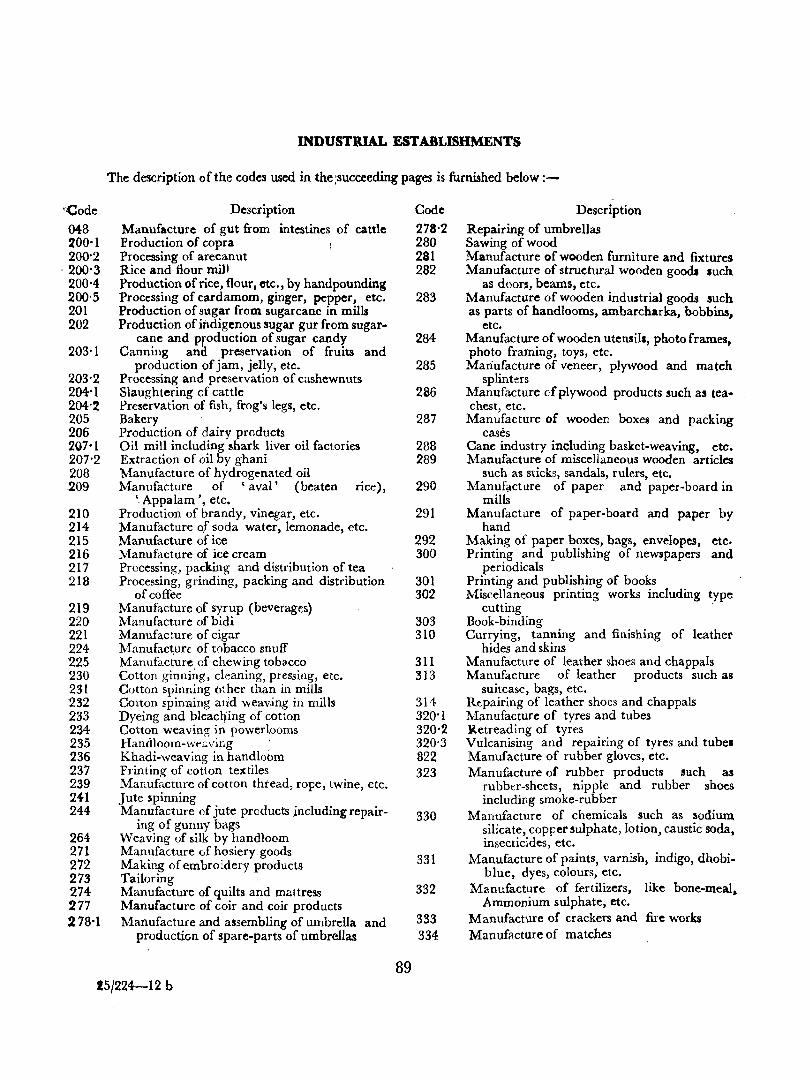
':Code -{)48 200'1 200'2
. 200'3 200'4-200-5 201 202
203'1
203'2 204'1 204'2 205 206 207'1 207'2 208 .209
210 214 215 216 217 218
219 220 221 224 "225 230 231 232 233 234 235 236 237 239 241 244
264 271 272 273 274-277 278'1
INDUSTRIAL ESTABLISHMENTS
The description of the codes used in the ;succeeding pages is furnished below :-
Description
Manufacture of gut from intestines. of cattle Production of copra Processing of arecanut Rice and flour mill Production of rice, flour, etc., by handpounding Processing of cardamom, ginger, pepper, etc. Production of S\1.gar from sugarcane in mills Production of indigenous sugar gur from sugar·
cane and production of sugar candy Canning ana preservation of fruits and
production of jam, jelly, etc. Processing and preservation of cashewnuts Slaughtering of cattle Preservation of fish, frog's legs, etc. Bakery Production of dairy products Oil mill including shark liver oil factories Extraction of oil by ghani Manufacture of hydrogenated oil Manufacture of ' aval' (beaten rice),
, Appa lam', etc. Production of brandy, vinegar, etc. Manufacture of soda water, lemonade, etc. Manufacture of ice Manufacture of ice cream Processing, packing and distribution of tea Processing, grinding, packing and distribution
of coffee Manufacture of syrup (beverages) Manufacture of bidi Manufacture of cigar Manufacture of tobacco snuff Manufacture of chewing tobacco Cotton ginning, cleaning, pressing, etc. Cotton spinning other than in mills Cotton spinning an'd weav;ing in mills Dyeing and bleacl1ing of cotton Cotton weaving in powerlooms Handloom-we;;ving Khadi-weaving in hand loom Printing of cotton textiles Manufacture of cotton thtead, rope, twine, etc. Jute spinning Manufacture of jute products including repair-
ing of gunny bags Weaving of silk by handloom ManufaGture <.of hosiery" goods Making of embroidery products Tailoring Manufacture of quilts and mattress Manufacture of coir and coir products Manufacture and assembling of umbrella and
productiGn of spare-parts of umbrellas
89
Code
278'2 280 281 282
283
284
285
226
287
288 289
29()
291
292 300
301 302
303 310
311 313
314 320'1 320'2 320-3 322 323
330
331
332
333 334
Description
Repairing of umbrellas Sawing of wood Manufacture of wooden furniture and fixtures Manufacture of struetural wooden goods such
as doon, beams, etc. Manufacture of wooden industrial goods such as parts of handlooms, arnbarcharka, bobbins,
etc. Manufacture of wooden utensil., photo frames, photo framing, toys, etc.
Mariufacture of veneer, plywood and match splinters
Manufacture of plywood products such as tea· chest, etc.
Manufacture of wooden boxes and packing cases
Cane industry including basket-weaving, etc. Manufacture of miscellaneous wooden articles
such as sticks, sandals, rulers, etc. Manufacture of paper and paper-board in
mills Manufacture of paper-board and paper by
hand Making of paper boxes, bags, envelopes, etc. Printing and publishing of newspapers and
periodicals Printing and publishing of books Miscellaneous printing works including type
cutting Book-binding Currying, tanning and finishing of leather
hides and skins Manufacture of leather shoes and chappals Manufacture of leather products such as
suitcase, bags, etc. Repairing of leather shoes and chappals Manufacture of tyres and tubes liiletreading of tyres Vulcanising and repairing of tyres and tube. Manufacture of rubber gloves, etc. Manufacture of rubber products such as
rubber-sheets, nipple and rubber shoes including smoke-rubber
Manufacture of chemicals such as sodium silicate, copper sulphate, lotion, caustic soda, insecticides, etc.
Manufacture of paints, varnish, indigo, dhobiblue, dyes, colours, etc.
Manufacture of fertilizers, like bone-meal, Ammonium sulphate, etc.
Manufacture of crackers and fire works Manufl1cture of matches
25/224-12 b
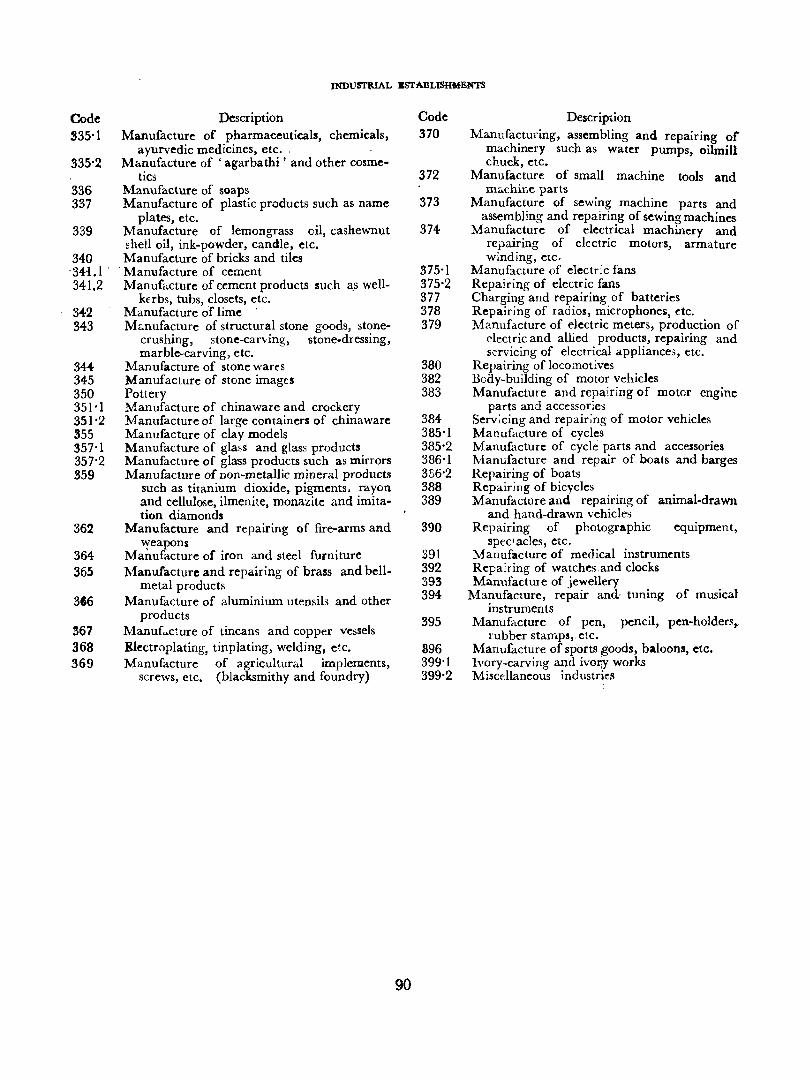
Code S35·1
335·2
336 337
339
340 -34-1.1 . 34}.2
342 343
34 .... 345 350 351·1 351·2 355 357·1 357·2 359
362
364 365
366
367 368 369
INDUSTlUAL ESTABLISHMENTS
Description Manufacture of pharmaceuticals, chemicals,
ayurvedic medicines, etc .. M ... nufacture of 'agarbathi' and other cosme
tics Manufacture of soaps Manufacture of plastic products such as name
plates, etc. Manufacture of lemongrass oil, cashewnut shell oil, ink-powder, candle, etc. Manufacture of bricks and tiles
. Manufacture of cement Manufacture of cement products such <loS well
kerbs, tubs, closets, etc. Manufacture of lime M~nufacture of structural stone goods, stone
crushing, stone-carving, stone.dressing, marble-carving, etc.
Manufacture of stone wares Manufacture of stone images Pottery Manufacture of chinaware and crockery Manufacture of large containers of china ware Manufacture of clay models Manufacture of gla,s and glass products Manufacture of glass products such as mirrors Manufacture of non-metallic mineral products
such as titanium dioxide, pigments. rayon and cellulose, ilmenite, monazite and imitation diamonds
Manufacture and repairing of fire-arms and "Yeapons
Manufacture of iron and steel furniture Manufacture and repairing of brass and bell
metal products Manufacture of aluminium utensils and other
products Manuf ... cture of tincam and copper vessels Electroplating, tinplating, welding, etc. Manufacture of agricultural implements,
screws, etc. (blacksmithy and foundry)
90
Code 370
372
373
374
375·1 375·2 377 378 379
380 382 383
384-385·1 385·2 386·1 386·2 388 389
390
.391 392 393 394
395
396 399'1 399·2
Description Manufacturing, assembling and repairing or
machinery such as water pumps, oilmill chuck, etc.
Manufacture of small machine tools and m",chine parts
Manufacture of sewing machine parts and assembling and repairing of sewing machines
Manufacture of electrical machinery and repairing of electric motors, armature winding, etc.
Manufacture of electric fans Repairing of electric fans Charging and repairing of batteries Repairing of radios, microphone~, etc. M2.nufacture of electric meters, production of
electric and allied products, repairing and servicing of electrical appliance3, etc.
Repairing of locomotives Boay-building of motor vehicles Manufacture and repairing of motor engine
parts and accessorie'i Serv;cing and repair;ng of motor vehicles Manufacture of cycles Manufacture of cycle parts and accessories Manufacture and repair of boats and barges Repairing of boats Repairing of bicycles Manufacture and repairing of animal-drawn
and hand-drawn vehicles Repairing of photographic equipment,
spectacles, etc. Manufacture of medical instruments Repairing of watches and clocks Manufacture of jewellery
Manufacture, repair and, tuning of musical instruments
Manufacture of pen, pencil, pen-holders .. rubber stamps,. etc.
Manufacture of sports ;goods, baloons, etc. Ivory-carving and ivo~y works Miscellaneous industries
I
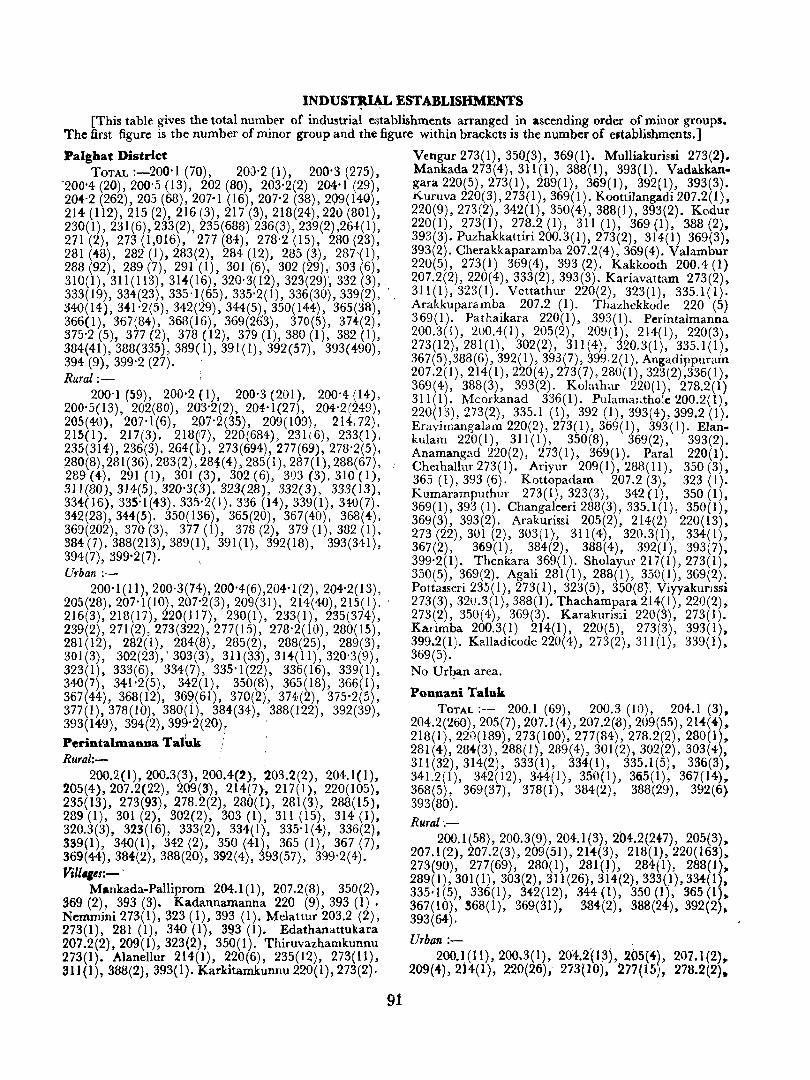
INDUS~IAL ESTABLISHMENTS [This table gives the total number of industrial establishments arranged in ascending order of minor groups.
The first figure is the number of minor group and the figure within brackets is the number of eltablishments.]
PaJghat District TOTAL :-200'1 (70), 20)'2 (I), 200'3 (275),
-200'4 (20),200'5 (13), 202 (80), 203'2(2) 204'1 (29), 204'2 (262),205 (68), 207·1 (16),207'2 (38),209(140), 214 (112), 215 (2), 216 (3),217 (3), 218(24),220 (801), 230(1),231(6),233(2),235(688) 236(3),239(2),26+(1), 271 (2), 273 (1,016), 277 (84), 278'2 (15), 280 (23), 281 (48), 282 (1), 283(2), 284 (12), 285 (3), 287,(1), 288 (92), 289 (7), 291 (1), 301 (6), 302 (29), 303 (6), 310(1), 311(113), 31-4-(16), 320'3(12), 323(29), 332 (3), 333(19), 334(23), 335'1(65). 335'2(1), 336(30),339(2), ' 340( 14), 341'2(5), 342(29), 344(5), 350( 1 H), 365(38), 366(1), 367(84), 368(16), 369(26'3), 370(5), 374-(2), 375'2 (5), 377 (2), 378 (12), 379 (1),380 (1), 382 (1), 384(41),388(335), 389(l), 391(l), 392(57), 393(490), 394 (9), 399'2 (27). ' Rural :-
200'1 (59), 200'2 (1), 200'3 (201). 200'4 (14), 200'5(13), 202(80), 2Q3'2(2), 204'1(27), 204'2(249), 205(40), 207'1(6), 207'2(35), 209(109), 214;72). 215(1). 217(3). 218(7), 220(684), 231(6), 233(1), 235(314),236(3). 264(t). 273(694),277(69),278'2(5). . 280(8),281(36), 283(2), 28t(4), 285(1), 287( 1),288(67), 289 (4). 291 (1), 301 (3), 302 (6), 303 (3). 310 (1), 311(80),314(5),320'3(3). 323(28), 332(3), 333(13), 334(16),335'1(43),335'2(1).336 (14), 339(1), 340(7). 342(28),344(5). 350(136), 365(20), 367(40). 368(4). 369(202), 370 (3), 377 (1), 378 (2), 379 (1).382 (1). 384(7).388(213),389(1), 391(1), 392(18), 393(341), 394(7), 399'2(7). . Urban :-
200'1(11),200'3(74),200'4(6),204'1(2),204'2(13), 205(28).207'1(10),207'2(3),209(31), 214(40),215(1) .. 216(3),218(17),220(117), 230(1), 233(1), 235(374), 239(2),271(2),273(322),277(15), 278'2(10),280(15), 281(12), 282(1), 284(8), 285(2), 288(25), 289(3), 301(3), 302(23),' 303(3),311(33),314(11),320'3(9), 323(1), 333(6), 334(7), 335'1(22), 336(16), 339(1), 340(7), 341'2(5), 342(1), 350(8), 365(18), 366(1), 367(44), 368(12), 36Q(61), 370(2), 374(2), 375'2(5), 377(1),378(10), 380(1), 384(34), 388(122), 392(39), 393(149), 394(2),399'2(20); .
Perintalmanua Taluk ' Rural:-
200.2(1),200.3(3),200.4(2), ,203.2(2), 204.1(1), 205(4),207.2(22), 209(3), 214(7}, 217(1), 220(105), 235(13), 273(93), 278.2(2), 280(1), 281(3), 288(15), 289 (1), 301 (2), 302(2), 303 (1), 311 (15), 314 (1), 320.3(3), 323(16), 333(2), 334(1), 335'1(4), 336(2), 339(1), 340(1), 342 (2), 350 (41), 365 (1), 367 (7), 369(44),384(2),388(20), 392(4), 393(57), 399'2(4). J'ill.,es:- '
Mankada-Palliprom 204.1(1), 207.2(8), 350(2), 369 (2), 393 (3). Kadannamanna 220 (9), 393 (1) . Nemmini 273(1),323 (1),393 (1). Melattur 203.2 (2), 273(1), 281 (1), 340 (1), 393 (1). Edathanattukara 207.2(2),209(1),323(2), 350(1). Thiruvazhamkunnu 273(1). AJanellur 214(1), 220(6), 235(12), 273(11), 311(1),388(2),393(1). Karkitamkunnu 220(1), 273(2).
91
Vengur 273(1),350\3), 369(1). Mulliakurissi 273(2). Mankada 273(4),311(1), 388(1), 393(1). Vadakkan. gara 220(5),273(1), 289(1), 369(1), 392(1), 393(3). Kuruva 220(3),273(1),369(1). Koottilangadi 207.2(1), 220(9),273(2), 342(1), 350(4), 388(1), 393(2). Kodur 220(1), 273(1), 278.2 (1), 311 (1), 369 (I), 388 (2), 393(3). Puzhakkattiri 200.3(1),273(2), 314(1) 369(3), 393(2). Cherakkaparamba 207.2(4), 369(4). Valambur 220(5), 273(1) 369(4), 393 (2). Kakkooth 200.4 (I) 207.2(2),220(4),333(2),393(3). Kariavattam 273(2), 311(1),323(1). Vcttathur 220(2), 323(1), 335.1(1). Arakkuparamba 207.2 (1). Thazhckkode 220 (5) 369(1). Pathaikara 220(1), 393(1). Perintalmanna 200.3(1), 200.4(1), 205(2), 209(1), 214(1), 220(3), 273(12),281(1), 302(2), 311(4), 320.3(1), 335.1(1), 367(5),388(6),392(1),393(7),399.2(1). Angadippurain 207.2(1),214(1),220(4),273(7),280(1),323(2),336(1), 369(4), 388(3), 393(2). Kolathur 220(1), 278.2(1) 311(1). Mcorkanad 336(1). Pulamal,tho~e 200.2(1), 220(13),273(2), 335.1 (1), 392 (1), 393(4),399.2 (1). Eravimangalam 220(2), 273(1), 369(1), 393(1). Elankulam 220(1), 311(1), 350(8), 369(2), 393(2). Anamangad 220(2), 273(1), 369(1). Paral 220(1) . Chethallur 273(1). Ariyur 209(1),288(11), 350 (3), 365 (1),393 (6). Kottopadam 207.2 (3), 323 (1). Kumaramputhur 273(1),323(3), 342 (1), 350 (I), 369(1),393 (1). Changaleeri 288(3),335.1(1), 350(1), 369(3), 393(2). Arakurissi 205(2), 214(2) 220(13), 273 (22),301 (2), 303(1}, 311(4), 320.3(1), 334(1), 367(2), 369(1), 384(2), 388(4), 392(1), 393(7), 399'2(1). Thenkara 369(1). Sholayur 217(1), 273(1), 350(5), 369(2). Agali 281(1), 288(1), 350(1),369(2). Pottasseri 235(1), 273(1), 323(5), 350(8}'. Viyyakunssi 273(3),320.3(1),388(1). Thachampara 214(1),220(2), 273(2), 350(4), 369(3). Karakuris:;i 220(3), 273( 1). Karimba 200.3(1) 214(1), 220(5), 273(3), 393(1), 399.2(1). Kalladicodc 220(4), 273(2), 311(1), 339(1» 369(5). No Urban area.
Ponnani Taluk TOTAL:- 200.1 (69), 200.3 (10), 204.1 (3).
204.2(260),205(7),207.1(4), 207.2(a), 209(55), 21<l(4)~ 218(1),220(189),273(100),277(84), 278.2(2), 280(1)~ 281(4),284(3),288(1),289(4),301(2),302(2),303(4), 311(32),314(2), 333(1), 334(1), 335.1(5), 336(3)~ 341.2(1), 342(12), 344(1), 350(1), 365(1), 367(14)~ 368(5), 369(37), 378(1), 384(2), 388(29), 392(6} 393(80).
Rural~-
200.1(58),200.3(9),204.1(3), 204.2(24-7), 205(3)~ 207.1(2),207.2(3),209(51),214(3), 218(1),220(163» 273(90), 277(69), 280(1), 2810), 284(1), 288(1)" 289(1),301(1),303(2), 311(26), ~14{2), 333(1),334-(1), 335'1(5), 336(1), 3-4:2(12), 344 (1), 350 (1), 365 (1),. 367(10), 568(1), 369(31), 384(2), 388(24), 392(2), 393 (64}
Urban :-200.1(11),200.3(1), 204.2(1,}, 205(4), 207.1(2)"
209(4-),214(1), 220(26), 273(10), 277(15), 278.2(2).
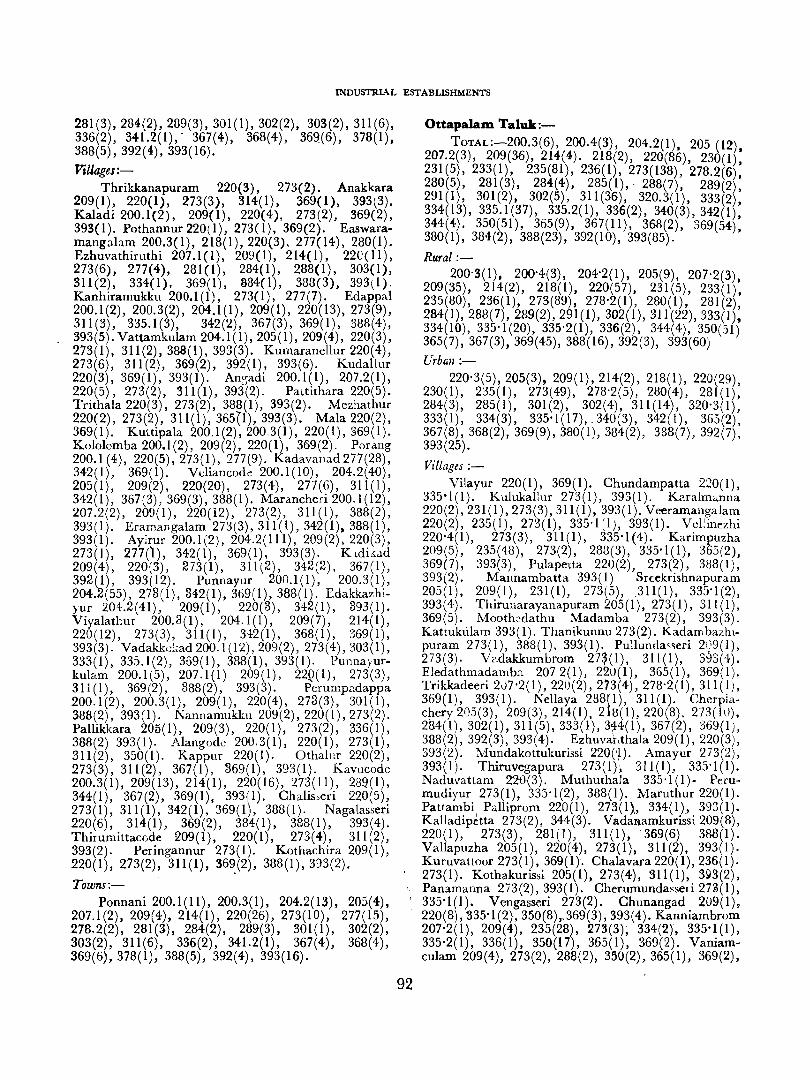
INDUSTRIAL ESTABLISHMENTS
281(3),284(2),289(3),301(1),302(2), 303(2),311(6), 336(2), 341.2(1), - 367(4), 368(4), 369(6), 378(1), 388(5),392(4),393(16).
Villages:-Thrikkanapuram 220(3), 273(2). Anakkara
209( I), 220(1), 273(3), 314( 1), 369( 1), 393(3). Kaladi 200.1(2), 209(1), 220(4), 273(2), 369(2), 393(1). Pothannur 220(1), 273(1), 369(2). Easwaramanga1am 200.3(1), 218(1),220(3). 277(14), 280(1). Ezhuvathiruthi 207.1(1), 209(1), 214(1), 220(11), 273(6), 277(4), 281(1), 284(1), 288(1), 303(1), 311(2), 334(1). 369(1), 384(1), 388(3), 393(1). Kanhiramukku 200.1(1), 273(1), 277(7). Edappal 200.1(2), 200.3(2), 204.1(1), 209(1), 220(13),273(9), 311 (3), 335.1 (3), 342(2), 367(3), 369( 1), 388(4), 393(5). Vattamkulam 204.1(1), 205(1),209(4), 220(3), 273(1), 311(2),388(1), 393(3). Kumaranellur 220(4), 273(6), 311(2), 369(2), 392(1), 393(6). Kudallur 220(3), 369(1), 393(1). An;~adi 200.1(1), 207.2(1), 220(5), 273(2), 311(1), 393(2). Pattithara 220(5). Trithala 220(3), 273(2), 388( 1), 393(2). Mezhathur 220(2), 273(2), 311(1),365(1), 393(3). Mala 220(2), 369(1). Kuttipala 200.1(2),200.3(1), 220(1),369(1). Kololomba 200.1(2), 209(2), 220(1), 369(2). Porang 200.1 (4), 220(5),273(1), 277(9). Kadavanad 277(28), 342(1), 369(1). Vdiancod~ 200.1(10), 204.2(40), 205(1), 209(2), 220(20), 273(4), 277(6), 311(1), 342(1), 367(3),369(3),388(1). Marancheri 200.1(12), 207.2(2), 209(1), 220(12), 273(2), 311(1), 388(2), 393( 1). Eramangalam 273(3), 311 (1), 342( 1), 388( 1), 393(1). Ayirur 200.1(2), 204.2(111), 209(2),220(3), 273(1), 277(), 342(l), 369(1), 393(3). Kldi~.ld 209(4), 220,:3), 273(1), 311(2), 342(2), 367(1), 392(1), 393(12). Punnayur 200.1(1), 200.3(1), 204.2(55), 273(1),342(1),369(1),388(1). Edakkazhiyur 204.2(41), 209(1), 220(3), 342(1), 393(1). Viyalathur 200.3(1), 204.1(1), 209(7), 214(1), 220(12), 273(3), 311(1), 342(1), 368(1), 369(1), 393(3). Vadakk<~kad 200.1(12),209(2),273(4),303(1), 333(1), 335.1(2), 369(1), 388(1), 393(1). Punnayurkulam 200.1(5), 207.1(1) 209(1), 22(>(1), 273(3), 311(1), 369(2), 388(2), 393(3). Perump;:dappa 200.1(2),200.3(1),209(1),220(4),273(3),301(1), 388(2), 393(1). Nannamukku 209(2),220(1),273(2). Pallikkara 205(1), 209(3), 220(1), 273(2), 336(1), 388(2) 393(1). Alangodc 200.3(1), 220(1), 273(1), 311(2), 350(1). Kappur 220(1). Othalur 220(2), 273(3), 311(2), 367(1), 369(1), 393(1). Kavucodc 200.3(1), 209(13), 214(1), 220(16), 273(11), 289(1), 344(1), 367(2), 369(1), 393(1). Chalis,eri 220(5), 273(1), 311 (1), 342(1), 369( 1), 388( 1). Nagalasseri 220(6), 314(1), 369(2), 384(1), 388(1), 393(4). Thirumittacode 209(1), 220(1), 273(4), 311(2), 393(2). Peringannur 273(1). Kothachira 209(1), 220(1), 273(2), 311(1), 36~(2), 388(1),393(2).
Towns:-Ponnani 200.1(11), 200.3(1), 204.2(13), 205(4),
207.1(2), 209(4), 214(1), 220(26), 273(10), 277(15), 278.2(2), 281(3), 284(2), 289(3), 301(1), 302(2), 303(2), 311(6), 336(2), 341.2(1), 367(4), 368(4), 369(6),378(1), 388(5), 392(4), 393(16).
Ottapalam Taluk:-TOTAL:-200.3(6), 200.4(3), 204.2(1). 205 (12)
207.2(3), 209(36), 214(4). 218(2), 220(86) 230(1)' 231(5), 233(1), 235(81), 236(1), 273(138), '278.2(6): 280(5), 281(3), 284(4), 285(1), - 288(7), 289(2), 291(1), 301(2), 302(5), 311(36), 320.3(1), 333(2), 334(13), 335.1(37), 335.2(1), 336(2), 340(3), 342(1), 344( 4). 350(51), 365(9), 367 (11), 368(2), 369(54) 380(1), 384(2), 388(23), 392(10), 393(85). '
Rural :-200'3(1), 200'4(3), 204'2(1), 205(9), 207'2(3).
209(35), 214(2), 218(1), 220(57), 231(5), 233(1) 235(80), 236(1), 273(89), 278'2(1), 280(1), 281(2): 284(1),288(7),289(2),291(1),302(1),311(22),333(1), 334(10), 335'1(20), 335'2(1), 336(2), 344(4), 350(51) 365(7), 367(3), 369(45), 388(16),392(3), 393(60)
Urban :-
220'3(5),205(3), 209(1),214(2), 218(1), 220(29), 230(1), 235(1), 273(49), 278'2(5), 280(4), 281(1), 284(3), 285(1), 301(2), 302(4), 311(14), 320'3(1), 333(1), 334(3), 335'1(17), 340(3), 342(1), 365(2), 367(8), 368(2), 369(9), 380(1), 384(2), 388(7), 392(7) 393(25). '
Villages :-Vilayur 220(1), 369(1). Chundampatta 220(1),
335'1(1). Kulukallur 273(1), 393(1). Karalm~nna 220(2),231(1),273(3),311(1), 393(1). Veeramangalam 220(2), 235(1), 273(1), 335'1 ~1), 393(1). VeI:inezhi 220'4(1), 273(3), 311(1), 335'1(4). Karimpuzha 209(5), 235(48), 273(2), 288(3), 335'1(1), 365(2), 369(7), 393(3), Pulaperta 220(2), 273(2), 388(1), 393(2). Mannambatta 393( 1) Sreekrishnapuram 205(1), 209(1), 231(1), 273(5), 311(1), 335'1(2), 393(4). Thirunarayanapuram 205(1),273(1),311(1), 369(5). Mooth2dathu Madamba 273(2), 393(3). Katmktilam 393(1). Thanikunnu 273(2). Kadambazhtpuram 273(1), 388(1). 393(1). PuHunda'~eri 2{}9(1), 273(3). VC'.dakkumbrom 27$(1), 311 (1), S93( 4). Eledathmadamba 2072(1), 22U(1), 365(1), 369(1). Trikkadeeri 207'2(1), 220(2), 273(4), 278'2(1), 311(1), 369(1), 393(1). Nellaya 288(1), 311(1). Cherplachery 205(3), 209(3),214(1), 2is(l), 220(8). 273(lU), 284(1),302(1),311(5),333(1),3(1-4(1),367(2), 369(1), 388(2),392(3),393(4). Ezhuva'fithala 209(1), 220(3), 393(2). Mundakottukurissi 220('n- Amayur 273(2), 393(1). Thiruvegapura 273(1» 311(1), 335'1(1). Naduvattam 220{3). Muthuthala 335'1(1)- Perumudiyur 273(1), 335'1(2), 388(1). Maruthur 220(1). Pattambi Palliprom 220(1), 273(1}, 334(1)., 393(1). Kalladipetta 273(2), 344(3). Vada~amkurissi 209(8), 220(1), 273(3), 281(1), 311(1), 369(6) 388(1). Vallapuzha 205(1), 220(4), 273(1), 311(2), 393(1). Kuruvattoor 273(1), 369(1). Chalavara 220(1),236(1).
\ 273(1). Kothakurissi 205(1), 273(4), 311(1), 393(2), Panamanna 273(2),393(1). Cherumundasseri 27:\3(1),
, 335'1(1). Vengasseri 273(2). Chunangad 209(1), 220(8), '335'1(2),350(8),.369(3),393(4). Kanniambrom 207'2(1), 209(4), 235(28), 273(3); 334(2}, 335'1(1), 335'2(1), 336(1), 350(17), 365(1), 369(2). Vaniamculam 209(4), 273(2), 288(2), 350(2),365(1), 369(2),
92
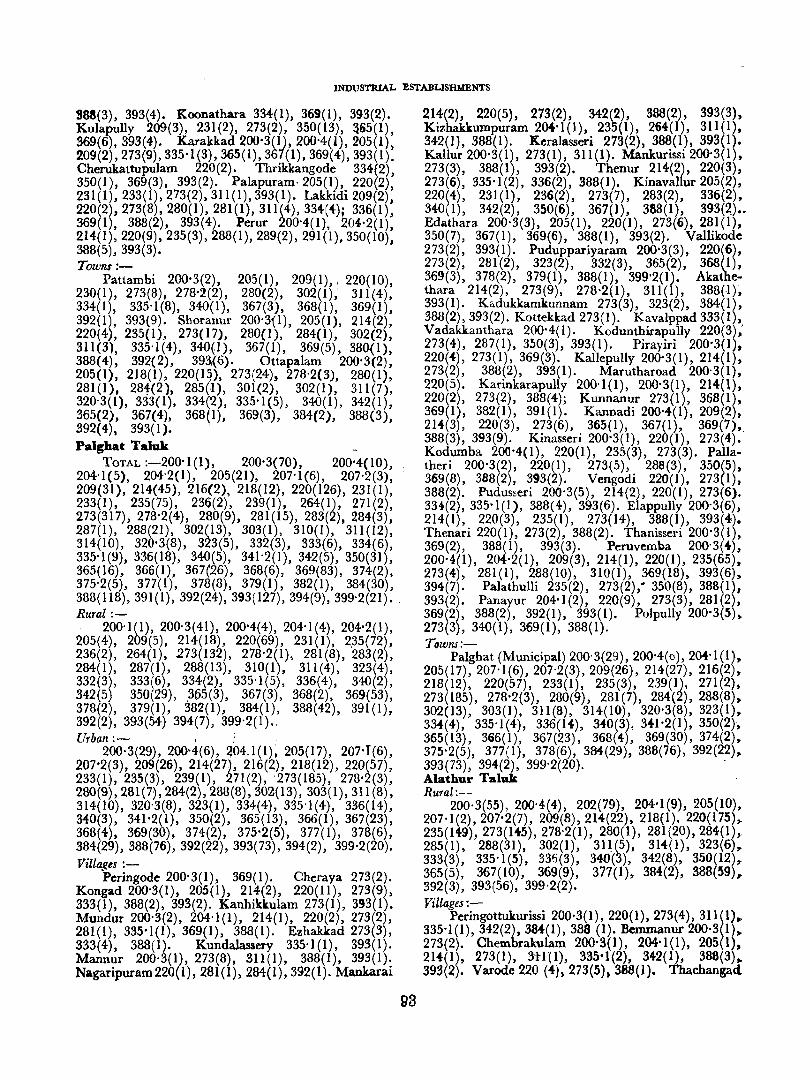
INDUSTRIAL ESTABLISHMENTS
g88(3) , 393(4). Koonathara 334(1), 369(1), 393(2). Kulapully 209(3), 231(2), 273(2), 350(13), ~65(1), 369(6),393(4)_ Karakkad 200-3(1), 200'4(1), 205(1), 209(2),273(9),335'1(3),365(1),367(1),369(4),393(1)_ Cherukattupulam 220(2). Thrikkangode 334(2), 350(1), 369(3), 393(2). Palapuram· 205(1), 220(2), 231(1),233(1),273(2), 3U(I), 393(1). Lakkidi 209(2), 220(2),273(8),280(1),281(1),311(4),334(4); 336(1), 369(1), 388(2), 393(4). Perur 200'4(1), 204'2(1), 214(1),220(9),235(3),288(1),289(2),291(1),350(10) 388(5), 393(3). ' Towns:-
Pattambi 200'3(2), 205(1), 209(1),. 220(10), 230(1), 273(8), 278'2(2), 280(2), 302(1); 311(4), 334(1), 335'1(8), 340(1), 367(3), 368(1), 369(1), 392(1), 393(9). Shoranur 200'3{1), 205(1), 214(2), 220(4), 235(1), 273(17), 280(1), 284(1), 302(2), Sll(3), 335'1(4), 340(1), 367(1), 369(5), 380{1), 388(4), 392{2), 393,(6). Ottapalam 200'3(2), 205(1), 218(1), 220(1~), 273(24), 278'2(3), 280(1), 281 (1), 28t(2), 285(1), 301 (2), 302(1), 311 (7), 320'3(1), 333( I). 334~), 335'1 (5), 340( 1), 342(1), 365(2), 367(4), 368~1), 369(3), 384(2), 388(3), 392(4), 393(1). Palghat Taluk
TOTAL :-200'1(1), 200'3(70), 200'4(10), 204'1 (5), 204-2(1), 205(21), 207'1 (6), 207'2(3), 209(31), 214(45), 216(2), 218(12), 220(126), 231(1), 233(1), 235(75), 236(2), 239(1), 264(1), 271(2), 273(317), 278-2(4), 280(9), 281(15), 283(2), 284(3), 287(1), 288(21), 302(13), ~03(1), 310(1), 311(12), 314(10), 320'3(8), 323(5), 332(3), 333(6), 334(6), 335-1 (9), 336(18), 340(5), 341'2(1), 342(5), 350(31), 365(16), 366(1), 367(26), 368(6), 369(83), 374(2), 375'2(5), 377(1), 378(8), 379(1), 382(1), 384(30), 388(118),391(1),392(24),393(127),394(9),399'2(21). , Rural :-
200'1(1), 200'3(41), 200'4(4), 204'1(4), 204'2(1), 205(4), 209(5), 214(18), 220(69), 231(1), 2,35{72), 236(2), 264(1), 273(132), 278'2(1), 281(8), 283(2), 284(1), 287(1), 288(13), 310(1), 311(4), 323(4), 332(3), 333(6), 334(2), 335'1(5), 336(4), 340(2), 342(5) 350(29), .3()5(3), 367(3), 368(2), 369(53), 378(2), 379(1), 382(1), 384(1), 388(42), 391(1), 392(2), 393(54) 394(7), 399'2(1) .. Urban:- \.'
200'3(29), 200'4(6), ~04.1(1)~ 205(17), 207'I(6), 207-2(3), 209(26), 214(27}, 216(2), 218(12), 220(57), 233(1), 235(3), 239(1), 271(2), :273(185), 278-2(3), 280(9),281(7),284(2),288(8),302(13), 303(1),311(8), 314(10), 320'3(8), 323(1), 334(4), 335'1(4), 336(14), 340(3), 341'2(1), 350(2), 365(13), 366(1), 367(23), 368(4), 369(30), 374(2), 375'2(5), 377(1), 378(6), 384(29),388(76),392(22),393(73),394(2), 399·2(20). Villages :-
Peringode 200'3(1), 369(1). Cheraya 273(2). Kongad 200'3(1), 205(1), 214(2), 220(11), 273(9), 333(1), 388(2), 393(2). Kanhikkulam 273(1), 393(1). Mundur 200'3(2), 204'1(1), 214(1), 220(2), 273(2), 281(1), 335-1(1), 369(1), 388(1). Ezhakkad 273(3), 333(4), 388(1). Kundalassery 335'1(1), 393(1). Mannur 200'3(1), 273(8), 311(1), 388(1), 393(1). Nagaripuram220(1), 281(1), 284(1),392(1). Mankarai
214(2), 220(5), 273(2), 342(2), 388(2), 393(3), Kizhakkumpuram 204'1(1), 235(1), 264(1), 311(1), 342(1}, 388(1). Keralasseri 273(2), 388(1), 393(1). Kallur 200'3(1), 273(1), 311(1). Mankurissi 200'3(1), 273(3), 388(1), 393(2). Thenur 214(2), 220(3), 273(6), 335'1 (2), 336(2), 388( 1). Kinavallur 205(2), 220(4), 231(1), 236(2), 273(7), 283(2), 336(2), 340(1), 342(2), 350(6), 367(1), 388(1), 393(2) •• Edathara 200'3(3), 205(1), 220(1), 273(6), 281(1), 350(7), 367(1), 369(6), 388(1), 393(2). Vallikode 273(2), 393(1). Puduppariyaram 200'3(3), 220(6), 273(2), 281(2), 323(2), 332(3), 365(2), 368(1), 369(3), 378(2), 379(1), 388(1), 399'2(1). Akathethara 214(2), 273(9), 278'2(1), 311(1), 388(-l)~ 393(1). Kadukkamkunnam 273(3), 323(2), 384(1), 388(2),393(2). Kottekkad 273(1). Kavalppad 333(1), Vadakkanthara 200-4(1). Kodunthirapully 220(3); 273(4), 287(1), 350(3), 393(1). Pirayiri 200'3(1), 220(4), 273(1), 369(3). KallepuUy 200-3(1), 214(1), 273(2), 388(2), 393(1). Marutharoad 200'3(1), 220(5). Karinkarapully 200'1(1), 200'3(1), 214(1), 220(2), 273(2), 388(4); Kunnanur 273(1), 368(1), 369(1), 382(1), 391(1). Kannadi 200-4(1), 209(2), 214(3), 220(3), 273(6), 365(1), 367(1), 369(7), 388(3), 393(9). Kinasseri 200'3(1), 220(1), 273(4). Kodumba 200'4(1), 220(1), 235(3), 273(3). Pallatheri 200'3(2), 220(1), 273(5), 288(3), 350(5). 369(8), 388(2), 393(2). Vengodi 220(1), 273(1). 388(2). Pudusseri 200'3(5), 214(2), 220(1), 273(6). 334(2),335-1(1), 388(4), 393(6). Elappully 200-3(6)t 214(1), 220(3), 235(1), 273(14), 388(1), 393(4). Thenari 220(1), 273(2), 388(2). Thanisseri 200'3(1), 369(2), 388(1), 393(3). Peruvemba 200'3(4), 200'4(1), 204'2(1), 209(3), 214(1), 220(1), 235(65), 273(4), 281(1), 288(10), 310(1), 369(18), 393(6), 394(7). Palathulli 235(2), 273(2); 350(8), 388{I)f 393(2). Panayur 204'1 (2), 220(9), 273(3), 281 (2), 369(2), 388(2), 392(1), 393(1). Polpully 200'3(5» 273(3), 340(1), 369(1), 388(1). Towns:-
Palghat (Municipal) 200'3(29), 200'4(0), 204'1(lh 205(17),207'1(6),207'2(3),209(26), 214(27), 216(2), 218(12), 220(57), 233(1), 235(3), 239(1), 271(2), 273(185), 278'2(3), 280(9), 281(7), 284(2), 288(8), 302(13), 303(1), 311(8), 314(10), 320'3(8), 323(1)t 33.f:(4) , 335'1(4), 336(14), 3.0(3), 341'2(1), 350(2);. 365(13), 366(1), 367(23), 368(4), 369(30), 374(2),. 375'2(5), 377(1), 378(6), 384(29), 388(76), 392(22),. 393(73), 394(2), 399'2(20). . Alathur Taluk Rural:-
200'3(55), 200'4(4), 202(79), 204'1(9), 205(10). 207'1(2),207'2(7), 209(8),214(22), 218(1), 220(175), 235(149), 273(1+5),278-2(1), 280(1), 281(20),284(1),. 285(1), 288(31), 302(1), 31H5), 314(1), 323(6),. 333(3), 335'1(5), 336(3), 340(3), 342(8), 350(12)" 365(5), 367(10), 369(9}, 377(1), 384(2), 388(39),. 392(3), 393(56), 399·2(2). Villages:-
Peringottukurissi 200'3(1),220(1),273(4),311(1)" 335'1(1),342(2).384(1),388 (I). Bemmanur 200·3(1)" 273(2). Chembrakulam 200'3(1), 204'1(1), 205(1), 214(1), 273(1), 3t1{l)~ 335'1(2), M2(1), 388(3),.. 393(2). VarQde 220 (4),273(5),388(1). Thachangad
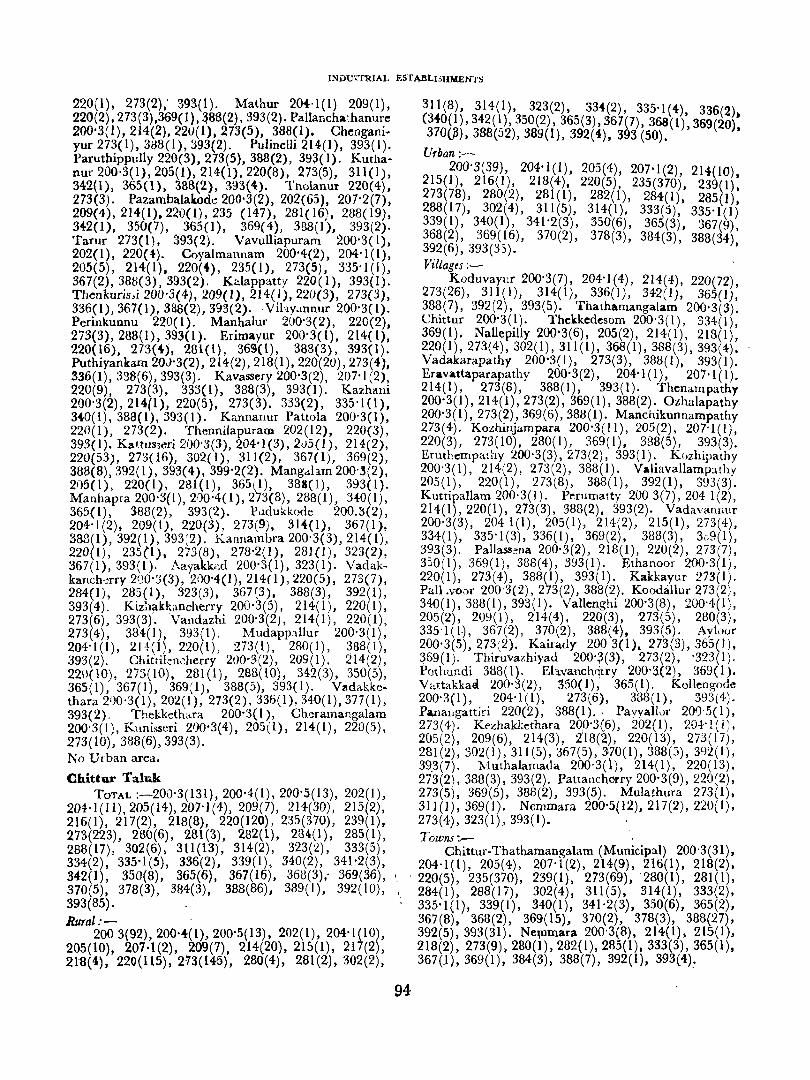
INDmTRIAL ESTAIlLI3HMENTS
220(1), 273(2); 393(1). Mathur 20{'1(1) 209(1), 220(2), 273(3),369( 1), ~88(2), 393(2). Pallancha,hanure 200'3(1),214(2), 22U(I), 273(5), 388(1). Chenganiyur 273(1),388(1),393(2). Pulinelli 214(1), 393(1). ParuthippuUy 220(3), 273(5),388(2), 393(1). Kutllanur 200·3( 1), 205( 1), 214( I), 220(8), 273(5), 311 (l), 342(1), 365(1), 388(2), 393(4). Tholanur 220(4), 273(3). Pazambalakod~ 200'3(2), 202(65), 207'2(7), 209(4), 214(1), 220(1), 235 (147), 281( 16), 288(19), 342(1), 350(7), 365(1), 369(4), 388(1), 393(2). Tarur 273(1), 393(2)_ Vavulliapuram 200'3(1), 202(1), 220(4). Coyalmannam 200'4(2), 204-1(1), 205(5), 214(1), 220(4), 235(1), 273(5), 335-1(1), 367(2),388(3), 393(2), Kalappatty 220( 1), 393(1)_ Thenkuris,i 200-3(4),209(1),214(1),220(3), 273(3), 336(1),367(1),388(2),393(2). ,Vihy.mnur 200-3(1)_ Perinkunnu 220(1)_ Manhalur 200-3(2), 220(2), 273(3),288(1),3930)_ Erimayur 200'3(1), 214(1), 220( 16), 273(4), 2Sl (I), 369(1), 388(3), 393( 1)_ Puthiyankam 20J'3(2), 214(2),218(1),220(20),273(4), 336(1),338(6),393(3). Kavassery 200-3(2), 207-1 (2), 220(9), 273(3), 333(1), 388(3), 393(1). Kazhalli 200'3(2),214(1), 220(5), 273(3). 333(2), 335-10), 340(1), 388(1),393(1)_ Kannanur Pattola 200'3(1), 220(1), 273(2)_ Thennilapuram 202(12), 220(3), 393(1). Kat.tusseri 200'3(3), 204·1(3), 21)5(1), 214(2), 220(53), 273(16), 302(1), 311(2), 367(1), 369(2), 388(8),392(1), 393(4), 399·2(2)_ Mang,ilam 200-3(2), 205(1), 220(1), 281(1), 365l1), 388(1), 393(1). Manhapra 200'3(1),200'4(1),273(8), 288(1), 340(1), 365(1), 388(2), 393(2). Pudukkode 200_3(2), 204-1(2), 209(1), 220(3), 273(9), 314(1), 367(1), 38B(I), 392(1), 393:2). Kannambra 200'3(3), 214(1), 220(1), 235(1), 273(8), 278-2(1), 281(1), 323(2), 367(1),393(1). i\ayakk<:d 200-3(1), 323(1). Vadakkanch·.:rry 21]0-3(3), 2()O'4(1), 214( 1),220(5), 273(7), 284(1), 285(1), 323(3), 367(3). 388(3), 392(1), 393(4). Kizh~kkancherry 200'3(5), 214(1), 220(1), 273(6), 393(3). Vandazhi 200'3(2), 214(1), 220(1), 273(4), 384(1), 393(1). J'\1udappallur 200-3(1), 204-1(1), 21+(1), 220(1), 273(1), 280(1), 388(1), 393(2). Chittil~n..::herry 200'3(2), 209(1), 214(2), 220(10), 273(10), 281(1), 288(10), 342(3), 350(5), 365(1), 367(1), 369(1), 388(5), 393(1)_ V2I.dakkethara 21)0'3(1),202(1), 273(2),336(1),34-0(1),377(1), 393(2). Thekketbra 200-3(1), Ch~ramangalam 200'3(1 t, Kunisscri 21)0'3(4), 205( 1), 214( 1), 220(5), 273(10), 388(6),393(3). No Urban area.
Chittur Taluk TOTAL :-200-3(131),200-4(1), 200-5(l3), 202(1),
204-1(11),205(14),20'7'1(4),209(7), 214(30), 215(2), 216(1), 217(2), 218(8), 220(120), 235(370), 239(1), 273(223), 280(6), 281(3), 282(1), 284(1), 285(1), 288(17), 302(6), 311(13), 314-(2), 323(2), 333(5), 334(2), 335'1 (5), 336(2), 339( I), 340(2), 341·2(3), 342(1), 350(8), 365(6), 367(16), 368(3), 369(36), 1
370(5), 378(3), 384(3), 388(86), 389(1), 392(10), \ 393(85). Rural:-
2003(92),200-4(1),200-5(13), 202(1), 204'1(10), 205(10), 207.1(2), 209(7), 214(20), 215(1), 217(2), 21'8(4), 220(115), 213(145), 280(4), 281(2), 302(2),
311(8), 314(1), 323(2), 33i(2) , 335-1(4) 336(2) (340(1),342(1),350(2), 36S(3), 367(7),368(1)' 369(20)-370(~), 388(52),389(1), 392(4), 393 (50).' ,
Urban :-200-3(39), 204'1(1), 20j(4), 207·1(2) 214(10)
215(1), 216(1), 218(4), 220(5), 235(370), 239(1): 273(78), 280(2), 281(1), 282(1), 284(1), 285(1), 288(17), 302(4), 311(5), 314(1), 333(5), 33S-I(I) 339(1), 340(1), 341-2(3), 350(6), 36S(3) 367(9) 368(2), 369(16), 370(2), 378(3), 384(3)' 388(34)' 392(6), 393(35). " Villagts :-
Koduvayur 200-3(7), 204-1(4), 214(4), 220(72), 273(26), 311 (I), 314( I), 336( I), 342( 1), 365(1) 388(7), 392(2), 393(5). Thathamangalam 200-3(3): Chittur 200'3(1)- Thekkedesom 200-3(1) 334(1) 369( 1). Nallepilly 200·3(6), 205(2), 2 I 4( 1)', 218( 1): 220(1),273(4),302(1),311(1), 368(1),388(3),393(4). Vadakarapathy 200-3(1), 273(3), 388(1), 393(1). Eravattaparapathy 200'3(2), 204'1(1), 207-1(1). 214(1), 273(8), 388(1), 393(1)_ Thenampathy 200-3(1),214(1),273(2), 369(1), 388(2)_ Ozhalapathy 200'3(1),273(2),369(6),388(1). Manchikunnampathy 273(4). Kozhiluampara 200-3(11), 205(2), 207-1(1), 220(3), 273(10), 280(1), 369(1), 338(5), 393(3). Eruthempqthy 200-3(3), 273(2), 393( 1) _ Kozhipathy 200'3(1), 214(2), 273(2), 388(1). Valiavallamp::tthy 205(1), 220(1),273(8),388(1),392(1),393(3)_ Kuttipallam 200'3(1)_ Perurnalty 2003(7),204 1(2), 214(1),220(1), 273(3), 388(2), 393(2)_ Vadavannur 200-3(3), 2041(1), 205(1), 214(2), 21S(I), 273(4), 334(1), 335-1(3), 336(1), 369(2), 388(3), 3c9(1), 393(3). Pallass~na 200-.3(2), 218(1), 220(2), 273(7), 350(1), 369(1), 388(4), 393(1). Ethanoor 200'3(1), 220(1), 273(4), 388(1), 393(1)_ Kakkayur 273(1)_ PalLvonf 200-3(2),273(2),388(2)_ Koodallur 273(2), 340(1), 388(1),393(1). Yallenghi 200-3(8), 200-4(1), 205(2), 209(1), 214(4), 220(3), 273(5), 280(3), 335·1(1.), 367(2), 370(2), 388(4), 393(5). Ayloor 200-3(5),273(2)_ Kairady 200 3(1). 273(3),365(1), 369(1). Thiruvazhiyad 200'~(3), 273(2), -323(1). Pothundi 388(1)_ EhV'anchtl1ry 200'3.(2), 369(1). V c.ttakkaa 200'3(2), 350( 1), 365( I) _ Kollengode 200'3( I), 204-1 (1), 273(6), 338(1), 393(4)_ Panangattiri 220(2), 388(1)., Payyallvr 2()!}5(1), 273(4)_ KezhakLethara 200'3(6), 202(1), 204'1(1). 205(2), 209(6), 214(3), 2'18(2), 220(13), 273(17), 281(2),302(1),311(5),367(5),3170(1),388(3),392(1), 39.3(7)_ Muthalamada 200'3(\), 214(1), 220(13), 273(2), 388(3), 393(2). Pattanchorry 200-3(9), 220(2), 273(5), 369(5), 388(2), 393(5)_ ~ulathura 273(1), 311(1),369(1). Nemmara 200-5(12),217(2),220(1), 273(4), 323(1), 393(1). Towns:- ,
Chittur-Thathamangalam (Municipal) 200'3(31), 204-1(1), 205(4), 207-1(2), 214(9), 216(1), 218(2),
. 220(5), 235(370), 239(1), 273(69), 280(1), 281(1), 284(1), 288(17), 302(4), 311(S), 314(1), 333(2), 335'1 (1), 339( I), 340(1), 341-2(3), 350(6), 365(2). 367(8), 368(2), 369(15), 370(2), 378(3), 388(27), 392(5),393(31). Neljl1mara 200'3(8), 214(1), 215(1), 218(2), 273(9),280(1),282(1),285(1),333(3),365(1). 367(.1),369(1), 384(3), 388(7), 392(1), 393(4)._
94
(iv) INDEX OF VILLAGES AND DESOMS
21/294-J3

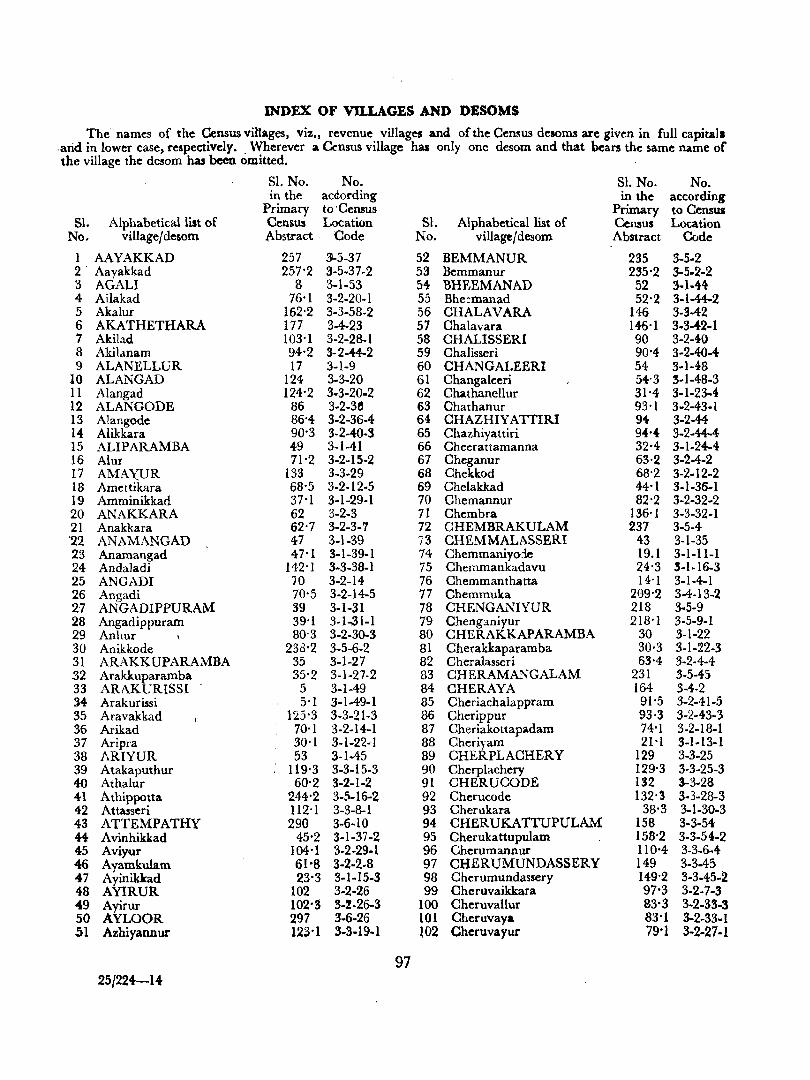
INDEX OF VD..LAGES AND DESOMS
The' names of the Census villages, viz., revenue villages and of the Census de.oms are given in full capital • . arid in lower case, respectively. . Wherever a (knsus village has only one desom and that bc;ars the same name of the village the desom has been omitted.
S1. No. .No. S1. No. No. in the ac¢ording in the according
Primary to'Census Primary to Census 51. Alphabetical list of Census Location 51. Alphabetical list of Census Location
No. village! desom Abstract Code No. village! desoro Abstract Code
1 AAYAKKAD 257 3-5-37 52 BEMMANUR 235 3-5-2 2' Aayakkad 257'2 3-5-37-2 53 Bemmanur 235'2 3-5.2-2 3 AGALI 8 3-1-53 54 BHEEMANAD 52 3-1-44 4 Ailakad 76,1 3-2-20-1 55 Bhe~manad 52'2 3-1-44-2 5 Akalur 162'2 3-3-58-2 56 CHALAVARA 146 3-3-42 6 AKATHETHARA 177 3-4-23 57 ChaJavara 146,1 3-3-42-1 7 Akilad 103'1 3-2-28-1 58 CHALISSERI 90 3-2-40 8 Akilanam 94,2 3-2-44-2 59 Chalisseri 90'4 3-2-40-4 9 ALANELLUR 17 3-1-9 60 CHANGALEERI 54 3-1-48
10 ALAN GAD 124 3-3-20 61 Changaleeri 54'3 3-1-48-3 11 Alangad 124'2 3-3-20-2 62 Chathanellur 31'4 3-1-23-4 12 ALANGODE 86 3-2-36 63 Chathanur 93,1 3-2-43-1 13 Alangode 86'4 3-2-36-4 64 CHAZHIY ATTIRI 94 3-2-44 14 Alikkara 90'3 3-2-40-3 65 Chazhiyattiri 94,4 3-2-44-4 15 ALIPARAMBA 49 3-1-41 66 Cheerattamanna 32·4- 3-1-24-4 16 Alur 71'2 3-2-15-2 67 Cheganur 63·2 3-2-4-2 17 AMAYUR 133 3-3-29 68 Chekkod 68'2 3-2-12-2 13 Amettikara 68'5 3-2-12-5 69 Chelakkad 44'1 3-1-36-1 19 Amminikkad 37'1 3-1-29-1 70 Chemannur 82'2 3-2-32-2 20 ANAKKARA 62 3-2-3 71 Chembra 136'1 3-3-32-1 21 Anakkara 62'7 3-2-3-7 72 CHEMBRAKULAM 237 3-5-4 '22 ANAMANGAD 47 3-1-39 73 CHEMMALASSERI 43 3-1-35 23 Anamangad 47,1 3-1-39-1 74 Chemmaniyode 19.1 3-1-11-1 24 Andaladi 142'1 3-3-38-1 75 Chemmankadavu 24'3 5-1-16-3 25 ANGADI 70 3-2-14 76 Chemmanthatta 14'1 3-1-4-1 26 Angadi 70'5 3-2-14-5 77 Chemmuka 209'2 3-4-13-2 27 ANGADIPPURAM 39 3-1-31 78 CHENGANIYUR 218 3-5-9 28 Angadippuram 39'1 3-1.,31-1 79 Chenganiyur 218'1 3-5-9-1 29 Anhur 80'3 3-2-30-3 80 CHERAKKAPARAMBA 30 3-1-22 30 Anikkode 238'2 3-5-6-2 81 Cherakkaparamba 30·3 3-1-22-3 31 ARAKKUPARAMBA 35 3-1-27 82 Cheralasseri 63'4 3-2-4-4 .32 Arakkuparamba 35-2 3-1-27-2 83 CHERAMANGALAM 231 3-5-45 33 ARAKURISSI 5 3-1-49 84 CHERAYA 164 3-4-2 34 Arakurissi 5'1 3-1-49-1 85 Cheriachalappram 91'5 3-2-41-5 35 Aravakkad 125-3 3-3-21-3 86 Cherippur 93·3 3-2-43-3 36 Arikad 70'1 3-2-14-1 87 Cheriakottapadam 74'1 3-2-18-1 37 Aripra 30'1 3-1-22-1 88 Cheriyam 21-1 3-1-13-1 38 ARIYUR 53 3-1-45 89 CHERPLACHERY 129 3-3-25 39 Atakaputhur 119'3 3-3-15-3 90 Cherplachery 129'3 3-3-25-3 40 Athalur 60'2 3-2-1-2 91 CHERUCODE 132 3-3-28 41 Athippotta 244'2 3-5-16-2 92 Cherucode 132,3 3-3-28-3 42 Attasseri 112'1 3-3-8-1 93 Cherukara 38'3 3-1-30-3 43 ATTEMPATHY 290 3-6-10 94 CHERUKATTUPULAM 158 3-3-54 44- Avinhikkad 45'2 3-1-37-2 95 Cherukattupulam 158'2 3-3-54-2 45 Aviyur 104,1 3-2-29-1 96 Cherumannur 110'4 3-3-6-4 46 Ayamkulam 61·8 3-2-2-8 97 CHERUMUNDASSERY 149 3-3-45 47 Ayinikkad 23-3 3-1-15-3 98 Cherumundassery 149'2 3-3-45-2 48 AYIRUR 102 3-2-26 99 Cheruvaikkara 97'3 3-2-7-3 49 Ayirur 102'3 3-2-26-3 100 Cheruvallur 83-3 3-2-33-3 50 AYLOOR 297 3-6-26 101 Cheruvaya 83'1 3-2-33-1 51 AzhiyannUf 123'1 3-3-19-1 102 Cheruvayur 79'} 3-2-27-1
97 25/224-14
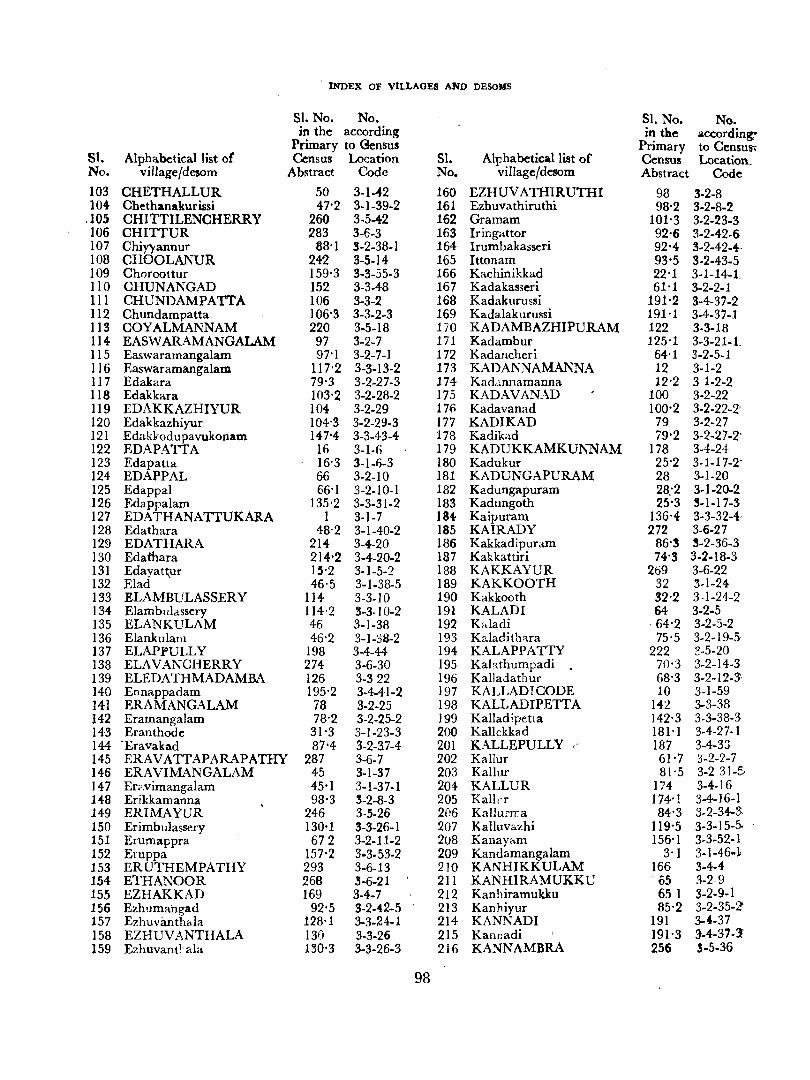
INDEX OF VILLAGES AND DESONS
SI. No. No. Sl. No. No. in the according in the according,-
Primary to Gensus Primary to Censust S1. Alphabetical list or Census Location 51. Alphabetical list of Census Location_ No. village/desom Abstract Code No. vil1age/desom Abstract Code 103 CHETHALLUR 50 3-1 .... 2 160 EZHUV ATHIRUTHI 98 3-2-8 104- Chethanakur issi 47'2 3-1-39-2 161 Ezhuvathiruthi 98'2 3-2-8-2
,105 CHITTILENCHERRY 260 3-5-42 162 Gramam 101'3 3.2-23-3 106 CHITTUR 283 3-6-3 163 Iring"ttor 92'6 3-2-42-6 107 Chinannur 88'1 3-2-38-1 164 lrumbakasseri 92'4 3-2-42-4-108 CHOOLANUR 242 3-5-14 165 Ittonam 93'5 3-2-43-5 109 Choroottur 159'3 3-3-55-3 166 Kachinikkad 22'1 3-1-14-1 110 CHUNANGAD 152 3-3-48 167 Kadakasseri 61·1 3-2-2-1 111 CHUNDAMPATTA 106 3-3-2 168 Kadakurussi 191'2 3-4-37-2 112 Chundampatta 106'3 3-3-2-3 169 Kadalakurussi 191'1 3-4-37-1 113 COYALMANNAM 220 3-5-18 170 KADAMBAZHIPURAM 122 3-3-18 114 EASWARAMANGALAM 97 3-2-7 171 Kadambur 125'1 3-3-21-1 115 Easwaramangalam 97'1 3-2-7-1 172 Kadancheri 64·1 3-2-5-1 116 Easwaramangalalll 117'2 3-3-13-2 173 KADANNAMANNA 12 3-1-2 117 Edakara 79-3 3-2-27-3 174 Kad,.l.nnamanna 12'2 3·1-2-2 118 Edakkara 103-2 3-2-28-2 175 KADAVANAD 100 3-2-22 119 EDAKKAZHIYUR 104- 3-2-29 176 Kadavanad 100'2 3-2-22-2' 120 Edakkazhiyur 104'3 3-2-29-3 177 KADIKAD 79 3-2-27 121 Edak¥odupavukonam 147'4 3-3-43-4 178 Kadikad 79'2 3-2-27-2' 122 EDAPATTA 16 3-1-6 179 KADUKKAMKUNNAM 178 3-4-24 123 Edapatta - 16-3 3-1-6-3 180 Kadukur 25-2 3-1-17-2' 124 EDAPPAL 66 3-2-10 181 KADUNGAPURAM 28 3-1-20 125 Edappal 66-1 3-2-10-1 182 Kadungapuram 28:2 3-1-20-2 126 Edappalam 135'2 3-3-31-2 183 Kadungoth 25-3 3-1-17-3 127 EDATHANATIUKARA 1 3-1-7 1S4 Kaipuram 136'4 3-3-32-4-128 Edathara 48-2 3-1-40-2 185 KAIRADY 272 3-6-27 129 EDATHARA 214 3-4-20 186 Kakkadipuram 86'3 3-2-36-3 130 Edatbara 214'2 3-4-20-2 187 Kakkattiri 74-3 3-2·18-3 131 Edayat~pr 13'2 3-1-5-2 188 KAKKAYUR 269 3-6-22 132 Elad 46'5 3-1-38-5 189 KAKKOOTH 32 ~-1-24 133 ELAMBULASSERY 114 3-3-10 190 Kakkooth 32·2 3·1-24-2 134- Elambulassery 114·2 3-3·10-2 191 KALADI 64 3-2·5 135 ELANKULAM 46 3-1-38 192 Kaladi ·64'2 3-2-5-2 136 Elankulam 46'2 3-1-:38-2 193 Kaladith'\ra 75'5 3-2-19-5-137 ELAPl"ULLY 198 3-4-44 194 KALAPPATTY 222 ?-5-20 138 ELAVANCHERRY 274- 3-6-30 195 Kabthumpadi . 70'3 3-2-14-3 139 ELEDATHMADAMBA 126 3-322 196 Kalladathur 68'3 3-2-12-3-140 Ennappadam 195'2 3-4-41-2 197 KAI_LADICODE 10 3-1-59 HI ERAMANGALAM 78 3-2-25 198 KALLADIPETTA 142 3-3-38 142 Eramangalam 78'2 3-2-25-2 199 Kalladipetta 142'3 3-3-38-3 143 Eranthode 31'3 3-1-23-3 200 Kallekkad 181-1 3-4-27-1 144 -Eravakad 87'4 3-2-37-4 201 KALLEPULLY 187 3.4-33 145 ERAVATTAPARAPATHY 287 3-6-7 202 Kallur 61'7 3-2-2-7 146 ERA VIMANGALAM 45 3-1-37 203 KaBur 81-5 3-231-5-147 Er?vimangalam 45·1 3-1-37-1 204 KALLUR 174 3-4-16 148 Erikkamanna 98·3 3-2-8-3 205 Kalkr 174'1 3-4-16-1 149 ERIMAYUR 246 3-5-26 206 KaIlurrra 84'3 3-2-34-3-150 Erimbulassery 130·1 3-3-26-1 207 Kalluvazhi 119'5 3-3-15-5-151 Erumappra 672 3-2-11-2 2u8 Kanay;:,.m 156-1 3-3-52-1 152 Eruppa 157-2 3-3-53-2 209 Kandamangalam 3-1 3-1-46-1 153 ERUTHEMPATHY 293 3-6-13 210 KANHIKK ULAM 166 3-4-4 154 ETHA:r\OOR 266 .5-6-21 211 KANHIRAMUKKU 05 3-2-9 155 EZHAKKAD 169 3-4-7 212 Kanhiramukku 65 1 3-2-9-1 156 Ezhum!l.hgad 92'5 3-2--42-5 213 Kanhiyur 85'2 3-2-35-2' 157 Ezhuvanth;;la 128·1 3-3-24.1 214 KANNADI 191 3-4-37 158 EZHUV ANTHALA 130 3-3-26 215 Kanr;adi 191-3 :t-4-37-l 159 Ezhuvant!· ala 130-3 3-3-26-3 216 KANNAMBRA 256 3-5-36
98
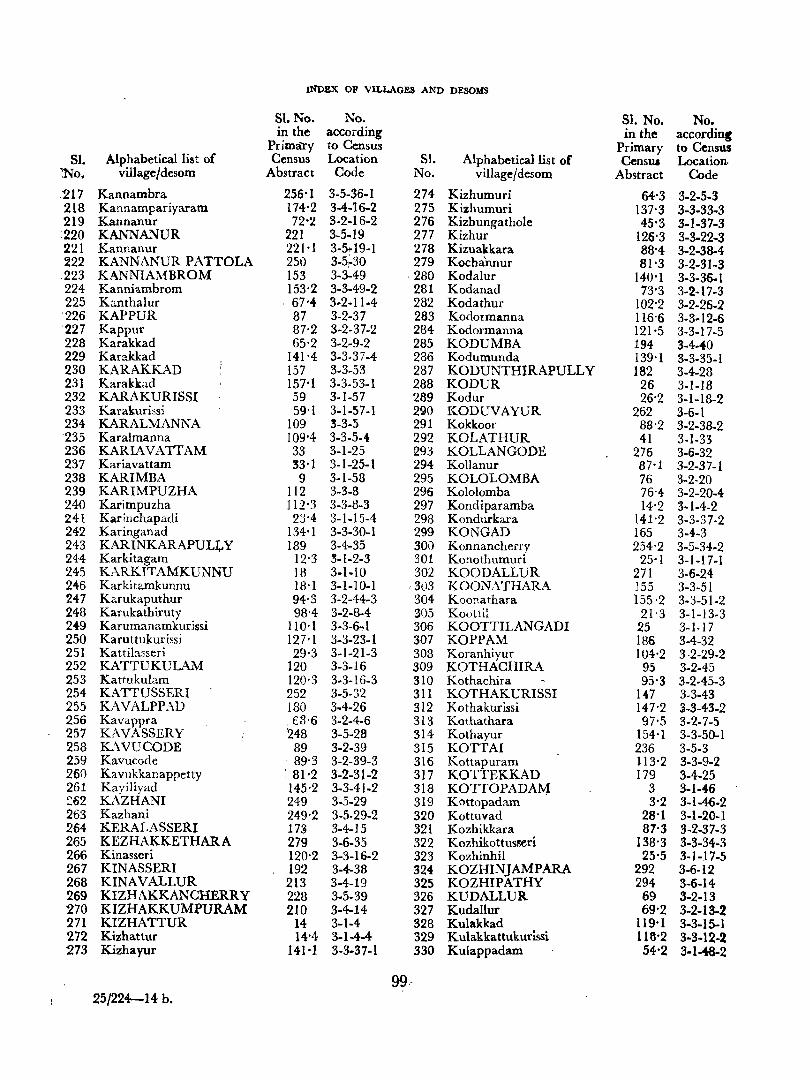
lNDEX OF VILLAGES AND DESOMS
SI. No. No, SI. No. No. in the according in the accordin«
Prima'ry to Census Primary to Census S1. Alphabetical1ist of Census Location S1, Alphabetical list of CensUl Location,
:No. village/desom Abstract Code No, village/desom Abstract Code
:217 Kannambra 256'1 3.5·$6.1 274 Kizhumuri 64'3 3-2-5-3 218 Kannampariyaram 174'2 3·4·16-2 275 Kizhumuri 137'3 3-3-33-3 219 Kannanur 72':.! 3-2-16-2 276 Kizhungathole 45'3 3-1-37-3 :220 KANNANUR 221 3-5-19 277 Kizhur 126-3 3-3-22-3 221 Kannanur 221'1 3-~19-1 278 Kizuakkara 88'4 3-2-38-4 222 KANNANUR PATTOLA 250 3-5~30 279 Kocha'nnur 81'3 3·2-31-3 223 KANNIAMBROM 153 3-3-49 280 Kodalur 140'1 3-3-36-1 224 Kanniambrom 153'2 3-3-49-2 281 Kodanad 73'3 3-2-17-3 225 Kanthalur 67'''' 3-2-11·4 282 Kodathur 102'2 3-2-26-2 '226 KAPPUR 87 3-2-37 283 Kodormanna 116'6 3-3-12-6 '227 Kappur 87'2 3-2-37-2 284 Kodormanna 121'5 3-3-17-5 228 Karakkad 65'2 3-2-9-2 285 KODUMBA 194 3-4"'0 229 Karakkad 141'4 3-3·37-4 286 Kodumunda 139'1 3-3-35-1 230 KARAKKAD 157 3-3-53 287 KODUNTHIRAPULLY 182 3-4-28 231 Karakkad 157'1 3-3-53-1 288 KODUR 26 3-1-18 232 KARAKURISSI 59 3.1-57 289 Kodur 26'2 3-1-18-2 233 Karakurissi 59,1 3-1-57-1 290 KODUVAYUR 262 3·6-1 234 KARALMANNA 109 3-3-5 291 Kokkoor 88'2 3-2-38-2 235 Karalmanna 109'4 3-3-5-4 292 KOLATHUR 41 3-1-33 236 KARIA VA TT AM 33 3-1-25 293 KOLLANGODE 276 3-6-32 237 Kariavattam 33'1 3-1-25-1 294 Kollanur 87'1 3-2-37-1 238 KARl MBA 9 3-1-58 295 KOLOLOMBA 76 3-2-20 239 KARIMPUZHA 112 3-3-8 296 Kololomba 76'4- 3-2-20-4-240 Karimpuzha 112'3 3-3-8-3 297 Kondiparamba 14'2 3-1-4-2 241 Karinchapadi 23'4 3-1-15-4 298 Kondurkara 141'2 3-3-37-2 242 Karinganad 134'1 3-3-30-1 299 KONGAD 165 3-4-3 243 KARINKARAPULJ;. Y 189 3-4-35 3011 Konnancherrv 254'2 3-5-34-2 244 Karkitagam 12'3 3-1-2-3 301 Konothumuri 25'1 3-1-17-1 245 KARKITAMKUNNU 18 3-1-10 302 KOODALLUR 271 3-6-24 246 Karkitamkunnu 18'1 3-1-10-1 ,303 KOONATHARA 155 3-3-51 247 Karukaputhur 94'3 3-2-44-3 304 Koo!1athara 155 ·2 3-3-51-2 248 Karukathiruty 98'4 3-2-8-4 l05 Koottil 21'3 3-1-13-3 2 .. 9 Karumanamkurissi 110'1 3-3-6~1 306 KOOTTILANGADI 25 3-1-17 250 Karuttukurissi 127'1 3-3-23-1 307 KOPPAM 186 3-4-32 251 Kattilasseri 29,3 3-1-21-3 308 Koranhiyur 104'2 3 ·2-29-2 252 KATTUKULAM 120 3-3-16 309 KOTHACHIRA 95 3-2-45 253 Kattukulam 120'3 3-3-16-3 310 Kothachira 95'3 3-2-45-3 254 KATTUSSERI 252 3-5-32 311 KOTHAKURISSI 147 3-3-43 255 KAVALPPAD 180 3-4-26 312 Kothakurissi 147'2 3-3-43-2 256 Kavappra . E3'6 3-2-4-6 313 Kothathara 97'5 3-2-7-5 257 KAVASSERY :248 3-5-28 314 Kothayur 154'1 3-3-50-1 258 KAVUCODE 89 3-2-39 315 KOTTAI 236 3-5.3 259 Kavucode . 89,3 3-2-39-3 316 Kottapuram 113'2 3-3-9-2 260 Kavukkar.appetty : 81-2 3-2-31-2 317 KOTTEKKAD 179 3-4-25 261 Kayiliyad 145,2 3-3-41-2 318 KOTTOPADAl'4 3 3-1-'6 ~62 KAZHANI 249 3-5-29 319 Kottopadam 3'2 3-1-46-2 263 Kazhani 249'2 3-5-29-2 320 Kottuvad 28'1 3·1-20-1 264 KERALASSERI 173 3-4-15 321 Kozhikkara 87'3 3-2-37-3 265 KEZHAKKETHARA 279 3-6-35 322 Kozhikottusseri 138'3 3-3-34-3 266 Kinasseri 120'2 3-3-16-2 323 Kozhinhil 25'S 3-1-17-5 267 KINASSERI 192 3-4-38 324- KOZHINJAMPARA 292 3-6-12 268 KINAVALLUR 213 3-4-19 325 KOZHIPATHY 294 3-6-14 269 KIZHAKKANCHERRY 228 3-5-39 326 KUDALLUR 69 3-2-13 '270 KIZHAKKUMPURAM 210 3-4-14 327 Kudallur 69'2 3-2-13-2 271 KIZHATTUR 14 3-1-4 328 Kulakkad 119'1 3-3-15-1 272 Kizhattur 14'4 3-1-4-4 329 Kulakkattukurissi 118'2 3-3-12-2 273 Kizhayur 141·1 3-3-37-1 330 Kulappadam 54-2 3-1-48-2
99,-25/224-14 b.
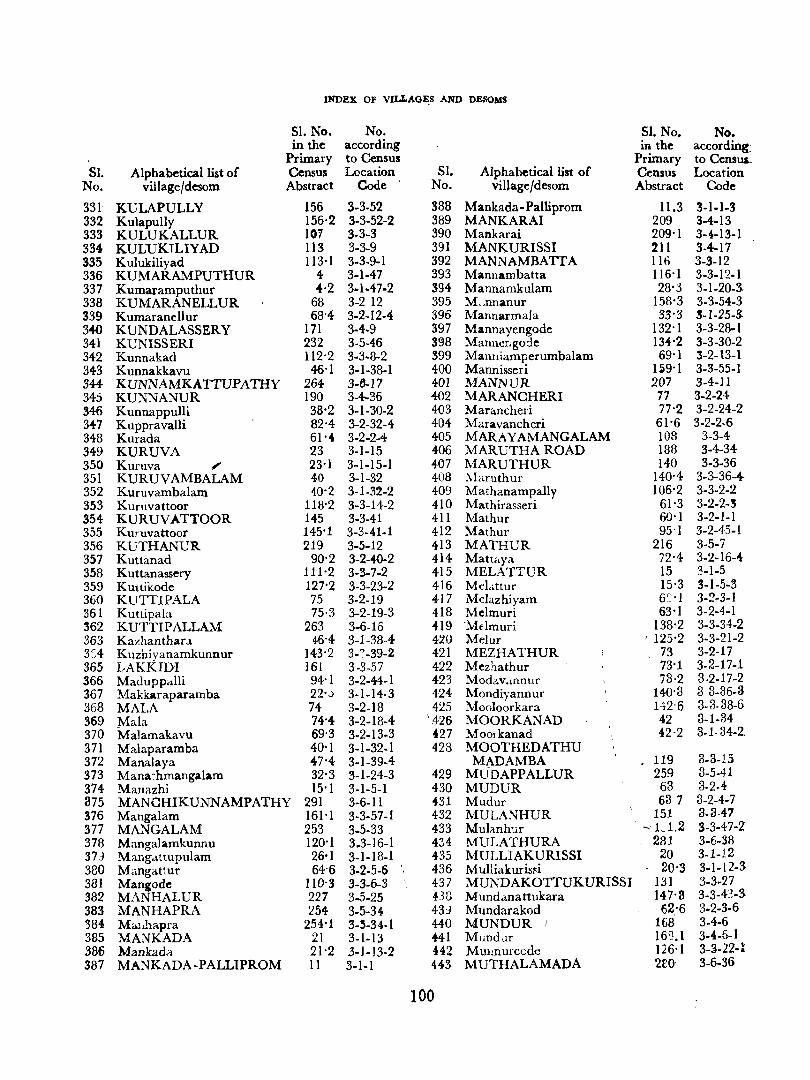
INDEX OF VILLAGE.S AND DESOMS
Sl. No. No. SI. No. No. in the according in the according:
Primary to Census Primary to Census. S1. Alphabetical list of Census Location Sl. Alphabetical list of ~nsus L<><.:ation
No. village/desom Abstract Code No. village/desom Abstract Code
331· KULAPULLY 156 3-3-52 388 Mankada-Palliprom 1l.3 3-1-1-3 332 Kulapully 156·2 3-3-52-2 389 MANKARAI 209 3-4-13 333 KULUKALLUR 107 3-3-3 390 Mankarai 209'1 3-4-13-1 334 KULDKTLIYAD 113 3-3-9 391 MANKURISSI 211 3-4-17 335 Kulukiliyad 113·1 3-3-9-1 392 MANNAMBATTA 116 3-3-12 336 KUMARAMPUTHUR 4 3-1-47 393 Mannambatta 116'1 3-3-12-1 337 Kumaramputhur 4·2 3-1-47-2 394 Mannamkulam 28'3 3-1-20·3-338 KUMARANELLUR 68 3-2 12 395 M,.nnanur 158'3 3-3-54-3 339 Kumaranellur 68'4 3-2-12-4 396 NIannarmala 33'3 3-1-25-S 340 KUNDALASSERY 17l 3-4-9 397 Mannayengode 132'1 3-3-28-1 341 KUNISSERI 232 3-5-46 398 Mannengode 134·2 3-3-30-2 342 Kunnakad 112'2 3-3-8-2 399 Manniamperumbalam 69'1 3-2-\3-1 343 Kunnakkavu 46'1 3-1-38-1 400 Mannisseri 1~9'1 3-3-55-1 344 KUNNAMKATTUPATHY 264 3-6-17 401 MANNUR 207 3-4-11 345 KUNNANUR 190 3-4-36 402 MARANCHERI 77 3-2-24 346 Kunnappulli 38'2 3-1-30-2 403 Marancheri 77'2 3-2-24-2 347 Kuppravalli 82'4 3-2-32-4 404 Maravancheri 61'6 3-2-2-6 348 Kurada 61'4 3-2-2-4 405 MARAYAMANGALAM 108 3-3-4 349 KURUVA 23 3-1-15 406 MARUTHA ROAD 188 3-4-34 350 Kuruva ;r 23'1 3-1-15-1 407 MARUTHUR 140 3-3-36 351 KURUVAMBALAM 40 3-1-32 408 Maruthur 140'4 3-3-36-4 352 Kuruvamba1am 40'2 3-1-32-2 409 Mathanampally 106'2 3-3-2-2 353 Kurllvattoor 118'2 3-3-14-2 410 Mathirasseri 61'3 3-2-2-~
354 KURUVATTOOR 145 3-3-41 411 Mathur 60'1 3-2-1-1 355 Kuruvattoor 145'1 3-3-41-1 412 Mathur 95·1 3-2-45-1 356 KUTHANUR 219 3-5-12 413 MATHUR 216 3-5-7 357 Kuttanad 90'2 3-2-40-2 414 Matte-ya 72·4 3-2-16-4 358 Kuttanassery 111'2 3-3-7-2 415 MELATTUR 15 3-1-5 359 Kuttikode 127'2 3-3-23-2 416 Mel,.ttur 15'3 3-1-5-3 360 KUTTIPALA 75 3-2-19 417 Melazhiyam 6'>1 3-2-3-1 361 Kuttipala 75·3 3-2-19-3 418 Me1muri 63'1 3-2-4-1 362 KUTTIPALLAM 263 3-6-16 419 'Melmuri 138'2 3-3-34-2 363 Kazhanthara 46'4 3-1-38-4 420 Melur ' 125'2 3-3-21-2 3::4 Kuzhivanamkunnur 143'2 3-"-39-2 421 MEZHATHUR 73 3-2-17 365 LAKKIDI 161 3-3-57 422 Mezhathur 73'1 3-2-17-1 366 Maduppalli 94'1 3-2-44-1 423 Modav.mnur 73·2 3·2-17-2 367 Makkaraparamba 22'j 3-1-14-3 424 Mondiyannur 140·3 3 3-36-3 368 MALA 74 3-2-18 425 Mooloorkara 142'6 3·3·38-6 369 Mala. 74'4 3-2-18-4 '426 MOORKANAD 42 3-1-34 370 Malamakavu 69'3 3-2-13-3 427 Moorkanad 42·2 3-1.34-2. 371 Malaparamba 40'1 3-1-32-1 428 MOOTHEDATHU 372 Manalaya 47'4 3-1-39-4 MADAMBA 119 3-3-15 373 Mana ~hmangalam 32'3 3-1-24-3 429 MUDAPPALLUR 259 3-5-41 374 Manazhi 15'1 3-1-5-1 430 MUDUR 63 3-2-4 375 MANCHIKUNNAMPATHY 291 3-6-11 431 Mudur 637 3-2-4-7 376 Manga1am 161·1 3-3-57-1 432 NlULANHUR 151 3-3-47 377 MANGALAM 253 3-5-33 433 Muhnhur -L1.2 3-3-47-2 378 Mangalamkunn u 120'1 3_3-16-1 434 MULATHURA 281 3-6-38 379 Mang4t tupu1am 26·1 3-1-18-1 435 MULLIAKURISSI 20 3-1-12 380 Mangattur 64'6 3-2-5-6 436 Mulliakuris~i 20'3 3-1-12-3-381 Mangode lID'3 3-3-6-3 437 MUNDAKOTTUKURISSI 131 3-3-27 382 MANHALUR 227 3..5-25 438 M und"ma ttukara 147'3 3-3-43-3-383 MANHAPRA :.!54 3-5-34 43) Mundarakod 62'6 3-2-3-6 '384 Malihi1.pra 254·1 3-~-34-1 440 MUNDUR I 168 3-4-6 385 MANKADA 21 3-1-13 441 Mundcl.r 16'U 3-4-6-1 386 Mankad.l. 21'2 3-J-13-2 442 MUlmurccd.~ 126'1 3-3-22-1 387 MANKADA-PALLIPROM 11 3-1~1 443 MUTHALAMADA 2~0 3-6-36
100
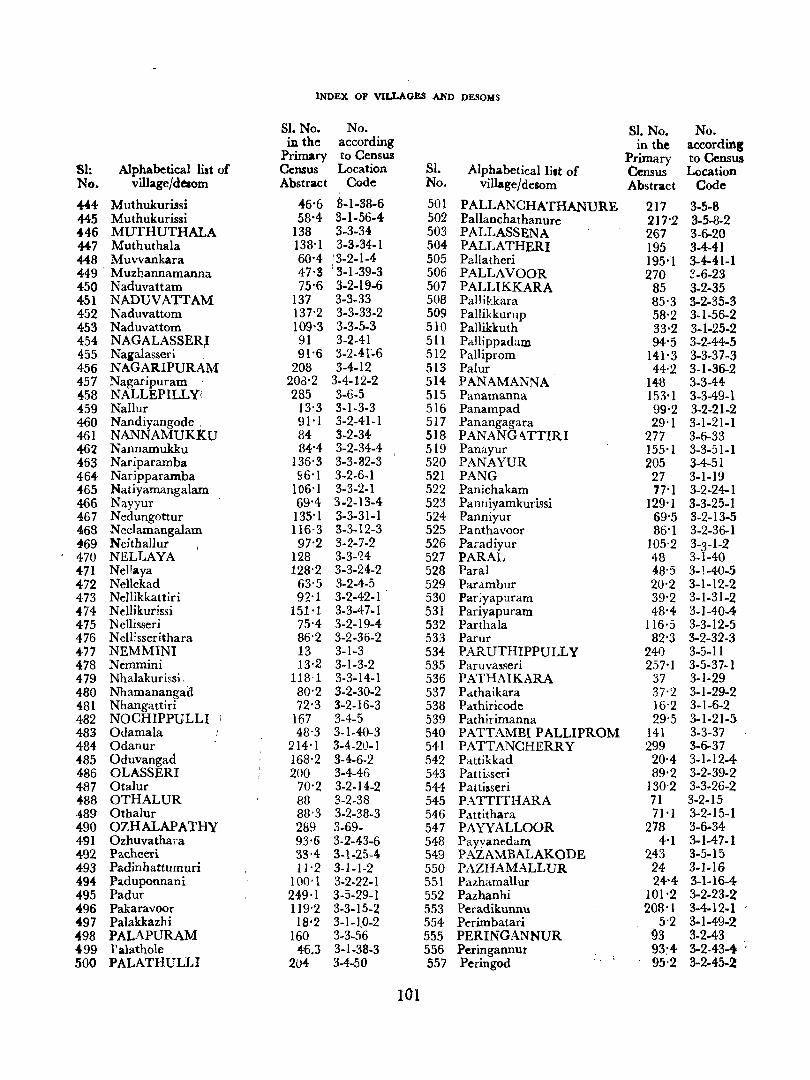
81: Alphabetical list of N<t. village/doom
444 Muthukurissi 445 Muthukurissi 446 MUTHUTHALA 44-7 Muthuthala 448 Muvvankara 449' Muzhannamanna 450 Naduvattam 451 NADUVATIAM 452 Naduvattom 453 Naduvattom 454 NAGALASSER~ 455 Na,alasseri I
456 NAGARIPURAM 457 Nagaripuram 458 NALLEPILLYi 459 Nallur 460 Nandiyangode 461 NANNAMUKKU 462 Nannamukku 463 Nariparamba 464 Naripparamba 465 Natiyamangalam 466 Nayyur 467 Nedungottur 468 Neelamangalam 4169 Ncithallur 470 NELLAYA HI Nellaya 472 Nellekad 473 NeIlikkattiri 474 Nellikurissi 475 Nellisseri 476 NelEsserithara 477 NEMMINI 478 Nemmini 479 Nhalakurissi, 480 Nhamanangad 481 Nhangattiri 482 NOCHIPPULLI 48~ Odamala 484 Odanur 485 Oduvangad 486 OLASSERI 487 Otalur 488 OTHALUR ·489 Othalur 490 OZHALAPATHY 491 Ozhuvathara 492 Pacheeri 493 Padinhattumuri 494 Paduponnani 495 Padur 496 Pakaravoor 497 Palakkazhi 498 PALAPURAM 499 l' alathole 500 PALATHULLI
INDEX OF VILLAGES AND DESOMS
SI. No. in the
Primary Census Abstract
No. according ~o Census Location
Code
46-6 8-1-38-6 58-4 3-1-56-4
138 3-3-34 138-1 3-3.34-1 60-4 !3-2-1-4 47 -3 I 3-1-39-3 75'6 3-2-19-6
137 3-3-33 137-2 3-3-33-2 109-3 3-3-5-3 91 3-2-41 91'6 3-2-41~6
208 3-4-12 203-2 3-4-12-2 285 3-6-5
13-3 3-1-3-3 91 -I 3-2-41-1 84 3-2-34 84-4 3-2-34-4
136-3 3-3-32-3 96-1 3-2-6-1
106-1 3-3-2-1 69-4 3·2-13-4
135-1 3-3-31-1 116·3 3-3-12-3 97-2 3-2-7-2
128 3-3-'24 128'2 3-3-24-2
63-S 3-2-4-5 92·1 3-2-42-1
151-1 3-3-47-1 75-4 3-2-19-4-86-2 3-2-36-2 13 3-1-3 13-2 3-1-3-2
118·1 3-3-14-1 80-2 3-2-30-2 72'3 3-2-16-3
167 3-4-5 48'3 3-1-40-3
214-1 3-4-2U-l 168-2 3-4-6-2 200 3-4-46
70-2 3-2-14-2 88 3-2-38 88' 3 3-2-38-3 289 3-69-93·6 3-2-43-6 33-4 3-1-25-4 IH? 3-1-1-2
100'1 3-2-22-1 249·1 3-5-29-1 119'2 3-3-15-2 18-2 3-1-l0-2
160 3-3-56 4:6_3 3-1-38-3
204 3-4-50
101
SI. No.
501 502 503 504 505 506 507 508 509 510 511 512 513 514 515 516 517 518 519 520 521 522 523 524 525 526 527 528 529 530 531 532 533 534-535 536 537 538 539 540 541 542 543 544 545 546 547 548 549 550 551 552 553 554 555 556 557
Alphabetical lilt of village/desom
PALLANCHATHANURE Pallanchathanure PALLASSENA PALLATHERI Pallatheri PALLAVOOR PALLIKKARA Pallikkara PalJikkurup Pallikkuth PallippadaIll Palliprom Palur PANAMANNA Panamanna Panampad Panangagara PANANG<\TTIRI Panayur PANAYUR PANG Panichakam Pal1lliyamkurissi Panniyur Panthavoor Paradiyur PARAL Paral ParJ.mbur Par;yapuram Pariyapuram Parthala Parur PARUTHIPPULLY Paruvasseri PATHAIKARA Pathaikara Pathiricode Pathirimanna PATTAMBI PALLIPROM PATTANCHERRY Pattikkad Patti,;seri Pattisseri PATTITHARA Pattithara PAYYALLOOR Payyanedam PAZAMBALAKODE PAZHAMALLUR Pazhamallur Pazhanhi Peradikunnu Perimbatari PERINGANNUR Peringannur Perin god
81. No. in the
Primary Census Abstract
217 2]7-2 267 195 195'1 270
85 85'3 58-2 33-2 94'5
141'3 44·2
148 153-1 99-2 29-1
277 155-1 205 27 77-1
129-1 69-5 86-1
105'2 48 48'5 20-2 39-2 48-4-
116-5 82-3
240 257-1
37 37-2 16-2 29'5
141 299
20-4 89-2
130'2 71 71'1
278 4-1
243 24 24-4
101'2 208-1
5'2 93 93:4 95-2
No. according to Census Location
Code
3-5-8 3-5-8-2 3-6-20 3-4-41 3-4-41-1 ?-6-23 3-2-35 3-2-35-3 3-1-56-2 3-1-25-2 3-2-44-5 3-3-37-3 3-1-36-2 3-3-H 3-3-49-1 3-2-21-2 3-1-21-1 3-6-33 3-3-51-1 3-4-51 3-1-19 3-2-24-1 3-3-25-1 3-2-13-5 3-2-36-1 3-3-1-2 3-1-40 3-)-40-5 3-1-12-2 3-1-31-2 3-1-40-4 3-3-12-5 3-2-32-3 3-5-11 3-5-37-1 3-1-29 3-1-29-2 3-1-6-2 3-1-21-5 3-3-37 3-6-37 3-1-12-4-3-2-39-2 3-3-26-2 3-2-15 3-2-15-1 3-6-34 3-1-47-1 3-5-15 3-1-16 3-1-16-4-3-2-23-2 3-4-12-1 3.1-49-2 3-2-43 3·2-43..... . 3-2-45-2
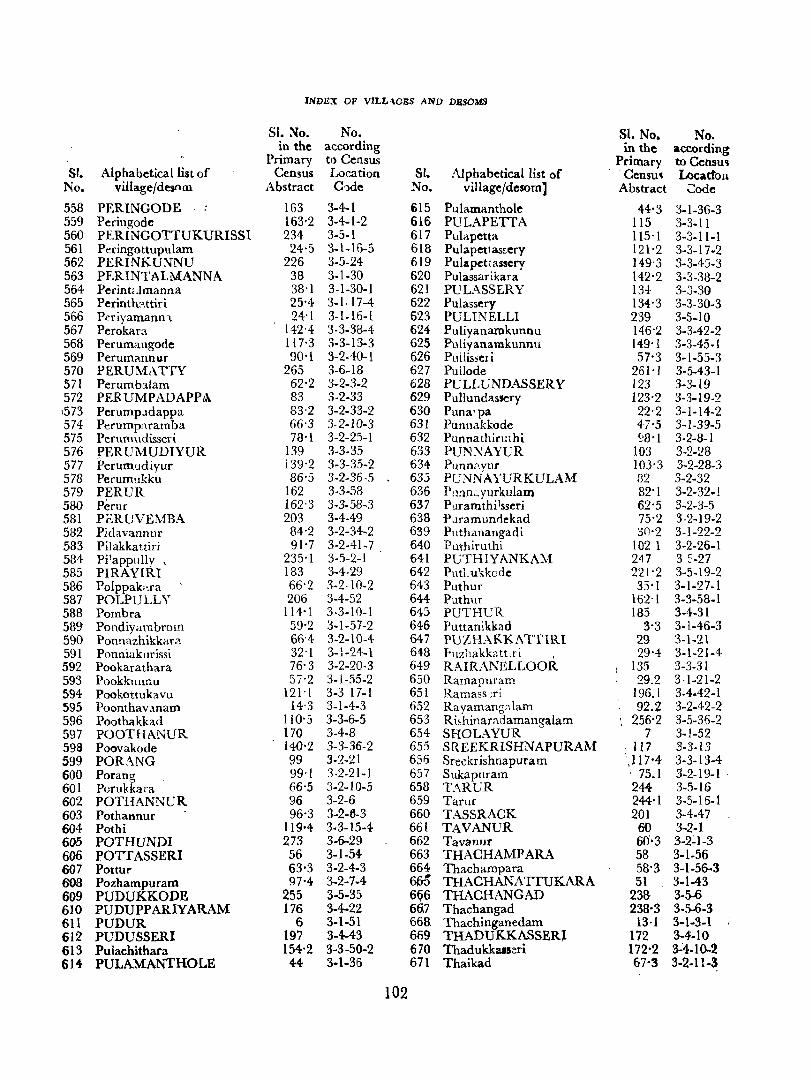
INDEX OF VILL lGBS AND DBSOMS
st. ~o. No. SI. No. No_ in the according in the according
Primary to Census Primary to Censu'J SI. Alphabetical list of Census Location SI. Alphabetical list of - 'Censu~ LocattolJ.
No. viilage/desnm Abstract C'lde No. village/dcsom] Abstract ~ode
558 PERINGODE 163 3-4-1 615 Pulamanthole 44-3 3-1-36-3 559 Peringode 163'2 3-4-1-2 616 PULAPETIA 115 3-3·11 560 PERINGOTTUKURISSI 234 3-5-1 617 Pulapetta 115'1 3-3-11-1 561 Peringottupulam 24·) 3-1-16-5 618 Pulapettas~ery 121'2 3-3-17-2 562 PERINKU~NU 226 3-5-24 619 Pulapct,assery 149-3 3-3-4,)-3 563 PERINTALMANNA 38 3-1-30 620 Pulassarikara 142'2 3-3-38-2 564 Perint<.lmanna 38'1 3-1-30-1 621 PLTLASSf,RY 134- 3-3-39 565 Perinth?ttiri 25'4 3-1-17-4 622 Pulassery 134'3 3-3-30-3 566 Periyamann:\ 24'1 3-1-16-1 623 PULINELLI 239 3-5~10 567 Perokar::o. 142'4 3-3-38-4 624 Puliyanamkunnu 146'2 3-3-42-2 568 Perumangode il7'3 3-3-13-3 625 Puliyanamkunnu 149' I 3-3-45-1 569 Perum<>.nnur 90'1 3-2-40-1 626 Pullisser i 57'3 3-1-55-3 570 PERUMATTY 265 3-6-18 627 PulJode 261'1 3-5-43-1 571 Perumbalam 62'2 3-2-3-2 628 Pt;LLUNDASSERY 123 3-3-19 572 PERUMPADAPPA 83 3-2-33 629 Pullundassery 123'2 3-3-19-2 ,573 PerumpJdappa 83·2 3-2-33-2 630 Punarpa 22·2 3-1-14-2 574- Perumpztramba 66·3 3-2-10-3 631 Punnakkode 47-5 3-1-39-5 575 Perum\\disseri 78'1 3-2-25-1 632 Punnathirut hi 98'1 3-2-8-1 576 PERUMUDIYUR 139 3-3-35 633 PUN:,\AYUR 103 3-2-28 577 Perumudiyur 139·2 3-3-35-2 634 Punn"vur 103·3 3-2-28-3 578 Perumukku 86'5 3-2-36-5 635 PUNNAYURKULAM 82 3-2-32 579 PERUR 162 3-3-58 636 Punn::. yurkulam 82-1 3-2-32-1 530 Perur 162·3 3-3·58-3 637 Puramthi1sseri 62'5 3-2-3-5 531 P.c:RUVEMBA 203 3-4-49 638 Puramundekad 75'2 3-2-19-2 532 Pidavannur 84'2 3-2-34-2 639 Puthanangadi 30'2 3-1-22-2 583 Pilakkattiri 91-7 3-2-41-7 640 Puthiruthi 102 1 3-2-26-1 584 Pi l applllly , 235'1 3-5-2-1 641 PUTHIYANKAM 247 3 ':-27 585 PIRAYIRI 183 3-4-29 642 PutLukkode 221'2 3-5-19-2 586 Polppak,·.ra 66'2 3-2-10-2 643 Puthur 35-1 3-1-27-1 587 POLPULLY 206 3-4-52 644 Puthur 162-1 3-3·58-1 588 Pombra 114'1 3-3-10-1 645 PUTHeR 185 3-4-31 589 Pondiyambrom 59'2 3-1-57-2 646 Puttanikkad 3-3 3-1-46-3 590 Ponnazhikkar? 66-4 3-2-10-4 647 PUZH.-\.KKATTIRI 29 3-1-2 t 591 Ponniakurissi 32'1 3-1-24-1 648 hlzhakbtt.ri 29'4 3-1-21-4 592 Pookarathara 76'3 3-2-20-3 649 RAIRANELLOOR 135 3-3-31 593 Pookkunnu 57'2 3-1-55-2 650 Ramapul'am 29.2 3-1-21-2 594 Pookottukavu 121-1 3-3 17-1 651 Ramass;ri 196.1 3-4-42-1 595 Poonthav.lnam 14-3 3-1-4-3 652 Rayamangalam 92.2 3-2-42-2 596 Poothakkad 110'5 3-3-6-5 653 Ri~hinar;1.damangalam 256-2 3-5-36-2 597 POOTHANUR 170 3-4-8 654 SHOLAYUR 7 3-1-52 598 Poovakode 140-2 3-3-36-2 655 SR EEKRISHNAPURAM • 117 3-3-13 599 PORANG 99 3-2-21 656 Sreckrishnapuram )17-4 3-3-13-4 600 Porang 99·1 3·2-21-1 657 Sukapuram ' 75_1 3-2-19-1 . 601 Porukkara 66'5 3-2-10-5 658 T:\RUR 244 3-5-16 602 POTHANNUR 96 3-2-6 659 Tarur 244,1 3-5-15-1 603 Pothannur 96·3 3-2-6-3 660 TASSRACK 201 3-4-47 604 Pothi 119-4- 3-3-15-4 661 TAVANUR 60 3-2-1 6(}5 POTHUNDI 273 3-6-29 662 Tavanur 60'03 3-2~1-3 606 POTTASSERI 56 3-1-54 663 THACHAMPARA 58 3-1-56 607 Pottur 63'3 3-2-4.3 664 Thachampara 58-3 3-1-56-3 60S Pozhampuram 97·4- 3-2-7-4 665 THACHANATTUKARA 51 3-1-43 609 PUDUKKODE 255 3-5-35 6~6 THACH AN GAD 238- 3-5-6 610 PUDUPPARIYARAM 176 3-4-22 6 7 Thachangad 238-3 3-5-6-3 611 PUDUR 6 3-1-51 668 Thachinganedam 13·1 3-1-3-1 612 PUDUSSERI 197 3-4-43 669 THADUKKASSERJ 172 3-4-10 613 Pulachithara 154-2 3-3-50-2 670 Thadukkus::n 172-2 34-10-2 614 PULAMANTHOLE 44 3-1-36 671 Thaikad 67-3 3-2-11-3
102
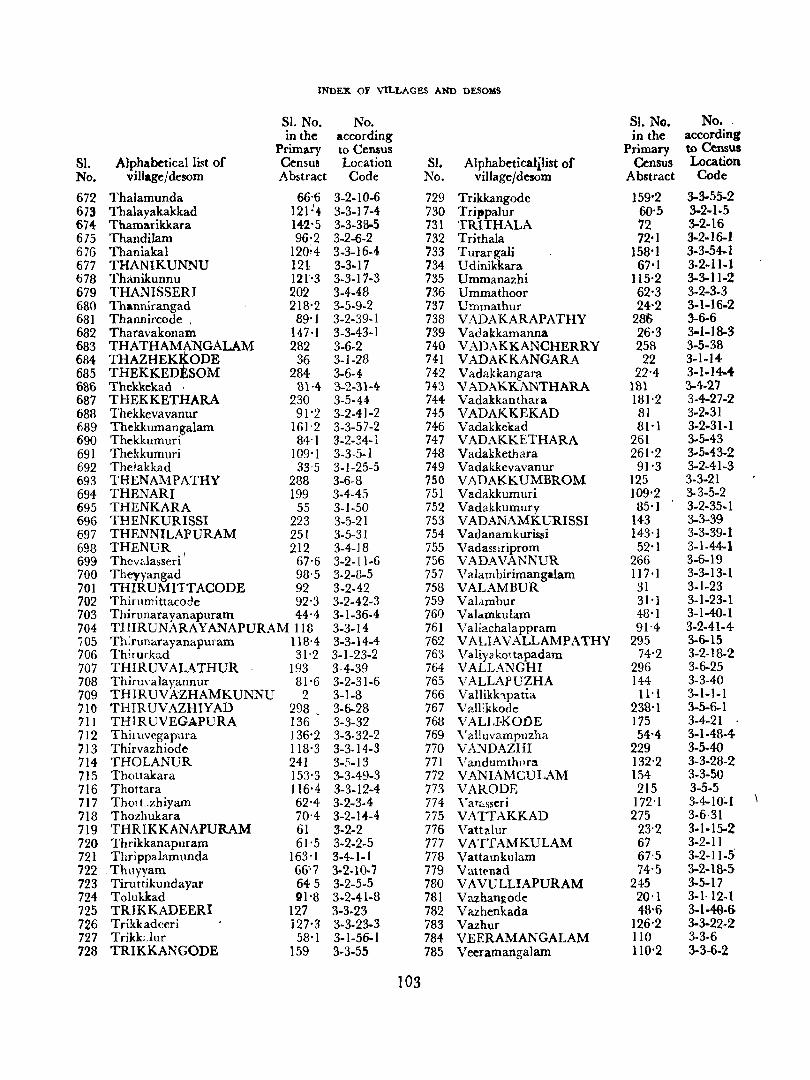
INDEX OF VILLAGES AND DESO'MS
SI. No. No. SI. No. No •. in the according in the according
Primary to Census Primary to Census S1. Alphabetical list of Census Location SI. Alphabeticalilist of Census Location No. village I desom Abstract Code No. vil1ageJdesom Abstract Code
672 Thalamunda 66'6 3-2-10-6 729 Trikkangode 159'2 3-3-55-2 673 Thalayakakkad 121 )4 3-3-17-4 730 TriItpalur 60'5 3-2-1-5 674 TbamarikkaTa 142-5 3-3-38-5 731 TRITHALA 72 3-2-16 675 Thandilam 96-2 3-2-6-2 732 Trithala 72'1 3-2-16-1 676 Thaniakal 120~4 3-3-16-4 733 Tural'gali 158'1 3-3-54-1 677 THANIKUNNU 121, 3-3-17 734 Udinikkara 67'1 3-2-11-1 678 Thanikunnu 121'3 3-3-17-3 735 Ummanazhi 115-2 3-3-11-2 679 THANISSERI 202 3-4-48 736 Ummathoor 62·3 3-2-3-3 680 Thannirangad 218'2 3-5-9-2 737 Ummathur 24'2 3-1-16-2 681 Thannircode . 89-1 3-2-39-1 738 VADAKARAPATHY 2$ 3-6-6 682 Tharavakonam 147,1 3-3-43-1 739 Vadakkamanna 26'3 3-1-18-3 683 THATHAl\~NGALAM 282 3-6-2 740 VADAKKANCHERRY 258 3-5-38 684 THAZHEK ODE 36 3-1-28 741 VADAKKANGARA 22 3-1-14 685 THEKKED SOM 284 3-6-4 742 Vadakkangara 22'4 3-1-14-4 686 Thekkekad 81·4 3-2-31-4- 743 VADAKKANTHARA un 3-4-27 687 THEKKETHARA 230 3-5-44 744- Vadakkanthar a 131'2 3-4-27-2 688 Thekkevavanur 91-2 3-2-41-2 745 VADAKKEKAD 81 3-2-31 689 Thekkumangalam 161'2 3-3-57-2 746 Vadakkekad 81'1 3-2-31-1 690 Thekkumuri 84'1 3-2-34-1 747 VADAKKETHARA 261 3-5-43 691 Thekkumuri 109'1 3-3,5-1 748 Vadakketh ara 261'2 3-5-43-2 692 Thelakkad 33-5 3- 1-25-5 749 Vadakkevavanur 91'3 3-2-41-3 693 THENAMPATHY 288 3-6-8 750 VADAKKUMBROM 125 3-3-21 694 THENARI 199 3-4-45 751 Vadakkumuri 109'2 3-3-5-2 695 THENKARA 55 3-1-50 752 Vadakkumury 85,) 3-2-35-1 696 THENKURISSI 223 3-5-21 753 V ADANAMKURISSI 143 3-3-39 697 THENNILAPURAM 251 3-5-31 754 Vadanamkurissi 143'1 3-3-39-1 698 THENUR 212 3-4-18 755 Vadasslriprom 52'1 3-1-44-1 699 Thcvdasseri I 67'6 3-2-11-6 756 VADAVANNUR 266 3-6-19 700 Theyyangad 98'5 3-2-8-5 757 Valambirimangalam II7'1 3-3-13-1 701 THIRUMITTACODE 92 3-2-42 758 VALAMBUR 31 3-1-23 702 Thirumittacode 92'3 3-2-42-3 759 Valambur 31'1 3-1-23-1 703 Thirunarayanapuram 44,4 3-1-36-4 761) Valamku1am 48'1 3-1-40-1 704 THIRUNARAYANAPURAM 118 3-3-14 761 Valiachala ppram 91'4 3 .. 2-41-4-'i05 Th:rund.rayanapuram 118·4 3-3-14-4 762 VALIAVALLAMPATHY 295 3-6-15 706 Thirurkad 31'2 3-1-23-2 763 Valiyakottapadam 74'2 3-2-18-2 707 THIRUV ALATHUR 193 3·4-39 764 VALLANGHI 296 3-6-25 708 Thirm'alavannur 81-6 3-2-31-6 765 VALLAPUZHA 144 3-3-40 709 THIRUVAZHAMKUNNU 2 3-1-8 766 Vallikk-tpatia 11'1 3-1-1-1 710 THIRUVAZHIYAD 298 3-6-28 767 V~IEkkode 238-1 3-5-6-1 711 THIR UVEGAPURA 136 3-3-32 768 VALLI-KODE 175 3-4-21 712 Thir uvegapura 136'2 3-3-32-2 769 \' all uvampllzha 54'4 3-1-48-4-713 Thirvazhiode 118'3 3-3-14-3 770 VANDAZHI 229 3-5-40 714 THOLANUR 241 3-.'>-13 771 Vandumthllra 132'2 3-3-28-2 715 Thottakara 153'3 3-3-49-3 772 VANIAMCULAM 154- 3-3-50 716 Thottara 116-4 3-3-12-4- 773 VARODE 215 3-5-5 717 ThotLzhiyam 62'4 3-2-3-4 774 Vat .. sseri 172'1 3-4-1O~I
718 Thozhukara 70'4- 3-2-14-4 775 VATTAKKAD 275 3-6·31 719 THRIKKANAPURAM 61 3-2-2 776 Vatt"luf 23·2 3-1-15-2 720 Thrikkanapuram 61'5 3-2-2-5 777 VATTAMKULAM 67 3-2-11 721 Thrippalamunda 163'1 3-4-1-1 778 Vattamkulam 67'5 3-2-11-5 722 . Thuyyam 66"7 3-2-10-7 779 Vattenad 74'5 3-2-18-5 723 Tiruttikundayar 645 3-2-5-5 780 VA VULLIAPURAM 245 3-5-17 724 Tolukkad 01'8 3-2-41-8 781 Vazhanll.ode 20,1 3-1· 12-1 725 TRIKKADEERI 127 3-3·23 782 Vazhenkada 48'6 3-1-49-6 726 Trikkadceri 127'3 3-3-23-3 783 Vazhur 126'2 3-3-22-2 727 Trikkdur 58'1 3-1-56-1 784 VEERAMANGALAM 110 3-3-6 728 TRIKKANGODE 159 3-3-55 785 Veeramangalarn 110-2 3-3-6-2
103
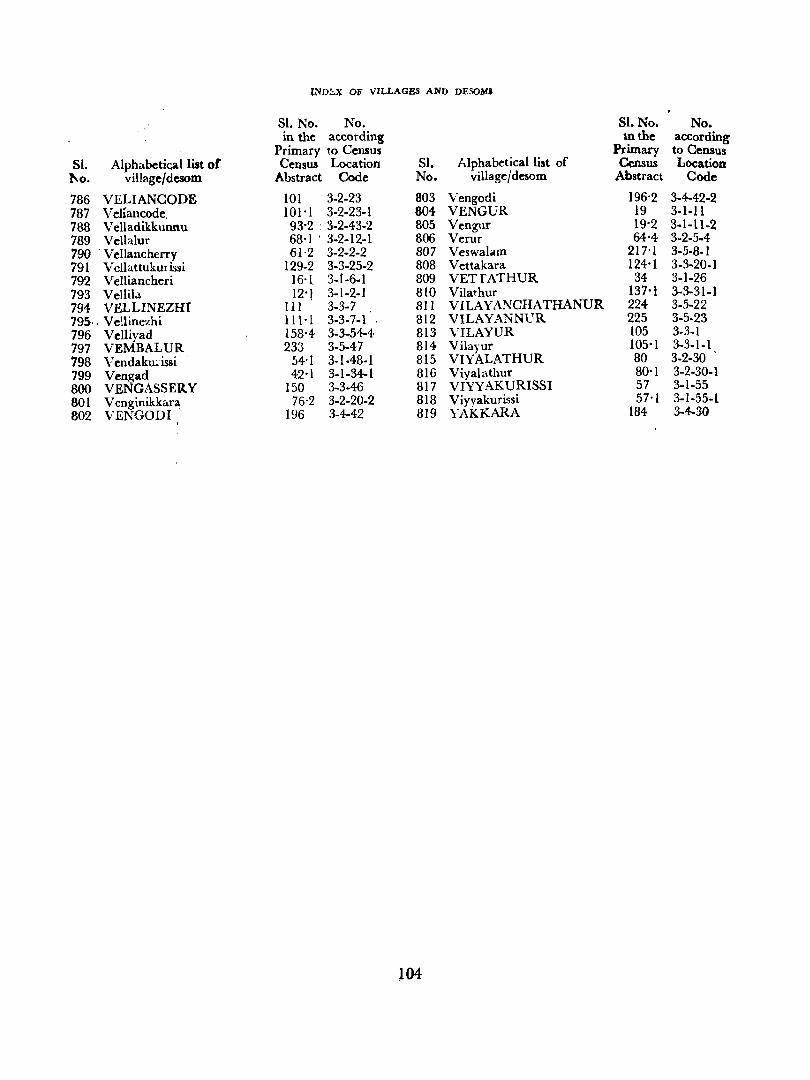
tNDl:.X OF VILLAGES AND DESOMS
51. No. No. 51. No. No. in the according mthe according
Primary to Census Primary to Census SI. Alphabeti~al list or Census Location 51. Alphabetical list of Census Location
1\0. village{desom Abstract Code No. village/desom Abstract Code
786 VELIANCQDE 101 3·2·23 803 Vengodi 196'2 3-4-42-2 787 Veliancode. 101'1 3-2-23-1 804 VENGUR 19 3-1-11 788 Velladikkunnu 93'2 . 3-2-43-2 805 Vengur 19'2 3-1-11-2 789 Vellalur 68'1 ' 3·2-12-1 806 Verur 64'4 3-2-5-4 790 . Vellancherry 61·2 3-2-2-2 807 Veswalam 217'1 3-5-8-1 791 Vellattukurissi 129-2 3-3-25-2 808 Vettakara 124'1 3-3-20-1 792 Velliancheri 16'1. 3-1-6-1 809 VETfATHUR 34 3-1-26 793 Vellila. 12'\ 3-1-2·1 810 Vilathur 137'1 3-3-31-1 794 VELLINEZHI III 3-3-7 811 VILA Y ANCHATHANUR 224 3-5-22 79~,. Vellinezhi I1H 3-3-7-1 812 VILA YANN1JR 225 3-5-23 796 Velliyad 158'4- 3-3-54-4 813 VILAYVR 105 3-3-1 797 VEMBALUR 233 3-5-47 814 Vilayur 105'1 3-3-1-1 798 Vendaktdssi 54'1 3-1-48-1 815 VIYALATHUR 80 3-2-30 .
799 Vengad 42" 3-1-34-1 816 Viyalathur 80'1 3-2-30-1 800 VENGASSERY 150 3-3-46 817 VIYYAKURISSI 57 3-1-55 801 Venginikkara 76·2 3-2-20-2 818 Viyyakurissi 57'1 3-1-55-1 802 VENGODI 196 3-4-42 819 YAKKARA 184 3-4.30
l04
Copyright © 2022 FDOKUMEN